UNITED STATES
SECURITIES AND EXCHANGE COMMISSION
Washington, D.C. 20549
FORM 6-K
REPORT OF FOREIGN PRIVATE ISSUER PURSUANT TO RULE 13A-16 OR 15D-16 OF THE SECURITIES EXCHANGE ACT OF 1934
| For the month of | July | 2025 | |
| Commission File Number | 001-40569 |
| Standard Lithium Ltd. |
| (Translation of registrant’s name into English) |
|
Suite 1625, 1075 W Georgia Street Vancouver, British Columbia, Canada V6E 3C9 |
| (Address of principal executive offices) |
Indicate by check mark whether the registrant files or will file annual reports under cover of Form 20-F or Form 40-F:
| Form 20-F | ¨ | Form 40-F | x |
DOCUMENTS INCLUDED AS PART OF THIS REPORT
SIGNATURES
Pursuant to the requirements of the Securities Exchange Act of 1934, the registrant has duly caused this report to be signed on its behalf by the undersigned, thereunto duly authorized.
| Standard Lithium Ltd. | |||||
| (Registrant) | |||||
| Date: | July 31, 2025 | By: | /s/ Salah Gamoudi | ||
| Name: | Salah Gamoudi | ||||
| Title: | Chief Financial Officer | ||||
Exhibit 99.1
| South West Arkansas Project Pre-Feasibility Study | 23 July 25 |
Cautionary Note Regarding Forward-Looking Information
Information contained in this report and the documents referred to herein which are not statements of historical facts, may be “forward-looking information” for the purposes of Canadian Securities laws. Such forward looking information involves risks, uncertainties and other factors that could cause actual results, performance, prospects and opportunities to differ materially from those expressed or implied by such forward looking information. The words “expect”, “target”, “estimate”, “may”, “anticipate”, “should”, “will”, and similar expressions identify forward-looking information.
These forward-looking statements relate to, among other things, resource estimates, grades and recoveries, development plans, mining methods and metrics including recovery process and, mining and production expectations including expected cash flows, capital cost estimates and expected life of mine, operating costs, the expected payback period, receipt of government approvals and licenses, time frame for construction, financial forecasts including net present value and internal rate of return estimates, tax and royalty rates, and other expected costs.
Forward-looking information is necessarily based upon a number of estimates and assumptions that, while considered reasonable, are inherently subject to significant political, business, economic and competitive uncertainties and contingencies. There may be factors that cause results, assumptions, performance, achievements, prospects or opportunities in future periods not to be as anticipated, estimated or intended.
There can be no assurances that forward-looking information and statements will prove to be accurate, as many factors and future events, both known and unknown could cause actual results, performance or achievements to vary or differ materially from the results, performance or achievements that are or may be expressed or implied by such forward-looking statements contained herein or incorporated by reference. Accordingly, all such factors should be considered carefully when making decisions with respect to the Project, and prospective investors should not place undue reliance on forward-looking information. Forward-looking information in this technical report is as of the issue date, July 23, 2025. Standard Lithium Ltd. assumes no obligation to update or revise forward-looking information to reflect changes in assumptions, changes in circumstances or any other events affecting such forward-looking information, except as required by applicable law.
| South West Arkansas Project Pre-Feasibility Study | 23 July 25 |
Table of Contents
| 1 | Summary | 1 |
| 1.1 | Issuer and Purpose | 1 |
| 1.2 | Property Location and Ownership | 1 |
| 1.3 | Geology and Mineralization | 2 |
| 1.4 | Status of Exploration | 2 |
| 1.5 | Updated Mineral Resource Estimation | 3 |
| 1.6 | Mining Methods | 5 |
| 1.7 | Recovery Method and Mineral Processing | 6 |
| 1.8 | Capital and Operating Cost Estimates | 7 |
| 1.8.1 | Capital Expenditure Costs | 7 |
| 1.8.2 | Operating Expenditure Costs (OPEX) | 8 |
| 1.9 | Economic Analysis | 10 |
| 1.10 | QP Conclusions | 12 |
| 1.10.1 | Exploration work | 12 |
| 1.10.2 | Mineral Processing work | 12 |
| 1.11 | Key Study Recommendations | 13 |
| 2 | Introduction | 15 |
| 2.1 | Issuer and Purpose | 15 |
| 2.2 | Technical Report Authors and Personal Inspection of Property | 17 |
| 2.3 | Sources of Information | 18 |
| 2.4 | Units of Measure, Currency, and Acronyms | 20 |
| 3 | Reliance on Other Experts | 24 |
| 4 | Property Description and Location | 25 |
| 4.1 | Property Description and Location | 25 |
| 4.2 | Lithium-Brine Mineral Production Rights | 25 |
| 4.2.1 | Summary of the Standard Lithium – TETRA Agreement | 27 |
| 4.2.2 | Summary of Salt Water (Brine) Deeds | 27 |
| 4.2.3 | Summary of Leases | 27 |
| South West Arkansas Project Pre-Feasibility Study | 23 July 25 |
| 4.2.4 | Mineral Brine Right Distribution on Individual Leases | 28 |
| 4.3 | Surface (and Mineral) Rights in Arkansas | 32 |
| 4.4 | Unitization | 33 |
| 4.5 | Potential Future Royalty Payments to Lessors | 34 |
| 4.6 | Property Environmental Liabilities and Permitting | 35 |
| 4.7 | Risks and Uncertainties | 36 |
| 5 | Accessibility, Climate, Local Resources, Infrastructure, and Physiography | 37 |
| 5.1 | Accessibility | 37 |
| 5.1.1 | Airport Access | 37 |
| 5.1.2 | Rail Access | 37 |
| 5.1.3 | Road Access | 37 |
| 5.2 | Climate | 39 |
| 5.3 | Local Resources and Infrastructure | 39 |
| 5.4 | Physiography | 39 |
| 6 | History | 41 |
| 6.1 | Introduction To Brine Production | 41 |
| 6.2 | Regional Assessment of the Lithium Potential of the Smackover Formation Brine | 43 |
| 6.3 | SWA Property Historical Infrastructure Summary | 48 |
| 7 | Geological Setting and Mineralization | 50 |
| 8 | Deposit Type | 58 |
| 9 | Exploration | 59 |
| 9.1 | Subsurface data review | 59 |
| 9.2 | 2018 and 2023 Lithium Concentration Data Sampling program | 59 |
| 9.3 | Exploration Results and Interpretation | 63 |
| 10 | Drilling | 65 |
| 10.1 | Standard Lithium exploration program | 68 |
| 10.1.1 | Taylor, Beulah et al 1 Well Re-entry | 71 |
| 10.1.2 | International Paper Company 1 Well Re-entry | 72 |
| 10.1.3 | Carter-Moore 1 Well Re-entry | 72 |
| South West Arkansas Project Pre-Feasibility Study | 23 July 25 |
| 10.1.4 | Speer 1 New Well | 72 |
| 10.1.5 | Montague 1 New Well | 72 |
| 11 | Sample Preparation, Analyses, and Security | 73 |
| 11.1 | Sampling Methods | 73 |
| 11.2 | Sample Preparation, Analyses And Security | 73 |
| 11.2.1 | Brine Sample Collection | 73 |
| 11.2.2 | Security | 75 |
| 11.2.3 | Analytical Methodology | 75 |
| 11.3 | Quality Control/Quality Assurance | 76 |
| 11.3.1 | Field Duplicate Samples | 76 |
| 11.4 | Other Data: Core Reports | 77 |
| 11.5 | Summary | 78 |
| 12 | Data Verification | 79 |
| 12.1 | Verification of Lithium Concentration Data, Well Logs, and Core Data | 79 |
| 12.2 | Verification of Metallurgical Process Data | 81 |
| 13 | Mineral Processing and Metallurgical Testing | 83 |
| 13.1 | Introduction | 83 |
| 13.1.1 | Process Selection Rationale | 84 |
| 13.1.2 | Process Overview | 85 |
| 13.2 | Historical Testing | 86 |
| 13.3 | Demonstration Plant Testing | 86 |
| 13.3.1 | Overview | 86 |
| 13.3.2 | Brine Pre-Treatment Testing | 91 |
| 13.3.3 | DLE Testing at the Demonstration Plant | 91 |
| 13.3.4 | LSS Laboratory Testing | 94 |
| 13.4 | Demonstration Plant LiCl Purification and Concentration | 95 |
| 13.5 | Additional LiCl Purification and Concentration Testing | 96 |
| 13.6 | LiCl Conversion Testing | 96 |
| 13.6.1 | Electrolysis | 97 |
| 13.6.2 | Bi-polar Membrane Electrodialysis (BPMED) | 98 |
| South West Arkansas Project Pre-Feasibility Study | 23 July 25 |
| 13.6.3 | Direct Lithium Conversion | 99 |
| 13.6.4 | Further Development | 99 |
| 13.7 | Crystallization and Packaging | 100 |
| 13.8 | Process Testing QA/QC | 100 |
| 13.9 | Process Scalability | 101 |
| 13.10 | Process Technical Risks and Mitigation Measures | 101 |
| 13.11 | Conclusions and Recommendations | 102 |
| 14 | Mineral Resource Estimates | 103 |
| 14.1 | Geologic Model Description | 104 |
| 14.2 | Lithium Resource Estimates | 113 |
| 14.3 | QP Discussion | 115 |
| 15 | Mineral Reserve Estimates | 117 |
| 16 | Mining Methods | 118 |
| 16.1 | Lithium Recovery Process | 118 |
| 16.2 | Methodology | 119 |
| 16.3 | Well Field Overview | 121 |
| 16.4 | Well Field Configuration | 122 |
| 16.4.1 | Production Wells | 122 |
| 16.4.2 | Injection Wells | 123 |
| 17 | Recovery Methods | 124 |
| 17.1 | Brine Production and Delivery | 126 |
| 17.2 | Production of Purified Lithium Chloride Solution | 126 |
| 17.2.1 | Pretreatment of the Feed Brine | 126 |
| 17.2.2 | Lithium Extraction Process | 127 |
| 17.2.3 | Lithium Barren Brine Disposal | 127 |
| 17.2.4 | Raw Lithium Chloride Purification and Concentration | 128 |
| 17.3 | Production of Lithium Hydroxide | 128 |
| 17.4 | Packaging of Lithium Hydroxide | 129 |
| 17.5 | Projected Energy, Water, and Raw Material Requirements | 129 |
| 18 | Project Infrastructure | 132 |
| South West Arkansas Project Pre-Feasibility Study | 23 July 25 |
| 18.1 | Brine Supply Wells Infrastructure | 132 |
| 18.1.1 | Well Field | 132 |
| 18.2 | Central Processing Facility Infrastructure | 136 |
| 18.2.1 | Fresh Water Supply and Distribution | 137 |
| 18.2.2 | Steam Supply | 138 |
| 18.2.3 | Power Supply | 138 |
| 18.2.4 | Compressed Air | 138 |
| 18.2.5 | Compressed Nitrogen | 138 |
| 18.2.6 | Sour Gas Transfer | 138 |
| 18.2.7 | Chemicals and Reagents | 139 |
| 18.2.8 | Auxiliary Facilities | 139 |
| 18.3 | Effluent Brine/Process Water Injection Wells Network Infrastructure | 140 |
| 18.3.1 | Well Field | 140 |
| 18.3.2 | Pipelines | 143 |
| 19 | Market Studies And Contracts | 144 |
| 19.1 | Background | 144 |
| 19.2 | Lithium Hydroxide Price | 147 |
| 20 | Environmental Studies, Permitting, and Social or Community Impact | 150 |
| 20.1 | Introduction | 150 |
| 20.2 | Environmental Considerations | 150 |
| 20.3 | Permitting | 151 |
| 20.3.1 | Overview | 151 |
| 20.3.2 | Clean Water Act Section 404 Permitting | 152 |
| 20.3.3 | Air Emissions Permitting | 153 |
| 20.3.4 | Water Discharge Permitting | 154 |
| 20.4 | Brine Supply/Disposal Well Permits | 155 |
| 20.4.1 | Underground Injection Control (UIC) Permitting | 156 |
| 20.4.2 | Public Water Supply | 157 |
| 20.4.3 | Resource Conservation Recovery Act | 157 |
| 20.4.4 | Construction Permits, Approvals, and Plans | 157 |
| South West Arkansas Project Pre-Feasibility Study | 23 July 25 |
| 20.5 | Social Impact | 158 |
| 20.6 | Environmental Management and Closure Plan | 159 |
| 21 | Capital and Operating Expenditure Costs | 160 |
| 21.1 | Capital Expenditure Estimate | 160 |
| 21.1.1 | Basis of Estimate | 160 |
| 21.1.2 | General | 160 |
| 21.1.3 | Brine Supply and Injection Well Fields | 160 |
| 21.1.4 | Brine Supply/Return and Sour Gas Pipeline Network | 161 |
| 21.1.5 | Central Processing Facility | 162 |
| 21.1.6 | CAPEX Summary | 163 |
| 21.1.7 | Sustaining Capital | 165 |
| 21.1.8 | Land Costs | 166 |
| 21.2 | Operating Expenditure Estimate | 167 |
| 21.2.1 | Basis of Estimate (BOE) | 167 |
| 21.2.2 | Direct Operational Expenditures | 167 |
| 21.2.3 | Indirect Operational Expenditures | 173 |
| 21.2.4 | Mineral Rights, Royalties and Land Fees | 174 |
| 21.2.5 | OPEX Summary | 175 |
| 21.2.6 | All-In Operating Costs | 177 |
| 21.3 | Exclusions | 177 |
| 21.4 | Upside Production Analysis | 178 |
| 22 | Economic Analysis | 179 |
| 22.1 | Evaluation Criteria | 179 |
| 22.2 | Taxes & Royalties | 180 |
| 22.2.1 | Royalties and Lease Fees | 180 |
| 22.2.2 | Depreciation | 180 |
| 22.2.3 | Corporate Taxes | 180 |
| 22.2.4 | Property Tax | 180 |
| 22.2.5 | Federal Funding and Tax Benefits | 181 |
| 22.3 | CAPEX Spend Schedule | 181 |
| South West Arkansas Project Pre-Feasibility Study | 23 July 25 |
| 22.4 | Production Revenues | 181 |
| 22.5 | Cash-Flow Projection | 181 |
| 22.6 | Economic Evaluation Results | 183 |
| 22.7 | Sensitivity Analysis | 184 |
| 22.8 | Sensitivity Analysis Conclusions | 187 |
| 22.9 | Upside Production Scenario | 187 |
| 22.9.1 | Deviation of Alternative Upside Scenario from Base Case | 187 |
| 23 | Adjacent Properties | 189 |
| 24 | Other Relevant Data and Information | 191 |
| 25 | Interpretations and Conclusions | 192 |
| 25.1 | Exploration Work | 192 |
| 25.2 | Process Development Work | 192 |
| 25.3 | SWA Pre-Feasibility Study Summary | 193 |
| 25.4 | Project Risks | 193 |
| 26 | Recommendations | 196 |
| 27 | References | 197 |
| 28 | Certificate of Authors | 204 |
| South West Arkansas Project Pre-Feasibility Study | 23 July 25 |
List of Figures
| Figure 1-1. SWA Project 2023 Exploration Program | 3 |
| Figure 2-1. SWA Project discussed in this Technical Report | 16 |
| Figure 4-1. SWA Project discussed in this Technical Report | 26 |
| Figure 4-2. SWA Property Ownership Summary | 31 |
| Figure 5-1. SWA Property with cities/towns and access routes, including major and secondary U.S. highways and railway lines | 38 |
| Figure 5-2. Average Temperature and Precipitation in Magnolia, AR | 39 |
| Figure 6-1. Summary of South Arkansas Oil and Gas Production | 42 |
| Figure 6-2. Summary of South Arkansas Brine Production | 43 |
| Figure 6-3. Regional Smackover Formation Lithium Brine Values from the USGS National Produced Waters Database | 45 |
| Figure 6-4. Historic Smackover Formation Lithium Brine Values Derived within, and Adjacent to, the South West Arkansas Property | 47 |
| Figure 6-5. Well Status on the SWA Property | 49 |
| Figure 7-1. Facies Map of the Smackover Formation, Northern Gulf Coast Basin | 52 |
| Figure 7-2. Structural Framework, Northern Gulf Coast | 53 |
| Figure 7-3. Stratigraphic Column of the Late Triassic to Late Jurassic Formations | 54 |
| Figure 7-4. Smackover Stratigraphic Column | 55 |
| Figure 7-5. Smackover Structure Map | 56 |
| Figure 7-6. Exploration Program Wells Cross Section | 57 |
| Figure 9-1. SWA Property Concentration Data | 63 |
| Figure 9-2. Lithium Concentration Map Based on Data Gathered by Standard Lithium | 64 |
| Figure 10-1. Upper Smackover Well Data Source | 66 |
| Figure 10-2. Middle Smackover Well Data Source | 67 |
| Figure 10-3. SWA Property Exploration Program | 69 |
| Figure 10-4. Montague 1 Type Well | 71 |
| South West Arkansas Project Pre-Feasibility Study | 23 July 25 |
| Figure 13-1. SWA Lithium Brine Project Flowsheet Schematic | 86 |
| Figure 14-1. South West Arkansas Field Smackover Type Well, Montague 1 | 108 |
| Figure 14-2. Core Data Plot | 109 |
| Figure 14-3. Porosity Log Calibration to Core Data Plot | 109 |
| Figure 14-4. Porosity Log Net Pay Example | 110 |
| Figure 14-5. Stratigraphic Cross Section, Exploration Program Wells | 111 |
| Figure 14-6. Total Upper Smackover Net Porosity-Thickness | 112 |
| Figure 14-7. Total Middle Smackover Net Porosity-Thickness | 113 |
| Figure 16-1. Core Data Plot with Permeability Data Fit and Equation | 121 |
| Figure 16-2. Supply Well Process | 122 |
| Figure 17-1. Overall Block Flow Diagram of Lithium Hydroxide Production from Smackover Formation Brine | 125 |
| Figure 18-1. Brine Supply Multi-Well Pad Conceptual Layout | 133 |
| Figure 18-2. Central Production Facility Conceptual Layout | 137 |
| Figure 18-3. Brine Injection Multi-Well Pad Conceptual Layout | 141 |
| Figure 19-1. Global Li-ion Battery Cell Demand, GWh, Base Case | 145 |
| Figure 19-2. Lithium Supply and Demand - Historical and forecast from 2020-2030 | 146 |
| Figure 19-3. Global Weighted Average Lithium Hydroxide | 148 |
| Figure 19-4. Global Lithium Price Forecast | 149 |
| Figure 21-1. CAPEX Breakdown | 165 |
| Figure 21-2. OPEX Breakdown | 177 |
| Figure 22-1. NPV Post Tax Sensitivity | 186 |
| Figure 22-2. IRR Post-Tax Sensitivity | 186 |
| Figure 23-1. Arkansas Regional Activity | 1989 |
| South West Arkansas Project Pre-Feasibility Study | 23 July 25 |
List of Tables
| Table 1-1. SWA Property Geologic Factors and Indicated Lithium Resource Estimates | 4 |
| Table 1-2. SWA Property Geologic Factors and Inferred Lithium Resource Estimates | 4 |
| Table 1-3. Capital Cost Summary | 8 |
| Table 1-4. Operating Cost Summary | 9 |
| Table 1-5. Economic Evaluation Summary | 11 |
| Table 2-1. Qualified Persons and Their Responsibilities | 17 |
| Table 2-2. Abbreviations | 20 |
| Table 4-1. SWA Property Ownership Summary | 29 |
| Table 9-1. SWA Property Lithium Concentration Data | 61 |
| Table 10-1. Types of Well Data | 65 |
| Table 10-2. Well Actions Taken During Exploration Program | 70 |
| Table 11-1. Comparison of Field Duplicate Samples from the 2023 Sampling Program | 77 |
| Table 12-1. Comparison of Verification Samples from the 2023 Sampling Program | 80 |
| Table 13-1. Representative Brine Analyses and LiCl Product | 89 |
| Table 14-1. SWA Property Geologic Factors and Indicated Lithium Resource Estimates | 114 |
| Table 14-2. SWA Property Geologic Factors and Inferred Lithium Resource Estimates | 115 |
| Table 17-1. Raw Material Requirements | 131 |
| Table 18-1. Power Consumption for the Brine Supply Well Facilities | 134 |
| Table 18-2. Estimated Brine Supply and Sour Gas Pipeline Details | 136 |
| Table 18-3. Estimated Sour Gas Disposal Pipeline Details | 139 |
| Table 18-4. Power Consumption for the Brine Injection Well Facilities | 142 |
| Table 18-5. Estimated Effluent Brine Pipeline Details | 143 |
| Table 20-1. Applicable Permits and Schedule for SWA Project | 158 |
| South West Arkansas Project Pre-Feasibility Study | 23 July 25 |
| Table 21-1. Pipeline Material Summary | 162 |
| Table 21-2. SWA Project Capital Expenditure Cost Estimate | 164 |
| Table 21-3. Sustaining Capital | 166 |
| Table 21-4. Well Facilities and Central Processing Plant Land Costs | 167 |
| Table 21-5. Manpower Cost Summary | 168 |
| Table 21-6. Annual Electrical Use and Cost | 169 |
| Table 21-7. Average Annual Reagents Cost For 30,000 Tonnes Lithium Hydroxide Per Year Production | 170 |
| Table 21-8. Natural Gas Use | 171 |
| Table 21-9. Maintenance & Servicing Costs | 172 |
| Table 21-10. Solids Disposal | 173 |
| Table 21-11. TETRA Brine Lease Agreement Summary | 175 |
| Table 21-12. Annual OPEX Summary | 176 |
| Table 22-1. Annual Operating Cost Summary | 182 |
| Table 22-2. Economic Evaluation – Case 1 (Base Case) Summary | 183 |
| Table 22-3. Sensitivity Analysis | 185 |
| Table 22-4. Economic Evaluation – Case 2 (Alternative Upside Scenario) Summary | 188 |
| Table 26-1. Recommendations Cost Summary | 197 |
| South West Arkansas Project Pre-Feasibility Study | 23 July 25 |
| 1 | Summary |
| 1.1 | Issuer and Purpose |
This Technical Report has been commissioned by, and completed for, Standard Lithium Ltd. (Standard Lithium, or the Company); a public company with its corporate headquarters in Vancouver, B.C. This report focuses on Standard Lithium’s greenfield development in southwest Arkansas referred to as the South West Arkansas Project (SWA Project), which considers extraction of lithium produced from brine associated with mineral leases acquired by TETRA Technologies Inc. (TETRA) under which Standard Lithium has an option agreement for the lithium.
This report outlines Standard Lithium’s plans for the SWA Project, including how the lease acreage could be unitized in compliance with the Arkansas Brine Statute (AR Code § 15-76-301) to facilitate production from the underlying Smackover Formation brine aquifer in conjunction with the preparation of a Pre-Feasibility Study (PFS). This Technical Report updates and refines the findings and recommendations presented in the 2021 Preliminary Economic Assessment (PEA). This PFS also outlines and updates the proposed method of extraction of the brine from the resource while also presenting a more refined flowsheet to extract and purify the lithium to produce a marketable product.
| 1.2 | Property Location and Ownership |
The center of the SWA Project is located approximately 24 km (15 miles) west of the City of Magnolia in Lafayette County, southwestern Arkansas, United States. The SWA Property encompasses Townships 16-17 South and Ranges 22-24 West of the 5th Meridian and lies wholly within Lafayette and Columbia counties.
The SWA Property is comprised of 489 land tracts containing 851 individual leases and eight salt water (brine) deeds that covers 27,066 net mineral acres (10,953 net mineral hectares). The proposed unitized SWA Property encompasses 36,839 gross mineral acres (14,908 gross mineral hectares) and forms the updated 2023 resource and project area.
The leases and deeds are held by TETRA. TETRA began acquiring brine deeds and/or brine leases in 1992 and added additional brine leases in 1994, 2006 and 2017. Standard Lithium acquired the SWA Project brine production rights to lithium directly from TETRA through an option agreement providing that Standard Lithium makes annual payments. At the time of writing, Standard Lithium is up to date with all required payments. As of the date of this report, the process of unitization has not commenced and neither Standard Lithium nor TETRA have developed the SWA Project brine leases and deeds for production of brine minerals.
| South West Arkansas Project Pre-Feasibility Study | 23 July 25 |
| 1.3 | Geology and Mineralization |
The SWA Property lithium deposit is a confined brine deposit in the form of a lithium-bearing brine contained within the porosity of the Smackover Formation within the SWA Property boundaries. The Smackover Formation in southern Arkansas is commonly subdivided into three intervals, the Reynolds Member Oolite (predominantly oolitic limestone), referred to in this report as the Upper Smackover, the Middle Smackover (a burrowed pellet packstone), and the Brown Dense (dark, dense limestone), referred to in this report as the Lower Smackover. The lithium brine resource, as reported, is contained within the Upper and Middle Members of the Smackover Formation (which underlie the entire Project area). The Lower Smackover does not contribute to the resource estimates in this report, but is a future target for exploration.
The depth of the top of the Smackover in the Property area generally dips from north-northeast to south-southwest and varies in depth from approximately 7,600 feet (2,316 meters) subsea to approximately 9,100 feet (2,773 meters) subsea. Brine has been extracted commercially from the Smackover in southern Arkansas for approximately 60 years and is well understood.
The volume of in-place lithium is proportional to the product of the brine-saturated pore volume and the lithium concentration, both of which are known with reasonable accuracy, based on the drilling, logging, coring, and sampling data obtained throughout the property area. The data used to estimate and model the resource were gathered from the five project specific wells described in Section 1.4 along with 424 existing and suspended oil and gas production wells on or adjacent to the SWA Project and surface seismic information.
| 1.4 | Status of Exploration |
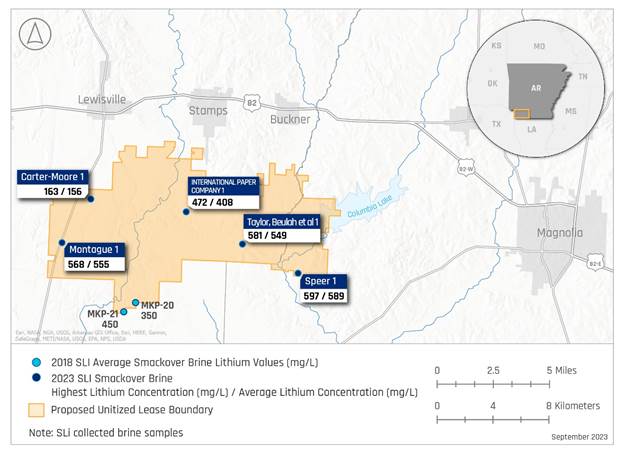
From February to July in 2023 Standard Lithium conducted a five-well exploration program at the SWA Property. The exploration program design and execution was supported by the QP Williams, including choice of well locations, data gathering plans, monitoring well progress, advising on coring targets and procedures, and interpretation of results. This program included re-entry into three existing abandoned wells (Taylor, Beulah et al 1, International Paper Co. 1, and Carter Moore 1) and drilling two all-new wells (Speer 1 and Montague 1). These five well locations were chosen to maximize the description of the geologic properties and lithium concentrations within the Property. Figure 1-1 depicts the locations of those five wells and the observed maximum and average lithium concentrations. In support of further project definition, up to three additional wells will be considered for the next phase to provide in-fill data in support of a reserve classification.
| South West Arkansas Project Pre-Feasibility Study | 23 July 25 |
Figure 1-1. SWA Project 2023 Exploration Program
| 1.5 | Updated Mineral Resource Estimation |
The resource present in the Smackover Formation below the SWA Project was updated based on the proposed unitized area encompassing 36,839 gross mineral acres (14,908 gross mineral hectares). Using a conversion factor of 5.323 kg of lithium carbonate equivalent (LCE) per kg of lithium, the Indicated Resource value corresponds to an estimate of 1,430 thousand metric tonnes LCE. For the Inferred Resource, the estimate is 392 thousand metric tonnes LCE; see Table 1-1 and Table 1-2 below for more detail.
| South West Arkansas Project Pre-Feasibility Study | 23 July 25 |
Table 1-1. SWA Property Geologic Factors and Indicated Lithium Resource Estimates
| Indicated Resource | |||
| Smackover Formation | North
Upper |
South
Upper |
Total
Upper |
| Gross Volume, km3 | 4.69 | 2.80 | 7.49 |
| Net Volume, km3 | 3.17 | 1.93 | 5.11 |
| Average Porosity | 11.7% | 11.9% | 11.8% |
| Average Lithium Concentration, mg/L | 408 | 507 | 446 |
| Indicated Lithium Resource, Thousand Tonnes | 152 | 116 | 269 |
| LCE, Thousand Tonnes | 810 | 620 | 1,430 |
Table 1-2. SWA Property Geologic Factors and Inferred Lithium Resource Estimates
| Inferred Resource | |||
| Smackover Formation | North Middle |
South Middle |
Total Middle |
| Gross Volume, km3 | 6.04 | 2.98 | 9.02 |
| Net Volume, km3 | 1.60 | 0.46 | 2.06 |
| Average Porosity | 9.0% | 8.1% | 8.8% |
| Average Lithium Concentration, mg/L | 379 | 508 | 405 |
| Inferred Lithium Resource, Thousand Tonnes | 55 | 19 | 74 |
| LCE, Thousand Tonnes | 291 | 100 | 392 |
| South West Arkansas Project Pre-Feasibility Study | 23 July 25 |
Notes for Table 1-1 and Table 1-2:
1. Mineral resources are not mineral reserves and do not have demonstrated economic viability. There is no guarantee that all or any part of the mineral resource will be converted into a mineral reserve. The estimate of mineral resources may be materially affected by geology, environment, permitting, legal, title, taxation, socio-political, marketing, or other relevant issues.
2. Numbers may not add up due to rounding to the nearest 1,000 unit.
3. A minimum lithium concentration cutoff was not applied in this analysis because the entirety of the SWA Property exceeds the previously used 100 mg/L cutoff value.
4. The resource estimate was developed and classified in accordance with guidelines established by the Canadian Institute of Mining and Metallurgy. The associated Technical Report was completed in accordance with the Canadian Securities Administration’s National Instrument 43-101 and all associated documents and amendments. As per these guidelines, the resource was estimated in terms of metallic (or elemental) lithium.
5. In order to describe the resource in terms of ‘industry standard’ lithium carbonate equivalent, a conversion factor of 5.323 was used to convert elemental lithium to LCE.
The average lithium concentrations used in the indicated resource calculation are 507 mg/L and 408 mg/L, for the South and North resource areas, respectively.
The updated 2023 SWA Project resource is 52% larger than the 2021 PEA resource estimate. The resource increase is primarily related to the higher concentration of lithium, which increased in concentration from an overall average of 255 mg/L to 437 mg/L. Higher lithium concentrations offset a reduction in brine volume associated with tightened and enhanced reservoir definition.
| 1.6 | Mining Methods |
The resource will be extracted using a network of brine supply wells and injection wells (which are required for pressure maintenance and are standard throughout the Arkansas brine industry). The configuration of this well field has been determined using a finite difference computer model based on the eight-layer geologic model developed for the resource categorization. The preliminary results of this model indicate the SWA Property appears to be capable of producing greater than 30,000 metric tonnes per annum (tpa) of lithium hydroxide monohydrate (the commercially sold form, also referred to as lithium hydroxide or hydroxide) for 20 years or more, and that production rates greater than 35,000 metric tpa are probable with modifications to the assumed production and injection well count and configuration, given the current understanding of the SWA Property’s geology and distribution of lithium.
| South West Arkansas Project Pre-Feasibility Study | 23 July 25 |
| 1.7 | Recovery Method and Mineral Processing |
Standard Lithium have operated a Demonstration Plant, exclusively processing Smackover brine, since May 2020. This has provided a valuable source of knowledge in regards to the behavior of the brine, testing of various flowsheet elements directly, and providing a test bed for operator training. In addition, the Demonstration Plant has facilitated an ability to produce lithium chloride samples along with brine samples from various stages of the flowsheet to support bench scale metallurgical testing, mini-pilot plant testing and vendor testing in support of equipment design and process guarantees. The Demonstration Plant is located about 40 km (25 miles) east of the SWA Project and it is the Company’s intent to continue to use the information obtained from the Demonstration Plant to aid in flowsheet development, optimize lithium extraction and lithium chloride purification and to develop operations capability.
The development plan considered for the SWA Project PFS demonstrates production of battery-quality lithium hydroxide averaging 30,000 tpa over a 20-year operating life. The Project will pump brine from the Smackover Formation aquifer via production wells, extract lithium from the brine, convert it to a saleable product, and then reinject the effluent brine via injection wells to maintain pressure in the reservoir.
The PFS assumes a network of 21 brine supply wells will be completed in the Smackover Formation, producing approximately 1,800 m3/hr or 7,925 US gallons per minute(gpm). Twenty-two injection wells will support pressure maintenance in the Smackover aquifer to maintain long-term production.
Brine from the supply wells will be routed to a lithium extraction and lithium hydroxide production facility by a network of underground fiberglass pipelines. The brine entering the production facility will be pre-treated and then processed via Koch Technology Solutions’ Lithium Selective Sorption (“LSS”) Direct Lithium Extraction (DLE) process. The lithium chloride extracted by the DLE has a significantly higher relative concentration of lithium chloride relative to the other naturally occurring salts in the brine and is subsequently purified and concentrated using industry proven and commercially established processes prior to conversion to lithium hydroxide via a modified chlor-alkali process.
After lithium extraction, the lithium-depleted, effluent brine will be returned to the resource area by a pipeline system to the network of brine injection wells.
The further concentrated and purified lithium chloride solution will be processed by electrolyzers to form a high-purity lithium hydroxide solution. The Company evaluated several technologies at laboratory and pilot scale testing to support the selection of electrolysis as the core technology for conversion of lithium chloride to lithium hydroxide.
The testing undertaken during the PFS phase produced battery-quality lithium hydroxide from Smackover brines processed through the Demonstration Plant, confirming the viability of the process. The output solution from electrolysis will be crystalized into a solid, battery-quality lithium hydroxide using standard, proven processes.
| South West Arkansas Project Pre-Feasibility Study | 23 July 25 |
The base case development for the project as proposed will produce, on average, 30,000 tonnes of battery-quality lithium hydroxide per year, over a 20-year timeframe with an upside production scenario of 35,000 tpa of lithium hydroxide production that was identified in July 2023 as a result of the exploration assessment and resource evaluation outlined in Sections 9, 10, 14 and 16.
Although the potential for further upside will be assessed further in the Feasibility Study phase, this PFS addresses the identified 35,000 tpa assessed as a probable upside economic case.
| 1.8 | Capital and Operating Cost Estimates |
| 1.8.1 | Capital Expenditure Costs |
At full build-out, with estimated average production over 20 years of 30,000 tpa of lithium hydroxide, the direct capital costs are estimated to be US$845 million, with indirect costs of US$218 million. A contingency of 20% was applied to direct costs (US$211 million) to yield an estimated all-in capital cost of US$1.3 billion. A summary of the capital costs is provided in Table 1-3.
| South West Arkansas Project Pre-Feasibility Study | 23 July 25 |
Table 1-3. Capital Cost Summary
| Description | Direct Costs Million US$[1] | Indirect Costs Million US$[2] |
| Extraction and Injection Well Field[3] | 234.6 | 2.2 |
| Pipelines[3] | 60.5 | 7.1 |
| Receiving/Pre-Treatment | 118.4 | 48.2 |
| Direct Lithium Extraction (LSS) | 110.3 | 28.8 |
| Purification & Concentration | 110.8 | 42.8 |
| Lithium Hydroxide Unit | 121.5 | 36.8 |
| Chemical Storage, Handling & Utilities | 74.0 | 50.1 |
| Plant Buildings | 6.8 | 1.8 |
| Sub-Total | 837.0 | 217.9 |
| Freight | 8.0 | - |
| Contingency | 211.0[4] |
- |
| CAPEX TOTAL | US$1.27 billion | |
Notes:
1. Direct costs were estimated using either vendor-supplied quotes, and/or engineer estimated pricing (based on recent experience) for all major equipment. Major equipment prices were scaled using appropriate AACE Class 4 Direct Cost Factors to derive all direct equipment costs.
2. Indirect costs were estimated using AACE Class 4 Indirect Cost Factors. Indirect costs include all contractor costs (including engineering), indirect labor costs, and Owner’s Engineer costs.
3. Exceptions to above costing estimate methodology were the well field and pipelines, which were based on HGA’s recent project experience in the local area.
4. AACE Class 4 estimate includes 20% contingency on direct capital costs.
| 1.8.2 | Operating Expenditure Costs (OPEX) |
The operating cost estimate includes both direct costs and indirect costs, as well as allowances for mine closure (see Table 1-4). The majority of the operating cost comprises electricity usage including conversion to lithium hydroxide, as well as reagent usage required to extract the lithium from the brine. The all-in operating cost is $5,229 per tonne of lithium hydroxide.
| South West Arkansas Project Pre-Feasibility Study | 23 July 25 |
Table 1-4. Operating Cost Summary
| Description | Operating
Cost US$/tonne Lithium Hydroxide[1] |
| Workforce[2] | 371 |
| Electrical Power[3] | 1,291 |
| Reagents and Consumables[4] | 1,158 |
| Natural Gas[5] | 15 |
| Maintenance/Waste Disposal/Misc[6] | 1,073 |
| Indirect Operational Costs[7] | 168 |
| Royalties[8] |
741 |
| Sustaining Capital[9] | 415 |
| All-in OPEX Total | 5,229 |
Notes:
1. Operating costs are calculated based on average annual production of 30,000 tonnes of lithium hydroxide.
2. Approximately 91 full time equivalent (FTE) positions.
3. Approximately 30% of electrical energy consumed by well field and pipelines; 70% by the processing facilities.
4. Majority of reagent costs are comprised of sodium hydroxide and soda ash. Other reagents and consumables are air, hydrochloric acid, sodium metabisulfite, lime, membrane replacement, nitrogen, and scale inhibitors for pumps/wellheads.
5. Assumes that all of the natural gas is purchased from open market and none is co-produced at the wellheads.
6. Includes all maintenance and workover costs and is based on experience in similar-sized electrochemical facilities, brine processing facilities, and Smackover Formation brine production well fields.
7. Indirect costs (insurance, environmental monitoring, etc.) are factored from other capital and operational costs, except for mine closure, which is based on known well-abandonment costs.
8. Based on agreed royalties and expected future lease costs. Does not include future lease-fees-in-lieu-of-royalties which are still to be determined and subject to regulatory approval (lease-fees-in-lieu-of-royalties have been determined for bromine and certain other minerals in the State of Arkansas, but have not yet been determined for lithium extraction).
9. Major equipment refurbishment and replacement is categorized as sustaining capital. Sustaining Capital is shown included in the OPEX here to present an all-in annual operating cost.
| South West Arkansas Project Pre-Feasibility Study | 23 July 25 |
| 1.9 | Economic Analysis |
The results for internal rate of return (IRR) and net present value (NPV) from the assumed Capital Expenditure (CAPEX), Operating Expenditure (OPEX) and price scenario at full Base Case production, are presented in Table 1-5.
In addition, the upside case of 35,000 tpa production was assessed. To support this assessment, CAPEX costs are scaled based on a capacity factored estimate considering the increased production, resulting in an estimated upside case CAPEX estimate of US$1.36 billion.
Operating costs were evaluated in two categories, fixed and variable. Manpower was assumed to be a fixed cost based on the incremental sizing of the facility. Variable costs including reagents, consumables and electrical usage were scaled linearly for the increased consumption. Other costs including maintenance and miscellaneous costs were automatically adjusted as a percentage of the increased CAPEX resulting in an average annual OPEX cost of US$3,964/tonne. The economic analysis for this upside scenario is presented in Table 1-5.
| South West Arkansas Project Pre-Feasibility Study | 23 July 25 |
Table 1-5. Economic Evaluation Summary
| Description | Units | Base Case | Upside Case |
| Average Annual Production of Lithium Hydroxide | tpa[1] | 30,000[2] | 35,000[2] |
| Plant Operating Life | years | 20 | 20 |
| Total Capital Expenditures | Million US$ | 1,274[3,4] | 1,360[3,4] |
| Average Annual Operating Cost | US$/t | 4,073 | 3,964 |
| Average Annual All-in Operating Cost | US$/t | 5,229[5,6] | 5,060[5,6] |
| Selling Price | US$/t | 30,000[7] | 30,000[7] |
| Discount Rate | % |
8.0 |
8.0 |
| Net Present Value (NPV) Pre-Tax | Million US$ | 4,473 | 5,367 |
| Net Present Value (NPV) After-Tax | Million US$ | 3,090[8] | 3,736[8] |
| Internal Rate of Return (IRR) Pre-Tax | % | 41.3 | 44.4 |
| Internal Rate of Return (IRR) After-Tax | % | 32.8 | 35.4 |
Notes: All model outputs are expressed on a 100% project ownership basis with no adjustments for project financing assumptions.
1. Metric tonnes (1,000 kg) per annum.
2. Resource modelling work indicates the SWA Property appears to be capable of producing more than 30,000 tpa of lithium hydroxide for 20 years or more, and that production rates greater than 35,000 tpa are probable.
3. Capital Expenditures include 20% contingency on total installed costs.
4. No inflation or escalation has been carried for the economic modelling.
5. Includes all operating expenditures, ongoing land costs, royalties, and sustaining capital.
6. Brine lease fees in-lieu-of-royalties (to be approved by the Arkansas Oil and Gas Commission) have not been defined and are not currently included in the economic modelling.
7. Selling price of battery-quality lithium hydroxide based on a flatline price of $30,000/t over total project lifetime.
8. Assumes a U.S. Federal tax rate of 21% and State of Arkansas Tax rate of 5.1%, as well as variable property taxes.
A sensitivity analysis for the project indicates that the economics remain robust even under the downside scenarios of a 20% increased CAPEX, a 20% reduced product selling price, a 5,000 tpa reduced production output, or a 20% increased OPEX.
| South West Arkansas Project Pre-Feasibility Study | 23 July 25 |
| 1.10 | QP Conclusions |
| 1.10.1 | Exploration work |
Standard Lithium successfully executed a five-well exploration program that significantly improved the geologic description of the target Smackover Formation. The program addressed the three key factors that determine the quality of the resource: the total volume of brine based on core and log porosity data, the brine’s lithium concentration based on the analysis of multiple brine samples from the wells, and the productivity of the formation based on the core permeability data collected. QP Williams was closely involved with all aspects of the exploration program, including selecting the well locations; designing the coring, logging, and sampling programs; attending the coring and sampling of the wells; and analyzing the resulting data. In the opinion of QP Williams, the resulting data and analyses fully support the conclusion that the inferred and indicated resources present at the SWA Property are of sufficient quality to justify pursuit of a lithium extraction project at the site.
| 1.10.2 | Mineral Processing work |
Because continuous start-to-finish DLE (without the use of evaporation ponds) is not yet commercially proven, test work becomes especially critical to reduce process and scale-up risks. The test work needs to be conducted over a reasonable period of time and at a suitable scale-up factor. The Demonstration Plant operation has achieved both these objectives. In addition, the equipment operated in the Demonstration Plant has shown reliability in terms of having the required availabilities for stable process operation. The process control and chemical analysis applied in the Demonstration Plant have provided a solid foundation for reliable results.
The LSS DLE process has been run over many months, demonstrating consistency of results and its applicability for the SWA project. For further effective optimization and applicability for the Definitive Feasibility Study (DFS), the LSS DLE process needs to be run on actual SWA brine for a long-term, continuous test.
The conversion of a lithium chloride solution to a lithium hydroxide solution using electrolysis has been shown to be the process route with the least process risk, mainly because it is based, to a large extent, on the commercially proven chlor-alkali process. The approach taken by Standard Lithium to develop this process route has been appropriate for the PFS stage of the project. During the DFS, Standard Lithium should focus on further reducing the process risk. This can be accomplished by longer testing and by larger scale testing.
| South West Arkansas Project Pre-Feasibility Study | 23 July 25 |
| 1.11 | Key Study Recommendations |
The recommended next steps for Standard Lithium to elevate the SWA Project to a higher level of resource classification and project definition are to:
| · | Further develop the reservoir model in support of development of an optimized well plan and brine production profile. |
| · | Develop and optimize the flowsheet using the Demonstration Plant with a target of additional optimization. For example, review and optimize the process such that the reagent usage can be minimized and solid-waste generation from the process can be substantially reduced or eliminated. |
| · | Continue optimization of the LSS DLE to improve the quality of the raw LiCl solution by elimination of impurities, including testing of new sorbents and adjustments to operating parameters. |
| · | Conduct all additional necessary engineering and feasibility studies (i.e. FEED level engineering definition) to integrate the project development findings into an updated resource classification and DFS. |
| · | Continue testing of electrolytic conversion of lithium chloride to lithium hydroxide in support of development of engineering inputs for design. |
| · | Undertake a logistics study to assess road versus rail for supply of reagents and for export of products during the next project phase. |
| · | Complete any necessary process equipment vendor testing for lithium hydroxide concentration and evaporation/crystallization to a battery-quality product. |
| · | Identify long lead items that impact project schedule and develop procurement packages and strategy to facilitate potential opportunity for early purchasing in support of optimizing the project execution schedule. |
| · | Engage with AOGC to support definition of royalty for lithium production from brine in Arkansas in support of detailed understanding of project economics. |
| · | Continue to engage with the local electrical supplier Southwest Arkansas Electric Cooperative to continue to work through the interconnection requirements and ensure timeliness of power availability for the project. |
| · | The project as it is currently envisaged does not trigger a National Environmental Policy Act (NEPA) process, however the NEPA process would be triggered if federal funds are obtained for the project. It is recommended to pro-actively assess NEPA requirements and initiate key activities to facilitate flexibility in project financing. |
| South West Arkansas Project Pre-Feasibility Study | 23 July 25 |
| · | Drill additional test wells targeting the Upper, Middle, and Lower Smackover to provide: |
| o | Geologic data; |
| o | Lithium concentrations; |
| o | Long term production test information to estimate well rates, the number of wells needed, facility rates, and the completion plans for those wells; |
| o | Information regarding the potential extent of a Lower Smackover development target; and, |
| o | Information regarding the benefit of well stimulation to well productivity. |
| o | Monitor the test wells for salt precipitation, evaluate the potential effect of salt precipitation on production operations, identify remediation options. |
| o | Conduct long term production tests on one or more of the 2023 exploration program wells; decide on scope of these tests based on the results of the new test wells. |
| · | Update the geologic description. |
| · | Revise and adjust the categories of the resource estimates. |
| · | Revise the simulation model input geologic description and optimize the SWA Property development plan, brine flow rate, well count, and well configuration. |
| South West Arkansas Project Pre-Feasibility Study | 23 July 25 |
| 2 | Introduction |
| 2.1 | Issuer and Purpose |
This Technical Report has been commissioned by, and completed for, Standard Lithium Ltd. (Standard Lithium, or the Company); a public company with its corporate headquarters in Vancouver, B.C. Standard Lithium is focused on unlocking the lithium potential from brine. As such, Standard Lithium has established ‘brine access agreements’ with historically/presently permitted and active brine operators that include:
| · | TETRA Technologies Inc. (TETRA) and National Chloride Company of America (National Chloride) in the Mojave Desert of California (Standard Lithium’s Bristol and Cadiz Dry Lakes play lithium-brine projects). |
| · | Lanxess Corporation (Lanxess) in the Smackover Formation of south-central Arkansas (Standard Lithium’s LANXESS Project Phase 1A). |
| · | TETRA in the Smackover Formation of southwestern Arkansas (Standard Lithium’s South West Arkansas (SWA) Project and the focus of this Technical Report). |
The center of the SWA Property is located approximately 24 km (15 miles) west of the City of Magnolia in Lafayette County, Arkansas, United States (Figure 2-1). The SWA Property encompasses Townships 16-17 South and Ranges 22-24 West of the 5th Meridian.
The SWA Property comprises 851 brine leases and 8 salt water (brine) deeds from private mineral owners covering 27,066 net mineral acres (10,953 net mineral hectares).
At the SWA Project, which is the focus of this report, Standard Lithium has outlined how it could unitize the underlying Smackover Formation brine aquifer in conjunction with the preparation of a PFS. This Technical Report updates the 2021 Preliminary Economic Assessment report and applies a gross acreage with 100% brine ownership that is consistent with unitization within the Arkansas Brine Statute. This PFS also outlines a proposed method of extraction of the brine from the resource, a proposed flowsheet to extract and purify the lithium to potentially produce a marketable product, as well as other necessary SWA Project information.
| South West Arkansas Project Pre-Feasibility Study | 23 July 25 |
Figure 2-1. SWA Project discussed in this Technical Report

Consequently, this Technical Report provides an updated 2023 mineral resource estimate at the SWA Project in accordance with the Canadian Securities Administration’s (CSA’s) National Instrument 43-101 (NI 43-101) with the mineral resource being estimated using the CIM “Estimation of Mineral Resources and Mineral Reserves Best Practice Guidelines” dated November 29th, 2019, the CIM “Definition Standards for Mineral Resources and Mineral Reserves” amended and adopted May 10th, 2014 and the CIM "Leading Practice Guidelines for Mineral Processing" adopted November 25th, 2022. The effective date of this Technical Report is August 8, 2023.
| South West Arkansas Project Pre-Feasibility Study | 23 July 25 |
| 2.2 | Technical Report Authors and Personal Inspection of Property |
Table 2-1 presents the list of Qualified Persons (QPs) for the Technical Report and their responsibilities.
Table 2-1. Qualified Persons and Their Responsibilities
| Qualified Person | Company | Sections |
| Frank Gay, P.E. | HGA | 1-6, 18-19, 22-27 |
| Marek Dworzanowski, EUR ING, CEng | N/A | 1, 12.2, 13, 17, 18, 21-22, 25, 26 |
| Randal M. Brush, P.E. | Cobb & Associates | 10, 14.2, 14.3, 15 and 16 |
| Robert E. Williams, P.G., CPG | Cobb & Associates | 7, 8, 9, 11, 12.1, and 14.1 |
| Caleb Mutschler, P.E. | HGA | 17.1-17.3, 17.5 |
| Dutch Johnson, P.E. | HGA | 17.4 |
| Charles Campbell, P.E. | Alliance Technical Group | 20 |
Notes:
1. N/A denotes not applicable.
2. Marek Dworzanowski operates as an independent contractor.
In accordance with the CIM Best Practice Guidelines for Resource and Reserve Estimation for Lithium Brines (1 November 2012), this lithium-brine PFS has been prepared by a multi-disciplinary team that includes geologists, hydrogeologists, chemical, process and civil engineers with relevant experience in the lithium-brine confined aquifer type deposits, Smackover Formation geology and brine processing.
Mr. Caleb Mutschler (HGA) and Mr. Marek Dworzanowski visited the existing Standard Lithium Demonstration Plant in El Dorado, AR on October 27, 2022 and November 14-15, 2022 respectively to inspect the LSS equipment in service and verify the process conditions and technology. Mr. Dworzanowski also inspected the electrolysis process on January 18-19, 2023 at Electrosynthesis Company, Inc. in Lancaster, NY.
| South West Arkansas Project Pre-Feasibility Study | 23 July 25 |
Mr. Robert Williams (Cobb & Associates) visited the Standard Lithium Project site April 19, May 23, and June 1, 2023, and participated in sampling three different wells (Taylor, Beulah et al 1, Carter Moore 1, and International Paper Company 1, respectively).
Randal Brush (Cobb & Associates) visited the Standard Lithium Project site on July 24, 2023, and inspected the Montague 1 well and the International Paper Co. 1 well.
All authors are independent of Standard Lithium (and TETRA) and are QPs as defined by the CSA’s NI 43-101.
| 2.3 | Sources of Information |
This Technical Report is based, in part, on internal company technical reports, maps, company letters, memoranda, public disclosure, and public information, as listed in the NI 43-101 Technical Report Preliminary Economic Assessment of Southwest Arkansas Smackover Project (Eccles, et al., 2019).
This Technical Report is a compilation of publicly available information, as well as information obtained from the 2018 and 2023 exploration programs. The 2018 exploration program included core analysis and brine analytical test programs conducted by Standard Lithium at the SWA Property. The 2023 exploration program included gathering and analyzing log data, core samples, pressure data, and brine samples from five wells: three were existing wells that were re-entered; two were new wells drilled by Standard Lithium.
References in this Technical Report are made to publicly available reports that were written prior to implementation of NI 43-101, including government geological publications. All reports are cited in Section 27, References.
Government reports include those that provide:
| · | Smackover Formation stratigraphic information; |
| · | Arkansas policy and regulation; |
| · | Well information; |
| · | Produced water geochemistry; and, |
| · | Oil, gas, and brine production statistics (e.g., Dickinson, 1968; Arkansas Code, 2016 a to f; Blondes et al., 2018; Arkansas Geological Survey, 2018; AOG Commission, 2021 & 2022 a to b). |
Miscellaneous journal articles were used to set the geological setting of southern Arkansas (e.g., Bishop, 1967; Alkin and Graves, 1969; Bishop, 1971a and b; Buffler et al., 1981; Moore and Druckman, 1981; Moore, 1984; Harris and Dodman, 1987; Salvador, 1991a and b; Troell and Robinson, 1987; Kopaska-Merkel et al., 1992; Moldovanyi and Walter, 1992; Zimmerman, 1992; Heydari and Baria, 2005; Mancini et al., 2008). Company information and news releases were used to reference any historical mineral exploration work at the SWA Property (e.g., Standard Lithium Ltd., 2018a and b).
| South West Arkansas Project Pre-Feasibility Study | 23 July 25 |
Geochemical data collected in 2018 presented in the previous revision of this Technical Report were analyzed at independent and accredited laboratories: ALS-Houston Environmental Services (ALS-Houston) in Houston, Texas, and Western Environmental Testing Laboratory (WetLab) in Sparks, Nevada. Geochemical data collected in 2023 presented in this Technical Report were analyzed at WetLab. Historical Smackover Formation brine geochemical data from a peer reviewed journal were also used (Moldovanyi and Walter, 1992).
Historic well log data and well status information used to create the layered geologic model was obtained from TGS and IHS, two companies that supply well log and well status information to the petroleum and bromine industry. Historical geotechnical data presented in this Technical Report include core reports that were prepared by independent petroleum laboratories and engineering firms that include:
| · | Core Laboratories Inc. in Dallas, TX and Shreveport, LA; |
| · | Delta Core Analysts in Shreveport, LA; |
| · | All Points Inc. in Houston, TX; |
| · | Thigpen Core Laboratories, Inc. in Shreveport, LA; |
| · | O’Malley Laboratories, Inc. in Natchez, Miss; and |
| · | Bell Core Laboratories in Shreveport, LA. |
The geotechnical data collected in the 2023 exploration program include core reports prepared by these independent petroleum laboratories and engineering firms:
| · | Intertek Westport Technology Center in Houston, TX; and, |
| · | Delta Core Analysts in Shreveport, LA. |
The laboratories and engineering firms are independent and certified third-party consultants and/or include certified Professional Geologists or Engineers. The geochemical laboratories for the brine samples collected in 2018 and 2023 cite National and State accreditations (e.g., ISO/IEC 17025:2005; 2009 TNI Environmental Testing Laboratory Standard; DoD Environmental Laboratory Accreditation Program (DoD ELAP); ISO/IEC Guide 25-1990; NAC 445A). Historical brine analytical data originated from a peer reviewed journal (American Association of Petroleum Geologist Bulletin) and is considered a reputable source of information (Moldovanyi and Walter, 1992).
| South West Arkansas Project Pre-Feasibility Study | 23 July 25 |
| 2.4 | Units of Measure, Currency, and Acronyms |
With respect to units of measure and currency, unless otherwise stated, this Report uses:
| · | Abbreviated shorthand consistent with the International System of Units (International Bureau of Weights and Measures, 2006); |
| · | ‘Bulk’ weight is presented in both metric and imperial units. Metric is presented as tonnes and is equivalent to 1,000 kg or 2,204.6 lbs. Imperial is United States short tons which is presented as tons and is equivalent to 2,000 lbs or 907.2 kg; |
| · | Geographic coordinates projected in the Universal Transverse Mercator (UTM) system relative to Zone 15 of the North American Datum (NAD) 1983; |
| · | Currency in U.S. dollars (USD$), unless otherwise specified (e.g., Canadian dollars, CDN$; Euros, €); |
| · | Key well field dimensions such as well depth, reservoir depth and casing sizes will be presented using standard oil field units as the primary unit of measure with SI units in brackets; and, |
| · | Brine leases and surface leases are presented in acres to maintain consistency with Arkansas brine leases and property legal descriptions. |
| · | Lithium hydroxide or hydroxide refer to lithium hydroxide monohydrate which is the commercially sold form of lithium. |
Table 2-2 describes the various abbreviations used in the Technical Report.
Table 2-2. Abbreviations
| Abbreviation | Description |
| mm | Micrometers |
| AACE | American Association of Cost Engineers |
| ADEE | Arkansas Department of Energy and Environment |
| ADEE-AOGC | Arkansas Department of Energy and Environment Arkansas Oil & Gas Commission |
| ADEE-DEQ | Arkansas Department of Energy and Environment Division of Environmental Quality |
| ADH | Arkansas Department of Health |
| AOGC | Arkansas Oil and Gas Commission |
| ASTM | American Society for Testing and Materials |
| South West Arkansas Project Pre-Feasibility Study | 23 July 25 |
| Abbreviation | Description |
| BFD | Block Flow Diagram |
| BOE | Basis of Estimate |
| CAPEX | Capital Expenditure |
| CIM | Canadian Institute of Mining |
| CIT | Corporate Income Tax |
| CPF | Central Processing Facility |
| CSA | Canadian Securities Administration |
| DCF | Discounted Cash Flow |
| DLE | Direct Lithium Extraction |
| EA | Environmental Assessment |
| EPA | Environmental Protection Agency |
| ESP | Electric Submersible Pump |
| ESS | Energy Storage Systems |
| EVs | Electric Vehicles |
| GPM | US Gallons per Minute |
| GWh | Gigawatt-hour |
| H2S | Hydrogen Sulfide |
| HDPE | High Density Polyethylene |
| HPRO | High Pressure Reverse Osmosis |
| ICE | Internal Combustion Engine |
| ICP-OES | Inductively Coupled Plasma Optical Emission Spectroscopy |
| IRR | Internal Rate of Return |
| ISBL | Inside Boundary Limit |
| South West Arkansas Project Pre-Feasibility Study | 23 July 25 |
| Abbreviation | Description |
| IX | Ion Exchange |
| LCE | Lithium Carbonate Equivalent |
| Li2CO3 | Lithium Carbonate |
| Li2O | Lithium Oxide |
| LiOH | Lithium Hydroxide |
| LiOH.H2O | Lithium Hydroxide Monohydrate |
| LiSTR | Lithium Stirred Tank Reactor |
| LSS | Lithium Selective Sorption |
| m3 | Cubic Meter |
| MCC | Motor Control Center |
| mD | Millidarcies |
| mg/L | Milligrams per litre |
| MKP | McKamie-Patton |
| MMBTU | Million British Thermal Units |
| MW | Megawatts |
| MWh | Megawatt-hour |
| NAD | North American Datum |
| NI 43-101 | National Instrument 43-101 |
| NPDES | National Pollutant Discharge Elimination System |
| NPV | Net Present Value |
| OARO | Osmotically Assisted Reserve Osmosis |
| OPEX | Operating Expenditure |
| PEA | Preliminary Economic Assessment |
| South West Arkansas Project Pre-Feasibility Study | 23 July 25 |
| Abbreviation | Description |
| PFD | Process Flow Diagram |
| PFS | Pre-Feasibility Study |
| ppm | Parts Per Million |
| psi | Pounds per square inch |
| QA/QC | Quality Assurance/Quality Control |
| QP(s) | Qualified Person(s) |
| RCRA | Resource Conservation and Recovery Act |
| RO | Reverse Osmosis |
| ROW | Right-of-Way |
| RPD | Relative Percentage Difference |
| SM | Standard Methods |
| SX | Solvent Extraction |
| TDS | Total Dissolved Solids |
| TEC | Total Equipment Cost |
| TIC | Total Installed Cost |
| TPC | Total Plant Cost |
| UIC | Underground Injection Control |
| USACE | U. S. Army Corps of Engineers |
| USGS | United States Geological Survey |
| UTM | Universal Transverse Mercator |
| WetLab | Western Environmental Testing Laboratory |
| South West Arkansas Project Pre-Feasibility Study | 23 July 25 |
| 3 | Reliance on Other Experts |
The authors are not qualified to provide an opinion or comment on issues related to legal agreements and royalties. They have relied entirely on background information and details regarding the nature and extent of TETRA’s Land Titles. The author has not reviewed the approximately 851 leases and 8 salt water (brine) deeds owned by TETRA or the transactional agreement between Standard Lithium and TETRA (and/or the agreement between TETRA and the underlying landowners) to obtain mineral brine production rights. The legal and survey validation of the leases and brine rights is not in our expertise, and we are relying on Standard Lithium and TETRA’s land-persons and lawyers.
The QP of Section 4 has no reason to question the validity or good standing of the TETRA leases and brine deeds through which Standard Lithium is gaining access to brine for process test work.
| South West Arkansas Project Pre-Feasibility Study | 23 July 25 |
| 4 | Property Description and Location |
| 4.1 | Property Description and Location |
The SWA Property encompasses Townships 16-17 South and Ranges 22-24 West of the 5th Meridian. The center of SWA Project is located approximately 24 km (15 miles) west of the City of Magnolia in Lafayette and Columbia Counties, Arkansas, United States. Coordinates for the Property center are:
| · | Latitude 33.2843 and Longitude -93.5135; or |
| · | Universal Transverse Mercator 452185.15 Easting, 3682922.78 Northing, Zone 15N, North American Datum 83 (Figure 4-1). |
The SWA Property consists of 27,066 net mineral acres (10,953 net mineral hectares) and covers a surface area of approximately 110 km2 (42 square miles) and is comprised of 489 land tracts containing 851 individual leases and 8 salt water (brine) deeds from private mineral owners, as illustrated in Figure 4-2. The proposed unitized area encompasses the individual leases and consists of 36,839 gross mineral acres (14,908 gross mineral hectares) (see Table 4-1).
| 4.2 | Lithium-Brine Mineral Production Rights |
Standard Lithium acquired the SWA Project brine rights to produce lithium from TETRA through an option agreement. As part of the agreement between Standard Lithium and TETRA, Standard Lithium owns the ‘lithium-brine’ production rights within the SWA Property brine lease holding. The Standard Lithium-TETRA agreement and a summary of the leases and deeds are discussed in more detail in the following sub-sections.
| South West Arkansas Project Pre-Feasibility Study | 23 July 25 |
Figure 4-1. SWA Project discussed in this Technical Report

| South West Arkansas Project Pre-Feasibility Study | 23 July 25 |
| 4.2.1 | Summary of the Standard Lithium – TETRA Agreement |
Standard Lithium owns the rights to produce lithium from TETRA’s brine leasehold for a period of 10-years (the exploratory period) through an option agreement providing that Standard Lithium makes annual payments on the annual anniversary of the effective date (December 29, 2017) of the agreement with TETRA, as follows:
| · | US$500,000 before January 28, 2018 (paid) |
| · | An additional US$600,000 on or before December 29, 2018 (paid) |
| · | An additional US$700,000 on or before December 29, 2019 (paid) |
| · | An additional US$750,000 on or before December 29, 2020 (paid) |
| · | Years 4-5: $1,000,000 per year (paid) |
| · | Years 6-10: $1,000,000 per year |
As of the writing of this report, the option agreement is still in place and all required payments have been fulfilled. When Standard Lithium commences production of lithium or exercises the option, Standard Lithium will pay TETRA a 2.5% royalty on gross revenue, and not less than $1,000,000 in any year, starting on the date that Standard Lithium exercises the option.
| 4.2.2 | Summary of Salt Water (Brine) Deeds |
In 1992, TETRA acquired the rights to 2,045 acres in the form of eight salt water (Brine) Deeds. The brine deeds are a 35-year term conveyance of brine within the Smackover Formation limestone. The initial brine deeds were executed from March 23 to April 29, 1992 and will expire in 2027 unless the term is extended by agreement.
The Brine Deeds permit TETRA or its assignee to produce brine attributable to its Grantor’s interest in the covered lands without royalty becoming due. Thus, with respect to those Grantors’ brine interests, no delay rental or brine royalty payment is required, and no additional royalty will become due upon commercial extraction of lithium. Instead, TETRA is obligated to make annual promissory note installment payments of $79,125, in the aggregate, on promissory notes executed by TETRA in favor of the Grantor and its related parties. These notes provide for 35 annual installments, coinciding with the term of the Brine Deed.
| 4.2.3 | Summary of Leases |
In 1994, TETRA implemented a brine leasing strategy and added additional brine leases in 2006 and 2017-2018 bringing their total lease holdings to 802 leases at the Effective Date of the PEA. Except for 3 leases with five-year terms dated 26 September 2018, representing 240 acres, each lease has a 25-year term, and there is an attempt to renew or extend the leases prior to the expiration of the original 25-year term. Since the publishing of the PEA, a campaign to maintain and increase the lease acreage in line with TETRA’s obligation under the option agreement was implemented and the number of leases was increased to 934.
| South West Arkansas Project Pre-Feasibility Study | 23 July 25 |
Subsequently, 83 leases totaling 196 net mineral acres have lapsed leaving a total of 851 leases at the effective date of this report. A summary of the leases in place at the effective date of this report can be found in Table 4-1 and shown in Figure 4-2.
The SWA Property brine leases have yet to be developed for production of brine minerals.
| 4.2.4 | Mineral Brine Right Distribution on Individual Leases |
In some instances, the property encompassed by an individual brine lease may be very small, less than one acre, or much larger, up to several hundred acres. The percentage of brine rights ownership varies from section to section. In some instances, the percentage of the area leased within an individual brine lease may be small, less than 10%, or up to 100% ownership within any arbitrary section.
Overall, the lease ownership is complex, however, Standard Lithium has conducted a due diligence compilation of the percentage ownership of the individual brine leases on a section-by-section basis. That is, Standard Lithium engaged third-party firm R&J Land Services, LLC (R&J Land) of Bossier City, Louisiana to conduct due diligence of TETRA title of the brine leases and salt water (brine) deeds.
Standard Lithium also retained Arkansas attorney, Mr. Robert Honea, of Hardin, Jesson & Terry PLC of Fort Smith, AR regarded as having expertise in Arkansas State brine as well as oil and gas law. Mr. Honea issued an opinion letter to Standard Lithium, prior to Standard Lithium signing the Option Agreement with TETRA, after reviewing R&J Land’s review into the documentation of title to TETRA leasehold, confirming his professional opinion that the title due diligence performed by R&J Land was reasonable. In July 2023, Tetra provided an updated status report for the validity of leases. Standard Lithium engaged third-party firm R&J Land Services, LLC (R&J Land) of Bossier City, Louisiana to review the original brine leases and the revised listing was subsequently confirmed as part of project specific due diligence. The updated list from Tetra was confirmed to be valid and the leases identified as being in good-standing.
The resulting section-based mineral brine lease percentage compilation is presented in Table 4-1 and Figure 4-2. To simplify the brine ownership for the purpose of reporting, TETRA has amassed a mineral brine rights ownership that encompasses approximately 73% of the total mineral brine rights at the SWA Property, of which, Standard Lithium has acquired the corresponding lithium-brine production rights as described in Section 4.2, Lithium Brine Mineral Production Rights.
| South West Arkansas Project Pre-Feasibility Study | 23 July 25 |
Table 4-1. SWA Property Ownership Summary
| Township | Range | Section | Net
Acres Leased |
Total
Gross acres within Section |
Percentage
leased |
| 16 | 22 | 31 | 37.815 | 200 | 19% |
| 16 | 23 | 19 | 80 | 80 | 100% |
| 16 | 23 | 24 | 40 | 50 | 80% |
| 16 | 23 | 25 | 80 | 80 | 100% |
| 16 | 23 | 26 | 20 | 80 | 25% |
| 16 | 23 | 29 | 192.5 | 195 | 99% |
| 16 | 23 | 30 | 213.84 | 516.34 | 41% |
| 16 | 23 | 31 | 610 | 640 | 95% |
| 16 | 23 | 32 | 511.34 | 545 | 94% |
| 16 | 23 | 33 | 267.013 | 335.36 | 80% |
| 16 | 23 | 34 | 255.33 | 296.6 | 86% |
| 16 | 23 | 35 | 192.58 | 499.33 | 39% |
| 16 | 23 | 36 | 160 | 640 | 25% |
| 16 | 24 | 25 | 586.66 | 640 | 92% |
| 16 | 24 | 26 | 566.71 | 640 | 89% |
| 16 | 24 | 27 | 36.67 | 40 | 92% |
| 16 | 24 | 34 | 136.67 | 160 | 85% |
| 16 | 24 | 35 | 593.68 | 640 | 93% |
| 16 | 24 | 36 | 613.33 | 640 | 96% |
| 17 | 22 | 5 | 407.5 | 640 | 64% |
| 17 | 22 | 6 | 473.09 | 640 | 74% |
| 17 | 22 | 7 | 640 | 640 | 100% |
| 17 | 22 | 8 | 160 | 160 | 100% |
| 17 | 22 | 17 | 276 | 280 | 99% |
| 17 | 22 | 18 | 560 | 640 | 88% |
| 17 | 22 | 19 | 320.5 | 320.5 | 100% |
| 17 | 22 | 20 | 357.5 | 400 | 89% |
| 17 | 23 | 1 | 31.27 | 640 | 5% |
| 17 | 23 | 2 | 405 | 640 | 63% |
| 17 | 23 | 3 | 556.92 | 640 | 87% |
| 17 | 23 | 4 | 270.64 | 640 | 42% |
| 17 | 23 | 5 | 351.5 | 640 | 55% |
| 17 | 23 | 6 | 554.17 | 640 | 87% |
| 17 | 23 | 7 | 498.83 | 640 | 78% |
| 17 | 23 | 8 | 541.04 | 640 | 85% |
| 17 | 23 | 9 | 429.51 | 640 | 67% |
| 17 | 23 | 10 | 308.19 | 640 | 48% |
| South West Arkansas Project Pre-Feasibility Study | 23 July 25 |
| Township | Range | Section | Net
Acres Leased |
Total
Gross acres within Section |
Percentage
leased |
| 17 | 23 | 11 | 140 | 640 | 22% |
| 17 | 23 | 12 | 315 | 640 | 49% |
| 17 | 23 | 13 | 450 | 640 | 70% |
| 17 | 23 | 14 | 573.8 | 600 | 96% |
| 17 | 23 | 15 | 368.32 | 478.32 | 77% |
| 17 | 23 | 16 | 409.38 | 640 | 64% |
| 17 | 23 | 17 | 585.46 | 640 | 91% |
| 17 | 23 | 18 | 570.83 | 640 | 89% |
| 17 | 23 | 19 | 207.497 | 640 | 32% |
| 17 | 23 | 24 | 125 | 165 | 76% |
| 17 | 23 | 31 | 14.92 | 40 | 37% |
| 17 | 24 | 1 | 561.489 | 640 | 88% |
| 17 | 24 | 2 | 548.634 | 640 | 86% |
| 17 | 24 | 3 | 457.951 | 640 | 72% |
| 17 | 24 | 4 | 453.345 | 640 | 71% |
| 17 | 24 | 5 | 562.46 | 640 | 88% |
| 17 | 24 | 8 | 397.95 | 640 | 62% |
| 17 | 24 | 9 | 416.025 | 640 | 65% |
| 17 | 24 | 10 | 594.76 | 640 | 93% |
| 17 | 24 | 11 | 627.58 | 640 | 98% |
| 17 | 24 | 12 | 623.87 | 640 | 97% |
| 17 | 24 | 13 | 638 | 638 | 100% |
| 17 | 24 | 14 | 525.48 | 640 | 82% |
| 17 | 24 | 15 | 535.78 | 640 | 84% |
| 17 | 24 | 16 | 582.5 | 640 | 91% |
| 17 | 24 | 17 | 640 | 640 | 100% |
| 17 | 24 | 20 | 290.846 | 640 | 45% |
| 17 | 24 | 21 | 441.53 | 640 | 69% |
| 17 | 24 | 22 | 498 | 640 | 78% |
| 17 | 24 | 23 | 614.3 | 640 | 96% |
| 17 | 24 | 24 | 452.71 | 640 | 71% |
| 17 | 24 | 25 | 20 | 40 | 50% |
| 17 | 24 | 26 | 206.39 | 320 | 64% |
| 17 | 24 | 35 | 240 | 240 | 100% |
| 17 | 24 | 36 | 40 | 640 | 6% |
| Total | 27,065.61 | 36,839.45 | 73.469% | ||
| South West Arkansas Project Pre-Feasibility Study | 23 July 25 |
Figure 4-2. SWA Property Ownership Summary

| South West Arkansas Project Pre-Feasibility Study | 23 July 25 |
| 4.3 | Surface (and Mineral) Rights in Arkansas |
The definition of minerals is established by Arkansas Code Title 15, Natural Resources and Economic Development § 15-56-301 (the Brine Statue), which has been amended to include salt water, or brine, “whose naturally dissolved components or solutes are used as a source of raw material for Bromine and other products derived therefrom." The mineral interest owner has the inherent right to develop the minerals and the right to lease the minerals to others for development. When a company desires to develop the mineral resources in an area, the company will need to secure mineral lease agreements from the mineral owners. The mineral lease is a legal binding contract between the mineral owner (Lessor) and an individual or company (Lessee), which allows for the exploration and extraction of the minerals covered under the lease.
Payments made to the Lessor for production of brine are known as “in lieu” royalty payments because the payments are made annually based on a statutory rate, as opposed to a true royalty based on the amount of the produced brine. The statutory in lieu royalty payment is increased or decreased annually based on changes in the Producer Price Index.
The Brine Deeds permit TETRA or its assignee to produce brine attributable to its Grantor’s interest in the covered lands without royalty becoming due. Thus, with respect to those Grantors’ brine interests, no delay rental or brine royalty payment is required, and no additional royalty will become due upon commercial extraction of Lithium. Instead, TETRA is obligated to make annual promissory note installment payments of $79,125, in the aggregate, on promissory notes executed by TETRA in favor of the Grantor and its related parties. These notes provide for 35 annual installments, coinciding with the term of the Brine Deed. TETRA is also required to pay annual rental of $100 each to the two surface owners who leased the surface right of ingress and egress to TETRA in documents called “Landowner Agreements.”
With respect to surface rights, Arkansas law allows the severance of the surface estate from the mineral estate by proper grant or reservation, thereby creating separate estates. Under the laws of conservation in the State of Arkansas, however, the mineral rights are dominant over the surface rights. In some cases, when the mineral owner leases the right to produce oil, gas and/or brine, the Lessee succeeds to the mineral owner’s right of surface use, subject to lease restrictions. Authority of the mineral estate over the surface is a crucial legal concept for the mineral owner and Lessee because ownership of subsurface minerals without the right to use the surface to explore for and produce them would be practically worthless. If a Lessor does not want the land surface disturbed a “No Surface Operations Clause” may be negotiated with the Lessee and included in the mineral Lease agreement. This clause may be used to limit or restrict the use of the property for drilling activity or long-term production operations. Conflicts arising between the Lessee and surface owner can be avoided by creating Lease agreements that clearly identify the scope of surface use rights.
| South West Arkansas Project Pre-Feasibility Study | 23 July 25 |
The Lessee holding the Lease has a legal authority to enter the property for exploration and production even if the non-mineral owning surface owner objects to the intrusion on the property. That does not mean the surface owner will be without compensation. The amount and type of compensation is strictly a matter of negotiation between the surface owner and the company entering the property. If mutual agreement cannot be reached, the surface owner always has the right to seek the advice of an attorney and relief through the court system.
In the State of Arkansas when a person sells a piece of property the mineral rights automatically transfer with the surface rights, unless otherwise stated in the deed.
| 4.4 | Unitization |
The Arkansas Brine Statute (AR Code § 15-76-301) was adopted by the Arkansas General Assembly in 1979 in response to expanding brine operations in southern Arkansas. Under the statute, the AOGC can authorize brine production units that contain one or more production/injection wells within a set amount of acreage to 1) provide a more efficient regulatory structure for the production of brine, 2) to protect the correlative rights of all mineral interest owners in the unit, and 3) to insulate brine operators from claims of trespass from adjacent mineral interest owners. Under the Brine Statute, brine owners are paid an annual amount known as an “in lieu royalty” based on a specific formula in the Brine Statute which is subject to annual adjustments under the applicable Producer Price Index.
Standard Lithium has contemplated how it might approach unitizing the underlying Smackover Formation brine aquifer in conjunction with the preparation of this PFS report. The unitized SWA Property encompasses 36,839 gross mineral acres (14,908 gross mineral hectares) and forms the updated resource and project area.
NOTE, Standard Lithium has NOT commenced the unitization process; the exercise described herein is an attempt to estimate the potential integrated lithium brine resource if Standard Lithium’s existing project leasehold area were to be unitized in the future for production, as it would need to be.
In order to unitize a contiguous area of acreage for brine production, the brine operator must file an application with the Commission supported by the following evidence:
| · | A description of the proposed brine unit. |
| · | A proposed plan of development and operation. |
| South West Arkansas Project Pre-Feasibility Study | 23 July 25 |
| · | Geological and engineering data supporting the feasibility of the proposed plan and the efficacy of the boundary lines of the proposed unit. |
| · | A plat of the proposed unit indicating the tracts or parcels included in the unit and the proposed location of production and injection wells. |
| · | A list of owners within the unit. |
| · | Evidence that the applicant has valid brine leases covering at least 75% of the net mineral acreage within the entire area of the unit. |
| · | Evidence that the operator has made reasonable efforts to lease all of the acreage within the proposed unit. |
| 4.5 | Potential Future Royalty Payments to Lessors |
The AOGC, in accordance with Arkansas law, has established ‘drilling units’ that consist of a set amount of acreage to protect correlative rights and ensure all mineral owners receive proper payment of production royalties (in the case of oil and gas production), and statutory in lieu royalty payments (in the case of brine production). Given that future brine production from the Project would be derived from a common aquifer in the Smackover Formation, the establishment of a unit(s) with defined boundaries would ensure that all mineral owners potentially impacted by the producing well(s) would receive proper compensation.
The AOGC was given the jurisdiction and authority to form brine production units in Ark. Code §§ 15-76-301 et seq. (the Brine Statute). The AOGC's rules and regulations are available on-line at: www.aogc.state.ar.us/ along with its hearing schedule and production data from 1992 forward. Pertinent provisions of the Brine Statute include:
| · | §15-76-308 which identifies who may make application for the establishment of brine production units and states that a brine production unit may consist of no fewer that 1,280 contiguous surface acres (Arkansas Code, 2016a); |
| · | §15-76-309 which prescribes what information must be provided in a petition to form a brine production unit (Arkansas Code, 2016b); |
| · | §15-76-312 which permits the owner of an interest in a tract of land that is adjacent to a brine production unit and is not included in the unit, to petition for inclusion within the unit (Arkansas Code, 2016c); |
| · | §15-76-314 which requires each owner of an unleased interest in an established production unit to elect within 60 days from the effective date of the order to either participate affirmatively in the operation or to transfer his interest in the brine to the participating producers; and |
| South West Arkansas Project Pre-Feasibility Study | 23 July 25 |
| · | § 15-76-315, which provides as follows: |
(c) (1) In addition to any other amounts due and owing by the producer or producers of any unit to the owners therein, the producer or producers shall account separately and on a fair and equitable basis to each owner in the unit for all substances which are found by the commission to be profitably extracted from brine by a producer and which were not extracted by a producer on January 1, 1979.
(2) Whether or not any such substance is extracted profitably shall be determined by the Oil and Gas Commission on the basis of the value at the time of extraction, without interest, after deducting all costs of producing and recovering the same.
It is the expectation of the AOGC that entities desiring to drill and operate an oil, gas, or brine well in Arkansas will attempt in good faith to negotiate a satisfactory mineral lease with mineral owners before resorting to the integration provisions of Arkansas law. In the case of brine production, the operator will negotiate a per acre bonus consideration to be paid upon signing of the lease. Under the Brine Statute, the AOGC will approve a unit for a brine operator when the operator files an application supported by the elements described in Section 4.3.1.
Moreover, pursuant to Ark. Code Ann. § 15-76-315(c) (as quoted above), the AOGC must approve the royalty rate for any “additional substance” profitably extracted from brine produced by an operator of a brine unit.
| 4.6 | Property Environmental Liabilities and Permitting |
Environmental and cultural impact studies pertaining to the possible future extraction of the Smackover Formation brine resource on the SWA Project are presented in Section 20.
Several Federal and State permits and approvals are required for brine production in Arkansas, for example:
| · | Clean Water Act Section 404 permitting through the USACE; |
| · | Air emissions permitting through the Arkansas Department of Energy and Environment-Division of Environmental Quality (ADEE-ADEQ); |
| · | Water discharge permitting through the ADEE-DEQ; |
| · | Well drilling and operating permits through the Arkansas Department of Energy and Environment-Arkansas Oil & Gas Commission (ADEE-AOGC); |
| · | Underground Injection Control permitting through the ADEE-AOGC and the ADEE-DEQ; and, |
| · | Public water supply permit through the Arkansas Department of Health (ADH). |
| South West Arkansas Project Pre-Feasibility Study | 23 July 25 |
Currently there is no brine production occurring on the SWA Project for the express purpose of mineral extraction. Brine is produced from the Smackover Formation across and immediately adjacent to the property as a normal part of oil and gas extraction operations, but any brine produced is removed and disposed of as per normal oilfield activities. Albemarle produces brine to the east of the SWA property.
If Smackover Formation brine from the SWA Project is to be used in the future for process testing work, some on-site pre-treatment may be required to remove dissolved hydrogen sulfide (H2S), and all necessary permitting should be implemented accordingly.
| 4.7 | Risks and Uncertainties |
As with any development project there exists potential risks and uncertainties. Standard Lithium will attempt to reduce risk/uncertainty through effective project management, engaging technical experts and developing contingency plans.
The following risks and uncertainties have been identified at this stage of project development:
| · | Lithium brine royalty assessment by the AOGC is not completed in a timely manner and/or the royalty rates overly impact project economics. |
| · | Unitization in-lieu royalty payments, which are meant to be to fair and equitable as determined by the Commission, are subject to annual adjustments under the applicable Producer Price Index and such changes may influence the economics of the project. |
| South West Arkansas Project Pre-Feasibility Study | 23 July 25 |
| 5 | Accessibility, Climate, Local Resources, Infrastructure, and Physiography |
| 5.1 | Accessibility |
The SWA Project area spans across Lafayette and Columbia counties, with the majority of the acreage located in Lafayette County. The proposed Central Processing Facility will be located approximately 11 km (7 miles) south of Lewisville. The largest nearby city is Magnolia, located about 34 km (21 miles) to the east. Magnolia is the County Seat of Columbia County and has a population of approximately 11,200. Magnolia is also the location of the main campus for the Southern Arkansas University and houses a student population of approximately 4,600. The combined population of Lafayette and Columbia Counties is estimated at approximately 29,000 based on census data from 2020.
The largest cities in the region are Shreveport-Bossier City, LA and Texarkana, TX. Shreveport is approximately 60 miles south and has a population of 393,000, and Texarkana is approximately 30 miles west with a population of 147,000.
| 5.1.1 | Airport Access |
The nearest airport is Magnolia Municipal Airport, located immediately to the east of the SWA Project, and approximately 5 km (3 miles) south-east of Magnolia in Columbia County.
The nearest commercial airports are Texarkana Regional Airport, approximately 30 miles west and Shreveport Regional Airport, approximately 60 miles to the south.
In addition, there are two airports, one commercial and a small general aviation airport, located in Union County near the city of El Dorado. El Dorado is approximately 55 km (34 miles) east of Magnolia.
| 5.1.2 | Rail Access |
There is existing rail access just to the west and across Hwy 29 from the proposed Central Processing Facility location.
| 5.1.3 | Road Access |
The area has an extensive all-season secondary road network. Access is provided by U.S. and Arkansas state highways. U.S. Highway 82 links the cities of Lewisville, Stamps, and Magnolia, running west-to-east, and U.S. Highway 371 runs just southeast of the property (Figure 5-1). Arkansas State Highways 29, 53, 313, and several improved county roads provide access to every section of the property.
| South West Arkansas Project Pre-Feasibility Study | 23 July 25 |
Figure 5-1. SWA Property with cities/towns and access routes, including major and secondary U.S. highways and railway lines

| South West Arkansas Project Pre-Feasibility Study | 23 July 25 |
| 5.2 | Climate |
The project area climate is generally humid with average temperature and precipitation of 23.6ºC (74.4ºF) and 126.7 cm, respectively (49.8 inches; Figure 5-2). Annual rainfall is evenly distributed throughout the year. The wettest month of the year is December with an average rainfall of 12.7 cm (5 inches). The warmest month of the year is July with an average maximum temperature of 34ºC (93ºF), while the coldest month of the year is January with an average minimum temperature of -2ºC (30ºF).
Figure 5-2. Average Temperature and Precipitation in Magnolia, AR
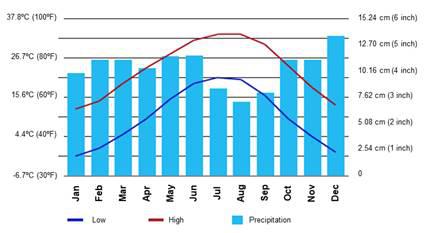
| 5.3 | Local Resources and Infrastructure |
Oil and gas extraction related infrastructure are present across the SWA Project area, particularly in the northern and southern parts of the property. This infrastructure consists of wellheads, collection facilities for various fluids, batteries, gas processing plant and associated pipelines, and cleared easements. Much of the infrastructure is variably in use by junior operators, and the operation thereof can be cyclical depending on hydrocarbon market conditions.
| 5.4 | Physiography |
Lafayette County has a total area of 1,430 km2 (545 square miles), of which 1,386 km2 is land-based (528 square miles) and 44 km2 is water-based (17 square miles). Columbia County has a total area of 1,996 km2 (767 square miles), of which 1,984 km2 is land-based (766 square miles), and 12 km2 is water-based (0.7 square miles).
The terrain consists of rolling hills with large timber farms and is sparsely populated by rural private residences.
| South West Arkansas Project Pre-Feasibility Study | 23 July 25 |
In Arkansas, the West Gulf Coastal Plain covers the southern portions of the state along the border of Louisiana. This lowland area of Arkansas is characterized by pine forests and farmlands. Natural resources include natural gas, petroleum deposits, and bromine-rich brine resources. The lowest point in the state is found on the Ouachita River approximately 90 km (56 miles) east of the property in the West Gulf Coastal Plain of Arkansas.
| South West Arkansas Project Pre-Feasibility Study | 23 July 25 |
| 6 | History |
| 6.1 | Introduction To Brine Production |
The brine production industry in southern Arkansas currently recovers bromine as its chief product. Bromine is one of two elements that are liquid at room temperature and found principally as dissolved species in seawater, evaporitic (salt) lakes and underground brine. The primary uses for bromine compounds include flame retardants, intermediates and industrial uses, drilling fluids, and water treatment. The United States is one of four leading bromine producers in the world, along with China, Israel, and Jordan. U.S. production and sold/used bromine values are withheld to avoid disclosing company proprietary data (USGS, 2016). Excluding the United States, total world bromine production is 345,000 tpa.
Some historical production of bromine occurred from ocean water, but since 1969, all U.S. bromine has been produced from subsurface brine in southern Arkansas. The first commercial recovery of bromine from brine in Arkansas occurred in 1957 in Union County. Since then, bromine production in Union County by Lanxess and in Columbia County by Albemarle has been continuous via a process in which the bromine-bearing brine is produced using production wells, the bromine is recovered through an exchange reaction with chlorine in surface facilities, and the bromine-free brine (effluent brine) is returned underground into the production formation via Class V injection wells that are regulated by the AOGC. Brine was initially encountered as a result of drilling for oil, which was first discovered in south Arkansas at the Hunter No. 1 well in Ouachita County in 1920, and first produced from the Busey No. 1 well in Columbia County in 1921. Oil and gas production has since increased, peaked, and is now in decline, as shown by Figure 6-1. The brine encountered with the oil and gas was initially considered a worthless by-product of production.
Over time, the oil and gas industry realized that the Smackover Formation brine contained elevated concentrations of elements, such as bromine in addition to hydrocarbons. For example, brine samples obtained by Standard Lithium within the SWA Property contain approximately 3,100 to 6,500 mg/L of bromine; compared to 65 mg/L in seawater (WetLab analyses of 2023 exploration program brine samples). Accordingly, the commercial potential of bromine gradually became apparent (McCoy, 2014). The large-scale development of this bromine-bearing brine resource has resulted in annual brine production volumes of between 150 million and 300 million barrels over the last 40 years (Figure 6-2). This brine production results from the Lanxess and Albemarle Smackover Formation bromine brine production projects in Union and Colombia Counties, respectively, the two principal bromine production projects in the United States. Their prolific and long-lived production projects clearly demonstrate the viability of brine production and processing from the Smackover formation in South Arkansas.
| South West Arkansas Project Pre-Feasibility Study | 23 July 25 |
Figure 6-1. Summary of South Arkansas Oil and Gas Production
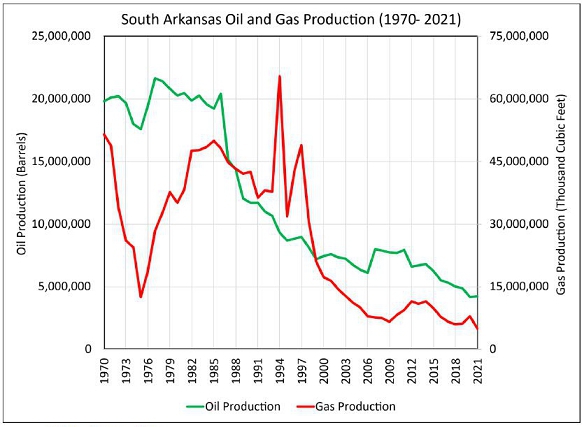
Source: AOGC, 2023
| South West Arkansas Project Pre-Feasibility Study | 23 July 25 |
Figure 6-2. Summary of South Arkansas Brine Production

Source: AOGC, 2023
The brine characteristics and productivity of these nearby Smackover properties resulted in Standard Lithium carrying out a data collection program on the subject SWA Property that has provided the information needed to describe the geologic characteristics, productivity and brine content of the Smackover Formation underlying the SWA Property, as described in Sections 9, 10, and 14.
| 6.2 | Regional Assessment of the Lithium Potential of the Smackover Formation Brine |
Note: (The discussion presented in this section extends beyond the boundary of the SWA Property.)
Adjacent properties have verified lithium-brine mineralization within the Smackover Formation. Accordingly, this discussion of lithium-brine information occurring near or adjacent to the Property is not necessarily indicative of the mineralization on the Property.
| South West Arkansas Project Pre-Feasibility Study | 23 July 25 |
Brine aquifers have different characteristics than traditional mineral deposits, such as precious and base metal deposits. Any given aquifer can have enormous sub-surface dimensions; therefore, the scale of the Smackover Formation brine aquifer (i.e., the nature and extent of the lithium-brine potential of the Smackover Formation), is important background information.
The USGS National Produced Waters Geochemical Database v2.3, contains geochemical information collected from wells across the United States. The database includes 114,943 produced water samples that were collected between 1905 and 2014 (Blondes et al., 2018). In addition to the major element data, the database contains trace elements, isotope and time-series data that provide spatial coverage from specific formations and/or aquifers. Quality control of the database must be performed by culling the data, based on geochemical criteria (Blondes et al., 2018). For this sub-section, and because the adjacent Property information is disclaimed as being not necessarily indicative of the mineralization on the Property, the QPs have not filtered any data and have included lithium-brine results directly from the USGS National Produced Waters Geochemical Database.
Figure 6-3 shows that lithium-enriched brine, specific to the database-searched: “Smackover,” “Upper Smackover,” or “Reynolds Member of the Smackover,” occurs throughout southern Arkansas within Union, Columbia, and Lafayette Counties. The highest recorded lithium-brine in this USGS-compiled database occurs within the Union County (1,700 mg/L lithium), followed by a sample with 1,430 mg/L lithium in Columbia County and 740 mg/L in northern Union County. Brine analyses between 300 mg/L and 500 mg/L lithium occur predominantly in Columbia County, with two recorded samples in Lafayette County. Brine yielding 100 to 300 mg/L lithium occurs across all three counties.
| South West Arkansas Project Pre-Feasibility Study | 23 July 25 |
Figure 6-3. Regional Smackover Formation Lithium Brine Values from the USGS National Produced Waters Database
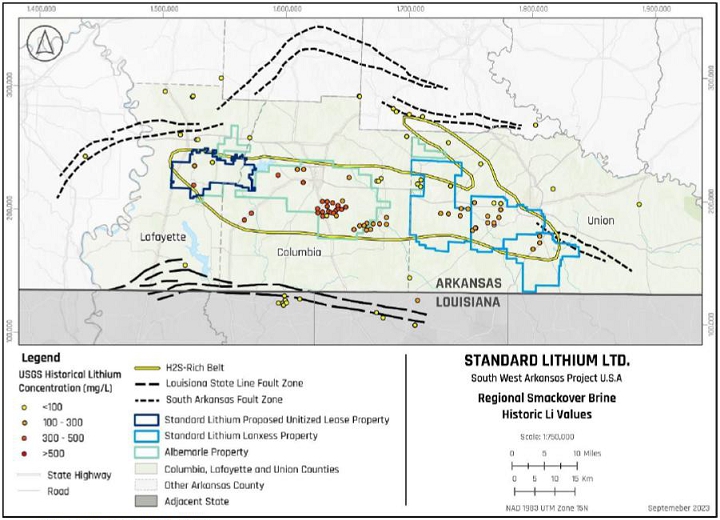
Source: Blondes et al., 2018
Moldovanyi and Walter (1992), whose brine geochemical data are included in the USGS National Produced Waters Geochemical Database, conducted a regional brine chemical study where Smackover Formation brine samples were collected and analyzed from 87 wells, which were producing from 45 Smackover Formation oil and natural gas reservoirs in southwest Arkansas, east Texas, and northern Louisiana. The study allowed these authors to hypothesize/conclude the following points with respect to the regional distribution of the elevated Smackover Formation lithium-brine:
| · | Boron (B) and alkali metal lithium (Li), potassium (K), and rubidium (Rb) concentrations in the Smackover Formation water exhibit coherent geochemical relations across the southwest Arkansas shelf. |
| · | In general, the concentration of these elements is greater and more heterogeneous in hydrogen sulfide (H2S)-rich brine than in H2S-free brine (see the H2S-rich polygon shown in Figure 6-2). |
| South West Arkansas Project Pre-Feasibility Study | 23 July 25 |
| · | Regional concentration gradients in H2S, B, Li, K, and Rb suggest fluids enriched in these elements may have migrated into the Smackover Formation reservoirs from large-scale circulation of deep-seated waters along segments of the South Arkansas and Louisiana State Line graben fault system (Moldovanyi and Walter, 1992). |
With respect to the SWA Project, the Moldovanyi and Walter (1992) dataset includes four brine analyses within the boundaries of the Property, as shown in Figure 6-4. Based on these data, lithium-brine values range from 132 mg/L lithium (Purser 2) to 432 mg/L lithium (Cornelius 2), with an average of 278 mg/L lithium. The latest concentration data gathered by Standard Lithium in 2023 demonstrates significantly higher lithium concentrations within much of the SWA Project area, and supersedes, to a large part, the Moldovanyi and Walter (1992) data, as will be discussed in the following sections.
| South West Arkansas Project Pre-Feasibility Study | 23 July 25 |
Figure 6-4. Historic Smackover Formation Lithium Brine Values Derived within, and Adjacent to, the South West Arkansas Property
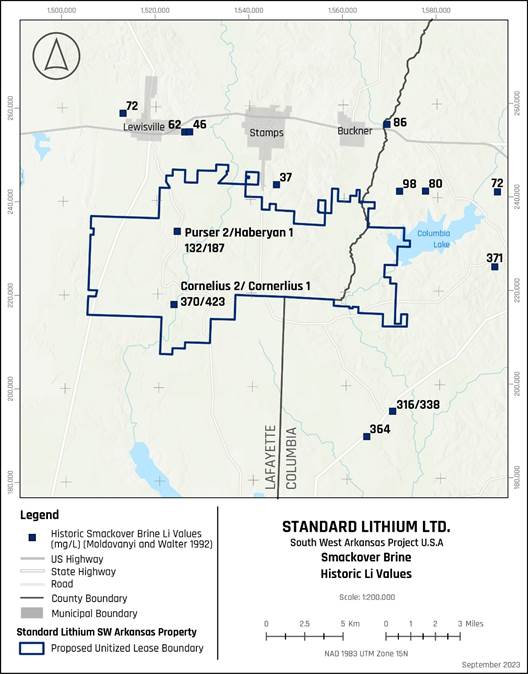
Source: Blondes et al., 2018
| South West Arkansas Project Pre-Feasibility Study | 23 July 25 |
| 6.3 | SWA Property Historical Infrastructure Summary |
Several Smackover Formation oil fields were located on the SWA Property and included: Lewisville, McKamie-Patton, McKamie NE, Mars Hill, Mt. Vernon, and Kress City (AOGC, 2016). Currently only the McKamie-Patton field is operating, and the other fields were abandoned. Prior to Standard Lithium’s activities 95 wells had been drilled by oil companies to a depth greater than 7,000 feet (2,133 meters) on the SWA Property during exploration of the Smackover Formation (Figure 6-5). Four of those wells are shut-in Smackover producers, three are completed in non-Smackover formations, and the remainder are plugged and abandoned.
The McKamie Patton oil and natural gas field is adjacent to and over-laps the south-central portion of the SWA Property. The status of 115 total wells drilled to greater than 7,000 feet (2,133 meters) within the McKamie-Patton field is as follows:
| · | 66 wells are plugged and abandoned (four within the SWA Property) |
| · | 29 wells are active producers in the Smackover formation (none within the SWA Property) |
| · | 13 wells are active producers in non-Smackover formations (none within the SWA Property) |
| · | 3 wells are injection wells (none within the SWA Property) |
| · | 4 wells are currently shut-in Smackover producers (all within the SWA Property) |
The oil and natural gas collected from the McKamie Patton oil field is directed by a gathering system of pipelines to the Dorcheat gas plant. The process facility owned by Mission Creek Resources, LLC (Mission Creek), the McKamie Gas Processing Facility, is located south of the SWA Property and is currently mothballed.
| South West Arkansas Project Pre-Feasibility Study | 23 July 25 |
Figure 6-5. Well Status on the SWA Property
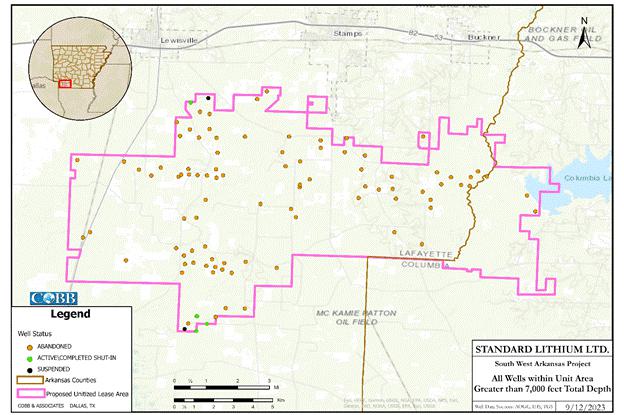
Note: Only wells with total depth greater than 7,000 feet are shown.
| South West Arkansas Project Pre-Feasibility Study | 23 July 25 |
| 7 | Geological Setting and Mineralization |
Two Qualified Professionals (Brush and Williams) have reviewed in detail the prior evaluations of the Project, including the “Amended Geological Introduction and Maiden Inferred Resource Estimate for Standard Lithium Ltd.’s Tetra Smackover Lithium-Brine Property in Arkansas, United States”, effective date 28 February 2019 (MIRE) (Eccles, et al, APEX, 2019) and the “Preliminary Economic Assessment of SW Arkansas Lithium Project”, effective date 20 November 2021 (PEA) (Eccles, et. al, APEX, 2021), and will note where its descriptions, results, or conclusions are adopted by this report. In particular, the extensive description of the geologic setting is accurate and is adopted here, and is summarized below.
The Smackover Formation is Upper Jurassic in age and was named after the Smackover Field, Union County, Arkansas, which first produced oil in 1922 (Schneider 1924). The Smackover Formation extends from the panhandle of Florida through Alabama, Mississippi, Louisiana, and Arkansas to Texas as shown in Figure 7-1. The portion of the Smackover generally known to contain significant bromine and lithium salts is found between the Jurassic Gulf Coast basin-bounding faults to the north-northwest of the Property and the “State Line” fault system to the south-southeast near the Arkansas-Louisiana border, shown in Figure 7-2.
Stratigraphically, the Smackover Formation is bounded on the top by the Buckner Formation and on the bottom by the Norphlet Formation (Figure 7-3). The lithium brine-bearing Upper Smackover Interval is overlain by the Buckner Formation, which in Arkansas is dominated by red shale in the upper part and anhydrite in the lower part above the Smackover carbonates, and, because of its low permeability, acts as a geologic seal which traps oil and gas. The dense, low-permeability carbonate of the Lower Smackover Interval is underlain by the clastic section of the Norphlet Formation. The Norphlet Formation is comprised of red and gray clays with varying amounts of intercalated sands and occasional gravels.
As shown in Figure 7-4 the Smackover Formation in southern Arkansas is commonly subdivided into three intervals, the Reynolds Member Oolite (referred to in this report as the Upper Smackover), the Middle Smackover, and the Brown Dense (referred to in this report as the Lower Smackover). The Upper Smackover is a predominantly oolitic limestone, and the Middle Smackover is a burrowed pellet packstone. The Lower Smackover (which does not contribute to the resource estimates in this report but is a future target for exploration) is largely composed of dark, dense limestone with argillaceous bands (Imlay 1940). As will be discussed later, the Lower Smackover has been found to contain porous and permeable intervals. The entire Smackover Formation has been dolomitized to varying degrees.
| South West Arkansas Project Pre-Feasibility Study | 23 July 25 |
As described in more detail in Section 14, the authors have subdivided the Upper and Middle Smackover Intervals into eight layers based on geologic characteristics and lateral correlations. The upper five layers comprise the Upper Smackover while the lower three layers comprise the Middle Smackover. To quantify the amount of porous and permeable Smackover Formation present within the SWA Property, the available core and log data was evaluated to determine the reservoir’s structure, porosity, gross layer thickness, net pay thickness (that portion of the gross layer thickness expected to be productive because it exceeded a 6.0 percent minimum porosity value) and net pay thickness to gross layer thickness ratio (equal to the fraction of the layer at a given location that was estimated to be productive) for each layer at each well location. Some wells did not drill deep enough to penetrate all layers, so only penetrated layers with data were used in the mapping effort at those locations.
| South West Arkansas Project Pre-Feasibility Study | 23 July 25 |
Figure 7-1. Facies Map of the Smackover Formation, Northern Gulf Coast Basin
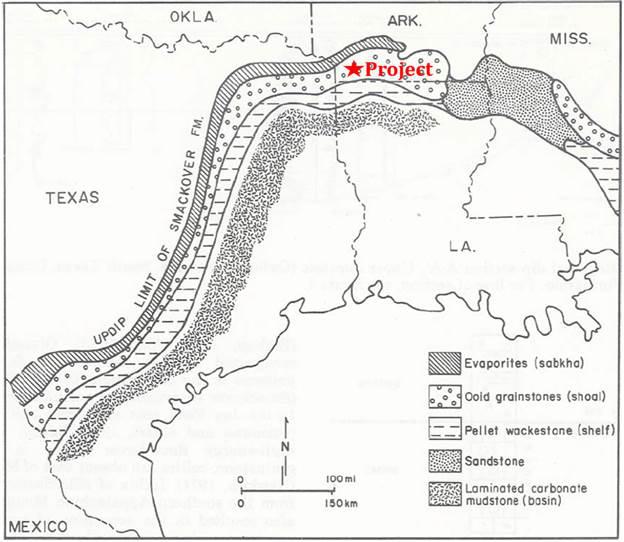
Source: BEG, 1981
| South West Arkansas Project Pre-Feasibility Study | 23 July 25 |
Figure 7-2. Structural Framework, Northern Gulf Coast
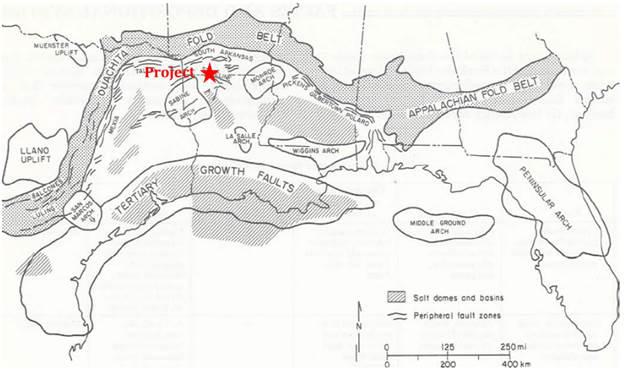
Source: BEG,1981
| South West Arkansas Project Pre-Feasibility Study | 23 July 25 |
Figure 7-3. Stratigraphic Column of the Late Triassic to Late Jurassic Formations of the Northern Gulf Coast The focus of this resource assessment is the South West Arkansas Property’s Smackover Formation.
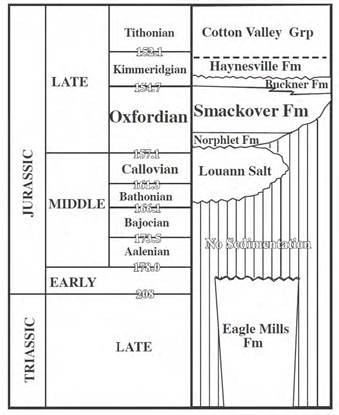
Source: Heydari and Baria, 2005
| South West Arkansas Project Pre-Feasibility Study | 23 July 25 |
Figure 7-4. Smackover Stratigraphic Column
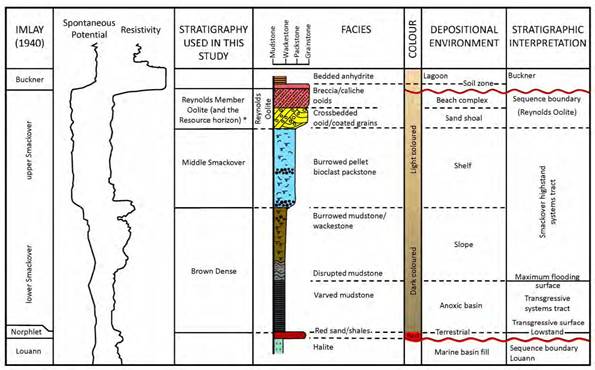
Source: Heydari and Baria, 2005
The lithium bearing Smackover reservoir is continuous across the SWA Property and extends beyond the SWA Property discussed in this Technical Report. The lithium concentration exhibited by the Smackover Formation brine varies throughout the Property, as described in Section 0. The depth of the top of the Smackover in the Property area generally dips from north-northeast to south-southwest (Figure 7-5) and varies in depth from approximately 7,600 feet (2,316 meters) subsea to approximately 9,100 feet (2,773 meters) subsea. The reservoir structure is not by itself an important factor in brine production because the similar density of injected and produced brines minimizes the influence of gravity on fluid flow in the reservoir. As shown on Figure 7-5, there is an east-west fault near the center of the SWA Property (the Brown Fault) and three more east-west faults along the southern edge of the SWA Property. The presence of these faults has been accounted for in the example development plan described in later Sections.
| South West Arkansas Project Pre-Feasibility Study | 23 July 25 |
Figure 7-5. Smackover Structure Map
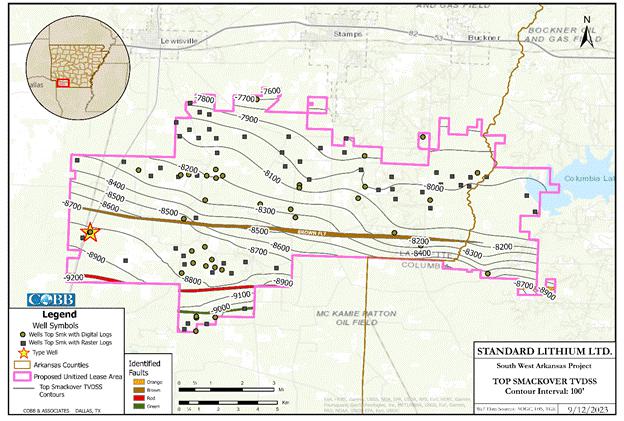
The lithium brine-bearing Upper Smackover Interval is overlain by the Buckner Formation, which in Arkansas is dominated by red shale in the upper part and anhydrite in the lower part above the Smackover carbonates, and, as a result of its low permeability, acts as a geologic seal which traps oil and gas. The dense, low-permeability carbonate of the Lower Smackover Interval is underlain by the clastic section of the Norphlet Formation. The Norphlet Formation is comprised of red and gray clays with varying amounts of intercalated sands and occasional gravels. The relationship between the Smackover Formation, the Buckner Formation, and the Norphlet Formation as shown in a cross-section through the Standard Lithium Exploration Wells, Figure 7-6.
| South West Arkansas Project Pre-Feasibility Study | 23 July 25 |
Figure 7-6. Exploration Program Wells Cross Section
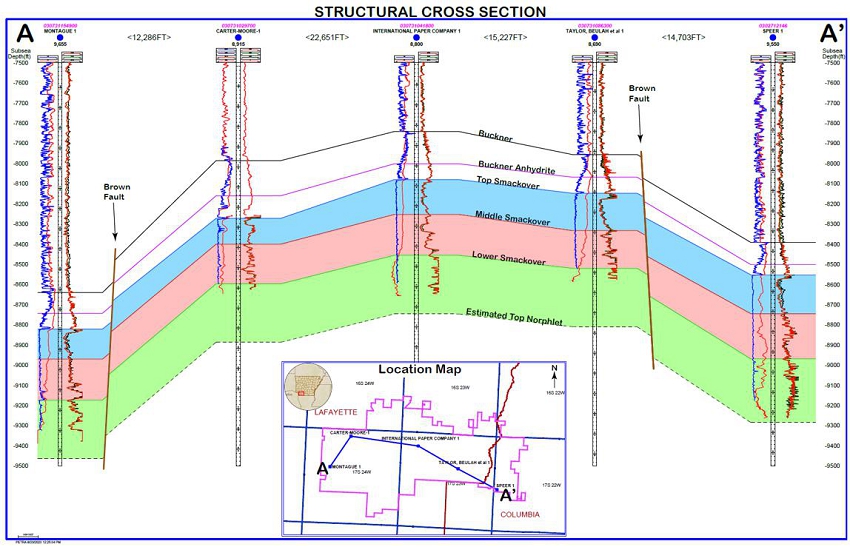
| South West Arkansas Project Pre-Feasibility Study | 23 July 25 |
| 8 | Deposit Type |
Lithium is extracted today from either mineral deposits (often from pegmatite deposits containing the lithium-rich mineral spodumene) or brine deposits. Brine deposits can either be unconfined in salars, where lithium has been concentrated by the surface evaporation of water from lithium-bearing brine (found in arid regions of countries such as in Bolivia, Chile, Argentina, and China) or confined in underground brine-bearing formations. The SWA Property lithium deposit is a confined brine deposit in the form of a lithium-bearing brine contained within the porosity of the Smackover Formation within the SWA Property boundaries. The Smackover formation in southern Arkansas has proven to be a prolific source of mineral resources, beginning with oil and gas, then transitioning to bromine, with lithium now an attractive development target. Bromine brine production from the Smackover Formation is extensive in Union and Columbia counties, to the east of the SWA Property.
The volume of in-place lithium is proportional to the product of the brine-saturated pore volume in the SWA Property and the lithium concentration, both of which are known with reasonable accuracy, based on the drilling, logging, coring, and sampling data obtained throughout the property. The geological model for the Smackover Formation is described in detail in Sections 9 and 14, and the lithium distribution is described in Section 9. The geologic characteristics of the reservoir and its lithium content estimates are based on the whole of the geologic data set and the results of recent well testing in the Upper and Middle Smackover. All this data provides the basis upon which to estimate the resource and to plan this lithium extraction Project.
| South West Arkansas Project Pre-Feasibility Study | 23 July 25 |
| 9 | Exploration |
| 9.1 | Subsurface data review |
This Technical Report incorporates the new lithium concentration data gathered by Standard Lithium from its 2023 five-well exploration program, along with the 2018 sampling program data. This new 2023 lithium concentration data has significantly improved the description of the lithium distribution within the SWA Property.
| 9.2 | 2018 and 2023 Lithium Concentration Data Sampling program |
The lithium concentration data used in this Technical Report resulted from brine samples collected by Standard Lithium in two sampling programs. In 2018 Standard Lithium gathered two samples from each of two McKamie Patton wells, MKP-20, and MKP-21, on the southwest boundary of the SWA Property. The McKamie Patton brine sampling program is discussed in detail in Section 9.2 of the PEA (Eccles, et. al, APEX, 2021). A summary of the McKamie Patton program is below.
To verify the historical lithium concentrations in the brine, Standard Lithium conducted a brine sampling program at the following McKamie-Patton wells: MKP-20 brine sample collected on June 22, 2018; and MKP-21 brine sample collected on July 23, 2018. These wells, MKP-20 and MKP-21, are completed in the Upper Smackover Formation. A WetLab laboratory analysis of the brine samples measured an average lithium content of 350 mg/L and 450 mg/L, from wells MKP-20 and MKP-21, respectively. The lithium concentrations obtained by Standard Lithium in the brine from wells MKP-20 and MKP-21 are similar to the historical SWA Property results from Cornelius 1 and Cornelius 2.
In 2023, Standard Lithium gathered a total of 21 samples from the three re-entry wells (Taylor, Beulah et al 1, International Paper Co. 1, Carter Moore 1) and two new wells (Montague 1, Speer 1) comprising the exploration program. Four additional samples were gathered from three of those wells by Robert Williams, QP as confirmation samples. All 29 samples from the 2018 and 2023 data gathering programs were analyzed by Western Environmental Testing Laboratory (WetLab), 475 E Greg Street, Suite 119, Sparks, Nevada 89431.
The 2023 five-well exploration program is described in detail in Section 10. The resulting lithium concentration values have greatly improved the description of the distribution of lithium within the Smackover Formation within the SWA Property, demonstrating higher levels of lithium concentration throughout much of the SWA Property than previously estimated. The resulting lithium concentration map was combined with the drilling data described in Section 10 to prepare the layered geologic model and resulting Resource estimates described in Section 14.
| South West Arkansas Project Pre-Feasibility Study | 23 July 25 |
Table 9-1 summarizes the lithium concentration data used in this Technical Report. Each well’s test values were averaged by tested interval to obtain the single Average Test concentration values for each tested interval. For wells with multiple tested intervals the Average Test values were combined based on each test interval’s fraction of the total estimated porosity-thickness (using a 6.0 percent porosity cutoff) for the well, resulting in each well’s Porosity Thickness-Weighted Concentration value. These values were used to map the distribution of lithium throughout the SWA Property. Figure 9-1 is a map showing the locations of the resulting concentration data.
Note the following:
| · | Test 5 for the Taylor, Beulah et al 1 well was excluded, because the apparent low permeability of the zone resulted in low flow rates which prevented the brine composition from stabilizing, resulting in an artificially-low lithium concentration value |
| · | The Ford zone test in the Carter Moore 1 well was excluded as a non-Smackover test. |
| South West Arkansas Project Pre-Feasibility Study | 23 July 25 |
Table 9-1. SWA Property Lithium Concentration Data
| Well | Test | Smackover
Zone Sampled |
Porosity
Thickness > 6% |
Standard
Lithium Sample Li, mg/L |
Standard
Lithium Duplicate Sample Li, mg/L |
Williams
Sample Li, mg/L |
Williams
Duplicate Sample Li, mg/L |
Average
Test Li, mg/L |
Porosity
Thickness- Weighted Lithium Concentration, mg/L |
| Taylor, Beulah et al 1 | 1 | Upper | 8.34 | 531 | 569 | 515 | - | 538 | - |
| Taylor, Beulah et al 1 | 2 | Upper | 2.84 | 574 | 581 | - | - | 578 | - |
| Taylor, Beulah et al 1 | 3 | Upper | 0.16 | 570 | - | - | - | 570 | - |
| Taylor, Beulah et al 1 | 4 | Middle | 0.71 | 551 | - | - | - | 551 | - |
| Taylor, Beulah et al 1 | 5 | Middle (Incomplete Test, Not Used) | NA | 263 | - | - | - | - | - |
| Taylor, Beulah et al 1 | Avg. 1-4 | Upper/Middle | 12.06 | - | - | - | - | - | 549 |
| Carter Moore 1 | 1 | Ford (Not Used) | NA | 199 | 206 | - | - | ||
| Carter Moore 1 | 2 | Upper/Middle | 9.33 | 163 | 150 | 156 | 156 | 156 | |
| International Paper Company 1 | 1 | Upper | 14.56 | 472 | 447 | 478 | 442 | 460 | - |
| South West Arkansas Project Pre-Feasibility Study | 23 July 25 |
| Well | Test | Smackover
Zone Sampled |
Porosity
Thickness > 6% |
Standard
Lithium Sample Li, mg/L |
Standard
Lithium Duplicate Sample Li, mg/L |
Williams
Sample Li, mg/L |
Williams
Duplicate Sample Li, mg/L |
Average
Test Li, mg/L |
Porosity
Thickness- Weighted Lithium Concentration, mg/L |
| International Paper Company 1 | 2.3 | Middle High Porosity | 6.39 | 282 | 289 | - | - | 286 | - |
| International Paper Company 1 | 2.2 | Base Upper+Middle Low Porosity | 1.08 | 420 | 432 | - | - | 426 | - |
| International Paper Company 1 | Avg. All | Upper/Middle | 22.02 | - | - | - | - | - | 408 |
| Speer 1 | 1 | Upper/top of Middle | 16.61 | 597 | 581 | - | - | 589 | 589 |
| Montague 1 | 1 | Upper | 3.80 | 542 | 568 | - | - | 555 | 555 |
| McKamie Patton 20 | Upper | 347 | 352 | - | - | 350 | 350 | ||
| McKamie Patton 21 | Upper | 461 | 439 | - | - | 450 | 450 |
| South West Arkansas Project Pre-Feasibility Study | 23 July 25 |
Figure 9-1. SWA Property Concentration Data
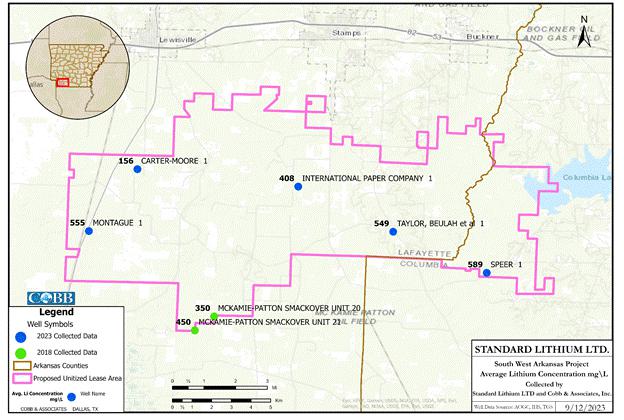
| 9.3 | Exploration Results and Interpretation |
The 2018 and 2023 lithium concentration data gathered by Standard Lithium (Table 9-1) was the basis for a map of the lithium concentrations in the SWA Property, Figure 9-2. To prevent unwarranted extrapolation of the concentration data the maps contours are limited to 95 percent of the minimum value and 105 percent of the maximum value. This map was used in the estimation of SWA Property lithium resources, as described in Section 14. The quantity and areal distribution of that lithium concentration data within the SWA Property now justifies the creation of this contoured concentration map, instead of the PEA’s two-value concentration map, which had a step-change in concentration occurring at the Brown Fault (PEA Figure 14-1, (Eccles, et. al, APEX, 2021)). The 2023 data demonstrate a significant change in the lithium concentrations from the prior map, with higher concentrations present both south and north of the Brown Fault, indicating the presence of a significant development target throughout most of the SWA Property. Generally high and uniform lithium concentrations were measured throughout most of the SWA Property (408 mg/L to 589 mg/L), except for the concentration measured at the Carter Moore 1 well (156 mg/L). As will be described in Section 14, the geologic character of the Smackover Formation at the Carter Moore 1 location differs from that observed at the well locations to the east and south, which may be related to the lower lithium concentration measured at the well. Additional delineation of the lithium concentrations in the SWA Property is one of the recommendations of this study.
| South West Arkansas Project Pre-Feasibility Study | 23 July 25 |
Figure 9-2. Lithium Concentration Map Based on Data Gathered by Standard Lithium
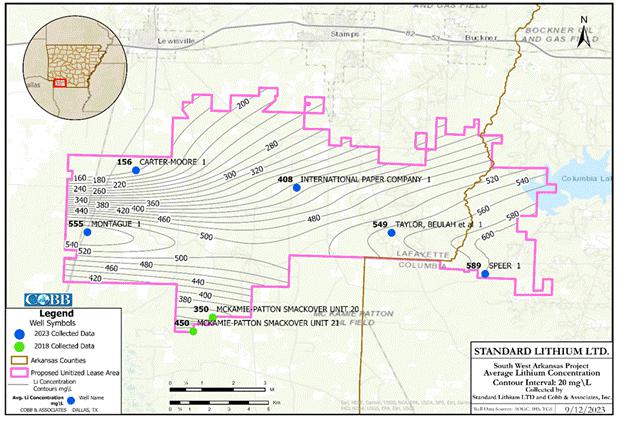
| South West Arkansas Project Pre-Feasibility Study | 23 July 25 |
| 10 | Drilling |
The layered geologic model as described in Section 14 is based on the well logs and core data obtained from 424 wells drilled in the Geologic Study Area that exceeded 7,000 feet (2,100 meters) in depth. These wells were drilled by operators exploring the area for hydrocarbons, along with the five wells either drilled or re-entered as part of the 2023 Standard Lithium exploration program, described in Section 10.1, below. Table 10-1 provides a breakdown of the types of data gathered from the wells. Figure 10-1 depicts the geologic study area and identifies the locations where these data were collected in the Upper Smackover. Figure 10-2 provides the same information for the data collected in the Middle Smackover. Both Figures highlight the five wells comprising the Standard Lithium exploration program.
Table 10-1. Types of Well Data
| Well Data | Wells
Inside SWA Property |
Wells
Outside SWA Property |
Total
Wells |
| Wells greater than 7000' within Geologic Study Area | 98 | 326 | 424 |
| Wells that penetrated top of Smackover marker | 97 | 322 | 419 |
| Wells that penetrated Middle Smackover marker | 32 | 99 | 131 |
| Digital Logs | 41 | 39 | 80 |
| Raster Logs | 96 | 325 | 421 |
| Porosity Logs | 36 | 34 | 70 |
| Core Data | 12 | 23 | 38 |
Two categories of geologic data were obtained from the wells drilled in the geologic study area that includes the SWA Property: well logs (either raster or digital) and core data. Some well logs provided structural data, while others provided porosity data. The core data provided porosity and permeability data. The structural data was obtained from 419 wells with log data that included at least the top of Smackover Formation, while the porosity data originated in two forms: the porosity logs (density porosity, sonic porosity, and neutron porosity logs) obtained from 70 wells, and the core samples obtained from 38 wells. The logs and cores were gathered for a number of different operators by contractors using industry-standard procedures, and typically experienced in their respective specialties.
| South West Arkansas Project Pre-Feasibility Study | 23 July 25 |
Figure 10-1. Upper Smackover Well Data Source
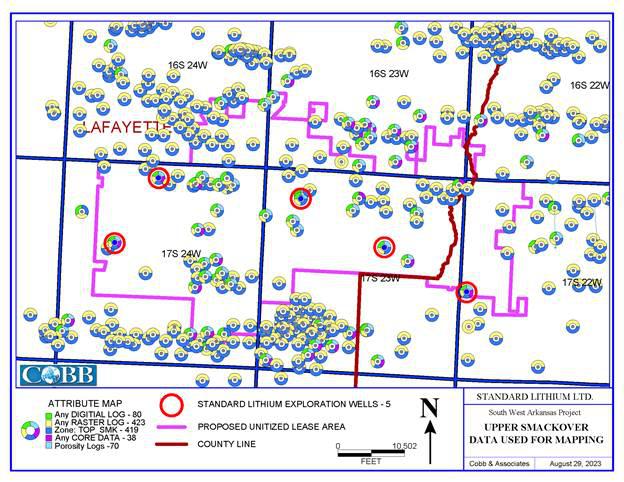
| South West Arkansas Project Pre-Feasibility Study | 23 July 25 |
Figure 10-2. Middle Smackover Well Data Source
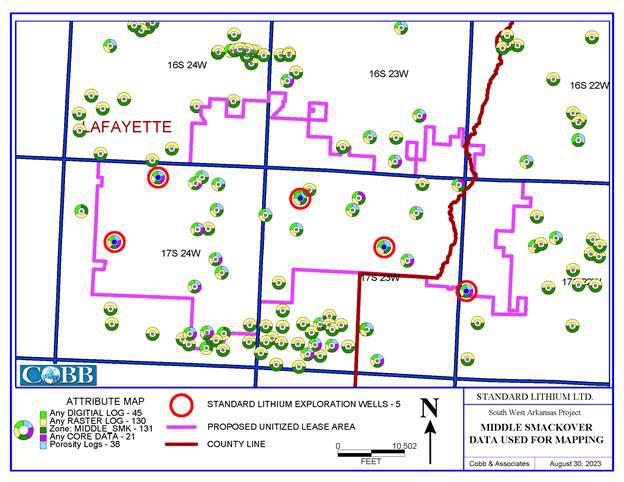
The log data was used to establish correlations for structural control, to identify zone boundaries, to define gross interval thickness for each Smackover zone, to identify net pay intervals, and to estimate the porosity values for those net pay intervals. The well log data included varying combinations of the following logs: spontaneous potential (SP), gamma ray (GR), resistivity (EL, ISFL, DIL, etc.), MicroLog, and various porosity logs (acoustic, neutron, and density). The by-zone gross thickness values obtained from the logs were used to constrain net reservoir thickness and to relate porosity to the established zone correlations. The primary source of log porosity data, the density porosity logs, were calibrated using the core porosity values, supplemented with the sonic porosity and neutron porosity logs, eliminating any significant systematic error or bias in the resulting porosity value estimates.
| South West Arkansas Project Pre-Feasibility Study | 23 July 25 |
The east-to-west fault system present in the southern portion of the SWA Property was previously identified and described in the PEA (Eccles, et. al, APEX, 2021). The seismic data used to create that interpretation was evaluated and confirmed by Robert Williams, QP, resulting in a similar fault configuration with minor modifications to the southeast fault traces to conform to the data provided by the new Standard Lithium Speer 1 well.
The resulting layered geologic model, discussed in Section 14, formed the basis for the geologic description of the brine-containing reservoir used for resource estimates. The geologic description was also used in the reservoir simulation model which provided an understanding of the potential for lithium recovery from the SWA Property, described in Section 16.
| 10.1 | Standard Lithium exploration program |
From February to July, 2023 Standard Lithium conducted a five-well exploration program at the SWA Property. QP Brush worked with Standard Lithium and the drilling contractor to help design and execute the exploration program, including choice of well locations, data gathering plans, monitoring well progress, advising on coring targets and procedures, and interpretation of results. This program included re-entry into three existing abandoned wells (Taylor, Beulah et al 1, International Paper Co. 1, and Carter-Moore 1) and drilling two all-new wells (Speer 1 and Montague 1). These five well locations were chosen to maximize the description of the geologic properties and lithium concentrations within the Property. Figure 10-3 depicts the locations of those five wells.
| South West Arkansas Project Pre-Feasibility Study | 23 July 25 |
Figure 10-3. SWA Property Exploration Program
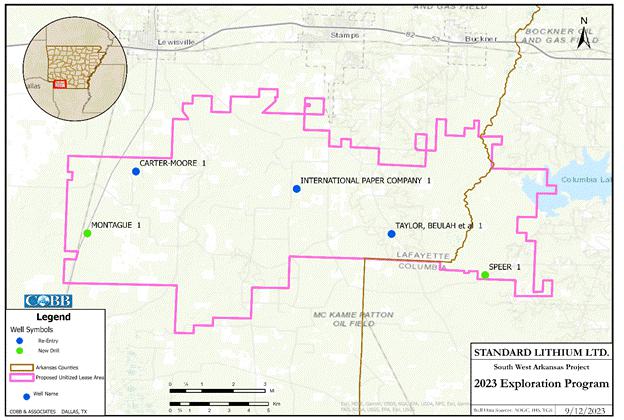
Each of the five wells collected well log data which was used to identify the zones in each well over which production tests were completed and brine samples collected during the exploration program. Both whole core and sidewall coring programs were complete in several of the wells. Table 10-2 summarizes actions taken at each well as part of the exploration program, including the well depths, sampling targets, amount of whole core, number of rotary sidewall cores, and the brine volumes obtained. Each well successfully tested the high-porosity interval in the Upper Smackover which is considered the SWA Property’s main pay zone. Additional productive pay was encountered and successfully tested at various depths in the Middle Smackover. In one case porous and permeable formation was identified in the Lower Smackover. During each production test the physical and chemical characteristics of the brine were monitored. Once those characteristics stabilized, samples were taken and shipped to the outside laboratory, WetLab, for compositional analysis.
| South West Arkansas Project Pre-Feasibility Study | 23 July 25 |
Table 10-2. Well Actions Taken During Exploration Program
| Well | Actions | Original
Measured Depth (Feet) |
Final
Measured Depth (Feet) |
Smackover Zones Sampled |
Interval
Where Whole Core Collected, Measured Depth (Feet) |
Total
Interval Cored (Feet) |
Amount
of Core Recovered (Feet) |
Number
of Rotary Sidewall Core Samples Collected |
Total Volume of Brine Produced (m3) |
| Taylor, Beulah et al 1 | Re-entry, deepen into Middle Smackover | 8,690 | 8,940 | Upper, Middle | 8,679.50 to 8,830.50 | 151.00 | 142.00 | 12 | 54 |
| Carter Moore 1 | Re-entry, deepen into Upper and Middle Smackover | 8,545 | 8,915 | Upper, Middle | None | None | None | None | 80 |
| International Paper Company 1 | Re-entry | 8,800 | 8,950 | Upper, Middle | None | None | None | 26 | 237 |
| Montague 1 | New well | Not Applicable | 9,655 | Upper | 9,053.00 to 9,388.00 | 335.00 | 235.45 | None | 149 |
| Speer 1 | New well | Not Applicable | 9,550 | Upper, Middle | 8,909.55 to 9,019.30 | 109.75 | 86.15 | 26 | 44 |
Figure 10-4 presents as a type well the Montague 1 well log, indicating the primary well log data, the cored interval, the intervals tested, the core permeabilities (shaded green where permeability is greater than 0.5 mD), and the intervals meeting the 6.0 percent porosity net pay cutoff (highlighted with the orange “Net Phi 6 Cobb” flag and shaded green where log porosity, “PhiND CC” is greater than 6.0 percent). Each well test is described in the following sections.
| South West Arkansas Project Pre-Feasibility Study | 23 July 25 |
Figure 10-4. Montague 1 Type Well
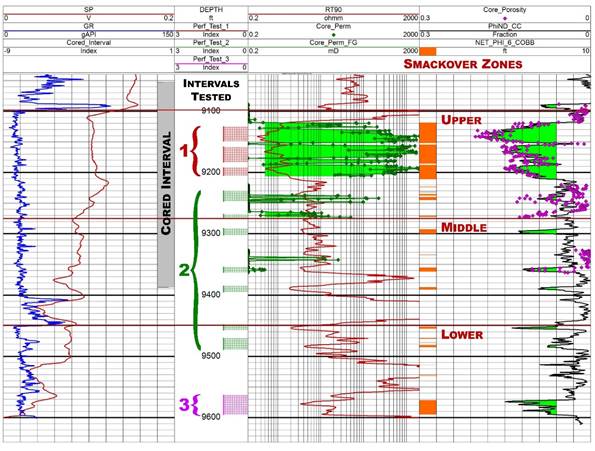
| 10.1.1 | Taylor, Beulah et al 1 Well Re-entry |
The Taylor, Beulah et al 1 well was originally drilled in 1982 to near the base of the Upper Smackover formation. The well was re-entered, deepened, cored, and logged. Whole core was taken over the Middle Smackover formation as part of the deepening, and rotary sidewall cores were taken over the previously-drilled Upper Smackover following logging. The well was then cased. Test intervals were chosen based on the combination of porosity values exceeding 6.0 percent (indicative of net pay) or resistivity values less than 6.0 ohm-meters, indicating the presence of conductive brine (the same criteria were applied to the remaining four wells). Five intervals were sequentially perforated and tested, starting with two in the Middle Smackover followed by three in the Upper Smackover. The lowest interval flowed small volumes of brine, the remaining four flowed significant volumes of brine.
| South West Arkansas Project Pre-Feasibility Study | 23 July 25 |
| 10.1.2 | International Paper Company 1 Well Re-entry |
The International Paper Company 1 well originally was drilled in 1978 to near the base of the Middle Smackover. The well was re-entered, deepened into the Lower Smackover, and logged, followed by gathering rotary sidewall cores and casing the well. Three successful tests were conducted in the Middle and Upper Smackover. The lower-porosity pay in the Middle Smackover and bottom of the Upper Smackover flowed following an acid stimulation. Those intervals were then isolated and a high-porosity zone in the Middle Smackover was successfully perforated and tested. Finally, the high-porosity main pay interval in the Upper Smackover was successfully perforated and tested. The Lower Smackover was found to be non-productive at this location.
| 10.1.3 | Carter-Moore 1 Well Re-entry |
The Carter-Moore 1 well originally was drilled in 1976 into the Ford Zone, a porous and productive zone immediately above the Upper Smackover. The well was re-entered and the original perforations were used to sample the Ford Zone. Those perforations were then cement squeezed and the well was deepened to the top of the Lower Smackover. Core data was not obtained in this well because the limited diameter of the deepened portion of the well below the Ford Zone was insufficient to allow coring operations. The deepened portion of the well, which covered the Upper and Middle Smackover, was logged, and then tested and sampled open hole.
| 10.1.4 | Speer 1 New Well |
The Speer 1 well was drilled into the Lower Smackover with core recovered in portions of the Upper and Middle Smackover. The well was cased and the net pay targets in the Upper Smackover and Middle Smackover were successfully perforated and tested.
| 10.1.5 | Montague 1 New Well |
The Montague 1 well was drilled into the Lower Smackover, with whole core recovered in the Upper and Middle Smackover. The high-porosity main pay target of the Upper Smackover was successfully tested and sampled. Results from the deeper zones were not obtained in time for this report. Therefore, the Upper Smackover main pay target lithium concentration value was used in the preparation of this Technical Report.
| South West Arkansas Project Pre-Feasibility Study | 23 July 25 |
| 11 | Sample Preparation, Analyses, and Security |
| 11.1 | Sampling Methods |
Standard Lithium’s 2018 sampling program for the two McKamie Patton wells is described in detail in Section 11.1 of the PEA (Eccles, et. al, APEX, 2021). QP Williams has reviewed that description and has found the procedures described reasonable and appropriate.
QP Williams worked with Standard Lithium, the drilling contractor, and the other technical personnel to help design and implement the sampling procedures used at each of the five 2023 exploration program wells. Robert Williams, QP participated in the 2023 brine sampling programs at the Taylor, Beulah et al 1, Carter Moore 1, and International Paper Co. 1 wells, carefully observing the procedures, completing the sample log, and monitoring the WetLab analysis confirmations for the samples. The samples were collected in a consistent and secure manner, with a clear chain of custody from the sample collection point to the shipment to the laboratory.
| 11.2 | Sample Preparation, Analyses And Security |
| 11.2.1 | Brine Sample Collection |
Brine samples were collected from three re-entered abandoned wells and two new wells (Section 10). A critical step to sampling brine for geochemical analysis is to ensure that the brine collected is considered a “fresh” representative of Upper or Middle Smackover Formation.
During the 2023 sampling programs conducted by Standard Lithium, the sample collection methodology included:
| · | For the three wells that were re-entered, the well construction schematic was reviewed, the target depth identified and the need for deepening the well was determined. Once deepened the logs were run and test intervals identified. For the two new wells logs were run once each well was drilled and the test intervals were identified. |
| · | For each test interval a cast iron bridge plug was set above the prior test interval (except for the first test), the test interval was perforated, a pressure gauge was set and the swabbing assembly was run in the well, including a packer assembly immediately above the perforated zone to isolate the testing horizon. New production tubing was also installed in the well. All the work was completed by a workover rig. |
| South West Arkansas Project Pre-Feasibility Study | 23 July 25 |
| · | After the test interval was perforated, brine was removed from the well by swabbing the production tubing. Swabbing involves lowering swab cups on steel wireline inside the production tubing from above the perforations. Once the wireline and swab cups were lowered to the desired depth through a fluid column of approximately 1000 feet (300 m) they were raised, and the entire 1000 feet (300 m) column of brine was brought to wellhead, conveyed through a piping system to a three-stage fluid/gas separator and then to a mud tank for storage. The volume of fluid removed from the well was measured with flow meters, and also calculated based upon the volume measured at regular intervals in the mud tank. |
| · | Field-measured parameters were collected and analyzed onsite by a Standard Lithium representative to assess brine density, electrical conductivity, pH, and temperature from brine on every swab run. Field measured parameters were compared to known values of the Smackover Formation. For example, the formation has a brine density of about 1.20 grams/cubic centimeter (10.2 lbs/gallon). Swabbing of the well continued until field-measured parameters had stabilized. |
| · | Brine established to be from the Smackover Formation (based on density, electrical conductivity, and pH) was collected by filling two 1,000 L (250 US gallon) intermediate bulk containers (IBCs) from a valve installed at the three-stage separator. Safety protocols were exercised on site due to the hydrogen sulfide (H2S) gas content associated with the produced Smackover Formation fluids. A new 4-litre carboy container was filled from the IBC to allow oil and brine to separate if oil was present. In all cases no oil was observed in the carboys attesting to the high brine to oil ratio. |
| · | The physical attributes of the brine sample were recorded (e.g., color, smell, contaminants, etc.). The sampling process was completed by recording any comments that might be significant to the sampling site, the sample collection, or the sample itself. |
| · | New laboratory-supplied sample containers with screw-on caps were labelled using Standard Lithium’s label procedure that includes recording the sample identification, date and time of sample collection, and sampler’s initials. |
| · | Three sample containers were collected from the 4-liter carboy container by Standard Lithium: 1-liter plastic, 500 ml plastic preserved with nitric acid (HNO3) and 250 ml glass preserved with phosphoric acid (H3PO4) for geochemical analysis at Western Environmental Testing Laboratory (WetLab), an independent laboratory. |
| South West Arkansas Project Pre-Feasibility Study | 23 July 25 |
| · | The sample containers were checked to verify that all sample label information was correct, and the sample container was properly closed. All sample containers were then stored in coolers for shipping to the laboratories. |
| 11.2.2 | Security |
Coolers holding the sample containers were taken from the field to a secured location to double check the sample IDs and make sure all containers are in good condition prior to shipment to the laboratory. Chain of Custody forms for the respective laboratories were filled out and included with the sample cooler. The cooler was taped closed and hand-delivered to the local courier company (Fed-Ex in El Dorado, AR) for delivery to the WetLab laboratory in Sparks, NV. The laboratory was instructed to confirm receipt of the samples and provide a statement pertaining to the condition of the samples upon receipt. The samples were then coded into the respective laboratories sample stream for analysis.
| 11.2.3 | Analytical Methodology |
Standard Lithium has prepared its own internal analytical protocols for the independent laboratories to follow. These include the following analytical work (with the associated American Society for Testing and Materials (ASTM), Standard Methods (SM) and Environmental Protection Agency (EPA) international and national method code): “Expanded Lithium Brine Analytical Suite”.
| · | General chemistry: density, pH, temperature, carbonate, bicarbonate, total dissolved solids, total organic carbon (ASTM 1963, SM 4500-H+B, SM 2550B, SM 2320B, SM 2540C and SM 5310B). |
| · | Anions by Ion Chromatography: chloride, sulfate, bromide, fluoride (EPA 300.0) |
| · | Sample preparation: trace metal digestion (EPA 200.2) |
| · | Trace metals by Inductively Coupled Plasma Optical Emission Spectroscopy (ICP-OES): Li, Al, Sb, As, Ba, Be, B, Cd, Ca, Cr, Co, Cu, Ga, Fe, Pb, Mg, Mn, Mo, Ni, P, K, Sc, Se, silicon, silica, Ag, Na, Sr, Sn, Ti, V and Zn (EPA 200.7) |
WetLab completed these analyses using the following corresponding methods: sample preparation by EPA 200.2; density by gravimetric; pH by SM 4500-H+B; temperature at pH by SM 2550B, carbonate and bicarbonate by SM 2320B; chloride and sulfate by EPA 300.0; total dissolved solids by SM 2540C; anions by ion chromatography by EPA 300.0; trace metal digestion by EPA 200.2; and trace metals by ICP-OES by EPA 200.7.
| South West Arkansas Project Pre-Feasibility Study | 23 July 25 |
| 11.3 | Quality Control/Quality Assurance |
| 11.3.1 | Field Duplicate Samples |
A field duplicate sample was collected for every sampling event. The field duplicate sample was taken at the same time as the original sample (i.e., back-to-back samples from the brine sample spigot). Random identifiers were given to the duplicate sample and duplicate field samples were never in sequential order and randomly presented to the laboratory.
A total of 12 primary brine samples were collected from the five newly completed wells and each well had multiple completion zones. In addition to the 12 primary samples, 9 duplicates samples were collected. Thus, representing almost one duplicate per primary brine sample. The lithium results of the duplicate sample analyses are presented in Table 11-1. The duplicate sample relative percentage difference (RPD) for WetLab was 1.2 % to 8.3 %. It should be noted that any result with an RPD less than 20% is considered acceptable.
| South West Arkansas Project Pre-Feasibility Study | 23 July 25 |
Table 11-1. Comparison of Field Duplicate Samples from the 2023 Sampling Program
| Lithium Concentrations | ||||
| Well Name | Smackover Zone |
Primary Sample (mg/L) |
Duplicate Sample (mg/L) |
RPD1 Percentage |
| Taylor, Beulah et. al 1 | Upper | 531 | 569 | 6.9 |
| Upper | 581 | 574 | 1.2 | |
| Carter-Moore 1 | Ford | 206 | 199 | 3.5 |
| Upper | 163 | 150 | 8.3 | |
| International Paper Company 1 | Upper | 472 | 447 | 5.4 |
| Middle | 432 | 420 | 2.8 | |
| Middle | 282 | 289 | 2.5 | |
| Montague 1 | Upper | 542 | 568 | 4.7 |
| Speer 1 | Upper | 597 | 581 | 2.7 |
Note: 1. RPD denotes relative percentage difference.
| 11.4 | Other Data: Core Reports |
Historical core reports include pertinent information on Upper and Middle Smackover formations core measurements conducted by independent engineering consultants (Core Laboratories Inc. in Dallas, TX and Shreveport, LA; Delta Core Analysts in Shreveport, LA; All Points Inc. in Houston, TX; Thigpen Laboratories, Inc. in Shreveport, LA: O’Malley Laboratories, Inc. in Natchez, MS; and Bell Core Laboratories in Shreveport, LA). These reports included core measurements that included porosity (%) and permeability (mD) from throughout and immediately surrounding the SWA Project. Some of the core report data also included: data for oil% in pore space; water% in pore space; bulk oil%; bulk gas%; bulk water%; and vertical permeability.
| South West Arkansas Project Pre-Feasibility Study | 23 July 25 |
| 11.5 | Summary |
These analytical brine and core report data were prepared by independent and accredited third-party companies. The resulting quantitative data are used to make inferences on the brine analytical values and hydrogeological characteristics of the Upper and Middle Smackover formations. The analytical methods carried out by the laboratories are standard and routine in the field of lithium brine geochemical analytical and petrophysical core characterization test work.
The author has reviewed the adequacy of the sample preparation, security and analytical procedures and found no significant issues or inconsistencies that would cause one to question the validity of the data. The QA/QC protocol adopted by Standard Lithium helped the authors to evaluate and validate the laboratory data as discussed in Section 12, Data Verification.
| South West Arkansas Project Pre-Feasibility Study | 23 July 25 |
| 12 | Data Verification |
| 12.1 | Verification of Lithium Concentration Data, Well Logs, and Core Data |
Robert Williams, QP verified the lithium concentration data four different ways:
| · | Reviewed the choice of analytical laboratory |
| · | Reviewed the overall scatter in each well’s lithium concentration data |
| · | Compared concentration results between samples independently taken and verified by Robert Williams, QP to those by Standard Lithium |
| · | Compared concentration results between known standards and reported concentrations |
The four comparisons confirmed the choice of WetLab, the consistency of the data, the close match between the independently-gathered samples and those of Standard Lithium, and the reasonable match between standard concentrations and test results.
In 2021 Standard Lithium conducted an extensive comparison test of four laboratories known for brine analysis. That study’s results indicate that WetLab is the appropriate choice for the range of lithium concentrations encountered in this Technical Report. Robert Williams, QP has reviewed the supporting documentation of that study and agrees with its conclusions. As a result, the WetLab-reported lithium concentration data is used throughout this Technical Report.
To verify the Standard Lithium test results, three wells were independently sampled by Robert Williams, QP, who independently followed the sampling procedures outlined in Section 11. Table 121 summarizes the results of that verification. The small relative percentage difference values, 0.1 percent to 6.4 percent, between the Williams samples and the Standard Lithium samples confirms the consistency of the Standard Lithium report concentrations with the independently gathered samples in the well sampling dataset.
| South West Arkansas Project Pre-Feasibility Study | 23 July 25 |
Table 12-1. Comparison of Verification Samples from the 2023 Sampling Program
| Well | Test | Smackover Zone Sampled |
Standard Lithium Sample Li, mg/L |
Standard Lithium Duplicate Sample Li, mg/L |
Williams Sample Li, mg/L |
Williams Duplicate Sample Li, mg/L |
Relative Percentage Difference, Williams to SLI Samples |
| Taylor, Beulah et al 1 | 1 | Upper | 531 | 569 | 515 | - | 4.3% |
| Carter Moore 1 | 2 | Upper/Middle | 163 | 150 | 156 | - | 0.2% |
| International Paper Company 1 | 1 | Upper | 472 | 447 | 478 | 442 | 0.1% |
The four historic on-property lithium concentration data depicted in Figure 6-3 (Blondes, et al. 2018) were not used in this Technical Report for these reasons:
| · | The testing methodologies employed in the Cornelius 1 and Cornelius 2 wells were unknown, even though the reported values were similar to the values measured by Standard Lithium at the nearby McKamie Patton wells. |
| · | The Purser 2 and Haberyan 1 wells’ values appear to have been taken from the Ford zone immediately above the Upper Smackover, and are not representative of Smackover lithium concentrations. One of this Technical Report’s recommendations is to gather additional Smackover Formation lithium concentration data, including in the area of these two wells. |
The well log and core data used to create the geologic model meets the standard of reliability required by this Technical Report. This data was taken by independent vendors in a manner meeting industry standards, consistent with the identical data collection procedures used in dozens of projects evaluated by QP Williams. Importantly, this data was obtained for a purpose unrelated to the estimation of lithium resources. Therefore, it was not subject to any biases related to that estimation process.
The data from each of the 98 wells in the SWA Property and 326 wells outside of the SWA Property but within the geologic study area, including the data from the five Standard Lithium wells, have been reviewed and the data was found suitable for this evaluation. The location of the different sources of data is summarized in Table 10 1 and depicted in Figure 10 1 and Figure 10 2. The lithium concentration, well log, core, and test data used in the preparation of this Technical Report meets the highest standards for the evaluation of the brine deposit. Any limitations present in the data are the unavoidable limitations present in all field measurements. Standard Lithium and the petroleum companies have exerted industry-standard efforts in gathering high-quality data on and around the SWA Property. Standard Lithium’s data gathering program has been thorough, and results directly in a high-quality database for use in this evaluation of the SWA Property’s lithium resources.
| South West Arkansas Project Pre-Feasibility Study | 23 July 25 |
| 12.2 | Verification of Metallurgical Process Data |
Mr. Marek Dworzanowski, QP verified the Standard Lithium Demonstration Plant analytical data in the following ways:
| · | Reviewed the choice of the independent analytical laboratory |
| · | Reviewed the analytical data from the demonstration plant analytical laboratory |
| · | Reviewed the analytical data from the independent analytical laboratory testing |
| · | Reviewed the demonstration plant sampling methodology |
In 2021 Standard Lithium conducted an extensive comparison test of four laboratories known for brine analysis. That study’s results indicate that WetLabs is the appropriate choice for the range of lithium concentrations encountered in this Technical Report. Mr.Marek Dworzanowski, QP has reviewed the supporting documentation of that study and agrees with its conclusions.
A review of the analytical data from the demonstration plant analytical laboratory shows the generation of all the required analyses and sufficient data points to allow meaningful statistical analysis. The laboratory uses ICP-OES as the primary analytical tool which is standard for lithium projects. Mr. Marek Dworzanowski QP visited this laboratory and assessed that the equipment and operations were appropriate for the generation of the required analytical data.
A review of the WetLab analytical data showed an extensive independent testing of samples from the Demonstration Plant. The degree and nature of this independent testing confirms an acceptable match between WetLab and the demonstration plant analytical laboratory.
Mr. Marek Dworzanowski, QP visited the Demonstration Plant and witnessed the automatic inline sampling of all the required streams. Because all the samples are liquid and are taken automatically, the sampling error will be within acceptable limits.
| South West Arkansas Project Pre-Feasibility Study | 23 July 25 |
The Demonstration Plant was commissioned to prove the applicability of DLE technology to the SWA Project. The chemical analyses generated by this Demonstration Plant were verified by using WetLab as an independent analytical laboratory. The process data generated by this plant (including the chemical analyses) was used to develop the Heat and Mass Balance and the Process Design Criteria which in turn supported the project process design. It is the opinion of Mr. Dworzanowski that the process data confirmed the applicability of DLE and was used to develop the engineering design of all the subsequent concentration and purification process steps.
| South West Arkansas Project Pre-Feasibility Study | 23 July 25 |
| 13 | Mineral Processing and Metallurgical Testing |
| 13.1 | Introduction |
Standard Lithium Limited has developed a process flowsheet to selectively extract lithium from Smackover Formation brine and produce battery-quality lithium chemicals at the Company’s projects in southern Arkansas. The mineral processing and hydrometallurgical flowsheet for the SWA Project consists of six main process areas:
| 1. | Brine production from multiple wells targeting specific zones of the Smackover Formation followed by primary three-phase separation of the produced brine at the wellhead to remove associated sour gas and crude oil from the brine and then pipelining of the brine to a Central Processing Facility (CPF). These processes are proven and industry-standard for handling produced water from oil and gas fields and have been used for over 60 years for handling Smackover brines for bromine production in Southern Arkansas and, therefore, require no process adaptations. |
| 2. | Pre-treatment of the produced Smackover brine at the SWA CPF to remove dissolved gases and suspended solids prior to lithium extraction. These processes are also industry standard and have been used on Smackover brines for 60 years as part of the bromine production process. |
| 3. | Selective extraction of lithium from the pre-treated brine using a proprietary Direct Lithium Extraction (DLE) technology to produce a purified lithium chloride (LiCl) solution. |
| 4. | Further purification and concentration of the LiCl solution using softening and salt removal processes that are industry standard processes for water and wastewater treatment. |
| 5. | Conversion of the purified and concentrated LiCl solution to a lithium hydroxide solution by an electrolysis process which is proven in the chlor-alkali industry, followed by evaporation, crystallization and drying to produce a high-purity lithium hydroxide crystal product. |
| 6. | Disposal of the lithium-depleted, effluent brine back into the Smackover Formation via multiple re-injection wells maintaining a controlled aquifer pressure throughout the area of the Smackover Formation. Pressure maintenance through brine reinjection is a common industry standard process. |
With regards to Process Areas 1 and 6, the SWA Project is located in a region with abundant oil, gas and brine operations, and as such, there are multiple service providers who can effectively support installation of the well field for production and separation of the brine prior to delivery into the CPF. Therefore, no additional technology development or proof of concept work has been undertaken for this part of the project.
| South West Arkansas Project Pre-Feasibility Study | 23 July 25 |
With respect to Process Areas 2, 3 and 4, Standard Lithium has been continuously running a pre-commercial Demonstration Plant at the Lanxess South bromine production facility near El Dorado since May 2020. As a result, significant data has been gathered regarding the performance of the various unit processes for pre-treatment of Smackover brine and operation of the DLE technology on the brine. The Demonstration Plant has produced significant quantities of purified and concentrated LiCl solution and has converted it, on site, to battery-grade lithium carbonate.
With respect to Process Area 5, Standard Lithium is relying on a combination of project specific laboratory-scale testing and previous hydrometallurgical and commercial scale electrochemical test work completed by NORAM Electrolysis Systems Inc (NESI) on multiple actual and synthetic lithium brines for over 1,000 hours each to produce battery-quality lithium hydroxide solutions.
Conversion of the purified and concentrated lithium hydroxide solution to battery-quality solid lithium hydroxide material will be done using proven crystallization technologies from globally recognized vendors. Large scale test production of lithium hydroxide from LiCl solution produced at Standard Lithium’s Demonstration Plant will be undertaken during the DFS phase in support of vendor guarantees.
The intent of this Section is to discuss the South West Arkansas Project specific lithium-brine mineral processing test work in accordance with CIM Leading Practice Guidelines for Mineral Processing (2022). The level of definition is appropriate to the confidence categories of mineral resources being supported and the current stage of project development.
| 13.1.1 | Process Selection Rationale |
Standard Lithium’s SWA Project has several unique aspects that support flowsheet development centered around a DLE approach to lithium recovery. The factors which affect the selected approach include the following:
| · | A well-understood and industry-friendly regulatory framework for brine operations, |
| · | Existing brine processing businesses (Lanxess and Albemarle bromine plants) provide a local workforce well versed in pumping, processing, and reinjecting very large volumes of brine, |
| · | Effluent-brine reinjection into the Smackover Formation is required to maintain aquifer pressurization. Evaporation of Smackover brine using solar evaporation (with no recovery of condensate) would not provide sufficient brine for reinjection and would negatively affect the water balance in the Smackover Formation beneath the Project area, resulting in a reduction in the reservoir pressure and a resultant reduction in productivity at the wells, |
| South West Arkansas Project Pre-Feasibility Study | 23 July 25 |
| · | Access to abundant fresh water, |
| · | Access to stable, high capacity and relatively inexpensive electricity, |
| · | Access to low-cost, readily available, chemical reagents (acids, bases etc.), and |
| · | Access to low-cost natural gas. |
| 13.1.2 | Process Overview |
As discussed above, the production of lithium-bearing brine from production wells and separation of the brine from sour natural gas and crude oil will use industry-standard techniques, similar to those already used at large scale in southern Arkansas at the active brine processing facilities (e.g. at Lanxess or Albemarle’s operations), or as part of produced-water management associated with oil and gas production in the region.
Pretreatment of the brine to remove dissolved gases and suspended solids will use proven standard processes in the brine, oilfield produced water and wastewater treatment industries.
Standard Lithium expects to use a well tested proprietary DLE technology (discussed further in Section 13.3.3) to extract lithium from the lithium-bearing Smackover brine and produce a concentrated and purified LiCl solution. Much of the flowsheet has been in pre-commercial operation and optimization since May 2020 at the Company’s Demonstration Plant. The specific lithium extraction technology described in the PFS has been operated consistently on a 24hr / 7 day per week basis at the Demonstration Plant since October 2022. This technology has been sufficiently tested and validated such that it can be used for commercial operation in the SWA Project.
The conversion of the purified and concentrated LiCl solution into a lithium hydroxide solution using an electrochemical process is based on technology developed and tested by NORAM at their testing facilities in Richmond, BC, and further supported by project specific testing with Electrosynthesis Company, Inc. (Electrosynthesis or ESC) in Lancaster, NY. Final concentration, crystallization of lithium hydroxide (LiOH•H2O) will use industry standard equipment and process technology.
Figure 13-1 is a simplified schematic showing the main process steps proposed for the SWA Project.
| South West Arkansas Project Pre-Feasibility Study | 23 July 25 |
Figure 13-1. SWA Lithium Brine Project Flowsheet Schematic
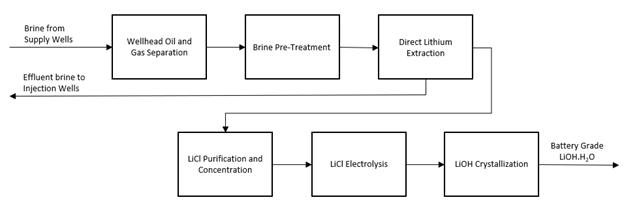
It is the opinion of the author preparing this section, that the discussion includes an objective level of reasonableness and demonstrates competence and due care in the execution of the metallurgical test work and lithium-brine recovery process steps.
| 13.2 | Historical Testing |
To the best of the author’s knowledge, no historical testing regarding lithium recovery from brine leases associated with the SWA Project has been performed. All testing discussed below was performed for Standard Lithium as part of the current development program.
| 13.3 | Demonstration Plant Testing |
| 13.3.1 | Overview |
Considering the factors outlined in Section 13.1.1, alternative methods to those commercially proven in lithium recovery from salar based brines are required to continuously extract and purify lithium from the Smackover brines. Standard Lithium has been assessing and testing technologies with a specific focus on direct lithium extraction which to date is relatively unproven at a commercial scale. The evaluation at the Demonstration Plant includes extensive testing of two separate DLE technologies:
| 1. | Lithium Stirred Tank Reactor (LiSTR), a proprietary DLE technology developed, owned, and patented by Standard Lithium, which directly extracts lithium from high total dissolved solids (TDS) brines using a high-capacity, lithium selective, solid sorbent based on lithium titanate, in a continuous stirred tank reactor configuration (operating from May 2020 through to October 2022); and, |
| 2. | Lithium Selective Sorption (LSS, a key component of Li-ProTM), an alternate Koch Technology Solutions (KTS) owned proprietary DLE technology that has been co-developed under a Joint Development Agreement between Standard Lithium and Koch Technology Solutions (Operating since October 2022). The LSS uses a fixed bed of commercially available alumina based sorbent. |
| South West Arkansas Project Pre-Feasibility Study | 23 July 25 |
The large-scale Demonstration Plant was designed and constructed in Ontario, Canada in 2019 by Zeton, Inc. The Demonstration Plant was designed to continuously process a slipstream of the effluent-brine produced by the Lanxess South bromine facility with a focus on developing and confirming the operation of an integrated DLE flowsheet to allow the design of a future commercial production facility. The two DLE processes operated in the Demonstration Plant have been adjusted and optimized over time to allow integration into the full flowsheet. At the Demonstration Plant, the lithium-barren effluent brine, added process water and the LiCl not used for testing are continuously transferred back to the Lanxess brine disposal system.
The Demonstration Plant, which consisted of 18 modules, was dismantled and transported to its current location at Lanxess’ South Plant bromine facility in Union County. It was erected within the existing fence line of the bromine plant on a 1-acre site. The site was levelled, foundations were poured, and all process, utility and power connections installed to ready the Demonstration Plant for operation in late 2019. The plant was installed/connected and enclosed in late 2019/early 2020 and underwent commissioning in early 2020. Early commissioning was delayed by the COVID-19 pandemic and associated lockdowns and the official start-date for the plant was during the second week of May 2020.
The Demonstration Plant initially comprised brine pre-treatment, LiSTR DLE and purification equipment for removal of calcium, magnesium, and silica. Process modifications to address scalability for commercialization were made in December 2020 and an osmotically-assisted reverse osmosis (OARO) unit was installed at the plant in August 2021 (the membrane concentration operation had, until that point, been completed off-site as an occasional batch process). Further modifications were implemented in September and October 2022 to further prove out an additional DLE process (LSS).
The Demonstration Plant has a dedicated team of engineers, chemists, and operators who run the plant on a 24/7 basis and it has operated continuously apart from shutdowns for maintenance, process improvements and supply outages caused by interruptions to Lanxess brine operations feeding the Demonstration Plant. The plant includes a dedicated analytical laboratory equipped to complete all on-site process control assays. The plant has been operating continuously to extract lithium from Smackover Formation brine over a 3-year period. The plant’s abundant process instrumentation and extensive program of sampling and analysis have generated large amounts of data. The data collection underpins the assessment in this report.
| South West Arkansas Project Pre-Feasibility Study | 23 July 25 |
The Demonstration Plant processes both effluent brine from Lanxess and Smackover Brine that has not been through the bromine extraction process. Testing of brine samples from across the entire Smackover brine field in southern Arkansas has proven the consistency of the resource in terms of key elements and relative ratios of chloride salts. Learnings from the Demonstration Plant are therefore considered to be directly applicable to both the Commercial Lithium Extraction Plant Project at Lanxess South Plant and SWA Projects. Representative analyses of two feed brines and the Demonstration Plant raw lithium chloride (Raw LiCl) solutions from the two DLE processes are provided in Table 13-1.
The LiCl Product along with brine from various stages of the Demonstration Plant flowsheet have been used to support vendor testing in support of equipment design and process guarantees. The LiCl product has been converted to battery-quality lithium carbonate and lithium hydroxide both on site at the Demonstration Plant and offsite by vendor testing.
| South West Arkansas Project Pre-Feasibility Study | 23 July 25 |
Table 13-1. Representative Brine Analyses and LiCl Product
| Brine feed to Demonstration Plant from Lanxess1,2 |
SWA Project feed brine1,3 |
Raw LiCl from LiSTR DLE1,4,5 |
Raw LiCl from LSS DLE1,4,6 |
Polished LiCl from Demonstration Plant1,4,7 |
|
| Lithium | 237 | 542 | 1,427 | 301 | 4,917 |
| Sodium | 61,136 | 87,398 | 2,217 | 817 | 28,896 |
| Calcium | 31,793 | 37,033 | 3,423 | 620 | 0.5 |
| Magnesium | 2,682 | 2,852 | 169 | 56 | 0 |
| Potassium | 2,385 | 9,577 | N/A | 30 | 672 |
| Strontium | 1,932 | 2,716 | N/A | 35 | 0 |
| Boron | 189 | 399 | N/A | 37 | 0 |
| Silicon | 10 | 16 | 26 | 4 | 0 |
Notes:
1. All units are mg/L
2. Demonstration Plant brine supply composition is average sample data collected in the Demonstration Plant from 4th May to 30th June 2023 to reflect the period when Sr was regularly measured.
3. SWA Lithium Project brine is average analytical results of four samples from the Upper Smackover from the 2023 resource evaluation program conducted in support of the SWA Project PFS. This approach differs from that presented in Section 9 on the basis that it is expected to present a higher grade scenario where high grade zones of the Smackover are targeted preferentially for production with injection in the lower grade zones. This is intended to ensure a robust design envelope given the Demonstration Plant currently processes a lower grade and is not intended to be reflective of project economics. It should be noted that the elements detected are materially the same, which is indicative of the consistency of the Smackover resource and the resultant applicability of the testing.
4. All LiCl compositional data is based on data collected during normal operation of the Demonstration Pant. The results from the on-site laboratory have been regularly validated by independent testing by WetLabs, NV, over the period of May 2020 through to June 2023.
5. The data from LiSTR is based on compositional averages of approximately 6,000 hours of operation from March 2021 through to November 2021. During this period, B, K, and Sr were not measured, but data from Wetlabs samples indicates typical values of 100, 67, and 221 respectively. Following November 2021, a sorbent development and optimization program was initiated to assess the performance of bespoke sorbents and target specific operating parameters and long term continuous operation was discontinued in support of shorter duration testing.
|
|
| South West Arkansas Project Pre-Feasibility Study | 23 July 25 |
6. The LSS data is based on compositional averages of a 1,200 hour period of continuous operation in Q2 2023.
7. The LiCl Product from the Demonstration Plant is based on the average of bulk samples sent for NaCl crystallization in support of electrolysis testing. The samples were produced in the Demonstration Plant by LSS DLE with subsequent IX processes for removal of bivalent cation and boron followed by OARO for concentration suitable for testing of NaCl crystallization planned in support of the Feasibility Study phase of the project.
It should be noted that although the SWA brine is materially similar to the brine tested in the Demonstration Plant in that it is a chloride-based brine with the same major constituents, the proposed brine feed does vary sufficiently (higher lithium concentration, higher boron, etc.) that its effect on lithium loading, and selectivity will need to be independently confirmed. This is planned as part of the Feasibility Study phase of the project and this PFS phase is relying on a combination of Demonstration Plant results and laboratory testing of synthetic brines.
The brine that is provided by Lanxess to the Demonstration Plant is de-brominated (by Lanxess) during normal operations. However, there have been several periods when bromine extraction has not occurred (for Lanxess’ operational reasons), and the Demonstration Plant has received brine with >4,000 mg/L bromide; this is relevant for assessing how the SWA Project brines may behave through the integrated DLE flowsheet. It has been observed that both of the DLE processes (LiSTR and LSS) are not adversely impacted by dissolved bromide, and that the bromides are largely rejected with the waste brine stream and do not pass through into the LiCl product stream in significant amounts.
As of the end of Q2 2023, the Demonstration Plant has processed approximately 55,500 m³ (approximately 14,655,990 US gallons) of brine.
Operations within the Demonstration Plant can be systematically varied, and as such, the effect of changing operating parameters on performance metrics such as degree of lithium recovery from the incoming brine, rejection of impurities, reagent usage and water balance have all been studied in a controlled manner. As with any industrial process, there are many competing factors, and the optimal operation has been proven to be a trade-off between the various inputs. For reference, representative LiCl analyses generated by the two flowsheets tested in the Demonstration Plant are provided in Table 13-1, though these can be modified by varying the processes in the Demonstration Plant.
|
|
| South West Arkansas Project Pre-Feasibility Study | 23 July 25 |
| 13.3.2 | Brine Pre-Treatment Testing |
As part of operating the pre-commercial Demonstration Plant at the Lanxess South Plant facility, several of the proposed pre-treatment processes have been demonstrated as part of normal operations at the facility. These include all wellhead operations to remove non-aqueous phases (oil, gas, other non-aqueous fluids) and removal of residual dissolved hydrogen sulfide (H2S) by vacuum degassing (by Lanxess), and bulk pH control, temperature adjustment, and final filtration (at the Demonstration Plant) prior to lithium extraction, using either pressurized membrane units or multi-media filtration.
Based on the Demonstration Plant findings, no additional pre-treatment testing is required for specifically assessing the SWA Project.
Key findings and outcomes from the Demonstration Plant testing are:
| · | Pre-treatment of the incoming brine is necessary to remove naturally occurring dissolved gasses such as methane and hydrogen sulfide, non-aqueous phases (oils and gas condensates), and suspended solids; |
| · | Real brines processed on a continuous basis are significantly more complex than synthetic brines based on the same underlying chloride matrix. Continuous, long-term (greater than two years) field testing of equipment is crucial in ensuring sufficient design inputs to support reliable scale-up; and, |
| · | The behaviors of potential fouling agents (transition metals, dissolved silica, alkaline-earth metals, non-halide anions, etc.) are complex and affected by subtle changes in pH, oxidation-reduction potential (ORP), pressure, temperature and reagent addition induced chemical reactions. The behavior of problematic elements is difficult to predict from either modelling, batch operation or short term (less than one year) operation. |
| 13.3.3 | DLE Testing at the Demonstration Plant |
As identified in Section 13.3.1, the Demonstration Plant has been used to conduct coincident testing of two different DLE processes, LiSTR and LSS as described below.
| 13.3.3.1 | LiSTR |
The LiSTR DLE method is a proprietary process designed, patented, and owned by Standard Lithium. It uses a high-capacity lithium titanate-based sorbent (meta-titanic acid in its active form) for selective extraction of lithium from the brine stream using stirred tank reactors and a conventional counter current decantation (CCD) circuit. The LiSTR technology was initially developed in 2017 and went through two main scale-ups (each approximately a 100× scale-up) during 2018 and 2019, resulting in operation in the Demonstration Plant in May 2020.
|
|
| South West Arkansas Project Pre-Feasibility Study | 23 July 25 |
LiSTR was originally commissioned and operated using a commercially produced sorbent. Standard Lithium has maintained a continued, dedicated sorbent development program over the past three years with the aim to develop improved parameters for lithium capacity, separation efficiency and physical/chemical robustness.
The pre-commercial operation in the Demonstration Plant has proven high selectivity for lithium, high recovery of lithium from the brine, and long-term reliability. Test work is currently on-going to optimize the sorbent characteristics to facilitate improved mechanical separation and to minimize or obviate the CCD circuit, reduce water consumption and sorbent inventory.
Key findings and outcomes from the Demonstration Plant testing are:
| · | Continuous and accurate pH control in the loading and stripping reactors is critical to good performance and sorbent stability, |
| · | Loading efficiency (lithium extraction efficiency) is a direct function of sorbent capacity and mass flux vs brine flow in the loading reactors – this is a variable that can be controlled. Lithium extraction during loading can exceed 90% when a two-stage counter-current loading configuration is used (the maximum sustained extraction efficiency was in excess of 95%), |
| · | Contaminant (Ca, Mg, K and Na) rejection efficiencies for most contaminants are consistently observed within the Demonstration Plant to be well over 98%, |
| · | Submerged membranes can be used effectively in the loading reactors to remove effluent (lithium-free) brine, but their utility is limited at very high solids concentrations in the sorption slurries, |
| · | The lithium-specific titanate-based sorbent has demonstrated excellent chemical and physical stability and has undergone several hundred loading and stripping cycles (each full loading and stripping/regeneration cycle lasts approximately one day in the Demonstration Plant), |
| · | Lithium loading capacity of fresh sorbent stabilizes during the initial cycles and then remains constant with no further capacity loss over hundreds of operating cycles, |
| · | The stripping performance of the sorbent is sensitive to temperature and pH and long-term operation under stable conditions is required to optimize performance, |
| · | Industry-standard CCD circuits can be used to wash the sorbent in either loaded or stripped (reactivated) state, |
|
|
| South West Arkansas Project Pre-Feasibility Study | 23 July 25 |
| · | Bulk properties and settling characteristics of the sorbent are key for proper product separation and recovery, |
| · | Bulk quantities of sorbent have been produced by an independent 3rd party with pilot scale equipment to demonstrate that sorbent can be produced at a commercial scale, and |
| · | LiSTR requires continuous addition of acid/base during loading and stripping and as a result, is more sensitive to reagent pricing than LSS. |
| 13.3.3.2 | LSS |
The LSS DLE is a Koch Technology Solutions proprietary technology for which Standard Lithium have a Joint Development Agreement and Smackover regional exclusivity agreement in place. This process uses a fixed bed adsorption using a selective solid sorbent based on aluminum hydroxide copolymer, a sorbent material with elution by fresh water rather than the acid strip used in LiSTR. The core of the technology was originally developed by a consultant to Standard Lithium and purchased by Koch Technology Solutions. The synergies associated with the relationship between Standard Lithium, various Koch Industries businesses and the process inventor led to an opportunity to operate and develop this process in parallel to LiSTR in the Demonstration Plant.
The LSS DLE process has been in operation at the Demonstration Plant since October 2022 and extensive work has been undertaken to prove scale-up and reliable operation. The LSS columns have been run for well in excess of 6,000 cycles at the time of this Technical Report. Process refinement is on-going at the Demonstration Plant and is aiming to optimize the process control steps to determine the best balance for lithium recovery, impurity rejection, water usage and lithium concentration that can be achieved.
To date, LSS has shown significant promise in reducing reagent use, excess water addition and simplifying the process due to lower equipment counts. It has the additional benefit of independent 3rd party process guarantees and has therefore been recommended as the core technology for Standard Lithium’s development of their Commercial Lithium Extraction Plant Project and consequently will also form the basis for the SWA Project. In support of project definition, the LSS has also been tested specifically for the SWA Project using a synthetic brine based on the major constituents identified as part of the resource evaluation and well sampling program identified in Section 9 and as discussed further in Section 13.3.4. As detailed elsewhere in this section, it is understood that ‘real brines’ exhibit different behavior from synthetic brines and therefore further project specific testing is recommended.
|
|
| South West Arkansas Project Pre-Feasibility Study | 23 July 25 |
This process will continue to be developed and optimized in parallel with the project execution.
Key findings and outcomes from the Demonstration Plant testing are:
| · | Lithium extraction efficiencies of greater than 95% have consistently been observed in the Demonstration Plant; similarly, contaminant (Ca, Mg, Na and K) rejection efficiencies for most contaminants are consistently observed within the Demonstration Plant to be well over 99%; |
| · | The key benefit of the LSS process over LiSTR is the reduced excess water which potentially allows better control and maintenance of the Smackover Formation; |
| · | The fixed bed resin can be sensitive to high solids in the feed so proper feed quality control is critical; |
| · | LSS operation has shown that fine control of key set points can be used to easily adjust and optimize the different elements affecting performance including lithium recovery and impurity rejection. This facilitates easy tuning for different brines of similar constituencies such as the Lanxess brine compared to the SWA brine; and, |
| · | The commercially available sorbent tested in the Demonstration Plant has performed well as can be seen by the performance shown in Table 13-1, however, the development team believe that better performance can be achieved in terms of selectivity of lithium and rejection of impurities. In support of this, continued optimization is on-going in the Demonstration Plant including testing of alternate sources of sorbent/resin including KTS developed sorbents. |
Both DLE processes show high selectivity for lithium extraction from the Smackover Formation brine to produce a LiCl solution in which the ratio of lithium to other components has been increased materially from <0.005:1 (i.e. 237 mg/L Lithium relative to the combined impurities at ~95,000 mg/L Na/K/Ca/Mg) to closer to a 0.2:1 (301mg/L lithium relative to ~1,500 mg/L). In addition, both lithium extraction processes are not measurably affected by the presence or absence of bromide in the incoming brine.
| 13.3.4 | LSS Laboratory Testing |
Laboratory testing of a synthetic brine, similar to the SWA brine identified in Table 13-1, was undertaken by KTS in support of evaluation of LSS. This validated the expected performance parameters identified for a comparative Demonstration Plant synthetic brine indicating that the differences in brine characteristics associated with differences in constituent ratios do not materially impact the performance. This testing in concert with the proven ‘real brine’ performance of LSS in the Demonstration Plant validates the selection for the SWA Project. However, further specific testing on ‘real brine’ from the SWA Project area is planned in the DFS to further validate this understanding of consistent LSS performance based on the underlying constituent make-up being more important than the constituent concentrations.
|
|
| South West Arkansas Project Pre-Feasibility Study | 23 July 25 |
| 13.4 | Demonstration Plant LiCl Purification and Concentration |
Downstream of the DLE processes, the LiCl solution is processed by various different technologies to remove unwanted impurities (e.g. calcium, magnesium, boron and silica) and to concentrate the purified solution by HPRO/OARO. The Demonstration Plant has shown a proven ability to produce LiCl solutions suitable as feedstock for offsite NaCl crystallization in preparation for both electrochemical processing and direct to carbonation process.
Key findings and outcomes from the Demonstration Plant testing are:
| · | The Demonstration Plant has consistently produced a polished LiCl product with the following parameters: |
| o | LiCl greater than 4,000 mg/L lithium; |
| o | Rejection of boron, magnesium, silicon and strontium to below detection limits; |
| o | Rejection of Calcium to less than 1 mg/L in the concentrated stream; |
| · | The raw LiCl solution from DLE can be efficiently purified via standard (off the shelf) ion exchange (IX) resins; |
| · | In addition, traditional chemical softening has also been proven to work reliably down to low levels of both calcium (< 2mg/L) and magnesium (not detectable) potentially reducing the load on IX and the associated reagent usage; |
| · | Boron has been shown to be easily removed from the concentrated LiCl solution by third party work using process equipment vendor industry standard IX technology (< 1 mg/L); and, |
| · | The final LiCl concentrate is suitable for further conversion and has been converted to battery quality lithium chemicals including lithium carbonate and lithium hydroxide. |
|
|
| South West Arkansas Project Pre-Feasibility Study | 23 July 25 |
| 13.5 | Additional LiCl Purification and Concentration Testing |
The PEA flowsheet envisaged the LiCl produced by DLE to undergo additional purification (by IX) and concentration (by reverse osmosis and thermal/evaporation) prior to being converted to lithium hydroxide. These processes have been tested extensively in the Demonstration Plant along with several other processes in order to evaluate the best fit technology for this project. All of the technologies are widely proven in industry, particularly wastewater treatment and have been shown to work reliably at the Demonstration Plant. The key technologies that have been evaluated include:
| · | Chemical softening using ion exchange (IX), |
| · | Chemical softening using lime and soda ash (to reduce IX operating costs due to cheaper reagents and lower fresh water demands), |
| · | Chemical softening using carbon dioxide (minimize introduction of additional impurities), |
| · | Boron ion exchange, |
| · | Chemical softening for Boron removal, |
| · | Silica removal by pH adjustment, |
| · | Silica removal using a proprietary IX approach, |
| · | Concentration using seawater RO (SWRO), and |
| · | Concentration using Osmotically Assisted RO (OARO). |
Based on the outcome of testing, the learnings from the Demonstration Plant and the LANXESS Project Phase 1A design work along with the SWA Project design work, the flowsheet for the PFS phase has been modified to comprise of; SWRO, chemical softening, boron IX, OARO/HPRO, IX polishing and salt crystallization to process the DLE output stream to a quality suitable for electrolysis.
Additional offsite pilot testing work is ongoing with SGS Lakefield to assess solvent extraction (SX) which was not complete at the time of publishing of this report. Whilst the proposed flowsheet is robust, it is recommended that a detailed analysis is conducted to evaluate the results of the SX pilot testing in support of a trade-off study for technology selection for commercialization.
| 13.6 | LiCl Conversion Testing |
Several technologies were evaluated and tested for conversion of lithium chloride solution to lithium hydroxide solution, these technologies being:
| · | Electrolysis, |
| · | Bi-polar membrane electrodialysis (BPMED); and, |
| · | Direct Lithium Hydroxide Conversion (DLC). |
|
|
| South West Arkansas Project Pre-Feasibility Study | 23 July 25 |
The process of wet liming for lithium hydroxide production from lithium carbonate is well understood and proven in commercial operation and has therefore not been tested specifically for the SWA Project. Wet liming remains a potential fallback option in the event that the continued testing and evaluation of the above listed technologies prove to not be technically or commercially viable. The key reason for not pursuing wet liming as the base case is that it is expected that the existing premium for the sale of lithium hydroxide over lithium carbonate will be eroded over the project execution timeline undermining the process economics. In addition, the wet liming process has the following drawbacks:
| · | Reaction yield is low; |
| · | Large recycle streams are required to minimize product losses; |
| · | Product purity control is more difficult requiring extensive operating experience; and, |
| · | Lots of solid waste is generated which offsets a key project benefit for reinjection of waste streams into the aquifer. |
This section of the report addresses the project specific testing to convert LiCl solution to lithium hydroxide that has been undertaken in support of the SWA Project.
| 13.6.1 | Electrolysis |
The electrolysis process for conversion of LiCl is fundamentally the same as the electrolysis process used extensively in the chlor-alkali industry for conversion of NaCl to NaOH and HCl. In order to confirm the suitability for lithium operation and specifically for LiCl from real brines, Standard Lithium commissioned a 100 hour test using LiCl produced from Smackover brine using the DLE processes at the Demonstration Plant.
The tested electrolysis process is based on NESI’s NORSCAND® electrolysis cell and LiCl process and utilizes a membrane electrolysis cell configured specifically for LiCl electrolysis. This produces a high purity lithium hydroxide solution whilst co-producing hydrogen and chlorine which can be reacted to produce concentrated HCl. This acid can then be utilized in the process or sold as a by-product dependent on the reagent usage and overall chemical balance.
NORAM’s wholly owned subsidiary, NORAM Electrolysis Systems Inc. (NESI) has supported Standard Lithium in development of both the PEA and PFS phases of the SWA Project and their technology therefore forms the basis for the evaluation of the suitability of Electrolysis for processing lithium brines from the Smackover Formation. NESI in turn have a long-term working relationship with Electrosynthesis Inc. for testing, with the laboratory scale testing preferentially undertaken in Lancaster. The 100 hour laboratory scale test of NESI’s electrochemical cell, was therefore undertaken at Electrosynthesis’ laboratory in Lancaster, NY.
A sample of LiCl produced by the Demonstration Plant was processed for purification and sent to Lancaster for conversion in the NS-01 cell from NESI (~150 cm²). The cell is a similar design to a commercial electrolyzer, using a DSA-Cl2 anode, SS316 cathode and S-2301 (AGC, Japan) a commercially-available perfluorinated cation exchange membrane. Testing was undertaken over the course of 146 hours. A portion of the lithium hydroxide solution produced was crystallized via a double crystallization to produce a battery-quality sample of lithium hydroxide.
|
|
| South West Arkansas Project Pre-Feasibility Study | 23 July 25 |
The testing confirmed the efficacy of electrolysis indicating that a commercial system could be expected to operate around 4.5V and 75% current efficiency for the production of a 2 Molar lithium hydroxide (LiOH) solution and producing a battery quality lithium hydroxide product meeting a typical high purity grade. Testing of conversion of the co-produced hydrogen and chlorine gas to HCl was not undertaken on the basis that this is well proven, commercially available technology that is in widespread use.
The testing validates the applicability of the electrolysis as a viable technology for converting LiCl from Smackover brines to lithium hydroxide.
In addition to the SWA Project specific testing, NESI have conducted several previous laboratory programs (including testing on multiple actual and synthetic lithium brines for over 1,000 hours each) in a scalable electrolyzer for other prospective lithium producers where similar LiOH conversion flowsheets have been tested, further providing confidence in the technology application. NESI has also confirmed the cell test performance at commercial electrode sizes.
Standard Lithium has undertaken project specific laboratory scale testing and have already commissioned full-height cell testing and 1,000-hour operational testing to be undertaken in H2 2023 as part of the DFS phase.
| 13.6.2 | Bi-polar Membrane Electrodialysis (BPMED) |
Electrosynthesis bipolar membrane electrodialysis testing is similar to the testing of the NORAM cell. A 100-hour test was undertaken for bipolar membrane electrodialysis using the same feedstock as the electrolysis testing in order to facilitate a like-for-like comparison and understand the magnitude of the potential benefits and downsides relative to each other. Similar to the electrolysis testing undertaken in Lancaster, a portion of the lithium hydroxide solution was subsequently crystallized to produce a battery-quality sample of lithium hydroxide.
The three-compartment experiments were carried out in an Eur-2C electrodialysis cell which comprises of five cells each with an area of 200 cm2 (the membranes used for these tests were from Neosepta/Astom). The 100 hour test proved the use of bipolar membrane electrodialysis as successful in the production of lithium hydroxide and hydrochloric acid from LiCl. The tests showed good efficiency for producing 1.5 Molar lithium hydroxide and 2.5 Molar HCl with an estimated average energy consumption of about 2,000 kWh/tonne of lithium hydroxide (100% LiOH.H2O) for the electrodialysis cells. A key downside identified was the large quantity (approximately 9,500 L) of low grade acid (~5% HCl) containing at least 100 ppm of LiCl that would also be produced per tonne of lithium hydroxide. Without recycle, this represents a potential loss of lithium.
|
|
| South West Arkansas Project Pre-Feasibility Study | 23 July 25 |
Whilst the testing validated the applicability of BPMED for Smackover brines, the large volume of low grade acid, potential lithium losses and larger maintenance burden due to the substantial number of membranes required, results in this technology not being recommended for the Standard Lithium flowsheet.
| 13.6.3 | Direct Lithium Conversion |
Direct Lithium Hydroxide Conversion (DLC) is a proprietary process developed by Suez Water Technologies & Solution (now Veolia Water Technologies) and uses a simulated moving bed to convert the LiCl to LiOH using NaOH – a pilot plant was installed at the Demonstration Plant site in October 2022 and commissioned and run continuously for 8 months using pre-treated Smackover brines directly from the Demonstration Plant. The simulated moving bed has been used elsewhere for LiCl extraction, with the development in this space to facilitate direct conversion of a purified LiCl stream to lithium hydroxide.
The pilot plant was proven to generate a suitable battery-quality product and is a viable technology for consideration on future projects. Although the simulated moving bed is commercially proven for other applications, this type of application is novel and it is recommended to pilot at larger scale prior to commercialization due to being first-of-a-kind.
| 13.6.4 | Further Development |
Electrolysis is deemed to be the most reliable, proven, and lowest risk of the technologies assessed to take through to commercialization. The key advantages over BPMED are:
| · | Electrolysis achieves an almost complete separation of the lithium and chloride, |
| · | Higher purity LiOH stream containing less chloride; |
| · | The high purity hydrogen and chlorine that are produced can be easily converted to high grade HCl that can be reused more easily in the process or sold commercially; |
| · | No lithium losses in the hydrochloric acid stream; |
| · | An electrolysis cellhouse of similar capacity will have a smaller footprint than a bi-polar membrane electrodialysis cell house; and, |
| · | Fewer membranes and resultant lower maintenance requirements. |
|
|
| South West Arkansas Project Pre-Feasibility Study | 23 July 25 |
It is recommended that electrolysis be the core technology for further flowsheet development with further testing for long term operation and for scaled-up operation undertaken to support design development and project de-risking.
| 13.7 | Crystallization and Packaging |
For commercial development, the lithium hydroxide solution produced by the electrolysis plant will be concentrated to saturation and lithium hydroxide crystals formed in the evaporator-crystallizer will be separated, dried, re-sized (if required) and packaged in an inert atmosphere.
It should be noted that the final concentration and evaporation-crystallization of lithium hydroxide is an industry-standard process and is practiced extensively at a commercial scale.
| 13.8 | Process Testing QA/QC |
During the operation of the Demonstration Plant, routine daily chemical analysis is conducted in the internal Standard Lithium laboratory using standard solution analysis instrumental techniques; principally, Inductively Coupled Plasma – Optical Emission Spectroscopy (ICP-OES). For more important determinations, duplicate samples are submitted to SGS Canada Inc. (SGS) for analysis using their standard ISO 9000 compliant protocols (principally ICP-OES), developed based on their experience working on numerous lithium projects. Additional brine and solid samples are also periodically sent to other third-party analytical laboratories (principally WetLabs) in order to provide suitable independent verification of data generated by the Demonstration Plant.
Other instrumentation in the Demonstration Plant undergoes a rigorous maintenance schedule to ensure accurate collection of data from the plant.
Throughout the process test work described, the author has had the following interactions:
| · | Visited the Demonstration Plant and observed all unit operations currently being tested there; |
| · | Witnessed the 100 hour electrolysis test work at ESC in Lancaster, NY; |
| · | Participated in weekly video meetings throughout the entire operating period of the PFS Project Phase; and, |
| · | Received daily data summaries regarding the operation of the Demonstration Plant and all analytical output. |
|
|
| South West Arkansas Project Pre-Feasibility Study | 23 July 25 |
| 13.9 | Process Scalability |
As noted above, the pre-treatment portion of the flowsheet is industry standard technology and is already in use at commercial scale in the southern Arkansas region. As such no scale-up risk is envisaged for this unit operation.
The selected LSS DLE process has now operated continuously for approximately 10 months at a pre-commercial Demonstration Plant scale and has been developed to FEED (DFS) level in support of the LANXESS Project Phase 1A and pre-FEED (PFS) level for the South West Arkansas Project and it has been confirmed that all of the operations involved in the DLE process can be reasonably scaled-up. Scale-up will occur by the addition of multiple standard size LSS columns operating in parallel with the number required determined based on brine flowrate and lithium concentration. Scale-up from the Demonstration Plant to prove commercialization as part of the Lanxess Project Phase 1A will be a 60:1 scale-up based on flowrate with subsequent scale-up to SWA Project capacity requiring a 2.5:1 scale-up based on flowrate.
The purification and concentration elements of the flowsheet are already in widespread use in similar industries and at larger scale than required for the SWA Project and is not deemed an area of risk for scale-up. Similarly the product crystallizer and product handling equipment is not deemed an area of risk.
Based on input from NORAM, referencing other lithium and sodium chemistries and test data, no significant issues are envisaged for scale-up of the electrochemical conversion and evaporation/crystallization of lithium hydroxide.
To date, no issues with process scale-up have been identified. It is feasible, and should not present any processing challenges, to divide the large flows into smaller parallel flows, should that be required for the full-scale plant.
| 13.10 | Process Technical Risks and Mitigation Measures |
Similar to all lithium brine processing projects (including those using ‘conventional’ evaporation ponds), there exist several risks that will need to be addressed or resolved as the project moves through the usual development stages:
| · | Effect of varying feed composition on lithium selectivity – to date, the Demonstration Plant at the Lanxess facility has been operated with the Lanxess South Plant brine feed (as shown in Table 13-1) which is materially similar to the SWA brine. However, the proposed brine feed does vary sufficiently (higher lithium concentration, higher boron, etc.) that its effect on lithium loading, and selectivity should be confirmed. Whilst the LSS has been tested for synthetic brines, similar to the SWA feed brine, it is understood that ‘real brines’ exhibit different behavior, therefore project specific testing is recommended. Large volume brine samples have already been collected from the South West Arkansas brine leases during the recent drilling campaign and it is planned to test these directly in the LSS process in support of the Feasibility Study phase of the project; and, |
|
|
| South West Arkansas Project Pre-Feasibility Study | 23 July 25 |
| · | Lithium chloride to hydroxide conversion – whilst the technology required to convert lithium chloride to lithium hydroxide is well understood, and analogous chlor-alkali technology has been operated at very large commercial scale for many decades, there are still likely hydrometallurgical and electrochemical subtleties that will need to be fully worked through for the Project’s specific feed composition. As such, a rigorous pilot program to test this part of the flowsheet using real LiCl solutions from the DLE process has been commenced with 100-hour testing and will be further developed with full height cell testing and 1,000-hour testing in support of the Feasibility Study phase of the project. |
| 13.11 | Conclusions and Recommendations |
Standard Lithium has completed substantial test work, and many aspects of the proposed flowsheet at the SWA Project are either normal industrial processes, have been demonstrated at substantial pre-commercial scale, or have been verified by pilot scale work on similar solutions. As such, it is felt by the author that sufficient test work has been completed to support the flowsheet proposed for the SWA Project at this stage of evaluation.
Recommendations are:
| · | Continue to operate and collect data from the existing Demonstration Plant; |
| · | Continue to optimize the LSS DLE to improve the quality of the Raw LiCl by elimination of impurities, including testing of new sorbents and adjustments to operating parameters; |
| · | Leverage the design development learnings form Standard Lithium’s Commercial Lithium Extraction Plant Project currently targeted to be in operation in 2026; |
| · | Process volumes of feed brine from the SWA Project location through the DLE; |
| · | Complete the SX testing and evaluate pros and cons relative to the currently proposed flowsheet; |
| · | Continue to execute the planned testing program using real LiCl solutions from the Demonstration Plant to obtain the key design parameters for lithium chloride to lithium hydroxide conversion for input to engineering design; and, |
| · | Complete any necessary process equipment vendor testing for lithium hydroxide concentration and evaporation/crystallization to a battery-quality product. |
|
|
| South West Arkansas Project Pre-Feasibility Study | 23 July 25 |
| 14 | Mineral Resource Estimates |
This section describes the preparation of the lithium resource estimates for the SWA Property, based on the volume of porous rock as estimated by the geologic model and the estimated lithium concentrations present in the brines stored within the Upper and Middle Smackover formations on the Property. The resource estimates associated with the Upper Smackover have been upgraded in this Technical Report from the Inferred category, PEA (Eccles, et. al, APEX, 2021), to the Indicated category based on the extensive geologic data and lithium concentration data gathered by Standard Lithium’s 2023 exploration program on the SWA Property. This new information demonstrates the presence of a porous and permeable Smackover reservoir containing brine with significant lithium concentrations. This upgrading of the resource estimates is described in more detail in Section 14.3.
This resource estimate has been prepared in accordance with the CIM Definition Standards for Mineral Resources and Mineral Reserves (CIM 2014). Mineral Resources are sub-divided, in order of increasing geological confidence, into inferred, indicated, and measured categories. An Inferred Mineral Resource has a lower level of confidence than that applied to an Indicated Mineral Resource. An Indicated Mineral Resource has a higher level of confidence than an Inferred Mineral Resource but has a lower level of confidence than a Measured Mineral Resource.
An Inferred Mineral Resource is that part of a Mineral Resource for which quantity and grade or quality are estimated on the basis of limited geological evidence and sampling. Geological evidence is sufficient to imply but not verify geological and grade or quality continuity.
An Indicated Mineral Resource is that part of a Mineral Resource for which quantity, grade or quality, densities, shape, and physical characteristics are estimated with sufficient confidence to allow the application of Modifying Factors in sufficient detail to support mine planning and evaluation of the economic viability of the deposit.
A Measured Mineral Resource is that part of a Mineral Resource for which quantity, grade or quality, densities, shape, and physical characteristics are estimated with confidence sufficient to allow the application of Modifying Factors to support detailed mine planning and final evaluation of the economic viability of the deposit.
The estimation of resources in this report have been carried out in conformance with NI 43-101 and have been estimated using the CIM “Estimation of Mineral Resources and Mineral Reserves Best Practice Guidelines” (23 November 2003), CIM “Definition Standards for Mineral Resources and Mineral Reserves” (amended and adopted 10 May 2014), and “CIM Best Practice Guidelines for Resource and Reserve Estimation for Lithium Brine” (1 November 2012).
|
|
| South West Arkansas Project Pre-Feasibility Study | 23 July 25 |
The Best Practice Guidelines (CIM, 2012) have been adapted for the specific conditions present at this Property. Unlike a brine-bearing salar, the SWA Property’s brine accumulation exists in a well-defined porous geologic formation at depth, the Smackover Formation. This extensive brine accumulation is bounded vertically by impermeable formations and laterally by the SWA Property boundaries. Also unlike a salar, the brine recovery from the Smackover is the result of rich brine (brine containing the original concentration of lithium) displacement by injected lean brine (brine that has had the lithium extracted in the processing plant). This brine-on-brine displacement mechanism is efficient, with all of the lithium-bearing brine in a given reservoir volume that is contacted by the injected brine being fully displaced. For this reason, the Guidelines’ use of Specific Yield for estimating resources, which assumes some remaining content of lithium in the subject formation, has been replaced here with the calibrated log or measured core porosity of the formation. In future evaluations the estimation of the overall fraction of the resources that will be recovered by the project (the recovery factor, equal to the estimated reserves divided by the estimated resource for the SWA Project area) will be done using a reservoir simulation incorporating the available geologic and fluid description data.
This approach to the estimation of resources using a detailed layered geologic model fully captures the factors that affect the content and quality of brine and the associated lithium in this porous underground formation.
| 14.1 | Geologic Model Description |
In order to understand and quantify the Smackover Formations’ structure, geometry, and the location of the porous and permeable zones within the formation, a multi-layer geologic model of the SWA Property was constructed as the basis of the resource estimates in this Technical Report using industry-standard software and procedures. Beginning with the structural understanding of the overall Smackover Formation developed through analysis of the well data and seismic data, the next level of detail was added to the geologic description by separating the Smackover Formation into eight separate layers and evaluating the geologic characteristics of each layer. This geologic mapping effort covered the SWA Property and the surrounding area (the Geologic Study Area) as depicted in Figure 10-1. The procedures followed in creating this multi-layer geologic model relate to well log and core data analysis, net pay estimation, the mapping procedures, and the estimation of in-place volumes. This geologic modeling exercise is significantly more detailed and rigorous than that carried out for the PEA, thanks to the large amount of new data provided by the Standard Lithium exploration program.
|
|
| South West Arkansas Project Pre-Feasibility Study | 23 July 25 |
The following steps were carried out to construct the multi-layer geologic model:
| 1. | The Smackover Formation was divided into eight layers, with five in the Upper Smackover zone and three in the Middle Smackover zone, based on their distinct geologic characteristics. These divisions are identified in the Montague 1 well type log, Figure 14-1. Included on the log is the interval cored, the measured core permeabilities (shaded green where permeability is greater than 0.5 mD), the intervals meeting the 6.0 percent porosity net pay cutoff (highlighted with the orange “Net Phi 6 Cobb” flag and shaded green where log porosity, “PhiND CC” is greater than 6.0 percent). The zone and layer picks were recorded for each of the 97 well logs within the SWA Property and 322 well logs outside the SWA Property, to the extent allowed by the depth encountered for each well. |
| 2. | Core data, obtained from whole cores and from rotary sidewall cores taken in 15 wells within the SWA Property and 23 wells outside the SWA Property, is the starting point for quantifying the amount of porous Smackover Formation in the SWA Property. The core data from both the prior wells and the 2023 Standard Lithium exploration program wells was compiled and reviewed. Figure 14-2 is a cross plot of the permeability values against the porosity values for this body of data. This evaluation demonstrates there is a large fraction of the core data with moderate to high permeability values (between 0.5 and 6,000 mD), which is important in a brine displacement process such as that used at the SWA Property to recover the target lithium. |
| 3. | The Smackover Formation core porosity data was compared to the log porosity data and a calibration function relating the log porosity data to the core porosity data (which is considered the most accurate measure of porosity) was created (see Figure 14-3). Each porosity well log was then calibrated using that equation. The type well (Figure 14-1) demonstrates the close relationship between the calibrated porosity log (PhiND_CC) and the Core Porosity data values in the Upper Smackover main pay zone from 9,120 feet to 9,220 feet (2,780m to 2,810m). |
| 4. | Consistent with the use of the most accurate data available, for those wells with both log and core porosity data, the core porosity data was used whenever available, with the calibrated log porosity curve used elsewhere. This resulting calibrated best estimate of formation porosity is labeled the “COBB Porosity” curve on Figure 14-4. |
| 5. | A 6.0 percent minimum porosity cutoff was applied to each well’s calibrated porosity values. This cutoff value corresponds to approximately a 0.1 mD permeability, the minimum permeability expected to contain mobile brine. |
|
|
| South West Arkansas Project Pre-Feasibility Study | 23 July 25 |
| 6. | The resulting net pay intervals were evaluated to determine for each of the eight layers the net pay thickness (the productive thickness of the layer exceeding the minimum porosity cutoff), the average porosity for that net pay interval, and the ratio of net pay thickness to gross thickness. Gross thickness values were also estimated for wells with only resistivity logs (which permitted layer boundary selection), but net pay thickness was only calculated when porosity data was available. |
| 7. | An example of this process is shown in Figure 14-4. The layer picks result in the gross pay values, the application of the 6.0 percent porosity cutoff results in the net pay values, the ratio of those two values provides the net to gross ratio, and the average porosity over each layer’s net pay intervals results in the average porosity of the net pay for that layer. |
| 8. | With regard to the software employed, each of the 98 wells within the SWA Property and 326 wells outside the SWA Property had their geologic data (location, wireline well logs) imported into Petra® Software. Available digital porosity data were imported into PowerLog ® Software database, calibrated to core porosity, and exported for inclusion in the Petra® Software. The top of Smackover Formation depths picks, along with the by-layer gross thickness, net to gross ratio, and porosity data were evaluated using the Petra® Software. |
| 9. | A 500 ft by 500 ft (152.4 m by 152.4 m) mapping grid was established, and the well geologic data was contoured using two Petra gridding options: |
| a. | The Highly Connected Features option applied a least-squares gridding algorithm that is well-suited to both structure maps and the smoothly-changing petrophysical data present here. The “grid flexing” option, appropriate for this type of well-behaved data, was used to regularize the maps’ contour lines. |
| b. | The Directional Bias option was used, with a direction of 95 degrees. This directional bias was applied to capture the regional strike direction of the Smackover Formation, corresponding to the orientation of the oolite bars as they were deposited. |
| 10. | Following the gridding and contouring process, bounding limits were applied to the gross thickness, porosity, and net thickness to gross thickness ratio grids. The gross thickness, porosity, and net thickness to gross grids were constrained to between 95 percent of the minimum observed value and 105 percent of the maximum observed value to prevent the mapping algorithm from extrapolating to unreasonable values. Additionally, porosity values were limited to no lower than the 6.0 percent cutoff for net pay. The net thickness to gross thickness ratio grids were further constrained between 0.0 and 1.0, corresponding to the physical limits of that ratio. |
|
|
| South West Arkansas Project Pre-Feasibility Study | 23 July 25 |
| 11. | The net pay grid for each of the individual layers was calculated by multiplying the gross thickness grid by the net thickness to gross grid. Similarly, the pore-thickness grids for each layer were calculated by multiplying the calculated net pay grids by that layer’s porosity grids. |
| 12. | The resulting layer grids for structure, porosity, gross pay, and net pay were then summed as appropriate to create maps of gross pay, net to gross ratio, net pay, average porosity, and pore-thickness for the Upper Smackover and the Middle Smackover zones. |
Figure 10-1 depicts the locations of the 98 wells within the SWA Property and 326 wells outside the SWA Property containing structure, porosity, or core data relevant to the description of one or more of the eight layers. Figure 7-5 presents the structure map for the top of the Smackover Formation. Figure 14-5 is a porosity cross section through the five 2023 exploration program wells. It uses as a datum the top of Upper Smackover, and illustrates the thick, continuous nature of the high-porosity net pay (shaded in green, yellow, orange, or red) Upper Smackover Formation, in comparison to the thinner, less-continuous Middle Smackover Formation net pay.
The net porosity-thickness (also known as Phi-H) maps for the Upper and Middle Smackover zones are presented in Figure 14-6 and Figure 14-7. Net porosity thickness is a direct indicator of the amount of brine below any location on the SWA Property. The greater the mapped pore-feet, the greater the volume of brine. Each porosity-thickness map is multiplied by the lithium concentration map, then integrated over the SWA Project area to obtain the in-place lithium resource estimates for each zone.
|
|
| South West Arkansas Project Pre-Feasibility Study | 23 July 25 |
Figure 14-1. South West Arkansas Field Smackover Type Well, Montague 1
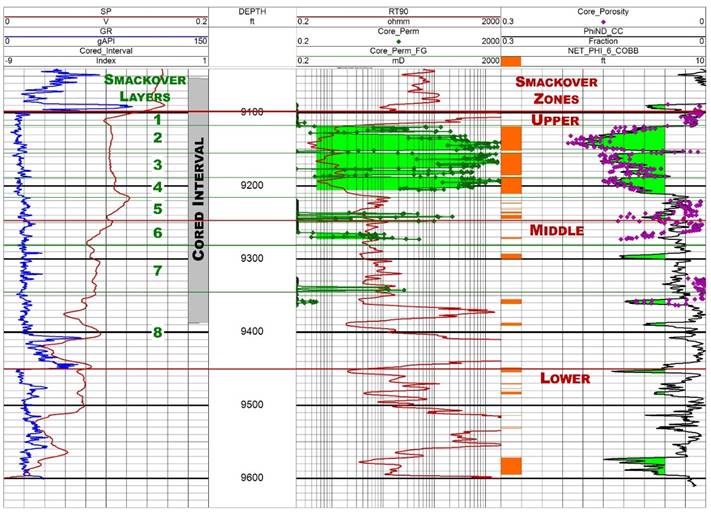
|
|
| South West Arkansas Project Pre-Feasibility Study | 23 July 25 |
Figure 14-2. Core Data Plot
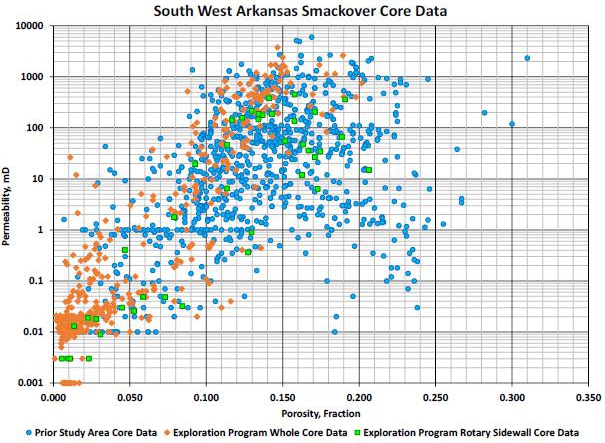
Figure 14-3. Porosity Log Calibration to Core Data Plot
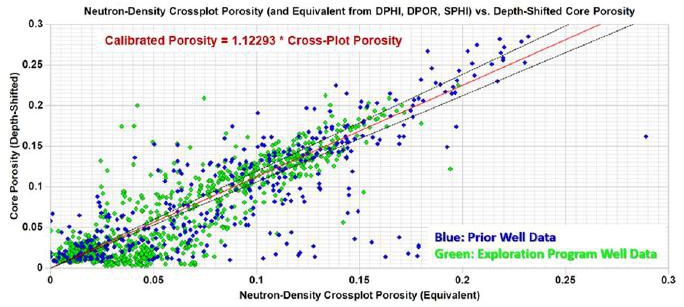
|
|
| South West Arkansas Project Pre-Feasibility Study | 23 July 25 |
Figure 14-4. Porosity Log Net Pay Example
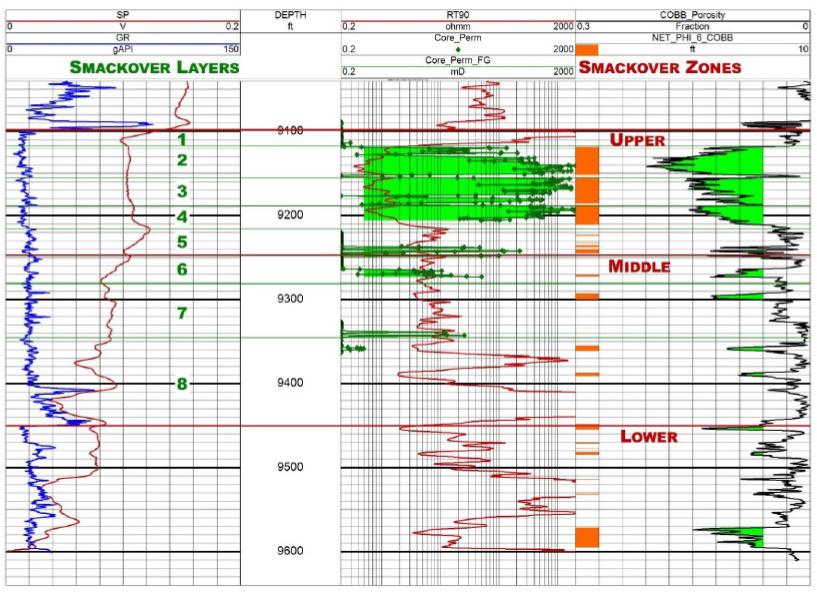
|
|
| South West Arkansas Project Pre-Feasibility Study | 23 July 25 |
Figure 14-5. Stratigraphic Cross Section, Exploration Program Wells
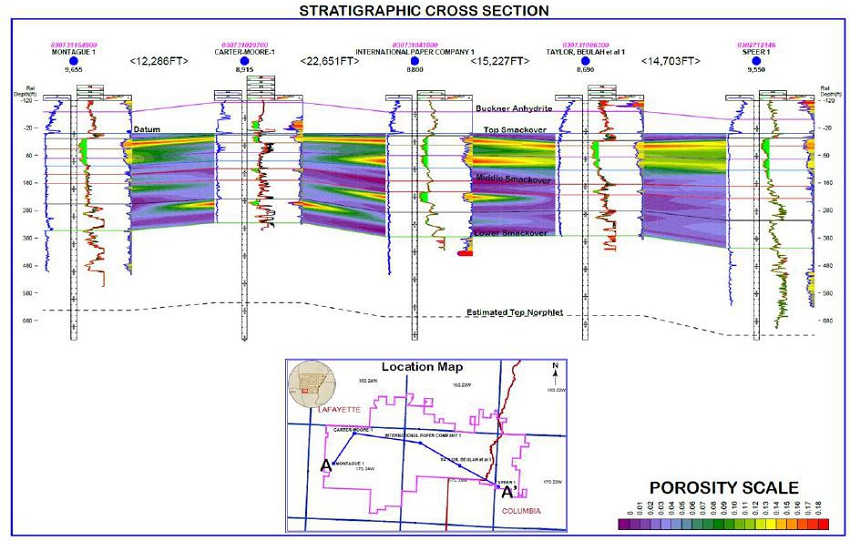
|
|
| South West Arkansas Project Pre-Feasibility Study | 23 July 25 |
Figure 14-6. Total Upper Smackover Net Porosity-Thickness

|
|
| South West Arkansas Project Pre-Feasibility Study | 23 July 25 |
Figure 14-7. Total Middle Smackover Net Porosity-Thickness

| 14.2 | Lithium Resource Estimates |
To obtain the in-place lithium resource estimates for Upper Smackover and Middle Smackover zones the corresponding net porosity-thickness map (Figure 14-6 and Figure 14-7) has been multiplied by the lithium concentration map (Figure 9-2), then integrated over the SWA Project area. The resulting estimated average geologic properties, average lithium concentrations and the estimated indicated (Upper Smackover) and inferred (Middle Smackover) lithium resource values for the total SWA Property Area are presented in Table 14-1 and Table 14-2. The distinction between North and South Areas, separated by the Brown Fault, has been retained to allow comparison to prior studies.
Using a conversion factor of 5.323 kg of lithium carbonate equivalent (LCE) per kg of lithium, the Indicated Resource value corresponds to an estimate of 1.43 million metric tonnes LCE. For the Inferred Resource, the estimate is 392 thousand metric tonnes LCE.
|
|
| South West Arkansas Project Pre-Feasibility Study | 23 July 25 |
The lithium resource estimates presented in Table 14-1 and Table 14-2, effective August 8, 2023, do not consider a minimum lithium concentration cutoff because the entirety of the SWA Property exceeds the previously-used 100 mg/L cutoff value, which is still considered an appropriate cutoff point for assessing project viability. In addition, it is important to note that mineral resources are not mineral reserves and do not have demonstrated economic viability. There is no guarantee that all or any part of the mineral resource will be converted into a mineral reserve. The estimate of mineral resources may be materially affected by geology, environment, permitting, legal, title, taxation, socio-political, marketing, or other relevant issues.
Table 14-1. SWA Property Geologic Factors and Indicated Lithium Resource Estimates
| Indicated Resource | |||
| Smackover Formation | North Upper |
South Upper |
Total Upper |
| Gross Volume, km3 | 4.69 | 2.80 | 7.49 |
| Net Volume, km3 | 3.17 | 1.93 | 5.11 |
| Average Porosity | 11.7% | 11.9% | 11.8% |
| Average Lithium Concentration, mg/L | 408 | 507 | 446 |
| Indicated Lithium Resource, Thousand Tonnes | 152 | 116 | 269 |
| LCE, Thousand Tonnes | 810 | 620 | 1,430 |
|
|
| South West Arkansas Project Pre-Feasibility Study | 23 July 25 |
Table 14-2. SWA Property Geologic Factors and Inferred Lithium Resource Estimates
| Inferred Resource | |||
| Smackover Formation | North Middle |
South Middle |
Total Middle |
| Gross Volume, km3 | 6.04 | 2.98 | 9.02 |
| Net Volume, km3 | 1.60 | 0.46 | 2.06 |
| Average Porosity | 9.0% | 8.1% | 8.8% |
| Average Lithium Concentration, mg/L | 379 | 508 | 405 |
| Inferred Lithium Resource, Thousand Tonnes | 55 | 19 | 74 |
| LCE, Thousand Tonnes | 291 | 100 | 392 |
Notes for Table 14-1 and Table 14-2:
1. Numbers may not add up due to rounding to the nearest 1,000 unit
2. The resource estimate was developed and classified in accordance with guidelines established by the Canadian Institute of Mining and Metallurgy. The associated Technical Report was completed in accordance with the Canadian Securities Administration’s National Instrument 43-101 and all associated documents and amendments. As per these guidelines, the resource was estimated in terms of metallic (or elemental) lithium.
3. In order to describe the resource in terms of ‘industry standard’ lithium carbonate equivalent, a conversion factor of 5.323 was used to convert elemental lithium to LCE.
| 14.3 | QP Discussion |
The resource category associated with the Upper Smackover Formation has been changed from the Inferred Resource category in the PEA (Eccles, et. al, APEX, 2021) to Indicated Resource in this Technical Report. This reclassification is based on the large amount of geologic and sample composition data collected within the SWA property by the 2023 exploration program. This body of data has clearly demonstrated the presence, volume, and quality (permeability) of the porous reservoir, and the high lithium content of the associated brine. The test program has demonstrated the ability of the Upper Smackover intervals to produce that brine. The lithium associated with the Middle Smackover has been maintained as an Inferred Resource, awaiting further testing and delineation.
|
|
| South West Arkansas Project Pre-Feasibility Study | 23 July 25 |
The entirety of the SWA Property exceeds the 100 mg/L minimum concentration cutoff value appropriate for this project. The resource estimates have been determined on the basis of 100 percent of the Upper and Middle Smackover within the proposed unitized boundary for the SWA Property. This is consistent with the AOGC approach to unitization and brine production. The application of the geologic data and the associated production that can be achieved from the resource are outlined in Section 16, with those production rates setting the basis for the PFS flowsheet development and project cost estimates and underlying economic viability.
|
|
| South West Arkansas Project Pre-Feasibility Study | 23 July 25 |
| 15 | Mineral Reserve Estimates |
No mineral reserve estimates were made. Mineral resources were not able to be converted into mineral reserves. This determination was made by Randy Brush, the Qualified Person of this section. The mineral resources were not converted to mineral reserves because additional information is needed to confirm the productivity of the Upper Smackover in the Project Area. While the geologic and sample data collected as of the date of this report clearly identifies the size and content of the lithium-bearing brine accumulation in the project area, well test data is needed to quantify the project’s potential production rates. Towards that end, one of the recommendations presented in Section 26 is to drill an additional test well and re-enter three existing wells targeting the Upper, Middle, and Lower Smackover in areas not tested by the 2018 and 2023 data gathering programs, such as in the areas of the Cornelius 1 and Haberyan 1 wells, to provide long term production test information to estimate well rates, the number of wells needed, facility rates, and the completion plans for those wells.
Gathering that test data is necessary to reasonably define the scope of the project’s wells and facilities investments. While the data gathered as of the date of this report is consistent with a productive Smackover formation suitable for development, quantitative well test data is needed to confirm the production rates that the production and injection wells will provide to the processing facility.
|
|
| South West Arkansas Project Pre-Feasibility Study | 23 July 25 |
| 16 | Mining Methods |
| 16.1 | Lithium Recovery Process |
Recovery of a portion of the SWA Property’s lithium resources described above will employ the same brine displacement process already in use throughout southern Arkansas for the recovery of bromine. This process incorporates brine production wells with down-hole pumps, surface flowlines, brine processing facilities, and effluent brine injection wells. Once the lithium is extracted from the produced brine in the processing facilities the resulting effluent brine will be injected into the Smackover Formation using the injection wells. For the purposes of reservoir evaluation, effluent brine with the lithium extracted is referred to as lean brine and is used to differentiate the reinjected brine from the in-situ lithium rich brine, specifically to allow the observation of break through where lean brine starts to be produced at a specific well resulting in a drop-off in lithium production. This production and injection process from a deep Smackover Formation brine reservoir is conducted at the adjacent Albemarle bromine project and the Lanxess bromine project further to the east and incorporates the production and injection technology and underground displacement mechanisms proved up by both those two projects for over 60 years and by the petroleum industry in thousands of oil field waterflood projects world-wide.
The brine recovery process applied at the SWA Property has as its basis the displacement of rich brine to the production wells by the injected lean brine. Three factors will determine the overall lithium recovery rate from this process: total brine throughput, rich brine recovery efficiency, and lithium extraction efficiency (discussed in Section 17, Recovery Methods).
The total brine throughput, which equates to the rate at which brine is processed by the facility, is determined by the number of production or injection wells and the average production or injection rate per well, which is a function of well operation and geologic characteristics (thickness and permeability) of the Smackover Formation at the well locations. Total production and injection rates will be nearly identical, both as a result of the small volume changes associated with the lithium extraction process and with the requirement that the produced brine volume needs to be replaced with a similar volume of injected brine (net reservoir voidage approximately zero) in order to maintain the average reservoir pressure at a nearly constant level. Brine-filled reservoirs are relatively incompressible, and are, therefore, sensitive to any significant mis-match in net reservoir voidage. Large pressure changes could potentially result from significant positive or negative net voidage. Total brine throughput can be increased by drilling more wells, but there are both the financial costs and the effect on produced lithium concentrations to consider.
|
|
| South West Arkansas Project Pre-Feasibility Study | 23 July 25 |
The rich brine recovery efficiency, a number that starts at zero and increases over time, with a maximum value of one, is equal to the volumetric sweep efficiency of the injected lean brine and is equal to the fraction of the total brine volume occupied by injected lean brine at a particular time. Up until lean brine breakthrough the rich brine recovery efficiency is equal to the cumulative injected lean brine volume divided by the total pore volume. Following lean brine breakthrough, the rich brine recovery efficiency is equal to the net cumulative injected lean brine volume (the cumulative injected lean brine volume minus the cumulative produced lean brine volume) divided by the total pre volume.
The rich brine recovery efficiency is affected by the speed and extent of lean brine breakthrough in the production wells. In brine recovery projects such as this, the injected lean brine moves through the geologic formation, displacing the rich brine to the production wells. The speed and extent of lean brine breakthrough for a given injection-production well configuration is determined by the degree of geologic heterogeneity of the Smackover Formation and the distance between the injection and production wells (also known as well spacing). This heterogeneity consists of the varying permeability of the formation, ranging from near zero to several thousand millidarcies, as observed in the core data (Figure 14-2). If additional wells are drilled the distance between injection and production wells typically decreases, resulting in higher brine throughput but faster breakthrough of injected lean brine. The Merlin simulation model described below will be used to both estimate reserves and to optimize the configuration of the injection and production wells, including the well spacing and alignment, in order to design an economic long-lived (20-year lifespan) project.
| 16.2 | Methodology |
This report’s eight-layer geologic model, described in Section 14 and used to estimate the resource values, was also used to provide the geologic inputs for a finite difference computer simulation model used to estimate the timing and amount of brine production from the SWA Property. The only difference between the geologic description used for the resource estimates and that used for the simulation model was the application of a more-stringent nine percent porosity cutoff. This higher porosity cutoff further restricted the simulation model’s net pay to that portion of the reservoir with sufficient permeability for brine to be displaced and produced over the expected distances between injection and production wells.
|
|
| South West Arkansas Project Pre-Feasibility Study | 23 July 25 |
The Merlin reservoir simulation model, an industry-standard finite-difference simulation model created by Gemini Solutions, Inc., was used to model brine movement and lithium recovery.
The Merlin simulation model was loaded with the by-layer geologic model maps, which were re-gridded by the Merlin software to conform to the model’s gridding scheme. The model covers an area of approximately 17.9 miles by 11.9 miles (28.8 km by 19.2 km). The model grid dimensions are 101 cells in the east-west direction, 67 cells in the north-south direction, and eight model layers, resulting in 54,136 cells in the model. An equation to calculate permeability as a function of porosity was developed based on the core permeability and porosity data, Figure 16-1, and was applied to each layers’ porosity data, resulting in variable permeability values for each cell in the model. This technique captures a large part of the permeability heterogeneity present in the Smackover Formation and its impact on brine movement.
The Merlin model has the capability of tracking different brines using a tracer element. This capability was used to initialize the model with lithium concentrations across the model area equal to the mapped lithium concentrations described in Section 9.2. The model then tracked the lithium concentration in the rich brine within the reservoir and in the brine produced in each well, as well as the injected lean brine (with lithium removed), and its movement through the reservoir during a 20-year proposed development.
The initial well count and locations resulted in brine production and injection rates sufficient for a 30,000 tonne per year facility capacity. This preliminary well field layout was used to estimate project well costs. Based on pressure profiles in the reservoir and the absence of significant predicted lean brine break through, this initial production and injection well configuration can be further optimized during the Feasibility Study phase of the SWA Project.
While preliminary, the model’s initial results indicate the SWA Property appears to be capable of producing greater than 30,000 metric tpa of lithium hydroxide for 20 years or more, and that production rates greater than 35,000 metric tpa are probable with modifications to the assumed production and injection well count and configuration, given our current understanding of the SWA Property’s geology and distribution of lithium. Quantifying the reserves associated with the SWA Property will be a goal for the next phase of evaluation, with the model description updated with additional geologic and concentration data. These further revisions to the well configuration will help optimize field lithium recovery and development economics.
|
|
| South West Arkansas Project Pre-Feasibility Study | 23 July 25 |
Figure 16-1. Core Data Plot with Permeability Data Fit and Equation
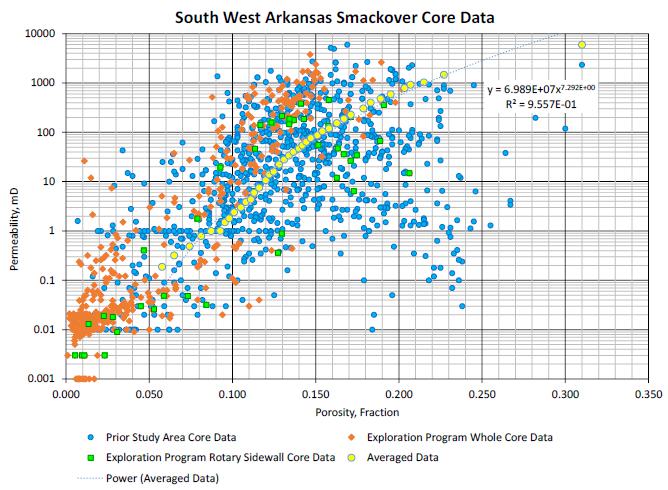
| 16.3 | Well Field Overview |
Based on the outputs of the Merlin modelling described in Section 16.2, a network of brine supply wells will produce from the Smackover Formation. For the purpose of the PFS, the number of supply wells is estimated to be 21, however this will be optimized in subsequent project development phases. The brine supply wells will produce between 200 m3/day and 2,100 m3/day with an average rate of 1,715 m3/day. The average brine production rate will be 1,800 m3/hr (7,925 US gpm) during the 8,000 hours in the operational year. The supply wells, as modelled, have been located on the unoptimized modelling parameters and without consideration for surface locations and therefore can be expected to change somewhat prior to commercial operations.
To support commercialization, the wells will be grouped into multi-well pad facilities based on the desired bottom hole locations and the distance from the drilling pad achievable for well bores of this size and depth. This has resulted in well pads with facilities for 2, 3, 4 or 5 wells. Multiple wells per pad is advantageous in minimizing initial capital expenditure and improving long-term maintainability. Brine from the supply facilities will be routed from the six (current estimate) multi-well pads to the single processing facility by a network of underground fiberglass pipelines totaling approximately 23.1 km (14.35 miles) in length. After processing, the lithium-depleted brine will be returned by a pipeline system 41.8 km (26 miles) in length to a network of brine injection wells completed in the Smackover Formation. For the purpose of the PFS, the number of injection wells is estimated to be 22, and it is expected that this will be optimized in subsequent project development phases. As with the supply wells, the injection wells are proposed to be grouped into nine (current estimate) multi-well pad facilities. All extraction and reinjection will occur in the single unitized area to maintain reservoir pressures.
|
|
| South West Arkansas Project Pre-Feasibility Study | 23 July 25 |
| 16.4 | Well Field Configuration |
| 16.4.1 | Production Wells |
The brine supply wells will extract the raw brine from the Smackover Formation on a continuous, 24-hour, 365 days per year operation. Operational up time has been estimated to be 8,000 hours per year to account for ongoing maintenance, system upsets, weather outages, etc. The brine supply wells will be conventional brine wells similar to those used through-out the Smackover and will be equipped with an 800 HP electric submersible pump (ESP) that will pump the brine to the surface through 7 inch tubing (~178mm) as depicted below in Figure 16-2.
Figure 16-2. Supply Well Process
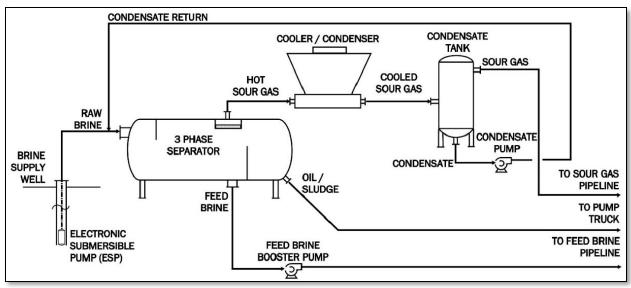
As the brine is pumped to the surface, naturally occurring gas (usually sour in the project area) will evolve out of the brine as the pressure drops. The brine, sour gas, and trace amounts of oil and solids will be separated from one another at the well pads using three-phase separators.
|
|
| South West Arkansas Project Pre-Feasibility Study | 23 July 25 |
The brine and sour gas streams produced will be sent from the separators in dedicated pipelines, with the production from each well at the well pad comingled prior to pumped delivery by pipeline to the main processing facility.
Fluid flow from each well pad will be further comingled to minimize the number of pipelines feeding the CPF. This has the added benefit of reducing the impact of brine compositional variability by mixing all the brine streams at the well pads and from all the well pads in the brine supply pipelines. Brine pumped from production wells and well pads through the brine pipeline is discharged to a large capacity brine receiving tank at the main processing facility.
The oil phase that is separated from the brine will be stored in tanks on the well pad and periodically removed via a pump truck for further processing at a local refinery or by a 3rd party.
The sour gas evolving from the brine containing light hydrocarbons such as methane and ethane in addition to hydrogen sulfide, carbon dioxide and water vapor is separated from the brine in the three-phase separators and cooled to condense out higher boiling point condensable hydrocarbons and water. The liquids (condensate) will be separated and returned to the three-phase separator feed to facilitate capture and separation with the oil phase. The resultant non-condensable sour gas from all of the brine supply wells is subsequently delivered to the central processing facility (CPF) by the motive force of the ESP pumped pressure. At the CPF, the sour gas will be compressed for delivery into an existing sour natural gas gathering pipeline, where it may be diverted for reinjection or sent to the nearby Mission Creek Dorcheat Gas Plant where it will be sweetened for beneficial re-use.
| 16.4.2 | Injection Wells |
Once the lithium is removed from the produced brine, effluent brine (or lithium-free brine) is then disposed of through the injection wells. A network of pipelines connects the CPF to the injection (or disposal) wells. Similar to the supply wells, the injection wells will be grouped into multi-well well pad facilities. Effluent brine is delivered from the main processing facility by brine pumps to the well pads. The effluent brine is then pumped down through the injection wells, which are similar in nature to the supply wells without the ESP’s, into the Smackover Formation. The reinjection of the effluent brine is necessary to maintain the pressure in the Smackover Formation aquifer and to displace the rich brine to the production wells and is standard practice in Smackover brine operations.
|
|
| South West Arkansas Project Pre-Feasibility Study | 23 July 25 |
| 17 | Recovery Methods |
Standard Lithium will produce battery-quality lithium hydroxide from Smackover Formation brine. Lithium-containing brine will be produced from brine supply wells, as discussed in Section 16. The produced brine will be pipelined to the Central Processing Facility (CPF) for recovery of lithium and for further processing to the final product. Base case lithium hydroxide production will be 30,000 tonnes/year over a 20-year operating lifetime. The lithium recovery from the brine into the final product is estimated to be approximately 92% based on the performance of the LSS DLE and associated lithium losses in other parts of the process. Optimization of the process during future design phases is expected to result in higher lithium recovery. This in turn would result in increased production or lower CAPEX costs. The production process includes the following major unit processes:
| · | Brine pre-treatment; |
| · | Lithium chloride extraction from the brine by Direct Lithium Extraction (DLE); |
| · | Lithium chloride purification and concentration; |
| · | Lithium chloride electrolysis to convert to lithium hydroxide; and, |
| · | Lithium hydroxide crystallization, drying and packaging. |
The overall process Block Flow Diagram (BFD) is shown in Figure 17-1 and described in additional detail below.
|
|
| South West Arkansas Project Pre-Feasibility Study | 23 July 25 |
Figure 17-1. Overall Block Flow Diagram of Lithium Hydroxide Production from Smackover Formation Brine
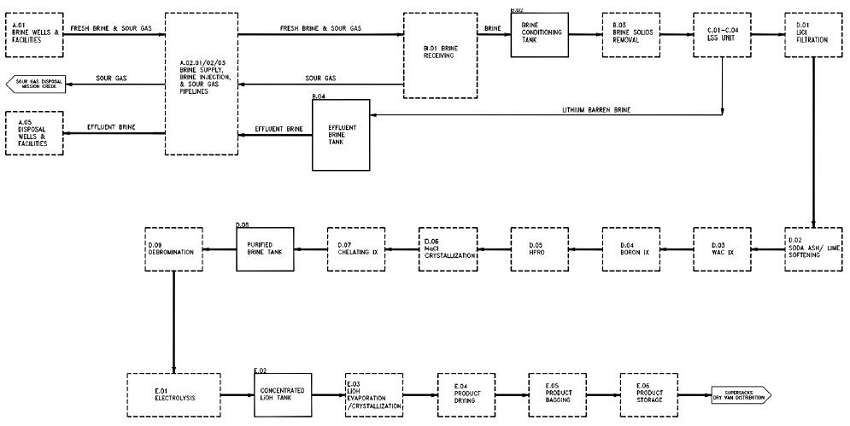
|
|
| South West Arkansas Project Pre-Feasibility Study | 23 July 25 |
| 17.1 | Brine Production and Delivery |
Brine will be delivered from the brine production well field via fiberglass pipelines to the brine receiving tank at the CPF as discussed in Section 16.
| 17.2 | Production of Purified Lithium Chloride Solution |
The first step in producing lithium hydroxide in the CPF will be pretreatment of the brine, including pH adjustment, H2S removal, and filtration to remove suspended solids. Next, lithium chloride will be selectively recovered from the pretreated brine using a Direct Lithium Extraction (DLE) technology. Then, the lithium chloride solution from the DLE process will be purified and concentrated, preparing it for electrolysis.
| 17.2.1 | Pretreatment of the Feed Brine |
Based on the average of the on-lease samples taken during the 2018 and 2023 sampling programs (see Figure 9-1), the blended produced brine delivered to the CPF is estimated to have a lithium concentration in the order of 437 mg/L as lithium. The brine will be hot (>70°C), highly saline (TDS of about 340,000 mg/L), low in sulfate, and will have a specific gravity of about 1.2. Sodium and calcium chlorides are the main constituents of the brines.
Prior to lithium extraction, the brine will be pre-treated to remove suspended solids, dissolved gas (including H2S), and crude oil. The brine will be treated with hydrochloric acid to lower its pH to ensure the sulfur components are in the sulfide form, and then vacuum-degassed to remove dissolved gases. Dissolved gases include hydrogen sulfide (H2S), carbon dioxide (CO2), low-boiling-point hydrocarbons such as methane (CH4), and inert gases such as nitrogen (N2). Gases separated from the brine in the vacuum-degassing process will be compressed and combined with the sour gas from the production wells and pipelined to the Mission Creek Dorcheat Gas Plant (or reinjected).
The degassed brine will then be treated with caustic soda to raise the pH to be slightly basic prior to filtration. The brine will then be passed through a walnut filter to remove residual dissolved oil and a pressurized ultrafiltration membrane filter to remove fine particulates including precipitated silica. The membrane brine filter will be backwashed periodically to remove captured solids. The captured solids and the backwash will be redissolved with acid (if required) and sent to the effluent brine stream for disposal.
|
|
| South West Arkansas Project Pre-Feasibility Study | 23 July 25 |
| 17.2.2 | Lithium Extraction Process |
The key unit process for the production of lithium chloride solution is the Direct Lithium Extraction process, the lithium selective sorption (LSS) process outlined in Section 13.
The LSS equipment is a Koch Technology Solutions proprietary technology for which Standard Lithium have a Joint Development Agreement and Smackover exclusivity agreement in place. The process will be a fixed bed, selective adsorption process that favors lithium chloride. Lithium-rich brine will be pumped through the fixed bed of sorbent, loading the sorbent with both lithium and chloride ions, and discharging a raffinate that is barren of lithium. The loading will be stopped at the point that lithium breakthrough occurs. After displacing remaining raffinate from the sorbent bed, the sorbent will be eluted with water, releasing the lithium and chloride, and producing an eluate that is higher in lithium concentration and much lower in other undesirable ions such as sodium, potassium, calcium, and magnesium. Remaining eluate will then be displaced from the column and the cycle will be repeated.
After the LSS DLE process, the eluate or raw lithium chloride solution will contain approximately 620 mg/L of lithium at ~95% recovery and will have rejected in excess of 98% of the major contaminants for sodium, calcium, magnesium, and potassium. This raw lithium chloride solution will then be sent to the first of two seawater reverse osmosis (SWRO) systems for preliminary concentration. The SWRO permeate will be recycled to the DLE process to minimize the freshwater consumption of the process and the retentate will pass to raw lithium chloride storage prior to further purification and concentration in preparation for processing by electrolysis.
Given the large volumes required to produce 30,000 tonnes per annum of lithium hydroxide product, the LSS unit will comprise of multiple columns (up to 36), and it is planned that these will be operating in various stages of loading and elution, smoothing out the semi-batch operation.
| 17.2.3 | Lithium Barren Brine Disposal |
The raffinate or lithium-barren brine from the DLE will be pumped to the effluent brine tank where other process waste streams such as filter backwash and resin regeneration streams are combined prior to pH adjustment to achieve a final discharge pH of between 4.5 and 5.5. This pH is required to:
| · | Avoid any precipitation issues in the brine injection wells; and, |
| · | Meet best-practice guidelines for reinjection of effluent brine into the Smackover Formation. |
|
|
| South West Arkansas Project Pre-Feasibility Study | 23 July 25 |
Effluent brine from the lithium extraction process will be pumped via pipelines to a dedicated set of brine injection wells for disposal back into the Smackover aquifer. The disposal of brine to the aquifer is important for management of the brine resource. Twenty-two brine injection wells are proposed to be used for disposal of lithium barren effluent brine (see Section 16).
| 17.2.4 | Raw Lithium Chloride Purification and Concentration |
The raw lithium chloride from raw lithium chloride storage will pass through a lithium chloride specific SWRO system to continue concentrating the solution. The retentate stream will then undergo removal of residual divalent ions, including calcium (Ca+2) and magnesium (Mg+2), using a lime and soda ash softening system followed by industry-standard ion exchange treatment.
After removal of divalent ions, the lithium chloride solution will pass through an industry-standard boron ion exchange resin for removal of residual boron.
Following ion exchange, the purified lithium chloride solution will be further concentrated to produce a lithium chloride concentrate with a range of lithium concentration over 80,000 mg/L. The first concentration step uses an ultra-high pressure reverse osmosis process. The second step uses an evaporator-crystallizer to remove water and precipitate sodium chloride and potassium chloride crystals. The evaporated water will be condensed and recycled to the process water system for reuse in the upstream process. Sodium chloride and potassium chloride crystallized out of the lithium chloride solution will be separated by centrifuging, then will be redissolved in the effluent brine for disposal. Lithium chloride concentrate from the evaporator-crystallizer will pass through a final ion exchange system for polishing to remove the remaining calcium and magnesium that will have been concentrated during the previous two steps.
The final purification step passes the lithium chloride concentrate through a cold debromination system to remove residual bromides from the solution. The debromination system has been considered for the PFS phase to ensure flexibility of design in advance of completion of longer term testing of electrolysis. Initial results from the Demonstration Plant indicate that this may not be required for electrolysis operation or for product quality. The purified lithium chloride concentrate will be considered ultrapure and will then be pumped to the lithium hydroxide process facility.
| 17.3 | Production of Lithium Hydroxide |
The ultrapure lithium chloride from the purification and concentration process will be sent to the electrolyzer where the lithium chloride will be converted to lithium hydroxide using a modified chlor-alkali type process. The lithium chloride along with any residual sodium chloride and potassium chloride will be converted to their hydroxide forms by the electrolyzer using lithium specific membranes. The electrolyzer will also produce the by-products of chlorine and hydrogen gas. These by-product gases will be sent to a hydrochloric acid synthesis unit where high purity hydrochloric acid will be produced for use in the upstream process with any excess sold commercially as a by-product.
|
|
| South West Arkansas Project Pre-Feasibility Study | 23 July 25 |
The lithium hydroxide solution will then be sent to an evaporator-crystallizer for production of lithium hydroxide crystals. Water evaporated in the crystallizer will be condensed and returned to the catholyte loop of the electrolyzer. Excess condensate will be recycled to the process water system for use in the upstream process. The lithium hydroxide crystals will be separated from the caustic solution using a centrifuge. The caustic liquid discharge from the centrifuge will be recycled to the upstream process for recovery of residual lithium content and for pH adjustment. The lithium hydroxide solids discharged from the centrifuge will be sent to a final product drier to remove residual moisture. The dried lithium hydroxide product will finally be routed to the packaging system under a nitrogen blanket to prevent degradation.
The lithium hydroxide production process is shown in the BFD presented in Figure 17-1.
| 17.4 | Packaging of Lithium Hydroxide |
The dried lithium hydroxide product will be a bulk dry granule packaged in 910 kg (2,000 lb) supersacks. The packaging equipment will include a day silo for bulk lithium hydroxide storage prior to bag filling. lithium hydroxide finished product is metered through a rotary valve to an automated bag filling station. The bag filling station will include a nitrogen purge and bag sealer to keep carbon dioxide from contacting the product after crystallization and through to packaging. The filled supersack will then be conveyed on a pallet to a hooding or stretch wrap station for final preparation for storage and transport.
| 17.5 | Projected Energy, Water, and Raw Material Requirements |
The total projected energy usage is estimated to be 433 GWh per annum. The Central Processing Facility total usage is approximately 306 GWh per annum and accounts for 71% of the total demand, with the lithium hydroxide electrolysis plant being the largest consumer at almost 60% of the CPF load, or 176 GWh per annum. The brine supply and injection systems will account for the remaining 29% of the total projected energy usage with the supply well field and injection well field accounting for approximately 92 GWh per annum and 35 GWh per annum, respectively.
|
|
| South West Arkansas Project Pre-Feasibility Study | 23 July 25 |
The Central Processing Facility will utilize several freshwater wells to meet the water requirements of the process. The total freshwater consumption is approximately 413 m3/hr. Approximately 292 m3/hr of the freshwater will be utilized as make-up water to the RO water system. Approximately 95% of the RO water will be used for the elution of lithium and chloride from the sorbent beds in the DLE process, while the remaining 5% will be utilized in the demineralized water system. The balance of freshwater will provide raw water, potable water, and cooling water makeup for use in the Central Processing Facility.
Raw materials used in the process consist primarily of reagents for the control of pH. 50% Sodium Hydroxide (NaOH) solution will be the preferred base used to raise the pH and 32% Hydrochloric Acid (HCl) will be the preferred acid used to lower the pH. The HCl usage in the process (3,165 kg/tonne of lithium hydroxide) will be almost entirely offset by the production capacity in the HCl Synthesis unit (3,102 kg/tonne of lithium hydroxide). This substantially reduces the quantity of fresh HCl that will need to be purchased and received at the facility each year. Other reagents that will be used in the process are lime and soda ash for softening, corrosion and scale inhibitors, and various chemicals for the cleaning of filter and RO membranes. The estimated raw material requirements for the process are summarized in Table 17-1 below.
|
|
| South West Arkansas Project Pre-Feasibility Study | 23 July 25 |
Table 17-1. Raw Material Requirements
| Description | Consumption per Tonne of Lithium Hydroxide Produced |
Total Annual Consumption |
| Well field | ||
| - Corrosion Inhibitors | 0. 245 L | 7,350 L |
| - Scale Inhibitors | 0. 397 L | 11,920 L |
| Central Processing Facility | ||
| - Hydrochloric Acid (HCl) - 32% Concentration | 63 kg | 1,893 tonnes |
| - Sodium Hydroxide (NaOH) - 50% Concentration | 1256 kg | 37,693 tonnes |
| - Soda Ash | 774 kg | 23,225 tonnes |
| - Lime | 14 kg | 418 tonnes |
| - Sodium Metabisulfite | 72 kg | 2,156 tonnes |
| - Citric Acid | 1 kg | 29 tonnes |
| - HEDP | 0.3 kg | 11 tonnes |
|
|
| South West Arkansas Project Pre-Feasibility Study | 23 July 25 |
| 18 | Project Infrastructure |
The infrastructure required to construct and operate the proposed project is described below.
| 18.1 | Brine Supply Wells Infrastructure |
| 18.1.1 | Well Field |
The brine well field development – comprising well locations, well pads, and pipelines, for the PFS phase – is based on resource modeling for the Smackover aquifer using the best data available at time of publishing. The resource definition will continue to be developed following the completion of this PFS and during the DFS phase, resulting in improved definition of the aquifer, updating of the reservoir model, and potential adjustments to the well field development plan. The information presented herewith should be considered indicative for the purposes of evaluating project costs and associated economic analysis of the SWA Project.
Brine used for recovery of lithium will be extracted from the Smackover Formation via a network of 21 brine supply wells located throughout the resource area of the SWA Project. The well field will utilize directional drilling technology to provide an optimal well field design that consolidates the surface locations of the wells into six multi-well pad locations. By grouping multiple supply wells into a common well pad, this will allow above ground utilities and infrastructure to be shared among the wells – see Figure 18-1. This will both minimize capital costs and improve ongoing operating costs. One of these multi-well pads is currently envisaged to also host injection wells.
|
|
| South West Arkansas Project Pre-Feasibility Study | 23 July 25 |
Figure 18-1. Brine Supply Multi-Well Pad Conceptual Layout
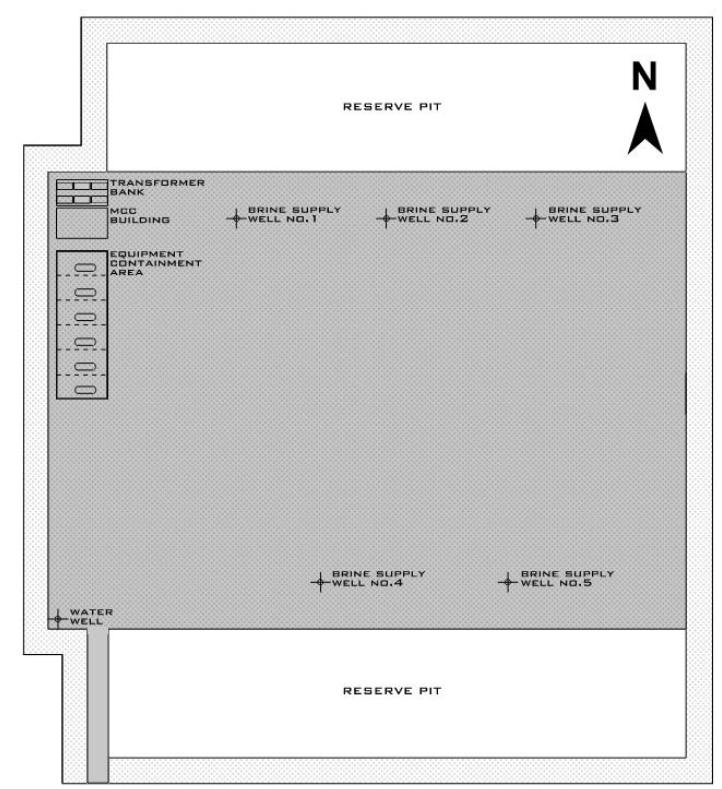
Each of the brine supply wells will be equipped with a multi-stage, electric submersible pump (ESP). The ESPs will pump the brine from the Smackover Formation to the surface where a three-phase gravity separator will remove sour gas and crude oil from the brine before it is pumped into the brine supply network for distribution to the Central Processing Facility.
|
|
| South West Arkansas Project Pre-Feasibility Study | 23 July 25 |
| 18.1.1.1 | Water Supply and Distribution |
Each of the well pad facilities will be equipped with a water well to provide approximately 10 m3/hr (45 US gpm) of water for drilling and routine well maintenance operations.
| 18.1.1.2 | Power Supply |
The well pad facilities for the brine supply wells will require approximately 12 megawatts (MW) of electric power for operating the ESPs and for routine operations of the facilities as outlined below in Table 18-1.
Table 18-1. Power Consumption for the Brine Supply Well Facilities
| Facility No. | Supply Well Count |
Operating Power (kW) |
Annual Electrical Consumption (MWh) |
| Brine Supply Facility No. 1 | 3 | 1,685 | 13,136 |
| Brine Supply Facility No. 2 | 4 | 2,226 | 17,465 |
| Brine Supply Facility No. 3 | 3 | 1,685 | 13,136 |
| Brine Supply Facility No. 4 | 4 | 2,226 | 17,465 |
| Brine Supply Facility No. 5 | 5 | 2,767 | 21,794 |
| Combined Well Facility | 2 | 1,526 | 11,868 |
| Total | 21 | 12,115 | 94,865 |
Each of the well pad facilities will include a prefabricated Motor Control Center (MCC) building, medium voltage drives for the ESPs, utility power supplies, and a capacitor bank for power factor correction. The power supply to each facility will be from the Southwest Arkansas Electric Cooperative power grid. New substations and transmission lines will likely be required for the facilities and are addressed as part of the cost of service.
| 18.1.1.3 | Compressed Air |
Compressed air will be supplied via an air compressor installed inside the MCC building on each well pad. Compressors are expected to be identical at each well pad with spare parts kept at a central maintenance warehouse.
|
|
| South West Arkansas Project Pre-Feasibility Study | 23 July 25 |
| 18.1.1.4 | Chemicals and Reagents |
Chemicals and reagents required for operation and maintenance of the brine supply wells and well pad facilities will be stored within the equipment containment areas at each well pad facility. These include, but are not limited to, anti-scalant and anti-corrosion chemicals.
| 18.1.1.5 | Auxiliary Infrastructure |
The following auxiliary infrastructure will be required for each well pad facility.
| · | Access roads to the facility; |
| · | Communication (internet to the site, whether that be ethernet or cellular service); |
| · | Medium voltage electrical power supply, including new powerlines and substations; |
| · | Metering stations for sour gas and brine; and, |
| · | Crude oil storage tank and truck loading facility. |
| 18.1.1.6 | Pipelines |
Brine will be transported via fiberglass pipelines, along pipeline right-of-way corridors, from booster pumps at each well pad facility to the CPF. Sour gas removed from the brine by the three-phase separators at the well facilities will be transported to the CPF via high density polyethylene plastic (HDPE) pipelines, following the same pipeline corridors. The estimated pipeline quantities and details are detailed below in Table 18-2.
|
|
| South West Arkansas Project Pre-Feasibility Study | 23 July 25 |
Table 18-2. Estimated Brine Supply and Sour Gas Pipeline Details
| Description | Material Type | Diameter – DN (NPS) | Length |
| Brine Supply | Fiberglass NOV Green Thread HP25 | 250 (10”), 350 (14”), 450 (18”), 500 (20”), 600 (24”) | 23.09 km (14.35 miles) |
| Sour Gas | HDPESDR-11/ PE3408 | 80 (3”), 125 (5”), 150 (6”), 200 (8”) | 23.09 km (14.35 miles) |
| Total | - | - | 46.18 km (28.7 miles) |
| 18.2 | Central Processing Facility Infrastructure |
A proposed location for the CPF is approximately 11 km (7 miles) south of the intersection of Highway 29 and Highway 82 in Lewisville, AR. Road access to the CPF will be via Highway 29. A conceptual layout showing the process areas and auxiliary facilities is provided below in Figure 18-2.
|
|
| South West Arkansas Project Pre-Feasibility Study | 23 July 25 |
Figure 18-2. Central Production Facility Conceptual Layout
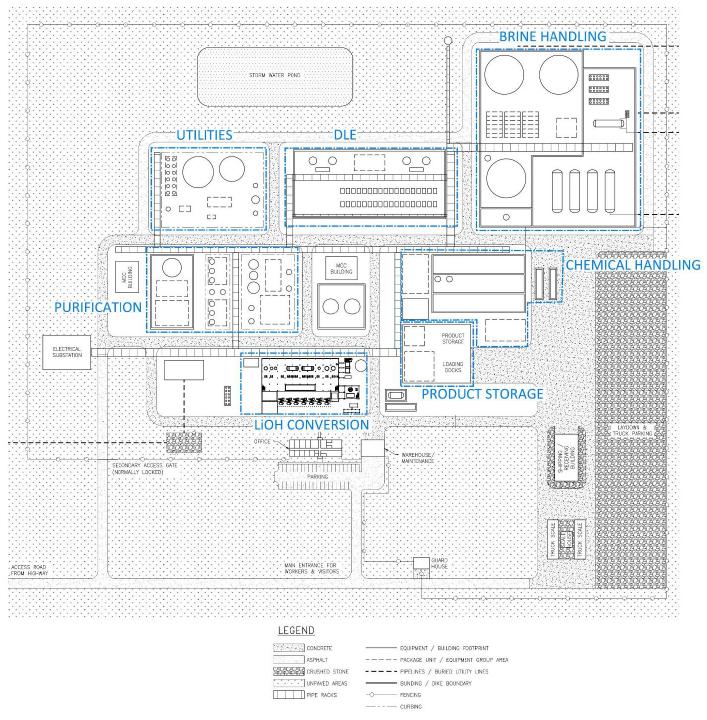
| 18.2.1 | Fresh Water Supply and Distribution |
Six fresh water supply wells will be installed with one spare to provide water to the CPF. The fresh water supply wells will be drilled to a depth of approximately 300 feet (100 m) below grade and designed to supply 477 m3/hr (2,100 US gpm) of fresh water to the facility. Water will be delivered to the well water/fire suppression storage tank with a storage capacity of 4,920 m3 (1.3 million gallons) of fresh water. Water that will be used for the CPF includes:
|
|
| South West Arkansas Project Pre-Feasibility Study | 23 July 25 |
| · | Fire Water – Fire water will be obtained directly from the tank. |
| · | Process Water – Process water will be obtained directly from the tank without further processing for general plant use. |
| · | High Purity Process Water/Potable Water – Purified water for process and potable use will be generated onsite using a reverse osmosis (RO) treatment unit. |
| · | Ultra-high Purity Water – Ultra-high purity water will be generated onsite using a demineralizer system. |
| 18.2.2 | Steam Supply |
The CPF will be equipped with a natural-gas-fired boiler unit to provide approximately 1,200 kg/hr. (2,650 lb/h) of medium pressure steam to the plant. The steam will primarily be used in the electrolysis unit but will also be required in the sodium chloride evaporator/crystallizer, lithium hydroxide evaporator/crystallizer, and debromination units for startup, trim heat, and various periodic maintenance activities.
| 18.2.3 | Power Supply |
The CPF will require a power supply of approximately 38 megawatts (MW).
The power supply to the CPF will be from the Southwest Arkansas Electric Cooperative power grid. A new substation and transmission line from the power utility will be required for the facilities.
| 18.2.4 | Compressed Air |
Compressed air will be supplied by multiple air compressors with a refrigeration dryer system to control moisture content.
| 18.2.5 | Compressed Nitrogen |
Compressed nitrogen for use in product packaging and tank blanketing will be supplied by a pressure swing generator.
| 18.2.6 | Sour Gas Transfer |
Sour gas gathered at the CPF will be compressed onsite for transfer via a dedicated high-density polyethylene (HDPE) pipeline tying into an existing Mission Creek pipeline for either reinjection or treatment (sweetening and separation of gas and liquids) at the nearby Mission Creek Dorcheat Gas Plant and then delivered either back to the CPF or to market. The estimated pipeline quantities and details are provided below in Table 18-3. An emergency flare system will be put in place to allow for safe handling of sour gas in the event of a downstream interruption.
|
|
| South West Arkansas Project Pre-Feasibility Study | 23 July 25 |
Table 18-3. Estimated Sour Gas Disposal Pipeline Details
| Description | Material Type | Diameter | Length |
| Sour Gas Disposal | HDPESDR-11/ PE3408 | 20.32cm (6”) |
14.0 km (8.71 miles) |
| 18.2.7 | Chemicals and Reagents |
Chemicals and reagents required for operation and maintenance of the CPF will be received via truck unloading stations and stored within containment areas, segregated as required to avoid adverse mixing in common drains. These include, but are not limited to:
| § | Sodium Hydroxide (NaOH) – delivered as 50% |
| § | Hydrochloric Acid (HCl) – delivered as 32% |
| § | Citric Acid (C6H8O7) |
| § | Chlorine (Cl2) – delivered as anhydrous |
| § | Flocculant (specifics TBD) |
| § | Calcium Hydroxide (Ca(OH)2) – lime |
| § | Sodium Carbonate (Na2CO3) – soda ash |
| § | Sodium Metabisulfite (Na2S2O5) – delivered as 39% |
| § | Anti-scalant |
| § | Corrosion Inhibitor |
| § | Glycol |
| 18.2.8 | Auxiliary Facilities |
The CPF will include the following auxiliary infrastructure facilities:
| § | Access/Security Checkpoint |
| § | Perimeter Fencing and Gates |
| § | Weigh Scale(s) |
| § | Internal Access Roads |
| § | Communication (telephone, cellular telephone, internal plant radio, security, and internet) |
| § | Electrical Substation and Power Distribution Lines |
| § | Natural Gas Metering Station and Distribution Lines |
| § | Sanitary Wastewater Treatment and Disposal System |
| § | Buildings |
| o | Administrative Office, Control Room, and Laboratory including a centralized control room for well field |
| o | Warehouse(s) |
|
|
| South West Arkansas Project Pre-Feasibility Study | 23 July 25 |
| o | Workshop(s) |
| o | Process Buildings for selected equipment |
| o | Shipping and Receiving |
| 18.3 | Effluent Brine/Process Water Injection Wells Network Infrastructure |
| 18.3.1 | Well Field |
The CPF will generate effluent brine including process wastewater. The effluent brine will be pumped from the CPF to a network of 22 brine injection wells located throughout the resource area of the SWA Property. This well field will use the same drilling technology used in the supply field to consolidate the surface facilities of the wells into nine multi-well pads. As stated in 18.1.1, well field development is based on the best data available at time of publishing and should be considered appropriate for the purpose of economic analysis of the SWA Project.
The arrangement of the brine injection well facilities will follow the same approach as the brine supply facilities by assembling multiple brine injection wells at each location to consolidate their individual surface facilities to minimize footprint, upfront cost and improve operations and maintenance (see Figure 18-3). Additionally, two of the injection wells are currently envisaged to be co-located with supply wells at one of the multi-well pads described in Section 18.1.1.
|
|
| South West Arkansas Project Pre-Feasibility Study | 23 July 25 |
Figure 18-3. Brine Injection Multi-Well Pad Conceptual Layout
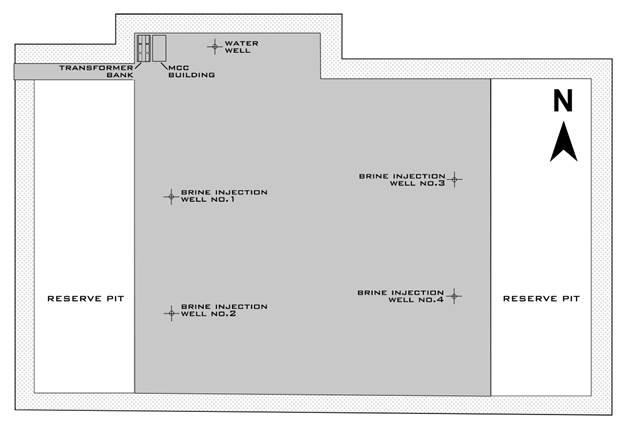
Each brine injection well will be equipped with a booster pump to reinject the effluent brine down through the injection well and into the Smackover Formation.
| 18.3.1.1 | Water Supply and Distribution |
Similar to the supply well pads, each of the brine injection well pad facilities will be equipped with a water well that will provide approximately 10m3/hr (45 US gpm) of water for drilling and routine well and well pad facilities maintenance operations.
| 18.3.1.2 | Power Supply |
The injection well pad facilities will require approximately 4.1 MW total for routine operations of the facilities as shown below in Table 18-4.
|
|
| South West Arkansas Project Pre-Feasibility Study | 23 July 25 |
Table 18-4. Power Consumption for the Brine Injection Well Facilities
| Facility No. | Injection
Well Count |
Operating Power (kW) |
Annual Electrical Consumption (MWh) |
| Brine Injection Facility No. 1 | 4 | 804 | 6,214 |
| Brine Injection Facility No. 2 | 2 | 421 | 3,152 |
| Brine Injection Facility No. 3 | 2 | 421 | 3,152 |
| Brine Injection Facility No. 4 | 2 | 421 | 3,152 |
| Brine Injection Facility No. 5 | 3 | 612 | 4,683 |
| Brine Injection Facility No. 6 | 2 | 421 | 3,152 |
| Brine Injection Facility No. 7 | 3 | 612 | 4,683 |
| Brine Injection Facility No. 8 | 2 | 421 | 3,152 |
| Combined Well Facility | 2 | -[1] | -[1] |
| Total | 22 | 4,133 | 31,341 |
Note: 1. Operating power and consumption for the Combined Well Facility is provided in Table 18-1.
Each of the brine injection well pad facilities will include a prefabricated MCC building, medium voltage drives for the booster pumps and utility power supplies, and a capacitor bank. The power supply to each facility will be from the Southwest Arkansas Electric Cooperative power grid. New substations and transmission lines will likely be required for the facilities.
| 18.3.1.3 | Compressed Air |
Similar to the supply well pads, compressed air will be supplied via a single compressor at each well pad facility. The compressors will be located within the MCC buildings.
| 18.3.1.4 | Auxiliary Infrastructure |
The following auxiliary infrastructure items will be required at each facility:
| · | Access roads to the facility. |
| · | Communication (Internet to the site whether that be ethernet or cellular service.) |
|
|
| South West Arkansas Project Pre-Feasibility Study | 23 July 25 |
| · | Medium voltage electrical power supply, including new powerlines and substations. |
| · | Metering stations for brine. |
| 18.3.2 | Pipelines |
Effluent brine will be pumped via fiberglass pipelines from the CPF to the booster pumps at each brine injection well pad and then pumped down each individual injection well back to the Smackover Formation. The estimated pipeline quantities and details are detailed below in Table 18-5.
Table 18-5. Estimated Effluent Brine Pipeline Details
| Description | Material Type | Diameter – DN (NPS) | Length |
| Effluent Brine | Fiberglass NOV Green Thread HP25 | 200 (8”), 250 (10”), 350 (14”), 500 (20”), 600 (24”) |
41.8 km (25.99 miles) |
|
|
| South West Arkansas Project Pre-Feasibility Study | 23 July 25 |
| 19 | Market Studies And Contracts |
| 19.1 | Background |
Two independent market studies were commissioned in support of forecasting Lithium market trends and pricing. These reports were executed by Benchmark Minerals Intelligence and Global Lithium. The key findings are summarized below.
When LCE demand reaches one million metric tonnes by the middle of this decade, it will have taken over 60 years to achieve that volume. The second million tonnes is expected to only take approximately four years as the energy transition in both transportation and Energy Storage Systems (ESS) for solar and wind power gains traction. Lithium is the most critical of battery metals required in the energy transition. Lithium-ion batteries can be made without nickel, cobalt, or manganese but all cathode technologies depend on either lithium carbonate or lithium hydroxide as the lithium source.
The Global Lithium report concludes that in 2010, global demand for lithium chemicals was less than 100K metric tonnes (MT) of lithium carbonate equivalents (LCEs) with sales spread across multiple market segments including glass, grease, pharmaceuticals, synthetic rubber, and lithium-ion batteries primarily used in mobile phones and other portable electronics.
By 2020, the demand had grown to over 300K MT LCE, with battery-related use approximately 60% of the market, primarily due to growing demand for electric transportation (EVs, buses, etc.).
By 2030, demand may exceed 3,000K MT with battery-related use forecasted to be over 90%. The main use of lithium is expected to be related to lithium-ion batteries in both electric transportation and energy storage. A key component of this change is the phasing out of internal combustion engine (ICE) vehicles in favor of electric vehicles (EVs), and increased use of lithium-ion batteries in energy storage systems (ESS) for renewable power from wind and solar. The lithium industry is not adequately prepared for this transition. New lithium resources and improved technology for lithium extraction will be required to satisfy the coming exponential growth. Demand for traditional non battery applications will continue to grow at low single digit rates. Based on the time it takes greenfield lithium projects to be developed and come into production, it is doubtful that the supply response will be equal to demand growth for the remainder of the decade.
A McKinsey forecast, shown in Figure 19-1 expects Lithium-ion battery cell demand to grow from approximately 700GWh in 2022 to approximately 1,700GWh in 2025, and approximately 4,700GWh in 2030 due to gradual global transition away from fossil fuels which will be replaced by increased use of renewable energy. Each terawatt hour (1,000GWh) requires a minimum of 800K MT of lithium carbonate equivalents (LCEs).
|
|
| South West Arkansas Project Pre-Feasibility Study | 23 July 25 |
Figure 19-1. Global Li-ion Battery Cell Demand, GWh, Base Case
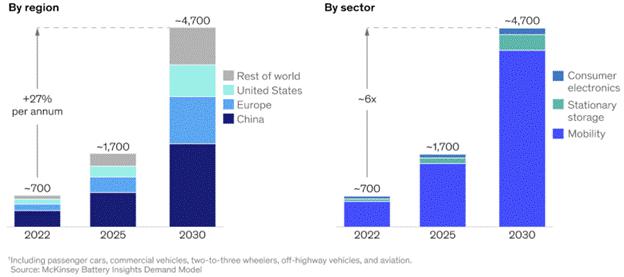
Lithium used in batteries is a specialty chemical as opposed to a commodity, which, due to the complexity of production, makes keeping up with demand even more challenging. Many lithium operations in production today were based on industrial demand for lithium, which required a product with much less stringent specifications than the battery industry.
The demand forecast provided by Global Lithium shows a lower demand than the consensus average of other lithium market forecasts such as the one shown above. Nevertheless, the forecast by Global Lithium LLC (shown in Figure 19-2) projects sustained lithium pricing strength over the next several years and, based on the demand growth and increasingly stringent quality standards, the lithium industry will struggle to supply in adequate volume to meet this growing demand. Although the supply line appears in relative balance with demand in some years, the reality of the supply chain will mean a portion of consumers may have difficulty sourcing qualified product in adequate volumes maintaining upward price pressure.
|
|
| South West Arkansas Project Pre-Feasibility Study | 23 July 25 |
Figure 19-2. Lithium Supply and Demand - Historical and forecast from 2020-2030
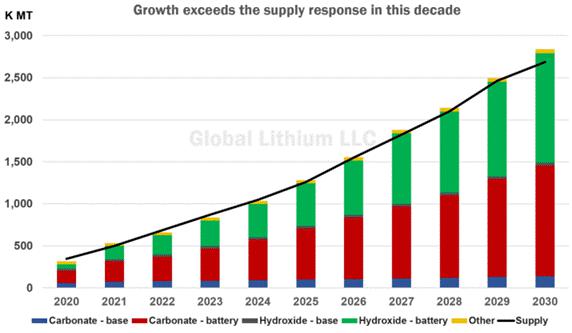
Note: Used with permission from Global Lithium LLC
The two fastest growing lithium chemicals will be battery quality hydroxide and carbonate through the remainder of this decade. These chemicals are produced primarily from two types of resources: hard rock (spodumene) and brines, although there may be production from sedimentary assets (also referred to as clay) later in this decade. Lithium chemical supply from recycling is not expected to be even 10% of supply until sometime in the 2030s.
Lithium hydroxide is primarily used in longer range EV batteries requiring high nickel content while carbonate is favored in lower capacity, less expensive EV batteries, electric buses, and energy storage systems. Although it is difficult to accurately forecast the exact future mix of cathode materials and whether carbonate or hydroxide will be required, the diversity of the battery market will likely result in a continued tight market for both forms of lithium chemicals into the next decade. Figure 19-2 shows a relatively even balance of carbonate and hydroxide demand in 2030.
Asia will remain the largest market for lithium chemicals for the remainder of the decade. China currently has 70% of lithium-ion battery cell production capacity and will remain the largest single market for EVs into the next decade. Korea and Japan are also significant battery producers. North America is expected to become the second-largest market for lithium chemicals by the end of the decade. US President Joe Biden has taken several steps to support growth of the domestic EV market and a North American battery supply chain which makes US-based lithium projects more attractive.
|
|
| South West Arkansas Project Pre-Feasibility Study | 23 July 25 |
The American Jobs Plan proposed $174 billion of investment to support development of the US EV market including the following incentives:
| · | Providing tax credits for EVs worth up to $7,500 for a new EV and $3,750 for a used EV. |
| · | Expanding access to charging stations with a goal of installing 500,000 new EV chargers by 2030. |
| · | Setting an ambitious goal of 50% of US auto sales being EVs by 2030. |
The European Union (EU) is supporting the growth of lithium-ion batteries through their “Green Deal” with programs similar to those in the US and a stated objective of making Europe the first carbon neutral continent by 2050.
Lithium supply is likely to become the critical path for EV adoption based on the fact it can take up to a decade to bring a greenfield lithium project online and takes only two to three years to build a battery gigafactory.
| 19.2 | Lithium Hydroxide Price |
Over the past few years, the price of lithium has been volatile. In 2017, the price of lithium hydroxide peaked at almost $30,000/tonne before several hard rock mines in Western Australia came online during 2018 and 2019 leading to a temporary oversupply situation where price fell below $10,000/tonne in some markets. In late 2020, EV growth in China and Europe moved the market back to a shortage situation. Global average price from 2016 to early 2023 by month is shown in Figure 19-3. The China spot market saw lithium hydroxide price exceed $80,000/tonne briefly before moderating. Spot pricing in China was very volatile in late 2022 through Q1 2023, while contract prices in Korea remained in the $70,000/tonne range through April 2023.
|
|
| South West Arkansas Project Pre-Feasibility Study | 23 July 25 |
Figure 19-3. Global Weighted Average Lithium Hydroxide

Global Lithium LLC estimates that average large ex China contract pricing will remain between $50,000 and $60,000/tonne through 2030 based on the assumption that demand will exceed battery quality supply until at least the early 2030s. The price forecast in Figure 19-4 shows multiple price scenarios including an average of the price forecasts of three major investment banks, the projection of China spot price by Benchmark Mineral Intelligence, along with what price would be if there was an oversupply situation and price dropped to the high marginal cost of production.
|
|
| South West Arkansas Project Pre-Feasibility Study | 23 July 25 |
Figure 19-4. Global Lithium Price Forecast
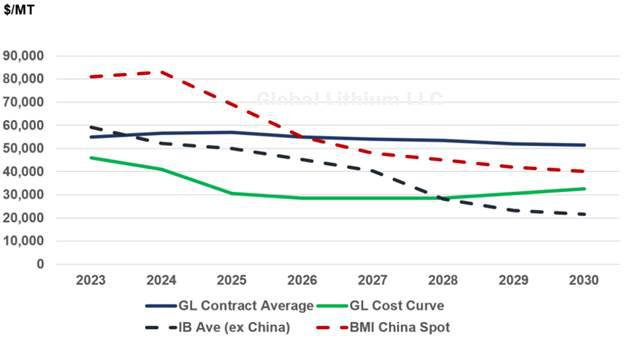
Notes:
GL Contract average is the ex-China average price per Global Lithium LLC estimates.
GL Cost Curve reflects the China hard rock converter cost.
IB Average is the ex-China price average from three major investment banks.
BMI China spot is per Benchmark’s report to Standard dated March 2023.
Presently, the high end of the cost curve is independent Chinese lithium chemical converters that source spodumene concentrate from offshore – mostly Australia, but also to a limited extent from other countries. As long as the spodumene price remains over $2,500/MT, the converter cost curve will be over $25,000/MT. Presently, spodumene prices are significantly higher than $2,500/MT yielding a cost curve price above $40,000/MT. Should spodumene price drop significantly, vertically integrated lepidolite production in China will replace independent spodumene converters as the high cost production, keeping the high end of the cost curve in the $30,000/MT range.
For purposes of estimating new project future cash flows, Global Lithium recommends a conservative approach using the forecast high end of the cost curve based on the Ex-China contract pricing through to 2030 and China’s spodumene sourcing and lepidolite production dynamics keeping conservative prices around the $30,000/MT price point. Although global lithium forecasts global pricing well above the green line in Figure 19-4, using a conservative price is recommended in case of unforeseen market circumstances. The economic evaluations of the project are therefore based on a $30,000/MT Lithium Hydroxide flat forecast price.
|
|
| South West Arkansas Project Pre-Feasibility Study | 23 July 25 |
| 20 | Environmental Studies, Permitting, and Social or Community Impact |
| 20.1 | Introduction |
Standard Lithium is proposing to build the SWA Project for lithium hydroxide production by processing brine with naturally occurring lithium found in the Smackover Formation. Standard Lithium will process the brine to form lithium chloride solution and then convert to lithium hydroxide. The proposed SWA Project includes construction of a Central Processing Facility (CPF) and brine supply and brine injection well fields, and pipelines. The brine supply wells and ancillary equipment will provide the CPF with brine while the injection wells will be used to inject tail-brine (lithium-depleted brine) and associated process water back into the Smackover Formation for pressure maintenance. This section of the report will focus on the listed components of Section 20 of a PFS for a new Standard Lithium facility near Magnolia, Arkansas. These components are as follows:
| · | Environmental Considerations |
| · | Permitting Overview |
| · | CWA Section 404 Permits |
| · | Air Emissions Permits |
| · | Surface Water Discharge Permits |
| · | Brine Supply and Disposal Well Drilling Permits |
| · | Underground Injection Control (UIC) Permits |
| · | Public Water Supply Permit |
| · | Resource Conservation and Recovery Act Subtitle C Treatment, Storage and Disposal Permit |
| · | Social Impact |
| · | Environmental Management and Closure Plan |
| 20.2 | Environmental Considerations |
Construction and operational emissions to air, surface waters, and subsurface waters, and proper management/disposal of solid wastes are regulated by the Federal and State agencies to protect the environment while allowing responsible development of the lithium resources. These are specifically addressed in Section 20.3. Further to this, activities that contain a Federal nexus (Federal funding, Federal permitting decision, or the activity is conducted by a Federal Agency) would trigger the National Environmental Policy Act (NEPA). The purpose of the NEPA process is to assess environmental impacts resulting from the project and can include 1) Categorical Exclusions, 2) Environmental Assessments (EA), 3) Finding of No Significant Impact (FONSI), and 4) Environmental Impact Statements (EIS). The first three options are relatively fast processes while the EIS can take more than a year to complete. Each process ends in a decision regarding environmental impacts; whether the project is approved or not; and if approved, any conditions required for implementation of the project.
|
|
| South West Arkansas Project Pre-Feasibility Study | 23 July 25 |
The project as it is currently envisaged, would not qualify as a Federal undertaking but may require a Federal permitting decision through the U.S. Army Corps of Engineers (USACE). For typical permitting decisions, the USACE conducts an Environmental Assessment (EA) in house. The USACE will either determine no significant impacts would result from the project and issue a FONSI or determine the project may have significant impacts and conduct an EIS. The USACE does not list numerical thresholds that would trigger a significant impact requiring an EIS; however, it is not a common practice for typical projects with under 10 acres of wetland impacts. Therefore, the project could be expected to require EA under this route.
The NEPA process would also be triggered if federal funds are obtained for the project. The level of effort would be dependent on the requirements of the Federal Agency from which funds are received. The typical process would be to evaluate whether a categorical exclusion exists for the activity. If no categorical exclusions exist, then an EA would be necessary resulting in a FONSI or decision to conduct an EIS. The Federal Agency may have numerical thresholds that automatically trigger an EIS. The EIS is typically conducted by a third party directly contracted by the Federal Agency at the expense of the permittee. Given that the project as it is currently envisaged is not considering federal funding, it is not expected to trigger an EIS.
Irrespective of whether federal funding is used or not, the proposed project will require multiple permits for air, water, waste, resource extraction, and underground injection. Permit application approvals in some cases will take more than a year from submission dates. The anticipated timeline for requisite permits is described in the respective categories of Section 20.3.
| 20.3 | Permitting |
| 20.3.1 | Overview |
The SWA Project will require permits to be completed prior to construction and operation of the facility. The permits will require review and approval from the Arkansas Department of Health (ADH), the Arkansas Department of Energy and Environment (ADEE), and potentially, the USACE.
The ADH regulates construction of potable water supplies and sanitary waste treatment/disposal facilities.
|
|
| South West Arkansas Project Pre-Feasibility Study | 23 July 25 |
The ADEE is the permitting agency for both the environmental permits and resource extraction for the facility through two Divisions, the Division of Environmental Quality (ADEE-DEQ) and the Arkansas Oil & Gas Commission (ADEE-AOGC). The ADEE-DEQ oversees the air, National Pollutant Discharge Elimination System (NPDES), Office of Water Quality No-Discharge, Solid Waste permits, and shares authorization for underground injection control (UIC) permits with the ADEE-AOGC. The ADEE-AOGC has sole permitting authority for extraction of the brine resource from drilled/completed supply wells and disposal of the lithium-depleted effluent brine to the Smackover Formation by deep well injection into UIC Class V wells.
Public notice of each individual permit proposed for issuance by the ADEE-DEQ and a thirty-day period for receipt of comments precedes final authorization of the specific permit. ADEE-DEQ may or may not conduct public meetings prior to their final approval.
The USACE is the permitting authority for construction activities impacting waters of the U. S. (WOTUS), and the SWA Project is within the jurisdiction of the USACE Vicksburg District. The USACE issues two types of authorizations, nationwide permits for certain categories of activities with minimal impacts to WOTUS, and an individual permit for all other activities.
| 20.3.2 | Clean Water Act Section 404 Permitting |
Section 404 of the Clean Water Act established a statutory mechanism for control of dredged or fill material into WOTUS, including wetlands. The USACE has final administrative authority to determine the status of land surface as WOTUS. Currently, certain land characteristics are scientifically used as indicators of WOTUS through a process known as a Jurisdictional Determination (JD). Private entities commonly prepare and submit JD reports to the USACE to expedite their decision-making process and in some cases, the USACE will conduct a site survey to confirm the private JD or absent a private submittal, to provide the basis for the agency’s permitting decision.
USACE authorizes impacts to WOTUS through nationwide or individual Section 404 permits. Nationwide permits are structured for specific activities and minimal impacts, usually limited to less than one acre, and do not require lengthy agency review. The current list of fifty-nine nationwide permits was issued by the USACE in 2021. The nationwide permits potentially applicable to the SWA Project are:
| · | NWP 7 – Outfall Structures and Associated Intake Structures |
| · | NWP 12 – Oil or Natural Gas Pipeline Activities |
| · | NWP 14 – Linear Transportation Projects |
| · | NWP 18 – Minor Discharges |
|
|
| South West Arkansas Project Pre-Feasibility Study | 23 July 25 |
| · | NWP 39 – Commercial and Institutional Developments |
| · | NWP 43 – Stormwater Management Facilities |
| · | NWP 57 – Electric Utility Line and Telecommunications Activities |
| · | NWP 58 – Utility Line Activities for Water and Other Substances |
An individual permit is required for activities not eligible for nationwide permits or those the USACE deems in the public interest. An individual Section 404 permit may require a year for issuance by the USACE and like nationwide permits, will mandate compensatory mitigation for impacts to WOTUS. Once the Section 404 permitting process is initiated, the USACE will institute a review of threatened/endangered species and cultural resources that may be impacted by the SWA Project.
Construction of the SWA Project CPF, well field (supply and disposal), pipelines, roads, and utilities is considered a singular project by USACE when evaluating eligibility for nationwide or an individual Section 404 permit. A preliminary scientific survey of the proposed project site and desktop review of the brine supply and injection well system, and pipelines indicate a Section 404 permit most likely will be necessary due to the magnitude of WOTUS impacted exceeding the nationwide permit disturbance thresholds.
| 20.3.3 | Air Emissions Permitting |
A single permit will be issued by ADEE-DEQ for construction and operation of the lithium extraction/processing facility. The permit must be in place prior to initiating construction, including preparation of foundations for any air emission source. The permit could take up to a year for approval depending on the level of pollutant emissions from the facility. The three levels of air permits available under the ADEE-DEQ air permitting program are directly tied to the annual total emissions of specific pollutants the plant will produce. Operational considerations to minimize potential emissions will be a factor in the CPF design phase, but systems such as closed-loop brine cooling to limit particulate emissions will be employed where practical. Initial calculations of likely annual emissions indicate the SWA Project should be permitted at the lowest permit tier. The lowest permit tier is a minor source permit and for the new facility will require approximately six to nine months for approval by ADEE-DEQ.
Design phase information will be utilized to determine the emissions rates for the minor source permit application. The calculations will take into consideration the production throughput, chemical reactions, and type of air emission controls used at the facility.
|
|
| South West Arkansas Project Pre-Feasibility Study | 23 July 25 |
| 20.3.4 | Water Discharge Permitting |
ADEQ-ADEE issues multiple NPDES permit variations for discharge of pollutants to surface waters depending on the activity associated with the permit request. The NPDES permits applicable to the SWA Project all may be categorized as general permits. These permits include:
| · | NPDES Construction General Permit (Stormwater) – The ADEE-DEQ, Office of Water Quality has issued a general permit for discharges of storm water runoff from construction (earthmoving) activities. General permits are developed for multiple facilities that have similar activities and limitations. The objective of permit ARR150000 is to eliminate or reduce the transport of sediments and construction-related contaminants from earthmoving and construction activities that disturb one acre or more area. As the Standard Lithium facility development will exceed five acres, a Storm Water Pollution Prevention Plan specific to the construction site must be prepared and submitted to ADEE-DEQ along with a Notice of Intent for coverage under the general NPDES permit. The Storm Water Pollution Prevention Plan includes management practices and physical controls to minimize sediment/contaminant transport off the construction area as a result of precipitation events. Once authorized, the permit is in effect until the disturbed area is stabilized after construction is completed. The current permit ARR150000 was effective November 1, 2021, and expires October 31, 2026. |
| · | NPDES Operational General Permits (Stormwater, Non-contact Wastewater, and Sanitary Wastewater) – General permits have been issued by ADEE-DEQ for stormwater discharges from industrial operations and common industrial non-contact effluents such as boiler blowdown, cooling tower overflow, and steam condensate. Discharges of treated sanitary wastes less than 1,500 gallons per day are also authorized using a general permit. |
| o | Operational Industrial Stormwater – Stormwater runoff discharges from certain industrial categories are regulated by the ADEE-DEQ Office of Water Quality in the NPDES program using a multi-sector general permit. The SWA Project lithium extraction and processing facility is included in Sector C: Chemicals and Allied Products. The industrial general permit ARR000000 for stormwater runoff discharges from industrial sites has requirements similar to the general permit for construction stormwater discharges (ARR150000) that emphasizes pollution prevention and best management practices. Likewise, a Stormwater Pollution Prevention Plan must be prepared specific to the operational site. Discharges of stormwater runoff from the area of industrial activity must be sampled and analyzed annually. ADEE-DEQ has established benchmark concentrations for various parameters based on the industrial category; those parameters are assessed and reported annually to ADEE-DEQ. The benchmark concentrations are established to alert facilities and the ADEE-DEQ of potential exposure to industrial materials or processes, and to provide the facility opportunity to implement new or amend existing management practices to reduce the parameter of concern. |
|
|
| South West Arkansas Project Pre-Feasibility Study | 23 July 25 |
| o | Cooling Tower Blowdown, Boiler Blowdown, Steam Condensate – Certain non-process contact wastewaters are regulated by the ADEE-DEQ by NPDES General Permit ARG250000. The maximum allowable daily discharge for general permit eligibility is 0.5 million gallons per day. Preliminary information on wastes to be generated by the SWA Project include cooling tower and boiler blowdown totaling less than 0.5 million gallons per day, thus making those effluents subject to the ARG250000. The general permit ARG250000 includes numeric discharge concentration limits for Chemical Oxygen Demand, Total Suspended Solids, Oil and Grease, pH, and Temperature with monitoring frequency set at twice per month. |
| o |
Sanitary Wastewater – Treated domestic (sanitary) wastewater is authorized for discharge by two potential permitting paths. The discharge of treated sanitary wastewater to a surface stream is regulated by the ADEE-DEQ and if the maximum daily discharge is less than 1,500 gallons per day, subject to NPDES General Permit ARG550000. Additionally, the treatment system used must be selected from an approved list developed by ADEE-DEQ. Permit ARG550000 includes discharge limitations for Biochemical Oxygen Demand (Five-Day), Total Suspended Solids, Dissolved Oxygen, Fecal Coliform Bacteria, and pH. Monitoring frequency is once per six months.
|
|
| Alternatively, if the sanitary wastewater is discharged subsurface using infiltration trenches based on a professional soil assessment and design, the system must be approved by the ADH. The ADH permit process is initiated by a professional soil classifier registered with ADH to design infiltration systems using data collected from the site of the proposed CPF. There are no monitoring or reporting requirements associated with a ADH-permitted subsurface discharge of treated sanitary wastes. |
| 20.4 | Brine Supply/Disposal Well Permits |
Authorization to drill and operate brine resource and/or injection wells is issued by the ADEE-AOGC. ADEE-AOGC has a Brine Production Regulatory Program that defines the requirements for establishing Brine Production Units that must be in place before an application to drill a supply or injection well is submitted by an operator or producer. Once a Brine Production Unit (or units) is created by ADEE-AOGC Commission Order and after a public hearing, drilling permit applications for new wells will be considered by the Agency. A petition to create a Brine Production Unit must include:
| 1. | A description of the proposed brine production unit or brine expansion unit. |
|
|
| South West Arkansas Project Pre-Feasibility Study | 23 July 25 |
| 2. | A statement of the plan of development and operation of the brine production unit or brine expansion unit. |
| 3. | All geological and engineering data necessary for the Oil and Gas Commission to be fully advised of the feasibility of the proposed plan. |
| 4. | A statement detailing all costs and expenses chargeable to the proposed brine production unit or a brine expansion unit and a statement of all credits due against costs and expenses. |
| 5. | A plat of each proposed brine production unit or brine expansion unit which indicates the tracts or parcels of land included in the plat and the location of each well then located within the proposed unit for the production of brine and the injection or disposal of effluent and the proposed location of each well that is proposed to be drilled for production and injection or disposal purposes. |
| 6. | A list of owners within the unit, including the brine, interest, and last known address of each such owner. |
| 7. | A statement that the petitioner has valid and subsisting leases or otherwise owns or controls the right to produce brine from not less than seventy-five percent (75%) of the entire area of the proposed brine production unit or brine expansion unit. |
Note: The petitioner may not combine its leases or other rights to produce brine, relative to an adjacent brine production unit or brine expansion unit, with leases or other rights to produce brine necessary to achieve the seventy-five-percent lease requirement to form a separate brine production unit or brine expansion unit.
| 20.4.1 | Underground Injection Control (UIC) Permitting |
There are two potential paths for management of waste (effluent) brine from the CPF. One is returning the brine to the Smackover Formation using UIC Class V injection wells. Class V injection wells are authorized by the ADEE-AOGC and do not require a lengthy permitting process as they have been used by bromine extraction operations in Arkansas for almost seventy years. Class V well authorizations do not expire until a well is permanently plugged and abandoned.
The Standard Lithium SWA Project will only utilize Class V injection wells for disposal of effluent brine at this stage of the project. Nevertheless, the other option for disposal of effluent brine is in UIC Class I Nonhazardous wells that inject the waste into subsurface formations other than the Smackover. Class I wells are strictly regulated under the Resource Conservation and Recovery Act (RCRA), and the Safe Drinking Water Act (SDWA) through permits issued by ADEE-DEQ. Class I permits are issued with ten-year terms and applications for renewal must be submitted prior to the expiration date. If the brine disposal scenario changes and a UIC Class I disposal permit is required, the time for ADEE-DEQ review and approval of a UIC Class I non-hazardous well permit application is approximately twelve to eighteen months.
|
|
| South West Arkansas Project Pre-Feasibility Study | 23 July 25 |
ADEE-DEQ also requires a State No-Discharge Permit for above-ground equipment, tanks, pumps, pipelines, etc. connected to either UIC Class I or V injection well systems. This permit may require nine months to one year for issuance by ADEE-DEQ.
| 20.4.2 | Public Water Supply |
The ADH issues approvals for Public Water Systems serving non-municipal potable water. The Standard Lithium SWA Project will require fresh water sources to support the lithium extraction process and provide potable water for personnel use. The most likely source of fresh water will be extracted from the underground Sparta Aquifer. Fresh water produced by the well(s) will be disinfected, stored, and distributed following ADH rules. Following submission of engineering design and construction plans and specifications that meet Department standards, the ADH will issue a Noncommunity Public Water System permit for the non-transient, non-municipal water system supplying potable water to the Standard Lithium facility.
| 20.4.3 | Resource Conservation Recovery Act |
A Resource Conservation and Recovery Act (RCRA) Hazardous Waste Permit is required of any facility that performs treatment, storage (greater than ninety days), or disposal of waste meeting the criteria to be classified as hazardous. The SWA Project is not anticipated to conduct any of the activities requiring a RCRA permit authorization. Process wastes generated by the facility are not expected to meet the hazardous classification. Small quantities of universal wastes (batteries, pesticides, mercury-containing equipment, lamps, electronics, and aerosol cans) may be generated by the operation and maintenance of the site. Title 40 Code of Federal Regulations, Part 273 provides an alternative set of management standards for universal wastes in lieu of regulation as hazardous waste.
| 20.4.4 | Construction Permits, Approvals, and Plans |
Engineering plans sufficient to allow calculation of probable emission levels will be requisite for preparation of the applications. The engineering details will be used in all permitting applications. Each permit will require its own permitting package and drawings. Depending on the permit and degree of complexity, the time necessary to complete the permit application package ranges from four to nine months and must be considered in addition to the permit processing time by the specific Agency when determining the overall permit timeline.
The regulatory actions and permits discussed have been identified as required or probable for construction and operation of the Standard Lithium SWA Project. Table 20-1 provides the anticipated schedule for obtaining the necessary authorizations for the facility once permit applications are submitted to the respective agencies.
|
|
| South West Arkansas Project Pre-Feasibility Study | 23 July 25 |
Table 20-1. Applicable Permits and Schedule for SWA Project
| Agency | Permitted Activity | Expected
Permit Issuance Time |
| ADEE-DEQ | Major Source Air Permit for Commercial Facility (CPF) | 6-9 months |
| ADH | Fresh Water Supply for Potable Water (CPF) | 9 months |
| ADEE-DEQ | NPDES General Permit for Construction Stormwater (CPF, Well Field, Pipelines) | 1 month |
| ADEE-DEQ | NPDES General Permit for Cooling Tower and Boiler Blowdown (CPF) | 1 month |
| ADEE-DEQ (Alt to ADH Subsurface Disposal Permit) | NPDES General Permit for Treated Sanitary Wastewater (CPF) | 1 month |
| ADH (Alt to ADEE-DEQ General Permit) | Sanitary Waste Subsurface Disposal System (CPF) | 1 month |
| ADEE-DEQ | NPDES General Permit for Storm Water Discharges from A Categorical Industry (CPF) | 1 month |
| ADEE-DEQ | State No-Discharge Permit to Construct/Operate Surface Facility for New Class V Injection Wells (CPF, Well Field) | 9 months |
| ADEE-DEQ | UIC Permit to Construct/Operate New Class I Nonhaz Injection Well(s) | Not planned |
| ADEE-AOGC | Construct Brine Supply and UIC Class V Disposal Wells (Well Field) | 1 month after brine production unit approved |
| USACE | Section 404 Permit for Impacts To WOTUS (CPF, Well Field, Pipelines, Roads, Utilities) | 1 year |
| 20.5 | Social Impact |
A formal social impact study has not been completed for this project. It is likely that public meetings will be required as a part of the overall permitting process. The region around the proposed facility is predominantly agricultural or silvicultural land uses in a sparsely populated area of the state. There is an opportunity for a positive social impact on the surrounding communities. The community will benefit from the construction phase because the project will require skilled labor and many contractors to complete. The community will also benefit with the additional opportunities for a labor market skilled in similar operations once the facility has been constructed. Local businesses that supply goods and services to the SWA Project facility may also be uplifted by the influx of capital associated with construction and operation of the facility.
|
|
| South West Arkansas Project Pre-Feasibility Study | 23 July 25 |
A preliminary review of the SWA Project footprint has been conducted to identify any potential cultural/archeological resources impact from the project. The review included all documented historical sites as well as the likelihood of incurring undocumented cultural locations within the project area. The findings did not identify any cataloged sites that will conflict with the SWA Project plan and expressed the potential for encountering cultural materials as low due to the soil classifications of the project area. However, one site considered eligible for listing on the National Register of Historic Places (Red River remnant of the AN/FPS-133 Air Force Space Surveillance System) is in the preliminary project area. The site was operational from 1961 until 2013. If an adverse impact is possible from construction of the SWA Project, avoidance or mitigative action at the eligible site will be required.
| 20.6 | Environmental Management and Closure Plan |
Environmental Management Plans to guide compliance with the various regulatory programs and requirements will be developed following receipt of applicable construction and/or operating permits from the State agencies. The Plans will address the various aspects of the design, construction, commissioning, and operation phases of the project, identify the key environmental issues from the various project phases, and provide plans and actions that will be undertaken to manage them effectively.
A Closure Plan addresses how a project will be decommissioned with minimal need of further maintenance and minimal impact to the environment, as well as address any reclamation or rehabilitation effort that is required if a facility permanently ceases operation. A Closure Plan specific to the Class I UIC wells, if constructed will be submitted to and approved by the ADEE-DEQ through the permit application process. All other operations of the Standard Lithium SWA Project facility are not subject to any State or Federal formal Closure Plan requirement. Nevertheless, Standard Lithium will function in an environmentally responsible manner should operations cease in the future. Process feedstock, liquids in vessels, reagents, finished products, and ancillary materials will be removed to a proper use, recycling, or disposal facility. Solid residuals and non-hazardous solid wastes will be transported off-site to an appropriate permitted recycling or disposal facility. Small quantities of regulated hazardous wastes/universal wastes accumulated during the operation and site termination activities will be transported to an authorized facility.
|
|
| South West Arkansas Project Pre-Feasibility Study | 23 July 25 |
| 21 | Capital and Operating Expenditure Costs |
The capital expenditure (CAPEX) cost estimate and operating expenditure (OPEX) cost estimate were prepared under the general provisions for a Class 4 Estimate, as defined in the American Association of Cost Engineers (AACE) International Recommended Practice No. 18R-97 Cost Estimate Classification System as Applied in Engineering, Procurement, and Construction for The Process Industries. The AACE classification system uses a 1 to 5 scale, where a “Class 1 Estimate” is the most accurate and a “Class 5 Estimate” is the least accurate.
An AACE Class 4 estimate is used for project screening and determination of feasibility. The estimate is suitable for detailed strategic planning and business development, as well as analyzing project alternatives before proceeding to the next stage.
It is the QP’s view that the quantity and quality of engineering along with the level of quotes obtained for equipment results in a level of accuracy appropriate for a Pre-Feasibility Study. The estimate includes a 20% contingency.
| 21.1 | Capital Expenditure Estimate |
| 21.1.1 | Basis of Estimate |
The basis of estimate (BOE) for the base case development CAPEX is a work breakdown of the project’s individual components. These components and the basis for their specific areas are broken down and further described below.
| 21.1.2 | General |
Project execution includes the construction of one (1) commercial scale production facility and the necessary brine production gathering and injection facilities.
| · | Design is for a facility that produces battery-quality lithium hydroxide product. |
| · | Lithium hydroxide production by the facility is based on an average brine grade of 437 mg/L of lithium. |
| · | Equipment size and related cost were developed based on an annual production rate of 30,000 metric tonnes of lithium hydroxide. |
| · | Estimated costs are based on budget quotations from selected vendors and contractors, and current North American pricing from established cost databases. |
| 21.1.3 | Brine Supply and Injection Well Fields |
The following items are included in the brine supply and injection well field estimate.
| · | The brine gathering system consists of 5 supply well pad facilities that will be comprised (as a whole) of 2 vertical wells and 17 directional wells. An additional combined well facility will host two (2) directional supply wells along with injection wells. |
|
|
| South West Arkansas Project Pre-Feasibility Study | 23 July 25 |
| · | Effluent brine disposal system consists of 8 injection well pad facilities that will be comprised (as a whole) of 4 vertical wells and 16 directional wells. The combined well facility will host 2 directional injection wells. |
| · | Capital cost estimates for the wells were completed in cooperation with an experienced drilling contractor. The drilling cost estimates are based on the updated brine supply and injection well field modeling and layout developed in accordance with methodology outlined in Section 16. Well pad locations and drilling methodologies were identified based on down hole location and proximity to group the wells as efficiently as possible. A “typical” drilling plan model was established and priced for the two drilling methods detailed below: |
| o | Vertical well |
| o | Directional well |
| · | The well sites are expected to be drilled on a continuous schedule from start to finish. This is expected to accrue certain cost savings for reduced mobilization costs, overhead, etc. over the course of this effort. A “Drilling Efficiencies Factor” of 5% has been included in the well field cost for the variable (daily) drilling expenses to account for these anticipated cost savings. |
| · | Cost estimates for the electrical submersible pumps (ESP) are based on an 800 horsepower, high flow rate pump. ESP sizing is based on historical pump sizing for similar wells in the region. The pump sizing and costs are subject to change depending on the requirements set forth in the final well field design. Further analysis should be conducted to better define the pump sizing requirements for the well field as the costs for these pumps vary significantly with size. |
| · | Cost estimates associated with surface facilities equipment at each facility are based on historical pricing for installation and budgetary equipment costs in Aspen In-Plant Cost Estimator SoftwareTM, Version 12. |
| · | Costs associated with the site preparation and auxiliary infrastructure to be installed at each well pad facility are based on budgetary contractor estimates. |
| · | Indirect Costs for the well field developments are factored at 15% of Direct Costs to account for Owner’s Engineering and other miscellaneous costs. |
| 21.1.4 | Brine Supply/Return and Sour Gas Pipeline Network |
The following items are included in the brine supply, brine return and sour gas disposal pipeline estimate.
|
|
| South West Arkansas Project Pre-Feasibility Study | 23 July 25 |
| · | Sour gas will be separated from the brine at the supply well facilities and delivered to the production facility in pipelines alongside the brine feedstock. |
| · | Anticipated brine feedstock flow to the production facility is approximately 1,800 m3/hour (7,925 gpm). |
| · | Pipeline cost estimates are based on material quotes received from suppliers – detailed below in Table 21-1 along with installation and land costs from previous projects. |
| · | Survey and land costs were estimated based on budgetary pricing developed by HGA. |
| · | Installation and environmental services were also based on budgetary pricing from local companies familiar with executing this type of work. |
| · | Indirect cost estimates, such as those for engineering and inspection, are based on similar sized projects. |
Table 21-1. Pipeline Material Summary
| Service | Type | Quantity |
| Brine Supply Pipelines | Fiberglass | 23.19 km (14.41 miles) |
| Effluent Brine (Injection) Pipelines | Fiberglass | 42.0 km (26.1 miles) |
| Sour Gas Pipelines | HDPE | 34.30 km (21.31 miles) |
| Total | - | 99.49 km (61.82 miles) |
| 21.1.5 | Central Processing Facility |
The basis of estimate for the Central Processing Facility (CPF) is as follows.
| · | The CPF includes the following processing units/areas: |
| o | Brine receiving unit for degassing, solids removal, and storage of pre-treated brine prior to its introduction into DLE; |
| o | Sour gas receiving and disposal unit to receive sour gas from the brine supply well system and the degassing system in the brine receiving area. Sour gas is expected to be metered and delivered to a nearby Mission Creek sour gas gathering pipeline feeding the Mission Creek Dorcheat Gas Plant; |
|
|
| South West Arkansas Project Pre-Feasibility Study | 23 July 25 |
| o | DLE unit produces lithium chloride (LiCl) solution with significantly reduced impurities; |
| o | Purification and concentration for removal of residual impurities and concentration of the LiCl suitable for electrolytic conversion; |
| o | Lithium hydroxide crystallization; |
| o | Packaging unit to pack the dried lithium hydroxide product into 2,000 lb. supersacks in a nitrogen purged environment; |
| o | Shipping and receiving unit for the storage and truck loading of the finished lithium hydroxide, and |
| o | Utilities equipment to provide medium pressure steam, water, cooling water, demineralized water, RO-filtered water, nitrogen, and compressed air for use in the process equipment and general plant needs. |
| · | Lithium hydroxide unit produces 30,000 metric tpa; |
| · | Annual production is based on approximately 91.3% availability per year (8,000 hours); and, |
| · | Lang Factors were used as the primary method to estimate the cost for the inside boundary limit (ISBL) areas of the production facility. The Lang Factor is one of the factored estimating techniques recommended by AACE International for Class 4 and Class 5 estimates. This method uses a formula that contains a set of factors multiplied by the total equipment cost (TEC) to obtain the total plant cost (TPC). |
| o | Equipment lists were prepared based on preliminary process flow diagrams (PFDs); |
| o | The equipment was priced based on formal budgetary pricing, informal vendor pricing, and historical pricing for the major pieces of equipment at the facility; and, |
| o | AACE percentage factors were then applied to equipment costs to estimate installation and indirect costs. Much of the equipment will either be packaged or require very little auxiliary equipment support. The AACE factors have been refined accordingly to reflect the level of pre-fabrication and modularization associated with each major equipment item. |
| 21.1.6 | CAPEX Summary |
The total capital cost for the project is detailed below in Table 21-2 and a breakdown of the CAPEX costs by area (not including freight or contingency) is shown in Figure 21-1.
|
|
| South West Arkansas Project Pre-Feasibility Study | 23 July 25 |
Table 21-2. SWA Project Capital Expenditure Cost Estimate
| Description | Equipment Cost US$ |
Factored Cost US$ |
| Well Field | Included | $236,751,000 |
| Pipelines | Included | $67,601,000 |
| Brine Receiving/Pre-Treatment | $44,783,522 | $166,627,000 |
| Direct Lithium Extraction Unit | $55,606,237 | $139,123,000 |
| Purification & Concentration | $66,020,375 | $153,645,000 |
| Lithium Hydroxide Unit | $72,007,009 | $158,354,000 |
| Chemical Storage, Handling, & Utilities | $30,052,094 | $124,229,000 |
| Plant Buildings | Included | $8,604,000 |
| Freight | Included | $8,054,000 |
| Contingency (20%) | Included | $210,987,000 |
| Total Factored Cost | $1,273,975,126 | |
|
|
| South West Arkansas Project Pre-Feasibility Study | 23 July 25 |
Figure 21-1. CAPEX Breakdown
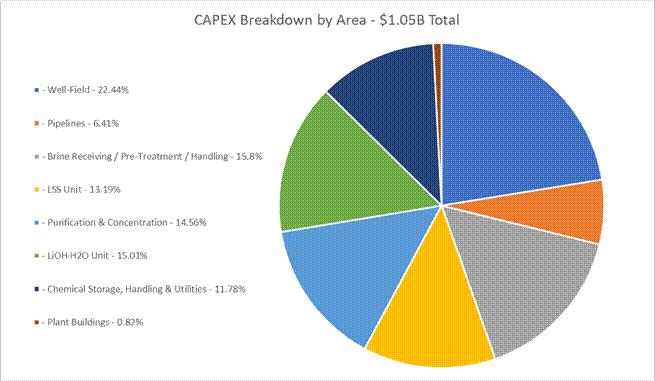
Note: $1.05B total does not include freight and contingency.
| 21.1.7 | Sustaining Capital |
Major equipment refurbishment and replacement is categorized as sustaining capital. The total sustaining capital cost for the 20-year project life is $248,721,000. These items are detailed below in Table 21-3.
|
|
| South West Arkansas Project Pre-Feasibility Study | 23 July 25 |
Table 21-3. Sustaining Capital
| Description | Replacement/Refurbishment Cost (US$) |
Frequency (years) |
| LSS Media | $13,500,000 | 3 |
| Calcium/Magnesium Resin | $1,648,000 | 3 |
| Boron IX Resin | $3,705,000 | 3 |
| ESP Workover Cost | $630,000 | 2 |
| ESP Replacement Cost | $9,122,400 | 4 |
| Filter Membrane | $3,570,000 | 3 |
| Electrolysis Unit (Anode & Membrane Service) | $7,460,000 | 3 |
| Reverse Osmosis Membranes | $667,500 | 1 |
| Sour Gas Compressor Overhaul | $1,080,000 | 6 |
| 21.1.8 | Land Costs |
| 21.1.8.1 | Well Facilities and Central Processing Plant |
The brine supply and injection well facilities will require approximately 320 acres of surface area for the facility arrangements detailed in Sections 18.1.1 and 18.3.1.
The CPF is proposed to be located on a 120-acre property described in Section 18.2. These costs have been included in the assessment based on an assumed purchase price of US$5,000 per acre plus 20% for property acquisition related fees (US$6,000 /Acre) as described below in Table 21-4.
|
|
| South West Arkansas Project Pre-Feasibility Study | 23 July 25 |
Table 21-4. Well Facilities and Central Processing Plant Land Costs
| Description | Quantity | Unit | Units
Cost US$ |
Total
Cost US$ |
| Supply Well Facilities (6 @ 16.73 Acres Each, including Combined Well Facility) | 100.38 | Acres | $6,000 | $602,124 |
| Injection Well Facilities (8 @ 12.63 Acres Each) | 101.04 | Acres | $6,000 | $606,446 |
| Central Processing Facility | 120.00 | Acres | $6,000 | $720,000 |
| Total | 321.42 | Acres | - | $1,928,570 |
| 21.1.8.2 | Pipeline Right-of-Way |
Approximately 38 km (31.2 miles) of Right-of-Way (ROW) will be required for the pipelines detailed in Sections 18.1.1.6, 18.2.6, and 18.3.2. It is assumed that the ROW’s will be purchased between years 2 and 3 of the project, after preliminary engineering and property negotiations are complete. The assessment includes an average cost of $189,819 per km ($118,637 per mile) of ROW which includes the ROW and labor/acquisition related costs for a total cost of $3,701,000.
| 21.2 | Operating Expenditure Estimate |
| 21.2.1 | Basis of Estimate (BOE) |
The BOE for the OPEX of the SWA Project is a breakdown of the project’s individual operating expenditures. The operating costs presented herein are for 30,000 metric tpa lithium hydroxide production over the 20-year life of the SWA Project.
| 21.2.2 | Direct Operational Expenditures |
The following cost elements have been taken into account for the direct OPEX estimation.
| 21.2.2.1 | Manpower |
Labor manning levels are based on experience and reported data from facilities operating in the region. A cost summary of manpower in all categories is provided below in Table 21-5.
|
|
| South West Arkansas Project Pre-Feasibility Study | 23 July 25 |
Table 21-5. Manpower Cost Summary
| Category |
Full Time Employees (FTE) |
Average
Annual Salary US$ |
Total
Annual Cost US$ |
| Management Personnel | 6 | $141,667 | $850,000 |
| Administration Personnel | 3 | $56,667 | $170,000 |
| Security Personnel | 4 | $55,000 | $220,000 |
| Production Personnel | 40 | $75,500 | $3,473,000 |
| Shipping & Receiving Personnel | 6 | $50,000 | $300,000 |
| Maintenance Personnel | 26 | $76,154 | $2,277,000 |
| QC & Lab Personnel | 6 | $64,167 | $385,000 |
| Total | 91 | $84,431 | $7,675,000 |
Salary and wage estimates are based on published data for various trades prevailing in the City of El Dorado, Arkansas. El Dorado is a similar population center to Magnolia with comparable industry. A 15% overtime allowance was applied to production and maintenance personnel. Manpower overheads (benefits) are included in the OPEX summary as 45% of manpower costs.
| 21.2.2.2 | Electrical Power |
Electrical energy will be delivered to the sites from the Southwest Arkansas Electric Cooperative power grid. The electrical costs were provided by Southwest Arkansas Electric Cooperative based on the estimated electric consumption and capital costs. These costs are combined into an all-in rate estimate for years 1-5 and years 6-20 following capital recovery. The electrical energy cost is summarized below in Table 21-6.
|
|
| South West Arkansas Project Pre-Feasibility Study | 23 July 25 |
Table 21-6. Annual Electrical Use and Cost
| Description | Quantity (kWh) |
Unit Cost (US$/kWh) |
Average Annual Cost US$[1] |
| Years 1-5 | |||
| Well Field | 126,205,328 | $0.106 | $13,406,893 |
| Central Processing Facility | 306,456,000 | $0.106 | $32,555,066 |
| Annual Total (Years 1-5) | $45,961,959 | ||
| Years 6-20 | |||
| Well Field | 126,205,328 | $0.084 | $10,595,467 |
| Central Processing Facility | 306,456,000 | $0.084 | $25,728,268 |
| Annual Total (Years 6-20) | $36,323,736 |
Note: 1. Annual consumption and cost figures are based on an average annual lithium hydroxide production rate of 30,000 tonnes.
The largest consumer of electrical power at the Central Processing Facility is the Electrolysis Plant, accounting for 57% of the CPF consumption at a cost of US$14,775,939/year (capital recovery costs excluded).
| 21.2.2.3 | Reagents and Consumables |
Reagents and consumables are the various additions required for the production process of lithium hydroxide.
Quantities for each item are estimated based on preliminary process flow calculations for the plant. The costs for the reagents and chemicals are based on pricing received from local suppliers as shown below in Table 21-7.
|
|
| South West Arkansas Project Pre-Feasibility Study | 23 July 25 |
Table 21-7. Average Annual Reagents Cost For 30,000 Tonnes Lithium Hydroxide Per Year Production
| Description | Average Annual Consumption |
Unit Cost US$ | Average Annual Cost US$[1] |
| Well Field | |||
| Scale Inhibitors | 11.9 m3 | $12,728 / m3 | $152,000 |
| Corrosion Inhibitors | 7.35 m3 | $19,905 / m3 | $146,000 |
| Subtotal | - | - | $298,000 |
| Central Processing Facility | |||
| Sodium Hydroxide – 50% | 37,693 tonnes | $542 / tonne | $20,442,000 |
| Hydrochloric Acid – 32% | 1,893 tonnes | $221 / tonne | $419,000 |
| Soda Ash | 23,225 tonnes | $485 / tonne | $11,265,000 |
| Sodium Metabisulfite | 2,156 tonnes | $860 / tonne | $1,854,000 |
| Lime | 418 tonnes | $170 / tonne | $71,000 |
| Nitrogen | 2,015 tonnes | $189 / tonne | $382,000 |
| Subtotal | - | - | $34,432,000 |
| Grand Total | - | - | $34,730, 000 |
Note: 1. Annual consumption and cost figures are based on an annual lithium hydroxide production rate of 30,000 tonnes.
| 21.2.2.4 | Water |
Water wells will be installed at each of the well facilities and CPF. Operating costs for the wells are included in the electrical power and maintenance, and servicing portions of this OPEX breakdown.
| 21.2.2.5 | Natural Gas |
Natural gas will be required as fuel gas for the 17,640 W (1,800 boiler hp) boiler at the CPF, as detailed below in Table 21-8.
|
|
| South West Arkansas Project Pre-Feasibility Study | 23 July 25 |
Table 21-8. Natural Gas Use
| Description | Average Annual Consumption | Unit Cost US$ | Average Annual Cost US$ |
| Natural Gas Consumption | 36,500 MMbtu | $4.25 / MMbtu | $155,125 |
| Minimum Demand Charge all years | 1,095,000 MMbtu | $0.2441 / MMbtu | $267,290 |
| Interconnection CAPEX | (5 year recovery) | $367,000 | $73,400 |
| Grand Total (Years 1-5) | - | - | $495,815 |
| Grand Total (Years 6-20) | - | - | $422,415 |
Note: Annual consumption and cost figures are based on an annual lithium hydroxide production rate of 30,000 tonnes.
The estimated cost of natural gas includes the requirement for transportation infrastructure to serve the CPF location. The infrastructure costs will be paid back over the first 5 years. The unit cost rate of natural gas used is provided by a potential gas supplier. The minimum demand charge is greater than the actual demand but has been set to ensure preferential supply. No credit is provided for any natural gas that may be co-produced with the brine.
| 21.2.2.6 | Maintenance and Servicing |
Routine maintenance and servicing activities are required for efficient operation of the well field, pipelines, and central processing facility. Estimated maintenance costs are provided below in Table 21-9.
|
|
| South West Arkansas Project Pre-Feasibility Study | 23 July 25 |
Table 21-9. Maintenance & Servicing Costs
| Description | Basis / Frequency |
Average Annual Cost US$ |
| Well Field Surface Equipment/Site Servicing | 3% Direct Cost Less Drilling & Equipment Costs | $1,068,000 |
| Pipelines ROW | 3% of Direct Cost | $2,028,000 |
| Central Processing Facility Equipment | 4% Equipment Costs | $10,739,000 |
| Central Processing Facility Infrastructure | 3% of Direct Costs | $258,000 |
| Total | - | $14,093,000 |
The estimated cost for the well field maintenance and servicing activities is based on historical pricing and factors used on similar well facilities in south Arkansas. Routine maintenance activities for the pipeline Right-of-Way (ROW) do not include major pipeline overhauls or repairs as the service life for the pipelines are expected to be greater than the service life of the project. A 4% factor was used to estimate the maintenance and servicing costs for equipment at the CPF. A 3% factor was used to estimate the general maintenance costs associated with the site/infrastructure upkeep at the facility.
| 21.2.2.7 | Product Transport |
All reagent pricing includes transportation to site. The lithium hydroxide cost in the model is considered over the fence pricing, with all freight and other costs to be borne by the purchaser.
| 21.2.2.8 | Solids Disposal |
Solids disposal costs are shown below in Table 21-10. It is assumed that two pump-outs will be required annually to remove the solids from the three-phase separators on each of the supply wells. The cost per pump out is based on historical pricing for a pump truck. Disposal will also be required for pre-treatment solids and softening sludge produced at the CPF. This pricing is based on the expected solids production rate and an estimated cost provided by a solid waste handling and disposal company. Given the CPF solids quantity and associated disposal cost, it is recommended that process optimization work be completed as part of the DFS phase to significantly reduce or eliminate CPF solid waste generation.
|
|
| South West Arkansas Project Pre-Feasibility Study | 23 July 25 |
Table 21-10. Solids Disposal
| Process Area | Qty. | Unit Cost US$ | Total Annual Cost US$ |
| Brine Supply Well Separators | 42 / year (2 pump outs per year for 21 separators) | $1,750.00 | $73,500.00 |
| CPF Solids Disposal | 4,329 /year | $3,764.14 | $16,294,962 |
| Grand Total | - | - | $16,368,462 |
| 21.2.2.2 | Miscellaneous Costs |
Miscellaneous operating costs include costs that are anticipated but cannot be accurately estimated at this stage of the project. These costs are estimated at 1.5% of the other direct costs or $1,696,000.
| 21.2.3 | Indirect Operational Expenditures |
The following indirect cost elements are included for the OPEX estimation.
| 21.2.3.1 | Insurance |
Insurance during the operation phase will cover property, general liability, and the risk of business interruption. The annual insurance premium has been estimated at 0.5% of direct CAPEX or $4,190,000.
| 21.2.3.2 | Sales, Marketing, and Customers Relations |
The annual cost of sales, marketing, and customer relations is estimated at 0.15% of direct OPEX or $172,145.
| 21.2.3.3 | Taxes |
Federal, state, and county taxes have been considered and are included in the economic model.
| 21.2.3.4 | Environmental Monitoring |
Environmental monitoring contains the annual cost of environmental assessment and monitoring including air emissions, water discharges, waste disposal, noise emission, and changes to the environment. The annual cost for environmental monitoring is estimated at 0.5% of direct OPEX or $573,816.
|
|
| South West Arkansas Project Pre-Feasibility Study | 23 July 25 |
| 21.2.3.5 | Mine Closure Fund |
Each well will need to be plugged and capped at the end of operations. A $35,000 allowance has been included for each brine supply and injection well to cover the cost to plug and cap the wells. These costs will be incurred as a one-time cost at the end of operations. A surety bond will be secured prior to operation of the plant to provide the necessary assurances that the mine closure funds will be available at or prior to the conclusion of operations of the facilities. The surety bond principal is assumed to be a one-time 3% fee of the total closure fund amount payable on the 1st year of operations of the plant.
| 21.2.4 | Mineral Rights, Royalties and Land Fees |
The following cost elements are taken into account for the mineral rights, royalties and land costs.
| 21.2.4.1 | Mineral Rights & Royalty Fees |
As detailed in Section 4, Standard Lithium have executed an option agreement with TETRA Technologies Inc. (TETRA) to acquire the rights to conduct exploration, production, and lithium extraction activities on brine leases in southern Arkansas, USA. Standard Lithium maintain the option agreement through a series of annual payments that will switch to royalty payments due when production commences. The terms of this agreement are summarized in Table 21-11, and the payments and royalties have been included in the project economic modeling.
|
|
| South West Arkansas Project Pre-Feasibility Study | 23 July 25 |
Table 21-11. TETRA Brine Lease Agreement Summary
| Description | Total
Amount US$ |
Remarks |
| Initial Payment | $500,000 | Paid Prior to Year 1 (2021) of Project. |
| - 30 Day Payment after Agreement | $500,000 | |
| - Payment 1 Year after Agreement | $600,000 | |
| - Payment 2 Years after Agreement | $700,000 | |
| - Payment 3 Years after Agreement | $750,000 | |
| - Annual Payments Starting 4 Years after Agreement through 10 Years After Agreement | $1,000,000 | Years 4 & 5 Paid |
| Royalties | ||
| - Initial US$1M Annual Payments | $4,000,000 | During Project Development & Startup |
| - Royalties – 2.5% of Gross Revenue | $21,160,714 | Average Annual Payments |
| $444,375,000 | Total Amount Paid for Life of Plant |
| 21.2.5 | OPEX Summary |
The annual operating cost summary is given in Table 21-12 and a breakdown of the OPEX costs by area is shown in Figure 21-2.
|
|
| South West Arkansas Project Pre-Feasibility Study | 23 July 25 |
Table 21-12. Annual OPEX Summary
| Description | Total Average Annual Cost US$ |
Total Average Cost US$ per Tonne Lithium Hydroxide |
| Direct Operational Expenditures | ||
| - Manpower | $11,130,000 | $371 |
| - Electrical Power | $38,730,000 | $1,291 |
| - Reagents & Consumables | $34,730,000 | $1,158 |
| - Natural Gas | $440,000 | $15 |
| - Maintenance | $14,090,000 | $470 |
| - Solids Disposal | $16,370,000 | $546 |
| - Miscellaneous Costs | $1,700,000 | $57 |
| Subtotal | $117,190,000 | $3,906 |
| Indirect Operational Expenditures | ||
| - Insurance | $4,190,000 | $140 |
| - Sales, Marketing & Customers Relations | $172,000 | $6 |
| - Environmental Monitoring | $574,000 | $19 |
| - Well Closure Fund | $80,000 | $3 |
| Subtotal | $5,010,000 | $167 |
| Total | $122,202,000 | $4,073 |
Note: LSS technology licensing fees have not been identified as an OPEX cost as these are expected to be paid as a one-off, up-front payment and are considered to be included in the factored CAPEX costs.
|
|
| South West Arkansas Project Pre-Feasibility Study | 23 July 25 |
Figure 21-2. OPEX Breakdown
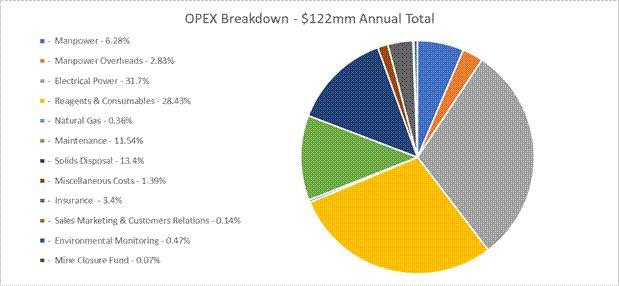
| 21.2.6 | All-In Operating Costs |
In order to provide an indication of the expected day-to-day costs to allow continuous, reliable operation of the Project facilities, a nominal “all-in” Operating Cost has been defined. This all-in operating cost includes the OPEX costs presented above, the sustaining capital costs and the royalties payable to TETRA. The “all-in” Operating Cost has been calculated to be $5,229/tonne of LiOH produced over the life of the facility.
Note that sustaining capital is variable and the electrical and natural gas costs over the first five years include the cost of capital recovery, therefore this cost represents an annual average over the lifespan of the project.
| 21.3 | Exclusions |
In order to limit unreasonable distortions to the base case Discounted Cash Flow (DCF) model, this estimate does not include allowances for escalation of equipment, materials, and labor costs. Similarly, no allowances have been made for product or reagent price inflation and revenue escalation. In addition, the following are excluded from the current CAPEX and OPEX estimates during the PFS phase but should be considered during more detailed future phases.
| · | Feasibility study fees |
| · | Sunk and legal costs |
| · | Interest and financing costs |
|
|
| South West Arkansas Project Pre-Feasibility Study | 23 July 25 |
| · | Start-up costs beyond those specifically included in the current estimate. |
| 21.4 | Upside Production Analysis |
As identified in Section 14, the assessment of the resource using the lease area data collected as part of the PFS exploration program resulted in a 52% increase in the resource. This in turn resulted in the identification of a potential upside production case of 35,000 tonnes/year for 20 years as noted in Section 16. This section outlines the methodologies applied to support an independent economic analysis of this scenario.
CAPEX costs are scaled based on a capacity factored estimated considering the increased production. The estimated upside case CAPEX estimate is $1,360 million.
Operating costs were evaluated in two categories, fixed and variable. Manpower was assumed to be a fixed cost based on the incremental sizing of the facility. Variable costs including reagents, consumables and electrical usage were scaled linearly for the increased consumption. Other costs including maintenance and miscellaneous costs were automatically adjusted as a percentage of the increased CAPEX as described above. The resulting average annual OPEX cost was determined to be $3,964/tonne.
Inclusive of royalties and sustaining capital, the all-in operating cost is $5,060/tonne.
Note that the $/tonne costs are lower for increased production due to the impact of the fixed OPEX costs.
|
|
| South West Arkansas Project Pre-Feasibility Study | 23 July 25 |
| 22 | Economic Analysis |
The objective of the economic analysis for this Project is to determine if the Project is financially viable. The analysis was prepared using a discounted cash flow economic model, showing both pre- and post-tax results, to evaluate the project. Capital (CAPEX) and Operational (OPEX) Expenditures presented in Section 21 have been used in this analysis. The model includes all taxes, government, and lease royalties/payments. It does not include future lease-fees-in-lieu-of-royalties which are still to be determined and subject to regulatory approval for lithium extraction. The results include Net Present Value (NPV) for an 8% discount rate, Internal Rate of Return (IRR), and sensitivity analysis of key inputs.
This section presents a comprehensive breakdown of the discounted cash flow model for the proposed SWA Project development.
| 22.1 | Evaluation Criteria |
The following criteria have been used to develop the economic model:
| · | CAPEX: Capital investment for the 30,000 tpa of battery-quality lithium hydroxide, including equipment, materials, indirect costs, and contingencies at 20%, is estimated to be US$1,274 Million. This total excludes interest expenses. Additionally, property fees (for Well Facilities, Production Facility, and TETRA Royalties) have been considered in the cash flow model, resulting in an overall CAPEX of US$1,279 Million. |
| · | OPEX: The yearly operating cost for the Project is estimated at around US$122 Million (no royalties considered in this number). The full breakdown of the OPEX costs are provided in Section 21. 83% of the OPEX costs are derived from the four (4) cost categories as shown below. |
| o | Electrical Power – 30% |
| o | Reagents & Consumables – 28% |
| o | Solid Disposal – 13% |
| o | Maintenance – 12% |
The remaining components of the operating costs have a significantly lower impact on the overall economics.
| · | Escalation: In order to limit unreasonable distortions to the base case DCF model, this estimate does not include allowances for escalation of equipment, materials, and labor costs. Similarly, no allowances have been made for product or reagent price inflation and revenue escalation. |
| · | Cash Flow: Cash flow includes a ramp-up phase (75% of production for the first 12 months of production) at 85% of OPEX. |
|
|
| South West Arkansas Project Pre-Feasibility Study | 23 July 25 |
| · | Early Detailed Engineering: Early engineering and permitting will commence in 2024. |
| · | Engineering, Procurement & Construction: Total engineering and construction time of the project is estimated at 27 months to completion for both the well field and the CPF. |
| · | Operating Life: The plant is expected to operate for a period of no less than 20 years from the start of production. |
| · | Commodity Pricing: Pricing for battery-quality lithium hydroxide is as per the conclusions in Section 19 Market Studies and Contracts assumed at a price of US$30,000/tonne flat over the operating life of the project. |
| · | Discounted Cash Flow (DCF): The DCF model has been based on an 8% discount ratio. |
| · | Equity Basis: It has been assumed that 100% of capital expenditures, including pre-production expenses, are financed with Owners’ equity for the purposes of the project DCF evaluation. |
| · | Pre-Construction Expenses: Pre-construction expenses other than land purchase are treated as sunk costs and not included in the DCF analysis. |
| 22.2 | Taxes & Royalties |
The following royalties and taxes have been applied to the economic analysis of the Project.
| 22.2.1 | Royalties and Lease Fees |
Yearly Lease Royalty payments of 2.5% of Gross Revenue are considered, which accumulates to Royalty payments of US$444 Million over the 20 years of Operating Life. Additional property fees, well facilities, production facility, and mineral lease fee accumulate to US$5.9 Million.
| 22.2.2 | Depreciation |
A yearly depreciation of 5% (facility evenly depreciated over 20 years of Operating Life) is used for this analysis.
Sustaining capital items are depreciated over the life span of the specific capital item.
| 22.2.3 | Corporate Taxes |
The US Federal Corporate Income Tax (CIT) rate of 21%, and the State Arkansas CIT rate of 5.1%, are used for this analysis.
| 22.2.4 | Property Tax |
For the Property Tax calculation, the “Assessed Value” of the Development Capital Expenditure is calculated as 80% of TIC (CAPEX incl. Property Fees). The Property Taxes are then calculated as 20% of the “Assessed Value” times the Property Tax rate of 4.18%.
|
|
| South West Arkansas Project Pre-Feasibility Study | 23 July 25 |
| 22.2.5 | Federal Funding and Tax Benefits |
The DCF analysis does not include any allowances for Federal funding for battery critical minerals projects or associated tax benefits. This will be reviewed during the Feasibility Study Phase of the project.
| 22.3 | CAPEX Spend Schedule |
The economic model assumes that capital investment disbursements inclusive of the early engineering activities will be spread over 33 months.
Full production of lithium hydroxide (30,000 tpa) will be achieved after a 12-month ramp-up period (ramp-up period assumes 75% of production, 85% of variable OPEX).
| 22.4 | Production Revenues |
Production revenues have been estimated based on the price scenario for a lithium hydroxide product ($30,000 flat over project lifetime), as identified in Section 19 Market Studies and Contracts.
| 22.5 | Cash-Flow Projection |
Table 22-1 summarizes the Discounted Cash Flow (DCF) for the assumed Base Case (Case 1) price and production level scenario.
|
|
| South West Arkansas Project Pre-Feasibility Study | 23 July 25 |
Table 22-1. Annual Operating Cost Summary
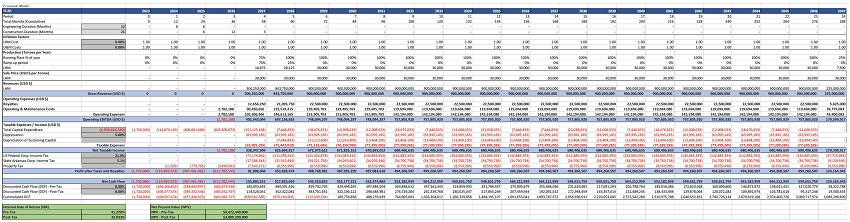
|
|
| South West Arkansas Project Pre-Feasibility Study | 23 July 25 |
| 22.6 | Economic Evaluation Results |
The Project economics resulting from the assumed price scenario at full production, which was used in the economic model, are presented in Table 22-2. Values of NPV were also calculated for a discount rate of 8%.
Table 22-2. Economic Evaluation – Case 1 (Base Case) Summary
| Overview | Units | Values |
| Production | Tonnes / Year | 30,000 |
| Plant Operation | Years | 20 |
| Capital Cost (CAPEX) | US$ | 1,273,975,000 |
| Annual Operating Cost (OPEX) | US$ | 122,202,000 |
| Selling Price | US$ / Tonne | 30,000 |
| Annual Revenue at full production | US$ | 900,000,000 |
| Discount Rate | % | 8 |
| Net Present Value (NPV) Post-Tax | US$ | 3,089,299,000 |
| Net Present Value (NPV) Pre-Tax | US$ | 4,472,449,000 |
| Internal Rate of Return (IRR) Post-Tax | % | 32.8 |
| Internal Rate of Return (IRR) Pre-Tax | % | 41.3 |
| Payback period | Years | 4 |
Notes:
| 1. | In order to limit unreasonable distortions to the base case DCF model, this estimate does not include allowances for escalation of equipment, materials, and labor costs. Similarly, no allowances have been made for product or reagent price inflation and revenue escalation. |
| 2. | The economic analysis does not include future lease-fees-in-lieu-of-royalties which are still to be determined and subject to regulatory approval for lithium extraction. |
| 3. | Lithium hydroxide pricing is considered to be ex-works with the buyer taking responsibility for transport. |
|
|
| South West Arkansas Project Pre-Feasibility Study | 23 July 25 |
| 22.7 | Sensitivity Analysis |
A sensitivity analysis methodology, using one-factor-at-a-time (OAT), involves changing one input variable, keeping others at their baseline (nominal) values, and then returning the variable to its nominal value. This is repeated for each of the other inputs in the same way.
OAT sensitivity analysis was conducted to illustrate the impact of changes on the corresponding values of NPV and IRR for the following project key variables;
| · | CAPEX (+/- 20%), |
| · | OPEX (+/- 20%), |
| · | Selling Price (+/- 20%), |
| · | Production (+/- 5,000 tonnes per annum) |
The results of the sensitivity analysis, with NPVs at an 8% discount rate, are presented in Table 22-3, and Figure 22-1 and Figure 22-2.
Sensitivity of NPV and IRR to the product selling price increase and decrease by 20%, OPEX increase and decrease by 20%, CAPEX increase and decrease by 20%, and production output increase and decrease by 5,000 tonnes/year is shown in Table 22-3. For the Sensitivity of the CAPEX Variation, the OPEX has been kept at the baseline (nominal) value.
|
|
| South West Arkansas Project Pre-Feasibility Study | 23 July 25 |
Table 22-3. Sensitivity Analysis
| After-Tax
NPV (US$ millions) |
After-Tax IRR (%) | |
| Base Case | $3,089 | 32.8% |
| -20% Lithium Hydroxide Price | $2,121 | 26.3% |
| +20% Lithium Hydroxide Price | $4,058 | 38.9% |
| +20% Operating Costs | $2,950 | 31.9% |
| -20% Operating Costs | $3,229 | 33.7% |
| +20% Capital Costs | $2,892 | 28.3% |
| -20% Capital Costs | $3,287 | 39.1% |
| -5,000 tonnes/year production | $2,282 | 27.4% |
| +5,000 tonnes/year production | $3,897 | 37.9% |
Tornado charts were created to show the sensitivity of NPV and IRR to changes in the key variables. Sensitivity of Post-Tax NPV at 8% discount rate to the changes in the CAPEX, OPEX, Selling Price, and Production output is illustrated in the tornado chart in Figure 22-1.
| South West Arkansas Project Pre-Feasibility Study | 23 July 25 |
Figure 22-1. NPV Post Tax Sensitivity
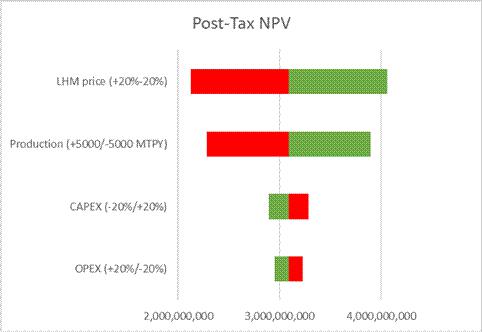
Sensitivity of Post-Tax IRR to the changes in the CAPEX, OPEX, Selling Price, and Production is illustrated in Figure 22-2.
Figure 22-2. IRR Post-Tax Sensitivity
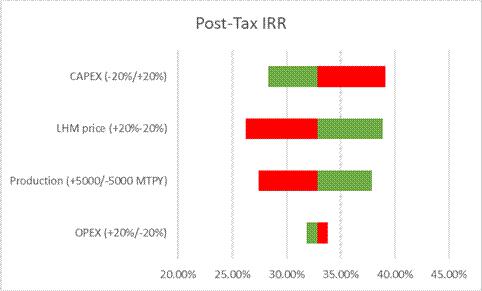
| South West Arkansas Project Pre-Feasibility Study | 23 July 25 |
| 22.8 | Sensitivity Analysis Conclusions |
The sensitivity analysis of the project indicates that the economics remain robust even under the downside scenarios of a 20% increased CAPEX, a 20% reduced product selling price, a 5,000 tpa reduced production output, or a 20% increased OPEX.
| 22.9 | Upside Production Scenario |
As identified in Section 16 the exploration program and resource evaluation undertaken during the PFS phase have confirmed the capacity of the resource to support a project producing 30,000 tpa lithium hydroxide. In addition, it was noted that due to the higher lithium grades detected during the PFS sampling program, the resource could be expected to produce up to 35,000 tpa. The potential impact of this was assessed by factoring the CAPEX based on plant capacity and linearly increasing reagent, power and natural gas demands as per the methodology outlined in Section 21.4.
This evaluation varies from the sensitivity analysis presented above in that rather than being a one-factor-at-a-time approach, this is more representative of a true project execution for increased production.
| 22.9.1 | Deviation of Alternative Upside Scenario from Base Case |
| • | CAPEX: The CAPEX estimate to account for an increase in production from 30,000 tonnes lithium hydroxide to 35,000 tonnes is US$1,360 million. |
| • | OPEX: The yearly operating cost for the Project is estimated at around US$139 Million. This figure includes Plant Manpower (including Overheads), Electrical Power, Reagents and Consumables, Natural Gas, Maintenance, Solids Disposal, Miscellaneous Costs, Insurance, Sales and Customers Relations, Plant Optimizations and Development, Environmental Monitoring, Natural Gas Interconnection Cost, Electrical Infrastructure Cost, and Mine Closure Fund. Royalties exclusive of lease-fees-in-lieu-of-royalties are included and have been adjusted in line with plant production increases. |
The results of the economic evaluation of the upside production case are shown in Table 22-4. All other Evaluation Criteria are maintained as described under Paragraph 22.1.
| South West Arkansas Project Pre-Feasibility Study | 23 July 25 |
Table 22-4. Economic Evaluation – Case 2 (Alternative Upside Scenario) Summary
| Overview | Units | Values |
| Production | Tonnes / Year | 35,000 |
| Plant Operation | Years | 20 |
| Capital Cost (CAPEX) | US$ | 1,360,426,585 |
| Annual Operating Cost (OPEX) | US$ | 138,756,440 |
| Selling Price | US$ / Tonne | 30,000 |
| Annual Revenue at full production | US$ | 1,050,000,000 |
| Discount Rate | % | 8 |
| Net Present Value (NPV) Post-Tax | US$ | 3,735,499,000 |
| Net Present Value (NPV) Pre-Tax | US$ | 5,366,652,000 |
| Internal Rate of Return (IRR) Post-Tax | % | 35.4 |
| Internal Rate of Return (IRR) Pre-Tax | % | 44.4 |
| Payback period | Years | 4 |
Notes:
| 1. | In order to limit unreasonable distortions to the base case DCF model, this estimate does not include allowances for escalation of equipment, materials, and labor costs. Similarly, no allowances have been made for product or reagent price inflation and revenue escalation. |
| 2. | The economic analysis does not include future lease-fees-in-lieu-of-royalties which are still to be determined and subject to regulatory approval for lithium extraction. |
| 3. | Lithium hydroxide pricing is considered to be ex-works with the buyer taking responsibility for transport. |
| South West Arkansas Project Pre-Feasibility Study | 23 July 25 |
| 23 | Adjacent Properties |
Several companies have significant stake-holdings to the North, South and East of the SWA Property as illustrated below in Figure 23-1 and further discussed in the sections that follow.
Figure 23-1. Arkansas Regional Activity
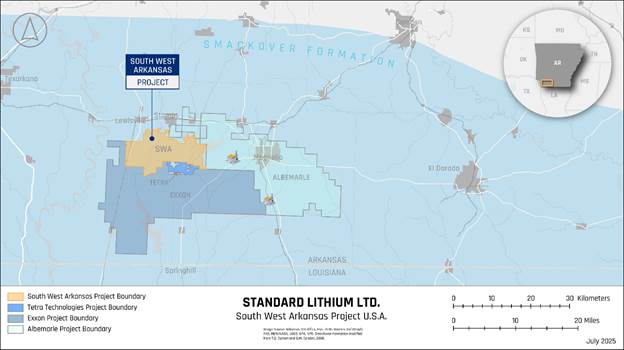
The authors have not verified the information associated with adjacent properties, and the information associated with these adjacent properties may not be indicative of mineralization that may exist on, or the potential for similar development at, the SWA Project.
Albemarle Corporation
Albemarle Corporation is one of the largest producers of bromine and lithium related resources / products world-wide with bromine operations in Arkansas (U.S.) and Jordan and lithium operations in Chile, Australia, Germany and Clayton Valley, Nevada (U.S.). Albemarle exclusively operates using conventional lithium extraction technologies at their commercial facilities but have invested significant resources into DLE research. To QP’s knowledge, no lithium has been commercially produced to date by Albemarle at either of their facilities in South Arkansas.
| South West Arkansas Project Pre-Feasibility Study | 23 July 25 |
Albemarle Corporation operates two (2) brine-based bromine extraction plants near Magnolia, AR. Albemarle's Magnolia North and South plants are fed by a network of brine production wells in Columbia County. During 2021, Albemarle Corporation processed approximately 20 million cubic meters (125. million U.S. Barrels) of brine to produce approximately 74,000 tons of bromine at its Magnolia facilities (Albemarle Corporation, 2021). In 2021, Albemarle announced the company will double capacity for brine extraction by 2025. The well field that supports Albemarle’s Magnolia operations directly abuts sections of the SWA Property on the northern and eastern boundaries.
Saltwerx (Subsidiary to Galvanic, LLC)
Saltwerx, LLC (Subsidiary to Galvanic Energy) has ownership of 120,000 gross acres of resource claims in the Smackover Formation. Saltwerx has completed well testing, reservoir modeling, and inferred mineral resource estimations on their lithium-brine prospect in southern Arkansas. They estimate that this acreage could contain 4 million tons of lithium carbonate equivalent (Saltwerx, 2021). The property is located directly south of the TETRA Property.
TETRA Technologies
In September 2022, TETRA completed a maiden inferred bromine and lithium brine resource estimation report for its leased acreage in the Smackover Formation. The brine resource underlying the approximately 5,000 gross acres where TETRA holds lithium mineral rights that are not subject to the lithium option agreement with Standard Lithium is estimated to contain an inferred resource of 212,000 tonnes of lithium carbonate equivalent (Tetra, 2022). In June 2023, TETRA filed an application to establish a unitized brine unit on this property and indicated an increase in the acreage to approximately 6,000 acres (Tetra, 2023). No further information was published on an increase to the inferred resource estimate.
| South West Arkansas Project Pre-Feasibility Study | 23 July 25 |
| 24 | Other Relevant Data and Information |
Not used.
| South West Arkansas Project Pre-Feasibility Study | 23 July 25 |
| 25 | Interpretations and Conclusions |
| 25.1 | Exploration Work |
Standard Lithium successfully executed a five-well exploration program that significantly improved the geologic description of the target Smackover Formation. The program addressed the three key factors that determine the quality of the resource: the total volume of brine based on core and log porosity data, the brine’s lithium concentration based on the analysis of multiple brine samples from the wells, and the productivity of the formation based on the core permeability data collected. QP Williams was closely involved with all aspects of the exploration program, including selecting the well locations; designing the coring, logging, and sampling programs; attending the coring and sampling of the wells; and analyzing the resulting data. In the opinion of QP Williams, the resulting data and analyses fully support the conclusion that the inferred and indicated resources present at the SWA Property are of sufficient quality to justify pursuit of a lithium extraction project at the site.
| 25.2 | Process Development Work |
Because continuous start-to-finish DLE (without the use of evaporation ponds) is not yet commercially proven, test work becomes especially critical to reduce process and scale-up risks. The test work needs to be conducted over a reasonable period of time and at a suitable scale-up factor. The Demonstration Plant operation has achieved both these objectives. In addition, the equipment operated in the Demonstration Plant has shown reliability in terms of having the required availabilities for stable process operation. The process control and chemical analysis applied in the Demonstration Plant have provided a solid foundation for reliable results.
The LSS DLE process has been run over many months, demonstrating consistency of results and its applicability for the SWA project. For further effective optimization and applicability for the DFS, the LSS DLE process needs to be run on actual SWA brine for a long-term, continuous test.
The conversion of a lithium chloride solution to a lithium hydroxide solution using electrolysis has been shown to be the process route with the least process risk, mainly because it is based, to a large extent, on the commercially proven chlor-alkali process. The approach taken by Standard Lithium to develop this process route has been appropriate for the PFS stage of the project. During the DFS, Standard Lithium should focus on further reducing the process risk. This can be accomplished by longer testing and by larger scale testing.
| South West Arkansas Project Pre-Feasibility Study | 23 July 25 |
| 25.3 | SWA Pre-Feasibility Study Summary |
The engineering work to develop the flowsheet undertaken in support of this Pre-Feasibility Study is considered appropriate for the level of development and the associated de-risking of the project. Although the flowsheet identifies a robust process, it is acknowledged that the design can be further optimized to better integrate the various elements of the flowsheet to target higher lithium recovery and more efficient conversion with reduced waste disposal requirements. To support this optimization, it is recommended that the engineering design work continue to leverage the learnings from the Demonstration Plant, off-site equipment and process testing results and vendor engagement. In the opinion of QP Frank Gay, the engineering definition and level of quoted equipment supports the CAPEX and OPEX basis which in turn supports the conclusion that the SWA Project can reasonably be expected to result in economic extraction of lithium with robust, reliable, and mostly proven, commercially available flowsheet elements.
| 25.4 | Project Risks |
The project risks identified, and an assessment of their potential impacts are presented below.
| • | If the brine production rate or lithium concentrations on which the PFS is based are unavailable throughout the life of the project, the economics of the project could be impacted. Standard Lithium has carried out additional well testing and reservoir modeling specific to the project brine leases during the PFS to further prove the anticipated lithium values. This process has identified lithium concentrations higher than those used as the basis for the PEA, resulting in potential upside production. This in turn validates the PFS base case of 30,000 tonnes of annual production of lithium hydroxide. As a result, downside economics associated with lack of understanding of the resource is seen as a low risk. |
| • | Changes to the key operating parameters of the DLE process on which the PFS is based could result in higher OPEX and/or CAPEX costs due to additional purification and concentration equipment requirements. To reduce this risk and optimize the process design, Standard Lithium continues to undertake extended testing, technology selection, and process optimization at their El Dorado, AR, Demonstration Plant. Based on this continued work, a reduction in DLE performance for the commercial operations is seen as a low risk. |
| • | If the electrochemical and associated lithium hydroxide conversion process does not perform as expected, it could result in higher OPEX and/or CAPEX costs. The technology is based on existing chlor-alkali industry technology and specific experience with lithium solutions, and Standard Lithium has successfully conducted testing of electrochemical cells using Smackover brines processed by the Demonstration Plant. Based on this experience, this is seen as a low risk. However, continued testing is recommended in support of scale-up, process optimization, and improved process understanding to provide inputs to engineering and further mitigate the process risk. |
| South West Arkansas Project Pre-Feasibility Study | 23 July 25 |
| • | If the market price of lithium hydroxide drops, project economics will be negatively affected. Standard Lithium has commissioned two independent market studies during the PFS that both showed continued, strong demand for lithium hydroxide throughout the project life. Based on the results of these studies and the current lithium market, the lithium hydroxide price used for the economic analysis is deemed to be conservative and any negative impact to project economics is seen as a low risk. |
| • | Global supply chain shortages and/or delays have been ongoing since the onset of the 2020 COVID-19 pandemic. These could negatively influence the project schedule and CAPEX. This is seen as a medium risk. To mitigate this risk, it is recommended that the long lead items be identified during the feasibility study phase and orders be executed in support of maintaining project schedule. |
| • | Natural disasters such as a tornado or earthquake in the project area could result in a loss of production. The likelihood of these events is understood based on local meteorological and geological data. The facilities will be designed to withstand the anticipated events based on their likelihood, and this is not cited as a cause of loss of production by other operators in the area. This is seen as a low risk. |
| • | If an unknown infringement of an existing process patent occurs, this could result in licensing claims which could affect the OPEX costs. Standard Lithium has a Joint Development Agreement in place with Koch Technologies for the DLE and the remaining process units are open art technologies, so this is seen as a low risk. |
| • | Construction costs and/or schedule overruns could impact the CAPEX costs. To mitigate this risk, a 20% contingency has been included in the current CAPEX and sensitivity analysis shows favorable economics for a higher CAPEX cost. Standard Lithium will work with experienced EPC contractors and issue lump sum turnkey contracts where possible, and the feasibility study will provide increased cost confidence. This risk is inherent in any project and with the proper mitigations is seen as a low risk. |
| • | Lithium brine-lease-fee-in-lieu-of-royalty assessment has not yet been completed by the Arkansas Oil and Gas Commission. This is an established process most recently completed for calcium chloride and magnesium chloride. Dependent on the determined rates, this could overly impact project economics. Based on Standard Lithium’s engagement with stakeholders in this process, this is seen as a low risk. |
| South West Arkansas Project Pre-Feasibility Study | 23 July 25 |
| • | The process for unitization of the leases into a production unit has not commenced. This is an established AOGC process, that has been undertaken in the past for Lanxess, and TETRA, with the most recent application by TETRA for their Evergreen Unit which was deferred due to insufficient information. Given the learnings from this process and on-going engagement with AOGC, the risk of delay to Standard Lithium is considered to be a moderate risk. It is recommended that Standard Lithium commence this process as soon as practical to mitigate this risk. |
| • | Potential geologic risks include unexpected reservoir heterogeneity, which could include: |
| o | The presence of high permeability pathways between injection and production wells which could reduce the displacement efficiency of the injected lean brine and lead to early breakthrough of the injected lean brine; |
| o | Insufficient productivity resulting from lower-than-expected formation permeability; |
| o | Discontinuity of the porous formation resulting in a smaller brine volume accessible from the project wells; and, |
| o | Unexpected faulting resulting in barriers to flow. |
These risks will be addressed in part during the DFS data gathering program and can also be addressed through adjustments to the injection and production well configuration if these factors are encountered during the project development. One such adjustment would be to drill additional injection and/or production wells to maintain the desired plant throughput.
There is also the potential that an optimized project could include additional wells and facilities to achieve a higher production level, but this is more of an opportunity than it is a risk.
It should be noted that all reservoirs are heterogeneous, and that this report fully incorporates the observed heterogeneity in its analysis and conclusions. Also, the Smackover Formation in the SWA Project area is similar to that underlying the successful brine recovery projects immediately to the east of the Project area.
| South West Arkansas Project Pre-Feasibility Study | 23 July 25 |
| 26 | Recommendations |
The recommended next steps for Standard Lithium to elevate the SWA Project to a higher level of resource classification and project definition are to:
| • | Further develop the reservoir model in support of development of an optimized well plan and brine production profile. |
| • | Develop and optimize the flowsheet using the Demonstration Plant with a target of lower lifecycle cost. For example, review and optimize processes such that the reagent usage can be optimized and solids waste generation from the overall process can be substantially reduced or eliminated. |
| • | Continue optimization of the LSS DLE to improve the quality of the Raw LiCl by elimination of impurities, including testing of new sorbents and adjustments to operating parameters. |
| • | Conduct all additional necessary engineering and feasibility studies (i.e. FEED level engineering definition) to integrate the project development findings into an updated resource classification and DFS. |
| • | Continue testing of electrolytic conversion of Smackover brine to convert LiCl to LiOH in support of development of engineering inputs for design. |
| • | Undertake a logistics study to assess road versus rail for supply of reagents and for export of products during the next project phase. |
| • | Complete any necessary process equipment vendor testing for lithium hydroxide concentration and evaporation/crystallization to a battery-quality product. |
| • | Identify long lead items that impact project schedule and develop procurement packages and strategy to facilitate potential opportunity for early purchasing in support of optimizing the project execution schedule. |
| • | Engage with AOGC to support definition of royalty for lithium production from brine in Arkansas in support of detailed understanding of project economics. |
| • | Continue to engage with the local electrical supplier Southwest Arkansas Electric Cooperative to continue to work through the interconnection requirements and ensure timeliness of power availability for the project. |
| • | The project as it is currently envisaged does not trigger a NEPA process, however the NEPA process would be triggered if federal funds are obtained for the project. It is recommended to pro-actively assess NEPA requirements and initiate key activities to facilitate flexibility in project financing. |
| South West Arkansas Project Pre-Feasibility Study | 23 July 25 |
| • | Drill additional test well and re-enter three existing wells targeting the Upper, Middle, and Lower Smackover in areas not tested by the 2018 and 2023 data gathering programs, such as in the areas of the Cornelius 1 and Haberyan 1 wells, to provide: |
| o | Geologic data; |
| o | Lithium concentrations; |
| o | Long term production test information to estimate well rates, the number of wells needed, facility rates, and the completion plans for those wells; |
| o | Information regarding the potential extent of a Lower Smackover development target; and, |
| o | Information regarding the benefit of well stimulation to well productivity. |
| • | Monitor the test wells for salt precipitation, evaluate the potential effect of salt precipitation on production operations, identify remediation options. |
| • | Conduct long term production tests on one or more of the 2023 exploration program wells; decide on scope of these tests based on the results of the new test wells. |
| • | Update the geologic description. |
| • | Revise and adjust the categories of the resource estimates and quantify the reserves in support of the commercialization of the project. |
| • | Revise the simulation model input geologic description and optimize the SWA Property development plan, including offtake rate, well count, and well configuration. |
The authors recommend Standard Lithium approaches accomplishing these tasks over a two-year period. The estimated cost of the recommended work is US$22.4 million. See Table 26-1 for the Recommendations Cost Summary.
Table 26-1. Recommendations Cost Summary
| Description | Cost US$ |
| Reservoir Model Update of resources and reserves | 1,000,000 |
| Complete FEED level feasibility studies including logistic study, flow sheet development and optimization LSS, and long-term production tests | 12,000,000 |
| Testing electrolytic conversion of LiCl to LiOH including vendors | 900,000 |
| Drilling (1), testing existing wells and long-term production test | 8,500,000 |
| Total | 22,400,000 |
| South West Arkansas Project Pre-Feasibility Study | 23 July 25 |
| 27 | References |
Alkin, R.H. and Graves, R.W. (1969): Reynolds oolite of southern Arkansas; The American Association of Petroleum Geologists, Bulletin v. 53, no. 9, p. 1909-1922.
APEX Geoscience, Ltd., 2018. Geological Introduction and Maiden Inferred Resource Estimate for Standard Lithium, Ltd’s Smackover Lithium-Brine Property in Arkansas, United States, prepared for Standard Lithium, Ltd., Calgary, Alberta, Canada, November 19.
APEX Geoscience, Ltd., 2022. Apex, Maiden Inferred Bromine- and Lithium-Brine Resource Estimations for Tetra Technologies, Inc.’s Tetra Property in Arkansas, United States.
Arkansas Code (2016a): § 15-76-308. Formation of a Brine Unit; Title 15 – Natural Resources and Economic Development, Subtitle 6 – Oil, Gas and Brine, Chapter 76 – Brine, Subchapter 3 – Brine Production, https://law.justia.com/codes/arkansas/2016/title-15/subtitle-6/chapter-76/subchapter-3/section-15-76-308/.
Arkansas Code (2016b): § 15-76-309. Petition for formation of a brine production unit or a brine expansion unit; Title 15 – Natural Resources and Economic Development, Subtitle 6 – Oil, Gas and Brine, Chapter 76 – Brine, Subchapter 3 – Brine Production, https://law.justia.com/codes/arkansas/2016/title-15/subtitle-6/chapter-76/subchapter-3/section-15-76-309/.
Arkansas Code (2016c): § 15-76-312. Unlawful drainage -- Unit inclusion or accounting; Title 15 – Natural Resources and Economic Development, Subtitle 6 – Oil, Gas and Brine, Chapter 76 – Brine, Subchapter 3 – Brine Production, https://law.justia.com/codes/arkansas/2016/title-15/subtitle-6/chapter-76/subchapter-3/section-15-76-312/.
Arkansas Code (2016d): § 15-76-314. Participation by owners and royalties; Title 15 – Natural Resources and Economic Development, Subtitle 6 – Oil, Gas and Brine, Chapter 76 – Brine, Subchapter 3 – Brine Production, https://law.justia.com/codes/arkansas/2016/title-15/subtitle-6/chapter-76/subchapter-3/section-15-76-314/.
Arkansas Code (2016e): § 15-76-315. Valuation of brine; Title 15 – Natural Resources and Economic Development, Subtitle 6 – Oil, Gas and Brine, Chapter 76 – Brine, Subchapter 3 – Brine Production, https://law.justia.com/codes/arkansas/2016/title-15/subtitle-6/chapter-76/subchapter-3/section-15-76-315/.
| South West Arkansas Project Pre-Feasibility Study | 23 July 25 |
Arkansas Code (2016f): § 15-76-318. Drilling permits – fees; Title 15 – Natural Resources and Economic Development, Subtitle 6 – Oil, Gas and Brine, Chapter 76 – Brine, Subchapter 3 – Brine Production, https://law.justia.com/codes/arkansas/2016/title-15/subtitle-6/chapter-76/subchapter-3/section-15-76-318/.
Arkansas Geological Survey (2018): Brine Resources; Arkansas Geological Survey, http://www.geology.ar.gov/energy/brine_resources.htm.
Arkansas Oil & Gas Commission, 2021. Production by Field – 2021. Accessed May 4, 2023, https://www.aogc.state.ar.us/annual/HistBrine.aspx?HYr=2021.
Arkansas Oil & Gas Commission, 2022a. South Arkansas Oil Production, 1970-2020. Accessed December 9, 2022, https://www.aogc.state.ar.us/annual/HistProduction.aspx?HYr=2020.
Arkansas Oil & Gas Commission, 2022b. Brine Production-Injection Data, 2017-2022. Accessed May 4, 2023, https://www.aogc.state.ar.us/data/querybuild.aspx and https://www.aogc.state.ar.us/welldata/production.aspx.
Bishop, 1967. Petrology of Upper Smackover Limestone in North Haynesville Field, Claiborne Parish, Louisiana, American Association of Petroleum Geologists Bulletin Vol. 52, No. 1
Bishop, W. F. (1968): Petrology of upper Smackover limestone in North Haynesville field, Claiborne Parish, Louisiana. American Association of Petroleum Geologists Bulletin, v. 52, p. 92–128.
Bishop, W. F. (1971a): Geology of a Smackover stratigraphic trap. American Association of Petroleum Geologists Bulletin, v. 55, p. 51–63.
Bishop, W. F. (1971b): Geology of upper member of Buckner Formation, Haynesville Field area, Claiborne Parish, Louisiana. American Association of Petroleum Geologists Bulletin, v. 55, p. 566–580.
Bishop, W. F. (1973): Late Jurassic contemporaneous faults in north Louisiana and south Arkansas. American Association of Petroleum Geologists Bulletin, v. 57, p. 566–580.
Blondes, M.S., Gans, K.D., Engle, M.A., Kharaka, Y.K., Reidy, M.E., Saraswathula, V., Thordsen, J.J., Rowan, E.L., and Morrissey, E.A., 2018. U.S. Geological Survey National Produced Waters Geochemical Database (ver. 2.3, January 2018): U.S. Geological Survey data release, https://doi.org/10.5066/F7J964W8.
Bradley, D., Munk, L., Jochens, H., Hynek, S. and Labay, K (2006): A Preliminary Deposit Model for Lithium Brines; USGS Open-File Report 2013–1006.
| South West Arkansas Project Pre-Feasibility Study | 23 July 25 |
Bradley, D.C., Stillings, L.L., Jaskulka, B.W., Munk, L. and McCauley, A.D. (2017): Lithium; In: Chapter K of Critical Mineral Resources of the United States—Economic and Environmental Geology and Prospects for Future Supply, K.J. Schulz, J.H. DeYoung, Jr., R.R. Seal II, and D.C. Bradley (Eds.), USGS Professional Paper 1802-K.
Budd, D. A. and Loucks, R. G. (1981): Smackover and lower Buckner formations, south Texas. Depositional systems on a carbonate ramp. Bureau of Economic Geology, The University of Texas at Austin, Report of Investigations.
Buffler, R.T. (1991): Early evolution of the Gulf of Mexico basin; In: D. Goldthwaite, (ed.), An Introduction to Central Gulf Coast Geology, New Orleans: New Orleans Geological Society, p. 1-15.
Buffler, R.T., Shaub, F.J., Huerta, R., Ibrahim, A.B.K. and Watkins, J.S. (1981): A model for the early evolution of the Gulf of Mexico; Oceanologica Acta, No. SP, p 129-136.
Canadian Institute of Mining, Metallurgy and Petroleum, 2003. “Best Practice Guidelines for Potash,”; https://mrmr.cim.org/en/best-practices/estimation-of-mineral-resources-mineral-reserves/
Canadian Institute of Mining, Metallurgy and Petroleum, 2012. “CIM Best Practice Guidelines for Resource and Reserve Estimation for Lithium Brines”; https://mrmr.cim.org/media/1041/best-practice-guidelines-for-reporting-of-lithium-brine-resources-and-reserves.pdf
Canadian Institute of Mining, Metallurgy and Petroleum, 2014. “CIM Definition Standards for Mineral Resources & Mineral Reserves”; https://mrmr.cim.org/media/1128/cim-definition-standards_2014.pdf
Canadian Institute of Mining, Metallurgy and Petroleum, 2019. CIM Estimation of Mineral Resources and Mineral Reserves Best Practice Guidelines, prepared by the Canadian Institute of Mining, Metallurgy, and Petroleum, CIM Mineral Resources & Mineral Reserve Committee, Westmount, QC, Canada. https://mrmr.cim.org/media/1146/cim-mrmr-bp-guidelines_2019_may2022.pdf Heydari, E. and Baria, L. (2005): A microbial Smackover Formation and the dual reservoir–seal system at the Little Cedar Creek Field in Conecuh County of Alabama; Gulf Coast Association of Geological Societies Transactions, v. 55, p. 294-320.
Dickinson, K.A. (1968); Upper Jurassic stratigraphy of some adjacent parts of Texas, Louisiana and Arkansas; U.S. Geol. Survey Prof. Paper, 594E.
Enverus, 2023. Drilling Info, https://app.drillinginfo.com/production/#/default.
Harris, P. M. and Dodman, C. A. (1987): Jurassic evaporites of the U.S. Gulf Coast: the Smackover-Buckner contact; Society of Economic Paleontologists and Mineralogists, Depositional and Diagenetic Spectra of Evaporites (CW3), p. 174–192.
| South West Arkansas Project Pre-Feasibility Study | 23 July 25 |
IHS S&P Global, 2023. Well log data, https://my.ihs.com/Energy/Products
Kalbacher, K., and A. A. Sartin (1986): Diagenetic study of the Upper Member of the Smackover Formation (Upper Jurassic), Columbia County, Arkansas: Gulf Coast Association of Geological Societies Transactions, v. 36, p. 191-199.
Kopaska-Merkel, D.C., Mann, S.D. and Tew, B.H. (1992): Geological setting, petrophysical characteristics, and regional heterogeneity patterns of the Smackover in southwest Alabama; Geological Survey of Alabama, Contract No. DE-FG22-89BC14425, 215 p.
Mancini, E. A., Mink, R. M., Tew, B. H., and Bearden, B. L. (1990): Natural gas plays in Jurassic reservoirs of southwestern Alabama and the Florida panhandle area; Gulf Coast Association of Geological Societies Transactions, v. 40, p. 513-519.
Mancini, E.A., Aharon, P., Goddard, D.A., Horn, M. and Barnaby, R. (2008): Basin analysis and petroleum system characterization and modelling, interior salt basins, central and eastern Gulf of Mexico, Part 3: tectonic / depositional history, resource assessment; Adapted from Final Report, issued June 30, 2008, for period May 1, 2003 to April 30, 2008, prepared for U.S. Department of Energy, for DOE Award Number DE-FC26-03NT15395 and available at Texas A&M University (http://berg-hughes.tamu.edu/research/sedimentary-basin-analysis-studies).
Moldovanyi, E.P. and L.M. Walter, 1992. Regional trends in water chemistry, Smackover Formation, southwest Arkansas: Geochemical and physical controls; The American Association of Petroleum Geologists, Bulletin, v. 76, no. 6., p. 864-894.
Moore, C.H. and Druckman (1981): Burial diagenesis and porosity evolution, Upper Jurassic Smackover, Arkansas and Louisiana; The American Association of Petroleum Geologists, 1981, p. 597-628.
Moore, C. H. (1984): The upper Smackover of the Gulf rim: depositional systems, diagenesis, porosity evolution and hydrocarbon production; In: W. P. S. Ventress, D. G. Bebout, B. F. Perkins, and C. H. Moore (eds.), The Jurassic of the Gulf rim: Gulf Coast Section SEPM, 3rd Annual Research Symposium, Program and Abstracts, p. 283–307.
NORAM, 2021. Preliminary Economic Assessment of SW Arkansas Lithium Project, prepared for Standard Lithium, 25 November 2021.
| South West Arkansas Project Pre-Feasibility Study | 23 July 25 |
Saltwerx, 2021: Saltwerx Secures 100,000-Acre Brine Prospect in Southern Arkansas, 1 July 2021, https://www.saltwerx.com/news/saltwerx-secures-100-000-acre-brine-prospect-in-southern-arkansas.
Salvador, A. (1987): Late Triassic-Jurassic paleography and origin of Gulf of Mexico basin; AAPG Bulletin, v. 71, p. 419-451.
Salvador, A. (1990): Triassic-Jurassic; In: Salvador, A., (ed.), The Geology of North America, v. J., The Gulf of Mexico Basin; Boulder, Geological Society of America, p. 131–180.
Salvador, A. (1991a): The Gulf of Mexico Basin: Decade of North American geology; v. DNAG, v. J: Boulder, Colorado, GSA, 568 p.
Salvador, A. (1991b): Triassic-Jurassic; In: A. Salvador, (ed.), The Gulf of Mexico Basin, Boulder, Colorado, GSA, p. 131-180.
Standard Lithium Ltd. (2018a): Standard Lithium to Acquire Lithium Brine Exploration and Production Rights; Standard Lithium Press Release, August 7, 2017, https://standardLithium.com/2017/08/02/standard-Lithium-acquire-Lithium-brine-exploration-production-rights/.
Standard Lithium Ltd. (2018b): Standard Lithium Commences Resource Definition in Southern Arkansas; Standard Lithium Press Release, January 30, 2018, https://standardLithium.com/2018/01/30/standard-Lithium-commences-resource-definition-southern-arkansas/.
Tetra, 2022. Tetra Technologies, Inc. Announces Maiden Inferred Resources Of 5.25 Million Tons Of Elemental Bromine and 234,000 Tons Of Lithium Carbonate Equivalent, 21 September 2022, https://www.prnewswire.com/news-releases/tetra-technologies-inc-announces-maiden-inferred-resources-of-5-25-million-tons-of-elemental-bromine-and-234-000-tons-of-lithium-carbonate-equivalent-301630186.html.
Tetra, 2023. Tetra Technologies, Inc. and Saltwerx, LLC Enter Into A Memorandum Of Understanding Regarding A Proposed Brine Production Unit In The Smackover Formation, 26 June 2023, https://ir.tetratec.com/2023-06-26-TETRA-TECHNOLOGIES,-INC-AND-SALTWERX,-LLC-ENTER-INTO-A-MEMORANDUM-OF-UNDERSTANDING-REGARDING-A-PROPOSED-BRINE-PRODUCTION-UNIT-IN-THE-SMACKOVER-FORMATION >.
TGS, 2023. Well log and well status data, https://www.tgsr360.com
| South West Arkansas Project Pre-Feasibility Study | 23 July 25 |
Troell, A. R. and Robinson, J. D. (1987): Regional stratigraphy of the Smackover limestone (Jurassic) in south Arkansas and north Louisiana, and the geology of Chalybeat Springs oil field. Gulf Coast Association of Geological Societies Transactions, v. 37, p. 225–262.
Worley, 2019. NI 43-101 Technical Report Preliminary Economic Assessment of Smackover Project, Document No.: 207036-00088-00-PM-REP-0002, prepared for Standard Lithium, Saskatoon, Saskatchewan, Canada, August 1, 230p.
Zimmerman, R. K. (1992): Fractured Smackover limestone in northeast Louisiana; Implications for hydrocarbon exploitation; AAPG Datapages/Archives, GCAGS Transactions, v. 42, p. 401-412.
| South West Arkansas Project Pre-Feasibility Study | 23 July 25 |
| 28 | Certificate of Authors |
I, Frank Gay, P. Eng., do hereby certify that:
| 1. | I am a Managing Technical Professional with Hunt, Guillot, & Associates LLC, 8401 New Trails Drive, Suite 175, The Woodlands, Texas 77381. |
| 2. | I graduated with a Bachelor of Science Degree in Chemical Engineering from Massachusetts Institute of Technology, Cambridge Massachusetts in 1979 and Master’s Degree in Chemical Engineering Practice from Massachusetts Institute of Technology in 1979. |
| 3. | I am a registered Professional Engineer in North Carolina. |
| 4. | I have practiced as a Professional Engineer for 35 years in project management, engineering management, and general management in the petrochemical and petroleum industries. As Senior Project Director, I led a team responsible for the cost estimate, financial model development, technical evaluation, and overall project execution planning of a $20 billion plus refining and petrochemical complex in Saudi Arabia. I managed the detailed design of twin Super Absorbent Polymer Plants in China and Brazil. As business unit leader, I had overall responsibility for the development of a detailed financial model, long lead procurement and supply chain plan, a logistics plan for major equipment, feedstock and product and an overall project execution plan for a $3 billion sustainable aviation fuel plant in Columbia, Louisiana. |
| 5. | I have read the definition of “qualified person” set out in the National Instrument 43-101 (“NI 43-101”) and certify that, by reason of my education, affiliation with a professional association (as defined in NI 43-101), and past relevant work experience, I fulfill the requirements to be a “Qualified Person” for the purposes of NI 43-101. |
| 6. | I oversaw the preparation and am responsible for Sections 1-6, 18-19, & 22-27 of the technical report titled “Amended and Restated NI 43-101 Technical Report; South West Arkansas Project Pre-Feasibility Study; Lewisville, Lafayette County AR”, with an effective date of August 8, 2023 (the “Technical Report”). |
| 7. | I visited the Demonstration Plant in El Dorado in November, 2021, but I have not visited the South West Arkansas Property. |
| 8. | I am not aware of any scientific or technical information with respect to the subject matter of the Technical Report that is not reflected in the Technical Report, the omission to disclose which makes the Technical Report misleading. |
| 9. | I am independent of the Issuer as per NI 43-101 and successfully pass the independence requirements of the Guidance of Independence test in item 1.5 of the Companion Policy to NI 43-101. I am not an employee, insider, director, or partner of the Issuer and do not hold any securities or direct/indirect interests related to the Issuer or the property and/or adjacent properties that is the subject of this Technical Report. |
| 10. | I have read NI 43-101 and Form 43-101F1, and the Technical Report has been prepared in compliance with that instrument and form. |
| 11. | I consent to the filing of the Technical Report with any stock exchange and other regulatory authority and any publication by them for regulatory purposes, including electronic publication in the public company files or their websites. |
|
Frank Gay, P. Eng.,
Effective Date: August 8, 2023
Signature Date: July 23, 2025
The Woodlands, Texas, United States |
 |
I, Marek Dworzanowski, EUR ING, CEng, do hereby certify that:
| 1. | I am an independent consulting metallurgical engineer based at 25 Rue Paul Doumer, Tregueux, 22950, France. |
| 2. | I graduated with a Bachelor of Science Degree (with honours) in Mineral Processing from the University of Leeds, United Kingdom, in 1980. |
| 3. | I am a registered European Engineer (EUR ING) and I am a registered Chartered Engineer (CEng) in the United Kingdom. |
| 4. | I have practiced metallurgical engineering for 44 years, with 37 years as a registered Professional Engineer, in the global mining industry. I have been a QP for more than 10 lithium brine projects. I have provided operational and project reviews for brine operations and lithium carbonate plants in South America. I have provided process consulting on geothermal brine projects in France. |
| 5. | I am an Honorary Life Fellow of the Southern African Institute of Mining and Metallurgy (SAIMM) and I am a Chartered Engineer of the Institute of Materials, Minerals and Mining (IMMM). |
| 6. | I have read the definition of "qualified person" set out in the National Instrument 43-101 ("NI 43-101") and certify that, by reason of my education, affiliation with a professional association (as defined in NI 43-101), and past relevant work experience, I fulfill the requirements to be a "Qualified Person" for the purposes of NI 43-101. |
| 7. | I oversaw the preparation and am responsible for Sections 1, 12.2, 13, 17, 18, 21, 22, 25 and 26 of the technical report titled "Amended and Restated NI 43-101 Technical Report; South West Arkansas Project Pre-Feasibility Study; Lewisville, Lafayette County AR", with an effective date of August 8, 2023 (the "Technical Report"). |
| 8. | I visited the Demonstration Plant in El Dorado during 14 & 15 November, 2022, but I have not visited the South West Arkansas Property. |
| 9. | I am not aware of any scientific or technical information with respect to the subject matter of the Technical Report that is not reflected in the Technical Report, the omission to disclose which makes the Technical Report misleading. |
| 10. | I am independent of the Issuer as per NI 43-101 and successfully pass the independence requirements of the Guidance of Independence test in item 1.5 of the Companion Policy to NI 43-101. I am not an employee, insider, director, or partner of the Issuer and do not hold any securities or direct/indirect interests related to the Issuer or the property and/or adjacent properties that is the subject of this Technical Report. |
| 11. | I have read NI 43-101and Form 43-101F1, and the Technical Report has been prepared in compliance with that instrument and form. |
| 12. | I consent to the filing of the Technical Report with any stock exchange and other regulatory authority and any publication by them for regulatory purposes, including electronic publication in the public company files or their websites. |

Marek Dworzanowski, EUR ING, CEng, HonFSAIMM, FIMMM
Effective Date: August 8, 2023
Signature Date: July 23, 2025
Tregueux, France
I, Randal M. Brush, PE, as a co-author of the technical report titled Amended and Restated NI 43-101 Technical Report – South West Arkansas Project – Pre-Feasibility Study (the “Technical Report”), effective date August 8, 2023, do hereby certify that:
| • | I am currently employed as a Senior Engineering Advisor of Haas & Cobb Petroleum Consultants (formerly William M. Cobb & Associates, Inc.) with an office at 12770 Coit Road, Suite 907, Dallas, Texas, 75251. |
| • | I hold a Master of Science degree in petroleum engineering from Stanford University and a Bachelor of Science degree in chemical engineering from Rice University. |
| • | I am a member in good standing of the Society of Petroleum Engineers, a constituent organization within the AIME, the American Institute of Mining, Metallurgical and Petroleum Engineers (Member # 0515460). I am also a member of the Society of Petroleum Evaluation Engineers. |
| • | I am and have been a professional engineer, registered in Texas (License #85165), since 1999. |
| • | As a professional engineer, I have over 42 years of experience in evaluating the injection and production of water, brines, and other fluids into and out of porous formations like the Smackover. This includes 10 years of evaluating brine recovery at a nearby Smackover field. These tasks have included the following: |
| o | Using engineering analysis, mathematical modeling, and appropriate data collection and analysis techniques to evaluate the injection of gases, water, brine, and steam into underground geologic formations, and the recovery of oil, gas, water, and brine from those formations. |
| o | Specializing in reservoir evaluation, management, and simulation studies to estimate hydrocarbon (crude oil, condensate, and natural gas) and non-hydrocarbon (e.g., bromine, lithium, CO2, and helium) reserves and inventories; provide ultimate recovery estimates by predicting reservoir performance under alternate development plans; and evaluate the performance of gas and CO2 storage reservoirs in response to internal and external operational factors. |
| • | As a result of my education, qualifications, affiliation with a professional association, and experience, I fulfil the requirements to be a “Qualified Person” as defined in National Instrument 43-101 (“NI 43-101”). |
| • | I am independent of Standard Lithium Ltd. applying all the tests in Section 1.5 of the Companion Policy to NI 43-101. |
| • | I am responsible for Sections 10, 14.2, 14.3, 15 and 16of this Technical Report |
| • | I have not had any prior involvement with the Property. |
| • | My most recent personal inspection of the Property was on July 24, 2023. |
| • | I have read NI 43-101, Form 43-101F1, and the Technical Report for which I am responsible, and the document has been prepared in compliance with NI 43-101. |
| • | As of the date of this certificate, to the best of my knowledge, information, and belief, this Technical Report contains all of the scientific and technical information that is required to be disclosed to make the Technical Report not misleading. |
| • | I consent to the filing of this Technical Report with any stock exchange, provided that the Technical Report complies with the framework of that regulatory exchange, and other regulatory authority or publication by them for regulatory purposes, including electronic publication in the public company files on their websites accessible by the public. |
| Signed in Dallas, Texas, July 23, 2025 | ||
 |
 |
|
|
Randal M. Brush, PE
Haas & Cobb Petroleum Consultants (formerly William M. Cobb & Associates, Inc.) |
||
I, Robert E. Williams, Jr., PG, CPG, as a co-author of the technical report titled Amended and Restated NI 43-101 Technical Report – South West Arkansas Project – Pre-Feasibility Study (the “Technical Report”), effective date August 8, 2023, do hereby certify that:
| • | I am currently employed as a Principal Geologist of Haas & Cobb Petroleum Consultants (formerly William M. Cobb & Associates) 12770 Coit Road Suite 907, Dallas Texas, 75251. |
| • | I am a graduate of Oklahoma State University and earned a degree Bachelor of Science in Geology in 1991. |
| • | I am a professional geologist registered with Texas Board of Professional Geoscientists #3964, awarded August 31, 2003. |
| • | I am a member in good standing of the American Institute of Professional Geologists (AIPG) Certification #12158, awarded January 9, 2023. |
| • | I have practiced my profession for 34 years. I have been involved in brine (for bromine, lithium, and other metals extraction) and petroleum geology projects during this time including: subsurface mapping, geologic modelling of carbonate reservoirs, geophysical log interpretation, drilling wells, reservoir volumetric analysis, resources and reserve estimates. |
| • | As a result of my education, qualifications, affiliation with a professional association, and experience, I fulfil the requirements to be a “Qualified Person” as defined in National Instrument 43-101 (“NI 43-101”). |
| • | I am independent of Standard Lithium applying all the tests in Section 1.5 of the Companion Policy to NI 43-101. |
| • | I am responsible for Sections 7, 8, 9, 11, 12.1, and 14.1of this Technical Report. |
| • | I have had no prior involvement with the Property. |
| • | My most recent personal inspection of the Property was on June 1, 2023. |
| • | I have read NI 43-101 and Form 43-101 and the Technical Report for which I am responsible, and the document has been prepared in compliance with NI 43-101. |
| • | As of the date of this certificate, to the best of my knowledge, information, and belief, this Technical Report contains all of the scientific and technical information that is required to be disclosed to make the Technical Report not misleading. |
| • | I consent to the filing of this Technical Report with any stock exchange, provided that the Technical Report complies with the framework of that regulatory exchange, and other regulatory authority or publication by them for regulatory purposes, including electronic publication in the public company files on their websites accessible by the public. |
| Signed in Tulsa, Oklahoma, July 23, 2025. | ||
 |
 |
|
|
Robert E. Williams, Jr., PG, CPG
Haas & Cobb Petroleum Consultants (formerly William M. Cobb & Associates, Inc.) |
||
I, Caleb Mutschler, P. Eng., do hereby certify that:
| 1. | I am a Managing Technical Professional with Hunt, Guillot, & Associates LLC, 8401 New Trails Drive, Suite 175, The Woodlands, Texas 77381. |
| 2. | I graduated with a Bachelor of Science Degree in Engineering with a Chemical Concentration from Calvin College, Grand Rapids, Michigan in 2011. |
| 3. | I am a registered Professional Engineer in Texas, Louisiana, and Arkansas. |
| 4. | I have practiced as a Professional Engineer for 7 years in the oil refining, chemicals, and midstream oil and gas industries. Engineering lead for pressure relief studies on brine supply wells, used to supply bromine-rich brine to bromine extraction facilities. Engineering lead for pipeline hydraulic modeling related to brinefield expansion.I have read the definition of "qualified person" set out in the National Instrument 43-101 ("NI 43-101") and certify that, by reason of my education, affiliation with a professional association (as defined in NI 43-101), and past relevant work experience, I fulfill the requirements to be a "Qualified Person" for the purposes of NI 43-101. |
| 5. | I oversaw the preparation and am responsible for Sections 17-17.3 & 17.5 of the technical report titled " Amended and Restated NI 43-101 Technical Report; South West Arkansas Project Pre-Feasibility Study; Lewisville, Lafayette County AR", with an effective date of August 8, 2023 (the "Technical Report"). |
| 6. | I visited the Demonstration Plant in El Dorado in October, 2022, to observe the test facilities but have not visited the South West Arkansas Project site. |
| 7. | I am not aware of any scientific or technical information with respect to the subject matter of the Technical Report that is not reflected in the Technical Report, the omission to disclose which makes the Technical Report misleading. |
| 8. | I am independent of the Issuer as per NI 43-101 and successfully pass the independence requirements of the Guidance of Independence test in item 1.5 of the Companion Policy to NI 43-101. I am not an employee, insider, director, or partner of the Issuer and do not hold any securities or direct/indirect interests related to the Issuer or the property and/or adjacent properties that is the subject of this Technical Report. |
| 9. | I have read NI 43-101 and Form 43-lOlFl, and the Technical Report has been prepared in compliance with that instrument and form. |
| 10. | I consent to the filing of the Technical Report with any stock exchange and other regulatory authority and any publication by them for regulatory purposes, including electronic publication in the public company files or their websites. |
 |
|
|
|
Caleb Mutschler, P. Eng.
Effective Date: August 8, 2023
Signature Date: July 23, 2025
The Woodlands, Texas, United States
|
I, Dutch Johnson, P. Eng., do hereby certify that:
| 1. | I am a Directing Technical Professional with Hunt, Guillot, & Associates LLC, 400 Texas Street, Third Floor, Suite 300, Shreveport, Louisiana 71101. |
| 2. | I graduated with a Bachelor of Science Degree in Mechanical Engineering from Louisiana Tech University, Ruston, Louisiana in 2003. |
| 3. | I am a registered Professional Engineer in Louisiana, Texas, and Arkansas. |
| 4. | I have practiced as a Professional Engineer for 19 years in various industries. I have contributed to the design and implementation of a pilot plant facility in Arkansas utilizing advanced brine processing technologies. My work has involved integrating modular systems for brine pre-treatment, lithium extraction, and lithium chloride polishing |
| 5. | I have read the definition of “qualified person” set out in the National Instrument 43-101 (“NI 43-101”) and certify that, by reason of my education, affiliation with a professional association (as defined in NI 43-101), and past relevant work experience, I fulfill the requirements to be a “Qualified Person” for the purposes of NI 43-101. |
| 6. | I oversaw the preparation and am responsible for Section 17.4 of the technical report titled “Amended and Restated NI 43-101 Technical Report; South West Arkansas Project Pre-Feasibility Study; Lewisville, Lafayette County AR”, with an effective date of August 8, 2023 (the “Technical Report”). |
| 7. | I have not visited the South West Arkansas Property. |
| 8. | I am not aware of any scientific or technical information with respect to the subject matter of the Technical Report that is not reflected in the Technical Report, the omission to disclose which makes the Technical Report misleading. |
| 9. | I am independent of the Issuer as per NI 43-101 and successfully pass the independence requirements of the Guidance of Independence test in item 1.5 of the Companion Policy to NI 43-101. I am not an employee, insider, director, or partner of the Issuer and do not hold any securities or direct/indirect interests related to the Issuer or the property and/or adjacent properties that is the subject of this Technical Report. |
| 10. | I have read NI 43-101 and Form 43-101F1, and the Technical Report has been prepared in compliance with that instrument and form. |
| 11. | I consent to the filing of the Technical Report with any stock exchange and other regulatory authority and any publication by them for regulatory purposes, including electronic publication in the public company files or their websites. |
|
Dutch Johnson, P. Eng.,
Effective Date: August 8, 2023
Signature Date: July 23, 2025
Shreveport, Louisiana, United States |
 |
I, Charles Daniel Campbell, P. Eng., do hereby certify that:
| 1. | I retired as Senior Managing Consultant on June 30, 2023, from Alliance Technical Group, LLC, 219 Brown Lane, Bryant, Arkansas 72022. |
| 2. | Alliance Technical Group, LLC has contractually retained my technical and engineering services post-retirement. |
| 3. | I graduated with a Bachelor of Science Degree in Petroleum Engineering from Louisiana Tech University, Ruston, Louisiana in 1983. |
| 4. | I am a registered Professional Engineer in Arkansas. |
| 5. | I have practiced as a Professional Engineer for 35 years in project management, engineering management, and general management in the environmental and petroleum industries. |
| 6. | I have read the definition of "qualified person" set out in the National Instrument 43-101 ("NI 43-101") and certify that, by reason of my education, affiliation with a professional association (as defined in NI 43-101), and past relevant work experience, I fulfill the requirements to be a "Qualified Person" for the purposes of NI 43-101. |
| 7. | I oversaw the preparation and am responsible for Section 20 of the technical report titled "Amended and Restated NI 43-101 Technical Report; South West Arkansas Project Pre-Feasibility Study; Lewisville, Lafayette County AR", with an effective date of August 8, 2023 (the "Technical Report'). |
| 8. | I visited the Demonstration Plant in El Dorado, Arkansas in February 2022, and the South West Arkansas Property in May 2023. |
| 9. | I am not aware of any scientific or technical information with respect to the subject matter of the Technical Report that is not reflected in the Technical Report, the omission to disclose which makes the Technical Report misleading. |
| 10. | I have not had any prior involvement with the Property. |
| 11. | I am independent of the Issuer as per NI 43-101 and successfully pass the independence requirements of the Guidance of Independence test in item 1.5 of the Companion Policy to NI 43-101. I am not an employee, insider, director, or partner of the Issuer and do not hold any securities or direct/indirect interests related to the Issuer or the property and/or adjacent properties that is the subject of this Technical Report. |
| 12. | I have read NI 43-101 and Form 43-101F1, and the Technical Report has been prepared in compliance with that instrument and form. |
| 13. | I consent to the filing of the Technical Report with any stock exchange and other regulatory authority and any publication by them for regulatory purposes, including electronic publication in the public company files or their websites. |
 |
|
|
|
Charles Daniel Campbell, P. Eng.,
Effective Date: August 8, 2023
Signature Date: July 23, 2025
Bryant, Arkansas, United States
|
Exhibit 99.2
Cautionary Note Regarding Forward-Looking Information
These forward-looking statements relate to, among other things, resource estimates, grades and recoveries, development plans, mining methods and metrics including recovery process and, mining and production expectations including expected cash flows, capital cost estimates and expected life of mine, operating costs, the expected payback period, receipt of government approvals and licenses, time frame for construction, financial forecasts including net present value and internal rate of return estimates, tax and royalty rates, and other expected costs.
Forward-looking information is necessarily based upon a number of estimates and assumptions that, while considered reasonable, are inherently subject to significant political, business, economic and competitive uncertainties and contingencies. There may be factors that cause results, assumptions, performance, achievements, prospects or opportunities in future periods not to be as anticipated, estimated or intended.
There can be no assurances that forward-looking information and statements will prove to be accurate, as many factors and future events, both known and unknown could cause actual results, performance or achievements to vary or differ materially from the results, performance or achievements that are or may be expressed or implied by such forward-looking statements contained herein or incorporated by reference. Accordingly, all such factors should be considered carefully when making decisions with respect to the Project, and prospective investors should not place undue reliance on forward-looking information. Forward-looking information in this technical report is as of the effective date, August 18, 2023. Standard Lithium Ltd. assumes no obligation to update or revise forward-looking information to reflect changes in assumptions, changes in circumstances or any other events affecting such forward-looking information, except as required by applicable law.

RSI-3353
CERTIFICATE OF AUTHOR
I, Randal M. “Randy” Brush, PE, as a co-author of the Technical Report titled Amended and Restated Technical Report for the Definitive Feasibility Study for Commercial Lithium Extraction Plant at LANXESS South Plant (the Technical Report), effective date August 18, 2023, do hereby certify that:
| / | I am currently employed as a Senior Engineering Advisor of Haas & Cobb Petroleum Consultants (formerly William M. Cobb & Associates, Inc.) with an office at 12770 Coit Road, Suite 907, Dallas, Texas, 75251. |
| / | I hold a Master of Science degree in petroleum engineering from Stanford University and a Bachelor of Science in chemical engineering from Rice University. |
| / | I am a member in good standing of the Society of Petroleum Engineers, a constituent organization within the AIME, the American Institute of Mining, Metallurgical and Petroleum Engineers (Member # 0515460). I am also a member of the Society of Petroleum Evaluation Engineers. |
| / | I am a professional engineer, registered in Texas, and have been practicing in this capacity since 1999. |
| / | As a professional engineer, I have over 42 years of experience in evaluating the injection and production of water, brines, and other fluids into and out of porous formations like the Smackover. This includes 10 years of evaluating this specific field. These tasks have included the following: |
| » | Using engineering analysis, mathematical modeling, and appropriate data collection and analysis techniques to evaluate the injection of gases, water, and steam into underground geologic formations, and the recovery of oil, gas, and water from those formations. |
| » | Specializing in reservoir evaluation, management, and simulation studies to define hydrocarbon (crude oil, condensate, and natural gas) and non-hydrocarbon (e.g., bromine, lithium, CO2, and helium) reserves and inventories, providing ultimate recovery estimates by predicting reservoir performance under alternate development plans and various reservoir drive mechanisms, and evaluating the performance of gas and CO2 storage reservoirs in response to internal and external operational factors. |
| / | As a result of my experience and qualifications, I am a Qualified Person as defined in National Instrument 43-101. |
| / | I am independent of Standard Lithium applying all the tests in Section 1.5 of NI 43101. |
| / | I am responsible for Sections 10, 15, 16, Subsections 1.0, 1.4, 1.5, 1.6, 1.13, 1.14, 12.3, 12.4, 14.2, 14.3, 14.4, 25.1, 25.9, and 26 of this Technical Report. |
| / | I have had prior involvement with the Property related to evaluating the field’s bromine recovery performance in connection with separate operations conducted by LANXESS, which is unrelated to the subject matter of this Technical Report, including any work contained herein for which I am responsible. |
| / | My most recent personal inspection of the Property was on May 17 to 19, 2022. |
| / | I have read National Instrument 43-101, Form 43-101F1, and the Technical Report for which I am responsible, and the document has been prepared in compliance with National Instrument 43-101. |
| / | As of the date of this certificate, to the best of my knowledge, information, and belief, this Technical Report contains all of the scientific and technical information that is required to be disclosed to clearly understand the Technical Report. |
| / | I consent to the filing of this Technical Report with any stock exchange, provided that the Technical Report complies with the framework of that regulatory exchange, and other regulatory authority or publication by them for regulatory purposes, including electronic publication in the public company files on their websites accessible by the public. |
| Signed in Dallas, Texas, July 23, 2025. |

|
|

|
||
| Randal M. Brush, PE | ||
| Haas & Cobb Petroleum Consultants (formerly William M. Cobb & Associates, Inc.) |
RSI-3353
CERTIFICATE OF AUTHOR
I, Robert E. Williams, Jr., PG, CPG, as a co-author of the Technical Report titled Amended and Restated Technical Report for the Definitive Feasibility Study for Commercial Lithium Extraction Plant at LANXESS South Plant (the Technical Report), effective date August 18, 2023, do hereby certify that:
| / | I am currently employed as a Principal Geologist of Haas &. Cobb Petroleum Consultants (formerly William M. Cobb & Associates, Inc.) 12770 Coit Road Suite 907, Dallas Texas, 75251. |
| / | I am a graduate of Oklahoma State University and earned a degree Bachelor of Science in Geology in 1991. |
| / | I am a member in good standing of American Institute of Professional Geologists (AIPG) Certification #12158, awarded January 9, 2023. |
| / | I am a professional geologist registered with Texas Board of Professional Geoscientists #3964, awarded August 31, 2003. |
| / | I have practiced my profession for 34 years. I have been involved in brine (for bromine, lithium, and other metals extraction) and petroleum geology projects during this time including: subsurface mapping, geologic modelling of carbonate reservoirs, geophysical log interpretation, drilling wells, reservoir volumetric analysis, resource and reserve estimates. |
| / | As a result of my experience and qualifications, I am a Qualified Person as defined in National Instrument 43-101. |
| / | I am independent of Standard Lithium applying all the tests in Section 1.5 of NI 43-101. |
| / | I am responsible for Sections 7, 8, 9, 11, and Subsections 1.0, 1.2, 1.3, 1.4, 1.13, 1.14, 12.1, 12.2, 12.4, 14.1, 25.1, 25.9, 26 of this Technical Report. |
| / | My most recent personal inspection of the Property was on May 17 to 19, 2022. |
| / | I have read National Instrument 43-101, Form 43-101F1 and the Technical Report for which I am responsible, and the document has been prepared in compliance with NI 43-101. |
| / | As of the date of this certificate, to the best of my knowledge, information, and belief, this Technical Report contains all of the scientific and technical information that is required to be disclosed to clearly understand the Technical Report. |
| / | I consent to the filing of this Technical Report with any stock exchange, provided that the Technical Report complies with the framework of that regulatory exchange, and other regulatory authority or publication by them for regulatory purposes, including electronic publication in the public company files on their websites accessible by the public. |
| Signed in Tulsa, Oklahoma, July 23, 2025. |

|
|

|
||
| Robert E. Williams, Jr., PG, CPG | ||
| Haas &. Cobb Petroleum Consultants (formerly William M. Cobb & Associates, Inc.) |
RSI-3353
CERTIFICATE OF AUTHOR
I, Charles Daniel Campbell, P.E., as a co-author of the Technical Report titled Amended and Restated Technical Report for the Definitive Feasibility Study for Commercial Lithium Extraction Plant at LANXESS South Plant (the Technical Report), effective date August 18, 2023, do hereby certify that:
| / | I am currently retained as a Consulting Engineer by Alliance Technical Group with an office at 219 Brown Lane, Bryant, Arkansas, 72022. |
| / | I hold a Bachelor of Science degree in petroleum engineering from Louisiana Tech University. |
| / | I am a registered professional engineer in AR, KS, LA, MS, MO, OK, SC, and TX, and have been practicing in this capacity since 1983. |
| / | As a professional engineer, I have over 35 years of experience in environmental engineering as a consultant, manager, and state regulator. I have performed environmental planning, cost analysis, design, and contract management for numerous industrial facilities. I have regulatory compliance experience including NPDES, wastewater treatment, evaluation of groundwater data, erosion/sediment control, Air (Title V and Minor Source), hazardous waste, solid waste, underground injection, and site remediation. Specific tasks include: |
| » | I directed environmental compliance activities programs for petroleum production and specialty chemical processing companies with multiple production, transportation, and distribution facilities in the U.S. |
| » | I was responsible for the preparation of NPDES, Title V, and RCRA permit applications |
| » | I have evaluated groundwater hydrology of monitoring well networks and prepared reports for regulatory agencies, conducted transient tests on recovery wells, and developed well rehabilitation projects |
| / | As a result of my experience and qualifications, I am a Qualified Person as defined in National Instrument 43-101. |
| / | I am independent of Standard Lithium applying all the tests in Section 1.5 of National Instrument 43-101. |
| / | I am responsible for Section 20 and Subsections 1.0, 1.10, 1.13, 1.14, 25.4, 25.5, 25.6, 25.9, 26 of this Technical Report. |
| / | I have had prior involvement with the Property when I was employed as an environmental professional by Great Lakes Chemical Corporation (GLCC), predecessor to LANXESS Corporation, and as a consulting environmental engineer to GLCC, Chemtura Corporation, and LANXESS Corporation. This prior involvement is unrelated to the subject matter of this Technical Report, including any work contained herein for which I am responsible. |
| / | I have provided environmental regulatory support to LANXESS Corporation and its predecessors, none of which relates to the work I completed for this Technical Report. |
| / | My most recent personal inspection of the Property was on November 8, 2022. |
| / | I have read National Instrument 43-101, Form 43-101F1, and the Technical Report for which I am responsible, and the document has been prepared in compliance with National Instrument 43-101. |
| / | As of the date of this certificate, to the best of my knowledge, information, and belief, this Technical Report contains all of the scientific and technical information that is required to be disclosed to clearly understand the Technical Report. |
| / | I consent to the filing of this Technical Report with any stock exchange, provided that the Technical Report complies with the framework of that regulatory exchange, and other regulatory authority or publication by them for regulatory purposes, including electronic publication in the public company files on their websites accessible by the public. |
| Signed in Bryant, Arkansas, July 23, 2025. |

|
|
 |
||
| Charles Daniel Campbell, PE | ||
| Alliance (formerly GBMc & Associates) |
RSI-3353
CERTIFICATE OF AUTHOR
I, Frank Gay, PE, as a co-author of the Technical Report titled Amended and Restated Technical Report for the Definitive Feasibility Study for Commercial Lithium Extraction Plant at LANXESS South Plant (the Technical Report), effective date August 18, 2023, do hereby certify that:
| / | I am the Vice President, Owner’s Representative Services of Hunt, Guillot & Associates, LLC, with an office at 8401 New Trails Drive, Suite 175, The Woodlands, TX 77381. |
| / | I hold a Bachelor of Science degree in chemical engineering from the Massachusetts Institute of Technology and a Master of Science degree in chemical engineering practice also from the Massachusetts Institute of Technology. |
| / | I am a professional engineer, registered in North Carolina, have been practicing in this capacity since 1985, and am in good standing. |
| / | As a professional engineer, I have more than 35 years of experience in project and engineering management, cost and scheduling control, process design, stress analysis, petrochemical industry, and design and execution. These tasks have included the following: |
| » | I participated in licensor selection, pre-front-end engineering design (pre-FEED), FEED, and Project Management Consulting (PMC) during the engineering, procurement, and construction (EPC) phase. I set up and led the project from early configuration studies through FEED, followed by the PMC role during detailed design, procurement, and construction. The project consisted of the design and installation of four major inside battery limits (ISBL) units, including a naphtha hydrocracker, diesel hydrotreater, a hydrogen production unit, a sulfur recovery unit, and associated utilities and off-sites for a major refinery expansion on the west coast of Saudi Arabia. My responsibilities included overall management of cost schedule and quality for the FEED and capital cost estimate for the project. |
| » | I developed Pre-FEED (design basis scoping paper [DBSP]) package for a new-technology polyols facility located in Saudi Arabia. The work was performed entirely in Saudi Arabia using approximately 30% Saudi engineers and other project management professionals. I was responsible for the execution of the project. |
| » | As Senior Project Director, I led a team responsible for the cost estimate, financial model development, technical evaluation, and overall project execution planning of a $20 billion plus refining and petrochemical complex in Saudi Arabia. As business unit leader, I had overall responsibility for the development of a detailed financial model, long lead procurement and supply chain plan, a logistics plan for major equipment, feedstock and product and an overall project execution plan for a $3 billion sustainable aviation fuel plant in Columbia, Louisiana. |
| / | As a result of my experience and qualifications, I am a Qualified Person as defined in National Instrument 43101. |
| / | I am independent of Standard Lithium applying all the tests in Section 1.5 of National Instrument 43-101. |
| / | I am responsible for Section 22 and Subsections 1.0, 1.12, 1.13, 1.14, 25.8, 25.9, and 26 (content pertaining to project economics for all Subsections listed) of this Technical Report. |
| / | I have not had prior involvement with the Property that is the subject of the Technical Report. |
| / | I have never visited the Property. |
| / | I have read National Instrument 43-101, Form 43-101F1, and the Technical Report for which I am responsible, and the document has been prepared in compliance with National Instrument 43-101. |
| / | As of the date of this certificate, to the best of my knowledge, information, and belief, this Technical Report contains all of the scientific and technical information that is required to be disclosed to clearly understand the Technical Report. |
| / | I consent to the filing of this Technical Report with any stock exchange, provided that the Technical Report complies with the framework of that regulatory exchange, and other regulatory authority or publication by them for regulatory purposes, including electronic publication in the public company files on their websites accessible by the public. |
| Signed in Ruston, Louisiana, July 23, 2025. |
|
|
 |
||
| Frank Gay, PE | ||
| Hunt, Guillot & Associates, LLC |
RSI-3353
RSI-3353
CERTIFICATE OF AUTHOR
I, Mike Rockandel, President, as an author of the Technical Report titled Amended and Restated Technical Report for the Definitive Feasibility Study for Commercial Lithium Extraction Plant at LANXESS South Plant (the Technical Report), effective date August 18, 2023, do hereby certify that:
| / | I am currently employed as President of Mike Rockandel Consulting, LLC with an office at 11414 N. Mountain Breeze, Tucson, Arizona, 85737. |
| / | I hold a Bachelor of Science degree in metallurgical engineering from the University of British Columbia. |
| / | I am a member in good standing of the Society for Mining, Metallurgy and Exploration (Member # 4122579). |
| / | As a process and engineering consultant, I have been involved with lithium since 2018. I have more than 45 years of varied process experience at all levels of project development from laboratory development through commissioning, startup, and operations supervision. I am skilled in process modeling with tools such as Metsim and HSC Chemistry. My career has been broad based covering projects in the hydro and pyrometallurgical, industrial minerals, chemical, and environmental industries. Throughout much of my career, I have worked as a lead process engineer responsible for the preparation of process flow diagrams, mass balances, process design specification, equipment sizing and specification, utility, and operating cost evaluation, bid evaluation, commissioning, start-up, and process optimization. These tasks have included the following: |
| » | I assisted Lithium Nevada in the development of their clay-based lithium project. My duties have included flowsheet development, simulation, and optimization of the process, preparation of specifications, and assistance with equipment selection. |
| » | I am the lead process engineer for the American Pacific Borate and Lithium pre-feasibility study (in-situ) colemanite leach process producing 90,000 t/y of boric acid. This project is now advancing to the FEED stage. This project includes a Mannheim potassium sulphate production facility. |
| / | As a result of my experience and qualifications, I am a Qualified Person as defined in National Instrument 43-101. |
| / | I am independent of Standard Lithium applying all the tests in Section 1.5 of NI 43-101. |
| / | I am responsible for Sections 13, 17, 18, 21 and Subsections 1.0, 1.7, 1.8, 1.11, 1.13 , 1.14 , 12.5, 25.2, 25.3, 25.7, 25.9 and 26 of this Technical Report. |
| / | I have had no prior involvement with the Property that is the subject of the Technical Report. |
| / | My most recent personal inspection of the Property was on October 10–12, 2022. |
| / | I have read National Instrument 43-101, Form 43-101F1 and the Technical Report for which I am responsible, and the document has been prepared in compliance with National Instrument 43-101. |
| / | As of the date of this certificate, to the best of my knowledge, information, and belief, this Technical Report contains all of the scientific and technical information that is required to be disclosed to clearly understand the Technical Report. |
| / | I consent to the filing of this Technical Report with any stock exchange, provided that the Technical Report complies with the framework of that regulatory exchange, and other regulatory authority or publication by them for regulatory purposes, including electronic publication in the public company files on their websites accessible by the public. |
| Signed in Tucson, Arizona, July 23, 2025. | ||
 |
||
| Mike Rockandel, President | ||
| Mike Rockandel Consulting, LLC |
RSI-3353
TABLE OF CONTENTS
| 1.0 | EXECUTIVE SUMMARY | 1 | ||
| 1.1 | Property Description | 1 | ||
| 1.2 | Geology and Mineralization | 4 | ||
| 1.3 | Status of Exploration | 4 | ||
| 1.4 | Mineral Resource Estimate | 4 | ||
| 1.5 | Mineral Reserve Estimate | 5 | ||
| 1.6 | Mining Methods | 6 | ||
| 1.7 | Recovery Method | 7 | ||
| 1.8 | Project Infrastructure | 7 | ||
| 1.9 | Marketing | 8 | ||
| 1.10 | Environmental Permitting | 9 | ||
| 1.11 | Capital and Operating Expenses | 9 | ||
| 1.12 | Economic Analysis | 11 | ||
| 1.13 | Qualified Person’s Conclusions | 13 | ||
| 1.14 | Qualified Person’s Recommendations | 14 | ||
| 2.0 | INTRODUCTION | 15 | ||
| 2.1 | Terms of Reference and Purpose of Report | 15 | ||
| 2.2 | Qualified Persons | 17 | ||
| 2.3 | Personal Inspection of Property by Qualified Persons | 17 | ||
| 2.4 | Sources of Information | 18 | ||
| 2.5 | Currency, Abbreviations, and Units of Measures | 19 | ||
| 3.0 | RELIANCE ON OTHER EXPERTS | 22 | ||
| 3.1 | Mineral Tenure | 22 | ||
| 4.0 | PROPERTY DESCRIPTION AND LOCATION | 23 | ||
| 4.1 | Property Description and Location | 23 | ||
| 4.2 | Surface and Mineral Rights | 25 | ||
| 4.2.1 | Mineral Rights | 25 | ||
| 4.2.2 | Surface Rights | 25 | ||
| 4.3 | Payments to Lessors | 26 | ||
| 4.4 | Overview of the Standard Lithium – LANXESS Agreements | 27 | ||
| 4.4.1 | Amended and Restated Memorandum of Understanding | 27 | ||
| 4.4.2 | Site Access, Reservation and License Agreement | 28 | ||
| 4.5 | Environmental Liabilities and Permitting | 30 | ||
| 4.6 | Significant Encumbrances or Risks to Perform Work on Property | 31 | ||
| 5.0 | ACCESSIBILITY, CLIMATE, LOCAL RESOURCES,INFRASTRUCTURE, AND PHYSIOGRAPHY | 32 | ||
| 5.1 | Accessibility | 32 | ||
| 5.1.1 | Airport Access | 32 | ||
| 5.1.2 | Rail Access | 32 |
RSI-3353
| 5.1.3 | Road Access | 32 | ||
| 5.2 | Climate | 34 | ||
| 5.3 | Local | 34 | ||
| 5.3.1 | Local Labor | 34 | ||
| 5.3.2 | Transport | 34 | ||
| 5.3.3 | Water | 35 | ||
| 5.3.4 | Power | 35 | ||
| 5.3.5 | Natural Gas | 35 | ||
| 5.3.6 | Supporting Services | 35 | ||
| 5.4 | Physiography | 35 | ||
| 5.5 | Summary | 35 | ||
| 6.0 | HISTORY | 36 | ||
| 6.1 | History of the LANXESS Property | 36 | ||
| 6.2 | Past Mineral Resource Estimates | 39 | ||
| 6.3 | Production from the Property | 40 | ||
| 7.0 | GEOLOGICAL SETTING AND MINERALIZATION | 41 | ||
| 7.1 | Gulf Coast Tectono-Depositional Framework | 41 | ||
| 7.2 | Triassic Jurassic Stratigraphy | 43 | ||
| 7.3 | Smackover Formation | 45 | ||
| 8.0 | DEPOSIT TYPE | 52 | ||
| 9.0 | EXPLORATION | 55 | ||
| 9.1 | Geologic Data Sampling Methods, Quality, and Extent | 55 | ||
| 9.2 | Lithium Concentration Data Sampling Methods, Quality, and Extent | 55 | ||
| 9.3 | Exploration Results and Interpretation | 57 | ||
| 10.0 | DRILLING | 61 | ||
| 11.0 | SAMPLE PREPARATION, ANALYSES, AND SECURITY | 65 | ||
| 11.1 | Summary of Brine Sampling Programs from 2018 to 2019 (Dworzanowski, 2019) | 65 | ||
| 11.2 | Summary of Brine Sampling Program in 2022 | 66 | ||
| 11.3 | Sampling Procedures | 66 | ||
| 11.3.1 | Methodology | 66 | ||
| 11.3.2 | Quality Assurance and Quality Control | 67 | ||
| 11.3.3 | Security | 67 | ||
| 11.3.4 | Analytical Protocol | 68 | ||
| 12.0 | DATA VERIFICATION | 69 | ||
| 12.1 | Verification of Lithium Concentration Data | 69 | ||
| 12.2 | Verification of Well Logs and Core Data | 74 | ||
| 12.3 | Verification of Production and Injection Data | 74 | ||
| 12.4 | Qualified Person’s Opinion on 12.1-12.3 | 75 | ||
| 12.5 | Verification of Metallurgical and Mineral Processing Data | 75 | ||
| 12.6 | VERIFICATION OF Property Data | 76 | ||
RSI-3353
| 13.0 | MINERAL PROCESSING AND METALLURGICAL TESTING | 77 | ||
| 13.1 | Introduction | 77 | ||
| 13.1 | Process Overview | 78 | ||
| 13.2 | Historical Testing | 79 | ||
| 13.3 | Demonstration Plant Testing | 79 | ||
| 13.1.1 | Demonstration Plant | 80 | ||
| 13.1.2 | Tail Brine Measurement Skid | 83 | |||
| 13.1.3 | Brine Pre-Treatment Testing | 83 | |||
| 13.2 | Brine Pre-treatment at LANXESS | 84 | |||
| 13.3 | Brine pH Control | 84 | |||
| 13.4 | Brine Filtration | 85 | |||
| 13.5 | Key Findings from Brine Pre-Treatment Test Work | 86 | |||
| 13.5.1 | DLE Testing at the Demonstration Plant | 86 | |||
| 13.5.1.1 | LiSTR DLE Testing | 86 | |||
| 13.5.1.2 | Key Findings from LiSTR DLE Test Work | 86 | |||
| 13.5.1.3 | LSS DLE Testing | 87 | |||
| 13.5.1.4 | Key Findings from LSS DLE Test Work | 88 | |||
| 13.6 | Demonstration Plant LiCl Solution Purification and Concentration | 88 | |||
| 13.7 | LiCl Solution Concentration by Reverse Osmosis | 89 | |||
| 13.7.1 | Brackish Water Reverse Osmosis (BWRO) | 89 | |||
| 13.7.2 | Osmotically Assisted Reverse Osmosis (OARO) | 89 | |||
| 13.8 | Calcium and Magnesium Removal Processes | 90 | |||
| 13.8.1 | Soda Lime Softening Testing | 90 | |||
| 13.8.2 | Calcium and Magnesium Ion Exchange | 93 | |||
| 13.9 | Boron Removal Ion Exchange | 93 | |||
| 13.10 | Key Findings from LiCl Purification and Concentration Test Work | 93 | |||
| 13.11 | Additional LiCl Purification and Concentration Testing | 94 | |||
| 13.12 | Lithium Carbonate Crystallization | 94 | |||
| 13.12.1 | First Production of Lithium Carbonate | 95 | |||
| 13.12.2 | Second Production of Lithium Carbonate | 97 | |||
| 13.12.3 | Third Production of Lithium Carbonate | 99 | |||
| 13.12.4 | Key Findings from Lithium Carbonate Crystallization Test Work | 101 | |||
| 13.13 | Process Testing QA/QC | 101 | |||
| 13.14 | Process Technical Risks and Mitigation Measures | 102 | |||
| 13.15 | Conclusions and Recommendations | 102 | |||
| 14.0 | MINERAL RESOURCES ESTIMATES | 103 | |||
| 14.1 Geologic Model Description | 104 | ||||
| 14.2 Simulation Model Description | 107 | ||||
| 14.3 Lithium Resource Estimate | 112 | ||||
| 14.4 Qualified Person Discussion | 114 | ||||
| 15.0 | MINERAL RESERVE ESTIMATES | 115 | |||
| 15.1 | Introduction | 115 | |||
RSI-3353
| 15.2 | Lithium Reserve Estimate | 115 | |
| 15.3 | Discussion of Results | 118 | |
| 16.0 | MINING METHODS | 119 | |
| 16.1 | Production Plan | 123 | |
| 17.0 | RECOVERY METHODS | 125 | |||
| 17.1 | Overview | 125 | |||
| 17.2 | Brine Supply and Reinjection (LANXESS) | 126 | |||
| 17.2.1 | Brine Supply | 126 | |||
| 17.2.2 | Brine reinjection | 126 | |||
| 17.3 | Brine Pre-Treatment | 127 | |||
| 17.4 | Direct Lithium Extraction | 127 | |||
| 17.4.1 | Lithium Selective Sorption | 127 | |||
| 17.4.2 | Lithium-Depleted Brine Processing | 128 | |||
| 17.5 | Purification and Concentration | 128 | |||
| 17.5.1 | Brackish Water Reverse Osmosis | 128 | |||
| 17.5.2 | Chemical Softening | 128 | |||
| 17.5.3 | Ion Exchange | 129 | |||
| 17.5.3.1 | Calcium and Magnesium Removal | 129 | |||
| 17.5.3.2 | Ion Exchange Boron Removal | 129 | |||
| 17.5.4 | Osmotically-Assisted Reverse Osmosis (OARO) | 129 | |||
| 17.6 | Lithium Carbonate Conversion | 129 | |||
| 17.6.1 | Lithium Carbonate Crystallization | 129 | |||
| 17.6.2 | Drying, Milling, and Packaging | 130 | |||
| 17.7 | Energy. Water, and Process Materials | 130 | |||
| 17.7.1 | Energy Requirements | 130 | |||
| 17.7.2 | Water Supply | 131 | |||
| 17.7.3 | Reagents | 131 | |||
| 18.0 | PROJECT INFRASTRUCTURE | 132 | |||
| 18.1 | Infrastructure Description | 132 | |||
| 18.1.1 | Geotechnical | 133 | |||
| 18.2 | Brine Supply and Return | 133 | |||
| 18.3 | Processing Plant | 134 | |||
| 18.3.1 | Brine Pre-Treatment | 135 | |||
| 18.3.2 | Lithium Selective Sorption (LSS) | 136 | |||
| 18.3.3 | Softening | 136 | |||
| 18.3.4 | Ion Exchange | 136 | |||
| 18.3.5 | Lithium Chloride Concentration | 136 | |||
| 18.3.6 | Lithium Carbonate Production | 136 | |||
| 18.3.7 | Drying, Milling, and Packaging | 137 | |||
| 18.3.8 | Effluent Brine | 137 | |||
| 18.3.9 | Process Control& Instrumentation Systems | 137 | |||
| 18.4 | Non-Process Buildings | 138 | |||
RSI-3353
| 18.5 | Support Services | 138 | ||
| 18.5.1 | Transportation | 138 | ||
| 18.5.2 | Reagents | 138 | |||
| 18.5.3 | Utilities | 139 | |||
| 18.5.3.1 | Natural Gas | 139 | |||
| 18.5.3.2 | Electrical Power | 139 | |||
| 18.5.3.3 | Water Supply | 139 | |||
| 18.5.3.4 | Steam& Condensate | 139 | |||
| 18.5.3.5 | Compressed Air | 139 | |||
| 18.5.3.6 | Sewage Treatment | 140 | |||
| 18.5.4 | Fire Protection | 140 | |||
| 18.5.5 | Stormwater Management | 140 | |||
| 18.5.6 | UIC Disposal Wells | 140 | |||
| 18.5.7 | Security | 140 | |||
| 18.5.8 | Telecommunications | 140 | |||
| 18.5.8.1 | Main Internet Service | 141 | |||
| 18.5.8.2 | Cloud Based PBX phone system | 141 | |||
| 18.5.8.3 | Plant Wireless System | 141 | |||
| 18.5.8.4 | VHF/UHF Radio System | 141 | |||
| 18.5.8.5 | Business lan/WAN | 141 | |||
| 18.5.8.6 | process Control lan | 142 | |||
| 18.6 | LANXESS Constructed Improvements | 142 | |||
| 19.0 | MARKET STUDIES AND CONTRACTS | 143 | |||
| 19.1 | The Lithium Market | 143 | |||
| 19.2 | Lithium Supply and Demand | 145 | |||
| 19.3 | Lithium Carbonate Price | 146 | |||
| 19.4 | LANXESS Memorandum of Understanding and Offtake Option | 148 | |||
| 20.0 | ENVIRONMENTAL STUDIES, PERMITTING, AND SOCIAL OR COMMUNITY IMPACT | 149 | |||
| 20.1 | Environmental Regulatory Setting | 149 | |||
| 20.2 | Permits and Authorities | 149 | |||
| 20.2.1 | Federal | 150 | |||
| 20.2.2 | State of Arkansas | 150 | |||
| 20.3 | Construction and/or Operation Permits | 151 | |||
| 20.3.1 | CWA SECTION 404 – Nationwide Permit 39 | 151 | |||
| 20.3.2 | Minor Source Air Permit | 152 | |||
| 20.3.3 | Public Water Supply | 152 | |||
| 20.3.4 | NPDES Construction Stormwater Discharge | 152 | |||
| 20.3.5 | NPDES Non-Brine Process Water Discharge | 153 | |||
| 20.3.6 | State Construction Permit for Wastewater Treatment | 153 | |||
| 20.3.7 | NPDES Stormwater Discharges from Categorical Industry | 153 | |||
| 20.3.8 | State No-Discharge Permit | 153 | |||
| 20.3.9 | Underground Injection Control Permit | 154 | |||
RSI-3353
| 20.3.10 | Resource Conservation and Recovery Act Subtitle C Treatment, Storage, and Disposal Permit | 154 | |||
| 20.4 | Permit Modifications | 155 | |||
| 20.5 | Environmental Liabilities | 155 | |||
| 20.6 | Environmental Baseline Studies | 156 | |||
| 20.6.1 | Subsurface – Groundwater | 156 | |||
| 20.6.2 | Subsurface – Soil | 157 | |||
| 20.6.3 | Surface – Stormwater | 157 | |||
| 20.6.4 | Surface – Sediment | 157 | |||
| 20.6.5 | Surface – Vegetation | 158 | |||
| 20.7 | Wildlife | 158 | |||
| 20.8 | Cultural Resources | 159 | |||
| 20.9 | Environmental Impact | 160 | |||
| 20.10 | Social Impact | 161 | |||
| 20.11 | Waste Management/Disposal | 161 | |||
| 20.12 | Environmental Management and Closure Plan | 162 | |||
| 21.0 | CAPITAL AND OPERATING COSTS | 163 | |||
| 21.1 | Capital Costs | 163 | |||
| 21.1.1 | Estimate Methodology | 164 | |||
| 21.1.2 | Scope of Estimate | 165 | |||
| 21.1.2.1 | Direct Costs | 165 | |||
| 21.1.2.2 | Indirect Costs | 166 | |||
| 21.1.3 | Schedule | 166 | |||
| 21.1.4 | Contracting Approach | 167 | |||
| 21.1.5 | Allowances | 167 | |||
| 21.1.6 | Contingency | 167 | |||
| 21.1.7 | Exclusions | 168 | |||
| 21.1.8 | Estimate Confidence | 168 | |||
| 21.2 | Operating Cost Estimate | 168 | |||
| 21.2.1 | Electric Power and Infrastructure | 169 | |||
| 21.2.2 | Reagents and Consumables | 169 | |||
| 21.2.3 | Maintenance Materials and External Services | 170 | |||
| 21.2.4 | Workforce | 170 | |||
| 21.2.5 | Insurance | 172 | |||
| 21.2.6 | Miscellaneous costs | 172 | |||
| 21.2.7 | Sustaining Capital | 172 | |||
| 21.2.8 | Exclusions | 173 | |||
| 21.3 QP Opinion | 173 | ||||
| 22.0 | ECONOMIC ANALYSIS | 174 | |||
| 22.1 | Inputs and Assumptions | 174 | |||
| 22.1.1 | CAPEX | 175 | |||
| 22.1.2 | OPEX | 175 |
RSI-3353
| 22.1.3 | Sustaining Capital | 175 | ||
| 22.1.4 | Cash Flow | 175 | ||
| 22.1.5 | Construction | 175 | ||
| 22.1.6 | Operating Life | 175 | ||
| 22.1.7 | Commodity Pricing | 175 | ||
| 22.1.8 | Discounted Cash Flow (DCF) | 175 | ||
| 22.1.9 | Pre-Construction Expenses | 176 | ||
| 22.2 | Taxes& Royalties | 176 | ||
| 22.2.1 | Fees and Royalties | 176 | ||
| 22.2.2 | Depreciation | 176 | ||
| 22.2.3 | Corporate Taxes | 176 | ||
| 22.2.4 | 45X MPTC Tax Credit | 176 | ||
| 22.3 | CAPEX Spending Schedule | 176 | ||
| 22.4 | Production Revenues | 176 | ||
| 22.5 | Cash-Flow Projection | 176 | ||
| 22.6 | Economic Evaluation Results | 177 | ||
| 22.7 | Sensitivity Analysis | 177 | ||
| 22.8 | Conclusions and Sensitivity Analysis | 181 | ||
| 23.0 | ADJACENT PROPERTIES | 182 | ||
| 23.1 | LANXESS Corporation | 182 | ||
| 23.2 | Albemarle Corporation | 182 | ||
| 23.3 | Saltwerx (Subsidiary to Galvanic, LLC) | 182 | ||
| 23.4 | Tetra Technologies | 183 | ||
| 24.0 | OTHER RELEVANT DATA AND INFORMATION | 184 | ||
| 25.0 | INTERPRETATIONS AND CONCLUSIONS | 185 | ||
| 25.1 | Geology, Resources and Reserve Estimate | 185 | ||
| 25.2 | Process Information and Design | 187 | ||
| 25.3 | Infrastructure | 187 | ||
| 25.4 | Environmental Studies | 188 | ||
| 25.5 | Environmental Regulatory Permitting | 188 | ||
| 25.6 | Social and Community Impact | 189 | ||
| 25.7 | Capital and Operating Costs | 189 | ||
| 25.8 | Economic Analysis | 190 | ||
| 25.9 | Project Risks | 191 | ||
| 26.0 | RECOMMENDATIONS | 192 | ||
| 27.0 | REFERENCES | 193 | ||
RSI-3353
LIST OF TABLES
| Table | Page |
| Table 1-1. Description of LANXESS Unitized and Non-Unitized Land Holdings for Brine Production | 4 |
| Table 1-2. LANXESS Project Mineral Resource Estimation by Unit | 5 |
| Table 1-3. LANXESS Project Phase 1A Mineral Reserves Estimation | 6 |
| Table 1-4. Project Permits | 9 |
| Table 1-5. Phase 1A Capital Cost Summary | 10 |
| Table 1-6. Phase 1A Operating Cost Summary | 11 |
| Table 1-7. Phase 1A Financial Results Summary | 11 |
| Table 2-1. Glossary of Terms | 16 |
| Table 2-2. Qualified Persons and Responsibilities | 17 |
| Table 2-3. Contributor Sub-Consultants | 18 |
| Table 2-4. Abbreviations and Acronyms | 19 |
| Table 2-5. Units of Measure | 21 |
| Table 2-6. Minerals | 21 |
| Table 4-1. Description of LANXESS Unitized Land Holdings for Brine Production | 23 |
| Table 4-2. Expected Permits for the Project | 30 |
| Table 6-1. Summary of Historical Brine Analyses (Worley 2019) | 37 |
| Table 6-2. 2018 Inferred Mineral Resource (Eccles et al. 2018) | 39 |
| Table 6-3. Indicated Mineral Resource (Dworzanowski et al. 2019) | 40 |
| Table 9-1. Average of Supply Well Lithium Concentration Data | 58 |
| Table 10-1. Well Data | 61 |
| Table 12-1. Sample Concentration Comparison | 73 |
| Table 13-1. Demonstration Plant LiCl Analysis | 82 |
| Table 13-2. LSS Process Parameters | 88 |
| Table 13-3. OARO Examples | 90 |
| Table 13-4. LiCl Product Used for Lithium Carbonate Conversion – Trial 1 | 95 |
| Table 13-5. Lithium Carbonate Product – Trial 1 | 96 |
| Table 13-6. LiCl Product Used for Lithium Carbonate Conversion – Trial 2 | 97 |
| Table 13-7. Lithium Carbonate Product – Trial 2 | 98 |
| Table 13-8. LiCl Product Used for Lithium Carbonate Conversion – Trial 3 | 100 |
| Table 13-9. Lithium Carbonate Product – Trial 3 | 101 |
| Table 14-1. Estimated Unit Properties Resulting from Finite Difference Modeling | 112 |
| Table 14-2. Statement of Resources In-Place by Unit effective date, August 18, 2023 | 113 |
| Table 15-1. Phase 1A Proven and Probable Reserves | 117 |
| Table 15-2. Phase 1A Modifying Factors | 117 |
RSI-3353
| Table 16-1. Planned South Unit Production by Year for First 25 Years of Production | 124 |
| Table 17-1. Reagent Consumption | 131 |
| Table 20-1. Permits for Project | 151 |
| Table 20-2. Permits for LANXESS South Plant to be Modified | 155 |
| Table 21-1. Project Capital Cost Estimate Summary | 163 |
| Table 21-2. Project Operating Cost Summary | 169 |
| Table 21-3. Reagent Cost Estimate | 170 |
| Table 21-4. Consumable Costs | 170 |
| Table 21-5. Workforce Positions | 171 |
| Table 21-6. Workforce Costs | 172 |
| Table 22-1. Project Economic Model Key Input Parameters | 174 |
| Table 22-2. Project Discounted Cashflow Model | 177 |
| Table 22-3. Project Economic Evaluation | 177 |
| Table 22-4. Sensitivity Analysis to CAPEX Variation | 178 |
| Table 22-5. Sensitivity Analysis to OPEX Variation | 178 |
| Table 22-6. Sensitivity Analysis to Product Price Variation | 178 |
| Table 22-7. Sensitivity Analysis to Production Volume Variation | 178 |
| Table 25-1. Statement of Resources In-Place by Unit effective date, August 18, 2023 | 185 |
| Table 25-2. Phase 1A Proven and Probable Reserves | 186 |
| Table 25-3. Project Economic Analysis Conclusions | 190 |
RSI-3353
LIST OF FIGURES
| FIGURE | Page |
| Figure 1-1. Overall Location Map | 3 |
| Figure 1-2. LANXESS Project Phase 1A Production Plan | 7 |
| Figure 1-3. Proposed Project Location | 8 |
| Figure 1-4. Project Schedule | 10 |
| Figure 4-1. Overall Property Location Map | 24 |
| Figure 4-2. Property Location showing LANXESS Plant Locations within Units | 25 |
| Figure 4-3. Land Reserved for Project Facility Construction | 26 |
| Figure 5-1. LANXESS Project Access Routes | 33 |
| Figure 5-2. Average Temperature and Total Precipitation at El Dorado, Arkansas, for 2022 (Weather.gov, 2023) | 34 |
| Figure 6-1. Smackover Formation Lithium Brine Values Derived within, and Adjacent to, the LANXESS Property (Blondes, et al. 2018) | 38 |
| Figure 7-1 Tectonic Framework of the Northern Part of the Gulf of Mexico Region (Marcini et.al. 2008, who modified the work of MacRai and Watkins (1996)) | 42 |
| Figure 7-2 Facies Map of the Smackover Formation, Northern Gulf Coast Basin (Budd et al. 1981) | 43 |
| Figure 7-3 Stratigraphic Table of the Late Triassic to Late Jurassic Formations of the Northern U.S. Gulf Coast (Heydari and Baria 2005) | 44 |
| Figure 7-4 Stratigraphic Depositional Environments of the Smackover Formation | 46 |
| Figure 7-5 LANXESS Project Area Map | 49 |
| Figure 7-6 Smackover Structure Map | 50 |
| Figure 7-7. North-South Cross Section with Geologic Model Oolite 1-6 Zones | 51 |
| Figure 9-1. Well Data Source | 56 |
| Figure 9-2. Standard Lithium Sample Locations | 59 |
| Figure 9-3. Estimated Initial Lithium Concentration | 60 |
| Figure 12-1. Recent Average Well Lithium Concentrations | 70 |
| Figure 12-2. Historical and Recent Well Lithium Concentrations | 71 |
| Figure 12-3. Duplicate Sample Comparison | 74 |
| Figure 13-1. Project Process Block Flow Diagram | 79 |
| Figure 13-2. Standard Lithium Demonstration Plant | 80 |
| Figure 13-3. Tail Brine Measurement Skid at the LANXESS Bromine Tower | 83 |
| Figure 13-4. Sludge Dissolution for Tail Brine pH Adjustment | 85 |
| Figure 13-5. Sludge Dissolution for Brine pH Control | 85 |
| Figure 13-6. Osmotically Assisted Reverse Osmosis System at the Demonstration Plant | 90 |
| Figure 13-7. Calcium Removal with Soda Ash | 91 |
| Figure 13-8. Magnesium Removal with Soda Ash | 92 |
RSI-3353
| Figure 13-9. Calcium and Magnesium Ion Exchange System at the Demonstration Plant | 93 |
| Figure 13-10. Photo of 2nd Stage Lithium Carbonate Crystals | 97 |
| Figure 13-11. Photo of 1st Stage Lithium Carbonate Crystals | 99 |
| Figure 13-12. Photo of 2nd Stage Lithium Carbonate Crystals | 99 |
| Figure 14-1. LANXESS Property Smackover Type Well | 105 |
| Figure 14-2. Porosity Log Net Pay Example | 106 |
| Figure 14-3. Total Gross Pay Map Zones 1-6 | 106 |
| Figure 14-4. Simulation Model Grid Layout | 108 |
| Figure 14-5. Simulation Model Match of Unit Produced Lithium Concentration Data | 109 |
| Figure 14-6. Simulation Model Match of South Unit Well Produced Lithium Concentration Data | 111 |
| Figure 16-1. Typical Brine Source Well Diagram | 119 |
| Figure 16-2. Typical Disposal Well Diagram | 120 |
| Figure 16-3. South Unit Well and Flow Line Configuration | 121 |
| Figure 16-4. South Unit Production - Concentration Estimates | 122 |
| Figure 16-5. Project Production Plan | 123 |
| Figure 17-1. Project Process Block Flow Diagram | 125 |
| Figure 17-2. Standard Lithium and LANXESS Process Block Flow Diagram | 126 |
| Figure 18-1. Proposed Project Facility Location | 132 |
| Figure 18-2. Project Site Overview | 133 |
| Figure 18-3. Brine Supply and Return Pipelines | 134 |
| Figure 18-4. Project Facility Layout | 135 |
| Figure 18-5. Project Brine Pipeline Network | 142 |
| Figure 19-1. Global Lithium-Ion Battery Cell Demand, GWh, Base (after McKinsey & Company 2023) | 143 |
| Figure 19-2. Forecasted Lithium Demand (Albemarle, 2023) | 144 |
| Figure 19-3. Lithium Supply and Demand Forecast (McKinsey & Company, 2023) | 145 |
| Figure 19-4. Global Weighted Average Lithium Carbonate Price From 2016 to Q1 2023 (source, https://tradingeconomics.com/commodity/lithium) | 146 |
| Figure 19-5. Battery Quality Lithium Price Carbonate Scenarios 2023-2030 | 147 |
| Figure 21-1. Project Capital Estimate Component Breakdown | 164 |
| Figure 21-2. Project Schedule | 167 |
| Figure 22-1. Pre-Tax IRR Sensitivity | 179 |
| Figure 22-2. Post-Tax IRR Sensitivity | 180 |
| Figure 22-3. Pre-Tax NPV Sensitivity | 180 |
| Figure 22-4. Post-Tax NPV Sensitivity | 180 |
| Figure 23-1. Location of Active and Potential Brine Producers in Southern Arkansas | 183 |
RSI-3353
1.0 EXECUTIVE SUMMARY
Standard Lithium Ltd. (Standard Lithium or Company) is a lithium development company with a portfolio of lithium production projects proposed for development in the United States of America (USA). The LANXESS Project refers to a suite of contemplated staged expansion projects relating to the LANXESS South, Central, and West Brine Production Units. This Commercial Lithium Extraction Plant Project at LANXESS South Plant (Phase 1A or Project) is the first stage of development of the LANXESS Project.
It is proposed that the Project will receive lithium-rich brine currently being produced from the Smackover Formation by LANXESS for their existing South Plant, and following bromine processing by LANXESS, extract the lithium from the residual brine using Direct Lithium Extraction technology, convert it to battery quality lithium carbonate, and then return the lithium-depleted brine to the existing South Plant brine disposal network for reinjection into the Smackover Formation.
Standard Lithium is a jointly listed company on the TSX Venture Exchange (stock symbol TSXV:SLI), New York Stock Exchange (stock symbol: NYSE American:SLI), and Frankfurt Stock Exchange (stock symbol: Frankfurt Exchange:S5L), with their head office in Vancouver, BC.
RESPEC Company, LLC (RESPEC) was commissioned by Standard Lithium to provide an independent Qualified Person’s (QP) review and National Instrument (NI) 43-101 Technical Report (TR) on the commercial viability of lithium extraction on a mass scale from brine that is already produced for an existing bromine production facility operated by LANXESS Corporation (LANXESS) located near the town of El Dorado in Union County, Arkansas, USA.
LANXESS has the exclusive brine extraction rights for a contiguous block of 60,477 hectares (ha) [149,442 acres (ac)], contained within three brine production units, referred to as the South, Central and West Brine Units of which 15,458 ha [38,198 ac] make up the South Unit, the Property associated with the Project.
The purpose of this report is to summarize the results of the feasibility of the Project at the LANXESS South Plant including establishment of the associated brine Mineral Reserves and update the broader Mineral Resources for the overall LANXESS Project. The Definitive Feasibility Study (DFS) encompassed the geologic modeling, resource and reserve estimation, extraction planning and design, methodology and equipment, hydrogeology modeling, surface infrastructure requirements, labor, lithium processing Demonstration Plant test work results, lithium brine field operations, environmental and permitting, marketing, project economics, project development schedule, and risks in developing the Project.
Standard Lithium’s objective is to become a leading American producer of high-quality lithium products from the Smackover region to supply domestic lithium markets and address long-term supply deficits. With the completion of the DFS the Project has demonstrated feasibility and established that lithium can be profitably extracted from Smackover brine.
1.1 PROPERTY DESCRIPTION
The LANXESS property is located south of the City of El Dorado in Union County, AR, USA, as presented in Figure 1-1. The southern and western edges of the Property border the state of Louisiana (LA) and Columbia County, respectively. The Property encompasses Townships 16-19 South, and Ranges 14-18, West of the 5th Meridian (W5M). The Property center is at Universal Transverse Mercator (UTM) 520600 Easting, 3670000 Northing, Zone 15N, NAD83.
RSI-3353
LANXESS has the rights to extract brine from the South, Central, and West brine production units through the unitization by the Arkansas Oil and Gas Commission (AOGC). Definitive commercial agreements between LANXESS and Standard Lithium, once in effect, will grant Standard Lithium the associated rights required for lithium extraction. The production units, which are shown on the property overview in Figure 1-1, consist of 60,477 ha [149,442 ac] that cover over 608 square kilometers (km2). Table 1-1 provides a description of the LANXESS Unitized land holdings. Each of the three Units (South, Central, and West) has their own brine supply wells, pipeline network, and bromine processing (extraction) infrastructure. The South Unit, which where referenced includes the South Unit Expansion, is the focus of the Project.
Standard Lithium and LANXESS signed a binding Revised and Restated Memorandum of Understanding (MOU) which forms the basis on which the parties agree to cooperate in a phased process towards developing commercial opportunities related to the production, marketing, and sale of battery-quality lithium products for South, Central and West Brine units (Standard Lithium Ltd., 2022). Specifically, the MOU sets out the process for the establishment of definitive commercial agreements between the parties, which once in place, will grant Standard Lithium rights required for development of the Project which is associated with the South Brine Unit and govern the broader relationship throughout the life of the Project. The MOU also provides LANXESS an option to acquire an ownership interest in the Project. A separate access, license and reservation agreement between the parties provides Standard Lithium the exclusive rights to 39 ha of surface lands for development of the Project and potential future stages of the LANXESS Project as well as access to the property for development purposes.
RSI-3353
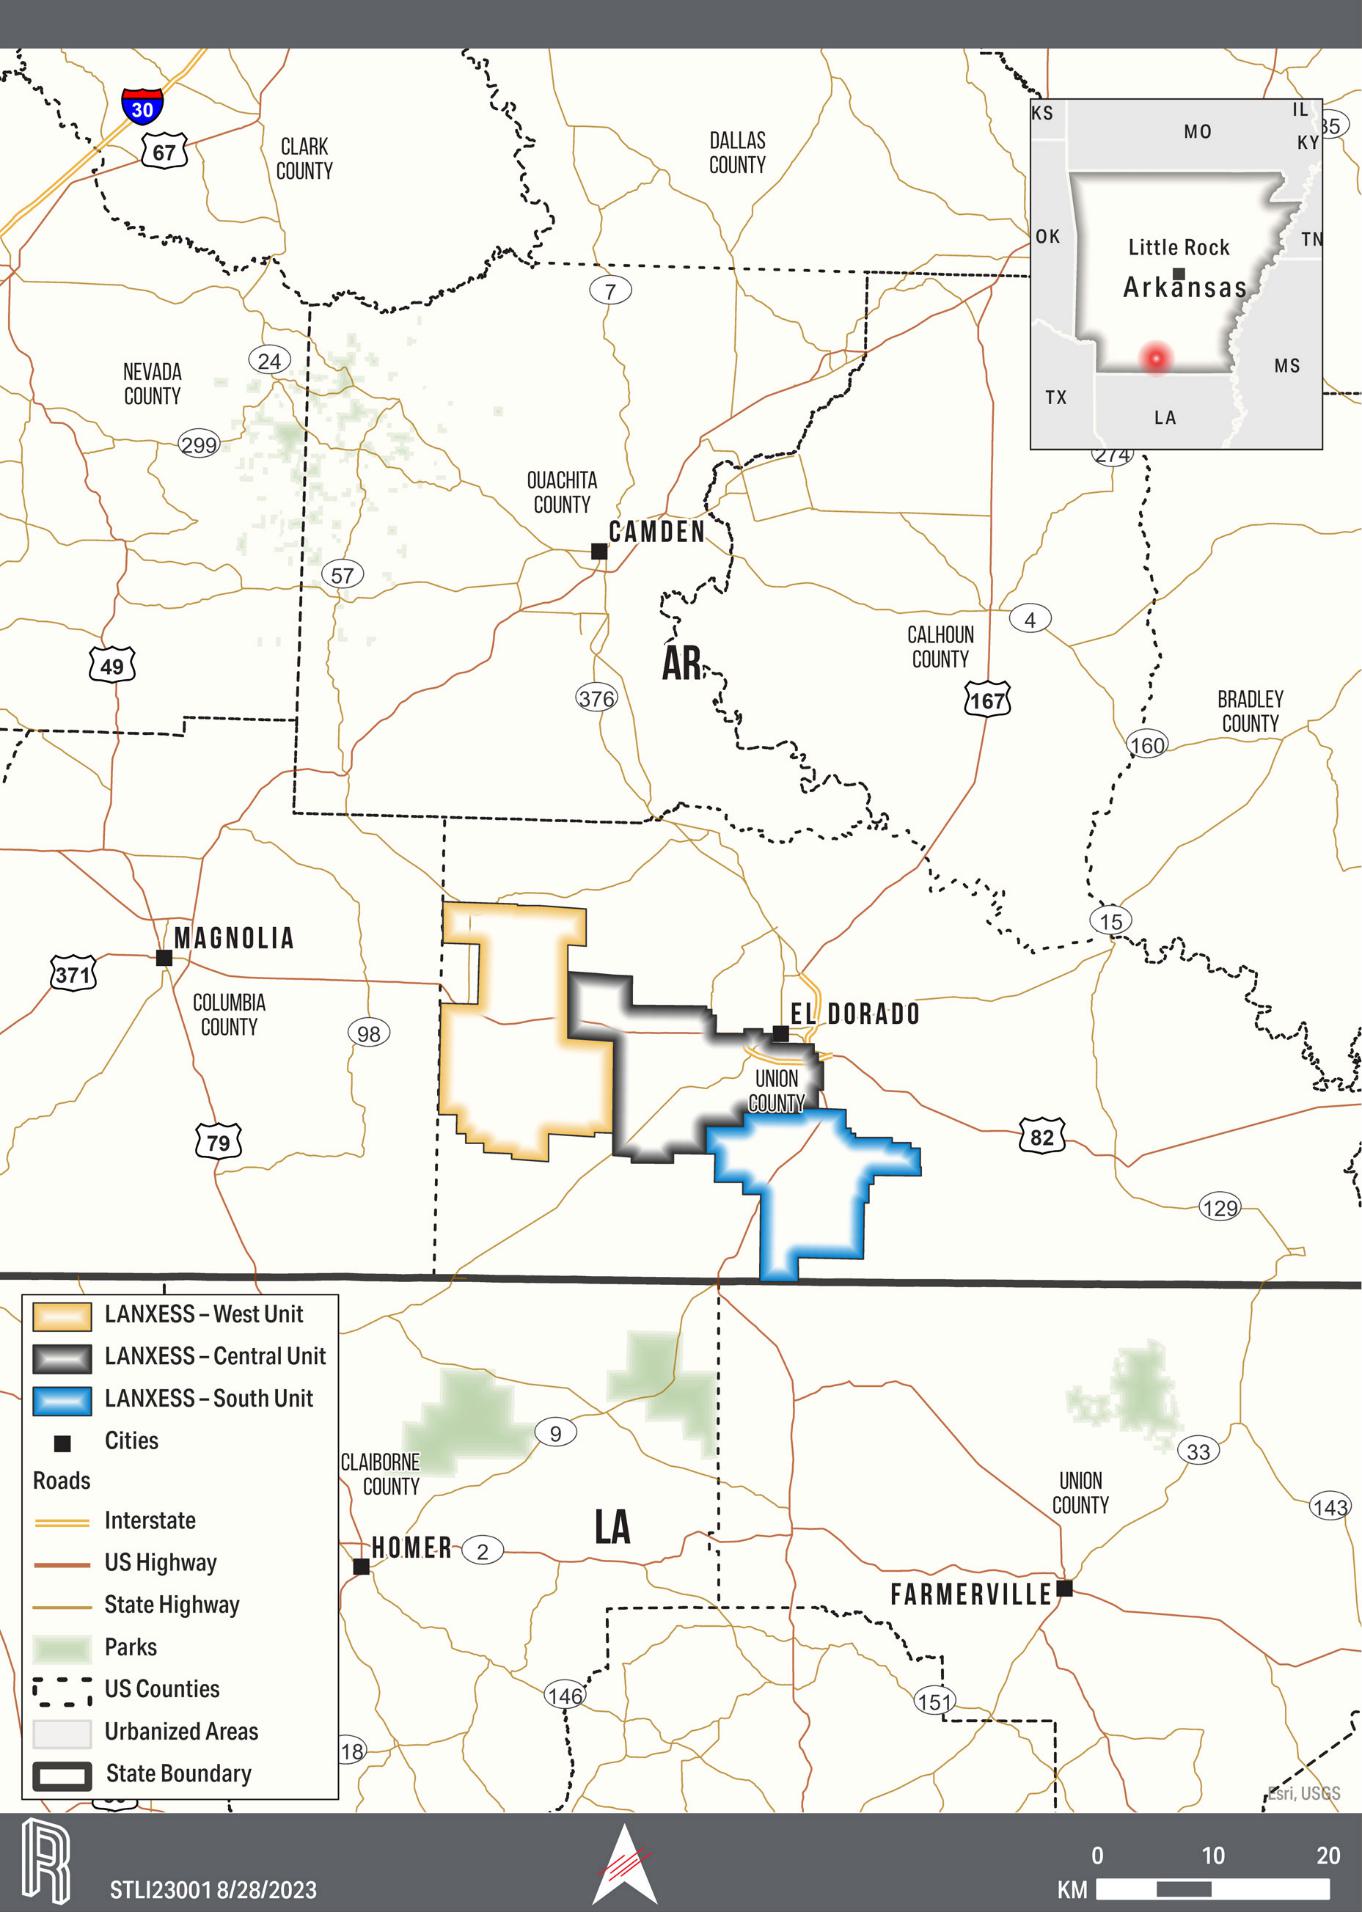
Figure 1-1. Overall Location Map
RSI-3353
Table 1-1. Description of LANXESS Unitized and Non-Unitized Land Holdings for Brine Production
| AOGC Order Reference |
Date | Acres | Hectares | |
| South Plant Brine Unit | BU 1-1995 | March 28, 1995 | 30,877 | 12,495 |
| South Expansion Brine Unit | 086-1-2016-11 | November 28, 2016 | 7,321 | 2,963 |
| Central Plant Brine Unit | BU 2-1995 | August 22, 1995 | 42,974 | 17,391 |
| Central Expansion Brine Unit | 095-2022-12 | January 5, 2023 | 6,560 | 2,655 |
| West Plant Brine Unit | BU 3-1995 | November 28, 1995 | 60,354 | 24,424 |
| West Expansion Brine Unit-H | 048-2-2015-04 | May 14, 2015 | 1,356 | 549 |
Notes:
[1] The expansion brine units listed in the table are to differentiate the AOGC orders and dates from the original area brine units. Unless specifically stated in the TR, any reference to an area brine unit includes the associated expansion brine unit.
1.2 GEOLOGY AND MINERALIZATION
The focus of this resource assessment is the lithium bearing Smackover Formation in southern Arkansas. The Smackover Formation, Upper Jurassic in age, is commonly subdivided into two intervals: Upper and Lower.
The Upper Smackover interval is the development target for the Project and has been subdivided into the Reynolds Member oolite, an oolitic limestone, and the Middle Smackover. The Lower Smackover interval, also known as the Brown Dense, is composed of dark, dense limestone with argillaceous bands. The structure of the Smackover in the Property generally dips from north-northeast to south-southwest and varies in depth from approximately 1,920 meters [6,300 feet] subsea to approximately 2,621 meters [8,600 feet] subsea.
The Smackover Formation’s productive characteristics have been extensively characterized by the drilling of over 1,000 wells in approximately 600 former and producing oil and gas fields, with approximately 150 of those fields in Arkansas.
1.3 STATUS OF EXPLORATION
No new exploration drilling has occurred for this TR as all production wells proposed for the Project are already constructed and producing. The lithium concentration data used in this TR resulted from brine samples collected by Standard Lithium from 2017 through May 2022 and analyzed by Western Environmental Testing Laboratory (WetLab). The concentration data for each well was used to develop a map of the initial distribution of lithium throughout the Property which formed the basis for the computer simulation model-based estimates. In addition, the brine samples collected at the inlet of each of the processing facilities were used to quantify the inlet lithium concentrations at the three bromine processing facilities for comparison to the simulation model’s initial predicted values.
1.4 MINERAL RESOURCE ESTIMATE
A geologic multi-zone model of the Property was constructed using Petra® that serves the basis of the brine body simulation model. The geologic mapping covered the Property and the surrounding area. The volume of porous rock as described in the geologic model and the estimated lithium concentrations present in the brines stored within the formation on the Property serve as the basis for the Mineral Resource estimate.
RSI-3353
The geologic multi-zone model was input into a Merlin finite-difference reservoir simulation model to estimate the resources present in each of the three Units. The Merlin finite-difference reservoir simulation model was used to model brine content, brine movement, bromine recovery, and lithium recovery. Simulation was required to estimate the resources because the ongoing production and injection of brine for bromine recovery project, while not altering the overall lithium content of the Property, results in geographical changes in lithium concentration over time.
Mineral Resources are subdivided in order of increasing geological confidence into Inferred, Indicated, and Measured categories. The total in-situ Measured and Indicated Brine Resource for the LANXESS Project are estimated at 2.8 Mt of Lithium Carbonate Equivalent (LCE) or 529,000 tonnes of elemental lithium at an average lithium concentration of 148 mg/L across all three units.
Table 1-2. LANXESS Project Mineral Resource Estimation by Unit
| Category | Units | South | West | Central | Central Expansion |
Total |
| Lithium Concentration | mg/L | 204 | 122 | 164 | 78 | 148 |
| Measured Resource | thousand tonnes | 148 | 192 | 173 | - | 513 |
| Indicated Resource | thousand tonnes | - | - | - | 16 | 16 |
| Measured LCE Resource | thousand tonnes | 788 | 1,022 | 921 | - | 2,731 |
| Indicated LCE Resource | thousand tonnes | - | - | - | 85 | 85 |
Notes:
[1] Volumes are in-place.
[2] Cutoff of 9% porosity.
[3] The effective date is August 18, 2023.
[4] Mineral Resources are inclusive of Mineral Reserves.
[5] The Qualified Persons for the Mineral Resource Estimates is Randal M. Brush, PE and Robert E. Williams, Jr., PG, CPG.
[6] The Mineral Resource estimate follows 2014 CIM Definition Standards and the 2019 CIM MRMR Best Practice Guidelines.
[7] These Mineral Resources are not Mineral Reserves as they have not demonstrated economic viability.
[8] Calculated brine volumes only include Measured and Indicated Mineral Resource volumes that when blended from the well field result in feed above the cut-off grade of 100 mg/L.
[9] Lithium Carbonate Equivalent (LCE) is calculated using mass of LCE = 5.323 multiplied by mass of lithium metal.
[10] Results are presented in-situ. The number of tonnes was rounded to the nearest thousand. Any discrepancies in the totals are due to rounding effects.
[11] The Qualified Person is not aware of any known environmental, permitting, legal, title-related, taxation, socio-political or market issues, or any other relevant issue that could materially affect the potential development of Mineral Resources other than those discussed in the Mineral Resource Estimates.
1.5 MINERAL RESERVE ESTIMATE
Reserves were calculated from the simulated Smackover Formation brine production rates as applied to the South Unit. Proven and Probable Reserves were estimated from the Measured and Indicated Resources based on the forecast operating capacity of the South Plant brine supply and disposal network projected for a 25 and 40-year period.
RSI-3353
Proven and Probable Lithium Brine Reserves are estimated to be recovered by the Project over a 25-year forecast period, with the anticipated Project start-up in 2026. Probable Lithium Brine Reserves are estimated to be recovered from year 26-40.
Table 1-3. LANXESS Project Phase 1A Mineral Reserves Estimation
| Category | Units | Proven | Probable | Proven + Probable |
| Brine Reserves | million m³ | 124 | 84 | 209 |
| Average Lithium Concentration | mg/L | 227 | 201 | 217 |
| Lithium Metal | thousand tonnes | 28.2 | 17.0 | 45.2 |
| LCE Reserves | thousand tonnes | 129 | 79 | 208 |
Notes:
[1] The effective date is August18, 2023.
[2] Any discrepancies in the totals are due to rounding effects.
[3] The Qualified Person for the Mineral Reserve estimate is Randal M. Brush, PE.
[4] Converted Reserves are exclusive to the South Brine Unit.
[5] The average lithium concentration is weighted per well simulated extraction rates.
[6] The Proven case assumes a 25-year operating life at 4.96 million m3/year of brine production at a cut-off of 100 mg/L.
[7] Proven plus Probable reserves assume a 40-year operating life at 5.21 million m3/year of brine production at a cut-off of 100 mg/L.
[8] The Reserves reference point for the Brine Pumped, Average Lithium Concentration, and Lithium Metal is the brine inlet to the processing plant.
[9] The Reserves reference point for the LCE is the product output of the processing plant.
[10] Lithium Carbonate production values consider plant processing efficiency factors.
[11] The Mineral Reserve estimate follows 2014 CIM Definition Standards and the 2019 CIM MRMR Best Practice Guidelines.
[12] Lithium Carbonate Equivalent (“LCE”) is calculated using mass of LCE = 5.323 multiplied by mass of lithium metal.
[13] The Qualified Person is not aware of any known environmental, permitting, legal, title-related, taxation, socio-political or marketing issues, or any other relevant issue, that could materially affect the potential development of Mineral Resources other than those discussed in the Mineral Resource Estimates.
1.6 MINING METHODS
Recovery of the lithium will use the existing LANXESS South Unit brine production facilities to supply the Feed Brine from the LANXESS South Plant to the Project. Once the lithium is extracted from the brine, the processed brine will be reinjected into existing LANXESS South Unit brine disposal wells.
The Project contemplates production of battery-quality lithium carbonate averaging 5,400 tonnes per annum (tpa) over a 25-year operating life, producing 135,000 tonnes LCE from the LANXESS South Brine Unit.
The Project has the potential to operate over a 40-year life based on the Proven and Probable Reserves of 208,000 tonnes LCE. The TR makes very conservative assumptions that production of brine will occur from the existing wellfield, and that no additional wells are drilled in the future to supplement or add to the current brine flow, or to add additional brine from higher lithium content zones available in the production unit(s). See Figure 1-2 for the annual production plan.
RSI-3353
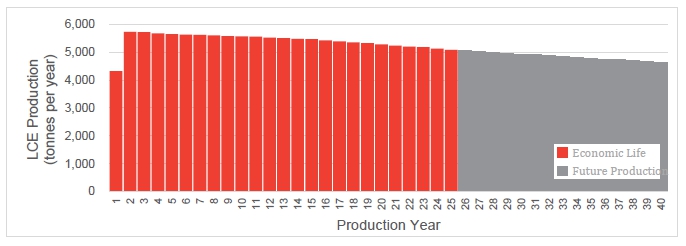
Figure 1-2. LANXESS Project Phase 1A Production Plan
1.7 RECOVERY METHOD
The Standard Lithium plant utilizes the Lithium Selective Sorption (LSS) process to directly extract lithium ions from bromine depleted pretreated Smackover brine delivered from the LANXESS South plant. LSS is a Koch Technology Solutions, LLC (KTS) proprietary technology. Under the joint development agreement with KTS, Standard Lithium has Smackover regional exclusivity for the LSS process for a period of time. Eluate from the LSS process (raw lithium chloride solution) is concentrated and purified and subsequently converted into battery-quality lithium carbonate.
Standard Lithium proposes to process up to 680 m3/hr [3,000 US gpm] of brine containing on average 227mg/L lithium over the 25-year life of the Project. The brine is filtered, pH and temperature adjusted, followed by lithium extraction using the LSS process. The LSS product eluate is concentrated by conventional reverse osmosis, chemically softened for calcium and magnesium removal, and then passed through ion exchange columns to remove the residual calcium, magnesium, and boron. The treated brine is further concentrated by Osmotically Assisted Reverse Osmosis (OARO) prior to conventional two-stage lithium carbonate crystallization to produce up to 5,730 tonnes per year of lithium carbonate. The effluent brine is returned to the LANXESS facility for reinjection into the Smackover Formation through existing injection wells.
Standard Lithium has operated a Demonstration Plant, exclusively processing Smackover brine from LANXESS South Unit, since May 2020. This has provided a valuable source of knowledge in regard to the behavior of the brine, direct testing of various process elements, and providing a test bed for operator training. In addition, the Demonstration Plant has facilitated an ability to produce lithium chloride samples along with brine samples from various stages of the process to support additional bench scale metallurgical testing, mini-pilot plant testing and vendor testing in support of equipment design and process guarantees. The testing undertaken during the DFS phase produced battery-quality lithium carbonate from LANXESS South Unit brines processed through the Demonstration Plant, confirming the viability of the process.
Based on the performance at the Demonstration Plant, process modelling, and various performance and design criteria from potential equipment vendors, the processing facility is expected to recover 93.1% of the lithium contained in the brine delivered by LANXESS into battery-quality lithium carbonate.
1.8 PROJECT INFRASTRUCTURE
The proposed Project Facility is strategically located on undeveloped lands adjacent to the existing LANXESS South Plant to allow interconnection with key elements of existing LANXESS South Plant infrastructure, specifically the brine handling system. Supporting services including power, natural gas, and water is readily available and in close proximity to the Project Site.
RSI-3353
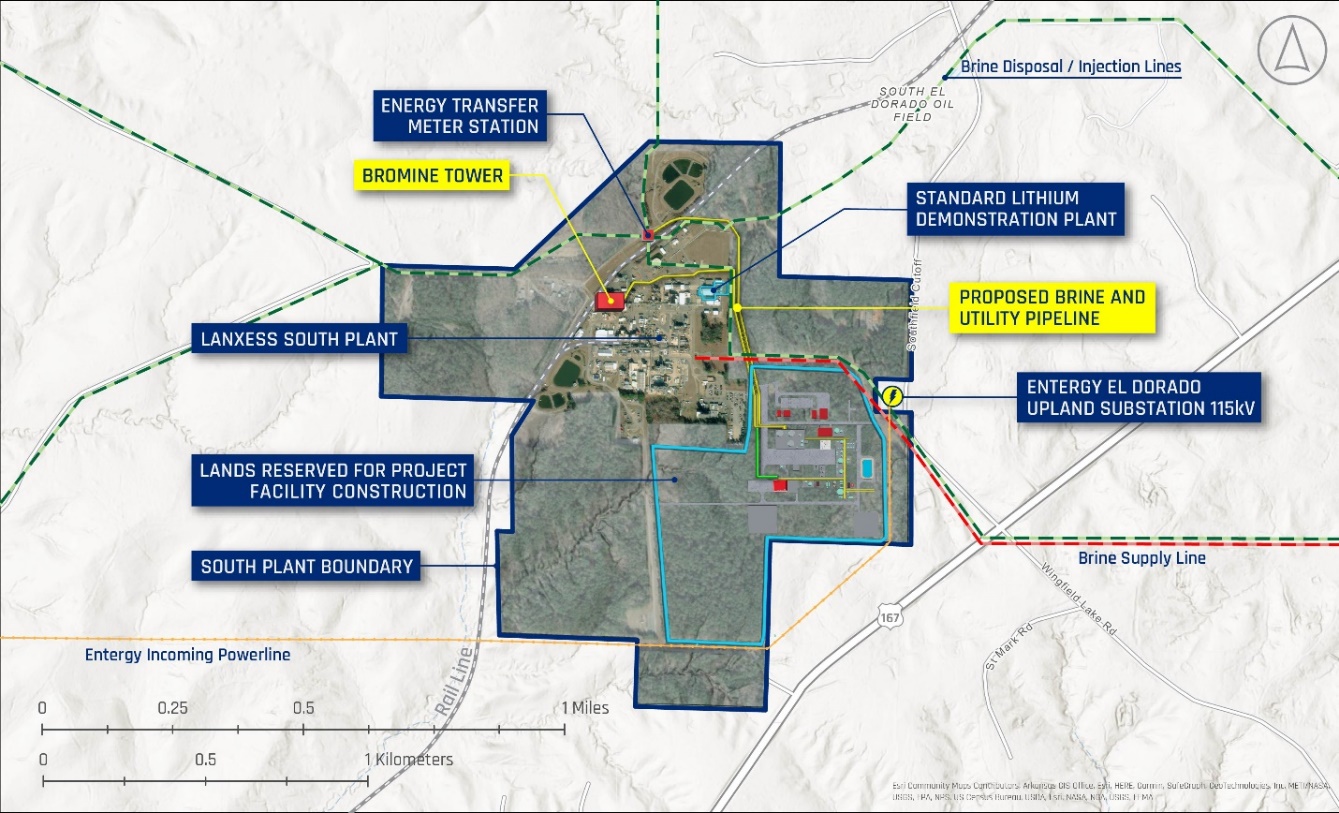
Figure 1-3. Proposed Project Location
Brine will be delivered to and from the Project Facility via two new fiberglass pipelines connecting the facility and the existing South Plant Tail Brine system. The processing plant includes facilities required for brine pre-treatment, direct lithium extraction, effluent brine handling, chemical softening, ion exchange, lithium chloride concentration, lithium carbonate production and product drying, milling, and packaging. The Project Facility also includes an administration building, hourly workers building, warehouse, maintenance shop, onsite laboratory, and guardhouse in support of the approximately 90 people anticipated to be required for its operation.
Natural gas will be delivered by Energy Transfer from their existing supply pipeline located north of the South Plant via a short dedicated interconnecting pipeline constructed and operated by the Project. A dedicated and independent power supply will be provided for the Project Facility by Entergy from their 115kV El Dorado Upland Substation which is located immediately to the east of the Project Facility. Two new Underground Injection Control Class I non-hazardous injection wells for disposal of any excess barren brine are also proposed to be constructed by the Project.
1.9 MARKETING
The demand for lithium is expected to continue to outpace supply for the foreseeable future even with the new supplies coming online due predominantly to the energy transition for lithium battery materials. For purposes of estimating project future cash flows a conservative price of $30,000/tonne was selected for use in economic evaluations over the lifetime of the project.
RSI-3353
1.10 ENVIRONMENTAL PERMITTING
The Project is not subject to review under the National Environmental Policy Act (NEPA). Construction and operational emissions to air, surface waters, and subsurface waters are regulated by the federal and state agencies to protect the environment while allowing responsible development of the lithium resources. Table 1-4 lists the permits required by the Project Company. In addition, the existing LANXESS brine reinjection permit will be modified to include the Project Facility. The permit modification request will be initiated by LANXESS and supported by the Project.
Standard Lithium has initiated early consultation with permitting agencies for the construction and operation of the Project. A Baseline Environmental Site Assessment has been conducted as well as investigations of jurisdictional waters of the U. S., wildlife studies, and cultural resources of the Project.
Table 1-4. Project Permits
| Agency | Permitted Activity |
| USACE | Placement of fill in waters of the U.S. |
| ADEE-DEQ | Air Permit for Commercial Facility |
| ADH | Fresh Water Supply for Potable Water |
| ADEE-DEQ | Construction Storm Water NPDES Permit for Facility Construction Site |
| ADEE-DEQ | Surface Discharge of Non-Brine Process Wastewater, Non-contact Cooling Water, Treated Sanitary Wastewater |
| ADEE-DEQ | Construction of Treatment System Associated with a NPDES Permit |
| ADEE-DEQ | Stormwater Discharges from a Categorical Industry |
| ADEE-DEQ | Construct/Operate Surface Facility for New Class I Nonhazardous Injection Wells |
| ADEE-DEQ | Construct/Operate New Class I Nonhazardous Injection Wells |
| ADEE-AOGC | Construct Drilling Pit for Class 1 Nonhazardous Injection Wells |
| ADEE-DEQ | Transfer Barren Brine to LANXESS No-Discharge Permitted Facility |
1.11 CAPITAL AND OPERATING EXPENSES
The total capital cost (CAPEX), including contingency, to construct the Project is estimated at $365 million. Direct project costs represent $259 million and indirect Project Costs represent $56 million of the total cost. A contingency of $50 million is included, which equates to approximately 15% of direct and indirect costs.
The capital cost estimate is considered to have an accuracy range of -15% to +20%. All costs are expressed in 2023 US Dollars. No allowances are included for cost escalation.
The total estimated capital cost for the Project by area is summarized in Table 1-5.
RSI-3353
Table 1-5. Phase 1A Capital Cost Summary
| Area | Capital Cost ($M) |
| Brine Delivery (Tie-ins) | 9.0 |
| Brine Pretreatment | 43.3 |
| Direct Lithium Extraction | 38.1 |
| Concentration and Purification | 53.3 |
| Carbonation | 53.4 |
| Drying, Milling and Packaging | 18.9 |
| Effluent Brine Disposal | 24.3 |
| Reagent Systems | 8.8 |
| Utilities | 51.1 |
| Other (First Fills, Membranes, Commercial Fees) | 14.7 |
| Contingency | 49.9 |
| Total Capital Cost | 364.9 |
Notes:
[1] Direct costs were estimated using either vendor-supplied quotes, and/or engineer estimated pricing (based on recent experience) for all major equipment.
[2] Indirect costs include all contractor costs (including engineering); indirect labor costs and Owner’s Engineer costs.
[3] Any discrepancies in the totals are due to rounding effects.
Standard Lithium has undertaken efforts to effectively de-risk the construction process for the Project and ensure on-time delivery. This includes a Term Sheet with the nominated EPC contractor, Optimized Process Designs LLC, which sets out construction performance and schedule guarantees to ensure on-time construction, as well as guarantees related to the production of battery-quality lithium carbonate at the facility’s design capacity. This Term Sheet is subject to agreement between the parties on pricing and definitive documentation.
The capital cost estimate is based on construction and commissioning of the facility in accordance with the Project contracting strategy and Project schedule as outlined in Figure 1-4. The Company expects to make a Final Investment Decision in the first half of 2024 which would result in first production of lithium carbonate in 2026.
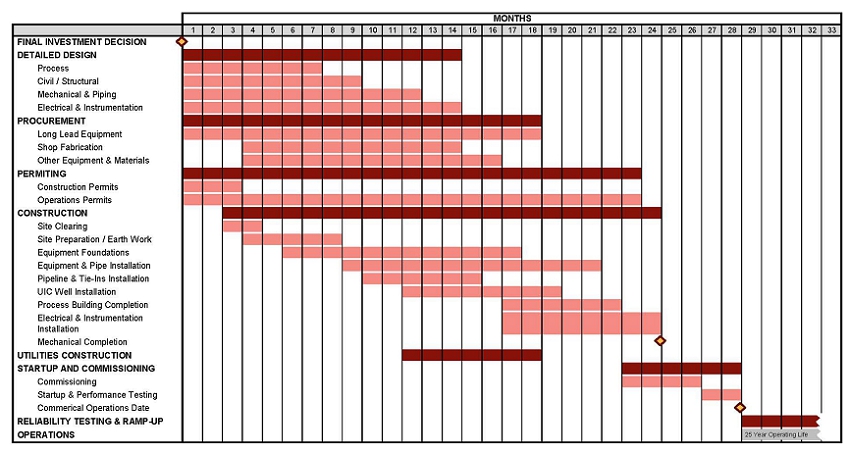
Figure 1-4. Project Schedule
The operating cost for the life of the Project is estimated to be $6,810/t of lithium carbonate. Labor, reagents, consumables, and energy account for over 70% of the operating costs. All-in operating cost, including sustaining capital expenditures is $7,390/t. A summary of the operating costs is included in Table 1-6.
RSI-3353
Table 1-6. Phase 1A Operating Cost Summary
| Category | Average Annual Cost ($/t) [1] |
| Electrical Power and Infrastructure | 950 |
| Reagents and Consumables | 2,880 |
| Maintenance and External Services [2] | 610 |
| Workforce [3] | 1,930 |
| Insurance | 340 |
| Miscellaneous Costs [4] | 100 |
| Total Operating Cost | 6,810 |
| Sustaining Capital Expenditures [5][6] | 580 |
| All-in Operating Cost | 7,390 |
Notes:
[1] Operating costs are calculated based on average annual production of 5,400 tonnes of lithium carbonate.
[2] Includes contract maintenance, solids waste disposal, and external lab services.
[3] Approximately 89 full time equivalent positions.
[4] Includes general and administrative expenses.
[5] Does not include future brine lease-fees-in-lieu-of-royalties which are still to be determined and subject to regulatory approval (lease-fees-in-lieu-of-royalties have been determined for bromine and certain other minerals in the State of Arkansas but have not yet been determined for lithium extraction).
[6] Does not include brine fees which may be due to LANXESS as a result of finalization of the commercial arrangements between LANXESS and Company.
1.12 ECONOMIC ANALYSIS
The financial results are derived from inputs based on the annual production schedule summarized in Table 1-7. Sensitivity analysis on the unlevered economic results over a 25-year operating life are summarized in Table 1-7.
Table 1-7. Phase 1A Financial Results Summary
| Category | Units | Value |
| Initial Annual Production of Li2CO3 | tpa{1] | 5,730[2] |
| Average Annual Production of Li2CO3 | tpa | 5,400 |
| Plant Operating Life | years | 25[3] |
| Total Capital Expenditures | $ millions | 365[4, 5] |
| Average Annual Operating Cost | $/t | 6,810 |
| Average Annual All-in Operating cost | $/t | 7,390[6, 7] |
| Selling Price | $/t | 30,000[8] |
| Discount Rate | % | 8 |
| Net Present Value (NPV) Pre-Tax | $ millions | 772 |
| NPV After-Tax | $ millions | 550[9] |
| Internal Rate of Return (IRR) Pre-Tax | % | 29.5 |
| IRR After -Tax | % | 24.0 |
Notes:
[1] Tonnes (1,000 kg) per annum.
[2] Initial annual production figure represents Year 2 production, following a ramp-up period in Year 1.
[3] Plant design and financial modelling based on 25-year economic life. Proven and Probable Reserves support a 40-year operating life.
RSI-3353
[4] Capital expenditures include 15% contingency.
[5] No inflation or escalation has been carried out for the economic modelling.
[6] Includes operating expenditures and sustaining capital.
[7] Brine lease-fees-in-lieu-of-royalties (to be approved by AOGC) have not been defined and are not currently included in the economic modelling.
[8] Selling price of battery-quality lithium carbonate based on a flatline price of $30,000/t over total project lifetime.
[9] Assumes a U.S. Federal tax rate of 21% and State of Arkansas Tax rate of 5.1%, as well as variable property taxes.
RSI-3353
Sensitivity analysis on the unlevered economic results over a 25-year operating life are summarized in Table 1-8.
Table 1-8. Sensitivity Analysis Summary
| Category | After-tax NPV ($millions) | After-Tax IRR (%) |
| Li2CO3 Price | ||
| -20% | 337 | 18.4 |
| 0% | 550 | 24.0 |
| +20% | 762 | 29.3 |
| Production | ||
| -5% | 502 | 22.8 |
| 0 | 550 | 24.0 |
| +5% | 597 | 25.3 |
| Capital Costs | ||
| +20% | 491 | 20.4 |
| 0% | 550 | 24.0 |
| -20% | 608 | 29.2 |
| Operating Costs | ||
| +20% | 507 | 22.9 |
| 0% | 550 | 24.0 |
| -20% | 592 | 25.2 |
| 1.13 | QUALIFIED PERSON’S CONCLUSIONS |
The Project has been independently evaluated, leading to the following conclusions and interpretations regarding the suitability of the proposed site and the viability of the Project. It is determined that a clear path is established to reach a positive Final Investment Decision subject to concluding remaining commercial agreements and obtaining the required financing.
| / | The Proven and Probable Reserves confirm the viability of the Project over its 25 year economic life at an average annual production rate of 5,400 tonne per annum of lithium carbonate. |
| / | The Proven and Probable Reserves support an operating life of up to 40 years. |
| / | The development and testing completed at the Demonstration Plant provides a robust basis for the commercial design which is based on Direct Lithium Extraction technology. |
| / | Work to date completed at the Demonstration Plant illustrates that lithium can be economically extracted from the lithium rich brine produced from the Smackover Formation. |
| / | The Project Site secured is considered well suited for development and is situated near all required utilities. |
| / | Environmental studies have concluded the site is suitable for development with limited adverse environmental and social impacts, generally limited to the boundaries of the Project Site. |
| / | There is a clear pathway for the Project to obtain the state permits required for development. |
| / | The economic analysis yielded positive results in a timeline for development and first production that is considered realistic based on timely funding and is typical of projects of similar magnitude within industry. |
| / | Overall, the result of this Feasibility Study demonstrates that lithium can be economically extracted from the lithium rich brine within the Smackover Formation. |
RSI-3353
| 1.14 | QUALIFIED PERSON’S RECOMMENDATIONS |
The Qualified Persons involved in the Report make the following recommendations:
| / | Obtain and review any new log and core data collected in the West, Central, and South Brine Units which may become available in the future. |
| / | Continue to monitor the LANXESS South Unit brine production performance. |
| / | Continue test work at the Demonstration Plant. |
| / | Continue to advance key permits and authorizations required for construction and operation of the Project. |
| / | Address the responsibility for pre-existing environmental conditions in commercial agreements. |
| / | Continue the process of establishing project-specific lithium royalties (lease-fees-in-lieu-of-royalties) with the AOGC. |
| / | Evaluate and pursue additional federal and state incentive programs which may be available to improve overall Project economics. |
| / | Given the sensitivity of the Project economics to the product price, consider offtake pricing mechanisms, to mitigate the commercial risk associated with short-term lithium price fluctuations. |
| / | Finalize definitive commercial agreements with LANXESS and other parties which are required to support a positive Final Investment Decision. |
RSI-3353
| 2.0 | INTRODUCTION |
| 2.1 | TERMS OF REFERENCE AND PURPOSE OF REPORT |
This Technical Report (TR) was prepared by RESPEC Company, LLC (RESPEC) at the request of Standard Lithium Ltd. (Standard Lithium, or the Company), a Canada Business Corporations Act company, for a Definitive Feasibility Study (DFS) of the Commercial Lithium Extraction Plant Project (Phase 1A of the LANXESS Project, or the Project) and an update of the Mineral Resource, located in Arkansas, USA. Standard Lithium, trading under the symbol SLI on the TSX Venture Exchange, the New York Stock Exchange, and the Frankfurt Exchange, is headquartered at 1625-1075 West Georgia Street, Vancouver, British Columbia.
Phase 1A, Standard Lithium’s first commercial lithium extraction plant, is proposed to be located at the LANXESS South Plant, approximately 13 kilometers [8 miles] southwest of the City of El Dorado in Union County, Arkansas. LANXESS Corporation, a US subsidiary of LANXESS AG, a specialty chemicals company, has exclusive brine extraction rights for 60,477 hectares [149,442 acres] which is contained within three brine production units, referred to as the South, Central, and West Brine Units. The development process for the Project, including development of definitive commercial agreements, equity participation and phasing are governed by a Memorandum of Understanding (MOU) between Standard Lithium and LANXESS.
This TR considers lithium brine at the Project that is present in the brines throughout the LANXESS South, Central, and West Brine Units. The Mineral Resources and Mineral Reserve estimates presented in this report have been prepared in accordance with the Canadian Institute of Mining, Metallurgy and Petroleum (CIM) CIM Estimation of Mineral Resources and Mineral Reserves Best Practice Guidelines (CIM, 2019) and CIM Definition Standards for Mineral Resources and Mineral Reserves (CIM, 2014), as referred to in National Instrument (NI) 43-101 and Form 43-101F, Standards of Disclosure for Mineral Projects and in force as of the effective date of this report. This is consistent with CIM Best Practice Guidelines for Resource and Reserve Estimation for Lithium Brines (CIM, 2012), in which it is stated that the CIM considers brine projects to be mineral projects, as defined in NI 43-101.
In this TR, the terms “Mineral Resource,” “Inferred Mineral Resource,” “Indicated Mineral Resource,” “Measured Mineral Resource,” “Proven Mineral Reserve,” and “Probable Mineral Reserves” have the meanings ascribed to those terms by the CIM Definition Standards on Mineral Resources and Mineral Reserves adopted by CIM Council, as amended. Investors are cautioned that Mineral Resources cannot be classified as Mineral Reserves until further work is completed to upgrade the material’s classification. Resources also cannot be reclassified until other economic and technical feasibility factors based upon such work have been resolved and can be demonstrated that the Resources may be legally and economically extracted and produced. As a result, investors should not assume that all or any part of the mineralized material reported in any of these categories referred to in the Resource Estimate and this TR will be converted into Mineral Reserves.
Throughout this TR, geological, technical, and lithium industry-specific terminology is commonly used. Table 2-1 provides a list of definitions for the most common terms and phrases.
RSI-3353
Table 2-1. Glossary of Terms
| Term | Definition |
| Assay | A test performed to determine a mineral sample’s chemical content. |
| Brine Expansion Unit | Each separate composite area of land so designated by order of the AOGC as an expansion area adjacent to an existing brine production unit to produce brine or the reinjection of effluent. |
| Brine Production Unit | Each separate composite area of land so designated by order of the Arkansas Oil and Gas Commission (AOGC) to produce brine and the reinjection of effluent. |
| Bypass Brine | The output brine that has bypassed the LANXESS bromine facility. |
| Company | Standard Lithium Ltd. (Standard Lithium) and its subsidiaries. |
| Eluate | A liquid solution resulting from desorbing an absorbed material using a solvent. |
| Feed Brine | The input brine to the Project. |
| Final Investment Decision | A milestone activity to determine the Project will proceed with acquiring funding. |
| LANXESS Project | Suite of contemplated staged expansion projects relating to the LANXESS South, Central, and West Brine Production Units for lithium extraction. |
| Project | Commercial Lithium Extraction Plant Project at the LANXESS South Plant which is Phase 1A of the LANXESS Project. |
| Project Company | Standard Lithium Ltd. El Dorado South LLC, a wholly owned subsidiary of Standard Lithium. |
| Project Facility | The buildings and areas associated to the Commercial Lithium Extraction Plant Project under future Standard Lithium Ltd. control. |
| Project Site | Location at which the Commercial Lithium Extraction Plant Project is to occur. |
| Property | LANXESS South, Central and West Units. |
| Raffinate | The liquid which comes out of an extraction process involving two liquids. |
| Tail Brine | The output brine from the LANXESS bromine facility. |
RSI-3353
| 2.2 | QUALIFIED PERSONS |
Table 2-2 presents the Qualified Persons (QPs) for the Technical Report and their responsibilities.
Table 2-2. Qualified Persons and Responsibilities
| Qualified Person | Company | Chapter(s) |
| Susan B. Patton, PE | RESPEC Company, LLC | Sections 2-6, 19, 23, 24, 26, 27. And Subsections 1.0, 1.1, 1.9, 1.13, 1.14, 25.9. |
| Randal M. Brush, PE | William M. Cobb & Associates, Inc. | Sections 10, 15, 16, Subsections 1.0, 1.4, 1.5, 1.6, 1.13, 1.14, 12.3, 12.4, 14.2, 14.3, 14.4, 25.1, 25.9, and 26 |
| Robert E. Williams, Jr., CPG | William M. Cobb & Associates, Inc. | Sections 7, 8, 9, 11, and Subsections 1.0, 1.2, 1.3, 1.4, 1.13, 1.14, 12.1, 12.2, 12.4, 14.1, 25.1, 25.9, 26 |
| Mike Rockandel, RM-SME | Mike Rockandel Consulting, LLC | Sections 13, 17, 18, 21 and Subsections 1.0, 1.7, 1.8, 1.11, 1.13 , 1.14 , 12.5, 25.2, 25.3, 25.7, 25.9 , and 26 |
| Charles Daniel Campbell, PE | Alliance (formerly GBMc & Associates) | Section 20 and Subsections 1.0, 1.10, 1.13, 1.14, 25.4, 25.5, 25.6, 25.9, 26 of this Technical Report. |
| Frank Gay, PE | Hunt, Guillot & Associates, LLC | Section 22 and Subsections 1.0, 1.12, 1.13, 1.14, 25.8, 25.9, and 26 |
Notes:
CPG, Certified Professional Geologist
PE, Professional Engineer
PG, Professional Geologist
RM-SME, Registered Member Society for Mining, Metallurgy and Exploration
| 2.3 | PERSONAL INSPECTION OF PROPERTY BY QUALIFIED PERSONS |
The following QPs personally inspected the Standard Lithium Project Site:
| / | Randal Brush, PE, and Robert E. Williams, Jr., PG, visited the Standard Lithium Project Site May 17 through 19, 2022, and participated in sampling 10 different operating brine supply wells at the LANXESS bromine Property. LANXESS personnel captured the samples, which were observed, recorded, labeled, and shipped to the laboratory for assay. Standard Lithium personnel were present and obtained additional samples. The sample results make up part of the lithium concentration data used in the analyses. |
| / | Charles Daniel Campbell, PE, visited the Standard Lithium Project Site on November 8, 2022, where he performed a reconnaissance of the proposed site to examine surface topography including surface water run-on from the adjacent property and runoff pathways. He confirmed locations for permanent groundwater monitoring wells to be installed and the general conditions of the undeveloped site. |
| / | Mike Rockandel, RM-SME, visited the Standard Lithium Project Site October 10 through 12, 2022, where he viewed the process tie-points, visited the Demonstration Plant for 1 day, and visited the laboratory to understand the analytical requirements. Mike held numerous discussions with plant personnel on operating issues and reviewed historical data. |
| / | Susan Patton visited the Standard Lithium Demonstration Plant site on June 27, 2023. She viewed the Tail Brine input from LANXESS, toured the operating Demonstration Plant, laboratory, and the proposed location of the commercial plant. |
RSI-3353
| 2.4 | SOURCES OF INFORMATION |
This TR is based, in part, on internal company technical reports, maps, company letters, memoranda, public disclosure, and public information, as listed in the NI 43-101 Technical Report Preliminary Economic Assessment of LANXESS Smackover Project (Worley, 2019). Information brought forward from previous reports has been reviewed and verified as accurate by the QPs.
The sub-consultants presented in Table 2-3 were contracted to complete specific technical studies/analyses for input into the DFS Report.
Table 2-3. Contributor Sub-Consultants
| Sub-Consultants | Area Contribution |
| Alliance (formerly GBMc & Associates) | Permitting and Site Conditions |
| Hunt, Guillot & Associates | FEED |
| M3 Engineering | FEED |
| Optimized Process Design | FEED |
| RHI-Group | FEED Cost Estimating |
| Terra Dynamics | UIC Permitting |
|
FEED = front-end engineering design UIC = Underground Injection Control |
RSI-3353
| 2.5 | CURRENCY, ABBREVIATIONS, AND UNITS OF MEASURES |
Unless otherwise stated, metric units and the United States dollar (USD) are used in this TR. Abbreviations, units of measure, and minerals referenced herein are defined in Tables 2-4, 2-5, and 2-6, respectively.
Table 2-4. Abbreviations and Acronyms
| Term | Definition | Term | Definition |
| AACE | Association for the Advancement of Cost Engineering | ML | Mother Liquor |
| ADEE-AOGC | Arkansas Oil and Gas Commission | MOU | Memorandum of Understanding |
| ADEE-DEQ | Arkansas Department of Energy & Environment Division of Environmental Quality | MRMR | Mineral Resource Mineral Reserve |
| ADH | Arkansas Department of Health | NAAQS | National Ambient Air Quality Standards |
| AHPP | Arkansas Historic Preservation Program | NEPA | National Environmental Policy Act |
| AIME | The American Institute of Mining, Metallurgy and Petroleum Engineers | NFPA | National Fire Protection Association |
| AIPG | American Institute of Professional Geologists | NI | National Instrument |
| API | American Petroleum Institute | NPDES | National Pollutant Discharge Elimination System |
| ASL | Above Sea Level | NPV | Net Present Value |
| BBLS | Barrels | NYSE | New York Stock Exchange |
| BOE | Basis of Estimate | OARO | Osmotically Assisted Reverse Osmosis |
| BSW | Brine Supply Well | OAT | One Factor at a Time |
| BV | Bed Volumes | OLI | Systems In. Process Software |
| BWRO | Brackish Water Reverse Osmosis | OPD | Optimized Process Designs, LLC |
| CAA | Clean Air Act | OPEX | Operating Cost |
| CAPEX | Capital Cost | ORP | Oxidation-Reduction Potential |
| CCR | Central Control Room | PAH | Polycyclic Aromatic Hydrocarbon |
| CCTV | Closed Circuit Television | PCS | Process Control System |
| CERCLA | Comprehensive Environmental Response, Compensation, and Liability Act | PDC | Power Distribution Center |
| CIM | Canadian Institute of Mining, Metallurgy and Petroleum | PE | Professional Engineer |
| CIP | Clean In-Place | PEA | Preliminary Economic Assessment |
| CIT | Corporate Income Tax | PG | Professional Geologist |
| CPG | Certified Professional Geologist | PMC | Project Management Consulting |
| CWA | Clean Water Act | PSI | Pounds per Square Inch |
| DBSP | Design Basis Scoping Paper | PSIG | Pounds per Square Inch Guage |
| DCF | Discounted Cashflow | PTZ | Pan-Tilt-Zoom |
| DFS | Definitive Feasibility Study | PVC | Polyvinyl Chloride |
| DLE | Direct Lithium Extraction | QA/QC | Quality Assurance Quality Control |
| DTB | Draft Tube Baffled | QP | Qualified Person |
| DXC | Dangxiongcuo | RCRA | The Resource Conservation and Recovery Act |
RSI-3353
| EA | Environmental Assessment | RESPEC | RESPEC Company, LLC |
| EDC | Dichloroethane | RIO | Remote Input/Output |
| EPA | Environmental Protection Agency | RM-SME | Registered Member of the Society of Mining, Metallurgy and Exploration |
| EPC | Engineering, Procurement and Construction | RO | Reverse Osmosis |
| ESA | Environmental Site Assessment | SARA | Superfund Amendment and Reauthorization Act |
| EV | Electric vehicle | SARL | Site Access, License and Reservation Agreement |
| FEED | Front End Engineering Design | SBS | Sodium Bisulfite |
| FID | Final Investment Decision | SCFM | Standard Cubic Feet per Minute |
| GHG | Greenhouse Gas | SDWA | Safe Drinking Water Act |
| GLCC | Great Lakes Chemical Corporation | SLL | Standard Lithium Limited |
| GLO | General Land Office | SP | Spontaneous Potential |
| GPM | Gallons per Minute | SVOC | Semi Volatile Organic compounds |
| GR | Gamma Ray | SWPPP | Stormwater Pollution Prevention Plan |
| GWH | Gigawatt Hour | SWRO | Sea Water Reverse Osmosis |
| HMI | Human Machine Interface | TDS | Total Dissolved Solids |
| HWY | Highway | TM | Trademark |
| IPaC | Information for Planning and Consulting | TR | Technical Report |
| IRR | Internal Rate of Return | TSXV | Toronto Venture Exchange |
| ISBL | Inside Battery Limits | UF | Ultrafiltration |
| IT | Internet Technology | UIC | Underground Injection Control |
| JV | Joint Venture | USACE | U.S. Army Corps of Engineers |
| KES | Koch Engineered Systems | USD | United States Dollar |
| KTS | Koch Technology Solutions | USFWS | United States Fish and Wildlife Service |
| LAS | Log ASCII Standard | USGS | United States Geological Survey |
| LCE | Lithium Carbonate Equivalent | UST | Underground Storage Tanks |
| LiSTR | Lithium Stirred Tank Reactors | UTM | Universal transverse Mercator |
| LLC | Limited Liability Company | UV | Ultraviolet |
| LSS | Lithium Selective Sorption | VOC | Volatile Organic Compounds |
| MCC | Motor Control Center | WCA | William M. Cobb & Associates |
| MIRE | Maiden Inferred Resource Estimate | XRD | X-Ray Diffraction |
RSI-3353
Table 2-5. Units of Measure
| Term | Definition |
| °C | degrees Celsius |
| g/L | grams per liter |
| L | liter |
| m | meters |
| mg | milligram |
| mg/L | milligrams per liter |
| mg/L | milligrams per liter |
| US BBLS | United States barrels |
| US$ | United States dollar |
| wt% | percentage by weight |
| μm | microns |
Table 2-6. Minerals
| Term | Chemical Formula |
| Boron | B |
| Bromine | Br2 |
| Calcium | Ca |
| Calcium Chloride | CaCl2 |
| Chlorine | Cl2 |
| Hydrogen Sulfide | H2S |
| Lithium | Li |
| Lithium Carbonate | Li2CO3 |
| Magnesium | Mg |
| Potassium | K |
| Rubidium | Rb |
| Silica | Si |
| Sodium | Na |
RSI-3353
| 3.0 | RELIANCE ON OTHER EXPERTS |
| 3.1 | MINERAL TENURE |
QP Patton has reviewed the mineral tenure of LANXESS using the publicly available information on Units approved by the AOGC: South Plant Brine Unit, BU 1-1995, March 28, 1995; South Expansion Brine Unit 086-1-2016-11 November 28, 2016; Central Plant Brine Unit BU 2-1995 August 22, 1995; Central Expansion Brine Unit 095-2022-12 January 5, 2023; West Plant Brine Unit BU 3-1995 November 28, 1995 and the West Expansion Brine Unit-H 048-2-2015-04 May 14, 2015. A declaration of net mineral acreage held by Great Lakes Chemical Corporation for the production of brine in South Arkansas was provided to QP Patton on May 8, 2023 via email for review by Dr. Antonis Papadourakis, Chief Executive Officer of Great Lakes Chemical Corporation, predecessor to LANXESS Corporation. The QP relied on LANXESS’ mineral tenure to the extent such data was relevant to inform the QP of the legal rights to such Units and their further dealings.
The Authors have not independently verified the legal status or ownership of the mineral title, and underlying property agreements of LANXESS. QP Patton reviewed the terms of the amended and restated MOU as between Standard Lithium and LANXESS dated February 23, 2022 using publicly available information from Standard Lithium's Management's Discussion and Analysis from the 2023 Quarterly Report dated May 11, 2023 concerning the rights of Standard Lithium to access the LANXESS brines and the conditions of the access in the Site Access Reservation and License Agreement dated November 15, 2022. The QP relied on the MOU and Site Access Reservation and License Agreement to the extent such information was relevant to inform the QP of the current ownership structure of the Property in question, and the conditions of access to the Property that may affect Standard Lithium’s ability to carry out any plans contemplated by this Technical Report.
RSI-3353
| 4.0 | PROPERTY DESCRIPTION AND LOCATION |
| 4.1 | PROPERTY DESCRIPTION AND LOCATION |
The Property, which includes the LANXESS South, Central and West Brine Units, is located south of the City of El Dorado in Union County, Arkansas, USA, as presented in Figure 4-1. The southern and western edges of the Property border the state of Louisiana and Columbia County, respectively. The Property encompasses Townships 16-19 South, and Ranges 14-18, West of the 5th Meridian. The Property center is at UTM 520600 Easting, 3670000 Northing, Zone 15N, North American Datum of 1983.
LANXESS has the rights to extract brine from the South, Central, and West brine production units through the unitization by the Arkansas Oil and Gas Commission (AOGC). Standard Lithium’s Memorandum of Understanding in place with LANXESS sets out the process for the establishment of definitive commercial agreements between the parties, which once in place, will grant Standard Lithium certain rights related to the extraction of lithium. (See Section 4.4 below).
Figure 4-2 provides an overview of the Property, including the location of the bromine processing facilities in the South, Central, and West Units. The land package, which is shown in Figure 4-2, consists of 60,477 hectares (149,442 acres) that cover more than 608 square kilometers (km2). Table 4-1 provides a description of the LANXESS Unitized land holdings.
Each Unit (South, Central, and West) has its own brine supply wells, pipeline network, and bromine processing (separation) infrastructure. The facilities and their locations, which are wholly owned and operated by LANXESS, are as follows:
| / | South Unit (South Plant): 324 Southfield Cutoff, El Dorado, Arkansas 71730 |
| / | Central Unit (Central Plant): 2226 Haynesville Highway (HWY 15S), El Dorado, Arkansas 71731 |
| / | West Unit (West Plant): 5821 Shuler Road, Magnolia, Arkansas 71731 |
Table 4-1. Description of LANXESS Unitized Land Holdings for Brine Production
| Unit | AOGC Order Reference | Date | Hectares | Acres |
| South Plant Brine Unit | BU 1-1995 | March 28, 1995 | 12,495 | 30,877 |
| South Expansion Brine Unit | 086-1-2016-11 | November 28, 2016 | 2,963 | 7,321 |
| Central Brine Unit | BU 2-1995 | August 22, 1995 | 17,391 | 42,974 |
| Central Expansion Brine Unit | 095-2022-12 | January 5, 2023 | 2,655 | 6,560 |
| West Brine Unit | BU 3-1995 | November 28, 1995 | 24,424 | 60,354 |
| West Expansion Brine Unit-H | 048-2-2015-04 | May 14, 2015 | 549 | 1,356 |
RSI-3353
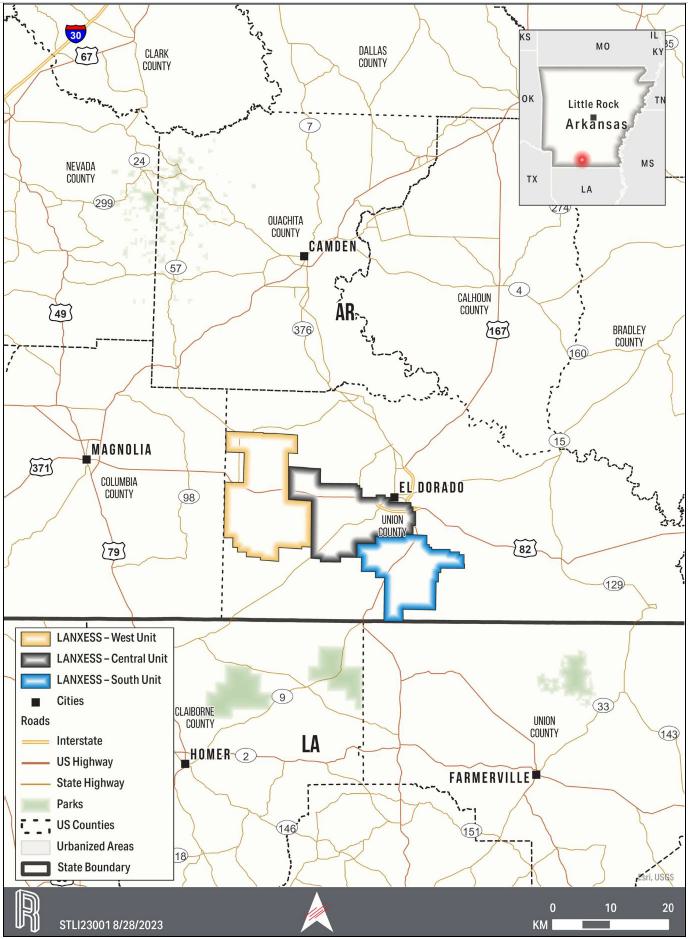
Figure 4-1. Overall Property Location Map
RSI-3353
| 4.2 | SURFACE AND MINERAL RIGHTS |
| 4.2.1 | MINERAL RIGHTS |
Per Arkansas Code Title 15, Natural Resources and Economic Development § 15-56-301 minerals “include oil, gas, asphalt, coal, iron, zinc, lead, cinnabar, bauxite, and salt water whose naturally dissolved components or solutes are used as a source of raw materials for bromine and other products derived there from in bromine production.” The mineral interest owner has the inherent right to develop the minerals and the right to lease the minerals to others for development. The development, production and royalties are regulated by the Arkansas Brine Conservation Act § 15-76-301(Arkansas, 2023).
Payments made to the Lessor for brine production are governed by statute in Arkansas. For brine used to produce bromine, the statutory rate is currently $66.93 per net mineral acre per year. For substances extracted from brine other than the bromine, the Arkansas Oil and Gas Commission is responsible for determining ‘fair and equitable’ compensation. The Arkansas Oil and Gas Commission has not yet determined what constitutes ‘fair and equitable’ compensation for brine used to produce lithium.
In many instances the surface estate has been severed from the mineral estate. The owner of the mineral estate, as the dominant estate, has the right to make reasonable use of the surface in order to extract minerals. In most cases brine leases include the right to use the surface to produce brine.
| 4.2.2 | SURFACE RIGHTS |
The proposed site (Project Site) for the Project is located approximately 13 km [8 miles] south of El Dorado, Arkansas in Union County, immediately east of the existing South Plant bromine extraction facility owned and operated by LANXESS. The location of the proposed Project Site is shown in Figure 4-2.
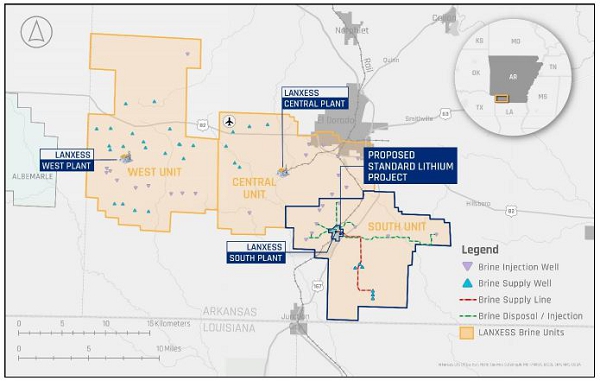
Figure 4-2. Property Location showing LANXESS Plant Locations within Units The Project Facility is proposed to be constructed on leased property which is owned by LANXESS Corporation, immediately to the East of the existing South Plant bromine extraction facility.
RSI-3353
The Project Company has entered into commercial agreements with LANXESS which reserves up to 39 hectares (96 acres) for the development of the Project and future phases of development at the site, which phases are subject to the completion of future feasibility studies. Refer to Section 4.4 for an overview of the Standard Lithium – LANXESS Agreements including the Site Access, Reservation and License Agreement.
Certain agreements with LANXESS contemplate future additional production of lithium chemicals across LANXESS’s facilities; the Project as described herein does not include any expansions or additional lithium plants.
Figure 4-3 outlines the land reserved for development by Standard Lithium, a portion of which is proposed to be leased for construction of the Project Facility.
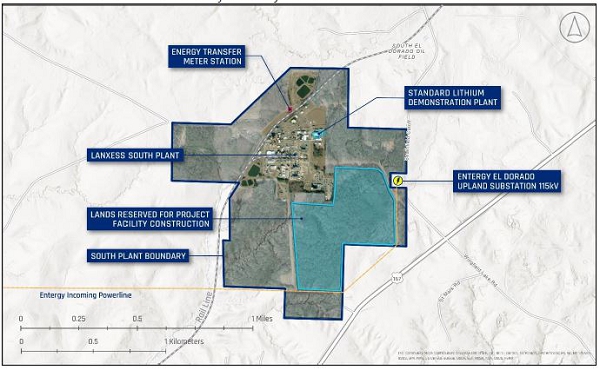
Figure 4-3. Land Reserved for Project Facility Construction
Road access to the Project Facility is contemplated to be via Southfield Cutoff. The nearest major intersection is 1 km southeast of the facility at the junction of Highway 63 and Southfield Cutoff. Refer to Section 5 for a description of accessibility, climate, local resources, infrastructure, and physiography.
| 4.3 | PAYMENTS TO LESSORS |
The AOGC, in accordance with Arkansas law to avoid waste and maximize recovery of Mineral Resources, establishes drilling units that ensure all mineral owners potentially impacted by a producing well receive proper payment.
The AOGC must approve the lease payment rate for any ‘additional substance’ profitably extracted from brine produced by an operator of a brine unit. The extraction of lithium from Tail Brine produced in South Arkansas is an additional substance triggering the fee analysis. Standard Lithium and LANXESS have a joint application before the AOGC which sets out a proposed royalty structure (also at times referred to as ‘Lease-fees-in-lieu-of-royalties’) as fair and equitable compensation to mineral owners for the commercial extraction of lithium from the South Brine Unit.
RSI-3353
On October 10, 2018, the AOGC granted an Order approving the deployment of the Demonstration Plant to test the commercial viability of the extraction of lithium from brine processed at the South Unit processing plant operated LANXESS and Arkansas Lithium Corporation (a wholly owned subsidiary of Standard Lithium). The Order took effect November 19, 2018 (AOGC, 2018a). The Demonstration Plant started operation in May of 2020. By Order No. 58-2023-08 the AOGC granted an additional extension to operate the Demonstration Plant through December 5, 2023 and Standard Lithium has an application before the AOGC for a further extension of operations. Standard Lithium asserts the successful testing and production of lithium products at the Demonstration Plant illustrates, subject to execution of lithium purchase agreement with a suitable Offtake counterparty, that lithium can be profitably extracted from brine.
| 4.4 | OVERVIEW OF THE STANDARD LITHIUM – LANXESS AGREEMENTS |
| 4.4.1 | AMENDED AND RESTATED MEMORANDUM OF UNDERSTANDING |
Standard Lithium entered into an Amended and Restated Memorandum of Understanding (“MOU”) on February 23, 2022, (Standard, 2022) with LANXESS. The MOU replaces the LANXESS MOU and LANXESS Joint Venture (JV) Term Sheet, which previously set out the basis on which the parties had agreed to cooperate in a phased process towards developing commercial opportunities related to the production, marketing, and sale of battery-quality lithium products.
Specifically, the MOU sets out the process for the establishment of definitive commercial agreements between the parties, which once in place, will grant Standard Lithium the rights required for development of the Project and govern the relationship throughout the life of the Project. Under the MOU, LANXESS is obliged to support development of the Project.
The Project is currently wholly owned by Standard Lithium’s wholly owned subsidiary project company (“Project Company”). With completion of this DFS, pursuant to the MOU, LANXESS will be given the option to acquire an equity interest in the Project Company of up to 49% and not less than 30%, at a price equal to a ratable share of Standard Lithium’s aggregate investment in the Project Company.
If LANXESS acquires an equity interest in the Project Company, the parties will share the costs of financing construction of the Project, on a ratable basis. The Project Company is expected to directly acquire the required debt financing for the Project and this process remains independent of the LANXESS equity election process.
If LANXESS does not acquire an equity interest in the Project Company, Standard Lithium will continue to own 100% and may elicit bids from other interested parties to acquire an interest of up to 50% in the Project Company.
Note that Standard Lithium retains 100% ownership of its South West Arkansas Project, including certain other sites in Arkansas, its Project Sites in East Texas, and all of the proprietary extraction technologies, relevant intellectual property and know-how owned or licensed by Standard Lithium.
Under the MOU, LANXESS has the right to acquire some, or all of the lithium carbonate offtake produced at the Project.
RSI-3353
The MOU also sets out the definitive commercial agreements between the parties which are currently contemplated to be completed prior to, or concurrent with, the Final Investment Decision for the Project, which include:
| / | Brine Agreement which will set out the terms and conditions for the supply and return of brine for the Project. |
| / | Lithium Purchase (Offtake) Agreement which sets out the terms and conditions for the purchase of Lithium Carbonate by LANXESS from the Project, if any. |
| / | Ground Lease Agreement for the lands required to construct the Project adjacent to the South Plant, including additional right of ways and easements on the broader LANXESS property. |
| / | Site Services Agreement which sets out the services to be provided by LANXESS to support the Project. |
Select key terms and conditions required to be included in these definitive commercial agreements are further set out in the MOU and the Site Access, Reservation and License Agreement as outlined below.
| 4.4.2 | SITE ACCESS, RESERVATION AND LICENSE AGREEMENT |
The Site Access, Reservation and License Agreement (“SARL”), executed in November 2022 between LANXESS, Standard Lithium and the Project Company, provides for access to the LANXESS properties during the term of the SARL for the purposes of developing the Project, reserves up to 96 acres for the development of the Project and any future phases of development and sets out key terms and conditions to be included in the definitive commercial agreements between the parties.
A principal purpose of the SARL is to facilitate access by the Project Company to complete surveying, sampling and other intrusive investigations on the LANXESS properties to support Project development. The permitted activities include:
| / | ground surveying and location of existing facilities; |
| / | conducting geotechnical field investigations, including drilling and test-pitting; |
| / | installation of groundwater monitoring wells; |
| / | establishing baseline environmental conditions, including sampling of surface water, soils, vegetation and ground water; and, |
| / | location of underground utilities. |
Under the SARL, the Project Company has the exclusive right to develop the Project on undeveloped land owned by LANXESS that is immediately east of the existing South Plant bromine extraction facility (refer to Figure 4-3), subject to execution of the definitive Ground Lease Agreement which is contemplated to become effective upon a successful FID.
The Project Company is expected to lease approximately 20 hectares (50 acres) of the reserved lands pursuant to the Ground Lease Agreement, leaving the balance available for future phases of development. The reservation of the real property for future development is anticipated to be addressed through a separate option agreement, which will supersede the SARL, and a separate future ground lease agreement.
In order to allow the Project to proceed with confidence, the SARL also establishes key terms to be incorporated into the definitive commercial agreements between LANXESS and the Project Company, with highlights as summarized below.
RSI-3353
Term of Agreements
| / | Definitive commercial agreements, including the Brine Agreement, Ground Lease Agreement and Site Services Agreement, will each have an initial term of 25 years, which aligns with the Project economic life. |
| / | The Project Company will have the right to extend the term of the commercial agreements up to 40 years, with notice, in 5 year increments. |
Brine Agreement
| / | LANXESS commits to supply the Project with a guaranteed minimum quantity of brine over the 25 year operating life of the Project in accordance with the development plan established for the South Brine Unit. |
| / | Establishment of the brine supply and discharge infrastructure to be constructed by the Project Company and that infrastructure to be constructed by LANXESS as currently set out in the SARL, as well as a commitment to construct such infrastructure by an agreed upon milestone schedule. |
| / | Conditions for brine supply and disposal including, quality parameters for both Feed Brine and the lithium-depleted effluent brine as well as minimum and maximum flow conditions and metering requirements. Metering will be the responsibility of the Project Company. |
| / | Responsibility of each party to maintain permits necessary to perform their respective obligations under the brine agreement, including supply and disposal of brine. |
Ground Lease
| / | Right to lease the real property required for the Project including a right to purchase the leased real property if LANXESS desires to sell, with the right to lease additional real property for future development of the Project pursuant to a separate option agreement ; |
| / | Permitted use of the leased property includes construction and operation of the commercial lithium extraction plant as well as research and development work; |
| / | Grant of permanent and temporary access rights, rights-of-way, licenses, easements required for construction, operation and maintenance of the Project and any future phases of development including rights required for infrastructure, utilities, site services, laydown, parking, pipelines and powerlines; |
| / | Decommissioning obligations by the Project Company; and, |
| / | Responsibility of each party for any current and future environmental liabilities. |
Site Services Agreement
| / | Provision of power and utilities for the Project infrastructure located outside the primary leased property within the LANXESS facility; and, |
| / | Provision of chlorinated water for the Project. |
RSI-3353
| 4.5 | ENVIRONMENTAL LIABILITIES AND PERMITTING |
Potential environmental liabilities associated with construction of the Project Facility include discovery of improperly abandoned oil/gas wells, permanent closure/abandonment of existing LANXESS ground water monitoring wells within the construction area, and potential off-site transport of sediments because of improper or inadequate erosion control measures.
LANXESS is responsible for environmental liabilities incurred by Standard Lithium arising from pre-existing environmental conditions (to the extent not exacerbated by Standard Lithium) during the investigative activities covered under the SARL. It is currently contemplated, subject to finalization of the Ground Lease Agreement, that environmental liabilities which arise from pre-existing environmental conditions (to the extent not exacerbated by Standard Lithium), will remain the responsibility of LANXESS as lessor.
Based on the permitting evaluations completed to date, the Project is not subject to review under the National Environmental Policy Act (NEPA). Construction and operational emissions to air, surface waters, and subsurface waters are regulated by the federal and state agencies to protect the environment while allowing responsible development of the lithium resources.
Standard Lithium has initiated early consultation with permitting agencies for the construction and operation of the Project. A Baseline Environmental Site Assessment has been conducted as well as investigations of jurisdictional waters of the U. S., cultural resource assessment, and wildlife studies for the Project. New permits expected to be required for the Project are summarized in Table 4-2.
Table 4-2. Expected Permits for the Project
| Agency | Permitted Activity |
| ADEE-DEQ | Air Permit for Commercial Facility |
| ADH | Fresh Water Supply for Potable Water |
| ADEE-DEQ | Construction Storm Water NPDES Permit for Facility Construction Site |
| ADEE-DEQ | Surface Discharge of Non-Brine Process Wastewater, Non-contact Cooling Water, Treated Sanitary Wastewater |
| ADEE-DEQ | Construction of Treatment System Associated with a NPDES Permit |
| ADEE-DEQ | Stormwater Discharges from a Categorical Industry |
| ADEE-DEQ | Construct/Operate Surface Facility for New Class I Nonhazardous Injection Wells |
| ADEE-DEQ | Construct/Operate Class I Nonhazardous Injection Wells |
| ADEE-AOGC | Construct Drilling Pit for Class 1 Nonhazardous Injection Wells |
| ADEE-DEQ | Transfer Barren Brine to LANXESS No-Discharge Permitted Facility |
| USACE | Placement of fill in waters of the U.S. |
RSI-3353
| 4.6 | SIGNIFICANT ENCUMBRANCES OR RISKS TO PERFORM WORK ON PROPERTY |
As with any development project, there exists potential risks and uncertainties. There are no known significant encumbrances on the property. Standard Lithium will attempt to reduce risk/uncertainty through effective project management, utilization of technical experts, community engagement, and development of contingency plans. These risks to perform work on the property include but are not limited to the following:
| / | Obtaining all the necessary licenses and permits on acceptable terms, in a timely manner. |
| / | Completing remaining commercial agreements with LANXESS on acceptable terms, in a timely manner. |
| / | Operational variances within the LANXESS plant that adversely impact the quality of the Tail Brine beyond those brine conditions that have already been tested in the Demonstration Plant. |
| / | Changes in laws and their implementation, impacting activities on the properties. |
| / | Activities on adjacent properties having an impact on the Project. |
RSI-3353
| 5.0 | ACCESSIBILITY, CLIMATE, LOCAL RESOURCES, INFRASTRUCTURE, AND PHYSIOGRAPHY |
| 5.1 | ACCESSIBILITY |
The Property consists of the LANXESS South, Central and West Units and is situated in Union County in southern Arkansas. Union County is the largest county in the State of Arkansas (2,730 km2) and borders the State of Louisiana. The LANXESS Central Unit is located directly adjacent to and southwest of the City of El Dorado, Arkansas, as shown in Figure 5-1. El Dorado is the County Seat of Union County and has a population of slightly more than 18,000. It is considered the population, cultural, and business center of the regional area. LANXESS’ South and West Units are located approximately 13 km [8 miles] and 35 km [22 miles] south and west of El Dorado, respectively. The LANXESS Property can be readily accessed via plane, rail, and an extensive road network.
| 5.1.1 | AIRPORT ACCESS |
National airports are regionally located in Little Rock, Arkansas (approximately 2.5 hours north of the Property by car) and Shreveport, Louisiana (1.5 hours southwest of the Property by car).
| 5.1.2 | RAIL ACCESS |
Products are shipped to and from the El Dorado predominantly by truck and rail; rail lines dissect the Central and South Units with direct access to both the LANXESS South and Central Plants. Railroad companies and rail lines within Union County include Camden & Southern, Union Pacific, Louisiana & North West, and El Dorado & Wesson railroads/railways.
| 5.1.3 | ROAD ACCESS |
The following primary U.S. Highways are in the region:
| / | South Unit (South Plant): U.S. Highway 7 and Highway 167 |
| / | Central Unit (Central Plant): U.S. Highway 15, Highway 82, and Highway 335 |
| / | West Unit (West Plant): U.S. Highway 82, Highway 57, Highway 160, and Highway 172 |
The secondary, major, Township, and well-pad access roads provide an integrated network that allows year-round access to almost every part of the Property and El Dorado has an extensive all-season secondary road network (see Figure 5-1).
RSI-3353
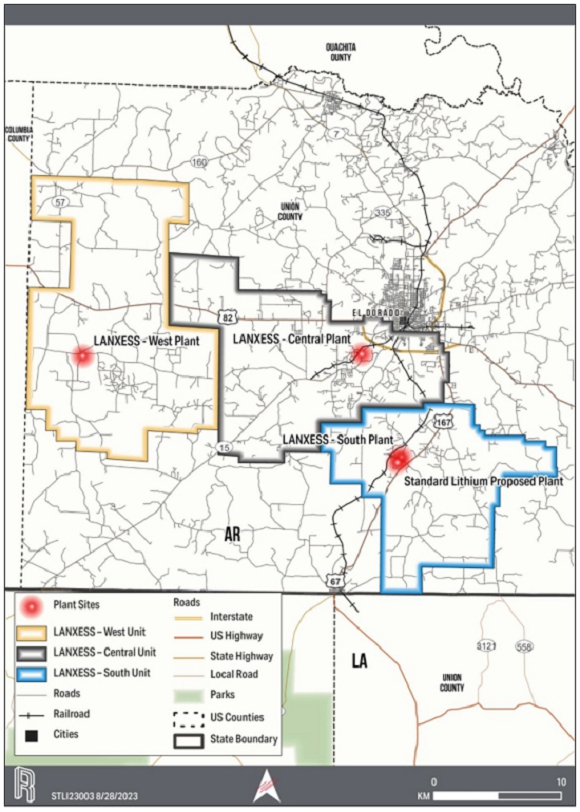
Figure 5-1. LANXESS Project Access Routes
RSI-3353
| 5.2 | CLIMATE |
The Project area’s climate is generally humid. The average annual temperature and total precipitation at El Dorado for 2022 (recorded at El Dorado Goodwin Field in Arkansas) is 17.61°C and 128.0 centimeters, respectively (Figure 5-2). Annual rainfall is evenly distributed throughout the year. The wettest month of the year is August, with a total rainfall of 19.1 centimeters (Weather.gov, 2023).
The warmest month of the year is July, with an average maximum temperature of 34.9°C , while the coldest month of the year is January with an average minimum temperature of -0.4°C.
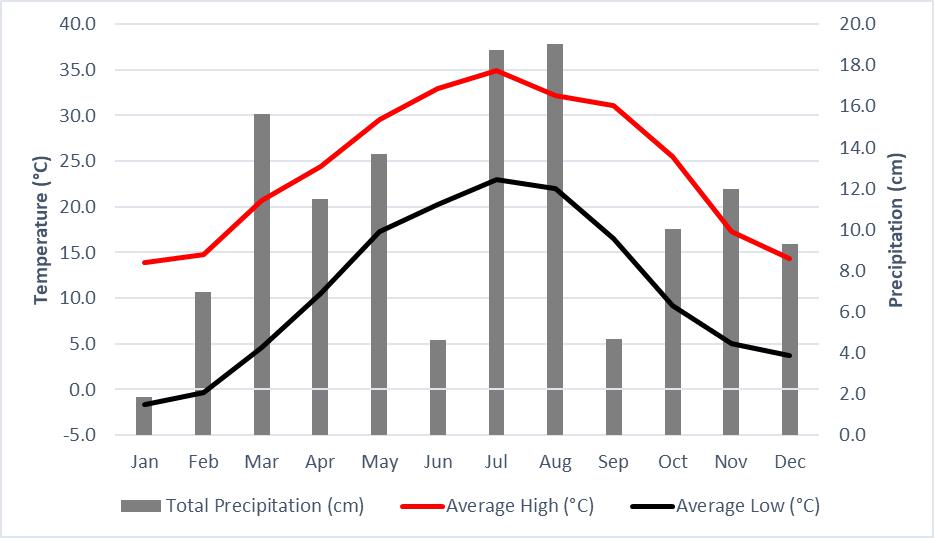
Figure 5-2. Average Temperature and Total Precipitation at El Dorado, Arkansas, for 2022 (Weather.gov, 2023)
| 5.3 | LOCAL RESOURCES AND INFRASTRUCTURE |
The greater than 60 years of brine production in the area has built a robust infrastructure and resource center to support the production from the Property.
| 5.3.1 | LOCAL LABOR |
In the El Dorado area, the largest manufacturers include Delek US – El Dorado Refinery, LANXESS, Pro Ampac, LSB Industries, and Milbank Manufacturing Co. Production of elemental bromine in Arkansas has a long history in the area including LANXESS and Albemarle. The work force supporting these industries has significant knowledge in brine technology, chemical engineering, and production.
| 5.3.2 | TRANSPORT |
There are multiple trucking and logistics companies operating in the area.
RSI-3353
| 5.3.3 | WATER |
The South Plant is fed by wells from the Sparta Aquifer and the intent of the new Project Facility is to have water supplied from the Sparta Aquifer as well.
| 5.3.4 | POWER |
The local electric power is provided by Entergy Arkansas, with its nearest generating facility , a 1,800-megawatt combined cycle gas plant, located approximately 12 km northeast of El Dorado.
| 5.3.5 | NATURAL GAS |
Energy Transfer for the gas transportation services currently supply the South Plant and the intent of the new Project Facility is to have gas tied in to the same metering station.
| 5.3.6 | SUPPORTING SERVICES |
The area has a significant number of businesses that service all aspects of the brine, oil, and gas industries.
| 5.4 | PHYSIOGRAPHY |
Union County covers a total area of 2,730 km2, of which 98.5 percent (2,690 km2) consists of land and 1.5 percent (41 km2) of water. The West Gulf Coastal Plain covers the southeastern and south-central portions of the state along the border of Louisiana. El Dorado, which lies within the West Gulf Coastal Plain, has an elevation of 102 meters (m) above sea level (asl).
The area surrounding the Property is characterized by pine forests and farmlands. The Felsenthal National Wildlife Refuge, the world’s largest green tree reservoir, is located approximately 45 km east of the City of El Dorado. The Property does not infringe on the Wildlife Refuge.
| 5.5 | SUMMARY |
Southern Arkansas, Union County, the City of El Dorado, and the Property all have well developed infrastructure and an experienced workforce available for the brine exploration, production, and processing in the region. The Property can be accessed year-round.
RSI-3353
| 6.0 | HISTORY |
Despite there having been many years of bromine production, the exploration and Mineral Resource estimates for lithium have only been occurring since 2018.
| 6.1 | HISTORY OF THE LANXESS PROPERTY |
LANXESS Corporation, a subsidiary of LANXESS AG, a specialty chemical company, has exclusive brine extraction rights over the Property. LANXESS was founded on September 22, 2004, via the spin-off of the chemicals division and parts of the polymers business from Bayer Aktiengesellschaft, which was founded in 1863.
The core business of LANXESS is the manufacturing of chemical intermediates, additives, specialty chemicals, and plastics. LANXESS has a specialty in bromine extraction from the Smackover Formation where the bromine is either sold as a product or used as a raw material within the other plants.
The following is an abbreviated history of the Property:
| / | Great Lakes Chemical Corporation was founded in Michigan in 1936 to extract bromine from underground saltwater brine deposits. |
| / | Great Lakes Chemical Corporation was acquired by McClanahan Oil in 1948 and the name changed to Great Lakes Oil and Chemical Company. |
| / | The company ended hydrocarbon production in 1957 and focused on the production of bromine-based chemicals in Arkansas. Around this time, the company assumed its original name of Great Lakes Chemical Corporation (GLCC). |
| / | The acquisition of the bromine operations of Northwest Industries operations near El Dorado, AR is noted as the early stages of the Property bromine assets. |
| / | In 2005, Great Lakes Chemical Corporation merged with Crompton to become Chemtura. Great Lakes Chemical Corporation remained in existence as a wholly owned subsidiary of Chemtura to own and operate all the brine production facilities in Union County. |
| / | In 2016, LANXESS acquired Chemtura. |
| / | In 2020, GLCC merged into its corporate parent LANXESS Corporation. As a result of this internal merger LANXESS is the owner and operator operations of the El Dorado facilities listed above. |
| / | All infrastructure on the Property is owned by LANXESS. Three bromine plants, West, Central and South Units, are in operation and produce bromine in the El Dorado region. |
The South Plant was the first bromine plant and was originally developed by Michigan/Chemical/Murphy Oil in 1957. The West Plant is the smallest of the three LANXESS El Dorado plants. The Central Plant was expanded in the 1970’s to produce flame retardants and oil field completion fluids.
LANXESS has conducted exploration on the property as an ongoing part of their operations and production planning. That exploration, while focused on bromine, also included brine analyses with lithium analytical results. LANXESS has also collected pre- and post-bromine processing brine samples. The historical brine samples by LANXESS that were analyzed for lithium as presented by Worley (Worley, 2019) are shown in Table 6-1. The average value of this lithium data is higher than that of the datasets presented by Moldovanyi and Walter (Moldovanyi, 1992) and the USGS National Produced Waters Geochemical Database (Blondes, 2016) of 141 to 150 mg/L Li.
RSI-3353
Table 6-1. Summary of Historical Brine Analyses (Worley 2019)
| Unit | Sample Source Point |
Number of Analyses |
Minimum Li (mg/L) |
Maximum Li (mg/L) |
Average Li (mg/L) |
| South | All wells | 25 | 177.0 | 547.0 | 349.9 |
| Post-bromine tail | 3 | 206.0 | 356.0 | 274.7 | |
| Central | All wells | 15 | 72.0 | 262.0 | 157.7 |
| Post-bromine tail | 7 | 69.8 | 272.0 | 119.6 | |
| West | All wells | 100 | 32.0 | 588.0 | 239.3 |
| Post-bromine feed | 1 | 80.0 | 1,800.0 | 180.0 | |
| Post-bromine tail | 6 | 79.6 | 229.0 | 123.9 | |
| All Analyses | 157 | 32.0 | 588.0 | 239.7 |
Moldovanyi and Walter conducted a regional brine chemical study of brine samples from 87 producing wells from Smackover Formation reservoirs in southwest Arkansas, east Texas, and northern Louisiana. Worley concluded the regional distribution of elevated Smackover Formation Li-brine exhibited the following:
| / | Boron (B) and alkali metal Li, potassium (K), rubidium (Rb) concentrations in Smackover Formation waters exhibit coherent geochemical relations across the southwest Arkansas shelf. |
| / | In general, the concentration of B, Li, K, and Rb is greater and more heterogeneous in hydrogen sulfide (H2S)-rich brine than in H2S-free brine. |
| / | Regional concentration gradients in H2S, B, Li, K, and Rb suggest fluids enriched in these elements may have migrated into the Smackover Formation reservoirs from large-scale circulation of deep-seated waters along segments of the South Arkansas and Louisiana State Line graben fault system (Moldovanyi and Walter, 1992). |
| Nineteen brine analyses within the boundaries of the Property are reported in the Moldovanyi and Walter (1992) dataset. Li-brine values reported range from 47 mg/L Li to 191 mg/L Li, with an average of 144 mg/L Li. |
RSI-3353
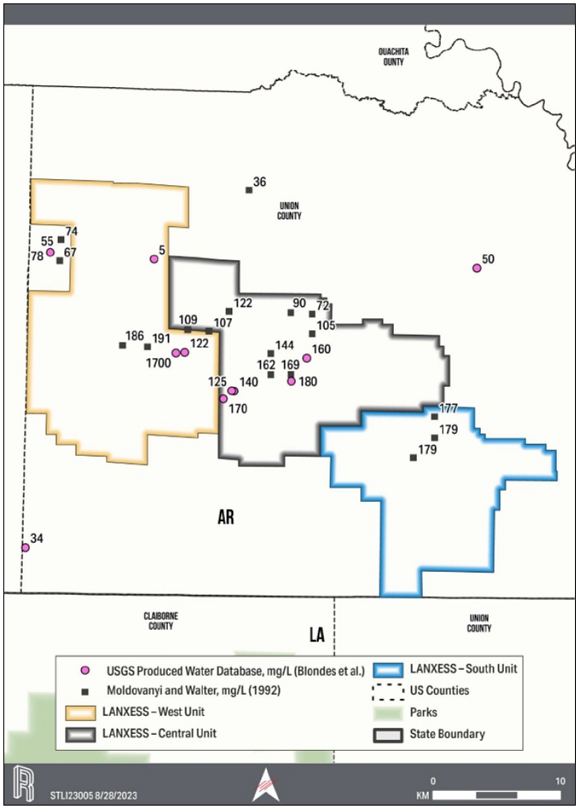
Figure 6-1. Smackover Formation Lithium Brine Values Derived within, and Adjacent to, the LANXESS Property (Blondes, et al. 2018)
RSI-3353
The USGS National Produced Waters Geochemical Database contains an additional seven brine analyses not included in the dataset published by Moldovanyi and Walter (1992). Of the seven analyses, five sample locations report between 122 mg/L and 180 mg/L Li. These data are unreferenced in the USGS database. Two outlier analytical results yield 5 mg/L and 1,700 mg/L Li, representing the lowest and highest Li-brine values in the Southern Arkansas historical Li-brine data, respectively. These outlier values are viewed with some skepticism.
Standard Lithium conducted a sampling program to verify the lithium content of the Smackover Formation brine underlying the Property. Past datasets show the Smackover Formation at the Property has average values of 141 to 150 mg/L Li.
| 6.2 | PAST MINERAL RESOURCE ESTIMATES |
Past Mineral Resource estimates have been completed by APEX Geoscience, Ltd. (2018) and Worley (2019). APEX (2018) reported a maiden Inferred resource of 580,000 tonnes of elemental Li (Table 6-2). The total LCE for the main resource is 3,086,000. Mineral Resources are not Mineral Reserves and do not have demonstrated economic viability. There is no guarantee that all or any part of the Mineral Resource will be converted into a Mineral Reserve.
Table 6-2. 2018 Inferred Mineral Resource (Eccles et al. 2018).
| Reporting Parameter | South Unit | Central Unit | West Unit | Total Resource |
| Aquifer volume (km3) | 5,828 | 8,289 | 16,310 | 30,427 |
| Brine Volume (km3) | 0.689 | 0.995 | 1.835 | 3.515 |
| Average lithium concentration (mg/L) | 164.9 | 164.9 | 164.9 | 164.9 |
| Average Porosity (%) | 11.8 | 12.0 | 11.2 | 11.6 |
| Total elemental Li resource (tonnes) | 114,000 | 164,000 | 303,000 | 580,000 |
| Total LCE (tonnes) | 605,000 | 873,000 | 1,610,000 | 3,086,000 |
Notes:
[1] Mineral Resources are not Mineral Reserves and do not have demonstrated economic viability. There is no guarantee that all or any part of the Mineral Resource will be converted into a Mineral Reserve. The estimate of Mineral Resources may be materially affected by geology, environment, permitting, legal, title, taxation, socio-political, marketing or other relevant issues.
[2] The weights are reported in metric tonnes (1,000 kg or 2,204.6 lbs)
[3] Numbers may not add up due to rounding of the resource values percentages (rounded to the nearest 1,000 unit).
[4] In a ‘confined’ aquifer (as reported herein), porosity is a proxy for specific yield; especially given the number of effective porosity measurements evaluated in this report and their positive correlation with Log ASCII Standard (LAS) log total porosity.
[5] The ‘Total’ volume and weights are estimated at volume-weighted average porosities of the block-model (i.e. calculated by using the porosity of the brine units and their respective unit areas). It is assumed that all pore space is occupied by brine.
[6] The LANXESS estimation was completed and reported using a cutoff of 50 mg/L Li.
[7] In order to describe the resource in terms of industry standard, a conversion factor of 5.323 is used to convert elemental Li to Li2CO3, or Lithium Carbonate Equivalent (LCE).
Worley (2019) reclassified the inferred Mineral Resource through the demonstration of potential economics in a PEA (Table 6-3) based on additional sampling and test work by Standard Lithium including:
| / | Smackover Formation brine sampling program and an assessment of the lithium concentration in the Smackover Formation brine over time |
| / | Disclosure of Li extraction technological information based on Standard Lithium’s bench-scale and mini-pilot-plant laboratory processing test work |
| / | An update on the Demonstration Plant with some discussion as to the scalability of the technology toward potential commercial production |
RSI-3353
Table 6-3. Indicated Mineral Resource (Dworzanowski et al. 2019).
| Reporting Parameter | South Unit | Central Unit | West Unit | Total Resource |
| Aquifer volume (km3) | 5,828 | 8,289 | 16,310 | 30,427 |
| Brine Volume (km3) | 0.689 | 0.995 | 1.835 | 3.515 |
| Average lithium concentration (mg/L) | 168 | 168 | 168 | 168 |
| Average Porosity (%) | 11.8 | 12.0 | 11.2 | 11.6 |
| Total elemental Li resource (tonnes) | 116,000 | 167,000 | 308,000 | 590,000 |
| Total LCE (tonnes) | 615,000 | 889,000 | 1,639,000 | 3,140,000 |
Notes:
[1] Mineral Resources are not Mineral Reserves and do not have demonstrated economic viability. There is no guarantee that all or any part of the Mineral Resource will be converted into a Mineral Reserve. The estimate of Mineral Resources may be materially affected by geology, environment, permitting, legal, title, taxation, socio-political, marketing or other relevant issues.
[2] The weights are reported in tonnes (1,000 kg).
[3] Numbers may not add up due to rounding of the resource values percentages (rounded to the nearest 1,000 unit).
[4] In a ‘confined’ aquifer (as reported herein), porosity is a proxy for specific yield; especially given the number of effective porosity measurements evaluated in this report and their positive correlation with Log ASCII Standard (LAS) log total porosity.
[5] The ‘Total’ volume and weights are estimated at volume-weighted average porosities of the block-model (i.e. calculated by using the porosity of the brine units and their respective unit areas). It is assumed that all pore space is occupied by brine.
[6] The LANXESS estimation was completed and reported using a cutoff of 100 mg/L Li.
[7] To describe the resource in terms of industry standard, a conversion factor of 5.323 is used to convert elemental Li to lithium carbonate, or Lithium Carbonate Equivalent (LCE).
The resource variation is attributed to the increase in the average lithium concentration used to calculate the resource estimate from 165 mg/L Li to 168 mg/L Li. The increase in the average concentration is from the analytical results of 90 brine analyses versus 45 analyses in (Eccles et al, 2018). The doubling of analytical data increased the confidence level of the information used to calculate the Indicated LANXESS Li-Brine Resource Estimate.
| 6.3 | PRODUCTION FROM THE PROPERTY |
No lithium has been commercially produced from the Property. A small quantity of lithium has been extracted from the LANXESS South Plant Tail Brine in the Demonstration Plant for testing and development purposes.
RSI-3353
| 7.0 | GEOLOGICAL SETTING AND MINERALIZATION |
QP Williams has reviewed in detail the prior geological setting and mineralization evaluations of the Project, including the “Amended Geological Introduction and Maiden Inferred Resource Estimate For Standard Lithium’s LANXESS Smackover Lithium-Brine Property In Arkansas, United States”, effective date 19 November 2018 (MIRE)(Eccles, D.R. et al. 2018), and the “Preliminary Economic Assessment of LANXESS Smackover Project”, dated 1 August 2019 (PEA) (Dworzanowski, et al. 2019), and will note where their descriptions, of the geological setting and mineralization are adopted by this report. In particular, the extensive descriptions of the geologic setting and Property history are accurate and are adopted here. Based upon these previous Property reports below the geological setting and mineralization is summarized.
| 7.1 | GULF COAST TECTONO-DEPOSITIONAL FRAMEWORK |
Deposition of the Late Jurassic Smackover Formation is directly linked to the evolution of the Gulf of Mexico. That is, the central Gulf Coast region is the site of Triassic-Jurassic rifting, which is associated with the opening of the Gulf of Mexico and a divergent margin basin characterized by extensional rift tectonics and wrench faulting (Pilger 1981; Van Siclen 1984; Salvador 1987; Winker and Buffler 1988; Buffler 1991). The history of the interior salt basins in the central and eastern Gulf of Mexico includes a phase of crustal extension and thinning, a phase of rifting and sea-floor spreading and a phase of thermal subsidence (Nunn 1984; Mancini et al. 2008).
A proposed model for the evolution of the Gulf of Mexico and related basin and arch formation in Mississippi, North Louisiana and Arkansas includes the following:
Late Triassic-Early Jurassic rifting that developed pronounced half-grabens bounded by listric normal faults. This phase was accompanied by widespread doming, rifting and filling of the rift basin(s) with volcanic and non-marine siliciclastic sedimentary (red beds) rocks as North America separated from Africa-South America (Buffler et al. 1981; Salvador 1991a; Sawyer et al. 1991; Marton and Buffler 2016).
Middle Jurassic rifting, crustal attenuation and the formation of transitional crust is characterized by the evolution of a pattern of alternating basement highs and lows as the Gulf area broke up into a series of separate arches/uplifts and subsiding basins, some of the latter became isolated and filled with thick sequences of evaporite, as shown in Figure 7-1 (Sawyer et al. 1991; MacRae and Watkins 1996; Mancini et al. 2008).
Late Jurassic sea-floor spreading and oceanic crust formation in the deep central Gulf of Mexico characterized by a regional marine transgression related to crustal cooling and subsidence (Sawyer et al. 1991).
Subsidence continued into the Early Cretaceous with a ramping up of a carbonate platform and deposition of shallow to deep-water sedimentary rocks along the margins of the basins. Evolution of the Gulf Coast region ended with a prominent period of igneous activity and global sea-level fall during the Late Cretaceous (mid-Cenomanian), that produced a major lowering of sea level in the region and resulted in the exposure of the shallow Cretaceous platform margin that rimmed the Gulf (Salvador 1991b). This event is defined by a Gulf-wide unconformity that is most pronounced in the northern Gulf of Mexico area.
RSI-3353
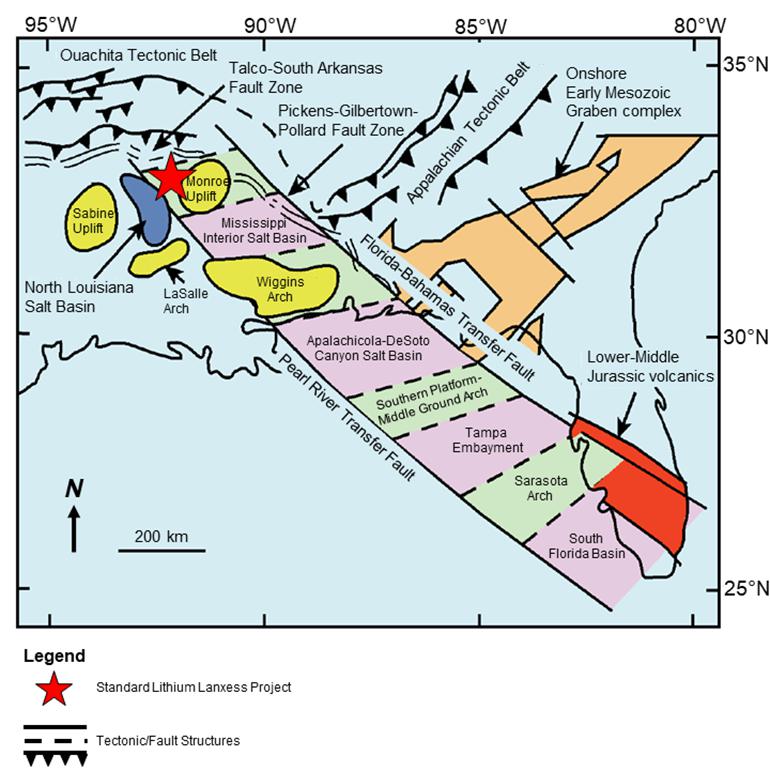
Figure 7-1 Tectonic Framework of the Northern Part of the Gulf of Mexico Region (Marcini et.al. 2008, who modified the work of MacRai and Watkins (1996)).
Given this scenario, Late Jurassic evaporite and sedimentary strata that form the integral geological units in this Technical Report, were deposited across much of the Gulf Coast basin as part of a seaward-dipping wedge of sediment that accumulated in differentially subsiding basins on the passive margin of the North American continent. These units include formations of the Louark Group: 1) the major Li-brine and hydrocarbon reservoir/aquifer known as the Smackover Formation; and 2) the Smackover Formation’s overlying and underlying aquitards, the Buckner Anhydrite Member of the Haynesville Formation and the Norphlet Formation and/or Louann salts.
The Smackover Formation is up to 365 m thick with an upper ooidal/oncolitic packstone and grainstone shoaling upward cycle facies that is nearly 100 m thick (Dickinson 1968; Moore and Druckman 1981). The Smackover Formation has been interpreted as a low-gradient slope (<1°) homoclinal ramp succession, due to its series of strike-oriented, relatively narrow depositional lithofacies belts across Texas, Arkansas, Louisiana and Mississippi (Ahr 1973; Bishop 1968; Handford and Baria 2007). Figure 7-2 presents a regional map of the Smackover lithofacies belts in the U.S. Gulf Coast Basin. These belts include evaporite and redbed sequences in the north that change basin-ward into ooidal (inner-ramp beaches and shoals) peloidal-facies belt (mid-outer ramp) and laminated mudstone (basin).
RSI-3353

Figure 7-2 Facies Map of the Smackover Formation, Northern Gulf Coast Basin (Budd et al. 1981)
| 7.2 | TRIASSIC JURASSIC STRATIGRAPHY |
During rifting phases, evolving grabens were filled with the earliest Late Triassic-Early Jurassic red-bed sedimentary sequences of the Eagle Mills Formation, as shown in Figure 7-3. This unit comprises a variety of terrestrial sedimentary rocks, including red, reddish-brown, purplish and greenish-gray coloured shale, mudstone, siltstone, and lesser amounts of sandstone and conglomerate. In southern Arkansas, the Eagle Mills Formation includes conglomeratic sandstone and red shale, with igneous fragments (diabase). The Late Triassic-Early Jurassic age is based on the study of remnant plants and radiometric dating of intrusive material (Scott et al. 1961; Baldwin and Adams 1971).
RSI-3353
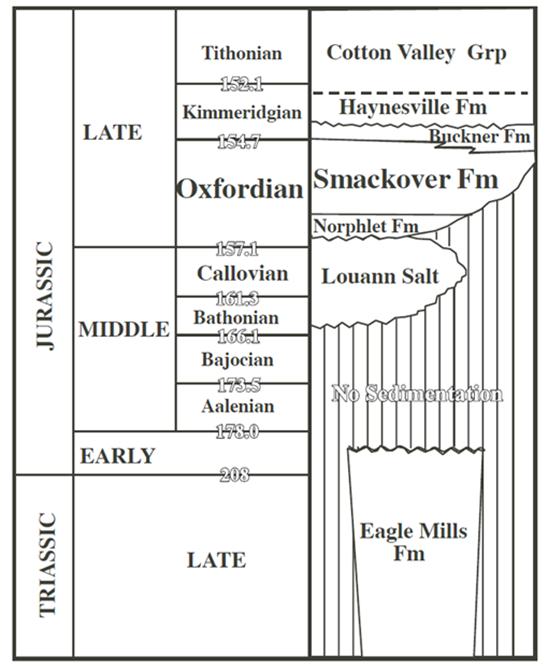
Figure 7-3 Stratigraphic Table of the Late Triassic to Late Jurassic Formations of the Northern U.S. Gulf Coast (Heydari and Baria 2005).
In central-north Louisiana and southern Arkansas, rifting and continental crustal attenuation resulted in a period of non-deposition, as evidenced by a 40-million-year hiatus of the depositional record. Late Middle Jurassic (Bathonian–Callovian) depositional units include evaporite, red clastic and basal conglomerate of the Werner Anhydrite (Hazzard et al. 1947). The Werner-Louann sequence unconformably overlies the Eagle Mills Formation, or older ‘basement’ rocks, and forms the basal unit(s) for the overlying Late Jurassic Louark Group, which includes the Norphlet, Smackover and Haynesville-Buckner formations (see Figure 7-3). More notably, continued basin-wide restriction resulted in deposition of a thick succession of the Louann Salt during the Callovian, which are over 3,050 m thick in some places (Salvador 1990; Zimmerman 1992). The Louann Salt has been estimated to cover as much as 466,000 km2 in the Gulf of Mexico region (Hazzard et al. 1947).
The South Arkansas fault system and the Louisiana State Line graben are approximately parallel to the regional strike of the Smackover Formation deposition and were active during the Jurassic; likely, resulting from salt tectonics in the underlying Louann Formation (see Figure 6-2); (Bishop 1973; Troell and Robinson 1987). The present up-dip limit of the Louann Salt is generally marked by the South Arkansas fault system, a feature believed to have been produced during the Late Jurassic by downdip gravity sliding of the Louann Salt (Troell and Robinson 1987).
The Late Jurassic Norphlet Formation unconformably overlies the Louann Salt, and older units, near the margins of the basin (Hazzard et al. 1947; Bishop 1967). The Norphlet Formation was deposited during a regional sea-level low and attains a maximum thickness of approximately 45 m and is comprised of alluvial-fan sandstone and conglomerate, channel and interdune red-bed and aeolian sandstone (Wade and Moore 1993; Mancini et al. 2008). Norphlet Formation fluvial deposition in southern Arkansas is characterized by gravel with interbedded red and grey mudstone (Mancini et al. 2008) and is approximately 15 m thick (Zimmerman 1992; Hunt 2013).
RSI-3353
Marine deposition resumed during the late Oxfordian, as the Late Jurassic seas transgressed, initiating the deposition of the Smackover Formation, which conformably overlies the Norphlet Formation.
The Smackover Formation carbonate rocks are succeeded by mixed evaporite, siliciclastic and dolomite of the Buckner Formation, and then by a thick Kimmeridgian–Tithonian succession of marine, deltaic and fluvial siliciclastic rocks of the Haynesville Formation and the Cotton Valley Group (Figure 7-4).
The Buckner Formation consists of evaporitic deposits and associated red-beds reflecting a depositional environment that is less marine, or shallower water marine, than those of the underlying Smackover Formation (Salvador 1987). The Buckner Formation is made up of intercalated 2–6 m thick salt/anhydrite and marine limestone and extends from the Florida Panhandle to South Texas (Mann 1988). A distinct facies change occurs along the crests of a line of anticlines, that extend from the Catesville oilfield in Union County, westward to the Dorcheat-Macedonia field in Columbia County. North of this structural trend, the Buckner Formation consists, from top to bottom, of non-marine red shale, anhydrite and dolomite (Akin and Graves 1969). To the south, equivalent beds become sandy. The anhydrite facies indicate the presence of a barrier restricting normal flow of seawater during Buckner Formation deposition.
In southern Arkansas and northern Louisiana, the Late Jurassic Cotton Valley Group lies unconformably on the Louark Group, Haynesville Formation. In ascending order, Swain and Anderson (1993) divided the Cotton Valley Group into the Millerton (siliciclastic, mainly shale, shelf unit), Shongaloo (foreshelf and shelf edge silty shale and sandstone) and Dorcheat (sandstone and siltstone) formations. The Millerton Formation, or Bossier marine shale, pinches out updip in southernmost Arkansas (Mancini et al. 2008). The Haynesville Formation conformably underlies the Bossier, and where the Haynesville is absent, the Bossier rests on the Smackover Formation limestone. In Arkansas, the Dorcheat Formation contains increasing amounts of sandstone before pinching out (Forgotson 1954).
| 7.3 | SMACKOVER FORMATION |
The Smackover Formation was named after the Smackover field, Union County, Arkansas, where oil was first produced. Hydrocarbons were discovered in the Late Jurassic Smackover Formation in the mid-1920s. Since then, the Smackover has produced large quantities of oil and gas in a production trend that extends over an area of 100 km x 1,000 km, on the margins of the Gulf of Mexico from Texas to Florida (Moore 1984). Consequently, the Smackover Formation has been subject to many investigations that address the unit’s stratigraphy, lithofacies and depositional environment (e.g. Ahr 1973; Akin and Graves 1969; Baria et al 1982; Bishop 1968, 1971a, 1973; Budd and Loucks 1981; Moore and Druckman 1981; Harris and Dodman 1982; Moore 1984; Troell and Robinson 1987; Chimene 1991; Hanford and Baria 2007; Marcini et al. 2008).
Based on ammonite studies from the lower portion of the unit, the Smackover Formation is late Oxfordian (Imlay 1945). The Smackover Formation resulted from carbonate deposition under shoaling conditions, following a relatively rapid transgression over the Norphlet Formation sandstone and Louann Salt. The transgression extended as far northwards in the State of Arkansas to Ouachita County (directly north of Union County). The distribution of facies of the ensuing carbonate deposits was controlled by local paleotopography where 1) high energy facies were deposited in nearshore areas; and 2) low-energy strata were deposited in basin centers.
The Late Jurassic Smackover Formation in Arkansas was traditionally divided into two members: 1) an upper ooidal to chalky porous limestone; and 2) a lower member composed of dense argillaceous limestone and dark calcareous shale (Imlay 1940). Jurassic rocks are not exposed in southern Arkansas. In southern Arkansas, the Smackover Formation oil and gas reservoir pay zone is situated at depths that range from 2,350 to 3,660 m below the Earth’s surface (Moore and Druckman 1981; Marcini et al. 2008). Accordingly, the two Smackover Formation members were divided based on their wire-line electric logs, where the upper member has high self-potential and lower resistivity and the lower member has low self-potential and high resistivity.
RSI-3353
More recently (e.g. Dickinson 1968), and in the general context of this Technical Report, the Smackover Formation has been divided into three informal sub-units:
| · | The Reynolds Member: an upper, clean, ooidal grainstone member that forms the main reservoir rock type of the region due to its high porosity (this unit correlates with the Mineral Resource estimate interval that is the focus of this Technical Report). |
| · | The Middle Smackover: a middle unit composed of brown, dense, laminated, pelletal, lime-mudstone and fossiliferous lime-wackestone. |
| · | The Brown Dense: a lower Smackover unit comprised of dark-brown, fine-grained, laminated, argillaceous, lime-mud sequence (Dickinson 1968; Moore and Druckman 1981; Troell and Robinson 1986), as shown in Figure 7-4. |

Figure 7-4 Stratigraphic Depositional Environments of the Smackover Formation
RSI-3353
The correlating depositional environment and stratigraphic interpretation of these three Smackover sub-units is shown on Figure 7-4 and from top to bottom as:
| · | An ooidal beach complex and/or sand shoal. |
| · | A shelf high-stand systems tract deposited at and near the time of maximum transgression, and during/after a period of rapidly-increasing water depth. During middle Smackover-time, prolific production of high-energy carbonate sediment on the flanks of the paleohighs initiated a progradation phase of Smackover Formation deposition. |
| · | Transgressive systems tract deposits formed in shallow water during relative-sea-level stillstand. The ooidal deposits are generally arranged in a succession of stacked, upward-shallowing cycles that grade from subtidal strata at their bases to shallower subtidal to supratidal strata at their tops (Benson, 1988; Mancini et al. 1990). |
From southern Arkansas to northern Louisiana, the Smackover Formation ranges from 0 to 365 m thick (Dickinson 1968). The Reynolds Member, which represents the uppermost Smackover Formation lime-grainstone-ooidal strata, maintains a thickness of 90 to 120 m across southern Arkansas (Akin and Graves 1969) and reaches a maximum thickness of almost 300 m near the Arkansas-Louisiana state line (Moore and Druckman 1981). The Smackover Formation thickens to the south of a westward-trending series of anticlines that extend westward from the Catesville oilfield in Union County to the Dorcheat-Macedonia field in Columbia County until it interfingers with the Millerton Formation (Bossier shale) to the south.
Smackover Formation hydrocarbon traps include structural and stratigraphic traps and a combination of the two. Evaporites, which have played a role in Smackover reservoir development are found in the underlying Louann Salt, the overlying Buckner Formation and within the Smackover Formation itself.
Smackover Formation diagenesis was dominated by early cementation, leaching of calcium carbonate allochems and dolomitization. Other processes include pressure solution, late (post-dolomitization) calcite and anhydrite cementation and fracturing; both tectonic and caused by collapse of partially dissolved rock frameworks (Kopaska-Merkel et al. 1992). Early marine-phreatic cementation was followed by leaching of ooids and widespread particle dissolution that vastly increased porosity values to 40% or more but had little direct effect on permeability. Early dolomitization of uppermost Smackover Formation strata by reflux of hypersaline brine was widespread and is responsible for formation and/or preservation of many permeable Smackover pore systems.
The Reynolds Member of the upper Smackover Formation is the target horizon for mineral resource evaluation in this Technical Report. The Reynolds Member was deposited during a high-stand systems tract in response to a decrease in relative sea level; consequently, the upper Smackover Formation Reynolds Member is composed of ooids and non-skeletal carbonate that formed ooidal, chalky limestone (Vestal 1950; Tonietto and Pope 2013).
This carbonate unit is widespread, relatively uniform in thickness and has definite patterns of regional and local lithic changes. The most common Smackover Formation reservoir rocks occur within the Reynolds Member, which can comprise a variety of grainstone and grainstone/packstone rock-units that are often dominated by pellets, ooids and oncoids (Akin and Graves 1969; Moore and Druckman 1981; Troell and Robinson 1987). The occurrence of reservoir-grade rocks (porosity of at least 6% and permeability of at least 0.1 millidarcy (mD)) in the Smackover Formation is dependent on: (1) deposition of porous and permeable sediments in a variety of settings; and (2) diagenetic processes that have preserved, enhanced or created porosity and permeability in originally permeable and/or impermeable strata (Kopaska-Merkel et al. 1992).
RSI-3353
The focus of this resource and reserves assessment is the LANXESS Project Area’s Smackover Formation in southern Arkansas. The LANXESS Property (Figure 7-5) is approximately 41 kilometers (km) east to west and 31.4 km north to south. The lithium bearing Smackover reservoir is continuous across the Property and extends beyond the property discussed in this TR. The lithium concentration within the Smackover Formation brines varies throughout the Property and generally increases from north-northeast to south-southwest.
The structure of the Smackover in the Property area generally dips from north-northeast to south-southwest, with a small structural high in southern portions of the West and Central Units (Figure 7-6) and varies in depth from approximately 1,920 meters subsea to approximately 2,621 meters subsea. Unlike the production of oil and gas, the reservoir structure is not by itself an important factor in brine production, because the similar densities of injected and produced brines minimizes the influence of gravity on fluid flow in the reservoir.
RSI-3353

Figure 7-5 LANXESS Project Area Map
RSI-3353
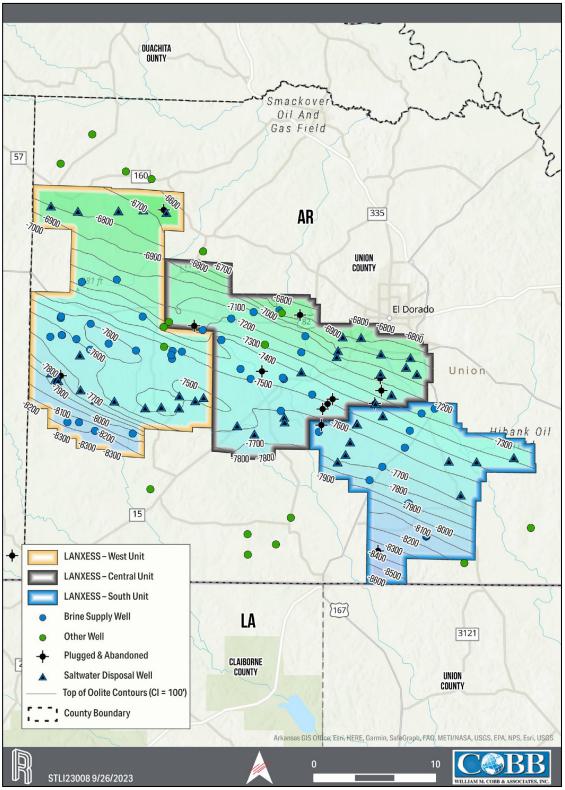
Figure 7-6 Smackover Structure Map
RSI-3353
The lithium brine-bearing Upper Smackover Interval is overlain by the Buckner Formation, which in Arkansas is dominated by red shale in the upper part and anhydrite in the lower part above the Smackover carbonates, and, as a result of its low permeability, acts as a geologic seal which traps oil and gas. The dense, low-permeability carbonate of the Lower Smackover interval is underlain by the clastic section of the Norphlet Formation. The Norphlet Formation is comprised of red and gray clays with varying amounts of intercalated sands and occasional gravels. The relationship between the Smackover Formation, the Buckner Formation, and the Norphlet Formation as shown in a north-south cross-section, Figure 7-7.

Figure 7-7. North-South Cross Section with Geologic Model Oolite 1-6 Zones
Also shown on Figure 7-7, and as described in more detail in Section 14, Cobb & Associates has subdivided the Upper Smackover Interval into six zones based on geologic characteristics and lateral correlations. These six zones are referred to as oolite zones. Zones two and four are low-permeability zones and were key correlation intervals used to define the six zones. The available well data was evaluated to determine the reservoir’s structure, porosity, gross zone thickness, net pay thickness (that portion of the gross zone thickness expected to be productive because it exceeded a minimum porosity value) and net pay thickness to gross zone thickness ratio (equal to the fraction of the oolite zone at a given location that was estimated to be productive) for each oolite zone at each well location. Some wells did not drill deeply enough to penetrate all oolite zones, so only penetrated oolite zones with data were used in the mapping effort at those locations.
RSI-3353
| 8.0 | DEPOSIT TYPE |
The Property lithium deposit is in the form of a lithium-bearing brine contained within the porosity of the Smackover Formation within the LANXESS unitized boundaries. The volume of in-place lithium is proportional to the product of the brine-saturated pore volume in the Property and the lithium concentration, both of which are known with reasonable accuracy, based on extensive drilling, logging, coring, and sampling data obtained throughout the Property. A refinement of this TR in comparison to the MIRE (Eccles et al. 2018) and PEA (Dworzanowski et al. 2019) reports is the inclusion of the varying lithium concentration in the Property, which changes both in location and with time. The balance of information in this section has been brought forward from the previously issued PEA (Dworzanowski et al. 2019).
Lithium is a silver-grey alkali metal that commonly occurs with other alkali metals (sodium, potassium, rubidium, cesium). Lithium’s atomic number is 3 and it has an atomic weight of 6.94, making it the lightest metal and the least dense of all elements that are not gases at 20°C (the density of lithium in solid form at 20°C is 534 kg/m3). Lithium has excellent electrical conductivity (i.e. a low electrical resistivity of 9.5 mΩ∙cm), making it an ideal component for battery manufacturing, where lithium ions move from the negative electrode to the positive electrode during discharge and back when charging. Lithium imparts high mechanical strength and thermal shock resistance in ceramics and glass.
The average crustal abundance of lithium is approximate 17-20 parts per million (ppm), with higher abundances in igneous (28-30 ppm) and sedimentary (53-60 ppm) rocks (Evans 2014; Kunasz 2006). Note: 1 mg/L Li is equivalent to 1 ppm (at a fluid density of 1 g/cm3) and 0.0001%. Lithium does not occur in elemental form in nature because of its reactivity. There are over 100 minerals that contain lithium, but only a few of these are currently economic to extract.
Lithium can be described, priced and quoted as lithium content (Li), lithium oxide (Li2O; 0.464 Li content; conversion is Li x 2.153), lithium carbonate (Li2CO3; 0.188 Li content) and lithium carbonate equivalent (LCE; conversion is Li x 5.323). Resource estimates and production quantities of lithium are most commonly expressed as LCE.
Lithium is extracted from two main categories of deposits: mineral and brine. With respect to mineral deposits, lithium is currently only extracted commercially from pegmatite deposits. Pegmatite lithium deposits are found globally and account for half of the lithium produced today (Benson et al. 2017). Spodumene is the most abundant Li-bearing mineral found in economic deposits.
Brine deposits include unconfined (i.e. continental) and confined (i.e. geothermal and subsurface aquifer) brine deposits. Continental brine occurs in endorheic basins, where inflowing surface and groundwater is moderately enriched in lithium. All producing lithium brine operations are unconfined, or partially confined, continental deposits. Several first-order characteristics of this type of brine deposit are: (1) arid climate; (2) closed basin containing a playa or salar; (3) tectonically driven subsidence; (4) associated igneous or geothermal activity; (5) suitable lithium source-rocks; (6) one or more adequate aquifers; and (7) sufficient time to concentrate a brine (Bradley et al. 2006).
RSI-3353
Economic continental brine deposits typically occur in areas where high solar evaporation results in beneficiating the Li-brine to higher levels of lithium. Geothermal and/or volcanic associations are the favoured mechanisms for introducing lithium into continental basins, because lithium-rich brines often exist in areas of volcanic activity (e.g. Imperial Valley, California; Reykjanes Field, Iceland; Taupo Volcanic Zone, New Zealand). Typical grades are 0.04-0.15 mg/L Li.
Selected continental brine deposit examples include: Salar de Uyuni in Bolivia (Bradley et al. 2017); Salar de Atacama in Chile (Garrett 2004); Salar de Hombre Muerto in Argentina (Tahil 2007); Salar del Rincon and the Salar del Olaroz in Argentina (Pavlovic and Fowler 2004; Houston and Gunn 2011); and the Zhabuye Salt Lake in the Tibetan Plateau, the DXC Salt Lake and the Qaidam Basin in China (Shengsong 1986; Zheng et al. 2007). The only active lithium mine in North America is in Silver Peak, Nevada, where lithium brine extraction started in 1966. The lithium occurs in an infilled playa sequence that covers an area of 72 km2 within a closed drainage basin of 1,342 km2 (Munk et al. 2011). Average lithium content at the initiation of production was 360 ppm in 1966, declining to 230 ppm in 2008 (Garrett 2004). The mine currently produces 3,500 tonnes of LCE per year, with the capability to produce 6,000 tonnes of LCE per year.
Deep aquifer Li-brine is frequently pumped as a waste product of hydrocarbon production from confined aquifers at depths of up to 4,000 m. Lithium enrichment of deep saline brine is known to occur worldwide in sedimentary basins of various age, including: the Cambrian Siberian Platform, Russia (Shouakar-Stash et al. 2007); Devonian Michigan Basin (Wilson and Long 1993); Mississippian–Pennsylvanian reservoirs of the Illinois Basin (Stueber et al. 1993); Pennsylvanian Paradox Basin, Utah (Garrett 2004); Triassic strata of the Paris Basin, France (Fontes and Matray 1993); and Jurassic Smackover strata from the Gulf Coast, Arkansas and Texas (Moldovanyi and Walter 1992).
If the aquifer contains elevated concentrations of lithium, deep, confined aquifers associated with mature (or dwindling or dormant) oil and gas fields can be converted to brine producing aquifers. A perfect example of this is bromine production from the Smackover Formation in southern Arkansas. At the LANXESS Property, LANXESS’s predecessors ceased hydrocarbon production in favour of bromine production in 1957 and this production has continued for over 50-years. Accordingly, these deep-seated aquifer brine deposits present enormous opportunity.
The source of lithium in hypersaline brine aquifers, including the Smackover Formation, remains subject to debate. Theories relevant to the Smackover Formation include, but are not limited to, the following:
| / | Smackover Li-brine could be a result of the continental drainage of lithium-enriched solutions into the sea, where the lithium stems from Triassic age volcanic rocks in the Gulf coast (Collins 1976). Continental water from springs or other hydrothermal fluids along fault systems could have leached lithium from Triassic aged volcanic rocks. These lithium-enriched fluids then drained into the Smackover Sea and the water was then concentrated by evaporation. |
| / | In the Smackover brine, radiogenic Strontium -87/Strontium -86 are significantly higher than Late Jurassic seawater, suggesting significant strontium contribution from detrital sources, such as the Bossier Formation, which overlies and/or interfingers with the upper Smackover Formation, or suggesting they were acquired during brine migration (Stueber et al. 1984). |
| / | Lithium was mobilized from the Alleghenian-sourced volcaniclastics (including plutonic rocks) and then concentrated in the underlying Norphlet Formation. These fluids could have originated in the Louann Salt and migrated upward through faults or from shallower circulation through the alluvial and wadi facies of the Norphlet (from Chuchla, unpublished, via Daitch 2018). |
RSI-3353
| / | The association between B, Li, K, and Rb, coupled with a general lack of clastic sediments in the upper Smackover Formation in southwest Arkansas, suggest that the Smackover Formation brines are mixing with deeper-seated waters that may have been geochemically modified by siliciclastic diagenesis at higher temperature (Walter et al. 1990) |
| / | Regional trends between H2S) and B, Li, K and Rb support the association of a higher temperature, deeper-seated fluid end member; these fluids may have migrated into upper Smackover reservoirs via major fault systems, the South Arkansas fault system and the Louisiana State Line graben, and their associated fractures (Moldovanyi and Walter 1992). |
With respect to resource modelling of confined aquifer Li-brine deposits, important criteria include defining the boundaries of the subsurface aquifer; brine chemistry; and understanding of the hydrology of the brine. The reader is referred to the CIM Best Practice Guidelines for Resource and Reserve Estimation for Lithium Brine (2012). While the guidelines define issues specific to unconfined continental brine deposits (i.e. salars), they do provide general direction for reporting on confined deep aquifer deposits.
RSI-3353
| 9.0 | EXPLORATION |
The exploration program to quantify the Property brine lithium accumulation has focused on quantifying two key parameters: the distribution of porosity in the Smackover Formation (which determines the volume of brine) and the initial distribution of lithium concentration within the Smackover Formation. The initial total quantity of lithium in the Property is fully described by the combination of the formation’s structure and pore volume, as estimated through the geologic characterization of the porosity and thickness of the Smackover Formation, as described in Section 14, with the mapped lithium concentration for the Smackover Formation, as estimated from the results of the Standard Lithium sampling program described here.
| 9.1 | GEOLOGIC DATA SAMPLING METHODS, QUALITY, AND EXTENT |
The Smackover Formation geologic data used in this analysis was obtained by LANXESS and its predecessors as they developed the Property for bromine recovery. Three categories of geologic data were obtained for the Property: well logs that provided structural data, well logs that provided porosity data, and cores that provided porosity and permeability data. Figure 9-1 identifies the locations where these data were collected. The structural data was obtained from 89 wells with log data in the Smackover Formation, while the porosity data originated in two forms: the porosity logs (density porosity, sonic porosity, and neutron porosity logs) obtained from 68 wells, and the core samples obtained from 27 wells. The logs and cores were gathered using industry-standard procedures by contractors experienced in their respective specialties.
All available wireline well log data from the 89 wells was used to establish correlations for structural control and to define gross interval thickness for each Smackover zone. Available well log data included spontaneous potential (SP), gamma ray (GR), resistivity (EL, ISFL, DIL, etc.), MicroLog, and various porosity curves when available (acoustic, neutron, and density). The number of wells with wireline log data available for structural and thickness determination exceeded the number of wells with porosity data from cores and porosity logs and was used to constrain net reservoir thickness and to relate porosity to the established zone correlations. The primary source of porosity data, the density porosity logs, were calibrated using the core porosity values, supplemented with the sonic porosity and neutron porosity well logs, eliminating any significant systematic error or bias in the resulting porosity value estimates. The resulting geologic model formed the basis for the geologic description of the brine-containing reservoir and the reservoir simulation model.
| 9.2 | LITHIUM CONCENTRATION DATA SAMPLING METHODS, QUALITY, AND EXTENT |
The lithium concentration data used in this TR resulted from brine samples collected by Standard Lithium from 2017 through May 2022 and analyzed by Western Environmental Testing Laboratory (WetLab), 1084 Lamoille Highway, Elko, Nevada 89801. The well concentration data were used to develop a map of the initial distribution of lithium throughout the Property area which formed the basis for the computer simulation model-based estimates for Project lithium production. In addition, the brine samples collected at the inlet of each of the processing facilities were used to quantify the inlet lithium concentrations at the three bromine processing facilities for comparison to the simulation model’s initial predicted values.
RSI-3353
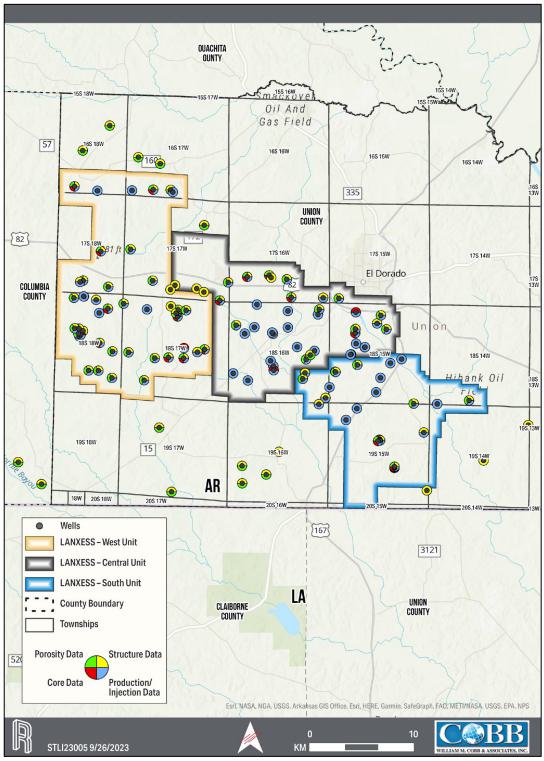
Figure 9-1. Well Data Source
RSI-3353
Standard Lithium’s 2017 (inlet brine samples only), 2018, and 2019 sampling programs on the Property and the resulting lithium concentration data are described in detail in sections 9.1 and 9.3 of the MIRE (Eccles, et al. 2018), and in section 9 of the PEA (Dworzanowski et al. 2019). The author has reviewed those reports and agrees that the sampling programs were appropriate, appear to have been executed correctly, and have provided reasonable estimates of the brine sample lithium compositions. QP Williams participated in Standard Lithium’s May 2022 brine sampling program using the sampling procedures described in Section 11. These results are incorporated with the 2017-2019 sampling data.
In total, there were six well sampling events from June 2018 to May 2022, where 22 to 37 samples were collected in each event, with a total of 162 samples analyzed. Table 9-1 lists the sample assay values averaged by well and Figure 9-2 is a map showing the locations of the sampled wells. The three right-hand columns on Table 9-1 relate to removing the impact of injected brine on measured lithium concentration.
| 9.3 | EXPLORATION RESULTS AND INTERPRETATION |
The extensive data collection programs for both porosity (Figure 9-1) and lithium concentration (Table 9-1) address the two key factors determining the volume and quality of the lithium resource for the Property, and the amount of lithium available for recovery in the South Unit by the Project. In the QP’s Brush and Williams’ opinion the Property has an exceptional quantity, quality, and coverage of the key data, thanks to the decades of data gathering associated with its development as a bromine recovery project and an extensive lithium sampling program.
Correctable bias exists in these recently measured lithium concentration values with respect to the initial (pre-bromine-development) concentration values because the recent values are affected to varying degrees by the presence of re-injected brine that has a lithium concentration different from the original lithium concentration at a specific well’s location. This effect was removed by accounting for the fraction of injected brine present in the samples, thereby providing the data needed to initialize the simulation model with the initial, pre-development lithium concentrations. This permitted the model to correctly evaluate the movement of lithium throughout the Property history.
The estimated original lithium concentrations are presented in the right-hand column of Table 9-1. These estimated values were used to create a map of estimated initial lithium concentrations throughout the Property, Figure 9-3. That map was then used as the initial lithium concentration data for the computer simulation of the Property from the date of first production and injection of brine. As demonstrated by Table 9-1, the large number of samples gathered over a broad area of the Property results in a high-quality data set suitable for estimating the initial distribution of lithium concentration throughout the Property.
RSI-3353
Table 9-1. Average of Supply Well Lithium Concentration Data
| Brine Sampling | Estimated Initial Deposit | ||||||
| Well | Unit |
Number Samples |
Average Lithium Concentration (mg/L) |
Percent Standard Deviation Samples |
Estimated Fraction Injected in |
Estimated Average Brine Lithium Concentration (mg/L) |
Estimated Original Concentration (mg/L) |
| BSW 13 | Central | 7 | 114 | 8.2% | 0.27 | 135 | 106 |
| BSW 14 | Central | 9 | 97 | 9.1% | 0.09 | 135 | 93 |
| BSW 15 | Central | 7 | 158 | 21.2% | 0.24 | 135 | 165 |
| BSW Car1N | Central | 7 | 195 | 10.2% | 0.18 | 135 | 208 |
| BSW Spen N | Central | 7 | 187 | 10.1% | 0.38 | 135 | 219 |
| BSW 10S1 | South | 3 | 192 | 0.6% | 0.77 | 200 | 164 |
| BSW 20S | South | 7 | 213 | 7.1% | 0.55 | 200 | 230 |
| BSW 21S | South | 6 | 238 | 6.9% | 0.14 | 200 | 244 |
| BSW 22S | South | 3 | 279 | 14.6% | 0.05 | 200 | 283 |
| BSW 23S | South | 4 | 256 | 9.4% | 0.03 | 200 | 258 |
| BSW 24S | South | 2 | 233 | 20.6% | 0.46 | 200 | 261 |
| BSW 25S | South | 2 | 250 | 2.0% | 0.05 | 200 | 252 |
| BSW 4S1 | South | 4 | 200 | 8.3% | 0.46 | 200 | 200 |
| BSW 5S1 | South | 3 | 176 | 3.5% | 0.48 | 200 | 154 |
| BSW 10M | West | 9 | 114 | 9.2% | 0.18 | 165 | 102 |
| BSW 12M | West | 7 | 256 | 6.7% | 0.15 | 165 | 272 |
| BSW 13M | West | 8 | 304 | 9.3% | 0.16 | 165 | 331 |
| BSW 14M | West | 7 | 255 | 11.4% | 0.25 | 165 | 285 |
| BSW 15M | West | 5 | 147 | 22.2% | 0.10 | 165 | 145 |
| BSW 16M | West | 5 | 171 | 9.7% | 0.14 | 165 | 172 |
| BSW 17M | West | 6 | 159 | 14.6% | 0.14 | 165 | 158 |
| BSW 18M | West | 6 | 82 | 5.2% | 0.13 | 165 | 70 |
| BSW 19M | West | 6 | 58 | 10.8% | 0.15 | 165 | 38 |
| BSW 1M | West | 8 | 183 | 7.2% | 0.44 | 165 | 196 |
| BSW 5M | West | 5 | 183 | 7.3% | 0.37 | 165 | 194 |
| BSW 6M | West | 3 | 194 | 3.0% | 0.30 | 165 | 207 |
| BSW 7M | West | 6 | 184 | 4.1% | 0.54 | 165 | 206 |
| BSW A8M | West | 5 | 205 | 11.2% | 0.14 | 165 | 211 |
| BSW JK2 | West | 5 | 185 | 4.5% | 0.59 | 165 | 215 |
| Average | 5.6 | 9.2% | |||||
Notes:
[1] Well no longer in service.
RSI-3353
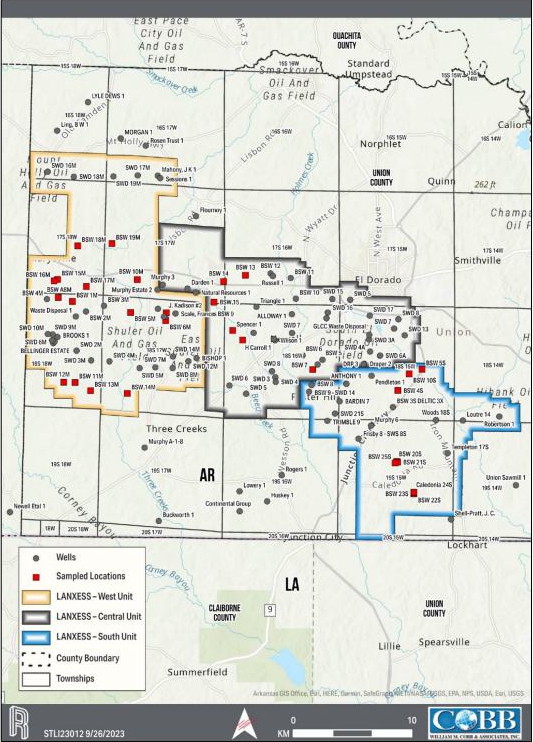
Figure 9-2. Standard Lithium Sample Locations
RSI-3353
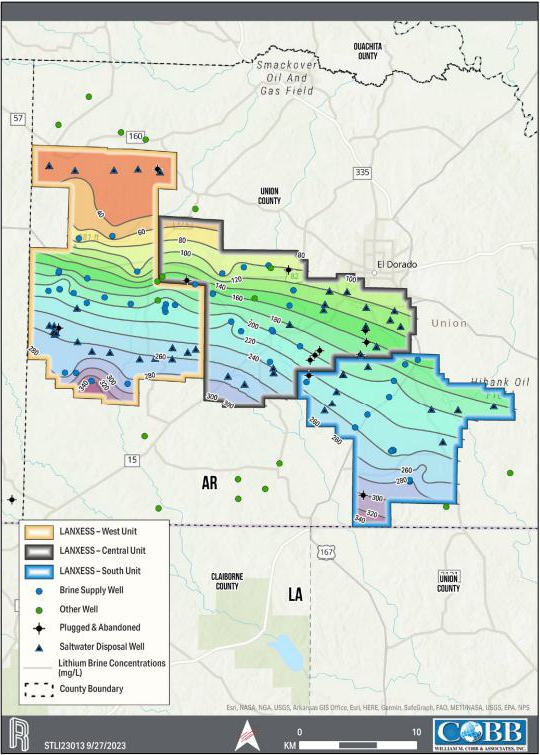
Figure 9-3. Estimated Initial Lithium Concentration
RSI-3353
| 10.0 | DRILLING |
The geologic model as described in Section 14 is based on the well logs and core data obtained from 85 wells drilled in the Geologic Study Area (Figure 7-1) that penetrated at least the top of the Smackover Formation. No new exploration wells were drilled as part of this estimate. These wells were drilled either by LANXESS and its predecessor companies to assess and access the bromine-bearing brine, or by other operators exploring the area for hydrocarbons. There are 89 wells with logs of various types providing structural control, with 68 wells providing log porosity data and 27 wells providing core porosity data. The majority of the wells have associated injection and withdrawal data. Table 10-1 summarizes the locations and data provided by all wells in the geologic study area.
Table 10-1. Well Data
| API Number | Well Name | Year Drilled |
Latitude | Longitude | Structure Data |
Porosity Data |
Core Data |
Production or Injection Data |
| 0313904787 | Alloway 1 | 1966 | 33.1864500 | -92.7435200 | YES | |||
| 0313910088 | Anthony 1 | 1947 | 33.1333295 | -92.6945771 | YES | |||
| 0313983123 | Arkansas Chemicals 6 | 1968 | 33.1723900 | -92.7782200 | YES | |||
| 0313910415 | Bardin 7 | 1972 | 33.1198800 | -92.7005500 | YES | |||
| 0313911278 | Bellinger Estate | 1980 | 33.1647342 | -92.9595850 | YES | |||
| 0313912191 | Bishop 1 | 1961 | 33.1531830 | -92.8298900 | YES | YES | YES | YES |
| 0313911279 | Brooks 1 | 1980 | 33.1693362 | -92.9558853 | YES | |||
| 0313910820 | BSW 10 | 1977 | 33.1983093 | -92.7399135 | YES | YES | YES | YES |
| 0313912920 | BSW 10M | 1993 | 33.2131270 | -92.8835200 | YES | YES | YES | |
| 0313910475 | BSW 10S | 1973 | 33.1406949 | -92.6374519 | YES | |||
| 0313911063 | BSW 11 | 1978 | 33.2141222 | -92.7444945 | YES | YES | YES | |
| 0313911522 | BSW 11M | 1994 | 33.1346777 | -92.9398784 | YES | YES | YES | |
| 0313912745 | BSW 12 | 1987 | 33.2176181 | -92.7627527 | YES | YES | YES | YES |
| 0313912946 | BSW 12M | 1995 | 33.1348063 | -92.9500576 | YES | YES | YES | |
| 0313912779 | BSW 13 | 1988 | 33.2163149 | -92.7854856 | YES | YES | YES | YES |
| 0313912948 | BSW 13M | 1995 | 33.1283211 | -92.9258458 | YES | YES | YES | |
| 0313912924 | BSW 14 | 1994 | 33.2115435 | -92.8053158 | YES | YES | YES | |
| 0313912949 | BSW 14M | 1995 | 33.1262500 | -92.8925400 | YES | YES | YES | |
| 0313912985 | BSW 15 | 1998 | 33.1957500 | -92.8139800 | YES | YES | YES | YES |
| 0313912970 | BSW 15M | 1996 | 33.2132500 | -92.9556600 | YES | YES | YES | YES |
| 0313912971 | BSW 16M | 1996 | 33.2121000 | -92.9558800 | YES | YES | ||
| 0313912965 | BSW 17M | 1996 | 33.2078053 | -92.9295332 | YES | YES | YES | |
| 0313912983 | BSW 18M | 1998 | 33.2388500 | -92.9373000 | YES | YES | YES | YES |
| 0313913041 | BSW 19M | 2005 | 33.2405837 | -92.9064449 | YES | YES | YES | |
| 0313910558 | BSW 1M | 1975 | 33.1964325 | -92.9421636 | YES | YES | ||
| 0313910552 | BSW 20S | 1974 | 33.0738200 | -92.6490700 | YES | YES | ||
| 0313912968 | BSW 21S | 1996 | 33.0732500 | -92.6482900 | YES | YES | ||
| 0313913549 | BSW 22S | 1996 | 33.0491314 | -92.6336003 | YES | YES | YES | YES |
| 0313913558 | BSW 23S | 2018 | 33.0498160 | -92.6335556 | YES | YES | YES | YES |
| 0313913560 | BSW 25S | 2018 | 33.0727400 | -92.6505300 | YES | YES | YES | YES |
RSI-3353
| API Number | Well Name | Year Drilled |
Latitude | Longitude | Structure Data |
Porosity Data |
Core Data |
Production or Injection Data |
| 0313910577 | BSW 2M | 1974 | 33.1887170 | -92.9300000 | YES | YES | YES | YES |
| 0313910616 | BSW 3M | 1975 | 33.1931071 | -92.9136646 | YES | YES | YES | |
| 0313910117 | BSW 3S DELTIC 3X | 1969 | 33.1153266 | -92.6522708 | YES | |||
| 0313910714 | BSW 4M | 1976 | 33.1981672 | -92.9652242 | YES | YES | YES | |
| 0313910248 | BSW 4S | 1970 | 33.1279821 | -92.6477757 | YES | |||
| 0313910099 | BSW 5 | 1969 | 33.1516340 | -92.7159650 | YES | |||
| 0313971205 | BSW 5M | 1977 | 33.1880308 | -92.8895329 | YES | |||
| 0313910411 | BSW 5S | 1972 | 33.1441965 | -92.6258082 | YES | |||
| 0313970114 | BSW 6 | 1970 | 33.1550500 | -92.7339700 | YES | |||
| 0313911211 | BSW 6M | 1979 | 33.1818300 | -92.8577400 | YES | YES | YES | YES |
| 0313910177 | BSW 7 | 1970 | 33.1442544 | -92.7247228 | YES | YES | YES | |
| 0313972061 | BSW 7M | 1977 | 33.1846430 | -92.8583700 | YES | |||
| 0313910184 | BSW 8 | 1970 | 33.1323599 | -92.7258727 | YES | YES | ||
| 0313911179 | BSW 8M | 1979 | 33.1993803 | -92.9548591 | YES | |||
| 0313910498 | BSW 9 – SWD 14 | 1979 | 33.1272655 | -92.7281765 | YES | YES | YES | |
| 0313913034 | BSW A8M | 2004 | 33.1994360 | -92.9551300 | YES | |||
| 0313903426 | BSW_WIL2N | 1963 | 33.1676505 | -92.7598252 | YES | |||
| 0313912880 | Buckworth 1 | 1991 | 33.0287550 | -92.8643200 | YES | YES | ||
| 0313913562 | Caledonia 24S | 2018 | 33.0502432 | -92.6335473 | YES | YES | YES | YES |
| 0313911374 | Continental Group | 1981 | 33.0361020 | -92.7911300 | YES | YES | ||
| 0313912660 | Darden 1 | 2004 | 33.2062028 | -92.8380019 | YES | |||
| 0313910089 | Draper 2 | 1969 | 33.1484896 | -92.6781299 | YES | |||
| 0313913539 | DRP 3 | 2017 | 33.1483300 | -92.6786250 | YES | |||
| 0313911523 | Etta, Mitz 1 | 1981 | 33.0860520 | -92.4948500 | YES | YES | ||
| 0313911269 | Flournoy 1 | 1980 | 33.2615000 | -92.8300600 | YES | YES | ||
| 0313910473 | Frisby 8 – SWS 8S | 1973 | 33.0912255 | -92.6835493 | YES | |||
| 0313912624 | GLCC Waste Disposal | 1973 | 33.1833202 | -92.7122686 | YES | |||
| 0313910076 | H Carroll 1 | 1969 | 33.1668170 | -92.7882400 | YES | |||
| 0313913017 | Huskey 1 | 2002 | 33.0436970 | -92.7662900 | YES | YES | ||
| 0313912864 | J. Kadison #2 | 1991 | 33.1876481 | -92.8572285 | YES | YES | YES | YES |
| 0302710233 | Jennings -Owens 1 | 1974 | 33.0547476 | -93.0229414 | YES | YES | ||
| 0313911491 | Jerry Estate 1 | 1981 | 33.1967050 | -92.5013200 | YES | YES | ||
| 0313904794 | Kadison, Joy 1 | 1966 | 33.1907270 | -92.8647700 | YES | |||
| 0313910555 | King, B W 1 | 1974 | 33.3268740 | -92.9559800 | YES | YES | ||
| 0313913545 | LANXESS 1 | 2017 | 33.0385880 | -92.6762690 | YES | YES | YES | |
| 0313910541 | Loutre 14 | 1974 | 33.1048891 | -92.5890446 | YES | |||
| 0313913014 | Lowery 1 | 2002 | 33.0513214 | -92.7912450 | YES | YES | ||
| 0313910831 | LYLE DEWS 1 | 1976 | 33.3486300 | -92.9279800 | YES | YES | ||
| 0313911459 | Mahony, J K 1 | 1981 | 33.2924350 | -92.8647900 | YES | YES | ||
| 0313910776 | McCorkle 1 | 1976 | 33.1480600 | -92.7203300 | YES | YES | ||
| 0313910815 | MORGAN 1 | 1976 | 33.3210030 | -92.8982900 | YES | YES | ||
| 0313912751 | Murphy 3 | 1988 | 33.2091400 | -92.8604000 | YES | |||
| 0313910461 | Murphy 6 | 1973 | 33.1011990 | -92.6722196 | YES | |||
| 0313911004 | Murphy A-1-8 | 1978 | 33.0848524 | -92.8769567 | YES | YES |
RSI-3353
| API Number | Well Name | Year Drilled |
Latitude | Longitude | Structure Data |
Porosity Data |
Core Data |
Production or Injection Data |
| 0313912661 | Murphy Estate 2 | 1986 | 33.2053450 | -92.8651400 | YES | |||
| 0313912662 | Natural Resources 1 | 1986 | 33.2030870 | -92.8304700 | YES | |||
| 0302710779 | Newell Etal 1 | 1980 | 33.0355461 | -92.9988495 | YES | YES | ||
| 0313912423 | Pendleton 1 | 1984 | 33.1393000 | -92.6716400 | YES | YES | YES | |
| 0313972061 | Reeves BSW 7M 1 | 1977 | 33.1846470 | -92.8583700 | YES | YES | ||
| 0313912867 | Robertson 1 | 1991 | 33.1078500 | -92.5561100 | YES | YES | YES | |
| 0313912905 | Rogers 1 | 1993 | 33.0635450 | -92.7530700 | YES | |||
| 0313910921 | Rosen Trust 1 | 1983 | 33.3153460 | -92.8756400 | YES | YES | ||
| 0313911387 | Russell 1 | 1980 | 33.2156140 | -92.7606900 | YES | |||
| 0313912789 | Scales, Frances BSW 9 | 1989 | 33.1871214 | -92.8489570 | YES | YES | YES | |
| 0313913401 | Sessions 1 | 1926 | 33.2905500 | -92.8625260 | YES | |||
| 0313904383 | Shell-Pratt, J. C. | 1948 | 33.0294040 | -92.6001400 | YES | |||
| 0313912177 | Spencer 1 | 1983 | 33.1741300 | -92.7971500 | YES | YES | YES | |
| 0313911402 | SWD 10M | 1980 | 33.1716357 | -92.9644587 | YES | YES | YES | |
| 0313911397 | SWD 12 | 1980 | 33.1705550 | -92.6735000 | YES | YES | YES | |
| 0313912790 | SWD 12M | 1989 | 33.1508013 | -92.8373076 | YES | YES | ||
| 0313912781 | SWD 13 | 1988 | 33.1702080 | -92.6414200 | YES | YES | YES | |
| 0313912921 | SWD 14M | 1993 | 33.1543553 | -92.8512415 | YES | YES | ||
| 0313912912 | SWD 15 | 1993 | 33.1979180 | -92.7068415 | YES | YES | ||
| 0313912919 | SWD 16 | 1993 | 33.1877020 | -92.7109900 | YES | YES | YES | |
| 0313912940 | SWD 16M | 1995 | 33.2955500 | -92.9645800 | YES | YES | YES | YES |
| 0313912925 | SWD 17 | 1994 | 33.1851655 | -92.6730410 | YES | |||
| 0313912942 | SWD 17M | 1995 | 33.2926369 | -92.8828778 | YES | YES | YES | YES |
| 0313912943 | SWD 18M | 1995 | 33.2917600 | -92.9408100 | YES | YES | ||
| 0313912947 | SWD 19M | 1995 | 33.2919511 | -92.9049207 | YES | YES | ||
| 0313910559 | SWD 1M | 1994 | 33.1660420 | -92.9582750 | YES | YES | ||
| 0313912939 | SWD 21S | 1995 | 33.1105533 | -92.7046875 | YES | YES | ||
| 0313913592 | SWD 22S | 2019 | 33.1331525 | -92.6942309 | YES | YES | YES | |
| 0313910578 | SWD 2M | 1975 | 33.1589583 | -92.9385476 | YES | YES | YES | YES |
| 0313904790 | SWD 3 | 1966 | 33.1384300 | -92.7586200 | YES | |||
| 0313911226 | SWD 3A | 1980 | 33.1670700 | -92.6737200 | YES | YES | YES | YES |
| 0313910803 | SWD 3M | 1976 | 33.1515200 | -92.9253300 | YES | YES | YES | |
| 0313904791 | SWD 4 | 1967 | 33.1348054 | -92.7583276 | YES | YES | ||
| 0313912800 | SWD 4A | 1989 | 33.1578570 | -92.6728418 | YES | |||
| 0313910671 | SWD 4M | 1975 | 33.1506974 | -92.9087054 | YES | YES | YES | |
| 0313910035 | SWD 5 | 1969 | 33.1259100 | -92.7851000 | YES | |||
| 0313910452 | SWD 5 | 1973 | 33.1973080 | -92.6906360 | YES | YES | YES | |
| 0313910863 | SWD 5M | 2008 | 33.1456000 | -92.8814800 | YES | YES | YES | |
| 0313910487 | SWD 6 | 1973 | 33.1547052 | -92.6639400 | YES | YES | YES | |
| 0313912713 | SWD 6 | 1987 | 33.1321730 | -92.8002839 | YES | |||
| 0313912933 | SWD 6A | 1994 | 33.1547740 | -92.6637200 | YES | |||
| 0313910929 | SWD 6M | 1977 | 33.1669120 | -92.9606200 | YES | YES | YES | |
| 0313910525 | SWD 7 | 1974 | 33.1753119 | -92.6509982 | YES | YES | ||
| 0313912749 | SWD 7 | 1988 | 33.1721080 | -92.7434840 | YES |
RSI-3353
| API Number | Well Name | Year Drilled |
Latitude | Longitude | Structure Data |
Porosity Data |
Core Data |
Production or Injection Data |
| 0313911122 | SWD 7M | 1979 | 33.1461423 | -92.8672778 | YES | YES | YES | YES |
| 0313910530 | SWD 8 | 1974 | 33.1824023 | -92.6470486 | YES | YES | YES | |
| 0313983124 | SWD 8 | 2008 | 33.1430100 | -92.7615900 | YES | |||
| 0313911129 | SWD 8M | 1979 | 33.1455100 | -92.8515300 | YES | YES | YES | YES |
| 0313911232 | SWD 9M | 1980 | 33.1713417 | -92.9600731 | YES | YES | YES | YES |
| 0313910561 | Templeton 17S | 1974 | 33.0800500 | -92.6030400 | YES | YES | ||
| 0313903415 | Triangle 1 | 1961 | 33.1921132 | -92.7755764 | YES | |||
| 0313910466 | Trimble 9 | 1973 | 33.1050570 | -92.7116400 | YES | YES | ||
| 0313904360 | Union Sawmill 1 | 1939 | 33.0553630 | -92.5413060 | YES | |||
| 0313912817 | Waste Disposal Well | 1989 | 33.1849300 | -92.9390700 | YES | |||
| 0313983122 | Wilson 1 | 1982 | 33.1666017 | -92.7588750 | YES | |||
| 0313912929 | Woods 18S | 1994 | 33.1052858 | -92.6134203 | YES | YES | YES |
Given these wells were drilled by either LANXESS and its predecessor companies, and no new wells were drilled by Standard Lithium, the QP was not able to verify the drilling procedures followed, and any drill, sampling and recovery factors that may have materially affected the accuracy and reliability of the results.
No new exploration drilling has occurred for this Technical Report as all production wells for the Project are already constructed and producing. Brine production has been occurring continuously on the LANXESS Property since 1957 and in 2021 processed 13.3 m3 (83.7 M BBLs) of brine (AOGC, 2021). LANXESS is required to submit to the AOGC monthly brine production and tailbrine injection volumes on a well-by-well basis (see Table 10-1). The information from the brine supply and injection wells is summarized in Table 10-1 detailing the number of wells with structure data (well logs), porosity data (density/neutron logs), core data and production/injection volumes. The well logs (including density/neutron logs) and core data used to create the geologic model were taken or completed by independent vendors in a manner meeting industry standards. The brine production and tailbrine injection volumes collected by LANXESS and submitted to the AOGC are deemed to be representative as these flow measurements have been routinely collected in the brine industry for several decades. Therefore, based upon the amount of geological and production data available on the LANXESS Property, no further drilling is required to collect additional geological information. There are no limitations on this data and the data can be used in this Technical Report.
RSI-3353
| 11.0 | SAMPLE PREPARATION, ANALYSES, AND SECURITY |
Standard Lithium’s Property sampling programs and the analyses performed prior to 2022 are described in detail in the MIRE (Eccles et al. 2018) and PEA (Dworzanowski et al. 2019). QP Williams has reviewed those reports and agrees with those reports’ conclusions that the sampling programs they described were appropriate, appear to have been executed correctly and securely, and provided samples that were used to prepare reasonable brine lithium composition estimates.
QP Williams participated in the May 2022 brine sampling program. The samples were collected in a consistent and secure manner, with a clear chain of custody from the sample collection point to the shipment to the laboratory and following the procedures summarized below.
| 11.1 | SUMMARY OF BRINE SAMPLING PROGRAMS FROM 2018 TO 2019 (DWORZANOWSKI, 2019) |
A total of 215 samples of brine, which includes Quality Assurance/Quality Control (QA/QC) samples, were collected from the Smackover Formation aquifer underlying the LANXESS Property by Standard Lithium in June 2018 and January 2019. A breakdown of the sample types includes the following: 90 brine samples from individual brine supply wells; 87 brine samples from brine access points at the three (3) LANXESS Bromine Plants; 14 duplicate brine samples; 11 sample blanks; seven UBC semi-certified sample standards; and six internal Company sample standards. The 2018 and 2019 program sample preparation, analyses and security of brine assay samples are the same as completed in the May 2022 brine sampling program and outlined in Section 11.3 - Sampling Procedures. All 215 samples were geochemically analysed at an independent laboratory, Western Environmental Testing Laboratory (WETLAB), located in Sparks, Nevada. The results from the 2018 to 2019 brine sampling programs are included in this Technical Report with the 2022 programs and average lithium analytical results and spatial distribution from the individual brine supply wells are discussed in Section 9.2.
The 2018 to 2019 lithium analytical results from the temporally-sampled brine supply wells were examined using their average percent relative standard deviation (also known as the % coefficient of variation or average RSD%), which is an estimate of reproducibility of the analytical results. The RSD% values for assays from the individual supply wells range from 0.6% to 8.5% (averaging 4.5%) demonstrating that the brine has good reproducibility from any single brine supply well over time.
A comparison of selected elements from the primary and duplicate brine sample pairs from the Standard Lithium 2018 to 2019 brine sampling programs had minimum, maximum and average lithium RSD%’s of zero, 7.7% and 2.4%, respectively, which denotes very good data quality.
A total of 11 sample standard blanks were entered randomly into the sample stream by Standard Lithium. All samples yielded lithium values below the minimum level of detection (2.0 mg/L Li at WetLab). These sample blank results are accurate, as the standard sample blanks were composed of store-purchased deionized water, and therefore, contained no lithium. The positive results of this test show there was no contamination induced during the sampling, sample preparation or the analytical work.
RSI-3353
| 11.2 | SUMMARY OF BRINE SAMPLING PROGRAM IN 2022 |
In May 26, 2022 a total of 52 samples were submitted to WetLab for analysis, including 37 samples gathered from 25 different wells, with two of the 12 duplicate samples gathered by Standard Lithium and the remaining 10 duplicate samples gathered by QP Williams (Cobb & Associates). Nine plant samples were gathered, three from each plant. In addition, three sample blanks (two by Standard Lithium, one by Cobb & Associate) and three synthetic brine samples (two by Standard Lithium, one by Cobb & Associates) were also sent to WetLab for analysis. Please see Section 12.1 for an analysis of the sample repeatability demonstrated by the duplicate samples and the sample accuracy demonstrated by the blank and synthetic brine samples.
| 11.3 | SAMPLING PROCEDURES |
| 11.3.1 | METHODOLOGY |
Two critical brine sampling requirements for this resource definition and geochemical analysis are, first, to collect brine samples that are representative of the Smackover Formation fluid. The LANXESS bromine plants and well/pipeline infrastructure were designed specifically for brine production, processing and production of bromine from the brine. Accordingly, as a brine-specific production-system, brine sampling points were available throughout the Property, providing access to fresh brine samples (brine is continually pumped as part of the normal bromine operations). Brine samples were collected from brine supply wells and three plant locations (before the bromine tower, after the bromine tower and tail brine prior to re-injection) at each of the three plants.
The second requirement is to ensure that brine sample integrity is maintained throughout the sampling process. The brine sample gathering procedure was designed to address all requirements for sample collection, handling and integrity. The brine sampling program methodology conducted by Standard Lithium and QP Roberts with LANXESS operators on hand to assist with the collection of brine samples included:
| / | Labelling new laboratory supplied containers (as outlined below) with screw-on caps; the labelling procedure included: the sample ID; the date and time of sample collection; and the sampler’s initials. Sample containers included: |
| » | 1-Liter Unpreserved Poly (density, pH, alkalinity, TDS, anions) |
| » | 500ml HNO3 Preserved Poly (Metals) |
| » | 250ml H3PO4 Preserved Amber Glass (TOC) |
| / | At each brine sample access points the sample spigot was gradually opened such that brine wasn’t discharged rapidly and sprayed over a wide area. Once a continual brine stream was achieved, the brine was allowed to flow for a period of 5-10 seconds to purge the sample point and ensure the spigot was cleared of any stagnant brine and/or oil, dirt, etc. |
| / | The three sample containers were then placed under brine sample spigots and filled. |
| / | The sample containers were filled to capacity, or near-capacity, then immediately sealed with a screw-on cap. |
| / | The sample containers were checked to verify that all sample label information was correct, and the sample container is properly closed. The sample container(s) were then stored in a cooler for transport to the WetLab analytical laboratory. |
RSI-3353
| / | An additional 250 ml (in a 1 -litre plastic bottle cut in half) of brine was collected in a plastic container for the collection of field measured parameters using a Myron Ultrameter 6PIIFCE. The following information was recorded: |
| » | Electrical conductivity; |
| » | Resistivity; |
| » | TDS; |
| » | pH; |
| » | Oxidation Reduction Potential; and, |
| » | Temperature. |
The Ultrameter was calibrated prior to use. Each value was recorded on the Brine Collection Log form. If the resulting analysis appeared to be significantly high or low the Ultrameter was re-calibrated immediately and the sample measurement repeated.
| / | The physical attributes of the brine sample was also recorded (e.g., color, smell, contaminants, etc.). The sampling process was completed by recording any comments that might be significant to the sampling site, the sample collection or the sample itself. |
Because the brine samples were hot (165F/ 75C), potentially contained H2S, and were collected within operating facilities (e.g., plant or well), appropriate safety procedures were followed.
| 11.3.2 | QUALITY ASSURANCE AND QUALITY CONTROL |
Three different types of samples were employed as part of the Standard Lithium Quality Assurance/Quality control program: duplicate samples, standard sample blanks and synthetic brine standard samples.
Duplicate sample was taken at the same time as the original sample (i.e., back-to-back samples from the brine sample spigot). Random IDs were given to the duplicate samples. The original and duplicate field samples were not numbered in sequential order and were randomly presented to WetLab. The purpose of the field duplicate samples was to measure the precision of the laboratory’s results.
Standard sample blanks were inserted as an additional laboratory check. The sample blanks were comprised of deionized water which contained no lithium.
Synthetic brine solution samples (in this case, 250 mg/L Li with a TDS of 250,000 mg/L prepared by University of British Columbia) were used to measure the accuracy of the laboratory.
| 11.3.3 | SECURITY |
Coolers full of sample containers were taken from the field to a secure location to double check the sample ID’s and make sure all containers were in good condition prior to shipment to the laboratory. Chain of Custody forms for the laboratory were completed and included with the sample coolers (inside within a zip lock bag). The coolers were taped closed and hand-delivered to the local courier company (Fed-Ex in El Dorado, AR) for rush delivery to the laboratory - WetLab in Sparks, NV (address below). The laboratory was instructed to confirm receipt of the samples and provide a statement pertaining to the condition of the samples upon receipt.
WETLAB - Western Environmental Testing Laboratory 475 E. Greg St, Suite 119 Sparks, NV 89431 (775) 355-0202 Standard Lithium prepared analytical protocols (the “Expanded Lithium Brine Analytical Suite”) for WetLab to follow.
RSI-3353
| 11.3.4 | ANALYTICAL PROTOCOL |
These included the following analytical work (following the associated ASTM, SM and EPA international and national method code):
| / | General chemistry: density, pH, temperature, carbonate, bicarbonate, total dissolved solids, total organic carbon (ASTM 1963, SM 4500-H+B, SM 2550B, SM 2320B, SM 2540C and SM 5310B). |
| / | Anions by Ion Chromatography: chloride, sulfate, bromide, fluoride (EPA 300.0). |
| / | Sample preparation: trace metal digestion (EPA 200.2). |
| / | Trace metals by ICP-OES: Al, Sb, As, Ba, Be, B, Cd, Ca, Cr, Co, Cu, Ga, Fe, Pb, Li, Mg, Mn, Mo, Ni, P, K, Sc, Se, Si, silica, Ag, Na, Sr, Sn, Ti, V and Zn (EPA 200.7). |
RSI-3353
| 12.0 | DATA VERIFICATION |
| 12.1 | VERIFICATION OF LITHIUM CONCENTRATION DATA |
QP Williams verified the lithium concentration data five different ways:
| / | Reviewed the choice of analytical laboratory |
| / | Reviewed the overall scatter in each well’s lithium concentration data |
| / | Compared concentration results between samples taken by the author and those by Standard Lithium |
| / | Compared concentration results between known standards and reported concentrations |
| / | Compared the recent Wetlabs results to historic data. |
In 2021, subsequent to the reviews of the analytical laboratories in the MIRE (Eccles et al. 2018) and PEA (Dworzanowski et al. 2019) which found WetLab to be acceptable as the primary analytical laboratory for the Project, Standard Lithium conducted an extensive comparison test of four laboratories known for brine analysis. This study’s results indicate that WetLabs is the appropriate choice for the range of lithium concentrations encountered in this TR. QP Williams has reviewed the supporting documentation of that study and agrees with its conclusions. As a result, WetLabs-reported lithium concentration data is used throughout this TR.
The lithium data summary, Table 9-1, shows the number of samples for each well over all sampling events and the percent standard deviation for each well, ranging from 0.6 percent to 22.2 percent, with an average of 9.2 percent for all the wells. This captures the variation between sampling events and between samples within a given sampling event. The observed standard deviation values are an acceptable level of uncertainty for the lithium concentration values.
While not used in this report’s lithium concentration analyses because of uncertainty in the testing methodologies, the available earlier lithium concentration data was reviewed and found to be consistent with the Wetlabs lithium concentration data. Figure 12-1 is a map of the average WetLab lithium concentration values from Table 9-1. Figure 12-2 adds the historical values from the USGS, LANXESS sampling in 1990, and other values presented in Moldovanyi and Walker, 1992. While there is the expected scatter in the data, the historical values are in close agreement with the WetLab values, aside from two clear errors in the historical data (the 5 mg/L and 1,700 mg/L data points). This exhibit confirms that the WetLab values reasonably represent the current distribution of lithium in the Property’s sampled wells.
RSI-3353
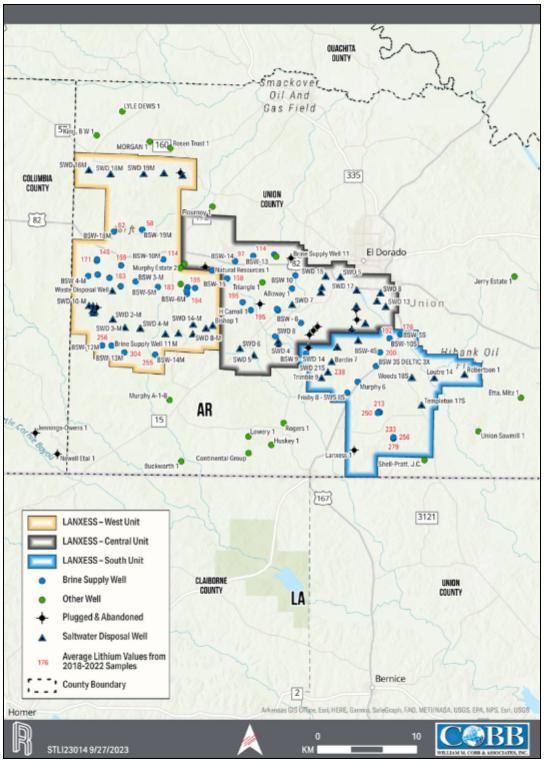
Figure 12-1. Recent Average Well Lithium Concentrations
RSI-3353
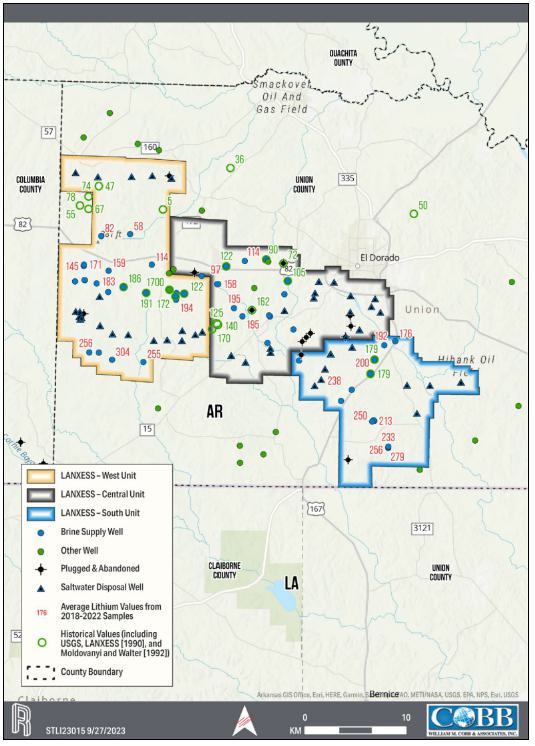
Figure 12-2. Historical and Recent Well Lithium Concentrations
RSI-3353
Table 12-1 lists the comparison samples' lithium concentrations, the absolute percent variation of the WCA samples from the Standard Lithium samples, and the statistical characterization of the comparison. Figure 12-3 compares those two sets of lithium concentration results. For each data point an error bar representing a two standard deviation range of Absolute Percent Variation is shown. From this plot one can conclude that the Standard Lithium samples results were closely related to the results for the WCA duplicate samples. In all but one case the error bar encounters the X = Y line. The best fit line to the cross plot of the two data sets indicates the WCA duplicate samples average 7.2 percent higher than the Standard Lithium samples.
To evaluate the accuracy of the laboratory two types of calibration samples were sent for analysis, interspersed with the well test samples. Three samples (two Standard Lithium, one WCA) of deionized water with no lithium were found to contain less than 2.0 mg/L of lithium (the minimum measurement sensitivity of the laboratory). A total of 17 samples (16 Standard Lithium, one WCA) of synthetic brine with 250 mg/L of lithium were found to contain, on average, 280 mg/L of lithium. This average value is within 0.8 standard deviation (37 mg/L) of the calibration sample lithium concentration. Both sets of comparisons demonstrate the accuracy and repeatability of the laboratory results.
Based on these three different analyses, QP Williams concludes that the preparation, security, and analysis of May 2022 sampling program, as well as the prior sampling programs, were appropriate, with no significant issues identified, resulting in lithium concentration values that are valid for the purposes of this report.
RSI-3353
Table 12-1. Sample Concentration Comparison
| Well | Standard Lithium Sample mg/L Li |
WCA
Sample mg/L Li |
Absolute
% Variation |
| BSW 14 | 101 | 111 | 9.4% |
| BSW 13 | 121 | 123 | 1.6% |
| BSW Spencer | 192 | 224 | 15.4% |
| BSW 15 | 199 | 200 | 0.5% |
| BSW 24S | 199 | 267 | 29.2% |
| BSW 20S | 220 | 224 | 1.8% |
| BSW Carrol | 224 | 223 | 0.4% |
| BSW 21S | 240 | 238 | 0.8% |
| BSW 22S | 264 | 325 | 20.7% |
| BSW 23S | 285 | 267 | 6.5% |
| Minimum | 0.4% | ||
| Maximum | 29.2% | ||
| Mean | 8.6% | ||
| Standard Deviation | 9.5% | ||
| Best Fit Slope | 1.072 | ||
| Best Fit R2 | 0.986 | ||
RSI-3353
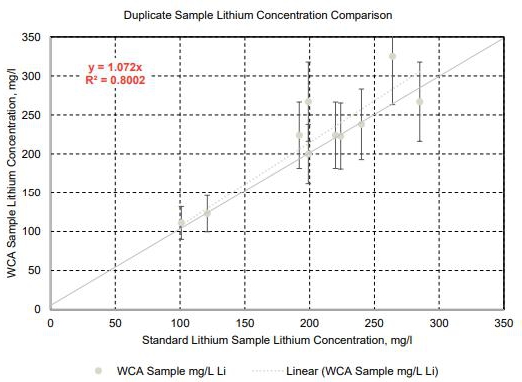
Figure 12-3. Duplicate Sample Comparison
| 12.2 | VERIFICATION OF WELL LOGS AND CORE DATA |
The well log and core data used to create the geologic model meets the standard of reliability required by this report. This data was taken by independent vendors in a manner meeting industry standards, consistent with the identical data collection procedures used in dozens of projects evaluated by QP Williams over the last 30+ years. Importantly, this data was obtained for a purpose unrelated to the estimation of lithium resources and reserves. Therefore, it was not subject to any biases related to that estimation process.
| 12.3 | VERIFICATION OF PRODUCTION AND INJECTION DATA |
The brine production and injection rates used to history match the reservoir simulation model are the product of LANXESS’ Property operations and are used as the basis of their daily operations. LANXESS has made every effort over the years to provide accurate data, recognizing that the quality of the bromine process evaluations depends directly on the quality of the data provided by LANXESS. The brine production and injection rates used in the reservoir simulation model forecasts are the result of discussions with LANXESS and represent their best current estimates for rates associated with future operations.
RSI-3353
| 12.4 | QUALIFIED PERSON’S OPINION ON 12.1-12.3 |
Each well’s production or injection data has been reviewed as part of the history matching process, and the data was found suitable for this evaluation. The lithium concentration, well log, core, production, and injection data used in the preparation of this TR meets the highest standards for the evaluation of the brine deposit. Any limitations present in the data are the unavoidable limitations present in all field measurements. LANXESS and its predecessor companies have exerted industry-standard efforts in gathering high-quality data on the Property. The Property’s data gathering program has been thorough over its history, and this history of high-quality data gathering results directly in a high-quality database for use in this evaluation of the Property’s lithium deposit.
| 12.5 | VERIFICATION OF METALLURGICAL AND MINERAL PROCESSING DATA |
QP Rockandel has extensively studied and evaluated the process data generated to demonstrate the Standard Lithium recovery process. It is important to understand that the chemical processes employed in the process is widely used in industry apart from the Direct Lithium Extraction (DLE) step and hence require less independent validation considering the proven nature of the mature technology.
For example, the brine pre-treatment steps include standard pH and ORP adjustments. The results were predicted using software such as OLI, HSC, and Stabcal, and were confirmed by the vendor and Standard Lithium on-site test work and which was reviewed by Mr. Rockandel.
DLE operated through more than 6,000 cycles. The key steps loading, rinsing and elution were sampled each cycle creating a comprehensive database of results. Representative results from the data historian were reviewed. Material balances were performed to confirm closure, that is, that the input matched the output.
Chemical softening using lime and soda ash or caustic and soda ash is practiced commercially extensively. Standard Lithium and various vendors demonstrated near complete removal of calcium, magnesium, and strontium. The ion-exchange processes to remove calcium, magnesium and boron were successfully demonstrated by Standard Lithium and by the vendors. Impurity removals matched expectations and supplier guidelines.
There are two reverse osmosis (RO) steps in the process. RO is a well understood process and vendor projected performance matched the subsequent test work. The demonstrated quality of the permeate was modelled in the process mass balance and predictably created a small but unimportant circulating load of impurities to DLE. The OARO concentrate while not achieving the commercially expected level of concentration, due to equipment limitations, sufficiently demonstrated the process is adequate for Lithium Carbonate production. Variations in the OARO concentrate quality could impact energy use but not the Lithium Carbonate product quality or overall Lithium recovery. It is believed that the commercial OARO system will achieve the expected ~160,000 mg/l TDS level.
The test work performed by two vendors in three Lithium Carbonate production runs utilized the commercially demonstrated two-stage Lithium Carbonate production process. The results were repeatable with battery grade lithium carbonate produced in all three runs and an excellent match on key stream analysis such as first and second-stage mother liquors and intermediate crystal analysis.
The Demonstration Plant has skilled personnel and leadership, utilizes state-of-the-art controls, employs a comprehensive data historian, and is supported by an effective and responsive analytical laboratory with established quality controls systems. Throughout the development program the findings have been corroborated by analytical software, laboratory quality assurance procedures, vendor specifications and an integrated mass and energy balance that evolved with the findings. QP Rockandel believes that the data developed by Standard Lithium can be relied upon for process facility design.
RSI-3353
| 12.6 | VERIFICATION OF PROPERTY DATA |
QP Patton has reviewed the mineral tenure of LANXESS using the publicly available information on Units approved by the AOGC: South Plant Brine Unit, BU 1-1995, March 28, 1995; South Expansion Brine Unit 086-1-2016-11 November 28, 2016; Central Plant Brine Unit BU 2-1995 August 22, 1995; Central Expansion Brine Unit 095-2022-12 January 5, 2023; West Plant Brine Unit BU 3-1995 November 28, 1995 and the West Expansion Brine Unit-H 048-2-2015-04 May 14, 2015.
QP Patton has also reviewed the terms of the amended and restated Memorandum of Understanding (“MOU”) as between Standard Lithium and LANXESS dated February 23, 2022 and the Site Access Reservation and License Agreement dated November 15, 2022. The MOU sets out the process for the establishment of definitive commercial agreements between the parties, which once in place, will grant Standard Lithium the rights required for development of the Project and govern the relationship throughout the life of the Project. The SARL provides Standard Lithium access to the LANXESS properties during the term of the SARL for the purposes of developing the Project.
It is the QP’s opinion that the Project Site secured is considered well suited for development and is situated near all necessary utilities.
RSI-3353
| 13.0 | MINERAL PROCESSING AND METALLURGICAL TESTING |
| 13.1 | INTRODUCTION |
Standard Lithium has developed a process flowsheet to selectively extract lithium from Smackover Formation brine and produce battery-quality lithium carbonate. Smackover brine used for lithium extraction by the Project will originate from the LANXESS Tail Brine system delivered from the existing South Brine Unit supply well network and South Plant bromine extraction operation. The Project will pre-treat the brine received from LANXESS to condition the brine prior to the lithium extraction process. The mineral processing and hydrometallurgical flowsheet for the Project consists of seven process areas, three of which areas are included in LANXESS’ existing operations:
| 1. | Brine Production – Brine from the Smackover Formation is produced from multiple existing brine supply wells, separated from associated sour gas and crude oil through three-phase separators at the wellheads, and then delivered via pipeline to the LANXESS South Plant. |
| 2. | Bromine Extraction and Tail and Bypass Brine Pre-treatment – Brine received from the field at the LANXESS South Plant is treated to remove most of the dissolved H2S in the brine by vacuum degassing. The degassed brine is fed into a bromine tower where it is reacted with elemental chlorine (Cl2), converting bromides in the brine to elemental bromine (Br2). Bromine extracted from the brine is recovered from the top of the bromine tower and (bromide-barren) Tail Brine discharges from the bottom of the bromine tower. Before the Tail Brine is delivered to Standard Lithium for lithium extraction, it is first pre-treated with sodium bisulfite (NaHSO3) to reduce the free chlorine and free bromine from the brine and then is partially neutralized with anhydrous ammonia. If the bromine tower is not operating for any reason, to avoid shutting down brine production wells, degassed brine bypasses the bromine tower and is discharged directly into the Tail Brine system downstream of sodium bisulfite dosing. Bypass Brine is partially neutralized, similar to Tail Brine. The pre-treated Tail Brine and Bypass Brine is then pumped to the Standard Lithium Plant. |
| 3. | Feed Brine Pre-Treatment for Lithium Extraction – Brine received from the LANXESS South Plant is neutralized, chemically adjusted to increase the ORP (oxidation-reduction potential), and then is filtered to remove suspended solids that could interfere with the downstream Direct Lithium Extraction (DLE) process. |
| 4. | Direct Lithium Extraction (DLE) Process) – A proprietary Direct Lithium Extraction (DLE) process is used for extraction of lithium from the pre-treated brine, producing a relatively pure lithium chloride (LiCl) solution that is low in contaminants. |
| 5. | Purification and Concentration of the LiCl Solution – Further purification and concentration of the LiCl solution produced by the DLE process uses chemical softening and impurity removal processes that are industry standard processes for water and wastewater treatment, including BWRO (Brackish Water Reverse Osmosis), lime soda softening, ion exchange for removal of calcium (Ca), magnesium (Mg), and boron (B), and OARO (Osmotically-Assisted Reverse Osmosis). |
| 6. | Battery-Quality Lithium Carbonate Production – Purified LiCl solution is converted to battery-quality lithium carbonate in an industry-proven process that includes reacting the LiCl with sodium carbonate (Na2CO3), producing crude lithium carbonate, conversion to lithium bicarbonate, ion exchange, secondary crystallization to produce pure lithium carbonate, and finally drying, milling, and packaging of the final product. |
| 7. | Effluent Brine Return to LANXESS for Reinjection – The final process is the return of the lithium-depleted, barren brine from the DLE process and other Project effluents back to LANXESS for reinjection into the Smackover Formation, and disposal of any excess effluent brine volume into two Underground Injection Control (UIC) wells. |
RSI-3353
With respect to the above identified process areas 1, 2 and 7, the Project relies on the existing brine infrastructure of the LANXESS South Plant for the supply of lithium-rich brine and disposal of most of the Project’s effluent brine. Testing programs associated with these process areas focused primarily on the characterization of the quality of Feed Brine to be processed by the Project.
With respect to process areas 3, 4 and 5, Standard Lithium has been continuously running a pre-commercial Demonstration Plant at the LANXESS South Plant since May 2020. This operation has produced significant data on the performance of the various unit processes for pre-treatment of brine from the South Plant and operation of the DLE technology on this brine. The Demonstration Plant has produced significant quantities of purified and concentrated LiCl solution and has converted portions into battery-quality lithium carbonate, on site and at vendor facilities.
With respect to process area 6, Standard Lithium is relying on commercially proven lithium carbonate conversion technologies from globally recognized vendors. These vendors have supported the Project with specific bench-scale testing at their laboratory facilities using LiCl solution produced at the Demonstration Plant to validate vendor guarantees related to commercial-scale production of battery-quality lithium carbonate in the Project.
The intent of this Section is to provide an overview of the specific lithium-brine mineral processing test work completed to support the characterization of the brine resource (i.e., brine quality) as well as support the development of commercial processes for the Project and confirm the associated process performance.
| 13.1 | PROCESS OVERVIEW |
Standard Lithium plans to use a demonstrated proprietary DLE technology (discussed further in Section 13.5.1) to extract lithium from the pre-treated, lithium-bearing, Smackover brine, supplied as tail and Bypass Brine from the LANXESS South Plant. The DLE process selected for the Project produces a slightly concentrated and significantly more pure brine than the received Feed Brine. The LiCl solution produced by the DLE process is purified and concentrated, then converted to battery-quality lithium carbonate using an industry-proven lithium carbonate process. The lithium extraction technology described in this study has been operated on a 24hr / 7 day per week basis at Standard Lithium’s Demonstration Plant since October 2022. The brine pre-treatment and DLE technology, while still being optimized, has been sufficiently tested and validated for commercial use for the Project.
RSI-3353
Figure 13-1 provides a simplified schematic illustrating the main process steps proposed for the Project using Feed Brine from the LANXESS South Plant.
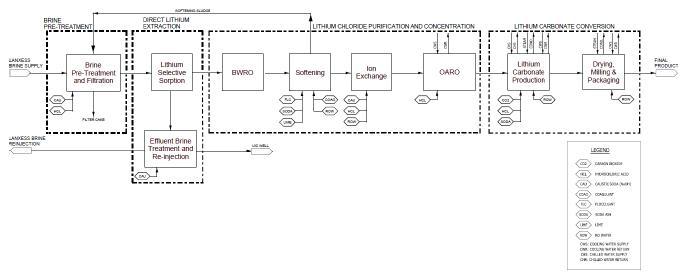
Figure 13-1. Project Process Block Flow Diagram
It is the opinion of the author preparing this section, that the discussion includes an objective level of reasonableness and demonstrates competence and due care in the execution of the metallurgical test work and lithium-brine recovery process steps.
| 13.2 | HISTORICAL TESTING |
All testing discussed below was performed for or by Standard Lithium as part of the current development program either to support the Project or the broader developments contemplated by Standard Lithium in the Smackover Formation.
| 13.3 | DEMONSTRATION PLANT TESTING |
Considering the factors outlined in Section 13.1.1, alternative methods to those commercially proven in lithium recovery from salar-based brines are required to continuously extract and purify lithium from the Smackover brines. Standard Lithium has been assessing and testing technologies with a specific focus on direct lithium extraction which to date is somewhat unproven at a commercial scale. The process evaluation conducted at the Demonstration Plant over 3 years of operation included extensive testing of two separate DLE technologies:
| 1. | LiSTR (Lithium Stirred Tank Reactor), a proprietary DLE technology developed, owned and patented by Standard Lithium, which directly extracts lithium from high total dissolved solids (TDS) brines using a high-loading-capacity, lithium-selective, solid sorbent based on lithium titanate, in a continuous stirred tank reactor configuration. (Testing of this DLE process occurred from May 2020 through to October 2022); and |
| 2. | LSS (Lithium Selective Sorption, a component of the broader Li-PROTM technology), a Koch Technology Solutions owned (KTS), proprietary, DLE technology. The LSS technology uses a fixed bed of commercially available alumina-based resin. This technology has been co-developed under a Joint Development Agreement between Standard Lithium and Koch Technology Solutions. (Testing of this DLE process has commenced in October 2022 and is ongoing as of the publishing date of this report). |
RSI-3353
| 13.1.1 | DEMONSTRATION PLANT |
The Standard Lithium LiSTR Demonstration Plant, was designed and constructed in Ontario, Canada in 2019 by Zeton Inc. The Demonstration Plant was designed to continuously process a slipstream of the lithium-containing Tail Brine produced by the LANXESS South Plant bromine facility with a focus on developing and confirming the operation of an integrated DLE flowsheet to allow the design of a future commercial production facility. The two DLE processes that have been operated in the Demonstration Plant have been adjusted and optimized over time to allow integration into the full commercial plant flowsheet. At the Demonstration Plant, the lithium-barren brine from the DLE processes, various other process effluents, and all of the LiCl solution not used for test production of lithium carbonate are continuously transferred back to the LANXESS brine disposal system; no lithium products were produced for sale at this test facility.
The Demonstration Plant as shown in Figure 13-2, which consisted of 18 modules, was dismantled and transported from Canada to its current location at the LANXESS South Plant bromine facility in Union County, Arkansas (south of the Town of El Dorado). It was erected within the existing fence line of the South Plant on a one acre site leased from LANXESS. The site was levelled, foundations were poured, and all process, utility and power connections were installed to ready the Demonstration Plant for operation in late 2019. The plant was installed/connected and enclosed in a tensile fabric building in late 2019 and underwent commissioning in early 2020. Commissioning was partially delayed by the COVID-19 pandemic and associated lockdowns. The Demonstration Plant commenced operations in May 2020.
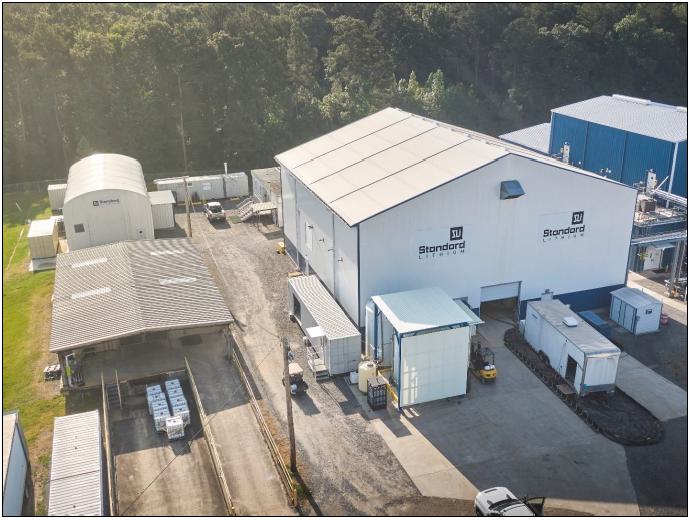
Figure 13-2. Standard Lithium Demonstration Plant
The Demonstration Plant initially comprised of brine pre-treatment, LiSTR DLE process tanks and equipment, and purification equipment for removal of calcium, magnesium and silica. Process modifications to address scalability for commercialization were made in December 2020 and an osmotically assisted reverse osmosis (OARO) unit was installed at the plant in August 2021 (membrane concentration of the purified LiCl product operation had, until that point, been completed off-site as an occasional batch process).
RSI-3353
Modifications were implemented in September and October 2022 to install a fixed bed column and support equipment to prove out the second DLE process (LSS). Several subsequent modifications have been made at the Demonstration Plant for continuing optimization of this process, including addition of a second LSS column in March 2023.
The Demonstration Plant has a dedicated team of approximately 30 engineers, chemists, operators, and maintenance staff who run and maintain the plant on a 24 hour per day, 7 day per week basis. The plant has operated continuously since it was started, apart from shutdowns for maintenance, process improvements, and supply outages caused by interruptions to the LANXESS brine supply. The plant includes a dedicated analytical laboratory equipped to complete all on-site process control assays. The plant’s high level of process instrumentation and extensive program of sampling and analysis have generated large amounts of data. The data collection underpins the assessment in this report. The Demonstration Plant has processed two different brines from the LANXESS South Plant: Tail Brine (brine that has been through the bromine extraction process) and Bypass Brine (brine that has been degassed to remove hydrogen sulfide but has not been through the bromine extraction process). Representative analyses of the Demonstration Plant brine solutions are provided in Table 13-1. There have been several periods when Bypass Brine with >4,000 mg/L of bromide has been supplied to the DLE processes and the rest of the Demonstration Plant’s purification and concentration processes.
Brine pre-treatment performed by LANXESS utilizes a reducing chemical, sodium bisulfite (NaHSO3), to reduce free bromine and chlorine to low levels by converting them to their respective bromides and chlorides. It has been observed that neither of the two DLE processes operated in the Demonstration Plant (LiSTR and LSS) were impacted by dissolved bromide concentrations in the brine. It was found that the bromides behave similarly to chlorides and are largely rejected with the lithium-barren brine and do not pass through into the LiCl product stream in any significant amounts.
As of the end of Q2 2023, the Demonstration Plant has processed approximately 55,500 m³ (approximately 14,700,000 US gallons) of brine from the LANXESS South Plant.
The purified and concentrated LiCl product solution from the Demonstration Plant along with brine from various stages of the Demonstration Plant flowsheet have been supplied to equipment vendors for testing in support of equipment design and process guarantees. The purified and concentrated LiCl product solution from the Demonstration Plant has also been converted to battery-quality lithium carbonate both on site at the Demonstration Plant and offsite by vendor testing laboratories.
The Demonstration Plant operation period when the LiSTR DLE process was operated between May 2020 and October 2022 provided useful information to further the overall process development. This included, but was not limited to:
| / | Development of analytical techniques to evaluate process operational performance, |
| / | Understanding the variability and characteristics of the Tail Brine received from LANXESS, |
| / | Evaluation of potential materials of construction through plant operation and submerged metallurgical coupon testing, |
| / | Demonstration of membrane ultra-filtration (UF) system operation, |
| / | Demonstration of multi-media filtration, |
| / | Demonstration of Osmotically Assisted Reverse Osmosis (OARO), |
| / | Operation of calcium, magnesium, and boron removal by ion exchange, |
| / | Preparation of samples for three lithium carbonate crystallization campaigns conducted in the laboratories of two vendors of lithium carbonate systems. |
RSI-3353
Since October 2022, test work at the Demonstration Plant is on-going using the LSS DLE technology. The LSS testing program is expected to continue to optimize the operation and product quality.
Operations within the Demonstration Plant can be systematically varied, and as such, the effect of changing operating parameters on performance metrics such as degree of lithium recovery from the incoming brine, rejection of impurities, reagent usage and water balance have all been studied in a controlled manner. As with any industrial process, there are many competing factors, and the optimal operation has been proven to be a trade-off between the various inputs. For reference, representative LiCl analyses generated by the two flowsheets tested in the Demonstration Plant are provided in Table 13-1, though these can be modified by varying the processes in the Demonstration Plant.
A test program is in progress at SGS (Société Générale de Surveillance) laboratory using brine and LSS eluate supplied from the Demonstration Plant which is exploring brine pretreatment (prior to LSS) and post treatment of the LSS Eluate. Specifically, this includes lime—soda softening which will precipitate calcium, magnesium, strontium, and silica followed by ion exchange to reduce the above impurities to levels near 1 mg/L.
Table 13-1. Representative Analyses of Brine and LiCl Products.
Table 13-1. Demonstration Plant LiCl Analysis
| Element | Brine
Feed to Demonstration Plant from LANXESS1 (mg/L) |
Raw LiCl from LiSTR DLE2,3(mg/L) |
Raw LiCl from LSS DLE2,4(mg/L) |
Polished LiCl from Demonstration Plant2,5(mg/L) |
| Lithium (Li) | 237 | 1427 | 301 | 4917 |
| Sodium (Na) | 61136 | 2217 | 817 | 28896 |
| Calcium (Ca) | 31793 | 3423 | 620 | 0.5 |
| Magnesium (Mg) | 2682 | 169 | 56 | 0 |
| Potassium (K) | 2385 | N/A | 30 | 672 |
| Strontium (Sr) | 1932 | N/A | 35 | 0 |
| Boron (B) | 189 | N/A | 37 | 0 |
| Silicon (Si) | 10 | 26 | 4 | 0 |
Notes:
[1] Demonstration Plant brine supply composition is average sample data collected in the Demonstration Plant from 4th May to 30th June 2023 to reflect the period when Sr was regularly measured.
[2] All LiCl compositional data is based on data collected during normal operation of the Demonstration Pant. The results from the on-site laboratory have been regularly validated by independent testing by WetLabs, NV, over the period of May 2020 through to June 2023.
[3] The data from LiSTR is based on compositional averages of approximately 6,000 hours of operation from March 2021 through to November 2021. During this period, B, K and Sr were not measured, but data from Wetlabs samples indicates typical values of 100, 67, and 221 respectively. Following November 2021, a sorbent development and optimization program was initiated to assess the performance of bespoke sorbents and target specific operating parameters and long-term continuous operation was discontinued in support of shorter duration testing.
RSI-3353
[4] The LSS data is based on compositional averages of a 1,200-hour period of continuous operation in Q2 2023.
[5] The LiCl Product from the Demonstration Plant is based on the average of bulk samples. The samples were produced in the Demonstration Plant by LSS DLE with subsequent IX processes for removal of bivalent cation and boron followed by OARO for concentration suitable for vendor testing of downstream processes.
| 13.1.2 | TAIL BRINE MEASUREMENT SKID |
A measurement and sampling skid was designed and built by Standard Lithium to enable the Tail Brine discharged directly from the LANXESS bromine tower to be measured continuously, and for samples of the Tail Brine to be more easily collected for laboratory analysis. A photograph of the Tail Brine measurement and sampling skid is shown in Figure 13-3, below. Direct measurements taken by the field instrumentation on the skid were recorded in the Demonstration Plant data archive. These measurements included: Tail Brine temperature, specific gravity, pH, ORP and turbidity.
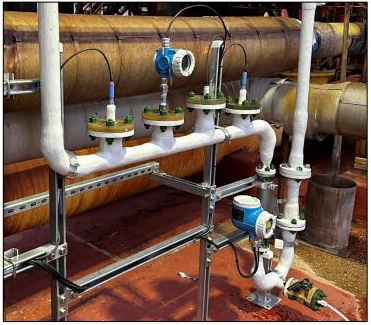
Figure 13-3. Tail Brine Measurement Skid at the LANXESS Bromine Tower
| 13.1.3 | BRINE PRE-TREATMENT TESTING |
As part of operating the pre-commercial Demonstration Plant facility, a variety of brine pre-treatment processes, including those proposed for inclusion in the commercial operation, have been demonstrated at the facility. These included:
| / | pH and chemical adjustment and control using reagents for preventing and encouraging solids precipitation and associated silica, iron, aluminum, and other metals removal, |
| / | Temperature adjustments for protection of downstream equipment |
| / | Different solid-liquid separation equipment: |
| » | Conventional fabric cartridge filters |
| » | Bag filters |
| » | Multi-media filters |
RSI-3353
| » | Pressurized ultrafiltration membrane filters |
| » | Submerged ultrafiltration membrane filters |
| » | Profiled metal plate filters |
| » | Conventional and lamella clarifiers, with and without coagulant and flocculant dosing |
| / | Alumina sorbent for removing silica from the brine, |
| / | Media filters for hydrocarbons removal |
| » | Walnut shell media filters |
| » | Activated carbon for hydrocarbons removal, |
Note that many of the pre-treatment technologies tested have subsequently been discarded as likely unsuitable or unnecessary for commercialization.
| 13.2 | BRINE PRE-TREATMENT AT LANXESS |
Tail Brine will be chemically reduced by the addition of sodium bisulfite (SBS) and Tail Brine or Bypass Brine will be neutralized with anhydrous ammonia at the LANXESS South Plant in a set of four new mixed reaction tanks prior to the brine being pumped to Standard Lithium. SBS is added to reduce free bromine and chlorine to bromide and chloride. Currently Standard Lithium is examining the use of chemical addition to stabilize the Tail Brine. This may not be necessary once the new buffer tanks are installed by LANXESS, allowing improved control over the brine quality.
| 13.3 | BRINEpH CONTROL |
Control of the incoming Tail and Bypass Brine pH is important for effective brine pre-treatment. The precipitate (sludge) formed during LiCl chemical softening will be recycled to the brine pretreatment area utilizing the brine acidity to dissolve the softening sludge which is primarily calcium carbonate and magnesium hydroxide. The Tail Brine from the bromine tower will typically be in the range of pH 0.5 to 0.7 and it will be partially neutralized by LANXESS to between approximately pH 1 and 5.5. In October 2022, Standard Lithium performed Feed Brine neutralization tests using softening sludge produced by treating the LSS eluate with sodium carbonate. Lime was not used and therefore the precipitate was substantially calcium carbonate (96.5%) with no magnesium hydroxide. The quantity of sludge required to neutralize the Tail Brine from pH 0.55 to 4.0 was measured to be 1.5 g/l (as CaCO3) and is shown in the following diagram. The tests performed demonstrate that softening sludge can effectively neutralize Feed Brine.
RSI-3353
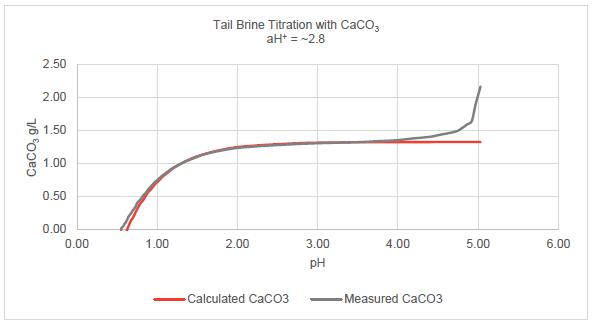
Figure 13-4. Sludge Dissolution for Tail Brine pH Adjustment
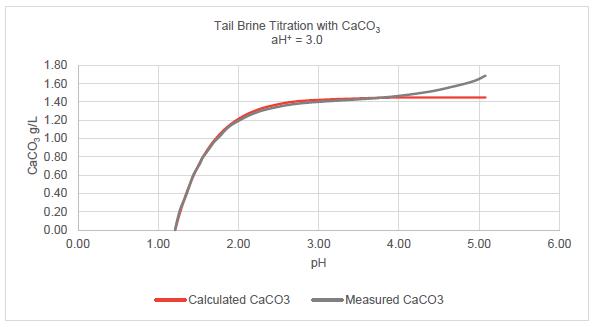
Figure 13-5. Sludge Dissolution for Brine pH Control
| 13.4 | BRINE FILTRATION |
The brine pretreatment includes membrane filtration to deliver a solids free liquid stream to LSS. A pilot system using Koch Separation System’s (KSS) Puron MP Filters has been in continuous service at the Standard Lithium Demonstration Plant since March 2022. The membrane has a pore size near 0.01 mm and is expected to remove all particles > 1 micron. There have been very few operational problems.
RSI-3353
| 13.5 | KEY FINDINGS FROM BRINE PRE-TREATMENT TEST WORK |
Key findings and outcomes from the Demonstration Plant pre-treatment testing work are:
| / | Pre-treatment of the incoming Tail and Bypass Brine is necessary to remove residual hydrogen sulfide, suspended solids, and other contaminants which may result from brine extraction and bromine processing. |
| / | Real brines processed on a continuous basis are significantly more complex than synthetic brines based on the same underlying chloride matrix. Continuous, long-term (greater than two years) field testing of equipment is crucial in ensuring sufficient design inputs to support reliable scale-up. |
| / | The Demonstration Plant has effectively pre-treated, neutralized, and filtered the Feed Brine to be suitable for DLE testing. |
| 13.5.1 | DLE TESTING AT THE DEMONSTRATION PLANT |
The Demonstration Plant has tested two different DLE processes, LiSTR and LSS, as described below.
| 13.5.1.1 | LISTR DLE TESTING |
The LiSTR DLE technology is a proprietary process designed, patented, and owned by Standard Lithium. It uses a high-loading-capacity lithium titanate-based sorbent (meta-titanic acid in its active form) for selective extraction of lithium from the brine stream using a slurry of the sorbent in stirred-tank reactors and a conventional Counter Current Decantation (CCD) circuit. The LiSTR technology was initially developed in 2017 and went through two main scale-ups (each approximately a 100× scale-up) during 2018 and 2019, resulting in operation in the Demonstration Plant in May 2020.
LiSTR was originally commissioned and operated using a commercially available sorbent from China. Since testing in the Demonstration Plant, Standard Lithium has maintained a continued, dedicated sorbent development program over the past 3 years with the aim to develop sorbents with improved parameters for lithium loading capacity, separation efficiency and physical/chemical robustness.
The pre-commercial operation of the LiSTR process in the Demonstration Plant has proven high selectivity for lithium, high recovery of lithium from the brine, and long-term reliability.
| 13.5.1.2 | KEY FINDINGS FROM LISTR DLE TEST WORK |
| / | Continuous and accurate pH control in the loading and stripping reactors is critical to good performance and sorbent stability. |
| / | Loading efficiency (lithium extraction efficiency) is a direct function of sorbent capacity and mass flux vs brine flow in the loading reactors – this is a variable that can be controlled. Lithium extraction during loading can exceed 90% when a two-stage counter-current loading configuration is used (the maximum sustained extraction efficiency was in excess of 95%). |
| / | Contaminant (Ca, Mg, and Na) rejection efficiencies for most contaminants are consistently observed within the Demonstration Plant to be over 98%. |
| / | Submerged membranes can be used effectively in the loading reactors to remove barren (lithium-free) brine, but their utility is limited at very high solids concentrations in the sorption slurries. |
| / | The stripping performance of the sorbent is sensitive to temperature and pH and long-term operation under stable conditions is required to optimize the process performance. |
| / | Industry-standard counter current decantation (CCD) circuits can be used to wash the sorbent in either the loaded or stripped (reactivated) state. |
RSI-3353
| / | Bulk properties and settling characteristics of the sorbent are key for effective solid-liquid separation and sorbent recovery for recycle. |
| / | Bulk quantities of suitable sorbent have been produced by independent third parties with pilot scale equipment to demonstrate that sorbent can be produced at a commercial scale in North America. |
| / | LiSTR requires continuous addition of acid/base during loading and stripping and as a result, is more sensitive to reagent pricing than LSS. |
| 13.5.1.3 | LSS DLE TESTING |
The Lithium Selective Sorption (LSS) DLE is a Koch Technology Solutions LLC (KTS) proprietary technology for which Standard Lithium has a Joint Development Agreement and Smackover regional exclusivity agreement in place (for a period of time). This process uses a fixed bed adsorption with a lithium-selective solid resin, based on aluminum hydroxide copolymer, a resin material with elution by fresh water rather than an acid strip as used in LiSTR process. The core of the technology was originally developed by a consultant to Standard Lithium and purchased by KTS. The synergies associated with the relationship between Standard Lithium, various Koch Industries businesses and the process inventor led to an opportunity to operate and develop this process in parallel to LiSTR in the Demonstration Plant.
The LSS DLE process has been in operation at the Demonstration Plant since October 2022 and extensive work has been undertaken to prove scale-up and reliable operation. The LSS columns have been operated more than 6,000 cycles at the time of this technical report. Process refinement is on-going at the Demonstration Plant and is aiming to optimize the process operation steps to determine the best balance for lithium recovery, impurity rejection, water usage and lithium concentration that can be achieved.
To date, LSS has shown significant promise in reducing reagent use, reducing excess water addition, and simplifying the DLE process with lower equipment costs. The LSS process has the additional benefit that independent third-party process guarantees can be provided, and, as a result, has been recommended as the core technology for Standard Lithium’s Commercial Lithium Extraction Plant Project.
RSI-3353
The average recovery of lithium and rejection of impurities for the current LSS column configuration and operating profile recorded between July 2023 and August 2023 is presented in Table 13-2 below. This process will continue to be developed and optimized in parallel with the project execution.
Table 13-2. LSS Process Parameters
| Dilution | Recovery/ Rejection (%) | |||||
| % | Li | Ca | Na | Mg | B | |
| Goal | <6 | >95 | >99.0 | >99.0 | >98.5 | >90 |
| Average | 4.7 | 95.6 | 99.7 | 99.9 | 99.3 | 95.0 |
| St. Dev | 0.0 | 2.7 | 0.2 | 0.1 | 0.3 | 2.5 |
| Max | 4.7 | 100.0 | 100.0 | 100.0 | 100.0 | 100.0 |
| Min | 4.7 | 90.3 | 99.1 | 99.7 | 98.3 | 83.6 |
| 13.5.1.4 | KEY FINDINGS FROM LSS DLE TEST WORK |
| / | Lithium extraction efficiencies of greater than 95% have been observed in the Demonstration Plant, which is consistent with the expected performance of the LSS technology provided by KTS; Similarly, contaminant (Ca, Mg, Na, and K) rejection efficiencies are consistently observed at over 99%, while boron rejection is typically over 90%. |
| / | The key benefits of the LSS process over LiSTR are reduced excess water use (contributing to lower dilution of the effluent brine) which allows better control and maintenance of the Smackover Formation pressure and the elimination of hydrochloric acid and sodium hydroxide in the elution/regeneration steps. |
| / | The fixed bed resin can be sensitive to high solids in the feed so proper brine feed quality control is critical. |
| / | LSS operation has shown that optimization of operating step volumes during loading, displacement, and elution can provide high lithium recovery, concentration, and impurity rejection while minimizing raffinate (lithium-barren brine) dilution. |
| / | The commercially available resin tested in the Demonstration Plant has performed well. Refer to the LSS performance data shown in Table 13-2. The KTS-Standard Lithium development team believe that better performance can be achieved in terms of selectivity of lithium and rejection of impurities. In support of this, continued optimization is on-going in the Demonstration Plant including testing of alternate resins. |
| / | Both DLE processes operated at the Demonstration Plant showed high selectivity for lithium extraction from the Smackover Formation brine to produce a LiCl solution in which the ratio of lithium to other components has been increased materially from <0.005:1 (i.e., 237 mg/L Lithium relative to the combined impurities at approximately 95,000 mg/L Na/Ca/Mg) to closer to a 0.2:1 (301mg/L lithium relative to approximately 1,500 mg/L). In addition, both lithium extraction processes are not measurably affected by the presence or absence of bromide in the incoming brine. |
| / | The proven performance of LSS in the Demonstration Plant, the reduced excess water use, and the absence of reagent use validates the selection of LSS as the DLE for the Project. |
| 13.6 | DEMONSTRATION PLANT LICL SOLUTION PURIFICATION AND CONCENTRATION |
Downstream of the DLE processes, the LiCl solution is processed by various technologies to remove unwanted impurities (e.g., calcium, magnesium, boron and silica) and to concentrate the purified solution by reverse osmosis processes, including brackish water reverse osmosis (BWRO) and osmotically assisted reverse osmosis (OARO); the latter is sometimes referred to as counter-flow reverse osmosis. The Demonstration Plant has demonstrated the ability to produce LiCl solutions suitable as feedstock for battery-quality lithium carbonate production.
RSI-3353
Standard Lithium had multiple lab-scale tests conducted of various technologies and for purification of the brines and concentration of the LiCl product from the DLE processes, including ion exchange, nanofiltration, ultrafiltration, high pressure reverse osmosis, and osmotically assisted reverse osmosis prior to selecting technology for installation in the Demonstration Plant.
The following sections describe the test work completed on the LiCl solution purification and concentration processes.
| 13.7 | LICL SOLUTION CONCENTRATION BY REVERSE OSMOSIS |
| 13.7.1 | BRACKISH WATER REVERSE OSMOSIS (BWRO) |
Eluate from the LSS process (LiCl product solution) will be concentrated using brackish water reverse osmosis (BWRO). The goal is to concentrate the LiCl and recover water (permeate) for recycle to the process, primarily to use for LSS elution.
A BWRO system was installed in the Demonstration Plant in January 2023. The BWRO system was tested to concentrate the LiCl solution from LSS separate from the main Demonstration Plant process. All components in the LSS eluate product (LiCl solution) are concentrated during BWRO.
| 13.7.2 | OSMOTICALLY ASSISTED REVERSE OSMOSIS (OARO) |
Following the removal of calcium, magnesium, and boron the purified LiCl solution is concentrated using Osmotically assisted Reverse Osmosis (OARO). OARO differs from BWRO in that recirculation of effluent to the permeate side allows concentration to TDS levels as high as 180,000 mg/L compared to 60,000 mg/L in the BWRO. The permeate has higher impurities and must be recycled to BWRO for improved impurity rejection.
An OARO system was installed in the Demonstration Plant in August 2021 to enable a concentrated high purity LiCl solution to be produced for testing lithium carbonate production at vendor laboratories and for use in testing Standard Lithium’s proprietary SiFT battery-quality lithium carbonate process installed at the Demonstration Plant. The OARO system was operated at the Demonstration Plant, on a batch basis for producing concentrated high purity LiCl solution. The OARO system has demonstrated the ability to concentrate the LiCl solution to greater than 10,000 mg/L Li, which is in excess of what is required for battery-quality lithium carbonate production processes contemplated for the Project.
Table 13-3 below shows two examples of the OARO concentrate that were produced using LSS eluate (LiCl) as the feed solution (post IX polishing). Trial 1 was completed in July 2023 and Trial 2 was completed in August 2023.
RSI-3353
Table 13-3. OARO Examples
| Trial 1 | Trial 2 | |||
| Average
LiCl Feed Composition |
Composite Concentrate after OARO |
Average LiCl Feed Composition |
Composite Concentrate after OARO |
|
| Lithium (Li) | 434 | 10,986 | 416 | 12,577 |
| Sodium (Na) | 694 | 14,488 | 162 | 6,559 |
| Calcium (Ca) | 2 | 3 | 11 | 181 |
| Magnesium (Mg) | 0 | 0.6 | 16 | 115 |
| Potassium (K) | 12 | 878 | 9 | 187 |
| Boron (B) | 20 | 150 | 19 | 159 |
| Silica (Si) | 2 | 42 | 7 | 45 |

Figure 13-6. Osmotically Assisted Reverse Osmosis System at the Demonstration Plant
| 13.8 | CALCIUM AND MAGNESIUM REMOVAL PROCESSES |
| 13.8.1 | SODA LIME SOFTENING TESTING |
Soda lime softening is included in the commercial LiCl solution purification process flow sheet for removing calcium and magnesium to reduce the reagent costs associated with the calcium and magnesium ion exchange process. The soda ash (sodium carbonate) and lime (calcium hydroxide) chemicals used in the softening process are significantly less expensive than the hydrochloric acid and sodium hydroxide required for the calcium and magnesium ion exchange resin regeneration. In addition, the softening sludge produced from the softening process can be used for neutralizing the tail and Bypass Brine received from LANXESS, reducing the amount of anhydrous ammonia required for this pre-treatment.
A small softening train including a flash mixing tank, a softening reaction tank, a clarifier with rake, and systems for dosing both coagulant and flocculant was constructed at the Demonstration Plant in March 2023 and used to treat the eluate from the LSS process.
RSI-3353
It has been demonstrated that Ca and Mg removal approaching 100% is achievable. However, this is not an efficient operating mode as it requires an excess of chemical reagent addition. Additional laboratory testing is ongoing at SGS in Lakefield, Ontario to independently confirm the results and to develop design and operating parameters to support the commercial facility. The recent results from SGS are presented below. This test work was performed by adjusting the pH to 10.5 with hydrated lime and then adding soda ash at 100 and 110% stochiometric dosage. The simple dosing with soda ash (even without lime) reliably reduced the calcium concentration in the eluate to below 5 mg/L. Dosing with lime and soda ash reliably reduced the magnesium concentration in the eluate to below 5 mg/L. No coagulant or flocculant was needed to produce a relatively clear supernatant from the softening clarifier.
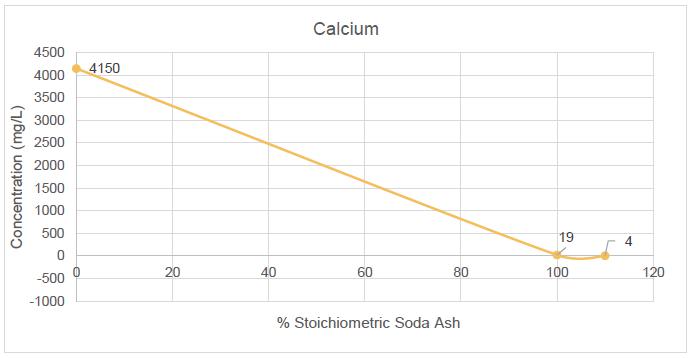
Figure 13-7. Calcium Removal with Soda Ash
RSI-3353
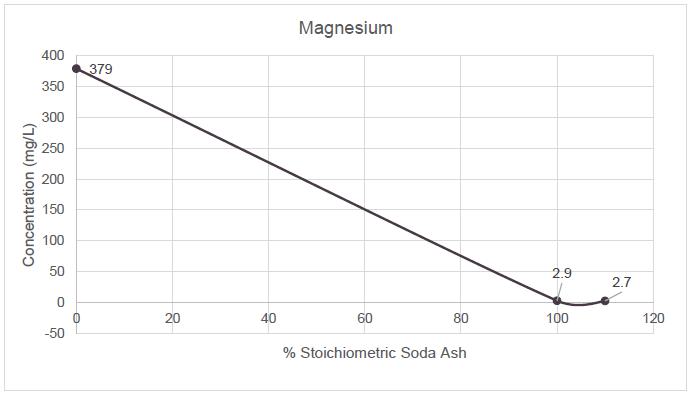
Note:
[1] pH increased to 10.5 with hydrated lime prior to soda ash addition.
Figure 13-8. Magnesium Removal with Soda Ash
RSI-3353
| 13.8.2 | CALCIUM AND MAGNESIUM ION EXCHANGE |
This is conventional technology which has been demonstrated by Standard Lithium and its vendors. The ion exchange resin being proposed are commercially available and are routinely used in large scale wastewater treatment for hardness removal, as seen in Figure 13-9.
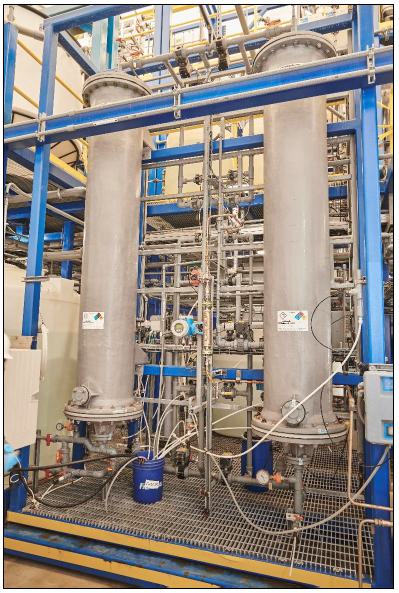
Figure 13-9. Calcium and Magnesium Ion Exchange System at the Demonstration Plant
| 13.9 | BORON REMOVAL ION EXCHANGE |
This technology has been demonstrated by Standard Lithium and its vendors. The ion exchange resin being proposed is commercially available and is routinely used in industry for boron removal.
| 13.10 | KEY FINDINGS FROM LICL PURIFICATION AND CONCENTRATION TEST WORK |
Key findings and outcomes from the Demonstration Plant testing are:
| / | The Demonstration Plant has produced polished LiCl product and has demonstrated: |
| » | LiCl solution with Li concentration greater than 10,000 mg/L. |
RSI-3353
| » | Rejection of calcium, boron and magnesium to less than 1 mg/l which meets rejection targets for the commercial process. |
| / | The LSS eluate (raw LiCl solution) from DLE can be efficiently purified by commercially available ion exchange (IX) resins. |
| / | Traditional soda lime chemical softening has also been proven to work reliably down to very low levels of both calcium and magnesium to less than 5 mg/L. For commercial operations, softening should be used only to reduce the calcium and magnesium to 30-100 mg/L before using calcium and magnesium IX. |
| / | Boron has been shown to be easily removed from the concentrated LiCl solution by Standard Lithium and third party work using OEM industry standard IX technology (< 1 mg/L). |
| / | The final LiCl concentrate is suitable for conversion to lithium carbonate. |
| 13.11 | ADDITIONAL LICL PURIFICATION AND CONCENTRATION TESTING |
A number of additional processes have been tested extensively in the Demonstration Plant to evaluate the best fit technology for the Project. All of the technologies have commercial precedent and have been shown to work at the Demonstration Plant. The key technologies that have been evaluated include:
| / | Chemical softening using carbon dioxide instead of sodium carbonate to minimize introduction of additional impurities. |
| / | Silica removal by pH adjustment. |
| / | Silica removal using a proprietary IX approach. |
| / | Silica removal by activated alumina. |
The outcomes of testing and the learnings from the Demonstration Plant operations, have facilitated the refinement of the process design for the Project to allow for the selection of the appropriate process unit operations to support a robust integrated flowsheet for the commercial facility.
| 13.12 | LITHIUM CARBONATE CRYSTALLIZATION |
One lithium carbonate system vendor performed two laboratory testing campaigns to demonstrate their ability to produce battery quality lithium carbonate from the Standard Lithium LiSTR LiCl product. The first proof of concept campaign performed in February 2021 successfully produced 1 kg of battery quality crystal lithium carbonate. The second campaign performed in October 2021 produced 3 kg of battery quality lithium carbonate and further clarified the commercial design parameters. A third program at a second lithium carbonate vendor laboratory was completed in June 2023 using LSS LiCl product. It produced 12kg of battery quality crystal lithium carbonate.
RSI-3353
| 13.12.1 | FIRST PRODUCTION OF LITHIUM CARBONATE |
In October 2021, the first lithium carbonate system vendor received 250 L of LiCl product solution produced by the LiSTR DLE process. The analysis of the LiCl is shown in Table 13-4, below.
Table 13-4 - LiCl Product Used for Lithium Carbonate Conversion – Trial 1
| Cation/Anion | Units | Concentration |
| Sodium (Na) | ppm | 11800 |
| Calcium (Ca) | ppm | 1344 |
| Magnesium (Mg) | ppm | 245 |
| Potassium (K) | ppm | 266 |
| Lithium (Li) | ppm | 2628 |
| Strontium (Sr) | ppm | 250 |
| Boron (B) | ppm | 106 |
| Chloride (Cl) | ppm | 35300 |
| Silicon (Si) | ppm | 81 |
| Sulfate (SO4) | ppm | 90 |
| Barium (Ba) | ppm | 14 |
| TDS | ppm | 52124 |
| SG | 1.05 |
The following describes the processes that the vendor used for purifying the LiCl solution for production of battery-quality lithium carbonate:
| / | The LiCl solution was initially processed by caustic and soda ash softening to remove the bulk of the calcium, and magnesium. Softening reduced calcium to 97 ppm and magnesium to 2 ppm, which is consistent with the expected commercial values. |
| / | The vendor then used a 4% stoichiometric excess of sodium carbonate and maintained pH at 11.5 with caustic soda. |
| / | Calcium IX was then used to reduce calcium and magnesium to a combined level of <1ppm (CaCO3 equivalent). |
| / | Boron Ion Exchange reduced Boron from 106 ppm to < 1ppm. |
The ion exchange test work was performed to generate brine suitable for lithium carbonate production. The goal was not to optimize reagents, water use or column design parameters but simply to produce solution for the crystallization work. The columns were not operated to breakthrough or exhaustion. Following purification, the brine was evaporatively concentrated to increase the lithium concentration and simultaneously crystallize sodium chloride. The crystallization of sodium chloride is not included in the current standard lithium carbonate flowsheet. Instead, concentrated brine from the OARO process will be delivered to the Lithium Carbonate Plant.
Lithium carbonate was produced in a two-stage process. In the 1st stage, lithium chloride was reacted with 25% sodium carbonate solution to crystallize crude lithium carbonate. The sodium carbonate used in the treatment was commercially available technical grade which contained about 100 ppm equivalent calcium and magnesium. The calcium and magnesium almost quantitatively reported to the 1st stage crystals. The crystals were coarse 200-300 microns in size and were mainly agglomerated. Washing could only remove a portion of the impurities.
RSI-3353
The crude 1st stage crystals were repulped in water and then carbonated to produce soluble lithium bicarbonate. Following filtration, the lithium bicarbonate solution was filtered, and then subjected to Ion Exchange to reduce the brine to < 1ppm calcium equivalent.
The lithium bicarbonate was thermally decomposed to release carbon dioxide and crystallize purified lithium carbonate. The carbon dioxide that is released would be recycled in the commercial plant. The 2nd stage or purified crystals were mainly singular crystals, 200-300 µm in length with an aspect ratio (length to width) of approximately 10. The photograph of the 2nd stage crystals shown in Figure 13-10, below, were de-watered, washed, analyzed, and confirmed to meet battery quality specification. See Table 13-5, below, comparing typical battery quality lithium carbonate specifications with laboratory-produced lithium carbonate made from Standard Lithium LiCl product solution. The vendor produced approximately 1 kg of battery quality lithium carbonate crystals during their laboratory testing.
Table 13-5 –Lithium Carbonate Product – Trial 1
| Element | Analysis Method |
Typical Specification1 |
Units | Standard Lithium Li2CO3 Sample Produced |
| Sodium (Na) | AA | <500 | ppm | 13 |
| Potassium (K) | AA | <10 | ppm | <10 |
| Calcium (Ca) | AA | <100 | ppm | <10 |
| Magnesium (Mg) | AA | <60 | ppm | <10 |
| Iron (Fe) | ICP | <10 | ppm | <1 |
| Manganese (Mn) | ICP | -- | ppm | <1 |
| Copper (Cu) | ICP | <10 | ppm | <1 |
| Nickel (Ni) | ICP | <10 | ppm | <1 |
| Zinc (Zn) | ICP | <10 | ppm | <1 |
| Sulfate (SO4) | ICP | <300 | ppm | <30 |
| Boron (B) | ICP | <10 | ppm | <1 |
| Aluminum (Al) | ICP | <10 | ppm | <3 |
| Lead (Pb) | ICP | <10 | ppm | <1 |
| Chromium (Cr) | ICP | <10 | ppm | <1 |
| Chloride (Cl) | Titration | <100 | ppm | <50 |
Notes:
[1] Typical specification listed is based on industry standards for reference only.
RSI-3353
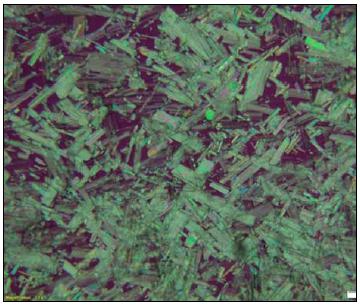
Figure 13-10. Photo of 2nd Stage Lithium Carbonate Crystals
| 13.12.2 | SECOND PRODUCTION OF LITHIUM CARBONATE |
In October 2021, the first lithium carbonate system vendor received 350 L of LiCl solution produced by the LiSTR process after RO concentration and Strong Acid Cation IX to remove calcium, and magnesium. The analysis of the brine is shown in Table 13-6 below.
Table 13-6 - LiCl Product Used for Lithium Carbonate Conversion – Trial 2
| Cation/Anion | Units | Concentration |
| Sodium (Na) | ppm | 18800 |
| Calcium (Ca) | ppm | <1 |
| Magnesium (Mg) | ppm | <1 |
| Potassium (K) | ppm | 122 |
| Lithium (Li) | ppm | 5500 |
| Strontium (Sr) | ppm | <1 |
| Boron (B) | ppm | 292 |
| Chloride (Cl) | ppm | 58600 |
| Silicon (Si) | ppm | 48 |
| Sulfate (SO4) | ppm | 30 |
| Barium (Ba) | ppm | <1 |
| TDS | ppm | 83400 |
| SG | - | 1.05 |
Boron IX reduced boron in the LiCl solution from 292 ppm to < 1ppm. The ion exchange test work was performed to generate a LiCl solution suitable for lithium carbonate production. Again, the goal was to produce solution for crystallization not to evaluate the purification processes.
Following purification, the LiCl solution was evaporatively concentrated to increase the lithium concentration and simultaneously crystallize out sodium chloride. The evaporation was performed continuously over a 14-day period using two 22-L bench scale evaporators. Lithium was concentrated to 24% by weight of lithium chloride. The crystallization of sodium chloride is not included in the current standard lithium carbonate flowsheet.
RSI-3353
Lithium carbonate was produced in a two-stage process. The campaign was conducted over one week. In the 1st stage, lithium chloride was reacted with 30% sodium carbonate solution to crystallize crude lithium carbonate at 95°C. The sodium carbonate used in the treatment was commercially available technical grade which contained about 100 ppm equivalent calcium and magnesium. Most of the calcium and magnesium from the sodium carbonated ended up in the 1st stage crude lithium carbonate crystals.
The 1st stage crystals were coarse 200-300 µm and mainly agglomerated. See Figure 13-11, below. Washing could only remove a portion of the impurities.
The crude 1st stage crystals were repulped in water and then carbonated to produce soluble lithium bicarbonate. Following filtration, the lithium carbonate brine was filtered, and then again subjected to Ion Exchange to reduce the brine to < 1ppm calcium equivalent. The column flux rate was 15 BV/h. The lithium carbonate was thermally decomposed to release carbon dioxide, which would be recycled in the commercial plant, and purified lithium carbonate crystallized. The 2nd stage crystals were mainly singular, 200-300 microns in length, with an aspect ratio (length to width) of approximately 10. See Figure 13-12, below. The crystals picture in Figure 13-12, below, were de-watered, washed, analyzed, and confirmed to meet battery quality specification. Approximately 3 kg of battery quality crystals were produced during the laboratory testing campaign. Refer to Table 13-7 below for the lithium carbonate sample analysis produced.
Table 13-7 - Lithium Carbonate Product – Trial 2
| Element | Analysis Method | Typical Specification |
Units | Standard Lithium Li2CO3 Sample Produced |
| Sodium (Na) | AA | <500 | ppm | <15 |
| Potassium (K) | AA | <10 | ppm | <10 |
| Calcium (Ca) | AA | <100 | ppm | <10 |
| Magnesium (Mg) | AA | <60 | ppm | <10 |
| Iron (Fe) | ICP | <10 | ppm | <1 |
| Manganese (Mn) | ICP | -- | ppm | <1 |
| Copper (Cu) | ICP | <10 | ppm | <1 |
| Nickel (Ni) | ICP | <10 | ppm | <1 |
| Zinc (Zn) | ICP | <10 | ppm | <1 |
| Sulfate (SO4) | ICP | <300 | ppm | <100 |
| Boron (B) | ICP | <10 | ppm | <1 |
| Aluminum (Al) | ICP | <10 | ppm | <5 |
| Lead (Pb) | ICP | <10 | ppm | <1 |
| Chromium (Cr) | ICP | <10 | ppm | <1 |
| Chloride (Cl) | Titration | <100 | ppm | <100 |
| Silicon (Si) | ICP | -- | ppm | <12 |
Notes:
[1] Typical specification listed is based on industry standards for reference only.
RSI-3353
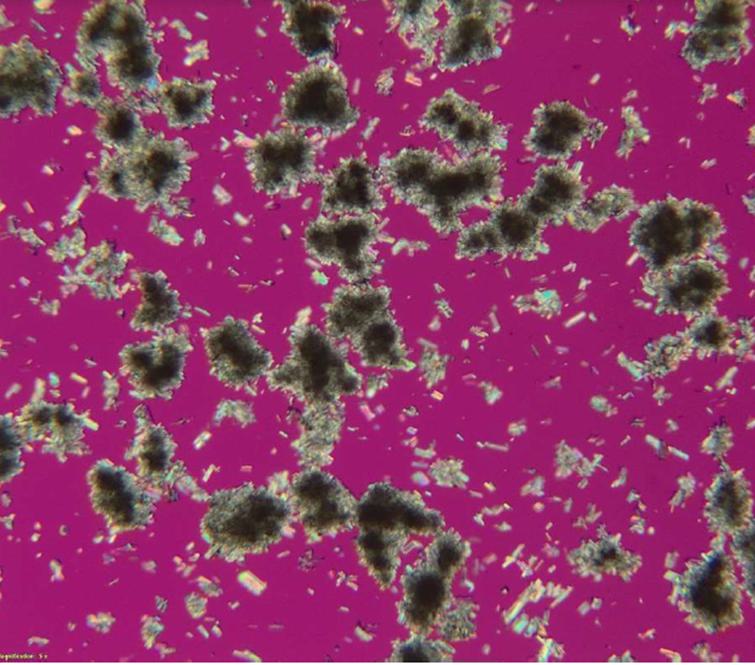
Figure 13-11. Photo of 1st Stage Lithium Carbonate Crystals
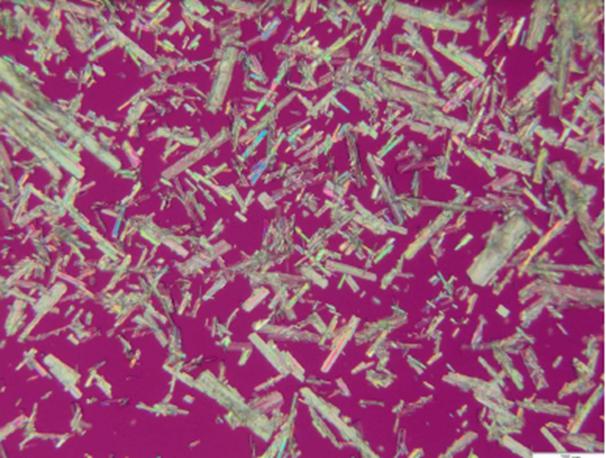
Figure 13-12. Photo of 2nd Stage Lithium Carbonate Crystals
| 13.12.3 | THIRD PRODUCTION OF LITHIUM CARBONATE |
In June 2023, a second lithium carbonate system vendor received 2800 L of LiCl solution produced by the LSS process and subsequently purified and concentrated in the Demonstration Plant. The LiCl eluate solution was treated to remove calcium and magnesium using strong acid cationic (SAC) IX followed by weak acid cationic (WAC) IX. The purified solution was next concentrated using OARO and then treated for boron removal using boron IX and finally treated one more time using WAC IX. The analysis of the brine is shown in Table 13-8 below.
RSI-3353
Table 13-8. LiCl Product Used for Lithium Carbonate Conversion – Trial 3
| Cation/Anion | Units | Concentration |
| Sodium (Na) | mg/L | 52083 |
| Calcium (Ca) | mg/L | 2.6 |
| Magnesium (Mg) | mg/L | 1.4 |
| Potassium (K) | mg/L | 1260 |
| Lithium (Li) | mg/L | 7703 |
| Boron (B) | mg/L | 2.2 |
| Chloride (Cl) | mg/L | 119600 |
| Silicon (SiO2) | mg/L | 21.4 |
| Sulfate (SO4) | mg/L | 145 |
| Ammonia (NH3) | mg/L | 15 |
| Bromine (Br) | mg/L | 304 |
| TDS | mg/L | 180000 |
| SG | 1.1 |
The test program simulated reactive crystallization of Li2CO3 through addition of soda ash to the OARO concentrated DLE eluate feed. The soda ash was provided by Standard Lithium to match the impurity profile expected during commercial operation. A thickening system was used to increase the slurry density in the crude crystallizer to match the commercial design. At periodic intervals, a centrifuge was used to separate the crude Li2CO3 crystals from the mother liquor (ML). The resulting Li2CO3 cake was then washed with mother liquor from the refined crystallizer to reduce impurities contained in the residual moisture on the crystal surface.
The dewatered and washed crude crystals were repulped in recycle ML from the refined crystallizer. Distillate was added to satisfy the material balance. CO2 was then sparged through this solution to convert the suspended Li2CO3 crystals to soluble LiHCO3. The resulting solution was filtered through a cloth filter and processed through a chelating ion exchange to remove multivalent cations.
The purified LiHCO3 solution was then fed to the refined crystallizer, where thermal decomposition released CO2 from the solution, leading to the precipitation of Li2CO3. A thickening system was used to increase the slurry density in the refined crystallizer to match the commercial design. At periodic intervals, a centrifuge was used to separate the refined Li2CO3 crystals from the mother liquor. The resulting Li2CO3 cake was then washed with distilled water to reduce impurities contained in the residual moisture on the crystal surface.
See Table 13-9 below comparing typical battery quality lithium carbonate specifications with laboratory-produced lithium carbonate made from Standard Lithium LiCl product solution. The vendor produced approximately 12 kg of battery quality lithium carbonate crystals during their pilot testing.
RSI-3353
Table 13-9. Lithium Carbonate Product – Trial 3
| Element | Analysis Method | Typical Specification |
Units | Standard Lithium Li2CO3 Sample Produced |
| Sodium (Na) | ICP-OES | <500 | ppm | <12 |
| Potassium (K) | ICP-OES | <10 | ppm | <0.3 |
| Calcium (Ca) | ICP-OES | <100 | ppm | <25 |
| Magnesium (Mg) | ICP-OES | <60 | ppm | <4 |
| Iron (Fe) | ICP-OES | <10 | ppm | <2 |
| Manganese (Mn) | ICP-OES | -- | ppm | <0.3 |
| Copper (Cu) | ICP-OES | <10 | ppm | <0.1 |
| Nickel (Ni) | ICP-OES | <10 | ppm | <0.3 |
| Zinc (Zn) | ICP-OES | <10 | ppm | <2 |
| Sulfate (SO4) | ICP-OES | <300 | ppm | <50 |
| Boron (B) | ICP-OES | <10 | ppm | <0.2 |
| Aluminum (Al) | ICP-OES | <10 | ppm | <2 |
| Lead (Pb) | ICP-OES | <10 | ppm | <0.3 |
| Chromium (Cr) | ICP-OES | <10 | ppm | <0.4 |
| Chloride (Cl) | Pyrohydrolysis then IC | <100 | ppm | <25 |
| Silicon (Si) | ICP-OES | -- | ppm | <10 |
| 13.12.4 | KEY FINDINGS FROM LITHIUM CARBONATE CRYSTALLIZATION TEST WORK |
| / | Pilot testing of the complete lithium carbonate crystallization process flowsheet including all unit operations has demonstrated commercial suitability |
| / | Testing confirmed battery-quality lithium carbonate can be produced meeting the required impurity specifications for the Project using LiCl produced from the Demonstration Plant from the same brine which will be processed by the Project |
| / | Produced representative refined crystals that were measured to be crystalline Li2CO3 with >99.98% purity excluding moisture as calculated by sum of impurities |
| 13.13 | PROCESS TESTING QA/QC |
During the operation of the Demonstration Plant, routine daily chemical analysis is conducted in the internal laboratory using standard solution analysis instrumental techniques; principally, Inductively Coupled Plasma – Optical Emission Spectroscopy (ICP-OES). For more important determinations, duplicate samples are submitted to SGS Canada Inc. (SGS) for analysis using their standard ISO 9000 compliant protocols (principally ICP-OES), developed based on their experience working on numerous lithium projects. Additional brine and solid samples are also periodically sent to other third-party analytical laboratories (principally Wetlabs) in order to provide suitable independent verification of data generated by the Demonstration Plant.
Other instrumentation in the Demonstration Plant undergoes a rigorous maintenance schedule to ensure accurate collection of data from the plant.
RSI-3353
| 13.14 | PROCESS TECHNICAL RISKS AND MITIGATION MEASURES |
Similar to all lithium brine processing projects (including those using ‘conventional’ evaporation ponds), there are risks that need to be addressed or resolved as the Project moves through the usual development stages:
| / | Effect of varying feed composition on lithium selectivity. The Demonstration Plant has been operated with the South Plant brine feed and as such little variation is expected. Extensive testing has been completed to characterize the brine. In addition, variations in Feed Brine will be commercially limited by commercial agreements which set out minimum brine quality requirements for the delivery of Feed Brine to the facility by LANXESS. |
| / | Process Scalability. The pre-treatment technology used on the Tail Brine and Bypass Brine supplied from the LANXESS South Plant to prepare it for the LSS DLE process is industry standard technology. The LSS DLE process has now been operated continuously for approximately 12 months at a pre-commercial Demonstration Plant scale and has been developed to FEED (DFS) level in support of the Commercial Lithium Extraction Plant Project. It is believed that all operations comprising the DLE process can be reasonably scaled-up. Scale-up will occur by the addition of multiple standard size LSS columns operating in parallel. The same fluid velocities and step bed volumes will be maintained in the commercial design. Scale up from the Demonstration Plant to the Commercial Lithium Extraction Plant Project will be about 60:1. The purification, concentration, and crystallization unit operations of the flowsheet are all commercially demonstrated. Similarly, the lithium carbonate drying, micronizing, product handling, and packaging equipment are commercial processes, and are not deemed to be areas of risk. |
| 13.15 | CONCLUSIONS AND RECOMMENDATIONS |
Standard Lithium has completed substantial test work at the Demonstration Plant and in external laboratories. Most aspects of the proposed flowsheet for the Project are commercially available industrial processes and have been demonstrated at substantial pre-commercial scale, or have been verified by pilot scale work on similar solutions. As such, the author feels that the test work completed supports the feasibility of the flowsheet proposed for the Project to use for commercial development, subject to the successful conclusion of additional on-going test work.
Recommendations are:
| / | Continue to operate and collect data from the existing Demonstration Plant. |
| / | Continue to test alternative filtration technologies and optimize brine filtration by varying the media and incoming brine temperature, pH, and ORP to optimize capital and operating costs. |
| / | Continue to optimize the LSS DLE to improve the quality of the Raw LiCl by elimination of impurities, including testing of alternative resins and adjustments to operating parameters to support future commercial operations. |
| / | Undertake continuous brine neutralization using softening sludge for commercial process optimization. |
RSI-3353
| 14.0 | MINERAL RESOURCES ESTIMATES |
This section describes the preparation of the Lithium Resource brine estimate for the three Units that make up the Property obtained from the simulation model results. These estimates are based on the volume of porous rock as described in the geologic model and the estimated lithium concentrations present in the brines stored within the formation on the Property as of the effective date of August 18, 2023.
A portion of the resource estimates have been upgraded from the Indicated category, PEA (Worley 2019), to the Measured category based on the extensive geologic data and lithium concentration data, combined with consideration of the 65-year history of brine recovery from the Property. This information demonstrates the proven capability of the existing field operations to effectively displace and recover brine from this Smackover reservoir. This upgrading of the resource estimates is described in more detail in Section 14.4.
This resource estimate has been prepared is in accordance with the CIM Definition Standards for Mineral Resources and Mineral Reserves (CIM, 2014).
Mineral Resources are sub-divided, in order of increasing geological confidence, into inferred, indicated and measured categories. An Inferred Mineral Resource has a lower level of confidence than that applied to an Indicated Mineral Resource. An Indicated Mineral Resource has a higher level of confidence than an Inferred Mineral Resource but has a lower level of confidence than a Measured Mineral Resource.
An Inferred Mineral Resource is that part of a Mineral Resource for which quantity and grade or quality are estimated on the basis of limited geological evidence and sampling. Geological evidence is sufficient to imply but not verify geological and grade or quality continuity.
An Indicated Mineral Resource is that part of a Mineral Resource for which quantity, grade or quality, densities, shape and physical characteristics are estimated with sufficient confidence to allow the application of Modifying Factors in sufficient detail to support mine planning and evaluation of the economic viability of the deposit.
A Measured Mineral Resource is that part of a Mineral Resource for which quantity, grade or quality, densities, shape, and physical characteristics are estimated with confidence sufficient to allow the application of Modifying Factors to support detailed mine planning and final evaluation of the economic viability of the deposit.
The estimation of resources and reserves in this report have been carried out in conformance with NI 43-101 and have been estimated using the CIM Definition Standards for Mineral Resources and Mineral Reserves, as amended and adopted (CIM, 2014), and CIM Best Practice Guidelines for Resource and Reserve Estimation for Lithium Brine (CIM, 2012).
The Best Practice Guidelines (CIM, 2012) have been adapted for the specific conditions present at this Property. Unlike a brine-bearing salar, the Property’s brine accumulation exists in a well-defined porous geologic formation at depth, the Smackover. This brine accumulation is bounded vertically by impermeable formations and laterally by changes in lithium concentration to the north and formation geologic properties to the south. The Property area itself is determined by the West, Central, and South Unit property boundaries. Also unlike a salar, the brine recovery from the Smackover is the result of rich brine displacement by injected lean brine. This brine-on-brine displacement mechanism is efficient, with all of the lithium-bearing brine in a given reservoir volume contacted by the injected brine displaced. For this reason, the Guidelines’ use of Specific Yield for estimating resources, which assumes some remaining content of lithium in the subject formation, has been replaced here with the Effective Porosity of the formation. The estimation of the fraction of the resources that will be recovered by the Project (the recovery factor, equal to the estimated reserves divided by the estimated resource for the Project area) is done using reservoir simulation. Simulation accounts for the key reservoir properties (lithium concentration, porosity, and permeability) and for the specific Project development activities, including time limits applied to those activities. The recovery factor is not pre-determined at the resource estimation step.
RSI-3353
This approach to the estimation of both resources and reserves using a detailed geologic model as the basis for the reservoir simulation model fully captures all factors and mechanisms that affect the content and recovery of brine and the associated lithium from this porous underground formation.
| 14.1 | GEOLOGIC MODEL DESCRIPTION |
The geologic characteristics of the reservoir and its productivity have been proven by the 65-year development history of bromine extraction by LANXESS and its predecessors. All this data and historical production information provides the basis upon which to estimate the resource and plan this lithium extraction Project.
A geologic multi-zone model of the Property was constructed using Petra that serves the basis of the brine body simulation model. The geologic mapping covered the Property and the surrounding area [Geologic Study Area] (Figure 7-1). The following steps were carried out to construct the geologic multi-zone model:
| 1. | The Smackover was divided into six zones called Oolites 1 through 6, based on their distinct geologic characteristics. These divisions are identified in the well type log, Figure 14-1. |
| 2. | The zone picks were made on each well log. |
| 3. | Each porosity well log was evaluated to determine each zone’s gross thickness, net pay thickness (which represents the productive thickness of the zone considering a minimum porosity cutoff of nine percent), average porosity for that net pay interval, and the ratio of net pay thickness to gross thickness. |
| 4. | An example of this process is shown in Figure 14-2. The zone picks result in the gross pay values, the application of the nine percent porosity cutoff results in the net pay values, the ratio of those two values provides the net to gross ratio, and the average porosity over each oolite zone’s net pay intervals results in the average porosity of the net pay for that Oolite zone. |
| 5. | Each well’s geologic data (location, top of Smackover depths picks, along with the by-zone gross thickness, net to gross ratio, and porosity data) were imported into Petra® Software. |
| 6. | A 500 ft by 500 ft (152.4 m by 152.4 m) grid was established, and the well geologic data was contoured using two Petra gridding options: |
| a. | The Highly Connected Features option utilizes a least-squares gridding algorithm that is well-suited to both structure maps and the smoothly changing petrophysical data present here. The “grid flexing” option, appropriate for this type of well-behaved data, was used to regularize the maps’ contour lines. |
| b. | The Directional Bias option was used, with a direction of 120 degrees. This directional bias was applied to capture the regional direction of strike of the Smackover Formation, corresponding to the orientation of the oolite bars as they were deposited. |
RSI-3353
| 7. | Following the gridding and contouring process, bounding limits were applied to the gross thickness, porosity, and net thickness to gross thickness ratio grids. The gross thickness and the porosity grids were constrained to between 95% of the minimum observed value and 105% of the maximum observed value to prevent the mapping algorithm from extrapolating to unreasonable values. Similarly, the net thickness to gross thickness ratio grids were limited between 0 and 1, corresponding to the physical limits of that ratio. |
| 8. | The resulting zone grids for structure, porosity, gross pay, and net pay were then exported from Petra and loaded into the simulation model. |
Figure 9-1 depicts the locations of wells containing structure, porosity, or core data relevant to the description of one or more of the six zones. In addition to calibrating the porosity well log data, the core data was used to establish correlation equations between permeability and porosity data. A total of 2187 core samples were analyzed. These relationships were then used to estimate the permeability values of each model layer based on their respective porosity values. Figure 7-2 presents the structure map for the top of the Smackover Formation, and Figure 14-1 presents the total gross pay for the six zones resulting from the analysis described above.

Figure 14-1. LANXESS Property Smackover Type Well
RSI-3353
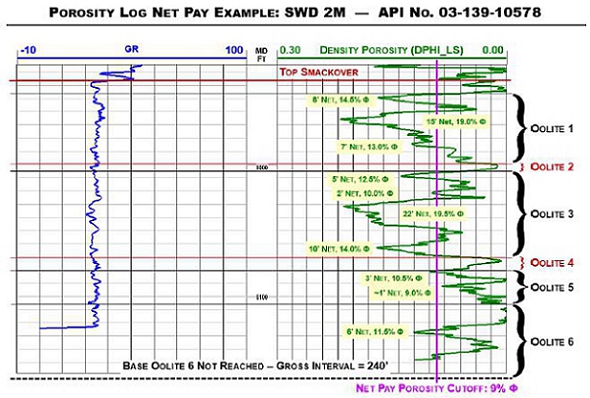
Figure 14-2. Porosity Log Net Pay Example
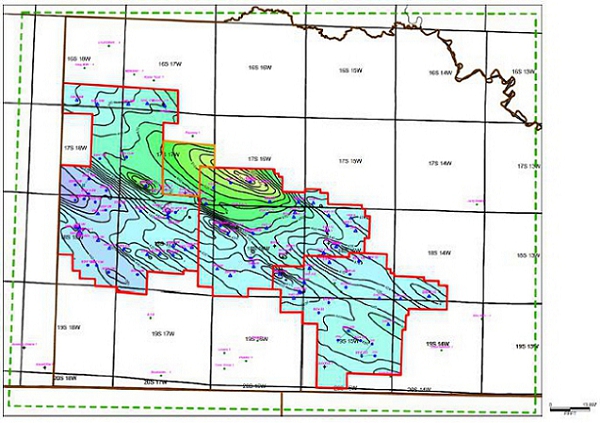
Figure 14-3. Total Gross Pay Map Zones 1-6
RSI-3353
| 14.2 | SIMULATION MODEL DESCRIPTION |
A simulation model, based on the layered geologic description, was used to estimate the resources present in each of the three Units. Simulation was required to estimate the resources as of August 18, 2023, because the ongoing bromine recovery process, while not altering the overall lithium content of the Property, has moved the lithium location as a result of the production and injection of brine.
The Merlin finite-difference reservoir simulation model, an industry-standard simulation model created by Gemini Solutions, Inc., was used to model brine content, brine movement, bromine recovery, and lithium recovery. The Merlin model has the capability of tracking two types of water: water without tracer and water with tracer, in varying relative combinations. That capability was adapted to track the injected lean brine (with either bromine or lithium removed) and original rich brine (for either bromine or for lithium). The physical process being modeled, the displacement of rich brine by lean brine, is identical for both bromine and lithium brines.
The model grid is shown in Figure 14-4. The by-zone geologic model maps, gridded on a 152.4 m spacing, were loaded into the model and re-gridded to conform to the model’s grid architecture. The model covers an area of approximately 48.3 km by 33.8 km. The grid dimensions are 120 cells in the east-west direction by 84 cells in the north-south direction, resulting in each 402.3 m by 402.3 m cell covering approximately 40 acres (16.2 hectares). There are 14 model layers, resulting in 141,120 model cells. Eight model layers were added to the six geologic zones by subdividing each of the four highly permeable geologic zones (oolites 1, 3, 5, and 6) into three layers. Based on the core permeability and porosity data, either a low, medium, or high permeability as a function of porosity equation was applied to that oolite zones’ porosity data. This technique better captures the permeability heterogeneity present in the Smackover Formation and its impact on brine movement.
Model parameters including average horizontal permeability, gross rock volume, average net-to-gross ratio, net rock volume, average porosity, and brine volume, were quantified on a Unit-by-Unit basis. These values are presented in Table 14-1.
The model was calibrated by achieving a historical match between field and model injection and production well rates and production well bromine concentrations over the life of the bromine recovery project. This history-matched and calibrated model was then converted to track the movement and production of lithium-containing brine, including the reinjection of the brine stripped of lithium once the Project is implemented.
The model was initialized with the estimated initial lithium concentration map, Figure 9-3. The model then tracked the movement of lithium-bearing brine in the reservoir during the history of the Property. While no lithium was removed during this period, the produced brine, with its lithium concentration varying by location, was combined at each Unit’s processing facility. As a result, each Units’ injected lithium concentration was based on the volume-weighted average produced lithium concentration for that Unit. Therefore, during this period (up to the start of the Project), the total lithium content of each Unit did not change significantly, but the distribution of lithium within each Unit did change. These changes were tracked by the varying lithium concentrations in the model cells.
Following Project startup, the future recovery of lithium from the South Unit was modeled by specifying the injection and production rates, with the injected brine lithium concentration reflecting the removal of lithium from the process stream by the Project. This report’s estimated lithium recovery values are based on the model’s produced volumes and associated lithium concentrations, which were then subjected to the appropriate recovery factors, as described in Section 16.
The simulation model’s ability to match the observed field performance (injection rates, production rates, bromine concentrations, and lithium concentrations) provides confidence in its forecasts for lithium production rates and the resulting Resource estimates. The model-simulated average produced lithium concentrations from the three Units, corresponding to each Unit’s plant inlet lithium concentrations, were found to closely match the measured plant inlet lithium concentrations, as obtained by Standard lithium, as shown in Figure 14-5. This accuracy in matching the field rate and concentration data extends to the match of individual wells. Figure 14-5 depicts the matches achieved for the six South Unit wells that will be produced as part of the Project. In QP Brush’s opinion this accurate history match confirms the suitability of the simulation model for use in estimating the lithium resources.
RSI-3353
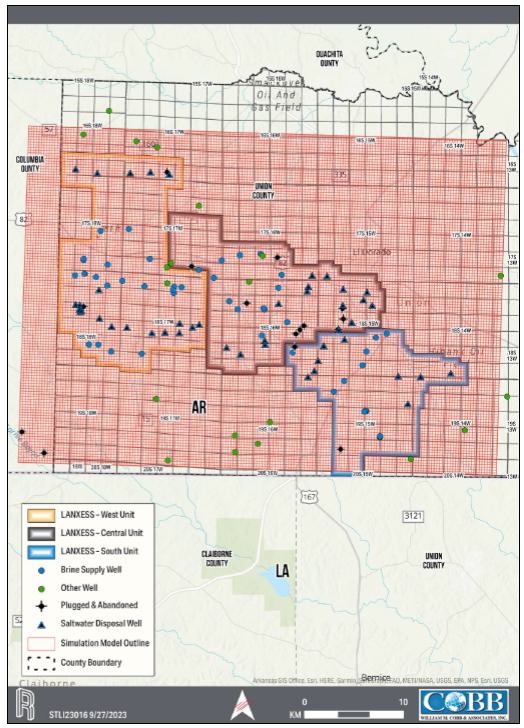
Figure 14-4. Simulation Model Grid Layout
RSI-3353
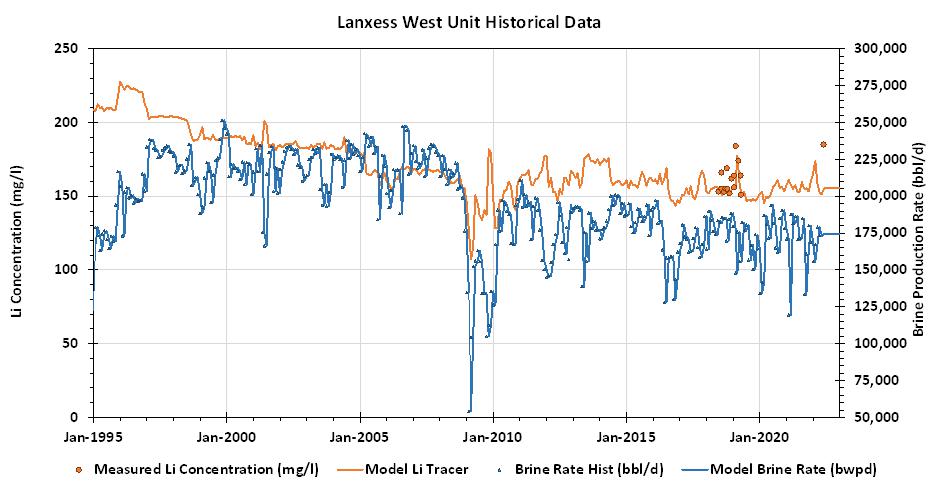
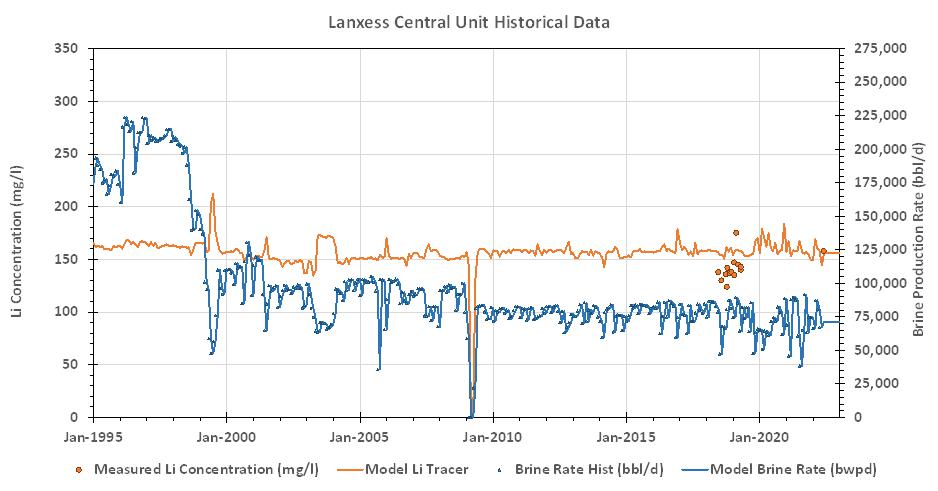
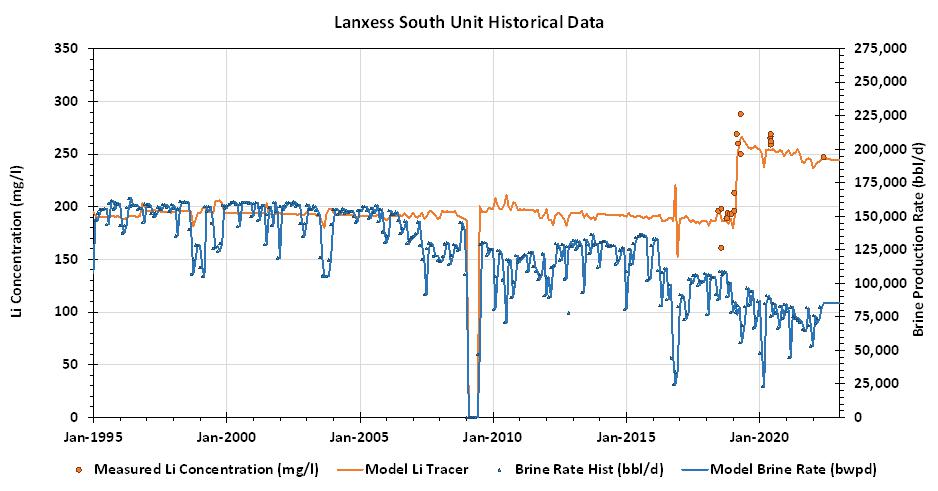
Figure 14-5. Simulation Model Match of Unit Produced Lithium Concentration Data
RSI-3353
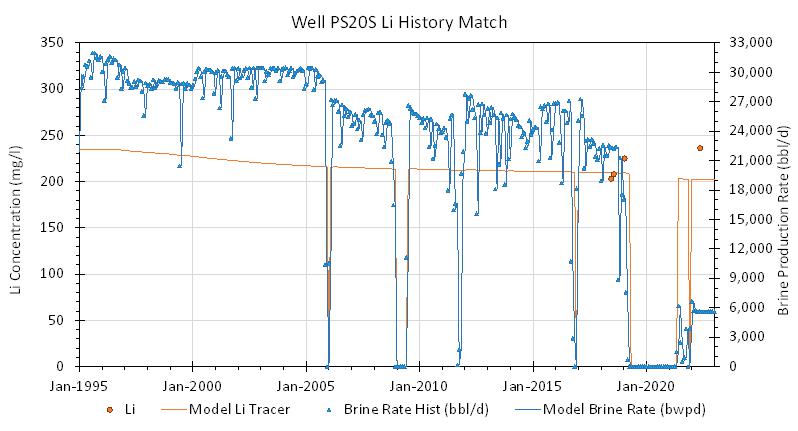
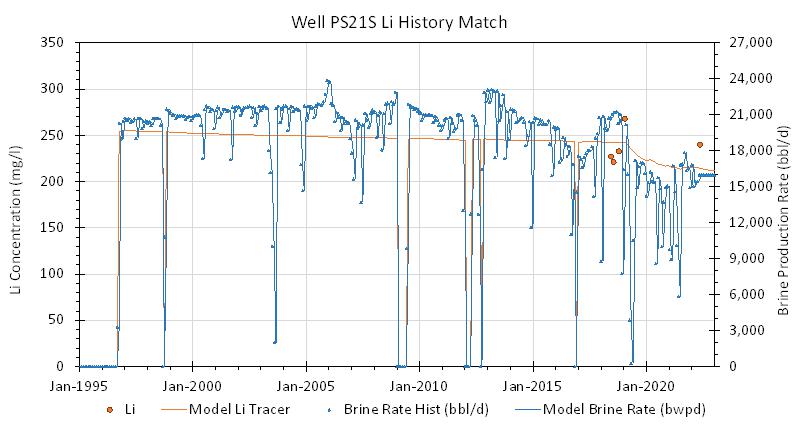
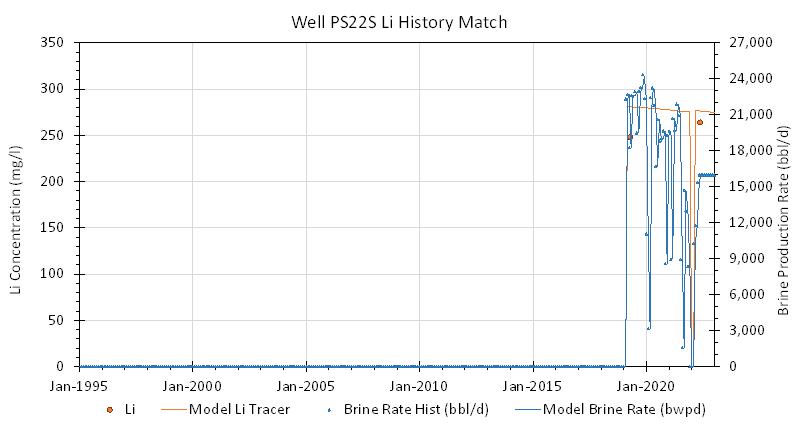
RSI-3353
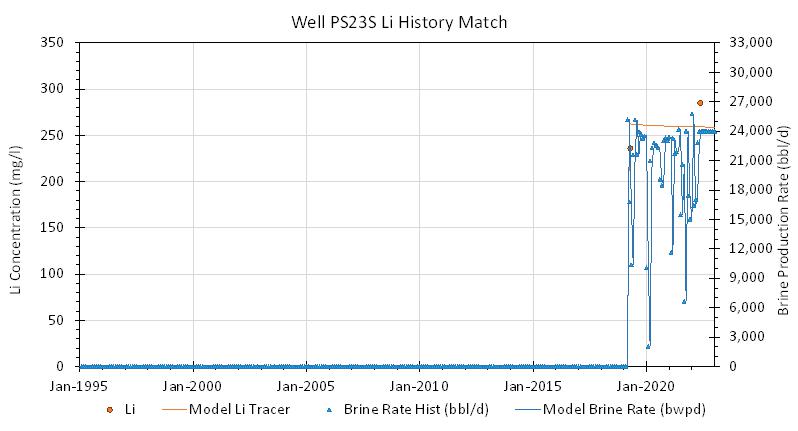
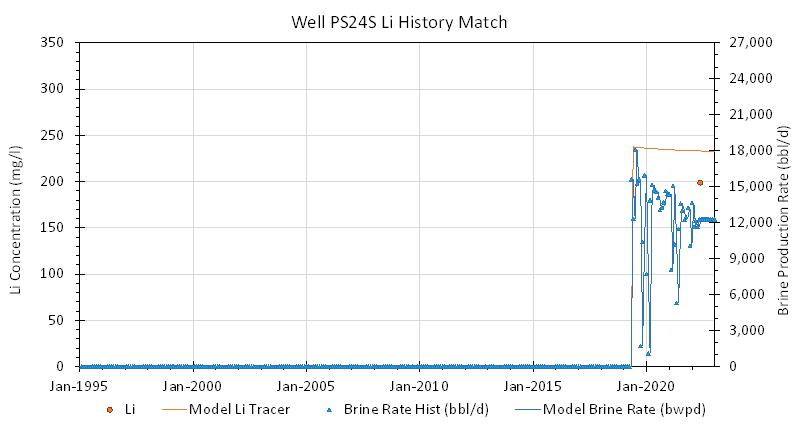
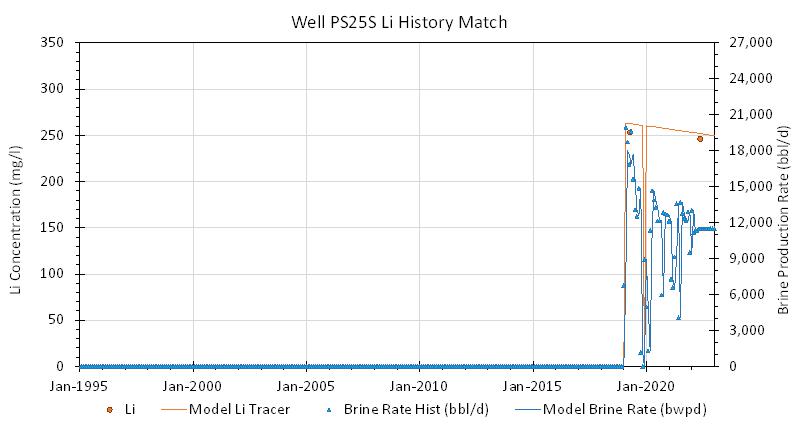
Figure 14-6. Simulation Model Match of South Unit Well Produced Lithium Concentration Data
RSI-3353
| 14.3 | LITHIUM RESOURCE ESTIMATE |
To estimate the in-place lithium Resource effective August 18, 2023, the simulation model was used instead of the layered geologic model, because the bromine production activities over the Property history moved the lithium around within each Unit. The lithium content was calculated by multiplying the brine volume for each of the simulation model’s cells by the lithium concentration on that date for that cell. The resulting values were then summed over each Unit. Any cell in more than one Unit was allocated between the Units, as were cells straddling the outer boundaries of the Units. The estimated properties for each Unit are listed in Table 14-1. The resulting estimated average lithium concentration and in-place estimated Lithium Mineral Resource value for each of the three Units as of August 18, 2023, are presented in Table 14-2.
Table 14-1. Estimated Unit Properties Resulting from Finite Difference Modeling
| Estimate | Units | West Unit | Central Unit | Central Unit Expansion |
South Unit | Total/Average |
| Average Horizontal Permeability | Md | 85 | 91 | 91 | 88 | 88 |
| Gross Rock Volume | 106 m3 | 32,800 | 24,000 | 3,900 | 20,800 | 81,500 |
| Average Net to Gross Ratio | % | 34.1 | 30.8 | 36.6 | 24.3 | 30.8 |
| Net Rock Volume | 106 m3 | 11,200 | 7,400 | 1,400 | 5,100 | 25,100 |
| Average Porosity | % | 14.1 | 14.2 | 14.3 | 14.4 | 14.2 |
The resulting estimated average lithium concentration and in-place estimated Measured and Indicated Estimated Lithium Resource value for each of the three Units (including the Central Unit Expansion) as of August 18, 2023, are presented in Table 14-2. The Estimated Lithium Resources are presented in tonnes of elemental lithium. The 529,000 tonnes of total Measured plus Indicated elemental lithium resources corresponds to approximately 2,820,000 tonnes of LCE, using a conversion factor of 5.323.
RSI-3353
Table 14-2. Statement of Resources In-Place by Unit effective date, August 18, 2023
| Units | South | West | Central | Central Expansion |
Total | |
| Gross Volume [1] | km³ | 20.8 | 32.8 | 24 | 3.9 | 81.5 |
| Net Volume [1] | km³ | 5.1 | 11.2 | 7.4 | 1.4 | 25.1 |
| Average Porosity [2] | % | 14.4 | 14.1 | 14.2 | 14.3 | 14.2 |
| Brine Volume [8] | km3 | 0.73 | 1.58 | 1.05 | 0.2 | 3.56 |
| Average Lithium Concentration | mg/L | 204 | 122 | 164 | 78 | 148 |
| Measured Resource | thousand tonnes | 148 | 192 | 173 | - | 513 |
| Indicated Resource | thousand tonnes | - | - | - | 16 | 16 |
| Measured LCE Resource [9] | thousand tonnes | 788 | 1,022 | 921 | - | 2,731 |
| Indicated LCE Resource [9] | thousand tonnes | - | - | - | 85 | 85 |
Notes:
[1] Volumes are in-place.
[2] Cutoff of 9% porosity.
[3] The effective date of the resource estimate is August 18, 2023
[4] Mineral Resources are inclusive of Mineral Reserves.
[5] The Qualified Person for the Mineral Resource Estimates is Randal M. Brush, PE.
[6] The Mineral Resource estimate follows 2014 CIM Definition Standards and the 2019 CIM MRMR Best Practice Guidelines.
[7] These Mineral Resources are not Mineral Reserves as they do not have demonstrated economic viability.
[8] Calculated brine volumes only include Measured and Indicated Mineral Resource volumes that when blended from the well field result in feed above the cut-off grade of 100 mg/L.
[9] Lithium Carbonate Equivalent (“LCE”) is calculated using mass of LCE = 5.323 multiplied by mass of lithium metal.
[10] Results are presented in-situ. The number of tonnes was rounded to the nearest thousand. Any discrepancies in the totals are due to rounding effects.
[11] The Qualified Person is not aware of any known environmental, permitting, legal, title-related, taxation, socio-political or market issues, or any other relevant issue that could materially affect the potential development of Mineral Resources other than those discussed in the Mineral Resource Estimates.
RSI-3353
| 14.4 | QUALIFIED PERSON DISCUSSION |
The simulation model was run to track changes in lithium concentrations over the entire Property history and was found to closely match the current produced lithium concentrations, indicating the model is well calibrated. Therefore, this simulation model is appropriate to use in modeling both the historic movement of lithium in the field and in estimating the future production of lithium from the Project’s brine source wells.
The Indicated Resources associated with the three Units evaluated in the PEA (Worley, 2019) have been reclassified in this report as Measured Resources. This reclassification is based on the following observations:
| / | The multi-zone geologic description incorporates the available well log and core data and describes the variation in reservoir properties over each of the three Units. This data covers the entire vertical and horizontal extent of the reservoir within the Units that has been developed, and there is not a significant undeveloped target within the three Units. |
| / | The Smackover has demonstrated sufficient permeability and thickness throughout the three Units to permit 55,600 to 87,400 m3 per day (350,000 to 550,000 barrels per day) of production and matching injection of brine (total Property throughput) over the last 30 years. |
| / | The reservoir simulation model based on that geologic description has been confirmed as reasonable by the match to Property production data achieved by the model, which has been history matched to 60+ years of bromine brine production and injection activities. |
| / | The simulation model has also been confirmed as reasonable by the match of model-estimated lithium concentrations to recently collected plant inlet lithium concentration data. |
| / | The lithium concentration data and the lean brine breakthrough data allow for the accurate mapping of the spatially varying original lithium concentration values, a significant increase in accuracy over the application of an average lithium concentration field wide. This map enables the modeling of the 60+ years of injection and production performance to estimate the current distribution of lithium within the three Units. |
| / | The recognition of the high levels of geologic continuity between injection and production wells in those formations, as demonstrated by the 60+ years of bromine-rich brine displacement by lean processed brine. This lean brine breakthrough behavior is matched by the simulation model, which incorporates 100 percent continuity of the net pay in its geologic layers. |
| / | In summary, all three Units have been fully developed over the last 60+ years for bromine production, providing geologic and engineering data to fully describe their lithium content. The addition of lithium recovery to the field takes full advantage of the information gathered by the existing bromine recovery project. |
The lithium resources associated with the recently approved approximate 6,560-acre (2,654.7-hectare) expansion to the Central Unit (Arkansas Oil & Gas Commission Order Number 095-2022-12, January 5, 2023) have been classified as Indicated Resources, based on this area’s location in close proximity to existing wells in the West Unit and Central Unit. As with the PEA (Worley 2019), there are no Inferred Resources.
A minimum lithium concentration cutoff of 100 mg/L was applied as part of the Indicated and Measured Resource estimation procedure. Because the ongoing bromine recovery process results in all of each Unit’s lithium-bearing formation contributing to the produced brines from the brine source wells, the cutoff did not impact the resource estimation. The brine from these wells is mixed at each Unit’s central plant. The option to selectively produce certain parts of the geologic formation does not exist because the wells produce from and inject into all the permeable parts of the formation, regardless of lithium concentration. As a result, all in-place brine subject to injection and production will be subject to the lithium recovery process. Therefore, the entirety of each Unit is part of that Unit’s lithium resource, regardless of its current lithium concentration.
Geological evidence is derived from detailed and reliable exploration, sampling and testing and is sufficient to confirm geological and grade or quality continuity between points of observation. In this case, the geologic and physical characteristics of the lithium accumulation have been fully analyzed, and the resulting description is suitable for detailed Project planning. Any revisions to the geologic and physical descriptions prior to Project implementation would result from additional lithium sampling at the same locations as previously sampled, which could produce minor changes in the estimated lithium concentration map. As of the date of this report no additional wells are planned to be drilled in the West and Central Units.
In addition to the technical and economic advantages of implementing the Project at an ongoing brine recovery facility, the uncertainties associated with permitting, environmental, legal, title, and other social and political issues are expected to be greatly reduced or eliminated because the Project is supported by the Property’s existing long-term bromine recovery operations.
RSI-3353
| 15.0 | MINERAL RESERVE ESTIMATES |
| 15.1 | INTRODUCTION |
This Report presents the estimate of Probable and Proven Mineral Reserves, consistent with the CIM Definitions (CIM, 2014), which state:
| / | A Mineral Reserve is the economically mineable part of a Measured and/or Indicated Mineral Resource. It includes diluting materials and allowances for losses, which may occur when the material is mined or extracted and is defined by studies at Pre-Feasibility or Feasibility level as appropriate that include application of Modifying Factors. Such studies demonstrate that, at the time of reporting, extraction could reasonably be justified. |
| / | A Probable Mineral Reserve is the economically mineable part of an Indicated, and in some circumstances, a Measured Mineral Resource. The confidence in the Modifying Factors applying to a Probable Mineral Reserve is lower than that applying to a Proven Mineral Reserve. |
| / | A Proven Mineral Reserve is the economically mineable part of a Measured Mineral Resource. A Proven Mineral Reserve implies a high degree of confidence in the Modifying Factors. |
| / | Modifying Factors are considerations used to convert Mineral Resources to Mineral Reserves. These include, but are not restricted to, mining, processing, metallurgical, infrastructure, economic, marketing, legal, environmental, social and governmental factors. |
The Project consists of the addition of lithium recovery facilities to the ongoing bromine production at the South Unit, thereby producing a portion of the South Unit’s Measured Mineral Resources described in Section 14. As an addition to the existing bromine recovery process, the Project is not subject to several of the uncertainties and economic costs associated with ‘greenfield’ projects; the production and injection facilities are already in place, are in operation, and benefit from the ongoing bromine production.
| 15.2 | LITHIUM RESERVE ESTIMATE |
The lithium Reserve estimates reported here were obtained using the simulation model described in Section 14. The lithium Mineral Reserves are that part of the Measured Mineral Resource for the South Unit effective August 18, 2023, that are estimated to be recovered by the Project over the 25-year forecast operating period, with project start-up of mid 2026. The basis for the forecast operating conditions is provided in Section 16.
Two cases of Feed Brine rates were evaluated to estimate the Project Reserves. The Proven Reserves case is based on LANXESS’s minimum annual average South Unit Feed Brine rate expected over the 25-year Project production period of 4.96 x 10⁶ m3 per year. This minimum annual average production rate is based on the South Unit Development Plan as set out in the Site Access, License and Reservation Agreement (SARL) between Company and LANXESS. (Standard Lithium 2023). The Proven plus Probable Reserves case rate forecast is based on the average South Unit brine production expected over the 25-year Project production period of 5.21 x 10⁶ m3 per year. Both cases assume the same process efficiency and lithium recovery factors over that period, with the Probable Reserves equal to the difference between the two cases. The estimated Proven and Probable reserves are presented in Table 15-1.
The Project’s Modifying Factors include the following, and are summarized in Table 15-2:
| / | South Unit Feed Brine Rate: The total volume of Feed Brine processed by the South Unit bromine plant which is available for processing by the Project. |
| / | System Availability: The availability of the lithium extraction facility. |
RSI-3353
| / | Lithium Recovery Efficiency: The fraction of the lithium contained in the brine received by the Project that is recovered by the process; unrecovered lithium is injected back into the reservoir. |
| / | Lithium Carbonate Attrition: The fraction of lithium lost in the production and handling of the lithium carbonate product, attributable to sampling, spillage, and other non-process related losses. |
Additional validation for the Probable and Proven Reserve estimates presented in Table 15.1 results from the potential Project upside aspects, including:
| / | Project Optimizations: The Project operating conditions assumed in this analysis do not include potential optimizations, such as modifying the injection locations for the processed lean brine to reduce lean brine breakthrough at production wells, or the implementation of more-efficient or less-expensive lithium recovery technologies. |
| / | Project Expansion: The reserve estimates are based on rates associated with current operations, and do not include any as-yet unplanned expansions to either processing facilities or Project area. |
| / | Increased Throughput: It may be possible to operate the South Unit at a higher brine production rate through improved brine field production system availability. |
RSI-3353
While a 100 mg/L minimum producing lithium concentration cutoff was evaluated for the estimation of South Unit lithium Brine Reserves, it did not affect the results, The Feed Brine concentration exceeded the 100 mg/L cutoff value throughout the 25-year evaluation period. This cutoff was not applied to individual wells because the wells will be produced for bromine recovery, regardless of lithium content. Unless otherwise noted, Brine Reserves are referenced at the inlet to the lithium processing plant.
Table 15-1. Phase 1A Proven and Probable Reserves
| Units | Proven | Probable | Proven + Probable |
|
| Brine Reserves [4,8] | million m³ | 124 | 84 | 209 |
| Average Lithium Concentration [4,8] | mg/L | 227 | 201 | 217 |
| Lithium Metal [4,8] | thousand tonnes | 28.2 | 17 | 45.2 |
| LCE Reserves [4,9,10,12] | thousand tonnes | 129 | 79 | 208 |
Notes:
[1] The effective date of the reserve estimate is August 18, 2023.
[2] Any discrepancies in the totals are due to rounding effects.
[3] The Qualified Person for the Mineral Reserve estimate is Randal M. Brush, PE.
[4] Reserves are exclusive to the South Brine Unit.
[5] The average lithium concentration is weighted per well simulated extraction rates.
[6] The Proven case assumes a 25-year operating life at 4.96 million m3/year of brine production at a cut-off of 100 mg/L.
[7] Proven plus Probable Reserves assume a 40-year operating life at 5.21 million m3/year of brine production at a cut-off of 100 mg/L.
[8] The Reserves reference point for the brine pumped, average lithium concentration, and lithium metal is the brine inlet to the Standard Lithium processing plant.
[9] The Reserves reference point for the LCE is the product output of the processing plant.
[10] Lithium Carbonate production values consider plant processing efficiency factors.
[11] The Mineral Reserve estimate follows 2014 CIM Definition Standards and the 2019 CIM MRMR Best Practice Guidelines.
[12] Lithium Carbonate Equivalent (“LCE”) is calculated using mass of LCE = 5.323 multiplied by mass of lithium metal.
[13] The Qualified Person is not aware of any known environmental, permitting, legal, title-related, taxation, socio-political or marketing issues, or any other relevant issue, that could materially affect the potential development of Mineral Resources other than those discussed in the Mineral Resource Estimates.
Table 15-2. Phase 1A Modifying Factors
| Modifying Factor | Units | Proven Reserves Case | Probable Reserves Case |
| South Unit Feed Brine Rate | million m3/yr | 4.96 | 5.21 |
| Years 2 through 25 System Availability | Percent | 94.0% | 94.0% |
| Lithium Recovery Efficiency | Percent | 93.1% | 93.1% |
| Lithium Carbonate Attrition | Percent | 0.5% | 0.5% |
Notes:
[1] Year 1 production is expected to be 75% of the facility capacity to account for the ramp-up period The lithium reserves estimate presented in this TR are supported in several ways:
RSI-3353
| 15.3 | DISCUSSION OF RESULTS |
| / | The successful brine injection and production activities associated with bromine recovery in south Arkansas and in the Property over the past 60 plus years provides compelling evidence regarding the brine content, the productivity, and the continuity of the Smackover Formation over large distances, essential elements to support of the lithium brine recovery Project described in this TR. |
| / | The bromine extraction process in the South Unit is planned to occur with or without the implementation of the lithium recovery process. This greatly reduces uncertainties associated with the Project life and creates potential project upside regarding the extension of the project if the bromine production is enhanced in the future. |
| / | The geological characteristics of the Property have already been fully delineated by the existing wells. Therefore, the estimated reservoir volumes associated with the Measured and Indicated Resources, and with the Proven and Probable Reserves have been fully delineated. |
| / | The geological model was incorporated into the reservoir simulation model, which was matched to the full life of the bromine production history which aligned with the lithium sampling results. |
| / | The simulation model, through its history match of field production, has confirmed the geological characteristics of the Property, demonstrating the reservoir to be productive, continuous, and to contain the estimated volume of brine. |
| / | This single calibrated and matched simulation model, used as the basis both for the Measured and Indicated Resources and for the Proven and Probable Reserves ensures consistency between the reported mineral resource and reserves estimates. |
For these reasons, the mineral reserve estimates reported here are considered to be reasonable, and in conformance with the requirements of NI 43-101.
RSI-3353
| 16.0 | MINING METHODS |
Recovery of the lithium will use the existing LANXESS South Unit brine production facilities (brine supply wells, down-hole pumps, surface flowlines, bromine processing facilities, and connecting pipelines and disposal wells, as described in the PEA (Dworzanowski et al. 2019) to supply the Feed Brine from the LANXESS South Plant to the Project. Once the lithium is extracted from the brine, the processed brine will be re-injected into brine disposal wells, along with any brine not processed by the Project. This production and injection process from a deep brine reservoir is identical to that used in the adjacent Albemarle bromine project and incorporates the production and injection technology which has been proven by the petroleum industry in thousands of fields worldwide.
Examples of a typical brine source well (BSW) and salt water disposal (SWD) wells are given in Figures 16-1 and 16-2, and the configuration of the South Unit wells and the existing pipeline network is presented in Figure 16-3.

Figure 16-1. Typical Brine Source Well Diagram
RSI-3353

Figure 16-2. Typical Disposal Well Diagram
RSI-3353
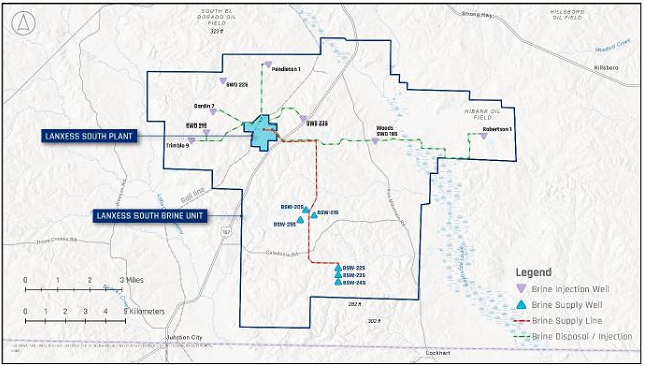
Figure 16-3. South Unit Well and Flow Line Configuration
The assumed Project injection and production rates are based on the existing well capacity and historic field operations, as LANXESS set out in the South Unit Development Plan, which sets out a high level, the contemplated production from the South Unit by LANXESS over the life of the Project. The extraction method is not expected to impose any significant changes on the existing bromine processing activities. Based on the current predicted life of the existing brine supply and disposal wells, no new wells are anticipated to be required during the initial 25-year operating life of the facility.
Proven Reserves case total brine rate and lithium concentration are plotted in Figure 16-4. The decrease in lithium concentration over the life of the Project results from the increasing production volume of injected lean brine that has been processed to remove the lithium, as expected in a brine displacement process.
RSI-3353
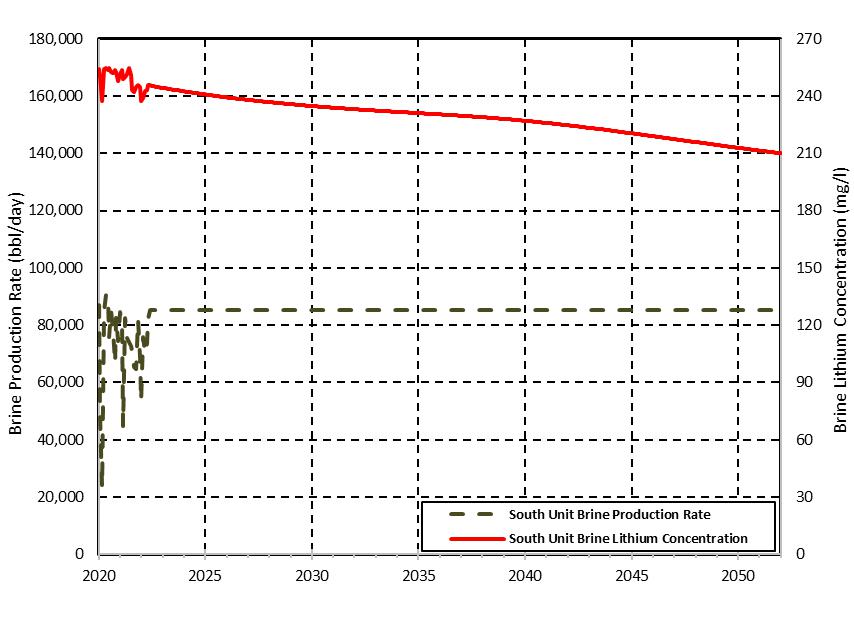
Figure 16-4. South Unit Production - Concentration Estimates
RSI-3353
| 16.1 | PRODUCTION PLAN |
The Project contemplates production of battery-quality lithium carbonate averaging 5,400 tonnes per annum (tpa) over a 25-year operating life, producing 135,000 tonnes LCE from the LANXESS South Brine Unit.
The Project has the potential to operate over a 40-year life based on the Proven and Probable Reserves of 208,000 tonnes LCE. The TR makes very conservative assumptions that production of brine will occur from the existing wellfield, and that no additional wells are drilled in the future to supplement or add to the current brine flow, or to add additional brine from higher lithium content zones available in the production unit(s). See Figure 16-5 for the annual production plan.
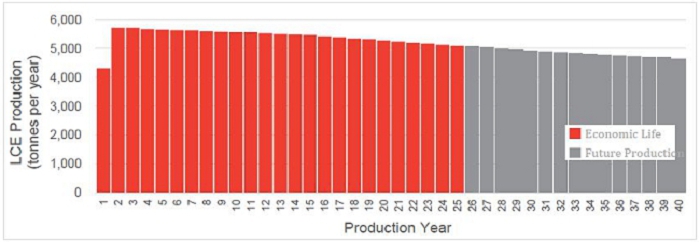
Figure 16-5. Project Production Plan
The LANXESS the South Unit Brine Resource and Proven Brine Reserves support the production of Lithium Carbonate well in excess of the initial 25-year economic life of the Project. The long-established history of brine production coupled with the proven experience of LANXESS in brine field operations, coupled with the fact that economic benefit will be obtained from both bromine and lithium extraction from the Project production, further supports planned future brine production from the South Unit.
RSI-3353
Table 16-1. Planned South Unit Production by Year for First 25 Years of Production
| Proven Reserves | Proven and Probable Reserves | ||||||
| Year No. |
Year | Average Lithium Concentration |
Lithium Processed by the Plant |
Equivalent Lithium at Plant Outlet, 100% Purity |
Average Lithium Concentration |
Lithium Processed by the Plant |
Equivalent Lithium at Plant Outlet, 100% Purity |
| (mg/L) | (tonnes/year) | (tonnes/year) | (mg/L) | (tonnes/year) | (tonnes/year) | ||
| 1 | 2026 | 239 | 888 | 780 | 239 | 932 | 864 |
| 2 | 2027 | 237 | 1,072 | 941 | 237 | 1,162 | 1,077 |
| 3 | 2028 | 236 | 1,070 | 939 | 236 | 1,160 | 1,074 |
| 4 | 2029 | 235 | 1,062 | 933 | 235 | 1,151 | 1,066 |
| 5 | 2030 | 234 | 1,058 | 929 | 234 | 1,147 | 1,062 |
| 6 | 2031 | 233 | 1,054 | 926 | 233 | 1,142 | 1,058 |
| 7 | 2032 | 233 | 1,053 | 925 | 232 | 1,142 | 1,058 |
| 8 | 2033 | 232 | 1,048 | 920 | 232 | 1,135 | 1,052 |
| 9 | 2034 | 231 | 1,045 | 917 | 231 | 1,132 | 1,048 |
| 10 | 2035 | 231 | 1,042 | 915 | 230 | 1,129 | 1,045 |
| 11 | 2036 | 230 | 1,042 | 915 | 230 | 1,128 | 1,045 |
| 12 | 2037 | 229 | 1,036 | 909 | 229 | 1,121 | 1,039 |
| 13 | 2038 | 229 | 1,032 | 906 | 228 | 1,117 | 1,035 |
| 14 | 2039 | 228 | 1,028 | 903 | 227 | 1,112 | 1,030 |
| 15 | 2040 | 227 | 1,027 | 902 | 226 | 1,109 | 1,028 |
| 16 | 2041 | 226 | 1,019 | 895 | 225 | 1,100 | 1,019 |
| 17 | 2042 | 224 | 1,014 | 890 | 223 | 1,093 | 1,013 |
| 18 | 2043 | 223 | 1,008 | 885 | 222 | 1,086 | 1,006 |
| 19 | 2044 | 222 | 1,005 | 882 | 220 | 1,081 | 1,002 |
| 20 | 2045 | 220 | 995 | 874 | 219 | 1,070 | 992 |
| 21 | 2046 | 219 | 989 | 868 | 217 | 1,063 | 984 |
| 22 | 2047 | 218 | 982 | 863 | 215 | 1,055 | 977 |
| 23 | 2048 | 216 | 979 | 859 | 214 | 1,050 | 973 |
| 24 | 2049 | 215 | 970 | 851 | 212 | 1,040 | 963 |
| 25 | 2050 | 213 | 963 | 846 | 211 | 1,032 | 956 |
RSI-3353
| 17.0 | RECOVERY METHODS |
| 17.1 | Overview |
The Project Facility will be constructed adjacent to the existing LANXESS South Plant which currently receives, processes, and reinjects Smackover brine from the South Unit via a series of brine supply and reinjection wells as described in Section 16. The Project will receive brine downstream of the bromine processing facility, recover the lithium and return the lithium-depleted brine to LANXESS for reinjection into the Smackover Formation.
The Feed Brine received by the Project is pH adjusted, filtered and conditioned in a series of pre-treatment processes in preparation for the Direct Lithium Extraction (DLE) process. The DLE technology chosen for the Project is Lithium Selective Sorption (LSS), a Koch Technology Solutions LLC (KTS) proprietary technology, which extracts lithium ions from the brine to produce a raw lithium chloride solution that is low in contaminants. The lithium chloride is then purified through chemical softening and ion exchange, and concentrated using reverse osmosis to produce a polished lithium chloride solution.
The polished lithium chloride then enters a conventional, two-stage, lithium carbonate crystallization process to produce battery quality lithium carbonate. The lithium carbonate is dried, milled, and packaged to produce the finished product.
The lithium recovery method within the Project Facility consists of the following major process blocks:
| / | Brine Pre-Treatment; |
| / | Direct Lithium Extraction; |
| / | Concentration and Purification; and |
| / | Lithium Carbonate Conversion. |
The process block flow diagram included in Figure 17-1 provides an overview of the lithium recovery process proposed for Standard Lithium’s Commercial Lithium Extraction Plant.
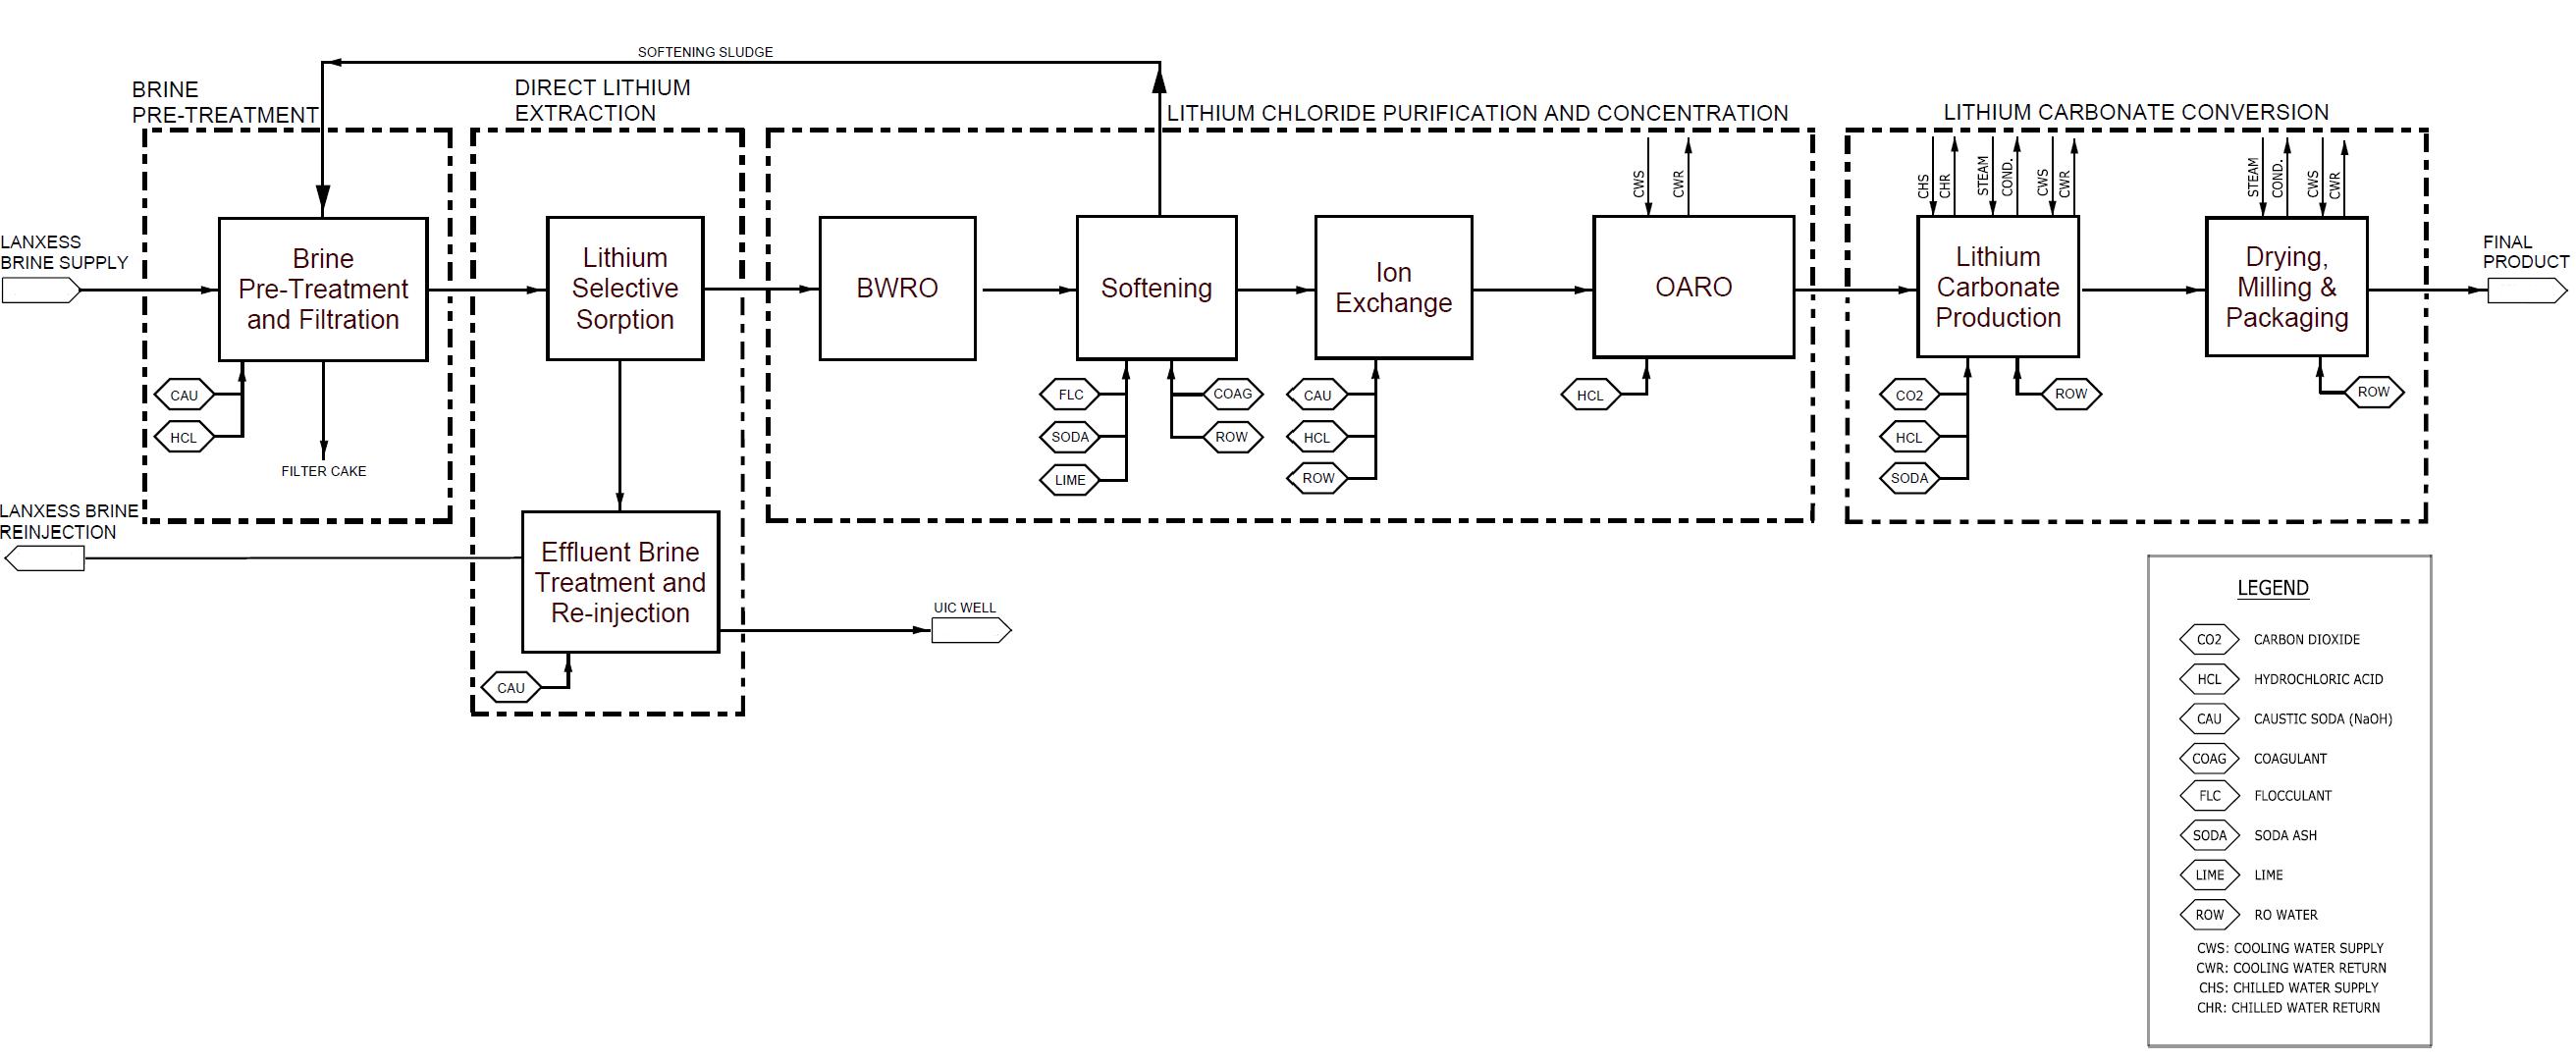
Figure 17-1. Project Process Block Flow Diagram
RSI-3353
| 17.2 | BRINE SUPPLY AND REINJECTION (LANXESS) |
Under the terms of the commercial agreements, LANXESS is responsible for the supply and reinjection of brine which meets the process conditions set out in the commercial agreements. Figure 17-2 provides an overview of the brine supply and return process between the Project Facility and LANXESS South Plant.
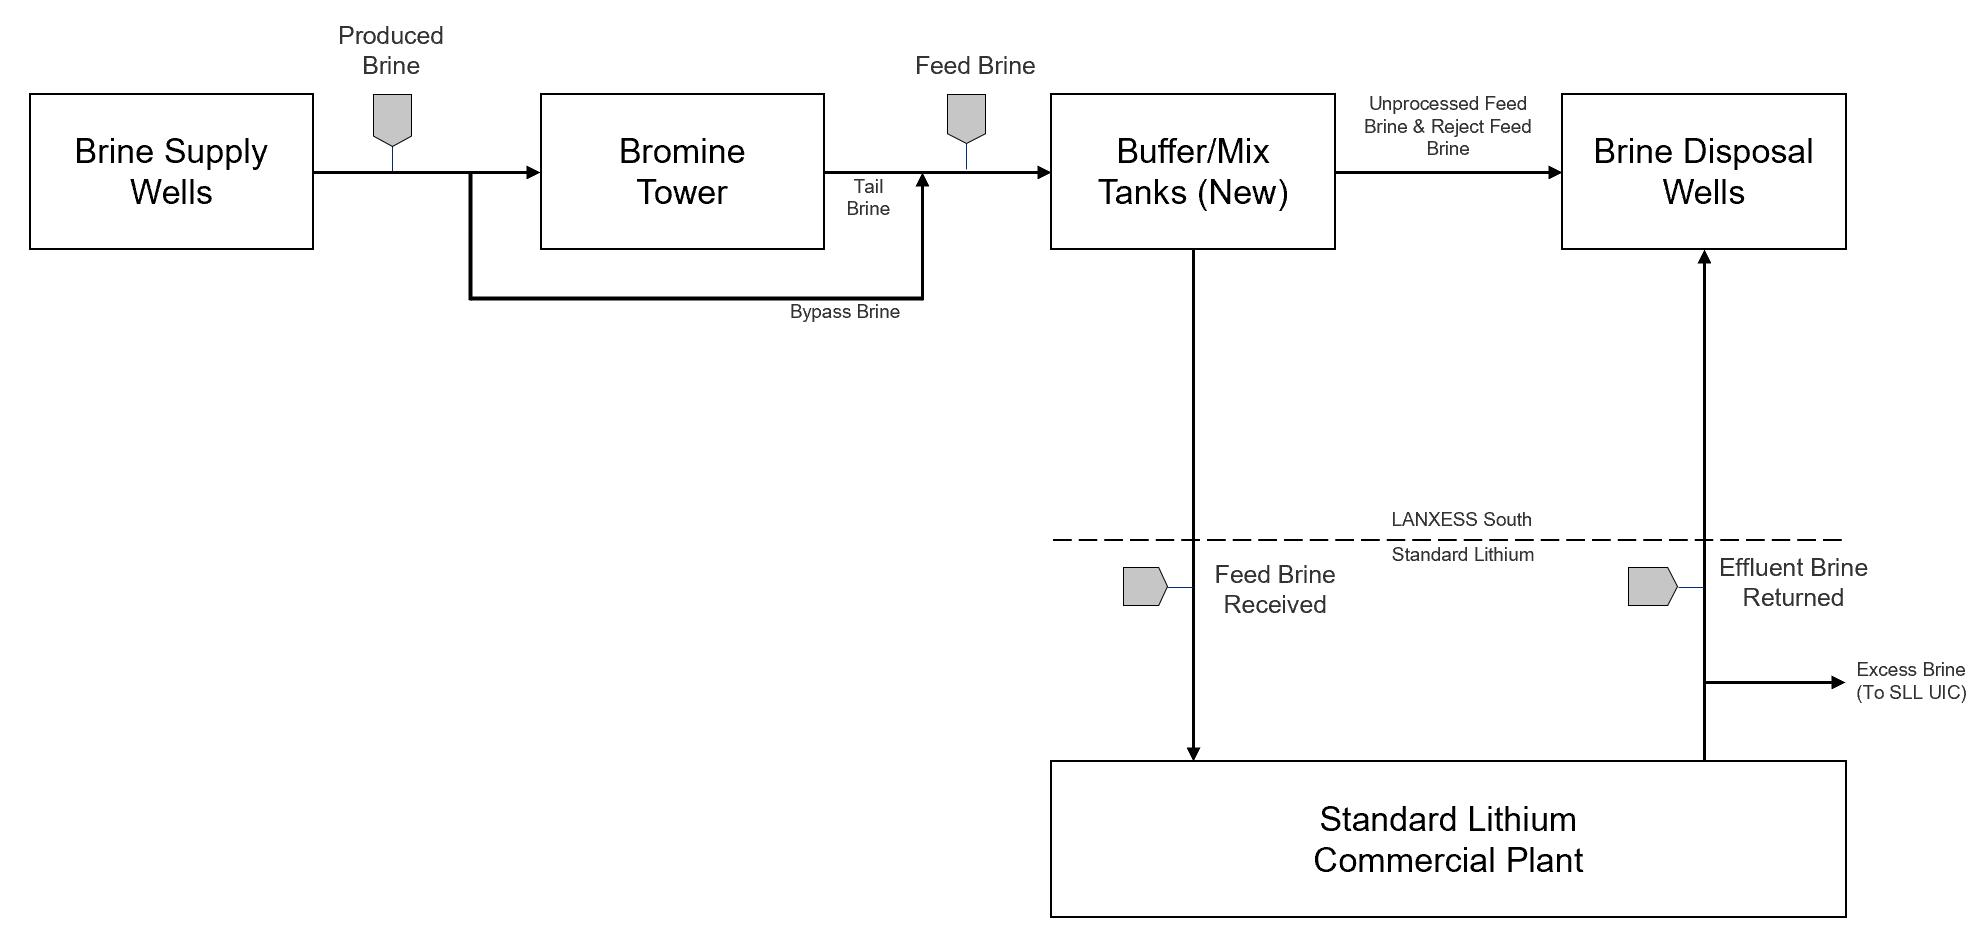
Figure 17-2. Standard Lithium and LANXESS Process Block Flow Diagram
| 17.2.1 | BRINE SUPPLY |
Smackover brine produced by LANXESS from the wells in the South Unit is treated and then gathered and delivered via pipeline to the South Plant for processing. Separation equipment at each well head is used to remove the bulk of any produced hydrocarbons and the sour gas (H2S) from the brine stream prior to delivery to the South Plant. The sour gas collected is transported to the LANXESS Central Plant via pipeline and then delivered to the Delek Refinery for processing. Any produced hydrocarbons are locally collected and transported to the Delek Refinery for processing.
Once the brine is received at the South Plant, it first passes through a LANXESS vacuum degasser to remove residual sulfides entrained in the brine to less than 30 ppm (wt/wt) of H2S, prior to the bromine extraction process. LANXESS may or may not extract bromine from the brine.
Brine which bypasses the bromine extraction facilities, referred to as Bypass Brine, requires pH adjustment using anhydrous ammonia (NH3) prior to delivery to the Project Facility or reinjection into the formation. Bromine-depleted brine, referred to as Tail Brine, requires a further treatment by LANXESS using sodium bisulfite (SBS) to reduce any residual bromine and chlorine in the Tail Brine stream to bromides and chlorides.
The Project will be able to treat Feed Brine (Tail Brine or Bypass Brine) from LANXESS at a range of pH between 1 to 5.5. By receiving the brine at a lower pH, softening sludge produced by the Project Facility’s downstream lithium chloride purification process can be used for coarse pH adjustment, which results in improved lithium recovery for the Project and an operating cost savings to LANXESS through reduced anhydrous ammonia consumption and to the Project through reduced reagent consumption.
| 17.2.2 | BRINE REINJECTION |
Following the lithium extraction process and any treatments required to meet reinjection specifications, the majority of the lithium-depleted brine and ancillary waste streams are consolidated and returned to LANXESS for reinjection into the Smackover Formation using the existing LANXESS reinjection well network. Any excess brine volumes are reinjected underground using the Project’s Class 1 Non-Hazardous Underground Injection Control (UIC) wells as described in Section 18.
RSI-3353
| 17.3 | BRINE PRE-TREATMENT |
The Project is designed to receive Feed Brine from the LANXESS South Plant at an operating rate of 680 m3/hr [3,000 US gpm] with a 10% design factor. This is to ensure the project maximizes the volume of Feed Brine processed accounting for fluctuation in brine delivery rates from South Plant. The Feed Brine is typically hot, acidic, and highly saline. Besides lithium, the brine’s primary constituents include sodium, potassium, magnesium, and calcium chlorides with minor quantities of boric acid.
The objective of Brine Pre-treatment is to neutralize, cool, and filter the Feed Brine in preparation for the Direct Lithium Extraction (DLE) process.
Feed Brine received from LANXESS is initially processed through two pH control tanks. Under normal operations, the first tank uses chemical softening sludge, primarily calcium carbonate and magnesium hydroxide produced in the downstream raw lithium chloride softening system, for coarse pH adjustment, specifically to raise the Feed Brine pH to approximately 4.0 - 4.5. The second tank uses caustic soda (sodium hydroxide solution) to further raise the brine pH to 5.5, the target pH for the DLE process. In the event there is insufficient softening sludge available, LANXESS will adjust the pH of the Feed Brine prior to delivery to the Project.
The Feed Brine temperature ranges between 60-90°C. To optimize the downstream process, two heat exchangers operating in parallel are used to moderate the brine temperature to 65°C primarily to protect the downstream membrane filtration system. The lithium-depleted brine produced downstream from the DLE process is used as coolant after passing through an evaporative cooling tower. The cooling tower is used to cool the lithium-depleted brine from 65°C to less than 40°C. The cooling tower also removes 35 m3/hr of water from the brine by evaporation, which reduces the total volume of brine required to be reinjected into the Smackover Formation.
The pH and temperature adjusted Feed Brine is pumped through ultrafiltration (UF) membrane filters, for the removal of any fine suspended solids (over 0.04 µm). The UF membrane filters consist of five operating and one standby module. The membrane modules are removed from service one at a time to release the collected solids by air scouring and backwashing. Lithium-depleted brine is used for regular backwash of the membrane filters. The solids-laden backwash is transferred to the effluent brine tank. Clean-in-Place (CIP) of the UF membranes is periodically required. CIP uses a combination of cleaning agents including acids and detergents to remove any buildup of solids on the membrane.
| 17.4 | DIRECT LITHIUM EXTRACTION |
| 17.4.1 | LITHIUM SELECTIVE SORPTION |
The key unit process for the production of lithium chloride solution is the Direct Lithium Extraction process. Standard Lithium has selected the Lithium Selective Sorption (LSS) process as the DLE process for the Project. The selection is based on improved economics, the expected performance guarantees to be provided by KTS, and the DLE test work undertaken as described in Section 13.3.3.
RSI-3353
The LSS equipment is a Koch Technology Solutions proprietary technology for which Standard Lithium have a Joint Development Agreement and Smackover Formation exclusivity agreement in place (for a period of time). The process will be a fixed bed, selective adsorption process that favors lithium chloride. Lithium-rich brine will be pumped through the fixed bed of sorbent, loading the sorbent with both lithium and chloride ions, and discharging a raffinate that is barren of lithium. The loading will be stopped at the point that lithium breakthrough occurs. After displacing remaining raffinate from the sorbent bed, the sorbent will be eluted with water, releasing the lithium and chloride, and producing an eluate that compared to Feed Brine is somewhat higher in lithium concentration and much lower in other undesirable ions such as sodium, potassium, calcium, magnesium and boron. The remaining eluate will then be displaced from the column to the feed tank and the cycle will be repeated.
After the LSS DLE process, the eluate or raw lithium chloride solution will recover approximately 95% lithium and will have rejected in excess of 98% of the major contaminants for sodium, calcium, magnesium, and potassium.
| 17.4.2 | LITHIUM-DEPLETED BRINE PROCESSING |
Lithium-depleted brine rejected from LSS passes through a brine cooling tower and heat exchangers described above in Brine Pre-treatment. Lithium-depleted brine is also reused as membrane filter backwash. All lithium-depleted brine and other process waste streams are ultimately consolidated, pH adjusted and then sent for reinjection either to the LANXESS brine reinjection network or to one of the Project’s two dedicated UIC wells.
| 17.5 | PURIFICATION AND CONCENTRATION |
| 17.5.1 | BRACKISH WATER REVERSE OSMOSIS |
The raw lithium chloride from LSS is concentrated via conventional Brackish Water Reverse Osmosis (BWRO) to remove nearly 90 percent of the water. In this process lithium in the chloride solution is concentrated to 2,500 to 3,000 mg/L along with 99% of the solution impurities. The BWRO concentrate is the product that continues to the next step as lithium chloride. The BWRO permeate is reused throughout the process but mainly as eluant for the DLE process.
CIP of the BWRO membranes is periodically required. CIP uses a combination of cleaning agents including acids, detergents, anti-scalant, and bases to remove any buildup of solids on the membrane.
| 17.5.2 | CHEMICAL SOFTENING |
The objective of chemical softening is to reduce calcium and magnesium from the lithium chloride rich solution.
The lithium chloride from BWRO is chemically treated with soda ash (Na2CO3) and lime (Ca(OH)2) to precipitate calcium carbonate and magnesium hydroxide. The lithium chloride is then separated from the precipitates through a clarifier.
The clarifier underflow is filtered and reslurried with Feed Brine to produce the softening sludge required in Brine Pre-treatment for pH adjustment.
The clarifier overflow following polishing by a multi-media filter continues to the next step as softened lithium chloride.
RSI-3353
| 17.5.3 | ION EXCHANGE |
The purity requirements for battery-quality lithium carbonate require near complete removal of calcium, magnesium, and boron. To meet the lithium carbonate purity requirements, two ion exchange systems are used. The first removes calcium and magnesium and the second removes boron from the softened lithium chloride.
| 17.5.3.1 | CALCIUM AND MAGNESIUM REMOVAL |
The softened lithium chloride is treated to remove calcium and magnesium using a chelating resin through a continuous ion exchange system. The columns will alternate between loading and regeneration.
The softened lithium chloride passes through the ion exchange columns during loading, where calcium and magnesium are loaded onto the resin and stripped from the lithium chloride. The calcium and magnesium are then stripped from the resin during regeneration using a combination of water, acid, and base which is then directed to the effluent brine system.
| 17.5.3.2 | ION EXCHANGE BORON REMOVAL |
The boron ion exchange system receives lithium chloride after calcium and magnesium removal and uses boron-selective chelating resin.
The lithium chloride passes through the ion exchange columns during loading, boron is loaded onto the resin and stripped from the lithium chloride. The boron is then stripped from the resin during regeneration using a combination of water, acid, and base and then directed to the effluent brine system.
| 17.5.4 | OSMOTICALLY-ASSISTED REVERSE OSMOSIS (OARO) |
The lithium chloride, after calcium, magnesium and boron removal, is concentrated via an Osmotically Assisted Reverse Osmosis (OARO) treatment system until lithium concentrations reach approximately 8,000 – 10,000 mg/L. The OARO permeate is reused as RO water and the OARO concentrate or polished lithium chloride is advanced for lithium carbonate conversion. After RO the lithium chloride brine contains lithium chloride, sodium chloride and minor levels of other impurities,
Impurities, including silica, aluminum, manganese, and iron, must be controlled ahead of the OARO to avoid fouling or damaging the membranes, and are expected to be reduced to acceptable levels during chemical softening and ion exchange. CIP of the OARO membranes is periodically required. CIP uses a combination of cleaning agents including acids, detergents, anti-scalant, and bases to remove any buildup of solids on the membrane.
| 17.6 | LITHIUM CARBONATE CONVERSION |
| 17.6.1 | LITHIUM CARBONATE CRYSTALLIZATION |
The lithium carbonate crystallization system receives polished lithium chloride solution from OARO and produces lithium carbonate using a two-stage conventional crystallization process with a bicarbonate process and further ion exchange treatment.
Low solubility lithium carbonate is produced by reacting lithium chloride with a sodium carbonate solution. Crude lithium carbonate that forms from the reaction is recovered with the following process.
First, the lithium carbonate is crystallized in a draft tube baffled (DTB) first stage lithium carbonate crystallizer. The lithium carbonate slurry is combined with the baffle overflow liquor before being pumped to a peeler type first stage lithium carbonate centrifuge. The crystals are de-watered and washed using centrate from the second stage lithium carbonate centrifuges. The cake discharged from the centrifuge is then repulped with recycled centrate from the second stage lithium carbonate centrifuges and RO water.
RSI-3353
The first stage lithium carbonate crystals produced from the first stage centrifuge are impure, containing unacceptable levels of calcium and magnesium contributed by the reaction with soda ash, and sodium and chloride from the lithium chloride feed.
The centrate from the first stage lithium carbonate is purged from the carbonation process to prevent a build-up of contaminants in the process. It is returned to the Feed Brine ahead of the LSS process as this carbonate purge stream has high lithium content.
The lithium carbonate slurry fed into the bicarbonate reactor is converted to soluble lithium bicarbonate by reaction with carbon dioxide under pressure. The lithium bicarbonate solution is then filtered and purified to remove calcium and magnesium in a fixed-bed ion exchange system.
The second stage lithium carbonate crystallizer is a DTB type crystallizer which is heated by sparged steam and operates at 95°C. At this temperature and atmospheric pressure, the lithium bicarbonate is converted to lithium carbonate with carbon dioxide evolving from the solution while the lithium carbonate crystallizes. The overhead vapor from the crystallizer is condensed with cooling water and the non-condensable carbon dioxide is recompressed and recycled to the lithium bicarbonate reactor. Lithium concentration in the mother liquor from the second stage crystallizer is about 3,000 mg/L. Lithium carbonate crystals at 15 wt.% slurry density are combined with the baffle overflow before being pumped to peeler-type second stage lithium carbonate centrifuges with hot treated water used to wash the lithium carbonate crystals in the centrifuge. The second stage centrate is used to repulp the first stage crude lithium carbonate and to wash the first stage centrifuge cake.
Crystals in the second stage centrifuge cake are battery-quality lithium carbonate. The washed, pure lithium carbonate second stage centrifuge cake is then dried in an indirect-steam-heated dryer.
| 17.6.2 | DRYING, MILLING, AND PACKAGING |
Following crystallization, the lithium carbonate will be dried in an indirect-steam heated dryer, cooled, micronized (crushed), and pneumatically conveyed for packaging. After sampling and laboratory analysis, the battery quality lithium carbonate is then loaded into 500 kg or 1,000 kg bulk bags, palletized, and ready for shipment.
| 17.7 | ENERGY. WATER, AND PROCESS MATERIALS |
| 17.7.1 | ENERGY REQUIREMENTS |
The electrical power required for the Project is estimated at 7.6 MWh during normal operation and will be supplied by the regional electric service provider Entergy. Entergy is currently completing a Facility Study to determine the specific upgrades required to the Entergy infrastructure for supplying this new connected load.
The natural gas required for the Project is estimated at 260 GJ per day to support boiler steam production and ancillary heating needs. The natural gas supply infrastructure will be provided by Energy Transfer and the natural gas will be purchased from a local supplier/marketer.
RSI-3353
| 17.7.2 | WATER SUPPLY |
Raw water for process uses will be sourced from one of two new wells to be drilled and completed on the Project Site. Each well will have the capacity to supply up to 160 m3/hr from the Sparta Aquifer. The plant raw water demand can be satisfied by either well. Water used for most lithium extraction processes and for boiler feedwater is first purified using reverse osmosis. Additional treatment is required to produce the high purity water used in the lithium carbonate washing circuit. Untreated well water and recycled storm water, when available, is used for fire protection, irrigation and general plant washdown.
Chlorinated well water for non-potable domestic uses will be sourced from either one of the new on-site wells and chlorinated, or chlorinated water will be purchased from LANXESS and delivered by pipeline from South Plant. Potable water for drinking water purposes will be locally purchased or produced on site from treated well water.
| 17.7.3 | REAGENTS |
The various lithium recovery and purification processes require hydrochloric acid (HCl) and caustic soda (NaOH) for pH adjustment and ion exchange resin regeneration, soda ash (Na2CO3) for softening and to precipitate lithium carbonate, and lime (Ca(OH)2) for magnesium removal in softening. Estimated annual consumption of reagents are presented in table 17-1 below.
Table 17-1. Reagent Consumption
| Description | Average Consumption per Year |
| 32% Hydrochloric Acid (HCl) | 6,200 tonnes |
| 50% Caustic Soda (NaOH) | 11,400 tonnes |
| Soda Ash (Na2CO3) | 15,500 tonnes |
| Lime ((Ca(OH)2) | 700 tonnes |
Other reagents and additives to the process include:
| / | anti-scalant; |
| / | carbon dioxide; |
| / | citric acid; |
| / | coagulant; |
| / | flocculant; and |
| / | surfactant. |
These chemicals are used in the lithium carbonate circuit, CIP systems, boiler feedwater treatment, cooling tower chemicals, and other ancillary processes.
RSI-3353
| 18.0 | PROJECT INFRASTRUCTURE |
| 18.1 | INFRASTRUCTURE DESCRIPTION |
The proposed Project Facility is strategically located on undeveloped lands adjacent to the existing LANXESS South Plant to allow interconnection with key elements of existing LANXESS South Plant infrastructure, specifically the brine handling system as generally shown on Figure 18-1. Supporting services including power, natural gas, and water is readily available at the Project Site.
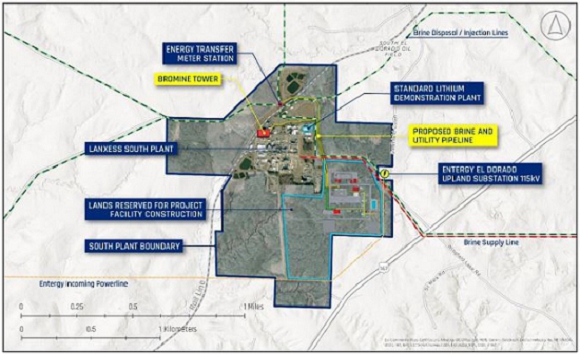
Figure 18-1. Proposed Project Facility Location
The infrastructure associated with the Project includes:
| / | Brine Supply and Return Pipelines; |
| / | Processing Plant; |
| / | Non-process Buildings; and |
| / | Supporting Infrastructure. |
Under the terms of the commercial agreements, LANXESS is responsible for construction of certain improvements (LANXESS Constructed Improvements) to the existing LANXESS Tail Brine system to facilitate the delivery of Feed Brine to the Project. This is further discussed in Section 18.6.
Figure 18-2 provides a general overview of the Project infrastructure.
RSI-3353

Figure 18-2. Project Site Overview
| 18.1.1 | GEOTECHNICAL |
A geotechnical field program and engineering study was completed in March 2023 to assess the suitability of the proposed Project Site for the proposed development. The field program included soil boring, test pitting and soil sampling to characterize ground conditions and confirm groundwater levels, with the objective of identifying any material ground risks, and to input into the design of the Project.
The field program confirmed the expected soil stratigraphy at the Project Site, determined to consist of highly variable layers of clay, silt, and sandy soils. Typically, the upper soils are more cohesive in content and become sandier with depth. The lower sand soils appear laminated and cross-bedded, with variable lenses of clay transitioning into in clayey sand soils. Groundwater was typically observed between a depth of 7m to 16m below the existing ground surface.
The study provided preliminary geotechnical recommendations for the earthworks, foundations, and pavements and to address seismic conditions. These recommendations are considered in the design of the Project Facility. Overall, the study concluded that the site is suitable for the proposed development and conventional foundation and construction techniques used in the area can be applied without the need for ground improvements.
| 18.2 | BRINE SUPPLY AND RETURN |
Brine will be delivered to and from the Project Facility via pipeline. Two operating and one standby centrifugal pumps with variable frequency drives located at the South Plant will be constructed to transfer Feed Brine to the Project Facility via a 1 km long, 300 mm (12 inch) fiberglass pipeline. A parallel 300 mm fiberglass pipeline will transfer Effluent Brine from the Project Facility back to the South Plant.
RSI-3353
The pipelines will be surface run within the fence line of the South Plant and buried outside. A horizontal direction drill (HDD) will be used to route the supply and return pipelines to pass under the existing LANXESS pipelines, utilities and main South Plant access road. Figure 18-3 shows the pipeline routing.
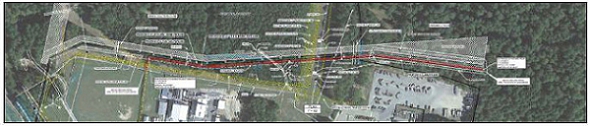
Figure 18-3. Brine Supply and Return Pipelines
Metering and sampling equipment will be installed by the Project on the brine supply and return pipelines to continuously monitor the volume and quality of brine received and discharged by the Project.
| 18.3 | PROCESSING PLANT |
The processing plant encompasses brine pre-treatment, lithium selective sorption, effluent brine, softening, ion exchange, lithium chloride concentration, and lithium carbonate production and drying, milling, and packaging. Figure 18-4 provides a layout of the Project Facility.
RSI-3353
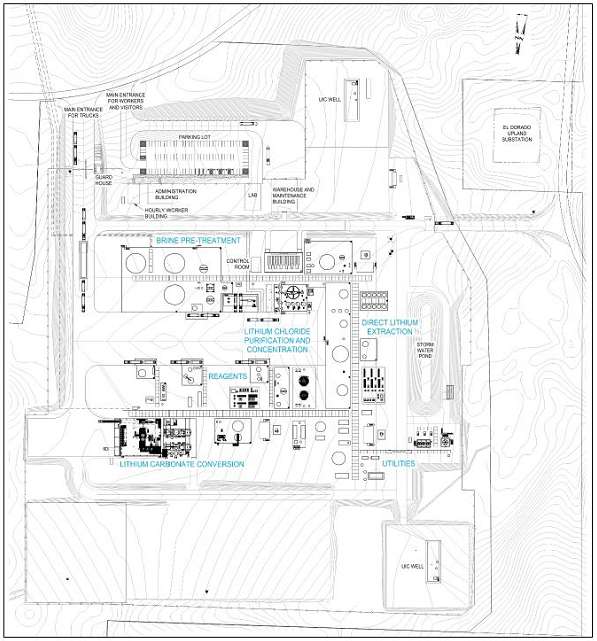
Figure 18-4. Project Facility Layout
| 18.3.1 | BRINE PRE-TREATMENT |
Feed Brine received from the brine supply pipeline must be chemically treated and conditioned prior to the direct lithium extraction process. Major equipment required to support Pre-Treatment includes:
| / | Softening recycle tank with agitator; |
| / | Neutralization tank with agitator; |
| / | Two Feed Brine storage tanks; |
| / | A storage swing tank that can be used either to store Feed Brine or Effluent Brine; |
| / | Two heat exchangers; |
| / | UF membrane filter package; and |
| / | Membrane backflush filter press. |
RSI-3353
The two Feed Brine storage tanks provide the ability to store up to eight (8) hours of brine production from LANXESS at the design capacity of 680 m3/hr. This allows the Project to continue to receive brine from LANXESS in the event of a downstream process interruption, or to continue running the downstream process in the event of an upstream interruption. The brine storage swing tank provides additional operational flexibility for additional Feed Brine or Effluent Brine storage as may be required.
| 18.3.2 | LITHIUM SELECTIVE SORPTION (LSS) |
The LSS package is a proprietary technology for direct lithium extraction. It includes multiple trains of columns filled with resin to load and elute lithium from the brine. Provisions for the inspection and efficient replacement of resin will be included.
| 18.3.3 | SOFTENING |
The softening circuit removes calcium and magnesium from the lithium chloride and recycles the softening sludge to pre-treatment for Feed Brine neutralization. The major equipment required for softening includes:
| / | Flash tank with agitator; |
| / | Reactor tanks with agitators; |
| / | Clarifier; |
| / | Media Polishing Filter; |
| / | Softened Brine storage; |
| / | Filter press; |
| / | Softened Sludge repulp and recycle. |
| 18.3.4 | ION EXCHANGE |
There will be two continuous ion exchange systems used to reduce impurities to acceptable levels for lithium carbonate production. The first system uses a chelating resin to target calcium and magnesium removal. The second system targets boron. A series of columns will be mounted on a rotating carousel. Each carousel is anticipated to include 30 columns.
| 18.3.5 | LITHIUM CHLORIDE CONCENTRATION |
There are two RO packages (BWRO and OARO) used to concentrate the lithium chloride to acceptable levels for lithium carbonate production. Both packages use cartridge filters, high pressure pumps, and RO membranes to increase concentration through desalination.
| 18.3.6 | LITHIUM CARBONATE PRODUCTION |
The lithium carbonate plant receives polished and concentrated lithium chloride to produce battery-quality lithium carbonate. The major equipment includes:
| / | Lithium chloride storage tank; |
| / | First stage crystallizer; |
| / | First stage centrifuge; |
| / | Lithium bicarbonate reactor; |
| / | Secondary calcium ion exchange system; |
| / | Second stage crystallizer; and |
| / | Second stage centrifuge. |
RSI-3353
The lithium chloride storage tank provides the ability to store up to 24 hours of lithium chloride to feed the lithium carbonate plant at the design capacity of approximately 30 m3/hr. This allows the project to continue producing lithium chloride in the event of a downstream process interruption, or to continue producing lithium carbonate in the event of an upstream process interruption.
| 18.3.7 | DRYING, MILLING, AND PACKAGING |
Drying, milling, and packaging of the lithium carbonate product will take place in a secure building. The lithium carbonate is stored in three shift bins. The product is then conveyed to the bagging system which loads the product into 500 kg or 1,000 kg bulk bags ready for delivery by truck. The building includes space to store the equivalent of three days of production of finished bagged lithium carbonate.
| 18.3.8 | EFFLUENT BRINE |
Lithium-depleted brine received from LSS is collected, along with other effluent brine streams as is collectively conditioned to ensure quality requirement for discharge are met prior to return to the South Plant or reinjection into UIC wells. Major equipment required to support effluent brine handling includes:
| / | Neutralization tank; |
| / | Brine cooling tower; and |
| / | Effluent Brine storage tank. |
The Effluent Brine storage tank provides the ability to store 4 hours of effluent brine at the design capacity of 680 m3/hr. This allows the Project to continue to process brine in the event of a downstream process interruption at LANXESS. If additional storage is required, the swing tank from Brine Pre-Treatment can be used for Effluent Brine.
| 18.3.9 | PROCESS CONTROL & INSTRUMENTATION SYSTEMS |
The Project facility will have a Process Control System (PCS) within a prefabricated and equipped Central Control Room (CCR). It will be a single-story building located within the processing plant. The system will be equipped with an onsite radio and communication system to provide access to the internet and telephones. In addition, the control room building will have main operator consoles, conference area, restrooms, and small kitchen area.
Controls will be implemented using a Distributed Control System (DCS) with remote I/O (RIO) panels placed throughout the facility. Placement of the panels will be defined by I/O count in the area and location of vendor control panels to minimize communication runs. Vendor PLC control panels will be integrated into the DCS controller. DCS area controllers will remain inside the area Power Distribution Centers (PDC) buildings.
The main operator interface will be via operator consoles in the new CCR. The operator consoles will show the graphic displays depicting the process units. Vendor control panels will be integrated into the DCS controller. The control system will employ redundant processors to provide a high level of reliability and uptime.
Control room design will have a separate and secure data/server room which will house the control system servers, HMI servers, data historian, cyber-security, firewall, and other network equipment.
RSI-3353
| 18.4 | NON-PROCESS BUILDINGS |
Non-process buildings include an administration building, hourly workers building, warehouse, maintenance shop, onsite laboratory, and guardhouse.
The administration and hourly workers buildings will be constructed to accommodate the approximately 90 people anticipated to be required to support operations. The administration building will include offices, a conference room, break room, and restroom facilities. The hourly workers building will include male and female locker rooms, restrooms, and a break room designed for 40 people. The number of staff and visitor parking stalls to be provided is 100 and will include EV changing facilities. The administration building will be accessible to guests and visitors from outside the process facilities.
A combined maintenance shop and warehouse facility will also be constructed in the non-process building area. It will be a well-ventilated (non-climate controlled) steel clad building with concrete flooring. The maintenance shop will include a tool crib, welding area, shop area and three climate-controlled offices. The warehouse will include a receiving dock for deliveries with direct access from outside of the process plant, one climate-controlled office, and parts storage including conditioned storage areas.
An on-site laboratory is provided to support the production of battery quality lithium carbonate as well as real-time assessment of process production conditions to ensure reliable continuous operation of the facility. The laboratory will be a modular facility that will be constructed next to the warehouse and shops.
A guard house will be provided at the plant entrance to control point entry and exit to the process facilities. The guard house will be a permanent stick built or pre-engineered modular facility. It will include workstations, a briefing room, restroom(s), and IT room.
To address the risk of extreme weather, specifically tornadoes, severe weather shelters will be incorporated into facility structures, such as the control room, or addressed using stand-alone pre-engineered structures designed to FEMA standards to protect on-site personnel.
| 18.5 | SUPPORT SERVICES |
| 18.5.1 | TRANSPORTATION |
The Project is based on the transportation of all products, byproducts, reagents, materials, and equipment by truck to and from the Project Facility.
| 18.5.2 | REAGENTS |
The primary reagents required for the operation of the Project Facility received by truck will be stored locally on site in permanent storage systems with sufficient inventory for reliable operation of the Project Facility.
Hydrochloric acid will be stored in a common tank and distributed to local day tanks to support the various unity operations. Caustic soda will be stored in a single tank and diluted with RO water for use. Soda ash will be delivered in bulk and stored dry in a storage bin. Citric Acid for membrane CIP will be bulk delivered and stored in a tank. Lime will be received in bulk bags.
RSI-3353
| 18.5.3 | UTILITIES |
| 18.5.3.1 | NATURAL GAS |
The supply of natural gas to the facility will be provided by Energy Transfer. There is an existing 150 mm [6 inch] pipeline nearby with sufficient capacity to serve the Project. The pipeline tie-in will be located to the north of the South Plant. Energy Transfer will construct a metering station at the tie-in location. From the meter station, a 100 mm [4 inch] natural gas pipeline approximately 1 km long, running parallel to the brine supply and return lines, will be installed by the Project to deliver gas to the Project facility. Similar to the brine pipelines, HDD will be used to allow the supply and return pipelines to pass under the existing LANXESS pipelines, utilities, and main South Plant access road as well as to pass under the existing the right-of-way for the Ouachita Railroad on the north side of the South Plant.
| 18.5.3.2 | ELECTRICAL POWER |
A dedicated and independent power supply will be provided for the Project Facility by Entergy, the current provider of electrical power the LANXESS South Plant, from Entergy’s 115kV El Dorado Upland Substation which is located immediately to the east of the Project Facility. The existing 13.8 kV distribution bus in the Entergy substation will be extended, and two new feeder bays and breakers will be installed by Entergy. Entergy will provide a metering pole at the boundary of the substation which will the electrical tie-in point for the Project. 13.8kV overhead lines will be installed by the Project between the Project Lease Area and Meter Pole tie-in location. The 13.8kV overhead lines will tie into the power distribution center (PDC) feeding the process facilities as well as supply power to pole mounted utility transformers feeding the non-process buildings. From the 13.8kV PDC, underground distribution will feed three local motor control center (MCC) buildings located strategically around the process plant. The MCC buildings will house the required switchgear, motor control centers and lighting panels. MCC’s will be smart type and the communication to the control system will be via ethernet over fiber optic cable.
| 18.5.3.3 | WATER SUPPLY |
Two new water wells will be installed and operated by the Project, one at the northeast corner and one on the southwest corner of the Project Facility. Each well, capable of supplying up to 160 m3/hr of water, will be used to support process water requirements, fire protection, or chlorinated on site for other domestic uses. A process water tank will provide buffer storage for the facility prior to distribution.
A 50 mm [2 inch] potable water line from the South Plant will provide an alternative source of chlorinated water for the Project Facility. The chlorinated water line from the South Plant will follow the same general routing as the brine and natural gas pipelines from South Plant and provide water at a rate of up to 11 m3/hour [50 US gpm]. Chlorinated water will be used for potable water needs including safety showers, eye wash stations, faucets, toilets, and showers.
A Reserve Osmosis (RO) package will be installed to supply RO water for boiler feed, seal water, CIP systems, reagent dilution, and for other process uses. An additional water chiller will provide chilled process water to support the production of lithium carbonate.
| 18.5.3.4 | STEAM & CONDENSATE |
A natural gas fired boiler will be installed to supply low pressure steam for processing and other ancillary heating requirements. A condensate return system will be included to recycle condensate to the boiler.
| 18.5.3.5 | COMPRESSED AIR |
A centralized compressed air system is provided to support both process air and instrument air requirements.
RSI-3353
| 18.5.3.6 | SEWAGE TREATMENT |
A small vendor supplied packaged wastewater treatment plant will be installed for treatment of domestic sewage prior to surface discharge.
| 18.5.4 | FIRE PROTECTION |
A fire protection system will be provided including fire detection in buildings and a fire water distribution piping and hydrant network. As there is no municipal fire water system in the Project Facility, fire water will be stored locally on site to support the plant fire water system. Local fire water pumps will be provided and installed in accordance with National Fire Protection Association (NFPA) requirements.
| 18.5.5 | STORMWATER MANAGEMENT |
The collection and disposal of stormwater on site will be managed in accordance with a comprehensive stormwater management plan which addresses both construction and operation of the Project Facility. Surface water will generally be directed via ditches and culverts, utilizing natural grade on the site, towards a sedimentation pond (which removes suspended solids) to be constructed along the east side of the site. Where process containment areas are constructed, stormwater collected within the containment areas will first be tested prior to discharge and once deemed safe for discharge, directed to the site sedimentation pond. The sedimentation pond will discharge to the east of the site, into the existing drainage which currently receives surface runoff for the undisturbed site.
| 18.5.6 | UIC DISPOSAL WELLS |
To support management of reservoir pressures in the Smackover Formation and minimize surface waste streams, the Project has committed to the safe disposing of any excess effluent brine and other process wastewater streams into the Hosston Formation using two redundant Class I Non-Hazardous UIC wells. Each well will be permitted to dispose of up to 70 m3/hr of brine or wastewater on an individual basis or up to a maximum of 100 m3/hr on a combined basis.
| 18.5.7 | SECURITY |
A perimeter fence will enclose the Project Facility with a minimum setback from the property boundary, providing a visual barrier into the facility. CCTV monitoring systems will be installed throughout the facility and monitored by site security personnel on a 24-hour, 7-days-per-week basis.
Truck and vehicle access to process areas of the facility will generally be restricted to essential activities and controlled by security personnel at the main gate house. The secondary construction access gate, provided for construction and future maintenance activities, will be located on the east side of the facility and will be either locally or remotely monitored.
Visitor access will be provided through the administration building. Deliveries will be received directly at the Warehouse from outside the process plant to limit non-essential personnel and vehicles inside the process plant.
Secondary security restrictions and access control within the process facility will be provided to protect personnel and visitors and restrict unnecessary access to critical process areas.
| 18.5.8 | TELECOMMUNICATIONS |
The plant telecommunications system consists of a private high speed fiber optic internet service, a cloud-based PBX phone system, a plant wireless system, VHF/UHF radios, a business LAN/WAN, and a process control LAN.
RSI-3353
| 18.5.8.1 | MAIN INTERNET SERVICE |
A private high speed fiber optic internet service is provided and continually monitored by the local internet provider to ensure high availability of internet service to support cloud-based business and process applications. Critical business and process applications are hosted from local servers within the plant.
| 18.5.8.2 | CLOUD BASED PBX PHONE SYSTEM |
The PBX phone system is proposed to be hosted in the cloud by a local telephone company.
| 18.5.8.3 | PLANT WIRELESS SYSTEM |
A plant wireless system is provided for a cohesive wireless communication platform across the physical and functional areas of the plant operations, enabling the wireless network to support diverse applications such as connected worker and industrial internet of things (IIoT).
| 18.5.8.4 | VHF/UHF RADIO SYSTEM |
Handheld VHF/UHF radios are provided to plant operations and maintenance personnel as the main source of communications for managing day-to-day activities. The control room will be provided with a VHF/UHF base station with an antenna to provide good radio coverage over the entire plant.
| 18.5.8.5 | BUSINESS LAN/WAN |
The business network consists of the hardware and software infrastructure that connects the plant’s business computers, servers, and other devices, providing employees with a connection to shared resources and access to internal and external applications.
The LAN infrastructure supports the connection to the plant’s local applications such as the card access system, the phone system, and the CCTV cameras. The cloud infrastructure supports the connection to cloud hosted applications, such as the Corporate ERP, lab information system, and maintenance management systems.
The main internet service terminates in the business server room located in the administration building. The server room incorporates redundant servers to host local business applications. On a power supply, hard drive or CPU failure, the redundant servers allow the business systems to run uninterrupted on the backup server. On a plant power outage, the server room UPSs provide power to the redundant servers and other critical networking equipment for a period of time, to allow for the operation and controlled shutdown of the systems. The business applications run in virtualized containers on the server to allow for easier administration and upgrades of the software. Daily backups of the business applications are automatically stored offsite in cloud storage. A disaster recovery procedure ensures quick recovery of the business systems in the event of a catastrophic failure.
The business network will be distributed throughout the plant via remote network cabinets installed in other buildings and in the field. Each network cabinet will house managed network switches used to connect business end devices such as desktop computers, printers, CCTV cameras, desktop phones, wireless ethernet access points, card access readers, and truck scale operator panels. The managed network switches use virtual Lans (VLANs) to separate the business network traffic to allow the traffic to be optimized based on the application.
The enterprise network security is designed and implemented using best practice standard ISO/IEC 27001 Information Security, Cybersecurity and Privacy Protection.
RSI-3353
| 18.5.8.6 | PROCESS CONTROL LAN |
The process control LAN consists of the hardware and software system used to control and monitor the process equipment running within the plant. The process control LAN provides the communication link between control equipment such as DCS controllers, remote IO junction boxes, motor starters, VFDs, process analyzers, operator consoles, data historians, and alarm management systems.
For security of process control equipment, the process LAN is physically isolated from the business LAN. The process control LAN is designed and implemented using best practice standards ISA/IEC62443 Security for Industrial Automation and ISA95 Enterprise Control System Integration.
| 18.6 | LANXESS CONSTRUCTED IMPROVEMENTS |
The purpose of the LANXESS constructed improvements is to support the supply and disposal of Feed Brine to and from the Standard Lithium facility. The scope and schedule for LANXESS Constructed Improvements is addressed in the SARL Agreement and will be further defined in the definitive Brine Agreement between LANXESS and the Project Company.
It is currently proposed that LANXESS will construct four (4) new buffering and mixing tanks downstream of their bromine tower Tail Brine surge tank to facilitate improved chemical conditioning of the Feed Brine to ensure the brine meets the required quality conditions prior to delivery to the Project. These agitated tanks will have the ability to receive both bromine-depleted brine, which has been processed through the LANXESS bromine tower, and bromine-rich brine, which bypasses the bromine extraction facility. The Project is designed to extract lithium from both bromine-depleted or bromine-rich Feed Brine. The Project will construct the pipelines and pumps from the outlet flange of the new LANXESS constructed tanks required to deliver the Feed Brine to the Project Facility.
Following lithium extraction, the Project will pump the lithium-depleted brine back to the bromine processing area where it will be discharged into a new LANXESS-constructed effluent brine tank to facilitate gravity discharge into the existing LANXESS Tail Brine and disposal system for reinjection back into the Smackover Formation. The Project will be responsible for delivering the lithium-depleted brine to the inlet flange of the new LANXESS constructed effluent brine tank.
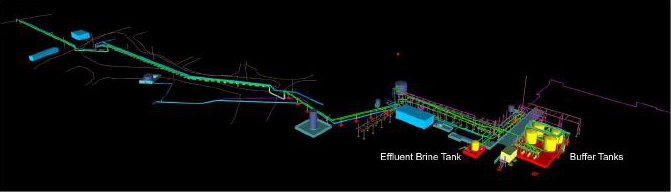
Figure 18-5. Project Brine Pipeline Network
RSI-3353
| 19.0 | MARKET STUDIES AND CONTRACTS |
| 19.1 | THE LITHIUM MARKET |
The lithium market is in a period of transformation because of the supply and demand response from a global demand in 2010 of less than 100k metric tons (Mt) of lithium carbonate equivalents (LCEs) to a demand in 2020 of more than 300k Mt LCE. Battery-related use accounts for approximately 60 percent of the market, driven in part by the growing demand for electric transportation, predominantly electric vehicles (EVs).
By 2030, demand may exceed 3,000k Mt with more than 90 percent of use related to lithium-ion batteries in electric transportation and energy storage. Considering the time it takes for greenfield lithium projects to be developed and come into production, the demand will likely outstrip supply for the remainder of the decade.
The consulting company McKinsey & Company forecasts lithium-ion battery cell demand to grow from 700 gigawatt hours (GWH) in 2022 to 4,700 GWH in 2030, as shown in Figure 19-1. Each terawatt hour (1,000 GWH) requires a minimum of 800k Mt of LCE.

Figure 19-1. Global Lithium-Ion Battery Cell Demand, GWh, Base (after McKinsey & Company 2023).
The world’s largest lithium producer, Albemarle, forecasts a similar demand pattern for LCE growth shown in Figure 19-2. The lithium use aligns well with the forecast in Figure 19-1.
RSI-3353
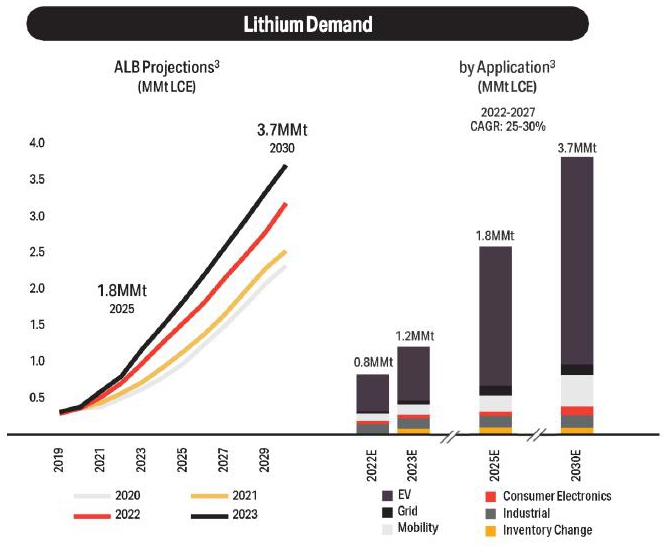
Figure 19-2. Forecasted Lithium Demand (Albemarle, 2023)
Asia is expected to remain the largest market for lithium chemicals for the remainder of the decade. China currently has 70 percent of lithium-ion battery cell production capacity and will remain the largest single market for EVs into the next decade. Korea and Japan are also significant battery producers.
North America is expected to become the second-largest market for lithium chemicals by the end of the decade. U.S. legislation has taken several steps to support growth of the domestic electric vehicle (EV) market and a North American battery supply chain.
The American Jobs Plan proposed $174 billion of investments to support development of the U.S. EV market by doing the following:
| / | Providing tax credits for EVs worth up to $7,500 for a new EV and $3,750 for a used EV |
| / | Expanding access to charging stations with a goal of installing 500,000 new EV chargers by 2030 |
| / | Setting an ambitious goal of 50 percent of U.S. automobile sales being EVs by 2030 |
The European Union is supporting the growth of lithium-ion batteries through their “Green Deal” with a stated objective of making Europe the first carbon neutral continent by 2050.
RSI-3353
Lithium-ion batteries are anticipated to play a central role in the global energy transition. Ensuring adequate supply of lithium chemicals to support the growth of batter demand is becoming a global concern. The Project is well positioned to support the growth in demand for lithium chemicals in North America and other world markets.
| 19.2 | LITHIUM SUPPLY AND DEMAND |
The supply of lithium chemicals is expected to remain constrained for this decade and perhaps longer with demand outpacing supply. Lithium for use in batteries remains a specialty chemical rather than a commodity because of the raw material specifications required for EV batteries.
Advisory firm Global Lithium LLC’s supply and demand forecast is shown in Figure 19-3. It is more conservative than demand shown in Figure 19-2, predicting a 2030 demand of approximately 3,000k Mt LCE versus Albemarle’s forecast of 3,700k Mt. Although the supply line appears in relative balance with demand in some years, consumers may have difficulty sourcing qualified product in adequate volumes maintaining upward price pressure.

Figure 19-3. Lithium Supply and Demand Forecast (McKinsey & Company, 2023)
The two fastest growing lithium chemicals sectors are expected to be battery quality lithium hydroxide (lithium hydroxide monohydrate) and lithium carbonate. Types of resources that provide a source of lithium include hard rock (spodumene), brines and clay deposits. Lithium chemical supply from recycling is not anticipated to be a significant source at this time.
Lithium hydroxide is primarily used in longer range EV batteries requiring high nickel content while lithium carbonate is favored in lower capacity, less expensive EV batteries, electric buses, and energy storage systems. Figure 19-3 shows a relatively even balance of lithium carbonate and lithium hydroxide demand by 2030.
RSI-3353
Lithium carbonate produced from brine sources is almost universally lower cost than the output from hard rock assets, giving brine-based sources a competitive advantage if market conditions move to an oversupply situation.
Currently, Western Australia is the largest global source of lithium supplying more than 40 percent of the total in 2022, mostly in the form of spodumene concentrate converted in China to lithium chemicals. Over the next several years, Australia is expected to convert significant volumes of their spodumene into lithium chemicals, causing China to seek feedstock elsewhere.
Chile is the second largest lithium producer, supplying approximately 30 percent of LCEs globally in 2022. China is the largest producer of lithium chemicals globally, sourced from imported feedstock.
| 19.3 | LITHIUM CARBONATE PRICE |
Since 2021, the price of lithium has shown volatility from lows of $10,000 USD/tonne to a peak of $70,000 USD/tonne. The global average price from 2016 to early 2023 by month is shown in Figure 19-4. Several hard rock mines in Western Australia came online in 2018 and 2019, leading to a temporary oversupply situation and causing the price to fall below $5,000 USD/tonne. In late 2020, EV growth in China and Europe shifted the market back to a shortage situation.

Figure 19-4. Global Weighted Average Lithium Carbonate Price From 2016 to Q1 2023 (source, https://tradingeconomics.com/commodity/lithium)
RSI-3353
Global Lithium LLC estimates that average large-contract pricing will remain between $50,000 and $60,000 USD/tonne through 2030 based on the assumption that demand will exceed battery quality supply until at least the early 2030s. The price forecast in Figure 19-5 shows multiple price scenarios, including an average of the price forecasts of three major investment banks, the projection of China spot price by Benchmark Mineral Intelligence, with pricing considerations in an oversupply situation and the price if the high-cost facility production was curtailed.
For purposes of estimating new project future cash flows, Global Lithium LLC recommended a conservative approach using the forecast high end of the cost curve. Although Global Lithium LLC forecasts global pricing well above the grey line in Figure 19-5, using a conservative price is recommended in case of unforeseen market circumstances. From 2031 to 2036, Global Lithium recommended using a price of $30,000 USD/tonne for economic evaluations.

Notes:
[1] Contract Average is the ex-China average price per Global Lithium LLC estimates
[2] Cost Curve reflects the China hard rock converter cost
[3] IB Average is the ex-China price average from three major investment banks Under the terms of an Amended and Restated MOU, dated February 23, 2022, between Standard Lithium and LANXESS Corporation, LANXESS was given the right to purchase and take from the Project up to 100% of the product.
[4] China spot price
Figure 19-5. Battery Quality Lithium Price Carbonate Scenarios 2023-2030
RSI-3353
| 19.4 | LANXESS MEMORANDUM OF UNDERSTANDING AND OFFTAKE OPTION |
In the event LANXESS desires to exercise this right, the parties are obligated to reasonably and in good faith negotiate the terms and conditions a definitive offtake agreement and use commercially reasonable efforts to cause the execution and delivery of such agreement by a date set forth in the MOU.
In the event LANXESS participates as an equity investor in the Project and is entitled to customary dividend, distribution or similar rights, the price under such offtake agreement for the market price less a handling fee. In the event that LANXESS does not participate as an equity investor in the Project or shall not enjoy customary dividend, distribution or similar rights, the price under such offtake agreement is established at the market price minus a discount up to 20%.
RSI-3353
| 20.0 | ENVIRONMENTAL STUDIES, PERMITTING, AND SOCIAL OR COMMUNITY IMPACT |
| 20.1 | ENVIRONMENTAL REGULATORY SETTING |
The Project Facility is situated in southern Union County, Arkansas, adjacent to developed chemical manufacturing facilities operated by LANXESS and The Chemours Company. The site is in a rural unincorporated area of Union County and not subject to local planning or zoning restrictions or any local permitting authority.
The environmental regulatory programs applicable to the Project Facility are administered by the U.S. Army Corps of Engineers (USACE), the Arkansas Department of Energy & Environment, and the Arkansas Department of Health (ADH). Those agencies have been delegated authority from the U.S. Environmental Protection Agency (EPA) for permits and approvals required for operation of the Project.
The Project Facility relies on the existing brine supply and disposal infrastructure associated with the LANXESS South Plant. After extraction of lithium from the brine, the majority of the lithium depleted brine will be returned to LANXESS for reinjection into the Smackover using the existing network of brine disposal pipelines and injection wells. Any excess volumes of lithium depleted brine will be managed and disposed of by Standard Lithium through two new injection wells to be permitted and constructed specifically for the Project.
No amendment to the existing LANXESS brine supply and disposal permits issued by the ADEE-AOGC are anticipated as a result of the Project. An amendment to the existing LANXESS ADEE-DEQ No Discharge Permit associated with the existing brine disposal surface infrastructure is required. Amendment of permits issued to LANXESS remains the responsibility of LANXESS as the permit holder. Excess brine, byproducts, wastes, and emissions not transferred to LANXESS will be addressed through permits issued directly for the Project as described below.
| 20.2 | PERMITS AND AUTHORITIES |
The Project has been evaluated to determine the specific permits necessary to construct and operate the facility and supporting infrastructure. Based on the evaluations completed to date, the Project is not subject to review under the National Environmental Policy Act (NEPA). Construction and operational emissions to air, surface waters, and subsurface waters are regulated by the federal and state agencies to protect the environment while allowing responsible development of the lithium resources.
Standard Lithium has initiated early consultation with permitting agencies for the construction and operation of the Project. A Baseline Environmental Site Assessment has been conducted as well as investigations of jurisdictional waters of the U. S., wildlife studies, and cultural resources of the Project, as discussed in Sections 20.6, 20.7 and 20.8, respectively.
RSI-3353
| 20.2.1 | FEDERAL |
Federal agency permitting required for the Project is limited to authorization from the USACE Vicksburg District for placement of dredged or fill material into waters of the U.S., including wetlands. Section 404 permits refer to that division of the Clean Water Act (CWA) to protect wetlands and jurisdictional waters of the U.S.
The area of development associated with the Project Facility has been assessed to identify jurisdictional waters of the U.S. The area designated for development will impact jurisdictional waters and a Nationwide Permit (NWP-39) will be required for construction of the Project Facility.
| 20.2.2 | STATE OF ARKANSAS |
The EPA has delegated responsibility for most of the regulatory programs under its jurisdiction to the Arkansas Department of Energy & Environment, Division of Environmental Quality (ADEE-DEQ) including programs under the CWA; Clean Air Act (CAA); Resource Conservation and Recovery Act (RCRA); Comprehensive Environmental Response, Compensation, and Liability Act (CERCLA); Underground Injection Control (UIC); and the Superfund Amendments and Reauthorization Act (SARA). Additionally, the Arkansas Department of Energy & Environment, Oil and Gas Commission (ADEE-AOGC) is the permitting authority for construction of drilling fluid temporary holding basins associated with drilling of the UIC injection well permits.
The ADEE-DEQ has primacy in issuing relevant environmental permits for the construction and operation of the proposed lithium extraction facility. Ancillary activities to support the manufacturing operations, specifically development of a non-transient non-community public water supply is authorized by a permit issued by the ADH. The list of identified permits necessary and the respective issuing agency is provided in Table 20-1.
RSI-3353
| 20.3 | CONSTRUCTION AND/OR OPERATION PERMITS |
New permits required to accommodate the Project Facility are provided in Table 20-1. A brief discussion of each approval required for construction and/or operation is provided below.
Table 20-1. Permits for Project
| Agency | Permitted Activity | Expected
Permit Issuance Time |
| USACE | Placement of fill in waters of the U.S. | 6 months |
| ADEE-DEQ | Air Permit for Commercial Facility | 9 months |
| ADH | Fresh Water Supply for Potable Water | 9 months |
| ADEE-DEQ | Construction Storm Water NPDES Permit for Facility Construction Site | 1 month |
| ADEE-DEQ | Surface Discharge of Non-Brine Process Wastewater, Non-contact Cooling Water, Treated Sanitary Wastewater | 12 months |
| ADEE-DEQ | Construction of Treatment System Associated with a NPDES Permit | 12 months |
| ADEE-DEQ | Stormwater Discharges from a Categorical Industry | 1 month |
| ADEE-DEQ | Construct/Operate Surface Facility for New Class I Nonhazardous Injection Wells | 9 months |
| ADEE-DEQ | Construct/Operate New Class I Nonhazardous Injection Wells | 12 months |
| ADEE-AOGC | Construct Drilling Pit for Class 1 Nonhazardous Injection Wells | 1 month |
| ADEE-DEQ | Transfer Barren Brine to LANXESS No-Discharge Permitted Facility | 9 months |
| 20.3.1 | CWA SECTION 404 – NATIONWIDE PERMIT 39 |
Section 404 of the Clean Water Act established a statutory mechanism for control of dredged or fill material into waters of the U. S., including wetlands. The USACE has final administrative authority to determine the status of land surface as jurisdictional waters. Currently, certain land characteristics are scientifically used as indicators of waters through a process known as a Jurisdictional Determination (JD). Private entities commonly prepare and submit JD reports to the USACE to expedite their decision-making process and in some cases, the USACE will conduct a site survey to confirm the private JD or absent a private submittal, to provide the basis for the agency’s permitting decision. Construction of the Project Facility includes placement of fill in an area and diversion of a small creek that a field investigations deemed to be waters of the U. S. Thus, Standard Lithium will be required to obtain a Section 404 permit for the proposed activity.
USACE authorizes impacts to WOTUS through nationwide or individual Section 404 permits. Nationwide permits are structured for specific activities and minimal impacts and do not require lengthy agency review. The Project Facility will be subject to NWP 39 – Commercial and Institutional Developments.
Nationwide permits mandate compensatory mitigation for impacts to waters of the U.S. Mitigation is commonly satisfied through purchase of wetlands credits from a USACE-recognized mitigation bank. Once the Section 404 permitting process is initiated, the USACE will determine the degree of compensatory mitigation (if any) and institute a review of threatened/endangered species and cultural resources that may be impacted by the Project Facility.
RSI-3353
| 20.3.2 | MINOR SOURCE AIR PERMIT |
The ADEE-DEQ, Office of Air Quality, issues new permits for proposed facilities after reviewing and evaluating permit applications for administrative and technical completeness and ensuring that each application meets regulatory adequacy, as required by Title V of the CAA. It is a legally enforceable document designed to improve compliance by clarifying what facilities (sources) must do to control air pollution. ADEE-DEQ has primacy for the issuance of permits and regulation of air emissions sources in Arkansas.
A single permit will be issued by ADEE-DEQ for construction and operation of the facility. The permit must be in place prior to initiating construction, including preparation of foundations for any air emission source.
Emissions estimates for the Project Facility have been developed using engineering calculations and preliminary equipment specifications. Based on the emissions estimates, the operation will be required to obtain a Minor Source permit, and an application for the new facility must be reviewed and approved by the ADEE-DEQ. The permit application will include a review of the applicability of federal rules for specific sources. The ADEE-DEQ has authority to issue a permit with federally enforceable conditions and limitations. The permit conditions and limitations will be developed by ADEE-DEQ to prevent deterioration of ambient air quality and to comply with State and National Ambient Air Quality Standards or with other applicable regulations.
| 20.3.3 | PUBLIC WATER SUPPLY |
The ADH issues approvals for Public Water Systems serving non-municipal potable water. The Project will require fresh water sources to support the lithium extraction process and provide potable for personnel use. There is no municipal water system in the vicinity of the project. Currently, the adjacent LANXESS South Plant has fresh water extracted from an underground source (Sparta Aquifer) approximately 275 m (900 feet) to 500 m (1,640 feet) but does not have sufficient excess capacity to support the Project.
Standard Lithium expects to drill and construct two Sparta Aquifer fresh water supply wells. Fresh water produced by the wells will be disinfected, stored, and distributed following ADH rules. Following submission of engineering design and construction plans and specifications that meet ADH standards, the ADH will issue a Noncommunity Public Water System permit for the non-transient, non-municipal water system supplying potable water to the Project Facility.
| 20.3.4 | NPDES CONSTRUCTION STORMWATER DISCHARGE |
The ADEE-DEQ, Office of Water Quality has been delegated authority by the EPA for administration of the NPDES permit program in accordance with the federal CWA.
The ADEE-DEQ, Office of Water Quality has issued a general permit for discharges of stormwater runoff from construction (earthmoving) activities. General permits are developed for multiple facilities that have similar activities and limitations. The objective of permit ARR150000 is to eliminate or reduce the transport of sediments and construction-related contaminants from earthmoving and construction activities that disturb 1 acre or more area. As the Project Facility development will exceed 5 acres, a Stormwater Pollution Prevention Plan (SWPPP) specific to the construction site must be prepared and submitted to ADEE-DEQ along with a Notice of Intent for coverage under the general NPDES permit. The SWPPP includes management practices and physical controls to minimize sediment/contaminant transport off the construction area as a result of precipitation events. Once authorized, the permit is in effect until the disturbed area is stabilized after construction is completed. The current permit ARR150000 was effective November 1, 2021, and expires October 31, 2026.
RSI-3353
| 20.3.5 | NPDES NON-BRINE PROCESS WATER DISCHARGE |
The ADEE-DEQ, Office of Water Quality regulates discharges of non-brine process-related effluents from industrial operations and sanitary or domestic wastewater through the NPDES permit program. Process effluent includes any water that, during manufacturing or processing, comes into direct contact with or results from the production or use of any raw material, intermediate byproduct, finished product, byproduct, or waste product. An individual NPDES permit will be required for non-brine effluents from the Project Facility that are discharged to surface waters. Tail-brine is prohibited from discharge to surface waters and must be disposed subsurface in UIC Class I or V injection wells.
An individual NPDES permit application includes information on the processes generating the effluent, treatment (if any) of the effluent before its discharge, an actual or predicted pollutant characterization of the effluent, and a schematic diagram depicting the mass flow of water through the facility before its discharge. Administrative information on the Project Facility will be included and the application must be signed by a Responsible Official. Individual NPDES permits are issued with 5-year expirations and must be renewed 180 days before the expiration date.
| 20.3.6 | STATE CONSTRUCTION PERMIT FOR WASTEWATER TREATMENT |
The ADEE-DEQ, Office of Water Quality requires a Construction Permit for industrial treatment and collection facilities that discharge treated effluent to a surface water as permitted by an individual NPDES permit. A Construction Permit will be necessary for the Project Facility. The Construction Permit is a state-only permit and is required to ensure that treatment systems proposed comply with the applicable provisions of the “Recommended Standards for Wastewater Facilities” by the Great Lakes – Upper Mississippi River Board of State and Provincial Public Health and Environmental Managers, commonly known as “The 10 States Standards.” The Construction Permit is an add on to the individual NPDES permit application submitted by an Arkansas Professional Engineer and is in effect until the treatment system is completed and operational. Construction in accordance with the issued permit must be certified by an Arkansas Professional Engineer at the completion of construction.
| 20.3.7 | NPDES STORMWATER DISCHARGES FROM CATEGORICAL INDUSTRY |
Stormwater runoff discharges from certain industrial categories are regulated by the ADEE-DEQ Office of Water Quality in the NPDES program using a multi-sector general permit. The Project Facility will require the general stormwater permit for operation and is included in Sector J3: Mineral Mining and Dressing, Chemical and Fertilizer Mineral Mining. Standard Lithium will submit a Notice of Intent to ADEE-DEQ to request coverage under the industrial general stormwater permit.
The industrial general permit ARR000000 for stormwater runoff discharges from industrial sites has requirements similar to the general permit for construction stormwater discharges (ARR150000) that emphasize pollution prevention and best management practices. A SWPPP must also be prepared specific to the operational site. Discharges of storm runoff from the area of industrial activity must be sampled, analyzed, and reported to ADEE-DEQ annually. ADEE-DEQ has established benchmark values for pH and Total Suspended Solids (TSS) in stormwater discharges from industrial Sector J3. The benchmark for pH is a range from 6.0 S.U. to 9.0 S.U. and for TSS is 100 mg/l, The benchmark concentrations are established to alert facilities and the ADEE-DEQ of potential exposure to industrial materials or processes, and to provide the facility opportunity to implement new or amend existing management practices to reduce the parameter of concern.
| 20.3.8 | STATE NO-DISCHARGE PERMIT |
The ADEE-DEQ regulates waste disposal systems that do not discharge to surface waters through a “No-Discharge Water Permit”. The State No-Discharge Permit (ADEQ NDSP) is required for the storage tanks and ancillary equipment associated with disposal of effluent brine in the two proposed Class I injection disposal wells. The intent of the ADEQ NDSP is to allow ADEE-DEQ the opportunity to review and approve the waste handling process and equipment with regard to good engineering practices to prevent unauthorized discharges to surface waters. The ADEQ NDSP application must be prepared and submitted by an Arkansas Professional Engineer.
RSI-3353
| 20.3.9 | UNDERGROUND INJECTION CONTROL PERMIT |
The Project will use two distinct paths for management of lithium-depleted (barren) brine from the lithium extraction process. The majority of the brine will be returned to the LANXESS South Plant for injection in the existing Class V wells and the remainder (excess over volume) will be injected into two new Class I Non-hazardous wells owned and operated by Standard Lithium. For the brine returned to LANXESS, refer to Section 20.4.
The ADEE-AOGC issues Class V Permits for brine injection wells. Disposal of barren brine processed through the Project Facility using the existing LANXESS brine disposal well network does not require modification of the existing ADEE-AOGC permits held by LANXESS as the injectate is still considered “spent brine” and the lithium-depleted brine remains consistent with fluids permitted for injection into the Class V wells. Class V well authorizations do not expire until a well is permanently plugged and abandoned.
Class I wells are used to inject non-hazardous waste into deep, confined rock formations. The Class I well target depths for the two new Hosston Formation wells in this project range from 1,151 m (3,775 feet) to 1,646 m (5,400 feet) below ground level elevation. Class I wells are strictly regulated under the Resource Conservation and Recovery Act (RCRA), and the Safe Drinking Water Act (SDWA). The Project is preparing and will submit an application for the two required UIC Class I wells. Class I permits are issued with 10-year terms and applications for renewal must be submitted before the expiration date.
| 20.3.10 | RESOURCE CONSERVATION AND RECOVERY ACT SUBTITLE C TREATMENT, STORAGE, AND DISPOSAL PERMIT |
A RCRA Hazardous Waste Permit is required of any facility that performs treatment, storage (greater than 90 days), or disposal of waste meeting the criteria to be classified as hazardous. The Project Facility will not conduct any of the activities requiring a RCRA permit authorization. Process wastes generated by the facility are not expected to meet the hazardous classification. Small quantities of universal wastes (e.g., batteries, pesticides, mercury-containing equipment, lamps, electronics, and aerosol cans) may be generated by the operation and maintenance of the site. Title 40 Code of Federal Regulations, Part 273 provides an alternative set of management standards for universal wastes in lieu of regulation as hazardous waste.
RSI-3353
| 20.4 | PERMIT MODIFICATIONS |
New permits required to accommodate the Project Facility are listed in Table 20-1. An existing State No-Discharge Permit issued to LANXESS for surface equipment associated with disposal of barren brine must be modified to include the Project Facility. Information regarding the permit is noted in Table 20-2.
Table 20-2. Permits for LANXESS South Plant to be Modified
| Permit,
Application, or Reference Number |
Activity | Construction or Operation |
Agency | Permit/Plan |
| ADEQ
PERMIT 5048-WR-2 |
Transfer Barren Brine to LXS for Smackover Injection | Operation | ADEE-DEQ | Modify LXS State No-Discharge Permit 5048-WR-2 |
Permit 5048-WR-2 is a State No-Discharge Permit issued by ADEE-DEQ to LANXESS for operation of the brine disposal system (tanks, equipment, pipelines) associated with the UIC Class V injection well network. The narrative description and flow schematic diagram of the permit must be revised to include brine diverted to and returned from the Project Facility. The permit modification request will be initiated by LANXESS and supported by the Project.
| 20.5 | ENVIRONMENTAL LIABILITIES |
The construction of the Project Facility has the potential to cause conditions which may create minor environmental liabilities through the discovery of improperly abandoned oil/gas wells, permanent closure/abandonment of existing LANXESS ground water monitoring wells within the construction area, and potential off-site transport of sediments because of improper or inadequate erosion control measures.
The Project Facility is included in a portion of the historical El Dorado South oil/gas field, which was discovered in 1922. The El Dorado South field is mostly depleted with a few “stripper” wells operated by independent producers remaining. An August 1957 historical field map of El Dorado South used by the ADEE-AOGC to indicate the location of producing and abandoned wells shows three possible abandoned well locations within the Project Facility boundary. ADEE-AOGC plugging and abandonment records for the period from 1922 to 1957 were researched but unsuccessful in identifying any documents regarding drilling, operation, or abandonment of the three wells. A field investigation of the mapped well locations did not indicate the presence of historical oil production or of any wellbores, and it is presumed the wells, if actually constructed within the boundary of the construction areas, were plugged and abandoned properly. If evidence of wellbores is discovered during construction, the ADEE-AOGC will be notified and further investigation conducted as to the plugging status of the well. The potential liability for improperly abandoned wells remains with the original permit holder. The ADEE-AOGC has a fund for plugging improperly abandoned wells for which ownership cannot be established. Any well discovered on the subject property would be eligible for public funding of the closure action, if required.
Monitoring wells owned and operated by LANXESS South are located within the proposed construction area of the project. If required, the wells will be plugged and abandoned in accordance with accepted groundwater protection measures; where possible existing wells will be maintained to allow for ongoing groundwater monitoring by LANXESS.
Earth disturbance during the construction of the facility will require preparation of a SWPPP in accordance with ADEE-DEQ NPDES Permit ARR150000 requirements discussed in Section 20.3.3. The SWPPP and other permit conditions are established to prevent transport of sediments off site during construction.
RSI-3353
Any additional environmental liabilities discovered during the course of construction or operation, and which are determined through investigation to be a result of pre-existing conditions, will remain the responsibility of LANXESS as lessor of the Project properties, the permit holder in the case of abandoned wells.
| 20.6 | ENVIRONMENTAL BASELINE STUDIES |
A Baseline Environmental Site Assessment (ESA) was conducted from November 2022 to March 2023 on property proposed to be leased from LANXESS for the construction of the Project Facility. The assessment was conducted to determine if historical activities and processes on the property or adjacent properties have impacted surface and subsurface soil and water quality, and to document the pre-construction conditions of the site prior to alterations associated with the Project Facility. Field investigation activities included collecting representative samples of subsurface groundwater and soil, surface stormwater and soil, and vegetation for chemical analysis. The investigation was based upon the best judgment of the environmental professional in consideration of the proximity of chemical manufacturing operations and historical oil/gas production in the area. The data collection was completed in accordance with standard operating procedure for quality assurance/quality control (QA/QC) consistent with EPA guidance.
| 20.6.1 | SUBSURFACE – GROUNDWATER |
The adjacent LANXESS chemical manufacturing operation has an established network of groundwater monitoring including wells on the Project Facility site. LANXESS groundwater monitoring wells are completed in the uppermost saturated zone less than 200 feet below ground surface. On November 28, 2022, two new permanent groundwater monitoring wells were installed by Standard Lithium on the Project Facility site. Well MGW-1 is located on the northern boundary of the subject property, east of the LANXESS South Plant entrance parking lot. Ground water monitoring well MWG-2 is located centrally on the site. Both groundwater wells were completed in the uppermost saturated zone equivalent in depth to the nearby LANXESS monitoring wells
From January 26 to February 2, 2023, 12 existing wells and the two newly installed wells were sampled using low-flow purging and sampling procedures. Water collected from the individual wells was sealed in appropriate sample containers and transported to the analytical laboratory. Samples were analyzed for sulfate, ammonia-nitrogen, nitrate-nitrogen, nitrite-nitrogen, hexavalent chromium, mercury, lead, zinc, barium, dioxins, non-pesticide organic compounds, RCRA characteristic hazardous waste parameters, adsorbable organic fluorine, halogens, major cations and other substances of potential interest. Three metals (mercury, barium, and manganese) and one halogen (chloride) were observed above health risk-based concentrations or primary drinking water maximum contaminant levels in some of the LANXESS monitoring wells.
In addition to the sampling performed January-February 2023, LANXESS provided historical groundwater information for the existing wells on the Property including analytical results of previous monitoring. As a result of historical operations at the LANXESS South facility, there is known subsurface contamination of chemical manufacturing-related constituents (e.g., chlorides, bromoform, methylene chloride, 1-2-Dichloroethane [EDC]). Groundwater collected during the baseline study further confirmed that there are contaminants in shallow groundwater at the proposed Project Facility. This pre-existing contamination is associated with documented historical releases from the LANXESS South Plant and is routinely monitored by LANXESS as the responsible party. Construction and operation of the Project Facility will not expose or impact the contaminated shallow groundwater thus no preventive or remedial action is required by Standard Lithium.
RSI-3353
| 20.6.2 | SUBSURFACE – SOIL |
Soil core sampling was conducted during the installation of MWG-1 and MWG-2, consisting of two borings at three different depths for a total of six core samples. Core sampling was conducted at surface level (0 to 4 ft) and at or directly above the saturated zone. Soil core samples submitted for laboratory analysis for MWG-1 included those taken at depths of 0 to 2 ft, 2 to 4 ft, and 55 ft. Samples of borings at 0 to 2 ft, 2 to 4 ft, and 40 to 42 ft were selected at MWG-2. Samples were analyzed for Total Recoverable Metals, VOCs, SVOCs, and halogens,.
Arsenic was detected at concentrations greater than health risk-based screening levels in all six soil cores. Selenium was detected from near-surface cores (0 to 4 ft subsurface) at both well locations was greater than health risk-based screening levels. Mercury and methylene chloride were detected from the soil core immediately above the saturated zone (42 to 44 ft subsurface) in MWG-2 exceeded the health risk-based screening levels for those analytes.
Arsenic is a naturally occurring heavy metal with documented background concentrations in the state of Arkansas. The core samples exceeded the EPA screening concentrations for arsenic; however, the arsenic concentration was well below the ambient background concentration of 9.7 mg/kg (Shacklette, 1984). The detection of arsenic can be assumed to be naturally occurring and not the result of industrial activities in the vicinity of the Property. Metals mercury and selenium detected at various depths may be present as a result of adjacent operations or as naturally occurring elements in the soil. However, the organic chemical methylene chloride observed above EPA screening levels in MWG-2 is presumed present because of historical industrial operations as discussed in 20.6.1.
Metals observed in shallow (0-4 feet) soil cores may be disturbed during construction and operation of the Project Facility. Exposure to and transport of soils at the Project Facility will be mitigated by management practices and if necessary, engineering controls and are unlikely to impair the ability to construct and operate the Project; no extraordinary measures are anticipated.
| 20.6.3 | SURFACE – STORMWATER |
Twelve individual locations for monitoring stormwater run-on/runoff of the subject property were identified based on topographical features of the site. Locations included five areas where stormwater runs on the property from the adjacent LANXESS South facility and seven monitoring locations where stormwater leaves the subject property.
Stormwater samples were collected during three events (January 24, 2023, February 14, 2023, and March 17, 2023) and analyzed for sulfate, ammonia-nitrogen, nitrate-nitrogen, nitrite-nitrogen, hexavalent chromium, mercury, lead, zinc, barium, dioxins, non-pesticide organic compounds, RCRA characteristic hazardous waste parameters, adsorbable organic fluorine, halogens, and major cations. Stormwater analyses did not exceed any health risk-based screening concentrations at any location sampled.
| 20.6.4 | SURFACE – SEDIMENT |
Sediment sampling was conducted at each of the stormwater monitoring locations between a depth of 0 to 6 inches subsurface in the drainage pathway. Samples were analyzed for the Total Recoverable Metals, VOCs, SVOCs, and halogens. Surface sediment exceeded the screening concentration for arsenic at all sampling locations. In addition, mercury was exceeded at multiple locations. Arsenic and mercury exceeded the EPA screening concentrations at the site; however, background concentrations of the two heavy metals are known to be elevated in the region, with concentrations of 9.7 mg/kg and 0.067 mg/kg, respectively (Shacklette, 1984). All of the sample concentrations fell below the background concentrations, suggesting that the detections of heavy metals in the soil are naturally occurring and are not caused by the industrial activity at the subject or adjacent property.
RSI-3353
Sediment samples collected at two run-on locations and one runoff location exhibited concentrations of polycyclic aromatic hydrocarbon (PAH) compounds greater than health risk-based screening levels. Detection of PAHs in sediments could be the result of historical oil production, forest management practices, or the adjacent chemical manufacturing operations and at the concentrations observed do not present an elevated worker exposure risk for the Project.
Detections of chemicals of potential concern in sediments and shallow soils do not present an elevated worker exposure risk or likely active remediation potential based on current regulations. Compound concentrations were screened against conservative risk-based concentrations and do not pose an appreciable threat to personnel.
| 20.6.5 | SURFACE – VEGETATION |
Vegetation samples were taken to establish baseline conditions and determine if air emissions from adjacent industrial operations may be affecting subject property vegetation. On November 29, 2022, vegetation samples were collected in three separate locations at the Property. One pine tree at each monitoring location was selected for collection of fresh pine needles from canopy height. Trees selected are estimated to have been approximately 40 ft tall and 6 to 8 inches in diameter. Pine needles from the canopy level branches were collected and analyzed for RCRA metals, and halogens. Screening levels for vegetation are not available; therefore, analytical results were compared to soil screening levels. No vegetation sample exceeded a health risk-based screening level for any parameter.
| 20.7 | WILDLIFE |
A threatened and endangered species review was conducted for the Project Facility. The basis of the review was information obtained from the U.S. Fish and Wildlife Service (USFWS) Information for Planning and Consulting (IPaC). Information provided through the IPaC review included a letter providing a list of threatened and endangered species that may occur in the proposed project area and consistency letters for several of the species. The consistency letters are developed after completion of determination keys in which several questions are answered to facilitate a determination of potential effects the project may have on listed species. The IPaC reports are valid for 90 days as new information obtained by the USFWS may result in changes to the list.
The Project Facility is located in an area within the distribution range of one endangered and one proposed endangered bat, the northern long-eared bat (Myotis septentrionalis) and the tricolored bat (Perrimyotis subflavus); four threatened/endangered birds—the eastern black rail (Laterallus jamaicensis spp. Jamaicensis), the piping plover (Charadrius melodus), the red knot (Calidris cantus rufa), the red-cockaded woodpecker (Picoides borealis); one proposed threatened reptile—the alligator snapping turtle (Macrochelys temminckii); one candidate insect—the monarch butterfly (Danaus plexippus); and one endangered flowing plant—pondberry (Lindera melissifolia).
The northern long-eared bat is primarily distributed in northern and western Arkansas where caves are prevalent for winter hibernation. Their summer ranges extend out but are still primarily confined to the northern and western parts of the state. During summer months northern long-eared bats roost in trees containing suitable cover such as snags or loose/shaggy bark. The tricolored bat is similar in respect to primarily hibernating in caves; however, these bats are known to be less selective in their roosting locations and tend to roost among leaves of deciduous hardwood trees. The eastern black rail prefers a marsh habitat with dense cover. The piping plover is a shore bird that prefers areas devoid of vegetation, typically sandy beach-type areas. The red knot is typically associated with ocean areas and depends heavily on horseshoe crab eggs to sustain their long migration. The red-cockaded woodpecker is strongly tied to old-growth pine forests that burn frequently, leaving the understory mostly clear of younger trees.
RSI-3353
The alligator snapping turtle prefers to inhabit the deeper beds of large rivers, canals, and lakes. The monarch butterfly utilizes a variety of habitats but depends on milkweed for breeding. Pondberry is associated with wetland habitats such as bottomland and hardwoods.
The IPaC multispecies determination key resulted in a determination of no effect for the eastern black rail, piping plover, pondberry, and red knot. Based on the multispecies key, the project may affect the red-cockaded woodpecker and would require further consultation with the USFWS to determine the effects. The northern long-eared bat determination key resulted in a determination of no effect based on the finding that the project action would not intersect an area where the northern long-eared bat is likely to occur. The determination keys do not cover species proposed for listing as threatened or endangered (alligator snapping turtle, monarch butterfly, and tricolored bat).
The Project Facility lacks large waterbodies or wetlands and would not likely support the alligator snapping turtle. Habitat for the monarch butterfly may exist in the vicinity of the Property, however, milkweed plants were not observed in the project area during site visits. Guidance on distribution for the tricolored bat and implementation of USFWS consultation is currently limited in Arkansas, but based on conversations with USFWS, the distribution and consultation requirements are expected to mimic that for the northern long-eared bat.
The red-cockaded woodpecker preferred habitat is very limited (old-growth pine forests). Union County is included in the known species range with some documented colonies in the county. A desktop review of the Property shows that the area has historically been silvicultural land use, with pine being the dominant tree species. Although pine has been a dominant species on site, it would not likely be classified as old-growth pine forests. The project area also contains dense understory particularly in the areas including the oldest pine stands on the site. Additionally, the USFWS ECOS website does not depict any known species locations within the project area. While impacts are not anticipated, consultation with USFWS is suggested to confirm that the Project would not adversely affect the red-cockaded woodpecker.
The USFWS IPaC report also generated a list of migratory birds of conservation concern. These are species identified by the USFWS that, without conservation efforts, are likely to become candidates for listing under the Endangered Species Act. The only migratory bird listed on the IPaC repot is the chimney swift (Chaetura pelagica). Chimney swifts breed in urban and suburban habitats and are most commonly found in areas with vertical structures that provide nest site (e.g., chimneys). They can also nest in hollow trees, tree cavities, and caves. They primarily forage over open areas, but are can be found foraging over forests, ponds, and residential areas. While potentially present, no hollow trees were observed during the site visits nor is there a high likelihood for hollow trees to be present based on the current makeup of the vegetative community. The proposed project will likely not have an adverse effect on the chimney swift.
Development of the Project Facility will result in temporary and permanent disturbance to the existing habitat. However, no adverse impacts to the threatened and endangered species or migratory birds listed are expected as a result of the Project. This assessment is contingent upon further consultation with the USFWS regarding the red-cockaded woodpecker.
| 20.8 | CULTURAL RESOURCES |
The Project Facility is located north of US Hwy 167 in Union County, adjacent to the LANXESS South Plant and within Section 32 of T18S R15W and Section 5 of T19S R15W. A desktop cultural review of the Project area was performed by Commonwealth Heritage Group on March 27, 2023. During the cultural review, one archaeological site was found to be within a 0.5-mile radius and two additional sites were within a 8 km [5-mile] radius of the Project Site. The St. Marks Church and Cemetery, located 0.6 km [0.4 mile] southeast of the site, is part of the Union County Historic Site Survey. The Smyrna Church and cemetery, located 3.1 km [1.9 miles] east of the Project Site, is also part of the Union County Historic Site Survey. The Joel Smith Plantation, located 3.5 km [2.2 miles] northeast of the site, is listed on the Arkansas Historic Preservation Program (AHPP) and is a National Register of Historic Places listed property. A further review of the AHPP shows that no historical tracts are within the Project Site. A review of the General Land Office (GLO) plat map dating back to 1845 shows one feature near the Property—the Pine Hill Road that runs north-south between the center of the sections reviewed (T18S R15W and T19N R15W). A review of historical quadrangle maps shows that three or four structures (i.e., houses) were located within the subject property prior to 1927. The structures were no longer present on a quadrangle map from 1951 and they do not exist today.
RSI-3353
No previously recorded archaeological sites or historic properties are located within the subject property of the proposed Project . Based on the desktop review the construction of the Project should not result in any threat or loss to historic and cultural resources. This will be confirmed through USACE during the Section 404 permitting process through agency consultation with the Arkansas Historic Preservation Program and Native American Tribal groups with interest in the Project area.
| 20.9 | ENVIRONMENTAL IMPACT |
Potential environmental impacts during the construction, operation, and closure stages of the Project have been identified but not quantified in consideration of the global effects of the Project. Those items are summarized as follows:
| / | Change in local air quality from construction and operation of the facility | |
| / | Removal of existing forested areas on the site for construction and operation of the facility | |
| / | Altered stormwater runoff hydrology from land development activities and installation of impervious surfaces for the operational facility | |
| / | Increased noise levels from the equipment, machinery and vehicles, and process operations | |
| / | Increased personal and transport vehicle traffic on county roads and state highways | |
| / | Increased light pollution from fixed lighting at the operational site | |
| / | Increased withdrawal of fresh water from the Sparta Aquifer via water supply wells drilled for the operational facility | |
| / | Increased greenhouse gas (GHG) emissions from hydrocarbon combustion and extraction/processing equipment | |
| / | Change in water characteristics in Bayou DeLoutre and Walker Branch from operational stormwater runoff | |
| / | Reduction of the usable life span of the Hosston Formation injection zone for waste disposal caused by the addition of new injection wells/wastes | |
| / | Reduction of non-renewable natural gas reserves because of its consumption by the facility | |
| / | Reduction in GHG emissions as a result of replacement of petroleum fueled vehicles with electric vehicles fueled by lithium batteries manufactured from Lithium Carbonate produced by the Project. | |
| / | Increased demand for electricity requiring potential increases in GHG emissions from power generation facilities |
The potential direct environmental impacts from construction, operation, and closure of the Project will be mitigated through compliance with rules and permits issued by ADEE-DEQ, ADH, ADEE-AOGC, and other regulatory agencies. The potential indirect environmental impacts will be mitigated or offset by actions of those entities directly responsible, such as public utility providers and government services.
RSI-3353
| 20.10 | SOCIAL IMPACT |
Standard Lithium is committed to conducting its future Project activities with best management practices and endeavors to maintain a collaborative relationship with the local communities that the Project may impact. Engagement consists of regular community meetings as required; newsletters; and attendance at community and business functions, and industry conferences.
The ADEE-DEQ permit process includes public notices and the opportunity for community input on the regulatory approvals necessary for the Project. This includes oversight for implementation of responsible environmental management; compliance reporting in accordance with approvals/permit conditions; consultation regarding changes or updates to approvals; and compliance audits and inspections.
There is an opportunity for a positive social impact on the surrounding communities. The community will benefit from the construction phase because the project will require skilled labor and many contractors to complete. The community will also benefit with the additional opportunities for a labor market skilled in similar operations once the facility has been constructed. Local businesses that supply goods and services to the Project may also be uplifted by the influx of capital associated with construction and operation of the facility.
The construction phase of the Project is approximately two years and will require an average of 200 workers and will include an overall payroll economic impact estimated at approximately $22M. The workforce staffing for the continuous operation of the facility would begin approximately 6 months before the completion of the construction phase. Standard Lithium estimates the continuous operation will require approximately 90 direct full time employees ranging from high school/GED to MS level education with an average salary of $70,000/yr (Arkansas mean annual wage = $48,570) (Bureau, 2022). The overall base salary economic impact is estimated to be between $6.3M and $7.0M per year. Currently over 80% of the Demonstration Plant full-time team in Arkansas are local workers that live less than 120 kilometers (less than 75 miles) from the facility.
Standard Lithium has partnered with South Arkansas College in El Dorado, Arkansas, for the new Catalyst Program, which is a collaborative effort between employer partners and sponsors to provide free, pre-employment training for individuals interested in the chemical production and services sector (SouthArk,2023). This 16-week program provides a great opportunity for local workers, including high school seniors and GED-level, to learn new skills and advance their careers and ensures there is a short-term workforce development pathway that leads to high-wage careers. Standard Lithium is fully committed to being a strong and supportive partner to the local community in southern Arkansas.
| 20.11 | WASTE MANAGEMENT/DISPOSAL |
The Project Facility will generate a small quantity of non-hazardous solid waste from the brine filtration and conditioning steps of the process. The solid waste is mainly filter-aid (diatomaceous earth), insoluble impurities from soda ash and lime, precipitated hydroxides and inorganics from the Feed Brine as well as undissolved calcium carbonate and magnesium hydroxide from the recycled softening sludge.
The waste streams amount to 1,000 to 1,800 tonnes per year and will be collected on site and transported to permitted disposal facilities. All waste container management will be performed on paved or concrete surfaces within the Project Facility. The non-hazardous solid wastes will be moved via transport truck to a land disposal facility licensed and permitted to accept the industrial wastes. The nearest ADEE-DEQ permitted waste disposal facility is the Union County Landfill, approximately 24 km [15 miles] north of the Project Facility.
RSI-3353
| 20.12 | ENVIRONMENTAL MANAGEMENT AND CLOSURE PLAN |
Environmental Management Plans to guide compliance with the various regulatory programs and requirements will be developed following receipt of applicable construction and/or operating permits from the state agencies. These plans will address the various aspects of the design, construction, commissioning, and operation phases of the Project, identify the key environmental issues from the various Project phases, and provide plans and actions that will be undertaken to manage the phases effectively.
A Closure Plan specific to the two new Class I UIC wells will be submitted to and approved by the ADEE-DEQ through the permit application process. All other operations of the Project are not subject to any state or federal formal Closure Plan requirement. The estimated cost of the closure fund related to the Class I UIC wells is estimated at approximately $650,000. It is currently contemplated that a surety bond will be secured (a condition of the permit) to provide the necessary assurances that the mine closure funding will be available at or prior to the conclusion of operations of the wells.
Standard Lithium is committed to decommissioning and restoring the Project Site when operations cease in the future. Process feedstock, liquids in vessels, reagents, finished products, and ancillary materials will be removed to a proper use, recycling, or disposal facility. Solid residuals and nonhazardous solid wastes will be transported off site to an appropriate permitted recycling or disposal facility. Small quantities of regulated hazardous wastes/universal wastes accumulated during the operation and site termination activities will be transported to an authorized facility. Surface facilities and equipment will be re-purposed or recycled where possible and where not possible, disassembled, scrapped and disposed of off-site in accordance with applicable commercial obligations and relevant regulatory requirements.
RSI-3353
| 21.0 | CAPITAL AND OPERATING COSTS |
Capital and Operating Costs for the Project were prepared in accordance with the principles set out by the AACE International (Association for Advancement of Cost Engineering International). The estimated costs are based on the engineering design completed for this study, supported by a combination of competitive quotes and engineering estimates compiled using industry standard estimating practices and the experience of the Project team with similar projects.
All dollars in the cost estimates are in 2023 United States of America (USA or US) dollars unless otherwise noted. Major components are presented in tabular form. Numbers stated are rounded such that differences may appear between individual and total values, or between tables.
| 21.1 | CAPITAL COSTS |
The total capital cost (CAPEX), including contingency, to construct the Project is estimated at $365 million. Direct project costs represent $259 million and indirect Project Costs represent $56 million of the total cost. A contingency of $50 million is included, which equates to approximately 15% of direct and indirect costs.
The capital cost estimate is considered to have an accuracy range of -15% to +20%. All costs are expressed in 2023 US Dollars. No allowances are included for cost escalation.
The total estimated capital cost for the Project by area is summarized in Table 21-1.
Table 21-1. Project Capital Cost Estimate Summary
| Area | $ M |
| Brine Delivery (Tie-ins) | 9.0 |
| Brine Pretreatment | 43.3 |
| Direct Lithium Extraction | 38.1 |
| Concentration and Purification | 53.3 |
| Carbonation | 53.4 |
| Drying, Milling, and Packaging | 18.9 |
| Effluent Brine Disposal | 24.3 |
| Reagent Systems | 8.8 |
| Utilities | 51.1 |
| Other (First Fills, Membranes, Licensing) | 14.7 |
| Subtotal | 315.0 |
| Contingency | 49.9 |
| Total CAPEX | 364.9 |
Notes:
[1] Any discrepancies in the totals are due to rounding effects.
RSI-3353
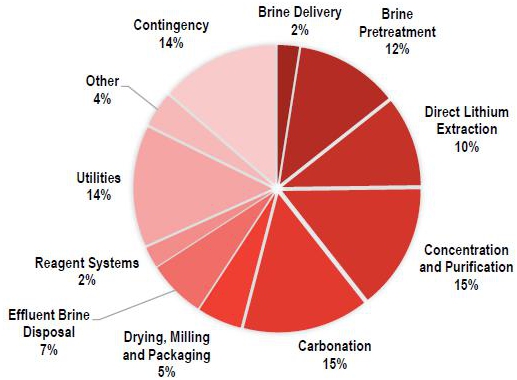
Figure 21-1. Project Capital Estimate Component Breakdown
| 21.1.1 | ESTIMATE METHODOLOGY |
The capital cost estimate was assembled based on costs established for each of the Project areas, following the area and cost breakdown structure developed for the Project. The estimate is considered to be reflective of the design completed to date, the proposed EPC contracting strategy and considers the anticipated construction schedule.
Estimated costs were established using industry standard estimating practices and methodologies. The estimate is generally derived from:
| / | Material and equipment vendor quotes | |
| / | Supply and installation quotes from contractors | |
| / | Unit pricing received from contractors, vendors and consultants | |
| / | Equipment factored cost estimates | |
| / | Historical pricing, rates or allowances based on experience with similar recent projects |
Quotations were obtained based on loose shipped field erected materials, pre-assembled modules or turnkey design, supply and installation work packages.
Multiple quotations were obtained for the majority of equipment and construction packages which were then tabulated, equalized, assessed, any gaps addressed and escalation applied to adjust price to align with the estimate date. The most appropriate bid, not necessarily the lowest price bid, was selected as the basis for the estimate. Unit pricing estimates were developed with supporting material take-offs based on design drawings.
For reference, equipment-factored estimates are produced by taking the cost of individual process equipment, and multiplying the equipment cost by an installation factor to arrive at a total installed costs. The installation factor, or total installed cost factor, includes subcontracted costs and direct labor costs and materials and indirect costs associated with the installation of the equipment. Where used, project specific installation factors are based on industry norms for US Gulf Coast installation. Where factored estimates were employed, the methodology followed Peters & Timmerhaus 2003 (P&T 2003) methodology.
RSI-3353
| 21.1.2 | SCOPE OF ESTIMATE |
The capital cost estimate includes all materials, equipment, and labor to construct the commercial scale lithium extraction plant required to produce an average 5400 tonnes per annum of battery-quality lithium carbonate over the 25-year life of the Project.
Capital costs include direct, indirect and associated owners costs associated with the Project which generally includes:
| / | Site preparation, including temporary access roads. | |
| / | Lithium extraction plant, including technology licenses. | |
| / | Brine supply and return pipelines (to and from the South Plant). | |
| / | Two (2) new Underground Injection Wells. | |
| / | Utility tie-ins and upgrades such as electric, gas, and water. | |
| / | Offices, shops, laboratory and other site buildings and infrastructure. | |
| / | Construction labor and supervision, equipment including mobilization, contractors overhead and profit and other construction expenses. | |
| / | Design engineering, permitting and environmental services required during construction. | |
| / | Commissioning and startup costs including first fills. | |
| / | Owner’s costs, insurance, spare parts, sureties and contingencies. |
| 21.1.2.1 | DIRECT COSTS |
Direct costs include, but are not limited to, the supply and installation of equipment, piping, electrical, instrumentation and controls, buildings, site improvements, service facilities, and non-process equipment as generally described below.
| · | Site improvements including site development, clearing and grading, roads, stormwater management systems, walkways, fences, parking areas and landscaping. |
| · | Equipment including the supply and installation of all process and mechanical equipment identified on design drawings / equipment lists, such as tanks, pumps, motors, cooling towers, and including equipment foundations, containments, structural supports, insulation, painting, and associated spare parts. |
| · | Piping including process piping with suitable structural supports, pipe hangers, fittings, valves, and insulation where required. |
| · | Electrical systems including power distribution centers, transformers, capacitor banks, switchgear, conduit, wire, fittings, feeders, grounding, instrument and control wiring, lighting, and panels, and associated electrical materials. |
| · | Instrumentation and controls including field instrumentation, control valves and their installation and calibration, and process control, security and communication systems including associated networks, wiring, hardware and software. |
| · | Buildings including process and auxiliary buildings, substructures, superstructures, platforms, supports, stairways, ladders, access ways, cranes, monorails, and hoists and associated building services which include plumbing, heating, ventilation, air conditioning, lighting, painting, and building fire protection. |
| · | Facility wide utility and distribution systems for steam, water, fuel gas, and waste disposal. |
RSI-3353
| · | Fire protection systems including fire water storage and distribution, fire detection and suppression systems and fire extinguishers and hose stations. |
| · | Non-process equipment including building furniture and equipment, safety and medical equipment, shop equipment, material-handling equipment, laboratory equipment, storage systems and other equipment required for the safe operation of the facility. |
| 21.1.2.2 | INDIRECT COSTS |
Indirect costs include, but are not limited to, temporary facilities, contractor management, engineering, supervision expenses, overhead and profit as generally described below:
| · | Temporary facilities, including construction offices, temporary roads and access, contractor parking, temporary power, utilities, communications, and construction fencing. |
| · | Construction tools and equipment. |
| · | Construction supervisors, accounting, timekeeping, purchasing, expediting, and warehouse personnel, security guards and safety personnel, and all associated travel and living expenses, medical and fringe benefits. |
| · | Construction-related permits, field tests, special licenses, taxes, insurance, and interest. |
| · | Engineering, including detailed discipline engineering design and consulting, cost engineering, engineering field supervision and reviews, environmental monitoring and testing, field and shop inspections and associated reporting. |
| · | Procurement including purchasing, expediting, receiving, testing and inspection and vendor field support during startup and commissioning. |
| · | Owner’s costs. |
| 21.1.3 | SCHEDULE |
The capital cost estimate is based on construction and commissioning of the facility in accordance with the Project contracting strategy and Project schedule as outlined in Figure 21-1. The Company expects to make a Final Investment Decision in the first half of 2024 which would result in first production of lithium carbonate in 2026.
RSI-3353

Figure 21-2. Project Schedule
| 21.1.4 | CONTRACTING APPROACH |
The construction of the Project is proposed to be contracted on a Lump-Sum-Turn-Key (LSTK) basis to a single EPCC (Engineering, Procurement and Construction and Commissioning) contractor who will be responsible for all remaining engineering, procurement, construction and commissioning activities required, except as may be otherwise provided directly by the Project Company. This approach provides the Project Company, and its financing partners, with execution certainty, primarily through the provision of certain performance and schedule guarantees included in the EPCC agreement. The cost of the proposed contracting approach is considered in the preparation of the cost estimate.
| 21.1.5 | ALLOWANCES |
An allowance of 12% is applied to the equipment purchase cost to cover freight, insurances, duties, and sales taxes associated with shipping to the Project Site which is included based on benchmarking and industry norms.
An allowance of 2.5% is applied to major equipment purchased cost, excluding buildings and tanks, for construction, commissioning, and startup spares.
| 21.1.6 | CONTINGENCY |
A contingency of $50 million is included, which equates to approximately 15% of the direct and indirect capital costs.
Contingency is included as a separate line item to address items, conditions or events which their state, occurrence, or effect is uncertain and that experience shows will likely result in additional costs. Contingency does not cover changes in scope, cost fluctuations or currency fluctuations, nor does contingency account for project event risks such as labor unrest, blockades, adverse market conditions, force majeure, but instead is included to allow for unknowns that arise during construction.
RSI-3353
| 21.1.7 | EXCLUSIONS |
The following items are not included within the capital cost estimate:
| / | Historical or sunk costs including Pre-Feasibility and Feasibility study costs |
| / | Interest and financing costs |
| / | Improvements to LANXESS owned facilities and equipment |
| / | Improvements to the Entergy electrical substation which is assumed to be addressed through electrical tariff |
| / | Sustaining capital and capital spares |
| / | Escalation |
It should be noted that the Project is based on receiving brine at current brine wellfield production rates and as such the existing brine field infrastructure can support the Project without new wells or additional capital improvements to existing wellfield infrastructure.
| 21.1.8 | ESTIMATE CONFIDENCE |
The cost estimate was developed following the principles set out by AACE International (Association for Advancement of Cost Engineering International) and has a stated accuracy range of -15% to +20%. This accuracy range is supported by over 95% of equipment items pricing based on vendor quotes, which range from an accuracy level of firm to +/- 15%. The estimate accuracy range is supported by engineering design maturity that meets the requirements for this classification of estimate.
| 21.2 | OPERATING COST ESTIMATE |
The operating cost (OPEX) of the Project is estimated to be $6,810 per tonne of lithium carbonate produced. The unit cost of operation is based on production of an average of 5,400 tonnes of lithium carbonate for sale per year over the 25-year life of the Project.
Operating costs are categorized as variable or fixed costs. Variable operating costs are those which are production rate dependent. Fixed operating costs do not vary with production and generally remain constant on an annualized basis. Variable costs include reagents, power, fuels, consumable operating supplies and production-based fees and royalties and were derived based on the steady state mass balance and considering vendor recommendations. Fixed costs include maintenance materials, rent and leases, insurance, labor and administrative costs.
The sustaining capital allowance included, specifically for those capital improvements required to maintain the Project over its economic life, are expected to be approximately $79M over the life of the project or approximately $580 per tonne of lithium carbonate produced. The all-in operating cost including OPEX and sustaining capital is estimated at $7,390 per tonne.
RSI-3353
The total estimated all-in operating cost for the Project is summarized in Table 21-2.
Table 21-2. Project Operating Cost Summary
| Category | Type | Average
Annual Cost ($/t)[1] |
| Electric Power and Infrastructure | Variable | 950 |
| Reagents and Consumables | Variable | 2,880 |
| Maintenance Materials and External Services[2] | Variable | 610 |
| Workforce[3] | Variable | 1,930 |
| Insurance | Fixed | 340 |
| Miscellaneous Costs[4] | Fixed | 100 |
| Total OPEX | 6,810 | |
| Sustaining Capital Cost | 580 | |
| All-in Operating Cost [5][6] | 7,390 |
Notes:
[1] Operating costs are calculated based on an average annual production of 5,400 tonnes of lithium carbonate.
[2] Includes contract maintenance, solid waste disposal, and external lab services.
[3] Approximately 89 full time equivalent positions.
[4] Includes general and administrative expenses.
[5] Does not include future royalties or brine lease-fees-in-lieu-of-royalties which are still to be determined and subject to regulatory approval (lease-fees-in-lieu-of-royalties have been determined for bromine and certain other minerals in the State of Arkansas but have not yet been determined for lithium extraction).
[6] Does not include brine fees which may be due to LANXESS as a result of finalization of the commercial arrangements between LANXESS and Company.
| 21.2.1 | ELECTRIC POWER AND INFRASTRUCTURE |
Electrical power and infrastructure related costs are estimated to average $5.1M/year or $950 per tonne of lithium carbonate produced on an average over the life of the Project. The major utility demand for the Project is electricity. The Project will utilize new dedicated infrastructure for the supply of electricity, natural gas and water.
The cost of power required to operate the Project Facility is estimated at $4.4M per year, based on an average annual consumption of 67 million kWh and a unit rate of $0.0655 per kWh. Electrical substation upgrades by Entergy in support of the Project are estimated at $3.0M. It is anticipated that the capital cost recovery will be distributed over the first five years through the electrical tariff by Entergy. Capital recovery charges are reflected in the annualized average power cost for the Project.
Natural gas will be delivered to the Project by Energy Transfer. Natural gas infrastructure improvements, including a new gas meter station, are assumed to be recovered through a component of the delivery charge. Natural gas delivery charges are estimated at $390,000 per year for the first five years to account for capital recovery and $270,000 per year thereafter. The project is expected to consume an average of 260 GJ per day. Annualized average natural gas costs are estimated at $380,000 per year based on unit cost of natural gas of $4.00 per GJ ($4.25 per MMBtu).
An allowance is included for the small quantity of chlorinated water supplied by LANXESS for domestic uses which will be charged to the project on a cost plus basis.
| 21.2.2 | REAGENTS AND CONSUMABLES |
Reagent and consumables costs are estimated to average $15.6M or $2,880 per tonne of lithium carbonate produced on an average over the life of the Project. A variety of reagents and consumables are necessary to support multiple steps throughout the lithium recovery process. Reagent costs are the single largest component of variable costs. Reagent consumption rates are estimate based on average steady state production of the Project Facility. Reagent costs are based on vendor pricing received from regional chemical suppliers generally located in the gulf coast region. Unit costs are based on expected long-term pricing forecasts supported by historical average pricing.
RSI-3353
Table 21-3. Reagent Cost Estimate
| Category | Units | Units/year | $/Unit | $ M/year |
| Caustic Soda (NaOH) | $/t | 6,250 | 542 | 3.4 |
| Soda Ash (Na2CO3) | $/t | 11,500 | 485 | 5.6 |
| Hydrochloric Acid (HCl) | $/t | 15,600 | 221 | 3.4 |
| Hydrated Lime (Ca(OH)2) | $/t | 740 | 766 | 0.6 |
| Citric Acid | $/t | 140 | 1296 | 0.2 |
| Other | $ | - | - | 1.7 |
| Total | 14.9 |
Notes:
[1] Any discrepancies in the totals are due to rounding effects.
[2] Other Reagents includes allowances for small quantities of surfactants, flocculants, coagulants and other reagents associated with the operation of the Project Facility.
Consumables required for the Plant are shown in Table 21-4.
Table 21-4. Consumable Costs
| Category | $/year |
| Filter clothes | 250,000 |
| Packaging materials | 175,000 |
| Membranes, filters | 130,000 |
| Fuel, diesel | 50,000 |
| Safety | 25,000 |
| Other | 100,000 |
| Total | 730,000 |
| 21.2.3 | MAINTENANCE MATERIALS AND EXTERNAL SERVICES |
Maintenance materials and external services costs are estimated to average $3.3M or $610 per tonne of lithium carbonate produced on an average over the life of the Project.
Maintenance materials include allowances for parts, equipment and other materials required to maintain the facility but excludes sustaining capital costs. Maintenance materials are estimated at $0.5M per year.
External services include laboratory support, third party chemical analysis, IT services, professional consultants, training services, contract maintenance, vendor support, boiler and cooling tower service, UIC well maintenance and waste management. External services are estimated at $2.8M per year.
| 21.2.4 | WORKFORCE |
Workforce costs are estimated to average $10.4M or $1,930 per tonne of lithium carbonate produced on an average over the life of the Project. Personnel is the seconded largest operating cost for Standard Lithium. Workforce positions are estimated based on the requirement for operation of the Project Facility on a 24 hours per day, seven days per week basis.
RSI-3353
Table 21-5. Workforce Positions
| Area | Position | Workforce
per Shift |
Shifts | Total |
| Operations | Operations Manager | 1 | 1 | 1 |
| Shift Foreman Pre-treatment | 1 | 4 | 4 | |
| Shift Foreman Lithium Carbonate | 1 | 4 | 4 | |
| Control Room Operator | 2 | 4 | 8 | |
| Production Operator | 4 | 4 | 16 | |
| Product Handling Operators | 3 | 2 | 6 | |
| Operations Subtotal | 39 | |||
| Maintenance | Maintenance Manager | 1 | 1 | 1 |
| Supervisor | 2 | 1 | 2 | |
| Planner | 2 | 1 | 2 | |
| Mech/Welder/Pipe Fitter | 4 | 1 | 4 | |
| Electrical/Instrument | 2 | 1 | 2 | |
| Shift Maintenance (Mech, Elect.) | 3 | 4 | 12 | |
| Electrical/Controls Engineers | 1 | 1 | 1 | |
| Maintenance/Reliability Engineer | 1 | 1 | 1 | |
| Maintenance Subtotal | 25 | |||
| Technical Services | Technical Manager | 1 | 1 | 1 |
| Plant Engineers | 2 | 1 | 2 | |
| QA/QC Supervisor | 1 | 1 | 1 | |
| Dayshift Technicians | 2 | 1 | 2 | |
| Lab Supervisor | 1 | 1 | 1 | |
| Chemists | 1 | 4 | 4 | |
| Technical Subtotal | 11 | |||
| General and Administration | Plant Manager | 1 | 1 | 1 |
| Controller | 1 | 1 | 1 | |
| Purchasing Supervisor | 1 | 1 | 1 | |
| Human Resources Supervisor | 1 | 1 | 1 | |
| Health Safety Enviro. Manager | 1 | 1 | 1 | |
| Purchasing Clerks | 1 | 1 | 1 | |
| Accounting / Payroll | 1 | 1 | 1 | |
| Administration Clerks | 1 | 1 | 1 | |
| Gatehouse (Shift) | 1 | 4 | 4 | |
| Warehouse Clerks | 1 | 2 | 2 | |
| General and Administration Subtotal | 14 | |||
| Workforce Total | 89 | |||
The average base salary for professional and hourly workers is approximately $83,000 per year. Workforce costs also include burdens estimated at an average of 45% of base salary and a 15% allowance for overtime.
RSI-3353
Table 21-6. Workforce Costs
| Category | Annual Cost ($M/year) |
| Operations | 4.3 |
| Maintenance | 3.1 |
| Technical Services | 1.4 |
| General and Administration | 1.6 |
| Total | 10.4 |
| 21.2.5 | INSURANCE |
Insurance costs are estimated to average $1.8M or $340 per tonne of lithium carbonate produced on an average annualized basis and are assumed to cover risks including property damage, general liability, and business interruption.
| 21.2.6 | MISCELLANEOUS COSTS |
Miscellaneous operating costs are estimated to average $0.5M or $100 per tonne of lithium carbonate produced on an average annualized basis. Miscellaneous costs include general and administrative expenses including mobile equipment leases, office and IT costs, telephone and fax, computer equipment, software, licenses, subscriptions, office supplies, and travel.
| 21.2.7 | SUSTAINING CAPITAL |
Sustaining capital costs are estimated at $79M over the life of the Project which on an annualized average basis equates to approximately US$580 per tonne of lithium carbonate produced.
Sustaining capital costs include repair or replacement of equipment or materials during the 25-year life of the Project. The frequency of repair or replacement of infrastructure considered ranges or replacement intervals between 1 and 10 years. The cost and frequency of sustaining capital expenditures are based on recommendations from vendors and equipment manufacturers, quotations, previous project experience, and industry standards.
Major equipment replacements and activities considered as sustaining capital expenditures and which are reflected in the sustaining capital cost estimate include, but are not limited to, the following:
| / | LSS DLE Resin replacement; |
| / | IX resin replacement; |
| / | Ultrafiltration membrane replacement; |
| / | BWRO/OARO membrane replacement; |
| / | Carbonate preheater plate replacement; |
| / | Filter press plate replacement; |
| / | Agitator seal replacement; |
| / | Rubber lining replacement; |
| / | Lithium carbonate centrifuge refurbishment; |
| / | Bicarbonate reactor cooler refurbishment; |
| / | Dryer refurbishment; |
| / | Tank coating refurbishment; |
RSI-3353
| / | Structure steel coating refurbishment; |
| / | Low pH service pump replacements; and |
| / | UIC well refurbishments including bullhead acidizing and radioactive tracer survey. |
| 21.2.8 | EXCLUSIONS |
The following items are not included within the operating cost estimate:
| / | Future royalties or brine lease-fees-in-lieu-of-royalties which are still to be determined and subject to regulatory approval. Lease-fees-in-lieu-of-royalties have been determined for bromine and certain other minerals in the State of Arkansas but have not yet been determined for lithium extraction. |
| / | Brine fees which may be due to LANXESS as a result of finalization of the commercial arrangements between LANXESS and Company. |
| / | Taxes, other than sales taxes which may be due on the purchase of materials and equipment. |
| / | Escalation. |
| 21.3 | QP OPINION |
It is the QP’s opinion that the estimated capital and operating costs accurately reflect the level of project understanding and are appropriate for a Feasibility Study.
RSI-3353
| 22.0 | ECONOMIC ANALYSIS |
The objective of the economic analysis is to determine if the Project is financially viable. The economic analysis was prepared using a Discounted Cash Flow (DCF) economic model, showing both pre-tax and post-tax results, to evaluate the Project. CAPEX and OPEX expenditures presented in Section 21 have been used in this analysis. The model includes taxes but excludes any government and commercial royalties/payments. The results include net present value (NPV) for an 8% discount rate, internal rate of return (IRR), and sensitivity analysis of key inputs.
| 22.1 | INPUTS AND ASSUMPTIONS |
The key inputs and assumptions are listed in Table 22-1. These assumptions represent the base case for the commercial operation.
Table 22-1. Project Economic Model Key Input Parameters
| Key Parameters | Units | Assumption |
| South Unit Brine Production (LANXESS) | m3/yr | 5.21 |
| Plant Availability (Plant + Utilities) [1, 2] | % | 94% |
| Effective Extraction Efficiency (Plant) [2] | % | 93.1 |
| Attrition (Lithium Carbonate Losses) [2] | % | 0.5 |
| Initial Annual Production of Li2CO3 | tpa[3] | 5,730[3,4,5] |
| Average Annual Production of Li2CO3 | tpa | 5,400[4] |
| Plant Operating Life | years | 25[6] |
| CAPEX – Confidence | P85 | |
| Total Capital Expenditures | $ millions | 365[7,8] |
| Average Annual Operating Cost | $/t | 6,810 |
| Average Annual All-in Operating Cost | $/t | 7,390[9,10] |
| Selling Price | $/t | 30,000[11] |
| Financing | Unlevered IRR | |
| Discount Rate | % | 8 |
| Federal Tax Rate | % | 21 |
| Arkansas State Tax | % | 5.1 |
| Inflation Reduction Act Manufacturing Tax Credit | - | 10 (45X) |
Notes:
[1] Plant Availability excludes LANXESS South Plant availability which is already considered in South Unit Feed Brine Rate.
[2] Refer to Section 15 for modifying factors considered.
[3] Tonnes (1,000 kg) per annum.
[4] Commercial production is based on the production plan. Refer to Section 16.
[5] Initial annual production figure represents Year 2 production, following a ramp-up period in Year 1.
[6] Plant design and financial modelling based on 25-year economic life. Proven and Probable Reserves support a 40-year operating life.
[7] Capital Expenditures include 15% contingency.
[8] No inflation or escalation has been
carried for the economic modelling.
[9] Includes operating expenditures and sustaining capital.
[10] Brine lease-fees-in-lieu-of-royalties (to be approved by AOGC) have not been defined and are not currently included in the economic
modelling.
[11] Selling price of battery-quality lithium carbonate based on a flatline price of $30,000/t over total project lifetime. Refer to
Section 19.
[12] Any discrepancies in the totals are due to rounding effects.
RSI-3353
| 22.1.1 | CAPEX |
Capital investment for the average annual production of 5,400 tonnes per year of battery-quality lithium carbonate, including equipment, materials, indirect costs, and contingency at 15% of direct and indirect costs, is estimated to be US$365 Million. This total excludes interest expenses that might be capitalized during the same period.
| 22.1.2 | OPEX |
The average annual operating cost for the Project is estimated at US $37 Million. As the cash flow model accounts for decreasing Lithium Carbonate production over the lifetime of the project, the annual operating costs correspondingly decreases each production year. The annual operating cost includes process reagents, utilities, process consumables, natural gas, maintenance materials, external services, labor, and miscellaneous general and administration (G&A) costs. Approximately 86% of the OPEX costs are derived from three (3) of OPEX cost categories as shown below.
| / | Process Reagents – 44% |
| / | Labor – 29% |
| / | Utilities – 13% |
The remaining components of the operating costs have a significantly lower impact on the overall economics. Insurance is added on top of the above-mentioned operating costs at 0.5% of CAPEX per year. A total of $2.98M of electrical infrastructure cost is distributed evenly over the first 5 years of production to account for capital costs related to the required Entergy Substation upgrades which are recovered by Entergy during the initial operating period.
| 22.1.3 | SUSTAINING CAPITAL |
Major repairs or replacements of critical processing plant items are included in sustaining capital. Sustaining capital is capitalized and depreciated over their useful lives. A provision of $78.8M for sustaining capital over the life of the Project was included in the economic model.
| 22.1.4 | CASH FLOW |
Cash flow will reach 100% after a production ramp-up period of twelve months. During the ramp-up period, it is assumed the facility will produce and monetize 75% of expected steady-state production of saleable lithium carbonate. Similarly, it is assumed that operating costs associated with process reagents and variable utilities will be at 85% of steady-state consumption (all other operating costs are assumed at 100% of steady-state consumption).
| 22.1.5 | CONSTRUCTION |
The economic model assumes a construction period of 27 months.
| 22.1.6 | OPERATING LIFE |
The Project is modelled with a 25-year economic life from the start of production. No allowances are included in the model for extension of the project life beyond 25 years. As described in Section 15, the Project’s Proven and Probable Reserves support a 40-year operating life.
| 22.1.7 | COMMODITY PRICING |
As described in Section 19, the selling pricing assumption for battery-quality Lithium Carbonate is US $30,000/tonne in 2023. Since the economics are calculated without any escalation, the price remains constant in the model over the 25 years of operation.
| 22.1.8 | DISCOUNTED CASH FLOW (DCF) |
A discount rate of 8% yearly has been assumed for the calculation of the NPV.
RSI-3353
| 22.1.9 | PRE-CONSTRUCTION EXPENSES |
Pre-construction expenses are treated as sunk costs and are not included in the DCF analysis.
| 22.2 | TAXES & ROYALTIES |
The following royalties and taxes have been applied to the economic analysis of the Project.
| 22.2.1 | FEES AND ROYALTIES |
The cash flow model does not consider any royalty payments (also referred to as Lease-fees-in-lieu-of-royalties) which may be due to mineral owners in relation to the profitable extraction of lithium from brine as to date the AOGC has not approved a lease payment related to lithium extraction from brine.
No allowances are included for brine fees which may be due to LANXESS as a result of finalization of definitive commercial arrangements between LANXESS and the Project Company.
| 22.2.2 | DEPRECIATION |
A yearly depreciation of 5% (facility evenly depreciated over 20 years of operating life) is used for this analysis.
| 22.2.3 | CORPORATE TAXES |
The US Federal Corporate Income Tax (CIT) rate of 21% and the State of Arkansas Corporate Income Tax rate of 5.1% are used for this analysis.
| 22.2.4 | 45X MPTC TAX CREDIT |
The cash flow model considers the Advanced Manufacturing Production Tax Credit (45X MPTC) for the business case. The Advanced Manufacturing Production Credit provides a tax credit for each “eligible component” which is produced in the U.S. The credit is 10% of costs incurred with respect to the production of critical minerals (of which lithium is one). For modeling purposes, a 10% credit is applied annually (with a 1-year lag) on the total operating cost, sustaining capital, and depreciation.
| 22.3 | CAPEX SPENDING SCHEDULE |
The economic model assumes that capital investments disbursements will be spread over 27 months.
| 22.4 | PRODUCTION REVENUES |
Production revenues have been estimated based on the price scenario for a Lithium Carbonate product, as identified in Section 19 and the production plan set out in Section 16.
| 22.5 | CASH-FLOW PROJECTION |
Table 22-2 summarizes the DCF for the assumed for the Project for the purposes of this Technical Report.
RSI-3353
Table 22-2. Project Discounted Cashflow Model
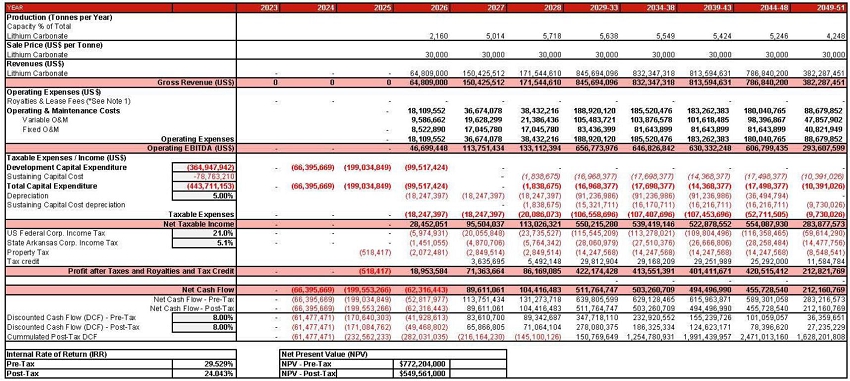
| 22.6 | ECONOMIC EVALUATION RESULTS |
The project economics resulting from the assumed price scenario at full production, which was used in the economic model, are presented in Table 22-3. The NPV values were also calculated for a discount rate of 8%.
Table 22-3. Project Economic Evaluation
| Internal Rate of Return (IRR) | Net Present Value (NPV) | ||
| Pre-Tax | 29.53% | NPV – Pre-Tax | $772,204,000 |
| Post-Tax | 24.04% | NPV – Post-Tax | $549,561,000 |
Notes:
[1] All model outputs are expressed on a 100% project ownership basis with no adjustments for project financing assumptions.
[2] Assumes a U.S. Federal tax rate of 21% and State of Arkansas Tax rate of 5.1%, as well as variable property taxes.
[3] Any discrepancies in the totals are due to rounding effects.
| 22.7 | SENSITIVITY ANALYSIS |
A sensitivity analysis methodology, using one-factor-at-a-time (OAT), involves changing one input variable, keeping others at their baseline (nominal) values, and then returning the variable to its nominal value. This is repeated for each of the other inputs in the same way.
OAT sensitivity analysis of the project key variables CAPEX, OPEX, Selling Price changing +/- 20%, and Production +/- 5% was conducted to illustrate the impact of changes on the corresponding values of NPV and IRR. The results of the sensitivity analysis, at an 8% discount rate, are presented in Tables 22-4 to Table 22-7, and Figures 22-1 to 22-4.
Table 22-4 shows the sensitivity of NPV and IRR to a 20% CAPEX increase and decrease from the base case. It must be noted that some of the OPEX items are percentages of the CAPEX.
RSI-3353
Table 22-4. Sensitivity Analysis to CAPEX Variation
| Overview | -20% | Base Case ($M) | +20% ($M) |
| Capital Cost (CAPEX) | 292.0 | 364.9 | 437.9 |
| NPV Pre-Tax | 837.6 | 772.2 | 706.8 |
| NPV Post-Tax | 608.3 | 549.6 | 490.8 |
| IRR Pre-Tax | 35.9% | 29.5% | 25.0% |
| IRR Post-Tax | 29.2% | 24.0% | 20.4% |
Table 22-5 shows the sensitivity of NPV and IRR to a 20% OPEX increase and decrease from the base case.
Table 22-5. Sensitivity Analysis to OPEX Variation
| Overview | -20% | Base Case ($M) | +20% ($M) |
| Operating Cost (OPEX) | 30.7 | 38.4 | 46.1 |
| NPV Pre-Tax | 837.6 | 772.2 | 706.8 |
| NPV Post-Tax | 608.3 | 549.6 | 490.8 |
| IRR Pre-Tax | 31.1% | 29.5% | 27.9% |
| IRR Post-Tax | 25.1% | 24.0% | 22.9% |
Table 22-6 shows the sensitivity of NPV and IRR to a 20% Product Price increase and decrease from the base case.
Table 22-6. Sensitivity Analysis to Product Price Variation
| Overview | -20% | Base Case ($M) | +20% ($M) |
| LCE Price | 24,000 | 30,000 | 36,000 |
| NPV Pre-Tax | 485.1 | 772.2 | 1,059.3 |
| NPV Post-Tax | 337.3 | 549.6 | 761.7 |
| IRR Pre-Tax | 22.4% | 29.5% | 36.2% |
| IRR Post-Tax | 18.4% | 24.0% | 29.3% |
Table 22-7 shows the sensitivity of NPV and IRR to a 5% Production Volume increase and decrease from the base case.
Table 22-7. Sensitivity Analysis to Production Volume Variation
| Overview | -20% | Base Case ($M) | +20% ($M) |
| Production first year (Mt) | 5,473 | 5,761 | 6,049 |
| NPV Pre-Tax | 708.9 | 772.2 | 835.5 |
| NPV Post-Tax | 502.0 | 54.9.6 | 597.1 |
| IRR Pre-Tax | 28.0% | 29.5% | 31.1% |
| IRR Post-Tax | 22.8% | 24.0% | 25.2% |
Sensitivity of Pre-Tax IRR to the changes in the CAPEX, OPEX, Selling Price, and Production Output is illustrated in the tornado chart in Figure 22-1.
RSI-3353

Figure 22-1. Pre-Tax IRR Sensitivity
Sensitivity of Post-Tax IRR to the changes in the CAPEX, OPEX, Selling Price, and Production Output is illustrated in the tornado chart in Figure 22-2.
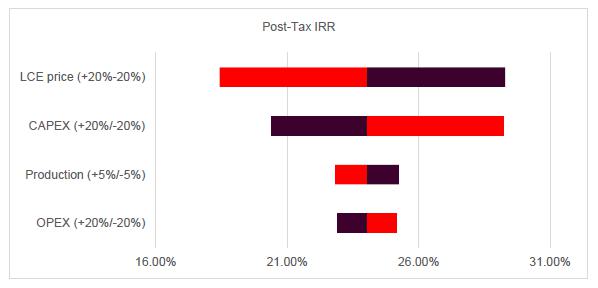
RSI-3353
Figure 22-2. Post-Tax IRR Sensitivity
Sensitivity of Pre-Tax NPV at an 8% discount rate to the changes in the CAPEX, OPEX, Selling Price, and Production Output is illustrated in the tornado chart in Figure 22-3.
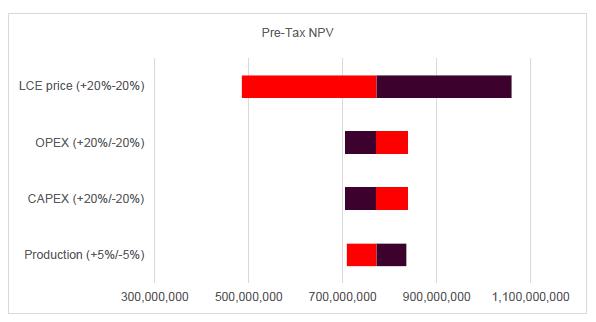
Figure 22-3. Pre-Tax NPV Sensitivity
Sensitivity of Post-Tax NPV at an 8% discount rate to the changes in the CAPEX, OPEX, Selling Price, and Production Output is illustrated in the tornado chart in Figure 22-4.

Figure 22-4. Post-Tax NPV Sensitivity
The OAT sensitivity analysis indicates that the project is as follows:
| / | IRR and NPV are most sensitive to the product Selling Price variation. |
| / | IRR and NPV are least sensitive to OPEX variation. |
| / | IRR and NPV are moderately sensitive to CAPEX and Production. |
RSI-3353
| 22.8 | CONCLUSIONS AND SENSITIVITY ANALYSIS |
The Project’s economics resulting from the assumed price scenario used in the economic model is presented in Table 22-1. A sensitivity analysis was conducted to illustrate the impact of +/-20% changes in CAPEX, OPEX, and Selling Price, and +/-5% changes in Production Output on the project’s NPV and IRR (Table 22-3 and 22-5).
The Sensitivity analysis of the project economics indicates that the project is economically viable under the base case conditions as well as under the condition of the isolated cases of a 20% increased CAPEX, a 20% reduced product Selling Price, a 5% reduced Production Output, and a 20% increased OPEX.
RSI-3353
| 23.0 | ADJACENT PROPERTIES |
This section discusses mineral-brine properties that occur outside of the Property. In some cases, the Authors have not been able to verify information pertaining to mineralization on the adjacent properties, and therefore, the Authors and Standard Lithium advocate that the information is not necessarily indicative of the mineralization on the Property that is subject to this report.
There are two major bromine producers in Arkansas: LANXESS and Albemarle Corporation (see Figure 23-1). LANXESS has its Arkansas headquarters in El Dorado, Arkansas. Albemarle’s Arkansas headquarters are at the center of its property in Magnolia, Arkansas. Albemarle’s property is situated approximately 3 km from the western boundary of the LANXESS Property. In addition, Saltwerx has developed a property package approximately 15km from the western boundary of the LANXESS Property. To date, there is no lithium production from adjacent properties but lithium leases have been established by Saltwerx and Tetra Technologies. The Standard Lithium Project stands to be the first commercial lithium production from the Smackover Formation.
| 23.1 | LANXESS CORPORATION |
LANXESS operates three brine-based bromine extraction plants near El Dorado, AR (U.S.). The well-field that supports the LANXESS El Dorado Plants is sub-divided into three contiguous ‘units’ based on the three unitized areas of bromine operation: South, Central, and West unit areas.
During 2021, LANXESS processed approximately 13.3 million cubic meters [83.7MM U.S. Barrels] of brine to support their South Arkansas Bromine Operations. In addition to bromine, LANXESS entered the battery chemistry business with electrolyte production for lithium-ion batteries in Leverkusen, Germany (LANXESS, 2021) and is actively supporting operation of Standard Lithium’s Demonstration Scale Lithium Pilot Plant which is located at the LANXESS South Plant.
| 23.2 | ALBEMARLE CORPORATION |
Albemarle Corporation is one of the largest producers of bromine and lithium related resources and products world-wide with bromine operations in Arkansas (U.S.) and Jordan and lithium operations in Chile, Australia, Germany and Clayton Valley, Nevada (U.S.). Albemarle exclusively operates using conventional lithium extraction technologies at their commercial facilities but have previously invested in DLE research. To QP’s knowledge, no lithium has been commercially produced to date by Albemarle at either of their facilities in South Arkansas.
Albemarle Corporation operates two (2) brine-based bromine extraction plants near Magnolia, AR. Albemarle's Magnolia North and South plants are fed by a network of brine production wells in Columbia County. During 2021, Albemarle Corporation processed approximately 20 million cubic meters (125.4MM U.S. Barrels) of brine to produce approximately 74,000 tons of bromine at its Magnolia facilities (Albemarle Corporation, 2021). In 2021, Albemarle announced the company will double capacity for brine extraction by 2025 at a cost of $30 miillion to $50 million (Albemarle Corporation, 2021c). The well field that supports Albemarle’s Magnolia operations directly abuts sections of the properties associated with Standard Lithium’s South West Arkansas project on the field’s northern and eastern boundaries.
| 23.3 | SALTWERX (SUBSIDIARY TO GALVANIC, LLC) |
Saltwerx, LLC (Subsidiary to Galvanic Energy) has ownership of 120,000 gross acres of resource claims in the Smackover Formation. Saltwerx has completed well testing, reservoir modeling, and inferred mineral resource estimations on their lithium-brine prospect in southern Arkansas. They estimate that this acreage could contain 4 million tons of lithium carbonate equivalent (Saltwerx, 2021). Saltwerx’s property is located approximately 15km west of the Property and directly south of the TETRA Property.
RSI-3353
| 23.4 | TETRA TECHNOLOGIES |
In June 2023, TETRA filed an application to establish a unitized brine unit (Evergreen Brine Unit) of approximately 6,000 acres (Tetra, 2023).
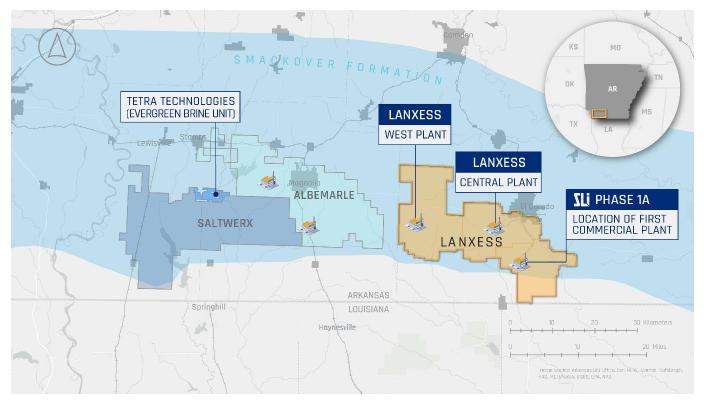
Figure 23-1. Location of Active and Potential Brine Producers in Southern Arkansas
RSI-3353
| 24.0 | OTHER RELEVANT DATA AND INFORMATION |
There is no other data and information relevant to this report.
RSI-3353
| 25.0 | INTERPRETATIONS AND CONCLUSIONS |
The Project has been independently evaluated, leading to the following conclusions and interpretations regarding the suitability of the proposed site and the viability of the Project. It is determined that a clear path is established to reach a positive Final Investment Decision subject to concluding remaining commercial agreements and obtaining the required financing.
| / | The Proven and Probable Reserves confirm the viability of the Project over its 25 year economic life at an average annual production rate of 5400 tonne per annum of lithium carbonate. |
| / | The Proven and Probable Reserves support an operating life of up to 40 years. |
| / | The development and testing completed at the Demonstration Plant provides a robust basis for the commercial design which is based on Direct Lithium Extraction technology. |
| / | Work to date completed at the Demonstration Plant illustrates that lithium can be economically extracted from the lithium rich brine produced from the Smackover Formation. |
| / | The Project Site secured is considered well suited for development and is situated near all necessary utilities. |
| / | Environmental studies have concluded the Project Site is suitable for development with limited adverse environmental and social impacts, generally limited to the boundaries of the Project Site. |
| / | There is a clear pathway for the Project to obtain the state permits required for development. |
| / | The economic analysis yielded positive results in a timeline for development and first production that is considered realistic based on timely funding and is typical of projects of similar magnitude within industry. |
| / | Overall, the result of this Feasibility Study demonstrates that lithium can be economically extracted from the lithium rich brine within the Smackover Formation. |
The opinions of the Qualified Persons are further stated in the following sections.
| 25.1 | GEOLOGY, RESOURCES AND RESERVE ESTIMATE |
Significant confidence within the geologic modeling was developed by utilizing decades of available bromine production data and ongoing lithium sampling from within the Property. Based on the geologic modeling the following Resource conclusions are summarized in Table 25-1:
Table 25-1. Statement of Resources In-Place by Unit effective date, August 18, 2023
| Units | South | West | Central | Central Expansion |
Total | |
| Average Lithium Concentration | mg/L | 204 | 122 | 164 | 78 | 148 |
| Measured Resource | thousand tonnes | 148 | 192 | 173 | - | 513 |
| Indicated Resource | thousand tonnes | - | - | - | 16 | 16 |
| Measured LCE Resource [9] | thousand tonnes | 788 | 1,022 | 921 | - | 2,731 |
| Indicated LCE Resource [9] | thousand tonnes | - | - | - | 85 | 85 |
RSI-3353
Notes:
[2] Cutoff of 9% porosity.
[3] The effective date of the resource estimate is August 18, 2023
[4] Mineral Resources are inclusive of Mineral Reserves.
[5] The Qualified Person for the Mineral Resource Estimates is Randal M. Brush, PE
[6] The Mineral Resource estimate follows 2014 CIM Definition Standards and the 2019 CIM MRMR Best Practice Guidelines.
[7] These Mineral Resources are not Mineral Reserves as they do not have demonstrated economic viability.
[8] Calculated brine volumes only include Measured and Indicated Mineral Resource volumes that when blended from the well field result in feed above the cut-off grade of 100 mg/L.
[9] Lithium Carbonate Equivalent (“LCE”) is calculated using mass of LCE = 5.323 multiplied by mass of lithium metal.
[10] Results are presented in-situ. The number of tonnes was rounded to the nearest thousand. Any discrepancies in the totals are due to rounding effects.
[11] The Qualified Person is not aware of any known environmental, permitting, legal, title-related, taxation, socio-political or market issues, or any other relevant issue that could materially affect the potential development of Mineral Resources other than those discussed in the Mineral Resource Estimates.
Based on the geologic modeling the following Reserve conclusions are summarized in Table 25-2:
Table 25-2. Phase 1A Proven and Probable Reserves
| Units | Proven | Probable | Proven
+ Probable |
|
| Brine Reserves [4,8] | million m³ | 124 | 84 | 209 |
| Average Lithium Concentration [4,8] | mg/L | 227 | 201 | 217 |
| Lithium Metal [4,8] | thousand tonnes | 28.2 | 17 | 45.2 |
| LCE Reserves [4,9,10,12] | thousand tonnes | 129 | 79 | 208 |
Notes:
[1] The effective date of the reserve estimate is August 18, 2023.
[2] Any discrepancies in the totals are due to rounding effects.
[3] The Qualified Person for the Mineral Reserve estimate is Randal M. Brush, PE.
[4] Reserves are exclusive to the South Brine Unit.
[5] The average lithium concentration is weighted per well simulated extraction rates.
[6] The Proven case assumes a 25-year operating life at 4.96 million m3/year of brine production at a cut-off of 100 mg/L.
[7] Proven plus Probable Reserves assume a 40-year operating life at 5.21 million m3/year of brine production at a cut-off of 100 mg/L.
[8] The Reserves reference point for the brine pumped, average lithium concentration, and lithium metal is the brine inlet to the Standard Lithium processing plant.
[9] The Reserves reference point for the LCE is the product output of the processing plant.
[10] Lithium Carbonate production values consider plant processing efficiency factors.
[11] The Mineral Reserve estimate follows 2014 CIM Definition Standards and the 2019 CIM MRMR Best Practice Guidelines.
[12] LCE is calculated using mass of LCE = 5.323 multiplied by mass of lithium metal.
[13] The Qualified Person is not aware of any known environmental, permitting, legal, title-related, taxation, socio-political or marketing issues, or any other relevant issue, that could materially affect the potential development of Mineral Resources other than those discussed in the Mineral Resource Estimates.
| / | The Property has the Resources and Reserves required to support the Project. |
| / | Resource Estimate is upgraded from the 2019 PEA from Indicated to Measured for the LANXESS Project. This upgrade is supported by numerical modelling and verified by correlating over 60 years of operating data, supported by a robust well sampling program, and 3.5 years of Demonstration Plant testing with extensive monitoring of brine characteristics and LANXESS operating performance. |
RSI-3353
| / | The Project is based on a 25-year economic life. The Proven and Probable Reserves of 208 Kt LCE at an average concentration of 217 mg/L can support up to 40 years of operations. |
| / | The Project is planned to produce 135,000 tonnes LCE from the LANXESS South Brine Unit over the 25-year life of the Project which represents production of approximately 5% of the in-situ Measured and Indicated Resources. |
| / | All LANXESS supply and disposal wells proposed to support the Project are currently in operation, with the latest wells commissioned in 2019. |
| / | The large underlying resource, existing operating brine field, experienced operator, coupled with sampling, testing and Demonstration Plant operations results in a Project which is substantially de-risked from a resource perspective when compared to other greenfield lithium projects. |
| / | The size of the broader Resource could support additional lithium extraction developments subject to additional feasibility studies. |
| 25.2 | PROCESS INFORMATION AND DESIGN |
Standard Lithium has successfully brought a new DLE technology to an established bromine producing region. Through multiple design iterations and testing, the studied processing approach is optimized for the Project’s Resource. The following conclusions can be reached regarding process information and design:
| / | The Project is based on processing a well understood feed stock, specifically brine which has been successfully produced from the Smackover Formation for more than 60 years, from existing infrastructure that supports the Project’s design capacity. |
| / | All unit operations have been demonstrated either by Standard Lithium or in vendor facilities using real brine from the Smackover. Numerous production options have been evaluated. The current design concept appears to be near optimal and poses minimal commercial risk. |
| / | The ongoing operation of the Demonstration Plant located at the South Plant and Project Site has provided invaluable information for the design of the commercial facility. |
| / | Long term Demonstration Plant testing has led to a thorough understanding of the brines and has provided key data which have been incorporated into the design of the commercial facility. |
| / | Two DLE technologies have been tested and evaluated. The current KTS LSS technology is considered to be the best technology for the Project, based upon lithium recovery, impurity rejection, operating cost and effluent dilution (i.e. lowest water use). |
| 25.3 | INFRASTRUCTURE |
The Project location in Union County offers a pool of skilled labor and services. The plant has modest water, power, and thermal energy requirements. All necessary utilities are within close proximity to the Project Site including power and natural gas with brine and water. High-capacity transportation routes are readily accessible within the region and locally in the area of the Project. The site requires little grading and has ample area for equipment layout and construction lay down areas. Space has been allocated in the plot plan to accommodate future expansion.
RSI-3353
| 25.4 | ENVIRONMENTAL STUDIES |
The Project Site has been investigated for potential risk to development from pre-existing conditions and the presence of waters of the United States. Based on the investigations conducted the conclusions are:
| / | The site has been subject to historical timber harvesting/production and possibly oil and gas exploration/production operations. The possible oil well locations were investigated during the environmental study and no evidence of their existence was observed. The site is currently undeveloped and has minimal infrastructure associated with the adjoining LANXESS operations. There is no known risk from historical operations. |
| / | Jurisdictional waters of the United States have been identified at the margin of the Project Site. Those areas will be minimally impacted by site development and will be eligible for a Nationwide Permit from the U. S. Army Corps of Engineers. The Project Site development is not expected to cause significant adverse effects to waters of the United States. |
| / | The presence of commercial chemical products was documented in surface and subsurface media at the Project Site. Those materials do not present a risk to construction or operation of the Project Facility based on concentration levels and/or potential exposure pathways. |
| / | In consideration of site characteristics and proximity to existing utility and transportation infrastructure, resource supply and disposal facilities, the Project Site is suitable for construction and operation of the lithium extraction facility. |
| / | Documented pre-existing conditions from historical operations are unlikely to have a material impact on the development and operation of the Project. |
| 25.5 | ENVIRONMENTAL REGULATORY PERMITTING |
The Project has been examined to establish specific environmental regulatory permits necessary for construction and operation of the Project Facility and its supporting infrastructure. Based on the examination the conclusions are:
| / | Standard Lithium has been proactive in assessing potential environmental and regulatory risks to improve the Project development certainty, including a comprehensive review of permit applicability, a preliminary review of site cultural resources, and performance of a multimedia baseline investigation of the Project Site. |
| / | The Project is designed in consideration of applicable environmental regulatory standards and does not present a risk of construction or operational permit denial or significant delay in issuance. |
| / | The Project is not subject to review, delay or denial under the NEPA thus there is no risk associated with NEPA applicability based on the current development program. |
| / | Construction and operation of the Project Facility are regulated through Federal and State agencies through established permit procedures. Project Facility emissions to air, surface waters and subsurface waters will require permit authorizations including restrictions to protect the environment while responsibly developing the lithium resources. There is no risk associated with permit(s) issuance on the basis the prescriptive requirements for receipt of the permits are met. |
| / | Minimization of emissions and wastes from construction and operation and avoidance of adverse environmental impact were significant factors in the engineering design of the Project, resulting in permit tiers that are not at risk of denial or delay by the regulatory agencies. |
| / | The Project Site plan factored the presence of waters of the United States in the development and as proposed avoids significant impacts to those waters. There is no risk associated with receiving Nationwide Permits requested from the U. S. Army Corps of Engineers. |
| / | The Arkansas Department of Energy and Environment is proficient in regulating the extraction of resources from brine reservoirs. The adjacent LANXESS bromine production facility has been in operation for decades as have multiple bromine production facilities in Union and Columbia Counties. The LANXESS facility is currently permitted for discharges similar to those proposed for the Project Facility including air emissions, wastewater surface discharges and underground injection of waste brine via Class I injection wells. |
RSI-3353
| / | The brine Resource for the Project is currently permitted and the supply well field is operational. Underground injection wells for management of waste brine following extraction of lithium are likewise permitted and operating. |
| / | Regulatory permit application documents are being prepared by Standard Lithium with priority for submission placed on those permits with longer agency review periods to maintain the project construction timeline. |
| / | The Project is viable and as proposed will perform within the boundaries of established environmental standards, noting that the regulatory programs that authorize construction and operation of the Project facility are based on protection of the environment and hence the sustainability of the site and the local community. |
| 25.6 | SOCIAL AND COMMUNITY IMPACT |
The Project is situated in a region significantly supported by natural resource production and refining for over one hundred years. Bromine production and associated chemical manufacturing operations have been a principal contributor to the local community for decades. In that context, the following opinions are presented regarding local, regional, and national impacts from the Project:
| / | South Arkansas is a regional hub for natural resource/brine production and processing industries. The Project is comparable to established mineral extraction operations and natural resource production/refining. The local community is generally supportive of those industries and recognizes the value of their existence and their positive impact on the regional economy. |
| / | The region will benefit from the infusion of capital via employment of skilled labor and contractors and acquisition of materials during the construction of the Project facility. The economic benefit will extend to the operation phase through staffing payrolls and ongoing supporting purchases. |
| / | Lithium is a critical mineral with national self-sufficiency implications for military/defense needs and for the transition away from fossil fueled transportation. The Project supports the goal of domestic lithium production. |
| / | Continuing engagement with the local/regional community is recommended as the Project proceeds through the investment decision and construction phases. |
| / | The Demonstration Plant and public disclosures regarding the Project have been met with positive regional support. The Project is generally well supported by the regional citizens and there is no legitimate basis for organized opposition to the Project. |
| 25.7 | CAPITAL AND OPERATING COSTS |
Project capital and operating cost estimates were developed utilizing industry standard approaches and benchmarked against related projects, as summarized below:
| / | The total capital estimate is $365 million and includes a contingency of $50M based on approximately 15% of direct and indirect costs. |
| / | The capital cost estimate is based on approximately 95% of equipment and packages being quoted. Embedded budgetary vendor quotations have a stated accuracy of +15%. |
| / | Reagent and utility consumptions have been developed from the integrated mass balance and vendor recommendations. Power costs are based upon vendor motor selections. |
| / | Labor and management costs, maintenance materials, sustaining capital and contract labor costs were developed with input from the Project’s operations team. |
RSI-3353
| / | The operating cost for the life of the Project is estimated to be $6,810/t of lithium carbonate. Labor, reagents, consumables, and energy account for over 70% of the operating costs. All-in operating cost, including sustaining capital expenditures is $7,390/t. |
| / | The operating costs exclude any potential brine fees and future royalties (or brine lease-fees-in-lieu-of-royalties) yet to be established. |
| / | The timeline for development and first production appears realistic based on timely funding and is typical of projects of similar magnitude within industry. |
| / | In the QPs opinion the estimated capital cost at $365 million reasonably reflects the level of project understanding. The operating cost estimate is well supported and is considered to reasonably represent the expected Project OPEX. Both the CAPEX and OPEX are considered appropriate for the Definitive Feasibility Study level. |
| 25.8 | ECONOMIC ANALYSIS |
Project economics were derived from inputs based on the annual production schedule, capital expense estimate, and operating expense estimate as set forth in the DFS. The positive results from the economic analysis are summarized within the following conclusions:
| / | An after-tax NPV of $550M and IRR of 24% assuming discount rate of 8% and a long-term price of $30,000/t for battery-quality lithium carbonate and capital expenditure of $365 Million. |
| / | First production of battery-quality lithium carbonate is to occur in 2026 with an average annual production of 5,400 tpa over the operating life and a peak annual production of 5,700 tpa. |
| / | The Sensitivity analysis of the Project economics indicates that the Project is economically viable under the base case conditions as well as under the condition of the isolated case. The isolated cases included modeling a 20% increased CAPEX, a 20% reduced product Selling Price, a 5% reduced Production Output, and a 20% increased OPEX. |
| / | Running sensitivity analysis on DCF parameters resulted in the following rank of sensitivity listed from the most to least sensitive, respectfully: +/-20% change in lithium carbonate price, +/- 20% change in capital costs, +/-5% change in production rate, and +/- change in operating costs. |
Table 25-3. Project Economic Analysis Conclusions
| Project Parameters | Units | Values |
| Initial Annual Production of Li2CO3 | tpa [1] | 5,730 [2] |
| Average Annual Production of Li2CO3 | tpa | 5400 |
| Plant Operating Life | years | 25 [3] |
| Total Capital Expenditures | $ millions | 365 [4,5] |
| Average Annual Operating Cost | $/t | 6810 |
| Average Annual All-in Operating Cost | $/t | 7,390 [6,7] |
| Selling Price | $/t | 30,000 [8] |
| Discount Rate | % | 8 |
| Net Present Value (NPV) Pre-Tax | $ millions | 772 |
| Net Present Value (NPV) After-Tax | $ millions | 550[9] |
| Internal Rate of Return (IRR) Pre-Tax | % | 29.5 |
| Internal Rate of Return (IRR) After-Tax | % | 24.0 |
RSI-3353
Notes:
All model outputs are expressed on a 100% project ownership basis with no adjustments for project financing assumptions.
[1] Tonnes (1,000 kg) per annum.
[2] Initial annual production figure represents Year 2 production, following a ramp-up period in Year 1.
[3] Plant design and financial modelling based on 25-year economic life. Proven and Probable Reserves support a 40-year operating life.
[4] Capital Expenditures include 15% contingency.
[5] No inflation or escalation has been carried for the economic modelling.
[6] Includes operating expenditures, assumed brine supply fees, and sustaining capital.
[7] Brine lease-fees-in-lieu-of-royalties (to be approved by AOGC) have not been defined and are not currently included in the economic modelling.
[8] Selling price of battery-quality lithium carbonate based on a flatline price of $30,000/t over total project lifetime.
[9] Assumes a U.S. Federal tax rate of 21% and State of Arkansas Tax rate of 5.1%, as well as variable property taxes.
[10] Any discrepancies in the totals are due to rounding effects.
| 25.9 | PROJECT RISKS |
As with any development project, there exists potential risks and uncertainties. There are no known significant encumbrances on the Property. Standard Lithium will attempt to reduce risk/uncertainty through effective project management, utilization of technical experts, continued Demonstration Plant testing, community engagement, and development of contingency plans. The Project development and contracting approach to-date has incorporated risk mitigation clauses that support Project development certainty (i.e., term sheets, mechanical and performance guarantees, and delivery schedules). The risks to developing the Project on the Property include, but are not limited to, the following:
| / | Variations in production rate resulting from unanticipated well production issues. |
| / | Variations in produced lithium concentrations resulting from unanticipated reservoir heterogeneity. |
| / | Operational variances within the LANXESS South Plant that adversely impact the quality of the Feed Brine beyond those conditions that have already been experienced during Demonstration Plant operations. |
| / | Scalability from the Demonstration Plant to the commercial scale production. |
| / | Obtaining all the necessary permits and authorizations on acceptable terms, in a timely manner. |
| / | Variations in pricing of capital. |
| / | Variations in lithium carbonate product price. |
| / | Lithium brine royalty assessment by the AOGC is not completed in a timely manner and/or the royalty rates have a significant impact on project economics. |
| / | Finalization of the definitive commercial agreements. |
| / | Changes in laws and their implementation impacting activities on the Property. |
RSI-3353
| 26.0 | RECOMMENDATIONS |
The Qualified Persons involved in the Report make the following recommendations:
| / | Obtain and review any new log and core data collected in the West, Central, and South Brine Units which may become available in the future. Continue to monitor and analyze brine data from production wells in the South, Central and West Brine Units, in particular in relation to lithium concentration. |
| / | Continue to monitor the LANXESS South Unit brine production performance. If field performance deviates materially from forecasts, make necessary adjustments to geologic and simulation models and revise forecasts. |
| / | No new exploration drilling is needed for the Project. Currently all production wells for the Project are already constructed and producing brine. Based upon the amount of geological and production data available on the LANXESS Property no further drilling is required to collect additional geological information. There are no limitations on this data and the data can be used in this Technical Report. |
| / | Continue test work at the Demonstration Plant with the objectives of: |
| » | obtaining further understanding of long-term process performance, in particular for the selected DLE technology and associated unit operations; |
| » | supporting detailed engineering, including alternative equipment evaluations, process optimizations and other cost saving opportunities; and, |
| » | increasing operating knowledge of the lithium extraction process and associated brine field operations in support of operator development and the future commercial operation of the Project (and subsequent developments). |
| / | Continue to advance key permits and authorizations required for construction and operation of the Project, to ensure permits and authorizations remain off the critical path to commercial operation. |
| / | Address the responsibility for pre-existing environmental conditions in commercial agreements. |
| / | Continue the process of establishing project-specific lithium royalties (lease-fees-in-lieu-of-royalties) with the AOGC, in accordance with Arkansas Statute, to facilitate the commercial extraction of lithium. |
| / | Evaluate and pursue additional federal and state incentive programs including sales tax credits, state and federal income tax reductions, government grants, and other Critical Mineral incentive programs which may be available to improve overall Project economics. |
| / | Given the sensitivity of the Project economics to the product price, consider offtake pricing mechanisms to mitigate the commercial risk associated with short-term lithium price fluctuations. |
| / | Finalize definitive commercial agreements with LANXESS and other parties which are required to support a positive Final Investment Decision. |
The recommendations do not include any further exploration work programs given the Qualified Persons have determined the material exploration activities and engineering studies have been largely completed, and further exploration programs are not required at this time.
RSI-3353
| 27.0 | REFERENCES |
Ahr, W. M., 1973. The carbonate ramp – an alternative to the shelf model. Gulf Coast Association of Geological Societies Transactions, v. 23, p. 221–225.
Akin, R.H. and Graves, R.W., 1969. Reynolds oolite of southern Arkansas; The American Association of Petroleum Geologists, Bulletin v. 53, no. 9, p. 1909-1922.
Arkansas Oil & Gas Commission, 2018. South Brine Unit & South Brine Expansion Unit, Order 057-2018-10, November 19, 2p.
Arkansas Oil & Gas Commission, 2021. Production by Field – 2021. Accessed May 4, 2023, https://www.aogc.state.ar.us/annual/HistBrine.aspx?HYr=2021.
Arkansas Oil & Gas Commission, 2022a. South Arkansas Oil Production, 1970-2020. Accessed December 9, 2022, https://www.aogc.state.ar.us/annual/HistProduction.aspx?HYr=2020.
Arkansas Oil & Gas Commission. 2022b. LANXESS Brine Production-Injection Data, 2017-2022. Accessed May 4, 2023, https://www.aogc.state.ar.us/data/querybuild.aspx and https://www.aogc.state.ar.us/welldata/production.aspx.
Arkansas Oil & Gas Commission, 2023. Central Brine Unit Expansion Order Number 095-2022-12, January 5, 2023
Baria, L. R., Stoudt, D. L., Harris, P. M. and Crevello, P. D., 1982. Late Jurassic reefs of Smackover Formation, United States Gulf Coast. American Association of Petroleum Geologists Bulletin, v. 66, p. 1449–1482.
Benson, D.J., 1988. Depositional history of the Smackover Formation in southwest Alabama: Gulf Coast Association of Geological Societies Transactions, v. 38, p. 197-205.
Benson, T.R., M.A., Coble, J.J. Rutyba, and G.A Mahood 2017. Lithium enrichment in intracontinental rhyolite magmas leads to lithium deposits in caldera basins; Nature Communications, v. 8, no. 270, p. 1–9.
Bishop, W. F., 1968. Petrology of upper Smackover limestone in North Haynesville field, Claiborne Parish, Louisiana. American Association of Petroleum Geologists Bulletin, v. 52, p. 92–128.
Bishop, W. F., 1971a. Geology of a Smackover stratigraphic trap. American Association of Petroleum Geologists Bulletin, v. 55, p. 51–63.
Bishop, W. F., 1971b. Geology of upper member of Buckner Formation, Haynesville Field area, Claiborne Parish, Louisiana. American Association of Petroleum Geologists Bulletin, v. 55, p. 566–580.
Bishop, W. F., 1973. Late Jurassic contemporaneous faults in north Louisiana and south Arkansas. American Association of Petroleum Geologists Bulletin, v. 57, p. 566–580.
Blondes, M.S., Gans, K.D., Rowan, E.L., Thordsen, J.J., Reidy, M.E., Engle, M.A., Kharaka, Y.K. and Thomas B. (2016). U.S. Geological Survey National Produced Waters Geochemical Database v2.2 (PROVISIONAL) Documentation; USGS Energy Resources Program: Produced Waters, 16 Feb 2016, < Available on 14 July 2018 https://archive.org/stream/USGSProducedWatersV2.2c/USGS%20Produced%20Waters%20Database%20 v2.2%20Documentation_djvu.txt >.
RSI-3353
Blondes, M.S., K.D. Gans, E.L. Rowan, J.J. Thordsen, M. E. Reidy, M.A. Engle, Y.K. Kharaka, and B. Thomas B, 2019. U.S. Geological Survey National Produced Waters Geochemical Database v2.2 (PROVISIONAL) Documentation; USGS Energy Resources Program: Produced Waters, 16 Feb 2016, < Available on 14 July 2018 at: https://archive.org/stream/USGSProducedWatersV2.2c/USGS%20Produced%20Waters%20Database%20v2.2%20Documentation_djvu.txt >.
Bradley, D., H. Jochens, S. Hynek, and K Labay 2006. A Preliminary Deposit Model for Lithium Brines; USGS Open-File Report 2013–1006, 9 p.
Bradley, D.C., L.L. Stillings, B.W. Jaskula, L. Munk, and A.D. McCauley, 2017. Lithium, Schulz, K.J., DeYoung, J.H., Jr., Seal, R.R., II, and Bradley, D.C. (eds.), Critical mineral resources of the United States-Economic and environmental geology and prospects for future supply, U.S. Geological Survey Professional Paper 1802, p. K1-K21.
Budd, D. A. and R. G. Loucks, 1981. Smackover and lower Buckner formations, south Texas. Depositional systems on a carbonate ramp. Bureau of Economic Geology, The University of Texas at Austin, Report of Investigations, 112 p.
Budd, D. A., and R.G. Loucks, 1981, Smackover and Lower Buckner Formations South Texas: Depositional Systems on a Jurassic Carbonate Ramp: The University of Texas at Austin, Bureau of Economic Geology, Report of Investigations No. 112, 38 p.
Buffler, R.T., 1991. Early evolution of the Gulf of Mexico basin; In: D. Goldthwaite, (ed.), An Introduction to Central Gulf Coast Geology, New Orleans: New Orleans Geological Society, p. 1-15.
Buffler, R.T., Shaub, F.J., Huerta, R., Ibrahim, A.B.K. and Watkins, J.S., 1981. A model for the early evolution of the Gulf of Mexico; Oceanologica Acta, No. SP, p 129-136.
Bureau of Labor, 2022. U.S. Bureau of Labor Statistics, https://www.bls.gov/oes/current/oes_ar.htm
Chimene, C. A., 1991. Walker Creek field. In: Foster, N. H. and Beaumont, E. A. (eds) Stratigraphic Traps II. Treatise of Petroleum Geology, Atlas of Oil and Gas Fields. American Association of Petroleum Geologists, p. 55–116.
CIM, 2012. CIM Best Practice Guidelines for Resource and Reserve Estimation for Lithium Brines available online at https://mrmr.cim.org/media/1041/best-practice-guidelines-for-reporting-of-lithium-brine-resources-and-reserves.pdf
CIM, 2014. “CIM Definition Standards for Mineral Resources & Mineral Reserves” available online at https://mrmr.cim.org/media/1128/cim-definition-standards_2014.pdf
CIM, 2019. CIM Estimation of Mineral Resources and Mineral Reserves Best Practice Guidelines, prepared by the Canadian Institute of Mining, Metallurgy, and Petroleum, CIM Mineral Resources & Mineral Reserve Committee, Westmount, QC, Canada. Available online at https://mrmr.cim.org/media/1146/cim-mrmr-bp-guidelines_2019_may2022.pdf Collins, A. G., 1976. Lithium abundance in oilfield waters; Lithium Resources and Requirements by the Year 2000, U.S. Geol. Survey Prof. Paper 1005, p. 116–123.
RSI-3353
Daitch, P.J., 2018. Lithium extraction from oilfield brine; MSc/MBA Thesis, University of Texas at Austin, May 2018, 141 p.
Dickinson, K. A., 1968. Late Jurassic stratigraphy of some adjacent parts of Texas, Louisiana and Arkansas; U.S. Geol. Survey Prof. Paper, 594E, 25 p.
Dworzanowski, M., and D.R. Eccles, 2019. Preliminary Economic Assessment of LANXESS Smackover Project NI 43-101 Technical Report, Document No.: 207036-00088-00-PM-REP-0002, prepared for Standard Lithium, Saskatoon, Saskatchewan, Canada, August 1, 230p.
Eccles, D.R., W. Black, K. Hill, R. Molnar, K. Rakhit. 2018. Geological Introduction and Maiden Inferred Resource Estimate for Standard Lithium Ltd.’s LANXESS Smackover Lithium-Brine Property in Arkansas, United States, prepared for Standard Lithium, Ltd., Calgary, Alberta, Canada, November 19.
Eccles, D.R., J. Touw, W. Novak, R.M. McGowen, 2022, Maiden Inferred Bromine- and Lithium-Brine Resource Estimations for Tetra Technologies, Inc.’s Tetra Property in Arkansas, United States, September 15.
Enverus, 2023. Drilling Info, https://app.drillinginfo.com/production/#/default.
Evans, R.K. 2014 Lithium; In: A.G. Gunn (Ed.), Critical Metals Handbook, John Wiley & Sones td., Chichester, UK.
Fontes, J-C. and J. M. Matray, 1993. Geochemistry and origin of formation brines from the Paris Basin, France; Chemical Geology, v. 109, p. 149–175.
Forgotson, J.M., 1954. Regional stratigraphic analysis of Cotton Valley Group of Upper Gulf Coastal Plain: AAPG Bulletin, v. 38, p. 2476-2499.
Garrett, D.E., 2004 Handbook of Lithium and Natural Calcium Chloride: Their Deposits, Processing, Uses and Properties. Elsevier. 476 p.
Hanford, and Baria, 2007. Geometry and seismic geomorphology of carbonate shoreface clinoforms, Jurassic Smackover Formation, north LouisianaIn: In: Davies, R. J., Posamentier, H. W., Wood, L. J. and Cartwright, J. A. (eds) Seismic Geomorphology: Applications to Hydrocarbon Exploration and Production. Geological Society, London, Special Publications, v. 277, 171–185.
Harris, P. M. and Dodman, C. A., 1987. Jurassic evaporites of the U.S. Gulf Coast: the Smackover-Buckner contact; Society of Economic Paleontologists and Mineralogists, Depositional and Diagenetic Spectra of Evaporites (CW3), p. 174–192.
Hazzard, R.T., W.C. Spooner, and Blanpied, B.W., 1947. Notes on the stratigraphy of the formations which underlie the Smackover Limestone in south Arkansas, northeast Texas, and north Louisiana; Shreveport Geological Society 1945 Reference Report, v. 2, p. 483-503.
Hunt, B.W., 2013. Regional Norphlet Facies Correlation, Analysis and Implications for Paleostructure and Provenance, Eastern Gulf of Mexico; ProQuest Dissertations Publishing (1539948).
RSI-3353
Imlay, R.W. 1940. Lower Cretaceous and Jurassic formations of southern Arkansas and their oil and gas possibilities; Arkansas Geological Survey, Information Circular 12, 64 p.
Kopaska-Merkel, D.C., Mann, S.D. and Tew, B.H., 1992. Geological setting, petrophysical characteristics, and regional heterogeneity patterns of the Smackover in southwest Alabama; Geological Survey of Alabama, Contract No. DE-FG22-89BC14425, 215 p.
Kunasz, I. 2006, Lithium Resources; In: J.E. Kogel, N.C. Trivedi, J.M. Barker and S.T. Kurkowski (Eds)., Industrial Minerals and Rocks, 7th Edition Society of Mining, Metallurgy and Exploration Inc., Little Colorado, U.S., p. 599-613.
MacRae, G., and Watkins, J.S., 1996. Desoto Canyon Salt Basin: tectonic evolution and salts structural styles; In: J.O. Jones, and R.L. Freed, (Eds.), Structural Framework of the Northern Gulf of Mexico: A Special Publication of GCAGS, Austin, GCAGS, p. 53-61.
Magnolia Reporter, 2023. Albemarle Corporation building lithium pilot plants in Columbia County, Mike McNeill, publisher and editor August 3, 2023 updated September 13, 2023
https://www.magnoliareporter.com/news_and_business/local_business/article_237518fa-3237-11ee-9fac-d3df52622fc9.html
Mancini, E.A., Aharon, P., Goddard, D.A., Horn, M. and Barnaby, R., 2008. Basin analysis and petroleum system characterization and modelling, interior salt basins, central and eastern Gulf of Mexico, Part 3: tectonic / depositional history, resource assessment; Adapted from Final Report, issued June 30, 2008, for period May 1, 2003 to April 30, 2008, prepared for U.S. Department of Energy, for DOE Award Number DE-FC26-03NT15395 and available at Texas A&M University (http://berg-hughes.tamu.edu/research/sedimentary-basin-analysis-studies).
Mann, S.D., 1988. Subaqueous evaporites of the Buckner Formation, Haynesville Formation, Northeastern Mobile County, Alabama. Gulf Coast Association of Geological Societies Transactions 38, 187–196.
Marton, G.L. and Buffler, R.T., 2016. Jurassic-Cretaceous Tectonic Evolution of the Southeastern Gulf of Mexico, Constrains on the Style and Timing of Gulf of Mexico Rift-Drift Development; AAPG 2016 International Convention and Exhibition, Cancun, Mexico, September 6-9, 2016.
McKinsey & Company, 2023. Battery 2030: Resilient, sustainable, and circular. January 16
https://www.mckinsey.com/industries/automotive-and-assembly/our-insights/battery-2030-resilient-sustainable-and-circular
Moldovanyi, E.P. and L.M. Walter, 1992. Regional trends in water chemistry, Smackover Formation, southwest Arkansas: Geochemical and physical controls; The American Association of Petroleum Geologists, Bulletin, v. 76, no. 6., p. 864-894.
Moore, C.H. and Druckman, 1981. Burial diagenesis and porosity evolution, Late Jurassic Smackover, Arkansas and Louisiana; The American Association of Petroleum Geologists, 1981, p. 597-628.
Moore, C. H., 1984: The upper Smackover of the Gulf rim: depositional systems, diagenesis, porosity evolution and hydrocarbon production; In: W. P. S. Ventress, D. G. Bebout, B. F. Perkins, and C. H. Moore (eds.), The Jurassic of the Gulf rim: Gulf Coast Section SEPM, 3rd Annual Research Symposium, Program and Abstracts, p. 283–307.
Munk, L., Jochens, H., Jennings, M., Bradley, D. Hynek, S. and Godfrey, L. (2011): Geochemistry of lithium-rich brines in Clayton Valley, Nevada, USA; Presentation and paper from the 11th Biennial Meeting of the Society for Geology Applied to Mineral Deposits, 26-29 September 2011, Antofagasta, Chile.
RSI-3353
Nunn, J.A., 1984. Subsidence histories for the Jurassic sediments of the northern Gulf Coast: thermal-mechanical model; Third Annual Research Conf., Gulf Coast Section, SEPM Foundation, p. 309-322.
Pilger, R.H., Jr., 1981. The opening of the Gulf of Mexico: implications for the tectonic evolution of the northern Gulf Coast; GCAGS Transactions, v. 31, p. 377-381.
Salvador, A., 1987. Late Triassic-Jurassic paleography and origin of Gulf of Mexico basin; AAPG Bulletin, v. 71, p. 419-451.
Salvador, A., 1990. Triassic-Jurassic; In: Salvador, A., (ed.), The Geology of North America, v. J., The Gulf of Mexico Basin; Boulder, Geological Society of America, p. 131–180.
Salvador, A., 1991a. The Gulf of Mexico Basin: Decade of North American geology; v. DNAG, v. J: Boulder, Colorado, GSA, 568 p.
Salvador, A., 1991b. Triassic-Jurassic; In: A. Salvador, (ed.), The Gulf of Mexico Basin, Boulder, Colorado, GSA, p. 131-180.
Sawyer, D.S., R.T. Buffler, and R.H. Pilger, Jr., 1991. The crust under the Gulf of Mexico, in A. Salvadore, (ed.), The Gulf of Mexico Basin: Decade of North American Geology, Boulder, GSA, p. 53-72.
Schneider, H.C., 1924. Smackover Oil Field, Ouachita and Union Counties, Ark.; The Society of Petroleum Engineers, Transactions 70 (01), p. 1079-1099
Standard Lithium, 2022, Standard Lithium and Lanxess Finalize Plan for First Commercial Lithium Project in Arkansas; https://www.standardlithium.com/investors/news-events/press-releases/detail/113/standard-lithium-and-lanxess-finalize-plan-for-first
Shengsong, Y., 1986. The hydrochemical features of salt lakes in Qaidam Basin; Chinese Journal of Oceanology and Limnology, v. 4, no. 3, p. 383-403.
Schouakar-Stash, O., S.V. Alexeev, S.K. Frape, L.P. Alexeeva, and R.J. Drimmie, 2007: Geochemistry and stable isotopic signatures, including chlorine and bromine isotopes, of the deep groundwaters of the Siberian Platform, Russia; Applied Geochemistry, v. 22, p. 589-605.
Scott, K.R., W.E. Hayes and Fietz, R.P., 1961. Geology of the Eagle Mills Formation; GCAGS Transactions, v. 11, p. 1-14.
SouthArk,2023. South Arkansas College Catalyst Program, https://www.southark.edu/in-the-news/1301-catalyst-program-enrolling-now
Standard Lithium Ltd. 2023. Management’s Discussion and Analysis for the Three and Nine Months Ended March 31, 2023, https://d1io3yog0oux5.cloudfront.net/_4b683aa985ac14cd157062faf4aa6159/standardlithium/db/385/2073/file/SLL-+MDA+March+31+2023+FINAL.pdf
Standard Lithium 2023 Confidential: Site Access, License and Reservation Agreement (SARL) between Standard Lithium Ltd and LANXESS.
Stueber, A. M., Pushkar, P. and Hetherington, E.A. 1984. A Strontium Isotopic Study of Smackover Brines and Associated Solids, Southern Arkansas; Geochimica et Cosmochimica Acta, v. 48, p. 1637-1649.
RSI-3353
Swain F.M. and Anderson, E.G., 1993. Stratigraphy and Ostracoda of the Cotton Valley Group, north central Louisiana; Louisiana Geological Survey, Geological Bulletin no. 45, 239 p.
Tahil, W., 2007. The trouble with lithium; Meridian International Research, January 2007.
Tetra Technologies, Inc. 2023, United States Securities and exchange Commission Form 8-k Item 1.01 Entry into a Material Definitive Agreement. June 19 https://www.sec.gov/ix?doc=/Archives/edgar/data/844965/000095017023029677/tti-20230619.htm
Tonietto, S.N. and Pope, M.C., 2013. Diagenetic evolution and its influence on petrophysical properties of the Jurassic Smackover Formation thrombolite and grainstone units of Little Cedar Creek Field, Alabama; GCAGS Journal, v. 2, p. 68-84.
Troell, A. R. and Robinson, J. D., 1987. Regional stratigraphy of the Smackover limestone (Jurassic) in south Arkansas and north Louisiana, and the geology of Chalybeat Springs oil field. Gulf Coast Association of Geological Societies Transactions, v. 37, p. 225–262.
Van Siclen, D.C., 1984. Early opening of initially-closed Gulf of Mexico and central North Atlantic Ocean; GCAGS Transactions, v. 34, p. 265-275.
Vestal, Jack H., 1950. Petroleum geology of the Smackover Formation of southern Arkansas; State of Arkansas Geological Commission, p. 1-37.
Wade, W.J., and Moore, C.H., 1993. Jurassic sequence stra¬tigraphy of southwest Alabama; Gulf Coast Association of Geological Societies Transactions, v. 43, p. 431–443.
Walter, L.M., E.P. Molclovanyi and L.S. Land, 1990. Boron isotopic composition of subsurface brines (Smackover Formation, southwest Arkansas): Implications for chemical evolution and migration; Geological Society of America 1990 Annual Meeting Abstracts with Programs, p. A62.
Weather.gov, 2023, NOWdata – NOAA online Weather Data, https://www.weather.gov/wrh/climate?wfo=shv
Wilson, T.P. and D.T. Long 1993 Geochemistry and isotope chemistry of Michigan Basin brines: Devonian formations, Applied Geochemistry, Volume 8, Issue 1, January, p 81-100.
Winker, C.D. and Buffler, R.T., 1988. Paleogeographic evolution of early deep-water Gulf of Mexico and margins, Jurassic to Middle Cretaceous (Comanchaean): AAPG Bulletin, v. 72, p. 318-346.
Worley, 2019. Preliminary Economic Assessment of LANXESS Smackover Project NI 43-101 Technical Report, Document No.: 207036-00088-00-PM-REP-0002, prepared for Standard Lithium, Saskatoon, Saskatchewan, Canada, August 1, 230p.
Zheng, M., Yuan, H., Liu, J., Li, Y., Ma, Z. and Sun, Q., 2007. Sedimentary characteristics and paleoenvironmental records of Zabuye Salt Lake, Tibetan Plateay, since 128 ka BP; Acta Geological Sinica, v. 81, no. 5, p. 681-879.
Zimmerman, R. K., 1992. Fractured Smackover limestone in northeast Louisiana; Implications for hydrocarbon exploitation; AAPG Datapages/Archives, GCAGS Transactions, v. 42, p. 401-412.
RSI-3353