UNITED STATES
SECURITIES AND EXCHANGE COMMISSION
Washington, D.C. 20549
FORM 8-K
CURRENT REPORT
Pursuant to Section 13 OR 15(d) of The Securities Exchange Act of 1934
Date of Report (Date of earliest event reported): July 23, 2025
THE CHEESECAKE FACTORY INCORPORATED
(Exact name of registrant as specified in its charter)
| Delaware | 0-20574 | 51-0340466 | ||
| (State or other jurisdiction | (Commission | (IRS Employer | ||
| of incorporation) | File Number) | Identification No.) |
| 26901
Malibu Hills Road Calabasas Hills, California |
91301 | |
| (Address of principal executive offices) | (Zip Code) |
Registrant’s telephone number, including area code (818) 871-3000
Not Applicable
(Former name or former address, if changed since last report.)
Check the appropriate box below if the Form 8-K filing is intended to simultaneously satisfy the filing obligation of the registrant under any of the following provisions:
| ¨ | Written communications pursuant to Rule 425 under the Securities Act (17 CFR 230.425) |
| ¨ | Soliciting material pursuant to Rule 14a-12 under the Exchange Act (17 CFR 240.14a-12) |
| ¨ | Pre-commencement communications pursuant to Rule 14d-2(b) under the Exchange Act (17 CFR 240.14d-2(b)) |
| ¨ | Pre-commencement communications pursuant to Rule 13e-4(c) under the Exchange Act (17 CFR 240.13e-4(c)) |
Securities registered pursuant to Section 12(b) of the Act:
| Title of each class: | Trading Symbol(s) | Name of each exchange on which registered: | ||
| Common Stock, par value $.01 per share | CAKE | The Nasdaq Stock Market LLC |
Indicate by check mark whether the registrant is an emerging growth company as defined in Rule 405 of the Securities Act of 1933 (§230.405 of this chapter) or Rule 12b-2 of the Securities Exchange Act of 1934 (§240.12b-2 of this chapter).
Emerging growth company ¨
If an emerging growth company, indicate by check mark if the registrant has elected not to use the extended transition period for complying with any new or revised financial accounting standards provided pursuant to Section 13(a) of the Exchange Act. ¨
The following information under Item 2.02 of Form 8-K, “Results of Operations and Financial Condition” and Item 7.01 of Form 8-K, “Regulation FD Disclosure” is intended to be furnished. This information shall not be deemed “filed” for purposes of Section 18 of the Securities Exchange Act of 1934, as amended (the “Exchange Act”), or incorporated by reference in any filing under the Securities Act of 1933, as amended, or the Exchange Act, whether made before or after the date of this report, regardless of any general incorporation language in the filing.
| ITEM 2.02 | RESULTS OF OPERATIONS AND FINANCIAL CONDITION |
In a press release dated July 29, 2025, a copy of which is furnished as Exhibit 99.1 to this report, The Cheesecake Factory Incorporated (the “Company”) reported financial results for the second quarter of fiscal 2025, which ended on July 1, 2025.
| ITEM 7.01 | REGULATION FD DISCLOSURE |
Also on July 29, 2025, the Company posted an updated Investor Presentation on the Company’s Investor Relations website at investors.thecheesecakefactory.com. A copy of the presentation is furnished as Exhibit 99.2 hereto and is incorporated by reference herein.
| ITEM 8.01 | OTHER EVENTS |
Additionally, on July 23, 2025, the Board of Directors of the Company (the “Board”) declared a quarterly cash dividend of $0.27 per share which will be paid on August 26, 2025 to the stockholders of record of each share of the Company’s common stock at the close of business on August 12, 2025. Future decisions to pay or to increase or decrease dividends are at the discretion of the Board and will depend upon operating performance and other factors.
| ITEM 9.01 | FINANCIAL STATEMENTS AND EXHIBITS |
| (d) | Exhibits | |
| 99.1 | Press release dated July 29, 2025 entitled “The Cheesecake Factory Reports Results for Second Quarter of Fiscal 2025” | |
| 99.2 | The Cheesecake Factory Investor Presentation dated July 29, 2025 | |
| 104.1 | Cover Page Interactive Data File (embedded within the inline XBRL document) |
SIGNATURES
Pursuant to the requirements of the Securities Exchange Act of 1934, the Registrant has duly caused this report to be signed on its behalf by the undersigned hereunto duly authorized.
| Date: July 29, 2025 | THE CHEESECAKE FACTORY INCORPORATED | |
| By: | /s/ Matthew E. Clark | |
| Matthew E. Clark | ||
| Executive Vice President and Chief Financial Officer | ||
Exhibit 99.1

PRESS RELEASE
| FOR IMMEDIATE RELEASE | Contact: Etienne Marcus |
| (818) 871-3000 | |
| investorrelations@thecheesecakefactory.com |
THE CHEESECAKE FACTORY REPORTS RESULTS FOR
SECOND QUARTER OF FISCAL 2025
CALABASAS HILLS, Calif. – July 29, 2025 – The Cheesecake Factory Incorporated (NASDAQ: CAKE) today reported financial results for the second quarter of fiscal 2025, which ended on July 1, 2025.
Total revenues were $955.8 million in the second quarter of fiscal 2025 compared to $904.0 million in the second quarter of fiscal 2024. Net income and diluted net income per share were $54.8 million and $1.14, respectively, in the second quarter of fiscal 2025.
The Company recorded a pre-tax net expense of $1.2 million related to Fox Restaurant Concepts (“FRC”) acquisition-related items, and impairment of assets and lease termination expenses. Excluding the after-tax impact of these items, adjusted net income and adjusted diluted net income per share for the second quarter of fiscal 2025 were $55.7 million and $1.16, respectively. Please see the Company’s reconciliation of non-GAAP financial measures at the end of this press release.
Comparable restaurant sales at The Cheesecake Factory restaurants increased 1.2% year-over-year in the second quarter of fiscal 2025.
“We delivered another quarter of strong results, with record-high revenue, continued margin expansion, and profitability that exceeded our guidance,” said David Overton, Chairman and Chief Executive Officer. "The Cheesecake Factory restaurants led our performance, with comparable sales finishing above our expectations, reflecting healthy consumer demand for the delicious, memorable dining experiences we provide. Our restaurant teams executed exceptionally well, delivering year-over-year improvements in labor productivity, food efficiency, wage management, hourly staff and manager retention and guest satisfaction scores, driving solid earnings growth.”
Overton continued, “We opened eight new restaurants across various concepts and markets during the second quarter to strong consumer reception and encouraging early sales trends, reinforcing the broad appeal of our high-quality, experiential concepts. Our development pipeline remains on track, and with 16 openings through the first half of 2025, we’re pleased with the progress we’ve made on new unit growth so far this year. Looking ahead, we remain focused on carrying the momentum, operational discipline, and strong execution from the first half of the year into the back half of 2025, to continue driving the consistent performance that has long defined The Cheesecake Factory.”
26901 Malibu Hills Road, Calabasas Hills, CA 91301 • Telephone (818) 871-3000
Development
During the second quarter of fiscal 2025, the Company opened eight new restaurants, including two Cheesecake Factory’s, one North Italia, three Flower Child’s and two FRC restaurants. Subsequent to quarter-end, the Company opened one FRC restaurant, and one Cheesecake Factory opened internationally under a licensing agreement in Puebla City, Mexico.
The Company continues to expect to open as many as 25 new restaurants in fiscal 2025, including as many as four The Cheesecake Factory restaurants, six North Italia locations, six Flower Child locations and nine FRC restaurants.
Liquidity and Capital Allocation
As of July 1, 2025, the Company had total available liquidity of $515.3 million, including a cash balance of $148.8 million and $366.5 million of availability on its revolving credit facility with no outstanding balance. Total principal amount of debt outstanding was $644.0 million, including $69.0 million in principal amount of 0.375% convertible senior notes due 2026 and $575.0 million in principal amount of 2.00% convertible senior notes due 2030.
The Company repurchased approximately 2,500 shares of its stock at a cost of $0.1 million in the second quarter of fiscal 2025. In addition, the Company’s Board of Directors has declared a quarterly dividend of $0.27 per share to be paid on August 26, 2025, to shareholders of record at the close of business on August 12, 2025.
Conference Call and Webcast
The Company will hold a conference call to review its results for the second quarter of fiscal 2025 today at 2:00 p.m. Pacific Time. The conference call will be webcast live on the Company’s website at investors.thecheesecakefactory.com.
About The Cheesecake Factory Incorporated
The Cheesecake Factory Incorporated is a leader in experiential dining. We are culinary forward and relentlessly focused on hospitality. Delicious, memorable experiences created by passionate people—this defines who we are and where we are going. We currently own and operate 363 restaurants throughout the United States and Canada under brands including The Cheesecake Factory®, North Italia®, Flower Child® and a collection of other FRC brands. Internationally, 34 The Cheesecake Factory® restaurants operate under licensing agreements. Our bakery division operates two facilities that produce quality cheesecakes and other baked products for our restaurants, international licensees and third-party bakery customers. In 2025, we were named to the FORTUNE Magazine “100 Best Companies to Work For®” list for the twelfth consecutive year. To learn more, visit www.thecheesecakefactory.com, www.northitalia.com, www.iamaflowerchild.com and www.foxrc.com.
From Fortune. ©2025 Fortune Media IP Limited. All rights reserved. Used under license. Fortune® and Fortune 100 Best Companies to Work For® are registered trademarks of Fortune Media IP Limited and are used under license. Fortune and Fortune Media IP Limited are not affiliated with, and do not endorse products or services of, The Cheesecake Factory Incorporated.
26901 Malibu Hills Road, Calabasas Hills, CA 91301 • Telephone (818) 871-3000
Safe Harbor Statement
This press release contains forward-looking statements within the meaning of the Private Securities Litigation Reform Act of 1995, as codified in Section 27A of the Securities Act of 1933, as amended, and Section 21E of the Securities Exchange Act of 1934, as amended. These statements include, without limitation, statements regarding the Company’s operations, growth, restaurant development and other objectives. Such forward-looking statements include all other statements that are not historical facts, as well as statements that are preceded by, followed by or that include words or phrases such as “believe,” “plan,” “will likely result,” “expect,” “intend,” “will continue,” “is anticipated,” “estimate,” “project,” “may,” “could,” “would,” “should” and similar expressions. These statements are based on current expectations and involve risks and uncertainties which may cause results to differ materially from those set forth in such statements. Investors are cautioned that forward-looking statements are not guarantees of future performance and that undue reliance should not be placed on such statements. These forward-looking statements may be affected by various factors including: economic, public health and political conditions that impact consumer confidence and spending, including trade policy, interest rate fluctuations, periods of heightened inflation and market instability, and armed conflicts; supply chain disruptions; demonstrations, political unrest, potential damage to or closure of the Company’s restaurants and potential reputational damage to the Company or any of its brands; pandemics and related containment measures, including the potential for quarantines or restriction on in-person dining; acceptance and success of The Cheesecake Factory in international markets; acceptance and success of North Italia, Flower Child and Other Fox Restaurant Concepts restaurants; the risks of doing business abroad through Company-owned restaurants and/or licensees; foreign exchange rates, tariffs and cross border taxation; changes in unemployment rates; increases in minimum wages and benefit costs; the economic health of the Company’s landlords and other tenants in retail centers in which its restaurants are located, and the Company’s ability to successfully manage its lease arrangements with landlords; the economic health of suppliers, licensees, vendors and other third parties providing goods or services to the Company; the timing of new unit development and related permitting; compliance with debt covenants; strategic capital allocation decisions including with respect to share repurchases or dividends; the ability to achieve projected financial results; the resolution of uncertain tax positions with the Internal Revenue Service and the impact of tax reform legislation, including the provisions of H.R. I enacted on July 4, 2025; changes in laws impacting the Company’s business; adverse weather conditions in regions in which the Company’s restaurants are located; factors that are under the control of government agencies, landlords and other third parties; the risks, costs and uncertainties associated with opening new restaurants; and other risks and uncertainties detailed from time to time in the Company’s filings with the Securities and Exchange Commission (“SEC”). Forward-looking statements speak only as of the dates on which they are made, and the Company undertakes no obligation to publicly update or revise any forward-looking statements or to make any other forward-looking statements, whether as a result of new information, future events or otherwise, unless required to do so by law. Investors are referred to the full discussion of risks and uncertainties associated with forward-looking statements and the discussion of risk factors contained in the Company’s latest Annual Report on Form 10-K, Quarterly Reports on Form 10-Q and Current Reports on Form 8-K as filed with the SEC, which are available at www.sec.gov.
26901 Malibu Hills Road, Calabasas Hills, CA 91301 • Telephone (818) 871-3000
The Cheesecake Factory Incorporated
Condensed Consolidated Statements of Income
(unaudited; in thousands, except per share data)
| 13 Weeks Ended | 13 Weeks Ended | 26 Weeks Ended | 26 Weeks Ended | ||||||||||||||||||||||||||
| Consolidated Statements of Income | July 1, 2025 | July 2, 2024 | July 1, 2025 | July 2, 2024 | |||||||||||||||||||||||||
| Amount | Percent
of Revenues |
Amount | Percent
of Revenues |
Amount | Percent
of Revenues |
Amount | Percent
of Revenues |
||||||||||||||||||||||
| Revenues | $ | 955,825 | 100.0 | % | $ | 904,042 | 100.0 | % | $ | 1,883,022 | 100.0 | % | $ | 1,795,265 | 100.0 | % | |||||||||||||
| Costs and expenses: | |||||||||||||||||||||||||||||
| Food and beverage costs | 205,843 | 21.6 | % | 201,694 | 22.3 | % | 408,104 | 21.7 | % | 404,947 | 22.6 | % | |||||||||||||||||
| Labor expenses | 333,519 | 34.9 | % | 317,282 | 35.1 | % | 664,594 | 35.3 | % | 638,212 | 35.5 | % | |||||||||||||||||
| Other operating costs and expenses | 255,722 | 26.8 | % | 239,097 | 26.4 | % | 502,147 | 26.7 | % | 472,638 | 26.3 | % | |||||||||||||||||
| General and administrative expenses | 58,778 | 6.1 | % | 54,384 | 6.0 | % | 118,710 | 6.3 | % | 114,750 | 6.4 | % | |||||||||||||||||
| Depreciation and amortization expenses | 26,860 | 2.8 | % | 24,960 | 2.8 | % | 52,942 | 2.8 | % | 49,716 | 2.8 | % | |||||||||||||||||
| Impairment of assets and lease termination expenses/(income) | 222 | 0.0 | % | (188 | ) | 0.0 | % | 600 | 0.0 | % | 1,895 | 0.1 | % | ||||||||||||||||
| Acquisition-related contingent consideration, compensation and amortization expenses | 1,012 | 0.1 | % | 1,146 | 0.1 | % | 2,010 | 0.1 | % | 2,267 | 0.1 | % | |||||||||||||||||
| Preopening costs | 9,047 | 0.9 | % | 6,975 | 0.8 | % | 17,134 | 0.9 | % | 12,855 | 0.7 | % | |||||||||||||||||
| Total costs and expenses | 891,003 | 93.2 | % | 845,350 | 93.5 | % | 1,766,241 | 93.8 | % | 1,697,280 | 94.5 | % | |||||||||||||||||
| Income from operations | 64,822 | 6.8 | % | 58,692 | 6.5 | % | 116,781 | 6.2 | % | 97,985 | 5.5 | % | |||||||||||||||||
| Interest expense, net | (2,873 | ) | (0.3 | )% | (2,761 | ) | (0.3 | )% | (5,201 | ) | (0.3 | )% | (5,539 | ) | (0.3 | )% | |||||||||||||
| Loss on debt extinguishment | - | 0.0 | % | - | 0.0 | % | (15,891 | ) | (0.8 | )% | - | 0.0 | % | ||||||||||||||||
| Other income, net | 280 | 0.0 | % | 413 | 0.0 | % | 1,023 | 0.0 | % | 1,430 | 0.0 | % | |||||||||||||||||
| Income before income taxes | 62,229 | 6.5 | % | 56,344 | 6.2 | % | 96,712 | 5.1 | % | 93,876 | 5.2 | % | |||||||||||||||||
| Income tax provision | 7,417 | 0.8 | % | 3,900 | 0.4 | % | 8,959 | 0.4 | % | 8,241 | 0.4 | % | |||||||||||||||||
| Net income | $ | 54,812 | 5.7 | % | $ | 52,444 | 5.8 | % | $ | 87,753 | 4.7 | % | $ | 85,635 | 4.8 | % | |||||||||||||
| Basic net income per share | $ | 1.18 | $ | 1.10 | $ | 1.87 | $ | 1.79 | |||||||||||||||||||||
| Basic weighted average shares outstanding | 46,391 | 47,702 | 46,958 | 47,726 | |||||||||||||||||||||||||
| Diluted net income per share | $ | 1.14 | $ | 1.08 | $ | 1.80 | $ | 1.76 | |||||||||||||||||||||
| Diluted weighted average shares outstanding | 48,102 | 48,775 | 48,679 | 48,685 | |||||||||||||||||||||||||
26901 Malibu Hills Road, Calabasas Hills, CA 91301 • Telephone (818) 871-3000
The Cheesecake Factory Incorporated
Selected Segment Information
(unaudited; in thousands)
| For the 13 Weeks Ended July 1, 2025 | ||||||||||||||||||||
| The Cheesecake | ||||||||||||||||||||
| Factory | North | Other | ||||||||||||||||||
| restaurants | Italia | FRC | Other | Total | ||||||||||||||||
| Revenues | $ | 683,257 | $ | 90,830 | $ | 90,178 | $ | 91,560 | $ | 955,825 | ||||||||||
| Costs and expenses: | ||||||||||||||||||||
| Food and beverage costs | 147,377 | 19,835 | 19,794 | 18,837 | 205,843 | |||||||||||||||
| Labor expenses | 231,241 | 33,519 | 33,445 | 35,314 | 333,519 | |||||||||||||||
| Other operating costs and expenses | 178,142 | 24,057 | 27,229 | 26,294 | 255,722 | |||||||||||||||
| General and administrative expenses | - | - | - | 58,778 | 58,778 | |||||||||||||||
| Depreciation and amortization expenses | 16,196 | 3,074 | 3,264 | 4,326 | 26,860 | |||||||||||||||
| Impairment of assets and lease terminations expenses | 196 | - | 15 | 11 | 222 | |||||||||||||||
| Acquisition-related contingent consideration, compensation and amortization expenses | - | - | 315 | 697 | 1,012 | |||||||||||||||
| Preopening costs | 3,558 | 1,946 | 2,202 | 1,341 | 9,047 | |||||||||||||||
| Total costs and expenses | 576,710 | 82,431 | 86,264 | 145,598 | 891,003 | |||||||||||||||
| Income/(loss) from operations | $ | 106,547 | $ | 8,399 | $ | 3,914 | $ | (54,038 | ) | $ | 64,822 | |||||||||
| For the 13 Weeks Ended July 2, 2024 | ||||||||||||||||||||
| The Cheesecake | ||||||||||||||||||||
| Factory | North | Other | ||||||||||||||||||
| restaurants | Italia | FRC | Other | Total | ||||||||||||||||
| Revenues | $ | 676,697 | $ | 75,514 | $ | 73,637 | $ | 78,194 | $ | 904,042 | ||||||||||
| Costs and expenses: | ||||||||||||||||||||
| Food and beverage costs | 151,768 | 17,412 | 16,648 | 15,866 | 201,694 | |||||||||||||||
| Labor expenses | 230,651 | 27,787 | 26,740 | 32,104 | 317,282 | |||||||||||||||
| Other operating costs and expenses | 174,345 | 21,074 | 21,368 | 22,310 | 239,097 | |||||||||||||||
| General and administrative expenses | - | - | - | 54,384 | 54,384 | |||||||||||||||
| Depreciation and amortization expenses | 16,257 | 2,322 | 2,790 | 3,591 | 24,960 | |||||||||||||||
| Impairment of assets and lease terminations (income)/expenses | 267 | - | - | (455 | ) | (188 | ) | |||||||||||||
| Acquisition-related contingent consideration, compensation and amortization expenses | - | - | 315 | 831 | 1,146 | |||||||||||||||
| Preopening costs | 2,374 | 1,412 | 2,186 | 1,003 | 6,975 | |||||||||||||||
| Total costs and expenses | 575,662 | 70,007 | 70,047 | 129,634 | 845,350 | |||||||||||||||
| Income/(loss) from operations | $ | 101,035 | $ | 5,507 | $ | 3,590 | $ | (51,440 | ) | $ | 58,692 | |||||||||
| For the 26 Weeks Ended July 1, 2025 | ||||||||||||||||||||
| The Cheesecake | ||||||||||||||||||||
| Factory | North | Other | ||||||||||||||||||
| restaurants | Italia | FRC | Other | Total | ||||||||||||||||
| Revenues | $ | 1,355,991 | $ | 174,240 | $ | 177,602 | $ | 175,189 | $ | 1,883,022 | ||||||||||
| Costs and expenses: | ||||||||||||||||||||
| Food and beverage costs | 295,032 | 38,250 | 38,943 | 35,879 | 408,104 | |||||||||||||||
| Labor expenses | 464,632 | 65,436 | 65,007 | 69,519 | 664,594 | |||||||||||||||
| Other operating costs and expenses | 352,746 | 46,677 | 52,794 | 49,930 | 502,147 | |||||||||||||||
| General and administrative expenses | - | - | - | 118,710 | 118,710 | |||||||||||||||
| Depreciation and amortization expenses | 32,422 | 5,872 | 6,299 | 8,349 | 52,942 | |||||||||||||||
| Impairment of assets and lease terminations expenses | 271 | - | 315 | 14 | 600 | |||||||||||||||
| Acquisition-related contingent consideration, compensation and amortization expenses | - | - | 631 | 1,379 | 2,010 | |||||||||||||||
| Preopening costs | 4,908 | 4,626 | 4,995 | 2,605 | 17,134 | |||||||||||||||
| Total costs and expenses | 1,150,011 | 160,861 | 168,984 | 286,385 | 1,766,241 | |||||||||||||||
| Income/(loss) from operations | $ | 205,980 | $ | 13,379 | $ | 8,618 | $ | (111,196 | ) | $ | 116,781 | |||||||||
| For the 26 Weeks Ended July 2, 2024 | ||||||||||||||||||||
| The Cheesecake | ||||||||||||||||||||
| Factory | North | Other | ||||||||||||||||||
| restaurants | Italia | FRC | Other | Total | ||||||||||||||||
| Revenues | $ | 1,344,491 | $ | 146,388 | $ | 147,866 | $ | 156,520 | $ | 1,795,265 | ||||||||||
| Costs and expenses: | ||||||||||||||||||||
| Food and beverage costs | 305,338 | 34,449 | 33,234 | 31,926 | 404,947 | |||||||||||||||
| Labor expenses | 465,863 | 54,989 | 52,856 | 64,504 | 638,212 | |||||||||||||||
| Other operating costs and expenses | 346,826 | 40,566 | 42,138 | 43,108 | 472,638 | |||||||||||||||
| General and administrative expenses | - | - | - | 114,750 | 114,750 | |||||||||||||||
| Depreciation and amortization expenses | 33,100 | 4,293 | 5,215 | 7,108 | 49,716 | |||||||||||||||
| Impairment of assets and lease terminations expenses/(income) | 2,126 | - | - | (231 | ) | 1,895 | ||||||||||||||
| Acquisition-related contingent consideration, compensation and amortization expenses | - | - | 631 | 1,636 | 2,267 | |||||||||||||||
| Preopening costs | 4,132 | 3,414 | 3,910 | 1,399 | 12,855 | |||||||||||||||
| Total costs and expenses | 1,157,385 | 137,711 | 137,984 | 264,200 | 1,697,280 | |||||||||||||||
| Income/(loss) from operations | $ | 187,106 | $ | 8,677 | $ | 9,882 | $ | (107,680 | ) | $ | 97,985 | |||||||||
26901 Malibu Hills Road, Calabasas Hills, CA 91301 • Telephone (818) 871-3000
The Cheesecake Factory Incorporated
Selected Operating, Restaurant and Balance Sheet Information
(unaudited; in thousands, except statistical data)
| 13 Weeks Ended | 13 Weeks Ended | 26 Weeks Ended | 26 Weeks Ended | |||||||||||||
| July 1, 2025 | July 2, 2024 | July 1, 2025 | July 2, 2024 | |||||||||||||
| The Cheesecake Factory restaurants operating information: | ||||||||||||||||
| Comparable restaurant sales vs. prior year | 1.2 | % | 1.4 | % | 1.1 | % | 0.4 | % | ||||||||
| Restaurants opened during period | 2 | 1 | 2 | 1 | ||||||||||||
| Restaurants open at period-end | 216 | 217 | 216 | 217 | ||||||||||||
| Restaurant operating weeks | 2,785 | 2,808 | 5,580 | 5,615 | ||||||||||||
| North Italia operating information: | ||||||||||||||||
| Comparable restaurant sales vs. prior year | (1 | )% | 2 | % | (1 | )% | 3 | % | ||||||||
| Restaurants opened during period | 1 | 1 | 4 | 3 | ||||||||||||
| Restaurants open at period-end | 46 | 39 | 46 | 39 | ||||||||||||
| Restaurant operating weeks | 591 | 499 | 1,151 | 979 | ||||||||||||
| Other Fox Restaurant Concepts (FRC) operating information:(1) | ||||||||||||||||
| Restaurants opened during period | 2 | 1 | 4 | 3 | ||||||||||||
| Restaurants open at period-end | 51 | 43 | 51 | 43 | ||||||||||||
| Restaurant operating weeks | 659 | 549 | 1,285 | 1,079 | ||||||||||||
| Other operating information:(2) | ||||||||||||||||
| Restaurants opened during period | 3 | 2 | 6 | 3 | ||||||||||||
| Restaurants open at period-end | 49 | 41 | 49 | 41 | ||||||||||||
| Restaurant operating weeks | 618 | 520 | 1,201 | 1,036 | ||||||||||||
| Number of company-owned restaurants: | ||||||||||||||||
| The Cheesecake Factory | 216 | |||||||||||||||
| North Italia | 46 | |||||||||||||||
| Other FRC | 51 | |||||||||||||||
| Other | 49 | |||||||||||||||
| Total | 362 | |||||||||||||||
| Number of international-licensed restaurants: | ||||||||||||||||
| The Cheesecake Factory | 33 | |||||||||||||||
| (1) The Other FRC segment includes all FRC brands except Flower Child. |
| (2) The Other segment includes the Flower Child, Grand Lux Cafe and Social Monk Asian Kitchen concepts, as well as the Company's third-party bakery, international and consumer packaged goods businesses, unallocated corporate expenses and gift card costs. |
| Selected Consolidated Balance Sheet Information | July 1, 2025 | December 31, 2024 | ||||||
| Cash and cash equivalents | $ | 148,763 | $ | 84,176 | ||||
| Current and long-term debt, net of issuance costs (1) | 628,237 | 452,062 | ||||||
| (1) Includes $68.6 million net balance of 0.375% convertible senior notes due 2026 (principal amount of $69 million less $0.4 million in unamortized issuance costs) and $559.6 million net balance of 2.00% convertible senior notes due 2030 (principal amount of $575 million less $15.4 million in unamortized issuance costs). The unamortized issuance costs were recorded as a contra-liability and netted with current and long-term debt on the Condensed Consolidated Balance Sheet and are being amortized as interest expense. |
26901 Malibu Hills Road, Calabasas Hills, CA 91301 • Telephone (818) 871-3000
Reconciliation of Non-GAAP Results to GAAP Results
In addition to the results provided in accordance with accounting principles generally accepted in the United States of America (“GAAP”) in this press release, the Company is providing non-GAAP measurements which present net income and net income per share excluding the impact of certain items. The non-GAAP measurements are intended to supplement the presentation of the Company’s financial results in accordance with GAAP. These non-GAAP measures are calculated by eliminating from net income and diluted net income per share the impact of items the Company does not consider indicative of its ongoing operations. The Company uses these non-GAAP financial measures for financial and operational decision-making and as a means to evaluate period-to-period comparisons.
The Cheesecake Factory Incorporated
Reconciliation
of Non-GAAP Financial Measures
(unaudited; in thousands, except per share data)
| 13 Weeks Ended | 13 Weeks Ended | 26 Weeks Ended | 26 Weeks Ended | |||||||||||||
| July 1, 2025 | July 2, 2024 | July 1, 2025 | July 2, 2024 | |||||||||||||
| Net income (GAAP) | $ | 54,812 | $ | 52,444 | $ | 87,753 | $ | 85,635 | ||||||||
| Impairment of assets and lease termination expenses/(income)(1) | 222 | (188 | ) | 600 | 1,895 | |||||||||||
| Acquisition-related contingent consideration, compensation and amortization expenses(2) | 1,012 | 1,146 | 2,010 | 2,267 | ||||||||||||
| Loss on extinguishment of debt(3) | - | - | 15,891 | - | ||||||||||||
| Tax effect of adjustments(4) | (321 | ) | (249 | ) | (4,811 | ) | (1,082 | ) | ||||||||
| Adjusted net income (non-GAAP) | $ | 55,725 | $ | 53,153 | $ | 101,443 | $ | 88,715 | ||||||||
| Diluted net income per share (GAAP) | $ | 1.14 | $ | 1.08 | $ | 1.80 | $ | 1.76 | ||||||||
| Impairment of assets and lease termination expenses/(income)(1) | 0.00 | (0.00 | ) | 0.01 | 0.04 | |||||||||||
| Acquisition-related contingent consideration, compensation and amortization expenses(2) | 0.02 | 0.02 | 0.04 | 0.05 | ||||||||||||
| Loss on extinguishment of debt(3) | - | - | 0.33 | - | ||||||||||||
| Tax effect of adjustments(4) | (0.01 | ) | (0.01 | ) | (0.10 | ) | (0.02 | ) | ||||||||
| Adjusted diluted net income per share (non-GAAP)(5) | $ | 1.16 | $ | 1.09 | $ | 2.08 | $ | 1.82 | ||||||||
| (1) A detailed breakdown of impairment of assets and lease termination expenses/(income) recorded in the thirteen and twenty-six weeks ended July 1, 2025 and July 2, 2024 can be found in the Selected Segment Information table. |
| (2) Represents changes in the fair value of the deferred consideration and contingent consideration and compensation liabilities related to the North Italia and FRC acquisition, as well as amortization of acquired definite-lived licensing agreements. |
| (3) Represents premium paid and acceleration of previously unamortized deferred financing costs as a result of partial redemption of our convertible senior notes due 2026. |
| (4) Based on the federal statutory rate and an estimated blended state tax rate, the tax effect on all adjustments assumes a 26% tax rate for the fiscal 2025 and 2024 periods. |
| (5) Adjusted net income per share may not add due to rounding. |
26901 Malibu Hills Road, Calabasas Hills, CA 91301 • Telephone (818) 871-3000
Exhibit 99.2
|
INVESTOR PRESENTATION July 29, 2025 |
|
SAFE HARBOR STATEMENT 2 This presentation contains forward-looking statements within the meaning of Section 27A of the Securities Act of 1933, as amended, and Section 21E of the Securities Exchange Act of 1934, as amended. This includes, without limitation, financial guidance and projections, including underlying assumptions, and statements with respect to expectations of the Company’s future financial condition, results of operations, cash flows, share repurchases, objectives, growth potential, engines and opportunities, expected growth rates and targets, market potential and total addressable market runway; growth outlook; industry-leading comparable sales growth, retention and competitive position; quality control and supply chain efficiencies; operational execution and retention; annualized average unit volume; the Company’s differentiation and strong foothold in the off-premise channel; the opportunity for additional domestic and foreign locations and licensees and territories; target returns for new restaurant openings; international expansion; North Italia and Fox Restaurant Concepts (“FRC”) as growth drivers and FRC as an incubation engine; new restaurant targeted ranges and unit growth rates. Such forward-looking statements include all other statements that are not historical facts, as well as statements that are preceded by, followed by or that include words or phrases such as “believe,” “plan,” “will likely result,” “expect,” “intend,” “will continue,” “is anticipated,” “estimate,” “project,” “may,” “could,” “would,” “should” and similar expressions. These statements are based on current expectations and involve risks and uncertainties which may cause results to differ materially from those set forth in such statements. Investors are cautioned that forward-looking statements are not guarantees of future performance and that undue reliance should not be placed on such statements. These forward-looking statements may be affected by various factors including: economic, public health and political conditions that impact consumer confidence and spending, including changes in interest rates, periods of heightened inflation and market instability, and armed conflicts; supply chain disruptions; demonstrations, political unrest, potential damage to or closure of our restaurants and potential reputational damage to us or any of our brands; pandemics and related containment measures, including the potential for quarantines or restriction on in-person dining; acceptance and success of The Cheesecake Factory in international markets; acceptance and success of North Italia and the FRC concepts; the risks of doing business abroad through Company-owned restaurants and/or licensees; foreign exchange rates, tariffs and cross border taxation; changes in unemployment rates; increases in minimum wages and benefit costs; the economic health of our landlords and other tenants in retail centers in which our restaurants are located, and our ability to successfully manage our lease arrangements with landlords; the economic health of suppliers, licensees, vendors and other third parties providing goods or services to us; the timing of our new unit development and related permitting; compliance with debt covenants; strategic capital allocation decisions including with respect to share repurchases or dividends; the ability to achieve projected financial results; the resolution of uncertain tax positions with the Internal Revenue Service and the impact of tax reform legislation, including the provisions of H.R.I enacted on July 4, 2025; changes in laws impacting our business; adverse weather conditions and natural disasters in regions in which our restaurants are located; factors that are under the control of government agencies, landlords and other third parties; the risks, costs and uncertainties associated with opening new restaurants; and other risks and uncertainties detailed from time to time in the Company’s filings with the Securities and Exchange Commission (“SEC”). Forward-looking statements speak only as of the dates on which they are made and the Company undertakes no obligation to publicly update or revise any forward-looking statements or to make any other forward-looking statements, whether as a result of new information, future events or otherwise, unless required to do so by law. Investors are referred to the full discussion of risks and uncertainties associated with forward-looking statements and the discussion of risk factors contained in the Company’s latest Annual Report on Form 10-K, Quarterly Reports on Form 10-Q and Current Reports on Form 8-K as filed with the SEC, which are available at www.sec.gov. |
|
COMPANY OVERVIEW |
|
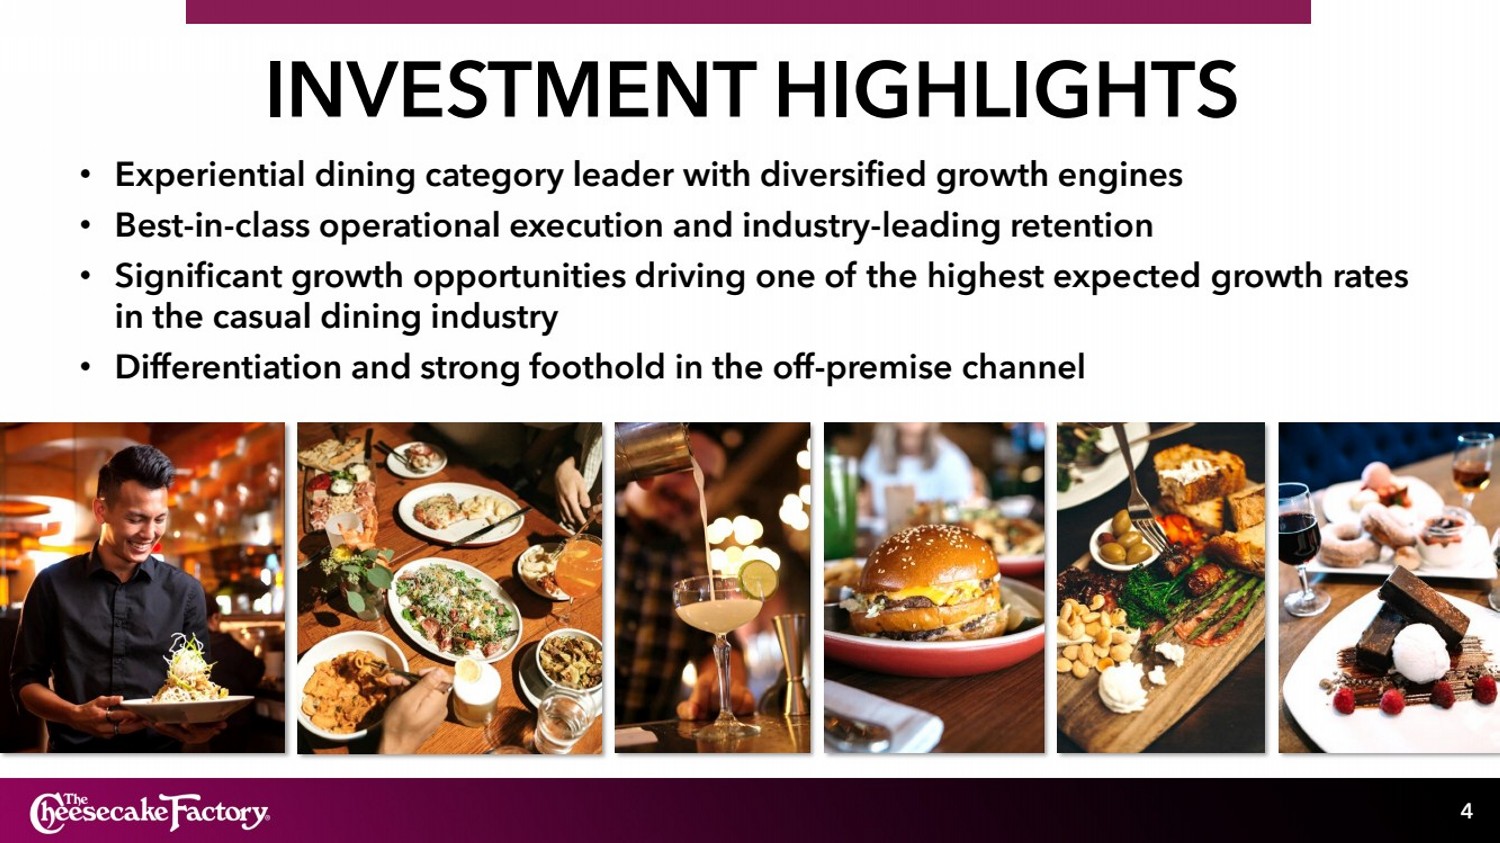
INVESTMENT HIGHLIGHTS 4 • Experiential dining category leader with diversified growth engines • Best-in-class operational execution and industry-leading retention • Significant growth opportunities driving one of the highest expected growth rates in the casual dining industry • Differentiation and strong foothold in the off-premise channel |
|
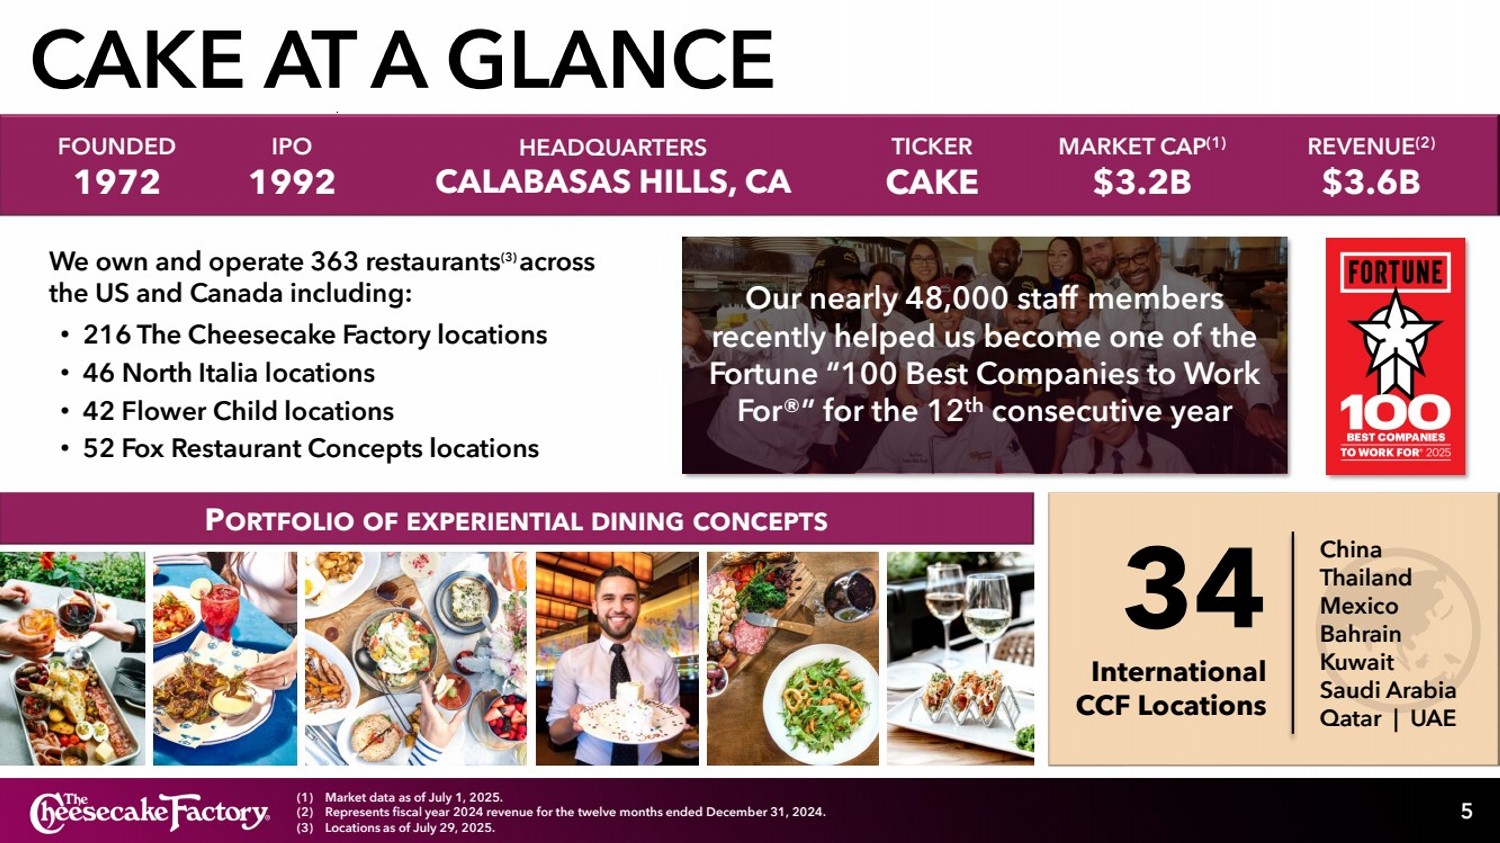
CAKE AT A GLANCE 5 (1) Market data as of July 1, 2025. (2) Represents fiscal year 2024 revenue for the twelve months ended December 31, 2024. (3) Locations as of July 29, 2025. We own and operate 363 restaurants(3) across the US and Canada including: • 216 The Cheesecake Factory locations • 46 North Italia locations • 42 Flower Child locations • 52 Fox Restaurant Concepts locations Our nearly 48,000 staff members recently helped us become one of the Fortune “100 Best Companies to Work For®” for the 12th consecutive year 34 International CCF Locations China Thailand Mexico Bahrain Kuwait Saudi Arabia Qatar | UAE FOUNDED 1972 IPO 1992 TICKER CAKE REVENUE(2) $3.6B HEADQUARTERS CALABASAS HILLS, CA MARKET CAP(1) $3.2B PORTFOLIO OF EXPERIENTIAL DINING CONCEPTS |
|
6 |
|
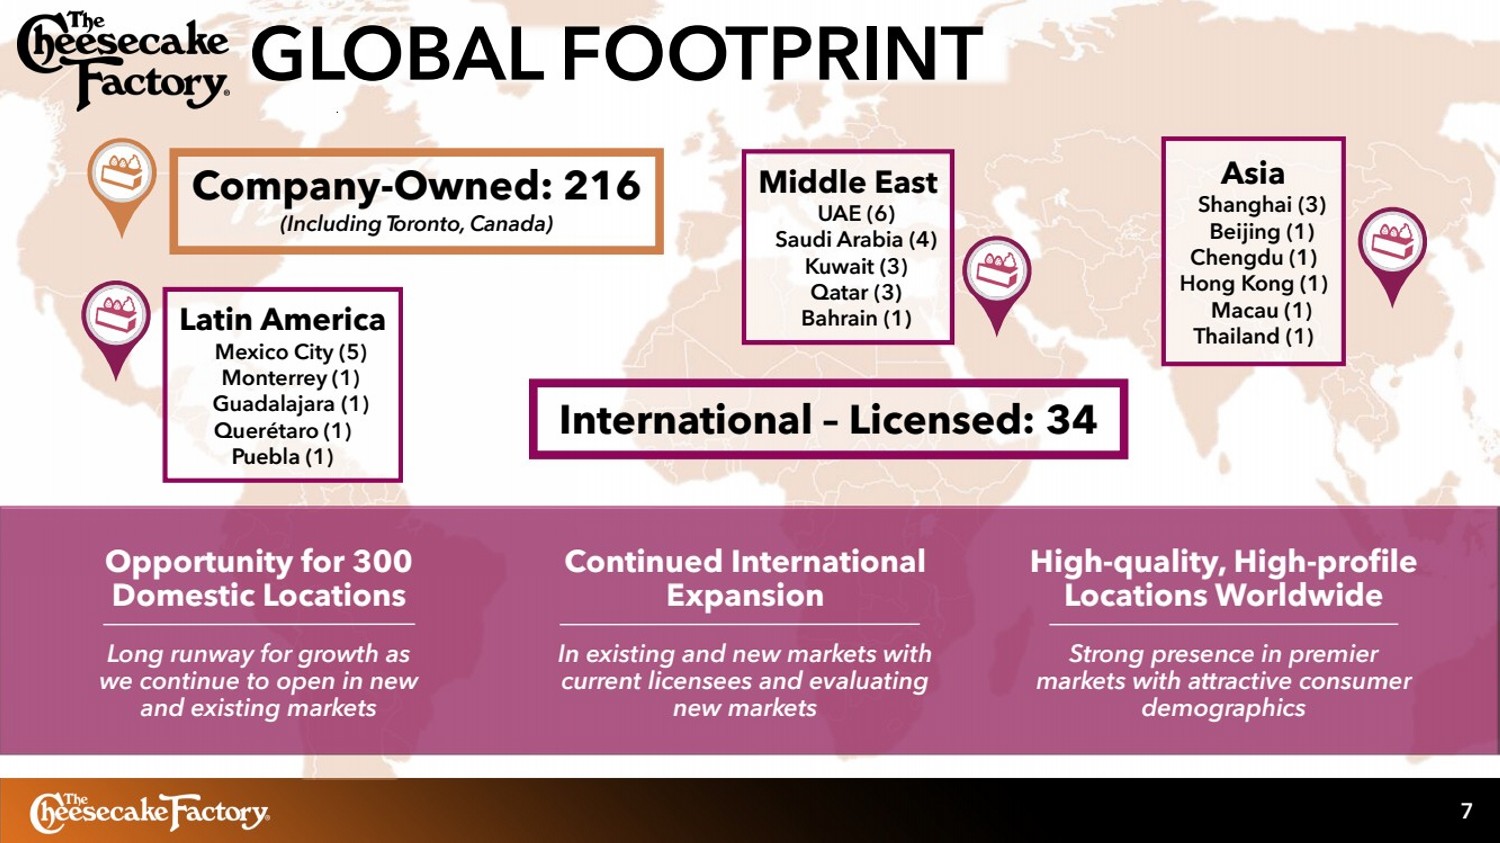
GLOBAL FOOTPRINT 7 Company-Owned: 216 (Including Toronto, Canada) Latin America Mexico City (5) Monterrey (1) Guadalajara (1) Querétaro (1) Puebla (1) Asia Shanghai (3) Beijing (1) Chengdu (1) Hong Kong (1) Macau (1) Thailand (1) Middle East UAE (6) Saudi Arabia (4) Kuwait (3) Qatar (3) Bahrain (1) International – Licensed: 34 Opportunity for 300 Domestic Locations Long runway for growth as we continue to open in new and existing markets Continued International Expansion In existing and new markets with current licensees and evaluating new markets High-quality, High-profile Locations Worldwide Strong presence in premier markets with attractive consumer demographics |
|
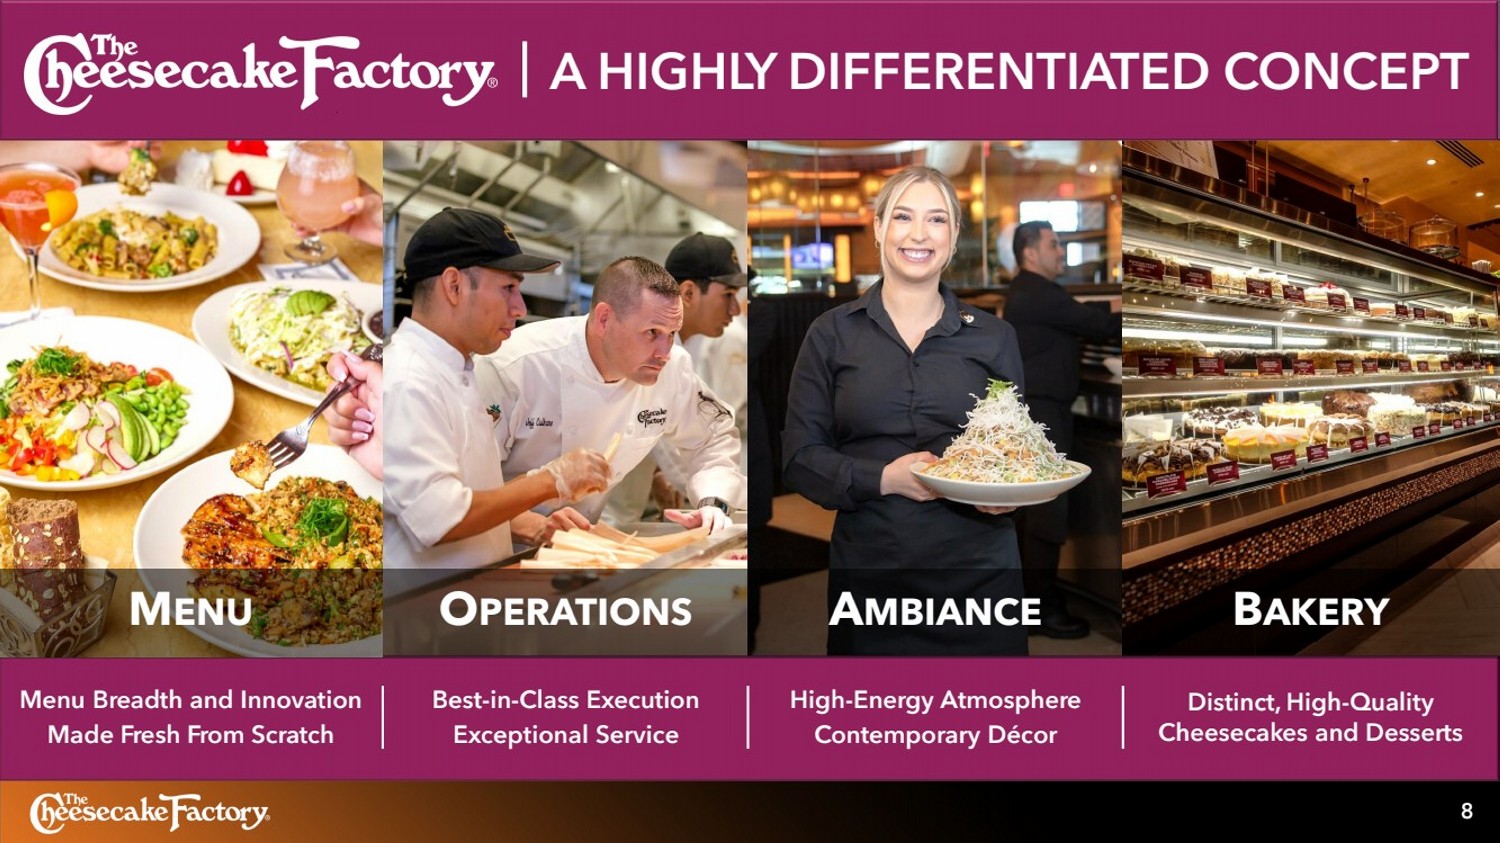
8 High-Energy Atmosphere Contemporary Décor Distinct, High-Quality Cheesecakes and Desserts Best-in-Class Execution Exceptional Service Menu Breadth and Innovation Made Fresh From Scratch MENU OPERATIONS AMBIANCE BAKERY A HIGHLY DIFFERENTIATED CONCEPT |
|
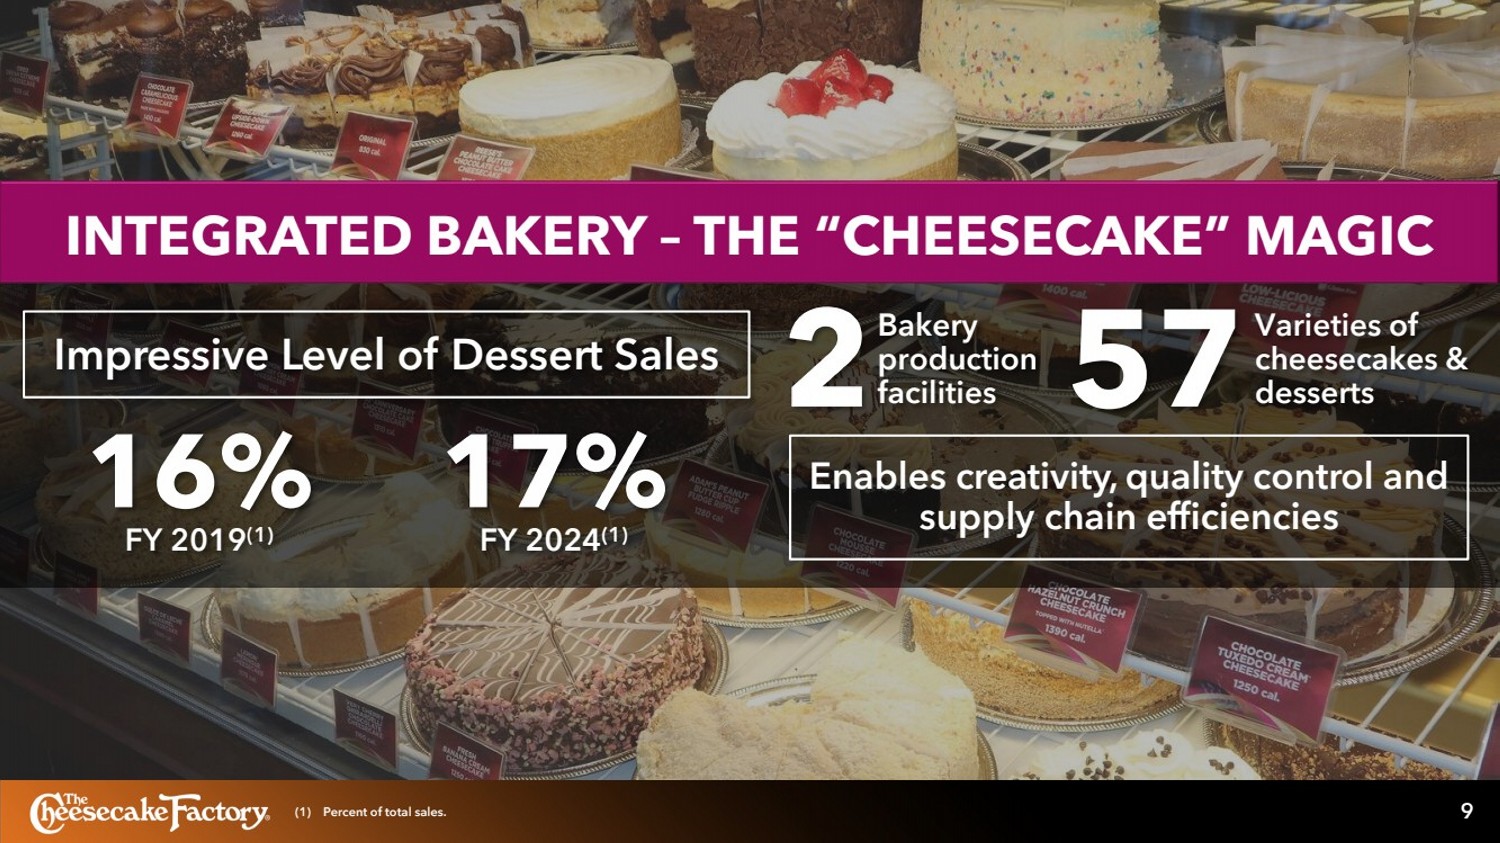
9 INTEGRATED BAKERY – THE “CHEESECAKE” MAGIC Enables creativity, quality control and supply chain efficiencies 57 Varieties of cheesecakes & 2 desserts Bakery production facilities 17% FY 2024(1) 1 FY 2019 6% (1) (1) Percent of total sales. Impressive Level of Dessert Sales |
|
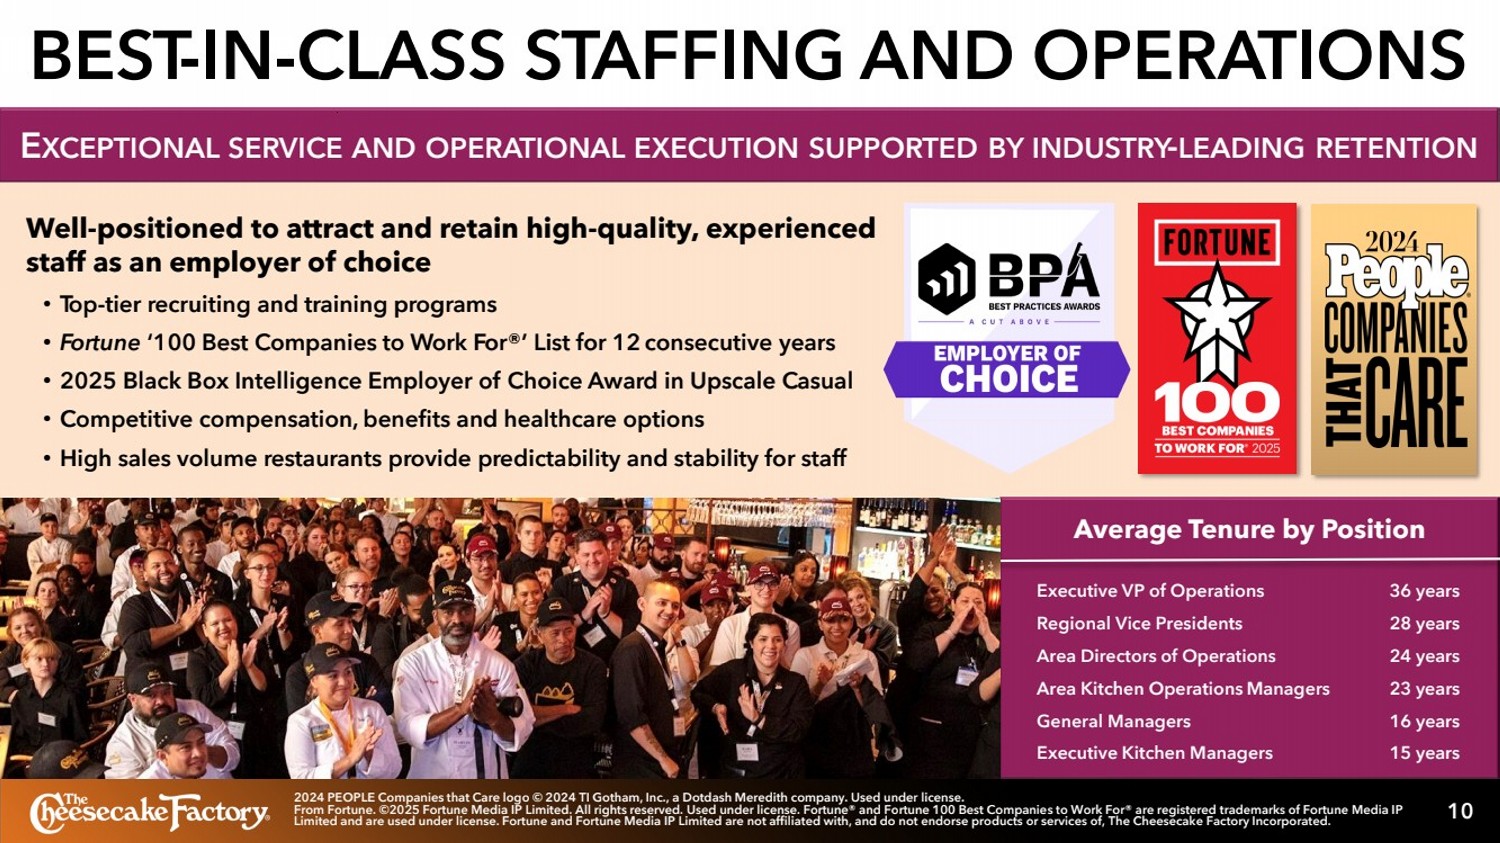
BEST-IN-CLASS STAFFING AND OPERATIONS 10 Well-positioned to attract and retain high-quality, experienced staff as an employer of choice • Top-tier recruiting and training programs • Fortune ‘100 Best Companies to Work For®’ List for 12 consecutive years • 2025 Black Box Intelligence Employer of Choice Award in Upscale Casual • Competitive compensation, benefits and healthcare options • High sales volume restaurants provide predictability and stability for staff Average Tenure by Position 36 years 28 years 24 years 23 years 16 years 15 years Executive VP of Operations Regional Vice Presidents Area Directors of Operations Area Kitchen Operations Managers General Managers Executive Kitchen Managers EXCEPTIONAL SERVICE AND OPERATIONAL EXECUTION SUPPORTED BY INDUSTRY-LEADING RETENTION 2024 PEOPLE Companies that Care logo © 2024 TI Gotham, Inc., a Dotdash Meredith company. Used under license. From Fortune. ©2025 Fortune Media IP Limited. All rights reserved. Used under license. Fortune® and Fortune 100 Best Companies to Work For® are registered trademarks of Fortune Media IP Limited and are used under license. Fortune and Fortune Media IP Limited are not affiliated with, and do not endorse products or services of, The Cheesecake Factory Incorporated. |
|
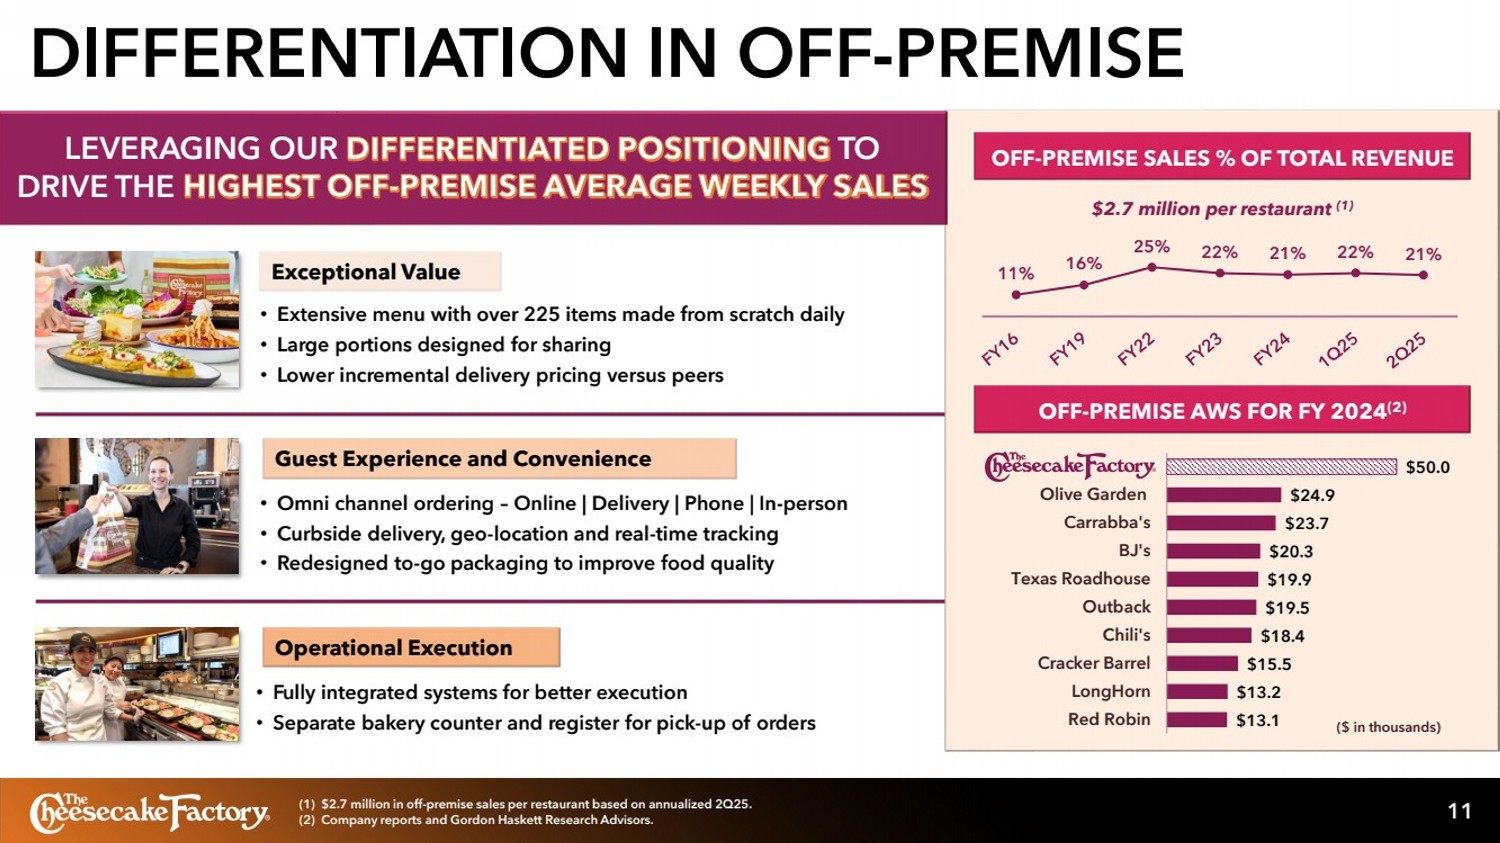
DIFFERENTIATION IN OFF-PREMISE 11 • Extensive menu with over 225 items made from scratch daily • Large portions designed for sharing • Lower incremental delivery pricing versus peers • Fully integrated systems for better execution • Separate bakery counter and register for pick-up of orders Exceptional Value Operational Execution • Omni channel ordering – Online | Delivery | Phone | In-person • Curbside delivery, geo-location and real-time tracking • Redesigned to-go packaging to improve food quality Guest Experience and Convenience 11% 16% 25% 22% 21% 22% 21% OFF-PREMISE SALES % OF TOTAL REVENUE OFF-PREMISE AWS FOR FY 2024(2) $50.0 $24.9 $23.7 $20.3 $19.9 $19.5 $18.4 $15.5 $13.2 $13.1 Olive Garden Carrabba's BJ's Texas Roadhouse Outback Chili's Cracker Barrel LongHorn Red Robin (1) $2.7 million in off-premise sales per restaurant based on annualized 2Q25. (2) Company reports and Gordon Haskett Research Advisors. ($ in thousands) $2.7 million per restaurant (1) LEVERAGING OUR DIFFERENTIATED POSITIONING TO DRIVE THE HIGHEST OFF-PREMISE AVERAGE WEEKLY SALES |
|
12 ICONIC BRAND AND CULT STATUS |
|
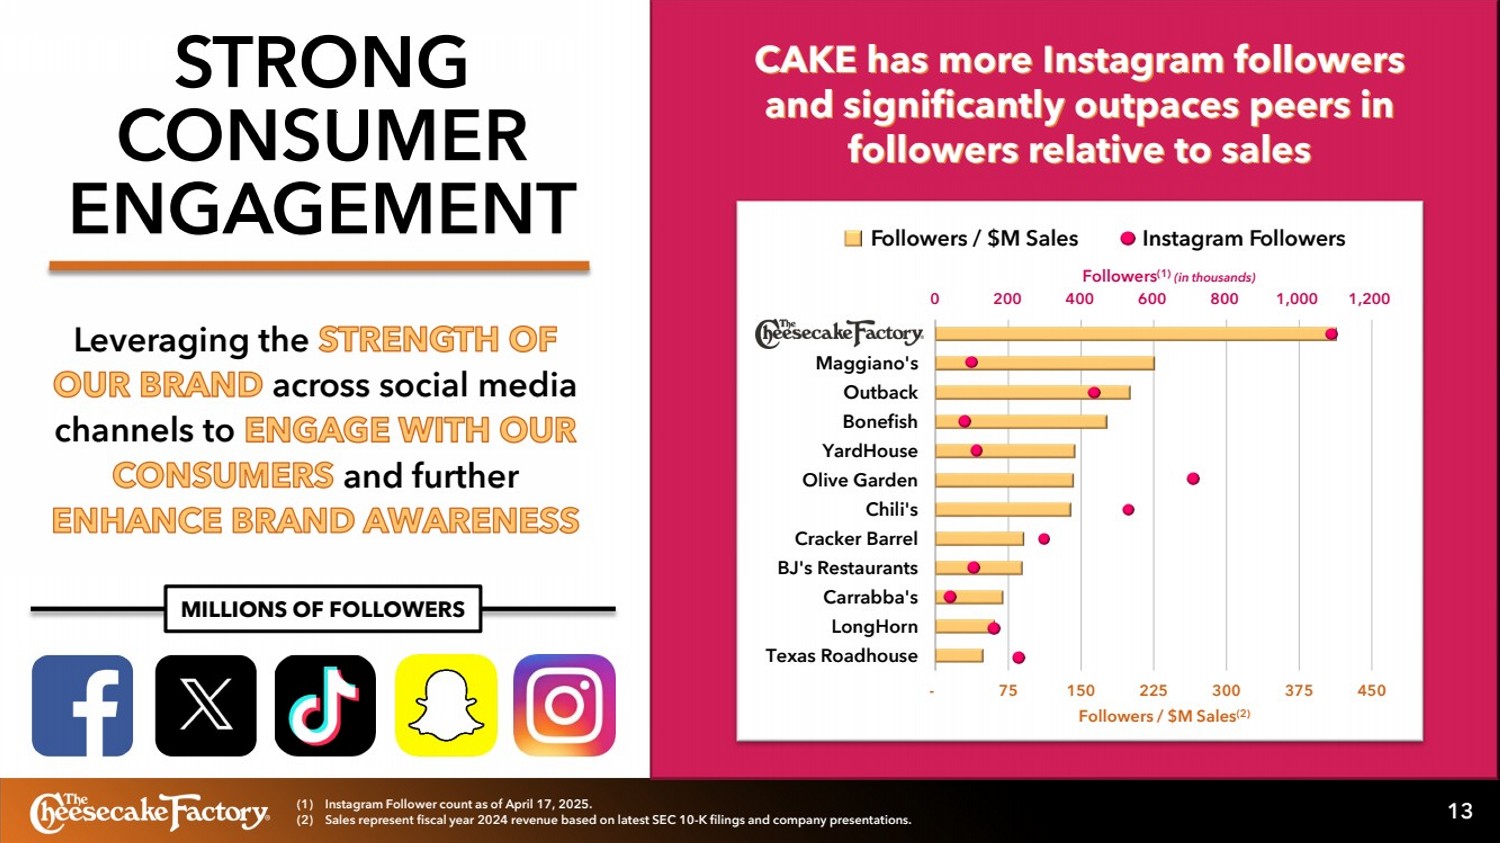
Followers(1) (in thousands) Followers / $M Sales(2) Followers / $M Sales Instagram Followers 0 200 400 600 800 1,000 1,200 CAKE Maggiano's Outback Bonefish YardHouse Olive Garden Chili's Cracker Barrel BJ's Restaurants Carrabba's LongHorn Texas Roadhouse - 75 150 225 300 375 450 CAKE Maggiano's Outback Bonefish YardHouse Olive Garden Chili's Cracker Barrel BJ's Restaurants Carrabba's LongHorn Texas Roadhouse 13 STRONG CONSUMER ENGAGEMENT CAKE has more Instagram followers and significantly outpaces peers in followers relative to sales Leveraging the STRENGTH OF OUR BRAND across social media channels to ENGAGE WITH OUR CONSUMERS and further ENHANCE BRAND AWARENESS MILLIONS OF FOLLOWERS (1) Instagram Follower count as of April 17, 2025. (2) Sales represent fiscal year 2024 revenue based on latest SEC 10-K filings and company presentations. |
|
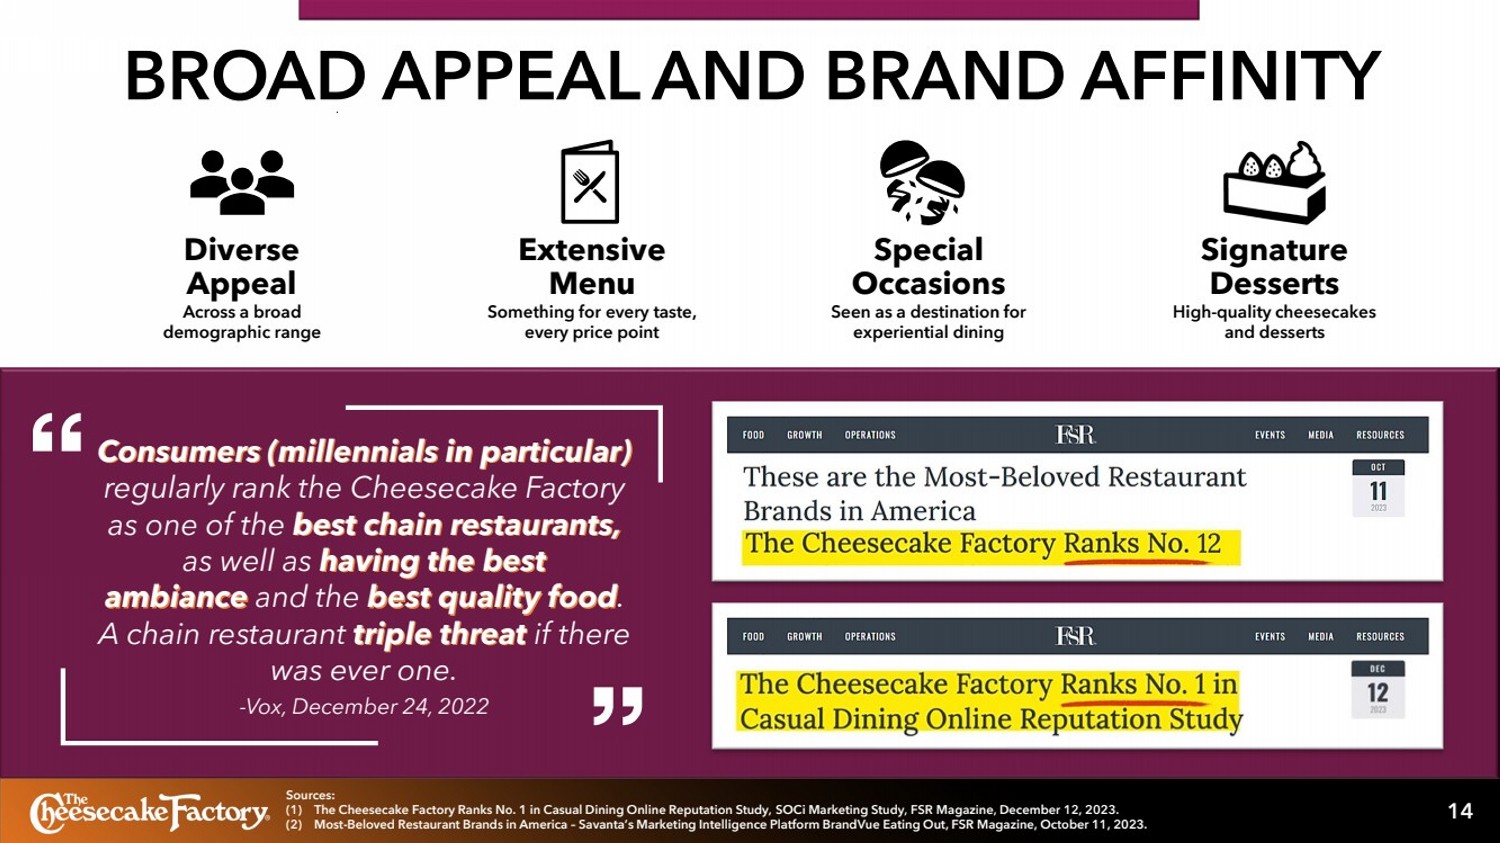
BROAD APPEAL AND BRAND AFFINITY 14 Diverse Appeal Across a broad demographic range Extensive Menu Something for every taste, every price point Special Occasions Seen as a destination for experiential dining Signature Desserts High-quality cheesecakes and desserts Consumers (millennials in particular) regularly rank the Cheesecake Factory as one of the best chain restaurants, as well as having the best ambiance and the best quality food. A chain restaurant triple threat if there was ever one. -Vox, December 24, 2022 Sources: (1) The Cheesecake Factory Ranks No. 1 in Casual Dining Online Reputation Study, SOCi Marketing Study, FSR Magazine, December 12, 2023. (2) Most-Beloved Restaurant Brands in America – Savanta’s Marketing Intelligence Platform BrandVue Eating Out, FSR Magazine, October 11, 2023. |
|
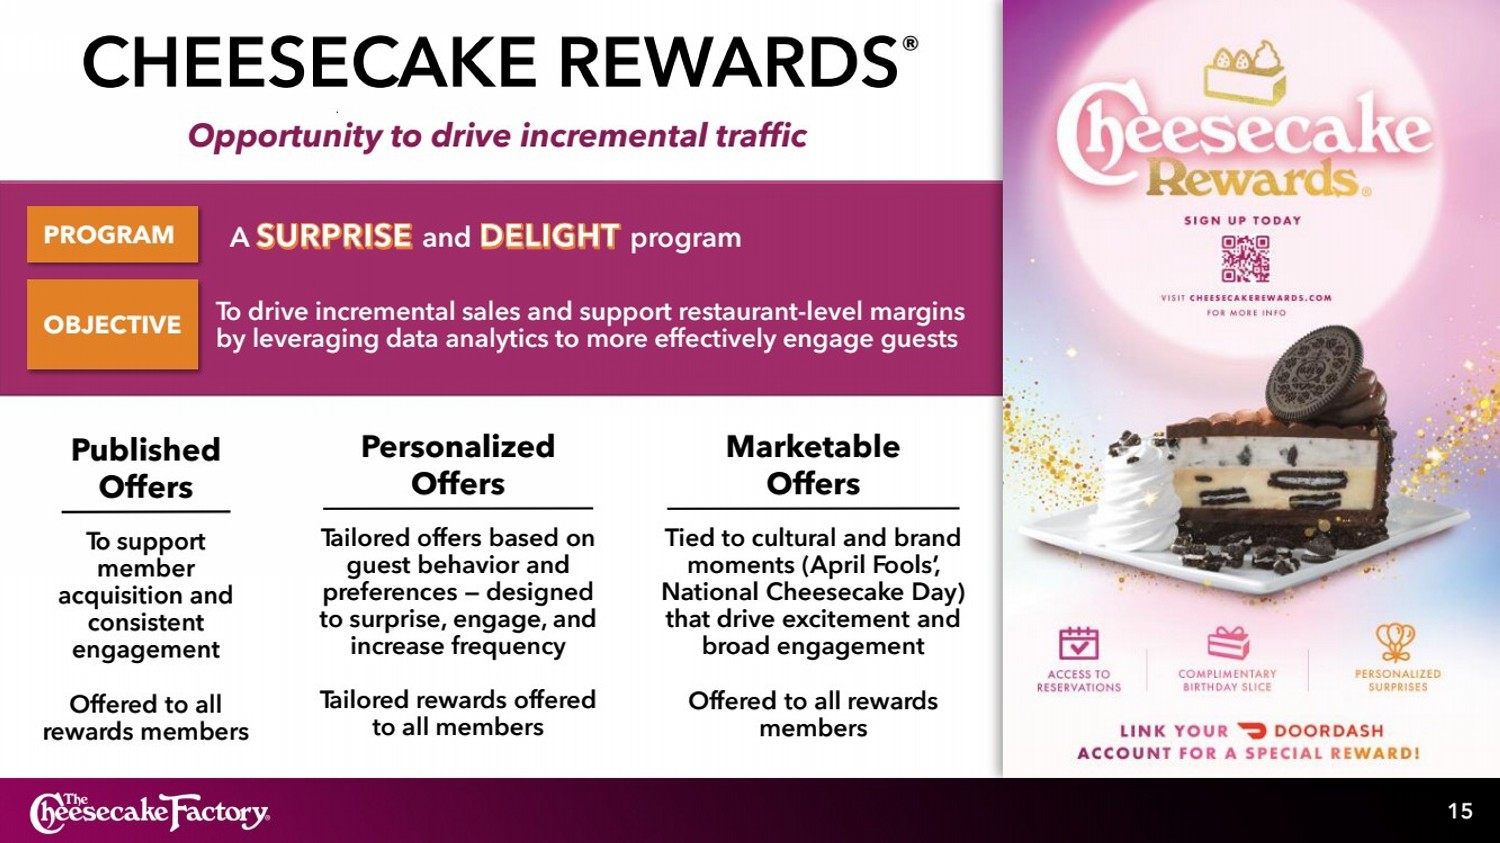
CHEESECAKE REWARDS® 15 Published Offers To support member acquisition and consistent engagement Offered to all rewards members Personalized Offers Tailored offers based on guest behavior and preferences — designed to surprise, engage, and increase frequency Tailored rewards offered to all members Marketable Offers Tied to cultural and brand moments (April Fools’, National Cheesecake Day) that drive excitement and broad engagement Offered to all rewards members Opportunity to drive incremental traffic To drive incremental sales and support restaurant-level margins by leveraging data analytics to more effectively engage guests PROGRAM OBJECTIVE A SURPRISE and DELIGHT program |
|
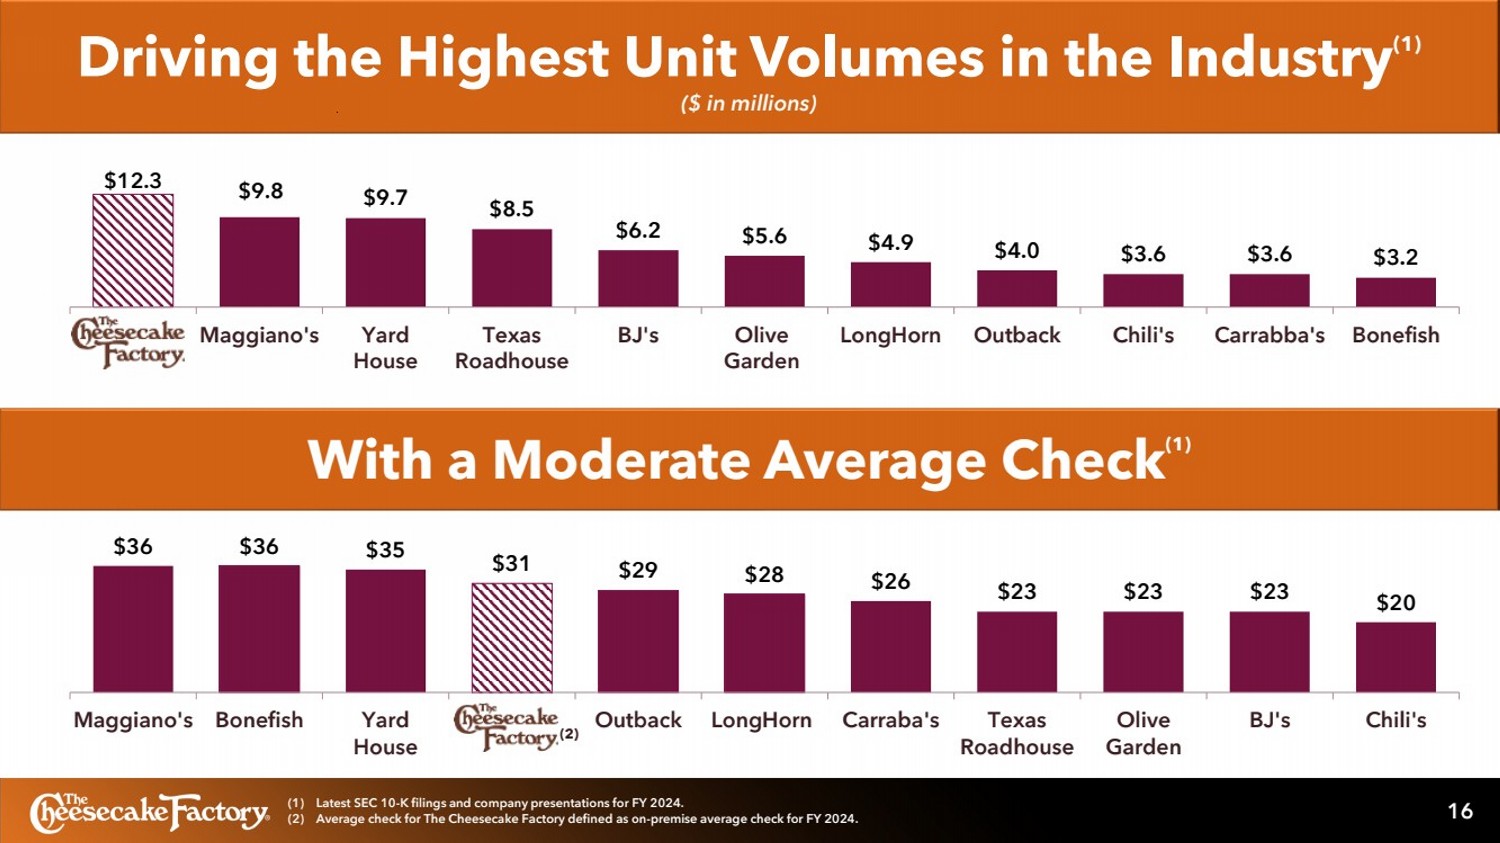
$12.3 $9.8 $9.7 $8.5 $6.2 $5.6 $4.9 $4.0 $3.6 $3.6 $3.2 Maggiano's Yard House Texas Roadhouse BJ's Olive Garden LongHorn Outback Chili's Carrabba's Bonefish With a Moderate Average Check(1) Driving the Highest Unit Volumes in the Industry(1) ($ in millions) $36 $36 $35 $31 $29 $28 $26 $23 $23 $23 $20 Maggiano's Bonefish Yard House Outback LongHorn Carraba's Texas Roadhouse Olive Garden BJ's Chili's 16 (1) Latest SEC 10-K filings and company presentations for FY 2024. (2) Average check for The Cheesecake Factory defined as on-premise average check for FY 2024. (2) |
|
17 |
|
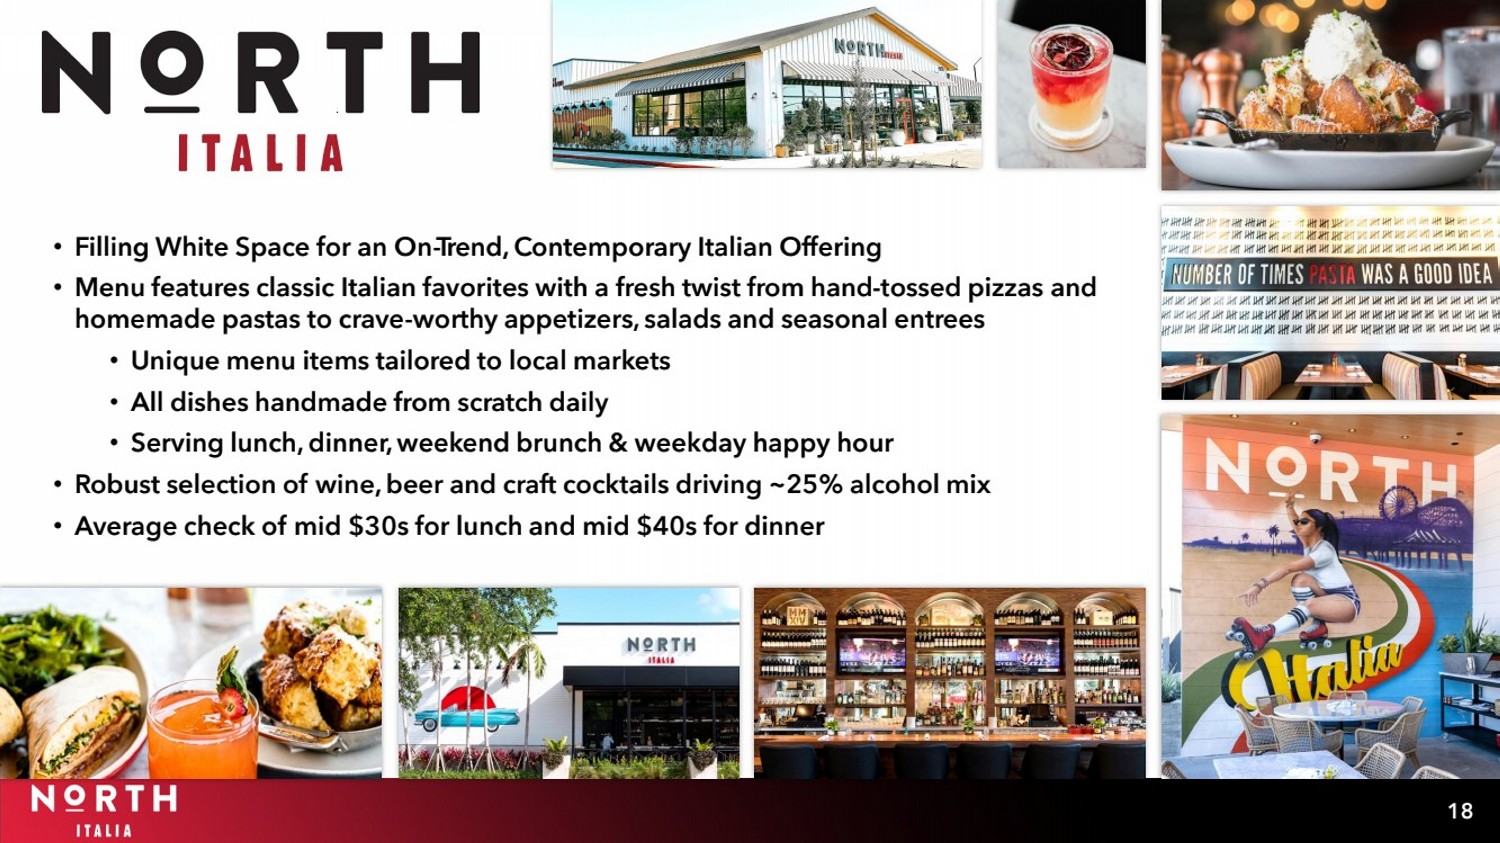
18 • Filling White Space for an On-Trend, Contemporary Italian Offering • Menu features classic Italian favorites with a fresh twist from hand-tossed pizzas and homemade pastas to crave-worthy appetizers, salads and seasonal entrees • Unique menu items tailored to local markets • All dishes handmade from scratch daily • Serving lunch, dinner, weekend brunch & weekday happy hour • Robust selection of wine, beer and craft cocktails driving ~25% alcohol mix • Average check of mid $30s for lunch and mid $40s for dinner |
|
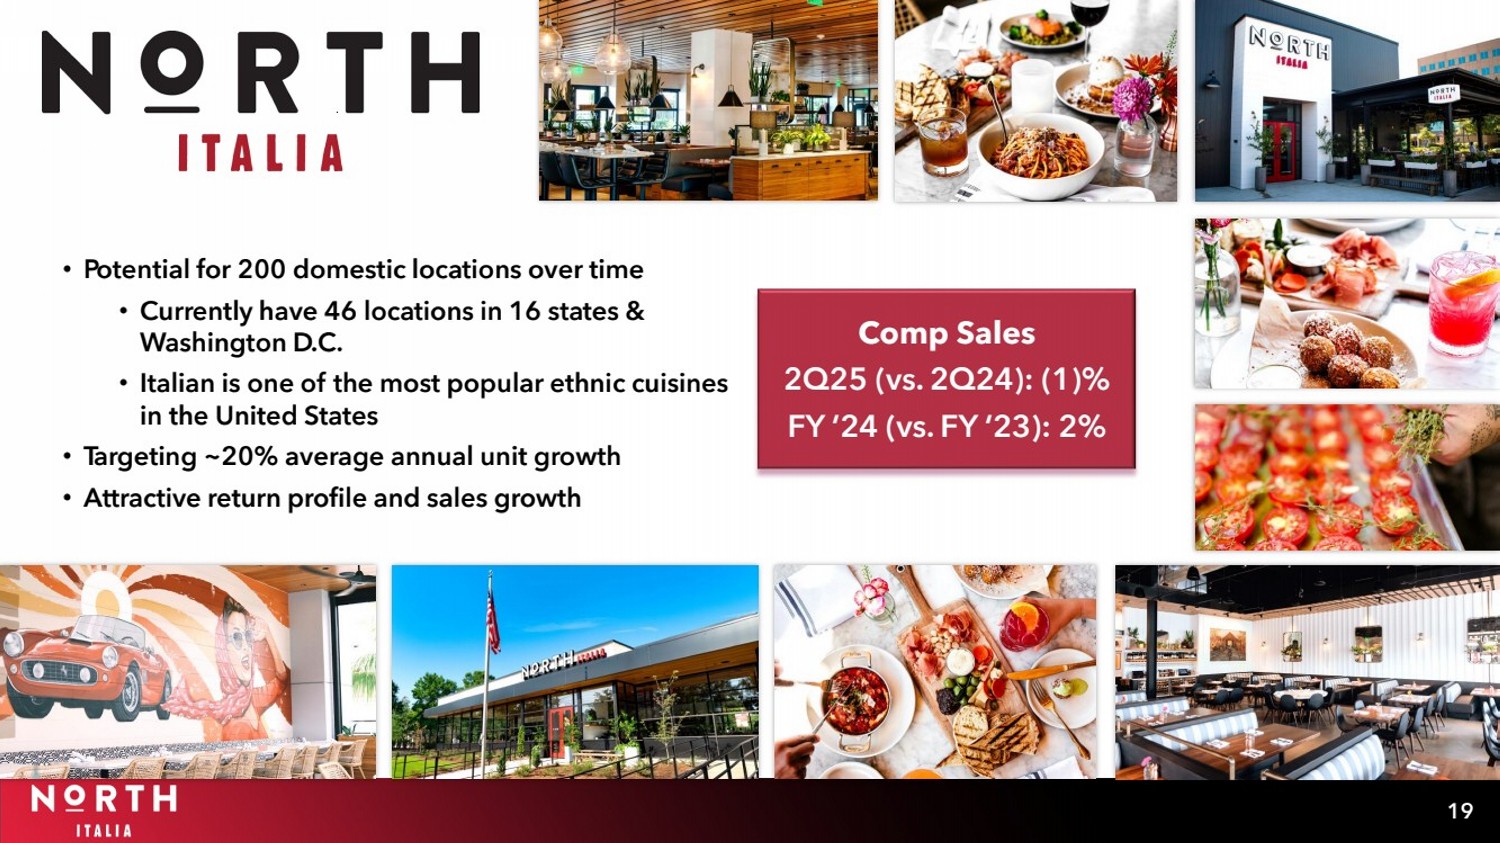
19 • Potential for 200 domestic locations over time • Currently have 46 locations in 16 states & Washington D.C. • Italian is one of the most popular ethnic cuisines in the United States • Targeting ~20% average annual unit growth • Attractive return profile and sales growth Comp Sales 2Q25 (vs. 2Q24): (1)% FY ‘24 (vs. FY ‘23): 2% |
|
20 |
|
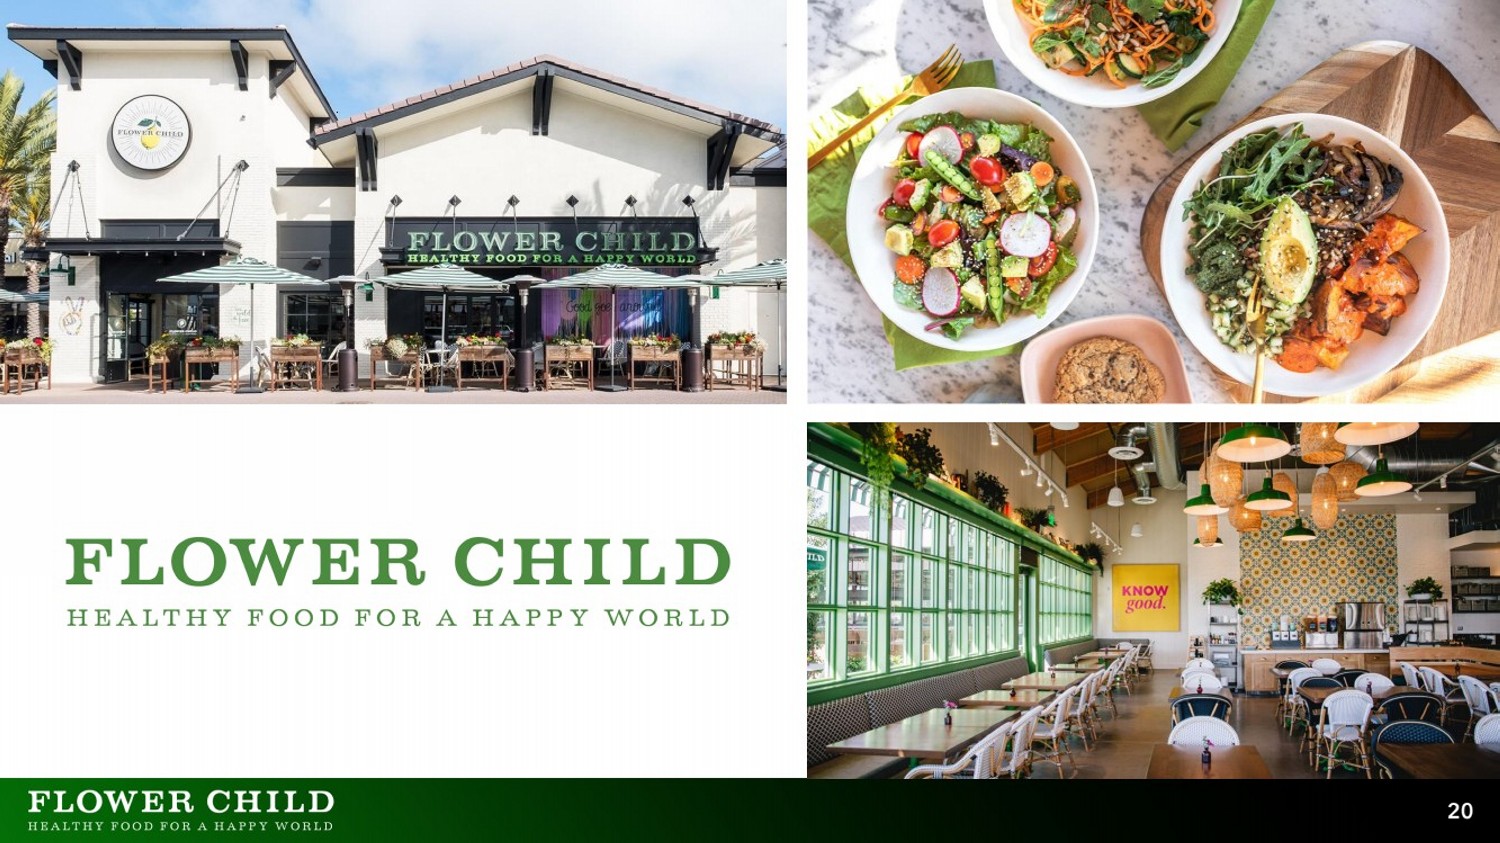
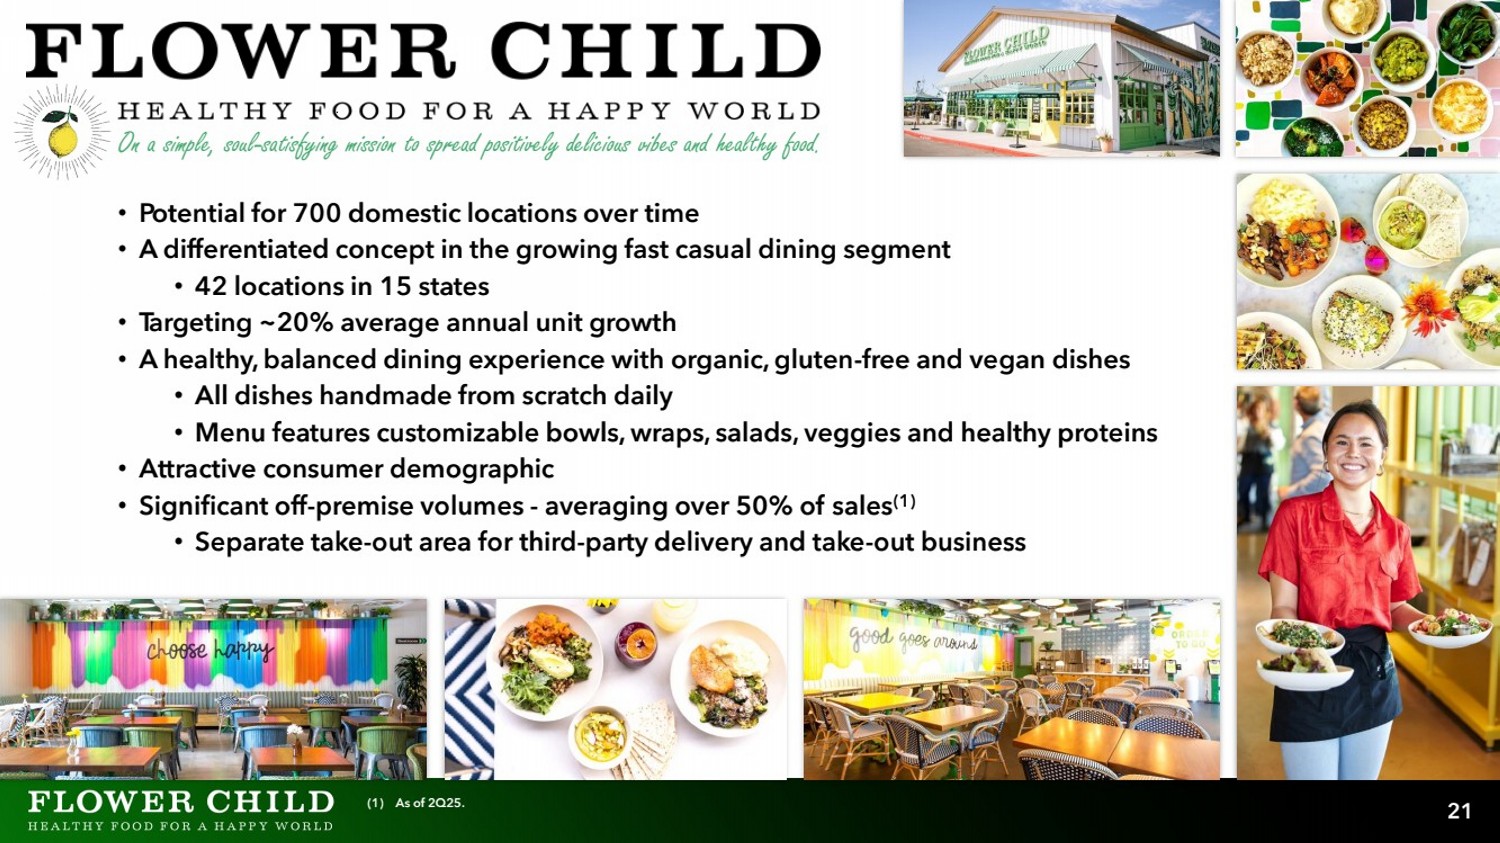
• Potential for 700 domestic locations over time • A differentiated concept in the growing fast casual dining segment • 42 locations in 15 states • Targeting ~20% average annual unit growth • A healthy, balanced dining experience with organic, gluten-free and vegan dishes • All dishes handmade from scratch daily • Menu features customizable bowls, wraps, salads, veggies and healthy proteins • Attractive consumer demographic • Significant off-premise volumes - averaging over 50% of sales(1) • Separate take-out area for third-party delivery and take-out business On a simple, soul-satisfying mission to spread positively delicious vibes and healthy food. 21 (1) As of 2Q25. |
|
22 |
|
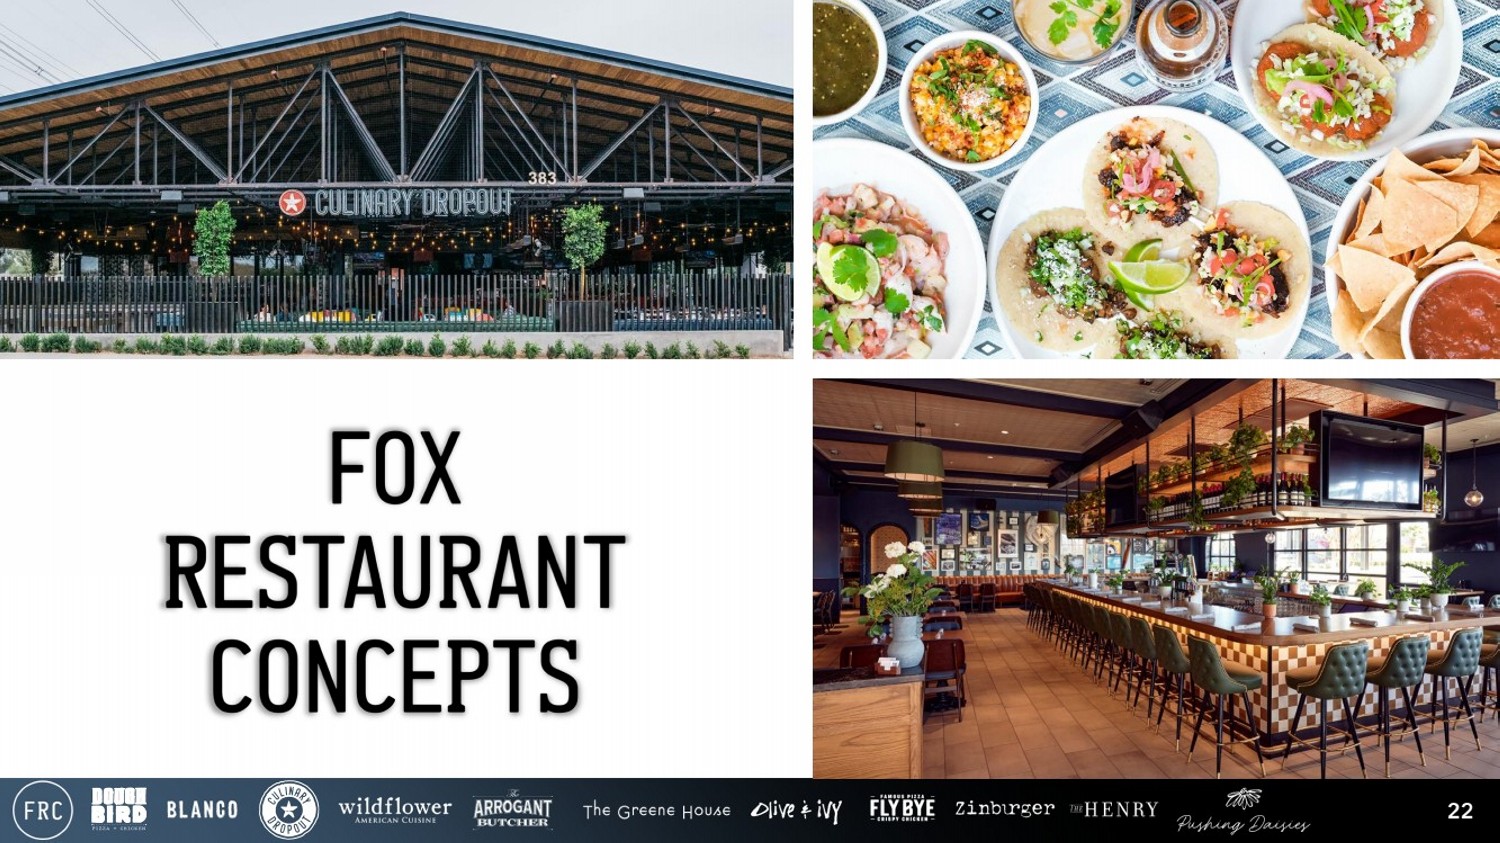
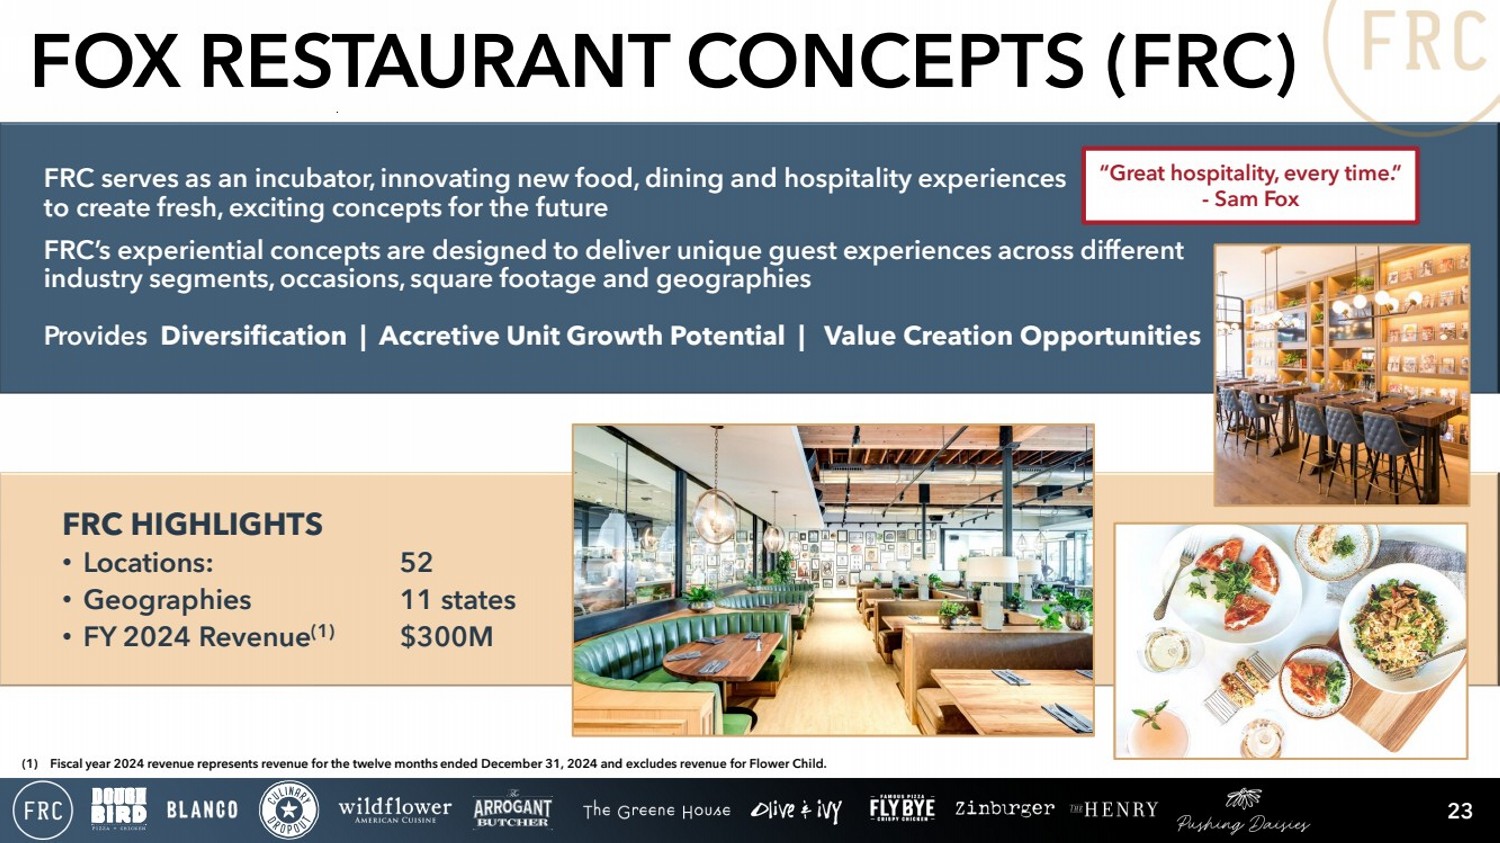
FOX RESTAURANT CONCEPTS (FRC) 23 FRC HIGHLIGHTS • Locations: 52 • Geographies 11 states • FY 2024 Revenue(1) $300M (1) Fiscal year 2024 revenue represents revenue for the twelve months ended December 31, 2024 and excludes revenue for Flower Child. FRC serves as an incubator, innovating new food, dining and hospitality experiences to create fresh, exciting concepts for the future FRC’s experiential concepts are designed to deliver unique guest experiences across different industry segments, occasions, square footage and geographies Provides Diversification | Accretive Unit Growth Potential | Value Creation Opportunities “Great hospitality, every time.” - Sam Fox |
|
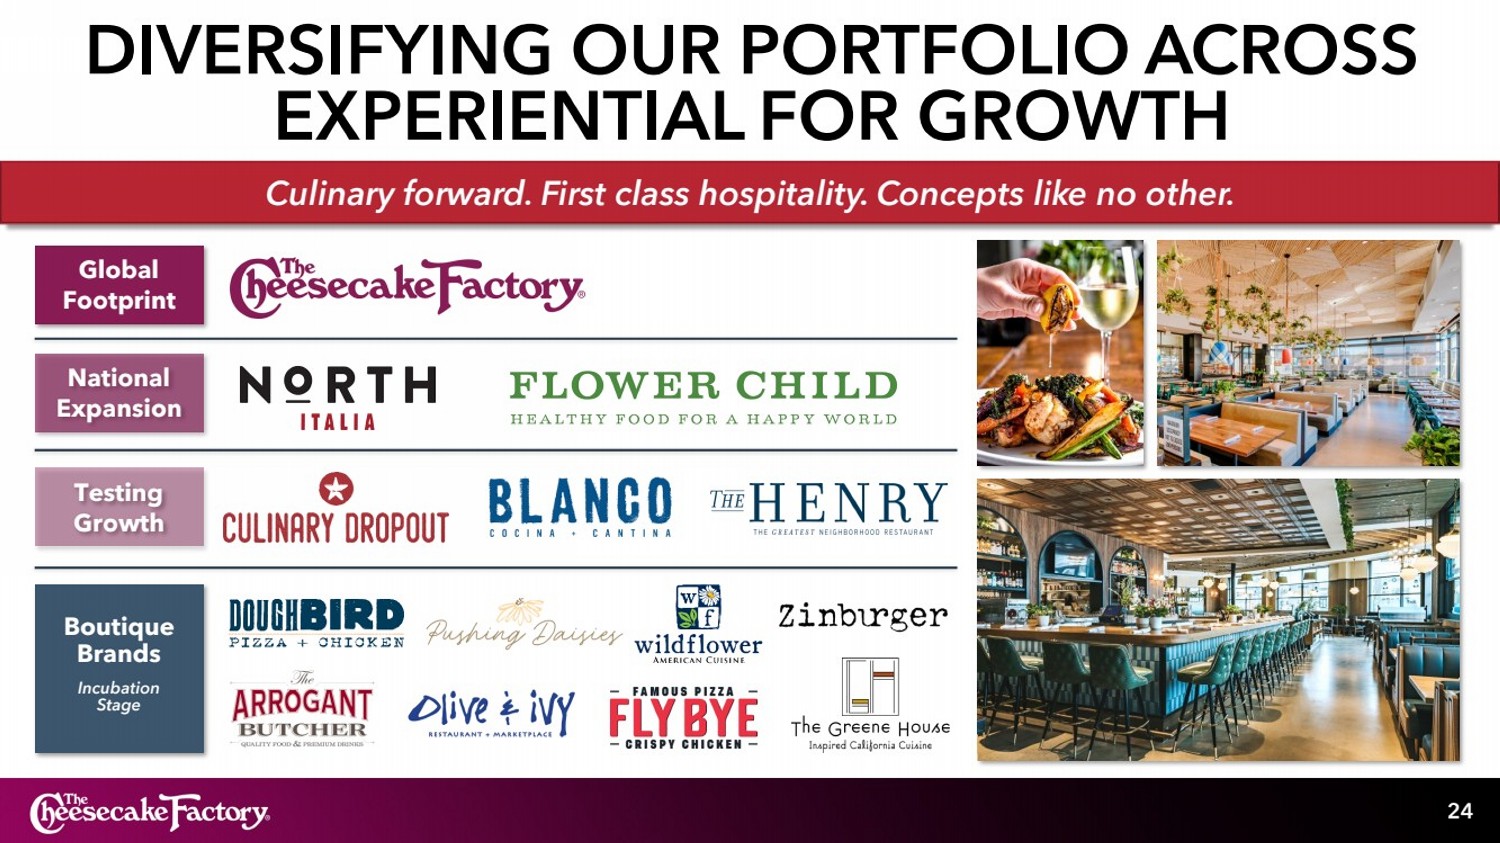
Culinary forward. First class hospitality. Concepts like no other. DIVERSIFYING OUR PORTFOLIO ACROSS EXPERIENTIAL FOR GROWTH 24 National Expansion Boutique Brands Incubation Stage Testing Growth Global Footprint |
|
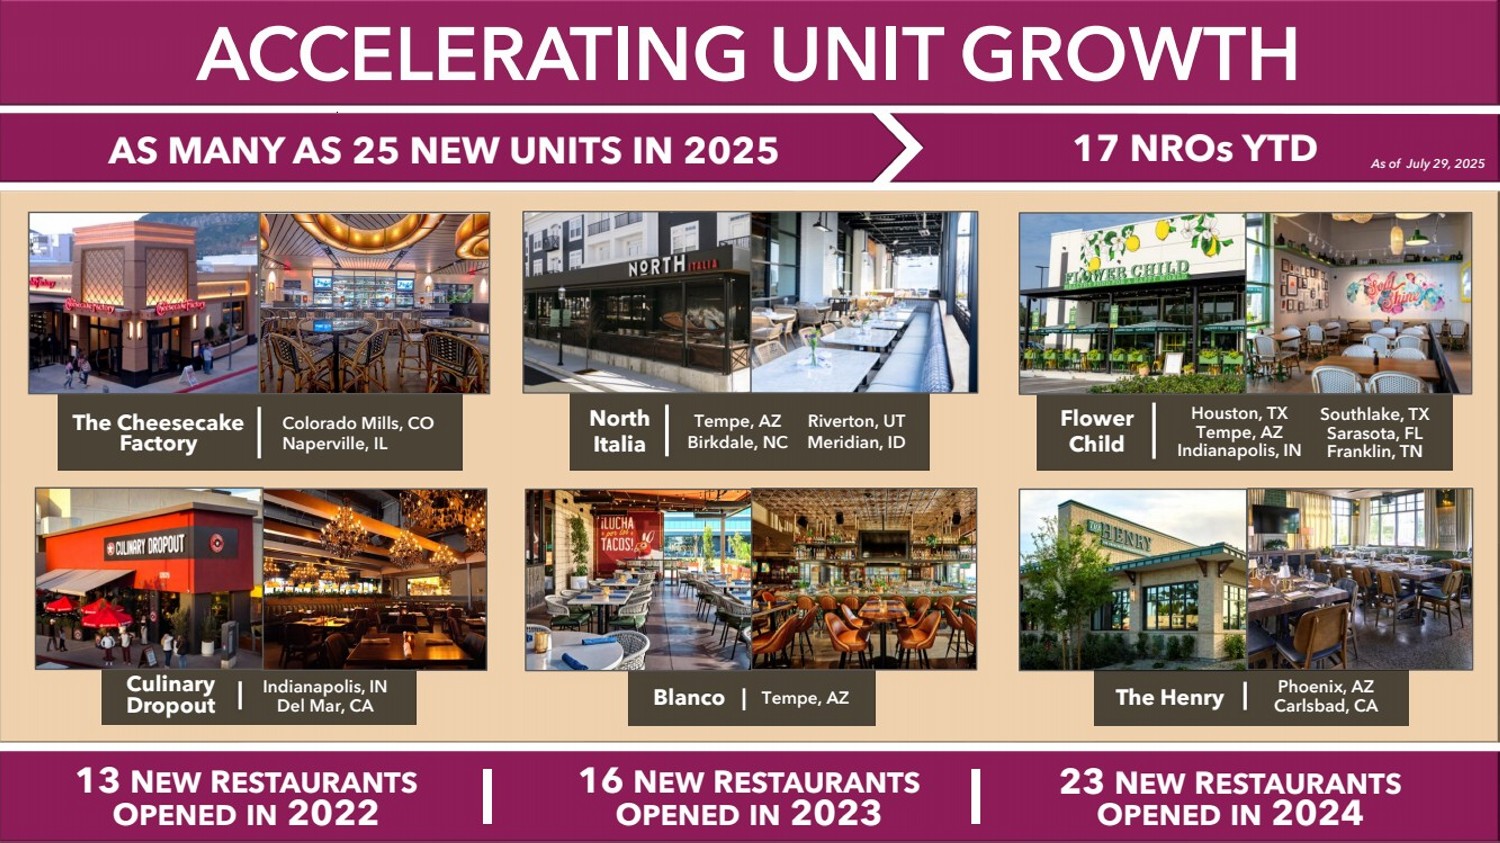
Accelerating Unit Growth AS MANY AS 25 NEW UNITS IN 2025 17 NROs YTD ACCELERATING UNIT GROWTH As of July 29, 2025 13 New Restaurants Opened in 2022 16 New Restaurants Opened in 2023 Culinary Dropout Indianapolis, IN Del Mar, CA Flower Child North Italia Tempe, AZ Birkdale, NC Riverton, UT Meridian, ID Houston, TX Tempe, AZ Indianapolis, IN Southlake, TX Sarasota, FL Franklin, TN Blanco | Tempe, AZ The Cheesecake Factory Colorado Mills, CO Naperville, IL 13 NEW RESTAURANTS OPENED IN 2022 16 NEW RESTAURANTS OPENED IN 2023 23 NEW RESTAURANTS OPENED IN 2024 The Henry Phoenix, AZ Carlsbad, CA |
|
FINANCIAL PERFORMANCE |
|
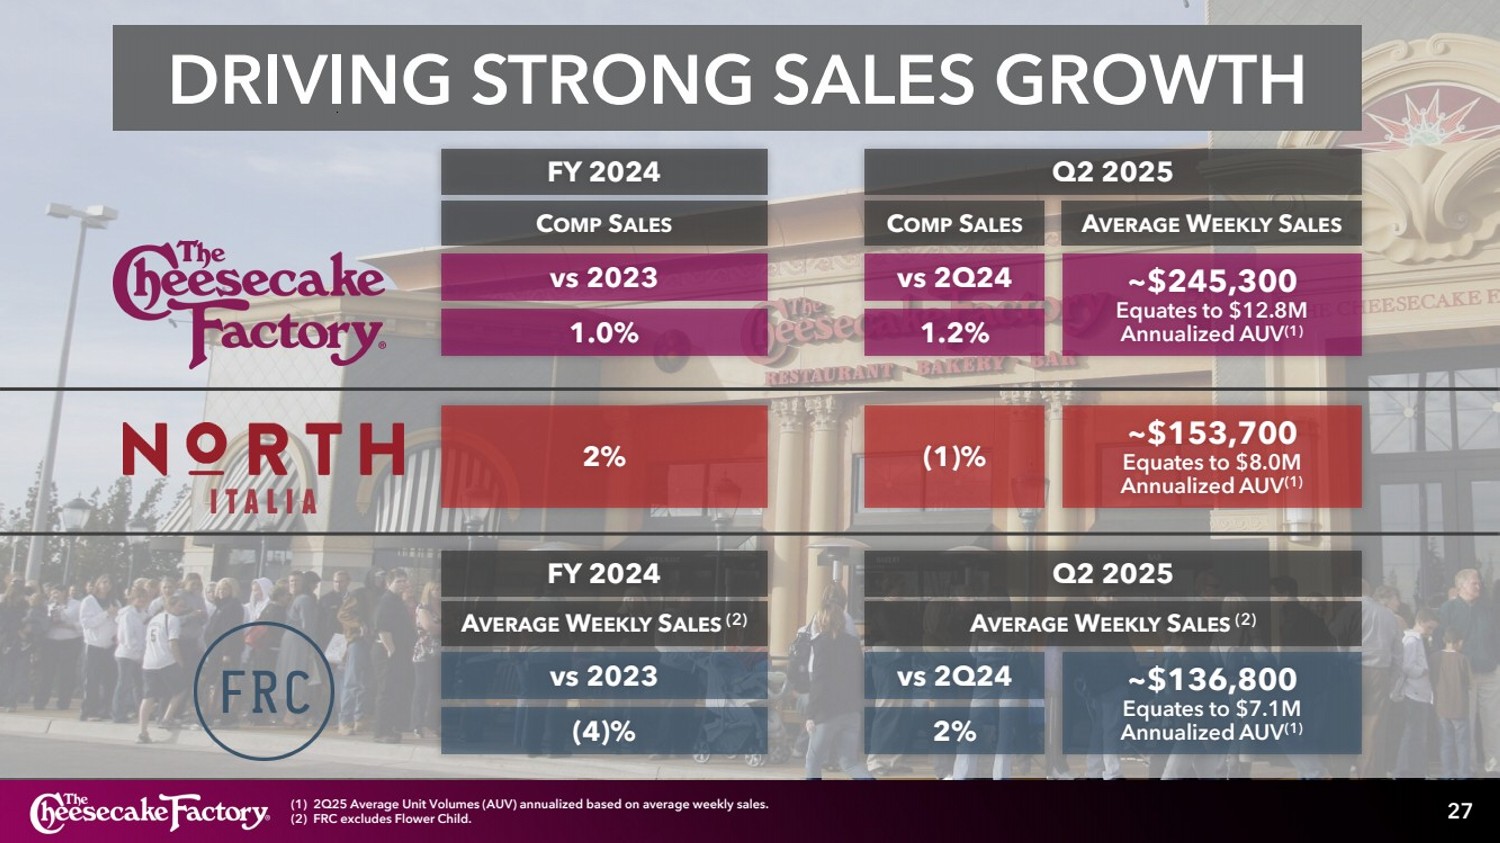
27 DRIVING STRONG SALES GROWTH FY 2024 COMP SALES AVERAGE WEEKLY SALES (2) FY 2024 AVERAGE WEEKLY SALES Q2 2025 COMP SALES AVERAGE WEEKLY SALES (2) Q2 2025 vs 2023 1.0% 2% vs 2023 (4)% vs 2Q24 1.2% (1)% vs 2Q24 2% ~$245,300 Equates to $12.8M Annualized AUV(1) ~$153,700 Equates to $8.0M Annualized AUV(1) ~$136,800 Equates to $7.1M Annualized AUV(1) (1) 2Q25 Average Unit Volumes (AUV) annualized based on average weekly sales. (2) FRC excludes Flower Child. |
|
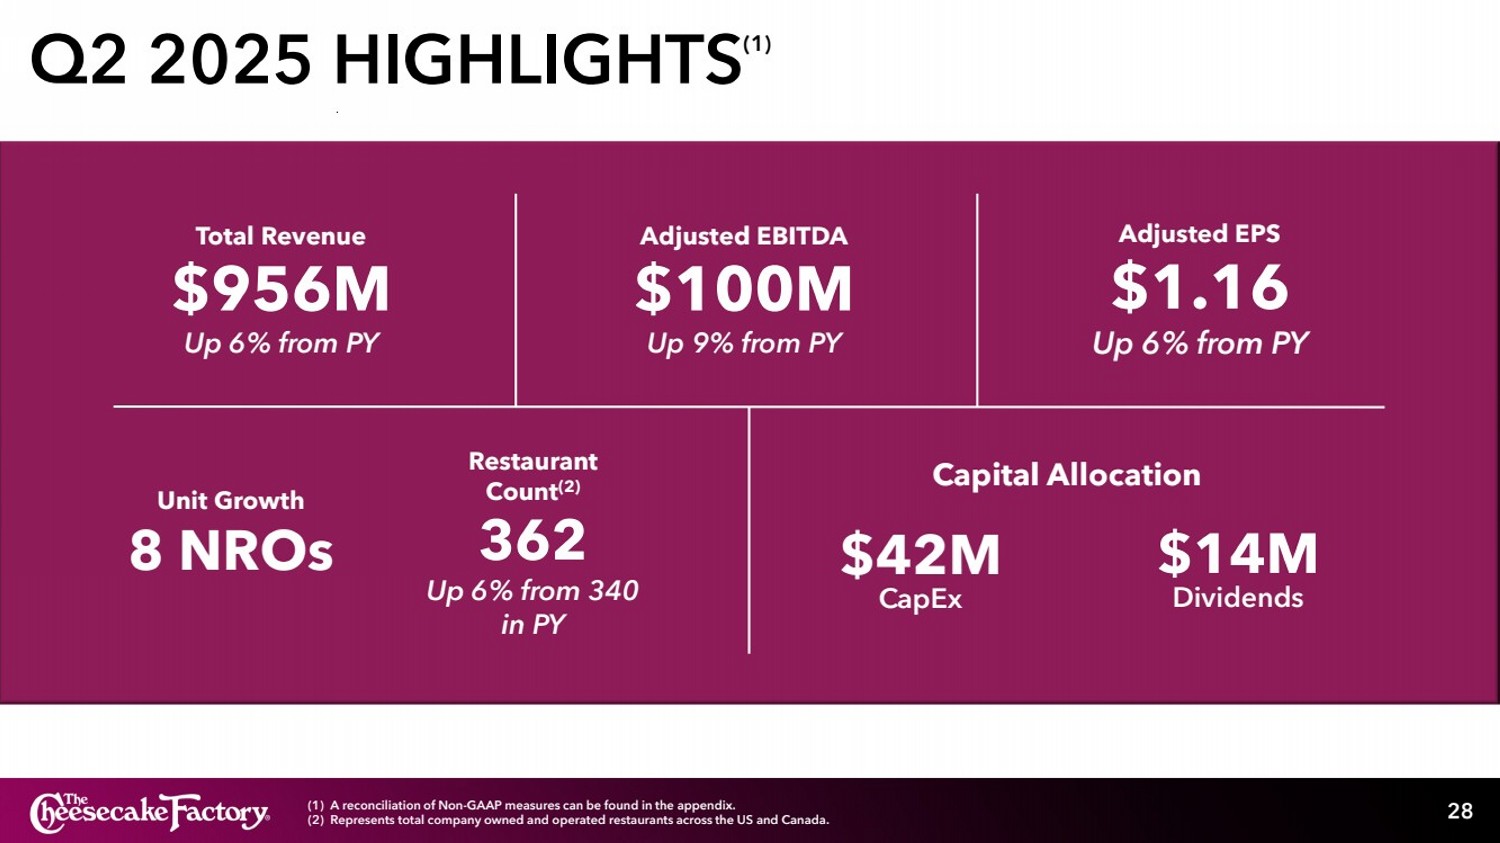
Q2 2025 HIGHLIGHTS(1) 28 Total Revenue $956M Up 6% from PY Capital Allocation (1) A reconciliation of Non-GAAP measures can be found in the appendix. (2) Represents total company owned and operated restaurants across the US and Canada. Adjusted EPS $1.16 Up 6% from PY $42M CapEx $14M Dividends Unit Growth 8 NROs Restaurant Count(2) 362 Up 6% from 340 in PY Adjusted EBITDA $100M Up 9% from PY |
|
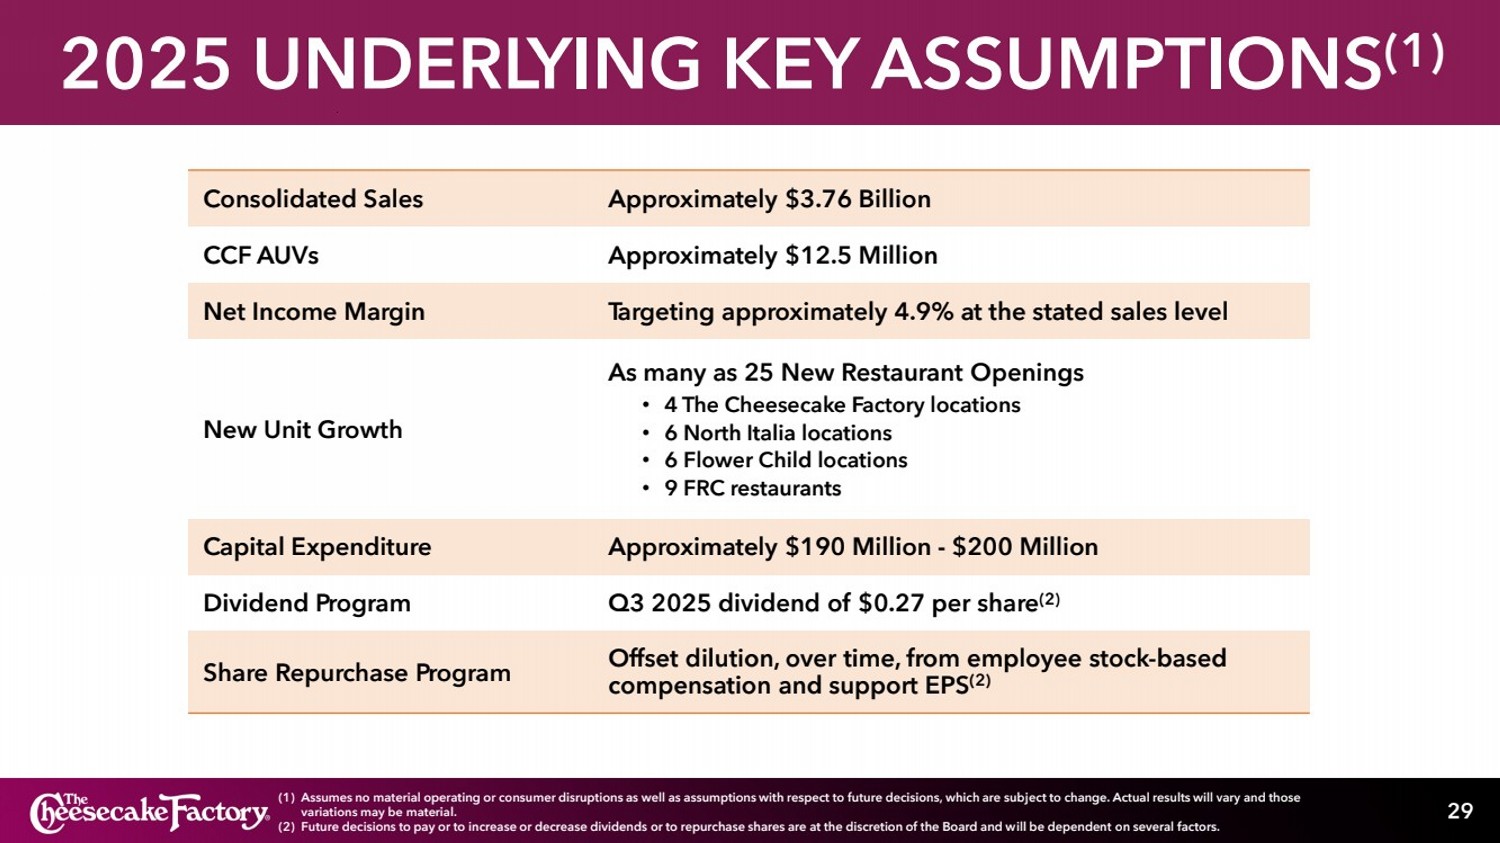
2025 UNDERLYING KEY ASSUMPTIONS(1) 29 (1) Assumes no material operating or consumer disruptions as well as assumptions with respect to future decisions, which are subject to change. Actual results will vary and those variations may be material. (2) Future decisions to pay or to increase or decrease dividends or to repurchase shares are at the discretion of the Board and will be dependent on several factors. Consolidated Sales Approximately $3.76 Billion CCF AUVs Approximately $12.5 Million Net Income Margin Targeting approximately 4.9% at the stated sales level New Unit Growth As many as 25 New Restaurant Openings • 4 The Cheesecake Factory locations • 6 North Italia locations • 6 Flower Child locations • 9 FRC restaurants Capital Expenditure Approximately $190 Million - $200 Million Dividend Program Q3 2025 dividend of $0.27 per share(2) Share Repurchase Program Offset dilution, over time, from employee stock-based compensation and support EPS(2) |
|
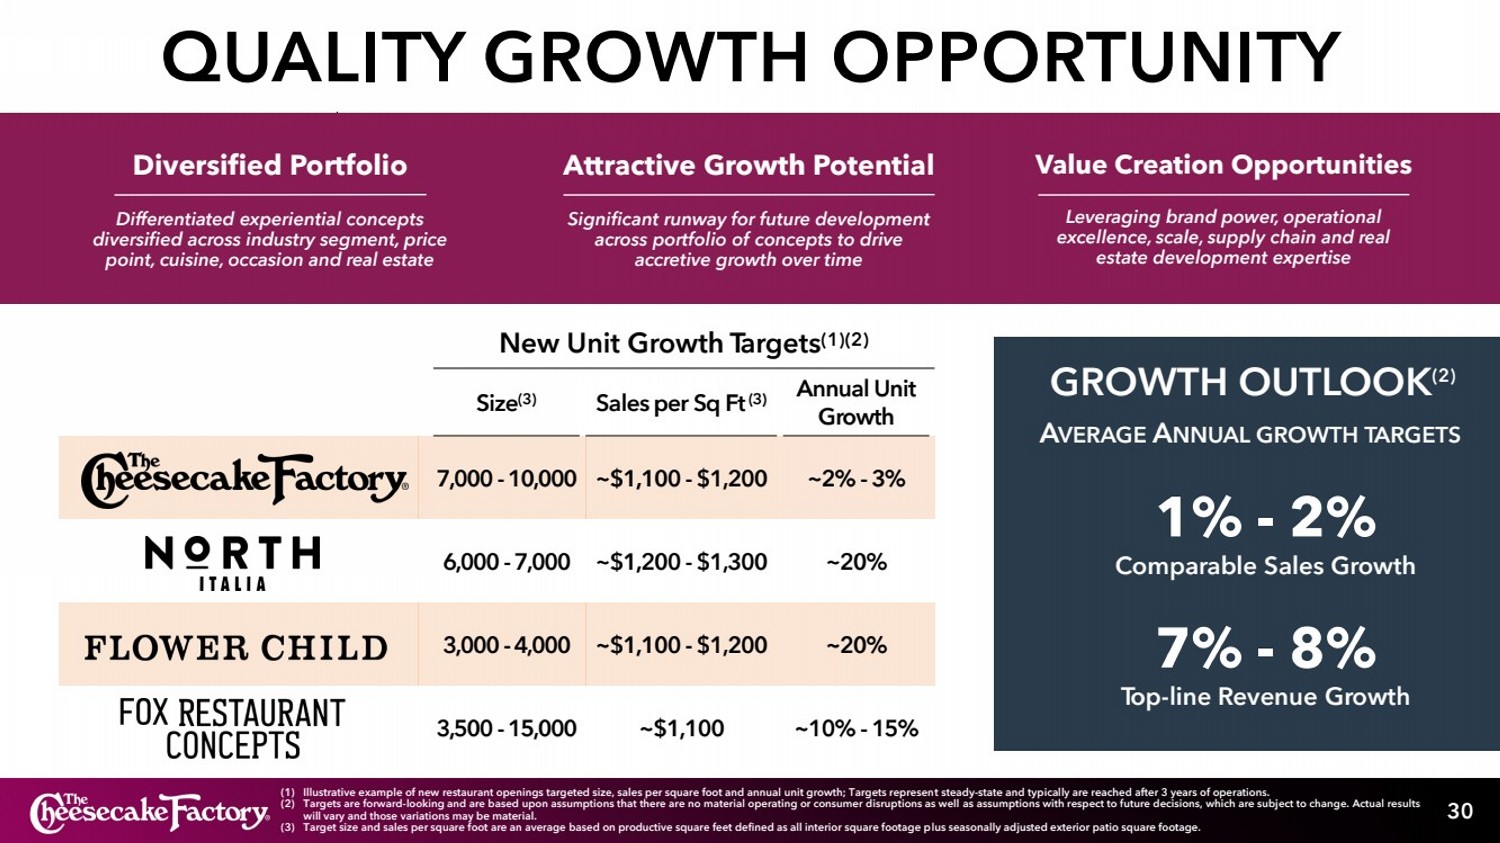
QUALITY GROWTH OPPORTUNITY 30 New Unit Growth Targets(1)(2) Size(3) Sales per Sq Ft(3) Annual Unit Growth 7,000 -10,000 ~$1,100 - $1,200 ~2% - 3% 6,000 -7,000 ~$1,200 - $1,300 ~20% 3,000 -4,000 ~$1,100 - $1,200 ~20% 3,500 -15,000 ~$1,100 ~10% - 15% Diversified Portfolio Differentiated experiential concepts diversified across industry segment, price point, cuisine, occasion and real estate Value Creation Opportunities Leveraging brand power, operational excellence, scale, supply chain and real estate development expertise Attractive Growth Potential Significant runway for future development across portfolio of concepts to drive accretive growth over time (1) Illustrative example of new restaurant openings targeted size, sales per square foot and annual unit growth; Targets represent steady-state and typically are reached after 3 years of operations. (2) Targets are forward-looking and are based upon assumptions that there are no material operating or consumer disruptions as well as assumptions with respect to future decisions, which are subject to change. Actual results will vary and those variations may be material. (3) Target size and sales per square foot are an average based on productive square feet defined as all interior square footage plus seasonally adjusted exterior patio square footage. 1% - 2% Comparable Sales Growth GROWTH OUTLOOK(2) AVERAGE ANNUAL GROWTH TARGETS 7% - 8% Top-line Revenue Growth |
|
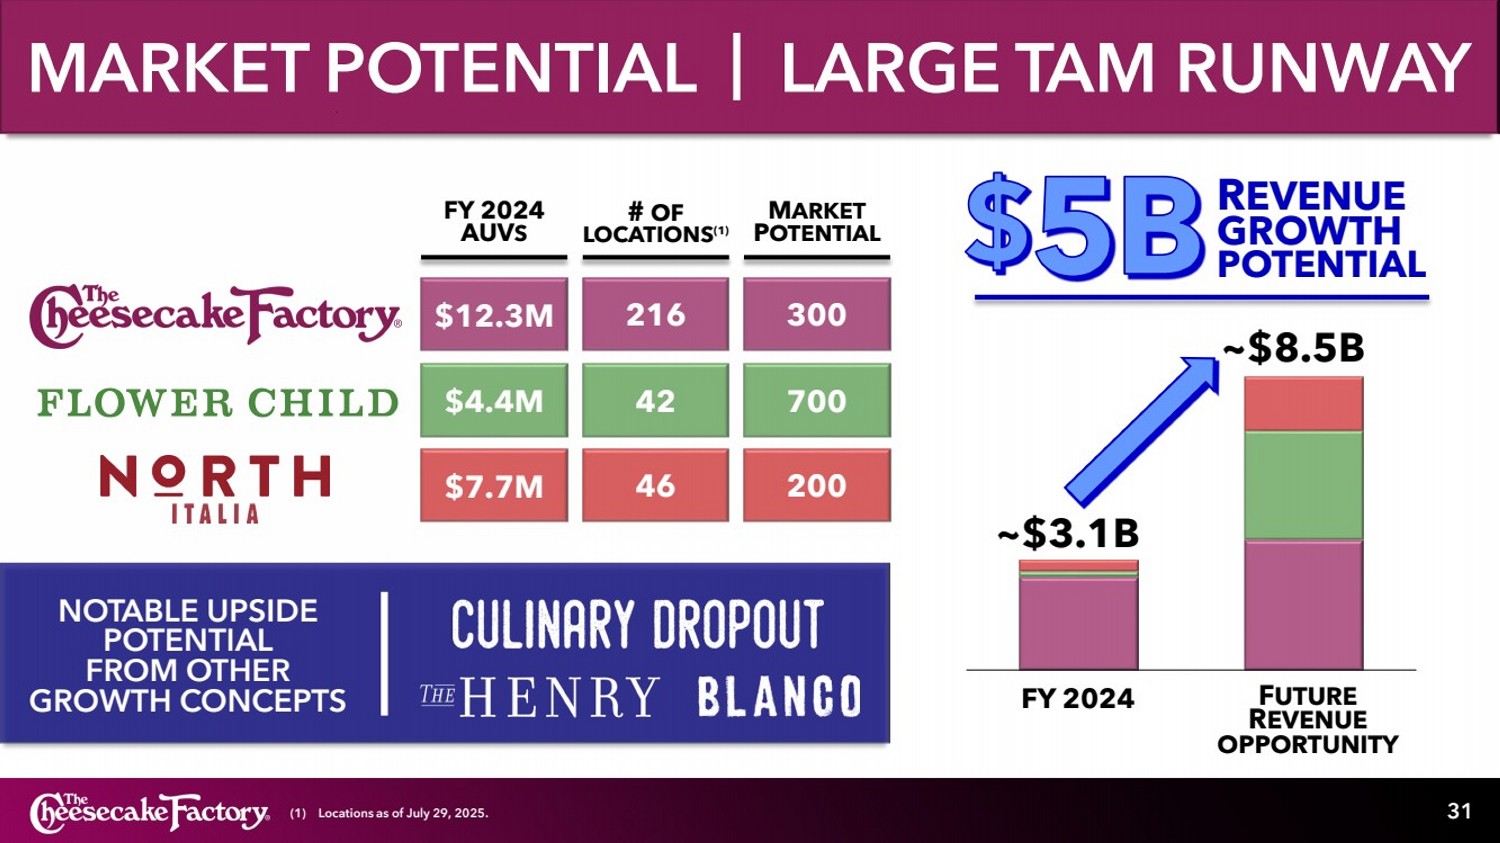
MARKET POTENTIAL LARGE TAM RUNWAY 31 # OF LOCATIONS(1) FY 2024 AUVS $12.3M 216 $7.7M 46 $4.4M 42 MARKET POTENTIAL 300 200 700 (1) Locations as of July 29, 2025. ~$3.1B ~$8.5B FUTURE REVENUE OPPORTUNITY REVENUE GROWTH $5BPOTENTIAL NOTABLE UPSIDE POTENTIAL FROM OTHER GROWTH CONCEPTS FY 2024 |
|
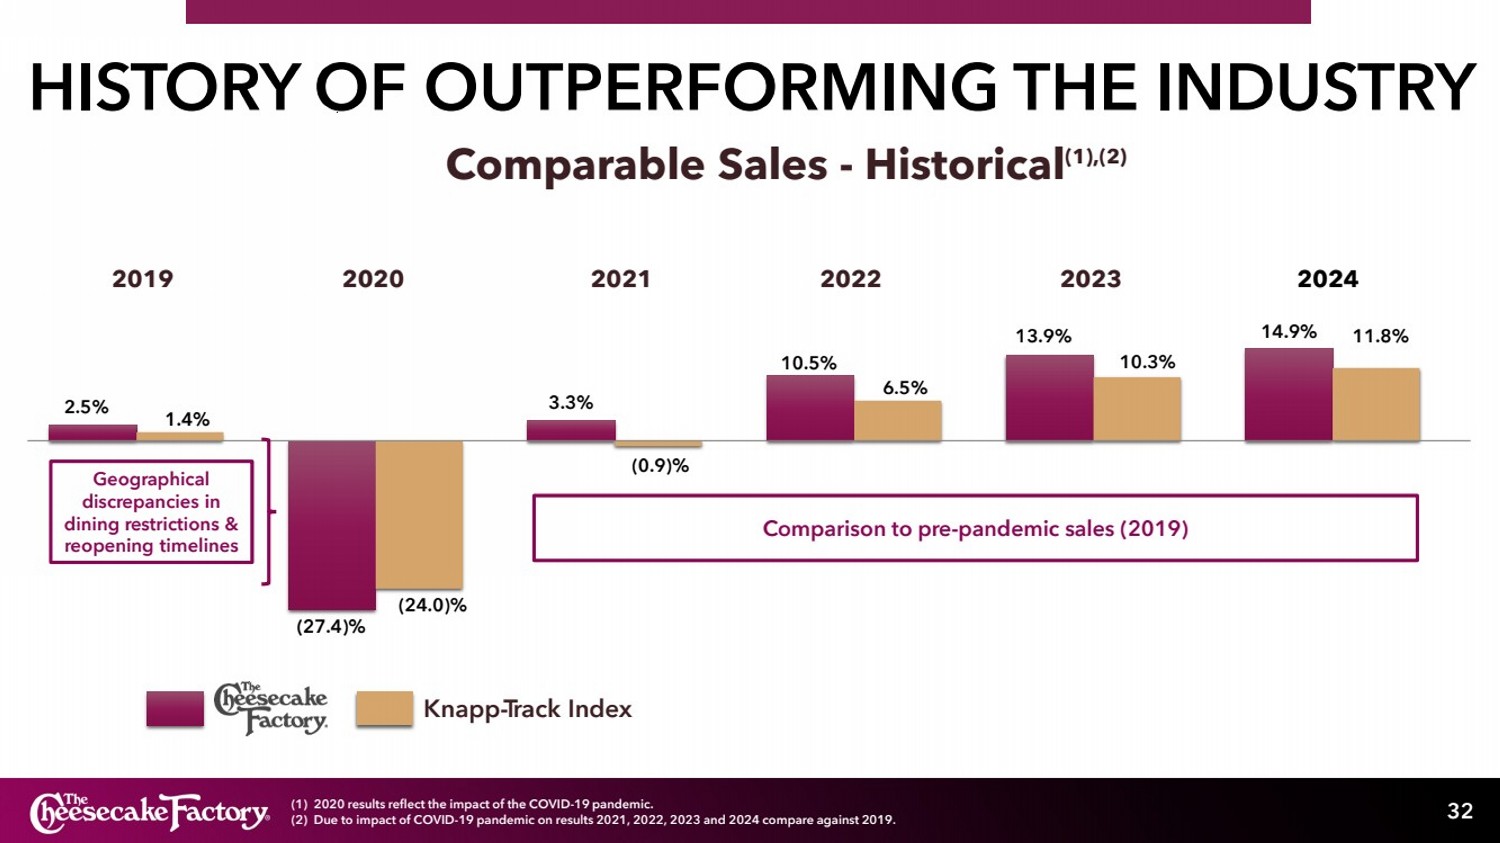
HISTORY OF OUTPERFORMING THE INDUSTRY 2.5% (27.4)% 3.3% 10.5% 13.9% 14.9% 1.4% (24.0)% (0.9)% 6.5% 10.3% 11.8% Geographical discrepancies in dining restrictions & reopening timelines Knapp-Track Index Comparable Sales - Historical(1),(2) 32 2019 2020 2021 2022 2023 Comparison to pre-pandemic sales (2019) (1) 2020 results reflect the impact of the COVID-19 pandemic. (2) Due to impact of COVID-19 pandemic on results 2021, 2022, 2023 and 2024 compare against 2019. 2024 |
|
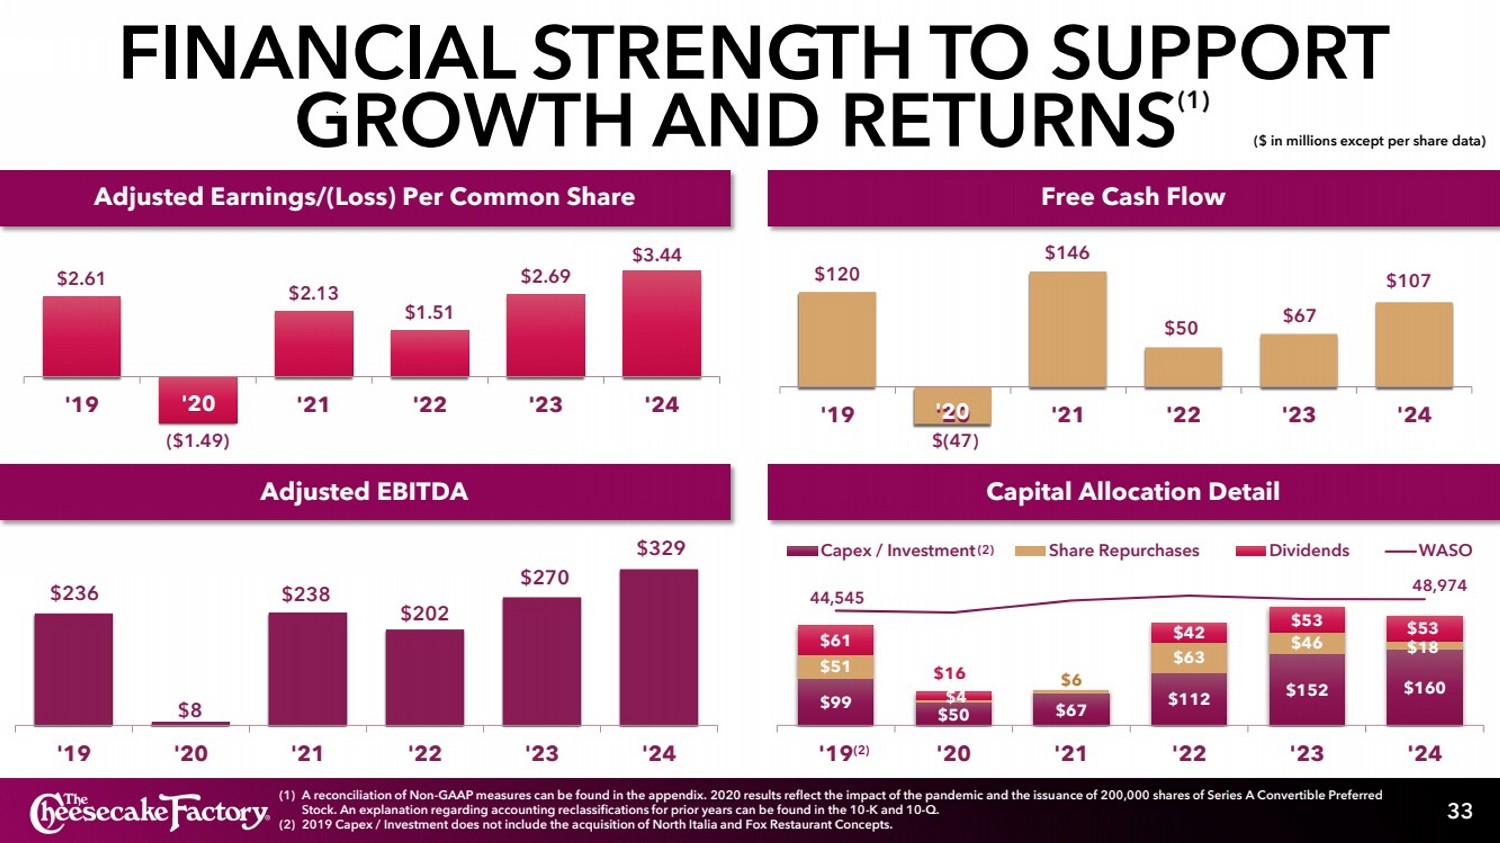
FINANCIAL STRENGTH TO SUPPORT GROWTH AND RETURNS(1) 33 $2.61 ($1.49) $2.13 $1.51 $2.69 $3.44 '19 '20 '21 '22 '23 '24 Capital Allocation Detail $120 $(47) $146 $50 $67 $107 '19 '20 '21 '22 '23 '24 $99 $50 $67 $112 $152 $160 $51 $4 $6 $63 $46 $18 $61 $16 $42 $53 $53 44,545 48,974 '19 '20 '21 '22 '23 '24 Capex / Investment Share Repurchases Dividends WASO Adjusted Earnings/(Loss) Per Common Share Free Cash Flow '20 (1) A reconciliation of Non-GAAP measures can be found in the appendix. 2020 results reflect the impact of the pandemic and the issuance of 200,000 shares of Series A Convertible Preferred Stock. An explanation regarding accounting reclassifications for prior years can be found in the 10-K and 10-Q. (2) 2019 Capex / Investment does not include the acquisition of North Italia and Fox Restaurant Concepts. (2) Adjusted EBITDA '20 '20 $236 $8 $238 $202 $270 $329 '19 '20 '21 '22 '23 '24 ($ in millions except per share data) (2) |
|
APPENDIX |
|
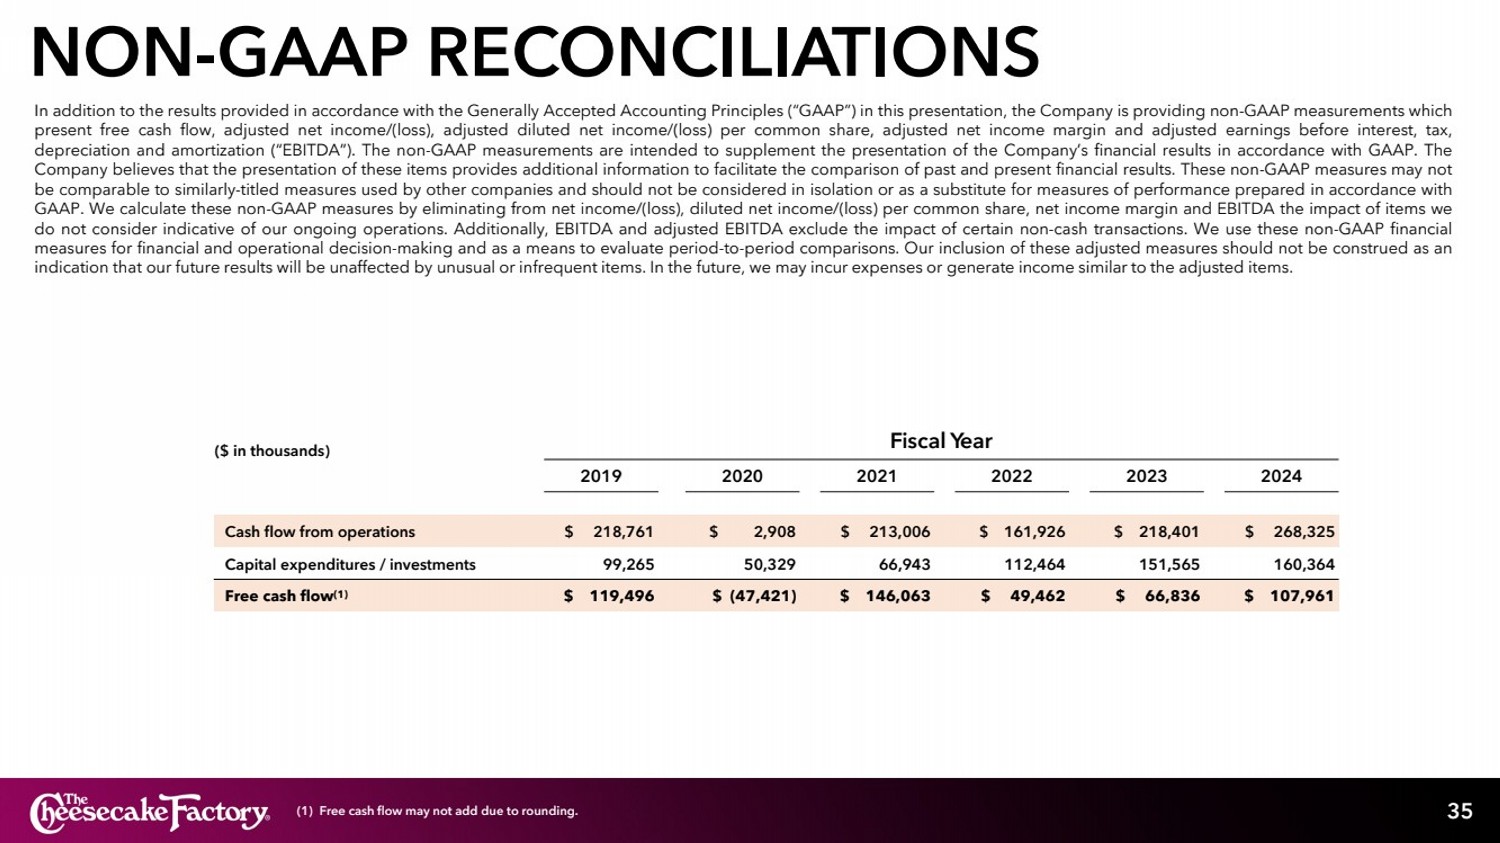
35 ($ in thousands) Fiscal Year 2019 2020 2021 2022 2023 2024 Cash flow from operations $ 218,761 $ 2,908 $ 213,006 $ 161,926 $ 218,401 $ 268,325 Capital expenditures / investments 99,265 50,329 66,943 112,464 151,565 160,364 Free cash flow(1) $ 119,496 $ (47,421) $ 146,063 $ 49,462 $ 66,836 $ 107,961 (1) Free cash flow may not add due to rounding. In addition to the results provided in accordance with the Generally Accepted Accounting Principles (“GAAP”) in this presentation, the Company is providing non-GAAP measurements which present free cash flow, adjusted net income/(loss), adjusted diluted net income/(loss) per common share, adjusted net income margin and adjusted earnings before interest, tax, depreciation and amortization (“EBITDA”). The non-GAAP measurements are intended to supplement the presentation of the Company’s financial results in accordance with GAAP. The Company believes that the presentation of these items provides additional information to facilitate the comparison of past and present financial results. These non-GAAP measures may not be comparable to similarly-titled measures used by other companies and should not be considered in isolation or as a substitute for measures of performance prepared in accordance with GAAP. We calculate these non-GAAP measures by eliminating from net income/(loss), diluted net income/(loss) per common share, net income margin and EBITDA the impact of items we do not consider indicative of our ongoing operations. Additionally, EBITDA and adjusted EBITDA exclude the impact of certain non-cash transactions. We use these non-GAAP financial measures for financial and operational decision-making and as a means to evaluate period-to-period comparisons. Our inclusion of these adjusted measures should not be construed as an indication that our future results will be unaffected by unusual or infrequent items. In the future, we may incur expenses or generate income similar to the adjusted items. NON-GAAP RECONCILIATIONS |
|
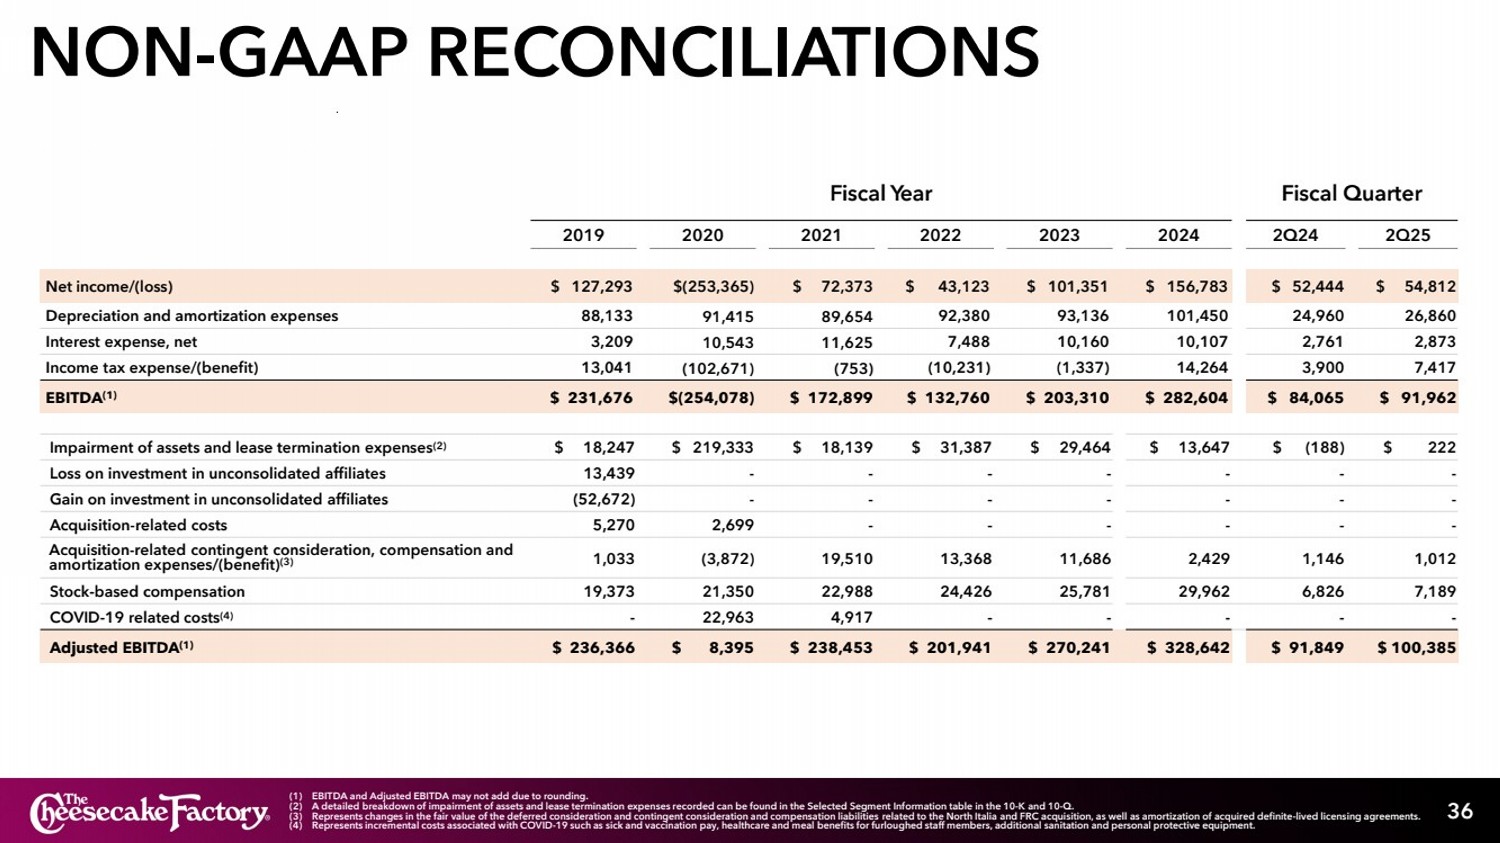
36 (1) EBITDA and Adjusted EBITDA may not add due to rounding. (2) A detailed breakdown of impairment of assets and lease termination expenses recorded can be found in the Selected Segment Information table in the 10-K and 10-Q. (3) Represents changes in the fair value of the deferred consideration and contingent consideration and compensation liabilities related to the North Italia and FRC acquisition, as well as amortization of acquired definite-lived licensing agreements. (4) Represents incremental costs associated with COVID-19 such as sick and vaccination pay, healthcare and meal benefits for furloughed staff members, additional sanitation and personal protective equipment. Fiscal Year Fiscal Quarter 2019 2020 2021 2022 2023 2024 2Q24 2Q25 Net income/(loss) $ 127,293 $(253,365) $ 72,373 $ 43,123 $ 101,351 $ 156,783 $ 52,444 $ 54,812 Depreciation and amortization expenses 88,133 91,415 89,654 92,380 93,136 101,450 24,960 26,860 Interest expense, net 3,209 10,543 11,625 7,488 10,160 10,107 2,761 2,873 Income tax expense/(benefit) 13,041 (102,671) (753) (10,231) (1,337) 14,264 3,900 7,417 EBITDA(1) $ 231,676 $(254,078) $ 172,899 $ 132,760 $ 203,310 $ 282,604 $ 84,065 $ 91,962 Impairment of assets and lease termination expenses(2) $ 18,247 $ 219,333 $ 18,139 $ 31,387 $ 29,464 $ 13,647 $ (188) $ 222 Loss on investment in unconsolidated affiliates 13,439 - - - - - - - Gain on investment in unconsolidated affiliates (52,672) - - - - - - - Acquisition-related costs 5,270 2,699 - - - - - - Acquisition-related contingent consideration, compensation and amortization expenses/(benefit)(3) 1,033 (3,872) 19,510 13,368 11,686 2,429 1,146 1,012 Stock-based compensation 19,373 21,350 22,988 24,426 25,781 29,962 6,826 7,189 COVID-19 related costs(4) - 22,963 4,917 - - - - - Adjusted EBITDA(1) $ 236,366 $ 8,395 $ 238,453 $ 201,941 $ 270,241 $ 328,642 $ 91,849 $ 100,385 NON-GAAP RECONCILIATIONS |
|
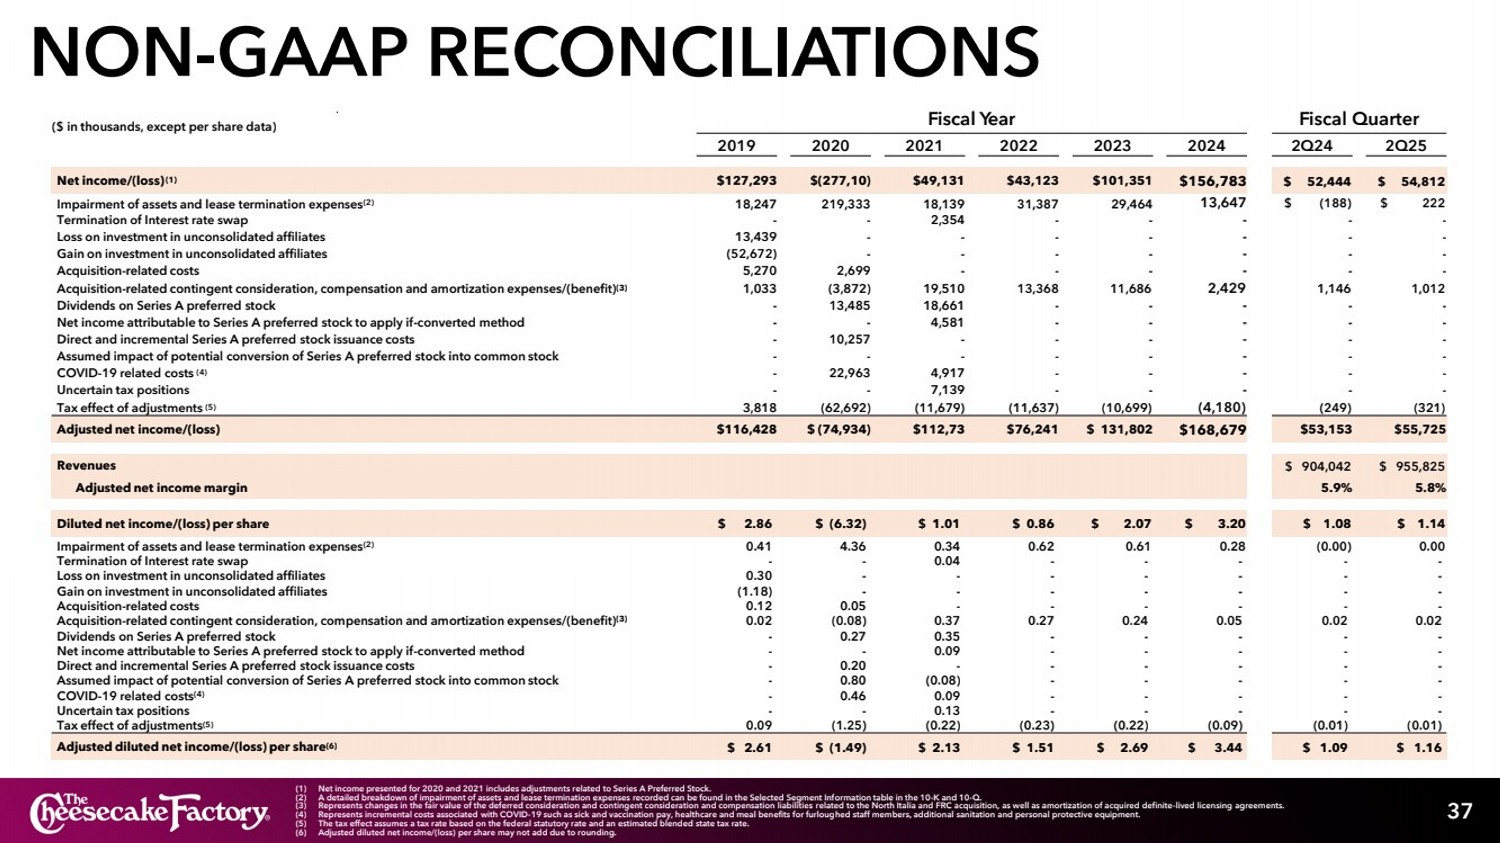
NON-GAAP RECONCILIATIONS 37 ($ in thousands, except per share data) Fiscal Year Fiscal Quarter 2019 2020 2021 2022 2023 2024 2Q24 2Q25 Net income/(loss)(1) $127,293 $(277,10) $49,131 $43,123 $101,351 $156,783 $ 52,444 $ 54,812 Impairment of assets and lease termination expenses(2) 18,247 219,333 18,139 31,387 29,464 13,647 $ (188) $ 222 Termination of Interest rate swap - - 2,354 - - - - - Loss on investment in unconsolidated affiliates 13,439 - - - - - - - Gain on investment in unconsolidated affiliates (52,672) - - - - - - - Acquisition-related costs 5,270 2,699 - - - - - - Acquisition-related contingent consideration, compensation and amortization expenses/(benefit)(3) 1,033 (3,872) 19,510 13,368 11,686 2,429 1,146 1,012 Dividends on Series A preferred stock - 13,485 18,661 - - - - - Net income attributable to Series A preferred stock to apply if-converted method - - 4,581 - - - - - Direct and incremental Series A preferred stock issuance costs - 10,257 - - - - - - Assumed impact of potential conversion of Series A preferred stock into common stock - - - - - - - - COVID-19 related costs (4) - 22,963 4,917 - - - - - Uncertain tax positions - - 7,139 - - - - - Tax effect of adjustments (5) 3,818 (62,692) (11,679) (11,637) (10,699) (4,180) (249) (321) Adjusted net income/(loss) $116,428 $ (74,934) $112,73 $76,241 $ 131,802 $168,679 $53,153 $55,725 Revenues $ 904,042 $ 955,825 Adjusted net income margin 5.9% 5.8% Diluted net income/(loss) per share $ 2.86 $ (6.32) $ 1.01 $ 0.86 $ 2.07 $ 3.20 $ 1.08 $ 1.14 Impairment of assets and lease termination expenses(2) 0.41 4.36 0.34 0.62 0.61 0.28 (0.00) 0.00 Termination of Interest rate swap - - 0.04 - - - - - Loss on investment in unconsolidated affiliates 0.30 - - - - - - - Gain on investment in unconsolidated affiliates (1.18) - - - - - - - Acquisition-related costs 0.12 0.05 - - - - - - Acquisition-related contingent consideration, compensation and amortization expenses/(benefit)(3) 0.02 (0.08) 0.37 0.27 0.24 0.05 0.02 0.02 Dividends on Series A preferred stock - 0.27 0.35 - - - - - Net income attributable to Series A preferred stock to apply if-converted method - - 0.09 - - - - - Direct and incremental Series A preferred stock issuance costs - 0.20 - - - - - - Assumed impact of potential conversion of Series A preferred stock into common stock - 0.80 (0.08) - - - - - COVID-19 related costs(4) - 0.46 0.09 - - - - - Uncertain tax positions - - 0.13 - - - - - Tax effect of adjustments(5) 0.09 (1.25) (0.22) (0.23) (0.22) (0.09) (0.01) (0.01) Adjusted diluted net income/(loss) per share(6) $ 2.61 $ (1.49) $ 2.13 $ 1.51 $ 2.69 $ 3.44 $ 1.09 $ 1.16 (1) Net income presented for 2020 and 2021 includes adjustments related to Series A Preferred Stock. (2) A detailed breakdown of impairment of assets and lease termination expenses recorded can be found in the Selected Segment Information table in the 10-K and 10-Q. (3) Represents changes in the fair value of the deferred consideration and contingent consideration and compensation liabilities related to the North Italia and FRC acquisition, as well as amortization of acquired definite-lived licensing agreements. (4) Represents incremental costs associated with COVID-19 such as sick and vaccination pay, healthcare and meal benefits for furloughed staff members, additional sanitation and personal protective equipment. (5) The tax effect assumes a tax rate based on the federal statutory rate and an estimated blended state tax rate. (6) Adjusted diluted net income/(loss) per share may not add due to rounding. |