UNITED STATES
SECURITIES AND EXCHANGE COMMISSION
Washington, D.C. 20549
Form 8-K
Current Report
Pursuant to Section 13 or 15(d) of the
Securities Exchange Act of 1934
Date of Report (Date of earliest event reported) July 29, 2025
AmeriServ Financial, Inc.
(exact name of registrant as specified in its charter)
| Pennsylvania | 0-11204 | 25-1424278 | ||
| (State or other jurisdiction | (Commission | (IRS Employer | ||
| of incorporation) | File Number) | Identification No.) |
| Main and Franklin Streets, Johnstown, PA | 15901 |
| (address of principal executive offices) | (Zip Code) |
Registrant's telephone number, including area code: 814-533-5300
N/A
(Former name or former address, if changed since last report.)
Check the appropriate box below if the Form 8-K filing is intended to simultaneously satisfy the filing obligation of the registrant under any of the following provisions:
¨ Written communications pursuant to Rule 425 under the Securities Act (17 CFR 230.425)
¨ Soliciting material pursuant to Rule 14a-12 under the Exchange Act (17 CFR 240.14a-12)
¨ Pre-commencement communications pursuant to Rule 14d-2(b) under the Exchange Act (17 CFR 240.14d-2(b))
¨ Pre-commencement communications pursuant to Rule 13e-4(c) under the Exchange Act (17 CFR 240.13e-4(c))
Securities registered pursuant to Section 12(b) of the Act:
| Title Of Each Class | Trading Symbol | Name of Each Exchange On Which Registered | ||
| Common Stock | ASRV | The NASDAQ Stock Market LLC |
Indicate by check mark whether the registrant is an emerging growth company as defined in Rule 405 of the Securities Act of 1933 (230.405 of this chapter) or Rule 12b-2 of the Securities Exchange Act of 1934 (240.12b-2 of this chapter).
Emerging growth company ¨
If an emerging growth company, indicate by check mark if the registrant has elected not to use the extended transition period for complying with any new or revised financial accounting standards provided pursuant to Section 13(a) of the Exchange Act. ¨
| Item 7.01 | Regulation FD Disclosure. |
On July 29, 2025, AmeriServ Financial, Inc. (the “Company”) made available on its website an investor presentation regarding the Company, which presentation is furnished as Exhibit 99.1 attached hereto and is incorporated herein by reference.
The information contained in this Report, including Exhibit 99.1 attached hereto, is considered to be “furnished” and shall not be deemed to be “filed” for purposes of Section 18 of the Securities Exchange Act of 1934, as amended, or otherwise subject to liability under that section. The information contained in this Report, including Exhibit 99.1 attached hereto, shall not be incorporated by reference into any filing or other document pursuant to the Securities Act of 1933, as amended, or the Exchange Act, except as expressly set forth by specific reference in such filing.
| Item 9.01 | Financial Statements and Exhibits. |
(d) Exhibits:
| 99.1 | Investor Presentation of AmeriServ Financial, Inc. | |
| 104 | Cover Page Interactive Data File (embedded within the Inline XBRL document). |
Pursuant to the requirements of the Securities Exchange Act of 1934, the registrant has duly caused this report to be signed on its behalf by the undersigned hereunto duly authorized.
| AMERISERV FINANCIAL, Inc. | ||
| Date: July 29, 2025 | By | /s/ Jeffrey A. Stopko |
| Jeffrey A. Stopko | ||
| President & Chief Executive Officer | ||
Exhibit 99.1

Annual Shareholder Meeting HELD: July 29, 2025

2 J. Michael Adams, Jr. Chairman of the Board Welcome 3 Welcome to our Annual Shareholder Meeting.

We appreciate your ongoing loyalty and support.
Agenda 4 • Welcome and Introductions • Report on Existence of Quorum • Opening of the Polls • Presentation and Voting on Proposals o Proposal 1 – Election of Directors o Proposal 2 – Advisory Vote on Executive Compensation o Proposal 3 – Advisory Vote on Frequency of Future Advisory Votes on Executive Compensation o Proposal 4 – Ratification of Appointment of Independent Registered Public Accounting Firm • Closing of the Polls • Management Presentations • Shareholder General Question and Answer Session • Announcement of Preliminary Voting Results • Adjournment Chairman Remarks • Board of Directors • Cooperation Agreement • Consulting Agreement • Business Development • Union Partnerships 5
Michael D.
Lynch Executive Vice President Chief Financial Officer | Chief Investment Officer | Chief Risk Officer 6 7 Forward - Looking Statements This presentation contains various forward - looking statements and includes assumptions concerning the Company’s beliefs, plans, objectives, goals, expectations, anticipations, estimates, intentions, operations, future results, and prospects, including statements that include the words “ma y,” “could,” “should,” “would,” “believe,” “expect,” “anticipate,” “estimate,” “intend,” “project,” “plan” or similar expressions. These forward - looking statements are bas ed upon current expectations, are subject to risk and uncertainties and are applicable only as of the dates of such statements. Forward - looking statements involve risks, uncertai nties and assumptions. Although we do not make forward - looking statements unless we believe we have a reasonable basis for doing so, we cannot guarantee their accuracy. Y ou should not put undue reliance on any forward - looking statements. These statements speak only as of the date of this presentation, even if subsequently made available on our website or otherwise, and we undertake no obligation to update or revise these statements to reflect events or circumstances occurring after the date of t his presentation. In connection with the “safe harbor” provisions of the Private Securities Litigation Reform Act of 1995, the Company provides the following cautionary sta tem ent identifying important factors (some of which are beyond the Company’s control) which could cause the actual results or events to differ materially from those set fo rth in or implied by the forward - looking statements and related assumptions. Such factors include the following: (i) the effect of changing regional and national economic conditions; (ii) the effects of tr ade, monetary and fiscal policies and laws, including interest rate policies of the Federal Reserve; (iii) significant changes in interest rates and prepayment speeds; ( iv) inflation, stock and bond market, and monetary fluctuations; (v) credit risks of commercial, real estate, consumer, and other lending activities; (vi) changes in federal an d s tate banking and financial services laws and regulations; (vii) the presence in the Company’s market area of competitors with greater financial resources than the Company ; ( viii) the timely development of competitive new products and services by the Company and the acceptance of those products and services by customers and regulators (when req uired); (ix) the willingness of customers to substitute competitors’ products and services for those of the Company and vice versa; (x) changes in consumer s pen ding and savings habits; (xi) unanticipated regulatory or judicial proceedings; and (xii) other external developments which could materially impact the Com pan y’s operational and financial performance. The foregoing list of important factors is not exclusive, and neither such list nor any forward - looking statement takes into acc ount the impact that any future acquisition may have on the Company and on any such forward - looking statement.
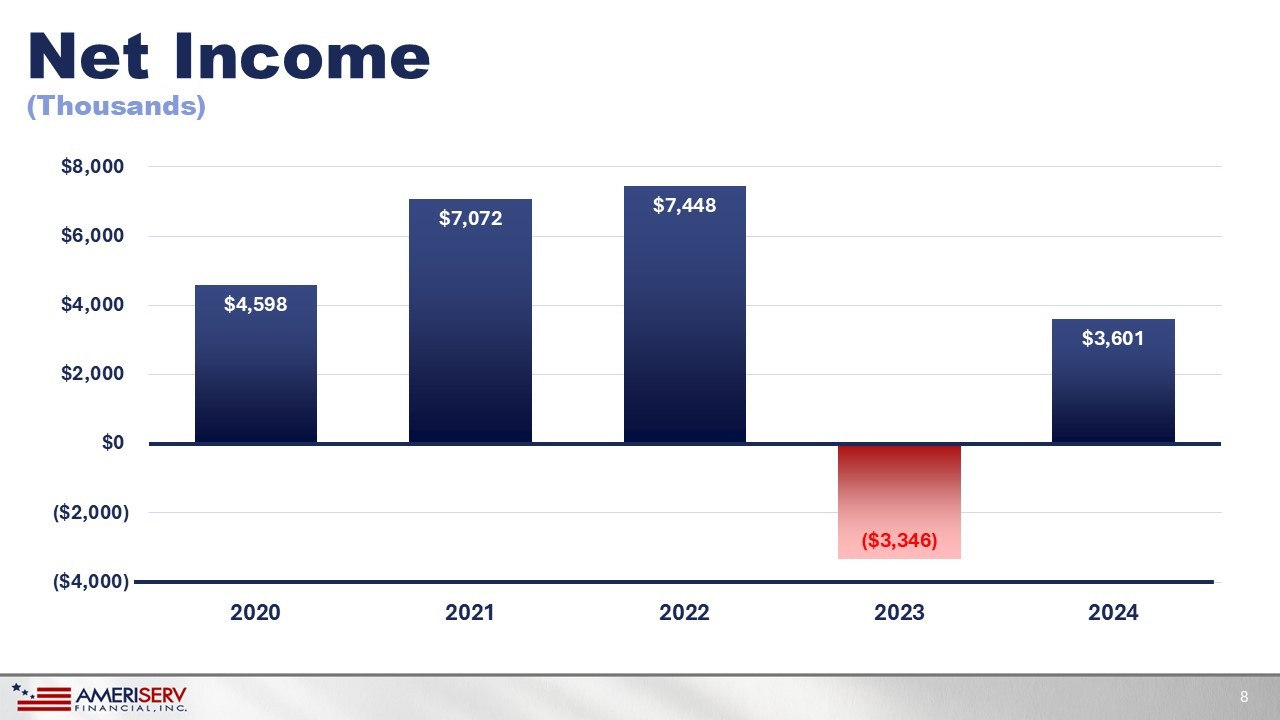
Net Income $4,598 $7,072 $7,448 ($3,346) $3,601 ($4,000) ($2,000) $0 $2,000 $4,000 $6,000 $8,000 2020 2021 2022 2023 2024 8 (Thousands)
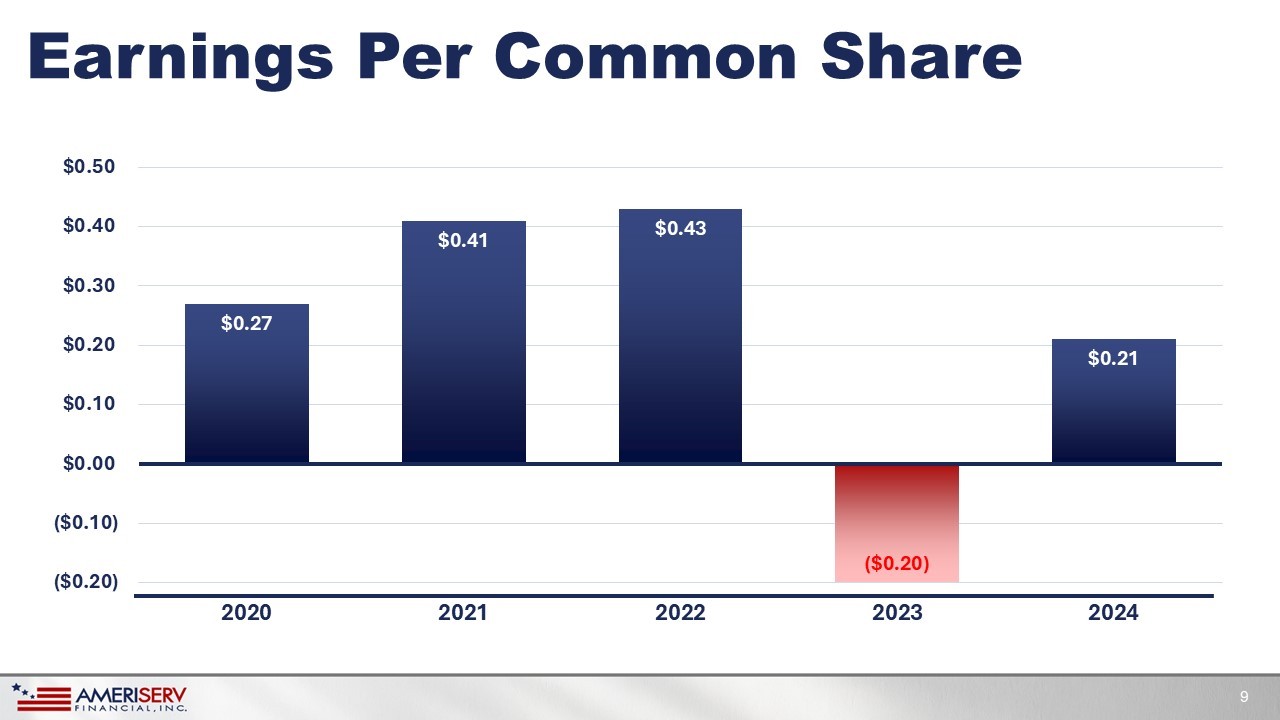
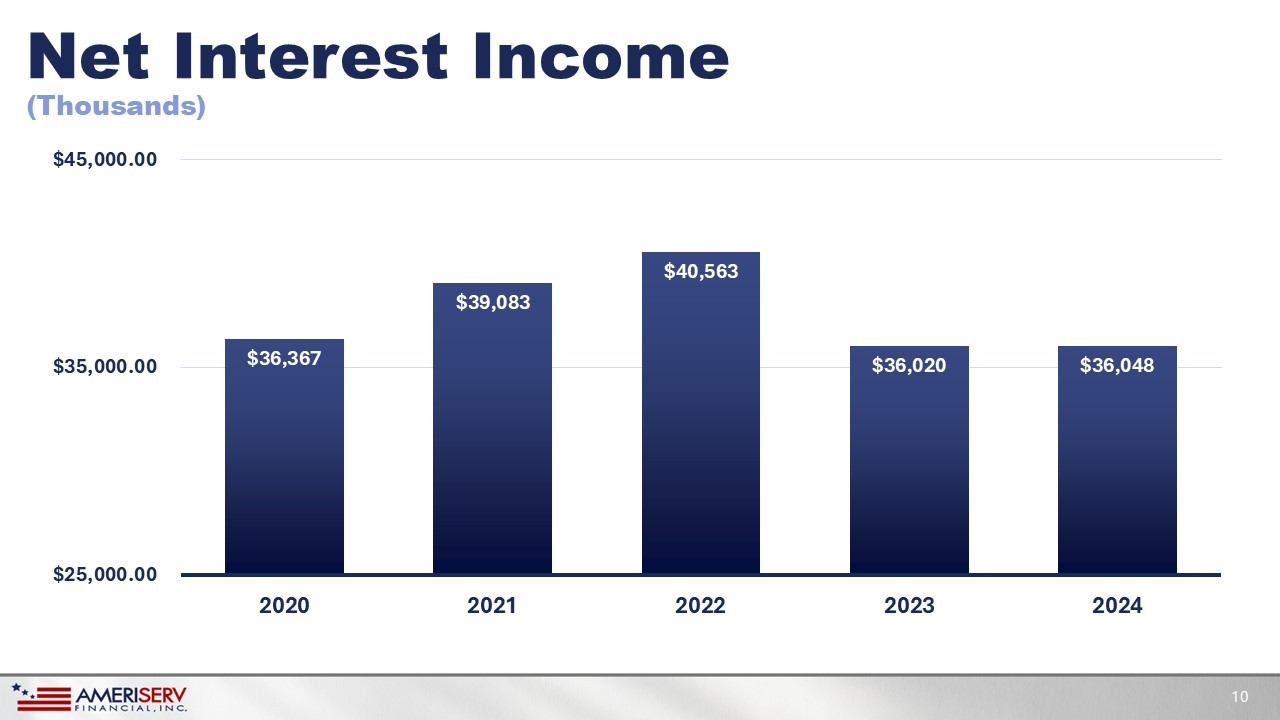
$0.27 $0.41 $0.43 ($0.20) $0.21 ($0.20) ($0.10) $0.00 $0.10 $0.20 $0.30 $0.40 $0.50 2020 2021 2022 2023 2024 Earnings Per Common Share 9 Net Interest Income $36,367 $39,083 $40,563 $36,020 $36,048 $25,000.00 $35,000.00 $45,000.00 2020 2021 2022 2023 2024 10 (Thousands)
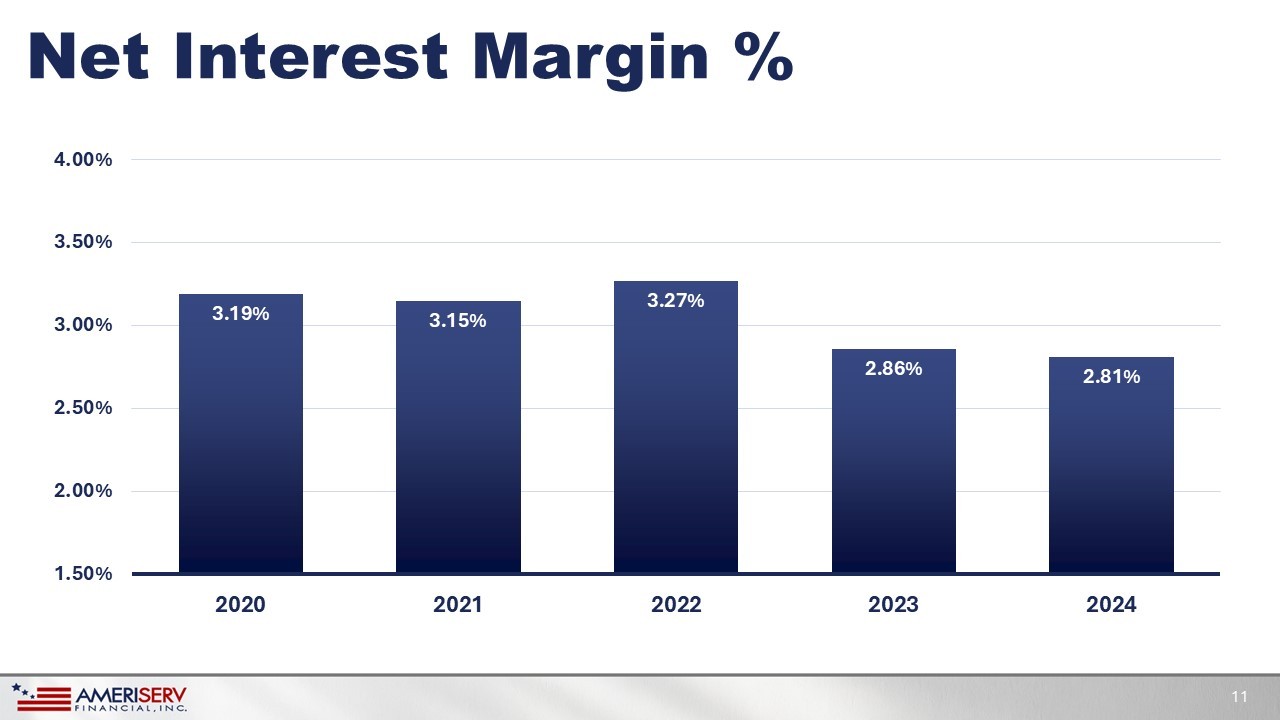
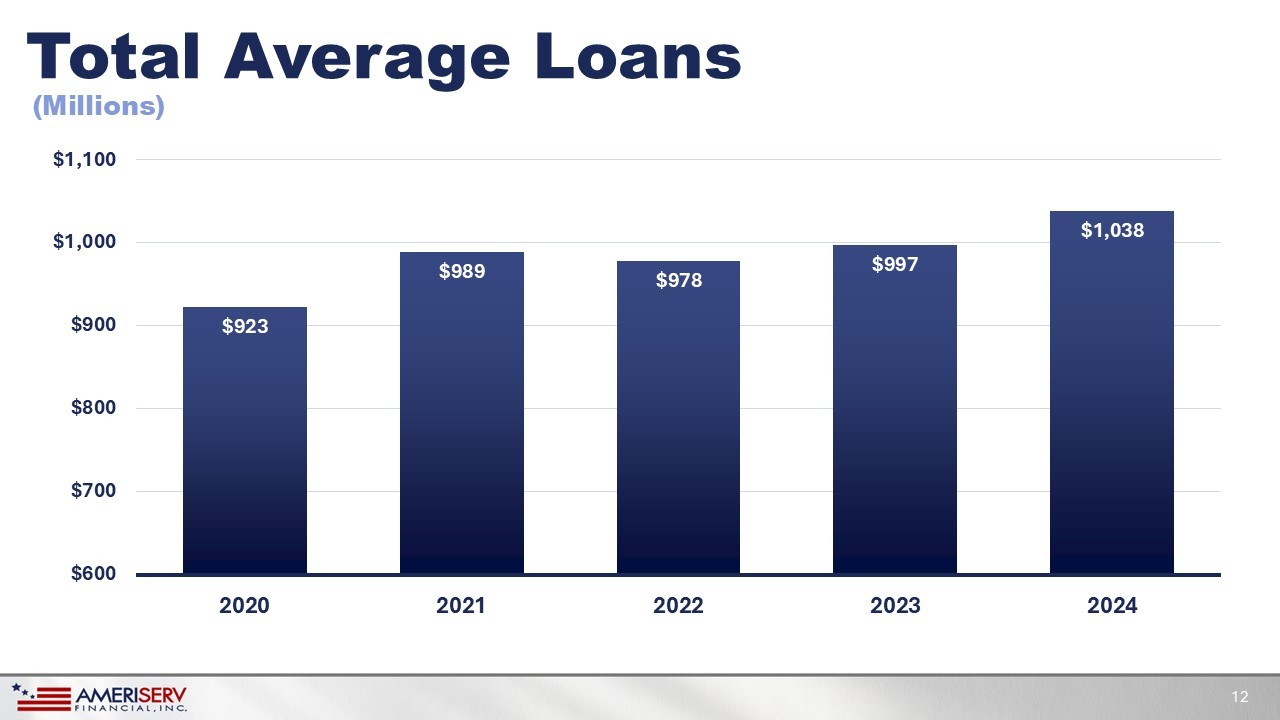
Net Interest Margin % 3.19% 3.15% 3.27% 2.86% 2.81% 1.50% 2.00% 2.50% 3.00% 3.50% 4.00% 2020 2021 2022 2023 2024 11 Total Average Loans $923 $989 $978 $997 $1,038 $600 $700 $800 $900 $1,000 $1,100 2020 2021 2022 2023 2024 12 (Millions)
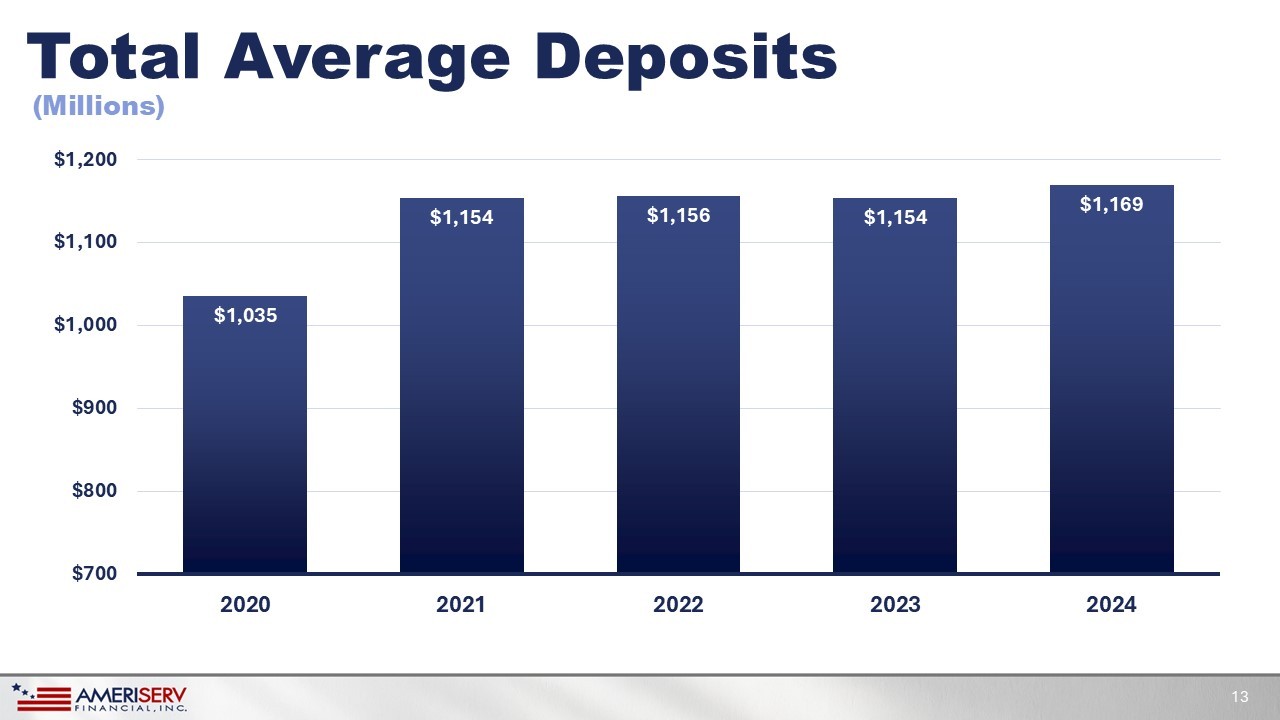
Total Average Deposits $1,035 $1,154 $1,156 $1,154 $1,169 $700 $800 $900 $1,000 $1,100 $1,200 2020 2021 2022 2023 2024 13 (Millions)
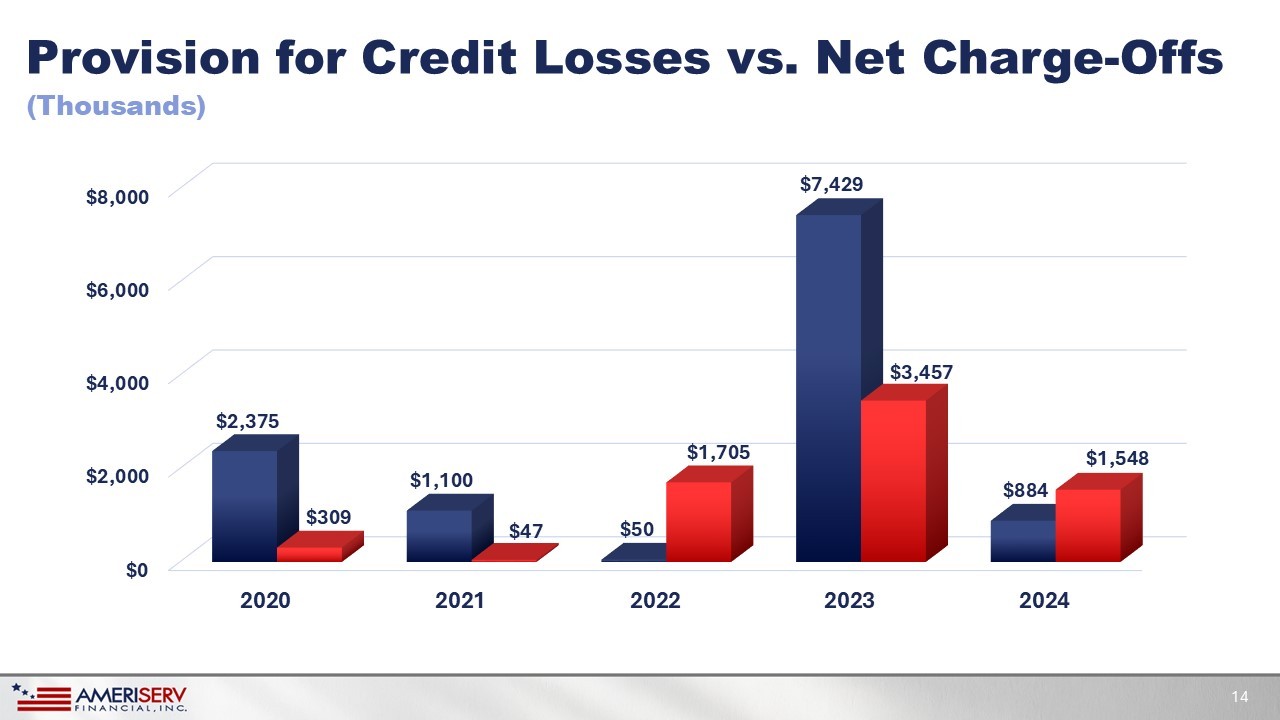
Provision for Credit Losses vs. Net Charge - Offs $0 $2,000 $4,000 $6,000 $8,000 2020 2021 2022 2023 2024 $2,375 $1,100 $50 $7,429 $884 $309 $47 $1,705 $3,457 $1,548 14 (Thousands)
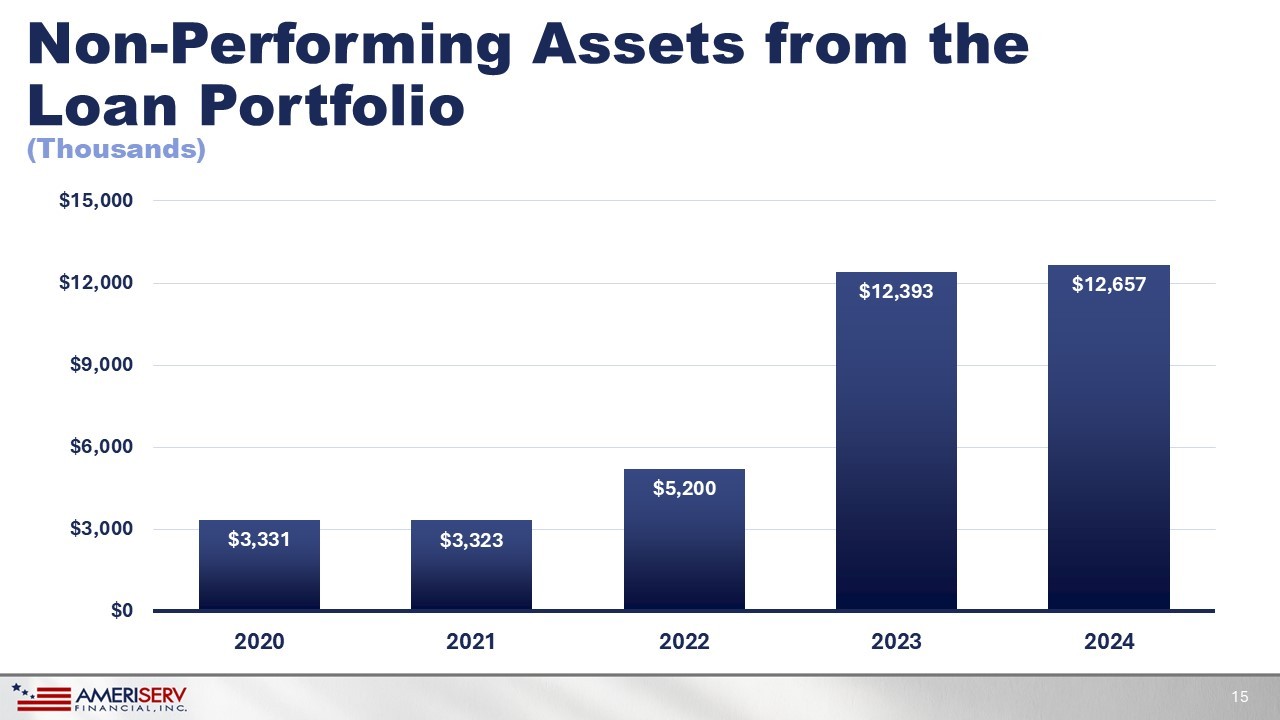
Non - Performing Assets from the Loan Portfolio $3,331 $3,323 $5,200 $12,393 $12,657 $0 $3,000 $6,000 $9,000 $12,000 $15,000 2020 2021 2022 2023 2024 15 (Thousands)
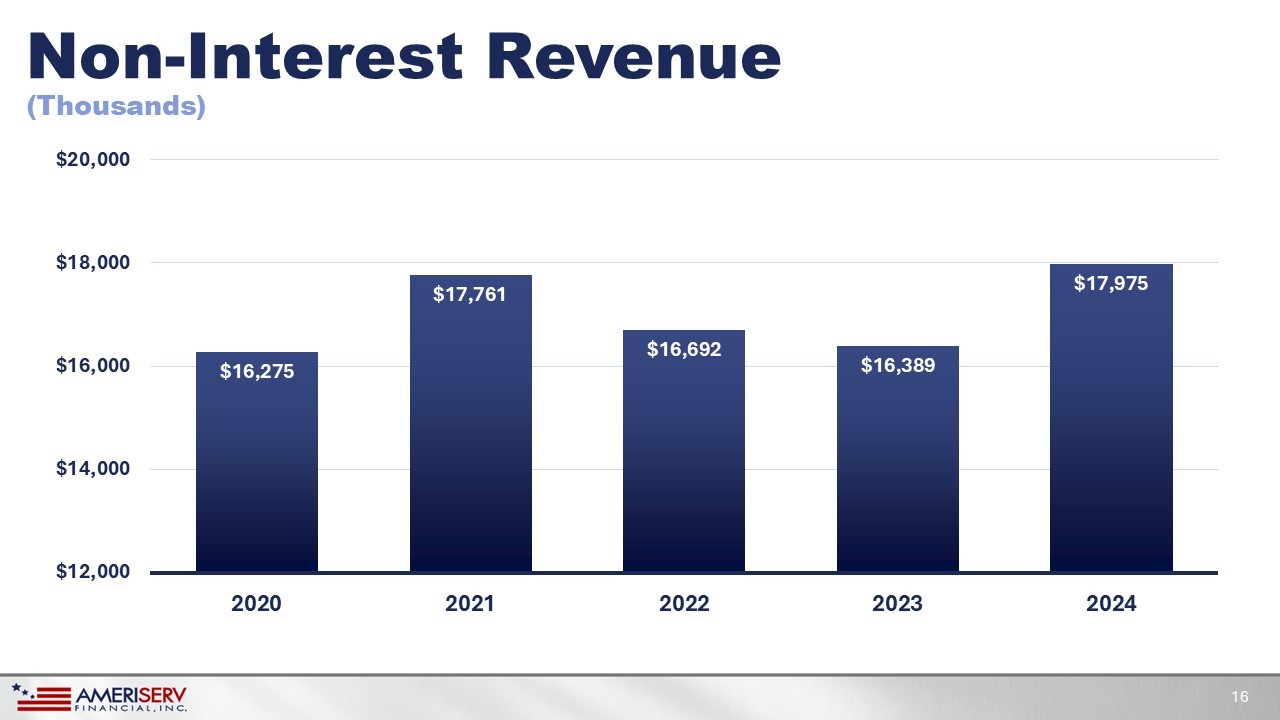
Non - Interest Revenue $16,275 $17,761 $16,692 $16,389 $17,975 $12,000 $14,000 $16,000 $18,000 $20,000 2020 2021 2022 2023 2024 16 (Thousands)
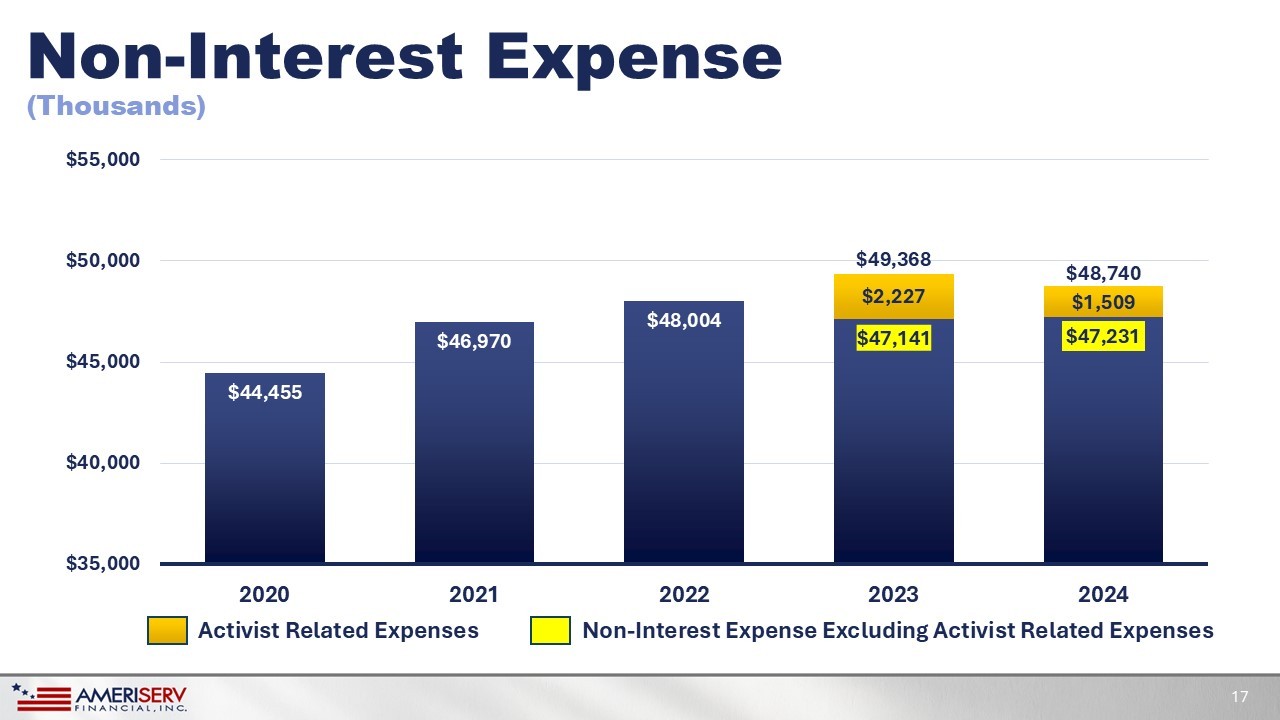
Non - Interest Expense $44,455 $46,970 $48,004 $47,141 $47,231 $2,227 $1,509 $35,000 $40,000 $45,000 $50,000 $55,000 2020 2021 2022 2023 2024 17 $ 49,368 Activist Related Expenses Non - Interest Expense Excluding Activist Related Expenses (Thousands) $ 48,740 18 2024 Summary • The Company’s 2024 earnings improvement was driven by the favorable comparison in the provision for credit losses, improved total revenue, and lower non - interest expense.
• Our community banking business continued to benefit from diversified revenue streams, with strong revenue and profit contribution from our wealth management business which caused total non - interest income to represent 33% of total revenue for 2024.
19 • We concluded 2024 with positive momentum driven by our strongest quarterly loan and deposit growth during the fourth quarter. We also saw solid growth in net interest income as our fourth quarter net interest margin increased by 17 basis points on a sequential basis. • We believe that our balance sheet is well positioned for further quarterly net interest income growth and net interest margin improvement which has occurred and will continue in 2025. 2024 Summary 20 Jeffrey A. Stopko President & CEO

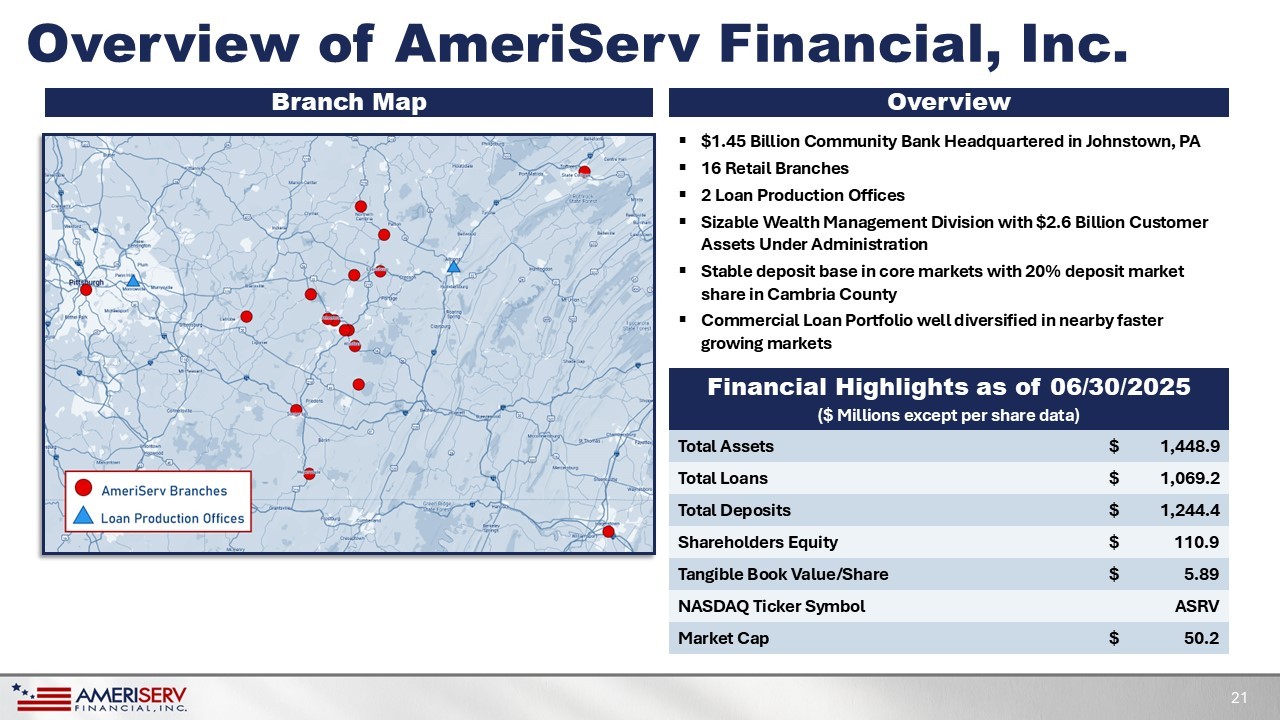
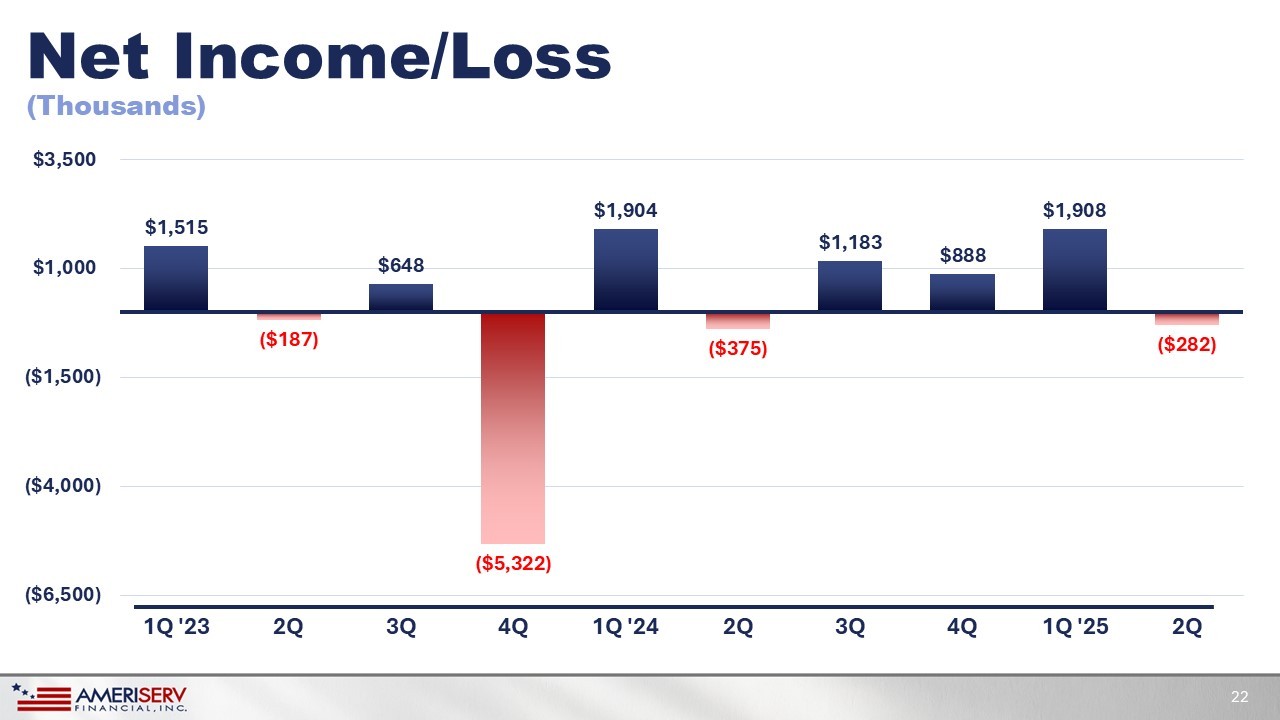
Branch Map Overview ▪ $1.45 Billion Community Bank Headquartered in Johnstown, PA ▪ 16 Retail Branches ▪ 2 Loan Production Offices ▪ Sizable Wealth Management Division with $2.6 Billion Customer Assets Under Administration ▪ Stable deposit base in core markets with 20% deposit market share in Cambria County ▪ Commercial Loan Portfolio well diversified in nearby faster growing markets Financial Highlights as of 06/30/2025 ($ Millions except per share data) 21 Overview of AmeriServ Financial, Inc. 1,448.9 $ Total Assets 1,069.2 $ Total Loans 1,244.4 $ Total Deposits 110.9 $ Shareholders Equity 5.89 $ Tangible Book Value/Share ASRV NASDAQ Ticker Symbol 50.2 $ Market Cap Net Income/Loss $1,515 ($187) $648 ($5,322) $1,904 ($375) $1,183 $888 $1,908 ($282) ($6,500) ($4,000) ($1,500) $1,000 $3,500 1Q '23 2Q 3Q 4Q 1Q '24 2Q 3Q 4Q 1Q '25 2Q 22 (Thousands)
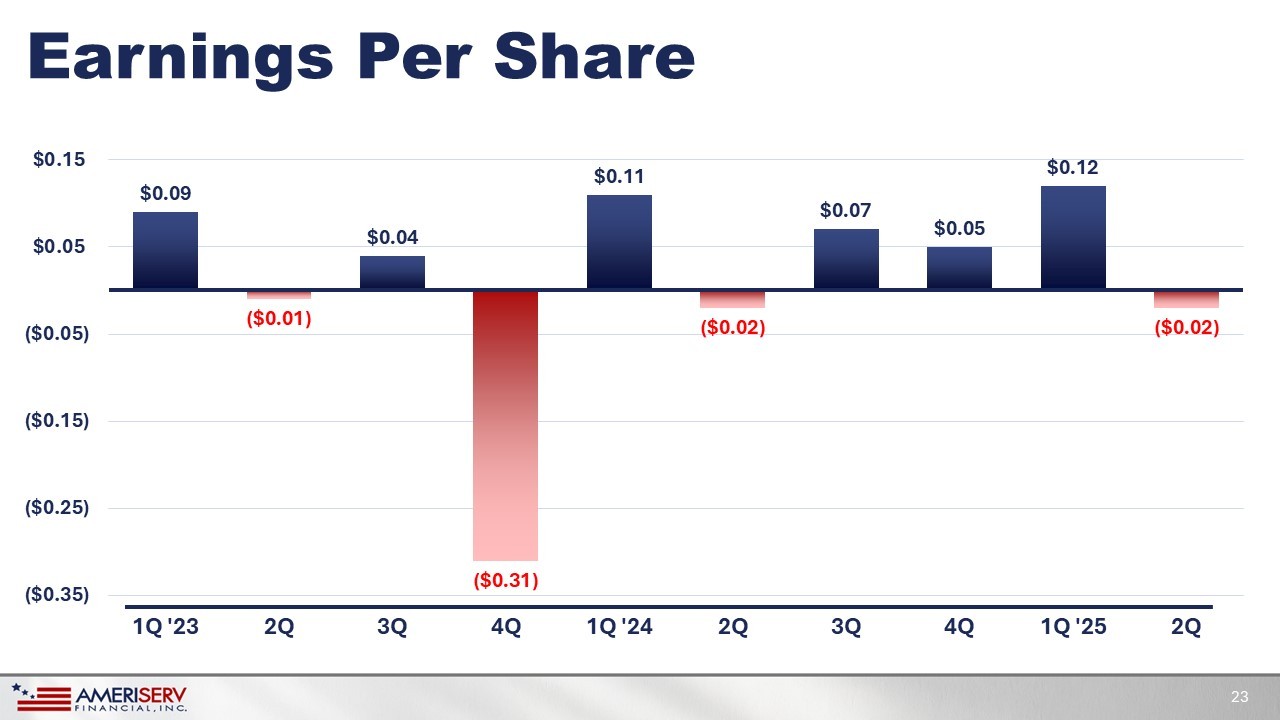
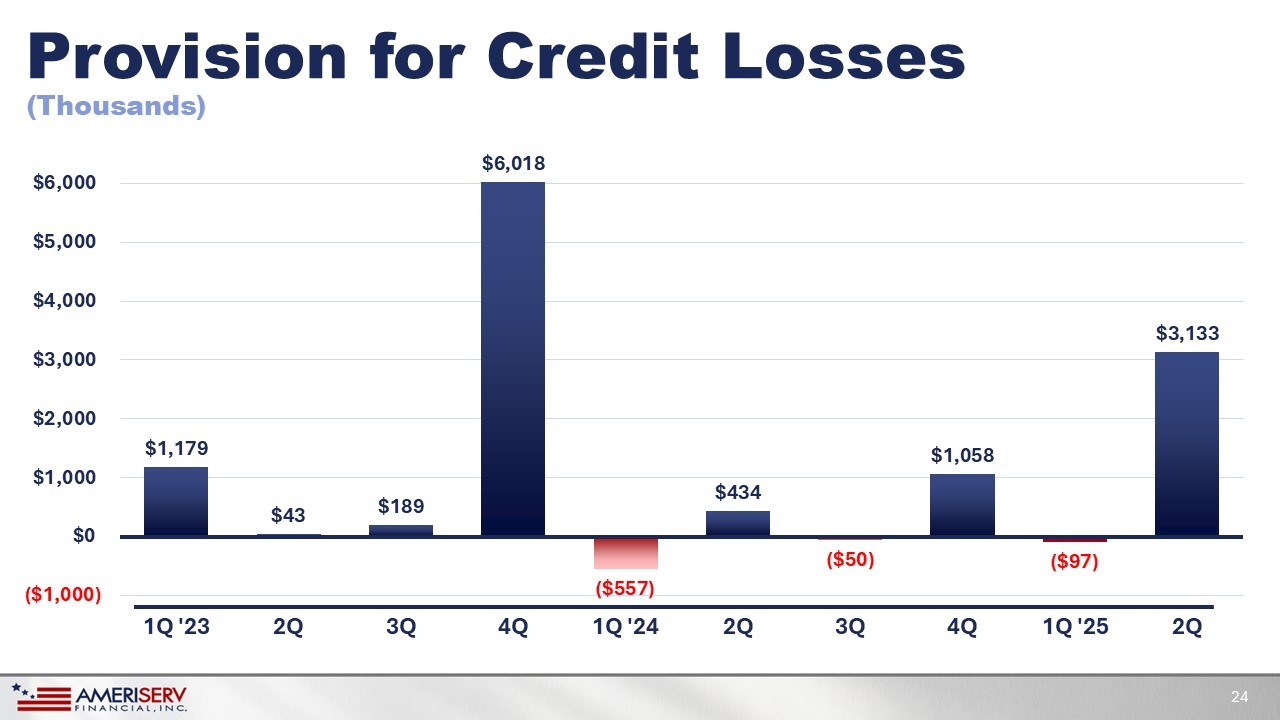
Earnings Per Share $0.09 ($0.01) $0.04 ($0.31) $0.11 ($0.02) $0.07 $0.05 $0.12 ($0.02) ($0.35) ($0.25) ($0.15) ($0.05) $0.05 $0.15 1Q '23 2Q 3Q 4Q 1Q '24 2Q 3Q 4Q 1Q '25 2Q 23 Provision for Credit Losses $1,179 $43 $189 $6,018 ($557) $434 ($50) $1,058 ($97) $3,133 ($1,000) $0 $1,000 $2,000 $3,000 $4,000 $5,000 $6,000 1Q '23 2Q 3Q 4Q 1Q '24 2Q 3Q 4Q 1Q '25 2Q 24 (Thousands)
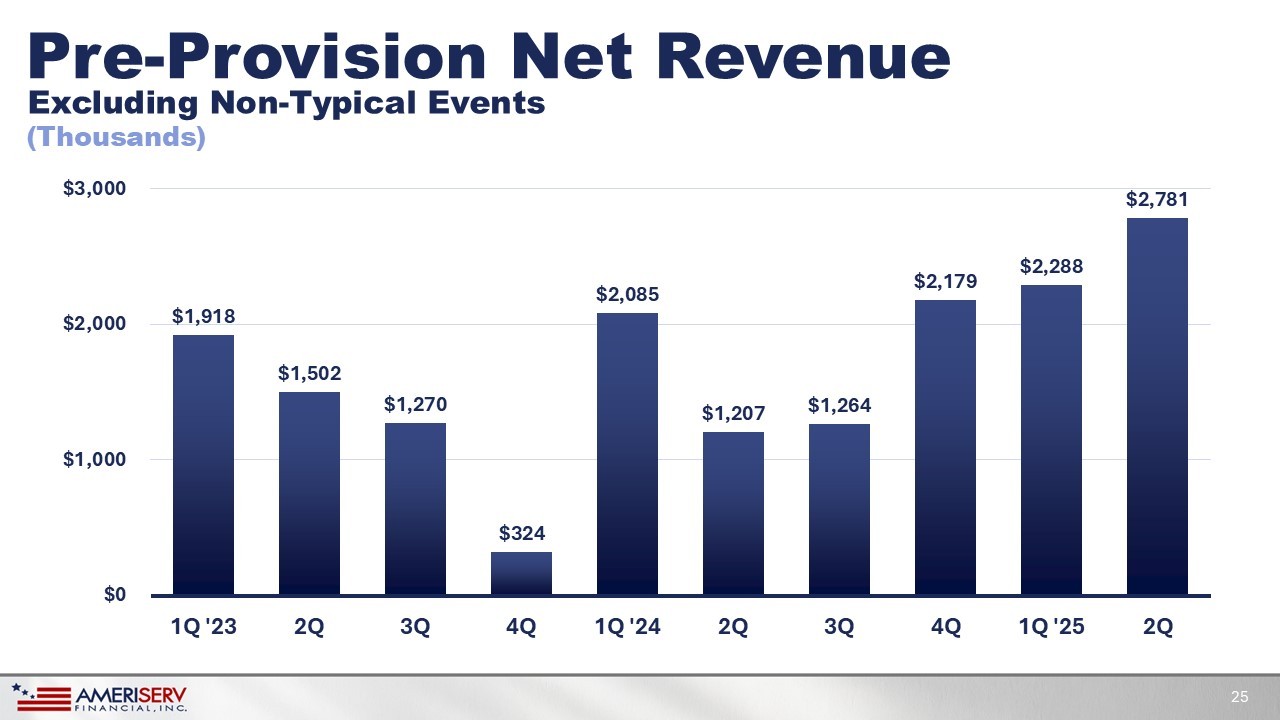
Pre - Provision Net Revenue $1,918 $1,502 $1,270 $324 $2,085 $1,207 $1,264 $2,179 $2,288 $2,781 $0 $1,000 $2,000 $3,000 1Q '23 2Q 3Q 4Q 1Q '24 2Q 3Q 4Q 1Q '25 2Q 25 Excluding Non - Typical Events (Thousands)
Key Constituents We Manage For 26 AmeriServ Strategic Plan Shareholders Customers Employees Community Create long - term value for our shareholders by: • Maintaining financially strong balance sheet • Appropriately managing risk • Improving earnings performance • Disciplined capital allocation AmeriServ Strategic Plan 27
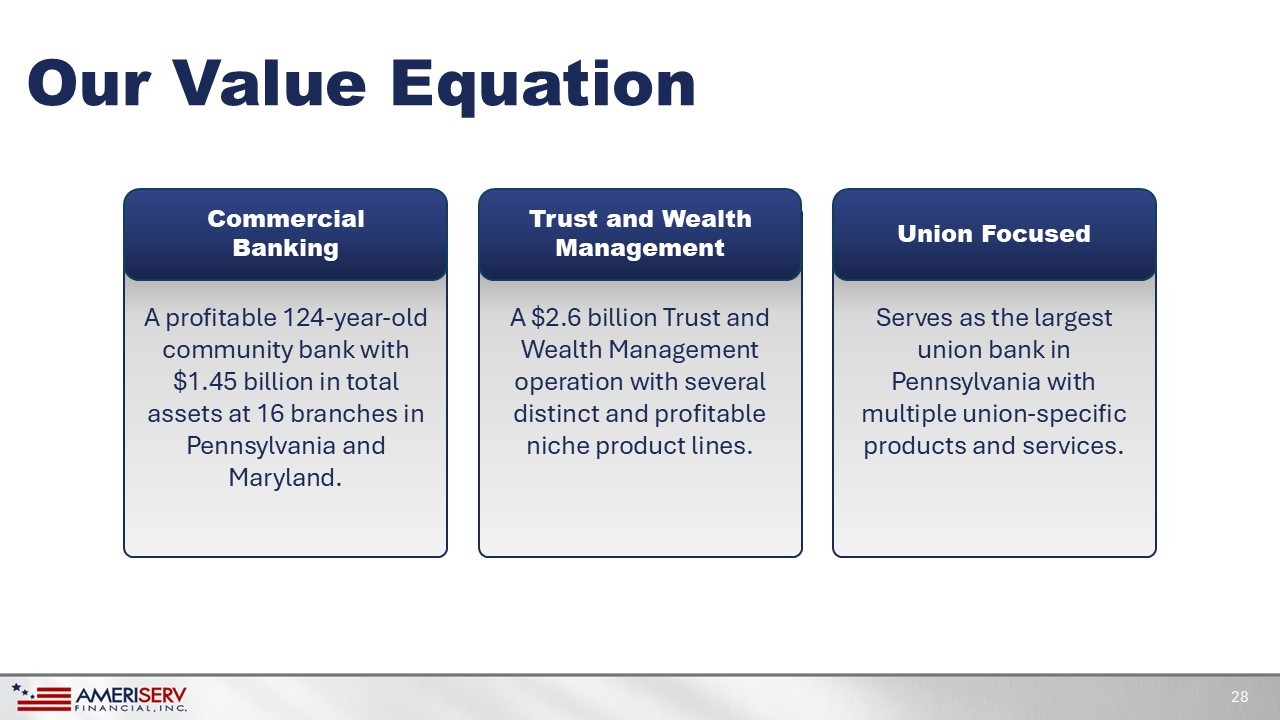
Our Value Equation 28 Commercial Banking A profitable 124 - year - old community bank with $1.45 billion in total assets at 16 branches in Pennsylvania and Maryland. Union Focused Serves as the largest union bank in Pennsylvania with multiple union - specific products and services. Trust and Wealth Management A $2.6 billion Trust and Wealth Management operation with several distinct and profitable niche product lines.
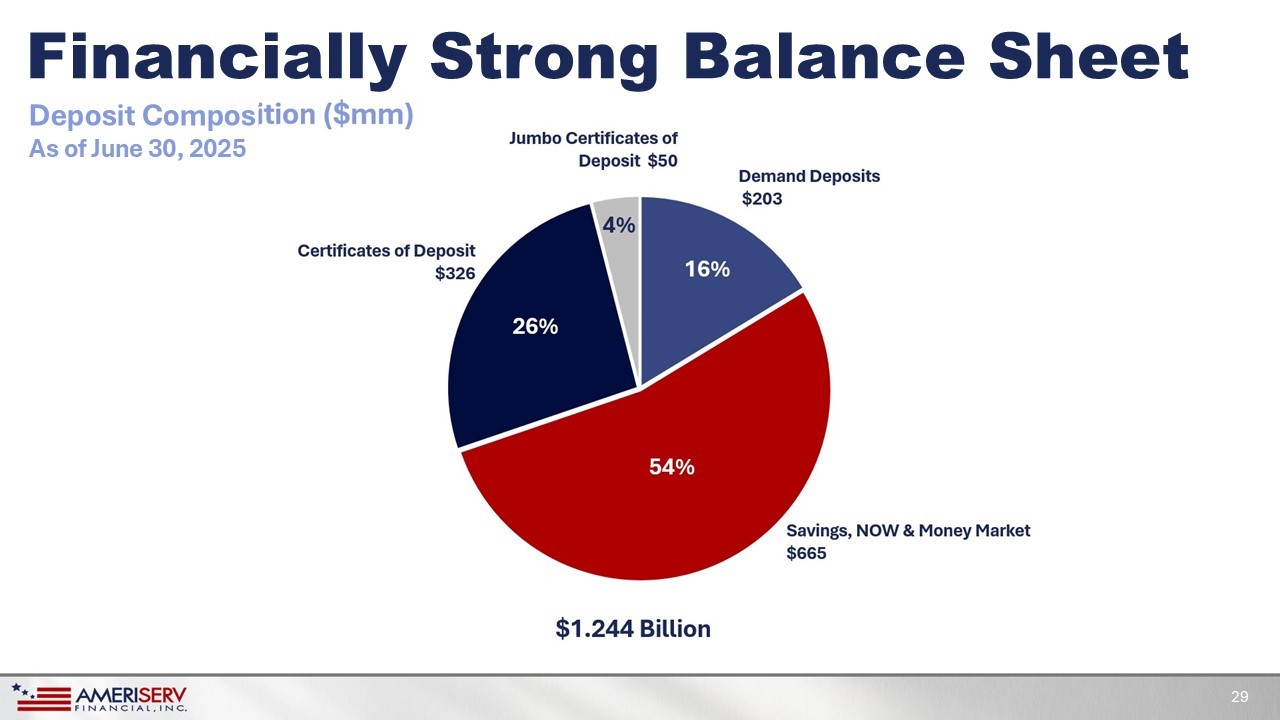
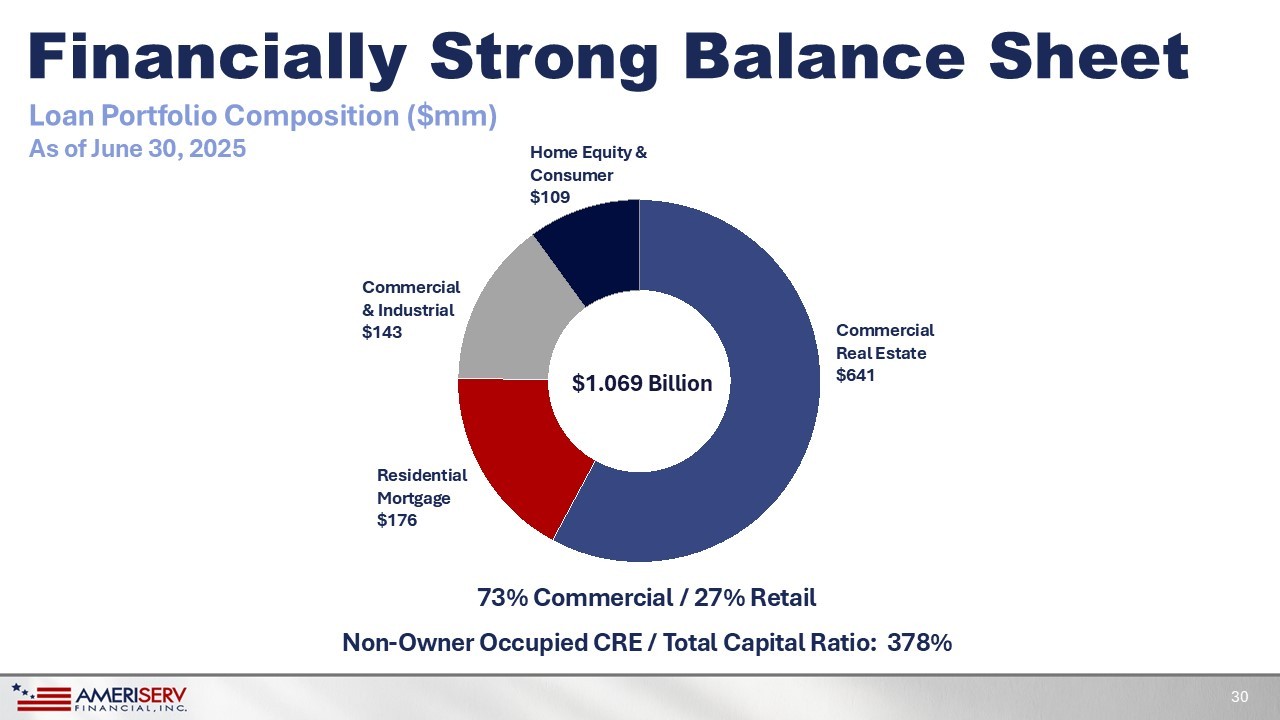
Demand Deposits $203 Savings, NOW & Money Market $665 Certificates of Deposit $326 Jumbo Certificates of Deposit $50 16% 54% 26% 4% $1.244 Billion Deposit Composition ($mm) As of June 30, 2025 Financially Strong Balance Sheet 29 Residential Mortgage $176 Home Equity & Consumer $109 Commercial & Industrial $143 Commercial Real Estate $641 $1.069 B illion 73% Commercial / 27% Retail Non - Owner Occupied CRE / Total Capital Ratio: 378% 30 Loan Portfolio Composition ($mm) As of June 30, 2025
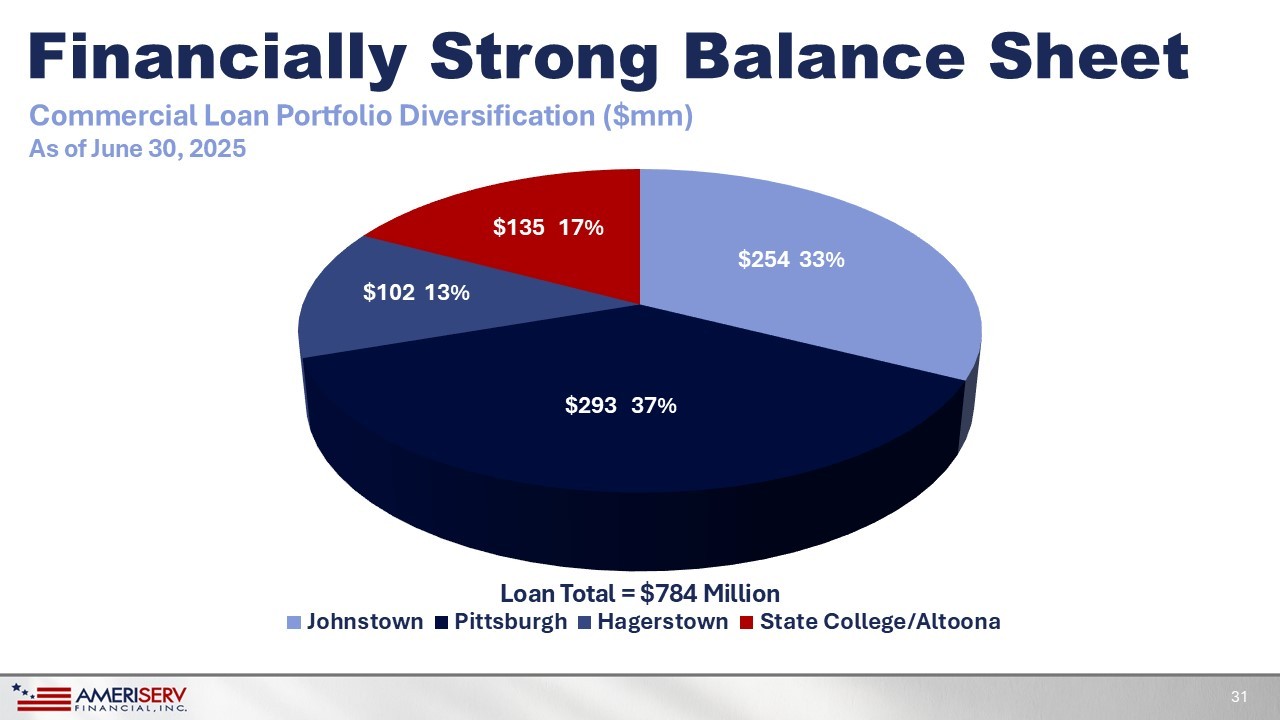
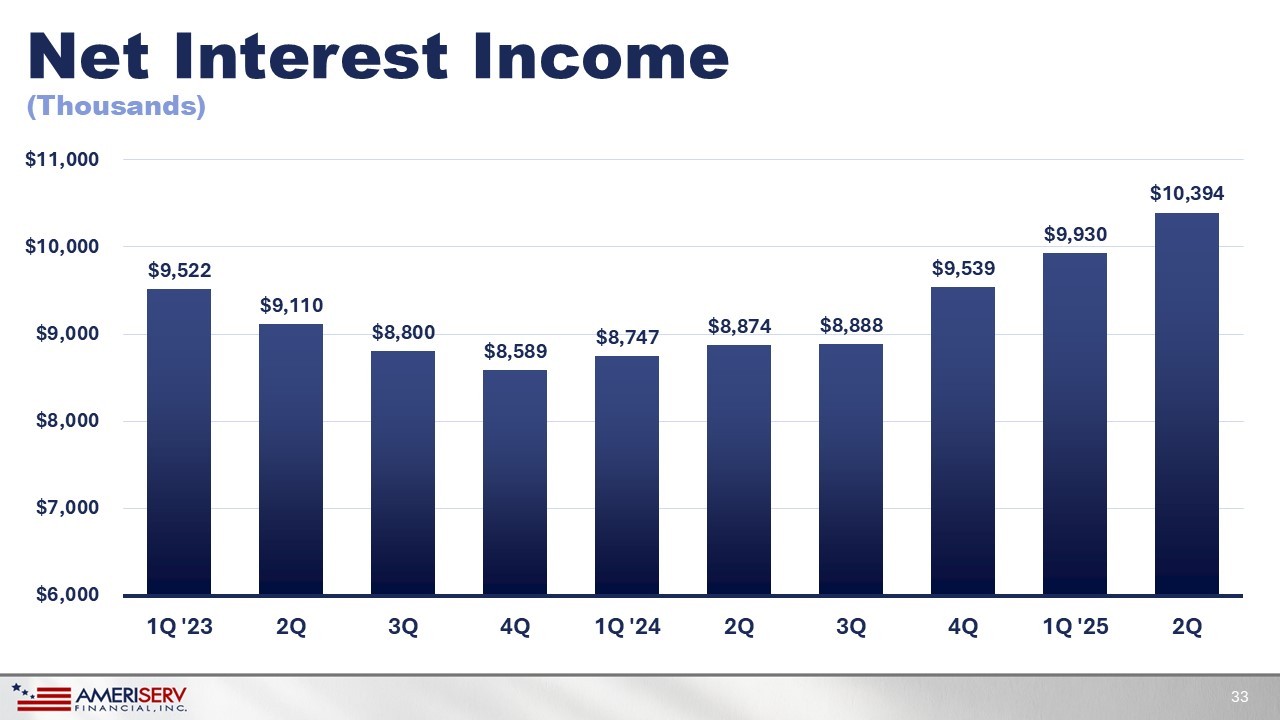
$254 33% $293 37% $102 13% $135 17% Johnstown Pittsburgh Hagerstown State College/Altoona Loan Total = $784 Million Financially Strong Balance Sheet 31 Commercial Loan Portfolio Diversification ($mm) As of June 30, 2025 Interest Rate Risk • Quarterly net interest income bottomed in the 4Q 2023 and has now grown for six consecutive quarters • Pace of net interest margin improvement has accelerated since the Federal Reserve reduced short term interest rates in the latter part of 2024 • Meaningful scheduled asset repricing projected to continue to benefit the net interest margin in the second half of 2025 and throughout 2026 as deposit costs have also stabilized Diligent Focus on Risk Management 32 Net Interest Income $9,522 $9,110 $8,800 $8,589 $8,747 $8,874 $8,888 $9,539 $9,930 $10,394 $6,000 $7,000 $8,000 $9,000 $10,000 $11,000 1Q '23 2Q 3Q 4Q 1Q '24 2Q 3Q 4Q 1Q '25 2Q 33 (Thousands)
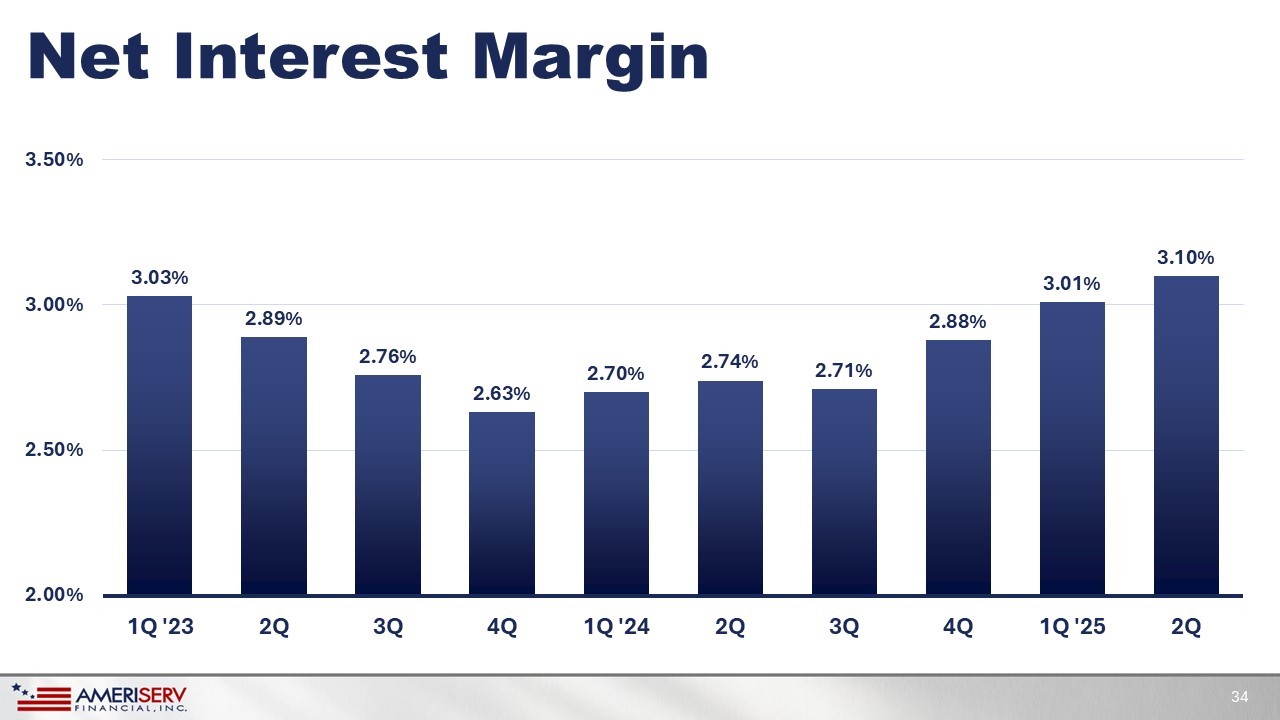
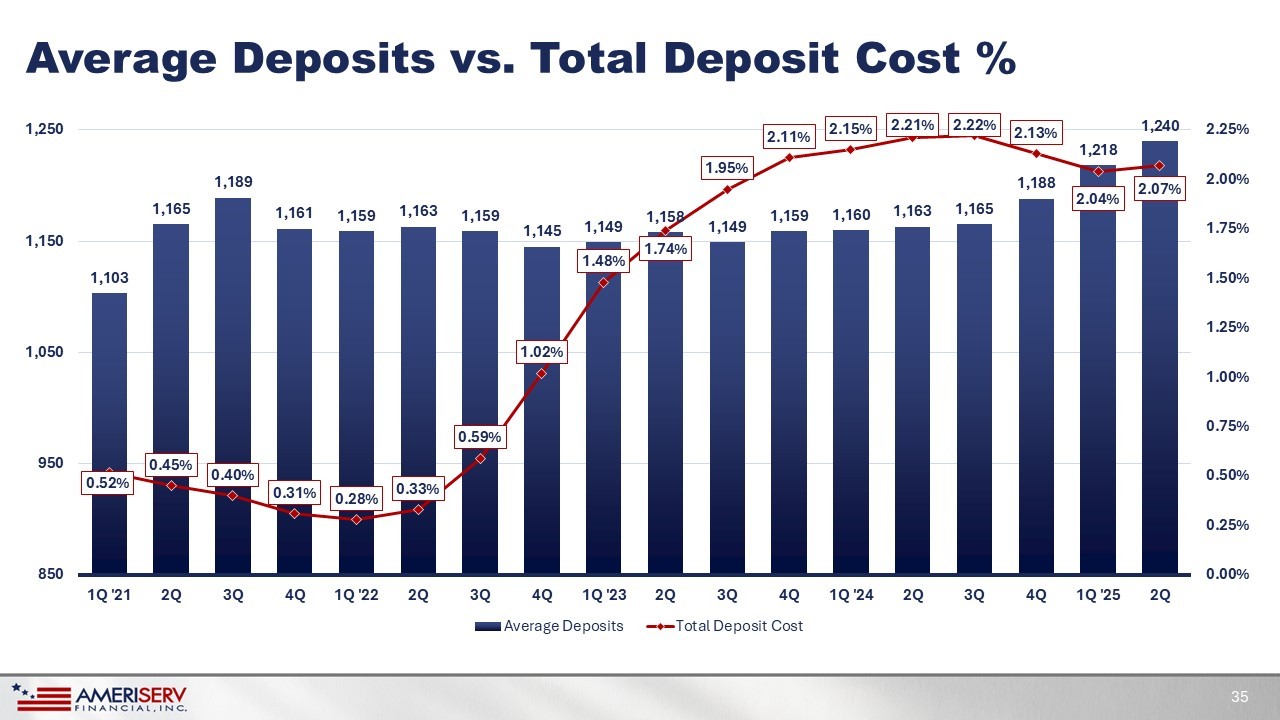
Net Interest Margin 3.03% 2.89% 2.76% 2.63% 2.70% 2.74% 2.71% 2.88% 3.01% 3.10% 2.00% 2.50% 3.00% 3.50% 1Q '23 2Q 3Q 4Q 1Q '24 2Q 3Q 4Q 1Q '25 2Q 34 Average Deposits vs. Total Deposit Cost % 1,103 1,165 1,189 1,161 1,159 1,163 1,159 1,145 1,149 1,158 1,149 1,159 1,160 1,163 1,165 1,188 1,218 1,240 0.52% 0.45% 0.40% 0.31% 0.28% 0.33% 0.59% 1.02% 1.48% 1.74% 1.95% 2.11% 2.15% 2.21% 2.22% 2.13% 2.04% 2.07% 0.00% 0.25% 0.50% 0.75% 1.00% 1.25% 1.50% 1.75% 2.00% 2.25% 850 950 1,050 1,150 1,250 1Q '21 2Q 3Q 4Q 1Q '22 2Q 3Q 4Q 1Q '23 2Q 3Q 4Q 1Q '24 2Q 3Q 4Q 1Q '25 2Q Average Deposits Total Deposit Cost 35 Liquidity Risk • Stable diverse core deposit base generated in our local communities • Do not use brokered deposits as a funding source • Bank has experienced good deposit growth in both 2024 and 2025 • High quality investment securities portfolio that has a manageable duration of four years and outperforms peer on a yield basis 36 Diligent Focus on Risk Management
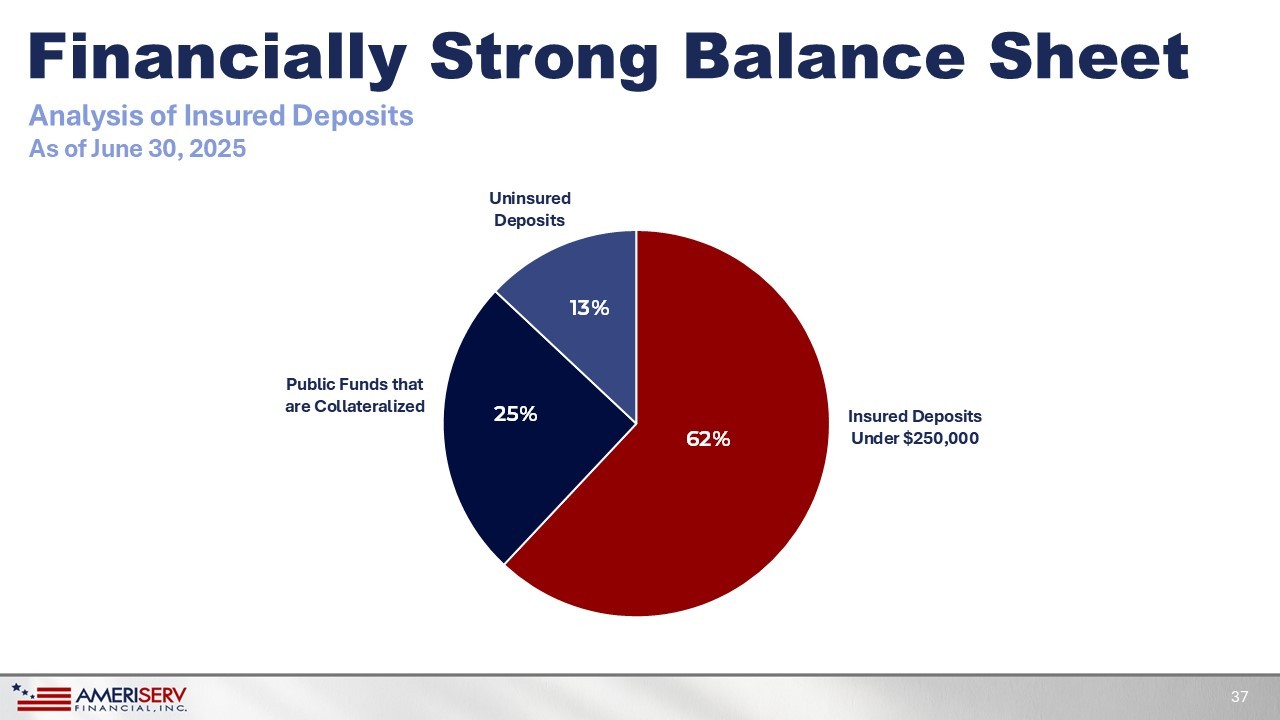
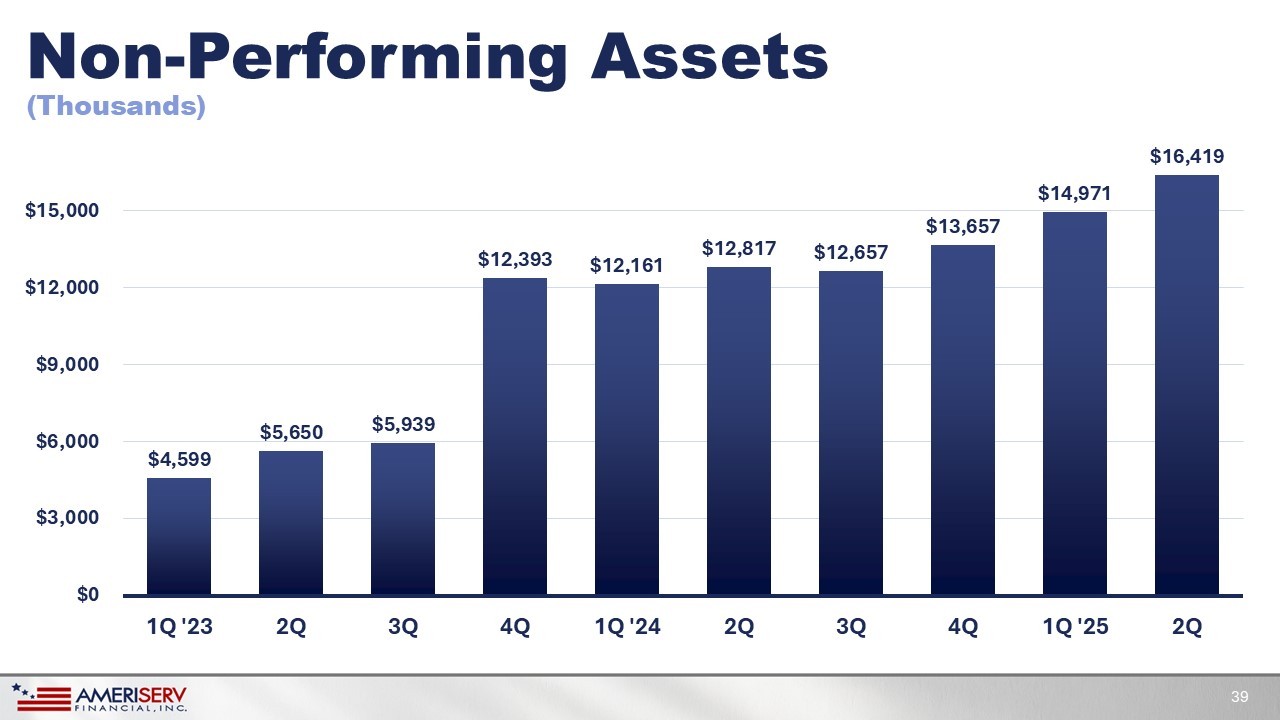
Insured Deposits Under $250,000 Public Funds that are Collateralized Uninsured Deposits 25% 13% 62% Financially Strong Balance Sheet 37 Analysis of Insured Deposits As of June 30, 2025 38 Credit Risk • Despite the second quarter 2025 adverse credit performance related to the resolution of the Bank’s largest problem loan, the Company has a longer - term history of disciplined underwriting, robust CRE risk management practices and controlled net loan charge - offs • Non - performing loans amounted to $15.2 million or 1.42% of total loans on June 30, 2025 • Have historically maintained solid allowance for credit losses which provided 93% coverage of non - performing loans and 1.32% of total loans on June 30, 2025 • Currently expect non - performing loans to decline in the third quarter by approximately $5 million Diligent Focus on Risk Management Non - Performing Assets $4,599 $5,650 $5,939 $12,393 $12,161 $12,817 $12,657 $13,657 $14,971 $16,419 $0 $3,000 $6,000 $9,000 $12,000 $15,000 1Q '23 2Q 3Q 4Q 1Q '24 2Q 3Q 4Q 1Q '25 2Q 39 (Thousands)
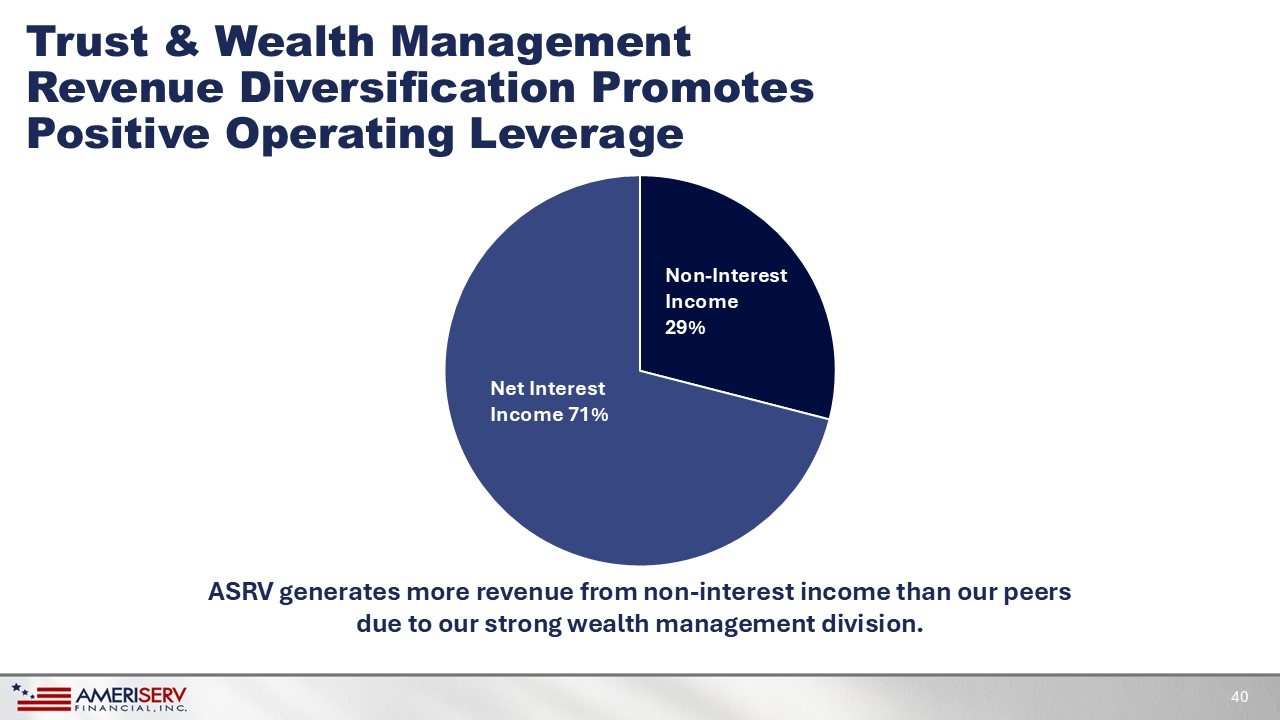
Non - Interest Income 29% Net Interest Income 71% ASRV generates more revenue from non - interest income than our peers due to our strong wealth management division.
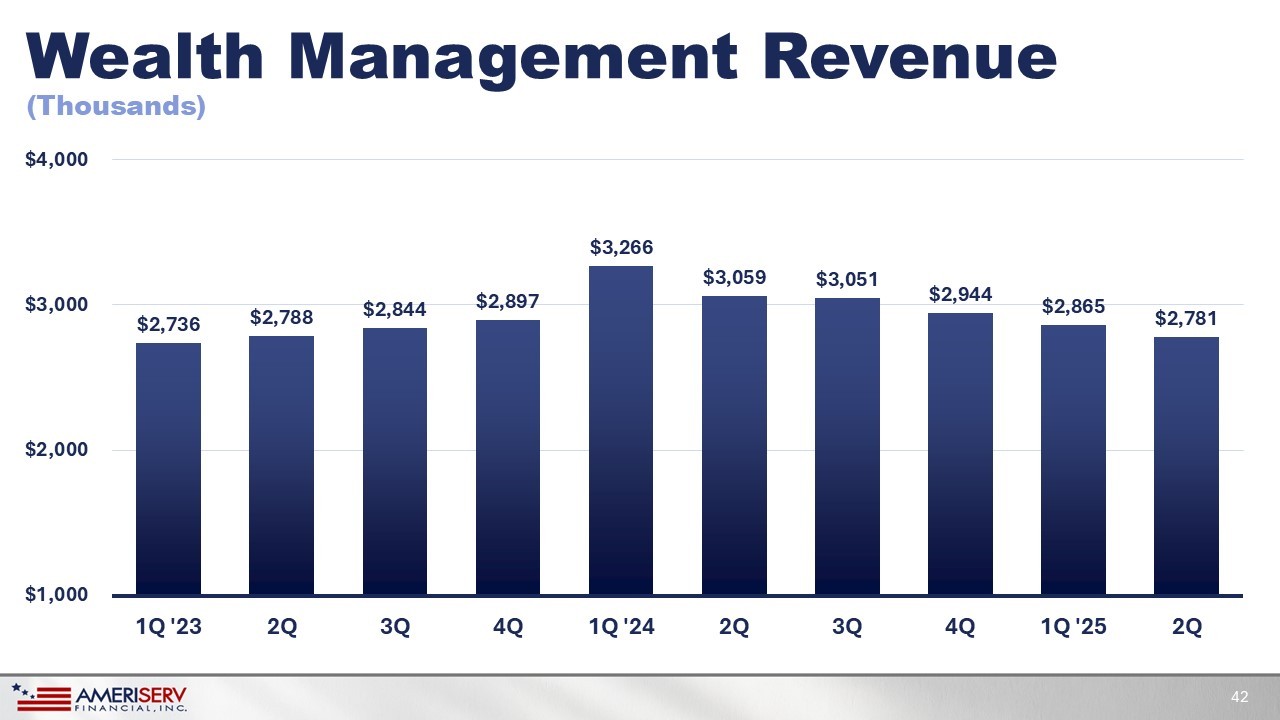
Trust & Wealth Management Revenue Diversification Promotes Positive Operating Leverage 40 Trust & Wealth Management • Profitable division with good financial contribution to ASRV • Has several distinct and profitable niche product lines: ▪ Retirement Services, Personal Trust, Investment Management, ERECT Fund & Perpetual Care Services • Scalable business model well positioned for further growth • Entered into a consulting agreement with large shareholder SB Value to strengthen the revenue growth trajectory in wealth management while also improving efficiencies 41 Wealth Management Revenue $2,736 $2,788 $2,844 $2,897 $3,266 $3,059 $3,051 $2,944 $2,865 $2,781 $1,000 $2,000 $3,000 $4,000 1Q '23 2Q 3Q 4Q 1Q '24 2Q 3Q 4Q 1Q '25 2Q 42 (Thousands)
• Wealth Management division is trustee for the $250 million ERECT FUND • ASRV Bank is a preferred mortgage and consumer loan provider for the Pennsylvania State Education Association ▪ Since inception we have originated $239 million of mortgage loans and $79 million of consumer loans • Commercial banking has financed several training centers for the building trades • ASRV Bank has meaningful union deposit relationships Union Focused Company 43 Existing Union Relationships that Generate Revenue • Robust union business development program being driven by board members with deep ties to organized labor • Internal team comprised of both management and union employees whose focus is on expanding relationships with existing union customers and the identification of banking and wealth management opportunities with new unions • Goal is to expand our reach of union - specific products and services throughout Pennsylvania for the benefit of union members Union Focused Company 44 Future Business Opportunities
• Focus on growing EPS, book value and tangible book value per share while executing an efficiency optimization strategy across all business lines. • Return capital to shareholders primarily through dividends. No share repurchases authorized at this time. • Capital return strategies are always subject to maintaining sufficient capital to support balance sheet growth. • We conservatively built our regulatory capital ratios since the pandemic.
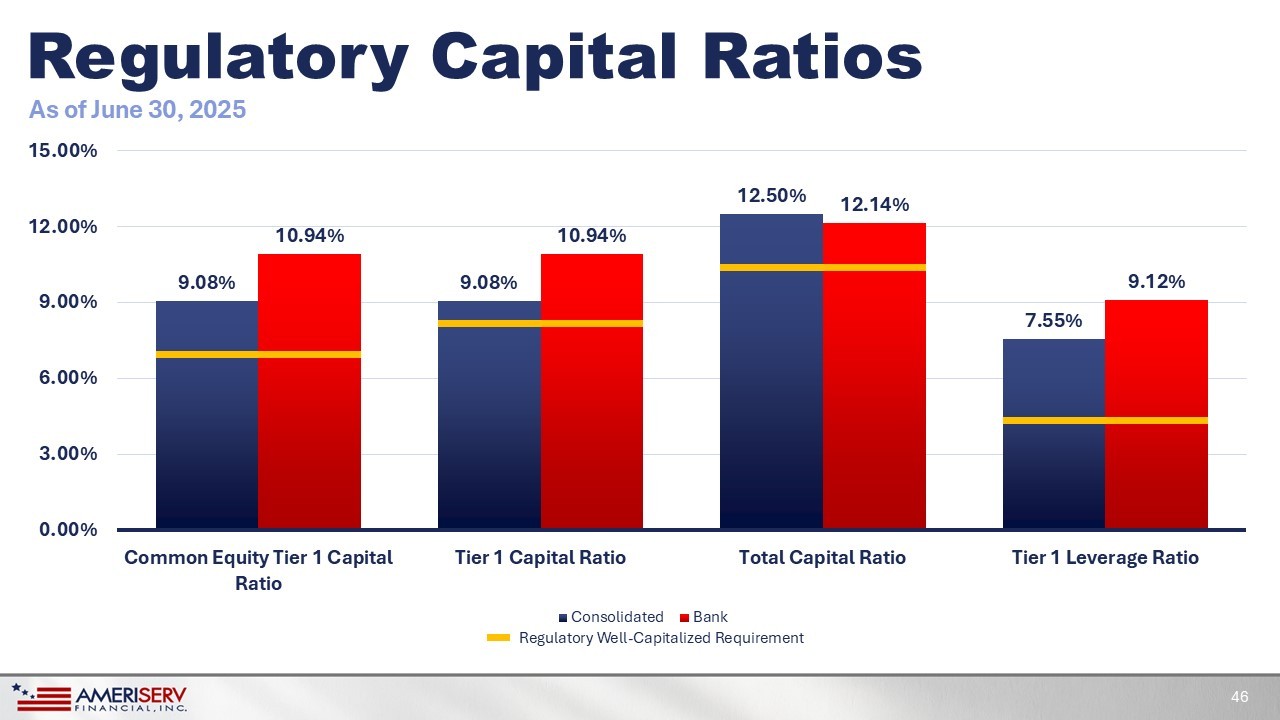
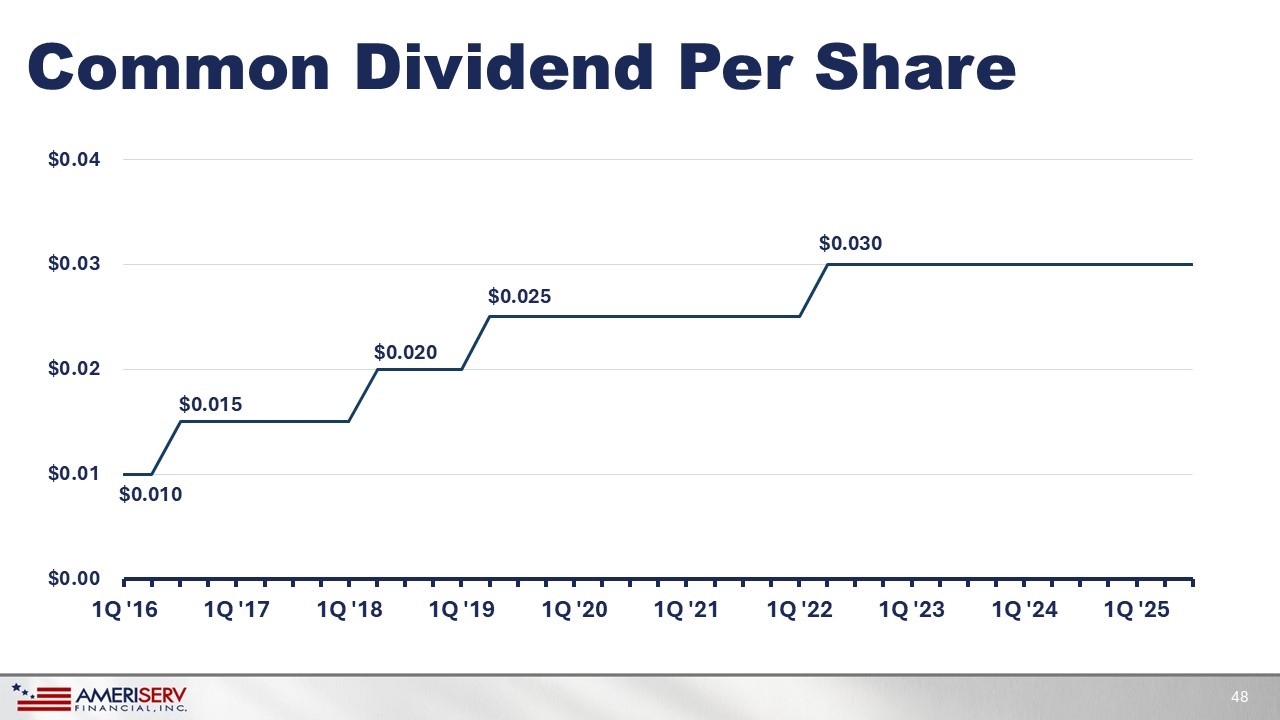
Capital Allocation Strategies and Earnings Growth 45 Regulatory Capital Ratios 9.08% 9.08% 12.50% 7.55% 10.94% 10.94% 12.14% 9.12% 0.00% 3.00% 6.00% 9.00% 12.00% 15.00% Common Equity Tier 1 Capital Ratio Tier 1 Capital Ratio Total Capital Ratio Tier 1 Leverage Ratio Consolidated Bank 46 As of June 30, 2025 Regulatory Well - Capitalized Requirement Capital Allocation – Common Stock Dividends 47 • Common stock dividends provide shareholders with an ongoing cash return and a competitive dividend yield of approximately 4% based upon the current stock price • ASRV has demonstrated a longer - term pattern of responsible dividend increases which correlate well with the Company’s earnings power • Recent earnings volatility has increased the dividend payout ratio above the targeted level of 35% of net income • The Board remains committed to maintaining the common dividend at the current quarterly rate of $0.03 per share Common Dividend Per Share $0.010 $0.015 $0.020 $0.025 $0.030 $0.00 $0.01 $0.02 $0.03 $0.04 1Q '16 1Q '17 1Q '18 1Q '19 1Q '20 1Q '21 1Q '22 1Q '23 1Q '24 1Q '25 48
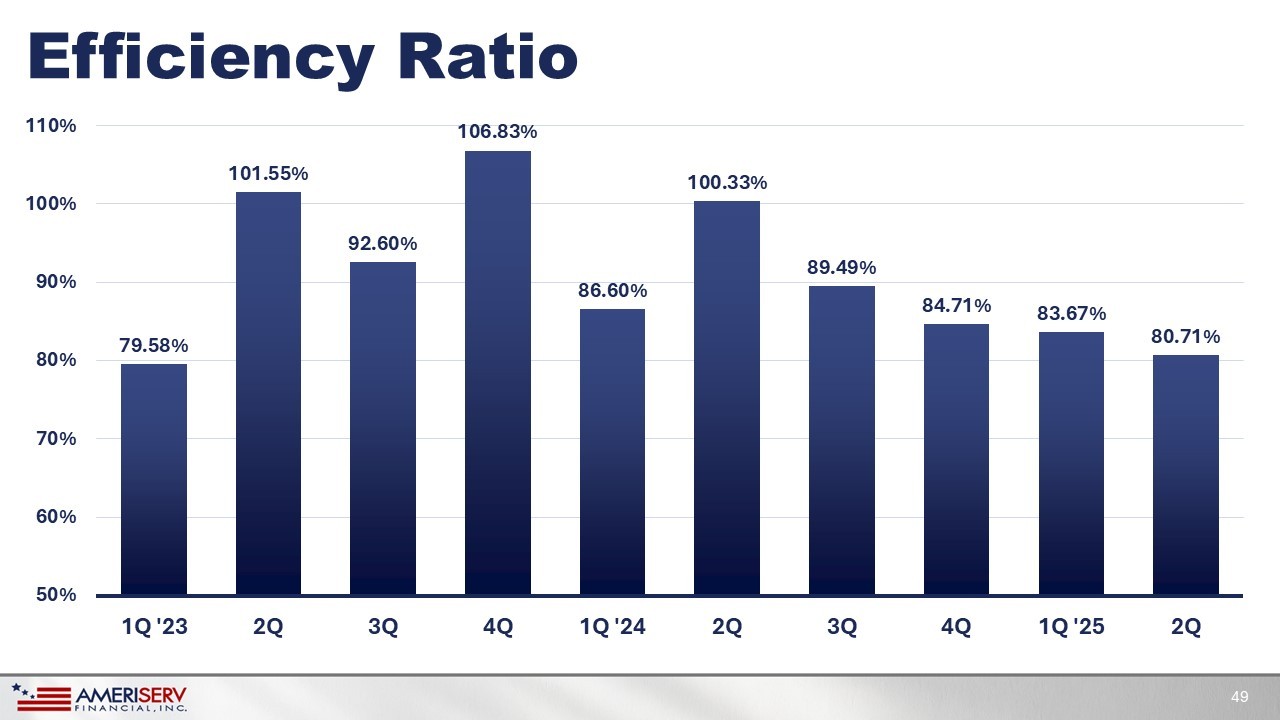
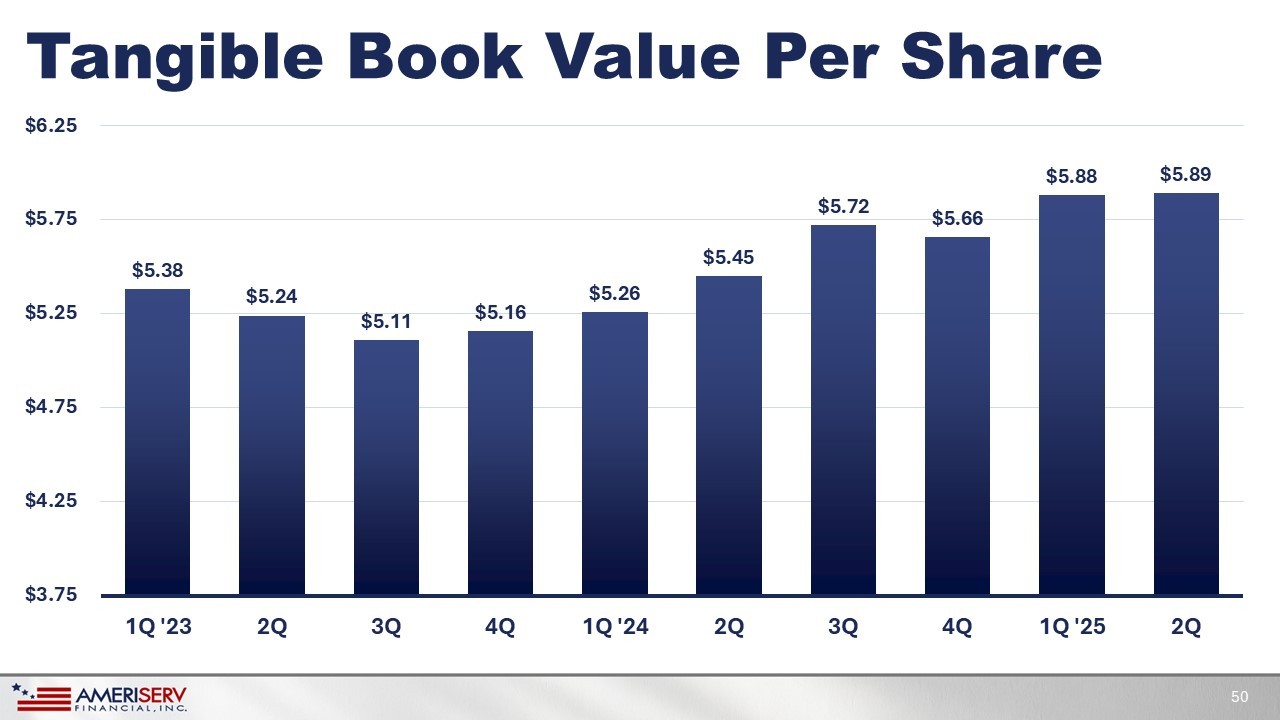
Efficiency Ratio 79.58% 101.55% 92.60% 106.83% 86.60% 100.33% 89.49% 84.71% 83.67% 80.71% 50% 60% 70% 80% 90% 100% 110% 1Q '23 2Q 3Q 4Q 1Q '24 2Q 3Q 4Q 1Q '25 2Q 49 Tangible Book Value Per Share $5.38 $5.24 $5.11 $5.16 $5.26 $5.45 $5.72 $5.66 $5.88 $5.89 $3.75 $4.25 $4.75 $5.25 $5.75 $6.25 1Q '23 2Q 3Q 4Q 1Q '24 2Q 3Q 4Q 1Q '25 2Q 50
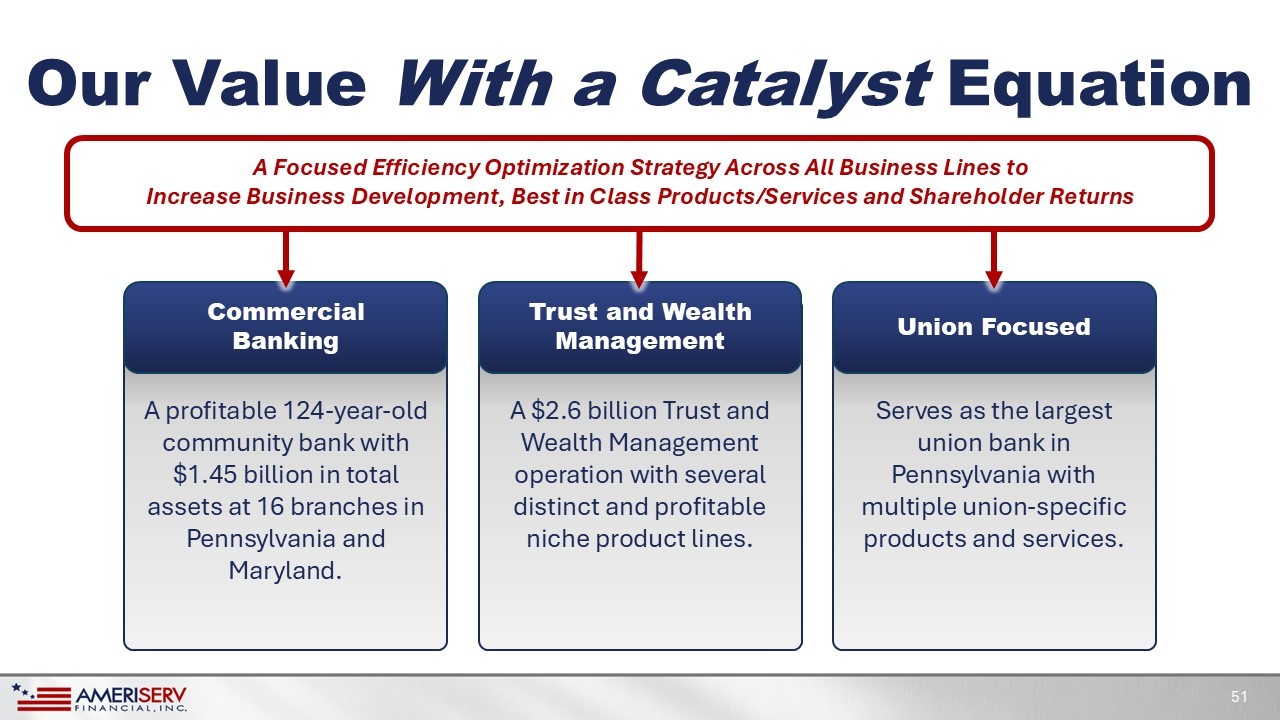
Our Value With a Catalyst Equation 51 Commercial Banking A profitable 124 - year - old community bank with $1.45 billion in total assets at 16 branches in Pennsylvania and Maryland. Union Focused Serves as the largest union bank in Pennsylvania with multiple union - specific products and services. Trust and Wealth Management A $2.6 billion Trust and Wealth Management operation with several distinct and profitable niche product lines. A Focused Efficiency Optimization Strategy Across All Business Lines to Increase Business Development, Best in Class Products/Services and Shareholder Returns 52 J. Michael Adams, Jr. Chairman of the Board


Announcement of Preliminary Voting Results 53

Annual Shareholder Meeting