UNITED STATES
SECURITIES AND EXCHANGE COMMISSION
Washington, D.C. 20549
FORM 8-K
CURRENT REPORT
PURSUANT TO SECTION 13 OR 15(d) OF THE SECURITIES EXCHANGE ACT OF 1934
Date of Report (Date of earliest event reported): July 23, 2025
UNITED COMMUNITY BANKS, INC.
(Exact name of registrant as specified in its charter)
| Georgia | 001-35095 | 58-1807304 |
| (State or other jurisdiction of incorporation) | (Commission file number) | (IRS Employer Identification No.) |
200 East Camperdown Way
Greenville, South Carolina 29601
(Address of principal executive offices)
Registrant’s telephone number,
including area code:
(800) 822-2651
Not applicable
(Former name or former address, if changed since last report)
Check the appropriate box below if the Form 8-K filing is intended to simultaneously satisfy the filing obligation of the registrant under any of the following provisions:
| ¨ | Written communications pursuant to Rule 425 under the Securities Act (17 CFR 230.425) | |
| ¨ | Soliciting material pursuant to Rule 14a-12 under the Exchange Act (17 CFR 240.14a-12) | |
| ¨ | Pre-commencement communications pursuant to Rule 14d-2(b) under the Exchange Act (17 CFR 240.14d-2(b)) | |
| ¨ | Pre-commencement communications pursuant to Rule 13e-4(c) under the Exchange Act (17 CFR 240.13e-4(c)) |
Securities registered pursuant to Section 12(b) of the Act:
| Title of Each Class | Trading Symbol(s) | Name of Each Exchange on Which Registered | ||
| Common stock, par value $1 per share | UCB | New York Stock Exchange | ||
| Depositary shares, each representing 1/1000th interest in a share of Series I Non-Cumulative Preferred Stock | UCB PRI | New York Stock Exchange |
Indicate by check mark whether the registrant is an emerging growth company as defined in as defined in Rule 405 of the Securities Act of 1933 (§230.405 of this chapter) or Rule 12b-2 of the Securities Exchange Act of 1934 (§240.12b-2 of this chapter).
Emerging growth company ¨
If an emerging growth company, indicate by check mark if the registrant has elected not to use the extended transition period for complying with any new or revised financial accounting standards provided pursuant to Section 13(a) of the Exchange Act. ¨
| Item 2.02 | Results of Operations and Financial Condition. |
|
On July 23, 2025, United Community Banks, Inc. (“United”) issued a press release announcing financial results for its second fiscal quarter of 2025. The press release is furnished as Exhibit 99.1 to this Current Report on Form 8-K.
The information furnished pursuant to this Item 2.02, including Exhibit 99.1, shall not be deemed “filed” for purposes of Section 18 of the Securities Exchange Act of 1934 (the “Exchange Act”) or otherwise subject to the liabilities under Section 18 of the Exchange Act and shall not be deemed to be incorporated by reference into any filing of the Company under the Securities Act of 1933 or the Exchange Act. |
|
| Item 7.01 | Regulation FD Disclosure. |
|
On July 23, 2025, United will hold an earnings conference call and webcast at 9:00 a.m. (Eastern Time) to discuss financial results for its second fiscal quarter of 2025. The press release referenced above in Item 2.02 contains information about how to access the conference call and webcast. A copy of the slide presentation to be used during the earnings call and webcast is furnished as Exhibit 99.2 to this Current Report on Form 8-K. The slide presentation also will be available on our website, www.ucbi.com, under the “Investor Relations – Events and Presentations” section.
The information furnished pursuant to this Item 7.01, including Exhibit 99.2, shall not be deemed “filed” for purposes of Section 18 of the Exchange Act or otherwise subject to the liabilities under Section 18 of the Exchange Act and shall not be deemed to be incorporated by reference into any filing of the Company under the Securities Act of 1933 or the Exchange Act. |
|
| Item 9.01 | Financial Statements and Exhibits. |
| (d) Exhibits | |
EXHIBIT INDEX
| Exhibit No. | Description |
|
| 99.1 | United Community Banks, Inc. Press Release, dated July 23, 2025. | |
| 99.2 | Slide presentation to be used during July 23, 2025 earnings call. | |
| 104 | The cover page from this Current Report on Form 8-K, formatted in Inline XBRL. | |
SIGNATURES
Pursuant to the requirements of the Securities Exchange Act of 1934, the registrant has duly caused this report to be signed on its behalf by the undersigned hereunto duly authorized.
| UNITED COMMUNITY BANKS, INC. | ||
| By: | /s/ Jefferson L. Harralson | |
| Jefferson L. Harralson | ||
| Executive Vice President and | ||
| Chief Financial Officer | ||
| Date: July 23, 2025 | ||
Exhibit 99.1

For Immediate Release
For more information:
Jefferson Harralson
Chief Financial Officer
(864) 240-6208
Jefferson_Harralson@ucbi.com
United Community Banks, Inc. Reports Second Quarter Earnings
Margin Expansion, Stable Credit Quality, and Disciplined Expense Control Drive Results
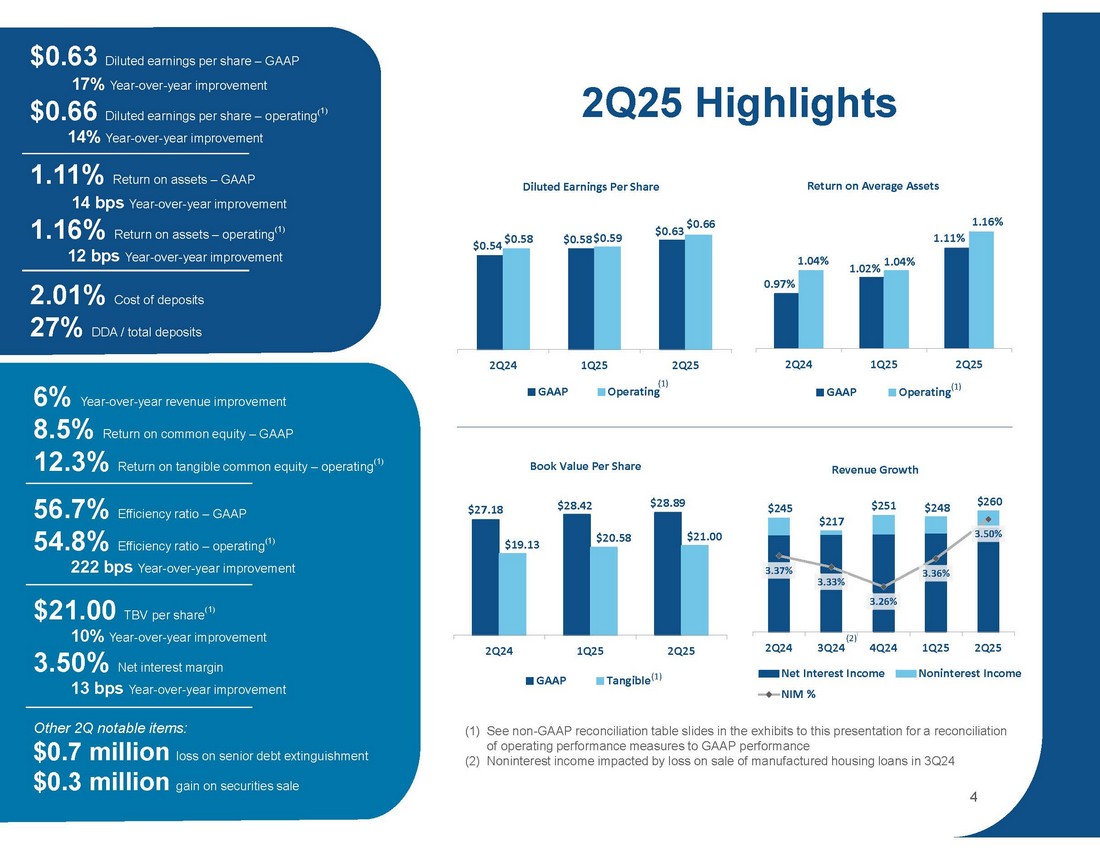
GREENVILLE, SC – July 23, 2025 – United Community Banks, Inc. (NYSE: UCB) (United) today announced net income for the second quarter of 2025 of $78.7 million and pre-tax, pre-provision income of $112.3 million. Diluted earnings per share of $0.63 for the quarter represented an increase of $0.09 from the second quarter a year ago and an increase of $0.05 from the first quarter.
On an operating basis, United’s diluted earnings per share of $0.66 were up 14% from the year-ago quarter. The primary drivers of the increased earnings per share year-over-year were higher net interest income and lower provision for credit losses, partly offset by a modest increase in noninterest expenses and lower noninterest income.
United’s return on assets was 1.11%, or 1.16% on an operating basis. Return on common equity was 8.5% and return on tangible common equity on an operating basis was 12.3%. On a pre-tax, pre-provision basis, operating return on assets was 1.66% for the quarter. At quarter-end, tangible common equity to tangible assets was 9.45%, up 27 basis points from the first quarter.
Chairman and CEO Lynn Harton stated, “This was a great quarter, with strong financial results and continued strategic accomplishments. Tangible book value per share grew by $0.42 and we successfully completed the acquisition of American National Bank on May 1. Excluding loans and deposits received from the American National Bank acquisition, loans grew by $194 million, or 4.2% annualized, while customer deposits, excluding the expected seasonal outflow of public funds, were up $64 million or 1.3% annualized. Second quarter loan growth was funded by cash flow from securities, creating a more favorable earning asset mix. Our net interest margin improved by 14 basis points, contributing to growth in our net interest income of $13.5 million when compared to the first quarter. Operating efficiency and operating leverage also both improved from the first quarter.”
Net charge-offs were $8.2 million, or 0.18% of average loans, during the quarter, down 3 basis points from the first quarter. Nonperforming assets were 30 basis points relative to total assets, improved from 33 basis points for the first quarter. Provision for credit losses improved by $3.6 million from the first quarter, covering second quarter net charge-offs and loan growth while holding the allowance for credit losses steady at 1.21% of loans. The second quarter provision for credit losses included $2.5 million to establish an allowance on the acquired American National Bank loans, commonly referred to as the “double dip.”
Harton continued, “This time of year is special in our culture, as we pause to celebrate our customers with our annual customer appreciation day. This year’s celebration was especially rewarding as we also acknowledged our 75th anniversary as a company. We continue to see great momentum in our business and look forward to many great years ahead.”
Second Quarter 2025 Financial Highlights:
| • | EPS of $0.63 was up $0.09 on a GAAP basis compared to second quarter 2024, and EPS of $0.66 was up $0.08, or 14%, on an operating basis; EPS up $0.05 compared to the first quarter on a GAAP basis and up $0.07, or 12%, on an operating basis |
| • | Net income of $78.7 million and pre-tax, pre-provision income of $112.3 million, up $7.3 million and $5.7 million, respectively, from the first quarter |
| • | Total revenue of $260 million improved $13 million, or 5%, from the first quarter |
| • | Net interest margin of 3.50% increased by 14 basis points from the first quarter, reflecting a lower cost of funds and improving asset mix |
| • | Noninterest income was down $948 thousand on a linked quarter basis mostly due to a $724 thousand loss on the redemption of $100 million in senior debt |
| • | Provision for credit losses was $11.8 million, down $3.6 million from the first quarter; allowance for credit losses coverage held steady at 1.21% of total loans; net charge-offs were $8.2 million, or 18 basis points as a percent of average loans, an improvement of 3 basis points compared to the first quarter |
| • | Noninterest expenses were up $6.8 million compared to the first quarter on a GAAP basis and up $3.3 million on an operating basis, of which approximately $1.2 million resulted from the acquisition of ANB |
| • | Efficiency ratio of 56.7% on a GAAP basis, or 54.8% on an operating basis, improved both linked quarter and year over year |
| • | Strong loan production led to loan growth of $194 million, excluding loans from the ANB acquisition, up 4.2% annualized, from the first quarter |
| • | Mortgage closings of $285 million compared to $215 million in second quarter 2024; mortgage rate locks of $359 million compared to $295 million in second quarter 2024 |
| • | Customer deposits, excluding deposits from the ANB acquisition, were down $169 million from the first quarter, mostly due to seasonal public funds attrition. Excluding public funds and ANB, customer deposits were up $64 million |
| • | Return on assets of 1.11%, or 1.16% on an operating basis |
| • | Return on common equity and return on tangible common equity on an operating basis improved from the first quarter to 8.5% and 12.3%, respectively |
| • | Maintained strong capital ratios with preliminary Common Equity Tier 1 of 13.3% |
| • | Quarterly common dividend of $0.24 per share declared during the quarter, up 4% year-over-year |
Conference Call
United will hold a conference call on Wednesday, July 23 at 9:00 a.m. ET to discuss the contents of this press release and to share business highlights for the quarter. Participants can pre-register for the conference call by navigating to https://dpregister.com/sreg/10200766/ff6c2759d0. Those without internet access or unable to pre-register may dial in by calling 1-844-676-1337. Participants are encouraged to dial in 15 minutes prior to the call start time. The conference call also will be webcast and can be accessed by selecting “Events and Presentations” under “News and Events” within the Investor Relations section of the company's website, ucbi.com.
| UNITED COMMUNITY BANKS, INC. | ||||||||||||||||||||||||||||||||||||
| Selected Financial Information | ||||||||||||||||||||||||||||||||||||
| (in thousands, except per share data) | ||||||||||||||||||||||||||||||||||||
| 2025 | 2024 |
Second Quarter 2025 - |
For the Six Months Ended June 30, |
YTD 2025 - | ||||||||||||||||||||||||||||||||
|
Second Quarter |
First Quarter |
Fourth Quarter |
Third Quarter |
Second Quarter |
2024 Change |
2025 | 2024 |
2024 Change |
||||||||||||||||||||||||||||
| INCOME SUMMARY | ||||||||||||||||||||||||||||||||||||
| Interest revenue | $ | 347,365 | $ | 335,357 | $ | 344,962 | $ | 349,086 | $ | 346,965 | $ | 682,722 | $ | 683,693 | ||||||||||||||||||||||
| Interest expense | 121,834 | 123,336 | 134,629 | 139,900 | 138,265 | 245,170 | 275,844 | |||||||||||||||||||||||||||||
| Net interest revenue | 225,531 | 212,021 | 210,333 | 209,186 | 208,700 | 8 | % | 437,552 | 407,849 | 7 | % | |||||||||||||||||||||||||
| Noninterest income | 34,708 | 35,656 | 40,522 | 8,091 | 36,556 | (5 | ) | 70,364 | 76,143 | (8 | ) | |||||||||||||||||||||||||
| Total revenue | 260,239 | 247,677 | 250,855 | 217,277 | 245,256 | 6 | 507,916 | 483,992 | 5 | |||||||||||||||||||||||||||
| Provision for credit losses | 11,818 | 15,419 | 11,389 | 14,428 | 12,235 | 27,237 | 25,134 | |||||||||||||||||||||||||||||
| Noninterest expenses | 147,919 | 141,099 | 143,056 | 143,065 | 147,044 | 1 | 289,018 | 292,046 | (1 | ) | ||||||||||||||||||||||||||
| Income before income tax expense | 100,502 | 91,159 | 96,410 | 59,784 | 85,977 | 17 | 191,661 | 166,812 | 15 | |||||||||||||||||||||||||||
| Income tax expense | 21,769 | 19,746 | 20,606 | 12,437 | 19,362 | 12 | 41,515 | 37,566 | 11 | |||||||||||||||||||||||||||
| Net income | 78,733 | 71,413 | 75,804 | 47,347 | 66,615 | 18 | 150,146 | 129,246 | 16 | |||||||||||||||||||||||||||
| Non-operating items | 4,833 | 1,297 | 2,203 | 29,385 | 6,493 | 6,130 | 8,680 | |||||||||||||||||||||||||||||
| Income tax benefit of non-operating items | (1,047 | ) | (281 | ) | (471 | ) | (6,276 | ) | (1,462 | ) | (1,328 | ) | (1,955 | ) | ||||||||||||||||||||||
| Net income - operating (1) | $ | 82,519 | $ | 72,429 | $ | 77,536 | $ | 70,456 | $ | 71,646 | 15 | $ | 154,948 | $ | 135,971 | 14 | ||||||||||||||||||||
| Pre-tax pre-provision income (5) | $ | 112,320 | $ | 106,578 | $ | 107,799 | $ | 74,212 | $ | 98,212 | 14 | $ | 218,898 | $ | 191,946 | 14 | ||||||||||||||||||||
| PERFORMANCE MEASURES | ||||||||||||||||||||||||||||||||||||
| Per common share: | ||||||||||||||||||||||||||||||||||||
| Diluted net income - GAAP | $ | 0.63 | $ | 0.58 | $ | 0.61 | $ | 0.38 | $ | 0.54 | 17 | $ | 1.21 | $ | 1.05 | 15 | ||||||||||||||||||||
| Diluted net income - operating (1) | 0.66 | 0.59 | 0.63 | 0.57 | 0.58 | 14 | 1.25 | 1.10 | 14 | |||||||||||||||||||||||||||
| Cash dividends declared | 0.24 | 0.24 | 0.24 | 0.24 | 0.23 | 4 | 0.48 | 0.46 | 4 | |||||||||||||||||||||||||||
| Book value | 28.89 | 28.42 | 27.87 | 27.68 | 27.18 | 6 | 28.89 | 27.18 | 6 | |||||||||||||||||||||||||||
| Tangible book value (3) | 21.00 | 20.58 | 20.00 | 19.66 | 19.13 | 10 | 21.00 | 19.13 | 10 | |||||||||||||||||||||||||||
| Key performance ratios: | ||||||||||||||||||||||||||||||||||||
| Return on common equity - GAAP (2)(4) | 8.45 | % | 7.89 | % | 8.40 | % | 5.20 | % | 7.53 | % | 8.18 | % | 7.34 | % | ||||||||||||||||||||||
| Return on common equity - operating (1)(2)(4) | 8.87 | 8.01 | 8.60 | 7.82 | 8.12 | 8.45 | 7.73 | |||||||||||||||||||||||||||||
| Return on tangible common equity - operating (1)(2)(3)(4) | 12.34 | 11.21 | 12.12 | 11.17 | 11.68 | 11.78 | 11.18 | |||||||||||||||||||||||||||||
| Return on assets - GAAP (4) | 1.11 | 1.02 | 1.06 | 0.67 | 0.97 | 1.06 | 0.94 | |||||||||||||||||||||||||||||
| Return on assets - operating (1)(4) | 1.16 | 1.04 | 1.08 | 1.01 | 1.04 | 1.10 | 0.99 | |||||||||||||||||||||||||||||
| Return on assets - pre-tax pre-provision, excluding non-operating items(1)(4)(5) | 1.66 | 1.55 | 1.55 | 1.50 | 1.54 | 1.61 | 1.47 | |||||||||||||||||||||||||||||
| Net interest margin (fully taxable equivalent) (4) | 3.50 | 3.36 | 3.26 | 3.33 | 3.37 | 3.43 | 3.28 | |||||||||||||||||||||||||||||
| Efficiency ratio - GAAP | 56.69 | 56.74 | 56.05 | 65.51 | 59.70 | 56.71 | 60.08 | |||||||||||||||||||||||||||||
| Efficiency ratio - operating (1) | 54.84 | 56.22 | 55.18 | 57.37 | 57.06 | 55.51 | 58.08 | |||||||||||||||||||||||||||||
| Equity to total assets | 12.86 | 12.56 | 12.38 | 12.45 | 12.35 | 12.86 | 12.35 | |||||||||||||||||||||||||||||
| Tangible common equity to tangible assets (3) | 9.45 | 9.18 | 8.97 | 8.93 | 8.78 | 9.45 | 8.78 | |||||||||||||||||||||||||||||
| ASSET QUALITY | ||||||||||||||||||||||||||||||||||||
| Nonperforming assets ("NPAs") | $ | 83,959 | $ | 93,290 | $ | 115,635 | $ | 114,960 | $ | 116,722 | (28 | ) | $ | 83,959 | $ | 116,722 | (28 | ) | ||||||||||||||||||
| Allowance for credit losses - loans | 216,500 | 211,974 | 206,998 | 205,290 | 213,022 | 2 | 216,500 | 213,022 | 2 | |||||||||||||||||||||||||||
| Allowance for credit losses - total | 228,045 | 223,201 | 217,389 | 215,517 | 224,740 | 1 | 228,045 | 224,740 | 1 | |||||||||||||||||||||||||||
| Net charge-offs | 8,225 | 9,607 | 9,517 | 23,651 | 11,614 | 17,832 | 24,522 | |||||||||||||||||||||||||||||
| Allowance for credit losses - loans to loans | 1.14 | % | 1.15 | % | 1.14 | % | 1.14 | % | 1.17 | % | 1.14 | % | 1.17 | % | ||||||||||||||||||||||
| Allowance for credit losses - total to loans | 1.21 | 1.21 | 1.20 | 1.20 | 1.23 | 1.21 | 1.23 | |||||||||||||||||||||||||||||
| Net charge-offs to average loans (4) | 0.18 | 0.21 | 0.21 | 0.52 | 0.26 | 0.20 | 0.27 | |||||||||||||||||||||||||||||
| NPAs to total assets | 0.30 | 0.33 | 0.42 | 0.42 | 0.43 | 0.30 | 0.43 | |||||||||||||||||||||||||||||
| AT PERIOD END ($ in millions) | ||||||||||||||||||||||||||||||||||||
| Loans | $ | 18,921 | $ | 18,425 | $ | 18,176 | $ | 17,964 | $ | 18,211 | 4 | $ | 18,921 | $ | 18,211 | 4 | ||||||||||||||||||||
| Investment securities | 6,382 | 6,661 | 6,804 | 6,425 | 6,038 | 6 | 6,382 | 6,038 | 6 | |||||||||||||||||||||||||||
| Total assets | 28,086 | 27,874 | 27,720 | 27,373 | 27,057 | 4 | 28,086 | 27,057 | 4 | |||||||||||||||||||||||||||
| Deposits | 23,963 | 23,762 | 23,461 | 23,253 | 22,982 | 4 | 23,963 | 22,982 | 4 | |||||||||||||||||||||||||||
| Shareholders’ equity | 3,613 | 3,501 | 3,432 | 3,407 | 3,343 | 8 | 3,613 | 3,343 | 8 | |||||||||||||||||||||||||||
| Common shares outstanding (thousands) | 121,431 | 119,514 | 119,364 | 119,283 | 119,175 | 2 | 121,431 | 119,175 | 2 | |||||||||||||||||||||||||||
(1) Excludes non-operating items as detailed on Non-GAAP Performance Measures Reconciliation on next page. (2) Net income less preferred stock dividends, divided by average realized common equity, which excludes accumulated other comprehensive income (loss). (3) Excludes effect of acquisition related intangibles and associated amortization. (4) Annualized. (5) Excludes income tax expense and provision for credit losses.
| UNITED COMMUNITY BANKS, INC. | ||||||||||||||||||||||||||||
| Non-GAAP Performance Measures Reconciliation | ||||||||||||||||||||||||||||
| (in thousands, except per share data) | ||||||||||||||||||||||||||||
| 2025 | 2024 |
For the Six Months Ended June 30, |
||||||||||||||||||||||||||
|
Second Quarter |
First Quarter |
Fourth Quarte |
Third Quarter |
Second Quarter |
2025 | 2024 | ||||||||||||||||||||||
| Noninterest income reconciliation | ||||||||||||||||||||||||||||
| Noninterest income (GAAP) | $ | 34,708 | $ | 35,656 | $ | 40,522 | $ | 8,091 | $ | 36,556 | $ | 70,364 | $ | 76,143 | ||||||||||||||
| Loss on sale of manufactured housing loans | — | — | — | 27,209 | — | — | — | |||||||||||||||||||||
| Gain on lease termination | — | — | — | — | — | — | (2,400 | ) | ||||||||||||||||||||
| Noninterest income - operating | $ | 34,708 | $ | 35,656 | $ | 40,522 | $ | 35,300 | $ | 36,556 | $ | 70,364 | $ | 73,743 | ||||||||||||||
| Noninterest expense reconciliation | ||||||||||||||||||||||||||||
| Noninterest expenses (GAAP) | $ | 147,919 | $ | 141,099 | $ | 143,056 | $ | 143,065 | $ | 147,044 | $ | 289,018 | $ | 292,046 | ||||||||||||||
| Loss on FinTrust (goodwill impairment) | — | — | — | — | (5,100 | ) | — | (5,100 | ) | |||||||||||||||||||
| FDIC special assessment | — | — | — | — | 764 | — | (1,736 | ) | ||||||||||||||||||||
| Merger-related and other charges | (4,833 | ) | (1,297 | ) | (2,203 | ) | (2,176 | ) | (2,157 | ) | (6,130 | ) | (4,244 | ) | ||||||||||||||
| Noninterest expenses - operating | $ | 143,086 | $ | 139,802 | $ | 140,853 | $ | 140,889 | $ | 140,551 | $ | 282,888 | $ | 280,966 | ||||||||||||||
| Net income to operating income reconciliation | ||||||||||||||||||||||||||||
| Net income (GAAP) | $ | 78,733 | $ | 71,413 | $ | 75,804 | $ | 47,347 | $ | 66,615 | $ | 150,146 | $ | 129,246 | ||||||||||||||
| Loss on sale of manufactured housing loans | — | — | — | 27,209 | — | — | — | |||||||||||||||||||||
| Gain on lease termination | — | — | — | — | — | — | (2,400 | ) | ||||||||||||||||||||
| Loss on FinTrust (goodwill impairment) | — | — | — | — | 5,100 | — | 5,100 | |||||||||||||||||||||
| FDIC special assessment | — | — | — | — | (764 | ) | — | 1,736 | ||||||||||||||||||||
| Merger-related and other charges | 4,833 | 1,297 | 2,203 | 2,176 | 2,157 | 6,130 | 4,244 | |||||||||||||||||||||
| Income tax benefit of non-operating items | (1,047 | ) | (281 | ) | (471 | ) | (6,276 | ) | (1,462 | ) | (1,328 | ) | (1,955 | ) | ||||||||||||||
| Net income - operating | $ | 82,519 | $ | 72,429 | $ | 77,536 | $ | 70,456 | $ | 71,646 | $ | 154,948 | $ | 135,971 | ||||||||||||||
| Net income to pre-tax pre-provision income reconciliation | ||||||||||||||||||||||||||||
| Net income (GAAP) | $ | 78,733 | $ | 71,413 | $ | 75,804 | $ | 47,347 | $ | 66,615 | $ | 150,146 | $ | 129,246 | ||||||||||||||
| Income tax expense | 21,769 | 19,746 | 20,606 | 12,437 | 19,362 | 41,515 | 37,566 | |||||||||||||||||||||
| Provision for credit losses | 11,818 | 15,419 | 11,389 | 14,428 | 12,235 | 27,237 | 25,134 | |||||||||||||||||||||
| Pre-tax pre-provision income | $ | 112,320 | $ | 106,578 | $ | 107,799 | $ | 74,212 | $ | 98,212 | $ | 218,898 | $ | 191,946 | ||||||||||||||
| Diluted income per common share reconciliation | ||||||||||||||||||||||||||||
| Diluted income per common share (GAAP) | $ | 0.63 | $ | 0.58 | $ | 0.61 | $ | 0.38 | $ | 0.54 | $ | 1.21 | $ | 1.05 | ||||||||||||||
| Loss on sale of manufactured housing loans | — | — | — | 0.18 | — | — | — | |||||||||||||||||||||
| Gain on lease termination | — | — | — | — | — | — | (0.02 | ) | ||||||||||||||||||||
| Loss on FinTrust (goodwill impairment) | — | — | — | — | 0.03 | — | 0.03 | |||||||||||||||||||||
| FDIC special assessment | — | — | — | — | — | — | 0.02 | |||||||||||||||||||||
| Merger-related and other charges | 0.03 | 0.01 | 0.02 | 0.01 | 0.01 | 0.04 | 0.02 | |||||||||||||||||||||
| Diluted income per common share - operating | $ | 0.66 | $ | 0.59 | $ | 0.63 | $ | 0.57 | $ | 0.58 | $ | 1.25 | $ | 1.10 | ||||||||||||||
| Book value per common share reconciliation | ||||||||||||||||||||||||||||
| Book value per common share (GAAP) | $ | 28.89 | $ | 28.42 | $ | 27.87 | $ | 27.68 | $ | 27.18 | $ | 28.89 | $ | 27.18 | ||||||||||||||
| Effect of goodwill and other intangibles | (7.89 | ) | (7.84 | ) | (7.87 | ) | (8.02 | ) | (8.05 | ) | (7.89 | ) | (8.05 | ) | ||||||||||||||
| Tangible book value per common share | $ | 21.00 | $ | 20.58 | $ | 20.00 | $ | 19.66 | $ | 19.13 | $ | 21.00 | $ | 19.13 | ||||||||||||||
| Return on tangible common equity reconciliation | ||||||||||||||||||||||||||||
| Return on common equity (GAAP) | 8.45 | % | 7.89 | % | 8.40 | % | 5.20 | % | 7.53 | % | 8.18 | % | 7.34 | % | ||||||||||||||
| Loss on sale of manufactured housing loans | — | — | — | 2.43 | — | — | — | |||||||||||||||||||||
| Gain on lease termination | — | — | — | — | — | — | (0.11 | ) | ||||||||||||||||||||
| Loss on FinTrust (goodwill impairment) | — | — | — | — | 0.46 | — | 0.23 | |||||||||||||||||||||
| FDIC special assessment | — | — | — | — | (0.07 | ) | — | 0.08 | ||||||||||||||||||||
| Merger-related and other charges | 0.42 | 0.12 | 0.20 | 0.19 | 0.20 | 0.27 | 0.19 | |||||||||||||||||||||
| Return on common equity - operating | 8.87 | 8.01 | 8.60 | 7.82 | 8.12 | 8.45 | 7.73 | |||||||||||||||||||||
| Effect of goodwill and other intangibles | 3.47 | 3.20 | 3.52 | 3.35 | 3.56 | 3.33 | 3.45 | |||||||||||||||||||||
| Return on tangible common equity - operating | 12.34 | % | 11.21 | % | 12.12 | % | 11.17 | % | 11.68 | % | 11.78 | % | 11.18 | % | ||||||||||||||
| Return on assets reconciliation | ||||||||||||||||||||||||||||
| Return on assets (GAAP) | 1.11 | % | 1.02 | % | 1.06 | % | 0.67 | % | 0.97 | % | 1.06 | % | 0.94 | % | ||||||||||||||
| Loss on sale of manufactured housing loans | — | — | — | 0.31 | — | — | — | |||||||||||||||||||||
| Gain on lease termination | — | — | — | — | — | — | (0.01 | ) | ||||||||||||||||||||
| Loss on FinTrust (goodwill impairment) | — | — | — | — | 0.06 | — | 0.03 | |||||||||||||||||||||
| FDIC special assessment | — | — | — | — | (0.01 | ) | — | 0.01 | ||||||||||||||||||||
| Merger-related and other charges | 0.05 | 0.02 | 0.02 | 0.03 | 0.02 | 0.04 | 0.02 | |||||||||||||||||||||
| Return on assets - operating | 1.16 | % | 1.04 | % | 1.08 | % | 1.01 | % | 1.04 | % | 1.10 | % | 0.99 | % | ||||||||||||||
| Return on assets to return on assets- pre-tax pre-provision reconciliation | ||||||||||||||||||||||||||||
| Return on assets (GAAP) | 1.11 | % | 1.02 | % | 1.06 | % | 0.67 | % | 0.97 | % | 1.06 | % | 0.94 | % | ||||||||||||||
| Income tax expense | 0.31 | 0.29 | 0.30 | 0.19 | 0.29 | 0.30 | 0.28 | |||||||||||||||||||||
| Provision for credit losses | 0.17 | 0.23 | 0.16 | 0.21 | 0.18 | 0.20 | 0.19 | |||||||||||||||||||||
| Loss on sale of manufactured housing loans | — | — | — | 0.40 | — | — | — | |||||||||||||||||||||
| Gain on lease termination | — | — | — | — | — | — | (0.02 | ) | ||||||||||||||||||||
| Loss on FinTrust (goodwill impairment) | — | — | — | — | 0.08 | — | 0.04 | |||||||||||||||||||||
| FDIC special assessment | — | — | — | — | (0.01 | ) | — | 0.01 | ||||||||||||||||||||
| Merger-related and other charges | 0.07 | 0.01 | 0.03 | 0.03 | 0.03 | 0.05 | 0.03 | |||||||||||||||||||||
| Return on assets - pre-tax pre-provision - operating | 1.66 | % | 1.55 | % | 1.55 | % | 1.50 | % | 1.54 | % | 1.61 | % | 1.47 | % | ||||||||||||||
| Efficiency ratio reconciliation | ||||||||||||||||||||||||||||
| Efficiency ratio (GAAP) | 56.69 | % | 56.74 | % | 56.05 | % | 65.51 | % | 59.70 | % | 56.71 | % | 60.08 | % | ||||||||||||||
| Loss on sale of manufactured housing loans | — | — | — | (7.15 | ) | — | — | — | ||||||||||||||||||||
| Gain on lease termination | — | — | — | — | — | — | 0.29 | |||||||||||||||||||||
| Loss on FinTrust (goodwill impairment) | — | — | — | — | (2.07 | ) | — | (1.05 | ) | |||||||||||||||||||
| FDIC special assessment | — | — | — | — | 0.31 | — | (0.36 | ) | ||||||||||||||||||||
| Merger-related and other charges | (1.85 | ) | (0.52 | ) | (0.87 | ) | (0.99 | ) | (0.88 | ) | (1.20 | ) | (0.88 | ) | ||||||||||||||
| Efficiency ratio - operating | 54.84 | % | 56.22 | % | 55.18 | % | 57.37 | % | 57.06 | % | 55.51 | % | 58.08 | % | ||||||||||||||
| Tangible common equity to tangible assets reconciliation | ||||||||||||||||||||||||||||
| Equity to total assets (GAAP) | 12.86 | % | 12.56 | % | 12.38 | % | 12.45 | % | 12.35 | % | 12.86 | % | 12.35 | % | ||||||||||||||
| Effect of goodwill and other intangibles | (3.10 | ) | (3.06 | ) | (3.09 | ) | (3.20 | ) | (3.24 | ) | (3.10 | ) | (3.24 | ) | ||||||||||||||
| Effect of preferred equity | (0.31 | ) | (0.32 | ) | (0.32 | ) | (0.32 | ) | (0.33 | ) | (0.31 | ) | (0.33 | ) | ||||||||||||||
| Tangible common equity to tangible assets | 9.45 | % | 9.18 | % | 8.97 | % | 8.93 | % | 8.78 | % | 9.45 | % | 8.78 | % | ||||||||||||||
| UNITED COMMUNITY BANKS, INC. | ||||||||||||||||||||||||||||
| Loan Portfolio Composition at Period-End | ||||||||||||||||||||||||||||
| 2025 | 2024 | Linked | Year over | |||||||||||||||||||||||||
| (in millions) |
Second Quarter |
First Quarter |
Fourth Quarter |
Third Quarter |
Second Quarter |
Quarter Change |
Year Change |
|||||||||||||||||||||
| LOANS BY CATEGORY | ||||||||||||||||||||||||||||
| Owner occupied commercial RE | $ | 3,563 | $ | 3,419 | $ | 3,398 | $ | 3,323 | $ | 3,297 | $ | 144 | $ | 266 | ||||||||||||||
| Income producing commercial RE | 4,548 | 4,416 | 4,361 | 4,259 | 4,058 | 132 | 490 | |||||||||||||||||||||
| Commercial & industrial | 2,516 | 2,506 | 2,428 | 2,313 | 2,299 | 10 | 217 | |||||||||||||||||||||
| Commercial construction | 1,752 | 1,681 | 1,656 | 1,785 | 2,014 | 71 | (262 | ) | ||||||||||||||||||||
| Equipment financing | 1,778 | 1,723 | 1,663 | 1,603 | 1,581 | 55 | 197 | |||||||||||||||||||||
| Total commercial | 14,157 | 13,745 | 13,506 | 13,283 | 13,249 | 412 | 908 | |||||||||||||||||||||
| Residential mortgage | 3,210 | 3,218 | 3,232 | 3,263 | 3,266 | (8 | ) | (56 | ) | |||||||||||||||||||
| Home equity | 1,180 | 1,099 | 1,065 | 1,015 | 985 | 81 | 195 | |||||||||||||||||||||
| Residential construction | 174 | 171 | 178 | 189 | 211 | 3 | (37 | ) | ||||||||||||||||||||
| Manufactured housing (1) | — | — | 2 | 2 | 321 | — | (321 | ) | ||||||||||||||||||||
| Consumer | 191 | 183 | 186 | 188 | 183 | 8 | 8 | |||||||||||||||||||||
| Other | 9 | 9 | 7 | 24 | (4 | ) | — | 13 | ||||||||||||||||||||
| Total loans | $ | 18,921 | $ | 18,425 | $ | 18,176 | $ | 17,964 | $ | 18,211 | $ | 496 | $ | 710 | ||||||||||||||
| LOANS BY MARKET | ||||||||||||||||||||||||||||
| Georgia | $ | 4,551 | $ | 4,484 | $ | 4,447 | $ | 4,470 | $ | 4,411 | $ | 67 | $ | 140 | ||||||||||||||
| South Carolina | 2,872 | 2,821 | 2,815 | 2,782 | 2,779 | 51 | 93 | |||||||||||||||||||||
| North Carolina | 2,626 | 2,666 | 2,644 | 2,586 | 2,591 | (40 | ) | 35 | ||||||||||||||||||||
| Tennessee | 1,881 | 1,880 | 1,799 | 1,848 | 2,144 | 1 | (263 | ) | ||||||||||||||||||||
| Florida | 2,966 | 2,572 | 2,527 | 2,423 | 2,407 | 394 | 559 | |||||||||||||||||||||
| Alabama | 1,016 | 1,009 | 996 | 996 | 1,021 | 7 | (5 | ) | ||||||||||||||||||||
| Commercial Banking Solutions | 3,009 | 2,993 | 2,948 | 2,859 | 2,858 | 16 | 151 | |||||||||||||||||||||
| Total loans | $ | 18,921 | $ | 18,425 | $ | 18,176 | $ | 17,964 | $ | 18,211 | $ | 496 | $ | 710 | ||||||||||||||
(1) For 2025 periods, manufactured housing loans are included with consumer loans.
| UNITED COMMUNITY BANKS, INC. | ||||||||||||
| Credit Quality | ||||||||||||
| (in thousands) | ||||||||||||
| 2025 | 2024 | |||||||||||
|
Second Quarter |
First Quarter |
Fourth Quarter |
||||||||||
| NONACCRUAL LOANS | ||||||||||||
| Owner occupied RE | $ | 8,207 | $ | 8,949 | $ | 11,674 | ||||||
| Income producing RE | 14,624 | 16,536 | 25,357 | |||||||||
| Commercial & industrial | 15,422 | 22,396 | 29,339 | |||||||||
| Commercial construction | 1,368 | 5,558 | 7,400 | |||||||||
| Equipment financing | 11,731 | 8,818 | 8,925 | |||||||||
| Total commercial | 51,352 | 62,257 | 82,695 | |||||||||
| Residential mortgage | 22,597 | 22,756 | 24,615 | |||||||||
| Home equity | 4,093 | 4,091 | 4,630 | |||||||||
| Residential construction | 1,203 | 811 | 57 | |||||||||
| Manufactured housing (2) | — | — | 1,444 | |||||||||
| Consumer | 1,207 | 1,423 | 138 | |||||||||
| Total nonaccrual loans | 80,452 | 91,338 | 113,579 | |||||||||
| OREO and repossessed assets | 3,507 | 1,952 | 2,056 | |||||||||
| Total NPAs | $ | 83,959 | $ | 93,290 | $ | 115,635 | ||||||
| 2025 | 2024 | |||||||||||||||||||||||
| Second Quarter | First Quarter | Fourth Quarter | ||||||||||||||||||||||
| (in thousands) | Net Charge-Offs | Net Charge-Offs to Average Loans (1) | Net Charge-Offs | Net Charge-Offs to Average Loans (1) | Net Charge-Offs | Net Charge-Offs to Average Loans (1) | ||||||||||||||||||
| NET CHARGE-OFFS (RECOVERIES) BY CATEGORY | ||||||||||||||||||||||||
| Owner occupied RE | $ | 470 | 0.05 | % | $ | 126 | 0.02 | % | $ | (184 | ) | (0.02 | )% | |||||||||||
| Income producing RE | 933 | 0.08 | 718 | 0.07 | (1,001 | ) | (0.09 | ) | ||||||||||||||||
| Commercial & industrial | 1,027 | 0.16 | 2,447 | 0.40 | 4,075 | 0.69 | ||||||||||||||||||
| Commercial construction | 89 | 0.02 | (138 | ) | (0.03 | ) | 2 | — | ||||||||||||||||
| Equipment financing | 4,963 | 1.16 | 5,042 | 1.21 | 5,812 | 1.43 | ||||||||||||||||||
| Total commercial | 7,482 | 0.22 | 8,195 | 0.24 | 8,704 | 0.26 | ||||||||||||||||||
| Residential mortgage | 313 | 0.04 | (1 | ) | — | 145 | 0.02 | |||||||||||||||||
| Home equity | (72 | ) | (0.03 | ) | (62 | ) | (0.02 | ) | (33 | ) | (0.01 | ) | ||||||||||||
| Residential construction | (9 | ) | (0.02 | ) | 219 | 0.51 | 7 | 0.02 | ||||||||||||||||
| Manufactured housing (2) | — | — | — | — | 114 | 23.41 | ||||||||||||||||||
| Consumer | 511 | 1.11 | 1,256 | 2.76 | 580 | 1.24 | ||||||||||||||||||
| Total | $ | 8,225 | 0.18 | $ | 9,607 | 0.21 | $ | 9,517 | 0.21 | |||||||||||||||
| (1) Annualized. | ||||||||||||
| (2) For 2025 periods, manufactured housing loans are included with consumer loans. | ||||||||||||
| UNITED COMMUNITY BANKS, INC. |
| Consolidated Balance Sheets (Unaudited) |
| (in thousands, except share and per share data) | June 30, 2025 |
December 31, 2024 |
||||||
| ASSETS | ||||||||
| Cash and due from banks | $ | 201,509 | $ | 296,161 | ||||
| Interest-bearing deposits in banks | 359,492 | 223,712 | ||||||
| Federal funds and other short-term investments | 13,955 | — | ||||||
| Cash and cash equivalents | 574,956 | 519,873 | ||||||
| Debt securities available-for-sale | 4,075,323 | 4,436,291 | ||||||
| Debt securities held-to-maturity (fair value $1,935,748 and $1,944,126, respectively) | 2,306,730 | 2,368,107 | ||||||
| Loans held for sale | 37,143 | 57,534 | ||||||
| Loans and leases held for investment | 18,920,875 | 18,175,980 | ||||||
| Less allowance for credit losses - loans and leases | (216,500 | ) | (206,998 | ) | ||||
| Loans and leases, net | 18,704,375 | 17,968,982 | ||||||
| Premises and equipment, net | 396,479 | 394,264 | ||||||
| Bank owned life insurance | 362,201 | 346,234 | ||||||
| Goodwill and other intangible assets, net | 974,385 | 956,643 | ||||||
| Other assets | 653,929 | 672,330 | ||||||
| Total assets | $ | 28,085,521 | $ | 27,720,258 | ||||
| LIABILITIES AND SHAREHOLDERS' EQUITY | ||||||||
| Liabilities: | ||||||||
| Deposits: | ||||||||
| Noninterest-bearing demand | $ | 6,381,975 | $ | 6,211,182 | ||||
| NOW and interest-bearing demand | 5,986,049 | 6,141,342 | ||||||
| Money market | 6,603,556 | 6,398,144 | ||||||
| Savings | 1,228,971 | 1,100,591 | ||||||
| Time | 3,606,511 | 3,441,424 | ||||||
| Brokered | 155,950 | 168,292 | ||||||
| Total deposits | 23,963,012 | 23,460,975 | ||||||
| Short-term borrowings | — | 195,000 | ||||||
| Long-term debt | 155,143 | 254,152 | ||||||
| Accrued expenses and other liabilities | 354,442 | 378,004 | ||||||
| Total liabilities | 24,472,597 | 24,288,131 | ||||||
| Shareholders' equity: | ||||||||
| Preferred stock; $1 par value; 10,000,000 shares authorized; 3,662 shares Series I issued and outstanding; $25,000 per share liquidation preference |
88,266 | 88,266 | ||||||
| Common stock, $1 par value; 200,000,000 shares authorized, 121,431,262 and 119,364,110 shares issued and outstanding, respectively |
121,431 | 119,364 | ||||||
| Common stock issuable; 592,256 and 600,168 shares, respectively | 13,190 | 12,999 | ||||||
| Capital surplus | 2,764,617 | 2,710,279 | ||||||
| Retained earnings | 802,590 | 714,138 | ||||||
| Accumulated other comprehensive loss | (177,170 | ) | (212,919 | ) | ||||
| Total shareholders' equity | 3,612,924 | 3,432,127 | ||||||
| Total liabilities and shareholders' equity | $ | 28,085,521 | $ | 27,720,258 | ||||
| UNITED COMMUNITY BANKS, INC. |
| Consolidated Statements of Income (Unaudited) |
|
Three Months Ended June 30, |
Six Months Ended June 30, |
|||||||||||||||
| (in thousands, except per share data) | 2025 | 2024 | 2025 | 2024 | ||||||||||||
| Interest revenue: | ||||||||||||||||
| Loans, including fees | $ | 288,284 | $ | 291,595 | $ | 562,340 | $ | 575,578 | ||||||||
| Investment securities, including tax exempt of $1,671, $1,699, $3,349 and $3,420, respectively | 55,862 | 50,063 | 114,712 | 96,499 | ||||||||||||
| Deposits in banks and short-term investments | 3,219 | 5,307 | 5,670 | 11,616 | ||||||||||||
| Total interest revenue | 347,365 | 346,965 | 682,722 | 683,693 | ||||||||||||
| Interest expense: | ||||||||||||||||
| Deposits: | ||||||||||||||||
| NOW and interest-bearing demand | 36,956 | 43,910 | 74,346 | 90,121 | ||||||||||||
| Money market | 49,603 | 53,531 | 99,144 | 104,009 | ||||||||||||
| Savings | 1,457 | 687 | 2,081 | 1,393 | ||||||||||||
| Time | 31,120 | 36,334 | 62,499 | 72,723 | ||||||||||||
| Deposits | 119,136 | 134,462 | 238,070 | 268,246 | ||||||||||||
| Short-term borrowings | 83 | 60 | 1,190 | 60 | ||||||||||||
| Federal Home Loan Bank advances | — | — | 433 | — | ||||||||||||
| Long-term debt | 2,615 | 3,743 | 5,477 | 7,538 | ||||||||||||
| Total interest expense | 121,834 | 138,265 | 245,170 | 275,844 | ||||||||||||
| Net interest revenue | 225,531 | 208,700 | 437,552 | 407,849 | ||||||||||||
| Noninterest income: | ||||||||||||||||
| Service charges and fees | 10,122 | 10,620 | 19,657 | 19,884 | ||||||||||||
| Mortgage loan gains and other related fees | 5,370 | 6,799 | 11,492 | 14,310 | ||||||||||||
| Wealth management fees | 4,400 | 6,386 | 8,865 | 12,699 | ||||||||||||
| Net gains from sales of other loans | 1,995 | 1,296 | 3,391 | 2,833 | ||||||||||||
| Lending and loan servicing fees | 3,690 | 3,328 | 7,855 | 7,538 | ||||||||||||
| Securities gains, net | 286 | — | 292 | — | ||||||||||||
| Other | 8,845 | 8,127 | 18,812 | 18,879 | ||||||||||||
| Total noninterest income | 34,708 | 36,556 | 70,364 | 76,143 | ||||||||||||
| Total revenue | 260,239 | 245,256 | 507,916 | 483,992 | ||||||||||||
| Provision for credit losses | 11,818 | 12,235 | 27,237 | 25,134 | ||||||||||||
| Noninterest expenses: | ||||||||||||||||
| Salaries and employee benefits | 86,997 | 85,818 | 171,264 | 170,803 | ||||||||||||
| Communications and equipment | 13,332 | 11,988 | 27,031 | 23,908 | ||||||||||||
| Occupancy | 10,935 | 11,056 | 21,864 | 22,155 | ||||||||||||
| Advertising and public relations | 2,881 | 2,459 | 4,762 | 4,360 | ||||||||||||
| Postage, printing and supplies | 2,495 | 2,251 | 5,056 | 4,899 | ||||||||||||
| Professional fees | 5,609 | 6,044 | 11,540 | 12,032 | ||||||||||||
| Lending and loan servicing expense | 2,330 | 2,014 | 4,317 | 3,841 | ||||||||||||
| Outside services - electronic banking | 3,570 | 2,812 | 6,333 | 5,730 | ||||||||||||
| FDIC assessments and other regulatory charges | 4,745 | 4,467 | 9,387 | 12,033 | ||||||||||||
| Amortization of intangibles | 3,292 | 3,794 | 6,578 | 7,681 | ||||||||||||
| Merger-related and other charges | 4,833 | 2,157 | 6,130 | 4,244 | ||||||||||||
| Other | 6,900 | 12,184 | 14,756 | 20,360 | ||||||||||||
| Total noninterest expenses | 147,919 | 147,044 | 289,018 | 292,046 | ||||||||||||
| Income before income taxes | 100,502 | 85,977 | 191,661 | 166,812 | ||||||||||||
| Income tax expense | 21,769 | 19,362 | 41,515 | 37,566 | ||||||||||||
| Net income | 78,733 | 66,615 | 150,146 | 129,246 | ||||||||||||
| Preferred stock dividends | 1,573 | 1,573 | 3,146 | 3,146 | ||||||||||||
| Earnings allocated to participating securities | 438 | 368 | 850 | 713 | ||||||||||||
| Net income available to common shareholders | $ | 76,722 | $ | 64,674 | $ | 146,150 | $ | 125,387 | ||||||||
| Net income per common share: | ||||||||||||||||
| Basic | $ | 0.63 | $ | 0.54 | $ | 1.21 | $ | 1.05 | ||||||||
| Diluted | 0.63 | 0.54 | 1.21 | 1.05 | ||||||||||||
| Weighted average common shares outstanding: | ||||||||||||||||
| Basic | 121,377 | 119,726 | 120,714 | 119,694 | ||||||||||||
| Diluted | 121,432 | 119,785 | 120,820 | 119,763 | ||||||||||||
| UNITED COMMUNITY BANKS, INC. |
| Average Consolidated Balance Sheets and Net Interest Analysis |
| For the Three Months Ended June 30, |
| 2025 | 2024 | |||||||||||||||||||||||
| (dollars in thousands, fully taxable equivalent (FTE)) |
Average Balance |
Interest |
Average Rate |
Average Balance |
Interest |
Average Rate |
||||||||||||||||||
| Assets: | ||||||||||||||||||||||||
| Interest-earning assets: | ||||||||||||||||||||||||
| Loans, net of unearned income (FTE) (1)(2) | $ | 18,664,228 | $ | 288,023 | 6.19 | % | $ | 18,213,384 | $ | 291,378 | 6.43 | % | ||||||||||||
| Taxable securities (3) | 6,492,288 | 54,191 | 3.34 | 5,952,414 | 48,364 | 3.25 | ||||||||||||||||||
| Tax-exempt securities (FTE) (1)(3) | 354,162 | 2,236 | 2.53 | 363,393 | 2,273 | 2.50 | ||||||||||||||||||
| Federal funds sold and other interest-earning assets | 451,953 | 3,898 | 3.46 | 499,565 | 6,011 | 4.84 | ||||||||||||||||||
| Total interest-earning assets (FTE) | 25,962,631 | 348,348 | 5.38 | 25,028,756 | 348,026 | 5.59 | ||||||||||||||||||
| Noninterest-earning assets: | ||||||||||||||||||||||||
| Allowance for credit losses | (220,059 | ) | (215,104 | ) | ||||||||||||||||||||
| Cash and due from banks | 203,909 | 204,792 | ||||||||||||||||||||||
| Premises and equipment | 398,241 | 392,325 | ||||||||||||||||||||||
| Other assets (3) | 1,637,125 | 1,605,558 | ||||||||||||||||||||||
| Total assets | $ | 27,981,847 | $ | 27,016,327 | ||||||||||||||||||||
| Liabilities and Shareholders' Equity: | ||||||||||||||||||||||||
| Interest-bearing liabilities: | ||||||||||||||||||||||||
| Interest-bearing deposits: | ||||||||||||||||||||||||
| NOW and interest-bearing demand | $ | 6,051,489 | 36,956 | 2.45 | $ | 5,866,038 | 43,910 | 3.01 | ||||||||||||||||
| Money market | 6,645,336 | 49,603 | 2.99 | 6,068,530 | 53,531 | 3.55 | ||||||||||||||||||
| Savings | 1,195,295 | 1,457 | 0.49 | 1,160,708 | 687 | 0.24 | ||||||||||||||||||
| Time | 3,532,848 | 30,596 | 3.47 | 3,544,327 | 35,695 | 4.05 | ||||||||||||||||||
| Brokered time deposits | 50,488 | 524 | 4.16 | 50,323 | 639 | 5.11 | ||||||||||||||||||
| Total interest-bearing deposits | 17,475,456 | 119,136 | 2.73 | 16,689,926 | 134,462 | 3.24 | ||||||||||||||||||
| Federal funds purchased and other borrowings | 7,412 | 83 | 4.49 | 4,093 | 60 | 5.90 | ||||||||||||||||||
| Federal Home Loan Bank advances | — | — | — | — | — | — | ||||||||||||||||||
| Long-term debt | 237,992 | 2,615 | 4.41 | 324,870 | 3,743 | 4.63 | ||||||||||||||||||
| Total borrowed funds | 245,404 | 2,698 | 4.41 | 328,963 | 3,803 | 4.65 | ||||||||||||||||||
| Total interest-bearing liabilities | 17,720,860 | 121,834 | 2.76 | 17,018,889 | 138,265 | 3.27 | ||||||||||||||||||
| Noninterest-bearing liabilities: | ||||||||||||||||||||||||
| Noninterest-bearing deposits | 6,351,540 | 6,283,487 | ||||||||||||||||||||||
| Other liabilities | 346,643 | 400,974 | ||||||||||||||||||||||
| Total liabilities | 24,419,043 | 23,703,350 | ||||||||||||||||||||||
| Shareholders' equity | 3,562,804 | 3,312,977 | ||||||||||||||||||||||
| Total liabilities and shareholders' equity | $ | 27,981,847 | $ | 27,016,327 | ||||||||||||||||||||
| Net interest revenue (FTE) | $ | 226,514 | $ | 209,761 | ||||||||||||||||||||
| Net interest-rate spread (FTE) | 2.62 | % | 2.32 | % | ||||||||||||||||||||
| Net interest margin (FTE) (4) | 3.50 | % | 3.37 | % | ||||||||||||||||||||
| (1) | Interest revenue on tax-exempt securities and loans includes a taxable-equivalent adjustment to reflect comparable interest on taxable securities and loans. The FTE adjustment totaled $983,000 and $1.06 million, respectively, for the three months ended June 30, 2025 and 2024. The tax rate used to calculate the adjustment was 25%, reflecting the statutory federal income tax rate and the federal tax adjusted state income tax rate. |
| (2) | Included in the average balance of loans outstanding are loans on which the accrual of interest has been discontinued and loans that are held for sale. |
| (3) | Unrealized gains and losses on AFS securities, including those related to the transfer from AFS to HTM, have been reclassified to other assets. Pretax unrealized losses of $240 million in 2025 and $344 million in 2024 are included in other assets for purposes of this presentation. |
| (4) | Net interest margin is taxable equivalent net interest revenue divided by average interest-earning assets. |
| UNITED COMMUNITY BANKS, INC. |
| Average Consolidated Balance Sheets and Net Interest Analysis |
| For the Six Months Ended June 30, |
| 2025 | 2024 | |||||||||||||||||||||||
| (dollars in thousands, fully taxable equivalent (FTE)) |
Average Balance |
Interest |
Average Rate |
Average Balance |
Interest |
Average Rate |
||||||||||||||||||
| Assets: | ||||||||||||||||||||||||
| Interest-earning assets: | ||||||||||||||||||||||||
| Loans, net of unearned income (FTE) (1)(2) | $ | 18,440,110 | $ | 561,953 | 6.15 | % | $ | 18,256,562 | $ | 575,338 | 6.34 | % | ||||||||||||
| Taxable securities (3) | 6,614,294 | 111,363 | 3.37 | 5,890,408 | 93,079 | 3.16 | ||||||||||||||||||
| Tax-exempt securities (FTE) (1)(3) | 355,430 | 4,481 | 2.52 | 364,873 | 4,584 | 2.51 | ||||||||||||||||||
| Federal funds sold and other interest-earning assets | 426,415 | 6,899 | 3.26 | 587,080 | 12,816 | 4.39 | ||||||||||||||||||
| Total interest-earning assets (FTE) | 25,836,249 | 684,696 | 5.34 | 25,098,923 | 685,817 | 5.49 | ||||||||||||||||||
| Non-interest-earning assets: | ||||||||||||||||||||||||
| Allowance for loan losses | (215,141 | ) | (214,050 | ) | ||||||||||||||||||||
| Cash and due from banks | 211,681 | 212,998 | ||||||||||||||||||||||
| Premises and equipment | 397,347 | 389,173 | ||||||||||||||||||||||
| Other assets (3) | 1,623,689 | 1,611,928 | ||||||||||||||||||||||
| Total assets | $ | 27,853,825 | $ | 27,098,972 | ||||||||||||||||||||
| Liabilities and Shareholders' Equity: | ||||||||||||||||||||||||
| Interest-bearing liabilities: | ||||||||||||||||||||||||
| Interest-bearing deposits: | ||||||||||||||||||||||||
| NOW and interest-bearing demand | $ | 6,092,519 | 74,346 | 2.46 | $ | 5,972,065 | 90,121 | 3.03 | ||||||||||||||||
| Money market | 6,614,819 | 99,144 | 3.02 | 5,966,374 | 104,009 | 3.51 | ||||||||||||||||||
| Savings | 1,146,075 | 2,081 | 0.37 | 1,176,768 | 1,393 | 0.24 | ||||||||||||||||||
| Time | 3,489,687 | 61,427 | 3.55 | 3,570,407 | 71,639 | 4.03 | ||||||||||||||||||
| Brokered time deposits | 50,468 | 1,072 | 4.28 | 50,333 | 1,084 | 4.33 | ||||||||||||||||||
| Total interest-bearing deposits | 17,393,568 | 238,070 | 2.76 | 16,735,947 | 268,246 | 3.22 | ||||||||||||||||||
| Federal funds purchased and other borrowings | 43,883 | 1,190 | 5.47 | 2,054 | 60 | 5.87 | ||||||||||||||||||
| Federal Home Loan Bank advances | 19,343 | 433 | 4.51 | 2 | — | — | ||||||||||||||||||
| Long-term debt | 246,061 | 5,477 | 4.49 | 324,854 | 7,538 | 4.67 | ||||||||||||||||||
| Total borrowed funds | 309,287 | 7,100 | 4.63 | 326,910 | 7,598 | 4.67 | ||||||||||||||||||
| Total interest-bearing liabilities | 17,702,855 | 245,170 | 2.79 | 17,062,857 | 275,844 | 3.25 | ||||||||||||||||||
| Noninterest-bearing liabilities: | ||||||||||||||||||||||||
| Noninterest-bearing deposits | 6,273,313 | 6,340,783 | ||||||||||||||||||||||
| Other liabilities | 358,227 | 395,713 | ||||||||||||||||||||||
| Total liabilities | 24,334,395 | 23,799,353 | ||||||||||||||||||||||
| Shareholders' equity | 3,519,430 | 3,299,619 | ||||||||||||||||||||||
| Total liabilities and shareholders' equity | $ | 27,853,825 | $ | 27,098,972 | ||||||||||||||||||||
| Net interest revenue (FTE) | $ | 439,526 | $ | 409,973 | ||||||||||||||||||||
| Net interest-rate spread (FTE) | 2.55 | % | 2.24 | % | ||||||||||||||||||||
| Net interest margin (FTE) (4) | 3.43 | % | 3.28 | % | ||||||||||||||||||||
| (1) | Interest revenue on tax-exempt securities and loans includes a taxable-equivalent adjustment to reflect comparable interest on taxable securities and loans. The FTE adjustment totaled $1.97 million and $2.12 million, respectively, for the six months ended June 30, 2025 and 2024. The tax rate used to calculate the adjustment was 25%, reflecting the statutory federal income tax rate and the federal tax adjusted state income tax rate. |
| (2) | Included in the average balance of loans outstanding are loans on which the accrual of interest has been discontinued and loans that are held for sale. |
| (3) | Unrealized gains and losses on AFS securities, including those related to the transfer from AFS to HTM, have been reclassified to other assets. Pretax unrealized losses of $254 million in 2025 and $333 million in 2024 are included in other assets for purposes of this presentation. |
| (4) | Net interest margin is taxable equivalent net-interest revenue divided by average interest-earning assets. |
About United Community Banks, Inc.
United Community Banks, Inc. (NYSE: UCB) is the financial holding company for United Community, a top 100 U.S. financial institution committed to building stronger communities and improving the financial health and well-being of its customers. United Community offers a full range of banking, mortgage and wealth management services. As of June 30, 2025, United Community Banks, Inc. had $28.1 billion in assets and operated 200 offices across Alabama, Florida, Georgia, North Carolina, South Carolina and Tennessee. The company also manages a nationally recognized SBA lending franchise and a national equipment finance subsidiary, extending its reach to businesses across the country. United is an 11-time winner of J.D. Power’s award for highest customer satisfaction among consumer banks in the Southeast and was named the most trusted bank in the region in 2025. The company has also been recognized eight consecutive years by American Banker as one of the “Best Banks to Work For.” In commercial banking, United earned five 2025 Greenwich Best Brand awards, including national honors for middle market satisfaction. Forbes has consistently named United among the World’s Best and America’s Best Banks. Learn more at ucbi.com.
Non-GAAP Financial Measures
This press release, including the accompanying financial statement tables, contains financial information determined by methods other than in accordance with generally accepted accounting principles, or GAAP. This financial information includes certain operating performance measures, which exclude merger-related and other charges that are not considered part of recurring operations, such as “noninterest income – operating”, “noninterest expense - operating”, “operating net income,” “pre-tax, pre-provision income,” “operating net income per diluted common share,” “operating earnings per share,” “tangible book value per common share,” “operating return on common equity,” “operating return on tangible common equity,” “operating return on assets,” “return on assets - pre-tax, pre-provision - operating,” “return on assets - pre-tax, pre-provision,” “operating efficiency ratio,” and “tangible common equity to tangible assets.” These non-GAAP measures are included because United believes they may provide useful supplemental information for evaluating United’s underlying performance trends. These measures should be viewed in addition to, and not as an alternative to or substitute for, measures determined in accordance with GAAP, and are not necessarily comparable to non-GAAP measures that may be presented by other companies. To the extent applicable, reconciliations of these non-GAAP measures to the most directly comparable measures as reported in accordance with GAAP are included with the accompanying financial statement tables.
Caution About Forward-Looking Statements
This press release contains “forward-looking statements” within the meaning of Section 27A of the Securities Act of 1933, as amended, and Section 21E of the Securities Exchange Act of 1934, as amended. In general, forward-looking statements usually may be identified through use of words such as “may,” “believe,” “expect,” “anticipate,” “intend,” “will,” “should,” “plan,” “estimate,” “predict,” “continue” and “potential,” or the negative of these terms or other comparable terminology. Forward-looking statements are not historical facts and represent management’s beliefs, based upon information available at the time the statements are made, with regard to the matters addressed; they are not guarantees of future performance. Actual results may prove to be materially different from the results expressed or implied by the forward-looking statements. Forward-looking statements are subject to numerous assumptions, risks and uncertainties that change over time and could cause actual results or financial condition to differ materially from those expressed in or implied by such statements.
Factors that could cause or contribute to such differences include, but are not limited to general competitive, economic, political, regulatory and market conditions. Further information regarding additional factors which could affect the forward-looking statements contained in this press release can be found in the cautionary language included under the headings “Cautionary Note Regarding Forward-Looking Statements” and “Risk Factors” in United’s Annual Report on Form 10-K for the year ended December 31, 2024, and other documents subsequently filed by United with the United States Securities and Exchange Commission (“SEC”).
Many of these factors are beyond United’s ability to control or predict. If one or more events related to these or other risks or uncertainties materialize, or if the underlying assumptions prove to be incorrect, actual results may differ materially from the forward-looking statements. Accordingly, shareholders and investors should not place undue reliance on any such forward-looking statements. Any forward-looking statement speaks only as of the date of this communication, and United undertakes no obligation to update or revise any forward-looking statements, whether as a result of new information, future events or otherwise, except as required by law. New risks and uncertainties may emerge from time to time, and it is not possible for United to predict their occurrence or how they will affect United.
United qualifies all forward-looking statements by these cautionary statements.
# # #
Exhibit 99.2

‹ 8QLWHG&RPPXQLW\%DQN_ XFELFRP 4 ,QYHVWRU 3UHVHQWDWLRQ July 23, 2025
'LVFORVXUHV 2 &$87,21$5<67$7(0(17 7KLV ,QYHVWRU 3UHVHQWDWLRQ FRQWDLQV ³ IRUZDUG ORRNLQJ VWDWHPHQWV ´ ZLWKLQ WKH PHDQLQJ RI 6HFWLRQ $ RI WKH 6HFXULWLHV $FW RI DV DPHQGHG DQG 6HFWLRQ ( RI WKH 6HFXULWLHV ([FKDQJH $FW RI DV DPHQGHG ,Q JHQHUDO IRUZDUG ORRNLQJ VWDWHPHQWV XVXDOO\ PD\ EH LGHQWLILHG WKURXJK XVH RI ZRUGV VXFK DV ³ PD\ ´ ³ EHOLHYH ´ ³ H[SHFW ´ ³ DQWLFLSDWH ´ ³ LQWHQG ´ ³ ZLOO ´ ³ VKRXOG ´ ³ SODQ ´ ³ HVWLPDWH ´ ³ SUHGLFW ´ ³ FRQWLQXH ´ DQG ³ SRWHQWLDO ´ RU WKH QHJDWLYH RI WKHVH WHUPV RU RWKHU FRPSDUDEOH WHUPLQRORJ\ )RUZDUG ORRNLQJ VWDWHPHQWV DUH QRW KLVWRULFDO IDFWV DQG UHSUHVHQW PDQDJHPHQW ¶ V EHOLHIV EDVHG XSRQ LQIRUPDWLRQ DYDLODEOH DW WKH WLPH WKH VWDWHPHQWV DUH PDGH ZLWK UHJDUG WR WKH PDWWHUV DGGUHVVHG WKH\ DUH QRW JXDUDQWHHV RI IXWXUH SHUIRUPDQFH $FWXDO UHVXOWV PD\ SURYH WR EH PDWHULDOO\ GLIIHUHQW IURP WKH UHVXOWV H[SUHVVHG RU LPSOLHG E\ WKH IRUZDUG ORRNLQJ VWDWHPHQWV )RUZDUG ORRNLQJ VWDWHPHQWV DUH VXEMHFW WR QXPHURXV DVVXPSWLRQV ULVNV DQG XQFHUWDLQWLHV WKDW FKDQJH RYHU WLPH DQG FRXOG FDXVH DFWXDO UHVXOWV RU ILQDQFLDO FRQGLWLRQ WR GLIIHU PDWHULDOO\ IURP WKRVH H[SUHVVHG LQ RU LPSOLHG E\ VXFK VWDWHPHQWV )DFWRUV WKDW FRXOG FDXVH RU FRQWULEXWH WR VXFK GLIIHUHQFHV LQFOXGH EXW DUH QRW OLPLWHG WR JHQHUDO FRPSHWLWLYH HFRQRPLF SROLWLFDO UHJXODWRU\ DQG PDUNHW FRQGLWLRQV )XUWKHU LQIRUPDWLRQ UHJDUGLQJ DGGLWLRQDO IDFWRUV ZKLFK FRXOG DIIHFW WKH IRUZDUG ORRNLQJ VWDWHPHQWV FRQWDLQHG LQ WKLV SUHVV UHOHDVH FDQ EH IRXQG LQ WKH FDXWLRQDU\ ODQJXDJH LQFOXGHG XQGHU WKH KHDGLQJV ³ &DXWLRQDU\ 1RWH 5HJDUGLQJ )RUZDUG /RRNLQJ 6WDWHPHQWV ´ DQG ³ 5LVN )DFWRUV ´ LQ 8QLWHG ¶ V $QQXDO 5HSRUW RQ )RUP . IRU WKH \HDU HQGHG 'HFHPEHU DQG RWKHU GRFXPHQWV VXEVHTXHQWO\ ILOHG E\ 8QLWHG ZLWK WKH 8QLWHG 6WDWHV 6HFXULWLHV DQG ([FKDQJH &RPPLVVLRQ ³ 6(& ´ 0DQ\ RI WKHVH IDFWRUV DUH EH\RQG 8QLWHG ¶ V DELOLW\ WR FRQWURO RU SUHGLFW ,I RQH RU PRUH HYHQWV UHODWHG WR WKHVH RU RWKHU ULVNV RU XQFHUWDLQWLHV PDWHULDOL]H RU LI WKH XQGHUO\LQJ DVVXPSWLRQV SURYH WR EH LQFRUUHFW DFWXDO UHVXOWV PD\ GLIIHU PDWHULDOO\ IURP WKH IRUZDUG ORRNLQJ VWDWHPHQWV $FFRUGLQJO\ VKDUHKROGHUV DQG LQYHVWRUV VKRXOG QRW SODFH XQGXH UHOLDQFH RQ DQ\ VXFK IRUZDUG ORRNLQJ VWDWHPHQWV $Q\ IRUZDUG ORRNLQJ VWDWHPHQW VSHDNV RQO\ DV RI WKH GDWH RI WKLV FRPPXQLFDWLRQ DQG 8QLWHG XQGHUWDNHV QR REOLJDWLRQ WR XSGDWH RU UHYLVH DQ\ IRUZDUG ORRNLQJ VWDWHPHQWV ZKHWKHU DV D UHVXOW RI QHZ LQIRUPDWLRQ IXWXUH HYHQWV RU RWKHUZLVH H[FHSW DV UHTXLUHG E\ ODZ 1HZ ULVNV DQG XQFHUWDLQWLHV PD\ HPHUJH IURP WLPH WR WLPH DQG LW LV QRW SRVVLEOH IRU 8QLWHG WR SUHGLFW WKHLU RFFXUUHQFH RU KRZ WKH\ ZLOO DIIHFW 8QLWHG 8QLWHG TXDOLILHV DOO IRUZDUG ORRNLQJ VWDWHPHQWV E\ WKHVH FDXWLRQDU\ VWDWHPHQWV NON - GAAP MEASURES This Investor Presentation includes financial information determined by methods other than in accordance with generally accepted accounting principles (“GAAP”) . This financial information includes certain operating performance measures, which exclude merger - related and other charges that are not considered part of recurring operations, such as "noninterest income – operating", “ noninterest expense – operating,” “operating net income,” “pre - tax, pre - provision income,” “operating net income per diluted common share,” “operating earnings per share,” “tangible book value per common share,” “operating return on common equity,” “operating return on tangible common equity,” “operating return on assets,” “return on assets - pre - tax pre - provision - operating,” “return on assets - pre - tax, pre - provision,” “operating efficiency ratio,” and “tangible common equity to tangible assets . ” These non - GAAP measures are included because United believes they may provide useful supplemental information for evaluating United’s underlying performance trends . Further, United’s management uses these measures in managing and evaluating United’s business and intends to refer to them in discussions about United’s operations and performance . These measures should be viewed in addition to, and not as an alternative to or substitute for, measures determined in accordance with GAAP, and are not necessarily comparable to non - GAAP measures that may be presented by other companies . To the extent applicable, reconciliations of these non - GAAP measures to the most directly comparable measures as reported in accordance with GAAP are included with the accompanying financial statement tables .

$28.1 BILLION IN TOTAL ASSETS United Community Banks, Inc. 1RWH6HH*ORVVDU\ORFDWHGDWWKHHQGRIWKLVSUHVHQWDWLRQIRUUHIHUHQFHRQFHUWDLQDFURQ\PV 4 UHJXODWRU\FDSLWDOUDWLRLVSUHOLPLQDU\ 3 8&%,%DQNLQJ2IILFHV Regional Full - Service Branch Network National Navitas and SBA Markets &RPSDQ\2YHUYLHZ $24.0 BILLION IN TOTAL DEPOSITS $3.3 BILLION IN AUM 13.3% CET1 RBC (1) %,//,21,1 727$/ /2$16 $0.24 QUARTERLY COMMON DIVIDEND %$1.,1*2)),&(6 $&52667+( 6287+($67 #1 IN CUSTOMER SATISFACTION with Consumer Banking in the Southeast in 2025 Plus #1 in Trust and People - J.D. Power %(67%$1.$:$5'6 DZDUGVIRURXWVWDQGLQJSHUIRUPDQFHLQVPDOO EXVLQHVVDQGPLGGOHPDUNHWEDQNLQJLQ &RDOLWLRQ*UHHQZLFK BEST BANKS TO WORK FOR in 2024 for the eighth consecutive year - American Banker Premier Southeast Regional Bank – Celebrating 75 Years of Exceptional Service Acquisition of ANB Holdings, Inc. (“ANB”) closed on May 1, 2025 Metro - focused branch network with locations in the fastest - growing MSAs in the Southeast 190 branches, 10 LPOs, and 5 MLOs across six Southeast states; Top 10 deposit market share in GA and SC ([WHQGHG1DYLWDVDQG6%$0DUNHWV Navitas subsidiary is a technology - enabled, small - ticket, essential - use commercial equipment financing provider SBA business has both in - footprint and national business (4 specific verticals)
Ϭ͘ϵϳ й 1.02% 1.11% 1.04% ϭ͘Ϭϰ й 1.16% 2Q24 1Q25 2Q25 ZĞƚƵƌŶŽŶǀĞƌĂŐĞƐƐĞƚƐ GAAP Operating $0.54 Ψ Ϭ͘ϱϴ $0.63 $0.58 $0.59 Ψ Ϭ͘ϲϲ 2Q24 1Q25 2Q25 Diluted Earnings Per Share GAAP Operating Ψ Ϯϳ͘ϭϴ $28.42 Ψ Ϯϴ͘ϴϵ $19.13 $20.58 $21.00 2Q24 1Q25 2Q25 ŽŽŬsĂůƵĞWĞƌ^ŚĂƌĞ GAAP Tangible 1.01% Return on assets – operating (1) 4 +LJKOLJKWV (1) See non - GAAP reconciliation table slides in the exhibits to this presentation for a reconciliation of operating performance measures to GAAP performance (2) Noninterest income impacted by loss on sale of manufactured housing loans in 3Q24 Ψ Ϯϰϱ $217 $251 $248 Ψ ϮϲϬ 3.37% ϯ͘ϯϯ й 3.26% ϯ͘ϯϲ й 3.50% 2Q24 3Q24 4Q24 1Q25 2Q25 Revenue Growth Net Interest Income Noninterest Income NIM % 4 ; ϭ Ϳ (1) 'LOXWHGHDUQLQJVSHUVKDUH ± *$$3 <HDU RYHU \HDULPSURYHPHQW 'LOXWHGHDUQLQJVSHUVKDUH ± RSHUDWLQJ <HDU RYHU \HDULPSURYHPHQW 1.11% Return on assets – GAAP 14 bps Year - over - year improvement 1.16% Return on assets – operating (1) 12 bps Year - over - year improvement &RVWRIGHSRVLWV ''$WRWDOGHSRVLWV 6% Year - over - year revenue improvement 8.5% Return on common equity – GAAP 12.3% Return on tangible common equity – operating (1) 56.7% Efficiency ratio – GAAP 54.8% Efficiency ratio – operating (1) 222 bps Year - over - year improvement $21.00 TBV per share (1) 10% Year - over - year improvement 3.50% Net interest margin 13 bps Year - over - year improvement ; ϭ Ϳ Other 2Q notable items: $0.7 million loss on senior debt extinguishment $0.3 million gain on securities sale ; Ϯ Ϳ 5.26% 5.25% ϱ͘ϭϴ й 4.58% 4.25% 4.25% Ϯ͘Ϭϯ й 2.35% 2.35% 2.20% Ϯ͘Ϭϱ й 2.01% 4Q23 2Q24 3Q24 4Q24 1Q25 2Q25 Fed Target Average Lower Bound UCB Cost of Deposits Outstanding Deposit Franchise Deposit Costs Down 4 bps in 2Q25 Customer Deposit Growth Excluding public funds and ANB, customer deposits grew $64 million, or 1.3% annualized, from 1Q25 ANB contributed $374 million in deposits as of May 1 transaction close date Public funds of $2.9 billion were down $233 million from 1Q25, primarily driven by seasonality Noninterest - bearing DDA grew $125 million in 2Q25 ANB contributed $108 million in noninterest - bearing DDA balances as of May 1 transaction close date 2Q25 Change in Customer Deposits $ 23,807 Ϯϯ͕ϲϬϮ $125 ( $169 ) $124 ; Ψ ϯϰ Ϳ $160 1Q25 Total Customer Deposits Noninterest- bearing NOW Savings MMA Time 2Q25 Total Customer Deposits $ in millions Deposit Costs Continue to Trend Down Reduction of 4 bps QoQ driven by active management, product mix, and benefit of CD repricing Cumulative total deposit beta of 34% through 2Q25 Cumulative non - maturity IB deposit beta of 48% through 2Q25 June monthly average cost of deposits of 1.99% Time MMA Savings NOW 1,% 2Q25 Public Funds Δ $22 ($21) $0 ($222) ($13) $67 $32 $144 $23 $108 ANB 5/1 Deposits


$18,921 $18,425 $154 $55 $132 $74 $81 1Q25 Total Loans C&I Equipment Finance CRE Construction Consumer 2Q25 Total Loans 2Q25 Loan Portfolio Growth Loan Growth Quarter Highlights Excluding ANB, loan growth of 4.2% annualized ANB contributed $301 million in loans as of May 1 transaction close date Senior Care portfolio of $279 million, down $10 million from 1Q25 Construction and CRE ratios as a percentage of total RBC were 62% and 204%, respectively Top 25 relationships totaled $982 million, or 5.2% of total loans, up $112 million from 2Q24 SNCs outstanding of $293 million, or 1.5% of total loans, up $74 million from 2Q24 Conservative relationship lending limits driven by risk grades 6 2Q25 Total Loans $18.9 Billion 6% 1% 1% 42% 24% 17% 9% C&I Commercial Construction CRE Other Consumer Residential Mortgage Home Equity Residential Construction $ in millions % QoQ annualized Note: C&I includes Commercial & Industrial and Owner Occupied CRE Consumer includes Mortgage, HELOC, and Other Consumer Consumer Construction CRE (TXLSPHQW )LQDQFH C&I ANB 5/1 Loans $11 $35 $151 -- $104 80% 78% 78% 78% 79% 91% 2Q24 3Q24 4Q24 1Q25 2Q25 United KRX Peer Median Substantial balance sheet liquidity and strong regulatory capital and tangible common equity ratios $6.4 billion securities portfolio offers significant near - and medium - term cash flow opportunities Redeemed $100 million of senior debt in June, where rate was adjusting from 5% to SOFR + 4.87% Incurred $0.7 million loss on extinguishment No outstanding wholesale borrowings at the end of 2Q25 0.7% of total deposits are brokered in 2Q25, compared to 2.7% for the KRX peer median 8.8% 8.9% 9.0% 9.2% 9.5% 8.4% 2Q24 3Q24 4Q24 1Q25 2Q25 United KRX Peer Median Loans / Core Deposits % Tangible Common Equity / Tangible Assets % Common Equity Tier 1 RBC %* 12.8% 13.1% 13.2% 13.3% 13.3% 12.2% 2Q24 3Q24 4Q24 1Q25 2Q25 United KRX Peer Median Balance Sheet Strength – Liquidity and Capital 7 *2Q25 regulatory capital ratio is preliminary


Risk - Based Capital Ratios Tangible Book Value Per Share Capital Ratios 2Q25 regulatory risk - based capital ratios remained strong and above peers The leverage ratio increased 22 bps to 10.37%, as compared to 1Q25 TCE of 9.45% increased 27 bps from 1Q25 Net unrealized securities losses in AOCI improved by $10.5 million to $184 million in 2Q25 Q2 Actions Quarterly common dividend of $0.24 per share during the quarter, up 4% vs. prior year Remaining outstanding common stock repurchase authorization of $86 million Repurchased $14 million of shares (507 thousand shares) in 2Q25 at average price of $27.49 per share 12.8% 13.1% 13.2% 13.3% 12.2% 13.3% 0.5% 0.5% 0.5% 0.4% 0.6% 0.4% 1.8% 1.8% 1.5% 1.4% 1.8% 1.4% 15.1% 15.3% 15.1% 15.1% 14.7% 15.1% 2Q24 3Q24 4Q24 1Q25 1Q25 KRX Peer Median 2Q25* CET1 Additional Tier 1 Tier 2 Capital Ratios $21.00 $20.58 $0.63 ( $0.25 ) $0.08 ( $0.04 ) 1Q25 TBV GAAP Earnings Dividends Change in AOCI Other 2Q25 TBV 8 *2Q25 regulatory capital ratios are preliminary (1) Dividends include both common and preferred dividends (1)
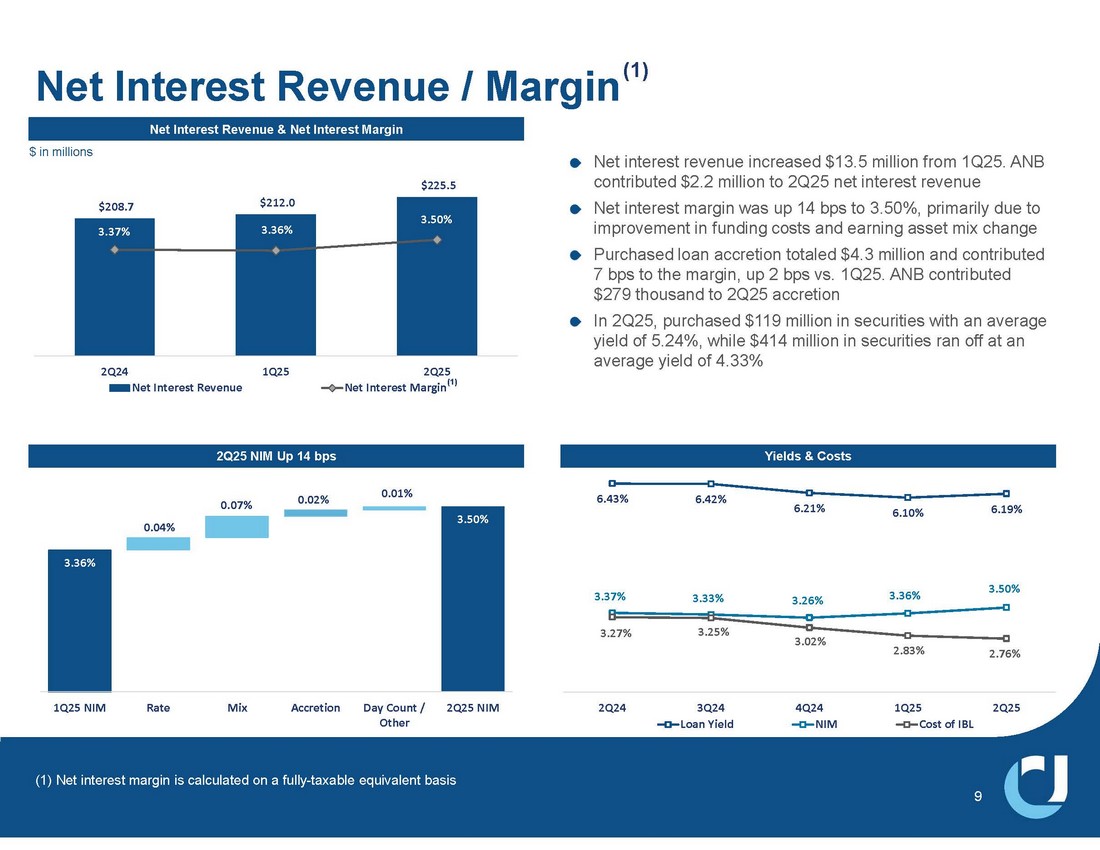
$208.7 $212.0 $225.5 3.37% 3.36% 3.50% $100.0 $120.0 $140.0 $160.0 $180.0 $200.0 $220.0 2.00% 2.50% 3.00% 3.50% 4.00% 2Q24 1Q25 2Q25 Net Interest Revenue Net Interest Margin 3.50% 3.36% 0.04% 0.07% 0.02% 0.01% 1Q25 NIM Rate Mix Accretion Day Count / Other 2Q25 NIM Net Interest Revenue & Net Interest Margin 2Q25 NIM Up 14 bps Net interest revenue increased $13.5 million from 1Q25. ANB contributed $2.2 million to 2Q25 net interest revenue Net interest margin was up 14 bps to 3.50%, primarily due to improvement in funding costs and earning asset mix change Purchased loan accretion totaled $4.3 million and contributed 7 bps to the margin, up 2 bps vs. 1Q25.

ANB contributed $279 thousand to 2Q25 accretion In 2Q25, purchased $119 million in securities with an average yield of 5.24%, while $414 million in securities ran off at an average yield of 4.33% Net Interest Revenue / Margin (1) Yields & Costs 6.43% 6.42% 6.21% 6.10% 6.19% 3.37% 3.33% 3.26% 3.36% 3.50% 3.27% 3.25% 3.02% 2.83% 2.76% 2Q24 3Q24 4Q24 1Q25 2Q25 Loan Yield NIM Cost of IBL (1) Net interest margin is calculated on a fully - taxable equivalent basis (1) 9 $ in millions $10.6 $10.5 $10.6 $9.5 $10.1 $6.8 $3.5 $9.7 $6.1 $5.4 $6.4 $6.3 $4.7 $4.5 $4.4 $1.3 $1.5 $1.6 $1.4 $2.0 $11.5 $13.4 $13.9 $14.1 $12.8 2Q24 3Q24 4Q24 1Q25 2Q25 Service Charges Mortgage Brokerage / Wealth Mgmt Loan Sale Gains Other $36.6 $35.3 Linked Quarter On an operating basis, noninterest income decreased $0.9 million from 1Q25 Mortgage fees decreased, primarily due to a negative MSR mark of $0.4 million in 2Q25 vs. a positive MSR mark of $0.3 million in 1Q25 Sold $21.8 million of SBA loans and $16.9 million of Navitas loans, resulting in $2.0 million of loan sale gains in the quarter Other income decreased $1.3 million, including a $0.7 million loss on extinguishment of senior debt Year - over - Year On an operating basis, noninterest income decreased $1.8 million from 2Q24 Mortgage fees decreased, primarily due to a negative MSR mark of $0.4 million in 2Q25 vs.

a positive MSR mark of $0.6 million in 1Q25 Brokerage fees decreased $1.8 million, primarily due to the impact of the FinTrust sale Other income increased $1.4 million, primarily due to an increase in customer swap income $40.5 10 Noninterest Income - Operating (1) See non - GAAP reconciliation table slides in the exhibits to this presentation for a reconciliation of operating performance meas ures to GAAP performance $35.7 $ in millions (1) $34.7 $147.0 $143.1 $143.1 $141.1 $147.9 $140.6 $140.9 $140.9 $139.8 $143.1 2Q24 3Q24 4Q24 1Q25 2Q25 GAAP Operating Noninterest Expense 2Q25 operating efficiency ratio of 54.8%, down 138 bps quarter - over - quarter and 222 bps year - over - year Improvement driven by higher revenue growth Operating efficiency ratio has been consistently below the KRX Peer Median Efficiency Ratio Noninterest Expense 59.7% 65.5% 56.1% 56.7% 56.7% 57.1% 57.4% 55.2% 56.2% 54.8% 58.1% 2Q24 3Q24 4Q24 1Q25 2Q25 GAAP Operating KRX Peer Median GAAP noninterest expense increased $6.8 million compared to the prior quarter Operating noninterest expense increased $3.3 million compared to the prior quarter primarily driven by merit increases ($1.8 million) and the ANB acquisition ($1.2 million) GAAP noninterest expense increased $0.9 million year - over - year Operating noninterest expense increased $2.5 million year - over - year also driven by merit increases and the ANB acquisition, partially offset by the sale of FinTrust 11 (1) See non - GAAP reconciliation table slides in the exhibits to this presentation for a reconciliation of operating performance meas ures to GAAP performance (1) $ in millions (1)

2Q25 net charge - offs of $8.2 million, or 0.18% of average loans Nonperforming assets improved $9.3 million during the quarter and were 0.44% of total loans, down 6 bps from 1Q25, driven by resolution of largest Senior Care non - accrual credit and successful exit of several C&I loans Past due loans improved $12.9 million during the quarter and were 0.14% of total loans, down 7 bps from 1Q25 Higher risk loans, defined as special mention plus substandard accruing, were 3.1%, steady from 1Q25 Credit Quality Net Charge - Offs as % of Average Loans Nonperforming Assets & Past Due Loans as a % of Total Loans 0.28% 0.51% 0.58% 0.64% 0.64% 0.64% 0.51% 0.44% 0.06% 0.18% 0.29% 0.28% 0.26% 0.19% 0.17% 0.21% 0.14% 2021 2022 2023 1Q24 2Q24 3Q24 4Q24 1Q25 2Q25 NPAs (%) Past Dues (%) 2.6% 1.6% 1.1% 1.6% 1.3% 1.3% 1.4% 1.2% 1.4% 1.4% 1.3% 1.6% 1.3% 1.5% 1.7% 1.8% 1.9% 1.8% 2021 2022 2023 1Q24 2Q24 3Q24 4Q24 1Q25 2Q25 Special Mention (%) Substandard Accruing (%) Special Mention & Substandard Accruing Loans as a % of Total Loans 12 0.00% 0.07% 0.30% 0.28% 0.26% 0.52% 0.21% 0.21% 0.18% - 0.03% 0.04% 0.20% 0.16% 0.15% 0.45% 0.08% 0.11% 0.08% 2021 2022 2023 1Q24 2Q24 3Q24 4Q24 1Q25 2Q25 United United Excl. Navitas 0.28% (1) Includes 24 basis points of expected lifetime losses related to the 3Q24 sale of manufactured housing loans (1)

Allowance for Credit Losses Allowance for Credit Losses (ACL) Walk - Forward Allowance for Credit Losses (ACL) Note: ACL includes the reserve for unfunded commitments Provision of $11.8 million, improved from $15.4 million in 1Q25, primarily driven by lower charge - offs Hurricane - related special reserve reduced by $2.8 million to $4.4 million We believe the $4.4 million reserve sufficiently covers credits of potential concern and active deferrals ANB non - PCD double - dip provision of $2.5 million Net charge - offs of $8.2 million improved $1.4 million from 1Q25, reflecting strong credit quality Allowance coverage of 1.21% flat to prior quarter $225 $216 $217 $223 $228 1.23% 1.20% 1.20% 1.21% 1.21% 0.65% 0.75% 0.85% 0.95% 1.05% 1.15% 1.25% 1.35% 1.45% 1.55% $50 $70 $90 $110 $130 $150 $170 $190 $210 $230 2Q24 3Q24 4Q24 1Q25 2Q25 ACL - Allowance for Credit Losses $ ACL - Allowance for Credit Losses / Loans % $223,201 $228,045 $ 2,870 ($ 8,226 ) ($ 987 ) $ 11,493 $ 2,494 ($ 2,800 ) 1Q25 ACL Loan Growth/ Mix Changes NCOs Specific Reserve Model Impact/ NCO Refill ANB Double Dip Hurricane Special Reserve 2Q25 ACL 13 $ in millions $ in thousands Cultural Foundations of United Community 15 Our Story Founded 75 years ago as Union County Bank, United Community has stayed true to its roots by prioritizing service.

2Q25 INVESTOR PRESENTATION Exhibits

We continue to embrace our small - town, personal touch while offering a comprehensive range of personal and business banking services. Team We play to win together as a team Truth We want to see things as they are, not as we want them to be Trust We trust in people Caring We treat our customers, and each other, the way that we would want to be treated Best Bank to Work F or in 2024 for the 8 th consecutive year Best Consumer Bank for Customer Satisfaction in the Southeast Region, 9 out of the last 11 years, including #1 in People and #1 in Trust in 2025 Best Bank for middle - market and small business banking for 9 years To Be a Legendary Bank Our Vision Our Core Values Our Accolades Our Purpose To Build Communities Average Deposit Costs 16 2Q25 1Q25 4Q24 3Q24 2Q24 $ in billions; rates annualized Average Rate Average Balance Average Rate Average Balance Average Rate Average Balance Average Rate Average Balance Average Rate Average Balance N/A $6.4 N/A $6.2 N/A $6.3 N/A $6.2 N/A $6.3 DDA 2.45% $6.1 2.47% $6.1 2.65% $6.3 2.98% $5.8 3.01% $5.9 NOW 2.99% $6.6 3.05% $6.6 3.31% $6.5 3.57% $6.3 3.55% $6.1 MMDA 0.49% $1.2 0.23% $1.1 0.23% $1.1 0.24% $1.1 0.24% $1.2 Savings 3.47% $3.5 3.63% $3.4 3.90% $3.5 3.97% $3.5 4.05% $3.5 Time 2.73% $17.5 2.79% $17.3 3.00% $17.4 3.23% $16.8 3.24% $16.7 Total Interest - Bearing 2.01% $23.8 2.05% $23.5 2.20% $23.7 2.35% $23.0 2.35% $23.0 Total Deposits


Navitas Portfolio Net Charge - Offs & Weighted Average FICO Scores Navitas represents 9% of total loans Navitas ACL / Loans of 2.59% Navitas 2Q25 NCOs of 1.14% annualized, or $5.0 million Of the $5.0 million of losses, $1.2 million came from the Long Haul Trucking segment as the book shrank to just $20 million Excluding Long Haul Trucking losses, Navitas losses were 0.87% of total Navitas loans, an 8 bps improvement from 1Q25 Navitas Performance $1,447 $1,510 $1,534 $1,543 $1,544 $1,581 $1,603 $1,663 $1,722 $1,778 8.99% 9.12% 9.25% 9.30% 9.43% 9.58% 9.64% 9.68% 9.70% 9.71% 1Q23 2Q23 3Q23 4Q23 1Q24 2Q24 3Q24 4Q24 1Q25 2Q25 Navitas Loans $ Portfolio Yield % 17 0.85% 0.32% 0.32% 0.93% 0.69% 1.62% 2.05% 1.66% 1.42% 1.34% 1.43% 1.20% 1.14% 748 750 751 752 754 755 756 757 758 759 760 761 761 2020 2021 2022 1Q23 2Q23 3Q23 4Q23 1Q24 2Q24 3Q24 4Q24 1Q25 2Q25 NCOs % - Navitas Weighted Average FICO - Total Portfolio $ in millions Navitas Portfolio Concentrations by State 11% 11% 10% 6% 5% 58% CA TX FL NY NJ Other States Rate locks were $359 million compared to $330 million in 1Q25, driven primarily by seasonal momentum Sold $175 million in 2Q25, up $34 million from $141 million sold in 1Q25 73% of locked loans were fixed - rate mortgages, which were either sold in 2Q25 or are contemplated to be sold once closed Mortgage Locks & Sales Mortgage Funded Volume Mortgage Activity Trends $295 $306 $285 $330 $359 $145 $172 $163 $141 $175 3.0% 2.8% 3.0% 2.9% 2.9% 2Q24 3Q24 4Q24 1Q25 2Q25 Mortgage Locks $ Loans Sold $ Gain on Sale % $182 $197 $195 $129 $196 $32 $42 $50 $58 $89 2Q24 3Q24 4Q24 1Q25 2Q25 HFS Funded $ HFI Funded $ 18 Purchase volume remained the primary driver of originations at 80% of the total Lock pull - through rate of approximately 75% in recent quarters Adjustable - rate mortgages (ARMs) comprised a growing percentage of rate locks in recent periods ARMs are generally held for investment on the balance sheet $ in millions


(1) Includes MSAs with a population greater than 1,000,000 (2) Includes MSAs with a population between 500,000 and 1,000,000 Footprint Focused on High - Growth Southeast MSAs 19 22.3% 8.8% 5.1% 4.8% 3.8% 3.3% 2.7% 2.3% 2.2% 2.0% Atlanta, GA Greenville, SC Nashville, TN Miami, FL Raleigh, NC Gainesville, GA Knoxville, TN Orlando, FL Rome, GA Myrtle Beach, SC Top 10 MSAs - % of Total Deposits UCBI's % of Total Deposits ’25 – ’30 Proj. Pop. Growth % ’25 – ’30 Proj. HHI. Growth % 1) Jacksonville, FL 0.68% 8.26 11.51 2) Raleigh, NC 3.80% 7.36 11.78 3) Orlando, FL 2.27% 7.10 11.04 4) Charlotte, NC 1.92% 6.55 10.29 5) Greenville, SC 8.83% 6.37 6.31 6) Tampa, FL 0.11% 5.66 12.13 7) Nashville, TN 5.12% 5.64 10.79 8) Richmond, VA -- 4.96 10.23 9) Atlanta, GA 22.26% 4.39 7.65 10) Miami, FL 4.77% 3.58 11.99 11) Washington, DC -- 2.45 8.11 12) Virginia Beach, VA -- 1.92 8.81 Fastest Growing Major Southeast MSAs (1) UCBI MSA Presence UCBI's % of Total Deposits ’25 – ’30 Proj. Pop. Growth % ’25 – ’30 Proj. HHI. Growth % 1) Winter Haven, FL -- 9.40 6.20 2) Huntsville, AL 1.43% 9.34 10.21 3) Fayetteville, AR -- 8.80 9.16 4) Port St. Lucie, FL 0.15% 8.78 9.16 5) Sarasota, Fl 0.15% 8.47 10.21 6) Charleston, SC 1.07% 7.37 10.12 7) Daytona Beach, FL -- 7.09 13.08 8) Melbourne, FL 0.16% 6.53 12.76 9) Pensacola, FL -- 6.40 11.34 10) Knoxville, TN 2.72% 5.89 10.74 11) Fort Myers, FL -- 5.05 9.86 12) Columbia, SC 0.22% 4.62 7.66 13) Chattanooga, TN 0.18% 4.52 10.74 14) Durham, NC -- 4.31 10.70 15) Augusta, GA -- 3.94 7.25 Fastest Growing Mid-Sized Southeast MSAs (2)

Non - GAAP Reconciliation Tables 20 2Q24 3Q24 4Q24 1Q25 2Q25 Noninterest Income Noninterest income - GAAP 36,556$ 8,091$ 40,522$ 35,656$ 34,708$ Loss on sale of manufactured housing loans - 27,209 - - - Noninterest income - operating 36,556$ 35,300$ 40,522$ 35,656$ 34,708$ Expenses Expenses - GAAP 147,044$ 143,065$ 143,056$ 141,099$ 147,919$ Merger-related and other charges (2,157) (2,176) (2,203) (1,297) (4,833) FDIC special assessment 764 - - - - Loss on FinTrust (goodwill impairment) (5,100) - - - - Expenses - operating 140,551$ 140,889$ 140,853$ 139,802$ 143,086$ Diluted Earnings Per Share Diluted earnings per share - GAAP 0.54$ 0.38$ 0.61$ 0.58$ 0.63$ Loss on sale of manufactured housing loans -$ 0.18$ -$ -$ -$ Merger-related and other charges 0.01 0.01 0.02 0.01 0.03 Loss on FinTrust (goodwill impairment) 0.03 - - - - Diluted earnings per share - operating 0.58$ 0.57$ 0.63$ 0.59$ 0.66$ Book Value Per Share Book value per share - GAAP 27.18$ 27.68$ 27.87$ 28.42$ 28.89$ Effect of goodwill and other intangibles (8.05) (8.02) (7.87) (7.84) (7.89) Tangible book value per share 19.13$ 19.66$ 20.00$ 20.58$ 21.00$ Return on Tangible Common Equity Return on common equity - GAAP 7.53 % 5.20 % 8.40 % 7.89 % 8.45 % Loss on sale of manufactured housing loans - 2.43 - - - Merger-related and other charges 0.20 0.19 0.20 0.12 0.42 FDIC special assessment (0.07) - - - - Loss on FinTrust (goodwill impairment) 0.46 - - - Return on common equity - operating 8.12 7.82 8.60 8.01 8.87 Effect of goodwill and intangibles 3.56 3.35 3.52 3.20 3.47 Return on tangible common equity - operating 11.68 % 11.17 % 12.12 % 11.21 % 12.34 % $ in thousands, except per share data Non - GAAP Reconciliation Tables 21 2Q24 3Q24 4Q24 1Q25 2Q25 Return on Assets Return on assets - GAAP 0.97 % 0.67 % 1.06 % 1.02 % 1.11 % Loss on sale of manufactured housing loans - 0.31 - - - Merger-related and other charges 0.01 0.03 0.02 0.02 0.05 Loss on FinTrust (goodwill impairment) 0.06 - - - - Return on assets - operating 1.04 % 1.01 % 1.08 % 1.04 % 1.16 % Return on Assets to Return on Assets - Pre-Tax Pre-Provision Return on assets - GAAP 0.97 % 0.67 % 1.06 % 1.02 % 1.11 % Income tax expense 0.29 0.19 0.30 0.29 0.31 Provision for credit losses 0.18 0.21 0.16 0.23 0.17 Return on assets - pre-tax, pre-provision 1.44 1.07 1.52 1.54 1.59 Loss on sale of manufactured housing loans - 0.40 - - - Merger-related and other charges 0.03 0.03 0.03 0.01 0.07 FDIC special assessment (0.01) - - - - Loss on FinTrust (goodwill impairment) 0.08 - - - - Return on assets - pre-tax pre-provision - operating 1.54 % 1.50 % 1.55 % 1.55 % 1.66 % Efficiency Ratio Efficiency ratio - GAAP 59.70 % 65.51 % 56.05 % 56.74 % 56.69 % Loss on sale of manufactured housing loans - (7.15) - - - Merger-related and other charges (0.88) (0.99) (0.87) (0.52) (1.85) FDIC special assessment 0.31 - - - - Loss on FinTrust (goodwill impairment) (2.07) - - - - Efficiency ratio - operating 57.06 % 57.37 % 55.18 % 56.22 % 54.84 % Tangible Common Equity to Tangible Assets Equity to assets ratio - GAAP 12.35 % 12.45 % 12.38 % 12.56 % 12.86 % Effect of goodwill and intangibles (3.24) (3.20) (3.09) (3.06) (3.10) Effect of preferred equity (0.33) (0.32) (0.32) (0.32) (0.31) Tangible common equity to tangible assets 8.78 % 8.93 % 8.97 % 9.18 % 9.45 % $ in thousands, except per share data


Glossary ACL – Allowance for Credit Losses MLO – Mortgage Loan Office ALLL – Allowance for Loan Losses MMDA – Money Market Deposit Account AOCI – Accumulated Other Comprehensive Income (Loss) MTM – Marked-to-Market AUA – Assets Under Administration MSA – Metropolitan Statistical Area BPS – Basis Points MSR – Mortgage Servicing Rights Asset C&I – Commercial and Industrial NCO – Net Charge-Offs C&D – Construction and Development NIM – Net Interest Margin CECL – Current Expected Credit Losses NOW – Negotiable Order of Withdrawal CET1 – Common Equity Tier 1 Capital NPA – Non-Performing Asset CRE – Commercial Real Estate NSF – Non-Sufficient Funds CSP – Customer Service Profiles OO CRE – Owner Occupied Commercial Real Estate DDA – Demand Deposit Account PCD – Loans Purchased with Credit Deterioration EOP – End of Period PPP – Paycheck Protection Program EPS – Earnings Per Share PTPP – Pre-Tax, Pre-Provision Earnings FHA – Federal Housing Administration RBC – Risk Based Capital FTE – Fully-Taxable Equivalent ROA – Return on Assets GAAP – Accounting Principles Generally Accepted in the USA SBA – United States Small Business Administration IBL – Interest-Bearing Liabilities TCE – Tangible Common Equity ICS – Insured Cash Sweep USDA – United States Department of Agriculture KRX – KBW Nasdaq Regional Banking Index VA – Veterans Affairs LPO – Loan Production Office YOY – Year over Year MH – Manufactured Housing 22