UNITED STATES
SECURITIES AND EXCHANGE COMMISSION
Washington, D.C. 20549
FORM 8-K
CURRENT REPORT
Pursuant to Section 13 or 15(d) of the Securities Exchange Act of 1934
Date of Report (Date of earliest event reported): July 22, 2025
PennyMac Financial Services, Inc.
(Exact name of registrant as specified in its charter)
| Delaware | 001-38727 | 83-1098934 |
| (State or other jurisdiction of incorporation) |
(Commission File Number) |
(IRS Employer Identification No.) |
| 3043 Townsgate Road, Westlake Village, California | 91361 |
| (Address of principal executive offices) | (Zip Code) |
(818) 224-7442
(Registrant’s telephone number, including area code)
Not Applicable
(Former name or former address, if changed since last report)
Check the appropriate box below if the Form 8-K filing is intended to simultaneously satisfy the filing obligation of the registrant under any of the following provisions:
| ¨ | Written communications pursuant to Rule 425 under the Securities Act (17 CFR 230.425) |
| ¨ | Soliciting material pursuant to Rule 14a-12 under the Exchange Act (17 CFR 240.14a-12) |
| ¨ | Pre-commencement communications pursuant to Rule 14d-2(b) under the Exchange Act (17 CFR 240.14d-2(b)) |
| ¨ | Pre-commencement communications pursuant to Rule 13e-4(c) under the Exchange Act (17 CFR 240.13e-4(c)) |
Securities registered pursuant to Section 12(b) of the Act:
| Title of each class | Trading Symbol(s) | Name of each exchange on which registered | ||
| Common Stock, $0.0001 par value | PFSI | New York Stock Exchange |
Indicate by check mark whether the registrant is an emerging growth company as defined in Rule 405 of the Securities Act of 1933 (§230.405 of this chapter) or Rule 12b-2 of the Securities Exchange Act of 1934 (§240.12b-2 of this chapter).
Emerging growth company ¨
If an emerging growth company, indicate by check mark if the registrant has elected not to use the extended transition period for complying with any new or revised financial accounting standards provided pursuant to Section 13(a) of the Exchange Act. ¨
Item 2.02 Results of Operations and Financial Condition.
On July 22, 2025, PennyMac Financial Services, Inc. (the “Company”) issued a press release and a slide presentation announcing its financial results for the fiscal quarter ended June 30, 2025. A copy of the press release and the slide presentation used in connection with the Company’s presentation of financial results were made available on July 22, 2025 and are furnished as Exhibits 99.1 and Exhibit 99.2, respectively. In addition, the Company has made available other supplemental financial information for the fiscal quarter ended June 30, 2025 on its website at pfsi.pennymac.com.
The information in Item 2.02 of this report, including the exhibits hereto, shall not be deemed “filed” for purposes of Section 18 of the Securities Exchange Act of 1934, or otherwise subject to the liabilities of Section 18, nor shall it be deemed incorporated by reference into any disclosure document relating to the Company, except to the extent, if any, expressly set forth by specific reference in such filing.
Item 9.01 Financial Statements and Exhibits.
(d) Exhibits.
| Exhibit No. | Description |
| 99.1 | Press Release, dated July 22, 2025, issued by PennyMac Financial Services, Inc. pertaining to its financial results for the fiscal quarter ended June 30, 2025. |
| 99.2 | Slide Presentation for use beginning on July 22, 2025 in connection with a presentation of financial results for the fiscal quarter ended June 30, 2025. |
| 104 | Cover Page Interactive Data File (embedded within the Inline XBRL document). |
SIGNATURE
Pursuant to the requirements of the Securities Exchange Act of 1934, the registrant has duly caused this report to be signed on its behalf by the undersigned hereunto duly authorized.
| PENNYMAC FINANCIAL SERVICES, INC. | |
| Dated: July 22, 2025 | /s/ Daniel S. Perotti |
| Daniel S. Perotti | |
| Senior Managing Director and Chief Financial Officer |
Exhibit 99.1

PennyMac Financial Services, Inc. Reports
Second Quarter 2025 Results
WESTLAKE VILLAGE, Calif. – July 22, 2025 – PennyMac Financial Services, Inc. (NYSE: PFSI) today reported net income of $136.5 million for the second quarter of 2025, or $2.54 per share on a diluted basis, on revenue of $444.7 million. Book value per share increased to $78.04 from $75.57 at March 31, 2025.
PFSI’s Board of Directors declared a second quarter cash dividend of $0.30 per share, payable on August 22, 2025, to common stockholders of record as of August 13, 2025.
Second Quarter 2025 Highlights
| · | Pretax income was $76.4 million, down from $104.2 million in the prior quarter and $133.9 million in the second quarter of 2024 |
| · | Production segment pretax income was $57.8 million, down from $61.9 million in the prior quarter and up from $55.2 million in the second quarter of 2024 |
| o | Total loan acquisitions and originations, including those fulfilled for PMT, were $37.9 billion in unpaid principal balance (UPB), up 31 percent from the prior quarter and 39 percent from the second quarter of 2024 |
| – | Correspondent acquisitions of conventional conforming and jumbo loans fulfilled for PennyMac Mortgage Investment Trust (NYSE: PMT) were $3.1 billion in UPB, up 11 percent from the prior quarter and 38 percent from the second quarter of 2024 |
| – | PMT retained 17 percent of total conventional conforming correspondent loans in the second quarter, down from 21 percent in the prior quarter |
| o | Total locks, including those for PMT, were $43.1 billion in UPB, up 26 percent from the prior quarter and 41 percent from the second quarter of 2024 |
| – | Correspondent lock volume for PMT’s account was $3.5 billion in UPB, up 29 percent from the prior quarter and 31 percent from the second quarter of 2024 |
| · | Servicing segment pretax income was $54.2 million, down from $76.0 million in the prior quarter and $90.7 million in the second quarter of 2024 |
| o | Pretax income excluding valuation-related changes was $143.7 million, down 16 percent from the prior quarter as higher loan servicing fees and earnings on custodial balances were more than offset by higher realization of mortgage servicing rights (MSR) cash flows and interest expense |
| o | Valuation-related changes included: |
| – | $15.9 million in MSR fair value gains more than offset by $109.1 million in hedging losses |
| · | Net impact on pretax income related to these items was $(93.2) million, or $(1.30) in diluted earnings per share |
| – | $3.6 million in reversals of provision for losses on active loans |
| o | Servicing portfolio grew to $699.7 billion in UPB, up 3 percent from March 31, 2025 and 11 percent from June 30, 2024 driven by production volumes which more than offset prepayment activity |
| · | Pretax loss from Corporate and Other was $35.5 million, up from $33.7 million in the prior quarter and $12.0 million in the second quarter of 2024 |
| · | Net income included a $60.0 million tax benefit, driven by a non-recurring tax benefit of $81.6 million which primarily consisted of a repricing of deferred tax liabilities due to state apportionment changes driven by recent legislation; impact of $1.52 on diluted earnings per share |
| · | Issued $850 million of 7-year unsecured senior notes due in May 2032 |
| · | Redeemed $650 million of unsecured senior notes due in October 2025 and $500 million of Ginnie Mae MSR term notes due in May 2027 |
"PennyMac Financial once again delivered solid financial performance, showcasing our enduring strength and strategic agility in today's dynamic market landscape," said Chairman and CEO David Spector. "Our multi-channel approach to production has allowed us to maintain a leading market position in today’s lower-volume, higher note rate origination market. In the second quarter alone, we acquired or originated nearly $40 billion in UPB of mortgage loans. This robust production also fueled the continued organic growth of our servicing portfolio, as it reached $700 billion in UPB with 2.7 million customers at quarter-end.”
Mr. Spector continued, “We are committed to ongoing technological enhancement and operational excellence, which includes the broad implementation of artificial intelligence across our production and servicing operations. Our strategic advancement in AI is poised to unlock significant efficiency gains and augment how we operate and serve our partners.”
Mr. Spector concluded, “Our commitment remains clear: to deliver strong financial results, create long-term value for our stockholders, and continue building on our balanced business model with an unwavering focus on strategic portfolio growth and core business objectives. I have never been more excited about the opportunities ahead, given the strong performance of our core operations and the significant benefits we expect with the implementation of AI across our businesses.”
The following table presents the contributions of PennyMac Financial’s segments to pretax income:
| Quarter ended June 30, 2025 | ||||||||||||||||||||
| Reportable | ||||||||||||||||||||
| Production | Servicing | segment total |
Corporate and other |
Total | ||||||||||||||||
| (in thousands) | ||||||||||||||||||||
| Revenue: | ||||||||||||||||||||
| Net gains on loans held for sale at fair value | $ | 203,961 | $ | 30,698 | $ | 234,659 | $ | - | $ | 234,659 | ||||||||||
| Loan origination fees | 59,091 | - | 59,091 | - | 59,091 | |||||||||||||||
| Fulfillment fees from PMT | 5,814 | - | 5,814 | - | 5,814 | |||||||||||||||
| Net loan servicing fees | - | 150,395 | 150,395 | - | 150,395 | |||||||||||||||
| Management fees | - | - | - | 6,869 | 6,869 | |||||||||||||||
| Net interest income (expense): | ||||||||||||||||||||
| Interest income | 104,205 | 117,123 | 221,328 | 601 | 221,929 | |||||||||||||||
| Interest expense | 93,622 | 145,955 | 239,577 | - | 239,577 | |||||||||||||||
| 10,583 | (28,832 | ) | (18,249 | ) | 601 | (17,648 | ) | |||||||||||||
| Other | 132 | 1,138 | 1,270 | 4,280 | 5,550 | |||||||||||||||
| Total net revenue | 279,581 | 153,399 | 432,980 | 11,750 | 444,730 | |||||||||||||||
| Expenses | ||||||||||||||||||||
| Compensation | 104,456 | 51,284 | 155,740 | 31,801 | 187,541 | |||||||||||||||
| Loan origination | 68,836 | - | 68,836 | - | 68,836 | |||||||||||||||
| Technology | 27,841 | 9,505 | 37,346 | 4,911 | 42,257 | |||||||||||||||
| Servicing | - | 28,286 | 28,286 | - | 28,286 | |||||||||||||||
| Marketing and advertising | 10,276 | 384 | 10,660 | 1,729 | 12,389 | |||||||||||||||
| Professional services | 3,545 | 1,798 | 5,343 | 3,037 | 8,380 | |||||||||||||||
| Occupancy and equipment | 4,109 | 2,731 | 6,840 | 1,539 | 8,379 | |||||||||||||||
| Other | 2,730 | 5,259 | 7,989 | 4,231 | 12,220 | |||||||||||||||
| Total expenses | 221,793 | 99,247 | 321,040 | 47,248 | 368,288 | |||||||||||||||
| Income (loss) before (benefit from) benefit from income taxes | $ | 57,788 | $ | 54,152 | $ | 111,940 | $ | (35,498 | ) | $ | 76,442 | |||||||||
Production Segment
The Production segment includes the correspondent acquisition of newly originated government-insured and conventional conforming loans for PennyMac Financial’s own account, fulfillment services on behalf of PMT and direct lending through the consumer direct and broker direct channels, including the underwriting and acquisition of loans from correspondent sellers on a non-delegated basis.
PennyMac Financial’s loan production activity for the quarter totaled $37.9 billion in UPB, $34.8 billion of which was for its own account, and $3.1 billion of which was fee-based fulfillment activity for PMT. Correspondent locks for PFSI and direct lending IRLCs totaled $39.6 billion in UPB, up 26 percent from the prior quarter and 41 percent from the second quarter of 2024.
Production segment pretax income was $57.8 million, down from $61.9 million in the prior quarter and up from $55.2 million in the second quarter of 2024. Production segment revenue totaled $279.6 million, up 13 percent from the prior quarter and 38 percent from the second quarter of 2024. The increase in revenue from the prior quarter and from the second quarter of 2024 was due primarily to higher overall volumes.
The components of net gains on loans held for sale are detailed in the following table:
| Quarter ended | ||||||||||||
| June 30, 2025 |
March 31, 2025 |
June 30, 2024 |
||||||||||
| (in thousands) | ||||||||||||
| Receipt of MSRs | $ | 814,538 | $ | 650,349 | $ | 541,207 | ||||||
| Gains on sale of loans to PennyMac Mortgage Investment Trust net of mortgage servicing rights recapture payable | 7,075 | 4,838 | (473 | ) | ||||||||
| Provision for representations and warranties, net | (1,834 | ) | (2,132 | ) | (53 | ) | ||||||
| Cash loss, including cash hedging results | (678,982 | ) | (587,009 | ) | (321,270 | ) | ||||||
| Fair value changes of pipeline, inventory and hedges | 93,862 | 154,991 | (43,347 | ) | ||||||||
| Net gains on mortgage loans held for sale | $ | 234,659 | $ | 221,037 | $ | 176,064 | ||||||
| Net gains on mortgage loans held for sale by segment: | ||||||||||||
| Production | $ | 203,961 | $ | 187,145 | $ | 154,317 | ||||||
| Servicing | $ | 30,698 | $ | 33,892 | $ | 21,747 | ||||||
PennyMac Financial performs fulfillment services for conventional conforming and jumbo loans acquired by PMT from non-affiliates in its correspondent production business. These services include, but are not limited to, marketing, relationship management, correspondent seller approval and monitoring, loan file review, underwriting, pricing, hedging and activities related to the subsequent sale and securitization of loans in the secondary mortgage markets for PMT.
Fees earned from the fulfillment of correspondent loans on behalf of PMT totaled $5.8 million in the second quarter, up 10 percent from the prior quarter and 31 percent from the second quarter of 2024. The quarter-over-quarter and year-over-year increases were driven by higher conventional acquisition volumes for PMT’s account.
Under a renewed mortgage banking services agreement with PMT, effective July 1, 2025, correspondent production volumes are now initially acquired by PFSI. PMT retains the right to purchase up to 100 percent of non-government correspondent loan production. In the third quarter of 2025, we expect PMT to acquire all jumbo correspondent production and 15 to 25 percent of total conventional conforming correspondent production, compared to its retention of 17 percent in the second quarter.
Net interest income in the second quarter totaled $10.6 million, compared to $8.8 million in the prior quarter. Interest income totaled $104.2 million, up from $85.3 million in the prior quarter, and interest expense totaled $93.6 million, up from $76.5 million in the prior quarter, both due to higher average balances of loans held for sale, reflecting the increase in volumes.
Production segment expenses were $221.8 million, up 19 percent from the prior quarter and 51 percent from the second quarter of 2024, driven primarily by increased compensation paid to brokers due to higher volumes. Compensation paid to brokers is included in loan origination expenses, which were up $24.7 million from the prior quarter.
Servicing Segment
The Servicing segment includes income from owned MSRs and subservicing. The total servicing portfolio grew to $699.7 billion in UPB at June 30, 2025, an increase of 3 percent from March 31, 2025 and 11 percent from June 30, 2024. PennyMac Financial’s owned MSR portfolio grew to $469.9 billion in UPB, an increase of 5 percent from March 31, 2025 and 17 percent from June 30, 2024. PennyMac Financial subservices $228.8 billion in UPB for PMT, $823 million in UPB of previously owned servicing that has been repurchased by the United States Veterans Affairs (VA) pursuant to the Veterans Affairs Servicing Purchase program on an interim basis, and $72 million in UPB for other non-affiliates.
The table below details PennyMac Financial’s servicing portfolio UPB:
| June 30, 2025 |
March 31, 2025 |
June 30, 2024 |
||||||||||
| (in thousands) | ||||||||||||
| Owned | ||||||||||||
| Mortgage servicing rights and liabilities | ||||||||||||
| Originated | $ | 448,312,667 | $ | 426,951,027 | $ | 379,882,952 | ||||||
| Purchased | 14,837,637 | 15,276,140 | 16,568,065 | |||||||||
| 463,150,304 | 442,227,167 | 396,451,017 | ||||||||||
| Loans held for sale | 6,783,240 | 6,911,473 | 6,108,082 | |||||||||
| 469,933,544 | 449,138,640 | 402,559,099 | ||||||||||
| Subserviced for: | ||||||||||||
| PMT | 228,838,699 | 229,907,855 | 230,179,513 | |||||||||
| U.S. Department of Veterans Affairs | 822,525 | 1,072,760 | - | |||||||||
| Other | 72,153 | 75,310 | - | |||||||||
| 229,733,377 | 231,055,925 | 230,179,513 | ||||||||||
| Total loans serviced | $ | 699,666,921 | $ | 680,194,565 | $ | 632,738,612 | ||||||
Servicing segment pretax income was $54.2 million, down from $76.0 million in the prior quarter and $90.7 million in the second quarter of 2024. Servicing segment net revenues totaled $153.4 million, down from $170.6 million in the prior quarter and $180.8 million in the second quarter of 2024.
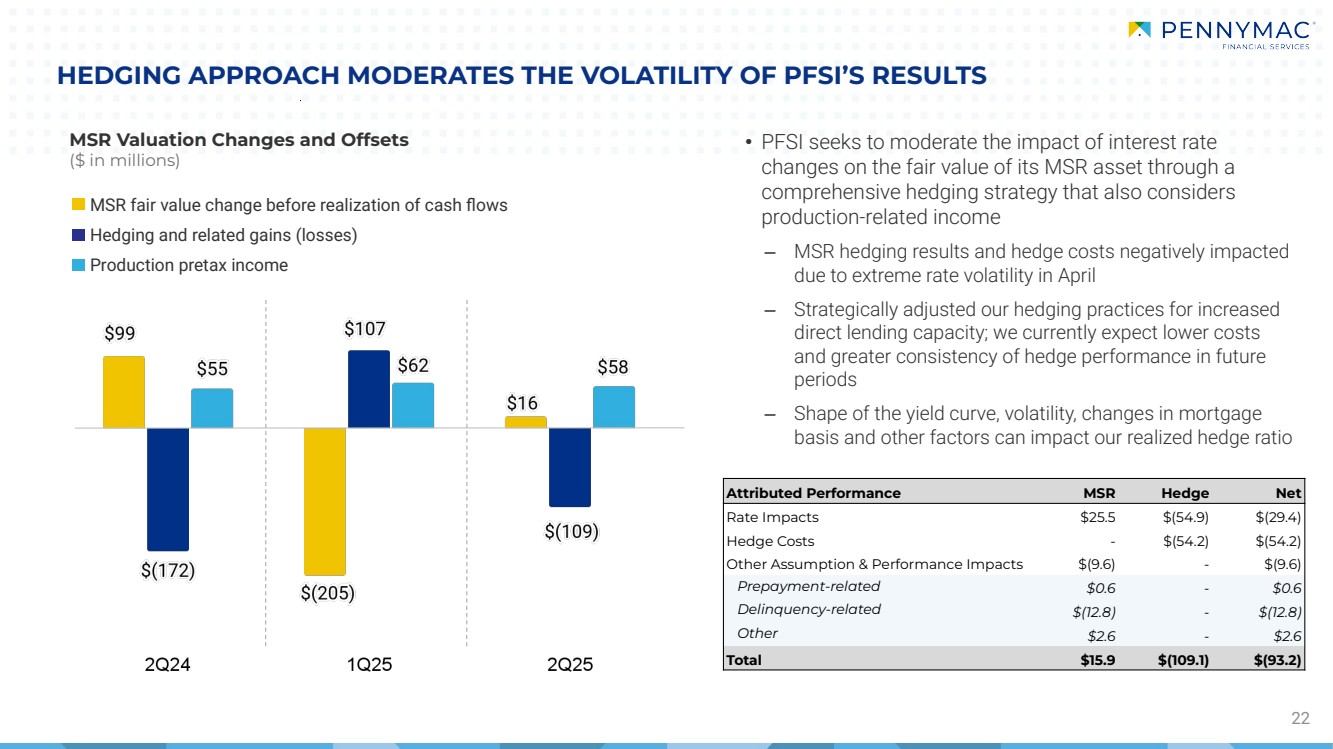
Revenue from net loan servicing fees totaled $150.4 million, down from $164.3 million in the prior quarter and $167.6 million in the second quarter of 2024. The decrease was primarily driven by increased realization of cash flows due to higher realized and expected prepayments. Net loan servicing fee revenues included $506.7 million in loan servicing fees, which were up from the prior quarter, reduced by $263.1 million from the realization of MSR cash flows. Net valuation-related losses totaled $93.2 million and included MSR fair value gains of $15.9 million, and hedging losses of $109.1 million which were impacted by elevated hedge costs due to extreme rate volatility in April.
The following table presents a breakdown of net loan servicing fees:
| Quarter ended | ||||||||||||
| June 30, 2025 |
March 31, 2025 |
June 30, 2024 |
||||||||||
| (in thousands) | ||||||||||||
| Loan servicing fees | $ | 506,667 | $ | 488,468 | $ | 440,696 | ||||||
| Changes in fair value of MSRs and MSLs resulting from: | ||||||||||||
| Realization of cash flows | (263,099 | ) | (225,462 | ) | (200,740 | ) | ||||||
| Change in fair value inputs | 15,929 | (205,494 | ) | 99,425 | ||||||||
| Hedging (losses) gains | (109,102 | ) | 106,774 | (171,777 | ) | |||||||
| Net change in fair value of MSRs and MSLs | (356,272 | ) | (324,182 | ) | (273,092 | ) | ||||||
| Net loan servicing fees | $ | 150,395 | $ | 164,286 | $ | 167,604 | ||||||
Servicing segment revenue included $30.7 million in net gains on loans held for sale related to early buyout loans (EBOs), down from $33.9 million in the prior quarter and up from $21.7 million in the second quarter of 2024. These EBOs are previously delinquent loans that were brought back to performing status through PennyMac Financial’s successful servicing efforts.
Net interest expense totaled $28.8 million, compared to $27.4 million in the prior quarter and $8.8 million in the second quarter of 2024. Interest income was $117.1 million, up from $104.1 million in the prior quarter due to increased placement fees on custodial balances due to higher average balances. Interest expense was $146.0 million, up from $131.6 in the prior quarter driven primarily by higher average balances of financing.
Servicing segment expenses totaled $99.2 million, up slightly from the prior quarter.
Corporate and Other
Corporate and Other items include amounts attributable to corporate activities not directly attributable to the production and servicing segments as well as management fees earned from PMT. PennyMac Financial manages PMT for which it earns base management fees and may earn performance incentive fees.
Pretax loss for Corporate and Other was $35.5 million, compared to $33.7 million in the prior quarter and $12.0 million in the second quarter of 2024.
Revenues from Corporate and Other were $11.8 million, and consisted of $6.9 million in management fees, $4.3 million in other revenue, and $0.6 million of net interest income. No performance incentive fees were earned in the second quarter.
Expenses were $47.2 million, up from $46.1 million in the prior quarter and up from $35.1 million in the second quarter of 2024.
Net assets under management were $1.9 billion as of June 30, 2025, down slightly from March 31, 2025 and June 30, 2024.
The following table presents a breakdown of management fees:
| Quarter ended | ||||||||||||
| June 30, 2025 |
March 31, 2025 |
June 30, 2024 |
||||||||||
| (in thousands) | ||||||||||||
| Management fees: | ||||||||||||
| Base | $ | 6,869 | $ | 7,012 | $ | 7,133 | ||||||
| Performance incentive | - | - | - | |||||||||
| Total management fees | $ | 6,869 | $ | 7,012 | $ | 7,133 | ||||||
| Net assets of PennyMac Mortgage Investment Trust | $ | 1,865,645 | $ | 1,902,718 | $ | 1,939,869 | ||||||
Consolidated Expenses
Total expenses were $368.3 million, up from $326.7 million in the prior quarter primarily due to higher loan origination expenses as mentioned above.
Taxes
PFSI recorded a $60.0 million tax benefit, driven by a non-recurring tax benefit of $81.6 million which primarily consisted of a repricing of deferred tax liabilities due to state apportionment changes driven by recent legislation. PFSI's tax provision rate in future periods is expected to be 25.2 percent, down from 26.7 percent in recent quarters.
***
Management’s slide presentation and accompanying material will be available in the Investor Relations section of the Company’s website at pfsi.pennymac.com after the market closes on Tuesday, July 22, 2025. Management will also host a conference call and live audio webcast at 5:00 p.m. Eastern Time to review the Company’s financial results. The webcast can be accessed at pfsi.pennymac.com, and a replay will be available shortly after its conclusion.
***
About PennyMac Financial Services, Inc.
PennyMac Financial Services, Inc. is a specialty financial services firm focused on the production and servicing of U.S. mortgage loans and the management of investments related to the U.S. mortgage market. Founded in 2008, the company is recognized as a leader in the U.S. residential mortgage industry and employs approximately 4,400 people across the country. For the twelve months ended June 30, 2025, PennyMac Financial’s production of newly originated loans totaled $134 billion in unpaid principal balance, making it a top lender in the nation. As of June 30, 2025, PennyMac Financial serviced loans totaling $700 billion in unpaid principal balance, making it a top mortgage servicer in the nation. Additional information about PennyMac Financial Services, Inc. is available at pfsi.pennymac.com.
| Media | Investors |
| Kristyn Clark | Kevin Chamberlain |
| mediarelations@pennymac.com | Isaac Garden |
| 805.395.9943 | PFSI_IR@pennymac.com |
| 818.264.4907 |
Forward-Looking Statements
This press release contains forward-looking statements within the meaning of Section 21E of the Securities Exchange Act of 1934, as amended, regarding management’s beliefs, estimates, projections, and assumptions with respect to, among other things, our financial results, future operations, business plans and investment strategies, as well as industry and market conditions, all of which are subject to change. Words like “believe,” “expect,” “anticipate,” “promise,” “project,” “plan,” and other expressions or words of similar meanings, as well as future or conditional verbs such as “will,” “would,” “should,” “could,” or “may” are generally intended to identify forward-looking statements. Actual results and operations for any future period may vary materially from those projected herein and from past results discussed herein. Factors which could cause actual results to differ materially from historical results or those anticipated include, but are not limited to: interest rate changes; real estate value changes, housing prices and housing sales; changes in macroeconomic, consumer and real estate market conditions; compliance with changing federal, state and local laws and regulations applicable to the highly regulated industry in which we operate; lawsuits or governmental actions that may result from any noncompliance with the laws and regulations applicable to our business; the mortgage lending and servicing-related regulations promulgated by federal and state regulators and the enforcement of these regulations; the licensing and operational requirements of states and other jurisdictions applicable to our business, to which our bank competitors are not subject; difficulties inherent in adjusting the size of our operations to reflect changes in business levels; purchase opportunities for mortgage servicing rights; our substantial amount of indebtedness; increases in loan delinquencies, defaults and forbearances; foreclosure delays and changes in foreclosure practices; our dependence on U.S. government-sponsored entities and changes in their current roles or their guarantees or guidelines; our reliance on PennyMac Mortgage Investment Trust (NYSE: PMT) as a significant contributor to our mortgage banking business; maintaining sufficient capital and liquidity and compliance with financial covenants; our obligation to indemnify third-party purchasers or repurchase loans if loans that we originate, acquire, service or assist in the fulfillment of, fail to meet certain criteria; our obligation to indemnify PMT if our services fail to meet certain criteria or characteristics or under other circumstances; investment management and incentive fees; the accuracy or changes in the estimates we make about uncertainties, contingencies and asset and liability valuations; conflicts of interest in allocating our services and investment opportunities among us and our advised entity; our ability to mitigate cybersecurity risks, cyber incidents and technology disruptions; the development of artificial intelligence; the effect of public opinion on our reputation; our exposure to risks of loss and disruptions in operations resulting from severe weather events, man-made or other natural conditions, including climate change and pandemics; our ability to effectively identify, manage and hedge our credit, interest rate, prepayment, liquidity and climate risks; expanding or creating new business activities or strategies; our ability to detect misconduct and fraud; our ability to pay dividends to our stockholders; and our organizational structure and certain requirements in our charter documents. You should not place undue reliance on any forward- looking statement and should consider all of the uncertainties and risks described above, as well as those more fully discussed in reports and other documents filed by the Company with the Securities and Exchange Commission from time to time. The Company undertakes no obligation to publicly update or revise any forward-looking statements or any other information contained herein, and the statements made in this press release are current as of the date of this release only.
The press release contains financial information calculated other than in accordance with U.S. generally accepted accounting principles (“GAAP”), such as pretax income excluding valuation-related items and operating net income that provide a meaningful perspective on the Company’s business results since the Company utilizes this information to evaluate and manage the business. Non-GAAP disclosures have limitations as an analytical tool and should not be viewed as a substitute for financial information determined in accordance with GAAP.
The following table presents the contributions of PennyMac Financial’s segments to pretax income in the second quarter of 2024:
| Quarter ended June 30, 2024 | ||||||||||||||||||||
| Reportable | ||||||||||||||||||||
| Production | Servicing | segment total |
Corporate and other |
Total | ||||||||||||||||
| (in thousands) | ||||||||||||||||||||
| Revenue: | ||||||||||||||||||||
| Net gains on loans held for sale at fair value | $ | 154,317 | $ | 21,747 | $ | 176,064 | $ | - | $ | 176,064 | ||||||||||
| Loan origination fees | 42,075 | - | 42,075 | - | 42,075 | |||||||||||||||
| Fulfillment fees from PMT | 4,427 | - | 4,427 | - | 4,427 | |||||||||||||||
| Net loan servicing fees | - | 167,604 | 167,604 | - | 167,604 | |||||||||||||||
| Management fees | - | - | - | 7,133 | 7,133 | |||||||||||||||
| Net interest income (expense): | ||||||||||||||||||||
| Interest income | 84,645 | 115,706 | 200,351 | 460 | 200,811 | |||||||||||||||
| Interest expense | 83,376 | 124,495 | 207,871 | - | 207,871 | |||||||||||||||
| 1,269 | (8,789 | ) | (7,520 | ) | 460 | (7,060 | ) | |||||||||||||
| Other | 155 | 194 | 349 | 15,535 | 15,884 | |||||||||||||||
| Total net revenue | 202,243 | 180,756 | 382,999 | 23,128 | 406,127 | |||||||||||||||
| Expenses | ||||||||||||||||||||
| Compensation | 70,900 | 49,460 | 120,360 | 21,596 | 141,956 | |||||||||||||||
| Loan origination | 40,270 | - | 40,270 | - | 40,270 | |||||||||||||||
| Technology | 22,977 | 9,774 | 32,751 | 2,939 | 35,690 | |||||||||||||||
| Servicing | - | 22,920 | 22,920 | - | 22,920 | |||||||||||||||
| Marketing and advertising | 4,793 | 21 | 4,814 | 631 | 5,445 | |||||||||||||||
| Professional services | 2,422 | 1,598 | 4,020 | 5,384 | 9,404 | |||||||||||||||
| Occupancy and equipment | 3,754 | 2,753 | 6,507 | 1,386 | 7,893 | |||||||||||||||
| Legal settlements | - | - | ||||||||||||||||||
| Other | 1,958 | 3,528 | 5,486 | 3,209 | 8,695 | |||||||||||||||
| Total expenses | 147,074 | 90,054 | 237,128 | 35,145 | 272,273 | |||||||||||||||
| Income (loss) before (benefit from) provision for income taxes | $ | 55,169 | $ | 90,702 | $ | 145,871 | $ | (12,017 | ) | $ | 133,854 | |||||||||
PENNYMAC FINANCIAL SERVICES, INC.
CONSOLIDATED BALANCE SHEETS (UNAUDITED)
| June 30, 2025 |
March 31, 2025 |
June 30, 2024 |
||||||||||
| (in thousands, except share amounts) | ||||||||||||
| ASSETS | ||||||||||||
| Cash | $ | 162,186 | $ | 211,093 | $ | 595,336 | ||||||
| Short-term investment at fair value | 462,262 | 443,393 | 188,772 | |||||||||
| Principal-only stripped mortgage-backed securities at fair value | 784,958 | 817,596 | 914,223 | |||||||||
| Loans held for sale at fair value | 6,961,224 | 7,095,270 | 6,238,959 | |||||||||
| Derivative assets | 180,642 | 171,931 | 145,887 | |||||||||
| Servicing advances, net | 430,602 | 496,917 | 414,235 | |||||||||
| Mortgage servicing rights at fair value | 9,531,249 | 8,963,889 | 7,923,078 | |||||||||
| Investment in PennyMac Mortgage Investment Trust at fair value | 965 | 1,099 | 1,031 | |||||||||
| Receivable from PennyMac Mortgage Investment Trust | 30,604 | 29,198 | 29,413 | |||||||||
| Loans eligible for repurchase | 4,962,535 | 4,979,127 | 4,560,058 | |||||||||
| Other | 714,677 | 663,363 | 566,573 | |||||||||
| Total assets | $ | 24,221,904 | $ | 23,872,876 | $ | 21,577,565 | ||||||
| LIABILITIES | ||||||||||||
| Assets sold under agreements to repurchase | $ | 7,344,254 | $ | 7,058,053 | $ | 6,408,428 | ||||||
| Mortgage loan participation purchase and sale agreements | 700,296 | 510,141 | 511,837 | |||||||||
| Notes payable secured by mortgage servicing assets | 1,327,143 | 1,724,608 | 1,723,144 | |||||||||
| Unsecured senior notes | 4,185,012 | 3,998,702 | 3,160,226 | |||||||||
| Derivative liabilities | 33,541 | 15,293 | 18,830 | |||||||||
| Mortgage servicing liabilities at fair value | 1,643 | 1,651 | 1,708 | |||||||||
| Accounts payable and accrued expenses | 394,785 | 365,056 | 294,812 | |||||||||
| Payable to PennyMac Mortgage Investment Trust | 86,174 | 101,175 | 100,220 | |||||||||
| Payable to exchanged Private National Mortgage Acceptance Company, LLC unitholders under tax receivable agreement | 24,806 | 25,898 | 26,099 | |||||||||
| Income taxes payable | 1,097,452 | 1,158,642 | 1,082,397 | |||||||||
| Liability for loans eligible for repurchase | 4,962,535 | 4,979,127 | 4,560,058 | |||||||||
| Liability for losses under representations and warranties | 31,763 | 30,774 | 28,688 | |||||||||
| Total liabilities | 20,189,404 | 19,969,120 | 17,916,447 | |||||||||
| STOCKHOLDERS' EQUITY | ||||||||||||
| Common stock¾authorized 200,000,000 shares of $0.0001 par value; issued and outstanding 51,671,905, 51,658,984, and 51,017,418 shares, respectively | 5 | 5 | 5 | |||||||||
| Additional paid-in capital | 76,991 | 68,902 | 30,053 | |||||||||
| Retained earnings | 3,955,504 | 3,834,849 | 3,631,060 | |||||||||
| Total stockholders' equity | 4,032,500 | 3,903,756 | 3,661,118 | |||||||||
| Total liabilities and stockholders’ equity | $ | 24,221,904 | $ | 23,872,876 | $ | 21,577,565 | ||||||
PENNYMAC FINANCIAL SERVICES, INC.
CONSOLIDATED STATEMENTS OF INCOME (UNAUDITED)
| Quarter ended | ||||||||||||
| June 30, 2025 |
March 31, 2025 |
June 30, 2024 |
||||||||||
| (in thousands, except per share amounts) | ||||||||||||
| Revenues | ||||||||||||
| Net gains on loans held for sale at fair value | $ | 234,659 | $ | 221,037 | $ | 176,064 | ||||||
| Loan origination fees | 59,091 | 46,611 | 42,075 | |||||||||
| Fulfillment fees from PennyMac Mortgage Investment Trust | 5,814 | 5,290 | 4,427 | |||||||||
| Net loan servicing fees: | ||||||||||||
| Loan servicing fees | 506,667 | 488,468 | 440,696 | |||||||||
| Change in fair value of mortgage servicing rights and mortgage servicing liabilities | (247,170 | ) | (430,956 | ) | (101,315 | ) | ||||||
| Mortgage servicing rights hedging results | (109,102 | ) | 106,774 | (171,777 | ) | |||||||
| Net loan servicing fees | 150,395 | 164,286 | 167,604 | |||||||||
| Net interest expense: | ||||||||||||
| Interest income | 221,929 | 189,871 | 200,811 | |||||||||
| Interest expense | 239,577 | 208,082 | 207,871 | |||||||||
| (17,648 | ) | (18,211 | ) | (7,060 | ) | |||||||
| Management fees from PennyMac Mortgage Investment Trust | 6,869 | 7,012 | 7,133 | |||||||||
| Other | 5,550 | 4,878 | 15,884 | |||||||||
| Total net revenues | 444,730 | 430,903 | 406,127 | |||||||||
| Expenses | ||||||||||||
| Compensation | 187,541 | 181,988 | 141,956 | |||||||||
| Loan origination | 68,836 | 44,096 | 40,270 | |||||||||
| Technology | 42,257 | 40,197 | 35,690 | |||||||||
| Servicing | 28,286 | 21,875 | 22,920 | |||||||||
| Marketing and advertising | 12,389 | 9,432 | 5,445 | |||||||||
| Professional services | 8,380 | 9,037 | 9,404 | |||||||||
| Occupancy and equipment | 8,379 | 8,382 | 7,893 | |||||||||
| Other | 12,220 | 11,700 | 8,695 | |||||||||
| Total expenses | 368,288 | 326,707 | 272,273 | |||||||||
| Income before (benefit from) provision for income taxes | 76,442 | 104,196 | 133,854 | |||||||||
| (Benefit from) provision for income taxes | (60,021 | ) | 27,916 | 35,596 | ||||||||
| Net income | $ | 136,463 | $ | 76,280 | $ | 98,258 | ||||||
| Earnings per share | ||||||||||||
| Basic | $ | 2.64 | $ | 1.48 | $ | 1.93 | ||||||
| Diluted | $ | 2.54 | $ | 1.42 | $ | 1.85 | ||||||
| Weighted-average common shares outstanding | ||||||||||||
| Basic | 51,667 | 51,506 | 50,955 | |||||||||
| Diluted | 53,635 | 53,624 | 53,204 | |||||||||
| Dividend declared per share | $ | 0.30 | $ | 0.30 | $ | 0.20 | ||||||
|
PennyMac Financial Services, Inc. 2Q25 EARNINGS REPORT July 2025 |
|
This presentation contains forward-looking statements within the meaning of Section 21E of the Securities Exchange Act of 1934, as amended, regarding management’s beliefs, estimates, projections and assumptions with respect to, among other things, our financial results, future operations, business plans and investment strategies, as well as industry and market conditions, all of which are subject to change. Words like “believe,” “expect,” “anticipate,” “promise,” “project,” “plan,” and other expressions or words of similar meanings, as well as future or conditional verbs such as “will,” “would,” “should,” “could,” or “may” are generally intended to identify forward-looking statements. Actual results and operations for any future period may vary materially from those projected herein and from past results discussed herein. These forward-looking statements include, but are not limited to, statements regarding future changes in interest rates, prepayment rates and the housing market; future loan origination, servicing and production, including future production, operating and hedge expenses; future loan delinquencies, defaults and forbearances; future earnings and return on equity as well as other business and financial expectations. Factors which could cause actual results to differ materially from historical results or those anticipated include, but are not limited to: interest rate changes; real estate value changes, housing prices and housing sales; changes in macroeconomic, consumer and real estate market conditions; compliance with changing federal, state and local laws and regulations applicable to the highly regulated industry in which we operate; lawsuits or governmental actions that may result from any noncompliance with the laws and regulations applicable to our business; the mortgage lending and servicing-related regulations promulgated by federal and state regulators and the enforcement of these regulations; the licensing and operational requirements of states and other jurisdictions applicable to our business, to which our bank competitors are not subject; difficulties inherent in adjusting the size of our operations to reflect changes in business levels; purchase opportunities for mortgage servicing rights; our substantial amount of indebtedness; increases in loan delinquencies, defaults and forbearances; foreclosure delays and changes in foreclosure practices; our dependence on U.S. government-sponsored entities and changes in their current roles or their guarantees or guidelines; our reliance on PennyMac Mortgage Investment Trust (NYSE: PMT) as a significant contributor to our mortgage banking business; maintaining sufficient capital and liquidity and compliance with financial covenants; our obligation to indemnify third-party purchasers or repurchase loans if loans that we originate, acquire, service or assist in the fulfillment of, fail to meet certain criteria; our obligation to indemnify PMT if our services fail to meet certain criteria or characteristics or under other circumstances; investment management and incentive fees; the accuracy or changes in the estimates we make about uncertainties, contingencies and asset and liability valuations; conflicts of interest in allocating our services and investment opportunities among us and our advised entity; our ability to mitigate cybersecurity risks, cyber incidents and technology disruptions; the development of artificial intelligence; the effect of public opinion on our reputation; our exposure to risks of loss and disruptions in operations resulting from severe weather events, man-made or other natural conditions, including climate change and pandemics; our ability to effectively identify, manage and hedge our credit, interest rate, prepayment, liquidity and climate risks; expanding or creating new business activities or strategies; our ability to detect misconduct and fraud; our ability to pay dividends to our stockholders; and our organizational structure and certain requirements in our charter documents. You should not place undue reliance on any forward-looking statement and should consider all of the uncertainties and risks described above, as well as those more fully discussed in reports and other documents filed by the Company with the Securities and Exchange Commission from time to time. The Company undertakes no obligation to publicly update or revise any forward-looking statements or any other information contained herein, and the statements made in this press release are current as of the date of this release only. This presentation contains financial information calculated other than in accordance with U.S. generally accepted accounting principles (“GAAP”), such as pretax income excluding valuation-related items and operating net income that provide a meaningful perspective on the Company’s business results since the Company utilizes this information to evaluate and manage the business. Non-GAAP disclosures have limitations as an analytical tool and should not be viewed as a substitute for financial information determined in accordance with GAAP. 2 FORWARD-LOOKING STATEMENTS |
|
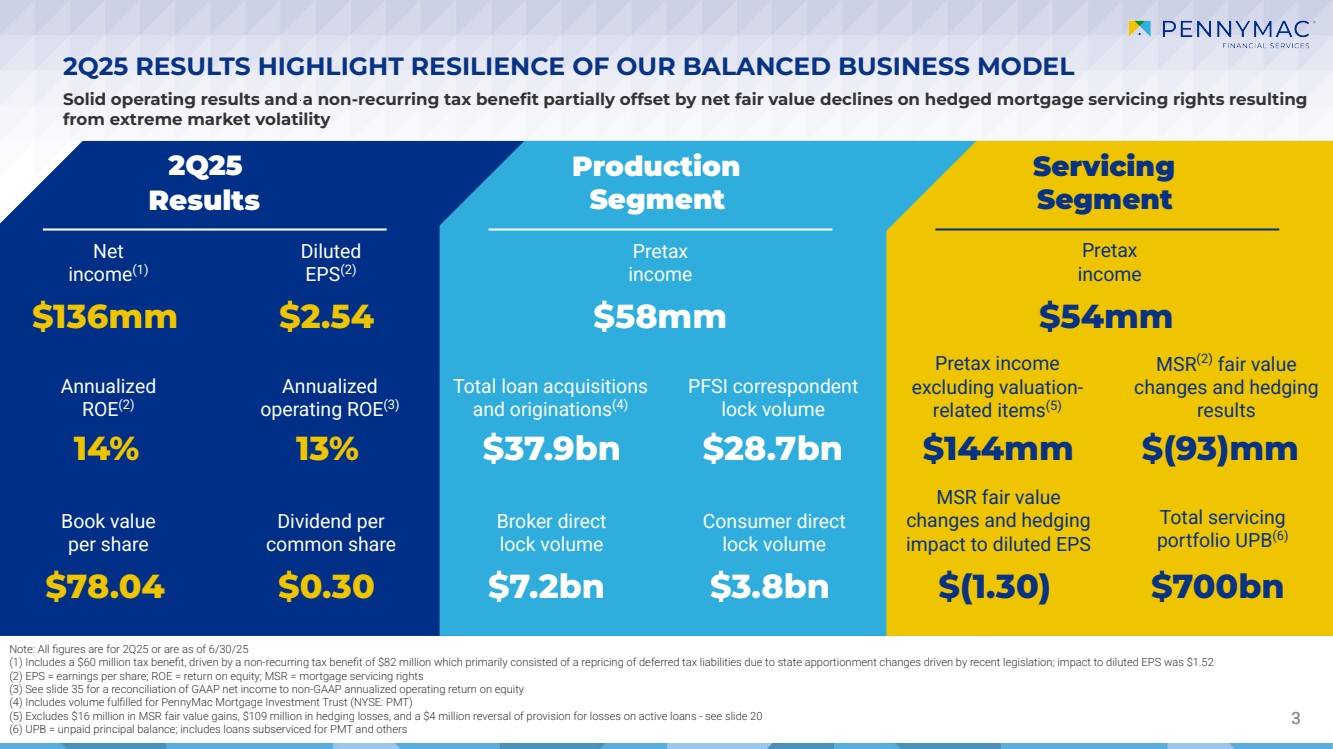
3 2Q25 Results Solid operating results and a non-recurring tax benefit partially offset by net fair value declines on hedged mortgage servicing rights resulting from extreme market volatility Production Segment Servicing Segment 2Q25 RESULTS HIGHLIGHT RESILIENCE OF OUR BALANCED BUSINESS MODEL Note: All figures are for 2Q25 or are as of 6/30/25 (1) Includes a $60 million tax benefit, driven by a non-recurring tax benefit of $82 million which primarily consisted of a repricing of deferred tax liabilities due to state apportionment changes driven by recent legislation; impact to diluted EPS was $1.52 (2) EPS = earnings per share; ROE = return on equity; MSR = mortgage servicing rights (3) See slide 35 for a reconciliation of GAAP net income to non-GAAP annualized operating return on equity (4) Includes volume fulfilled for PennyMac Mortgage Investment Trust (NYSE: PMT) (5) Excludes $16 million in MSR fair value gains, $109 million in hedging losses, and a $4 million reversal of provision for losses on active loans - see slide 20 (6) UPB = unpaid principal balance; includes loans subserviced for PMT and others Net income(1) Diluted EPS(2) Annualized ROE(2) Annualized operating ROE(3) Book value per share Dividend per common share Pretax income Total loan acquisitions and originations(4) PFSI correspondent lock volume Broker direct lock volume Consumer direct lock volume Pretax income Pretax income excluding valuation-related items(5) MSR(2) fair value changes and hedging results MSR fair value changes and hedging impact to diluted EPS Total servicing portfolio UPB(6) $136mm $2.54 14% 13% $78.04 $0.30 $37.9bn $28.7bn $7.2bn $3.8bn $58mm $54mm $144mm $(93)mm $(1.30) $700bn |
|
2Q25 STRATEGIC UPDATE |
|
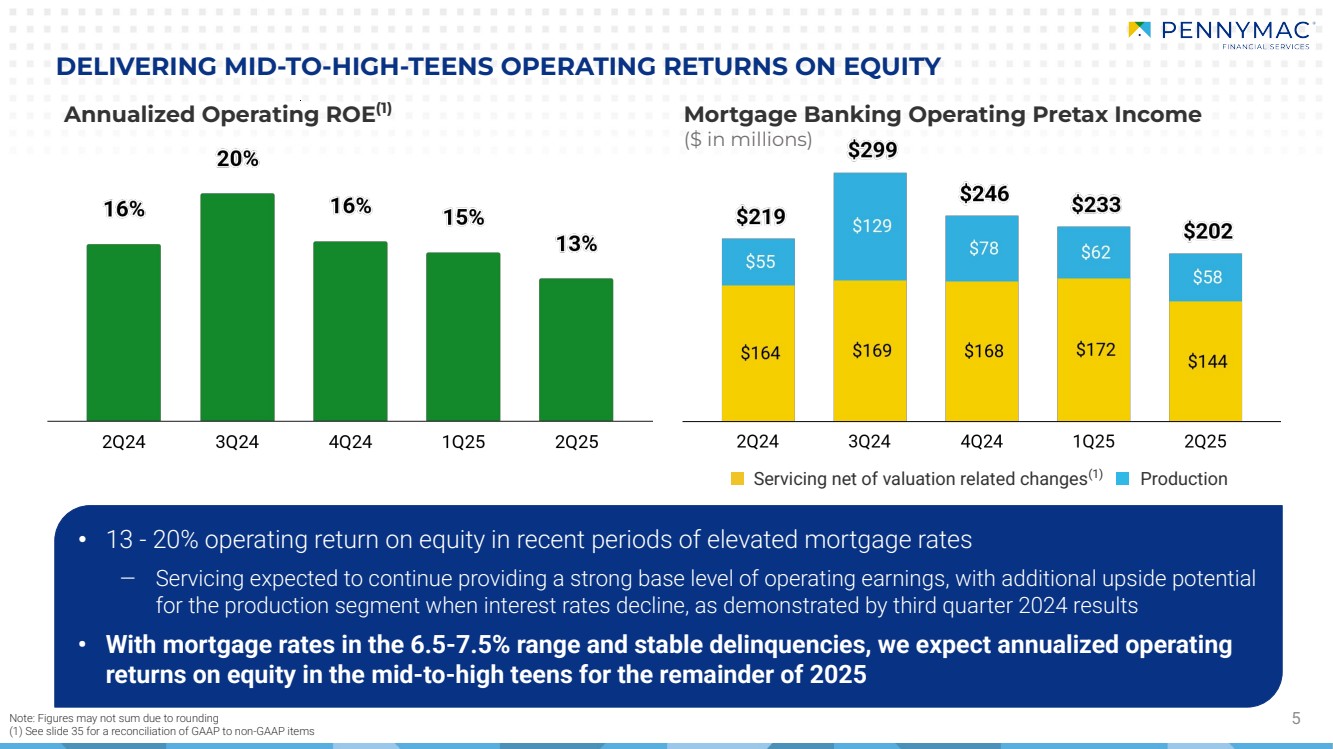
Mortgage Banking Operating Pretax Income ($ in millions) Production • 13 - 20% operating return on equity in recent periods of elevated mortgage rates ‒ Servicing expected to continue providing a strong base level of operating earnings, with additional upside potential for the production segment when interest rates decline, as demonstrated by third quarter 2024 results • With mortgage rates in the 6.5-7.5% range and stable delinquencies, we expect annualized operating returns on equity in the mid-to-high teens for the remainder of 2025 5 DELIVERING MID-TO-HIGH-TEENS OPERATING RETURNS ON EQUITY Annualized Operating ROE(1) Note: Figures may not sum due to rounding (1) See slide 35 for a reconciliation of GAAP to non-GAAP items Servicing net of valuation related changes(1) |
|
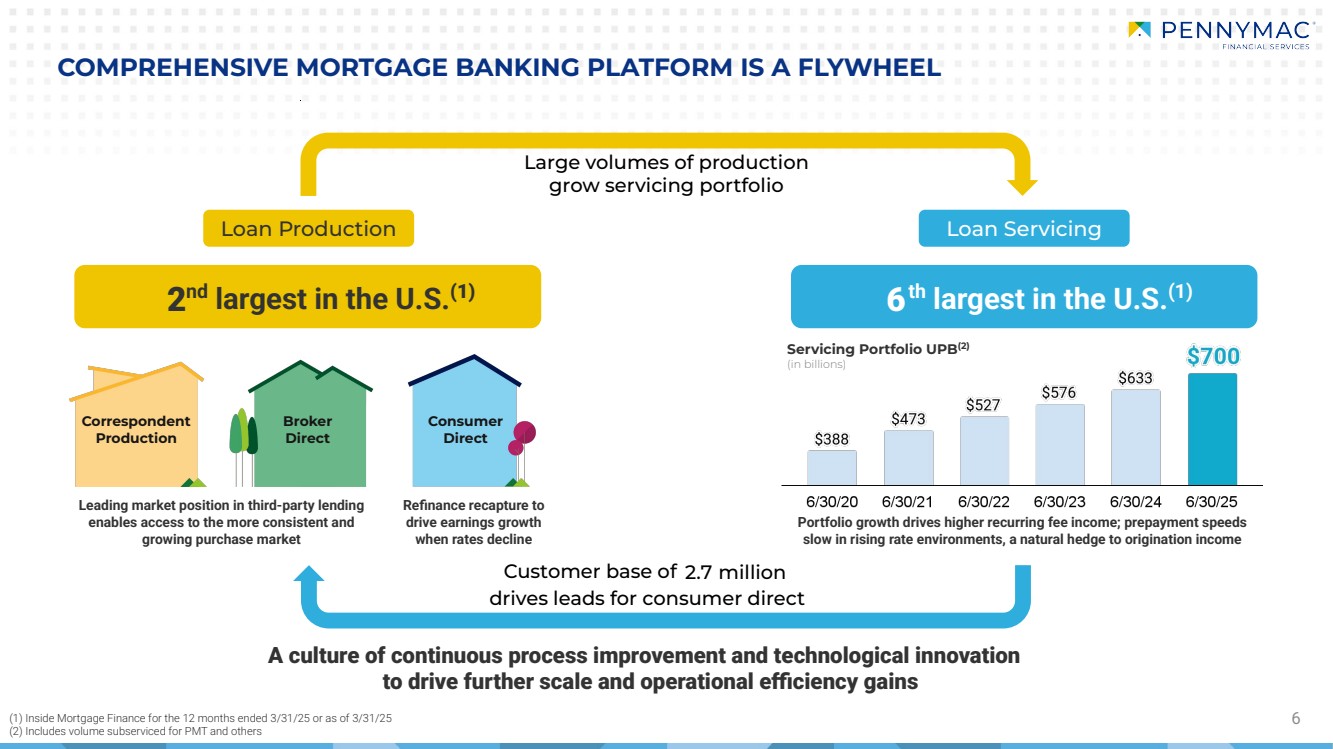
Portfolio growth drives higher recurring fee income; prepayment speeds slow in rising rate environments, a natural hedge to origination income Refinance recapture to drive earnings growth when rates decline 6 COMPREHENSIVE MORTGAGE BANKING PLATFORM IS A FLYWHEEL Large volumes of production grow servicing portfolio nd largest in the U.S.(1) th largest in the U.S.(1) A culture of continuous process improvement and technological innovation to drive further scale and operational efficiency gains 2 6 Customer base of 2.7 million drives leads for consumer direct Correspondent Production Broker Direct Consumer Direct Leading market position in third-party lending enables access to the more consistent and growing purchase market Servicing Portfolio UPB(2) (in billions) (1) Inside Mortgage Finance for the 12 months ended 3/31/25 or as of 3/31/25 (2) Includes volume subserviced for PMT and others Loan Production Loan Servicing |
|
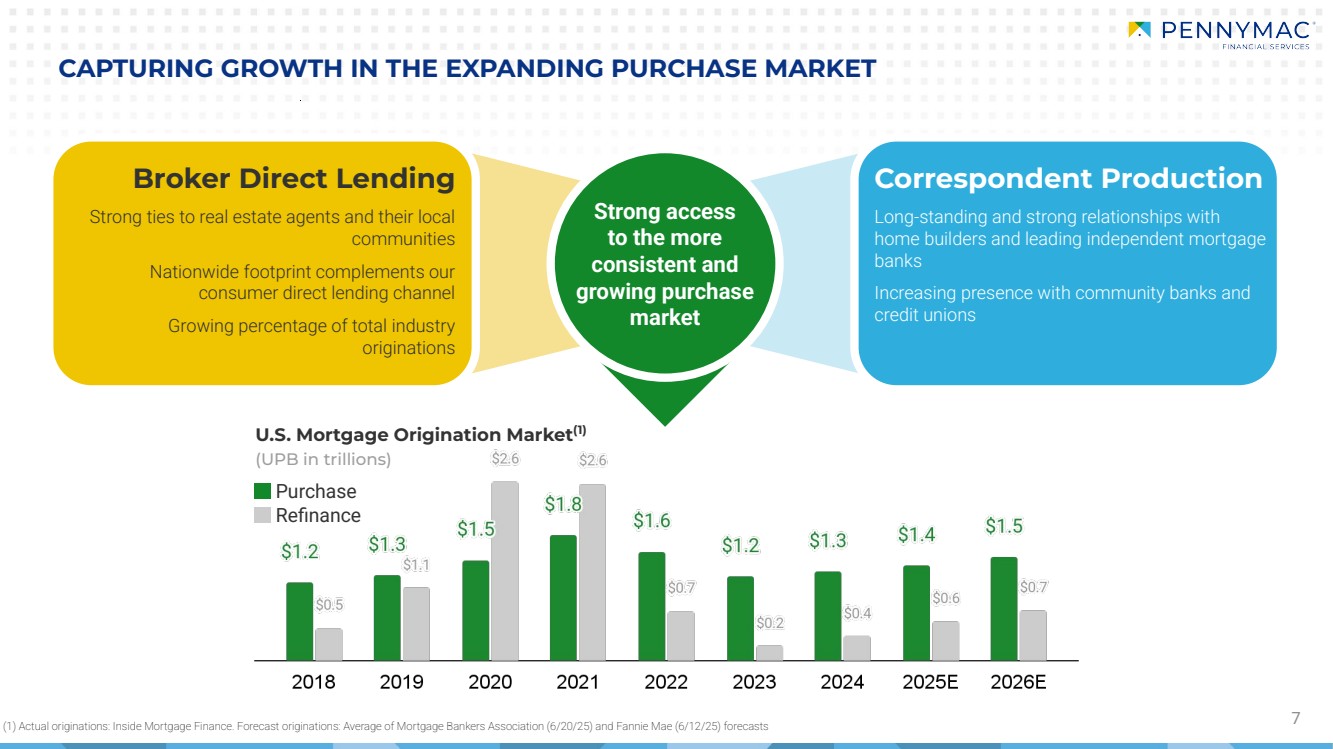
7 Correspondent Production Long-standing and strong relationships with home builders and leading independent mortgage banks Increasing presence with community banks and credit unions Broker Direct Lending Strong ties to real estate agents and their local communities Nationwide footprint complements our consumer direct lending channel Growing percentage of total industry originations Strong access to the more consistent and growing purchase market U.S. Mortgage Origination Market(1) (UPB in trillions) Purchase Refinance (1) Actual originations: Inside Mortgage Finance. Forecast originations: Average of Mortgage Bankers Association (6/20/25) and Fannie Mae (6/12/25) forecasts CAPTURING GROWTH IN THE EXPANDING PURCHASE MARKET |
|
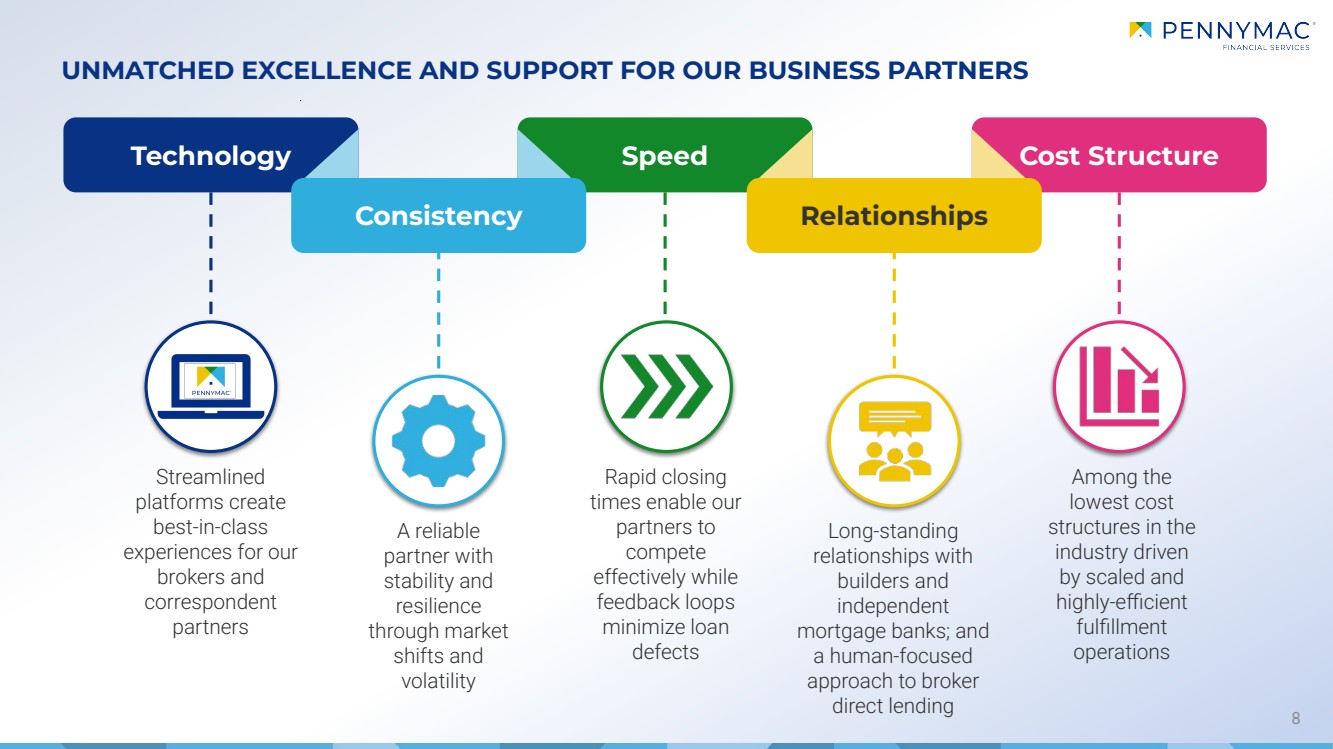
Rapid closing times enable our partners to compete effectively while feedback loops minimize loan defects A reliable partner with stability and resilience through market shifts and volatility Technology Speed Cost Structure 8 Consistency Relationships Streamlined platforms create best-in-class experiences for our brokers and correspondent partners Long-standing relationships with builders and independent mortgage banks; and a human-focused approach to broker direct lending Among the lowest cost structures in the industry driven by scaled and highly-efficient fulfillment operations UNMATCHED EXCELLENCE AND SUPPORT FOR OUR BUSINESS PARTNERS |
|
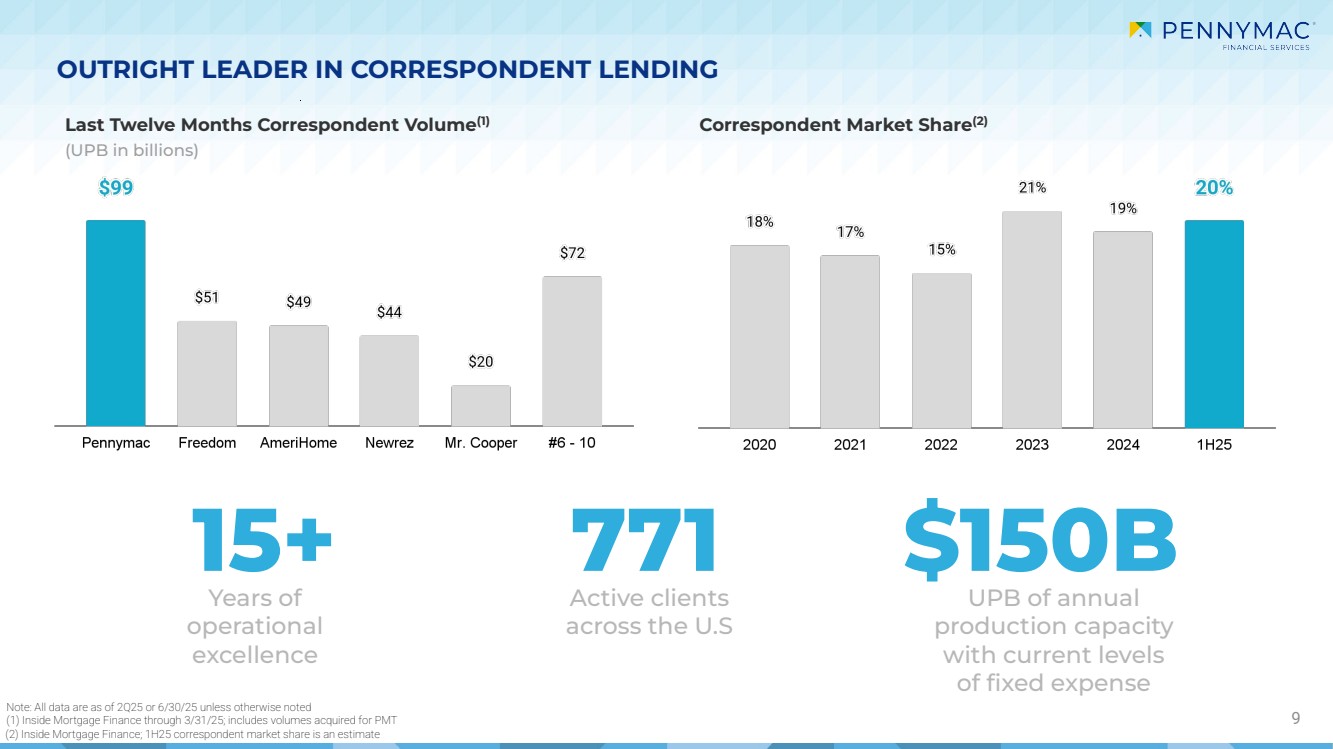
9 Last Twelve Months Correspondent Volume(1) (UPB in billions) Note: All data are as of 2Q25 or 6/30/25 unless otherwise noted (1) Inside Mortgage Finance through 3/31/25; includes volumes acquired for PMT (2) Inside Mortgage Finance; 1H25 correspondent market share is an estimate Correspondent Market Share(2) 15+ 771 $150B Years of operational excellence Active clients across the U.S UPB of annual production capacity with current levels of fixed expense OUTRIGHT LEADER IN CORRESPONDENT LENDING |
|
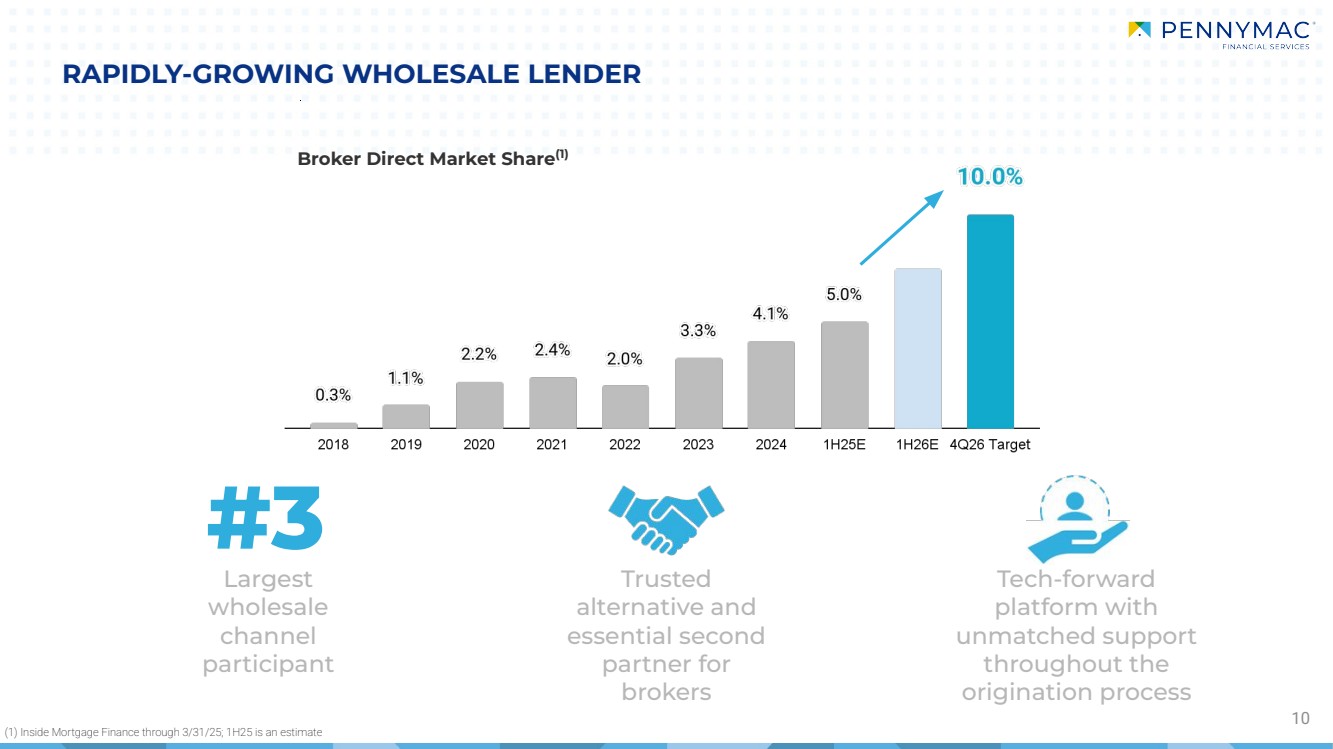
10 RAPIDLY-GROWING WHOLESALE LENDER Broker Direct Market Share(1) #3 Largest wholesale channel participant Trusted alternative and essential second partner for brokers Tech-forward platform with unmatched support throughout the origination process (1) Inside Mortgage Finance through 3/31/25; 1H25 is an estimate |
|
(1) ICE Mortgage Monitor Report - June 2025 11 INTENSE FOCUS ON EXECUTION IN CONSUMER DIRECT PENNYMAC CONSUMER DIRECT Portfolio & Ex Portfolio New Customers Robust data analytics to identify potential opportunities and products to help borrowers meet their needs Refinance recapture rates 2x the industry average(1) offsets lower MSR fair values as rates decline Leveraging our Olympics partnership to increase visibility and recognition Brand marketing to significantly expand our addressable market Serving our large network of more than 5 million current and past homeowners who know and trust Pennymac Targeted, model-driven acquisition campaigns to increase new customer acquisition |
|
12 EARNINGS POTENTIAL FROM CONSUMER DIRECT RECAPTURE OPPORTUNITY Gov’t. Loan Refinance Recapture Rates Conv. Loans Refinance Recapture Rates > 7.00% 6.50 - 6.99% 5.50 - 5.99% 6.00 - 6.49% 5.00 - 5.49% > 7.00% 6.50 - 6.99% 6.00 - 6.49% 5.50 - 5.99% 5.00 - 5.49% • Investments in technology and process innovation have driven meaningful improvements in recapture rates • Large opportunity when rates decline as borrowers with loans originated at higher note rates seek to refinance • Introduction of closed-end second liens in 2022 for customers to access home equity while retaining their low-rate, first lien mortgage Note: Figures may not sum due to rounding (1) Includes first-lien serviced for PFSI’s own account as well as those subserviced for PMT (2) Numerator = UPB of new consumer direct first lien refinance originations for existing portfolio customers; denominator = UPB of payoffs with no transfer of title or MLS listing identified (3) Numerator = UPB of new consumer direct first lien refinance originations for existing portfolio customers + UPB of new consumer direct closed-end second lien (CES) originations from portfolio customers + UPB of retained first-liens for associated CES originations; denominator = UPB of payoffs with no transfer of title or MLS listing identified + UPB of retained first-liens for associated CES originations Refinance recapture(2) Refinance recapture (inc. CES)(3) Refinance recapture(2) Refinance recapture (inc. CES)(3) Gov’t. Loans: Note Rates >5%(1) (UPB in billions) Conv. Loans: Note Rates >5%(1) (UPB in billions) 6/30/25 6/30/25 |
|
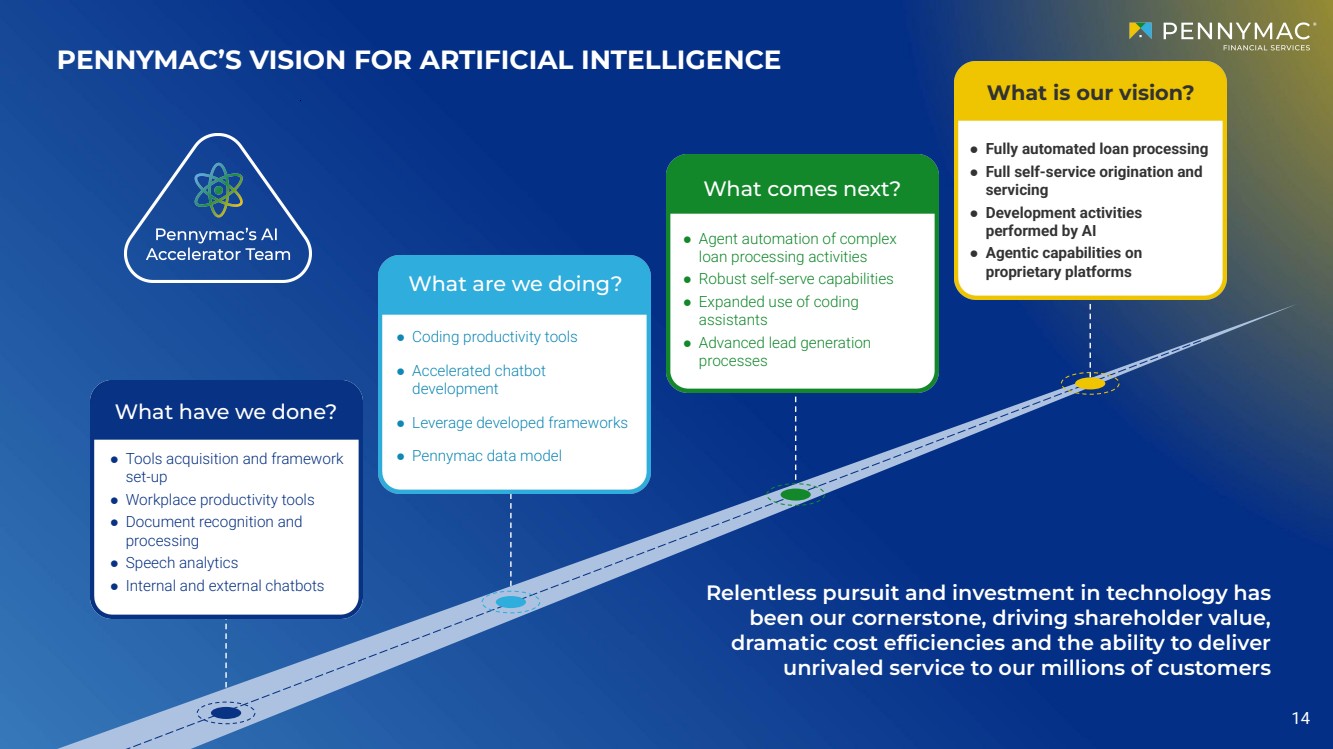
Rapidly advancing AI capabilities while making prudent investments and managing risk that will support our ability to: BUILDING MOMENTUM IN THE DEPLOYMENT OF ARTIFICIAL INTELLIGENCE Improve the Customer Experience Generate Additional Revenues Continue to Reduce Expenses Pennymac’s AI Accelerator Team We have implemented or are developing 35+ AI tools and applications with a projected economic benefit of approximately $25 million annually, while meaningfully improving our customer experience, which is expected to unlock significant revenue growth ● Top AI engineers and experts dedicated to advancing the implementation of AI across our businesses ● Key objective: increase the speed of delivery and adoption of AI productivity tools and applications while ensuring proper governance within our operating model 1 2 3 13 |
|
Relentless pursuit and investment in technology has been our cornerstone, driving shareholder value, dramatic cost efficiencies and the ability to deliver unrivaled service to our millions of customers PENNYMAC’S VISION FOR ARTIFICIAL INTELLIGENCE What have we done? What are we doing? What comes next? What is our vision? ● Tools acquisition and framework set-up ● Workplace productivity tools ● Document recognition and processing ● Speech analytics ● Internal and external chatbots ● Coding productivity tools ● Accelerated chatbot development ● Leverage developed frameworks ● Pennymac data model ● Agent automation of complex loan processing activities ● Robust self-serve capabilities ● Expanded use of coding assistants ● Advanced lead generation processes ● Fully automated loan processing ● Full self-service origination and servicing ● Development activities performed by AI ● Agentic capabilities on proprietary platforms 14 |
|
KEY OPERATING METRICS & OTHER FINANCIAL SCHEDULES |
|
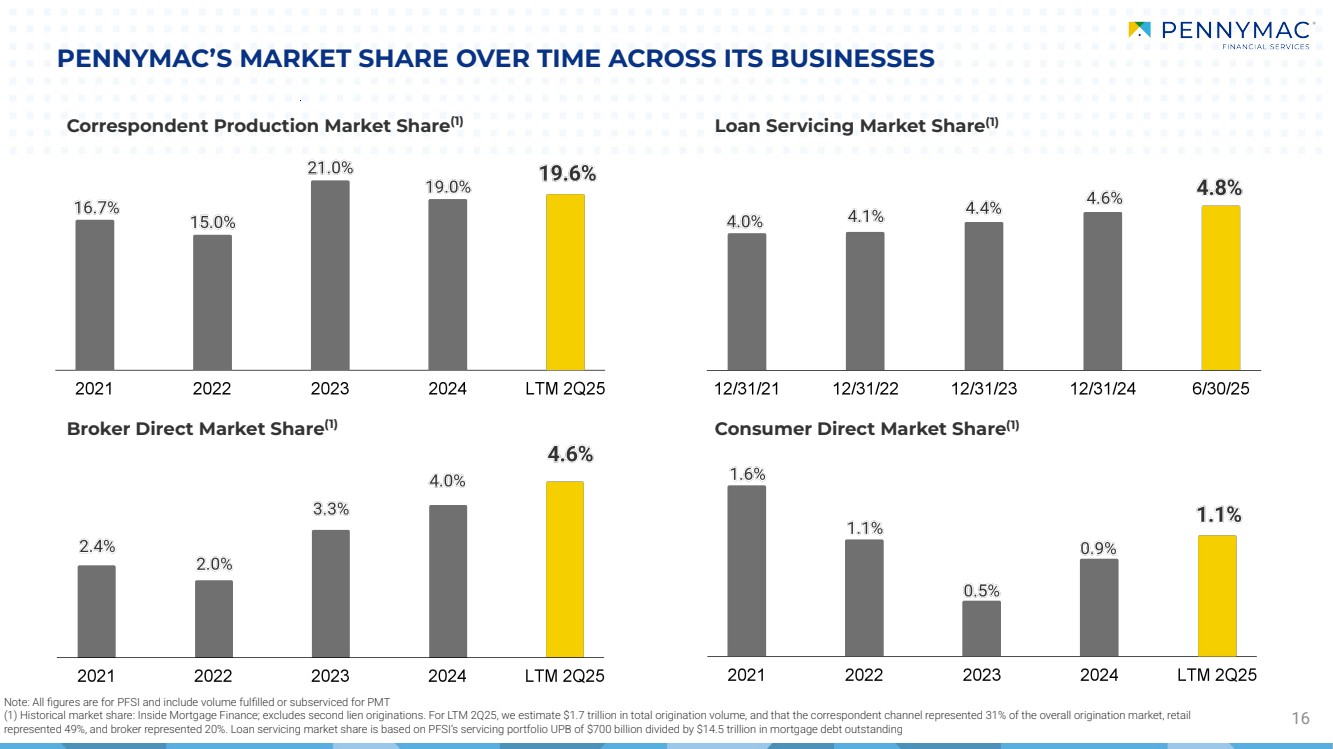
PENNYMAC’S MARKET SHARE OVER TIME ACROSS ITS BUSINESSES 16 Loan Servicing Market Share Correspondent Production Market Share(1) (1) Broker Direct Market Share(1) Consumer Direct Market Share(1) Note: All figures are for PFSI and include volume fulfilled or subserviced for PMT (1) Historical market share: Inside Mortgage Finance; excludes second lien originations. For LTM 2Q25, we estimate $1.7 trillion in total origination volume, and that the correspondent channel represented 31% of the overall origination market, retail represented 49%, and broker represented 20%. Loan servicing market share is based on PFSI’s servicing portfolio UPB of $700 billion divided by $14.5 trillion in mortgage debt outstanding |
|
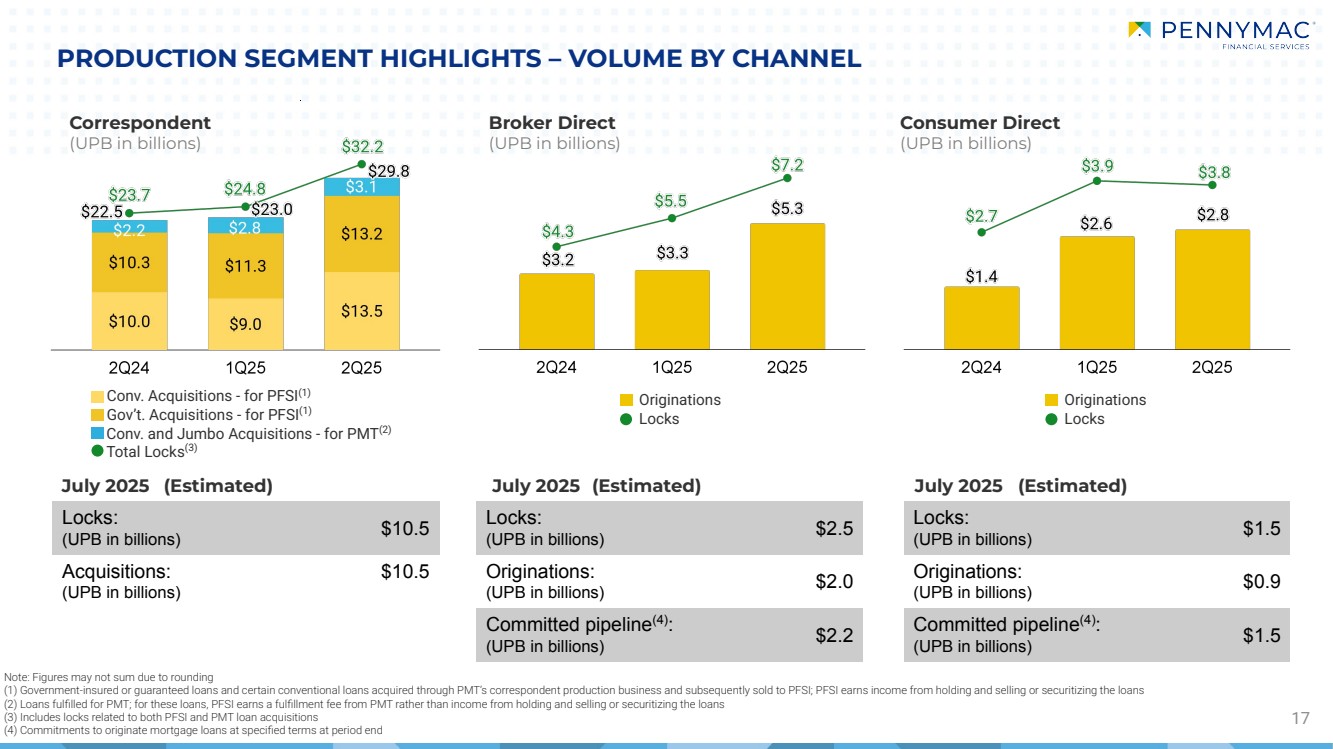
17 PRODUCTION SEGMENT HIGHLIGHTS – VOLUME BY CHANNEL Broker Direct (UPB in billions) Consumer Direct (UPB in billions) Note: Figures may not sum due to rounding (1) Government-insured or guaranteed loans and certain conventional loans acquired through PMT’s correspondent production business and subsequently sold to PFSI; PFSI earns income from holding and selling or securitizing the loans (2) Loans fulfilled for PMT; for these loans, PFSI earns a fulfillment fee from PMT rather than income from holding and selling or securitizing the loans (3) Includes locks related to both PFSI and PMT loan acquisitions (4) Commitments to originate mortgage loans at specified terms at period end Correspondent (UPB in billions) Conv. and Jumbo Acquisitions - for PMT(2) Total Locks(3) Originations Locks Locks: (UPB in billions) $10.5 Acquisitions: (UPB in billions) $10.5 Locks: (UPB in billions) $2.5 Originations: (UPB in billions) $2.0 Committed pipeline(4): (UPB in billions) $2.2 Locks: (UPB in billions) $1.5 Originations: (UPB in billions) $0.9 Committed pipeline(4): (UPB in billions) $1.5 Originations Locks Conv. Acquisitions - for PFSI(1) Gov’t. Acquisitions - for PFSI(1) July 2025 (Estimated) July 2025 (Estimated) July 2025 (Estimated) |
|
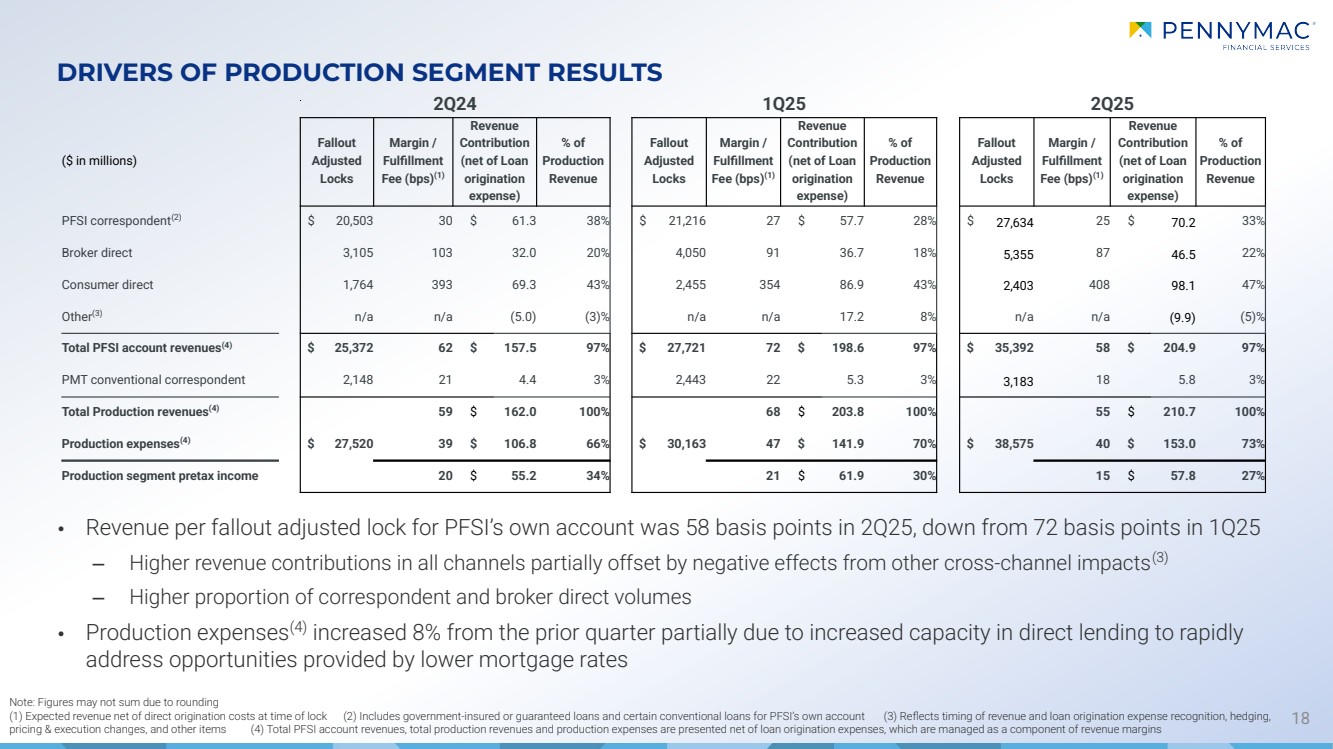
• Revenue per fallout adjusted lock for PFSI’s own account was 58 basis points in 2Q25, down from 72 basis points in 1Q25 ‒ Higher revenue contributions in all channels partially offset by negative effects from other cross-channel impacts(3) ‒ Higher proportion of correspondent and broker direct volumes • Production expenses(4) increased 8% from the prior quarter partially due to increased capacity in direct lending to rapidly address opportunities provided by lower mortgage rates 18 DRIVERS OF PRODUCTION SEGMENT RESULTS 2Q24 1Q25 2Q25 ($ in millions) Fallout Adjusted Locks Margin / Fulfillment Fee (bps)(1) Revenue Contribution (net of Loan origination expense) % of Production Revenue Fallout Adjusted Locks Margin / Fulfillment Fee (bps)(1) Revenue Contribution (net of Loan origination expense) % of Production Revenue Fallout Adjusted Locks Margin / Fulfillment Fee (bps)(1) Revenue Contribution (net of Loan origination expense) % of Production Revenue PFSI correspondent(2) $ 20,503 30 $ 61.3 38% $ 21,216 27 $ 57.7 28% $ 27,634 25 $ 70.2 33% Broker direct 3,105 103 32.0 20% 4,050 91 36.7 18% 5,355 87 46.5 22% Consumer direct 1,764 393 69.3 43% 2,455 354 86.9 43% 2,403 408 98.1 47% Other(3) n/a n/a (5.0) (3)% n/a n/a 17.2 8% n/a n/a (9.9) (5)% Total PFSI account revenues(4) $ 25,372 62 $ 157.5 97% $ 27,721 72 $ 198.6 97% $ 35,392 58 $ 204.9 97% PMT conventional correspondent 2,148 21 4.4 3% 2,443 22 5.3 3% 3,183 18 5.8 3% Total Production revenues(4) 59 $ 162.0 100% 68 $ 203.8 100% 55 $ 210.7 100% Production expenses(4) $ 27,520 39 $ 106.8 66% $ 30,163 47 $ 141.9 70% $ 38,575 40 $ 153.0 73% Production segment pretax income 20 $ 55.2 34% 21 $ 61.9 30% 15 $ 57.8 27% Note: Figures may not sum due to rounding (1) Expected revenue net of direct origination costs at time of lock (2) Includes government-insured or guaranteed loans and certain conventional loans for PFSI’s own account (3) Reflects timing of revenue and loan origination expense recognition, hedging, pricing & execution changes, and other items (4) Total PFSI account revenues, total production revenues and production expenses are presented net of loan origination expenses, which are managed as a component of revenue margins |
|
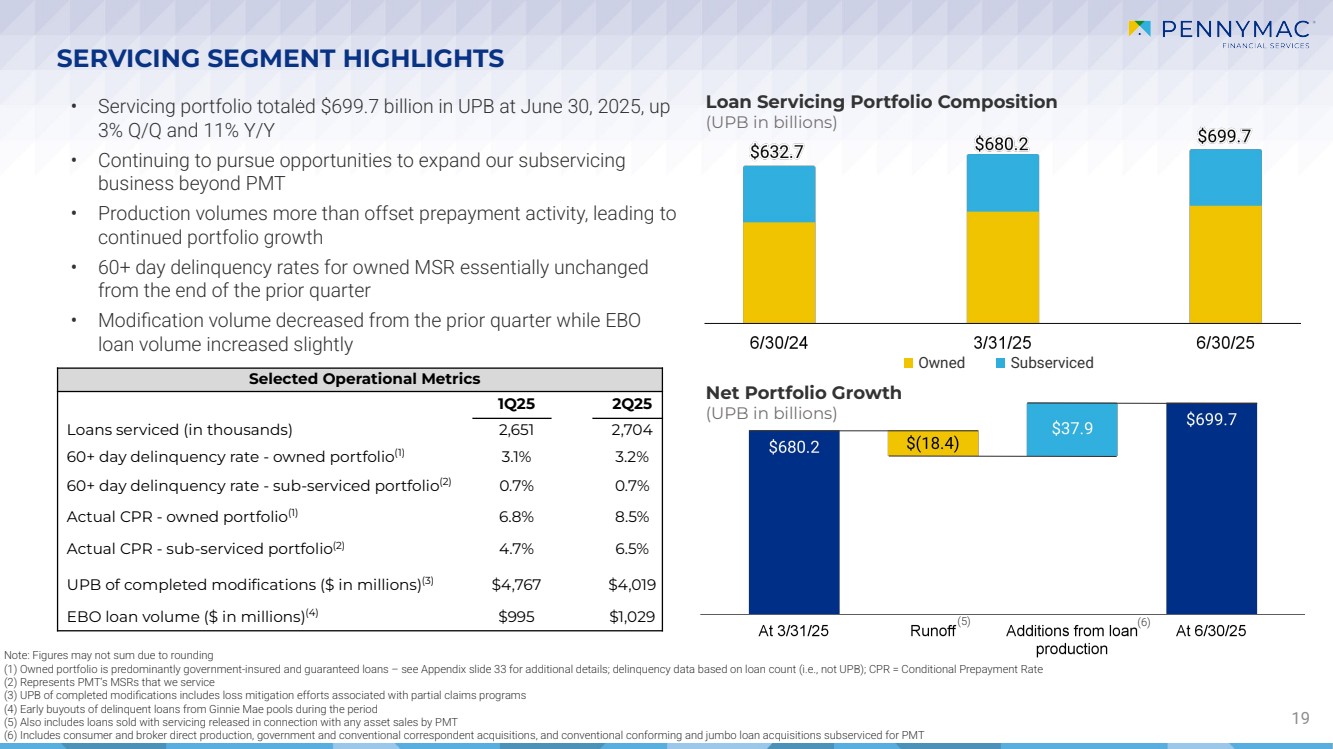
Selected Operational Metrics 1Q25 2Q25 Loans serviced (in thousands) 2,651 2,704 60+ day delinquency rate - owned portfolio(1) 3.1% 3.2% 60+ day delinquency rate - sub-serviced portfolio(2) 0.7% 0.7% Actual CPR - owned portfolio(1) 6.8% 8.5% Actual CPR - sub-serviced portfolio(2) 4.7% 6.5% UPB of completed modifications ($ in millions)(3) $4,767 $4,019 EBO loan volume ($ in millions)(4) $995 $1,029 Owned Subserviced SERVICING SEGMENT HIGHLIGHTS 19 Loan Servicing Portfolio Composition (UPB in billions) Net Portfolio Growth (UPB in billions) Note: Figures may not sum due to rounding (1) Owned portfolio is predominantly government-insured and guaranteed loans – see Appendix slide 33 for additional details; delinquency data based on loan count (i.e., not UPB); CPR = Conditional Prepayment Rate (2) Represents PMT’s MSRs that we service (3) UPB of completed modifications includes loss mitigation efforts associated with partial claims programs (4) Early buyouts of delinquent loans from Ginnie Mae pools during the period (5) Also includes loans sold with servicing released in connection with any asset sales by PMT (6) Includes consumer and broker direct production, government and conventional correspondent acquisitions, and conventional conforming and jumbo loan acquisitions subserviced for PMT (5) • Servicing portfolio totaled $699.7 billion in UPB at June 30, 2025, up 3% Q/Q and 11% Y/Y • Continuing to pursue opportunities to expand our subservicing business beyond PMT • Production volumes more than offset prepayment activity, leading to continued portfolio growth • 60+ day delinquency rates for owned MSR essentially unchanged from the end of the prior quarter • Modification volume decreased from the prior quarter while EBO loan volume increased slightly (6) |
|
SERVICING PROFITABILITY EXCLUDING VALUATION-RELATED CHANGES 20 Note: Figures may not sum due to rounding (1) Of average portfolio UPB, annualized (2) Comprised of net gains on mortgage loans held for sale at fair value and interest income related to EBO loans (3) Consists of interest shortfall and recording and release fees (4) Changes in fair value do not include realization of MSR cash flows (5) Considered in the assessment of MSR fair value changes 2Q24 1Q25 2Q25 $ in millions basis points⁽¹⁾ $ in millions basis points⁽¹⁾ $ in millions basis points⁽¹⁾ Loan servicing fees $ 440.7 28.2 $ 488.5 29.0 $ 506.7 29.4 Earnings on custodial balances and deposits and other income 110.6 7.1 102.1 6.1 115.9 6.7 Realization of MSR cash flows (200.7) (12.9) (225.5) (13.4) (263.1) (15.3) EBO loan-related revenue⁽²⁾ 26.8 1.7 36.0 2.1 33.0 1.9 Servicing expenses: Operating expenses (75.8) (4.9) (80.8) (4.8) (79.6) (4.6) Payoff-related expense⁽³⁾ (10.4) (0.7) (13.3) (0.8) (17.2) (1.0) Losses and provisions for defaulted loans (13.3) (0.9) (15.4) (0.9) (21.5) (1.2) EBO loan transaction-related expense (0.6) (0.0) (0.9) (0.1) (0.8) (0.0) Interest expense (113.6) (7.3) (119.2) (7.1) (129.6) (7.5) Non-GAAP: Pretax income excluding valuation-related changes $ 163.6 10.5 $ 171.5 10.2 $ 143.7 8.3 Valuation-related changes MSR fair value⁽⁴⁾ 99.4 (205.5) 15.9 Hedging derivatives (losses) gains (171.8) 106.8 (109.1) Reversal of (provision for) losses on active loans⁽⁵⁾ (0.6) 3.2 3.6 GAAP: Servicing segment pretax income $ 90.7 $ 76.0 $ 54.2 Average servicing portfolio UPB $ 624,746 $ 672,965 $ 689,612 • Loan servicing fees increased from the prior quarter due to growth in the MSR portfolio; operating expenses were down slightly • Earnings on custodial balances and deposits increased from the prior quarter due to higher average balances – Custodial funds managed for PFSI’s owned servicing portfolio averaged $7.5 billion in 2Q25, up from $6.2 billion in 1Q25 • Realization of cash flows was up from the prior quarter due to growth in the MSR portfolio and higher realized and projected prepayment activity |
|
• Pennymac’s per loan servicing expenses are among the lowest in the industry, despite a higher concentration of government loans, which are more difficult to service • Industry-leading customer service as evidenced by our multi-year servicing excellence awards from HUD, Fannie Mae and Freddie Mac • Lower unit costs due to the implementation of SSE, our proprietary servicing system, in 2019 21 Operating Expenses (annualized bps of average servicing portfolio UPB) Direct Servicing Expense(1) (annual $ cost per loan) TECHNOLOGY DRIVING EFFICIENCIES AND LOWER EXPENSES IN SERVICING • Culture of continuous process improvement • Continuing to increase efficiency through the use of emerging technologies, including capabilities of generative artificial intelligence • Increased scale and efficiency as the portfolio grows • Delinquencies remain moderated in the current market environment, further reducing operating expenses % Government Portfolio (1) MBA 2025 Servicing Operations Study (2024 data), Pennymac is included within Large IMBs |
|
• PFSI seeks to moderate the impact of interest rate changes on the fair value of its MSR asset through a comprehensive hedging strategy that also considers production-related income ‒ MSR hedging results and hedge costs negatively impacted due to extreme rate volatility in April ‒ Strategically adjusted our hedging practices for increased direct lending capacity; we currently expect lower costs and greater consistency of hedge performance in future periods ‒ Shape of the yield curve, volatility, changes in mortgage basis and other factors can impact our realized hedge ratio 22 HEDGING APPROACH MODERATES THE VOLATILITY OF PFSI’S RESULTS MSR Valuation Changes and Offsets ($ in millions) MSR fair value change before realization of cash flows Hedging and related gains (losses) Production pretax income Attributed Performance MSR Hedge Net Rate Impacts $25.5 $(54.9) $(29.4) Hedge Costs - $(54.2) $(54.2) Other Assumption & Performance Impacts $(9.6) - $(9.6) Prepayment-related $0.6 - $0.6 Delinquency-related $(12.8) - $(12.8) Other $2.6 - $2.6 Total $15.9 $(109.1) $(93.2) |
|
• Targeted debt-to-equity ratio near 3.5x with fluctuations largely driven by the origination environment or other market opportunities • Targeted non-funding debt-to-equity ratio near 1.5x; may be modestly above at current interest rate levels MSR & Servicing Advance Financing PFSI’S STRONG BALANCE SHEET AND DIVERSE CAPITAL STRUCTURES 23 Low Debt-to-Equity (D/E) Ratio Diverse Financing Sources High Tangible Net Worth (TNW)(2)/Assets • High tangible net worth (TNW) / assets excluding loans eligible for repurchase • Unsecured senior notes provide low, fixed interest rates; first maturity in October 2029 • Issued $850 million of senior unsecured notes due May 2032 • Redeemed $650 million of unsecured senior notes due October 2025 and $500 million of GNMA MSR term notes due May 2027 • As of June 30, 2025 total liquidity including cash and amounts available to draw with collateral pledged was $4.2 billion Non-funding D/E(1) Total D/E TNW / Assets TNW / Assets ex. Loans eligible for repurchase Financing capacity across multiple banks Note: All figures are as of June 30, 2025 (1) Non-funding debt includes face value of unsecured senior notes and notes payable secured by MSR, in addition to the amount drawn on the variable funding note (2) Tangible net worth excludes capitalized software |
|
APPENDIX |
|
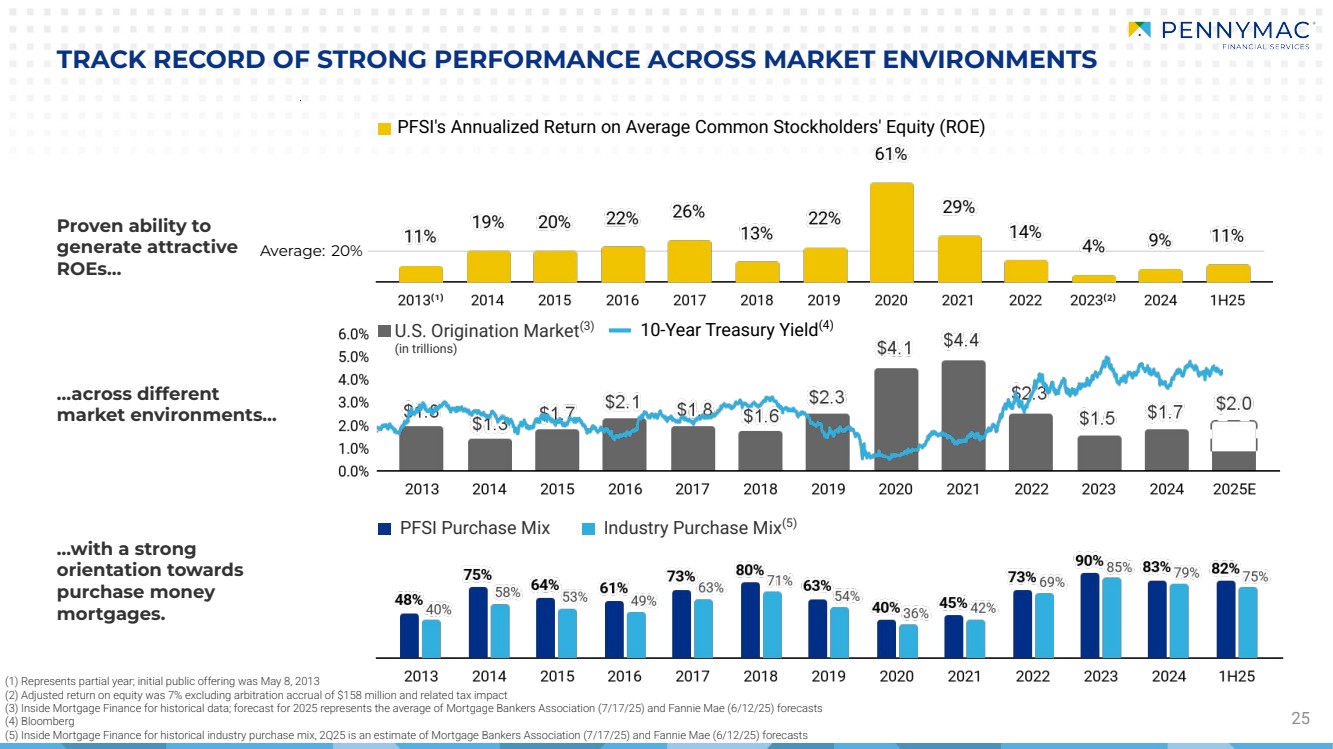
PFSI Purchase Mix Industry Purchase Mix(5) 25 TRACK RECORD OF STRONG PERFORMANCE ACROSS MARKET ENVIRONMENTS Proven ability to generate attractive ROEs… …across different market environments… …with a strong orientation towards purchase money mortgages. (1) Represents partial year; initial public offering was May 8, 2013 (2) Adjusted return on equity was 7% excluding arbitration accrual of $158 million and related tax impact (3) Inside Mortgage Finance for historical data; forecast for 2025 represents the average of Mortgage Bankers Association (7/17/25) and Fannie Mae (6/12/25) forecasts (4) Bloomberg (5) Inside Mortgage Finance for historical industry purchase mix, 2Q25 is an estimate of Mortgage Bankers Association (7/17/25) and Fannie Mae (6/12/25) forecasts Average: 20% U.S. Origination Market(3) (in trillions) PFSI's Annualized Return on Average Common Stockholders' Equity (ROE) 10-Year Treasury Yield(4) |
|
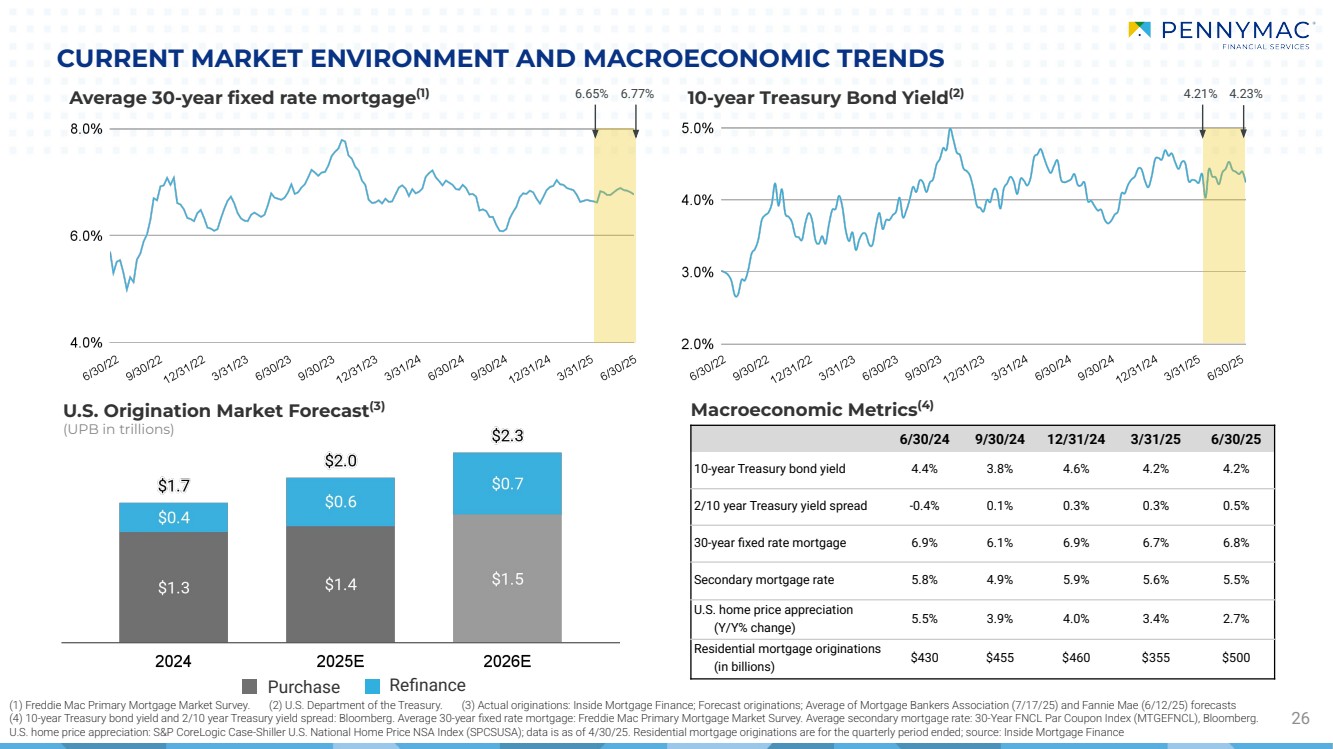
(1) Freddie Mac Primary Mortgage Market Survey. (2) U.S. Department of the Treasury. (3) Actual originations: Inside Mortgage Finance; Forecast originations; Average of Mortgage Bankers Association (7/17/25) and Fannie Mae (6/12/25) forecasts (4) 10-year Treasury bond yield and 2/10 year Treasury yield spread: Bloomberg. Average 30-year fixed rate mortgage: Freddie Mac Primary Mortgage Market Survey. Average secondary mortgage rate: 30-Year FNCL Par Coupon Index (MTGEFNCL), Bloomberg. U.S. home price appreciation: S&P CoreLogic Case-Shiller U.S. National Home Price NSA Index (SPCSUSA); data is as of 4/30/25. Residential mortgage originations are for the quarterly period ended; source: Inside Mortgage Finance CURRENT MARKET ENVIRONMENT AND MACROECONOMIC TRENDS 26 Average 30-year fixed rate mortgage(1) Macroeconomic Metrics(4) U.S. Origination Market Forecast(3) (UPB in trillions) 10-year Treasury Bond Yield(2) 6/30/24 9/30/24 12/31/24 3/31/25 6/30/25 10-year Treasury bond yield 4.4% 3.8% 4.6% 4.2% 4.2% 2/10 year Treasury yield spread -0.4% 0.1% 0.3% 0.3% 0.5% 30-year fixed rate mortgage 6.9% 6.1% 6.9% 6.7% 6.8% Secondary mortgage rate 5.8% 4.9% 5.9% 5.6% 5.5% U.S. home price appreciation (Y/Y% change) 5.5% 3.9% 4.0% 3.4% 2.7% Residential mortgage originations (in billions) $430 $455 $460 $355 $500 6.65% 6.77% 4.21% 4.23% Purchase Refinance |
|
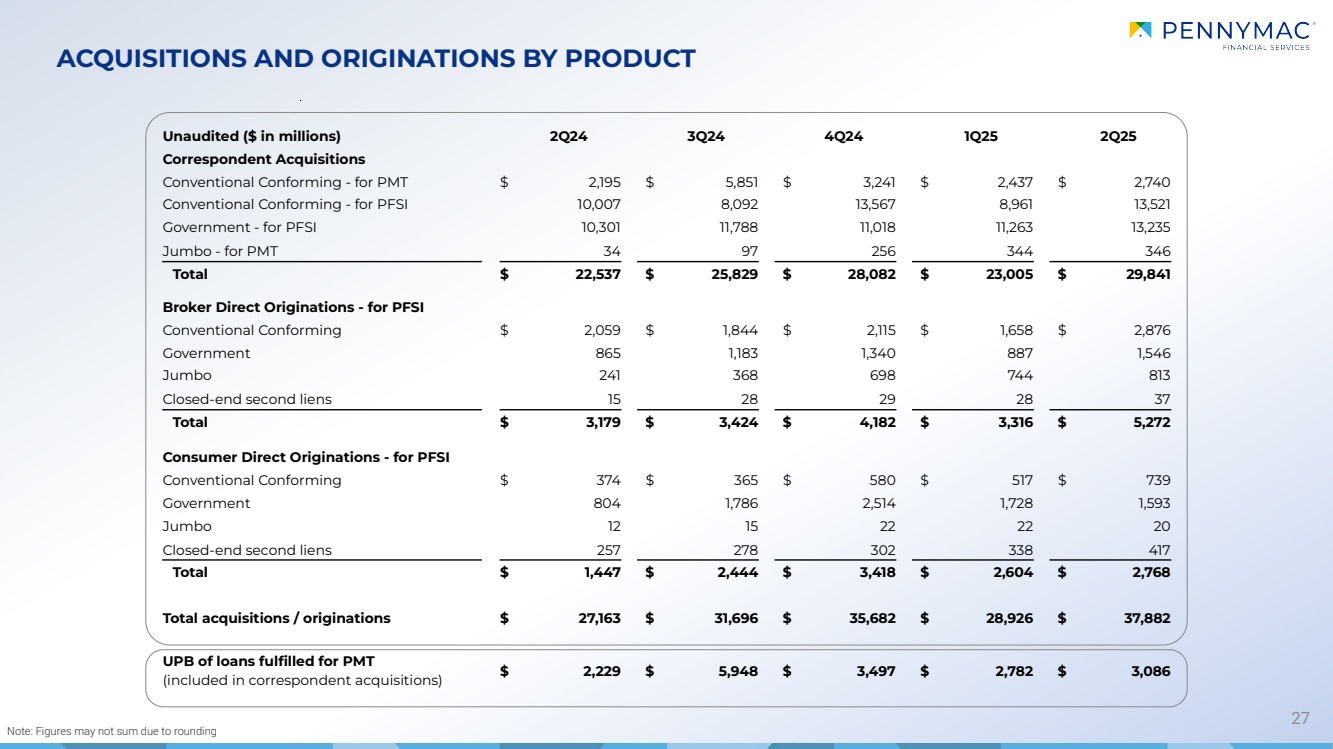
ACQUISITIONS AND ORIGINATIONS BY PRODUCT 27 Note: Figures may not sum due to rounding Unaudited ($ in millions) 2Q24 3Q24 4Q24 1Q25 2Q25 Correspondent Acquisitions Conventional Conforming - for PMT $ 2,195 $ 5,851 $ 3,241 $ 2,437 $ 2,740 Conventional Conforming - for PFSI 10,007 8,092 13,567 8,961 13,521 Government - for PFSI 10,301 11,788 11,018 11,263 13,235 Jumbo - for PMT 34 97 256 344 346 Total $ 22,537 $ 25,829 $ 28,082 $ 23,005 $ 29,841 Broker Direct Originations - for PFSI Conventional Conforming $ 2,059 $ 1,844 $ 2,115 $ 1,658 $ 2,876 Government 865 1,183 1,340 887 1,546 Jumbo 241 368 698 744 813 Closed-end second liens 15 28 29 28 37 Total $ 3,179 $ 3,424 $ 4,182 $ 3,316 $ 5,272 Consumer Direct Originations - for PFSI Conventional Conforming $ 374 $ 365 $ 580 $ 517 $ 739 Government 804 1,786 2,514 1,728 1,593 Jumbo 12 15 22 22 20 Closed-end second liens 257 278 302 338 417 Total $ 1,447 $ 2,444 $ 3,418 $ 2,604 $ 2,768 Total acquisitions / originations $ 27,163 $ 31,696 $ 35,682 $ 28,926 $ 37,882 UPB of loans fulfilled for PMT (included in correspondent acquisitions) $ 2,229 $ 5,948 $ 3,497 $ 2,782 $ 3,086 |
|
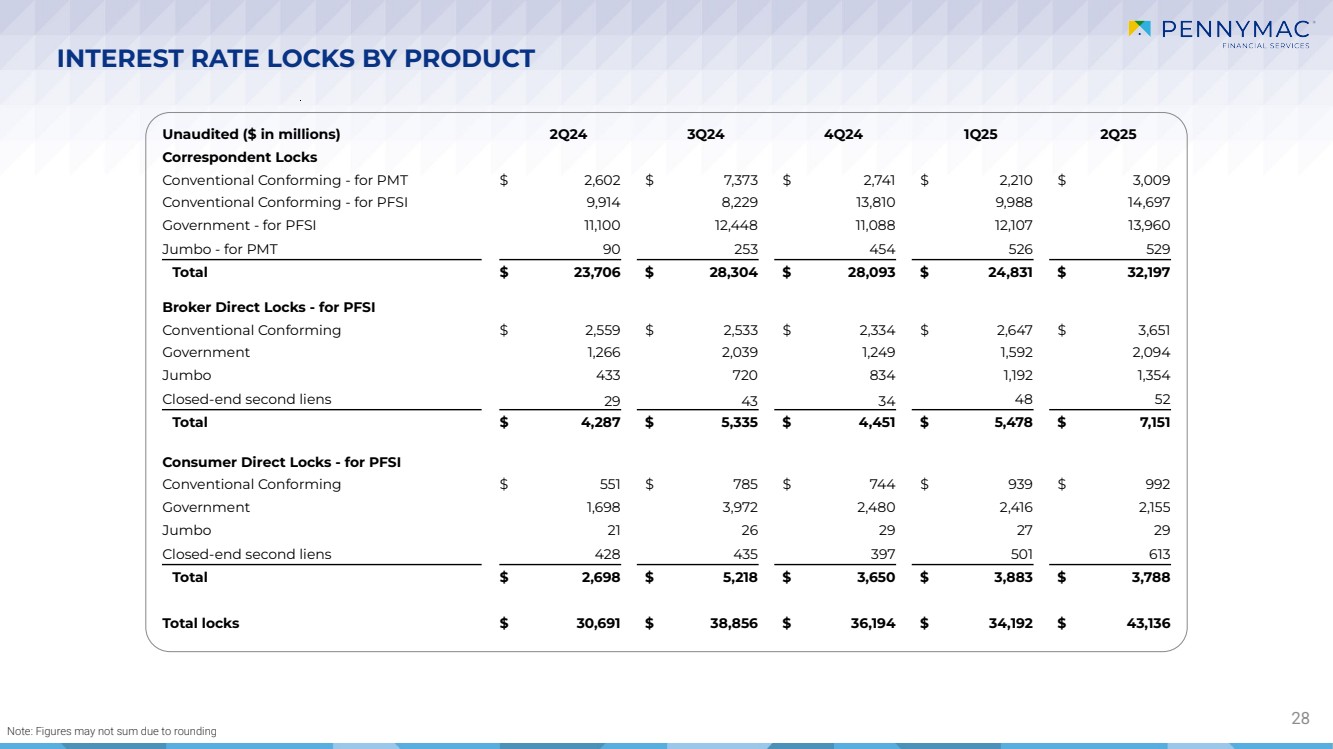
INTEREST RATE LOCKS BY PRODUCT 28 Note: Figures may not sum due to rounding Unaudited ($ in millions) 2Q24 3Q24 4Q24 1Q25 2Q25 Correspondent Locks Conventional Conforming - for PMT $ 2,602 $ 7,373 $ 2,741 $ 2,210 $ 3,009 Conventional Conforming - for PFSI 9,914 8,229 13,810 9,988 14,697 Government - for PFSI 11,100 12,448 11,088 12,107 13,960 Jumbo - for PMT 90 253 454 526 529 Total $ 23,706 $ 28,304 $ 28,093 $ 24,831 $ 32,197 Broker Direct Locks - for PFSI Conventional Conforming $ 2,559 $ 2,533 $ 2,334 $ 2,647 $ 3,651 Government 1,266 2,039 1,249 1,592 2,094 Jumbo 433 720 834 1,192 1,354 Closed-end second liens 29 43 34 48 52 Total $ 4,287 $ 5,335 $ 4,451 $ 5,478 $ 7,151 Consumer Direct Locks - for PFSI Conventional Conforming $ 551 $ 785 $ 744 $ 939 $ 992 Government 1,698 3,972 2,480 2,416 2,155 Jumbo 21 26 29 27 29 Closed-end second liens 428 435 397 501 613 Total $ 2,698 $ 5,218 $ 3,650 $ 3,883 $ 3,788 Total locks $ 30,691 $ 38,856 $ 36,194 $ 34,192 $ 43,136 |
|
Correspondent Broker Direct PRODUCTION SEGMENT HIGHLIGHTS – BUSINESS TRENDS BY CHANNEL 29 Consumer Direct ● Pennymac remains the largest correspondent aggregator in the U.S. ● Lock volumes for PFSI’s account were up 30% and acquisitions were up 32% from 1Q25, consistent with the growth in the overall market ● PMT retained 17% of total conventional conforming correspondent production in 2Q25 compared to 21% in 1Q25 ‒ We expect PMT to retain approximately 15 - 25% of total conventional conforming correspondent production in 3Q25 ● 771 correspondent sellers at June 30, 2025, down slightly from March 31, 2025 ● Purchase volume in 2Q25 was 90% of total acquisitions Multi-channel approach provides flexibility and has proven to be a competitive advantage, supporting profitability and pricing discipline while driving growth of the servicing portfolio ● Lock volumes were up 31% and originations were up 59% from 1Q25 ● Approved brokers totaled 5,084 at June 30, 2025 up 5% from March 31, 2025 and 19% from June 30, 2024 ‒ Top brokers see Pennymac as a strong alternative to the top two channel lenders ● Purchase volume in 2Q25 was 81% of total originations ● Continued strength in jumbo originations, which were 15% of total originations in 2Q25 compared to 22% in 1Q25 ● Lock volumes were down 2% and originations were up 6% from 1Q25 ● Continue to provide for the spectrum of needs of the 2.7 million customers in our servicing portfolio ‒ Refinance lock volume in 2Q25 was $2.7 billion, or 70% of total locks ‒ 95% of total lock volume, including both first and second-liens, was sourced from our large and growing servicing portfolio ‒ $417 million of closed-end second lien mortgage loans funded in 2Q25, up from $338 million in 1Q25 |
|
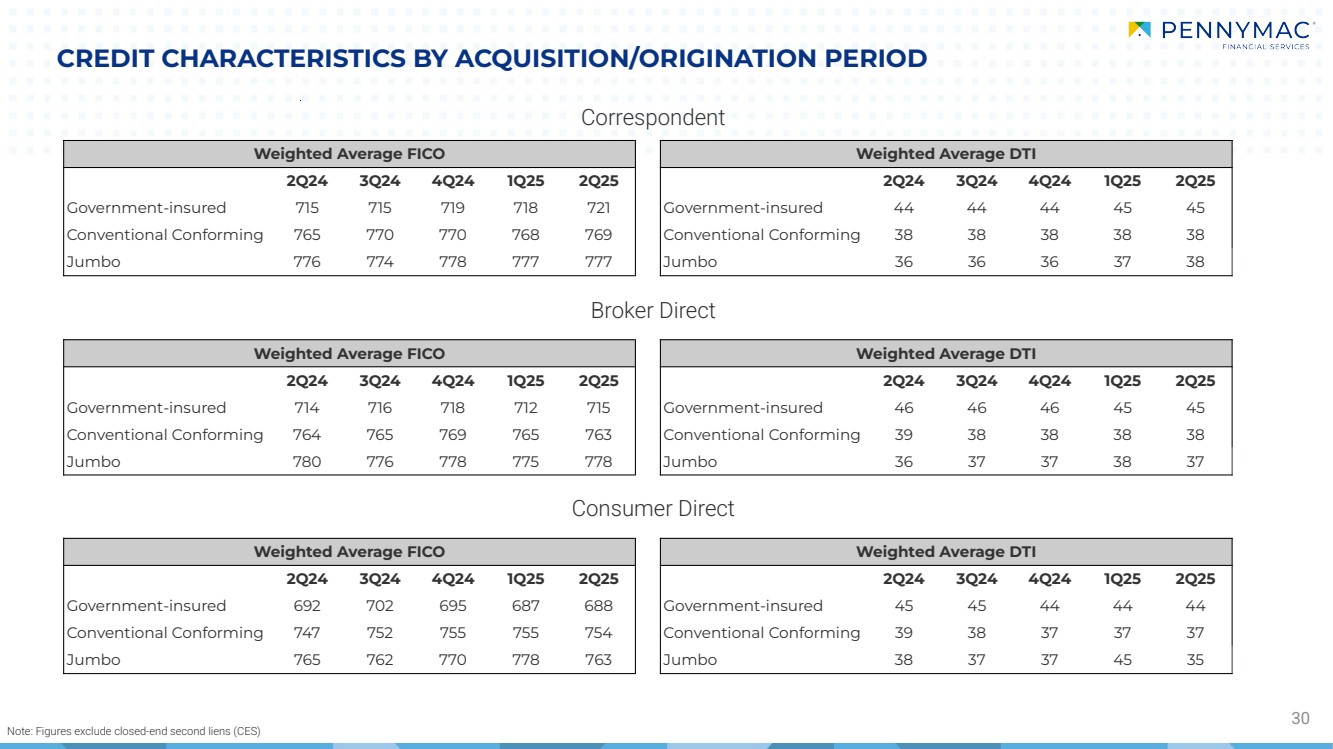
CREDIT CHARACTERISTICS BY ACQUISITION/ORIGINATION PERIOD 30 Correspondent Broker Direct Consumer Direct Note: Figures exclude closed-end second liens (CES) Weighted Average FICO Weighted Average DTI 2Q24 3Q24 4Q24 1Q25 2Q25 2Q24 3Q24 4Q24 1Q25 2Q25 Government-insured 715 715 719 718 721 Government-insured 44 44 44 45 45 Conventional Conforming 765 770 770 768 769 Conventional Conforming 38 38 38 38 38 Jumbo 776 774 778 777 777 Jumbo 36 36 36 37 38 Weighted Average FICO Weighted Average DTI 2Q24 3Q24 4Q24 1Q25 2Q25 2Q24 3Q24 4Q24 1Q25 2Q25 Government-insured 714 716 718 712 715 Government-insured 46 46 46 45 45 Conventional Conforming 764 765 769 765 763 Conventional Conforming 39 38 38 38 38 Jumbo 780 776 778 775 778 Jumbo 36 37 37 38 37 Weighted Average FICO Weighted Average DTI 2Q24 3Q24 4Q24 1Q25 2Q25 2Q24 3Q24 4Q24 1Q25 2Q25 Government-insured 692 702 695 687 688 Government-insured 45 45 44 44 44 Conventional Conforming 747 752 755 755 754 Conventional Conforming 39 38 37 37 37 Jumbo 765 762 770 778 763 Jumbo 38 37 37 45 35 |
|
June 30, 2025 Mortgage Servicing Rights Unaudited ($ in millions) Pool UPB(1) $463,132 Weighted average coupon 4.7% Weighted average servicing fee/spread 0.39% Weighted average prepayment speed assumption (CPR) 8.9% Fair value $9,531 As a multiple of servicing fee 5.3 31 MSR ASSET VALUATION (1) Excludes loans held for sale at fair value |
|
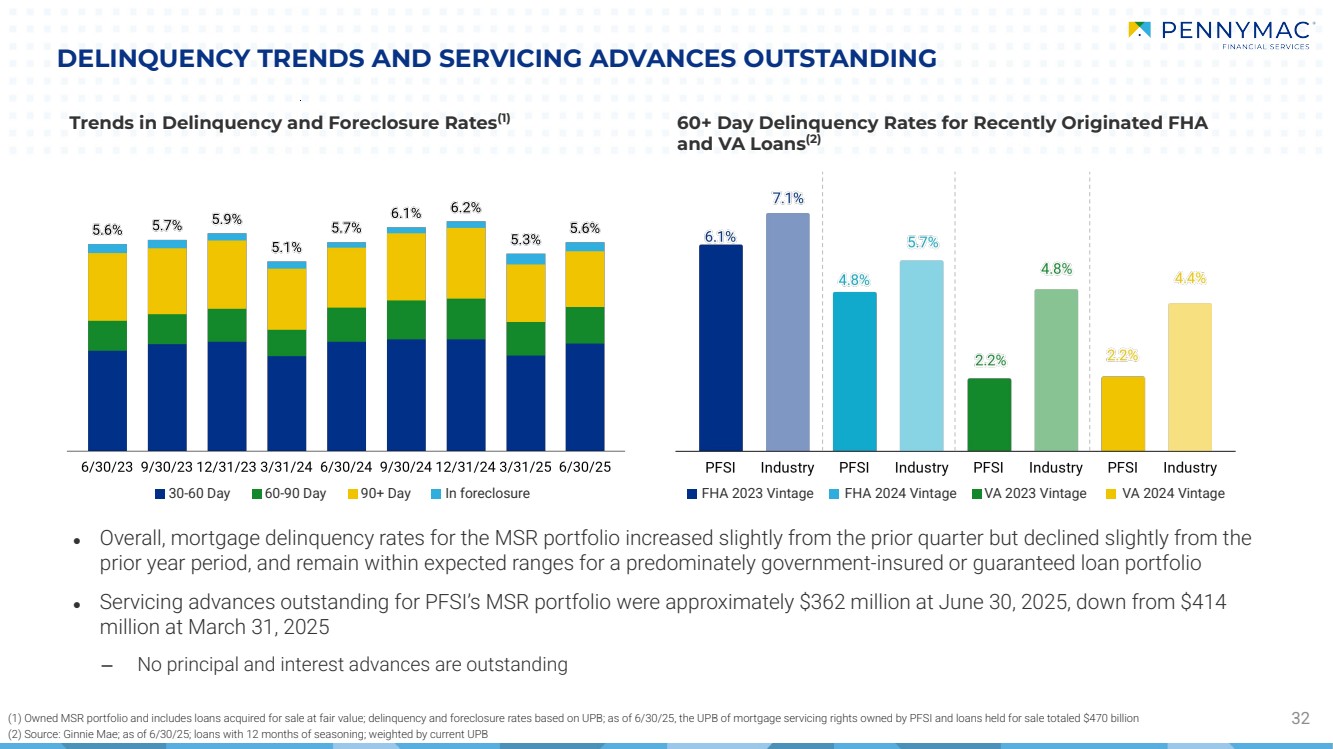
FHA 2023 Vintage FHA 2024 Vintage VA 2023 Vintage VA 2024 Vintage DELINQUENCY TRENDS AND SERVICING ADVANCES OUTSTANDING 32 Trends in Delinquency and Foreclosure Rates(1) 30-60 Day 60-90 Day 90+ Day In foreclosure (1) Owned MSR portfolio and includes loans acquired for sale at fair value; delinquency and foreclosure rates based on UPB; as of 6/30/25, the UPB of mortgage servicing rights owned by PFSI and loans held for sale totaled $470 billion (2) Source: Ginnie Mae; as of 6/30/25; loans with 12 months of seasoning; weighted by current UPB ● Overall, mortgage delinquency rates for the MSR portfolio increased slightly from the prior quarter but declined slightly from the prior year period, and remain within expected ranges for a predominately government-insured or guaranteed loan portfolio ● Servicing advances outstanding for PFSI’s MSR portfolio were approximately $362 million at June 30, 2025, down from $414 million at March 31, 2025 ‒ No principal and interest advances are outstanding 60+ Day Delinquency Rates for Recently Originated FHA and VA Loans(2) |
|
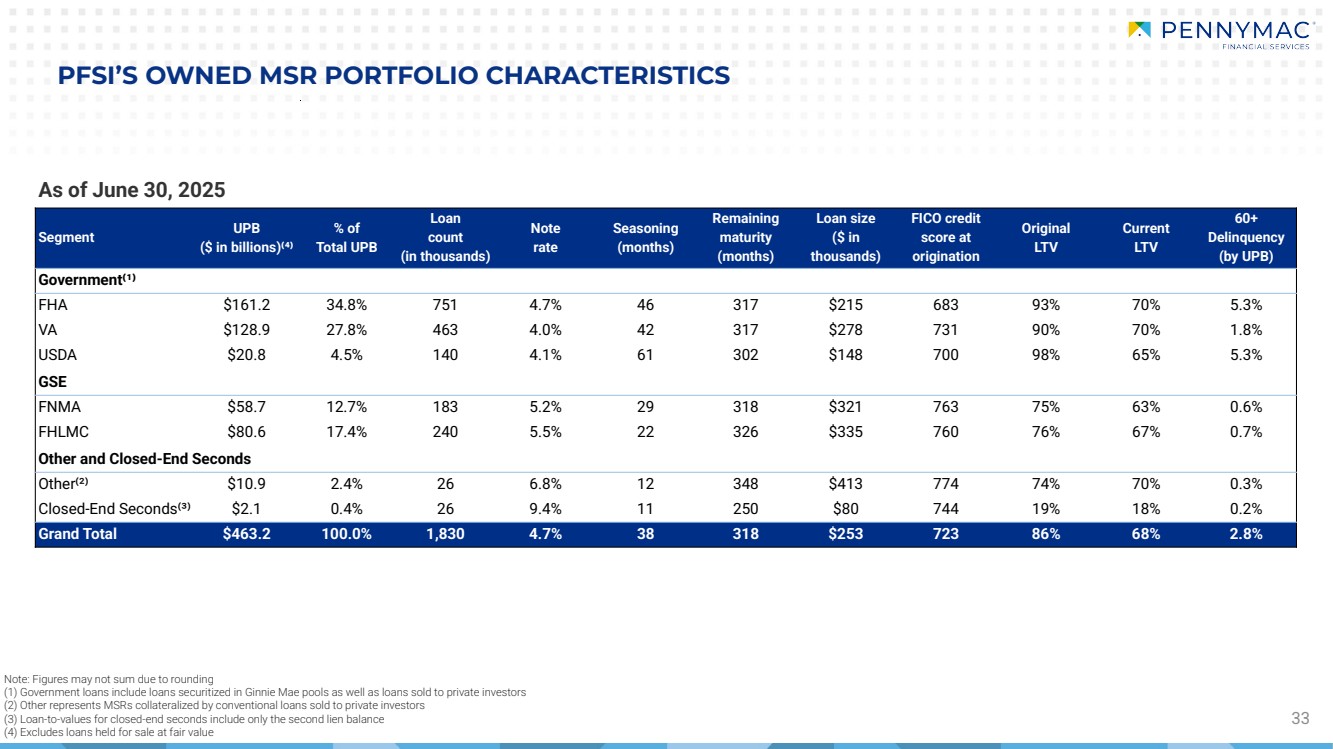
33 PFSI’S OWNED MSR PORTFOLIO CHARACTERISTICS Note: Figures may not sum due to rounding (1) Government loans include loans securitized in Ginnie Mae pools as well as loans sold to private investors (2) Other represents MSRs collateralized by conventional loans sold to private investors (3) Loan-to-values for closed-end seconds include only the second lien balance (4) Excludes loans held for sale at fair value As of June 30, 2025 Segment UPB ($ in billions)⁽⁴⁾ % of Total UPB Loan count (in thousands) Note rate Seasoning (months) Remaining maturity (months) Loan size ($ in thousands) FICO credit score at origination Original LTV Current LTV 60+ Delinquency (by UPB) Government⁽¹⁾ FHA $161.2 34.8% 751 4.7% 46 317 $215 683 93% 70% 5.3% VA $128.9 27.8% 463 4.0% 42 317 $278 731 90% 70% 1.8% USDA $20.8 4.5% 140 4.1% 61 302 $148 700 98% 65% 5.3% GSE FNMA $58.7 12.7% 183 5.2% 29 318 $321 763 75% 63% 0.6% FHLMC $80.6 17.4% 240 5.5% 22 326 $335 760 76% 67% 0.7% Other and Closed-End Seconds Other⁽²⁾ $10.9 2.4% 26 6.8% 12 348 $413 774 74% 70% 0.3% Closed-End Seconds⁽³⁾ $2.1 0.4% 26 9.4% 11 250 $80 744 19% 18% 0.2% Grand Total $463.2 100.0% 1,830 4.7% 38 318 $253 723 86% 68% 2.8% |
|
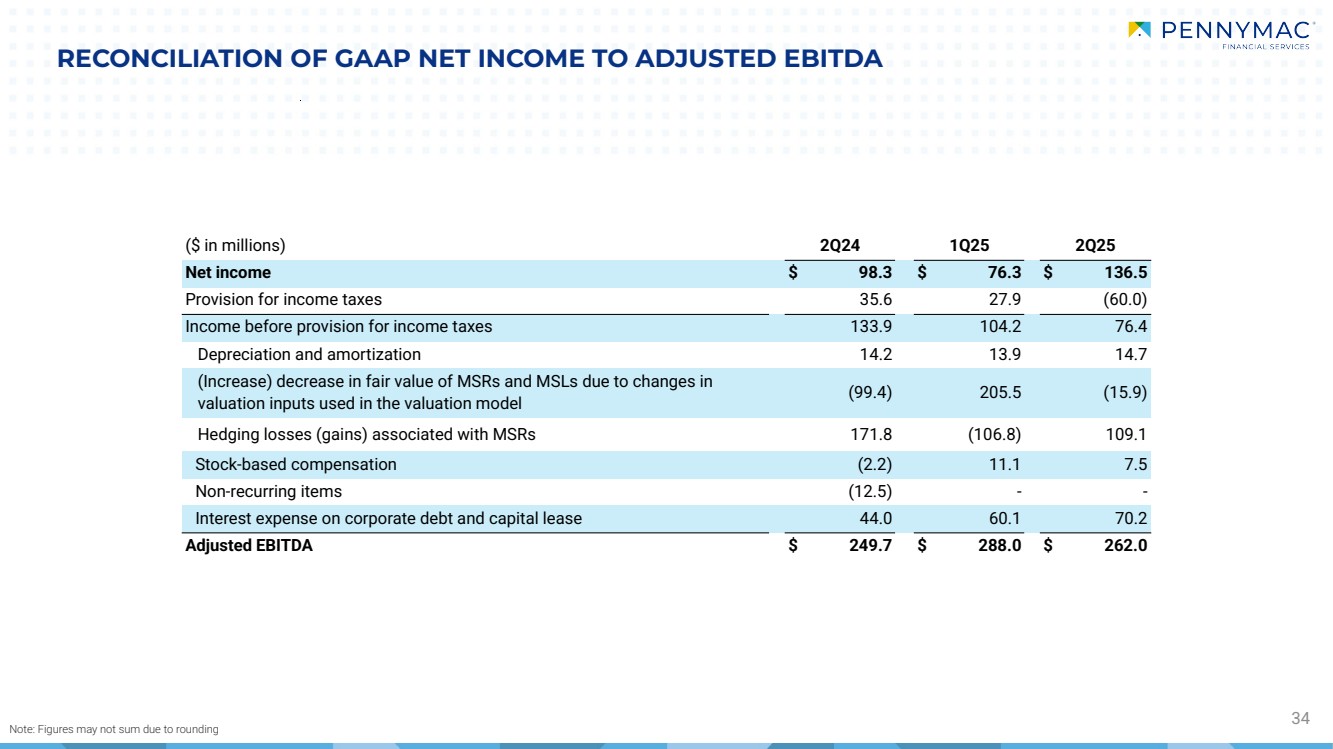
RECONCILIATION OF GAAP NET INCOME TO ADJUSTED EBITDA 34 Note: Figures may not sum due to rounding ($ in millions) 2Q24 1Q25 2Q25 Net income $ 98.3 $ 76.3 $ 136.5 Provision for income taxes 35.6 27.9 (60.0) Income before provision for income taxes 133.9 104.2 76.4 Depreciation and amortization 14.2 13.9 14.7 (Increase) decrease in fair value of MSRs and MSLs due to changes in valuation inputs used in the valuation model (99.4) 205.5 (15.9) Hedging losses (gains) associated with MSRs 171.8 (106.8) 109.1 Stock-based compensation (2.2) 11.1 7.5 Non-recurring items (12.5) - - Interest expense on corporate debt and capital lease 44.0 60.1 70.2 Adjusted EBITDA $ 249.7 $ 288.0 $ 262.0 |
|
Reconciliation of GAAP net income to operating net income and annualized operating return on equity RECONCILIATION OF GAAP ITEMS TO NON-GAAP ITEMS Note: Figures may not sum due to rounding 35 (1) Assumes a tax rate of 26.85% in periods prior to 4Q24, 26.70% in 4Q24 and 1Q25, and 25.165% in 2Q25 Reconciliation of GAAP servicing pretax income (loss) to servicing pretax income net of valuation related changes ($ in millions) 2Q24 3Q24 4Q24 1Q25 2Q25 Net income $ 98.3 $ 69.4 $ 104.5 $ 76.3 $ 136.5 (Increase) decrease in fair value of MSRs and MSLs due to changes in valuation inputs used in the valuation model (99.4) 402.4 (540.4) 205.5 (15.9) Hedging losses (gains) associated with MSRs 171.8 (242.1) 608.1 (106.8) 109.1 Non-recurring items (12.5) - - - - Adjustments 59.9 160.4 67.7 98.7 93.2 Tax impacts of adjustments(1) 16.1 43.1 18.1 26.4 23.4 Non-recurring tax adjustment - - - - (81.6) Operating net income $ 142.1 $ 186.7 $ 154.1 $ 148.6 $ 124.6 Average stockholders' equity $ 3,614.2 $ 3,694.8 $ 3,779.2 $ 3,857.5 $ 3,939.9 Annualized operating return on equity 16% 20% 16% 15% 13% ($ in millions) 2Q24 3Q24 4Q24 1Q25 2Q25 Servicing pretax income $ 90.7 $ 3.3 $ 87.3 $ 76.0 $ 54.2 (Increase) decrease in fair value of MSRs and MSLs due to changes in valuation inputs used in the valuation model (99.4) 402.4 (540.4) 205.5 (15.9) Hedging losses (gains) associated with MSRs 171.8 (242.1) 608.1 (106.8) 109.1 Non-recurring items - - - - - Provision for credit losses on active loans 0.6 5.7 13.3 (3.2) (3.6) Servicing pretax income net of valuation related changes $ 163.6 $ 169.4 $ 168.3 $ 171.5 $ 143.7 |
|