UNITED STATES
SECURITIES AND EXCHANGE COMMISSION
Washington, D.C. 20549
FORM 8-K
CURRENT REPORT
Pursuant to Section 13 or 15(d) of the
Securities Exchange Act of 1934
Date of Report (Date of earliest event reported): June 24, 2025
GERMAN AMERICAN BANCORP, INC.
(Exact name of registrant as specified in its charter)
Indiana
(State or other jurisdiction of incorporation)
| 001-15877 | 35-1547518 | |
| (Commission File Number) | (IRS Employer Identification No.) |
| 711 Main Street | ||
| Jasper, Indiana | 47546 | |
| (Address of principal executive offices) | (Zip Code) |
Registrant’s telephone number, including area code: (812) 482-1314
Not Applicable
(Former name or former address, if changed since last report)
Check the appropriate box below if the Form 8-K filing is intended to simultaneously satisfy the filing obligation of the registrant under any of the following provisions:
¨ Written communications pursuant to Rule 425 under the Securities Act (17 CFR 230.425)
¨ Soliciting material pursuant to Rule 14a-12 under the Exchange Act (17 CFR 240.14a-12)
¨ Pre-commencement communications pursuant to Rule 14d-2(b) under the Exchange Act (17 CFR 240.14d-2(b))
¨ Pre-commencement communications pursuant to Rule 13e-4(c) under the Exchange Act (17 CFR 240.13e-4(c))
Indicate by check mark whether the registrant is an emerging growth company as defined in Rule 405 under the Securities Act (17 CFR 230.405) or Rule 12b-2 under the Exchange Act (17 CFR 240.12b-2).
Emerging growth company ¨
If an emerging growth company, indicate by check mark if the registrant has elected not to use the extended transition period for complying with any new or revised financial accounting standards provided pursuant to Section 13(a) of the Exchange Act. ¨
Securities registered pursuant to Section 12(b) of the Act:
| Title of each class | Trading Symbol(s) |
Name of each exchange on which registered |
||
| Common Stock, no par value | GABC | Nasdaq Global Select Market |
Item 7.01. Regulation FD Disclosure.
D. Neil Dauby, Chairman and Chief Executive Officer, and Bradley M. Rust, President and Chief Financial Officer, of German American Bancorp, Inc. will participate in the Raymond James Small-Cap Bank Day being held on June 24, 2025, by hosting a series of meetings with investors during the event.
Attached as Exhibit 99.1 is the information that will be provided to meeting participants. Such information is incorporated herein by reference.
The information in this Item 7.01, including the information incorporated herein from Exhibit 99.1, is furnished pursuant to Item 7.01 of Form 8-K and shall not be deemed “filed” for purposes of Section 18 of the Securities Exchange Act of 1934, as amended (the “Exchange Act”), or incorporated by reference in any filing under the Securities Act of 1933, as amended, or the Exchange Act, except as shall be expressly set forth by specific reference in such a filing.
Item 9.01. Financial Statements and Exhibits.
| (d) | Exhibits |
| Exhibit No. | Description |
| 99.1 | German American Bancorp, Inc. Presentation dated June 24, 2025. |
| 104 | Cover Page Interactive Data File (embedded within the Inline XBRL document). |
* * * * * *
SIGNATURE
Pursuant to the requirements of the Securities Exchange Act of 1934, the Registrant has duly caused this report to be signed on its behalf by the undersigned hereunto duly authorized.
| GERMAN AMERICAN BANCORP, INC. | ||
| Date: June 24, 2025 | By: | /s/ D. Neil Dauby |
| D. Neil Dauby, Chairman and Chief Executive Officer | ||
| - 2 - |
Exhibit 99.1
Symbol: GABC June 24, 2025 Raymond James Small - Cap Bank Day German American 1 ]‚¨ÈØ ›¼›ãØȯ Õ؛ܛÂã‚ã¯È V؛ܛÂ㛕ö D. Neil Dauby , Chairman and Chief Executive Officer (812) 482 - 0707 neil.dauby@germanamerican.com Bradley M. Rust, President and CFO (812) 482 - 0718 brad.rust@germanamerican.com 2
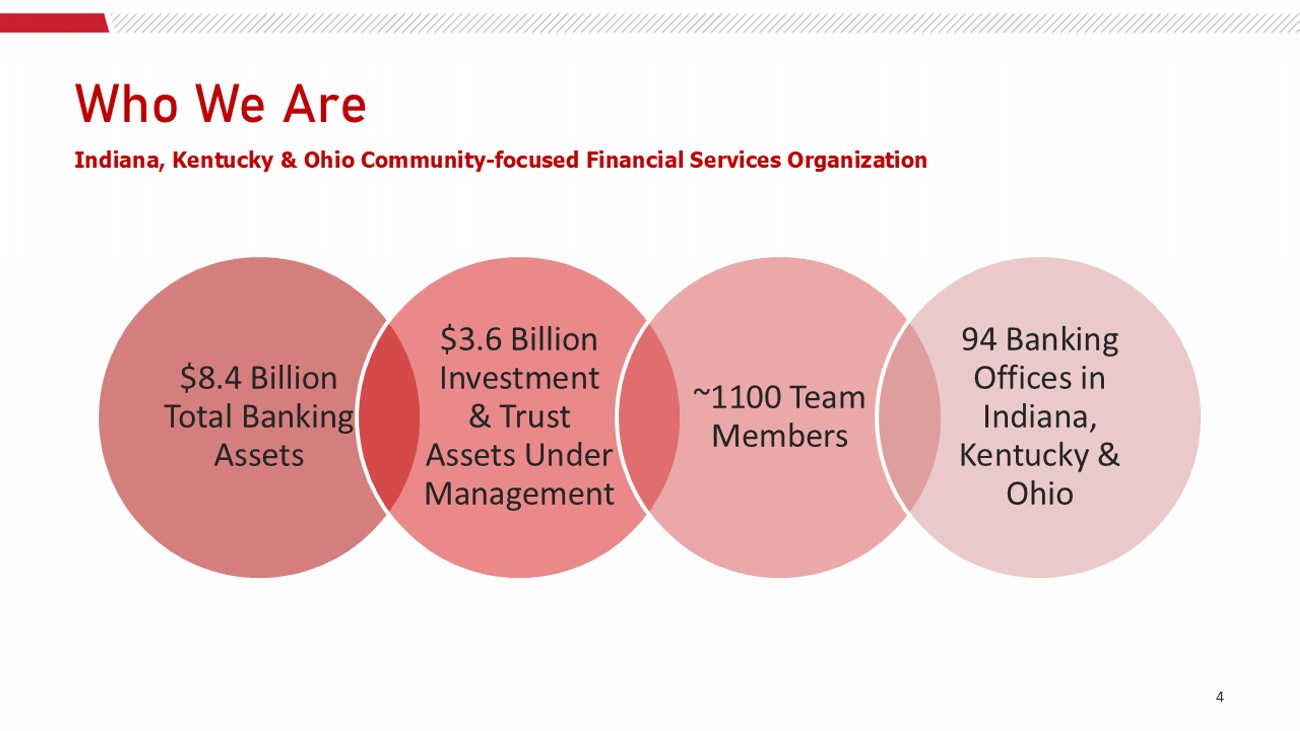
CAUTIONARY NOTE REGARDING FORWARD - LOOKING STATEMENTS When used in this presentation and our oral statements, the words or phrases “believe,” “will likely result,” “are expected to,” “will continue,” “is anticipated,” “estimate,” “project,” “plans,” or similar expressions are intended to identify “forward - looking statements” within the meaning of the Private Securities Litigation Reform Act of 1995 . You are cautioned not to place undue reliance on any forward - looking statements, which speak only as of the date of this presentation, and we do not undertake any obligation to update any forward - looking statement to reflect circumstances or events that occur in the future . By their nature, these statements are subject to numerous risks and uncertainties that could cause actual results to differ materially from those anticipated in the statements . Factors that could cause actual results and performance to vary materially from those expressed or implied by any forward - looking statement include those that are discussed in Item 1 , “Business – Forward Looking Statements and Associated Risk,” and Item 1 A, “Risk Factors,” in our Annual Report on Form 10 - K for 2024 as updated and supplemented by our other SEC reports filed from time to time . 3 Indiana, Kentucky & Ohio Community - focused Financial Services Organization wÈw›Ø› 4 $8.4 Billion Total Banking Assets $3.6 Billion Investment & Trust Assets Under Management ~1100 Team Members 94 Banking Offices in Indiana, Kentucky & Ohio
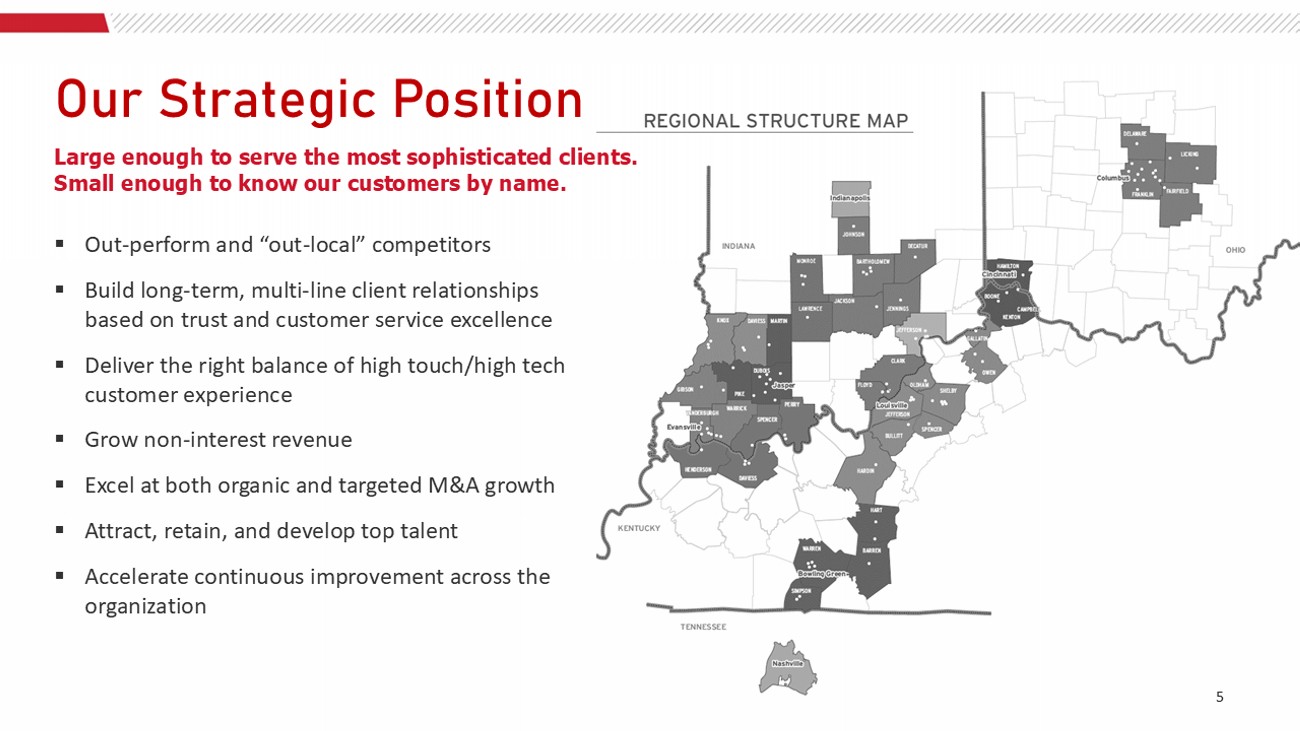
▪ Out - perform and “out - local” competitors ▪ Build long - term, multi - line client relationships based on trust and customer service excellence ▪ Deliver the right balance of high touch/high tech customer experience ▪ Grow non - interest revenue ▪ Excel at both organic and targeted M&A growth ▪ Attract, retain, and develop top talent ▪ Accelerate continuous improvement across the organization IçØ]ã؂㛩¯VÈܯã¯È 5 Large enough to serve the most sophisticated clients. Small enough to know our customers by name.
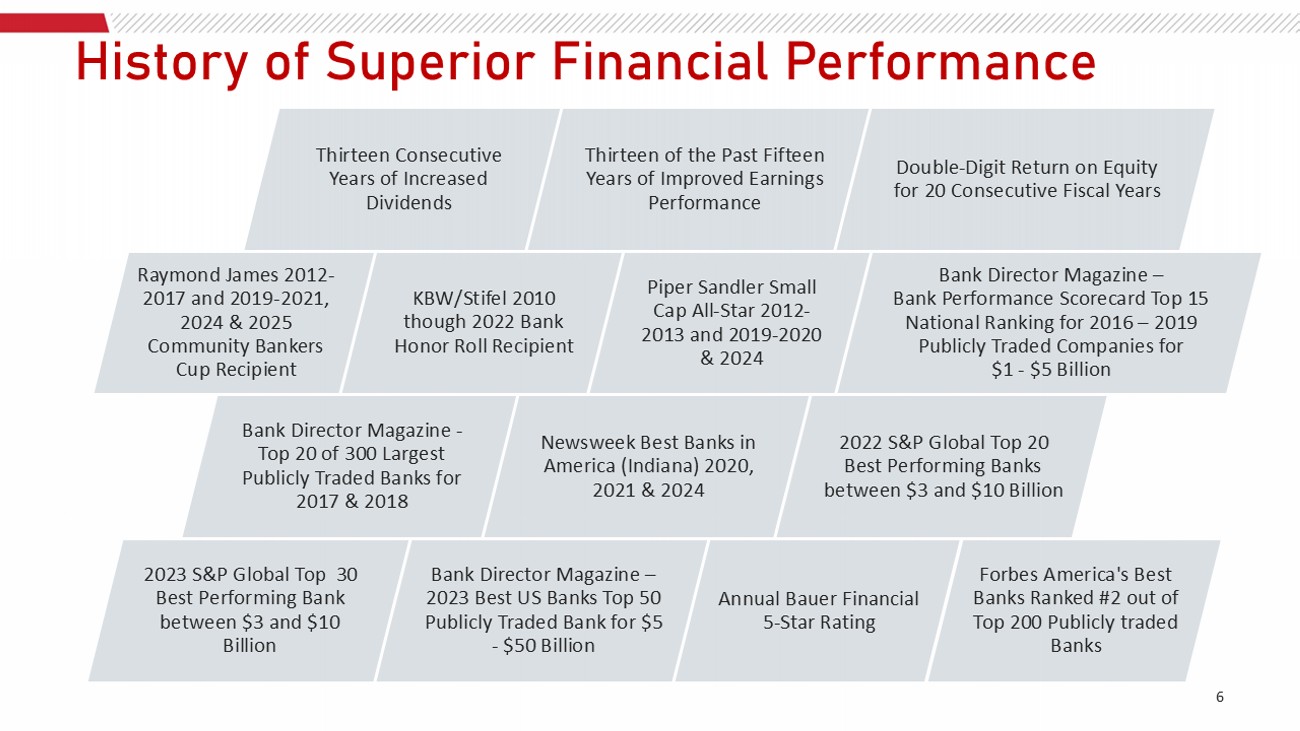
.¯ÜãÈØöȨ]ç՛دÈØ(¯Â‚¯‚¼V›Ø¨ÈØÁ‚› 6 Bank Director Magazine - Top 20 of 300 Largest Publicly Traded Banks for 2017 & 2018 Newsweek Best Banks in America (Indiana) 2020, 2021 & 2024 2022 S&P Global Top 20 Best Performing Banks between $3 and $10 Billion 2023 S&P Global Top 30 Best Performing Bank between $3 and $10 Billion Bank Director Magazine – 2023 Best US Banks Top 50 Publicly Traded Bank for $5 - $50 Billion Annual Bauer Financial 5 - Star Rating Forbes America's Best Banks Ranked #2 out of Top 200 Publicly traded Banks Thirteen Consecutive Years of Increased Dividends Thirteen of the Past Fifteen Years of Improved Earnings Performance Double - Digit Return on Equity for 20 Consecutive Fiscal Years Raymond James 2012 - 2017 and 2019 - 2021, 2024 & 2025 Community Bankers Cup Recipient KBW/Stifel 2010 though 2022 Bank Honor Roll Recipient Piper Sandler Small Cap All - Star 2012 - 2013 and 2019 - 2020 & 2024 Bank Director Magazine – Bank Performance Scorecard Top 15 National Ranking for 2016 – 2019 Publicly Traded Companies for $1 - $5 Billion dÈゼÜÜ›ãÜ 8 $4,978 $5,609 $6,156 $6,152 $6,296 $8,420 1.32% 1.57% 1.26% 1.43% 1.34% 1.43% 12/31/20 12/31/21 12/31/22 12/31/23 12/31/24 03/31/25 (dollars in millions, except per share amount) Return on Average Assets * 2022 was impacted by acquisition - related expenses and the Day 1 provision for credit losses under the CECL model for the CUB transaction that closed on January 1, 2022 of $18.623 million ($14.097 million or $0.48 per share on an after tax basis).

(0CC0=dYC] 7
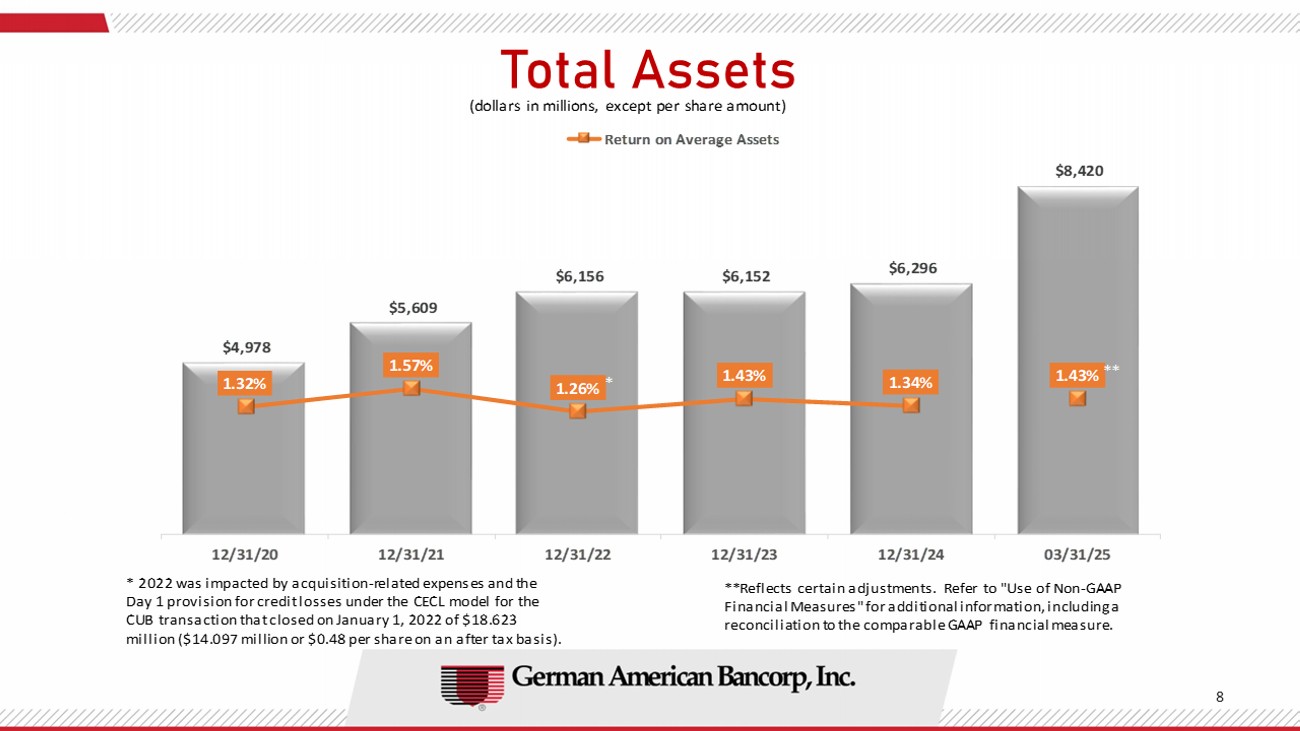
* ** **Reflects certain adjustments. Refer to "Use of Non - GAAP Financial Measures" for additional information, including a reconciliation to the comparable GAAP financial measure.
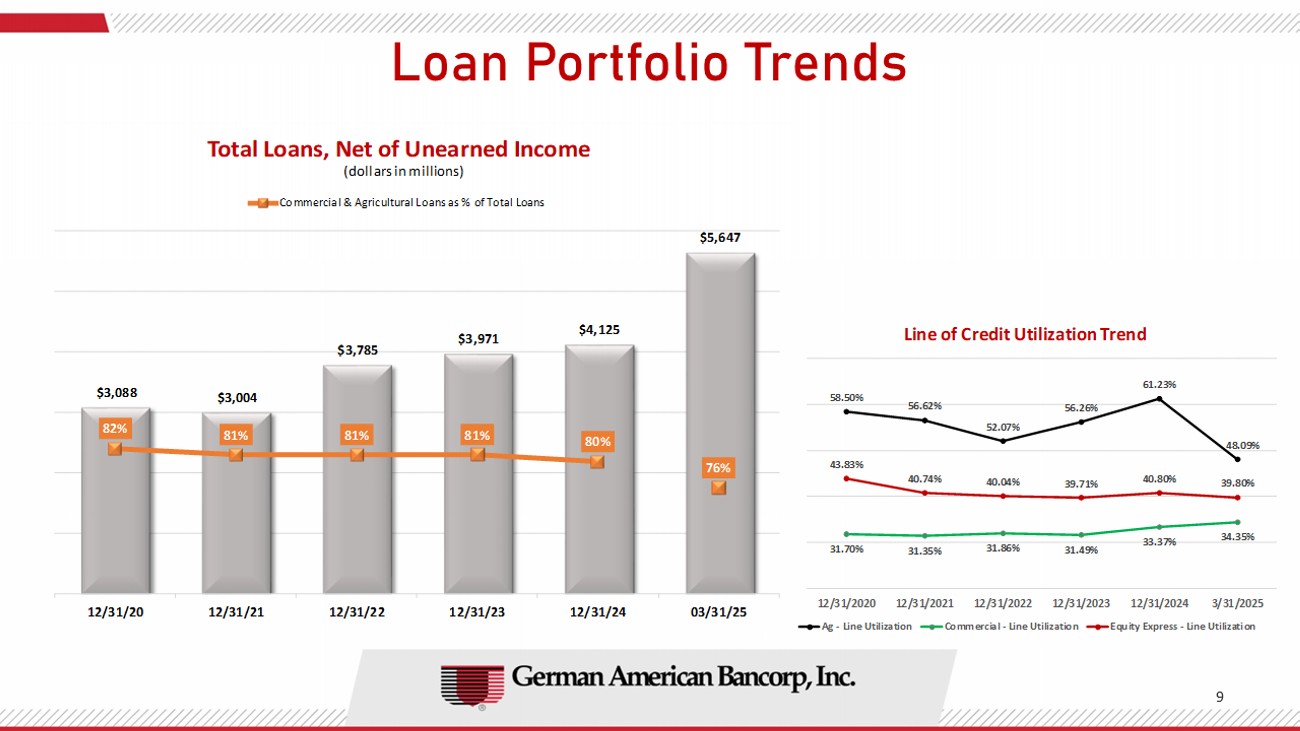
=È‚ÂVÈØã¨È¼¯ÈdØ›Â•Ü 9 58.50% 56.62% 52.07% 56.26% 61.23% 48.09% 31.70% 31.35% 31.86% 31.49% 33.37% 34.35% 43.83% 40.74% 40.04% 39.71% 40.80% 39.80% 12/31/2020 12/31/2021 12/31/2022 12/31/2023 12/31/2024 3/31/2025 Line of Credit Utilization Trend Ag - Line Utilization Commercial - Line Utilization Equity Express - Line Utilization $3,088 $3,004 $3,785 $3,971 $4,125 $5,647 82% 81% 81% 81% 80% 76% 12/31/20 12/31/21 12/31/22 12/31/23 12/31/24 03/31/25 Total Loans, Net of Unearned Income Commercial & Agricultural Loans as % of Total Loans (dollars in millions)
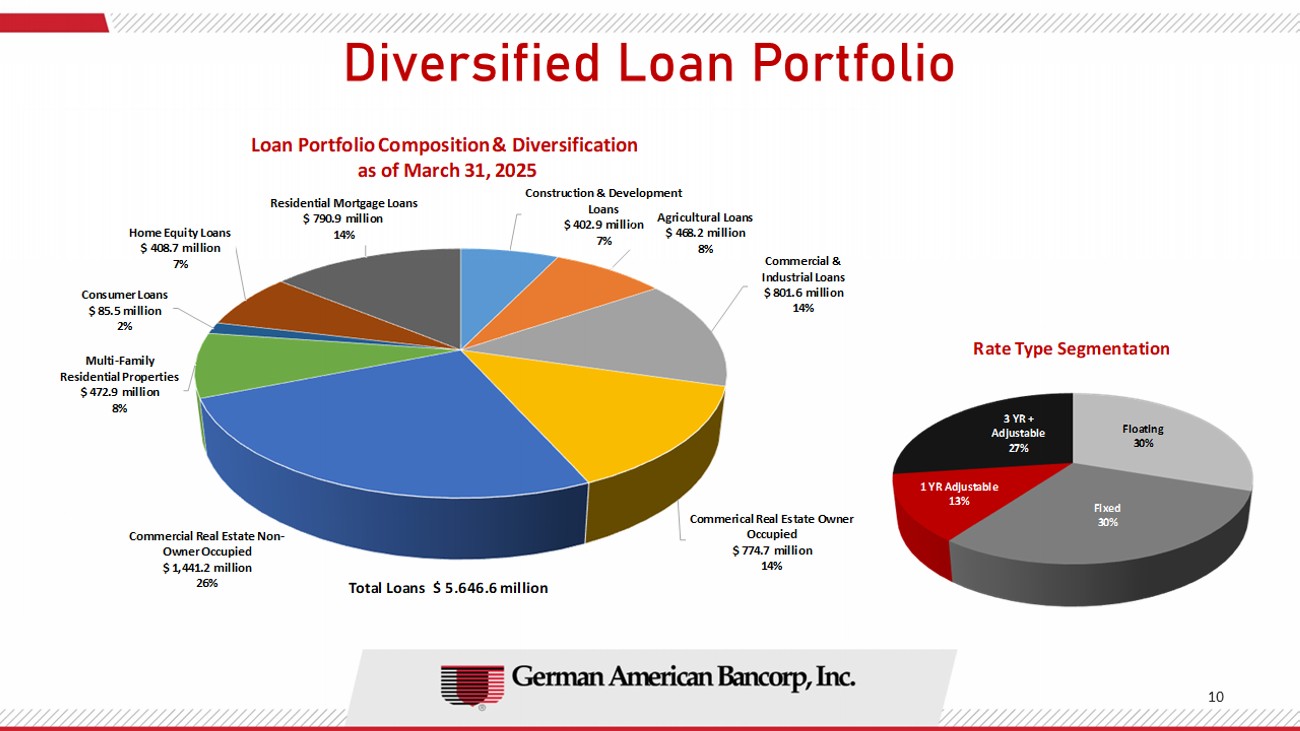
¯ó›Øܯ¨¯›•=È‚ÂVÈØã¨È¼¯È 10 Construction & Development Loans $ 402.9 million 7% Agricultural Loans $ 468.2 million 8% Commercial & Industrial Loans $ 801.6 million 14% Commerical Real Estate Owner Occupied $ 774.7 million 14% Commercial Real Estate Non - Owner Occupied $ 1,441.2 million 26% Multi - Family Residential Properties $ 472.9 million 8% Consumer Loans $ 85.5 million 2% Home Equity Loans $ 408.7 million 7% Residential Mortgage Loans $ 790.9 million 14% Loan Portfolio Composition & Diversification as of March 31, 2025 Total Loans $ 5,646.6 million CÈ ʣ V›Ø¨ÈØÁ¯Â©ÜÜ›ãÜãÈdÈゼÜÜ›ãÜ 11 0.44% 0.26% 0.23% 0.15% 0.18% 0.22% 0.52% 0.34% 0.29% 0.37% 0.49% 0.49% 12/31/20 12/31/21 12/31/22 12/31/23 12/31/24 03/31/25 GABC Peer Group * Peer Group (St.
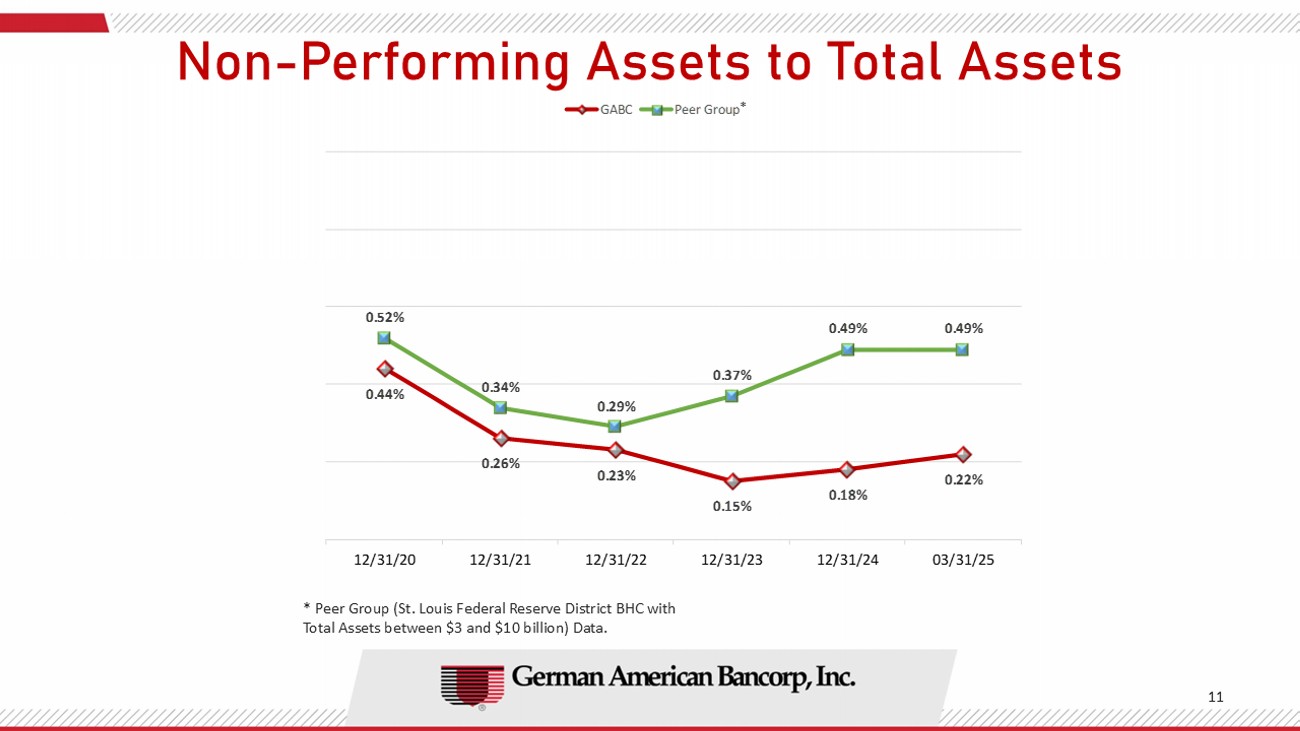
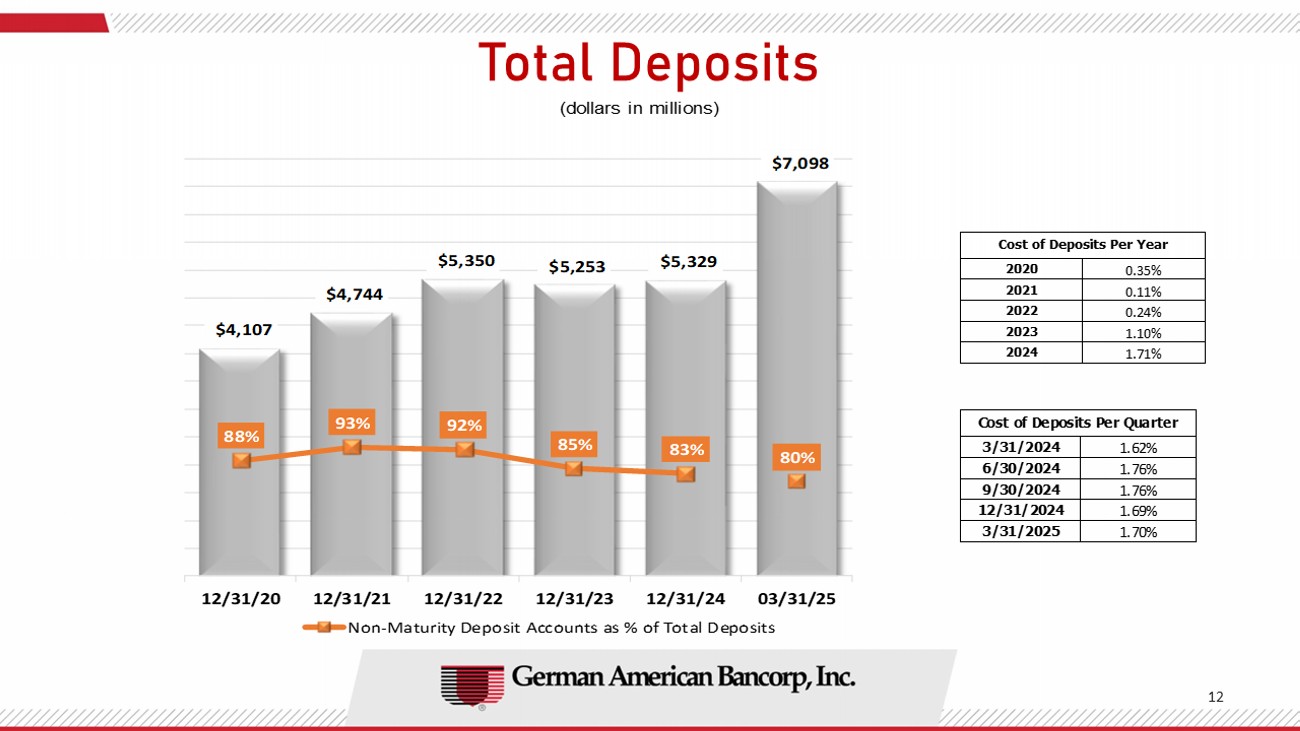
Louis Federal Reserve District BHC with Total Assets between $3 and $10 billion) Data. * dÈゼ›ÕÈܯãÜ 12 $4,107 $4,744 $5,350 $5,253 $5,329 $7,098 88% 93% 92% 85% 83% 80% 12/31/20 12/31/21 12/31/22 12/31/23 12/31/24 03/31/25 Non-Maturity Deposit Accounts as % of Total Deposits (dollars in millions)
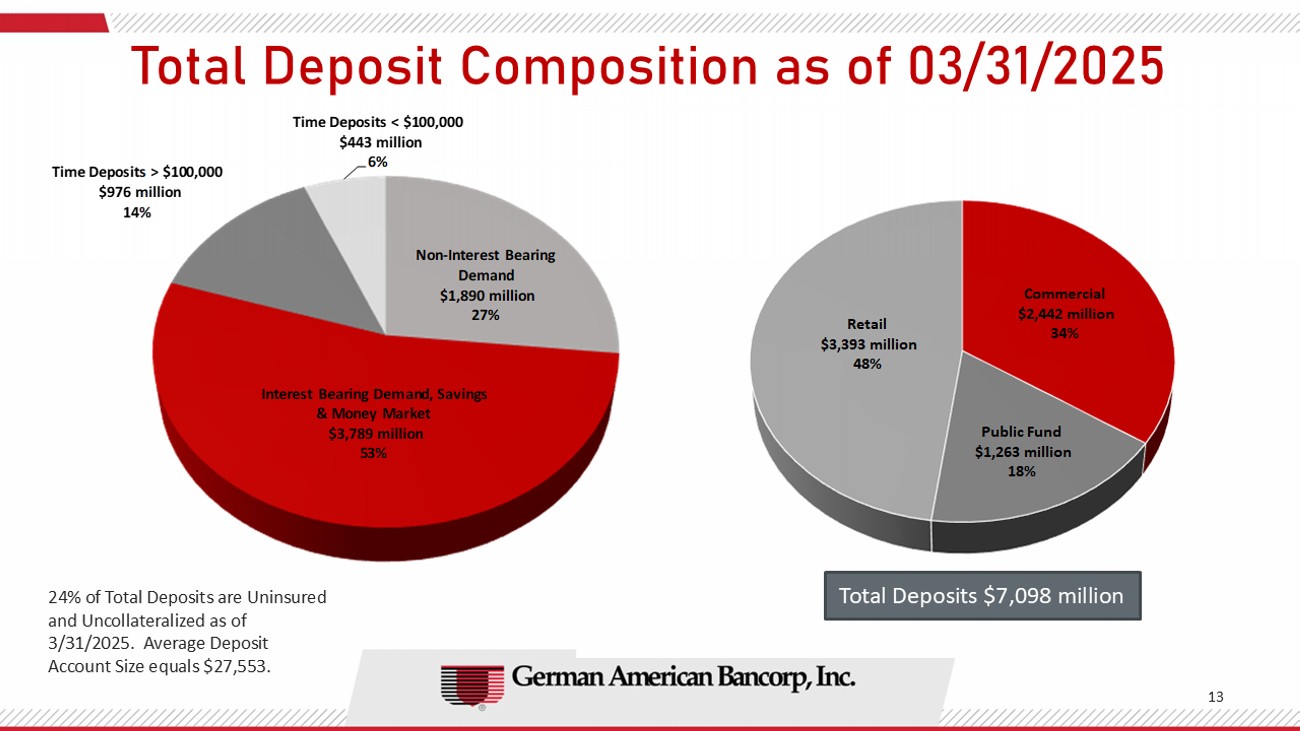
Commercial $2,442 million 34% Public Fund $1,263 million 18% Retail $3,393 million 48% 13 dÈゼ›ÕÈܯãÈÁÕÈܯã¯È‚ÜȨɶɹʘɹɷʘɸɶɸɻ Total Deposits $7,098 million 24% of Total Deposits are Uninsured and Uncollateralized as of 3/31/2025. Average Deposit Account Size equals $27,553. Non - Interest Bearing Demand $1,890 million 27% Interest Bearing Demand, Savings & Money Market $3,789 million 53% Time Deposits > $100,000 $976 million 14% Time Deposits < $100,000 $443 million 6% dÈゼ]‚؛ȼ•›ØÜʖ×ç¯ãö 14 $625 $668 $558 $664 $715 $1,046 12/31/20 12/31/21 12/31/22 12/31/23 12/31/24 03/31/25 (dollars in millions) *Reflects certain adjustments.
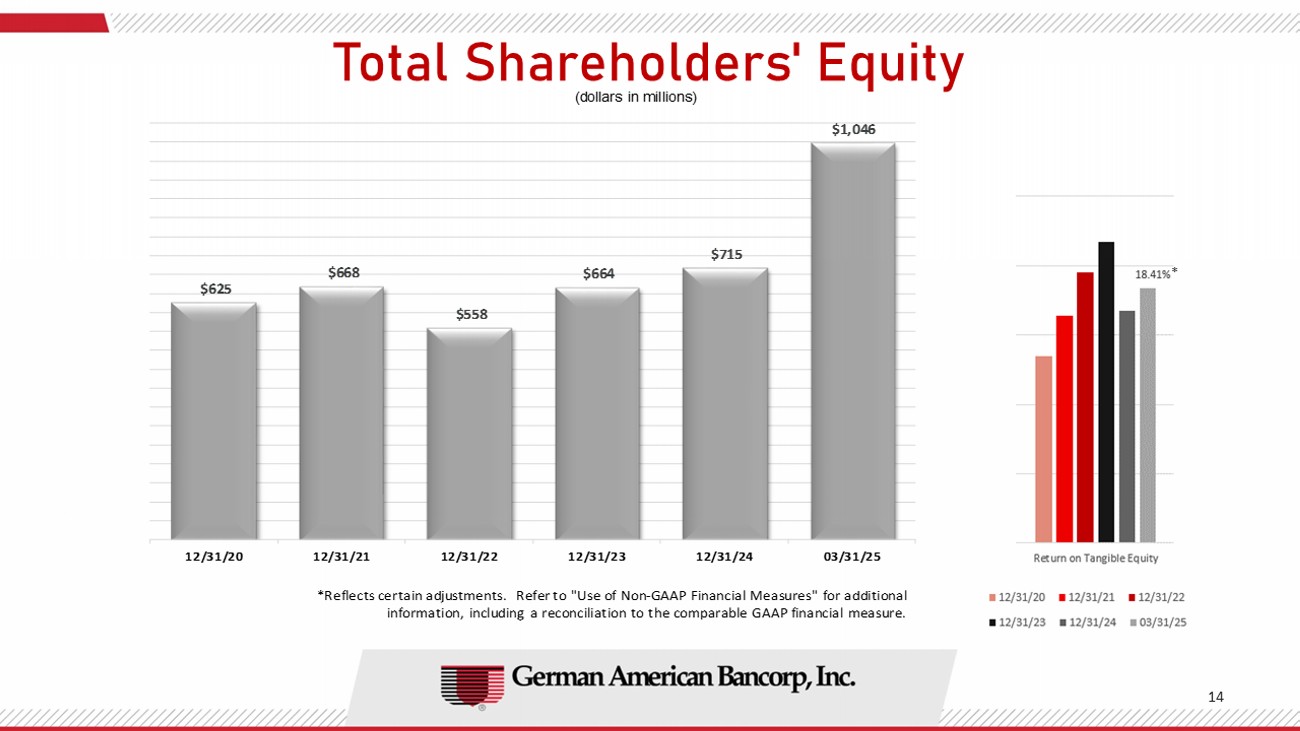
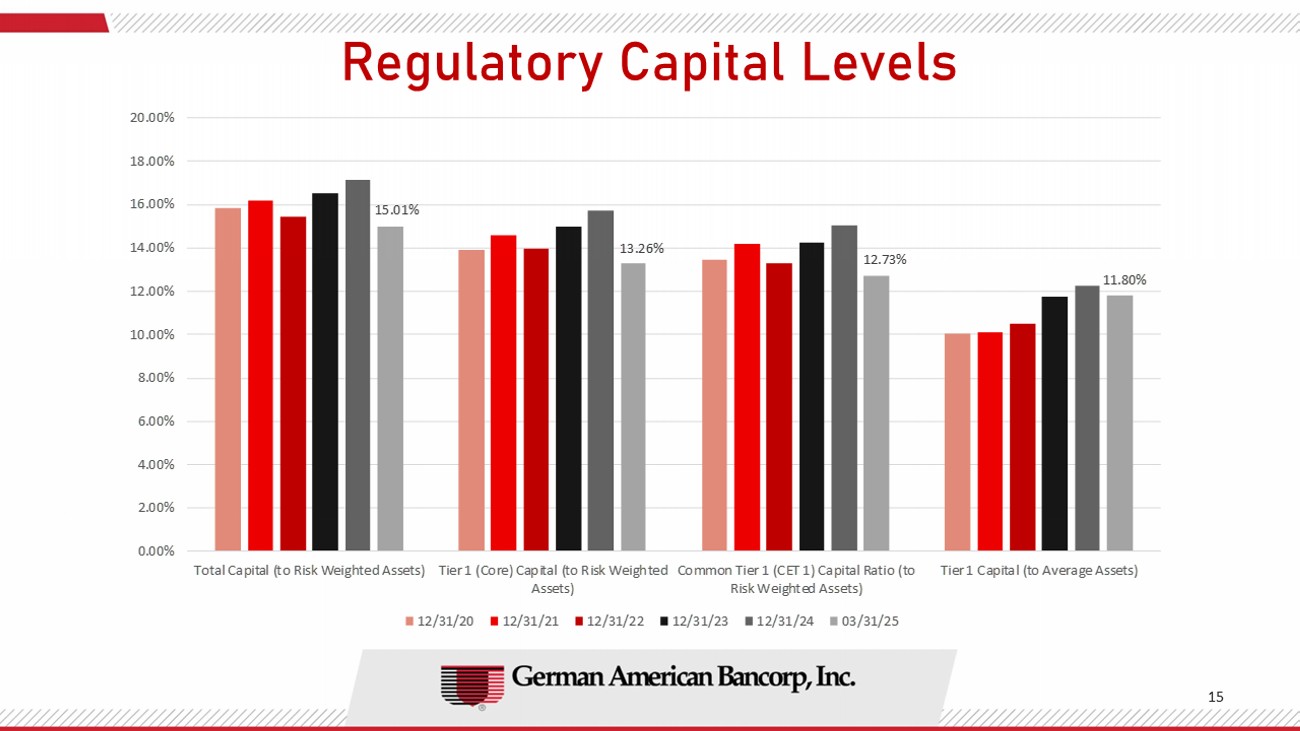
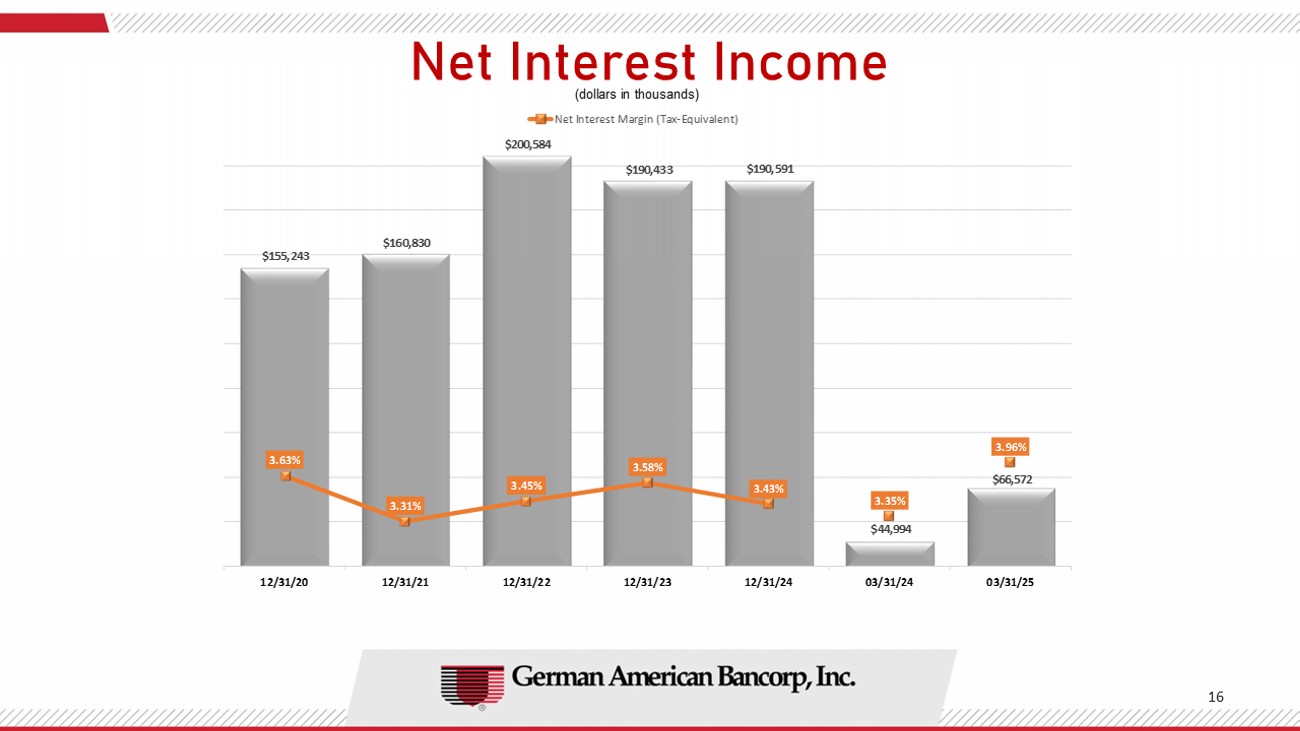
Refer to "Use of Non - GAAP Financial Measures" for additional information, including a reconciliation to the comparable GAAP financial measure. * Y›©ç¼‚ãÈØö‚կゼ=›ó›¼Ü 15 15.01% 13.26% 12.73% 11.80% 0.00% 2.00% 4.00% 6.00% 8.00% 10.00% 12.00% 14.00% 16.00% 18.00% 20.00% Total Capital (to Risk Weighted Assets) Tier 1 (Core) Capital (to Risk Weighted Assets) Common Tier 1 (CET 1) Capital Ratio (to Risk Weighted Assets) Tier 1 Capital (to Average Assets) 12/31/20 12/31/21 12/31/22 12/31/23 12/31/24 03/31/25 C›ã0Âã›Ø›Üã0ÂÈÁ› 16 $155,243 $160,830 $200,584 $190,433 $190,591 $44,994 $66,572 3.63% 3.31% 3.45% 3.58% 3.43% 3.35% 3.96% 12/31/20 12/31/21 12/31/22 12/31/23 12/31/24 03/31/24 03/31/25 Net Interest Margin (Tax-Equivalent) (dollars in thousands)
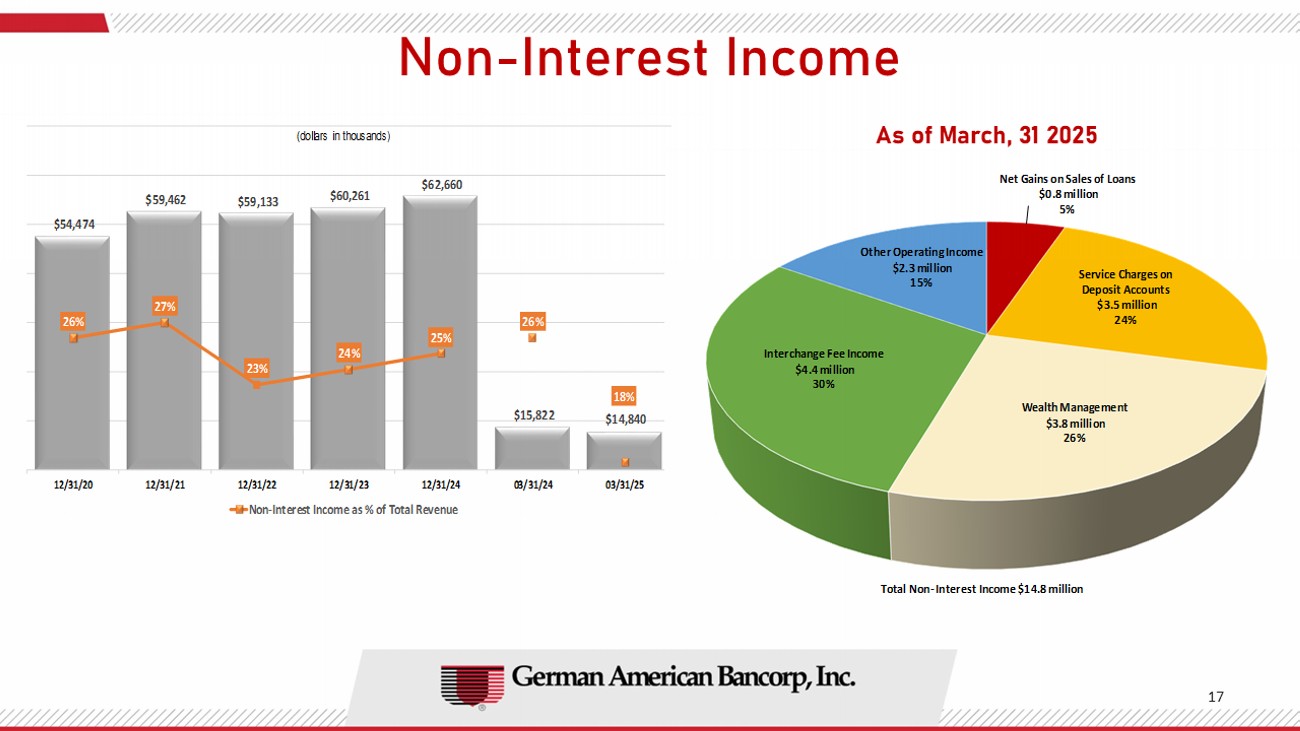
CÈ ʣ 0Âã›Ø›Üã0ÂÈÁ› 17 ÜȨB‚Øʍɹɷɸɶɸɻ $54,474 $59,462 $59,133 $60,261 $62,660 $15,822 $14,840 26% 27% 23% 24% 25% 26% 18% 12/31/20 12/31/21 12/31/22 12/31/23 12/31/24 03/31/24 03/31/25 Non-Interest Income as % of Total Revenue (dollars in thousands) Net Gains on Sales of Loans $0.8 million 5% Service Charges on Deposit Accounts $3.5 million 24% Wealth Management $3.8 million 26% Interchange Fee Income $4.4 million 30% Other Operating Income $2.3 million 15% Total Non - Interest Income $14.8 million CÈ ʣ 0Âã›Ø›ÜãõÕ›ÂÜ› 18 $117,123 $124,007 $154,191 $144,497 $146,377 $36,738 $46,850 54.3% 54.4% 56.6% 55.1% 49.2% 57.9% 54.1% 12/31/20 12/31/21 12/31/22 12/31/23 12/31/24 03/31/24 03/31/25 Efficiency Ratio * 2022 was impacted by acquisition - related expenses for the CUB transaction that closed on January 1, 2022 * (dollars in thousands) **Reflects certain adjustments.
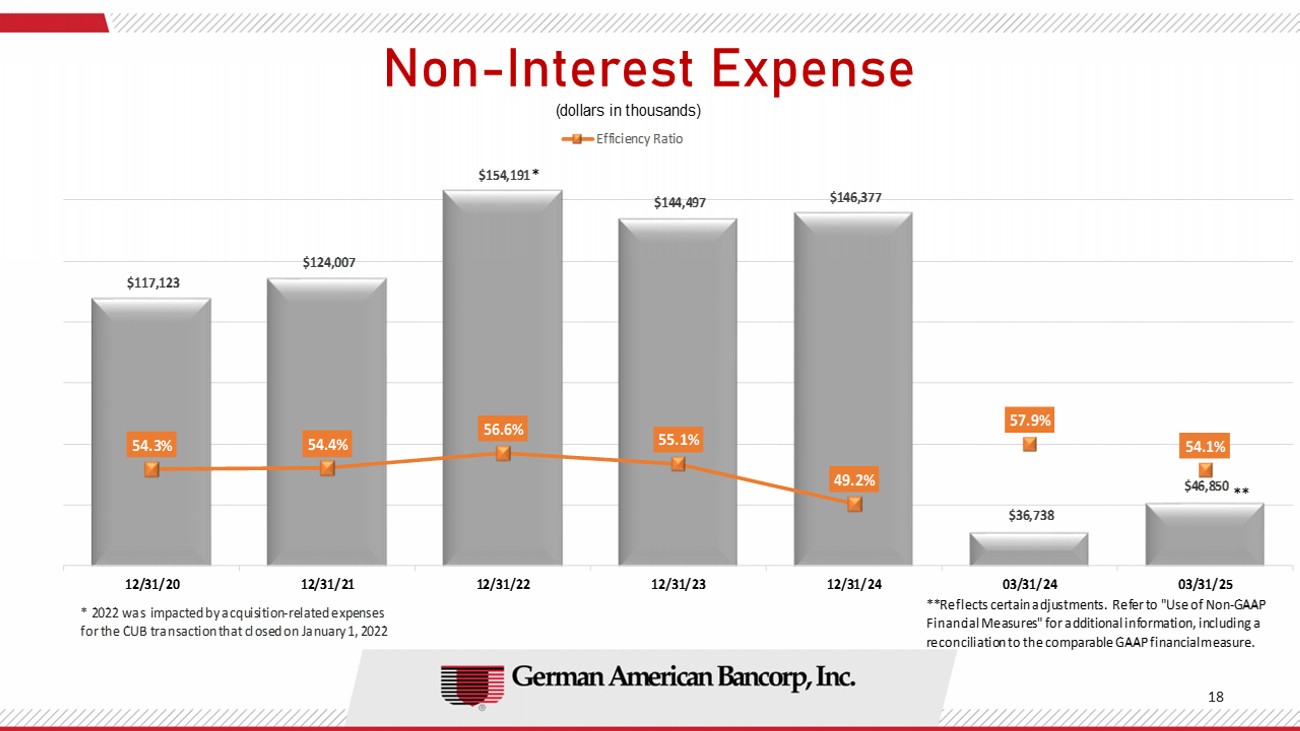
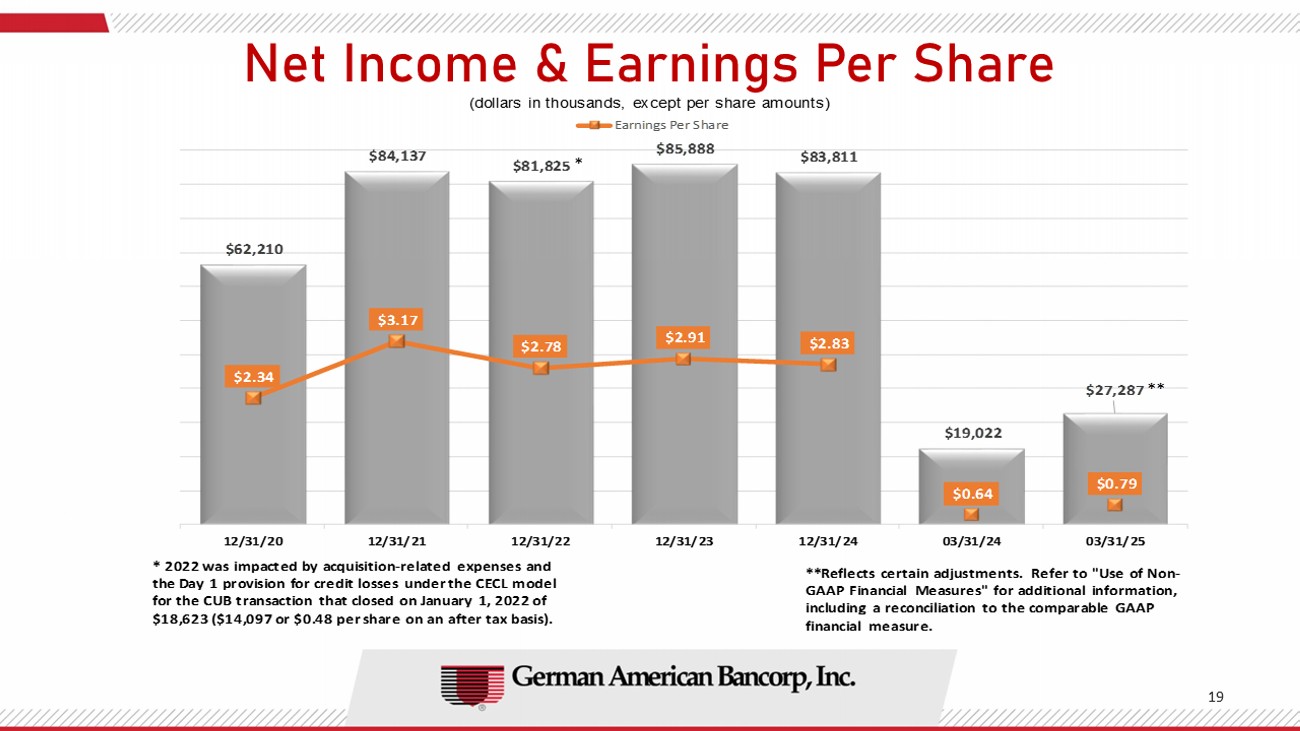
Refer to "Use of Non - GAAP Financial Measures" for additional information, including a reconciliation to the comparable GAAP financial measure. ** C›ã0ÂÈÁ›ˬ‚د©ÜV›Ø]‚Ø› 19 $62,210 $84,137 $81,825 $85,888 $83,811 $19,022 $27,287 $2.34 $3.17 $2.78 $2.91 $2.83 $0.64 $0.79 12/31/20 12/31/21 12/31/22 12/31/23 12/31/24 03/31/24 03/31/25 Earnings Per Share * 2022 was impacted by acquisition - related expenses and the Day 1 provision for credit losses under the CECL model for the CUB transaction that closed on January 1, 2022 of $18,623 ($14,097 or $0.48 per share on an after tax basis). * (dollars in thousands, except per share amounts) ** **Reflects certain adjustments. Refer to "Use of Non - GAAP Financial Measures" for additional information, including a reconciliation to the comparable GAAP financial measure.
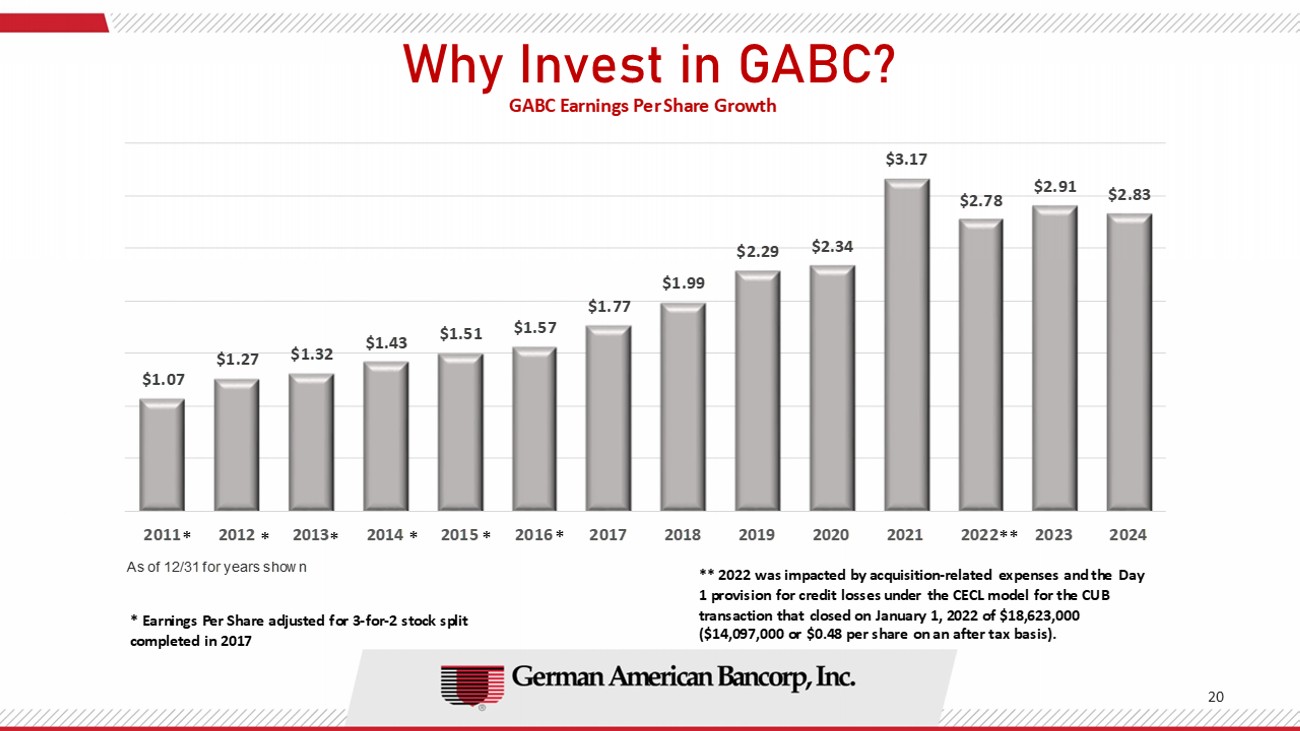
wö0Âó›Üã¯Â*ʓ 20 $1.07 $1.27 $1.32 $1.43 $1.51 $1.57 $1.77 $1.99 $2.29 $2.34 $3.17 $2.78 $2.91 $2.83 2011 2012 2013 2014 2015 2016 2017 2018 2019 2020 2021 2022 2023 2024 As of 12/31 for years shown * Earnings Per Share adjusted for 3 - for - 2 stock split completed in 2017 ** 2022 was impacted by acquisition - related expenses and the Day 1 provision for credit losses under the CECL model for the CUB transaction that closed on January 1, 2022 of $18,623,000 ($14,097,000 or $0.48 per share on an after tax basis).
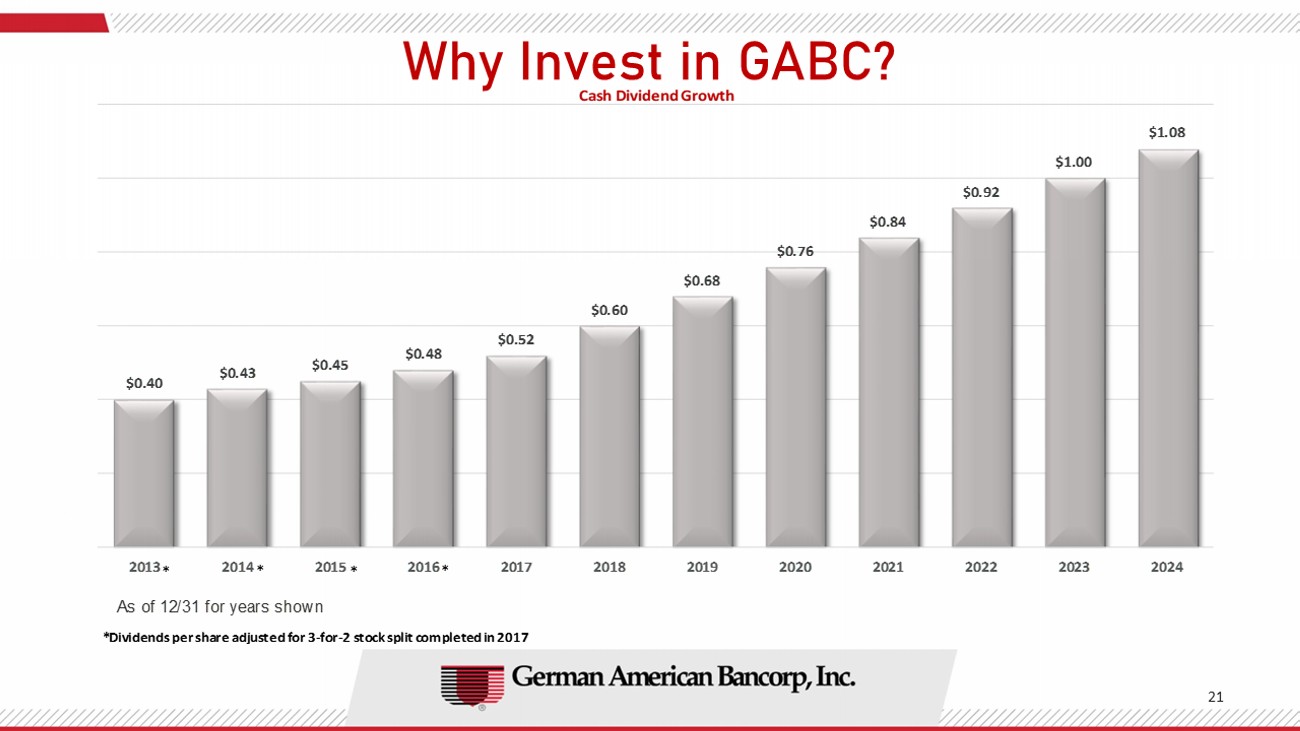
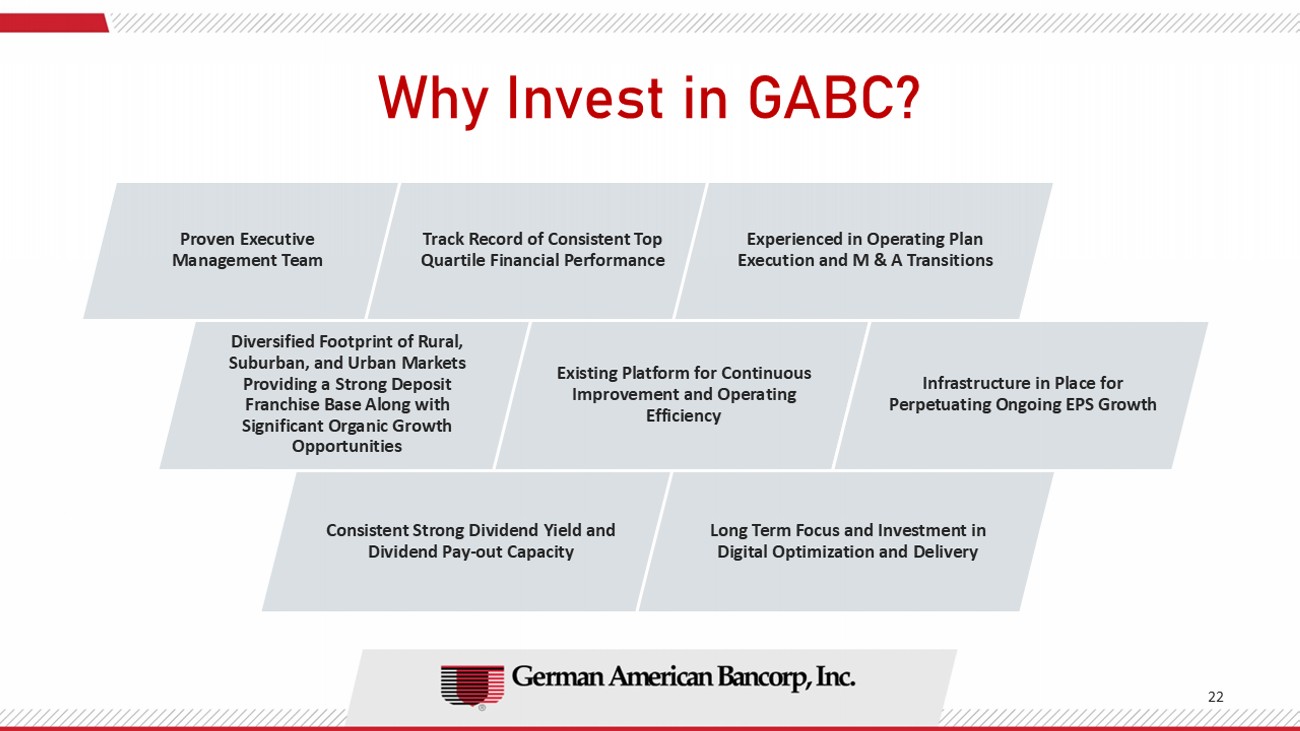
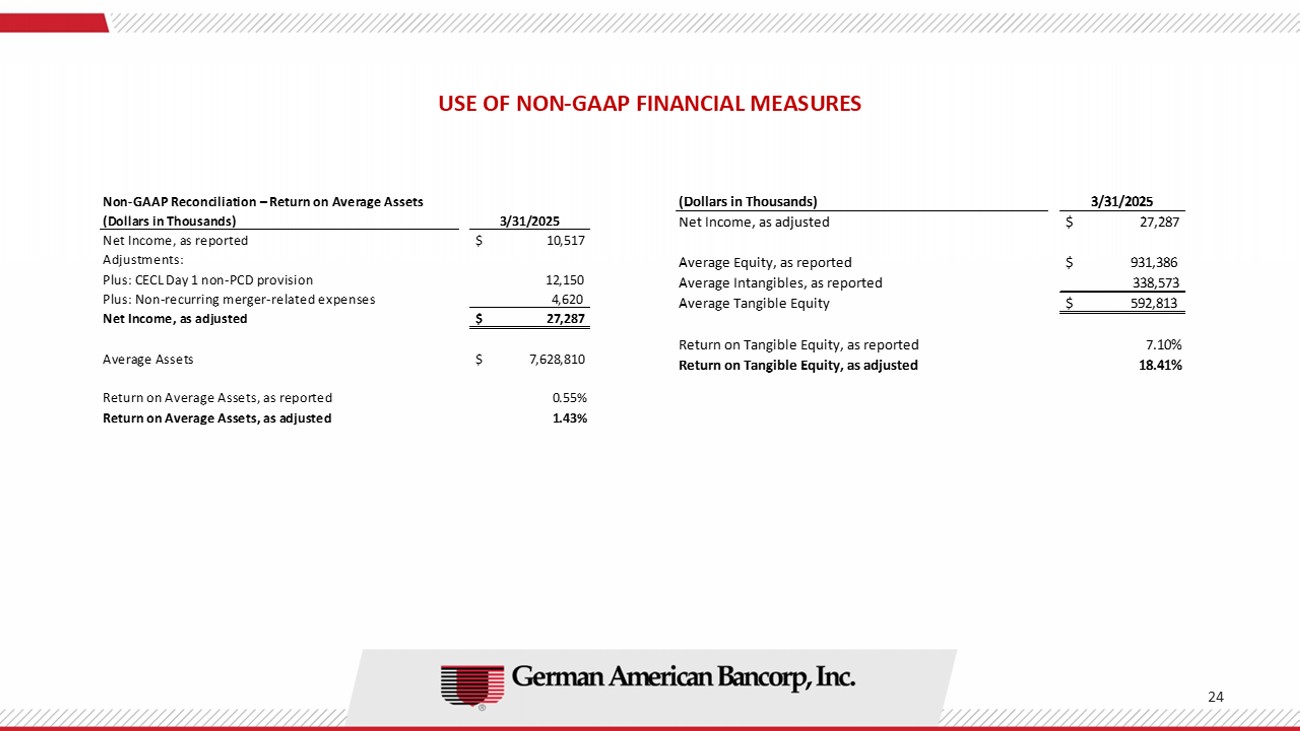
** * * * * * * GABC Earnings Per Share Growth wö0Âó›Üã¯Â*ʓ 21 $0.40 $0.43 $0.45 $0.48 $0.52 $0.60 $0.68 $0.76 $0.84 $0.92 $1.00 $1.08 2013 2014 2015 2016 2017 2018 2019 2020 2021 2022 2023 2024 *Dividends per share adjusted for 3 - for - 2 stock split completed in 2017 As of 12/31 for years shown * * * * Cash Dividend Growth wö0Âó›Üã¯Â*ʓ 22 Diversified Footprint of Rural, Suburban, and Urban Markets Providing a Strong Deposit Franchise Base Along with Significant Organic Growth Opportunities Existing Platform for Continuous Improvement and Operating Efficiency Infrastructure in Place for Perpetuating Ongoing EPS Growth Consistent Strong Dividend Yield and Dividend Pay - out Capacity Long Term Focus and Investment in Digital Optimization and Delivery Proven Executive Management Team Track Record of Consistent Top Quartile Financial Performance Experienced in Operating Plan Execution and M & A Transitions USE OF NON - GAAP FINANCIAL MEASURES The accounting and reporting policies of German American Bancorp, Inc . (the “Company”) conform to U . S . generally accepted accounting principles (“GAAP”) and general practices within the banking industry . As a supplement to GAAP, the Company has provided certain, non - GAAP financial measures, which it believes are useful because they assist investors in assessing the Company’s operating performance . Specifically, the Company has presented its net income, earnings per share, provision for credit losses, non - interest expense, non - interest income, efficiency ratio, and net interest margin on an as adjusted basis for the periods set forth below to reflect the exclusion of the following items : ( 1 ) the Current Expected Credit Losses (“CECL”) “Day 2 ” provision expense for acquired loans that have only insignificant credit deterioration (i . e . , non - PCD loans) related to the Heartland merger ; and ( 2 ) non - recurring expenses related to the Heartland merger . Management believes excluding such items from these financial measures may be useful in assessing the Company’s underlying operational performance since the applicable transactions do not pertain to its core business operations and exclusion may facilitate better comparability between periods . In addition, management believes that by excluding such items the measures are useful to the Company, as well as analysts and investors, in assessing operating performance . Management also believes excluding these items may enhance comparability for peer comparison purposes . Management believes that it is standard practice in the banking industry to present the efficiency ratio and net interest margin on a fully tax - equivalent basis and that, by doing so, it may enhance comparability for peer comparison purposes . The tax - equivalent adjustment to net interest income (for purposes of the efficiency ratio) and net interest margin recognizes the income tax savings when comparing taxable and tax - exempt assets . Interest income and yields on tax - exempt securities and loans are presented using the current federal income tax rate of 21 % . Although intended to enhance investors’ understanding of the Company’s business and performance, these non - GAAP financial measures should not be considered an alternative to GAAP . 23 USE OF NON - GAAP FINANCIAL MEASURES 24 Non-GAAP Reconciliation – Return on Average Assets (Dollars in Thousands) 3/31/2025 Net Income, as reported $ 10,517 Adjustments: Plus: CECL Day 1 non-PCD provision 12,150 Plus: Non-recurring merger-related expenses 4,620 Net Income, as adjusted $ 27,287 Average Assets $ 7,628,810 Return on Average Assets, as reported 0.55% Return on Average Assets, as adjusted 1.43% (Dollars in Thousands) 3/31/2025 Net Income, as adjusted $ 27,287 Average Equity, as reported $ 931,386 Average Intangibles, as reported 338,573 Average Tangible Equity $ 592,813 Return on Tangible Equity, as reported 7.10% Return on Tangible Equity, as adjusted 18.41%
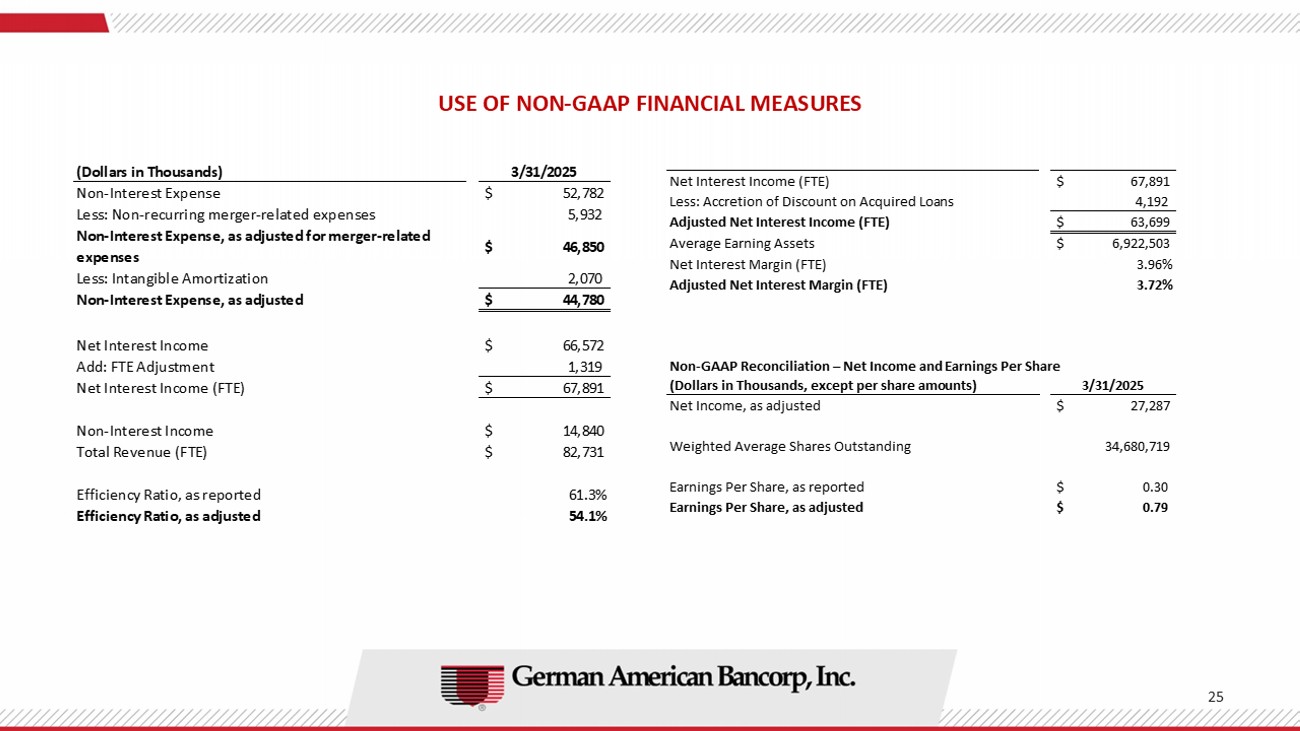
USE OF NON - GAAP FINANCIAL MEASURES 25 (Dollars in Thousands) 3/31/2025 Non-Interest Expense $ 52,782 Less: Non-recurring merger-related expenses 5,932 Non-Interest Expense, as adjusted for merger-related expenses $ 46,850 Less: Intangible Amortization 2,070 Non-Interest Expense, as adjusted $ 44,780 Net Interest Income $ 66,572 Add: FTE Adjustment 1,319 Net Interest Income (FTE) $ 67,891 Non-Interest Income $ 14,840 Total Revenue (FTE) $ 82,731 Efficiency Ratio, as reported 61.3% Efficiency Ratio, as adjusted 54.1% Net Interest Income (FTE) $ 67,891 Less: Accretion of Discount on Acquired Loans 4,192 Adjusted Net Interest Income (FTE) $ 63,699 Average Earning Assets $ 6,922,503 Net Interest Margin (FTE) 3.96% Adjusted Net Interest Margin (FTE) 3.72% Non-GAAP Reconciliation – Net Income and Earnings Per Share (Dollars in Thousands, except per share amounts) 3/31/2025 Net Income, as adjusted $ 27,287 Weighted Average Shares Outstanding 34,680,719 Earnings Per Share, as reported $ 0.30 Earnings Per Share, as adjusted $ 0.79

26