UNITED STATES
SECURITIES AND EXCHANGE COMMISSION
Washington, D.C. 20549
Form 6-K
REPORT OF FOREIGN PRIVATE ISSUER PURSUANT TO
RULE
13a-16 OR 15d-16 UNDER
THE SECURITIES EXCHANGE ACT OF 1934
For the month of May 2025
Commission File Number: 001-34936
Noah Holdings Limited
(Registrant’s name)
No. 1226, South Shenbin Road, Minhang District,
Shanghai, People’s Republic of China
+86 (21) 8035-8292
(Address of principal executive office)
Indicate by check mark whether the registrant files or will file annual reports under cover Form 20-F or Form 40-F.
Form 20-F x Form 40-F ¨
EXHIBIT INDEX
Exhibit 99.1 Press Release - Unaudited Financial Results for the First Quarter 2025
Exhibit 99.2 Next Day Disclosure Return Dated May 26, 2025
Exhibit 99.3 Next Day Disclosure Return Dated May 28, 2025
SIGNATURE
Pursuant to the requirements of the Securities Exchange Act of 1934, the registrant has duly caused this report to be signed on its behalf by the undersigned, thereunto duly authorized.
| Noah Holdings Limited | ||
| By: | /s/ Qing Pan | |
| Name: | Qing Pan | |
| Title: | Chief Financial Officer | |
| Date: May 28, 2025 | ||
Exhibit 99.1
NOAH HOLDINGS LIMITED ANNOUNCES UNAUDITED
FINANCIAL RESULTS FOR THE FIRST QUARTER OF 2025
SHANGHAI, May 29, 2025 — Noah Holdings Limited ("Noah" or the "Company") (NYSE: NOAH and HKEX: 6686), a leading and pioneer wealth management service provider offering comprehensive one-stop advisory services on global investment and asset allocation primarily for global Chinese high-net-worth investors, today announced its unaudited financial results for the first quarter of 2025.
Starting from the fourth quarter of 2024, the Company has adopted refined segment reporting structure to disclose net revenue by each domestic and overseas business segment. The Company believes that this will better reflect its recent operational adjustments and organizational restructuring, providing investors with a clearer understanding of the financial performance and strategic progress of each business segment. Historical financial information has been recast to conform to the new structure, and additional business information is provided for comparison purposes.
FIRST QUARTER 2025 FINANCIAL HIGHLIGHTS
| · | Net revenues for the first quarter of 2025 were RMB614.6 million (US$84.7 million), a 5.4% decrease from the corresponding period in 2024, mainly due to a decrease in distribution of insurance products. Net revenues decreased by 5.7% from the fourth quarter of 2024, primarily due to decreases in performance-based income generated from RMB private equity products and private secondary products and recurring service fees generated from RMB private equity products. |
Net revenues from overseas for the first quarter of 2025 was RMB304.2 million (US$41.9 million), compared with RMB306.7 million for the corresponding period in 2024, which was effectively flat. Net revenues increased by 5.0% from the fourth quarter of 2024, primarily due to increases in distribution of overseas insurance products.
| · | Income from operations for the first quarter of 2025 was RMB186.0 million (US$25.6 million), a 53.1% increase from the corresponding period in 2024, primarily due to a 21.8% decrease in compensation and benefits. |
| · | Net income attributable to Noah shareholders for the first quarter of 2025 was RMB149.0 million (US$20.5 million), a 13.3% increase from the corresponding period in 2024, mainly due to a 53.1% increase in income from operations, and partially offset by a 29.0% decrease in interest income, a 42.0% increase in income tax expenses and a loss from equity in affiliates. |
| · | Non-GAAP1 net income attributable to Noah shareholders for the first quarter of 2025 was RMB168.8 million (US$23.3 million), a 4.7% increase from the corresponding period in 2024. |
FIRST QUARTER 2025 OPERATIONAL UPDATES
Wealth Management Business
Noah offers global investment products and provides value-added services to global Chinese high-net-worth investors in its wealth management business. Noah primarily distributes private equity, private secondary, mutual funds and other products denominated in RMB, USD and other currencies.
| · | Total number of registered clients as of March 31, 2025 was 463,161, a 1.2% increase from March 31, 2024, and a 0.2% increase from December 31, 2024. Among such clients, the number of overseas registered clients as of March 31, 2025 was 18,207, a 15.8% increase from March 31, 2024 and a 3.1% increase from December 31, 2024. |
| · | Total number of active clients2 who transacted with us during the first quarter of 2025 was 8,822, a 15.1% decrease from the first quarter of 2024, and a 0.5% decrease from the fourth quarter of 2024. Among such clients, the number of overseas active clients who transacted with us during the first quarter of 2025 was 3,384, a 23.3% increase from the first quarter of 2024, and a 16.1% increase from the fourth quarter of 2024. |
| 1 | Noah’s Non-GAAP financial measures are its corresponding GAAP financial measures excluding the effects of all forms of share-based compensation and net of relevant tax impact, if any. See “Reconciliation of GAAP to Non- GAAP Results” at the end of this press release. | |
| 2 | “Active clients” for a given period refers to registered investors who purchase investment products distributed or receive services provided by us during that given period. |
|
|
| · | Aggregate value of investment products distributed during the first quarter of 2025 was RMB16.1 billion (US$2.2 billion), a 14.7% decrease from the first quarter of 2024, mainly due to a 39.8% decrease in distribution of mutual fund products. Among such products distributed, Noah distributed RMB8.1 billion (US$1.1 billion) of overseas investment products, a 3.6% decrease from the first quarter of 2024, mainly due to a 13.2% decrease in distribution of mutual fund products and partially offset by a 25.0% increase in distribution of private equity products. |
The aggregate value of investment products distributed, categorized by product type, is as follows:
| Three months ended March 31, | ||||||||||||||||
| 2024 | 2025 | |||||||||||||||
| (RMB in billions, except percentages) | ||||||||||||||||
| Mutual fund products | 12.6 | 66.8 | % | 7.6 | 47.2 | % | ||||||||||
| Private secondary products | 3.8 | 20.0 | % | 6.1 | 37.9 | % | ||||||||||
| Private equity products | 1.2 | 6.3 | % | 1.5 | 9.3 | % | ||||||||||
| Other products3 | 1.3 | 6.9 | % | 0.9 | 5.6 | % | ||||||||||
| All products | 18.9 | 100.0 | % | 16.1 | 100.0 | % | ||||||||||
The aggregate value of investment products distributed, categorized by geography, is as follows:
| Three months ended March 31, | ||||||||||||||||
| Type of products in Mainland China | 2024 | 2025 | ||||||||||||||
| (RMB in billions, except percentages) | ||||||||||||||||
| Mutual fund products | 8.8 | 84.3 | % | 4.3 | 53.7 | % | ||||||||||
| Private secondary products | 1.0 | 8.8 | % | 3.3 | 41.3 | % | ||||||||||
| Other products | 0.7 | 6.9 | % | 0.4 | 5.0 | % | ||||||||||
| All products in Mainland China | 10.5 | 100.0 | % | 8.0 | 100.0 | % | ||||||||||
| Three months ended March 31, | ||||||||||||||||
| Type of overseas products | 2024 | 2025 | ||||||||||||||
| (RMB in billions, except percentages) | ||||||||||||||||
| Mutual fund products | 3.8 | 44.9 | % | 3.3 | 40.7 | % | ||||||||||
| Private secondary products | 2.8 | 33.9 | % | 2.8 | 34.6 | % | ||||||||||
| Private equity products | 1.2 | 14.2 | % | 1.5 | 18.5 | % | ||||||||||
| Other products | 0.6 | 7.0 | % | 0.5 | 6.2 | % | ||||||||||
| All Overseas products | 8.4 | 100.0 | % | 8.1 | 100.0 | % | ||||||||||
| · | Coverage network in mainland China included 11 cities as of March 31, 2025, compared with 18 cities as of March 31, 2024 and 11 cities as of December 31, 2024, primarily due to the continued streamlining of the Company’s domestic coverage network. |
| · | Aggregate number of overseas relationship managers was 131 as of March 31, 2025, a 44.0% increase from March 31, 2024, and a 5.1% decrease from December 31, 2024. |
| 3 | “Other products” refers to other investment products, which includes insurance products, multi-strategies products and others. |
|
|
Asset Management Business
Our asset management business is conducted through Gopher Asset Management Co., Ltd. ("Gopher Asset Management" or “Gopher”), a leading multi-asset manager in China, and Olive Asset Management Co., Ltd. (“Olive Asset Management” or “Olive”), as the overseas asset management brand focused on providing global investment solutions with offices in Hong Kong and the United States. Gopher Asset Management and Olive Asset Management develop and manage assets ranging from private equity, real estate, public securities to multi-strategy investments denominated in RMB, USD and other currencies.
| · | Total assets under management as of March 31, 2025 remained relatively stable at RMB149.3 billion (US$20.6 billion), compared with RMB153.3 billion as of March 31, 2024 and RMB151.5 billion as of December 31, 2024. Mainland China assets under management as of March 31, 2025 were RMB106.6 billion (US$14.7 billion), compared with RMB116.1 billion as of March 31, 2024 and RMB108.9 billion as of December 31, 2024. Overseas assets under management as of March 31, 2025 were RMB42.7 billion (US$5.9 billion), compared with RM37.2 billion as of March 31, 2024 and RMB42.6 billion as of December 31, 2024. |
Total assets under management, categorized by investment type, are as follows:
| Investment type | As of December 31, 2024 |
Growth | Allocation/ Redemption 4 |
As of March 31, 2025 |
||||||||||||||||||||
| (RMB billions, except percentages) | ||||||||||||||||||||||||
| Private equity | 131.5 | 86.8 | % | 0.4 | 1.5 | 130.4 | 87.4 | % | ||||||||||||||||
| Public securities5 | 9.4 | 6.2 | % | 1.6 | 1.6 | 9.4 | 6.3 | % | ||||||||||||||||
| Real estate | 6.2 | 4.1 | % | - | 1.1 | 5.1 | 3.4 | % | ||||||||||||||||
| Multi-strategies | 3.9 | 2.6 | % | - | - | 3.9 | 2.6 | % | ||||||||||||||||
| Others | 0.5 | 0.3 | % | - | - | 0.5 | 0.3 | % | ||||||||||||||||
| All Investments | 151.5 | 100.0 | % | 2.0 | 4.2 | 149.3 | 100.0 | % | ||||||||||||||||
Total assets under management, categorized by geography, are as follows:
| Mainland China Investment type |
As of December 31, 2024 |
Growth | Allocation/ Redemption |
As of March 31, 2025 |
||||||||||||||||||||
| (RMB billions, except percentages) | ||||||||||||||||||||||||
| Private equity | 98.6 | 90.5 | % | - | 1.3 | 97.3 | 91.2 | % | ||||||||||||||||
| Public securities | 5.3 | 4.9 | % | 0.5 | 0.5 | 5.3 | 5.0 | % | ||||||||||||||||
| Real estate | 2.2 | 2.0 | % | - | 1.0 | 1.2 | 1.1 | % | ||||||||||||||||
| Multi-strategies | 2.3 | 2.1 | % | - | - | 2.3 | 2.2 | % | ||||||||||||||||
| Others | 0.5 | 0.5 | % | - | - | 0.5 | 0.5 | % | ||||||||||||||||
| All Investments | 108.9 | 100.0 | % | 0.5 | 2.8 | 106.6 | 100.0 | % | ||||||||||||||||
| Overseas Investment type | As of December 31, 2024 |
Growth | Allocation/ Redemption |
As of March 31, 2025 |
||||||||||||||||||||
| (RMB billions, except percentages) | ||||||||||||||||||||||||
| Private equity | 32.9 | 77.2 | % | 0.4 | 0.2 | 33.1 | 77.5 | % | ||||||||||||||||
| Public securities | 4.1 | 9.6 | % | 1.1 | 1.1 | 4.1 | 9.6 | % | ||||||||||||||||
| Real estate | 4.0 | 9.4 | % | - | 0.1 | 3.9 | 9.1 | % | ||||||||||||||||
| Multi-strategies | 1.6 | 3.8 | % | - | - | 1.6 | 3.8 | % | ||||||||||||||||
| All Investments | 42.6 | 100.0 | % | 1.5 | 1.4 | 42.7 | 100.0 | % | ||||||||||||||||
| 4 | The asset allocation/redemption of overseas investment products includes the fluctuation result of foreign currencies exchange rate. | |
| 5 | The asset allocation/redemption of public securities also includes market appreciation or depreciation. |
|
|
Other Businesses
Noah's other businesses mainly include providing clients with additional comprehensive services and investment products. Operating results for other businesses (under the Company’s traditional segmentation) also include headquarters rental income, depreciation and amortization, as well as operating expenses.
Ms. Jingbo Wang, co-founder and chairwoman of Noah, commented, “We have been making progress since last year in repositioning ourselves to drive growth in this challenging market environment. We are delighted to announce that the Group achieved a recovery in profitability this quarter, reflecting improved operational efficiency and strategic progress. Income from operations grew by 53.1% year-on-year and 35.2% quarter-on-quarter, while non-GAAP net profit rose by 27.4% quarter-on-quarter. Net revenues declined due to a decrease in distribution of domestic insurance products and RMB private equity management fees; however, overseas revenue continued to grow and now accounts for nearly 50% of total net revenues, showcasing our diversification efforts. Looking ahead, we remain committed to advancing our strategy, driving sustainable growth, and delivering reasonable shareholders returns.”
FIRST QUARTER 2025 FINANCIAL RESULTS
Net Revenues
Net revenues for the first quarter of 2025 were RMB614.6 million (US$84.7 million), a 5.4% decrease from the corresponding period in 2024, mainly due to a decrease in distribution of insurance products.
Net Revenues under the segmentation adopted in Q4 2024 is as follows:
| (RMB millions, except percentages) | Q1 2024 | Q1 2025 | YoY Change | |||||||||
| Domestic public securities6 | 119.0 | 127.5 | 7.1 | % | ||||||||
| Domestic asset management7 | 194.9 | 167.0 | (14.3 | )% | ||||||||
| Domestic insurance8 | 18.7 | 6.4 | (65.6 | )% | ||||||||
| Overseas wealth management9 | 178.5 | 162.0 | (9.2 | )% | ||||||||
| Overseas asset management10 | 91.6 | 112.0 | 22.3 | % | ||||||||
| Overseas insurance and comprehensive services11 | 36.7 | 30.2 | (17.8 | )% | ||||||||
| Headquarters | 10.1 | 9.5 | (5.5 | )% | ||||||||
| Total net revenues | 649.5 | 614.6 | (5.4 | )% | ||||||||
| · | Domestic public securities is the business that distributes mutual funds and private secondary products. Net revenues for the first quarter of 2025 were RMB127.5 million (US$17.6 million), a 7.1% increase from the corresponding period in 2024, mainly due to an increase in distribution of private secondary products. |
| 6 | Operates under the Noah Upright brand | |
| 7 | Operates under the Gopher Asset Management brand | |
| 8 | Operates under the Glory brand | |
| 9 | Operates under the ARK Wealth Management brand | |
| 10 | Operates under the Olive Asset Management brand | |
| 11 | Operates under the Glory Family Heritage brand |
|
|
| · | Domestic asset management is the business that manages RMB-denominated private equity funds and private secondary products. Net revenues for the first quarter of 2025 were RMB167.0 million (US$23.0 million), a 14.3% decrease from the corresponding period in 2024, primarily due to decreases in recurring service fees generated from private equity products. |
| · | Domestic insurance is the business that distributes insurance products, consisting mainly of life and health insurance products. Net revenues for the first quarter of 2025 were RMB6.4 million (US$0.9 million), a 65.6% decrease from the corresponding period in 2024, mainly due to a decrease in distribution of insurance products. |
| · | Overseas wealth management is the business that provides offline and online wealth management services. Net revenues for the first quarter of 2025 were RMB162.0 million (US$22.3 million), a 9.2% decrease from the corresponding period in 2024, mainly due to a decrease in allocated commission gained from distribution of overseas insurance products. |
| · | Overseas asset management is the business that manages USD-denominated private equity funds and private secondary products. Net revenues for the first quarter of 2025 were RMB112.0 million (US$15.4 million),a 22.3% increase from the corresponding period in 2024, due to an increase in the amount of private equity investments managed by Olive. |
| · | Overseas insurance and comprehensive services is the business that provides comprehensive overseas services such as insurance, trust services and other services. Net revenues for the first quarter of 2025 were RMB30.2 million (US$4.2 million), a 17.8% decrease from the corresponding period in 2024, mainly due to a decrease in distribution of overseas insurance products. |
| · | Headquarters reflects revenue generated from corporate operations at the Company’s headquarters in Shanghai as well as administrative costs and expenses that were not directly allocated to the aforementioned six business segments. Net revenues during the first quarter of 2025 were RMB9.5 million (US$1.3 million), compared with RMB10.1 million for the corresponding period in 2024, which effectively remained flat. |
Operating Costs and Expenses
Operating costs and expenses for the first quarter of 2025 were RMB428.6 million (US$59.1 million), an 18.8% decrease from the corresponding period in 2024. Operating costs and expenses for the first quarter of 2025 primarily consisted of (i) compensation and benefits of RMB303.9 million (US$41.9 million); (ii) selling expenses of RMB51.1 million (US$7.0 million); (iii) general and administrative expenses of RMB64.4 million (US$8.9 million); (iv) provision for credit losses of RMB2.8 million (US$0.4 million); (v) other operating expenses of RMB15.7 million (US$2.2 million); and (vi) income gained from government subsidies of RMB9.3 million (US$1.3 million).
| · | Operating costs and expenses for Domestic public securities for the first quarter of 2025 were RMB32.5 million (US$4.5 million), a 16.4% decrease from the corresponding period in 2024, primarily due to the decrease in relationship manager compensation. |
| · | Operating costs and expenses for Domestic asset management for the first quarter of 2025 were RMB31.1 million (US$4.3 million), a 10.8% decrease from the corresponding period in 2024, primarily due to the decrease in general and administrative expenses. |
| · | Operating costs and expenses for Domestic insurance for the first quarter of 2025 were RMB22.2 million (US$3.1 million), a 50.9% decrease from the corresponding period in 2024, primarily due to the decrease in consulting fee. |
| · | Operating costs and expenses for Overseas wealth management for the first quarter of 2025 were RMB104.0 million (US$14.3 million), a 40.2% decrease from the corresponding period in 2024, primarily due to the decrease in marketing activities and travel expenses. |
| · | Operating costs and expenses for Overseas asset management for the first quarter of 2025 were RMB21.8 million (US$3.0 million), a 4.6% decrease from the corresponding period in 2024, which effectively remained flat. |
|
|
| · | Operating costs and expenses for Overseas insurance and comprehensive services for the first quarter of 2025 were RMB27.5 million (US$3.8 million), a 52.8% increase from the corresponding period in 2024, primarily due to the increase in other operating expenses. |
| · | Operating costs and expenses for Headquarters for the first quarter of 2025 were RMB189.6 million (US$26.1 million), a 2.5% decrease from the corresponding period in 2024, which effectively remained flat. |
Income(loss) from operations
Income(loss) from operations under the segmentation adopted in Q4 2024 is as follows:
(RMB millions, except percentages) |
Q1 2024 | Q1 2025 | YoY Change | |||||||||
| Domestic public securities | 80.3 | 95.0 | 18.4 | % | ||||||||
| Domestic asset management | 160.1 | 135.9 | (15.1 | )% | ||||||||
| Domestic insurance | (26.5 | ) | (15.7 | ) | 40.6 | % | ||||||
| Overseas wealth management | 4.7 | 58.1 | 1129.6 | % | ||||||||
| Overseas asset management | 68.7 | 90.1 | 31.2 | % | ||||||||
| Overseas insurance and comprehensive services | 18.7 | 2.7 | (85.4 | )% | ||||||||
| Headquarters | (184.5 | ) | (180.1 | ) | 2.4 | % | ||||||
| Total income from operations | 121.5 | 186.0 | 53.1 | % | ||||||||
| · | Income from operations for Domestic public securities for the first quarter of 2025 was RMB95.0 million (US$13.1 million), an 18.4% increase from the corresponding period in 2024, primarily due to increases in one-time commissions generated from private secondary products. |
| · | Income from operations for Domestic asset management for the first quarter of 2025 RMB135.9 million (US$18.7 million), a 15.1% decrease from the corresponding period in 2024, primarily due to decreases in recurring service fees generated from RMB private equity products. |
| · | Loss from operations for Domestic insurance for the first quarter of 2025 was RMB15.7 million (US$2.2 million), a 40.6% decrease from the corresponding period in 2024, primarily due to the decrease in operating expenses. |
| · | Income from operations for Overseas wealth management for the first quarter of 2025 was RMB58.1 million (US$8.0 million), compared with RMB4.7 million for the corresponding period in 2024, primarily due to a decrease in compensation and benefits in the first quarter of 2025. |
| · | Income from operations for Overseas asset management for the first quarter of 2025 was RMB90.1 million (US$12.4 million), a 31.2% increase from the corresponding period in 2024, primarily due to a 22.3% increase in net revenues of the segment. |
| · | Income from operations for Overseas insurance and comprehensive services for the first quarter of 2025 RMB2.7 million (US$0.4 million), an 85.4% decrease from the corresponding period in 2024, primarily due to a 17.8% decrease in net revenues of the segment and an increase in operating expenses. |
| · | Loss from operations for Headquarters for the first quarter of 2025 was RMB180.1 million (US$24.8 million), a 2.4% slight decrease from the corresponding period in 2024. |
|
|
Operating Margin
Operating margin for the first quarter of 2025 was 30.3%, compared with 18.7% for the corresponding period in 2024, primarily due to a 21.8% decrease in compensation and benefits.
Interest Income
Interest income for the first quarter of 2025 was RMB32.8 million (US$4.5 million), a 29.0% decrease from the corresponding period in 2024.
Investment Income
Investment income for the first quarter of 2025 was RMB6.3 million (US$0.9 million), a 20.9% increase from the corresponding period in 2024.
Income Tax Expense
Income tax expense for the first quarter of 2025 were RMB60.6 million (US$8.4 million), a 42.0% increase from the corresponding period in 2024.
Net Income
| · | Net Income |
| · | Net income for the first quarter of 2025 was RMB149.8 million (US$20.6 million), a 13.6% increase from the corresponding period in 2024. |
| · | Net margin for the first quarter of 2025 was 24.4%, up from 20.3% for the corresponding period in 2024. |
| · | Net income attributable to Noah shareholders for the first quarter of 2025 was RMB149.0 million (US$20.5 million), a 13.3% increase from the corresponding period in 2024. |
| · | Net margin attributable to Noah shareholders for the first quarter of 2025 was 24.2%, up from 20.2% for the corresponding period in 2024. |
| · | Net income attributable to Noah shareholders per basic and diluted ADS for the first quarter of 2025 was RMB2.13 (US$0.29) and RMB2.11 (US$0.29), compared with RMB1.88 and RMB1.88 for the corresponding period in 2024, respectively. |
| · | Non-GAAP Net Income Attributable to Noah Shareholders |
| · | Non-GAAP net income attributable to Noah shareholders for the first quarter of 2025 was RMB168.8 million (US$23.3 million), a 4.7% increase from the corresponding period in 2024. |
| · | Non-GAAP net margin attributable to Noah shareholders for the first quarter of 2025 was 27.5%, up from 24.8% for the corresponding period in 2024. |
| · | Non-GAAP net income attributable to Noah shareholders per diluted ADS for the first quarter of 2025 was RMB2.39 (US$0.33), up from RMB2.31 for the corresponding period in 2024. |
Balance Sheet and Cash Flow
As of March 31, 2025, the Company had RMB4,075.4 million (US$561.6 million) in cash and cash equivalents, compared with RMB3,822.3 million as of December 31, 2024 and RMB5,129.4 million as of March 31, 2024, respectively.
Net cash inflow from the Company’s operating activities during the first quarter of 2025 was RMB253.4 million (US$34.9 million), compared with net cash outflow of RMB181.8 million in the corresponding period in 2024, primarily due to cash inflow generated from net income from operations in the first quarter of 2025.
|
|
Net cash inflow from the Company’s investing activities during the first quarter of 2025 was RMB20.0 million (US$2.8 million), compared with net cash outflow of RMB59.1 million in the corresponding period in 2024, primarily due to increased redemptions of term deposits in the first quarter of 2025.
Net cash outflow to the Company’s financing activities was RMB9.4 million (US$1.3 million) in the first quarter of 2025, compared with net cash outflow of RMB12.3 million in the corresponding period in 2024.
CONFERENCE CALL
Senior management will host a combined English and Chinese language conference call to discuss the Company’s first quarter of 2025 unaudited financial results and recent business activities.
The conference call will be accessed via Zoom webinar with the following details:
Dial-in details:
| Conference title: | Noah First Quarter 2025 Earnings Conference Call |
| Date/Time: | Wednesday, May 28, 2025, at 8:00 p.m., U.S. Eastern Time |
| Thursday, May 29, 2025, at 8:00 a.m., Hong Kong Time | |
| Dial in: | |
| – Hong Kong Toll Free: | 800-963976 |
| – United States Toll Free: | 1-888-317-6003 |
| – Mainland China Toll Free: | 4001-206115 |
| – International Toll: | 1-412-317-6061 |
| Participant Password: | 1593238 |
A telephone replay will be available starting approximately one hour after the end of the conference until June 5, 2025 at 1-877-344-7529 (US Toll Free) and 1-412-317-0088 (International Toll) with the access code 9541104.
A live and archived webcast of the conference call will be available at the Company’s investor relations website under the “Financial Reports” section at http://ir.noahgroup.com.
DISCUSSION ON NON-GAAP MEASURES
In addition to disclosing financial results prepared in accordance with U.S. GAAP, the Company’s earnings release contains non-GAAP financial measures excluding the effects of all forms of share-based compensation, non-cash settlement expenses or reversal and net of tax impact, if any. See “Reconciliation of GAAP to Non-GAAP Results” at the end of this press release.
The non-GAAP financial measures disclosed by the Company should not be considered a substitute for financial measures prepared in accordance with U.S. GAAP. The financial results reported in accordance with U.S. GAAP and reconciliation of GAAP to non-GAAP results should be carefully evaluated. The non-GAAP financial measures used by the Company may be prepared differently from and, therefore, may not be comparable to similarly titled measures used by other companies.
When evaluating the Company’s operating performance in the periods presented, management reviewed the foregoing non-GAAP net income attributable to Noah shareholders and per diluted ADS and non-GAAP net margin attributable to Noah shareholders to supplement U.S. GAAP financial data. As such, the Company’s management believes that the presentation of the non-GAAP financial measures provides important supplemental information to investors regarding financial and business trends relating to its results of operations in a manner consistent with that used by management.
|
|
ABOUT NOAH HOLDINGS LIMITED
Noah Holdings Limited (NYSE: NOAH and HKEX: 6686) is a leading and pioneer wealth management service provider offering comprehensive one-stop advisory services on global investment and asset allocation primarily for global Chinese high-net-worth investors. Noah's American depositary shares, or ADSs, are listed on the New York Stock Exchange under the symbol "NOAH," and its shares are listed on the main board of the Hong Kong Stock Exchange under the stock code "6686." One ADS represents five ordinary shares, par value $0.00005 per share.
In the first quarter of 2025, Noah distributed RMB16.1 billion (US$2.2 billion) of investment products. Through Gopher Asset Management and Olive Asset Management, Noah had assets under management of RMB149.3 billion (US$20.6 billion) as of March 31, 2025.
Noah's domestic and overseas wealth management business primarily distributes private equity, public securities and insurance products denominated in RMB and other currencies. Noah's network covers major cities in mainland China, as well as Hong Kong (China), New York, Silicon Valley, Singapore, and Los Angeles. The Company’s wealth management business had 463,161 registered clients as of March 31, 2025. Through its domestic and overseas asset management business operated by Gopher Asset Management and Olive Asset Management, Noah manages private equity, public securities, real estate, multi-strategy and other investments denominated in RMB and other currencies. The Company also provides other businesses.
For more information, please visit Noah at ir.noahgroup.com.
FOREIGN CURRENCY TRANSLATION
In this announcement, the unaudited financial results for the first quarter of 2025 ended March 31, 2025 are stated in RMB. This announcement contains currency conversions of certain RMB amounts into US$ at specified rates solely for the convenience of the reader. Unless otherwise noted, all translations from RMB to US$ are made at a rate of RMB7.2567 to US$1.00, the effective noon buying rate for March 31, 2025 as set forth in the H.10 statistical release of the Federal Reserve Board.
|
|
SAFE HARBOR STATEMENT
This announcement contains forward-looking statements. These statements are made under the “safe harbor” provisions of the U.S. Private Securities Litigation Reform Act of 1995. These forward-looking statements can be identified by terminology such as “will,” “expects,” “anticipates,” “future,” “intends,” “plans,” “believes,” “estimates,” “confident” and similar statements. Noah may also make written or oral forward-looking statements in its periodic reports to the U.S. Securities and Exchange Commission, in its annual report to shareholders, in announcements, circulars or other publications made on the website of The Stock Exchange of Hong Kong Limited (the "Hong Kong Stock Exchange"), in press releases and other written materials and in oral statements made by its officers, directors or employees to third parties. Statements that are not historical facts, including statements about Noah's beliefs and expectations, are forward-looking statements. Forward-looking statements involve inherent risks and uncertainties. These statements include, but are not limited to, estimates regarding the sufficiency of Noah’s cash and cash equivalents and liquidity risk. A number of factors could cause Noah’s actual results to differ materially from those contained in any forward-looking statement, including but not limited to the following: its goals and strategies; its future business development, financial condition and results of operations; the expected growth of the wealth management and asset management market in China and internationally; its expectations regarding demand for and market acceptance of the products it distributes; investment risks associated with investment products distributed to Noah’s investors, including the risk of default by counterparties or loss of value due to market or business conditions or misconduct by counterparties; its expectations regarding keeping and strengthening its relationships with key clients; relevant government policies and regulations relating to its industries; its ability to attract and retain qualified employees; its ability to stay abreast of market trends and technological advances; its plans to invest in research and development to enhance its product choices and service offerings; competition in its industries in China and internationally; general economic and business conditions in China; and its ability to effectively protect its intellectual property rights and not to infringe on the intellectual property rights of others. Further information regarding these and other risks is included in Noah's filings with the U.S. Securities and Exchange Commission and the Hong Kong Stock Exchange. All information provided in this press release and in the attachments is as of the date of this press release, and Noah does not undertake any obligation to update any such information, including forward-looking statements, as a result of new information, future events or otherwise, except as required under the applicable law.
Contacts:
Noah Holdings Limited
Rick Chan
Tel: +86-21-8035-8292
ir@noahgroup.com
-- FINANCIAL AND OPERATIONAL TABLES FOLLOW --
|
|
Noah Holdings Limited
Condensed Consolidated Balance Sheets
(unaudited)
| As of | ||||||||||||
| December 31, | March 31, | March 31, | ||||||||||
| 2024 | 2025 | 2025 | ||||||||||
| RMB'000 | RMB'000 | USD'000 | ||||||||||
| Assets | ||||||||||||
| Current assets: | ||||||||||||
| Cash and cash equivalents | 3,822,339 | 4,075,358 | 561,599 | |||||||||
| Restricted cash | 8,696 | 8,435 | 1,162 | |||||||||
| Short-term investments | 1,274,609 | 1,316,190 | 181,376 | |||||||||
| Accounts receivable, net | 473,490 | 406,167 | 55,971 | |||||||||
| Amounts due from related parties | 499,524 | 536,316 | 73,906 | |||||||||
| Loans receivable, net | 169,108 | 158,990 | 21,909 | |||||||||
| Other current assets | 226,965 | 217,566 | 29,982 | |||||||||
| Total current assets | 6,474,731 | 6,719,022 | 925,905 | |||||||||
| Long-term investments, net | 971,099 | 888,987 | 122,506 | |||||||||
| Investment in affiliates | 1,373,156 | 1,328,980 | 183,138 | |||||||||
| Property and equipment, net | 2,382,247 | 2,368,830 | 326,434 | |||||||||
| Operating lease right-of-use assets, net | 121,115 | 113,827 | 15,686 | |||||||||
| Deferred tax assets | 319,206 | 317,107 | 43,699 | |||||||||
| Other non-current assets | 137,291 | 136,959 | 18,873 | |||||||||
| Total Assets | 11,778,845 | 11,873,712 | 1,636,241 | |||||||||
| Liabilities and Equity | ||||||||||||
| Current liabilities: | ||||||||||||
| Accrued payroll and welfare expenses | 412,730 | 422,444 | 58,214 | |||||||||
| Income tax payable | 63,892 | 75,108 | 10,350 | |||||||||
| Deferred revenues | 72,259 | 72,415 | 9,979 | |||||||||
| Contingent liabilities | 476,107 | 473,328 | 65,226 | |||||||||
| Other current liabilities | 404,288 | 353,214 | 48,674 | |||||||||
| Total current liabilities | 1,429,276 | 1,396,509 | 192,443 | |||||||||
| Deferred tax liabilities | 246,093 | 244,205 | 33,652 | |||||||||
| Operating lease liabilities, non-current | 75,725 | 64,066 | 8,829 | |||||||||
| Other non-current liabilities | 15,011 | 14,003 | 1,930 | |||||||||
| Total Liabilities | 1,766,105 | 1,718,783 | 236,854 | |||||||||
| Equity | 10,012,740 | 10,154,929 | 1,399,387 | |||||||||
| Total Liabilities and Equity | 11,778,845 | 11,873,712 | 1,636,241 | |||||||||
|
|
Noah
Holdings Limited
Condensed Consolidated Income Statements
(In RMB'000, except for ADS data, per ADS data and percentages)
(unaudited)
| Three months ended | ||||||||||||||||
| March 31, | March 31, | March 31, | ||||||||||||||
| 2024 | 2025 | 2025 | Change | |||||||||||||
| RMB'000 | RMB'000 | USD'000 | ||||||||||||||
| Revenues: | ||||||||||||||||
| Revenues from others: | ||||||||||||||||
| One-time commissions | 185,255 | 154,991 | 21,358 | (16.3 | )% | |||||||||||
| Recurring service fees | 155,165 | 151,596 | 20,890 | (2.3 | )% | |||||||||||
| Performance-based income | 5,528 | 13,986 | 1,927 | 153.0 | % | |||||||||||
| Other service fees | 34,960 | 36,863 | 5,080 | 5.4 | % | |||||||||||
| Total revenues from others | 380,908 | 357,436 | 49,255 | (6.2 | )% | |||||||||||
| Revenues from funds Gopher/Olive manages: | ||||||||||||||||
| One-time commissions | 1,827 | 3,750 | 517 | 105.3 | % | |||||||||||
| Recurring service fees | 262,689 | 244,380 | 33,676 | (7.0 | )% | |||||||||||
| Performance-based income | 8,844 | 14,529 | 2,002 | 64.3 | % | |||||||||||
| Total revenues from funds Gopher/Olive manages | 273,360 | 262,659 | 36,195 | (3.9 | )% | |||||||||||
| Total revenues | 654,268 | 620,095 | 85,450 | (5.2 | )% | |||||||||||
| Less: VAT related surcharges | (4,733 | ) | (5,501 | ) | (758 | ) | 16.2 | % | ||||||||
| Net revenues | 649,535 | 614,594 | 84,692 | (5.4 | )% | |||||||||||
| Operating costs and expenses: | ||||||||||||||||
| Compensation and benefits | ||||||||||||||||
| Relationship manager compensation | (144,295 | ) | (122,568 | ) | (16,890 | ) | (15.1 | )% | ||||||||
| Other compensations | (244,490 | ) | (181,327 | ) | (24,989 | ) | (25.8 | )% | ||||||||
| Total compensation and benefits | (388,785 | ) | (303,895 | ) | (41,879 | ) | (21.8 | )% | ||||||||
| Selling expenses | (62,332 | ) | (51,072 | ) | (7,038 | ) | (18.1 | )% | ||||||||
| General and administrative expenses | (71,116 | ) | (64,441 | ) | (8,880 | ) | (9.4 | )% | ||||||||
| Reversal of (provision for) credit losses | 97 | (2,810 | ) | (387 | ) | .N.A | ||||||||||
| Other operating expenses | (17,146 | ) | (15,699 | ) | (2,163 | ) | (8.4 | )% | ||||||||
| Government grants | 11,233 | 9,331 | 1,286 | (16.9 | )% | |||||||||||
| Total operating costs and expenses | (528,049 | ) | (428,586 | ) | (59,061 | ) | (18.8 | )% | ||||||||
| Income from operations | 121,486 | 186,008 | 25,631 | 53.1 | % | |||||||||||
| Other income: | ||||||||||||||||
| Interest income | 46,185 | 32,801 | 4,520 | (29.0 | )% | |||||||||||
| Investment income | 5,185 | 6,270 | 864 | 20.9 | % | |||||||||||
| Other income (expenses) | 3,935 | (3,081 | ) | (425 | ) | .N.A | ||||||||||
| Total other income | 55,305 | 35,990 | 4,959 | (34.9 | )% | |||||||||||
| Income before taxes and income from equity in affiliates | 176,791 | 221,998 | 30,590 | 25.6 | % | |||||||||||
| Income tax expense | (42,686 | ) | (60,605 | ) | (8,352 | ) | 42.0 | % | ||||||||
| Loss from equity in affiliates | (2,242 | ) | (11,574 | ) | (1,595 | ) | 416.2 | % | ||||||||
| Net income | 131,863 | 149,819 | 20,643 | 13.6 | % | |||||||||||
| Less: net income attributable to non-controlling interests | 372 | 855 | 118 | 129.8 | % | |||||||||||
| Net income attributable to Noah shareholders | 131,491 | 148,964 | 20,525 | 13.3 | % | |||||||||||
| Income per ADS, basic | 1.88 | 2.13 | 0.29 | 13.3 | % | |||||||||||
| Income per ADS, diluted | 1.88 | 2.11 | 0.29 | 12.2 | % | |||||||||||
| Margin analysis: | ||||||||||||||||
| Operating margin | 18.7 | % | 30.3 | % | 30.3 | % | ||||||||||
| Net margin | 20.3 | % | 24.4 | % | 24.4 | % | ||||||||||
| Weighted average ADS equivalent | ||||||||||||||||
| [1]: | ||||||||||||||||
| Basic | 69,781,578 | 69,913,957 | 69,913,957 | |||||||||||||
| Diluted | 69,788,638 | 70,600,397 | 70,600,397 | |||||||||||||
| ADS equivalent outstanding at end of period | 65,685,535 | 66,508,418 | 66,508,418 | |||||||||||||
[1] Assumes all outstanding ordinary shares are represented by ADSs. Five ordinary share represents one ADSs.
|
|
Noah Holdings Limited
Condensed Comprehensive Income Statements
(unaudited)
| Three months ended | ||||||||||||||||
| March 31, 2024 |
March 31, 2025 |
March 31, 2025 |
Change | |||||||||||||
| RMB'000 | RMB'000 | USD'000 | ||||||||||||||
| Net income | 131,863 | 149,819 | 20,643 | 13.6 | % | |||||||||||
| Other comprehensive income, net of tax: | ||||||||||||||||
| Foreign currency translation adjustments | 53,400 | (22,834 | ) | (3,147 | ) | N.A. | ||||||||||
| Fair value fluctuation of available-for-sale investment | - | 233 | 32 | N.A. | ||||||||||||
| Comprehensive income | 185,263 | 127,218 | 17,528 | (31.3 | )% | |||||||||||
| Less: Comprehensive (loss) gain attributable to non-controlling interests | (492 | ) | 910 | 125 | N.A. | |||||||||||
| Comprehensive income attributable to Noah shareholders | 185,755 | 126,308 | 17,403 | (32.0 | )% | |||||||||||
|
|
Noah Holdings Limited
Supplemental Information
(unaudited)
| As of | ||||||||||||
| March 31, 2024 |
March 31, 2025 |
Change | ||||||||||
| Number of registered clients | 457,705 | 463,161 | 1.2 | % | ||||||||
| Three months ended | ||||||||||||
| March 31, 2024 |
March 31, 2025 |
Change | ||||||||||
| (in millions of RMB, except number of active clients and percentages) |
||||||||||||
| Number of active clients | 10,391 | 8,822 | (15.1 | )% | ||||||||
| Transaction value: | ||||||||||||
| Private equity products | 1,195 | 1,461 | 22.3 | % | ||||||||
| Private secondary products | 3,772 | 6,114 | 62.1 | % | ||||||||
| Mutual fund products | 12,610 | 7,595 | (39.8 | )% | ||||||||
| Other products | 1,309 | 934 | (28.6 | )% | ||||||||
| Total transaction value | 18,886 | 16,104 | (14.7 | )% | ||||||||
|
|
Noah Holdings Limited
Segment Condensed Income Statements
(unaudited)
| Three months ended March 31, 2025 | ||||||||||||||||||||||||||||||||
| Domestic public securities |
Domestic asset management |
Domestic insurance |
Overseas wealth management |
Overseas asset management |
Overseas insurance and comprehensive services |
Headquarters | Total | |||||||||||||||||||||||||
| RMB’000 | RMB’000 | RMB’000 | RMB’000 | RMB’000 | RMB’000 | RMB’000 | RMB’000 | |||||||||||||||||||||||||
| Revenues: | ||||||||||||||||||||||||||||||||
| Revenues from others | ||||||||||||||||||||||||||||||||
| One-time commissions | 14,034 | 68 | 6,474 | 105,689 | 5,532 | 23,194 | - | 154,991 | ||||||||||||||||||||||||
| Recurring service fees | 85,803 | 35,392 | - | 9,120 | 21,281 | - | - | 151,596 | ||||||||||||||||||||||||
| Performance-based income | 13,800 | 45 | - | - | 141 | - | - | 13,986 | ||||||||||||||||||||||||
| Other service fees | - | - | - | 16,315 | - | 6,992 | 13,556 | 36,863 | ||||||||||||||||||||||||
| Total revenues from others | 113,637 | 35,505 | 6,474 | 131,124 | 26,954 | 30,186 | 13,556 | 357,436 | ||||||||||||||||||||||||
| Revenues from funds Gopher/Olive manages | ||||||||||||||||||||||||||||||||
| One-time commissions | 3,336 | - | - | 290 | 124 | - | - | 3,750 | ||||||||||||||||||||||||
| Recurring service fees | 10,669 | 131,673 | - | 30,611 | 71,427 | - | - | 244,380 | ||||||||||||||||||||||||
| Performance-based income | 1,076 | - | - | - | 13,453 | - | - | 14,529 | ||||||||||||||||||||||||
| Total revenues from funds Gopher/Olive manages | 15,081 | 131,673 | - | 30,901 | 85,004 | - | - | 262,659 | ||||||||||||||||||||||||
| Total revenues | 128,718 | 167,178 | 6,474 | 162,025 | 111,958 | 30,186 | 13,556 | 620,095 | ||||||||||||||||||||||||
| Less: VAT related surcharges | (1,252 | ) | (186 | ) | (37 | ) | - | - | - | (4,026 | ) | (5,501 | ) | |||||||||||||||||||
| Net revenues | 127,466 | 166,992 | 6,437 | 162,025 | 111,958 | 30,186 | 9,530 | 614,594 | ||||||||||||||||||||||||
| Operating costs and expenses: | ||||||||||||||||||||||||||||||||
| Compensation and benefits | ||||||||||||||||||||||||||||||||
| Relationship managers compensation | (21,798 | ) | (14,966 | ) | (8,692 | ) | (70,217 | ) | (1,303 | ) | (5,592 | ) | - | (122,568 | ) | |||||||||||||||||
| Other compensations | (7,050 | ) | (15,918 | ) | (7,598 | ) | (19,840 | ) | (14,956 | ) | (11,554 | ) | (104,411 | ) | (181,327 | ) | ||||||||||||||||
| Total compensation and benefits | (28,848 | ) | (30,884 | ) | (16,290 | ) | (90,057 | ) | (16,259 | ) | (17,146 | ) | (104,411 | ) | (303,895 | ) | ||||||||||||||||
| Selling expenses | (3,140 | ) | (2,044 | ) | (3,669 | ) | (12,857 | ) | (5,361 | ) | (2,606 | ) | (21,395 | ) | (51,072 | ) | ||||||||||||||||
| General and administrative expenses | (118 | ) | (1,092 | ) | (2,213 | ) | (1,047 | ) | (205 | ) | (575 | ) | (59,191 | ) | (64,441 | ) | ||||||||||||||||
| Provision for credit losses | - | - | - | - | - | (1,600 | ) | (1,210 | ) | (2,810 | ) | |||||||||||||||||||||
| Other operating expenses | (410 | ) | (2,380 | ) | - | - | - | (5,523 | ) | (7,386 | ) | (15,699 | ) | |||||||||||||||||||
| Government grants | 40 | 5,309 | 12 | - | - | - | 3,970 | 9,331 | ||||||||||||||||||||||||
| Total operating costs and expenses | (32,476 | ) | (31,091 | ) | (22,160 | ) | (103,961 | ) | (21,825 | ) | (27,450 | ) | (189,623 | ) | (428,586 | ) | ||||||||||||||||
| Income (loss) from operations | 94,990 | 135,901 | (15,723 | ) | 58,064 | 90,133 | 2,736 | (180,093 | ) | 186,008 | ||||||||||||||||||||||
|
|
Noah Holdings Limited
Segment Condensed Income Statements
(unaudited)
| Three months ended March 31, 2024 | ||||||||||||||||||||||||||||||||
| Domestic public securities |
Domestic asset management |
Domestic insurance |
Overseas wealth management |
Overseas
asset management |
Overseas insurance and comprehensive services |
Headquarters | Total | |||||||||||||||||||||||||
| RMB’000 | RMB’000 | RMB’000 | RMB’000 | RMB’000 | RMB’000 | RMB’000 | RMB’000 | |||||||||||||||||||||||||
| Revenues: | ||||||||||||||||||||||||||||||||
| Revenues from others | ||||||||||||||||||||||||||||||||
| One-time commissions | 3,316 | 657 | 18,863 | 128,715 | 3,661 | 30,043 | - | 185,255 | ||||||||||||||||||||||||
| Recurring service fees | 92,210 | 48,060 | - | 4,356 | 10,164 | - | 375 | 155,165 | ||||||||||||||||||||||||
| Performance-based income | 4,366 | - | - | - | 1,162 | - | - | 5,528 | ||||||||||||||||||||||||
| Other service fees | - | - | - | 15,566 | - | 6,666 | 12,728 | 34,960 | ||||||||||||||||||||||||
| Total revenues from others | 99,892 | 48,717 | 18,863 | 148,637 | 14,987 | 36,709 | 13,103 | 380,908 | ||||||||||||||||||||||||
| Revenues from funds Gopher/Olive manages | ||||||||||||||||||||||||||||||||
| One-time commissions | 1,683 | - | - | 101 | 43 | - | - | 1,827 | ||||||||||||||||||||||||
| Recurring service fees | 17,420 | 146,037 | - | 29,763 | 69,469 | - | - | 262,689 | ||||||||||||||||||||||||
| Performance-based income | 1,156 | 634 | - | - | 7,054 | - | - | 8,844 | ||||||||||||||||||||||||
| Total revenues from funds Gopher/Olive manages | 20,259 | 146,671 | - | 29,864 | 76,566 | - | - | 273,360 | ||||||||||||||||||||||||
| Total revenues | 120,151 | 195,388 | 18,863 | 178,501 | 91,553 | 36,709 | 13,103 | 654,268 | ||||||||||||||||||||||||
| Less: VAT related surcharges | (1,088 | ) | (467 | ) | (163 | ) | - | - | - | (3,015 | ) | (4,733 | ) | |||||||||||||||||||
| Net revenues | 119,063 | 194,921 | 18,700 | 178,501 | 91,553 | 36,709 | 10,088 | 649,535 | ||||||||||||||||||||||||
| Operating costs and expenses: | ||||||||||||||||||||||||||||||||
| Compensation and benefits | ||||||||||||||||||||||||||||||||
| Relationship managers compensation | (29,161 | ) | (9,231 | ) | (19,102 | ) | (85,482 | ) | (1,177 | ) | (142 | ) | - | (144,295 | ) | |||||||||||||||||
| Other compensations | (9,234 | ) | (23,182 | ) | (12,386 | ) | (49,344 | ) | (13,242 | ) | (11,448 | ) | (125,654 | ) | (244,490 | ) | ||||||||||||||||
| Total compensation and benefits | (38,395 | ) | (32,413 | ) | (31,488 | ) | (134,826 | ) | (14,419 | ) | (11,590 | ) | (125,654 | ) | (388,785 | ) | ||||||||||||||||
| Selling expenses | (2,967 | ) | (2,570 | ) | (825 | ) | (33,688 | ) | (6,654 | ) | (268 | ) | (15,360 | ) | (62,332 | ) | ||||||||||||||||
| General and administrative expenses | (198 | ) | (3,002 | ) | (12,829 | ) | (5,265 | ) | (1,795 | ) | (1,070 | ) | (46,957 | ) | (71,116 | ) | ||||||||||||||||
| (Provision for) reversal of credit losses | - | - | - | - | - | (3,637 | ) | 3,734 | 97 | |||||||||||||||||||||||
| Other operating expenses | (451 | ) | (976 | ) | (17 | ) | - | - | (1,403 | ) | (14,299 | ) | (17,146 | ) | ||||||||||||||||||
| Government grants | 3,175 | 4,092 | 7 | - | - | - | 3,959 | 11,233 | ||||||||||||||||||||||||
| Total operating costs and expenses | (38,836 | ) | (34,869 | ) | (45,152 | ) | (173,779 | ) | (22,868 | ) | (17,968 | ) | (194,577 | ) | (528,049 | ) | ||||||||||||||||
| Income (loss) from operations | 80,227 | 160,052 | (26,452 | ) | 4,722 | 68,685 | 18,741 | (184,489 | ) | 121,486 | ||||||||||||||||||||||
|
|
Noah Holdings Limited
Additional Business Information
(unaudited)
| Three months ended March 31, 2025 | ||||||||||||||||
| Wealth Management Business |
Asset Management Business |
Other Businesses |
Total | |||||||||||||
| RMB'000 | RMB'000 | RMB'000 | RMB'000 | |||||||||||||
| Revenues: | ||||||||||||||||
| Revenues from others: | ||||||||||||||||
| One-time commissions | 154,991 | - | - | 154,991 | ||||||||||||
| Recurring service fees | 151,596 | - | - | 151,596 | ||||||||||||
| Performance-based income | 13,986 | - | - | 13,986 | ||||||||||||
| Other service fees | 25,477 | - | 11,386 | 36,863 | ||||||||||||
| Total revenues from others | 346,050 | - | 11,386 | 357,436 | ||||||||||||
| Revenues from funds Gopher/Olive manages: | ||||||||||||||||
| One-time commissions | 2,639 | 1,111 | - | 3,750 | ||||||||||||
| Recurring service fees | 81,426 | 162,954 | - | 244,380 | ||||||||||||
| Performance-based income | - | 14,529 | - | 14,529 | ||||||||||||
| Total revenues from funds Gopher/Olive manages | 84,065 | 178,594 | - | 262,659 | ||||||||||||
| Total revenues | 430,115 | 178,594 | 11,386 | 620,095 | ||||||||||||
| Less: VAT related surcharges | (2,008 | ) | (188 | ) | (3,305 | ) | (5,501 | ) | ||||||||
| Net revenues | 428,107 | 178,406 | 8,081 | 614,594 | ||||||||||||
| Operating costs and expenses: | ||||||||||||||||
| Compensation and benefits | ||||||||||||||||
| Relationship manager compensation | (122,103 | ) | (465 | ) | - | (122,568 | ) | |||||||||
| Other compensations | (118,617 | ) | (53,594 | ) | (9,116 | ) | (181,327 | ) | ||||||||
| Total compensation and benefits | (240,720 | ) | (54,059 | ) | (9,116 | ) | (303,895 | ) | ||||||||
| Selling expenses | (35,429 | ) | (10,210 | ) | (5,433 | ) | (51,072 | ) | ||||||||
| General and administrative expenses | (42,196 | ) | (13,251 | ) | (8,994 | ) | (64,441 | ) | ||||||||
| Provision for credit losses | (1,219 | ) | (438 | ) | (1,153 | ) | (2,810 | ) | ||||||||
| Other operating expenses | (7,644 | ) | (2,380 | ) | (5,675 | ) | (15,699 | ) | ||||||||
| Government grants | 4,002 | 5,315 | 14 | 9,331 | ||||||||||||
| Total operating costs and expenses | (323,206 | ) | (75,023 | ) | (30,357 | ) | (428,586 | ) | ||||||||
| Income (loss) from operations | 104,901 | 103,383 | (22,276 | ) | 186,008 | |||||||||||
|
|
Noah Holdings Limited
Additional Business Information
(unaudited)
| Three months ended March 31, 2024 | ||||||||||||||||
| Wealth Management Business |
Asset Management Business |
Other Businesses |
Total | |||||||||||||
| RMB'000 | RMB'000 | RMB'000 | RMB'000 | |||||||||||||
| Revenues: | ||||||||||||||||
| Revenues from others: | ||||||||||||||||
| One-time commissions | 185,255 | - | - | 185,255 | ||||||||||||
| Recurring service fees | 155,165 | - | - | 155,165 | ||||||||||||
| Performance-based income | 5,528 | - | - | 5,528 | ||||||||||||
| Other service fees | 25,711 | - | 9,249 | 34,960 | ||||||||||||
| Total revenues from others | 371,659 | - | 9,249 | 380,908 | ||||||||||||
| Revenues from funds Gopher/Olive manages: | ||||||||||||||||
| One-time commissions | 1,793 | 34 | - | 1,827 | ||||||||||||
| Recurring service fees | 89,719 | 172,970 | - | 262,689 | ||||||||||||
| Performance-based income | 1,039 | 7,805 | - | 8,844 | ||||||||||||
| Total revenues from funds Gopher/Olive manages | 92,551 | 180,809 | - | 273,360 | ||||||||||||
| Total revenues | 464,210 | 180,809 | 9,249 | 654,268 | ||||||||||||
| Less: VAT related surcharges | (1,530 | ) | (440 | ) | (2,763 | ) | (4,733 | ) | ||||||||
| Net revenues | 462,680 | 180,369 | 6,486 | 649,535 | ||||||||||||
| Operating costs and expenses: | ||||||||||||||||
| Compensation and benefits | ||||||||||||||||
| Relationship manager compensation | (136,644 | ) | (7,651 | ) | - | (144,295 | ) | |||||||||
| Other compensations | (164,652 | ) | (61,548 | ) | (18,290 | ) | (244,490 | ) | ||||||||
| Total compensation and benefits | (301,296 | ) | (69,199 | ) | (18,290 | ) | (388,785 | ) | ||||||||
| Selling expenses | (47,547 | ) | (11,825 | ) | (2,960 | ) | (62,332 | ) | ||||||||
| General and administrative expenses | (43,641 | ) | (16,605 | ) | (10,870 | ) | (71,116 | ) | ||||||||
| (Provision for) reversal of credit losses | (4,735 | ) | (996 | ) | 5,828 | 97 | ||||||||||
| Other operating expenses | (7,306 | ) | (974 | ) | (8,866 | ) | (17,146 | ) | ||||||||
| Government grants | 7,108 | 4,093 | 32 | 11,233 | ||||||||||||
| Total operating costs and expenses | (397,417 | ) | (95,506 | ) | (35,126 | ) | (528,049 | ) | ||||||||
| Income (loss) from operations | 65,263 | 84,863 | (28,640 | ) | 121,486 | |||||||||||
|
|
Noah Holdings Limited
Supplement Revenue Information by Geography
(unaudited)
| Three months ended | ||||||||||||
| March 31, 2024 |
March 31, 2025 |
Change | ||||||||||
| (in thousands of RMB, except percentages) | ||||||||||||
| Revenues: | ||||||||||||
| Mainland China | 347,505 | 315,927 | (9.1 | )% | ||||||||
| Hong Kong | 234,403 | 227,148 | (3.1 | )% | ||||||||
| Others | 72,360 | 77,020 | 6.4 | % | ||||||||
| Total revenues | 654,268 | 620,095 | (5.2 | )% | ||||||||
Noah Holdings Limited
Supplement Revenue Information by Product Types
(unaudited)
| Three months ended | ||||||||||||
| March 31, 2024 |
March 31, 2025 |
Change | ||||||||||
| (in thousands of RMB, except percentages) | ||||||||||||
| Mainland China: | ||||||||||||
| Public securities products [1] | 120,151 | 128,720 | 7.1 | % | ||||||||
| Private equity products | 195,388 | 166,769 | (14.6 | )% | ||||||||
| Insurance products | 18,863 | 6,474 | (65.7 | )% | ||||||||
| Others | 13,103 | 13,964 | 6.6 | % | ||||||||
| Subtotal | 347,505 | 315,927 | (9.1 | )% | ||||||||
| Overseas: | ||||||||||||
| Investment products [2] | 130,238 | 156,714 | 20.3 | % | ||||||||
| Insurance products | 150,217 | 115,976 | (22.8 | )% | ||||||||
| Online business [3] | 5,139 | 10,495 | 104.2 | % | ||||||||
| Others | 21,169 | 20,983 | (0.9 | )% | ||||||||
| Subtotal | 306,763 | 304,168 | (0.8 | )% | ||||||||
| Total revenues | 654,268 | 620,095 | (5.2 | )% | ||||||||
[1] Includes mutual funds and private secondary products.
[2] Includes non-money market mutual fund products, discretionary products, private secondary products, private equity products, real estate products and private credit products.
[3] Includes money market mutual fund products, securities brokerage business.
|
|
Noah Holdings Limited
Supplement Information of Overseas Business
(unaudited)
| Three months ended | ||||||||||||
| March 31, 2024 |
March 31, 2025 |
Change | ||||||||||
| Net Revenues from Overseas (RMB, million) | 306.8 | 304.2 | (0.8 | )% | ||||||||
| Number of Overseas Registered Clients | 15,725 | 18,207 | 15.8 | % | ||||||||
| Number of Overseas Active Clients | 2,745 | 3,384 | 23.3 | % | ||||||||
| Transaction Value of Overseas Investment Products (RMB, billion) | 8.4 | 8.1 | (3.6 | )% | ||||||||
| Number of Overseas Relationship Managers | 91 | 131 | 44.0 | % | ||||||||
| Overseas Assets Under Management (RMB, billion) | 37.2 | 42.7 | 14.8 | % | ||||||||
Noah Holdings Limited
Reconciliation of GAAP to Non-GAAP Results
(In RMB, except for per ADS data and percentages)
(unaudited) 12
| Three months ended | ||||||||||||
| March 31, | March 31, | |||||||||||
| 2024 | 2025 | |||||||||||
| RMB'000 | RMB'000 | Change | ||||||||||
| Net income attributable to Noah shareholders | 131,491 | 148,964 | 13.3 | % | ||||||||
| Adjustment for share-based compensation | 36,599 | 24,780 | (32.3 | )% | ||||||||
| Less: Tax effect of adjustments | 6,922 | 4,956 | (28.4 | )% | ||||||||
| Adjusted net income attributable to Noah shareholders (non-GAAP) | 161,168 | 168,788 | 4.7 | % | ||||||||
| Net margin attributable to Noah shareholders | 20.2 | % | 24.2 | % | ||||||||
| Non-GAAP net margin attributable to Noah shareholders | 24.8 | % | 27.5 | % | ||||||||
| Net income attributable to Noah shareholders per ADS, diluted | 1.88 | 2.11 | 12.2 | % | ||||||||
| Non-GAAP net income attributable to Noah shareholders per ADS, diluted | 2.31 | 2.39 | 3.5 | % | ||||||||
12 Noah’s Non-GAAP financial measures reflect the respective most directly comparable GAAP financial measures excluding the effects of all forms of share-based compensation and net of relevant tax impact, if any.
|
|
|
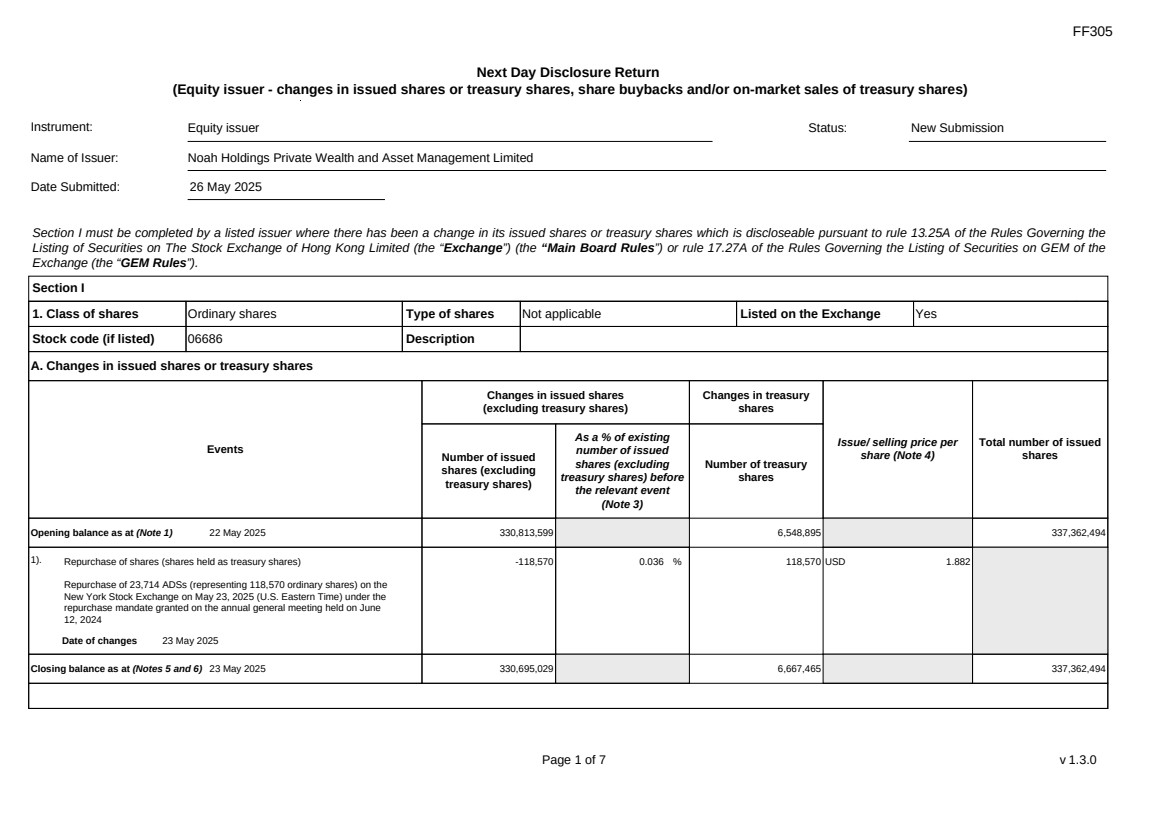
FF305 Page 1 of 7 v 1.3.0 Next Day Disclosure Return (Equity issuer - changes in issued shares or treasury shares, share buybacks and/or on-market sales of treasury shares) Instrument: Equity issuer Status: New Submission Name of Issuer: Noah Holdings Private Wealth and Asset Management Limited Date Submitted: 26 May 2025 Section I must be completed by a listed issuer where there has been a change in its issued shares or treasury shares which is discloseable pursuant to rule 13.25A of the Rules Governing the Listing of Securities on The Stock Exchange of Hong Kong Limited (the “Exchange”) (the “Main Board Rules”) or rule 17.27A of the Rules Governing the Listing of Securities on GEM of the Exchange (the “GEM Rules”). Section I 1. Class of shares Ordinary shares Type of shares Not applicable Listed on the Exchange Yes Stock code (if listed) 06686 Description A. Changes in issued shares or treasury shares Events Changes in issued shares (excluding treasury shares) Number of issued shares (excluding treasury shares) As a % of existing number of issued shares (excluding treasury shares) before the relevant event (Note 3) Changes in treasury shares Number of treasury shares Issue/ selling price per share (Note 4) Total number of issued shares Opening balance as at (Note 1) 22 May 2025 330,813,599 6,548,895 337,362,494 1). Repurchase of shares (shares held as treasury shares) Repurchase of 23,714 ADSs (representing 118,570 ordinary shares) on the New York Stock Exchange on May 23, 2025 (U.S. Eastern Time) under the repurchase mandate granted on the annual general meeting held on June 12, 2024 Date of changes 23 May 2025 -118,570 0.036 % 118,570 USD 1.882 Closing balance as at (Notes 5 and 6) 23 May 2025 330,695,029 6,667,465 337,362,494 |
|
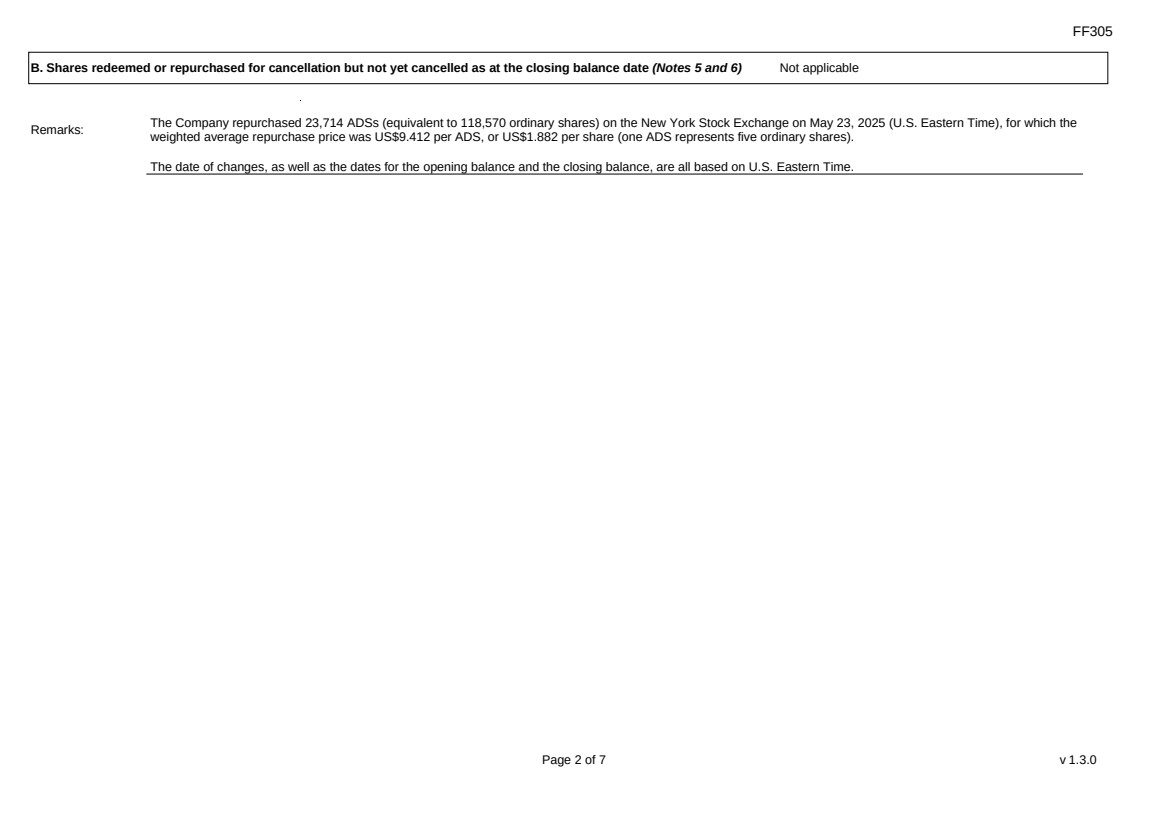
FF305 Page 2 of 7 v 1.3.0 B. Shares redeemed or repurchased for cancellation but not yet cancelled as at the closing balance date (Notes 5 and 6) Not applicable Remarks: The Company repurchased 23,714 ADSs (equivalent to 118,570 ordinary shares) on the New York Stock Exchange on May 23, 2025 (U.S. Eastern Time), for which the weighted average repurchase price was US$9.412 per ADS, or US$1.882 per share (one ADS represents five ordinary shares). The date of changes, as well as the dates for the opening balance and the closing balance, are all based on U.S. Eastern Time. |
|
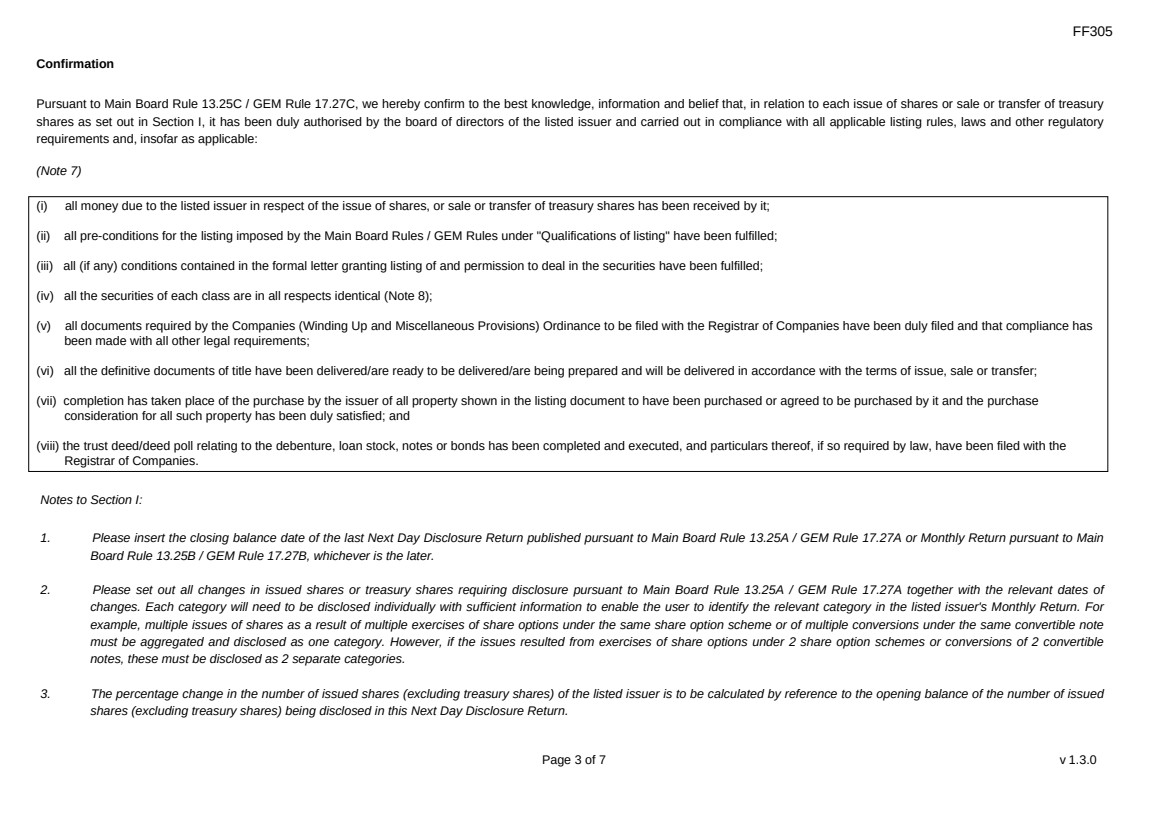
FF305 Page 3 of 7 v 1.3.0 Confirmation Pursuant to Main Board Rule 13.25C / GEM Rule 17.27C, we hereby confirm to the best knowledge, information and belief that, in relation to each issue of shares or sale or transfer of treasury shares as set out in Section I, it has been duly authorised by the board of directors of the listed issuer and carried out in compliance with all applicable listing rules, laws and other regulatory requirements and, insofar as applicable: (Note 7) (i) all money due to the listed issuer in respect of the issue of shares, or sale or transfer of treasury shares has been received by it; (ii) all pre-conditions for the listing imposed by the Main Board Rules / GEM Rules under "Qualifications of listing" have been fulfilled; (iii) all (if any) conditions contained in the formal letter granting listing of and permission to deal in the securities have been fulfilled; (iv) all the securities of each class are in all respects identical (Note 8); (v) all documents required by the Companies (Winding Up and Miscellaneous Provisions) Ordinance to be filed with the Registrar of Companies have been duly filed and that compliance has been made with all other legal requirements; (vi) all the definitive documents of title have been delivered/are ready to be delivered/are being prepared and will be delivered in accordance with the terms of issue, sale or transfer; (vii) completion has taken place of the purchase by the issuer of all property shown in the listing document to have been purchased or agreed to be purchased by it and the purchase consideration for all such property has been duly satisfied; and (viii) the trust deed/deed poll relating to the debenture, loan stock, notes or bonds has been completed and executed, and particulars thereof, if so required by law, have been filed with the Registrar of Companies. Notes to Section I: 1. Please insert the closing balance date of the last Next Day Disclosure Return published pursuant to Main Board Rule 13.25A / GEM Rule 17.27A or Monthly Return pursuant to Main Board Rule 13.25B / GEM Rule 17.27B, whichever is the later. 2. Please set out all changes in issued shares or treasury shares requiring disclosure pursuant to Main Board Rule 13.25A / GEM Rule 17.27A together with the relevant dates of changes. Each category will need to be disclosed individually with sufficient information to enable the user to identify the relevant category in the listed issuer's Monthly Return. For example, multiple issues of shares as a result of multiple exercises of share options under the same share option scheme or of multiple conversions under the same convertible note must be aggregated and disclosed as one category. However, if the issues resulted from exercises of share options under 2 share option schemes or conversions of 2 convertible notes, these must be disclosed as 2 separate categories. 3. The percentage change in the number of issued shares (excluding treasury shares) of the listed issuer is to be calculated by reference to the opening balance of the number of issued shares (excluding treasury shares) being disclosed in this Next Day Disclosure Return. |
|
FF305 Page 4 of 7 v 1.3.0 4. In the case of a share repurchase or redemption, the “issue/ selling price per share” shall be construed as “repurchase price per share” or “redemption price per share”. Where shares have been issued/ sold/ repurchased/ redeemed at more than one price per share, a volume-weighted average price per share should be given. 5. The closing balance date is the date of the last relevant event being disclosed. 6. For repurchase or redemption of shares, disclosure is required when the relevant event has occurred (subject to the provisions of Main Board Rules 10.06(4)(a), 13.25A and 13.31 / GEM Rules 13.13(1), 17.27A and 17.35), even if the repurchased or redeemed shares have not yet been cancelled. If repurchased or redeemed shares are to be cancelled upon settlement of such repurchase or redemption after the closing balance date, they shall remain part of the issued shares as at the closing balance date in Part A. Details of these repurchased or redeemed shares shall be disclosed in Part B. 7. Items (i) to (viii) are suggested forms of confirmation. The listed issuer may amend the item(s) that is/are not applicable to meet individual cases. 8. “Identical” means in this context: - the securities are of the same nominal value with the same amount called up or paid up; - they are entitled to dividend/interest at the same rate and for the same period, so that at the next ensuing distribution, the dividend/interest payable per unit will amount to exactly the same sum (gross and net); and - they carry the same rights as to unrestricted transfer, attendance and voting at meetings and rank pari passu in all other respects. |
|
FF305 Page 5 of 7 v 1.3.0 Section II must also be completed by a listed issuer where it has made a repurchase of shares which is discloseable under Main Board Rule 10.06(4)(a) / GEM Rule 13.13(1). Repurchase report Section II 1. Class of shares Ordinary shares Type of shares Not applicable Listed on the Exchange Yes Stock code (if listed) 06686 Description A. Repurchase report Trading date Number of shares repurchased Method of repurchase (Note 1) Repurchase price per share or highest repurchase price per share $ Lowest repurchase price per share $ Aggregate price paid $ 1). 23 May 2025 118,570 On another stock exchange New York Stock Exchange USD 1.898 USD 1.872 USD 223,191.43 Total number of shares repurchased 118,570 Aggregate price paid $ USD 223,191.43 Number of shares repurchased for cancellation 0 Number of shares repurchased for holding as treasury shares 118,570 B. Additional information for issuer who has a primary listing on the Exchange 1). Date of the resolution granting the repurchase mandate 12 June 2024 2). Total number of shares which the issuer is authorised to repurchase under the repurchase mandate 33,043,675 3). Number of shares repurchased on the Exchange or another stock exchange under the repurchase mandate (a) 6,667,465 4). As a % of number of issued shares (excluding treasury shares) as at the date of the resolution granting the repurchase mandate (a) x 100 / number of issued shares (excluding treasury shares) as at the date of the resolution granting the repurchase mandate 2.018 % 5). Moratorium period for any issue of new shares, or sale or transfer of treasury shares after the share repurchase(s) set out in Part A (Note 2) Up to 22 June 2025 |
|
FF305 Page 6 of 7 v 1.3.0 We hereby confirm that the repurchases made on the Exchange set out in Part A above were made in accordance with the Main Board Rules and that there have been no material changes to the particulars contained in the Explanatory Statement dated April 25, 2024 which has been filed with the Exchange. We also confirm that any repurchases made on another stock exchange set out in Part A above were made in accordance with the domestic rules applying to repurchases on that other stock exchange. Remarks: The trading date and the ending date for the moratorium period for any issue of new shares, or sale or transfer of treasury shares after the share repurchase(s) referred to above are based on U.S. Eastern Time. Notes to Section II: 1. Please state whether the repurchase was made on the Exchange, on another stock exchange (stating the name of the exchange), by private arrangement or by general offer. 2. Subject to the carve-out set out in Main Board Rule 10.06(3)(a)/ GEM Rule 13.12, an issuer may not (i) make a new issue of shares, or a sale or transfer of any treasury shares; or (ii) announce a proposed new issue of shares, or a sale or transfer of any treasury shares, for a period of 30 days after any purchase by it of shares, whether on the Exchange or otherwise, without the prior approval of the Exchange. |
|
FF305 Page 7 of 7 v 1.3.0 Section III must also be completed by a listed issuer where it has made a sale of treasury shares on the Exchange or any other stock exchange on which the issuer is listed which is discloseable under Main Board Rule 10.06B / GEM Rule 13.14B. Report of on-market sale of treasury shares Not applicable Submitted by: Jingbo Wang (Name) Title: Director (Director, Secretary or other Duly Authorised Officer) |
|
FF305 Page 1 of 7 v 1.3.0 Next Day Disclosure Return (Equity issuer - changes in issued shares or treasury shares, share buybacks and/or on-market sales of treasury shares) Instrument: Equity issuer Status: New Submission Name of Issuer: Noah Holdings Private Wealth and Asset Management Limited Date Submitted: 28 May 2025 Section I must be completed by a listed issuer where there has been a change in its issued shares or treasury shares which is discloseable pursuant to rule 13.25A of the Rules Governing the Listing of Securities on The Stock Exchange of Hong Kong Limited (the “Exchange”) (the “Main Board Rules”) or rule 17.27A of the Rules Governing the Listing of Securities on GEM of the Exchange (the “GEM Rules”). Section I 1. Class of shares Ordinary shares Type of shares Not applicable Listed on the Exchange Yes Stock code (if listed) 06686 Description A. Changes in issued shares or treasury shares Events Changes in issued shares (excluding treasury shares) Number of issued shares (excluding treasury shares) As a % of existing number of issued shares (excluding treasury shares) before the relevant event (Note 3) Changes in treasury shares Number of treasury shares Issue/ selling price per share (Note 4) Total number of issued shares Opening balance as at (Note 1) 23 May 2025 330,695,029 6,667,465 337,362,494 1). Repurchase of shares (shares held as treasury shares) Repurchase of 17,838 ADSs (representing 89,190 ordinary shares) on the New York Stock Exchange on May 27, 2025 (U.S. Eastern Time) under the repurchase mandate granted on the annual general meeting held on June 12, 2024 Date of changes 27 May 2025 -89,190 0.027 % 89,190 USD 1.893 Closing balance as at (Notes 5 and 6) 27 May 2025 330,605,839 6,756,655 337,362,494 |
|
FF305 Page 2 of 7 v 1.3.0 B. Shares redeemed or repurchased for cancellation but not yet cancelled as at the closing balance date (Notes 5 and 6) Not applicable Remarks: The Company repurchased 17,838 ADSs (equivalent to 89,190 ordinary shares) on the New York Stock Exchange on May 27, 2025 (U.S. Eastern Time), for which the weighted average repurchase price was US$9.463 per ADS, or US$1.893 per share (one ADS represents five ordinary shares). The date of changes, as well as the dates for the opening balance and the closing balance, are all based on U.S. Eastern Time. |
|
FF305 Page 3 of 7 v 1.3.0 Confirmation Pursuant to Main Board Rule 13.25C / GEM Rule 17.27C, we hereby confirm to the best knowledge, information and belief that, in relation to each issue of shares or sale or transfer of treasury shares as set out in Section I, it has been duly authorised by the board of directors of the listed issuer and carried out in compliance with all applicable listing rules, laws and other regulatory requirements and, insofar as applicable: (Note 7) (i) all money due to the listed issuer in respect of the issue of shares, or sale or transfer of treasury shares has been received by it; (ii) all pre-conditions for the listing imposed by the Main Board Rules / GEM Rules under "Qualifications of listing" have been fulfilled; (iii) all (if any) conditions contained in the formal letter granting listing of and permission to deal in the securities have been fulfilled; (iv) all the securities of each class are in all respects identical (Note 8); (v) all documents required by the Companies (Winding Up and Miscellaneous Provisions) Ordinance to be filed with the Registrar of Companies have been duly filed and that compliance has been made with all other legal requirements; (vi) all the definitive documents of title have been delivered/are ready to be delivered/are being prepared and will be delivered in accordance with the terms of issue, sale or transfer; (vii) completion has taken place of the purchase by the issuer of all property shown in the listing document to have been purchased or agreed to be purchased by it and the purchase consideration for all such property has been duly satisfied; and (viii) the trust deed/deed poll relating to the debenture, loan stock, notes or bonds has been completed and executed, and particulars thereof, if so required by law, have been filed with the Registrar of Companies. Notes to Section I: 1. Please insert the closing balance date of the last Next Day Disclosure Return published pursuant to Main Board Rule 13.25A / GEM Rule 17.27A or Monthly Return pursuant to Main Board Rule 13.25B / GEM Rule 17.27B, whichever is the later. 2. Please set out all changes in issued shares or treasury shares requiring disclosure pursuant to Main Board Rule 13.25A / GEM Rule 17.27A together with the relevant dates of changes. Each category will need to be disclosed individually with sufficient information to enable the user to identify the relevant category in the listed issuer's Monthly Return. For example, multiple issues of shares as a result of multiple exercises of share options under the same share option scheme or of multiple conversions under the same convertible note must be aggregated and disclosed as one category. However, if the issues resulted from exercises of share options under 2 share option schemes or conversions of 2 convertible notes, these must be disclosed as 2 separate categories. 3. The percentage change in the number of issued shares (excluding treasury shares) of the listed issuer is to be calculated by reference to the opening balance of the number of issued shares (excluding treasury shares) being disclosed in this Next Day Disclosure Return. |
|
FF305 Page 4 of 7 v 1.3.0 4. In the case of a share repurchase or redemption, the “issue/ selling price per share” shall be construed as “repurchase price per share” or “redemption price per share”. Where shares have been issued/ sold/ repurchased/ redeemed at more than one price per share, a volume-weighted average price per share should be given. 5. The closing balance date is the date of the last relevant event being disclosed. 6. For repurchase or redemption of shares, disclosure is required when the relevant event has occurred (subject to the provisions of Main Board Rules 10.06(4)(a), 13.25A and 13.31 / GEM Rules 13.13(1), 17.27A and 17.35), even if the repurchased or redeemed shares have not yet been cancelled. If repurchased or redeemed shares are to be cancelled upon settlement of such repurchase or redemption after the closing balance date, they shall remain part of the issued shares as at the closing balance date in Part A. Details of these repurchased or redeemed shares shall be disclosed in Part B. 7. Items (i) to (viii) are suggested forms of confirmation. The listed issuer may amend the item(s) that is/are not applicable to meet individual cases. 8. “Identical” means in this context: - the securities are of the same nominal value with the same amount called up or paid up; - they are entitled to dividend/interest at the same rate and for the same period, so that at the next ensuing distribution, the dividend/interest payable per unit will amount to exactly the same sum (gross and net); and - they carry the same rights as to unrestricted transfer, attendance and voting at meetings and rank pari passu in all other respects. |
|
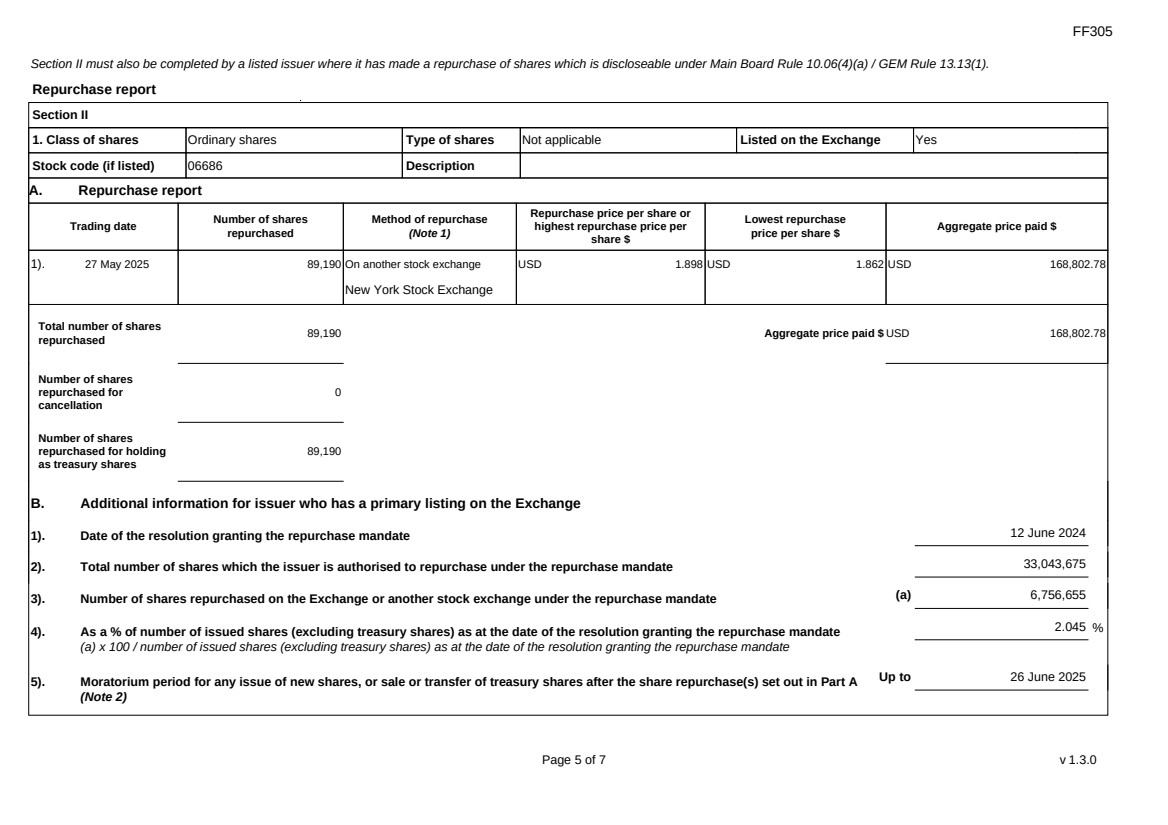
FF305 Page 5 of 7 v 1.3.0 Section II must also be completed by a listed issuer where it has made a repurchase of shares which is discloseable under Main Board Rule 10.06(4)(a) / GEM Rule 13.13(1). Repurchase report Section II 1. Class of shares Ordinary shares Type of shares Not applicable Listed on the Exchange Yes Stock code (if listed) 06686 Description A. Repurchase report Trading date Number of shares repurchased Method of repurchase (Note 1) Repurchase price per share or highest repurchase price per share $ Lowest repurchase price per share $ Aggregate price paid $ 1). 27 May 2025 89,190 On another stock exchange New York Stock Exchange USD 1.898 USD 1.862 USD 168,802.78 Total number of shares repurchased 89,190 Aggregate price paid $ USD 168,802.78 Number of shares repurchased for cancellation 0 Number of shares repurchased for holding as treasury shares 89,190 B. Additional information for issuer who has a primary listing on the Exchange 1). Date of the resolution granting the repurchase mandate 12 June 2024 2). Total number of shares which the issuer is authorised to repurchase under the repurchase mandate 33,043,675 3). Number of shares repurchased on the Exchange or another stock exchange under the repurchase mandate (a) 6,756,655 4). As a % of number of issued shares (excluding treasury shares) as at the date of the resolution granting the repurchase mandate (a) x 100 / number of issued shares (excluding treasury shares) as at the date of the resolution granting the repurchase mandate 2.045 % 5). Moratorium period for any issue of new shares, or sale or transfer of treasury shares after the share repurchase(s) set out in Part A (Note 2) Up to 26 June 2025 |
|
FF305 Page 6 of 7 v 1.3.0 We hereby confirm that the repurchases made on the Exchange set out in Part A above were made in accordance with the Main Board Rules and that there have been no material changes to the particulars contained in the Explanatory Statement dated April 25, 2024 which has been filed with the Exchange. We also confirm that any repurchases made on another stock exchange set out in Part A above were made in accordance with the domestic rules applying to repurchases on that other stock exchange. Remarks: The trading date and the ending date for the moratorium period for any issue of new shares, or sale or transfer of treasury shares after the share repurchase(s) referred to above are based on U.S. Eastern Time. Notes to Section II: 1. Please state whether the repurchase was made on the Exchange, on another stock exchange (stating the name of the exchange), by private arrangement or by general offer. 2. Subject to the carve-out set out in Main Board Rule 10.06(3)(a)/ GEM Rule 13.12, an issuer may not (i) make a new issue of shares, or a sale or transfer of any treasury shares; or (ii) announce a proposed new issue of shares, or a sale or transfer of any treasury shares, for a period of 30 days after any purchase by it of shares, whether on the Exchange or otherwise, without the prior approval of the Exchange. |
|
FF305 Page 7 of 7 v 1.3.0 Section III must also be completed by a listed issuer where it has made a sale of treasury shares on the Exchange or any other stock exchange on which the issuer is listed which is discloseable under Main Board Rule 10.06B / GEM Rule 13.14B. Report of on-market sale of treasury shares Not applicable Submitted by: Jingbo Wang (Name) Title: Director (Director, Secretary or other Duly Authorised Officer) |