UNITED STATES
SECURITIES AND EXCHANGE COMMISSION
Washington, D.C. 20549
FORM 6-K
Report of Foreign Private Issuer Pursuant to
Rule 13a-16 or 15d-16
under the Securities Exchange Act of 1934
For the month of May 2025
Commission File Number 001-11444
| MAGNA INTERNATIONAL INC. |
| (Exact Name of Registrant as specified in its Charter) |
| 337 Magna Drive, Aurora, Ontario, Canada L4G 7K1 |
| (Address of principal executive office) |
Indicate by check mark whether the registrant files or will file annual reports under cover Form 20-F or Form 40-F.
Form 20-F ¨ Form 40-F x Pursuant to the requirements of the Securities Exchange Act of 1934, the registrant has duly caused this report to be signed on its behalf by the undersigned, thereunto duly authorized.
SIGNATURES
|
|
MAGNA INTERNATIONAL INC. |
|
| (Registrant) | ||
| Date: May 2, 2025 | ||
| By: | /s/ “Bassem Shakeel” | |
| Bassem A. Shakeel, | ||
| Vice-President, Associate General Counsel and Corporate Secretary | ||
EXHIBITS
| Exhibit 99.1 | Q1 2025 Financial Review |
| Exhibit 99.2 | Q1 2025 Results Webcast Presentation (May 2, 2025) |
| Exhibit 99.3 | Q1 2025 Results Webcast Transcript (May 2, 2025) |
Exhibit 99.1
FINANCIAL REVIEW OF MAGNA INTERNATIONAL INC.
(United States dollars in millions, except per share figures) (Unaudited)
Prepared in accordance with U.S. GAAP
| 2023 | 2024 | 2025 | ||||||||||||||||||||||||||||||||||||||||||||||
| Note | 1st Q | 2nd Q | 3rd Q | 4th Q | TOTAL | 1st Q | 2nd Q | 3rd Q | 4th Q | TOTAL | 1st Q | |||||||||||||||||||||||||||||||||||||
| VEHICLE VOLUME STATISTICS (in millions) | ||||||||||||||||||||||||||||||||||||||||||||||||
| North America | 3.884 | 4.079 | 3.930 | 3.721 | 15.614 | 3.976 | 4.096 | 3.676 | 3.631 | 15.379 | 3.780 | |||||||||||||||||||||||||||||||||||||
| Europe | 4.639 | 4.659 | 3.867 | 4.447 | 17.612 | 4.567 | 4.443 | 3.720 | 4.169 | 16.899 | 4.192 | |||||||||||||||||||||||||||||||||||||
| China | 5.923 | 6.783 | 7.603 | 8.847 | 29.156 | 6.434 | 7.163 | 7.363 | 9.879 | 30.839 | 6.541 | |||||||||||||||||||||||||||||||||||||
| Other | 6.956 | 6.727 | 6.985 | 7.120 | 27.788 | 6.713 | 6.744 | 6.900 | 7.205 | 27.562 | 6.600 | |||||||||||||||||||||||||||||||||||||
| Global | 21.402 | 22.248 | 22.385 | 24.135 | 90.170 | 21.690 | 22.445 | 21.659 | 24.885 | 90.679 | 21.113 | |||||||||||||||||||||||||||||||||||||
| Magna Steyr vehicle assembly volumes | 0.034 | 0.027 | 0.023 | 0.021 | 0.105 | 0.022 | 0.019 | 0.015 | 0.016 | 0.072 | 0.017 | |||||||||||||||||||||||||||||||||||||
| AVERAGE FOREIGN EXCHANGE RATES | ||||||||||||||||||||||||||||||||||||||||||||||||
| 1 Canadian dollar equals U.S. dollars | 0.740 | 0.745 | 0.746 | 0.735 | 0.742 | 0.741 | 0.731 | 0.733 | 0.715 | 0.730 | 0.697 | |||||||||||||||||||||||||||||||||||||
| 1 euro equals U.S. dollars | 1.073 | 1.089 | 1.088 | 1.076 | 1.082 | 1.085 | 1.076 | 1.099 | 1.066 | 1.082 | 1.053 | |||||||||||||||||||||||||||||||||||||
| 1 Chinese renminbi equals U.S. dollars | 0.146 | 0.143 | 0.138 | 0.138 | 0.141 | 0.139 | 0.138 | 0.140 | 0.139 | 0.139 | 0.138 | |||||||||||||||||||||||||||||||||||||
| CONSOLIDATED STATEMENTS OF INCOME (LOSS) | ||||||||||||||||||||||||||||||||||||||||||||||||
| Sales | ||||||||||||||||||||||||||||||||||||||||||||||||
| Body Exteriors & Structures | 4,439 | 4,540 | 4,354 | 4,178 | 17,511 | 4,429 | 4,465 | 4,038 | 4,067 | 16,999 | 3,966 | |||||||||||||||||||||||||||||||||||||
| Power & Vision | 3,323 | 3,462 | 3,745 | 3,775 | 14,305 | 3,842 | 3,926 | 3,837 | 3,786 | 15,391 | 3,646 | |||||||||||||||||||||||||||||||||||||
| Seating Systems | 1,486 | 1,603 | 1,529 | 1,429 | 6,047 | 1,455 | 1,455 | 1,379 | 1,511 | 5,800 | 1,312 | |||||||||||||||||||||||||||||||||||||
| Complete Vehicles | 1,626 | 1,526 | 1,185 | 1,201 | 5,538 | 1,383 | 1,242 | 1,159 | 1,402 | 5,186 | 1,276 | |||||||||||||||||||||||||||||||||||||
| Corporate & Other | (201 | ) | (149 | ) | (125 | ) | (129 | ) | (604 | ) | (139 | ) | (130 | ) | (133 | ) | (138 | ) | (540 | ) | (131 | ) | ||||||||||||||||||||||||||
| 10,673 | 10,982 | 10,688 | 10,454 | 42,797 | 10,970 | 10,958 | 10,280 | 10,628 | 42,836 | 10,069 | ||||||||||||||||||||||||||||||||||||||
| Costs and expenses | ||||||||||||||||||||||||||||||||||||||||||||||||
| Cost of goods sold | 9,416 | 9,544 | 9,264 | 8,961 | 37,185 | 9,642 | 9,494 | 8,828 | 9,073 | 37,037 | 8,827 | |||||||||||||||||||||||||||||||||||||
| Selling, general and administrative | 488 | 505 | 491 | 566 | 2,050 | 516 | 523 | 487 | 535 | 2,061 | 539 | |||||||||||||||||||||||||||||||||||||
| Equity income | (33 | ) | (36 | ) | (40 | ) | (3 | ) | (112 | ) | (34 | ) | (9 | ) | (13 | ) | (45 | ) | (101 | ) | (20 | ) | ||||||||||||||||||||||||||
| Adjusted EBITDA | 802 | 969 | 973 | 930 | 3,674 | 846 | 950 | 978 | 1,065 | 3,839 | 723 | |||||||||||||||||||||||||||||||||||||
| Depreciation | 353 | 353 | 358 | 372 | 1,436 | 377 | 373 | 384 | 376 | 1,510 | 369 | |||||||||||||||||||||||||||||||||||||
| Adjusted EBIT | 449 | 616 | 615 | 558 | 2,238 | 469 | 577 | 594 | 689 | 2,329 | 354 | |||||||||||||||||||||||||||||||||||||
| Amortization of acquired intangible assets | 12 | 13 | 32 | 31 | 88 | 28 | 28 | 28 | 28 | 112 | 26 | |||||||||||||||||||||||||||||||||||||
| Other expense (income), net | 1 | 142 | 86 | (4 | ) | 164 | 388 | 356 | 68 | (188 | ) | 228 | 464 | 53 | ||||||||||||||||||||||||||||||||||
| Interest expense, net | 20 | 34 | 49 | 53 | 156 | 51 | 54 | 54 | 52 | 211 | 50 | |||||||||||||||||||||||||||||||||||||
| Income from operations before income taxes | 275 | 483 | 538 | 310 | 1,606 | 34 | 427 | 700 | 381 | 1,542 | 225 | |||||||||||||||||||||||||||||||||||||
| Income tax expense | 58 | 129 | 121 | 12 | 320 | 8 | 99 | 192 | 147 | 446 | 72 | |||||||||||||||||||||||||||||||||||||
| Net income | 217 | 354 | 417 | 298 | 1,286 | 26 | 328 | 508 | 234 | 1,096 | 153 | |||||||||||||||||||||||||||||||||||||
| Income attributable to non-controlling interests | (8 | ) | (15 | ) | (23 | ) | (27 | ) | (73 | ) | (17 | ) | (15 | ) | (24 | ) | (31 | ) | (87 | ) | (7 | ) | ||||||||||||||||||||||||||
| Net income attributable to Magna International Inc. | 209 | 339 | 394 | 271 | 1,213 | 9 | 313 | 484 | 203 | 1,009 | 146 | |||||||||||||||||||||||||||||||||||||
| Diluted earnings per common share | $ | 0.73 | $ | 1.18 | $ | 1.37 | $ | 0.94 | $ | 4.23 | $ | 0.03 | $ | 1.09 | $ | 1.68 | $ | 0.71 | $ | 3.52 | $ | 0.52 | ||||||||||||||||||||||||||
| Weighted average number of Common Shares outstanding during the period (in millions): | 286.6 | 286.3 | 286.8 | 286.6 | 286.6 | 287.1 | 287.3 | 287.3 | 285.9 | 286.9 | 282.0 | |||||||||||||||||||||||||||||||||||||
| NON-GAAP MEASURES | ||||||||||||||||||||||||||||||||||||||||||||||||
| Adjusted EBITDA | 802 | 969 | 973 | 930 | 3,674 | 846 | 950 | 978 | 1,065 | 3,839 | 723 | |||||||||||||||||||||||||||||||||||||
| Adjusted EBIT | 2 | 449 | 616 | 615 | 558 | 2,238 | 469 | 577 | 594 | 689 | 2,329 | 354 | ||||||||||||||||||||||||||||||||||||
| Adjusted return on invested capital | 2 | 8.7 | % | 11.0 | % | 10.3 | % | 9.6 | % | 9.9 | % | 7.8 | % | 9.4 | % | 9.0 | % | 11.8 | % | 9.5 | % | 5.7 | % | |||||||||||||||||||||||||
| Adjusted net income attributable to Magna International Inc. | 2 | 329 | 441 | 419 | 383 | 1,572 | 311 | 389 | 369 | 482 | 1,551 | 219 | ||||||||||||||||||||||||||||||||||||
| Adjusted Diluted earnings per common share | 2 | $ | 1.15 | $ | 1.54 | $ | 1.46 | $ | 1.33 | $ | 5.49 | $ | 1.08 | $ | 1.35 | $ | 1.28 | $ | 1.69 | $ | 5.41 | $ | 0.78 | |||||||||||||||||||||||||
| PROFITABILITY RATIOS | ||||||||||||||||||||||||||||||||||||||||||||||||
| Selling, general and administrative /Sales | 4.6 | % | 4.6 | % | 4.6 | % | 5.4 | % | 4.8 | % | 4.7 | % | 4.8 | % | 4.7 | % | 5.0 | % | 4.8 | % | 5.4 | % | ||||||||||||||||||||||||||
| Adjusted EBIT /Sales | 4.2 | % | 5.6 | % | 5.8 | % | 5.3 | % | 5.2 | % | 4.3 | % | 5.3 | % | 5.8 | % | 6.5 | % | 5.4 | % | 3.5 | % | ||||||||||||||||||||||||||
| Income (loss) from operations before income taxes /Sales | 2.6 | % | 4.4 | % | 5.0 | % | 3.0 | % | 3.8 | % | 0.3 | % | 3.9 | % | 6.8 | % | 3.6 | % | 3.6 | % | 2.2 | % | ||||||||||||||||||||||||||
| Effective tax rate Reported | 21.1 | % | 26.7 | % | 22.5 | % | 3.9 | % | 19.9 | % | 23.5 | % | 23.2 | % | 27.4 | % | 38.6 | % | 28.9 | % | 32.0 | % | ||||||||||||||||||||||||||
| Excluding Other expense (income) and amortization, net of taxes and valuation allowance adjustments | 21.4 | % | 21.6 | % | 21.9 | % | 18.8 | % | 21.0 | % | 21.5 | % | 22.8 | % | 27.2 | % | 19.5 | % | 22.7 | % | 25.7 | % | ||||||||||||||||||||||||||
| Q1 2025 Financial Review of Magna International Inc. | Page |
Prepared as at 28-04-25 |
FINANCIAL REVIEW OF MAGNA INTERNATIONAL INC.
(United States dollars in millions) (Unaudited)
Prepared in accordance with U.S. GAAP
| 2023 | 2024 | 2025 | ||||||||||||||||||||||||||||||||||
| 1st Q | 2nd Q | 3rd Q | 4th Q | 1st Q | 2nd Q | 3rd Q | 4th Q | 1st Q | ||||||||||||||||||||||||||||
| CONSOLIDATED BALANCE SHEETS | ||||||||||||||||||||||||||||||||||||
| FUNDS EMPLOYED | ||||||||||||||||||||||||||||||||||||
| Current assets: | ||||||||||||||||||||||||||||||||||||
| Accounts receivable | 7,959 | 8,556 | 8,477 | 7,881 | 8,379 | 8,219 | 8,377 | 7,376 | 8,198 | |||||||||||||||||||||||||||
| Inventories | 4,421 | 4,664 | 4,751 | 4,606 | 4,511 | 4,466 | 4,592 | 4,151 | 4,184 | |||||||||||||||||||||||||||
| Prepaid expenses and other | 367 | 455 | 387 | 352 | 399 | 314 | 303 | 344 | 358 | |||||||||||||||||||||||||||
| 12,747 | 13,675 | 13,615 | 12,839 | 13,289 | 12,999 | 13,272 | 11,871 | 12,740 | ||||||||||||||||||||||||||||
| Current liabilities: | ||||||||||||||||||||||||||||||||||||
| Accounts payable | 7,731 | 7,984 | 7,911 | 7,842 | 7,855 | 7,639 | 7,608 | 7,194 | 7,376 | |||||||||||||||||||||||||||
| Accrued salaries and wages | 822 | 858 | 900 | 912 | 883 | 862 | 962 | 867 | 893 | |||||||||||||||||||||||||||
| Other accrued liabilities | 2,526 | 2,637 | 2,537 | 2,626 | 2,728 | 2,650 | 2,642 | 2,572 | 2,723 | |||||||||||||||||||||||||||
| Income taxes payable (receivable) | 9 | (14 | ) | 33 | 125 | 132 | 79 | 176 | 192 | 152 | ||||||||||||||||||||||||||
| 11,088 | 11,465 | 11,381 | 11,505 | 11,598 | 11,230 | 11,388 | 10,825 | 11,144 | ||||||||||||||||||||||||||||
| Working capital | 1,659 | 2,210 | 2,234 | 1,334 | 1,691 | 1,769 | 1,884 | 1,046 | 1,596 | |||||||||||||||||||||||||||
| Investments | 1,390 | 1,287 | 1,311 | 1,273 | 1,195 | 1,161 | 1,165 | 1,045 | 1,062 | |||||||||||||||||||||||||||
| Fixed assets, net | 8,304 | 8,646 | 8,778 | 9,618 | 9,545 | 9,623 | 9,836 | 9,584 | 9,650 | |||||||||||||||||||||||||||
| Goodwill, other assets and intangible assets | 3,640 | 4,733 | 4,726 | 4,962 | 4,646 | 4,709 | 4,865 | 4,532 | 4,669 | |||||||||||||||||||||||||||
| Operating lease right-of-use assets | 1,638 | 1,667 | 1,696 | 1,744 | 1,733 | 1,688 | 1,780 | 1,941 | 2,032 | |||||||||||||||||||||||||||
| Funds employed | 16,631 | 18,543 | 18,745 | 18,931 | 18,810 | 18,950 | 19,530 | 18,148 | 19,009 | |||||||||||||||||||||||||||
| FINANCING | ||||||||||||||||||||||||||||||||||||
| Straight debt: | ||||||||||||||||||||||||||||||||||||
| Cash and cash equivalents | (2,429 | ) | (1,281 | ) | (1,022 | ) | (1,198 | ) | (1,517 | ) | (999 | ) | (1,061 | ) | (1,247 | ) | (1,059 | ) | ||||||||||||||||||
| Short-term borrowings | 4 | 150 | 2 | 511 | 838 | 848 | 828 | 271 | 614 | |||||||||||||||||||||||||||
| Long-term debt due within one year | 668 | 1,426 | 1,398 | 819 | 824 | 65 | 65 | 708 | 1,005 | |||||||||||||||||||||||||||
| Long-term debt | 4,500 | 4,159 | 4,135 | 4,175 | 4,549 | 4,863 | 4,916 | 4,134 | 3,892 | |||||||||||||||||||||||||||
| Current portion of operating lease liabilities | 285 | 303 | 384 | 399 | 306 | 306 | 319 | 293 | 305 | |||||||||||||||||||||||||||
| Operating lease liabilities | 1,318 | 1,345 | 1,289 | 1,319 | 1,407 | 1,378 | 1,458 | 1,662 | 1,742 | |||||||||||||||||||||||||||
| 4,346 | 6,102 | 6,186 | 6,025 | 6,407 | 6,461 | 6,525 | 5,821 | 6,499 | ||||||||||||||||||||||||||||
| Long-term employee benefit liabilities | 563 | 579 | 564 | 591 | 584 | 564 | 571 | 533 | 552 | |||||||||||||||||||||||||||
| Other long-term liabilities | 451 | 448 | 453 | 475 | 471 | 507 | 339 | 396 | 349 | |||||||||||||||||||||||||||
| Deferred tax assets, net | (218 | ) | (242 | ) | (210 | ) | (437 | ) | (576 | ) | (592 | ) | (592 | ) | (542 | ) | (557 | ) | ||||||||||||||||||
| 796 | 785 | 807 | 629 | 479 | 479 | 318 | 387 | 344 | ||||||||||||||||||||||||||||
| Shareholders' equity | 11,489 | 11,656 | 11,752 | 12,277 | 11,924 | 12,010 | 12,687 | 11,940 | 12,166 | |||||||||||||||||||||||||||
| 16,631 | 18,543 | 18,745 | 18,931 | 18,810 | 18,950 | 19,530 | 18,148 | 19,009 | ||||||||||||||||||||||||||||
| ASSET UTILIZATION RATIOS | ||||||||||||||||||||||||||||||||||||
| Days in accounts receivable | 67.1 | 70.1 | 71.4 | 67.8 | 68.7 | 67.5 | 73.3 | 62.5 | 73.3 | |||||||||||||||||||||||||||
| Days in accounts payable | 73.9 | 75.3 | 76.9 | 78.8 | 73.3 | 72.4 | 77.6 | 71.4 | 75.2 | |||||||||||||||||||||||||||
| Inventory turnover - cost of goods sold | 8.5 | 8.2 | 7.8 | 7.8 | 8.5 | 8.5 | 7.7 | 8.7 | 8.4 | |||||||||||||||||||||||||||
| Working capital turnover | 25.7 | 19.9 | 19.1 | 31.3 | 25.9 | 24.8 | 21.8 | 40.6 | 25.2 | |||||||||||||||||||||||||||
| Total asset turnover | 2.6 | 2.4 | 2.3 | 2.2 | 2.3 | 2.3 | 2.1 | 2.3 | 2.1 | |||||||||||||||||||||||||||
| CAPITAL STRUCTURE | ||||||||||||||||||||||||||||||||||||
| Straight debt | 26.1 | % | 32.9 | % | 33.0 | % | 31.8 | % | 34.1 | % | 34.1 | % | 33.4 | % | 32.1 | % | 34.2 | % | ||||||||||||||||||
| Long-term employee benefit liabilities, other long-term liabilities & deferred tax liabilities, net | 4.8 | % | 4.2 | % | 4.3 | % | 3.3 | % | 2.5 | % | 2.5 | % | 1.6 | % | 2.1 | % | 1.8 | % | ||||||||||||||||||
| Shareholders' equity | 69.1 | % | 62.9 | % | 62.7 | % | 64.9 | % | 63.4 | % | 63.4 | % | 65.0 | % | 65.8 | % | 64.0 | % | ||||||||||||||||||
| 100.0 | % | 100.0 | % | 100.0 | % | 100.0 | % | 100.0 | % | 100.0 | % | 100.0 | % | 100.0 | % | 100.0 | % | |||||||||||||||||||
| Adjusted Debt to Adjusted EBITDA | 2.19 | x | 2.19 | x | 2.02 | x | 1.89 | x | 1.98 | x | 1.90 | x | 1.93 | x | 1.77 | x | 1.92 | x | ||||||||||||||||||
| Debt to total capitalization | 37.1 | % | 38.8 | % | 38.0 | % | 37.0 | % | 39.9 | % | 38.3 | % | 37.4 | % | 37.2 | % | 38.3 | % | ||||||||||||||||||
| Q1 2025 Financial Review of Magna International Inc. | Page |
Prepared as at 28-04-25 |
FINANCIAL REVIEW OF MAGNA INTERNATIONAL INC.
(United States dollars in millions) (Unaudited)
Prepared in accordance with U.S. GAAP
| 2023 | 2024 | 2025 | ||||||||||||||||||||||||||||||||||||||||||||
| Note | 1st Q | 2nd Q | 3rd Q | 4th Q | TOTAL | 1st Q | 2nd Q | 3rd Q | 4th Q | TOTAL | 1st Q | |||||||||||||||||||||||||||||||||||
| CONSOLIDATED STATEMENTS OF CASH FLOWS | ||||||||||||||||||||||||||||||||||||||||||||||
| Operating activities | ||||||||||||||||||||||||||||||||||||||||||||||
| Net income | 217 | 354 | 417 | 298 | 1,286 | 26 | 328 | 508 | 234 | 1,096 | 153 | |||||||||||||||||||||||||||||||||||
| Items not involving current cash flows | 351 | 525 | 404 | 362 | 1,642 | 565 | 353 | 277 | 662 | 1,857 | 394 | |||||||||||||||||||||||||||||||||||
| 568 | 879 | 821 | 660 | 2,928 | 591 | 681 | 785 | 896 | 2,953 | 547 | ||||||||||||||||||||||||||||||||||||
| Changes in operating assets and liabilities | (341 | ) | (332 | ) | (24 | ) | 918 | 221 | (330 | ) | 55 | (58 | ) | 1,014 | 681 | (470 | ) | |||||||||||||||||||||||||||||
| Cash provided from operating activities | 227 | 547 | 797 | 1,578 | 3,149 | 261 | 736 | 727 | 1,910 | 3,634 | 77 | |||||||||||||||||||||||||||||||||||
| Investment activities | ||||||||||||||||||||||||||||||||||||||||||||||
| Fixed asset additions | (424 | ) | (502 | ) | (630 | ) | (944 | ) | (2,500 | ) | (493 | ) | (500 | ) | (476 | ) | (709 | ) | (2,178 | ) | (268 | ) | ||||||||||||||||||||||||
| Increase in investments, other assets and intangible assets | (101 | ) | (96 | ) | (176 | ) | (189 | ) | (562 | ) | (125 | ) | (170 | ) | (115 | ) | (207 | ) | (617 | ) | (148 | ) | ||||||||||||||||||||||||
| Net cash (outflow) inflow from disposal of facilities | 1(f), 1(g) | (25 | ) | - | (23 | ) | - | (48 | ) | 4 | - | 78 | - | 82 | - | |||||||||||||||||||||||||||||||
| (Decrease) increase in public and private equity investments | - | (3 | ) | (7 | ) | (1 | ) | (11 | ) | (23 | ) | 2 | (1 | ) | 10 | (12 | ) | (1 | ) | |||||||||||||||||||||||||||
| Proceeds from disposition | 19 | 44 | 32 | 27 | 122 | 87 | 57 | 38 | 37 | 219 | 26 | |||||||||||||||||||||||||||||||||||
| Business combinations | - | (1,475 | ) | - | (29 | ) | (1,504 | ) | (30 | ) | (56 | ) | - | - | (86 | ) | (4 | ) | ||||||||||||||||||||||||||||
| Cash used for investment activities | (531 | ) | (2,032 | ) | (804 | ) | (1,136 | ) | (4,503 | ) | (580 | ) | (667 | ) | (476 | ) | (869 | ) | (2,592 | ) | (395 | ) | ||||||||||||||||||||||||
| Financing activities | ||||||||||||||||||||||||||||||||||||||||||||||
| Net issues (repayments) of debt | 1,636 | 544 | (135 | ) | (119 | ) | 1,926 | 757 | (416 | ) | (47 | ) | (513 | ) | (219 | ) | 322 | |||||||||||||||||||||||||||||
| Common Shares issued on exercise of stock options | 6 | - | 8 | 6 | 20 | 30 | - | - | - | 30 | - | |||||||||||||||||||||||||||||||||||
| Repurchase of Common Shares | (9 | ) | (2 | ) | - | (2 | ) | (13 | ) | (3 | ) | (2 | ) | - | (202 | ) | (207 | ) | (51 | ) | ||||||||||||||||||||||||||
| Tax withholdings on vesting of equity awards | (9 | ) | (1 | ) | - | (1 | ) | (11 | ) | (4 | ) | (1 | ) | - | (3 | ) | (8 | ) | (4 | ) | ||||||||||||||||||||||||||
| Contributions to subsidiaries by non-controlling interests | - | - | - | 11 | 11 | - | - | - | - | - | - | |||||||||||||||||||||||||||||||||||
| Dividends paid to non-controlling interests | (7 | ) | (24 | ) | (18 | ) | (25 | ) | (74 | ) | - | (26 | ) | (10 | ) | (10 | ) | (46 | ) | - | ||||||||||||||||||||||||||
| Dividends paid | (132 | ) | (129 | ) | (128 | ) | (133 | ) | (522 | ) | (134 | ) | (134 | ) | (138 | ) | (133 | ) | (539 | ) | (136 | ) | ||||||||||||||||||||||||
| Cash provided from (used for) financing activities | 1,485 | 388 | (273 | ) | (263 | ) | 1,337 | 646 | (579 | ) | (195 | ) | (861 | ) | (989 | ) | 131 | |||||||||||||||||||||||||||||
| Effect of exchange rate changes on cash and cash equivalents | 14 | (51 | ) | 21 | (3 | ) | (19 | ) | (8 | ) | (8 | ) | 6 | 6 | (4 | ) | (1 | ) | ||||||||||||||||||||||||||||
| Net increase (decrease) in cash and cash equivalents, during the period | 1,195 | (1,148 | ) | (259 | ) | 176 | (36 | ) | 319 | (518 | ) | 62 | 186 | 49 | (188 | ) | ||||||||||||||||||||||||||||||
| Cash and cash equivalents, beginning of period | 1,234 | 2,429 | 1,281 | 1,022 | 1,234 | 1,198 | 1,517 | 999 | 1,061 | 1,198 | 1,247 | |||||||||||||||||||||||||||||||||||
| Cash and cash equivalents, end of period | 2,429 | 1,281 | 1,022 | 1,198 | 1,198 | 1,517 | 999 | 1,061 | 1,247 | 1,247 | 1,059 | |||||||||||||||||||||||||||||||||||
| Q1 2025 Financial Review of Magna International Inc. | Page |
Prepared as at 28-04-25 |
FINANCIAL REVIEW OF MAGNA INTERNATIONAL INC.
(United States dollars in millions, except per share figures) (Unaudited)
Prepared in accordance with U.S. GAAP
This Analyst should be read in conjunction with the audited consolidated financial statements for the year ended December 31, 2024.
| Note 1: | OTHER EXPENSE (INCOME), NET |
Other expense (income), net consists of significant items such as: impairment charges; restructuring costs generally related to significant plant closures or consolidations; net losses (gains) on investments; gains or losses on disposal of facilities or businesses; and other items not reflective of on-going operating profit or loss. Other expense (income), net consists of:
| 2023 | 2024 | 2025 | ||||||||||||||||||||||||||||||||||||||||||||
| 1st Q | 2nd Q | 3rd Q | 4th Q | TOTAL | 1st Q | 2nd Q | 3rd Q | 4th Q | TOTAL | 1st Q | ||||||||||||||||||||||||||||||||||||
| Restructuring activities | [a] | 118 | (35 | ) | (1 | ) | 66 | 148 | 38 | 55 | - | 94 | 187 | 44 | ||||||||||||||||||||||||||||||||
| Investment revaluations, (gains) losses on sales, and impairments | [b] | 2 | 85 | (1 | ) | 5 | 91 | 2 | 3 | 1 | 3 | 9 | 9 | |||||||||||||||||||||||||||||||||
| Impacts related to Fisker Inc. [“Fisker”] | [c] | 22 | 13 | (18 | ) | 93 | 110 | 316 | 19 | (189 | ) | 52 | 198 | - | ||||||||||||||||||||||||||||||||
| Impairments | [d] | - | - | - | - | - | - | - | - | 79 | 79 | - | ||||||||||||||||||||||||||||||||||
| Gain on business combination | [e] | - | - | - | - | - | - | (9 | ) | - | - | (9 | ) | - | ||||||||||||||||||||||||||||||||
| Veoneer AS transaction costs | [f] | - | 23 | - | - | 23 | - | - | - | - | - | - | ||||||||||||||||||||||||||||||||||
| Operations in Russia | [g] | - | - | 16 | - | 16 | - | - | - | - | - | - | ||||||||||||||||||||||||||||||||||
| 142 | 86 | (4 | ) | 164 | 388 | 356 | 68 | (188 | ) | 228 | 464 | 53 | ||||||||||||||||||||||||||||||||||
| [a] | Restructuring activities |
| 2023 | 2024 | 2025 | ||||||||||||||||||||||||||||||||||||||||||
| 1st Q | 2nd Q | 3rd Q | 4th Q | TOTAL | 1st Q | 2nd Q | 3rd Q | 4th Q | TOTAL | 1st Q | ||||||||||||||||||||||||||||||||||
| Power & Vision | 105 | (44 | ) | (1 | ) | 57 | 117 | - | 55 | - | 49 | 104 | 11 | |||||||||||||||||||||||||||||||
| Complete Vehicles | - | - | - | - | - | 26 | - | - | 29 | 55 | 33 | |||||||||||||||||||||||||||||||||
| Body Exteriors & Structures | 13 | 9 | - | 9 | 31 | 12 | - | - | 16 | 28 | - | |||||||||||||||||||||||||||||||||
| 118 | (35 | ) | (1 | ) | 66 | 148 | 38 | 55 | - | 94 | 187 | 44 | ||||||||||||||||||||||||||||||||
Restructuring charges generally related to significant plant closures and consolidations primarily in Europe and to a lesser extent in North America. During the second quarter of 2024, the Company recorded $35 million of restructuring charges associated with its acquisition of the Veoneer Active Safety Business [“Veoneer AS”]; during the second and third quarters of 2023, the Company’s Power & Vision segment recorded a $10 million and $8 million gain on the sale of a building as a result of restructuring activities, respectively; during the second quarter of 2023, the Company’s Power & Vision segment reversed $39 million of charges due to a change in the restructuring plans related to a plant closure.
| [b] | Investment revaluations, (gains) losses on sales, and impairments |
The Company revalues its public and private equity investments and certain public company warrants every quarter. The gains and losses related to this revaluation, as well as gain and losses on disposition, are primarily recorded in Corporate. In the second quarter of 2023, the Company recorded a non-cash impairment charge of $85 million on a private equity investment and related long-term receivables within Other assets in its Corporate segment. In the fourth quarter of 2023, the Company also recorded a non-cash impairment charge of $5 million on a private equity investment in its Power & Vision segment. In the fourth quarter of 2024, the Company recorded a non-cash impairment charge of $13 million on a private equity investment in its Corporate segment. The revaluation of Fisker warrants previously presented within Investment revaluations, (gains) losses on sales, and impairments has now been presented within Impacts related to Fisker.
| [c] | Impacts related to Fisker Inc. [“Fisker”] |
During 2023 and 2024, the Company recorded impairment charges on its Fisker related net assets, including its Fisker warrants, which were received in connection with the agreements with Fisker for platform sharing, engineering and manufacturing of the Fisker Ocean SUV. The Company also recorded additional restructuring charges during the first quarter of 2024 related to its Fisker related assembly operations. In the course of such bankruptcy proceedings, the Company terminated its manufacturing agreement for the Fisker Ocean SUV and recognized the remaining $196 million of deferred revenue into income.
| 2023 | 2024 | 2025 | ||||||||||||||||||||||||||||||||||||||||||
| 1st Q | 2nd Q | 3rd Q | 4th Q | TOTAL | 1st Q | 2nd Q | 3rd Q | 4th Q | TOTAL | 1st Q | ||||||||||||||||||||||||||||||||||
| Impairment of Fisker related net assets | - | - | - | - | - | 261 | 19 | 7 | 43 | 330 | - | |||||||||||||||||||||||||||||||||
| Impairment of Fisker warrants | 22 | 13 | (18 | ) | 93 | 110 | 33 | - | - | - | 33 | - | ||||||||||||||||||||||||||||||||
| Additional restructuring related to Complete Vehicles | - | - | - | - | - | 22 | - | - | 9 | 31 | - | |||||||||||||||||||||||||||||||||
| Recognition of related deferred revenue | - | - | - | - | - | - | - | (196 | ) | - | (196 | ) | - | |||||||||||||||||||||||||||||||
| 22 | 13 | (18 | ) | 93 | 110 | 316 | 19 | (189 | ) | 52 | 198 | - | ||||||||||||||||||||||||||||||||
| [d] | Impairments |
During 2024, the Company recorded an impairment charge of $79 million on fixed assets, right of use assets and intangible assets at two European facilities in its Power & Vision segment.
| [e] | Gain on business combination |
During 2024, the Company acquired a business in the Body Exteriors & Structures segment for $5 million, resulting in a bargain purchase gain of $9 million.
| [f] | Veoneer AS transaction costs |
During 2023, the Company incurred $23 million of transaction costs related to the acquisition of the Veoneer Active Safety Business.
| [g] | Operations in Russia |
As a result of the expected lack of future cashflows and the continuing uncertainties connected with the Russian economy, during 2023, the Company completed the sale of all of its investments in Russia resulting in a final loss of $16 million including a net cash outflow of $23 million.
| Q1 2025 Financial Review of Magna International Inc. | Page |
Prepared as at 28-04-25 |
| Note 2: | NON-GAAP MEASURES |
The Company presents Adjusted EBIT (Earnings before interest, taxes, Other expense (income), net and amortization of acquired intangible assets); Adjusted Net Income (Net Income before Other expense (income), net, net of tax excluding significant income tax valuation allowance adjustments, and amortization of acquired intangible assets); Adjusted Diluted Earnings per Share; Adjusted EBIT as a percentage of sales; and Adjusted Return on Invested Capital. The Company presents these financial figures because such measures are widely used by analysts and investors in evaluating the operating performance of the Company. However, such measures do not have any standardized meaning under U.S. generally accepted accounting principles and may not be comparable to the calculation of similar measures by other companies.
The following table reconciles Income from operations before income taxes to Adjusted EBIT:
| 2023 | 2024 | 2025 | ||||||||||||||||||||||||||||||||||||||||||
| 1st Q | 2nd Q | 3rd Q | 4th Q | TOTAL | 1st Q | 2nd Q | 3rd Q | 4th Q | TOTAL | 1st Q | ||||||||||||||||||||||||||||||||||
| Income from operations before income taxes | 275 | 483 | 538 | 310 | 1,606 | 34 | 427 | 700 | 381 | 1,542 | 225 | |||||||||||||||||||||||||||||||||
| Exclude: | ||||||||||||||||||||||||||||||||||||||||||||
| Amortization of acquired intangible assets | 12 | 13 | 32 | 31 | 88 | 28 | 28 | 28 | 28 | 112 | 26 | |||||||||||||||||||||||||||||||||
| Other expense (income), net | 142 | 86 | (4 | ) | 164 | 388 | 356 | 68 | (188 | ) | 228 | 464 | 53 | |||||||||||||||||||||||||||||||
| Interest expense, net | 20 | 34 | 49 | 53 | 156 | 51 | 54 | 54 | 52 | 211 | 50 | |||||||||||||||||||||||||||||||||
| Adjusted EBIT | 449 | 616 | 615 | 558 | 2,238 | 469 | 577 | 594 | 689 | 2,329 | 354 | |||||||||||||||||||||||||||||||||
The following table shows the calculation of Adjusted Return on Invested Capital:
| 2023 | 2024 | 2025 | ||||||||||||||||||||||||||||||||||||||||||
| 1st Q | 2nd Q | 3rd Q | 4th Q | FY | 1st Q | 2nd Q | 3rd Q | 4th Q | FY | 1st Q | ||||||||||||||||||||||||||||||||||
| Net income | 217 | 354 | 417 | 298 | 1,286 | 26 | 328 | 508 | 234 | 1,096 | 153 | |||||||||||||||||||||||||||||||||
| Add (deduct): | ||||||||||||||||||||||||||||||||||||||||||||
| Interest expense, net | 20 | 34 | 49 | 53 | 156 | 51 | 54 | 54 | 52 | 211 | 50 | |||||||||||||||||||||||||||||||||
| Amortization of acquired intangible assets | 12 | 13 | 32 | 31 | 88 | 28 | 28 | 28 | 28 | 112 | 26 | |||||||||||||||||||||||||||||||||
| Other expense (income), net | 142 | 86 | (4 | ) | 164 | 388 | 356 | 68 | (188 | ) | 228 | 464 | 53 | |||||||||||||||||||||||||||||||
| Tax effect on Interest expense, net, Amortization of acquired intangible assets and Other expense, net | (38 | ) | (4 | ) | (14 | ) | (46 | ) | (103 | ) | (93 | ) | (32 | ) | 30 | (38 | ) | (133 | ) | (19 | ) | |||||||||||||||||||||||
| Adjustments to Deferred Tax Valuation Allowances | - | - | - | (47 | ) | (47 | ) | - | - | - | 51 | 51 | - | |||||||||||||||||||||||||||||||
| Adjusted After-tax operating profits | 353 | 483 | 480 | 453 | 1,768 | 368 | 446 | 432 | 555 | 1,801 | 263 | |||||||||||||||||||||||||||||||||
| Total Assets | 30,654 | 31,837 | 31,675 | 32,255 | 32,678 | 31,986 | 32,790 | 31,039 | 32,074 | |||||||||||||||||||||||||||||||||||
| Excluding: | ||||||||||||||||||||||||||||||||||||||||||||
| Cash and cash equivalents | (2,429 | ) | (1,281 | ) | (1,022 | ) | (1,198 | ) | (1,517 | ) | (999 | ) | (1,061 | ) | (1,247 | ) | (1,059 | ) | ||||||||||||||||||||||||||
| Deferred tax assets | (506 | ) | (535 | ) | (527 | ) | (621 | ) | (753 | ) | (807 | ) | (811 | ) | (819 | ) | (862 | ) | ||||||||||||||||||||||||||
| Less Current Liabilities | (12,045 | ) | (13,358 | ) | (13,165 | ) | (13,234 | ) | (13,566 | ) | (12,449 | ) | (12,600 | ) | (12,097 | ) | (13,068 | ) | ||||||||||||||||||||||||||
| Excluding: | ||||||||||||||||||||||||||||||||||||||||||||
| Short-term borrowing | 4 | 150 | 2 | 511 | 838 | 848 | 828 | 271 | 614 | |||||||||||||||||||||||||||||||||||
| Long-term debt due within one year | 668 | 1,426 | 1,398 | 819 | 824 | 65 | 65 | 708 | 1,005 | |||||||||||||||||||||||||||||||||||
| Current portion of operating lease liabilities | 285 | 303 | 384 | 399 | 306 | 306 | 319 | 293 | 305 | |||||||||||||||||||||||||||||||||||
| Invested Capital | 16,631 | 18,542 | 18,745 | 18,931 | 18,810 | 18,950 | 19,530 | 18,148 | 19,009 | |||||||||||||||||||||||||||||||||||
| Adjusted After-tax operating profits | 353 | 483 | 480 | 453 | 1,768 | 368 | 446 | 432 | 555 | 1,801 | 263 | |||||||||||||||||||||||||||||||||
| Average Invested Capital | 16,318 | 17,587 | 18,644 | 18,838 | 17,771 | 18,871 | 18,880 | 19,240 | 18,839 | 18,875 | 18,579 | |||||||||||||||||||||||||||||||||
| Adjusted Return on Invested Capital | 8.7 | % | 11.0 | % | 10.3 | % | 9.6 | % | 9.9 | % | 7.8 | % | 9.4 | % | 9.0 | % | 11.8 | % | 9.5 | % | 5.7 | % | ||||||||||||||||||||||
| Q1 2025 Financial Review of Magna International Inc. | Page |
Prepared as at 28-04-25 |
| Note 2: | NON-GAAP MEASURES (Continued) |
The following table reconciles Net income attributable to Magna International Inc. to Adjusted net income attributable to Magna International Inc.:
| 2023 | 2024 | 2025 | ||||||||||||||||||||||||||||||||||||||||||||
| 1st Q | 2nd Q | 3rd Q | 4th Q | TOTAL | 1st Q | 2nd Q | 3rd Q | 4th Q | TOTAL | 1st Q | ||||||||||||||||||||||||||||||||||||
| Net income attributable to Magna International Inc. | 209 | 339 | 394 | 271 | 1,213 | 9 | 313 | 484 | 203 | 1,009 | 146 | |||||||||||||||||||||||||||||||||||
| Exclude: | ||||||||||||||||||||||||||||||||||||||||||||||
| Amortization of acquired intangible assets | 10 | 11 | 25 | 25 | 71 | 22 | 23 | 22 | 22 | 89 | 21 | |||||||||||||||||||||||||||||||||||
| Restructuring activities | 92 | (26 | ) | (2 | ) | 60 | 124 | 32 | 45 | - | 82 | 159 | 44 | |||||||||||||||||||||||||||||||||
| Investment revaluations, (gains) losses on sales, and impairments | 2 | 85 | (1 | ) | 4 | 90 | 1 | 2 | 3 | 6 | 12 | 8 | ||||||||||||||||||||||||||||||||||
| Impacts related to Fisker Inc. [“Fisker”] | 16 | 10 | (13 | ) | 70 | 83 | 247 | 15 | (140 | ) | 39 | 161 | - | |||||||||||||||||||||||||||||||||
| Impairments | - | - | - | - | - | - | - | - | 79 | 79 | - | |||||||||||||||||||||||||||||||||||
| Gain on business combination | - | - | - | - | - | - | (9 | ) | - | - | (9 | ) | - | |||||||||||||||||||||||||||||||||
| Veoneer AS transaction costs | - | 22 | - | - | 22 | - | - | - | - | - | - | |||||||||||||||||||||||||||||||||||
| Operations in Russia | - | - | 16 | - | 16 | - | - | - | - | - | - | |||||||||||||||||||||||||||||||||||
| Adjustments to Deferred Tax Valuation Allowance | [i] | - | - | - | (47 | ) | (47 | ) | - | - | - | 51 | 51 | - | ||||||||||||||||||||||||||||||||
| - | ||||||||||||||||||||||||||||||||||||||||||||||
| Adjusted net income attributable to Magna International Inc. | 329 | 441 | 419 | 383 | 1,572 | 311 | 389 | 369 | 482 | 1,551 | 219 | |||||||||||||||||||||||||||||||||||
The following table reconciles diluted earnings per common share to Adjusted diluted earnings per common share:
| 2023 | 2024 | 2025 | ||||||||||||||||||||||||||||||||||||||||||||
| 1st Q | 2nd Q | 3rd Q | 4th Q | TOTAL | 1st Q | 2nd Q | 3rd Q | 4th Q | TOTAL | 1st Q | ||||||||||||||||||||||||||||||||||||
| Diluted earnings per common share | $ | 0.73 | $ | 1.18 | $ | 1.37 | $ | 0.94 | $ | 4.23 | $ | 0.03 | $ | 1.09 | $ | 1.68 | $ | 0.71 | $ | 3.52 | $ | 0.52 | ||||||||||||||||||||||||
| Exclude: | ||||||||||||||||||||||||||||||||||||||||||||||
| Amortization of acquired intangible assets | 0.04 | 0.04 | 0.09 | 0.09 | 0.25 | 0.08 | 0.08 | 0.08 | 0.08 | 0.31 | 0.08 | |||||||||||||||||||||||||||||||||||
| Restructuring activities | 0.31 | (0.09 | ) | - | 0.20 | 0.43 | 0.11 | 0.15 | - | 0.29 | 0.55 | 0.15 | ||||||||||||||||||||||||||||||||||
| Investment revaluations, (gains) losses on sales, and impairments | 0.01 | 0.30 | (0.01 | ) | 0.01 | 0.31 | - | 0.01 | 0.01 | 0.01 | 0.04 | 0.03 | ||||||||||||||||||||||||||||||||||
| Impacts related to Fisker Inc. [“Fisker”] | 0.06 | 0.03 | (0.05 | ) | 0.25 | 0.29 | 0.86 | 0.05 | (0.49 | ) | 0.14 | 0.56 | - | |||||||||||||||||||||||||||||||||
| Impairments | - | - | - | - | - | - | - | - | 0.28 | 0.28 | - | |||||||||||||||||||||||||||||||||||
| Gain on business combination | - | - | - | - | - | - | (0.03 | ) | - | - | (0.03 | ) | - | |||||||||||||||||||||||||||||||||
| Veoneer AS transaction costs | - | 0.08 | - | - | 0.08 | - | - | - | - | - | - | |||||||||||||||||||||||||||||||||||
| Operations in Russia | - | - | 0.06 | - | 0.06 | - | - | - | - | - | - | |||||||||||||||||||||||||||||||||||
| Adjustments to Deferred Tax Valuation Allowance | [i] | - | - | - | (0.16 | ) | (0.16 | ) | - | - | - | 0.18 | 0.18 | - | ||||||||||||||||||||||||||||||||
| Adjusted diluted earnings per common share | $ | 1.15 | $ | 1.54 | $ | 1.46 | $ | 1.33 | $ | 5.49 | $ | 1.08 | $ | 1.35 | $ | 1.28 | $ | 1.69 | $ | 5.41 | $ | 0.78 | ||||||||||||||||||||||||
[i] Adjustments to Deferred Tax Valuation Allowance
The Company records quarterly adjustments to the valuation allowance against its deferred tax assets and liabilities in continents like North America, Europe, Asia, and South America. The net effect of these adjustments is an increase to income tax expense in the fourth quarter of 2024 and a reduction in the fourth quarter of 2023.
| Note 3: | SEGMENTED INFORMATION |
| 2023 | 2024 | 2025 | ||||||||||||||||||||||||||||||||||||||||||
| 1st Q | 2nd Q | 3rd Q | 4th Q | TOTAL | 1st Q | 2nd Q | 3rd Q | 4th Q | TOTAL | 1st Q | ||||||||||||||||||||||||||||||||||
| Body Exteriors & Structures | ||||||||||||||||||||||||||||||||||||||||||||
| Sales | 4,439 | 4,540 | 4,354 | 4,178 | 17,511 | 4,429 | 4,465 | 4,038 | 4,067 | 16,999 | 3,966 | |||||||||||||||||||||||||||||||||
| Adjusted EBIT | 272 | 394 | 358 | 280 | 1,304 | 298 | 341 | 273 | 371 | 1,283 | 230 | |||||||||||||||||||||||||||||||||
| Adjusted EBIT as a percentage of sales | 6.1 | % | 8.7 | % | 8.2 | % | 6.7 | % | 7.4 | % | 6.7 | % | 7.6 | % | 6.8 | % | 9.1 | % | 7.5 | % | 5.8 | % | ||||||||||||||||||||||
| Power & Vision | ||||||||||||||||||||||||||||||||||||||||||||
| Sales | 3,323 | 3,462 | 3,745 | 3,775 | 14,305 | 3,842 | 3,926 | 3,837 | 3,786 | 15,391 | 3,646 | |||||||||||||||||||||||||||||||||
| Adjusted EBIT | 92 | 124 | 221 | 231 | 668 | 98 | 198 | 279 | 235 | 810 | 124 | |||||||||||||||||||||||||||||||||
| Adjusted EBIT as a percentage of sales | 2.8 | % | 3.6 | % | 5.9 | % | 6.1 | % | 4.7 | % | 2.6 | % | 5.0 | % | 7.3 | % | 6.2 | % | 5.3 | % | 3.4 | % | ||||||||||||||||||||||
| Seating Systems | ||||||||||||||||||||||||||||||||||||||||||||
| Sales | 1,486 | 1,603 | 1,529 | 1,429 | 6,047 | 1,455 | 1,455 | 1,379 | 1,511 | 5,800 | 1,312 | |||||||||||||||||||||||||||||||||
| Adjusted EBIT | 37 | 67 | 70 | 44 | 218 | 52 | 53 | 51 | 67 | 223 | (30 | ) | ||||||||||||||||||||||||||||||||
| Adjusted EBIT as a percentage of sales | 2.5 | % | 4.2 | % | 4.6 | % | 3.1 | % | 3.6 | % | 3.6 | % | 3.6 | % | 3.7 | % | 4.4 | % | 3.8 | % | -2.3 | % | ||||||||||||||||||||||
| Complete Vehicles | ||||||||||||||||||||||||||||||||||||||||||||
| Sales | 1,626 | 1,526 | 1,185 | 1,201 | 5,538 | 1,383 | 1,242 | 1,159 | 1,402 | 5,186 | 1,276 | |||||||||||||||||||||||||||||||||
| Adjusted EBIT | 52 | 34 | (5 | ) | 43 | 124 | 27 | 20 | 27 | 56 | 130 | 44 | ||||||||||||||||||||||||||||||||
| Adjusted EBIT as a percentage of sales | 3.2 | % | 2.2 | % | -0.4 | % | 3.6 | % | 2.2 | % | 2.0 | % | 1.6 | % | 2.3 | % | 4.0 | % | 2.5 | % | 3.4 | % | ||||||||||||||||||||||
| Corporate and other | ||||||||||||||||||||||||||||||||||||||||||||
| Intercompany eliminations | (201 | ) | (149 | ) | (125 | ) | (129 | ) | (604 | ) | (139 | ) | (130 | ) | (133 | ) | (138 | ) | (540 | ) | (131 | ) | ||||||||||||||||||||||
| Adjusted EBIT | (4 | ) | (3 | ) | (29 | ) | (40 | ) | (76 | ) | (6 | ) | (35 | ) | (36 | ) | (40 | ) | (117 | ) | (14 | ) | ||||||||||||||||||||||
| Total | ||||||||||||||||||||||||||||||||||||||||||||
| Sales | 10,673 | 10,982 | 10,688 | 10,454 | 42,797 | 10,970 | 10,958 | 10,280 | 10,628 | 42,836 | 10,069 | |||||||||||||||||||||||||||||||||
| Adjusted EBIT | 449 | 616 | 615 | 558 | 2,238 | 469 | 577 | 594 | 689 | 2,329 | 354 | |||||||||||||||||||||||||||||||||
| Adjusted EBIT as a percentage of sales | 4.2 | % | 5.6 | % | 5.8 | % | 5.3 | % | 5.2 | % | 4.3 | % | 5.3 | % | 5.8 | % | 6.5 | % | 5.4 | % | 3.5 | % | ||||||||||||||||||||||
| Q1 2025 Financial Review of Magna International Inc. | Page |
Prepared as at 28-04-25 |
|
May 2, 2025 First Quarter 2025 Results Webcast 1 FIRST QUARTER 2025 RESULTS WEBCAST |
|
2 FIRST QUARTER 2025 RESULTS WEBCAST Vice President, Investor Relations Louis Tonelli |
|
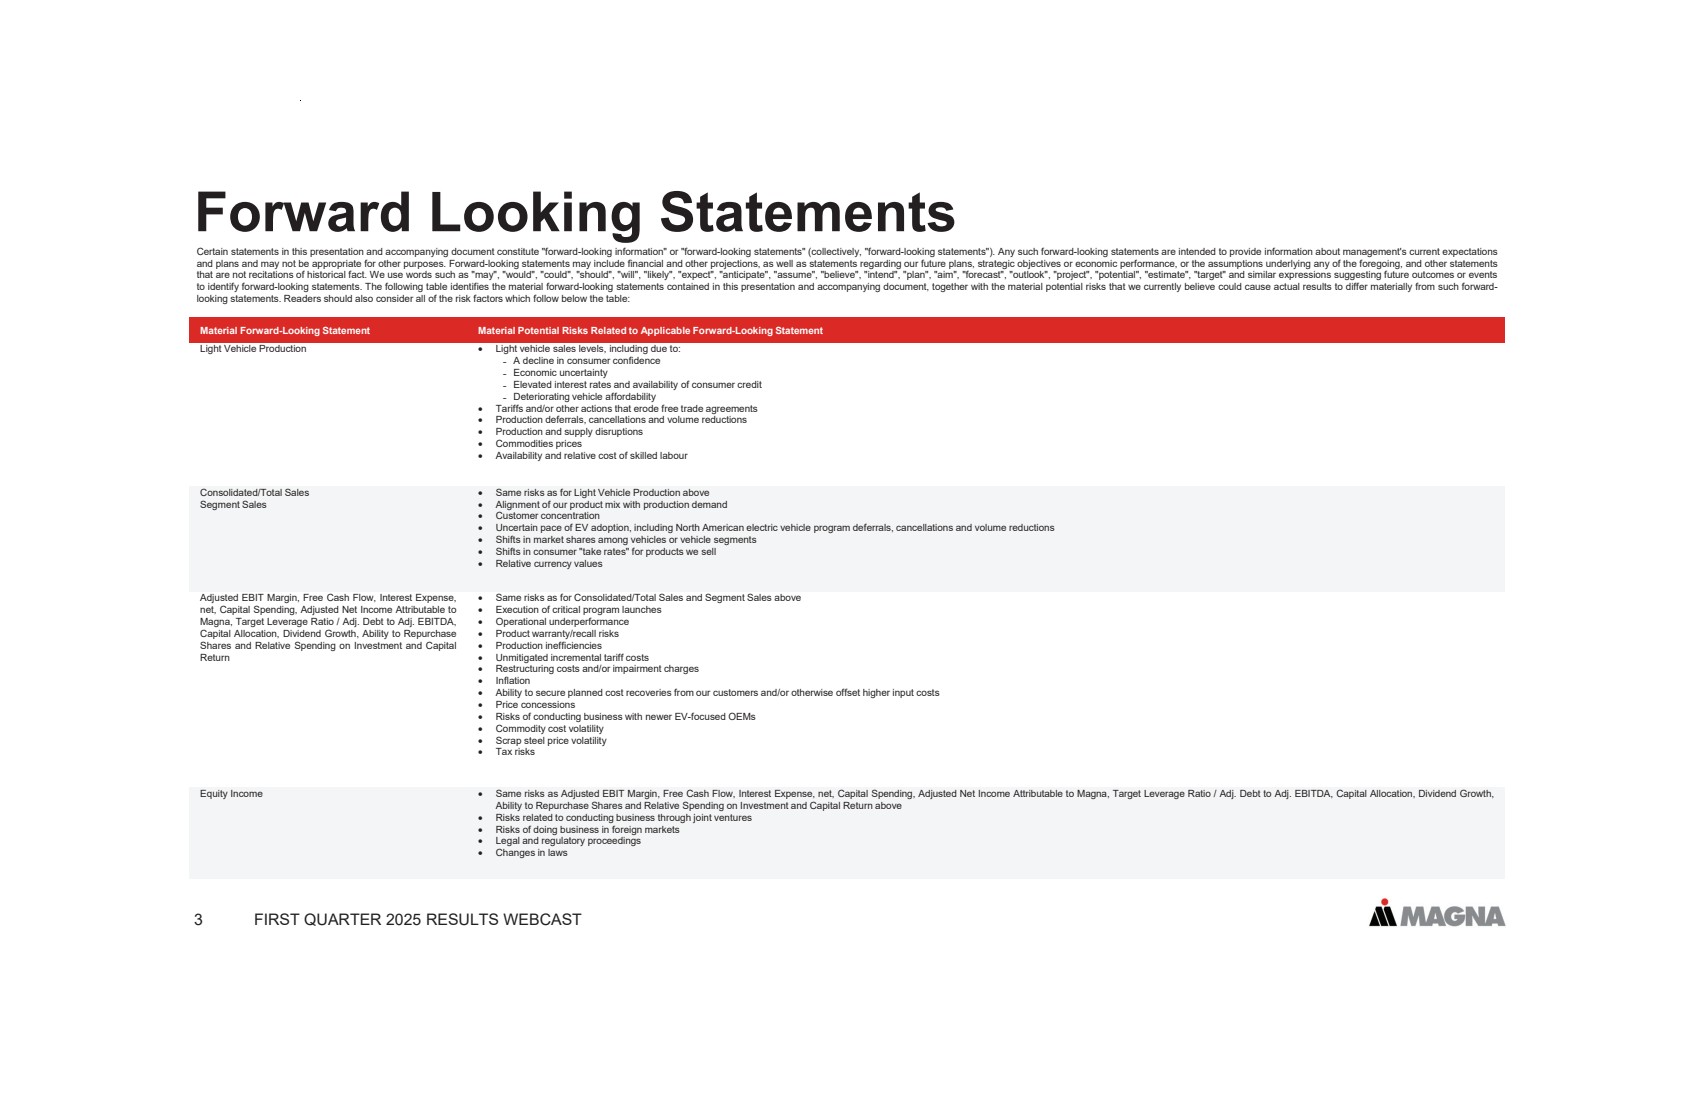
3 FIRST QUARTER 2025 RESULTS WEBCAST Forward Looking Statements Certain statements in this presentation and accompanying document constitute "forward-looking information" or "forward-looking statements" (collectively, "forward-looking statements"). Any such forward-looking statements are intended to provide information about management's current expectations and plans and may not be appropriate for other purposes. Forward-looking statements may include financial and other projections, as well as statements regarding our future plans, strategic objectives or economic performance, or the assumptions underlying any of the foregoing, and other statements that are not recitations of historical fact. We use words such as "may", "would", "could", "should", "will", "likely", "expect", "anticipate", "assume", "believe", "intend", "plan", "aim", "forecast", "outlook", "project", "potential", "estimate", "target" and similar expressions suggesting future outcomes or events to identify forward-looking statements. The following table identifies the material forward-looking statements contained in this presentation and accompanying document, together with the material potential risks that we currently believe could cause actual results to differ materially from such forward-looking statements. Readers should also consider all of the risk factors which follow below the table: Material Forward-Looking Statement Material Potential Risks Related to Applicable Forward-Looking Statement x Light vehicle sales levels, including due to: ࡲ A decline in consumer confidence ࡲ Economic uncertainty ࡲ Elevated interest rates and availability of consumer credit ࡲ Deteriorating vehicle affordability x Tariffs and/or other actions that erode free trade agreements x Production deferrals, cancellations and volume reductions x Production and supply disruptions x Commodities prices x Availability and relative cost of skilled labour Light Vehicle Production x Same risks as for Light Vehicle Production above x Alignment of our product mix with production demand x Customer concentration x Uncertain pace of EV adoption, including North American electric vehicle program deferrals, cancellations and volume reductions x Shifts in market shares among vehicles or vehicle segments x Shifts in consumer "take rates" for products we sell x Relative currency values Consolidated/Total Sales Segment Sales x Same risks as for Consolidated/Total Sales and Segment Sales above x Execution of critical program launches x Operational underperformance x Product warranty/recall risks x Production inefficiencies x Unmitigated incremental tariff costs x Restructuring costs and/or impairment charges x Inflation x Ability to secure planned cost recoveries from our customers and/or otherwise offset higher input costs x Price concessions x Risks of conducting business with newer EV-focused OEMs x Commodity cost volatility x Scrap steel price volatility x Tax risks Adjusted EBIT Margin, Free Cash Flow, Interest Expense, net, Capital Spending, Adjusted Net Income Attributable to Magna, Target Leverage Ratio / Adj. Debt to Adj. EBITDA, Capital Allocation, Dividend Growth, Ability to Repurchase Shares and Relative Spending on Investment and Capital Return x Same risks as Adjusted EBIT Margin, Free Cash Flow, Interest Expense, net, Capital Spending, Adjusted Net Income Attributable to Magna, Target Leverage Ratio / Adj. Debt to Adj. EBITDA, Capital Allocation, Dividend Growth, Ability to Repurchase Shares and Relative Spending on Investment and Capital Return above x Risks related to conducting business through joint ventures x Risks of doing business in foreign markets x Legal and regulatory proceedings x Changes in laws Equity Income |
|
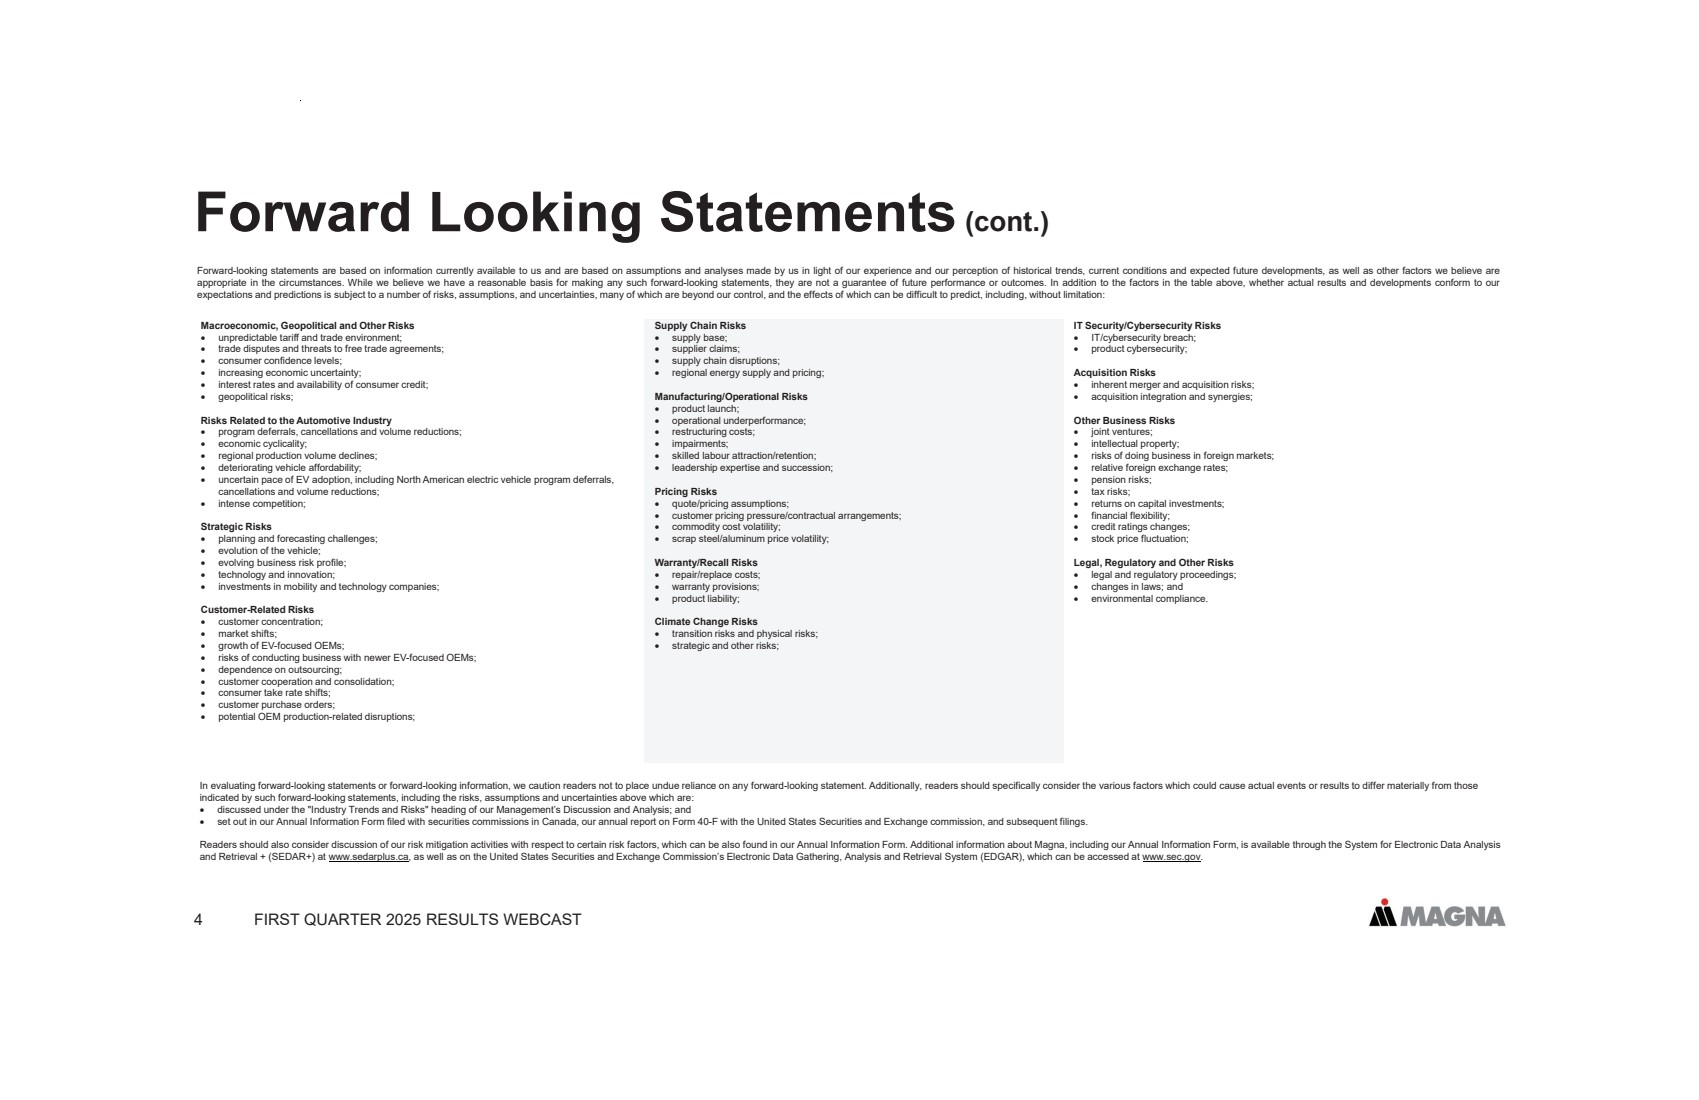
4 FIRST QUARTER 2025 RESULTS WEBCAST Forward Looking Statements (cont.) Forward-looking statements are based on information currently available to us and are based on assumptions and analyses made by us in light of our experience and our perception of historical trends, current conditions and expected future developments, as well as other factors we believe are appropriate in the circumstances. While we believe we have a reasonable basis for making any such forward-looking statements, they are not a guarantee of future performance or outcomes. In addition to the factors in the table above, whether actual results and developments conform to our expectations and predictions is subject to a number of risks, assumptions, and uncertainties, many of which are beyond our control, and the effects of which can be difficult to predict, including, without limitation: IT Security/Cybersecurity Risks x IT/cybersecurity breach; x product cybersecurity; Acquisition Risks x inherent merger and acquisition risks; x acquisition integration and synergies; Other Business Risks x joint ventures; x intellectual property; x risks of doing business in foreign markets; x relative foreign exchange rates; x pension risks; x tax risks; x returns on capital investments; x financial flexibility; x credit ratings changes; x stock price fluctuation; Legal, Regulatory and Other Risks x legal and regulatory proceedings; x changes in laws; and x environmental compliance. Supply Chain Risks x supply base; x supplier claims; x supply chain disruptions; x regional energy supply and pricing; Manufacturing/Operational Risks x product launch; x operational underperformance; x restructuring costs; x impairments; x skilled labour attraction/retention; x leadership expertise and succession; Pricing Risks x quote/pricing assumptions; x customer pricing pressure/contractual arrangements; x commodity cost volatility; x scrap steel/aluminum price volatility; Warranty/Recall Risks x repair/replace costs; x warranty provisions; x product liability; Climate Change Risks x transition risks and physical risks; x strategic and other risks; Macroeconomic, Geopolitical and Other Risks x unpredictable tariff and trade environment; x trade disputes and threats to free trade agreements; x consumer confidence levels; x increasing economic uncertainty; x interest rates and availability of consumer credit; x geopolitical risks; Risks Related to the Automotive Industry x program deferrals, cancellations and volume reductions; x economic cyclicality; x regional production volume declines; x deteriorating vehicle affordability; x uncertain pace of EV adoption, including North American electric vehicle program deferrals, cancellations and volume reductions; x intense competition; Strategic Risks x planning and forecasting challenges; x evolution of the vehicle; x evolving business risk profile; x technology and innovation; x investments in mobility and technology companies; Customer-Related Risks x customer concentration; x market shifts; x growth of EV-focused OEMs; x risks of conducting business with newer EV-focused OEMs; x dependence on outsourcing; x customer cooperation and consolidation; x consumer take rate shifts; x customer purchase orders; x potential OEM production-related disruptions; In evaluating forward-looking statements or forward-looking information, we caution readers not to place undue reliance on any forward-looking statement. Additionally, readers should specifically consider the various factors which could cause actual events or results to differ materially from those indicated by such forward-looking statements, including the risks, assumptions and uncertainties above which are: x discussed under the "Industry Trends and Risks" heading of our Management’s Discussion and Analysis; and x set out in our Annual Information Form filed with securities commissions in Canada, our annual report on Form 40-F with the United States Securities and Exchange commission, and subsequent filings. Readers should also consider discussion of our risk mitigation activities with respect to certain risk factors, which can be also found in our Annual Information Form. Additional information about Magna, including our Annual Information Form, is available through the System for Electronic Data Analysis and Retrieval + (SEDAR+) at www.sedarplus.ca, as well as on the United States Securities and Exchange Commission’s Electronic Data Gathering, Analysis and Retrieval System (EDGAR), which can be accessed at www.sec.gov. |
|
5 FIRST QUARTER 2025 RESULTS WEBCAST All amounts are in U.S. Dollars Today's discussion excludes the impact of other expense (income), net ("Unusual Items") and amortization of acquired intangible assets. Please refer to the reconciliation of Non-GAAP measures in our press release dated May 2, 2025 for further information. "Organic", in the context of sales movements, means "excluding the impact of foreign exchange, acquisitions and divestitures". Weighted Sales Growth over Market (GoM) compares organic sales growth (%) to vehicle production change (%) after applying Magna geographic sales weighting, excluding Complete Vehicles, to regional production. Reminders |
|
6 FIRST QUARTER 2025 RESULTS WEBCAST Chief Executive Officer Swamy Kotagiri |
|
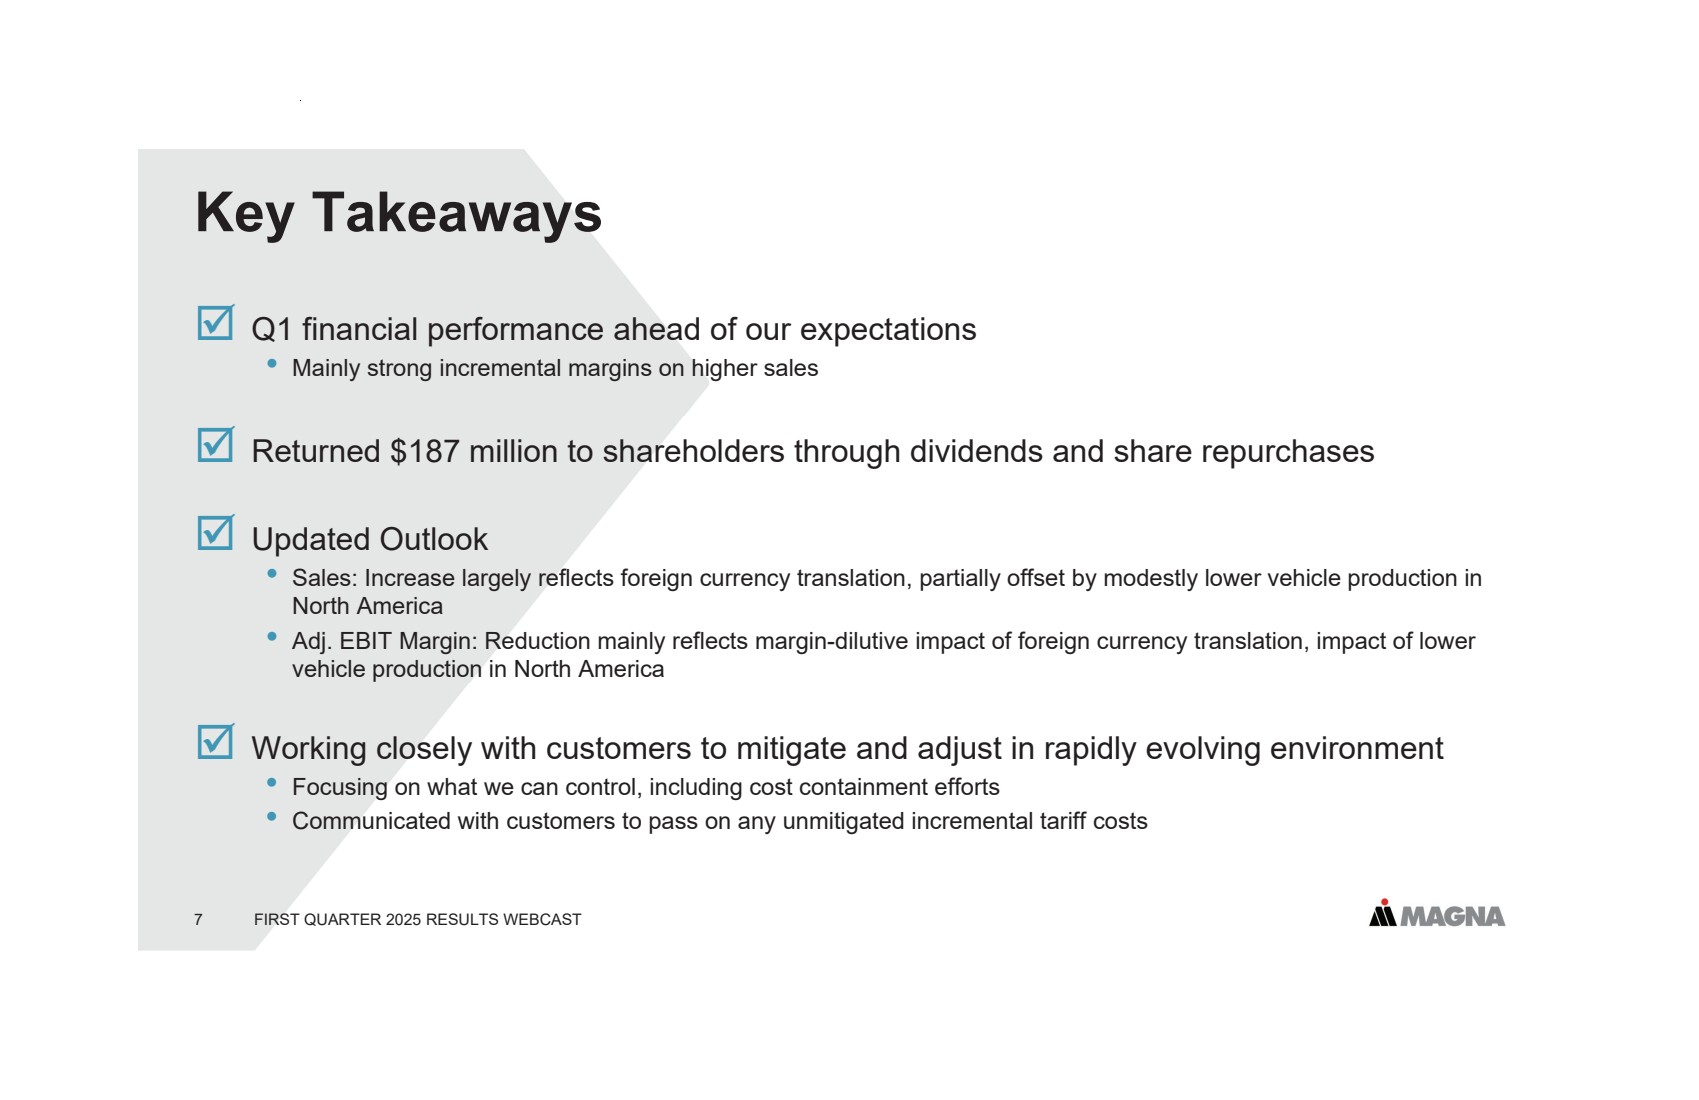
7 FIRST QUARTER 2025 RESULTS WEBCAST ; Q1 financial performance ahead of our expectations • Mainly strong incremental margins on higher sales ; Returned $187 million to shareholders through dividends and share repurchases ; Updated Outlook • Sales: Increase largely reflects foreign currency translation, partially offset by modestly lower vehicle production in North America • Adj. EBIT Margin: Reduction mainly reflects margin-dilutive impact of foreign currency translation, impact of lower vehicle production in North America ; Working closely with customers to mitigate and adjust in rapidly evolving environment • Focusing on what we can control, including cost containment efforts • Communicated with customers to pass on any unmitigated incremental tariff costs Key Takeaways |
|
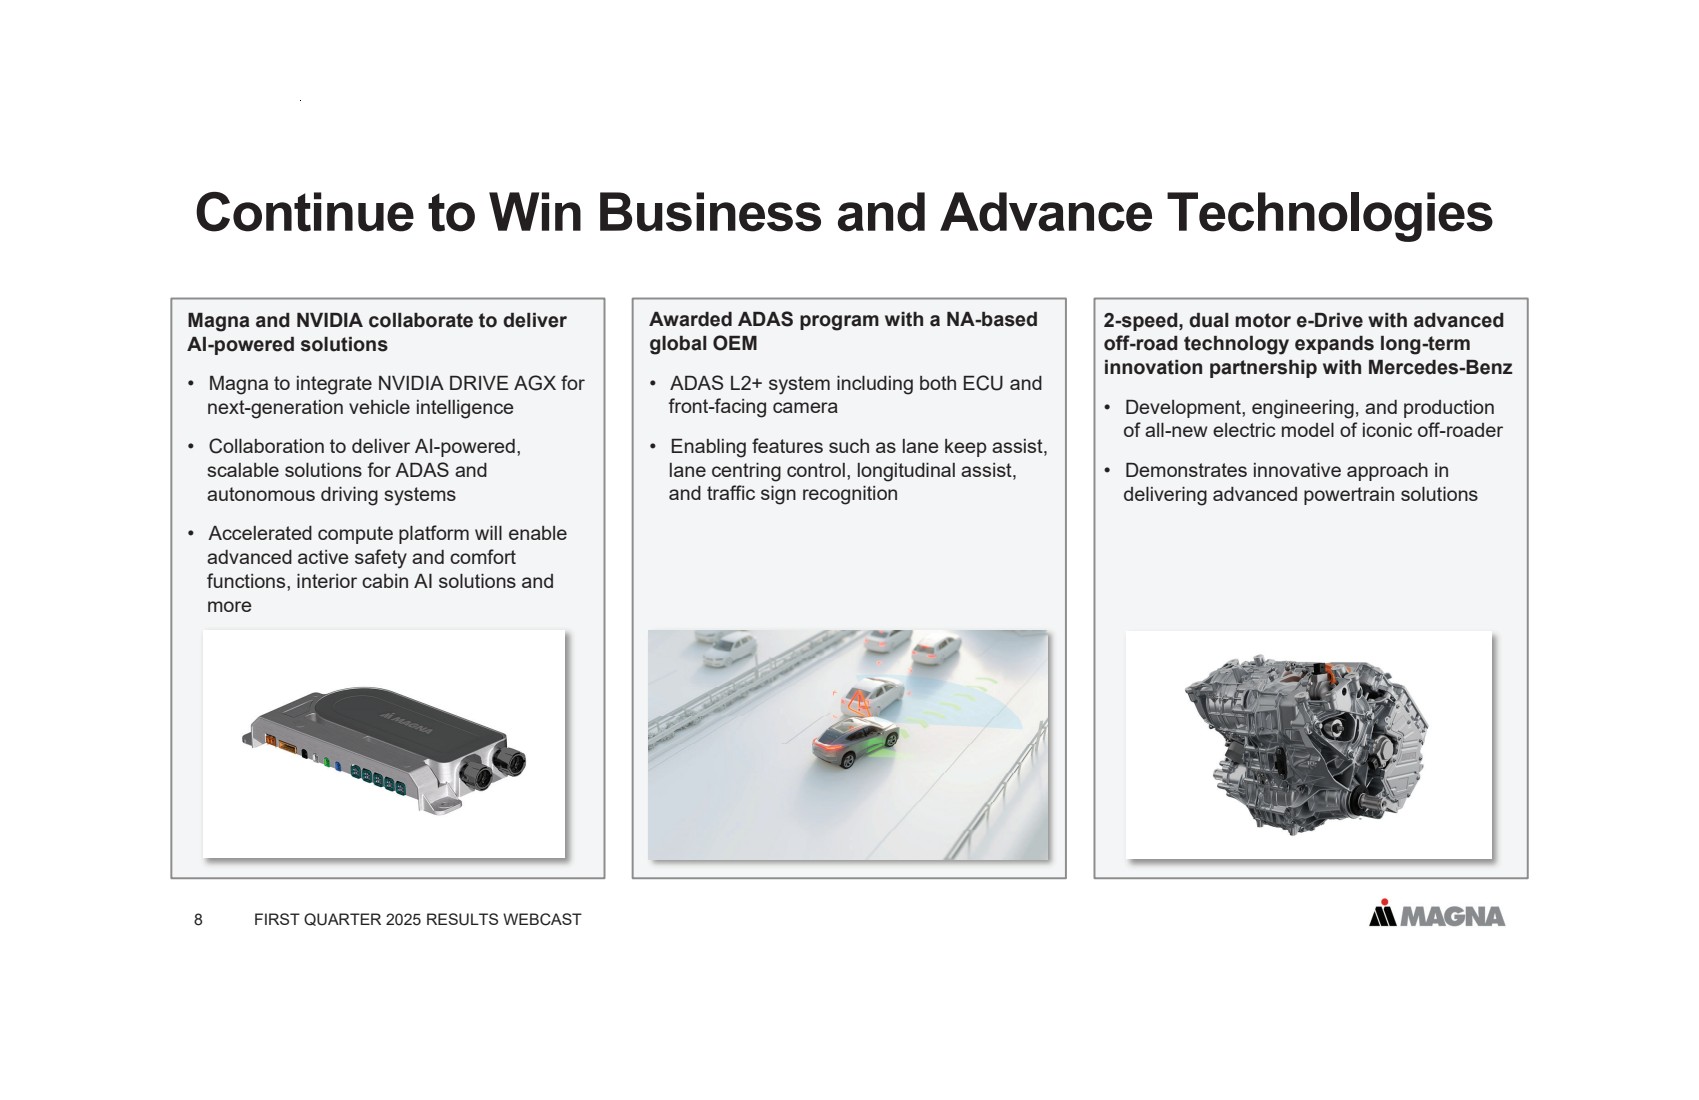
8 FIRST QUARTER 2025 RESULTS WEBCAST Continue to Win Business and Advance Technologies 2-speed, dual motor e-Drive with advanced off-road technology expands long-term innovation partnership with Mercedes-Benz • Development, engineering, and production of all-new electric model of iconic off-roader • Demonstrates innovative approach in delivering advanced powertrain solutions Magna and NVIDIA collaborate to deliver AI-powered solutions • Magna to integrate NVIDIA DRIVE AGX for next-generation vehicle intelligence • Collaboration to deliver AI-powered, scalable solutions for ADAS and autonomous driving systems • Accelerated compute platform will enable advanced active safety and comfort functions, interior cabin AI solutions and more Awarded ADAS program with a NA-based global OEM • ADAS L2+ system including both ECU and front-facing camera • Enabling features such as lane keep assist, lane centring control, longitudinal assist, and traffic sign recognition |
|
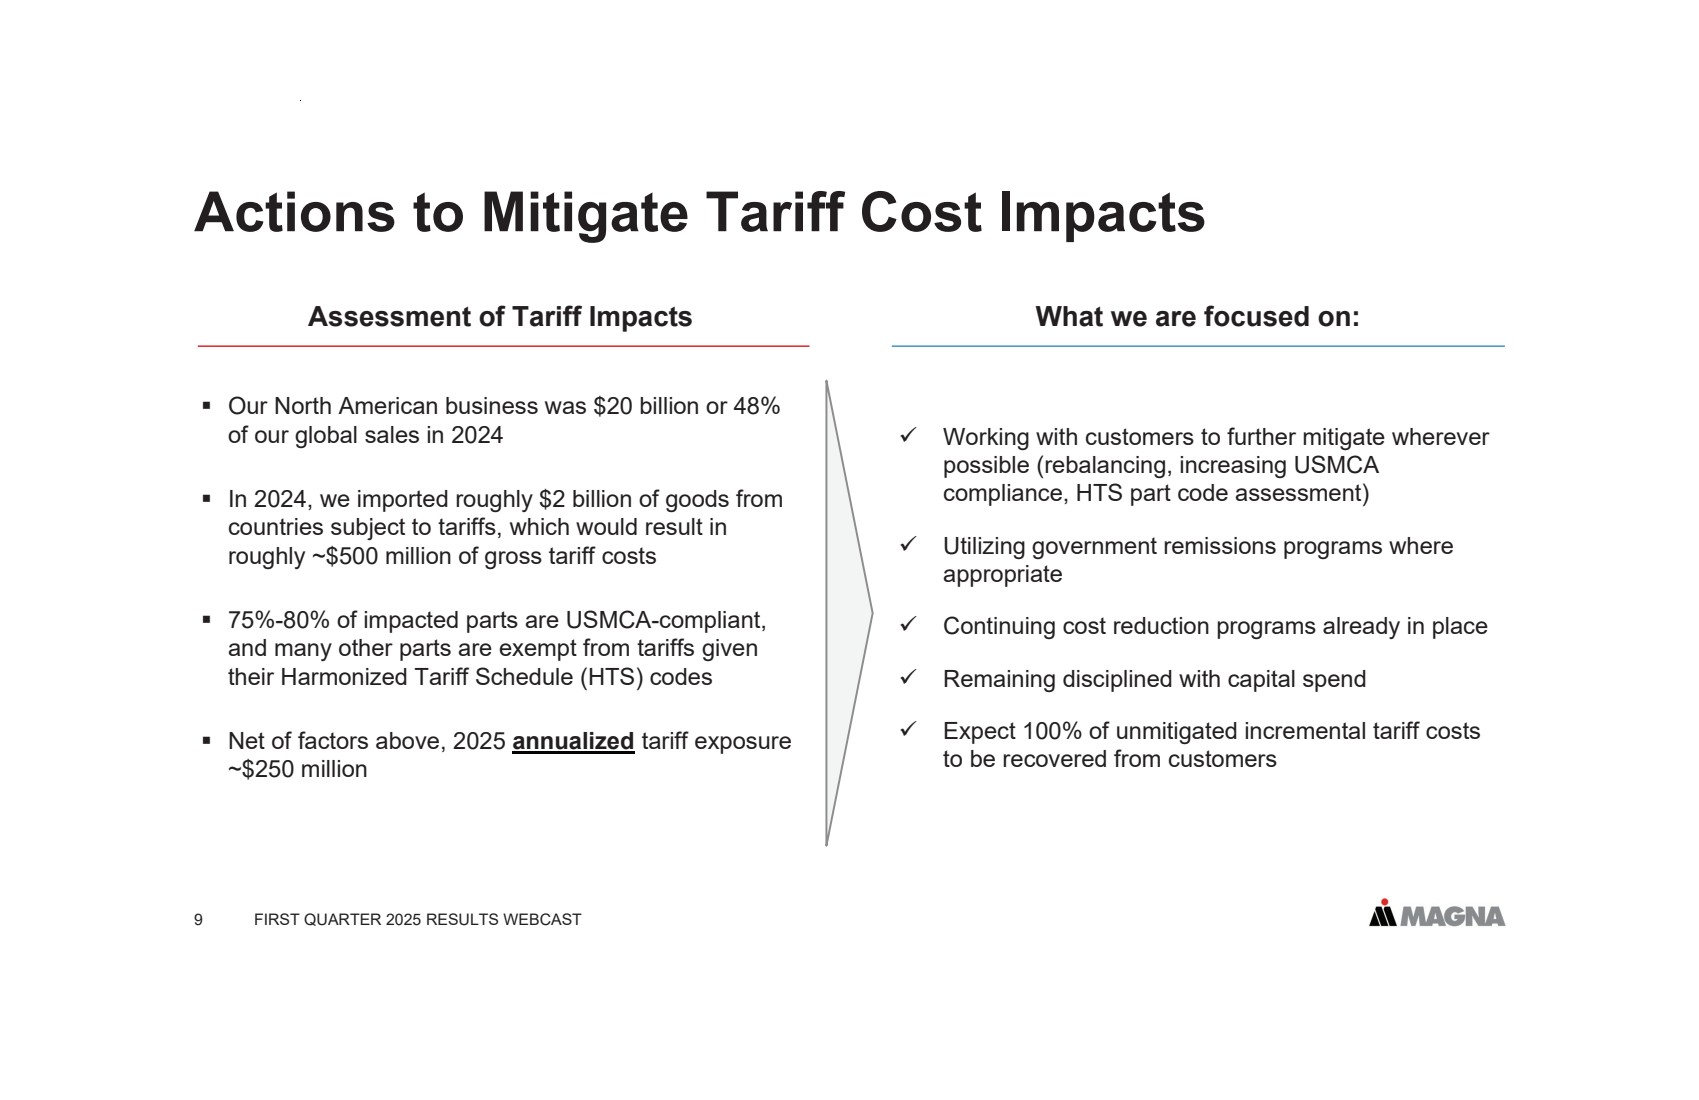
9 Actions to Mitigate Tariff Cost Impacts Assessment of Tariff Impacts What we are focused on: ƒ Our North American business was $20 billion or 48% of our global sales in 2024 ƒ In 2024, we imported roughly $2 billion of goods from countries subject to tariffs, which would result in roughly ~$500 million of gross tariff costs ƒ 75%-80% of impacted parts are USMCA-compliant, and many other parts are exempt from tariffs given their Harmonized Tariff Schedule (HTS) codes ƒ Net of factors above, 2025 annualized tariff exposure ~$250 million 9 Working with customers to further mitigate wherever possible (rebalancing, increasing USMCA compliance, HTS part code assessment) 9 Utilizing government remissions programs where appropriate 9 Continuing cost reduction programs already in place 9 Remaining disciplined with capital spend 9 Expect 100% of unmitigated incremental tariff costs to be recovered from customers FIRST QUARTER 2025 RESULTS WEBCAST |
|
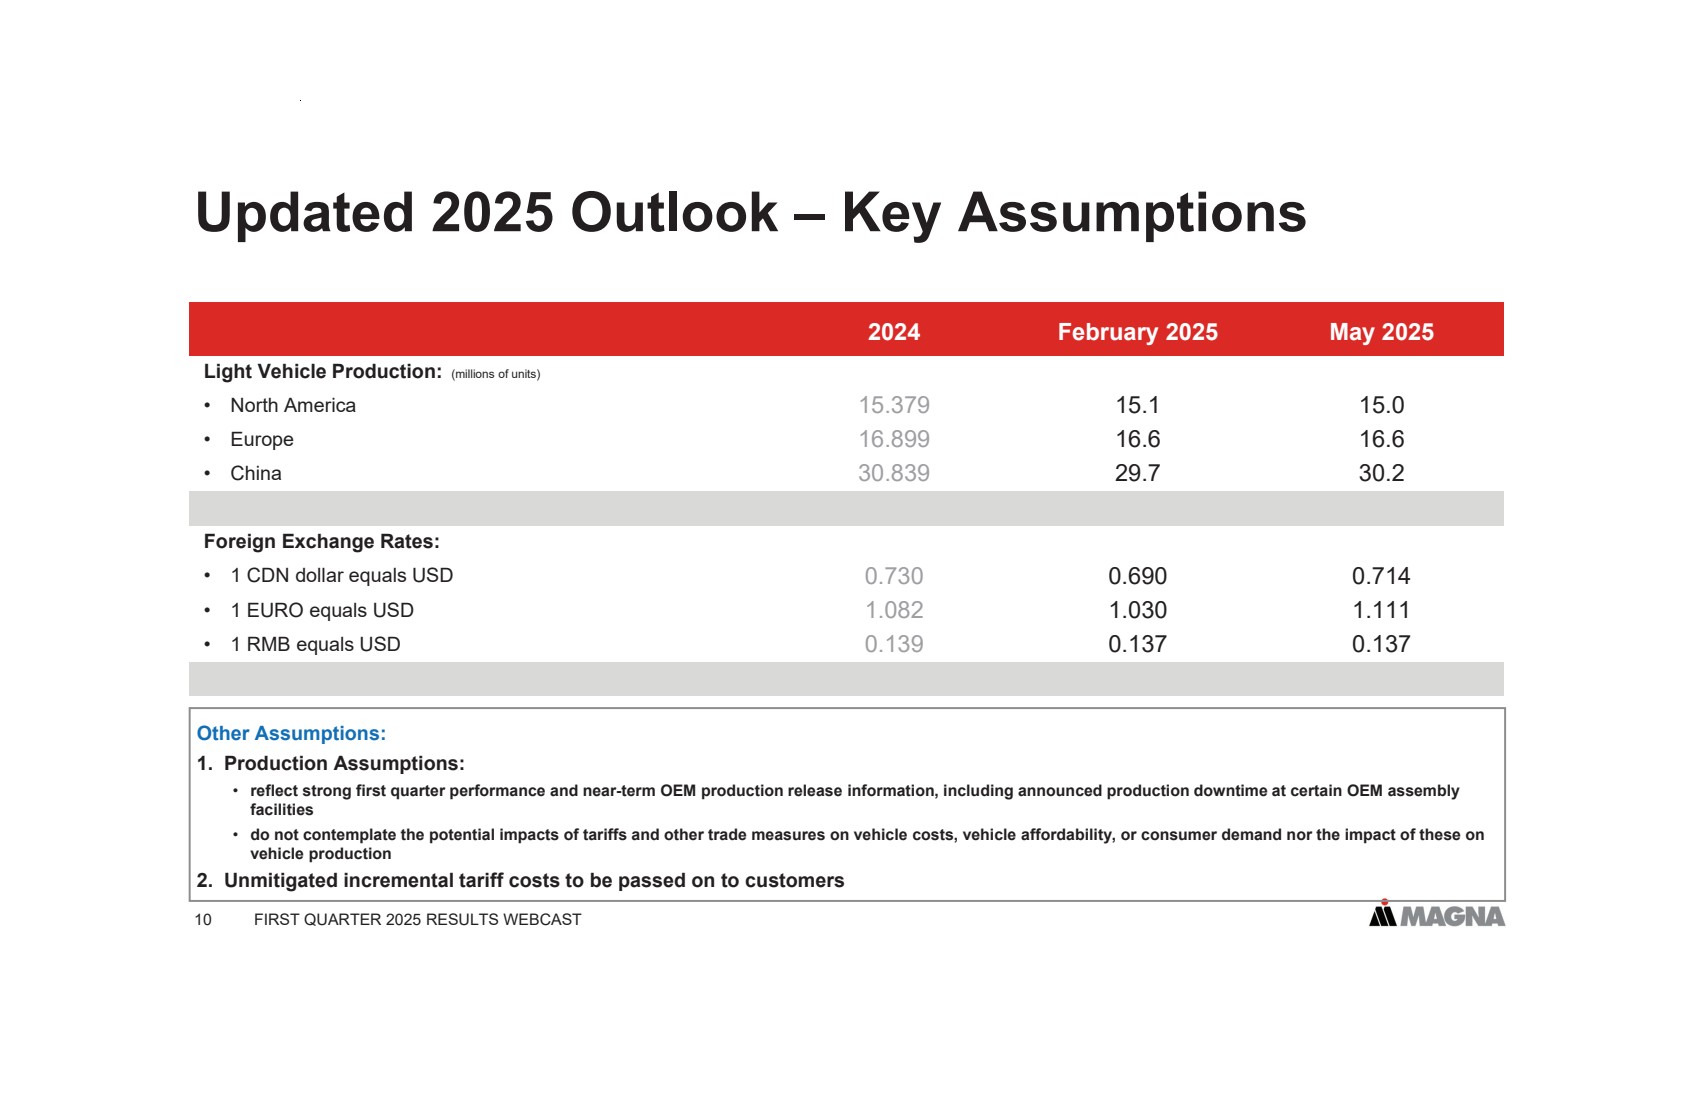
10 FIRST QUARTER 2025 RESULTS WEBCAST Updated 2025 Outlook – Key Assumptions 2024 February 2025 May 2025 Light Vehicle Production: (millions of units) • North America 15.379 15.1 15.0 • Europe 16.899 16.6 16.6 • China 30.839 29.7 30.2 Foreign Exchange Rates: • 1 CDN dollar equals USD 0.730 0.690 0.714 • 1 EURO equals USD 1.082 1.030 1.111 • 1 RMB equals USD 0.139 0.137 0.137 Other Assumptions: 1. Production Assumptions: • reflect strong first quarter performance and near-term OEM production release information, including announced production downtime at certain OEM assembly facilities • do not contemplate the potential impacts of tariffs and other trade measures on vehicle costs, vehicle affordability, or consumer demand nor the impact of these on vehicle production 2. Unmitigated incremental tariff costs to be passed on to customers |
|
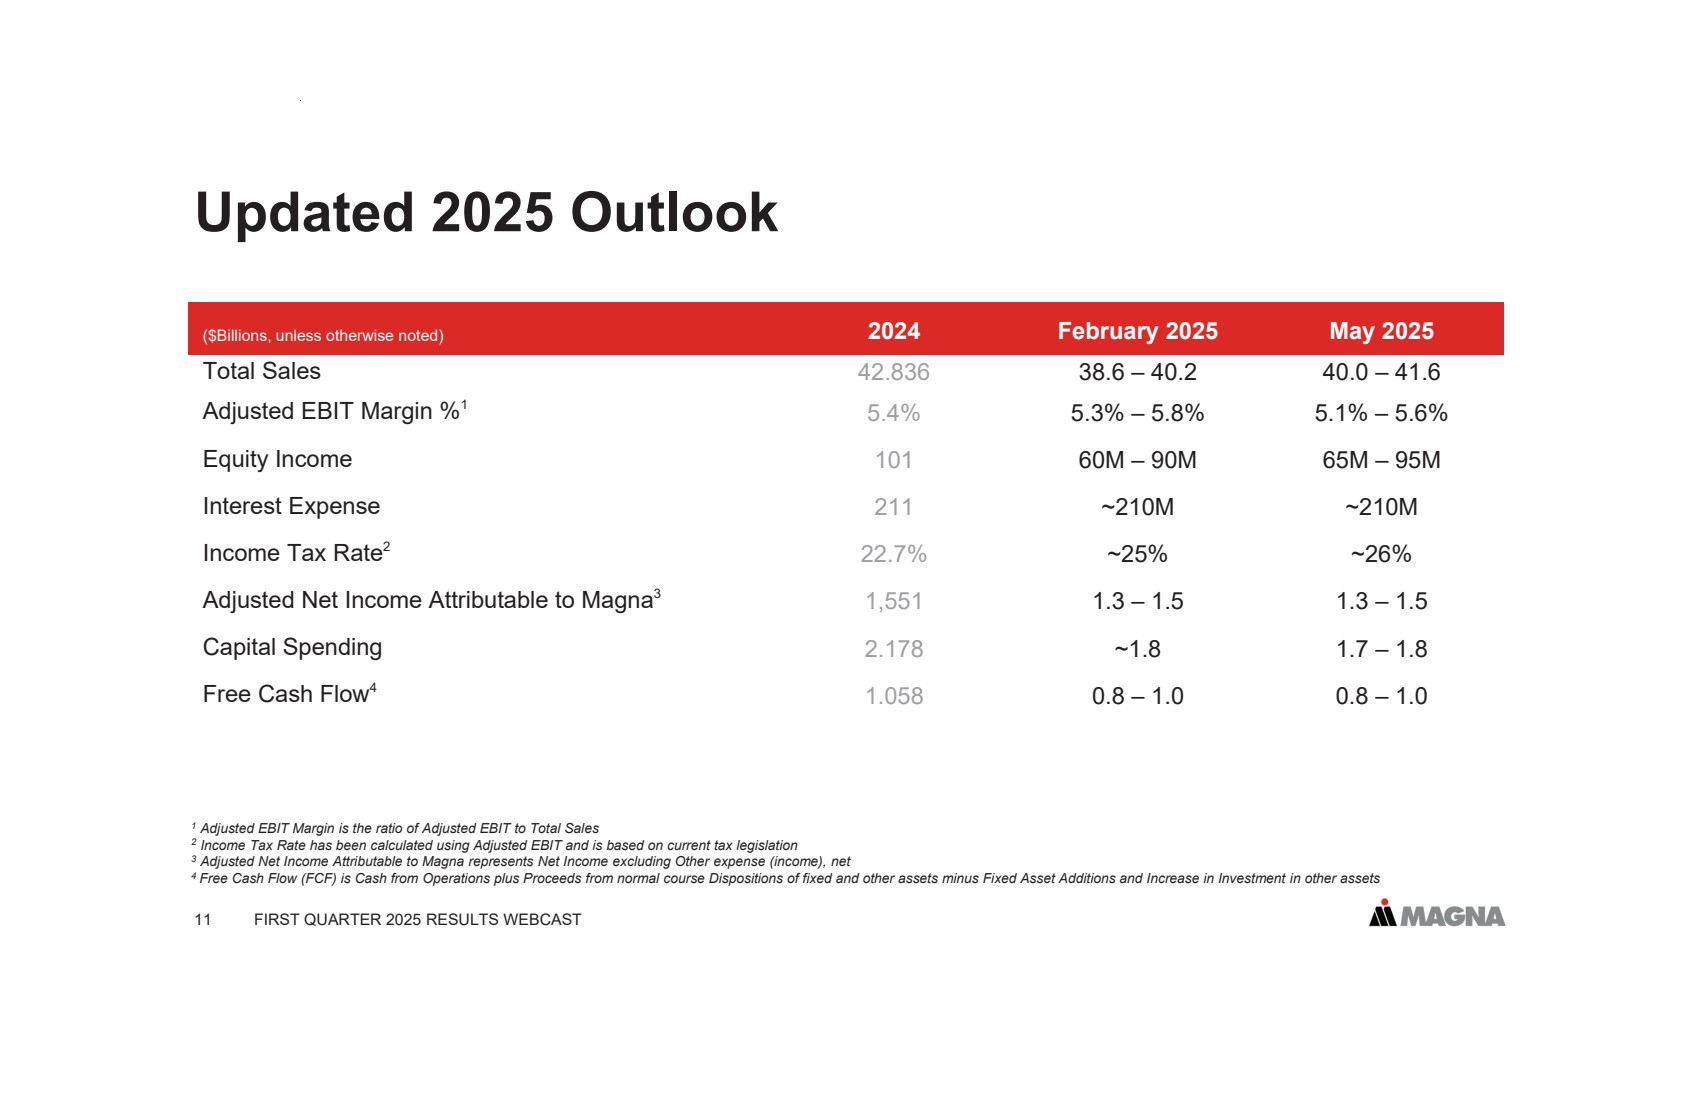
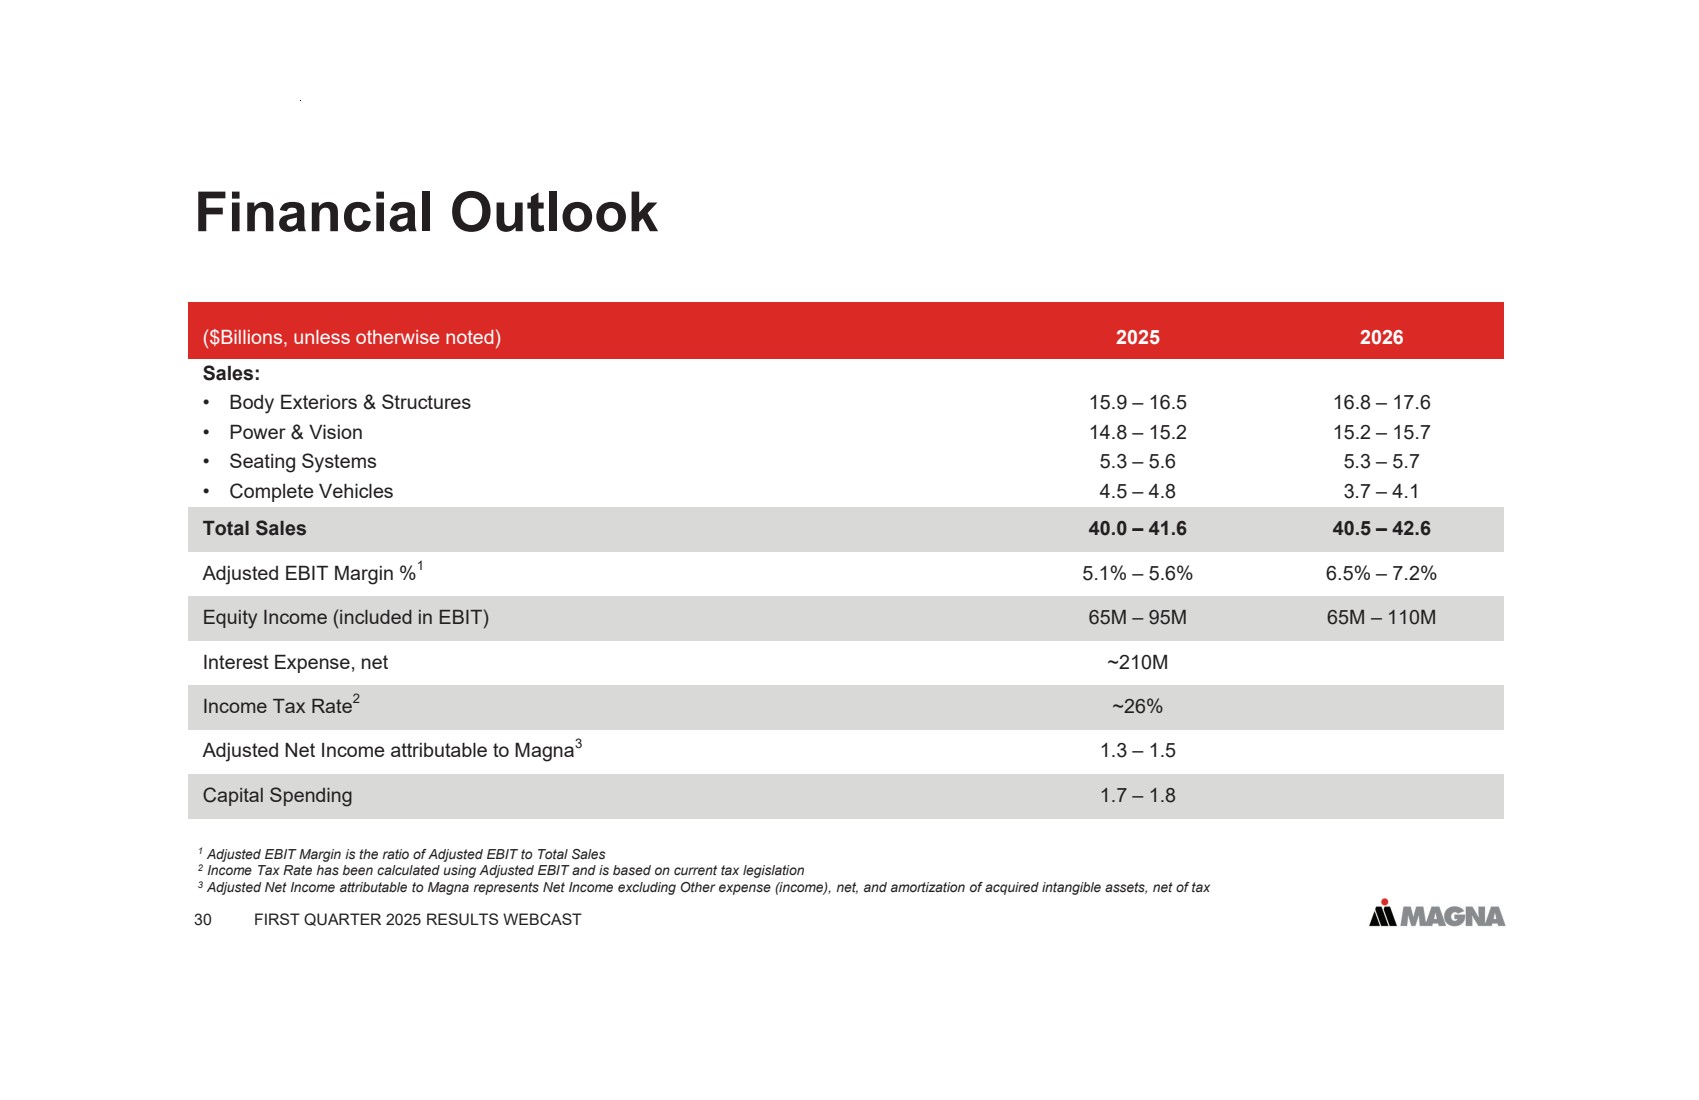
11 FIRST QUARTER 2025 RESULTS WEBCAST Updated 2025 Outlook ($Billions, unless otherwise noted) 2024 February 2025 May 2025 Total Sales 42.836 38.6 – 40.2 40.0 – 41.6 Adjusted EBIT Margin % 5.4% 5.3% – 5.8% 5.1% – 5.6% 1 Equity Income 101 60M – 90M 65M – 95M Interest Expense 211 ~210M ~210M Income Tax Rate 22.7% ~25% ~26% 2 Adjusted Net Income Attributable to Magna 1,551 1.3 – 1.5 1.3 – 1.5 3 Capital Spending 2.178 ~1.8 1.7 – 1.8 Free Cash Flow 1.058 0.8 – 1.0 0.8 – 1.0 4 1 Adjusted EBIT Margin is the ratio of Adjusted EBIT to Total Sales 2 Income Tax Rate has been calculated using Adjusted EBIT and is based on current tax legislation 3 Adjusted Net Income Attributable to Magna represents Net Income excluding Other expense (income), net 4 Free Cash Flow (FCF) is Cash from Operations plus Proceeds from normal course Dispositions of fixed and other assets minus Fixed Asset Additions and Increase in Investment in other assets |
|
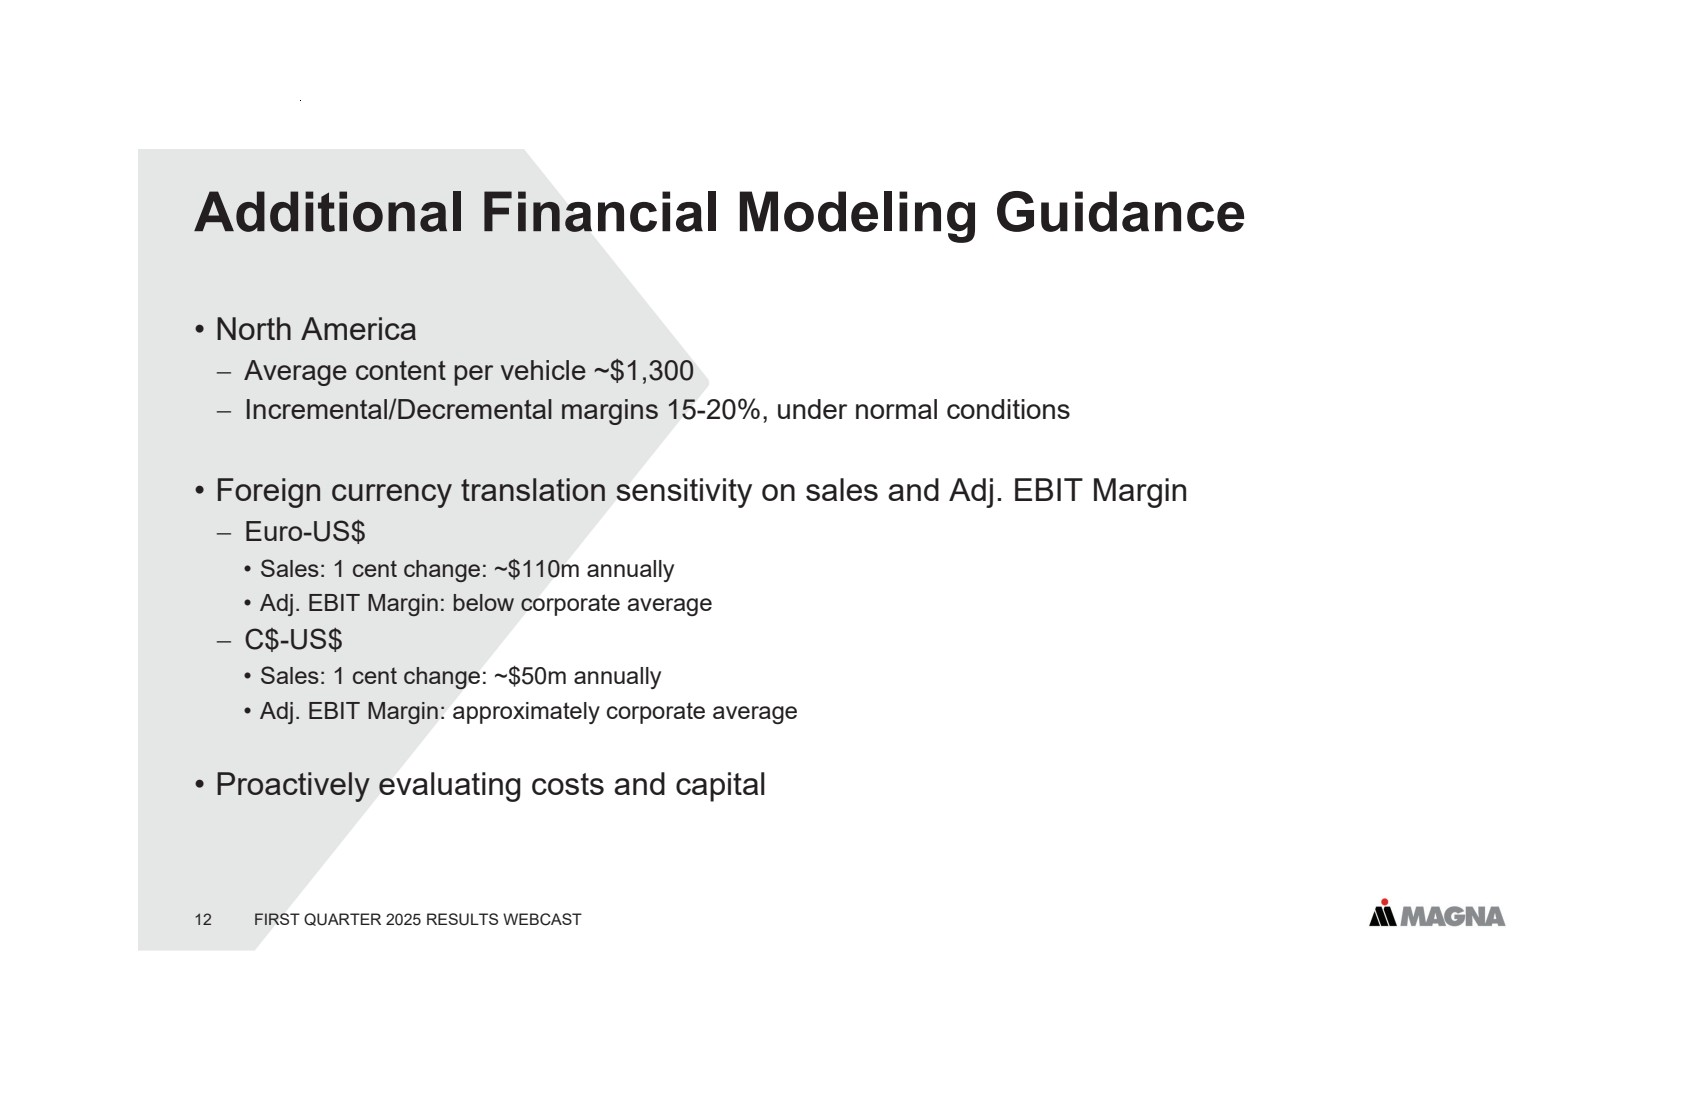
12 FIRST QUARTER 2025 RESULTS WEBCAST • North America Average content per vehicle ~$1,300 Incremental/Decremental margins 15-20%, under normal conditions • Foreign currency translation sensitivity on sales and Adj. EBIT Margin Euro-US$ • Sales: 1 cent change: ~$110m annually • Adj. EBIT Margin: below corporate average C$-US$ • Sales: 1 cent change: ~$50m annually • Adj. EBIT Margin: approximately corporate average • Proactively evaluating costs and capital Additional Financial Modeling Guidance |
|
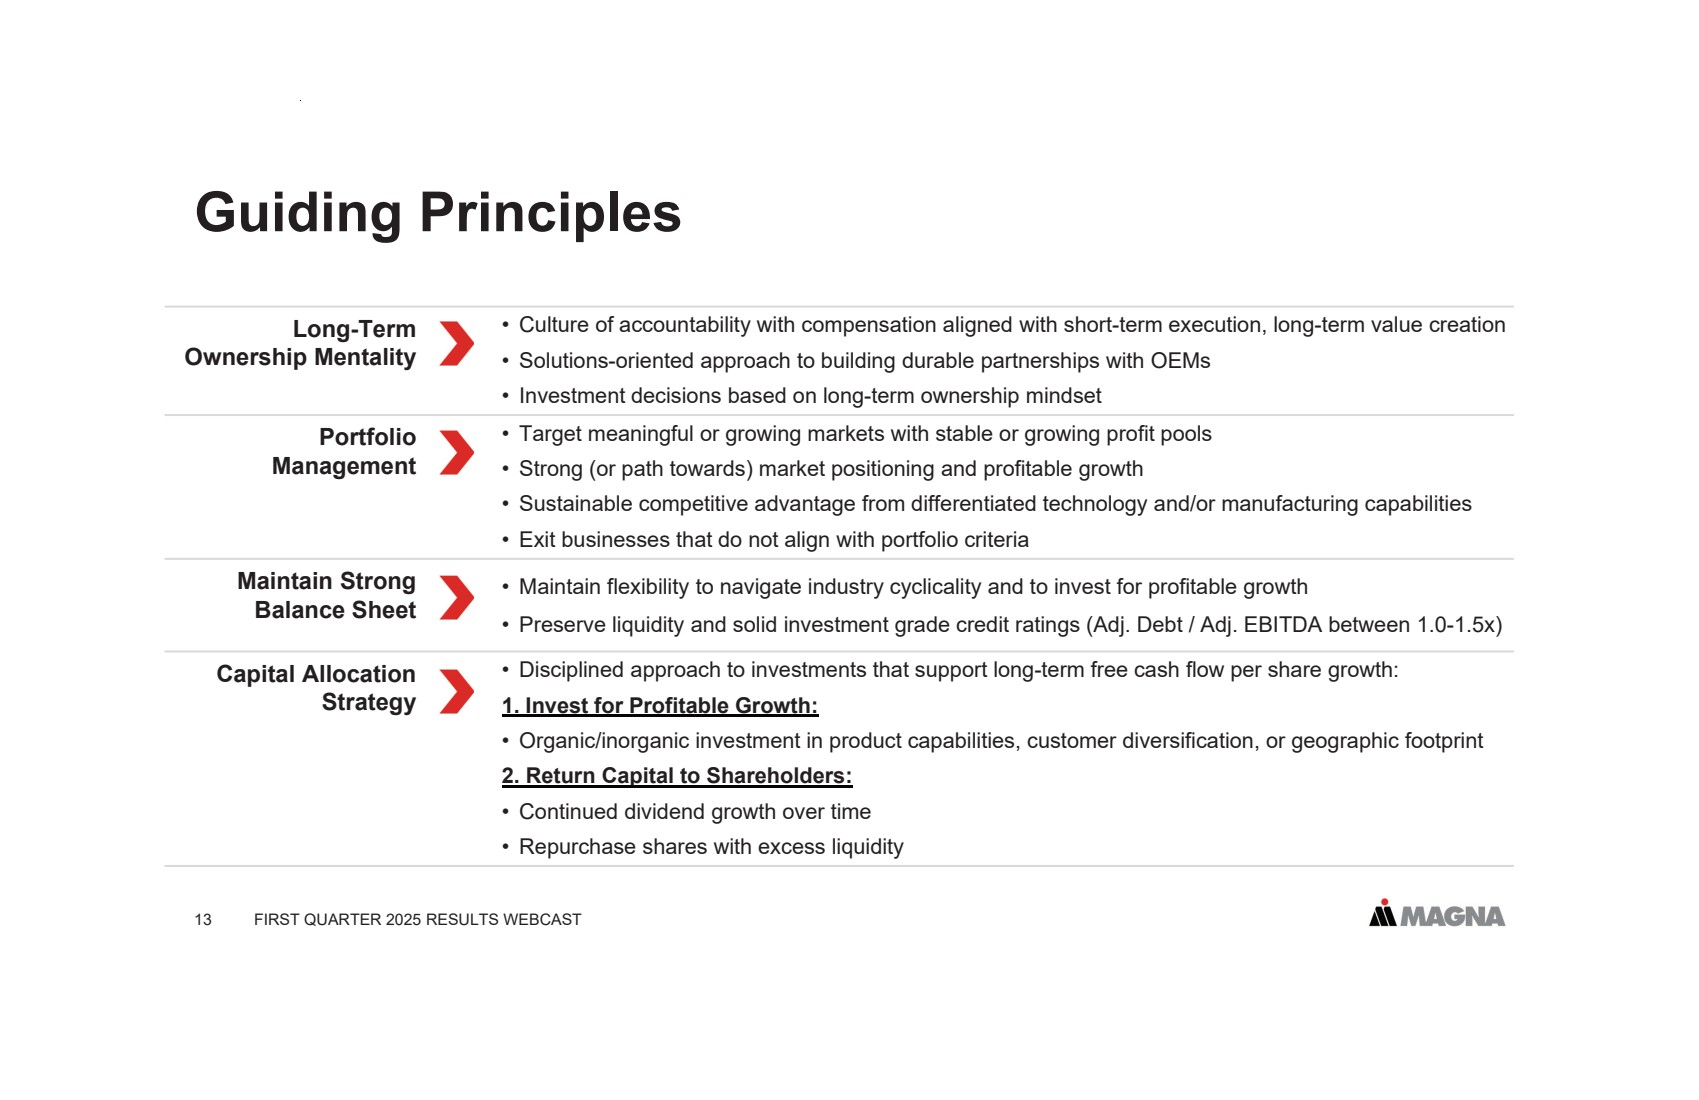
13 FIRST QUARTER 2025 RESULTS WEBCAST Guiding Principles • Culture of accountability with compensation aligned with short-term execution, long-term value creation • Solutions-oriented approach to building durable partnerships with OEMs • Investment decisions based on long-term ownership mindset Long-Term Ownership Mentality • Target meaningful or growing markets with stable or growing profit pools • Strong (or path towards) market positioning and profitable growth • Sustainable competitive advantage from differentiated technology and/or manufacturing capabilities • Exit businesses that do not align with portfolio criteria Portfolio Management • Maintain flexibility to navigate industry cyclicality and to invest for profitable growth • Preserve liquidity and solid investment grade credit ratings (Adj. Debt / Adj. EBITDA between 1.0-1.5x) Maintain Strong Balance Sheet • Disciplined approach to investments that support long-term free cash flow per share growth: 1. Invest for Profitable Growth: • Organic/inorganic investment in product capabilities, customer diversification, or geographic footprint 2. Return Capital to Shareholders: • Continued dividend growth over time • Repurchase shares with excess liquidity Capital Allocation Strategy |
|
14 FIRST QUARTER 2025 RESULTS WEBCAST Executive Vice President & Chief Financial Officer Pat McCann |
|
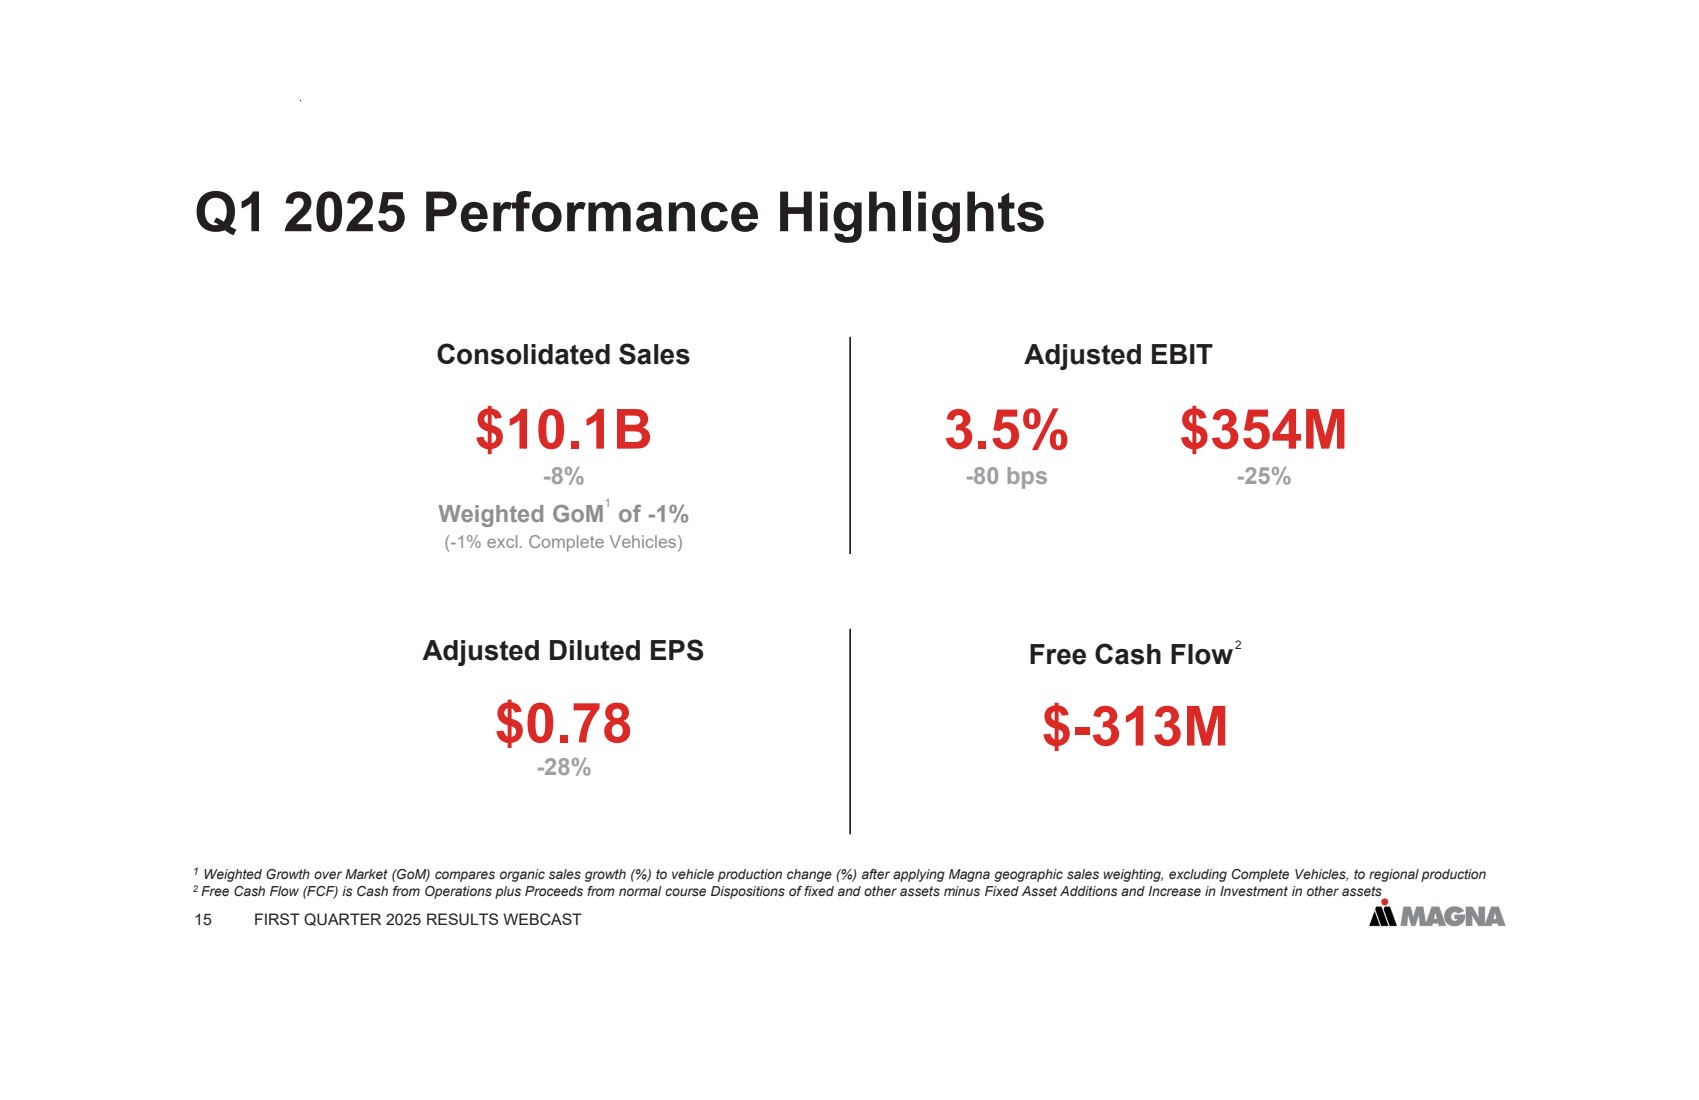
15 FIRST QUARTER 2025 RESULTS WEBCAST Q1 2025 Performance Highlights Consolidated Sales $10.1B Weighted GoM1 of -1% (-1% excl. Complete Vehicles) -8% Adjusted Diluted EPS $0.78 -28% Free Cash Flow2 $-313M 1 Weighted Growth over Market (GoM) compares organic sales growth (%) to vehicle production change (%) after applying Magna geographic sales weighting, excluding Complete Vehicles, to regional production 2 Free Cash Flow (FCF) is Cash from Operations plus Proceeds from normal course Dispositions of fixed and other assets minus Fixed Asset Additions and Increase in Investment in other assets Adjusted EBIT 3.5% -80 bps $354M -25% |
|
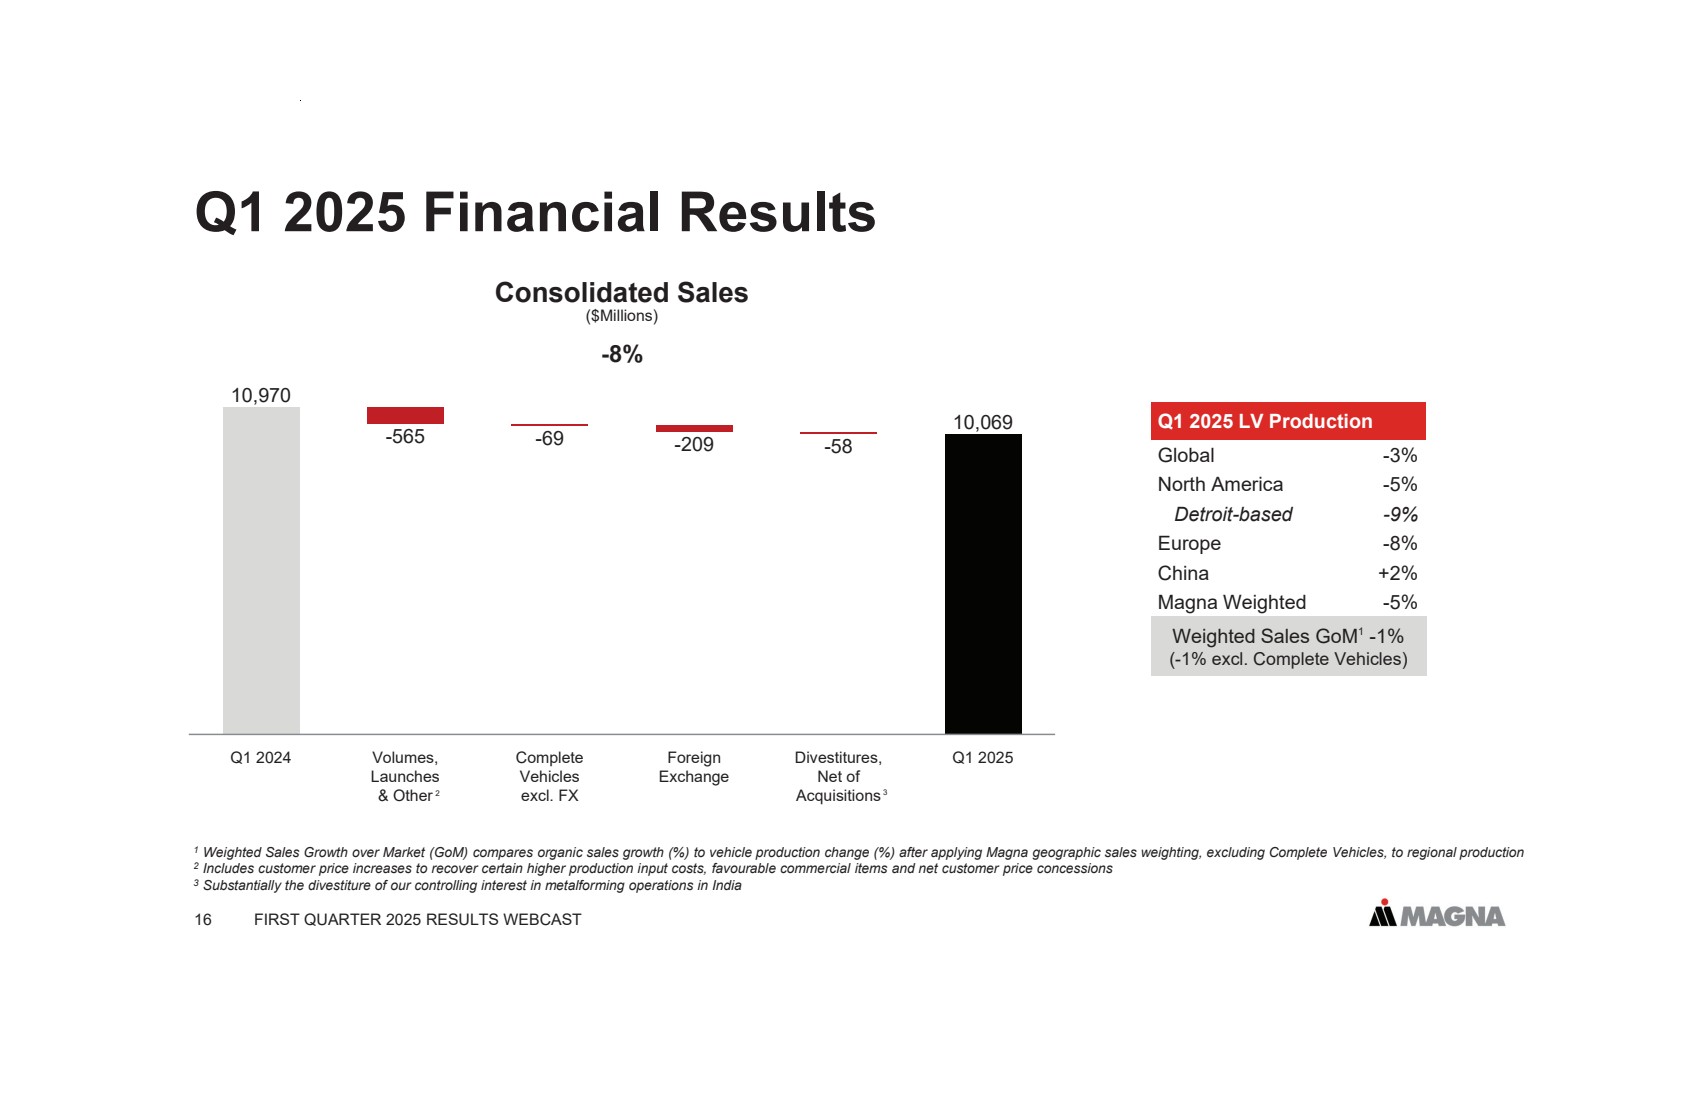
16 FIRST QUARTER 2025 RESULTS WEBCAST Q1 2025 Financial Results Weighted Sales GoM1 -1% (-1% excl. Complete Vehicles) Q1 2025 LV Production Global -3% North America -5% Detroit-based -9% Europe -8% China +2% Magna Weighted -5% 1 Weighted Sales Growth over Market (GoM) compares organic sales growth (%) to vehicle production change (%) after applying Magna geographic sales weighting, excluding Complete Vehicles, to regional production 2 Includes customer price increases to recover certain higher production input costs, favourable commercial items and net customer price concessions 3 Substantially the divestiture of our controlling interest in metalforming operations in India Consolidated Sales ($Millions) -8% 10,970 -565 -69 -209 -58 10,069 Q1 2024 Volumes, Launches & Other Complete Vehicles excl. FX Foreign Exchange Divestitures, Net of Acquisitions Q1 2025 2 3 |
|
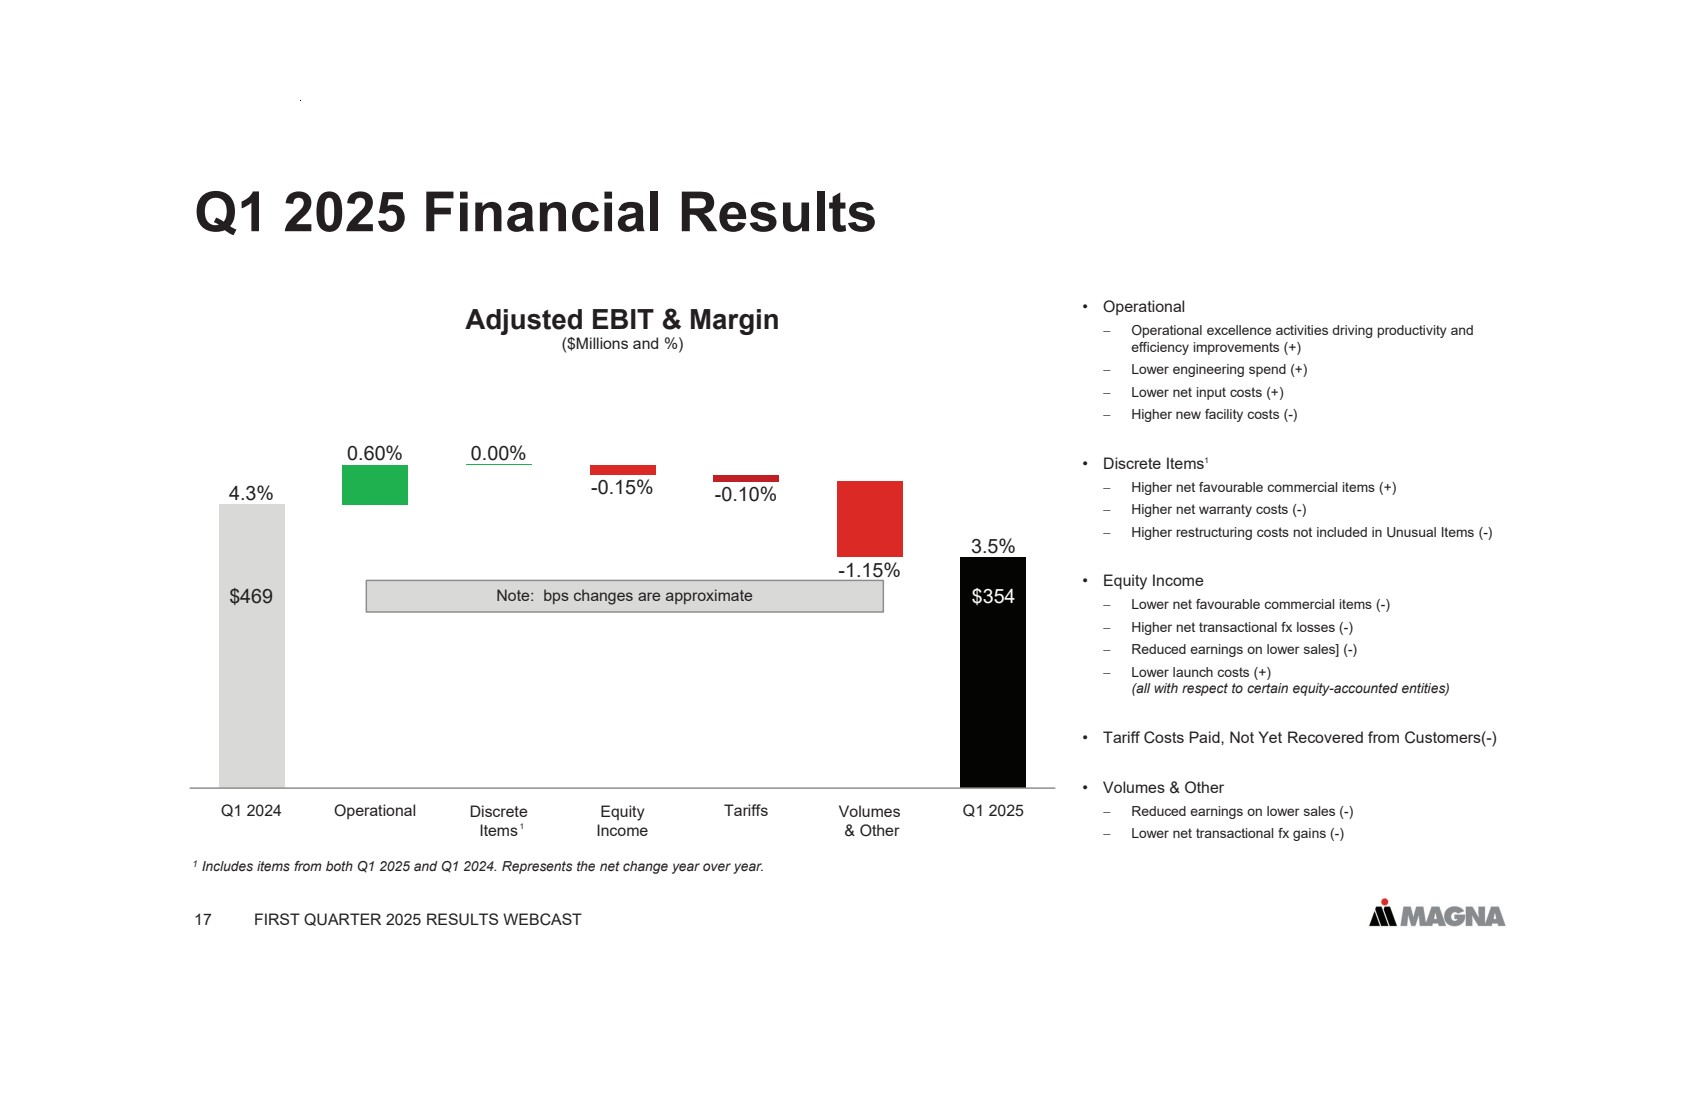
17 FIRST QUARTER 2025 RESULTS WEBCAST Q1 2025 Financial Results 0.60% 0.00% -0.15% -0.10% -1.15% 4.3% 3.5% Q1 2024 Operational Discrete Items Equity Income Tariffs Volumes & Other Q1 2025 $469 $354 Adjusted EBIT & Margin ($Millions and %) Note: bps changes are approximate 1 • Operational Operational excellence activities driving productivity and efficiency improvements (+) Lower engineering spend (+) Lower net input costs (+) Higher new facility costs (-) • Discrete Items1 Higher net favourable commercial items (+) Higher net warranty costs (-) Higher restructuring costs not included in Unusual Items (-) • Equity Income Lower net favourable commercial items (-) Higher net transactional fx losses (-) Reduced earnings on lower sales] (-) Lower launch costs (+) (all with respect to certain equity-accounted entities) • Tariff Costs Paid, Not Yet Recovered from Customers(-) • Volumes & Other Reduced earnings on lower sales (-) Lower net transactional fx gains (-) 1 Includes items from both Q1 2025 and Q1 2024. Represents the net change year over year. |
|
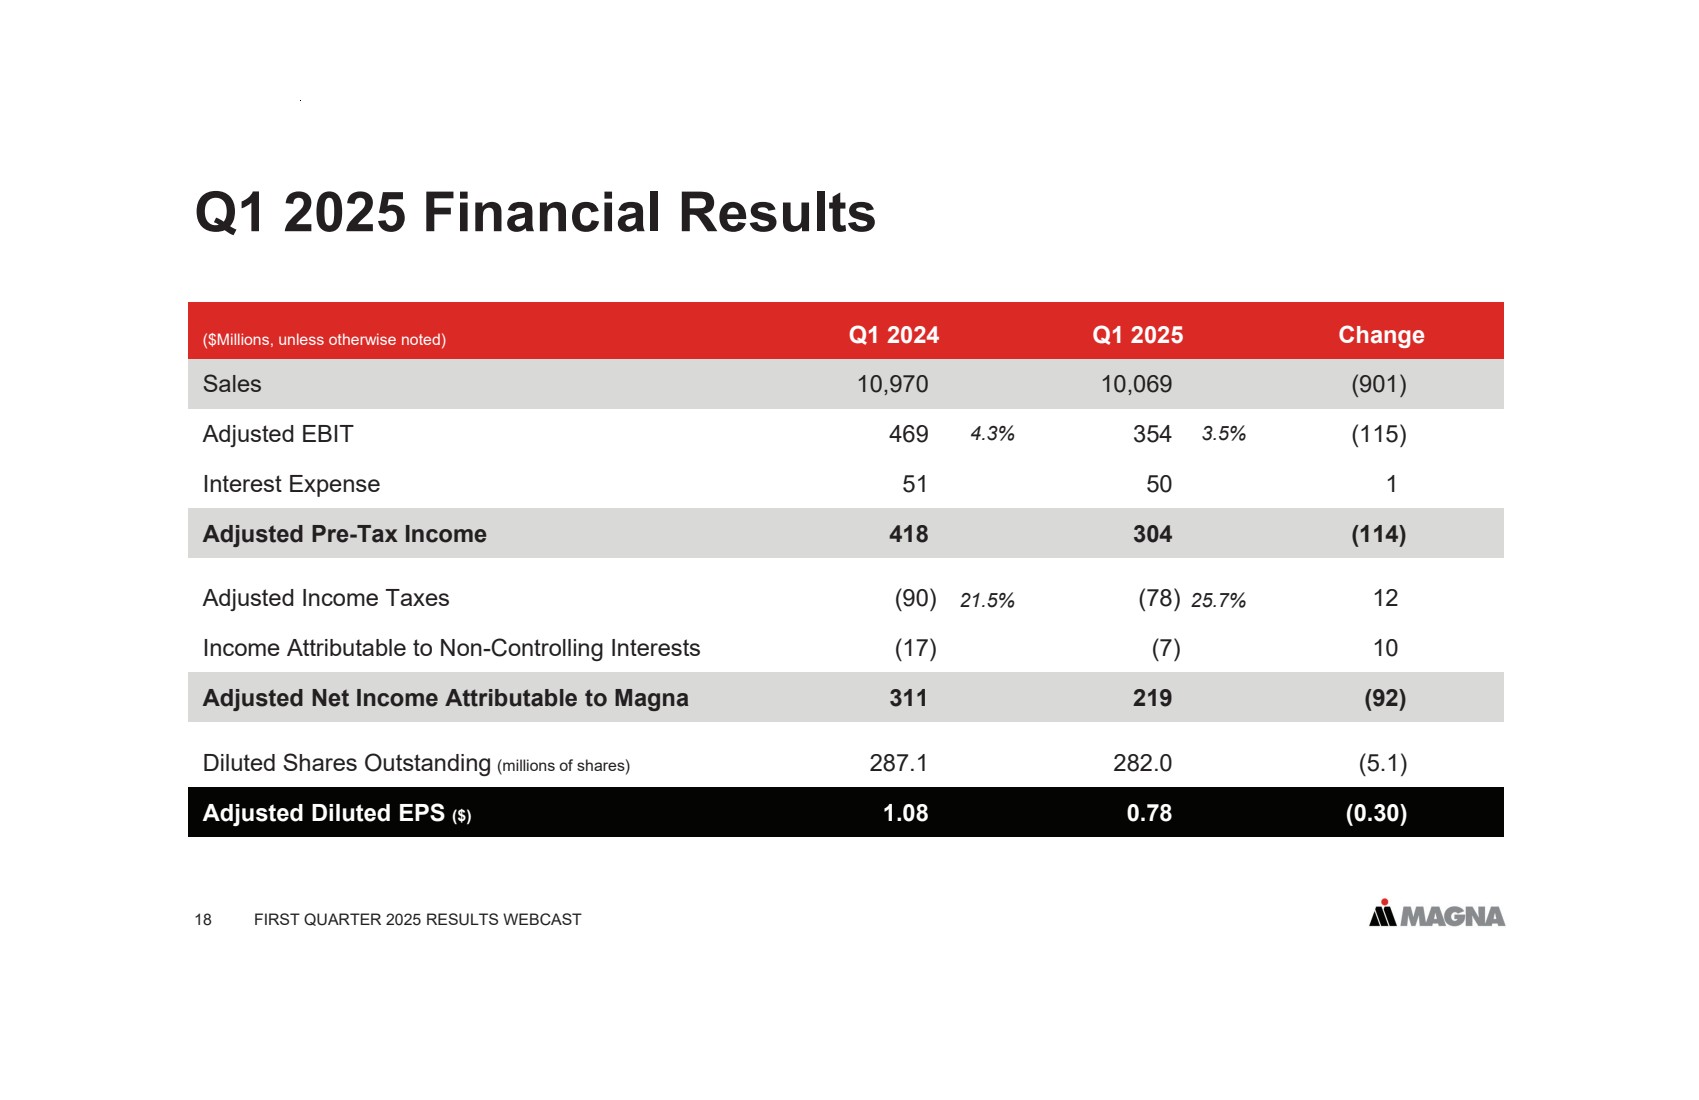
18 FIRST QUARTER 2025 RESULTS WEBCAST Q1 2025 Financial Results ($Millions, unless otherwise noted) Q1 2024 Q1 2025 Change Sales 10,970 10,069 (901) Adjusted EBIT 469 354 (115) Interest Expense 51 50 1 Adjusted Pre-Tax Income 418 304 (114) Adjusted Income Taxes (90) (78) 12 Income Attributable to Non-Controlling Interests (17) (7) 10 Adjusted Net Income Attributable to Magna 311 219 (92) Diluted Shares Outstanding (millions of shares) 287.1 282.0 (5.1) Adjusted Diluted EPS ($) 1.08 0.78 (0.30) 21.5% 25.7% 4.3% 3.5% |
|
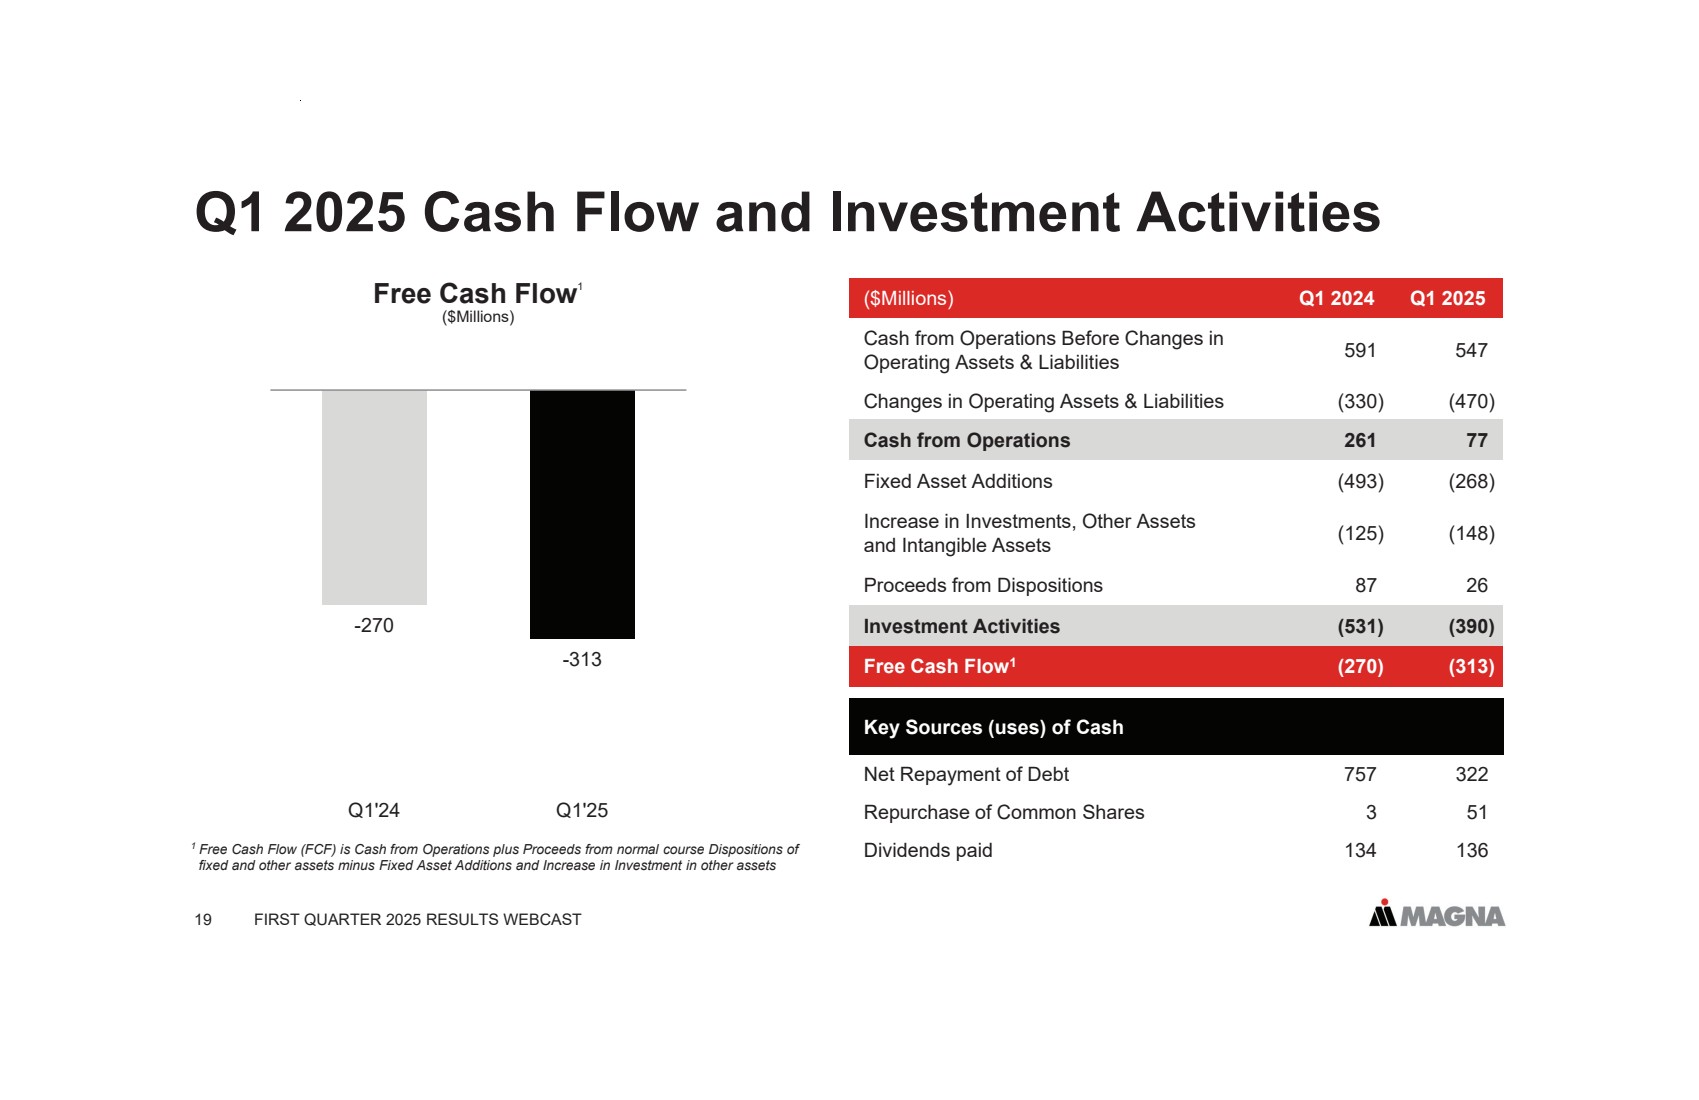
19 FIRST QUARTER 2025 RESULTS WEBCAST Q1 2025 Cash Flow and Investment Activities Free Cash Flow1 ($Millions) -270 -313 -500 -450 -400 -350 -300 -250 -200 -150 -100 -50 0 Q1'24 Q1'25 1 Free Cash Flow (FCF) is Cash from Operations plus Proceeds from normal course Dispositions of fixed and other assets minus Fixed Asset Additions and Increase in Investment in other assets Key Sources (uses) of Cash Net Repayment of Debt 757 322 Repurchase of Common Shares 3 51 Dividends paid 134 136 ($Millions) Q1 2024 Q1 2025 591 547 Cash from Operations Before Changes in Operating Assets & Liabilities Changes in Operating Assets & Liabilities (330) (470) Cash from Operations 261 77 Fixed Asset Additions (493) (268) (125) (148) Increase in Investments, Other Assets and Intangible Assets Proceeds from Dispositions 87 26 Investment Activities (531) (390) Free Cash Flow (270) (313) 1 |
|
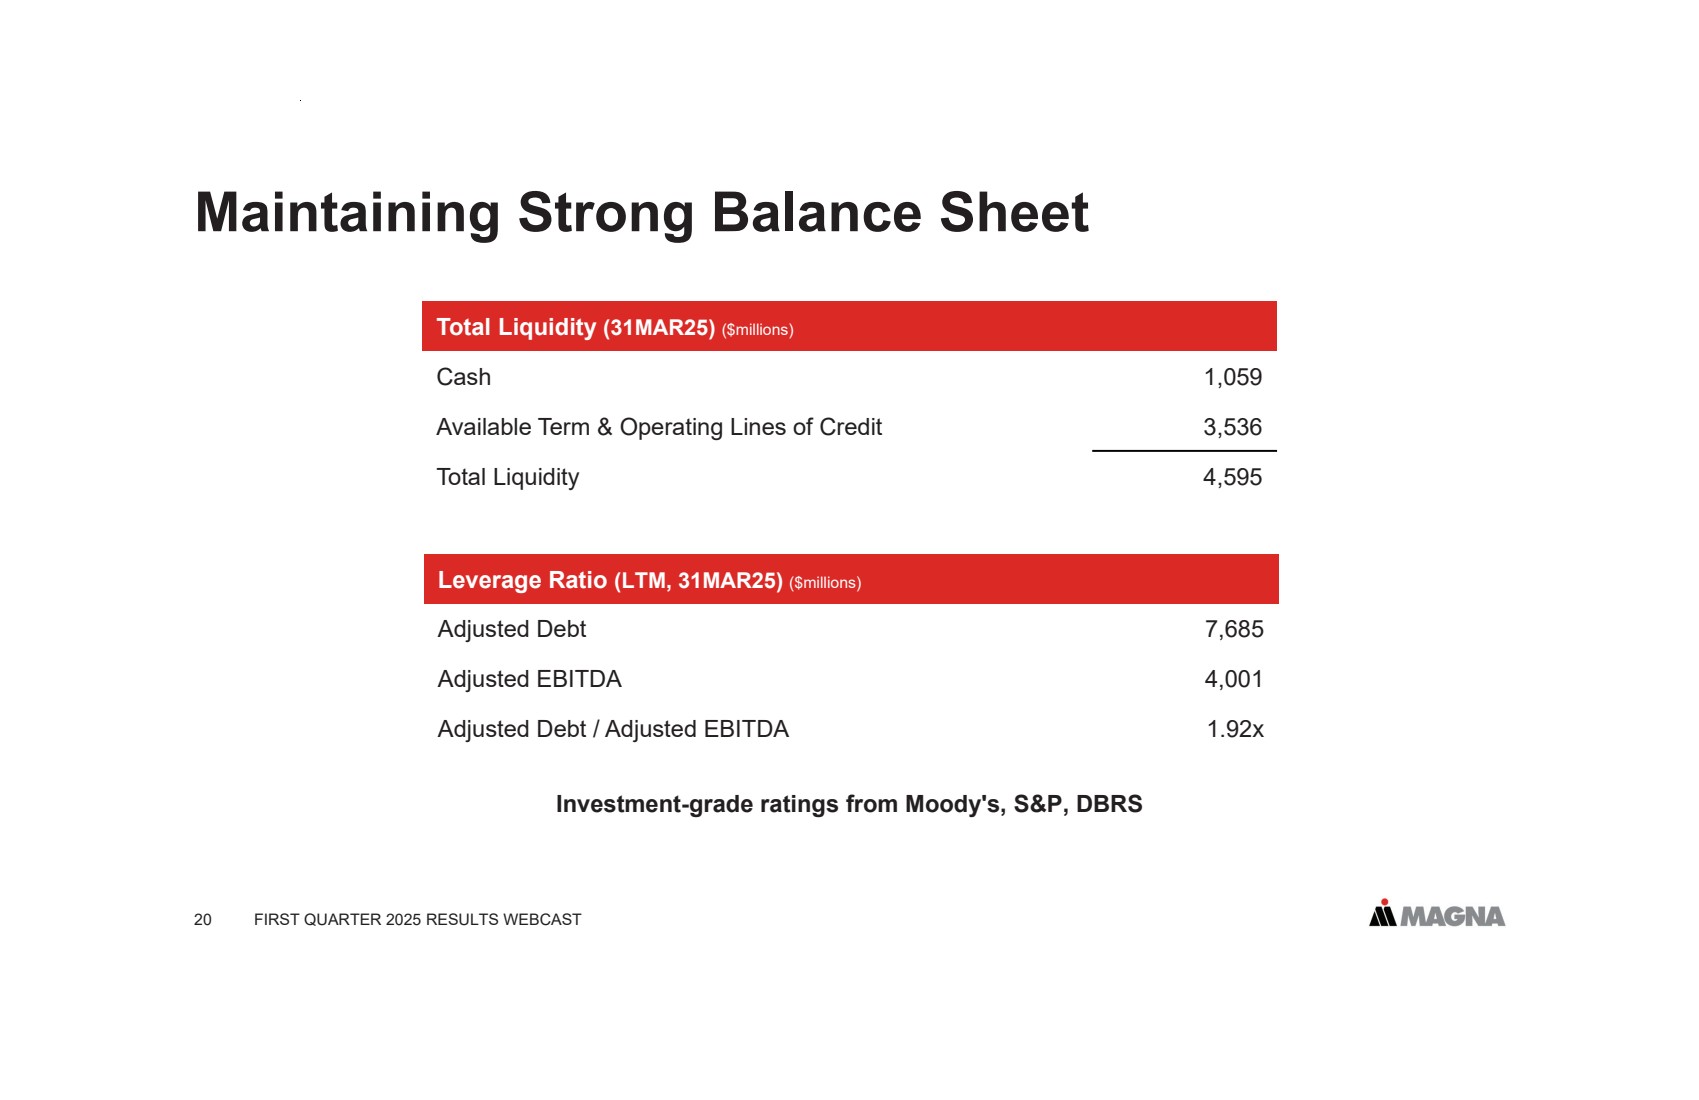
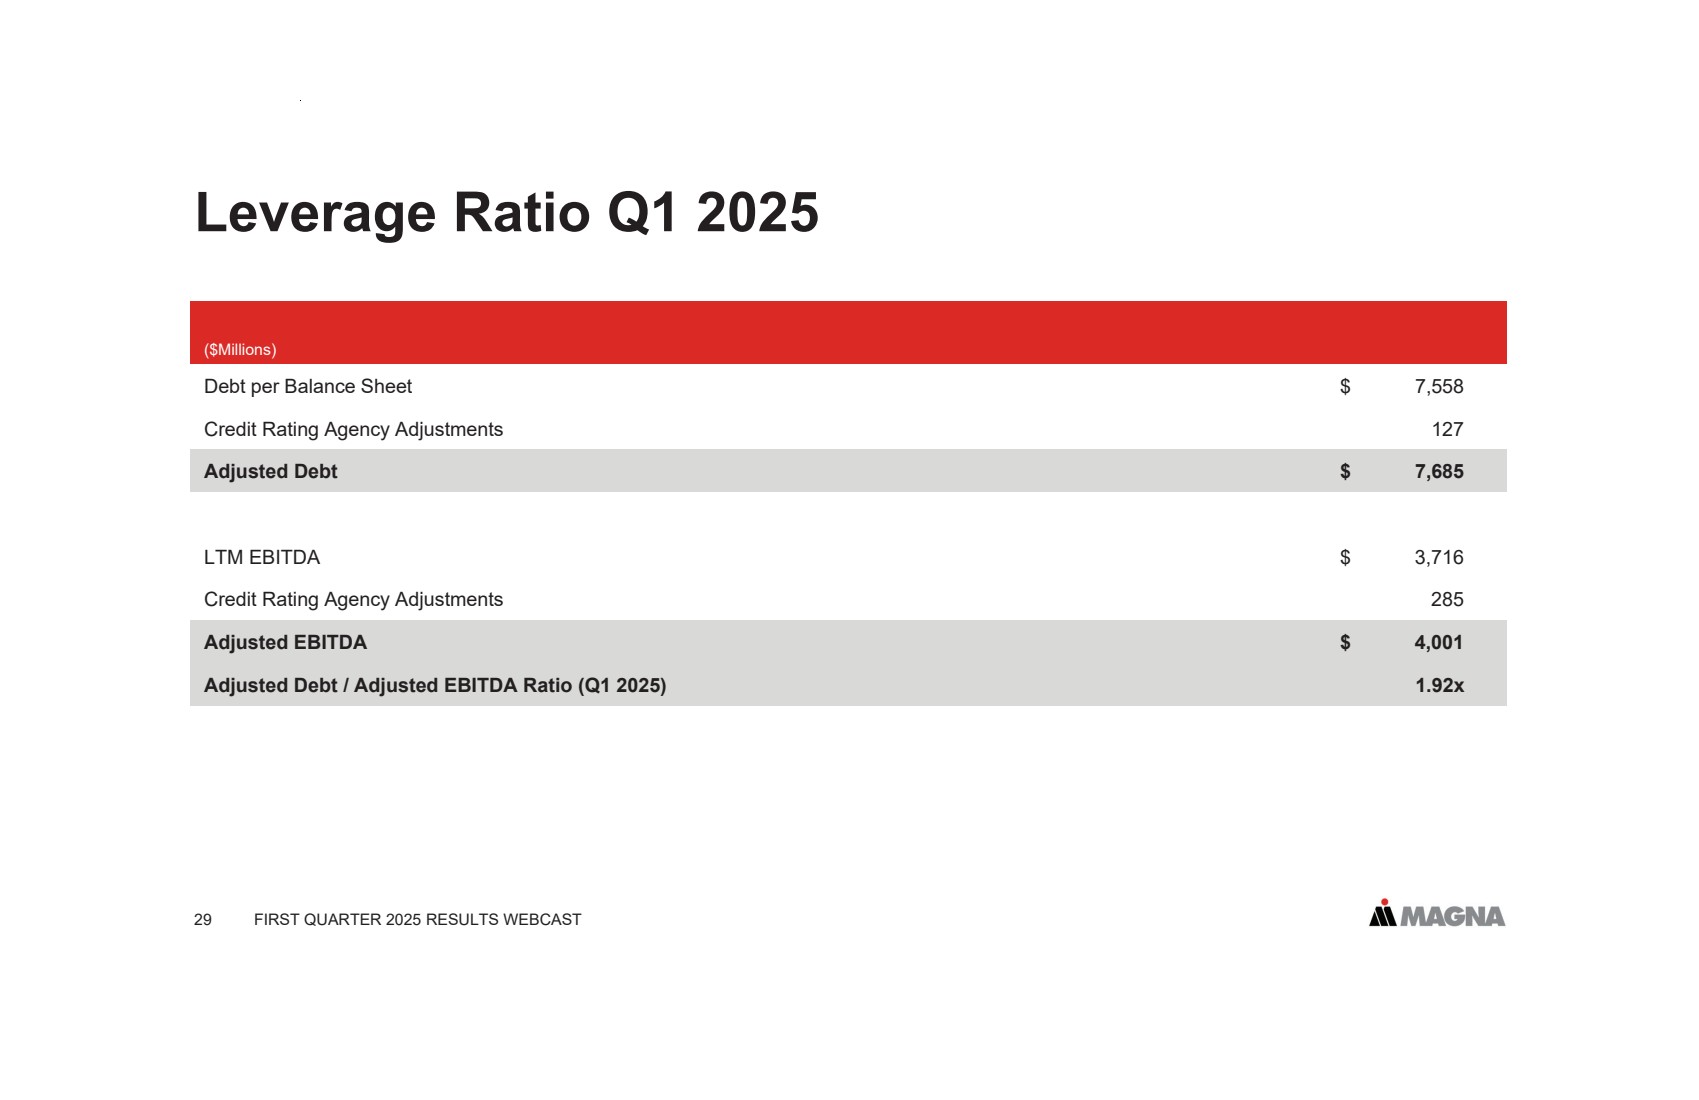
20 FIRST QUARTER 2025 RESULTS WEBCAST Maintaining Strong Balance Sheet Leverage Ratio (LTM, 31MAR25) ($millions) Adjusted Debt 7,685 Adjusted EBITDA 4,001 Adjusted Debt / Adjusted EBITDA 1.92x Total Liquidity (31MAR25) ($millions) Cash 1,059 Available Term & Operating Lines of Credit 3,536 Total Liquidity 4,595 Investment-grade ratings from Moody's, S&P, DBRS |
|
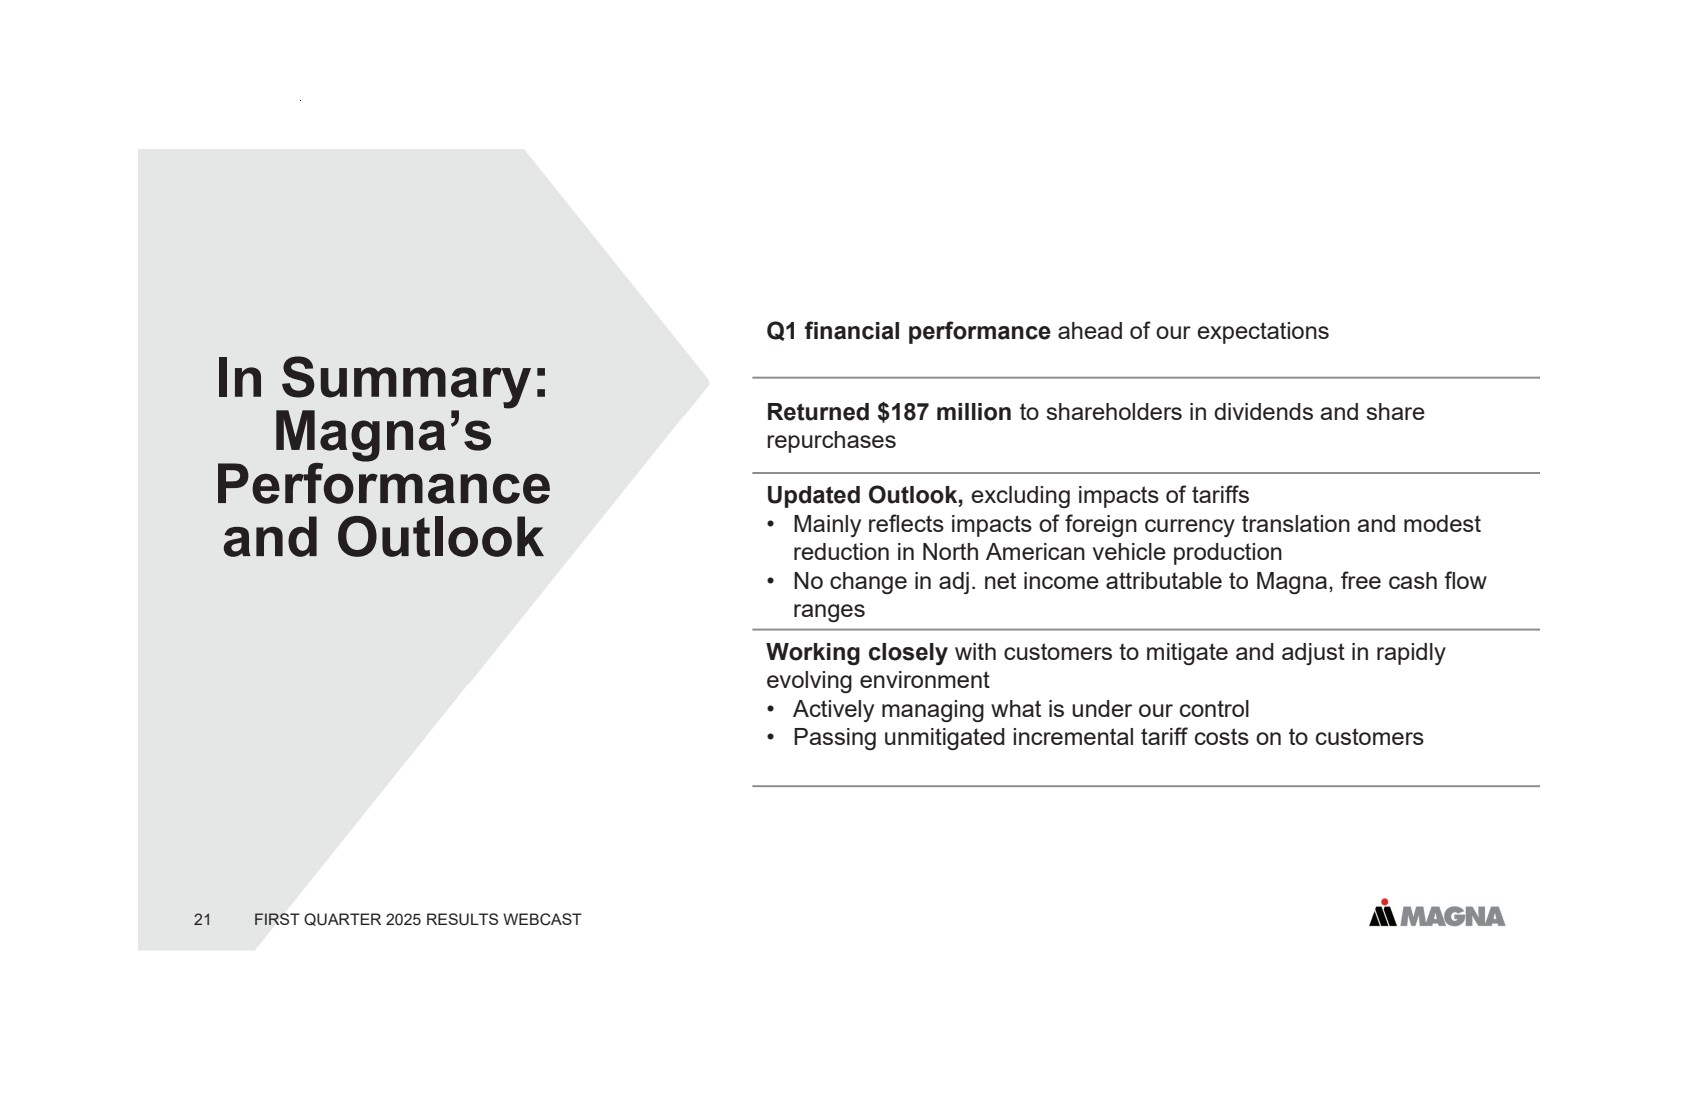
21 FIRST QUARTER 2025 RESULTS WEBCAST In Summary: Magna’s Performance and Outlook Q1 financial performance ahead of our expectations Returned $187 million to shareholders in dividends and share repurchases Updated Outlook, excluding impacts of tariffs • Mainly reflects impacts of foreign currency translation and modest reduction in North American vehicle production • No change in adj. net income attributable to Magna, free cash flow ranges Working closely with customers to mitigate and adjust in rapidly evolving environment • Actively managing what is under our control • Passing unmitigated incremental tariff costs on to customers |
|
22 FIRST QUARTER 2025 RESULTS WEBCAST Appendix |
|
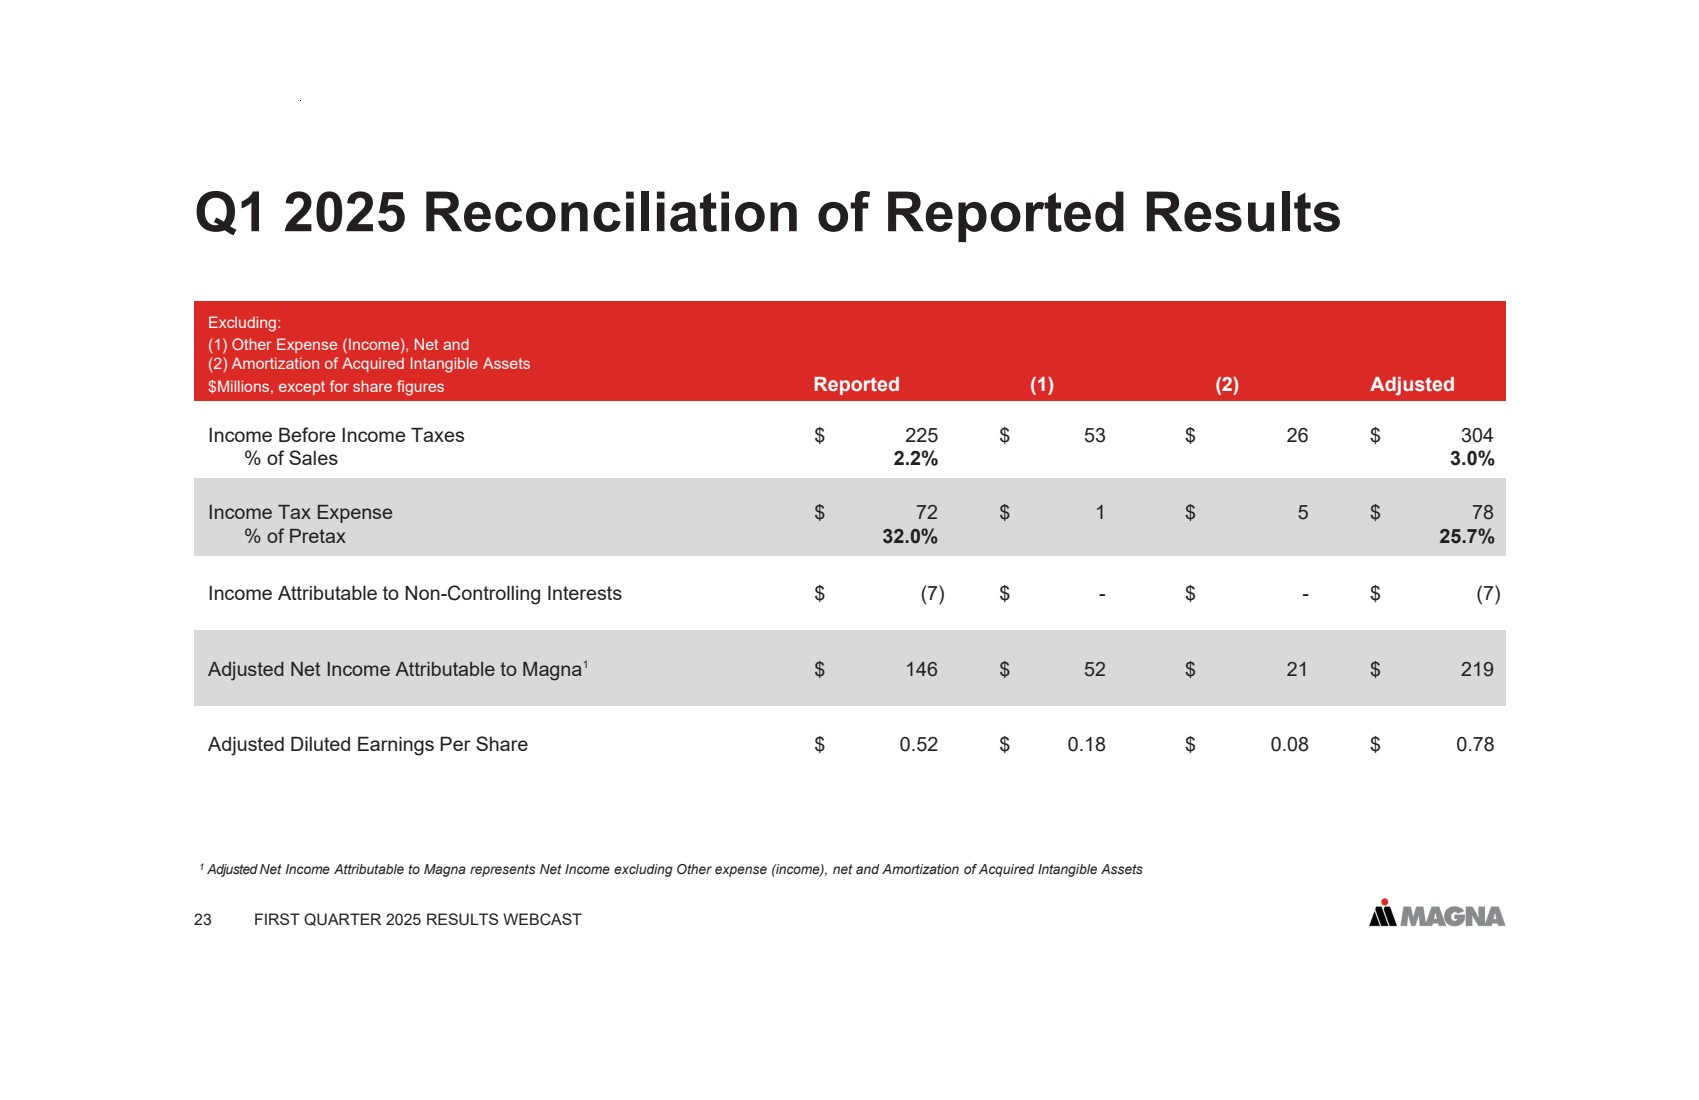
23 FIRST QUARTER 2025 RESULTS WEBCAST Q1 2025 Reconciliation of Reported Results Reported (1) (2) Adjusted Excluding: (1) Other Expense (Income), Net and (2) Amortization of Acquired Intangible Assets $Millions, except for share figures Income Before Income Taxes $ 225 $ 53 $ 26 $ 304 % of Sales 2.2% 3.0% Income Tax Expense $ 72 $ 1 $ 5 $ 78 % of Pretax 32.0% 25.7% Income Attributable to Non-Controlling Interests $ (7) $ - $ - $ (7) Adjusted Net Income Attributable to Magna $ 146 $ 52 $ 21 $ 219 1 Adjusted Diluted Earnings Per Share $ 0.52 $ 0.18 $ 0.08 $ 0.78 1 Adjusted Net Income Attributable to Magna represents Net Income excluding Other expense (income), net and Amortization of Acquired Intangible Assets |
|
24 FIRST QUARTER 2025 RESULTS WEBCAST Q1 2024 Reconciliation of Reported Results Reported (1) (2) Adjusted Excluding: (1) Other Expense (Income), Net and (2) Amortization of Acquired Intangible Assets $Millions, except for share figures Income Before Income Taxes $ 34 $ 356 $ 28 $ 418 % of Sales 0.3% 3.8% Income Tax Expense $ 8 $ 76 $ 6 $ 90 % of Pretax 23.5% 21.5% Income Attributable to Non-Controlling Interests $ (17) $ - $ - $ (17) Adjusted Net Income Attributable to Magna $ 9 $ 280 $ 22 $ 311 1 Adjusted Diluted Earnings Per Share $ 0.03 $ 0.97 $ 0.08 $ 1.08 1 Adjusted Net Income Attributable to Magna represents Net Income excluding Other expense (income), net and Amortization of Acquired Intangible Assets |
|
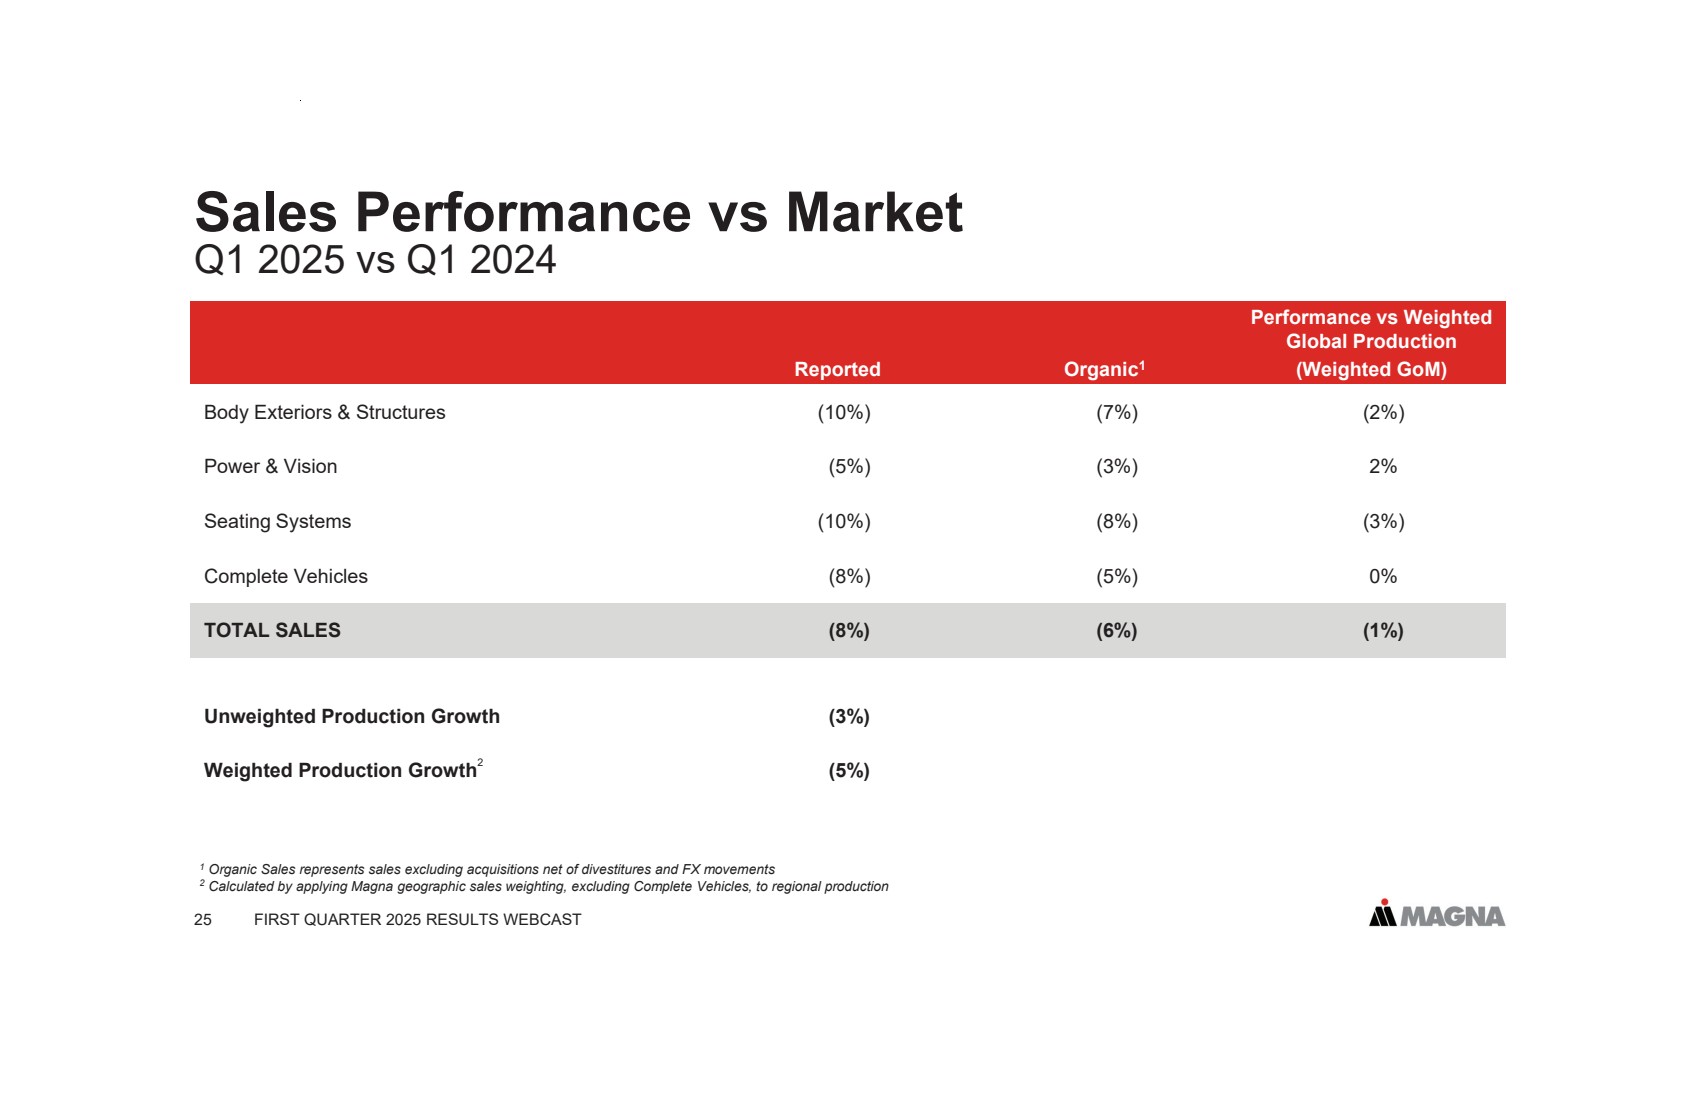
25 FIRST QUARTER 2025 RESULTS WEBCAST Q1 2025 vs Q1 2024 Sales Performance vs Market Performance vs Weighted Global Production Organic (Weighted GoM) Reported 1 Body Exteriors & Structures (10%) (7%) (2%) Power & Vision (5%) (3%) 2% Seating Systems (10%) (8%) (3%) Complete Vehicles (8%) (5%) 0% TOTAL SALES (8%) (6%) (1%) Unweighted Production Growth (3%) Weighted Production Growth (5%) 2 1 Organic Sales represents sales excluding acquisitions net of divestitures and FX movements 2 Calculated by applying Magna geographic sales weighting, excluding Complete Vehicles, to regional production |
|
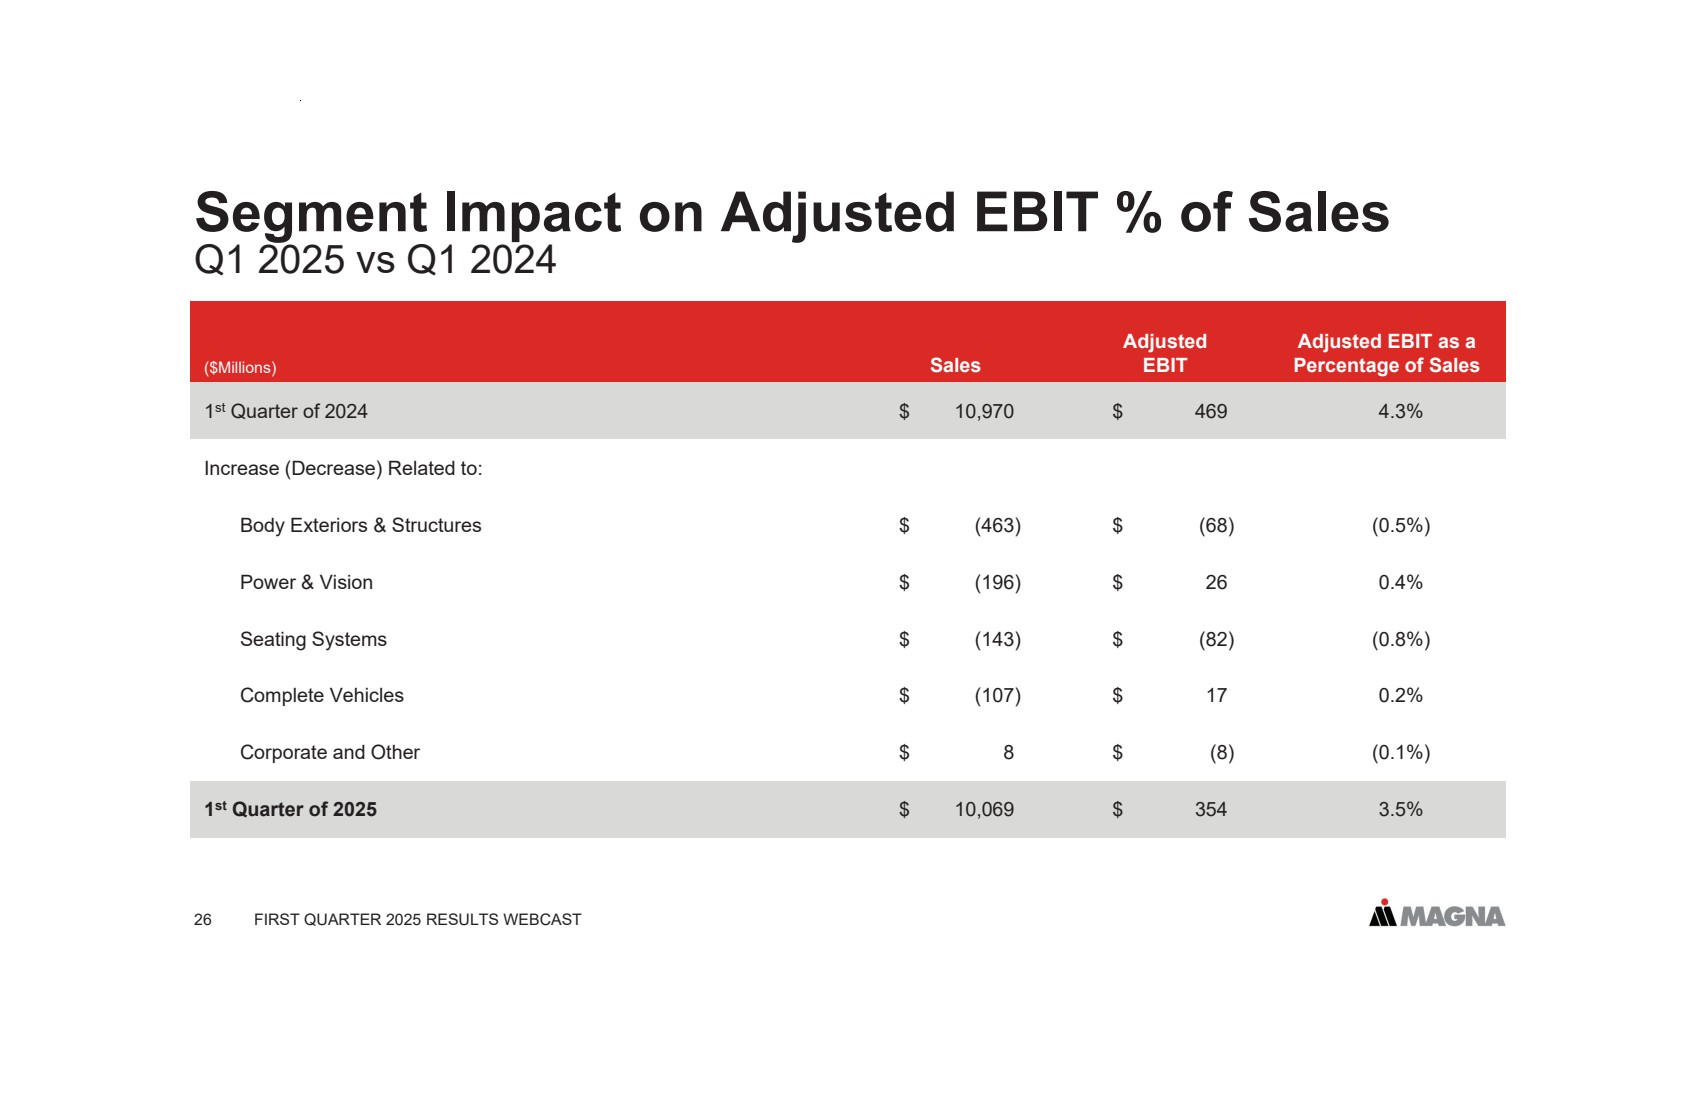
26 FIRST QUARTER 2025 RESULTS WEBCAST Q1 2025 vs Q1 2024 Segment Impact on Adjusted EBIT % of Sales Adjusted EBIT as a Percentage of Sales Adjusted ($Millions) Sales EBIT 1st Quarter of 2024 $ 10,970 $ 469 4.3% Increase (Decrease) Related to: Body Exteriors & Structures $ (463) $ (68) (0.5%) Power & Vision $ (196) $ 26 0.4% Seating Systems $ (143) $ (82) (0.8%) Complete Vehicles $ (107) $ 17 0.2% Corporate and Other $ 8 $ (8) (0.1%) 1st Quarter of 2025 $ 10,069 $ 354 3.5% |
|
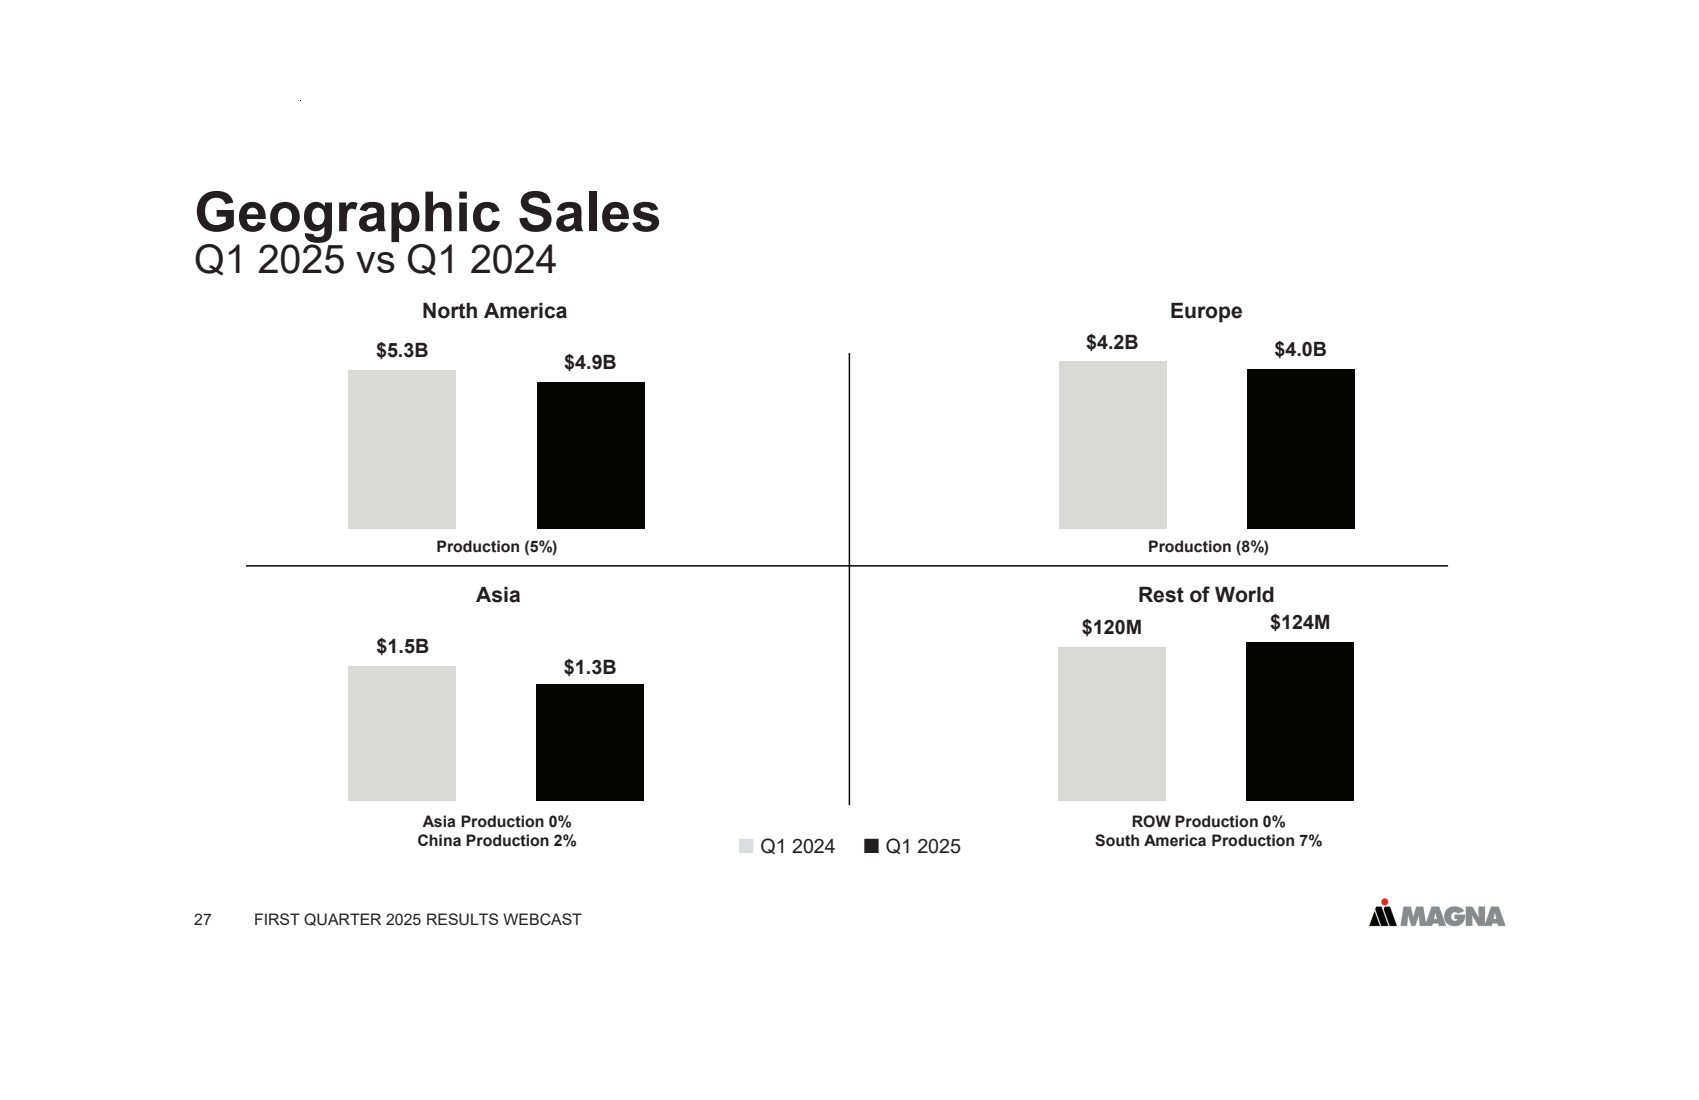
27 FIRST QUARTER 2025 RESULTS WEBCAST Q1 2025 vs Q1 2024 Geographic Sales „ Q1 2024 „ Q1 2025 Asia Asia Production 0% China Production 2% $1.5B $1.3B $0.00B $0.20B $0.40B $0.60B $0.80B $1.00B $1.20B $1.40B $1.60B $1.80B $2.00B $5.3B $4.9B $0.0B $1.0B $2.0B $3.0B $4.0B $5.0B $6.0B North America Production (5%) $4.2B $4.0B $0.0B $0.5B $1.0B $1.5B $2.0B $2.5B $3.0B $3.5B $4.0B $4.5B Europe Production (8%) $120M $124M $0M $20M $40M $60M $80M $100M $120M $140M ROW Production 0% South America Production 7% Rest of World |
|
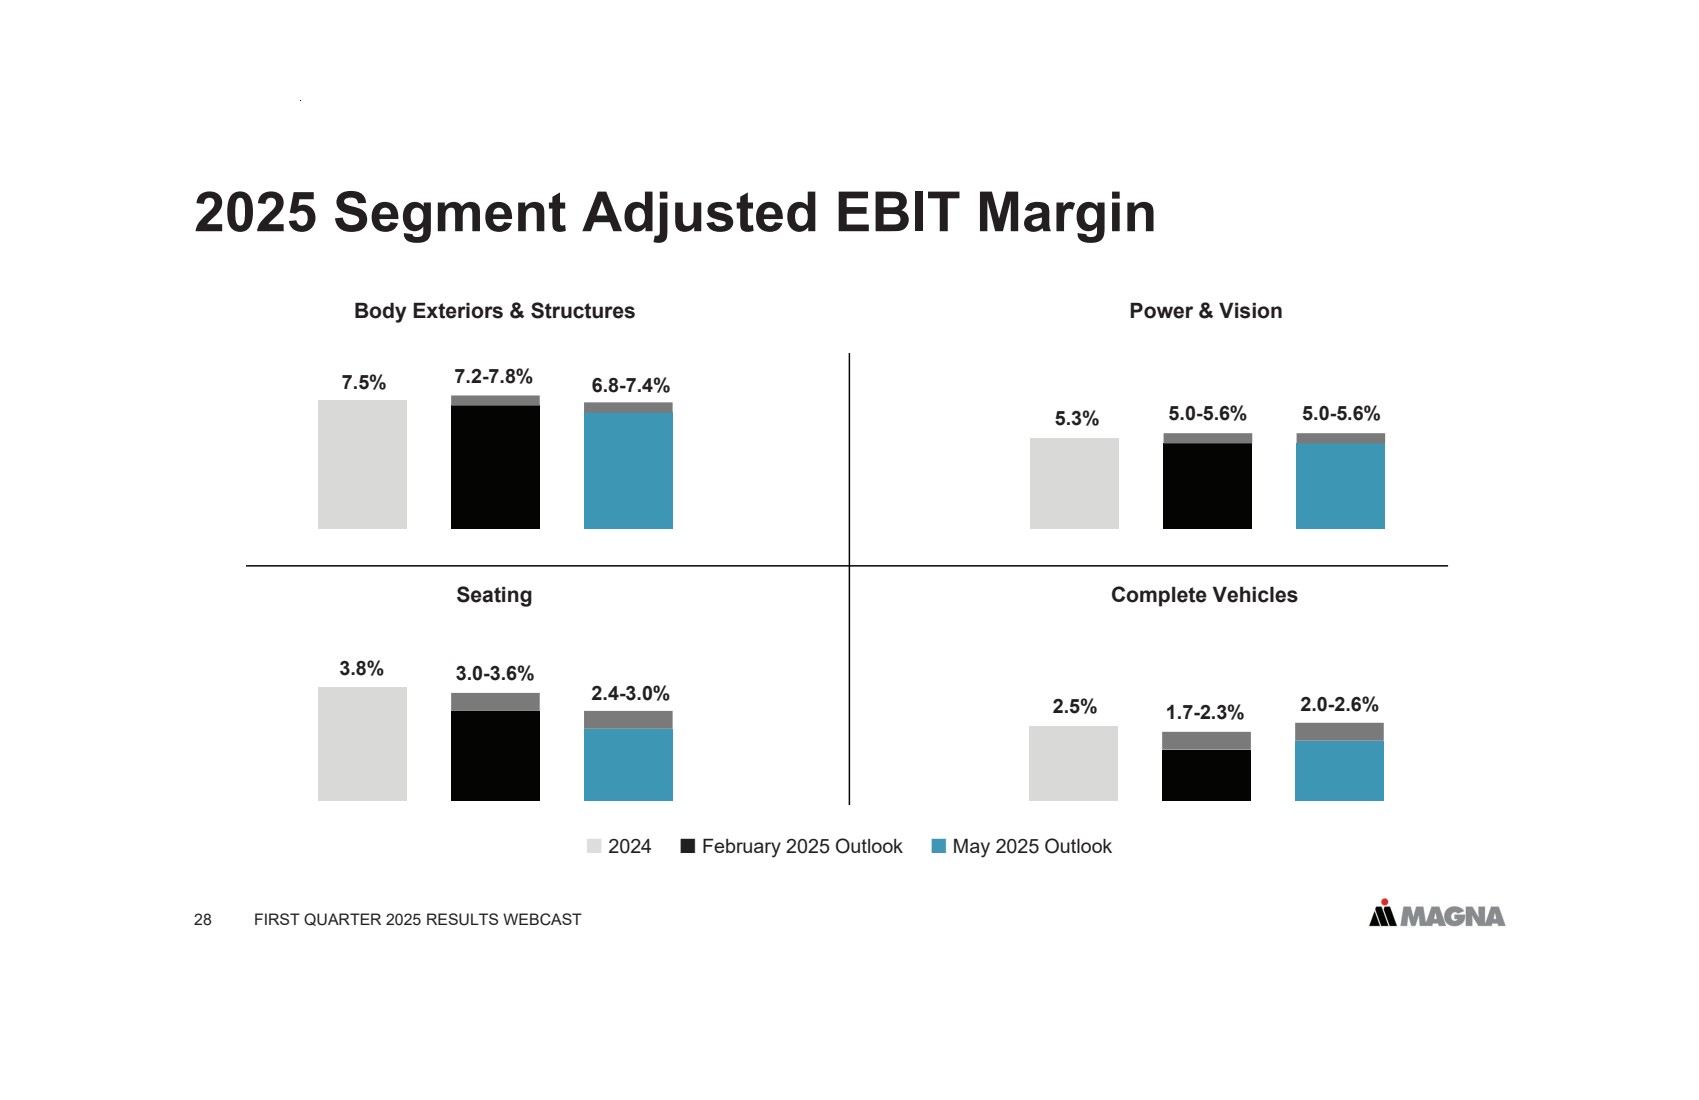
28 FIRST QUARTER 2025 RESULTS WEBCAST 2025 Segment Adjusted EBIT Margin „ 2024 „ February 2025 Outlook „ May 2025 Outlook Seating Body Exteriors & Structures Power & Vision Complete Vehicles 7.5% 7.2-7.8% 5.3% 5.0-5.6% 3.8% 3.0-3.6% 2.5% 1.7-2.3% 6.8-7.4% 2.4-3.0% 5.0-5.6% 2.0-2.6% |
|
29 FIRST QUARTER 2025 RESULTS WEBCAST Leverage Ratio Q1 2025 ($Millions) Debt per Balance Sheet $ 7,558 Credit Rating Agency Adjustments 127 Adjusted Debt $ 7,685 LTM EBITDA $ 3,716 Credit Rating Agency Adjustments 285 Adjusted EBITDA $ 4,001 Adjusted Debt / Adjusted EBITDA Ratio (Q1 2025) 1.92x |
|
30 FIRST QUARTER 2025 RESULTS WEBCAST Financial Outlook ($Billions, unless otherwise noted) 2025 2026 16.8 – 17.6 15.2 – 15.7 5.3 – 5.7 3.7 – 4.1 15.9 – 16.5 14.8 – 15.2 5.3 – 5.6 4.5 – 4.8 Sales: • Body Exteriors & Structures • Power & Vision • Seating Systems • Complete Vehicles Total Sales 40.0 – 41.6 40.5 – 42.6 Adjusted EBIT Margin % 5.1% – 5.6% 6.5% – 7.2% 1 Equity Income (included in EBIT) 65M – 95M 65M – 110M Interest Expense, net ~210M Income Tax Rate ~26% 2 Adjusted Net Income attributable to Magna 1.3 – 1.5 3 Capital Spending 1.7 – 1.8 1 Adjusted EBIT Margin is the ratio of Adjusted EBIT to Total Sales 2 Income Tax Rate has been calculated using Adjusted EBIT and is based on current tax legislation 3 Adjusted Net Income attributable to Magna represents Net Income excluding Other expense (income), net, and amortization of acquired intangible assets, net of tax |
|
31 FIRST QUARTER 2025 RESULTS WEBCAST |
Exhibit 99.3
TRANSCRIPT
05 - 02 - 2025
| Magna International Inc. |
| FIRST QUARTER 2025 RESULTS WEBCAST |
TOTAL PAGES: 22
| Page | |
| Magna International Inc. |
| FIRST QUARTER 2025 RESULTS WEBCAST |
DISCLAIMER:
This transcript is derived from a recording of the webcast. While efforts have been made to transcribe accurately, the following transcription may still contain inaccuracies, errors, or omissions. Readers are advised to refer to the webcast itself together with additional information about Magna, including in our Annual Information Form filed with securities commissions in Canada, our annual report on Form 40-F with the United States Securities and Exchange Commission, and subsequent filings, available through the System for Electronic Data Analysis and Retrieval + (SEDAR+) at www.sedarplus.ca, as well as on the United States Securities and Exchange Commission’s Electronic Data Gathering, Analysis, and Retrieval System (EDGAR), which can be accessed at www.sec.gov.
CORPORATE SPEAKERS:
Louis Tonelli
Magna International Inc.; Vice President of Investor Relations
Swamy Kotagiri
Magna International Inc.; Chief Executive Officer
Pat McCann
Magna International Inc.; Executive Vice President & Chief Financial Officer
PARTICIPANTS:
John Murphy
Bank of America; Managing Director
Tamy Chen
BMO Capital Markets; Director
Dan Levy
Barclays; Senior Equity Research Analyst
Doug Dutton
Evercore ISI; Vice President
Joe Spak
UBS; Managing Director
Adam Jonas
Morgan Stanley; Managing Director
James Picariello
BNP Paribas Exane; Senior Automotive Analyst
Shreyas Patil
Wolfe Research; Vice President, Equity Research
Mark Delaney
Goldman Sachs; Analyst
Jonathan Goldman
Scotiabank; Equity Research Analyst
Michael Glen
Raymond James; Managing Director
| Page | |
| Magna International Inc. |
| FIRST QUARTER 2025 RESULTS WEBCAST |
PRESENTATION:
Operator^ Hello and welcome to the Magna International First Quarter 2025 Results Webcast.
All lines have been placed on mute to prevent any background noise. After the speaker's remarks, there will be a question-and-answer session. (Operator Instructions) Thank you.
And as a reminder, this call is being recorded. I would now like to hand the call over to Louis Tonelli, VP of Investor Relations. Louis, please go ahead.
Louis Tonelli^ Thanks, operator. Hello, everyone, and welcome to our conference call covering our first quarter 2025 results. Joining me today are Swamy Kotagiri and Pat McCann.
Yesterday, our Board of Directors met and approved our financial results for the first quarter of '25 and our updated outlook.
We issued a press release this morning outlining our results. You'll find the press release, today's conference call webcast, the slide presentation to go along with the call, and our updated quarterly financial review all in the Investor Relations section of our website at magna.com.
Before we get started, just as a reminder, discussion today may contain forward-looking information or forward-looking statements within the meaning of applicable securities legislation. Such statements involve certain risks, assumptions, and uncertainties, which may cause the company's actual or future results and performance to be materially different from those expressed or implied in these statements.
Please refer to today's press release for a complete description of our Safe Harbor Disclaimer.
Please also refer to the Reminders slide included in our presentation that relates to our commentary today.
With that, I'll pass it over to Swamy.
Swamy Kotagiri^ Thank you, Louis. Good morning, everyone. I appreciate you joining our call today.
Before we start, I want to express our deep sadness here at Magna with the passing of our former CFO, Vince Galifi. Vince was not only a remarkable leader, but also a cherished colleague, mentor, and a friend to me and many of us.
Vince's contributions to Magna over his 30-plus year career were invaluable, including playing a crucial role in shaping our financial strategies, providing stability, and ensuring our disciplined profitable growth. Many of you listening in today benefited from his knowledge, wisdom, and insight. As we mourn his loss, we also celebrate his life and the profound influence he had on Magna.
| Page | |
| Magna International Inc. |
| FIRST QUARTER 2025 RESULTS WEBCAST |
There are some notable takeaways from the quarter that I would like to highlight before getting into some of the details. We are pleased that our Q1 results came in ahead of our quarterly planning cadence, mainly reflecting strong incremental margin on higher sales.
You may recall that in our February call, I mentioned that the first half of 2025 would be weaker than the second half, and of the first two quarters, Q1 would be weaker.
We returned $187 million to shareholders in the first quarter in the form of dividends and share repurchases.
Despite increased uncertainty due to the current tariff environment, we have updated our outlook which includes higher sales largely due to foreign currency translation, partially offset by slightly lower vehicle production in North America and a modest reduction in margin mainly due to the higher euro and decremental margins related to the North American volume reduction.
We continue to work closely with our customers to mitigate the tariff impacts and adjust in this rapidly evolving environment, focusing on what is under our control, including cost containment efforts. And we have clearly communicated to our customers our intention to pass on any unmitigated incremental tariff costs.
We continue to win new business and advance automotive technologies. We are collaborating with NVIDIA for next-generation scalable active safety and autonomous driving systems as well as other applications. We have been awarded a new complete ADAS system with a North American-based global OEM, and we are supplying a two-speed dual motor E drive with advanced off-road technology for Mercedes-Benz.
Our customers and the industry continue to recognize Magna for excellence in launch and innovation. We recently won GM Supplier of The Year and Overdrive Awards, and Automotive News recently selected our AI-based thermal sensing technology as a 2025 PACE Pilot Innovation to Watch.
As I said earlier, the industry is facing a high degree of uncertainty as a result of the tariffs and trade environment. Let me frame tariffs in the context of Magna.
Last year, our North American business was about $20 billion or less than half of our global sales. In 2024, we imported roughly $2 billion of goods from countries including Canada and Mexico that are subject to tariffs, which would result in roughly $500 million in gross tariff costs.
Based on our analysis to date, 75% to 80% of our parts crossing the border are already USMCA compliant, which puts our 2025 annualized direct tariff impact estimate at about $250 million.
| Page | |
| Magna International Inc. |
| FIRST QUARTER 2025 RESULTS WEBCAST |
We continue to evaluate options that will further increase USMCA compliance to mitigate tariff impacts. In some instances, it'll require design modifications, validation, and our customer approvals. We will continue to evaluate the full scope of these opportunities.
As a result, we are highly focused on working with customers to consider further mitigation opportunities, utilizing government remission programs where appropriate, continuing cost reduction programs already in place, and remaining disciplined with capital spend. As I said at the outset, we expect 100% of unmitigated incremental direct tariff costs to be recovered from customers.
Next, I will cover our updated outlook.
Uncertainty in the current business environment caused by tariffs and other trade measures has made forecasting more challenging than normal. Our outlook reflects our strong first quarter performance and near-term OEM production release information, including announced production downtime at certain OEM assembly facilities.
Our production assumptions do not contemplate the potential impacts of tariffs and other trade measures on vehicle costs, vehicle affordability, or consumer demand, nor the impact of these on vehicle production.
Relative to our previous outlook, we have reduced North American production by about 100,000 units to 15 million, held Europe production unchanged, and have raised our China production assumptions by roughly our Q1 outperformance to 30.2 million units.
We also assume exchange rates in our outlook will approximate recent rates. We now expect a higher euro and Canadian dollar for 2025 relative to our previous outlook.
The increase in our sales range is predominantly associated with foreign exchange translations due to the higher euro relative to the U.S. dollar, partially offset by lower vehicle production in North America, particularly with respect to certain programs with high Magna content.
The lowering our EBIT margin range reflects the margin dilutive impact of euro-U.S. dollar translation as well as decremental margin on the lower sales associated with the volume reductions in North America.
We increased our tax rate to approximately 26% from approximately 25%, mainly due to mix of earnings. We expect capital spending to be in the $1.7 billion to $1.8 billion range, down slightly from $1.8 billion previously, reflecting our continuing efforts to defer or reduce capital wherever possible.
And our interest expense, net income and free cash flow ranges are all unchanged from our last outlook.
| Page | |
| Magna International Inc. |
| FIRST QUARTER 2025 RESULTS WEBCAST |
In addition, we are providing some helpful financial modeling guidance with respect to Magna. Our average content per vehicle in North America is approximately $1,300 and we would estimate incremental and decremental margins in North America to be in the 15% to 20% range at the Magna level under normal conditions.
We have also seen relatively volatile foreign exchange rate swings over the past few months. As you model sales, keep in mind that $0.01 change in the euro-USD rate has about $110 million impact on annual sales, with a margin below our corporate average. And $0.01 change in the Canadian to U.S. dollar is about $50 million in annual sales with a margin at about our corporate average.
Lastly, we are proactively evaluating costs and capital.
I would like to reiterate that our guiding principles remain the cornerstone of Magna, a long-term ownership mentality that starts with our culture of accountability and alignment of interests at all levels of the company. Managing our portfolio under a consistent set of criteria and dispassionately assess our product lines in terms of the markets, market positions, and returns. Maintaining a strong balance sheet to have the financial flexibility to manage through the cyclicality of our industry, and a capital allocation strategy that entails the long-term balance of investing for profitable growth together with returning capital to shareholders.
Regardless of where we are in the cycle or challenges we are facing, these overarching principles govern the way we manage Magna for long-term success.
With that, I'll pass the call over to Pat.
Pat McCann^ Thanks, Swamy, and good morning everyone.
As Swamy indicated, we delivered solid first quarter earnings, ahead of our expectations. Recall that we indicated on our February call that we expected our 2025 earnings to be lowest in the first quarter of the year.
Now, comparing the first quarter of 2025 to the first quarter of 2024, consolidated sales were $10.1 billion, down 8% compared to a 3% decline in global light vehicle production. Adjusted EBIT was $354 million and adjusted EBIT margin was 3.5%. Adjusted EPS came in at $0.78, down 28% year-over-year, primarily due to decremental margins on lower sales, but ahead of our expectations. And free cash flow used in the quarter was $313 million, ahead of our expectations, and compared it to $270 million in the first quarter of 2024.
Let me take you through some of the details.
| Page | |
| Magna International Inc. |
| FIRST QUARTER 2025 RESULTS WEBCAST |
North American and European light vehicle production decreased 5% and 8%, respectively, and production in China increased 2%, netting to a 3% decrease in global production.
On a sales-weighted basis, light vehicle production declined 5% from the prior year. Our consolidated sales were $10.1 billion compared to $11 billion in the first quarter of 2024.
On an organic basis, our sales decreased 6% year-over-year for a negative 1% growth over market in the quarter, in part reflecting negative production mix from lower D3 production in North America; lower light vehicle production; a decline in complete vehicle assembly volumes including the end of production of the Jaguar E- and I-Pace in Graz, Austria; the end of production of certain other programs; the divestiture of a controlling interest in our metal forming operations in India; the impact of changes in foreign exchange rates and normal course customer price givebacks.
These were partially offset by the launch of new programs, higher commercial recoveries and customer price increases to recover certain higher production input costs.
Adjusted EBIT was $354 million and adjusted EBIT margin was 3.5%, down 80 basis points from Q1 2024. The lower EBIT percent in the quarter reflects positive 60 basis points from operational items reflecting operational excellence activities, lower engineering spend and lower net input costs, partially offset by higher new facility costs.
Negative 15 basis points related to lower equity income as a result of lower net favorable commercial items, higher net transactional FX losses, and reduced earnings on lower sales, partially offset by lower launch costs, all with respect to certain equity accounted investments.
Negative 10 basis points for tariff costs paid out, but not yet recovered from customers, and volume and other items which impacted us by negative 150 basis points reflecting reduced earnings on lower sales and lower net transactional FX gains.
In net discrete items, higher net favorable commercial items was completely offset by higher net warranty costs and higher restructuring costs not called out as unusual.
Interest was essentially in line with last year. Our adjusted effective income tax rate came in at 25.7%, higher than Q1 of last year, primarily due to higher losses not benefited in Europe, unfavorable foreign exchange adjustments for U.S. GAAP purposes and a change in the mix of earnings, partially offset by favorable changes in our reserves for uncertain tax positions.
Net income was $219 million compared to $311 million in Q1 2024, mainly reflecting lower EBIT, partially offset by lower income tax and lower minority interest. And adjusted EPS was $0.78 compared to $1.08 last year, reflecting lower net income, partially offset by fewer diluted shares outstanding. The fewer shares outstanding largely reflects share repurchases in the fourth quarter of 2024 and the first quarter of 2025.
| Page | |
| Magna International Inc. |
| FIRST QUARTER 2025 RESULTS WEBCAST |
Turning to a review of our cash flows and investment activities.
In the first quarter of 2025, we generated $547 million in cash from operations before changes in working capital and used $470 million in working capital. Investment activities in the quarter included $268 million for fixed assets and $148 million increase in investments, other assets, and intangibles.
Overall, we used free cash flow of $313 million in Q1, better than we were forecasting and compared to $270 million in the first quarter of 2024. And we continue to return capital to shareholders, paying $136 million in dividends along with $51 million in share repurchases during the first quarter of 2025.
Our balance sheet continues to be strong with investment-grade ratings from the major credit agencies. At the end of Q1, we had just under $4.6 billion in liquidity, including about $1.1 billion in cash. Currently, our adjusted debt-to-adjusted EBITDA ratio is at 1.92, better than we had anticipated coming into the quarter.
In summary, we had solid financial performance in the quarter, ahead of what we had expected. We returned $187 million to shareholders in the quarter in the form of dividends and share repurchases. We updated our outlook excluding the impacts of tariffs, which includes higher sales largely due to foreign currency translation, partially offset by lower volumes in North America and a modest reduction in margin mainly due to the higher euro and decremental margins related to North American volume reduction. And we are working closely with our customers to mitigate tariff impacts and adjust in a rapidly involving environment.
Thanks for your attention this morning. We would be happy to take your questions.
Operator^ We will now begin the question-and-answer session. (Operator Instructions)
And your first question comes from the line of John Murphy with Bank of America. John, please go ahead.
John Murphy^ Good morning, guys. Very sorry to hear about Vince. It's tough news for all of us. I think we all learned a lot from him. He was a great friend, so that's rough way to start the call. Thoughts are out to all you guys.
Swamy Kotagiri^ Thank you.
John Murphy^ I guess first here, maybe kind of thinking sort of mid to the long-term, Swamy, on the seating business, it just seems like even adjusting for tariffs, the business remains kind of tough. I'm just curious, as you think about that business mid to long-term, if there's something you need to do on a micro basis, organically, or do you need to get larger scale? Because there's a lot of other folks out there that are kind of tripping over that business as well and it seems like it should be an okay business, but it seems like you just can't get it to turn the corner. What are your thoughts there on seating?
| Page | |
| Magna International Inc. |
| FIRST QUARTER 2025 RESULTS WEBCAST |
Swamy Kotagiri^ Good morning, John, and thanks for your comments.
On the seating, I don't know if you caught it. The big topic, the one-time which would be behind us was a $30 million magnitude warranty topic that's included in the quarter, right now, and that's behind us. Operationally, continuing to look at what we had last year and what we had in the past. It continues to track.
Given the volatility and the program that we talked about in South Carolina and it comes onboard for next year, the macro variables that we talked about in seating as a business hasn't changed.
From an operations perspective, the execution plans that we have been talking about stay on track.
But on the bigger context, not just the seating, John, as I mentioned before, we continue to look at all product lines, so that's always a part of the process.
John Murphy^ Okay. And then just a second question, as you think about tariffs, and I hate to harp on this. Yesterday, the Customs and Border Patrol, they put out a sort of a notice that seems to be an indication that USMCA compliant parts are going to remain on tariff beyond sort of the 90-day review, certainly beyond May 3rd, and it seems like that may be in perpetuity. I'm just curious what you are hearing there and if that's correct interpretation because that would create some pretty extreme relief for you guys here, at least in North America.
Swamy Kotagiri^ John, that's -- I read that report and you're absolutely right. I think, I mentioned in the call, we are about -- that's where the focus has been. We have had work streams looking at, in intricate detail of every part that crosses the border. We are about between 75% to 80% USMCA compliant. A lot of discussions on how to take that percentage up.
Yes, definitely that gives a lot more certainty and relief in our planning process. And that is the assumption that we are going with and hope to get some more clarity and certainty on that decision.
John Murphy^ And maybe just to follow on that, I mean, as far as schedule changes and program launch changes, what have you heard from automakers so far? It seems like everybody is kind of trying to plow ahead without making significant changes yet. Have you seen big changes in short-term schedules or potential program launches for the second half of this year or maybe even into next year?
| Page | |
| Magna International Inc. |
| FIRST QUARTER 2025 RESULTS WEBCAST |
Swamy Kotagiri^ John, we have not, not just looking at releases. So first to address the releases, right, April seemed pretty aligned with our planning. May from a visibility perspective also looks normal. But we've always have been thinking about depending on any announcements that might change pretty quickly. But as we see it today, it looks pretty aligned. And obviously, we don't stop just by looking at the data here, we have been in conversations with OEMs at least two or three times a week at my level even to get an understanding and not depend only on the releases.
Overall, we have not seen any changes in terms of planning or in terms of production schedules, at least from the programs that we are involved with. But even at a macro level, we are not seeing it. A lot of discussions on how to get more USMCA compliance for sure, but that's where the chips fall today.
John Murphy^ And then just lastly, China seems like it's showing some relative strength and absolute strength relative to expectations. Can you just remind us of your footprint or your mix of customers there, domestic Chinese OEMs versus international?
Swamy Kotagiri^ Yes, it happens to be, we were in China about just three weeks ago. About $5.5 billion of our revenue is from China. Of that, just about over 60%, 65% of the business is with Chinese OEMs and they're, I would say, largely, John, with five to six customers, the major Chinese OEMs there. If you remember, we started in China predominantly with all the Western OEMs and we've been able to move that mix from 10% to 65% plus or in that range today. So we continue to gain traction.
Even last year, we grew 15% in China compared to the roughly 5% that China market was growing. So we feel pretty good about it. We are deliberate which product, which customer, but we continue to gain or improve our mix there.
John Murphy^ Swamy, I thought just about a year ago that was 50/50. I mean, did it move that quickly or was my numbers kind of --
Swamy Kotagiri^ Yes.
John Murphy^ It did move that quickly?
Swamy Kotagiri^ John, your numbers are correct. We continue to make good progress and have traction.
John Murphy^ Great. Thank you very much guys.
Swamy Kotagiri^ Thanks, John.
| Page | |
| Magna International Inc. |
| FIRST QUARTER 2025 RESULTS WEBCAST |
Operator^ And your next question comes from the line of Tamy Chen with BMO Capital Markets. Tamy, please go ahead.
Tamy Chen^ Hi, good morning. Thanks for the question.
First, I just wanted to clarify, so Swamy and Pat, the annualized tariff exposure this year, you said $250 million, so much to interpret, that is essentially the COGS exposure from you importing into your U.S. plants parts from Canada and Mexico. And are you saying this number, you believe, you would get 100% recovery from your customers?
Swamy Kotagiri^ So Tamy, good morning. First, yes, what you said, the $250 million we are talking about where we are the importer of that (inaudible).
Pat McCann^ Beyond Canada and Mexico. (Multiple speakers) --
Swamy Kotagiri^ Beyond Canada and Mexico. China and Europe, although those numbers are smaller, but it's a very comprehensive list.
Second, obviously our first initiative is to mitigate that as much as possible with all our internal actions, resourcing, rebalancing, continuing to work with our customers to increase the USMCA compliance. Some of it might need design modifications or validations or the production party approval process. And we are working with them and we'll continue to.
So now, anything that is remaining past all those efforts, yes, our intent is to pass it on to the customer.
Tamy Chen^ Okay, understood. And yes, on that, with respect to increasing USMCA compliance and also I'm curious, if at this point, well, I think first of all, you said a lot of discussions around that, increasing USMCA compliance with your customers. I'm also wondering, most recently, after we've got a little bit of relief and clarity earlier this week, do you also believe your customers may be thinking more about increasing U.S. content, not just USMCA compliance? And can you talk a little bit more about, between the two of them, what that means for you, incremental capital investment? What do you need to do? How does that impact you if both of those things continue from here?
Swamy Kotagiri^ Yes, I think, Tamy, it's only fair to say that all scenarios have -- are being considered. But from what we are hearing, given in my discussions, I think it is not a knee-jerk reaction given the capital allocation and the magnitude of what's being discussed. They're looking at very carefully, if there is a rebalancing possible, I think that is the first option. If there is a resourcing, that is also an option.
| Page | |
| Magna International Inc. |
| FIRST QUARTER 2025 RESULTS WEBCAST |
I haven't heard in all the discussions that I'm having with all the customers that anybody is looking at a knee-jerk reaction. They're looking at it and they've been very collaborative and sharing data with us. So that's on one side of things.
Magna has a footprint in Canada, in Mexico, and in United States. As you can imagine, there is not capacity available at any point of time, but is there a possibility of rebalancing some of the things? Yes, that we continue to look at, but again, we cannot do it unilaterally. We have to work with our customers, to make those changes. So, that's how we are proceeding to mitigate any impacts that are there.
Tamy Chen^ Okay. Got it. And my last question is on your share buyback. Could you confirm at this point, I think you had said earlier, that, a month or so ago, you've paused it. I just want to understand at this point, how are you thinking about the buyback? Is that still on pause given the macro uncertainty? Is it also related to the, where your leverage currently is at and where you expect that going forward? Thanks.
Swamy Kotagiri^ So Tamy, yes, you're right. We talked about pausing and we have always talked about it as a strategy, right, in managing our balance sheet. To answer your question very directly, yes, it is paused given the uncertainty that we have in the market. But as you know, we had the NCIB about to purchase 28.5 million shares approximately. If uncertainty goes away and there is a lot of clarity, there is always the possibility to look at it later in the year.
For now, given where the market is and given where uncertainty is, yes, we have paused.
Tamy Chen^ Thank you.
Swamy Kotagiri^ But, also to add, Tamy, the leverage ratio, as Pat mentioned, is on track and we continue to make good progress as discussed. And I think we are just a little bit ahead compared to where we are planning, as Pat mentioned in the comments.
Tamy Chen^ Great. Thank you.
Operator^ And your next question comes from the line of Dan Levy with Barclays. Dan, please go ahead.
Dan Levy^ Hi, good morning. Thanks for taking the question. Wanted to first just ask on advanced programs launch activity, what have you seen there? Has there been any change in the activity, behavior of automakers on this front? And maybe you can just include in that, what's the tone and tenor of commercial discussions with the automakers right now?
Swamy Kotagiri^ Good morning, Dan. From an overall planning, launch perspective, we have not seen any change, right? But in terms of sourcing, there is a lot of scenarios being discussed and talked through. And I think, we are fortunate in a way to say that most of our major customers have had discussions with us because of the footprint and capacity and our ability. So, we are getting a viewpoint on that.
| Page | |
| Magna International Inc. |
| FIRST QUARTER 2025 RESULTS WEBCAST |
So I wouldn't say it has slowed, but I think there is deliberation on the footprint and the cadence of the decision making. But we are not really seeing a change in what we are going after in terms of business and how it's being sourced.
Dan Levy^ Okay, thank you. And then, as far as the complete vehicle segment, if you could just give any color on the outperformance in the quarter, but also, how should we assess the risk for complete vehicles given G-Wagon is a central program and there's some questions on the demand and the tariff environment as those are all exported?
Swamy Kotagiri^ Yes, Dan, I think part of the outperformance has been based on how our complete vehicle assembly segment has the terms, right? So, there is commercial recoveries as volumes grow -- change because of how the terms are there. So that's one.
And over the last year, we've been talking about restructuring and getting the cost structure of that facility to the current volume scenarios and the programs that we have had. We talked about some of the programs ending and some coming to an end in the 2026, towards the end of '26. So we have proactively taken steps to restructure the cost base and we continue to see that flow through.
On the Mercedes G-Wagon, I won't comment for our customers, obviously, but you've seen the public statement of holding the price. But, if there is a demand reduction for that vehicle in North America, I'm sure there is an impact, but you got to keep in mind the margin profile of that business is substantially lower than the normal Magna average.
Pat McCann^ The only thing I'd add, Dan, is it comes back to the contract Swamy's talking about, there are fixed coverage unit. So, even if the volume is small, we can have that fixed coverage regardless.
Swamy Kotagiri^ And we continue to have discussions as mentioned with different OEMs for getting on additional programs. And this seems, I would say, pretty encouraging, Dan.
Dan Levy^ Okay, thanks. If I could just squeeze one in, just to clarify the pieces of the business that are not USMCA compliant, those are which products or in which segments?
Swamy Kotagiri^ Dan, I think it's across. We haven't seen any significant point to make on one specific segment, right? I would say it's all across. But there's not a marked difference from one to the other. So, it's across Magna.
Dan Levy^ Great. Thank you.
| Page | |
| Magna International Inc. |
| FIRST QUARTER 2025 RESULTS WEBCAST |
Operator^ And your next question comes from the line of Doug Dutton with Evercore ISI. Doug, please go ahead.
Doug Dutton^ Yes. Hey, Swamy. Hey, team. Just looking at the body and exterior segment here. Margins were particularly weak. They were down from most of last year, from all of last year, actually. I understand there's some FX volume effect there. But in terms of timing, is this likely to be a first-half or first-quarter phenomenon, or is this something that could persist with the uncertainty that we're seeing? How do you see those margins progressing throughout the course of '25?
Pat McCann^ Hi, Doug. It's Pat. Just grabbed my numbers here. But I think your thesis, broadly speaking, is correct. We're operating where we expected to operate in the BES group. So, we came in at an EBIT number of 5.8%. We're seeing that increase as we progress through the year. And it would be consistent with what we had seen last year.
But remember, we're still in a situation where a lot of our commercial upgrades tend to be recovered in the back half of the year. That's probably going to be amplified this year, given all the volume uncertainty. So, I think we're still expecting a strong margin performance in Q4 compared to the first three quarters of the year.
Swamy Kotagiri^ So, it might be a cadence. But operationally and foundationally, this segment, BES, is really doing well and continues to perform at the level that we -- and I say, no difference in the operations from where we had last year versus now, except volume and other things I just talked about.
Doug Dutton^ Okay, that's helpful. And then that's a good segue to my next question here. On slide 17, you mentioned those tariff costs that have been paid and not recovered from customers as a headwind. Is this going to be the norm going forward, where those tariff costs are treated similarly to your cost recoveries from your customers? Basically, it's Magna fronting any incremental cost, and then you will be reimbursed in the future. Is that the correct way to think about this incremental tariff cost?
Pat McCann^ Yes, I think, Doug, this is an accounting issue. It's not really the commercial side of it. Under the accounting rules, until you have a legal agreement with your customer for recovery, you have to expense those costs. The cost in the corner of about $10 million gross for perspective. Obviously, we're pushing to close as quickly as we can, but that is -- expect that same cadence as other commercials.
Doug Dutton^ Awesome. Thanks, team.
Pat McCann^ Thanks, Doug.
Swamy Kotagiri^ Thanks, Doug.
| Page | |
| Magna International Inc. |
| FIRST QUARTER 2025 RESULTS WEBCAST |
Operator^ And your next question comes from the line of Joe Spak with UBS. Joe, please go ahead.
Joe Spak^ Thank you, everyone. And thanks for the tariff impact color. Sorry to go back, because I just want to understand some of the math here. The $2 billion of goods that cross the border, I get 25% of that is the $500 million. Then you're saying 25% of the parts are non-USMCA compliant.
So, how do you get to a $250 million impact? Is that because the compliance, that percentage you gave is parts-based, not dollar-weighted? So, you really mean only half the dollars are exempt?
And then just to be very clear, I know you're not assuming the -- any volume impact, but in the guidance, are you assuming in the revenue guidance that you recover that $250 million -- I'm sorry, the half of that on an annualized basis?
Swamy Kotagiri^ So, I think to clarify, right, in the math, there is also remission programs from governments, right, for example, on the Canada. So, that would offset some of the things that are there. And net of that remission is how you get to the $250 million approximate number that you're seeing, Joe. And we are not including the volume impact, right? Is that your question?
Joe Spak^ (multiple speakers) Well, yes. Sorry, but the remissions would help further, right? I guess what I'm saying is just very simple math. If you're saying [$500 million] across.
Swamy Kotagiri^ The remissions are included is what I'm saying. After remissions, we are having the $250 million.
Joe Spak^ All right. Maybe we could take it offline. But because, again, if 25% is not compliant, I would have thought the impact would have been $125 million before remissions, and remissions would bring it down further.
Pat McCann^ I think, Joe, we can take it offline. But forget -- don't forget that it's not all 25% across the board. We are importing parts from China and other parts of the world that have a higher tariff greater than [25%].
Joe Spak^ Fair enough. Okay. All right. And then, sorry, I know the volume -- yes. Okay. (multiple speakers). Sorry, go ahead.
Pat McCann^ Sorry, you also asked about (multiple speakers) --
Joe Spak^ Sorry, I know the volume impact from tariffs is not included, but is the recovery of that, let's say three-quarters of that $250 million included in the revenue outlook?
| Page | |
| Magna International Inc. |
| FIRST QUARTER 2025 RESULTS WEBCAST |
Pat McCann^ We've assumed in our outlook that at the EBIT level, we have zero impact from tariffs because any residual is going to be recovered from the customer. It's not included in revenues. It's just as a cost recovery.
Joe Spak^ Okay. So, it's not in the revenue, but then you assume -- but in reality, it would be, but then it's zero impact to EBIT.
Pat McCann^ I can't -- it's going to depend, Joe, on how we structure those agreements with the customer. It's going to be more complicated than we can answer just yet.
Joe Spak^ Okay. And then I guess just on the -- when you look at some of this, the margin revisions by segment was mostly in BES and Seating. And I know Swamy just said the tariff impact is mostly -- or across all segments. So, is that really just a result of some of the softer 1Q results?
Pat McCann^ So, just broadly speaking, Joe, when you look at the revenue changes from our outlook in February to our current outlook, midpoint to midpoint, we're seeing roughly about a $1.5 billion increase just related to quality exchange. And that's spread out quite evenly across our four segments.
When you look at the pure volume declines, as you know, just manufacturing activity, the bulk of that decline is in BES, and we're seeing weakness in seating. And the seating, that's primarily related to announced shutdowns in April and May already.
Joe Spak^ Okay. I appreciate it. Thank you.
Pat McCann^ You're welcome.
Operator^ And your next question comes from the line of Adam Jonas with Morgan Stanley. Adam, please go ahead.
Adam Jonas^ Thanks, Swamy, and Pat, and everybody. I wanted to offer my condolences for the loss of Vince. He was a really talented, kind, humorous, and gentle soul who left the world a better place than he found it. And to those lucky enough to know him, his memory is a real blessing.
And I believe if he were here, if he was listening to this call from up above, he'd be saying, just all right, back to work, keep your head down, and cut through the challenges and the opportunities of the day. And I think he'd have great confidence in the team. And I just wanted to offer my condolences to the Magna’s family and his own family and children as well. And that's all I want to say. I don't have any questions. So, get back to the call. Thank you.
| Page | |
| Magna International Inc. |
| FIRST QUARTER 2025 RESULTS WEBCAST |
Pat McCann^ Thanks, Adam.
Swamy Kotagiri^ Thank you, Adam. I appreciate it.
Pat McCann^ We'll pass it on to Joanne and the family.
Operator^ And your next question comes from the line of James Picariello with BNP Paribas. James, please go ahead.
James Picariello^ Hi. Good morning, everybody. My question is on, Swamy, you mentioned in your prepared remarks that the 1Q exceeded internal expectations, and the 2025 EBIT range is unchanged. Just curious, do you still expect the first half to represent about 40% of the full year, right? This would imply something modestly above $500 million for the second quarter.
I know tariffs and the timing of recoveries could swing the answer. But if you were to get full recovery in the second quarter, which I don't think is -- I don't -- I imagine it's pretty reasonable given that the parts rebate mechanism is now in place for OEMs, and given Magna's critical role as a supplier to your customers, just how are you thinking about that 40-60 split?
Swamy Kotagiri^ I think, James, the simple answer is yes. Based on all the visibility that we have, April behind us, and unless something drastically changes, and nowadays that seems to be happening, I would say the 40% in the first half, 60% in the second half is still a good assumption. Yes.
James Picariello^ Good, thank you. And then my follow-up is just on buybacks. I think it was mentioned at a -- Magna mentioned at a recent conference that typically for the -- when you get the authorization for buyback, you want to -- a company would typically want to buy back at least half of the authorization. That was something, again, mentioned at a conference, not necessarily my words. Just wondering, if volumes overall for the industry hang in, you get full recovery or most recoveries for the tariff exposure that you have, is that the target, at least half of this authorization gets done this year?
Swamy Kotagiri^ I don't know about the comment about the half. I don't think, James, it's from us. But like I said, when we look at share repurchases, we always looked at it as a tool to give excess liquidity back to our investors and shareholders. But the most important thing is operationally, how do you maintain liquidity and have the balance sheet and look at possible programs and opportunities even they come up in a normal course, right, like additional volume and programs from other places that customers might reach out to us, especially in terms of uncertainty like this.
Beyond that, and that's the reason why we said we are paused, we have to see if everything returns back to normalcy. We would still go back to the NCIB authorization that we have. And we have this as our surplus at that point of time, given we are still tracking the way we want it to for our leverage ratio. I wouldn't say it's half, or our intent from the start is to say we want to get as close as to the NCIB as possible, right? Our intent is always that.
| Page | |
| Magna International Inc. |
| FIRST QUARTER 2025 RESULTS WEBCAST |
James Picariello^ Understood, thank you.
Operator^ And your next question comes from the line of Shreyas Patil with Wolfe Research. Shreyas, please go ahead.
Shreyas Patil^ Hey, thanks so much for taking my questions, and my condolences to Vincent and his family. Wanted to maybe just come back to the guidance for this year. I understand it does not reflect tariffs, but just to confirm you, have revised it for the latest FX assumptions, because I guess just looking at the euro, for example, that alone would be maybe a $650 million benefit to revenue for this year, or $35 million or so to EBIT, Canadian dollar is another benefit. And so, is that correct? And if so, can you maybe just expand on the offset that you mentioned? I think there was some headwinds on key programs that you noted.
Swamy Kotagiri^ So, good morning, Shreyas. I think the FX, what they have taken is as dollar stands with respect to euro and Canadian dollar today, right, which is how we do every time. I don't know the exact number for how much of that is in euro. Some of it is in style. Some of it is in Europe for sure. And [Pat’s] maybe --
Pat McCann^ I think we'd have to break it down, Shreyas, but just broadly speaking, the FX impact, including Q1, is $1.5 billion. That's the goal. Then the offsets are primarily where we're seeing some volume. Remember, just broadly speaking, our volumes in North America are down just over 100,000 units, and that's primarily impacting our BES segment and our seating segment.
Swamy Kotagiri^ And we have taken what we have seen in terms of closures to date, right?
Shreyas Patil^ Okay, yes. So, just -- so, basically, revenue is up $1.5 billion on FX, and then it's offset by lower volume. That's the primary headwind.
Pat McCann^ That's 95% of the answer, correct?
Swamy Kotagiri^ Yes.
Shreyas Patil^ Okay. Okay, understood. And then, just maybe, if you could help us just understand mechanically the process by which you would get recovery from the OEM, because I understand your expectation is to get 100%.
I guess what we've seen in the past, I think about the semiconductor shortage from '21 and '22, is there is a bit of a lag in recovery. Would you expect this time around if you're looking at tariff costs to incur a lag through negotiation, or do you feel like because this is an industry-wide problem, that the pace of which you could get recovery is much quicker?
| Page | |
| Magna International Inc. |
| FIRST QUARTER 2025 RESULTS WEBCAST |
Swamy Kotagiri^ So, Shreyas, even during the semiconductor crisis, yes, there is a little bit of time, and it depends. We had three-way conversations, some of it was directly with the customers. And keep in mind that we recovered pretty much 95% plus, if not 100% of the semiconductor at that point in time.
So, we have a process, is what I'm trying to say, and we will set up a process again similar to what we have. So, would there be a little bit of back and forth in terms of timing? Depends on customer and program and the magnitude of it, but we feel pretty confident. And I have to say that customers have been open to discussion and collaborative as we are discussing. But all I have to say is stay tuned.
Shreyas Patil^ Okay, thanks.
Operator^ And your next question comes from the line of Mark Delaney with Goldman Sachs. Mark, please go ahead.
Mark Delaney^ Yes, good morning. Thank you very much for taking my questions, and please allow me to pass my sympathies on to Magna and Vince's family on his passing. He's very detail-oriented and always quite generous with his time, so he will be missed for sure.
Pat McCann^ Thank you.
Swamy Kotagiri^ Thank you.
Mark Delaney^ I did want to speak a bit on schedules and understand your comments that customer production schedules have been stable. When you speak to your broader set of customers on their plans, can you help us better understand what they're indicating they'll do with vehicles being exported, and now seeing tariffs, and help us better understand why there wouldn't be a change to those exported vehicles given the tariff dynamic?
And then just overall, as you think about the second half, what's the confidence you have in production schedules tracking in line with your prior review for 2H?
Swamy Kotagiri^ Mark, it's a little bit of a crystal ball, right? When we made the comments, we're talking about releases that are in the system. And it also depends on what programs and platforms we are on, right? So, our comments are very much dependent on that. And we haven't seen, I would say, any significant change compared to the normal course of going up and down a little bit.
| Page | |
| Magna International Inc. |
| FIRST QUARTER 2025 RESULTS WEBCAST |
What you're talking about is a little bit macro. If it is, what, 800,000 units that are imported from Europe into North America because of tariffs, would that have an impact on those 800,000 units? I think so. But difficult to quantify what that would be, depending on would the customers look at keeping the market share, managing pricing for the short term. There's so many variables here. I would not know how to quantify that yet, but our answers are purely based on the data that we are seeing and based on the conversations we are having with our customers on the programs that we are active.
Mark Delaney^ Thanks for that color, Swamy. My second question was about EBIT margins. The company had been expecting to achieve 75 bps of EBIT margin tailwind over the next two years in total. I'm hoping to better understand if there's been any change in either the magnitude of savings or the timing of which it may flow through, given the current industry backdrop. Thanks.
Swamy Kotagiri^ No, I would say we are on track, right? We talked about roughly 35 basis points in 2025 and similar in 2026. They had visibility for the continuous improvement and other activities. I can tell you the entire organization is focused on all those actions plus anything else that we have to mitigate. Fundamentally, the organization is looking at the cost structure to be viable and good at the current levels. And as the volume comes back, we are talking flexed up to be able to take advantage and get our incrementals to be better. That's the philosophy, that's the mindset in the entire organization. So, we feel pretty good.
And to the given set of volumes, obviously, you know that has a significant impact. As the volumes continue as they are and slowly come back over time and the uncertainty calms down, we feel pretty good about what we are doing now in terms of our actions, as well as through 2026, which we are keeping a very close eye on.
Mark Delaney^ Thank you.
Operator^ And your next question comes from the line of Jonathan Goldman with Scotiabank. Jonathan, please go ahead.
Jonathan Goldman^ Hi, good morning, guys, and thanks for taking my questions. Most of them have been asked already, but just one for me then. We've seen the light vehicle inventories come down in the past two months in North America, and maybe that's related to the pull forward and demand. But in your production outlook for North America, does that assume any rebuild of inventories at all this year?
Swamy Kotagiri^ We keep an eye on the inventory, Jonathan. What I would say is where we ended up in December, there was a spike in January, February. What we see today goes back to what December was. But our planning or our production is based on releases, not on where the inventory is, or the assumption whether it's going to fill up or not, right? That's for the customers to make, not us. So, I would say what we are telling you is based on releases in the system.
| Page | |
| Magna International Inc. |
| FIRST QUARTER 2025 RESULTS WEBCAST |
Jonathan Goldman^ No, that's fair. I appreciate the color. Thanks, Swamy.
Pat McCann^ Thanks, Jonathan.
Operator^ And your final question comes from the line of Michael Glen with Raymond James. Michael, please go ahead.
Michael Glen^ Hey, good morning. Swamy, thank you for the answer with regard to the European export for assembled vehicles. But could you provide some context to Magna's exposure to Mexico -- Mexican and Canadian assembled vehicles? What the outlook is there, and maybe what customers are communicating to you in terms of what might happen with those production schedules and any movement we might see?
Swamy Kotagiri^ Good morning, Michael. Maybe two parts. I'll try to get it and Pat can add color.
We -- when we talk about releases, obviously, looking across the North America ecosystem, we are not seeing a change in the platform or the mix at this point of time. And when we talk about tariffs, again, we are taking Canada and Mexico and our content in all these platforms crossing borders, whether it's resupply from Canada into Canada vehicles, but those vehicles might be coming over. We are looking at it broadly. I don't know if I can give more color than that at this point of time or I have more than that to give you.
Pat McCann^ I think, Michael, we have that data point. I just don't have it handy. Only have production in Canada and Mexico that's shipped into the U.S. for sale. We have that data. We can follow up with you. I just don't have it handy.
But from our point of view, our -- we know our sales piece. We have sales of just over $4 billion in Canada. About 70% of that is sold into the U.S., where the OEMs is the importer of record. And in Mexico, we're about $5.5 billion of sales. And about 25% of that is sold into the U.S.
Your question of what the OEMs are building in those two countries [has] shifted, I would have to get back to you.
Michael Glen^ And not to put you on the spot with this question or anything like that, but when you -- do you believe that the 25% on assembled vehicles from Canada or Mexico into the U.S. will remain in place?
Swamy Kotagiri^ You are putting us [fast] on the spot and I don't have the answer for you. I know what I wish, but that doesn't matter.
| Page | |
| Magna International Inc. |
| FIRST QUARTER 2025 RESULTS WEBCAST |
Michael Glen^ Okay. And just some of the reshoring efforts that you might look for to pursue, to increase USMCA compliant, how do you think about the tier two, tier three, or tier four supplier base? Do you see this as feasible? I'm just trying to assess your opportunity to reshore some of those components.
Swamy Kotagiri^ Yes, I mean, if you go back to the COVID and the semiconductor crisis, there was a little bit of reshoring, I would say rebalancing. And looking at the possibilities, Michael, this is no different from that perspective, I would say. All those work streams are in place today. Does it mean you can take everything and reshore in the short period of time? I don't think so. But I'm just one voice in the industry.
Just -- semiconductors you saw, right? So, we look at it part by part. It depends on that. And obviously, as I said, our goal is to figure out how to increase the USMCA-compliant first. And then we have to follow how the OEMs are thinking and how they are going to optimize or manage their footprint because, based on logistics and other things, we have to work collaboratively and cannot make that decision unilaterally.
Pat McCann^ Okay, I think [to add to] Swamy's point is very, very important because there's a business case that the customer has to agree to behind each of these reshoring opportunities, right? So, that a [P] -- it's a granular bottoms-up, case-by-case analysis that the customer has to sign up for with commercial terms.
Operator^ That concludes our question-and-answer session. I will now hand it back over to Swamy Kotagiri for closing remarks. Swamy?
Swamy Kotagiri^ Thanks, everyone, for listening in today. We all talked about the high degree of uncertainty in the industry that we're all facing. But I want to assure you we remain focused on execution. All things that we control, including cost and capital discipline. Free cash flow is primary focus, and getting back within our target leverage ratio. So, we remain highly confident in Magna's future, and thanks for listening in, and have a great day.
Operator^ That concludes today's call. You may now disconnect.
| Page | |