UNITED STATES
SECURITIES AND EXCHANGE COMMISSION
Washington, D.C. 20549
FORM 8-K
CURRENT REPORT
Pursuant to Section 13 OR 15(d)
of The Securities Exchange Act of 1934
Date of Report (Date of earliest event reported): May 1, 2025
![]()
Smurfit Westrock plc
(Exact name of registrant as specified in its charter)
| Ireland (State or other jurisdiction of incorporation) |
001-42161 (Commission |
98-1776979 (I.R.S. Employer Identification No.) |
Beech Hill, Clonskeagh
Dublin 4, D04 N2R2
Ireland
(Address of principal executive offices, including Zip Code)
+353 1 202 7000
(Registrant’s telephone phone number, including area code)
Check the appropriate box below if the Form 8-K filing is intended to simultaneously satisfy the filing obligation of the registrant under any of the following provisions:
| ¨ | Written communications pursuant to Rule 425 under the Securities Act (17 CFR 230.425) |
| ¨ | Soliciting material pursuant to Rule 14a-12 under the Exchange Act (17 CFR 240.14a-12) |
| ¨ | Pre-commencement communications pursuant to Rule 14d-2(b) under the Exchange Act (17 CFR 240.14d-2(b)) |
| ¨ | Pre-commencement communications pursuant to Rule 13e-4(c) under the Exchange Act (17 CFR 240.13e-4(c)) |
Securities registered pursuant to Section 12(b) of the Act:
| Title of each class | Trading Symbol(s) | Name of each exchange on which registered |
| Ordinary shares, par value $0.001 per share | SW | New York Stock Exchange (NYSE) |
Indicate by check mark whether the registrant is an emerging growth company as defined in Rule 405 of the Securities Act of 1933 (§230.405 of this chapter) or Rule 12b-2 of the Securities Exchange Act of 1934 (§240.12b-2 of this chapter).
Emerging growth company ¨
If an emerging growth company, indicate by check mark if the registrant has elected not to use the extended transition period for complying with any new or revised financial accounting standards provided pursuant to Section 13(a) of the Exchange Act. ¨
| Item 2.02. | Results of Operations and Financial Condition |
On May 1, 2025, Smurfit Westrock plc (the “Company”) issued a press release announcing the financial results for the first quarter ended March 31, 2025. The press release is furnished as Exhibit 99.1 and is incorporated into this Item 2.02 by reference.
The information furnished in this Item 2.02, including the exhibit described above, is being “furnished” and shall not be deemed “filed” hereunder for purposes of Section 18 of the Securities Exchange Act of 1934, as amended (the “Exchange Act”), or incorporated by reference in any filing under the Securities Act of 1933, as amended (the “Securities Act”), or the Exchange Act, except as shall be expressly set forth by specific reference in any such filings.
| Item 7.01. | Regulation FD Disclosure |
On May 1, 2025, the Company will host a conference call during which it will discuss the Company’s financial results for the first quarter ended March 31, 2025. The presentation to be used in connection with the conference call is attached as Exhibit 99.2.
The information provided pursuant to this Item 7.01, including Exhibit 99.2, is being “furnished” and shall not be deemed to be “filed” with the SEC or incorporated by reference in any filing under the Securities Act or the Exchange Act, except as shall be expressly set forth by specific reference in any such filings.
| Item 9.01. | Financial Statements and Exhibits |
(d) Exhibits
| 99.1 | First Quarter 2025 Earnings Press Release dated May 1, 2025 |
| 99.2 | First Quarter 2025 Earnings Presentation |
| 104 | Cover Page Interactive Data File (embedded within the Inline XBRL document) |
SIGNATURES
Pursuant to the requirements of the Securities Exchange Act of 1934, the registrant has duly caused this report to be signed on its behalf by the undersigned hereunto duly authorized.
| Smurfit Westrock plc | ||
| /s/ Ken Bowles | ||
| Name: | Ken Bowles | |
| Title: | Executive Vice President & Group Chief Financial Officer | |
Date: May 1, 2025
Exhibit 99.1
|
www.smurfitwestrock.com |

| Smurfit Westrock Reports First Quarter 2025 Results |
Dublin – May 1, 2025 – Smurfit Westrock plc (NYSE: SW, LSE: SWR) today announced the financial results for the first quarter ended March 31, 2025.
Key points:
| · | First quarter Net Sales of $7,656 million |
| · | First quarter Net Income of $382 million, with a Net Income Margin of 5.0% |
| · | First quarter Adjusted EBITDA1 of $1,252 million, with an Adjusted EBITDA Margin1 of 16.4% |
| · | Quarterly dividend of $0.4308 per ordinary share |
Smurfit Westrock plc’s performance for the three months ended March 31, 2025 and 2024 (in millions, except margins):
| March 31, | ||||||||
| 2025 | 20242 | |||||||
| Net Sales | $ | 7,656 | $ | 2,930 | ||||
| Net Income | $ | 382 | $ | 191 | ||||
| Net Income Margin | 5.0 | % | 6.5 | % | ||||
| Adjusted EBITDA1 | $ | 1,252 | $ | 475 | ||||
| Adjusted EBITDA Margin1 | 16.4 | % | 16.2 | % | ||||
| Net Cash provided by Operating Activities | $ | 235 | $ | 42 | ||||
| Adjusted Free Cash Flow1 | $ | (144 | ) | $ | (130 | ) | ||
Tony Smurfit, President and CEO, commented:
“I am pleased to report a strong first quarter performance with Net Income of $382 million, Adjusted EBITDA of $1,252 million, in-line with our stated guidance, and an Adjusted EBITDA margin of 16.4%. This performance was driven by good results across all three segments, with notable progress in North America, and is significantly ahead of the combined result for the prior year.
“I am especially pleased with how well the combination has come together, with strong operational and cultural integration taking place across all three regions. Coupled with our geographic footprint and our unrivalled portfolio of innovative and sustainable packaging solutions, we have a customer-focused and performance-driven team that is delivering for all stakeholders.
“Our synergy program is on track to deliver $400 million, with approximately $350 million in the current year. We believe there is substantial opportunity to continue to structurally improve the business through a sharper commercial and operational focus, at least equal to our synergy target.
“We continue to actively optimize our asset base. We have recently announced the closure of over 500,000 tons of paper capacity in North America. We are also closing two converting facilities in our North American region and have initiated consultations to close two of our converting facilities in EMEA & APAC.
“To consolidate our leadership position and better support our customers, we have constructed two state-of-the-art converting plants in Washington and Wisconsin and are completing a new Bag-in-Box facility in South Carolina in our North American region. Comparable investments in EMEA & APAC, in high-performing converting equipment, will reduce our cost base and strengthen our overall footprint in the region while in Latin America, we continue to invest in cost take-out and growth projects, for example, the biomass boiler in Colombia which is nearing completion.
1 Adjusted EBITDA, Adjusted EBITDA Margin and Adjusted Free Cash Flow are non-GAAP measures. See the “Non-GAAP Financial Measures and Reconciliations” below for discussion and reconciliation of these measures to the most comparable GAAP measures.
2 All results reported for the three months ended March 31, 2024 reflect the historical financial results of legacy Smurfit Kappa Group plc, which is considered the accounting acquirer in the combination between Smurfit Kappa Group plc and WestRock Company, which closed on July 5, 2024.
Page
“Consistent with our disciplined operating approach and before we see the impact in our system of the announced closures, we expect to incur additional economic downtime in the second quarter costing approximately $100 million versus the first quarter. While the demand outlook is uncertain, we expect second quarter Adjusted EBITDA3 to be approximately $1.2 billion and our current estimate for a full year Adjusted EBITDA3 is between $5.0 billion and $5.2 billion.
“Our progressive improvement together with a strong margin performance is a clear demonstration of the strength of Smurfit Westrock in a period characterised by significant volatility. As the global leader, with leading market positions across many of the 40 countries in which we operate, we continue to see significant opportunity for growth, development and cost take-out. We believe that the actions we have taken, and continue to take, will translate to superior operating and financial performance for Smurfit Westrock.”
Dividend
Smurfit Westrock plc announced today that its Board approved a quarterly dividend of $0.4308 per share on its ordinary shares. The quarterly dividend of $0.4308 per ordinary share is payable June 18, 2025 to shareholders of record at the close of business on May 16, 2025.
The default payment currency is U.S. Dollar for shareholders who hold their ordinary shares through a Depository Trust Company participant. It is also U.S. Dollar for shareholders holding their ordinary shares in registered form, unless a currency election has been registered with the Company’s Transfer Agent, Computershare Trust Company N.A. by 5:00 p.m. (New York) / 10:00 p.m. (Dublin) on May 15, 2025.
The default payment currency for shareholders holding their ordinary shares in the form of Depository Interests is U.S. Dollar. Such shareholders can elect to receive the dividend in Pounds Sterling or Euro by providing their instructions to the Company’s Depositary Interest provider, Computershare Investor Services plc, by 12:00 p.m. (New York) / 5:00 p.m. (Dublin) on May 27, 2025.
Earnings Call
Management will host an earnings conference call today at 7:30 AM ET / 12:30 PM BST to discuss Smurfit Westrock’s financial results. The conference call will be accessible through a live webcast. Interested investors and other individuals can access the webcast, earnings release, and earnings presentation via the Company’s website at www.smurfitwestrock.com. The webcast will be available at https://investors.smurfitwestrock.com/overview and a replay of the webcast will be available on the website shortly after the call.
3Adjusted EBITDA is a non-GAAP financial measure. We have not reconciled Adjusted EBITDA outlook to the most comparable GAAP outlook because it is not possible to do so without unreasonable efforts due to the uncertainty and potential variability of reconciling items, which are dependent on future events and often outside of management’s control and which could be significant. Because such items cannot be reasonably predicted with the level of precision required, we are unable to provide an outlook for the comparable GAAP measure (net income).
Page
Forward Looking Statements
This press release includes certain “forward-looking statements” (including within the meaning of Section 27A of the Securities Act of 1933, as amended, and Section 21E of the Securities Exchange Act of 1934, as amended) regarding, among other things, the plans, strategies, outcomes, outlooks, and prospects, both business and financial, of Smurfit Westrock, the expected benefits of the completed combination of Smurfit Kappa Group plc and WestRock Company (the “Combination”), including, but not limited to, synergies as well as our scale, geographic reach and product portfolio, demand outlook, impact of announced closures, additional economic downtime and any other statements regarding the Company's future expectations, beliefs, plans, objectives, results of operations, financial condition and cash flows, or future events, outlook or performance. Statements that are not historical facts, including statements about the beliefs and expectations of the management of the Company, are forward-looking statements. Words such as “may”, “will”, “could”, “should”, “would”, “anticipate”, “intend”, “estimate”, “project”, “plan”, “believe”, “expect”, “target”, “prospects”, “potential”, “commit”, “forecasts”, “aims”, “considered”, “likely”, “estimate” and variations of these words and similar future or conditional expressions are intended to identify forward-looking statements but are not the exclusive means of identifying such statements. While the Company believes these expectations, assumptions, estimates and projections are reasonable, such forward-looking statements are only predictions and involve known and unknown risks and uncertainties, many of which are beyond the control of the Company. By their nature, forward-looking statements involve risk and uncertainty because they relate to events and depend upon future circumstances that may or may not occur. Actual results may differ materially from the current expectations of the Company depending upon a number of factors affecting its business, including risks associated with the integration and performance of the Company following the Combination. Important factors that could cause actual results to differ materially from plans, estimates or expectations include: our ability to deliver on our closure plan and associated efforts; our future cash payments associated with these initiatives; potential future cost savings associated with such initiatives; the amount of charges and the timing of such charges or actions described herein; potential future impairment charges; accuracy of assumptions associated with the charges; economic, competitive and market conditions generally, including macroeconomic uncertainty, customer inventory rebalancing, the impact of inflation and increases in energy, raw materials, shipping, labor and capital equipment costs; geo-economic fragmentation and protectionism such as tariffs, trade wars or similar governmental actions affecting the flows of goods, services or currency (including the recent implementation of tariffs by the US federal government and reciprocal tariffs and other protectionist or retaliatory measures governments in Europe, Asia, and other countries have taken or may take in response); the impact of public health crises, such as pandemics and epidemics and any related company or governmental policies and actions to protect the health and safety of individuals or governmental policies or actions to maintain the functioning of national or global economies and markets; reduced supply of raw materials, energy and transportation, including from supply chain disruptions and labor shortages; developments related to pricing cycles and volumes; intense competition; the ability of the Company to successfully recover from a disaster or other business continuity problem due to a hurricane, flood, earthquake, terrorist attack, war, pandemic, security breach, cyber-attack, power loss, telecommunications failure or other natural or man-made events, including the ability to function remotely during long-term disruptions; the Company's ability to respond to changing customer preferences and to protect intellectual property; the amount and timing of the Company's capital expenditures; risks related to international sales and operations; failures in the Company's quality control measures and systems resulting in faulty or contaminated products; cybersecurity risks, including threats to the confidentiality, integrity and availability of data in the Company's systems; works stoppages and other labor disputes; the Company’s ability to establish and maintain effective internal controls over financial reporting in accordance with the Sarbanes Oxley Act of 2002, as amended, and remediate any weaknesses in controls and processes; the Company's ability to retain or hire key personnel; risks related to sustainability matters, including climate change and scarce resources, as well as the Company's ability to comply with changing environmental laws and regulations; the Company's ability to successfully implement strategic transformation initiatives; results and impacts of acquisitions by the Company; the Company's significant levels of indebtedness; the impact of the Combination on the Company's credit ratings; the potential impairment of assets and goodwill; the availability of sufficient cash to distribute dividends to the Company's shareholders in line with current expectations; the scope, costs, timing and impact of any restructuring of operations and corporate and tax structure; evolving legal, regulatory and tax regimes; changes in economic, financial, political and regulatory conditions in Ireland, the United Kingdom, the United States and elsewhere, and other factors that contribute to uncertainty and volatility, natural and man-made disasters, civil unrest, geopolitical uncertainty, and conditions that may result from legislative, regulatory, trade and policy changes associated with the current or subsequent Irish, US or UK administrations; legal proceedings instituted against the Company; actions by third parties, including government agencies; the Company's ability to promptly and effectively integrate Smurfit Kappa's and WestRock's businesses; the Company's ability to achieve the synergies and value creation contemplated by the Combination; the Company's ability to meet expectations regarding the accounting and tax treatments of the Combination, including the risk that the Internal Revenue Service may assert that the Company should be treated as a US corporation or be subject to certain unfavorable US federal income tax rules under Section 7874 of the Internal Revenue Code of 1986, as amended, as a result of the Combination; other factors such as future market conditions, currency fluctuations, the behavior of other market participants, the actions of regulators and other factors such as changes in the political, social and regulatory framework in which the Company's group operates or in economic or technological trends or conditions, and other risk factors included in the Company's filings with the Securities and Exchange Commission, including the Company’s Annual Report on Form 10-K for the fiscal year ended December 31, 2024. Neither the Company nor any of its associates or directors, officers or advisers provides any representation, assurance or guarantee that the occurrence of the events expressed or implied in any such forward-looking statements will actually occur. You are cautioned not to place undue reliance on these forward-looking statements. Other than in accordance with its legal or regulatory obligations (including under the UK Listing Rules, the Disclosure Guidance and Transparency Rules, the UK Market Abuse Regulation and other applicable regulations), the Company is under no obligation, and the Company expressly disclaims any intention or obligation, to update or revise publicly any forward-looking statements, whether as a result of new information, future events or otherwise.
About Smurfit Westrock
Smurfit Westrock is a leading provider of paper-based packaging solutions in the world, with approximately 100,000 employees across 40 countries.
| Contacts | |
|
Ciarán Potts Smurfit Westrock T: +353 1 202 71 27 E: ir@smurfitwestrock.com |
FTI Consulting
T: +353 1 765 0800 E: smurfitwestrock@fticonsulting.com |
Page
|
www.smurfitwestrock.com |
| Condensed Consolidated Statements of Operations (Unaudited) |
| (in millions, except per share data) |
| Three Months Ended | ||||||||
| March 31, | ||||||||
| 2025 | 2024 | |||||||
| Net sales | $ | 7,656 | $ | 2,930 | ||||
| Cost of goods sold | (6,079 | ) | (2,220 | ) | ||||
| Gross profit | 1,577 | 710 | ||||||
| Selling, general and administrative expenses | (988 | ) | (380 | ) | ||||
| Transaction and integration-related expenses associated with the Combination | (36 | ) | (23 | ) | ||||
| Operating profit | 553 | 307 | ||||||
| Pension and other postretirement non-service income (expense), net | 9 | (10 | ) | |||||
| Interest expense, net | (167 | ) | (25 | ) | ||||
| Other expense, net | (5 | ) | (5 | ) | ||||
| Income before income taxes | 390 | 267 | ||||||
| Income tax expense | (8 | ) | (76 | ) | ||||
| Net income | 382 | 191 | ||||||
| Net loss attributable to noncontrolling interests | 2 | - | ||||||
| Net income attributable to common shareholders | $ | 384 | $ | 191 | ||||
| Basic earnings per share attributable to common shareholders | $ | 0.74 | $ | 0.74 | ||||
| Diluted earnings per share attributable to common shareholders | $ | 0.73 | $ | 0.73 | ||||
Page
Segment Information
We report our financial results of operations in the following three reportable segments:
| i. | North America, which includes operations in the U.S., Canada and Mexico. |
| ii. | Europe, the Middle East and Africa (“MEA”) and Asia-Pacific (“APAC”). |
| iii. | Latin America (“LATAM”), which includes operations in Central America and Caribbean, Argentina, Brazil, Chile, Colombia, Ecuador and Peru. |
Segment profitability is measured based on Adjusted EBITDA, defined as income before income taxes, unallocated corporate costs, depreciation, depletion and amortization, interest expense, net, pension and other postretirement non-service income (expense), net, share-based compensation expense, other expense, net, amortization of fair value step up on inventory, transaction and integration-related expenses associated with the Combination and other specific items that management believes are not indicative of the ongoing operating results of the business. The chief operating decision maker (“CODM”) uses Adjusted EBITDA for each segment predominantly: to forecast and assess the performance of the segments, individually and comparatively; to set pricing strategies for the segments; and to make decisions about the allocation of operating and capital resources to each segment strategically, in the annual budget and in the quarterly forecasting process. The CODM considers budget, or forecast, -to-actual variances on a quarterly and annual basis for segment Adjusted EBITDA to inform these decisions.
Financial information by segment is summarized below (in millions, except margins).
| Three Months Ended | ||||||||
| March 31, | ||||||||
| 2025 | 2024 | |||||||
| Net sales (aggregate) | ||||||||
| North America | $ | 4,669 | $ | 412 | ||||
| Europe, MEA and APAC | 2,582 | 2,194 | ||||||
| LATAM | 513 | 341 | ||||||
| Total | $ | 7,764 | $ | 2,947 | ||||
| Less net sales (intersegment) | ||||||||
| North America | $ | 91 | $ | - | ||||
| Europe, MEA and APAC | 6 | 4 | ||||||
| LATAM | 11 | 13 | ||||||
| Total | $ | 108 | $ | 17 | ||||
| Net sales (unaffiliated customers) | ||||||||
| North America | $ | 4,578 | $ | 412 | ||||
| Europe, MEA and APAC | 2,576 | 2,190 | ||||||
| LATAM | 502 | 328 | ||||||
| Total | $ | 7,656 | $ | 2,930 | ||||
| Segment Adjusted EBITDA | ||||||||
| North America | $ | 785 | $ | 59 | ||||
| Europe, MEA and APAC | 389 | 385 | ||||||
| LATAM | 115 | 54 | ||||||
| Total | $ | 1,289 | $ | 498 | ||||
| Adjusted EBITDA Margin | ||||||||
| Adjusted EBITDA / Net sales (aggregate) | ||||||||
| North America | 16.8 | % | 14.3 | % | ||||
| Europe, MEA and APAC | 15.1 | % | 17.6 | % | ||||
| LATAM | 22.5 | % | 16.0 | % | ||||
Page
| Condensed Consolidated Balance Sheets (Unaudited) |
| (in millions, except share and per share data) |
| March 31, | December 31, | |||||||
| 2025 | 2024 | |||||||
| Assets | ||||||||
| Current assets: | ||||||||
| Cash and cash equivalents (amounts related to consolidated variable interest entities of $7 million and $2 million at March 31, 2025 and December 31, 2024, respectively) |
$ | 797 | $ | 855 | ||||
| Accounts receivable, net (amounts related to consolidated variable interest entities of $806 million and $767 million at March 31, 2025 and December 31, 2024, respectively) |
4,548 | 4,117 | ||||||
| Inventories | 3,670 | 3,550 | ||||||
| Other current assets | 1,615 | 1,533 | ||||||
| Total current assets | 10,630 | 10,055 | ||||||
| Property, plant and equipment, net | 22,792 | 22,675 | ||||||
| Goodwill | 6,969 | 6,822 | ||||||
| Intangibles, net | 1,141 | 1,117 | ||||||
| Prepaid pension asset | 654 | 635 | ||||||
| Other non-current assets (amounts related to consolidated variable interest entities of $390 million and $389 million at March 31, 2025 and December 31, 2024, respectively) |
2,463 | 2,455 | ||||||
| Total Assets | $ | 44,649 | $ | 43,759 | ||||
| Liabilities and Equity | ||||||||
| Current liabilities: | ||||||||
| Accounts payable | $ | 3,171 | $ | 3,290 | ||||
| Accrued compensation and benefits | 799 | 882 | ||||||
| Current portion of debt | 1,300 | 1,053 | ||||||
| Other current liabilities | 2,175 | 2,108 | ||||||
| Total current liabilities | 7,445 | 7,333 | ||||||
| Non-current debt due after one year (amounts related to consolidated variable interest entities of $165 million and $8 million at March 31, 2025 and December 31, 2024, respectively) |
12,919 | 12,542 | ||||||
| Deferred tax liabilities | 3,608 | 3,600 | ||||||
| Pension liabilities and other postretirement benefits, net of current portion | 716 | 706 | ||||||
| Other non-current liabilities (amounts related to consolidated variable interest entities of $335 million and $335 million at March 31, 2025 and December 31, 2024, respectively) |
2,072 | 2,191 | ||||||
| Total liabilities | 26,760 | 26,372 | ||||||
| Equity: | ||||||||
| Preferred stock; $0.001 par value; 500,000,000 shares authorized; 10,000 shares outstanding | - | - | ||||||
| Common stock; $0.001 par value; 9,500,000,000 shares authorized; 521,979,145 and 520,444,261 shares outstanding at March 31, 2025 and December 31, 2024, respectively |
1 | 1 | ||||||
| Deferred shares; €1 par value; 25,000 shares authorized; 25,000 shares outstanding | - | - | ||||||
| Treasury stock; at cost; 1,467,950 and 2,037,589 common stock at March 31, 2025 and December 31, 2024, respectively |
(65 | ) | (93 | ) | ||||
| Capital in excess of par value | 15,977 | 15,948 | ||||||
| Accumulated other comprehensive loss | (1,079 | ) | (1,446 | ) | ||||
| Retained earnings | 3,030 | 2,950 | ||||||
| Total shareholders' equity | 17,864 | 17,360 | ||||||
| Noncontrolling interests | 25 | 27 | ||||||
| Total equity | 17,889 | 17,387 | ||||||
| Total liabilities and equity | $ | 44,649 | $ | 43,759 | ||||
Page
| Condensed Consolidated Statements of Cash Flows (Unaudited) |
| (in millions) |
| Three Months Ended | ||||||||
| March 31, | ||||||||
| 2025 | 2024 | |||||||
| Operating activities: | ||||||||
| Net income | $ | 382 | $ | 191 | ||||
| Adjustments to reconcile consolidated net income to net cash provided by operating activities: | ||||||||
| Depreciation, depletion and amortization | 603 | 148 | ||||||
| Cash surrender value increase in excess of premiums paid | (5 | ) | - | |||||
| Share-based compensation expense | 43 | 15 | ||||||
| Deferred income tax benefit | (29 | ) | (2 | ) | ||||
| Pension and other postretirement funding more than cost | (23 | ) | (8 | ) | ||||
| Other | 1 | 1 | ||||||
| Change in operating assets and liabilities, net of acquisitions and divestitures: | ||||||||
| Accounts receivable | (342 | ) | (196 | ) | ||||
| Inventories | (62 | ) | 8 | |||||
| Other assets | (47 | ) | (51 | ) | ||||
| Accounts payable | (117 | ) | (102 | ) | ||||
| Income taxes | (70 | ) | 60 | |||||
| Accrued liabilities and other | (99 | ) | (22 | ) | ||||
| Net cash provided by operating activities | 235 | 42 | ||||||
| Investing activities: | ||||||||
| Capital expenditures | (477 | ) | (208 | ) | ||||
| Cash paid for purchase of businesses, net of cash acquired | (4 | ) | - | |||||
| Other | 5 | 1 | ||||||
| Net cash used for investing activities | (476 | ) | (207 | ) | ||||
| Financing activities: | ||||||||
| Additions to debt | 295 | 55 | ||||||
| Repayments of debt | (65 | ) | (27 | ) | ||||
| Debt issuance costs | (5 | ) | - | |||||
| Changes in commercial paper, net | 246 | - | ||||||
| Other debt repayments, net | (16 | ) | - | |||||
| Repayments of finance lease liabilities | (16 | ) | (1 | ) | ||||
| Tax paid in connection with shares withheld from employees | (64 | ) | - | |||||
| Purchases of treasury stock | - | (27 | ) | |||||
| Cash dividends paid to shareholders | (225 | ) | - | |||||
| Other | 1 | - | ||||||
| Net cash provided by financing activities | 151 | - | ||||||
| Effect of exchange rate changes on cash and cash equivalents | 32 | (24 | ) | |||||
| Decrease in cash and cash equivalents | (58 | ) | (189 | ) | ||||
| Cash and cash equivalents at beginning of period | 855 | 1,000 | ||||||
| Cash and cash equivalents at end of period | $ | 797 | $ | 811 | ||||
Page
Non-GAAP Financial Measures and Reconciliations
Smurfit Westrock plc (“Smurfit Westrock”) reports its financial results in accordance with accounting principles generally accepted in the United States ("GAAP"). However, management believes certain non-GAAP financial measures provide Smurfit Westrock’s Board of directors, investors, potential investors, securities analysts and others with additional meaningful financial information that should be considered when assessing its ongoing performance. Smurfit Westrock management also uses these non-GAAP financial measures in making financial, operating and planning decisions, and in evaluating company performance. Non-GAAP financial measures are not intended to be considered in isolation of or as a substitute for, or superior to, financial information prepared and presented in accordance with GAAP and should be viewed in addition to, and not as an alternative for, the GAAP results. The non-GAAP financial measures we present may differ from similarly captioned measures presented by other companies. Smurfit Westrock uses the non-GAAP financial measures “Adjusted EBITDA,” “Adjusted EBITDA Margin,” and “Adjusted Free Cash Flow.” We discuss below details of the non-GAAP financial measures presented by us and provide reconciliations of these non-GAAP financial measures to the most directly comparable financial measures calculated in accordance with GAAP.
Definitions
Smurfit Westrock uses the non-GAAP financial measures “Adjusted EBITDA” and “Adjusted EBITDA Margin” to evaluate its overall performance. The composition of Adjusted EBITDA is not addressed or prescribed by GAAP. Smurfit Westrock defines Adjusted EBITDA as net income before income tax expense, depreciation, depletion and amortization, interest expense, net, pension and other postretirement non-service (income) expense, net, share-based compensation expense, other expense, net, amortization of fair value step up on inventory, transaction and integration-related expenses associated with the Combination and other specific items that management believes are not indicative of the ongoing operating results of the business.
Management believes Adjusted EBITDA and Adjusted EBITDA Margin measures provide Smurfit Westrock’s management, Board of directors, investors, potential investors, securities analysts and others with useful information to evaluate Smurfit Westrock’s performance relative to other periods because it adjusts out non-recurring items that management believes are not indicative of the ongoing results of the business. Adjusted EBITDA Margin is calculated as Adjusted EBITDA divided by Net Sales.
Smurfit Westrock uses the non-GAAP financial measure “Adjusted Free Cash Flow”. Smurfit Westrock defines Adjusted Free Cash Flow as net cash provided by operating activities as adjusted for capital expenditures and to exclude certain costs not reflective of underlying ongoing operations. Management utilizes this measure in connection with managing Smurfit Westrock’s business and believes that Adjusted Free Cash Flow is useful to investors as a liquidity measure because it measures the amount of cash generated that is available, after reinvesting in the business, to maintain a strong balance sheet, pay dividends, repurchase stock, service debt and make investments for future growth. It should not be inferred that the entire free cash flow amount is available for discretionary expenditures. By adjusting for certain items that are not indicative of Smurfit Westrock’s underlying operational performance, Smurfit Westrock believes that Adjusted Free Cash Flow also enables investors to perform meaningful comparisons between past and present periods.
Page
Reconciliation to Most Comparable GAAP Measure
Set forth below is a reconciliation of the non-GAAP financial measures Adjusted EBITDA and Adjusted EBITDA Margin to Net income and Net Income Margin, the most directly comparable GAAP measures, for the periods indicated (in millions, except margins).
| Three Months Ended | ||||||||
| March 31, | ||||||||
| 2025 | 2024 | |||||||
| Net income | $ | 382 | $ | 191 | ||||
| Income tax expense | 8 | 76 | ||||||
| Depreciation, depletion and amortization | 603 | 148 | ||||||
| Transaction and integration-related expenses associated with the Combination | 36 | 23 | ||||||
| Interest expense, net | 167 | 25 | ||||||
| Pension and other postretirement non-service (income) expense, net | (9 | ) | 10 | |||||
| Share-based compensation expense | 43 | 15 | ||||||
| Other expense, net | 5 | 5 | ||||||
| Other adjustments (1) | 17 | (18 | ) | |||||
| Adjusted EBITDA | $ | 1,252 | $ | 475 | ||||
| Net Sales | $ | 7,656 | $ | 2,930 | ||||
| Net Income Margin (Net Income / Net Sales) |
5.0 | % | 6.5 | % | ||||
| Adjusted EBITDA Margin (Adjusted EBITDA / Net Sales) |
16.4 | % | 16.2 | % | ||||
(1) Other adjustments for the three months ended March 31, 2025, include restructuring costs of $15 million and losses at closed facilities of $2 million (three months ended March 31, 2024: $- million and $- million, respectively). Other adjustments for the three months ended March 31, 2024, include a reimbursement of a fine from the Italian Competition Authority of $18 million.
Page
Reconciliations to Most Comparable GAAP Measure (continued)
Set forth below is a reconciliation of the non-GAAP financial measure Adjusted Free Cash Flow to Net cash provided by operating activities, the most directly comparable GAAP measure, for the periods indicated (in millions).
| Three Months Ended | ||||||||
| March 31, | ||||||||
| 2025 | 2024 | |||||||
| Net cash provided by operating activities | $ | 235 | $ | 42 | ||||
| Capital expenditures | (477 | ) | (208 | ) | ||||
| Free Cash Flow | (242 | ) | (166 | ) | ||||
| Adjustments: | ||||||||
| Transaction and integration costs | 76 | 34 | ||||||
| Restructuring costs | 44 | 3 | ||||||
| Tax on above items | (22 | ) | (1 | ) | ||||
| Adjusted Free Cash Flow | $ | (144 | ) | $ | (130 | ) | ||
Page
Exhibit 99.2
Paper | Packaging | Solutions 2025 First Quarter Results May 1, 2025
Smurfit Westrock Q1 | 2025 Results | 2 Paper | Packaging | Solutions Forward Looking Statements The presentation includes certain “forward - looking statements” (including within the meaning of Section 27A of the Securities Act of 1933, as amended, and Section 21E of the Securities Exchange Act of 1934, as amended) regarding, among other things, the plans, strategies, outcomes, outlooks, and prospects, both business and financial, of Smurfit Westrock, the expected benefits of the completed Combination including, but not limited to, synergies as well as our scale, geographic reach and product portfolio, demand outlook, impact of announced closures, additional economic downtime, and any other statements regarding the Company's future expectations, beliefs, plans, objectives, results of operations, financial condition and cash flows, or future events, outlook, or performance. Statements that are not historical facts, including statements about the beliefs and expectations of the management of the Company, are forward - looking statements. Words such as “may”, “will”, “could”, “should”, “would”, “anticipate”, “intend”, “estimate”, “project”, “plan”, “believe”, “expect”, “target”, “prospects”, “potential”, “commit”, “forecasts”, “aims”, “considered”, “likely”, “estimate” and variations of these words and similar future or conditional expressions are intended to identify forward - looking statements but are not the exclusive means of identifying such statements. While the Company believes these expectations, assumptions, estimates and projections are reasonable, such forward - looking statements are only predictions and involve known and unknown risks and uncertainties, many of which are beyond the control of the Company. By their nature, forward - looking statements involve risk and uncertainty because they relate to events and depend upon future circumstances that may or may not occur. Actual results may differ materially from the current expectations of the Company depending upon a number of factors affecting its business, including risks associated with the integration and performance of the Company following the Combination. Important factors that could cause actual results to differ materially from plans, estimates or expectations include: our ability to deliver on our closure plan and associated efforts; our future cash payments associated with these initiatives; potential future cost savings associated with such initiatives; the amount of charges and the timing of such charges or actions described herein; potential future impairment charges; accuracy of assumptions associated with the charges; economic, competitive and market conditions generally, including macroeconomic uncertainty, customer inventory rebalancing, the impact of inflation and increases in energy, raw materials, shipping, labor and capital equipment costs, geo - economic fragmentation and protectionism such as tariffs, trade wars or similar governmental actions affecting the flows of goods, services or currency (including the recent implementation of tariffs by the US federal government and reciprocal tariffs and other protectionist or retaliatory measures governments in Europe, Asia, and other countries have taken or may take in response;; the impact of public health crises, such as pandemics and epidemics and any related company or governmental policies and actions to protect the health and safety of individuals or governmental policies or actions to maintain the functioning of national or global economies and markets; reduced supply of raw materials, energy and transportation, including from supply chain disruptions and labor shortages; developments related to pricing cycles and volumes; intense competition; the ability of the Company to successfully recover from a disaster or other business continuity problem due to a hurricane, flood, earthquake, terrorist attack, war, pandemic, security breach, cyber - attack, power loss, telecommunications failure or other natural or man - made events, including the ability to function remotely during long - term disruptions; the Company's ability to respond to changing customer preferences and to protect intellectual property; the amount and timing of the Company's capital expenditures; risks related to international sales and operations; failures in the Company's quality control measures and systems resulting in faulty or contaminated products; cybersecurity risks, including threats to the confidentiality, integrity and availability of data in the Company's systems; works stoppages and other labor disputes; the Company’s ability to establish and maintain effective internal controls over financial reporting in accordance with the Sarbanes Oxley Act of 2002, as amended, and remediate any weaknesses in controls and processes; the Company's ability to retain or hire key personnel; risks related to sustainability matters, including climate change and scarce resources, as well as the Company's ability to comply with changing environmental laws and regulations; the Company's ability to successfully implement strategic transformation initiatives; results and impacts of acquisitions by the Company; the Company's significant levels of indebtedness; the impact of the Combination on the Company's credit ratings; the potential impairment of assets and goodwill; the availability of sufficient cash to distribute dividends to the Company's shareholders in line with current expectations; the scope, costs, timing and impact of any restructuring of operations and corporate and tax structure; evolving legal, regulatory and tax regimes; changes in economic, financial, political and regulatory conditions in Ireland, the United Kingdom, the United States and elsewhere, and other factors that contribute to uncertainty and volatility, natural and man - made disasters, civil unrest, geopolitical uncertainty, and conditions that may result from legislative, regulatory, trade and policy changes associated with the current or subsequent Irish, US or UK administrations,; legal proceedings instituted against the Company; actions by third parties, including government agencies; the Company's ability to promptly and effectively integrate Smurfit Kappa's and WestRock's businesses; the Company's ability to achieve the synergies and value creation contemplated by the Combination; the Company's ability to meet expectations regarding the accounting and tax treatments of the Combination, including the risk that the Internal Revenue Service may assert that the Company should be treated as a US corporation or be subject to certain unfavorable US federal income tax rules under Section 7874 of the Internal Revenue Code of 1986, as amended, as a result of the Combination; other factors such as future market conditions, currency fluctuations, the behavior of other market participants, the actions of regulators and other factors such as changes in the political, social and regulatory framework in which the Company's group operates or in economic or technological trends or conditions, and other risk factors included in the Company's filings with the Securities and Exchange Commission, including the Company’s Annual Report on Form 10 - K for the fiscal year ended December 31, 2024 . Neither the Company nor any of its associates or directors, officers or advisers provides any representation, assurance or guarantee that the occurrence of the events expressed or implied in any such forward - looking statements will actually occur. You are cautioned not to place undue reliance on these forward - looking statements. Other than in accordance with its legal or regulatory obligations (including under the UK Listing Rules, the Disclosure Guidance and Transparency Rules, the UK Market Abuse Regulation and other applicable regulations), the Company is under no obligation, and the Company expressly disclaims any intention or obligation, to update or revise publicly any forward - looking statements, whether as a result of new information, future events or otherwise.
Smurfit Westrock Q1 | 2025 Results | 3 Paper | Packaging | Solutions Non - GAAP Financial Measures and Reconciliations Smurfit Westrock plc (“Smurfit Westrock”) reports its financial results in accordance with accounting principles generally accepted in the United States ("GAAP"). However, management believes certain non - GAAP financial measures provide Smurfit Westrock’s Board of directors, investors, potential investors, securities analysts and others with additional meaningful financial information that should be considered when assessing its ongoing performance. Smurfit Westrock management also uses these non - GAAP financial measures in making financial, operating and planning decisions, and in evaluating company performance. Non - GAAP financial measures are not intended to be considered in isolation of or as a substitute for, or superior to, financial information prepared and presented in accordance with GAAP and should be viewed in addition to, and not as an alternative for, the GAAP results. The non GAAP financial measures we present may differ from similarly captioned measures presented by other companies. Smurfit Westrock uses the non - GAAP financial measures “Adjusted EBITDA” and “Adjusted EBITDA Margin”. We discuss below details of the non - GAAP financial measures presented by us and provide reconciliations of these non GAAP financial measures to the most directly comparable financial measures calculated in accordance with GAAP. Definitions Smurfit Westrock uses the non - GAAP financial measures “Adjusted EBITDA” and “Adjusted EBITDA Margin” to evaluate its overall performance. The composition of Adjusted EBITDA is not addressed or prescribed by GAAP. Smurfit Westrock defines Adjusted EBITDA as net income before income tax expense, depreciation, depletion and amortization, interest expense, net, pension and other postretirement non - service (income) expense, net, share based compensation expense, other expense, net, amortization of fair value step up on inventory, transaction and integration - related expenses associated with the Combination and other specific items that management believes are not indicative of the ongoing operating results of the business. Management believes Adjusted EBITDA and Adjusted EBITDA Margin measures provide Smurfit Westrock’s management, Board of directors, investors, potential investors, securities analysts and others with useful information to evaluate Smurfit Westrock’s performance relative to other periods because it adjusts out non recurring items that management believes are not indicative of the ongoing results of the business. Adjusted EBITDA Margin is calculated as Adjusted EBITDA divided by Net Sales.
Smurfit Westrock Q1 | 2025 Results | 4 Adjusted EBITDA* of $1,252 million Adjusted EBITDA margin* of 16.4% ▪ Strong first quarter performance across all three regions ▪ Synergy program on track ▪ Ongoing system optimization through investment and rationalization ▪ Proven team with an established track record of superior performance Key messages Smurfit Westrock Q1 | 2025 Results | 4 Paper | Packaging | Solutions *Adjusted EBITDA and Adjusted EBITDA Margin are non - GAAP financial measures. See the Appendix for the reconciliation of these measures to the most comparable GAAP measures.
Smurfit Westrock Q1 | 2025 Results | 5 Smurfit Westrock Q1 | 2025 Results | 5 Paper | Packaging | Solutions Optimizing the system Investing ▪ Well invested asset base and opportunities identified: – Investment across all three regions in containerboard, corrugated and consumer systems – Examples include: • Expansion of Bag - in - Box offering in Spain and the U.S. • Efficiency, capacity and environmental upgrades in the mill systems of Brazil, Colombia, France, Germany, Italy, the Netherlands and the U.S. • State - of - the - art converting equipment to take out cost and strengthen our innovative offering Smurfit Westrock Q1 | 2025 Results | 6 Rationalizing ▪ Four closures, capacity reduction approximately 600kt – Forney, US with capacity to produce approx.
350kt of containerboard – St. Paul, US with capacity to produce approx. 160kt of CRB – Monterrey, Mexico with capacity to produce approx. 35kt of containerboard – Roermond, the Netherlands with capacity to produce approx.
40kt of containerboard ▪ Ongoing optimization of packaging footprint – A plant closure in Portland, Oregon – A plant closure in Chicago, Illinois – Two plant consultations in Germany Paper | Packaging | Solutions Optimizing the system Smurfit Westrock Q1 | 2025 Results | 6 Smurfit Westrock Q1 | 2025 Results | 7 Unrivalled geographic scale and product portfolio ▪ Improvement in North American business year - on - year due to sharper operating and commercial focus ▪ Improving European market conditions, from a position of strength ▪ Continued Adjusted EBITDA margin* expansion in LATAM ▪ >90 Quick Win projects in North America expected to deliver >$40 million Adjusted EBITDA* within 2 years ▪ Major EMEA & APAC Quick Win projects have IRR’s ranging from 25% – 150% ▪ Expansion projects progressing in LATAM Paper | Packaging | Solutions Positioned for performance Smurfit Westrock Q1 | 2025 Results | 7 * Adjusted EBITDA and Adjusted EBITDA margin are non - GAAP financial measures. We have not reconciled Adjusted EBITDA outlook to the most comparable GAAP outlook because it is not possible to do so without unreasonable efforts due to the uncertainty and potential variability of reconciling items, which are dependent on future events and often outside of management's control and which could be significant. Because such items cannot be reasonably predicted with the level of precision required, we are unable to provide an outlook for the comparable GAAP measure (net income).

Smurfit Westrock Q1 | 2025 Results | 8 ns Paper | Packaging | Solutio Financials Smurfit Westrock Q1 | 2025 Results | 8 Smurfit Westrock Q1 | 2025 Results | 9 $7.656 Paper | Packaging | Solutions Billion Net Sales $1.252 Billion Adjusted EBITDA* 16.4% Adjusted EBITDA Margin* Q1 2025 Smurfit Westrock results *Adjusted EBITDA and Adjusted EBITDA Margin are non - GAAP financial measures.
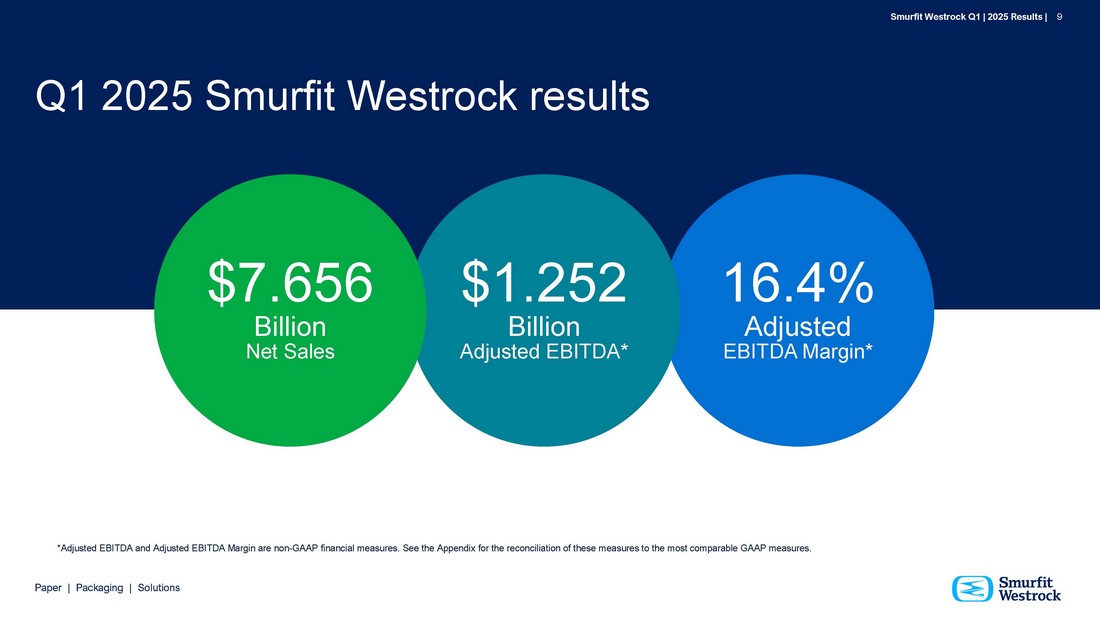
See the Appendix for the reconciliation of these measures to the most comparable GAAP measures.
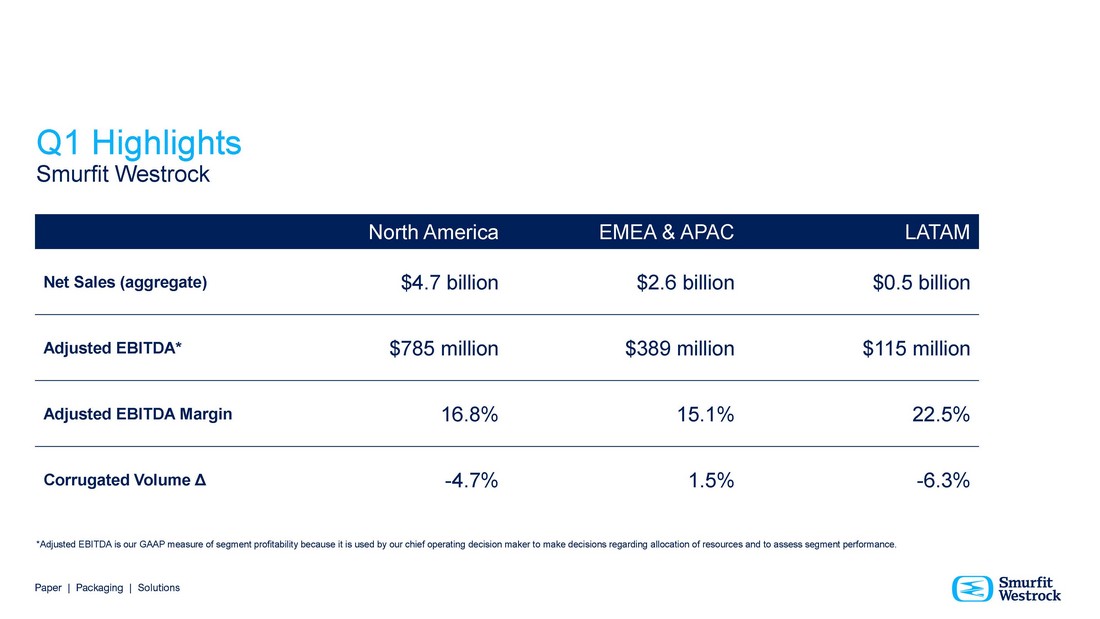
Smurfit Westrock Q1 | 2025 Results | 9 Q1 Highlights Smurfit Westrock Paper | Packaging | Solutions LATAM EMEA & APAC North America $0.5 billion $2.6 billion $4.7 billion Net Sales (aggregate) $115 million $389 million $785 million Adjusted EBITDA* 22.5% 15.1% 16.8% Adjusted EBITDA Margin - 6.3% 1.5% - 4.7% Corrugated Volume Δ *Adjusted EBITDA is our GAAP measure of segment profitability because it is used by our chief operating decision maker to make decisions regarding allocation of resources and to assess segment performance.
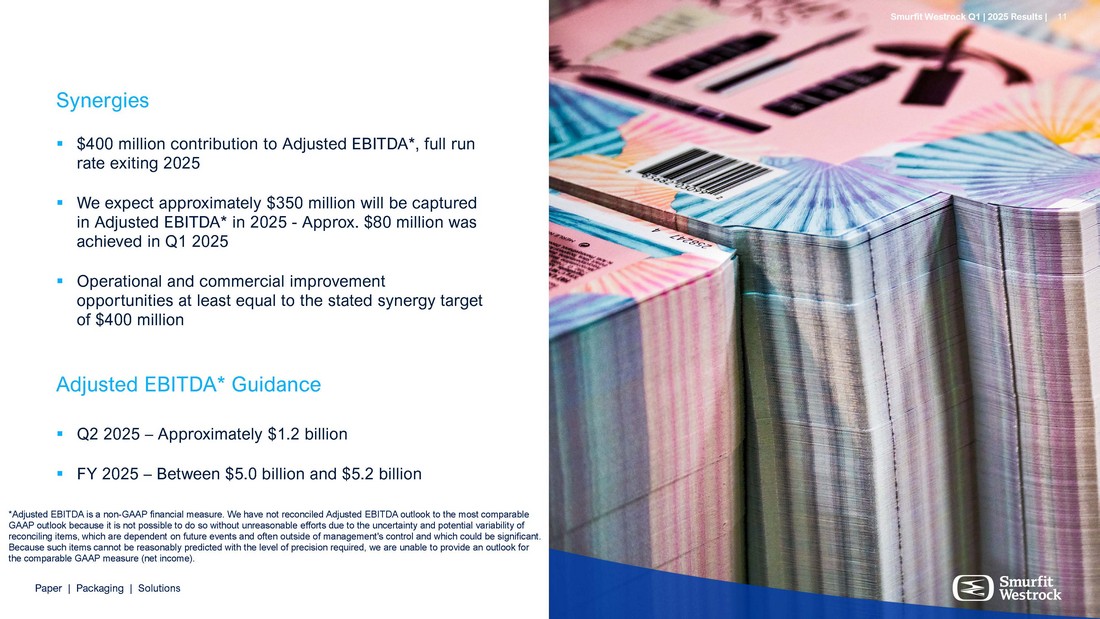
Smurfit Westrock Q1 | 2025 Results | 10 Smurfit Westrock Q1 | 2025 Results | 11 ▪ $ 400 million contribution to Adjusted EBITDA*, full run rate exiting 2025 ▪ We expect approximately $ 350 million will be captured in Adjusted EBITDA* in 2025 - Approx . $ 80 million was achieved in Q 1 2025 ▪ Operational and commercial improvement opportunities at least equal to the stated synergy target of $400 million Adjusted EBITDA* Guidance ▪ Q2 2025 – Approximately $1.2 billion ▪ FY 2025 – Between $5.0 billion and $5.2 billion Paper | Packaging | Solutions Synergies Smurfit Westrock Q1 | 2025 Results | 11 *Adjusted EBITDA is a non - GAAP financial measure. We have not reconciled Adjusted EBITDA outlook to the most comparable GAAP outlook because it is not possible to do so without unreasonable efforts due to the uncertainty and potential variability of reconciling items, which are dependent on future events and often outside of management's control and which could be significant. Because such items cannot be reasonably predicted with the level of precision required, we are unable to provide an outlook for the comparable GAAP measure (net income).
Smurfit Westrock Q1 | 2025 Results | 12 Paper | Packaging | Solutions Conclusion Smurfit Westrock Q1 | 2025 Results | 13 Attractive long - term fundamentals “ Paper | Packaging | Solutions Paper | Packaging | Solutions “ x Strong structural growth drivers x Product that is increasingly valued by the end consumer and our customers x Differentiated offering wins and retains business x Team with a strong track record of delivery x Shared commitment to driving shareholder value creation From already strong foundations, the actions we have taken, and continue to take, will translate to superior operating and financial performance. - Tony Smurfit Smurfit Westrock Q1 | 2025 Results | 13 Smurfit Westrock Q1 | 2025 Results | 14 Paper | Packaging | Solutions Appendices
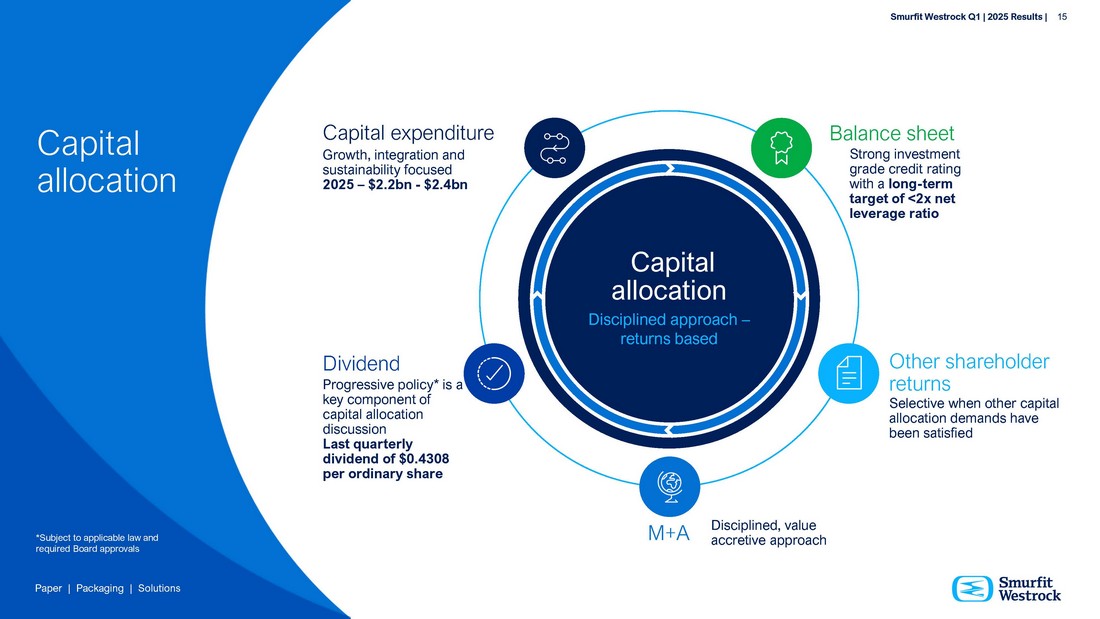
Smurfit Westrock Q1 | 2025 Results | 15 Capital expenditure Growth, integration and sustainability focused 2025 – $2.2bn - $2.4bn Dividend Progressive policy* is a key component of capital allocation discussion Last quarterly dividend of $0.4308 per ordinary share Balance sheet Strong investment grade credit rating with a long - term target of <2x net leverage ratio Other shareholder returns Selective when other capital allocation demands have been satisfied Capital allocation Disciplined approach – returns based Disciplined, value accretive approach M+A Capital allocation *Subject to applicable law and required Board approvals Paper | Packaging | Solutions Paper | Packaging | Solutions EBITDA margin* Dividend** Net leverage ratio* Return on capital employed* 2012 2013 2014 2015 2016 2017 2018 2019 2020 2021 2022 2023 5 10 15 2012 2013 2014 2015 2016 2017 2018 2019 2020 2021 2022 2023 3 2.5 2 1.5 1 0.5 0 2012 2013 2014 2015 2016 2017 2018 2019 2020 2021 2022 2023 50 0 150 100 2011 2012 2013 2014 2015 2016 2017 2018 2019 2020 2021 2022 2023 % 20 18 16 14 12 10 % 20 € cent 200 *EBITDA margin, net leverage ratio and return on capital employed are historic reported non - GAAP IFRS performance measures, and are calculated in euro.
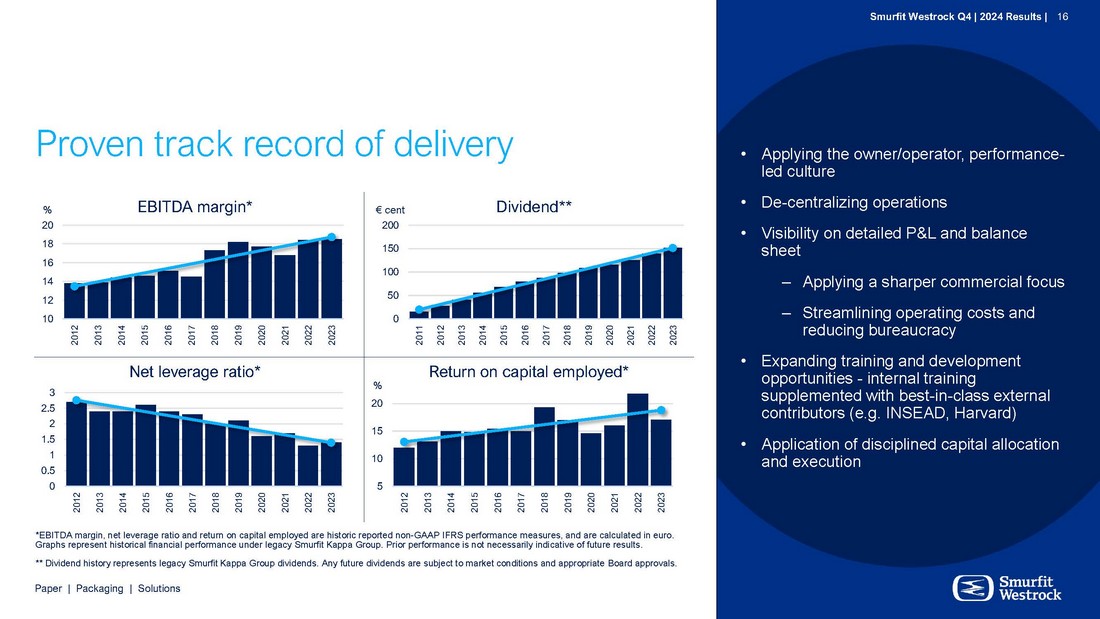
Graphs represent historical financial performance under legacy Smurfit Kappa Group. Prior performance is not necessarily indicative of future results. ** Dividend history represents legacy Smurfit Kappa Group dividends. Any future dividends are subject to market conditions and appropriate Board approvals. Proven track record of delivery • Applying the owner/operator, performance - led culture • De - centralizing operations • Visibility on detailed P&L and balance sheet – Applying a sharper commercial focus – Streamlining operating costs and reducing bureaucracy • Expanding training and development opportunities - internal training supplemented with best - in - class external contributors (e.g.
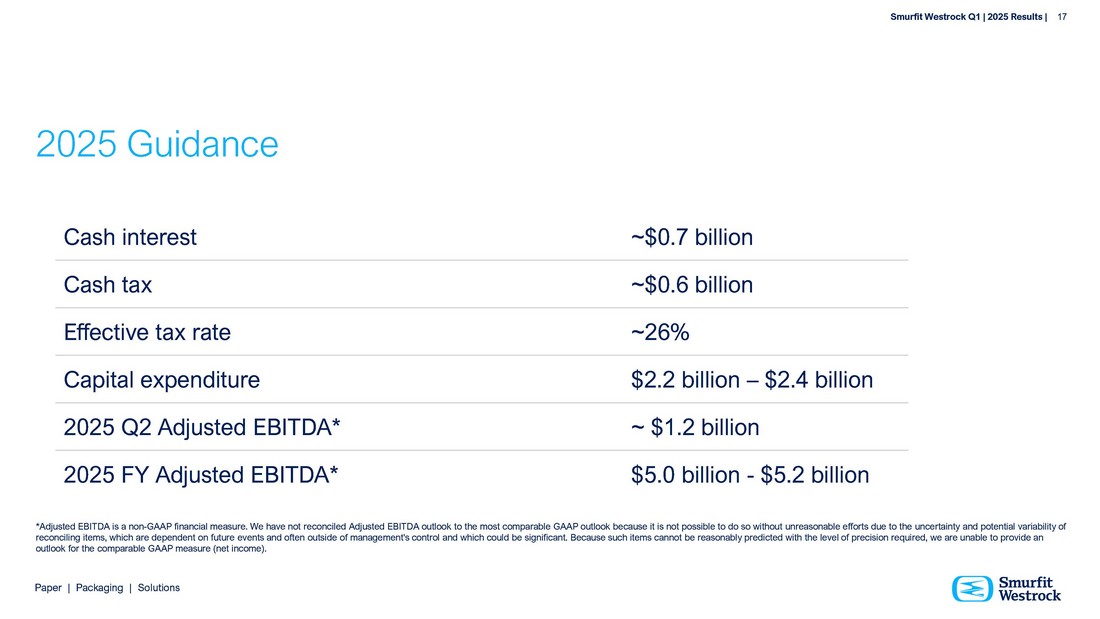
INSEAD, Harvard) • Application of disciplined capital allocation and execution Smurfit Westrock Q4 | 2024 Results | 16 Paper | Packaging | Solutions Smurfit Westrock Q1 | 2025 Results | 17 Paper | Packaging | Solutions ~$0.7 billion Cash interest ~$0.6 billion Cash tax ~26% Effective tax rate $2.2 billion – $2.4 billion Capital expenditure ~ $1.2 billion 2025 Q2 Adjusted EBITDA* $5.0 billion - $5.2 billion 2025 FY Adjusted EBITDA* 2025 Guidance *Adjusted EBITDA is a non - GAAP financial measure. We have not reconciled Adjusted EBITDA outlook to the most comparable GAAP outlook because it is not possible to do so without unreasonable efforts due to the uncertainty and potential variability of reconciling items, which are dependent on future events and often outside of management's control and which could be significant. Because such items cannot be reasonably predicted with the level of precision required, we are unable to provide an outlook for the comparable GAAP measure (net income).
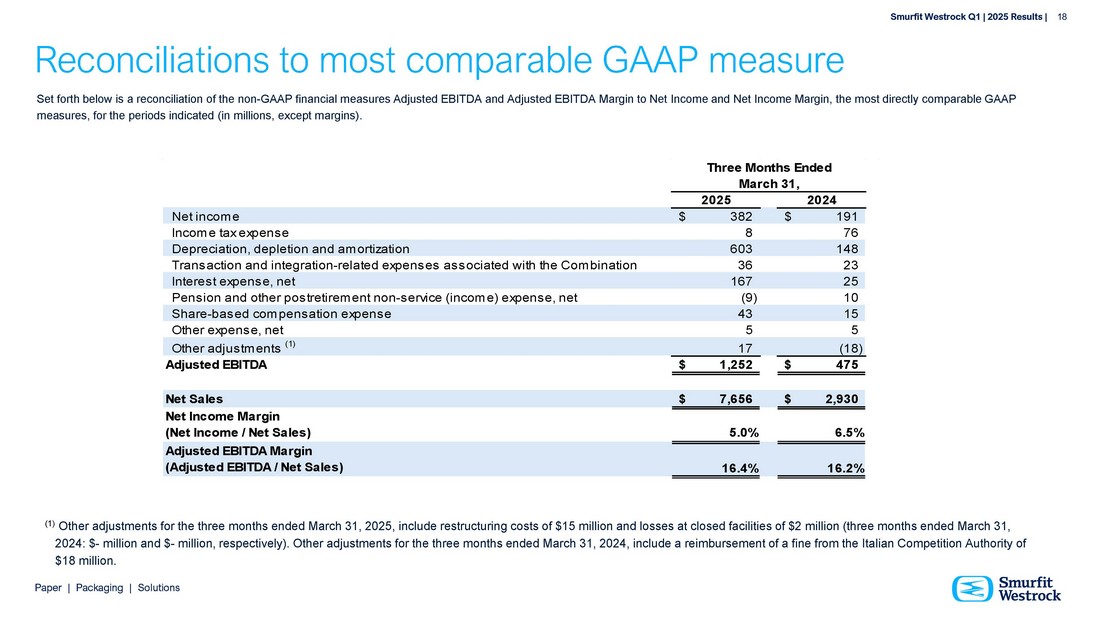
Smurfit Westrock Q1 | 2025 Results | 18 Reconciliations to most comparable GAAP measure Set forth below is a reconciliation of the non - GAAP financial measures Adjusted EBITDA and Adjusted EBITDA Margin to Net Income and Net Income Margin, the most directly comparable GAAP measures, for the periods indicated (in millions, except margins). (1 ) Other adjustments for the three months ended March 31, 2025, include restructuring costs of $15 million and losses at closed facilities of $2 million (three months ended March 31, 2024: $ - million and $ - million, respectively). Other adjustments for the three months ended March 31, 2024, include a reimbursement of a fine from the Italian Competition Authority of $18 million. 2024 2025 $ 191 $ 382 Net income 76 8 Income tax expense 148 603 Depreciation, depletion and amortization 23 36 Transaction and integration - related expenses associated with the Combination 25 167 Interest expense, net 10 (9) Pension and other postretirement non - service (income) expense, net 15 43 Share - based compensation expense 5 5 Other expense, net (18) 17 Other adjustments (1) $ 475 $ 1,252 Adjusted EBITDA 2,930 $ $ 7,656 Net Sales 6.5% 5.0% Net Income Margin (Net Income / Net Sales) 16.2% 16.4% Adjusted EBITDA Margin (Adjusted EBITDA / Net Sales) Three Months Ended March 31, Paper | Packaging | Solutions Smurfit Westrock Q4 | 2024 Results | 19 Paper | Packaging | Solutions