UNITED STATES
SECURITIES AND EXCHANGE COMMISSION
WASHINGTON, D.C. 20549
FORM 6-K
REPORT OF FOREIGN PRIVATE ISSUER
PURSUANT TO RULE 13a-16 OR 15d-16
OF THE SECURITIES EXCHANGE ACT OF 1934
For the Month of April 2025
Commission File Number: 001-41569
LANVIN GROUP HOLDINGS LIMITED
4F, 168 Jiujiang Road,
Carlowitz & Co, Huangpu District
Shanghai, 200001, China
(Address of principal executive offices)
Indicate by check mark whether the registrant files or will file annual reports under cover of Form 20-F or Form 40-F.
Form 20-F x Form 40-F ¨
INCORPORATION BY REFERENCE
Exhibits 99.1 and 99.2 to this Form 6-K are incorporated by reference into the registration statement on Form F-3 (No. 333-276476), the post-effective amendment No. 5 to Form F-1 on Form F-3 (No. 333-269150) and the registration statement amendment No. 1 on Form F-3 (No. 333-280891) of Lanvin Group Holdings Limited, and shall be a part thereof from the date on which this report is furnished, to the extent not superseded by documents or reports subsequently filed or furnished.
EXHIBIT INDEX
| Exhibit Number | Description | ||
| 99.1 | Lanvin Group 2024 Full-Year Results Presentation | ||
| 99.2 | Lanvin Group 2024 Full-Year Earning Results Press Release |
SIGNATURES
Pursuant to the requirements of the Securities Exchange Act of 1934, the registrant has duly caused this report to be signed on its behalf by the undersigned, thereunto duly authorized.
| LANVIN GROUP HOLDINGS LIMITED | ||
| By: | /s/ Kat Yu David, Chan | |
| Name: Kat Yu David, Chan | ||
| Title: Chief Financial Officer | ||
Date: April 30, 2025
|
April 30, 2025 |
|
2 Forward-Looking Statements This presentation, including the sections “2025 GUIDANCE”, “BRAND-LEVEL PERFORMANCE” and “APPENDIX”, contain “forward-looking statements” within the meaning of the “safe harbor” provisions of the Private Securities Litigation Reform Act of 1995. Forward-looking statements generally are accompanied by words such as “believe,” “may,” “will,” “estimate,” “continue,” “anticipate,” “intend,” “expect,” “should,” “would,” “plan,” “predict,” “potential,” “seem,” “seek,” “future,” “outlook,” “project” and similar expressions that predict or indicate future events or trends or that are not statements of historical matters. These forward-looking statements include, but are not limited to, statements regarding estimates and forecasts of other financial and performance metrics and projections of market opportunity. These statements are based on various assumptions, whether or not identified in this presentation, and on the current expectations of the respective management of Lanvin Group and are not predictions of actual performance. These forward-looking statements are provided for illustrative purposes only and must not be relied on by an investor as, a guarantee, an assurance, a prediction or a definitive statement of fact or probability. Actual events and circumstances are difficult or impossible to predict and will differ from assumptions. Many actual events and circumstances are beyond the control of Lanvin Group. Potential risks and uncertainties that could cause the actual results to differ materially from those expressed or implied by forward-looking statements include, but are not limited to, changes adversely affecting the business in which Lanvin Group is engaged; Lanvin Group’s projected financial information, anticipated growth rate, profitability and market opportunity may not be an indication of its actual results or future results; management of growth; the impact of health epidemics, pandemics and similar outbreaks, including the COVID-19 pandemic on Lanvin Group’s business; Lanvin Group’s ability to safeguard the value, recognition and reputation of its brands and to identify and respond to new and changing customer preferences; the ability and desire of consumers to shop; Lanvin Group’s ability to successfully implement its business strategies and plans; Lanvin Group’s ability to effectively manage its advertising and marketing expenses and achieve desired impact; its ability to accurately forecast consumer demand; high levels of competition in the personal luxury products market; disruptions to Lanvin Group’s distribution facilities or its distribution partners; Lanvin Group’s ability to negotiate, maintain or renew its license agreements; Lanvin Group’s ability to protect its intellectual property rights; Lanvin Group’s ability to attract and retain qualified employees and preserve craftsmanship skills; Lanvin Group’s ability to develop and maintain effective internal controls; general economic conditions; the result of future financing efforts; and those factors discussed in the reports filed by Lanvin Group from time to time with the SEC. If any of these risks materialize or Lanvin Group’s assumptions prove incorrect, actual results could differ materially from the results implied by these forward-looking statements. There may be additional risks that Lanvin Group presently does not know, or that Lanvin Group currently believes are immaterial, that could also cause actual results to differ from those contained in the forward-looking statements. In addition, forward-looking statements reflect Lanvin Group’s expectations, plans, or forecasts of future events and views as of the date of this presentation. Lanvin Group anticipates that subsequent events and developments will cause Lanvin Group’s assessments to change. However, while Lanvin Group may elect to update these forward-looking statements at some point in the future, Lanvin Group specifically disclaim any obligation to do so. These forward-looking statements should not be relied upon as representing Lanvin Group’s assessments of any date subsequent to the date of this presentation. Accordingly, reliance should not be placed upon the forward-looking statements. Use of Non-IFRS Financial Metrics This presentation includes certain non-IFRS financial measures (including on a forward-looking basis) such as contribution profit, contribution profit margin, adjusted earnings before interest and taxes (“Adjusted EBIT”), and adjusted earnings before interest, taxes, depreciation and amortization (“Adjusted EBITDA”) and trade working capital. These non-IFRS measures are an addition, and not a substitute for or superior to measures of financial performance prepared in accordance with IFRS and should not be considered as an alternative to net income, operating income or any other performance measures derived in accordance with IFRS. Reconciliations of non-IFRS measures to their most directly comparable IFRS counterparts are included in the Appendix to this presentation. Lanvin Group believes that these non- IFRS measures of financial results (including on a forward-looking basis) provide useful supplemental information to investors about Lanvin Group. Lanvin Group's management uses forward looking non-IFRS measures to evaluate Lanvin Group's projected financial and operating performance. Lanvin Group believes that the use of these non-IFRS financial measures provides an additional tool for investors to use in evaluating projected operating results and trends in and in comparing Lanvin Group's financial measures with other similar companies, many of which present similar non-IFRS financial measures to investors. However, there are a number of limitations related to the use of these non-IFRS measures and their nearest IFRS equivalents. For example, other companies may calculate non-IFRS measures differently, or may use other measures to calculate their financial performance, and therefore Lanvin Group's non-IFRS measures may not be directly comparable to similarly titled measures of other companies. Lanvin Group does not consider these non-IFRS measures in isolation or as an alternative to financial measures determined in accordance with IFRS. The principal limitation of these non-IFRS financial measures is that they exclude significant expenses, income and tax liabilities that are required by IFRS to be recorded in Lanvin Group's financial statements. In addition, they are subject to inherent limitations as they reflect the exercise of judgements by Lanvin Group about which expense and income are excluded or included in determining these non-IFRS financial measures. In order to compensate for these limitations, Lanvin Group presents non-IFRS financial measures in connection with IFRS results. |
|
Lanvin Group is a leading global luxury fashion group headquartered in Shanghai, China, managing iconic brands worldwide, including Lanvin, Wolford, Sergio Rossi, St. John Knits, and Caruso. Harnessing the power of its unique strategic alliance of industry-leading partners in the luxury fashion sector, Lanvin Group strives to expand the global footprint of its portfolio brands and achieve sustainable growth through strategic investment and extensive operational know-how, combined with an intimate understanding and unparalleled access to the fastest-growing luxury fashion markets in the world. |
|
4 PAGE 11 PAGE 23 PAGE 16 PAGE 32 |
|
Revenue of €329 million for FY 2024, a 23% decrease over FY 2023 Challenging macro backdrop weighing on consumer sentiment and challenging industry environment in 2024 Measures implemented to reduce G&A expenses and improve working capital management Proactively consolidated stores network to optimize the retail footprint and concentrate on core business units Appointment of Andy Lew as Executive President expected to drive strategic implementation and bring transformative initiatives |
|
6 Note: Figures in this presentation have been rounded, which may affect the result of certain mathematical calculations presented herein. (1) DOS refers to Directly Operated Stores which include boutiques, outlets, concession shop-in-shops and pop-up stores. 2024 Global Revenue 2024 Directly Operated Stores(1) 2024 vs. 2023 G&A Expenses Savings 2024 Global Gross Margin 2020-2024 Improvement in Operating Cash Flow 2020-2024 Global Revenue CAGR Retail revenue resilient coupled with footprint optimization drove improving store metrics Refocused retail network with attention on high potential markets New product offerings and choice collaborations drove significant brand heat |
|
7 (1) These are Non-IFRS Financial Measures and will be mentioned throughout this presentation. Please see Page 50 for Non-IFRS Financial Measures and Definition. (2) Based on Sergio Rossi FY2021 data. BUSINESS TRANSFORMATION PACE REFLECTS BRAND LEGACY STRUCTURES, MARKET POSITIONING, AND OPERATIONAL COMPLEXITY 2020 2024 Future Contribution Profit(1) € 3.2mm € 8.8mm Continue to improve profit margin with stronger distribution Contribution Profit(1) -€ 9.3mm € 8.0mm Continue to improve profit margin with light-asset model € 35.0mm € 82.7mm Drive topline growth with new Revenue collection and categories Channel Evolution 50% / 50% between DTC and Wholesale(2) Global retail network expansion since 2022 Boost revenue by enhancing wholesale with new collection Product Mix 30% RTW / 41% Legwear 46% RTW / 39% Legwear Diversified product mix with an increase of RTW% |
|
(1) Opex includes marketing and selling expenses and general and administrative expenses. 8 DESPITE FACING CHALLENGING MACRO HEADWINDS, WE MANAGED TO IMPROVE OPERATIONAL EFFICIENCY Gross Profit Opex Where we are now Our breakeven point Our revenue has experienced a certain decline due to the impact of macroeconomic conditions and industry trends. Despite this, we are resolutely implementing our turnaround plan by streamlining expenses and enhancing operational efficiency. (1) Time |
|
9 -€ 81 -€ 58 -€ 59 FY2022 FY2023 FY2024 (1) Opex includes marketing and selling expenses and general and administrative expenses. € 378 € 365 € 326 FY2022 FY2023 FY2024 DESPITE FACING CHALLENGING MACRO HEADWINDS, WE MANAGED TO IMPROVE OPERATIONAL EFFICIENCY |
|
10 “ a strong start for the seasoned British designer ” ⁃ WWD “ If someone doesn’t wear them to at least one award show this season, the stylist community is not doing its job ” -The New York Times “ Andrew is poised to shake up the Italian shoe game once again ” - Highsnobiety “ Andrew created a new, edgy chain (…) that will become a new signature for the brand ” - WWD “ an ideal fit for Sergio Rossi, a label synonymous with luxurious and meticulously crafted footwear ” - Designscene “ A reincarnation of Jeanne Lanvin’s fashion-setting robe de style silhouette ” - Vogue US” NEW APPOINTMENTS MARKING THE OPENING OF AN EXCITING NEW CHAPTER OF LANVIN AND SERGIO ROSSI |
|
Source: Bain-Altagamma Luxury Goods Worldwide Market Study (Fall 2021-20 11 th). Euromonitor. Section I |
|
Note: Revenue eliminations are not allocated by brand and result mainly from intragroup transactions. Brand-level results are presented exclusive of eliminations. 12 … SINCE 2024 Revenues – €83 million % of Group Revenues – 25% The Oldest Operating French Couture House SINCE 2024 Revenues – €88 million % of Group Revenues – 27% Iconic Skinwear Brand Originated from Austria that Combines Luxury, Technology, and Premier Manufacturing SINCE 2024 Revenues – €79 million % of Group Revenues – 24% A Foundation of American Luxury; Building Wardrobes with Timeless yet Contemporary Style SINCE 2024 Revenues – €42 million % of Group Revenues – 13% A Forerunner in Design; Manufacturing Shoes and Accessories with Provocative, Modern Sophistication from Italy SINCE 2024 Revenues – €37 million % of Group Revenues – 11% The Reference Luxury Tailoring Manufacturer in Italy, Combining Traditional Skills with Innovation in Shapes and Material LANVIN GROUP’S BRANDS WORK TOGETHER TO BUILD A WARDROBE OF MODERN, GENERATIONAL LUXURY FOR ITS CONSUMERS BY SYNERGIZING EACH BRAND’S CREATIVITY AND CORE SKILLS IN DESIGN AND PRODUCTION |
|
13 … KEY STRATEGIES AND INITIATIVES IN BRAND, PRODUCT, CHANNEL AND REGION CONTINUE TO PROMOTE GROWTH • Back to brand DNAs and ethos • Focus on core iconic offerings • Continued investment in branding • Targeted brand collaborations • Increased accessory contribution • Successful category extension • Rebalanced store network • Expansion into Middle East markets • Strengthened e-commerce channels • Digital infrastructure implementation |
|
14 … |
|
15 … PROVEN RESULTS FROM SUCCESSFUL IMPLEMENTATION OF GROUP STRATEGIES Lanvin 2020 – 2024 Global Revenue Lanvin 2020 – 2024 Global Digital Revenue Wolford 2020 – 2024 The % of W Collection in Seasonal Sales Lanvin Group 2020 – 2024 Greater China Revenue Lanvin Group 2020 – 2024 Global Revenue Lanvin Group 2020 – 2024 Other Asia Revenue |
|
|
17 Peter Copping joined Lanvin in Sep 2024 as the new Artistic Director charged with propelling brand momentum and bringing a fresh creative vision Couture and contemporary culture meet through a series of ambitious artistic initiatives including Steven Meisel’s ‘Character Studies’ and Benjamin Millepied’s ‘Elegance in Motion’ Highly anticipated and critically acclaimed debut fashion show by Peter Copping inspired by a return to the founding ideas of the French couture house, a significant return to heritage Gross profit margin maintained through effective cost control and inventory management, demonstrating resilience and strength in the face of market pressure |
|
18 Brand campaigns and product narratives crafted to highlight Wolford’s unique value proposition and elevate its positioning within the luxury market Elevate brand experience through a refreshed webshop identity and an optimized Retail and Wholesale distribution to ensure a cohesive and premium brand presence across all touchpoints Capsule collections in collaboration with Italian fashion brand ETRO contributed to maintain cultural relevance, expand brand reach and strengthen its appeal towards a larger audience Balanced product offering that merges innovation and heritage, delivering a cohesive assortment across timeless essentials and trend-driven pieces |
|
19 Announced the appointment of Paul Andrew as Creative Director in July 2024. His first collection will be FW2025 Opened franchise stores in the Middle East and Taiwan through cooperations with local partners Streamlined the network by focusing on the key locations and closure of underperforming stores to optimize the resource allocation Undertook a series of factory restructuring measures to improve production lead time and productivity, and reduce cost |
|
20 Focus and streamline the business to North America and upgraded flagship stores in key cities to more viable locations Created a new site experience and aesthetics through a more agile platform that allows adding multiple add-on tools to improve conversions Continued to convert wholesale distribution to a new wholesession model to have better image, merchandising controls and margins Successfully consummated the sale of the property and improved operational efficiency |
|
21 Single-digit revenue decrease even in a very challenging luxury landscape. Proprietary brand business still growing Growing Caruso brand awareness and appeal also thanks to high-standard yet efficient content creation, credible collaborations and trade events Maintained marginality both at Gross Margin and EBITDA level, positive Net Profit obtained. Operations generating significant cash flow Caruso brand made-to-measure business growth thanks to flawless service; new maisons business developed also thanks to effective prototype and fashion-show pieces management |
|
22 DRIVING PROFITABILITY Enhance management by cultivating a dynamic and experienced leadership team that is agile and adaptable to change Establish a second European headquarters to streamline operations and boost decision-making agility Anticipate sales growth following the appointment of new Artistic Director at Lanvin and Creative Director at Sergio Rossi Prioritize cost and expense efficiency to optimize spending and improve return on marketing investment Search for new growth initiatives in regions, product categories and business models via strategic partnerships and ecosystem |
|
|
24 BRANDS COMPLETED RESTRUCTURING SHOW GREAT RESILIENCE THROUGH CHALLENGING MACRO-HEADWINDS 2020 2021 Eliminations 2024 €223 €309 €422 €426 -€29 -€38 -€18 -€11 -€3 €329 2020 2021 2022 2023 Lanvin Wolford Sergio Rossi SJK Caruso Elimination 2024 2022 2023 €2 |
|
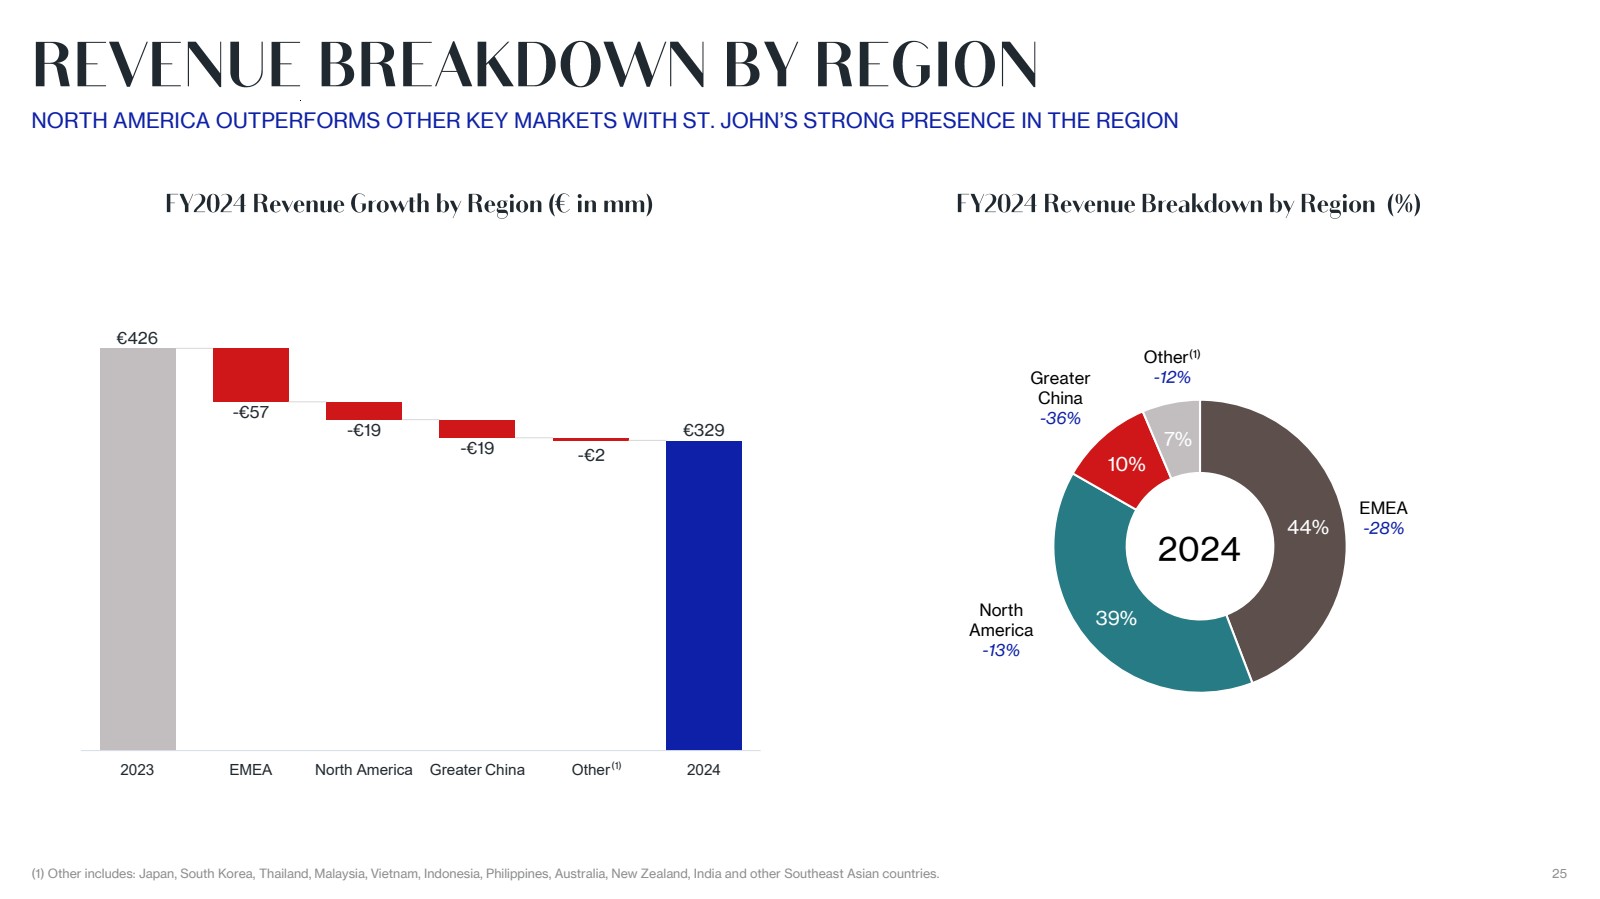
(1) Other includes: Japan, South Korea, Thailand, Malaysia, Vietnam, Indonesia, Philippines, Australia, New Zealand, India and other Southeast Asian countries. 25 NORTH AMERICA OUTPERFORMS OTHER KEY MARKETS WITH ST. JOHN’S STRONG PRESENCE IN THE REGION (1) -€19 -€19 €329 €426 -€57 2023 EMEA North America Greater China Other 2024 44% 39% 10% 7% 2024 North America -13% EMEA -28% Greater China -36% Other(1) -12% -€2 |
|
26 ST. JOHN AND SERGIO ROSSI SHOW RESILIENCE IN KEY RETAIL MARKETS, AND CARUSO’S WHOLESALE KEEPS SOLID (1) Other includes: fees for royalties, licenses received from third party, and clearance. (1) €426 -€46 -€46 -€5 €329 2023 DTC Wholesale Other 2024 61% 35% 4% 2024 Other(1) -31% DTC -19% Wholesale -28% |
|
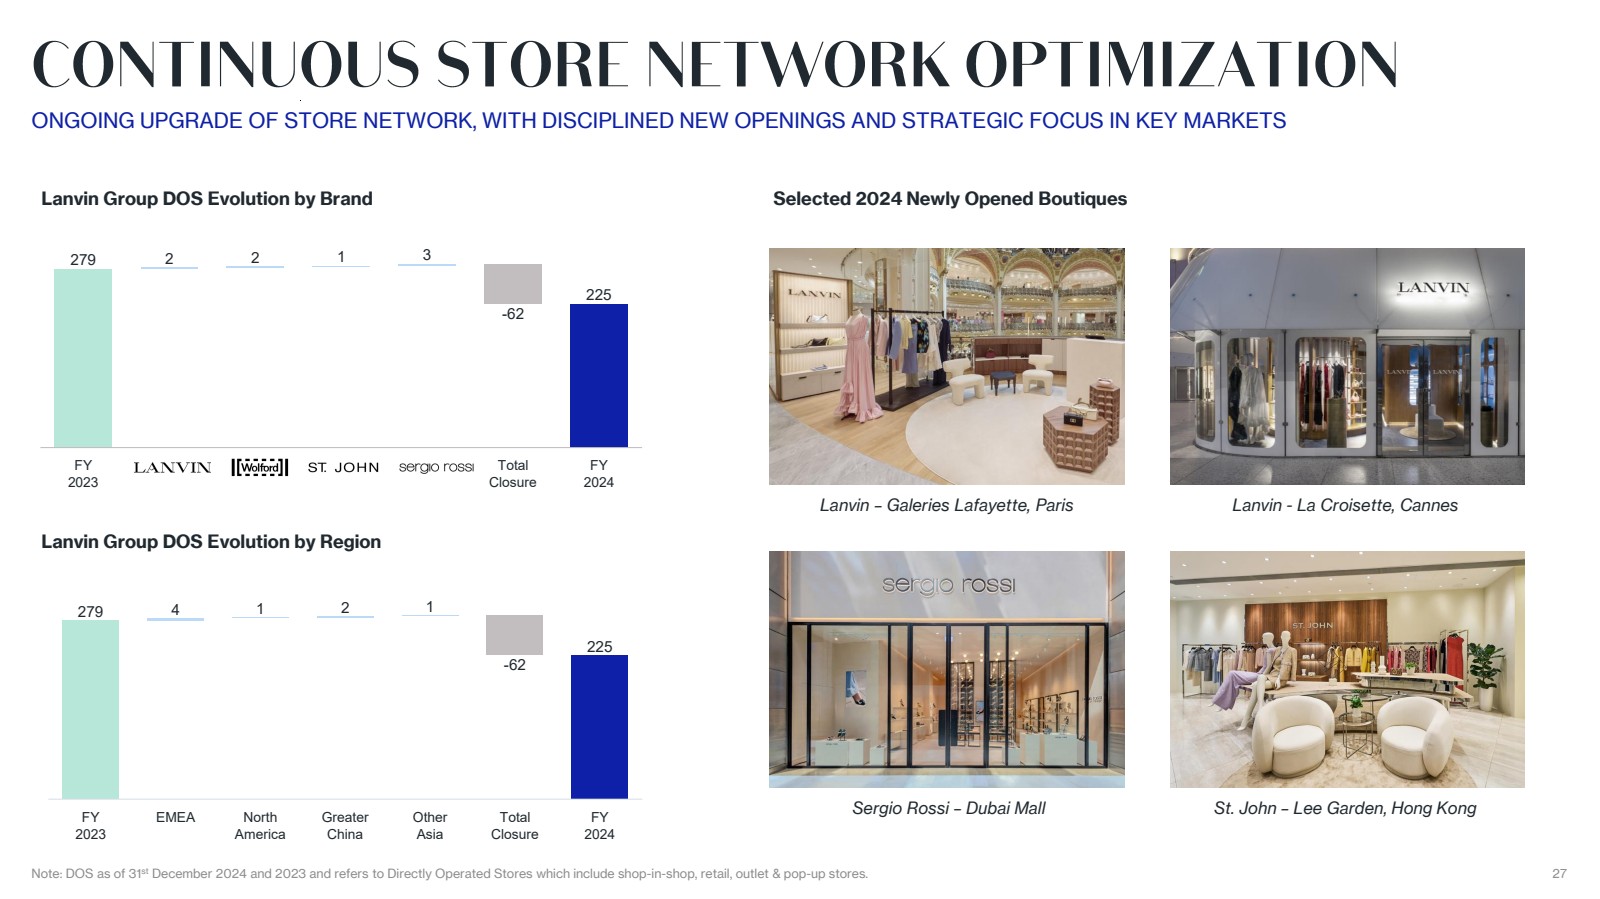
27 279 4 1 2 1 -62 225 FY 2023 EMEA North America Greater China Other Asia Total Closure FY 2024 279 2 2 1 3 -62 225 FY 2023 Lanvin Wolford St. John Sergio Rossi Total Closure FY 2024 Note: DOS as of 31st December 2024 and 2023 and refers to Directly Operated Stores which include shop-in-shop, retail, outlet & pop-up stores. ONGOING UPGRADE OF STORE NETWORK, WITH DISCIPLINED NEW OPENINGS AND STRATEGIC FOCUS IN KEY MARKETS Lanvin Group DOS Evolution by Brand Selected 2024 Newly Opened Boutiques Lanvin Group DOS Evolution by Region Lanvin – Galeries Lafayette, Paris Lanvin - La Croisette, Cannes Sergio Rossi – Dubai Mall St. John – Lee Garden, Hong Kong |
|
28 -€ 88 -€ 59 -€ 72 -€ 64 FY2020 FY2021 FY2022 FY2023 FY2024 € 117 € 170 € 238 € 251 FY2020 FY2021 FY2022 FY2023 FY2024 (1) These are Non-IFRS Financial Measures and will be mentioned throughout this presentation. Please see Page 50 for Non-IFRS Financial Measures and Definition. GP% 53% CP% Adj. EBITDA% MARGIN DECREASES WITH REVENUE WHILE RESTRUCTURING EFFORTS HELP TO OPTIMIZE COST STRUCTURE € 183 55% 56% 59% 56% -€ 34 € 4 € 13 € 24 FY2020 FY2021 FY2022 FY2023 FY2024 -€ 26 -15% 1% 3% 6% -8% -€ 92 -40% -19% -17% -15% -28% |
|
29 2023 2024 HQ and Eliminations (1) Non-IFRS Financial Measure. Please see Page 50 for Non-IFRS Financial Measures and Definition. Note: HQ and eliminations are not allocated by brand and result mainly from intragroup transactions. Brand-level results are presented exclusive of eliminations. € 24 -€ 12 -€ 23 -€ 8 -€ 3 -€ 1 -€ 4 -€ 26 2023 Lanvin Wolford Sergio Rossi SJK Caruso Elimination 2024 -€ 3 |
|
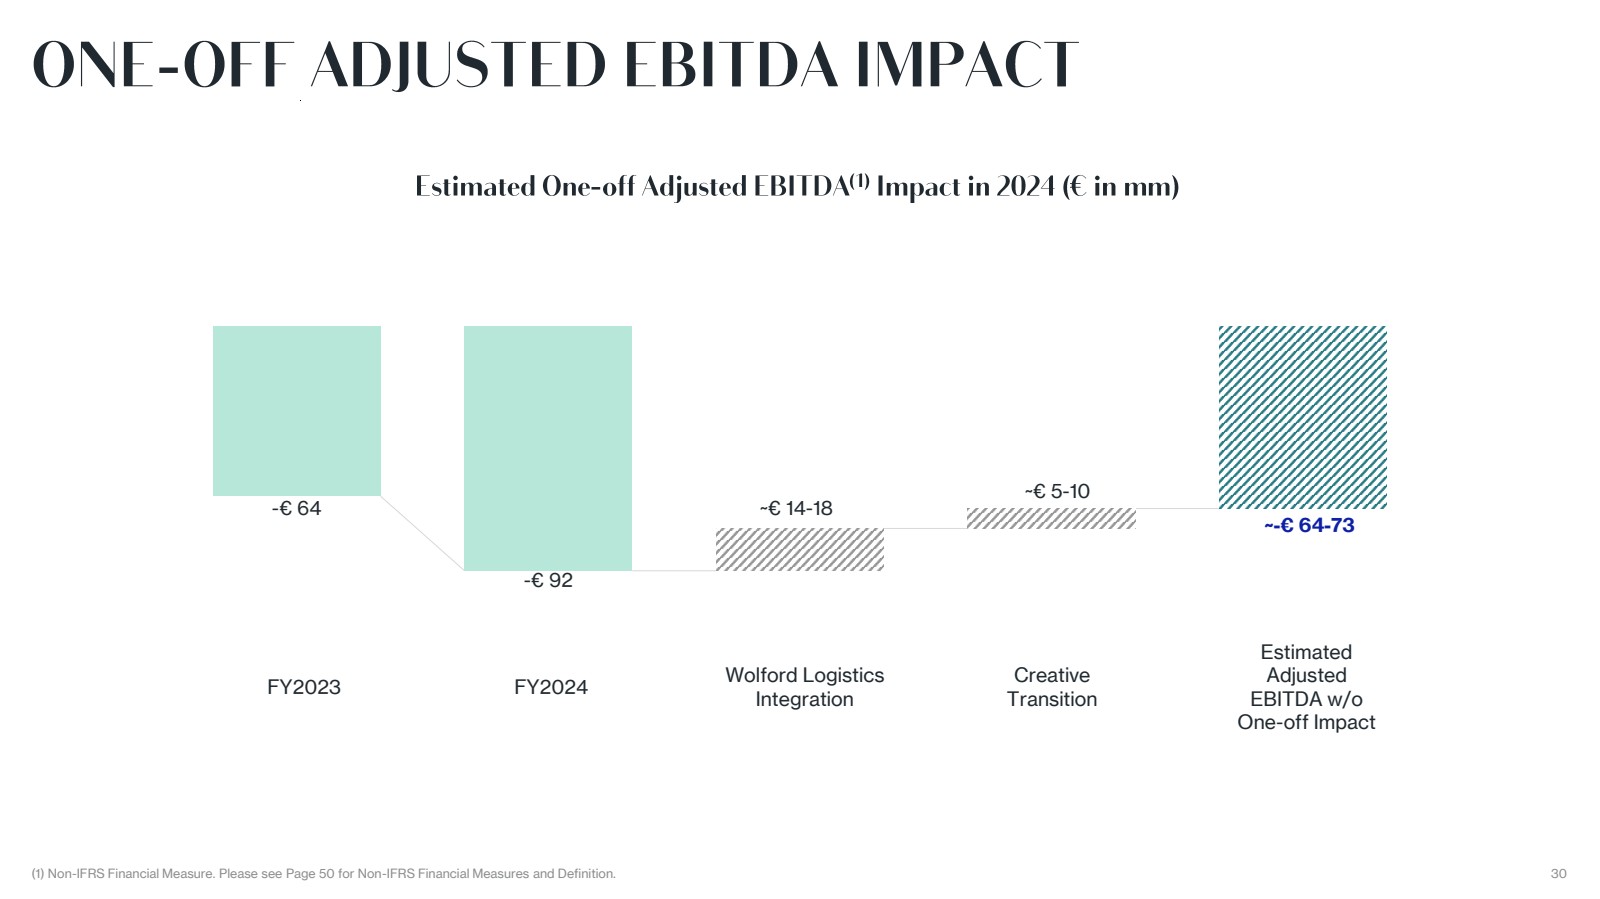
30 FY2023 -€ 64 -€ 92 FY2024 Wolford Logistics Integration ~€ 14-18 ~-€ 64-73 ~€ 5-10 Creative Transition Estimated Adjusted EBITDA w/o One-off Impact (1) Non-IFRS Financial Measure. Please see Page 50 for Non-IFRS Financial Measures and Definition. |
|
31 €22 €40 €49 €46 €28 €76 €92 €109 €107 €90 -€47 -€58 -€73 -€79 -€80 Y202 0 Y202 1 Y202 2 Y202 3 Y202 4 Trade payables Inventories Trade receivables €51 €74 €85 2020 2021 2022 DSO(1) 36 43 42 DIO(1) 263 216 216 DPO(1) 165 136 145 Cash Conversion Cycle(1) 134 123 113 % of Revenues 23% 22% 20% (1) Non-IFRS Financial Measure. Please see Page 50 for Non-IFRS Financial Measures and Definition. Trade working capital is defined as the sum of inventories as well as trade receivables less trade payables. DSO (Days Sales Outstanding)=Trade receivables/Total sales x 365; DIO (Days Inventory Outstanding)=Inventory/Cost of sales x 365; DPO (Days Payable Outstanding)=Trade payables/Cost of sales x 365; Cash Conversion Cycle =DSO+DIO-DPO €74 2023 39 223 164 98 17% €38 2024 31 225 201 54 11% |
|
|
33 €34,989 €72,872 €119,847 €111,740 -€11,788 -€12,820 -€4,412 €82,720 2020 2021 2022 2023 DTC Wholesale Other 2024 Lanvin Global Revenue Bridge (€ in Thousands) KEY TAKEAWAYS 33 (1) Non-IFRS Financial Measure. Please see Page 50 for Non-IFRS Financial Measures and Definition. Note: Brand-level results are presented exclusive of eliminations. • A pivotal year of transition for Lanvin: Revenue declined by 26% in the context of slowing luxury demand, changing tastes and behaviors of aspirational customers and the absence of creative leadership. • Wholesale impact significant: weak retail markets, contracting global wholesale opportunity; notwithstanding, slight gross margin improvement. • Decisive actions taken to protect fiscal health with positive results: G&A expenses reduced by 14% with limited impact to contribution profit; inventory management showed steady improvement. • Actively rebalancing distribution approach with strategic adjustments to the retail network. • Peter Copping’s acclaimed January 2025 fashion show captured significant industry interest worldwide, with investments beginning Q4 2024 and product deliveries expected in H2 2025. Lanvin Key Financials (€ in Thousands) FY2020 FY2021 FY2022 FY2023 FY2024 Revenues €34,989 €72,872 €119,847 €111,740 €82,720 YoY% 108% 64% -7% -26% Gross profit €13,573 €34,028 €60,513 €64,547 €48,440 GP Margin% 39% 47% 50% 58% 59% Contribution profit (1) -€29,574 -€24,096 -€15,339 -€11,986 -€23,801 CP Margin% -85% -33% -13% -11% -29% |
|
34 €95,384 €109,332 €125,514 €126,280 -€20,346 -€17,221 -€822 €87,891 2020 2021 2022 2023 DTC Wholesale Other 2024 Wolford Global Revenue Bridge (€ in Thousands) 34 (1) Non-IFRS Financial Measure. Please see Page 50 for Non-IFRS Financial Measures and Definition. Note: Brand-level results are presented exclusive of eliminations. Wolford Key Financials (€ in Thousands) FY2020 FY2021 FY2022 FY2023 FY2024 Revenues €95,384 €109,332 €125,514 €126,280 €87,891 YoY% 15% 15% 1% -30% Gross profit €65,865 €79,070 €86,228 €83,339 €50,995 GP Margin% 69% 72% 69% 66% 58% Contribution profit (1) €859 €19,719 €4,327 €4,279 -€18,608 CP Margin% 1% 18% 3% 3% -21% • Revenue declined by 30%, dropping from €126M in 2023 to €88M in 2024. EMEA region and wholesale channel experienced the greatest impact. • The year was marked by challenges including macroeconomic uncertainties, organizational changes and disruptions in logistics in Q2. • Marketing and branding efforts have been streamlined to focus on key product launches and commercial moments. • Established new management board to aim at a sustainable future growth for the company. • Etro x Wolford capsule collection was successfully launched in H2, supported by a 360°activation strategy. • In 2025, Wolford is expected to stabilize the organization and will celebrate its 75th anniversary with a significant brand push in the second half of the year. KEY TAKEAWAYS |
|
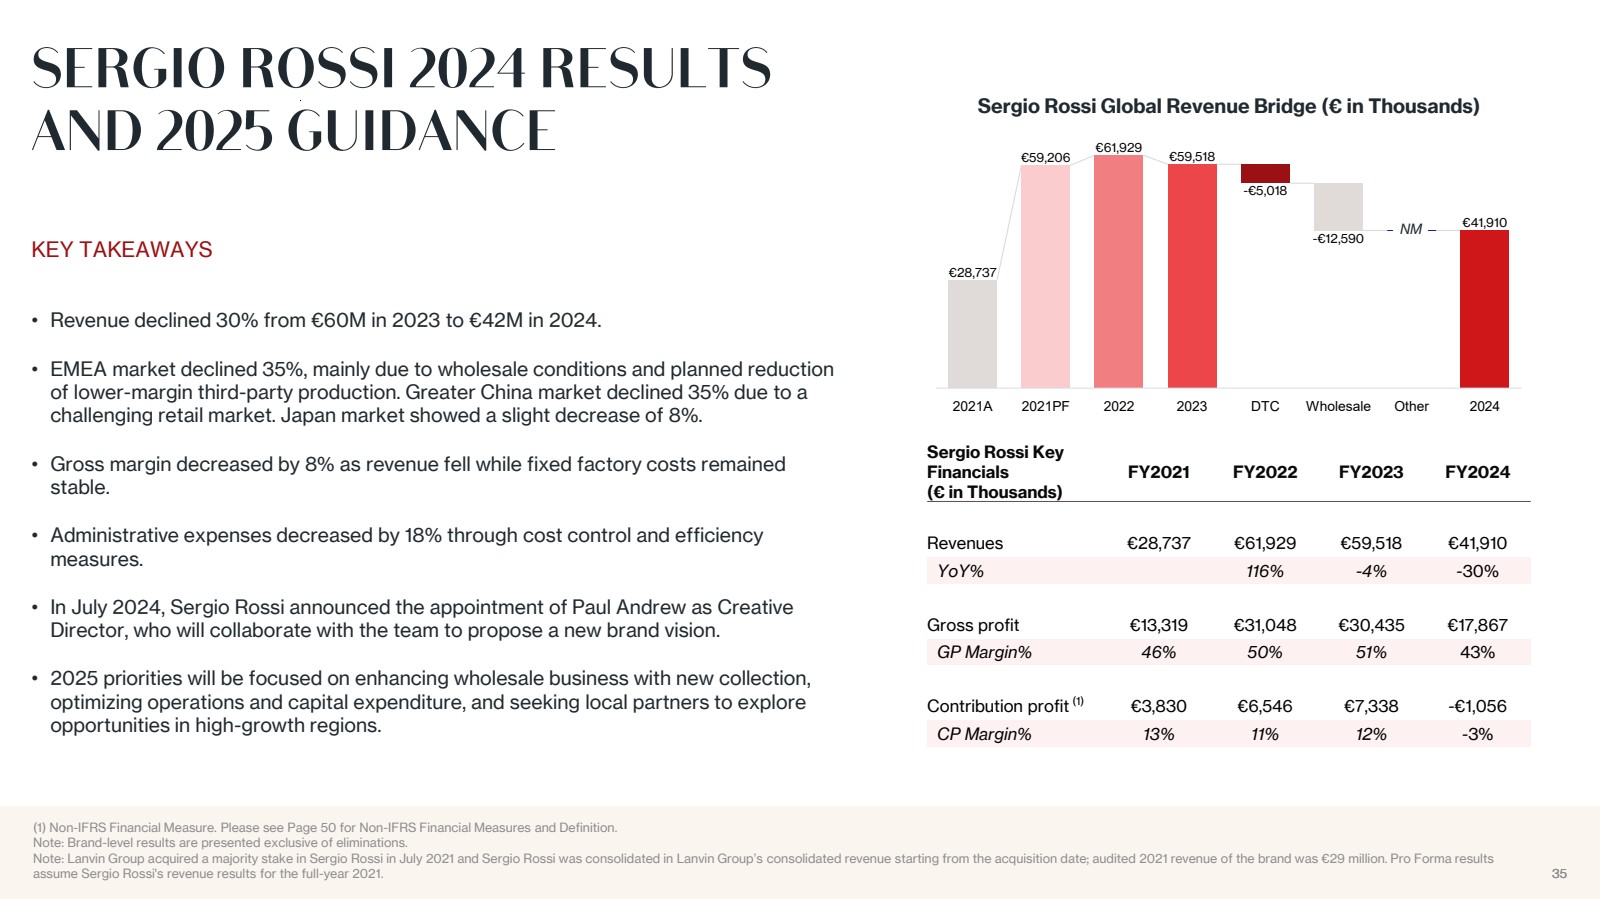
35 KEY TAKEAWAYS • Revenue declined 30% from €60M in 2023 to €42M in 2024. • EMEA market declined 35%, mainly due to wholesale conditions and planned reduction of lower-margin third-party production. Greater China market declined 35% due to a challenging retail market. Japan market showed a slight decrease of 8%. • Gross margin decreased by 8% as revenue fell while fixed factory costs remained stable. • Administrative expenses decreased by 18% through cost control and efficiency measures. • In July 2024, Sergio Rossi announced the appointment of Paul Andrew as Creative Director, who will collaborate with the team to propose a new brand vision. • 2025 priorities will be focused on enhancing wholesale business with new collection, optimizing operations and capital expenditure, and seeking local partners to explore opportunities in high-growth regions. 35 (1) Non-IFRS Financial Measure. Please see Page 50 for Non-IFRS Financial Measures and Definition. Note: Brand-level results are presented exclusive of eliminations. Note: Lanvin Group acquired a majority stake in Sergio Rossi in July 2021 and Sergio Rossi was consolidated in Lanvin Group’s consolidated revenue starting from the acquisition date; audited 2021 revenue of the brand was €29 million. Pro Forma results assume Sergio Rossi's revenue results for the full-year 2021. Sergio Rossi Key Financials (€ in Thousands) FY2021 FY2022 FY2023 FY2024 Revenues €28,737 €61,929 €59,518 €41,910 YoY% 116% -4% -30% Gross profit €13,319 €31,048 €30,435 €17,867 GP Margin% 46% 50% 51% 43% Contribution profit (1) €3,830 €6,546 €7,338 -€1,056 CP Margin% 13% 11% 12% -3% €28,737 €59,206 €61,929 €59,518 -€5,018 -€12,590 €41,910 2021A 2021PF 2022 2023 DTC Wholesale Other 2024 Sergio Rossi Global Revenue Bridge (€ in Thousands) NM |
|
36 KEY TAKEAWAYS (1) Non-IFRS Financial Measure. Please see Page 50 for Non-IFRS Financial Measures and Definition. Note: Brand-level results are presented exclusive of eliminations. St. John Key Financials (€ in Thousands) FY2020 FY2021 FY2022 FY2023 FY2024 Revenues €66,512 €73,094 €85,884 €90,398 €79,267 YoY% 10% 17% 5% -12% Gross profit €32,987 €38,987 €52,642 €57,374 €54,451 GP Margin% 50% 53% 61% 63% 69% Contribution profit (1) -€9,286 €1,290 €10,144 €10,679 €8,006 CP Margin% -14% 2% 12% 12% 10% • Revenue declined 12% from €90M in 2023 to €79M in 2024. • North America outperformed other regions. Wholesale remained stable, driven by strategic key account partnership with Nordstrom. • International revenue decreased by 46% as St. John repositioned its retail portfolio to North America amid global economy challenges. • Gross Margin improved significantly from 63% to 69%, due to improved full-price sell-through and new wholesale model with Nordstrom. • Administrative expenses decreased by 9% through effective measures. • North America will continue to be the primary focus moving into 2025 as St. John looks to simplify and streamline its business. The brand will lean into its Southern California heritage through powerful storytelling and strong product positioning in knits. €66,512 €73,094 €85,884 €90,398 -€1,579 €79,267 2020 2021 2022 2023 DTC Wholesale Other 2024 St. John Global Revenue Bridge (€ in Thousands) -€9,394 -€158 |
|
37 €26,351 €24,695 €30,819 €40,011 €24 -€2,928 €0 €37,107 2020 2021 2022 2023 DTC Wholesale Other 2024 Caruso Global Revenue Bridge (€ in Thousands) KEY TAKEAWAYS • Revenue decreased slightly 7% from €40mn in 2023 to €37M in 2024. • The Caruso brand business grew double-digit, gaining market share thanks to the appeal of its playful-elegant collections and its undisputed quality level offered at a customer-respectful luxury price. • Caruso brand’s made-to-measure business grew as a result of its outstanding service level. • Gross margin remains sustainable despite the market headwinds with a slight increase from 28% in 2023 to 29% in 2024. • 2025 luxury market is expected to remain challenging while management is committed to continuing developing new business relationships. • The Caruso Brand is expected to keep growing as a result of renewed and strengthened distribution team and appealing marketing initiatives implemented. 37 (1) Non-IFRS Financial Measure. Please see Page 50 for Non-IFRS Financial Measures and Definition. Note: Brand-level results are presented exclusive of eliminations. Caruso Key Financials (€ in Thousands) FY2020 FY2021 FY2022 FY2023 FY2024 Revenues €26,351 €24,695 €30,819 €40,011 €37,107 YoY% -6% 25% 30% -7% Gross profit €4,881 €4,449 €7,147 €11,351 €10,628 GP Margin% 19% 18% 23% 28% 29% Contribution profit (1) €3,173 €3,305 €5,701 €9,451 €8,767 CP Margin% 12% 13% 18% 24% 24% NM |
|
|
39 (1) 2022 was impacted by a €84 million cost related to the Reverse Recapitalization that occurred as part of the SPAC merger; this cost is non-recurring in nature. (2) These are Non-IFRS Financial Measures and will be mentioned throughout this presentation. Please see Page 50 for Non-IFRS Financial Measures and Definition. (2) (2) (2) (1) (€ in Thousands, unless otherwise noted) FY % FY % FY % FY % FY % Revenue 222,612 100% 308,822 100% 422,312 100% 426,178 100% 328,610 100% Cost of sales -105,218 -47% -138,920 -45% -184,368 -44% -175,236 -41% -145,847 -44% Gross profit 117,394 53% 169,902 55% 237,944 56% 250,942 59% 182,763 56% Marketing and selling expenses -151,631 -68% -165,502 -54% -224,733 -53% -226,750 -53% -208,803 -64% General and administrative expenses -115,181 -52% -122,497 -40% -153,138 -36% -138,215 -32% -117,368 -36% Impairment of goodwill 0 0 % 0 0 % 0 0 % 0 0 % -31,208 -9% Other operating income and expenses -18,399 -8% 10,083 3% -2,340 -1% -4,534 -1% 7,977 2 % Loss from operations before non-underlying items -167,817 -75% -108,014 -35% -142,267 -34% -118,557 -28% -166,639 -51% Non-underlying items 43,546 20% 45,206 15% -83,057 -20% -3,858 -1% 10,243 3% Loss from operations -124,271 -56% -62,808 -20% -225,324 -53% -122,415 -29% -156,396 -48% Finance cost – net -12,989 -6% -9,313 -3% -14,556 -3% -20,431 -5% -29,821 -9% Loss before income tax -137,260 -62% -72,121 -23% -239,880 -57% -142,846 -34% -186,217 -57% Income tax expenses 1,603 1% -4,331 -1% 129 0 % -3,407 -1% -3,078 -1% Loss for the period -135,657 -61% -76,452 -25% -239,751 -57% -146,253 -34% -189,295 -58% Contribution profit -34,237 -15% 4,400 1% 13,211 3% 24,192 6% -26,040 -8% Adjusted EBIT -162,428 -73% -100,806 -33% -134,836 -32% -115,808 -27% -166,088 -51% Adjusted EBITDA -88,116 -40% -58,945 -19% -71,958 -17% -64,173 -15% -92,320 -28% 2024A Lanvin Group Consolidated P&L 2020A 2021A 2022A 2023A |
|
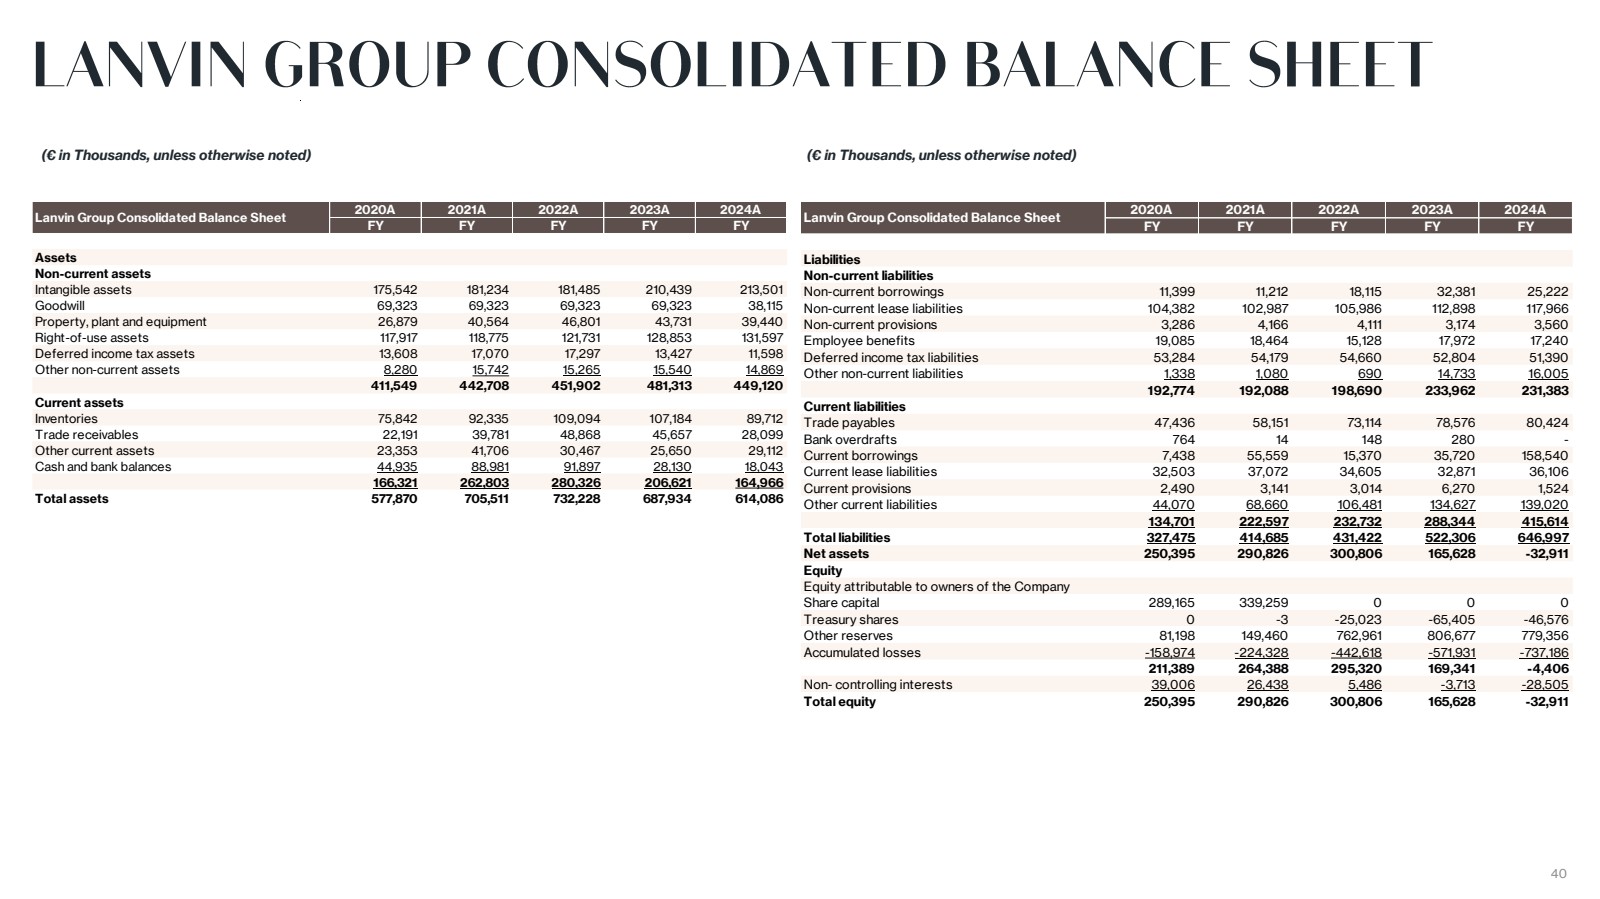
40 (€ in Thousands, unless otherwise noted) (€ in Thousands, unless otherwise noted) 2020A 2021A 2022A 2023A 2024A FY FY FY FY FY Assets Non-current assets Intangible assets 175,542 181,234 181,485 210,439 213,501 Goodwill 69,323 69,323 69,323 69,323 38,115 Property, plant and equipment 26,879 40,564 46,801 43,731 39,440 Right-of-use assets 117,917 118,775 121,731 128,853 131,597 Deferred income tax assets 13,608 17,070 17,297 13,427 11,598 Other non-current assets 8,280 15,742 15,265 15,540 14,869 411,549 442,708 451,902 481,313 449,120 Current assets Inventories 75,842 92,335 109,094 107,184 89,712 Trade receivables 22,191 39,781 48,868 45,657 28,099 Other current assets 23,353 41,706 30,467 25,650 29,112 Cash and bank balances 44,935 88,981 91,897 28,130 18,043 166,321 262,803 280,326 206,621 164,966 Total assets 577,870 705,511 732,228 687,934 614,086 Lanvin Group Consolidated Balance Sheet 2020A 2021A 2022A 2023A 2024A FY FY FY FY FY Liabilities Non-current liabilities Non-current borrowings 11,399 11,212 18,115 32,381 25,222 Non-current lease liabilities 104,382 102,987 105,986 112,898 117,966 Non-current provisions 3,286 4,166 4,111 3,174 3,560 Employee benefits 19,085 18,464 15,128 17,972 17,240 Deferred income tax liabilities 53,284 54,179 54,660 52,804 51,390 Other non-current liabilities 1,338 1,080 690 14,733 16,005 192,774 192,088 198,690 233,962 231,383 Current liabilities Trade payables 47,436 58,151 73,114 78,576 80,424 Bank overdrafts 764 14 148 280 - Current borrowings 7,438 55,559 15,370 35,720 158,540 Current lease liabilities 32,503 37,072 34,605 32,871 36,106 Current provisions 2,490 3,141 3,014 6,270 1,524 Other current liabilities 44,070 68,660 106,481 134,627 139,020 134,701 222,597 232,732 288,344 415,614 Total liabilities 327,475 414,685 431,422 522,306 646,997 Net assets 250,395 290,826 300,806 165,628 -32,911 Equity Equity attributable to owners of the Company Share capital 289,165 339,259 0 0 0 Treasury shares 0 -3 -25,023 -65,405 -46,576 Other reserves 81,198 149,460 762,961 806,677 779,356 Accumulated losses -158,974 -224,328 -442,618 -571,931 -737,186 211,389 264,388 295,320 169,341 -4,406 Non- controlling interests 39,006 26,438 5,486 -3,713 -28,505 Total equity 250,395 290,826 300,806 165,628 -32,911 Lanvin Group Consolidated Balance Sheet |
|
41 (€ in Thousands, unless otherwise noted) 2020A 2021A 2022A 2023A 2024A FY FY FY FY FY Net cash used in operating activities -87,297 -73,088 -80,851 -57,891 -59,381 Net cash flows from/(used in) investing activities 67,038 6,346 -21,799 -38,615 -125 Net cash flows generated from financing activities -41,447 110,065 104,937 34,131 49,066 Net increase/(decrease) in cash and cash equivalents -61,706 43,323 2,287 -62,375 -10,440 Cash and cash equivalents less bank overdrafts at the beginning of the year 106,642 44,171 88,658 91,749 27,850 Effect of foreign exchange rate changes -765 1,164 804 -1,524 633 Cash and cash equivalents less bank overdrafts at end of the year 44,171 88,658 91,749 27,850 18,043 Lanvin Group Consolidated Cash Flow |
|
42 (1) Non -IFRS Financial Measure. Please see Page 50 for Non -IFRS Financial Measures and Definition. Note: Brand -level results are presented exclusive of eliminations. (€ in thousands, unless otherwise noted) 2021 A v 2022 A v 2023 A v 2024 A v 20-24 FY % FY % FY % FY % FY % 2020 A 2021 A 2022 A 2023 A CAGR Key Financials on P&L Revenues 34,989 100% 72,872 100% 119,847 100% 111,740 100% 82,720 100% 108% 64% -7% -26% 24% Gross profit 13,573 39% 34,028 47% 60,513 50% 64,547 58% 48,440 59% Selling and distribution expenses -43,147 -123% -58,124 -80% -75,852 -63% -76,533 -68% -72,241 -87% Contribution profit (1) -29,574 -85% -24,096 -33% -15,339 -13% -11,986 -11% -23,801 -29% Revenues by Geography EMEA 18,501 53% 31,683 43% 61,092 51% 51,585 46% 38,859 47% 71% 93% -16% -25% 20% North America 4,525 13% 15,964 22% 28,524 24% 28,210 25% 22,843 28% 253% 79% -1% -19% 50% Greater China 10,054 29% 23,541 32% 25,742 21% 24,649 22% 14,763 18% 134% 9% -4% -40% 10% Other 1,909 5 % 1,684 2 % 4,489 4% 7,296 7% 6,254 8% -12% 167% 63% -14% 35% Revenues by Channel DTC 16,959 48% 46,134 63% 58,536 49% 55,357 50% 43,569 53% 172% 27% -5% -21% 27% Wholesale 12,974 37% 21,161 29% 51,898 43% 39,933 36% 27,113 33% 63% 145% -23% -32% 20% Other 5,056 14% 5,577 8% 9,413 8% 16,450 15% 12,038 15% 10% 69% 75% -27% 24% 2024A Lanvin Brand Key Financials 2020A 2021A 2022A 2023A |
|
43 (1) Non -IFRS Financial Measure. Please see Page 50 for Non -IFRS Financial Measures and Definition. Note: Brand -level results are presented exclusive of eliminations. (€ in thousands, unless otherwise noted) 2021 A v 2022 A v 2023 A v 2024 A v 20-24 FY % FY % FY % FY % FY % 2020 A 2021 A 2022 A 2023 A CAGR Key Financials on P&L Revenues 95,384 100% 109,332 100% 125,514 100% 126,280 100% 87,891 100% 15% 15% 1% -30% -2% Gross profit 65,865 69% 79,070 72% 86,228 69% 83,339 66% 50,995 58% Selling and distribution expenses -65,006 -68% -59,351 -54% -81,901 -65% -79,060 -63% -69,603 -79% Contribution profit (1) 859 1% 19,719 18% 4,327 3% 4,279 3% -18,608 -21% Revenues by Geography EMEA 73,794 77% 79,236 72% 86,501 69% 85,084 67% 54,934 63% 7% 9% -2% -35% -7% North America 16,367 17% 21,824 20% 31,535 25% 31,310 25% 25,930 30% 33% 44% -1% -17% 12% Greater China 4,867 5 % 7,289 7% 6,791 5 % 9,176 7% 6,661 8% 50% -7% 35% -27% 8% Other 356 0 % 983 1% 687 1% 710 1% 366 0 % 176% -30% 3% -49% 1% Revenues by Channel DTC 62,323 65% 74,622 68% 90,408 72% 87,352 69% 67,006 76% 20% 21% -3% -23% 2 % Wholesale 33,061 35% 34,710 32% 34,426 27% 38,071 30% 20,850 24% 5 % -1% 11% -45% -11% Other 0 0 % 0 0 % 680 1% 857 1% 35 0 % 26% -96% 2024A Wolford Brand Key Financials 2020A 2021A 2022A 2023A |
|
44 (1) Non -IFRS Financial Measure. Please see Page 50 for Non -IFRS Financial Measures and Definition. Note: Brand -level results are presented exclusive of eliminations. (€ in thousands, unless otherwise noted) 2022 A v 2022 A v 2023 A v 2024 A v 21-24 FY % FY % FY % FY % FY % 2021 PF 2021 A 2022 A 2023 A CAGR Key Financials on P&L Revenues 59,206 100% 28,737 100% 61,929 100% 59,518 100% 41,910 100% 5 % 116% -4% -30% 13% Gross profit 13,319 46% 31,048 50% 30,435 51% 17,867 43% Selling and distribution expenses -9,489 -33% -24,502 -40% -23,097 -39% -18,923 -45% Contribution profit (1) 3,830 13% 6,546 11% 7,338 12% -1,056 -3% Revenues by Geography EMEA 33,435 56% 17,009 59% 35,023 57% 31,801 53% 20,704 49% 5 % 106% -9% -35% 7% North America 1,290 2 % 107 0 % 1,181 2 % 2,006 3% 740 2 % -8% 1004% 70% -63% 91% Greater China 11,331 19% 4,595 16% 10,809 17% 11,872 20% 7,741 18% -5% 135% 10% -35% 19% Other 13,150 22% 7,027 24% 14,916 24% 13,838 23% 12,726 30% 13% 112% -7% -8% 22% Revenues by Channel DTC 28,911 49% 14,349 50% 31,910 52% 32,962 55% 27,944 67% 10% 122% 3% -15% 25% Wholesale 30,295 51% 14,389 50% 30,019 48% 26,556 45% 13,966 33% -1% 109% -12% -47% -1% Other 0 0 % 0 0 % 0 0 % 0 0 % 0 0 % 2024A Sergio Rossi Brand Key Financials 2021PF 2021A 2022A 2023A |
|
45 (1) Non -IFRS Financial Measure. Please see Page 50 for Non -IFRS Financial Measures and Definition. Note: Brand -level results are presented exclusive of eliminations. (€ in thousands, unless otherwise noted) 2021 A v 2022 A v 2023 A v 2024 A v 20-24 FY % FY % FY % FY % FY % 2020 A 2021 A 2022 A 2023 A CAGR Key Financials on P&L Revenues 66,512 100% 73,094 100% 85,884 100% 90,398 100% 79,267 100% 10% 17% 5 % -12% 4% Gross profit 32,987 50% 38,987 53% 52,642 61% 57,374 63% 54,451 69% Selling and distribution expenses -42,273 -64% -37,697 -52% -42,498 -49% -46,695 -52% -46,445 -59% Contribution profit (1) -9,286 -14% 1,290 2 % 10,144 12% 10,679 12% 8,006 10% Revenues by Geography EMEA 2,254 3% 779 1% 1,224 1% 1,541 2 % 651 1% -65% 57% 26% -58% -27% North America 60,528 91% 65,534 90% 78,774 92% 81,382 90% 74,403 94% 8% 20% 3% -9% 5 % Greater China 2,919 4% 6,467 9% 5,153 6% 7,161 8% 4,101 5 % 122% -20% 39% -43% 9% Other 811 1% 315 0 % 733 1% 314 0 % 113 0 % -61% 133% -57% -64% -39% Revenues by Channel DTC 44,778 67% 51,581 71% 66,412 77% 71,007 79% 61,612 78% 15% 29% 7% -13% 8% Wholesale 21,734 33% 21,513 29% 19,077 22% 19,126 21% 17,547 22% -1% -11% 0 % -8% -5% Other 0 0 % 0 0 % 395 0 % 265 0 % 108 0 % -33% -59% 2024A St.John Brand Key Financials 2020A 2021A 2022A 2023A |
|
46 (1) Non -IFRS Financial Measure. Please see Page 50 for Non -IFRS Financial Measures and Definition. Note: Brand -level results are presented exclusive of eliminations. (€ in thousands, unless otherwise noted) 2021 A v 2022 A v 2023 A v 2024 A v 20-24 FY % FY % FY % FY % FY % 2020 A 2021 A 2022 A 2023 A CAGR Key Financials on P&L Revenues 26,351 100% 24,695 100% 30,819 100% 40,011 100% 37,107 100% -6% 25% 30% -7% 9% Gross profit 4,881 19% 4,449 18% 7,147 23% 11,351 28% 10,628 29% Selling and distribution expenses -1,708 -6% -1,144 -5% -1,446 -5% -1,900 -5% -1,861 -5% Contribution profit (1) 3,173 12% 3,305 13% 5,701 18% 9,451 24% 8,767 24% Revenues by Geography EMEA 20,318 77% 19,475 79% 23,050 75% 33,739 84% 30,900 83% -4% 18% 46% -8% 11% North America 4,252 16% 3,272 13% 5,833 19% 4,580 11% 4,662 13% -23% 78% -21% 2 % 2 % Greater China 480 2 % 549 2 % 559 2 % 44 0 % 2 9 0 % 14% 2 % -92% -34% -50% Other 1,301 5 % 1,399 6% 1,377 4% 1,648 4% 1,516 4% 8% -2% 20% -8% 4% Revenues by Channel DTC 0 0 % 0 0 % 0 0 % 40 0 % 64 0 % 60% Wholesale 26,351 100% 24,695 100% 30,819 100% 39,971 100% 37,043 100% -6% 25% 30% -7% 9% Other 0 0 % 0 0 % 0 0 % 0 0 % 0 0 % 2024A Caruso Brand Key Financials 2020A 2021A 2022A 2023A |
|
47 (1) DOS refers to Directly Operated Stores which include boutiques, outlets, concession shop-in-shops and pop-up stores. (2) POS refers to Point of Sales which include DOS and wholesale accounts. (1) (2) (1) (2) DOS POS DOS POS DOS POS DOS POS Lanvin 2 7 287 31 339 36 319 33 277 Wolford 167 227 163 225 150 201 112 163 St. John 48 133 46 106 45 107 37 88 Sergio Rossi 5 0 328 5 0 346 48 289 43 154 Caruso 1 144 1 189 0 183 0 181 Total 293 1,119 291 1,205 279 1,099 225 863 2024 Footprint By Brand 2021 2022 2023 |
|
(1) Non-IFRS Financial Measure. Please see Page 50 for Non-IFRS Financial Measures and Definition. 48 (€ in Thousands, unless otherwise noted) 2020A 2021A 2022A 2023A 2024A FY FY FY FY FY Revenue 222,612 308,822 422,312 426,178 328,610 Cost of sales -105,218 -138,920 -184,368 -175,236 -145,847 Gross profit 117,394 169,902 237,944 250,942 182,763 Marketing and selling expenses -151,631 -165,502 -224,733 -226,750 -208,803 Contribution profit (1) -34,237 4,400 13,211 24,192 -26,040 Reconciliation of Contribution Margin |
|
49 (1) 2022 was impacted by a €84 million cost related to the Reverse Recapitalization that occurred as part of the SPAC merger; this cost is non -recurring in nature. (2) These are Non -IFRS Financial Measures and will be mentioned throughout this presentation. Please see Page 50 for Non -IFRS Financial Measures and Definition. (€ in Thousands, unless otherwise noted) 2020A 2021A 2022A 2023A 2024A FY FY FY FY FY Loss for the year -135,657 -76,452 -239,751 -146,253 -189,295 Add / (Deduct) the impact of: Income tax benefits / (expenses) -1,603 4,331 -129 3,407 3,078 Finance cost - net 12,989 9,313 14,556 20,431 29,821 Non-underlying items (1) -43,546 -45,206 83,057 3,858 -10,243 Loss from operating before non-underlying items -167,817 -108,014 -142,267 -118,557 -166,639 Add / (Deduct) the impact of: Share based compensation 5,389 7,208 7,431 2,749 551 Adjusted EBIT (2) -162,428 -100,806 -134,836 -115,808 -166,088 Depreciation / Amortization 48,332 41,584 45,810 46,946 46,542 Provision and impairment losses 22,676 10,766 16,729 79 34,935 Net foreign exchange (gains) / losses 3,304 -10,489 339 4,610 -7,709 Adjusted EBITDA (2) -88,116 -58,945 -71,958 -64,173 -92,320 Reconciliation of Adjusted EBIT and EBITDA |
|
50 Our management monitors and evaluates operating and financial performance using several non-IFRS financial measures including: contribution profit, contribution profit margin, Adjusted EBIT and Adjusted EBITDA. Our management believes that these non-IFRS financial measures provide useful and relevant information regarding our performance and improve their ability to assess financial performance and financial position. They also provide comparable measures that facilitate management’s ability to identify operational trends, as well as make decisions regarding future spending, resource allocations and other operational decisions. While similar measures are widely used in the industry in which we operate, the financial measures that we use may not be comparable to other similarly named measures used by other companies nor are they intended to be substitutes for measures of financial performance or financial position as prepared in accordance with IFRS. Contribution profit is defined as revenues less the cost of sales and selling and marketing expenses. Contribution profit subtracts the main variable expenses of selling and marketing expenses from gross profit, and our management believes this measure is an important indicator of profitability at the marginal level. Below contribution profit, the main expenses are general administrative expenses and other operating expenses (which include foreign exchange gains or losses and impairment losses). As we continue to improve the management of our portfolio brands, we believe we can achieve greater economy of scale across the different brands by maintaining the fixed expenses at a lower level as a proportion of revenue. We therefore use contribution profit margin as a key indicator of profitability at the group level as well as the portfolio brand level. Contribution profit margin is defined as contribution profit divided by revenues. Adjusted EBIT is defined as profit or loss before income taxes, net finance cost, share based compensation, adjusted for income and costs which are significant in nature and that management considers not reflective of underlying operational activities, mainly including net gains on disposal of long-term assets, negative goodwill from acquisition of Sergio Rossi, gain on debt restructuring and government grants. Adjusted EBITDA is defined as profit or loss before income taxes, net finance cost, exchange gains/(losses), depreciation, amortization, share based compensation and provisions and impairment losses adjusted for income and costs which are significant in nature and that management considers not reflective of underlying operational activities, mainly including net gains on disposal of long-term assets, negative goodwill from acquisition of Sergio Rossi, gain on debt restructuring and government grants. Trade working capital is defined as the sum of inventories as well as trade receivables less trade payables. |
Exhibit 99.2

Lanvin Group Demonstrates Strategic Resilience in Challenging Luxury Market, Lays Foundation for Future Growth
| · | The Group reported revenue of €329 million in FY2024, down 23% over FY2023, reflecting a transitional year marked by creative evolution and strategic realignment amid market headwinds |
| · | Gross profit margin remained stable at 56%, supported by disciplined pricing, a higher mix of DTC sales, and improved inventory management |
| · | Operational efficiency improved, with G&A expenses reduced by 15% and working capital turnover showing steady progress |
| · | Strategic store optimization continued, with disciplined new retail openings and underperforming locations consolidation, reinforcing the Group’s focus on core and high-potential markets |
| · | Sustained performance in Japan and North America contrasts with EMEA and Greater China, where proactive adjustments made to address dynamic market shifts |
| · | 2025 stands as a pivotal milestone, where the Group’s sharpened leadership and visionary creativity unlock fresh momentum across its portfolio, setting the stage for dynamic renewal and long-term growth |
April 30, 2025 - Lanvin Group (NYSE: LANV, the “Group”), a global luxury fashion group with Lanvin, Wolford, Sergio Rossi, St. John and Caruso in its portfolio of brands, today announced its results for the full-year 2024. The Group achieved revenue of €329 million, a 23% decrease year-over-year versus 2023; and gross profit of €183 million, representing a relatively stable gross margin of 56%.
Zhen Huang, Chairman of Lanvin Group, said: “2024 was a year of transformation for Lanvin Group. While market conditions were challenging, we made critical strides in strengthening our brands, optimizing our operations, and laying the groundwork for future growth. With our renewed creative leadership and disciplined execution, we are confident in our ability to navigate the evolving luxury landscape and deliver long-term value.”
Review of the Full-Year 2024 Results
Lanvin Group Revenue by Segment
(€ in Thousands, unless otherwise noted)
| Revenue | Growth % | ||||||||||||||||||||
| 2021A | 2022A | 2023A | 2024A | 2022 A v | 2023 A v | 2024 A v | |||||||||||||||
| Lanvin Group by Brand | FY | FY | FY | FY | 2021 A | 2022 A | 2023 A | ||||||||||||||
| Lanvin | 72,872 | 119,847 | 111,740 | 82,720 | 64 | % | -7 | % | -26 | % | |||||||||||
| Wolford | 109,332 | 125,514 | 126,280 | 87,891 | 15 | % | 1 | % | -30 | % | |||||||||||
| St. John | 73,094 | 85,884 | 90,398 | 79,267 | 17 | % | 5 | % | -12 | % | |||||||||||
| Sergio Rossi | 28,737 | 61,929 | 59,518 | 41,910 | 116 | % | -4 | % | -30 | % | |||||||||||
| Caruso | 24,695 | 30,819 | 40,011 | 37,107 | 25 | % | 30 | % | -7 | % | |||||||||||
| Total Brand | 308,730 | 423,993 | 427,947 | 328,895 | 37 | % | 1 | % | -23 | % | |||||||||||
| Eliminations | 92 | -1,681 | -1,769 | -285 | -1927 | % | 5 | % | -84 | % | |||||||||||
| Total Group | 308,822 | 422,312 | 426,178 | 328,610 | 37 | % | 1 | % | -23 | % | |||||||||||
Lanvin Group Key Financials
(€ in Thousands, unless otherwise noted)
| 2021A | 2022A | 2023A | 2024A | |||||||||||||||||
| Lanvin Group Key Financials | FY | % | FY | % | FY | % | FY | % | ||||||||||||
| Revenue | 308,822 | 100 | % | 422,312 | 100 | % | 426,178 | 100 | % | 328,610 | 100 | % | ||||||||
| Gross profit | 169,902 | 55 | % | 237,944 | 56 | % | 250,942 | 59 | % | 182,763 | 56 | % | ||||||||
| Contribution profit (1) | 4,400 | 1 | % | 13,211 | 3 | % | 24,192 | 6 | % | -26,040 | -8 | % | ||||||||
| Adjusted EBITDA | -58,945 | -19 | % | -71,958 | -17 | % | -64,173 | -15 | % | -92,320 | -28 | % | ||||||||
Selected Highlights
Resilient in key regions and key channels: North America and Japan outperformed other regions, contributed by the strong presence of St. John and Sergio Rossi. EMEA and Greater China experienced declines due to challenges within the luxury industry. Despite the Group's focus on optimizing its retail footprint and concentrating on core business units, DTC channels remained resilient, accounting for 61% of total sales, highlighting the effectiveness of the store optimization and market-focused strategy by the Group.
Strong improvement in working capital: Effective management of working capital in FY2024. G&A expenses were reduced by 15%, while improvements in receivables turnover and inventory management contributed to a stronger cash flow position and enhanced operational efficiency. Meanwhile, marketing and selling expenses saw a slight decrease of 8%, as targeted marketing activities were implemented.
Retail network optimization: Lanvin Group continued to optimize its retail footprint by optimizing underperforming stores and selectively opening new retail locations. Lanvin and Sergio Rossi successfully expanded their presence in the Middle East.
Brands with strategic adaptation: The Group’s diversified brand portfolio exhibited varying levels of resilience in 2024. St. John and Caruso remained stable, underscoring the strength of their loyal customer bases and distinct market positions. Despite facing industry-wide challenges, Lanvin and Sergio Rossi embraced bold creative renewal, positioning themselves to redefine their artistic visions and pave the way for future growth.
Discussion of FY2024 Financials
Revenue
For FY2024, the Group generated revenue of €329 million, a 23% decrease year-over-year. Specifically, EMEA wholesale and Greater China retail market experienced softer demand, in line with the market trend since first half of 2024. This decline was driven by a combination of macroeconomic headwinds, shifts in consumer behavior, and strategic realignments. Full details of the Group’s revenue can be found in our Annual Report on Form 20-F for the year ended December 31, 2024.
Gross Profit
Gross profit decreased to €183 million, reflecting a margin of 56%, compared to €251 million in 2023 with a margin of 59%. The decline in gross profit is primarily attributed to a drop in gross profit from Wolford with increased costs related to the new logistics provider. Overall, the Group has managed to maintain a relatively stable gross margin, which indicates effective cost control and inventory management.
Contribution Profit (1)
Contribution profit, defined internally as gross profit less selling and marketing expenses, was used to understand the variable profitability performance and analyze performance across our brands. In FY2024, contribution profit amounted to negative €26 million, representing a margin of -8%, a drop from the €24 million contribution profit in 2023. The decline was primarily driven by lower gross profit due to reduced sales volumes, especially in Wolford. Despite this, the Group has shown steady progress in managing its fixed expenses over the past few years.
Adjusted EBITDA
Adjusted EBITDA remained at loss for FY2024, reaching €-92 million, compared to €-64 million in 2023. While the Group has made significant efforts to optimize the cost structure and enhance operational efficiency in FY2024, the increase in Adjusted EBITDA loss was primarily driven by a decline in gross profit, which was only partially mitigated by the reduction in operational expenses.
Results by Segment
Lanvin: Revenue was down by 26%, with revenue of €83 million. Gross profit decreased to €48 million, at a margin of 59%, from €65 million, at a margin of 58%, in 2023. Gross profit declined due to lower sales volumes, while the margin remained stable. Contribution profit decreased to a loss of €24 million in 2024, with margin declining to negative 29% from negative 11% in 2023. Despite the reduction in retail traffic, effective cost controls are in place and inventory management showed steady improvement.
Wolford: Revenue decreased by 30%, decreasing from €126 million in 2023 to €88 million in 2024, a result of multiple challenges faced in 2024 such as macroeconomic uncertainties, organizational changes, and disruptions in logistics. Gross profit decreased to €51 million from €83 million in 2023, and margin declined from 66% to 58% due to increased costs caused by delays in integrating with the new logistics provider. Contribution profit turned negative, reaching €-19 million in 2024, with the margin falling to negative 21% from 3%.
Sergio Rossi: Revenue was down by 30%, decreasing from €60 million in 2023 to €42 million in 2024. Gross profit margin decreased from 51% to 43% in 2024, due to fixed production costs on lower revenues. Contribution profit margin dropped to negative 3% in 2024, compared to 12% in 2023. Marketing and selling expenses decreased €4 million as a result of cost control and the implementation of efficiency improvement measures, partially offsetting the loss in gross profit.
St. John: Driven by the decline in luxury demand in North America and the strategic contraction in Greater China, St. John’s revenue in 2024 decreased by 12%, from €90 million in 2023 to €79 million. Gross profit decreased to €54 million, with the margin improving to 69% from 63% in 2023, due to improved full-price sell-through and reduction in production costs. Contribution profit decreased slightly, with the margin dropping by 2%.
Caruso: Revenue decreased by 7%, from €40 million in 2023 to €37 million in 2024. B2B Maisons orders decreased while Caruso brand business grew by double digits. Gross profit remained stable at €11 million, with the margin increasing to 29% from 28% in 2023. Contribution profit margin remains steady at 24%.
2025 Outlook
In 2025, while macroeconomic uncertainty persists, Lanvin Group is poised for a robust recovery and remains unwavering in its long-term vision, driven by operational discipline and a surge in creative momentum. Under the leadership of the new Executive President, Andy Lew, the Group is enhancing its management capabilities and establishing a second headquarters in Europe to further streamline the organization. The Group will continue to maintain a strategic focus on key areas and core products, while exploring undiscovered regions and emerging product categories to unlock new growth opportunities. Retail network optimization will continue to be a priority, with efforts to refine the store footprint, simplify the operations and concentrate on core business units.
The Group is experiencing a surge of creative momentum in 2025, fueled by the appointment of new creative leaders who are poised to redefine the brand visions. At Lanvin, Peter Copping brings his unique artistic vision and expertise to the forefront, promising to infuse the brand with fresh perspectives and innovative designs that resonate with both existing and new customers. At Sergio Rossi, Paul Andrew is leveraging his extensive experience and creative acumen to revitalize the brand’s image and product offerings. With a strengthened leadership team and bold creative visions, Lanvin Group is well-positioned to drive innovation and secure long-term success in the luxury fashion industry.
Note: All % changes are calculated on an actual currency exchange rate basis.
Note: This communication includes certain non-IFRS financial measures such as contribution profit, contribution margin, adjusted earnings before interest and taxes (“Adjusted EBIT”), and adjusted earnings before interest, taxes, depreciation and amortization (“Adjusted EBITDA”). Please see Non-IFRS Financial Measures and Definition.
| (1) | Contribution Profit is defined as Gross Profit less Selling and Marketing Expenses |
***
Annual Report on Form 20-F
Our annual report on Form 20-F, including the consolidated financial statements for the fiscal year ended December 31, 2024, can be downloaded from the Company’s investor relations website (ir.lanvin-group.com) under the section Financials / SEC Filings, or from the SEC’s website (www.sec.gov).
***
Conference Call
As previously announced, today at 8:00AM EST/8:00PM CST/2:00PM CET, Lanvin Group will host a conference call to discuss its results for the full-year 2024 and provide an outlook for 2025. Management will refer to a slide presentation during the call, which will be made available on the day of the call. To view the presentation, please visit the "Events" tab of the Group's investor relations website at https://ir.lanvin-group.com.
To participant in the conference call, please register by clicking on the following link: https://dpregister.com/sreg/10199129/fefc237249
A replay of the conference call will be accessible approximately one hour after the live call until May 07, 2025, by dialing the following numbers:
US Toll Free: 1-877-344-7529
International Toll: 1-412-317-0088
Canada Toll Free: 855-669-9658
Replay Access Code: 2450816
A recorded webcast of the conference call and a slide presentation will also be available on the Group's investor relations website at https://ir.lanvin-group.com.
***
Next Scheduled Announcement
The next scheduled announcement will be the H1 2025 earnings results release in August 2025. To receive email alerts of the timing of future financial news releases, as well as future announcements, please register at https://ir.lanvin-group.com.
***
About Lanvin Group
Lanvin Group is a leading global luxury fashion group headquartered in Shanghai, China, managing iconic brands worldwide including Lanvin, Wolford, Sergio Rossi, St. John Knits, and Caruso. Harnessing the power of its unique strategic alliance of industry-leading partners in the luxury fashion sector, Lanvin Group strives to expand the global footprint of its portfolio brands and achieve sustainable growth through strategic investment and extensive operational know-how, combined with an intimate understanding and unparalleled access to the fastest-growing luxury fashion markets in the world. Lanvin Group is listed on the New York Stock Exchange under the ticker symbol 'LANV'. For more information about Lanvin Group, please visit www.lanvin- group.com, and to view our investor presentation, please visit https://ir.lanvin- group.com.
***
Forward-Looking Statements
This communication, including the section “2025 Outlook”, contains “forward-looking statements” within the meaning of the “safe harbor” provisions of the Private Securities Litigation Reform Act of 1995. Forward-looking statements generally are accompanied by words such as “believe,” “may,” “will,” “estimate,” “continue,” “anticipate,” “intend,” “expect,” “should,” “would,” “plan,” “predict,” “potential,” “seem,” “seek,” “future,” “outlook,” “project” and similar expressions that predict or indicate future events or trends or that are not statements of historical matters. These forward-looking statements include, but are not limited to, statements regarding estimates and forecasts of other financial and performance metrics and projections of market opportunity. These statements are based on various assumptions, whether or not identified in this communication, and on the current expectations of the respective management of Lanvin Group and are not predictions of actual performance. These forward-looking statements are provided for illustrative purposes only and must not be relied on by an investor as, a guarantee, an assurance, a prediction or a definitive statement of fact or probability. Actual events and circumstances are difficult or impossible to predict and will differ from assumptions. Many actual events and circumstances are beyond the control of Lanvin Group. Potential risks and uncertainties that could cause the actual results to differ materially from those expressed or implied by forward-looking statements include, but are not limited to, changes adversely affecting the business in which Lanvin Group is engaged; Lanvin Group’s projected financial information, anticipated growth rate, profitability and market opportunity may not be an indication of its actual results or future results; management of growth; the impact of COVID-19 or similar public health crises on Lanvin Group’s business; Lanvin Group’s ability to safeguard the value, recognition and reputation of its brands and to identify and respond to new and changing customer preferences; the ability and desire of consumers to shop; Lanvin Group’s ability to successfully implement its business strategies and plans; Lanvin Group’s ability to effectively manage its advertising and marketing expenses and achieve desired impact; its ability to accurately forecast consumer demand; high levels of competition in the personal luxury products market; disruptions to Lanvin Group’s distribution facilities or its distribution partners; Lanvin Group’s ability to negotiate, maintain or renew its license agreements; Lanvin Group’s ability to protect its intellectual property rights; Lanvin Group’s ability to attract and retain qualified employees and preserve craftmanship skills; Lanvin Group’s ability to develop and maintain effective internal controls; general economic conditions; the result of future financing efforts; and those factors discussed in the reports filed by Lanvin Group from time to time with the SEC. If any of these risks materialize or Lanvin Group’s assumptions prove incorrect, actual results could differ materially from the results implied by these forward-looking statements. There may be additional risks that Lanvin Group presently does not know, or that Lanvin Group currently believes are immaterial, that could also cause actual results to differ from those contained in the forward-looking statements. In addition, forward-looking statements reflect Lanvin Group’s expectations, plans, or forecasts of future events and views as of the date of this communication. Lanvin Group anticipates that subsequent events and developments will cause Lanvin Group’s assessments to change. However, while Lanvin Group may elect to update these forward-looking statements at some point in the future, Lanvin Group specifically disclaim any obligation to do so. These forward-looking statements should not be relied upon as representing Lanvin Group’s assessments of any date subsequent to the date of this communication. Accordingly, reliance should not be placed upon the forward-looking statements.
***
Use of Non-IFRS Financial Metrics
This communication includes certain non-IFRS financial measures such as contribution profit, contribution margin, adjusted earnings before interest and taxes (“Adjusted EBIT”), and adjusted earnings before interest, taxes, depreciation and amortization (“Adjusted EBITDA”). These non-IFRS measures are an addition, and not a substitute for or superior to measures of financial performance prepared in accordance with IFRS and should not be considered as an alternative to net income, operating income or any other performance measures derived in accordance with IFRS. Reconciliations of non-IFRS measures to their most directly comparable IFRS counterparts are included in the Appendix to this communication. Lanvin Group believes that these non-IFRS measures of financial results provide useful supplemental information to investors about Lanvin Group. Lanvin Group believes that the use of these non-IFRS financial measures provides an additional tool for investors to use in evaluating projected operating results and trends in and in comparing Lanvin Group's financial measures with other similar companies, many of which present similar non-IFRS financial measures to investors. However, there are a number of limitations related to the use of these non-IFRS measures and their nearest IFRS equivalents. For example, other companies may calculate non-IFRS measures differently, or may use other measures to calculate their financial performance, and therefore Lanvin Group's non-IFRS measures may not be directly comparable to similarly titled measures of other companies. Lanvin Group does not consider these non-IFRS measures in isolation or as an alternative to financial measures determined in accordance with IFRS. The principal limitation of these non-IFRS financial measures is that they exclude significant expenses, income and tax liabilities that are required by IFRS to be recorded in Lanvin Group's financial statements. In addition, they are subject to inherent limitations as they reflect the exercise of judgements by Lanvin Group about which expense and income are excluded or included in determining these non-IFRS financial measures. In order to compensate for these limitations, Lanvin Group presents non-IFRS financial measures in connection with IFRS results.
***
Enquiries:
Media
Lanvin Group
Winni Ren
winni.ren@lanvin-group.com
Investors
Lanvin Group
Coco Wang
coco.wang@lanvin-group.com
Appendix
Lanvin Group Consolidated Income Statement
(€ in Thousands, unless otherwise noted)
| 2021A | 2022A | 2023A | 2024A | ||||||||||||||||||
| Lanvin Group Consolidated P&L | FY | % | FY | % | FY | % | FY | % | |||||||||||||
| Revenue | 308,822 | 100 | % | 422,312 | 100 | % | 426,178 | 100 | % | 328,610 | 100 | % | |||||||||
| Cost of sales | -138,920 | -45 | % | -184,368 | -44 | % | -175,236 | -41 | % | -145,847 | -44 | % | |||||||||
| Gross profit | 169,902 | 55 | % | 237,944 | 56 | % | 250,942 | 59 | % | 182,763 | 56 | % | |||||||||
| Marketing and selling expenses | -165,502 | -54 | % | -224,733 | -53 | % | -226,750 | -53 | % | -208,803 | -64 | % | |||||||||
| General and administrative expenses | -122,497 | -40 | % | -153,138 | -36 | % | -138,215 | -32 | % | -117,368 | -36 | % | |||||||||
| Impairment of goodwill | 0 | 0 | % | 0 | 0 | % | 0 | 0 | % | -31,208 | -9 | % | |||||||||
| Other operating income and expenses | 10,083 | 3 | % | -2,340 | -1 | % | -4,534 | -1 | % | 7,977 | 2 | % | |||||||||
| Loss from operations before non-underlying items | -108,014 | -35 | % | -142,267 | -34 | % | -118,557 | -28 | % | -166,639 | -51 | % | |||||||||
| Non-underlying items | 45,206 | 15 | % | -83,057 | -20 | % | -3,858 | -1 | % | 10,243 | 3 | % | |||||||||
| Loss from operations | -62,808 | -20 | % | -225,324 | -53 | % | -122,415 | -29 | % | -156,396 | -48 | % | |||||||||
| Finance cost – net | -9,313 | -3 | % | -14,556 | -3 | % | -20,431 | -5 | % | -29,821 | -9 | % | |||||||||
| Loss before income tax | -72,121 | -23 | % | -239,880 | -57 | % | -142,846 | -34 | % | -186,217 | -57 | % | |||||||||
| Income tax expenses | -4,331 | -1 | % | 129 | 0 | % | -3,407 | -1 | % | -3,078 | -1 | % | |||||||||
| Loss for the period | -76,452 | -25 | % | -239,751 | -57 | % | -146,253 | -34 | % | -189,295 | -58 | % | |||||||||
| Contribution profit (2) | 4,400 | 1 | % | 13,211 | 3 | % | 24,192 | 6 | % | -26,040 | -8 | % | |||||||||
| Adjusted EBIT (2) | -100,806 | -33 | % | -134,836 | -32 | % | -115,808 | -27 | % | -166,088 | -51 | % | |||||||||
| Adjusted EBITDA (2) | -58,945 | -19 | % | -71,958 | -17 | % | -64,173 | -15 | % | -92,320 | -28 | % | |||||||||
Lanvin Group Consolidated Balance Sheet
(€ in Thousands, unless otherwise noted)
| 2021A | 2022A | 2023A | 2024A | |||||||||||||
| Lanvin Group Consolidated Balance Sheet | FY | FY | FY | FY | ||||||||||||
| Assets | ||||||||||||||||
| Non-current assets | ||||||||||||||||
| Intangible assets | 181,234 | 181,485 | 210,439 | 213,501 | ||||||||||||
| Goodwill | 69,323 | 69,323 | 69,323 | 38,115 | ||||||||||||
| Property, plant and equipment | 40,564 | 46,801 | 43,731 | 39,440 | ||||||||||||
| Right-of-use assets | 118,775 | 121,731 | 128,853 | 131,597 | ||||||||||||
| Deferred income tax assets | 17,070 | 17,297 | 13,427 | 11,598 | ||||||||||||
| Other non-current assets | 15,742 | 15,265 | 15,540 | 14,869 | ||||||||||||
| 442,708 | 451,902 | 481,313 | 449,120 | |||||||||||||
| Current assets | ||||||||||||||||
| Inventories | 92,335 | 109,094 | 107,184 | 89,712 | ||||||||||||
| Trade receivables | 39,781 | 48,868 | 45,657 | 28,099 | ||||||||||||
| Other current assets | 41,706 | 30,467 | 25,650 | 29,112 | ||||||||||||
| Cash and bank balances | 88,981 | 91,897 | 28,130 | 18,043 | ||||||||||||
| 262,803 | 280,326 | 206,621 | 164,966 | |||||||||||||
| Total assets | 705,511 | 732,228 | 687,934 | 614,086 | ||||||||||||
| Liabilities | ||||||||||||||||
| Non-current liabilities | ||||||||||||||||
| Non-current borrowings | 11,212 | 18,115 | 32,381 | 25,222 | ||||||||||||
| Non-current lease liabilities | 102,987 | 105,986 | 112,898 | 117,966 | ||||||||||||
| Non-current provisions | 4,166 | 4,111 | 3,174 | 3,560 | ||||||||||||
| Employee benefits | 18,464 | 15,128 | 17,972 | 17,240 | ||||||||||||
| Deferred income tax liabilities | 54,179 | 54,660 | 52,804 | 51,390 | ||||||||||||
| Other non-current liabilities | 1,080 | 690 | 14,733 | 16,005 | ||||||||||||
| 192,088 | 198,690 | 233,962 | 231,383 | |||||||||||||
| Current liabilities | ||||||||||||||||
| Trade payables | 58,151 | 73,114 | 78,576 | 80,424 | ||||||||||||
| Bank overdrafts | 14 | 148 | 280 | - | ||||||||||||
| Current borrowings | 55,559 | 15,370 | 35,720 | 158,540 | ||||||||||||
| Current lease liabilities | 37,072 | 34,605 | 32,871 | 36,106 | ||||||||||||
| Current provisions | 3,141 | 3,014 | 6,270 | 1,524 | ||||||||||||
| Other current liabilities | 68,660 | 106,481 | 134,627 | 139,020 | ||||||||||||
| 222,597 | 232,732 | 288,344 | 415,614 | |||||||||||||
| Total liabilities | 414,685 | 431,422 | 522,306 | 646,997 | ||||||||||||
| Net assets | 290,826 | 300,806 | 165,628 | -32,911 | ||||||||||||
| Equity | ||||||||||||||||
| Equity attributable to owners of the Company | ||||||||||||||||
| Share capital | 339,259 | 0 | 0 | 0 | ||||||||||||
| Treasury shares | -3 | -25,023 | -65,405 | -46,576 | ||||||||||||
| Other reserves | 149,460 | 762,961 | 806,677 | 779,356 | ||||||||||||
| Accumulated losses | -224,328 | -442,618 | -571,931 | -737,186 | ||||||||||||
| 264,388 | 295,320 | 169,341 | -4,406 | |||||||||||||
| Non- controlling interests | 26,438 | 5,486 | -3,713 | -28,505 | ||||||||||||
| Total equity | 290,826 | 300,806 | 165,628 | -32,911 | ||||||||||||
Lanvin Group Consolidated Cash Flow
(€ in Thousands, unless otherwise noted)
| 2021A | 2022A | 2023A | 2024A | |||||||||||||
| Lanvin Group Consolidated Cash Flow | FY | FY | FY | FY | ||||||||||||
| Net cash used in operating activities | -73,088 | -80,851 | -57,891 | -59,381 | ||||||||||||
| Net cash flows from/(used in) investing activities | 6,346 | -21,799 | -38,615 | -125 | ||||||||||||
| Net cash flows generated from financing activities | 110,065 | 104,937 | 34,131 | 49,066 | ||||||||||||
| Net increase/(decrease) in cash and cash equivalents | 43,323 | 2,287 | -62,375 | -10,440 | ||||||||||||
| Cash and cash equivalents less bank overdrafts at the beginning of the year | 44,171 | 88,658 | 91,749 | 27,850 | ||||||||||||
| Effect of foreign exchange rate changes | 1,164 | 804 | -1,524 | 633 | ||||||||||||
| Cash and cash equivalents less bank overdrafts at end of the year | 88,658 | 91,749 | 27,850 | 18,043 | ||||||||||||
Lanvin Brand Key Financials (3)
(€ in Thousands, unless otherwise noted)
| 2021A | 2022A | 2023A | 2024A | 2022
A v |
2023
A v |
2024
A v |
|||||||||||||||||||||||
| Lanvin Brand Key Financials | FY | % | FY | % | FY | % | FY | % | 2021 A | 2022 A | 2023 A | ||||||||||||||||||
| Key Financials on P&L | |||||||||||||||||||||||||||||
| Revenues | 72,872 | 100 | % | 119,847 | 100 | % | 111,740 | 100 | % | 82,720 | 100 | % | 64 | % | -7 | % | -26 | % | |||||||||||
| Gross profit | 34,028 | 47 | % | 60,513 | 50 | % | 64,547 | 58 | % | 48,440 | 59 | % | |||||||||||||||||
| Selling and distribution expenses | -58,124 | -80 | % | -75,852 | -63 | % | -76,533 | -68 | % | -72,241 | -87 | % | |||||||||||||||||
| Contribution profit (2) | -24,096 | -33 | % | -15,339 | -13 | % | -11,986 | -11 | % | -23,801 | -29 | % | |||||||||||||||||
| Revenues by Geography | |||||||||||||||||||||||||||||
| EMEA | 31,683 | 43 | % | 61,092 | 51 | % | 51,585 | 46 | % | 38,859 | 47 | % | 93 | % | -16 | % | -25 | % | |||||||||||
| North America | 15,964 | 22 | % | 28,524 | 24 | % | 28,210 | 25 | % | 22,843 | 28 | % | 79 | % | -1 | % | -19 | % | |||||||||||
| Greater China | 23,541 | 32 | % | 25,742 | 21 | % | 24,649 | 22 | % | 14,763 | 18 | % | 9 | % | -4 | % | -40 | % | |||||||||||
| Other | 1,684 | 2 | % | 4,489 | 4 | % | 7,296 | 7 | % | 6,254 | 8 | % | 167 | % | 63 | % | -14 | % | |||||||||||
| Revenues by Channel | |||||||||||||||||||||||||||||
| DTC | 46,134 | 63 | % | 58,536 | 49 | % | 55,357 | 50 | % | 43,569 | 53 | % | 27 | % | -5 | % | -21 | % | |||||||||||
| Wholesale | 21,161 | 29 | % | 51,898 | 43 | % | 39,933 | 36 | % | 27,113 | 33 | % | 145 | % | -23 | % | -32 | % | |||||||||||
| Other | 5,577 | 8 | % | 9,413 | 8 | % | 16,450 | 15 | % | 12,038 | 15 | % | 69 | % | 75 | % | -27 | % | |||||||||||
Wolford Brand Key Financials (3)
(€ in Thousands, unless otherwise noted)
| 2021A | 2022A | 2023A | 2024A | 2022 A v |
2023
A v |
2024 A v |
|||||||||||||||||||||||
| Wolford Brand Key Financials | FY | % | FY | % | FY | % | FY | % | 2021 A | 2022 A | 2023 A | ||||||||||||||||||
| Key Financials on P&L | |||||||||||||||||||||||||||||
| Revenues | 109,332 | 100 | % | 125,514 | 100 | % | 126,280 | 100 | % | 87,891 | 100 | % | 15 | % | 1 | % | -30 | % | |||||||||||
| Gross profit | 79,070 | 72 | % | 86,228 | 69 | % | 83,339 | 66 | % | 50,995 | 58 | % | |||||||||||||||||
| Selling and distribution expenses | -59,351 | -54 | % | -81,901 | -65 | % | -79,060 | -63 | % | -69,603 | -79 | % | |||||||||||||||||
| Contribution profit (2) | 19,719 | 18 | % | 4,327 | 3 | % | 4,279 | 3 | % | -18,608 | -21 | % | |||||||||||||||||
| Revenues by Geography | |||||||||||||||||||||||||||||
| EMEA | 79,236 | 72 | % | 86,501 | 69 | % | 85,084 | 67 | % | 54,934 | 63 | % | 9 | % | -2 | % | -35 | % | |||||||||||
| North America | 21,824 | 20 | % | 31,535 | 25 | % | 31,310 | 25 | % | 25,930 | 30 | % | 44 | % | -1 | % | -17 | % | |||||||||||
| Greater China | 7,289 | 7 | % | 6,791 | 5 | % | 9,176 | 7 | % | 6,661 | 8 | % | -7 | % | 35 | % | -27 | % | |||||||||||
| Other | 983 | 1 | % | 687 | 1 | % | 710 | 1 | % | 366 | 0 | % | -30 | % | 3 | % | -49 | % | |||||||||||
| Revenues by Channel | |||||||||||||||||||||||||||||
| DTC | 74,622 | 68 | % | 90,408 | 72 | % | 87,352 | 69 | % | 67,006 | 76 | % | 21 | % | -3 | % | -23 | % | |||||||||||
| Wholesale | 34,710 | 32 | % | 34,426 | 27 | % | 38,071 | 30 | % | 20,850 | 24 | % | -1 | % | 11 | % | -45 | % | |||||||||||
| Other | 0 | 0 | % | 680 | 1 | % | 857 | 1 | % | 35 | 0 | % | 26 | % | -96 | % | |||||||||||||
Sergio Rossi Brand Key Financials (3)
(€ in Thousands, unless otherwise noted)
| 2021A | 2022A | 2023A | 2024A | 2022
A v |
2023
A v |
2024
A v |
|||||||||||||||||||||||
| Sergio Rossi Brand Key Financials | FY | % | FY | % | FY | % | FY | % | 2021 A | 2022 A | 2023 A | ||||||||||||||||||
| Key Financials on P&L | |||||||||||||||||||||||||||||
| Revenues | 28,737 | 100 | % | 61,929 | 100 | % | 59,518 | 100 | % | 41,910 | 100 | % | 116 | % | -4 | % | -30 | % | |||||||||||
| Gross profit | 13,319 | 46 | % | 31,048 | 50 | % | 30,435 | 51 | % | 17,867 | 43 | % | |||||||||||||||||
| Selling and distribution expenses | -9,489 | -33 | % | -24,502 | -40 | % | -23,097 | -39 | % | -18,923 | -45 | % | |||||||||||||||||
| Contribution profit (2) | 3,830 | 13 | % | 6,546 | 11 | % | 7,338 | 12 | % | -1,056 | -3 | % | |||||||||||||||||
| Revenues by Geography | |||||||||||||||||||||||||||||
| EMEA | 17,009 | 59 | % | 35,023 | 57 | % | 31,801 | 53 | % | 20,704 | 49 | % | 106 | % | -9 | % | -35 | % | |||||||||||
| North America | 107 | 0 | % | 1,181 | 2 | % | 2,006 | 3 | % | 740 | 2 | % | 1004 | % | 70 | % | -63 | % | |||||||||||
| Greater China | 4,595 | 16 | % | 10,809 | 17 | % | 11,872 | 20 | % | 7,741 | 18 | % | 135 | % | 10 | % | -35 | % | |||||||||||
| Other | 7,027 | 24 | % | 14,916 | 24 | % | 13,838 | 23 | % | 12,726 | 30 | % | 112 | % | -7 | % | -8 | % | |||||||||||
| Revenues by Channel | |||||||||||||||||||||||||||||
| DTC | 14,349 | 50 | % | 31,910 | 52 | % | 32,962 | 55 | % | 27,944 | 67 | % | 122 | % | 3 | % | -15 | % | |||||||||||
| Wholesale | 14,389 | 50 | % | 30,019 | 48 | % | 26,556 | 45 | % | 13,966 | 33 | % | 109 | % | -12 | % | -47 | % | |||||||||||
| Other | 0 | 0 | % | 0 | 0 | % | 0 | 0 | % | 0 | 0 | % | |||||||||||||||||
St. John Brand Key Financials (3)
(€ in Thousands, unless otherwise noted)
| 2021A | 2022A | 2023A | 2024A | 2022
A v |
2023
A v |
2024
A v |
|||||||||||||||||||||||
| St. John Brand Key Financials | FY | % | FY | % | FY | % | FY | % | 2021 A | 2022 A | 2023 A | ||||||||||||||||||
| Key Financials on P&L | |||||||||||||||||||||||||||||
| Revenues | 73,094 | 100 | % | 85,884 | 100 | % | 90,398 | 100 | % | 79,267 | 100 | % | 17 | % | 5 | % | -12 | % | |||||||||||
| Gross profit | 38,987 | 53 | % | 52,642 | 61 | % | 57,374 | 63 | % | 54,451 | 69 | % | |||||||||||||||||
| Selling and distribution expenses | -37,697 | -52 | % | -42,498 | -49 | % | -46,695 | -52 | % | -46,445 | -59 | % | |||||||||||||||||
| Contribution profit (2) | 1,290 | 2 | % | 10,144 | 12 | % | 10,679 | 12 | % | 8,006 | 10 | % | |||||||||||||||||
| Revenues by Geography | |||||||||||||||||||||||||||||
| EMEA | 779 | 1 | % | 1,224 | 1 | % | 1,541 | 2 | % | 651 | 1 | % | 57 | % | 26 | % | -58 | % | |||||||||||
| North America | 65,534 | 90 | % | 78,774 | 92 | % | 81,382 | 90 | % | 74,403 | 94 | % | 20 | % | 3 | % | -9 | % | |||||||||||
| Greater China | 6,467 | 9 | % | 5,153 | 6 | % | 7,161 | 8 | % | 4,101 | 5 | % | -20 | % | 39 | % | -43 | % | |||||||||||
| Other | 315 | 0 | % | 733 | 1 | % | 314 | 0 | % | 113 | 0 | % | 133 | % | -57 | % | -64 | % | |||||||||||
| Revenues by Channel | |||||||||||||||||||||||||||||
| DTC | 51,581 | 71 | % | 66,412 | 77 | % | 71,007 | 79 | % | 61,612 | 78 | % | 29 | % | 7 | % | -13 | % | |||||||||||
| Wholesale | 21,513 | 29 | % | 19,077 | 22 | % | 19,126 | 21 | % | 17,547 | 22 | % | -11 | % | 0 | % | -8 | % | |||||||||||
| Other | 0 | 0 | % | 395 | 0 | % | 265 | 0 | % | 108 | 0 | % | -33 | % | -59 | % | |||||||||||||
Caruso Brand Key Financials (3)
(€ in Thousands, unless otherwise noted)
| 2021A | 2022A | 2023A | 2024A | 2022 A v |
2023 A v |
2024 A v |
|||||||||||||||||||||||
| Caruso Brand Key Financials | FY | % | FY | % | FY | % | FY | % | 2021 A | 2022 A | 2023 A | ||||||||||||||||||
| Key Financials on P&L | |||||||||||||||||||||||||||||
| Revenues | 24,695 | 100 | % | 30,819 | 100 | % | 40,011 | 100 | % | 37,107 | 100 | % | 25 | % | 30 | % | -7 | % | |||||||||||
| Gross profit | 4,449 | 18 | % | 7,147 | 23 | % | 11,351 | 28 | % | 10,628 | 29 | % | |||||||||||||||||
| Selling and distribution expenses | -1,144 | -5 | % | -1,446 | -5 | % | -1,900 | -5 | % | -1,861 | -5 | % | |||||||||||||||||
| Contribution profit (2) | 3,305 | 13 | % | 5,701 | 18 | % | 9,451 | 24 | % | 8,767 | 24 | % | |||||||||||||||||
| Revenues by Geography | |||||||||||||||||||||||||||||
| EMEA | 19,475 | 79 | % | 23,050 | 75 | % | 33,739 | 84 | % | 30,900 | 83 | % | 18 | % | 46 | % | -8 | % | |||||||||||
| North America | 3,272 | 13 | % | 5,833 | 19 | % | 4,580 | 11 | % | 4,662 | 13 | % | 78 | % | -21 | % | 2 | % | |||||||||||
| Greater China | 549 | 2 | % | 559 | 2 | % | 44 | 0 | % | 29 | 0 | % | 2 | % | -92 | % | -34 | % | |||||||||||
| Other | 1,399 | 6 | % | 1,377 | 4 | % | 1,648 | 4 | % | 1,516 | 4 | % | -2 | % | 20 | % | -8 | % | |||||||||||
| Revenues by Channel | |||||||||||||||||||||||||||||
| DTC | 0 | 0 | % | 0 | 0 | % | 40 | 0 | % | 64 | 0 | % | 60 | % | |||||||||||||||
| Wholesale | 24,695 | 100 | % | 30,819 | 100 | % | 39,971 | 100 | % | 37,043 | 100 | % | 25 | % | 30 | % | -7 | % | |||||||||||
| Other | 0 | 0 | % | 0 | 0 | % | 0 | 0 | % | 0 | 0 | % | |||||||||||||||||
Lanvin Group Brand Footprint
| 2021 | 2022 | 2023 | 2024 | |||||||||||||||||||||||||||||
| Footprint By Brand | DOS (4) | POS (5) | DOS (4) | POS (5) | DOS (4) | POS (5) | DOS (4) | POS (5) | ||||||||||||||||||||||||
| Lanvin | 27 | 287 | 31 | 339 | 36 | 319 | 33 | 277 | ||||||||||||||||||||||||
| Wolford | 167 | 227 | 163 | 225 | 150 | 201 | 112 | 163 | ||||||||||||||||||||||||
| St. John | 48 | 133 | 46 | 106 | 45 | 107 | 37 | 88 | ||||||||||||||||||||||||
| Sergio Rossi | 50 | 328 | 50 | 346 | 48 | 289 | 43 | 154 | ||||||||||||||||||||||||
| Caruso | 1 | 144 | 1 | 189 | 0 | 183 | 0 | 181 | ||||||||||||||||||||||||
| Total | 293 | 1,119 | 291 | 1,205 | 279 | 1,099 | 225 | 863 | ||||||||||||||||||||||||
Non-IFRS Financial Measures Reconciliation
(€ in Thousands, unless otherwise noted)
| 2021A | 2022A | 2023A | 2024A | |||||||||||||
| Reconciliation of Contribution Margin | FY | FY | FY | FY | ||||||||||||
| Revenue | 308,822 | 422,312 | 426,178 | 328,610 | ||||||||||||
| Cost of sales | -138,920 | -184,368 | -175,236 | -145,847 | ||||||||||||
| Gross profit | 169,902 | 237,944 | 250,942 | 182,763 | ||||||||||||
| Marketing and selling expenses | -165,502 | -224,733 | -226,750 | -208,803 | ||||||||||||
| Contribution profit (2) | 4,400 | 13,211 | 24,192 | -26,040 | ||||||||||||
(€ in Thousands, unless otherwise noted)
| 2021A | 2022A | 2023A | 2024A | |||||||||||||
| Reconciliation of Adjusted EBIT and EBITDA | FY | FY | FY | FY | ||||||||||||
| Loss for the year | -76,452 | -239,751 | -146,253 | -189,295 | ||||||||||||
| Add / (Deduct) the impact of: | ||||||||||||||||
| Income tax benefits / (expenses) | 4,331 | -129 | 3,407 | 3,078 | ||||||||||||
| Finance cost - net | 9,313 | 14,556 | 20,431 | 29,821 | ||||||||||||
| Non-underlying items (1) | -45,206 | 83,057 | 3,858 | -10,243 | ||||||||||||
| Loss from operating before non-underlying items | -108,014 | -142,267 | -118,557 | -166,639 | ||||||||||||
| Add / (Deduct) the impact of: | ||||||||||||||||
| Share based compensation | 7,208 | 7,431 | 2,749 | 551 | ||||||||||||
| Adjusted EBIT (2) | -100,806 | -134,836 | -115,808 | -166,088 | ||||||||||||
| Depreciation / Amortization | 41,584 | 45,810 | 46,946 | 46,542 | ||||||||||||
| Provision and impairment losses | 10,766 | 16,729 | 79 | 34,935 | ||||||||||||
| Net foreign exchange (gains) / losses | -10,489 | 339 | 4,610 | -7,709 | ||||||||||||
| Adjusted EBITDA (2) | -58,945 | -71,958 | -64,173 | -92,320 | ||||||||||||
Note:
| (1) | 2022 was impacted by a €84 million cost related to the Reverse Recapitalization that occurred as part of the SPAC merger; this cost is non-recurring in nature. |
| (2) | These are Non-IFRS Financial Measures and will be mentioned throughout this communication. Please see Non-IFRS Financial Measures and Definition. | |
| (3) | Brand-level results are presented exclusive of eliminations. | |
| (4) | DOS refers to Directly Operated Stores which include boutiques, outlets, concession shop-in-shops and pop-up stores. | |
| (5) | POS refers to Point of Sales which include DOS and wholesale accounts. |
Non-IFRS Financial Measures and Definition
Our management monitors and evaluates operating and financial performance using several non-IFRS financial measures including: contribution profit, contribution margin, Adjusted EBIT and Adjusted EBITDA. Our management believes that these non-IFRS financial measures provide useful and relevant information regarding our performance and improve their ability to assess financial performance and financial position. They also provide comparable measures that facilitate management’s ability to identify operational trends, as well as make decisions regarding future spending, resource allocations and other operational decisions. While similar measures are widely used in the industry in which we operate, the financial measures that we use may not be comparable to other similarly named measures used by other companies nor are they intended to be substitutes for measures of financial performance or financial position as prepared in accordance with IFRS.
Contribution profit is defined as revenue less the cost of sales and selling and marketing expenses. Contribution profit subtracts the main variable expenses of selling and marketing expenses from gross profit, and our management believes this measure is an important indicator of profitability at the marginal level. Below contribution profit, the main expenses are general administrative expenses and other operating expenses (which include foreign exchange gains or losses and impairment losses). As we continue to improve the management of our portfolio brands, we believe we can achieve greater economy of scale across the different brands by maintaining the fixed expenses at a lower level as a proportion of revenue. We therefore use contribution profit margin as a key indicator of profitability at the group level as well as the portfolio brand level.
Contribution margin is defined as contribution profit divided by revenue.
Adjusted EBIT is defined as profit or loss before income taxes, net finance cost, share based compensation, adjusted for income and costs which are significant in nature and that management considers not reflective of underlying operational activities, mainly including net gains on disposal of long-term assets, negative goodwill from acquisition of Sergio Rossi, gain on debt restructuring and government grants.
Adjusted EBITDA is defined as profit or loss before income taxes, net finance cost, exchange gains/(losses), depreciation, amortization, share based compensation and provisions and impairment losses adjusted for income and costs which are significant in nature and that management considers not reflective of underlying operational activities, mainly including net gains on disposal of long-term assets, negative goodwill from acquisition of Sergio Rossi, gain on debt restructuring and government grants.