UNITED STATES
SECURITIES AND EXCHANGE COMMISSION
Washington, D.C. 20549
FORM 8-K
CURRENT REPORT
Pursuant to Section 13 or 15(d) of the Securities Exchange Act of 1934
Date of Report (Date of earliest event reported): April 22, 2025
PennyMac Financial Services, Inc.
(Exact name of registrant as specified in its charter)
| Delaware | 001-38727 | 83-1098934 |
| (State or other jurisdiction of incorporation) |
(Commission File Number) |
(IRS Employer Identification No.) |
| 3043 Townsgate Road, Westlake Village, California |
91361 |
| (Address of principal executive offices) |
(Zip Code) |
(818) 224-7442
(Registrant’s telephone number, including area code)
Not Applicable
(Former name or former address, if changed since last report)
Check the appropriate box below if the Form 8-K filing is intended to simultaneously satisfy the filing obligation of the registrant under any of the following provisions:
| ¨ | Written communications pursuant to Rule 425 under the Securities Act (17 CFR 230.425) |
| ¨ | Soliciting material pursuant to Rule 14a-12 under the Exchange Act (17 CFR 240.14a-12) |
| ¨ | Pre-commencement communications pursuant to Rule 14d-2(b) under the Exchange Act (17 CFR 240.14d-2(b)) |
| ¨ | Pre-commencement communications pursuant to Rule 13e-4(c) under the Exchange Act (17 CFR 240.13e-4(c)) |
Securities registered pursuant to Section 12(b) of the Act:
| Title of each class | Trading Symbol(s) | Name of each exchange on which registered | ||
| Common Stock, $0.0001 par value | PFSI | New York Stock Exchange |
Indicate by check mark whether the registrant is an emerging growth company as defined in Rule 405 of the Securities Act of 1933 (§230.405 of this chapter) or Rule 12b-2 of the Securities Exchange Act of 1934 (§240.12b-2 of this chapter).
Emerging growth company ¨
If an emerging growth company, indicate by check mark if the registrant has elected not to use the extended transition period for complying with any new or revised financial accounting standards provided pursuant to Section 13(a) of the Exchange Act. ¨
Item 2.02 Results of Operations and Financial Condition.
On April 22, 2025, PennyMac Financial Services, Inc. (the “Company”) issued a press release and a slide presentation announcing its financial results for the fiscal quarter ended March 31, 2025. A copy of the press release and the slide presentation used in connection with the Company’s presentation of financial results were made available on April 22, 2025 and are furnished as Exhibits 99.1 and Exhibit 99.2, respectively. In addition, the Company has made available other supplemental financial information for the fiscal quarter ended March 31, 2025 on its website at pfsi.pennymac.com.
The information in Item 2.02 of this report, including the exhibits hereto, shall not be deemed “filed” for purposes of Section 18 of the Securities Exchange Act of 1934, or otherwise subject to the liabilities of Section 18, nor shall it be deemed incorporated by reference into any disclosure document relating to the Company, except to the extent, if any, expressly set forth by specific reference in such filing.
Item 9.01 Financial Statements and Exhibits.
(d) Exhibits.
| Exhibit No. | Description |
| 99.1 | Press Release, dated April 22, 2025, issued by PennyMac Financial Services, Inc. pertaining to its financial results for the fiscal quarter ended March 31, 2025. |
| 99.2 | Slide Presentation for use beginning on April 22, 2025 in connection with a presentation of financial results for the fiscal quarter ended March 31, 2025. |
| 104 | Cover Page Interactive Data File (embedded within the Inline XBRL document). |
SIGNATURE
Pursuant to the requirements of the Securities Exchange Act of 1934, the registrant has duly caused this report to be signed on its behalf by the undersigned hereunto duly authorized.
| PENNYMAC FINANCIAL SERVICES, INC. | |
| Dated: April 22, 2025 | /s/ Daniel S. Perotti |
| Daniel S. Perotti | |
| Senior Managing Director and Chief Financial Officer |
Exhibit 99.1

PennyMac Financial Services, Inc. Reports
First Quarter 2025 Results
WESTLAKE VILLAGE, Calif. – April 22, 2025 – PennyMac Financial Services, Inc. (NYSE: PFSI) today reported net income of $76.3 million for the first quarter of 2025, or $1.42 per share on a diluted basis, on revenue of $430.9 million. Book value per share increased to $75.57 from $74.54 at December 31, 2024.
PFSI’s Board of Directors declared a first quarter cash dividend of $0.30 per share, payable on May 23, 2025, to common stockholders of record as of May 14, 2025.
First Quarter 2025 Highlights
| · | Pretax income was $104.2 million, down from pretax income of $129.4 million in the prior quarter and up from $43.9 million in the first quarter of 2024 |
| · | Production segment pretax income was $61.9 million, down from $78.0 million in the prior quarter and up from $48.7 million in the first quarter of 2024 |
| o | Total loan acquisitions and originations, including those fulfilled for PMT, were $28.9 billion in unpaid principal balance (UPB), down 19 percent from the prior quarter and up 33 percent from the first quarter of 2024 |
| – | Correspondent acquisitions of conventional conforming and jumbo loans fulfilled for PennyMac Mortgage Investment Trust (NYSE: PMT) were $2.8 billion in UPB, down 20 percent from the prior quarter and up 57 percent from the first quarter of 2024 |
| – | PMT retained 21 percent of total conventional conforming correspondent loans in the first quarter, up from 19 percent in the prior quarter |
| o | Total locks, including those for PMT, were $34.2 billion in UPB, down 6 percent from the prior quarter and up 36 percent from the first quarter of 2024 |
| – | Correspondent lock volume for PMT’s account was $2.7 billion in UPB, down 14 percent from the prior quarter and up 10 percent from the first quarter of 2024 |
| · | Servicing segment pretax income was $76.0 million, down from $87.3 million in the prior quarter and up from $23.7 million in the first quarter of 2024 |
| o | Pretax income excluding valuation-related changes was $171.5 million, up 2 percent from the prior quarter as higher loan servicing fees and lower payoff-related expenses were largely offset by higher realization of mortgage servicing rights (MSR) cash flows and lower earnings on custodial balances |
| o | Valuation-related changes included: |
| – | $205.5 million in MSR fair value losses partially offset by $106.8 million in hedging gains |
| · | Net impact on pretax income related to these items was $(98.7) million, or $(1.35) in earnings per share |
| – | $3.2 million of reversals related to provisions for losses on active loans |
| o | Servicing portfolio grew to $680.2 billion in UPB, up 2 percent from December 31, 2024 and 10 percent from March 31, 2024 driven by production volumes which more than offset prepayment activity |
| · | Pretax loss from Corporate and Other was $33.7 million, compared to $35.9 million in the prior quarter and $28.4 million in the first quarter of 2024 |
| · | Issued $850 million of 8-year unsecured senior notes due in February 2033 |
“PennyMac Financial delivered solid first quarter financial results, demonstrating our ability to consistently generate strong returns in a volatile market,” said Chairman and CEO David Spector. “In our production segment, we acquired or originated nearly $30 billion in unpaid principal balance of loans at higher note rates, which strategically positions our consumer direct division for significant growth when interest rates decline. This production led to continued growth of our servicing portfolio, which ended the quarter at $680 billion in unpaid principal balance.”
Mr. Spector continued, “The strategic alignment of our loan production to our defined credit standards, combined with our synergistic relationship with PMT and our dynamic hedging program uniquely positions us to thrive in a market environment characterized by broader economic volatility, consolidation and regulatory change. We remain intensely focused on the organic growth of our servicing portfolio and the continued development of our balanced business model, and we are committed to successfully navigating this economic landscape without distraction.”
Mr. Spector concluded, “Finally, we are focused on maximizing the opportunities presented by our balanced business model. This includes leveraging our unmatched expertise and servicing technology to expand our subservicing business beyond PMT. We are also committed to implementing artificial intelligence throughout our technology stack, with the potential to unlock additional efficiencies and further enhance our capabilities. In total, we are confident in our ability to continue delivering strong financial performance and creating value for our stockholders, driven by our strategic portfolio growth, credit management capabilities, and an unwavering focus on our core business objectives.”
The following table presents the contributions of PennyMac Financial’s segments to pretax income:
| Quarter ended March 31, 2025 | ||||||||||||||||||||
| Reportable | ||||||||||||||||||||
| Production | Servicing | segment total |
Corporate and other |
Total | ||||||||||||||||
| (in thousands) | ||||||||||||||||||||
| Revenue: | ||||||||||||||||||||
| Net gains on loans held for sale at fair value | $ | 187,145 | $ | 33,892 | $ | 221,037 | $ | - | $ | 221,037 | ||||||||||
| Loan origination fees | 46,611 | - | 46,611 | - | 46,611 | |||||||||||||||
| Fulfillment fees from PMT | 5,290 | - | 5,290 | - | 5,290 | |||||||||||||||
| Net loan servicing fees | - | 164,286 | 164,286 | - | 164,286 | |||||||||||||||
| Management fees | - | - | - | 7,012 | 7,012 | |||||||||||||||
| Net interest income (expense): | ||||||||||||||||||||
| Interest income | 85,288 | 104,134 | 189,422 | 449 | 189,871 | |||||||||||||||
| Interest expense | 76,526 | 131,556 | 208,082 | - | 208,082 | |||||||||||||||
| 8,762 | (27,422 | ) | (18,660 | ) | 449 | (18,211 | ) | |||||||||||||
| Other | 131 | (173 | ) | (42 | ) | 4,920 | 4,878 | |||||||||||||
| Total net revenue | 247,939 | 170,583 | 418,522 | 12,381 | 430,903 | |||||||||||||||
| Expenses | ||||||||||||||||||||
| Compensation | 98,869 | 52,970 | 151,839 | 30,149 | 181,988 | |||||||||||||||
| Loan origination | 44,096 | - | 44,096 | - | 44,096 | |||||||||||||||
| Technology | 25,100 | 10,385 | 35,485 | 4,712 | 40,197 | |||||||||||||||
| Servicing | - | 21,875 | 21,875 | - | 21,875 | |||||||||||||||
| Marketing and advertising | 8,023 | 373 | 8,396 | 1,036 | 9,432 | |||||||||||||||
| Professional services | 3,134 | 1,681 | 4,815 | 4,222 | 9,037 | |||||||||||||||
| Occupancy and equipment | 4,128 | 2,729 | 6,857 | 1,525 | 8,382 | |||||||||||||||
| Other | 2,646 | 4,569 | 7,215 | 4,485 | 11,700 | |||||||||||||||
| Total expenses | 185,996 | 94,582 | 280,578 | 46,129 | 326,707 | |||||||||||||||
| Income (loss) before provision for income taxes | $ | 61,943 | $ | 76,001 | $ | 137,944 | $ | (33,748 | ) | $ | 104,196 | |||||||||
Production Segment
The Production segment includes the correspondent acquisition of newly originated government-insured and certain conventional conforming loans for PennyMac Financial’s own account, fulfillment services on behalf of PMT and direct lending through the consumer direct and broker direct channels, including the underwriting and acquisition of loans from correspondent sellers on a non-delegated basis.
PennyMac Financial’s loan production activity for the quarter totaled $28.9 billion in UPB, $26.1 billion of which was for its own account, and $2.8 billion of which was fee-based fulfillment activity for PMT. Correspondent locks for PFSI and direct lending IRLCs totaled $31.5 billion in UPB, down 5 percent from the prior quarter and up 39 percent from the first quarter of 2024.
Production segment pretax income was $61.9 million, down from $78.0 million in the prior quarter and up from $48.7 million in the first quarter of 2024. Production segment revenue totaled $247.9 million, down 5 percent from the prior quarter and up 35 percent from the first quarter of 2024. The decrease from the prior quarter was driven by a decline in origination fees and net gains on loans held for sale at fair value due to lower funded volumes. The increase from the first quarter of 2024 was driven primarily by higher volumes across all channels.
The components of net gains on loans held for sale are detailed in the following table:
| Quarter ended | ||||||||||||
| March 31, 2025 |
December 31, 2024 |
March 31, 2024 |
||||||||||
| (in thousands) | ||||||||||||
| Receipt of MSRs | $ | 650,349 | $ | 748,121 | $ | 412,520 | ||||||
| Gains on sale of loans to PennyMac Mortgage Investment Trust net of mortgage servicing rights recapture payable | 4,838 | 2,387 | (353 | ) | ||||||||
| Provision for representations and warranties, net | (2,132 | ) | (1,633 | ) | (632 | ) | ||||||
| Cash loss, including cash hedging results | (587,009 | ) | (373,307 | ) | (158,971 | ) | ||||||
| Fair value changes of pipeline, inventory and hedges | 154,991 | (153,524 | ) | (90,123 | ) | |||||||
| Net gains on mortgage loans held for sale | $ | 221,037 | $ | 222,044 | $ | 162,441 | ||||||
| Net gains on mortgage loans held for sale by segment: | ||||||||||||
| Production | $ | 187,145 | $ | 195,070 | $ | 141,431 | ||||||
| Servicing | $ | 33,892 | $ | 26,974 | $ | 21,010 | ||||||
PennyMac Financial performs fulfillment services for certain conventional conforming and jumbo loans acquired by PMT from non-affiliates in its correspondent production business. These services include, but are not limited to, marketing, relationship management, correspondent seller approval and monitoring, loan file review, underwriting, pricing, hedging and activities related to the subsequent sale and securitization of loans in the secondary mortgage markets for PMT.
Fees earned from the fulfillment of correspondent loans on behalf of PMT totaled $5.3 million in the first quarter, down 17 percent from the prior quarter and up 32 percent from the first quarter of 2024. The quarter-over-quarter decrease was driven by lower conventional acquisition volumes for PMT’s account. In the second quarter of 2025, we expect PMT to retain all jumbo production and 15 to 25 percent of total conventional conforming correspondent production, compared to 21 percent in the first quarter.
Under a renewed mortgage banking services agreement with PMT, effective July 1, 2025, correspondent production volumes will initially be acquired by PFSI. PMT will retain the right to purchase up to 100 percent of non-government correspondent loan production.
Net interest income in the first quarter totaled $8.8 million, compared to $1.8 million in the prior quarter. Interest income totaled $85.3 million, down from $93.8 million in the prior quarter, and interest expense totaled $76.5 million, down from $92.0 million in the prior quarter, both due to lower average balances of loans held for sale due the decline in funded volumes.
Production segment expenses were $186.0 million, up 2 percent from the prior quarter and 38 percent from the first quarter of 2024.
Servicing Segment
The Servicing segment includes income from owned MSRs and subservicing. The total servicing portfolio grew to $680.2 billion in UPB at March 31, 2025, an increase of 2 percent from December 31, 2024 and 10 percent from March 31, 2024. PennyMac Financial’s owned MSR portfolio grew to $449.1 billion in UPB, an increase of 3 percent from December 31, 2024 and 16 percent from March 31, 2024. PennyMac Financial subservices $229.9 billion in UPB for PMT, $75 million in UPB for other non-affiliates, and subservices on an interim basis $1.1 billion in UPB of previously owned servicing that has been repurchased by the United States Veterans Affairs (VA) pursuant to the Veterans Affairs Servicing Purchase (VASP) program.
The table below details PennyMac Financial’s servicing portfolio UPB:
| March 31, 2025 |
December 31, 2024 |
March 31, 2024 |
||||||||||
| (in thousands) | ||||||||||||
| Owned | ||||||||||||
| Mortgage servicing rights and liabilities | ||||||||||||
| Originated | $ | 426,951,027 | $ | 410,393,342 | $ | 364,441,567 | ||||||
| Purchased | 15,276,140 | 15,681,406 | 17,051,740 | |||||||||
| 442,227,167 | 426,074,748 | 381,493,307 | ||||||||||
| Loans held for sale | 6,911,473 | 8,128,914 | 5,111,719 | |||||||||
| 449,138,640 | 434,203,662 | 386,605,026 | ||||||||||
| Subserviced for: | ||||||||||||
| PMT | 229,907,855 | 230,753,581 | 230,819,012 | |||||||||
| U.S. Department of Veterans Affairs | 1,072,760 | 806,584 | - | |||||||||
| Other non-affiliates | 75,310 | - | - | |||||||||
| 231,055,925 | 231,560,165 | 230,819,012 | ||||||||||
| Total loans serviced | $ | 680,194,565 | $ | 665,763,827 | $ | 617,424,038 | ||||||
Servicing segment pretax income was $76.0 million, down from $87.3 million in the prior quarter and up from $23.7 million in the first quarter of 2024. Servicing segment net revenues totaled $170.6 million, down from $197.5 million in the prior quarter and up from $111.1 million in the first quarter of 2024.
Revenue from net loan servicing fees totaled $164.3 million, down from $189.3 million in the prior quarter and up from $101.0 million in the first quarter of 2024. The decrease from the prior quarter was primarily driven by an increase in net valuation-related losses. Net loan servicing fee revenues included $488.5 million in loan servicing fees, which was up from the prior quarter due to growth in the owned portfolio, reduced by $225.5 million from the realization of MSR cash flows. Net valuation-related losses totaled $98.7 million and included MSR fair value losses of $205.5 million driven by the decrease in market interest rates, and hedging gains of $106.8 million.
The following table presents a breakdown of net loan servicing fees:
| Quarter ended | ||||||||||||
| March 31, 2025 |
December 31, 2024 |
March 31, 2024 |
||||||||||
| (in thousands) | ||||||||||||
| Loan servicing fees | $ | 488,468 | $ | 472,563 | $ | 424,184 | ||||||
| Changes in fair value of MSRs and MSLs resulting from: | ||||||||||||
| Realization of cash flows | (225,462 | ) | (215,590 | ) | (198,564 | ) | ||||||
| Change in fair value inputs | (205,494 | ) | 540,406 | 169,979 | ||||||||
| Hedging gains (losses) | 106,774 | (608,112 | ) | (294,645 | ) | |||||||
| Net change in fair value of MSRs and MSLs | (324,182 | ) | (283,296 | ) | (323,230 | ) | ||||||
| Net loan servicing fees | $ | 164,286 | $ | 189,267 | $ | 100,954 | ||||||
Servicing segment revenue included $33.9 million in net gains on loans held for sale related to early buyout loans (EBOs), up from $27.0 million in the prior quarter and $21.0 million in the first quarter of 2024. These EBOs are previously delinquent loans that were brought back to performing status through PennyMac Financial’s successful servicing efforts.
Net interest expense totaled $27.4 million, compared to $19.5 million in the prior quarter and $11.3 million in the first quarter of 2024. Interest income was $104.1 million, down from $116.7 million in the prior quarter due to decreased placement fees on custodial balances due to lower average balances from seasonal impacts and lower prepayment activity. Interest expense was $131.6 million, down from $136.1 in the prior quarter as a higher average balances of financing for MSR assets was offset by lower financing rates on floating rate debt.
Servicing segment expenses totaled $94.6 million, down from $110.2 million in the prior quarter primarily due to a reversal in the provision for credit losses on active loans.
Corporate and Other
Corporate and Other items include amounts attributable to corporate activities not directly attributable to the production and servicing segments as well as management fees earned from PMT. PennyMac Financial manages PMT for which it earns base management fees and may earn incentive compensation.
Pretax loss for Corporate and Other was $33.7 million, compared to $35.9 million in the prior quarter and $28.4 million in the first quarter of 2024.
Revenues from Corporate and Other were $12.4 million, and consisted of $7.0 million in management fees, $4.9 million in other revenue, and $0.4 million of net interest income. No performance incentive fees were earned in the first quarter.
Expenses were $46.1 million, down from $47.4 million in the prior quarter and up from $39.6 million in the first quarter of 2024.
Net assets under management were $1.9 billion as of March 31, 2025, essentially unchanged from December 31, 2024 and down slightly from $2.0 billion at March 31, 2024.
The following table presents a breakdown of management fees:
| Quarter ended | ||||||||||||
| March 31, 2025 |
December 31, 2024 |
March 31, 2024 |
||||||||||
| (in thousands) | ||||||||||||
| Management fees: | ||||||||||||
| Base | $ | 7,012 | $ | 7,149 | $ | 7,188 | ||||||
| Performance incentive | - | - | - | |||||||||
| Total management fees | $ | 7,012 | $ | 7,149 | $ | 7,188 | ||||||
| Net assets of PennyMac Mortgage Investment Trust | $ | 1,902,718 | $ | 1,938,500 | $ | 1,958,914 | ||||||
Consolidated Expenses
Total expenses were $326.7 million, down from $340.7 million in the prior quarter primarily due to lower expenses in the servicing segment as mentioned above.
Taxes
PFSI recorded a provision for tax expense of $27.9 million, resulting in an effective tax rate of 26.8 percent.
***
Management’s slide presentation and accompanying material will be available in the Investor Relations section of the Company’s website at pfsi.pennymac.com after the market closes on Tuesday, April 22, 2025. Management will also host a conference call and live audio webcast at 5:00 p.m. Eastern Time to review the Company’s financial results. The webcast can be accessed at pfsi.pennymac.com, and a replay will be available shortly after its conclusion.
***
About PennyMac Financial Services, Inc.
PennyMac Financial Services, Inc. is a specialty financial services firm focused on the production and servicing of U.S. mortgage loans and the management of investments related to the U.S. mortgage market. Founded in 2008, the company is recognized as a leader in the U.S. residential mortgage industry and employs approximately 4,200 people across the country. For the twelve months ended March 31, 2025, PennyMac Financial’s production of newly originated loans totaled $123 billion in unpaid principal balance, making it a top lender in the nation. As of March 31, 2025, PennyMac Financial serviced loans totaling $680 billion in unpaid principal balance, making it a top mortgage servicer in the nation. Additional information about PennyMac Financial Services, Inc. is available at pfsi.pennymac.com.
| Media | Investors |
| Kristyn Clark | Kevin Chamberlain |
| mediarelations@pennymac.com | Isaac Garden |
| 805.395.9943 | PFSI_IR@pennymac.com |
| 818.264.4907 |
Forward-Looking Statements
This press release contains forward-looking statements within the meaning of Section 21E of the Securities Exchange Act of 1934, as amended, regarding management’s beliefs, estimates, projections, and assumptions with respect to, among other things, our financial results, future operations, business plans and investment strategies, as well as industry and market conditions, all of which are subject to change. Words like “believe,” “expect,” “anticipate,” “promise,” “project,” “plan,” and other expressions or words of similar meanings, as well as future or conditional verbs such as “will,” “would,” “should,” “could,” or “may” are generally intended to identify forward-looking statements. Actual results and operations for any future period may vary materially from those projected herein and from past results discussed herein. Factors which could cause actual results to differ materially from historical results or those anticipated include, but are not limited to: interest rate changes; real estate value changes, housing prices and housing sales; changes in macroeconomic, consumer and real estate market conditions; the continually changing federal, state and local laws and regulations applicable to the highly regulated industry in which we operate; lawsuits or governmental actions that may result from any noncompliance with the laws and regulations applicable to our business; the mortgage lending and servicing-related regulations promulgated by federal and state regulators and the enforcement of these regulations; the licensing and operational requirements of states and other jurisdictions applicable to our business, to which our bank competitors are not subject; foreclosure delays and changes in foreclosure practices; difficulties inherent in adjusting the size of our operations to reflect changes in business levels; purchase opportunities for mortgage servicing rights; our substantial amount of indebtedness; increases in loan delinquencies, defaults and forbearances; our dependence on U.S. government-sponsored entities and changes in their current roles or their guarantees or guidelines; our reliance on PennyMac Mortgage Investment Trust (NYSE: PMT) as a significant contributor to our mortgage banking business; maintaining sufficient capital and liquidity and compliance with financial covenants; our obligation to indemnify third-party purchasers or repurchase loans if loans that we originate, acquire, service or assist in the fulfillment of fail to meet certain criteria; our obligation to indemnify PMT if our services fail to meet certain criteria or characteristics or under other circumstances; investment management and incentive fees; conflicts of interest in allocating our services and investment opportunities among us and our advised entity; our ability to mitigate cybersecurity risks, cyber incidents and technology disruptions; the development of artificial intelligence; the effect of public opinion on our reputation; our exposure to risks of loss and disruptions in operations resulting from severe weather events, man-made or other natural conditions, including climate change and pandemics; our ability to effectively identify, manage and hedge our credit, interest rate, prepayment, liquidity and climate risks; our initiation or expansion of new business activities or strategies; our ability to detect misconduct and fraud; our ability to pay dividends to our stockholders; and our organizational structure and certain requirements in our charter documents. You should not place undue reliance on any forward- looking statement and should consider all of the uncertainties and risks described above, as well as those more fully discussed in reports and other documents filed by the Company with the Securities and Exchange Commission from time to time. The Company undertakes no obligation to publicly update or revise any forward-looking statements or any other information contained herein, and the statements made in this press release are current as of the date of this release only.
The press release contains financial information calculated other than in accordance with U.S. generally accepted accounting principles (“GAAP”), such as pretax income excluding valuation-related items and operating net income that provide a meaningful perspective on the Company’s business results since the Company utilizes this information to evaluate and manage the business. Non-GAAP disclosures have limitations as an analytical tool and should not be viewed as a substitute for financial information determined in accordance with GAAP.
The following table presents the contributions of PennyMac Financial’s segments to pretax income in the first quarter of 2024:
| Quarter ended March 31, 2024 | ||||||||||||||||||||
| Reportable | ||||||||||||||||||||
| Production | Servicing | segment total |
Corporate and other |
Total | ||||||||||||||||
| (in thousands) | ||||||||||||||||||||
| Revenue: | ||||||||||||||||||||
| Net gains on loans held for sale at fair value | $ | 141,431 | $ | 21,010 | $ | 162,441 | $ | - | $ | 162,441 | ||||||||||
| Loan origination fees | 36,371 | - | 36,371 | - | 36,371 | |||||||||||||||
| Fulfillment fees from PMT | 4,016 | - | 4,016 | - | 4,016 | |||||||||||||||
| Net loan servicing fees | - | 100,954 | 100,954 | - | 100,954 | |||||||||||||||
| Management fees | - | - | - | 7,188 | 7,188 | |||||||||||||||
| Net interest income (expense): | ||||||||||||||||||||
| Interest income | 63,371 | 92,541 | 155,912 | 514 | 156,426 | |||||||||||||||
| Interest expense | 61,896 | 103,873 | 165,769 | - | 165,769 | |||||||||||||||
| 1,475 | (11,332 | ) | (9,857 | ) | 514 | (9,343 | ) | |||||||||||||
| Other | 116 | 507 | 623 | 3,410 | 4,033 | |||||||||||||||
| Total net revenue | 183,409 | 111,139 | 294,548 | 11,112 | 305,660 | |||||||||||||||
| Expenses | ||||||||||||||||||||
| Compensation | 70,193 | 52,400 | 122,593 | 23,783 | 146,376 | |||||||||||||||
| Loan origination | 30,568 | - | 30,568 | - | 30,568 | |||||||||||||||
| Technology | 22,768 | 9,764 | 32,532 | 3,435 | 35,967 | |||||||||||||||
| Servicing | - | 16,104 | 16,104 | - | 16,104 | |||||||||||||||
| Marketing and advertising | 3,596 | 29 | 3,625 | 46 | 3,671 | |||||||||||||||
| Professional services | 2,062 | 1,348 | 3,410 | 5,852 | 9,262 | |||||||||||||||
| Occupancy and equipment | 4,138 | 2,905 | 7,043 | 1,633 | 8,676 | |||||||||||||||
| Other | 1,406 | 4,936 | 6,342 | 4,811 | 11,153 | |||||||||||||||
| Total expenses | 134,731 | 87,486 | 222,217 | 39,560 | 261,777 | |||||||||||||||
| Income (loss) before provision for income taxes | $ | 48,678 | $ | 23,653 | $ | 72,331 | $ | (28,448 | ) | $ | 43,883 | |||||||||
PENNYMAC FINANCIAL SERVICES, INC.
CONSOLIDATED BALANCE SHEETS (UNAUDITED)
| March 31, 2025 |
December 31, 2024 |
March 31, 2024 |
||||||||||
| (in thousands, except share amounts) | ||||||||||||
| ASSETS | ||||||||||||
| Cash | $ | 211,093 | $ | 238,482 | $ | 927,394 | ||||||
| Short-term investment at fair value | 443,393 | 420,553 | 69 | |||||||||
| Principal-only stripped mortgage-backed securities at fair value | 817,596 | 825,865 | 524,576 | |||||||||
| Loans held for sale at fair value | 7,095,270 | 8,217,468 | 5,200,350 | |||||||||
| Derivative assets | 171,931 | 113,076 | 108,987 | |||||||||
| Servicing advances, net | 496,917 | 568,512 | 499,955 | |||||||||
| Mortgage servicing rights at fair value | 8,963,889 | 8,744,528 | 7,483,210 | |||||||||
| Investment in PennyMac Mortgage Investment Trust at fair value | 1,099 | 944 | 1,101 | |||||||||
| Receivable from PennyMac Mortgage Investment Trust | 29,198 | 30,206 | 30,835 | |||||||||
| Loans eligible for repurchase | 4,979,127 | 6,157,172 | 4,401,896 | |||||||||
| Other | 663,363 | 770,081 | 623,368 | |||||||||
| Total assets | $ | 23,872,876 | $ | 26,086,887 | $ | 19,801,741 | ||||||
| LIABILITIES | ||||||||||||
| Assets sold under agreements to repurchase | $ | 7,058,053 | $ | 8,685,207 | $ | 5,435,354 | ||||||
| Mortgage loan participation purchase and sale agreements | 510,141 | 496,512 | 363,798 | |||||||||
| Notes payable secured by mortgage servicing assets | 1,724,608 | 2,048,972 | 1,972,020 | |||||||||
| Unsecured senior notes | 3,998,702 | 3,164,032 | 2,521,031 | |||||||||
| Derivative liabilities | 15,293 | 40,900 | 40,784 | |||||||||
| Mortgage servicing liabilities at fair value | 1,651 | 1,683 | 1,732 | |||||||||
| Accounts payable and accrued expenses | 365,056 | 354,414 | 263,338 | |||||||||
| Payable to PennyMac Mortgage Investment Trust | 101,175 | 122,317 | 127,993 | |||||||||
| Payable to exchanged Private National Mortgage Acceptance Company, LLC unitholders under tax receivable agreement | 25,898 | 25,898 | 26,099 | |||||||||
| Income taxes payable | 1,158,642 | 1,131,000 | 1,047,337 | |||||||||
| Liability for loans eligible for repurchase | 4,979,127 | 6,157,172 | 4,401,896 | |||||||||
| Liability for losses under representations and warranties | 30,774 | 29,129 | 29,976 | |||||||||
| Total liabilities | 19,969,120 | 22,257,236 | 16,231,358 | |||||||||
| STOCKHOLDERS' EQUITY | ||||||||||||
| Common stock¾authorized 200,000,000 shares of $0.0001 par value; issued and outstanding 51,658,984, 51,376,616, and 50,907,865 shares, respectively | 5 | 5 | 5 | |||||||||
| Additional paid-in capital | 68,902 | 56,072 | 27,179 | |||||||||
| Retained earnings | 3,834,849 | 3,773,574 | 3,543,199 | |||||||||
| Total stockholders' equity | 3,903,756 | 3,829,651 | 3,570,383 | |||||||||
| Total liabilities and stockholders’ equity | $ | 23,872,876 | $ | 26,086,887 | $ | 19,801,741 | ||||||
PENNYMAC FINANCIAL SERVICES, INC.
CONSOLIDATED STATEMENTS OF INCOME (UNAUDITED)
| Quarter ended | ||||||||||||
| March 31, 2025 |
December 31, 2024 |
March 31, 2024 |
||||||||||
| (in thousands, except per share amounts) | ||||||||||||
| Revenues | ||||||||||||
| Net gains on loans held for sale at fair value | $ | 221,037 | $ | 222,044 | $ | 162,441 | ||||||
| Loan origination fees | 46,611 | 57,824 | 36,371 | |||||||||
| Fulfillment fees from PennyMac Mortgage Investment Trust | 5,290 | 6,356 | 4,016 | |||||||||
| Net loan servicing fees: | ||||||||||||
| Loan servicing fees | 488,468 | 472,563 | 424,184 | |||||||||
| Change in fair value of mortgage servicing rights and mortgage servicing liabilities | (430,956 | ) | 324,816 | (28,585 | ) | |||||||
| Mortgage servicing rights hedging results | 106,774 | (608,112 | ) | (294,645 | ) | |||||||
| Net loan servicing fees | 164,286 | 189,267 | 100,954 | |||||||||
| Net interest expense: | ||||||||||||
| Interest income | 189,871 | 210,859 | 156,426 | |||||||||
| Interest expense | 208,082 | 228,111 | 165,769 | |||||||||
| (18,211 | ) | (17,252 | ) | (9,343 | ) | |||||||
| Management fees from PennyMac Mortgage Investment Trust | 7,012 | 7,149 | 7,188 | |||||||||
| Other | 4,878 | 4,722 | 4,033 | |||||||||
| Total net revenues | 430,903 | 470,110 | 305,660 | |||||||||
| Expenses | ||||||||||||
| Compensation | 181,988 | 173,090 | 146,376 | |||||||||
| Loan origination | 44,096 | 48,046 | 30,568 | |||||||||
| Technology | 40,197 | 40,831 | 35,967 | |||||||||
| Servicing | 21,875 | 38,088 | 16,104 | |||||||||
| Marketing and advertising | 9,432 | 7,765 | 3,671 | |||||||||
| Professional services | 9,037 | 9,987 | 9,262 | |||||||||
| Occupancy and equipment | 8,382 | 8,173 | 8,676 | |||||||||
| Other | 11,700 | 14,766 | 11,153 | |||||||||
| Total expenses | 326,707 | 340,746 | 261,777 | |||||||||
| Income before provision for income taxes | 104,196 | 129,364 | 43,883 | |||||||||
| Provision for income taxes | 27,916 | 24,875 | 4,575 | |||||||||
| Net income | $ | 76,280 | $ | 104,489 | $ | 39,308 | ||||||
| Earnings per share | ||||||||||||
| Basic | $ | 1.48 | $ | 2.04 | $ | 0.78 | ||||||
| Diluted | $ | 1.42 | $ | 1.95 | $ | 0.74 | ||||||
| Weighted-average common shares outstanding | ||||||||||||
| Basic | 51,506 | 51,274 | 50,547 | |||||||||
| Diluted | 53,624 | 53,576 | 53,100 | |||||||||
| Dividend declared per share | $ | 0.30 | $ | 0.30 | $ | 0.20 | ||||||
|
PennyMac Financial Services, Inc. 1Q25 EARNINGS REPORT April 2025 |
|
This presentation contains forward-looking statements within the meaning of Section 21E of the Securities Exchange Act of 1934, as amended, regarding management’s beliefs, estimates, projections and assumptions with respect to, among other things, our financial results, future operations, business plans and investment strategies, as well as industry and market conditions, all of which are subject to change. Words like “believe,” “expect,” “anticipate,” “promise,” “project,” “plan,” and other expressions or words of similar meanings, as well as future or conditional verbs such as “will,” “would,” “should,” “could,” or “may” are generally intended to identify forward-looking statements. Actual results and operations for any future period may vary materially from those projected herein and from past results discussed herein. These forward-looking statements include, but are not limited to, statements regarding future changes in interest rates, prepayment rates and the housing market; future loan origination, servicing and production, including future production, operating and hedge expenses; future loan delinquencies, defaults and forbearances; future earnings and return on equity as well as other business and financial expectations. Factors which could cause actual results to differ materially from historical results or those anticipated include, but are not limited to: interest rate changes; real estate value changes, housing prices and housing sales; changes in macroeconomic, consumer and real estate market conditions; the continually changing federal, state and local laws and regulations applicable to the highly regulated industry in which we operate; lawsuits or governmental actions that may result from any noncompliance with the laws and regulations applicable to our business; the mortgage lending and servicing-related regulations promulgated by federal and state regulators and the enforcement of these regulations; the licensing and operational requirements of states and other jurisdictions applicable to our business, to which our bank competitors are not subject; foreclosure delays and changes in foreclosure practices; difficulties inherent in adjusting the size of our operations to reflect changes in business levels; purchase opportunities for mortgage servicing rights; our substantial amount of indebtedness; increases in loan delinquencies, defaults and forbearances; our dependence on U.S. government-sponsored entities and changes in their current roles or their guarantees or guidelines; our reliance on PennyMac Mortgage Investment Trust (NYSE: PMT) as a significant contributor to our mortgage banking business; maintaining sufficient capital and liquidity and compliance with financial covenants; our obligation to indemnify third-party purchasers or repurchase loans if loans that we originate, acquire, service or assist in the fulfillment of, fail to meet certain criteria; our obligation to indemnify PMT if our services fail to meet certain criteria or characteristics or under other circumstances; investment management and incentive fees; conflicts of interest in allocating our services and investment opportunities among us and our advised entity; our ability to mitigate cybersecurity risks, cyber incidents and technology disruptions; the development of artificial intelligence; the effect of public opinion on our reputation; our exposure to risks of loss and disruptions in operations resulting from severe weather events, man-made or other natural conditions, including climate change and pandemics; our ability to effectively identify, manage and hedge our credit, interest rate, prepayment, liquidity and climate risks; our initiation or expansion of new business activities or strategies; our ability to detect misconduct and fraud; our ability to pay dividends to our stockholders; and our organizational structure and certain requirements in our charter documents. You should not place undue reliance on any forward-looking statement and should consider all of the uncertainties and risks described above, as well as those more fully discussed in reports and other documents filed by the Company with the Securities and Exchange Commission from time to time. The Company undertakes no obligation to publicly update or revise any forward-looking statements or any other information contained herein, and the statements made in this press release are current as of the date of this release only. This presentation contains financial information calculated other than in accordance with U.S. generally accepted accounting principles (“GAAP”), such as pretax income excluding valuation-related items and operating net income that provide a meaningful perspective on the Company’s business results since the Company utilizes this information to evaluate and manage the business. Non-GAAP disclosures have limitations as an analytical tool and should not be viewed as a substitute for financial information determined in accordance with GAAP. 2 FORWARD-LOOKING STATEMENTS |
|
3 Annualized return on equity Annualized operating return on equity⁽²⁾ 8% 15% FIRST QUARTER HIGHLIGHTS 1Q25 Results Book value per share Dividend per common share $75.57 $0.30 Note: All figures are for 1Q25 or are as of 3/31/25 (1) EPS = earnings per share; MSR = mortgage servicing rights; UPB = unpaid principal balance, includes loans held for sale at fair value (2) See slide 36 for a reconciliation of GAAP net income to non-GAAP annualized operating return on equity (3) Includes volume fulfilled or subserviced for PMT (4) Excludes $205 million in MSR fair value declines, $107 million in hedging gains, and a $3 million reversal of provision for gains on active loans - see slide 18 for additional details Strong operating results partially offset by net fair value declines on hedged mortgage servicing rights Production Segment Servicing Segment Total loan acquisitions and originations⁽³⁾ PFSI correspondent lock volume $28.9bn $22.1bn Pretax income $62mm Broker direct lock volume Consumer direct lock volume $5.5bn $3.9bn Pretax income $76mm MSR⁽¹⁾ fair value changes and hedging results $(99)mm Pretax income excluding valuation-related items⁽⁴⁾ $172mm Total servicing portfolio UPB⁽¹⁾⁽³⁾ $680bn MSR fair value changes and hedging impact to diluted EPS $(1.35) Net income Diluted EPS⁽¹⁾ $76mm $1.42 |
|
CONFIDENTIAL & PROPRIETARY ● Represents a significant milestone in our brand-building efforts ● Reinforces our core values and creates meaningful connections with the customers and communities we serve ● Underscores our commitment to excellence, community engagement and national pride With recent investments in technology and capacity, we are primed for a sustained investment in our brand; this highly respected partnership distinguishes Pennymac and establishes brand recognition and credibility with our many stakeholders PENNYMAC IS PROUD TO BE THE OFFICIAL MORTGAGE SUPPORTER OF THE 2026 AND 2028 U.S. OLYMPIC AND PARALYMPIC TEAMS, AND A PROUD SUPPORTER OF TEAM USA AND THE LA28 GAMES 4 |
|
CONFIDENTIAL & PROPRIETARY Our commitment aligns with the spirit of Team USA and the values they serve: pursuit of excellence, leading courageously, serving others, and fostering belonging TEAM USA AND THE OLYMPIC AND PARALYMPIC GAMES REPRESENT THE BEST OF LIVE SPORTS 5 US fan base of over 170 million, larger than all major sports leagues and franchises(1) More family and female fans(1) and strong connections to the Veteran community Brands associated with Team USA have increases in engagement, and customers are more likely to buy and use their products(2) Increased awareness and familiarity with Pennymac to drive growth in portfolio recapture and non-portfolio originations Elevates the company’s positioning with customers and key stakeholders while fostering a strong employment brand (1) Nielsen, MRI Survey of the American Consumer, Spring 2024 (2) NBCU Olympics Ad Engine, LA28/USOPC US Olympic Brand Tracker |
|
6 ORIGINATION MARKET EXPECTATIONS REFLECT GROWTH U.S. Mortgage Origination Market(1) ($ in trillions) Mortgage Rates Remain Elevated Note: Figures may not sum due to rounding (1) Actual originations: Inside Mortgage Finance. Forecast originations: Average of Mortgage Bankers Association (4/11/25) and Fannie Mae (3/12/25) forecasts. (2) Freddie Mac Primary Mortgage Market Survey. 6.83% as of 4/17/25 • Current third-party estimates for industry originations average $2.0 trillion in 2025, reflecting projections for growth in overall volumes • Mortgage banking companies with large servicing portfolios and diversified business models are positioned to generate meaningful profitability whether the mortgage markets decrease or increase in size Purchase Average 30-year fixed rate mortgage Refinance (2) |
|
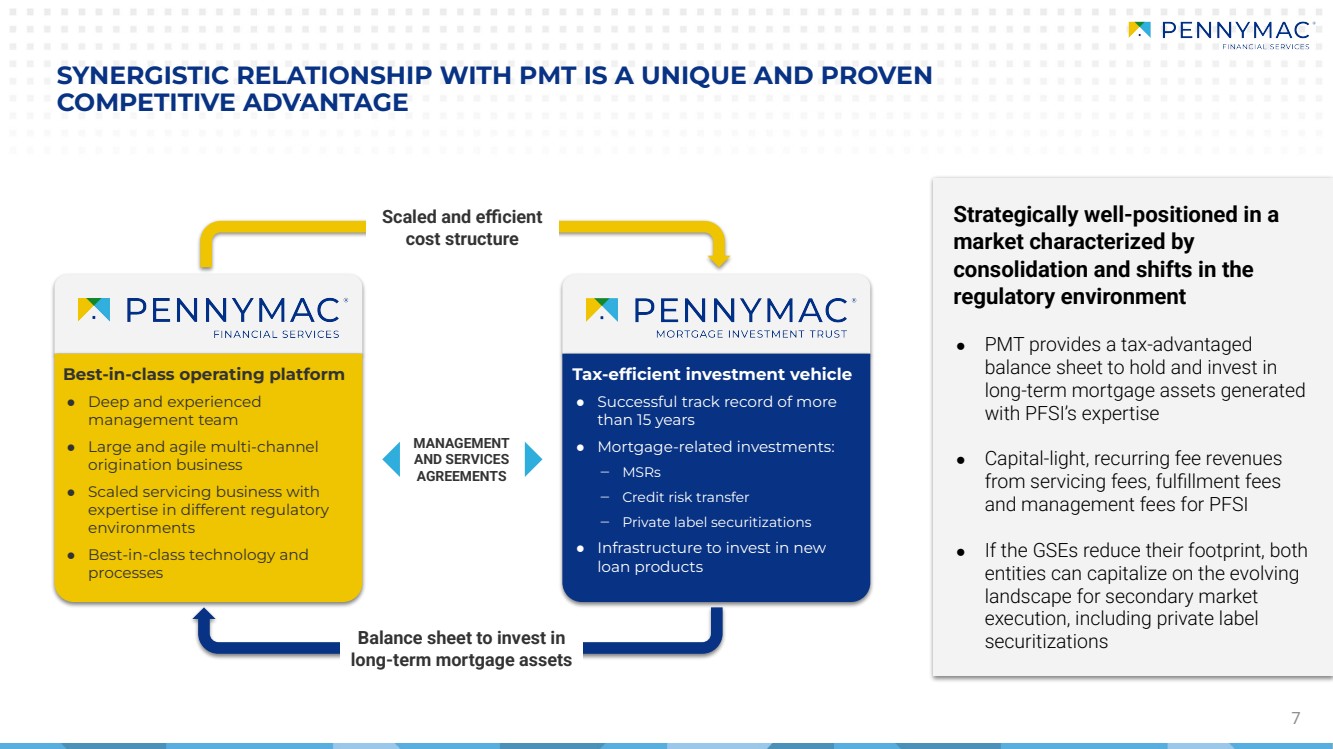
Strategically well-positioned in a market characterized by consolidation and shifts in the regulatory environment ● PMT provides a tax-advantaged balance sheet to hold and invest in long-term mortgage assets generated with PFSI’s expertise ● Capital-light, recurring fee revenues from servicing fees, fulfillment fees and management fees for PFSI ● If the GSEs reduce their footprint, both entities can capitalize on the evolving landscape for secondary market execution, including private label securitizations 7 SYNERGISTIC RELATIONSHIP WITH PMT IS A UNIQUE AND PROVEN COMPETITIVE ADVANTAGE MANAGEMENT AND SERVICES AGREEMENTS Scaled and efficient cost structure Tax-efficient investment vehicle ● Successful track record of more than 15 years ● Mortgage-related investments: ‒ MSRs ‒ Credit risk transfer ‒ Private label securitizations ● Infrastructure to invest in new loan products Best-in-class operating platform ● Deep and experienced management team ● Large and agile multi-channel origination business ● Scaled servicing business with expertise in different regulatory environments ● Best-in-class technology and processes Balance sheet to invest in long-term mortgage assets |
|
Mortgage Banking Operating Pretax Income ($ in millions) Production • 15 - 20% operating return on equity in recent periods of elevated mortgage rates ‒ Servicing expected to continue providing a strong base level of operating earnings, with additional upside potential for the production segment when interest rates decline, as demonstrated by third quarter 2024 results • With mortgage rates in the 6.5-7.5% range and stable delinquencies, we expect annualized operating returns on equity in the mid-to-high teens in 2025 8 HIGH-TEENS OPERATING RETURNS ON EQUITY Annualized Operating ROE(1) Note: Figures may not sum due to rounding (1) See slide 36 for a reconciliation of GAAP to non-GAAP items Servicing net of valuation related changes(1) |
|
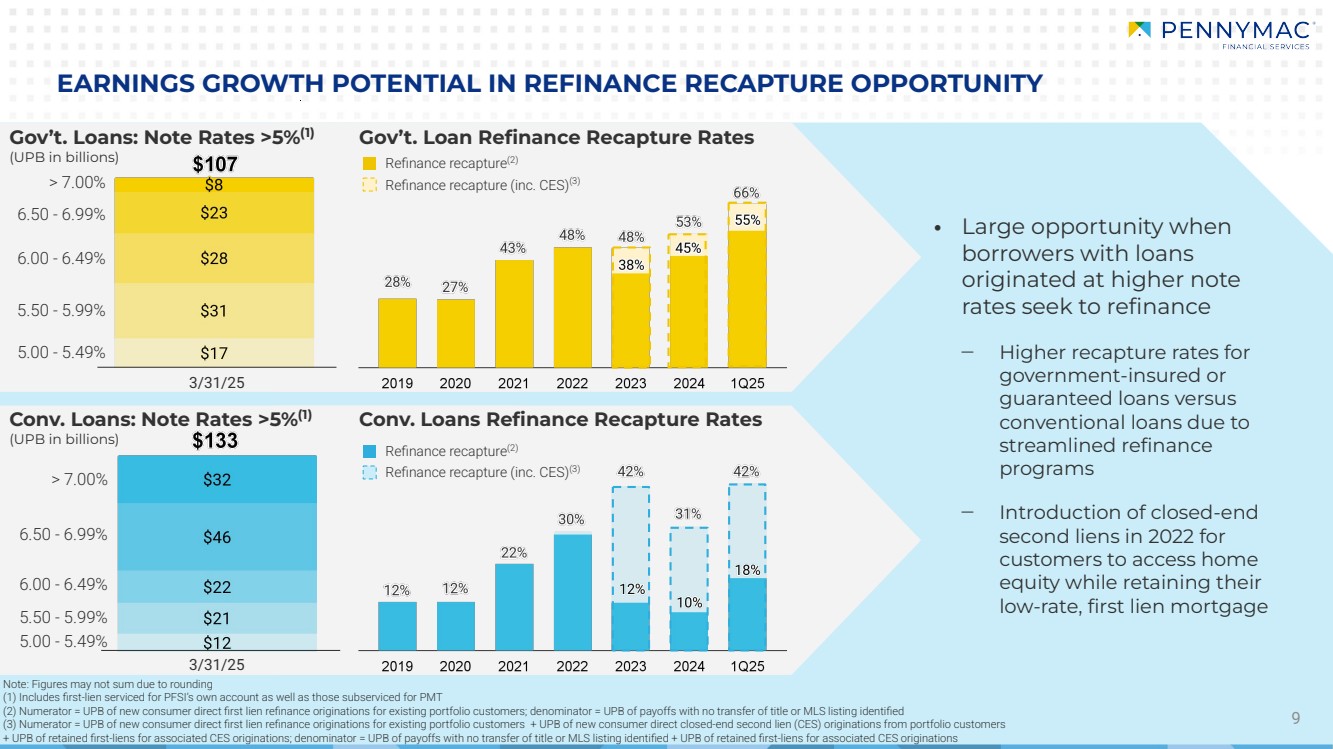
9 EARNINGS GROWTH POTENTIAL IN REFINANCE RECAPTURE OPPORTUNITY Gov’t. Loan Refinance Recapture Rates Conv. Loans Refinance Recapture Rates > 7.00% 6.50 - 6.99% 6.00 - 6.49% 5.50 - 5.99% 5.00 - 5.49% > 7.00% 6.50 - 6.99% 6.00 - 6.49% 5.50 - 5.99% 5.00 - 5.49% • Large opportunity when borrowers with loans originated at higher note rates seek to refinance ‒ Higher recapture rates for government-insured or guaranteed loans versus conventional loans due to streamlined refinance programs ‒ Introduction of closed-end second liens in 2022 for customers to access home equity while retaining their low-rate, first lien mortgage Note: Figures may not sum due to rounding (1) Includes first-lien serviced for PFSI’s own account as well as those subserviced for PMT (2) Numerator = UPB of new consumer direct first lien refinance originations for existing portfolio customers; denominator = UPB of payoffs with no transfer of title or MLS listing identified (3) Numerator = UPB of new consumer direct first lien refinance originations for existing portfolio customers + UPB of new consumer direct closed-end second lien (CES) originations from portfolio customers + UPB of retained first-liens for associated CES originations; denominator = UPB of payoffs with no transfer of title or MLS listing identified + UPB of retained first-liens for associated CES originations Refinance recapture(2) Refinance recapture (inc. CES)(3) Refinance recapture(2) Refinance recapture (inc. CES)(3) Gov’t. Loans: Note Rates >5%(1) (UPB in billions) Conv. Loans: Note Rates >5%(1) (UPB in billions) 3/31/25 3/31/25 |
|
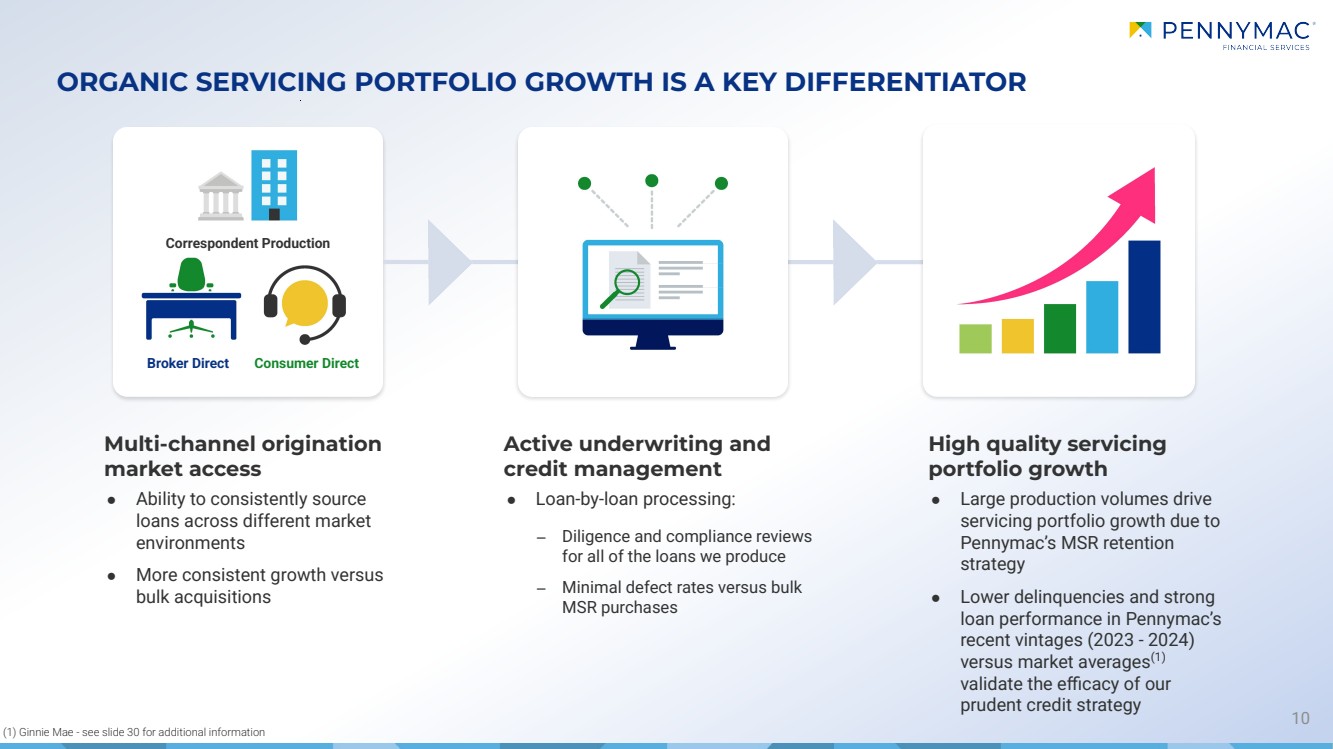
10 ORGANIC SERVICING PORTFOLIO GROWTH IS A KEY DIFFERENTIATOR (1) Ginnie Mae - see slide 30 for additional information Correspondent Production Broker Direct Consumer Direct Multi-channel origination market access ● Ability to consistently source loans across different market environments ● More consistent growth versus bulk acquisitions Active underwriting and credit management ● Loan-by-loan processing: ‒ Diligence and compliance reviews for all of the loans we produce ‒ Minimal defect rates versus bulk MSR purchases High quality servicing portfolio growth ● Large production volumes drive servicing portfolio growth due to Pennymac’s MSR retention strategy ● Lower delinquencies and strong loan performance in Pennymac’s recent vintages (2023 - 2024) versus market averages(1) validate the efficacy of our prudent credit strategy Correspondent Production Broker Direct Consumer Direct |
|
11 Operating Expenses (bps of average servicing portfolio UPB) Revenue From Servicing & Placement Fees ($ in millions) SERVICING PROVIDES GROWING CASH FLOW AND SCALE BENEFITS • Increasing revenue contribution due to portfolio growth over time • Higher proportion of owned servicing in more recent periods drives increased servicing fees • Increased contribution from placement fees driven by higher short-term rates in recent periods • Increased scale and efficiency as the portfolio grows • Lower variable costs due to the implementation of SSE, our proprietary servicing system in 2019 • Continuing to increase efficiency through the use of emerging technologies, including capabilities of generative artificial intelligence • Delinquencies remain moderated in the current market environment, further reducing operating expenses Loan servicing, ancillary, and other fees Earnings on custodial balances and deposits and other income |
|
12 COMMITTED TO UNLOCKING ADDITIONAL VALUE THROUGH SUB-SERVICING PENNYMAC FINANCIAL’S VALUE PROPOSITION: Unmatched excellence in servicing Early Momentum… Signed 3 clients, with 1 onboarded and ongoing conversations with 20 prospects representing $65 billion in UPB Targeting a Robust Market… We estimate our correspondent clients collectively own $465 billion in UPB of MSRs; total addressable market of approximately $4 trillion in UPB Enhancing Our Capabilities… White-label subservicing on track for full release in 2Q25 Further Market Penetration… Targeting the broader market of MSR owners seeking a best-in-class, low cost subservicer ● Performing loan servicing: proprietary, industry-leading servicing technology with extensive customer self-service capabilities and a Top 3 ranking as a servicer for CFPB complaint avoidance ● Non-performing loan servicing: proprietary models for loss mitigation best execution and online tools for foreclosure avoidance ● Lead generation: utilization of our marketing and recapture tools to best support clients’ origination efforts |
|
PENNYMAC’S MARKET SHARE OVER TIME ACROSS ITS BUSINESSES 13 Loan Servicing Market Share Correspondent Production Market Share(1) (1) Broker Direct Market Share(1) Consumer Direct Market Share(1) Note: All figures are for PFSI and include volume fulfilled or subserviced for PMT (1) Historical market share: Inside Mortgage Finance; excludes second lien originations. For LTM 1Q25, we estimate $1.7 trillion in total origination volume, and that the correspondent channel represented 30% of the overall origination market, retail represented 51%, and broker represented 19%. Loan servicing market share is based on PFSI’s servicing portfolio UPB of $680 billion divided by $14.4 trillion in mortgage debt outstanding |
|
14 PRODUCTION SEGMENT HIGHLIGHTS – VOLUME BY CHANNEL Broker Direct (UPB in billions) Consumer Direct (UPB in billions) Note: Figures may not sum due to rounding (1) Government-insured or guaranteed loans and certain conventional loans acquired through PMT’s correspondent production business and subsequently sold to PFSI; PFSI earns income from holding and selling or securitizing the loans (2) Loans fulfilled for PMT; for these loans, PFSI earns a fulfillment fee from PMT rather than income from holding and selling or securitizing the loans (3) Includes locks related to both PFSI and PMT loan acquisitions (4) Commitments to originate mortgage loans at specified terms at period end Correspondent (UPB in billions) Conv. and Jumbo Acquisitions - for PMT(2) Total Locks(3) Originations Locks Locks: (UPB in billions) $9.9 Acquisitions: (UPB in billions) $8.8 Locks: (UPB in billions) $2.2 Originations: (UPB in billions) $1.7 Committed pipeline(4): (UPB in billions) $2.1 Locks: (UPB in billions) $1.4 Originations: (UPB in billions) $1.1 Committed pipeline(4): (UPB in billions) $1.5 Originations Locks Conv. Acquisitions - for PFSI(1) Gov’t. Acquisitions - for PFSI(1) April 2025 (Estimated) April 2025 (Estimated) April 2025 (Estimated) |
|
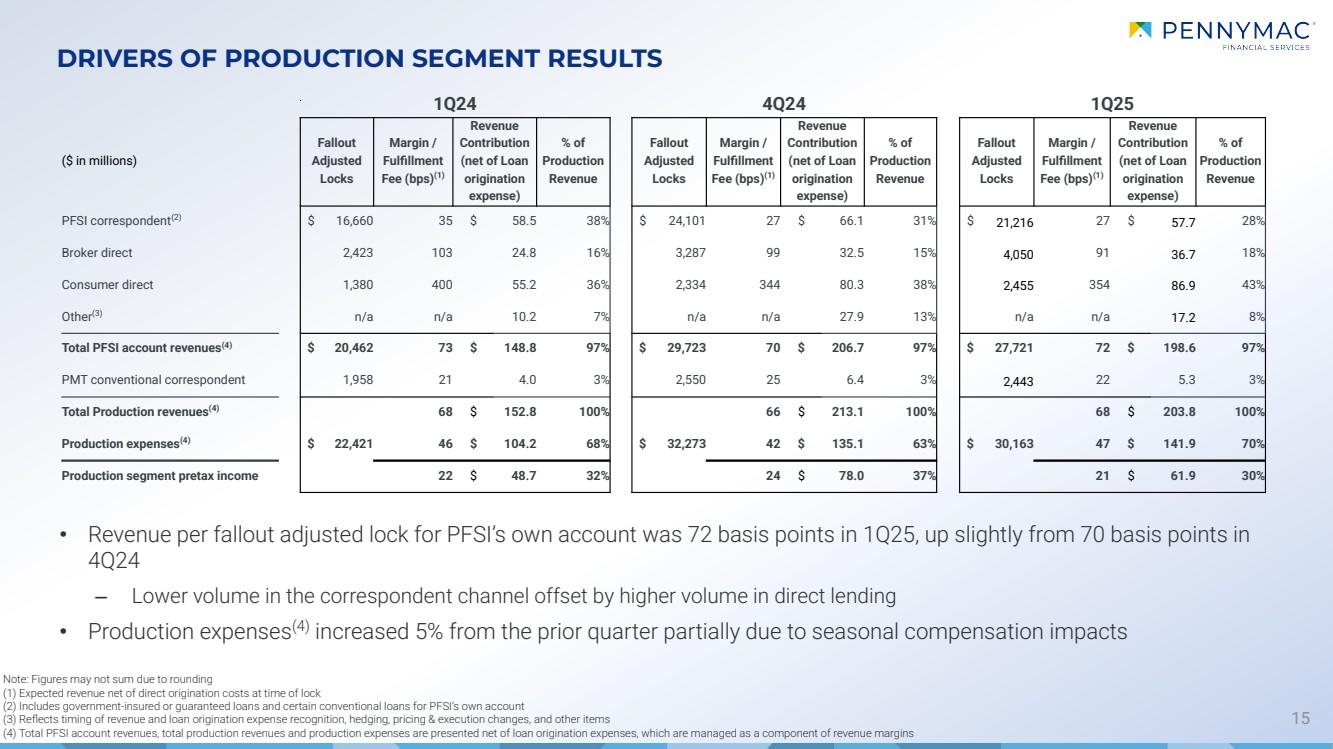
• Revenue per fallout adjusted lock for PFSI’s own account was 72 basis points in 1Q25, up slightly from 70 basis points in 4Q24 ‒ Lower volume in the correspondent channel offset by higher volume in direct lending • Production expenses(4) increased 5% from the prior quarter partially due to seasonal compensation impacts 15 DRIVERS OF PRODUCTION SEGMENT RESULTS 1Q24 4Q24 1Q25 ($ in millions) Fallout Adjusted Locks Margin / Fulfillment Fee (bps)(1) Revenue Contribution (net of Loan origination expense) % of Production Revenue Fallout Adjusted Locks Margin / Fulfillment Fee (bps)(1) Revenue Contribution (net of Loan origination expense) % of Production Revenue Fallout Adjusted Locks Margin / Fulfillment Fee (bps)(1) Revenue Contribution (net of Loan origination expense) % of Production Revenue PFSI correspondent(2) $ 16,660 35 $ 58.5 38% $ 24,101 27 $ 66.1 31% $ 21,216 27 $ 57.7 28% Broker direct 2,423 103 24.8 16% 3,287 99 32.5 15% 4,050 91 36.7 18% Consumer direct 1,380 400 55.2 36% 2,334 344 80.3 38% 2,455 354 86.9 43% Other(3) n/a n/a 10.2 7% n/a n/a 27.9 13% n/a n/a 17.2 8% Total PFSI account revenues(4) $ 20,462 73 $ 148.8 97% $ 29,723 70 $ 206.7 97% $ 27,721 72 $ 198.6 97% PMT conventional correspondent 1,958 21 4.0 3% 2,550 25 6.4 3% 2,443 22 5.3 3% Total Production revenues(4) 68 $ 152.8 100% 66 $ 213.1 100% 68 $ 203.8 100% Production expenses(4) $ 22,421 46 $ 104.2 68% $ 32,273 42 $ 135.1 63% $ 30,163 47 $ 141.9 70% Production segment pretax income 22 $ 48.7 32% 24 $ 78.0 37% 21 $ 61.9 30% Note: Figures may not sum due to rounding (1) Expected revenue net of direct origination costs at time of lock (2) Includes government-insured or guaranteed loans and certain conventional loans for PFSI’s own account (3) Reflects timing of revenue and loan origination expense recognition, hedging, pricing & execution changes, and other items (4) Total PFSI account revenues, total production revenues and production expenses are presented net of loan origination expenses, which are managed as a component of revenue margins |
|
Correspondent Broker Direct PRODUCTION SEGMENT HIGHLIGHTS – BUSINESS TRENDS BY CHANNEL 16 Consumer Direct ● Pennymac remains the largest correspondent aggregator in the U.S. ● Lock volumes for PFSI’s account were down 11% and acquisitions were down 18% from 4Q24, consistent with the decline in the overall market ● PMT retained 21% of total conventional conforming correspondent production in 1Q25 compared to 19% in 4Q24 ‒ We expect PMT to retain approximately 15 - 25% of total conventional conforming correspondent production in 2Q25 ● 787 correspondent sellers at March 31, 2025, down slightly from December 31, 2024 ● Purchase volume in 1Q25 was 89% of total acquisitions Multi-channel approach provides flexibility and has proven to be a competitive advantage, supporting profitability and pricing discipline while driving growth of the servicing portfolio ● Lock volumes were up 23% and originations were down 21% from 4Q24 ● Approved brokers totaled 4,853 at March 31, 2025 up 5% from December 31, 2024 and 19% from March 31, 2024 ‒ Top brokers see Pennymac as a strong alternative to the top two channel lenders ● Purchase volume in 1Q25 was 79% of total originations ● Strong trends in jumbo originations, which were 22% of total originations in 1Q25 compared to 17% in 4Q24 ● Lock volumes were up 6% and originations were down 24% from 4Q24 ‒ Increase in locks due to lower rates; decrease in originations consistent with the overall market ● Continue to provide for the spectrum of needs of the 2.7 million customers in our servicing portfolio ‒ Refinance lock volume in 1Q25 was $3.0 billion, or 77% of total locks ‒ 95% of total lock volume, including both first and second-liens, was sourced from our large and growing servicing portfolio ‒ $338 million of closed-end second lien mortgage loans funded in 1Q25, up from $302 million in 4Q24 |
|
Selected Operational Metrics 4Q24 1Q25 Loans serviced (in thousands) 2,607 2,651 60+ day delinquency rate - owned portfolio(1) 3.7% 3.1% 60+ day delinquency rate - sub-serviced portfolio(2) 0.8% 0.7% Actual CPR - owned portfolio(1) 9.7% 6.8% Actual CPR - sub-serviced portfolio(2) 5.7% 4.7% UPB of completed modifications ($ in millions)(3) $4,420 $4,767 EBO loan volume ($ in millions)(4) $923 $995 Owned Subserviced SERVICING SEGMENT HIGHLIGHTS 17 Loan Servicing Portfolio Composition (UPB in billions) Net Portfolio Growth (UPB in billions) Note: Figures may not sum due to rounding (1) Owned portfolio is predominantly government-insured and guaranteed loans – see Appendix slide 31 for additional details; delinquency data based on loan count (i.e., not UPB); CPR = Conditional Prepayment Rate (2) Represents PMT’s MSRs that we service (3) UPB of completed modifications includes loss mitigation efforts associated with partial claims programs (4) Early buyouts of delinquent loans from Ginnie Mae pools during the period (5) Also includes loans sold with servicing released in connection with any asset sales by PMT (6) Includes consumer and broker direct production, government and conventional correspondent acquisitions, and conventional conforming and jumbo loan acquisitions subserviced for PMT (5) (6) • Servicing portfolio totaled $680.2 billion in UPB at March 31, 2025, up 2% Q/Q and 10% Y/Y • Production volumes more than offset prepayment activity, leading to continued portfolio growth • 60+ day delinquency rates for owned MSR declined from the end of the prior quarter • Modification and EBO loan volume increased from the prior quarter |
|
SERVICING PROFITABILITY EXCLUDING VALUATION-RELATED CHANGES 18 Note: Figures may not sum due to rounding (1) Of average portfolio UPB, annualized (2) Comprised of net gains on mortgage loans held for sale at fair value and interest income related to EBO loans (3) Consists of interest shortfall and recording and release fees (4) Changes in fair value do not include realization of MSR cash flows (5) Considered in the assessment of MSR fair value changes 1Q24 4Q24 1Q25 $ in millions basis points⁽¹⁾ $ in millions basis points⁽¹⁾ $ in millions basis points⁽¹⁾ Loan servicing fees $ 424.2 27.7 $ 472.6 28.8 $ 488.5 29.0 Earnings on custodial balances and deposits and other income 87.2 5.7 109.7 6.7 102.1 6.1 Realization of MSR cash flows (198.6) (13.0) (215.6) (13.1) (225.5) (13.4) EBO loan-related revenue⁽²⁾ 26.4 1.7 34.1 2.1 36.0 2.1 Servicing expenses: Operating expenses (80.0) (5.2) (81.5) (5.0) (80.8) (4.8) Payoff-related expense⁽³⁾ (8.2) (0.5) (20.0) (1.2) (13.3) (0.8) Losses and provisions for defaulted loans (13.2) (0.9) (13.4) (0.8) (15.4) (0.9) EBO loan transaction-related expense (0.2) (0.0) (1.1) (0.1) (0.9) (0.1) Interest expense (95.8) (6.3) (116.6) (7.1) (119.2) (7.1) Non-GAAP: Pretax income excluding valuation-related changes $ 141.8 9.3 $ 168.3 10.3 $ 171.5 10.2 Valuation-related changes MSR fair value⁽⁴⁾ 170.0 540.4 (205.5) Hedging derivatives gains (losses) (294.6) (608.1) 106.8 Reversal of (provision for) losses on active loans⁽⁵⁾ 6.6 (13.3) 3.2 GAAP: Servicing segment pretax income $ 23.7 $ 87.3 $ 76.0 Average servicing portfolio UPB $ 612,733 $ 656,406 $ 672,965 • Loan servicing fees increased from the prior quarter due to growth in the owned portfolio; operating expenses were unchanged • Earnings on custodial balances and deposits decreased from the prior quarter due to seasonal impacts and lower prepayments – Custodial funds managed for PFSI’s owned servicing portfolio averaged $6.2 billion in 1Q25, down from $7.3 billion in 4Q24 • Realization of cash flows was up from the prior quarter due growth in the owned portfolio and expectations for higher prepayment activity in the future |
|
19 HEDGING APPROACH MODERATES THE VOLATILITY OF PFSI’S RESULTS MSR Valuation Changes and Offsets ($ in millions) MSR fair value change before realization of cash flows Hedging and related gains (losses) Production pretax income Attributed Performance MSR Hedge Net Rate Impacts $(183.0) $130.8 $(52.2) Hedge Costs - $(24.0) $(24.0) Other Assumption & Performance Impacts $(22.5) - $(22.5) Prepayment-related $(12.6) - $(12.6) Delinquency-related $(5.0) - $(5.0) Other $(4.9) - $(4.9) Total $(205.5) $106.8 $(98.7) • PFSI seeks to moderate the impact of interest rate changes on the fair value of its MSR asset through a comprehensive hedging strategy that also considers production-related income ‒ When refinance volumes and production-related income are highly responsive to changes in interest rates, our targeted hedge ratio can decline to as low as 60% ‒ When refinance volumes and production-related income are less responsive to changes in interest rates, our targeted hedge ratio can increase to as high as 100% ‒ Shape of the yield curve, volatility, changes in mortgage basis and other factors can impact our realized hedge ratio |
|
APPENDIX |
|
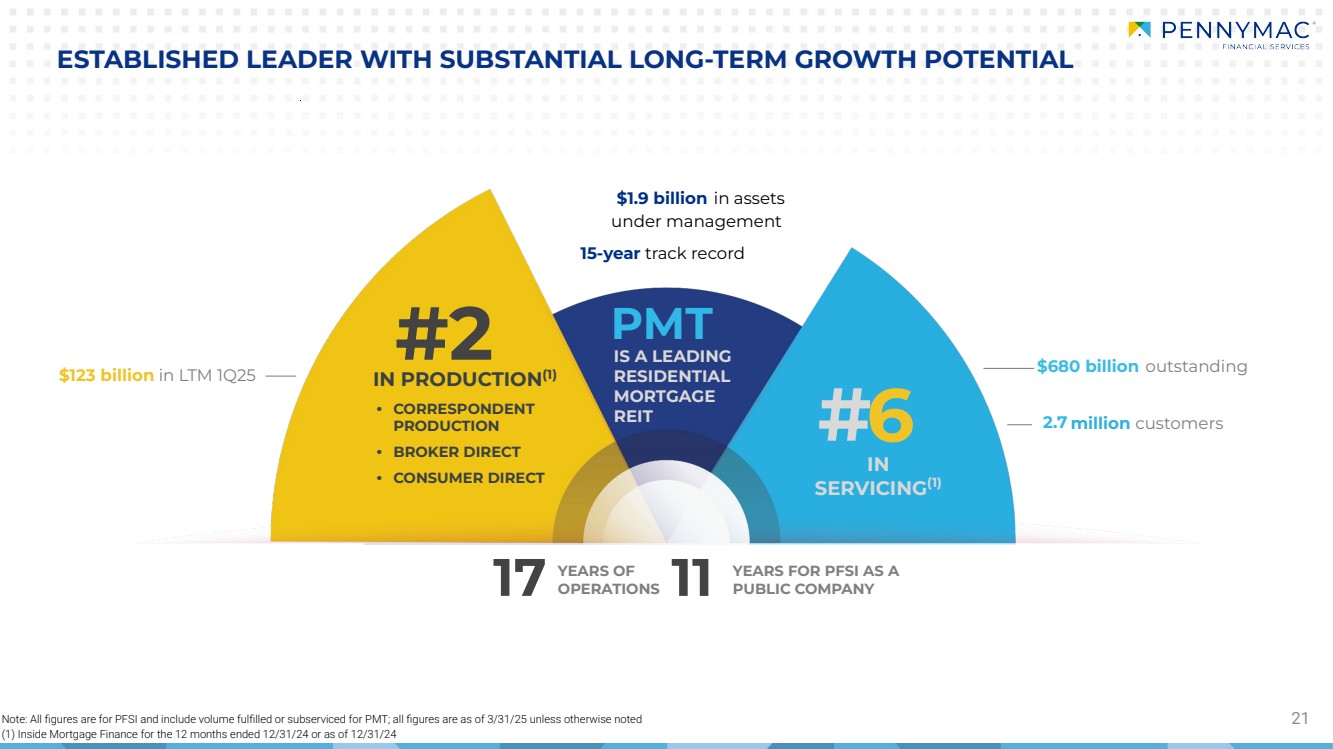
21 ESTABLISHED LEADER WITH SUBSTANTIAL LONG-TERM GROWTH POTENTIAL IN SERVICING(1) YEARS FOR PFSI AS A PUBLIC COMPANY YEARS OF OPERATIONS PMT • CORRESPONDENT PRODUCTION • BROKER DIRECT • CONSUMER DIRECT IN PRODUCTION(1) IS A LEADING RESIDENTIAL MORTGAGE REIT # $680 billion outstanding 17 11 $123 billion in LTM 1Q25 Note: All figures are for PFSI and include volume fulfilled or subserviced for PMT; all figures are as of 3/31/25 unless otherwise noted (1) Inside Mortgage Finance for the 12 months ended 12/31/24 or as of 12/31/24 $1.9 billion in assets under management 6 15-year track record #2 2.7 million customers |
|
OVERVIEW OF PENNYMAC FINANCIAL’S BUSINESSES 22 LOAN PRODUCTION Correspondent aggregation of newly originated loans from third-party sellers Fulfillment fees for PMT’s delegated conventional loans PFSI earns gains on all loan production with the exception of loans fulfilled for PMT Broker direct and consumer direct origination of conventional and government-insured loans LOAN SERVICING Servicing for owned MSRs and subservicing for MSRs owned by PMT Major loan servicer for Fannie Mae, Freddie Mac and Ginnie Mae Industry-leading capabilities in special servicing Organic growth results from loan production, supplemented by MSR acquisitions and PMT investment activity INVESTMENT MANAGEMENT External manager and synergistic partnership with PMT, which invests in mortgage-related assets: GSE credit risk transfer investments Investments in non-Agency subordinate bonds from PMT securitizations MSR investments paired with agency MBS and senior non-agency MBS Complex and highly regulated mortgage industry requires effective governance, compliance and operating systems Operating platform has been developed organically and is highly scalable Commitment to strong corporate governance, compliance and risk management since inception PFSI is well-positioned to navigate the current market and regulatory environment |
|
23 PFSI’S BALANCED BUSINESS MODEL IS A FLYWHEEL • Diversified business through correspondent, broker direct and consumer direct channels • Correspondent and broker direct channels in particular allow PFSI to access purchase-money volume • Lacks the fixed overhead of the traditional, retail origination model • Recurring fee income business captured over the life of the loan • With higher interest rates, expected life of the loan increases resulting in a more valuable MSR asset • Creates a natural hedge to production income Large volumes of production grow servicing portfolio Loan Production nd largest in the U.S.(1) Loan Servicing th largest in the U.S.(1) In both businesses, scale and efficiency are critical for success 2 6 Customer base of 2.7 million customers drives leads for consumer direct Note: All figures are for PFSI and include volume fulfilled or subserviced for PMT; all figures are as of 3/31/25 unless otherwise noted (1) Inside Mortgage Finance for the 12 months ended 12/31/24 or as of 12/31/24 |
|
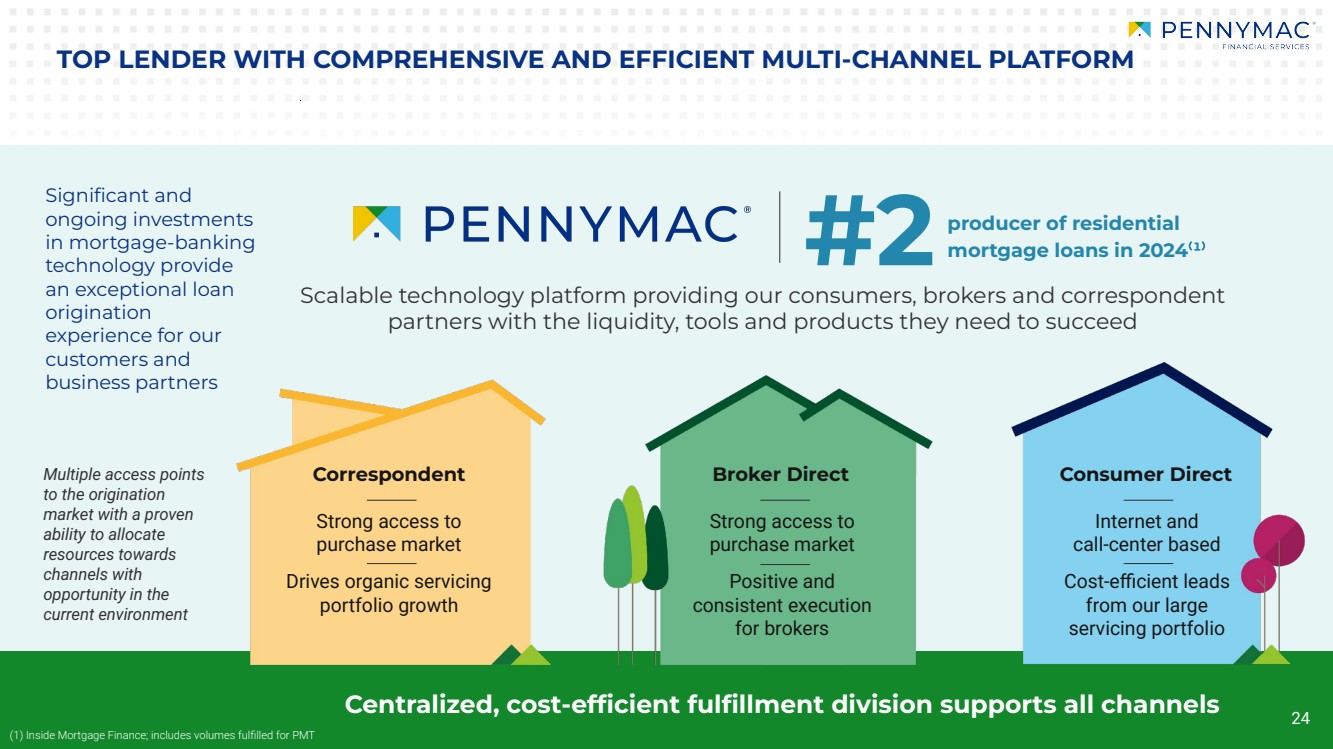
24 TOP LENDER WITH COMPREHENSIVE AND EFFICIENT MULTI-CHANNEL PLATFORM Centralized, cost-efficient fulfillment division supports all channels Multiple access points to the origination market with a proven ability to allocate resources towards channels with opportunity in the current environment Significant and ongoing investments in mortgage-banking technology provide an exceptional loan origination experience for our customers and business partners Scalable technology platform providing our consumers, brokers and correspondent partners with the liquidity, tools and products they need to succeed (1) Inside Mortgage Finance; includes volumes fulfilled for PMT Strong access to purchase market Drives organic servicing portfolio growth Strong access to purchase market Positive and consistent execution for brokers Internet and call-center based Cost-efficient leads from our large servicing portfolio Correspondent Broker Direct Consumer Direct #2 producer of residential mortgage loans in 2024⁽¹⁾ 24 |
|
25 TECHNOLOGY INNOVATION TO UNLOCK ADDITIONAL STAKEHOLDER VALUE Servicing Systems Environment Direct and white label subservicing Partnerships with third parties Licensing Drive efficiencies for our core businesses Leverage SSE to expand our current sub-servicing business beyond PMT License SSE as a multi-tenant, industry-leading servicing software platform Partner with innovative technologists to develop a comprehensive marketplace of next generation mortgage banking technology Proven, low-cost servicing system with multiple competitive advantages versus others in the market With our SSE technology free and clear of any restrictions on use or development, we are actively exploring a continuum of potential opportunities with benefits for our many stakeholders |
|
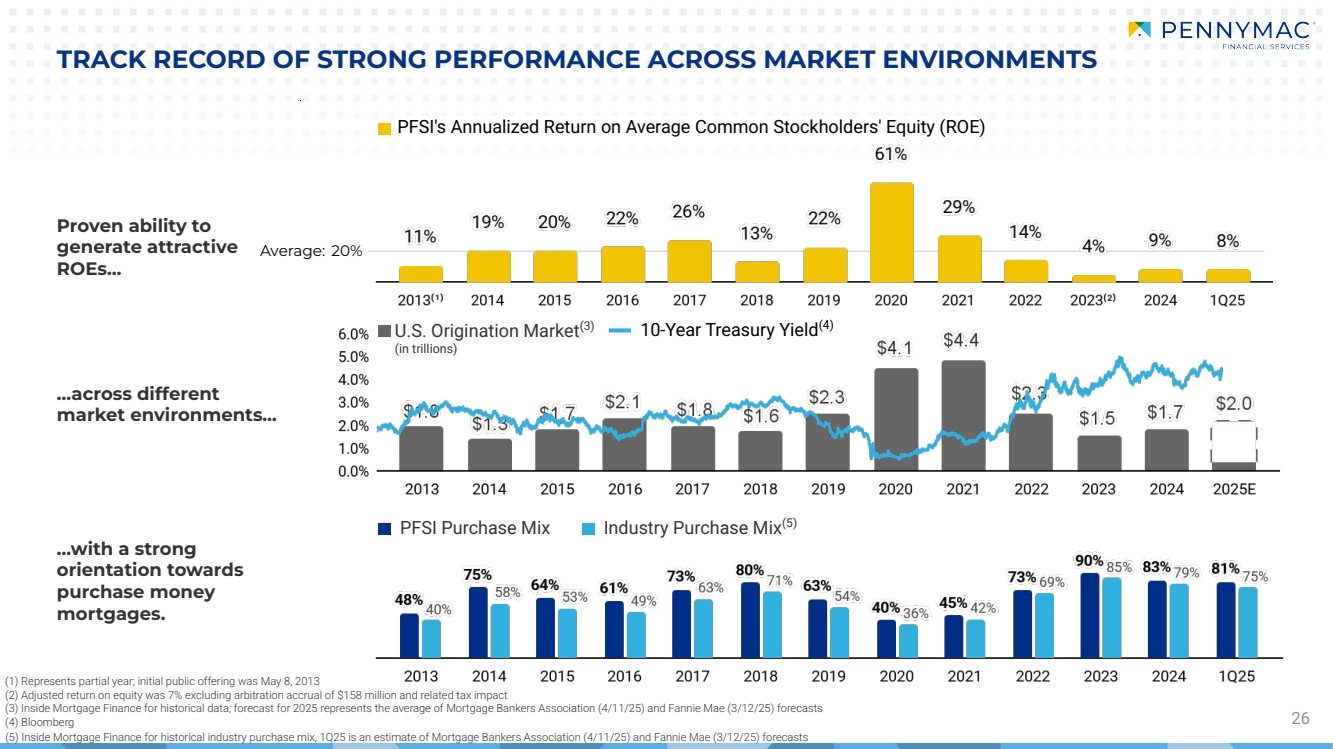
PFSI Purchase Mix Industry Purchase Mix(5) 26 TRACK RECORD OF STRONG PERFORMANCE ACROSS MARKET ENVIRONMENTS Proven ability to generate attractive ROEs… …across different market environments… …with a strong orientation towards purchase money mortgages. (1) Represents partial year; initial public offering was May 8, 2013 (2) Adjusted return on equity was 7% excluding arbitration accrual of $158 million and related tax impact (3) Inside Mortgage Finance for historical data; forecast for 2025 represents the average of Mortgage Bankers Association (4/11/25) and Fannie Mae (3/12/25) forecasts Average: 20% U.S. Origination Market(3) (in trillions) PFSI's Annualized Return on Average Common Stockholders' Equity (ROE) 10-Year Treasury Yield(4) (4) Bloomberg (5) Inside Mortgage Finance for historical industry purchase mix, 1Q25 is an estimate of Mortgage Bankers Association (4/11/25) and Fannie Mae (3/12/25) forecasts |
|
• Targeted debt-to-equity ratio near 3.5x with fluctuations largely driven by the origination environment or other market opportunities • Targeted non-funding debt-to-equity ratio near 1.5x; may be modestly above at current interest rate levels MSR & Servicing Advance Financing PFSI’S STRONG BALANCE SHEET AND DIVERSE CAPITAL STRUCTURES 27 Low Debt-to-Equity (D/E) Ratio Diverse Financing Sources High Tangible Net Worth (TNW)(2)/Assets • High tangible net worth (TNW) / assets excluding loans eligible for repurchase • Unsecured senior notes provide low, fixed interest rates; first maturity in October 2025 • Issued $850 million of senior unsecured notes due February 2033 • As of March 31, 2025 total liquidity including cash and amounts available to draw with collateral pledged was $4.0 billion Non-funding D/E(1) Total D/E TNW / Assets TNW / Assets ex. Loans eligible for repurchase Financing capacity across multiple banks Note: All figures are as of March 31, 2025 (1) Non-funding debt includes face value of unsecured senior notes and notes payable secured by MSR, in addition to the amount drawn on the variable funding note (2) Tangible net worth excludes capitalized software |
|
CURRENT MARKET ENVIRONMENT AND MACROECONOMIC TRENDS 28 Average 30-year fixed rate mortgage(1) Macroeconomic Metrics(3) Footnotes 10-year Treasury Bond Yield(2) 3/31/24 6/30/24 9/30/24 12/31/24 3/31/25 10-year Treasury bond yield 4.2% 4.4% 3.8% 4.6% 4.2% 2/10 year Treasury yield spread -0.4% -0.4% 0.1% 0.3% 0.3% 30-year fixed rate mortgage 6.8% 6.9% 6.1% 6.9% 6.7% Secondary mortgage rate 5.6% 5.8% 4.9% 5.9% 5.5% U.S. home price appreciation (Y/Y% change) 6.5% 5.5% 3.9% 3.9% 4.1% Residential mortgage originations (in billions) $320 $430 $455 $460 $355 6.85% 6.65% 4.57% 4.21% (1) Freddie Mac Primary Mortgage Market Survey. 6.83% as of 4/17/25 (2) U.S. Department of the Treasury. 4.32% as of 4/18/25 (3) 10-year Treasury bond yield and 2/10 year Treasury yield spread: Bloomberg Average 30-year fixed rate mortgage: Freddie Mac Primary Mortgage Market Survey Average secondary mortgage rate: 30-Year FNCL Par Coupon Index (MTGEFNCL), Bloomberg U.S. home price appreciation: S&P CoreLogic Case-Shiller U.S. National Home Price NSA Index (SPCSUSA); data is as of 1/31/25 Residential mortgage originations are for the quarterly period ended; source: Inside Mortgage Finance |
|
March 31, 2025 Mortgage Servicing Rights Unaudited ($ in millions) Pool UPB(1) $442,208 Weighted average coupon 4.6% Weighted average servicing fee/spread 0.38% Weighted average prepayment speed assumption (CPR) 8.8% Fair value $8,964 As a multiple of servicing fee 5.3 29 MSR ASSET VALUATION (1) Excludes loans held for sale at fair value |
|
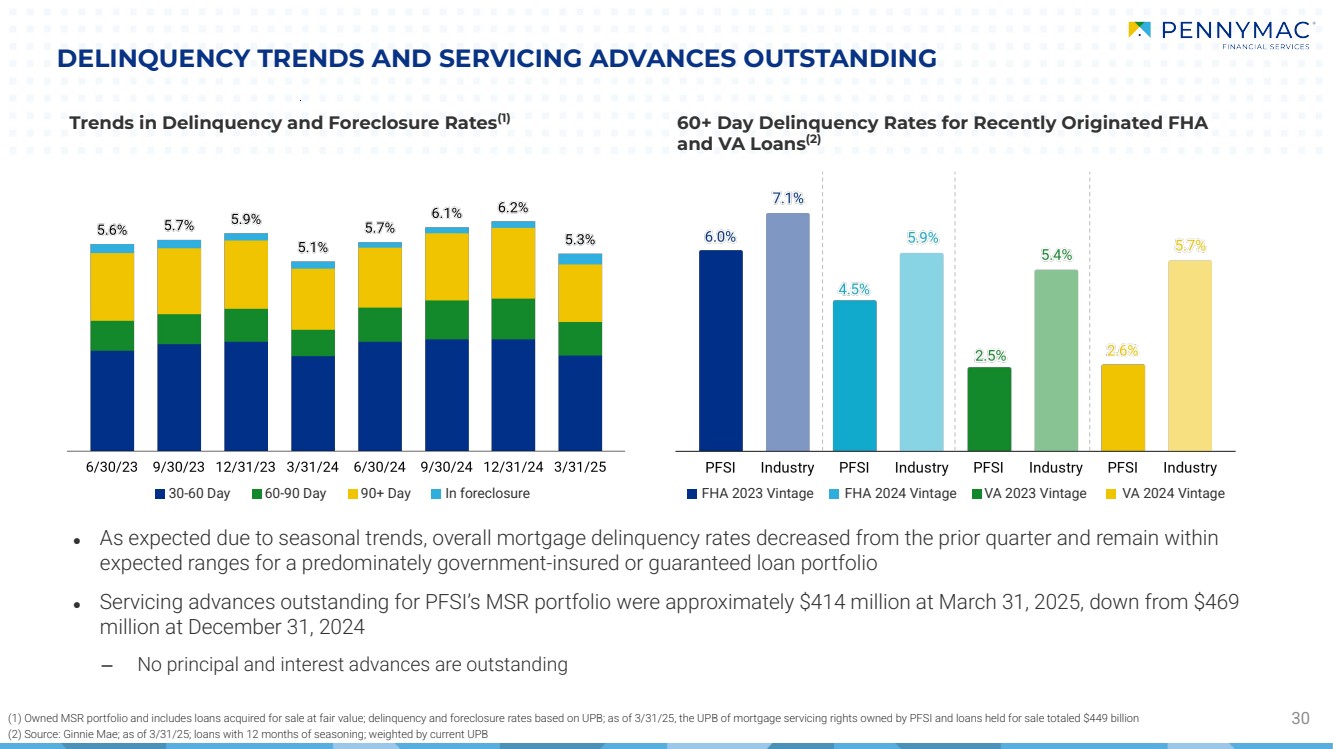
FHA 2023 Vintage FHA 2024 Vintage VA 2023 Vintage VA 2024 Vintage DELINQUENCY TRENDS AND SERVICING ADVANCES OUTSTANDING 30 Trends in Delinquency and Foreclosure Rates(1) 30-60 Day 60-90 Day 90+ Day In foreclosure (1) Owned MSR portfolio and includes loans acquired for sale at fair value; delinquency and foreclosure rates based on UPB; as of 3/31/25, the UPB of mortgage servicing rights owned by PFSI and loans held for sale totaled $449 billion (2) Source: Ginnie Mae; as of 3/31/25; loans with 12 months of seasoning; weighted by current UPB ● As expected due to seasonal trends, overall mortgage delinquency rates decreased from the prior quarter and remain within expected ranges for a predominately government-insured or guaranteed loan portfolio ● Servicing advances outstanding for PFSI’s MSR portfolio were approximately $414 million at March 31, 2025, down from $469 million at December 31, 2024 ‒ No principal and interest advances are outstanding 60+ Day Delinquency Rates for Recently Originated FHA and VA Loans(2) |
|
31 PFSI’S OWNED MSR PORTFOLIO CHARACTERISTICS Note: Figures may not sum due to rounding (1) Government loans include loans securitized in Ginnie Mae pools as well as loans sold to private investors (2) Other represents MSRs collateralized by conventional loans sold to private investors (3) Loan-to-values for closed-end seconds include only the second lien balance (4) Excludes loans held for sale at fair value As of March 31, 2025 Segment UPB ($ in billions)⁽⁴⁾ % of Total UPB Loan count (in thousands) Note rate Seasoning (months) Remaining maturity (months) Loan size ($ in thousands) FICO credit score at origination Original LTV Current LTV 60+ Delinquency (by UPB) Government⁽¹⁾ FHA $154.6 34.9% 730 4.6% 46 316 $212 682 93% 70% 5.2% VA $126.7 28.6% 459 3.9% 41 318 $276 730 90% 70% 1.9% USDA $20.8 4.7% 140 4.1% 60 303 $148 700 98% 65% 5.1% GSE FNMA $55.8 12.6% 176 5.1% 28 317 $318 763 75% 63% 0.6% FHLMC $73.3 16.6% 222 5.4% 22 325 $330 759 76% 67% 0.7% Other and Closed-End Seconds Other⁽²⁾ $9.4 2.1% 24 6.8% 11 348 $398 774 74% 71% 0.2% Closed-End Seconds⁽³⁾ $1.7 0.4% 21 9.6% 10 250 $81 744 19% 18% 0.2% Grand Total $442.2 100.0% 1,773 4.6% 38 318 $249 722 87% 68% 2.8% |
|
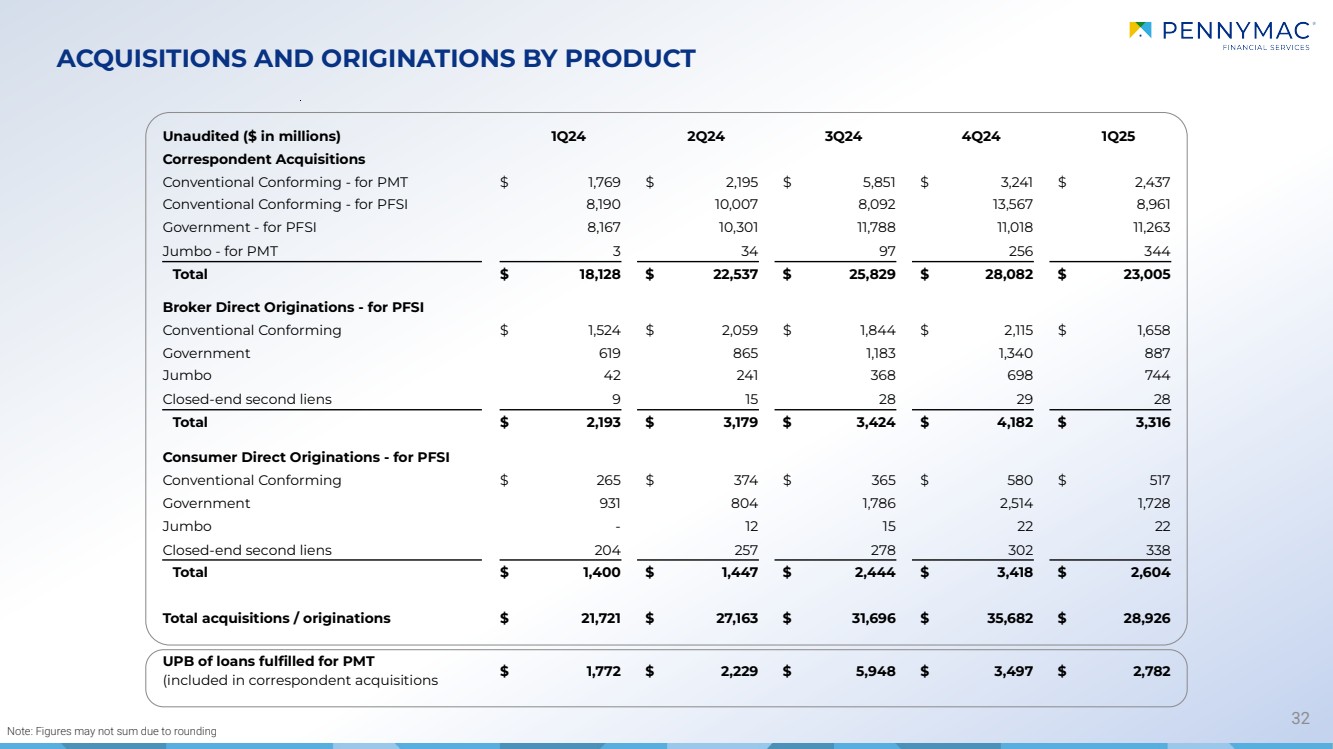
ACQUISITIONS AND ORIGINATIONS BY PRODUCT 32 Note: Figures may not sum due to rounding Unaudited ($ in millions) 1Q24 2Q24 3Q24 4Q24 1Q25 Correspondent Acquisitions Conventional Conforming - for PMT $ 1,769 $ 2,195 $ 5,851 $ 3,241 $ 2,437 Conventional Conforming - for PFSI 8,190 10,007 8,092 13,567 8,961 Government - for PFSI 8,167 10,301 11,788 11,018 11,263 Jumbo - for PMT 3 34 97 256 344 Total $ 18,128 $ 22,537 $ 25,829 $ 28,082 $ 23,005 Broker Direct Originations - for PFSI Conventional Conforming $ 1,524 $ 2,059 $ 1,844 $ 2,115 $ 1,658 Government 619 865 1,183 1,340 887 Jumbo 42 241 368 698 744 Closed-end second liens 9 15 28 29 28 Total $ 2,193 $ 3,179 $ 3,424 $ 4,182 $ 3,316 Consumer Direct Originations - for PFSI Conventional Conforming $ 265 $ 374 $ 365 $ 580 $ 517 Government 931 804 1,786 2,514 1,728 Jumbo - 12 15 22 22 Closed-end second liens 204 257 278 302 338 Total $ 1,400 $ 1,447 $ 2,444 $ 3,418 $ 2,604 Total acquisitions / originations $ 21,721 $ 27,163 $ 31,696 $ 35,682 $ 28,926 UPB of loans fulfilled for PMT (included in correspondent acquisitions $ 1,772 $ 2,229 $ 5,948 $ 3,497 $ 2,782 |
|
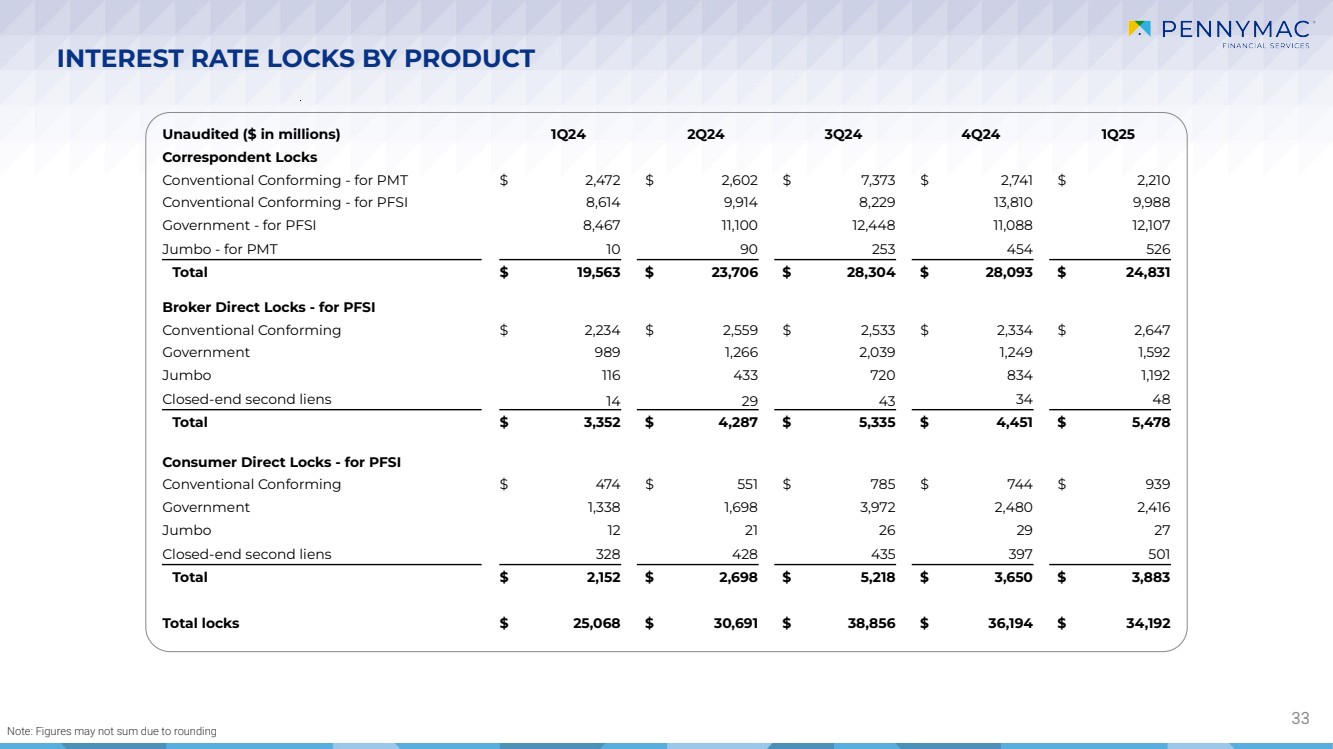
INTEREST RATE LOCKS BY PRODUCT 33 Note: Figures may not sum due to rounding Unaudited ($ in millions) 1Q24 2Q24 3Q24 4Q24 1Q25 Correspondent Locks Conventional Conforming - for PMT $ 2,472 $ 2,602 $ 7,373 $ 2,741 $ 2,210 Conventional Conforming - for PFSI 8,614 9,914 8,229 13,810 9,988 Government - for PFSI 8,467 11,100 12,448 11,088 12,107 Jumbo - for PMT 10 90 253 454 526 Total $ 19,563 $ 23,706 $ 28,304 $ 28,093 $ 24,831 Broker Direct Locks - for PFSI Conventional Conforming $ 2,234 $ 2,559 $ 2,533 $ 2,334 $ 2,647 Government 989 1,266 2,039 1,249 1,592 Jumbo 116 433 720 834 1,192 Closed-end second liens 14 29 43 34 48 Total $ 3,352 $ 4,287 $ 5,335 $ 4,451 $ 5,478 Consumer Direct Locks - for PFSI Conventional Conforming $ 474 $ 551 $ 785 $ 744 $ 939 Government 1,338 1,698 3,972 2,480 2,416 Jumbo 12 21 26 29 27 Closed-end second liens 328 428 435 397 501 Total $ 2,152 $ 2,698 $ 5,218 $ 3,650 $ 3,883 Total locks $ 25,068 $ 30,691 $ 38,856 $ 36,194 $ 34,192 |
|
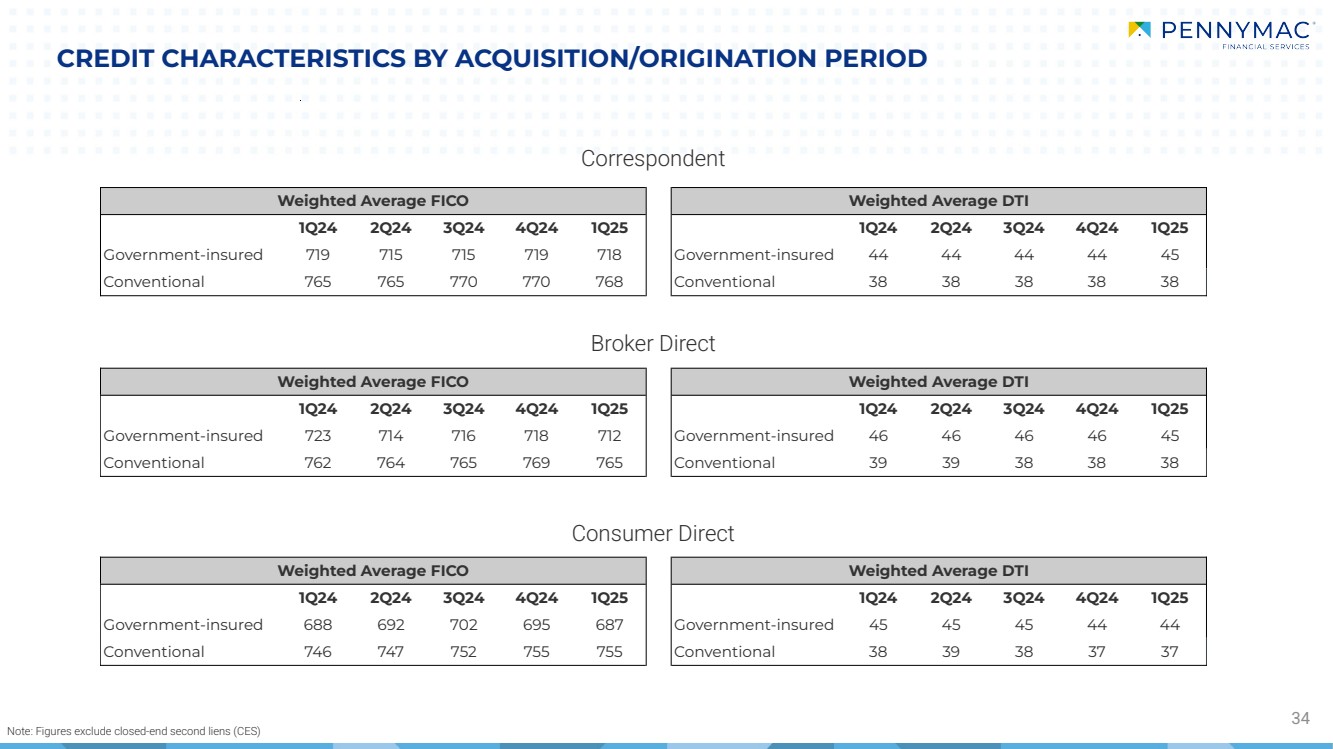
CREDIT CHARACTERISTICS BY ACQUISITION/ORIGINATION PERIOD 34 Correspondent Broker Direct Consumer Direct Weighted Average FICO Weighted Average DTI 1Q24 2Q24 3Q24 4Q24 1Q25 1Q24 2Q24 3Q24 4Q24 1Q25 Government-insured 719 715 715 719 718 Government-insured 44 44 44 44 45 Conventional 765 765 770 770 768 Conventional 38 38 38 38 38 Weighted Average FICO Weighted Average DTI 1Q24 2Q24 3Q24 4Q24 1Q25 1Q24 2Q24 3Q24 4Q24 1Q25 Government-insured 723 714 716 718 712 Government-insured 46 46 46 46 45 Conventional 762 764 765 769 765 Conventional 39 39 38 38 38 Weighted Average FICO Weighted Average DTI 1Q24 2Q24 3Q24 4Q24 1Q25 1Q24 2Q24 3Q24 4Q24 1Q25 Government-insured 688 692 702 695 687 Government-insured 45 45 45 44 44 Conventional 746 747 752 755 755 Conventional 38 39 38 37 37 Note: Figures exclude closed-end second liens (CES) |
|
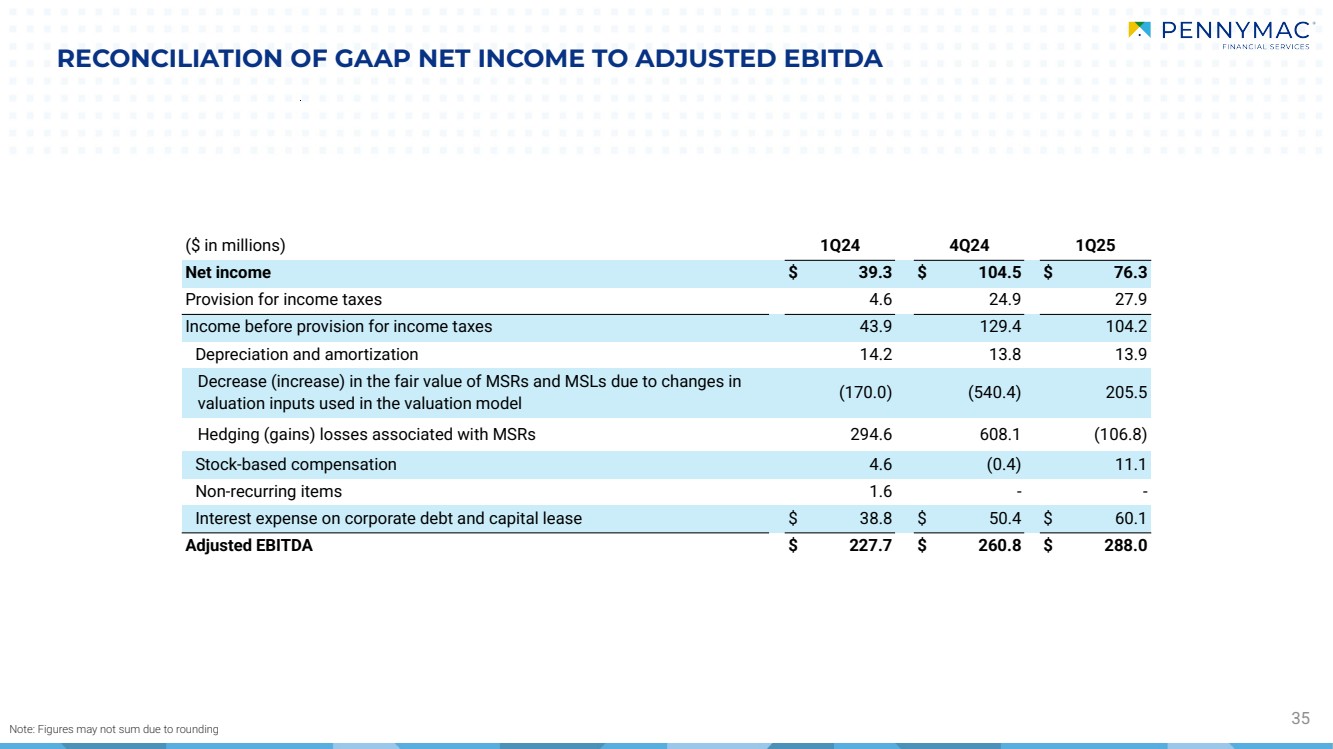
RECONCILIATION OF GAAP NET INCOME TO ADJUSTED EBITDA 35 Note: Figures may not sum due to rounding ($ in millions) 1Q24 4Q24 1Q25 Net income $ 39.3 $ 104.5 $ 76.3 Provision for income taxes 4.6 24.9 27.9 Income before provision for income taxes 43.9 129.4 104.2 Depreciation and amortization 14.2 13.8 13.9 Decrease (increase) in the fair value of MSRs and MSLs due to changes in valuation inputs used in the valuation model (170.0) (540.4) 205.5 Hedging (gains) losses associated with MSRs 294.6 608.1 (106.8) Stock-based compensation 4.6 (0.4) 11.1 Non-recurring items 1.6 - - Interest expense on corporate debt and capital lease $ 38.8 $ 50.4 $ 60.1 Adjusted EBITDA $ 227.7 $ 260.8 $ 288.0 |
|
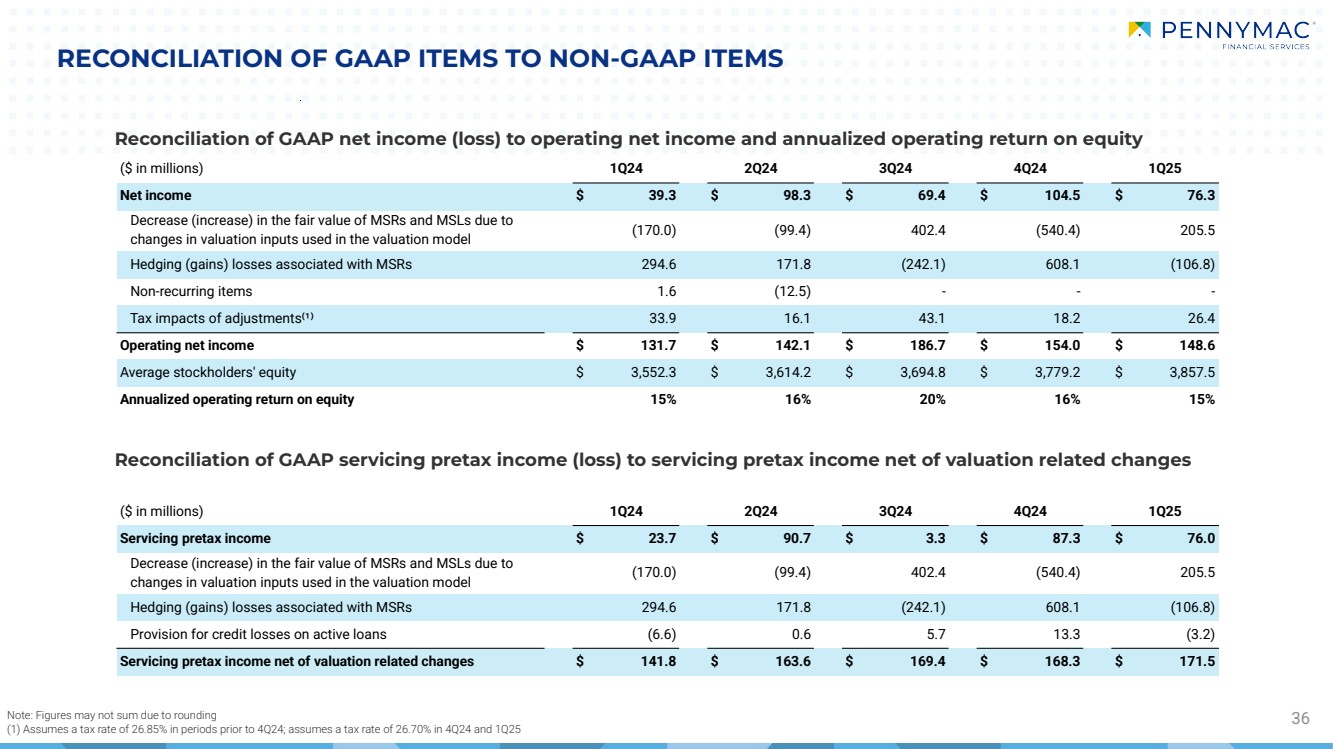
($ in millions) 1Q24 2Q24 3Q24 4Q24 1Q25 Net income $ 39.3 $ 98.3 $ 69.4 $ 104.5 $ 76.3 Decrease (increase) in the fair value of MSRs and MSLs due to changes in valuation inputs used in the valuation model (170.0) (99.4) 402.4 (540.4) 205.5 Hedging (gains) losses associated with MSRs 294.6 171.8 (242.1) 608.1 (106.8) Non-recurring items 1.6 (12.5) - - - Tax impacts of adjustments⁽¹⁾ 33.9 16.1 43.1 18.2 26.4 Operating net income $ 131.7 $ 142.1 $ 186.7 $ 154.0 $ 148.6 Average stockholders' equity $ 3,552.3 $ 3,614.2 $ 3,694.8 $ 3,779.2 $ 3,857.5 Annualized operating return on equity 15% 16% 20% 16% 15% ($ in millions) 1Q24 2Q24 3Q24 4Q24 1Q25 Servicing pretax income $ 23.7 $ 90.7 $ 3.3 $ 87.3 $ 76.0 Decrease (increase) in the fair value of MSRs and MSLs due to changes in valuation inputs used in the valuation model (170.0) (99.4) 402.4 (540.4) 205.5 Hedging (gains) losses associated with MSRs 294.6 171.8 (242.1) 608.1 (106.8) Provision for credit losses on active loans (6.6) 0.6 5.7 13.3 (3.2) Servicing pretax income net of valuation related changes $ 141.8 $ 163.6 $ 169.4 $ 168.3 $ 171.5 RECONCILIATION OF GAAP ITEMS TO NON-GAAP ITEMS Note: Figures may not sum due to rounding 36 (1) Assumes a tax rate of 26.85% in periods prior to 4Q24; assumes a tax rate of 26.70% in 4Q24 and 1Q25 Reconciliation of GAAP net income (loss) to operating net income and annualized operating return on equity Reconciliation of GAAP servicing pretax income (loss) to servicing pretax income net of valuation related changes |
|