United States
Securities and Exchange Commission
Washington, D.C. 20549
Form 8-K
Current Report
Pursuant to Section 13 or 15(d) of the Securities Exchange Act of 1934
Date of Report (Date of earliest event reported): March 6, 2025
CLARUS CORPORATION
(Exact name of registrant as specified in its charter)
|
Delaware (State or other jurisdiction of incorporation) |
001-34767 (Commission File Number) |
58-1972600 (IRS Employer Identification Number) |
|
2084 East 3900 South, Salt Lake City, Utah (Address of principal executive offices) |
84124 (Zip Code) |
Registrant’s telephone number, including area code: (801) 278-5552
N/A
(Former name or former address, if changed since last report.)
Check the appropriate box below if the Form 8-K filing is intended to simultaneously satisfy the filing obligation of the registrant under any of the following provisions:
| ¨ | Written communications pursuant to Rule 425 under the Securities Act (17 CFR 230.425) |
| ¨ | Soliciting material pursuant to Rule 14a-12 under the Exchange Act (17 CFR 240.14a-12) |
| ¨ | Pre-commencement communications pursuant to Rule 14d-2(b) under the Exchange Act (17 CFR 240.14d-2(b)) |
| ¨ | Pre-commencement communications pursuant to Rule 13e-4(c) under the Exchange Act (17 CFR 240.13e-4(c)) |
Indicate by check mark whether the registrant is an emerging growth company as defined in Rule 405 of the Securities Act of 1933 (§230.405 of this chapter) or Rule 12b-2 of the Securities Exchange Act of 1934 (§240.12b-2 of this chapter).
| ¨ | Emerging growth company |
If an emerging growth company, indicate by check mark if the registrant has elected not to use the extended transition period for complying with any new or revised financial accounting standards provided pursuant to Section 13(a) of the Exchange Act. ¨
Securities registered pursuant to Section 12(b) of the Act:
| Title of each class | Trading Symbol | Name
of each exchange on which registered |
||
| Common Stock, par value $.0001 per share | CLAR | NASDAQ Global Select Market |
| Item 2.02 | Results of Operations and Financial Condition |
On March 6, 2025, Clarus Corporation (the “Company”) issued a press release announcing results for the fourth quarter and year ended December 31, 2024 (the “Press Release”). A copy of the Press Release is furnished as Exhibit 99.1 and incorporated herein by reference. Attached hereto as Exhibit 99.2 and incorporated herein by reference is a presentation regarding the Company’s financial results for the fourth quarter and year ended December 31, 2024 (the “Presentation”).
The Press Release and/or the Presentation contain the non-GAAP measures: (i) adjusted gross margin and adjusted gross profit, (ii) adjusted (loss) income from continuing operations and related earnings (loss) per diluted share, (iii) earnings before interest, taxes, other income or expense, depreciation and amortization (“EBITDA”), EBITDA margin, adjusted EBITDA, and adjusted EBITDA margin, and (iv) free cash flow (defined as net cash provided by operating activities less capital expenditures). The Company believes that the presentation of certain non-GAAP measures, i.e.: (i) adjusted gross margin and adjusted gross profit, (ii) adjusted (loss) income from continuing operations and related earnings (loss) per diluted share, (iii) EBITDA, EBITDA margin, adjusted EBITDA and adjusted EBITDA margin, and (iv) free cash flow, provide useful information for the understanding of its ongoing operations and enables investors to focus on period- over -period operating performance, and thereby enhances the user's overall understanding of the Company's current financial performance relative to past performance and provides, along with the nearest GAAP measures, a baseline for modeling future earnings expectations. Non-GAAP measures are reconciled to comparable GAAP financial measures within the Press Release and/or the Presentation. We do not provide a reconciliation of the non-GAAP guidance measures adjusted EBITDA and/or adjusted EBITDA margin for the fiscal year 2025 to net income for the fiscal year 2025, the most comparable GAAP financial measure, due to the inherent difficulty of forecasting certain types of expenses and gains, without unreasonable effort, which affect net income but not adjusted EBITDA and/or adjusted EBITDA margin. The Company cautions that non-GAAP measures should be considered in addition to, but not as a substitute for, the Company's reported GAAP results. Additionally, the Company notes that there can be no assurance that the above referenced non-GAAP financial measures are comparable to similarly titled financial measures used by other publicly traded companies.
The information in Item 2.02 of this Current Report on Form 8-K (including Exhibits 99.1 and 99.2) shall not be deemed “filed” for purposes of Section 18 of the Securities Act of 1934, as amended, nor shall it be deemed incorporated by reference in any filing under the Securities Act of 1933, as amended, except as shall be expressly set forth by specific reference in such filing.
| Item 9.01. | Financial Statements and Exhibits |
(d) Exhibits.
| Exhibit | Description |
| 99.1 | Press Release dated March 6, 2025 (furnished only). |
| 99.2 | Slide Presentation for Conference Call held on March 6, 2025 (furnished only) |
| 104 | Cover Page Interactive Data File (embedded within the Inline XBRL document). |
SIGNATURES
Pursuant to the requirements of the Securities Exchange Act of 1934, as amended, the Company has duly caused this report to be signed on its behalf by the undersigned hereunto duly authorized.
Dated: March 6, 2025
| CLARUS CORPORATION | ||
| By: | /s/ Michael J. Yates | |
| Name: | Michael J. Yates | |
| Title: | Chief Financial Officer | |
Exhibit 99.1
Clarus Reports Fourth Quarter and Full Year 2024 Results
Fourth Quarter Sales of $71.4 million, Adjusted EBITDA of $4.4 million, and Free Cash Flow of $14.4 million
Completed the Acquisition of RockyMounts, Expanding Adventure’s Bike-Rack Product Capabilities Globally
SALT LAKE CITY, March 6, 2025 (GLOBE NEWSWIRE) -- Clarus Corporation (NASDAQ: CLAR) (“Clarus” and/or the “Company”), a global company focused on the outdoor enthusiast markets, reported financial results for the fourth quarter and full year ended December 31, 2024.
Fourth Quarter 2024 Financial Summary vs. Same Year-Ago Quarter (adjusted to reflect the reclassification of the Precision Sport segment as discontinued operations)
| · | Sales of $71.4 million compared to $76.5 million. |
| · | Gross margin was 33.4% compared to 28.9%; adjusted gross margin of 38.0% compared to 34.7%. |
| · | Net loss, which includes the impact of discontinued operations, of $65.5 million, or $(1.71) per diluted share1, compared to net loss of $8.4 million, or $(0.22) per diluted share. |
| · | Loss from continuing operations of $73.3 million, or $(1.92) per diluted share, compared to loss from continuing operations of $7.2 million, or $(0.19) per diluted share. |
| · | Adjusted loss from continuing operations of $3.2 million, or $(0.08) per diluted share, compared to adjusted income from continuing operations of $1.6 million, or $0.04 per diluted share. |
| · | Adjusted EBITDA from continuing operations of $4.4 million with an adjusted EBITDA margin of 6.1% compared to $1.6 million with an adjusted EBITDA margin of 2.1%. |
2024 Financial Summary vs. 2023 (adjusted to reflect the reclassification of the Precision Sport segment as discontinued operations)
| · | Sales of $264.3 million compared to $286.0 million. |
| · | Gross margin was 35.0% compared to 34.1%; adjusted gross margin was 37.5% compared to 35.6%. |
| · | Net loss, which includes the impact of discontinued operations, of $52.3 million, or $(1.37) per diluted share2, compared to net loss of $10.1 million, or $(0.27) per diluted share. |
1 Includes $44.8 million impairment of goodwill and indefinite-lived intangible assets as well as a $21.0 million tax expense for the establishment of a valuation allowance associated with deferred tax assets.
2 Includes gain on sale Precision Sport segment of $40.6 million as well as $44.8 million impairment of goodwill and indefinite-lived intangible assets as well as a $21.0 million tax expense for the establishment of a valuation allowance associated with deferred tax assets.

| · | Loss from continuing operations of $88.4 million, or $(2.31) per diluted share, compared to loss from continuing operations of $15.8 million, or $(0.42) per diluted share. |
| · | Adjusted loss from continuing operations of $2.6 million, or $(0.07) per diluted share, compared to adjusted income from continuing operations of $3.8 million, or $0.10 per diluted share. |
| · | Adjusted EBITDA of $6.9 million with an adjusted EBITDA margin of 2.6% compared to $7.3 million with an adjusted EBITDA margin of 2.6%. |
Management Commentary
“During 2024 we remained focused on executing against our strategic roadmap and positioning Clarus for profitable growth over the long term,” said Warren Kanders, Clarus’ Executive Chairman. “Despite significant market headwinds, we took important steps during the year to simplify and strengthen the core at the Outdoor segment, while investing in new R&D and product development initiatives to scale the Adventure segment. At Outdoor, we made steady progress building a smaller, more profitable business in 2024. Primarily as a result of our product simplification and SKU rationalization initiatives, Outdoor adjusted gross margin improved to 36.9% in Q4 compared to 32.8% in the year ago quarter. In the Adventure segment, we anticipated this past year would require significant investment, and despite a difficult 2024, we are committed to maintaining these fixed investments to scale the business globally outside the home region of Australia.
Mr. Kanders added, “We enter 2025 encouraged by the strides our teams have made to advance our turnaround and excited about the potential to unlock new growth opportunities going forward. Following multiple quarters of incremental progress at Outdoor, we believe our success simplifying the business, rightsizing inventory and reshaping the organization positions Black Diamond for a return to growth as the market stabilizes. While initiatives to accelerate our Adventure brands’ traction in global markets will continue to take time, we have enhanced product development and the commercialization processes and plan to launch compelling new products throughout the coming year. With the recent acquisition of RockyMounts, we now have a comprehensive portfolio of roof and hitch-mounted bike racks solutions to reach a broader addressable market of customers in North America, Australia and New Zealand.
Fourth Quarter 2024 Financial Results
On a consolidated basis, sales in the fourth quarter were $71.4 million compared to $76.5 million in the same year-ago quarter. This decrease was primarily driven by isolated challenges with two large accounts in our OEM and Australian wholesale channels in our Adventure segment. This decline was partly offset by growth in the North American wholesale and international distribution channels at the Outdoor segment.
Sales in the Outdoor segment were $51.1 million, compared to $50.1 million in the year-ago quarter. Sales in the Adventure segment decreased 22.9% to $20.3 million, compared to $26.4 million in the year-ago quarter.
Gross margin in the fourth quarter was 33.4% compared to 28.9% in the year-ago quarter. The increase in gross margin was primarily due to lower PFAS inventory reserves related movements compared to the prior year at the Outdoor segment. This was further improved by favorable product mix due to continued product simplification and SKU rationalization efforts at the Outdoor segment, as well as a favorable channel mix at the Adventure segment due to lower OEM sales. This was partially offset by a $2.3 million increase in the inventory reserve at the Adventure segment to address slow-moving and obsolete inventory. Adjusted gross margin reflecting the PFAS related, other one-time inventory reserve movements, and inventory fair value adjustments as a result of purchase accounting was 38.0% for the quarter compared to 34.7% in the year-ago quarter.
Selling, general and administrative expenses in the fourth quarter were $27.8 million compared to $30.0 million in the same year-ago quarter. The decrease was primarily a result of lower marketing, research and development, and retail expenses due to store closures at the Outdoor segment as well as lower corporate costs. These reductions were partially offset by investments in marketing, research and development, and e-commerce initiatives, primarily at Rhino-Rack USA in the Adventure segment.
During the fourth quarter, the Company incurred non-cash expense for goodwill and indefinite-lived assets impairments of $44.8 million as well as an increase in tax expense of $21.0 million for a valuation allowance to fully reserve all deferred tax assets associated with U.S. federal income taxes.
The loss from continuing operations in the fourth quarter of 2024 was $73.3 million, or $(1.92) per diluted share, compared to loss from continuing operations of $7.2 million, or $(0.19) per diluted share in the year-ago quarter. Loss from continuing operations in the fourth quarter included a non-cash impairment of goodwill and indefinite-lived intangible assets charge of $44.8 million in the Adventure segment due to the decline in the Company’s stock price and lower sales and profitability in the segment compared to expectations. The loss also includes $8.7 million of cost and charges associated with amortization of intangibles, restructuring charges, transactions costs, inventory fair value adjustment from purchase accounting, PFAS and other inventory reserves, legal costs and regulatory matter expenses, and stock-based compensation.
Adjusted loss from continuing operations in the fourth quarter of 2024 was $3.2 million, or $(0.08) per diluted share, compared to adjusted income from continuing operations of $1.6 million, or $0.04 per diluted share, in the year-ago quarter. Adjusted loss from continuing operations excludes amortization of intangibles, impairment of goodwill and indefinite-lived intangible assets, restructuring charges, transactions costs, inventory fair value adjustment from purchase accounting, PFAS and other inventory reserves, legal costs and regulatory matter expenses, and stock-based compensation.
Adjusted EBITDA from continuing operations in the fourth quarter was $4.4 million, or an adjusted EBITDA margin of 6.1%, compared to adjusted EBITDA from continuing operations of $1.6 million, or an adjusted EBITDA margin of 2.1%, in the same year-ago quarter.
Net cash provided in operating activities for the three months ended December 31, 2024, was $16.6 million compared to net cash provided by operating activities of $14.5 million in the prior year quarter. Capital expenditures in the fourth quarter of 2024 were $2.2 million compared to $1.2 million in the prior year quarter. Free cash flow for the fourth quarter of 2024 was $14.4 million compared to $13.3 million in the prior year quarter.
Liquidity at December 31, 2024 vs. December 31, 2023
| · | Cash and cash equivalents totaled $45.4 million compared to $11.3 million. | |
| · | Total debt of $1.9 million (related to the RockyMounts acquisition) compared to $119.8 million. |
Full Year 2024 Financial Results
Sales in 2024 decreased 7.6% to $264.3 million compared to $286.0 million in 2023. The decrease in sales was primarily driven by continued softness across all selling channels in Outdoor, combined with the effects of the Company’s product line simplification strategy, as well as lower Adventure segment sales. The Adventure decline resulted from less OEM channel demand and challenging wholesale markets globally, partially offset by the benefit from the TRED Outdoors acquisition.
From a segment perspective, Outdoor sales were down 10.0% to $183.6 million and Adventure sales were down 1.5% to $80.7 million, or $81.3 million on a constant currency basis, compared to 2023.
Gross margin in 2024 was 35.0% compared to 34.1% in 2023 primarily due to favorable product mix at the Outdoor segment as a result of product simplification and SKU rationalization efforts, combined with favorable Adventure segment channel mix due to lower OEM sales. This was partially offset by a $2.3 million inventory reserve expenses at the Adventure segment. Adjusted gross margin reflecting the PFAS related inventory reserve, Adventure inventory reserve, and inventory fair value purchase accounting was 37.5% for the year compared to 35.6% in the prior year.
Selling, general and administrative expenses in 2024 were $111.9 million compared to $114.6 million in 2023. The decrease was primarily due to lower retail expenses due to store closures and lower marketing and research and development expenses at the Outdoor segment. These decreases were partially offset by investments in global marketing, operational improvements, and e-commerce initiatives to accelerate growth at the Adventure segment and incremental SG&A from the TRED Outdoors acquisition.
Loss from continuing operations in 2024 was $88.4 million, or $(2.31) per diluted share, compared to net loss of $15.8 million, or $(0.42) per diluted share, in the prior year. Loss from continuing operations for 2024 included a non-cash impairment of goodwill and indefinite-lived intangible assets charge of $44.8 million in the Adventure segment due to the decline in the Company’s stock price and lower sales and profitability in the segment compared to expectations. The loss also includes $28.4 million of cost and charges associated with amortization of intangibles, restructuring charges, transactions costs, contingent consideration benefit, inventory fair value of purchase accounting, PFAS and other inventory reserves, legal costs and regulatory matter expenses, and stock-based compensation.
Adjusted loss from continuing operations in 2024 was $2.6 million, or $(0.07) per diluted share, compared to adjusted income from continuing operations of $3.8 million, or $0.10 per diluted share in the year-ago quarter. Adjusted loss from continuing operations excludes amortization of intangibles, impairment of goodwill and indefinite-lived intangible assets, restructuring expenses, transactions costs, contingent consideration benefit, inventory fair value of purchase accounting, PFAS and other inventory reserves, legal costs and regulatory matter expenses, and stock-based compensation.
Adjusted EBITDA in 2024 was $6.9 million, or an adjusted EBITDA margin of 2.6%, compared to $7.3 million, or an adjusted EBITDA margin of 2.6%, in 2023.
Net cash used in operating activities for the year ended December 31, 2024, was $7.3 million compared to net cash provided by operating activities of $31.9 million in 2023. Capital expenditures in 2024 were $6.7 million compared to $5.7 million in the prior year. Free cash flow for the year ended December 31, 2024, was $(14.0) million compared to $26.2 million in the same year-ago period.
Acquisition of RockyMounts
In December, Rhino-Rack USA completed the acquisition of certain assets and liabilities constituting the RockyMounts business, a Colorado-based brand specializing in bicycle transport products, that we expect to deepen Rhino-Rack’s product expertise in a key growth vertical. For over 30 years, RockyMounts has designed innovative roof and hitch rack solutions, attracting a dedicated following of customers thanks to the products’ distinct style and exceptional durability. Founded in Boulder, Colorado in 1993, RockyMounts is known for making well designed and dependable premium bicycle racks and other accessories compatible with vehicles of all sizes, including SUVs, vans and trucks. Its award-winning products can be found in local and national retailers across North America.
2025 Outlook
The Company expects fiscal year 2025 sales to range between $250 million to $260 million and adjusted EBITDA of approximately $14 million to $16 million, or an adjusted EBITDA margin of 5.9% at the mid-point of revenue and adjusted EBITDA. In addition, capital expenditures are expected to range between $4 million to $5 million and free cash flow is expected to range between $8 million to $10 million for the full year 2025. Clarus has not provided net income guidance due to the inherent difficulty of forecasting certain types of expenses and gains, which affect net income but not Adjusted EBITDA and/or Adjusted EBITDA Margin. Therefore, we do not provide a reconciliation of Adjusted EBITDA and/or Adjusted EBITDA Margin guidance to net income guidance.
Net Operating Loss (NOL) and Deferred Tax Asset Valuation Allowance
The Company has historically had net operating loss carryforwards (“NOLs”) for U.S. federal income tax purposes. During 2024 the remaining NOLs have been utilized. Additionally, during the fourth quarter of 2024 the Company established a full valuation allowance through a charge to income tax expense for $21.0 million.
Conference Call
The Company will hold a conference call today at 5:00 p.m. Eastern time to discuss its fourth quarter 2024 results.
Date: Thursday, March 6, 2025
Time: 5:00 pm ET
Registration Link: https://register.vevent.com/register/BI193a68bc624f4d3cb299c6cede17b335
To access the call by phone, please register via the live call registration link above and you will be provided with dial-in instructions and details. The conference call will be broadcast live and available for replay here and on the Company’s website at www.claruscorp.com.
About Clarus Corporation
Headquartered in Salt Lake City, Utah, Clarus Corporation is a global leader in the design and development of best-in-class equipment and lifestyle products for outdoor enthusiasts. Driven by our rich history of engineering and innovation, our objective is to provide safe, simple, effective and beautiful products so that our customers can maximize their outdoor pursuits and adventures. Each of our brands has a long history of continuous product innovation for core and everyday users alike. The Company’s products are principally sold globally under the Black Diamond®, Rhino-Rack®, MAXTRAX®, and TRED Outdoors® brand names through outdoor specialty and online retailers, our own websites, distributors, and original equipment manufacturers.
Use of Non-GAAP Measures
The Company reports its financial results in accordance with U.S. generally accepted accounting principles (“GAAP”). This press release contains the non-GAAP measures: (i) adjusted gross margin and adjusted gross profit, (ii) adjusted (loss) income from continuing operations and related earnings (loss) per diluted share, (iii) earnings before interest, taxes, other income or expense, depreciation and amortization (“EBITDA”), EBITDA margin, adjusted EBITDA, and adjusted EBITDA margin, and (iv) free cash flow (defined as net cash provided by operating activities less capital expenditures). The Company believes that the presentation of certain non-GAAP measures, i.e.: (i) adjusted gross margin and adjusted gross profit, (ii) adjusted (loss) income from continuing operations and related earnings (loss) per diluted share, (iii) EBITDA, EBITDA margin, adjusted EBITDA and adjusted EBITDA margin, and (iv) free cash flow, provide useful information for the understanding of its ongoing operations and enables investors to focus on period-over-period operating performance, and thereby enhances the user's overall understanding of the Company's current financial performance relative to past performance and provides, along with the nearest GAAP measures, a baseline for modeling future earnings expectations. Non-GAAP measures are reconciled to comparable GAAP financial measures within this press release. We do not provide a reconciliation of the non-GAAP guidance measures Adjusted EBITDA and/or Adjusted EBITDA Margin for the fiscal year 2025 to net income for the fiscal year 2025, the most comparable GAAP financial measure, due to the inherent difficulty of forecasting certain types of expenses and gains, without unreasonable effort, which affect net income but not Adjusted EBITDA and/or Adjusted EBITDA Margin. The Company cautions that non-GAAP measures should be considered in addition to, but not as a substitute for, the Company's reported GAAP results. Additionally, the Company notes that there can be no assurance that the above referenced non-GAAP financial measures are comparable to similarly titled financial measures used by other publicly traded companies.
Forward-Looking Statements
Please note that in this press release we may use words such as “appears,” “anticipates,” “believes,” “plans,” “expects,” “intends,” “future,” and similar expressions which constitute forward-looking statements within the meaning of the safe harbor provisions of the Private Securities Litigation Reform Act of 1995. Forward-looking statements are made based on our expectations and beliefs concerning future events impacting the Company and therefore involve a number of risks and uncertainties. We caution that forward-looking statements are not guarantees and that actual results could differ materially from those expressed or implied in the forward-looking statements. Potential risks and uncertainties that could cause the actual results of operations or financial condition of the Company to differ materially from those expressed or implied by forward-looking statements in this press release, include, but are not limited to, those risks and uncertainties more fully described from time to time in the Company's public reports filed with the Securities and Exchange Commission, including under the section titled “Risk Factors” in the Company's Annual Report on Form 10-K, and/or Quarterly Reports on Form 10-Q, as well as in the Company’s Current Reports on Form 8-K. All forward-looking statements included in this press release are based upon information available to the Company as of the date of this press release and speak only as of the date hereof. We assume no obligation to update any forward- looking statements to reflect events or circumstances after the date of this press release.
Company Contact:
Michael J. Yates
Chief Financial Officer
mike.yates@claruscorp.com
Investor Relations:
The IGB Group
Leon Berman / Matt Berkowitz
Tel 1-212-477-8438 / 1-212-227-7098
lberman@igbir.com / mberkowitz@igbir.com
CLARUS CORPORATION
CONDENSED CONSOLIDATED BALANCE SHEETS
(Unaudited)
(In thousands, except per share amounts)
| December 31, 2024 | December 31, 2023 | |||||||
| Assets | ||||||||
| Current assets | ||||||||
| Cash | $ | 45,359 | $ | 11,324 | ||||
| Accounts receivable, net | 43,678 | 53,971 | ||||||
| Inventories | 82,278 | 91,409 | ||||||
| Prepaid and other current assets | 5,555 | 4,865 | ||||||
| Income tax receivable | 910 | 892 | ||||||
| Assets held for sale | - | 137,284 | ||||||
| Total current assets | 177,780 | 299,745 | ||||||
| Property and equipment, net | 17,606 | 16,587 | ||||||
| Other intangible assets, net | 31,516 | 41,466 | ||||||
| Indefinite-lived intangible assets | 46,750 | 58,527 | ||||||
| Goodwill | 3,804 | 39,320 | ||||||
| Deferred income taxes | 36 | 22,869 | ||||||
| Other long-term assets | 16,602 | 16,824 | ||||||
| Total assets | $ | 294,094 | $ | 495,338 | ||||
| Liabilities and Stockholders’ Equity | ||||||||
| Current liabilities | ||||||||
| Accounts payable | $ | 11,873 | $ | 20,015 | ||||
| Accrued liabilities | 22,276 | 24,580 | ||||||
| Income tax payable | - | 805 | ||||||
| Current portion of long-term debt | 1,888 | 119,790 | ||||||
| Liabilities held for sale | - | 5,744 | ||||||
| Total current liabilities | 36,037 | 170,934 | ||||||
| Deferred income taxes | 12,210 | 18,124 | ||||||
| Other long-term liabilities | 12,754 | 14,160 | ||||||
| Total liabilities | 61,001 | 203,218 | ||||||
| Stockholders’ Equity | ||||||||
| Preferred stock, $0.0001 par value per share; 5,000 shares authorized; none issued | - | - | ||||||
| Common stock, $0.0001 par value per share; 100,000 shares authorized; 43,004 and 42,761 issued and 38,362 and 38,149 outstanding, respectively | 4 | 4 | ||||||
| Additional paid in capital | 697,592 | 691,198 | ||||||
| Accumulated deficit | (406,857 | ) | (350,739 | ) | ||||
| Treasury stock, at cost | (33,114 | ) | (32,929 | ) | ||||
| Accumulated other comprehensive loss | (24,532 | ) | (15,414 | ) | ||||
| Total stockholders’ equity | 233,093 | 292,120 | ||||||
| Total liabilities and stockholders’ equity | $ | 294,094 | $ | 495,338 | ||||
CLARUS CORPORATION
CONDENSED CONSOLIDATED STATEMENTS OF LOSS
(Unaudited)
(In thousands, except per share amounts)
| Three Months Ended | ||||||||
| December 31, 2024 | December 31, 2023 | |||||||
| Sales | ||||||||
| Domestic sales | $ | 30,162 | $ | 31,840 | ||||
| International sales | 41,243 | 44,663 | ||||||
| Total sales | 71,405 | 76,503 | ||||||
| Cost of goods sold | 47,540 | 54,361 | ||||||
| Gross profit | 23,865 | 22,142 | ||||||
| Operating expenses | ||||||||
| Selling, general and administrative | 27,772 | 29,963 | ||||||
| Restructuring charges | 939 | 1,411 | ||||||
| Transaction costs | 408 | 134 | ||||||
| Legal costs and regulatory matter expenses | 47 | 702 | ||||||
| Impairment of goodwill | 36,264 | - | ||||||
| Impairment of indefinite-lived intangible assets | 8,545 | - | ||||||
| Total operating expenses | 73,975 | 32,210 | ||||||
| Operating loss | (50,110 | ) | (10,068 | ) | ||||
| Other income (expense) | ||||||||
| Interest income, net | 269 | 35 | ||||||
| Other, net | (2,342 | ) | 1,104 | |||||
| Total other (expense) income, net | (2,073 | ) | 1,139 | |||||
| Loss before income tax | (52,183 | ) | (8,929 | ) | ||||
| Income tax expense (benefit) | 21,142 | (1,700 | ) | |||||
| Loss from continuing operations | (73,325 | ) | (7,229 | ) | ||||
| Discontinued operations, net of tax | 7,804 | (1,160 | ) | |||||
| Net loss | $ | (65,521 | ) | $ | (8,389 | ) | ||
| Loss from continuing operations per share: | ||||||||
| Basic | $ | (1.92 | ) | $ | (0.19 | ) | ||
| Diluted | (1.92 | ) | (0.19 | ) | ||||
| Net loss per share: | ||||||||
| Basic | $ | (1.71 | ) | $ | (0.22 | ) | ||
| Diluted | (1.71 | ) | (0.22 | ) | ||||
| Weighted average shares outstanding: | ||||||||
| Basic | 38,262 | 38,312 | ||||||
| Diluted | 38,262 | 38,312 | ||||||
CLARUS CORPORATION
CONDENSED CONSOLIDATED STATEMENTS OF LOSS
(Unaudited)
(In thousands, except per share amounts)
| Twelve Months Ended | ||||||||
| December 31, 2024 | December 31, 2023 | |||||||
| Sales | ||||||||
| Domestic sales | $ | 105,745 | $ | 112,385 | ||||
| International sales | 158,570 | 173,635 | ||||||
| Total sales | 264,315 | 286,020 | ||||||
| Cost of goods sold | 171,696 | 188,509 | ||||||
| Gross profit | 92,619 | 97,511 | ||||||
| Operating expenses | ||||||||
| Selling, general and administrative | 111,948 | 114,603 | ||||||
| Restructuring charges | 1,948 | 3,223 | ||||||
| Transaction costs | 576 | 593 | ||||||
| Contingent consideration benefit | (125 | ) | (1,565 | ) | ||||
| Legal costs and regulatory matter expenses | 3,842 | 1,764 | ||||||
| Impairment of goodwill | 36,264 | - | ||||||
| Impairment of indefinite-lived intangible assets | 8,545 | - | ||||||
| Total operating expenses | 162,998 | 118,618 | ||||||
| Operating loss | (70,379 | ) | (21,107 | ) | ||||
| Other (expense) income | ||||||||
| Interest income, net | 1,467 | 67 | ||||||
| Other, net | (1,673 | ) | 961 | |||||
| Total other (expense) income, net | (206 | ) | 1,028 | |||||
| Loss before income tax | (70,585 | ) | (20,079 | ) | ||||
| Income tax expense (benefit) | 17,852 | (4,291 | ) | |||||
| Loss from continuing operations | (88,437 | ) | (15,788 | ) | ||||
| Discontinued operations, net of tax | 36,150 | 5,642 | ||||||
| Net loss | $ | (52,287 | ) | $ | (10,146 | ) | ||
| Loss from continuing operations per share: | ||||||||
| Basic | $ | (2.31 | ) | $ | (0.42 | ) | ||
| Diluted | (2.31 | ) | (0.42 | ) | ||||
| Net loss per share: | ||||||||
| Basic | $ | (1.37 | ) | $ | (0.27 | ) | ||
| Diluted | (1.37 | ) | (0.27 | ) | ||||
| Weighted average shares outstanding: | ||||||||
| Basic | 38,305 | 37,485 | ||||||
| Diluted | 38,305 | 37,485 | ||||||
CLARUS CORPORATION
RECONCILIATION FROM GROSS PROFIT TO ADJUSTED GROSS PROFIT
AND ADJUSTED GROSS MARGIN
THREE MONTHS ENDED
| December 31, 2024 | December 31, 2023 | |||||||||
| Sales | $ | 71,405 | Sales | $ | 76,503 | |||||
| Gross profit as reported | $ | 23,865 | Gross profit as reported | $ | 22,142 | |||||
| Plus impact of inventory fair value adjustment | 61 | Plus impact of inventory fair value adjustment | 64 | |||||||
| Plus impact of PFAS and other inventory reserves | 3,179 | Plus impact of PFAS and other inventory reserves | 4,370 | |||||||
| Adjusted gross profit | $ | 27,105 | Adjusted gross profit | $ | 26,576 | |||||
| Gross margin as reported | 33.4 | % | Gross margin as reported | 28.9 | % | |||||
| Adjusted gross margin | 38.0 | % | Adjusted gross margin | 34.7 | % | |||||
TWELVE MONTHS ENDED
| December 31, 2024 | December 31, 2023 | |||||||||
| Sales | $ | 264,315 | Sales | $ | 286,020 | |||||
| Gross profit as reported | $ | 92,619 | Gross profit as reported | $ | 97,511 | |||||
| Plus impact of inventory fair value adjustment | 61 | Plus impact of inventory fair value adjustment | 64 | |||||||
| Plus impact of PFAS and other inventory reserves | 6,502 | Plus impact of PFAS and other inventory reserves | 4,370 | |||||||
| Adjusted gross profit | $ | 99,182 | Adjusted gross profit | $ | 101,945 | |||||
| Gross margin as reported | 35.0 | % | Gross margin as reported | 34.1 | % | |||||
| Adjusted gross margin | 37.5 | % | Adjusted gross margin | 35.6 | % | |||||
CLARUS CORPORATION
RECONCILIATION
FROM LOSS FROM CONTINUING OPERATIONS TO ADJUSTED (LOSS) INCOME FROM CONTINUING OPERATIONS
AND RELATED EARNINGS PER DILUTED SHARE
(In thousands, except per share amounts)
| Three Months Ended December 31, 2024 | ||||||||||||||||||||||||||||
| Total | Gross | Operating | Income tax | Tax | (Loss) income from | Diluted | ||||||||||||||||||||||
| sales | profit | expenses | (benefit) expense | rate | continuing operations | EPS (1) | ||||||||||||||||||||||
| As reported | $ | 71,405 | $ | 23,865 | $ | 73,975 | $ | 21,142 | 40.5 | % | $ | (73,325 | ) | $ | (1.92 | ) | ||||||||||||
| Amortization of intangibles | - | - | (2,468 | ) | 1,240 | 1,228 | ||||||||||||||||||||||
| Impairment of goodwill | - | - | (36,264 | ) | - | 36,264 | ||||||||||||||||||||||
| Impairment of indefinite-lived intangible assets | - | - | (8,545 | ) | 2,564 | 5,981 | ||||||||||||||||||||||
| Restructuring charges | - | - | (939 | ) | 251 | 688 | ||||||||||||||||||||||
| Transaction costs | - | - | (408 | ) | 87 | 321 | ||||||||||||||||||||||
| Inventory fair value of purchase accounting | - | 61 | - | 13 | 48 | |||||||||||||||||||||||
| PFAS and other inventory reserves | - | 3,179 | - | 766 | 2,413 | |||||||||||||||||||||||
| Legal costs and regulatory matter expenses | - | - | (47 | ) | 23 | 24 | ||||||||||||||||||||||
| Stock-based compensation | - | - | (1,570 | ) | (588 | ) | 2,158 | |||||||||||||||||||||
| Valuation allowance | - | - | - | (21,038 | ) | 21,038 | ||||||||||||||||||||||
| As adjusted | $ | 71,405 | $ | 27,105 | $ | 23,734 | $ | 4,460 | 343.6 | % | $ | (3,162 | ) | $ | (0.08 | ) | ||||||||||||
(1) Potentially dilutive securities are excluded from the computation of diluted earnings (loss) per share if their effect is anti-dilutive to the loss from continuing operations. Reported loss from continuing operations per share and adjusted loss from continuing operations per share are both calculated based on 38,262 basic and diluted weighted average shares of common stock.
| Three Months Ended December 31, 2023 | ||||||||||||||||||||||||||||
| Total | Gross | Operating | Income tax | Tax | (Loss) income from | Diluted | ||||||||||||||||||||||
| sales | profit | expenses | (benefit) expense | rate | continuing operations | EPS (1) | ||||||||||||||||||||||
| As reported | $ | 76,503 | $ | 22,142 | $ | 32,210 | $ | (1,700 | ) | (19.0 | )% | $ | (7,229 | ) | $ | (0.19 | ) | |||||||||||
| Amortization of intangibles | - | - | (2,680 | ) | 536 | 2,144 | ||||||||||||||||||||||
| Restructuring charges | - | - | (1,411 | ) | 282 | 1,129 | ||||||||||||||||||||||
| Transaction costs | - | - | (134 | ) | 27 | 107 | ||||||||||||||||||||||
| Inventory fair value of purchase accounting | - | 64 | - | 13 | 51 | |||||||||||||||||||||||
| PFAS and other inventory reserves | - | 4,370 | - | 575 | 3,795 | |||||||||||||||||||||||
| Legal costs and regulatory matter expenses | - | - | (702 | ) | 35 | 667 | ||||||||||||||||||||||
| Stock-based compensation | - | - | (1,218 | ) | 244 | 974 | ||||||||||||||||||||||
| As adjusted | $ | 76,503 | $ | 26,576 | $ | 26,065 | $ | 12 | 0.7 | % | $ | 1,638 | $ | 0.04 | ||||||||||||||
(1) Potentially dilutive securities are excluded from the computation of diluted earnings (loss) per share if their effect is anti-dilutive to the loss from continuing operations. Reported loss from continuing operations per share is calculated based on 38,312 basic and diluted weighted average shares of common stock. Adjusted income from continuing operations per share is calculated based on 38,479 diluted shares of common stock.
CLARUS CORPORATION
RECONCILIATION
FROM LOSS FROM CONTINUING OPERATIONS TO ADJUSTED (LOSS) INCOME FROM CONTINUING OPERATIONS
AND RELATED EARNINGS PER DILUTED SHARE
(In thousands, except per share amounts)
| Twelve Months Ended December 31, 2024 | ||||||||||||||||||||||||||||
| Total | Gross | Operating | Income tax | Tax | (Loss) income from | Diluted | ||||||||||||||||||||||
| sales | profit | expenses | (benefit) expense | rate | continuing operations | EPS (1) | ||||||||||||||||||||||
| As reported | $ | 264,315 | $ | 92,619 | $ | 162,998 | $ | 17,852 | 25.3 | % | $ | (88,437 | ) | $ | (2.31 | ) | ||||||||||||
| Amortization of intangibles | - | - | (9,784 | ) | 2,751 | 7,033 | ||||||||||||||||||||||
| Impairment of goodwill | - | - | (36,264 | ) | - | 36,264 | ||||||||||||||||||||||
| Impairment of indefinite-lived intangible assets | - | - | (8,545 | ) | 2,564 | 5,981 | ||||||||||||||||||||||
| Restructuring charges | - | - | (1,948 | ) | 459 | 1,489 | ||||||||||||||||||||||
| Transaction costs | - | - | (576 | ) | 122 | 454 | ||||||||||||||||||||||
| Contingent consideration benefit | - | - | 125 | (26 | ) | (99 | ) | |||||||||||||||||||||
| Inventory fair value of purchase accounting | - | 61 | - | 13 | 48 | |||||||||||||||||||||||
| PFAS and other inventory reserves | - | 6,502 | - | 1,453 | 5,049 | |||||||||||||||||||||||
| Legal costs and regulatory matter expenses | - | - | (3,842 | ) | 807 | 3,035 | ||||||||||||||||||||||
| Stock-based compensation | - | - | (5,823 | ) | 291 | 5,532 | ||||||||||||||||||||||
| Valuation allowance | - | - | - | (21,038 | ) | 21,038 | ||||||||||||||||||||||
| As adjusted | $ | 264,315 | $ | 99,182 | $ | 96,341 | $ | 5,248 | 199.2 | % | $ | (2,613 | ) | $ | (0.07 | ) | ||||||||||||
(1) Potentially dilutive securities are excluded from the computation of diluted earnings (loss) per share if their effect is anti-dilutive to the loss from continuing operations. Reported loss from continuing operations per share and adjusted loss from continuing operations per share are both calculated based on 38,305 basic and diluted weighted average shares of common stock.
| Twelve Months Ended December 31, 2023 | ||||||||||||||||||||||||||||
| Total | Gross | Operating | Income tax | Tax | (Loss) income from | Diluted | ||||||||||||||||||||||
| sales | profit | expenses | (benefit) expense | rate | continuing operations | EPS (1) | ||||||||||||||||||||||
| As reported | $ | 286,020 | $ | 97,511 | $ | 118,618 | $ | (4,291 | ) | (21.4 | )% | $ | (15,788 | ) | $ | (0.42 | ) | |||||||||||
| Amortization of intangibles | - | - | (10,715 | ) | 2,293 | 8,422 | ||||||||||||||||||||||
| Restructuring charges | - | - | (3,223 | ) | 690 | 2,533 | ||||||||||||||||||||||
| Transaction costs | - | - | (593 | ) | 127 | 466 | ||||||||||||||||||||||
| Contingent consideration benefit | - | - | 1,565 | (335 | ) | (1,230 | ) | |||||||||||||||||||||
| Inventory fair value of purchase accounting | - | 64 | - | 14 | 50 | |||||||||||||||||||||||
| PFAS and other inventory reserves | - | 4,370 | - | 575 | 3,795 | |||||||||||||||||||||||
| Legal costs and regulatory matter expenses | - | - | (1,764 | ) | 261 | 1,503 | ||||||||||||||||||||||
| Stock-based compensation | - | - | (5,141 | ) | 1,100 | 4,041 | ||||||||||||||||||||||
| As adjusted | $ | 286,020 | $ | 101,945 | $ | 98,747 | $ | 434 | 10.3 | % | $ | 3,792 | $ | 0.10 | ||||||||||||||
(1) Potentially dilutive securities are excluded from the computation of diluted earnings (loss) per share if their effect is anti-dilutive to the loss from continuing operations. Reported loss from continuing operations per share is calculated based on 37,485 basic and diluted weighted average shares of common stock. Adjusted income from continuing operations per share is calculated based on 38,088 diluted shares of common stock.
CLARUS CORPORATION
RECONCILIATION FROM OPERATING (LOSS) INCOME TO EARNINGS BEFORE INTEREST, TAXES, DEPRECIATION, AND AMORTIZATION (EBITDA), EBITDA MARGIN, ADJUSTED EBITDA, AND ADJUSTED EBITDA MARGIN
(In thousands)
| Three Months Ended December 31, 2024 | Three Months Ended December 31, 2023 | |||||||||||||||||||||||||||||||
| Outdoor Segment |
Adventure Segment |
Corporate Costs |
Total | Outdoor Segment |
Adventure Segment |
Corporate Costs |
Total | |||||||||||||||||||||||||
| Operating (loss) income | $ | 1,897 | $ | (48,582 | ) | $ | (3,425 | ) | $ | (50,110 | ) | $ | (7,002 | ) | $ | 1,051 | $ | (4,117 | ) | $ | (10,068 | ) | ||||||||||
| Depreciation | 614 | 369 | - | 983 | 715 | 371 | - | 1,086 | ||||||||||||||||||||||||
| Amortization of intangibles | 285 | 2,183 | - | 2,468 | 285 | 2,395 | - | 2,680 | ||||||||||||||||||||||||
| EBITDA | 2,796 | (46,030 | ) | (3,425 | ) | (46,659 | ) | (6,002 | ) | 3,817 | (4,117 | ) | (6,302 | ) | ||||||||||||||||||
| Restructuring charges | 789 | 150 | - | 939 | 1,372 | 39 | - | 1,411 | ||||||||||||||||||||||||
| Transaction costs | 65 | 307 | 36 | 408 | - | 1 | 133 | 134 | ||||||||||||||||||||||||
| Legal costs and regulatory matter expenses | 10 | - | 37 | 47 | 260 | - | 442 | 702 | ||||||||||||||||||||||||
| Impairment of goodwill | - | 36,264 | - | 36,264 | - | - | - | - | ||||||||||||||||||||||||
| Impairment of indefinite-lived intangible assets | - | 8,545 | - | 8,545 | - | - | - | - | ||||||||||||||||||||||||
| Stock-based compensation | - | - | 1,570 | 1,570 | - | - | 1,218 | 1,218 | ||||||||||||||||||||||||
| Inventory fair value of purchase accounting | - | 61 | - | 61 | - | 64 | - | 64 | ||||||||||||||||||||||||
| PFAS and other inventory reserves | 869 | 2,310 | - | 3,179 | 4,370 | - | - | 4,370 | ||||||||||||||||||||||||
| Adjusted EBITDA | $ | 4,529 | $ | 1,607 | $ | (1,782 | ) | $ | 4,354 | $ | - | $ | 3,921 | $ | (2,324 | ) | $ | 1,597 | ||||||||||||||
| Sales | $ | 51,072 | $ | 20,333 | $ | - | $ | 71,405 | 50,135 | 26,368 | - | 76,503 | ||||||||||||||||||||
| EBITDA margin | 5.5 | % | (226.4 | )% | (65.3 | )% | (12.0 | )% | 14.5 | % | (8.2 | )% | ||||||||||||||||||||
| Adjusted EBITDA margin | 8.9 | % | 7.9 | % | 6.1 | % | - | % | 14.9 | % | 2.1 | % | ||||||||||||||||||||
CLARUS CORPORATION
RECONCILIATION FROM OPERATING (LOSS) INCOME TO EARNINGS BEFORE INTEREST, TAXES, DEPRECIATION, AND AMORTIZATION (EBITDA), EBITDA MARGIN, ADJUSTED EBITDA, AND ADJUSTED EBITDA MARGIN
(In thousands)
| Twelve Months Ended December 31, 2024 | Twelve Months Ended December 31, 2023 | |||||||||||||||||||||||||||||||
| Outdoor Segment |
Adventure Segment |
Corporate Costs |
Total | Outdoor Segment |
Adventure Segment |
Corporate Costs |
Total | |||||||||||||||||||||||||
| Operating (loss) income | $ | (999 | ) | $ | (53,126 | ) | $ | (16,254 | ) | $ | (70,379 | ) | $ | (5,155 | ) | $ | 911 | $ | (16,863 | ) | $ | (21,107 | ) | |||||||||
| Depreciation | 2,588 | 1,446 | - | 4,034 | 2,848 | 1,302 | - | 4,150 | ||||||||||||||||||||||||
| Amortization of intangibles | 1,142 | 8,642 | - | 9,784 | 1,057 | 9,658 | - | 10,715 | ||||||||||||||||||||||||
| EBITDA | 2,731 | (43,038 | ) | (16,254 | ) | (56,561 | ) | (1,250 | ) | 11,871 | (16,863 | ) | (6,242 | ) | ||||||||||||||||||
| Restructuring charges | 1,349 | 599 | - | 1,948 | 2,754 | 306 | 163 | 3,223 | ||||||||||||||||||||||||
| Transaction costs | 65 | 396 | 115 | 576 | - | 30 | 563 | 593 | ||||||||||||||||||||||||
| Contingent consideration benefit | - | (125 | ) | - | (125 | ) | - | (1,565 | ) | - | (1,565 | ) | ||||||||||||||||||||
| Legal costs and regulatory matter expenses | 3,088 | - | 754 | 3,842 | 476 | - | 1,288 | 1,764 | ||||||||||||||||||||||||
| Impairment of goodwill | - | 36,264 | - | 36,264 | - | - | - | - | ||||||||||||||||||||||||
| Impairment of indefinite-lived intangible assets | - | 8,545 | - | 8,545 | - | - | - | - | ||||||||||||||||||||||||
| Stock-based compensation | - | - | 5,823 | 5,823 | - | - | 5,141 | 5,141 | ||||||||||||||||||||||||
| Inventory fair value of purchase accounting | - | 61 | - | 61 | - | 64 | - | 64 | ||||||||||||||||||||||||
| PFAS and other inventory reserves | 4,192 | 2,310 | - | 6,502 | 4,370 | - | - | 4,370 | ||||||||||||||||||||||||
| Adjusted EBITDA | $ | 11,425 | $ | 5,012 | $ | (9,562 | ) | $ | 6,875 | $ | 6,350 | $ | 10,706 | $ | (9,708 | ) | $ | 7,348 | ||||||||||||||
| Sales | $ | 183,568 | $ | 80,747 | $ | - | $ | 264,315 | 204,053 | 81,967 | - | 286,020 | ||||||||||||||||||||
| EBITDA margin | 1.5 | % | (53.3 | )% | (21.4 | )% | (0.6 | )% | 14.5 | % | (2.2 | )% | ||||||||||||||||||||
| Adjusted EBITDA margin | 6.2 | % | 6.2 | % | 2.6 | % | 3.1 | % | 13.1 | % | 2.6 | % | ||||||||||||||||||||
Exhibit 99.2

Q4 EARNINGS PRESENTATION MARCH 6, 2025

6 February 2023 PAGE 2 Forward - Looking Statements Please note that in this presentation we may use words such as “appears,” “anticipates,” “believes,” “plans,” “expects,” “int end s,” “future,” and similar expressions which constitute forward - looking statements within the meaning of the safe harbor provisions of the Private Securities Litigation Reform Act of 1995. Forward - looking statem ents are made based on our expectations and beliefs concerning future events impacting the Company and therefore involve a number of risks and uncertainties. We caution that forward - looking statements are not guarantees and that actual results could differ materially from those expressed or implied in the forward - looking statements. Potential risks and uncertainties that could cause the actual results of operations or financial condition of the Company to differ materially from those expressed or implied by forward - looking statements in this presentation, include, but are not limited to, those risks and uncert ainties more fully described from time to time in the Company's public reports filed with the Securities and Exchange Commission, including under the section titled “Risk Factors” in the Company's Annual Report on Form 10 - K, and/or Quarterly Reports on Form 10 - Q, as well as in the Company’s Current Reports on Form 8 - K. All forward - looking statements included in this presentation are based upon information available t o the Company as of the date of this presentation and speak only as of the date hereof. We assume no obligation to update any forward - looking statements to reflect events or circumstances after the date of t his presentation. Non - GAAP Financial Measures The Company reports its financial results in accordance with U.S. generally accepted accounting principles (“GAAP”). This pre sen tation contains the non - GAAP measures: ( i ) adjusted gross margin and adjusted gross profit, (ii) adjusted (loss) income from continuing operations and related earnings (loss) per diluted share, (iii) ear nin gs before interest, taxes, other income or expense, depreciation and amortization (“EBITDA”), EBITDA margin, adjusted EBITDA, and adjusted EBITDA margin , (iv) segment EBITDA and adjusted segment EBITDA, and (v) free cash flow (defined as net cash provided by operating activities less capital expenditures). The Company believes that the presentation of certain non - GAAP measures, i.e.: ( i ) adjusted gross margin and adjusted gross profit, (ii) adjusted (loss) income from continuing operations and related earnings (loss) per diluted share , (iii) EBITDA, EBITDA margin, adjusted EBITDA and adjusted EBITDA margin, (iv) segment EBITDA and adjusted segment EBITDA, an d (v) free cash flow, provide useful information for the understanding of its ongoing operations and enables investors to focus on period - over - period operating per formance, and thereby enhances the user's overall understanding of the Company's current financial performance relative to past performance and provides, along with the nearest GAAP measures, a ba sel ine for modeling future earnings expectations. Non - GAAP measures are reconciled to comparable GAAP financial measures herein. We do not provide a reconciliation of the non - GAAP guidance measures adjusted EBITDA and/or adjusted EBITDA margin for the fisca l year 2025 to net income for the fiscal year 2025, the most comparable GAAP financial measure, due to the inherent difficulty of forecasting ce rta in types of expenses and gains, without unreasonable effort, which affect net income but not adjusted EBITDA and/or adjusted EBITDA margin. The Company cautions that non - GAAP measures should be considered in addition to, but not as a substitute for, the Company's repo rted GAAP results. Additionally, the Company notes that there can be no assurance that the above referenced non - GAAP financial measures ar e comparable to similarly titled financial measures used by other publicly traded companies. Market and Industry Data The market and industry data used throughout this presentation was obtained from various sources, including the Company’s own re search and estimates, surveys or studies conducted by third parties and industry or general publications and forecasts. Industry publications, surveys and forecasts generally state that they have o bta ined information from sources believed to be reliable, but there can be no assurance as to the accuracy and completeness of such information. While the Company believes that each of these surveys, studies, publ ica tions and forecasts is reliable, it has not independently verified such data and the Company is not making any representation as to the accuracy of such information. Similarly, the Company believes its internal re search and estimates are reliable but it has not been verified by any independent sources. In addition, while the Company believes that the industry and market information included herein is generally reliab le, such information is inherently imprecise. While the Company is not aware of any misstatements regarding the industry and market data presented herein, its estimates involve risks and uncertainties and are sub ject to change based on various factors, including those discussed under the heading “Forward - Looking Statements” above. DISCLAIMER Warren Kanders EXECUTIVE CHAIRMAN Clarus TODAY’S PRESENTERS Mike Yates CFO Clarus Neil Fiske PRESIDENT Black Diamond Equipment Mat Hayward MANAGING DIRECTOR Adventure


6 February 2023 PAGE 4 STRATEGIC PRIORITIES: Q4 AND YTD HIGHLIGHTS Positioned for long - term sustainable growth Strategic roadmap continues to guide execution Black Diamond objective : Simplify and focus on the core Steady progress building a smaller, more profitable business — led to Q4 adj. GM of 36.9%, representing 410 bps of improvement y/y Adventure objective: Invest to scale Initiatives to scale business globally beginning to show green shoots outside the home region of Australia Strong balance sheet/ p rudent capital allocation Nearly debt - free 1 with $45.4 million of cash on the balance sheet at 12/31 1 Total debt of $1.9 million at 12/31 related to the RockyMounts acquisition Continued operational progress at Outdoor and roadmap in place at Adventure $71.4 m $20.3 m $ 51.1m 38.0 % $4.4 m Revenue - 7% Y/Y Adventure Revenue - 23% Y/Y Outdoor Revenue + 2% Y/Y Adj.

Gross Margin +330 BPS Y/Y Adj. EBITDA + 173% Y/Y FOURTH QUARTER RESULTS AT A GLANCE Adventure Adj. EBITDA: $1.6m Outdoor Adj.

EBITDA: $4.5m 6 February 2023 PAGE 6 ADVENTURE - STRATEGIC PRIORITIES AND HIGHLIGHTS • Primary objective to increase scale globally continued to guide investment and execution in Q4 • Results impacted by slowdown in home market of Australia and production stoppage by largest OEM customer • Positive trends thus far in 2025 outside home market supported by growing auto sales in the U.S. • Allocating resources to focus on initiatives that are expected to drive market share gains internationally • Acquisition of RockyMounts deepens product expertise in key growth vertical • Increased fitments from 28 to more than 100 new vehicles in 2024 — the more vehicles we can fit, the more racks we can sell and the more accessories we can add on • Rollout of more than 15 new product introductions in 2025 MANAGEMENT COMMENTARY BUILDING BLOCKS IN FOCUS INVESTMENT INTO U.S.

AND ROW INVESTMENT INTO BRAND REBUILT LEADERSHIP TEAM 6 February 2023 PAGE 7 OUTDOOR - STRATEGIC PRIORITIES AND HIGHLIGHTS • Delivered on commitment to reshape business and set foundation for LT growth w/ double digit annual EBITDA margins • While FY24 revenue down 10% y/y, consistent with expectations, adjusted EBITDA up 80% • Worked through $21.4M of PFAS inventory in 2024 with the issue now behind us • Gross margins lifting and expected to expand; Q4 adj.

GM of 36.9% reflected benefit of product / inventory / simplification initiatives • Operating expenses down 16% y/y • Combination of revenue, GM improvement, and operating cost efficiency expected to generate run rate towards double - digit EBITDA • Still uncertainty and caution in Outdoor market, particularly related to tariffs MANAGEMENT COMMENTARY BUILDING BLOCKS IN FOCUS SIMPLIFICATION EXECUTION PRODUCT LEADERSHIP FEWER, BIGGER, BETTER 6 February 2023 PAGE 8 8,058 6,810 6,015 6,026 5,767 5,704 5,640 1,347 1,166 1,116 1,029 992 1,017 1,005 0 1,000 2,000 3,000 4,000 5,000 6,000 7,000 8,000 9,000 Spring 2023 Fall 2023 Spring 2024 Fall 2024 Spring 2025 Fall 2025 Spring 2026 Simplification: Reduction in SKUs and Styles Total SKUs Total Styles $204.1M $7.7M $3.6M $31.8M $183.6M - 50,000 100,000 150,000 200,000 250,000 FY 2023 "A" Products "B" Products Simplification FY 2024 Increased Revenue from High - Margin Products • “A” and “B” products represent high margins/high volumes and high margins/low volumes, respectively • While overall revenue declined y/y, grew “A” and “B” revenue by $11.3M, compared to revenue reduction of $31.8M as a result of simplification initiatives • Steady progress executing initiatives focused on simplification and right sizing of inventory • Reduced total SKUs 30% since S23 (~8,100 to ~5,600) • Reduced total styles 25% since S23 (~1,350 to ~1,000) OUTDOOR - BUILDING A SMALLER, MORE PROFITABLE BUSINESS 6 February 2023 PAGE 9 NET SALES Q4 AND FY 2024 FINANCIAL RESULTS Q 4 202 4 Q4 2023 ADJ. GROSS MARGIN ADJ. EBITDA ADJ. EBITDA MARGIN 6.1% $4.4M 38.0% $71.4M 2.1% $1 .6 M 34.7% $ 76.5 M FY 202 4 FY 2023 2.6% $6.9M 37.5% $ 264.3 M 2.6% $ 7.3 M 35.6% $286.0M

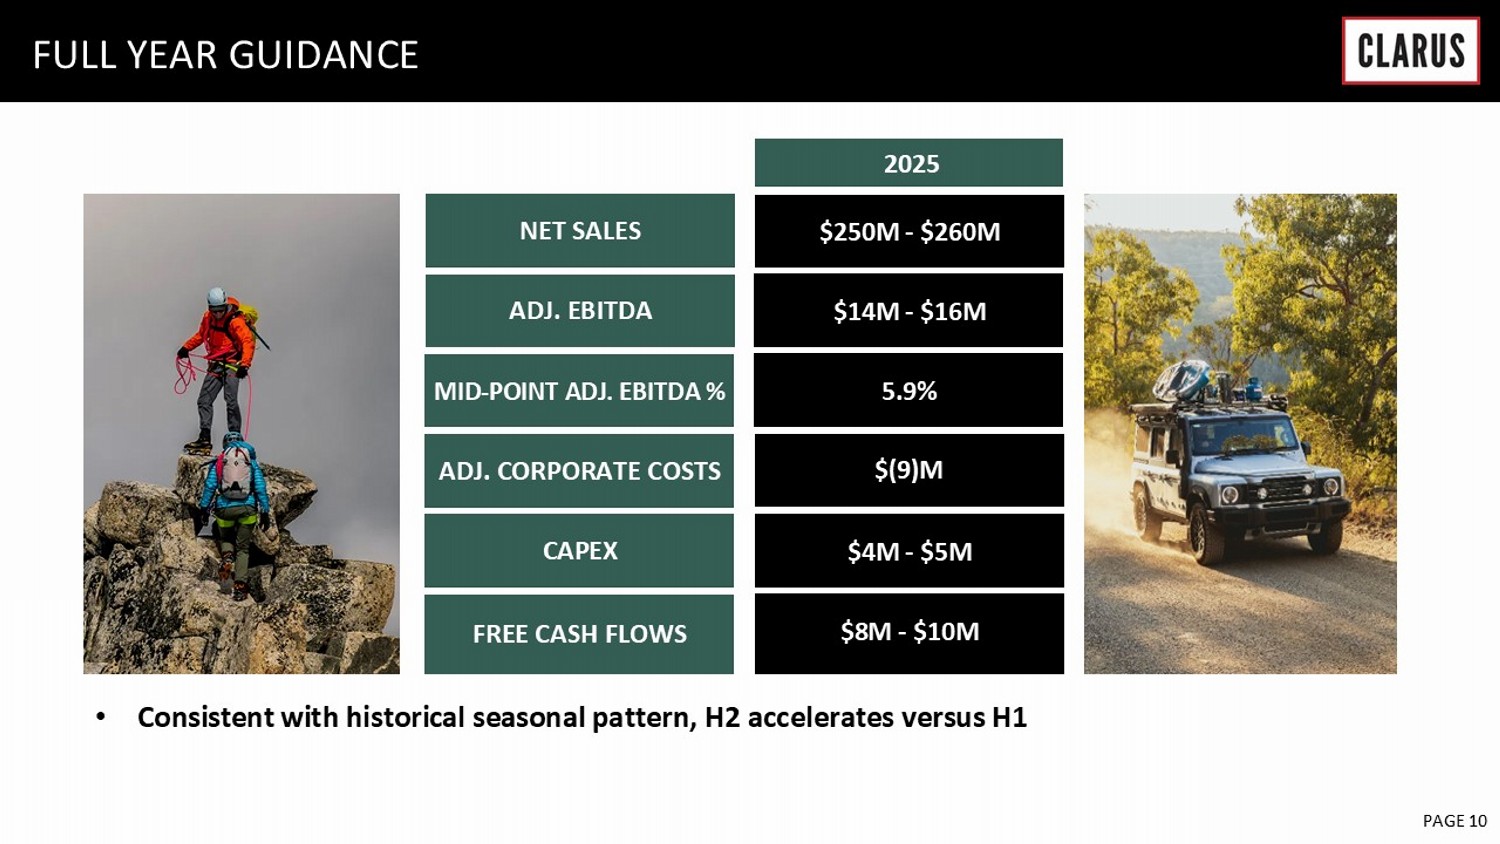
6 February 2023 PAGE 10 NET SALES FULL YEAR GUIDANCE ADJ. CORPORATE COSTS ADJ. EBITDA MID - POINT ADJ.

APPENDIX

EBITDA % CAPEX FREE CASH FLOWS $ 250M - $ 260M $4M - $5M $14M - $16M 5.9% $(9)M $ 8 M - $10M 2025 • Consistent with historical seasonal pattern, H 2 accelerates versus H 1 6 February 2023 PAGE 12 BALANCE SHEET Assets Current assets Cash $ 45,359 $ 11,324 Accounts receivable, net 43,678 53,971 Inventories 82,278 91,409 Prepaid and other current assets 5,555 4,865 Income tax receivable 910 892 Assets held for sale - 137,284 Total current assets 177,780 299,745 Property and equipment, net 17,606 16,587 Other intangible assets, net 31,516 41,466 Indefinite-lived intangible assets 46,750 58,527 Goodwill 3,804 39,320 Deferred income taxes 36 22,869 Other long-term assets 16,602 16,824 Total assets $ 294,094 $ 495,338 Liabilities and Stockholders’ Equity Current liabilities Accounts payable $ 11,873 $ 20,015 Accrued liabilities 22,276 24,580 Income tax payable - 805 Current portion of long-term debt 1,888 119,790 Liabilities held for sale - 5,744 Total current liabilities 36,037 170,934 Deferred income taxes 12,210 18,124 Other long-term liabilities 12,754 14,160 Total liabilities 61,001 203,218 Stockholders’ Equity Preferred stock, $0.0001 par value per share; 5,000 shares authorized; none issued - - Common stock, $0.0001 par value per share; 100,000 shares authorized; 43,004 and 42,761 issued and 38,362 and 38,149 outstanding, respectively 4 4 Additional paid in capital 697,592 691,198 Accumulated deficit (406,857) (350,739) Treasury stock, at cost (33,114) (32,929) Accumulated other comprehensive loss (24,532) (15,414) Total stockholders’ equity 233,093 292,120 Total liabilities and stockholders’ equity $ 294,094 $ 495,338 December 31, 2024 December 31, 2023 CLARUS CORPORATION CONDENSED CONSOLIDATED BALANCE SHEETS (Unaudited) (In thousands, except per share amounts)

6 February 2023 PAGE 13 INCOME STATEMENT (Q4) Sales Domestic sales $ 30,162 $ 31,840 International sales 41,243 44,663 Total sales 71,405 76,503 Cost of goods sold 47,540 54,361 Gross profit 23,865 22,142 Operating expenses Selling, general and administrative 27,772 29,963 Restructuring charges 939 1,411 Transaction costs 408 134 Legal costs and regulatory matter expenses 47 702 Impairment of goodwill 36,264 - Impairment of indefinite-lived intangible assets 8,545 - Total operating expenses 73,975 32,210 Operating loss (50,110) (10,068) Other income (expense) Interest income, net 269 35 Other, net (2,342) 1,104 Total other (expense) income, net (2,073) 1,139 Loss before income tax (52,183) (8,929) Income tax expense (benefit) 21,142 (1,700) Loss from continuing operations (73,325) (7,229) Discontinued operations, net of tax 7,804 (1,160) Net loss $ (65,521) $ (8,389) Loss from continuing operations per share: Basic $ (1.92) $ (0.19) Diluted (1.92) (0.19) Net loss per share: Basic $ (1.71) $ (0.22) Diluted (1.71) (0.22) Weighted average shares outstanding: Basic 38,262 38,312 Diluted 38,262 38,312 CLARUS CORPORATION CONDENSED CONSOLIDATED STATEMENTS OF LOSS (Unaudited) (In thousands, except per share amounts) Three Months Ended December 31, 2024 December 31, 2023 6 February 2023 PAGE 14 INCOME STATEMENT (FULL YEAR) Sales Domestic sales $ 105,745 $ 112,385 International sales 158,570 173,635 Total sales 264,315 286,020 Cost of goods sold 171,696 188,509 Gross profit 92,619 97,511 Operating expenses Selling, general and administrative 111,948 114,603 Restructuring charges 1,948 3,223 Transaction costs 576 593 Contingent consideration benefit (125) (1,565) Legal costs and regulatory matter expenses 3,842 1,764 Impairment of goodwill 36,264 - Impairment of indefinite-lived intangible assets 8,545 - Total operating expenses 162,998 118,618 Operating loss (70,379) (21,107) Other (expense) income Interest income, net 1,467 67 Other, net (1,673) 961 Total other (expense) income, net (206) 1,028 Loss before income tax (70,585) (20,079) Income tax expense (benefit) 17,852 (4,291) Loss from continuing operations (88,437) (15,788) Discontinued operations, net of tax 36,150 5,642 Net loss $ (52,287) $ (10,146) Loss from continuing operations per share: Basic $ (2.31) $ (0.42) Diluted (2.31) (0.42) Net loss per share: Basic $ (1.37) $ (0.27) Diluted (1.37) (0.27) Weighted average shares outstanding: Basic 38,305 37,485 Diluted 38,305 37,485 December 31, 2024 December 31, 2023 CLARUS CORPORATION CONDENSED CONSOLIDATED STATEMENTS OF LOSS (Unaudited) (In thousands, except per share amounts) Twelve Months Ended


6 February 2023 PAGE 15 NON - GAAP RECONCILIATION Sales $ 71,405 Sales $ 76,503 Gross profit as reported $ 23,865 Gross profit as reported $ 22,142 Plus impact of inventory fair value adjustment 61 Plus impact of inventory fair value adjustment 64 Plus impact of PFAS and other inventory reserves 3,179 Plus impact of PFAS and other inventory reserves 4,370 Adjusted gross profit $ 27,105 Adjusted gross profit $ 26,576 Gross margin as reported 33.4% Gross margin as reported 28.9% Adjusted gross margin 38.0% Adjusted gross margin 34.7% Sales $ 264,315 Sales $ 286,020 Gross profit as reported $ 92,619 Gross profit as reported $ 97,511 Plus impact of inventory fair value adjustment 61 Plus impact of inventory fair value adjustment 64 Plus impact of PFAS and other inventory reserves 6,502 Plus impact of PFAS and other inventory reserves 4,370 Adjusted gross profit $ 99,182 Adjusted gross profit $ 101,945 Gross margin as reported 35.0% Gross margin as reported 34.1% Adjusted gross margin 37.5% Adjusted gross margin 35.6% TWELVE MONTHS ENDED December 31, 2024 December 31, 2023 CLARUS CORPORATION RECONCILIATION FROM GROSS PROFIT TO ADJUSTED GROSS PROFIT AND ADJUSTED GROSS MARGIN THREE MONTHS ENDED December 31, 2024 December 31, 2023 6 February 2023 PAGE 16 NON - GAAP RECONCILIATION (Q4) As reported $ 71,405 $ 23,865 $ 73,975 $ 21,142 40.5 % $ (73,325) $ (1.92) Amortization of intangibles - - (2,468) 1,240 1,228 Impairment of goodwill - - (36,264) - 36,264 Impairment of indefinite-lived intangible assets - - (8,545) 2,564 5,981 Restructuring charges - - (939) 251 688 Transaction costs - - (408) 87 321 Inventory fair value of purchase accounting - 61 - 13 48 PFAS and other inventory reserves - 3,179 - 766 2,413 Legal costs and regulatory matter expenses - - (47) 23 24 Stock-based compensation - - (1,570) (588) 2,158 Valuation allowance - - - (21,038) 21,038 As adjusted $ 71,405 $ 27,105 $ 23,734 $ 4,460 343.6 % $ (3,162) $ (0.08) As reported $ 76,503 $ 22,142 $ 32,210 $ (1,700) (19.0) % $ (7,229) $ (0.19) Amortization of intangibles - - (2,680) 536 2,144 Restructuring charges - - (1,411) 282 1,129 Transaction costs - - (134) 27 107 Inventory fair value of purchase accounting - 64 - 13 51 PFAS and other inventory reserves - 4,370 - 575 3,795 Legal costs and regulatory matter expenses - - (702) 35 667 Stock-based compensation - - (1,218) 244 974 As adjusted $ 76,503 $ 26,576 $ 26,065 $ 12 0.7 % $ 1,638 $ 0.04 continuing operations EPS (1) (1) Potentially dilutive securities are excluded from the computation of diluted earnings (loss) per share if their effect is anti-dilutive to the loss from continuing operations.

Reported loss from continuing operations per share is calculated based on 38,312 basic and diluted weighted average shares of common stock. Adjusted income from continuing operations per share is calculated based on 38,479 diluted shares of common stock. Tax (Loss) income from Diluted sales profit expenses (benefit) expense rate Three Months Ended December 31, 2023 Total Gross Operating Income tax (benefit) expense rate continuing operations EPS (1) (1) Potentially dilutive securities are excluded from the computation of diluted earnings (loss) per share if their effect is anti-dilutive to the loss from continuing operations. Reported loss from continuing operations per share and adjusted loss from continuing operations per share are both calculated based on 38,262 basic and diluted weighted average shares of common stock.

sales profit expenses CLARUS CORPORATION RECONCILIATION FROM LOSS FROM CONTINUING OPERATIONS TO ADJUSTED (LOSS) INCOME FROM CONTINUING OPERATIONS AND RELATED EARNINGS PER DILUTED SHARE (In thousands, except per share amounts) Three Months Ended December 31, 2024 Total Gross Operating Income tax Tax (Loss) income from Diluted 6 February 2023 PAGE 17 NON - GAAP RECONCILIATION (FULL YEAR) As reported $ 264,315 $ 92,619 $ 162,998 $ 17,852 25.3 % $ (88,437) $ (2.31) Amortization of intangibles - - (9,784) 2,751 7,033 Impairment of goodwill - - (36,264) - 36,264 Impairment of indefinite-lived intangible assets - - (8,545) 2,564 5,981 Restructuring charges - - (1,948) 459 1,489 Transaction costs - - (576) 122 454 Contingent consideration benefit - - 125 (26) (99) Inventory fair value of purchase accounting - 61 - 13 48 PFAS and other inventory reserves - 6,502 - 1,453 5,049 Legal costs and regulatory matter expenses - - (3,842) 807 3,035 Stock-based compensation - - (5,823) 291 5,532 Valuation allowance - - - (21,038) 21,038 As adjusted $ 264,315 $ 99,182 $ 96,341 $ 5,248 199.2 % $ (2,613) $ (0.07) As reported $ 286,020 $ 97,511 $ 118,618 $ (4,291) (21.4) % $ (15,788) $ (0.42) Amortization of intangibles - - (10,715) 2,293 8,422 Restructuring charges - - (3,223) 690 2,533 Transaction costs - - (593) 127 466 Contingent consideration benefit - - 1,565 (335) (1,230) Inventory fair value of purchase accounting - 64 - 14 50 PFAS and other inventory reserves - 4,370 - 575 3,795 Legal costs and regulatory matter expenses - - (1,764) 261 1,503 Stock-based compensation - - (5,141) 1,100 4,041 As adjusted $ 286,020 $ 101,945 $ 98,747 $ 434 10.3 % $ 3,792 $ 0.10 continuing operations EPS (1) (1) Potentially dilutive securities are excluded from the computation of diluted earnings (loss) per share if their effect is anti-dilutive to the loss from continuing operations. Reported loss from continuing operations per share is calculated based on 37,485 basic and diluted weighted average shares of common stock. Adjusted income from continuing operations per share is calculated based on 38,088 diluted shares of common stock. Tax (Loss) income from Diluted sales profit expenses (benefit) expense rate Twelve Months Ended December 31, 2023 Total Gross Operating Income tax (benefit) expense rate continuing operations EPS (1) (1) Potentially dilutive securities are excluded from the computation of diluted earnings (loss) per share if their effect is anti-dilutive to the loss from continuing operations. Reported loss from continuing operations per share and adjusted loss from continuing operations per share are both calculated based on 38,305 basic and diluted weighted average shares of common stock.

sales profit expenses CLARUS CORPORATION RECONCILIATION FROM LOSS FROM CONTINUING OPERATIONS TO ADJUSTED (LOSS) INCOME FROM CONTINUING OPERATIONS AND RELATED EARNINGS PER DILUTED SHARE (In thousands, except per share amounts) Twelve Months Ended December 31, 2024 Total Gross Operating Income tax Tax (Loss) income from Diluted 6 February 2023 PAGE 18 NON - GAAP RECONCILIATION (Q4) Operating (loss) income $ 1,897 $ (48,582) $ (3,425) $ (50,110) $ (7,002) $ 1,051 $ (4,117) $ (10,068) Depreciation 614 369 - 983 715 371 - 1,086 Amortization of intangibles 285 2,183 - 2,468 285 2,395 - 2,680 EBITDA 2,796 (46,030) (3,425) (46,659) (6,002) 3,817 (4,117) (6,302) Restructuring charges 789 150 - 939 1,372 39 - 1,411 Transaction costs 65 307 36 408 - 1 133 134 Legal costs and regulatory matter expenses 10 - 37 47 260 - 442 702 Impairment of goodwill - 36,264 - 36,264 - - - - Impairment of indefinite-lived intangible assets - 8,545 - 8,545 - - - - Stock-based compensation - - 1,570 1,570 - - 1,218 1,218 Inventory fair value of purchase accounting - 61 - 61 - 64 - 64 PFAS and other inventory reserves 869 2,310 - 3,179 4,370 - - 4,370 Adjusted EBITDA $ 4,529 $ 1,607 $ (1,782) $ 4,354 $ - $ 3,921 $ (2,324) $ 1,597 Sales $ 51,072 $ 20,333 $ - $ 71,405 50,135 26,368 - 76,503 EBITDA margin 5.5 % (226.4) % (65.3) % (12.0) % 14.5 % (8.2) % Adjusted EBITDA margin 8.9 % 7.9 % 6.1 % - % 14.9 % 2.1 % Outdoor Segment Adventure Segment Corporate Costs Total Outdoor Segment Adventure Segment Corporate Costs Total CLARUS CORPORATION RECONCILIATION FROM OPERATING (LOSS) INCOME TO EARNINGS BEFORE INTEREST, TAXES, DEPRECIATION, AND AMORTIZATION (EBITDA), EBITDA MARGIN, ADJUSTED EBITDA, AND ADJUSTED EBITDA MARGIN (In thousands) Three Months Ended December 31, 2024 Three Months Ended December 31, 2023 6 February 2023 PAGE 19 NON - GAAP RECONCILIATION (FULL YEAR) Operating (loss) income $ (999) $ (53,126) $ (16,254) $ (70,379) $ (5,155) $ 911 $ (16,863) $ (21,107) Depreciation 2,588 1,446 - 4,034 2,848 1,302 - 4,150 Amortization of intangibles 1,142 8,642 - 9,784 1,057 9,658 - 10,715 EBITDA 2,731 (43,038) (16,254) (56,561) (1,250) 11,871 (16,863) (6,242) Restructuring charges 1,349 599 - 1,948 2,754 306 163 3,223 Transaction costs 65 396 115 576 - 30 563 593 Contingent consideration benefit - (125) - (125) - (1,565) - (1,565) Legal costs and regulatory matter expenses 3,088 - 754 3,842 476 - 1,288 1,764 Impairment of goodwill - 36,264 - 36,264 - - - - Impairment of indefinite-lived intangible assets - 8,545 - 8,545 - - - - Stock-based compensation - - 5,823 5,823 - - 5,141 5,141 Inventory fair value of purchase accounting - 61 - 61 - 64 - 64 PFAS and other inventory reserves 4,192 2,310 - 6,502 4,370 - - 4,370 Adjusted EBITDA $ 11,425 $ 5,012 $ (9,562) $ 6,875 $ 6,350 $ 10,706 $ (9,708) $ 7,348 Sales $ 183,568 $ 80,747 $ - $ 264,315 204,053 81,967 - 286,020 EBITDA margin 1.5 % (53.3) % (21.4) % (0.6) % 14.5 % (2.2) % Adjusted EBITDA margin 6.2 % 6.2 % 2.6 % 3.1 % 13.1 % 2.6 % Adventure Segment Corporate Costs Total CLARUS CORPORATION RECONCILIATION FROM OPERATING (LOSS) INCOME TO EARNINGS BEFORE INTEREST, TAXES, DEPRECIATION, AND AMORTIZATION (EBITDA), EBITDA MARGIN, ADJUSTED EBITDA, AND ADJUSTED EBITDA MARGIN (In thousands) Twelve Months Ended December 31, 2024 Twelve Months Ended December 31, 2023 Outdoor Segment Adventure Segment Corporate Costs Total Outdoor Segment
