UNITED STATES
SECURITIES AND EXCHANGE COMMISSION
Washington, D.C. 20549
Form 6-K
REPORT OF FOREIGN PRIVATE ISSUER PURSUANT TO RULE 13a-16 OR 15d-16
UNDER THE SECURITIES EXCHANGE ACT OF 1934
For the month of February 2025
Commission File No. 001-35193
Grifols, S.A.
(Translation of registrant’s name into English)
Avinguda de la Generalitat, 152-158
Parc de Negocis Can Sant Joan
Sant Cugat del Valles 08174
Barcelona, Spain
(Address of registrant’s principal executive office)
Indicate by check mark whether the registrant files or will file annual reports under cover Form 20-F or Form 40-F.
Form 20-F x Form 40-F ¨
Grifols, S.A.
TABLE OF CONTENTS
| Item | Sequential Page Number | ||
| 1. | Presentation for Capital Markets day, dated February 27, 2025 | 3 |
|
2025 Capital Markets Day - 1 - Capital Markets Day February 27, 2025 |
|
2025 Capital Markets Day - 2 - Disclaimer This document has been prepared by GRIFOLS, S.A. (Grifols or the “Company”) exclusively for use during the 2025 Capital Markets Day on February 27, 2025. Therefore, it cannot be disclosed or made public by any person or entity with an aim other than the one expressed above, without the prior written consent of the Company. The Company does not assume any liability for the content of this document if used for different purposes thereof. The information and any opinions or statements made in this document have neither been verified by independent third parties nor audited; therefore, no express or implied warranty is made as to the impartiality, accuracy, completeness or correctness of the information or the opinions or statements expressed herein. Neither the Company, its subsidiaries nor any entity within the GRIFOLS group or any subsidiaries, the company’s advisors or representatives assume liability of any kind, whether for negligence or any other reason, for any damage or loss arising from any use of this document or its contents. Neither this document nor any part of it constitutes a contract, nor may it be used for incorporation into or construction of any contract or agreement. IMPORTANT INFORMATION This document does not constitute an offer or invitation to purchase or subscribe shares, in accordance with the provisions of the Spanish Securities Market and Investment Services Law (Law 6/2023, of 17 March, as amended and restated from time to time), and its implementing regulations. In addition, this document does not constitute an offer of purchase, sale or exchange, nor a request for an offer of purchase, sale or exchange of securities, nor a request for any vote or approval in any other jurisdiction. FORWARD-LOOKING STATEMENTS This document contains forward-looking information and statements about Grifols based on current assumptions and forecast made by GRIFOLS management, including pro forma figures, estimates and their underlying assumptions, statements regarding plans, objectives and expectations with respect to capital expenditures, synergies, products and services, and statements regarding future performance. Forward-looking statements are statements that are not historical facts and are generally identified by the words “expected”, “potential”, “estimates” and similar expressions. Although Grifols believes that the expectations reflected in such forward-looking statements are reasonable, various known and unknown risks, uncertainties and other factors could lead to material differences between the actual future results, financial situation, development or performance of the Company and the estimates given here. These factors include those discussed in our public reports filed with the Comisión Nacional del Mercado de Valores and the Securities and Exchange Commission, which are accessible to the public. The Company assumes no liability whatsoever to update these forward-looking statements or conform them to future events or developments. Forward-looking statements are not guarantees of future performance. They have not been reviewed by the auditors of Grifols. |
|
2025 Capital Markets Day - 3 - Time (UK; pm) Topic Presenter 12:30 – 1:30 Registration & welcome lunch 1:30 – 5:00 Welcome Daniel Segarra, VP Investor Relations and Sustainability Investment proposition and vision Nacho Abia, Chief Executive Officer Unlocking significant value by prioritizing free cash flow growth Rahul Srinivasan, Chief Financial Officer Break Value creation plan Roland Wandeler, President Biopharma Nacho Abia, Chief Executive Officer Final remarks Nacho Abia, Chief Executive Officer Q&A 5:15 – 7:00 Drinks Reception Agenda |
|
2025 Capital Markets Day - 4 - Today’s objectives 2025 Capital Markets Day - 4 - 01 Meet Grifols’ Management 02 Introduce our company and investment proposition 03 Present our Strategic Plan, targets and growth drivers 04 Discuss our financial framework 05 Answer your questions |
|
2025 Capital Markets Day - 5 - Today’s presenters Rahul Srinivasan Chief Financial Officer Roland Wandeler President Biopharma Nacho Abia Chief Executive Officer |
|
2025 Capital Markets Day - 6 - Nacho Abia Chief Executive Officer Investment proposition and vision 01. |
|
2025 Capital Markets Day - 7 - 2025 Capital Markets Day | CEO Remarks 1 3 Our strong foundation 5-yr Strategic Plan and 10-yr vision 2 Compelling investment proposition |
|
2025 Capital Markets Day - 8 - Industry pioneers Internationalization Acquisition of Talecris Biotherapeutics Acquisition of Novartis transfusion diagnostic business unit Acquisition of Hologic’s NAT donor screening unit Acquisition of plasma centers in Germany Strategic alliance with SRAAS Laboratorios Grifols opened in Barcelona Production of the first lyophilized plasma in Spain Development of the plasmapheresis technique Operations of Spain’s 1 st fractionation facility start 3 rd European company to earn FDA approval for installations and biological medicine Acquisition of SeraCare (Biomat) and its plasma centers Acquisition of Alpha Therapeutic Corporation Mitsubishi assets Foundation of Instituto Central de Análisis Clínicos, Bacteriológicos y Químicos in Barcelona Beginnings - 1909 Stock market launch in Spain (Ibex-35) Stock market launch in the U.S. (Nasdaq Biotech) through ADRs Implemented the Operational Improvement Plan Turnaround plan leading to solid financial and operating profile Accelerating innovation and digital SRAAS partial divestment Laser focus on cash flow generation Strengthened governance and new leadership Our strong foundation A listed company Global expansion Bolstering innovation Reshaped company for profitable & sustainable growth 1940-1958 2011-2019 1995-2003 2006-2011 2020-2022 2023-2024 Acquisition of Alkahest Acquisition of GigaGen Acquisition of Biotest |
|
2025 Capital Markets Day - 9 - 0 500 1,000 1,500 2,000 2,500 3,000 3,500 4,000 4,500 5,000 5,500 6,000 6,500 7,000 7,500 1985 1986 1987 1988 1989 1990 1991 1992 1993 1994 1995 1996 1997 1998 1999 2000 2001 2002 2003 2004 2005 2006 2007 2008 2009 2010 2011 2012 2013 2014 2015 2016 2017 2018 2019 2020 2021 2022 2023 2024 Our strong foundation Proven track-record delivering substantial growth €m in revenues IBBI Haema Biotest US 24 plasma centers MedKeeper* Hologic NAT Screening Access Biologicals* & GigaGen* Kiro* IBBI* Progenika* Alkahest* Taiwan & Indonesia Novartis Diagnostic Kiro* Hong Kong Progenika* Dubai Talecris, Canada China, Colombia, Scandinavia Switzerland, Australia PlasmaCare y Baxter centers Alpha Therapeutic Corporation Mitsubishi assets (Entrance in the U.S.) SeraCare Italy UK GE Portugal LATAM Eastern Europe BCN plant obtains FDA approval Araclon* MedKeeper Green Cross Alkahest SRAAS* BPL Kedrion GigaGen Biotest* (*) Partial acquisition; Legend: Legend: (i) Acquisitions & (ii) entry in new geographies Access Biologicals |
|
2025 Capital Markets Day - 10 - Our strong foundation Doubled revenue and EBITDA over the last decade Doubled revenue in the past decade… … with multiplier effect on profitability levels 2004 2014 2024 2004 2014 2024 0.5 3.4 7.2 0.1 0.9 1.8 x7 x2 x19 x2 Revenue (bn€) Adjusted EBITDA (bn€) |
|
2025 Capital Markets Day - 11 - Our strong foundation Built foundations for future growth Invested for business growth • A market leading presence with strong growth fundamentals • Reinforced pipeline with Biotest new assets • Expanded plasma supply capabilities • Pioneered strategic partnerships (Egypt, China and Canada) • Performed necessary investments to enable business growth Redefined the organization model • Strengthened governance and renewed leadership • Established and empowered key functions • Reshaped organization structure • Formalized sustainability function Streamlined operations and increased resilience • Achieved savings through the implementation of an operational improvement plan • Launched yield transformation program with initial impacts • Established a continuous improvement culture • Focused on cash generation and deleveraging |
|
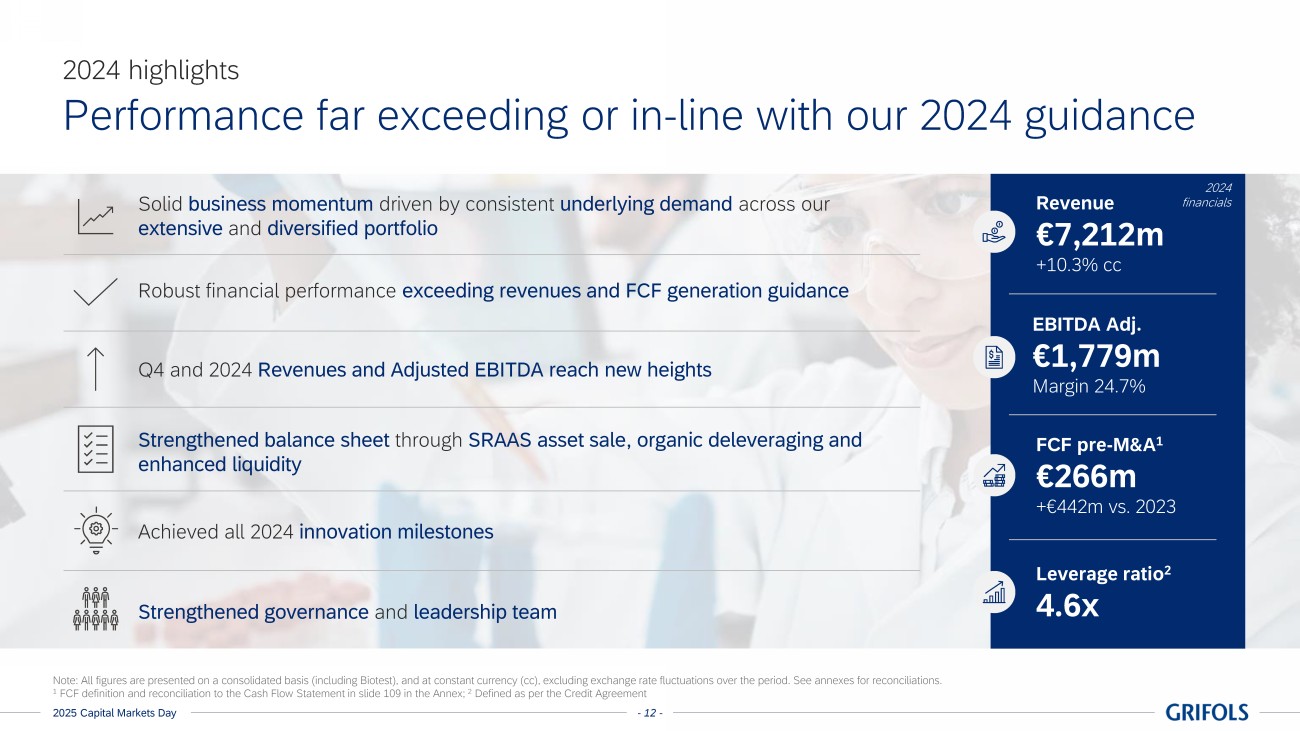
2025 Capital Markets Day - 12 - 2024 highlights Performance far exceeding or in-line with our 2024 guidance Revenue €7,212m +10.3% cc EBITDA Adj. €1,779m Margin 24.7% FCF pre-M&A1 €266m +€442m vs. 2023 Leverage ratio2 4.6x Note: All figures are presented on a consolidated basis (including Biotest), and at constant currency (cc), excluding exchange rate fluctuations over the period. See annexes for reconciliations. 1 FCF definition and reconciliation to the Cash Flow Statement in slide 109 in the Annex; 2 Defined as per the Credit Agreement Q4 and 2024 Revenues and Adjusted EBITDA reach new heights Robust financial performance exceeding revenues and FCF generation guidance Solid business momentum driven by consistent underlying demand across our extensive and diversified portfolio Strengthened governance and leadership team Strengthened balance sheet through SRAAS asset sale, organic deleveraging and enhanced liquidity Achieved all 2024 innovation milestones 2024 financials |
|
2025 Capital Markets Day - 13 - Governance Strengthened corporate governance A highly experienced and diverse Board of Directors Appointed in 2024 Independent directors 6 Members with an international nationality 46% <3 years tenure 54% Broad expertise and know-how healthcare 54% plasma 38% life, tech & innovation 69% financial and accounting 54% ✓ Executive Chairman and CEO roles split ✓ Chairman turned Non-Executive ✓ Separation of ownership from management Thomas Glanzmann Non-executive Chairman Nacho Abia Chief Executive Officer Raimon Grifols Roura Proprietary Director | Vice-Chairman Víctor Grifols Deu Director | Proprietary Tomás Dagá Gelabert Director | Other external Íñigo Sánchez-Asiaín Mardones Director | Independent Enriqueta Felip Font Director | Independent Susana González Rodríguez Director | Independent Montserrat Muñoz Abellana Lead Independent Director Anne-Catherine Berner Director | Independent Pascal Ravery Director | Independent Paul S. Herendeen Director | Proprietary Albert Grifols Coma-Cros Director | Proprietary Chairman/CEO Proprietary and other external Independent |
|
2025 Capital Markets Day - 14 - Leadership Seasoned management team to lead our Strategic Plan • Forum with representation of core areas • Focused on making company-wide decisions Rahul Srinivasan Chief Financial Officer (since 2024) Nacho Abia Chief Executive Officer (since 2024) Roland Wandeler President Biopharma (since 2024) Jordi Balsells President Plasma (since 2022) Antonio Martínez President Diagnostic (since 2013) David Bell Chief Corporate Affairs & Legal Officer (since 2003) Camille Alpi Chief HR Officer (since 2024) Daniel Fleta Chief Industrial Services (since 2001) CEO Extended Executive Committee Executive Committee Board of Directors • Forum with representation of all the company functions • Ensure top management has visibility on company performance and key priorities |
|
2025 Capital Markets Day - 15 - 2025 Capital Markets Day | CEO Remarks 1 3 Our strong foundation 5-yr Strategic Plan and 10-yr vision 2 Compelling investment proposition |
|
2025 Capital Markets Day - 16 - Managing the whole supply chain from donor to patient Vertically integrated Benefit from leadership and scale backed by 110+ years legacy Scaled and top-tier player Compelling investment proposition A global company with strong fundamentals and unparalleled potential to unlock further value Executing our value creation plan to reach our vision and increase shareholders return High single-digit growth plasma industry with compelling prospects Attractive high-potential industry Industrial and plasma capacity in place to fuel future growth Well-invested 1 2 3 4 |
|
2025 Capital Markets Day - 17 - ~30bn€ Global plasma market Attractive and high-growth potential industry Compelling investment proposition High single-digit growth industry at the intersection of industrial and pharmaceutical sectors Plasma as established standard of care Rising demand for plasma proteins in emerging markets A number of targeted diseases remain under-diagnosed Large potential from new indications and proteins Lack of cost-effective alternatives 1 |
|
2025 Capital Markets Day - 18 - Uniquely positioned as a leading and scaled global player Compelling investment proposition Grifols is one of the top 3 leading global players with a clear competitive advantage Global presence with diversified revenue base Well-established safety and quality record Industrial and plasma collection capacity in place to fuel growth Solid innovation pipeline across 4 therapeutic areas Experienced management team with proven track-record Strong client perception with brands highly recognized 2 |
|
2025 Capital Markets Day - 19 - Compelling investment proposition Capturing value through vertical integration Management of the entire value chain ✓ Supply reliability ✓ Safety and quality ✓ Cost control ✓ Faster response times to market changes Robust plasma-center network centers Strong manu-facturing footprint Diversified commercial presence PATIENT Plasma collection Testing, manufacturing, formulation Commercialization and distribution DONOR Solid testing capabilities (Diagnostic) Large expertise in optimizing and gaining efficiencies throughout the process 3 |
|
2025 Capital Markets Day - 20 - Compelling investment proposition Highly strategic and global network allowing us agility in a dynamic environment Barcelona (Parets) Los Angeles North Carolina (Clayton, RTP) Dublin Montreal Dreieich New Cairo 298 DCs 10 DCs 12 DCs 98 DCs Manufacturing plants Future Manufacturing plants Donor centers Note(s): (1) Bubble size is relative to manufacturing capacity; (2) donor centers data at end of 2024 • 400+ plasma centers across the globe • Productions sites: • 7 manufacturing locations for Biopharma • 100+ markets served Biopharma network 4 |
|
2025 Capital Markets Day - 21 - 2025 Capital Markets Day | CEO Remarks 1 3 Our strong foundation 5-yr Strategic Plan and 10-yr vision 2 Compelling investment Proposition |
|
2025 Capital Markets Day - 22 - 5-yr Strategic Plan and 10-yr vision OUR VISION & MISSION OUR VALUES & BEHAVIORS Commitment to sustainability Financial and capital allocation discipline Plasma & Industrial network Talent & performance culture IT, Digital & Analytics Enablers Core principles OUR AMBITION BY BUSINESS BIOPHARMA Become an industry leading biopharma company in plasma and beyond, with best-in-class portfolio and leading productivity DIAGNOSTIC Improve Donor and Patient care by enhancing Laboratorians with innovative Dx solutions BIO SUPPLIES HEALTHCARE SOLUTIONS Innovation Our value creation framework |
|
2025 Capital Markets Day - 23 - We foresee a future where every patient in the world has access to our life-enhancing therapies and solutions Vision Mission Innovate to deliver differentiated biopharma therapeutics and unique diagnostic solutions globally and sustainably Our vision and mission Ensure all patients have access to our trusted treatments and healthcare solutions |
|
2025 Capital Markets Day - 24 - 5-yr Strategic Plan and 10-yr vision 10-year vision with a 5-year plan • Detailed and greater visibility • Value Creation Plan in place to deliver on revenues growth, margin expansion & free cash flow growth • Industrial & plasma supply in place to deliver growth 2025-2029 2034 vision • Use the 2029 Strategic Plan guidance as a stepping stone towards our longer-term 2034 vision • Decision-making for some areas that require a wider vision • Goals to break new ground going beyond current capabilities and market conditions |
|
2025 Capital Markets Day - 25 - 5-yr Strategic Plan and 10-yr vision Setting the foundation to reach ~€14bn revenues in 2034 Revenue (bn€) Adjusted EBITDA (bn€, % for margin) FCF pre-M&A1 (bn€; % for FCF conversion 2 ) 7.2 ~10.0 ~14.0 2x 1.8 ~ 2.9 1.6x 24.7% 29-30% 2024 2029 2034 0.3 ~1.2 4x 15% ~40% Note: 2025-2029 projections based on current FX 1 FCF definition and reconciliation to the Cash Flow Statement in slide 109 in the Annex 2 FCF conversion = FCF pre-M&A/Adj. EBITDA FCF conversion |
|
2025 Capital Markets Day - 26 - 5-yr Strategic Plan and 10-yr vision We aim to achieve ~€10bn revenues in 2029 driving EBITDA margin to ~29-30% and FCF conversion to ~40% Revenue (bn€) Adjusted EBITDA (bn€, % for margin) FCF pre-M&A1 (bn€; % for FCF conversion 2 ) 7.2 ~10.0 1.4x 1.8 ~ 2.9 1.6x 2024 2029 0.3 ~1.2 4x 24.7% 29-30% Value-driven capital investment • Disciplined capital allocation • Harvesting full organic potential • No major changes in business perimeter Biopharma business • New proteins launch • Operational improvement plan • IRA impact on US price Controlled expenses growth • Maintaining SG&A cost discipline • Harnessing operational leverage to reinvigorate R&D • Progressing digitalization 15% ~40% FCF conversion2 Note: 2025-2029 projections based on current FX 1 FCF definition and reconciliation to the Cash Flow Statement in slide 109 in the Annex 2 FCF conversion = FCF pre-M&A/Adj. EBITDA |
|
2025 Capital Markets Day - 27 - 5-yr Strategic Plan and 10-yr vision Clear path to deliver on revenue growth and margin expansion Strong revenue growth … … and expansion of EBITDA margin • Mostly driven by Biopharma in the next 5 years (~7% CAGR) • IgG high-single digit growth • Fibrinogen launch as leading therapy • Alpha-1 & specialty products well-positioned as trusted provider worldwide • Diagnostic expected to increase at ~5% CAGR • Biopharma mainly due to: • Increased plasma utilization (new proteins launches) • Operational efficiencies (plasma CPL) • Yield improvements • Optimization of plasma mix • Diagnostic due to economies of scale in the commercial and service functions Value creation plan in place to support revenue growth and EBITDA margin expansion |
|
2025 Capital Markets Day - 28 - 5-yr Strategic Plan and 10-yr vision Clear value creation levers offer a unique potential for Grifols Commercial growth • Drive profitable IG growth as core • Sustain leadership position in Alpha-1 • Successfully launch Fibrinogen Liter economics by plasma utilization (illustrative) Margin Expansion • Set up & deliver a yield optimization program • Enhance E2E efficiencies (e.g., CPL optimization) Pipeline execution • Accelerate current pipeline execution • Explore new models to create value in the future C B A D Cash Mindfulness – end-to-end supply chain excellence + Cash Mindfulness • Net working capital optimization • Improve capital allocation • Drive cost and cash efficiencies across the board D Others Fibrinogen & Trimodulin CPL (Cost per Liter) 0% Revenue per Liter Alpha-1 AT IgG Albumin 100% % of plasma utilization A Commercial growth (increase revenue – volume & price) Margin Expansion (CPL optimization) B Pipeline execution (Expand products & indications) C |
|
2025 Capital Markets Day - 29 - Key Takeaways Success story led to doubling revenue and EBITDA over last decade and built foundations for growth 1 We aim to double revenues again in the next decade reaching ~14 bn€ by 2034 with ~10 bn€ revenues by 2029 with 29-30% EBITDA margin 2 4 Value Creation Plan in place to support the Strategic Plan 2025 Capital Markets Day - 29 - 3 Free Cash Flow pre-M&A to reach ~1.2bn€ and a ~40% conversion rate by 2029 |
|
2025 Capital Markets Day - 30 - Rahul Srinivasan Chief Financial Officer Unlocking significant value by prioritizing free cash flow growth 02. |
|
2025 Capital Markets Day - 31 - 2025 Capital Markets Day | CFO Remarks 1 3 2024 Highlights 2025-2029 Strategic Plan 2 2025 Guidance 4 Capital allocation framework |
|
2025 Capital Markets Day - 32 - 2024 Highlights | A record year Delivering significant growth vs. prior record in 2023 Note: All figures are presented on a consolidated basis (including Biotest), and at constant currency (cc), excl. exchange rate fluctuations over the period 1 Adjusted EBITDA is defined as reported EBITDA on a P&L basis plus: (i) extraordinary, unusual, or non-recurring charges and expenses; (ii) any other non-recurring costs of doing business; minus (iii) non-recurring revenues and earnings. Revenues (in bn€, % growth at cc) 2023 2024 6.6 7.2 ~10% • Performance driven by strong sales across the board • Biopharma driven by key proteins led by immunoglobulin‘s double-digit growth EBITDA1 (in bn€, % growth) • Strong EBITDA growth • Greater convergence of reported & adjusted EBITDA • Margin improvement driven by: • CPL reduction • Volume growth • Yield improvements • Operational leverage and cost discipline 1.2 1.5 2023 1.6 1.8 2024 +32% +21% Reported EBITDA Adjusted EBITDA 18.8% 22.4% 22.6% 24.7% |
|
2025 Capital Markets Day - 33 - 2024 Highlights | A record year Far exceeding FCF generation guidance, continued deleveraging progress Note: All figures are presented on a consolidated basis (including Biotest), and at constant currency (cc), excl. exchange rate fluctuations over the period; 1 FCF definition and reconciliation to the Cash Flow Statement in slide 109 in the Annex; 2 Defined as per the Credit Agreement; 3 Cash and cash equivalents of €980m + unused credit facilities €1,279m - unused RCF facilities maturing in Nov 2025 c€399m. Free Cash Flow (pre-M&A)1 (in bn€, % at cc) -0.2 -0.2 0.3 +0.5 • Free Cash Flow generation driven by • Significantly higher EBITDA • CPL reduction • Yield improvements • Granular inventory and net working capital management • Lower restructuring and transaction costs Leverage ratio2 • Significant deleveraging achieved • Strengthened balance sheet and liquidity Q4’23 Q4’24 6.4x 4.6 -1.8x 2023 2024 Liquidity €~1.1bn €~1.9bn3 |
|
2025 Capital Markets Day - 34 - 2024 Highlights | A record year Balance sheet de-risking substantially progressed; continued focus on boosting free cash flow generation and organic deleveraging Debt maturity schedule (in m€) No meaningful debt maturities until Q4’27 Strong credit re-rating potential given our continued focus on free cash flow generation and deleveraging Demonstrable access to capital markets Fortress liquidity position 1 Defined as per the Credit Agreement 552 50 32 2025 50 34 2026 3,121 50 2027 11 2,129 2028 50 0 2029 2,600 50 2030 0 2036 82 84 3,172 2,139 50 2,650 552 Secured Unsecured Significantly deleveraged • Total net leverage: 4.6x1 • Net secured leverage: 2.7x1 |
|
2025 Capital Markets Day - 35 - 2025 Capital Markets Day | CFO Remarks 1 3 2024 Highlights 2025-2029 Strategic Plan 2 2025 Guidance 4 Capital allocation framework |
|
2025 Capital Markets Day - 36 - 2025 Guidance | Targeting another record year Supported by strong momentum and positive IG market growth fundamentals, excl. IRA1 impact, expecting ~€7.7bn revenues and ~€2.025bn Adj. EBITDA 2024 2025 7.2 ~7.7 ~7% • Biopharma as key sales growth driver: • IG growth in all regions and administrations, with tremendous momentum in SCIG • Albumin progress in international markets • Alpha-1 growth in the US and international markets, with new dosing launches in Europe • Volume impact from Biopharma • Operational improvements • Plasma cost optimization through streamlined organization and efficient donor center operations • Yield & manufacturing efficiencies • Tight control of operating expenses 2024 2025 1.8 ~2.025 ~14% 24.7% ~26.3% Excluding IRA1 Revenues (in bn€, % at cc) Adj. EBITDA (in m€, % at cc) 1 Inflation Reduction Act (IRA) Part D Redesign; Note: projections based on current FX; 2 FCF definition and reconciliation to the Cash Flow Statement in slide 109 in the Annex; 3 FCF conversion = FCF pre-M&A/Adj. EBITDA Free Cash Flow (Pre-M&A)2 266 (15% conversion rate3 ) ~500 (~25% conversion rate) |
|
2025 Capital Markets Day - 37 - 2025 Guidance | Targeting another record year IRA impact will depend on patient share treated under Part D Price negotiation: Plasma Derived Therapies exempt Negotiation targeted at drugs with greatest Medicare expenditure does not apply to plasma-derived products Inflation price ceiling: factored in Price increases above inflation requiring rebates to Medicare Part D redesign (relevant for us) Caps patient out-of-pocket cost affecting all drugs covered under Medicare Part D (e.g., orals, subQ) • Part D redesign brings: • Lower co-pay for patients, removing access hurdles • Shifting part of cost to manufacturers and payers, specifically 20% manufacturer liability of gross spend after initial coverage phase • Two products affected in our portfolio: IgG & Alpha-1. Both partly covered under Part B (medical benefit) and Part D (drug benefit), with route depending on payer and provider • 2025 impact will depend on actual share of patients treated under Part D, but estimated at €100-150M 1 3 2 |
|
2025 Capital Markets Day - 38 - 2025 Guidance | Targeting another record year 2025 underlying performance and guidance Revenues in million € Implied FCF conversion rate Free Cash Flow pre-M&A2 Adjusted EBITDA Actual 2024 7,212 15% 266 1,779 2025 (excl. IRA) ~7,700 ~25% ~500 ~2,025 1 Inflation Reduction Act (IRA) Part D Redesign; 2 FCF definition and reconciliation to the Cash Flow Statement in slide 109 in the Annex Note: projections based on current FX IRA1 impact 100-150m 2025 (incl. IRA) 7,550-7,600 ~20% 350-400 1,875-1,925 ~7% ~14% ~88% |
|
2025 Capital Markets Day - 39 - 2025 Guidance | Targeting another record year Relative FCF drivers in 2025 vs 2024 15% ~25% Free Cash Flow pre-M&A1 in m€ (illustrative); FCF conversion rate 2 FCF 2024 EBITDA CAPEX Restructuring, transaction costs and others Interest Net working capital Taxes Others FCF 2025 (Excl. IRA) IRA impact FCF 2025 (incl. IRA) 266 ~500 350-400 ~20% 1 FCF definition and reconciliation to the Cash Flow Statement in slide 109 in the Annex 2 FCF conversion = FCF pre-M&A/Adj. EBITDA 2 |
|
2025 Capital Markets Day - 40 - 2025 Capital Markets Day | CFO Remarks 1 3 2024 Highlights 2025-2029 Strategic Plan 2 2025 Guidance 4 Capital allocation framework |
|
2025 Capital Markets Day - 41 - 2025-2029 Strategic Plan Cumulative FCF generation pre-M&A of €3.5-3.75Bn and free cash flow conversion increase to ~40% Free Cash Flow pre-M&A1 (2026-2028 illustrative) 15% ~20% FCF conversion2 ~40% 2024 2025 2026 2027 2028 2029 0.3 0.35-0.40 ~1.2 +35% CAGR 3.5-3.75Bn€ Cumulative free cash flow generation pre-M&A expectation in the next 5 years (2025-2029) ~€1.75-2bn FCF pre-M&A (2024-2027) Note: 2025-2029 projections based on current FX; 1 FCF definition and reconciliation to the Cash Flow Statement in slide 109 in the Annex; 2 FCF conversion = FCF pre-M&A/Adj. EBITDA |
|
2025 Capital Markets Day - 42 - 2025-2029 Strategic Plan Significant organic deleveraging capacity Theoretical illustrative deleveraging profile (pre-M&A and pre-dividends; 2026-2028 illustrative) 2024 2025 2026 2027 2028 2029 4.6x ~4.0x ~1.50-1.75x Theoretical illustrative deleveraging to ~1.50-1.75x1 by 2029 (pre-M&A and pre-dividends) Significant deleveraging capacity 1 Defined as per the Credit Agreement Note: 2025-2029 projections based on current FX Net leverage target (see capital allocation framework) ~3.0-3.5x1 |
|
2025 Capital Markets Day - 43 - 2025-2029 Strategic Plan Strong revenues growth expectation led by Biopharma, with Diagnostic growth expected in the latter years Revenues (in bn€) Strategic Plan is conservatively based on growing in line with the Biopharma market (notwithstanding our recent track-record of growing meaningfully faster than the market) • 24-29 CAGR ~7% vs. 22-24 CAGR 13% Biopharma continues to be a key driver: • Proteins growth: • IgG: high-single-digit growth based on strong underlying market demand • Albumin: balanced growth with IgG • Alpha-1: leverage leading position further strengthened by key LCM projects • Fibrinogen: increasing contribution throughout 2025-2029 • Geographic mix: • US: continue to deliver growth in core geography • Ex-US: continue strong ex-US growth Diagnostic growth expected in latter stages, with inflexion point expected in 2026/2027 Note: growth at constant currency (cc) and 2025-2029 projections based on current FX; 1 Includes the rest of BUs 2024 Biopharma Diagnostic Others1 2029 7.2 ~10.0 ~7% CAGR ~7% CAGR ~5% CAGR |
|
2025 Capital Markets Day - 44 - 2025-2029 Strategic Plan EBITDA margin to expand by ~500bps in 5 years Note: growth at constant currency (cc) and 2025-2029 projections based on current FX 1 Includes impacts from Opex other than R&D (mainly IT), Amortizations and SRAAS 2024 Biopharma Diagnostic Others1 2029 1.8 ~2.9 ~10% CAGR Forecasted EBITDA growth relative to revenues growth is more prudent than our recent track-record • 24-29 CAGR ~10% vs. 22-24 CAGR 23% EBITDA margin growth driven by: • Biopharma positively fueled by: • CPL optimization, plasma source mix & yield improvements • Commercial growth • Product mix & Fibrinogen • Diagnostic improvement due to volume effect in both Blood Typing Solutions (Barcelona instrument launch) and Molecular Donor Screening 24.7% ~29.5% • Partially offset by increasing IT and R&D expenses EBITDA margin Adjusted EBITDA (in bn€) ~10% CAGR ~12% CAGR |
|
2025 Capital Markets Day - 45 - 2025-2029 Strategic Plan Growth expectations across both revenues and EBITDA are relatively uniform over the Plan period Revenues (in bn€; 2026-2028 illustrative) Adjusted EBITDA (in bn€; 2026-2028 illustrative) 2024 2025 2026 2027 2028 2029 7.2 7.55-7.60 +7% ~10.0 CAGR 2024 2025 2026 2027 2028 2029 1.8 1.875-1.925 ~2.9 +10% CAGR 24.7% ~25% ~29.5% EBITDA margin Note: 2025-2029 projections based on current FX |
|
2025 Capital Markets Day - 46 - 2025-2029 Strategic Plan A clear CAPEX plan to support our strategic positioning and strong growth prospects Total planned CAPEX investments Cumulative 2025-2029, in EUR CAPEX spend: • Regular CAPEX €300-350m/year • IT and R&D capitalized €125-150m/year • Ranges from €475-575m/year in forecast period (includes Extraordinary Growth CAPEX) Limited needs to expand donor center base in US and EU • Greater focus on maximizing collections per center ~1.1bn ~0.7bn ~0.7bn ~2.5bn Growth1,2 Maintenance1 Capitalized IT and R&D Well invested facilities with sufficient capacity to deal with strong growth fundamentals CAPEX as % of revenues to progressively decline to ~5% in 2029 from ~9% in 2024 1 Growth CAPEX defined as investments made to expand the company’s operations, enter new markets or develop new products, and maintenance CAPEX as expenditures related to maintain and sustain existing operations and assets 2 Growth CAPEX includes previously identified extraordinary growth CAPEX Note: 2025-2029 projections based on current FX |
|
2025 Capital Markets Day - 47 - 2025-2029 Strategic Plan Other drivers of Free Cash Flow pre-M&A • Inventory ‐ Necessary investment in 2025-2029 to support strong growth fundamentals ‐ CPL, yield improvements and end-to-end supply-chain efficiencies driving inventory optimization • Relatively stable receivable and payable days • Expected normalization of net working capital investment up to 3-3.5% of sales progressively over Plan period Working capital • Strong re-rating potential given continued focus on free cash flow generation and deleveraging • Scope to mitigate refinancing costs of attractively priced debt by ‐ Refinancing more expensive debt ‐ Using secured capacity if needed • Rates outlook Interest • Reduction in restructuring and transaction costs • Non-controlling interests' simplification plans (to be further addressed within Capital Allocation) Others • Principal tax jurisdictions are U.S., Ireland, Spain and Germany • Cash tax guidance on avg. ~27% on pre-tax income • Final cash tax could vary based on profit mix by jurisdiction Tax Note: FCF definition and reconciliation to the Cash Flow Statement in slide 109 in the Annex |
|
2025 Capital Markets Day - 48 - 2025-2029 Strategic Plan Free Cash Flow pre-M&A generation improvements expected, ~40% EBITDA conversion rate by 2029 15% ~40% Strong Biopharma growth and improved Diagnostic‘s contribution to cash generation ~€2.5bn CAPEX investments in 5 years support strong growth fundamentals Working capital consumption to support business growth Cash interest optimization opportunities reflecting re-rating potential, net debt evolution, and rates outlook Free cash flow pre-M&A1 in billion EUR; Note: 2025-2029 projections based on current FX; assuming conversion of reported and adjusted EBITDA from 2026 onwards 1 FCF definition and reconciliation to the Cash Flow Statement in slide 109 in the Annex; 2 FCF conversion = FCF pre-M&A/Adj. EBITDA FCF conversion rate 2 2024 EBITDA CAPEX, R&D and IT Interest Others Taxes Net working capital 2029 0.3 ~1.2 +35% CAGR Uniform FCF conversión improvement |
|
2025 Capital Markets Day - 49 - Free Cash Flow pre-M&A1 (in bn€; % as CAGR; 2026-2028 illustrative) Theoretical illustrative deleveraging profile3 (pre-M&A and pre-dividends; 2026-2028 illustrative) 2025-2029 Strategic Plan Step-change in FCF generation pre-M&A and deleveraging capacity significantly improves capital allocation optionality 15% ~20% ~40% 0.3 0.35-0.40 ~1.2 2024 2025 2026 2027 2028 2029 +35% CAGR FCF conversion rate2 Significant deleveraging 4.6x capacity ~1.50-1.75x 2024 2025 2026 2027 2028 2029 Note: 2025-2029 projections based on current FX 1 FCF definition and reconciliation to the Cash Flow Statement in slide 109 in the Annex; 2 FCF conversion = FCF pre-M&A/Adj. EBITDA; 3 Defined as per the Credit Agreement ~4.0x |
|
2025 Capital Markets Day - 50 - 2025 Capital Markets Day | CFO Remarks 1 3 2024 Highlights 2025-2029 Strategic Plan 2 2025 Guidance 4 Capital allocation framework |
|
2025 Capital Markets Day - 51 - Financial framework Highly disciplined capital allocation, fully aligned with our Strategic Plan Deliver significant and sustained FCF1 growth Balance sheet strength Shareholder returns Organic business reinvestment Inorganic efforts • Net leverage target: 3.0-3.5x2 • Net debt reduction • Reinstatement of shareholder returns from 2025 onwards • Progressive and sustainable dividend policy backed by: o Delivering on FCF generation o Continued deleveraging • Scope for share buybacks within Strategic Plan • Prioritize highly accretive and necessary business re-investment opportunities • Reinvigorate R&D potential • Digitalization initiatives • Limited to corporate simplification and portfolio optimization • Funded via FCF generation whilst continuing deleveraging path • Major M&A not envisaged 1 FCF definition and reconciliation to the Cash Flow Statement in slide 109 in the Annex; 2 Defined as per the Credit Agreement |
|
2025 Capital Markets Day - 52 - Capital allocation framework Corporate simplification and portfolio optimization plans Biotest • As originally planned, intend to integrate Biotest (at the right time/conditions) • High potential proteins under development • Complementary (markets and products) If executed, expected to be financed by FCF generation whilst continuing our deleveraging path; 2027 net leverage <3.5x1 . Haema & BPC • Current intention is to exercise call option in 2026/2027 • Secure plasma supply for ex-US growth • Corporate simplification 1 Defined as per the Credit Agreement Note: 2025-2029 projections based on current FX; FCF definition and reconciliation to the Cash Flow Statement in slide 109 in the Annex |
|
2025 Capital Markets Day - 53 - Capital allocation framework Using significant balance sheet capacity available within Plan period to further bolster strategic positioning and shareholder returns Reinstatement of progressive and sustainable dividend policy from 2025 onwards ~1.50- 1.75x 3.0-3.5x 2029 Value accretive opportunities (e.g., in-licensing, M&A) Any excess capital to be returned to shareholders in the most efficient manner Leverage Ratio (as per Credit Agreement) |
|
2025 Capital Markets Day - 54 - Sustainability Sustainability embedded into our Strategic Plan to support long-term value for stakeholders Grounded in 6 pillars Commitment to patients and society health Environmental responsibility Responsible to our Donors and our communities Our people Business Ethics Innovation Ranked nº1 biotech company in Dow Jones Best-in-Class Indices • Included in DJSI World for fourth consecutive year • Included in DJSI Europe for fifth consecutive year 2025 industry ESG top rated according to Sustainalytics Gold Medal Increased rating to 68 |
|
2025 Capital Markets Day - 55 - Key Takeaways Strong market fundamentals and a market leading position supporting solid FCF generation growth whilst continuing on our deleveraging path 1 2 Delivering on corporate simplification and portfolio optimization 4 Sustainability embedded in our Plan to support long-term value creation 2025 Capital Markets Day - 55 - Significant capacity over the Strategic Plan to make a step-change in shareholder returns whilst being able to support our vision for 2034 3 5 Highly attractive, unique re-rating potential |
|
2025 Capital Markets Day - 56 - Break |
|
2025 Capital Markets Day - 57 - Roland Wandeler President Biopharma Value Creation Plan 03. Nacho Abia Chief Executive Officer |
|
2025 Capital Markets Day - 58 - Value creation Value creation levers Value creation enablers A Commercial growth B Margin expansion C Pipeline execution Plasma supply & industrial Innovation |
|
2025 Capital Markets Day - 59 - Value creation – Three levers to drive Plasma Economics Liter economics by plasma utilization (illustrative) CPL (Cost per Liter) 0% Others Revenue per Liter Alpha-1 AT IgG Albumin % of plasma utilization 100% Fibrinogen Trimodulin A Commercial growth (Increase revenue – volume & price) Margin Expansion B (Decrease CPL) Pipeline execution (Expand products & indications) C A Commercial growth B Margin expansion C Pipeline execution Plasma Liters Levers |
|
2025 Capital Markets Day - 60 - Value creation Value creation levers Value creation enablers A Commercial growth B Margin expansion C Pipeline execution Plasma supply & industrial Innovation |
|
2025 Capital Markets Day - 61 - Commercial growth Strong portfolio of leading brands 60% 14% 26% IG Albumin Alpha-1 & specialty proteins1 Total 6.1bn • GAMUNEX-C: Leading IVIG, first FDA therapy for CIDP, >20 years of experience, proven efficacy and leadership in the US • XEMBIFY: Only 20% SCIG with FDA-approved dosing for treatment-naïve patients2 • YIMMUGO: New IVIG from Biotest, about to launch in US IG • ALBUTEIN: FlexBag focused on differentiation for the end user and available in multiple sizes and concentrations • Various Albumin Brands: Comprehensive offering of vials in various sizes to support albumin need across the globe Albumin • PROLASTIN / PROLASTIN C: Leading Alpha-1 market for >35 years, #1 prescribed augmentation therapy • HyperRAB: Leading the global market, treating >1M patients and #1 prescribed in the US • Various Hyper-Immunes: Meeting medical need Alpha-1 & specialty proteins1 1 Includes Hyperimmune IgG, coagulation factors, Fibrin Sealant, Antithrombin III and Tavlesse 2 Go straight to SCIg without IVIG therapy first Biopharma FY24 global revenues (in EUR) |
|
2025 Capital Markets Day - 62 - Commercial growth Positioned to continue to drive high single-digit revenue growth Biopharma revenue evolution (billion EUR) 2024 2029 6.1 High single-digit CAGR High market potential across indications Strong demand led by IG (PID / SID diagnosis rate, IG in CIDP SoC1 ) and other indications (Alpha-1 diagnosis rate) Strong position and building capabilities Grifols well positioned to compete effectively (leading brands, strengthening commercial capabilities, investing in LCM projects and new product launches) Positive momentum from 2024 2024's progress has built strong momentum, and we're optimistic about continued growth 1 Standard of Care |
|
2025 Capital Markets Day - 63 - Commercial growth Clear growth levers and opportunities per protein IG Albumin Alpha-1 & specialty proteins Fibrinogen Proteins in portfolio Proteins in pipeline • Robust market growth and promising future potential • Strong 2024 Biopharma performance and momentum • Well positioned to drive continued product growth for Grifols (volume, price) • Continued Albumin demand across the world • Grifols well-positioned worldwide ✓ Strong presence in China through SRAAS partnership ✓ Established supplier in US ✓ Positioning in the RoW Alpha-1 • Low Alpha-1 diagnosis and treatment • SPARTA efficacy data to enable access ex-US • Potential to increase patient convenience Hyperimmunes • Continued demand across the world • Grifols trusted provider worldwide • Grifols Fibrinogen launch as leading therapy • Evolution of US Standard of Care from Cryo to Fibrinogen concentrate Opportunities Goal Grow Balance Lead Launch |
|
2025 Capital Markets Day - 64 - Immunoglobulin Grifols IG with strong 2024 performance and momentum Grifols IG 2024 revenue growth (% cc) 2023 2024 +15% 14% 55% IVIG SCIG FY growth (cc) By geography By administration Accelerating growth in the US (high single-digit growth) Strong Xembify momentum and potential as new SCIG Strong performance ex-US (~3x revenues since 2021) US Int’l IVIG SCIG Double-digit Gamunex-C growth as established and leading IVIG |
|
2025 Capital Markets Day - 65 - 1 Source: MRB 2 Only ~10-30% PID patients are diagnosed, prevalence of SID is 30x > PID. Source: Primary Immunodeficiencies (PID) – driving diagnosis for optimal care in Europe, European Reference Paper 3 Not yet approved in the US 4 US IG consumption per capita is 3x than EU countries 2024 2029 6-8% Projected global IG market volume1 Strong market growth fundamentals • Low diagnosis and treatment rate in approved indications (especially PID2 & SID3 ) • IgG potential beyond approved indications • Low IG use per capita in many Ex-US regions4 IG uniquely positioned as Therapy of Choice • Multi-modal mechanism of action – able to effectively address multifactorial diseases and heterogeneity within disease origins • Strong experience and body of evidence – 70+ year established safety profile Immunoglobulin Market Outlook: IG market with strong growth potential |
|
2025 Capital Markets Day - 66 - Blockade of FcRn receptors3 Inhibition of complement activation1 Regulation of T-cell and B-cell activation4 Macrophage inhibition via Fc-gamma receptors3,4 Neutralization of pathologic autoantibodies4 Downregulation of inflammatory cytokines1,5b Several mechanisms play a role in CIDP including inflammation, demyelination, and axonal damage CIDP is a multifactorial disease IVIG disrupts inflammation through multiple MoAs Diseases PID / SID CIDP MG ITP Multifactorial diseases Immunoglobulin Example CIDP: Complex condition involving multiple MoAs |
|
2025 Capital Markets Day - 67 - Build on Grifols’ leading brands (Gamunex-C, Xembify, Yimmugo) Lead growth in immunodeficiencies (accelerating diagnosis and treatment) Maintain leadership in CIDP, strengthening IG as SoC1 and developing CIDP indication for Xembify Continue to drive profitable ex-US growth 1 2 3 IG volume Four levers to drive growth … … underpinned by continued innovation 2024 2029 Grifols Market High single-digit 6-8% Immunoglobulin Grifols Outlook: Positioned to drive high single-digit growth Life cycle management to improve offering • Xembify Pre-filled syringes • Gamunex-C in bags New products & indications to expand use Short-mid & long-term yield improvements • Xembify SID in CLL, MM & NHL • Xembify in CIDP 4 • IgG in Dry Eye Disease 1 Standard of Care |
|
2025 Capital Markets Day - 68 - Launch Expand Differentiate Immunoglobulin Investing in LCM to differentiate and foster market growth Xembify: • 2024: Launch in 9 EU markets and Australia • 2025-2026: 10-13 additional markets Yimmugo: • 2025: Launch in US Xembify Pre-filled Syringes1 , improving patient convenience Gamunex-C in bags1 (vs. vials), providing more options Xembify CIDP Xembify SID Gamunex-C SID Leverage Real World Evidence Bringing products to new markets Untap potential through new indications, e.g.: Providing best-in-class offering, e.g.: 1 Not yet approved by the FDA |
|
2025 Capital Markets Day - 69 - Alpha-1 Grifols clear leader in Alpha-1 with large market opportunity Alpha-1 market opportunity Grifols Global market leadership Leading Alpha-1 market for >35 years with ~70% market share Prolastin-C's direct model and dedicated specialty pharmacy are key differentiators in the US Unique Alpha-1 testing capabilities Leader in identifying AATD patients by offering screening for genetic risk and AAT serum levels Launched direct-to-patient test in the US 1 2 Grifols’ unique positioning 1 Source: Estimated Worldwide Prevalence of the PI*ZZ Alpha-1 Antitrypsin Genotype in Subjects With Chronic Obstructive Pulmonary Disease. Ignacio Blanco, Isidro Diego, César Castanón, Patricia Bueno, Marc Miravitlles., 2023 2 Source: Campos MA, Wanner A, Zhang G, et al. Trends in the diagnosis of symptomatic patients with alpha1-antitrypsin deficiency between 1968 and 2003. Chest. 2005;128(3):1179-86 ~10% Diagnosed patients ~90% Not diagnosed patients2 Estimated PiZZ patients (worldwide) 1 ~230k patients |
|
2025 Capital Markets Day - 70 - Alpha-1 15% SubQ Double-dose Next generation Alpha-1 therapeutic SPARTA: Largest ever efficacy study in AATD designed to show outcomes Alpha-1 Investing to maintain Alpha-1 leadership and treat more patients Three levers for growth … Sustain leadership position leveraging unique value proposition and best-in-class patient support Grow the market: Lead patient identification (HCP screening and Alpha-1 ID at home) Expand patient access (US access, ex-US reimbursement) 1 2 … underpinned by investment in innovation 3 Strengthen body of evidence Evolve product offering SPARTA: enhancing payer proposition • Strengthen payer position in US • Secure broader reimbursement ex-US Expand reimbursement Working with leading IDNs on programs to leverage electronic medical records Improve patient identification |
|
2025 Capital Markets Day - 71 - Congenital Fibrinogen Deficiency (CFD) • Very rare(4), inherited bleeding disorder affecting either the quantity or quality of circulating fibrinogen • Fibrinogen concentrate used in prophylaxis and treatment of bleeding episodes in these patients Acquired Fibrinogen Deficiency (AFD) • May be due to bleeding (increased consumption, hemodilution) or reduced synthesis • AFD can only be corrected through administration of exogenous fibrinogen(5) . • Fibrinogen concentrate allows for rapid and convenient correction of AFD Fibrinogen On track to launch Fibrinogen as new protein(1) in our portfolio Fibrinogen (coagulation factor I) is fundamental to effective clot formation(1) During major bleeding episodes, it is the first clotting factor to reach critically low levels(2) Fibrinogen deficiency is consistently associated with poor patient outcomes (3) (1) Not yet approved in the US; (2) Levy JH, et al. Transfusion. 2014 May;54(5):1389-405 (3) Grottke O, et al. Semin Thromb Hemost. 2020 Feb;46(1):38-49 (4) Novak A, et al. Expert Rev Hematol. 2018 May;11(5):351-360 (5) Prevalence of afibrinogenemia is 1:106 inhabitants. Hypo- and dysfibrinogenemia are more frequent, but their prevalence is difficult to establish as they may be asymptomatic (6) (Boer C, et al. J Cardiothorac Vasc Anesth. 2018 Feb;32(1):88-120.);, McQuilten ZK, et al. Injury 2017; 48: 1074e81., Charbit B, et al. J Thromb Haemost. 2007 Feb;5(2):266-73.). Roy A, et al. J Thromb Haemost. 2020 Feb;18(2):352-363. Fibrinogen physiology Fibrinogen Concentrate use 95% 5% |
|
2025 Capital Markets Day - 72 - Fibrinogen Important opportunity to evolve the Standard of Care in the US Current SoC Cryo Combination of FC and Cryo Fibrinogen Concentrate Per capita consumption of fibrinogen concentrate, 2023 (g/1k population) 0.2 0.4 1.1 1.4 2.1 2.1 3.2 5.5 Markets to be developed Growing markets Established markets Note: Cryo = Cryoprecipitate; AFD = Acquired Fibrinogen Deficiency; SoC = Standard of Care; FC = Fibrinogen Concentrate (1) MRB 2023: The plasma proteins market in Europe (published Dec 2024) (2) CA Market volume based on: Provincial Laboratory Medicine Services/ Provincial blood coordination office of Canada (3) CA revenue calculated with commercial ASP published in MRB 2021/2022: The plasma proteins market in Canada (published Nov 2022) (4) MRB 2023: The plasma proteins market in The United States (published June 2024) Current market size ($M) 54(4) 10(1) 20(1) 43(1) 29(2,3) 37(1) 75(1) 13(1) Fibrinogen Concentrate is SoC in many EU markets US & UK use Cryo as the source for fibrinogen in AFD Canadian market has grown rapidly since adopting fibrinogen concentrate >800M$ US market size |
|
2025 Capital Markets Day - 73 - Fibrinogen On track to launch Fibrinogen post approval end of 2025 Regulatory dossiers submitted, on track for launches 2024 2025 2026 Fibrinogen AdFirst1 clinical study completed EU DCP submitted US BLA submitted Expect approval & launch end of 2025 • First in the EU (Q4'25) • Later on in the US (1H'26) Opportunity both in the US and established markets Aim to position Fibrinogen concentrate as a differentiated therapy given its clinical profile and evidence2 Lead evolution of US Standard of Care from Cryo to Fibrinogen Concentrate Gain share in established markets Expand body of evidence through LCM 1 Ph3 in AFD due to severe bleeding in 2 different surgical settings (non-inferiority trial): spinal surgery (vs FFP), cytoreductive surgery for PMP (vs Cryo) 2 The new Fibrinogen concentrate has been designed to allow a swift replenishment of fibrinogen levels in bleeding patients, as it can be stored next to the patient, readily available at room temperature, and be reconstituted in a quick and simple way 1 2 3 Preparing to share AdFirst study results • Publication and medical conference 4 |
|
2025 Capital Markets Day - 74 - Value creation Value creation levers Value creation enablers A Commercial growth C Pipeline execution Plasma supply & industrial Innovation B Margin expansion |
|
2025 Capital Markets Day - 75 - Margin expansion Three levers to drive margin expansion Plasma sourcing mix Plasma collection excellence Yield & manufacturing efficiencies 2024 2029 2 3 1 Yield 1 2 3 Mfg. |
|
2025 Capital Markets Day - 76 - Note: Data at end of 2024 Margin expansion | 1 – Plasma sourcing mix Optimize plasma sourcing in a global & diversified network US 298 DCs (8 IK centers integrated by Jan 1st ‘25) Europe 58 DCs 40 DCs from Biotest Egypt 10 DCs Strategic partnership Canada 12 DCs (including strategic partnership with CBS) Optimize US footprint Preserve the business Egypt self-sufficiency and possible expansion to other regions Canada self-sufficiency Optimize plasma mix based on demand growth Enabling Profitable ex-US growth Note: Data at end of 2024 |
|
2025 Capital Markets Day - 77 - 2019 2021 2024 Plasma Cost Per Liter Margin expansion | 2 – Plasma collection excellence Considerable progress with Cost per Liter reduction Network rationalization Streamlined organization and donor center operations Optimized donor compensation Individualized nomogram rollout (partially) Close to pre-covid levels (adjusted for inflation) |
|
2025 Capital Markets Day - 78 - 2019 2021 2024 2029 Plasma Cost Per Liter Margin expansion | 2 – Plasma collection excellence Four clear drivers to further reduce Cost per Liter Further reduction of cost per liter Increase collections per center Increase donor center utilization by improving center performance, donor retention and capacity management Personalize donor compensation Leverage data analytics to implement smart compensation model and a differentiated, digitally-enabled experience Drive operational excellence Deliver an improved donor service across the fleet by enhancing throughput times, plasma yield and optimal staffing levels Full individualized nomogram rollout Further expand implementation of improved nomogram by rolling it out across all US donor centers (detail next) Plasma Cost Per Liter |
|
2025 Capital Markets Day - 79 - Weight-based nomogram Individualized nomogram Enhanced donor collection target based on weight, height and hematocrit Margin expansion | 2 – Plasma collection excellence Driving progress: On track for 100% US implementation of individualized nomogram by 2026 Improves quality and donor satisfaction while optimizing donation productivity through higher plasma yields Achieved ~60% implementation in our U.S. donor centers 2024 2025 – 2026 Reach 100% individualized nomogram US adoption by 2026 • Increased plasma volume per donation • Impact mostly reflected in 2025 P&L |
|
2025 Capital Markets Day - 80 - • Improvements within current IgG manufacturing process Progress so far Evolve (3-7 years) Transform (+7 years) >5% IgG Yield improvement >20% IgG Yield Improvement >30% IgG Yield Improvement Note(s): Figures based on Gamunex yield improvement and compared to 2023 data Margin expansion | 3 – Yield improvement Roadmap in place to continue to increase E2E IgG yield Optimize (1-4 years) • Further incremental plant improvement for current Gamunex-C process • Enabled by Advanced analytics • Embrace new technology to obtain IgG, improving manufacturing recovery • Revised Gamunex-C next generation process, seeking improvements in yield and product profile >10% IgG Yield Improvement |
|
2025 Capital Markets Day - 81 - Margin expansion | 3 – Continuous improvement Continuous improvement to further improve margin Operational improvement Plan Since 2022, we have significantly increased our margins across our value chain Building on process and capabilities to drive continued improvement across the organization and improve margins Continuous Improvement approach & mindset Labor productivity (Plasma collections per FTE) Plasma cost per Liter Plasma volume supply Manufacturing cost per liter Biopharma: manufacturing and commercial excellence Innovation: R&D acceleration Plasma: donor attraction & retention, operational efficiencies Corporate: OpEx optimization Examples Yield improvement |
|
2025 Capital Markets Day - 82 - Value creation Value creation levers Value creation enablers A Commercial growth B Margin expansion C Pipeline execution Plasma supply & industrial Innovation |
|
2025 Capital Markets Day - 83 - Streamline and focus our pipeline Strengthen capabilities across R&D value chain • Systematic portfolio and pipeline review, closing projects from non-core therapeutic areas • >120M€ reallocated • Enhanced prioritization & mindful growth pipeline over time • New leadership with new talent and capabilities brought in • Further developed external innovation capabilities • Stepping up digital & AI capabilities Pipeline execution Strengthening our portfolio and innovation engine • Focus on bringing the current pipeline to the market faster • Improved cross-functional governance for fast decision-making & business focus Accelerate time-to-market for key programs 1 2 3 |
|
2025 Capital Markets Day - 84 - Bring new proteins & products to market to address unmet medical needs and improve patient outcomes Develop new manufacturing processes to make the most of each donation Maximize value of current products by serving more patients across indications and enhancing their experience Lifecycle Management (LCM) New products Yield optimization ▪ Gamunex-C in bags ▪ Alpha-1 pivotal efficacy trial (SPARTA) ▪ Alpha-1 SubQ 15% ▪ Xembify into SID in CLL, MM & NHL ▪ Xembify pre-filled syringes ▪ Trimodulin in sCAP (and beyond) ▪ IgG in Dry Eye Disease ▪ Fibrinogen in congenital and acquired Fibrinogen deficiency Pipeline execution Driving traction across LCM, new products & yield optimization ▪ Short term: current process improvement ▪ Mid term: Gamunex-C next generation ▪ Long term: embrace new technology to obtain IgG ▪ GigaGen ▪ Gamunex in SID ▪ Xembify in CIDP |
|
2025 Capital Markets Day - 85 - Value creation Value creation levers Value creation enablers A Commercial growth B Margin expansion C Pipeline execution Plasma supply & industrial Innovation |
|
2025 Capital Markets Day - 86 - Plasma supply footprint Donor centers network in place to enable future growth Note(s): Donor centers data at end of 2024 US 298 DCs (8 IK centers integrated by Jan 1st ‘25) Europe 58 DCs 40 DCs from Biotest Egypt 10 DCs Strategic partnership Canada 12 DCs (including strategic partnership with CBS) • Network in place to support growth in the next 5 years • Focus on increasing collections per center in the US • Doubling plasma collection network in Egypt in 2025 and completing Canada network Plasma network |
|
2025 Capital Markets Day - 87 - Barcelona (Parets) Los Angeles North Carolina (Clayton, RTP) Dublin Montreal Dreieich New Cairo Industrial footprint Manufacturing network in place to enable future growth … Note(s): Bubble size is relative to manufacturing capacity … with targeted and efficient CAPEX investment over the next 5 years Industrial capacity • Added capacity from recent investments (Clayton, Montreal and Dublin) • Focused investments to maximize current potential (Barcelona, Clayton and LA) • Paving the road for next major expansion in 2030+ Manufacturing plants Future Manufacturing plants |
|
2025 Capital Markets Day - 88 - Value creation Value creation levers Value creation enablers A Commercial growth B Margin expansion C Pipeline execution Plasma supply & industrial Innovation |
|
2025 Capital Markets Day - 89 - Plasma In addition to plasma Pulmonology Critical care Infectious diseases 2 Immunology / Autoimmune 1 Opportunistic 3 4 5 Plasma is our core: raw material that we already collect, where we have extensive knowledge, with significant future potential, and a priority for value maximization Evolve premium plasma therapeutics portfolio with leading brands in Grifols core Therapeutic Areas (Prioritize within TAs and partner outside) We have unique knowledge in certain Therapeutic Areas that we can leverage to expand beyond plasma Create a unique pipeline of non-plasma assets (e.g., GigaGen for immunology / autoimmune and infectious diseases) with clear competitive advantage based on Grifols heritage Therapeutic Areas Innovation Our strategic framework |
|
2025 Capital Markets Day - 90 - Innovation Biopharma R&D pipeline Phase 1 Phase 2 Phase 3 Product Development Plasma In addition to plasma Xembify SID in CLL, MM & NHL Gamunex-C in bags Xembify Pre-filled syringes Giga 2339 HBV Trimodulin new indication Alpha-1 SubQ 15% Alpha-1 SPARTA (post-marketing commitment) Fibrinogen congenital and acquired deficiency IgG (Flebo) in Dry Eye Disease1 Giga 564 Onco Regulatory Trimodulin in sCAP Pre-clinical Recombinant IgG polyclonal antibodies for infectious diseases Next generation Alpha-1 GigaGen platform (Botulism Toxin & others) Xembify in CIDP External collaboration Selection of key projects Chronos Parkinson Disease New recombinant treatments for autoimmune disease Immunology / autoimmune Infectious diseases Pulmonology Critical care Others Note(s): 1. Start in 2025; 2. Based on RWE Next generation process for Gamunex-C IgG Gamunex in SID2 |
|
2025 Capital Markets Day - 91 - 2024 2025-2029 Innovation Launch dates Fibrinogen congenital & acquired deficiency Gamunex-C in bags Xembify Pre-Filled Syringes Alpha-1 SPARTA (efficacy) • Xembify biweekly dosing Label expansion • Prolastin 4-5g Launched in 5 European markets (+3-5 in 2025) • Fibrin sealant pediatric Label change Today Alpha-1 SubQ 15% Xembify SID in CLL, MM & NHL Trimodulin in sCAP • Xembify in Europe Launched in 9 EU markets and Australia (+10-13 countries in 2025-2026) Gamunex in SID Xembify in CIDP |
|
2025 Capital Markets Day - 92 - Innovation 2025 key milestones • IgG: ✓ Xembify CIDP: IND Submission ✓ Gamunex-C in bags: FDA submission • Alpha-1 SubQ 15%: Phase 1/2 topline results • Fibrinogen Congenital & Acquired Deficiency: EU approval • Giga HBV: Complete 25% patient enrollment • Giga Oncology Phase 1B (dose expansion): 1st patient enrolled • OSIG in Dry Eye Disease: Phase 2 IND submission H1 H2 |
|
2025 Capital Markets Day - 93 - New products Trimodulin: ESsCAPE trial (sCAP indication) • Unique IgG preparation: combination of polyclonal antibodies (IgG, IgM and IgA) • Triple MoA: clearing pathogens, neutralizing toxins and modulating uncontrolled hyper-inflammatory patient response Promising clinical evidence in phase 2 Ph2 CIGMA Study post-hoc results demonstrate there is a significant reduction in mortality with Trimodulin Positive feedback from FDA, PEI and clinical experts on population selection & clinical trial design for phase 3 27.8 22.2 30.5 13.8 30.9 14.3 36.6 11.8 80% 45% 46% 32% Placebo Trimodulin Mortality rate (%) of Ph2 CIGMA study All patients (n=160) CRP ≥ 70mg/ml (n=124) IgM ≤ 0.8g/L (n=111) CRP ≥ 70mg/ml and IgM ≤ 0.8g/L (n=92) |
|
2025 Capital Markets Day - 94 - New products | Trimodulin Trimodulin: pipeline in a product opportunity Current pipeline: severe community-acquired pneumonia (sCAP) Future potential: broad sepsis indication being explored, affecting multiple severe infections, mainly LRTIs, IAIs and UTIs Leading indication: sCAP Indication sequencing: pipeline in a product sCAP1 Sepsis Patients in Intensive Care Unit (ICU) 300 800-1000 Potential population (k patients) Current pipeline Future potential Note(s): 1. Severe Community-acquired pneumonia Sources: Market Understanding and Commercial Opportunity of Trimodulin in sCAP, 2023; Market Understanding and Commercial Opportunity of Trimodulin in Sepsis, 2024 These infections account for ~80% of all sepsis cases Severe Infections on ICU Mortality Rate (%) LRTIs - Low Respiratory Tract Infections 28% IAIs – Intra Abdominal Infections 31% UTIs – Urinary Tract Infections 17% |
|
2025 Capital Markets Day - 95 - Early-stage innovation GigaGen platform disruptive technology Adler A et al. MAbs 2017;9(8):1282-1296 Capture Re-create Recombinant polyclonal antibodies Immune repertoire GigaGen technology is a disruptive drug discovery platform of recombinant polyclonal and monoclonal antibodies Exceptional monoclonal antibodies Progressing with clinical development |
|
2025 Capital Markets Day - 96 - Partnership with BARDA (up to 135M$) starting with Botulinum Neurotoxin program; platform for emerging threats countermeasure Scale the pipeline with multiple targets in infectious diseases and immunodeficiencies (discovery programs) 1 st in human monoclonal antibody for oncology (Q2’24), in partnership with National Cancer Institute 1 st in human polyclonal antibodies to cure Hepatitis B (Q4’24); human proof-of-concept for polyclonal approach (3+B€ worldwide total spending per year) 2024 Progressing with platform validation Scale Early-stage innovation GigaGen: Ready to scale up |
|
2025 Capital Markets Day - 97 - Early-stage innovation Chronos PD: a bridge between plasma knowledge & analytics >100M plasma donor samples collected over 15 years Pilot study for Parkinson’s Disease Establish an early-warning system for the emergence of the disease • Financed by Michael J. Fox Foundation for Parkinson’s Disease • Project status on track for completion in Q2 2025 Donor samples Health data Real-world and individual health data (tokenized electronic medical records) Enabled by unique AI capabilities and machine learning platforms to understand disease drivers and markers Detect disease before symptoms appear, personalize treatments, and improve outcomes and QoL for patients worldwide Data Analytics Path forward: expand to other disease areas with multiple partnerships Chronos: moving from age-related to disease specific proteomics + |
|
2025 Capital Markets Day - 98 - Diagnostic Significant cash contributor with a clear plan to increase value Diagnostic is not distractive from Biopharma core, but complementary (e.g., supporting strategic initiatives like A1AT testing program, AT-III and fibrinogen) Significant EBITDA margin and cash flow contribution to the group Clear strategy, plan and initiatives defined to execute the vision becoming a leading player in Transfusion Medicine and expansion to the broadest market of Clinical Diagnostics |
|
2025 Capital Markets Day - 99 - Diagnostic | Strategy Path to solidify leadership in Transfusion Medicine and expand ~1 ~1 ~1 In Vitro Dx market (2024) ~121 Bn€ Transfusion medicine Adjacent clinical Dx Secure leadership in the IVD Transfusion Medicine segment Become an innovative and specialized player in Clinical DX Leverage new testing platforms to enter adjacent Clinical Diagnostics segments • Manage Procleix Panther Life-Cycle (e.g., Arboplex, UPW & Plasmodium) • Sustain leadership position • Develop Next Generation NAT • Keep double-digit growth • Strengthen presence in core markets (US, EMEA & APAC) • Continue increasing profitability • Develop next-gen BTS instruments to further boost growth Blood Typing Solutions Donor Screening (Immunoassay) Donor Screening (Molecular) • Develop new immunoassay technology for blood and plasma screening Support Biopharma testing programs & new drug development Pipeline projects |
|
2025 Capital Markets Day - 100 - Diagnostic | Innovation Strong progress in our pipeline execution Mundaka Molecular Platform (2030) ISARD Immunoassay Platform (2029) Barcelona Platform (2026) Most innovative Blood Typing solutions (BTS) platform: gel Card tech, modular and trackable 1 st Grifols Immunoassay platform: multiplexing, ultra highly sensitive, modular and trackable Grifols next generation NAT platform: high multiplexing, sensitive, fast and integrated Our new testing platforms will allow us to untap other markets in the Clinical Diagnostic segment as Immunoassays and Molecular Dx Achieve leadership position in Blood Typing Untap 1B$ Serology Donor Screening market Maintain NAT leadership in the long-term ~1 ~1 ~1 In Vitro Dx market (2024) ~121 Bn€ Transfusion medicine Adjacent clinical Dx |
|
2025 Capital Markets Day - 101 - Key Takeaways Strong plasma demand across indications with a clear plan to drive IgG growth, maximize opportunities of additional proteins and launch Fibrinogen 1 2025 Capital Markets Day - 101 - Plasma sourcing mix, collection excellence and yield & manufacturing efficiencies as the three key levers to boost profitability 2 Well-invested to support future growth leveraging current plasma centers fleet and maximizing fractionation capacity 3 Focus on accelerating pipeline execution (LCM and new proteins) and developing new models to create further value in the future (e.g., GigaGen, Chronos & Transfusion medicine projects) 4 |
|
2025 Capital Markets Day - 102 - Nacho Abia Chief Executive Officer 04. Concluding Remarks |
|
2025 Capital Markets Day - 103 - Key Takeaways Grifols is well-positioned to unlock its full potential to deliver remarkable value creation We are confident about achieving our financial metrics (in €) 2025 Capital Markets Day - 103 - Revenues 7,550-7,600m 2025 ~10.0bn 2029 EBITDA 1,875-1,925bn 2025 ~2.9bn 2029 Free Cash Flow pre-M&A1 350-400m 2025 ~1.2bn 2029 We have a clear strategy in place backed by strong fundamentals We leverage our leadership position in an attractive industry We are disciplined with our capital allocation to drive FCF growth and deleveraging We plan to deliver on corporate simplification & portfolio optimization We have talented leaders and world-class teams to succeed 1 Free Cash Flow pre-M&A: Cash flow generation from operating and investing activities (Free Cash Flow) excluding net proceeds from the sale of SRAAS shares; |
|
2025 Capital Markets Day - 104 - Q&A |
|
2025 Capital Markets Day - 105 - 05. Annex |
|
2025 Capital Markets Day - 106 - EBIT to EBITDA and EBITDA Adjusted In thousand of euros 371,859 317,034 299,321 203,802 1,192,016 782,317 255,252 (110,130) (108,364) (114,310) (106,139) (438,944) (456,263) (113,869) Reported EBITDA 481,990 425,398 413,631 309,941 1,630,960 1,238,580 369,122 % Net revenue 24.4% 23.7% 22.8% 19.1% 22.6% 18.8% 20.9% Restructuring costs 1,889 21,673 10,095 2,326 35,982 159,343 19,916 Transaction costs 9,306 7,882 16,145 15,318 48,650 47,602 19,590 Impairments 24,265 787 - - 25,052 1,794 1,794 Biotest Next Level Project 7,340 5,113 4,922 16,798 34,173 33,100 33,100 SRAAS One-off - - (5,618) - (5,618) - - Other non-recurring items 1,155 1,245 1,613 6,020 10,032 (18,830) - Total adjustments 43,954 36,700 27,157 40,461 148,271 223,009 74,400 Adjusted EBITDA 525,944 462,098 440,788 350,402 1,779,232 1,461,589 443,522 % Net revenue 26.6% 25.8% 24.2% 21.6% 24.7% 22.2% 25.1% Q4 2024 Q3 2024 Q2 2024 Q1 2024 FY 2024 FY 2023 Q4 2023 Depreciation & Amortization OPERATING RESULT (EBIT) |
|
2025 Capital Markets Day - 107 - Leverage Ratio as per Credit Agreement In millions of euros except ratio. Q4'24 Q3'24 Q2'24 Q1'24 Q4'23 Non-Current Financial Liabilities 9,491 8,836 8,752 9,650 10,034 Non-recurrent Lease Liabilities (IFRS16) (1,025) (969) (1,025) (1,026) (1,004) Current Financial Liabilities 676 1,017 2,757 1,745 1,023 Recurrent Lease Liabilities (IFRS16) (117) (111) (109) (111) (107) Cash and Cash Equivalents (980) (645) (2,113) (449) (530) Net Financial Debt as per Credit Agreement 8,046 8,128 8,262 9,811 9,416 In millions of euros except ratio. LTM Q4'24 LTM Q3'24 LTM Q2'24 LTM Q1'24 FY 2023 OPERATING RESULT (EBIT) 1,192 1,075 1,005 934 781 Depreciation & Amortization (439) (443) (444) (441) (458) Reported EBITDA 1,631 1,518 1,450 1,375 1,239 IFRS 16 (113) (113) (110) (104) (102) Restructuring costs 55 57 34 24 159 Transaction costs 49 59 65 59 48 Cost savings, operating improvements and synergies on a "run rate" 159 146 136 131 134 Other one-offs (28) (62) (75) (43) (7) Total adjustments 122 8 7 5 0 6 6 232 Adjusted EBITDA LTM as per Credit Agreement 1,753 1,605 1,500 1,442 1,471 Leverage Ratio as per Credit Agreeement 4.6x 5.1x 5.5x 6.8x 6.4x |
|
2025 Capital Markets Day - 108 - Leverage Ratio as per Consolidated EBITDA and Net Debt as per Balance Sheet In millions of euros except ratio. Q4'24 Q3'24 Q2'24 Q1'24 Q4'23 Non-Current Financial Liabilities 9,491 8,752 8,752 9,650 10,034 Current Financial Liabilities 676 2,757 2,757 1,745 1,023 Cash and Cash Equivalents (980) (2,113) (2,113) (449) (530) Net Financial Debt 9,187 9,396 9,396 10,947 10,527 In millions of euros except ratio. LTM Q4'24 LTM Q3'24 LTM Q2'24 LTM Q1'24 FY 2023 OPERATING RESULT (EBIT) 1,192 1,005 1,005 934 781 Depreciation & Amortization (439) (444) (444) (441) (458) Reported EBITDA 1,631 1,450 1,450 1,375 1,239 Leverage Ratio Reported 5.6x 6.5x 6.5x 8.0x 8.5x |
|
2025 Capital Markets Day - 109 - In million Euros 2024 2023 In million Euros 2024 2023 EBITDA Adjusted 1,779 1,474 Net Cash Flow From Operating Activities 1 902 219 Changes in working capital (14) (406) Net Cash Flow From Investing Activities 1 887 (395) CAPEX (233) (224) Free Cash Flow 1,789 (176) R&D and IT (139) (86) SRAAS proceeds net of transaction costs and taxes2 1,523 - Taxes (176) (159) Free Cash Flow pre-M&A 266 (176) Interests (561) (515) Others (8) -65 FCF Before Extraordinary Items 649 2 0 Extraordinary Growth CAPEX (276) -73 Restructuring and transaction costs (107) -122 Free Cash Flow 266 (176) 1 Statement of Cash Flow According IFRS-EU 2 As per Note (12) of the 2024 Consolidated Annual Accounts Free Cash Flow pre-M&A reconciliation Free Cash Flow pre-M&A = Adjusted EBITDA - Net Working Capital - CAPEX (including capitalized IT and R&D, and extraordinary growth CAPEX) - Others - Interest - Taxes. In the Consolidated Annual Accounts, this reconciles to Cash flow generation from operating and investing activities excluding impact from M&A and associated costs and expenses. Excludes lease payments, consistent with prior disclosed guidance. |
|
2025 Capital Markets Day - 110 - Investor Relations & Sustainability +34 93 571 02 21 investors@grifols.com sustainability@grifols.com inversores@grifols.com sostenibilidad@grifols.com |
SIGNATURES
Pursuant to the requirements of the Securities Exchange Act of 1934, the registrant has duly caused this report to be signed on its behalf by the undersigned, thereto duly authorized.
| Grifols, S.A. | |||
| By: | /s/ David I. Bell | ||
| Name: | David I. Bell | ||
| Title: | Authorized Signatory | ||
Date: February 27, 2025