UNITED STATES SECURITIES AND EXCHANGE COMMISSION
Washington, D.C. 20549
FORM 20-F
☐ |
REGISTRATION STATEMENT PURSUANT TO SECTION 12(b) OR (g) |
OR | |
þ |
ANNUAL REPORT PURSUANT TO SECTION 13 OR 15(d) |
|
For the fiscal year ended December 31, 2024 |
OR | |
☐ |
TRANSITION REPORT PURSUANT TO SECTION 13 OR 15(d) |
OR | |
☐ |
SHELL COMPANY REPORT PURSUANT TO SECTION 13 OR 15(d) |
|
Date of event requiring this shell company report…………… |
|
For the transition period from to |
Commission file number: 1-14251
SAP SE
(Exact name of Registrant as specified in its charter)
SAP EUROPEAN COMPANY
(Translation of Registrant’s name into English)
Federal Republic of Germany
(Jurisdiction of incorporation or organization)
Dietmar-Hopp-Allee 16
69190 Walldorf
Federal Republic of Germany
(Address of principal executive offices)
Wendy Boufford
c/o SAP Labs
3410 Hillview Avenue, Palo Alto, CA, 94304, United States of America
650-849-4000 (Tel),
650-843-2041 (Fax)
(Name, Telephone, Email and/or Facsimile number and Address of Company Contact Person)
Securities registered or to be registered pursuant to Section 12(b) of the Act:
|
||
Title of each class (SAP) |
SAP |
Name of each exchange on which registered |
American Depositary Shares, each Representing one Ordinary Share, without nominal value |
|
New York Stock Exchange |
Ordinary Shares, without nominal value |
|
New York Stock Exchange* |
Securities registered or to be registered pursuant to Section 12(g) of the Act: None
Securities for which there is a reporting obligation pursuant to Section 15(d) of the Act: None
Indicate the number of outstanding shares of each of the issuer’s classes of capital or common stock as of the close of the period covered by the annual report:
Ordinary Shares, without nominal value: 1,228,504,232 (as of December 31, 2024)**
Indicate by check mark if the registrant is a well-known seasoned issuer, as defined in Rule 405 of the Securities Act.
Yes þ No ☐
If this report is an annual or transition report, indicate by check mark if the registrant is not required to file reports pursuant to Section 13 or 15(d) of the Securities Exchange Act of 1934.
Yes ☐ No þ
Note — Checking the box above will not relieve any registrant required to file reports pursuant to Section 13 or 15(d) of the Securities Exchange Act of 1934 from their obligations under those Sections.
Indicate by check mark whether the registrant (1) has filed all reports required to be filed by Section 13 or 15(d) of the Securities Exchange Act of 1934 during the preceding 12 months (or for such shorter period that the registrant was required to file such reports), and (2) has been subject to such filing requirements for the past 90 days.
Yes þ No ☐
Indicate by check mark whether the registrant has submitted electronically, if any, every Interactive Data File required to be submitted pursuant to Rule 405 of Regulation S-T (§232.405 of this chapter) during the preceding 12 months (or for such shorter period that the registrant was required to submit such files.)
Yes þ No ☐
Indicate by check mark whether the registrant is a large accelerated filer, an accelerated filer, a non-accelerated filer or an emerging growth company. See definition of “accelerated filer,” “large accelerated filer,” and “emerging growth company” in Rule 12b-2 of the Exchange Act. (Check one):
Large accelerated filer þ |
Accelerated filer ☐ |
Non-accelerated filer ☐ |
Emerging growth company ☐ |
If an emerging growth company that prepares its financial statements in accordance with U.S. GAAP, indicate by check mark if the registrant has elected not to use the extended transition period for complying with any new or revised financial accounting standards† provided pursuant to Section 13(a) of the Exchange Act.
†The term “new or revised financial accounting standard” refers to any update issued by the Financial Accounting Standards Board to its Accounting Standards Codification after April 5, 2012.
Indicate by check mark whether the registrant has filed a report on and attestation to its management’s assessment of the effectiveness of its internal control over financial reporting under Section 404(b) of the Sarbanes-Oxley Act (15 U.S.C. 7262 (b)) by the registered public accounting firm that prepared or issued its audit report þ
If securities are registered pursuant to Section 12(b) of the Act, indicate by check mark whether the financial statements of the registrant included in the filing reflect the correction of an error to previously issued financial statements. þ
Indicate by check mark whether any of those error corrections are restatements that required a recovery analysis of incentive-based compensation received by any of the registrant’s executive officers during the relevant recovery period pursuant to §240.10D-1(b). ☐
Indicate by check mark which basis of accounting the registrant has used to prepare the financial statements included in this filing:
U.S. GAAP ☐ International Financial Reporting Standards as issued by the International Accounting Standards Board þ Other ☐
If “Other” has been checked in response to the previous question, indicate by check mark which financial statement item the registrant has elected to follow.
Item 17 ☐ Item 18 ☐
If this is an annual report, indicate by check mark whether the registrant is a shell company (as defined in Rule 12b-2 of the Exchange Act).
Yes ☐ No þ
* |
Listed not for trading or quotation purposes, but only in connection with the registration of American Depositary Shares representing such ordinary shares pursuant to the requirements of the Securities and Exchange Commission. |
** |
Including 61,914,771 treasury shares. |
|
7 |
|
|
7 |
|
|
8 |
|
|
8 |
|
|
9 |
|
|
10 |
|
|
10 |
|
|
|
|
|
15 |
|
ITEM 1. IDENTITY OF DIRECTORS, SENIOR MANAGEMENT AND ADVISERS |
|
15 |
|
15 |
|
|
15 |
|
|
15 |
|
|
15 |
|
|
15 |
|
|
16 |
|
|
17 |
|
|
22 |
|
|
24 |
|
|
24 |
|
|
24 |
|
|
24 |
|
|
25 |
|
|
25 |
|
|
25 |
|
|
28 |
|
|
29 |
|
|
30 |
|
|
31 |
|
|
31 |
|
|
34 |
|
|
34 |
|
|
37 |
|
|
40 |
|
|
40 |
|
|
41 |
|
|
41 |
|
|
42 |
|
|
42 |
|
|
42 |
|
|
43 |
|
|
43 |
|
|
43 |
|
|
45 |
|
|
45 |
|
|
51 |
|
|
51 |
|
|
53 |
|
|
54 |
|
|
54 |
|
|
54 |
|
|
58 |
|
|
58 |
|
|
59 |
|
|
59 |
|
|
60 |
|
|
60 |
|
|
60 |
|
|
62 |
4
|
62 |
|
|
63 |
|
|
63 |
|
|
64 |
|
|
64 |
|
|
65 |
|
Share - Based Payment Information Relating to Long - Term Incentives |
|
85 |
|
88 |
|
|
94 |
|
|
98 |
|
|
98 |
|
|
99 |
|
|
99 |
|
|
99 |
|
|
99 |
|
|
99 |
|
|
99 |
|
|
99 |
|
|
100 |
|
Consolidated Financial Statements and Financial Statement Schedule |
|
100 |
|
100 |
|
|
100 |
|
|
101 |
|
|
101 |
|
|
101 |
|
|
101 |
|
|
105 |
|
|
106 |
|
|
106 |
|
|
107 |
|
|
110 |
|
|
111 |
|
ITEM 11. QUANTITATIVE AND QUALITATIVE DISCLOSURES ABOUT MARKET RISK |
|
111 |
ITEM 12. DESCRIPTION OF SECURITIES OTHER THAN EQUITY SECURITIES |
|
111 |
|
111 |
|
|
|
|
|
112 |
|
|
112 |
|
ITEM 14. MATERIAL MODIFICATIONS TO THE RIGHTS OF SECURITY HOLDERS AND USE OF PROCEEDS |
|
112 |
|
112 |
|
|
112 |
|
Management's Annual Report on Internal Control Over Financial Reporting |
|
112 |
|
112 |
|
|
113 |
|
|
113 |
|
|
113 |
|
|
113 |
|
|
113 |
|
|
113 |
|
ITEM 16D. EXEMPTIONS FROM THE LISTING STANDARDS FOR AUDIT COMMITTEES |
|
114 |
ITEM 16E. PURCHASES OF EQUITY SECURITIES BY THE ISSUER AND AFFILIATED PURCHASERS |
|
114 |
|
115 |
|
|
115 |
|
|
115 |
|
|
115 |
|
|
115 |
|
|
116 |
|
|
116 |
|
|
117 |
|
|
117 |
5
|
117 |
|
|
117 |
|
|
118 |
|
|
118 |
|
|
118 |
|
ITEM 16I. DISCLOSURE REGARDING FOREIGN JURISDICTIONS THAT PREVENT INSPECTIONS |
|
118 |
|
118 |
|
|
118 |
|
|
118 |
|
|
119 |
|
|
|
|
|
122 |
|
|
122 |
|
|
122 |
|
|
123 |
|
|
124 |
|
|
F-1 |
6
Introduction
SAP SE is a European Company (Societas Europaea, or “SE”) and is referred to in this report, together with its subsidiaries, as SAP, or as “Company,” “Group,” “we,” “our,” or “us.”
In this report: (i) references to “US$,” “$,” or “dollars” are to U.S. dollars; (ii) references to ‘‘€” or “euro” are to the euro. Our financial statements are denominated in euros, which is the currency of our home country, Germany. Certain amounts that appear in this report may not add up because of differences due to rounding. All numbers in SAP’s Consolidated Financial Statements IFRS are presented according to IFRS 5 (unless otherwise noted, figures are based on continuing operations). For more information, see Note D.1.
Unless otherwise specified herein, euro financial data have been converted into dollars at the noon buying rate in New York City for cable transfers in foreign currencies as certified for customs purposes by the Federal Reserve Bank of New York (the “Noon Buying Rate”) on December 31, 2024, which was 1.0351 EUR/USD. No representation is made that such euro amounts actually represent such dollar amounts or that such euro amounts could have been or can be converted into dollars at that or any other exchange rate on such date or on any other date. On February 7, 2025, the Noon Buying Rate for converting euro to dollars was US$1.03 per €1.00.
Unless the context otherwise requires, references in this report to ordinary shares are to SAP SE’s ordinary shares, without nominal value. References in this report to “ADRs” are to SAP SE’s American Depositary Receipts, each representing one SAP ordinary share. References in this report to “ADSs” are to SAP SE’s American Depositary Shares, which are the deposited securities evidenced by the ADRs.
SAP, Adaptive Server, Advantage Database Server, BusinessObjects, ExpenseIt, PartnerEdge, PowerBuilder, PowerDesigner, Replication Server, SAP Ariba, SAP BusinessObjects Explorer, SAP BW/4HANA, SAP Concur, SAP EarlyWatch, SAP Emarsys, SAP Fieldglass, SAP Fiori, SAP HANA, SAP Jam, SAP LeanIX, SAP Lumira, SAP S/4HANA, SAP SuccessFactors, SAP Vora, Sapphire, SAP Signavio, SQL Anywhere, Taulia, TripIt, TripLink, WalkMe, Web Intelligence and other SAP products and services mentioned herein as well as their respective logos are trademarks or registered trademarks of SAP SE (or an SAP affiliate company) in Germany and other countries.
Throughout this report, whenever a reference is made to our website, such reference does not incorporate by reference into this report the information contained on our website.
We intend to make this report and other periodic reports publicly available on our website (www.sap.com) without charge immediately following our filing with the U.S. Securities and Exchange Commission (SEC). Such reports are also available on the website maintained by the SEC (www.sec.gov). We assume no obligation to update or revise any part of this report, whether as a result of new information, future events or otherwise, unless we are required to do so by law.
Forward-Looking Statements
This report contains forward-looking statements and information based on the beliefs of, and assumptions made by, our management using information currently available to them. Any statements contained in this report that are not historical facts are forward-looking statements as defined in the U.S. Private Securities Litigation Reform Act of 1995. We have based these forward-looking statements on our current expectations, assumptions, and projections about future conditions and events. As a result, our forward-looking statements and information are subject to uncertainties and risks. A broad range of uncertainties and risks, many of which are beyond our control, could cause our actual results and performance to differ materially from any projections expressed in or implied by our forward-looking statements. The uncertainties and risks include, but are not limited to:
- |
Cybersecurity and Security: Cybersecurity attacks or breaches, and security vulnerabilities in our infrastructure or services or those of our third-party partners could materially impact our business operations, products and service delivery. |
- Technology and Products: Our technology and products may experience undetected defects, coding, or configuration errors, may not integrate as expected, or may not meet customer expectations.
- |
Ethical Behavior: Our global business exposes us to risks related to unethical behavior and non-compliance with policies by employees, other individuals, partners, third parties or entities associated with SAP. |
- International Laws and Regulations: Laws, regulatory requirements and standards in Germany, the United States, and elsewhere continue to be very stringent. Our international business activities and processes expose us to numerous and often conflicting laws and regulations, policies, standards, or other requirements and sometimes even conflicting regulatory requirements.
- |
Market Share and Profit: Our market share and profit could decline due to increased competition, market consolidation, technological innovation, and new business models in the software industry. |
- Global Economic and Political Environment: Uncertainty in the global economy and/or, financial markets, and social and political instability caused by state-based conflicts, terrorist attacks, civil unrest, war, or international hostilities could lead to disruptions in our business.
- Data Protection and Privacy: Non-compliance with increasingly complex and stringent, sometimes even conflicting, applicable data protection and privacy laws or failure to meet the contractual requirements of SAP’s customers with respect to our products and services could lead to civil liabilities and fines, as well as loss of customers.
- |
Cloud Operations: We may not be able to properly protect and safeguard our critical information and assets, business operations, cloud offerings and portfolio presentation, and related infrastructure against cyberattacks, insufficient infrastructure, disruption or deficient performance |
- Innovation: We might not be able to compete effectively if we strategize our solution portfolio ineffectively or if we are unable to keep up with rapid technological and product innovations, enhancements, new business models, and changing market expectations.
7
- Sales and Services: Sales and implementation of SAP software and services, including cloud, are subject to several significant risks sometimes beyond our direct control.
- |
Mergers and Acquisitions: We might not acquire, integrate ordivest companies effectively or successfully. |
- |
Legal and IP: Claims and lawsuits against us, such as for IP infringements, or our inability to obtain or maintain adequate licenses for third-party technology, or if we are unable to adequately protect or enforce our own intellectual property, may result in adverse outcomes. |
- Partner Ecosystem: If we are unable to scale, maintain, and enhance an effective partner ecosystem, revenue might not increase as expected.
We describe these and other risks and uncertainties in the Risk Factors section.
If one or more of these uncertainties or risks materializes, or if management’s underlying assumptions prove incorrect, our actual results could differ materially from those described in or inferred from our forward-looking statements and information.
The words “aim,” “anticipate,” “assume,” “believe,” “continue,” “could,” “counting on,” “is confident,” “development,” “estimate,” “expect,” “forecast,” “future trends,” “guidance,” “intend,” “may,” “might,” “outlook,” “plan,” “predict,” “project,” “seek,” “should,” “strategy,” “want,” “will,” “would,” and similar expressions as they relate to us are intended to identify such forward-looking statements. Such statements include, for example, those made in the Operating Results (IFRS) subsection; our quantitative and qualitative disclosures about market risk pursuant to the International Financial Reporting Standards (IFRS) accounting standards, namely IFRS 7 and related statements in our Notes to the Consolidated Financial Statements; Expected Developments and Risk Factors sections; and other forward-looking information appearing in other parts of this report.
To fully consider the factors that could affect our future financial results, both this report and our Annual Report should be considered, as well as all our other filings and furnishings with the U.S. Securities and Exchange Commission (SEC). Readers are cautioned not to place undue reliance on these forward-looking statements, which speak only as of the date specified or the date of this report. We undertake no obligation to publicly update or revise any forward-looking statements as a result of new information that we receive about conditions that existed upon issuance of this report, future events, or otherwise, unless we are required to do so by law.
This report includes statistical data about the IT industry and global economic trends that comes from information published by sources including International Data Corporation (IDC), McKinsey, the European Central Bank (ECB), and the International Monetary Fund (IMF). This type of data represents only the estimates of IDC, McKinsey, the ECB, the IMF, and other sources of industry data. SAP does not adopt or endorse any of the statistical information provided by sources such as IDC, McKinsey, the ECB, the IMF, or other similar sources that is contained in this report. The data from these sources is subject to risks and uncertainties, and subject to change based on various factors, including those described above, in the Risk Factors section, and elsewhere in this report. These and other factors could cause our results to differ materially from those expressed in the estimates made by third parties and SAP. We caution readers not to place undue reliance on this data.
Performance Management System
In the reporting year, we used various measures to manage our performance on our primary financial objectives, which are growth and profitability, and on our primary non-financial objectives, which are customer loyalty, employee engagement, climate performance, and Women in Executive Roles.
Measures to Manage Our Financial Performance
The following are the key measures we use to manage our operating and overall financial performance. Except for free cash flow, we report our key measures at both actual and constant currencies.
We use cloud revenue, cloud and software revenue, current cloud backlog (CCB), and total revenue to measure our progress toward our growth targets. Cloud revenue comprises the main revenues of our cloud business and is derived from fees earned from providing customers with software as a service (SaaS), platform as a service (PaaS), and infrastructure as a service (IaaS). Cloud and software revenue includes cloud revenue, software license revenue, and software support revenue. The vast majority of customers who purchase software licenses also enter into related support contracts with us that generate recurring support revenue after the software sale. Cloud revenue is our largest revenue stream, followed by software support revenue. For more information about our revenue measures, see the Notes to the Consolidated Financial Statements 2024, Note (A.1).
As of a specific key date, the CCB is the contractually committed cloud revenue we expect to recognize over the upcoming 12 months. It is therefore a subcomponent of our overall remaining performance obligations, as per IFRS 15.120. For our committed cloud business, we believe the CCB is a valuable indicator of our go-to-market success, as it reflects both new contracts won and existing contracts renewed.
To measure our profitability, we primarily use operating profit (non-IFRS) and free cash flow. Operating profit (non-IFRS) offers insight into our overall operational process efficiency and business performance, while free cash flow provides management with supplemental information for assessing our liquidity needs and position. Free cash flow is used to determine the cash flow remaining after all expenditures required to maintain or expand our organic business have been paid off. In the reporting year, we calculated free cash flow as net cash flows from operating activities adjusted for purchases (other than purchases made in connection with business combinations) of intangible assets and property, plant, and equipment, and for payments of lease liabilities.
8
Besides the key measures mentioned above, SAP also uses various supporting measures to offer further insight into our financial performance. These include Cloud ERP Suite revenue,1 total cloud backlog (TCB),2 share of more predictable revenue,3 cloud gross profit, and effective tax rate (non-IFRS).4 We report most of our supporting measures at both actual and constant currencies.
Measures to Manage Our Non-Financial Performance
The following are the key measures we used to manage our non-financial performance in the reporting year.
We assess customer loyalty annually by means of a survey that tracks our customer net promoter score (NPS). The customer NPS5 is determined based on the “likelihood to recommend” question with its proprietary scoring, expressed on a scale of 0–10. We use this measure because we believe that we can only achieve our financial goals if our customers are loyal to, and satisfied with, SAP and our solutions.
The Employee Engagement Index measures the satisfaction and commitment of our employees, how proud they are of our company, and how strongly they identify with SAP. Applying this measure is recognition that our growth strategy depends on having engaged employees. The index is expressed as a percentage of favorable responses to five questions in our #Unfiltered engagement survey and we report it as the average of the scores retrieved in each of the surveys we run in a fiscal year. The #Unfiltered program is based on a “continuous listening” approach that includes multiple data collections throughout the year. The average scores provide an assessment, for the full year, of our employees’ engagement level.
The Women in Executive Roles (WiER) metric measures the percentage of women in the top three management levels below the Executive Board, namely the Global Executive Level, the Senior Executive Level, and the Executive Level, compared to the total number of individuals across all genders in these levels (calculated in heads).SAP is committed to being an equal opportunity employer, ensuring everyone can thrive based on merit and skill, regardless of their diverse backgrounds. Our priority, with the help of this metric, is to monitor how the Company is progressing on this commitment, especially at the most senior levels of the organization.
The gross greenhouse gas emissions metric is used to measure greenhouse gas emissions along the value chain (Scope 1, Scope 2, and Scope 3 emissions relevant for SAP’s business model) as part of our net-zero commitment. We apply a market-based approach. Renewable energies, for example in the form of self-generated renewable electricity, investments in certified renewable energy certificates, long-term green electricity contracts (power purchase agreements), or renewable electricity purchased by our suppliers and customers can be counted toward the reduction of greenhouse gas emissions. We define, measure, and report our greenhouse gas emissions according to the Greenhouse Gas (GHG) Protocol (in millions of tons of CO2 equivalents). The reporting also fulfills ESRS requirements.
1 We use Cloud ERP Suite revenue as a metric to measure the growth of our portfolio of strategic cloud solutions. Cloud ERP Suite references those offerings that are tightly integrated with our core ERP solutions and are included in key commercial packages, such as RISE with SAP. The following offerings contribute to Cloud ERP Suite revenue: SAP S/4HANA Cloud, SAP Business Technology Platform, and core solutions for HR and payroll, spend management, commerce, customer data solutions, business process transformation, and working capital management.
2 As of a specific key date, the TCB is the total contractually committed cloud revenue we expect to recognize. Thus, TCB and CCB are both subcomponents of our overall remaining performance obligations following IFRS 15.120. For our committed cloud business, we believe that the TCB and the CCB are valuable indicators of our go-to-market success, as they reflect both new contracts won and existing contracts renewed. For more information on how we calculate these numbers, see the Notes to the Consolidated Financial Statements, Note (A.1).
3 The share of more predictable revenue is the total of cloud revenue and software support revenue divided by total revenue.
4 We define our effective tax rate as the ratio of income tax expense (non-IFRS) to profit before tax (non-IFRS), expressed as a percentage.
5 To derive the customer NPS, we start with the percentage of “promoters” of SAP, that is, those giving us a score of 9 or 10 on a scale of 0–10. We then subtract the percentage of “detractors,” that is, those giving us a score of 0–6. The method ignores “passives,” that is, those giving us a score of 7 or 8. Consequently, the range of achievable scores is –100 to +100, with the latter being the best achievable score for customer loyalty as measured by the customer NPS methodology.
9
Value-Based Management
Our holistic view of the performance measures described above, and the associated analyses, together form the foundation of our value-based management. We use planning and control processes to manage the compilation of these key measures and their availability to our decision-makers across various management levels.
SAP’s long-term strategic plans are the point of reference for our short- and medium-term planning and controlling processes. We initially identify future growth and profitability drivers at a highly aggregated level for the entire SAP Group. In a first step, the financial plan’s growth ambition is determined by the Group’s comprehensive product portfolio, which is grouped into solution areas for topline growth, with profitability drivers allocated to functions such as development, marketing, sales, delivery, and administration. In a second step, the planned total revenues and total expenses are generally allocated to the areas of functional responsibility of the individual members of the Executive Board (“Board area”). Budget adjustments may be applied during the year to reflect changes in priorities, to achieve efficiency targets, and to reflect endogenous and exogenous factors. These adjustments, and the assessment of performance, are handled at Board area level. It is then the individual Executive Board member’s responsibility to break down the allocated budget. In a final step, customer-facing revenue targets and cost-of-sales and marketing targets are broken down into sales regions and market units.
We use our detailed annual plans to determine the budget for the respective fiscal year. We also have processes in place to forecast revenue and profit on a quarterly basis, to quantify whether we expect to realize our financial targets, and to identify any deviations from plan. We continuously monitor the affected Board areas in the SAP Group to analyze their developments and define any appropriate actions. Our entire network of planning, control, and reporting processes is implemented in integrated planning and information systems, based on SAP software, across all organizational units so that we can conduct the evaluations and analyses needed to make informed decisions.
Non-IFRS Financial Measures Cited in This Report
Explanation of Non-IFRS Measures
We disclose certain financial measures that are not prepared in accordance with IFRS and are therefore considered non-IFRS financial measures. Our non-IFRS financial measures may not correspond to non-IFRS financial measures that other companies report. The non-IFRS financial measures that we report should only be considered in addition to, and not as substitutes for, nor as superior to, our IFRS financial measures.
We believe that the supplemental historical and prospective non-IFRS financial information we disclose is useful to investors because it is used by our management, in addition to financial data prepared in accordance with IFRS, to gain a more transparent understanding of our past performance and our anticipated future results.
We use the non-IFRS measures consistently in our internal planning and forecasting, reporting, and compensation, as well as in our external communications, as follows:
- Our management primarily uses the non-IFRS measures, rather than the IFRS measures, as the basis for making financial, strategic, and operating decisions.
- |
The variable components of our Executive Board members’ and employees’ remuneration are based on non-IFRS numbers such as operating profit (non-IFRS) and operating margin (non-IFRS) rather than on the respective IFRS measures. An additional variable component used is CCB. |
- The annual budgeting process for all management units is based on operating profit (non-IFRS) numbers rather than the respective IFRS financial measure.
- All forecast and performance reviews with all senior managers globally are based on the non-IFRS measures, rather than the respective IFRS financial measures.
- Our internal performance targets and the guidance we provide to the capital markets are based on profit (non-IFRS) measures rather than the respective IFRS financial measures.
Our non-IFRS financial measures reflect adjustments based on the items below, as well as adjustments for the related income tax effects.
Operating Expense (Non-IFRS)
Numbers that are identified as operating expenses (non-IFRS) have been adjusted by excluding the following expenses:
- Acquisition-related charges
| ■ | Amortization expense/impairment charges for intangibles acquired in business combinations, including goodwill, and certain stand-alone acquisitions of intellectual property (including purchased in-process research and development) |
| ■ | Settlements of preexisting business relationships in connection with a business combination |
| ■ | Acquisition-related third-party expenses |
- Restructuring expenses in accordance with IFRS
- Expenses for regulatory compliance matters associated with the provision for (potential) penalties arising from certain ongoing governmental investigations into our business operations, which are described in the Notes to the Consolidated Financial Statements 2024, Note (G.3), and are limited to the scope of IAS 37.
10
We exclude certain acquisition-related expenses for the purpose of calculating operating profit (non-IFRS) and operating margin (non-IFRS) when evaluating SAP’s continuing operational performance, because these expenses generally cannot be changed or influenced by management after the relevant acquisition other than by disposing of the acquired assets. Since management at levels below the Executive Board does not influence these expenses, we generally do not consider these expenses for the purpose of evaluating the performance of management units. We also exclude restructuring expenses because they are volatile and generally cannot be influenced by management at levels below the Executive Board. Furthermore, we exclude expenses for regulatory compliance matters (as these expenses are non-recurring and relate to conduct that took place in prior performance periods) so that users of our consolidated financial statements and the Combined Management Report can see the information that our management uses to manage the business.
Non-Operating Income, Net (Non-IFRS)
Numbers that are identified as non-operating income, net (non-IFRS) have been adjusted by excluding the following effects:
- Acquisition-related charges
| ■ | Net disposal gains and losses arising from the sale of intangibles acquired in business combinations |
Consistent with the adjustments we make to our operating expenses (non-IFRS) by excluding amortization expenses and impairment charges for intangibles acquired in business combinations, we adjust our non-operating income, net (non-IFRS) by excluding disposal gains and losses arising from the sale of these intangibles. These net disposal gains and losses are not indicative of SAP’s operations. We believe that by excluding these gains and losses we improve our period-over-period comparability.
Financial Income, Net (Non-IFRS)
Numbers that are identified as financial income, net (non-IFRS) have been adjusted by excluding the following gains and losses:
- Gains and losses from equity securities, net
| ■ | Includes realized and unrealized effects from the disposal of equity securities, ongoing mark-to-market adjustments on marketable equity investments, changes in fair value of non-marketable equity securities, and others. |
Excluding gains and losses from equity securities, net, improves the period-over-period comparability by reducing volatility caused by share price fluctuation, market developments, and other factors beyond our control.
Effective Tax Rate (Non-IFRS)
The effective tax rate (non-IFRS) is presented for supplemental informational purposes only. We do not provide an outlook for the effective tax rate (IFRS) due to the uncertainty and potential variability of gains and losses associated with equity investments, which are reconciling items between the two effective tax rates (non-IFRS and IFRS). These items cannot be provided without unreasonable efforts, but they could have a significant impact on our future effective tax rate (IFRS).
Constant Currencies Information
We believe it is important for investors to have information that provides insight into the development of our sales. Revenue measures determined under IFRS provide information that is useful in this regard. However, both sales volume and currency effects impact period-over-period changes in sales revenue. We do not sell standardized units of products and services so we cannot provide relevant information on sales volume by providing data on the changes in product and service units sold. To provide additional information that may be useful to investors in breaking down and evaluating changes in sales volume, we present information about our revenue and about various values and components relating to operating profit that are adjusted for foreign currency effects. We calculate constant currency measures by translating foreign currencies using the average exchange rates from the comparative period instead of the current period. Constant currency values for our current cloud backlog and total cloud backlog measures use the closing exchange rate from the previous year’s corresponding key date instead of the average exchange rate.
Free Cash Flow
Among other measures, we use free cash flow to manage our overall financial performance. We define free cash flow as net cash from operating activities adjusted for purchases of intangible assets and property, plant, and equipment, and for payments of lease liabilities.
11
Starting in 2025, our definition of free cash flow will be updated to include proceeds from the sale of intangible assets and property, plant, and equipment, which better reflects the way our management evaluates the remaining cash flow generated by our operating activities after investments into long-term assets and leasing. Further impacting our free cash flow, starting 2025, we will no longer include interest paid and interest received in net cash flows from operating activities. Interest paid will be presented under cash flows from financing activities, and interest received under cash flows from investing activities. Had these changes been applied in the reporting year, SAP’s free cash flow would have been €4,222 million (2023: €5,116 million)6.
Usefulness of Non-IFRS Measures
We believe that our non-IFRS measures are useful to investors for the following reasons:
- Our non-IFRS measures provide investors with insight into management’s decision-making because management uses these measures to run our business and make financial, strategic, and operating decisions. We exclude the expense adjustments outlined above when making decisions to allocate resources. In addition, we use these non-IFRS measures to facilitate comparisons of SAP’s operating performance from period to period.
- The non-IFRS measures provide investors with additional information that enables a comparison of year-over-year operating and non-operating performance by excluding certain direct effects of acquisitions, restructuring plans, regulatory compliance matters, and gains and losses from equity securities, net.
- Non-IFRS and non-GAAP (Generally Accepted Accounting Principles) measures are widely used in the software industry. In many cases, our non-IFRS measures may facilitate comparisons with our competitors’ corresponding non-IFRS and non-GAAP measures.
Limitations of Non-IFRS Measures
Without being analyzed in conjunction with the corresponding IFRS measures, the non-IFRS measures are not indicative of our present and future performance primarily for the following reasons:
| - | While our profit (non-IFRS) numbers reflect the elimination of certain acquisition-related expenses, no eliminations are made for the additional revenue or other income that results from the acquisitions. |
| - | The acquisition-related amortization expense that we eliminate in deriving our profit (non-IFRS) numbers is a recurring expense that will impact our financial performance in future years. |
| - | The remaining acquisition-related charges that we eliminate in deriving our profit (non-IFRS) numbers are likely to recur if SAP enters into business combinations in the future. Similarly, the restructuring expenses that we eliminate in deriving our profit (non-IFRS) numbers are likely to recur if SAP performs restructurings in the future. |
| - | The expense adjustment for acquisition-related charges does not arise from a common conceptual basis. This is because the expense adjustment aims to improve comparability between post-acquisition periods and pre-acquisition periods. This should particularly be considered when evaluating our operating profit (non-IFRS) and operating margin (non-IFRS) numbers, as these combine our revenue and expenses (non-IFRS) despite the absence of a common conceptual basis. |
| - | Our restructuring charges and the realized net gains from equity securities resulted in significant cash outflows in the past and could do so in the future. |
| - | Expenses ascribed to regulatory compliance matters may include penalties and legal costs, all of which would impact the operating cash flows of the business. |
| - | The gains and losses from equity securities, net, that we eliminate in deriving our financial income, net (non-IFRS) numbers are recurring effects that have impacted our financial performance in the past and will do so in the future. Similarly, the acquisition-related effects related to the sale of intangibles arising from business combinations that we eliminate in deriving our non-operating income, net (non-IFRS) have impacted our financial performance in the past and could do so in the future. |
We believe that constant currency measures have limitations, particularly as the currency effects that are eliminated constitute a significant element of our revenue and expenses and could materially impact our performance.We therefore limit our use of constant currency measures to the analysis of changes in volume as one element of the full change in a financial measure. We do not evaluate our results and performance without considering operating profit (non-IFRS) at both nominal and constant currencies on the one hand, and changes in operating expenses, operating profit, or other measures of financial performance prepared in accordance with IFRS on the other. We caution the readers of our financial reports to follow a similar approach by considering actual and constant currency non-IFRS measures only in addition to, and not as a substitute for,nor as superior to, changes in revenue, operating expenses, operating profit, or other measures of financial performance prepared in accordance with IFRS.
Despite these limitations, we believe that the presentation of our non-IFRS measures and the corresponding IFRS measures, together with the relevant reconciliations, provides useful information to management and investors about present and future business trends relating to our financial condition and results of operations.
6 In the reporting year, free cash flow was €4,113 million (2023: €5,093 million). Under our revised definition, which applies from 2025, free cash flow would have been €4,222 million (2023: €5,116 million). The revised definition excludes the net impact of interest paid and received (2024: €13 million, 2023: €76 million) and includes the proceeds from the sale of intangible assets and property, plant, and equipment (2024: €122 million, 2023: €99 million).
12
Reconciliation of IFRS to Non-IFRS Financial Measures for 2024 and 2023
Reconciliation of Non-IFRS Revenue
€ millions, unless otherwise stated |
|
2024 |
|
2023 |
||||
|
|
IFRS |
|
Currency |
|
Non-IFRS |
|
IFRS |
|
|
|
|
Impact |
|
Constant |
|
|
|
|
|
|
|
|
Currency |
|
|
Revenue Numbers |
|
|
|
|
|
|
|
|
Cloud |
|
17,141 |
|
72 |
|
17,212 |
|
13,664 |
Software licenses |
|
1,399 |
|
1 |
|
1,400 |
|
1,764 |
Software support |
|
11,290 |
|
53 |
|
11,343 |
|
11,496 |
Software licenses and support |
|
12,689 |
|
54 |
|
12,743 |
|
13,261 |
Cloud and software |
|
29,830 |
|
126 |
|
29,955 |
|
26,924 |
Services |
|
4,346 |
|
9 |
|
4,355 |
|
4,283 |
Total revenue |
|
34,176 |
|
135 |
|
34,310 |
|
31,207 |
Reconciliation of Non-IFRS Operating Expenses
€ millions, unless otherwise stated |
|
2024 |
|
2023 |
||||||||||||
|
|
IFRS |
|
Adj. |
|
Non-IFRS |
|
Currency |
|
Non-IFRS |
|
IFRS |
|
Adj. |
|
Non-IFRS |
|
|
|
|
|
|
|
|
Impact |
|
Constant |
|
|
|
|
|
|
Operating Expense Numbers |
|
|
|
|
|
|
|
|
|
Currency |
|
|
|
|
|
|
Cost of cloud |
|
-4,660 |
|
78 |
|
-4,582 |
|
|
|
|
|
-3,884 |
|
42 |
|
-3,842 |
Cost of software licenses and support |
|
-1,262 |
|
0 |
|
-1,262 |
|
|
|
|
|
-1,383 |
|
26 |
|
-1,356 |
Cost of cloud and software |
|
-5,922 |
|
78 |
|
-5,844 |
|
|
|
|
|
-5,267 |
|
68 |
|
-5,199 |
Cost of services |
|
-3,321 |
|
1 |
|
-3,321 |
|
|
|
|
|
-3,407 |
|
2 |
|
-3,405 |
Total cost of revenue |
|
-9,243 |
|
79 |
|
-9,165 |
|
|
|
|
|
-8,674 |
|
70 |
|
-8,604 |
Gross profit |
|
24,932 |
|
79 |
|
25,011 |
|
112 |
|
25,124 |
|
22,534 |
|
70 |
|
22,603 |
Research and development |
|
-6,514 |
|
5 |
|
-6,508 |
|
|
|
|
|
-6,324 |
|
7 |
|
-6,316 |
Sales and marketing |
|
-9,090 |
|
234 |
|
-8,856 |
|
|
|
|
|
-8,828 |
|
412 |
|
-8,415 |
General and administration |
|
-1,435 |
|
27 |
|
-1,409 |
|
|
|
|
|
-1,364 |
|
11 |
|
-1,354 |
Restructuring |
|
-3,144 |
|
3,144 |
|
0 |
|
|
|
|
|
-215 |
|
215 |
|
0 |
Other operating income/expense, net |
|
-85 |
|
0 |
|
-85 |
|
|
|
|
|
-4 |
|
0 |
|
-4 |
Total operating expenses |
|
-29,511 |
|
3,489 |
|
-26,022 |
|
-56 |
|
-26,079 |
|
-25,408 |
|
715 |
|
-24,693 |
13
Reconciliation of Non-IFRS Profit Numbers, Income Tax Expense, and Key Ratios
€ millions, unless otherwise stated |
|
2024 |
|
2023 |
||||||||||||
|
|
IFRS |
|
Adj. |
|
Non-IFRS |
|
Currency |
|
Non-IFRS |
|
IFRS |
|
Adj. |
|
Non-IFRS |
|
|
|
|
|
|
|
|
Impact |
|
Constant |
|
|
|
|
|
|
Profit Numbers |
|
|
|
|
|
|
|
|
|
Currency |
|
|
|
|
|
|
Operating profit (loss) |
|
4,665 |
|
3,489 |
|
8,153 |
|
78 |
|
8,232 |
|
5,799 |
|
715 |
|
6,514 |
Other non-operating income/expense, net |
|
-298 |
|
0 |
|
-298 |
|
|
|
|
|
-3 |
|
0 |
|
-3 |
Finance income |
|
1,429 |
|
-777 |
|
652 |
|
|
|
|
|
857 |
|
-380 |
|
477 |
Finance costs |
|
-1,031 |
|
316 |
|
-715 |
|
|
|
|
|
-1,313 |
|
525 |
|
-788 |
Financial income, net |
|
398 |
|
-461 |
|
-63 |
|
|
|
|
|
-456 |
|
145 |
|
-311 |
Profit (loss) before tax from continuing operations |
|
4,764 |
|
3,028 |
|
7,792 |
|
|
|
|
|
5,341 |
|
860 |
|
6,201 |
Income tax expense |
|
-1,614 |
|
-899 |
|
-2,513 |
|
|
|
|
|
-1,741 |
|
-139 |
|
-1,880 |
Profit (loss) after tax from continuing operations |
|
3,150 |
|
2,129 |
|
5,279 |
|
|
|
|
|
3,600 |
|
721 |
|
4,321 |
Attributable to owners of parent |
|
3,124 |
|
2,162 |
|
5,286 |
|
|
|
|
|
3,634 |
|
704 |
|
4,338 |
Attributable to non-controlling interests |
|
26 |
|
-33 |
|
-7 |
|
|
|
|
|
-33 |
|
16 |
|
-17 |
Profit (loss) after tax1 |
|
3,150 |
|
2,129 |
|
5,279 |
|
|
|
|
|
5,964 |
|
139 |
|
6,103 |
Attributable to owners of parent1 |
|
3,124 |
|
2,162 |
|
5,286 |
|
|
|
|
|
6,139 |
|
297 |
|
6,436 |
Attributable to non-controlling interests1 |
|
26 |
|
-33 |
|
-7 |
|
|
|
|
|
-175 |
|
-158 |
|
-333 |
|
|
|
|
|
|
|
|
|
|
|
|
|
|
|
|
|
Key Ratios |
|
|
|
|
|
|
|
|
|
|
|
|
|
|
|
|
Operating margin (in %) |
|
13.6 |
|
|
|
23.9 |
|
|
|
24.0 |
|
18.6 |
|
|
|
20.9 |
Effective tax rate (in %) |
|
33.9 |
|
|
|
32.3 |
|
|
|
|
|
32.6 |
|
|
|
30.3 |
Earnings per share, basic (in €) from continuing operations |
|
2.68 |
|
|
|
4.53 |
|
|
|
|
|
3.11 |
|
|
|
3.72 |
Earnings per share, basic (in €)1 |
|
2.68 |
|
|
|
4.53 |
|
|
|
|
|
5.26 |
|
|
|
5.51 |
1 From continuing and discontinued operations.
Reconciliation of Operating Cash Flow from Continuing Operations to Free Cash Flow
€ millions |
|
2024 |
|
2023 |
Net cash flows from operating activities – continuing operations |
|
5,220 |
|
6,210 |
Purchase of intangible assets and property, plant, and equipment |
|
-797 |
|
-785 |
Payments of lease liabilities |
|
-310 |
|
-332 |
Free cash flow |
|
4,113 |
|
5,093 |
|
|
|
|
|
Net cash flows from investing activities – continuing operations |
|
-656 |
|
-4,603 |
Net cash flows from financing activities – continuing operations |
|
-3,412 |
|
-7,758 |
Non-IFRS Operating Expense Adjustments by Functional Areas
|
|
|
|
|
|
|
|
|
|
|
|
|
|
|
|
|
|
|
|
|
€ millions |
|
2024 |
|
2023 |
||||||||||||||||
|
|
IFRS |
|
Acquisition- |
|
Restructuring |
|
RCM1 |
|
Non-IFRS |
|
IFRS |
|
Acquisition- |
|
Restructuring |
|
RCM1 |
|
Non-IFRS |
|
|
|
|
Related |
|
|
|
|
|
|
|
|
|
Related |
|
|
|
|
|
|
Cost of cloud |
|
-4,660 |
|
78 |
|
0 |
|
0 |
|
-4,582 |
|
-3,884 |
|
42 |
|
0 |
|
0 |
|
-3,842 |
Cost of software licenses and support |
|
-1,262 |
|
0 |
|
0 |
|
0 |
|
-1,262 |
|
-1,383 |
|
26 |
|
0 |
|
0 |
|
-1,356 |
Cost of services |
|
-3,321 |
|
1 |
|
0 |
|
0 |
|
-3,321 |
|
-3,407 |
|
2 |
|
0 |
|
0 |
|
-3,405 |
Research and development |
|
-6,514 |
|
5 |
|
0 |
|
0 |
|
-6,508 |
|
-6,324 |
|
7 |
|
0 |
|
0 |
|
-6,316 |
Sales and marketing |
|
-9,090 |
|
255 |
|
0 |
|
-22 |
|
-8,856 |
|
-8,828 |
|
257 |
|
0 |
|
155 |
|
-8,415 |
General and administration |
|
-1,435 |
|
16 |
|
0 |
|
11 |
|
-1,409 |
|
-1,364 |
|
11 |
|
0 |
|
0 |
|
-1,354 |
Restructuring |
|
-3,144 |
|
0 |
|
3,144 |
|
0 |
|
0 |
|
-215 |
|
0 |
|
215 |
|
0 |
|
0 |
Other operating income/expense, net |
|
-85 |
|
0 |
|
0 |
|
0 |
|
-85 |
|
-4 |
|
0 |
|
0 |
|
0 |
|
-4 |
Total operating expenses |
|
-29,511 |
|
356 |
|
3,144 |
|
-11 |
|
-26,022 |
|
-25,408 |
|
345 |
|
215 |
|
155 |
|
-24,693 |
1 Regulatory compliance matters.
14
PART I
ITEM 1. IDENTITY OF DIRECTORS, SENIOR MANAGEMENT AND ADVISERS
Not applicable.
ITEM 2. OFFER STATISTICS AND EXPECTED TIMETABLE
Not applicable.
ITEM 3. KEY INFORMATION
Exchange Rates
The sales prices for our ordinary shares traded on German stock exchanges are denominated in euro. Fluctuations in the exchange rate between the euro and the U.S. dollar affect the dollar equivalent of the euro price of the ordinary shares traded on the German stock exchanges and, as a result, may affect the price of the ADRs traded on the New York Stock Exchange (NYSE) in the United States. See “Item 9. The Offer and Listing” for a description of the ADRs. In addition, SAP SE pays cash dividends, if any, in euro. As a result, any exchange rate fluctuations will also affect the dollar amounts received by the holders of ADRs on the conversion into dollars of cash dividends paid in euro on the ordinary shares represented by the ADRs. Deutsche Bank Trust Company Americas is the depositary (the Depositary) for SAP SE’s ADR program. The deposit agreement with respect to the ADRs requires the Depositary to convert any dividend payments from euro into dollars as promptly as practicable upon receipt. For additional information on the Depositary and the fees associated with SAP’s ADR program see “Item 12. Description of Securities Other Than Equity Securities — American Depositary Shares.”
For details on the impact of exchange rate fluctuations see “Item 5. Operating and Financial Review and Prospects — Foreign Currency Exchange Rate Exposure”.
Dividends
Dividend Distribution Policy
Dividends are jointly proposed by SAP SE’s Supervisory Board (Aufsichtsrat) and Executive Board (Vorstand) based on SAP SE’s year-end stand-alone statutory financial statements, subject to approval by the Annual General Meeting of Shareholders. Dividends are officially declared for the prior year at SAP SE’s Annual General Meeting of Shareholders. SAP SE’s Annual General Meeting of Shareholders usually convenes during the second quarter of each year. Following joint market standards in Europe for corporate actions processing, dividends are remitted to the custodian bank on behalf of the shareholders on the third business day following the Annual General Meeting of Shareholders. Record holders of the ADRs on the dividend record date will be entitled to receive payment of the dividend declared in respect of the year for which it is declared. Cash dividends payable to such holders will be paid to the Depositary in euro and, subject to certain exceptions, will be converted by the Depositary into U.S. dollars.
Dividends paid to holders of the ADRs may be subject to German withholding tax. See “Item 10. Additional Information — Taxation,” for further information.
15
Annual Dividends Paid and Proposed
The following table sets forth in euro the annual dividends paid or proposed to be paid per ordinary share in respect of each of the years indicated. One SAP ADR currently represents one SAP SE ordinary share. Accordingly, the final dividend per ADR is equal to the dividend for one SAP SE ordinary share and is dependent on the euro/U.S. dollar exchange rate. The table does not reflect tax credits that may be available to German taxpayers who receive dividend payments. If you own our ordinary shares or ADRs and if you are a U.S. resident, refer to “Item 10. Additional Information — Taxation,” for further information.
|
|
Dividend Paid per Ordinary Share |
|
||
Year Ended December 31, |
|
€ |
|
US$ |
|
2020 |
|
1.85 |
|
2.26 |
1 |
2021 |
|
2.45 |
4 |
2.61 |
1 |
2022 |
|
2.05 |
|
2.23 |
1 |
2023 |
|
2.20 |
|
2.37 |
1 |
2024 (proposed) |
|
2.35 |
2 |
2.43 |
2, 3 |
1 Translated for the convenience of the reader from euro into U.S. dollars at the Noon Buying Rate for converting euro into U.S. dollars on the dividend payment date. The Depositary is required to convert any dividend payments received from SAP as promptly as practicable upon receipt.
2 Subject to approval at the Annual General Meeting of Shareholders of SAP SE currently scheduled to be held on May 13, 2025.
3 Translated for the convenience of the reader from euro into U.S. dollars at the Noon Buying Rate for converting euro into U.S. dollars on February 7, 2025 of US$1.03 per €1.00. The dividend paid may differ due to changes in the exchange rate.
4 Includes special increase of €0.50 to celebrate SAP's 50th anniversary.
The amount of dividends paid on the ordinary shares depends on the amount of non - IFRS profits to be distributed by SAP SE, which depends in part upon our financial performance. The Executive Board and the Supervisory Board of SAP SE will recommend to the Annual General Meeting of Shareholders in May 2025 that the total dividend be €2,35 per share. In addition, the amount of dividends received by holders of ADRs may be affected by fluctuations in exchange rates (see “Item 3. Key Information — Exchange Rates”). The timing, declaration, amount and payment of any future dividend will depend upon our future earnings, capital needs and other relevant factors, in each case as proposed by the Executive Board and the Supervisory Board of SAP SE and approved by the Annual General Meeting of Shareholders.
16
Risk Factors
Our operations and financial results are subject to various risks and uncertainties, including those described below, that could adversely affect our business, financial condition, results of operations, cash flows, and the trading price of our ADRs and ordinary shares.
Economic, Political, Social, and Regulatory Risks
Global Economic and Political Environment: Uncertainty in the global economy and/or financial markets, and social and political instability caused by state-based conflicts, terrorist attacks, civil unrest, war, or international hostilities could lead to disruptions in our business.
As a global company, we are influenced by multiple external factors that are difficult to predict, may develop quickly, and are beyond our influence and control. These include, among others: crises affecting credit or liquidity markets; regional or global recessions; sharp fluctuations in commodity prices, currency exchange rates or interest rates; inflation or deflation; sovereign debt and bank debt rating downgrades; restructurings or defaults; adverse geopolitical events (such as Russia’s invasion of Ukraine and the Israel - Hamas conflict); rising military tensions around the world (such as the China-Taiwan tensions) and in particular within Europe’s borders; global policy including in the United States, the European Union (EU), Russia, and China; and global pandemic diseases such as COVID-19.
Any of these events could have an adverse effect on our reputation, business, competitive or financial position, profit, and cash flows.
International Laws and Regulations: Laws, regulatory requirements and standards in Germany, the United States, and elsewhere continue to be very stringent. Our international business activities and processes expose us to numerous and often conflicting laws and regulations, policies, standards, or other requirements, and sometimes even conflicting regulatory requirements.
The SAP Group has a global presence and operates in most countries of the world. As a European company domiciled in Germany with securities listed in Germany and the United States, we are subject to European, German, U.S., and other governance-related regulatory requirements of the countries we operate in.
Our business is subject to numerous risks inherent to international business operations and associated consequences, such as changes in tax laws, changes in external reporting standards, and the interpretation of the complex tax rules in certain countries, including but not limited to conflict and overlap among tax regimes as well as the introduction of new tax concepts that harm digitalized business models; discriminatory, protectionist, or conflicting fiscal policies and tax laws; import and export regulations and trade sanctions; counter or even conflicting sanctions; embargoes, including but not limited to country-specific software certification requirements; and newly emerging cybersecurity and environmental, social, and governance (ESG) compliance and disclosure laws.
As we expand into new countries and markets or extend our business activities in these markets, including emerging and high-risk markets, these risks could intensify. The application of the respective local laws and regulations to our business is sometimes unclear, subject to change over time, and often conflicting among jurisdictions. Additionally, these laws and government approaches to enforcement continue to change and evolve, just as our products and services continually evolve. Compliance with these varying laws and regulations (including, and in particular, global anti-trust regulations) could involve significant costs or require changes in our products or business practices. Non-compliance could result in the imposition of penalties or cessation of orders due to alleged non-compliant activity. Governmental authorities could use considerable discretion in applying these statutes and any imposition of sanctions against us could be material.
Any of these events could have a material adverse effect on our operations globally or in one or more countries or regions, which could have a material adverse effect on our business, financial position, profit, and cash flows.
Legal and IP: Claims and lawsuits against us, such as for IP infringements or breaches of contract, or our inability to obtain or maintain adequate licenses for third-party technology, or if we are unable to protect or enforce our own intellectual property, may result in adverse outcomes.
We have in the past, and believe that we will continue to be subject to, claims and lawsuits, including intellectual property infringement claims, as our solution portfolio grows; as we acquire companies with increased use of third-party code including open source code; as we expand into new industries with our offerings, resulting in greater overlap in the functional scope of offerings; and as non-practicing entities that do not design, manufacture, or distribute products assert intellectual property infringement claims.
Moreover, protecting and defending our intellectual property is crucial to our success. The outcome of litigation and other claims or lawsuits is intrinsically uncertain.
17
We are subject to risks and associated consequences in the following areas, among others: dependency in the aggregate on third-party technology, including cloud and Web services, that we embed in our products or that we resell to our customers; integration of open source software components from third parties into our software and the implications derived from it; inability to prevent third parties from obtaining, using, or selling without authorization what we regard as our proprietary technology and information; and the possibility that third parties might reverse-engineer or otherwise obtain and use technology and information that we regard as proprietary. Moreover, the laws and courts of certain countries might not offer effective means to enforce our legal or intellectual property rights. Finally, SAP might face significant adverse rulings in commercial disputes, or might not be able to collect or otherwise enforce all judgments awarded to it in legal proceedings. The outcome of litigation and other claims or lawsuits is intrinsically uncertain. Management’s view of the litigation might also change in the future. Actual outcomes of litigation and other claims or lawsuits could differ from the assessments made by management in prior periods, which are the basis for our accounting for these litigations and claims under IFRS.
Any of these events could have a material adverse effect on our reputation, business, competitive or financial position, profit, or cash flows.
Data Protection and Privacy: Non-compliance with increasingly complex and stringent, sometimes even conflicting, applicable data protection and privacy laws, or failure to meet the contractual requirements of SAP’s customers with respect to our products and services, could lead to civil liabilities and fines, as well as loss of customers.
As a global software and service provider, SAP is required to comply with local laws wherever it does business. One of the relevant European data protection laws is the General Data Protection Regulation. International data transfers to third countries that do not provide for an adequate level of data protection require additional safeguards, including transfer risk assessments, to justify a transfer from the EU to a third country under the new EU standard contractual clauses. In addition, other countries establish safeguards to justify data transfers to further countries, by implementing their own standard contractual clauses.
Furthermore, data protection and privacy laws, regulations, and other standards around the world are evolving to better protect individuals’ personal information when it comes to marketing activities and to tracking online behavior. Examples include the EU’s Data Act, Digital Services Act, AI Act, and e-Privacy Directive, the Turkish Personal Data Protection Law, China’s Personal Information Protection Law, and Saudi Arabia’s Personal Data Protection Law, which also imposes requirements regarding data localization. This may impose additional burdens for SAP due to increasing compliance standards that could restrict the use and adoption of SAP’s products and services (particularly cloud services) and make it more challenging and complex to meet customer expectations. These changing criteria also impact the compliant use of new technology, such as machine learning and Artificial Intelligence for product development and deployment of intelligent applications.
Non-compliance with applicable data protection and privacy laws by SAP or any of the subprocessors engaged by SAP while processing personal data could lead to risks. These include, among others: mandatory disclosure of breaches to affected individuals, customers, and data protection supervisory authorities; investigations and administrative measures by data protection supervisory authorities, such as the instruction to alter or stop non-compliant data processing activities, including the instruction to stop using non-compliant subprocessors; or the possibility of damage claims by customers and individuals, contract terminations, and potential fines.
In addition, the German Federal Office for the Protection of the Constitution and security industry experts continue to warn of risks related to a globally growing number of cybersecurity attacks aimed at obtaining or violating company data including personal data.
Any of these events could have a material adverse effect on our reputation, business, financial performance, competitive or financial position, revenue, profit, and cash flows.
Corporate Governance and Compliance Risks
Ethical Behavior: Our global business exposes us to risks related to unethical behavior and non-compliance with policies by employees, other individuals, partners, third parties, or entities associated with SAP.
SAP’s leadership position in the global market is founded on the long-term and sustainable trust of our stakeholders worldwide. Our overarching approach is one of corporate transparency, open communication with financial markets, regulators, and authorities, and adherence to recognized standards of business integrity. This commitment to recognized standards of business integrity is formalized in SAP’s Global Code of Ethical Business Conduct (CoEBC) and supporting guidelines.
We are subject to risks and associated consequences in the following areas, among others: non-compliance with our policies; violation of compliance-related rules, regulations, and legal requirements including, but not limited to, antitrust, anticorruption, and antibribery legislation in Germany, the U.S. Foreign Corrupt Practices Act, the UK Bribery Act, and other applicable laws; collusion with external third parties; fraud and corruption; public sector transactions in territories exposed to a high risk of corruption; or increased exposure and impact on business activities in highly regulated industries, all of which may lead to civil or criminal charges, fines, or claims by affected parties as well as reputational damage.
In recent years, SAP’s Office of Ethics & Compliance (OEC), together with the assistance of an external law firm, investigated non-compliance with SAP’s policies and procedures or applicable laws. These investigations culminated in January 2024 in settlement agreements with the U.S. Securities and Exchange Commission (U.S. SEC) and the U.S. Department of Justice (U.S. DOJ), as well as with authorities in South Africa. During the investigations, SAP fully cooperated with law enforcement authorities and took immediate steps to discipline the employees involved, including terminating the employment of all those implicated in potential law violations. Since these allegations were first made, SAP has also significantly strengthened its compliance program and related internal controls in accordance with DOJ and regulatory expectations and requirements. Separately, in December 2024, SAP’s Brazilian subsidiary reached a settlement with the Office of the Comptroller General of the State of Minas Gerais (CGE) and the State of Minas Gerais Public Prosecutor’s Office (MPMG) in Brazil. SAP fully cooperated with the CGE and MPMG, applied appropriate consequence management, and enhanced its compliance program.
18
Any of these events could have a material adverse effect on our reputation, business, competitive or financial position, profit, or cash flows.
Operational Business Risks
Sales and Services: Sales and implementation of SAP software and services, including cloud, are subject to several significant risks sometimes beyond our direct control.
A core element of our business is the successful implementation of software and service solutions. The implementation of SAP software and cloud-based service deliveries is led by SAP, by partners, by customers, or by a combination thereof.
We are subject to risks and associated consequences in the following areas, among others: implementation risks caused by insufficient or incorrect information provided by customers, insufficient customer expectation management, including scope, integration capabilities and aspects, and a lack of purposeful selection, implementation, or utilization of SAP solutions; a lack of customer commitments and respective engagements; challenges to achieve a seamlessly integrated, sufficiently automated and aligned service delivery; unrenderable services committed during the sales stage; inadequate contracting and consumption models based on subscription models for services, support, and application management; deviations from standard terms and conditions; or statements concerning solution developments that might be misperceived by customers as commitments on future software functionalities.
Any of these events could have an adverse effect on our reputation, business, competitive or financial position, profit, and cash flows.
Partner Ecosystem: If we are unable to scale, maintain, and enhance an effective partner ecosystem, revenue might not increase as expected.
An open and vibrant partner ecosystem is a fundamental pillar of our success and growth strategy. We have entered into partnership agreements that drive co-innovation on our platforms, profitably expand our routes to market to optimize market coverage, optimize cloud delivery, and provide high-quality services capacity in all market segments. Partners play a key role in driving market adoption of our entire solutions portfolio, by co-innovating on our platforms, embedding our technology, and reselling or implementing our software.
We are subject to risks and associated consequences in the following areas, among others: failure to establish and enable a network of qualified and fully committed partners; failure of partners to develop sufficient innovative solutions and content on our platforms or to provide high-quality products or services to meet customer expectations; failure of partners to embed our solutions sufficiently enough to profitably drive product adoption; failure of partners to adhere to applicable legal and compliance regulations; failure of partners to transform their business model in accordance with the transformation of SAP’s business model in a timely manner; and failure of partners to comply with contract terms in embargoed or high-risk countries.
If any of these risks materialize, this might adversely affect the demand for our products and services as well as the partner’s loyalty and ability to deliver. As a result, we might not be able to scale our business to compete successfully with other vendors, which could have an adverse effect on our reputation, business, competitive or financial position, profit, and cash flows.
Cloud Operations: We may not be able to properly protect and safeguard our critical information and assets, business operations, cloud offerings and portfolio presentation, and related infrastructure against cyberattacks, insufficient infrastructure, disruption, or deficient performance.
SAP is highly dependent on the availability, integrity, and reliability of our infrastructure, including infrastructure provided by third-party business partners, and the software used in our cloud portfolio is inherently complex. Customers using our cloud services rely on the security of our infrastructure to protect the availability of our services and the data that they store on our infrastructure. Threat actors are focused on attacking third-party product and service providers, such as SAP, as a means of compromising our and our downstream customers’ systems and data.
We are subject to risks and associated consequences in the following areas, among others: the cloud portfolio or strategic direction of cloud operations may not fully meet customer demands; customers’ cloud service demands may not match our data center capacity or control investments; capacity shortages could affect SAP’s ability to deliver and operate cloud services as expected by or committed to our customers; scalability demands on infrastructure and operation could lead to cost increases and margin impacts; hyperscaler or infrastructure instabilities and the lack of availability or comprehensive contractual agreements could lead to challenges in meeting service level agreement (SLA) commitments; we might lack sufficient “future skills” for delivering and operating hybrid environments; we might lack the automation, standardization, and tools to manage and optimize operations and infrastructure; local legal requirements or changes to data sovereignty may lead to customers relocating their landscapes to a different data center; the loss of the right to use hardware purchased or leased from third parties could affect our ability to provide our cloud applications; disruptions to SAP’s cloud applications portfolio (such as system outages or downtimes, SAP network failure due to human or other errors, security breaches, or variability in user traffic for cloud applications) could affect customer SLAs; hardware failures or system errors might result in data loss or corruption; partner co-location of data centers might not adhere to our quality standards; or we might not comply with applicable certification requirements, such as the Payment Card Industry Data Security Standard (PCI DSS).
Any of these events could have a material adverse effect on our reputation, business, competitive or financial position, profit, and cash flows.
19
Cybersecurity and Security: Cybersecurity attacks or breaches, and security vulnerabilities in our infrastructure or services or those of our third-party partners could materially impact our business operations, products, and service delivery.
SAP delivers a full portfolio of solutions, hosts or manages elements of our customers’ businesses in the cloud, processes large amounts of data, and provides mobile solutions to users either directly or through partners and other third parties. This can include the incorporation of third-party data, products, and services into SAP products and services. SAP runs complex cloud services across different complex architectures, with services implemented through SAP’s own cloud and data centers as well as through hyperscalers.
Our industry operates in a complex and evolving cybersecurity landscape with increasingly sophisticated attacks, such as the use of AI and cloud scale, or the exploitation by threat actors of known and unknown “zero-day” security vulnerabilities in our or our customers’ systems or software. These cybersecurity threats can arise from our or our customers’ failure to patch such vulnerabilities in a timely or effective manner. Geopolitical tensions can exacerbate such threats and potentially lead to hybrid warfare between nation states that can include cybersecurity attacks on private companies, with threat actors targeting IT products, businesses, and the supply chain. Like many companies, SAP and certain of our third-party partners have experienced and expect to continue to experience cyberattacks and other security incidents that could affect our business. However, we are not aware of any such incidents that have had a material impact on our business.
SAP is guided by the NIST CSF and employs a multilayered control strategy to identify, detect, protect, respond, and recover from cybersecurity attacks. When we become aware of unauthorized access to our systems or those of our third-party partners, we have action plans in place intended to identify and remediate the source and impact of such events.
The scanning tools we deploy across our networks and products regularly identify and track security vulnerabilities, which are prioritized based on known and anticipated risks, and our remediation activities aim to patch within the designated timeframes.
We have also implemented patch management processes. However, we may be unable to comprehensively apply patches or to confirm that mitigating measures are in place to mitigate all such vulnerabilities, or that any patches will be applied before exploitation by a threat actor. Vulnerabilities may persist even after we have issued security patches should our customers fail to either apply the patches, update their systems, or authorize service downtime sufficient to allow for patching by SAP. If attackers are able to exploit vulnerabilities before patches are installed or mitigating measures are implemented, significant compromises could impact our and our customers’ systems and data.
We could also experience material exposure to our business operations and service delivery due to disruptions in backups, in disaster recovery processes, or in business-continuity management processes, or as the result of malicious or inadvertent actions by employees, contractors, or other parties. Security threats may also exist due to delayed or insufficient responses to identified issues or other interdependencies such as cloud service providers and those beyond SAP’s cybersecurity infrastructure and protocols.
SAP and/or its partners may have inadequate security controls or insufficient compliance with existing controls, which could impact SAP’s and/or its partners’ ability to comply with applicable regulations and customer requirements. SAP and/or its partners could unknowingly introduce security threats and vulnerabilities if they have not established relevant security evaluation processes. Failure to integrate or maintain SAP’s cybersecurity framework and protocols with network systems obtained through acquisitions could also introduce cybersecurity vulnerabilities.
The foregoing and other events such as these could result in a loss of customers or customer opportunities, a diminished reputation in the marketplace, government investigations or enforcement actions, internal investigations, litigation including class actions, fines, or penalties, increased costs associated with remediation or compliance requirements, required changes to our business model or operations, and a host of other costs and losses, any or all of which could have a material adverse effect on our reputation, business, financial performance, competitive or financial position, profit, and cash flows.
Technology and Products: Our technology and products may experience undetected defects, coding or configuration errors, may not integrate as expected, or may not meet customer expectations.
We are subject to risks and associated consequences in the following areas, among others: failure of software products and services to fully meet market needs or customer expectations; failure of software products and services from acquired companies to fully comply with SAP quality standards; failure of new products, services, and cloud offerings, including third-party technologies, to comply with local standards and requirements; the possibility that new products, services, and cloud offerings or subsequent versions and updates to existing products, services, and cloud offerings might contain defects or security vulnerabilities, or might not be mature enough from the customer’s point of view for business-critical solutions, or might not be sufficiently secure after release or shipment despite all the due diligence SAP puts into quality; inability of algorithms to correctly adapt to evolving circumstances, which may lead to adverse decision-making processes in the context of AI-related technologies; and the inability to fulfil expectations of customers regarding time and quality in the defect resolution process.
Any of these events could have a material adverse effect on our reputation, business, competitive or financial position, profit, and cash flows.
20
Strategic Risks
Market Share and Profit: Our market share and profit could decline due to increased competition, market consolidation, technological innovation, and new business models in the software industry.
The market for cloud computing is increasingly competitive and is exhibiting strong growth relative to the market for on-premise solutions. To maintain or improve our operating results in the cloud business, it is important that we not only attract new customers but also that our existing customers renew their agreements with us when the initial contract term expires and purchase additional modules or additional capacity. Additionally, we need to bring innovations to the market in line with the demands of our ecosystem and ahead of our competitors, such as solutions to support new data-driven applications and the extension of our suite of intelligent technologies based on SAP Business Technology Platform (SAP BTP).
We are subject to risks and associated consequences in the following areas, among others: inability to deliver fully suitable solution and transformation services to our customers on the cloud transformation journey, both in cloud-only and hybrid scenarios; inability to successfully execute on our hyperscaler strategy; adverse, near-term revenue effects due to increasing cloud business and conversions from on-premise licenses to cloud subscriptions from existing SAP customers, which could have an adverse effect on related maintenance and services revenue; insufficient solution and service adoption together with increased complexity, as well as failures during the execution of our corporate strategy in the context of our portfolio for solutions and services, which could lead to a loss of SAP’s position as a leading cloud company and subsequently to reduced customer adoption; customers and partners being reluctant or unwilling to migrate and adapt to the cloud; customers considering cloud offerings from our competitors; strategic alliances among competitors; price pressure, cost increases, and loss of market share through traditional, new, and cooperating competitors and hyperscalers; and the inability to achieve the planned margin increase in time as planned.
Any of these events could have a material adverse effect on our reputation, business, competitive or financial position, profit, and cash flows.
Mergers and Acquisitions: We might not acquire, integrate, or divest companies or their components effectively or successfully.
To expand and consolidate our business, we acquire and divest businesses, products, and technologies, and we expect to continue doing so in the future. Over time, some of these acquisitions have increased in size and in strategic importance for SAP. Management negotiation of potential acquisitions and divestures and the integration and carve-out of acquired businesses, products, or technologies demands time, focus, and resources of both management and the workforce, and exposes us to unpredictable operational difficulties.
We are subject to risks and associated consequences in the following areas, among others: incorrect information or assumptions during the due diligence process for acquisitions, divestitures, and other transactions; failure to integrate acquired technologies or solutions successfully and profitably into SAP’s solution portfolio and strategy; failure to successfully integrate acquired entities and their operations; failure to fulfill the needs of the acquired company’s customers or partners; failure to implement, restore, or maintain internal controls, disclosure controls, and procedures and policies within acquired companies; debt incurrence or significant unexpected cash expenditures; impairment of goodwill and other intangible assets acquired in business combinations; and failure of acquired companies to comply with regulatory requirements.
We have in the past, and may in the future, choose to divest certain entities, businesses, or product lines. We may have difficulty obtaining terms acceptable to us. Additionally, we may have difficulty carving out portions of or entire businesses, we may incur a loss of revenue or experience a negative impact on margins, or we may not achieve the desired strategic and financial benefits. Such potential transactions may also delay achievement of our strategic objectives, cause us to incur additional expenses, disrupt customer, partner, and employee relationships, and may expose us to unanticipated or ongoing obligations and liabilities, including because of indemnification obligations. Further, during the pendency of a divestiture, we may be subject to risks such as a decline in the business to be divested, a loss of employees, customers, or suppliers, and the risk that the transaction may not close, any of which could have a material adverse effect on the business to be divested as well as our retained business. If a divestiture is not completed for any reason, we may not be able to find another buyer on the same terms, and we may have incurred significant costs without the corresponding benefit.
Any of these events could have a material adverse effect on our reputation, business, competitive or financial position, profit, and cash flows.
Innovation: We might not be able to compete effectively if we strategize our solution portfolio ineffectively or if we are unable to keep up with rapid technological and product innovations, enhancements, new business models, and changing market expectations.
Our future success depends on our ability to keep pace with technological and process innovations and new business models, as well as on our ability to develop new products and services, enhance and expand our existing products and services portfolio, and integrate products and services we obtain through acquisitions. To be successful, we are required to adapt our products and our go-to-market approach to a cloud-based delivery and consumption model so as to satisfy increasing customer demand and to ensure an appropriate level of adoption, customer satisfaction, and retention.
We are subject to risks and associated consequences in the following areas, among others: inability to develop and sell new cloud products spanning various organizations on time and in line with market demands due to complexity in heterogeneous technical environments; inability to anticipate and develop technological improvements or succeed in adapting SAP products, services, processes, and business models to technological change, changing regulatory requirements, or emerging industry standards; a change in requirements of our customers and partners to strengthen the Intelligent Enterprise strategy; the possibility that our product and technology strategy might not be successful, or that our customers and partners might not adopt our technology platforms, applications, or cloud services quickly enough, or that they might consider other competing solutions in the market, or that our strategy might not match customers’ expectations and needs, specifically in the context of expanding the product portfolio into additional markets.
21
We are integrating AI into several of our products, including our suite of enterprise applications and SAP BTP, and we expect our use of AI across our portfolio to continue to grow. As with many innovations, AI presents risks and challenges that could affect its adoption and therefore our business. AI algorithms or training methodologies may be flawed. Data sets may be overbroad, insufficient, or contain biased information. Content generated by AI systems may be offensive, illegal, or otherwise harmful. Ineffective or inadequate AI development or deployment practices by SAP or our partners could result in incidents that impair the acceptance of AI solutions or cause harm to individuals, customers, or society, or result in our products and services not working as intended. Human review of certain outputs may be required, which could introduce error or inefficiencies to the intended use of our AI-enabled offerings. As a result of these and other challenges associated with innovative technologies, our implementation of AI systems could subject us to competitive harm, regulatory action, legal liability, and brand or reputational harm.
There is significant uncertainty surrounding the applications of intellectual property and privacy laws to AI technology. Intellectual property ownership and license rights, including copyright, surrounding AI technology have not been fully addressed by courts or other laws or regulations of the jurisdictions in which we operate, and our use of AI technology or integration of AI technology into our products and services may result in disputes with respect to ownership or intellectual property, or exposure to claims of copyright or other intellectual property misappropriation. In addition, our AI technology may involve the processing of personal and other sensitive data and may be subject to laws, policies, legal obligations, and contractual requirements related to privacy, data protection, and information security. Various privacy laws extend rights to consumers (such as the right to obtain consent or delete certain personal data) and regulate automated decision making. An alleged or actual failure to meet these obligations may lead to regulatory investigations and fines or penalties; may require us to change our business practices or retrain our algorithms; or may prevent or limit our use of AI technology. It is also possible that we are held liable for intellectual property, privacy, or other legal violations of third-party AI technology that we use, and that we may not have full recourse for any damages that we suffer (for example, our use of third-party AI technology may be subject to limitations of liability or provide no liability coverage).
In addition, some AI scenarios present ethical issues or may have broad impacts on society, and there can be no assurance that our Global AI Ethics Policy or similar policies and procedures will be sufficient to address such issues. If we enable or offer AI solutions that have unintended consequences, unintended usage or customization by our customers and partners, or are controversial because of their impact on human rights, privacy, employment, or other social, economic, or political issues, we may experience reputational harm, adversely affecting our business and consolidated financial statements.
Any of these events could have a material adverse effect on our reputation, business, competitive or financial position, profit, and cash flows.
ITEM 4. INFORMATION ABOUT SAP
Our legal corporate name is SAP SE. SAP SE is translated in English to SAP European Company (Societas Europaea, or “SE”). SAP SE is organized in the Federal Republic of Germany under German and European law, see “Item 10. Additional Information.” Where the context requires in the discussion below, SAP SE also refers to our predecessor or previous legal forms and names, as the case may be, i.e. Systemanalyse und Programmentwicklung GbR (1972-1976), SAP Systeme, Anwendungen, Produkte in der Datenverarbeitung GmbH (1976-1988), “SAP Aktiengesellschaft Systeme, Anwendungen, Produkte in der Datenverarbeitung” (1988 – 2005) and “SAP AG” (2005 – 2014). Our principal executive offices, headquarters and registered office are located at Dietmar-Hopp-Allee 16, 69190 Walldorf, Germany. Our telephone number is +49-6227-7-47474.
For (i) a description of our principal capital expenditures and divestitures and the amount invested (including interests in other companies) since January 1, 2024 until the date of this report and (ii) information concerning our principal capital expenditures and divestitures currently in progress, including the distribution of these investments geographically and the method of financing, see “Item 4. Information About SAP – Description of Property.”
22
The following table sets forth our most significant subsidiaries based on total revenues of SAP group in 2024. All of these subsidiaries are wholly owned or controlled by SAP SE.
Name of Subsidiary |
|
Country of |
Germany |
|
|
SAP Deutschland SE & Co. KG, Walldorf |
|
Germany |
Rest of EMEA |
|
|
SAP (Schweiz) AG, Biel |
|
Switzerland |
SAP (UK) Limited, Feltham |
|
United Kingdom |
SAP España – Sistemas, Aplicaciones y Productos en la Informática, S.A., Madrid |
|
Spain |
SAP France, Levallois Perret |
|
France |
SAP Italia Sistemi Applicazioni Prodotti in Data Processing S.p.A., Vimercate |
|
Italy |
SAP Nederland B.V., 's-Hertogenbosch |
|
The Netherlands |
United States |
|
|
Ariba, Inc., Palo Alto |
|
USA |
Concur Technologies, Inc., Bellevue |
|
USA |
SAP America, Inc., Newtown Square |
|
USA |
SAP Industries, Inc., Newtown Square |
|
USA |
SAP National Security Services, Inc., Newtown Square |
|
USA |
Rest of Americas |
|
|
SAP Brasil Ltda., São Paulo |
|
Brazil |
SAP Canada, Inc., Toronto |
|
Canada |
SAP México S.A. de C.V., Mexico City |
|
Mexico |
Japan |
|
|
SAP Japan Co., Ltd., Tokyo |
|
Japan |
Rest of APJ |
|
|
SAP Australia Pty Ltd., Sydney |
|
Australia |
SAP China Co., Ltd., Shanghai |
|
China |
SAP India Private Limited, Bengaluru |
|
India |
23
Strategy and Business Model
Overview of SAP
Founded in 1972, SAP is a global company headquartered in Walldorf, Germany. Our legal corporate name is SAP SE. SAP has been ranked first in market share in the following areas worldwide: enterprise applications software,7 enterprise resource management applications,8 supply chain management applications,9 procurement applications software,10 travel and expense management software,11 and enterprise resource planning software.12 The SAP Group has a global presence and employed more than 109,000 people as at December 31, 2024.
Our ordinary shares are listed on the Frankfurt Stock Exchange. American Depositary Receipts (ADRs) representing SAP SE ordinary shares are listed on the New York Stock Exchange (NYSE). SAP is a member of Germany’s DAX and TecDAX, the Dow Jones EURO STOXX 50, the Dow Jones Sustainability Index World, and the Dow Jones Sustainability Index Europe. As at December 31, 2024, SAP was the most valuable company in the DAX based on market capitalization and has been ranked among the top 5% of S&P Global ESG Scores in the S&P Global Corporate Sustainability Assessment.
Our Purpose
At SAP, we remain steadfast in our purpose to “help the world run better and improve people’s lives.” Together with our customers, we not only rise to meet today’s challenges, but we are also shaping the future by empowering each other to continuously improve and deliver better outcomes. Technology is essential in addressing the most profound economic, environmental, and social challenges. Software and analytics help predict and prevent disasters, make cities smarter, and foster equity in workplaces. By leveraging innovative tools and business models, we help everyone in the SAP ecosystem make business decisions that have a lasting impact.
We recognize our role in minimizing carbon footprints and promoting human rights through AI and data-driven insights. We are committed to providing AI solutions that are integral to our customers’ most critical business processes and aim to ensure that these solutions are relevant, reliable, and responsible.
In addition, we want our own business operations and practices to be sustainable and inclusive. SAP is committed to the goal set by the Paris Agreement of limiting global warming to 1.5 degrees Celsius in comparison to preindustrial levels. SAP aims to reduce its gross greenhouse gas (GHG) emissions by at least 90% across our relevant value chain by 2030 as part of its net-zero commitment. We also support the United Nations Sustainable Development Goals (UN SDGs). Together with our customers and partners, we engage in several initiatives across the UN SDGs.
Our Vision
Our vision of bringing out the best in every business reflects our commitment to transform organizations globally. We aim to build a future where businesses adapt rapidly to changes and opportunities, embed sustainability in their operations, and drive efficiency throughout the value chain. Our commitment to this vision is based on three pillars:
Agile Business Transformation at Scale
To stay competitive in a rapidly changing landscape, businesses need to transform at scale with agility. Our cloud solutions and real-time data insights, supported by our platform, enable organizations to achieve greater flexibility and efficiency and to adapt rapidly to evolving demands. Our SAP Business Suite unlocks new pathways to organizational innovation and excellence to enhance agility and drive scalable growth.
Achieve More Across the Value Chain
We assist organizations in utilizing collective intelligence to help achieve efficiency, resilience, and agility across the whole value chain. By embedding AI and connecting end-to-end business processes – from finance to supply chains, and human resources to customer relations – we fuel efficient growth throughout businesses. Our solutions go beyond internal systems: they link businesses across enterprises and, by digitalizing transactions, foster transparent, resilient, and sustainable value chains.
7 IDC, Worldwide Enterprise Applications Software Market Shares, 2023: Cloud Foundation Brings Preparedness for AI, Doc #US51079524, June 2024. IDC declares a statistical tie in the worldwide enterprise applications market when there is a difference of 0.5% or less in the share of revenues among two or more vendors.
8 IDC, Worldwide Semiannual Software Tracker, 2024H1, October 2024.
9 IDC, Worldwide Semiannual Software Tracker, 2024H1, October 2024. IDC declares a statistical tie in the worldwide supply chain management market when there is a difference of 0.5% or less in the share of revenues among two or more vendors.
10 IDC, Worldwide Semiannual Software Tracker, 2024H1, October 2024.
11 IDC, Worldwide Travel and Expense Management Software Market Shares, 2023: Resurgence of Business Travel Heralds a New Chapter in Travel and Expense Software, Doc #US51658524, August 2024.
12 IDC, Worldwide Enterprise Resource Planning Applications Market Shares, 2023: Preparing for the AI-Enabled World, #US52728224, December 2024.
24
Sustainability at Your Core
We have evolved beyond mere sustainability aspirations to actionable, sustainable outcomes. Our SAP Green Ledger solution aims to ensure robust, auditable sustainability practices are a natural extension of business operations. This innovative approach enables organizations to capture real-time impacts, report audit-ready ESG metrics, and integrate ESG principles into business processes to create genuine data-driven sustainability management.
At SAP, our journey is one of continuous innovation and transformation. We are committed to delivering solutions that integrate seamlessly, evolve alongside our customers, and are ready to grow with their ambitions.
Our Business Model
Our business model, through which we implement our vision and strategy, can be summarized as follows:
We create value by first identifying the business needs of our customers and then developing and delivering a portfolio of cloud solutions, services, and support that address these needs. We strive to continuously improve our solutions, identify further business needs, and deliver enhanced value to our customers.
We derive revenue from fees charged to our customers for subscriptions to use our cloud solutions. Software licenses, on-premise support, consulting, development, training, and other services also contribute significant revenue.
For an overview of our product portfolio, see the Our Product Strategy section.
Subsidiaries, Acquisitions, and Joint Ventures
Subsidiaries
SAP SE is the ultimate parent company of the SAP Group. As at December 31, 2024, the SAP Group comprised 226 companies.
For a list of our subsidiaries, associates, and other equity investments, see the Notes to the Consolidated Financial Statements, Note (G.9).
Material Acquisitions
We continue to focus on organic investments in technology and innovations that should ensure sustainable growth of our product portfolio. Additionally, we may make targeted acquisitions to complement our solution offerings and improve coverage in key strategic markets.
On June 5, 2024, SAP announced its intent to acquire 100% of WalkMe Ltd. (WalkMe), a leader in digital adoption platforms (DAPs). The transaction closed on September 12, 2024, following satisfaction of regulatory and other approvals.
For more information about WalkMe, see the Notes to the Consolidated Financial Statements, Note (D.1).
Sapphire Ventures
In addition to our investments in organic growth and acquisitions, SAP also supports entrepreneurs who aspire to build industry-leading businesses through venture capital funds managed by Sapphire Ventures. Sapphire Ventures manages more than US$10 billion (over €9 billion) and has invested in more than 200 companies. It pursues opportunities in which it can help fuel enterprise growth by adding expertise, relationships, geographic reach, and capital. It places a particular focus on companies and venture funds in Europe, Israel, the United Kingdom, and the United States. Sapphire Ventures has committed to investing more than US$1 billion in the next generation of AI - powered enterprise technology startups.
Our Product Strategy
Current market trends for enterprise management require interconnected, intelligent systems capable of predicting, adapting, and acting autonomously. To address this, an integrated foundation that seamlessly brings together applications, data, and AI is essential.
25
The recently launched SAP Business Suite leverages the powerful combination of these three components. It offers a comprehensive set of integrated solutions, combining our core cloud ERP and line-of-business (LoB) applications to seamlessly connect functions across the business end to end. An integral part of this offering is SAP Business Technology Platform (SAP BTP), ensuring harmonized data and seamless process flows across SAP and non-SAP systems. Driven by business data and artificial intelligence (AI), our strategy emphasizes a modular, composable design, addressing critical business processes while offering flexibility and scalability. This aims to ensure immediate value and supports future expansion as customer needs evolve.
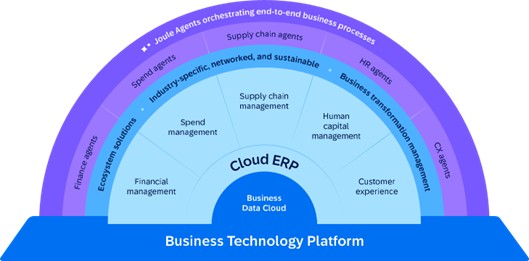
Figure 1: SAP Business Suite
The Cloud ERP Suite metric is the subset of SAP Business Suite that includes our strategic cloud solutions, which are most of the solutions in SAP Business Suite. For more information about this metric, see the Performance Management System section. The remaining offerings are part of the extension Suite, which supplement and extend the functional coverage of SAP’s solutions for the cloud.
To accelerate our own transformation and strengthen our position as a leading enterprise software company, we have adopted an AI-First, Suite-First strategy, which aims to ensure that our initiatives focus on our key differentiators.
AI-First means that we are not just adding AI capabilities to existing business processes, but fundamentally rethinking our approach to product development. We aim to redefine user interaction by offering our generative AI copilot, Joule. Already available in many of our most frequently used process steps, Joule aims to create an intelligent copilot experience for business users.
Our strategy also entails being data-focused. With our applications covering a vast array of business processes and, crucially, their data, we intend to harmonize our semantic model so that our customers can benefit from highly valuable insights, enriched by AI.
For our cloud products, Suite-First describes our objective of delivering a consistent, or suite-like, experience across our portfolio. In our user interface based on a modern design system, Suite First aims to ensure faster time to value for customers; in our extensibility approach for SAP BTP, it helps our customers extend and enhance our applications; and in product localization, it is central to helping customers operate in different geographies while ensuring compliance with local regulations.
SAP strives to help customers grow their businesses profitably, while at the same time minimizing the risks. To this end, SAP has two journeys, RISE with SAP and GROW with SAP, which cater to different customer objectives and requirements.
RISE with SAP is targeted at our installed base customers and helps them on their journey from legacy ERP systems to the SAP Business Suite.
GROW with SAP is targeted at new ERP customers and comprises an ERP software-as-a-service (SaaS) suite of solutions that aims to help customers grow their business and simplify work processes.
As the IT landscape continues to rapidly evolve, SAP is seeing a clear shift in customer preferences to the cloud, and a growing demand for flexibility, agility, scalability, and cost-effectiveness. Understanding the importance of helping customers embrace digital technologies to thrive in today’s dynamic business environment, SAP has committed to a forward-thinking cloud strategy. We acknowledge that every organization’s experience with the cloud can be unique and can therefore be challenging, yet many customers shifting to a cloud strategy can already achieve the benefits that today’s business environments require, such as redistributing resources previously needed to manage internal IT teams, and ensuring remote global accessibility from any location through the Internet. This strategy shift to the cloud allows SAP to address these new market opportunities and requirements.
The pillars of SAP’s product strategy, and our development and innovations, are presented below.
26
SAP Business AI
SAP Business AI capabilities are available across SAP’s suite of enterprise applications and SAP BTP and are grounded in customers’ own business data. SAP offers a range of AI-powered use cases built into core business processes across cloud ERP and finance, supply chain, procurement, human resources (HR), sales, marketing and commerce, as well as in IT and across industries, which are used by more than 30,000 customers.
By using these embedded AI capabilities, customers can benefit from immediate business value through increased automation, leading to more productivity. And by using Joule, SAP’s AI copilot, users can interact with enterprise software in natural language, while AI agents are able to take over complex tasks that span the enterprise. In addition, partners and customers can build custom or extend existing AI capabilities based on a comprehensive set of SAP AI Services in AI Foundation on SAP BTP.
Our goal is to make every SAP end user 30% more efficient with SAP Business AI. To achieve this, we will significantly increase our AI investments, and our more than 37,000 developers will work on enhancing our AI foundation and building new use cases.
Cloud ERP
SAP S/4HANA Cloud provides software capabilities mainly for finance, risk management, project management, procurement, manufacturing, supply chain management, asset management, and R&D. This also includes platform capabilities such as the SAP HANA in-memory database, data management, AI, and application lifecycle management, as well as SAP cloud ERP solutions, which our customers consume as part of their transformation to the cloud. These cloud ERP solutions help customers adopt new business models, such as subscription-based services, by using AI, machine learning, and other intelligent technologies for enhanced data analytics and automation.
Human Capital Management
SAP SuccessFactors solutions aim to optimize the relationship between employees and employers, and empower organizations to create an agile, future-ready workforce in a rapidly changing workplace. The portfolio includes an AI-enabled suite of cloud solutions spanning core HR, time, payroll, and talent management, analytics and planning, and employee experience management.
Spend Management
SAP’s spend management solutions aim to provide a more unified view of a customer’s spending to help reduce costs, mitigate risks, improve collaboration, and align spend decisions with business strategy. They cover direct and indirect spend, travel and expenses, and external workforce management. Our SAP Ariba solutions combine industry-leading cloud-based applications to help companies discover and collaborate with a global network of partners. Our SAP Concur solutions portfolio contains world-leading solutions for integrated travel, expense, and invoice management. SAP Fieldglass solutions help businesses find, engage, and manage their global external workforce.
Customer Experience
SAP Customer Experience solutions help businesses create customer journeys that aim to boost loyalty and drive sustainable growth. The key advantage of SAP applications lies in their ability to link customer demand with operational processes, using AI to facilitate smart decision-making and automation throughout the value chain. Integrated with SAP S/4HANA, SAP S/4HANA Cloud, and other SAP ERP systems, this portfolio offers solutions with embedded AI for customer engagement, commerce, sales, service, and data management.
SAP Business Technology Platform
SAP Business Technology Platform (SAP BTP) is our business-centric open platform. Consisting of market-leading technologies infused with AI, it enables SAP development, customers, and our partner ecosystem to unlock innovation across the enterprise. SAP BTP enables customers and partners to build, integrate, and automate applications while leveraging insights from business data on a trusted enterprise-grade environment.
Key capabilities of SAP BTP include: SAP Build and SAP Build Code tools, ABAP Cloud development model, which provides an intuitive, modern development environment for IT and citizen developers; SAP HANA Cloud, SAP Datasphere, and SAP Analytics Cloud solutions, which offer database, data management, analysis, and planning capabilities that utilize the value of data; SAP Integration Suite, an integration platform as a service (iPaaS) and management capabilities for Application Programming Interfaces (APIs) to connect and automate business processes; and AI Foundation on SAP BTP, which has a rich toolset including access to a broad range of large language models (LLMs) from third-party providers and vector database capabilities to enable developers to create AI-powered and generative-AI-powered extensions and applications.
Industry Solutions
Our industry solutions aim to differentiate our RISE with SAP and GROW with SAP offerings by providing customers and partners with industry-specific innovations that extend SAP’s core offering. These innovations leverage SAP Business AI to create tailored and intelligent solutions that customers can use to meet their unique industry-specific needs.
27
SAP Business Network
SAP Business Network is a business-to-business collaboration platform trusted by companies in 190 countries. The network helps digitalize key business processes across the supply chain and enables communication between trading partners beyond the four walls of an organization. This enables buyers and suppliers to find each other and execute end-to-end transactions, and helps businesses be transparent, resilient, and sustainable.
Business Transformation Management
SAP’s business transformation management solutions help customers realize holistic data-driven business transformation across several pillars: With SAP Signavio solutions, organizations can analyze, discover, and understand their business process operations. By benchmarking current process landscapes against best practices and acting on change recommendations, customers can define a target state and adapt as-is processes accordingly, while measuring whether realized outcomes match strategic goals.
With SAP LeanIX solutions, customers can visualize their as-is enterprise architecture, assess interdependencies and the potential impact of IT modernization, and manage the transition toward the target landscape with established best practices and a detailed roadmap.
WalkMe solutions can help organizations navigate constant technology change by providing users with advanced guidance and automation features that enable them to execute workflows seamlessly across any number of applications. In addition, the SAP Enable Now solution provides e-learning content embedded in SAP workflows. Combined, SAP Enable Now and WalkMe will offer customers a comprehensive learning and digital adoption solution to improve the adoption of cloud solutions from SAP and drive faster value realization.
Working Capital Management
The SAP Taulia portfolio provides tools and expertise to help businesses create and deliver the right cash flow strategy, and the flexibility to adjust it to meet evolving liquidity challenges. The SAP Taulia Cash Flow Acceleration platform is designed to help optimize cash flow while ensuring supply chain health and resilience. SAP Taulia solutions also embed sustainability functions into core processes, providing financial incentives to encourage the supply base to improve its ESG (environmental, social, and governance) credentials.
Sustainability Management
SAP offers sustainability solutions and services that help customers drive sustainable practices not only inside their organization but across the entire value chain. SAP Sustainability is an ERP-centric, cloud-based, AI-enabled solutions portfolio that supports companies with ESG reporting and management, carbon management, material transition, and operational compliance. It integrates robust, auditable sustainability data into core processes to improve ESG transparency and sustainable business performance. The portfolio includes the following offerings: SAP Sustainability Control Tower, SAP Sustainability Footprint Management, SAP Sustainability Data Exchange, and SAP Green Ledger, which became generally available in December 2024. SAP Green Ledger integrates sustainability data directly with customers’ financial data. This allows customers to use actual verified and reported data to allocate carbon emissions to specific products, services, organizational units, and business transactions.
Partners and Ecosystem
Our worldwide ecosystem of more than 25,000 partners delivers not only services and support for our customers but also partner innovations that extend our solutions and are built ideally on SAP BTP.
Services and Support
We continue to evolve our cloud-focused services and support portfolio to focus on customer adoption and consumption.
Central to the Services and Support portfolio is SAP Enterprise Support, which provides foundational tools and services, curated content, and mission-critical support. SAP Enterprise Support, cloud editions are included with cloud solution subscriptions. If customers require more guidance from SAP, they can opt for incremental service plans such as SAP Preferred Success and SAP Cloud Application Services, as well as professional services to address project-specific objectives, timelines, and plans.
To help customers who intend to make an enterprise-wide transformational change, SAP offers SAP MaxAttention and SAP ActiveAttention services for tailored, long-term strategic engagement. Learning and user enablement is available throughout a customer’s journey and ranges from role-based digital content to expert-led live sessions, hands-on practical training, custom learning content, and certification.
Our Customers
Focusing on Customer Success
We aim to maximize the value our customers derive from their investment in, and relationship with, SAP. We do so at every touchpoint in their experience with us over the entire engagement lifecycle. Our customer-facing teams – across solutions, sales, services, customer engagement, ecosystem, and others – work together along an operating model that aims to harmonize internal processes with the goal of delivering improved outcomes for our customers. Their feedback is crucial for our journey together.
28
To further address and improve customer feedback, we have a Company-Wide Global Experience Management (XM) Program in place. This program aims to achieve a consistent end-to-end experience for our customers by standardizing experience initiatives and methodologies to help identify and close experience gaps across SAP. The head of Competitive Market Intelligence (CMI) in the Office of the CEO leads our Global XM Program, which includes conducting the Customer Net Promoter Score (NPS) survey. Our Customer NPS is a KPI in the short-term incentive component of Executive Board remuneration. For more information about the Customer NPS, see the Performance Management System section.
Policies such as our Global Code of Ethics and Business Conduct for Employees and applicable General Terms and Conditions for our products govern our relationships with our customers.
How We Measure and Manage Our Performance
We use the Customer NPS as a feedback mechanism to measure customer loyalty. This and other results from the customer survey allow us to directly understand the customer experience and identify key pain points for action. Because of the importance of our customers to SAP, Customer NPS is one of our main non-financial KPIs.
In 2024, our Customer NPS increased 3 points year over year to 12 (2023: 9), which is within our target range of 9 to 13. The increase was driven by growing customer satisfaction with SAP’s cloud solutions and the efficacy of our technical support organization. We observed material improvement in the NPS for SAP S/4HANA Cloud Private Edition, SAP SuccessFactors solutions, and SAP Integration Suite services, leading to an overall increase across our suite of cloud offerings.
Related Risks for SAP
For related financial risks, see Sales and Services in the Risk Factors section.
Our Investments in Innovation
SAP’s strong commitment to research and development (R&D) is reflected in our expenditure:
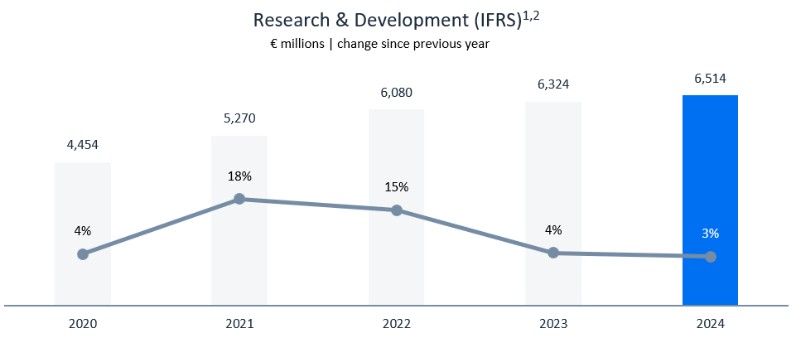
1 The numbers from 2021 to 2024 reflect continuing operations as a result of the divestiture of Qualtrics.
2 In 2023, SAP updated its cost allocation policy. R&D numbers for 2020 have not been retrospectively adjusted.
To drive competitive edge, the focus of our R&D activities is on advancing our product portfolio. Our priorities here are to strengthen our AI foundation and seamlessly integrate our products.
In 2024, our IFRS R&D ratio, which reflects R&D expenditure as a portion of total revenue, decreased 1.2 percentage points (pp) to 19.1% (2023: 20.3%). Our non-IFRS R&D ratio likewise decreased 1.2pp year over year to 19.0% (2023: 20.2%). At the end of 2024, our total full-time equivalent (FTE) headcount in development was 37,590 (2023: 36,444). Measured in FTEs, our R&D headcount remained at 34% of total headcount (2023: 34%).
Total R&D expenditure not only includes our own personnel costs but also the external costs of work and services from the providers and cooperation partners we work with to deliver and enhance our products. We also incur external costs for the following:
- Translating, localizing, and testing products
- Obtaining certification for products in different markets
- Patent attorney services and fees
- Consulting related to our product strategy
- Professional development of our R&D workforce
29
Patents
Our investment in R&D has resulted in numerous patents. As at December 31, 2024, SAP held in excess of 13,000 (2023: close to 13,000) validated patents worldwide. Of these, more than 700 (2023: more than 650) were granted and validated in 2024.
While our intellectual property is important to our success, we believe our business as a whole is not dependent on any particular patent or a combination of patents.
Competitive Intangibles
The majority of (intangible) resources that are the basis for our current and future success do not appear in the book value of equity in our Consolidated Financial Statements. This is apparent from a comparison of the market capitalization of SAP SE (based on all issued shares), which was €290.3 billion at the end of 2024 (2023: €171.4 billion), with the book value of our equity in the Consolidated Financial Statements, which was €45.8 billion (2023: €43.4 billion). This means that the market capitalization of our equity is more than six times the book value.
Measuring Our Success
We use the following financial and non-financial strategic objectives to steer our company:
- Growth
- Profitability
- Customer loyalty
- Employee engagement
- Climate performance
- Women in Executive Roles
Outlook and Results for 2024
Strategic Objective |
|
KPI |
|
2024 Outlook1 |
|
2024 Results |
Growth |
|
Cloud revenue3 |
|
€17.0 billion to €17.3 billion |
|
€17.21 billion |
|
|
Cloud and software revenue3 |
|
€29.5 billion to €29.8 billion |
|
€29.96 billion |
Profitability |
|
Operating profit2,3 |
|
€7.8 billion to €8.0 billion |
|
€8.23 billion |
|
|
Free cash flow |
|
€3.5 billion to €4.0 billion |
|
€4.11 billion |
Customer loyalty |
|
Customer Net Promoter Score |
|
9 to 13 |
|
12 |
Employee engagement |
|
Employee Engagement Index |
|
70% to 74% |
|
74% |
Climate performance |
|
Gross greenhouse gas emissions |
|
Steady decrease in our greenhouse gas emissions across the relevant value chain in line with our net-zero target |
|
6.9 Mt |
Women in Executive Roles |
|
% of women in the top three management levels below the Executive Board, compared to the total number of individuals across all genders in these levels (calculated in heads) |
|
Steadily increase in the share of Women in Executive Roles |
|
22.5% |
1 The initial 2024 outlook was communicated in January 2024. The 2024 outlook numbers above reflect the updated outlook from October 2024.
2 Non-IFRS.
3 At constant currencies.
Note: For a reconciliation of non-IFRS results to IFRS equivalents, see the Performance Management System section.
30
Outlook for 2025
The outlook for 2025 replaces SAP’s Ambition 2025.
Strategic Objective |
|
KPI |
|
2024 Results |
|
2025 Outlook |
Growth |
|
Cloud revenue |
|
€17.14 billion |
|
€21.6 billion to €21.9 billion2 |
|
|
Cloud and software revenue |
|
€29.83 billion |
|
€33.1 billion to €33.6 billion2 |
|
|
Total revenue growth |
|
10% |
|
To slightly accelerate2 |
|
|
Current cloud backlog growth |
|
32% |
|
To slightly decelerate2 |
Profitability |
|
Operating profit1 |
|
€8.15 billion |
|
€10.3 billion to €10.6 billion1,2 |
|
|
Free cash flow3 |
|
€4.22 billion |
|
Approx. €8.0 billion |
Customer loyalty |
|
Customer Net Promoter Score |
|
12 |
|
12 to 16 |
Employee engagement |
|
Employee Engagement Index |
|
74% |
|
74% to 78% |
Climate performance |
|
Gross greenhouse gas emissions |
|
6.9 Mt |
|
To steadily decrease carbon emissions across the relevant value chain |
Women in Executive Roles |
|
% of women in the top three management levels below the Executive Board, compared to the total number of individuals across all genders in these levels (calculated in heads) |
|
22.5% |
|
To steadily increase the share of Women in Executive Roles. |
1 Non-IFRS.
2 At constant currencies.
3 The 2024 results and the 2025 outlook for free cash flow are based on the revised definition applicable from 2025. Free cash flow in 2024 was €4.11 billion. For more information, see the Performance Management System section.
Note: For a reconciliation of non-IFRS results to IFRS equivalents, see the Performance Management System section.
Seasonality
Our business has historically experienced the highest revenue in the fourth quarter of each year, primarily due to year-end capital purchases by customers. Such factors have resulted in 2024, 2023, and 2022 first quarter revenue being lower than revenue in the prior year’s fourth quarter. We believe that this trend will continue in the near future but to a smaller extent as predictable revenues will further increase their share of total revenues. Unlike our on-premise software revenues, our on-premise support revenues and cloud revenues are less subject to seasonality and thus help to reduce this effect. For more information about the development of our share of more predictable revenue in 2024, see Item 5. Operating and Financial Review and Prospects – Operating Results (IFRS). For more information about the expected development of our share of more predictable revenue, see Item 5. Operating and Financial Review and Prospects – Expected Developments.
Security, Cloud Compliance, Data Protection and Privacy
SAP Global Security and Cloud Compliance
Cloud solutions and services are increasingly important to many companies’ daily operations. Organizations today are facing many risk factors and disruptions, such as war, political unrest, severe weather, pandemics, cyberattacks, and supply chain disruption, making digital solutions critical to organizational resilience. As a result, digital transformation is accelerating and cybersecurity is now even more crucial to IT security professionals, and to leaders in business and government, particularly in those organizations that have moved their core processes to the cloud.
The SAP strategy is focused on helping our customers in their digital transformation. Our SAP Global Security and Cloud Compliance (SGSC) unit supports this journey with the goals of reducing risk and promoting regulatory compliance, and by aligning people, procedures, and technology to protect business processes and data. The organization embraces a security-minded culture that embeds security and compliance in our development, deployment and cloud operations processes and helps secure digital transformation.
SGSC supports key stakeholders across SAP in our lines of business (LoBs), IT, and the presales organization in securing solutions, and drives operational excellence for security and cloud compliance across the enterprise. To protect our organization’s data and assets, and support high-quality risk management and reporting, SGSC regularly reviews and adapts our security policies, standards, and frameworks.
We strive to protect the rights of data subjects and meet applicable local requirements in both our product and service portfolios. Our approach to data protection, privacy, and security aligns with our overarching business strategy and supports our aim of strengthening SAP’s reputation as a sustainable and trustworthy partner in the market.
31
To further enhance our commitment to security and compliance, security considerations are integrated into every stage of the software development lifecycle. We utilize various methodologies, guidelines, processes, and tools to address and adapt effectively to evolving cybersecurity threats.
These safeguards were designed and implemented to protect the fundamental rights of everyone whose data is processed by SAP, and of those who use SAP’s products, including customers, suppliers, partners, prospects, employees, and applicants.
SAP Global Security Policy Framework
The SAP Global Security Policy Framework is a layered structure of documents consisting of the SAP Global Security Policy and of security standards, procedures, and good practices that define the objectives, values, minimum requirements, and obligations we follow to protect SAP against security threats.
- The SAP Global Security Policy13 is a high-level security document aligned with SAP’s overall strategy and vision to maintain the highest level of security. It defines management intent, expectations, direction, and a responsibility matrix.
- SAP Security Standards, owned by central service leaders in SAP Global Security and Cloud Compliance (SGSC) define the minimum security requirements for numerous domains, including risk management, asset management, information classification, physical security, threat detection, and vulnerability management. Requirements are regularly reviewed to ensure they are appropriate, adequate, and effective.
- SAP Security Procedures set out detailed steps for implementing and operationalizing the security standard requirements.
- SAP Security Good Practices are checklists designed to simplify the implementation process.
The objectives of the SAP Global Security Policy Framework are to:
- Preserve the confidentiality, integrity, and availability of SAP information and of information entrusted to SAP
- Protect all SAP assets from internal and external threats, deliberate or accidental, based on a risk assessment
- Fulfill the legal, regulatory, operational, and contractual requirements of SAP
The SAP Executive Board is responsible for SAP’s security strategy and endorses the Global Security Policy. The Chief Security Officer and Chief Security Compliance and Risk Officer oversee the policy, ensuring its definition, implementation, monitoring, and development in line with industry standards. Business Information Security Officers (BISOs) lead the security strategy in their respective lines of business and ensure adherence to the policy. All SAP employees and external workers must familiarize themselves with the policy and complete security awareness training. The Global Security Policy Framework is published internally, with regular updates communicated to key stakeholders.
Data Protection and Privacy
The SAP Global Data Protection and Privacy Policy14 sets a Group-wide governance standard and creates a structure for the handling of personal data in accordance with data protection and privacy requirements. Where applicable, it references the SAP Global Artificial Intelligence (AI) Ethics Policy, which reflects the guiding principles of the International Bill of Human Rights.
The SAP Global Data Protection and Privacy Policy sets out:
- The rules and principles for the processing of personal data in the SAP Group. The rules also apply to the personal data of customers, partners, and other third parties to ensure compliance with applicable data protection and privacy laws.
- Responsibilities within the organization for the processing of personal data
- Guidelines for the organizational execution of data protection and privacy principles
The SAP Global Data Protection and Privacy Policy applies to all SAP Group companies and is rolled out to all SAP employees globally by Data Protection and Privacy. All SAP employees and other individuals working on behalf of SAP are obligated to familiarize themselves with this policy and other internal policies governing the handling of personal data. They must commit to keep personal data confidential and not to collect, process, or use personal data without authorization.
The global Data Protection Officer (DPO) is responsible for monitoring compliance with data protection laws and regularly reports to the CFO, who is the Executive Board member responsible for data protection compliance matters and the enforcement of data protection and privacy. The DPO is responsible for the SAP Global Data Protection and Privacy Policy, which addresses SAP’s data protection governance, and regularly reports to the CFO on data protection compliance in the SAP Group. To ensure consistent security and data protection compliance, SAP has implemented a formal governance model that assigns clear responsibilities across the SAP Group.
Management plays a critical role in establishing data protection requirements and business processes to ensure compliance with applicable data protection and privacy laws. To implement data privacy requirements effectively, management can delegate these responsibilities to various levels of management in the organization. In accordance with these principles, the individual global SAP lines of business (LoBs) have a mandate to implement data privacy requirements within their area of responsibility.
13 The policy was not extended to the acquired companies Taulia or WalkMe.
14 The policy was not extended to the acquired companies Taulia or WalkMe.
32
At local level, operational responsibility for compliance is transferred to the local CFOs, who are supported by a network of local Data Protection and Privacy Coordinators (DPPCs). Unless one has already been appointed by the Data Protection and Privacy team (DPP), each CFO must appoint a local Data Protection and Privacy Coordinator (DPPC), who conducts audits to ensure compliance with regulations. The CFO is also tasked with facilitating these audits and implementing the measures necessary to address compliance gaps.
How We Measure and Manage Our Performance
Security and Cloud Compliance
Compliance processes at SAP adhere to trust-service criteria established by the American Institute of Certified Public Accountants (AICPA). Our security, privacy, confidentiality, and processing integrity controls are designed to achieve the appropriate control objectives. In addition, independent, external auditing partners regularly conduct security compliance audits.
SAP discloses vulnerabilities to customers and provides accompanying patches or instructions when the customer needs to take action. This procedure also applies to the rarer cases where SAP patches to cloud services require customer action. We disclose these instructions using SAP Security Notes published every second Tuesday of the month (Patch Day). This process is further supported by the publication of Common Vulnerabilities and Exposures (CVE documents) through MITRE CVE is a disclosure mechanism that provides customers with authoritative, public information from SAP about SAP software vulnerabilities that can be integrated with their existing risk and vulnerability management processes and tools.
We strive to reduce risk by continuously improving our processes for detecting and remediating attacks and vulnerabilities To ensure effective implementation of the SAP Global Security Policy Framework we:
- Support our cloud and IT units with operational controls that are monitored and tested for design and operational effectiveness.
- Have established an independent internal audit function which reports the audit planning and the audit results to the Board of Directors on a regular basis.
- Engage external internationally accredited auditors to regularly assess the design and operational effectiveness of the implementation.
- Offer service organization control (SOC) reports – such as SOC 1 Type II/ISAE 3402 and SOC 2 Type II/ISAE 3000 for our cloud services, issued by external internationally accredited auditors.
- Publish certificates for compliance to international standards, such as ISO 9001, ISO 27001, ISO 27017, ISO 27018, ISO 22301, and BS 10012.
- Offer further industry-specific and regional compliance attestations, certifications, and reports via SAP Trust Center.
Data Protection
SAP monitors compliance with data protection procedures across SAP and maintains a record of processing activities (in a procedure enrollment tool) involving different categories of personal data (applicants, customers, employees, partners/suppliers, and other data subjects). These records contain general information about the procedure according to defined criteria that are necessary to meet proper documentation. The records are reportable and regularly reviewed.
We also track the quality of our data protection compliance level based on the annual recertification of our Data Protection Management System (DPMS) by the British Standards Institute (BSI). SAP is audited by BSI annually and has been awarded certifications according to BS 10012 since 2011. The most recent certification is valid until the end of 2025.
Global data protection and privacy training is mandatory for SAP employees. It is conducted every two years, most recently in 2023. New hires are required to complete the training when they join the Company. The training is validated as part of the DPMS audit carried out by BSI.
The SAP Third-Party Risk Management Process follows SAP’s own quality standards and international regulations, which require the careful selection and monitoring of subprocessors who handle personal data on behalf of SAP and SAP’s customers. The process ensures that all subprocessors meet the necessary data protection and security requirements for the processing of personal data, thereby safeguarding the interests of SAP, its customers, partners, employees, and end users.
The data subject rights request process is managed across lines of business and helps customers, employees, and end users exercise their right to receive information about how their personal data is processed, where legally applicable. This process ensures that the rights of data subjects under the applicable data protection laws are upheld, and that all necessary information is easily accessible on SAP’s websites and through other sources. The process is validated as part of the DPMS audit carried out by BSI.
In 2024, there were nine notifiable data protection incidents under the GDPR for data that SAP processes for its own purposes and one notifiable data protection incident under the Singapore Personal Data Protection Act and related regulations and guidelines for data that SAP processes for its own purposes. All ten incidents were reported to the relevant supervisory authorities.
Related Risks for SAP
For related financial risks, see the Risk Factors section, specifically the Cybersecurity and Security and Data Protection and Privacy subsections.
33
Human Capital Resources
People Agenda
Established in 2024, the People Agenda is a holistic system in which people, organizational, and technological development are interconnected. We have defined three key strategic pillars built on a strong foundation that together make up our People Agenda:
– Our growth culture guides how we work internally and address the market and customers externally. It increases our capacity for change, drives efficiency, and ensures accountability, helping us deliver high-performance results for our customers and markets. By executing in line with our strategy, we strengthen the engagement and commitment of everyone – employees, partners, customers, and shareholders. Additionally, we are investing in comprehensive leadership development programs that will equip all our leaders with the skills to develop teams, lead transformation, and consistently deliver results. While individual growth is important, we also recognize the need to enhance our organizational capabilities to fully support our culture. We are committed to building high-quality methodologies and tools in organizational development and change management. These resources will be essential for enabling SAP’s ongoing transformation and ensuring that we remain agile in a rapidly changing environment.
– Our skills-led people ecosystem prioritizes HR practices that focus on skills at every stage of the employee lifecycle: from skills-based job descriptions and personalized skill assessments, to enhanced individual learning and development opportunities tailored to growth, to hiring based on skills and abilities rather than just experience or academic qualifications.
– Our game-changing people technology harnesses SAP’s own technological capabilities. SAP SuccessFactors will form the core of our processes going forward and equip us to deliver data-driven, AI-enhanced, and fully individualized solutions for everyone at SAP. This will enable us to foster data-driven and transparent decision-making for leaders and allow everyone to grow and develop to their best abilities based on data insights. As the number one showcase and customer of SAP SuccessFactors ourselves, we will actively drive the Human Capital Management (HCM) roadmap and pioneer innovations – for our customers too.
These pillars rest on the strong foundation of our people-centric work environment, which fosters employee well-being, safety, and health, as well as workforce diversity and workplace inclusion. Together, these elements are designed to establish a forward-thinking workplace.
Processes for Engaging with Our Own Workforce
At SAP, we engage and communicate with our own workforce regularly, using a variety of formats and media as part of our comprehensive, continuous efforts to listen and to maintain a dialogue. This includes dedicated follow-up actions to address employee feedback.
To ensure good communication with our employees, we have dedicated communication teams at global, Board area, regional, and local level.
We communicate with our workforce about topics that are important for them through a range of channels. Examples are shown below. Global communications to all employees do not usually include temporary staff, due to the dynamic nature of distribution lists for them. For local events and communication channels, local laws stipulate whether or not temporary staff should be included. Temporary staff can also access information published on SAP One, our internal employee portal.
Audience |
|
Asset/ Channel |
|
Cadence |
|
Description |
All Employees |
|
Global Employee Meeting (GEM) - (hybrid live event) |
|
Quarterly |
|
The GEM is a meeting that connects members of the Executive Board with employees. Top-voted employee questions are addressed on stage and online by an expert panel. |
|
Earnings Check-In (hybrid live event) |
|
Quarterly |
|
This event complements the GEM by providing an additional, dedicated discussion forum with the CFO and CEO, on or immediately after earnings day. Top-voted employee questions are addressed on stage and online by an expert panel. |
|
|
Unplugged sessions with CEO (hybrid live event) |
|
Quarterly |
|
Unplugged sessions offer an informal forum for employees to ask the CEO questions on all topics related to SAP. |
|
|
Sessions with HR directors |
|
Six-monthly |
|
These live meetings allow HR directors to share insights and provide context for country-specific topics, regional updates, and global announcements (to outline the local impact). Employees can ask questions and share feedback. |
|
|
Coffee Corner Espresso Edition (hybrid live event) |
|
Monthly |
|
These sessions take place in a short, moderated Q&A format, in which a Board member and/or L1 executive answers questions from employees. |
|
|
Employee checklist (newsletter) |
|
Monthly |
|
This checklist is sent by e-mail as a source of information to all SAP employees worldwide. Content must be globally relevant. |
|
|
What’s Up Work Zone (website) |
|
Multiple per month |
|
An internal website featuring internal global news, information, and events. |
|
|
-Coffee Corner (onsite live event) -Coffee Call (hybrid live event) |
|
Multiple per month |
|
Q&A sessions, during which executives answer employees’ questions. |
|
|
Announcements widget (SAP One Home) |
|
Weekly |
|
A collection of globally relevant, need-to-know information for employees. |
|
|
Organizational announcements |
|
As needed |
|
Major organizational changes are followed by multi-channel communications cascades. These include e-mails, in-person events, internal online articles, FAQs, and other documentation, depending on the need. |
|
All Managers |
|
Leaders What’s Next Call |
|
Monthly |
|
These live calls for all leaders cover relevant and timely HR and people management topics to help leaders manage their teams and organizations. |
|
Manager checklist |
|
Monthly |
|
An informational e-mail sent to all managers worldwide. Content must be globally applicable and relevant to managers in their supervisory capacity. |
|
All Managers and Chief Experts |
|
Leadership Communications Pack (LCP) |
|
Quarterly |
|
The LCP includes a summary of important company-wide topics for leaders to share with their teams. |
Executive Leadership |
|
SAP Forward Call (virtual) |
|
Monthly, and as needed |
|
These meetings connect the Executive Board and SAP’s senior and global executives. They cover need-to-know, critical company topics and allow time for discussion and Q&As. |
In a concerted effort to continuously promote a diverse and inclusive culture – and ensure wider accessibility to global employee events – we deploy assistive technology, including sign language interpreting (primarily American Sign Language), assistive listening devices (ALDs), closed caption screens, reserved priority seating, and post-event recordings with professional captioning.
34
In addition, HR directors (HRDs) engage with employee representatives regularly on the legal requirements of their respective countries and timely inform and consult these representatives about measures that impact employees and which require codetermination. These interactions can be initiated by either side.
To ensure the effectiveness of its communications, our People Communications team regularly tracks the reach, engagement, and sentiment of its owned channels. This data is used to inform stakeholders and improve future communications, as well as to continuously refine communication channels and approaches. The team uses a combination of e-mail marketing tools, data analytics tools, and manual analysis. One of our platforms for internal e-mail communication is an in-house tool called Communications Hub. It enables us to track open rates, read rates, and link clicks. The Global Communications Team (specifically, People Communications) also measures pre-event engagement through the volume of questions submitted, and uses in-event polling, to gather feedback from attendees. Attendance numbers (virtual) and replay views are also tracked.
At SAP, we recognize that employee engagement is a critical driver of innovation, productivity, and long-term organizational success. Our Executive Board members play an important role in fostering and maintaining employee engagement. Given SAP’s approach to employee engagement, no single role is operationally responsible for employee engagement. It falls within the role of the chief human resources officer to foster engagement between SAP and its employees through various formats for interacting and listening, and through our People Agenda. Further, the responsibilities of HR directors include supporting communication and dialogue, and implementing the People Agenda at country level. The chief communications officer is responsible for ensuring communication between SAP and its employees.
#Unfiltered
|
y Definitions Leadership Trust Net Promoter Score (Leadership Trust NPS): The metric is derived from a question in our #Unfiltered survey that gauges employees’ trust in our leaders. Based on the Customer NPS methodology, it is calculated as a percentage of “promoters” (a score of 9 or 10 on a 10-point scale) minus the percentage of “detractors” (a score of 1 through 6). The method ignores “passives” (a score of 7 or 8). Consequently, the value range of the NPS is –100 to +100, with the latter being the best achievable score. Business Health Culture Index (BHCI): This metric was collected in the #Unfiltered survey run in June 2024. Simplification of Processes: This index shows the impact of our continued efforts to simplify our processes. It is measured on the basis of answers to 14 questions in our #Unfiltered program (November 2024 survey). Diversity & Inclusion Index: The Diversity & Inclusion Score from #Unfiltered indicates the extent to which SAP successfully offers employees a working environment that promotes diversity and inclusion. The index is measured on the basis of answers to three questions (June 2024 survey). |
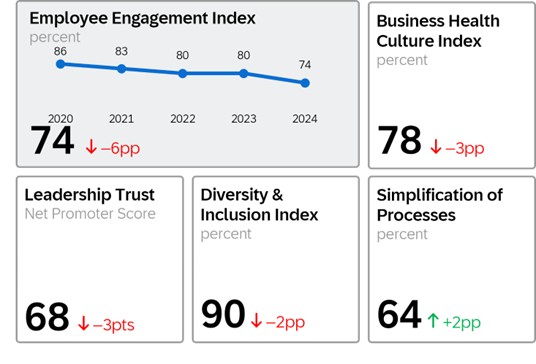
35
#Unfiltered, 15 our employee engagement survey program, runs twice a year to measure key people metrics, engagement drivers, and employee sentiment. #Unfiltered is a demonstration of our commitment to listen regularly to our employees and act together on their feedback. In 2024, we ran surveys in June and November to gauge sentiment on employee engagement, leadership trust, health and well-being, and other topics. The average scores from both surveys were used as the full-year Employee Engagement Index and Leadership Trust NPS.
The EEI is part of the short-term, one-year performance-based compensation (Short-Term Incentive, STI) of the Executive Board members. The target range for the EEI in 2024 was 76% to 80%. In July, SAP adjusted the EEI outlook for the full-year 2024 to 70% to 74% based on the latest available results by the end of Q2. The EEI, along with other survey metrics, such as BHCI and Leadership Trust NPS, declined due to multiple factors, including, for example, the transformation and restructuring efforts, the evolution in SAP’s hybrid work guidance, or external influences which were beyond SAP’s control. The adjustment of the outlook did not affect the Executive Board’s compensation targets. The target range for 2025 is between 74% and 78%. Measures were introduced to counteract the decline in EEI, which already showed positive effects in the second half of the year.
Additionally, we use a number of feedback instruments within our continuous listening approach to assess how individual employees experience the various touchpoints along the employee lifecycle. This approach enables us to understand how employees perceive SAP, to enhance our processes, and to optimize the employee experience.
We act on the feedback we receive from these various listening measures to improve organizational and team development. Our follow-up activities are driven by a two-fold approach: global focus areas are coordinated centrally, while team-related activities are coordinated within the respective teams.
We also track the Diversity & Inclusion Index of our own workforce through our #Unfiltered survey, which allows us to take a deeper look at the aspects of gender, age, job level, and geography for all employee engagement scores.
True to our commitment to nurture a diverse and inclusive work environment in which each person’s unique background and identity is not just acknowledged but celebrated, we aspire to offer enhanced support to employees worldwide. To this end, in 2023, we launched our Global Diversity Survey.16 This annual survey allows individuals to share – on a voluntary basis and in compliance with the legislation of the respective country – personal characteristics, such as their ethnicity, gender identity, sexual orientation, disability status, nationality, military/veteran status, and caregiver status. In 2024, the survey achieved a response rate of 10%. The feedback provided new insights into our understanding of diversity in the workforce, including:
| - | Expressions of pansexuality and self-described gender identities |
| - | The underrepresentation of nationalities, religions, and of people from ethnic backgrounds |
| - | ‘Caregiving,’ which encompasses responsibility for children, parents, grandparents, spouses, or partners, as well as those preparing to become caregivers. |
SAP has 13 employee network groups (ENGs), 17 which are voluntary initiatives. At regular meetings with Executive Board members and other leaders, the ENGs share grassroots level feedback and ideas to improve systemic inclusion.
Diversity & Inclusion
Our Approach and Policies
Our diversity and inclusion (D&I) strategy supports SAP’s corporate goals by fostering innovation and profitability. A diverse workforce produces innovative ideas and solutions, and drives engagement and productivity. This not only strengthens our business; it also helps us serve our global customer base better. By recruiting a diverse workforce, we enhance our reputation, attract top talent, and align with the values of our customers.
The benefits of this comprehensive strategy to SAP include:
| - | Data-driven insights: Data can reveal areas for improvement in product development, marketing strategies, and workforce development programs. |
| - | Employee engagement and productivity: A diverse and inclusive workplace fosters higher employee engagement, leading to increased productivity and better business outcomes. |
| - | Brand reputation and social responsibility: Strong practices which value contributions from a diverse population of employees enhance SAP’s brand image as a responsible and ethical company, attracting socially conscious customers and partners. |
| - | Future-proofing the business: Diversity prepares SAP to adapt to changing demographics and evolving customer expectations in a globalized world. |
For D&I KPIs, we focus on headcount-relevant employees for impact measurement.
The benefits of diversity extend to interns and temporary staff through events, ENGs, and awareness programs.
15 83,042 employees participated in the #Unfiltered survey in June (response rate: 76%) and 77,577 employees participated in the #Unfiltered survey in November (response rate: 70%). All headcount-relevant employees and also (in Germany) non-headcount relevant employees on parental leave, on long-term sick leave, with a tenure of more than six months, PhD students, and vocational trainees were invited to take part in the 2024 #Unfiltered survey cycle. The survey did not include employees at Taulia, LeanIX, or WalkMe.
16 This survey is available for all headcount-relevant employees, except those in Chile, Israel, and Thailand, which do not allow for self-identification.
17 An employee network group (ENG) is a voluntary, employee-led diversity and inclusion initiative that is formally supported by SAP.
36
Our headcount-relevant employees benefit from our various initiatives to create better diverse representation through our wide variety of recruiting sources, development initiatives, and other engagement and retention strategies. Inclusive hiring is pivotal to our journey at SAP, amplifying our capacity for diverse perspectives and propelling our business transformation.
In compliance with legal requirements, we uphold an Equal Employment Opportunity Policy in the United States and Canada. This policy describes the framework in place to ensure equal employment and access to opportunities, respectful treatment of all individuals, and an environment free from unlawful discrimination. It covers all aspects of employment, including selection, job assignment, promotion, transfer, compensation, discipline, layoff, terminations, and access to benefits and training. The policy is governed by the head of HR of North America and the head of HR of Canada.
Diversity & Inclusion (D&I) Narrative
We cover our commitment to the topics of diversity, gender equality, employment, and inclusion of persons with disabilities through our D&I narrative, which is available to all employees on our internal employee portal and externally on our Web site. The narrative below covers our entire workforce, including temporary staff and interns, and is overseen by the chief diversity & inclusion officer.
The Narrative
In striving to be the most inclusive software company in the world, SAP works to reflect a higher standard of business, societal values, and perspectives in all that we do – from maintaining a truly welcoming culture and providing our customers with greater transparency to measure their own progress, to serving our broader communities to develop the next generation of innovators. We believe that through our actions, we can create transformative change toward a more equitable, sustainable, and connected world.
Creating a vibrant and caring environment for our people, where everyone can be their authentic self, is key. Our goal is to take best advantage of all systems and processes to make an impact that positively impacts not only SAP but all its stakeholders. We believe in a future where respect is the hallmark for all, and therefore tailor our initiatives around three pillars: Workforce Diversity, Workplace Inclusion, and Marketplace Leadership.
| – | Workforce Diversity: increasing diversity in the workforce composition at all levels of SAP to appropriately reflect the diversity in society. |
| – | Workplace Inclusion: creating a positive work environment where all colleagues can thrive and engage to their fullest potential in driving SAP’s purpose. |
| – | Marketplace Leadership: extending the impact of diversity and inclusion efforts within the communities we serve. |
As we move forward, our objective is to embed these principles into all parts of our people processes and fundamentally elevate the employee experience. We aim to do this by integrating respect-based perspectives in our strategy through a Global D&I Advisory Council comprised of members from various parts of SAP; and through systemic inclusion by prioritizing people processes such as learning, talent acquisition, benefits and, policies, so that they are inclusive to all. In addition, we will continue to build inclusive features into our products and services in connection with customer demand which will enable us to keep innovating for a better future for all. Our AI Ethics Steering Committee ensures that many safeguards are put in place to avoid discriminatory or biased outcomes.
Energy and Emissions
Our Approach and Policies
For over a decade now, climate action has been at the top of SAP’s corporate sustainability agenda in light of the increasing impacts of climate change and escalating global challenges. We aim to take climate action through our dual approach as enabler and exemplar to help pave the way toward a low-carbon future for our customers, partners, and SAP, and create impact while respecting planetary boundaries.
The following sections describe in detail how we mitigate negative impacts and risks, and how we pursue positive impacts and opportunities through our policies, actions, targets, and metrics.
Our Actions and Targets
Our Targets Related to Climate Change Mitigation
Transition Plan for Climate Change Mitigation
Our net-zero commitment is the cornerstone of our climate change mitigation. Under this commitment, aim to reduce our Gross Greenhouse Gas (GHG) Emissions (market-based) by at least 90% across the relevant value chain by 2030. The net-zero target has been validated and approved by the Science Based Targets initiative (SBTi), which also verified that SAP’s target is compatible with limiting global warming to 1.5°C as advocated by the Paris Agreement .
37
SAP’s ambitious climate change mitigation commitment has been recognized also by the investment market, as demonstrated by SAP’s inclusion in the EU Paris-aligned benchmarks.
Target |
|
Base Year |
|
Target Year |
|
Target Description |
1.5°C-aligned science-based target (SBT) |
|
2023: 6.9 million tons Gross GHG Emissions (market-based) |
|
2030: Reduction of Gross GHG Emissions (market-based) by at least 90%, which corresponds to less than 0.7 million tons (near-term and long-term target) |
|
Reduce SAP’s Gross GHG Emissions (market-based) across our value chain (Scope 1, 2 and 3) by at least 90% to reach net zero by 2030. Remaining residual emissions will be neutralized by a maximum of 10% carbon removals. Scope: GHG Protocol-aligned baseline, including Scope 1, Scope 2 market-based, and all business-relevant Scope 3 value chain emissions. |
We acknowledge the recent reports issued by various companies, including some of our vendors, in which they state that they are reconsidering or adjusting their net-zero targets. In light of these developments, and given the increasing demand for energy due to the widening use of artificial intelligence, we are closely monitoring our progress and evaluating whether we can achieve our net-zero target by 2030 as planned or if we might need to adjust it.
SAP’s decarbonization and transformation plan tackles four main areas:

| – | Cloud transformation: Moving our on-premise solutions to the cloud represents our most important GHG-reduction lever. SAP’s own data centers and colocations are powered with 100% renewable energy.19 We aim to increase the share of renewable energy in our upstream and downstream value chain by working together with our suppliers with a specific focus on our hyperscale providers and customers and by constantly improving the data quality in our GHG emissions calculations (from averages to actuals). |
| – | Upstream supply chain: We are working on reducing supply chain emissions by maintaining strong supplier partnerships and by adjusting and refining internal procurement processes and policies. In this context, we recognize that there are interdependencies with our suppliers and their decarbonization strategies and timelines, which are beyond SAP’s direct control. In addition, the growing demand for energy due to the increasing use of artificial intelligence could have a negative impact on GHG emissions in the upstream supply chain which, due to the advances in this technology, cannot be evaluated fully at this point in time. |
| – | Own operations: We aim to drive real avoidance and reduction of GHG emissions by, for instance, transitioning our car fleet to electric vehicles and strengthening our environmental and energy management system (ISO 14001 and ISO 50001). |
| – | Carbon removals: By investing in nature-based and technical removals, we aim to neutralize any remaining residual GHG emissions by 2030 (maximum: 10% in line with the Science Based Target Initiative standard for net-zero targets). |
In all four areas, leveraging our own solution portfolio is fundamental to improving how we manage and plan our initiatives, resources, and value chain partner relationships to achieve net zero by 2030. When modeling our reduction pathway to 2030, we considered future developments, such as the expected growth of the company and the effects from our cloud strategy. Our transition plan is closely connected to our business model and financial planning according to SAP’s corporate business trajectory and financial forecasts. Doing so ensures that we incorporate estimated company growth and cloud development projections to formulate a comprehensive emissions plan that reflects anticipated developments and considers investments in reducing GHG emissions. Taking this approach allows us to ensure that our climate change mitigation actions are viewed not as separate initiatives but as an integrated element of our financial growth strategy, corporate risk management, technology adoption, and product portfolio development.
By way of these decarbonization levers, SAP envisions that its transformation plan will steadily reduce GHG emissions, with our supply chain and cloud transformation being the biggest drivers. If GHG emissions still remain, SAP plans to leverage removals in line with the SBTi standard as explained above. However, we recognize certain externalities such as some of our vendors reconsidering or adjusting their net-zero targets and the uncertainty of growing energy needs due to the increasing use of artificial intelligence. Therefore, we are closely monitoring our progress and evaluating whether we can achieve our original goal as planned, or if adjustments may be necessary.
18 Expressed in millions of tons of CO2e.
38
19 In addition, we are voluntarily reducing the non-renewable electricity consumption of our hyperscale providers by procuring EACs on their behalf. This is not eligible for our science-based net-zero target and solely contributes to our long-standing commitment to power all our data centers with 100% renewables.
Energy Consumption and Mix
Energy Consumption
in MWh (rounded to 100 MWh) |
|
2024 |
||||
Total Energy Consumption |
|
757,900 |
||||
|
|
Energy from Fossil |
|
Energy from Renewable |
|
Energy from Nuclear |
|
|
Sources |
|
Sources1 |
|
Sources |
Total Energy Consumption |
|
447,900 |
|
310,000 |
|
0 |
Scope 1 |
|
|
|
|
|
|
Fuel consumption from natural gas and other sources |
|
|
|
|
|
|
Stationary combustion2 |
|
92,600 |
|
1,100 |
|
0 |
Mobile combustion from corporate cars (gasoline, diesel) |
|
339,900 |
|
0 |
|
0 |
Mobile combustion from corporate jets (kerosene) |
|
7,900 |
|
0 |
|
0 |
Scope 2 |
|
|
|
|
|
|
Consumption of purchased or acquired electricity |
|
|
|
|
|
|
Electricity in office buildings |
|
0 |
|
112,000 |
|
0 |
Electricity in own data centers |
|
0 |
|
95,200 |
|
0 |
Electricity in colocation data centers |
|
0 |
|
87,700 |
|
0 |
E-mobility electricity |
|
0 |
|
12,700 |
|
0 |
Consumption of purchased or acquired heat, steam, and cooling (district heating) |
|
7,500 |
|
0 |
|
0 |
1 Refers to the consumption of (1) self-generated renewable energy (produced on-site) and (2) the procurement of high-quality EACs.
2 This includes gas and oil heating systems in office buildings (owned and leased) as well as the combustion of diesel in generators and gas in co-generation units / Combined heat and power (CHP) systems. In our CHP system in Walldorf, we also use wood pellets as a renewable source to generate heat.
Share of Energy Consumed |
|
2024 |
|
Share of fossil sources in total energy consumption |
|
59 |
% |
Share of consumption from nuclear sources in total energy consumption |
|
0 |
% |
Share of renewable sources in total energy consumption |
|
41 |
% |
Disaggregation of Renewable Energy (including certificates) Sources (in MWh rounded to 100 MWh) |
|
2024 |
Fuel consumption for renewable energy sources including biomass |
|
1,100 |
Consumption of purchased or acquired electricity, heat, steam and cooling from renewable sources |
|
307,600 |
Consumption of self-generated non-fuel renewable energy |
|
1,300 |
Renewable Electricity
We define renewable electricity as electricity coming from renewable electricity sources such as wind, solar, geothermal, sustainably sourced biomass (including biogas), and sustainable hydropower. As recommended by the Greenhouse Gas Protocol and CDP/RE100, we actively look for the best available quality and standards, which support renewable electricity projects that meet robust criteria in terms of environmental integrity, reporting, and verification. We have defined quality criteria for the procurement of EACs by SAP to drive change in the electricity market and to avoid the risk caused by low-quality products. The key characteristics of our renewable electricity purchasing guidelines are as follows:
Quality Criteria for SAP’s Procurements of EACs
Type of renewable electricity |
|
Currently, SAP considers only solar photovoltaics (PV) and wind for its own renewable electricity sourcing. |
|
Installation |
|
The power plant producing the renewable electricity must not be older than 10 years. Where an old power plant has been renovated, the 10-year rule applies only to the additional electricity output due to increased efficiency. SAP strives to avoid considering EACs from government-supported power plants. |
|
Vintage |
|
The renewable electricity must be produced in the same year or the year preceding the reporting period to which it will be applied. |
|
EKOenergy |
|
All our purchased renewable electricity is EKOenergy-certified, a high-quality, internationally recognized not-for-profit ecolabel for renewable energy installations that fulfill additional sustainability criteria. By purchasing EKOenergy-certified electricity, we also contribute to EKOenergy’s Climate Fund, which finances solar projects tackling energy poverty. |
|
Calculation of Contractual Instruments
For our science-based target (net zero by 2030) baseline, we account for GHG Emissions Scope 2 (market-based) in line with the GHG Protocol Scope 2 Guidance.
SAP proactively purchases contractual instruments such as EACs as credible evidence that we power all our facilities with 100% renewable electricity.
39
We calculate the amount of renewable electricity we use by adding together the amounts of renewable electricity a) produced on site, b) covered by EACs, and c) sourced through local green tariff agreements.
The total of purchased EACs is the sum of all the electricity consumed (excluding self-generated renewable electricity) from all electricity-related Scope 2 categories: electricity in office buildings, electricity in own data centers, electricity in colocation data centers, and e-mobility (2024: 308,000 MWh).
The renewable electricity from EACs is considered only if it is verified by an official certificate or written confirmation from our EAC suppliers (100% data coverage).
For market-based reporting, we apply a region-based approach. Following this approach, we map the electricity our SAP sites consume to defined regions to ensure regional purchasing of EACs.
In 2024, contractual instruments allowed us to reduce our entire GHG Emissions Scope 2 (location-based) related to electricity consumption by 118 kilotons CO2e.
Contractual Instruments |
|
2024 |
|
GHG Emissions Scope 2 (location-based)1 |
|
120 |
|
GHG Emissions Scope 2 (market-based)1 |
|
1 |
|
Percentage of contractual instruments (location-based) |
|
99 |
% |
1 In kilotons CO2e
SAP’s energy contractual instruments can be disaggregated into unbundled and an insignificant portion of bundled instruments. Unbundled instruments allow SAP to claim renewable energy attributes separately from our physical electricity use. Bundled instruments that SAP purchases are green tariffs in selected locations, such as Australia. The percentage of these types of instruments in our strategy is set out in the table below.
Types of Contractual Instruments |
|
2024 |
|
Percentage of contractual instruments of energy bundle with attributes about energy generation |
|
0 |
% |
Percentage of contractual instruments of energy unbundled with energy attributes claims |
|
100 |
% |
Intellectual Property, Proprietary Rights and Licenses
We rely on a combination of the protections provided by applicable statutory and common law rights, including trade secret, copyright, patent, and trademark laws, license and non-disclosure agreements, and technical measures to establish and protect our proprietary rights in our products. For further details on risks related to SAP’s intellectual property rights, see “Item 3. Key Information — Risk Factors — Operational Risks.”
We may be dependent in the aggregate on technology that we license from third parties that is embedded into our products or that we resell to our customers. We have licensed and will continue to license numerous third-party software products that we incorporate into and/or distribute with our existing products. We endeavor to protect ourselves in the respective agreements by obtaining certain rights in case such agreements are terminated.
We are a party to patent cross-license agreements with several third parties.
We are named as a defendant or plaintiff in various legal proceedings for alleged intellectual property infringements. See Note (G.3) to our Consolidated Financial Statements for a more detailed discussion relating to certain of these legal proceedings.
Description of Property
Our principal office is located in Walldorf, Germany, where we own and occupy approximately 405,000 square meters of office and datacenter space including our facilities in neighboring St. Leon-Rot. We also own and lease office space in various other locations in Germany, totaling approximately 190,000 square meters. In approximately 80 countries worldwide, we occupy roughly 1,560,000 square meters. Except for our main office in Germany, most of our office spaces are leased. We also own certain real estate properties in Newtown Square, Palo Alto, and Colorado Springs (United States); Bangalore (India); Sao Leopoldo (Brazil); London (UK); Ra’anana (Israel); Sofia (Bulgaria) and a few other locations.
The office and datacenter space we occupy includes approximately 305,000 square meters in the EMEA region, excluding Germany, approximately 315,000 square meters in North and Latin America, and approximately 345,000 square meters in the APJ Region.
The space is being utilized for various corporate functions including research and development, our data centers, customer support, sales and marketing, consulting, training, and administration. Despite COVID-19 related aftereffects, substantially all our facilities are being fully used or sublet. We started in Q1/2023 with the renovation of our “headquarter building – WDF01” in Walldorf which won’t be usable until completion in early 2027. The footprint of this building is not included in the 2024 numbers above. We have closed our remaining offices in Russia and Belarus (except a small space for the “closure team”). For a disclosure on our non-current assets by geographic region see Note (D.7) to our Consolidated Financial Statements. Also see, “Item 6. Directors, Senior Management and Employees — Employees,” which discusses the numbers of our employees, in FTE’s, by business area and by geographic region, which may be used to approximate the productive capacity of our workspace in each region.
40
We believe that our facilities are in good operating condition and adequate for our present usage. We do not have any significant encumbrances on our properties. We do not believe we are subject to any environmental issues that may affect our utilization of any of our material assets. We continue investing in the Flex Work readiness of our existing properties and where necessary we are undertaking construction activities to increase our capacity for future expansion of our business. We are also reviewing our portfolio to ensure that it covers our office space demands in line with the evolved Hybrid Work Guidance. Our significant construction activities are described below, under the heading “Principal Investments and Divestitures Currently in Progress.”
Investments
Principal Investments Currently in Progress
In 2024, we finalized various construction projects and continued construction activities in several locations. We plan to finance all of these projects from operating cash flow. Our most important projects are listed below.
Construction Projects
€ millions |
|
|
|
|
|
|
|
|
|
|
Country |
|
Location of Facility |
|
Short Description |
|
Estimated Total |
|
Costs Incurred as at |
|
Estimated Completion |
|
|
|
|
|
|
Cost |
|
12/31/2024 |
|
Date |
Germany |
|
Walldorf |
|
General renovation of headquarters building for approx. 1,600 employees |
|
232 |
|
50 |
|
March 2027 |
India |
|
Bangalore |
|
New office building for approx. 3,500 employees |
|
86 |
|
47 |
|
December 2025 |
For more information about our planned investment expenditures, see the Investment Goals section. There were no material divestitures of facilities within the reporting period.
Principal Investments and Divestitures for the Last Three Years
Our principal investments for property, plant, and equipment (other than from business combinations) amounted to € 1,138 million in 2024 (2023: €810 million; 2022 €1,129 million). Principal investments in 2024 for property, plant, and equipment increased compared to 2023. The additions relate primarily to the replacement and purchase of information technology equipment and the construction and leasing of buildings and data centers. For further details related to property, plant, and equipment, see Note (D.4).
Our investments for intangible assets such as acquired technologies and customer relationships amounted to € 591 million in 2024 compared to €560 million in 2023 (2022: €472 million). Our investments allocated to goodwill decreased to €654 million in 2024 from €859 million in 2023 (2022: €560 million). As the initial accounting for the WalkMe business combination is incomplete (for more information, see Note (D.1)), the goodwill added to our single operating segment through the acquisition of WalkMe (€654 million) is provisional. For further details on investments related to acquisitions, see Notes (D.2) and (D.3) to our Consolidated Financial Statements.
For further information regarding the principal markets in which SAP conducts business, including a breakdown of total revenues by category of activity and geographic market for each of the last three years, see “Item 5. Operating and Financial Review and Prospects — Operating Results (IFRS)” of this report.
ITEM 4A. UNRESOLVED STAFF COMMENTS
None.
41
ITEM 5. OPERATING AND FINANCIAL REVIEW AND PROSPECTS
Overview
For information on our principal sources of revenue and how the different types of revenue are classified in our income statement refer to Note (A.1) to our Consolidated Financial Statements.
See “Item 4. Information about SAP — Products, Research & Development, and Services” for a more detailed description of the products and services we offer.
The following discussion is provided to enable a better understanding of our operating results for the periods covered, including:
- the factors that we believe impacted our performance in 2024;
- our outlook for 2024 compared to our 2024 actual performance (non-IFRS);
- a discussion of our operating results for 2024 compared to 2023 and for 2023 compared to 2022;
- the factors that we believe will impact our performance in 2025; and
- our financial targets and prospects.
The preceding overview should be read in conjunction with the more detailed discussion and analysis of our financial condition and results of operations in this Item 5, “Item 3. Key Information — Risk Factors”, “Item 18. Financial Statements”,and Note (D.1).
Economy and the Market
In 2024, friction in global trade weighed on economic growth, as reported by the European Central Bank (ECB) in its most recent Economic Bulletin Issue 1. Dampening exports impaired the global economy and prevented consumption and investment from recovering as fast as expected earlier in the year. This was amplified by geopolitical risks, such as Russia’s war against Ukraine and the conflict in the Middle East. However, according to the ECB, although inflation continued to moderate, upward pressures on prices for services remained. Towards the end of the year, global economic growth became robust with broad-based improvements across sectors, particularly the services sector.
For the euro area, the disinflation process was well on track in 2024, says the ECB. Financing conditions eased, as interest rate cuts made new borrowing gradually less expensive, even though, on the whole, monetary policy remained restrictive. Economic recovery continued more slowly than expected in earlier projections with growth picking up in the third quarter due to one-off factors. Over the year, consumption recovered, and inventories were built-up, while net trade contracted. The services sector expanded, but industrial activity declined, reflecting weak demand, competitiveness losses, and rising uncertainty.
Regarding the Americas region, according to the ECB, economic growth remained robust in the latter half of the year. Strong private demand and government consumption supported stronger economic data in the United States. In contrast, the contribution of U.S. private investment decelerated.
Concerning the APJ region, the ECB finds that economic growth momentum in China strengthened over the year. However, due to lingering weakness in the Chinese real estate sector, the government announced more fiscal support in November.
1 European Central Bank, Economic Bulletin, Issue 8/2024, Publication Date: January 9, 2025.
42
The IT Market
The global IT industry market continued its growth trajectory in 2024, strongly driven by digital transformation initiatives across various sectors. According to International Data Corporation (IDC), a U.S.-based market research firm, “Digital transformation (DX) is the way to expand in industries where substantial investments are proceeding. It is also a way to more efficiently reduce costs and optimize processes. These benefits will help drive DX growth in the double digits over the forecast period.”1
“New digital business is not happening without AI,”2 writes IDC in one of its latest research papers. IDC’s market observers report that artificial intelligence (AI) has become a key priority for business leaders since its arrival in the enterprise sector two years ago. Research shows that planned investment in all types of AI is growing at a much faster rate than that for digital technology overall. These investments are creating strong demand, even though the financial return for AI-related use cases can be hard to quantify initially. IDC summarizes these developments as follows, “AI and its many flavors have started a new technology evolution that is even more pronounced and significant to organizations globally. This ‘AI everywhere’ evolution, which includes all generative AI (GenAI), has been in the early stages of organizational acceptance and experimentation during 2024, with many proof of concepts (POCs) and new products emerging.”3 IDC considers these early stages of acceptance to be a “hyper-experimentation phase” that, it reports, has “dominated the conversations of business and technology leaders in organizations of all sizes, across all industries, and in all countries for the past 18 months.”4
Nevertheless, since generative AI in a business context also requires cloud-based deployments, companies’ willingness to embark on their digital transformation journey to the cloud resulted in continued high growth rates for this operational model in 2024. According to IDC, “The demand for cloud-based ERP software, which continues to be the foundational deployment model in the digital era and AI everywhere world, outpaces that of on-premises and other software solutions.”5
Impact on SAP
Following the significant investments we have made in recent years for our cloud transition, 2024 was another transformative year for SAP. We focused particularly on key growth areas and on scaling revenue and profitability. Despite economic pressure in some regions, especially in developed Europe, SAP’s global market footprint showed resilience and our business performance continued its strong upward trend. The solid cloud gross margin and operating margin (non-IFRS) at year-end are evidence that our focus on operational efficiency paid off. Our ambition announced at the beginning of the year to decouple revenue and expense growth rates has been achieved.
Topline growth drivers were RISE and GROW with SAP, and SAP Business AI, which was part of many new deals this year. Due to the growing demand for greater efficiencies and cost optimization, SAP’s cloud offerings resonated well, as they offer our customers a comprehensive approach to their cloud transition. Our company-wide restructuring program, which was announced in January 2024 and affected approximately 10,000 employees globally, addressed the need to build AI expertise in our workforce, and created efficiency gains.
Spurred on by the fast-paced development of (generative) AI in the market and the willingness of enterprises to leverage this technology in their business processes, SAP provided more than 100 SAP Business AI use cases in 2024. And, by the end of the year, SAP had embedded Joule, the SAP Business AI copilot launched in June 2023, across the whole product portfolio.
We remain vigilant in our execution to sustain growth and pave the way to long-term success.
Performance Against Our Outlook for 2024 (Non-IFRS)
As in previous years, our 2024 operating profit-related goals and published outlook were based on our non-IFRS financial measures at constant currencies. In this section, we therefore discuss performance against our outlook in terms of non-IFRS numbers, unless otherwise stated, (at constant currencies) derived from IFRS measures. The subsequent section about IFRS operating results discusses numbers only in terms of IFRS; thus, the numbers in that section are not expressly identified as IFRS numbers.
Outlook for 2024 (Non-IFRS)
The initial outlook for 2024, based on SAP’s updated non-IFRS definition of profit measures (which, beginning in 2024, include share-based compensation expenses and exclude gains and losses from equity securities (for more information, see the table Comparison of Outlook and Results for 2024)), expected full-year cloud revenue to range between €17.0 billion and €17.3 billion, and cloud and software revenue to range between €29.0 billion and €29.5 billion. Furthermore, we expected operating profit (non-IFRS) to range between €7.6 billion and €7.9 billion, and free cash flow to be approximately €3.5 billion. We expected a full-year 2024 effective tax rate of approximately 32%.20
This initial outlook reflected SAP’s execution of its cloud strategy, which is accelerating cloud growth through the addition of new business and enhanced cloud adoption by current customers, driving SAP closer to its midterm objectives.
In April 2024 and July 2024, SAP confirmed its 2024 outlook for all the key performance indicators specified above.
1 EMEA Digital Transformation Market Forecast, 2024–2028, December 2024, IDC #EUR150281123.
2 IDC FutureScape: Worldwide Digital Business and AI Transformation 2025 Predictions, October 2024, IDC #US52641124.
3 IDC FutureScape: Worldwide Intelligent ERP 2025 Predictions, October 2024, IDC #US51078024.
4 IDC FutureScape: Worldwide IT Industry 2025 Predictions, October 2024, IDC #US51736824.
5 IDC Worldwide Enterprise Resource Planning Applications Software Forecast, 2024–2028: GenAI Revamps Road Maps, December 2024, IDC #US52739624.
20 We do not provide an outlook for the effective tax rate (IFRS) due to the uncertainty and potential variability of gains and losses associated with equity securities, which are reconciling items between the two effective tax rates (non-IFRS and IFRS). These items cannot be provided without unreasonable efforts but could have a significant impact on our future effective tax rate (IFRS).
43
In October 2024, SAP updated its 2024 outlook for cloud and software revenue, operating profit, and free cash flow, revising its expectations for cloud and software revenue upward from the previous range of between €29.0 billion and €29.5 billion at constant currencies to a range of between €29.5 billion and €29.8 billion at constant currencies (2023: €27.64 billion), thereby raising the midpoint by €400 million.
For non-IFRS operating profit, SAP adjusted its expectations upward from the previous range of between €7.6 billion and €7.9 billion at constant currencies to a range of between €7.8 billion and €8.0 billion at constant currencies (2023: €6.78 billion), raising the midpoint by €150 million.
SAP also raised its 2024 outlook for free cash flow from approximately €3.5 billion to a range of between €3.5 billion and €4.0 billion (2023: €5.08 billion).
In October 2024, SAP still expected cloud revenue to range between €17.0 billion and €17.3 billion at constant currencies (2023: €14.06 billion) and the effective tax rate (non-IFRS) to be approximately 32% (2023: 30.3%.)
2024 Actual Revenue and Profit Performance Compared to Outlook (Non-IFRS)
Cloud revenue is within the range of our revised 2024 outlook, with the combined cloud and software and operating profit exceeding the upper end of our outlook range.
Comparison of Outlook and Results for 2024
|
|
|
|
Outlook for 2024 |
|
Outlook |
|
Outlook |
|
Revised Outlook |
|
|
|
|
Results |
|
(Integrated |
|
for 2024 |
|
for 2024 |
|
for 2024 |
|
Results |
|
|
for 2023 |
|
Report 2023) |
|
(Q1 Quarterly Statement) |
|
(Half-Year Report) |
|
(Q3 Quarterly Statement) |
|
for 2024 |
Cloud revenue |
|
€14.06 billion |
|
€17.0 billion |
|
€17.0 billion |
|
€17.0 billion |
|
€17.0 billion |
|
€17.21 billion |
(non-IFRS, at constant currencies) |
|
|
|
to €17.3 billion |
|
to €17.3 billion |
|
to €17.3 billion |
|
to €17.3 billion |
|
|
Cloud and software revenue |
|
€27.64 billion |
|
€29.0 billion |
|
€29.0 billion |
|
€29.0 billion |
|
€29.5 billion |
|
€29.96 billion |
(non-IFRS, at constant currencies) |
|
|
|
to €29.5. billion |
|
to €29.5 billion |
|
to €29.5 billion |
|
to €29.8 billion |
|
|
Operating profit |
|
€6.78 billion |
|
€7.6 billion |
|
€7.6 billion |
|
€7.6 billion |
|
€7.8 billion |
|
€8.23 billion |
(non-IFRS, at constant currencies) |
|
|
|
to €7.9 billion |
|
to €7.9 billion |
|
to €7.9 billion |
|
to €8.0 billion |
|
|
Free cash flow |
|
€5.09 billion |
|
Approx. €3.5 billion |
|
Approx. €3.5 billion |
|
Approx. €3.5 billion |
|
€3.5 billion to €4.0 billion |
|
€4.11 billion |
Effective tax rate (non-IFRS) |
|
30.3% |
|
Approx. 32% |
|
Approx. 32% |
|
Approx. 32% |
|
Approx. 32% |
|
32.3% |
In today’s global economic environment, which is marked by international disruptions and a growing need for AI and data warehousing, the demand for our cloud solutions and services meets or even exceeds our revised forecasts, indicating strong business performance that we expect will drive continued cloud revenue growth.
Our current cloud backlog (contractually committed cloud revenue that we expect to recognize over the upcoming 12 months) reached €18.08 billion at actual currencies (€17.69 billion at constant currencies; 2023: €14.04 billion at constant currencies). This was an increase of 32% (29% on a constant currency basis; 2023: 27%).
On December 31, 2024, our total cloud backlog was up 43% to €63.29 billion (up 40% to €62.08 billion at constant currencies). Around 50% of our cloud order entries in the fourth quarter 2024 included SAP Business AI.
At constant currencies, the resulting cloud revenue grew from €14.06 billion in 2023 to €17.21 billion in 2024, in line with our guidance range of €17.0 billion to €17.3 billion. That represented an increase of 26% at constant currencies.
Cloud and software revenue grew 11% at constant currencies to €29.96 billion (2023: €27.64 billion at constant currencies), and thus ended higher than our revised outlook range for 2024 of €29.5 billion to €29.8 billion.
Total revenue on a constant currency basis grew 10% in 2024 to €34.31 billion (2023: €32.03 billion at constant currencies).
Operating expenses (non-IFRS) on a constant currency basis increased 6% in 2024 to €26.08 billion (2023: €25.25 billion at constant currencies).
Our expenses base in 2024 was impacted by our transformation to a fast-growing cloud business and by share-based compensation. For more information about share-based payments, see the Notes to the Consolidated Financial Statements, Note (B.3).
The cloud gross margin (non-IFRS) for 2024 was 73.3%, increasing 1.4pp at constant currencies year over year. Our cloud margin benefitted from a stronger increase in cloud revenue compared to its associated costs and the completion of the Next-Generation Cloud Delivery initiative in mid-2023 (modernization of our cloud delivery to enable a more resilient and scalable cloud infrastructure).
Our overall headcount increased by 1,519 full-time equivalents, or FTEs (607 thereof organically), primarily in the areas of research & development and cloud.
Non-IFRS operating profit in 2024 was €8.23 billion on a constant currency basis (2023: €6.78 billion at constant currencies), reflecting an increase of 26%. IFRS and non-IFRS operating profit and margin benefitted from a strong performance in SAP’s software licenses and support business and from disciplined execution of the 2024 transformation program.
44
Thus, non-IFRS operating profit came in above the target range (€7.8 billion to €8.0 billion at constant currencies).
We achieved an effective tax rate (non-IFRS) of 32.3%, which is in line with the outlook of approximately 32% (non-IFRS).
Operating Results (IFRS)
This section on operating results (IFRS) discusses results only in terms of IFRS measures.
Our 2024 Results Compared to Our 2023 Results (IFRS)

1 The numbers from 2021 to 2024 reflect continuing operations as a result of the divestiture of Qualtrics.
Total revenue rose from €31,207 million in 2023 to €34,176 million in 2024, representing an increase of €2,968 million, or 10%. This increase was predominantly driven by the revenues generated by our cloud business. Cloud revenue growth was largely due to a rise in the number of customers using multiple SAP solutions, with those using over four SAP solutions more than doubling since 2021 and now accounting for over 20% of our customer base.
Cloud and software revenue represented 87% of total revenue in 2024 (2023: 86%). Services revenue increased 1% from €4,283 million in 2023 to €4,346 million in 2024, which was 13% of total revenue (2023: 14%).
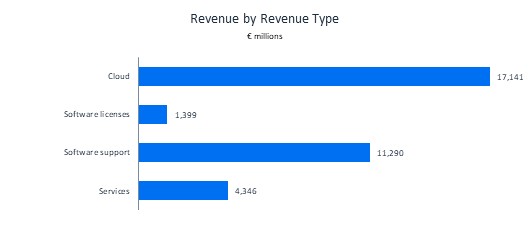
For a detailed description of our revenue types, see the Notes to the Consolidated Financial Statements, Note (A.1).
45
For more information about our regional performance, see the Revenue by Region section.
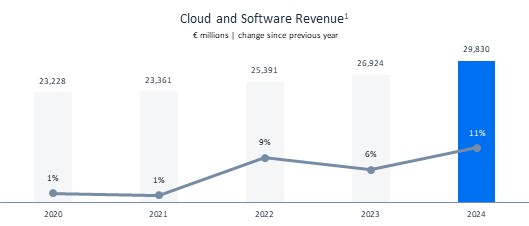
1 The numbers from 2021 to 2024 reflect continuing operations as a result of the divestiture of Qualtrics.
Cloud and software revenue grew from €26,924 million in 2023 to €29,830 million in 2024, representing an increase of 11%.
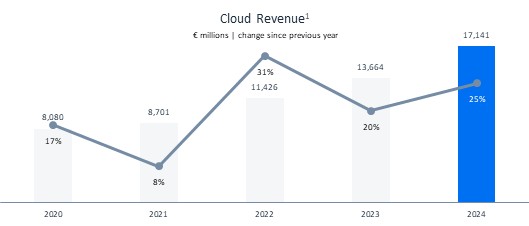
1 The numbers from 2021 to 2024 reflect continuing operations as a result of the divestiture of Qualtrics .
Cloud revenue increased €3,477 million, or 25%, from €13,664 million in 2023 to €17,141 million in 2024, fueled by Cloud ERP Suite revenue, which grew €3,540 million, or 33%, to €14,166 million in 2024 (2023: €10,626 million). Cloud ERP Suite contributed 83% to overall cloud revenue (2023: 78%). Cloud ERP Suite revenue growth benefitted from the accelerated transition of our customers to the cloud. Extension Suite cloud revenue grew from €2,290 million in 2023 to €2,435 million in 2024, representing an increase of 6%. In 2024, the IaaS cloud revenue declined €208 million, or 28%, to €540 million (2023: €748 million). For more information about Cloud ERP Suite, see the Performance Management System section.
The current cloud backlog increased €4,333 million, or 32%, to €18,078 million in 2024 (2023: €13,745 million). Our total cloud backlog increased 43% from €44.25 billion in 2023 to €63.29 billion in 2024.
Our software licenses revenue declined €365 million from €1,764 million in 2023 to €1,399 million in 2024. The continuous decline is in line with our cloud transformation.
The demand for SAP software helped us maintain a stable maintenance customer base for software support, resulting in software support revenue of €11,290 million in 2024 (2023: €11,496 million). The slight decline is attributable to the accelerated transition of our customers to the cloud. SAP Enterprise Support was the largest contributor to our software support revenue.
46
Software licenses and software support revenue decreased €572 million, or 4%, from €13,261 million in 2023 to €12,689 million in 2024.
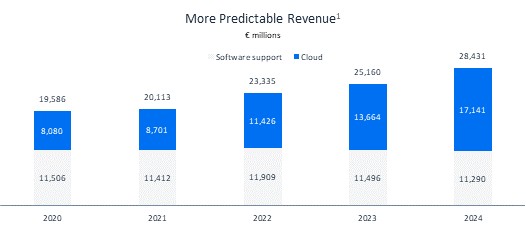
1 The numbers from 2021 to 2024 reflect continuing operations as a result of the divestiture of Qualtrics
We define more predictable revenue as the sum of our cloud revenue and our software support revenue. Our more predictable revenue increased 13%, from €25,160 million in 2023 to €28,431 million in 2024. This increase was predominantly driven by the revenues generated by our cloud business. More predictable revenue accounted for 83% of our total revenue in 2024 (2023: 81%), continuing the upward trend from prior years.
Services revenue increased slightly, by €63 million, or 1%, from €4,283 million in 2023 to €4,346 million in 2024, fueled by consulting revenue and premium support revenue, which increased €99 million, or 3%, from €3,874 million in 2023 to €3,973 million in 2024. In 2024, consulting and premium support revenue contributed 91% of the total services revenue (2023: 90%) and 12% of total revenue (2023: 12%).
Revenue from other services decreased €36 million, or 9%, to €373 million in 2024 (2023: €409 million).
Revenue by Region
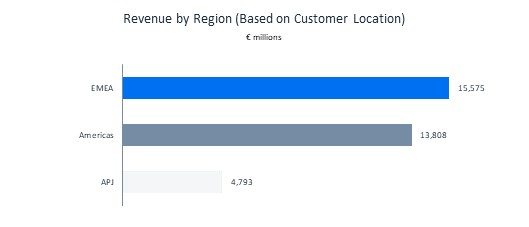
47
EMEA Region
In 2024, the EMEA region generated €15,575 million in revenue (2023: €14,004 million), which was 46% of total revenue (2023: 45%). Revenue in Germany increased 9% to €5,359 million (2023: €4,921 million). Germany contributed 34% (2023: 35%) of all EMEA region revenue. The remaining revenue in the EMEA region was primarily generated in France, Italy, the Netherlands, Switzerland, and the United Kingdom.
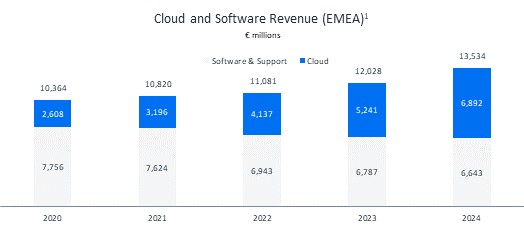
1 The numbers from 2021 to 2024 reflect continuing operations as a result of the divestiture of Qualtrics.
Cloud and software revenue generated in the EMEA region totaled €13,534 million (2023: €12,028 million), which represents 87% of all revenue from the region (2023: 86%). Cloud revenue in the EMEA region rose 32% to €6,892 million in 2024 (2023: €5,241 million). Software licenses and software support revenue decreased 2% to €6,643 million in 2024 (2023: €6,787 million).
Americas Region
In 2024, 40% of our total revenue was generated in the Americas region (2023: 41%). Total revenue in the Americas region increased 8% to €13,808 million (2023: €12,762 million). Revenue in the United States increased to €11,056 million (2023: €10,204 million). The United States contributed 80% (2023: 80%) of all revenue generated in the Americas region. In the remaining countries of the Americas region, revenue increased 8% to €2,752 million. The remaining revenue in the Americas region was primarily generated in Brazil, Canada, and Mexico.
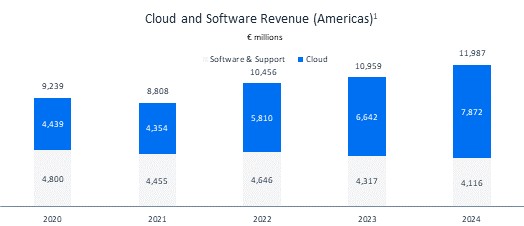
1 The numbers from 2021 to 2024 reflect continuing operations as a result of the divestiture of Qualtrics.
Cloud and software revenue generated in the Americas region totaled €11,987 million (2023: €10,959 million), which represents 87% of all revenue from the region (2023: 86%). Cloud revenue in the Americas region rose 19% to €7,872 million in 2024 (2023: €6,642 million). The United States contributed 80% of cloud revenue generated in the Americas region. Software licenses and software support revenue in the Americas regions amounted to €4,116 million in 2024 (2023: €4,317 million).
48
APJ Region
In 2024, 14% of our total revenue was generated in the APJ region (2023: 14%). Total revenue in the APJ region increased 8% to €4,793 million (2023: €4,441 million). Total revenue in Japan increased to €1,388 million (2023: €1,243 million). Revenue from Japan accounted for 29% of all revenue generated in the APJ region (2023: 28%). In the remaining countries of the APJ region, revenue increased 6%. Revenue in the remaining countries of the APJ region was primarily generated in Australia, China, and India.
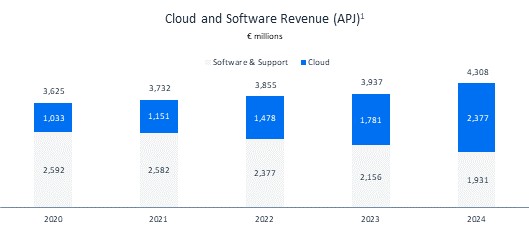
1 The numbers from 2021 to 2024 reflect continuing operations as a result of the divestiture of Qualtrics.
Cloud and software revenue in the APJ region totaled €4,308 million (2023: €3,937 million). That represents 90% of all revenue from the region (2023: 89%). Cloud revenue in the APJ region rose 33% to €2,377 million in 2024 (2023: €1,781 million). Software licenses and software support revenue decreased from €2,156 million in 2023 to €1,931 million in 2024.
Operating Profit and Operating Margin
Operating profit decreased to €4,665 million and operating margin declined 4.9pp to 13.6%. Operating profit was impacted by a reduced contribution from software licenses revenue and from increased total operating expenses.
In 2024, SAP increased its focus on key strategic growth areas, in particular business AI. To this end, as announced in January 2024, SAP is executing a company-wide restructuring program which will conclude in early 2025. In 2024, SAP recognized restructuring expenses amounting to €3,144 million (2023: €215 million). For more information about the 2024 transformation program, see the Notes to the Consolidated Financial Statements, Note (B.6).
Share-based payment expenses rose to €2,385 million (2023: €2,220 million), mainly due to an increase in the SAP share price of more than €95 in 2024 (compared to an increase of more than €40 in 2023) and SAP’s temporarily increased contribution (from 40% to 100% from October to December 2024) to the Own SAP Plan to recognize its employees’ contribution to SAP’s success in 2024. For more information about share-based payments, see the Notes to the Consolidated Financial Statements, Note (B.3).
Furthermore, operating profit was impacted by expenses for sales and marketing initiatives to capture current and future growth opportunities.
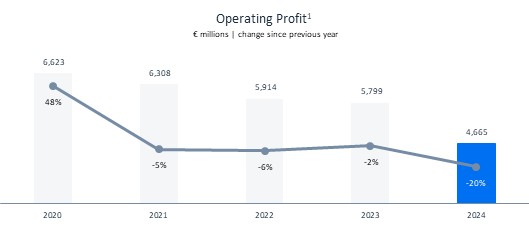
1 The numbers from 2021 to 2024 reflect continuing operations as a result of the divestiture of Qualtrics.
49
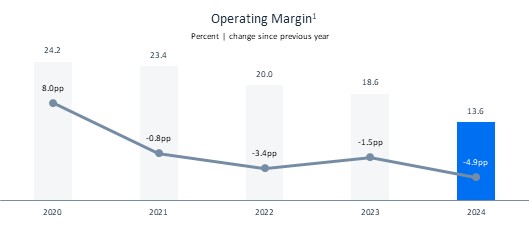
1 The numbers from 2021 to 2024 reflect continuing operations as a result of the divestiture of Qualtrics.
Changes to the individual elements in our cost of revenue were as follows:
Cost of Cloud and Software
Cost of cloud and software consists primarily of costs for deploying and operating cloud solutions, the cost of developing custom solutions that address customers’ specific business requirements, and customer support costs.
Cost of cloud and software benefitted from prior-year investments into the Next Generation Cloud Delivery campaign, which entailed the modernization of our cloud delivery to enable a more resilient and scalable cloud infrastructure and ended mid-2023.
In 2024, the cost of cloud and software increased 12% to €5,922 million (2023: €5,267 million) and our cloud margin increased 1.2pp from 71.6% in 2023 to 72.8% in 2024, based on strong revenue growth paired with a slower growth in cost of cloud due to a scalable cloud infrastructure and operational efficiency. The software licenses and software support margin was 90.1% in 2024, 0.5pp above the prior-year level (2023: 89.6%). Software licenses and software support revenue decreased 4% to €12,689 million (2023: €13,261 million), primarily attributable to a 21% decline in software license revenue. Software licenses and software support costs decreased 9% year over year to €1,262 million (2023: €1,383 million).
Cost of Services
Cost of services consists primarily of the cost of consulting, premium services, and training courses, and the cost of bought-in consulting and training resources. The cost of services decreased 3% to €3,321 million (2023: €3,407 million). Our gross margin on services, which is defined as services profit as a percentage of services revenue, increased 3.1pp to 23.6% (2023: 20.5%). As our services business trends away from traditional software licensing and consulting revenue toward more subscription revenue from cloud solutions, we continue to adjust our service delivery resources to support our cloud offerings.
Research and Development
Our research and development (R&D) expense consists primarily of the personnel cost of our R&D employees, costs incurred for independent contractors whom we retain to assist in our R&D activities, data center infrastructure used for R&D activities, and depreciation of the computer hardware and amortization of the software we use for our R&D activities.
The R&D expense rose 3% to €6,514 million in 2024 from €6,324 million in 2023. This increase was mainly due to higher personnel costs driven by higher share-based payment expenses. R&D expense as a percentage of total revenue decreased to 19.1% in 2024 (2023: 20.3%). For more information, see the Our Investments in Innovation section.
Sales and Marketing Expense
Sales and marketing expense consists mainly of personnel costs, direct sales costs, and the cost of marketing our products and services.
Our sales and marketing expense grew 3% from €8,828 million in 2023 to €9,090 million in 2024. This increase is mainly attributable to several marketing initiatives to capture current and future growth opportunities.
The ratio of sales and marketing expense to total revenue, expressed as a percentage, decreased 1.7pp in 2024 to 26.6% (2023: 28.3%).
50
General and Administration Expense
Our general and administration expense consists mainly of personnel costs to support our finance and administration, human resources, and corporate functions.
General and administration expense increased 5% from €1,364 million in 2023 to €1,435 million in 2024. This increase is primarily due to higher personnel expenses in 2024, the majority thereof due to higher share-based payment expenses. The ratio of general and administration expense to total revenue decreased 0.2pp year over year to 4.2% (2023: 4.4%).
Segment Information
At the end of 2024, SAP had one operating segment. In January 2025, SAP announced several organizational changes. As a result of these, SAP is currently assessing a separate operating segment for the services function within the Customer Services & Delivery (CS&D) Board Area, led by Thomas Saueressig.
For more information about our segment reporting, see the Notes to the Consolidated Financial Statements, Note (C.1) and Note (C.2). For more information about our operating performance, see the Operating Results (IFRS) section.
Financial Income, Net
Financial income, net, improved to €398 million (2023: –€456 million). Our finance income was €1,429 million (2023: €857 million) and our finance costs were €1,031 million (2023: €1,313 million).
Finance income primarily consists of interest income on investments in the amount of €631 million (2023: €486 million), of gains from IFRS 9-related fair value adjustments, mainly of Sapphire Ventures investments, and of the disposal of equity securities totaling €779 million (2023: €380 million).
Finance costs mainly consist of interest expense on financial liabilities and from derivative instruments amounting to €545 million (2023: €639 million), and of IFRS 9-related fair value adjustments or losses from disposal of Sapphire Ventures investments totaling €316 million (2023: €525 million). For more information about financing instruments, see the Notes to the Consolidated Financial Statements, Note (D.1) and Note (E.3).
Income Taxes
The effective tax rate in 2024 was 33.9% (2023: 32.6%). The year-over-year increase mainly resulted from a temporary inability to offset withholding taxes in Germany due to tax losses in 2024 resulting from restructuring. This effect was partly compensated by changes in tax exempt income. For more information about income taxes, see the Notes to the Consolidated Financial Statements, Note (C.5).
Our 2023 Results Compared to Our 2022 Results (IFRS)
Total Revenue
Total revenue increased from €29,520 million in 2022 to €31,207 million in 2023, representing an increase of €1,688 million, or 6%.
Cloud and software revenue represented 86% of total revenue in 2023 (2022: 86%). Service revenue increased 4% from €4,128 million in 2022 to €4,283 million in 2023, which was 14% of total revenue (2022: 14%).
For more information about our regional performance, see the Revenue by Region section.
Cloud and Software Revenue
Cloud and software revenue grew from €25,391 million in 2022 to €26,924 million in 2023, an increase of 6%.
Cloud Revenue
Cloud revenue increased €2,238 million, or 20%, from €11,426 million in 2022 to €13,664 million in 2023. Cloud revenue growth benefitted from the accelerated transition of our customers to the cloud. The transactional cloud revenue remained approximately at the level of the previous year. Cloud revenue for Cloud ERP Suite increased 29%, or €2,417 million, to €10,626 million in 2023 (2022: €8,209 million). The current cloud backlog increased €2,721 million, or 25%, to €13,745 million in 2023 (2022: €11,024 million).
Software Licenses and Support
Our software licenses revenue declined €292 million from €2,056 million in 2022 to €1,764 million in 2023.
The demand for SAP software helped us maintain a stable maintenance customer base for software support, resulting in software support revenue of €11,496 million in 2023 (2022: €11,909 million). The slight decline is attributable to the accelerated transition of our customers to the cloud and to unfavorable currency exchange rates. SAP Enterprise Support was the largest contributor to our software support revenue.
Software licenses and software support revenue decreased €705 million, or 5%, from €13,965 million in 2022 to €13,261 million in 2023.
51
We define more predictable revenue as the sum of our cloud revenue and our software support revenue. Our more predictable revenue increased from €23,335 million in 2022 to €25,160 million in 2023. Cloud revenue surpassed support revenue in 2023 and drove the growth of 7%. More predictable revenue accounted for 81% of our total revenue in 2023 (2022: 79%), continuing the upward trend from prior years.
Services Revenue
Services revenue increased €155 million, or 4%, from €4,128 million in 2022 to €4,283 million in 2023. This increase was predominantly caused by very strong growth across the entire services portfolio of offerings with accelerated growth in our premium support revenues. At the same time, the revenue development was positively impacted by a year-over-year increase in order entry.
Consulting revenue and premium support revenue increased €165 million, or 4%, from €3,709 million in 2022 to €3,874 million in 2023. In 2023, consulting and premium support revenue contributed 90% of the total services revenue (2022: 90%) and 12% of total revenue (2022: 13%).
Revenue from other services decreased €10 million, or 2%, to €409 million in 2023 (2022: €419 million).
Revenue by Region
EMEA Region
In 2023, the EMEA region generated €14,004 million in revenue (2022: €12,909 million), which was 45% of total revenue (2022: 44%). Revenue in Germany increased 10% to €4,921 million (2022: €4,469 million). Germany contributed 35% (2022: 35%) of all EMEA region revenue. The remaining revenue in the EMEA region was primarily generated in France, Italy, the Netherlands, Switzerland, and the United Kingdom.
Cloud and software revenue generated in the EMEA region totaled €12,028 million (2022: €11,081 million). That was 86% of all revenue from the region (2022: 86%). Cloud revenue in the EMEA region rose 27% to €5,241 million in 2023 (2022: €4,137 million). Software licenses and software support revenue decreased 2% to €6,787 million in 2023 (2022: €6,943 million).
Americas Region
In 2023, 41% of our total revenue was generated in the Americas region (2022: 41%). Total revenue in the Americas region increased 4% to €12,762 million (2022: €12,227 million). Revenue in the United States increased to €10,204 million (2022: €9,799 million). The United States contributed 80% (2022: 80%) of all revenue generated in the Americas region. In the remaining countries of the Americas region, revenue increased 5% to €2,558 million. Revenue in the remaining countries of the Americas region was generated primarily in Brazil, Canada, and Mexico.
Cloud and software revenue generated in the Americas region totaled €10,959 million (2022: €10,456 million). That was 86% of all revenue from the region (2022: 86%). Cloud revenue in the Americas region rose 14% to €6,642 million in 2023 (2022: €5,810 million). The United States contributed 81% of cloud revenue generated in the Americas region. Software licenses and software support revenue in the Americas regions amounted to €4,317 million in 2023 (2022: €4,646 million).
APJ Region
In 2023, 14% of our total revenue was generated in the APJ region (2022: 15%). Total revenue in the APJ region increased 1% to €4,441 million (2022: €4,384 million) despite unfavorable changes in currency exchange rates for SAP. Total revenue in Japan increased to €1,243 million (2022: €1,218 million). Revenue from Japan accounted for 28% of all revenue generated in the APJ region (2022: 28%). In the remaining countries of the APJ region, revenue increased 1%. Revenue in the remaining countries of the APJ region was generated primarily in Australia, China, and India.
Cloud and software revenue in the APJ region totaled €3,937 million (2022: €3,855 million). That was 89% of all revenue from the region (2022: 88%). Cloud revenue in the APJ region rose 21% to €1,781 million in 2023 (2022: €1,478 million). Software licenses and software support revenue decreased from €2,377 million in 2022 to €2,156 million in 2023.
Operating Profit and Operating Margin
Operating profit decreased to €5,799 million and operating margin decreased 1.5pp to 18.6%. Operating profit was impacted by a reduced contribution from software licenses revenue and from increased total operating expenses. Share-based payment expenses increased to €2,220 million (2022: €1,431 million), mainly due to an increase in the SAP share price of more than €40 from January 1, 2023, to December 31, 2023 (January 1, 2022, to December 31, 2022: drop in the SAP share price of around €30). A shorter contract life for on-premise support contracts led to accelerated amortization of costs related to these contracts, resulting in higher amortization expenses amounting to €121 million for 2023 (2022: €0 million). Furthermore, higher personnel costs were driven by higher bonus expenses prompted by strong revenue growth and robust attainment of other bonus measures. In addition, the recognition of a provision for fines in regard to anti-bribery matters led to expenses of €155 million in 2023 (2022: €0 million). Operating profit was also impacted by investments in the Next-Generation Cloud Delivery campaign and in other research and development and sales and marketing initiatives to capture current and future growth opportunities. Next-Generation Cloud Delivery from SAP is the modernization of our cloud delivery to enable a more resilient and scalable cloud infrastructure and ended mid-2023.
52
Due to a change in presentation of gains and losses from minor divestitures, not qualifying as discontinued operations, a loss of € 12 million for 2023, and a gain of €176 million for 2022 are presented under other non-operating income/expense instead of other operating income/expense, net. The Operating expense and profit figures presented in this section are restated accordingly.
Changes to the individual elements in our cost of revenue were as follows:
Cost of Cloud and Software
In 2023, the cost of cloud and software increased 8% to €5,267 million (2022: €4,883 million) and our cloud margin increased 2.2pp from 69.4% in 2022 to 71.6% in 2023, based on strong revenue growth paired with a slower growth in cost of cloud due to a scalable cloud infrastructure and operational efficiency. The software licenses and software support margin was 89.6%, 0.5pp below the prior-year level (2022: 90.1%). Software licenses and software support revenue decreased 5% to €13,261 million (2022: €13,965 million), primarily attributable to a 14% decline in software revenue. Software licenses and software support costs remained relatively constant year over year at €1,383 million (2022: €1,384 million).
Cost of Services
The cost of services increased 8% to €3,407 million (2022: €3,155 million), in line with increased demand for project consulting and premium engagement services as well as higher business travel costs as COVID-related travel restrictions further eased around the world. Our gross margin on services, defined as services profit as a percentage of services revenue, decreased 3.1pp to 20.5% (2022: 23.6%). As our services business trends away from traditional software licensing and consulting revenue toward more subscription revenue from cloud solutions, we continue to adjust our service delivery resources to support our cloud offerings.
Research and Development
The R&D expense rose 4% to €6,324 million in 2023 from €6,080 million in 2022. This increase was mainly due to higher personnel costs driven by a 3% year-over-year growth in our R&D headcount for additional capacity demands in relation to the increased revenue. The R&D expense was also impacted by several initiatives to capture current and future growth opportunities. R&D expense as a percentage of total revenue decreased to 20.3% in 2023 (2022: 20.6%). For more information, see the Our Investments in Innovation section.
Sales and Marketing Expense
Our sales and marketing expense grew 11% from €7,946 million in 2022 to €8,828 million in 2023. This increase is mainly attributable to higher personnel costs due to higher bonus payments prompted by strong revenue growth. In addition, travel costs for sales teams increased as COVID-related global travel restrictions accelerated to ease.
Accordingly, the ratio of sales and marketing expense to total revenue, expressed as a percentage, increased 1.4pp in 2023 to 28.3% (2022: 26.9%).
General and Administration Expense
General and administration expense increased 6% from €1,289 million in 2022 to €1,364 million in 2023. This increase is primarily due to higher personnel expenses in 2023, the majority thereof due to higher bonus payments. The ratio of general and administration expense to total revenue was flat year over year at 4.4% (2022: 4.4%).
Segment Information
At the end of 2024, SAP had one operating segment. As result of the organizational changes in the first quarter of 2025, SAP is currently assessing a separate operating segment for the services function within the Customer Services & Delivery (CS&D) Board area, led by Thomas Saueressig.
For more information about our segment reporting, see the Notes to the Consolidated Financial Statements, Note (C.1) and Note (C.2). For more information about our operating performance, see the sections above in the Our 2023 Results Compared to Our 2022 Results (IFRS) chapter.
Financial Income, Net
Financial income, net, increased to –€456 million (2022: –€1,389 million). Our finance income was €857 million (2022: €811 million) and our finance costs were €1,313 million (2022: €2,200 million).
Finance income primarily consists of interest income on investments in the amount of €486 million (2022: €193 million) and gains from IFRS 9-related fair value adjustments, mainly of Sapphire Ventures investments, and the disposal of equity securities totaling €380 million (2022: €608 million).
Finance costs mainly consist of interest expense on financial liabilities and from derivative instruments (including a forward contract to hedge the USD purchase price from the Qualtrics sale against EUR-USD fluctuations. This forward contract matured in the second quarter of 2023 with a total realized loss of €91 million, of which €106 million was recognized in finance costs) amounting to €639 million (2022: €272 million), and IFRS 9-related fair value adjustments or losses from disposal of Sapphire Ventures investments totaling €525 million (2022: €1,802 million). For more information about financing instruments, see the Notes to the Consolidated Financial Statements, Note (D.1) and Note (E.3).
53
Income Taxes
The effective tax rate in 2023 was 32.6% (2022: 32.0%). The year-over-year increase mainly resulted from changes in valuation allowances on deferred tax assets, in non-deductible expenses and withholding taxes, which were partly compensated by changes in tax-exempt income, mainly related to Sapphire Ventures. For more information about income taxes, see the Notes to the Consolidated Financial Statements, Note (C.5).
Foreign Currency Exchange Rate Exposure
Although our reporting currency is the euro, a significant portion of our business is conducted in currencies other than the euro. Since the Group’s entities usually conduct their business in their respective functional currencies, our risk of exchange rate fluctuations from ongoing ordinary operations is not considered significant. However, occasionally we generate foreign-currency-denominated receivables, payables, and other monetary items by transacting in a currency other than the functional currency; to mitigate the extent of the associated foreign currency exchange rate risk, a significant portion of these transactions is hedged. For more information about foreign currencies and our hedging activities, see Note (F.1) and Note (IN.1).
Approximately 71% of our total revenue in 2024 (2023: 71%) was attributable to operations in non-euro participating countries. We translated that revenue into euros for financial reporting purposes. Fluctuations in the exchange rate of the euro had an unfavorable impact of € 135 million on our total revenue for 2024, an unfavorable impact of €826 million on our total revenue for 2023 and a favorable impact of €1.620 million on our total revenue for 2022.
The impact of foreign currency exchange rate fluctuations discussed in the preceding paragraph is calculated by translating current period figures in local currency to euros at the monthly average exchange rate for the corresponding month in the prior year. Our revenue analysis, included within the “Operating Results” section of Item 5, discusses at times the effect of currency movements which are calculated in the same manner.
Liquidity and Capital Resources
Finances (IFRS)
Overview
Global Financial Management
We use global centralized financial management to control liquid assets and monitor exposure to interest rates and currencies. The primary aim of our financial management is to maintain liquidity in the Group at a level that is adequate to meet our financial obligations at all times. Most SAP entities have their liquidity managed centrally by the Group, so that liquid assets across the Group can be consolidated, monitored, and invested in accordance with Group policy. High levels of liquid assets help keep SAP flexible, sound, and independent. In addition, various credit facilities are currently available for additional liquidity, if required. For more information about these facilities, see the Credit Facilities section.
We manage credit, liquidity, interest rate, equity price, and foreign exchange rate risks on a Group-wide basis. We use selected derivatives exclusively for this purpose and not for speculation, which is defined as entering into a derivative instrument for which we do not have corresponding underlying transactions. The rules for the use of derivatives and other rules and processes concerning the management of financial risks are documented in our Treasury Guideline, which applies globally to all companies in the Group. For more information about the management of each financial risk and about our risk exposure, see the Notes to the Consolidated Financial Statements, Note (F.1) and Note (F.2).
Capital Structure Management
The primary objective of our capital structure management is to maintain a strong financial profile for investor, creditor, and customer confidence, and to support the growth of our business. We seek to maintain a capital structure that will enable us to cover our funding requirements through the capital markets at reasonable conditions, and in so doing, ensure a high level of independence, and financial flexibility. For more information about the capital structure and its analysis, see the Notes to the Consolidated Financial Statements, Note (E.1).
The long-term credit rating for SAP SE is “A+” by S&P Global Ratings (stable outlook). Moody’s upgraded our credit rating to “A1” (stable outlook) on March 20, 2024.
On May 16, 2023, SAP announced a new share repurchase program with an aggregate volume of up to €5 billion and a term until December 31, 2025. As at December 31, 2024, SAP had repurchased 10,865,684 shares at an average price of €188.19, with a purchased volume of approximately €2 billion under the program in 2024. Since the start of the program, SAP has repurchased 18,429,480 shares at an average price of €162.46, resulting in a purchased volume of approximately €3 billion.
54
Liquidity Management
Our primary source of cash, cash equivalents, and current investments is funds generated from our business operations. Over the past several years, our principal use of cash has been to support operations and our capital expenditure requirements resulting from our growth, to quickly repay financial debt, to acquire businesses, to pay dividends on our shares, and to buy back SAP shares on the open market. On December 31, 2024, our cash, cash equivalents, and current investments were primarily held in euros and U.S. dollars. We generally invest only in the financial assets of issuers or funds with a minimum credit rating of BBB, and pursue a policy of cautious investment characterized by wide portfolio diversification with a variety of counterparties, predominantly short-term investments, and standard investment instruments. Our investments in financial assets of issuers with a credit rating lower than BBB were not material in 2024.
We believe that our liquid assets combined with our undrawn credit facilities are sufficient to meet our operating financing needs in 2025 and, together with expected cash flows from operations, will support debt repayments, currently planned capital expenditure requirements, and capital returns to our shareholders over the near term and medium term. It may also be necessary to enter into financing transactions when additional funds are required that cannot be wholly sourced from free cash flow, to maintain flexibility, and/or limit repayment risk.
Therefore, we continuously monitor funding options available in the capital markets and trends in the availability of funds, as well as the cost of such funding. In recent years, we were able to repay additional debt within a short period of time due to our persistently strong free cash flow. For more information about the financial debt, see the Cash Flows and Liquidity section.
For further information about our planned capital expenditures see Investment Goals and Goals for Liquidity and Finance section. See Note (D.6) and Note (D.8) for our capital contribution commitments and purchase obligations respectively and Note (F.1) for lease and other financial liabilities.
As of December 31, 2024, €414 million of our other non-current non-financial liabilities have a maturity between 1 and 5 years and €335 million have a maturity of more than 5 years. €286 million of our derivative financial liabilities have a maturity of less than 1 year and €339 million have a maturity between 1 and 5 years. €69 million of our derivative financial liabilities have a maturity of more than 5 years.
As of December 31, 2023, €336 million of our other non-current non-financial liabilities have a maturity between 1 and 5 years and €362 million have a maturity of more than 5 years. €220 million of our derivative financial liabilities have a maturity of less than 1 year and €420 million have a maturity between 1 and 5 years. €127 million of our derivative financial liabilities have a maturity of more than 5 years.
The timing of payments for the contractual obligations is based on payment schedules for those obligations where set payments exist. For other obligations with no set payment schedules, estimates for the most likely timing of cash payments have been made. The ultimate timing of these future cash flows may differ from these estimates. We do not believe we have forms of material off-balance sheet arrangements that would require disclosure other than those already disclosed.
Financial Debt
Financial debt is defined as the nominal volume of bank loans, commercial paper, private placements, and bonds.
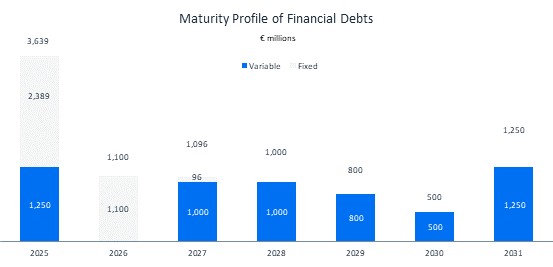
The nominal volume of financial debt on December 31, 2024, included amounts in euros (€9,385 million) and U.S. dollars (€96 million). On December 31, 2024, approximately 62% of the financial debt was held at variable interest rates, partially swapped from fixed into variable using interest rate swaps.
For information about the intended repayments, see the goals for liquidity and finance in the Financial Targets and Prospects section.
55
Financial Debt by Instrument
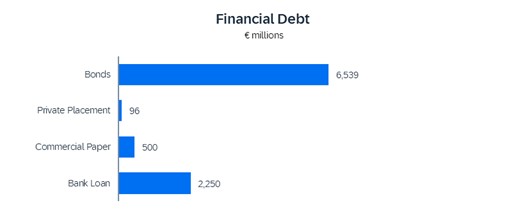
For more information about our financial debt, see the Notes to the Consolidated Financial Statements, Note (E.3).
Cash Flows and Liquidity
2024 Actual Cash Flow and Liquidity Performance Compared to Outlook
We met or exceeded the revised outlook for 2024.
€ billions |
|
2023 Results |
|
2024 Outlook1 |
|
2024 Results |
Free cash flow |
|
5.09 |
|
3.5 to 4.0 |
|
4.11 |
1 The 2024 outlook was communicated in January 2024 and revised in October 2024. The 2024 outlook numbers above reflect the revised outlook from October 2024.
Group Liquidity and Net Liquidity/Net Debt
€ millions |
|
2024 |
|
2023 |
|
∆ |
Cash and cash equivalents |
|
9,609 |
|
8,124 |
|
1,485 |
Current time deposits and debt securities |
|
1,471 |
|
3,151 |
|
-1,680 |
Group liquidity |
|
11,080 |
|
11,275 |
|
-195 |
Current financial debt |
|
-3,639 |
|
-1,143 |
|
-2,496 |
Non-current financial debt |
|
-5,746 |
|
-6,612 |
|
866 |
Financial debt |
|
-9,385 |
|
-7,755 |
|
-1,631 |
Net liquidity (+)/net debt (–) |
|
1,695 |
|
3,521 |
|
-1,825 |
Lease liabilities |
|
-1,715 |
|
-1,621 |
|
-93 |
Net liquidity (+)/net debt (–) including lease liabilities |
|
-19 |
|
1,899 |
|
-1,919 |
Group liquidity consists of cash and cash equivalents (for example, cash at banks, money market funds, and time deposits with original maturities of three months or less) and current investments (for example, time deposits and debt securities with original maturities of greater than three months, and remaining maturities of less than one year included in current other financial assets). Group liquidity on December 31, 2024, primarily comprised amounts in euros and U.S. dollars.
The net decrease in group liquidity compared to 2023 is mainly due to payouts from our restructuring program and the share buyback program, which were mainly offset by higher net borrowings.
Net liquidity/net debt is group liquidity less financial debt. For more information about our liquidity, see the Notes to the Consolidated Financial Statements, Note (E.3).
For more information about the impact of cash, cash equivalents, current investments, and our financial liabilities on our income statements, see the analysis of our financial income, net, in the Operating Results (IFRS) section.
56
Development of Net Debt
|
|
|
|
2024 |
|
2023 1 |
Net liquidity (+)/net debt (–) 12/31/2023 (PY: 12/31/2022) |
|
Free Cash Flow |
|
3,521 |
|
-2,070 |
Net cash flows from operating activities – continuing operations |
|
4,113 |
|
5,220 |
|
6,210 |
Capital expenditure |
|
|
|
-797 |
|
-785 |
Lease payments |
|
|
|
-310 |
|
-332 |
Business combinations |
|
|
|
-1,114 |
|
-1,168 |
Dividends |
|
|
|
-2,565 |
|
-2,395 |
Treasury shares |
|
|
|
-2,106 |
|
-949 |
Net proceeds from Qualtrics sale |
|
|
|
0 |
|
5,510 |
Other |
|
|
|
-155 |
|
-500 |
Net liquidity (+)/net debt (–) 12/31/2024 (PY: 12/31/2023) |
|
|
|
1,695 |
|
3,521 |
1 Net debt as at December 31, 2022 includes continuing and discontinued operations, net liquidity/net debt as at December 31, 2023 only includes continuing operations.
Analysis of Consolidated Statements of Cash Flows
€ millions |
|
Years ended December 31, |
|
∆ in % |
|
∆ in % |
||||
|
|
2024 |
|
2023 |
|
2022 |
|
2024 vs. 2023 |
|
2023vs. 2022 |
Net cash flows from operating activities |
|
5,220 |
|
6,210 |
|
5,675 |
|
-16 |
|
9 |
Net cash flows from investing activities |
|
-656 |
|
-4,603 |
|
699 |
|
-86 |
|
<-100 |
Net cash flows from financing activities |
|
-3,412 |
|
-7,758 |
|
-6,074 |
|
-56 |
|
28 |
Analysis of Consolidated Statements of Cash Flows: 2024 compared to 2023
In 2024, cash inflows from operating activities decreased €990 million to €5,220 million (2023: €6,210 million). This is particularly due to significantly higher restructuring payouts (€2.5 billion in 2024 compared to €0.2 billion in 2023), increased share-based payments (€1.3 billion in 2024 compared to €1.1 billion in 2023), and higher income tax payments of €2.3 billion in 2024 (€2.2 billion in 2023). Prepayments to suppliers and to the tax authorities increased €0.3 billion in 2024. Cash collected from customer contracts increased in 2024, driven by continued revenue growth, improved collection effectiveness, and approximately €0.2 billion in customer payments before the due date in late December. In 2024, we discontinued the SAP-triggered financing (2023: €0.2 billion).
Cash outflows from investing activities totaled €656 million in 2024, compared to €4,603 million in 2023. We decreased our short-term time deposits and debt instruments by €1.7 billion in 2024 (2023: increased by €2.5 billion). We paid €1.1 billion, net of cash received, in 2024, chiefly to acquire WalkMe, compared to €1.2 billion in 2023, which was mainly used for the acquisition of LeanIX. Capital expenditure on intangible assets and property, plant, and equipment remained at €0.8 billion (€0.8 billion in 2023). For more information about current and planned capital expenditures, see the Investment Goals section.
In 2024, free cash flow (for the definition, see the Performance Management System section) decreased to €4,113 million (2023: €5,093 million). The free cash flow conversion rate, defined as free cash flow as a percentage of profit after tax, decreased to 131% (2023: 141%). Since December 2024, our forecasted exposure hedging strategy is aimed at reducing volatility from foreign currency fluctuations on the forecasted Free Cash Flow (FCF) of a calendar year. For more information, see the Notes to the Consolidated Financial Statements, Note (F.1).
Net cash outflows from financing activities were €3,412 million in 2024, compared to €7,758 million in 2023. In September 2024, SAP secured a short-term loan of €1.25 billion to finance the WalkMe acquisition, with flexible repayment terms through September 2025. In December 2024, SAP raised a total of €1 billion via bilateral credit lines with a term of one year as well as €0.5 billion via two commercial paper tranches of €0.25 billion each. Additionally, we repurchased shares with a volume of €2.1 billion in 2024 as part of our share buyback program. Apart from the buyback of shares, cash outflows in 2024 resulted from the repayment of €0.85 billion in Eurobonds, and US$0.32 billion in U.S. private placements upon maturity. In 2023, we repurchased shares worth €0.95 billion as part of the share buyback program. Further cash outflows in 2023 resulted from the repayment of €1.6 billion in Eurobonds, €1.45 billion in loans, and €0.93 billion in commercial paper upon maturity.
In 2024, we distributed €2,565 million in dividends, compared to €2,395 million in the previous year.
Analysis of Consolidated Statements of Cash Flows: 2023 Compared to 2022
In 2023, cash inflows from operating activities increased €535 million to €6,210 million (2022: €5,675 million). This is particularly due to higher profitability, improvements in working capital, lower share-based payments (€1.1 billion in 2023 compared to €1.2 billion in 2022), and higher net interest received (€0.1 billion in 2023 compared to €0.1 billion net interest paid in 2022), which were compensated by higher income tax payments (€2.2 billion in 2023 compared to €1.6 billion in 2022) and higher restructuring payouts (€0.2 billion in 2023 compared to €0.1 billion in 2022). In addition, the decreased volume of trade receivables sold in 2023 amounting to €0.6 billion (€0.9 billion in 2022) affected operating cash flow. Cash collected from customer contracts increased compared to 2022.
57
Cash outflows from investing activities were €4,603 million in 2023, compared to €699 million cash inflows in 2022. We increased short-term time deposits and debt instruments by €2.5 billion. We paid, net of cash received, a total of €1.2 billion mainly for the LeanIX acquisition in 2023, compared to €0.7 billion mainly for the Taulia and Askdata acquisitions in 2022. We received, net of taxes paid, approximately €5.5 billion for the divestiture of Qualtrics in 2023. Capital expenditure on intangible assets and property, plant, and equipment decreased to €0.8 billion (€0.9 billion in 2022). For more information about current and planned capital expenditures, see the Investment Goals section.
In 2023, free cash flow (for the definition, see the Performance Management System section) increased to €5,093 million (2022: €4,388 million). The free cash flow conversion rate, defined as free cash flow as a percentage of profit after tax, decreased to 141% (2022: 143%).
Net cash outflows from financing activities were €7,758 million in 2023, compared to €6,074 million in 2022. The buyback of treasury shares with a volume of €0.95 billion in 2023 is included herein. Apart from the buyback of treasury shares, cash outflows in 2023 resulted from the repayment of €1.6 billion in Eurobonds, €1.45 billion in loans, and €0.93 billion in commercial paper when they matured. In 2022, we bought back treasury shares with a volume of €1.5 billion. Further cash outflows in 2022 resulted from the repayment of €0.9 billion in Eurobonds and US$0.445 billion in U.S. private placements when they matured.
The dividend payment made in 2023 was €2,395 million compared to €2,865 million paid the preceding year.
Credit Facilities
Other sources of liquidity are available to us through various credit facilities, if required.
To retain high financial flexibility, SAP SE entered into a €3 billion syndicated revolving credit facility on March 8, 2023, with an initial term of five years plus two one-year extension options. In 2024, the initial term of this facility was extended for an additional period of one year until March 2029. A possible future utilization is not subject to any financial covenants. So far, we have not used, and do not currently foresee any need to use, this credit facility.
As at December 31, 2024, SAP SE had additional available credit facilities totaling €1.2 billion, and utilized €1.0 billion thereof through short-term money market loans. Several other SAP entities have credit facilities available that allow them to borrow funds at prevailing interest rates.
Obligations under Indemnifications and Guarantees
Our software license agreements and our cloud subscription agreements generally include certain provisions for indemnifying customers against liabilities if our software products infringe a third party’s intellectual property rights. In addition, we occasionally provide function or performance guarantees in routine consulting contracts and development arrangements. We also generally provide a six to twelve-month warranty on our software and a subscription-length warranty on cloud services with a 90 day claim cut off. Our warranty liability is included in other provisions. For more information on other provisions see Notes (A.4), (B.5), and (B.6) to our Consolidated Financial Statements. For more information on obligations and contingent liabilities refer to Notes (A.4), (D.6), (D.8) and (G.3) in our Consolidated Financial Statements.
Research and Development
For information on our R&D activities see “Item 4. Information about SAP — Our Investments in Innovation.” For information on our R&D costs see “Item 5. Operating and Financial Review and Prospects — Operating Results (IFRS)” and for information related to our R&D employees see “Item 6. Directors, Senior Management and Employees — Employees.”
New Accounting Standards Not Yet Adopted
See Note (IN.1) to our Consolidated Financial Statements for our discussion on new accounting standards not yet adopted.
58
Expected Developments
Future Trends in the Global Economy
In the December 2024 edition of its Economic Bulletin, the European Central Bank (ECB) states that, at the beginning of 2025, the outlook on global economic growth is uncertain.21 It attributes this situation to geopolitical tensions, lingering weakness in the Chinese real estate sector, and uncertainties about the policies of the next administration in the United States. The ECB predicts that global economic activity could decelerate in the near term, but moderate slightly thereafter, and it expects inflation across major advanced and emerging market economies to decline gradually over the projection horizon.
For the EMEA region, the ECB expects a gradual economic recovery in the euro area over the coming years, albeit amid significant uncertainty. The effects of restrictive monetary policy should fade gradually, it says, and support a pick-up both in domestic demand and corporate investment. However, moving into 2025, the ECB has revised down earlier outlooks, as firms hold back their investment spending in the face of weak demand and high geopolitical and policy uncertainty. Over the projection horizon, the ECB expects foreign demand to strengthen and support euro area exports. Although structural challenges remain, productivity could pick up, it says, and inflation in the euro area will probably settle at around the 2% target on a sustained basis during the projection period.
Regarding the Americas region, the ECB projects some deceleration in the United States. It also predicts significant uncertainty due to the difficulty at this stage of gauging coming policy measures.
Concerning the APJ region, the ECB expects slower economic growth in China due to unfavorable demographics. The new Chinese fiscal package, it predicts, is unlikely to provide much stimulus, as it mainly represents a migration of debt toward bonds with lower service costs that will probably leave the overall debt level unchanged.
Economic Trends – GDP Growth Year Over Year
Percent |
|
2024 |
|
2025p |
|
2026p |
World |
|
3.2 |
|
3.3 |
|
3.3 |
Advanced Economies |
|
1.7 |
|
1.9 |
|
1.8 |
Emerging Markets and Developing Economies |
|
4.2 |
|
4.2 |
|
4.3 |
Regions (According to IMF Taxonomy) |
|
|
|
|
|
|
Euro Area |
|
0.8 |
|
1.0 |
|
1.4 |
Germany |
|
-0.2 |
|
0.3 |
|
1.1 |
Emerging and Developing Europe |
|
3.2 |
|
2.2 |
|
2.4 |
Middle East and Central Asia |
|
2.4 |
|
3.6 |
|
3.9 |
Sub-Saharan Africa |
|
3.8 |
|
4.2 |
|
4.2 |
United States |
|
2.8 |
|
2.7 |
|
2.1 |
Canada |
|
1.3 |
|
2.0 |
|
2.0 |
Latin America and the Caribbean |
|
2.4 |
|
2.5 |
|
2.7 |
Japan |
|
-0.2 |
|
1.1 |
|
0.8 |
Emerging and Developing Asia |
|
5.2 |
|
5.1 |
|
5.1 |
China |
|
4.8 |
|
4.6 |
|
4.5 |
p = projection |
|
|
|
|
|
|
Source: International Monetary Fund (IMF), World Economic Outlook Update January 2025, Global Growth: Divergent and Uncertain
(https://www.imf.org/-/media/Files/Publications/WEO/2025/update/january/english/text.ashx), p. 9.
21 European Central Bank, Economic Bulletin, Issue 8/2024, Publication Date: January 9, 2025.
59
The IT Market: Outlook for 2025 and Beyond
“Tech transformations are not singular events but rather a constant reality of corporate life,” reports McKinsey & Company in their recent global survey of technology and business leaders.1 According to the survey, most companies are investing in tech with future growth in mind and are seeing positive results from the transformation work they have already completed. The survey’s findings also suggest, however, that there is still a significant gap between the best technology transformations and the rest. According to McKinsey’s research, the top performers (131 out of 500 survey respondents), “particularly those enterprises with high-performing IT organizations, have up to 35 percent higher revenue growth and 10 percent higher profit margins.” The research also finds that “an average company has an opportunity to optimize and potentially reinvest 30 percent of its IT spend through improvements to IT productivity.”2
McKinsey goes on to report that “the top performers are more effective than others at executing specific transformation initiatives (or ‘plays’) and at realizing the business value they are seeking as a result. They rate their technology organizations as more effective, and they plan to invest further in nearly every play, with the greatest focus on continuing to shape a technology-based business strategy. The one exception is infrastructure modernization, likely because these companies have already been investing in this for several years.”1
Adding to the McKinsey findings, International Data Corporation (IDC), a U.S.-based market research firm, revealed that organizations are starting to make strategic, long-term investments in technology with greater AI-enabled capabilities. One of IDC’s recent studies predicts that: “2025 will be the year that all enterprises begin the AI pivot with the goal of improving their reaction time for accessing, adopting, and ultimately scaling up to becoming a resilient AI-fueled business by 2027.” And, further, that: “By 2026, 75% of Global 1000 organizations will adopt value-based AI economics models covering tech acquisition cost, productivity gains, decision-making, and innovation, or risk missing new ROI benchmarks.”3 Particularly on the ability of organizations to prepare for and embrace the AI-enabled technology, IDC warns that organizations themselves have to adapt and transform because “without strategic and organizational pivots, frustration with low ROI due to poor planning and misallocated spending will cause 30% of organizations to reduce GenAI investments.”3
Those companies that adopt AI at scale and change their operational models and organizations accordingly will benefit significantly from further technological developments. Market observers from IDC predict that: “By 2025, 50% of organizations will use enterprise agents configured for specific business functions, instead of focusing on individual copilot technologies to achieve faster business value from AI.”3 Enterprise agents are fully automated software components that are empowered to assess a situation and take actions independently and without human intervention. The expected leverage on organizational efficiency is significant. IDC predicts that: “By 2027, agentic workflows will reshape how tasks are delivered and performed, impacting at least 40% of Global 2000 knowledge work and doubling productivity.”3
From a vendor perspective, the adaptation and adoption of AI-enabled solutions by companies will result in further expansion of the addressable market. IDC forecasts that: “AI spending will grow at 2x the rate of overall digital technology spending in the next three years, generating a global economic impact of over $7.6 trillion by the end of 2027.”4
Impact on SAP
Many economists are predicting that uncertainty will dominate the outlook for business in the foreseeable future. Ongoing conflicts in Ukraine and the Middle East, the announcement of restrictive trade policies by the new U.S. administration, and the growing likelihood of natural disasters are among the challenges that could weigh heavily on markets, economies, and, ultimately, our customers going forward. Withstanding external influences such as these requires companies to be agile and resilient. Thus, SAP will continue to position itself as a partner of choice for its customers, helping them overcome obstacles and future-proof their business.
SAP is built on robust operational foundations: already today, 85% of its revenues are recurring. The transformation of our installed base is in full swing and our focus on relentlessly executing our strategy will be central to achieving the success we expect to enjoy in the future. We remain optimistic about the opportunities ahead – and confident that our commitment to innovation and our disciplined operating strategy will continue to drive positive results.
Financial Targets and Prospects
Revenue and Operating Profit Targets and Prospects (Non-IFRS)
Outlook 2025
The outlook for 2025 replaces SAP’s Ambition 2025. Unless otherwise stated, all forward-looking statements for revenue and operating profit are at constant currencies.
1 McKinsey: Investing in the future of tech: Lessons from winning companies, December 9, 2024, https://www.mckinsey.com/capabilities/mckinsey-digital/our-insights/investing-in-the-future-of-tech-lessons-from-winning-companies?cid=eml-web#/
2 McKinsey: How high performers optimize IT productivity for revenue growth: A leader’s guide, November 27, 2024, https://www.mckinsey.com/capabilities/mckinsey-digital/our-insights/how-high-performers-optimize-it-productivity-for-revenue-growth-a-leaders-guide.
3 IDC FutureScape: Worldwide IT Industry 2025 Predictions, October 2024, IDC #US51736824
4 IDC FutureScape: Worldwide Digital Business and AI Transformation 2025 Predictions, October 2024, IDC #US52641124 For the full year 2025, SAP expects:
60
| – | €21.6 billion to €21.9 billion in cloud revenue (2024: €17.14 billion), up 26% to 28%. |
| – | €33.1 billion to €33.6 billion in cloud and software revenue (2024: €29.83 billion), up 11% to 13%. |
| – | €10.3 billion to €10.6 billion non-IFRS operating profit (2024: €8.15 billion), up 26% to 30%. |
| – | An effective tax rate (non-IFRS) of approximately 32% (2024: 32.3%).22 |
Furthermore, SAP provides the following additional forward-looking information for selected metrics:
| – | Total revenue growth to slightly accelerate when compared to the growth rate in 2024 (2024: 10%). |
| – | CCB growth to slightly decelerate when compared to the growth rate in 2024 (2024: 32%). |
| – | A decrease in expenses for share-based payments to around €2 billion. |
Beyond the outlook for 2025, SAP expects:
| – | Non-IFRS operating margin to expand beyond 2025. This considers among other factors efficiency effects from the internal rollout and implementation of AI. |
| – | Total revenue growth to accelerate through 2027. |
| – | Software support revenue to decrease over the coming years. |
SAP’s full-year 2025 business outlook is at constant currencies. Where numbers are presented in actual currencies, these are likely to be affected by exchange rate fluctuations as the year progresses. See the table below for the expected currency impacts for the full year 2025. These expectations are based on the December 2024 level.
|
|
FY/2025 |
Cloud revenue growth |
|
2.5pp |
Cloud and software revenue growth |
|
2.0pp |
Operating profit growth (non-IFRS) |
|
4.0pp |
The following table shows the estimates of the items that represent the differences between our non-IFRS financial measures and our IFRS financial measures for operating profit.
€ millions |
|
Estimated |
|
Actual |
|
|
Amounts for |
|
Amounts for |
|
|
2025 |
|
2024 |
Acquisition-related charges |
|
380-460 |
|
355 |
Restructuring |
|
Approximately 100 |
|
3,144 |
Regulatory compliance matters |
|
0 |
|
-11 |
Proposed Dividend
In 2025, we intend to pay a dividend of €2.35 per share (subject to shareholder approval at the Annual General Meeting of Shareholders in May 2025).
Investment Goals
Our planned investment expenditures for 2025 and 2026, other than for business combinations, consist primarily of the purchase of IT infrastructure and construction activities. We expect investments in IT infrastructure to be approximately €450 million and in construction activities to be approximately €300 million in 2025. In 2025, we expect total capital expenditures of approximately €800 million. In 2026, capital expenditures are expected to increase to approximately €900 million due to increased investment in cloud capacity.
Goals for Liquidity and Finance
As of December 31, 2024, our net liquidity was €1.7 billion. We believe that our liquid assets combined with our undrawn credit facilities are sufficient to meet our operating financing needs in 2025 as well, and, together with expected cash flows from operations, will support debt repayments and our currently planned capital expenditure requirements over the near and medium term.
In 2025, we expect a free cash flow of approximately €8.0 billion (compared to €4.2 billion in 2024), based on our revised definition of free cash flow. For more information, see the Performance Management System section. The increase in free cash flow is expected to be driven predominantly by improved profitability and lower outflows for restructuring, compliance matters, and share-based compensation.
22 We do not provide an outlook for the effective tax rate (IFRS) due to the uncertainty and potential variability of gains and losses associated with equity securities, which are reconciling items between the two effective tax rates (non-IFRS and IFRS). These items cannot be provided without unreasonable effort but could have a significant impact on our future effective tax rate (IFRS).
61
The differences between free cash flow as our non-IFRS financial measure and operating cash flow as our IFRS financial measure include estimated cash flows in 2025 for expenditures and proceeds from the sale of intangible assets and property, plant, and equipment, and expenditures for leasing of €1.0 billion (2024: €1.0 billion, based on the updated free cash flow definition).
At this point in time, we intend to repay €600 million in Eurobonds, US$300 million in U.S. dollar bonds, €500 million in commercial papers, and €2.25 billion in bank term loans in 2025:
Non-Financial Goals for 2025
In addition to our financial goals, we also focus on four non-financial targets: customer loyalty, employee engagement, climate performance, and Women in Executive Roles.
For 2025, SAP expects employee engagement, measured by the Employee Engagement Index, to be between 74% and 78% (2024: 74%).
SAP measures customer loyalty using the Customer Net Promoter Score (Customer NPS). We expect the score to be between 12 and 16 (2024: 12) in 2025.
In 2025, we expect to steadily decrease carbon emissions across the relevant value chains. By 2030, we aim to reduce our gross greenhouse gas (GHG) emissions by at least 90% across our relevant value chains as part of our net-zero commitment.23
SAP expects to steadily increase the share of Women in Executive Roles in 2025. Beyond this, we aim to achieve our target of 25% by the end of 2027.
Premises on Which Our Outlook and Prospects Are Based
In preparing our outlook and prospects, we have taken into account all events known to us at the time we prepared this report that could influence SAP’s business going forward.
23 We acknowledge the recent reports issued by various companies, including some of our vendors, in which they state that they are reconsidering or adjusting their net-zero targets. In light of these developments, and given the growing demand for energy due to the increasing use of AI, we are closely monitoring our progress and evaluating whether we can achieve our net-zero target by 2030 as planned or if we might need to adjust it.
62
ITEM 6. DIRECTORS, SENIOR MANAGEMENT AND EMPLOYEES
Supervisory Board
The current members of the Supervisory Board of SAP SE, each member’s principal occupation, the year in which each was first elected and the year in which the term of each expires, respectively, are as follows:
Name |
|
Age |
|
Principal Occupation |
|
Year First |
|
Year Term |
Dr. h. c. mult. Pekka Ala-Pietilä, Chairperson1,3, 7, 8 |
68 |
Chairman of the Board of Directors of Sanoma Corporation |
2024 |
2026 |
||||
Lars Lamadé, Deputy Chairperson2, 3, 8 |
|
53 |
|
Employee, Head of Global Sponsorships |
|
2002 |
|
2029 |
Jakub Cerny2, 5, 6 |
42 |
Employee, Demand Manager |
2024 |
2029 |
||||
Pascal Demat2, 5, 8 |
57 |
Employee, Solution Advisor HCM, Member of SAP SE Works Council (Europe) |
2024 |
2029 |
||||
Aicha Evans3, 6, 7 |
56 |
Chief Executive Officer and Member of the Board of Directors, Zoox, Inc. |
2017 |
2028 |
||||
Andreas Hahn2, 3, 3 |
54 |
Employee, Product Expert Digital Supply Chain Standards, Chairperson of SAP SE Works Council (Europe) |
2024 |
2029 |
||||
Prof. Dr. Ralf Herbrich1, 5, 6 |
50 |
Managing Director and Professor for Artificial intelligence and sustainability, Hasso Plattner Institute for Digital Engineering gGmbH |
2024 |
2028 |
||||
Margret Klein-Magar3, 4 |
60 |
Employee, Vice President, Head of SAP Alumni Relations |
2012 |
2029 |
||||
Jennifer Xin-Zhe Li4, 5, 9 |
57 |
General Partner, Changcheng Investment Partners |
2022 |
2027 |
||||
Dr. Qi Lu6 |
|
63 |
|
CEO, MiraclePlus |
|
2020 |
|
2027 |
César Martin2, 4, 6 |
52 |
Employee, SAP EMEA Enterprise Architect, Chairperson of the SAP Spain Works Council |
2024 |
2029 |
||||
Gerhard Oswald4, 6, 8 |
|
71 |
|
Managing Director of Oswald Consulting GmbH |
|
2019 |
|
2026 |
Dr. Friederike Rotsch3, 4, 7, 8 |
52 |
Group General Counsel, Deutsche Bank AG |
2018 |
2028 |
||||
Nicolas Sabatier2, 3, 6 |
64 |
Employee, Chief Product Expert, Member of SAP SE Works Council (Europe) |
2024 |
2029 |
||||
Dr. Eberhard Schick2, 4, 5 |
|
57 |
|
Employee, Chairperson of SAP SE Works Council |
|
2024 |
|
2029 |
Nina Strassner2, 4, 5, 8 |
43 |
Employee, HRBP Senior Manager, Global Head of People Initiatives |
2024 |
2029 |
||||
Dr. Rouven Westphal3, 5, 7 |
52 |
Member of the Executive Board of the Hasso Plattner Foundation and Managing Director of the General Partner of HPC Germany GmbH & Co. KG |
2021 |
2026 |
||||
Dr. Gunnar Wiedenfels4, 5, 7, 9 |
47 |
Chief Financial Officer, Warner Bros. Discovery Inc. |
2019 |
2026 |
1 Elected by SAP SE’s shareholders on May 15, 2024.
2 Appointed by the SAP SE Works Council Europe on April 25, 2024.
3 Member of the Personnel and Governance Committee.
4 Member of the Audit and Compliance Committee.
5 Member of the Finance and Investment Committee.
6 Member of the Product and Technology Committee.
7 Member of the Nomination Committee.
8 Member of the Government Security Committee.
9 Audit Committee financial experts.
For detailed information on the Supervisory Board committees and their tasks, including the Audit and Compliance Committee and the Personnel and Governance Committee, please refer to “Item 10 Additional Information — Corporate Governance.”
Pursuant to the Articles of Incorporation of SAP SE and the Agreement on the Involvement of Employees in SAP SE, members of the Supervisory Board of SAP SE consist of nine representatives of the shareholders and nine representatives of the European employees.
Certain current members of the Supervisory Board of SAP SE were members of supervisory boards and comparable governing bodies of enterprises other than SAP SE in Germany and other countries as of December 31, 2024. See Note (G.4) to our Consolidated Financial Statements for more detail. Apart from pension obligations for employees, SAP SE has not entered into contracts with any member of the Supervisory Board that provide for benefits upon a termination of the employment or service of the member.
63
Executive Board
The current members of the Executive Board, the year in which each member was first appointed and the year in which the term of each expires, respectively, are as follows:
Name |
|
Year First |
|
Year Current |
Christian Klein, CEO |
2018 |
2028 |
||
Muhammad Alam |
2024 |
2027 |
||
Dominik Asam |
2023 |
2026 |
||
Thomas Saueressig |
2019 |
2028 |
||
Sebastian Steinhaeuser |
2025 |
2028 |
||
Gina Vargiu-Breuer |
|
2024 |
|
2027 |
A description of the management responsibilities and backgrounds of the current members of the Executive Board are as follows:
Christian Klein, CEO (Vorstandsvorsitzender), 44 years old, holds a diploma in international business administration from the University of Cooperative Education in Mannheim, Germany. He joined SAP in 1999 and became a member of the Executive Board in 2018. On October 10, 2019 he became co-CEO alongside Jennifer Morgan and on April 20, 2020 he was appointed sole CEO. Christian oversees strategy & operations, corporate development, sustainability, business AI, compliance, corporate communications. He is further responsible for customer success and technology & innovation on an interim basis.
Muhammad Alam, 47 years old, holds a bachelor's degree from Morehouse College, Atlanta, Georgia. He joined SAP in 2022 as president and chief product officer of the Intelligent Spend Management program and became a member of the Executive Board in April 2024. Muhammad leads the board area SAP Product & Engineering and has global responsibility for all business software applications. Before joining SAP, he spent 17 years at Microsoft, leading various teams in the Business Applications division.
Dominik Asam, 55 years old, graduated in mechanical engineering at Technical University of Munich and École Centrale Paris. He also holds a master’s degree in business administration from INSEAD (European Institute of Business Administration). He joined SAP in March 2023 as Chief Financial Officer (CFO) and member of the Executive Board. He is responsible for global finance and administration including legal, investor relations, internal audit, data protection and export control as well as government affairs. Prior to joining SAP, Dominik had served as CFO at Airbus SE from April 2019 to February 2023 and Infineon Technologies AG from 2011.
Thomas Saueressig, 39 years old, holds a degree in Business Information Technology from the University of Cooperative Education in Mannheim, Germany, and a joint executive MBA from ESSEC, France, and Mannheim Business School, Germany. He joined SAP in 2004 and became a member of the Executive Board in 2019. Thomas leads the Board area customer services & delivery and has global responsibility for long-term customer value in the cloud including customer services, premium engagements, customer innovation services and customer support. He is also responsible for cloud infrastructure, cloud operations, cloud lifecycle management, and private cloud delivery.
Sebastian Steinhaeuser, 39 years old, holds a degree in Business Administration from the European Business School in Oestrich - Winkel, Germany and an MBA from Stanford University. He first joined SAP in 2020 and became a member of the Executive Board in 2025. Sebastian is Chief Operating Officer (COO) and has global responsibility for the Strategy & Operations board area, including corporate strategy, operations, global marketing and partner management.
Gina Vargiu-Breuer, 50 years old, holds a postgraduate diploma in advanced management from ESMT Berlin and a master degree in economic psychology from the Catholic University of Eichstätt-Ingolstadt. She first joined SAP in February 2024 as member of the Executive Board. Gina is Chief People Officer with global responsibility for the people & culture organization. She also serves as Labor Director. Before joining SAP, Gina was Senior Vice President Global Human Resources at Siemens Energy.
The members of the Executive Board of SAP SE as of December 31, 2024 that are members on other supervisory boards and comparable governing bodies of enterprises, other than SAP, in Germany and other countries, are set forth in Note (G.4) to our Consolidated Financial Statements. SAP SE has not entered into contracts with any member of the Executive Board that provide for benefits upon a termination of the employment of service of the member, apart from pensions, benefits payable in the event of an early termination of service, and abstention compensation for the postcontractual noncompete period.
To our knowledge, there are no family relationships among any of the Supervisory Board and Executive Board members.
Compensation Report
Compensation for Executive and Supervisory Board Members
This compensation report describes the two compensation systems for Executive and Supervisory Board members, outlines the criteria that apply to the compensation for the year 2024, and discloses the amount of compensation. The compensation system for the Executive Board members was approved by the Annual General Meeting on May 11, 2023, and the compensation system for the Supervisory Board members was approved by the Annual General Meeting on May 15, 2024.
64
The current compensation report meets the requirements of section 162 of the German Stock Corporation Act (AktG). The compensation report for 2023 was approved by the Annual General Meeting on May 15, 2024.
Compensation for Executive Board Members
Compensation System
The compensation for Executive Board members is intended to reflect the demanding responsibilities of Executive Board members leading a global company in a rapidly evolving sector. The compensation level is aimed to be competitive to support SAP in the global market for highly skilled executives, especially in the context of the international software industry. It is our goal that our Executive Board compensation provides sustainable incentive for committed, successful work in a dynamic business environment.
We have retained the proven basic structure of the compensation system and its regular compensation components. Total compensation under this system can be broken down into the individual compensation components as shown below.
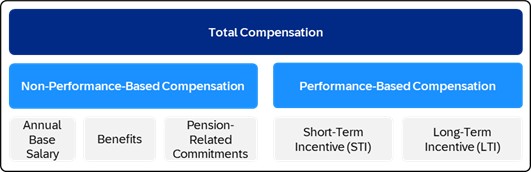
Building on this structure, the compensation system seeks to ensure that compensation:
| – | Promotes the business strategy |
| – | Ensures that extraordinary performance is appropriately rewarded and any failure to achieve specific targets triggers a tangible reduction in the compensation |
| – | Is in line with market standards in terms of its level and structure and reflects the Company's size, complexity, and economic situation |
| – | Takes account of the pay structure in the Company as a whole. In this context, the compensation is compared with the pay of SAP executives and non-executive SAP employees to ensure that the principle of proportionality is observed within SAP. |
The compensation system has been changed as follows:
– |
To place more emphasis on the long-term performance of the Company, a ratio of 40:60 between short-term and long-term performance-based compensation now applies. |
– |
Long-term performance-based compensation now incorporates important environmental, social, and governance (ESG) targets. |
– |
Retention share units, previously granted as non-performance-based elements, have been eliminated. |
– |
The option of awarding a discretionary bonus has been discontinued. |
– |
The maximum compensation amount has been reduced significantly, and greater consideration given to international market conditions. |
– |
The system now provides an option to grant like-for-like replacement awards to compensate for benefits from previous employment that an Executive Board member forfeited on joining SAP’s Executive Board, and an option to grant virtual shares with different terms. |
– |
It now incorporates share ownership guidelines. |
– |
It now provides for partly deferred payment of short-term performance-based compensation by converting the payout amount into virtual shares. |
– |
It now places greater emphasis on the LTI forfeiture rules on the retention of Executive Board members while fully retaining performance criteria and without changing the vesting conditions. |
– |
A mobility package has replaced the previous relocation package. |
65
Application of the Compensation System
The Supervisory Board – supported by its Personnel and Governance Committee – ensures that the compensation agreements and the individual target total compensation for each Executive Board member are aligned with the compensation system.
The Supervisory Board sets the target total compensation for each Executive Board member based on their individual role and performance. This target total compensation is aligned with SAP’s global strategy, market position, business performance, the economic outlook, and the compensation paid at comparable national and international companies. The annual benchmarking is based on the compensation data from the DAX 40 companies as well as selected U.S.-based IT and other technology companies.24 The benchmark was the basis for all compensation decisions made in 2024. The Supervisory Board reviews, assesses, and sets the target total compensation in its first meeting of each fiscal year (February 21, 2024, for 2024). The Supervisory Board is of the opinion that this approach ensures that the compensation is appropriate.
The amount of performance-based compensation depends on the performance of SAP’s KPIs (key performance indicators) against predefined target values and on SAP’s share price, and is subject to hurdles and caps. These KPIs, their target values, and their weighting are reviewed and set by the Supervisory Board each year and are aligned to the SAP budget for that year or to SAP’s externally communicated financial ambitions.
The individual elements of SAP’s Executive Board compensation are described in more detail below.
Non-Performance-Based Compensation
Annual Base Salary
The annual base salary is paid monthly in equal installments in the Executive Board member’s home currency. Home currency is the currency of the Executive Board member’s primary place of residence.
Fringe Benefits
The contractually guaranteed fringe benefits mainly comprise insurance contributions, benefits in kind, expenses for maintenance of two households, use of aircraft, payment of fees for tax advice (for example, if service as an Executive Board member triggers a tax liability, a duty to file tax returns in additional countries or special tax audits) and tax gross-ups according to local conditions.
Pension-Related Commitments
Executive Board members receive a cash allowance, as an annual one-off payment, toward their own pension provision. The Supervisory Board may grant the Executive Board members the option to elect that some or all of the cash allowance be paid into the Employee-Financed Pension Plan (Mitarbeiterfinanzierte Altersvorsorge) in place at SAP SE. Under this option, part of the Executive Board member’s gross pay is exchanged in return for an entitlement to occupational pension benefits payable at a future date.
Thomas Saueressig opted to remain with the defined-contribution pension plan instead of receiving the cash allowance.
For Executive Board members whose permanent place of residence is outside Germany, SAP may specify a retirement pension plan that applies for employees at a company belonging to the SAP Group in the relevant country.
Event-Related Compensation Elements
Replacement Award
To the extent that compensation benefit earned prior to moving to the SAP Executive Board is lost due to this move, a replacement award reasonably replicating the structure of the forfeited compensation in terms of the payment times and amounts (like-for-like) may be granted. The replacement award may comprise cash payments and/or virtual shares.
If virtual shares are granted, the following applies:
– |
The number of virtual shares is determined by dividing a grant amount by the relevant SAP share price (“initial price”). The initial price is based on an average price over a period of 10 trading days. |
– |
The terms of the virtual shares must appropriately replicate the forfeited compensation components. |
– |
The payout of the virtual shares corresponds to the relevant SAP share price at the end of the term of the respective virtual shares, but no more than 200% of the initial price. The relevant SAP share price is based on an average price of a period of 10 trading days. |
– |
Payments made under the replacement award must not exceed 100% of the maximum compensation in the first year of the new Board member joining SAP. |
24The following U.S.-based companies were included: Adobe, Amazon.com, Apple, Automatic Data Processing, Cisco Systems, Cognizant Technology Solutions, Dell Technologies, DXC Technology, Meta, Hewlett Packard Enterprise, International Business Machines, Microsoft, Netflix, Oracle, salesforce.com, ServiceNow, VMware, Western Digital, and Workday.
66
Mobility Package
Executive Board members who, at the request of SAP, relocate their place of work or permanent place of residence, and Executive Board members who are appointed for the first time and relocate their permanent place of residence on account of the appointment, may be granted one-time and temporary benefits as support in this connection.
If SAP grants an Executive Board member a mobility package, it will be paid as compensation for the financial year in which the member relocates their place of work or permanent place of residence. The maximum compensation for this financial year is increased by the value of the mobility package, but by no more than 5% of the maximum compensation.
Performance-Based Compensation
Short-Term Incentive
The short-term, one-year performance-based compensation (“short-term incentive,” STI) is granted in the Executive Board member’s home currency for a single year. Payment of part of the payout amount under the STI is deferred by one or two additional years and linked to the performance of the SAP share price (“STI deferral”). The basic structure of the STI, including the STI deferral, is as follows:
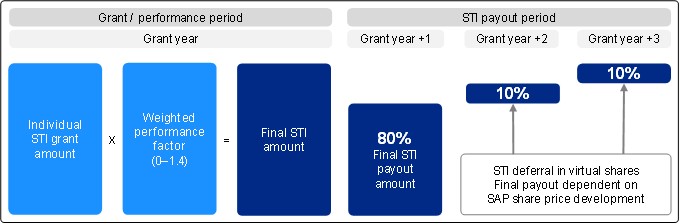
The final STI amount depends on target achievement against certain financial and non-financial KPIs. The KPIs and their weightings are as follows:

1Based on non-IFRS metrics published in the Integrated Report 2023 (for more information, see the Decisions for 2024 section below).
67
For the STI 2024, the financial KPIs have a total weighting of 80% and comprise non-IFRS constant currency operating margin increase in 2024 year over year; non-IFRS constant currency current cloud backlog in 2024; and year-over-year growth in non-IFRS constant currency cloud and software revenue in 2024.
The non-financial KPIs have a total weighting of 20%, and comprise the Customer Net Promoter Score, which measures SAP’s customer loyalty; and the Employee Engagement Index score, which measures SAP’s employee commitment, pride, and loyalty.
The KPIs and their respective target values are derived from SAP’s budget for the respective year. For more information about KPIs, see the sections Performance Management System and Outlook and Results for 2024.
Planned Replacement of KPIs in Line with the Compensation System
On November 7, 2024, the Supervisory Board resolved to replace the STI KPI operating margin increase with the KPI free cash flow from 2025 onward in accordance with the compensation system for Executive Board members. With this change, the Supervisory Board recognizes the role that free cash flow plays in value creation for the Company. It also believes that this change better aligns the steering to value creation. Based on the respective target value, a specific target achievement curve is defined for each KPI. Each target achievement curve defines a performance corridor, which should be within a range of 90% to 110% of the KPI target value based on absolute numbers. If the lower threshold of the performance corridor is not reached, the performance factor is zero. If the lower threshold is reached, the performance factor is 0.5. If the upper threshold of the performance corridor is reached or exceeded, the performance factor is 1.4 (cap).
STI Deferral
Eighty percent of the STI will be paid out after the Annual General Meeting of Shareholders in the year after the STI was granted (grant year +1). Twenty percent of the final STI amount, the STI deferral, is converted into virtual shares, 50% of which have a term of approximately one year and 50% a term of approximately two years. The number of virtual shares is determined by dividing the STI deferral by the relevant SAP share price (“initial price”). The initial price is based on an average SAP share price over a period of 10 trading days after publication of SAP’s preliminary results for the financial year in which the STI was granted.
The virtual shares will be paid out at the relevant SAP share price, but no more than 200% of the initial price, at the end of the term of the virtual shares.
The virtual shares are paid out after the Annual General Meeting of Shareholders in the grant year +2 and grant year +3.
Long-Term Incentive
The SAP Long-Term Incentive Program 2024 (LTI 2024) is granted in annual tranches and reflects SAP’s long-term strategy and thus sets uniform incentives for the Executive Board members to achieve key targets from the long-term strategic plans. The LTI 2024 is fully performance-based and rewards the Executive Board members for the long-term SAP share price performance as compared to the market, thus ensuring that shareholders’ interests are also honored. The LTI 2024 also includes ESG targets to reward the Executive Board members for the long-term sustainability of the Company.
The LTI 2024 is a virtual share program under which annual tranches with a term of approximately four years each are granted. When the individual tranches are granted, a certain grant amount specified in the Executive Board member’s service contract is converted into virtual shares (“performance share units,” PSUs) in each case. The grant amount is divided by the SAP share price, which corresponds to the average on the 10 trading days after publication of the preliminary results for the financial year (grant price). In 2024, the financial results were published before the Frankfurt Stock Exchange opened on January 24, 2024. The PSUs have a vesting period of approximately four years.
The basic structure of the LTI 2024 is as follows:
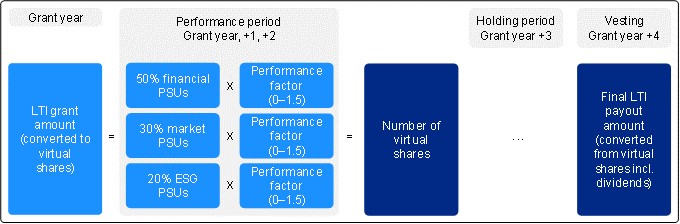
68
The underlying KPIs and their weightings are as follows:
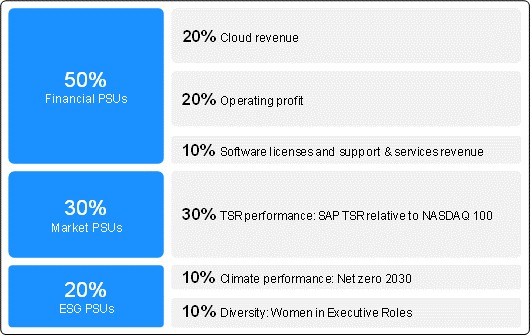
Planned Replacement of KPIs in Line with the Compensation System
On December 8, 2024, the Supervisory Board resolved to replace the KPIs cloud revenue and software licenses and support & services revenue with the KPI total revenue with a weighting of 30% beginning with the tranche 2025. The Supervisory Board gave more weight to cloud revenue, given the importance of this metric to the cloud transition. As cloud revenue now represents the majority of total revenue, the Supervisory Board aims to simplify the structure of the LTI with this change.
Changes in the Number of Financial PSUs
The final number of financial PSUs changes depending on SAP’s performance against the three financial KPI target values over the entire three-year performance period. The target values for each tranche are based on the cumulative three-year values of each KPI. The cloud revenue KPI and the software licenses & support and services revenue KPI each have a performance corridor comprising a cap of 110% and a hurdle of 90% target achievement, while the operating profit KPI has a cap of 120% and a hurdle of 80% target achievement. If the lower threshold of the performance corridor for the respective KPI is not reached, the financial performance factor is zero. If the lower threshold is reached, the financial performance factor is 0.5. If the upper threshold of the performance corridor is reached or exceeded, the financial performance factor is 1.5 (cap).
69

1 Based on non-IFRS metrics published in the Integrated Report 2023 (for more information, see the Decisions for 2024 section below).
70
The following tables illustrate possible outcomes for a hypothetical grant of 1,000 financial PSUs:
SAP financial performance is better than targets |
|
|
|
|
20% Cloud revenue performance factor |
|
|
|
1.25 |
20% Operating profit performance factor capped at |
|
|
|
1.50 |
10% Software licenses and support & services revenue performance factor |
|
|
|
1.00 |
Weighted financial performance factor |
|
|
|
1.30 |
Final number of financial PSUs |
|
1.30 x 1,000 |
|
1,300 |
|
|
|
|
|
SAP financial performance does not meet the targets |
|
|
|
|
20% Cloud revenue performance factor |
|
|
|
0.65 |
20% Operating profit performance factor |
|
|
|
1.00 |
10% Software licenses and support & services revenue performance factor below 50% |
|
|
|
0 |
Weighted financial performance factor |
|
|
|
0.66 |
Final number of financial PSUs |
|
0.66 x 1,000 |
|
660 |
71
Changes in the Number of Market PSUs
The number of market PSUs initially awarded is multiplied by a market performance factor. The market performance factor depends on the amount of the total shareholder return (TSR) on SAP share, measured for an entire performance period of approximately three years, and ranked in relation to the TSR performance of the companies in the NASDAQ-100 Index (Index). TSR reflects the performance of share, combining share price changes and granted and reinvested dividends. The market performance factor has a cap at 1.5 at the 75th percentile (P-75) and a hurdle of 0.5 at the 25th percentile (P-25); below the hurdle, no market PSUs are considered.
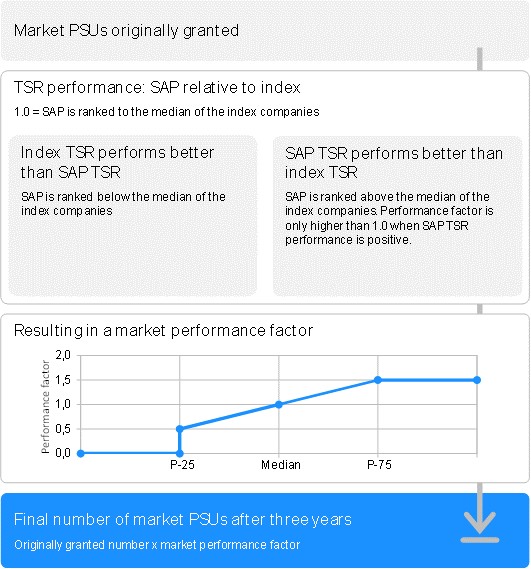
72
The following tables illustrate possible outcomes for a hypothetical grant of 1,000 market PSUs:
SAP TSR performs better than TSR of NASDAQ-100 companies |
|
|
|
|
SAP TSR performance |
|
|
|
+10% |
Market performance factor |
|
55th percentile |
|
1.10 |
Final number of market PSUs |
|
1.10 x 1,000 |
|
1,100 |
|
|
|
|
|
SAP TSR performs better than TSR of NASDAQ-100 companies; cap is triggered |
|
|
|
|
SAP TSR performance |
|
|
|
+18% |
Market performance factor |
|
80th percentile |
|
1.60 |
|
|
Cap 75th percentile |
|
1.50 |
Final number of market PSUs |
|
1.50 x 1,000 |
|
1,500 |
|
|
|
|
|
SAP TSR performs better than TSR of NASDAQ-100 companies; in a downwards market trend |
|
|
|
|
SAP TSR performance |
|
|
|
–5% |
Market performance factor |
|
60th percentile |
|
1.20 |
|
|
Cap due to required positive performance |
|
1.00 |
Final number of market PSUs |
|
1.00 x 1,000 |
|
1,000 |
|
|
|
|
|
TSR of NASDAQ-100 companies perform better than SAP TSR; low hurdle is triggered |
|
|
|
|
SAP TSR performance |
|
|
|
–5% |
Market performance factor |
|
20th percentile |
|
0.40 |
|
|
Hurdle 25th percentile |
|
0 |
Final number of market PSUs |
|
0.00 x 1,000 |
|
0 |
Changes in the Number of ESG PSUs
The final number of ESG PSUs changes depending on SAP’s performance against the two non-financial KPI target values over the entire three-year performance period. The target values for each tranche are based on the cumulative three-year values of each KPI. The net zero 2030 KPI considers gross greenhouse gas emissions along the value chain in line with the Greenhouse Gas Protocol. The Women in Executive Roles KPI considers the ratio of women to all genders in the three executive levels below the Executive Board, namely the Group Executive Level, the Senior Executive Level, and the Executive Level. The net zero 2030 KPI will be assessed in absolute values; the Women in Executive Roles KPI will be measured as a percentage.
73
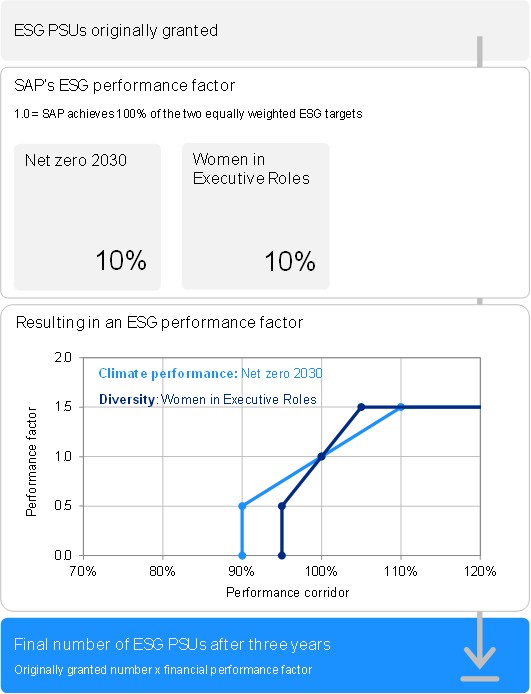
The Women in Executive Roles KPI has a performance corridor with a cap of 105% and a hurdle of 95% target achievement; the net zero 2030 KPI has a cap of 110% and a hurdle of 90% target achievement. If the lower threshold of the performance corridor is not reached, the ESG performance factor is zero. If the lower threshold is reached, the ESG performance factor is 0.5. If the upper threshold of the performance corridor is reached or exceeded, the ESG performance factor is 1.5 (cap).
Payout of PSUs
The value of all PSUs is paid out after the Annual General Meeting of Shareholders at which the financial statements for the third financial year following the financial year in which the PSUs were granted are presented (grant year +4). The performance of the PSUs is linked to the performance of the SAP share price, including dividend payments. Dividend equivalents are only awarded for vesting PSUs following the performance assessment. Accordingly, an amount is paid out for each PSU (subject to the specifics described below) that equals the then-current SAP share price plus the dividends disbursed in respect of an SAP share in the period from the beginning of the year in which the PSU were granted until the end of the third year following the year in which the PSU were granted. The average price of SAP shares on the 10 trading days after publication of the preliminary results for the financial year determines the payout price.
74
The final LTI payout amount per PSU, including the dividend due on the PSU, is capped at 200% of the grant price. Due to the potential change in the number of PSUs, the maximum possible payout amount under any of the annual tranches of the LTI 2024 is thus 300% of the grant amount. Currency exchange rate risks are borne by the Executive Board members.
However, under certain conditions, each type of PSU may expire during the term of a tranche.
LTI Forfeiture Rule
If an Executive Board member’s service contract is terminated before the end of the third year following the year in which the share units were granted, the PSUs are forfeited in whole or in part, depending on the circumstances in which the member resigns from office or the service contract is terminated. Where share units are forfeited in part, the percentage of the forfeiture is proportional to the four-year vesting period of each grant. This means that 25% of the grant is earned each year of the vesting period. Unearned grants are forfeited.
LTI Forfeiture Rules and Example Calculation1
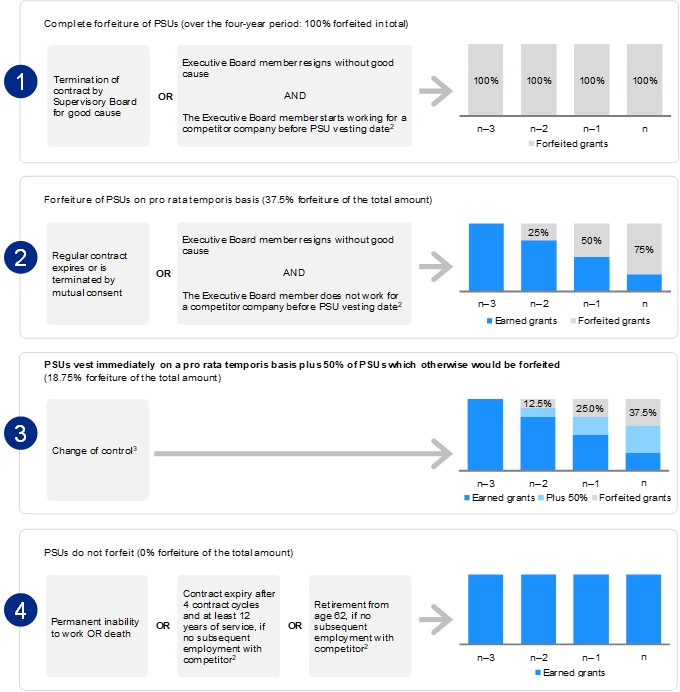
1 Example calculation with four tranches (grant allocation of 100%, stable share price from grant to vest, and no consideration of performance criteria); Executive Board member’s contract terminates after year four.
2 As defined in the individual Executive Board members’ contracts.
3 For the definition, see the Early End-of-Service Undertakings section.
75
Share Ownership Guidelines (SOG)
The Executive Board members must acquire SAP shares and hold them at least for the duration of their term of office. Following a build-up period of up to three years (beginning at the start of the member’s first term of office but not before January 1, 2024), the shareholding for ordinary Executive Board members corresponds to a target value equal to 100% of annual base salary, and for the CEO 200% of annual base salary.
During the build-up period, the SOG shareholding must reach certain interim values. The SOG interim value at the end of the first year equals 20% of the SOG target value and the SOG interim value at the end of the second year equals 50% of the SOG target value. The SOG target value must have been achieved at the end of the third year.
|
|
SOG Target |
|
SOG Interim |
|
SOG Share Price |
|
SOG Shareholding on |
|
|
|
|
Value |
|
Value |
|
2024 |
|
12/31/2024 (in shares) |
Christian Klein |
|
€ |
2,200,000 |
|
440,000 |
|
163.08 |
|
2,698 |
Muhammad Alam (from 4/1/2024) |
|
US$ |
860,000 |
|
172,000 |
|
176.50 |
|
975 |
Dominik Asam |
|
€ |
800,000 |
|
160,000 |
|
163.08 |
|
981 |
Thomas Saueressig |
|
€ |
800,000 |
|
160,000 |
|
163.08 |
|
981 |
Gina Vargiu-Breuer (from 2/1/2024) |
|
€ |
800,000 |
|
160,000 |
|
163.08 |
|
981 |
On an annual basis, the number of shares to be held by an Executive Board member will be adjusted in line with SAP’s share price performance. The SOG share price corresponds to the average on the 10 trading days after publication of the preliminary results for the financial year. The number of shares determined by the Supervisory Board on this basis, and the date from which this number must be held, will be communicated to the Executive Board member. Where the shareholding is greater than the number that applied on December 31 of the current year, the Executive Board member is free to sell any excess number of SAP shares during the respective financial year.
Foreign Currency Exchange Rate Cap
Where the non-performance-based compensation and the STI are paid out in the Executive Board member's home currency, the total (gross) payout amount resulting from the non-performance-based compensation and the STI for a financial year is limited to a maximum euro equivalent in case of exchange rate fluctuations. The euro cap for a full financial year equals 120% each for the sum of the non-performance-based compensation and STI target amount converted into euros plus 20% of the grant amount for a tranche under the LTI 2024.
Maximum Compensation
Maximum compensation under the compensation system effective since 2024 is the value that the total compensation for any financial year (irrespective of the time of receipt) must not exceed. Maximum compensation is €11.0 million for each ordinary Executive Board member and €20.0 million for a CEO. If an Executive Board member has their place of work in a country where the levels of compensation are higher than in Germany, maximum compensation could be 130% of the relevant value.
If an Executive Board member is granted a mobility package or a replacement award, the compensation they receive for the financial year may exceed the maximum compensation defined above. If a mobility package is granted, its maximum value is capped at 5% of the maximum compensation defined above. If a replacement award is granted, its maximum value is capped at 100% of the maximum compensation defined above.
|
|
|
|
|
|
|
|
Increased |
|
|
Maximum |
|
Replacement |
|
Mobility |
|
Maximum |
€ thousands |
|
Compensation |
|
Awards |
|
Package |
|
Compensation |
Christian Klein |
|
20,000.0 |
|
|
|
|
|
20,000.0 |
Muhammad Alam (from 4/1/2024) |
|
8,250.0 |
|
|
|
|
|
8,250.0 |
Dominik Asam |
|
11,000.0 |
|
2,850.0 |
|
|
|
13,850.0 |
Juergen Mueller (until 9/30/2024) |
|
8,250.0 |
|
|
|
|
|
8,250.0 |
Scott Russell (until 8/31/2024) |
|
9,533.3 |
|
|
|
|
|
9,533.3 |
Thomas Saueressig |
|
11,000.0 |
|
|
|
|
|
11,000.0 |
Gina Vargiu-Breuer (from 2/1/2024) |
|
10,083.3 |
|
680.0 |
|
40.0 |
|
10,803.3 |
Julia White (until 8/31/2024) |
|
7,333.3 |
|
|
|
|
|
7,333.3 |
The final confirmation of compliance with the maximum compensation for fiscal year 2024 will be disclosed in the Compensation Report for fiscal year 2027 at the earliest, when the LTI tranche for 2024 is settled.
The maximum compensation under the compensation system applicable until 2023 still applies until the last granted variable compensation component of the LTI 2020 (tranche 2023) is paid out in 2026. The maximum compensation is €15.0 million for ordinary Executive Board members and €34.5 million for a CEO. When determining the compensation structure and the target compensation for the individual members of the Executive Board, the Supervisory Board ensured that the potential payments, did not exceed maximum compensation.
Clawback Provisions and Clawback Policy
SAP has the contractual right to request that an Executive Board member return any payments made from the STI or LTI if it subsequently emerges that the information used to determine the payout was inaccurate and that therefore the amount paid out was not justified, either in whole or in part, because targets were either not achieved or not achieved to the extent initially assumed. In this event, the Executive Board member is obliged to repay to SAP the amount by which the initial payment exceeds the amended payment as determined on the basis of the targets actually achieved.
76
In addition, in compliance with requirements issued by the U.S. Securities and Exchange Commission and the New York Stock Exchange for companies listed in the United States, including foreign private issuers such as SAP, SAP adopted a clawback policy in 2023. This policy requires the Supervisory Board to recoup incentive-based compensation from current and former Executive Board members in the event that financial statements are restated due to material non-compliance with any financial reporting requirement under the U.S. federal securities laws that impacts the calculation of incentive-based compensation paid out in the last three years.
Offsetting Compensation for Roles Assumed Inside and Outside the Group
At the request of the Supervisory Board, the Executive Board member will assume roles on the supervisory board or similar bodies at affiliates of SAP without receiving separate compensation. If, in exceptional cases, compensation is, however, paid for a role assumed within the Group, it will be offset against the other compensation due to the Executive Board member. The Supervisory Board has to agree before an Executive Board member assumes any roles on supervisory boards or similar bodies at companies outside the Group and will decide in each case whether and to what extent any compensation is to be offset against compensation paid by SAP.
Decisions for 2024
No adjustments were made to the payout amounts for the STI 2023 or LTI 2020 tranche 2020 paid in May 2024. The Supervisory Board did not request that any Executive Board member return payments under the clawback provision. On February 19, 2025, the Supervisory Board assessed SAP’s performance against the previously agreed targets and determined the amount of the STI 2024 for all members of the Executive Board.
At its meeting on February 21, 2024, the Supervisory Board resolved to adjust the U.S.-dollar compensation for Scott Russell and Julia White with effect from January 1, 2024. The exchange rate on December 1, 2023, was applied. This led to an increase in the U.S.-dollar compensation and a change in the STI and LTI amounts, while the annual compensation in euros remained the same.
On May 5, 2024, the Supervisory Board resolved, by way of circular resolution, to extend the term of Christian Klein’s appointment for three years from May 1, 2025, to April 30, 2028, and to appoint him as chairperson of the Executive Board with immediate effect.
On July 29, 2024, the Supervisory Board resolved to terminate the service contracts of Julia White and Scott Russell by mutual agreement. On September 1, 2024, the Supervisory Board resolved to terminate the service contract of Juergen Mueller by mutual agreement. For more information, see the section Agreements with Executive Board Members for Early End-of-Service.
On November 7, 2024, the Supervisory Board decided to exclude the effect of the WalkMe acquisition from the target achievement for the STI 2024 and the LTI tranche 2022. For the LTI tranches 2023 and 2024, the Supervisory Board resolved updated targets to neutralize the effects of the acquisition.
Furthermore, based on the decision the Supervisory Board made in September 2023, the expenses related to compliance matters from the variable Executive Board compensation are excluded for 2023 and 2024. This applies for the Executive Board members’ compensation components STI and LTI related to the KPIs operating margin increase (STI) and operating profit (LTI) for the fiscal years 2023 and 2024. This decision also affects the 2021, 2022, and 2023 tranches of the LTI 2020, the LTI 2024 tranche 2024, and the STI for the year 2024 (STI 2024).
The exclusion of expenses related to compliance matters from the variable Executive Board compensation led to a higher performance factor of 0.005 for the financial PSUs of the LTI tranche 2021 and 2022, a performance factor of 0.049 for the STI 2023, and had no effect on the performance factor of the STI 2024.
STI Performance Factor 2024
KPI |
|
100% Target Value |
|
Results |
|
Performance Factor |
Current cloud backlog1 |
|
€17,539 million |
|
€17,515 million |
|
0.993 |
Cloud and software revenue growth1 |
|
+8.64 |
% |
+11.05 |
% |
1.260 |
Operating margin increase1 |
|
+182bps |
|
+325bps |
|
1.400 |
Customer Net Promoter Score |
|
+11 |
|
+12 |
|
1.050 |
Employee Engagement Index |
|
78 |
% |
74 |
% |
0.750 |
1 Non-IFRS, at constant currencies.
77
The weighted performance factor for the STI 2024 was 1.143. The final STI payout amount related to the STI deferral depends on SAP share price development.
The following target achievement curves applied for the STI 2024:
Financial KPIs
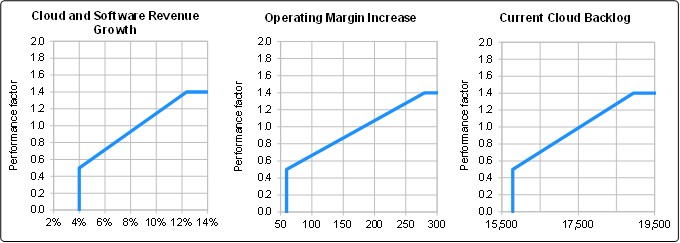
Non-Financial KPIs
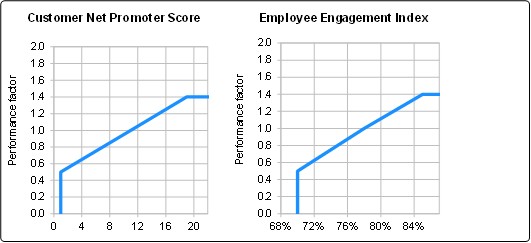
The final performance factor for the STI reflects the relation between the grant amount and the final STI amount. The STIs for the years 2020 to 2023 were already paid out.
STI Final Performance Factor
|
|
2024 |
|
2023 |
|
2022 |
|
2021 |
|
2020 |
|
|
1.143 |
|
1.151 |
|
0.612 |
|
1.333 |
|
0 |
|
|
|
|
STI Grant Amount |
|
Final STI Amount1 |
|
STI Non-Deferral |
|
STI Deferral |
|
Virtual Shares2 |
Christian Klein (CEO) |
|
€ |
|
2,960,000 |
|
3,382,984 |
|
2,706,387 |
|
676,597 |
|
2,506 |
Muhammad Alam (from 4/1/2024) |
|
US$ |
|
1,196,013 |
|
1,366,923 |
|
1,093,539 |
|
273,385 |
|
978 |
Dominik Asam |
|
€ |
|
1,990,000 |
|
2,274,371 |
|
1,819,497 |
|
454,874 |
|
1,684 |
Juergen Mueller (until 9/30/2024) |
|
€ |
|
958,251 |
|
1,095,185 |
|
876,148 |
|
219,037 |
|
812 |
Scott Russell (until 8/31/2024) |
|
US$ |
|
1,581,000 |
|
1,806,925 |
|
1,445,540 |
|
361,385 |
|
1,292 |
Thomas Saueressig |
|
€ |
|
1,600,000 |
|
1,828,640 |
|
1,462,912 |
|
365,728 |
|
1,354 |
Gina Vargiu-Breuer (from 2/1/2024) |
|
€ |
|
1,171,585 |
|
1,339,004 |
|
1,071,203 |
|
267,801 |
|
992 |
Julia White (until 8/31/2024) |
|
US$ |
|
1,063,000 |
|
1,214,903 |
|
971,922 |
|
242,981 |
|
868 |
1 STI performance factor 1.143
2 STI initial price €269.98 and US$279.71
78
LTI 2024 − Tranche 2024 – Financial PSUs and ESG PSUs 100% Target Values
In 2024, the Supervisory Board set the 100% target values for the financial PSUs and the ESG PSUs of the LTI 2024 tranche 2024. The target values are derived from the 2025 ambition communicated in October 2020 and were adjusted in July 2023 to reflect the impact of the Qualtrics divestiture.
|
|
100% Target Value |
KPI |
|
(cumulative 2024 to 2026) |
Cloud revenue1 |
|
67,300 |
Operating profit1 |
|
29,600 |
Software licenses and support & services revenue1 |
|
47,800 |
1 Non-IFRS, at constant currencies 2023.
|
|
100% Target Value |
KPI |
|
(cumulative 2024 to 2026) |
Net zero 2030 CO2e in kt |
|
17,400 |
% of women in executive roles |
|
70.8 |
The target value of 70.8 is the sum of the values over the three years.
LTI 2020 − Tranche 2021 – Performance Factor
In 2024, the Supervisory Board determined the LTI performance factor of the financial PSUs and the market PSUs of the LTI 2020 tranche 2021.
KPI |
|
100% Target Value |
|
|
|
|
|
|
(cumulative 2021 to |
|
Results |
|
Performance Factor |
|
|
2023) |
|
|
|
|
Financial performance factor |
|
|
|
|
|
|
Cloud revenue1 |
|
33,000 |
|
34,898 |
|
1.288 |
Total revenue1 |
|
85,000 |
|
88,553 |
|
1.209 |
Operating profit1 |
|
23,900 |
|
24,725 |
|
1.086 |
Market performance factor |
|
|
|
|
|
|
Ranking to NASDAQ-100 companies |
|
median |
|
19 |
|
1.500 |
1 Non - IFRS, at constant currencies 2020.
The relation between the LTI grant amounts for the 2021 to 2024 tranches and the hypothetical payout amounts are based on SAP’s share price at year end. The 2020 tranche discloses the relation between the respective grant amount and the final LTI payout amount in May 2024. The payout price for the tranche 2020 was calculated as the average share price between January 25, 2024, and February 22, 2024.
Relation Between Grant Amount and Final LTI Payout Amount
Percentage |
|
LTI 2024 |
|
LTI 2020 |
||||||
|
|
|
|
|
|
|
||||
|
|
2024 |
|
2023 |
|
2022 |
|
2021 |
|
2020 |
|
|
Tranche1 |
|
Tranche1 |
|
Tranche1 |
|
Tranche1 |
|
Tranche |
12/31/2024 |
|
167.3 |
|
250.7 |
|
237.0 |
|
246.8 |
|
73.5 |
12/31/2023 |
|
NA |
|
149.1 |
|
158.5 |
|
165.9 |
|
63.0 |
1 Consideration of hypothetical payout amounts based on SAP’s share price and market data at year end.
Compensation for 2024
We present the Executive Board compensation disclosures in accordance with section 162 of the German Stock Corporation Act, for the current year as well as for the previous year 2023. For each member of the Executive Board, the following tables disclose the compensation awarded and due as well as the contractual compensation in the reporting year.
Contractual Compensation
The contractual compensation shows the target amounts agreed in the individual employment contracts, including fringe benefits, and corresponds to a target achievement of 100% for the respective periods. If the appointment term commences or ends during a financial year, the compensation is disclosed pro rata temporis.
79
As the non-performance-based compensation and the STI are determined in the Executive Board member’s home currency, a maximum euro equivalent (“euro cap”) is considered to limit the exchange rate fluctuations to 20% of the sum of contractual values for non-performance-based compensation, STI, and LTI in euros. For purposes of converting the amounts from the home currency into euro, for non-performance-based compensation the average exchange rate, and for the one-year variable compensation the year-end exchange rate, of the respective period applies. The difference to the contractual exchange rate is disclosed.
Compensation Awarded and Due
Compensation that has been received and/or earned in the reporting year is defined as compensation awarded and due based on section 162 of the German Stock Corporation Act. This means that the underlying services were fully rendered by the end of the reporting year, although payout occurs only after the end of the reporting year to make reporting transparent and comprehensible and to ensure a connection between performance and compensation in the reporting period.
Therefore, the STI 2024 and the LTI 2020 tranche 2021 are both reported in 2024. The compensation awarded and due related to the LTI 2020 tranche 2021 is disclosed with the share price at year-end and the performance factor of the PSUs at year end. The payout of this tranche in May 2025 will be calculated based on the performance period according to the plan terms. The difference in the payout amount according to share price and performance factor development between year-end and the end of the performance period pursuant to the plan terms will also be disclosed. In addition, the difference in the payout amount according to share price and performance factor development between year-end and the end of the performance period pursuant to the plan terms of the LTI 2020 tranche 2020 is disclosed in 2024.
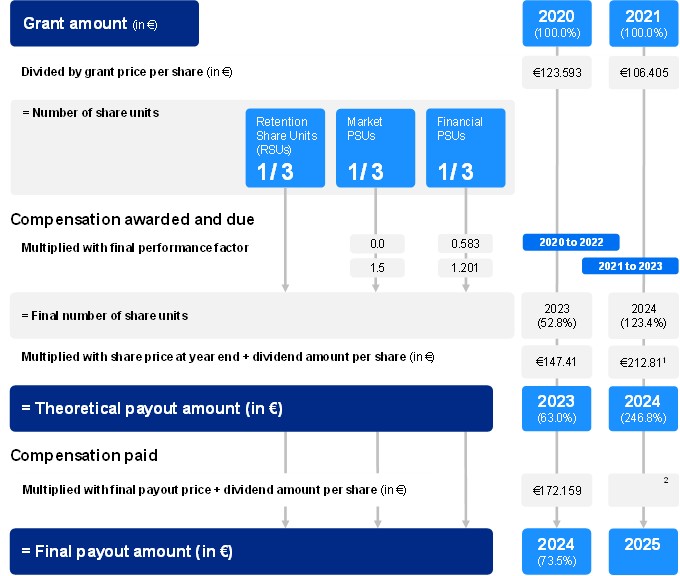
1 Cap at 200% of grant price per share.
2 Value is determined at time of payout after the Compensation Report has been prepared.
80
The individual amount resulting from the difference between the final payout amount of 73.5% and the hypothetical payout amount of 63.0% is disclosed in the following tables under “LTI 2020 – Tranche 2020” in 2024.
For the non-performance-based compensation and the STI paid out in the Executive Board member’s home currency, the amounts are converted to euro for reporting purposes. While for the non-performance-based compensation conversion into euro the annual average exchange rate applies, the STI is converted using the exchange rate at year-end. For the payout of the STI non-deferral (which is due after the annual general meeting of shareholders) and the STI deferral, the exchange rate at payout will apply. The individual amount resulting from the difference between the exchange rate at year end and at payout will be disclosed in the following tables under “Exchange rate fluctuations” in the year of payment.
Executive Board Members’ Compensation
|
|
Christian Klein |
|
Muhammad Alam |
|||||||||||||||||
|
|
CEO |
|
Member of the Executive Board (from 4/1/2024) |
|||||||||||||||||
|
|
Contractual Compensation |
|
Compensation Awarded and Due |
|
Contractual Compensation |
|
Compensation Awarded and Due |
|||||||||||||
|
|
2024 |
|
2023 |
|
2024 |
|
in % |
|
2023 |
|
in % |
|
2024 |
|
2023 |
|
|
|
|
|
€ thousands |
|
|
|
|
|
|
|
|
|
|
|
|
|
|
|
|
|
2024 |
in % |
2023 |
in % |
Annual base salary |
|
1,100.0 |
|
1,100.0 |
|
1,100.0 |
|
5.8 |
|
1,100.0 |
|
15.4 |
|
600.0 |
|
|
|
600.0 |
31.0 |
|
0 |
Fringe benefits1 |
|
15.2 |
|
21.7 |
|
15.2 |
|
0.1 |
|
21.7 |
|
0.3 |
|
24.1 |
|
|
|
24.1 |
1.2 |
|
0 |
Pension-related commitments |
|
330.0 |
|
|
|
330.0 |
|
1.7 |
|
|
|
0 |
|
|
|
|
|
|
0 |
|
0 |
Exchange rate fluctuations (euro cap)2 |
|
|
|
|
|
|
|
|
|
|
|
|
|
40.9 |
|
|
|
40.9 |
|
|
|
Total non-performance-based compensation |
|
1,445.2 |
|
1,121.7 |
|
1,445.2 |
|
7.6 |
|
1,121.7 |
|
15.7 |
|
664.9 |
|
0 |
|
664.9 |
34.3 |
0 |
0 |
One-year variable compensation |
|
|
|
|
|
|
|
|
|
|
|
|
|
|
|
|
|
|
|
|
|
STI 2023 |
|
|
|
1,900.0 |
|
|
|
0 |
|
2,186.9 |
|
30.6 |
|
|
|
|
|
|
0 |
|
0 |
STI 2024 non-deferral (80%) |
|
2,368.0 |
|
|
|
2,706.4 |
|
14.3 |
|
|
|
0 |
|
889.6 |
|
|
|
1,016.7 |
52.5 |
|
0 |
STI 2024 deferral I (10%) |
|
296.0 |
|
|
|
338.3 |
|
1.8 |
|
|
|
0 |
|
111.2 |
|
|
|
127.1 |
6.6 |
|
0 |
STI 2024 deferral II (10%) |
|
296.0 |
|
|
|
338.3 |
|
1.8 |
|
|
|
0 |
|
111.2 |
|
|
|
127.1 |
6.6 |
|
0 |
Multiyear variable compensation |
|
|
|
|
|
|
|
|
|
|
|
|
|
|
|
|
|
|
|
|
|
LTI 2016 Plan – Tranche 2019 |
|
|
|
|
|
|
|
0 |
|
386.9 |
|
5.4 |
|
|
|
|
|
|
0 |
|
0 |
LTI 2020 – Tranche 2020 |
|
|
|
|
|
581.4 |
|
3.1 |
|
3,462.6 |
|
48.4 |
|
|
|
|
|
|
0 |
|
0 |
LTI 2020 – Tranche 2021 |
|
|
|
|
|
13,573.4 |
|
71.5 |
|
|
|
0 |
|
|
|
|
|
|
0 |
|
0 |
LTI 2020 – Tranche 2023 |
|
|
|
5,500.0 |
|
|
|
0 |
|
|
|
0 |
|
|
|
|
|
|
0 |
|
0 |
LTI 2024 – Tranche 2024 |
|
4,440.0 |
|
|
|
|
|
0 |
|
|
|
0 |
|
1,668.0 |
|
|
|
|
0 |
|
0 |
Total performance-based compensation |
|
7,400.0 |
|
7,400.0 |
|
17,537.8 |
|
92.4 |
|
6,036.4 |
|
84.3 |
|
2,780.1 |
|
0 |
|
1,270.9 |
65.7 |
0 |
0 |
Total |
|
8,845.2 |
|
8,521.7 |
|
18,983.0 |
|
100.0 |
|
7,158.1 |
|
100.0 |
|
3,445.0 |
|
0 |
|
1,935.9 |
100.0 |
0 |
0 |
81
For the LTI 2020 tranche 2020, the difference between the actual payout amount of €4,044.0 thousand and the hypothetical payout amount of €3,462.6 thousand for Christian Klein is €581.4 thousand.
|
|
Dominik Asam |
|
Juergen Mueller |
|||||||||||||||||
|
|
Member of the Executive Board |
|
Member of the Executive Board (until 9/30/2024) |
|||||||||||||||||
€ thousands |
|
Contractual Compensation |
|
Compensation Awarded and Due |
|
Contractual Compensation |
|
Compensation Awarded and Due |
|||||||||||||
|
|
2024 |
|
2023 |
|
2024 |
|
in % |
|
2023 |
|
in % |
|
2024 |
|
2023 |
|
|
|
|
|
|
|
|
|
|
|
|
|
|
|
|
|
|
|
|
|
|
|
2024 |
in % |
2023 |
in % |
Annual base salary |
|
800.0 |
|
655.1 |
|
800.0 |
|
24.4 |
|
655.1 |
|
16.6 |
|
600.0 |
|
700.0 |
|
600.0 |
8.4 |
700.0 |
19.2 |
Fringe benefits1 |
|
26.8 |
|
57.5 |
|
26.8 |
|
0.8 |
|
57.5 |
|
1.5 |
|
11.3 |
|
15.7 |
|
11.3 |
0.2 |
15.7 |
0.4 |
Pension-related commitments |
|
180.0 |
|
|
|
180.0 |
|
5.5 |
|
|
|
0 |
|
180.0 |
|
|
|
180.0 |
2.5 |
|
0 |
Replacement award |
|
|
|
1,600.0 |
|
|
|
0 |
|
1,600.0 |
|
40.6 |
|
|
|
|
|
|
0 |
|
0 |
Total non-performance-based compensation |
|
1,006.8 |
|
2,312.5 |
|
1,006.8 |
|
30.7 |
|
2,312.5 |
|
58.7 |
|
791.3 |
|
715.7 |
|
791.3 |
11.1 |
715.7 |
19.6 |
One-year variable compensation |
|
|
|
|
|
|
|
|
|
|
|
|
|
|
|
|
|
|
|
|
|
STI 2023 |
|
|
|
1,416.3 |
|
|
|
0 |
|
1,630.2 |
|
41.3 |
|
|
|
1,125.8 |
|
|
0 |
1,295.7 |
35.5 |
STI 2024 non-deferral (80%) |
|
1,592.0 |
|
|
|
1,819.5 |
|
55.5 |
|
|
|
0 |
|
766.6 |
|
|
|
876.1 |
12.3 |
|
0 |
STI 2024 deferral I (10%) |
|
199.0 |
|
|
|
227.4 |
|
6.9 |
|
|
|
0 |
|
95.8 |
|
|
|
109.5 |
1.5 |
|
0 |
STI 2024 deferral II (10%) |
|
199.0 |
|
|
|
227.4 |
|
6.9 |
|
|
|
0 |
|
95.8 |
|
|
|
109.5 |
1.5 |
|
0 |
Multiyear variable compensation |
|
|
|
|
|
|
|
|
|
|
|
|
|
|
|
|
|
|
|
|
|
LTI 2016 Plan - Tranche 2019 |
|
|
|
|
|
|
|
0 |
|
|
|
0 |
|
|
|
|
|
|
0 |
272.8 |
7.5 |
LTI 2020 - Tranche 2020 |
|
|
|
|
|
|
|
0 |
|
|
|
0 |
|
|
|
|
|
229.9 |
3.2 |
1,368.8 |
37.5 |
LTI 2020 - Tranche 2021 |
|
|
|
|
|
|
|
0 |
|
|
|
0 |
|
|
|
|
|
5,028.1 |
70.4 |
|
0 |
LTI 2020 – Tranche 2023 |
|
|
|
2,654.8 |
|
|
|
0 |
|
|
|
0 |
|
|
|
2,174.3 |
|
|
0 |
|
0 |
LTI 2024 - Tranche 2024 |
|
2,932.1 |
|
|
|
|
|
0 |
|
|
|
0 |
|
1,920.0 |
|
|
|
|
0 |
|
0 |
Total performance-based compensation |
|
4,922.1 |
|
4,071.1 |
|
2,274.4 |
|
69.3 |
|
1,630.2 |
|
41.3 |
|
2,878.3 |
|
3,300.1 |
|
6,353.1 |
88.9 |
2,937.3 |
80.4 |
Total |
|
5,928.9 |
|
6,383.6 |
|
3,281.2 |
|
100.0 |
|
3,942.7 |
|
100.0 |
|
3,669.5 |
|
4,015.7 |
|
7,144.4 |
100.0 |
3,653.0 |
100.0 |
82
On his appointment to the Executive Board, Dominik Asam received exceptional grants to compensate the loss of previously earned and forfeited compensation from his previous employer. The total loss of compensation was €3.85 million. The distribution of this amount reflects the nature and timing of the forfeited compensation as far as possible under the SAP compensation system. This results for 2024 in an STI of €0.51 million and an LTI grant of €0.71 million. These amounts are included in the table above in addition to the regular compensation. For 2024, the replacement award increased his maximum compensation for 2024 by €2.85 million.
For the LTI 2020 tranche 2020, the difference between the actual payout amount of €1,598.7 thousand and the hypothetical payout amount of €1,368.8 thousand for Juergen Mueller is €229.9 thousand.
|
|
Scott Russell |
|
Thomas Saueressig |
|||||||||||||||||
|
|
Member of the Executive Board (until 8/31/2024) |
|
Member of the Executive Board |
|||||||||||||||||
|
|
Contractual Compensation |
|
Compensation Awarded and Due |
|
Contractual Compensation |
|
Compensation Awarded and Due |
|||||||||||||
|
|
2024 |
|
2023 |
|
2024 |
|
in % |
|
2023 |
|
in % |
|
2024 |
|
2023 |
|
|
|
|
|
€ thousands |
|
|
|
|
|
|
|
|
|
|
|
|
|
|
|
|
|
2024 |
in % |
2023 |
in % |
Annual base salary |
|
698.9 |
|
1,000.0 |
|
698.9 |
|
8.2 |
|
1,000.0 |
|
32.5 |
|
800.0 |
|
800.0 |
|
800.0 |
9.7 |
800.0 |
22.2 |
Fringe benefits1 |
|
112.6 |
|
64.5 |
|
112.6 |
|
1.3 |
|
64.5 |
|
2.1 |
|
17.0 |
|
15.9 |
|
17.0 |
0.2 |
15.9 |
0.4 |
Pension-related commitments |
|
|
|
|
|
|
|
0 |
|
|
|
0 |
|
|
|
|
|
|
0 |
|
0 |
Exchange rate fluctuations (euro cap)2 |
|
117.3 |
|
112.7 |
|
117.3 |
|
1.4 |
|
112.7 |
|
3.7 |
|
|
|
|
|
|
|
|
|
Total non-performance-based compensation |
|
928.8 |
|
1,177.3 |
|
928.8 |
|
10.9 |
|
1,177.3 |
|
38.3 |
|
817.0 |
|
815.9 |
|
817.0 |
9.9 |
815.9 |
22.6 |
One-year variable compensation |
|
|
|
|
|
|
|
|
|
|
|
|
|
|
|
|
|
|
|
|
|
STI 2023 |
|
|
|
1,650.0 |
|
|
|
0 |
|
1,899.2 |
|
61.7 |
|
|
|
1,200.0 |
|
|
0 |
1,381.2 |
38.2 |
STI 2024 non-deferral (80%) |
|
1,163.0 |
|
|
|
1,329.2 |
|
15.7 |
|
|
|
0 |
|
1,280.0 |
|
|
|
1,462.9 |
17.8 |
|
0 |
STI 2024 deferral I (10%) |
|
145.4 |
|
|
|
166.2 |
|
2.0 |
|
|
|
0 |
|
160.0 |
|
|
|
182.9 |
2.2 |
|
0 |
STI 2024 deferral II (10%) |
|
145.4 |
|
|
|
166.2 |
|
2.0 |
|
|
|
0 |
|
160.0 |
|
|
|
182.9 |
2.2 |
|
0 |
Multiyear variable compensation |
|
|
|
|
|
|
|
|
|
|
|
|
|
|
|
|
|
|
|
|
|
LTI 2016 Plan – Tranche 2019 |
|
|
|
|
|
|
|
0 |
|
|
|
0 |
|
|
|
|
|
|
0 |
45.6 |
1.3 |
LTI 2020 – Tranche 2020 |
|
|
|
|
|
|
|
0 |
|
|
|
0 |
|
|
|
|
|
229.9 |
2.8 |
1,368.8 |
37.9 |
LTI 2020 - Tranche 2021 |
|
|
|
|
|
5,898.9 |
|
69.5 |
|
|
|
0 |
|
|
|
|
|
5,365.8 |
65.1 |
|
0 |
LTI 2020 - Tranche 2023 |
|
|
|
2,850.0 |
|
|
|
0 |
|
|
|
0 |
|
|
|
2,800.0 |
|
|
0 |
|
0 |
LTI 2024 - Tranche 2024 |
|
3,271.0 |
|
|
|
|
|
0 |
|
|
|
0 |
|
2,400.0 |
|
|
|
|
0 |
|
0 |
Total performance-based compensation |
|
4,724.8 |
|
4,500.0 |
|
7,560.4 |
|
89.1 |
|
1,899.2 |
|
61.7 |
|
4,000.0 |
|
4,000.0 |
|
7,424.3 |
90.1 |
2,795.6 |
77.4 |
Total |
|
5,653.6 |
|
5,677.3 |
|
8,489.2 |
|
100.0 |
|
3,076.4 |
|
100.0 |
|
4,817.0 |
|
4,815.9 |
|
8,241.3 |
100.0 |
3,611.5 |
100.0 |
For the LTI 2020 tranche 2020, the difference between the actual payout amount of €1,598.7 thousand and the hypothetical payout amount of €1,368.8 thousand for Thomas Saueressig is €229.9 thousand.
83
|
|
Gina Vargiu-Breuer |
|
Julia White |
|||||||||||||||||
|
|
Member of the Executive Board (from 2/1/2024) |
|
Member of the Executive Board (until 8/31/2024) |
|||||||||||||||||
|
|
Contractual Compensation |
|
Compensation Awarded and Due |
|
Contractual Compensation |
|
Compensation Awarded and Due |
|||||||||||||
|
|
2024 |
|
2023 |
|
2024 |
|
in % |
|
2023 |
|
in % |
|
2024 |
|
2023 |
|
|
|
|
|
€ thousands |
|
|
|
|
|
|
|
|
|
|
|
|
|
|
|
|
|
2024 |
in % |
2023 |
in % |
Annual base salary |
|
733.3 |
|
|
|
733.3 |
|
34.8 |
|
|
|
0 |
|
556.3 |
|
750.0 |
|
556.3 |
6.9 |
750.0 |
29.3 |
Fringe benefits1 |
|
36.4 |
|
|
|
36.4 |
|
1.7 |
|
|
|
0 |
|
81.2 |
|
73.9 |
|
81.2 |
1.0 |
73.9 |
2.9 |
Pension-related commitments |
|
220.0 |
|
|
|
|
|
0 |
|
|
|
0 |
|
|
|
|
|
|
0 |
|
0 |
Exchange rate fluctuations (euro cap)2 |
|
|
|
|
|
|
|
|
|
|
|
|
|
85.3 |
|
230.1 |
|
85.3 |
1.1 |
230.1 |
9.0 |
Replacement Award |
|
300.0 |
|
|
|
|
|
0 |
|
|
|
0 |
|
|
|
|
|
|
0 |
|
0 |
Total non-performance-based compensation |
|
1,289.8 |
|
0 |
|
769.8 |
|
36.5 |
|
0 |
|
0 |
|
722.8 |
|
1,053.9 |
|
722.8 |
8.9 |
1,053.9 |
41.2 |
One-year variable compensation |
|
|
|
|
|
|
|
|
|
|
|
|
|
|
|
|
|
|
|
|
|
STI 2023 |
|
|
|
|
|
|
|
0 |
|
|
|
0 |
|
|
|
1,304.9 |
|
|
0 |
1,502.0 |
58.8 |
STI 2024 non-deferral (80%) |
|
937.3 |
|
|
|
1,071.2 |
|
50.8 |
|
|
|
0 |
|
782.0 |
|
|
|
893.7 |
11.0 |
|
0 |
STI 2024 deferral I (10%) |
|
117.2 |
|
|
|
133.9 |
|
6.3 |
|
|
|
0 |
|
97.7 |
|
|
|
111.7 |
1.4 |
|
0 |
STI 2024 deferral II (10%) |
|
117.2 |
|
|
|
133.9 |
|
6.3 |
|
|
|
0 |
|
97.7 |
|
|
|
111.7 |
1.4 |
|
0 |
Multiyear variable compensation |
|
|
|
|
|
|
|
|
|
|
|
|
|
|
|
|
|
|
|
|
|
LTI 2020 - Tranche 2021 |
|
|
|
|
|
|
|
0 |
|
|
|
0 |
|
|
|
|
|
6,262.8 |
77.3 |
|
0 |
LTI 2020 - Tranche 2023 |
|
|
|
|
|
|
|
0 |
|
|
|
0 |
|
|
|
2,461.5 |
|
|
0 |
|
0 |
LTI 2024 - Tranche 2024 |
|
1,757.4 |
|
|
|
|
|
0 |
|
|
|
0 |
|
2,199.3 |
|
|
|
|
0 |
|
0 |
Total performance-based compensation |
|
2,929.0 |
|
0 |
|
1,339.0 |
|
63.5 |
|
0 |
|
0 |
|
3,176.8 |
|
3,766.5 |
|
7,379.9 |
91.1 |
1,502.0 |
58.8 |
Total |
|
4,218.7 |
|
0 |
|
2,108.8 |
|
100.0 |
|
0 |
|
0 |
|
3,899.6 |
|
4,820.4 |
|
8,102.7 |
100.0 |
2,555.9 |
100.0 |
84
|
|
Total Executive Board |
|||||||
|
|
Contractual Compensation |
|
Compensation Awarded and Due |
|||||
|
|
|
|
|
|
|
|
|
|
€ thousands |
|
2024 |
|
2023 |
|
2024 |
in % |
2023 |
in % |
Annual base salary |
|
5,888.5 |
|
5,005.1 |
|
5,888.5 |
10.1 |
5,005.1 |
20.9 |
Fringe benefits1 |
|
324.6 |
|
249.1 |
|
324.6 |
0.6 |
249.1 |
1.0 |
Pension-related commitments |
|
910.0 |
|
0 |
|
690.0 |
1.2 |
0 |
0 |
Exchange rate fluctuations (euro cap)2 |
|
243.4 |
|
342.8 |
|
243.4 |
0.4 |
342.8 |
1.4 |
Replacement award |
|
300.0 |
|
1,600.0 |
|
0 |
0 |
1,600.0 |
6.7 |
Total non-performance-based compensation |
|
7,666.5 |
|
7,197.0 |
|
7,146.5 |
12.3 |
7,197.0 |
30.0 |
One-year variable compensation |
|
|
|
|
|
|
|
|
|
STI 2023 |
|
0 |
|
8,597.0 |
|
0 |
0 |
9,895.1 |
41.2 |
STI 2024 non-deferral (80%) |
|
9,778.5 |
|
0 |
|
11,175.8 |
19.2 |
0 |
0 |
STI 2024 deferral I (10%) |
|
1,222.3 |
|
0 |
|
1,397.0 |
2.4 |
0 |
0 |
STI 2024 deferral II (10%) |
|
1,222.3 |
|
0 |
|
1,397.0 |
2.4 |
0 |
0 |
Multiyear variable compensation |
|
|
|
|
|
|
|
|
|
LTI 2016 Plan - Tranche 2019 |
|
0 |
|
0 |
|
0 |
0 |
705.3 |
2.9 |
LTI 2020 - Tranche 2020 |
|
0 |
|
0 |
|
1,041.2 |
1.8 |
6,200.2 |
25.8 |
LTI 2020 - Tranche 2021 |
|
0 |
|
0 |
|
36,129.0 |
62.0 |
0 |
0 |
LTI 2020 - Tranche 2023 |
|
0 |
|
18,440.6 |
|
0 |
0 |
0 |
0 |
LTI 2024 - Tranche 2024 |
|
20,587.8 |
|
0 |
|
0 |
0 |
0 |
0 |
Total performance-based compensation |
|
12,223.1 |
|
27,037.6 |
|
51,139.9 |
87.7 |
16,800.6 |
70.0 |
Total |
|
19,889.7 |
|
34,234.6 |
|
58,286.5 |
100.0 |
23,997.6 |
100.0 |
1 Insurance contributions, the private use of company cars and aircraft, payments and related supplements for relocation, benefits in kind, reimbursement of costs for preparation of tax returns, and tax gross-ups according to local conditions
2 The value of the fixed and one-year variable compensation is granted in U.S. dollars.
Share-Based Payment Information Relating to Long-Term Incentives
Members of the Executive Board received, hold, or held Share Units issued to them under the LTI 2024 and hold or held Share Units issued to them under the LTI 2020. For more information about the terms and details of these programs, see the Notes to the Consolidated Financial Statements, Note (B.3).
85
Executive Board Members’ Holdings
|
|
|
|
|
|
1/1/2024 |
|
During the Year |
|
12/31/2024 |
||||
|
|
|
|
|
|
|
|
|
|
Exercised (E)/ |
|
|
|
Thereof |
|
|
|
|
|
|
|
|
|
|
Adjusted (A)/ |
|
|
|
Subject to |
|
|
Specification |
|
Grant Date |
|
Outstanding |
|
Granted |
|
Forfeited (F) |
|
Outstanding |
|
Holding Period |
|
|
LTI 2024 - Tranche 2024 - Market PSU |
|
3/12/2024 |
|
0 |
|
8,168 |
|
0 |
|
8,168 |
|
8,168 |
|
|
LTI 2024 - Tranche 2024 - Financial PSU |
|
3/12/2024 |
|
0 |
|
13,613 |
|
0 |
|
13,613 |
|
13,613 |
|
|
LTI 2024 - Tranche 2024 - ESG PSU |
|
3/12/2024 |
|
0 |
|
5,445 |
|
0 |
|
5,445 |
|
5,445 |
|
|
LTI 2020 - Tranche 2023 - Market PSU |
|
3/24/2023 |
|
16,726 |
|
0 |
|
0 |
|
16,726 |
|
16,726 |
|
|
LTI 2020 - Tranche 2023 - Financial PSU |
|
3/24/2023 |
|
16,726 |
|
0 |
|
0 |
|
16,726 |
|
16,726 |
|
|
LTI 2020 - Tranche 2023 - RSU |
|
3/24/2023 |
|
16,726 |
|
0 |
|
0 |
|
16,726 |
|
16,726 |
|
|
LTI 2020 - Tranche 2022 - Market PSU |
|
3/28/2022 |
|
17,197 |
|
0 |
|
0 |
|
17,197 |
|
17,197 |
|
|
LTI 2020 - Tranche 2022 - Financial PSU |
|
3/28/2022 |
|
17,197 |
|
0 |
|
0 |
|
17,197 |
|
17,197 |
Christian Klein (CEO) |
|
LTI 2020 - Tranche 2022 - RSU |
|
3/28/2022 |
|
17,197 |
|
0 |
|
0 |
|
17,197 |
|
17,197 |
|
|
LTI 2020 - Tranche 2021 - Market PSU |
|
3/22/2021 |
|
17,230 |
|
0 |
|
8,615 |
A |
25,845 |
|
25,845 |
|
|
LTI 2020 - Tranche 2021 - Financial PSU |
|
3/22/2021 |
|
17,230 |
|
0 |
|
3,477 |
A |
20,707 |
|
20,707 |
|
|
LTI 2020 - Tranche 2021 - RSU |
|
3/22/2021 |
|
17,230 |
|
0 |
|
0 |
|
17,230 |
|
17,230 |
|
|
LTI 2020 - Tranche 2020 - Financial PSU |
|
2/29/2020 |
|
8,656 |
|
0 |
|
-8,656 |
E |
0 |
|
0 |
|
|
LTI 2020 - Tranche 2020 - RSU |
|
2/29/2020 |
|
14,834 |
|
0 |
|
-14,834 |
E |
0 |
|
0 |
|
|
LTI 2024 - Tranche 2024 - Market PSU |
|
4/2/2024 |
|
0 |
|
3,068 |
|
0 |
|
3,068 |
|
3,068 |
Muhammad Alam (from 4/1/2024) |
|
LTI 2024 - Tranche 2024 - Financial PSU |
|
4/2/2024 |
|
0 |
|
5,114 |
|
0 |
|
5,114 |
|
5,114 |
|
|
LTI 2024 - Tranche 2024 - ESG PSU |
|
4/2/2024 |
|
0 |
|
2,046 |
|
0 |
|
2,046 |
|
2,046 |
|
|
LTI 2024 – Tranche 2024 – Market PSU |
|
3/12/2024 |
|
0 |
|
5,394 |
|
0 |
|
5,394 |
|
5,394 |
|
|
LTI 2024 – Tranche 2024 – Financial PSU |
|
3/12/2024 |
|
0 |
|
8,990 |
|
0 |
|
8,990 |
|
8,990 |
Dominik Asam |
|
LTI 2024 – Tranche 2024 – ESG PSU |
|
3/12/2024 |
|
0 |
|
3,596 |
|
0 |
|
3,596 |
|
3,596 |
|
|
LTI 2020 – Tranche 2023 – Market PSU |
|
3/24/2023 |
|
8,073 |
|
0 |
|
0 |
|
8,073 |
|
8,073 |
|
|
LTI 2020 – Tranche 2023 – Financial PSU |
|
3/24/2023 |
|
8,073 |
|
0 |
|
0 |
|
8,073 |
|
8,073 |
|
|
LTI 2020 – Tranche 2023 – RSU |
|
3/24/2023 |
|
8,073 |
|
0 |
|
0 |
|
8,073 |
|
8,073 |
|
|
LTI 2024 – Tranche 2024 – Market PSU |
|
3/12/2024 |
|
0 |
|
6,017 |
|
-5,012 |
F |
1,005 |
|
1,005 |
|
|
LTI 2024 – Tranche 2024 – Financial PSU |
|
3/12/2024 |
|
0 |
|
10,029 |
|
-8,354 |
F |
1,675 |
|
1,675 |
|
|
LTI 2024 – Tranche 2024 – ESG PSU |
|
3/12/2024 |
|
0 |
|
4,012 |
|
-3,342 |
F |
670 |
|
670 |
|
|
LTI 2020 – Tranche 2023 – Market PSU |
|
3/24/2023 |
|
8,667 |
|
0 |
|
-5,054 |
F |
3,613 |
|
3,613 |
|
|
LTI 2020 – Tranche 2023 – Financial PSU |
|
3/24/2023 |
|
8,667 |
|
0 |
|
-5,054 |
F |
3,613 |
|
3,613 |
|
|
LTI 2020 – Tranche 2023 – RSU |
|
3/24/2023 |
|
8,667 |
|
0 |
|
-5,054 |
F |
3,613 |
|
3,613 |
Scott Russell (until 8/31/2024) |
|
LTI 2020 – Tranche 2022 – Market PSU |
|
3/28/2022 |
|
8,911 |
|
0 |
|
-2,970 |
F |
5,941 |
|
5,941 |
|
|
LTI 2020 – Tranche 2022 – Financial PSU |
|
3/28/2022 |
|
8,911 |
|
0 |
|
-2,970 |
F |
5,941 |
|
5,941 |
|
|
LTI 2020 – Tranche 2022 – RSU |
|
3/28/2022 |
|
8,911 |
|
0 |
|
-2,970 |
F |
5,941 |
|
5,941 |
|
|
LTI 2020 – Tranche 2021 – Market PSU |
|
3/22/2021 |
|
8,170 |
|
0 |
|
3,062 |
A/F |
11,232 |
|
11,232 |
|
|
LTI 2020 – Tranche 2021 – Financial PSU |
|
3/22/2021 |
|
8,170 |
|
0 |
|
829 |
A/F |
8,999 |
|
8,999 |
|
|
LTI 2020 – Tranche 2021 – RSU |
|
3/22/2021 |
|
8,170 |
|
0 |
|
-682 |
F |
7,488 |
|
7,488 |
|
|
LTI 2024 – Tranche 2024 – Market PSU |
|
3/12/2024 |
|
0 |
|
3,532 |
|
-2,870 |
F |
662 |
|
662 |
|
|
LTI 2024 – Tranche 2024 – Financial PSU |
|
3/12/2024 |
|
0 |
|
5,887 |
|
-4,783 |
F |
1,104 |
|
1,104 |
|
|
LTI 2024 – Tranche 2024 – ESG PSU |
|
3/12/2024 |
|
0 |
|
2,355 |
|
-1,913 |
F |
442 |
|
442 |
|
|
LTI 2020 – Tranche 2023 – Market PSU |
|
3/24/2023 |
|
6,612 |
|
0 |
|
-3,720 |
F |
2,892 |
|
2,892 |
|
|
LTI 2020 – Tranche 2023 – Financial PSU |
|
3/24/2023 |
|
6,612 |
|
0 |
|
-3,720 |
F |
2,892 |
|
2,892 |
|
|
LTI 2020 – Tranche 2023 – RSU |
|
3/24/2023 |
|
6,612 |
|
0 |
|
-3,720 |
F |
2,892 |
|
2,892 |
Juergen Mueller (until 9/30/2024) |
|
LTI 2020 – Tranche 2022 – Market PSU |
|
3/28/2022 |
|
6,798 |
|
0 |
|
-2,126 |
F |
4,672 |
|
4,672 |
|
|
LTI 2020 – Tranche 2022 – Financial PSU |
|
3/28/2022 |
|
6,798 |
|
0 |
|
-2,126 |
F |
4,672 |
|
4,672 |
86
|
|
LTI 2020 – Tranche 2022 – RSU |
|
3/28/2022 |
|
6,798 |
|
0 |
|
-2,126 |
F |
4,672 |
|
4,672 |
|
|
LTI 2020 – Tranche 2021 – Market PSU |
|
3/22/2021 |
|
6,811 |
|
0 |
|
2,763 |
F |
9,574 |
|
9,574 |
|
|
LTI 2020 – Tranche 2021 – Financial PSU |
|
3/22/2021 |
|
6,811 |
|
0 |
|
860 |
F |
7,671 |
|
7,671 |
|
|
LTI 2020 – Tranche 2021 – RSU |
|
3/22/2021 |
|
6,811 |
|
0 |
|
-429 |
F |
6,382 |
|
6,382 |
|
|
LTI 2020 – Tranche 2020 – Financial PSU |
|
2/29/2020 |
|
3,422 |
|
0 |
|
-3,422 |
E |
0 |
|
0 |
|
|
LTI 2020 – Tranche 2020 – RSU |
|
2/29/2020 |
|
5,864 |
|
0 |
|
-5,864 |
E |
0 |
|
0 |
|
|
LTI 2024 – Tranche 2024 – Market PSU |
|
3/12/2024 |
|
0 |
|
4,415 |
|
0 |
|
4,415 |
|
4,415 |
|
|
LTI 2024 – Tranche 2024 – Financial PSU |
|
3/12/2024 |
|
0 |
|
7,358 |
|
0 |
|
7,358 |
|
7,358 |
|
|
LTI 2024 – Tranche 2024 – ESG PSU |
|
3/12/2024 |
|
0 |
|
2,943 |
|
0 |
|
2,943 |
|
2,943 |
|
|
LTI 2020 – Tranche 2023 – Market PSU |
|
3/24/2023 |
|
8,515 |
|
0 |
|
0 |
|
8,515 |
|
8,515 |
|
|
LTI 2020 – Tranche 2023 – Financial PSU |
|
3/24/2023 |
|
8,515 |
|
0 |
|
0 |
|
8,515 |
|
8,515 |
|
|
LTI 2020 – Tranche 2023 – RSU |
|
3/24/2023 |
|
8,515 |
|
0 |
|
0 |
|
8,515 |
|
8,515 |
Thomas Saueressig |
|
LTI 2020 – Tranche 2022 – Market PSU |
|
3/28/2022 |
|
7,125 |
|
0 |
|
0 |
|
7,125 |
|
7,125 |
|
|
LTI 2020 – Tranche 2022 – Financial PSU |
|
3/28/2022 |
|
7,125 |
|
0 |
|
0 |
|
7,125 |
|
7,125 |
|
|
LTI 2020 – Tranche 2022 – RSU |
|
3/28/2022 |
|
7,125 |
|
0 |
|
0 |
|
7,125 |
|
7,125 |
|
|
LTI 2020 – Tranche 2021 – Market PSU |
|
3/22/2021 |
|
6,811 |
|
0 |
|
3,406 |
A |
10,217 |
|
10,217 |
|
|
LTI 2020 – Tranche 2021 – Financial PSU |
|
3/22/2021 |
|
6,811 |
|
0 |
|
1,375 |
A |
8,186 |
|
8,186 |
|
|
LTI 2020 – Tranche 2021 – RSU |
|
3/22/2021 |
|
6,811 |
|
0 |
|
0 |
|
6,811 |
|
6,811 |
|
|
LTI 2020 – Tranche 2020 – Financial PSU |
|
2/29/2020 |
|
3,422 |
|
0 |
|
-3,422 |
E |
0 |
|
0 |
|
|
LTI 2020 – Tranche 2020 – RSU |
|
2/29/2020 |
|
5,864 |
|
0 |
|
-5,864 |
E |
0 |
|
0 |
|
|
LTI 2024 – Tranche 2024 – Market PSU |
|
3/12/2024 |
|
0 |
|
3,233 |
|
0 |
|
3,233 |
|
3,233 |
Gina Vargiu-Breuer (from 2/1/2024) |
|
LTI 2024 – Tranche 2024 – Financial PSU |
|
3/12/2024 |
|
0 |
|
5,388 |
|
0 |
|
5,388 |
|
5,388 |
|
|
LTI 2024 – Tranche 2024 – ESG PSU |
|
3/12/2024 |
|
0 |
|
2,155 |
|
0 |
|
2,155 |
|
2,155 |
|
|
LTI 2024 – Tranche 2024 – Market PSU |
|
3/12/2024 |
|
0 |
|
4,046 |
|
-3,370 |
F |
676 |
|
676 |
|
|
LTI 2024 – Tranche 2024 – Financial PSU |
|
3/12/2024 |
|
0 |
|
6,743 |
|
-5,617 |
F |
1,126 |
|
1,126 |
|
|
LTI 2024 – Tranche 2024 – ESG PSU |
|
3/12/2024 |
|
0 |
|
2,697 |
|
-2,247 |
F |
450 |
|
450 |
|
|
LTI 2020 – Tranche 2023 – Market PSU |
|
3/24/2023 |
|
7,486 |
|
0 |
|
-4,366 |
F |
3,120 |
|
3,120 |
Julia White |
|
LTI 2020 – Tranche 2023 – Financial PSU |
|
3/24/2023 |
|
7,486 |
|
0 |
|
-4,366 |
F |
3,120 |
|
3,120 |
(until 8/31/2024) |
|
LTI 2020 – Tranche 2023 – RSU |
|
3/24/2023 |
|
7,486 |
|
0 |
|
-4,366 |
F |
3,120 |
|
3,120 |
|
|
LTI 2020 – Tranche 2022 – Market PSU |
|
3/28/2022 |
|
10,944 |
|
0 |
|
-3,648 |
F |
7,296 |
|
7,296 |
|
|
LTI 2020 – Tranche 2022 – Financial PSU |
|
3/28/2022 |
|
10,944 |
|
0 |
|
-3,648 |
F |
7,296 |
|
7,296 |
|
|
LTI 2020 – Tranche 2022 – RSU |
|
3/28/2022 |
|
10,944 |
|
0 |
|
-3,648 |
F |
7,296 |
|
7,296 |
|
|
LTI 2020 – Tranche 2021 – Market PSU |
|
3/22/2021 |
|
8,674 |
|
0 |
|
3,251 |
A/F |
11,925 |
|
11,925 |
|
|
LTI 2020 – Tranche 2021 – Financial PSU |
|
3/22/2021 |
|
8,674 |
|
0 |
|
880 |
A/F |
9,554 |
|
9,554 |
|
|
LTI 2020 – Tranche 2021 – RSU |
|
3/22/2021 |
|
8,674 |
|
0 |
|
-724 |
F |
7,950 |
|
7,950 |
Total |
|
|
|
|
|
506,312 |
|
126,244 |
|
-118,539 |
|
514,017 |
|
514,017 |
87
Main Conditions
|
|
|
|
|
|
Grant Date Fair Value |
|
End of |
|
End of |
|
|
Specification |
|
Grant Date |
|
Grant Price (in €) |
|
(in €) |
|
Performance |
|
Vesting Period |
|
Payout |
LTI 2024 – Tranche 2024 – Financial PSU |
|
3/12/2024 |
|
|
|
165.71 |
|
December 2026 |
|
|
|
|
|
|
4/2/2024 |
|
|
|
166.25 |
|
|
|
|
|
|
LTI 2024 – Tranche 2024 – Market PSU |
|
3/12/2024 |
|
163.08 |
|
201.42 |
|
February 2027 |
|
12/31/2027 |
|
May 2028 |
|
|
4/2/2024 |
|
|
|
202.37 |
|
|
|
|
|
|
LTI 2024 – Tranche 2024 – ESG PSU |
|
3/12/2024 |
|
|
|
165.71 |
|
February 2027 |
|
|
|
|
|
|
4/2/2024 |
|
|
|
166.25 |
|
|
|
|
|
|
LTI 2020 – Tranche 2023 – Financial PSU |
|
|
|
|
|
105.81 |
|
December 2025 |
|
|
|
|
LTI 2020 – Tranche 2023 – Market PSU |
|
3/24/2023 |
|
109.612 |
|
130.56 |
|
February 2026 |
|
12/31/2026 |
|
May 2027 |
LTI 2020 – Tranche 2023 – RSU |
|
|
|
|
|
105.81 |
|
NA |
|
|
|
|
LTI 2020 – Tranche 2022 – Financial PSU |
|
|
|
|
|
96.84 |
|
December 2024 |
|
|
|
|
LTI 2020 – Tranche 2022 – Market PSU |
|
3/28/2022 |
|
106.605 |
|
108.20 |
|
February 2025 |
|
12/31/2025 |
|
May 2026 |
LTI 2020 – Tranche 2022 – RSU |
|
|
|
|
|
96.84 |
|
NA |
|
|
|
|
LTI 2020 – Tranche 2021 – Financial PSU |
|
|
|
|
|
100.28 |
|
December 2023 |
|
|
|
|
LTI 2020 – Tranche 2021 – Market PSU |
|
3/22/2021 |
|
106.405 |
|
115.19 |
|
February 2024 |
|
12/31/2024 |
|
May 2025 |
LTI 2020 – Tranche 2021 – RSU |
|
|
|
|
|
100.28 |
|
NA |
|
|
|
|
LTI 2020 – Tranche 2020 – Financial PSU |
|
|
|
|
|
110.65 |
|
December 2022 |
|
|
|
|
LTI 2020 – Tranche 2020 – Market PSU |
|
2/29/2020 |
|
123.593 |
|
122.22 |
|
February 2023 |
|
12/31/2023 |
|
May 2024 |
LTI 2020 – Tranche 2020 – RSU |
|
|
|
|
|
110.65 |
|
NA |
|
|
|
|
End-of-Service Benefits
Regular End-of-Service Undertakings
Retirement Pension Plan
Under the new compensation system, active Executive Board members were granted a one-time right to opt to remain in the current pension plan or to receive an annual one-time payment in the form of a cash allowance that they can use for their own pension provision.
The Executive Board members can transfer all or part of this cash allowance into SAP SE’s employee-financed pension scheme. Under this option, gross pay is exchanged for an entitlement to Company pension benefits, payable as a lump-sum retirement benefit at the age of either 60 or 62.
The following pension agreements were concluded with the individual members of the Executive Board:
Christian Klein, Dominik Asam, Juergen Mueller, and Gina Vargiu-Breuer have opted for a cash allowance. Where a member of the Executive Board joins or leaves the Company during the year, the annual cash allowance is granted pro rata. The existing defined-contribution pension entitlements for Christian Klein, Dominik Asam, and Juergen Mueller will be preserved as vested benefits on the basis of the account balances that have accrued by the applicable date.
Thomas Saueressig has opted to stay in the current pension plan, which is a defined-contribution plan. The contribution is 4% of pensionable income up to the threshold for statutory pension insurance in Germany, plus 14% pensionable income above that threshold. For this purpose, pensionable income is 180% of annual base salary. The applicable threshold is the annual income threshold for statutory pension insurance in the former West German states.
Executive Board members qualify for a retirement pension when they reach the age of 62 if their service contract ends or they left the Company on a disability pension before reaching regular retirement age. The disability pension is 100% of the vested retirement pension benefit and is payable until the beneficiary’s 62nd birthday, after which it is replaced by a retirement pension.
If applicable, a widow’s or widower’s pension is paid in the event of the death of a former Executive Board member. This pension is 60% of the retirement pension the former Executive Board member was receiving or of the future pension payments to which he or she was entitled.
Entitlements are enforceable against SAP SE. Current pension payments are reviewed annually for adjustments and, if applicable, increased according to the surplus in the pension liability insurance or by 1% annually, depending on the agreement. If service is ended before the retirement age of 62, the pension entitlement is reduced pro rata based on the length of service. Alternatively, the entitlement to benefits corresponds to the pension contributions paid up to that point.
For Muhammad Alam, Scott Russell, and Julia White, SAP pays pension contributions to a third-party pension plan. SAP’s contributions match the contributions that Muhammad Alam, Scott Russell, and Julia White pay into that pension plan.
88
Pension Entitlements of Current Executive Board Members
|
|
|
|
|
|
Defined Benefit Obligations |
|
|
|
|
|
Net Defined Benefit Liability |
||||
|
|
Service Cost |
|
(DBO) |
|
Plan Assets |
|
(Asset) |
||||||||
€ thousands |
|
2024 |
|
2023 |
|
12/31/2024 |
|
12/31/2023 |
|
12/31/2024 |
|
12/31/2023 |
|
12/31/2024 |
|
12/31/2023 |
Christian Klein (CEO)1 |
|
0 |
|
85.5 |
|
452.2 |
|
621.8 |
|
1,275.1 |
|
1,244.8 |
|
-822.9 |
|
-623.0 |
Dominik Asam1 |
|
71.4 |
|
0 |
|
99.2 |
|
57.7 |
|
203.1 |
|
0 |
|
-103.9 |
|
57.7 |
Juergen Mueller1 (until 9/30/2024) |
|
0 |
|
46.4 |
|
238.5 |
|
286.7 |
|
796.5 |
|
777.4 |
|
-558.0 |
|
-490.7 |
Thomas Saueressig1 |
|
74.0 |
|
52.9 |
|
396.7 |
|
307.2 |
|
800.9 |
|
625.3 |
|
-404.2 |
|
-318.1 |
Total |
|
145.4 |
|
184.8 |
|
1,186.6 |
|
1,273.4 |
|
3,075.6 |
|
2,647.5 |
|
-1,889.0 |
|
-1,374.1 |
1 The values reflect the pension entitlements from the retirement pension plan for Executive Board members.
Pension Entitlements of Former Executive Board Members
|
|
|
|
|
|
Defined Benefit Obligations |
|
|
|
|
|
Net Defined Benefit Liability |
||||
|
|
Pension Payments |
|
(DBO) |
|
Plan Assets |
|
(Asset) |
||||||||
€ thousands |
|
2024 |
|
2023 |
|
12/31/2024 |
|
12/31/2023 |
|
12/31/2024 |
|
12/31/2023 |
|
12/31/2024 |
|
12/31/2023 |
Adaire Fox-Martin |
|
0 |
|
0 |
|
414.0 |
|
386.3 |
|
768.3 |
|
750.2 |
|
-354.3 |
|
-363.9 |
Bernd Leukert |
|
0 |
|
0 |
|
625.6 |
|
589.8 |
|
1,159.0 |
|
1,135.7 |
|
-533.4 |
|
-545.9 |
Luka Mucic |
|
0 |
|
0 |
|
726.8 |
|
681.5 |
|
1,382.0 |
|
1,358.5 |
|
-655.2 |
|
-677.0 |
Gerhard Oswald |
|
399.8 |
|
377.6 |
|
6,593.5 |
|
6,944.0 |
|
6,421.3 |
|
6,617.9 |
|
172.2 |
|
326.1 |
Stefan Ries |
|
0 |
|
0 |
|
370.0 |
|
345.5 |
|
696.1 |
|
680.1 |
|
-326.1 |
|
-334.6 |
Sabine Bendiek |
|
0 |
|
0 |
|
258.2 |
|
237.1 |
|
487.8 |
|
487.4 |
|
-229.6 |
|
-250.3 |
Total |
|
399.8 |
|
377.6 |
|
8,988.1 |
|
9,184.2 |
|
10,914.5 |
|
11,029.8 |
|
-1,926.4 |
|
-1,845.6 |
Postcontractual Non-Compete Provisions
Each Executive Board member’s contract includes a 12-month postcontractual non-compete agreement. During this non-compete period, Executive Board members receive abstention payments corresponding to 50% of their average contractual compensation as members. This average is calculated on the basis of the preceding three years. Any other occupational income generated by the Executive Board member is deducted from their compensation. In accordance with the German Corporate Governance Code (GCGC), the Supervisory Board will offset any severance payments against such compensation for abstention.
The following table presents the hypothetical amounts for the net present values of the postcontractual non-compete abstention payments. The calculation assumes the following:
- The Executive Board member leaves SAP at the end of their respective current contract term.
- Their final average contractual compensation prior to their departure equals their compensation in 2024.
Actual postcontractual non-compete payments will likely differ from these amounts depending on the time of departure and the compensation levels and target achievements at the time of departure.
Net Present Values of the Postcontractual Non-Compete Abstention Payments
€ thousands |
|
Contract Term Expires |
|
Discount Rate (in %) |
|
Net Present Value |
Christian Klein (CEO) |
|
4/30/2028 |
|
2.85 |
|
8,644.1 |
Muhammad Alam (from 4/1/2024) |
|
3/31/2027 |
|
2.76 |
|
910.5 |
Dominik Asam |
|
3/6/2026 |
|
2.68 |
|
1,590.3 |
Thomas Saueressig |
|
10/31/2025 |
|
2.67 |
|
4,031.2 |
Gina Vargiu-Breuer (from 2/1/2024) |
|
1/31/2027 |
|
2.74 |
|
996.6 |
Total |
|
|
|
|
|
16,172.8 |
89
Early End-of-Service Undertakings
Severance Payments
The contracts for all Executive Board members provide that on termination before full term (for example, by the Company without cause where the member’s appointment is revoked, where the member becomes occupationally disabled, or in connection with a change of control), SAP SE will pay to the member the outstanding part of the compensation target for the entire remainder of the term, appropriately discounted for early payment. In accordance with section G.13 of the GCGC, payments made to an Executive Board member due to early termination must not exceed twice the annual total compensation. The annual total compensation is defined as the individual total target compensation comprised of the annual base salary and the two performance-based elements. The Supervisory Board may specify that Executive Board members are not entitled to such severance payment if they have not served SAP as a member of the Executive Board for at least one year.
If an Executive Board member’s appointment to the Executive Board expires or ceases because of, or as a consequence of, change or restructuring, or due to a change of control, SAP SE and each Executive Board member has the right to terminate the employment contract within eight weeks of the occurrence by giving six months’ notice. A change of control is deemed to occur when:
| – | A third party is required to make a mandatory takeover offer to the shareholders of SAP SE under the German Securities Acquisition and Takeover Act; |
| – | SAP SE merges with another company and becomes the subsumed entity; |
| – | A control or profit transfer agreement is concluded with SAP SE as the dependent company. |
An Executive Board member’s contract can also be terminated before full term if their appointment as an Executive Board member of SAP SE is revoked in connection with a change of control.
Postcontractual Non-Compete Provisions
Abstention compensation for the postcontractual non-compete period as described above is also payable on early contract termination.
Permanent Disability
If an Executive Board member becomes permanently disabled, that member’s contract will end at the end of the quarter in which the permanent inability to work was determined. The Executive Board member will receive their monthly basic salary for a further 12 months starting from the date on which the permanent disability was determined.
Agreements with Executive Board Members for Early End-of-Service
Juergen Mueller reached a mutual agreement with the Supervisory Board to end his employment at SAP effective September 30, 2024. Pursuant to the termination agreement, the following payments in connection with his early termination apply:
| – | Monthly instalments of the annual base salary until September 30, 2024 |
| – | The cash allowance for pension-related commitments has been reduced on a pro rata temporis basis. |
| – | The STI 2024 has been reduced on a pro rata temporis basis and will be handled according to plan terms. |
| – | Rights granted under the LTI 2020 and the LTI 2024 will be handled according to plan terms. |
| – | The post-contractual non-compete obligation has been waived. |
Scott Russell resigned from his position as Executive Board member effective August 31, 2024. He reached a mutual agreement with the Supervisory Board to end his employment at SAP effective December 31, 2024. Pursuant to the termination agreement, the following payments in connection with his early termination apply:
| – | A severance payment for the remainder of his original term of appointment until January 31, 2027, totaling €12,614,920, which complies with section G.13 of the GCGC on severance caps. |
| – | Monthly instalments of the annual base salary until December 31, 2024 |
| – | The STI 2024 has been reduced on a pro rata temporis basis until August 31, 2024, and will be handled according to plan terms. |
| – | Rights granted under the LTI 2020 and the LTI 2024 until August 31, 2024 will be handled according to plan terms. |
| – | The post-contractual non-compete obligation applies, with the abstention compensation being offset against the severance payment in accordance with section G. 13 of the GCGC. |
90
Julia White reached a mutual agreement with the Supervisory Board to end her employment at SAP effective August 31, 2024. Pursuant to the termination agreement, the following payments in connection with her early termination apply:
| – | A severance payment for the remainder of her original term of appointment until February 28, 2027, totaling €9,000,000, which complies with section G.13 of the GCGC on severance caps. |
| – | Monthly instalments of the annual base salary until August 31, 2024 |
| – | The STI 2024 has been reduced on a pro rata temporis basis and will be handled according to plan terms. |
| – | Rights granted under the LTI 2020 and the LTI 2024 will be handled according to plan terms. |
| – | The post-contractual non-compete obligation applies, with the abstention compensation being offset against the severance payment in accordance with section G. 13 of the GCGC. |
Compensation of Former Executive Board Members in 2024
|
|
Non-Performance Compensation |
|
|
||||||||||||||
|
|
|
|
|
|
Total Non |
|
|
|
|
|
|
|
|
|
|
|
|
|
|
|
|
|
|
Performance |
|
|
|
LTI 2020 Plan – |
|
LTI 2020 Plan – |
|
Total Performance |
|
|
|
|
€ thousands |
|
Others |
|
Severance |
|
Compensation |
|
% of Total |
|
Tranche 2021 |
|
Tranche 20201 |
|
Compensation |
|
% of Total |
|
Total |
Sabine Bendiek (until 12/31/2023) |
|
|
|
|
|
0 |
|
0 |
|
6,240.9 |
|
|
|
6,240.9 |
|
100.0 |
|
6,240.9 |
Luka Mucic (until 3/31/2023) |
|
|
|
|
|
0 |
|
0 |
|
3,837.4 |
|
203.7 |
|
4,041.1 |
|
100.0 |
|
4,041.1 |
Scott Russell (until 8/31/2024) |
|
354.8 |
|
12,614.9 |
|
12,969.7 |
|
100.0 |
|
|
|
|
|
|
|
0 |
|
12,969.7 |
Julia White (until 8/31/2024) |
|
|
|
9,000.0 |
|
9,000.0 |
|
100.0 |
|
|
|
|
|
|
|
0 |
|
9,000.0 |
1 Individual amount resulting from the difference between the actual payout amount in 2024 and the theoretical payout amount as at December 31, 2023.
A difference of €531,000 between the actual payout amount and the hypothetical payout amount for the LTI 2020 tranche 2020 applied for former Executive Board members Michael Kleinemeier, Jennifer Morgan, and Stefan Ries.
91
LTI Holdings of Former Executive Board Members in 2024
|
|
|
|
|
|
1/1/2024 |
|
During the Year |
|
12/31/2024 |
|||
|
|
|
|
|
|
|
|
Exercised (E)/ |
|
|
|
|
Thereof Subject |
|
|
|
|
|
|
|
|
Adjusted (A)/ |
|
|
|
|
to Holding |
|
|
Specification |
|
Grant Date |
|
Outstanding |
|
Forfeited (F) |
|
Outstanding |
|
|
Period |
|
|
LTI 2020 - Tranche 2023 - Market PSU |
|
3/24/2023 |
|
1,652 |
|
0 |
|
1,652 |
|
|
1,652 |
|
|
LTI 2020 - Tranche 2023 - Financial PSU |
|
3/24/2023 |
|
1,652 |
|
0 |
|
1,652 |
|
|
1,652 |
|
|
LTI 2020 - Tranche 2023 - RSU |
|
3/24/2023 |
|
1,652 |
|
0 |
|
1,652 |
|
|
1,652 |
Sabine Bendiek |
|
LTI 2020 - Tranche 2022 - Market PSU |
|
3/28/2022 |
|
4,303 |
|
0 |
|
4,303 |
|
|
4,303 |
(until 12/31/2023) |
|
LTI 2020 - Tranche 2022 - Financial PSU |
|
3/28/2022 |
|
4,303 |
|
0 |
|
4,303 |
|
|
4,303 |
|
|
LTI 2020 - Tranche 2022 - RSU |
|
3/28/2022 |
|
4,303 |
|
0 |
|
4,303 |
|
|
4,303 |
|
|
LTI 2020 - Tranche 2021 - Market PSU |
|
3/22/2021 |
|
7,922 |
|
3,961 |
A |
11,883 |
|
|
11,883 |
|
|
LTI 2020 - Tranche 2021 - Financial PSU |
|
3/22/2021 |
|
7,922 |
|
1,599 |
A |
9,521 |
|
|
9,521 |
|
|
LTI 2020 - Tranche 2021 - RSU |
|
3/22/2021 |
|
7,922 |
|
0 |
|
7,922 |
|
|
7,922 |
Michael Kleinemeier |
|
LTI 2020 - Tranche 2020 - Market PSU |
|
2/29/2020 |
|
0 |
|
0 |
|
0 |
|
|
0 |
(until 4/30/2020) |
|
LTI 2020 - Tranche 2020 - Financial PSU |
|
2/29/2020 |
|
3,736 |
|
-3,736 |
E |
0 |
|
|
0 |
|
|
LTI 2020 - Tranche 2020 - RSU |
|
2/29/2020 |
|
6,403 |
|
-6,403 |
E |
0 |
|
|
0 |
Jennifer Morgan |
|
LTI 2020 - Tranche 2020 - Market PSU |
|
2/29/2020 |
|
0 |
|
0 |
|
0 |
|
|
0 |
(until 4/30/2020) |
|
LTI 2020 – Tranche 2020 – Financial PSU |
|
2/29/2020 |
|
2,861 |
|
-2,861 |
E |
0 |
|
|
0 |
|
|
LTI 2020 - Tranche 2020 - RSU |
|
2/29/2020 |
|
4,904 |
|
-4,904 |
E |
0 |
|
|
0 |
|
|
LTI 2020 - Tranche 2023 - Market PSU |
|
3/24/2023 |
|
543 |
|
0 |
|
543 |
|
|
543 |
|
|
LTI 2020 - Tranche 2023 - Financial PSU |
|
3/24/2023 |
|
543 |
|
0 |
|
543 |
|
|
543 |
|
|
LTI 2020 - Tranche 2023 - RSU |
|
3/24/2023 |
|
543 |
|
0 |
|
543 |
|
|
543 |
|
|
LTI 2020 - Tranche 2022 - Market PSU |
|
3/28/2022 |
|
2,824 |
|
0 |
|
2,824 |
|
|
2,824 |
|
|
LTI 2020 - Tranche 2022 - Financial PSU |
|
3/28/2022 |
|
2,824 |
|
0 |
|
2,824 |
|
|
2,824 |
Luka Mucic |
|
LTI 2020 - Tranche 2022 - RSU |
|
3/28/2022 |
|
2,824 |
|
0 |
|
2,824 |
|
|
2,824 |
(until 3/31/2023) |
|
LTI 2020 - Tranche 2021 - Market PSU |
|
3/22/2021 |
|
4,871 |
|
2,436 |
A |
7,307 |
|
|
7,307 |
|
|
LTI 2020 - Tranche 2021 - Financial PSU |
|
3/22/2021 |
|
4,871 |
|
983 |
A |
5,854 |
|
|
5,854 |
|
|
LTI 2020 - Tranche 2021 - RSU |
|
3/22/2021 |
|
4,871 |
|
0 |
|
4,871 |
|
|
4,871 |
|
|
LTI 2020 - Tranche 2020 - Market PSU |
|
2/29/2020 |
|
0 |
|
0 |
|
0 |
|
|
0 |
|
|
LTI 2020 - Tranche 2020 - Financial PSU |
|
2/29/2020 |
|
3,033 |
|
-3,033 |
E |
0 |
|
|
0 |
|
|
LTI 2020 - Tranche 2020 - RSU |
|
2/29/2020 |
|
5,198 |
|
-5,198 |
E |
0 |
|
|
0 |
Stefan Ries |
|
LTI 2020 - Tranche 2020 - Market PSU |
|
2/29/2020 |
|
0 |
|
0 |
|
0 |
|
|
0 |
(until 5/31/2020) |
|
LTI 2020 - Tranche 2020 - Financial PSU |
|
2/29/2020 |
|
1,307 |
|
-1,307 |
E |
0 |
|
|
0 |
|
|
LTI 2020 - Tranche 2020 - RSU |
|
2/29/2020 |
|
2,240 |
|
-2,240 |
E |
0 |
|
|
0 |
Total |
|
|
|
|
|
96,027 |
|
-20,703 |
|
75,324 |
|
|
75,324 |
92
Executive Board: Other Information
We did not grant any compensation advance or credit to, or enter into any commitment for the benefit of, any member of our Executive Board in 2024 or the previous year.
As far as the law permits, SAP SE and its affiliated companies in Germany and elsewhere indemnify and hold harmless their respective directors and officers against and from the claims of third parties. To this end, we maintain directors’ and officers’ (D&O) group liability insurance. The policy is annual and is renewed from year to year. The insurance covers the personal liability of the insured group for financial loss caused by its managerial acts and omissions. The current D&O policy includes an individual deductible for Executive Board members of SAP SE as required by section 93 (2) of the German Stock Corporation Act.
Comparative Information on the Change of Compensation and Company Performance
The following table discloses the relative change in compensation of active and former Executive Board members, the average compensation of the employees of the SAP Group (full-time equivalents), and year-over-year changes in selected earnings indicators. The compensation awarded and due to Executive Board members is presented in accordance with section 162 of the German Stock Corporation Act.
The presentation of average employee compensation is based on the average full-time equivalent number of employees in the respective year. Average employee compensation comprises the personnel expenses for salaries, fringe benefits, employer contributions to social insurance, and any short-term and long-term variable compensation components attributable to the fiscal year. Therefore, employee compensation is also equivalent to compensation awarded and due within the meaning of section 162 of the German Stock Corporation Act and thus in line with Executive Board and Supervisory Board compensation.
|
|
2020 to 2019 |
|
2021 to 2020 |
|
2022 to 2021 |
|
20231) |
|
2023 to 20221) |
|
20241) |
|
2024 to 20231) |
|
|
|
Change in % |
|
Change in % |
|
Change in % |
|
€ thousands |
|
Change in % |
|
€ thousands |
|
Change in % |
|
Current Executive Board Members |
|
|
|
|
|
|
|
|
|
|
|
|
|
|
|
Christian Klein (CEO) (from 1/1/2018) |
|
-40 |
|
425 |
|
-20 |
|
7,158 |
|
53 |
|
18,983 |
|
165 |
|
Muhammad Alam (from 4/1/2024) |
|
NA |
|
NA |
|
NA |
|
NA |
|
NA |
|
1,936 |
|
NA |
|
Dominik Asam (from 3/7/2023) |
|
NA |
|
NA |
|
NA |
|
3,943 |
|
NA |
|
3,281 |
|
-17 |
|
Thomas Saueressig (from 11/1/2019) |
|
162 |
|
307 |
|
-41 |
|
3,611 |
|
109 |
|
8,241 |
|
128 |
|
Gina Vargiu-Breuer (from 2/1/2024) |
|
NA |
|
NA |
|
NA |
|
NA |
|
NA |
|
2,109 |
|
NA |
|
Former Executive Board Members |
|
|
|
|
|
|
|
|
|
|
|
|
|
|
|
Sabine Bendiek (until 12/31/2023) |
|
NA |
|
NA |
|
-65 |
|
2,017 |
|
43 |
|
6,241 |
|
209 |
|
Werner Brandt (until 6/30/2014) |
|
2 |
|
2 |
|
0 |
|
110 |
|
8 |
|
119 |
|
8 |
|
Luka Mucic (until 3/31/2023) |
|
-46 |
|
127 |
|
-25 |
|
11,634 |
|
258 |
|
4,041 |
|
-65 |
|
Juergen Mueller (until 9/30/2024) |
|
-56 |
|
307 |
|
10 |
|
3,653 |
|
14 |
|
7,144 |
|
96 |
|
Gerhard Oswald (until 12/31/2016) |
|
-53 |
|
0 |
|
0 |
|
378 |
|
10 |
|
400 |
|
6 |
|
Scott Russell (until 8/31/2024) |
|
NA |
|
NA |
|
2 |
|
3,076 |
|
35 |
|
21,459 |
|
598 |
|
Julia White (until 8/31/2024) |
|
NA |
|
NA |
|
-45 |
|
2,556 |
|
12 |
|
17,103 |
|
569 |
|
Earnings Indicators |
|
|
|
|
|
|
|
|
|
|
|
|
|
|
|
Total Revenue SAP Group (Non-IFRS, in € millions) |
|
-1 |
|
2 |
|
11 |
|
31,207 |
|
6 |
|
34,176 |
|
10 |
|
Total Revenue SAP SE (German Commercial Code, in € millions) |
|
-4 |
|
5 |
|
16 |
|
19,018 |
|
7 |
|
21,412 |
|
13 |
|
Operating Profit SAP Group (Non-IFRS, in € millions)2) |
|
1 |
|
-1 |
|
-2 |
|
6,514 |
|
9 |
|
8,153 |
|
25 |
|
Net Income SAP SE (German Commercial Code, in € millions) |
|
87 |
|
8 |
|
-29 |
|
4,766 |
|
149 |
|
366 |
|
-92 |
|
Average Annual Compensation of Employees SAP Group3 |
|
-12 |
|
13 |
|
4 |
|
156 |
|
12 |
|
184 |
|
18 |
|
1 SAP Group (non - IFRS) 2022, 2023, and 2024 from continuing operations.
2 Operating profit (non-IFRS) 2019 to 2022 based on non-IFRS metrics published in the Integrated Report 2023.
3 This average was impacted by restructuring expenses associated with the 2024 transformation program in the amount of €3.1 billion. Not considering this effect, the increase in average annual compensation of the employees would be 1%.
93
Compensation for Supervisory Board Members
Compensation System
Supervisory Board members’ compensation is governed by section 16 of our Articles of Incorporation, which was amended by resolution of our Annual General Meeting of Shareholders on May 15, 2024, to adjust the compensation payable to the chairperson of the Supervisory Board.
Each member of the Supervisory Board receives, in addition to the reimbursement of their expenses, an annual basic compensation of € 165,000. The chairperson receives €600,000 and the deputy chairperson € 220,000 annually. In addition, we reimburse members of the Supervisory Board for the value-added tax payable on their compensation.
For membership of the Audit and Compliance Committee, Supervisory Board members receive an additional fixed annual compensation of €50,000, and for membership of any other Supervisory Board committee €35,000, provided that the committee concerned has met in the year. The chairperson of the Audit and Compliance Committee receives €95,000, and the chairpersons of the other committees receive €50,000. If a deputy chairperson is appointed to a committee, he or she receives €43,500 per year, and €72,500 per year for the Audit and Compliance Committee. The chairperson of the Supervisory Board shall not receive any additional compensation for chairing, or being a member of, any committees. The fixed remuneration is payable after the end of the year.
If the Supervisory Board appoints a Lead Independent Director, the Lead Independent Director shall receive compensation of €50,000 per year in addition to their basic compensation and in addition to their compensation for any memberships in committees.
Any members of the Supervisory Board who have served for less than the entire year receive one-twelfth of the annual compensation for each month of service commenced. This also applies to the increased compensation for the chairperson and the deputy chairperson(s) and to the compensation for the chairperson, any possible deputy chairperson, the members of a committee, and to the additional compensation for the Lead Independent Director.
94
Supervisory Board Members’ Compensation in 2024
€ thousands |
|
2024 |
|
2023 |
||||||||||||||||
|
|
Fixed |
|
|
|
Compensation for |
|
|
|
Total |
|
Fixed |
|
|
|
Compensation for |
|
|
|
Total |
|
|
Compensation |
|
% of Total |
|
Committee Work |
|
% of Total |
|
|
|
Compensation |
|
% of Total |
|
Committee Work |
|
% of Total |
|
|
Dr. h. c. mult. Pekka Ala-Pietilä (Chairperson from 5/15/2024) |
|
400.0 |
|
100.0 |
|
0 |
|
0 |
|
400.0 |
|
NA |
|
NA |
|
NA |
|
NA |
|
NA |
Prof. Dr. h. c. mult. Hasso Plattner (Chairperson until 5/15/2024) |
|
114.6 |
|
64.0 |
|
64.6 |
|
36.0 |
|
179.2 |
|
275.0 |
|
64.0 |
|
155.0 |
|
36.0 |
|
430.0 |
Lars Lamadé (Deputy Chairperson) |
|
220.0 |
|
68.9 |
|
99.2 |
|
31.1 |
|
319.2 |
|
220.0 |
|
67.7 |
|
105.0 |
|
32.3 |
|
325.0 |
Manuela Asche-Holstein (until 5/15/2024) |
|
68.8 |
|
57.9 |
|
50.0 |
|
42.1 |
|
118.7 |
|
165.0 |
|
57.9 |
|
120.0 |
|
42.1 |
|
285.0 |
Jakub Černý (from 5/15/2024) |
|
110.0 |
|
70.2 |
|
46.7 |
|
29.8 |
|
156.7 |
|
NA |
|
NA |
|
NA |
|
NA |
|
NA |
Pascal Demat (from 5/15/2024) |
|
110.0 |
|
70.2 |
|
46.7 |
|
29.8 |
|
156.7 |
|
NA |
|
NA |
|
NA |
|
NA |
|
NA |
Aicha Evans |
|
165.0 |
|
54.3 |
|
138.7 |
|
45.7 |
|
303.7 |
|
165.0 |
|
51.6 |
|
155.0 |
|
48.4 |
|
320.0 |
Andreas Hahn (from 5/15/2024) |
|
110.0 |
|
70.2 |
|
46.7 |
|
29.8 |
|
156.7 |
|
NA |
|
NA |
|
NA |
|
NA |
|
NA |
Prof. Dr. Ralf Herbrich (from 5/15/2024) |
|
110.0 |
|
70.2 |
|
46.7 |
|
29.8 |
|
156.7 |
|
NA |
|
NA |
|
NA |
|
NA |
|
NA |
Prof. Dr. Gesche Joost (until 5/11/2023) |
|
NA |
|
NA |
|
NA |
|
NA |
|
NA |
|
68.8 |
|
70.3 |
|
29.2 |
|
29.8 |
|
97.9 |
Margret Klein-Magar |
|
165.0 |
|
62.4 |
|
99.6 |
|
37.6 |
|
264.6 |
|
165.0 |
|
57.9 |
|
120.0 |
|
42.1 |
|
285.0 |
Monika Kovachka-Dimitrova (until 5/15/2024) |
|
68.8 |
|
61.1 |
|
43.7 |
|
38.9 |
|
112.5 |
|
165.0 |
|
61.1 |
|
105.0 |
|
38.9 |
|
270.0 |
Peter Lengler (until 5/15/2024) |
|
68.8 |
|
51.6 |
|
64.6 |
|
48.4 |
|
133.3 |
|
165.0 |
|
57.9 |
|
120.0 |
|
42.1 |
|
285.0 |
Jennifer Xin-Zhe Li |
|
165.0 |
|
55.9 |
|
130.0 |
|
44.1 |
|
295.0 |
|
165.0 |
|
55.9 |
|
130.0 |
|
44.1 |
|
295.0 |
Dr. Qi Lu |
|
165.0 |
|
72.0 |
|
64.2 |
|
28.0 |
|
229.2 |
|
165.0 |
|
61.1 |
|
105.0 |
|
38.9 |
|
270.0 |
César Martin (from 5/15/2024) |
|
110.0 |
|
66.0 |
|
56.7 |
|
34.0 |
|
166.7 |
|
NA |
|
NA |
|
NA |
|
NA |
|
NA |
Gerhard Oswald |
|
165.0 |
|
51.5 |
|
155.4 |
|
48.5 |
|
320.4 |
|
165.0 |
|
51.4 |
|
156.3 |
|
48.6 |
|
321.3 |
Christine Regitz (until 5/15/2024) |
|
68.8 |
|
59.2 |
|
47.3 |
|
40.8 |
|
116.0 |
|
165.0 |
|
59.2 |
|
113.5 |
|
40.8 |
|
278.5 |
Dr. h. c. Punit Renjen (from 5/11/2023 until 5/15/2024) |
|
91.7 |
|
75.0 |
|
30.6 |
|
25.0 |
|
122.2 |
|
146.7 |
|
64.5 |
|
80.9 |
|
35.6 |
|
227.5 |
Dr. Friederike Rotsch |
|
165.0 |
|
40.4 |
|
243.7 |
|
59.6 |
|
408.7 |
|
165.0 |
|
42.9 |
|
220.0 |
|
57.1 |
|
385.0 |
Nicolas Sabatier (from 5/15/2024) |
|
110.0 |
|
70.2 |
|
46.7 |
|
29.8 |
|
156.7 |
|
NA |
|
NA |
|
NA |
|
NA |
|
NA |
Dr. Eberhard Schick (from 5/15/2024) |
|
110.0 |
|
66.0 |
|
56.7 |
|
34.0 |
|
166.7 |
|
NA |
|
NA |
|
NA |
|
NA |
|
NA |
Heike Steck (until 5/15/2024) |
|
68.8 |
|
54.1 |
|
58.3 |
|
45.9 |
|
127.1 |
|
165.0 |
|
56.3 |
|
128.3 |
|
43.7 |
|
293.3 |
Helmut Stengele (until 5/15/2024) |
|
68.8 |
|
100.0 |
|
0 |
|
0 |
|
68.8 |
|
165.0 |
|
100.0 |
|
0 |
|
0 |
|
165.0 |
Nina Straßner (from 5/15/2024) |
|
110.0 |
|
57.9 |
|
80.0 |
|
42.1 |
|
190.0 |
|
NA |
|
NA |
|
NA |
|
NA |
|
NA |
Dr. Rouven Westphal |
|
165.0 |
|
53.5 |
|
143.3 |
|
46.5 |
|
308.3 |
|
165.0 |
|
53.4 |
|
143.8 |
|
46.6 |
|
308.8 |
Dr. Gunnar Wiedenfels |
|
165.0 |
|
52.9 |
|
146.7 |
|
47.1 |
|
311.7 |
|
165.0 |
|
55.0 |
|
135.0 |
|
45.0 |
|
300.0 |
James Wright (until 5/15/2024) |
|
68.8 |
|
51.6 |
|
64.6 |
|
48.4 |
|
133.3 |
|
165.0 |
|
57.9 |
|
120.0 |
|
42.1 |
|
285.0 |
Total |
|
3,507.5 |
|
|
|
2,071.2 |
|
|
|
5,578.7 |
|
3,185.4 |
|
|
|
2,241.9 |
|
|
|
5,427.3 |
In 2024, we received services from members of the Supervisory Board (including services from employee representatives on the Supervisory Board in their capacity as employees of SAP) in the amount of €1,987,000 (2023: €1,959,000).
Long-Term Incentives for the Supervisory Board
We do not offer members of the Supervisory Board share-based payment for their Supervisory Board work. Any share-based payment awards received by employee-elected members relate to their position as SAP employees and not to their work on the Supervisory Board.
Supervisory Board: Other Information
In 2023, SAP granted a loan within the SAP-Flex Loan program for its employees, amounting to €5,000 to one of the employees that later joined the Supervisory Board as employee representative in 2024. Besides this loan, SAP did not grant any compensation advance or credit to, or enter into any commitment for the benefit of, any member of its Supervisory Board in 2024 or the previous year.
Hasso Plattner, who resigned in May 2024 as chairperson of the Supervisory Board, entered into a consulting contract with SAP after joining the Supervisory Board in May 2003. The contract does not provide for any compensation. The only cost we incurred under the contract was the reimbursement of expenses.
95
As far as the law permits, we indemnify Supervisory Board members against, and hold them harmless from, claims brought by third parties. To this end, we maintain directors’ and officers’ (D&O) group liability insurance. In accordance with our Articles of Incorporation, the premiums for the insurance policy are paid by SAP.
Comparative Information on the Change of Compensation and Company Performance
The following table discloses the relative change in compensation of active and former Supervisory Board members, the average compensation of all SAP employees (full-time equivalents), and year-over-year changes in selected earnings indicators.
|
|
2020 to 2019 |
|
2021 to 2020 |
|
2022 to 2021 |
|
20231) |
|
2023 to 20221) |
|
20241) |
|
2024 to 20231) |
|
|
|
Change in % |
|
Change in % |
|
Change in % |
|
€ thousands |
|
Change in % |
|
€ thousands |
|
Change in % |
|
Current Supervisory Board Members |
|
|
|
|
|
|
|
|
|
|
|
|
|
|
|
Dr. h. c. mult. Pekka Ala-Pietilä (member from 5/3/2002 until 5/12/2021, Chairperson from 5/15/2024) |
|
8 |
|
-58 |
|
NA |
|
NA |
|
NA |
|
400 |
|
NA |
|
Lars Lamadé (Deputy Chairperson from 1/1/2022) |
|
0 |
|
6 |
|
64 |
|
325 |
|
0 |
|
319 |
|
-2 |
|
Jakub Černý (from 5/15/2024) |
|
NA |
|
NA |
|
NA |
|
NA |
|
NA |
|
157 |
|
NA |
|
Pascal Demat (from 5/15/2024) |
|
NA |
|
NA |
|
NA |
|
NA |
|
NA |
|
157 |
|
NA |
|
Aicha Evans |
|
0 |
|
6 |
|
52 |
|
320 |
|
0 |
|
304 |
|
-5 |
|
Andreas Hahn (from 5/15/2024) |
|
NA |
|
NA |
|
NA |
|
NA |
|
NA |
|
157 |
|
NA |
|
Prof. Dr. Ralf Herbrich (from 5/15/2024) |
|
NA |
|
NA |
|
NA |
|
NA |
|
NA |
|
157 |
|
NA |
|
Margret Klein-Magar (Deputy Chairperson until 12/31/2021) |
|
0 |
|
4 |
|
10 |
|
285 |
|
0 |
|
265 |
|
-7 |
|
Jennifer Xin-Zhe Li (from 5/18/2022) |
|
NA |
|
NA |
|
NA |
|
295 |
|
63 |
|
295 |
|
0 |
|
César Martin (from 5/15/2024) |
|
NA |
|
NA |
|
NA |
|
0 |
|
NA |
|
167 |
|
NA |
|
Dr. Qi Lu (from 12/21/2020) |
|
NA |
|
1,288 |
|
41 |
|
270 |
|
0 |
|
229 |
|
-15 |
|
Gerhard Oswald (from 1/1/2019) |
|
6 |
|
-3 |
|
24 |
|
321 |
|
16 |
|
320 |
|
0 |
|
Dr. Friederike Rotsch |
|
3 |
|
8 |
|
44 |
|
385 |
|
15 |
|
409 |
|
6 |
|
Nicolas Sabatier (from 5/15/2024) |
|
NA |
|
NA |
|
NA |
|
NA |
|
NA |
|
157 |
|
NA |
|
Dr. Eberhard Schick (from 5/15/2024) |
|
NA |
|
NA |
|
NA |
|
NA |
|
NA |
|
167 |
|
NA |
|
Nina Straßner (from 5/15/2024) |
|
NA |
|
NA |
|
NA |
|
NA |
|
NA |
|
190 |
|
NA |
|
Dr. Rouven Westphal (from 5/12/2021) |
|
NA |
|
NA |
|
133 |
|
309 |
|
-4 |
|
312 |
|
1 |
|
Dr. Gunnar Wiedenfels (from 5/15/2019) |
|
50 |
|
0 |
|
52 |
|
300 |
|
-3 |
|
NA |
|
NA |
|
Former Supervisory Board Members |
|
|
|
|
|
|
|
|
|
|
|
|
|
|
|
Prof. Dr. h. c. mult. Hasso Plattner (Chairperson until 5/15/2024) |
|
4 |
|
1 |
|
27 |
|
430 |
|
-2 |
|
179 |
|
-58 |
|
Manuela Asche-Holstein (from 7/8/2021 until 5/15/2024) |
|
NA |
|
NA |
|
200 |
|
285 |
|
11 |
|
119 |
|
-58 |
|
Monika Kovachka-Dimitrova (from 5/15/2019 until 5/15/2024) |
|
50 |
|
1 |
|
42 |
|
270 |
|
0 |
|
113 |
|
-58 |
|
Prof. Dr. Gesche Joost (until 5/11/2023) |
|
0 |
|
0 |
|
26 |
|
98 |
|
-58 |
|
NA |
|
NA |
|
Peter Lengler (from 8/10/2021 until 5/15/2024) |
|
NA |
|
NA |
|
255 |
|
285 |
|
0 |
|
133 |
|
-53 |
|
Christine Regitz (until 5/15/2024) |
|
1 |
|
5 |
|
34 |
|
279 |
|
0 |
|
NA |
|
NA |
|
Dr. h. c. Punit Renjen (from 5/11/2023 until 5/15/2024) |
|
NA |
|
NA |
|
NA |
|
219 |
|
NA |
|
116 |
|
-47 |
|
Heike Steck (from 5/15/2019 until 5/15/2024) |
|
50 |
|
9 |
|
32 |
|
270 |
|
0 |
|
127 |
|
-53 |
|
Helmut Stengele (from 10/29/2021 until 5/15/2024) |
|
NA |
|
NA |
|
300 |
|
165 |
|
0 |
|
69 |
|
-58 |
|
James Wright (from 5/15/2019 until 5/15/2024) |
|
50 |
|
0 |
|
40 |
|
285 |
|
0 |
|
133 |
|
-53 |
|
Earnings Indicators |
|
|
|
|
|
|
|
|
|
|
|
|
|
|
|
Total Revenue SAP Group (Non-IFRS, in € millions) |
|
-1 |
|
2 |
|
11 |
|
31,207 |
|
6 |
|
34,176 |
|
10 |
|
Total Revenue SAP SE (German Commercial Code, in € millions) |
|
-4 |
|
5 |
|
16 |
|
19,018 |
|
7 |
|
21,412 |
|
13 |
|
Operating Profit SAP Group (Non-IFRS, in € millions)2) |
|
1 |
|
-1 |
|
-2 |
|
6,514 |
|
9 |
|
8,153 |
|
25 |
|
Net Income SAP SE (German Commercial Code, in € millions) |
|
87 |
|
8 |
|
-29 |
|
4,766 |
|
149 |
|
366 |
|
-92 |
|
Average Annual Compensation of Employees SAP Group3 |
|
-12 |
|
13 |
|
4 |
|
156 |
|
12 |
|
184 |
|
18 |
|
1 SAP Group (non-IFRS) 2022, 2023, and 2024 from continuing operations.
2 Operating profit (non-IFRS) 2019 to 2022 based on non-IFRS metrics published in the Integrated Report 2023.
96
3 This average was impacted by restructuring expenses associated with the 2024 transformation program in the amount of €3.1 billion. Not considering this effect, the increase in average annual compensation of the employees would be 1%.
97
Employees
Headcount and Personnel Expense
Numbers disclosed in the Employees section are based on headcount (exceptions in FTE are indicated). We define headcount in FTE as the number of people on permanent employment contracts, taking into account their staffing percentage. Students, individuals employed by SAP but currently not working for reasons such as maternity/parental leave, and temporary employees on limited contracts of less than six months are excluded from our figures. The number of temporary employees is not material.
Gender |
|
Number of employees (headcount) |
Male |
|
71,007 |
Female |
|
38,965 |
Other |
|
1 |
Not reported |
|
0 |
Total employees |
|
109,973 |
For more information about restructuring activities, see the Notes to the Consolidated Financial Statements, Note (B.6). For more information about employee compensation and a breakdown of personnel expense, see the Notes to the Consolidated Financial Statements, Note (B.1) and Note (B.2).
Employee and Labor Relations
On a worldwide basis, we believe that our employee and labor relations are excellent.
On a corporate level, all employees of SAP in the member states of the European Union (with the United Kingdom included for a transition period until May 2024) and in the contract states of the European Economic Area are represented by the SAP SE Works Council (WoC) (Europe). By law and agreement with SAP, the SAP SE WoC (Europe) is entitled to receive information on certain transnational matters and to consult with the Executive Board or a representative thereof. On the legal entity level, the SAP SE works council (Germany) represents the employees of SAP SE. The employees of SAP Deutschland SE & Co. KG (SAP Germany), Concur (Germany) GmbH, and Emarsys Interactive Services GmbH (Germany) are represented by separate works councils. Other employee representatives include the group works council (composed of members of the works councils of SAP SE, SAP Germany, Concur (Germany) GmbH and Emarsys Interactive Services GmbH (Germany)), the representatives of severely disabled persons in SAP SE and SAP Germany and the spokespersons committee as the representation of the executives of SAP SE (Germany).
Employees of each of SAP France, SAP France Holding, SAP Labs France and Concur (France) SAS are subject to the same collective agreement: “SYNTEC”. In France, effective December 31, 2019 the Workers Council, the Health and Safety Committee and the employee representative were replaced by a single instance named the “Economic and Social Committee”. Today, SAP France/SAP France Holding (in the same legal entity), SAP Labs France and Concur (France) SAS are represented by an Economic and Social Committee. The represented unions negotiate agreements with each of SAP France/SAP France Holding and SAP Labs France. For Concur (France) SAS the agreements are negotiated with the Economic and Social Committee. In addition, the employees of various other SAP entities, including SAP Österreich GmbH (Austria), SAP España – Sistemas, Aplicaciones y Productos en la Informática, S.A., SAO D.O.O. (Croatia), SAP Belgium NV/SA., SAP Israel, SAP Nederland B.V., SAP Italia Sistemi Applicazioni Prodotti in Data Processing S.p.A., SAP China Beijing Branch, all entities in the Czech Republic (SAP ČR, spol. s r.o., SAP Services s.r.o., Ariba Czech s.r.o. and Concur Czech (s.r.o.)), SAP Brasil Ltda, SAP Korea Ltd. (Korea), SAP North West Africa Ltd. (Maroc), SAP Slovensko s.r.o. (Slovakia), SAP sistemi, aplikacije in produkti za obdelavo podatkov d.o.o. (Slovenia), SAP Romania SRL, SAP Svenska Aktiebolag (Sweden), SAP UK Ltd., and SAP Ireland Ltd. are represented by works councils, worker representatives, employee consultation forums and/or unions. In addition, some of these employees are subject to a collective bargaining agreement.
98
Share Ownership
Beneficial Ownership of Shares
The ordinary shares beneficially owned by the persons listed in "Item 6. Directors, Senior Management and Employees — Compensation Report ” are disclosed in “Item 7. Major Shareholders and Related-Party Transactions — Major Shareholders.”
Share-Based Compensation Plans
Share- Based Compensation
We maintain certain share-based compensation plans. The share-based compensation from these plans result from cash-settled and equity-settled awards issued to employees. For more information on our share-based compensation plans refer to “Item 6. Directors, Senior Management and Employees — Compensation Report” and Note (B.3) to our Consolidated Financial Statements.
ITEM 7. MAJOR SHAREHOLDERS AND RELATED-PARTY TRANSACTIONS
Major Shareholders
The share capital of SAP SE consists of ordinary shares, which are issued only in bearer form. Accordingly, SAP SE generally cannot determine the identity of its shareholders or how many shares a particular shareholder owns. SAP’s ordinary shares are traded in the United States by means of ADRs. Each ADR currently represents one SAP SE ordinary share. On February 7, 2025, based on information provided by the Depositary there were 70,213,035 ADRs held of record by 623 registered holders. The ordinary shares underlying such ADRs represented 5.72% of the then-outstanding ordinary shares (including treasury stock). Because SAP’s ordinary shares are issued in bearer form only, we are unable to determine the number of ordinary shares directly held by persons with U.S. addresses.
The following table sets forth certain information regarding the beneficial ownership of the ordinary shares to the extent known to SAP as of February 7, 2025 of: (i) each person or group known by SAP SE to own beneficially 5% or more of the outstanding ordinary shares; and (ii) the beneficial ownership of all individuals who are currently members of the Supervisory Board and all members of the Executive Board, individually and as a group, in each case as reported to SAP SE by such persons. There was, as far as we are able to tell given the nature of our shares, no significant change in the percentage ownership held by any major shareholder during the past three years. None of the major shareholders have special voting rights.
Major Shareholders |
|
Ordinary Shares Beneficially Owned |
||
|
|
Number |
|
% of Outstanding |
Dietmar Hopp, collectively1 |
|
62,548,065 |
|
5.1 |
Executive Board Members as a group (6 persons) |
|
37,930 |
|
0.0 |
Supervisory Board Members as a group (18 persons) |
|
25,857 |
|
0.0 |
Executive Board Members and Supervisory Board Members as a group (24 persons)2 |
|
63,787 |
|
0.0 |
BlackRock, Inc.3 |
|
76,782,227 |
|
6.3 |
1 The foregoing information is based on a Schedule 13G filed by Dietmar Hopp and other affiliated persons and companies on February 11, 2022.
2 We believe that each of the members of the Supervisory Board and the Executive Board beneficially owns less than 1% of SAP SE’s ordinary shares as of February 7, 2025.
3 As required under German law, BlackRock, Inc. informed SAP that they own more than 5% of SAP's outstanding ordinary shares. BlackRock, Inc. is not required to provide SAP with the number of shares owned as of February 7, 2025, and has not provided such information. The foregoing information is based on a Schedule 13G filed by BlackRock, Inc. on February 2, 2024.
Currently we are not aware of any arrangements, the operation of which may, at a subsequent date, result in a change in control of the company.
Related-Party Transactions
For information on related-party transactions see Note (G.6) to our Consolidated Financial Statements.
99
ITEM 8. FINANCIAL INFORMATION
Consolidated Financial Statements and Financial Statement Schedule
See “Item 18. Financial Statements” and pages F-1 through F-93.
Other Financial Information
Legal Proceedings
We are subject to a variety of legal proceedings and claims, either asserted or unasserted, which arise in the ordinary course of business, including claims and lawsuits involving businesses we have acquired.
Refer to Note (G.3) to our Consolidated Financial Statements for a detailed discussion of our material legal proceedings.
Dividend Policy
For more information on dividend policy see the disclosure in “Item 3. Key Information — Dividends”.
Significant Changes
Extension of Thomas Saueressig Executive Board Member Contract
On January 28, 2025, the company announced that the Supervisory Board extended Thomas Saueressig’s Executive Board contract for another three years until the end of October 2028.
Sebastian Steinhaeuser Joins the Executive Board as Chief Operating Officer
Effective February 1, 2025, the Supervisory Board appointed Sebastian Steinhaeuser to the Executive Board in the role of Chief Operating Officer. In this role, Sebastian will lead the new Strategy and Operations Executive Board area, focusing on our ongoing transformation and strategic objectives.
Extended Board
Effective February 1, 2025, the Executive Board established the Extended Board. The Extended Board is a committee of the Executive Board comprised of senior leaders from key functions and regulated by the Rules of Procedure of the Executive Board. The Executive Board appoints the Extended Board members, with the Supervisory Board providing consultation on these appointments. Currently, the Extended Board is comprised of eight members. The Extended Board performs advisory, coordination and decision-preparation functions for the Executive Board, however the Executive Board retains ultimate responsibility for overseeing and deciding on the activities of the company. All Extended Board members report to an Executive Board member. The Executive Board and the Extended Board plan to meet regularly, and Extended Board members will join Executive Board meetings as relevant.
Operating Segments
As result of the organizational changes in the first quarter of 2025, SAP is currently assessing a separate operating segment for the services function within the Customer Services & Delivery (CS&D) Board area, led by Thomas Saueressig.
100
ITEM 9. THE OFFER AND LISTING
Our ordinary shares are officially listed on the Frankfurt Stock Exchange, the Berlin Stock Exchange and the Stuttgart Stock Exchange. The principal trading market for the ordinary shares is Xetra, the electronic dealing platform of Deutsche Boerse AG.
ADRs representing SAP SE ordinary shares are listed on the NYSE under the symbol “SAP,” and currently each ADR represents one ordinary share.
ITEM 10. ADDITIONAL INFORMATION
Articles of Incorporation
Organization and Register
SAP SE is a European Company (Societas Europaea, or “SE”) duly established under the laws of Germany and the European Union, registered in the Commercial Register (Handelsregister) at the Lower Court of Mannheim, Germany, under the entry number “HRB 719915.” SAP SE publishes its official notices in the Company Register (www.unternehmensregister.de) and Federal Gazette (www.bundesanzeiger.de).
Objects and Purposes
SAP’s Articles of Incorporation state that our objects involve, directly or indirectly, the development, production and marketing of products and the provision of services in the field of information technology and telecommunication, particularly in the following fields:
- |
developing and marketing integrated product and service solutions for e-commerce; |
- |
developing software and cloud solutions and the licensing of their use to others; |
- |
organization and deployment consulting, as well as user training, for software and cloud solutions; |
- |
selling, leasing, renting and arranging the procurement and provision of all other forms of use of information technology systems and relevant accessories; and |
- |
making capital investments in enterprises active within the scope of the corporate purpose to promote the opening and advancement of international markets in these fields. |
SAP is authorized to act in all the business areas listed above and to delegate such activities to affiliated entities within the meaning of the German Stock Corporation Act; in particular SAP is authorized to delegate its business in whole or in part to such entities. SAP SE is authorized to establish branch offices in Germany and other countries, as well as to form, acquire or invest in other companies of the same or related kind and to enter into collaboration and joint venture agreements. SAP is further authorized to invest in enterprises of all kinds principally for investment purposes. SAP is authorized to dispose of investments, to consolidate the management of enterprises in which it participates, to enter into affiliation agreements with such entities, or to limit its activities to manage its shareholdings.
Corporate Governance
Introduction
SAP SE, as a European Company with a two-tier board system, is governed by three separate bodies: the Supervisory Board, the Executive Board and the Annual General Meeting of Shareholders. Their rules are defined by European and German law, by the Agreement on the Involvement of Employees in SAP SE (“Employee Involvement Agreement", "EIA”), by the German Corporate Governance Code and by SAP’s Articles of Incorporation (Satzung) and are summarized below. See “Item 16G. Differences in Corporate Governance Practices” for additional information on our corporate governance practices.
The Supervisory Board
The Supervisory Board appoints and removes the members of the Executive Board and oversees and advises the management of the corporation. At regular intervals it meets to discuss current business as well as business development and planning. The SAP Executive Board must consult with the Supervisory Board concerning the corporate strategy, which is developed by the Executive Board. Types of transactions for which the Executive Board requires the Supervisory Board’s consent are listed in the Articles of Incorporation; in addition, the Supervisory Board has specified further types of transactions that require its consent. Accordingly, the Supervisory Board must also approve the annual budget of SAP upon submission by the Executive Board and certain subsequent deviations from the approved budget. The Supervisory Board is also responsible for representing SAP SE in transactions between SAP SE and Executive Board members.
101
The Supervisory Board, based on a recommendation by its Audit and Compliance Committee, provides its proposal for the election of the external independent auditor to the Annual General Meeting of Shareholders. Based on the preparatory work of the Audit and Compliance Committee, the Supervisory Board deliberates and resolves on the adoption of the SAP SE financial statements and is responsible for the approval of the SAP SE financial statements, the consolidated financial statements, and the combined management report (including the Consolidated Sustainability Statement). The Supervisory Board is also responsible for monitoring the auditor’s independence and the audit quality, a task it has delegated to the Audit and Compliance Committee.
Pursuant to Article 40 (3) sentence 1 of the SE Regulation, the number of members of the supervisory board and the rules for determining this number are to be laid down in the Articles of Incorporation. Furthermore, pursuant to Section 17 (1) SE-AG, the size of supervisory boards of companies which, like SAP SE, have a capital stock exceeding €10,000,000, is limited to twenty - one members. In line with these provisions as well as the EIA, the Articles of Incorporation of SAP SE provide that the Supervisory Board shall be composed of eighteen members.
The current Supervisory Board of SAP SE consists of eighteen members, nine of whom are elected by the Annual General Meeting of Shareholders as shareholders’ representatives with the remaining nine being appointed as employees’ representatives by the SE Works Council in accordance with the EIA (see below for details). The SE Works Council represents the SAP employees in member states of the European Union and in the contract states of the European Economic Area. Pursuant to Section 17(2) SE-AG, the Supervisory Board of SAP SE must have a minimum of 30% men and 30% women. This quota for the Supervisory Board must be observed for any new appointment to the Supervisory Board. During all of 2024 there were three women on the shareholder representatives’ side of the Supervisory Board. In 2024 there were five women on the employee representatives’ side until May 15, 2024, and two women on the employee representatives’ side from May 15, 2024, onwards. Thus, the percentage of women on the Supervisory Board exceeded the minimum quota of 30% throughout 2024.
The procedure for the appointment of the employee representatives on the Supervisory Board of SAP SE is governed by the EIA, as amended from time to time. In accordance with the EIA, for the current composition of the Supervisory Board, the nine seats reserved for employees’ representatives (“Employee Seats”) are allocated as follows: the first seven of the Employee Seats are allocated in proportion to the numbers of SAP employees employed in the individual countries (d`Hondt method), provided that if the first six seats are allocated to one country, the seventh seat is for the country with the second highest number of SAP employees. The eighth seat is allocated to the country represented in the SE Works Council with the highest number of SAP employees. The ninth seat is allocated to a country not already allocated a seat in the Supervisory Board but represented on the SE Works Council. From the beginning of 2024 until the end of the Annual General Meeting of Shareholders on May 15, 2024, the first six seats were allocated to Germany, the seventh seat was allocated to the UK, the eighth seat was also allocated to Germany, and the ninth seat was allocated to a European country not represented by the first eight seats, as determined by the SE Works Council. The employees’ representatives for the first six seats allocated to Germany were determined by direct vote by all SAP employees with their principal place of employment in Germany. The employees’ representative for the seventh seat allocated to the UK was determined according to the applicable provisions of the UK law. With regard to the eighth and ninth seats, members of the SE Works Council from Germany and Bulgaria were appointed by the SE Works Council as employees’ representatives.
Following regular elections of the employee representatives in 2024, which were based on a temporary amendment of the EIA regarding the fifth and sixth seats, the composition of the Employee Seats changed with effect from the close of the Annual General Meeting of Shareholders on May 15, 2024, and was as follows until year - end 2024: The first four seats were determined by direct vote by all SAP employees with their principal place of employment in Germany. The employee representatives for the fifth and sixth seats were appointed by the SE Works Council from candidates nominated by the trade unions represented at the SAP entities in the European Economic Area. The seventh seat was allocated to the Czech Republic and determined according to applicable provisions of Czech law. With regard to the eighth and ninth seats, members of the SE Works Council from Germany and Spain were appointed by the SE Works Council as employees' representatives.
Any Supervisory Board member elected by the shareholders at the Annual General Meeting of Shareholders may be removed by three-quarters of the votes cast at the Annual General Meeting of Shareholders. Any Supervisory Board member appointed in accordance with the EIA may be removed by the SE Works Council upon application by the body that nominated the respective employees’ representative for appointment by the SE Works Council or, in case the employees’ representative was directly elected, by the majority of the employees entitled to vote.
The Supervisory Board elects a chairperson and one or two deputy chairperson(s) among its members by a majority of the votes cast. Only a shareholders’ representative may be elected as chairperson of the Supervisory Board. When electing the chairperson of the Supervisory Board, the oldest member in terms of age of the shareholders’ representatives on the Supervisory Board will chair the meeting and, in the event of a tied vote, will have the casting vote.
Unless otherwise mandatorily prescribed by law or the Articles of Incorporation, resolutions of the Supervisory Board are adopted by simple majority of the votes cast. In the event of a tie, the vote of the chairperson and, if the chairperson does not participate in passing the resolution, the vote of the deputy chairperson, provided that he or she is a shareholders’ representative, will be decisive (casting vote).
Other than for the employees’ representatives on the first Supervisory Board of SAP SE, the Supervisory Board members may be elected or appointed for a period ending with the close of the Annual General Meeting of Shareholders at which the acts of the Supervisory Board are formally approved for the fourth fiscal year following the commencement of the term of office, not counting the year in which their term of office commences. In any event, the term of office shall end after six years at most. Re-election is possible. Our Supervisory Board holds four ordinary meetings per year and in addition convenes extraordinary meetings as needed or resolves by way of circular resolution. The compensation of the members of the Supervisory Board is set in the Articles of Incorporation.
102
All of the shareholder representatives are considered independent from SAP and the Supervisory Board. This follows the German Corporate Governance Code (GCGC), which stipulates that an adequate number of the shareholder representatives on our Supervisory Board be independent. To be considered for appointment to the Supervisory Board and for as long as they serve, members must comply with certain criteria concerning independence, conflicts of interest and multiple memberships of management, and supervisory and other governing bodies. They must be loyal to SAP in their conduct and must not accept any position in companies that are in competition with SAP. Members are subject to insider trading prohibitions and the respective directors’ dealing rules of the European Regulation (EU) No 596/2014 of the European Parliament and the Council of 16 April 2014 on market abuse and the German Securities Trading Act. A member of the Supervisory Board may not vote on matters relating to certain contractual agreements between such member and SAP SE. Further, as the compensation of the Supervisory Board members is set in the Articles of Incorporation, Supervisory Board members are unable to vote on their own compensation, with the exception that they are able to exercise voting rights in an Annual General Meeting of Shareholders in connection with a resolution amending the Articles of Incorporation.
The duties and procedures of the Supervisory Board and its committees are specified in their respective rules of procedure, if any, which reflect the requirements of European and German law, including the SE Regulation and the German Stock Corporation Act, the Articles of Incorporation and the recommendations of the GCGC.
According to the provisions of the Sarbanes-Oxley Act, SAP does not grant loans to the members of the Executive Board or the Supervisory Board.
The Supervisory Board may appoint committees from among its members and may, to the extent permitted by law, entrust such committees with the authority to make decisions on behalf of the Supervisory Board. Currently the Supervisory Board maintains the following committees:
The Audit and Compliance Committee
The Audit and Compliance Committee (Prüfungs- und Compliance-Ausschuss) handles matters concerning the financial statements and the auditing of the Group and SAP SE standalone accounting and reporting. Additionally, the Audit and Compliance Committee handles all investigative compliance related topics and the external reporting of the Group. Among the tasks of the Audit and Compliance Committee are the discussion of SAP’s quarterly statements, half year report and the year-end financial and sustainability reporting prepared under German and U.S. regulations, including this report. The Audit and Compliance Committee recommends to the Supervisory Board the appointment of the external independent auditor, determines focus audit areas, discusses critical accounting policies and estimates with the auditors, reviews the audit reports issued and audit issues identified by the auditor, and monitors the effectiveness of the internal audit function and receives regular reports about the function’s resources, audit plans (including the criteria used to create the plans), its audit methods and activities, and audit results. The Audit and Compliance Committee also negotiates the audit fees with the auditor and monitors the auditor’s independence and audit quality. SAP’s Office of Ethics and Compliance, SAP Global Legal and SAP’s Global Security & Cloud Compliance Office reports regularly to the Audit and Compliance Committee, as well as upon request and the occurrence of certain findings. The Audit and Compliance Committee reviews the effectiveness of SAP’s system for monitoring corporate security, which includes cybersecurity, with a focus on risk and incident management and mitigation. Finally, the Audit and Compliance Committee reviews the compensation report and prepares a recommendation for Supervisory Board to adapt and release the report for the respective fiscal year.
The Audit and Compliance Committee has established procedures regarding the approval of all audit and non-audit services provided by our external independent auditor. See “Item 16C. Principal Accountant Fees and Services” for details.
The Audit and Compliance Committee also does preparatory work for the full Supervisory Board’s deliberations and resolutions on the adoption of the annual financial statements, the approval of the consolidated annual financial statements and the Integrated Report, and on the dividend proposal. Additionally, the Audit and Compliance Committee assists in the preparation of the compensation report by reviewing it with regard to the fulfillment of all regulatory requirements. Furthermore, the Audit and Compliance Committee and the Finance and Investment Committee jointly prepare the full Supervisory Board’s resolution to approve the group annual financial plan.
The Supervisory Board has determined each of Jennifer Xin-Zhe Li, the Audit and Compliance Committee’s chairperson, and Dr. Gunnar Wiedenfels to be an audit committee financial expert as defined by the regulations of the SEC issued under Section 407 of the Sarbanes-Oxley Act as well as financial experts as defined by the German Stock Corporation Act, with both of them having expertise in the fields of accounting and auditing. Each of Ms. Li and Dr. Wiedenfels are “independent”, as such term is defined in Rule 10A-3 under the Exchange Act. See “Item 16A. Audit Committee Financial Expert” for details.
The Personnel and Governance Committee
The Personnel and Governance Committee (Personal- und Governance-Ausschuss) is responsible for personnel matters related to the Executive Board and matters concerning the coordination of the Supervisory Board. The Committee carries out the preparatory work necessary for key decisions made by the Supervisory Board concerning the members of the Executive Board, e.g. appointment and remuneration, as well as conclusion of, amendments to, and termination of Executive Board members’ service contracts and succession planning. The Committee also handles all matters related to corporate governance.
The German Stock Corporation Act prohibits the Personnel and Governance Committee from deciding on the compensation of the Executive Board members on behalf of the Supervisory Board and requires that such decision is made by the entire Supervisory Board. This Act also provides the Annual General Meeting of Shareholders with the right to vote on the system for the compensation of Executive Board members, such vote, however, not being legally binding for the Supervisory Board.
103
The Finance and Investment Committee
The Finance and Investment Committee (Finanz- und Investitionsausschuss) addresses general financing issues and is responsible for all matters related to financing, mergers & acquisitions, joint ventures, strategic investments and divestitures. Furthermore, it regularly discusses acquisitions of intellectual property and companies, venture capital investments and other investments with the Executive Board and reports to the Supervisory Board on such investments. It is also responsible for the approval of such investments if the individual investment amount exceeds certain specified limits, as well as – together with the Audit and Compliance Committee – for the preparation of the full Supervisory Board’s resolution to approve the group annual financial plan.
The Product and Technology Committee
The Product and Technology Committee (Produkt- und Technologieausschuss) advises the Executive Board with regard to the development and use of technologies and the development of software product strategy. It also covers all go to market related matters. SAP’s Global Security & Cloud Compliance Office reports regularly to the Product and Technology Committee, as well as upon request and the occurrence of certain findings.
The Nomination Committee
The Nomination Committee (Nominierungsausschuss) is exclusively composed of shareholder representatives. The purpose of this Committee is to propose suitable candidates for the Supervisory Board to recommend when the Annual General Meeting of Shareholders elects Supervisory Board members.
The Government Security Committee
Effective January 1, 2024, the Supervisory Board established the Government Security Committee (Ausschuss für staatliche Sicherheit), which is responsible for SAP's corporate activities in context of national security regulations.
The Executive Board
The Executive Board manages the Company’s business, is responsible for preparing its strategy and represents it in dealings with third parties. The Executive Board reports regularly to the Supervisory Board about SAP operations and business strategies and prepares special reports upon request. A person may not serve on the Executive Board and on the Supervisory Board at the same time.
The Executive Board and the Supervisory Board cooperate closely for the benefit of the Company. The Executive Board is required to provide the Supervisory Board regular, prompt and comprehensive information about all of the essential issues affecting the SAP Group’s business progress and its potential business risks. Furthermore, the Executive Board must maintain regular contact with the chairperson of the Supervisory Board and vice versa. The Executive Board must inform the chairperson of the Supervisory Board promptly about exceptional events that are of significance to SAP’s business. The Supervisory Board chairperson must inform the Supervisory Board accordingly and shall, if required, convene an extraordinary meeting of the Supervisory Board.
Pursuant to the Articles of Incorporation, the Executive Board must consist of at least two members. SAP SE’s Executive Board is currently comprised of six members. Any two members of the Executive Board jointly or one member of the Executive Board and the holder of a special power of attorney (Prokurist) jointly may legally represent SAP SE. The Supervisory Board appoints each member of the Executive Board for a maximum term of five years, with the possibility of re-appointment. Under certain circumstances, a member of the Executive Board may be removed by the Supervisory Board prior to the expiration of that member’s term. A member of the Executive Board may not vote on matters relating to certain contractual agreements between such member and SAP SE and may be liable to SAP SE if such member has a material interest in any contractual agreement between SAP and a third party which was not previously disclosed to and approved by the Supervisory Board. Further, as the compensation of the Executive Board members is set by the Supervisory Board, Executive Board members are unable to vote on their own compensation, with the exception that they are able to exercise voting rights in an Annual General Meeting of Shareholders resolving a non-binding vote on the system for the compensation of Executive Board members.
Under German law SAP SE’s Supervisory Board members and Executive Board members have a duty of loyalty and care towards SAP SE. They must exercise the standard of care of a prudent and diligent businessman and bear the burden of proving they did so if their actions are contested. Both bodies must consider the interest of SAP SE shareholders and our employees and, to some extent, the common good. Those who violate their duties may be held jointly and severally liable for any resulting damages unless they acted pursuant to a lawful resolution of the Annual General Meeting of Shareholders.
SAP has a Global Code of Ethics and Business Conduct for Employees (CoEBC) that is applicable to all employees, managers, the members of SAP’s Executive Board, as well as employee representatives of the Supervisory Board (see “Item 16B. Code of Ethics” for details).
Under German law the Executive Board of SAP SE is required to assess and manage all major risks for the SAP Group. In addition, all measures taken by management to reduce and handle the risks have to be documented. Therefore, SAP’s Executive Board has adopted suitable measures such as implementing an enterprise-wide risk monitoring system to ensure that adverse developments endangering the corporate standing are recognized at a reasonably early point in time.
104
The Office of Ethics and Compliance (OEC) was created by the SAP Executive Board in 2006 with the remit of corruption, bribery and substantial fraud. The Group Chief Compliance Officer heading the OEC reports directly to CEO Christian Klein and also has direct communication channels and reporting obligations to the Audit and Compliance Committee. Amongst its many other compliance-related functions, the OEC manages a network of globally-based field compliance officers who act as the first point of contact for the business regarding compliance matters. The OEC provides targeted compliance training and compliance-related communications to SAP employees to raise awareness and understanding of legal and regulatory compliance policies. Speak Out at SAP is SAP’s independently managed whistleblower reporting tool, through which any matters or concerns can be reported easily, and, if desired, anonymously. The tool is available twenty-four hours a day, seven days a week, both internally to SAP employees and externally to concerned parties, including customers, suppliers, and partners. Beyond Speak Out at SAP, we provide further reporting channels, including an internal ticketing system, a postal address for written submissions, as well as local contact persons worldwide. Employee help lines are also supported in each region where questions can be posed or questionable conduct can be reported without fear of retaliation.
The Extended Board
Effective February 1, 2025, the Executive Board established the Extended Board. The Extended Board is a committee of the Executive Board comprised of senior leaders from key functions and regulated by the Rules of Procedure of the Executive Board. The Executive Board appoints the Extended Board members, with the Supervisory Board providing consultation on these appointments. Currently, the Extended Board is comprised of eight members. The Extended Board performs advisory, coordination and decision - preparation functions for the Executive Board, however the Executive Board retains ultimate responsibility for overseeing and deciding on the activities of the company. All Extended Board members report to an Executive Board member. The Executive Board and the Extended Board plan to meet regularly, and Extended Board members will join Executive Board meetings as relevant.
The Annual General Meeting of Shareholders
Shareholders of the Company exercise their voting rights at shareholders’ meetings. The Executive Board calls the Annual General Meeting of Shareholders, which must take place within the first six months of each fiscal year. The Supervisory Board or the Executive Board may call an extraordinary meeting of the shareholders if the interests of the stock corporation so require. Additionally, shareholders of SAP SE holding in the aggregate a minimum of 5% of SAP SE’s issued share capital may call an extraordinary meeting of the shareholders. Shareholders as of the record date are entitled to attend and participate in shareholders’ meetings if they have provided timely notice of their intention to attend the meeting.
At the Annual General Meeting of Shareholders, the shareholders are asked, among other things, to formally approve the actions taken by the Executive Board and the Supervisory Board in the preceding fiscal year, to approve the appropriation of the corporation’s distributable profits and to appoint an external independent auditor. Shareholder representatives of the Supervisory Board are generally elected at the Annual General Meeting of Shareholders for a term not longer than six years. Shareholders may also be asked to grant authorization to repurchase treasury shares, to resolve on measures to raise or reduce the capital of the Company or to ratify amendments of our Articles of Incorporation. The Annual General Meeting of Shareholders can make management decisions only if requested to do so by the Executive Board.
Change in Control
There are no provisions in the Articles of Incorporation of SAP SE that would have the effect of delaying, deferring, or preventing a change in control of SAP SE and that would only operate with respect to a merger, acquisition or corporate restructuring involving it or any of its subsidiaries.
According to the German Securities Acquisition and Takeover Act (Wertpapiererwerbs- und Übernahmegesetz) a bidder seeking control of a company with its corporate seat in Germany or another state of the European Economic Area (EEA) and its shares being traded on an EEA stock exchange must publish an advance notice of its decision to make a tender offer, submit an offer statement to the Federal Financial Supervisory Authority (Bundesanstalt für Finanzdienstleistungsaufsicht) for review, and obtain certification from a qualified financial institution that adequate financing is in place to complete the offer. The offer statement must be published upon approval by the Federal Financial Supervisory Authority or expiry of a certain time period without such publication being prohibited by the Federal Financial Supervisory Authority. Once a shareholder has acquired shares representing at least 30% of the voting rights in an EEA-listed company, it must make an offer for all remaining shares. The Securities Acquisition and Takeover Act requires the executive board of the target company to refrain from taking any measures that may frustrate the success of the takeover offer. However, the target executive board is permitted to take any action that a prudent and diligent management of a company that is not the target of a takeover bid would also take. Moreover, the target executive board may search for other bidders and, with the prior approval of the supervisory board, may take other defensive measures, provided that both boards act within the parameters of their general authority under the German Stock Corporation Act. An executive board may also adopt specific defensive measures if such measures have been approved by the supervisory board and were specifically authorized by the Annual General Meeting of Shareholders no earlier than 18 months in advance of such measures by a resolution of at least 75% of the shares represented.
Under the European Takeover Directive of 2004 member states had to choose whether EU restrictions on defensive measures apply to companies that are registered in their territory. Germany decided to opt out and to retain its current restrictions on a board implementing defensive measures (as described above). As required by the European Takeover Directive if a country decides to opt out the German Securities Acquisition and Takeover Act grants companies the option of voluntarily applying the European standard by a change of the Articles of Incorporation (opt-in). SAP SE has not made use of this option.
105
Change in Share Capital
Under German law, the capital stock may be increased in consideration of contributions in cash or in kind, or by establishing authorized capital or contingent capital or by an increase of the company’s capital reserves. Authorized capital provides the Executive Board with the flexibility to issue new shares for a period of up to five years. The Executive Board must obtain the approval of the Supervisory Board before issuing new shares with regard to the authorized capital. Contingent capital allows the issuance of new shares for specified purposes, including stock option plans for Executive Board members or employees and the issuance of shares upon conversion of convertible bonds and exercise of stock options. By law, the Executive Board may only issue new shares with regard to the contingent capital for the specified purposes. Capital increases require an approval by at least 75% of the valid votes cast at the Annual General Meeting of Shareholders in which the increase is proposed and require an amendment to the Articles of Incorporation.
The share capital may be reduced by an amendment to the Articles of Incorporation approved by at least 75% of the valid votes cast at the Annual General Meeting of Shareholders. In addition, the Executive Board of SAP SE is allowed to authorize a reduction of the company’s capital stock by canceling a defined number of repurchased treasury shares if this repurchasing and the subsequent reduction have already been approved by the Annual General Meeting of Shareholders.
The Articles of Incorporation do not contain conditions regarding changes in the share capital that are more stringent than those provided by applicable European and German law.
Rights Accompanying our Shares
There are no limitations imposed by German law or the Articles of Incorporation of SAP SE on the rights to own securities, including the rights of non-residents or foreign holders to hold the ADRs or ordinary shares, to exercise voting rights or to receive dividends or other payments on such shares.
According to the German stock corporation law, the rights of shareholders cannot be amended without shareholders’ consent. The Articles of Incorporation do not provide more stringent conditions regarding changes of the rights of shareholders than those provided by applicable European and German law.
Voting Rights
Each ordinary SAP SE share represents one vote. Cumulative voting is not permitted under applicable European and German law. A corporation’s Articles of Incorporation may stipulate a majority necessary to pass a shareholders’ resolution differing from the majority provided by law, unless the law mandatorily requires a certain majority. Section 21 (1) of SAP SE’s Articles of Incorporation provides that resolutions may be passed at the Annual General Meeting of Shareholders with a majority of valid votes cast, unless a larger majority is prescribed by law or the Articles of Incorporation. SAP SE’s Articles of Incorporation as well as applicable European and German law require that the following matters, among others, be approved by at least 75% of the valid votes cast at the Annual General Meeting of Shareholders in which the matter is proposed:
- |
changing the corporate purpose of the company set out in the Articles of Incorporation; |
- |
capital increases and capital decreases; |
- |
excluding preemptive rights of shareholders to subscribe for new shares or for treasury shares; |
- |
dissolution; |
- |
a merger into, or a consolidation with, another company; |
- |
a transfer of all or virtually all of the assets; |
- |
a change of corporate form, including re-conversion into a German stock corporation; |
- |
a transfer of the registered seat to another EU member state; and |
- |
any other amendment to the Articles of Incorporation (pursuant to section 21 (2) sentence 1 of the Articles of Incorporation). For any amendments of the Articles of Incorporation which require a simple majority for stock corporations established under German law, however, section 21 (2) sentence 2 of SAP SE’s Articles of Incorporation provides that the simple majority of the valid votes cast is sufficient if at least half of the subscribed capital is represented or, in the absence of such quorum, the majority prescribed by law (i.e. two thirds of the votes cast, pursuant to sec. 59 of the SE Regulation) is sufficient. |
Dividend Rights
See “Item 3. Key Information — Dividends.”
Preemptive Rights
Shareholders have preemptive rights to subscribe (Bezugsrecht) for any issue of additional shares in proportion to their shareholdings in the issued capital. The preemptive rights may be excluded under certain circumstances by a shareholders’ resolution (approved by at least 75% of the valid votes cast at the Annual General Meeting of Shareholders) or by the Executive Board authorized by such shareholders’ resolutions and subject to the consent of the Supervisory Board.
106
Liquidation
If SAP SE were to be liquidated, any liquidation proceeds remaining after all of our liabilities were paid would be distributed to our shareholders in proportion to their shareholdings.
Disclosure of Shareholdings
SAP SE’s Articles of Incorporation do not require shareholders to disclose their shareholdings. The German Securities Trading Act (Wertpapierhandelsgesetz), however, requires holders of voting securities of SAP SE to notify SAP SE and the Federal Financial Supervisory Authority of the number of shares they hold if that number reaches, exceeds or falls below specified thresholds. These thresholds are 3%, 5%, 10%, 15%, 20%, 25%, 30%, 50% and 75% of the corporation’s outstanding voting rights. In respect of certificates representing shares, the notification requirement shall apply exclusively to the holder of the certificates. In addition, the German Securities Trading Act also obliges anyone who holds, directly or indirectly, financial instruments that convey an unconditional entitlement to acquire under a legally binding agreement, shares in SAP SE, to notify SAP SE and the Federal Financial Supervisory Authority if the thresholds mentioned above have been reached, exceeded or fallen below, with the exception of the 3% threshold. This notification obligation also exists for the holder of a financial instrument which merely de facto enables its holder or a third party to acquire shares in SAP SE, subject to the thresholds mentioned in the preceding sentence. In connection with this notification, obligation positions in voting rights and other financial instruments have to be aggregated.
Exchange Controls and Other Limitations Affecting Security Holders
The euro is a fully convertible currency. At the present time, Germany does not restrict the export or import of capital, except for investments in certain areas in accordance with applicable resolutions adopted by the United Nations and the European Union. However, for statistical purposes only, every individual or corporation residing in Germany (“Resident”) must report to the German Central Bank (Deutsche Bundesbank), subject only to certain immaterial exceptions, any payment received from or made to an individual or a corporation residing outside of Germany (“Non-Resident”) if such payment exceeds €12,500 (or the equivalent in a foreign currency). In addition, German Residents (except for individuals and certain financial institutions) must report any accounts payable to or receivable from Non-Residents if such payables or receivables, in the aggregate, exceed €5 million (or the equivalent in a foreign currency) at the end of any calendar month. Furthermore, companies resident in Germany with accounts payable to or receivable from Non-Residents in excess of €500 million have to report any payables or receivables to/from Non-Residents arising from derivative instruments at the end of each calendar quarter. Residents are also required to report annually to the German Central Bank any shares or voting rights of 10% or more which they hold directly or indirectly in non-resident corporations with total assets of more than €3 million. Corporations residing in Germany with assets in excess of €3 million must report annually to the German Central Bank any shares or voting rights of 10% or more held directly or indirectly by a Non-Resident.
Taxation
General
The following discussion is a summary of certain material German tax and U.S. federal income tax consequences of the acquisition, ownership and disposition of our ADRs or ordinary shares to a U.S. Holder. In general, a U.S. Holder (as hereinafter defined) is any beneficial owner of our ADRs or ordinary shares that (i) is a citizen or resident of the U.S. or a corporation organized under the laws of the U.S. or any political subdivision thereof, an estate whose income is subject to U.S. federal income tax regardless of its source or a trust, if a U.S. court can exercise primary supervision over its administration and one or more U.S. persons are authorized to control all substantial decisions of the trust; (ii) is not a resident of Germany for purposes of the income tax treaty between the U.S. and Germany (Convention between the Federal Republic of Germany and the United States of America for the Avoidance of Double Taxation and the Prevention of Fiscal Evasion with respect to Taxes on Income and Capital and to certain other Taxes, as amended by the Protocol of June 1, 2006 and as published in the German Federal Law Gazette 2008 vol. II pp. 611/851; the “Treaty”); (iii) owns the ADRs or ordinary shares as capital assets; (iv) does not hold the ADRs or ordinary shares as part of the business property of a permanent establishment or a fixed base in Germany; and (v) is fully entitled to the benefits under the Treaty with respect to income and gain derived in connection with the ADRs or ordinary shares. Special rules which are not discussed in the following summary apply to pension funds and certain other tax-exempt investors.
THE FOLLOWING IS NOT A COMPREHENSIVE DISCUSSION OF ALL GERMAN TAX AND U.S. FEDERAL INCOME TAX CONSEQUENCES THAT MAY BE RELEVANT FOR U.S. HOLDERS OF OUR ADRs OR ORDINARY SHARES. THEREFORE, U.S. HOLDERS ARE STRONGLY URGED TO CONSULT THEIR OWN TAX ADVISORS REGARDING THE OVERALL GERMAN TAX AND U.S. FEDERAL INCOME TAX CONSEQUENCES OF THE ACQUISITION, OWNERSHIP AND DISPOSITION OF OUR ADRs OR ORDINARY SHARES IN LIGHT OF THEIR PARTICULAR CIRCUMSTANCES, INCLUDING THE EFFECT OF ANY STATE, LOCAL OR OTHER FOREIGN OR DOMESTIC LAWS.
German Taxation
The summary set out below is based on German tax laws, interpretations thereof and applicable tax treaties to which Germany is a party and that are in force at the date of this report; it is subject to any changes in such authority occurring after that date, potentially with retroactive effect, that could result in German tax consequences different from those discussed below. This discussion is also based, in part, on representations of the Depositary and assumes that each obligation of the Deposit Agreement and any related agreements will be performed in accordance with its terms. For additional information on the Depository and the fees associated with SAP’s ADR program see “Item 12. Description of Securities Other Than Equity Securities — American Depository Shares.”
107
For purposes of applying German tax law and the applicable tax treaties to which Germany is a party, a holder of ADRs will generally be treated as owning the ordinary shares represented thereby.
German Taxation of Dividends
Under German income tax law, the full amount of dividends distributed by an incorporated company is generally subject to German withholding tax at a domestic rate of 25% plus a solidarity surtax of 5.5% thereon (effectively 1.375% of dividends before withholding tax), resulting in an aggregate withholding tax rate from dividends of 26.375%. Since January 1, 2017, taxes are incurred on the third bank working day after the Annual General Meeting of Shareholders, or at a later date as may be stipulated by SAP’s Articles of Incorporation or by the Annual General Meeting of Shareholders’ decision on dividends. Non-resident corporate shareholders will generally be entitled to a refund in the amount of two-fifths of the withholding tax (including solidarity surtax thereon). This does not preclude a further reduction or refund of withholding tax, if any, available under a relevant tax treaty.
Generally, for many non-resident shareholders the withholding tax rate is currently reduced under applicable income tax treaties. Rates and refund procedures may vary according to the applicable treaty. To reduce the withholding tax to the applicable treaty tax rate a non-resident shareholder must apply for a refund of withholding taxes paid. Any refund applications must be submitted electronically to the German Federal Tax Office (Bundeszentralamt für Steuern, BZSt). For details, such non-resident shareholders are urged to consult their own tax advisors. Special rules apply for the refund to U.S. Holders (we refer to the below section “Refund Procedures for U.S. Holders”).
Refund Procedures for U.S. Holders
Under the Treaty, a partial refund of the 25% withholding tax equal to 10% of the gross amount of the dividend and a full refund of the solidarity surtax can be obtained by a U.S. Holder. Thus, for each US$100 of gross dividends paid by SAP SE to a U.S. Holder, the dividends (which are dependent on the euro/U.S. dollar exchange rate at the time of payment) will be initially subject to a German withholding tax of US$26.375, of which US$11.375 may be refunded under the Treaty. As a result, a U.S. Holder effectively would receive a total dividend of US$85 (provided the euro/U.S. dollar exchange rate at the time of payment of the dividend is the same as at the time of refund, otherwise the effective dividend may be higher or lower). Further relief of German withholding tax under the Treaty may be available for corporate U.S. Holders owning at least 10% of the voting stock of SAP or U.S. Holders qualifying as pension fund within the meaning of the Treaty, subject to further requirements being met, in particular certain holding requirements.
To claim the refund of amounts withheld in excess of the Treaty rate, a U.S. Holder must submit a claim for refund including a certificate of residence and all relevant tax certificates to the German tax authorities. Since the beginning of 2023, applications for the exemption and reimbursement from withholding tax must be filed electronically using the officially prescribed data set. Hereby, it is necessary to use the official online portal of the Federal Central Tax Office (BZSt Online Portal, BOP) to file the application. To submit an application online, a software certificate (a BOP certificate or an Elster certificate) is required. The registration process for the certificate can take up to six weeks. Respective guidelines are available on the homepage of the German Federal Tax Office (http://www.bzst.de).
U.S. Holders must also submit to the German tax authorities a certification of their U.S. residency status (IRS Form 6166). This certification can be obtained from the Internal Revenue Service (IRS) by filing a request for certification on IRS Form 8802, which will not be processed unless a user fee is paid. IRS Form 8802 and its instructions can be obtained from the IRS website at www.irs.gov. U.S. Holders should consult their own tax advisors regarding how to obtain an IRS Form 6166.
The German tax authorities reserve the right to audit the entitlement to tax refunds for several years following their payment pursuant to the Treaty in individual cases.
The German tax authorities will issue refunds denominated in euros. In the case of shares held through banks or brokers participating in the Depository, the refunds will be issued to the Depository, which will convert the refunds to U.S. dollar. The resulting amounts will be paid to banks or brokers for the account of the U.S. Holders.
German Taxation of Capital Gains
Under German income tax law, a capital gain derived from the sale or other disposition of ADRs or ordinary shares by a non-resident shareholder is subject to income tax in Germany only if such non-resident shareholder has held, directly or indirectly, ADRs or ordinary shares representing 1% or more of the registered share capital of a company at any time during the five-year period immediately preceding the sale or other disposition.
However, a U.S. Holder of ADRs or ordinary shares that qualifies for benefits under the Treaty is not subject to German income or corporate income tax on the capital gain derived from the sale or other disposition of ADRs or ordinary shares.
German Gift and Inheritance Tax
Generally, a transfer of ADRs or ordinary shares by a shareholder at death or by way of gift will be subject to German gift or inheritance tax, respectively, if (i) the decedent or donor, or the heir, donee or other transferee is resident in Germany at the time of the transfer, or with respect to German citizens who are not resident in Germany, if the decedent or donor, or the heir, donee or other transferee has not been continuously outside of Germany for a period of more than five years; (ii) the ADRs or ordinary shares are part of the business property of a permanent establishment or a fixed base in Germany; or (iii) the ADRs or ordinary shares subject to such transfer form part of a portfolio that represents 10% or more of the registered share capital of the Company and has been held, directly or indirectly, by the decedent or donor, respectively, at the time of the transfer, actually or constructively together with related parties.
108
However, the right of the German government to impose gift or inheritance tax on a non-resident shareholder may be limited by an applicable estate tax treaty. In the case of a U.S. Holder, a transfer of ADRs or ordinary shares by a U.S. Holder at death or by way of gift generally will not be subject to German gift or inheritance tax by reason of the estate tax treaty between the U.S. and Germany (Convention between the Federal Republic of Germany and the United States of America for the Avoidance of Double Taxation with respect to Estate, Gift and Inheritance Taxes, German Federal Law Gazette 1982 vol. II page 846, as amended by the Protocol of December 14, 1998 and as published on December 21, 2000, German Federal Law Gazette 2001 vol. II, page 65; the “Estate Tax Treaty”) so long as (i) the decedent or donor, and (ii) the heir, donee or other transferee was not domiciled in Germany for purposes of the Estate Tax Treaty at the time the gift was made, or at the time of the decedent’s death, and the ADRs or ordinary shares were not held in connection with a permanent establishment or a fixed base in Germany. In general, the Estate Tax Treaty provides a credit against the U.S. federal gift or estate tax liability for the amount of gift or inheritance tax paid in Germany, subject to certain limitations, in a case where the ADRs or ordinary shares are subject to German gift or inheritance tax and U.S. federal gift or estate tax.
Other German Taxes
There are currently no German net worth, transfer, stamp or other similar taxes that would apply to a U.S. Holder on the acquisition, ownership, sale or other disposition of our ADRs or ordinary shares.
U.S. Taxation
The following discussion applies to U.S. Holders only if the ADRs and ordinary shares are held as capital assets for tax purposes. It does not address tax considerations applicable to U.S. Holders that may be subject to special tax rules, such as dealers or traders in securities, financial institutions, insurance companies, tax-exempt entities, regulated investment companies, U.S. Holders that hold ordinary shares or ADRs as a part of a straddle, conversion transaction or other arrangement involving more than one position, U.S. Holders that own (or are deemed for U.S. tax purposes to own) 10% or more (by vote or value) of the stock of SAP SE, U.S. Holders subject to special tax accounting rules as a result of any item of gross income with respect to the ADRs or shares being taken into account in the applicable financial statement, U.S. Holders that have a principal place of business or “tax home” outside the United States or U.S. Holders whose “functional currency” is not the U.S. dollar and U.S. Holders that hold ADRs or ordinary shares through partnerships or other pass-through entities.
The summary set out below is based upon the U.S. Internal Revenue Code of 1986, as amended (the “Code”), the Treaty and regulations, rulings and judicial decisions thereunder at the date of this report. Any such authority may be repealed, revoked or modified, potentially with retroactive effect, so as to result in U.S. federal income tax consequences different from those discussed below. No assurance can be given that the conclusions set out below would be sustained by a court if challenged by the IRS. The discussion below is based, in part, on representations of the Depositary, and assumes that each obligation in the Deposit Agreement and any related agreements will be performed in accordance with its terms.
For U.S. federal income tax purposes, a U.S. Holder of ADRs will be considered to own the ordinary shares represented thereby. Accordingly, unless the context otherwise requires, all references in this section to ordinary shares are deemed to refer likewise to ADRs representing an ownership interest in ordinary shares.
U.S. Taxation of Dividends
Subject to the discussion below under “Passive Foreign Investment Company Considerations”, distributions made by SAP SE with respect to ordinary shares (other than distributions in liquidation and certain distributions in redemption of stock), including the amount of German tax deemed to have been withheld in respect of such distributions, will generally be taxed to U.S. Holders as ordinary dividend income.
As discussed above, a U.S. Holder may obtain a refund of German withholding tax under the Treaty to the extent that the German withholding tax exceeds 15% of the dividend distributed. Thus, for each US$100 of gross dividends paid by SAP SE to a U.S. Holder, the dividends (which are dependent on the euro/ U.S. dollar exchange rate at the time of payment) will be initially subject to German withholding tax of US$25 plus US$1.375 solidarity surtax, and the U.S. Holder will receive US$73.625. A U.S. Holder who obtains the Treaty refund will receive from the German tax authorities an additional amount in euro that would be equal to US$11.375. For U.S. tax purposes, such U.S. Holder will be considered to have received a total distribution of US$100, which will be deemed to have been subject to German withholding tax of US$15 (15% of US$100) resulting in the net receipt of US$85 (provided the euro/ U.S. dollar exchange rate at the time of payment of the dividend is the same as at the time of refund, otherwise the effective dividend may be higher or lower).
In the case of a distribution in euro, the amount of the distribution generally will equal the U.S. dollar value of the euro distributed (determined by reference to the spot currency exchange rate on the date of receipt of the distribution, or receipt by the Depositary in the case of a distribution on ADRs), regardless of whether the holder in fact converts the euro into U.S. dollar, and the U.S. Holder will not realize any separate foreign currency gain or loss (except to the extent that such gain or loss arises on the actual disposition of foreign currency received). However, a U.S. Holder may be required to recognize foreign currency gain or loss on the receipt of a refund in respect of German withholding tax to the extent the U.S. dollar value of the refund differs from the U.S. dollar equivalent of that amount on the date of receipt of the underlying dividend.
109
Dividends paid by SAP SE generally will constitute “portfolio income” for purposes of the limitations on the use of passive activity losses (and, therefore, generally may not be offset by passive activity losses) and as “investment income” for purposes of the limitation on the deduction of investment interest expense. Dividends paid by SAP SE will not be eligible for the dividends received deduction generally allowed to U.S. corporations under Section 243 of the Code. Dividends paid by SAP SE to an individual are treated as “qualified dividends” (assuming the holding requirement is met) subject to capital gains rates, i.e., at a maximum rate of 20%, if SAP SE was not in the prior year and, is not in the year in which the dividend is paid, a passive foreign investment company (“PFIC”). Based on our audited financial statements and relevant market and shareholder data, we believe that we were not treated as a PFIC for U.S. federal income taxes with respect to our 2024 tax year. In addition, based on our audited financial statements and our current expectations regarding the value and nature of our assets, the sources and nature of our income, and relevant market and shareholder data, we do not anticipate becoming a PFIC for the 2025 tax year. Certain U.S. holders who are individuals, trusts, or estates, must pay a Medicare tax at a rate of 3.8% on the lesser of (i) net investment income such as dividends and (ii) the excess of modified adjusted gross income over the statutory thresholds.
U.S. Taxation of Capital Gains
In general, assuming that SAP SE at no time is a PFIC, upon a sale or exchange of ordinary shares to a person other than SAP SE, a U.S. Holder will recognize gain or loss in an amount equal to the difference between the amount realized on the sale or exchange and the U.S. Holder’s adjusted tax basis in the ordinary shares. Such gain or loss will be a capital gain or loss and will be considered a long-term capital gain (taxable at a reduced rate for individuals) if the ordinary shares were held for more than one year. Capital gains may also be subject to the Medicare tax at a rate of 3.8%. The deductibility of capital losses is subject to significant limitations. Upon a sale of ordinary shares to SAP SE, a U.S. Holder may recognize a capital gain or loss or, alternatively, may be considered to have received a distribution with respect to the ordinary shares, in each case depending upon the application to such sale of the rules of Section 302 of the Code.
Deposit and withdrawal of ordinary shares in exchange for ADRs by a U.S. Holder will not result in its realization of gain or loss for U.S. federal income tax purposes.
U.S. Information Reporting and Backup Withholding
Dividend payments made to holders and proceeds paid from the sale of shares or ADRs are subject to information reporting to the Internal Revenue Service (IRS) and will be subject to backup withholding (currently imposed at a 24% rate for 2024-2025) unless the holder (i) is a corporation or other exempt recipient or (ii) provides a taxpayer identification number on a properly completed IRS Form W-9 and certifies that no loss of exemption from backup withholding has occurred. Holders that are not U.S. persons are not subject to information reporting or backup withholding. However, such a holder may be required to provide a certification of its non-U.S. status in connection with payments received within the United States or through a U.S.-related financial intermediary.
Backup withholding is not an additional tax and any amounts withheld as backup withholding may be credited against a holder’s U.S. federal income tax liability. A holder may obtain a refund of any excess amounts withheld under the backup withholding rules by timely filing the appropriate claim for refund with the Internal Revenue Service and furnishing any required information.
Shareholders may be subject to other U.S. information reporting requirements and should consult their own tax advisors for application of these reporting requirements to their own facts and circumstances.
U.S. Foreign Tax Credit
In general, in computing its U.S. federal income tax liability, a U.S. Holder may elect for each taxable year to claim a deduction or, subject to the limitations on foreign tax credits generally, a credit for foreign income taxes paid or accrued by it. For U.S. foreign tax credit purposes, subject to the applicable limitations under the foreign tax credit rules, German tax withheld from dividends paid to a U.S. Holder, up to the 15% provided under the Treaty will be eligible for credit against the U.S. Holder’s federal income tax liability or, if the U.S. Holder has elected to deduct such taxes, may be deducted in computing taxable income. U.S. Holders should consult their tax advisors about potential U.S. tax consequences of German tax withheld and/or refunded, including with respect to fluctuation of the euro/U.S. dollar exchange rate.
For U.S. foreign tax credit purposes, dividends paid by SAP SE generally will be treated as foreign-source income and as “passive category income”. Gains or losses realized by a U.S. Holder on the sale or exchange of ordinary shares generally will be treated as U.S.-source gain or loss.
Passive Foreign Investment Company Considerations
Special and adverse U.S. tax rules apply to a U.S. Holder that holds an interest in a PFIC. Based on current projections concerning the composition of SAP SE’s income and assets, SAP SE does not believe that it will be treated as a PFIC for its current or future taxable years. However, because this conclusion is based on our current projections and expectations as to its future business activity, SAP SE can provide no assurance that it will not be treated as a PFIC in respect of its current or any future taxable years.
Material Contracts
See “Item 5. Operating and Financial Review and Prospects—Liquidity and Capital Disclosures”, for information on our credit facilities.
110
Documents on Display
We are subject to the informational requirements of the Securities Exchange Act of 1934 (“Exchange Act”), as amended. In accordance with these requirements, we file reports and furnish other information as a foreign private issuer with the SEC. These materials, including this report and the exhibits thereto, are available at www.sec.gov. In addition, information about us is available at our Web site: www.sap.com.
ITEM 11. QUANTITATIVE AND QUALITATIVE DISCLOSURES ABOUT MARKET RISK
We are exposed to various financial risks, such as market risks, including changes in foreign currency exchange rates, interest rates and equity prices, as well as credit risk and liquidity risk. We manage these risks on a Group-wide basis. Selected derivatives are exclusively used for this purpose and not for speculation, which is defined as entering into derivative instruments without a corresponding underlying transaction. Financial risk management is done centrally. See Note (F.1) to our Consolidated Financial Statements for our quantitative and qualitative disclosures about market risk.
ITEM 12. DESCRIPTION OF SECURITIES OTHER THAN EQUITY SECURITIES
American Depositary Shares
Fees and Charges Payable by ADR Holders
Deutsche Bank Trust Company Americas is the Depositary for SAP SE’s ADR program. ADR holders may be required to pay the following charges:
- |
taxes and other governmental charges; |
- |
registration fees as may be in effect from time to time for the registration of transfers of SAP ordinary shares on any applicable register to the Depositary or its nominee or the custodian or its nominee in connection with deposits or withdrawals under the Deposit Agreement; |
- |
applicable air courier, cable, telex and facsimile expenses of the Depositary; |
- |
expenses incurred by the Depositary in the conversion of foreign currency; |
- |
US $5.00 or less per 100 ADSs (or portion thereof) to the Depositary for the execution and delivery of ADRs (including in connection with the depositing of SAP ordinary shares or the exercising of rights) and the surrender of ADRs; |
- |
a maximum aggregate service fee of US $3.00 per 100 ADSs (or portion thereof) per calendar year to the Depositary for the services performed by the Depositary in administering the ADR program, including for processing any cash dividends and other cash distributions; and |
- |
US $5.00 or less per 100 ADSs (or portion thereof) to the Depositary for distribution of securities other than SAP ordinary shares or rights. |
These fees may at any time and from time to time be changed by agreement between SAP SE and the Depositary. These charges are described more fully in Section 5.9 of the Amended and Restated Deposit Agreement dated as of November 25, 2009, as amended by Amendment No. 1 dated as of March 18, 2016 and as may be further amended from time to time, incorporated by reference as Exhibits 4.1.1 and 4.1.2 to this report.
Applicable service fees are either deducted from any cash dividends or other cash distributions or charged separately to holders in a manner determined by the Depositary, depending on whether ADSs are registered in the name of investors (whether certificated or in book-entry form) or held in brokerage and custodian accounts (via the Depository Trust Company, or DTC). In the case of distributions of securities, the Depositary charges the applicable ADS record date holder concurrent with the distribution. In the case of ADSs registered in the name of the investor, whether certificated or in book entry form, the Depositary sends invoices to the applicable record date ADS holders. For ADSs held in brokerage and custodian accounts via DTC, the Depositary may, if permitted by the settlement systems provided by DTC, collect the fees through those settlement systems from the brokers and custodians holding ADSs in their DTC accounts. The brokers and custodians who hold their clients’ ADSs in DTC accounts in such case may in turn charge their clients’ accounts the amount of the service fees paid to the Depositary.
In the event of a refusal to pay applicable fees, the Depositary may refuse the requested services until payment is received or may set off the amount of the fees from any distribution to be made to the ADR holder, all in accordance with the Deposit Agreement.
If any taxes or other governmental charges are payable by the holders and/or beneficial owners of ADSs to the Depositary, the Depositary, the custodian or SAP may withhold or deduct from any distributions made in respect of the deposited SAP ordinary share and may sell for the account of the holder and/or beneficial owner any or all of the deposited ordinary shares and apply such distributions and sale proceeds in payment of such taxes (including applicable interest and penalties) or charges, with the holder and the beneficial owner thereof remaining fully liable for any deficiency.
Fees and Other Payments Payable by the Depositary to SAP
In connection with the ADR program, the Depositary has agreed to make certain payments to SAP and waive certain costs of providing ADR administrative and reporting services, including reporting of ADR program activity, distribution of information to investors and managing the ADR program. For the period beginning October 29, 2023 and ending October 28, 2024, the Depositary made direct and indirect payments to SAP in an aggregate amount of US$3,020,799 related to the ADR program.
111
PART II
ITEM 13. DEFAULTS, DIVIDEND ARREARAGES AND DELINQUENCIES
None.
ITEM 14. MATERIAL MODIFICATIONS TO THE RIGHTS OF SECURITY HOLDERS AND USE OF PROCEEDS
None.
ITEM 15. CONTROLS AND PROCEDURES
Evaluation of Disclosure Controls and Procedures
SAP designs disclosure controls and procedures to ensure that information required to be disclosed by SAP in reports that it files or submits under the Exchange Act is recorded, processed, summarized, and reported within the time periods specified in the Commission’s rules and forms. Disclosure controls and procedures include, without limitation, controls and procedures designed to ensure that information required to be disclosed by SAP in the reports that it files or submits under the Exchange Act is accumulated and communicated to SAP management, including SAP’s principal executive and financial officers (i.e. SAP’s chief executive officer (CEO) and chief financial officer (CFO)), or persons performing similar functions, as appropriate to allow timely decisions regarding required disclosure. SAP’s management evaluated, with the participation of SAP’s CEO and CFO the effectiveness of SAP’s disclosure controls and procedures as of December 31, 2024. The evaluation was led by SAP’s Global Risk & Assurance Services (GR&AS) function, including dedicated “GR&AS Internal Auditors” in all of SAP’s major entities and business units with the participation of process owners, SAP’s key corporate senior management, senior management of each business group, and as indicated above under the supervision of SAP’s CEO and CFO. Based on the foregoing management evaluation, SAP’s CEO and CFO, concluded that as of December 31. 2024, SAP’s disclosure controls and procedures were effective.
Management’s Annual Report on Internal Control Over Financial Reporting
The management of SAP is responsible for establishing and maintaining adequate internal control over financial reporting as such term is defined in Rules 13a-15(f) and 15d-15(f) under the Securities Exchange Act of 1934. SAP’s internal control over financial reporting is a process designed under the supervision of SAP’s CEO and CFO to provide reasonable assurance regarding the reliability of financial reporting and the preparation of financial statements for external reporting purposes in accordance with International Financial Reporting Standards as issued by the International Accounting Standards Board.
SAP’s management assessed the effectiveness of the Company’s internal control over financial reporting as of December 31, 2024. In making this assessment, it used the criteria set forth by the Committee of Sponsoring Organizations of the Treadway Commission in “Internal Control — Integrated Framework (2013)”.
Based on the assessment under these criteria, SAP management has concluded that, as of December 31, 2024, the Company’s internal control over financial reporting was effective.
BDO AG Wirtschaftsprüfungsgesellschaft defined as BDO, our independent registered public accounting firm, has issued its audit report on the effectiveness of SAP’s internal control over financial reporting, which is included in Item 18. Financial Statements, “Report of Independent Registered Public Accounting Firm.”
Changes in Internal Control Over Financial Reporting
There has been no change in our internal control over financial reporting framework during the period covered by this report that has materially affected, or is reasonably likely to materially affect, our internal control over financial reporting.
112
ITEM 16. [RESERVED]
ITEM 16A. AUDIT COMMITTEE FINANCIAL EXPERT
Our Supervisory Board has determined that each of Jennifer Xin-Zhe Li and Dr. Gunnar Wiedenfels qualify as an “audit committee financial expert”, as defined by the regulations of the Commission issued pursuant to Section 407 of the Sarbanes-Oxley Act of 2002 and meet the requirements of Item 16A. Each of Ms. Li and Dr. Wiedenfels is “independent”, as such term is defined in Rule 10A-3 under the Exchange Act.
ITEM 16B. CODE OF ETHICS
In 2024, SAP’s Global Code of Ethics and Business Conduct for Employees (CoEBC) continued to apply to all employees, managers, the members of SAP’s Executive Board, as well as employee representatives on the Supervisory Board. It is the primary ethical framework guiding the way SAP conducts business and remains on course for success. It is available in 22 languages, and it is one of a number of global policies that provide clear guidance to employees. Newly acquired companies are required to meet the minimum standards set forth in the CoEBC. Our CoEBC constitutes a “code of ethics” as defined in Item 16.B of Form 20-F, and, together with our Partner and Supplier Codes of Conduct, sets standards for all dealings with customers, partners, competitors, and suppliers, including regulations with regard to confidentiality, loyalty, preventing conflicts of interest, preventing bribery, data protection and privacy, and avoiding anti-competitive practices. The CoEBC is available on our website under http://www.sap.com/corporate-en/investors/governance/policies-statutes.epx.
ITEM 16C. PRINCIPAL ACCOUNTANT FEES AND SERVICES
Audit Fees, Audit Related Fees, Tax Fees and All Other Fees
Refer to Note (G.7) to our Consolidated Financial Statements for information on fees charged by our independent registered public accounting firm, BDO, for audit services and other professional services.
Audit Committee’s Pre-Approval Policies and Procedures
As required under German law, our shareholders appoint our external independent auditors to audit our financial statements, based on a proposal that is legally required to be submitted by the Supervisory Board. The Supervisory Board’s proposal is based on a recommendation by the Audit and Compliance Committee. See also the description in “Item 10. Additional Information — Corporate Governance.”
In 2002 our Audit and Compliance Committee adopted a policy with regard to the pre-approval of audit and non-audit services to be provided by our external independent auditors. This policy, which is designed to assure that such engagements do not impair the independence of our auditors, was amended several times since 2002 with the latest changes made to reflect the provisions on audit and non-audit services introduced by European Union in 2014. The policy requires prior approval of the Audit and Compliance Committee for audit services to be provided by our external independent auditors for the SAP Group which includes audit services for consolidated local SAP entities. With regard to non-audit services the policy distinguishes among three categories of services:
- |
“Prohibited services:” This category includes services that our external independent auditors must not be engaged to perform. These are services that are not permitted by applicable law or that would be inconsistent with maintaining the auditors’ independence. |
- |
“Services requiring universal approval:” Services of this category may be provided by our external independent auditors up to a certain aggregate amount in fees per year that is determined by the Audit and Compliance Committee. |
- |
“Services requiring individual approval:” Services of this category may only be provided by our external independent auditors if they have been individually (specifically) pre-approved by the Audit and Compliance Committee or an Audit and Compliance Committee member who is authorized by the Audit and Compliance Committee to make such approvals. |
According to delegation rules as defined in the policy for approval of audit and non - audit services our Chief Accounting Officer or individuals empowered by him review all individual requests to engage our external independent auditors as a service provider in accordance with this policy and determines the category to which the requested service belongs. All requests for engagements with expected fees over a specified limit are additionally reviewed by our CFO. Based on the determination of the category the request is (i) declined if it is a “prohibited service,” (ii) approved if it is a “service requiring universal approval” and the maximum aggregate amount fixed by the Audit and Compliance Committee has not been reached or (iii) forwarded to the Audit and Compliance Committee for individual approval if the “service requires individual approval” or is a “service requiring universal approval” and the maximum aggregate amount fixed by the Audit and Compliance Committee has been exceeded.
Our Audit and Compliance Committee’s pre-approval policies also include information requirements to ensure the Audit and Compliance Committee is kept aware of the volume and nature of engagements involving our external independent auditors that were not individually pre-approved by the Audit and Compliance Committee itself.
Substantially all of the work performed to audit our Consolidated Financial Statements was performed by our principal independent public accounting firm’s full-time, permanent employees. See Note (G.7) to our Consolidated Financial Statements for additional information related to our principal accountant fees and services.
113
ITEM 16D. EXEMPTIONS FROM THE LISTING STANDARDS FOR AUDIT COMMITTEES
Rule 10A-3 of the Exchange Act requires that all members of our audit committee be independent, subject to certain exceptions. In accordance with German law, the Audit and Compliance Committee consists of both employee and shareholder elected members. Rule 10A-3 provides an exception for an employee of a foreign private issuer such as SAP who is not an executive officer of that issuer and who is elected to the supervisory board or audit committee of that issuer pursuant to the issuer’s governing law. In this case, the employee is exempt from the independence requirements of Rule 10A-3 and is permitted to sit on the audit committee.
We rely on this exemption. Our Audit and Compliance Committee includes four employee representatives, Margret Klein-Magar, César Martin, Dr. Eberhard Schick and Nina Strassner, who were appointed to our Supervisory Board pursuant to the Agreement on the Involvement of Employees in SAP SE (see “Item 6. Directors, Senior Management and Employees.” for details). We believe that our reliance on this exemption does not materially adversely affect the ability of our Audit and Compliance Committee to act independently and to satisfy the other requirements of Rule 10A-3.
ITEM 16E. PURCHASES OF EQUITY SECURITIES BY THE ISSUER AND AFFILIATED PURCHASERS
At the Annual General Meeting of Shareholders on May 11, 2023, the Executive Board was authorized to acquire until the expiry of May 10, 2028, shares in the Company representing a pro rata amount of capital stock of up to €120 million.
The authorization is subject to the provision that the shares to be purchased, together with any other shares already acquired and held by SAP or which are attributable to SAP pursuant to Section 71d and Section 71e AktG (German Stock Corporation Act), do not account for more than 10% of SAP’s capital stock.
We did not purchase any ADRs in 2024. The following table sets out information concerning repurchases of SAP's ordinary shares. In May 2023 we announced a new share buy-back program, with an aggregate volume of up to €5 billion and a term until December 31, 2025. In 2024, purchases of SAP’s ordinary shares were conducted under several tranches of this program. The first tranche was started on August 14, 2023 and was finalized on February 14, 2024. The second tranche of the program was executed from February 26, 2024 until August 26, 2024. Both tranches were in aggregate totaling approximately €2 billion. The third tranche began on September 02, 2024 and ran through the end of the fiscal year. The maximum number of SAP shares that SAP was able to additionally purchase under existing repurchase programs as of December 31, 2024 was 60.935.652.
|
|
|
|
|
|
(c) Total Number of |
|
(d) Maximum Number of |
|
|
|
|
|
|
Shares Purchased as |
|
Shares that May Yet Be |
|
|
(a) Total Number of |
|
(b) Average Price Paid |
|
Part of Publicly Announced |
|
Purchased Under these |
Period |
|
Shares Purchased |
|
per Share (in €) |
|
Plans and Programs |
|
Plans and Programs |
January 2024 |
|
21.120 |
|
141.64 |
|
21.120 |
|
61.554.127 |
February 2024 |
|
524.954 |
|
172.97 |
|
524.954 |
|
61.029.173 |
March 2024 |
|
1.914.971 |
|
175.79 |
|
1.914.971 |
|
61.481.736 |
April 2024 |
|
1.269.316 |
|
171.93 |
|
1.269.316 |
|
60.212.420 |
May 2024 |
|
575.330 |
|
169.69 |
|
575.330 |
|
59.637.090 |
June 2024 |
|
1.026.038 |
|
172.50 |
|
1.026.038 |
|
60.827.178 |
July 2024 |
|
239.246 |
|
186.29 |
|
239.246 |
|
60.587.932 |
August 2024 |
|
167.596 |
|
196.08 |
|
167.596 |
|
60.420.336 |
September 2024 |
|
3.406.883 |
|
198.11 |
|
3.406.883 |
|
60.062.246 |
October 2024 |
|
667,658 |
|
202.91 |
|
667,658 |
|
59,394,588 |
November 2024 |
|
925,557 |
|
22,024 |
|
925,557 |
|
58,502,226 |
December 2024 |
|
127,015 |
|
23,477 |
|
127,015 |
|
60,935,652 |
Total |
|
10,865,684 |
|
18,819 |
|
10,865,684 |
|
|
114
ITEM 16F. CHANGES IN REGISTRANT’S CERTIFYING ACCOUNTANT
Not applicable
ITEM 16G. DIFFERENCES IN CORPORATE GOVERNANCE PRACTICES
The following summarizes the principal ways in which our corporate governance practices differ from the NYSE corporate governance rules applicable to U.S. domestic issuers (the NYSE Rules).
Introduction
SAP is incorporated under the laws of the European Union and Germany, with securities publicly traded on markets in Germany, including the Frankfurt Stock Exchange, and in the United States on the NYSE.
The NYSE Rules permit foreign private issuers to follow applicable home country corporate governance practices in lieu of the NYSE corporate governance standards, subject to certain exceptions. Foreign private issuers electing to follow home country corporate governance rules are required to disclose the principal differences in their corporate governance practices from those required under the NYSE Rules. This Item 16G summarizes the principal ways in which SAP’s corporate governance practices differ from the NYSE Rules applicable to domestic issuers.
Legal Framework
The primary sources of law relating to the corporate governance of a European Company are the Council Regulation (EC) No. 2157/2001 on the Statute for a European Company (the “SE Regulation”), the German Act on the Implementation of Council Regulation No. 2157/2001 of October 8, 2001 on the Statute for a European Company (Gesetz zur Ausführung der Verordnung (EG) Nr. 2157/2001 des Rates vom 8. Oktober 2001 über das Statut der Europäischen Gesellschaft (SE) – SE-Ausführungsgesetz; “SE-AG”) of December 22, 2004, and the German Stock Corporation Act (Aktiengesetz). Additionally, the European Regulation (EU) No 596/2014 of the European Parliament and the Council on market abuse (the “MAR”), the German Securities Trading Act (Wertpapierhandelsgesetz), the German Securities Purchase and Take Over Act (Wertpapiererwerbs- und Übernahmegesetz), the Stock Exchange Admission Regulations, the German Commercial Code (Handelsgesetzbuch) and certain other German statutes contain corporate governance rules applicable to SAP. In addition to these mandatory rules, the GCGC summarizes the mandatory statutory corporate governance principles found in the German Stock Corporation Act and other provisions of German law. Further, the GCGC contains supplemental recommendations and suggestions for standards on responsible corporate governance intended to reflect generally accepted best practices.
The German Stock Corporation Act requires the executive and the supervisory board of publicly listed companies like SAP to declare annually that the recommendations set forth in the GCGC have been and are being complied with or which of the recommendations have not been or are not being complied with and why not. SAP disclosed and reasoned deviations from a few of the GCGC recommendations in its Declaration of Compliance on a yearly basis from 2003 onwards. In its most recent Declaration of Compliance issued in October 2024, SAP declared that it has complied with all recommendations set out in the GCGC since the last declaration with the below exception. In the future, SAP will comply with the recommendations set out in the Code with the following exception:
Disbursement of remaining variable remuneration components if an Executive Board member`s service contract is terminated (precautionary declaration of non-conformity with recommendation G. 12 GCGC).
The service contracts for Executive Board members and the renumeration system in place for the Executive Board of SAP provide that in the event of a premature termination of the service contract for Executive Board members due to a change of control (as defined in the service contract for Executive Board members) the tranches already granted under the respective SAP Long-Term Incentive Plan will be disbursed without undue delay. The disbursement will be made pro rata temporis in the proportion which the actual term that was shortened due to the change of control bears to the four-year-term of a tranche plus 50% of the portion which should be forfeited if pro rata temporis aspects alone were considered. In view of the above, SAP declares, by way of precaution, non-conformity with the recommendation set out in section G.12 GCGC. The reason for the provision described above is that a change of control regularly entails changes within a company that let it appear unjustified to make the disbursement amount from long-term variable remuneration components dependent on the performance of the company and its share price after the change of control. In addition, SAP is convinced that the intended linkage of the remuneration to sustainable and long-term development is not lost due to this provision since the Executive Board members, during their term of service, cannot expect a change of control to later occur.
Declarations from 2019 to 2024 are available on the SAP website.
Significant Differences
We believe the following to be the significant differences between applicable European and German corporate governance practices, as SAP has implemented them, and those applicable to domestic companies under the NYSE Rules.
115
SAP SE is a European Company With a Two-Tier Board System
SAP is governed by three separate bodies: (i) the Supervisory Board, which counsels, supervises and controls the Executive Board; (ii) the Executive Board, which is responsible for the management of SAP; and (iii) the Annual General Meeting of Shareholders. The rules applicable to these governing bodies are defined by European and German law and by SAP’s Articles of Incorporation. This corporate structure differs from the unitary board of directors established by the relevant laws of all U.S. states and the NYSE Rules. Under the SE Regulation and the German Stock Corporation Act, the Supervisory Board and Executive Board are separate and no individual may be a member of both boards. See “Item 10. Additional Information — Corporate Governance” for additional information on the corporate structure.
Director Independence Rules
The NYSE Rules require that a majority of the members of the board of directors of a listed issuer and each member of its nominating, corporate governance, compensation and audit committee be “independent.” As a foreign private issuer, SAP is not subject to the NYSE board, compensation committee and corporate governance committee independence requirements but instead can elect to follow its home country rules. With respect to the audit committee, SAP is required to satisfy Rule 10A-3 of the Exchange Act, which provides certain exemptions from the audit committee independence requirements in the case of employee board representatives. The NYSE Rules stipulate that no director qualifies as “independent” unless the board of directors has made an affirmative determination that the director has no material direct or indirect relationship with the listed company. However, under the NYSE Rules a director may still be deemed independent even if the director or a member of a director’s immediate family has received during a 12-month period within the prior three years up to $120,000 in direct compensation. In addition, a director may also be deemed independent even if a member of the director’s immediate family works for the company’s auditor in a non-partner capacity and not on the company’s audit.
By contrast, the German Stock Corporation Act and the GCGC require that the Supervisory Board ensure that its members collectively have the knowledge, competencies and professional experience required to properly perform their duties. Additionally, the GCGC recommends that the Supervisory Board must have an appropriate number of independent shareholder representative members, as determined by those members, that also reflects the shareholder structure (C.6 GCGC), and determine annually whether such numbers have been met. More than half of the shareholder representatives must be independent from the company and from the Executive Board (C.7 GCGC). According to this definition, a Supervisory Board member is considered independent if he or she is independent from the company and the Executive Board, and independent from any controlling shareholder (C.6 GCGC). In the absence of a controlling shareholder at SAP, this last proviso does not apply. Supervisory Board members are considered independent from the company and the Executive Board if they have no personal or business relationship with the company or the Executive Board that may cause a substantial and not merely temporary conflict of interest (C.7 GCGC). Independence is assessed against a set of indicators (C.7 GCGC). The assessment should particularly take into consideration whether the Supervisory Board member (or a close family member) (i) was a member of the company`s Executive Board in the two years prior to the appointment to the Supervisory Board; (ii) has, or in the year prior to the appointment, had, directly or as a shareholder, or in a leading position at a non-group entity, a material business relationship with the company or one of the entities dependent on the company (for example, as a customer, supplier, lender, or advisor); (iii) is a close family member of a member of the Executive Board; (iv) has been a member of the Supervisory Board for more than 12 years. Under the Code, a Supervisory Board member can still be deemed independent even if one or more of the indicators applies; if one or more of the indicators applies and the Supervisory Board member concerned is still considered independent, the reasons for this must be given in the Corporate Governance Statement (C.8 GCGC). According to section C.10 GCGC, the chairpersons of the Supervisory Board, the Audit Committee, and the committee that addresses Executive Board compensation should be independent from the company and the Executive Board. The members of the Supervisory Board must ensure that they have enough time to perform their board duties and must carry out their duties carefully and in the company’s best interests. They must be loyal to SAP in their conduct, and the GCGC recommends that they should not accept appointment to governing bodies of, or exercise advisory functions at, companies that are in significant competition with SAP. The GCGC further recommends that each member of the Supervisory Board should inform the Supervisory Board of any conflicts of interest, and that material and sustained conflicts of interest involving a member of the Supervisory Board should result in the termination of that member’s Supervisory Board mandate. Supervisory Board members must disclose any planned conclusion of advisory or other service agreements or contracts for work with SAP, or loan agreements between them or persons closely related to them and SAP to the Supervisory Board promptly. Such agreements require the consent of the Supervisory Board. The Supervisory Board may grant its permission for any such transaction only if it is based on terms and conditions that are standard for the type of transaction in question and if the transaction is not contrary to SAP’s interest.
SAP complies with the director independence requirements and recommendations described above. In particular, the Supervisory Board of SAP SE determined in fiscal year 2024 that the shareholder representatives are all independent in the meaning of the recommendations at sections C.6 and C.7 of the Code, and, likewise, in accordance with the recommendation at section C.7 of the Code, more than half of the shareholder representatives are independent from the company and the Executive Board. In this context, the shareholder representatives determined that five (and thus more than half their total number) constitutes an appropriate number of independent shareholder representative members. Consequently, they determined that, when also considering the company`s shareholder structure, the Supervisory Board has an appropriate number of independent members in the meaning of section C.6 of the Code.
116
Principle 15 of the GCGC states that at least one member of the Audit Committee must have expertise in the field of accounting and at least one other member of the Audit Committee must have expertise in the field of auditing. According to Section D.3 of the GCGC the expertise in the field of accounting shall consist of special knowledge and experience in the application of accounting principles and internal control and risk management systems, and the expertise in the field of auditing shall consist of special knowledge and experience in the auditing of financial statements. Accounting and auditing also include sustainability reporting and its audit and assurance. Section D.3 of the GCGC recommends that the chairperson of the Audit Committee of the Supervisory Board should have appropriate expertise in at least one of the two areas. Section C.10 of the GCGC recommends that the chairperson of the Audit Committee should be independent from the company and the Executive Board as well as from the controlling shareholder. Furthermore, the chairperson of the Audit Committee should not simultaneously chair the Supervisory Board as a whole. Ms. Jennifer Xin-Zhe Li who is the current Chairperson of the Audit and Compliance Committee and Dr. Gunnar Wiedenfels as another member of the Audit and Compliance Committee meet these recommendations. However, applicable European and German corporate law does not require the Supervisory Board to make an affirmative determination for each individual member that it is independent or that a majority of Supervisory Board members or the members of a specific committee are independent. As described above, the GCGC only recommends that the shareholder representatives on the Supervisory Board determine whether they are independent in the meaning of and in compliance with the Code.
The NYSE independence requirements are closely linked with risks specific to unitary boards of directors that are customary for U.S. companies. In contrast, the two-tier board structure requires a strict separation of the executive board and supervisory board. In addition, the supervisory board of a European Company formed by conversion from a large German stock corporation which was subject to the principle of employee codetermination as outlined in the German Co-Determination Act of 1976 (Mitbestimmungsgesetz) is subject to at least the same level of employee participation which formerly existed in the German stock corporation that was converted to an SE. The terms of employee participation with regard to the Supervisory Board of SAP SE are, among others, set out in the Agreement on the Involvement of Employees in SAP SE, as amended from time to time. As a result, the Supervisory Board of SAP SE consists of 18 members, of which nine are representatives of SAP SE’s shareholders elected at the Annual General Meeting of Shareholders and nine members are representatives of the European employees. Only a shareholders’ representative may be elected as chairperson of the Supervisory Board. In case of a tied vote, the vote of the chairperson and, in the event that the chairperson does not participate in passing the resolution, the vote of the deputy chairperson, provided that he or she is a shareholders’ representative, will be decisive (casting vote). This board structure creates a different system of checks and balances, including employee participation, and cannot be directly compared with a unitary board system.
Audit Committee Independence
As a foreign private issuer, the NYSE Rules require SAP to establish an Audit Committee that satisfies the requirements of Rule 10A-3 of the Exchange Act with respect to audit committee independence. SAP is in compliance with these requirements. The Chairperson of SAP’s Audit and Compliance Committee (Jennifer Xin-Zhe Li), Dr. Gunnar Wiedenfels, Dr. Friederike Rotsch and Gerhard Oswald meet the independence requirements of Rule 10A-3 of the Exchange Act. The other four Audit and Compliance Committee members, Margret Klein-Magar, César Martin, Dr. Eberhard Schick and Nina Strassner, are employee representatives who are eligible for the exemption provided by Rule 10A-3 (b) (1) (iv) (C) (see “Item 16D Exemptions from the listing standards for audit committees” for details).
The Audit Committee independence requirements are similar to the Board independence recommendations of the GCGC. See the section above under “Director Independence Rules.” Nonetheless, SAP meets the NYSE Rules on audit committee independence applicable to foreign private issuers.
Rules on Non-Management Board Meetings are Different
Section 303 A.03 of the NYSE Rules stipulates that the non-management board of each listed issuer must meet at regularly scheduled executive sessions without the management. Under applicable European and German corporate law and the GCGC the Supervisory Board is entitled but not required to exclude Executive Board members from its meetings. The Supervisory Board exercises this right generally during its meetings. However, the Executive Board members should not attend Supervisory Board and its committees’ meetings at which the statutory auditor is called in as an expert. An exception can be made in the event that participation of the Executive Board is deemed necessary by the Supervisory Board or the relevant committee.
Rules on Establishing Committees Differ
Pursuant to Section 303 A.04 and 303 A.05 of the NYSE Rules listed companies are required to set up a Nominating/Corporate Governance Committee and a Compensation Committee, each composed entirely of independent directors and having a written charter specifying the committee’s purpose and responsibilities. In addition, each committee’s performance must be reviewed annually. Applicable European and German corporate law does not mandate the creation of specific supervisory board committees. The GCGC recommends that the Supervisory Board establishes a Nomination Committee; according to Principle 14 of the GCGC an Audit Committee is to be established. Currently, SAP has the following committees, which are in compliance with the GCGC: the Personnel and Governance Committee, the Audit and Compliance Committee, the Product and Technology Committee, the Finance and Investment Committee, the Nomination Committee and the Government Security Committee (See “Item 10. Additional Information — Corporate Governance” for more information).
Rules on Shareholders’ Compulsory Approval are Different
Section 312 of the NYSE Rules requires U.S. companies to seek shareholder approval of all equity-compensation plans, including certain material revisions thereto (subject to certain exemptions as described in the rules), issuances of common stock, including convertible stock, if the common stock has, or will have upon issuance, voting power of or in excess of 20% of the then outstanding common stock, and issuances of common stock if they trigger a change of control.
117
According to applicable European law, the German Stock Corporation Act and other applicable German laws, shareholder approval is required for a broad range of matters, such as amendments to the articles of association, certain significant corporate transactions (including inter-company agreements and material restructurings), the offering of stock options and similar equity compensation to its Executive Board members or its employees by a way of a conditional capital increase or by using treasury shares (including significant aspects of such an equity compensation plan as well as the exercise thresholds), the issuance of new shares, the authorization to purchase the corporation’s own shares, and other essential issues, such as transfers of all, or substantially all, of the assets of the stock corporation, including shareholdings in subsidiaries.
Specific Principles of Corporate Governance
Under the NYSE Rules Section 303A.09 listed companies must adopt and disclose corporate guidelines. Since October 2007, SAP has applied, with few exceptions, and currently with only one exception, recommended corporate governance standards of the GCGC rather than company-specific principles of corporate governance. The GCGC recommendations differ from the NYSE Standards primarily as outlined in this Item 16G.
Specific Code of Business Conduct
The NYSE Rules Section 303 A.10 requires listed companies to adopt and disclose a code of business conduct and ethics for directors, officers and employees, and to disclose promptly any waivers of the code for directors or executive officers. Although not required under applicable European and German law, SAP has a Global Code of Ethics and Business Conduct for Employees (CoEBC) that applies to all employees, managers, the members of SAP’s Executive Board, as well as employee representatives on the Supervisory Board. The CoEBC is available in 22 languages and it is one of a number of global policies that provide clear guidance to employees. SAP complies with the requirement to disclose the Code of Ethics and Business Conduct and any waivers of the code with respect to directors and executive officers. See “Item 16B. Code of Ethics” for details.
ITEM 16H. MINE SAFETY DISCLOSURE
Not applicable
ITEM 16I. DISCLOSURE REGARDING FOREIGN JURISDICTIONS THAT PREVENT INSPECTIONS
Not applicable
ITEM 16J. INSIDER TRADING POLICIES
SAP has a global insider trading regulations policy (the Global Insider Trading Regulations Policy) and a U.S. Insider Trading Policy (the U.S. Insider Trading Policy) governing the purchase, sale and other dispositions of the Company’s securities that applies to all Company personnel, including directors, officers, employees, and other covered persons. The Company believes that the Global Insider Trading Regulations Policy, the U.S. Insider Trading Policy, and the repurchase procedures are reasonably designed to promote compliance with insider trading laws, rules and regulations, and listing standards applicable to the Company. A copy of the Company’s Global Insider Regulations Policy is filed as Exhibit 11.1 to this Annual Report on Form 20-F. A copy of the Company’s U.S. Insider Trading Policy is filed as Exhibit 11.2 to this Annual Report on Form 20-F.
ITEM 16K. CYBERSECURITY
Risk Management and Strategy
We have developed and implemented a cybersecurity risk management approach intended to protect the confidentiality, integrity, and availability of our critical systems, information, and our customers’ data. Our cybersecurity risk management approach and processes are part of our Executive Board-issued risk management policy that aligns our management of risk to our risk appetite, and is consistent with the methodologies, reporting channels and governance processes that apply across our enterprise risk management program to legal, compliance, strategic, operational, financial and other risk areas of the SAP Group. We have central processes and corresponding solutions to store, maintain, and report enterprise risk-relevant information, including cybersecurity risks.
Our cybersecurity risk management approach includes a security software development and operations program intended to reduce risks to our products, a software vulnerability and patch management program, and cybersecurity incident detection, response, and recovery programs, among others. Our cybersecurity risk team is committed to integrating cybersecurity risks into our overall enterprise risk management approach and processes.
118
We design and implement a solid security and cloud compliance strategy in line with the overall SAP business, product, and technology strategies. To execute on that strategy, we establish and manage a risk-based cybersecurity framework for SAP according to well accepted industry standards such as the National Institute of Standards and Technology Cybersecurity Framework (NIST CSF) and ISO 27001. In doing so, we use NIST CSF as a guide to advocate a risk-based approach to identify and assess cybersecurity risks relevant to our business.
Cybersecurity risks are reported regularly to the Executive Board through cumulative risk reporting and risk updates are steered via regular security updates to the Executive Board. The Supervisory Board’s Product and Technology Committee (formerly the Technology and Strategy Committee) (PTC) and its Audit & Compliance Committee (ACC) are apprised of key cybersecurity risks. By bringing these risks to the attention of the Executive Board, the PTC, and the ACC as appropriate, SAP’s disclosure decision makers have an early and recurring opportunity to assess the materiality of these cybersecurity risks.
Key elements of our cybersecurity risk management approach include:
| ● | a security team responsible for managing (1) our cybersecurity risk assessment processes, (2) our security controls, and (3) our response to cybersecurity incidents; |
| ● | a Global Risk Management Policy that applies to employees and which is reviewed and updated as necessary; |
| ● | an Executive Board-established early warning risk management system designed to enable transparency and compliance with applicable regulations; |
| ● | risk assessments designed to help identify material cybersecurity risks to our critical systems, information, products, services, and our broader enterprise IT environment; |
| ● | a third-party risk management process for service providers, suppliers, and vendors; |
| ● | a Global Security Policy that applies to all employees and which is reviewed and updated as necessary; |
| ● | the use of external service providers, where appropriate, to assess, test or otherwise assist with aspects of our security controls; |
| ● | a cybersecurity incident response plan that includes procedures for responding to cybersecurity incidents and which is reviewed and updated as necessary; and |
| ● | cybersecurity awareness training of our employees, consultants, incident response personnel, and senior management. |
SAP internal and external experts are engaged to evaluate SAP’s risk identification, assessment, and monitoring systems and processes, including with respect to cybersecurity risks. For example, SAP engaged third party consultants to assist with its implementation of the SAP Cybersecurity Framework according to NIST CSF and the development of a NIST CSF self-assessment methodology which was also contributed to the community under a creative license. The PTC and ACC periodically request an independent review of the quality of our cybersecurity risk monitoring systems.
Additionally, our risk management systems are regularly audited by our external auditors and are subject to internal audits, including our cybersecurity monitoring systems. We consider the results of external and internal audits of our risk detection and monitoring systems and implement modifications as necessary. Finally, SAP engages third party legal consultants as necessary to assist with the implementation of legal requirements and industry standards, and to identify process weaknesses and track improvements.
We have not identified risks from existing and known cybersecurity threats that have materially affected or are reasonably likely to materially affect us, including our operations, business strategy, results of operations, or financial condition. However, we are subject to certain risks that if realized and sufficiently severe, are reasonably likely to materially affect our operations, business strategy or financial condition. See “Risk Factors – Cybersecurity and Security: Cybersecurity attacks or breaches, and security vulnerabilities in our infrastructure or services or those of our third-party partners could materially impact our business operations, products, and service delivery.”
Cybersecurity Governance
(1)Supervisory Board Oversight of Risks from Cybersecurity Threats
Starting in 2023, the Supervisory Board, through the Product and Technology Committee (PTC) (formerly the Technology and Strategy Committee) and its Audit & Compliance Committee (ACC), governs the Executive Board’s oversight of SAP’s cybersecurity risk management approach. Before 2023, the ACC had full oversight responsibility for SAP’s cybersecurity risk management approach.
The ACC reviews the effectiveness of SAP’s system for monitoring corporate security, which includes cybersecurity. The ACC coordinates with the members of the Executive Board, as well as the Chief Security Officer (CSO) and the Chief Security Compliance & Risk Officer (CSCRO), on the cybersecurity controls and other measures established by the Executive Board. The ACC is focused on cybersecurity risk and incident management and mitigation.
The PTC reviews and monitors the technical systems and processes intended to defend against cybersecurity attacks and improve the security of SAP’s infrastructure. The PTC coordinates with the members of the Executive Board as well as the CSO and the CSCRO on the potential and actual, if any, product and operational impacts of known cybersecurity risks and incidents. The PTC is focused on mitigating the product and operational-related impacts, if any, of cybersecurity risks and incidents.
The PTC and the ACC are informed about risks from cybersecurity threats by the Executive Board and security executives, with additional input from SAP’s Global Security & Cloud Compliance organization (SGSC), the Global Risk & Assurance Services group (GR&AS), SAP Legal, Business Information Security Officers (BISOs), and internal and external cybersecurity and legal consultants. SAP's Global Security & Cloud Compliance Office reports regularly to the PTC and to the ACC, as well as upon request and the occurrence of certain findings. In addition, the PTC and ACC often participate in meetings with the Executive Board or members thereof and security executives for the purpose of receiving information on and discussing SAP’s cybersecurity risks and risk management approach. The PTC and ACC participate in key decisions on cybersecurity-related issues, including risk materiality assessments, incident response and the provision of any necessary related disclosures.
119
(2)Executive Board’s Role in Assessing and Managing SAP’s Material Risks from Cybersecurity Threats
(i) Executive Board Role in Assessing and Managing Material Risks from Cybersecurity Threats and Executive Board Expertise
The Executive Board is responsible for assessing and managing material risks, including cybersecurity risks. Specifically, the Executive Board supervises SAP’s efforts to prevent, detect, mitigate, and remediate cybersecurity risks through various means, including briefings from SAP security personnel and other SAP personnel involved in cybersecurity matters; threat detection and other intelligence information obtained from governmental, public, or private sources, including external consultants engaged by us; and alerts and reports produced by security tools deployed in the IT environment. In addition, the Executive Board supervises SAP’s internal cybersecurity personnel. Certain members of SAP’s Executive Board have engineering, computer science and data science backgrounds and degrees, and knowledge, skills, and hands on experience in cybersecurity risk and incident management.
(ii) Executive Board – Briefing on and Monitoring of Cybersecurity Risks and Incidents
The Executive Board is regularly apprised of and monitors SAP’s initiatives to prevent, detect, mitigate, and remediate cybersecurity risks and incidents, including processes supported by SGSC, SAP’s BISOs, GR&AS, SAP Legal, the Cybersecurity Control Team, and external legal and cybersecurity experts. The SAP Security and Cloud Compliance Governance Model is designed to ensure executive engagement and facilitates shared responsibility in quarterly SAP Security Advisory Board and Security Council meetings and in periodic updates to the Executive Board.
SAP Global Security & Cloud Compliance
SGSC is co-led by SAP’s CSO and its CSCRO, both of whom report to the Member of the Executive Board for Customer Service & Delivery. SGSC is responsible for areas such as product and application security, cyber defense, operational security risk management, security compliance, physical security, as well as the Trust Office that supports customers and partners with security-related issues. SGSC coordinates with SAP Legal and reports to the ACC and/or the PTC as well as the Executive Board regarding the prevention, detection, mitigation and remediation of cybersecurity risks and incidents, including assessments of the materiality of cybersecurity risks and incidents. In addition, the SGSC reports to the Executive Board, the PTC and/or ACC as necessary outside of the quarterly reporting cadence on any potentially material cybersecurity risks and incidents.
Business Information Security Officers (BISO)
Each of SAP’s product Lines of Business (LOB) has a BISO, who is a senior security leader assigned to manage the security strategy and operations of the LOB and coordinate with other BISOs through a BISO Council reporting to our CSO. These BISOs serve many important functions, including managing SAP’s risk within each LOB. It is the responsibility of each BISO to supervise and monitor the specific risks associated with their respective LOB. This facilitates the reporting of security threats to the Security & Risk Assurance (SRA) Team through the local unit risk coordinator. The SRA Team evaluates and measures the security risks using a cyber risk quantification tool. Once validated, these risks are recorded and included in the Global Enterprise risk register and subject to risk mitigation actions. In the event of an incident, the BISO helps manage the event and support the CSO, CSCRO and, ultimately, the Executive Board in their decision-making processes. BISOs are supported by local security resources to assist with implementing SAP’s security strategy and protections within the business and technology context best suited for the LOB in question. BISOs and SAP Legal coordinate on significant cybersecurity risks and incidents impacting their LOB.
Risk Coordinator
A Risk Coordinator assumes the delegated responsibilities of the business unit head to support risk management activities in the relevant areas of responsibility. However, not every LOB necessarily has a dedicated Risk Coordinator if the Business Unit Head is directly involved.
Global Risk & Assurance Services Organization
SAP’s GR&AS organization, led by our Chief Risk Officer/Chief Audit Executive (CRO), provides regular updates to the ACC, the PTC, and the Executive Board on SAP’s risk management systems and risks meeting SAP’s internal risk threshold. The CRO reports to SAP’s Group CFO and is responsible for designing and implementing SAP’s risk management system, with oversight by the Executive Board.
Cybersecurity Control Team
SAP maintains a cross functional cybersecurity control team consisting of the CSO, the CSCRO, SVP Legal - Litigation and Cybersecurity, Chief Cybersecurity Counsel, Senior Corporate & Securities Counsel, Group Data Protection Officer & Head of SAP Data Protection, and members of SAP’s Global Accounting, Reporting & Tax department. This group meets on both a quarterly and an ad hoc basis to review cybersecurity issues, including but not limited to actual and potential cybersecurity incidents, thwarted attempts, cyber-related risks, and internal investigations (collectively, cybersecurity events). As part of its review and assessment, this group evaluates the implications, if any, of the cybersecurity events on SAP’s financial statements and related disclosures. Where appropriate, matters are escalated and discussed among SAP’s General Counsel, the Executive Board, the PTC and/or the ACC. Assessments ensue at this level with senior leaders from the Cybersecurity Control Team and cybersecurity consultants who provide the Executive Board, the PTC and/or the ACC with updates on an as-needed basis and in SAP Security briefings. SAP discusses any significant cybersecurity events, their impact on SAP's financial statements, and any related disclosures with its external auditors.
120
Employee Cybersecurity Education, Training and Compliance
SGSC provides annual, mandatory security training which includes education and training on key cybersecurity risks companies like SAP face, and SAP’s expectations of employees as part of its risk mitigation strategy. In addition to this regular education, the Executive Board, the PTC and the ACC receive training on cybersecurity topics from our CSO, CSCRO and internal security staff as part of the continuing education on cybersecurity topics that impact public companies.
(iii) Executive Board Reporting of Cybersecurity Risks to the ACC and the PTC of the Supervisory Board
The Executive Board regularly reports cybersecurity risks and incidents to the PTC and ACC, as outlined above, with a focus on significant risks and incidents. This reporting occurs through various processes with input from SGSC, GR&AS, SAP Legal, BISOs and internal and external cybersecurity and legal consultants. Additionally, the Executive Board often participates in meetings with each of the PTC and the ACC on cybersecurity-related issues, including risk materiality assessments, incident response, third party audit matters and the provision of any necessary related disclosures. In the case of a significant cybersecurity incident, the Executive Board, the PTC and/or the ACC coordinate as necessary with others both within SAP (including with respect to any significant cybersecurity incidents, the Disclosure Committee) and any outside experts involved in the matter on the determination of the materiality of cybersecurity risks and incidents to SAP and the provision of any related disclosures. Since SAP is a reporting entity under both German and U.S. laws, SAP adheres to both the Ad Hoc reporting requirements of the European Market Abuse Regulation and the U.S. federal securities laws requirements for periodic and annual disclosures.
121
PART III
ITEM 17. FINANCIAL STATEMENTS
Not applicable.
ITEM 18. FINANCIAL STATEMENTS
The Consolidated Financial Statements are included herein on pages F-1 through F-106.
The following are filed as part of this report:
- |
Report of Independent Registered Public Accounting Firm. |
- |
Consolidated Financial Statements |
| ● | Consolidated Income Statements for the years ended December 31, 2024, 2023, and 2022. |
| ● | Consolidated Statements of Comprehensive Income for the years ended December 31, 2024, 2023, and 2022. |
| ● | Consolidated Statements of Financial Position as of December 31, 2024, and 2023. |
| ● | Consolidated Statements of Changes in Equity for the years ended December 31, 2024, 2023, and 2022. |
| ● | Consolidated Statements of Cash Flows for the years ended December 31, 2024, 2023, and 2022. |
| ● | Notes to the Consolidated Financial Statements. |
122
ITEM 19. EXHIBITS
The following documents are filed as exhibits to this report:
1 |
Articles of Incorporation (Satzung) of SAP SE, effective as of May 15, 2024 (English translation). 1 |
|
|
2.1 |
|
|
|
4.1.1 |
|
|
|
4.1.2 |
|
|
|
8 |
For a list of our subsidiaries see Note (G.9) to our Consolidated Financial Statements in “Item 18. Financial Statements”. |
|
|
11.1 |
|
|
|
11.2 |
|
|
|
12.1 |
|
|
|
12.2 |
|
|
|
13.1 |
|
|
|
13.2 |
|
|
|
15 |
Consent of BDO, Independent Registered Public Accounting Firm. |
|
|
15.1 |
Consent of KPMG, Independent Registered Public Accounting Firm. |
|
|
97. |
|
|
|
101.INS |
iXBRL Instance Document |
|
|
101.SCH |
iXBRL Taxonomy Schema Linkbase Document |
|
|
101.CAL |
iXBRL Taxonomy Calculation Linkbase Document |
|
|
101.DEF |
iXBRL Taxonomy Definition Linkbase Document |
|
|
101.LAB |
iXBRL Taxonomy Labels Linkbase Document |
|
|
101.PRE |
iXBRL Taxonomy Presentation Linkbase Document |
|
|
104.Cover Page |
Interactive Data File (formatted as Inline XBRL and included in Exhibit 101) |
1 |
Incorporated by reference to Exhibit 4.1 to SAP SE's Registration Statement on Form S - 8 filed with the SEC on September 12, 2024. |
2 |
Incorporated by reference to Exhibit 2.1 to SAP SE’s 2014 Annual Report on Form 20-F filed with the SEC on March 20, 2015. |
3 |
Incorporated by reference to Exhibit 99.(a)(2) of Post Effective Amendment #1 to SAP SE’s Registration Statement on Form F-6 filed on November 25, 2009. |
4 |
Incorporated by reference to Exhibit 99.(a)(2) of Post Effective Amendment #2 to SAP SE’s Registration Statement on Form F-6 filed on March 18, 2016 |
5 |
Incorporated by reference to Exhibit 97 of SAP SE's Annual Report on Form 20 - F for the fiscal year ended December 31, 2023 filed with the SEC on February 29, 2024. |
123
Signatures
The Registrant hereby certifies that it meets all of the requirements for filing on Form 20-F and that it has duly caused and authorized the undersigned to sign this report on its behalf.
|
SAP SE |
||
|
(Registrant) |
||
|
By: |
/s/ CHRISTIAN KLEIN |
|
|
|
|
|
|
Name: Christian Klein |
||
|
Title: Chief Executive Officer |
||
|
|
||
|
|
||
Dated: February 27, 2025 |
|||
|
|
||
|
By: |
/s/ DOMINIK ASAM |
|
|
|
|
|
|
Name:Dominik Asam |
||
|
Title: Chief Financial Officer |
||
|
|
||
|
|
||
Dated: February 27, 2025 |
|
||
|
|
||
SAP SE AND SUBSIDIARIES |
|
||
124
Index to the Consolidated Financial Statements
|
|
|
Page |
Reports of Independent Registered Public Accounting Firm (BDO AG Wirtschaftsprüfungsgesellschaft, Frankfurt am Main, Germany, Auditor Firm ID: 1010) |
F-2 |
Report of Independent Registered Public Accounting Firm (KPMG AG Wirtschaftsprüfungsgesellschaft, Mannheim, Germany, Auditor Firm ID: 1021) |
F-5 |
Consolidated Financial Statements: |
|
Consolidated Income Statements for the years ended December 31, 2024, 2023 and 2022 |
F-6 |
Consolidated Statements of Comprehensive Income for the years ended December 31, 2024, 2023 and 2022 |
F-7 |
Consolidated Statements of Financial Position as of December 31, 2024 and 2023 |
F-8 |
Consolidated Statements of Changes in Equity for the years ended December 31, 2024, 2023 and 2022 |
F-9 |
Consolidated Statements of Cash Flows for the years ended December 31, 2024, 2023 and 2022 |
F-10 |
F-11 to F-106 |
F-1
Report of Independent Registered Public Accounting Firm
To the Shareholders and Supervisory Board of SAP SE:
Opinion on the Consolidated Financial Statements
We have audited the accompanying consolidated statements of financial position of SAP SE (the “Company”) as of December 31, 2024 and 2023, the related consolidated income statements, consolidated statements of comprehensive income, changes in equity and cash flows for each of the two years in the period ended December 31, 2024, and the related notes (collectively referred to as the “consolidated financial statements”). In our opinion, the consolidated financial statements present fairly, in all material respects, the financial position of the Company at December 31, 2024 and 2023, and the results of its operations and its cash flows for each of the two years in the period ended December 31, 2024, in conformity with IFRS Accounting Standards as issued by the International Accounting Standards Board (IFRS).
We also have audited the adjustments to the 2022 consolidated financial statements to retrospectively apply the change in accounting to present gains and losses from minor divestitures, not qualified as discontinued operations, under other non-operating income/expense instead of other operating income/expense, net, as discussed in Note C.3. as well as the restated segment information in conformity with the new segment composition, as described in Note C.1 to the consolidated financial statements of the Company as of December 31, 2024.
Furthermore, we have audited the adjustments to the 2022 consolidated financial statements to retrospectively apply the change in accounting to present the Qualtrics disposal group as a discontinued operation, as discussed in Note D.1 as well as for the updated cost allocation policy, as described in Note IN.1 to the consolidated financial statements of the Company as of December 31, 2023.
In our opinion, such adjustments are appropriate and have been properly applied. We were not engaged to audit, review, or apply any procedures to the 2022 consolidated financial statements of the Company other than with respect to the adjustments and, accordingly, we do not express an opinion or any other form of assurance on the 2022 consolidated financial statements taken as a whole.
We also have audited, in accordance with the standards of the Public Company Accounting Oversight Board (United States) (“PCAOB”), the Company's internal control over financial reporting as of December 31, 2024, based on criteria established in Internal Control – Integrated Framework (2013) issued by the Committee of Sponsoring Organizations of the Treadway Commission (“COSO”) and our report dated February 19, 2025, expressed an unqualified opinion thereon.
Basis for Opinion
These consolidated financial statements are the responsibility of the Company’s management. Our responsibility is to express an opinion on the Company’s consolidated financial statements based on our audits. We are a public accounting firm registered with the PCAOB and are required to be independent with respect to the Company in accordance with the U.S. federal securities laws and the applicable rules and regulations of the Securities and Exchange Commission and the PCAOB.
We conducted our audits in accordance with the standards of the PCAOB. Those standards require that we plan and perform the audit to obtain reasonable assurance about whether the consolidated financial statements are free of material misstatement, whether due to error or fraud.
Our audits included performing procedures to assess the risks of material misstatement of the consolidated financial statements, whether due to error or fraud, and performing procedures that respond to those risks. Such procedures included examining, on a test basis, evidence regarding the amounts and disclosures in the consolidated financial statements. Our audits also included evaluating the accounting principles used and significant estimates made by management, as well as evaluating the overall presentation of the consolidated financial statements. We believe that our audits provide a reasonable basis for our opinion.
Critical Audit Matters
The critical audit matters communicated below are matters arising from the current period audit of the consolidated financial statements that were communicated or required to be communicated to the audit committee and that: (1) relate to accounts or disclosures that are material to the consolidated financial statements; and (2) involved our especially challenging, subjective, or complex judgments. The communication of critical audit matters does not alter in any way our opinion on the consolidated financial statements, taken as a whole, and we are not, by communicating the critical audit matters below, providing separate opinions on the critical audit matters or on the accounts or disclosures to which they relate.
Cloud revenue recognition
As discussed in note A.1 to the consolidated financial statements, the Company generated revenue in 2024 of EUR 34,176 million, of which EUR 17,141 million relates to cloud revenues from fees earned from providing customers a cloud offering with software as a service, platform as a service, infrastructure as a service and/or premium cloud support through subscriptions for use of the Company’s cloud solutions. For most of the Company’s cloud offerings, measured both in volume and number, the customer is entitled to continuously access and use one or more cloud solutions for a specified term, therefore cloud revenue is recognized based on time elapsed and thus ratably over the term of access. However, some cloud business models are provisioned on a consumption basis where a customer commits to a fixed value of spend on cloud services throughout the contract term, but with the discretion to call off cloud services on an as needed basis. For those arrangements cloud revenue is recognized based on consumption as it best reflects the measure towards satisfaction of the performance obligation(s).
F-2
We identified cloud revenue recognition of certain contracts as a critical audit matter. The principal considerations that led to the determination are the complex auditor judgments required to evaluate: (1) whether certain agreements with the same customer were economically linked and need to be combined; (2) whether the various services that are owed by the Company according to the contract qualified as separate performance obligations; (3) the allocation of the transaction price of a customer contract to the performance obligations in the contract based on standalone-selling prices; and (4) the point in time at which the provision of services by the Company for the specific performance obligation commences. Auditing these elements involved especially challenging and complex auditor judgment due to the complex nature of certain of the Company’s customer contracts and extent of audit effort required to address these matters.
The primary procedures we performed to address this critical audit matter included: (1) testing the design and the operating effectiveness of certain internal controls related to the revenue process, including controls related to the identification of certain economically linked agreements and separate performance obligations, the allocation of the transaction price to the performance obligations in certain contracts, and the point in time at which the provisioning of service commenced; (2) testing a sample of underlying contractual agreements and other related documents to evaluate the Company’s assessment of whether certain agreements were economically linked, the identified performance obligations, the allocation of the transaction price and the point in time at which the provision of service for the performance obligations identified commenced; and (3) testing key contractual terms and conditions from the respective contracts to evaluate the identified performance obligations and the point in time at which the provision of service for the identified performance obligations commenced.
Assessment of the Company’s uncertain tax treatments
As discussed in note C.5 to the consolidated financial statements, the Company disclosed contingent liabilities relating to tax uncertainties of EUR 1,250 million. The Company operates in multiple tax jurisdictions which continually revise, change, and implement tax laws with complexities and uncertainties due to different interpretations of these tax laws, especially relating to transfer pricing and intercompany transactions for the use of intellectual property. The nature of these activities can result in uncertainties in the estimation of the related tax exposures.
We identified the assessment of the Company’s tax provision related to uncertain tax positions, specifically from transfer pricing and intercompany transactions for the use of intellectual property, as a critical audit matter. The principal considerations that led to the determination included complex auditor judgement related to: (1) auditing key assumptions applied to the interpretation of tax laws, related regulations, case laws, and mutual agreement procedures across multiple jurisdictions; (2) determining whether a transfer pricing tax position is more-likely-than-not to be sustained; and (3) assessing whether intercompany transactions are based on the arm’s length principle. Auditing these elements involved especially challenging and complex auditor judgment due to the nature and extent of audit effort required to address these matters, including involvement of personnel with specialized skills and knowledge.
The primary procedures we performed to address this critical audit matter included utilizing personnel with specialized skill and knowledge in taxation to evaluate the appropriateness of management’s methods and key assumptions used to estimate certain uncertain tax positions by: (1) verifying understanding of the relevant facts by evaluating certain of the Company’s transfer pricing documentation; (2) assessing whether the Company’s processes and guidelines in connection with certain intercompany transactions support an arm’s length position; (3) evaluating for certain company business activities the reasonableness and consistency of management’s judgments (including application of tax regulations and interpretations), key assumptions and processes; and (4) assessing the overall reasonableness of conclusions reached regarding the identification, recognition, measurement, and disclosure of certain uncertain tax positions from transfer pricing and intercompany transactions for the use of intellectual property.
Measurement of unlisted equity securities
As discussed in note F.2 to the consolidated financial statements, the Company holds unlisted equity securities held at fair value of EUR 6,266 million as of December 31, 2024, primarily relating to Sapphire Ventures’ investments. These investments in unlisted equity securities are classified as financial instruments at fair value through profit and loss requiring a recurring fair value measurement using significant unobservable inputs.
We identified the measurement of certain unlisted equity securities at fair value as a critical audit matter due to the significant measurement uncertainty associated with the fair value of such investments relating to significant unobservable inputs used, such as the selection of appropriate comparable company data, in deriving revenue multiples as well as forecasted performance of the investees. Auditing these elements involved especially challenging and subjective auditor judgment due to the extent of specialized skills or knowledge needed.
The primary audit procedures we performed to address this critical audit matter included utilizing personnel with specialized knowledge and skill in valuation to assist in assessing and evaluating the appropriateness of the valuation technique used for a selection of certain investments in unlisted equity securities relating to Sapphire Ventures’ investments by: (1) assessing the appropriateness of the valuation technique selected by comparing it to our expectation based on industry experience and knowledge of the investment; (2) assessing the source, reliability and relevance of evidence used in determining significant unobservable inputs; (3) evaluating the significant unobservable inputs considered in the recurring measurement of fair value by comparing them to historical and market information; and (4) developing an independent range of acceptable fair value estimates utilizing available market information from third party sources to assess whether managements’ estimates are reasonable.
/s/ BDO AG Wirtschaftsprüfungsgesellschaft
We have served as the Company's auditor since 2023.
Frankfurt am Main, Germany
February 19, 2025
F-3
Report of Independent Registered Public Accounting Firm
To the Shareholders and Supervisory Board of SAP SE:
Opinion on Internal Control over Financial Reporting
We have audited SAP SE’s (the “Company’s”) internal control over financial reporting as of December 31, 2024, based on criteria established in Internal Control – Integrated Framework (2013) issued by the Committee of Sponsoring Organizations of the Treadway Commission (the “COSO criteria”). In our opinion, the Company maintained, in all material respects, effective internal control over financial reporting as of December 31, 2024, based on the COSO criteria.
We also have audited, in accordance with the standards of the Public Company Accounting Oversight Board (United States) (“PCAOB”), the consolidated statements of financial position of the Company as of December 31, 2024 and 2023, the related consolidated income statements and the consolidated statements of comprehensive income, changes in equity and cash flows for each of the two years in the period ended December 31, 2024, and the related notes and our report dated February 19, 2025, expressed an unqualified opinion thereon.
Basis for Opinion
The Company’s management is responsible for maintaining effective internal control over financial reporting and for its assessment of the effectiveness of internal control over financial reporting, included in the accompanying Item 15, Controls and Procedures. Our responsibility is to express an opinion on the Company’s internal control over financial reporting based on our audit. We are a public accounting firm registered with the PCAOB and are required to be independent with respect to the Company in accordance with U.S. federal securities laws and the applicable rules and regulations of the Securities and Exchange Commission and the PCAOB.
We conducted our audit of internal control over financial reporting in accordance with the standards of the PCAOB. Those standards require that we plan and perform the audit to obtain reasonable assurance about whether effective internal control over financial reporting was maintained in all material respects. Our audit included obtaining an understanding of internal control over financial reporting, assessing the risk that a material weakness exists, and testing and evaluating the design and operating effectiveness of internal control based on the assessed risk. Our audit also included performing such other procedures as we considered necessary in the circumstances. We believe that our audit provides a reasonable basis for our opinion.
Definition and Limitations of Internal Control over Financial Reporting
A company’s internal control over financial reporting is a process designed to provide reasonable assurance regarding the reliability of financial reporting and the preparation of financial statements for external purposes in accordance with generally accepted accounting principles. A company’s internal control over financial reporting includes those policies and procedures that (1) pertain to the maintenance of records that, in reasonable detail, accurately and fairly reflect the transactions and dispositions of the assets of the company; (2) provide reasonable assurance that transactions are recorded as necessary to permit preparation of financial statements in accordance with generally accepted accounting principles, and that receipts and expenditures of the company are being made only in accordance with authorizations of management and directors of the company; and (3) provide reasonable assurance regarding prevention or timely detection of unauthorized acquisition, use, or disposition of the company’s assets that could have a material effect on the financial statements.
Because of its inherent limitations, internal control over financial reporting may not prevent or detect misstatements. Also, projections of any evaluation of effectiveness to future periods are subject to the risk that controls may become inadequate because of changes in conditions, or that the degree of compliance with the policies or procedures may deteriorate.
/s/ BDO AG Wirtschaftsprüfungsgesellschaft
Frankfurt am Main, Germany
February 19, 2025
F-4
Report of Independent Registered Public Accounting Firm
To the Shareholders and Supervisory Board of SAP SE:
Opinion on the Consolidated Financial Statements
We have audited, before the effects of the adjustments to: (a) retrospectively apply the change in accounting to present gains and losses from minor divestitures, not qualified as discontinued operations, under other non-operating income/expense instead of other operating income/expense, net described in Note C.3, (b) restate segment information in conformity with the new segment composition described in Note C.1, (c) retrospectively apply the change in accounting to present the Qualtrics disposal group as a discontinued operation described in Note D.1, and (d) present the updated cost allocation policy described in Note IN.1, the consolidated income statements, and the consolidated statements of comprehensive income, changes in equity, and cash flows of SAP SE and subsidiaries (the Company) (SAP) for the year ended December 31, 2022, and the related notes (collectively, the consolidated financial statements). The 2022 consolidated financial statements before the effects of the adjustments described in Notes C.3, C.1, D.1 and IN.1 are not presented herein. In our opinion, the consolidated financial statements, before the effects of the adjustments to: (a)retrospectively apply the change in accounting to present gains and losses from minor divestitures, not qualified as discontinued operations, under other non-operating income/expense instead of other operating income/expense, net described in Note C.3, (b) restate segment information in conformity with the new segment composition described in Note C.1, (c) retrospectively apply the change in accounting to present the Qualtrics disposal group as a discontinued operation described in Note D.1, and (d) present the updated cost allocation policy described in Note IN.1, present fairly, in all material respects, the results of operations of the Company and its cash flows for the year ended December 31, 2022, in conformity with International Financial Reporting Standards as issued by the International Accounting Standards Board (IFRS).
We were not engaged to audit, review, or apply any procedures to adjustments to: (a)retrospectively apply the change in accounting to present gains and losses from minor divestitures, not qualified as discontinued operations, under other non-operating income/expense instead of other operating income/expense, net described in Note C.3, (b) restate segment information in conformity with the new segment composition described in Note C.1, (c) retrospectively apply the change in accounting to present the Qualtrics disposal group as a discontinued operation described in Note D.1, and (d) present the updated cost allocation policy described in Note IN.1 and, accordingly, we do not express an opinion or any other form of assurance about whether such adjustments are appropriate and have been properly applied. Those adjustments were audited by other auditors.
Basis for Opinion
These consolidated financial statements are the responsibility of the Company’s management. Our responsibility is to express an opinion on these consolidated financial statements based on our audit. We are a public accounting firm registered with the Public Company Accounting Oversight Board (United States) (PCAOB) and are required to be independent with respect to the Company in accordance with the U.S. federal securities laws and the applicable rules and regulations of the Securities and Exchange Commission and the PCAOB.
We conducted our audit in accordance with the standards of the PCAOB. Those standards require that we plan and perform the audit to obtain reasonable assurance about whether the consolidated financial statements are free of material misstatement, whether due to error or fraud.
Our audit included performing procedures to assess the risks of material misstatement of the consolidated financial statements, whether due to error or fraud, and performing procedures that respond to those risks. Such procedures included examining, on a test basis, evidence regarding the amounts and disclosures in the consolidated financial statements. Our audit also included evaluating the accounting principles used and significant estimates made by management, as well as evaluating the overall presentation of the consolidated financial statements. We believe that our audit provides a reasonable basis for our opinion.
/s/ KPMG AG Wirtschaftsprüfungsgesellschaft
We served as the Company’s auditor from 2002 to 2023.
Mannheim, Germany
February 22, 2023
F-5
Consolidated Financial Statements IFRS
Consolidated Income Statements of SAP Group for the Years Ended December 31
€ millions, unless otherwise stated |
|
Notes |
|
2024 |
|
2023 |
|
2022 |
Cloud |
|
|
|
17,141 |
|
13,664 |
|
11,426 |
Software licenses |
|
|
|
1,399 |
|
1,764 |
|
2,056 |
Software support |
|
|
|
11,290 |
|
11,496 |
|
11,909 |
Software licenses and support |
|
|
|
12,689 |
|
13,261 |
|
13,965 |
Cloud and software |
|
|
|
29,830 |
|
26,924 |
|
25,391 |
Services |
|
|
|
4,346 |
|
4,283 |
|
4,128 |
Total revenue |
|
(A.1), (C.2) |
|
34,176 |
|
31,207 |
|
29,520 |
|
|
|
|
|
|
|
|
|
Cost of cloud |
|
|
|
-4,660 |
|
-3,884 |
|
-3,499 |
Cost of software licenses and support |
|
|
|
-1,262 |
|
-1,383 |
|
-1,384 |
Cost of cloud and software |
|
|
|
-5,922 |
|
-5,267 |
|
-4,883 |
Cost of services |
|
|
|
-3,321 |
|
-3,407 |
|
-3,155 |
Total cost of revenue |
|
|
|
-9,243 |
|
-8,674 |
|
-8,038 |
Gross profit |
|
|
|
24,932 |
|
22,534 |
|
21,482 |
Research and development |
|
(D.9) |
|
-6,514 |
|
-6,324 |
|
-6,080 |
Sales and marketing |
|
|
|
-9,090 |
|
-8,828 |
|
-7,946 |
General and administration |
|
|
|
-1,435 |
|
-1,364 |
|
-1,289 |
Restructuring |
|
(B.6) |
|
-3,144 |
|
-215 |
|
-138 |
Other operating income/expense, net |
|
|
|
-85 |
|
-4 |
|
-116 |
Total operating expenses |
|
|
|
-29,511 |
|
-25,408 |
|
-23,606 |
Operating profit |
|
|
|
4,665 |
|
5,799 |
|
5,914 |
|
|
|
|
|
|
|
|
|
Other non-operating income/expense, net |
|
(C.3) |
|
-298 |
|
-3 |
|
-11 |
Finance income |
|
|
|
1,429 |
|
857 |
|
811 |
Finance costs |
|
|
|
-1,031 |
|
-1,313 |
|
-2,200 |
Financial income, net |
|
(C.4) |
|
398 |
|
-456 |
|
-1,389 |
Profit before tax from continuing operations |
|
(C.2) |
|
4,764 |
|
5,341 |
|
4,513 |
|
|
|
|
|
|
|
|
|
Income tax expense |
|
(C.5) |
|
-1,614 |
|
-1,741 |
|
-1,446 |
Profit after tax from continuing operations |
|
|
|
3,150 |
|
3,600 |
|
3,068 |
Attributable to owners of parent |
|
|
|
3,124 |
|
3,634 |
|
3,277 |
Attributable to non-controlling interests |
|
|
|
26 |
|
-33 |
|
-210 |
Profit (loss) after tax from discontinued operations |
|
(D.1) |
|
0 |
|
2,363 |
|
-1,359 |
Profit after tax1 |
|
|
|
3,150 |
|
5,964 |
|
1,708 |
Attributable to owners of parent1 |
|
|
|
3,124 |
|
6,139 |
|
2,284 |
Attributable to non-controlling interests1 |
|
|
|
26 |
|
-175 |
|
-576 |
|
|
|
|
|
|
|
|
|
Earnings per share, basic (in €) from continuing operations |
|
(C.6) |
|
2.68 |
|
3.11 |
|
2.80 |
Earnings per share, basic (in €)1 |
|
(C.6) |
|
2.68 |
|
5.26 |
|
1.95 |
Earnings per share, diluted (in €) from continuing operations |
|
(C.6) |
|
2.65 |
|
3.08 |
|
2.79 |
Earnings per share, diluted (in €)1 |
|
(C.6) |
|
2.65 |
|
5.20 |
|
1.94 |
1 From continuing and discontinued operations.
The accompanying Notes are an integral part of these Consolidated Financial Statements.
F-6
Consolidated Statements of Comprehensive Income of SAP Group for the Years Ended December 31
€ millions |
|
Notes |
|
2024 |
|
2023 |
|
2022 |
Profit after tax1 |
|
|
|
3,150 |
|
5,964 |
|
1,708 |
Items that will not be reclassified to profit or loss |
|
|
|
|
|
|
|
|
Remeasurements on defined benefit pension plans, before tax |
|
|
|
-30 |
|
-45 |
|
71 |
Income taxes relating to remeasurements on defined benefit pension plans |
|
|
|
6 |
|
10 |
|
-15 |
Remeasurements on defined benefit pension plans, net of tax |
|
|
|
-23 |
|
-36 |
|
56 |
Other comprehensive income for items that will not be reclassified to profit or loss, net of tax |
|
|
|
-23 |
|
-36 |
|
56 |
Items that will be reclassified subsequently to profit or loss |
|
|
|
|
|
|
|
|
Gains (losses) on exchange differences on translation, before tax |
|
|
|
2,371 |
|
-1,631 |
|
2,190 |
Reclassification adjustments on exchange differences on translation, before tax |
|
|
|
18 |
|
12 |
|
6 |
Exchange differences, before tax |
|
|
|
2,389 |
|
-1,618 |
|
2,195 |
Income taxes relating to exchange differences on translation |
|
|
|
-17 |
|
21 |
|
-10 |
Exchange differences, net of tax |
|
(E.2) |
|
2,372 |
|
-1,597 |
|
2,186 |
Gains (losses) on cash flow hedges/cost of hedging, before tax |
|
|
|
-111 |
|
-11 |
|
53 |
Reclassification adjustments on cash flow hedges/cost of hedging, before tax |
|
|
|
78 |
|
0 |
|
0 |
Cash flow hedges/cost of hedging, before tax |
|
(F.1) |
|
-32 |
|
-11 |
|
53 |
Income taxes relating to cash flow hedges/cost of hedging |
|
|
|
9 |
|
3 |
|
-14 |
Cash flow hedges/cost of hedging, net of tax |
|
(E.2) |
|
-24 |
|
-8 |
|
39 |
Other comprehensive income for items that will be reclassified to profit or loss, net of tax |
|
|
|
2,349 |
|
-1,605 |
|
2,224 |
Other comprehensive income, net of tax |
|
|
|
2,326 |
|
-1,641 |
|
2,280 |
Total comprehensive income |
|
|
|
5,476 |
|
4,323 |
|
3,988 |
Attributable to owners of parent |
|
|
|
5,421 |
|
4,670 |
|
4,385 |
Attributable to non-controlling interests |
|
|
|
54 |
|
-347 |
|
-396 |
1 From continuing and discontinued operations.
The accompanying Notes are an integral part of these Consolidated Financial Statements.
F-7
/ Consolidated Statements of Financial Position of SAP Group as at December 31
€ millions |
|
Notes |
|
2024 |
|
2023 |
Cash and cash equivalents |
|
(E.3) |
|
9,609 |
|
8,124 |
Other financial assets |
|
(D.6), (E.3) |
|
1,629 |
|
3,344 |
Trade and other receivables |
|
(A.2) |
|
6,774 |
|
6,322 |
Other non-financial assets |
|
(A.3), (G.1) |
|
2,682 |
|
2,374 |
Tax assets |
|
|
|
707 |
|
407 |
Total current assets |
|
|
|
21,401 |
|
20,571 |
Goodwill |
|
(D.2) |
|
31,147 |
|
29,081 |
Intangible assets |
|
(D.3) |
|
2,706 |
|
2,505 |
Property, plant, and equipment |
|
(D.4), (D.5) |
|
4,493 |
|
4,276 |
Other financial assets |
|
(D.6), (E.3) |
|
7,141 |
|
5,543 |
Trade and other receivables |
|
(A.2) |
|
209 |
|
203 |
Other non-financial assets |
|
(A.3), (G.1) |
|
3,990 |
|
3,573 |
Tax assets |
|
|
|
359 |
|
382 |
Deferred tax assets |
|
(C.5) |
|
2,676 |
|
2,197 |
Total non-current assets |
|
|
|
52,721 |
|
47,760 |
Total assets |
|
|
|
74,122 |
|
68,331 |
|
|
|
|
|
|
|
Trade and other payables |
|
|
|
1,990 |
|
1,783 |
Tax liabilities |
|
|
|
585 |
|
266 |
Financial liabilities |
|
(E.3), (D.5) |
|
4,277 |
|
1,735 |
Other non-financial liabilities |
|
(B.3), (B.5), (G.2) |
|
5,533 |
|
5,647 |
Provisions |
|
(A.4), (B.6), (G.3) |
|
716 |
|
235 |
Contract liabilities |
|
(A.1) |
|
5,978 |
|
4,975 |
Total current liabilities |
|
|
|
19,079 |
|
14,641 |
Trade and other payables |
|
|
|
10 |
|
39 |
Tax liabilities |
|
|
|
509 |
|
874 |
Financial liabilities |
|
(E.3), (D.5) |
|
7,169 |
|
7,941 |
Other non-financial liabilities |
|
(B.3), (B.5), (G.2) |
|
749 |
|
698 |
Provisions |
|
(A.4), (B.4), (B.6) |
|
494 |
|
432 |
Deferred tax liabilities |
|
(C.5) |
|
215 |
|
267 |
Contract liabilities |
|
(A.1) |
|
88 |
|
33 |
Total non-current liabilities |
|
|
|
9,235 |
|
10,284 |
Total liabilities |
|
|
|
28,314 |
|
24,925 |
Issued capital |
|
|
|
1,229 |
|
1,229 |
Share premium |
|
|
|
2,564 |
|
1,845 |
Retained earnings |
|
|
|
42,907 |
|
42,457 |
Other components of equity |
|
|
|
4,694 |
|
2,367 |
Treasury shares |
|
|
|
-5,954 |
|
-4,741 |
Equity attributable to owners of parent |
|
|
|
45,440 |
|
43,157 |
Non-controlling interests |
|
(E.2) |
|
368 |
|
249 |
Total equity |
|
(E.2) |
|
45,808 |
|
43,406 |
Total equity and liabilities |
|
|
|
74,122 |
|
68,331 |
The accompanying Notes are an integral part of these Consolidated Financial Statements.
F-8
Consolidated Statements of Changes in Equity of SAP Group for the Years Ended December 31
€ millions |
|
Equity Attributable to Owners of Parent |
|
Non- |
|
Total Equity |
||||||||||
|
|
Issued Capital |
|
Share |
|
Retained |
|
Other |
|
Treasury |
|
Total |
|
Controlling |
|
|
|
|
|
|
Premium |
|
Earnings |
|
Components |
|
Shares |
|
|
|
Interests |
|
|
|
|
|
|
|
|
|
|
of Equity |
|
|
|
|
|
|
|
|
Notes |
|
(E.2) |
|
(E.2) |
|
|
|
(E.2) |
|
(E.2) |
|
|
|
|
|
|
1/1/2022 |
|
1,229 |
|
1,918 |
|
37,022 |
|
1,757 |
|
-3,072 |
|
38,853 |
|
2,670 |
|
41,523 |
Profit after tax1 |
|
|
|
|
|
2,284 |
|
|
|
|
|
2,284 |
|
-576 |
|
1,708 |
Other comprehensive income |
|
|
|
|
|
56 |
|
2,044 |
|
|
|
2,100 |
|
180 |
|
2,280 |
Comprehensive income |
|
|
|
|
|
2,340 |
|
2,044 |
|
|
|
4,385 |
|
-396 |
|
3,988 |
Share-based payments |
|
|
|
1,163 |
|
|
|
|
|
|
|
1,163 |
|
325 |
|
1,488 |
Dividends |
|
|
|
|
|
-2,865 |
|
|
|
|
|
-2,865 |
|
-29 |
|
-2,895 |
Purchase of treasury shares |
|
|
|
|
|
|
|
|
|
-1,500 |
|
-1,500 |
|
|
|
-1,500 |
Reissuance of treasury shares under share-based payments |
|
|
|
|
|
|
|
|
|
230 |
|
230 |
|
|
|
230 |
Changes in non-controlling interests |
|
|
|
|
|
-92 |
|
|
|
|
|
-92 |
|
90 |
|
-3 |
Other changes |
|
|
|
|
|
13 |
|
|
|
|
|
13 |
|
2 |
|
15 |
12/31/2022 |
|
1,229 |
|
3,081 |
|
36,418 |
|
3,801 |
|
-4,341 |
|
40,186 |
|
2,662 |
|
42,848 |
Profit after tax1 |
|
|
|
|
|
6,139 |
|
|
|
|
|
6,139 |
|
-175 |
|
5,964 |
Other comprehensive income |
|
|
|
|
|
-36 |
|
-1,433 |
|
|
|
-1,469 |
|
-172 |
|
-1,641 |
Comprehensive income |
|
|
|
|
|
6,103 |
|
-1,433 |
|
|
|
4,670 |
|
-347 |
|
4,323 |
Share-based payments |
|
|
|
1,032 |
|
|
|
|
|
|
|
1,032 |
|
121 |
|
1,153 |
Dividends |
|
|
|
|
|
-2,395 |
|
|
|
|
|
-2,395 |
|
-21 |
|
-2,417 |
Purchase of treasury shares |
|
|
|
|
|
|
|
|
|
-968 |
|
-968 |
|
|
|
-968 |
Reissuance of treasury shares under share-based payments |
|
|
|
|
|
|
|
|
|
568 |
|
568 |
|
|
|
568 |
Changes in non-controlling interests |
|
|
|
-2,268 |
|
2,197 |
|
|
|
|
|
-71 |
|
-2,164 |
|
-2,235 |
Other changes |
|
|
|
|
|
135 |
|
|
|
|
|
135 |
|
-1 |
|
134 |
12/31/2023 |
|
1,229 |
|
1,845 |
|
42,457 |
|
2,367 |
|
-4,741 |
|
43,157 |
|
249 |
|
43,406 |
Profit after tax |
|
|
|
|
|
3,124 |
|
|
|
|
|
3,124 |
|
26 |
|
3,150 |
Other comprehensive income |
|
|
|
|
|
-23 |
|
2,320 |
|
|
|
2,297 |
|
28 |
|
2,326 |
Comprehensive income |
|
|
|
|
|
3,101 |
|
2,320 |
|
|
|
5,421 |
|
54 |
|
5,476 |
Share-based payments, before tax |
|
|
|
399 |
|
|
|
|
|
|
|
399 |
|
|
|
399 |
Income taxes relating to share-based payments |
|
|
|
320 |
|
|
|
|
|
|
|
320 |
|
|
|
320 |
Dividends |
|
|
|
|
|
-2,565 |
|
|
|
|
|
-2,565 |
|
-2 |
|
-2,566 |
Purchase of treasury shares |
|
|
|
|
|
|
|
|
|
-2,108 |
|
-2,108 |
|
|
|
-2,108 |
Reissuance of treasury shares under share-based payments |
|
|
|
|
|
|
|
|
|
895 |
|
895 |
|
|
|
895 |
Other changes |
|
|
|
|
|
-86 |
|
7 |
|
|
|
-79 |
|
66 |
|
-13 |
12/31/2024 |
|
1,229 |
|
2,564 |
|
42,907 |
|
4,694 |
|
-5,954 |
|
45,440 |
|
368 |
|
45,808 |
1 From continuing and discontinued operations.
The accompanying Notes are an integral part of these Consolidated Financial Statements.
F-9
Consolidated Statements of Cash Flows of SAP Group for the Years Ended December 31
€ millions |
|
Notes |
|
2024 |
|
2023 |
|
2022 |
Profit after tax1 |
|
|
|
3,150 |
|
5,964 |
|
1,708 |
Adjustments to reconcile profit after tax to net cash flow from operating activities: |
|
|
|
|
|
|
|
|
(Profit) loss after tax from discontinued operations |
|
|
|
0 |
|
-2,363 |
|
1,359 |
Depreciation and amortization |
|
(D.2)–(D.4) |
|
1,280 |
|
1,373 |
|
1,569 |
Share-based payment expenses |
|
(B.3) |
|
2,385 |
|
2,220 |
|
1,431 |
Income tax expense |
|
(C.5) |
|
1,614 |
|
1,741 |
|
1,446 |
Financial income, net |
|
(C.4) |
|
-398 |
|
456 |
|
1,389 |
Decrease/increase in allowances on trade receivables |
|
|
|
30 |
|
-10 |
|
77 |
Other adjustments for non-cash items |
|
|
|
110 |
|
23 |
|
-175 |
Decrease/increase in trade and other receivables |
|
|
|
-247 |
|
-393 |
|
196 |
Decrease/increase in other assets |
|
|
|
-632 |
|
-700 |
|
-1,213 |
Increase/decrease in trade payables, provisions, and other liabilities |
|
|
|
603 |
|
633 |
|
154 |
Increase/decrease in contract liabilities |
|
|
|
869 |
|
443 |
|
643 |
Share-based payments |
|
(B.3) |
|
-1,282 |
|
-1,091 |
|
-1,180 |
Interest paid |
|
|
|
-550 |
|
-393 |
|
-244 |
Interest received |
|
|
|
563 |
|
469 |
|
156 |
Income taxes paid, net of refunds2 |
|
|
|
-2,277 |
|
-2,161 |
|
-1,642 |
Net cash flows from operating activities – continuing operations |
|
|
|
5,220 |
|
6,210 |
|
5,675 |
Net cash flows from operating activities – discontinued operations |
|
(D.1) |
|
0 |
|
122 |
|
-29 |
Net cash flows from operating activities1 |
|
|
|
5,220 |
|
6,332 |
|
5,647 |
Cash flows for business combinations, net of cash and cash equivalents acquired |
|
|
|
-1,114 |
|
-1,168 |
|
-679 |
Proceeds from sales of subsidiaries or other businesses |
|
|
|
0 |
|
0 |
|
289 |
Cash flows from derivative financial instruments related to the sale of subsidiaries or businesses |
|
|
|
0 |
|
-91 |
|
0 |
Purchase of intangible assets and property, plant, and equipment |
|
|
|
-797 |
|
-785 |
|
-877 |
Proceeds from sales of intangible assets or property, plant, and equipment |
|
|
|
122 |
|
99 |
|
95 |
Purchase of equity or debt instruments of other entities |
|
|
|
-6,401 |
|
-3,566 |
|
-2,320 |
Proceeds from sales of equity or debt instruments of other entities |
|
|
|
7,533 |
|
907 |
|
4,190 |
Net cash flows from investing activities – continuing operations |
|
|
|
-656 |
|
-4,603 |
|
699 |
Net cash flows from investing activities – discontinued operations |
|
(D.1) |
|
0 |
|
5,510 |
|
-32 |
Net cash flows from investing activities1 |
|
|
|
-656 |
|
906 |
|
667 |
Dividends paid |
|
(E.2) |
|
-2,565 |
|
-2,395 |
|
-2,865 |
Dividends paid on non-controlling interests |
|
|
|
-1 |
|
-13 |
|
-12 |
Purchase of treasury shares |
|
(E.2) |
|
-2,106 |
|
-949 |
|
-1,500 |
Proceeds from borrowings |
|
(E.3) |
|
2,767 |
|
13 |
|
158 |
Repayments of borrowings |
|
(E.3) |
|
-1,185 |
|
-4,081 |
|
-1,445 |
Payments of lease liabilities |
|
|
|
-310 |
|
-332 |
|
-410 |
Transactions with non-controlling interests |
|
(E.2) |
|
-11 |
|
0 |
|
0 |
Net cash flows from financing activities – continuing operations |
|
|
|
-3,412 |
|
-7,758 |
|
-6,074 |
Net cash flows from financing activities – discontinued operations |
|
(D.1) |
|
0 |
|
24 |
|
-263 |
Net cash flows from financing activities1 |
|
|
|
-3,412 |
|
-7,734 |
|
-6,337 |
Effect of foreign currency rates on cash and cash equivalents |
|
|
|
333 |
|
-388 |
|
134 |
Net decrease/increase in cash and cash equivalents |
|
|
|
1,485 |
|
-883 |
|
109 |
/ Cash and cash equivalents at the beginning of the period |
|
(E.3) |
|
8,124 |
|
9,008 |
|
8,898 |
/ Cash and cash equivalents at the end of the period |
|
(E.3) |
|
9,609 |
|
8,124 |
|
9,008 |
1 From continuing and discontinued operations.
2 Total income taxes paid, net of refunds 2023: —€2,973 million, thereof contained in the line item "Net cash flows from investing activities - discontinued operations": —€815 million.
The accompanying Notes are an integral part of these Consolidated Financial Statements.
F-10
SAP SE AND SUBSIDIARIES
NOTES TO THE CONSOLIDATED FINANCIAL STATEMENTS IFRS
(IN.1) Basis for Preparation
General Information
The registered domicile of SAP SE is in Walldorf, Germany (Commercial Register of the Lower Court of Mannheim HRB 719915). The Consolidated Financial Statements for 2024 of SAP SE and its subsidiaries (collectively, “we,” “us,” “our,” “SAP,” “Group,” and “Company”) have been prepared in accordance with International Financial Reporting Standards (IFRS) and the additional requirements set forth in section 315e (1) of the German Commercial Code (HGB).
We have applied all IFRS standards and interpretations that were effective on and endorsed by the European Union (EU) as at December 31, 2024. There were no standards or interpretations as at December 31, 2024, impacting our Consolidated Financial Statements for the years ended December 31, 2024, 2023, and 2022, that were effective but not yet endorsed. Therefore, our Consolidated Financial Statements comply with both, IFRS as issued by the International Accounting Standards Board (IASB) and IFRS as endorsed by the EU.
Our Executive Board approved the Consolidated Financial Statements on February 19, 2025, for submission to our Supervisory Board which approved the Consolidated Financial Statements on the same day.
All amounts included in the Consolidated Financial Statements are reported in millions of euros (€ millions) except where otherwise stated. As figures are rounded, numbers presented throughout this document may not add up precisely to the totals we provide and percentages may not precisely reflect the absolute figures.
Amounts disclosed in the Notes that are taken directly from our Consolidated Income Statements or our / Consolidated Statements of Financial Position are marked with the symbols and /, respectively.
Furthermore, all financial numbers in the Consolidated Financial Statements are based on continuing operations (unless otherwise noted).
Accounting Policies, Management Judgments, and Sources of Estimation Uncertainty
How We Present Our Accounting Policies, Judgments, and Estimates
To ease the understanding of our financial statements, we present the accounting policies, management judgments, and sources of estimation uncertainty (hereafter: accounting policies, judgments, and estimates) on a given subject together with other disclosures related to the same subject in the Note that deals with this subject. Accounting policies, judgments, and estimates that do not relate to a specific subject are presented in the following section.
For easier identification of our accounting policies, judgments, and estimates, the respective disclosures are marked with the symbol y and highlighted with a light gray box. They focus on the accounting choices made within the framework of the prevailing IFRS and refrain from repeating the underlying promulgated IFRS guidance, unless we consider it particularly important to the understanding of a Note’s content.
F-11
The following table provides an overview of where our accounting policies, management judgments, and estimates are disclosed:
Note |
|
y Accounting Policies, Judgments, and Estimates |
(IN.1) |
|
Basis for Preparation |
(A.1) |
|
Revenue |
(A.2) |
|
Trade and Other Receivables |
(A.3) |
|
Capitalized Cost from Contracts with Customers |
(A.4) |
|
Customer-Related Provisions |
(B.3) |
|
Share-Based Payments |
(B.4) |
|
Pension Plans and Similar Obligations |
(B.5) |
|
Other Employee-Related Obligations |
(B.6) |
|
Restructuring |
(C.1) |
|
Results of Segment |
(C.5) |
|
Income Taxes |
(D.1) |
|
Business Combinations and Divestitures |
(D.2) |
|
Goodwill |
(D.3) |
|
Intangible Assets |
(D.4) |
|
Property, Plant, and Equipment |
(D.5) |
|
Leases |
(D.6) |
|
Equity Investments |
(D.9) |
|
Income-Related Government Grants |
(E.2) |
|
Total Equity |
(E.3) |
|
Liquidity |
(F.1) |
|
Financial Risk Factors and Risk Management |
(F.2) |
|
Fair Value Disclosures on Financial Instruments |
(G.3) |
|
Other Litigation, Claims, and Legal Contingencies |
(G.5) |
|
Executive and Supervisory Board Compensation |
y General Accounting Policies |
Bases of Measurement |
The Consolidated Financial Statements have been prepared on the historical cost basis except for the following: |
- Derivative financial instruments, liabilities for cash-settled share-based payments, and financial assets with cash flows that are not solely payments of principal or interest are measured at fair value. |
- Post-employment benefits are measured at the present value of the defined benefit obligations less the fair value of the plan assets. |
- Monetary assets and liabilities denominated in foreign currencies are translated at period-end exchange rates. |
- Provisions are recognized at the best estimate of their fulfillment amount when they occur. |
Foreign Currencies
Income and expenses and operating cash flows of our foreign subsidiaries that use a functional currency other than the Euro are translated at average rates of foreign exchange (FX) computed on a monthly basis. Exchange differences resulting from foreign currency transactions are recognized in other non-operating income/expense, net.
F-12
The exchange rates of key currencies affecting the Company were as follows:
Exchange Rates
Equivalent to €1 |
|
|
|
Middle Rate |
|
Annual Average Exchange Rate |
||||||
|
|
|
|
as at 12/31 |
|
|
||||||
|
|
|
|
2024 |
|
2023 |
|
2024 |
|
2023 |
|
2022 |
Australian dollar |
|
AUD |
|
1.6772 |
|
1.6263 |
|
1.6399 |
|
1.6285 |
|
1.5174 |
Canadian dollar |
|
CAD |
|
1.4948 |
|
1.4642 |
|
1.4819 |
|
1.4596 |
|
1.3703 |
Swiss franc |
|
CHF |
|
0.9412 |
|
0.9260 |
|
0.9526 |
|
0.9717 |
|
1.0052 |
Pound sterling |
|
GBP |
|
0.8292 |
|
0.8691 |
|
0.8466 |
|
0.8699 |
|
0.8526 |
Japanese yen |
|
JPY |
|
163.06 |
|
156.33 |
|
163.82 |
|
151.94 |
|
138.01 |
U.S. dollar |
|
USD |
|
1.0389 |
|
1.1050 |
|
1.0821 |
|
1.0816 |
|
1.0539 |
Cost Classification
Cost of Cloud and Software
Cost of cloud and software includes the costs incurred in providing the services and producing the goods that generate cloud and software revenue. Consequently, this line item primarily includes employee expenses relating to these services, amortization of acquired intangibles, fees for third-party licenses, depreciation of our property, plant, and equipment (for example, of our data centers in which we host our cloud solutions), and costs for third-party hosting services. For more information about the capitalization of costs from contracts with customers, see Note (A.3).
Cost of Services
Cost of services includes the costs incurred in providing the services that generate service revenue. Consequently, this line item primarily includes employee expenses and related training, system and system administration costs, and costs for third-party resources.
Research and Development
Research and development includes the costs incurred by activities related to the development of cloud and software solutions including resource and hardware costs for the development systems. The same applies for all activities related to changes in the code of SAP's cloud and software solutions. For more information about the recognition of internally generated intangible assets from development, see Note (D.3).
Sales and Marketing
Sales and marketing includes the costs incurred for the selling activities (such as sales commissions and amortization of capitalized sales commissions) and marketing activities related to our software and cloud solutions and our service portfolio. For more information about the capitalization of costs from contracts with customers, see Note (A.3).
General and Administration
General and administration includes the costs related to finance and administrative functions, human resources, and general management as long as they are not directly attributable to one of the other operating expense line items.
y Management Judgments and Sources of Estimation Uncertainty
The preparation of the Consolidated Financial Statements requires our management to make judgments, estimates, and assumptions that affect the application of accounting policies and the reported amounts of assets, liabilities, revenues, and expenses, as well as disclosure of contingent liabilities.
We base our judgments, estimates, and assumptions on historical and forecast information, and on regional and industry economic conditions in which we or our customers operate. Changes to these conditions could adversely affect our estimates. Although we believe we have made reasonable estimates about the ultimate resolution of the underlying uncertainties, no assurance can be given that the final outcome of these matters will be consistent with what is reflected in our recognized assets, liabilities, revenues, and expenses and disclosed contingent liabilities. Actual results could differ significantly from original estimates.
F-13
The accounting policies that most frequently or significantly require us to make judgments, estimates, and assumptions, and therefore are critical to understanding our results of operations, include the following:
Note |
|
☐ Material Accounting Policies |
(A.1) |
|
Revenue recognition and revenue presentation |
(A.2) |
|
Valuation of trade receivables |
(A.4), (G.3) |
|
Accounting for legal contingencies, provisions |
(B.3) |
|
Accounting for share-based payments |
(C.5) |
|
Accounting for income taxes |
(D.1) |
|
Accounting for business combinations |
(D.2) |
|
Accounting for goodwill |
(D.3) |
|
Accounting for intangible assets (including recognition of internally generated intangible assets from development) |
(D.6) |
|
Accounting for equity investments |
Our management periodically discusses these material accounting policies with the Audit and Compliance Committee of our Supervisory Board. |
y New Accounting Standards Not Yet Adopted |
|
|
The IASB has issued various amendments to the IFRS standards (such as IFRS 9 and IFRS 7 (Amendments to the Classification, Measurement, and Disclosure of Financial Instruments) and IFRS 9 and IFRS 7 (Amendments to Contracts Referencing Nature-dependent Electricity)) that are relevant for SAP but not yet effective. We are currently assessing the impact on SAP, but do not expect material effects on our financial position or profit after tax. In April 2024, the IASB released IFRS 18 (Presentation and Disclosure in Financial Statements). The new standard will substantially affect the presentation of consolidated income statements and introduce additional disclosure requirements. The standard will become effective on January 1, 2027. SAP is currently evaluating this standard and the impact it may have on SAP’s financial statements disclosures. |
F-14
Section A — Customers
This section discusses disclosures related to contracts with our customers. These include but are not limited to explanations of how we recognize revenue, revenue disaggregation, and information about our trade receivables and customer-related obligations.
(A.1) Revenue
y Accounting for Revenue from Contracts with Customers |
|
Classes of Revenue |
|
We derive our revenue from fees charged to our customers for the use of our cloud offerings, for licenses to our on-premise software products, and for standardized and premium support services, consulting, customer-specific software developments, training, and other services. |
|
Cloud and software revenue, as presented in our Consolidated Income Statements, is the sum of our cloud revenue, our software license revenue, and our software support revenue. |
|
Cloud revenue represents fees earned from providing customers with any of the following: |
|
|
Software as a service (SaaS), that is, a right to use software functionality (including standard functionalities and custom cloud applications and extensions) in a cloud-based infrastructure hosted by SAP or third parties engaged by SAP, where the customer does not have the right to terminate the hosting contract and take possession of the software to either run it on its own IT infrastructure or to engage a third-party provider unrelated to SAP to host and manage the software; SaaS also includes transaction and agent fees for transactions that customers execute on our cloud-based transaction platforms. Platform as a service (PaaS), that is, access to a cloud-based platform to develop, deploy, integrate, and manage applications. Infrastructure as a service (IaaS), that is, hosting and related application management services for software hosted by SAP or third parties engaged by SAP. Premium cloud support, that is, support beyond the regular support embedded in the underlying cloud subscription services. |
Software license revenue represents fees earned from the sale or license of software to customers for use on the premises owned or fully controlled by the customer, in other words, where the customer has the right to take possession of the software for installation on the customer’s premises or on hardware of third-party hosting providers unrelated to SAP (on-premise software). Software license revenue includes revenue from both the sale of our standard software products and customer-specific on-premise-software development agreements. |
|
Software support revenue represents fees earned from providing customers with standardized support services that comprise unspecified future software updates, upgrades, and enhancements as well as technical product support services for on-premise software products. |
|
Services revenue primarily represents fees earned from professional consulting services, premium support services, and training services. |
|
Identification of a Contract |
|
We frequently enter into multiple contracts with the same customer. For accounting purposes, we treat these contracts as a single contract if they are entered into at or near the same time and are economically interrelated. We do not combine contracts with closing days more than three months apart because we do not consider them being entered into near the same time. Judgment is required in evaluating whether various contracts are interrelated, which includes considerations as to whether they were negotiated as a package with a single commercial objective, whether the amount of consideration on one contract is dependent on the performance of the other contract, or if some or all goods in the contracts are a single performance obligation. |
|
New arrangements with existing customers can be either a new contract or the modification of prior contracts with the customer. Our judgment in making this determination considers whether there is a connection between the new arrangement and the pre-existing contracts, whether the goods and services under the new arrangement are highly interrelated with the goods and services sold under prior contracts, and how the goods and services under the new arrangement are priced. In determining whether a change in transaction price represents a contract modification or a change in variable consideration, we examine whether the change in price results from changing the contract or from applying unchanged existing contract provisions. |
F-15
Identification of Performance Obligations |
|
Our customer contracts often include various products and services. Typically, the products and services outlined in the Classes of Revenue section qualify as separate performance obligations and the portion of the contractual fee allocated to them is recognized separately. Judgment is required, however, in determining whether a good or service is considered a separate performance obligation. For our professional services and implementation activities, judgment is required to evaluate whether such services significantly integrate, customize, or modify the on-premise software or cloud service to which they relate. In this context, we consider the nature of the services and their volume relative to the volume of the on-premise software or cloud service to which they relate. In general, the implementation services for our cloud services go beyond pure setup activities and qualify as separate performance obligations. Similarly, our on-premise implementation services and our custom development services typically qualify as separate performance obligations. Non-distinct goods and services are combined into one distinct bundle of goods and services (combined performance obligation). |
|
When selling goods or services, we frequently grant customers options to acquire additional goods or services (for example, renewals of cloud or support arrangements, or additional volumes of purchased cloud solutions or software). We apply judgment in determining whether such options provide a material right to the customer that the customer would not receive without entering into that contract. In this judgment, we consider, for example, whether the options entitle the customer to a discount that exceeds the discount granted for the respective goods or services sold together with the option. |
|
|
In scenarios where SAP - Sells indirectly to end customers via partners - Sells third-party products to end customers - Provides services to end customers with the support of suppliers, |
|
SAP determines the respective nature of the performance obligation and whether SAP is providing the specified good or service itself or arranging for the good or service to be provided by the third party. SAP identifies whether it (or the partner) is acting as principal or agent in line with this performance obligation assessment. SAP exercises judgment in making this assessment, which is based on the question of whether the intermediary controls the specified good or service before it is transferred to the customer. In exercising this judgment, SAP relies in the majority of cases on the legal responsibility towards the customer in providing the specified good or service and on its pricing discretion for that good or service. |
|
Determination of Transaction Price |
|
We apply judgment in determining the amount to which we expect to be entitled in exchange for transferring promised goods or services to a customer. Generally, variable consideration is estimated based on the most likely amount and is included in the transaction price to the extent that the constraint does not apply. This includes estimates as to whether and to what extent subsequent concessions may be granted to customers and whether the customer is expected to pay the contractual fees. In this judgment, we consider our history with the respective customer or on a portfolio basis. |
|
The recognition constraint is applied to on-premise software transactions that include usage-based or sales-based contingent fees. In contrast, our typical cloud services do not provide the customer with a software license because the customer does not have the right to terminate the hosting contract and take possession of the software. Consequently, variable cloud fees are considered in the transaction price based on estimates, rather than being accounted for as usage-based or sales-based license royalties. If SAP pays consideration to a customer in exchange for a distinct good or service, and such purchase is linked to a customer contract, an estimate of fair value of such goods and services is required to conclude whether or not to account for a reduction in the transaction price of the linked customer contract. |
|
Only very rarely do our contracts include significant financing components. We do not account for financing components if the period between when SAP transfers the promised goods or services to the customer and when the customer pays for those goods or services is one year or less. |
F-16
Allocation of Transaction Price |
|
We have established a hierarchy to identify the standalone selling prices (SSPs) that we use to allocate the transaction price of a customer contract to the performance obligations in the contract. |
|
|
- Where the SSPs for an offering are observable and reasonably consistent across customers (that is, not highly variable), our SSP estimates are derived from our respective pricing history. Typically, our standardized support offerings and our professional service offerings follow this approach. - Where sales prices for an offering are not directly observable or highly variable across customers, we use estimation techniques. Effective 2024, we applied a new technique to estimate the SSP of our cloud offerings, using input parameters that more appropriately reflect SAP’s matured commercial models and observed pricing practices in the cloud. This SSP considers overall pricing objectives, taking market conditions and other factors into account. We estimate the SSP using a specific pricing range that encompasses the majority of our transactions. SAP estimates the impact of this change in estimation technique for our cloud offerings on the allocation of transaction prices to performance obligations within customer contracts to be immaterial for the current period. –As SAP’s go-to-market strategies evolve further, SAP continuously monitors its commercial models and pricing practices, which could result in changes to our SSPs in the future. For offerings for which we cannot justify a range and we observe highly variable pricing, and for which we lack substantial direct costs to estimate based on a cost-plus-margin approach, we allocate the transaction price by applying a residual approach. We use this technique in particular for our standard on-premise software offerings. |
|
Judgment is required when estimating SSPs. To judge whether the historical pricing of our goods and services is highly variable, we have established thresholds of pricing variability. |
|
When we estimate an SSP range based on pricing objectives, we use judgment in determining the upper and lower end of the range. Such judgment considers price points achieved in the market as well as strategic pricing decisions. |
|
The SSPs of material right options depend on the probability of option exercise. In estimating these probabilities, we apply judgment considering historical exercise patterns. |
- Recognition of Revenue |
|
Cloud revenue is recognized over time as the services are performed. For cloud business models where we grant rights to continuously access and use one or more cloud offerings for a certain term, revenue is recognized based on time elapsed and thus ratably over this term. For cloud business models provisioned on a consumption basis where a customer commits to a fixed value of spend on cloud services throughout the contract term, but with the discretion to call off cloud services during the contract term, we recognize revenue based on consumption as it best reflects our measure towards satisfaction of that performance obligation. In limited scenarios where the transaction price is entirely variable and determined by the customer’s consumption, we recognize revenue based on usage in the period in which it was earned. |
|
Software license revenue is recognized at a point in time or over time depending on whether we deliver standard software, customer-specific software, or software subscription contracts that combine the delivery of software and the obligation to deliver, in the future, unspecified software products: |
|
- Licenses for our standard on-premise software products are typically delivered by providing the customer with access to download the software. We recognize revenue for these on-premise licenses at the point in time when we grant the license rights to the customer and the customer has access to and thus control over the software. In judging whether our on-premise software offerings grant customers a right to use, rather than a right to access, our intellectual property, we have considered the usefulness of our software without subsequent updates to it. - Typically, our customer-specific on-premise software development agreements: ◾ Represent software developed for specific needs of individual customers and therefore do not have any use for us ◾ Provide us with an enforceable right to payment for performance completed to date |
|
For such development agreements, we recognize revenue over time as the software development progresses. Judgment is required in identifying an appropriate method to measure the progress toward complete satisfaction of such performance obligations. We typically measure progress of our development agreements based on the direct costs incurred to date in developing the software as a percentage of the total reasonably estimated direct costs to fully complete the development work (input-based percentage-of-completion method). This method of measuring progress faithfully depicts the transfer of the development services to the customer, as substantially all of these costs are cost of the staff or third parties performing the development work. In estimating the total cost to fully complete the development work, we consider our history with similar projects. |
|
- For agreements that combine the delivery of software and the obligation to deliver, in the future, unspecific software products, we recognize revenue at a point in time for licenses that are made immediately accessible to the customer. We recognize revenue ratably over the term of the software subscription contract for the unspecified software products, as our performance obligation is to stand ready to deliver such products on a when-and-if-available basis. |
|
Software support revenue is typically recognized based on time elapsed and thus ratably over the term of the support arrangement. Under our standardized support services, our performance obligation is to stand ready to provide technical product support and unspecified updates, upgrades, and enhancements on a when-and-if-available basis. Our customers simultaneously receive and consume the benefits of these support services as we perform. |
|
F-17
Service revenue is typically recognized over time. Where we stand ready to provide the service (such as access to learning content), we recognize revenue based on time elapsed and thus ratably over the service period. Consumption-based services (such as separately identifiable consulting services and premium support services and classroom training services) are recognized over time as the services are utilized, typically following the percentage-of-completion method or ratably. We apply judgment in determining whether a service qualifies as a stand-ready service or as a consumption-based service. |
|
Revenue for combined performance obligations is recognized over the longest period of all promises in the combined performance obligation. |
|
Judgment is also required in determining whether revenue is to be recognized at a point in time or over time. For performance obligations satisfied over time, we need to measure progress using the method that best reflects SAP’s performance. When using cost incurred as a measure of progress for recognizing revenue over time, we apply judgment in estimating the total cost to satisfy the performance obligation. |
|
All of the judgments and estimates mentioned above can significantly impact the timing and amount of revenue to be recognized. |
Contract Balances |
|
We recognize trade receivables for performance obligations satisfied over time gradually as the performance obligation is satisfied and in full once the invoice is due. Judgment is required in determining whether a right to consideration is unconditional and thus qualifies as a receivable. |
|
Contract liabilities primarily reflect invoices due or payments received in advance of revenue recognition. |
|
Typically, we invoice fees for on-premise standard software on contract closure and software delivery. Periodic fixed fees for cloud subscription services, software support services, and other multi-period agreements are typically invoiced yearly or quarterly in advance. Such fee prepayments account for the majority of our contract liability balance. Fees based on actual transaction volumes for cloud subscriptions and fees charged for non-periodical services are invoiced as the services are delivered. While payment terms and conditions vary by contract type and region, our terms typically require payment within 30 to 60 days. |
Geographic Information
The amounts for revenue by region in the following tables are based on the location of customers. The regions in the following table are EMEA (Europe, Middle East, and Africa), Americas (North America and Latin America), and APJ (Asia Pacific Japan).
Total Revenue by Region
€ millions |
|
2024 |
|
2023 |
|
2022 |
Germany |
|
5,359 |
|
4,921 |
|
4,469 |
Rest of EMEA |
|
10,216 |
|
9,083 |
|
8,440 |
EMEA |
|
15,575 |
|
14,004 |
|
12,909 |
United States |
|
11,056 |
|
10,204 |
|
9,799 |
Rest of Americas |
|
2,752 |
|
2,558 |
|
2,427 |
Americas |
|
13,808 |
|
12,762 |
|
12,227 |
Japan |
|
1,388 |
|
1,243 |
|
1,218 |
Rest of APJ |
|
3,404 |
|
3,199 |
|
3,166 |
APJ |
|
4,793 |
|
4,441 |
|
4,384 |
SAP Group |
|
34,176 |
|
31,207 |
|
29,520 |
Major Revenue Classes by Region
€ millions |
|
Cloud Revenue |
|
Cloud and Software Revenue |
||||||||
|
|
|
|
|
||||||||
|
|
2024 |
|
2023 |
|
2022 |
|
2024 |
|
2023 |
|
2022 |
EMEA |
|
6,892 |
|
5,241 |
|
4,137 |
|
13,534 |
|
12,028 |
|
11,081 |
Americas |
|
7,872 |
|
6,642 |
|
5,810 |
|
11,987 |
|
10,959 |
|
10,456 |
APJ |
|
2,377 |
|
1,781 |
|
1,478 |
|
4,308 |
|
3,937 |
|
3,855 |
SAP Group |
|
17,141 |
|
13,664 |
|
11,426 |
|
29,830 |
|
26,924 |
|
25,391 |
F-18
Remaining Performance Obligations
Amounts of a customer contract’s transaction price that are allocated to the remaining performance obligations represent contracted revenue that has not yet been recognized. They include amounts recognized as contract liabilities and amounts that are contracted but not yet due.
The transaction price allocated to performance obligations that were unsatisfied or partially unsatisfied as at December 31, 2024, was €78.4 billion (December 31, 2023: €58.7 billion). The prior-year’s figure was corrected to reflect an increase of €0.7 billion to include the transaction price from premium engagement contracts previously classified as having a termination-for-convenience-right. The transaction price thereof allocated to cloud performance obligations that were unsatisfied or partially unsatisfied (total cloud backlog) as at December 31, 2024, was €63.3 billion (December 31, 2023: €44.3 billion). The remaining amount mostly comprises obligations to provide software support services. The vast majority of software support contracts are contracts in the renewal phase that typically have a one-year contract term, while cloud subscription contracts typically are multiple-year contracts. The portion of remaining performance obligations related to services consists of non-cancelable revenue from contracts for projects with a predefined output and from premium engagements. Overall, approximately 40% of the total remaining performance obligations is expected to be recognized over the next 12 months following the respective balance sheet date.
The transaction price allocated to remaining performance obligations varies between reporting periods, primarily due to the recognition of revenue for performance obligations outstanding at the end of the prior year and the addition of new contracts within SAP’s cloud, maintenance, and services business. Other contributing factors include contract modifications, upsells, renewals, currency exchange rate fluctuations, and pricing adjustments.
The revenue recognized in fiscal year 2024 for contract renewals, new contracts, and contract modifications is presented on a gross basis in the following reconciliation of outstanding performance obligations. This means that it is included as a positive entry under “Add renewals, new contracts and modifications” and as a negative entry under “Less revenue recognized in 2024.”
Reconciliation of Remaining Performance Obligations
€ billions |
|
2024 |
/ 12/31/2023 |
|
58.7 |
Add renewals, new contracts and modifications: |
|
|
- Cloud |
|
36.2 |
- Maintenance |
|
10.8 |
- Services and others1 |
|
5.1 |
Less revenue recognized in 2024: |
|
|
- Cloud |
|
17.1 |
- Maintenance |
|
11.3 |
- Services |
|
4.3 |
|
|
|
Acquisitions and divestments2 |
|
0.4 |
|
|
|
/ 12/31/2024 |
|
78.4 |
1 Others mainly comprises currency fluctuations for our services and maintenance contracts, price increases for our maintenance contracts, and changes to the remaining performance obligations for our software contracts.
2 The 2024 acquisitions and divestments figure refers to the acquisition of WalkMe.
F-19
Performance Obligations Satisfied in Previous Years
Revenue recognized in the reporting period for performance obligations satisfied in earlier periods was €75 million (December 31, 2023: €78 million), mainly resulting from changes in estimates of variable considerations and changes in estimates related to percentage-of-completion-based contracts.
Contract Balances
The following table presents the activities impacting contract liabilities balances during the year ended December 31, 2024:
Contract Liabilities
€ billions |
|
2024 |
/ 1/1/2024 |
|
5.0 |
Increases resulting from billing and invoices becoming due |
|
13.2 |
Decreases resulting from satisfaction of performance obligations |
|
-12.3 |
Other1 |
|
0.2 |
/ 12/31/2024 |
|
6.1 |
1 Other includes, for example, the impact of foreign currency translation and business combinations.
The amount of revenue recognized in the reporting period that was included in the contract liability balance at the beginning of the reporting period was €4.7 billion (December 31, 2023: €4.5 billion).
F-20
(A.2) Trade and Other Receivables
y Accounting for Trade and Other Receivables |
|
|
Depending on the business model, we measure trade receivables and contract assets from contracts with customers either at amortized cost, or at fair value through other comprehensive income (OCI) less expected credit losses. We account for expected credit losses by recording an allowance on a portfolio basis. We apply the simplified impairment approach. On initial measurement of the receivables, we consider all credit losses that are expected to occur during the lifetime of the receivables. We use a provision matrix to estimate these losses. Additionally, we recognize allowances for individual receivables if there is objective evidence of credit impairment. Account balances are written off either partially or in full if we judge that the likelihood of recovery is remote. For information about how the default risk for trade receivables is analyzed and managed, how the loss rates for the provision matrix are determined, how credit impairment is determined and what our criteria for write-offs are, see the section on credit risk in Note (F.1). In our Consolidated Income Statements, net gains/losses from expected credit loss allowances are included in Other operating income/expense, net. Gains/losses from foreign currency exchange rate fluctuations are included in Other non-operating income/expense, net. Determining our expected credit loss allowance involves significant judgment. In this judgment, we primarily consider our historical experience with credit losses in the respective provision matrix risk class and current data on overdue receivables. We expect that our historical default rates represent a reasonable approximation for future expected customer defaults. Besides historical data, our judgment used in developing the provision matrix considers reasonable and supportable forward-looking information (for example, changes in country risk ratings, and fluctuations in credit default swaps of the countries in which our customers are located). The assessment of whether a receivable is collectible involves the use of judgment and requires us to make assumptions about customer defaults that could change significantly. By applying this judgment, we record an allowance for a specific customer when it is probable that a credit loss has occurred and the amount of the loss is reasonably estimable. Basing the expected credit loss allowance for the remaining receivables primarily on our historical loss experience likewise requires judgment, as history may not be indicative of future development. Also, including reasonable and supportable forward-looking information in the loss rates of the expected credit loss allowance requires judgment, as they may not provide a reliable prediction for future development. |
Trade and Other Receivables
€ millions |
|
2024 |
|
2023 |
||||||||
|
|
Current |
|
Non-Current |
|
Total |
|
Current |
|
Non-Current |
|
Total |
Trade receivables, net |
|
6,231 |
|
0 |
|
6,231 |
|
5,892 |
|
5 |
|
5,897 |
Other receivables |
|
543 |
|
209 |
|
752 |
|
429 |
|
198 |
|
627 |
/ Total |
|
6,774 |
|
209 |
|
6,983 |
|
6,321 |
|
203 |
|
6,524 |
Contract assets are included in Other receivables in our Statements of Financial Position.Contract assets as at December 31, 2024, were €441 million (December 31, 2023: €307 million).
For more information about financial risk, how we manage credit risk, and details of our trade receivables and contract assets allowances, see Note (F.1).
F-21
(A.3) Capitalized Cost from Contracts with Customers
|
|
y Costs of Obtaining Customer Contracts Capitalized costs from customer contracts are classified as Other non-financial assets in our Statements of Financial Position. The capitalized assets for the incremental costs of obtaining a customer contract consist of sales commissions earned by our sales force and partners as well as amounts paid to employees with non-sales roles when the payments meet the definition of being an incremental cost to obtain a contract with a customer. Judgment is required in determining the amounts to be capitalized, particularly where the commissions are based on cumulative targets and where commissions relate to multiple performance obligations in one customer contract. We capitalize such cumulative target commissions for all customer contracts that count towards the cumulative target but only if nothing other than obtaining customer contracts can contribute to achieving the cumulative target. Commissions for contracts with multiple performance obligations or for probable renewals thereof are allocated to these performance obligations and probable renewals relative to the respective standalone selling price. Our sales commission payments for customer contract renewals are typically not commensurate with the commissions paid for new contracts. Thus, the commissions paid for renewable new contracts also relate to expected renewals of these contracts. Consequently, we amortize sales commissions paid for new customer contracts on a straight-line basis over the expected contract life including probable contract renewals. Judgment is required in estimating these contract lives. In exercising this judgment, we consider our expectation about future contract renewals which we evaluate periodically to confirm that the resulting amortization period properly reflects the expected contract life or if there are potential indicators of impairment. Commensurate payments are amortized over the contract term to which they relate. The amortization periods range from 18 months to seven years depending on the type of offering. Amortization of the capitalized costs of obtaining customer contracts is classified mainly as sales and marketing expense. We expense the incremental costs of obtaining a customer contract as incurred if we expect an amortization period of one year or less. y Costs to Fulfill Customer Contracts Capitalized costs incurred to fulfill customer contracts mainly consist of direct costs for set-up and implementation of cloud products and custom cloud development contracts as far as these costs are not in scope of other accounting standards than IFRS 15. These costs are amortized after completion of the setup and implementation or the development, respectively, on a straight-line basis over the expected life of the cloud subscription contract including expected renewals. For the life of the contract, we consider our expectation about future contract renewals which we evaluate periodically to confirm that the resulting amortization period properly reflects the expected contract life. The amortization periods range from five to seven years depending on the type of offering. In addition, the capitalized costs include third-party license fees which are amortized over the term of the third-party license contract. Judgment is required in evaluating whether costs are directly related to customer contracts and in estimating contract lives. Amortization of capitalized costs to fulfill customer contracts is included in the cost of cloud. |
Capitalized Cost from Contracts with Customers
€ millions |
|
2024 |
|
2023 |
||||||||
|
|
Current |
|
Non-Current |
|
Total |
|
Current |
|
Non-Current |
|
Total |
Capitalized cost of obtaining customer contracts |
|
1,086 |
|
3,221 |
|
4,307 |
|
1,046 |
|
2,918 |
|
3,964 |
Capitalized cost to fulfill customer contracts |
|
264 |
|
272 |
|
536 |
|
199 |
|
236 |
|
436 |
Capitalized contract cost |
|
1,350 |
|
3,492 |
|
4,843 |
|
1,246 |
|
3,154 |
|
4,400 |
/ Other non-financial assets |
|
2,682 |
|
3,990 |
|
6,672 |
|
2,374 |
|
3,573 |
|
5,947 |
Capitalized contract cost as % of / Other non-financial assets |
|
50 |
|
88 |
|
73 |
|
52 |
|
88 |
|
74 |
Amortization Expense
€ millions |
|
2024 |
|
2023 |
Capitalized cost of obtaining customer contracts |
|
1,107 |
|
1,000 |
Capitalized cost to fulfill customer contracts |
|
418 |
|
327 |
F-22
(A.4) Customer-Related Provisions
y Expected Contract Losses |
|
|
Customer-related provisions mainly include expected contract losses. We adjust these provisions as further information becomes available and as circumstances change. Non-current provisions are measured at the present value of their expected settlement amounts as at the reporting date. The unit of account for the identification of potential onerous customer contracts is based on the contract definition of IFRS 15 including the contract combination guidance. The economic benefits considered in the assessment comprise the future benefits we are directly entitled to under the contract as well as the anticipated future benefits that are the economic consequence of the contract if these benefits can be reliably determined. y Customer-Related Litigation and Claims Customer-related provisions also include obligations resulting from customer-related litigation and claims. We are currently confronted with various claims and legal proceedings, including claims that relate to customers demanding indemnification for proceedings initiated against them based on their use of SAP software, and occasionally claims that relate to customers being dissatisfied with the products and services that we have delivered to them. The obligations arising from customer-related litigation and claims comprise cases in which we indemnify our customers against liabilities arising from a claim that our products infringe a third party’s patent, copyright, trade secret, or other proprietary rights. Due to uncertainties relating to these matters, provisions are based on the best information available. Significant judgment is required in the determination of whether and when a provision is to be recorded and what the appropriate amount for such provision should be. Notably, judgment is required in the following areas: - Determining whether an obligation exists - Determining the probability of outflow of economic benefits - Determining whether the amount of an obligation is reliably estimable - Estimating the amount of the expenditure required to settle the present obligation At the end of each reporting period, we reassess the potential obligations related to our pending claims and litigation and adjust our respective provisions to reflect the current best estimate. In addition, we monitor and evaluate new information that we receive after the end of the respective reporting period, but before the Consolidated Financial Statements are authorized for issue, to determine whether this provides additional information regarding conditions that existed at the end of the reporting period. Changes to the estimates and assumptions underlying our accounting for legal contingencies, and outcomes that differ from these estimates and assumptions, could require material adjustments to the carrying amounts of the respective provisions recorded and additional provisions. The expected timing or amounts of any outflows of economic benefits resulting from these lawsuits and claims are uncertain and not estimable, as they generally depend on the duration of the legal proceedings and settlement negotiations required to resolve the litigation and claims and the unpredictability of the outcomes of legal disputes in several jurisdictions. |
Contingent liabilities exist in respect of customer-related litigation and claims for which no provision has been recognized. It is not practicable to estimate the financial impact of these contingent liabilities due to the uncertainties around these lawsuits and claims as outlined above.
F-23
Section B — Employees
This section provides financial insights into our employee benefit arrangements. It should be read in conjunction with the compensation disclosures for key management personnel in Note (G.5).
(B.1) Employee Headcount
The following table provides an overview of employee headcount, broken down by function and by the regions EMEA (Europe, Middle East, and Africa), Americas (North America and Latin America), and APJ (Asia Pacific Japan).
Employee Headcount by Region and Function
Full-time equivalents |
|
12/31/2024 |
|
12/31/2023 |
|
12/31/2022 |
||||||||||||||||||
|
|
EMEA |
|
Americas |
|
APJ |
|
Total |
|
EMEA |
|
Americas |
|
APJ |
|
Total |
|
EMEA |
|
Americas |
|
APJ |
|
Total |
Cloud and software |
|
4,543 |
|
4,339 |
|
4,764 |
|
13,646 |
|
4,389 |
|
4,266 |
|
4,426 |
|
13,080 |
|
4,178 |
|
4,025 |
|
4,538 |
|
12,740 |
Services |
|
8,485 |
|
4,719 |
|
5,566 |
|
18,770 |
|
8,178 |
|
5,013 |
|
5,481 |
|
18,672 |
|
8,129 |
|
5,106 |
|
5,769 |
|
19,005 |
Research and development |
|
18,819 |
|
5,677 |
|
13,094 |
|
37,590 |
|
18,086 |
|
5,884 |
|
12,474 |
|
36,444 |
|
17,764 |
|
5,752 |
|
11,764 |
|
35,280 |
Sales and marketing |
|
12,042 |
|
9,801 |
|
5,139 |
|
26,983 |
|
12,086 |
|
10,300 |
|
5,342 |
|
27,728 |
|
11,671 |
|
10,633 |
|
5,463 |
|
27,766 |
General and administration |
|
3,836 |
|
1,836 |
|
1,300 |
|
6,971 |
|
3,619 |
|
1,777 |
|
1,307 |
|
6,704 |
|
3,387 |
|
1,804 |
|
1,240 |
|
6,431 |
Infrastructure |
|
3,076 |
|
1,164 |
|
921 |
|
5,161 |
|
2,834 |
|
1,274 |
|
867 |
|
4,975 |
|
2,795 |
|
1,382 |
|
912 |
|
5,089 |
SAP Group (December 31) |
|
50,801 |
|
27,536 |
|
30,784 |
|
109,121 |
|
49,191 |
|
28,515 |
|
29,897 |
|
107,602 |
|
47,924 |
|
28,702 |
|
29,686 |
|
106,312 |
thereof acquisitions |
|
413 |
|
414 |
|
86 |
|
912 |
|
421 |
|
138 |
|
0 |
|
558 |
|
188 |
|
189 |
|
8 |
|
385 |
SAP Group (months' end average) |
|
49,764 |
|
27,394 |
|
29,997 |
|
107,155 |
|
48,222 |
|
28,239 |
|
29,582 |
|
106,043 |
|
47,359 |
|
28,785 |
|
29,438 |
|
105,582 |
Most of the employees participating in the Company’s voluntary leave programs are scheduled to leave SAP at the beginning of 2025. For more information about the transformation program and its impact on employee headcount, see Note (B.6).
(B.2) Employee Benefits Expenses
€ millions |
|
2024 |
|
2023 |
|
2022 |
Salaries |
|
12,244 |
|
12,128 |
|
11,369 |
Social security expenses |
|
2,003 |
|
1,919 |
|
1,779 |
Share-based payment expenses |
|
2,385 |
|
2,220 |
|
1,431 |
Pension expenses |
|
435 |
|
438 |
|
447 |
Employee-related restructuring expenses |
|
3,143 |
|
222 |
|
85 |
Termination benefits outside of restructuring plans |
|
68 |
|
64 |
|
44 |
Employee benefits expenses |
|
20,278 |
|
16,992 |
|
15,157 |
F-24
(B.3) Share-Based Payments
y Accounting for Share-Based Payments |
|
Classification in the Income Statements |
|
|
Share-based payments cover equity-settled and cash-settled awards issued to our employees. The respective expenses are recognized as employee benefits and classified in our Consolidated Income Statements according to the activities that the receiving employees perform. Accelerated share - based payment expenses triggered by SAP's restructuring program are classified as restructuring expenses in our Consolidated Income Statements and included in the restructuring provisions in our Statements of Financial Position. For more information about SAP's transformation program, see Note (B.6). Valuation, Judgment, and Sources of Estimation Uncertainty We use certain assumptions in estimating the fair values for our share-based payments, including expected share price volatility and expected dividend yields. In addition, the final number of Performance Share Units (PSUs) vesting also depends on the achievement of performance indicators. Furthermore, the payout for cash-settled share units depends on our share price on the respective vesting dates. Changes to these assumptions and outcomes that differ from these assumptions could require material adjustments to the carrying amount of the liabilities we have recognized for these share-based payments. The fair value of the share units granted under the SAP Long-Term Incentive Program 2024 and 2020 (LTI 2024 and LTI 2020) is dependent on our performance against the total shareholder return (TSR) for NASDAQ-100 companies, the volatility, and the expected correlation between the TSR of the NASDAQ-100 companies and our TSR. Regarding future payout under our cash-settled plans, the SAP share price is the most relevant factor. With respect to our LTI 2024 and LTI 2020, we believe that future payout will be significantly impacted not only by our share price but also by the relative TSR performance against the NASDAQ-100 companies. Future payouts under our LTI 2024 and LTI 2020 will also be dependent on meeting non-market-based performance conditions based on SAP's long-term strategy. The latter, however, is not incorporated into our fair value calculation but leads to adjustments of the quantity of awards granted. Changes in these factors could significantly affect the estimated fair values as calculated by the valuation model, and the future payout. Under the OWN SAP share purchase plan, we grant our employees discounts on share purchases. As those discounts are not dependent on future services to be provided by our employees, the discount is recognized as an expense when the discounts are granted. Presentation in the Statements of Cash Flows We present the payments of our cash-settled share-based payment plans and our equity-settled share-based payment plans that are fulfilled by share purchases at the market separately in our Statements of Cash Flows under Cash flows from operating activities. As a result, the changes in Other assets and in Other liabilities presented in the reconciliation of operating cash flow do not consider share-based payment-related assets or liabilities. Payments of cash-settled share-based payments triggered by SAP’s restructuring program are included in the restructuring payments. |
The operating expense line items in our income statements include the following share-based payment expenses:
Share-Based Payment Expenses by Functional Area
€ millions |
|
2024 |
|
2023 |
|
2022 |
Cost of cloud |
|
138 |
|
94 |
|
53 |
Cost of software licenses and support |
|
42 |
|
38 |
|
48 |
Cost of services |
|
360 |
|
375 |
|
250 |
Research and development |
|
751 |
|
703 |
|
440 |
Sales and marketing |
|
876 |
|
834 |
|
503 |
General and administration |
|
217 |
|
175 |
|
137 |
Share-based payment expenses |
|
2,385 |
|
2,220 |
|
1,431 |
thereof equity-settled share-based payments |
|
1,591 |
|
1,414 |
|
1,075 |
thereof cash-settled share-based payments |
|
794 |
|
806 |
|
356 |
Additionally, SAP also recognized €309 million (2023: €0 million) in accelerated share-based payment expenses triggered by SAP’s transformation program. These share-based payment expenses are classified as restructuring expenses in our consolidated income statements. For more information about SAP’s restructuring program, see Note (B.6).
Our major share-based payment plans are described below.
F-25
Equity-Settled Move SAP Plan (Move)
To retain and engage executives and certain employees, we grant share units under Move that we intend to predominantly settle in shares. For more information about the terms and conditions of the cash-settled Move plan, see section b) Cash-Settled Share-Based Payments in this Note (B.3).
Different vesting schedules apply to specific share units. Granted share units will vest in different tranches mainly as follows:
| - | Restricted Stock Units (RSUs) with service condition only |
| - | Over a half-year period, |
| - | Over a three-year period on a quarterly basis after a waiting period of six months, or |
| - | Performance Share Units (PSUs) with service condition and upon achieving certain key performance indicators (KPIs) |
| - | Over a three-year period on a quarterly basis after a waiting period of 12 months. |
The number of PSUs that will vest under the different tranches is mainly contingent upon achievement of two equally weighted KPIs in the year of grant: Operating profit (non-IFRS at constant currencies) and Cloud revenue (at constant currencies). Depending on the weighted average performance, the number of PSUs vesting ranges between 0% and 200% of the number initially granted. Performance against the KPI target was 134.5% in 2024 (2023: 112.4)%.
We intend to settle the share units classified as equity-settled by reissuing treasury shares upon vesting (for more information, see Note (E.2)).
The valuation was based on the following parameters and assumptions:
Fair Value and Parameters Used at Grant Date in 2024
|
|
Move |
€, unless otherwise stated |
|
(2024 Tranche) |
Weighted average fair value as at grant date |
|
175.09 |
Information how fair value was measured at grant date |
|
|
Valuation model used |
|
Other1 |
Weighted average share price |
|
170.40 |
Weighted average expected dividend yield (in %) |
|
1.23 |
Weighted average initial life at grant date (in years) |
|
1.7 |
1 For these awards, the fair value is calculated by subtracting expected future dividends until maturity of the respective award from the prevailing share price as at the measurement date.
Fair Value and Parameters Used at Grant Date in 2023
€, unless otherwise stated |
|
Move |
|
|
(2023 Tranche) |
Weighted average fair value as at grant date |
|
111.23 |
Information how fair value was measured at grant date |
|
|
Valuation model used |
|
Other1 |
Weighted average share price |
|
114.25 |
Weighted average expected dividend yield (in %) |
|
1.79 |
Weighted average initial life at grant date (in years) |
|
1.7 |
1 For these awards, the fair value is calculated by subtracting expected future dividends until maturity of the respective award from the prevailing share price as at the measurement date.
F-26
Changes in Outstanding Awards
|
|
Move |
Thousands, unless otherwise stated |
|
(2022-2024 Tranches) |
12/31/2022 |
|
11,504 |
Granted2 |
|
13,760 |
Adjustment based on KPI target achievement |
|
115 |
Exercised |
|
-7,675 |
Forfeited |
|
-403 |
Change in settlement2 |
|
-471 |
12/31/2023 |
|
16,830 |
Granted2 |
|
6,944 |
Adjustment based on KPI target achievement |
|
151 |
Exercised |
|
-10,193 |
Forfeited |
|
-392 |
Change in settlement2 |
|
-1,149 |
12/31/2024 |
|
12,192 |
2 We have changed the classification of some share units granted under the Move plan with the initial intention to settle in shares from equity-settled to cash-settled because a cash outflow became probable, in particular due to the restructuring program. Share units with switched classification are considered in the number of granted share units.
The weighted average share price for awards exercised in 2024 was €197.14 (2023: €130.59). The weighted average remaining life of awards outstanding as at December 31, 2024, was 0.9 years (December 31, 2023: 1.1 years).
Own SAP Plan (Own)
Under the share purchase plan Own, employees have the opportunity to purchase, on a monthly basis, SAP shares without any required holding period. The investment per each eligible employee is limited to a percentage of the respective employee's monthly base salary. SAP matches the employee investment by 40% and adds a subsidy of €20 per month for non-executives. To recognize the employees' contribution to SAP’s success in 2024, SAP’s contribution was temporarily increased from 40% to 100% from October to December 2024. This plan is not open to members of the Executive Board.
Numbers of Shares Purchased
Millions |
|
2024 |
|
2023 |
|
2022 |
Own |
|
4.9 |
|
6.5 |
|
9.2 |
As a result of Own, we have commitments to grant SAP shares to employees. We have fulfilled and intend to continue to meet these commitments through an agent who administers the equity-settled programs and purchases shares on the open market. The fair value at grant date is determined based on the average share price of €196.90 (2023: €124.20).
Equity - Settled WalkMe Awards Replacing Pre - Acquisition WalkMe Awards (WalkMe Rights)
In conjunction with the acquisition of WalkMe in 2024, under the terms of the acquisition agreement, SAP exchanged unvested equity - settled Restricted Share Units (RSUs) and Performance Share Units (PSUs) held by employees of WalkMe into equity - settled share - based payment awards of SAP (WalkMe Rights). The WalkMe Rights closely mirror the terms of the replaced awards except that:
| - | They are settled in SAP American Depositary Receipts (ADRs). |
| - | The number of outstanding units were adjusted based on the ratio derived from SAP's consideration per share (US$14.00) divided by the average closing price of the SAP ADRs over the 10 trading days ending on the third trading day prior to the closing date (US$215.89), resulting in an Equity Award Exchange Ratio of 0.0648. |
There were 0.3 million unvested RSUs and PSUs on the closing date of the WalkMe acquisition, representing a fair value of €42 million after considering expected forfeitures dependent on grant dates and remaining vesting periods. Of the total fair value, €18 million was allocated to consideration transferred, while €24 million was allocated to future services to be provided. Post - acquisition compensation expenses will be recognized as the awards vest over the remainder of the original vesting terms.
F-27
The first vesting occurred on November 20, 2024, with the remaining WalkMe Rights vesting over a period of 4.2 years from the closing date.
On December 31, 2024, the unrecognized expense related to WalkMe Rights was €17 million after considering expected forfeitures and will be recognized over a remaining vesting period of up to 3.9 years.
Recognized Expense
€ millions |
|
2024 |
|
2023 |
|
2022 |
Move (2022–2024 Tranches) |
|
1,240 |
|
1,175 |
|
768 |
Own |
|
343 |
|
239 |
|
307 |
WalkMe Rights |
|
9 |
|
NA |
|
NA |
Total |
|
1,591 |
|
1,414 |
|
1,075 |
Cash-Settled Move SAP Plan (Move) Including Grow SAP Plan
We also grant share units in certain circumstances under Move representing a contingent right to receive a cash payment that is determined by the SAP share price and the number of share units that ultimately vest. For more information about the terms and conditions of the equity-settled Move plan, see section a) Equity-Settled Share-Based Payments in this Note (B.3).
From 2020 to 2023, we granted share units under the Grow SAP Plan that we intend to settle in cash. This fixed term plan has broadly the same terms and conditions as Move and recognizes all employees’ commitment to SAP’s success, and deepens their participation in our future company performance.
Different vesting schedules apply to specific share units. Granted share units under the respective plans will vest in different tranches, mainly as follows:
–Restricted Stock Units (RSUs) with service condition only
| - | Over a half-year period, |
| - | Over a three-year period on annual basis, |
| - | Over a three-year period on a quarterly basis after a waiting period of six months, or |
–Performance Share Units (PSUs) with service condition and upon achieving certain key performance indicators (KPIs)
| - | Over a three-year period, or |
| - | Over a three-year period on a quarterly basis after a waiting period of 12 months. |
The number of PSUs that will vest under the different tranches is mainly contingent upon achievement of two equally weighted KPIs in the year of grant: operating profit (non-IFRS at constant currencies) and cloud revenue (at constant currencies). Depending on the weighted average performance, the number of PSUs vesting ranges between 0% and 200% of the number initially granted. Performance against the KPI target was 134.5% in 2024 (2023: 112.4%, 2022: 84.3%).
The share units classified as cash-settled are paid out in cash upon vesting.
SAP Long-Term Incentive Program 2020 and 2024 (LTI 2020 and LTI 2024)
The LTI 2024 and LTI 2020 are long-term, multiyear performance-based elements of our Executive Board compensation that are granted in annual tranches. The LTI 2024 and LTI 2020 reflect SAP’s long-term strategy and thus set uniform incentives to achieve key targets from the long-term strategic plans. The LTI 2024 and LTI 2020 also serve to reward the Executive Board members for long-term SAP share price performance as compared to the market, thus ensuring that shareholders’ interests are also honored. In addition, the LTI 2024 and LTI 2020 include a component to ensure long-term retention of our Executive Board members.
The LTI 2024 and LTI 2020 are virtual share programs under which annual tranches with a term of approximately four years each are granted. When the individual tranches are granted, a certain grant amount specified in the Executive Board member’s service contract is converted into virtual shares (share units). For this purpose, the grant amount is divided by the SAP share price, which corresponds for the LTI 2020 to the average of the SAP share price on the 20 trading days and for the LTI 2024 to the average of the SAP share price on the 10 trading days after scheduled publication of the preliminary results for the financial year (grant price). The share units allocated are composed for the LTI 2024 of 50% Financial Performance Share Units (Financial PSUs), 30% Market Performance Share Units (Market PSUs), and 20% ESG Performance Share Units (ESG PSUs), and for the LTI 2020 of 1/3 Financial Performance Share Units (Financial PSUs), 1/3 Market Performance Share Units (Market PSUs), and 1/3 Retention Share Units. All types of share units have a vesting period of approximately four years. In contrast to Retention Share Units, Financial PSUs, Market PSUs, and ESG PSUs are subject to changes in number. In this context, the following applies:
F-28
The number of Financial PSUs initially awarded is multiplied by a performance factor. The performance factor consists of three individual performance indicators relating to the three non-IFRS KPIs at constant currencies, derived from SAP’s long-term strategy, which for the LTI 2024 are: cloud revenue, software licenses and support & services revenue, and operating profit, and for the LTI 2020: cloud revenue, total revenue, and operating profit. The performance period throughout which the target achievement for these three KPIs is measured starts at the beginning of the financial year in which the Financial PSUs are awarded and concludes upon the end of the second year following the year in which the share units were awarded. A numerical target value equaling 100% target achievement is set for each KPI. This constitutes, in each case, a cumulative value for the three years of the performance period.
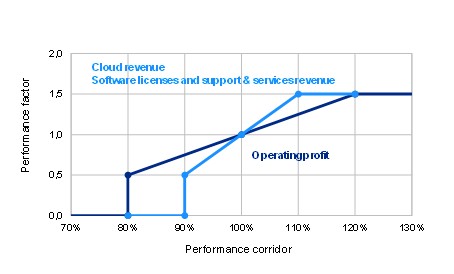
The number of Market PSUs initially awarded is multiplied by a performance factor. The performance factor depends on the amount of the TSR on SAP share, measured for an entire performance period of approximately three years, and ranked in relation to the TSR performance of the companies in the NASDAQ-100 index (Index). If the TSR for the SAP share equals the median, the performance factor will be 1.0. However, if the TSR for the SAP share over the performance period is negative, the maximum performance factor will, in deviation from the summary above, be 1.0.
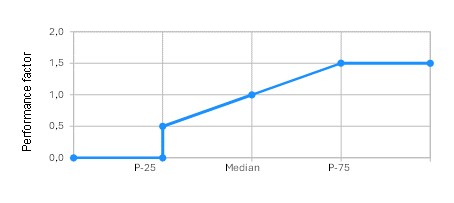
The number of ESG PSUs initially awarded is multiplied by a performance factor. The performance factor consists of two individual performance indicators relating to the two non - financial KPIs, derived from SAP’s long-term strategy, which are: Climate performance: net zero 2030, and Diversity: Women in Executive Roles. The performance period throughout which the target achievement for these two KPIs is measured starts at the beginning of the financial year in which the ESG PSUs are awarded and concludes upon the end of the second year following the year in which the share units were awarded. A numerical target value equaling 100% target achievement is set for each KPI. This constitutes, in each case, a cumulative value for the three years of the performance period.
F-29

The performance of the share units is linked to the performance of the SAP share price, including dividend payments. Accordingly, an amount is paid out for each share unit that equals the then-current SAP share price plus the dividends disbursed in respect of an SAP share in the period from the beginning of the year in which the share units were awarded until the end of the third year following the year in which the share units were awarded. The average SAP share price for the LTI 2024 on the 10 trading days and for the LTI 2020 on the 20 trading days after scheduled publication of the preliminary results for the financial year determines the payout price. The payout amount per share unit, including the dividend amounts due on the share units, is capped at 200% of the grant price. The tranche is cash-settled and paid in euros after the Annual General Meeting of Shareholders of the corresponding year.
If an Executive Board member’s service contract is terminated before the end of the third year following the year in which the share units were granted, the share units are forfeited in whole or in part, depending on the circumstances in which the member resigns from office or the service contract is terminated.
The valuation was based on the following parameters and assumptions:
Fair Value and Parameters Used at Year End 2024
€, unless otherwise stated |
|
LTI 2024 |
|
LTI 2020 |
|
Move |
|
|
(2024 |
|
(2021–2023 |
|
(2021–2024 |
|
|
Tranche) |
|
Tranches) |
|
Tranches) |
Weighted average fair value as at 12/31/2024 |
|
248.23 |
|
222.26 |
|
234.51 |
Information how fair value was measured at measurement date |
|
|
|
|
|
|
Valuation model used |
|
Monte Carlo |
|
Monte Carlo |
|
Other3 |
Share price |
|
236.30 |
|
236.30 |
|
236.30 |
Expected volatility (in %) |
|
23 |
|
20 to 22 |
|
NA |
Expected dividend yield (in %) |
|
NA |
|
NA |
|
0.91 |
Weighted average remaining life of awards outstanding as at 12/31/2024 (in years) |
|
3.2 |
|
1.0 |
|
0.8 |
3 For these awards, the fair value is calculated by subtracting expected future dividends, if any, until maturity of the respective award from the prevailing share price as at the measurement date.
F-30
Fair Value and Parameters Used at Year End 2023
€, unless otherwise stated |
|
LTI 2020 |
|
Move |
|
|
(2020 -2023 |
|
(2020-2023 |
|
|
Tranches) |
|
Tranches) |
Weighted average fair value as at 12/31/2023 |
|
154.24 |
|
137.98 |
Information how fair value was measured at measurement date |
|
|
|
|
Valuation model used |
|
Monte Carlo |
|
Other3 |
Share price |
|
139.48 |
|
139.48 |
Expected volatility (in %) |
|
15 to 23 |
|
NA |
Expected dividend yield (in %) |
|
NA |
|
1.52 |
Weighted average remaining life of awards outstanding as at 12/31/2023 (in years) |
|
1.9 |
|
0.7 |
3 For these awards, the fair value is calculated by subtracting expected future dividends, if any, until maturity of the respective award from the prevailing share price as at the measurement date.
For the LTI 2020 valuation, the expected volatility of the NASDAQ-100 companies of 31% (2023: 34% to 36%), and the expected correlation of SAP and the NASDAQ-100 companies of 16% to 21% (2023: 24% to 27%) are based on historical TSR data for SAP and the NASDAQ-100 companies.
For the LTI 2024 valuation, the expected volatility of the NASDAQ-100 companies of 34%, and the expected correlation of SAP and the NASDAQ-100 companies of 25%, are based on historical TSR data for SAP and the NASDAQ-100 companies. The NASDAQ-100 Total Return Index on December 31, 2024, was US$25,376.22 (2023: US$20,158.42).
The SAP dividend yield is based on expected future dividends.
F-31
Changes in Outstanding Awards
Thousands, unless otherwise stated |
|
LTI 2024 |
|
LTI 2020 |
|
Move |
|
|
(2024 |
|
(2020–2023 |
|
(2021–2024 |
|
|
Tranche) |
|
Tranches) |
|
Tranches) |
12/31/2022 |
|
NA |
|
546 |
|
11,859 |
Granted4 |
|
NA |
|
215 |
|
1,900 |
Adjustment based upon KPI target achievement |
|
NA |
|
-64 |
|
-57 |
Exercised |
|
NA |
|
0 |
|
-7,234 |
Forfeited |
|
NA |
|
-91 |
|
-266 |
Change in settlement4 |
|
NA |
|
NA |
|
470 |
12/31/2023 |
|
NA |
|
605 |
|
6,672 |
Granted4 |
|
126 |
|
0 |
|
823 |
Adjustment based upon KPI target achievement |
|
0 |
|
41 |
|
15 |
Exercised |
|
0 |
|
-72 |
|
-6,333 |
Forfeited |
|
-37 |
|
-74 |
|
-126 |
Change in settlement4 |
|
NA |
|
NA |
|
1,149 |
12/31/2024 |
|
89 |
|
501 |
|
2,200 |
|
|
|
|
|
|
|
Total carrying amount (in € millions) of liabilities as at |
|
|
|
|
|
|
12/31/2023 |
|
NA |
|
59 |
|
644 |
12/31/2024 |
|
7 |
|
98 |
|
343 |
|
|
|
|
|
|
|
Total intrinsic value of vested awards (in € millions) as at |
|
|
|
|
|
|
12/31/2023 |
|
NA |
|
15 |
|
0 |
12/31/2024 |
|
2 |
|
57 |
|
0 |
|
|
|
|
|
|
|
Weighted average share price (in €) for awards exercised in |
|
|
|
|
|
|
2023 |
|
NA |
|
NA |
|
117.86 |
2024 |
|
NA |
|
172.16 |
|
181.68 |
|
|
|
|
|
|
|
Total expense (in € millions) recognized in |
|
|
|
|
|
|
2022 |
|
NA |
|
8 |
|
346 |
2023 |
|
NA |
|
36 |
|
764 |
2024 |
|
7 |
|
51 |
|
729 |
4 We have changed the classification of some share units granted under the Move plan with the initial intention to settle in shares from equity-settled to cash-settled because a cash outflow became probable, in particular due to the restructuring program.
Share-Based Payment Balances
€ millions |
|
2024 |
|
2023 |
||||||||
|
|
Current |
|
Non-Current |
|
Total |
|
Current |
|
Non-Current |
|
Total |
Share-based payment liabilities |
|
303 |
|
151 |
|
453 |
|
555 |
|
152 |
|
707 |
/ Other non-financial liabilities |
|
5,533 |
|
749 |
|
6,282 |
|
5,648 |
|
698 |
|
6,346 |
Share-based payment liabilities as % of / Other non-financial liabilities |
|
5 |
|
20 |
|
7 |
|
10 |
|
22 |
|
11 |
F-32
(B.4) Pension Plans and Similar Obligations
y Defined Contribution Plans |
|
|
Amounts for domestic and foreign defined contribution plans are based on a percentage of the employees’ salaries or on the amount of contributions made by employees. In Germany and some other countries, we make contributions to public pension schemes that are operated by national or local government or similar institutions. Expenses for such local state pension plans are recognized as short-term employee benefits, that is, social security expenses. y Defined Benefit Pension Plans The discount rates used in measuring our post-employment benefit assets and liabilities are derived from rates available on high-quality corporate bonds and government bonds for which the timing and amounts of payments match the timing and the amounts of our projected pension payments. Net interest expense and other expenses related to defined benefit plans are recognized as employee benefits expenses and classified in our Consolidated Income Statements according to the activities that the employees owning the awards perform. Since our domestic defined benefit pension plans primarily consist of an employee-financed post-retirement plan that is fully financed with qualifying insurance policies, current service cost may become a credit as a result of adjusting the defined benefit liability’s carrying amount to the fair value of the qualifying plan assets. Such adjustments are recorded in service cost. Total expenses on defined benefit pension plans comprise related current and past service costs as well as interest income and expense. |
Total Expense of Pension Plans
€ millions |
|
2024 |
|
2023 |
|
2022 |
Defined contribution plans |
|
396 |
|
381 |
|
425 |
Defined benefit pension plans |
|
39 |
|
57 |
|
22 |
Pension expenses |
|
435 |
|
438 |
|
447 |
Defined Benefit Plans
Present Value of the Defined Benefit Obligations (DBO) and the Fair Value of the Plan Assets
|
|
Domestic Plans |
|
Foreign Plans |
|
Other Foreign Post- |
|
Total |
||||||||
€ millions |
|
|
|
|
|
Employment Plans |
|
|
||||||||
|
|
2024 |
|
2023 |
|
2024 |
|
2023 |
|
2024 |
|
2023 |
|
2024 |
|
2023 |
Present value of the DBO |
|
1,204 |
|
1,060 |
|
752 |
|
686 |
|
285 |
|
256 |
|
2,241 |
|
2,002 |
Fair value of the plan assets |
|
1,209 |
|
1,063 |
|
707 |
|
672 |
|
124 |
|
98 |
|
2,040 |
|
1,833 |
Net defined benefit liability (asset)1 |
|
0 |
|
0 |
|
61 |
|
64 |
|
161 |
|
158 |
|
222 |
|
222 |
thereof: Net defined benefit asset |
|
0 |
|
0 |
|
-18 |
|
-17 |
|
-1 |
|
-63 |
|
-19 |
|
-79 |
Net defined benefit liability |
|
0 |
|
0 |
|
79 |
|
80 |
|
162 |
|
221 |
|
241 |
|
301 |
|
|
|
|
|
|
|
|
|
|
|
|
|
|
|
|
|
Net defined benefit asset as % of / Non-current other financial assets |
|
0 |
|
0 |
|
0 |
|
0 |
|
0 |
|
1 |
|
0 |
|
1 |
Net defined benefit liability as % of / Non-current provisions |
|
0 |
|
0 |
|
16 |
|
19 |
|
33 |
|
51 |
|
49 |
|
69 |
¹ After the effects of the asset ceiling.
Of the present value of the DBO of our domestic plans, €1,150 million (2023: €1,006 million) relate to plans that provide for lump-sum payments not based on final salary; of the present value of the DBO of our foreign plans, €597 million (2023: €535 million) relate to plans that provide for annuity payments not based on final salary.
The following significant weighted average assumptions were used for the actuarial valuation of our domestic and foreign pension liabilities as well as other post-employment benefit obligations as at the respective measurement date:
Significant Actuarial Assumptions
Percent |
|
Domestic Plans |
|
Foreign Plans |
|
Other Foreign Post-Employment Plans |
||||||||||||
|
|
2024 |
|
2023 |
|
2022 |
|
2024 |
|
2023 |
|
2022 |
|
2024 |
|
2023 |
|
2022 |
Discount rate |
|
3.4 |
|
3.5 |
|
4.2 |
|
1.5 |
|
2.0 |
|
2.6 |
|
5.3 |
|
5.3 |
|
5.5 |
F-33
The sensitivity analysis table below shows how the present value of all defined benefit obligations would have been influenced by reasonably possible changes to significant actuarial assumptions. The sensitivity analysis considers change in discount rate assumptions, holding all other actuarial assumptions constant.
Sensitivity Analysis
€ millions |
|
Domestic Plans |
|
Foreign Plans |
|
Other Foreign Post-Employment Plans |
|
Total |
||||||||||||||||
|
|
2024 |
|
2023 |
|
2022 |
|
2024 |
|
2023 |
|
2022 |
|
2024 |
|
2023 |
|
2022 |
|
2024 |
|
2023 |
|
2022 |
Present value of all defined benefit obligations if: |
|
|
|
|
|
|
|
|
|
|
|
|
|
|
|
|
|
|
|
|
|
|
|
|
Discount rate was 50 basis points higher |
|
1,156 |
|
1,015 |
|
908 |
|
710 |
|
649 |
|
505 |
|
271 |
|
247 |
|
203 |
|
2,137 |
|
1,911 |
|
1,616 |
Discount rate was 50 basis points lower |
|
1,256 |
|
1,108 |
|
993 |
|
798 |
|
727 |
|
562 |
|
292 |
|
266 |
|
219 |
|
2,346 |
|
2,101 |
|
1,774 |
Investments in Plan Assets
Our investment strategy on domestic benefit plans is to invest all contributions in stable insurance policies.
Our investment strategies for foreign benefit plans vary according to the conditions in the country in which the respective benefit plans are situated. We have adopted a long-term investment horizon for all major foreign benefit plans. Although our policy is to invest in a risk-diversified portfolio consisting of a mix of assets, both the defined benefit obligation and plan assets can fluctuate over time, which exposes the Group to actuarial and market (investment) risks. Depending on the statutory requirements in each country, it might be necessary to reduce any underfunding by addition of liquid assets.
Plan Asset Allocation
€ millions |
|
2024 |
|
2023 |
||||
|
|
Quoted in an |
|
Not Quoted in an |
|
Quoted in an |
|
Not Quoted in an |
|
|
Active Market |
|
Active Market |
|
Active Market |
|
Active Market |
Total plan assets |
|
701 |
|
1,338 |
|
714 |
|
1,120 |
thereof: Asset category |
|
|
|
|
|
|
|
|
Equity investments |
|
220 |
|
0 |
|
190 |
|
0 |
Corporate bonds |
|
240 |
|
0 |
|
233 |
|
0 |
Insurance policies |
|
10 |
|
1,337 |
|
59 |
|
1,120 |
Our expected contribution in 2025 to our domestic and foreign defined benefit pension plans is immaterial. The weighted duration of our defined benefit plans amounted to 10 years as at December 31, 2024 and 2023.
Total future benefit payments from our defined benefit plans as at December 31, 2024, are expected to be €2,803 million (2023: €2,707 million). Of this amount, 73% (2023: 76%) have maturities of over five years, and 58% (2023: 55%) relate to domestic plans.
(B.5) Other Employee-Related Obligations
y Accounting Policy |
As far as the obligation for long-term employee benefits is secured by pledged reinsurance coverage, it is offset with the relating plan asset. |
Other Employee-Related Liabilities
€ millions |
|
2024 |
|
2023 |
||||||||
|
|
Current |
|
Non-Current |
|
Total |
|
Current |
|
Non-Current |
|
Total |
Other employee-related liabilities |
|
4,208 |
|
598 |
|
4,806 |
|
4,205 |
|
546 |
|
4,751 |
/ Other non-financial liabilities |
|
5,533 |
|
749 |
|
6,282 |
|
5,647 |
|
698 |
|
6,345 |
Other employee-related liabilities as % of / Other non-financial liabilities |
|
76 |
|
80 |
|
77 |
|
74 |
|
78 |
|
75 |
Other employee-related liabilities mainly relate to obligations from bonuses and sales commissions, outstanding vacation, time credits accumulated in the working time account, employee-related social security expenses and deferred compensation liabilities.
F-34
(B.6) Restructuring
y Recognition of Restructuring Provisions |
|
|
We only recognize provisions for restructuring if and when the following occurs: - SAP has designed a program that materially changes the scope of one of our businesses or the manner in which the business is conducted, and - A detailed and documented restructuring plan has been approved by our Executive Board, a member thereof, or a direct report of an Executive Board member, and - The program established is planned to start shortly after the program plan is approved and is expected to be completed in a timeframe that makes significant changes to the plan unlikely, and - The program has been announced to the parties affected or has commenced. We consider whether a change in business is material based on the business affected rather than for SAP as a whole. In judging whether a unit qualifies as a business for restructuring purposes, we consider if the unit has its own management team, has access to all inputs and processes necessary to provide outputs, and generates or could generate revenues. The materiality of a change to a business is assessed based on both the size and the nature of the change and therefore does not necessarily involve a material quantitative impact on our financial statements. |
Restructuring Expenses
€ millions |
|
2024 |
|
2023 |
|
2022 |
Employee-related restructuring expenses |
|
-3,143 |
|
-222 |
|
-85 |
Onerous contract-related restructuring expenses and restructuring-related impairment losses |
|
-2 |
|
8 |
|
-52 |
Restructuring expenses |
|
-3,144 |
|
-215 |
|
-138 |
In 2024, SAP increased its focus on key strategic growth areas, in particular business AI. It is transforming its operational setup to capture organizational synergies and AI-driven efficiencies, and to prepare the Company for highly scalable future revenue growth. To this end, as announced in January 2024, SAP is executing a Company-wide restructuring program which will conclude in early 2025. The restructuring program was set up to ensure that SAP’s skillset and resources continue to meet future business needs, and affects around 10,000 positions, a majority of which have been covered by voluntary leave programs and internal re-skilling measures. Most of the employees participating in voluntary leave programs are scheduled to leave SAP at the beginning of 2025. Reflecting re-investments into strategic growth areas and the acquisition of WalkMe, SAP’s headcount was slightly higher at year end 2024 than at year end 2023.
Overall expenses associated with the program are estimated to be approximately €3.2 billion. Restructuring expenses primarily include employee-related benefits such as severance payments and accelerated share-based payment expenses triggered by the transformation program (for more information about the recognition and measurement of share-based payment programs, see Note (B.3)). The restructuring costs presented in 2024 mainly include expenses related to the 2024 transformation program.
Restructuring payouts in 2024 amounted to €2.5 billion. Further payouts of approximately €0.7 billion associated with the 2024 transformation program are expected to occur in 2025.
F-35
If not presented separately in our income statements, restructuring expenses would have been classified in the different expense items in our income statements as follows:
Restructuring Expenses by Functional Area
€ millions |
|
2024 |
|
2023 |
|
2022 |
Cost of cloud |
|
-95 |
|
7 |
|
20 |
Cost of software licenses and support |
|
-85 |
|
-8 |
|
-9 |
Cost of services |
|
-566 |
|
-31 |
|
-70 |
Research and development |
|
-1,197 |
|
-42 |
|
-16 |
Sales and marketing |
|
-1,043 |
|
-121 |
|
-58 |
General and administration |
|
-158 |
|
-19 |
|
-4 |
Restructuring expenses |
|
-3,144 |
|
-215 |
|
-138 |
For the movement of the restructuring provision in 2024, see the table below:
€ millions |
|
Restructuring Provision |
1/1/2024 |
|
37 |
Additions |
|
3,144 |
Utilizations |
|
-1,061 |
Transfer to other employee-related obligations |
|
-1,310 |
Transfer to share-based compensation liability |
|
-123 |
Currency effects |
|
-6 |
12/31/2024 |
|
681 |
The following table reconciles the utilization of the restructuring provision with the overall cash outflow related to restructuring:
€ millions |
|
2024 |
Utilizations |
|
1,061 |
Net cash flows time account |
|
1,325 |
Cash-outflows of share-based payments related to restructuring |
|
171 |
Employees taxes payable |
|
-70 |
Net cash flows |
|
2,487 |
In 2024, employees participating in the early retirement plan in Germany as part of the restructuring program opted to convert termination benefits into credits to their working time accounts. To protect against insolvency, SAP transferred the time account balance of €1.3 billion to an insurance company. These obligations are presented as ‘Other employee-related obligations’ (see Note (B.5)), which are netted off against the fair value of the plan assets (qualified insurance policy). The net balance of cash flows related to time accounts also includes cash inflows from the insurance company as well as payouts to the employees from their working time accounts relating to prior programs.
The additions to the restructuring provisions include accelerated share-based payment expenses. The timing of expense recognition is accelerated due to the shortened vesting period. The accelerated share-based payment expenses are transferred to ‘Share-based payment liabilities’ for payout. Cash outflows of share-based payments that are triggered by the restructuring program include payments due to the accelerated vesting and due to the conversion of share settlement to cash settlement.
F-36
Section C — Financial Results
This section provides insight into the financial results of SAP's reportable segments and of SAP overall as far as not already covered by previous sections. This includes, but is not limited to, segment results, income taxes, and earnings per share.
(C.1) Results of Segment
General Information
At year end 2024, SAP had one operating segment. We concluded in the second quarter of 2024 that SAP is a holistically steered cloud company with a cohesive product portfolio and commercialization of product bundles (such as RISE with SAP and GROW with SAP).
The segment information for 2024 and the comparative prior periods were restated to conform with the new segment composition.
y Segment Reporting Policies |
|
|
Our management reporting system produces reports that present information about our business activities in a variety of ways - for example, by line of business, geography, and areas of responsibility of individual Board members. Based on these reports, the Executive Board, which is responsible for assessing the performance of our Company and for making resource allocation decisions as our Chief Operating Decision Maker (CODM), evaluates business activities based on several different results. However, operating results of SAP are reviewed on a Group level by the CODM as a whole. There are no parts of our Company that qualify as separate operating segments, and our Executive Board assesses the financial performance of our Company on a consolidated basis. Our management reporting system produces a variety of reports that differ due to the currency exchange rates used in the accounting for foreign-currency transactions and operations, where both actual and constant currency numbers are reported to and used by our CODM. Reports based on actual currencies use the same currency rates that are used in our financial statements, whereas reports based on constant-currency report revenues and expenses use the average exchange rates from the previous year’s corresponding period. We use an operating profit indicator to measure the performance of our operating segments. The accounting policies applied in the measurement of operating segment expenses and profit differ as follows from the IFRS accounting principles used to determine the operating profit measure in our income statements: The expense measures exclude: -
Acquisition-related charges such as amortization expense and impairment charges for intangibles acquired in business combinations, including goodwill impairment charges, and certain standalone acquisitions of intellectual property (including purchased in-process research and development) as well as settlements of pre-existing business relationships in connection with a business combination, and acquisition-related third-party expenses
-
Restructuring expenses
-
Regulatory compliance matter expenses
Information about assets and liabilities is not regularly provided to our CODM. |
F-37
Results of Segment
€ millions |
|
2024 |
|
2023 |
|
2022 |
||||
|
|
Actual |
|
Constant |
|
Actual |
|
Constant |
|
Actual |
|
|
Currency |
|
Currency1 |
|
Currency |
|
Currency1 |
|
Currency |
Cloud |
|
17,141 |
|
17,212 |
|
13,664 |
|
14,058 |
|
11,426 |
Software licenses |
|
1,399 |
|
1,400 |
|
1,764 |
|
1,801 |
|
2,056 |
Software support |
|
11,290 |
|
11,343 |
|
11,496 |
|
11,782 |
|
11,909 |
Software licenses and support |
|
12,689 |
|
12,743 |
|
13,261 |
|
13,584 |
|
13,965 |
Cloud and software |
|
29,830 |
|
29,955 |
|
26,924 |
|
27,641 |
|
25,391 |
Services |
|
4,346 |
|
4,355 |
|
4,283 |
|
4,392 |
|
4,128 |
Total segment revenue |
|
34,176 |
|
34,310 |
|
31,207 |
|
32,033 |
|
29,520 |
Cost of cloud |
|
-4,582 |
|
-4,597 |
|
-3,842 |
|
-3,930 |
|
-3,445 |
Cost of software licenses and support |
|
-1,262 |
|
-1,261 |
|
-1,356 |
|
-1,372 |
|
-1,350 |
Cost of cloud and software |
|
-5,844 |
|
-5,858 |
|
-5,199 |
|
-5,302 |
|
-4,795 |
Cost of services |
|
-3,321 |
|
-3,329 |
|
-3,405 |
|
-3,473 |
|
-3,154 |
Total cost of revenue |
|
-9,165 |
|
-9,187 |
|
-8,604 |
|
-8,775 |
|
-7,949 |
Cloud gross profit |
|
12,559 |
|
12,616 |
|
9,821 |
|
10,128 |
|
7,981 |
Segment gross profit |
|
25,011 |
|
25,124 |
|
22,603 |
|
23,258 |
|
21,571 |
Other segment expenses |
|
-16,858 |
|
-16,892 |
|
-16,089 |
|
-16,476 |
|
-15,124 |
Segment profit |
|
8,153 |
|
8,232 |
|
6,514 |
|
6,781 |
|
6,447 |
1 The 2024 constant currency amounts are only comparable to 2023 actual currency amounts; 2023 constant currency amounts are only comparable to 2022 actual currency amounts.
The expenses for depreciation and amortization decreased 9% (9% at constant currencies), from €1,034 million in 2023 to €940 million in 2024.
For more information about the disaggregation of revenues, see Note (A.1).
F-38
(C.2) Reconciliation of Segment Measures to the Consolidated Income Statements
€ millions |
|
2024 |
|
2023 |
|
2022 |
||||
|
|
Actual |
|
Constant |
|
Actual |
|
Constant |
|
Actual |
|
|
Currency |
|
Currency1 |
|
Currency |
|
Currency1 |
|
Currency |
Total segment revenue |
|
34,176 |
|
34,310 |
|
31,207 |
|
32,033 |
|
29,520 |
Adjustment for currency impact |
|
0 |
|
-135 |
|
0 |
|
-826 |
|
0 |
Total revenue |
|
34,176 |
|
34,176 |
|
31,207 |
|
31,207 |
|
29,520 |
Total segment profit |
|
8,153 |
|
8,232 |
|
6,514 |
|
6,781 |
|
6,447 |
Adjustment for currency impact |
|
0 |
|
-78 |
|
0 |
|
-267 |
|
0 |
Adjustment for |
|
|
|
|
|
|
|
|
|
|
Acquisition-related charges |
|
-356 |
|
-356 |
|
-345 |
|
-345 |
|
-395 |
Restructuring |
|
-3,144 |
|
-3,144 |
|
-215 |
|
-215 |
|
-138 |
Regulatory compliance matter expenses |
|
11 |
|
11 |
|
-155 |
|
-155 |
|
0 |
Operating profit |
|
4,665 |
|
4,665 |
|
5,799 |
|
5,799 |
|
5,914 |
Other non-operating income/expense, net |
|
-298 |
|
-298 |
|
-3 |
|
-3 |
|
-11 |
Financial income, net |
|
-63 |
|
-63 |
|
-311 |
|
-311 |
|
-196 |
Adjustment for gains and losses from equity securities, net |
|
461 |
|
461 |
|
-145 |
|
-145 |
|
-1,194 |
Profit before tax |
|
4,764 |
|
4,764 |
|
5,341 |
|
5,341 |
|
4,513 |
1 The 2024 constant currency amounts are only comparable to 2023 actual currency amounts; 2023 constant currency amounts are only comparable to 2022 actual currency amounts.
(C.3) Other Non-Operating Income/Expense, Net
€ millions |
|
2024 |
|
2023 |
|
2022 |
Foreign currency exchange gain/loss, net |
|
-246 |
|
46 |
|
-144 |
thereof from financial assets at fair value through profit or loss |
|
355 |
|
543 |
|
-188 |
thereof from financial assets at amortized cost |
|
300 |
|
56 |
|
243 |
thereof from financial liabilities at fair value through profit or loss |
|
-496 |
|
-514 |
|
17 |
thereof from financial liabilities at amortized cost |
|
-348 |
|
-30 |
|
-317 |
thereof from non-financial assets/liabilities |
|
-69 |
|
18 |
|
39 |
Miscellaneous income/expense, net1 |
|
-52 |
|
-48 |
|
133 |
Other non-operating income/expense, net |
|
-298 |
|
-3 |
|
-11 |
1 Due to a change in presentation of gains and losses from minor divestitures, not qualifying as discontinued operations, a loss of €18 million for 2024, a loss of €12 million for 2023, and a gain of €176 million for 2022 are presented under Other non-operating income/expense instead of Other operating income/expense, net.
The movement in other non-operating income/expense is mainly driven by changes in foreign exchange rates.
F-39
(C.4) Financial Income, Net
€ millions |
|
2024 |
|
2023 |
|
2022 |
Finance income |
|
1,429 |
|
857 |
|
811 |
thereof interest income from financial assets at amortized cost |
|
348 |
|
376 |
|
100 |
thereof interest income from financial assets at fair value through profit or loss |
|
91 |
|
99 |
|
88 |
thereof gains from financial assets at fair value through profit or loss |
|
943 |
|
380 |
|
608 |
Finance costs1 |
|
-1,031 |
|
-1,313 |
|
-2,200 |
thereof interest expense from financial liabilities at amortized cost |
|
-316 |
|
-336 |
|
-153 |
thereof losses from financial assets at fair value through profit or loss1 |
|
-316 |
|
-525 |
|
-1,802 |
thereof interest expense from financial liabilities at fair value through profit or loss |
|
-111 |
|
-105 |
|
-87 |
Financial income, net |
|
398 |
|
-456 |
|
-1,389 |
1 Prior-year figures were updated.
Financial income, net, increased by €853 million in 2024, in comparison to 2023, mainly due to higher net gains from the fair valuation of our equity investments (€606 million).
(C.5) Income Taxes
y Accounting Policies, Judgments, and Estimates |
|
|
We are subject to changing tax laws in multiple jurisdictions within the countries in which we operate. Our ordinary business activities also include transactions where the ultimate tax outcome is uncertain due to different interpretations of tax laws, such as those involving transfer pricing and intercompany transactions between SAP Group entities. In addition, the amount of income taxes we pay is generally subject to ongoing audits by domestic and foreign tax authorities. In determining our worldwide income tax provisions, judgment is involved in assessing whether to consider each uncertain tax treatment separately or together with one or more other uncertain tax treatments and whether to reflect the respective effect of uncertainty based on the most likely amount or the expected value. In applying these judgments, we consider the nature and the individual facts and circumstances of each uncertain tax treatment as well as the specifics of the respective jurisdiction, including applicable tax laws and our interpretation thereof. The assessment whether a deferred tax asset is impaired requires judgment, as we need to estimate future taxable profits to determine whether the utilization of the deferred tax asset is probable. In evaluating our ability to utilize our deferred tax assets, we consider all available positive and negative evidence, including the level of historical taxable income and projections for future taxable income over the periods in which the deferred tax assets are recoverable. Our judgment regarding future taxable income is based on assumptions about future market conditions and future profits of SAP. SAP has applied the mandatory exception to recognizing and disclosing information about deferred tax assets and liabilities related to the global minimum tax. Judgment is also required in evaluating whether interest or penalties related to income taxes meet the definition of income taxes, and, if not, whether it is of financial nature. In this judgment, we particularly consider applicable local tax laws and interpretations on IFRS by national standard setters in the area of group financial reporting. |
Tax Expense by Geographic Location
€ millions |
|
2024 |
|
2023 |
|
2022 |
Current tax expense |
|
|
|
|
|
|
Germany |
|
418 |
|
596 |
|
539 |
Foreign |
|
1,516 |
|
1,356 |
|
1,165 |
Total current tax expense |
|
1,934 |
|
1,952 |
|
1,704 |
Deferred tax expense/income |
|
|
|
|
|
|
Germany |
|
-67 |
|
74 |
|
86 |
Foreign |
|
-253 |
|
-285 |
|
-344 |
Total deferred tax income |
|
-320 |
|
-211 |
|
-258 |
Total income tax expense |
|
1,614 |
|
1,741 |
|
1,446 |
F-40
Major Components of Tax Expense
€ millions |
|
2024 |
|
2023 |
|
2022 |
Current tax expense/income |
|
|
|
|
|
|
Tax expense for current year |
|
1,881 |
|
1,935 |
|
1,717 |
Taxes for prior years |
|
53 |
|
17 |
|
-13 |
Total current tax expense |
|
1,934 |
|
1,952 |
|
1,704 |
Deferred tax expense/income |
|
|
|
|
|
|
Origination and reversal of temporary differences |
|
-258 |
|
-222 |
|
-216 |
Unused tax losses, research and development tax credits, and foreign tax credits |
|
-62 |
|
11 |
|
-42 |
Total deferred tax income |
|
-320 |
|
-211 |
|
-258 |
Total income tax expense |
|
1,614 |
|
1,741 |
|
1,446 |
Profit Before Tax by Geographic Location
€ millions |
|
2024 |
|
2023 |
|
2022 |
Germany |
|
-1,078 |
|
1,201 |
|
1,814 |
Foreign |
|
5,842 |
|
4,140 |
|
2,699 |
Total |
|
4,764 |
|
5,341 |
|
4,513 |
The following table reconciles the expected income tax expense, computed by applying our combined German tax rate of 26.7% (2023: 26.5%; 2022: 26.4%), to the actual income tax expense. Our 2024 combined German tax rate includes a corporate income tax rate of 15.0% (2023: 15.0%; 2022: 15.0%), plus a solidarity surcharge of 5.5% (2023: 5.5%; 2022: 5.5%) thereon, and trade taxes of 10.8% (2023: 10.7%; 2022: 10.6%).
Relationship Between Tax Expense and Profit Before Tax
€ millions, unless otherwise stated |
|
2024 |
|
2023 |
|
2022 |
Profit before tax from continuing operations |
|
4,764 |
|
5,341 |
|
4,513 |
Tax expense at applicable tax rate of 26.7% (2023: 26.5%; 2022: 26.4%) |
|
1,270 |
|
1,418 |
|
1,193 |
Tax effect of: |
|
|
|
|
|
|
Foreign tax rates |
|
-220 |
|
-210 |
|
-134 |
Non-deductible expenses |
|
325 |
|
241 |
|
138 |
Tax-exempt income |
|
-208 |
|
-77 |
|
297 |
Withholding taxes |
|
465 |
|
297 |
|
176 |
Research and development and foreign tax credits |
|
-91 |
|
-89 |
|
-84 |
Prior-year taxes |
|
-70 |
|
-8 |
|
4 |
Assessment of deferred tax assets, research and development tax credits, and foreign tax credits |
|
100 |
|
138 |
|
-124 |
Other |
|
43 |
|
31 |
|
-20 |
Total income tax expense |
|
1,614 |
|
1,741 |
|
1,446 |
Effective tax rate (in %) |
|
33.9 |
|
32.6 |
|
32.0 |
F-41
Components of Recognized Deferred Tax Assets and Liabilities
€ millions |
|
2024 |
|
2023 |
Deferred tax assets |
|
|
|
|
Intangible assets |
|
1,120 |
|
1,074 |
Property, plant, and equipment |
|
39 |
|
37 |
Leases |
|
374 |
|
379 |
Other financial assets1 |
|
69 |
|
85 |
Trade and other receivables1 |
|
79 |
|
61 |
Other non-financial assets1 |
|
48 |
|
27 |
Pension provisions |
|
215 |
|
211 |
Share-based compensation |
|
313 |
|
267 |
Contract liabilities1 |
|
928 |
|
813 |
Trade and other payables1 |
|
148 |
|
188 |
Financial liabilities1 |
|
138 |
|
164 |
Other non-financial liabilities1 |
|
844 |
|
679 |
Provisions1 |
|
107 |
|
21 |
Net operating loss carryforwards1 |
|
310 |
|
151 |
Research and development and foreign tax credits |
|
80 |
|
44 |
Total deferred tax assets (gross) |
|
4,812 |
|
4,201 |
Netting |
|
-2,136 |
|
-2,004 |
/ Total deferred tax assets (net) |
|
2,676 |
|
2,197 |
Deferred tax liabilities |
|
|
|
|
Intangible assets |
|
596 |
|
581 |
Property, plant, and equipment |
|
80 |
|
89 |
Leases1 |
|
336 |
|
334 |
Other financial assets1 |
|
249 |
|
199 |
Trade and other receivables1 |
|
79 |
|
135 |
Other non-financial assets1 |
|
739 |
|
648 |
Pension provisions |
|
28 |
|
33 |
Share-based compensation1 |
|
5 |
|
6 |
Contract liabilities1 |
|
21 |
|
10 |
Trade and other payables1 |
|
44 |
|
42 |
Financial liabilities1 |
|
157 |
|
191 |
Other non-financial liabilities1 |
|
12 |
|
1 |
Provisions1 |
|
5 |
|
2 |
Total deferred tax liabilities (gross) |
|
2,351 |
|
2,271 |
Netting |
|
-2,136 |
|
-2,004 |
/ Total deferred tax liabilities (net) |
|
215 |
|
267 |
1 Prior-period comparative amounts have been adjusted for a more transparent and detailed presentation of the Components of Recognized Deferred Tax Assets and Liabilities in line with our Consolidated Statements of Financial Position, without effecting net amounts. For more information about further adjustments of prior-period comparative amounts, see Note (D.1).
F-42
Movement of Deferred Tax Assets and Liabilities
€ millions |
|
2024 |
|
2023 |
|
2022 |
Total deferred tax assets (net) at the beginning of the period |
|
1,930 |
|
1,854 |
|
1,490 |
Change in items of the consolidated income statements |
|
320 |
|
211 |
|
258 |
Change in items of the consolidated statements of comprehensive income |
|
-2 |
|
34 |
|
-39 |
Change in items of the consolidated statements of changes in equity |
|
155 |
|
53 |
|
0 |
Change in consolidated companies |
|
-9 |
|
-128 |
|
81 |
Other changes (includes mainly currency translation differences) |
|
67 |
|
-94 |
|
64 |
Total deferred tax assets (net) at the end of the period |
|
2,461 |
|
1,930 |
|
1,854 |
Items Not Resulting in a Deferred Tax Asset
€ millions |
|
2024 |
|
2023 |
|
2022 |
Unused tax losses |
|
|
|
|
|
|
Not expiring |
|
291 |
|
151 |
|
315 |
Expiring in the following year |
|
4 |
|
28 |
|
14 |
Expiring after the following year |
|
392 |
|
216 |
|
344 |
Total unused tax losses |
|
687 |
|
395 |
|
673 |
Deductible temporary differences |
|
375 |
|
325 |
|
378 |
Unused research and development and foreign tax credits |
|
|
|
|
|
|
Not expiring |
|
41 |
|
59 |
|
9 |
Expiring after the following year |
|
8 |
|
5 |
|
20 |
Total unused tax credits |
|
49 |
|
64 |
|
29 |
Of the unused tax losses, €146 million (2023: €181 million; 2022: €276 million) relate to U.S. state tax loss carryforwards.
In 2024, SAP Group entities that suffered a tax loss in either the current or the preceding period recognized deferred tax assets amounting to €494 million (2023: €90 million; 2022: €17 million) in excess of deferred tax liabilities. The tax loss mainly results from restructuring expenses, and it is probable that sufficient future taxable profit will be available to allow the benefit of the deferred tax assets to be utilized.
We have not recognized a deferred tax liability on approximately €19.57 billion (2023: €22.15 billion) for undistributed profits of our subsidiaries, because we are in a position to control the timing of the reversal of the temporary difference and it is probable that such differences will not reverse in the foreseeable future.
Income Tax-Related Litigation
We are subject to ongoing tax audits by domestic and foreign tax authorities. Currently, we are in dispute with the German and foreign tax authorities. The disputes almost exclusively pertain to deductibility of intercompany royalty payments, intercompany services, and other payments. In all cases, we expect that a favorable outcome can only be achieved through litigation. For all of these matters, we have not recorded a provision as we believe that the tax authorities’ claims have no merit and that no adjustment is warranted. If, contrary to our view, the tax authorities were to prevail in their arguments before the court, we would expect to have an additional expense of approximately €1,250 million (2023: €1,815 million) in total (including related interest expenses and penalties of €726 million (2023: €1,003 million)).
F-43
(C.6) Earnings per Share
€ millions, unless otherwise stated |
|
2024 |
|
2023 |
|
2022 |
Profit attributable to equity holders of SAP SE |
|
3,124 |
|
3,634 |
|
3,277 |
Profit attributable to equity holders of SAP SE1 |
|
3,124 |
|
6,139 |
|
2,284 |
Issued ordinary shares2 |
|
1,229 |
|
1,229 |
|
1,229 |
Effect of treasury shares2 |
|
-62 |
|
-61 |
|
-58 |
Weighted average shares outstanding, basic2 |
|
1,166 |
|
1,167 |
|
1,170 |
Dilutive effect of share-based payments2 |
|
13 |
|
12 |
|
5 |
Weighted average shares outstanding, diluted2 |
|
1,180 |
|
1,180 |
|
1,175 |
Earnings per share, basic, attributable to equity holders of SAP SE (in €) from continuing operations |
|
2.68 |
|
3.11 |
|
2.80 |
Earnings per share, basic, attributable to equity holders of SAP SE (in €)1 |
|
2.68 |
|
5.26 |
|
1.95 |
Earnings per share, diluted, attributable to equity holders of SAP SE (in €) from continuing operations |
|
2.65 |
|
3.08 |
|
2.79 |
Earnings per share, diluted, attributable to equity holders of SAP SE (in €)1 |
|
2.65 |
|
5.20 |
|
1.94 |
1 From continuing and discontinued operations.
2 Number of shares in millions.
F-44
Section D — Invested Capital
This section highlights our non-current assets including investments that form the basis of our operating activities. Additions to invested capital include separate asset acquisitions or business combinations. Further, we disclose information about purchase obligations and capital contributions.
(D.1) Business Combinations and Divestitures
y Measuring Non-Controlling Interests and Allocation of Consideration Transferred |
|
|
We decide for each business combination whether to measure the non-controlling interest in the acquiree at fair value or at the proportionate share of the acquiree’s identifiable net assets. We classify costs related to executing business combinations as general and administration expense. In our accounting for business combinations, judgment is required in determining whether an intangible asset is identifiable and whether it should be recorded separately from goodwill. Additionally, estimating the acquisition-date fair values of the identifiable assets acquired and liabilities assumed involves considerable judgment. The necessary measurements are based on information available on the acquisition date and are based on expectations and assumptions that have been deemed reasonable by management. These judgments, estimates, and assumptions can materially affect our financial position and profit for several reasons, including the following: – Fair values assigned to assets subject to depreciation and amortization affect the amounts of depreciation and amortization to be recorded in operating profit in the periods following the acquisition. – Subsequent negative changes in the estimated fair values of assets may result in additional expense from impairment charges. – Subsequent changes in the estimated fair values of liabilities and provisions may result in additional expense (if increasing the estimated fair value) or additional income (if decreasing the estimated fair value). |
We acquire businesses in specific areas of strategic interest to us, particularly to broaden our product and service portfolio.
2024 Acquisitions
WalkMe Acquisition
On June 5, 2024, SAP announced its intent to acquire 100% of the shares of WalkMe Ltd. (“WalkMe”), a leader in Digital Adoption Platforms (DAP). The transaction closed on September 12, 2024, following satisfaction of regulatory and other approvals. WalkMe’s shares were delisted after meeting all relevant criteria on September 12, 2024.
The acquisition is expected to help SAP expand its business transformation portfolio. WalkMe’s solutions are designed to help companies navigate ongoing technological change by providing users with advanced guidance and automation capabilities.
€ millions |
|
|
Cash paid |
|
1,257 |
Replacement share-based payment awards |
|
41 |
Call option exercise liability |
|
31 |
Total consideration transferred |
|
1,329 |
The consideration transferred amounted to US$1.4 billion. (€1.3 billion) and the majority was paid in cash. SAP hedged this cash amount with respect to foreign currency risks. The replacement of share-based payment awards figure relates to the earned portion of unvested WalkMe equity-settled share-based payment awards. Upon acquisition, SAP exchanged these awards held by employees of WalkMe for either deferred fixed cash compensation or equity-settled share-based payment awards of SAP (both collectively referred as replacement awards). For more information about the terms and conditions of the WalkMe Rights, see Note (B.3).
F-45
The following table summarizes the values of identifiable assets acquired and liabilities assumed in connection with the acquisition of WalkMe, as at the acquisition date:
€ millions |
|
|
Intangible assets |
|
502 |
Cash and cash equivalents |
|
202 |
Other identifiable assets |
|
235 |
Total identifiable assets |
|
939 |
Other identifiable liabilities |
|
264 |
Total identifiable liabilities |
|
264 |
Total identifiable net assets |
|
675 |
Goodwill |
|
654 |
Total consideration transferred |
|
1,329 |
The initial accounting for the WalkMe business combination is incomplete because we are still obtaining the information necessary to identify and measure items such as tax-related assets and liabilities of WalkMe. Accordingly, the amounts recognized in our financial statements for these items are regarded as provisional as at December 31, 2024.
In general, the goodwill arising from our acquisitions consists largely of the synergies and the know-how and skills of the acquired businesses’ workforces. WalkMe goodwill was attributed to expected synergies from the acquisition, particularly in the following areas:
– |
Evolution of SAP’s strategy to improve adoption, through a WalkMe solution that empowers companies to enhance the utilization of their SaaS systems, increase employee and end-user productivity, and reduce training and support costs. |
– |
Cross-selling of WalkMe products to existing SAP customers across all regions, enabling seamless workflow execution across business software applications |
– |
Improved user experience and user productivity by coupling WalkMe’s AI capabilities with SAP's copilot Joule, driving adoption of existing SAP solutions |
– |
Creation of new business process intelligence offerings by combining WalkMe products and SAP products |
– |
Improved profitability in WalkMe sales and operations. |
The operating results and the assets and liabilities are reflected in our consolidated financial statements starting September 12, 2024.
Impact of Business Combinations on Our Financial Statements
The amounts of revenue and profit or loss of the WalkMe businesses acquired in 2024 since the acquisition date are included in the 2024 consolidated income statements as follows:
€ millions |
|
2024 |
|
Contribution of |
|
|
as Reported |
|
WalkMe |
Revenue |
|
34,176 |
|
61 |
Profit after tax |
|
3,150 |
|
-47 |
Had WalkMe been consolidated as at January 1, 2024, our estimated pro forma revenue for the reporting period would have been €34,328 million and proforma profit after tax would have been €3,050 million.
These pro forma numbers have been prepared for comparative purposes only. The pro forma revenue and profit numbers are not necessarily indicative of the results of operations that would have actually occurred had the acquisition been in effect at the beginning of the respective periods or of future results.
F-46
2023 Acquisitions
LeanIX Acquisition
On September 7, 2023, SAP announced its intent to acquire 100% of the shares of LeanIX GmbH (“LeanIX”), a leader in enterprise architecture management (EAM) software.
The acquisition closed on November 7, 2023, following satisfaction of customary closing conditions and regulatory approvals; the operating results and the assets and liabilities are reflected in our Consolidated Financial Statements starting on that date.
Consideration transferred amounted to €1,231 million paid in cash.
The following table summarizes the values of identifiable assets acquired and liabilities assumed in connection with the acquisition of LeanIX, as at the acquisition date:
LeanIX Acquisition: Recognized Assets and Liabilities
€ millions |
|
|
Intangible assets |
|
476 |
Other identifiable assets |
|
106 |
Total identifiable assets |
|
582 |
Other identifiable liabilities |
|
210 |
Total identifiable liabilities |
|
210 |
Total identifiable net assets |
|
372 |
Goodwill |
|
859 |
Total consideration transferred |
|
1,231 |
In the fourth quarter of 2024, measurement of tax-related assets and liabilities for the LeanIX business combination accounting was completed and resulted in €8 million adjusted to the Other identifiable assets/liabilities opening balance and Goodwill.
In general, the goodwill arising from our acquisitions consists largely of the synergies and the know-how and skills of the acquired businesses’ workforces.
LeanIX goodwill was attributed to expected synergies from the acquisition, particularly in the following areas:
| - | Cross-selling to existing SAP customers across all regions, using SAP’s sales organization |
| - | Creation of new offerings by combining LeanIX products and SAP products |
| - | Enhanced transformation capabilities of SAP Signavio solutions, giving SAP customers unique clarity on the IT landscapes they need to reap the full benefit of business transformation |
F-47
The allocation of the goodwill resulting from the LeanIX acquisition to our operating segments depends on how our operating segments actually benefit from the synergies of the LeanIX business combination. For more information, see Note (D.2).
Impact of the Business Combination on Our Financial Statements
The amounts of revenue and profit or loss of the LeanIX business acquired in 2023 since the acquisition date were included in our Consolidated Income Statements for 2023 as follows:
|
|
2023 |
|
|
€ millions |
|
as Reported |
|
Contribution of LeanIX |
Revenue |
|
31,207 |
|
10 |
Profit after tax |
|
5,964 |
|
-8 |
Had LeanIX been consolidated as at January 1, 2023, our revenue and profit after tax for 2023 would not have been materially different.
2023 Divestitures
Qualtrics Disposal
On March 13, 2023, resulting from a process that was initiated on January 26, 2023, SAP announced it had agreed to sell all of its 423 million shares of Qualtrics International Inc. as part of the acquisition of Qualtrics by funds affiliated with Silver Lake as well as the Canada Pension Plan Investment Board. The sale closed on June 28, 2023, following satisfaction of customary closing conditions and regulatory approvals. At a purchase price of US$18.15 in cash per share, SAP’s stake was acquired for approximately US$7.7 billion. To secure the euro countervalue of the US$7.7 billion purchase price, we hedged an amount of US$7.1 billion by entering into a deal contingent forward applying net investment hedge accounting. For more information, see Note (F.1). At the time that Qualtrics was classified as a discontinued operation (following IFRS 5), there was no indication of an impairment (as the fair value less cost of disposal (calculated based on share prices) significantly exceeded the carrying amount).
SAP is a close go-to-market and technology partner for Qualtrics.
SAP’s financial results present Qualtrics as a discontinued operation as required under IFRS 5. The Qualtrics disposal group was previously included in the Qualtrics reportable segment.
The pre-tax disposal gain included in discontinued operations (€3,562 million) was calculated by adjusting the purchase price less the cost of disposal (€7,003 million) for net assets leaving the SAP Group (€5,800 million, consisting mostly of goodwill (€4,007 million) and other intangible assets (€1,294 million)), the corresponding non-controlling interests (€2,337 million), and amounts of other comprehensive income (€22 million). SAP incurred taxes amounting to €799 million in connection with the transaction.
The cash inflow resulting from the purchase price (€7,068 million) was offset by cash and cash equivalents of €713 million leaving the SAP Group.
SAP continues to provide rental guarantees for certain offices used by Qualtrics. Qualtrics is obligated to indemnify SAP with respect to the guarantees.
F-48
Additional financial information relating to Qualtrics is presented in the following tables (revenues and expenses are presented after consolidation of transactions between Qualtrics and SAP’s continuing operations):
€ millions, unless otherwise stated |
|
2023 |
|
2022 |
Consolidated Income Statements |
|
|
|
|
Cloud revenue |
|
621 |
|
1,129 |
Total revenue |
|
745 |
|
1,351 |
Cost of cloud |
|
-88 |
|
-265 |
Total cost of revenue |
|
-196 |
|
-499 |
Total operating expenses (including total cost of revenue) |
|
-1,155 |
|
-2,771 |
Disposal gain before tax |
|
3,562 |
|
0 |
Operating profit |
|
3,152 |
|
-1,420 |
Profit (loss) before tax |
|
3,162 |
|
-1,423 |
Income tax expense1 |
|
-799 |
|
64 |
Profit (loss) after tax |
|
2,363 |
|
-1,359 |
Attributable to owners of parent |
|
2,505 |
|
-993 |
|
|
|
|
|
Earnings per share, basic (IFRS, in €)2 |
|
2.15 |
|
-0.85 |
Earnings per share, diluted (IFRS, in €)2 |
|
2.12 |
|
-0.85 |
|
|
|
|
|
Consolidated Statements of Cash Flow |
|
|
|
|
Net operating cash flow |
|
122 |
|
-29 |
Net investing cash flow |
|
5,510 |
|
-32 |
Net financing cash flow |
|
24 |
|
-263 |
1 For 2023, €799 million relates to the gain on sale of discontinued operations.
2 For 2023 and 2022, the weighted average number of shares was 1,167 million (diluted: 1,180 million) and 1,170 million (diluted: 1,175 million), respectively (treasury stock excluded).
Total operating expenses includes share-based payment expenses related to Qualtrics' equity-settled plan of €403 million in 2023 (€1,182 million in 2022).
2022 Acquisitions
In 2022, we closed the acquisition of Taulia Inc., San Francisco, California (USA) (“Taulia”) and of INNAAS srl, Rome (Italy).
Taulia Acquisition
On January 27, 2022, SAP announced its intent to acquire a majority stake of Taulia, a leading provider of cloud-based working capital management solutions (for SAP's current shareholding percentage, see Note (G.9)). The acquisition closed on March 9, 2022, following satisfaction of customary closing conditions and regulatory approvals; the operating results and the assets and liabilities are reflected in our consolidated financial statements starting on that date.
Consideration transferred amounted to €705 million.
F-49
The following table summarizes the values of identifiable assets acquired and liabilities assumed in connection with the acquisition of Taulia, as at the acquisition date:
Taulia Acquisition: Recognized Assets and Liabilities
€ millions |
|
|
Intangible assets |
|
157 |
Other identifiable assets |
|
87 |
Total identifiable assets |
|
244 |
Other identifiable liabilities |
|
88 |
Total identifiable liabilities |
|
88 |
Total identifiable net assets |
|
156 |
Goodwill |
|
549 |
Total consideration transferred |
|
705 |
Prior to December 31, 2022, we completed our accounting assessment relating to the supply chain financing (SCF) transactions offered by Taulia. Based on the setup of the compartments and series within which the SCF receivables and liabilities are siloed, and on the related contractual and founding agreements, we concluded that we do not control the receivables and liabilities resulting from the SCF activities under IFRS 10.Thus, we do not include the respective items in our balance sheet and do not show cash flows linked to the SCF transactions in investing/financing cash flow.
In Q1 2023, measurement of tax-related assets and liabilities for the Taulia business combination accounting was completed and resulted in €28 million adjusted to the Other identifiable assets' opening balance and Goodwill.
In general, the goodwill arising from our acquisitions consists largely of the synergies and the know-how and skills of the acquired businesses’ workforces.
Taulia goodwill was attributed to expected synergies from the acquisition, particularly in the following areas:
| - | Cross-selling to existing SAP customers across all regions, using SAP’s sales organization |
| - | Further expansion of SAP Business Network capabilities and strengthening of SAP’s solutions for the CFO office |
| - | Creation of new offerings by combining Taulia products and SAP products |
| - | Improved profitability in Taulia sales and operations |
The allocation of the goodwill resulting from the Taulia acquisition to our operating segments depends on how our operating segments actually benefit from the synergies of the Taulia business combination.
Impact of the Business Combination on Our Financial Statements
The amounts of revenue and profit or loss of the Taulia business acquired in 2022 since the acquisition date were included in our Consolidated Income Statements for 2022 as follows:
Taulia Acquisition: Impact on SAP’s Financials
€ millions |
|
2022 |
|
Contribution of |
|
|
as Reported |
|
TauliaI |
Revenue |
|
30,871 |
|
59 |
Profit after tax |
|
1,708 |
|
-38 |
1 From continuing and discontinued operations.
Had Taulia been consolidated as at January 1, 2022, our revenue and profit after tax for 2022 would not have been materially different.
2022 Divestitures
On August 17, 2022, SAP and Francisco Partners (FP) announced that FP had signed a definitive agreement with SAP America, Inc. under which FP would acquire SAP Litmos from SAP. The transaction closed on December 1, 2022, following satisfaction of applicable regulatory and other approvals.
The disposal gain of €175 million is included in Other non-operating income/expense, net.
F-50
(D.2) Goodwill
y Goodwill and Intangible Asset Impairment Testing |
|
|
The annual goodwill impairment test is performed at the operating segment level, since there are no lower levels in SAP at which goodwill is monitored for internal management purposes. In general, the test is performed at the same time (at the beginning of the fourth quarter) for each annual reporting period. In making impairment assessments for our goodwill and intangible assets, the outcome of these tests is highly dependent on management’s assumptions regarding future cash flow projections and economic risks, which require significant judgment and assumptions about future developments. They can be affected by a variety of factors, including: - Changes in business strategy - Internal forecasts - Estimation of weighted-average cost of capital Changes to the assumptions underlying our goodwill and intangible assets impairment assessments could require material adjustments to the carrying amount of our recognized goodwill and intangible assets as well as the amounts of impairment charges recognized in profit or loss. Changes in our segment structure result in the reallocation of goodwill with the reallocated goodwill being calculated based on relative values (if a direct allocation is not possible). |
Goodwill
€ millions |
|
Goodwill |
Historical cost |
|
|
1/1/2023 |
|
33,181 |
Foreign currency exchange differences |
|
-848 |
Additions from business combinations |
|
859 |
Retirements/disposals |
|
-4,008 |
12/31/2023 |
|
29,184 |
Foreign currency exchange differences |
|
1,415 |
Additions from business combinations |
|
654 |
12/31/2024 |
|
31,253 |
|
|
|
Accumulated amortization |
|
|
1/1/2023 |
|
104 |
Foreign currency exchange differences |
|
-1 |
12/31/2023 |
|
103 |
Foreign currency exchange differences |
|
2 |
12/31/2024 |
|
105 |
|
|
|
Carrying amount |
|
|
12/31/2023 |
|
29,081 |
12/31/2024 |
|
31,148 |
In the first half of 2024, the Company underwent several changes in its segment structure. Starting in the second quarter of 2024, the Company has a single operating segment (at year end 2023, SAP had five operating segments) and monitors its goodwill at this level. For more information about our segments and the changes in 2024, see Note (C.1).
As the initial accounting for the WalkMe business combination is incomplete (for more information, see Note (D.1)), the goodwill added to our single operating segment through the acquisition of WalkMe (€654 million) is provisional.
F-51
Goodwill Impairment Test
Our assessment of internal and external factors in 2024, including a) the change in segment structure and b) reorganizations which had no adverse effect, led us to conclude that no triggering events occurred since our annual goodwill impairment test in 2023. Throughout 2024, we have – through a qualitative and quantitative analysis – been continuously monitoring whether triggering events exist. We did not identify any aspects that qualify as a triggering event that would cause the carrying amount of the single operating segment to exceed the recoverable amount. On October 1, 2024, we performed a goodwill impairment test for the operating segment. Significant qualitative inputs used in our impartment test include, but are not limited to, consideration of general macroeconomic conditions, industry market conditions, SAP’s overall financial performance, and movement in the SAP share price. The primary quantitative input for our impairment test is SAP’s market capitalization as at the beginning of the fourth quarter. We believe there is no reasonably plausible change in the SAP share price that would cause the carrying amount of our single operating segment to exceed the recoverable amount.
(D.3) Intangible Assets
y Recognition of Intangibles |
|
|
Whereas in general, expenses for internally generated intangibles are expensed as incurred, development expenses incurred on standard-related customer development projects (for which the IAS 38 criteria are met cumulatively) are capitalized on a limited scale with those amounts being amortized over the estimated useful life for the majority of the projects of five to seven years. Determining whether internally generated intangible assets from development qualify for recognition requires significant judgment, particularly in the following areas: - Determining whether activities should be considered research activities or development activities - Determining whether the conditions for recognizing an intangible asset are met requires assumptions about future market conditions, customer demand, and other developments. - The term “technical feasibility” is not defined in IFRS, and therefore determining whether the completion of an asset is technically feasible requires judgment and a company-specific approach. - Determining the future ability to use or sell the intangible asset arising from the development and the determination of the probability of future benefits from sale or use - Determining whether a cost is directly or indirectly attributable to an intangible asset and whether a cost is necessary for completing a development These judgments impact the total amount of intangible assets that we present in our balance sheet as well as the timing of recognizing development expenses in profit or loss. y Measurement of Intangibles All our purchased intangible assets other than goodwill have finite useful lives. They are initially measured at acquisition cost and subsequently amortized based on the expected consumption of economic benefits over their estimated useful lives ranging from two to 20 years. Judgment is required in determining the following: - The useful life of an intangible asset, as this is based on our estimates regarding the period over which the intangible asset is expected to generate economic benefits to us - The amortization method, as IFRS requires the straight-line method to be used unless we can reliably determine the pattern in which the asset’s future economic benefits are expected to be consumed by us Both the amortization period and the amortization method have an impact on the amortization expense that is recorded in each period. y Classification of Intangibles We classify intangible assets according to their nature and use in our operations. Software and database licenses consist primarily of technology for internal use, whereas acquired technology consists primarily of purchased software to be incorporated into our product offerings. Customer relationships and other intangibles consist primarily of customer relationships and acquired trademark licenses. Amortization expenses of intangible assets are classified as Cost of cloud, Cost of services, Research and development, Sales and marketing, and General and administration, depending on the use of the respective intangible assets. |
F-52
Intangible Assets
€ millions |
|
Software and |
|
Acquired |
|
Customer |
|
Total |
|
|
Database Licenses |
|
Technology |
|
Relationships and |
|
|
|
|
|
|
|
|
Other Intangibles |
|
|
Historical cost |
|
|
|
|
|
|
|
|
1/1/2023 |
|
1,057 |
|
2,527 |
|
7,057 |
|
10,641 |
Foreign currency exchange differences |
|
-1 |
|
-65 |
|
-185 |
|
-251 |
Additions from business combinations |
|
0 |
|
121 |
|
355 |
|
476 |
Other additions |
|
22 |
|
3 |
|
59 |
|
84 |
Retirements/disposals |
|
-92 |
|
-767 |
|
-2,307 |
|
-3,166 |
Transfers |
|
87 |
|
0 |
|
-87 |
|
0 |
12/31/2023 |
|
1,073 |
|
1,819 |
|
4,892 |
|
7,784 |
Foreign currency exchange differences |
|
2 |
|
103 |
|
247 |
|
352 |
Additions from business combinations |
|
0 |
|
187 |
|
315 |
|
502 |
Other additions |
|
20 |
|
3 |
|
66 |
|
89 |
Retirements/disposals |
|
-84 |
|
-326 |
|
-174 |
|
-584 |
Transfers |
|
25 |
|
0 |
|
-25 |
|
0 |
12/31/2024 |
|
1,036 |
|
1,786 |
|
5,321 |
|
8,143 |
|
|
|
|
|
|
|
|
|
Accumulated amortization |
|
|
|
|
|
|
|
|
1/1/2023 |
|
544 |
|
2,041 |
|
4,221 |
|
6,806 |
Foreign currency exchange differences |
|
-1 |
|
-57 |
|
-118 |
|
-176 |
Additions amortization |
|
146 |
|
77 |
|
305 |
|
528 |
Retirements/disposals |
|
-95 |
|
-477 |
|
-1,307 |
|
-1,879 |
12/31/2023 |
|
594 |
|
1,584 |
|
3,101 |
|
5,279 |
Foreign currency exchange differences |
|
2 |
|
89 |
|
151 |
|
242 |
Additions amortization |
|
139 |
|
89 |
|
253 |
|
481 |
Retirements/disposals |
|
-68 |
|
-326 |
|
-171 |
|
-565 |
12/31/2024 |
|
667 |
|
1,436 |
|
3,334 |
|
5,437 |
|
|
|
|
|
|
|
|
|
Carrying amount |
|
|
|
|
|
|
|
|
12/31/2023 |
|
479 |
|
235 |
|
1,791 |
|
2,505 |
12/31/2024 |
|
369 |
|
350 |
|
1,987 |
|
2,706 |
Significant Intangible Assets
€ millions, unless otherwise stated |
|
|
|
Remaining |
||||
|
|
Carrying Amount |
|
Useful Life |
||||
|
|
2024 |
|
2023 |
|
(in years) |
||
Concur – Customer relationships |
|
540 |
|
588 |
|
6 |
to |
10 |
LeanIX - Customer relationships |
|
333 |
|
345 |
|
|
|
12 |
WalkMe - Customer relationships |
|
246 |
|
0 |
|
|
|
14 |
WalkMe - Acquired technology |
|
183 |
|
0 |
|
|
|
7 |
Total significant intangible assets |
|
1,302 |
|
933 |
|
|
|
|
F-53
(D.4) Property, Plant, and Equipment
y Depreciation of Property, Plant, and Equipment |
|
Property, plant, and equipment are typically depreciated using the straight-line method. Judgment is required in estimating the useful life of the assets. In this assessment we consider, among others, our history with similar assets and current and future changes in technology. |
Useful Lives of Property, Plant, and Equipment
Buildings |
|
Predominantly 25 to 50 years |
Leased assets and leasehold improvements |
|
Based on the term of the lease contract |
Information technology equipment |
|
2 to 6 years |
Office furniture |
|
4 to 20 years |
Automobiles |
|
4 to 5 years |
Property, Plant, and Equipment
€ millions |
|
Land and Buildings |
|
Land and |
|
Other Property, |
|
Other Property, |
|
Advance |
|
Total |
|
|
|
|
Buildings Leased |
|
Plant, and |
|
Plant, and |
|
Payments and |
|
|
|
|
|
|
|
|
Equipment |
|
Equipment |
|
Construction |
|
|
|
|
|
|
|
|
|
|
Leased |
|
in Progress |
|
|
12/31/2023 |
|
1,430 |
|
1,320 |
|
1,309 |
|
55 |
|
162 |
|
4,276 |
12/31/2024 |
|
1,501 |
|
1,391 |
|
1,379 |
|
66 |
|
156 |
|
4,493 |
|
|
|
|
|
|
|
|
|
|
|
|
|
Additions |
|
|
|
|
|
|
|
|
|
|
|
|
12/31/2023 |
|
58 |
|
102 |
|
470 |
|
82 |
|
98 |
|
810 |
12/31/2024 |
|
87 |
|
321 |
|
549 |
|
90 |
|
91 |
|
1,138 |
The additions (other than from business combinations) relate primarily to the replacement and purchase of information technology equipment and the construction and leasing of buildings and data centers. The increase in additions is primarily related to renewals of leased buildings. For more information about leases, see Note (D.5).
(D.5) Leases
y Accounting Policies, Judgments, and Estimates |
|
Under IFRS 16, a contract is or contains a lease if the contract conveys the right to control the use of an identified asset for a period of time in exchange for consideration. As a lessee, SAP recognizes a right-of-use asset representing its right to use the underlying asset and a lease liability representing its obligation to make lease payments. The right-of-use assets are depreciated on a straight-line basis and interest expense is recognized on the lease liabilities. The vast majority of our leases consist of facility and data center leases. Payments for short-term and low-value leases are expensed over the lease term. Extension options are included in the lease term if their exercise is reasonably certain. |
F-54
Leases in the Balance Sheet
€ millions |
|
12/31/2024 |
|
12/31/2023 |
Right-of-use assets |
|
|
|
|
Right-of-use assets – land and buildings |
|
1,391 |
|
1,320 |
Right-of-use assets – other property, plant, and equipment |
|
66 |
|
55 |
Total right-of-use assets |
|
1,457 |
|
1,375 |
/ Property, plant, and equipment |
|
4,493 |
|
4,276 |
Right-of-use assets as % of / Property, plant, and equipment |
|
32 |
|
32 |
|
|
|
|
|
Lease liabilities |
|
|
|
|
Current lease liabilities |
|
295 |
|
294 |
/ Current financial liabilities |
|
4,277 |
|
1,735 |
Current lease liabilities as % of / Current financial liabilities |
|
7 |
|
17 |
|
|
|
|
|
Non-current lease liabilities |
|
1,420 |
|
1,327 |
/ Non-current financial liabilities |
|
7,169 |
|
7,941 |
Non-current lease liabilities as % of / Non-current financial liabilities |
|
20 |
|
17 |
Leases in the Income Statements
€ millions |
|
2024 |
|
2023 |
Lease expenses within operating profit |
|
|
|
|
Depreciation of right-of-use assets |
|
280 |
|
325 |
For more information about right-of-use asset additions, see Note (D.4), and for a maturity analysis of lease liabilities, see Note (F.1). For more information about the cash flow related to lease liabilities, see the “Reconciliation of Liabilities Arising from Financing Activities” table within Note (E.3).
F-55
(D.6) Equity Investments
y Accounting Policies, Judgments, and Estimates |
|
|
As we do not designate financial assets as “at fair value through profit or loss,” we generally classify financial assets into the following categories: at amortized cost (AC), at fair value through other comprehensive income (FVOCI), and at fair value through profit or loss (FVTPL), depending on the contractual cash flows of and our business model for holding the respective asset. For equity securities, as the cash flow characteristics are other than solely principal and interest, we take an investment-by-investment decision whether to classify as FVTPL or FVOCI. The valuation of equity securities of private companies requires judgment because it is typically based on significant unobservable inputs, as no market prices are available and there is inherent lack of liquidity. We take the most recent qualitative and quantitative information aspects into consideration to determine the fair value estimates of these equity securities. Considerable judgment and assumptions are involved with regard to the selection of appropriate comparable company data, the assessment of cash requirements of the business, the acceptance of the technology or products in the addressable markets, the actual and forecasted performance, the milestone achievements, the adequacy of price points from financing rounds, the transaction of similar securities of the same company, the rights and preferences of the underlying securities, the selection of adequate equity allocation parameters, the possible exit scenarios and associated weightings. Because all of these assumptions could change significantly, and because valuation is inherently uncertain, our estimated fair values may differ significantly from the values that would have been used had market prices for the investments existed and that will ultimately be realized, and those differences could be material. Gains/losses on equity securities at FVTPL include gains/losses from fair value fluctuations, from disposals as well as dividends, while gains/losses on equity securities at FVOCI only include dividends, all of which are shown in Financial income, net. Regular way purchases and sales are recorded as at the trade date. |
Equity Investments
€ millions |
|
2024 |
|
2023 |
||||||||
|
|
Current |
|
Non-Current |
|
Total |
|
Current |
|
Non-Current |
|
Total |
Equity securities |
|
0 |
|
6,401 |
|
6,401 |
|
0 |
|
4,967 |
|
4,967 |
Investments in associates |
|
0 |
|
144 |
|
144 |
|
0 |
|
135 |
|
135 |
Equity investments |
|
0 |
|
6,545 |
|
6,545 |
|
0 |
|
5,102 |
|
5,102 |
Other financial assets |
|
1,629 |
|
7,141 |
|
8,770 |
|
3,344 |
|
5,543 |
|
8,887 |
Equity investments as % of / Other financial assets |
|
0 |
|
92 |
|
75 |
|
0 |
|
92 |
|
57 |
Investments in Associates
SAP has interests in a number of individually immaterial associates. We own more than 20% of the equity interests or have at least 20% of the voting rights in these entities. Based on these facts and the nature of the relationships, SAP has determined that it has significant influence.
The following table shows, in aggregate, the carrying amount and share of profit of these associates.
€ millions |
|
2024 |
|
2023 |
Carrying amount of interest in associates |
|
144 |
|
135 |
Share of profit and losses from continuing operations |
|
10 |
|
-16 |
The vast majority of the carrying amount of interest in associates relates to SAP Fioneer GmbH.
For a list of the names of other equity investments, see Note (G.9).
Financial Commitments in Venture Capital Funds
€ millions |
|
2024 |
|
2023 |
Committed investments in venture capital funds |
|
267 |
|
269 |
SAP invests and holds interests in unrelated parties that manage investments in venture capital. On December 31, 2024, total commitments to make such investments amounted to €1,100 million (2023: €977 million), of which €833 million had been drawn (2023: €708 million). By investing in such venture capital funds, we are exposed to the risks inherent in the business areas in which the entities operate. Our maximum exposure to loss is the amount invested plus contractually committed future capital contributions.
F-56
Maturities
€ millions |
|
12/31/2024 |
|
|
Investments in Venture |
|
|
Capital Funds |
Due 2025 |
|
267 |
Total |
|
267 |
(D.7) Non-Current Assets by Region
The table below shows non-current assets excluding financial instruments, deferred tax assets, post-employment benefit assets, and rights arising under insurance contracts.
Non-Current Assets by Region
€ millions |
|
2024 |
|
2023 |
Germany |
|
7,351 |
|
7,117 |
Rest of EMEA |
|
6,781 |
|
5,902 |
EMEA |
|
14,132 |
|
13,019 |
United States |
|
26,840 |
|
25,236 |
Rest of Americas |
|
511 |
|
526 |
Americas |
|
27,351 |
|
25,762 |
India |
|
405 |
|
361 |
Rest of APJ |
|
952 |
|
809 |
APJ |
|
1,356 |
|
1,170 |
SAP Group |
|
42,839 |
|
39,951 |
The increase in non-current assets in the rest of EMEA region is primarily due to the acquisition of WalkMe. For more information, see Note (D.1). The increase in the United States region is primarily due to foreign currency exchange differences for goodwill. For more information, see Note (D.2).
For a breakdown of our employee headcount by region, see Note (B.1), and for a breakdown of revenue by region, see Note (A.1).
F-57
(D.8) Purchase Obligations
€ millions |
|
2024 |
|
2023 |
Contractual obligations for acquisition of property, plant, and equipment and intangible assets |
|
270 |
|
164 |
Other purchase obligations |
|
9,322 |
|
10,377 |
Purchase obligations |
|
9,592 |
|
10,541 |
The contractual obligations for acquisition of property, plant, and equipment and intangible assets relate primarily to the purchase of hardware, software, patents, office equipment, and vehicles. The remaining obligations relate mainly to cloud services, marketing, consulting, maintenance, license agreements, and other third-party agreements. The decrease is mainly due to payments made for cloud infrastructure services. Historically, the majority of such purchase obligations have been realized.
Maturities
€ millions |
|
12/31/2024 |
|
|
Purchase Obligations |
Due 2025 |
|
2,870 |
Due 2026 to 2029 |
|
6,576 |
Due thereafter |
|
146 |
Total |
|
9,592 |
(D.9)Income-Related Government Grants
y Recognition of Income-Related Government Grants |
|
We recognize income-related government grants as a reduction of the related expense in the period in which the expense is incurred. |
At the end of 2023, we received a grant from the German government to fund research and development expenditures related to cloud infrastructure. The grant will provide reimbursements of up to €329 million for qualifying expenditures through 2027. As at December 31, 2024, the total amount recognized for reimbursement since the inception of the project was not material.
F-58
Section E — Capital Structure, Financing, and Liquidity
This section describes how SAP manages its capital structure. Our capital management is based on a high equity ratio, modest financial leverage, a well-balanced maturity profile, and deep debt capacity.
(E.1) Capital Structure Management
The primary objective of our capital structure management is to maintain a strong financial profile for investor, creditor, and customer confidence, and to support the growth of our business. We seek to maintain a capital structure that will allow us to continuously cover our funding requirements through the capital markets on reasonable terms and, in so doing, ensure a high level of independence, confidence, and financial flexibility.
SAP’s prime principle of financial risk management is to safeguard liquidity at a level to be able to meet all our financial obligations. In order to support this goal, SAP’s principal use of cash is focused on:
| - | Capital expenditure |
| - | Quick repayment of financial debt |
| - | Acquisitions and venture activities |
| - | Payment of dividends |
| - | Share buybacks to return excess cash to shareholders |
SAP SE’s long-term credit rating is “A1” by Moody’s (stable outlook) and “A+” by S&P Global Ratings (stable outlook).
|
|
12/31/2024 |
|
12/31/2023 |
|
|
||||
|
|
€ millions |
|
% of |
|
€ millions |
|
% of |
|
∆ in % |
|
|
|
|
Total Equity and |
|
|
|
Total Equity and |
|
|
|
|
|
|
Liabilities |
|
|
|
Liabilities |
|
|
/ Equity |
|
45,808 |
|
62 |
|
43,406 |
|
64 |
|
6 |
/ Current liabilities |
|
19,079 |
|
26 |
|
14,641 |
|
21 |
|
30 |
/ Non-current liabilities |
|
9,235 |
|
12 |
|
10,284 |
|
15 |
|
-10 |
/ Liabilities |
|
28,314 |
|
38 |
|
24,925 |
|
36 |
|
14 |
thereof financial debt |
|
9,385 |
|
13 |
|
7,755 |
|
11 |
|
21 |
thereof lease liabilities |
|
1,715 |
|
2 |
|
1,621 |
|
2 |
|
6 |
/ Total equity and liabilities |
|
74,122 |
|
100 |
|
68,331 |
|
100 |
|
8 |
In September 2024, SAP issued a short-term loan of €1.25 billion to finance the acquisition of WalkMe, which can be repaid flexibly until September 2025. In December 2024, SAP drew a total of €1 billion via bilateral credit lines with a term of one year as well as €500 million via two commercial paper tranches of €250 million each. In 2024, we also repaid €850 million in Eurobonds and US$323 million in private placements at maturity. The ratio of total nominal volume of financial debt to total equity and liabilities increased 1pp.
(E.2) Total Equity
y Accounting for Interests in Subsidiaries
Changes in SAP's interest in a subsidiary that do not result in a loss of control are accounted for as equity transactions. When SAP loses control over the subsidiary, it derecognizes the assets and liabilities of the subsidiary, and any related non-controlling interests (NCI) and other components of equity. Any resulting gain or loss is recognized in profit or loss.
Issued Capital
SAP SE has issued no-par value bearer shares with a calculated nominal value of €1 per share. All of the shares issued are fully paid.
F-59
Number of Shares
|
|
Issued |
|
Treasury |
Millions |
|
Capital |
|
Shares |
1/1/2022 |
|
1,228.5 |
|
-48.9 |
Purchase of treasury shares |
|
0 |
|
-15.7 |
Reissuance of treasury shares under share-based payments |
|
0 |
|
3.3 |
12/31/2022 |
|
1,228.5 |
|
-61.4 |
Purchase of treasury shares |
|
0 |
|
-7.6 |
Reissuance of treasury shares under share-based payments |
|
0 |
|
7.7 |
12/31/2023 |
|
1,228.5 |
|
-61.3 |
Purchase of treasury shares |
|
0 |
|
-10.9 |
Reissuance of treasury shares under share-based payments |
|
0 |
|
10.2 |
12/31/2024 |
|
1,228.5 |
|
-61.9 |
For more details about the share repurchase program executed in 2023 and 2024, see the section Treasury Shares below.
Authorized Shares
The Articles of Incorporation authorize the Executive Board to increase the issued capital as follows:
| - | By up to a total amount of €250 million by issuing new no-par value bearer shares against contributions in cash until May 19, 2025 (Authorized Capital I). The issuance is subject to the statutory subscription rights of existing shareholders. |
| - | By up to a total amount of €250 million by issuing new no-par value bearer shares against contributions in cash or in kind until May 19, 2025 (Authorized Capital II). Subject to the consent of the Supervisory Board, the Executive Board is authorized to exclude the shareholders’ statutory subscription rights in certain cases. |
Contingent Shares
SAP SE’s share capital is subject to a contingent capital increase, which will be implemented only insofar as the holders or creditors of convertible bonds or stock options issued or guaranteed by SAP SE or any of its directly or indirectly controlled subsidiaries under certain share-based payments exercise their conversion or subscription rights, and no other methods for servicing these rights are used. As at December 31, 2024, €100 million, representing 100 million shares, was still available for issuance (2023: €100 million).
Retained Earnings
Retained earnings mainly comprise profit after tax and dividend payments as well as transactions with non-controlling interests.
Other Components of Equity
€ millions |
|
Exchange |
|
Cash Flow |
|
Total |
|
|
Differences |
|
Hedges/Cost of |
|
|
|
|
|
|
Hedging |
|
|
1/1/2022 |
|
1,830 |
|
-22 |
|
1,808 |
Other comprehensive income for items that will be reclassified to profit or loss, net of tax |
|
2,186 |
|
39 |
|
2,224 |
12/31/2022 |
|
4,015 |
|
16 |
|
4,031 |
Other comprehensive income for items that will be reclassified to profit or loss, net of tax |
|
-1,597 |
|
-8 |
|
-1,605 |
12/31/2023 |
|
2,418 |
|
9 |
|
2,426 |
Other comprehensive income for items that will be reclassified to profit or loss, net of tax |
|
2,372 |
|
-24 |
|
2,349 |
12/31/2024 |
|
4,790 |
|
-15 |
|
4,775 |
F-60
Treasury Shares
By resolution of SAP SE’s Annual General Meeting of Shareholders held on May 11, 2023, the authorization granted by the Annual General Meeting of Shareholders on May 17, 2018, regarding the acquisition of treasury shares was revoked to the extent it had not been exercised at that time, and replaced by a new authorization of the Executive Board of SAP SE to acquire, on or before May 10, 2028, shares of SAP SE representing a pro rata amount of capital stock of up to €120 million in aggregate, provided that the shares purchased under the authorization, together with any other shares in the Company previously acquired and held by, or attributable to, SAP SE do not account for more than 10% of SAP SE’s issued share capital. Although treasury shares are legally considered outstanding, there are no dividend or voting rights associated with them. We may redeem or resell shares held in treasury, or we may use treasury shares for the purpose of servicing option or conversion rights under the Company’s share-based payment plans. Also, we may use shares held in treasury as consideration in connection with mergers with, or acquisitions of, other companies.
Following the above authorization, in May 2023 we announced a new share buyback program with an aggregate volume of up to €5 billion and a term until December 31, 2025, which is designed primarily to service share-based compensation awards. As part of this program, we acquired shares with a volume of €2,108 million (without incidental acquisition costs) in 2024.
Distribution Policy and Dividends
Our general intention is to remain in a position to return liquidity to our shareholders by distributing annual dividends totaling at least 40% of the SAP Group’s non-IFRS profit after tax from continuing operations (previously: 40% or more of the Group’s IFRS profit after tax) and by potentially repurchasing treasury shares in future.
In 2024, we distributed €2,565 million (€2.20 per share) in dividends for 2023, compared to €2,395 million (€2.05 per share) paid in 2023 for 2022 and €2,865 million (€2.45 per share, including a special dividend of €0.50 to celebrate SAP’s 50th anniversary) paid in 2022 for 2021.
The total dividend available for distribution to SAP SE shareholders is based on the profits of SAP SE as reported in its statutory financial statements prepared under the accounting rules in the German Commercial Code (Handelsgesetzbuch). For the year ended December 31, 2024, the Executive Board intends to propose that a dividend of €2.35 per share (that is, an estimated total dividend of €2,741 million), be paid from the profits of SAP SE.
Non-Controlling Interests
In 2024, a profit of €26 million was attributed to non-controlling interests (2023: a loss of €33 million was attributed to non-controlling interests of other SAP entities, and a loss of € 141 million was attributed to Qualtrics).
F-61
(E.3) Liquidity
y Accounting for Non-Derivative Financial Instruments |
|
Classification and Measurement of Non-Derivative Financial Debt Investments |
|
|
Our non-derivative financial debt investments comprise cash at banks and cash equivalents (highly liquid investments with original maturities of three months or less, such as time deposits and money-market funds), loans and other financial receivables, and acquired debt securities. We generally classify financial assets as: at amortized cost (AC), at fair value through other comprehensive income (FVOCI), or at fair value through profit or loss (FVTPL), depending on the contractual cash flows of, and our business model for, holding the respective asset. Financial assets having cash flow characteristics other than solely principal and interest such as money market and similar funds are classified as FVTPL. Generally, other financial assets with cash flows consisting solely of principal and interest are held within a business model whose objective is "hold to collect" and are thus classified as AC. Occasionally, such other financial assets are held within a business model whose objective is "hold to collect and sell" in which case they are classified as FVOCI. Gains/losses on non-derivative financial debt investments at FVTPL are reported in Financial income, net and show interest income/expenses separately from other gains/losses which include gains/losses from fair value fluctuations and disposals. Gains/losses on non-derivative financial debt investments at AC are reported in Financial income, net and show interest income/expenses separately from other gains/losses which include gains/losses on disposals and changes in expected and incurred credit losses. Gains/losses from foreign currency exchange rate fluctuations are included in Other non-operating income/expense, net. Regular way purchases and sales are recorded as at the trade date. |
|
Impairment of Non-Derivative Financial Debt Investments For these financial assets, we apply considerable judgment by employing the general impairment approach as follows: -
For cash at banks, time deposits, and debt securities such as acquired bonds and acquired commercial paper, we apply the low credit risk exception, as it is our policy to invest only in high-quality assets of issuers with a minimum rating of at least investment grade to minimize the risk of credit losses. Thus, these assets are always allocated to stage 1 of the three-stage credit loss model, and we record a loss allowance at an amount equal to 12-month expected credit losses. This loss allowance is calculated based on our exposure at the respective reporting date, the loss given default for this exposure, and the credit default swap spread as a measure for the probability of default. Even though we invest only in assets of at least investment-grade, we also closely observe the development of credit default swap spreads as a measure of market participants’ assessments of the creditworthiness of a debtor to evaluate probable significant increases in credit risk to timely react to changes should these manifest. Among others, we consider cash at banks, time deposits, and debt securities to be in default when the counterparty is unlikely to pay its obligations in full, when there is information about a counterparty’s financial difficulties or if there is a drastic increase in a counterparty’s credit default swap spread for a prolonged time period while the overall market environment remains generally stable. Such financial assets are written off either partially or in full if the likelihood of recovery is considered remote, which might be evidenced, for example, by the bankruptcy of a counterparty of such financial assets.
-
Loans and other financial receivables are monitored based on borrower-specific internal and external information to determine whether there has been a significant increase in credit risk since initial recognition. We consider such assets to be in default if they are significantly beyond their due date or if the borrower is unlikely to pay its obligation. A write-off occurs when the likelihood of recovery is considered remote, for example when bankruptcy proceedings have been finalized or when all enforcement efforts have been exhausted.
|
Non-Derivative Financial Liabilities |
|
Non-derivative financial liabilities include bank loans, issued bonds, private placements, and other financial liabilities. Other financial liabilities also include customer funding liabilities which are funds we draw from and make payments on behalf of our customers for customers’ employee expense reimbursements, related credit card payments, and vendor payments. We present these funds in cash and cash equivalents and record our obligation to make these expense reimbursements and payments on behalf of our customers as customer funding liabilities. As we do not designate financial liabilities as FVTPL, we generally classify non-derivative financial liabilities as AC. Expenses and gains or losses on financial liabilities at AC mainly consist of interest expense which is shown in Financial income, net. Gains/losses from foreign currency exchange rate fluctuations are included in Other non-operating income/expense, net. Group Liquidity, Financial Debt, and Net Debt Group liquidity consists of cash at banks, money market and other funds, as well as time deposits and debt securities (both with remaining maturities of less than one year). Financial debt is defined as the nominal volume of bank loans, issued commercial paper, private placements, and bonds. Net debt is group liquidity less financial debt. |
F-62
Group Liquidity and Net Debt
€ millions |
|
2024 |
|
2023 |
|
∆ |
/ Cash and cash equivalents |
|
9,609 |
|
8,124 |
|
1,485 |
Current time deposits and debt securities |
|
1,471 |
|
3,151 |
|
-1,680 |
Group liquidity |
|
11,080 |
|
11,275 |
|
-195 |
Current financial debt |
|
-3,639 |
|
-1,143 |
|
-2,496 |
Non-current financial debt |
|
-5,746 |
|
-6,612 |
|
866 |
Financial debt |
|
-9,385 |
|
-7,755 |
|
-1,631 |
Net debt (–) |
|
1,695 |
|
3,521 |
|
-1,825 |
While we continuously monitor the ratios presented in the capital structure table, we actively manage our liquidity and structure of our financial indebtedness based on the ratios group liquidity and net debt.
Cash and Cash Equivalents
€ millions |
|
2024 |
|
2023 |
||||||||
|
|
Current |
|
Non-Current |
|
Total |
|
Current |
|
Non-Current |
|
Total |
Cash at banks |
|
3,962 |
|
0 |
|
3,962 |
|
3,369 |
|
0 |
|
3,369 |
Time deposits |
|
1,659 |
|
0 |
|
1,659 |
|
2,130 |
|
0 |
|
2,130 |
Money market and other funds |
|
3,991 |
|
0 |
|
3,991 |
|
2,478 |
|
0 |
|
2,478 |
Debt securities |
|
0 |
|
0 |
|
0 |
|
150 |
|
0 |
|
150 |
Expected credit loss allowance |
|
-3 |
|
0 |
|
-3 |
|
-3 |
|
0 |
|
-3 |
/ Cash and cash equivalents |
|
9,609 |
|
0 |
|
9,609 |
|
8,124 |
|
0 |
|
8,124 |
Non-Derivative Financial Debt Investments
€ millions |
|
2024 |
|
2023 |
||||||||
|
|
Current |
|
Non-Current |
|
Total |
|
Current |
|
Non-Current |
|
Total |
Time deposits |
|
1,425 |
|
0 |
|
1,425 |
|
3,028 |
|
0 |
|
3,028 |
Debt securities |
|
53 |
|
74 |
|
128 |
|
129 |
|
0 |
|
129 |
Financial instruments related to employee benefit plans |
|
0 |
|
287 |
|
287 |
|
0 |
|
244 |
|
244 |
Loans and other financial receivables |
|
98 |
|
231 |
|
329 |
|
58 |
|
50 |
|
108 |
Expected credit loss allowance |
|
-7 |
|
0 |
|
-7 |
|
-7 |
|
0 |
|
-7 |
Non-derivative financial debt investments |
|
1,569 |
|
593 |
|
2,161 |
|
3,209 |
|
294 |
|
3,503 |
/ Other financial assets |
|
1,629 |
|
7,141 |
|
8,770 |
|
3,344 |
|
5,543 |
|
8,887 |
Non-derivative financial debt investments as % of / Other financial assets |
|
96 |
|
8 |
|
25 |
|
96 |
|
5 |
|
39 |
Time deposits with original maturity of three months or less are presented as cash and cash equivalents, and those with original maturities of greater than three months (investments considered in group liquidity) are presented as other financial assets. Debt securities consist of acquired commercial paper and acquired bonds of mainly financial and non-financial corporations and municipalities.
The increase in money market funds and other funds was offset by a decrease in time deposits. This strategic shift was aimed at securing liquidity as needed.
For more information about financial risk and the nature of risk, see Note (F.1).
F-63
Financial Debt
€ millions |
|
2024 |
|
2023 |
||||||||||||||||
|
|
Nominal Volume |
|
Carrying Amount |
|
Nominal Volume |
|
Carrying Amount |
||||||||||||
|
|
Current |
|
Non-Current |
|
Current |
|
Non-Current |
|
Total |
|
Current |
|
Non-Current |
|
Current |
|
Non-Current |
|
Total |
Bonds |
|
889 |
|
5,650 |
|
888 |
|
5,201 |
|
6,090 |
|
850 |
|
6,521 |
|
849 |
|
5,932 |
|
6,780 |
Private placement transactions |
|
0 |
|
96 |
|
0 |
|
99 |
|
99 |
|
292 |
|
90 |
|
294 |
|
95 |
|
388 |
Commercial Paper |
|
500 |
|
0 |
|
498 |
|
0 |
|
498 |
|
0 |
|
0 |
|
0 |
|
0 |
|
0 |
Bank loans |
|
2,250 |
|
0 |
|
2,250 |
|
0 |
|
2,250 |
|
0 |
|
0 |
|
0 |
|
0 |
|
0 |
Financial debt |
|
3,639 |
|
5,746 |
|
3,636 |
|
5,301 |
|
8,937 |
|
1,143 |
|
6,612 |
|
1,143 |
|
6,026 |
|
7,169 |
/ Financial liabilities |
|
|
|
|
|
4,277 |
|
7,169 |
|
11,446 |
|
|
|
|
|
1,735 |
|
7,941 |
|
9,676 |
Financial debt as % of / Financial liabilities |
|
|
|
|
|
85 |
|
74 |
|
78 |
|
|
|
|
|
66 |
|
76 |
|
74 |
Financial liabilities are unsecured, except for the retention of title and similar rights customary in our industry. Effective interest rates on our financial debt (including the effects from interest rate swaps) were 3.33% in 2024, 3.49% in 2023, and 1.23% in 2022.
None of our financial debt is restricted by financial covenants. Our financial debt includes covenants customarily used, such as change of control or regulatory changes that trigger an immediate repayment. Bonds and private placements are classified as non-current as at December 31, 2024, as SAP has an existing right to defer settlement for at least 12 months after the reporting period. For more information about the risk associated with our financial liabilities, see Note (F.1). For more information about fair values, see Note (F.2).
Bonds
|
|
2024 |
|
2023 |
|||||||||||
|
|
Maturity |
|
Issue Price |
|
Coupon Rate |
|
Effective Interest |
|
Nominal Volume |
|
Carrying |
|
Carrying |
|
|
|
|
|
|
|
|
|
Rate |
|
(in respective |
|
Amount |
|
Amount |
|
|
|
|
|
|
|
|
|
|
|
currency |
|
(in € millions) |
|
(in € millions) |
|
|
|
|
|
|
|
|
|
|
|
in millions) |
|
|
|
|
|
Eurobond 9 – 2014 |
|
2027 |
|
99.284 |
% |
1.750% (fix) |
|
1.87 |
% |
€ |
1,000 |
|
947 |
|
914 |
Eurobond 12 – 2015 |
|
2025 |
|
99.264 |
% |
1.000% (fix) |
|
1.13 |
% |
€ |
600 |
|
600 |
|
599 |
Eurobond 15 – 2018 |
|
2026 |
|
99.576 |
% |
1.000% (fix) |
|
1.06 |
% |
€ |
500 |
|
500 |
|
499 |
Eurobond 16 – 2018 |
|
2030 |
|
98.687 |
% |
1.375% (fix) |
|
1.50 |
% |
€ |
500 |
|
442 |
|
428 |
Eurobond 19 – 2018 |
|
2024 |
|
99.227 |
% |
0.750% (fix) |
|
0.89 |
% |
€ |
850 |
|
0 |
|
849 |
Eurobond 20 – 2018 |
|
2028 |
|
98.871 |
% |
1.250% (fix) |
|
1.38 |
% |
€ |
1,000 |
|
923 |
|
891 |
Eurobond 21 – 2018 |
|
2031 |
|
98.382 |
% |
1.625% (fix) |
|
1.78 |
% |
€ |
1,250 |
|
1,079 |
|
1,045 |
Eurobond 23 – 2020 |
|
2026 |
|
99.200 |
% |
0.125% (fix) |
|
0.26 |
% |
€ |
600 |
|
599 |
|
598 |
Eurobond 24 – 2020 |
|
2029 |
|
98.787 |
% |
0.375% (fix) |
|
0.51 |
% |
€ |
800 |
|
712 |
|
686 |
Eurobonds |
|
|
|
|
|
|
|
|
|
|
|
|
5,801 |
|
6,509 |
USD bond - 2018 |
|
2025 |
|
100.000 |
% |
4.69% (fix) |
|
4.74 |
% |
US$ |
300 |
|
289 |
|
271 |
Bonds |
|
|
|
|
|
|
|
|
|
|
|
|
6,090 |
|
6,780 |
All of our Eurobonds are listed for trading on the Luxembourg Stock Exchange.
F-64
Private Placements
|
|
2024 |
|
2023 |
||||||||
|
|
Maturity |
|
Coupon Rate |
|
Effective Interest |
|
Nominal Volume |
|
Carrying Amount |
|
Carrying Amount |
|
|
|
|
|
|
Rate |
|
(in respective |
|
(in € millions) |
|
(in € millions) |
|
|
|
|
|
|
|
|
currency in |
|
|
|
|
|
|
|
|
|
|
|
|
millions) |
|
|
|
|
U.S. private placements |
|
|
|
|
|
|
|
|
|
|
|
|
Tranche 8 – 2012 |
|
2024 |
|
3.33% (fix) |
|
3.37 |
% |
US$ |
|
0 |
|
294 |
Tranche 9 – 2012 |
|
2027 |
|
3.53% (fix) |
|
3.57 |
% |
US$ |
|
99 |
|
95 |
Private placements |
|
|
|
|
|
|
|
|
|
99 |
|
388 |
The U.S. private placement notes were issued by one of our subsidiaries that has the U.S. dollar as its functional currency.
Commercial Paper Program
The net proceeds from our commercial paper program (Commercial Paper, or CP) are being used for general corporate purposes. As at December 31, 2024, we have €500 million of CP outstanding with maturities generally less than 12 months and the carrying amount amounted to €498 million (December 31, 2023: €0). The weighted average interest rate of our CP is – 3.03% as at December 31, 2024 (December 31, 2023: 0%).
Loans
SAP drew short-term loans of €2,250 million for general corporate purposes, including the acquisition of WalkMe, that can be flexibly repaid until December 2025. The effective interest rate on the loans is 3.25% in 2024 (2023: 0%). The loans contain information covenants.
F-65
Reconciliation of Liabilities Arising from Financing Activities
The changes in our financial debts are reconciled to the cash flows from borrowings included in the cash flow from financing activities.
€ millions |
|
1/1/2024 |
|
Cash Flows |
|
Business |
|
Foreign |
|
Fair Value |
|
Other |
|
12/31/2024 |
|
|
|
|
|
|
Combinations |
|
Currency |
|
Changes |
|
|
|
|
Current financial debt |
|
1,143 |
|
1,594 |
|
0 |
|
35 |
|
0 |
|
868 |
|
3,639 |
Non-current financial debt |
|
6,612 |
|
0 |
|
0 |
|
2 |
|
0 |
|
-868 |
|
5,746 |
Financial debt (nominal volume) |
|
7,755 |
|
1,594 |
|
0 |
|
37 |
|
0 |
|
0 |
|
9,385 |
Basis adjustment |
|
-550 |
|
0 |
|
0 |
|
0 |
|
131 |
|
0 |
|
-419 |
Transaction costs |
|
-35 |
|
-3 |
|
0 |
|
0 |
|
0 |
|
10 |
|
-29 |
Financial debt (carrying amount) |
|
7,169 |
|
1,591 |
|
0 |
|
37 |
|
131 |
|
10 |
|
8,937 |
Accrued interest and payment to banks |
|
94 |
|
13 |
|
0 |
|
0 |
|
0 |
|
123 |
|
230 |
Interest rate swaps |
|
537 |
|
0 |
|
0 |
|
0 |
|
-129 |
|
0 |
|
408 |
Lease1 |
|
1,621 |
|
-310 |
|
0 |
|
32 |
|
0 |
|
372 |
|
1,715 |
Total liabilities from financing activities |
|
9,421 |
|
1,294 |
|
0 |
|
69 |
|
2 |
|
504 |
|
11,290 |
1 Other includes new lease liabilities.
€ millions |
|
1/1/2023 |
|
Cash Flows |
|
Business |
|
Foreign |
|
Fair Value |
|
Other |
|
12/31/2023 |
|
|
|
|
|
|
Combinations |
|
Currency |
|
Changes |
|
|
|
|
Current financial debt |
|
3,986 |
|
-3,986 |
|
0 |
|
0 |
|
0 |
|
1,142 |
|
1,143 |
Non-current financial debt |
|
7,778 |
|
0 |
|
0 |
|
-24 |
|
0 |
|
-1,142 |
|
6,612 |
Financial debt (nominal volume) |
|
11,764 |
|
-3,986 |
|
0 |
|
-24 |
|
0 |
|
0 |
|
7,755 |
Basis adjustment |
|
-773 |
|
0 |
|
0 |
|
2 |
|
221 |
|
0 |
|
-550 |
Transaction costs |
|
-47 |
|
0 |
|
0 |
|
0 |
|
0 |
|
12 |
|
-35 |
Financial debt (carrying amount) |
|
10,943 |
|
-3,986 |
|
0 |
|
-22 |
|
221 |
|
12 |
|
7,169 |
Accrued interest |
|
203 |
|
-83 |
|
0 |
|
0 |
|
0 |
|
-27 |
|
94 |
Interest rate swaps |
|
753 |
|
0 |
|
0 |
|
-1 |
|
-215 |
|
0 |
|
537 |
Lease |
|
2,140 |
|
-332 |
|
0 |
|
55 |
|
0 |
|
-241 |
|
1,621 |
Total liabilities from financing activities |
|
14,039 |
|
-4,400 |
|
0 |
|
32 |
|
7 |
|
-256 |
|
9,421 |
F-66
Section F — Management of Financial Risk Factors
This section discusses financial risk factors and risk management regarding foreign currency exchange rate risk, interest rate risk, equity price risk, credit risk, and liquidity risk. Further, it contains information about financial instruments.
(F.1) Financial Risk Factors and Risk Management
y Accounting for Derivative Financial Instruments |
|
We use derivatives to hedge foreign currency risk or interest rate risk and designate them as cash flow or fair value hedges if they qualify for hedge accounting under IFRS 9, which involves judgment. Derivatives Not Designated as Hedging Instruments in Hedge Accounting Relationships Many transactions constitute economic hedges, and therefore contribute effectively to the securing of financial risks but do not qualify for hedge accounting under IFRS 9. To hedge currency risks inherent in foreign-currency denominated and recognized monetary assets and liabilities, we do not designate our held-for-trading derivative financial instruments in hedge accounting, because the profits and losses from the underlying transactions are recognized in profit or loss in the same periods as the profits or losses from the derivatives. In addition, we occasionally have contracts that contain foreign currency embedded derivatives that are required to be accounted for separately. Fair value fluctuations in the spot component of such derivatives at FVTPL are included in Other non-operating income/expense, net while the forward element is shown in Financial income, net. |
F-67
|
Derivatives Designated as Hedging Instruments a) Cash Flow Hedge In general, we apply cash flow hedge accounting to the foreign currency risk of highly probable forecasted transactions. With regard to foreign currency risk, hedge accounting relates to the spot price and to the intrinsic values of the derivatives designated and qualifying as cash flow hedges. Accordingly, the effective portion of these components determined on a present value basis is recorded in other comprehensive income. The forward element and time value as well as foreign currency basis spreads excluded from the hedging relationship are recorded as cost of hedging in a separate position in other comprehensive income. As the amounts are not material, they are presented together with the effective portion of the cash flow hedges in our consolidated statements of comprehensive income and consolidated statements of changes in equity. All other components including counterparty credit risk adjustments of the derivative and the ineffective portion are immediately recognized in Financial Income, net in profit or loss. Amounts accumulated in other comprehensive income are generally reclassified to profit or loss to Other non-operating income/expense, net and Financial income, net in the same period when the hedged item affects profit or loss. b) Net Investment Hedge In general, we do not hedge the foreign currency exposure from the net assets of subsidiaries with a functional currency different from the euro, and we do not apply net investment hedge accounting. However, in selected cases we might do so, and we applied net investment hedge accounting in 2023. For more information, see Note (D.1). The designated component in hedge accounting is the spot price of the derivatives designated and qualifying as net investment hedges. Accordingly, the effective portion of this component determined on a present value basis is recorded in Other comprehensive income. All other not-designated components or ineffective portions are immediately recognized in Financial Income, net in profit or loss. Amounts accumulated in Other comprehensive income are reclassified to Other non-operating income/expense, net within profit or loss in the same period when the foreign operation is partially disposed of or sold. c) Fair Value Hedge We apply fair value hedge accounting for certain of our fixed-rate financial liabilities and show the fair value fluctuations in Financial income, net. d) Valuation and Testing of Effectiveness At inception of a designated hedging relationship, we document our risk management strategy and the economic relationship between hedged item and hedging instrument. The existence of an economic relationship is demonstrated as well as the effectiveness of the hedging relationship tested prospectively by applying the critical terms match for our foreign currency hedges, since currencies, maturities, and the amounts are closely aligned for the forecasted transactions and for the spot element of the forward exchange rate contract or intrinsic value of the currency options, respectively. For interest rate swaps, effectiveness is tested prospectively using statistical methods in the form of a regression analysis, by which the validity and extent of the relationship between the change in value of the hedged items as the independent variable and the fair value change of the derivatives as the dependent variable is determined. The main sources of ineffectiveness are: -
The effect of the counterparty and our own credit risk on the fair value of the forward exchange contracts and interest rate swaps, which is not reflected in the respective hedged item.
|
F-68
We are exposed to various financial risks, such as market risks (that is, foreign currency exchange rate risk, interest rate risk, and equity price risk), credit risk, and liquidity risk.
We manage market risks, credit risk, and liquidity risk on a Group-wide basis through our global treasury department, global risk management, and global credit management. Risk management policies are established to identify risks, to set appropriate risk limits, and to monitor risks. Risk management policies and hedging strategies are laid out in our internal guidelines (for example, treasury and other internal guidelines), and are subject to continuous internal review, analysis, and update to reflect changes in market conditions and our business.
We only purchase derivative financial instruments to reduce risks and not for speculation, which is defined as entering into derivative instruments without a corresponding underlying transaction.
Foreign Currency Exchange Rate Risk
Foreign Currency Exchange Rate Risk Factors
As we are active worldwide, our ordinary operations are subject to risks associated with fluctuations in foreign currencies. Since the Group’s entities mainly conduct their operating business in their own functional currencies, our risk of exchange rate fluctuations from ongoing ordinary operations is not considered significant. However, the Group's entities occasionally generate foreign currency-denominated receivables, payables, and other monetary items by transacting in a currency other than the respective functional currency. To mitigate the extent of the associated foreign currency exchange rate risk, a significant portion of these transactions is hedged as described below.
In rare circumstances, transacting in a currency other than the functional currency also leads to embedded foreign currency derivatives being separated and measured at fair value through profit or loss.
In addition, the intellectual property (IP) holders in the SAP Group are exposed to risks associated with forecasted intercompany cash flows in foreign currencies. These cash flows arise out of royalty payments from subsidiaries to the respective IP holder. The royalties are linked to the subsidiaries’ external revenue. This arrangement leads to a concentration of the foreign currency exchange rate risk with the IP holders, as the royalties are mostly denominated in the subsidiaries’ local currencies, while the functional currency of the IP holders with the highest royalty volume is the euro. The highest foreign currency exchange rate exposure of this kind relates to the currencies of subsidiaries with significant operations, for example the U.S. dollar, the pound sterling, the Japanese yen, the Swiss franc, and, in 2023, the Australian dollar.
Generally, we are not exposed to any significant foreign currency exchange rate risk with regard to our investing and financing activities, as such activities are normally conducted in the functional currency of the investing or borrowing entity.
Foreign Currency Exchange Rate Risk Management
We continuously monitor our exposure to currency fluctuation risks based on monetary items and forecasted transactions and pursue a Group-wide strategy to manage foreign currency exchange rate risk, using derivative financial instruments, primarily foreign exchange forward contracts.
With regard to our exposure from monetary items, our primary aim is to reduce profit or loss volatility. Therefore, related hedging instruments are not designated as being in a hedge accounting relationship because the profits and losses from the underlying transactions are recognized in profit or loss in the same periods as the profits or losses from the derivatives.
With respect to forecasted transactions, up until December 2024 our risk management strategy was to reduce year-over-year profit or loss volatility via a rolling 12-month hedge horizon. Since December 2024, our forecasted exposure hedging strategy is aimed at reducing volatility from foreign currency fluctuations on the forecasted Free Cash Flow (FCF) of a calendar year by preserving foreign exchange rates valid at the beginning of the calendar year when the FCF guidance is given. Notwithstanding the change in foreign currency exchange rate risk management, our hedged item remains a layer of the forecasted cash flows from royalty payments to IP holders as they correlate to our FCF. Due to the change in our foreign currency exchange rate risk management, we re-designated all existing cash flow hedge relationships and entered into new cash flow hedge relationships in December 2024.
Currency Hedges Designated as Hedging Instruments (Cash Flow Hedges)
We enter into derivative financial instruments, primarily foreign exchange forward contracts, to hedge significant forecasted cash flows (royalties) from foreign subsidiaries denominated in foreign currencies with a hedge ratio of 1:1 and a hedge horizon of up to 12 months, which is also the maximum maturity of the foreign exchange derivatives we use.
For all years presented, no previously highly probable transaction designated as a hedged item in a foreign currency cash flow hedge relationship ceased to be probable. Therefore, we did not discontinue any of our cash flow hedge relationships except for those affected by the change in our foreign currency exchange rate risk management. Also, ineffectiveness was either not material or non-existent in all years reported. Generally, the cash flows of the hedged forecasted transactions are expected to occur and to be recognized in profit or loss monthly within the respective calendar year.
F-69
Currency Hedges Designated as Hedging Instruments (Net Investment Hedges)
In 2023, we hedged part of our net investment in our U.S. subsidiaries which have the U.S. dollar as their functional currency, by entering into a deal contingent forward. The hedged risk is the weakening of the U.S. dollar against the euro. The deal contingent forward was designated as a hedging instrument for the changes in the value of the net investment that is attributable to changes in the U.S. dollar/euro spot rate.
To assess hedge effectiveness, we have determined the economic relationship between the hedging instrument and the hedged item, by comparing changes in the carrying amount of the deal contingent forward that is attributable to a change in the spot rate with changes in the investment in the U.S. subsidiaries due to movements in the spot rate.
The amounts as at December 31 relating to items designated as hedged items were as follows:
Designated Hedged Items in Foreign Currency Exchange Rate Hedges
€ millions |
|
Forecasted |
|
Net Investment |
|
Forecasted |
|
Net Investment |
|
|
|
2024 |
|
2023 |
|||||
Change in value used for calculating hedge ineffectiveness |
|
|
-19 |
|
0 |
|
19 |
|
-15 |
Cash flow hedge |
|
|
-19 |
|
0 |
|
19 |
|
0 |
Cost of hedging |
|
|
-3 |
|
0 |
|
-7 |
|
0 |
Balances remaining in cash flow hedge reserve for which hedge accounting is no longer applied |
|
|
0 |
|
-15 |
|
0 |
|
-15 |
The amounts as at December 31 designated as hedging instruments were as follows:
Designated Hedging Instruments in Foreign Currency Exchange Rate Hedges
€ millions |
|
Forecasted License |
|
Net Investment |
|
Forecasted License |
|
Net Investment |
|
|
2024 |
|
2023 |
||||
Nominal amount |
|
3,735 |
|
0 |
|
2,390 |
|
0 |
Carrying amount |
|
|
|
|
|
|
|
|
Other financial assets |
|
12 |
|
0 |
|
33 |
|
0 |
Other financial liabilities |
|
-32 |
|
0 |
|
-20 |
|
0 |
Change in value recognized in OCI |
|
-19 |
|
0 |
|
19 |
|
15 |
Hedge ineffectiveness recognized in Finance income, net |
|
0 |
|
0 |
|
0 |
|
-106 |
Cost of hedging recognized in OCI |
|
-3 |
|
0 |
|
-7 |
|
0 |
Amount reclassified from cash flow hedge in OCI to Other non-operating income, net |
|
-78 |
|
0 |
|
62 |
|
0 |
Amount reclassified from cost of hedging in OCI to Finance income, net |
|
-17 |
|
0 |
|
-9 |
|
0 |
On December 31, we held the following instruments to hedge exposures to changes in foreign currency:
Details on Hedging Instruments in Foreign Currency Exchange Rate Hedges
|
|
Maturity |
||||||
|
|
2024 |
|
2023 |
||||
|
|
1–6 Months |
|
7–12 Months |
|
1–6 Months |
|
7–12 Months |
Forward exchange contracts |
|
|
|
|
|
|
|
|
Net exposure in € millions |
|
2,078 |
|
1,657 |
|
1,364 |
|
1,025 |
Average EUR:GBP forward rate |
|
0.83 |
|
0.84 |
|
0.88 |
|
0.88 |
Average EUR:JPY forward rate |
|
158.63 |
|
157.46 |
|
148.12 |
|
152.10 |
Average EUR:CHF forward rate |
|
0.92 |
|
0.91 |
|
0.96 |
|
0.94 |
Average EUR:AUD forward rate |
|
0 |
|
0 |
|
1.64 |
|
1.67 |
Average EUR:USD forward rate |
|
1.06 |
|
1.07 |
|
1.10 |
|
1.09 |
F-70
Foreign Currency Exchange Rate Exposure
Our risk exposure is based on the following assumptions:
| - | The SAP Group’s entities generally operate in their functional currencies. In exceptional cases and limited economic environments, operating transactions are denominated in currencies other than the functional currency, leading to a foreign currency exchange rate risk for the related monetary instruments. Where material, this foreign currency exchange rate risk is hedged. Therefore, fluctuations in foreign currency exchange rates only have an impact on profit with regard to our unhedged non-derivative monetary financial instruments and related income or expenses. |
| - | Our free-standing derivatives designed for hedging foreign currency exchange rate risks almost completely balance the changes in the fair values of the hedged item attributable to exchange rate movements in the Consolidated Income Statements in the same period. As a consequence, the hedged items and the hedging instruments are not exposed to foreign currency exchange rate risks, and thereby have no effect on profit. |
Consequently, we are only exposed to significant foreign currency exchange rate fluctuations with regard to the following:
| - | The spot component of derivatives held within a designated cash flow hedge relationship affecting other comprehensive income |
| - | Foreign currency embedded derivatives affecting other non-operating expense, net |
| - | Unhedged foreign - currency monetary assets and liabilities affecting other non - operating expense, net |
Thus, our foreign currency exposure (and our average/high/low exposure) as at December 31 was as follows:
Foreign Currency Exposure
€ billions |
|
2024 |
|
2023 |
Year-end exposure toward all our major currencies |
|
5.6 |
|
4.2 |
Average exposure |
|
4.5 |
|
3.3 |
Highest exposure |
|
5.6 |
|
4.2 |
Lowest exposure |
|
3.3 |
|
2.5 |
Foreign Currency Exchange Rate Sensitivity
If, on December 31, the foreign currency exchange rates had been higher/lower as described below, this would have had the following effects on other non-operating expense, net and other comprehensive income:
Foreign Currency Sensitivity
€ millions |
|
Effects on Other Non-Operating Expense, Net |
|
Effects on Other Comprehensive Income |
||||||||
|
|
2024 |
|
2023 |
|
2022 |
|
2024 |
|
2023 |
|
2022 |
Derivatives held within a designated cash flow hedge relationship |
|
|
|
|
|
|
|
|
|
|
|
|
All major currencies –10% against the euro |
|
|
|
|
|
|
|
375 |
|
238 |
|
135 |
All major currencies +10% against the euro |
|
|
|
|
|
|
|
-375 |
|
-238 |
|
-135 |
thereof: USD –10% against the euro |
|
|
|
|
|
|
|
281 |
|
131 |
|
29 |
thereof: USD +10% against the euro |
|
|
|
|
|
|
|
-281 |
|
-131 |
|
-29 |
Embedded derivatives |
|
|
|
|
|
|
|
|
|
|
|
|
All currencies –10% against the respective functional currency |
|
-56 |
|
-63 |
|
-38 |
|
|
|
|
|
|
All currencies +10% against the respective functional currency |
|
56 |
|
64 |
|
31 |
|
|
|
|
|
|
thereof: EUR –10% against the respective functional currency |
|
-45 |
|
-48 |
|
-20 |
|
|
|
|
|
|
thereof: EUR +10% against the respective functional currency |
|
45 |
|
48 |
|
20 |
|
|
|
|
|
|
Unhedged monetary assets and liabilities |
|
|
|
|
|
|
|
|
|
|
|
|
All currencies –10% against the respective functional currency |
|
-101 |
|
-112 |
|
-63 |
|
|
|
|
|
|
All currencies +10% against the respective functional currency |
|
101 |
|
112 |
|
63 |
|
|
|
|
|
|
thereof: USD –10% against the respective functional currency |
|
-39 |
|
-46 |
|
-44 |
|
|
|
|
|
|
thereof: USD +10% against the respective functional currency |
|
39 |
|
46 |
|
44 |
|
|
|
|
|
|
F-71
Interest Rate Risk
Interest Rate Risk Factors
We are exposed to interest rate risk as a result of our investing and financing activities mainly in euros and U.S. dollars, since a large part of our investments are based on variable rates and/or short maturities (2024:60%; 2023: 53%) and most of our financing transactions are based on fixed rates and long maturities (2024: 86%; 2023: 100%).
Interest Rate Risk Management
The aim of our interest rate risk management is to reduce profit or loss volatility and optimize our interest result by creating a balanced structure of fixed and variable cash flows. We therefore manage interest rate risks by adding interest-rate-related derivative instruments to a given portfolio of investments and debt financing. The desired fixed-floating mix of our net debt is set by the Treasury Committee.
Derivatives Designated as Hedging Instruments (Fair Value Hedges)
To match the interest rate risk from our financing transactions to our investments, we use receiver interest rate swaps to alter the interest cash flows of certain fixed-rate financial liabilities to floating, and by this means secure the fair value of the swapped financing transactions on a 1:1 ratio. Including interest rate swaps, 40% (2023: 43%) of our total interest-bearing financial liabilities outstanding as at December 31, 2024, had a fixed interest rate.
The amounts as at December 31 relating to items designated as hedged items were as follows:
Designated Hedged Items in Interest Rate Hedges
€ millions |
|
2024 |
|
|
|
2023 |
||
|
|
Fixed-Rate |
|
Fixed-Rate |
|
Fixed-Rate |
|
Fixed-Rate |
|
|
Borrowing in EUR |
|
Borrowing in USD |
|
Borrowing in EUR |
|
Borrowing in USD |
Notional amount |
|
4,550 |
|
0 |
|
4,550 |
|
90 |
Carrying amount |
|
4,103 |
|
0 |
|
3,964 |
|
89 |
Accumulated fair value adjustments in Other financial liabilities |
|
423 |
|
-3 |
|
556 |
|
-6 |
Change in fair value used for measuring ineffectiveness for the reporting period |
|
133 |
|
-3 |
|
226 |
|
1 |
Accumulated amount of fair value hedge adjustments for hedged items ceased to be adjusted for hedging gains/losses |
|
0 |
|
-3 |
|
0 |
|
-7 |
The amounts as at December 31 designated as hedging instruments were as follows:
Designated Hedging Instruments in Interest Rate Hedges
€ millions |
|
2024 |
|
|
|
2023 |
||
|
|
Interest Rate |
|
Interest Rate |
|
Interest Rate |
|
Interest Rate |
|
|
Swaps for |
|
Swaps for |
|
Swaps for |
|
Swaps for |
|
|
EUR Borrowing |
|
USD Borrowing |
|
EUR Borrowing |
|
USD Borrowing |
Notional amount |
|
4,550 |
|
0 |
|
4,550 |
|
90 |
Carrying amount |
|
|
|
|
|
|
|
|
Other financial assets |
|
0 |
|
0 |
|
0 |
|
0 |
Other financial liabilities |
|
-408 |
|
0 |
|
-535 |
|
-1 |
Change in fair value used for measuring ineffectiveness for the reporting period |
|
-127 |
|
-1 |
|
-214 |
|
-2 |
As at December 31, we held the following instruments to hedge exposures to changes in interest rates:
F-72
Details on Hedging Instruments in Interest Rate Hedges
€ millions |
|
|
|
|
|
|
|
|
|
|
|
2024 |
|
|
|
|
|
|
|
|
|
|
|
|
|
Maturity |
|
|
|
|
|
2027 |
|
2028 |
|
2029 |
|
2030 |
|
2031 |
|
EUR interest rate swaps |
|
|
|
|
|
|
|
|
|
|
|
|
|
Nominal amounts |
|
|
|
1,000 |
|
1,000 |
|
800 |
|
500 |
|
1,250 |
|
Average variable interest rate1 |
|
|
|
4.535 |
% |
3.827 |
% |
3.056 |
% |
3.746 |
% |
3.912 |
% |
USD interest rate swaps |
|
|
|
|
|
|
|
|
|
|
|
|
|
Nominal amounts |
|
|
|
|
|
|
|
|
|
|
|
|
|
Average variable interest rate1 |
|
|
|
|
|
|
|
|
|
|
|
|
|
€ millions |
|
|
|
|
|
|
|
|
|
|
|
2023 |
|
|
|
|
|
|
|
|
|
|
|
|
|
Maturity |
|
|
|
2024 |
|
2027 |
|
2028 |
|
2029 |
|
2030 |
|
2031 |
|
EUR interest rate swaps |
|
|
|
|
|
|
|
|
|
|
|
|
|
Nominal amounts |
|
|
|
1,000 |
|
1,000 |
|
800 |
|
500 |
|
1,250 |
|
Average variable interest rate1 |
|
|
|
4.324 |
% |
3.679 |
% |
2.924 |
% |
3.630 |
% |
3.817 |
% |
USD interest rate swaps |
|
|
|
|
|
|
|
|
|
|
|
|
|
Nominal amounts |
|
90 |
|
|
|
|
|
|
|
|
|
|
|
Average variable interest rate1 |
|
5.695 |
% |
|
|
|
|
|
|
|
|
|
|
1 Computed based on the interest rate curve as at December 31 of the respective reporting period. Prior-year rates were adjusted.
Interest Rate Exposure
Our interest rate exposure (and our average/high/low exposure) as at December 31 was as follows:
Interest Rate Risk Exposure
€ billions |
|
2024 |
|
2023 |
||||||||||||
|
|
Year-End |
|
Average |
|
High |
|
Low |
|
Year-End |
|
Average |
|
High |
|
Low |
Fair value interest rate risk |
|
|
|
|
|
|
|
|
|
|
|
|
|
|
|
|
From investments1 |
|
3.99 |
|
3.85 |
|
4.29 |
|
3.29 |
|
2.48 |
|
4.12 |
|
6.93 |
|
2.48 |
Cash flow interest rate risk |
|
|
|
|
|
|
|
|
|
|
|
|
|
|
|
|
From investments (including interest - bearing cash)1 |
|
0.72 |
|
0.74 |
|
0.78 |
|
0.75 |
|
0.78 |
|
0.58 |
|
0.78 |
|
0.51 |
From financing |
|
1.25 |
|
0.42 |
|
1.25 |
|
0 |
|
0 |
|
1.10 |
|
1.73 |
|
0 |
From interest rate swaps |
|
4.55 |
|
4.63 |
|
4.64 |
|
4.55 |
|
4.64 |
|
4.64 |
|
4.64 |
|
4.64 |
1 To more accurately present the nature of the risk, we have revised the classification of investment-related risk for the current and previous year. Specifically, we have separated the component to fair value interest rate risk, which was previously included in the cash flow interest rate risk in 2023.
Interest Rate Sensitivity
A sensitivity analysis is provided to show the impact of our interest rate risk exposure on profit or loss and equity in accordance with IFRS 7, considering the following:
| - | Changes in interest rates only affect the accounting for non-derivative fixed-rate financial instruments if they are recognized at fair value. Therefore, such interest rate changes do not change the carrying amounts of our non-derivative fixed-rate financial liabilities, as we account for them at amortized cost. Investments in fixed-rate financial assets classified as fair value through profit or loss were not material at each year end reported. Thus, we do not consider any fixed-rate instruments in the equity-related sensitivity calculation. |
| - | Income or expenses recorded in connection with non-derivative financial instruments with variable interest rates are subject to interest rate risk if they are not hedged items in an effective hedge relationship. Thus, we take into consideration interest rate changes relating to our variable-rate financing and our investments in money market instruments in the profit-related sensitivity calculation. |
F-73
| - | The designation of interest rate receiver swaps in a fair value hedge relationship leads to interest rate changes affecting Financial income, net. The fair value movements related to the interest rate swaps are not reflected in the sensitivity calculation, as they offset the fixed interest rate payments for the bonds and private placements as hedged items. However, changes in market interest rates affect the amount of interest payments from the interest rate swap. As a consequence, we include those effects of market interest rates on interest payments in the profit-related sensitivity calculation. |
If, on December 31, interest rates had been higher/lower, this would have had the following effects on Financial income, net:
Interest Rate Sensitivity
€ millions |
|
Effects on Financial Income, Net |
||||
|
|
2024 |
|
2023 |
|
2022 |
Derivatives held within a designated fair value hedge relationship |
|
|
|
|
|
|
Interest rates +100bps for U.S. dollar area/+100bps for euro area (2023: +100bps for U.S. dollar area/+100bps for euro area; 2022: +75bps/+125bps for U.S. dollar/euro area) |
|
-46 |
|
-46 |
|
-58 |
Interest rates –100bps for U.S. dollar area/–100bps for euro area (2023: –100bps for U.S. dollar area/–100bps for euro area; 2022: –25bps/–10bps for U.S. dollar/euro area) |
|
46 |
|
46 |
|
5 |
Variable-rate financing |
|
|
|
|
|
|
Interest rates +100bps for U.S. dollar area/+100bps for euro area (2023: +100bps for U.S. dollar area/+100bps for euro area; 2022: +75bps/+125bps for U.S. dollar/euro area) |
|
-4 |
|
0 |
|
-14 |
Interest rates –100bps for U.S. dollar area/–100bps for euro area (2023: –100bps for U.S. dollar area/–100bps for euro area; 2022: –25bps/–10bps for U.S. dollar/euro area) |
|
4 |
|
0 |
|
1 |
Variable-rate investments |
|
|
|
|
|
|
Interest rates +100bps for U.S. dollar area/+100bps for euro area (2023: +100bps for U.S. dollar area/+100bps for euro area; 2022: +75bps/+125bps for U.S. dollar/euro area) |
|
47 |
|
32 |
|
26 |
Interest rates –100bps for U.S. dollar area/–100bps for euro area (2023: –100bps for U.S. dollar area/–100bps for euro area; 2022: –25bps/–10bps for U.S. dollar/euro area) |
|
-47 |
|
-32 |
|
-5 |
Equity Price Risk
Equity Price Risk Factors
We are exposed to equity price risk with regard to our investments in equity securities.
Equity Price Risk Management
Our listed equity investments are monitored based on the current market value that is affected by the fluctuations in the volatile stock markets worldwide. Unlisted equity investments are monitored based on detailed financial information provided by the investees. The fair value of our listed equity investments depends on the equity prices, while the fair value of the unlisted equity investments is influenced by various unobservable input factors.
Equity Price Exposure
On December 31, 2024, our exposure from our investments in equity securities was €6,401 million (2023: €4,967 million; 2022: €5,137 million).
Equity Price Sensitivity
Our sensitivity towards a fluctuation in equity prices is as follows:
Equity Price Sensitivity
€ millions |
|
2024 |
|
2023 |
|
2022 |
Investments in equity securities |
|
|
|
|
|
|
Increase in equity prices and respective unobservable inputs of 10% (2023: 22%) - increase of financial income, net |
|
640 |
|
1,093 |
|
503 |
Decrease in equity prices and respective unobservable inputs of 10% (2023: 22%) - decrease of financial income, net |
|
-640 |
|
-1,093 |
|
-503 |
1 For 2022, a +/-10% increase and decrease was assumed.
Most of our equity securities are within the venture-capital-related investment activities. For purposes of our equity price sensitivity disclosure, we benchmarked the historical average of public market returns of the NASDAQ and S&P 500 to the average annual venture capital benchmark returns over a 12-year period, which is the assumed average holding period of venture capital funds. Overall, our analysis indicated a blended return range of +/- 10% in 2024 (+/-22% in 2023).
F-74
Credit Risk
Credit Risk Factors
To reduce the credit risk in investments, we arrange to receive rights to collateral for certain investing activities in the full amount of the investment volume, which we would be allowed to make use of only in the case of default of the counterparty to the investment. In the absence of other significant agreements to reduce our credit risk exposure, the total amounts recognized as cash and cash equivalents, current investments, loans, and other financial receivables, trade receivables, and derivative financial assets represent our maximum exposure to credit risks, except for the agreements mentioned above.
Credit Risk Management
Cash at Banks, Time Deposits, and Debt Securities
To mitigate the credit risk from our investing activities and derivative financial assets, we conduct all our activities only with approved major financial institutions and issuers that carry high external ratings, as required by our internal treasury guideline. Among its stipulations, the guideline requires that we invest only in assets from issuers with a minimum rating of at least “BBB flat.” We only invest in issuers with a lower rating in exceptional cases. Such investments were not material in all years presented. The weighted average rating of our financial assets is A. We pursue a policy of cautious investments characterized by predominantly current investments, standard investment instruments, as well as a wide portfolio diversification by doing business with a variety of counterparties.
To further reduce our credit risk, we require collateral for certain investments in the full amount of the investment volume, which we would be allowed to make use of in the case of default of the counterparty to the investment. As such collateral, we only accept bonds with at least investment-grade rating level.
In addition, the concentration of credit risk that exists when counterparties are involved in similar activities by instrument, sector, or geographic area is further mitigated by diversification of counterparties throughout the world and adherence to an internal limit system for each counterparty. This internal limit system stipulates that the business volume with individual counterparties is restricted to a defined limit that depends on the lowest official long-term credit rating available by at least one of the major rating agencies, the Tier 1 capital of the respective financial institution, or participation in the German Depositors’ Guarantee Fund or similar protection schemes. We continuously monitor strict compliance with these counterparty limits. As the premium for credit default swaps mainly depends on market participants’ assessments of the creditworthiness of a debtor, we also closely observe the development of credit default swap spreads in the market to evaluate probable risk developments and react in a timely manner to changes should these manifest.
For cash at banks, time deposits, and debt securities such as acquired bonds or commercial paper, we apply the general impairment approach. As it is our policy to only invest in high-quality assets of issuers with a minimum rating of at least investment grade so as to minimize the risk of credit losses, we use the low credit risk exception. Thus, these assets are always allocated to stage 1 of the three-stage credit loss model and we record a loss allowance for an amount equal to 12-month expected credit losses. This loss allowance is calculated based on our exposure as at the respective reporting date, the loss given default for this exposure, and the credit default swap spread as a measure for the probability of default. To ensure that during their lifetime our investments always fulfill the requirement of being investment-grade, we monitor changes in credit risk by tracking published external credit ratings. Among other things, we consider cash at banks, time deposits, and debt securities to be in default when the counterparty is unlikely to pay its obligations in full, when there is information about a counterparty’s financial difficulties, or in case of a drastic increase in the credit default swap spread of a counterparty for a prolonged time period while the overall market environment remains rather stable. Such financial assets are written off either partially or in full if the likelihood of recovery is considered remote, which might be evidenced, for example, by the bankruptcy of a counterparty of such financial assets.
Trade Receivables
The default risk of our trade receivables is managed separately, mainly based on assessing the creditworthiness of customers through external ratings and on our past experience with the customers concerned. Based on this assessment, individual credit limits are established for each customer and deviations from such credit limits need to be approved by management.
F-75
We apply the simplified impairment approach using a provision matrix for all trade receivables and contract assets to take into account any lifetime expected credit losses already at initial recognition. For the purpose of the provision matrix, customers are clustered into different risk classes, mainly based on historical experience with credit losses in the respective SAP subsidiaries. Loss rates used to reflect lifetime expected credit losses are determined using a roll-rate method based on the probability of a receivable progressing through different stages of being overdue and on our actual credit loss experience over the past years. These loss rates are enhanced by forward-looking information to reflect differences between economic conditions during the period over which the historical data has been collected, current conditions, and the expected changes in the economic conditions over the expected life of the receivables. Forward-looking information is based on changes in country risk ratings, or fluctuations in credit default swaps of countries of the customers we do business with. We continuously monitor outstanding receivables locally to assess whether there is objective evidence that our trade receivables and contract assets are credit-impaired. Evidence that trade receivables and contract assets are credit-impaired include, among the trade receivables being past due, information about significant financial difficulty of the customer or non-adherence to a payment plan. We consider receivables to be in default when the counterparty is unlikely to pay its obligations in full, However, a delay of payments (for example, more than 90 days past due) in the normal course of business alone does not necessarily indicate a customer default. We write off account balances either partially or in full if we judge that the likelihood of recovery is remote, which might be evidenced, for example, when bankruptcy proceedings for a customer are finalized or when all enforcement efforts have been exhausted.
The impact of default on our trade receivables from individual customers is mitigated by our large customer base and its distribution across many different industries, company sizes, and countries worldwide. For more information about our trade receivables, see Note (A.2).
Credit Risk Exposure
Cash, Time Deposits, and Debt Securities
As at December 31, our exposure to credit risk from cash, time deposits, and debt securities was as follows:
Credit Risk Exposure from Cash, Time Deposits, and Debt Securities
€ millions, unless otherwise stated |
|
2024 |
||||||||
|
|
Equivalent to External |
|
Weighted Average Loss |
|
Gross Carrying Amount |
|
Gross Carrying Amount |
|
ECL Allowance |
|
|
Rating |
|
Rate |
|
Not Credit-Impaired |
|
Credit-Impaired |
|
|
Risk class 1 - low risk |
|
AAA to BBB- |
|
-0.1 |
% |
7,004 |
|
0 |
|
-7 |
Risk class 2 - high risk |
|
BB+ to D |
|
0.0 |
% |
105 |
|
0 |
|
0 |
Risk class 3 - unrated |
|
NA |
|
-5.5 |
% |
55 |
|
0 |
|
-3 |
Total |
|
|
|
-0.1 |
% |
7,164 |
|
0 |
|
-10 |
€ millions, unless otherwise stated |
|
2023 |
||||||||
|
|
Equivalent to External |
|
Weighted Average Loss |
|
Gross Carrying Amount |
|
Gross Carrying Amount |
|
ECL Allowance |
|
|
Rating |
|
Rate |
|
Not Credit-Impaired |
|
Credit-Impaired |
|
|
Risk class 1 - low risk |
|
AAA to BBB– |
|
-0.1 |
% |
8,664 |
|
0 |
|
-7 |
Risk class 2 - high risk |
|
BB+ to D |
|
0.0 |
% |
66 |
|
0 |
|
0 |
Risk class 3 - unrated |
|
NA |
|
-3.9 |
% |
77 |
|
0 |
|
-3 |
Total |
|
|
|
-0.1 |
% |
8,807 |
|
0 |
|
-10 |
F-76
Master Netting and Similar Arrangements
We enter into derivatives on the basis of the German Master Agreement on Financial Derivatives Transactions (“Deutscher Rahmenvertrag für Finanztermingeschäfte”) and similar agreements. The regulations of these agreements apply particularly in the case of insolvency and not during the normal course of business.
The following table shows the derivative instruments that are subject to such netting arrangements:
Master Netting and Similar Arrangements
€ millions |
|
2024 |
|
2023 |
||||||||
|
|
|
|
Nettable Amounts |
|
|
|
|
|
|
|
|
|
|
|
|
in Case of |
|
|
|
|
|
Nettable Amounts in |
|
|
|
|
Carrying Amounts |
|
Insolvency |
|
Net Amount |
|
Carrying Amounts |
|
Case of Insolvency |
|
Net Amount |
Financial assets |
|
60 |
|
42 |
|
18 |
|
90 |
|
55 |
|
35 |
Financial liabilities |
|
-525 |
|
-42 |
|
-483 |
|
-623 |
|
-55 |
|
-568 |
Trade Receivables
As at December 31, our exposure to credit risk from trade receivables was as follows:
Credit Risk Exposure from Trade Receivables
€ millions, unless otherwise stated |
|
2024 |
||||||
|
|
Weighted Average Loss Rate |
|
Gross Carrying Amount |
|
Gross Carrying Amount |
|
ECL Allowance |
|
|
|
|
Not Credit-Impaired |
|
Credit-Impaired |
|
|
AR not due and due |
|
-0.2 |
% |
4,439 |
|
— |
|
-7 |
AR overdue 1 to 30 days |
|
-0.9 |
% |
619 |
|
64 |
|
-6 |
AR overdue 30 to 90 days |
|
-1.4 |
% |
603 |
|
28 |
|
-9 |
AR overdue more than 90 days |
|
-29.2 |
% |
445 |
|
263 |
|
-207 |
TOTAL |
|
-3.5 |
% |
6,106 |
|
355 |
|
-229 |
€ millions, unless otherwise stated |
|
2023 |
||||||
|
|
Weighted Average Loss Rate |
|
Gross Carrying Amount |
|
Gross Carrying Amount |
|
ECL Allowance |
|
|
|
|
Not Credit-Impaired |
|
Credit-Impaired |
|
|
AR not due and due |
|
-0.3 |
% |
4,036 |
|
2 |
|
-13 |
AR overdue 1 to 30 days |
|
-0.6 |
% |
770 |
|
51 |
|
-5 |
AR overdue 30 to 90 days |
|
-1.5 |
% |
564 |
|
32 |
|
-9 |
AR overdue more than 90 days |
|
-27.3 |
% |
432 |
|
213 |
|
-176 |
TOTAL |
|
-3.3 |
% |
5,802 |
|
298 |
|
-203 |
The movement in the ECL allowance for trade receivables is as follows:
Movement in ECL Allowance for Trade Receivables
€ millions |
|
2024 |
|
2023 |
|
|
ECL Allowance |
|
ECL Allowance |
Balance as at 1/1 |
|
-203 |
|
-261 |
Net credit losses recognized |
|
-112 |
|
-32 |
Amounts written off |
|
86 |
|
90 |
Balance as at 12/31 |
|
-229 |
|
-203 |
F-77
Liquidity Risk
Liquidity Risk Factors
We are exposed to liquidity risk from our obligations towards suppliers, employees, and financial institutions.
Liquidity Risk Management
Our liquidity is managed by our global treasury department with the primary aim of maintaining liquidity at a level that is adequate to meet our financial obligations.
Generally, our primary source of liquidity is funds generated from our business operations. Our global treasury department manages liquidity centrally for all subsidiaries. Where possible, we pool their cash surplus so that we can use liquidity centrally for our business operations, for subsidiaries’ funding requirements, or to invest any net surplus in the market. With this strategy, we seek to optimize yields, while ensuring liquidity, by investing only with counterparties and issuers of high credit quality, as explained before. Hence, high levels of liquid assets and marketable securities provide a strategic reserve, helping keep SAP flexible, sound, and independent.
Apart from effective working capital and cash management, we have reduced the liquidity risk inherent in managing our day-to-day operations and meeting our financing responsibilities by arranging an adequate volume of available credit facilities with various financial institutions on which we can draw if necessary.
To retain high financial flexibility, in 2023, SAP SE entered into a sustainability-linked revolving credit facility with a volume of €3.0 billion with an initial term until 2028 plus two one-year extension options, replacing its previous credit facility of €2.5 billion from 2017. The use of the facility is not restricted by any financial covenants. Borrowings under the facility bear interest of EURIBOR or the agreed benchmark rate for the respective currency plus a base margin which might be adjusted depending on the fulfillment of agreed sustainability performance targets. We are also required to pay a commitment fee of 7bps per annum on the unused available credit. We have not drawn on the facility.
In September 2019, we initiated a commercial paper (Commercial Paper, or CP) program. As at December 31, 2024, we had €498 million of CP outstanding with maturities generally less than six months (2023: €0 million).
Additionally, as at December 31, 2024 and 2023, the Group had available lines of credit totaling €1,200 million and €555 million, respectively. In 2024, an amount of €1 billion was used through money market loans (for more information, see Note (E.3)). There were immaterial borrowings outstanding under these lines of credit in 2023.
Liquidity Risk Exposure
The table below is an analysis of the remaining contractual maturities of all our financial liabilities and guarantees held as at December 31.
Financial liabilities for which repayment can be requested by the contract partner at any time are assigned to the earliest possible period. Variable interest payments were calculated using the latest relevant interest rate fixed as at December 31. As we generally settle our derivative contracts gross, we show the pay and receive legs separately for all our currency and interest rate derivatives, whether or not the fair value of the derivative is negative. The cash outflows for the currency derivatives are translated using the applicable spot rate.
We continue to provide rental guarantees for certain offices used by Qualtrics. The amounts shown for the financial guarantees are the gross amounts we guarantee, however, we are entitled to indemnification payments by Qualtrics which will reduce the guarantee amounts disclosed.
F-78
Contractual Maturities of Non-Derivative Financial Liabilities
€ millions |
|
Carrying |
|
Contractual Cash Flows |
||||||||||
|
|
Amount |
|
|
||||||||||
|
|
12/31/2024 |
|
2025 |
|
2026 |
|
2027 |
|
2028 |
|
2029 |
|
Thereafter |
Non-derivative financial liabilities |
|
|
|
|
|
|
|
|
|
|
|
|
|
|
Trade payables |
|
-1,178 |
|
-1,178 |
|
0 |
|
0 |
|
0 |
|
0 |
|
0 |
Bonds |
|
-6,090 |
|
-970 |
|
-1,161 |
|
-1,045 |
|
-1,033 |
|
-828 |
|
-1,775 |
Private placements |
|
-99 |
|
-3 |
|
-3 |
|
-100 |
|
0 |
|
0 |
|
0 |
Loans |
|
-2,250 |
|
-2,300 |
|
0 |
|
0 |
|
0 |
|
0 |
|
0 |
Commercial Paper |
|
-498 |
|
-500 |
|
0 |
|
0 |
|
0 |
|
0 |
|
0 |
Lease liabilities |
|
-1,715 |
|
-371 |
|
-287 |
|
-237 |
|
-184 |
|
-148 |
|
-821 |
Other financial liabilities1 |
|
-270 |
|
-21 |
|
-32 |
|
0 |
|
0 |
|
0 |
|
0 |
Total of non-derivative financial liabilities |
|
-12,099 |
|
-5,343 |
|
-1,483 |
|
-1,382 |
|
-1,217 |
|
-976 |
|
-2,596 |
|
|
|
|
|
|
|
|
|
|
|
|
|
|
|
Financial guarantees |
|
0 |
|
-19 |
|
-19 |
|
-19 |
|
-20 |
|
-20 |
|
-315 |
€ millions |
|
Carrying |
|
Contractual Cash Flows |
||||||||||
|
|
Amount |
|
|
||||||||||
|
|
12/31/2023 |
|
2024 |
|
2025 |
|
2026 |
|
2027 |
|
2028 |
|
Thereafter |
Non-derivative financial liabilities |
|
|
|
|
|
|
|
|
|
|
|
|
|
|
Trade payables |
|
-1,022 |
|
-1,022 |
|
0 |
|
0 |
|
0 |
|
0 |
|
0 |
Bonds |
|
-6,780 |
|
-941 |
|
-952 |
|
-1,161 |
|
-1,045 |
|
-1,033 |
|
-2,604 |
Private placements |
|
-388 |
|
-305 |
|
-3 |
|
-3 |
|
-94 |
|
0 |
|
0 |
Loans |
|
0 |
|
0 |
|
0 |
|
0 |
|
0 |
|
0 |
|
0 |
Commercial Paper |
|
0 |
|
0 |
|
0 |
|
0 |
|
0 |
|
0 |
|
0 |
Lease liabilities |
|
-1,621 |
|
-350 |
|
-260 |
|
-204 |
|
-159 |
|
-127 |
|
-804 |
Other financial liabilities1 |
|
-263 |
|
-34 |
|
-30 |
|
0 |
|
0 |
|
0 |
|
0 |
Total of non-derivative financial liabilities |
|
-10,075 |
|
-2,652 |
|
-1,245 |
|
-1,368 |
|
-1,298 |
|
-1,160 |
|
-3,408 |
|
|
|
|
|
|
|
|
|
|
|
|
|
|
|
Financial guarantees |
|
0 |
|
-19 |
|
-19 |
|
-19 |
|
-19 |
|
-19 |
|
-309 |
1 The carrying amount of other financial liabilities includes accrued interest for our non - derivative financial debt as well as for derivatives, while the cash outflow of these accrued interest is presented together with the underlying liability in the maturity analysis.
F-79
Contractual Maturities of Derivative Financial Liabilities and Financial Assets
€ millions |
|
Carrying |
|
Contractual Cash Flows |
|
Carrying |
|
Contractual Cash Flows |
||||
|
|
Amount |
|
|
|
Amount |
|
|
||||
|
|
12/31/2024 |
|
2025 |
|
Thereafter |
|
12/31/2023 |
|
2024 |
|
Thereafter |
Derivative financial liabilities and assets |
|
|
|
|
|
|
|
|
|
|
|
|
Derivative financial liabilities |
|
|
|
|
|
|
|
|
|
|
|
|
Currency derivatives not designated as hedging instruments |
|
-85 |
|
|
|
|
|
-66 |
|
|
|
|
Cash outflows |
|
|
|
-4,003 |
|
0 |
|
|
|
-2,048 |
|
0 |
Cash inflows |
|
|
|
3,942 |
|
0 |
|
|
|
2,017 |
|
0 |
Currency derivatives designated as hedging instruments |
|
-32 |
|
|
|
|
|
-20 |
|
|
|
|
Cash outflows |
|
|
|
-2,805 |
|
|
|
|
|
-958 |
|
|
Cash inflows |
|
|
|
2,749 |
|
|
|
|
|
948 |
|
|
Interest rate derivatives designated as hedging instruments |
|
-408 |
|
|
|
|
|
-537 |
|
|
|
|
Cash outflows |
|
|
|
-230 |
|
-649 |
|
|
|
-242 |
|
-848 |
Cash inflows |
|
|
|
60 |
|
241 |
|
|
|
63 |
|
301 |
Total of derivative financial liabilities |
|
-525 |
|
-287 |
|
-408 |
|
-623 |
|
-220 |
|
-547 |
Derivative financial assets |
|
|
|
|
|
|
|
|
|
|
|
|
Currency derivatives not designated as hedging instruments |
|
51 |
|
|
|
|
|
52 |
|
|
|
|
Cash outflows |
|
|
|
-2,921 |
|
|
|
|
|
-2,992 |
|
|
Cash inflows |
|
|
|
2,977 |
|
|
|
|
|
3,042 |
|
|
Currency derivatives designated as hedging instruments |
|
12 |
|
|
|
|
|
33 |
|
|
|
|
Cash outflows |
|
|
|
-948 |
|
|
|
|
|
-1,418 |
|
|
Cash inflows |
|
|
|
964 |
|
|
|
|
|
1,441 |
|
|
Total of derivative financial assets |
|
63 |
|
72 |
|
0 |
|
85 |
|
73 |
|
0 |
Total of derivative financial liabilities and assets |
|
-462 |
|
-215 |
|
-408 |
|
-538 |
|
-147 |
|
-547 |
(F.2) Fair Value Disclosures on Financial Instruments
y Level Transfers |
It is our policy that transfers between the different levels of the fair value hierarchy are deemed to have occurred at the beginning of the period of the event or change in circumstances that caused the transfer. |
Fair Value of Financial Instruments
We use various types of financial instruments in the ordinary course of business, which are classified as either amortized cost (AC), fair value through other comprehensive income (FVOCI), or fair value through profit or loss (FVTPL). For those financial instruments measured at fair value or for which fair value must be disclosed, we have categorized the financial instruments into a three-level fair value hierarchy depending on the inputs used to determine fair value and their significance for the valuation techniques.
F-80
Fair Values of Financial Instruments and Classification Within the Fair Value Hierarchy
€ millions |
|
Category |
|
12/31/2024 |
||||||||||||
|
|
|
|
Carrying Amount |
|
Measurement Categories |
|
Fair Value |
||||||||
|
|
|
|
|
|
|
|
|
|
|
|
|
|
|
||
|
|
|
|
|
|
At Amortized |
|
At Fair Value |
|
Level 1 |
|
Level 2 |
|
Level 3 |
|
Total |
|
|
|
|
|
|
Cost |
|
|
|
|
|
|
|
|
|
|
|
|
|
|
|
|
|
|
|
|
|
|
|
|
|
|
|
Assets |
|
|
|
|
|
|
|
|
|
|
|
|
|
|
|
|
Cash and cash equivalents |
|
|
|
9,609 |
|
|
|
|
|
|
|
|
|
|
|
|
Cash at banks1 |
|
AC |
|
3,962 |
|
3,962 |
|
|
|
|
|
|
|
|
|
|
Time deposits1 |
|
AC |
|
1,656 |
|
1,656 |
|
|
|
|
|
|
|
|
|
|
Money market and similar funds |
|
FVTPL |
|
3,991 |
|
|
|
3,991 |
|
3,991 |
|
|
|
|
|
3,991 |
Trade and other receivables |
|
|
|
6,983 |
|
|
|
|
|
|
|
|
|
|
|
|
Trade receivables1 |
|
AC |
|
6,231 |
|
6,231 |
|
|
|
|
|
|
|
|
|
|
Other receivables2 |
|
— |
|
752 |
|
|
|
|
|
|
|
|
|
|
|
|
Other financial assets |
|
|
|
8,770 |
|
|
|
|
|
|
|
|
|
|
|
|
Debt securities |
|
AC |
|
53 |
|
53 |
|
|
|
53 |
|
|
|
|
|
53 |
Debt securities |
|
FVOCI |
|
74 |
|
|
|
74 |
|
74 |
|
|
|
|
|
74 |
Equity securities |
|
FVTPL |
|
6,401 |
|
|
|
6,401 |
|
135 |
|
|
|
6,266 |
|
6,401 |
Investments in associates2 |
|
— |
|
144 |
|
|
|
|
|
|
|
|
|
|
|
|
Time deposits1 |
|
AC |
|
1,418 |
|
1,418 |
|
|
|
|
|
|
|
|
|
|
Financial instruments related to employee benefit plans2 |
|
— |
|
287 |
|
|
|
|
|
|
|
|
|
|
|
|
Loans and other financial receivables |
|
AC |
|
329 |
|
329 |
|
|
|
|
|
329 |
|
|
|
329 |
Derivative assets |
|
|
|
|
|
|
|
|
|
|
|
|
|
|
|
|
Designated as hedging instrument |
|
|
|
|
|
|
|
|
|
|
|
|
|
|
|
|
FX forward contracts |
|
— |
|
12 |
|
|
|
12 |
|
|
|
12 |
|
|
|
12 |
Not designated as hedging instrument |
|
|
|
|
|
|
|
|
|
|
|
|
|
|
|
|
FX forward contracts |
|
FVTPL |
|
51 |
|
|
|
51 |
|
|
|
51 |
|
|
|
51 |
Liabilities |
|
|
|
|
|
|
|
|
|
|
|
|
|
|
|
|
Trade and other payables |
|
|
|
-2,000 |
|
|
|
|
|
|
|
|
|
|
|
|
Trade payables1 |
|
AC |
|
-1,178 |
|
-1,178 |
|
|
|
|
|
|
|
|
|
|
Other payables2 |
|
— |
|
-823 |
|
|
|
|
|
|
|
|
|
|
|
|
Financial liabilities |
|
|
|
-11,446 |
|
|
|
|
|
|
|
|
|
|
|
|
Non-derivative financial liabilities |
|
|
|
|
|
|
|
|
|
|
|
|
|
|
|
|
Loans1 |
|
AC |
|
-2,250 |
|
-2,250 |
|
|
|
|
|
|
|
|
|
|
Bonds |
|
AC |
|
-6,090 |
|
-6,090 |
|
|
|
-6,286 |
|
|
|
|
|
-6,286 |
Private placements |
|
AC |
|
-99 |
|
-99 |
|
|
|
|
|
-94 |
|
|
|
-94 |
Lease liabilities3 |
|
|
|
-1,715 |
|
-1,715 |
|
|
|
|
|
|
|
|
|
|
Commercial Paper |
|
AC |
|
-498 |
|
-498 |
|
|
|
|
|
-498 |
|
|
|
-498 |
Other non-derivative financial liabilities |
|
AC |
|
-270 |
|
-270 |
|
|
|
|
|
-270 |
|
|
|
-270 |
Derivative liabilities |
|
|
|
|
|
|
|
|
|
|
|
|
|
|
|
|
Designated as hedging instrument |
|
|
|
|
|
|
|
|
|
|
|
|
|
|
|
|
FX forward contracts |
|
— |
|
-32 |
|
|
|
-32 |
|
|
|
-32 |
|
|
|
-32 |
Interest rate swaps |
|
— |
|
-408 |
|
|
|
-408 |
|
|
|
-408 |
|
|
|
-408 |
Not designated as hedging instrument |
|
|
|
|
|
|
|
|
|
|
|
|
|
|
|
|
FX forward contracts |
|
FVTPL |
|
-85 |
|
|
|
-85 |
|
|
|
-85 |
|
|
|
-85 |
Total financial instruments, net |
|
|
|
11,916 |
|
1,550 |
|
10,004 |
|
-2,032 |
|
-995 |
|
6,266 |
|
3,238 |
F-81
Fair Values of Financial Instruments and Classification Within the Fair Value Hierarchy
€ millions |
|
Category |
|
12/31/2023 |
||||||||||||
|
|
|
|
Carrying Amount |
|
Measurement Categories |
|
Fair Value |
||||||||
|
|
|
|
|
|
|
|
|
|
|
|
|
|
|
||
|
|
|
|
|
|
At Amortized |
|
At Fair Value |
|
Level 1 |
|
Level 2 |
|
Level 3 |
|
Total |
|
|
|
|
|
|
Cost |
|
|
|
|
|
|
|
|
|
|
|
|
|
|
|
|
|
|
|
|
|
|
|
|
|
|
|
Assets |
|
|
|
|
|
|
|
|
|
|
|
|
|
|
|
|
Cash and cash equivalents |
|
|
|
8,124 |
|
|
|
|
|
|
|
|
|
|
|
|
Cash at banks1 |
|
AC |
|
3,369 |
|
3,369 |
|
|
|
|
|
|
|
|
|
|
Time deposits1 |
|
AC |
|
2,277 |
|
2,277 |
|
|
|
|
|
|
|
|
|
|
Money market and similar funds |
|
FVTPL |
|
2,478 |
|
|
|
2,478 |
|
2,478 |
|
|
|
|
|
2,478 |
Trade and other receivables |
|
|
|
6,525 |
|
|
|
|
|
|
|
|
|
|
|
|
Trade receivables1 |
|
AC |
|
5,775 |
|
5,775 |
|
|
|
|
|
|
|
|
|
|
Trade receivables1 |
|
FVOCI |
|
122 |
|
|
|
122 |
|
|
|
122 |
|
|
|
|
Other receivables2 |
|
— |
|
628 |
|
|
|
|
|
|
|
|
|
|
|
|
Other financial assets |
|
|
|
8,887 |
|
|
|
|
|
|
|
|
|
|
|
|
Debt securities |
|
AC |
|
129 |
|
129 |
|
|
|
129 |
|
|
|
|
|
129 |
Equity securities |
|
FVTPL |
|
4,967 |
|
|
|
4,967 |
|
156 |
|
0 |
|
4,811 |
|
4,967 |
Investments in associates2 |
|
— |
|
135 |
|
|
|
|
|
|
|
|
|
|
|
|
Time deposits |
|
AC |
|
3,021 |
|
3,021 |
|
|
|
|
|
3,021 |
|
|
|
3,021 |
Financial instruments related to employee benefit plans2 |
|
— |
|
244 |
|
|
|
|
|
|
|
|
|
|
|
|
Loans and other financial receivables |
|
AC |
|
300 |
|
300 |
|
|
|
|
|
300 |
|
|
|
300 |
Derivative assets |
|
|
|
|
|
|
|
|
|
|
|
|
|
|
|
|
Designated as hedging instrument |
|
|
|
|
|
|
|
|
|
|
|
|
|
|
|
|
FX forward contracts |
|
— |
|
33 |
|
|
|
33 |
|
|
|
33 |
|
|
|
33 |
Not designated as hedging instrument |
|
|
|
|
|
|
|
|
|
|
|
|
|
|
|
|
FX forward contracts |
|
FVTPL |
|
52 |
|
|
|
52 |
|
|
|
52 |
|
|
|
52 |
Call option on equity shares |
|
FVTPL |
|
5 |
|
|
|
5 |
|
|
|
|
|
5 |
|
5 |
Liabilities |
|
|
|
|
|
|
|
|
|
|
|
|
|
|
|
|
Trade and other payables |
|
— |
|
1,822 |
|
|
|
|
|
|
|
|
|
|
|
|
Trade payables1 |
|
AC |
|
-1,022 |
|
-1,022 |
|
|
|
|
|
|
|
|
|
|
Other payables2 |
|
— |
|
-800 |
|
|
|
|
|
|
|
|
|
|
|
|
Financial liabilities |
|
|
|
-9,676 |
|
|
|
|
|
|
|
|
|
|
|
|
Non-derivative financial liabilities |
|
|
|
|
|
|
|
|
|
|
|
|
|
|
|
|
Bonds |
|
AC |
|
-6,780 |
|
-6,780 |
|
|
|
-7,005 |
|
0 |
|
|
|
-7,005 |
Private placements |
|
AC |
|
-388 |
|
-388 |
|
|
|
|
|
-374 |
|
|
|
-374 |
Lease liabilities3 |
|
— |
|
-1,621 |
|
-1,621 |
|
|
|
|
|
|
|
|
|
|
Other non-derivative financial liabilities |
|
AC |
|
-263 |
|
-263 |
|
|
|
|
|
-263 |
|
|
|
-263 |
Derivative liabilities |
|
|
|
|
|
|
|
|
|
|
|
|
|
|
|
|
Designated as hedging instrument |
|
|
|
|
|
|
|
|
|
|
|
|
|
|
|
|
FX forward contracts |
|
— |
|
-20 |
|
|
|
-20 |
|
|
|
-20 |
|
|
|
-20 |
Interest rate swaps |
|
— |
|
-537 |
|
|
|
-537 |
|
|
|
-537 |
|
|
|
-537 |
Not designated as hedging instrument |
|
|
|
|
|
|
|
|
|
|
|
|
|
|
|
|
FX forward contracts |
|
FVTPL |
|
-66 |
|
|
|
-66 |
|
|
|
-66 |
|
|
|
-66 |
Total financial instruments, net |
|
|
|
12,038 |
|
4,798 |
|
7,034 |
|
-4,242 |
|
2,268 |
|
4,816 |
|
2,720 |
1 We do not separately disclose the fair value for cash and cash equivalents, trade receivables, and accounts payable as their carrying amounts are a reasonable approximation of their fair values.
2 Since the line items Trade receivables, Trade payables, and Other financial assets contain both financial and non-financial assets or liabilities (such as other taxes or advance payments), the carrying amounts of non-financial assets or liabilities are shown to allow a reconciliation to the corresponding line items in the Consolidated Statements of Financial Position.
3 For lease liabilities, separate disclosure of fair value is not required.
F-82
Fair Values of Financial Instruments by Instrument Classification
€ millions |
|
Category |
|
12/31/2024 |
||||
|
|
|
|
Carrying Amount |
|
At Amortized Cost |
|
At Fair Value |
Financial assets |
|
|
|
|
|
|
|
|
At fair value through profit or loss |
|
FVTPL |
|
10,443 |
|
|
|
10,443 |
At fair value through other comprehensive income |
|
FVOCI |
|
74 |
|
|
|
74 |
At amortized cost |
|
AC |
|
13,649 |
|
13,649 |
|
|
Financial liabilities |
|
|
|
|
|
|
|
|
At fair value through profit or loss |
|
FVTPL |
|
-85 |
|
|
|
-85 |
At amortized cost |
|
AC |
|
-10,385 |
|
-10,385 |
|
|
Fair Values of Financial Instruments by Instrument Classification
€ millions |
|
Category |
|
12/31/2023 |
||||
|
|
|
|
Carrying Amount |
|
At Amortized Cost |
|
At Fair Value |
Financial assets |
|
|
|
|
|
|
|
|
At fair value through profit or loss |
|
FVTPL |
|
7,502 |
|
|
|
7,502 |
At fair value through other comprehensive income |
|
FVOCI |
|
122 |
|
|
|
122 |
At amortized cost |
|
AC |
|
14,873 |
|
14,873 |
|
|
Financial liabilities |
|
|
|
|
|
|
|
|
At fair value through profit or loss |
|
FVTPL |
|
-66 |
|
|
|
-66 |
At amortized cost |
|
AC |
|
-8,454 |
|
-8,454 |
|
|
F-83
Determination of Fair Values
A description of the valuation techniques and the inputs used in the fair value measurement is given below:
Financial Instruments Measured at Fair Value on a Recurring Basis
Type |
|
Fair Value |
|
Determination of Fair |
|
Significant |
|
Interrelationship |
|---|---|---|---|---|---|---|---|---|
Other financial assets |
|
|
|
|
|
|
|
|
Money-market and similar funds |
|
Level 1 |
|
Quoted prices in an active market |
|
NA |
|
NA |
Debt securities |
|
Level 1 |
|
Quoted prices in an active market |
|
NA |
|
NA |
Listed equity securities |
|
Level 1 |
|
Quoted prices in an active market |
|
NA |
|
NA |
Unlisted equity securities |
|
Level 3 |
|
Market approach. Comparable company valuation using revenue multiples derived from companies comparable to the investee. |
|
Peer companies used (revenue multiples range from 1.5 to 24.0) Revenues of investees Discounts for lack of marketability (5% to 39%) |
|
The estimated fair value would increase (decrease) if: -The revenue multiples were higher (lower) -The investees’ revenues were higher (lower) -The liquidity discounts were lower (higher) |
|
|
|
|
Market approach. Venture capital method evaluating a variety of quantitative and qualitative factors such as actual and forecasted results, cash position, recent or planned transactions, and market comparable companies. |
|
- Nature and selection of financing rounds - Weighting of financings rounds - Discounts for lack of marketability - Weighting of equity allocation method such as option pricing model and common stock equivalent model - Volatility assumptions - Estimated time to exit - Imminent exit value |
|
The estimated fair value would increase (decrease) if: - Different financing rounds are selected - Weighting of financing rounds changes -Weighting of the applied equity allocation methods changes - Volatility assumptions were higher (lower) - Estimated time to exit increases (decreases) - The imminent exit value increases (decreases) |
|
|
|
|
Last financing round valuations |
|
Nature and pricing indication of latest financing round |
|
The estimated fair value would increase (decrease) if: -Price of latest financing round would increase (decrease) - the overall company value would be higher (lower) - the respective analyzed share class would be affected by this change due to its rights and preferences |
|
|
|
|
Net asset value/fair market value as reported by the respective funds |
|
Net asset value calculations of the respective funds |
|
The estimated fair value would increase (decrease) if: Reported net asset value of respective fund would be higher (lower) |
Call option on equity shares |
|
Level 3 |
|
Market approach. Venture capital method evaluating a variety of quantitative and qualitative factors such as actual and forecasted results, cash position, recent or planned transactions, and market comparable companies. |
|
NA |
|
NA |
Other financial assets/ Financial liabilities |
|
|
|
|
||||
FX forward contracts |
|
Level 2 |
|
Discounted cash flow using par method. Expected future cash flows based on forward exchange rates are discounted over the respective remaining term of the contracts using the respective deposit interest rates and spot rates. |
|
NA |
|
NA |
Interest rate swaps |
|
Level 2 |
|
Discounted cash flow. Expected future cash flows are estimated based on forward interest rates from observable yield curves and contract interest rates, discounted at a rate that reflects the credit risk of the counterparty. |
|
NA |
|
NA |
F-84
Financial Instruments Not Measured at Fair Value
Type |
|
Fair Value Hierarchy |
|
Determination of Fair Value/Valuation Technique |
Financial liabilities |
|
|
|
|
Fixed-rate bonds (financial liabilities) |
|
Level 1 |
|
Quoted prices in an active market |
Fixed-rate private placements/ loans (financial liabilities) |
|
Level 2 |
|
Discounted cash flows Future cash outflows for fixed interest and principal are discounted over the term of the respective contracts using the market interest rates as at the reporting date. |
For other non-derivative financial assets/liabilities and variable rate financial debt, it is assumed that their carrying value reasonably approximates their fair values.
Transfers Between Levels 1 and 2
Transfers of equity securities from Level 2 to Level 1, which occurred because disposal restrictions lapsed and deducting a discount for such restriction was no longer necessary, did not take place in 2024 and in 2023 (2022: €93 million), while transfers from Level 1 to Level 2 did not occur at all.
Level 3 Fair Value Disclosures
The following table shows the reconciliation of fair values from the opening to the closing balances for our unlisted equity securities and call options on equity shares, as well as the deal contingent forward from our net investment hedge classified as Level 3 fair values:
Reconciliation of Level 3 Fair Values
€ millions |
|
2024 |
|
|
|
2023 |
|
|
|
|
Unlisted Equity Securities |
|
|
|
|
Unlisted Equity Securities |
|
and Call Options on |
|
Deal Contingent Forward |
|
|
|
|
Equity Shares |
|
|
1/1 |
|
4,817 |
|
4,883 |
|
0 |
Transfers |
|
|
|
|
|
|
Into Level 3 |
|
7 |
|
9 |
|
|
Out of Level 3 |
|
-2 |
|
-8 |
|
|
Purchases |
|
773 |
|
417 |
|
|
Sales |
|
-132 |
|
-101 |
|
|
Settlements |
|
|
|
|
|
91 |
Gains/losses |
|
|
|
|
|
|
Included in financial income, net |
|
481 |
|
-219 |
|
-106 |
Included in exchange differences in other comprehensive income |
|
325 |
|
-164 |
|
15 |
12/31 |
|
6,269 |
|
4,817 |
|
0 |
Change in unrealized gains/losses in profit or loss for equity investments held at the end of the reporting period |
|
674 |
|
532 |
|
0 |
Transfers out of Level 3 are due to initial public offerings of the respective investees or distributions in kind in the form of listed investees. Changing the unobservable inputs to reflect reasonably possible alternative assumptions would not have a material impact on the fair values of our unlisted equity securities held as FVTPL as at the reporting date.
F-85
Section G — Other Disclosures
This section provides additional disclosures on miscellaneous topics, including information pertaining to the Executive Board, the Supervisory Board, related-party transactions, and other corporate governance topics.
(G.1) Prepaid Expenses and Other Tax Assets
€ millions |
|
2024 |
|
2023 |
||||||||
|
|
Current |
|
Non-Current |
|
Total |
|
Current |
|
Non-Current |
|
Total |
Prepaid expenses |
|
988 |
|
430 |
|
1,418 |
|
844 |
|
386 |
|
1,230 |
Other tax assets |
|
256 |
|
67 |
|
323 |
|
241 |
|
33 |
|
274 |
Total |
|
1,244 |
|
497 |
|
1,741 |
|
1,085 |
|
419 |
|
1,504 |
/ Other non-financial assets |
|
2,682 |
|
3,990 |
|
6,672 |
|
2,374 |
|
3,573 |
|
5,947 |
Prepaid expenses and other tax assets as % of / Other non-financial assets |
|
46 |
|
12 |
|
26 |
|
46 |
|
12 |
|
25 |
Prepaid expenses primarily consist of prepayments for hyperscalers, support services, and software royalties. Other tax assets primarily consist of value-added tax (VAT).
(G.2) Provisions for Interest and Penalties Related to Taxes and Other Tax Liabilities
Provisions for Interest and Penalties Related to Taxes
€ millions |
|
2024 |
||||
|
|
Current |
|
Non-Current |
|
Total |
1/1/2024 |
|
11 |
|
142 |
|
153 |
Addition |
|
30 |
|
84 |
|
114 |
Utilization |
|
0 |
|
-71 |
|
-71 |
Release |
|
0 |
|
-16 |
|
-16 |
Transfer |
|
9 |
|
-9 |
|
0 |
Currency impact |
|
2 |
|
4 |
|
6 |
12/31/2024 |
|
52 |
|
134 |
|
186 |
Total provisions |
|
716 |
|
494 |
|
1,210 |
Provisions for interest and penalties related to taxes as % of Provisions |
|
7 |
|
27 |
|
15 |
The provisions primarily consist of interest related to income taxes.
Other Tax Liabilities
€ millions |
|
2024 |
|
2023 |
||||||||
|
|
Current |
|
Non-Current |
|
Total |
|
Current |
|
Non-Current |
|
Total |
Other tax liabilities |
|
1,009 |
|
0 |
|
1,009 |
|
870 |
|
0 |
|
870 |
/ Other non-financial liabilities |
|
5,533 |
|
749 |
|
6,282 |
|
5,647 |
|
698 |
|
6,345 |
Other tax liabilities as % of / Other non-financial liabilities |
|
18 |
|
0 |
|
16 |
|
15 |
|
0 |
|
14 |
Other tax liabilities primarily consist of VAT, payroll tax, and withholding tax.
F-86
(G.3) Other Litigation, Claims, and Legal Contingencies
This Note discloses information about intellectual property-related litigation and claims, tax-related litigation other than income tax-related litigation (see Note (C.5)), and anti-bribery matters.
y Uncertainty in Context of Legal Matters |
|
The policies outlined in Note (A.4) for customer-related provisions, which include provisions for customer-related litigation cases and claims, equally apply to our other litigation, claims, and legal contingencies disclosed in this Note. The outcome of litigation and claims is intrinsically subject to considerable uncertainty. Management’s view of these matters may also change in the future. Actual outcomes of litigation and claims may differ from the assessments made by management in prior periods, which could result in a material impact on our business, financial position, profit, cash flows, or reputation. Most of the lawsuits and claims are of a very individual nature and claims are either not quantified by the claimants or the claim amounts quantified are, based on historical evidence, not expected to be a good proxy for the expenditure that would be required to resolve the case concerned. The specifics of the jurisdictions where most of the claims are located further impair the predictability of the outcome of the cases. Therefore, it is typically not practicable to reliably estimate the financial effect that these lawsuits and claims would have if SAP were to incur expenditure for these cases. Further, the expected timing of any resulting outflows of economic benefits from these lawsuits and claims is typically uncertain and not estimable, as it depends generally on the duration of the legal proceedings and settlement negotiations required to resolve them. |
We are subject to a variety of claims and lawsuits that arise from time to time in the ordinary course of our business, including proceedings and claims that relate to companies we have acquired. We will continue to vigorously defend against all claims and lawsuits against us.The provisions recorded for these claims and lawsuits as at December 31, 2024, are neither individually nor in the aggregate material to SAP.
Among the claims and lawsuits disclosed in this Note are the following classes:
Intellectual Property-Related Litigation and Claims
Intellectual property-related litigation and claims are cases in which third parties have threatened or initiated litigation claiming that SAP violates one or more intellectual property rights that they possess. Such intellectual property rights may include patents, copyrights, and other similar rights.
Contingent liabilities exist from intellectual property-related litigation and claims for which no provision has been recognized. Generally, it is not practicable to estimate the financial impact of these contingent liabilities due to the uncertainties around the litigation and claims, as outlined above. Based on our past experience, most of the intellectual property-related litigation and claims tend to be either dismissed in court or settled out of court for amounts significantly below the originally claimed amounts. We currently believe that resolving the intellectual property-related claims and lawsuits pending as at December 31, 2024, will neither individually nor in the aggregate have a material adverse effect on our business, financial position, profit, or cash flows.
Individual cases of intellectual property-related litigation and claims include the following:
In June 2018, Teradata Corporation, Teradata US, Inc. and Teradata Operations, Inc. (collectively “Teradata”) filed a civil lawsuit against SAP SE, SAP America, Inc., and SAP Labs, LLC in U.S. federal court in California. Teradata alleged that SAP had misappropriated trade secrets of Teradata, had infringed Teradata’s copyrights (this claim was subsequently withdrawn by Teradata), and had violated U.S. antitrust laws. Teradata sought unspecified monetary damages and injunctive relief. In 2019, SAP asserted patent infringement counterclaims against Teradata seeking monetary damages and injunctive relief. In 2020, Teradata initiated a second civil lawsuit against SAP asserting patent infringement, seeking monetary damages and injunctive relief; in February 2021, SAP filed patent infringement counterclaims against Teradata in this second U.S. lawsuit as well as a civil lawsuit against Teradata in Germany asserting patent infringement, seeking monetary damages and injunctive relief. All claims between the parties were dismissed in November 2021 after the district court issued a summary judgment decision in SAP's favor on Teradata's antitrust and trade secret claims. Teradata appealed the district court's summary judgment decision. In December 2024, the U.S. Appeals Court granted Teradata’s appeal and ordered that the case be returned to the district court for further proceedings and potentially including trial on Teradata’s antitrust and trade secret claims.
Tax-Related Litigation
We are subject to ongoing audits by domestic and foreign tax authorities. In respect of non-income taxes, we are involved in various proceedings with foreign tax authorities regarding assessments and litigation matters on intercompany royalty payments and intercompany services. The total potential amount in dispute related to these matters for all applicable years is approximately €274 million (2023: €416 million). We have not recorded a provision for these matters, as we believe that we will prevail.
For more information about our income tax-related litigation, see Note (C.5).
F-87
Anti-Bribery Matters
In January 2024, following comprehensive and exhaustive investigations, dialogue, and corresponding remediation activities, SAP entered into a final settlement agreement with the U.S. SEC and the U.S. DOJ, as well as with local authorities and parties in South Africa, to resolve the criminal and civil claims fully and finally against SAP. Under this agreement, SAP has been required to make payments amounting to €207 million and will continue to enhance its compliance program, including related internal controls, policies, and procedures, and report to and cooperate with relevant regulators.
As a consequence, as at December 31, 2023, provisions for fines in regulatory compliance matters totaling €155 million were recognized in our Consolidated Financial Statements for the year 2023, as were repayments to customers, for which revenue recognized from contracts with customers have been reversed. A considerable portion of these repayments to customers was eligible to be credited against the fines incurred in the regulatory compliance matters. The settlement payments were completed in 2024.
(G.4) Board of Directors
Executive Board
Memberships on supervisory boards and other comparable governing bodies of enterprises, other than subsidiaries of SAP, on December 31, 2024
Christian Klein
Chief Executive Officer
Strategy & Operations, Corporate Development, Sustainability, Business AI, Compliance, Corporate Communications, Customer Success, Technology & Innovation
Supervisory Board, adidas AG, Herzogenaurach, Germany
Muhammad Alam (from April 1, 2024)
SAP Product Engineering
Global responsibility for all SAP business software applications including product strategy, product management, design, and development
Dominik Asam
Chief Financial Officer
Global Finance & Administration including Legal, Investor Relations, Internal Audit, Data Protection & Export Control, Government Affairs
Supervisory Board, Bertelsmann Management SE and Bertelsmann SE & Co. KGaA, Guetersloh, Germany
Thomas Saueressig
Customer Services & Delivery
Global responsibility for long-term customer value in the cloud including customer services, premium engagements and customer support; cloud infrastructure, cloud operations, cloud lifecycle management, and private cloud delivery
Board of Directors, Nokia Corporation, Espoo, Finland
Gina Vargiu-Breuer (from February 1, 2024)
Chief People Officer, Labor Director
People & Culture
Executive Board Members Who Left During 2024
Scott Russell (until August 31, 2024)
Julia White (until August 31, 2024)
Juergen Mueller (until September 30, 2024)
Supervisory Board
Memberships on supervisory boards and other comparable governing bodies of enterprises, other than subsidiaries of SAP, on December 31, 2024
Dr. h. c. mult. Pekka Ala-Pietilä (from May 15, 2024)2, 6, 7
Chairperson
Chairperson of the Board of Directors of Sanoma Corporation, Helsinki, Finland Head of Global Sponsorships, SAP SE, Walldorf, Germany
F-88
Lars Lamadé1, 2, 7
Deputy Chairperson
Supervisory Board, Rhein-Neckar Loewen GmbH, Kronau, Germany
Jakub Černý (from May 15, 2024)1, 4, 5
Demand Manager, SAP ČR, Prague, Czech Republic
Pascal Demat (from May 15, 2024)1, 5, 7
Solution Advisor HCM, SAP Belgium, Brussels, Belgium
SAP SE Works Council (Europe), Walldorf, Germany
Aicha Evans2, 4, 6
Chief Executive Officer and Member of the Board of Directors, Zoox, Inc., Foster City, CA, United States
Board of Directors, Joby Aviation LLC, Santa Cruz, CA, United States
Andreas Hahn (from May 15, 2024)1, 2, 4
Product Expert, Digital Supply Chain Standards SAP SE, Walldorf, Germany
Chairperson of the SAP SE Works Council (Europe), Walldorf, Germany
Member of the SAP SE Works Council, Walldorf, Germany
Prof. Dr. Ralf Herbrich (from May 15, 2024)4, 5
Managing Director and Professor for artificial intelligence and sustainability, Hasso Plattner Institute for Digital Engineering gGmbH, Potsdam, Germany
Margret Klein-Magar1, 2, 3
Head of SAP Alumni Relations SAP SE, Walldorf, Germany
Chairperson of the Spokespersons’ Committee of Senior Managers of SAP SE
Jennifer Xin-Zhe Li3, 5
General Partner of Changcheng Investment Partners, Beijing, China
Board of Directors, ABB Ltd., Zurich, Switzerland
Board of Directors, Full Truck Alliance Co. Ltd., Nanjing, Jiangsu, China, and Cayman Islands
Dr. Qi Lu4
CEO, MiraclePlus Ltd., Beijing, China
Board of Directors, Pinduoduo Inc., Shanghai, China
Chairperson of the Board of Directors, Pine Field Holding Limited, Cayman Islands
Chairperson of the Board of Directors, Pine Field Holding Limited, Hong Kong, China
Chairperson of the Board of Directors, Pine Field Ltd., Beijing, China
César Martin (from May 15, 2024)1, 3, 4
SAP EMEA Enterprise Architect, SAP Spain, Madrid, Spain
Chairperson of the SAP Spain Works Council, Madrid, Spain
Member of the SAP SE Works Council (Europe), Walldorf, Germany
Gerhard Oswald3, 4, 7
Managing Director of Oswald Consulting GmbH, Walldorf, Germany
Advisory Board, TSG 1899 Hoffenheim Fußball-Spielbetriebs GmbH, Sinsheim, Germany
Advisory Board, appliedAI Initiative GmbH, Munich, Germany Group General Counsel, Deutsche Bank AG, Frankfurt am Main, Germany
F-89
Dr. Friederike Rotsch2, 3, 6, 7
Nicolas Sabatier (from May 15, 2024)1, 2, 4
Chief Product Expert, Sustainability Innovation, SAP France SA, Paris, France
Member of the SAP SE Works Council (Europe), Walldorf, Germany
Secretary of the SAP France Works Council, Paris, France
Dr. Eberhard Schick (from May 15, 2024)1, 3, 5
Chairperson of the SAP SE Works Council, Walldorf, Germany
Nina Straßner (from May 15, 2024)1, 3, 5, 7
HRBP Senior Manager, Global Head of People Initiatives, SAP SE, Walldorf, Germany
Dr. Rouven Westphal2, 5, 6
Member of the Executive Board of the Hasso Plattner Foundation, Potsdam, Germany, and Managing Director of the General Partner of HPC Germany GmbH & Co. KG, Potsdam, Germany
Advisory Board, Sharks Sports & Entertainment LLC, San José, CA, United States
Dr. Gunnar Wiedenfels3, 5, 6
Chief Financial Officer, Warner Bros. Discovery, Inc., New York, NY, United States
Board of Directors, OWN LLC, West Hollywood, CA, United States
Board of Directors, Speechagain, Inc., New York, NY, United States
Supervisory Board Members Who Left During 2024
Prof. Dr. h. c. Hasso Plattner (until May 15, 2024)
Manuela Asche-Holstein (until May 15, 2024)
Monika Kovachka-Dimitrova (until May 15, 2024)
Peter Lengler (until May 15, 2024)
Christine Regitz (until May 15, 2024)
Dr. h. c. Punit Renjen (until May 15, 2024)
Heike Steck (until May 15, 2024)
Helmut Stengele (until May 15, 2024)
James Wright (until May 15, 2024)
F-90
(G.5) Executive and Supervisory Board Compensation
y Accounting Policy |
|
The short-term employee benefits disclosed below in the table “Executive Board Compensation” include a short-term, one-year performance-based compensation (“short-term incentive,” STI). The STI is granted in the Executive Board member’s home currency for a single year. Payment of part of the payout amount under the STI is deferred by one or two additional years and linked to the performance of the SAP share price (“STI deferral”). The short-term employee benefits include both the granted and the deferred amount. The share-based payment amounts disclosed below in the table “Executive Board Compensation” are based on the grant date fair value of the share units in the respective year. In 2024, share units were issued to the Executive Board members under the LTI 2024. In 2023 and 2022, share units were issued to the Executive Board members under the LTI 2020. For more information about the terms and details of these plans, see Note (B.3). In the table “Share-Based Payment for Executive Board Members,” the share-based payment expense is the amount recorded in profit or loss under IFRS 2 (Share-Based Payment) in the respective period. |
The total compensation of the Executive Board members for each of the years 2024, 2023, and 2022 was as follows:
Executive Board Compensation
€ thousands |
|
2024 |
|
2023 |
|
2022 |
Short-term employee benefits |
|
21,116 |
|
19,632 |
|
12,556 |
Share-based payment |
|
22,279 |
|
24,469 |
|
20,726 |
Subtotal |
|
43,395 |
|
44,101 |
|
33,282 |
Post-employment benefits |
|
-269 |
|
1,033 |
|
-1,429 |
thereof defined-benefit |
|
-711 |
|
673 |
|
-1,433 |
thereof defined-contribution |
|
441 |
|
360 |
|
4 |
Termination benefits |
|
21,615 |
|
NA |
|
9,600 |
Total |
|
64,741 |
|
45,134 |
|
41,453 |
Share-Based Payment for Executive Board Members
|
|
2024 |
|
2023 |
|
2022 |
Number of share units granted |
|
126,244 |
|
214,530 |
|
205,965 |
Total expense in € thousands |
|
52,062 |
|
36,127 |
|
9,986 |
The defined benefit obligation (DBO) for pensions to Executive Board members and the annual pension entitlement of the members of the Executive Board on reaching age 62 based on entitlements from performance-based and salary-linked plans were as follows:
Retirement Pension Plan for Executive Board Members
€ thousands |
|
2024 |
|
2023 |
|
2022 |
DBO 12/31 |
|
1,187 |
|
2,192 |
|
1,462 |
Annual pension entitlement |
|
88 |
|
137 |
|
114 |
The total annual compensation of the Supervisory Board members is as follows:
Supervisory Board Compensation
€ thousands |
|
2024 |
|
2023 |
|
2022 |
Total compensation |
|
5,579 |
|
5,427 |
|
5,206 |
thereof fixed compensation |
|
3,507 |
|
3,185 |
|
3,149 |
thereof committee remuneration |
|
2,071 |
|
2,242 |
|
2,058 |
The Supervisory Board compensation is a short-term benefit. The Supervisory Board members do not receive any share-based payment for their services. As far as members who are employee representatives on the Supervisory Board receive share-based payment, such compensation is for their services as employees only and is unrelated to their status as members of the Supervisory Board.
F-91
Payments to/DBO for Former Executive Board Members
€ thousands |
|
2024 |
|
2023 |
|
2022 |
Payments |
|
2,444 |
|
2,329 |
|
2,217 |
DBO 12/31 |
|
32,213 |
|
33,251 |
|
31,217 |
In 2023, SAP granted a loan within the SAP - Flex Loan program for its employees, amounting to €5,000 to an employee who later joined the Supervisory Board as an employee representative in 2024. Besides this loan, SAP did not grant any compensation advance or credit to, or enter into any commitment for the benefit of, any member of the Executive Board or Supervisory Board in 2024, 2023, or 2022.
(G.6) Related Party Transactions Other Than Board Compensation
Certain Supervisory Board members of SAP SE currently hold, or held within the last year, positions of significant responsibility with other entities. We have relationships with certain of these entities in the ordinary course of business, whereby we buy and sell products, assets, and services on terms believed to be consistent with those negotiated at arm’s length between unrelated parties.
Occasionally, members of the Executive Board of SAP SE obtain services from SAP for which they pay a consideration consistent with those negotiated at arm’s length between unrelated parties.
All amounts related to the abovementioned transactions were immaterial to SAP in all periods presented.
On May 15, 2024, the Annual General Meeting of Shareholders elected Pekka Ala Pietilä as chairperson of the Supervisory Board as successor to Hasso Plattner, whose term of office expired with effect from that date. As of his election date, Pekka Ala-Pietilä became a related party. Subsequently, all parties that were considered related to SAP due to their connection to and/or their relationship with Hasso Plattner are not considered as related parties after May 15, 2024. This includes transactions after that date as well as outstanding balances and commitments.
SAP has relationships with joint ventures and associates in the ordinary course of business whereby SAP buys and sells a wide variety of products and services generally on arm’s length terms.
Related Party Transactions
|
|
|
|
|
|
|
|
|
|
Companies Controlled by |
|
|
|
|
||
|
|
Executive Board Members |
|
Supervisory Board Members |
|
Supervisory Board Members |
|
Associated Entities |
||||||||
€ millions |
|
2024 |
|
2023 |
|
2024 |
|
2023 |
|
2024 |
|
2023 |
|
2024 |
|
2023 |
Products and services provided |
|
NA |
|
NA |
|
NA |
|
0 |
|
0 |
|
0 |
|
55 |
|
13 |
Products and services received |
|
NA |
|
NA |
|
2 |
1 |
2 |
1 |
1 |
|
3 |
|
90 |
|
110 |
Sponsoring and other financial support provided |
|
NA |
|
NA |
|
NA |
|
NA |
|
5 |
|
7 |
|
NA |
|
NA |
Outstanding balances at year end (Vendors) |
|
NA |
|
NA |
|
NA |
|
0 |
|
NA |
|
0 |
|
2 |
|
6 |
Outstanding balances at year end (Customers) |
|
NA |
|
NA |
|
0 |
|
0 |
|
NA |
|
0 |
|
20 |
|
0 |
Commitments at year end |
|
NA |
|
NA |
|
NA |
|
0 |
|
NA |
|
42 |
|
NA |
|
NA |
1 Including services from employee representatives on the Supervisory Board in their capacity as employees of SAP.
All of these balances are unsecured and interest-free and settlement is expected to occur in cash.
For information about the compensation of our Executive Board and Supervisory Board members, see Note (G.5).
F-92
(G.7) Principal Accountant Fees
At the Annual General Meeting of Shareholders held on May 15, 2024, our shareholders elected BDO AG Wirtschaftsprüfungsgesellschaft (BDO) as SAP’s independent auditor for 2024. BDO has been the Company’s principal auditor since the fiscal year 2023.
For fiscal years 2002 to 2022, KPMG AG Wirtschaftsprüfungsgesellschaft was the Company’s principal auditor.
BDO and other firms in the global BDO network charged the following fees to SAP for audit and other professional services related to 2024 and 2023 (KPMG for 2022):
€ millions |
|
2024 |
|
2023 |
|
2022 |
||||||||||||
|
|
BDO AG |
|
Foreign BDO |
|
|
|
BDO AG |
|
Foreign BDO |
|
|
|
KPMG AG |
|
Foreign |
|
|
|
|
(Germany) |
|
Firms |
|
Total |
|
(Germany) |
|
Firms |
|
Total |
|
(Germany) |
|
KPMG Firms |
|
Total |
Audit fees |
|
8 |
|
6 |
|
14 |
|
8 |
|
5 |
|
13 |
|
4 |
|
10 |
|
14 |
Audit-related fees |
|
1 |
|
6 |
|
7 |
|
0 |
|
1 |
|
1 |
|
3 |
|
7 |
|
10 |
Tax fees |
|
0 |
|
0 |
|
0 |
|
0 |
|
0 |
|
0 |
|
0 |
|
0 |
|
0 |
All other fees |
|
0 |
|
0 |
|
0 |
|
0 |
|
0 |
|
0 |
|
0 |
|
0 |
|
0 |
Total |
|
9 |
|
11 |
|
20 |
|
8 |
|
6 |
|
14 |
|
7 |
|
17 |
|
24 |
Audit fees are the aggregate fees charged by BDO for auditing our consolidated financial statements and the statutory financial statements of SAP SE and its subsidiaries. Audit-related fees are fees charged by BDO for assurance and related services that are reasonably related to the performance of the audit and for service organization attestation procedures.
(G.8) Events After the Reporting Period
Organizational Changes
In January 2025, SAP announced the following organizational changes, among others:
– |
The Supervisory Board had extended Thomas Saueressig’s Executive Board contract for another three years until the end of October 2028. |
– |
Effective February 1, 2025, the Supervisory Board had appointed Sebastian Steinhaeuser to the Executive Board in the role of Chief Operating Officer. |
– |
Effective February 1, 2025, the Executive Board had established an Extended Board, comprised of senior leaders from key functions supporting the Executive Board with advisory, coordination, and decision preparation. |
Operating Segments
As result of the organizational changes in the first quarter of 2025, SAP is currently assessing a separate operating segment for the services function within the Customer Services & Delivery (CS&D) Board area, led by Thomas Saueressig.
(G.9) Scope of Consolidation; Subsidiaries and Other Equity Investments
Entities Consolidated in the Financial Statements
|
|
Total |
12/31/2022 |
|
288 |
Additions |
|
12 |
Disposals |
|
-65 |
12/31/2023 |
|
235 |
Additions |
|
10 |
Disposals |
|
-19 |
12/31/2024 |
|
226 |
The additions relate to legal entities added in connection with acquisitions and foundations. The disposals are mainly due to mergers, liquidations, and divestitures of legal entities.
F-93
Subsidiaries1
Major Subsidiaries
Name and Location of Company |
|
Ownership |
|
Total Revenue |
|
Profit/Loss |
|
Total Equity as |
|
Number of |
|
|
|
|
|
|
in 20242 |
|
(–) After Tax for |
|
at 12/31/20242 |
|
Employees as |
|
Footnote |
|
|
|
|
|
|
20242 |
|
|
|
at 12/31/20243 |
|
|
|
|
% |
|
€ thousands |
|
€ thousands |
|
€ thousands |
|
|
|
|
Ariba Technologies India Private Limited, Bengaluru, India |
|
100 |
|
134,983 |
|
27,654 |
|
60,931 |
|
1,345 |
|
|
Ariba, Inc., Palo Alto, CA, United States |
|
100 |
|
1,197,707 |
|
481,663 |
|
3,637,872 |
|
1,393 |
|
|
Concur Technologies, Inc., Bellevue, WA, United States |
|
100 |
|
2,269,859 |
|
599,747 |
|
7,579,955 |
|
2,763 |
|
|
SAP (China) Co., Ltd., Shanghai, China |
|
100 |
|
1,322,903 |
|
15,722 |
|
-81,494 |
|
6,442 |
|
13 |
SAP (Schweiz) AG, Biel, Switzerland |
|
100 |
|
1,519,757 |
|
55,674 |
|
252,873 |
|
821 |
|
|
SAP (UK) Limited, Feltham, United Kingdom |
|
100 |
|
1,565,630 |
|
49,980 |
|
223,774 |
|
1,531 |
|
13 |
SAP America, Inc., Newtown Square, PA, United States |
|
100 |
|
9,534,492 |
|
9,274,460 |
|
21,910,872 |
|
8,521 |
|
|
SAP Argentina S.A., Buenos Aires, Argentina |
|
100 |
|
238,181 |
|
2,785 |
|
12,472 |
|
1,262 |
|
13 |
SAP Asia Pte. Ltd., Singapore, Singapore |
|
100 |
|
771,104 |
|
57,192 |
|
62,465 |
|
1,128 |
|
13 |
SAP Australia Pty. Ltd., Sydney, Australia |
|
100 |
|
864,311 |
|
28,631 |
|
114,584 |
|
1,187 |
|
|
SAP Brasil Ltda., São Paulo, Brazil |
|
100 |
|
860,542 |
|
16,541 |
|
100,749 |
|
3,234 |
|
13 |
SAP Canada Inc., Toronto, Canada |
|
100 |
|
1,312,653 |
|
111,144 |
|
770,602 |
|
2,961 |
|
|
SAP Deutschland SE & Co. KG, Walldorf, Germany |
|
100 |
|
6,343,048 |
|
534,083 |
|
1,578,098 |
|
5,217 |
|
9 |
SAP España - Sistemas, Aplicaciones y Productos en la Informática, S.A., Madrid, Spain |
|
100 |
|
718,448 |
|
122,449 |
|
110,369 |
|
997 |
|
|
SAP France S.A., Levallois-Perret, France |
|
100 |
|
1,369,306 |
|
136,775 |
|
1,849,849 |
|
1,406 |
|
|
SAP Hungary Rendszerek, Alkalmazások és Termékek az Adatfeldolgozásban Informatikai Kft., Budapest, Hungary |
|
100 |
|
202,374 |
|
6,111 |
|
36,671 |
|
1,607 |
|
|
SAP India Private Limited, Bengaluru, India |
|
100 |
|
902,960 |
|
73,322 |
|
263,069 |
|
2,567 |
|
|
SAP Industries, Inc., Newtown Square, PA, United States |
|
100 |
|
646,265 |
|
185,900 |
|
1,709,305 |
|
192 |
|
|
SAP Italia Sistemi Applicazioni Prodotti in Data Processing S.p.A., Vimercate, Italy |
|
100 |
|
848,348 |
|
59,871 |
|
120,584 |
|
823 |
|
|
SAP Japan Co., Ltd., Tokyo, Japan |
|
100 |
|
1,234,747 |
|
75,870 |
|
186,110 |
|
1,364 |
|
|
SAP Labs Bulgaria EOOD, Sofia, Bulgaria |
|
100 |
|
147,639 |
|
7,814 |
|
40,977 |
|
1,648 |
|
|
SAP Labs India Private Limited, Bengaluru, India |
|
100 |
|
1,052,776 |
|
152,223 |
|
359,228 |
|
11,474 |
|
|
SAP Labs, LLC, Palo Alto, CA, United States |
|
100 |
|
694,989 |
|
108,643 |
|
1,002,786 |
|
1,462 |
|
|
SAP México S.A. de C.V., Mexico City, Mexico |
|
100 |
|
583,793 |
|
3,365 |
|
113,858 |
|
1,218 |
|
13 |
SAP National Security Services, Inc., Newtown Square, PA, United States |
|
100 |
|
1,182,435 |
|
203,689 |
|
617,815 |
|
726 |
|
|
SAP Nederland B.V., 's-Hertogenbosch, the Netherlands |
|
100 |
|
887,685 |
|
165,855 |
|
593,195 |
|
667 |
|
|
SAP Philippines, Inc., Taguig City, Philippines |
|
100 |
|
127,743 |
|
4,116 |
|
12,794 |
|
1,033 |
|
13 |
SAP Service and Support Centre (Ireland) Limited, Dublin, Ireland |
|
100 |
|
356,597 |
|
84,637 |
|
174,992 |
|
1,732 |
|
|
SAP Services s.r.o., Prague, Czech Republic |
|
100 |
|
151,161 |
|
3,719 |
|
24,496 |
|
1,574 |
|
13 |
F-94
Other Subsidiaries4
Name and Location of Company |
|
Ownership |
|
Footnote |
|
|
% |
|
|
"SAP Kazakhstan" LLP, Almaty, Kazakhstan |
|
100 |
|
|
110405, Inc., Newtown Square, PA, United States |
|
100 |
|
|
Abakus Ukraine Limited Liability Company, Kyiv, Ukraine |
|
100 |
|
|
Ambin Properties Proprietary Limited, Johannesburg, South Africa |
|
100 |
|
13 |
AppGyver Inc., Indianapolis, IN, United States |
|
100 |
|
|
AppGyver Oy., Espoo, Finland |
|
100 |
|
|
Ariba Czech s.r.o., Prague, Czech Republic |
|
100 |
|
13 |
Ariba India Private Limited, Gurugram, India |
|
100 |
|
|
Ariba International Holdings, Inc., Wilmington, DE, United States |
|
100 |
|
|
Ariba Technologies Netherlands B.V., 's-Hertogenbosch, the Netherlands |
|
100 |
|
|
Baiza Capital Designated Activity Company, Dublin, Ireland |
|
0 |
|
8 |
Baiza Capital Italia s.r.l., Milan, Italy |
|
0 |
|
8 |
Baiza Capital LLC, Newark, NJ, United States |
|
0 |
|
8 |
Baiza Capital S.A., Luxembourg, Luxembourg |
|
0 |
|
8 |
Business Objects Option, LLC, Wilmington, DE, United States |
|
100 |
|
|
Business Objects Software Limited (Trading as SAP Solutions), Dublin, Ireland |
|
100 |
|
|
Callidus Software Inc., San Ramon, CA, United States |
|
100 |
|
|
CallidusCloud (India) Private Limited, Hyderabad, India |
|
100 |
|
|
Cleanshelf, Inc., San Francisco, CA, United States |
|
100 |
|
|
F-95
Name and Location of Company |
|
Ownership |
|
Footnote |
|
|
% |
|
|
CNQR Operations Mexico S. de. R.L. de. C.V., Mexico City, Mexico |
|
100 |
|
|
Concur (Canada), Inc., Toronto, Canada |
|
100 |
|
|
Concur (Czech) s.r.o., Prague, Czech Republic |
|
100 |
|
13 |
Concur (France) S.A.S., Levallois-Perret, France |
|
100 |
|
|
Concur (Germany) GmbH, Frankfurt am Main, Germany |
|
100 |
|
10, 11 |
Concur (Japan) Ltd., Tokyo, Japan |
|
100 |
|
|
Concur (Philippines) Inc., Makati City, Philippines |
|
100 |
|
|
Concur (Switzerland) GmbH, Zurich, Switzerland |
|
100 |
|
|
Concur Holdings (Netherlands) B.V., 's-Hertogenbosch, the Netherlands |
|
100 |
|
|
Concur Technologies (Australia) Pty. Ltd., Sydney, Australia |
|
100 |
|
|
Concur Technologies (Hong Kong) Limited, Hong Kong, China |
|
100 |
|
|
Concur Technologies (India) Private Limited, Bengaluru, India |
|
100 |
|
|
Concur Technologies (Singapore) Pte. Ltd., Singapore, Singapore |
|
100 |
|
13 |
Concur Technologies (UK) Limited, Feltham, United Kingdom |
|
100 |
|
13 |
ConTgo Consulting Limited, Feltham, United Kingdom |
|
100 |
|
|
ConTgo Limited, Feltham, United Kingdom |
|
100 |
|
|
Delos Cloud GmbH, Walldorf, Germany |
|
100 |
|
|
Emarsys eMarketing Systems GmbH, Vienna, Austria |
|
100 |
|
13 |
Emarsys İletişim Sistemleri Tic. Ltd Şti., Istanbul, Turkey |
|
100 |
|
|
Emarsys Interactive Services GmbH, Berlin, Germany |
|
100 |
|
|
Emarsys Limited, Hong Kong, China |
|
100 |
|
|
Emarsys North America, Inc., Indianapolis, IN, United States |
|
100 |
|
|
Emarsys Pte. Ltd., Singapore, Singapore |
|
100 |
|
|
Emarsys Pty. Ltd., Sydney, Australia |
|
100 |
|
|
Emarsys S.A.S., Levallois-Perret, France |
|
100 |
|
13 |
Emarsys Schweiz GmbH, Zurich, Switzerland |
|
100 |
|
|
Emarsys UK Ltd, London, United Kingdom |
|
100 |
|
13 |
EMARSYS-Technologies Informatikai Szolgáltató Kft., Budapest, Hungary |
|
100 |
|
|
F-96
Name and Location of Company |
|
Ownership |
|
Footnote |
|
|
% |
|
|
FreeMarkets Ltda., São Paulo, Brazil |
|
100 |
|
|
LeadFormix, Inc., San Ramon, CA, United States |
|
100 |
|
|
LeanIX France S.A.R.L., Courbevoie, France |
|
100 |
|
|
LeanIX GmbH, Bonn, Germany |
|
100 |
|
|
LeanIX SI d.o.o., Ljubljana, Slovenia |
|
100 |
|
|
LeanIX UK Limited, London, United Kingdom |
|
100 |
|
|
LeanIX US Holdings, Inc., Watertown, MA, United States |
|
100 |
|
|
LeanIX, B.V., Amsterdam, the Netherlands |
|
100 |
|
|
LeanIX, Inc., Houston, TX, United States |
|
100 |
|
|
LLC “SAP Labs“, Moscow, Russia |
|
100 |
|
|
LLC “SAP Ukraine”, Kyiv, Ukraine |
|
100 |
|
13 |
Loyalsys Technologies Israel Ltd., Tel Aviv - Yafo, Israel |
|
100 |
|
|
LXTECH India Private Limited, Hyderabad, India |
|
100 |
|
|
Outerjoin, Inc., San Ramon, CA, United States |
|
100 |
|
|
OutlookSoft Deutschland GmbH, Walldorf, Germany |
|
100 |
|
10, 11 |
PT SAP Indonesia, Jakarta, Indonesia |
|
99 |
|
|
Quadrem Africa Pty. Ltd., Johannesburg, South Africa |
|
100 |
|
|
Quadrem Brazil Ltda., Rio de Janeiro, Brazil |
|
100 |
|
|
Quadrem Chile Ltda., Santiago de Chile, Chile |
|
100 |
|
|
Quadrem International Ltd., Hamilton, Bermuda |
|
100 |
|
|
F-97
Name and Location of Company |
|
Ownership |
|
Footnote |
|
|
% |
|
|
Quadrem Netherlands B.V., 's-Hertogenbosch, the Netherlands |
|
100 |
|
|
Quadrem Overseas Cooperatief U.A., 's-Hertogenbosch, the Netherlands |
|
100 |
|
|
Quadrem Peru S.A.C., Lima, Peru |
|
100 |
|
|
SAP (Beijing) Software System Co., Ltd., Beijing, China |
|
100 |
|
|
SAP (China) Holding Co., Ltd., Beijing, China |
|
100 |
|
|
SAP Andina y del Caribe C.A., Caracas, Venezuela |
|
100 |
|
13 |
SAP AZ LLC, Baku, Azerbaijan |
|
100 |
|
|
SAP Belgium – Systems, Applications and Products S.A., Brussels, Belgium |
|
100 |
|
|
SAP Beteiligungs GmbH, Walldorf, Germany |
|
100 |
|
|
SAP Bulgaria EOOD, Sofia, Bulgaria |
|
100 |
|
|
SAP Chile Limitada, Santiago de Chile, Chile |
|
100 |
|
13 |
SAP CIS, LLC, Moscow, Russia |
|
100 |
|
|
SAP Colombia S.A.S., Bogotá, D.C., Colombia |
|
100 |
|
13 |
SAP Costa Rica, S.A., Escazú, Costa Rica |
|
100 |
|
13 |
SAP ČR, spol. s r.o., Prague, Czech Republic |
|
100 |
|
|
SAP Cyprus Limited, Strovolos, Cyprus |
|
100 |
|
|
SAP Danmark A/S, Copenhagen, Denmark |
|
100 |
|
|
SAP Dritte Beteiligungs- und Vermögensverwaltungs GmbH, Walldorf, Germany |
|
100 |
|
|
SAP društvo s ograničenom odgovornošću za digitalnu ekonomiju novog tisućljeća, Zagreb, Croatia |
|
100 |
|
|
SAP East Africa Limited, Nairobi, Kenya |
|
100 |
|
13 |
SAP Egypt LLC, Cairo, Egypt |
|
100 |
|
13 |
SAP EMEA Inside Sales S.L., Madrid, Spain |
|
100 |
|
|
F-98
Name and Location of Company |
|
Ownership |
|
Footnote |
|
|
% |
|
|
SAP Erste Beteiligungs- und Vermögensverwaltungs GmbH, Walldorf, Germany |
|
100 |
|
10, 11 |
SAP Estonia OÜ, Tallinn, Estonia |
|
100 |
|
|
SAP Financial, Inc., Toronto, Canada |
|
100 |
|
|
SAP Finland Oy, Espoo, Finland |
|
100 |
|
|
SAP Foreign Holdings GmbH, Walldorf, Germany |
|
100 |
|
|
SAP France Holding S.A., Levallois-Perret, France |
|
100 |
|
|
SAP Global Marketing, Inc., New York, NY, United States |
|
100 |
|
|
SAP Hellas Single Member S.A., Athens, Greece |
|
100 |
|
|
SAP Hong Kong Co., Ltd., Hong Kong, China |
|
100 |
|
13 |
SAP Hosting Beteiligungs GmbH, St. Leon-Rot, Germany |
|
100 |
|
10, 11 |
SAP India (Holding) Pte. Ltd., Singapore, Singapore |
|
100 |
|
|
SAP International Panama, S.A., Panama City, Panama |
|
100 |
|
|
SAP International, Inc., Miami, FL, United States |
|
100 |
|
|
SAP Investments, Inc., Wilmington, DE, United States |
|
100 |
|
|
SAP Ireland Limited, Dublin, Ireland |
|
100 |
|
13 |
SAP Ireland US - Financial Services Designated Activity Company, Dublin, Ireland |
|
100 |
|
|
SAP Israel Ltd., Ra’anana, Israel |
|
100 |
|
13 |
SAP Korea Ltd., Seoul, South Korea |
|
100 |
|
|
SAP Labs France S.A.S., Mougins, France |
|
100 |
|
|
SAP Labs Israel Ltd., Ra’anana, Israel |
|
100 |
|
|
SAP Labs Korea, Inc., Seoul, South Korea |
|
100 |
|
|
SAP Latvia SIA, Riga, Latvia |
|
100 |
|
|
SAP Lietuva UAB, Vilnius, Lithuania |
|
100 |
|
|
SAP Malaysia Sdn. Bhd., Kuala Lumpur, Malaysia |
|
100 |
|
|
F-99
Name and Location of Company |
|
Ownership |
|
Footnote |
|
|
% |
|
|
SAP Middle East and Africa North Regional Headquarter Company, Riyadh, Kingdom of Saudi Arabia |
|
100 |
|
5 |
SAP Middle East and North Africa L.L.C., Dubai, United Arab Emirates |
|
100 |
|
13 |
SAP Middle East FZ-LLC, Dubai, United Arab Emirates |
|
100 |
|
13 |
SAP Nederland Holding B.V.,‘s-Hertogenbosch, the Netherlands |
|
100 |
|
|
SAP New Zealand Limited, Auckland, New Zealand |
|
100 |
|
|
SAP Norge AS, Oslo, Norway |
|
100 |
|
|
SAP North West Africa Ltd, Casablanca, Morocco |
|
100 |
|
|
SAP Österreich GmbH, Vienna, Austria |
|
100 |
|
|
SAP Perú S.A.C., Lima, Peru |
|
100 |
|
13 |
SAP Polska Sp. z o.o., Warsaw, Poland |
|
100 |
|
|
SAP Portals Holding Beteiligungs GmbH, Walldorf, Germany |
|
100 |
|
|
SAP Portals Israel Ltd., Ra’anana, Israel |
|
100 |
|
|
SAP Portugal – Sistemas, Aplicações e Produtos Informáticos, Sociedade Unipessoal, Lda., Porto Salvo, Portugal |
|
100 |
|
|
SAP Projektverwaltungs- und Beteiligungs GmbH, Walldorf, Germany |
|
100 |
|
|
SAP Public Services, Inc., Washington, DC, United States |
|
100 |
|
|
SAP Puerto Rico GmbH, Walldorf, Germany |
|
100 |
|
10, 11, 13 |
SAP Retail Solutions Beteiligungsgesellschaft GmbH, Walldorf, Germany |
|
100 |
|
|
SAP Saudi Software Services Ltd., Riyadh, Kingdom of Saudi Arabia |
|
100 |
|
|
SAP Saudi Software Trading Ltd., Riyadh, Kingdom of Saudi Arabia |
|
75 |
|
13 |
F-100
Name and Location of Company |
|
Ownership |
|
Footnote |
|
|
% |
|
|
SAP Sechste Beteiligungs- und Vermögensverwaltungs GmbH, Walldorf, Germany |
|
100 |
|
10, 11 |
SAP Siebte Beteiligungs- und Vermögensverwaltungs GmbH, Walldorf, Germany |
|
100 |
|
10, 11 |
SAP sistemi, aplikacije in produkti za obdelavo podatkov d.o.o., Ljubljana, Slovenia |
|
100 |
|
|
SAP Slovensko s.r.o., Bratislava, Slovakia |
|
100 |
|
|
SAP Software and Services WLL, Doha, Qatar |
|
49 |
|
6, 13 |
SAP Svenska Aktiebolag, Stockholm, Sweden |
|
100 |
|
|
SAP System Application and Products Asia Myanmar Limited, Yangon, Myanmar |
|
100 |
|
|
SAP Systems, Applications and Products in Data Processing (Thailand) Ltd., Bangkok, Thailand |
|
100 |
|
|
SAP Taiwan Co., Ltd., Taipei, Taiwan |
|
100 |
|
|
SAP Technologies Inc., Palo Alto, CA, United States |
|
100 |
|
|
SAP Training and Development Institute FZCO, Dubai, United Arab Emirates |
|
100 |
|
|
SAP Türkiye Yazilim Üretim ve Ticaret A.Ş., Istanbul, Turkey |
|
100 |
|
|
SAP Ventures Investment GmbH, Walldorf, Germany |
|
100 |
|
10, 11 |
SAP Vierte Beteiligungs- und Vermögensverwaltungs GmbH, Walldorf, Germany |
|
100 |
|
|
SAP Vietnam Company Limited, Ho Chi Minh City, Vietnam |
|
100 |
|
|
SAP West Balkans d.o.o., Belgrade, Serbia |
|
100 |
|
|
SAP Zweite Beteiligungs- und Vermögensverwaltungs GmbH, Walldorf, Germany |
|
100 |
|
10, 11 |
SAP.io Fund, L.P., Austin, TX, United States |
|
0 |
|
7 |
Sapphire Fund Investments II Holdings, LLC, Austin, TX, United States |
|
100 |
|
7 |
Sapphire Fund Investments II, L.P., Austin, TX, United States |
|
0 |
|
7 |
Sapphire Fund Investments III Holdings, LLC, Austin, TX, United States |
|
100 |
|
7 |
Sapphire Fund Investments III, L.P., Austin, TX, United States |
|
0 |
|
7 |
Sapphire SAP HANA Fund of Funds, L.P., Austin, TX, United States |
|
0 |
|
7 |
Sapphire Ventures Fund I, L.P., Austin, TX, United States |
|
0 |
|
7 |
Sapphire Ventures Fund II, L.P., Austin, TX, United States |
|
0 |
|
7 |
Sapphire Ventures Fund III, L.P., Austin, TX, United States |
|
0 |
|
7 |
Sapphire Ventures Fund IV, L.P., Austin, TX, United States |
|
0 |
|
7 |
Sapphire Ventures Fund V, L.P., Austin, TX, United States |
|
0 |
|
7 |
Sapphire Ventures Fund VI, L.P., Austin, TX, United States |
|
0 |
|
7 |
Sapphire Ventures Fund VII-A, L.P., Austin, TX, United States |
|
0 |
|
7 |
SAPV (Mauritius), Ebene, Mauritius |
|
100 |
|
7 |
SC SAP Romania SRL, Bucharest, Romania |
|
100 |
|
|
Shanghai SAP Cloud Technology Company, Ltd., Shanghai, China |
|
100 |
|
|
Signavio, Inc., Newtown Square, PA, United States |
|
100 |
|
|
SuccessFactors (Philippines), Inc., Pasig City, Philippines |
|
100 |
|
13 |
F-101
Name and Location of Company |
|
Ownership |
|
Footnote |
|
|
% |
|
|
SuccessFactors, Inc., Newtown Square, PA, United States |
|
100 |
|
|
Sybase Angola, LDA, Luanda, Angola |
|
100 |
|
|
Sybase, Inc., San Ramon, CA, United States |
|
100 |
|
|
Systems Applications Products (Africa Region) Proprietary Limited, Johannesburg, South Africa |
|
100 |
|
|
Systems Applications Products (Africa) Proprietary Limited, Johannesburg, South Africa |
|
100 |
|
|
Systems Applications Products (South Africa) Proprietary Limited, Johannesburg, South Africa |
|
81 |
|
13 |
Systems Applications Products Nigeria Limited, Victoria Island, Nigeria |
|
100 |
|
13 |
Taulia (Shanghai) Smart Technology Co. Ltd., Shanghai, China |
|
100 |
|
|
Taulia Arabia LLC, Riyadh, Kingdom of Saudi Arabia |
|
100 |
|
|
Taulia Australia Pty. Ltd., Sydney, Australia |
|
100 |
|
|
Taulia Bulgaria EOOD, Sofia, Bulgaria |
|
100 |
|
|
Taulia GmbH, Düsseldorf, Germany |
|
100 |
|
12 |
Taulia LLC, San Francisco, CA, United States |
|
96 |
|
|
Taulia Singapore Pte. Ltd., Singapore, Singapore |
|
100 |
|
|
Taulia Trade Technology GmbH, Düsseldorf, Germany |
|
100 |
|
12 |
Taulia UK Ltd., London, United Kingdom |
|
100 |
|
13 |
TRX Europe Limited, Feltham, United Kingdom |
|
100 |
|
|
TRX Technologies India Private Limited, Bengaluru, India |
|
100 |
|
|
TRX UK Limited, Feltham, United Kingdom |
|
100 |
|
|
TRX, Inc., Bellevue, WA, United States |
|
100 |
|
|
Volume Integration, Inc., Chantilly, VA, United States |
|
100 |
|
|
WalkMe Australia Pty. Ltd., Sydney, Australia |
|
100 |
|
5 |
WalkMe Canada Ltd., Toronto, Canada |
|
100 |
|
5 |
WalkMe Germany GmbH, Frankfurt am Main, Germany |
|
100 |
|
5,12 |
WalkMe K.K., Tokyo, Japan |
|
100 |
|
5 |
WalkMe Ltd., Tel Aviv - Yafo, Israel |
|
100 |
|
5 |
WalkMe Middle East LLC - FZ, Dubai, United Arab Emirates |
|
100 |
|
5 |
WalkMe Singapore Pte. Ltd., Singapore, Singapore |
|
100 |
|
5 |
WalkMe UK Limited, London, United Kingdom |
|
100 |
|
5 |
WalkMe, Inc., San Francisco, CA, United States |
|
100 |
|
5 |
1 For the classification of the subsidiaries, the following figures are considered: revenues, profit/loss after tax, total equity, and number of employees.
2 These figures are based on our local IFRS financial statements prior to eliminations resulting from consolidation and therefore do not reflect the contribution of these companies included in the Consolidated Financial Statements. The translation of the equity into Group currency is based on period-end closing exchange rates, and on average exchange rates for revenue and net income/loss.
3 As at December 31, 2024, including managing directors, in FTE.
4 Figures for profit/loss after tax and total equity pursuant to HGB, section 285 and section 313 are not disclosed if they are of minor significance for a fair presentation of the profitability, liquidity, capital resources, and financial position of SAP SE, pursuant to HGB, section 313 (2) sentence 3 no. 4 and section 286 (3) sentence 1 no. 1.
5 Consolidated for the first time in 2024.
6 Agreements with the other shareholders provide that SAP SE fully controls the entity.
7 Structured entity belonging to SAP SE. The results of operations of these entities are included in SAP’s Consolidated Financial Statements in accordance with IFRS 10 (Consolidated Financial Statements).
8 In accordance with IFRS 10 the structured entity does not include the receivables and liabilities resulting from the supply chain financing (SCF) activities.
9 Entity whose personally liable partner is SAP SE.
10 Entity with (profit and) loss transfer agreement.
11 Pursuant to HGB, section 264 (3) or section 264b, the subsidiary is exempt from applying certain legal requirements to their statutory stand-alone financial statements including the requirement to prepare notes to the financial statements and a review of operations, the requirement of independent audit, and the requirement of public disclosure.
12 Pursuant to HGB, section 316 (1), the subsidiary is exempt from having its financial statements audited in respect of its financial year ended December 31, 2024.
13 Entity with support letter issued.
F-102
Other Equity Investments
Name and Location of Company |
|
Ownership |
|
|
% |
Joint Arrangements and Investments in Associates |
|
|
China DataCom Corporation Limited, Guangzhou, China |
|
28 |
Procurement Negócios Eletrônicos S/A, Rio de Janeiro, Brazil |
|
17 |
SAP Fioneer GmbH, Walldorf, Germany |
|
20 |
Name and Location of Company |
|
Equity Investments with Ownership of at Least 5% |
|
All Tax Platform - Solucoes Tributarias S.A., São Paulo, Brazil |
|
CDQ AG, St. Gallen, Switzerland |
|
Charlton House Professional Services Limited, Norwich, United Kingdom |
|
Cofinity-X GmbH, Cologne, Germany |
|
Data.R.X. Ltd. (dba Datricks Ltd.), Tel Aviv, Israel |
|
Digital Hub Rhein-Neckar GmbH, Ludwigshafen, Germany |
|
InnovationLab GmbH, Heidelberg, Germany |
|
innoWerft Walldorf GmbH, Walldorf, Germany |
|
Smart City Planning, Inc., Tokyo, Japan |
|
Vistex, Inc., Hoffman Estates, IL, United States |
|
47th Street Partners I, L.P., Menlo Park, CA, United States |
|
83North IV, L.P., Hertzalia, Israel |
|
Adverity GmbH, Vienna, Austria |
|
Alation, Inc., Redwood City, CA, United States |
|
Alchemist Accelerator Fund I LLC, San Francisco, CA, United States |
|
Aleph-Bigg SPV, L.P., Grand Cayman, Cayman Islands |
|
Amplify Partners II L.P., Menlo Park, CA, United States |
|
Amplify Partners III, L.P., Menlo Park, CA, United States |
|
Amplify Partners IV, L.P., Menlo Park, CA, United States |
|
Amplify Partners, L.P., Menlo Park, CA, United States |
|
Ask Sage, Inc., Arlington, VA, United States |
|
Asylum Ventures 2024, LP (fka Filament 2024, LP), Brooklyn, NY, United States |
|
BGS Holdings, Inc., Austin, TX, United States |
|
BioCatch Ltd., Tel Aviv, Israel |
|
Bitonic Technology Labs, Inc., Karnataka, India |
|
BlueYard Crypto 2, L.P. (fka BlueYard Crypto 1, L.P.), Hot Springs Village, AR, United States |
|
Boldstart Ventures V, L.P., Miami, FL, United States |
|
Boldstart Ventures VI, L.P., Miami, FL, United States |
|
Brightfield Holdings, Inc., New York, NY, United States |
|
Bryj Technologies, Inc. (fka Follow Analytics, Inc.), San Francisco, CA, United States |
|
BY Crypto 1 GmbH & Co. KG (fka BY Capital 1 Alternative GmbH & Co. KG), Berlin, Germany |
|
Blue Yard Capital I GmbH & Co. KG, Berlin, Germany |
|
BY Capital 2 GmbH & Co. KG, Berlin, Germany |
|
Catchpoint Systems, Inc., New York, NY, United States |
|
Chalfen Ventures Fund I L.P., St Heiler, Jersey, Channel Islands |
|
Chalfen Ventures Fund II L.P., St Helier, Jersey, Channel Islands |
|
F-103
Chalfen Ventures Fund III L.P., St Helier, Jersey, Channel Islands |
|
CircleCI, Inc., San Francisco, CA, United States |
|
Clari, Inc., Sunnyvale, CA, United States |
|
Collectly, Inc., Pasadena, CA, United States |
|
ComponentLab, Inc., Seattle, WA, United States |
|
Constructor Topco Inc., San Francisco, CA, United States |
|
Contentful Global, Inc., Berlin, Germany |
|
Costanoa Venture Capital II L.P., Palo Alto, CA, United States |
|
Costanoa Venture Capital QZ, LLC, Palo Alto, CA, United States |
|
Costanoa Venture Capital III L.P., Palo Alto, CA, United States |
|
Creandum SPV TR (D) AB, Stockholm, Sweden |
|
Creatio Inc., Boston, MA, United States |
|
Culture Amp, Inc., Melbourne, Australia |
|
Cypress.io, Inc., Atlanta, GA, United States |
|
Data Collective II L.P., Palo Alto, CA, United States |
|
Data Collective III L.P., Palo Alto, CA, United States |
|
Data Collective IV, L.P., Palo Alto, CA, United States |
|
Defense Unicorns, Inc., Colorado Springs, CO, United States |
|
DocEquity, Inc. (dba Supio), Seattle, WA, United States |
|
Dremio Corporation, Santa Clara, CA, United States |
|
Elise A.I. Technologies Corp., New York, NY, United States |
|
Essence VC III, L.P., Seattle, WA, United States |
|
FeedZai S.A., Coimbra, Portugal |
|
Felix Ventures II, L.P., London, United Kingdom |
|
Felix Capital Fund III, London, United Kingdom |
|
Finco Services, Inc. (dba Current), New York, NY, United States |
|
FloQast, Inc., Los Angeles, California, United States |
|
GitGuardian SAS, Paris, France |
|
Gorgias Inc., San Francisco, CA, United States |
|
Haystack Ventures V, L.P., Mill Valley, CA, United States |
|
Haystack Ventures VI, L.P., Mill Valley, CA, United States |
|
Haystack Ventures VII, L.P., San Francisco, CA, United States |
|
Huntress Labs Incorporated, Ellicott City, MD, United States |
|
IDG Ventures USA III, L.P., San Francisco, CA, United States |
|
IEX Group, Inc., New York, NY, United States |
|
InfluxData, Inc., San Francisco, CA, United States |
|
Initialized CBH SPV LLC, San Francisco, CA, United States |
|
Involve.ai, Inc., Santa Monica, CA, United States |
|
JetLenses Inc. (dba Verse Medical), New York, NY, United States |
|
JupiterOne, Inc., Morrisville, NC, United States |
|
LeanData, Inc., Sunnyvale, CA, United States |
|
LGVP F I LLC, Dover, DE, United States |
|
Local Globe Opportunity Fund, L.P., St. Peter Port, Guernsey, Channel Islands |
|
Local Globe VII, L.P., St. Peter Port, Guernsey, Channel Islands |
|
Local Globe VIII, L.P., St. Peter Port, Guernsey, Channel Islands |
|
Local Globe X, L.P., St. Peter Port, Guernsey, Channel Islands |
|
F-104
LocalGlobe XI, L.P., St. Peter Port, Guernsey, Channel Islands |
|
Mango Capital 2018, L.P., Los Altos, CA, United States |
|
Mango Capital 2020, L.P., Los Altos, CA, United States |
|
Mango Capital 2022, L.P., Los Altos, CA, United States |
|
Matillion Ltd., Altrincham, United Kingdom |
|
Medable Inc., Palo Alto, CA, United States |
|
Mosaic Ventures Investors Fund I, L.P., London, United Kingdom |
|
Moxxie Ventures III, L.P., Mountain View, CA, United States |
|
Notation Capital II CIRC, LLC, Brooklyn, NY, United States |
|
Notation Capital II, L.P., Brooklyn, NY, United States |
|
Notation Capital III, L.P., Brooklyn, NY, United States |
|
Notation Capital, L.P., Brooklyn, NY, United States |
|
OpenX Software Limited, Pasadena, CA, United States |
|
Paper Education Company Inc., Montreal, Canada |
|
Pendo.io, Inc., Raleigh, NC, United States |
|
PivotNorth Early Fund I, L.P., Atherton, CA, United States |
|
Point Nine Annex GmbH & Co. KG, Berlin, Germany |
|
Point Nine Capital Fund II GmbH & Co. KG, Berlin, Germany |
|
Point Nine Capital Fund III GmbH & Co. KG, Berlin, Germany |
|
Point Nine Capital Fund IV GmbH & Co. KG, Berlin, Germany |
|
Point Nine Capital Fund V GmbH & Co. KG, Berlin, Germany |
|
Project 44, Inc., Chicago, IL, United States |
|
PubNub, Inc., San Francisco, CA, United States |
|
Qualified.com, Inc., San Francisco, CA, United States |
|
Reltio, Inc., Redwood Shores, CA, United States |
|
Restream, Inc., Austin, TX, United States |
|
Rewst Inc., Westchase, FL, United States |
|
Ridge Ventures IV, L.P., San Francisco, CA, United States |
|
Ridge Ventures V, L.P., San Francisco, CA, United States |
|
SafeGraph, Inc., Denver, CO, United States |
|
Sapphire Sport Parallel Fund II, L.P., Austin, TX, United States |
|
Sapphire Sport, L.P., Austin, TX, United States |
|
Sapphire Sport Parallel Fund, L.P., Austin, TX, United States |
|
Side, Inc., San Francisco, CA, United States |
|
Simpplr Inc., Redwood City, CA, United States |
|
Splashtop, Inc., San Jose, CA, United States |
|
Spring Mobile Solutions, Inc., Reston, VA, United States |
|
StackHawk, Inc., Denver, CO, United States |
|
Storm Ventures V, L.P., Menlo Park, CA, United States |
|
SV Angel IV, L.P., San Francisco, CA, United States |
|
Tetrate.io, Inc., Milpitas, CA, United States |
|
The SaaStr Fund, L.P., Palo Alto, CA, United States |
|
The SaaStr Fund II, L.P., Palo Alto, CA, United States |
|
Third Kind Venture Capital II, L.P., New York, NY, United States |
|
Third Kind Venture Capital III, L.P., New York, NY, United States |
|
Tractian Ltd, Atlanta, GA, United States |
|
F-105
Tribe Capital LLC Series 3, Redwood City, CA, United States |
|
Tribe Capital LLC Series 8, Redwood City, CA, United States |
|
UJET, Inc., San Francisco, CA, United States |
|
Unmind Ltd., London, United Kingdom |
|
Upfront V, L.P., Santa Monica, CA, United States |
|
Uptycs, Inc., Waltham, MA, United States |
|
Upvest GmbH, Berlin, Germany |
|
VerbIT, Inc., New York, NY, United States |
|
Walkabout Ventures Fund II L.P., Los Angeles, CA, United States |
|
Yapily Ltd., London, United Kingdom |
|
Zesty Tech Ltd., Ramat Gan, Israel |
|
Kaltura, Inc., New York, NY, United States |
|
F-106
Exhibit 11.1
|
|
|
|
SAP GLOBAL
INSIDER REGULATIONS POLICY
Version Number: 3.2
Effective Date: October 16, 2023
Document Classification: PUBLIC
|
Version 3.2, October 16, 2023 Document Classification: PUBLIC The online version of this document is the officially released version. Any copies or print-outs are not controlled |
SAP Global Insider Regulations Policy
CONTENTS
1 |
INTRODUCTION AND PURPOSE |
3 |
|||
2 |
SCOPE |
4 |
|||
3 |
TERMS AND DEFINITIONS |
4 |
|||
4 |
MAIN POLICY CONTENT |
4 |
|||
|
4.1 |
Provisions of the European Market Abuse Regulation and the German Securities Trading Act |
4 |
||
|
4.1.1 |
Prohibition of Insider Dealing and Unlawful Disclosure of Inside Information |
4 |
||
|
4.1.2 |
Prohibitions Applicable to All SAP Employees |
5 |
||
|
4.1.3 |
Consequences of Breach |
5 |
||
|
4.1.4 |
Consequences of Being Registered in an Insider List |
6 |
||
|
4.2 |
Urgent Appeal of the Executive Board Not to Trade During Blackout Periods |
6 |
||
|
Version 3.2, October 16, 2023 Document Classification: PUBLIC The online version of this document is the officially released version. Any copies or print-outs are not controlled. |
2
SAP Global Insider Regulations Policy
1 |
INTRODUCTION AND PURPOSE |
◼ |
When trading in SAP securities, SAP employees must obey local insider trading rules, meaning the laws of the jurisdictions where they trade. As SAP securities are traded on financial markets all over the world, SAP cannot provide employees with information on the local insider laws of each jurisdiction where SAP securities are traded. Instead, SAP employees are themselves responsible for ensuring that their transactions comply with applicable local insider laws. |
◼ |
In addition, transactions in SAP’s securities are governed by European or US rules, depending on whether the transaction is made in SAP shares or SAP American Depositary Receipts (“ADRs”), as SAP has securities listed in both Germany and the US. |
◼ |
SAP’s shares are admitted to trading on the Frankfurt Stock Exchange in Germany, which means that any transactions in SAP shares (whether carried out within or without the EU) are subject to European insider law. As a result, transactions in SAP shares carried out on markets outside the EU will not only be subject to the local insider laws of the relevant markets but also to European insider law. The European insider law is described in detail in this Policy. |
◼ |
SAP’s ADRs are admitted to trading on the New York Stock Exchange (the “NYSE”). As a result, any transaction in SAP ADRs carried out on markets within or outside the US are subject to US insider laws. This means that transactions in SAP ADRs carried out outside the US will be subject to both US insider laws and local insider laws of the relevant market. Additionally, the trading of any other (non US-listed) securities, such as SAP’s shares, are subject to US insider trading laws if the purchase/sale transaction actually occurs within the US. Transactions in SAP shares executed in the US will therefore be subject to both EU and US insider laws. US insider laws are described in the U.S. Insider Trading Policy which is available on SAP One under Policies and Guidelines (int.sap). |
◼ |
SAP employees should therefore make sure that their transactions in SAP securities comply: |
(i) with local insider laws applicable to the market in which they trade, AND
(ii) with the law applicable to the SAP security in which they trade (i.e., US laws if they trade in SAP ADRs, and European laws if they trade in SAP shares).
◼ |
Furthermore, all transactions in publicly traded securities are subject to insider laws, including transactions in listed securities issued by SAP customers, suppliers, competitors, or partners. This means SAP employees must be very careful when trading in listed securities of SAP customers, suppliers, competitors, or partners, to avoid trading on the basis of inside information relating to the SAP customer, suppliers, competitor or partner which SAP employees may possess through their work for SAP or otherwise. Passing on such inside information to others (“tipping”) is prohibited as well. |
◼ |
For information on US or European insider laws please refer to the applicable SAP Policy. |
◼ |
This Insider Regulations Policy which is part of the Global Code of Ethics and Business Conduct for Employees of SAP describes the statutory prohibitions pursuant to the European Market Abuse Regulation1 and the German Securities Trading Act of insider dealing and unlawful disclosure of inside information and the consequences in case of breach, as well as the urgent appeal of the SAP Executive Board to all employees as of May 1997 not to trade in SAP shares or bonds or their derivatives during the so-called “Blackout Period”. |
1 Regulation (EU) No. 596/2014 on market abuse.
|
Version 3.2, October 16, 2023 Document Classification: PUBLIC The online version of this document is the officially released version. Any copies or print-outs are not controlled. |
3
SAP Global Insider Regulations Policy
◼ |
In their own interest and that of SAP, and to avoid any suspicion of insider trading, SAP employees are strongly recommended not to trade in SAP securities during the Blackout Period. In cases of doubt please reach out the Corporate and Capital Markets Team of SAP Global Legal prior to trading. |
2 |
SCOPE |
This Policy applies to the entire management of the SAP Group and to all SAP employees worldwide.
3TERMS AND DEFINITIONS
Financial Instruments |
The prohibition of insider dealing and unlawful disclosure of inside information stipulated in the European Market Abuse Regulation applies to, inter alia, financial instruments that have been admitted to trading on a stock exchange in the European Economic Area, or the price or value of which depends on or has an effect on the price or value of such a financial instrument, like SAP’s shares and bonds as well as related derivatives. |
Inside Information |
The European Market Abuse Regulation defines inside information as information of a precise nature, which has not been made public, relating, directly or indirectly, to one or more financial instruments or the companies that issue them, and which, if it were made public, would be likely to have a significant effect on the prices of those financial instruments or on the price of related derivative financial instruments. The test for whether information would be likely to significantly impact the price is whether a reasonable investor would be likely to use the information as part of the basis of his or her investment decision. |
Information regarding future circumstances or events shall be deemed to be of a precise nature if such circumstances or events may reasonably be expected to come into existence or occur, and where it is specific enough to enable a conclusion to be drawn as to the possible effect of such circumstances or events on the price of the financial instrument to which the information relates. |
|
Capital Market |
As part of the SAP Legal Department the Capital Market Compliance Team deals with all legal aspects of insider law, keeps the insider lists of SAP and may also be contacted by employees with respect to any questions arising in connection with the prohibition of insider dealing and unlawful disclosure of inside information. |
4MAIN POLICY CONTENT
 Provisions of the European Market Abuse Regulation and the German Securities Trading Act
4.1.1Prohibition of Insider Dealing and Unlawful Disclosure of Inside Information
| ● | Pursuant to the European Market Abuse Regulation, it is prohibited to |
(a)Engage or attempt to engage in insider dealing, i.e. use inside information by acquiring or disposing of, for one’s own account or for that of another person, directly or indirectly, financial instruments to which that information relates;
(b)Recommend that another person engage in insider dealing, or induce another person to do so; or
|
Version 3.2, October 16, 2023 Document Classification: PUBLIC The online version of this document is the officially released version. Any copies or print-outs are not controlled. |
4
SAP Global Insider Regulations Policy
(c)Unlawfully disclose inside information to any other person, i.e. except where the disclosure is made in the normal exercise of an employment, a profession or duties.
| ● | This prohibition applies to everyone who possesses inside information, irrespective of how the inside information was obtained, including through |
(a) |
Being a member of the Executive Board or Supervisory Board of SAP or an SAP shareholder, |
(b) |
The exercise of a profession, employment, or duties, or |
(c) |
Under any other circumstances, where that person knows or ought to know that it is inside information. |
| ● | It makes no difference whether the employee has signed a special insider or confidentiality declaration or he/she is included on a list of insiders. This means employees must obey the insider regulations not only if they have knowledge of (not yet published) SAP financial data due to their employment but also if, for example, they are an employee in development working on development projects that could significantly influence the price of the SAP share if they became publicly known. Furthermore, employees must obey the regulations if they happen to obtain inside information, for example, by talking to other people or if it is directly disclosed to them, or if they somehow read inside information. |
4.1.2Prohibitions Applicable to All SAP Employees
| ● | The prohibitions of insider dealing and unlawful disclosure of inside information stipulated in the European Market Abuse Regulation apply to actions committed within and also outside of the European Union with respect to the financial instruments described in section 2 above. As a consequence they apply to all employees of the SAP Group worldwide. |
| ● | Similar prohibitions of insider dealing and unlawful disclosure also apply under US law with regard to SAP’s ADRs listed on the New York Stock Exchange, and also in other countries outside the European Union. All such provisions must also be obeyed. |
4.1.3Consequences of Breach
Breaches of the statutory provisions can have serious consequences for the person concerned:
| ● | A willful or attempted breach of the prohibition of insider dealing or unlawful disclosure of inside information stipulated in the European Market Abuse Regulation constitutes a criminal offence under the German Securities Trading Act punishable with up to five years’ imprisonment or a fine. |
| ● | Furthermore, it is an administrative offence under the German Securities Trading Act if the prohibition of insider dealing or unlawful disclosure of inside information stipulated in the MAR is breached by gross negligence, e.g. in cases where someone is not aware that information is inside information or makes accessible inside information to others (e.g. by leaving confidential information unlocked). Such breach may be sanctioned by a penalty of up to 5 million Euro (if committed by a natural person) or a higher penalty of up to the higher of 15 million Euro or 15% of the legal person’s total revenue in the preceding fiscal year, or up to three times the estimated economic advantage drawn from the breach. In addition, the German Federal Financial Supervisory Authority (BaFin) will publish on its website any measures and sanctions imposed for breaches of the prohibition, naming the offender. |
| ● | Breaches of the MAR prohibition of insider dealing or unlawful disclosure of inside information committed in another member state of the EU or outside of the EU, as well as any breaches of similar prohibitions stipulated under the laws of other countries outside the European Union (including under US law), may be punishable by similar criminal and/or administrative sanctions under applicable local law. |
| ● | There may also be consequences under applicable local employment law. |
|
Version 3.2, October 16, 2023 Document Classification: PUBLIC The online version of this document is the officially released version. Any copies or print-outs are not controlled. |
5
SAP Global Insider Regulations Policy
4.1.4Consequences of Being Registered in an Insider List
| ● | The European Market Abuse Regulation requires SAP SE to keep lists of insiders. The lists must indicate all persons who have access to inside information and who are employed by SAP SE or otherwise perform tasks through which they have access to inside information (e.g. as employees of any of SAP SE’s subsidiaries). This affects SAP employees, for example, who, due to their work, have access to (not yet published) SAP business and financial data or who work on projects with an inside information element. Any SAP employees who have gained, or are about to gain, access to inside information relating to SAP SE and/or its financial instruments will be kept on an insider list until they cease to have such access. |
| ● | Furthermore, all SAP employees who have gained, or are about to gain, access to inside information relating to SAP SE and/or its financial instruments will be requested to acknowledge in writing (“Insider Declaration”) the legal and regulatory duties entailed to their position as potential insiders (including the duty of preserving the confidentiality of the inside information and the prohibition of using such information by trading in SAP securities), and the sanctions applicable to insider dealing and unlawful disclosure of inside information. |
| ● | Every employee must note that trading in SAP shares or bonds or related derivatives while his/her name is kept on an insider list can give rise to the suspicion that he/she is engaging in insider dealing. |
 Urgent Appeal of the Executive Board Not to Trade During Blackout Periods
| ● | To forestall any suspicion that SAP employees engage in insider dealing, as long ago as May 1997 the SAP Executive Board made an urgent appeal to all employees not to trade in SAP shares or bonds or their derivatives during the period from the 15th day of the third month of any reporting quarter until the figures for that quarter are published by SAP (“Blackout Period”, see the Global Code of Ethics and Business Conduct for Employees, section 5.6). Deviations from this guideline should only be made in emergencies (for example, where an employee has a sudden unexpected cash requirement). Cases of doubt should be discussed with the SAP SE Capital Market Compliance Team beforehand. If SAP publishes figures before the planned date, the Disclosure Committee decides whether this publication is sufficient to end the Blackout Period ahead of time. This decision will be communicated to all employees immediately. |
| ● | The current Blackout Periods are listed in the Blackout Period Calendar available on SAP One. |
|
Version 3.2, October 16, 2023 Document Classification: PUBLIC The online version of this document is the officially released version. Any copies or print-outs are not controlled. |
6
Exhibit 11.2
|
|
|
|
SAP U.S. INSIDER TRADING POLICY
Version Number: 2.1
Effective Date: January 1, 2025
Document Classification: PUBLIC
|
Version 2.1 January 1, 2025 Document Classification: PUBLIC The online version of this document is the officially released version. Any copies or print-outs are not controlled |
SAP U.S. Insider Trading Policy
CONTENTS
1 |
|
INTRODUCTION AND PURPOSE |
3 |
||
2 |
|
SCOPE |
4 |
||
3 |
|
MAIN POLICY CONTENT |
4 |
||
|
3.1 |
|
APPLICATION OF THIS POLICY |
4 |
|
|
|
3.1.1 |
Covered Persons and Transactions |
4 |
|
|
|
3.1.2 |
Equity Plan Securities |
4 |
|
|
3.2 |
|
OVERVIEW |
4 |
|
|
|
3.2.1 |
Expectations |
4 |
|
|
3.3 |
|
LEGAL BACKGROUND |
4 |
|
|
|
3.3.1 |
Definitions |
4 |
|
|
|
3.3.2 |
Potential Criminal and Civil Liability and/or Disciplinary Action. |
6 |
|
|
3.4 |
|
POLICIES REGARDING TRANSACTIONS IN SAP’S SECURITIES |
6 |
|
|
|
3.4.1 |
No Trading on Material Non-Public Information |
6 |
|
|
|
3.4.2 |
No Tipping |
7 |
|
|
|
3.4.3 |
No Short Sales. |
7 |
|
|
|
3.4.4 |
No Investments in Derivatives of the Company’s Securities. |
7 |
|
|
|
3.4.5 |
No Margin Purchases. |
7 |
|
|
|
3.4.6 |
401(k) Plan. |
8 |
|
|
|
3.4.7 |
Black Out Window. |
8 |
|
|
|
3.4.8 |
Special Black Out Window |
8 |
|
|
|
3.4.9 |
Rule 10b5-1 Trading Plans |
8 |
|
|
3.5 |
|
POLICIES REGARDING THE USE, DISCLOSURE AND PROTECTION OF MATERIAL, NON-PUBLIC INFORMATION |
9 |
|
|
|
3.5.1 |
Use and Disclosure of Material Non-Public Information Regarding SAP |
9 |
|
|
|
3.5.2 |
Material Non-Public Information Regarding Other Companies |
9 |
|
|
|
3.5.3 |
Unauthorized Disclosure of Confidential Information |
9 |
|
|
3.6 |
|
REPORTING OF VIOLATIONS OF THIS POLICY |
10 |
|
|
Version 2.1 January 1, 2025 Document Classification: PUBLIC The online version of this document is the officially released version. Any copies or print-outs are not controlled. |
2
SAP U.S. Insider Trading Policy
1INTRODUCTION AND PURPOSE
When trading in SAP securities, SAP employees must obey local insider trading rules, meaning the laws of the jurisdictions where they trade. As SAP securities are traded on financial markets all over the world, SAP cannot provide employees with information on the local insider laws of each jurisdiction where SAP securities are traded. Instead, SAP employees are themselves responsible for ensuring that their transactions comply with applicable local insider laws.
In addition, transactions in SAP’s securities are governed by European or US rules, depending on whether the transaction is made in SAP shares or SAP American Depositary Receipts (“ADRs”), as SAP has securities listed in both Germany and the U.S. SAP’s shares are admitted to trading on the Frankfurt Stock Exchange in Germany, which means that any transactions in SAP shares (whether carried out within or without the EU) are subject to European insider law. As a result, transactions in SAP shares carried out on markets outside the EU will not only be subject to the local insider laws of the relevant markets but also to European insider law. The European insider law is described in detail in the SAP Global Insider Regulations Policy.
SAP’s ADRs are admitted to trading on the New York Stock Exchange (the “NYSE”). As a result, any transaction in SAP ADRs carried out on markets within or outside the U.S. are subject to U.S. insider laws. This means that transactions in SAP ADRs carried out outside the U.S. will be subject to both U.S. insider laws and local insider laws of the relevant market. Additionally, the trading of any other (non-U.S. listed) securities, such as SAP’s shares, are subject to U.S. insider trading laws if the purchase/sale transaction actually occurs within the U.S. Transactions in SAP shares executed in the U.S. will therefore be subject to both EU and U.S. insider laws. U.S. insider laws are described in this SAP Insider Trading Policy – U.S. Laws.
SAP persons should therefore make sure that their transactions in SAP securities comply:
(i) |
with local insider laws, AND |
(ii)with the law applicable to the SAP security in which they trade (i.e., U.S. laws if they trade in SAP ADRs, and European laws if they trade in SAP shares (and U.S. laws as well if they trade in SAP shares in the U.S.)
Furthermore, all transactions in publicly traded securities are subject to insider laws, including transactions in listed securities issued by SAP customers, suppliers, competitors, or partners. This means SAP employees must be very careful when trading in listed securities of SAP customers, suppliers, competitors, or partners, to avoid trading on the basis of material non-public information relating to the SAP customer, suppliers, competitor or partner which SAP employees may possess through their work for SAP or otherwise. Passing on such material non-public information to others (“tipping”) is prohibited as well.
For information on U.S. or European insider laws please refer to the applicable SAP Policy.
In their own interest and that of SAP, and to avoid any suspicion of insider trading, SAP employees are strongly recommended not to trade in SAP securities during the Blackout Period. In cases of doubt please contact our U.S. Corporate and Capital Markets Team at SAP_USA_Insider_Trading_Plan_Inquiries@global.corp.sap prior to trading.
*Note: this Policy relates only to U.S. insider laws and regulations. Further information on SAP’s German and European insider laws and regulations is available here: SAP Global Insider Regulations Policy.
|
Version 2.1 January 1, 2025 Document Classification: PUBLIC The online version of this document is the officially released version. Any copies or print-outs are not controlled. |
3
SAP U.S. Insider Trading Policy
2SCOPE
This Policy applies to the entire management of the SAP Group, and to employees (full and part-time), contractors, consultants and agents worldwide.
3MAIN POLICY CONTENT
 APPLICATION OF THIS POLICY
3.1.1Covered Persons and Transactions
This Policy applies to all SAP board members, employees (full and part time), contractors, consultants and agents worldwide (collectively “SAP persons”) with respect to:
(i) |
All transactions in SAP’s ordinary shares by SAP employees while the person is physically located in the U.S.; and |
(ii) |
All transactions in SAP’s ADRs, whether the person is physically located in the U.S. or outside of the U.S. |
3.1.2Equity Plan Securities
See section below entitled “Policies Regarding Transactions in SAP SE’s Securities” for additional information regarding the insider trading policies applicable to SAP securities acquired through SAP equity plans.
 OVERVIEW
3.2.1Expectations
SAP depends upon the appropriate conduct and diligence of their employees, in both their professional and personal capacities, to ensure full compliance with this Policy. This Policy provides procedures and guidelines with respect to transactions in SAP SE securities, the protection of material, non-public information with respect to SAP SE's securities and those of other issuers, and the standard of conduct expected of SAP persons in this highly sensitive area. It is the personal obligation and responsibility of each SAP person to act in a manner consistent with this Policy. This Policy does not attempt to deal with all of the prohibitions and restrictions which might be applicable to transactions in securities by employees. Specific questions should be directed to the U.S. Corporate and Capital Markets Team at SAP_USA_Insider_Trading_Plan_Inquiries@global.corp.sap.
Failure to comply with this policy could result in the termination of your employment, as well as substantial civil and criminal penalties. Please read this policy carefully.
 LEGAL BACKGROUND
3.3.1Definitions
Insider trading is a top enforcement priority of the U.S. Securities and Exchange Commission (the “SEC”), the Department of Justice, and self-regulatory bodies such as the Financial Industry Regulatory Authority and the NYSE. Criminal prosecutions and civil charges for insider trading are commonplace and may result in fines and/or imprisonment.
What is insider trading? Insider trading is the purchase or sale of SAP securities (including ADRs) while in possession of material non-public information about SAP. Additionally, insider trading occurs when material, non-public information is passed on to a person (“tipping”) who then trades in the security. Insider trading is not limited to SAP’s securities but can include trading in the securities of another company about which you have obtained material, non-public information in the course of
|
Version 2.1 January 1, 2025 Document Classification: PUBLIC The online version of this document is the officially released version. Any copies or print-outs are not controlled. |
4
SAP U.S. Insider Trading Policy
your duties at SAP. Finally, assisting someone who is engaged in any of the above activities could constitute insider trading. Please note that under U.S. law, depending on the facts and circumstances, possession (rather than actual use of) material non-public information could be sufficient grounds for a finding of insider trading. Intent is not necessarily required. Therefore, being in possession of material, non-public information imposes an obligation not to disclose that information to anyone except those who are already SAP insiders or who otherwise have a need to know that information.
Who is an insider? The term “insider” applies to anyone who, by virtue of a special relationship with SAP SE or any of its affiliated companies, possesses material, non-public information regarding SAP.
An individual can be considered an insider for a limited time with respect to certain material, non-public information even though he or she is not a director, officer or even an employee. For example, an assistant who is engaged as a contractor and who knows that an acquisition is about to occur could be regarded as an insider with respect to that information until the news of such acquisition has been fully disclosed to the public.
What is material, non-public information? Information is generally deemed to be “material” if there is a substantial likelihood a “reasonable investor” would rely on it in deciding to purchase, sell or hold a security to which the information relates. As a practical matter, materiality often is determined after the fact, when it is known that someone has traded on the information and after the information has been made public and its effects upon the market are more certain. Examples of information that is or may generally be regarded as material, particularly if it is not in line with market expectations, are:
This list is not exhaustive. When in doubt about whether information is material, do not trade in SAP securities and do not discuss this information with anyone other than those already disclosed until the information becomes public. Remember that your conduct will be assessed with the benefit of hindsight.
“Non-public” information is any information that has not been previously disclosed and is not otherwise available to investors generally. Filings with the SEC and press releases are generally regarded as public information. Information about undisclosed financial results or a possible merger, acquisition, or other material development, whether concerning SAP SE or otherwise, that is obtained in the normal course of employment or through a rumor, tip or just “loose talk”, is not public information. Information should be considered “public” in the U.S. only once one full Trading Day (as defined below) has elapsed following wide public dissemination of such information
|
Version 2.1 January 1, 2025 Document Classification: PUBLIC The online version of this document is the officially released version. Any copies or print-outs are not controlled. |
5
SAP U.S. Insider Trading Policy
through press releases, news release, quarterly or annual reports or other widely disseminated means, whether on-line or in print .1
For purposes of this Policy, a “Trading Day” shall mean, with respect to SAP SE’s ADRs, a day on which the NYSE is open for trading.
3.3.2Potential Criminal and Civil Liability and/or Disciplinary Action.
The Securities Exchange Act of 1934, as amended (the “Exchange Act”), and specifically Rule 10b-5 of the Exchange Act, makes it illegal to use, directly or indirectly, any means to defraud, make false statements, omit relevant information or otherwise deceive another person in the process of engaging in securities transactions. This rule precludes the use of material non-public information to manipulate the stock market in one’s own favor. There are no limits on the size of a transaction that will trigger insider trading liability. In the past, even relatively small trades have resulted in SEC investigations and lawsuits.
Individuals found liable for insider trading could face penalties of up to three (3) times the profit gained, or loss avoided, a criminal fine of up to $5 million and up to twenty (20) years in jail. In addition to the potential criminal and civil liabilities mentioned above, in certain circumstances SAP SE may be able to recover all profits made by an insider who traded illegally, plus collect other damages. In addition, SAP SE (and its executive officers and directors) could face penalties of the greater of $1 million or three (3) times the profit gained, or loss avoided as a result of an employee’s violation and/or a criminal penalty of up to $25 million for failing to take steps to prevent insider trading. Without regard to the civil or criminal penalties that may be imposed by others, violation of this Policy and its procedures may constitute grounds for dismissal.
The procedures regarding securities trading outlined below are designed to deter and, where possible, to prevent such improper trading. When you are in possession of material non-public information, even transactions that you believe may be necessary or excusable for independent reasons (such as the need to raise money for an emergency) are no exception. Even when you are not in possession of material non-public information, the appearance of an improper transaction should be avoided.
3.4POLICIES REGARDING TRANSACTIONS IN SAP’S SECURITIES
The following policies apply to all transactions, direct or indirect, in all of SAP SE’s listed securities, including, but not limited to, ordinary shares, ADRs, bonds and derivative securities (including stock options, put or call options and other similar securities) (collectively “SAP SE Securities”).
3.4.1No Trading on Material Non-Public Information
No SAP person who is aware of any material, non-public information concerning SAP SE is permitted to buy or sell SAP SE Securities (including shares acquired through participation in SAP equity plans*), including any offer to purchase or sell, during any period commencing with the date that he or she obtains such material, non-public information and ending after one full Trading Day has elapsed following the date of public disclosure of that information. Therefore, persons subject to this Policy must wait a full Trading Day after public disclosure before trading in SAP SE Securities. Please contact the U.S. Corporate and Capital Markets Team at SAP_USA_Insider_Trading_Plan_Inquiries@global.corp.sap in case of questions regarding the trading window. Similarly, after termination of employment or contract for any reason, any SAP person
1 U.S. caselaw requires the passage of at least one (1) full trading day from the publication of material non-public information before trading can begin. This is different from German law, which provides that trading can begin as soon as material non-public information becomes public. The SAP SE Corporate Portal trading window notification is based on German law.
|
Version 2.1 January 1, 2025 Document Classification: PUBLIC The online version of this document is the officially released version. Any copies or print-outs are not controlled. |
6
SAP U.S. Insider Trading Policy
who is in possession of material, nonpublic information is prohibited from trading in SAP SE Securities until that information has become public or is no longer material.
*Note Regarding SAP Equity Plans
Sale of SAP SE Equity Securities Acquired Through an SAP Equity Plan
Employees are not permitted to sell SAP SE Securities they acquired through participation in the OWN SAP Plan, MOVE SAP Plan, or any other SAP equity plan while in possession of material non-public information. Additionally, employees are urged not to sell any SAP SE Securities they acquired through participation in the OWN SAP Plan, MOVE SAP Plan, or any other SAP equity plan during the Black Out Window (See Section 3.4.7 below for further information on the Black Out Window.)
Enrollment, Modification or Termination of Participation in an SAP Equity Plan
Employees are not permitted to enroll in the OWN SAP Plan, nor alter or terminate their participation in the OWN SAP Plan while in possession of material non-public information. During a Black Out Window, however, employees may enroll, modify or terminate their participation in the OWN SAP Plan
Employees are not permitted to make or alter their MOVE SAP Plan “Sell to Cover” or “Sell All” election while in possession of material non-public information. Currently MOVE SAP Plan Sell to Cover/Sell All Elections are required to be made prior to the appliable SAP Black Out Window. Therefore, the MOVE SAP Plan Sell to Cover/Sell All Elections do not conflict with the SAP Black Out Period.
3.4.2No Tipping
No SAP person shall disclose (“tip”) material, non-public information to any other person where such information may be used by such person to his or her benefit by trading in the securities of the company to which such information relates, nor shall any SAP person make any recommendations or express any opinions as to trading in SAP SE Securities or a third-party's securities to any other person on the basis of material, non-public information.
3.4.3No Short Sales
No SAP person shall engage in a short sale of SAP SE’s securities, even those persons who are not in possession of material, non-public information about SAP SE. A short sale is a sale of securities not owned by the seller or, if owned, not delivered against such sale within twenty (20) days thereafter (a “short against the box”). Short sales of SAP SE’s securities evidence an expectation on the part of the seller that the securities will decline in value, and, therefore, signal to the market that the seller has no confidence in SAP SE or its short-term prospects. In addition, short sales may reduce the seller’s incentive to improve SAP SE’s performance.
3.4.4No Investments in Derivatives of the Company’s Securities
No SAP person shall invest in SAP SE-based derivative securities. “Derivative Securities” are options, warrants, stock appreciation rights or similar rights whose value is derived from the value of an equity security, such as SAP SE’s ordinary shares or ADRs. This prohibition includes, but is not limited to, trading in SAP SE-based put or call option contracts, trading in straddles and the like. However, holding and exercising stock options, restricted stock units or other derivative securities granted under SAP SE’s equity compensation plans is not prohibited by this Policy.
3.4.5No Margin Purchases
No SAP person shall purchase SAP SE’s securities on margin. This means such persons are prohibited from borrowing from a brokerage firm, bank, or other entity to purchase SAP SE’s securities (other than in connection with “cashless” exercises of stock options under SAP SE’s equity compensation plans).
|
Version 2.1 January 1, 2025 Document Classification: PUBLIC The online version of this document is the officially released version. Any copies or print-outs are not controlled. |
7
SAP U.S. Insider Trading Policy
3.4.6401(k) Plans
This Policy does not apply to purchases of SAP SE stock in its 401(k)-plan resulting from periodic contributions of money pursuant to a payroll deduction election. The Policy does apply, however, to certain elections made under SAP SE’s 401(k) plan, including (a) an election to increase or decrease the percentage of periodic contributions that will be allocated to an SAP SE stock fund, (b) an election to make an intra-plan transfer of an existing account balance into or out of an SAP SE stock fund, (c) an election to borrow money against a 401(k) plan account if the loan will result in a liquidation of some or all of an SAP SE stock fund balance, and (d) an election to pre-pay a plan loan if the pre-payment will result in allocation of loan proceeds to a SAP SE stock fund.
3.4.7Black Out Window
In addition to the above, to avoid any suspicion of insider trading, the Executive Board has made an urgent appeal to all employees not to execute any transactions in SAP SE securities (on the Frankfurt Exchange, the NYSE or otherwise) during the period beginning on the 15th day of the month preceding the end of a calendar quarter (March 15, June 15, September 15 and December 15) and ending after one full trading day has elapsed following the publication by SAP of the financial results for the quarter in question (the “Black Out Window”). Deviations from this guideline should only be made in emergencies (for example, where an employee has a sudden unexpected cash requirement). Cases of doubt should be discussed with the U.S. Corporate and Capital Markets Team at SAP_USA_Insider_Trading_Plan_Inquiries@global.corp.sap beforehand. See Section 3.4.1 for the treatment of SAP Equity Plans during the Black Out Window.
3.4.8Special Black Out Window
SAP senior management may, from time to time, issue instructions advising designated personnel, or the entire staff, that they may not execute transactions in SAP SE securities during other specified time periods, or that no such securities may be traded by designated persons without the prior approval of the persons designated in such notice.
3.4.9Rule 10b5-1 Trading Plans 2
Notwithstanding the foregoing, a transaction may be exempt from the Black Out Window if it is made pursuant to a written trading plan that has been approved in writing by our U.S. Corporate and Capital Markets Team at SAP_USA_Insider_Trading_Plan_Inquiries@global.corp.sap outside of a Black Out Window and while the employee was not in possession of material non-public information and which plan meets all of the requirements of the SEC’s rules and regulations, including Rule 10b5-1 of the Exchange Act. These SEC rules and regulations include:
| ● | For Supervisory Board members, Executive Board members, and any other L1s who have been notified that they are subject to this requirement in connection with a 10b5-1 Plan (collectively “10b5-1 Plan Covered Persons”), a cooling off period ending on the later of 90 days after the adoption or modification of the Rule 10b5-1 plan or two business days after the disclosure of SAP’s financial results for the fiscal quarter in which the plan was adopted or modified, in either case with a maximum 120 day cooling off period after plan adoption or modification. |
| ● | For 10b5-1 Plan Covered Persons, the requirement to include in the plan a representation certifying that, at the time of adoption or modification or a Rule 10b5-1 plan that: |
| o | They are not aware of any material non-public information about SAP or the SAP SE Securities; and |
| o | They are adopting the Rule 10b5-1 Plan in good faith and not as part of a scheme to evade the prohibitions of Rule 10b-5. |
2If you intend to enter into, alter or terminate a 10b5-1 Plan, contact the U.S. Corporate and Capital Markets Team at: SAP_USA_Insider_Trading_Plan_Inquiries@global.corp.sap.
|
Version 2.1 January 1, 2025 Document Classification: PUBLIC The online version of this document is the officially released version. Any copies or print-outs are not controlled. |
8
SAP U.S. Insider Trading Policy
| ● | For employees other than 10b5-1 Plan Covered Persons, a cooling off period ending 30 days after the adoption or modification of the plan. |
| ● | For employees other than 10b5-1 Plan Covered Persons, a requirement to adopt the Rule 10b5-1 Plan in good faith and not as part of a scheme to evade the prohibitions of Rule 10b-5. |
| ● | For all Rule 10b5-1 Plans, a modification to the amount, price, or timing of the purchase or sale of the securities underlying a Rule 10b5-1 Plan will be considered a termination of such plan and the adoption of a new plan will trigger a new cooling off period. |
| ● | For all Rule 10b5-1 Plans, multiple overlapping and single trade Rule 10b5-1 Plans are subject to additional restrictions; for additional information contact the U.S. Corporate and Capital Markets team at SAP_USA_Insider_Trading_Plan_Inquiries@global.corp.sap. |
3.5 POLICIES REGARDING THE USE, DISCLOSURE AND PROTECTION OF MATERIAL, NON-PUBLIC INFORMATION
3.5.1Use and Disclosure of Material Non-Public Information Regarding SAP
Under no circumstances may an SAP person use material, non-public information about SAP SE or its affiliates for his or her personal benefit. Moreover, except as specifically authorized or in the performance of regular corporate duties, under no circumstances may any SAP person release to others information that might affect the market price for SAP SE’s securities. Therefore, it is important that SAP persons not disclose material, non-public information to anyone, including other SAP persons, unless the other person needs to know such information in order to fulfill his or her job responsibilities. Under no other circumstances should such information be disclosed to anyone, including family, relatives or business or social acquaintances. In maintaining the confidentiality of the information, the individual in possession of such information shall not affirm or deny statements made by others, either directly or through electronic means, if such affirmation or denial would result in the disclosure of material, non-public information.
If an SAP person has any doubt about whether certain information is non-public or material, such doubt should be resolved in favor of not communicating such information or trading without discussing with the assigned compliance officer or raising it with in-house counsel. Questions concerning what is or is not material, non-public information should be directed to our U.S. Corporate and Capital Markets Team at SAP_USA_Insider_Trading_Plan_Inquiries@global.corp.sap.
3.5.2Material Non-Public Information Regarding Other Companies
In the ordinary course of doing business, SAP persons may come into possession of material, non-public information with respect to other companies. An individual receiving material, non-public information in such a manner has the same duty not to disclose the information to others or to use that information in connection with securities transactions of such other company as such individual has with respect to material, non-public information about SAP SE.
If SAP SE is in the process of negotiating a significant transaction with another company, SAP persons are cautioned not to trade in the stock of that company if they are in possession of material, non-public information concerning such company.
If an SAP person is not certain whether it is permissible to trade in the stock of such company, such person should contact our U.S. Corporate and Capital Markets Team at SAP_USA_Insider_Trading_Plan_Inquiries@global.corp.sap before making any trades.
3.5.3Unauthorized Disclosure of Confidential Information
General. Unauthorized disclosure of confidential information about SAP SE may create serious problems for SAP SE whether or not the information constitutes material non-public information or whether it is used to facilitate improper trading in SAP SE Securities. Therefore, it shall be the duty of each person employed or affiliated with SAP SE to maintain the confidentiality of information relating to SAP SE or obtained through a relationship of confidence. SAP persons should not discuss
|
Version 2.1 January 1, 2025 Document Classification: PUBLIC The online version of this document is the officially released version. Any copies or print-outs are not controlled. |
9
SAP U.S. Insider Trading Policy
confidential SAP SE matters or developments with anyone outside SAP SE, except in the performance of regular corporate duties.
Precautions to Prevent Misuse or Unauthorized Disclosure of Sensitive Information. When an SAP person is involved in a matter or transaction which is sensitive and, if disclosed, could reasonably be expected to have an effect on the market price of the securities of SAP SE or any other company involved in the transaction, that individual should consider taking extraordinary precautions to prevent misuse or unauthorized disclosure of such information. Such measures include the following:
1.Maintaining files securely and avoiding storing information on computer systems that can be accessed by other individuals;
2.Avoiding the discussion of confidential matters in areas where the conversation could possibly be overheard;
3. |
Not gossiping about SAP SE affairs; and |
4. |
Restricting the copying and distribution of sensitive documents within SAP SE. |
3.6 REPORTING OF VIOLATIONS OF THIS POLICY
Any person who believes that a violation of this Policy has taken place shall report such violation promptly to our U.S. Corporate and Capital Markets Team at SAP_USA_Insider_Trading_Plan_Inquiries@global.corp.sap. SAP SE may not, directly or indirectly, discharge, demote, suspend, threaten, harass, or otherwise discriminate against any employee who in good faith reports or complains through internal channels or to the relevant authorities about conduct such person reasonably believes is a violation of the law, applicable rules and regulations, or this Policy. SAP SE takes allegations of any such retaliation extremely seriously.
Any questions concerning this Policy should be addressed to your local legal or compliance officer, the Compliance Department, or our U.S. Corporate and Capital Markets Team at SAP_USA_Insider_Trading_Plan_Inquiries@global.corp.sap.
|
Version 2.1 January 1, 2025 Document Classification: PUBLIC The online version of this document is the officially released version. Any copies or print-outs are not controlled. |
10
Exhibit 12.1
CERTIFICATION
I, Christian Klein, certify that:
1.I have reviewed this annual report on Form 20-F of SAP SE;
2. |
Based on my knowledge, this report does not contain any untrue statement of a material fact or omit to state a material fact necessary to make the statements made, in light of the circumstances under which such statements were made, not misleading with respect to the period covered by this report; |
3. |
Based on my knowledge, the financial statements, and other financial information included in this report, fairly present in all material respects the financial condition, results of operations and cash flows of the company as of, and for, the periods presented in this report; |
4. |
The company’s other certifying officers and I are responsible for establishing and maintaining disclosure controls and procedures (as defined in Exchange Act Rules 13a-15(e) and 15d-15(e)) and internal control over financial reporting (as defined in Exchange Act Rules 13a-15(f) and 15d-15(f)) for the company and have: |
a) |
Designed such disclosure controls and procedures, or caused such disclosure controls and procedures to be designed under our supervision, to ensure that material information relating to the company, including its consolidated subsidiaries, is made known to us by others within those entities, particularly during the period in which this report is being prepared; |
b) |
Designed such internal control over financial reporting, or caused such internal control over financial reporting to be designed under our supervision, to provide reasonable assurance regarding the reliability of financial reporting and the preparation of financial statements for external purposes in accordance with generally accepted accounting principles; |
c) |
Evaluated the effectiveness of the company’s disclosure controls and procedures and presented in this report our conclusions about the effectiveness of the disclosure controls and procedures, as of the end of the period covered by this report based on such evaluation; and |
d) |
Disclosed in this report any change in the company’s internal control over financial reporting that occurred during the period covered by the annual report that has materially affected, or is reasonably likely to materially affect, the company’s internal control over financial reporting; and |
5. |
The company’s other certifying officers and I have disclosed, based on our most recent evaluation of internal control over financial reporting, to the company’s auditors and the audit committee of the company’s board of directors (or persons performing the equivalent functions): |
a) |
All significant deficiencies and material weaknesses in the design or operation of internal control over financial reporting which are reasonably likely to adversely affect the company’s ability to record, process, summarize and report financial information; and |
b) |
Any fraud, whether or not material, that involves management or other employees who have a significant role in the company’s internal control over financial reporting. |
Date: February 27, 2025 |
|
|
/s/ Christian Klein |
|
|
|
|
Name: |
Christian Klein |
|
|
|
Title: |
Chief Executive Officer |
Exhibit 12.2
CERTIFICATION
I, Dominik Asam, certify that:
1.I have reviewed this annual report on Form 20-F of SAP SE;
2. |
Based on my knowledge, this report does not contain any untrue statement of a material fact or omit to state a material fact necessary to make the statements made, in light of the circumstances under which such statements were made, not misleading with respect to the period covered by this report; |
3. |
Based on my knowledge, the financial statements, and other financial information included in this report, fairly present in all material respects the financial condition, results of operations and cash flows of the company as of, and for, the periods presented in this report; |
4. |
The company’s other certifying officers and I are responsible for establishing and maintaining disclosure controls and procedures (as defined in Exchange Act Rules 13a-15(e) and 15d-15(e)) and internal control over financial reporting (as defined in Exchange Act Rules 13a-15(f) and 15d-15(f)) for the company and have: |
a) |
Designed such disclosure controls and procedures, or caused such disclosure controls and procedures to be designed under our supervision, to ensure that material information relating to the company, including its consolidated subsidiaries, is made known to us by others within those entities, particularly during the period in which this report is being prepared; |
b) |
Designed such internal control over financial reporting, or caused such internal control over financial reporting to be designed under our supervision, to provide reasonable assurance regarding the reliability of financial reporting and the preparation of financial statements for external purposes in accordance with generally accepted accounting principles; |
c) |
Evaluated the effectiveness of the company’s disclosure controls and procedures and presented in this report our conclusions about the effectiveness of the disclosure controls and procedures, as of the end of the period covered by this report based on such evaluation; and |
d) |
Disclosed in this report any change in the company’s internal control over financial reporting that occurred during the period covered by the annual report that has materially affected, or is reasonably likely to materially affect, the company’s internal control over financial reporting; and |
5. |
The company’s other certifying officers and I have disclosed, based on our most recent evaluation of internal control over financial reporting, to the company’s auditors and the audit committee of the company’s board of directors (or persons performing the equivalent functions): |
a) |
All significant deficiencies and material weaknesses in the design or operation of internal control over financial reporting which are reasonably likely to adversely affect the company’s ability to record, process, summarize and report financial information; and |
b) |
Any fraud, whether or not material, that involves management or other employees who have a significant role in the company’s internal control over financial reporting. |
Date: February 27, 2025 |
|
|
/s/ Dominik Asam |
|
|
|
|
Name: |
Dominik Asam |
|
|
|
Title: |
Chief Financial Officer |
Exhibit 13.1
CERTIFICATION OF CHRISTIAN KLEIN, CHIEF EXECUTIVE OFFICER OF SAP SE
PURSUANT TO 18 U.S.C. SECTION 1350, AS ADOPTED PURSUANT TO SECTION 906
OF THE SARBANES-OXLEY ACT OF 2002
In connection with the Annual Report of SAP SE (the “Company”) on Form 20-F for the period ending December 31, 2024, as filed with the Securities and Exchange Commission on February 27, 2025 (the “Report”), the undersigned hereby certifies that, to his knowledge:
1. |
The Report fully complies with the requirements of Section 13(a) or 15(d) of the Securities Exchange Act of 1934; and |
2. |
The information contained in the Report fairly presents in all material respects the financial condition and results of operations of the Company. |
Date February 27, 2025 |
|
/s/ Christian Klein |
|
Name: |
Christian Klein |
|
Title: |
Chief Executive Officer |
The foregoing certification is being furnished solely pursuant to 18 U.S.C. § 1350 and is not being filed as part of the Report or as a separate disclosure document.
Exhibit 13.2
CERTIFICATION OF DOMINIK ASAM, CHIEF FINANCIAL OFFICER OF SAP SE PURSUANT TO 18
U.S.C. SECTION 1350, AS ADOPTED PURSUANT TO SECTION 906
OF THE SARBANES-OXLEY ACT OF 2002
In connection with the Annual Report of SAP SE (the “Company”) on Form 20-F for the period ending December 31, 2024, as filed with the Securities and Exchange Commission on February 27, 2025 (the “Report”), the undersigned hereby certifies that, to his knowledge:
1. |
The Report fully complies with the requirements of Section 13(a) or 15(d) of the Securities Exchange Act of 1934; and |
2. |
The information contained in the Report fairly presents in all material respects the financial condition and results of operations of the Company. |
Date February 27, 2025 |
|
/s/ Dominik Asam |
|
Name: |
Dominik Asam |
|
Title: |
Chief Financial Officer |
The foregoing certification is being furnished solely pursuant to 18 U.S.C. § 1350 and is not being filed as part of the Report or as a separate disclosure document.
Exhibit 15
 |
Telefon: +49 69 95941-0 |
Hanauer Landstraße 115 |
Consent of Independent Registered Public Accounting Firm
We hereby consent to the incorporation by reference in the Registration Statements on Form S-8 (No. 333-282065, No. 333-263468, No. 333-213436, and No. 333-252295) of SAP SE (the Company) of our reports dated February 19, 2025, relating to the consolidated financial statements, and the effectiveness of the Company’s internal control over financial reporting, which appear in this Annual Report on Form 20-F.
/s/ BDO AG Wirtschaftsprüfungsgesellschaft
Frankfurt am Main, Germany
February 27, 2025
Chairman of the Supervisory Board: Dr. Holger Otte • Executive Board: WP StB Andrea Bruckner and RA Parwäz Rafiqpoor (Chairpersons) • WP StB Roland Schulz • WP Dr. Jens Freiberg
Registered Office: Hamburg (District Court of Hamburg HR B 1981)
Berlin • Bielefeld • Bonn • Bremen • Chemnitz • Cologne • Dortmund • Dresden • Dusseldorf • Erfurt • Essen • Flensburg • Frankfurt am Main • Freiburg • Hamburg • Hannover • Kassel • Kiel • Leer • Leipzig • Lubeck • Oldenburg • Mainz • Munich • Muenster • Nuremberg • Oldenburg • Rostock • Stuttgart
BDO AG Wirtschaftsprüfungsgesellschaft, a German company limited by shares, is a member of BDO International Limited, a UK company limited by guarantee, and forms part of the international BDO network of independent member firms.
BDO is the brand name for the BDO network and for each of the BDO Member Firms.
Exhibit 15.1
Consent of Independent Registered Public Accounting Firm
We consent to the incorporation by reference in the registration statements (Nos. 333-282065, 333-263468, 333-213436, and 333-252295) on Form S-8 of our report dated February 22, 2023, except for the adjustments to: (a) retrospectively apply the change in accounting to present gains and losses from minor divestitures, not qualified as discontinued operations, under other non-operating income/expense instead of other operating income/expense, net described in Note C.3, (b) restate segment information in conformity with the new segment composition described in Note C.1, (c) retrospectively apply the change in accounting to present the Qualtrics disposal group as a discontinued operation described in Note D.1, and (d) present the updated cost allocation policy described in Note IN.1, with respect to the consolidated financial statements of SAP SE.
/s/ KPMG AG Wirtschaftsprüfungsgesellschaft
Mannheim, Germany
February 27, 2025