UNITED STATES
SECURITIES AND EXCHANGE COMMISSION
Washington, D.C. 20549
FORM 8-K
CURRENT REPORT
Pursuant to Section 13 or 15(d) of
the Securities Exchange Act of 1934
Date of Report (Date of earliest event reported): November 12, 2024
Natera, Inc.
(Exact name of registrant as specified in its charter)
| Delaware | 001-37478 | 01-0894487 | ||
|
(State or other jurisdiction of incorporation) |
(Commission File Number) |
(IRS Employer Identification No.) |
13011 McCallen Pass
Building A Suite 100
Austin, TX 78753
(Address of principal executive offices, including zip code)
(650) 980-9190
(Registrant’s telephone number, including area code)
N/A
(Former name or former address, if changed since last report)
Check the appropriate box below if the Form 8-K filing is intended to simultaneously satisfy the filing obligation of the registrant under any of the following provisions:
| ¨ | Written communications pursuant to Rule 425 under the Securities Act (17 CFR 230.425) |
| ¨ | Soliciting material pursuant to Rule 14a-12 under the Exchange Act (17 CFR 240.14a-12) |
| ¨ | Pre-commencement communications pursuant to Rule 14d-2(b) under the Exchange Act (17 CFR 240.14d-2(b)) |
| ¨ | Pre-commencement communications pursuant to Rule 13e-4(c) under the Exchange Act (17 CFR 240.13e-4(c)) |
Securities registered pursuant to Section 12(b) of the Act:
| Title of each class |
Trading Symbol(s) |
Name of each exchange on which registered |
||
| Common Stock, par value $0.0001 per share | NTRA |
Nasdaq Stock Market LLC (Nasdaq Global Select Market) |
Indicate by check mark whether the registrant is an emerging growth company as defined in Rule 405 of the Securities Act of 1933 (§230.405 of this chapter) or Rule 12b-2 of the Securities Exchange Act of 1934 (§240.12b-2 of this chapter).
Emerging growth company ¨
If an emerging growth company, indicate by check mark if the registrant has elected not to use the extended transition period for complying with any new or revised financial accounting standards provided pursuant to Section 13(a) of the Exchange Act. ¨
| Item 2.02. | Results of Operations and Financial Condition. |
On November 12, 2024, Natera, Inc. issued a press release announcing the results for its third quarter ended September 30, 2024 and provided a related investor presentation. A copy of the press release and a copy of the investor presentation are furnished herewith as Exhibit 99.1 and Exhibit 99.2, respectively, to this Current Report on Form 8-K and are incorporated herein by reference.
The information in this Current Report on Form 8-K and the accompanying Exhibit 99.1 and Exhibit 99.2 shall not be deemed “filed” for purposes of Section 18 of the Securities Exchange Act of 1934, as amended (the “Exchange Act”) or otherwise subject to the liabilities of that section, nor shall it be deemed incorporated by reference in any filing under the Securities Act of 1933, as amended, or the Exchange Act, regardless of any general incorporation language in such filing, unless expressly incorporated by reference in such filing.
| Item 9.01. | Financial Statements and Exhibits. |
(d) Exhibits.
|
Exhibit No. |
Description |
|
| 99.1 | Press Release dated November 12, 2024. | |
| 99.2 | Investor Presentation. | |
| 104 | Cover Page Interactive Data File (formatted as inline XBRL). | |
SIGNATURES
Pursuant to the requirements of the Securities Exchange Act of 1934, as amended, the registrant has duly caused this report to be signed on its behalf by the undersigned hereunto duly authorized.
| Natera, Inc. | ||
| By: | /s/ Michael Brophy | |
| Michael Brophy | ||
| Chief Financial Officer (Principal Financial and Accounting Officer) | ||
| Dated: November 12, 2024 | ||
Exhibit 99.1
Natera Reports Third Quarter 2024 Financial Results
AUSTIN, Texas, November 12, 2024 /PRNewswire/ — Natera, Inc. (NASDAQ: NTRA), a global leader in cell-free DNA and genetic testing, today reported its financial results for the third quarter ended September 30, 2024.
Recent Strategic and Financial Highlights
| · | Generated total revenues of $439.8 million in the third quarter of 2024, compared to $268.3 million in the third quarter of 2023, a record increase of 63.9%. Product revenues grew 64.4% over the same period. |
| · | Generated a gross margin of 61.8% in the third quarter of 2024, compared to a gross margin of 45.1% in the third quarter of 2023. |
| · | Processed approximately 775,800 tests in the third quarter of 2024, compared to approximately 626,000 tests in the third quarter of 2023, an increase of 23.9%. |
| · | Performed approximately 137,100 oncology tests in the third quarter of 2024, compared to approximately 88,800 in the third quarter of 2023, an increase of 54.4%. |
| · | Achieved positive cash flow of approximately $34.5 million1 in the third quarter of 2024. |
| · | Raising annual guidance and now expecting 2024 total revenue of $1.61 to $1.64 billion, gross margin of 58% to 61%, and $50 to $75 million in net cash inflow. |
| · | Announced completion of study using SignateraTM from the CALGB (Alliance)/SWOG 80702 randomized, phase III clinical trial in colorectal cancer. |
| · | Published first-of-its-kind colorectal cancer data from the GALAXY study in Nature Medicine and concurrently presented the data at the 2024 Congress of the European Society for Medical Oncology (ESMO). |
“Our strong performance in the third quarter reflects our unwavering dedication to the patients we serve and the passion of our employees in each of our business areas,” said Steve Chapman, chief executive officer of Natera. “We grew volumes, revenue, gross margin, and cash flow in what continues to be a transformational year for Natera.”
Third Quarter Ended September 30, 2024 Financial Results
Total revenues were $439.8 million in the third quarter of 2024 compared to $268.3 million in the third quarter of 2023, an increase of 63.9%. The increase in total revenues was driven primarily by a 64.4% increase in product revenues, which were $436.1 million in the third quarter of 2024 compared to $265.2 million in the third quarter of 2023. The increase in product revenues was primarily driven by an increase in volume, average selling price improvements, as well as cash receipts that were collected during the quarter related to tests delivered in prior quarters that were fully collected.
Natera processed approximately 775,800 tests in the third quarter of 2024, including approximately 760,700 tests accessioned in its laboratory, compared to approximately 626,000 tests processed, including approximately 609,800 tests accessioned in its laboratory, in the third quarter of 2023.
In the third quarter of 2024, Natera recognized revenue on approximately 750,100 tests for which results were reported to customers in the period (tests reported), including approximately 735,900 tests reported from its laboratory, compared to approximately 590,000 tests reported, including approximately 575,000 tests reported from its laboratory, in the third quarter of 2023, an increase of 27.1% from the prior period.
Gross profit2 for the three months ended September 30, 2024 and September 30, 2023 was $271.7 million and $121.0 million, respectively, representing a gross margin of 61.8% and 45.1%, respectively. Natera had higher gross margin in the third quarter of 2024 primarily as a result of higher revenues, continued progress in reducing cost of revenues associated with tests processed, as well as incremental cash receipts during the quarter associated with tests delivered in prior periods that were fully collected. Total operating expenses, representing research and development expenses and selling, general and administrative expenses, for the third quarter of 2024 were $311.1 million, compared to $232.0 million in the same period of the prior year, an increase of 34.0%. The increase was primarily driven by headcount growth to support new product offerings as well as increases in consulting and legal expenses.
Loss from operations for the third quarter of 2024 was $39.3 million compared to $111.0 million for the same period of the prior year. Natera reported a net loss for the third quarter of 2024 of $31.6 million, or ($0.26) per diluted share, compared to a net loss of $109.0 million, or ($0.95) per diluted share, for the same period in 2023. Weighted average shares outstanding were approximately 123.3 million in the third quarter of 2024 compared to 115.2 million in the third quarter of the prior year.
At September 30, 2024, Natera held approximately $922.3 million in cash, cash equivalents, short-term investments and restricted cash, compared to $879.0 million as of December 31, 2023. As of September 30, 2024, Natera had a total outstanding debt balance of $367.0 million, comprised of $80.4 million including accrued interest under its line of credit with UBS at a variable interest rate of 30-day SOFR plus 50 bps and a net carrying amount of $286.6 million under its seven-year convertible senior notes issued in April 2020. The gross principal balance outstanding for the convertible senior notes was $287.5 million as of September 30, 2024. All outstanding convertible senior notes were redeemed or converted on October 11, 2024.
Financial Outlook
Natera anticipates 2024 total revenue of $1.61 billion to $1.64 billion; 2024 gross margin to be approximately 58% to 61% of revenues; selling, general and administrative costs to be approximately $775 million to $825 million; research and development costs to be $375 million to $400 million; and net cash inflow to be $50 million to $75 million3.
| Test Volume Summary | ||||||
| Unit | Q3
2024 |
Q3
2023 |
Definition | |||
| Tests processed | 775,800 | 626,000 | Tests accessioned in our laboratory plus units processed outside of our laboratory | |||
| Tests accessioned | 760,700 | 609,800 | Test accessioned in our laboratory | |||
| Tests reported | 750,100 | 590,000 | Total tests reported | |||
| Tests reported in our laboratory | 735,900 | 575,000 | Total tests reported in our laboratory less units reported outside of our laboratory | |||
About Natera
Natera™ is a global leader in cell-free DNA and genetic testing, dedicated to oncology, women’s health, and organ health. We aim to make personalized genetic testing and diagnostics part of the standard of care to protect health and enable earlier, more targeted interventions that help lead to longer, healthier lives. Natera’s tests are validated by more than 200 peer-reviewed publications that demonstrate high accuracy. Natera operates ISO 13485-certified and CAP-accredited laboratories certified under the Clinical Laboratory Improvement Amendments (CLIA) in Austin, Texas and San Carlos, California. For more information, visit www.natera.com.
Conference Call Information
| Event: | Natera’s Third Quarter 2024 Financial Results Conference Call |
| Date: | Tuesday, November 12, 2024 |
| Time: | 1:30 p.m. PT (4:30 p.m. ET) |
| Live Dial-In: | 1-888-770-7321 (Domestic) 1-929-201-7107 (International) |
| Conference ID: | 7684785 |
| Webcast Link: | https://events.q4inc.com/attendee/883846048 |
Forward-Looking Statements
This press release contains forward-looking statements under the meaning of the Private Securities Litigation Reform Act of 1995. All statements other than statements of historical facts, including the company’s financial guidance for fiscal 2024, its market opportunity, anticipated products and launch schedules, reimbursement coverage and product costs, commercial and strategic partnerships and acquisitions, user experience, clinical trials and studies, and its strategies, goals and general business and market conditions, are forward-looking statements. Any forward-looking statements contained in this press release are based upon Natera’s current plans, estimates, and expectations, as of the date of this release, and are not a representation that such plans, estimates, or expectations will be achieved.
These forward-looking statements are subject to known and unknown risks and uncertainties that may cause actual results to differ materially, including: we face numerous uncertainties and challenges in achieving our financial projections and goals; we may be unable to further increase the use and adoption of our products through our direct sales efforts or through our laboratory partners; we have incurred losses since our inception and we anticipate that we will continue to incur losses for the foreseeable future; our quarterly results may fluctuate from period to period; our estimates of market opportunity and forecasts of market growth may prove to be inaccurate; we may be unable to compete successfully with existing or future products or services offered by our competitors; we may engage in acquisitions, dispositions or other strategic transactions that may not achieve our anticipated benefits and could otherwise disrupt our business, cause dilution to our stockholders or reduce our financial resources; we may not be successful in commercializing our cloud-based distribution model; our products may not perform as expected; the results of our clinical studies, including our SNP-based Microdeletion and Aneuploidy Registry, or SMART, Study, may not be compelling to professional societies or payors as supporting the use of our tests, particularly for microdeletions screening, or may not be able to be replicated in later studies required for regulatory approvals or clearances; if either of our primary CLIA-certified laboratories becomes inoperable, we will be unable to perform our tests and our business will be harmed; we rely on a limited number of suppliers or, in some cases, single suppliers, for some of our laboratory instruments and materials and may not be able to find replacements or immediately transition to alternative suppliers; if we are unable to successfully scale our operations, our business could suffer; the marketing, sale, and use of Panorama and our other products could result in substantial damages arising from product liability or professional liability claims that exceed our resources; we may be unable to expand, obtain or maintain third-party payer coverage and reimbursement for our tests, and we may be required to refund reimbursements already received; third-party payers may withdraw coverage or provide lower levels of reimbursement due to changing policies, billing complexities or other factors; we could incur substantial costs and delays associated with trying to obtain premarket clearance or approval, and incur costs associated with complying with post-market controls, if and when the FDA begins actively regulating our tests pursuant to recently enacted FDA regulations; litigation or other proceedings, resulting from either third party claims of intellectual property infringement or third party infringement of our technology, is costly, time-consuming and could limit our ability to commercialize our products or services; any inability to effectively protect our proprietary technology could harm our competitive position or our brand; and we cannot guarantee that we will be able to service and comply with our outstanding debt obligations.
Additional risks and uncertainties that could affect our financial results are included under the captions, "Risk Factors" and "Management’s Discussion and Analysis of Financial Condition and Results of Operations" in our most recent filings on Forms 10-K and 10-Q and in other filings that we make with the SEC from time to time. These documents are available on our website at www.natera.com under the Investor Relations section and on the SEC’s website at www.sec.gov.
In light of the significant uncertainties in these forward-looking statements, you should not regard these statements as a representation or warranty by us or any other person that we will achieve our objectives and plans in any specified time frame, or at all. Natera assumes no obligation to, and does not currently intend to, update any such forward-looking statements after the date of this release.
References
| 1. | Positive cash flow for the quarter ended September 30, 2024, is derived from the GAAP Statement of Cash Flows as follows: net cash provided by operating activities of $51.8 million, net cash provided by financing activities of $1.7 million, offset by net cash used in investing activities for purchases of property and equipment, and investment in related party of $19.0 million. |
| 2. | Gross profit is calculated as GAAP total revenues less GAAP cost of revenues. Gross margin is calculated as gross profit divided by GAAP total revenues. |
| 3. | Cash (outflow) inflow is calculated as the sum of GAAP net cash provided by (used in) operating activities, GAAP net cash provided by (used in) financing activities, and GAAP net cash provided by (used in) investing activities for purchases of property and equipment, investment in related party, and acquisition of assets. |
Contacts
Investor Relations
Mike Brophy, CFO, Natera, Inc., 510-826-2350
Media
Lesley Bogdanow, VP of Corporate Communications, Natera, Inc., pr@natera.com
Natera, Inc.
Consolidated Balance Sheets
(Unaudited)
(in thousands, except shares)
| September 30, | December 31, | |||||||
| 2024 | 2023(1) | |||||||
| Assets | ||||||||
| Current assets: | ||||||||
| Cash, cash equivalents and restricted cash | $ | 892,844 | $ | 642,095 | ||||
| Short-term investments | 29,490 | 236,882 | ||||||
| Accounts receivable, net of allowance of $6,252 and $6,481 at September 30, 2024 and December 31, 2023, respectively | 306,876 | 278,289 | ||||||
| Inventory | 48,724 | 40,759 | ||||||
| Prepaid expenses and other current assets, net | 44,631 | 60,524 | ||||||
| Total current assets | 1,322,565 | 1,258,549 | ||||||
| Property and equipment, net | 142,170 | 111,210 | ||||||
| Operating lease right-of-use assets | 87,856 | 56,537 | ||||||
| Other assets | 38,356 | 15,403 | ||||||
| Total assets | $ | 1,590,947 | $ | 1,441,699 | ||||
| Liabilities and Stockholders’ Equity | ||||||||
| Current liabilities: | ||||||||
| Accounts payable | $ | 27,834 | $ | 14,998 | ||||
| Accrued compensation | 49,051 | 45,857 | ||||||
| Other accrued liabilities | 126,176 | 149,405 | ||||||
| Deferred revenue, current portion | 17,886 | 16,612 | ||||||
| Short-term debt financing | 80,469 | 80,402 | ||||||
| Total current liabilities | 301,416 | 307,274 | ||||||
| Long-term debt financing | 286,549 | 282,945 | ||||||
| Deferred revenue, long-term portion and other liabilities | 25,504 | 19,128 | ||||||
| Operating lease liabilities, long-term portion | 98,953 | 67,025 | ||||||
| Total liabilities | 712,422 | 676,372 | ||||||
| Commitments and contingencies | ||||||||
| Stockholders’ equity: | ||||||||
| Common stock (2) | 12 | 11 | ||||||
| Additional paid-in capital | 3,393,369 | 3,145,837 | ||||||
| Accumulated deficit | (2,514,091 | ) | (2,377,436 | ) | ||||
| Accumulated other comprehensive loss | (765 | ) | (3,085 | ) | ||||
| Total stockholders’ equity | 878,525 | 765,327 | ||||||
| Total liabilities and stockholders’ equity | $ | 1,590,947 | $ | 1,441,699 | ||||
| (1) | The consolidated balance sheet at December 31, 2023 has been derived from the audited consolidated financial statements at that date included in the Company’s Annual Report on Form 10-K for the year ended December 31, 2023. |
| (2) | As of September 30, 2024 and December 31, 2023, there were approximately 124,137,000 and 119,581,000 shares of common stock issued and outstanding, respectively. |
Natera, Inc.
Consolidated Statements of Operations and Comprehensive Loss
(Unaudited)
(in thousands, except per share data)
| Three months ended | Nine months ended | |||||||||||||||
| September 30, | September 30, | |||||||||||||||
| 2024 | 2023 | 2024 | 2023 | |||||||||||||
| Revenues | ||||||||||||||||
| Product revenues | $ | 436,127 | $ | 265,218 | $ | 1,212,163 | $ | 761,271 | ||||||||
| Licensing and other revenues | 3,631 | 3,088 | 8,687 | 10,195 | ||||||||||||
| Total revenues | 439,758 | 268,306 | 1,220,850 | 771,466 | ||||||||||||
| Cost and expenses | ||||||||||||||||
| Cost of product revenues | 167,657 | 146,962 | 496,340 | 437,524 | ||||||||||||
| Cost of licensing and other revenues | 354 | 349 | 990 | 1,060 | ||||||||||||
| Research and development | 96,931 | 77,235 | 274,677 | 237,714 | ||||||||||||
| Selling, general and administrative | 214,154 | 154,742 | 606,397 | 456,877 | ||||||||||||
| Total cost and expenses | 479,096 | 379,288 | 1,378,404 | 1,133,175 | ||||||||||||
| Loss from operations | (39,338 | ) | (110,982 | ) | (157,554 | ) | (361,709 | ) | ||||||||
| Interest expense | (3,142 | ) | (3,252 | ) | (9,393 | ) | (9,490 | ) | ||||||||
| Interest and other income, net | 11,618 | 5,406 | 32,342 | 14,509 | ||||||||||||
| Loss before income taxes | (30,862 | ) | (108,828 | ) | (134,605 | ) | (356,690 | ) | ||||||||
| Income tax expense | (730 | ) | (202 | ) | (2,050 | ) | (80 | ) | ||||||||
| Net loss | $ | (31,592 | ) | $ | (109,030 | ) | $ | (136,655 | ) | $ | (356,770 | ) | ||||
| Unrealized gain on available-for-sale securities, net of tax | 593 | 3,807 | 2,320 | 10,966 | ||||||||||||
| Comprehensive loss | $ | (30,999 | ) | $ | (105,223 | ) | $ | (134,335 | ) | $ | (345,804 | ) | ||||
| Net loss per share: | ||||||||||||||||
| Basic and diluted | $ | (0.26 | ) | $ | (0.95 | ) | $ | (1.12 | ) | $ | (3.14 | ) | ||||
| Weighted-average number of shares used in computing basic and diluted net loss per share: | ||||||||||||||||
| Basic and diluted | 123,775 | 115,171 | 122,486 | 113,559 | ||||||||||||
Exhibit 99.2

Natera, Inc. Investor presentation Q3 2024 Earnings Call Nov. 12, 2024 1

Not for reproduction or further distribution. This presentation contains forward - looking statements under the meaning of the Private Securities Litigation Reform Act of 1995 . All statements other than statements of historical facts contained in this presentation, including statements regarding our market opportunity, our anticipated products and launch schedules, our reimbursement coverage and our product costs, our commercial and strategic partnerships and potential acquisitions, our user experience, our clinical trials and studies, and our strategies, goals and general business and market conditions are forward - looking statements . These forward - looking statements are subject to known and unknown risks and uncertainties that may cause actual results to differ materially, including : we face numerous uncertainties and challenges in achieving our financial projections and goals ; we may be unable to further increase the use and adoption of our products through our direct sales efforts or through our laboratory partners ; we have incurred losses since our inception and we anticipate that we will continue to incur losses for the foreseeable future ; our quarterly results may fluctuate from period to period ; our estimates of market opportunity and forecasts of market growth may prove to be inaccurate ; we may be unable to compete successfully with existing or future products or services offered by our competitors ; we may engage in acquisitions, dispositions or other strategic transactions that may not achieve our anticipated benefits and could otherwise disrupt our business, cause dilution to our stockholders or reduce our financial resources ; we may not be successful in commercializing our cloud - based distribution model ; our products may not perform as expected ; the results of our clinical studies, including our SNP - based Microdeletion and Aneuploidy Registry, or SMART, Study, may not be compelling to professional societies or payors as supporting the use of our tests, particularly for microdeletions screening, or may not be able to be replicated in later studies required for regulatory approvals or clearances ; if either of our primary CLIA - certified laboratories becomes inoperable, we will be unable to perform our tests and our business will be harmed ; we rely on a limited number of suppliers or, in some cases, single suppliers, for some of our laboratory instruments and materials and may not be able to find replacements or immediately transition to alternative suppliers ; if we are unable to successfully scale our operations, our business could suffer ; the marketing, sale, and use of Panorama and our other products could result in substantial damages arising from product liability or professional liability claims that exceed our resources ; we may be unable to expand, obtain or maintain third - party payer coverage and reimbursement for our tests, and we may be required to refund reimbursements already received ; third - party payers may withdraw coverage or provide lower levels of reimbursement due to changing policies, billing complexities or other factors ; we could incur substantial costs and delays associated with trying to obtain premarket clearance or approval and incur costs associated with complying with post - market controls, if and when the FDA begins actively regulating our tests pursuant to recently enacted FDA regulations ; litigation or other proceedings, resulting from either third party claims of intellectual property infringement or third party infringement of our technology, is costly, time - consuming and could limit our ability to commercialize our products or services ; any inability to effectively protect our proprietary technology could harm our competitive position or our brand ; and we cannot guarantee that we will be able to service and comply with our outstanding debt obligations . We discuss these and other risks and uncertainties in greater detail in the sections entitled “Risk Factors” and “Management’s Discussion and Analysis of Financial Condition and Results of Operations” in our periodic reports on Forms 10 - K and 10 - Q and in other filings we make with the SEC from time to time . Moreover, we operate in a very competitive and rapidly changing environment . New risks emerge from time to time . It is not possible for our management to predict all risks, nor can we assess the impact of all factors on our business or the extent to which any factor, or combination of factors, may cause actual results to differ materially from those contained in any forward - looking statement . In light of these risks, uncertainties and assumptions, the forward - looking events and circumstances discussed in this presentation may not occur and our actual results could differ materially and adversely from those anticipated or implied . As a result, you should not place undue reliance on our forward - looking statements . Except as required by law, we undertake no obligation to update publicly any forward - looking statements for any reason after the date of this presentation to conform these statements to actual results or to changes in our expectations . We file reports, proxy statements, and other information with the SEC . Such reports, proxy statements, and other information concerning us is available at http : //www . sec . gov . Requests for copies of such documents should be directed to our Investor Relations department at Natera, Inc . , 13011 McCallen Pass, Building A Suite 100 , Austin, TX 78753 . Our telephone number is ( 650 ) 980 - 9190 . 2 Safe harbor statement Not for reproduction or further distribution.
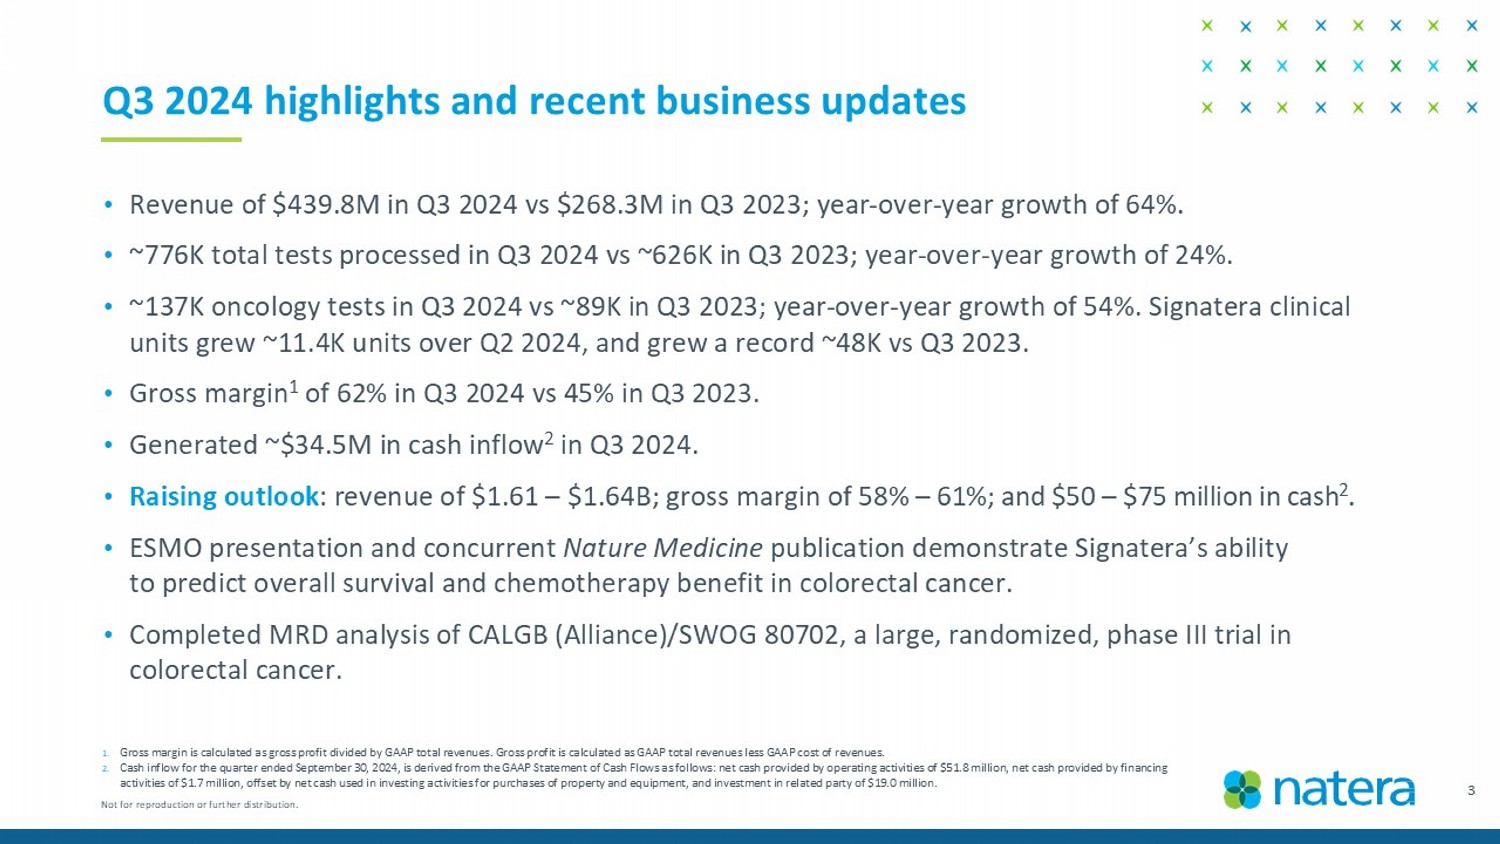
• Revenue of $439.8M in Q3 2024 vs $268.3M in Q3 2023; year - over - year growth of 64%. • ~776K total tests processed in Q3 2024 vs ~626K in Q3 2023; year - over - year growth of 24%. • ~137K oncology tests in Q3 2024 vs ~89K in Q3 2023; year - over - year growth of 54%. Signatera clinical units grew ~11.4K units over Q2 2024, and grew a record ~48K vs Q3 2023. • Gross margin 1 of 62% in Q3 2024 vs 45% in Q3 2023. • Generated ~$34.5M in cash inflow 2 in Q3 2024. • Raising outlook : revenue of $1.61 – $1.64B; gross margin of 58% – 61%; and $50 – $75 million in cash 2 . • ESMO presentation and concurrent Nature Medicine publication demonstrate Signatera’s ability to predict overall survival and chemotherapy benefit in colorectal cancer. • Completed MRD analysis of CALGB (Alliance)/SWOG 80702, a large, randomized, phase III trial in colorectal cancer. 3 1. Gross margin is calculated as gross profit divided by GAAP total revenues. Gross profit is calculated as GAAP total revenues les s GAAP cost of revenues. 2. Cash inflow for the quarter ended September 30, 2024, is derived from the GAAP Statement of Cash Flows as follows: net cash p rov ided by operating activities of $51.8 million, net cash provided by financing activities of $1.7 million, offset by net cash used in investing activities for purchases of property and equipment, and inve stm ent in related party of $19.0 million. Q3 2024 highlights and recent business updates Not for reproduction or further distribution.

200K 262K 407K 518K 626K 776K Q3'19 Q3'20 Q3'21 Q3'22 Q3'23 Q3'24 4 Quarterly volumes demonstrate continued momentum Core Volume Drivers • New features and products leading to women’s health account wins • New data and guidelines driving organ health • Signatera continues to ramp Not for reproduction or further distribution.

37K 37K 38K 44K 46K 48K 2Q23 3Q23 4Q23 1Q24 2Q24 3Q24 5 Signatera clinical units jump again, up ~11.4K units in Q3 2024 vs Q2 2024; record year - over - year growth 52K 61K 72K 81K 91K 106K 118K 130K 4Q22 1Q23 2Q23 3Q23 4Q23 1Q24 2Q24 3Q24 Signatera clinical tests processed Clinical test unit growth 1 (change in clinical units y/y) 1. Clinical test unit growth is calculated as the difference between current quarter Signatera clinical volume and the prior year respective quarter Signatera clinical volume.

Not for reproduction or further distribution. $261M $268M $311M $368M $413M $440M Q2'23 Q3'23 Q4'23 Q1'24 Q2'24 Q3'24 $78M $98M $158M $211M $268M $440M Q3'19 Q3'20 Q3'21 Q3'22 Q3'23 Q3'24 6 Record revenue growth quarter Total revenues: YoY Q3 trend Total revenues: Last consecutive q uarters 26% 61% 33% 27% 64% Not for reproduction or further distribution.
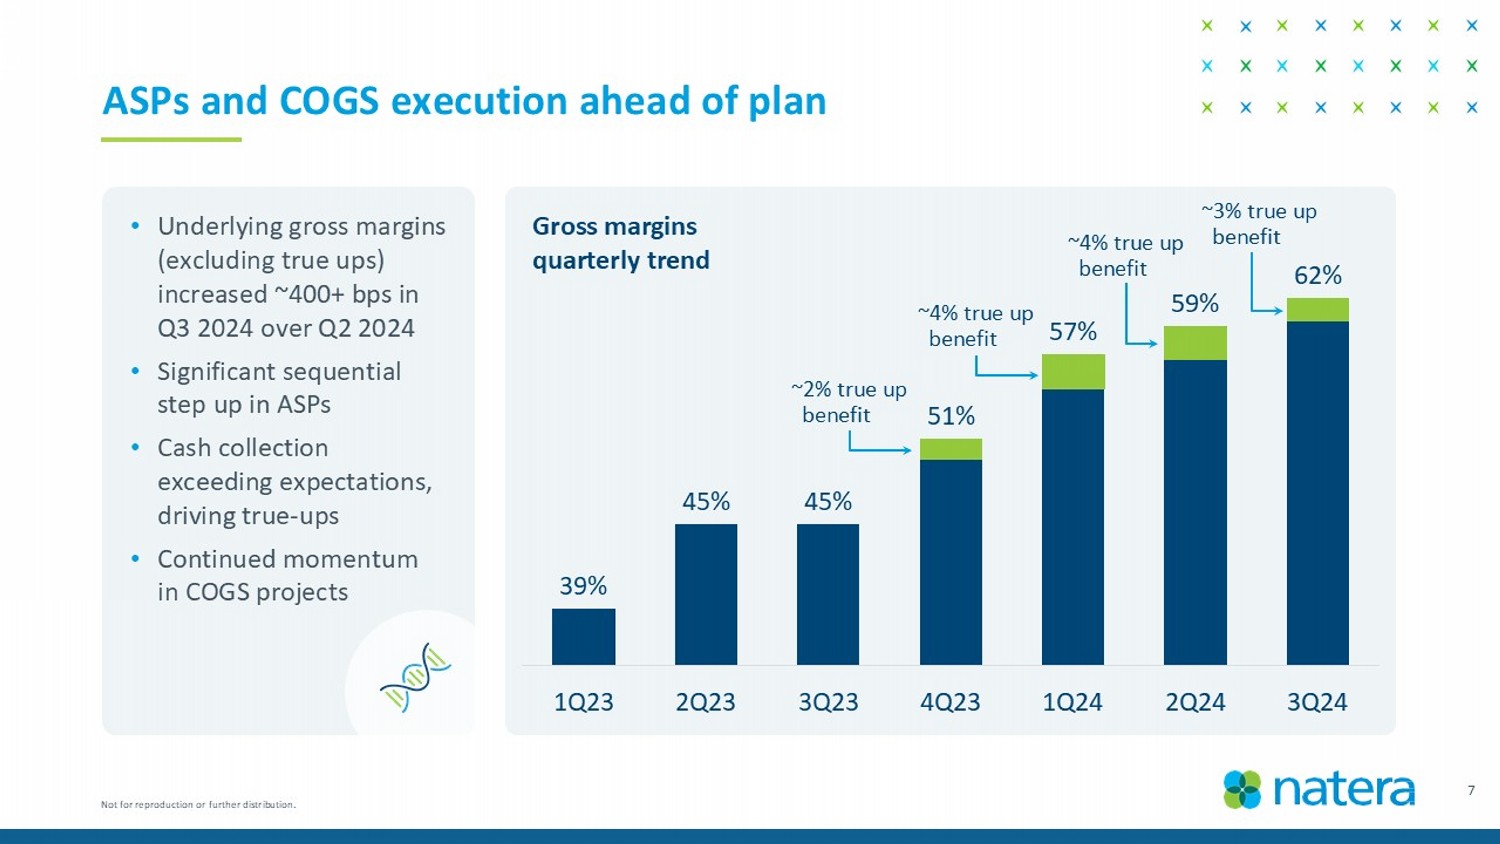
39% 45% 45% 51% 57% 59% 62% 1Q23 2Q23 3Q23 4Q23 1Q24 2Q24 3Q24 7 ASPs and COGS execution ahead of plan • Underlying gross margins (excluding true ups) increased ~400+ bps in Q3 2024 over Q2 2024 • Significant sequential step up in ASPs • Cash collection exceeding expectations, driving true - ups • Continued momentum in COGS projects Gross margins quarterly trend ~ 2 % true up benefit ~4% true up benefit ~4% true up benefit ~3% true up benefit Not for reproduction or further distribution.
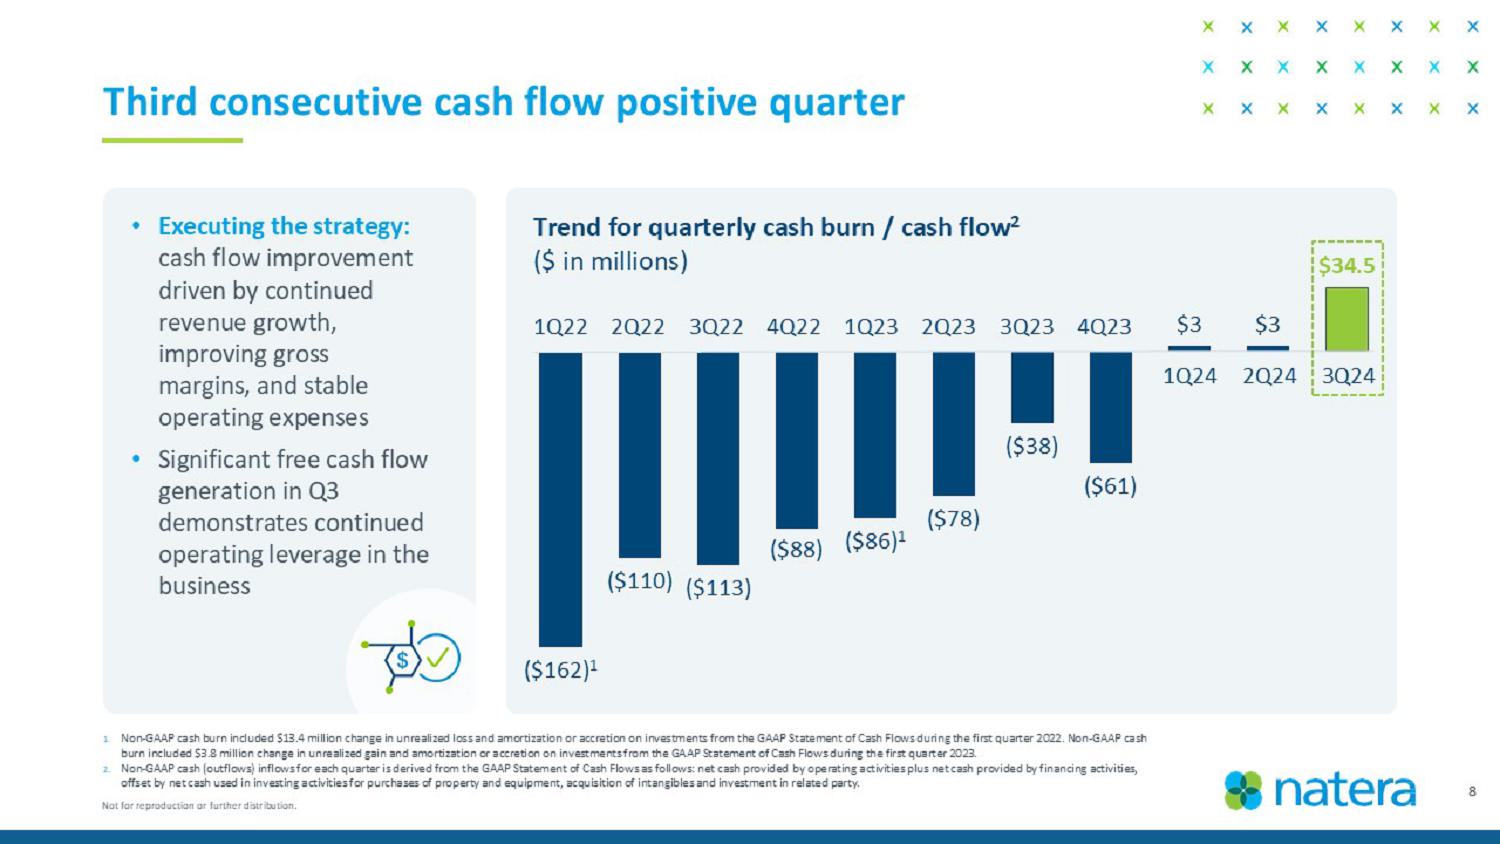
8 1. Non - GAAP cash burn included $13.4 million change in unrealized loss and amortization or accretion on investments from the GAAP S tatement of Cash Flows during the first quarter 2022. Non - GAAP cash burn included $3.8 million change in unrealized gain and amortization or accretion on investments from the GAAP Statement of Cas h Flows during the first quarter 2023. 2. Non - GAAP cash (outflows) inflows for the quarter is derived from the GAAP Statement of Cash Flows as follows: net cash provided by operating activities plus net cash provided by financing activities, offset by net cash used in investing activities for purchases of property and equipment, acquisition of intangibles and inves tme nt in related party. Third consecutive cash flow positive quarter • Executing the strategy: cash flow improvement driven by continued revenue growth, improving gross margins, and stable operating expenses • Significant free cash flow generation in Q3 demonstrates continued operating leverage in the business Trend for quarterly cash burn / cash flow 2 ($ in millions) ($162) 1 ($110) ($113) ($88) ($86) 1 ($78) ($38) ($61) $3 $3 $34.5 1Q22 2Q22 3Q22 4Q22 1Q23 2Q23 3Q23 4Q23 1Q24 2Q24 3 Q24 Not for reproduction or further distribution.
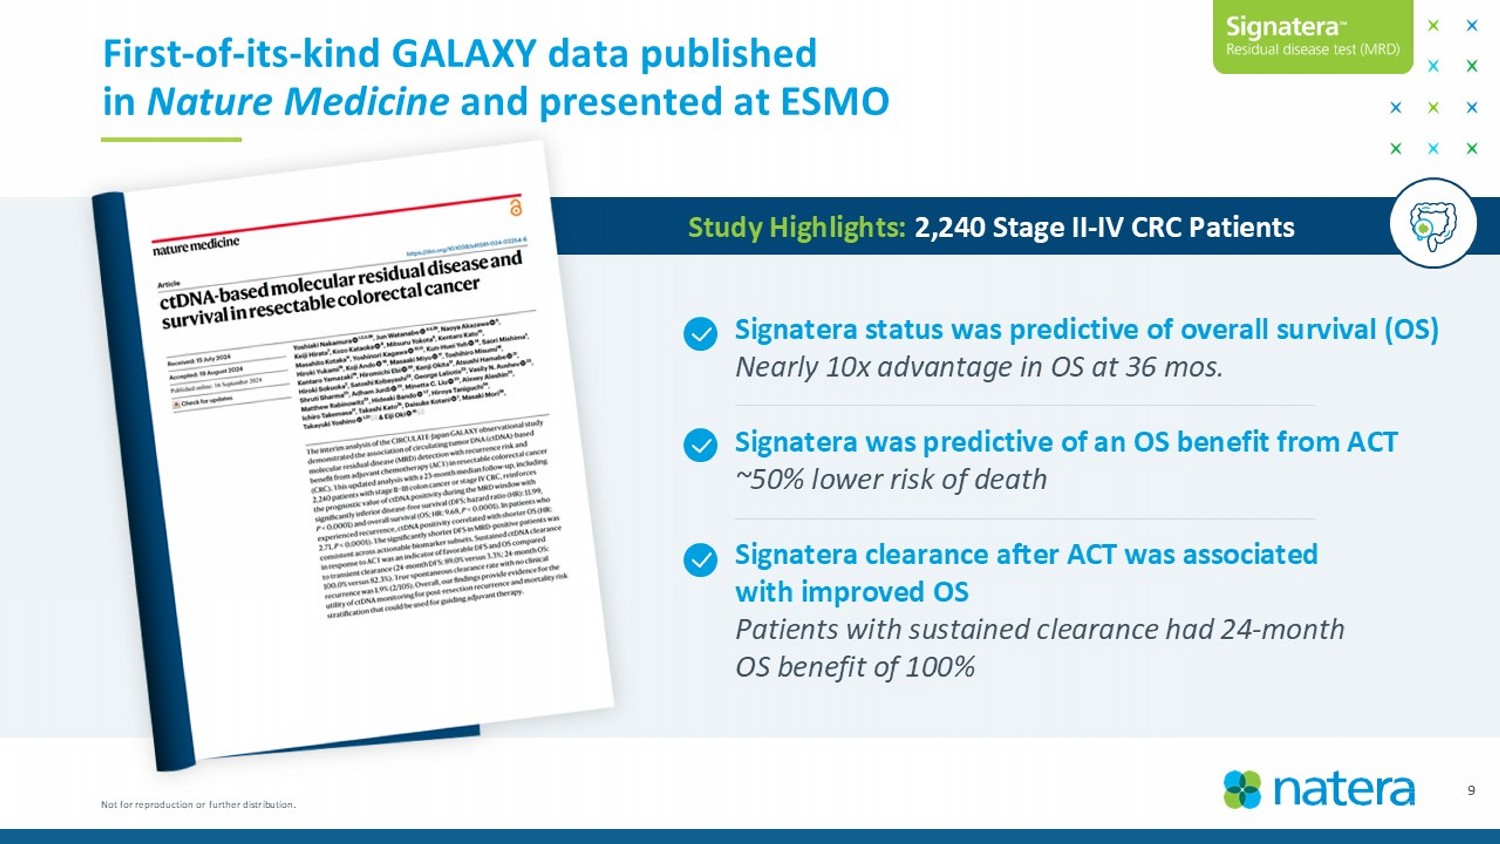
9 First - of - its - kind GALAXY data published in Nature Medicine and presented at ESMO Signatera status was predictive of overall survival (OS) Nearly 10x advantage in OS at 36 mos. Signatera was predictive of an OS benefit from ACT ~50% lower risk of death Signatera clearance after ACT was associated with improved OS Patients with sustained clearance had 24 - month OS benefit of 100% Study Highlights: 2,240 Stage II - IV CRC Patients Not for reproduction or further distribution.

10 Completed analysis of randomized, phase III CRC trial First - of - its - kind analysis from CALGB (Alliance)/SWOG 80702 trial of >1K patients; presenting results at ASCO GI in Jan. 2025 Study Highlights Study Schema • Pre - specified analysis of CALGB (Alliance)/ SWOG 80702, a randomized, phase III trial. • Study objective: to evaluate if Signatera can identify which patients may benefit from the addition of celecoxib to standard of care ACT. • Primary endpoint is DFS; secondary endpoint is OS. • Initial readout expected in 2025. ACT + Celecoxib ACT + Placebo Randomization Resected Stage III Colon Cancer (N = 1,011 patients with Signatera results)

Not for reproduction or further distribution. 11 Celecoxib utility in colorectal cancer patients Celecoxib summary & profile Potential benefit to CRC patients Addressing an unmet need • Some evidence suggests that NSAIDs reduce the risk of precancer adenomas and CRC. 1 • Celecoxib is a nonsteroidal anti - inflammatory drug (NSAID). • NSAIDs are widely available, typically well - tolerated and generally affordable. • There is a critical need to identify new therapies to reduce recurrence risk in CRC. • The analysis of CALGB (Alliance)/SWOG 80702 is the first randomized study to address this need. 1. BMJ2016;355:i6188 Not for reproduction or further distribution.
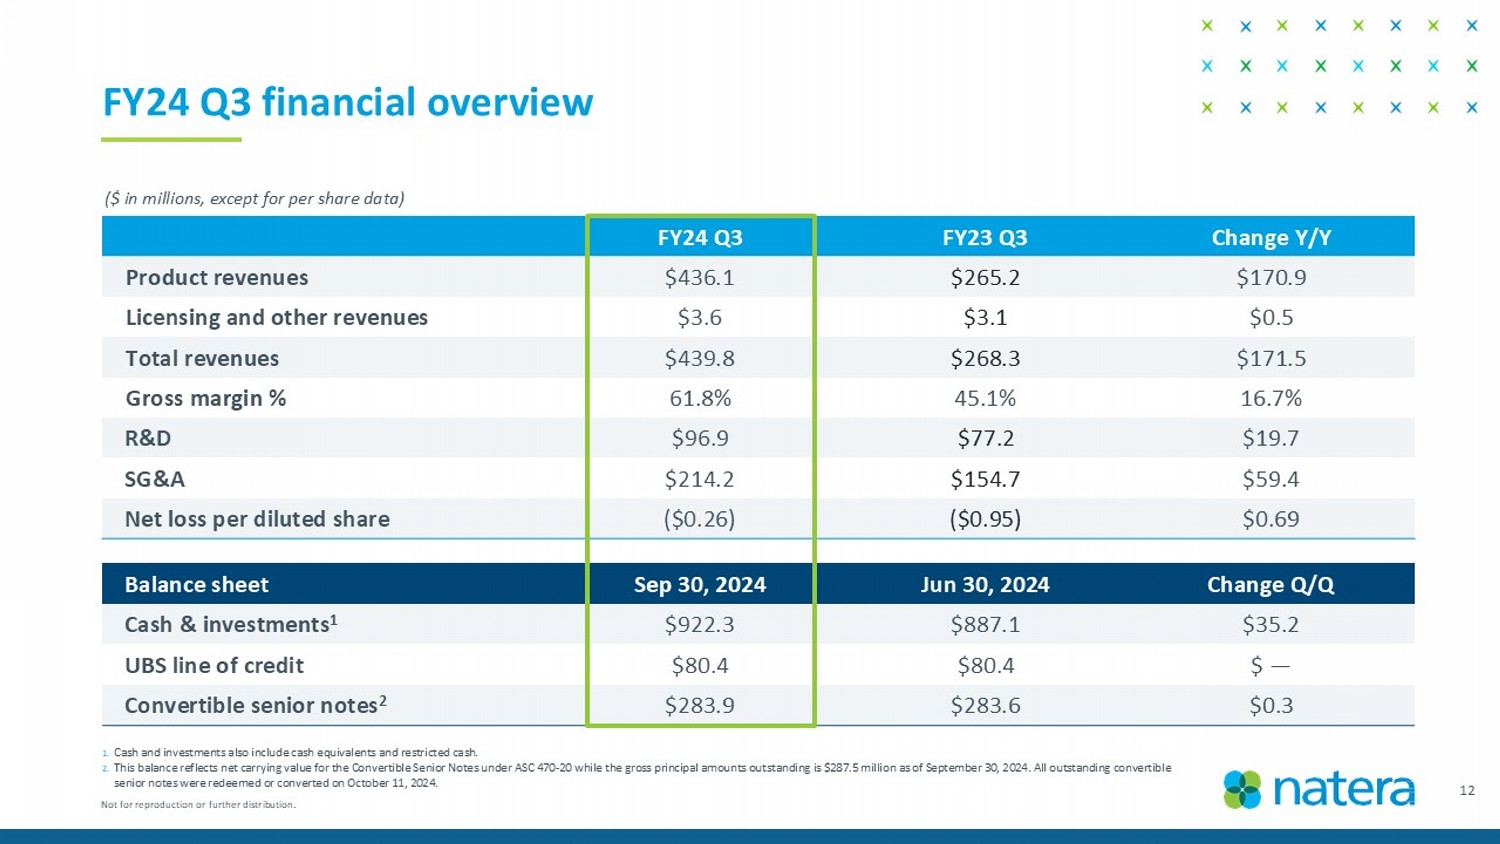
FY24 Q3 financial overview 1. Cash and investments also include cash equivalents and restricted cash. 2. This balance reflects net carrying value for the Convertible Senior Notes under ASC 470 - 20 while the gross principal amounts out standing is $287.5 million as of September 30, 2024. All outstanding convertible senior notes were redeemed or converted on October 11, 2024. ($ in millions, except for per share data) Change Q/Q Jun 30, 2024 Sep 30, 2024 Balance sheet $35. 2 $887.1 $922.3 Cash & investments 1 $ — $80.4 $80.4 UBS line of credit $0.3 $283.6 $283.9 Convertible senior notes 2 Change Y/Y FY23 Q3 FY24 Q3 $170.9 $265.2 $436.1 Product revenues $0.5 $3.1 $3.6 Licensing and other revenues $171.5 $268.3 $439.8 Total revenues 16.7% 45.1% 61.8% Gross margin % $19.7 $77.2 $96.9 R&D $59.4 $154.7 $214.2 SG&A $0.69 ($0.95) ($0.26) Net loss per diluted share 12 Not for reproduction or further distribution.

Key drivers Current Q2 24 Q1 24 Original Guide ($ millions) Continued volume growth, conservative ASPs, strong oncology contribution $1,610 – $1,640 $ 1,490 – $1,520 $ 1,420 – $1, 450 $ 1,320 – $1, 350 Revenue ASPs, COGS on track 58 % – 61 % 54 % – 56 % 53 % – 55 % 50 % – 53 % Gross margin % revenue Accelerating growth plans $ 775 – $ 825 $ 700 – $ 750 $ 700 – $ 750 $ 630 – $ 650 SG&A Continued substantial investment in R&D $3 75 – $ 400 $ 350 – $ 375 $ 350 – $ 375 $325 – $345 R&D Now generating cash for the full year $ 50 – $ 75 ( $25) - $25 ( $25) - $25 ($ 75) – ($ 50) C hange in cash 2024 guidance: raising expectations for revenue, gross margin and cash inflow 13 NOTE: Cash (outflow) inflow is calculated as the sum of GAAP net cash provided by (used in) operating activities, GAAP net ca sh provided by (used in) financing activities, and GAAP net cash provided by (used in) investing activities for purchases of property and equipment, investment in related party, and acquisition of assets.

©2024 Natera, Inc. All Rights Reserved. Not for reproduction or further distribution. ® 14