UNITED STATES
SECURITIES
AND EXCHANGE COMMISSION
WASHINGTON, D.C. 20549
FORM 6-K
Report of Foreign Private Issuer
Pursuant to Rule 13a-16 or 15d-16
under the Securities Exchange Act of 1934
For the month of November 2024
Commission File Number 001-15144
TELUS
CORPORATION
(Translation of registrant's name into English)
23rd
Floor, 510 West Georgia Street
Vancouver, British Columbia V6B 0M3
Canada
(Address of principal executive office)
Indicate by check mark whether the registrant files or will file annual reports under cover of Form 20-F or Form 40-F:
Form 20-F ¨ Form 40-F þ This report on Form 6-K and the exhibits hereto are specifically incorporated by reference into the registration statement on Form F-10 (File No.
Incorporation by Reference
333-281233), the registration statement on Form F-3D (File No. 333-258770) and the registration statements on Form S-8 (File Nos. 333-268186, 333-181463 and 333-125486), of TELUS Corporation.
Signatures
Pursuant to the requirements of the Securities Exchange Act of 1934, the registrant has duly caused this report to be signed on its behalf by the undersigned, thereunto duly authorized.
| TELUS CORPORATION | |||
| By: | /s/ Andrea Wood | ||
| Name: | Andrea Wood | ||
| Title: | Executive Vice President and Chief Legal and Governance Officer | ||
Date: November 8, 2024
Exhibit Index
| Exhibit Number | Description of Document | |
| 99.1 | Consolidated Financial Statements | |
| 99.2 | Management’s Discussion and Analysis |
Exhibit 99.1
|
TELUS CORPORATION
CONDENSED INTERIM CONSOLIDATED FINANCIAL STATEMENTS
(UNAUDITED)
SEPTEMBER 30, 2024 |
| condensed interim consolidated statements of income and other comprehensive income | (unaudited) |
| Three months | Nine months | |||||||||||||||||||
| Periods ended September 30 (millions except per share amounts) | Note | 2024 | 2023 | 2024 | 2023 | |||||||||||||||
| OPERATING REVENUES | ||||||||||||||||||||
| Service | $ | 4,410 | $ | 4,388 | $ | 13,081 | $ | 13,091 | ||||||||||||
| Equipment | 632 | 602 | 1,727 | 1,758 | ||||||||||||||||
| Operating revenues (arising from contracts with customers) | 6 | 5,042 | 4,990 | 14,808 | 14,849 | |||||||||||||||
| Other income | 7 | 57 | 18 | 197 | 69 | |||||||||||||||
| Operating revenues and other income | 5,099 | 5,008 | 15,005 | 14,918 | ||||||||||||||||
| OPERATING EXPENSES | ||||||||||||||||||||
| Goods and services purchased | 16 | 1,868 | 1,858 | 5,503 | 5,451 | |||||||||||||||
| Employee benefits expense | 8, 16 | 1,475 | 1,633 | 4,432 | 4,741 | |||||||||||||||
| Depreciation | 17 | 597 | 611 | 1,895 | 1,849 | |||||||||||||||
| Amortization of intangible assets | 18 | 371 | 389 | 1,130 | 1,179 | |||||||||||||||
| 4,311 | 4,491 | 12,960 | 13,220 | |||||||||||||||||
| OPERATING INCOME | 788 | 517 | 2,045 | 1,698 | ||||||||||||||||
| Financing costs | 9 | 479 | 352 | 1,255 | 995 | |||||||||||||||
| INCOME BEFORE INCOME TAXES | 309 | 165 | 790 | 703 | ||||||||||||||||
| Income taxes | 10 | 52 | 28 | 172 | 146 | |||||||||||||||
| NET INCOME | 257 | 137 | 618 | 557 | ||||||||||||||||
| OTHER COMPREHENSIVE INCOME (LOSS) | 11 | |||||||||||||||||||
| Items that may subsequently be reclassified to income | ||||||||||||||||||||
| Change in unrealized fair value of derivatives designated as cash flow hedges | (21 | ) | 30 | 11 | (5 | ) | ||||||||||||||
| Foreign currency translation adjustment arising from translating financial statements of foreign operations | 23 | 7 | 64 | (28 | ) | |||||||||||||||
| 2 | 37 | 75 | (33 | ) | ||||||||||||||||
| Items never subsequently reclassified to income | ||||||||||||||||||||
| Change in measurement of investment financial assets | 1 | (4 | ) | (2 | ) | (12 | ) | |||||||||||||
| Employee defined benefit plan re-measurements | (20 | ) | 60 | 31 | 59 | |||||||||||||||
| (19 | ) | 56 | 29 | 47 | ||||||||||||||||
| (17 | ) | 93 | 104 | 14 | ||||||||||||||||
| COMPREHENSIVE INCOME | $ | 240 | $ | 230 | $ | 722 | $ | 571 | ||||||||||||
| NET INCOME ATTRIBUTABLE TO: | ||||||||||||||||||||
| Common Shares | $ | 280 | $ | 136 | $ | 635 | $ | 553 | ||||||||||||
| Non-controlling interests | (23 | ) | 1 | (17 | ) | 4 | ||||||||||||||
| $ | 257 | $ | 137 | $ | 618 | $ | 557 | |||||||||||||
| COMPREHENSIVE INCOME ATTRIBUTABLE TO: | ||||||||||||||||||||
| Common Shares | $ | 271 | $ | 218 | $ | 717 | $ | 573 | ||||||||||||
| Non-controlling interests | (31 | ) | 12 | 5 | (2 | ) | ||||||||||||||
| $ | 240 | $ | 230 | $ | 722 | $ | 571 | |||||||||||||
| NET INCOME PER COMMON SHARE | 12 | |||||||||||||||||||
| Basic | $ | 0.19 | $ | 0.09 | $ | 0.43 | $ | 0.38 | ||||||||||||
| Diluted | $ | 0.19 | $ | 0.09 | $ | 0.43 | $ | 0.38 | ||||||||||||
| TOTAL WEIGHTED AVERAGE COMMON SHARES OUTSTANDING | ||||||||||||||||||||
| Basic | 1,492 | 1,454 | 1,483 | 1,447 | ||||||||||||||||
| Diluted | 1,497 | 1,459 | 1,488 | 1,451 | ||||||||||||||||
The accompanying notes are an integral part of these condensed interim consolidated financial statements.
|
|
 |
| condensed interim consolidated statements of financial position | (unaudited) |
| As at (millions) | Note | September 30, 2024 |
December 31, 2023 |
|||||||||
| ASSETS | ||||||||||||
| Current assets | ||||||||||||
| Cash and temporary investments, net | $ | 814 | $ | 864 | ||||||||
| Accounts receivable | 6(b) | 3,554 | 3,597 | |||||||||
| Income and other taxes receivable | 55 | 205 | ||||||||||
| Inventories | 1(b) | 492 | 484 | |||||||||
| Contract assets | 6(c) | 413 | 445 | |||||||||
| Prepaid expenses | 20 | 779 | 682 | |||||||||
| Current derivative assets | 4(d) | 17 | 36 | |||||||||
| 6,124 | 6,313 | |||||||||||
| Non-current assets | ||||||||||||
| Property, plant and equipment, net | 17 | 17,210 | 17,248 | |||||||||
| Intangible assets, net | 18 | 20,526 | 19,721 | |||||||||
| Goodwill, net | 18 | 10,323 | 10,058 | |||||||||
| Contract assets | 6(c) | 277 | 303 | |||||||||
| Other long-term assets | 20 | 2,526 | 2,493 | |||||||||
| 50,862 | 49,823 | |||||||||||
| $ | 56,986 | $ | 56,136 | |||||||||
| LIABILITIES AND OWNERS’ EQUITY | ||||||||||||
| Current liabilities | ||||||||||||
| Short-term borrowings | 22 | $ | 925 | $ | 104 | |||||||
| Accounts payable and accrued liabilities | 23 | 3,419 | 3,391 | |||||||||
| Income and other taxes payable | 156 | 126 | ||||||||||
| Dividends payable | 13 | 578 | 550 | |||||||||
| Advance billings and customer deposits | 24 | 950 | 971 | |||||||||
| Provisions | 25 | 235 | 317 | |||||||||
| Current maturities of long-term debt | 26 | 2,613 | 3,994 | |||||||||
| Current derivative liabilities | 4(d) | 15 | 25 | |||||||||
| 8,891 | 9,478 | |||||||||||
| Non-current liabilities | ||||||||||||
| Provisions | 25 | 736 | 744 | |||||||||
| Long-term debt | 26 | 25,387 | 23,355 | |||||||||
| Other long-term liabilities | 27 | 865 | 867 | |||||||||
| Deferred income taxes | 4,180 | 4,390 | ||||||||||
| 31,168 | 29,356 | |||||||||||
| Liabilities | 40,059 | 38,834 | ||||||||||
| Owners’ equity | ||||||||||||
| Common equity | 28 | 15,771 | 16,112 | |||||||||
| Non-controlling interests | 1,156 | 1,190 | ||||||||||
| 16,927 | 17,302 | |||||||||||
| $ | 56,986 | $ | 56,136 | |||||||||
| Contingent liabilities | 29 | |||||||||||
The accompanying notes are an integral part of these condensed interim consolidated financial statements.
|
|
September 30, 2024 | |
| condensed interim consolidated statements of changes in owners’ equity | (unaudited) |
| Common equity | ||||||||||||||||||||||||||||||||||
| Equity contributed | ||||||||||||||||||||||||||||||||||
| Common Shares (Note 28) | Accumulated | |||||||||||||||||||||||||||||||||
| (millions) | Note | Number
of shares |
Share capital |
Contributed surplus |
Retained earnings |
other comprehensive income |
Total | Non- controlling interests |
Total | |||||||||||||||||||||||||
| Balance as at January 1, 2023 | 1,431 | $ | 11,399 | $ | 956 | $ | 4,104 | $ | 110 | $ | 16,569 | $ | 1,089 | $ | 17,658 | |||||||||||||||||||
| Net income | — | — | — | 553 | — | 553 | 4 | 557 | ||||||||||||||||||||||||||
| Other comprehensive income (loss) | 11 | — | — | — | 59 | (39 | ) | 20 | (6 | ) | 14 | |||||||||||||||||||||||
| Dividends | 13 | — | — | — | (1,561 | ) | — | (1,561 | ) | — | (1,561 | ) | ||||||||||||||||||||||
| Dividends reinvested and optional cash payments | 13(b), 14(c) | 22 | 559 | — | — | — | 559 | — | 559 | |||||||||||||||||||||||||
| Equity accounted share-based compensation | — | 1 | 87 | — | — | 88 | 3 | 91 | ||||||||||||||||||||||||||
| Change in ownership interests of subsidiaries | 28(b) | 2 | 54 | 35 | — | — | 89 | 99 | 188 | |||||||||||||||||||||||||
| Balance as at September 30, 2023 | 1,455 | $ | 12,013 | $ | 1,078 | $ | 3,155 | $ | 71 | $ | 16,317 | $ | 1,189 | $ | 17,506 | |||||||||||||||||||
| Balance as at January 1, 2024 | 1,468 | $ | 12,324 | $ | 997 | $ | 2,835 | $ | (44 | ) | $ | 16,112 | $ | 1,190 | $ | 17,302 | ||||||||||||||||||
| Net income | — | — | — | 635 | — | 635 | (17 | ) | 618 | |||||||||||||||||||||||||
| Other comprehensive income | 11 | — | — | — | 31 | 51 | 82 | 22 | 104 | |||||||||||||||||||||||||
| Dividends | 13 | — | — | — | (1,709 | ) | — | (1,709 | ) | — | (1,709 | ) | ||||||||||||||||||||||
| Dividends reinvested and optional cash payments | 13(b), 14(c) | 24 | 508 | — | — | — | 508 | — | 508 | |||||||||||||||||||||||||
| Equity accounted share-based compensation | 14(b) | — | 2 | 85 | — | — | 87 | 4 | 91 | |||||||||||||||||||||||||
| Issue of Common Shares in business combination | 18(b) | — | 7 | — | — | — | 7 | — | 7 | |||||||||||||||||||||||||
| Change in ownership interests of subsidiaries | 28(b) | — | — | 49 | — | — | 49 | (43 | ) | 6 | ||||||||||||||||||||||||
| Balance as at September 30, 2024 | 1,492 | $ | 12,841 | $ | 1,131 | $ | 1,792 | $ | 7 | $ | 15,771 | $ | 1,156 | $ | 16,927 | |||||||||||||||||||
The accompanying notes are an integral part of these condensed interim consolidated financial statements.
|
|
|
| condensed interim consolidated statements of cash flows | (unaudited) |
| Three months | Nine months | |||||||||||||||
| Periods ended September 30 (millions) | 2024 | 2023 | 2024 | 2023 | ||||||||||||
| OPERATING ACTIVITIES | ||||||||||||||||
| Net income | $ | 257 | $ | 137 | $ | 618 | $ | 557 | ||||||||
| Adjustments to reconcile net income to cash provided by operating activities: | ||||||||||||||||
| Depreciation and amortization | 968 | 1,000 | 3,025 | 3,028 | ||||||||||||
| Deferred income taxes (Note 10) | (117 | ) | (98 | ) | (285 | ) | (227 | ) | ||||||||
| Share-based compensation expense, net (Note 14(a)) | 44 | 27 | 110 | 100 | ||||||||||||
| Net employee defined benefit plans expense (Note 15(a)) | 16 | 15 | 50 | 46 | ||||||||||||
| Employer contributions to employee defined benefit plans (Note 15(a)) | (2 | ) | (7 | ) | (16 | ) | (23 | ) | ||||||||
| Loss from equity accounted investments (Notes 7, 21) | 3 | 2 | 13 | 10 | ||||||||||||
| Other | (43 | ) | 10 | (88 | ) | 79 | ||||||||||
| Net change in non-cash operating working capital (Note 31(a)) | 306 | 221 | 343 | (385 | ) | |||||||||||
| Cash provided by operating activities | 1,432 | 1,307 | 3,770 | 3,185 | ||||||||||||
| INVESTING ACTIVITIES | ||||||||||||||||
| Cash payments for capital assets, excluding spectrum licences (Note 31(a)) | (679 | ) | (745 | ) | (2,157 | ) | (2,498 | ) | ||||||||
| Cash payments for spectrum licences (Note 18(a)) | — | (24 | ) | (620 | ) | (29 | ) | |||||||||
| Cash payments for acquisitions, net (Note 18(b)) | (91 | ) | (11 | ) | (258 | ) | (1,273 | ) | ||||||||
| Advances to, and investment in, real estate joint ventures and associates (Note 21) | (7 | ) | (19 | ) | (12 | ) | (136 | ) | ||||||||
| Real estate joint venture receipts (Note 21) | 2 | 1 | 5 | 5 | ||||||||||||
| Proceeds on disposition | — | — | 21 | 7 | ||||||||||||
| Investment in portfolio investments and other | (7 | ) | 7 | (8 | ) | (108 | ) | |||||||||
| Cash used by investing activities | (782 | ) | (791 | ) | (3,029 | ) | (4,032 | ) | ||||||||
| FINANCING ACTIVITIES (Note 31(b)) | ||||||||||||||||
| Dividends paid to holders of Common Shares (Note 13(a)) | (384 | ) | (338 | ) | (1,174 | ) | (976 | ) | ||||||||
| Issue (repayment) of short-term borrowings, net | (118 | ) | (490 | ) | 822 | — | ||||||||||
| Long-term debt issued (Note 26) | 1,294 | 2,808 | 5,083 | 8,325 | ||||||||||||
| Redemptions and repayment of long-term debt (Note 26) | (1,529 | ) | (1,925 | ) | (5,480 | ) | (6,195 | ) | ||||||||
| Shares of subsidiary purchased from non-controlling interests, net | (25 | ) | — | (25 | ) | (57 | ) | |||||||||
| Other | (1 | ) | (16 | ) | (17 | ) | (20 | ) | ||||||||
| Cash provided (used) by financing activities | (763 | ) | 39 | (791 | ) | 1,077 | ||||||||||
| CASH POSITION | ||||||||||||||||
| Increase (decrease) in cash and temporary investments, net | (113 | ) | 555 | (50 | ) | 230 | ||||||||||
| Cash and temporary investments, net, beginning of period | 927 | 649 | 864 | 974 | ||||||||||||
| Cash and temporary investments, net, end of period | $ | 814 | $ | 1,204 | $ | 814 | $ | 1,204 | ||||||||
| SUPPLEMENTAL DISCLOSURE OF OPERATING CASH FLOWS | ||||||||||||||||
| Interest paid | $ | (362 | ) | $ | (307 | ) | $ | (1,011 | ) | $ | (888 | ) | ||||
| Interest received | $ | 9 | $ | 4 | $ | 30 | $ | 11 | ||||||||
| Income taxes paid, net | $ | (63 | ) | $ | (63 | ) | $ | (258 | ) | $ | (342 | ) | ||||
The accompanying notes are an integral part of these condensed interim consolidated financial statements.
|
|
September 30, 2024 | |
| notes to condensed interim consolidated financial statements | (unaudited) |
SEPTEMBER 30, 2024
TELUS Corporation is one of Canada’s largest telecommunications companies, providing a wide range of technology solutions, which include: mobile and fixed voice and data telecommunications services and products; healthcare services, software and technology solutions (including employee and family assistance programs and benefits administration); agriculture and consumer goods services (software, data management and data analytics-driven smart-food chain and consumer goods technologies); and digital experiences. Data services include: internet protocol; television; hosting, managed information technology and cloud-based services; and home and business security.
TELUS Corporation was incorporated under the Company Act (British Columbia) on October 26, 1998, under the name BCT.TELUS Communications Inc. (BCT). On January 31, 1999, pursuant to a court-approved plan of arrangement under the Canada Business Corporations Act among BCT, BC TELECOM Inc. and the former Alberta-based TELUS Corporation (TC), BCT acquired all of the shares of BC TELECOM Inc. and TC in exchange for Common Shares and Non-Voting Shares of BCT, and BC TELECOM Inc. was dissolved. On May 3, 2000, BCT changed its name to TELUS Corporation and in February 2005, TELUS Corporation transitioned under the Business Corporations Act (British Columbia), successor to the Company Act (British Columbia). TELUS Corporation maintains its registered office at Floor 5, 510 West Georgia Street, Vancouver, British Columbia, V6B 0M3.
The terms “TELUS”, “we”, “us”, “our” or “ourselves” refer to TELUS Corporation and, where the context of the narrative permits or requires, its subsidiaries. Our principal subsidiaries are: TELUS Communications Inc., in which, as at September 30, 2024, we have a 100% equity interest; and TELUS International (Cda) Inc. (d.b.a. TELUS Digital Experience), in which, as at September 30, 2024, we have a 57.7% equity interest, as discussed further in Note 28(b), and which completed its initial public offering in February 2021.
| Notes to consolidated financial statements | Page | ||
| General application | |||
| 1. | Condensed interim consolidated financial statements | 7 | |
| 2. | Accounting policy developments | 7 | |
| 3. | Capital structure financial policies | 8 | |
| 4. | Financial instruments | 12 | |
| Consolidated results of operations focused | |||
| 5. | Segment information | 19 | |
| 6. | Revenue from contracts with customers | 22 | |
| 7. | Other income | 23 | |
| 8. | Employee benefits expense | 23 | |
| 9. | Financing costs | 24 | |
| 10. | Income taxes | 24 | |
| 11. | Other comprehensive income | 26 | |
| 12. | Per share amounts | 28 | |
| 13. | Dividends per share | 28 | |
| 14. | Share-based compensation | 29 | |
| 15. | Employee future benefits | 32 | |
| 16. | Restructuring and other costs | 34 | |
| Consolidated financial position focused | |||
| 17. | Property, plant and equipment | 35 | |
| 18. | Intangible assets and goodwill | 36 | |
| 19. | Leases | 38 | |
| 20. | Other long-term assets | 38 | |
| 21. | Real estate joint ventures and investments in associates | 39 | |
| 22. | Short-term borrowings | 41 | |
| 23. | Accounts payable and accrued liabilities | 42 | |
| 24. | Advance billings and customer deposits | 42 | |
| 25. | Provisions | 44 | |
| 26. | Long-term debt | 45 | |
| 27. | Other long-term liabilities | 50 | |
| 28. | Owners’ equity | 50 | |
| 29. | Contingent liabilities | 51 | |
| Other | |||
| 30. | Related party transactions | 52 | |
| 31. | Additional statement of cash flow information | 54 | |
|
|
|
| notes to condensed interim consolidated financial statements | (unaudited) |
| 1 | condensed interim consolidated financial statements |
| (a) | Basis of presentation |
The notes presented in our condensed interim consolidated financial statements include only significant events and transactions and are not fully inclusive of all matters normally disclosed in our annual audited financial statements; thus, our interim consolidated financial statements are referred to as condensed. Our condensed interim consolidated financial statements should be read in conjunction with our audited consolidated financial statements for the year ended December 31, 2023.
Our condensed interim consolidated financial statements are expressed in Canadian dollars and follow the same accounting policies and methods of their application as set out in our consolidated financial statements for the year ended December 31, 2023. The generally accepted accounting principles that we use are International Financial Reporting Standards as issued by the International Accounting Standards Board (IFRS-IASB) and Canadian generally accepted accounting principles. Our condensed interim consolidated financial statements comply with International Accounting Standard 34, Interim Financial Reporting and reflect all adjustments (which are of a normal recurring nature) that are, in our opinion, necessary for a fair statement of the results for the interim periods presented.
These consolidated financial statements for the three-month and nine-month periods ended September 30, 2024, were authorized by our Board of Directors for issue on November 8, 2024.
| (b) | Inventories |
Our inventories primarily consist of mobile handsets, parts and accessories totalling $387 million as at September 30, 2024 (December 31, 2023 – $369 million), and communications equipment held for resale. Inventories are valued at the lower of cost and net realizable value, with cost being determined on an average cost basis. Costs of goods sold for the three-month and nine-month periods ended September 30, 2024, totalled $0.6 billion (2023 – $0.6 billion) and $1.7 billion (2023 – $1.7 billion), respectively.
| 2 | accounting policy developments |
| (a) | Initial application of standards, interpretations and amendments to standards and interpretations in the reporting period |
| · | In May 2023, the International Accounting Standards Board issued Supplier Finance Arrangements, which amended IAS 7, Statement of Cash Flows and IFRS 7, Financial Instruments: Disclosures, and requires additional quantitative and qualitative disclosure about supplier finance arrangements. The amendments are effective for annual reporting periods beginning on or after January 1, 2024, although earlier application is permitted; comparative prior-period information is not required in the year of initial application. We are currently assessing the impacts of the amended standards, but do not expect that our financial disclosure, set out in Note 23, will be materially affected by the application of the amendments. |
| · | In May 2023, the International Accounting Standards Board issued International Tax Reform – Pillar Two Model Rules (Amendments to IAS 12), which amended IAS 12, Income Taxes. The amendments provide, and we use, temporary relief from accounting for deferred income taxes arising from the Organisation for Economic Co-operation and Development’s Pillar Two model rules (such rules ensuring that large multinational corporations would be subject to a minimum 15% income tax rate in every jurisdiction in which they operate). As different jurisdictions are expected to implement the OECD rules at different speeds and at different points in time, the amendments are intended to help ensure consistency within, and comparability across, financial statements. The amendments are effective for annual reporting periods beginning on or after January 1, 2023, and for interim periods ending after December 31, 2023; the effects of these amendments are as set out in Note 10. |
| (b) | Standards, interpretations and amendments to standards and interpretations not yet effective and not yet applied |
| · | In April 2024, the International Accounting Standards Board issued IFRS 18, Presentation and Disclosure in the Financial Statements, which sets out the overall requirements for presentation and disclosures in the financial statements. The new standard will replace IAS 1, Presentation of Financial Statements. Although much of the substance of IAS 1, Presentation of Financial Statements, will carry over into the new standard, the new standard incrementally will: |
|
|
September 30, 2024 | |
| notes to condensed interim consolidated financial statements | (unaudited) |
| · | With a view to improving comparability amongst entities, require presentation in the statement of operations of a subtotal for operating profit and a subtotal for profit before financing and income taxes (both subtotals as defined in the new standard); |
| · | Require disclosure and reconciliation, within a single financial statement note, of management-defined performance measures that are used in public communications to share management’s views of various aspects of an entity’s performance and which are derived from the statements of income and other comprehensive income; |
| · | Enhance the requirements for aggregation and disaggregation of financial statement amounts; and |
| · | Require limited changes to the statement of cash flows, including elimination of options for the classification of interest and dividend cash flows. |
The new standard is effective for annual reporting periods beginning on or after January 1, 2027, with earlier adoption permitted. We are currently assessing the impacts of the new standard; while there will be a limited shift of where a number of our management-defined performance measures are disclosed and reconciled (primarily a shift from management’s discussion and analysis to the financial statements) and where certain cash flows will be categorized in our statements of cash flows (primarily a shift of interest paid from operating activities to financing activities), we do not expect that the totality of our financial disclosure will be materially affected by the application of the new standard.
| · | In May 2024, the International Accounting Standards Board issued Amendments to the Classification and Measurement of Financial Instruments (Amendments to IFRS 9 and IFRS 7). The narrow-scope amendments are to address diversity in accounting practice in respect of: the classification of financial assets with environmental, social and corporate governance and similar features; and to clarify the date on which a financial asset or financial liability is derecognized when using electronic payment systems. The new standard is effective for annual reporting periods beginning on or after January 1, 2026, with earlier adoption permitted. We are currently assessing the impacts of the new standard but do not expect to be materially affected by the application of the amendments. |
| 3 | capital structure financial policies |
General
Our objective when managing financial capital is to maintain a flexible capital structure that optimizes the cost and availability of capital at an acceptable level of risk. In our definition of financial capital, we include:
| · | Common equity (excluding accumulated other comprehensive income); |
| · | Non-controlling interests; |
| · | Long-term debt (including long-term credit facilities, commercial paper backstopped by long-term credit facilities and any hedging assets or liabilities associated with long-term debt items, net of amounts recognized in accumulated other comprehensive income); |
| · | Cash and temporary investments; |
| · | Short-term borrowings (including those arising from securitized trade receivables and unbilled customer finance receivables); and |
| · | Other long-term debts. |
We manage our financial capital structure and make adjustments to it in light of changes in economic conditions and the risk characteristics of our business. In order to maintain or adjust our financial capital structure, we may:
| · | Adjust the amount of dividends paid to holders of Common Shares; |
| · | Purchase Common Shares for cancellation pursuant to normal course issuer bids; |
| · | Issue new shares (including Common Shares and TELUS International (Cda) Inc. subordinate voting shares); |
| · | Issue new debt, issue new debt to replace existing debt with different characteristics; and/or |
| · | Increase or decrease the amount of short-term borrowings arising from securitized trade receivables and unbilled customer finance receivables. |
During 2024, our financial objectives, which are reviewed annually, were unchanged from 2023. We believe that our financial objectives support our long-term strategy.
We monitor financial capital utilizing a number of measures, including: net debt to earnings before interest, income taxes, depreciation and amortization (EBITDA*) – excluding restructuring and other costs ratio; coverage ratios; and dividend payout ratios.
|
|
|
| notes to condensed interim consolidated financial statements | (unaudited) |
Debt and coverage ratios
Net debt to EBITDA – excluding restructuring and other costs is calculated as net debt at the end of the period, divided by 12-month trailing EBITDA – excluding restructuring and other costs. Historically, this measure is substantially similar to the leverage ratio covenant in our credit facilities. Net debt and EBITDA – excluding restructuring and other costs are measures that do not have any standardized meanings prescribed by IFRS-IASB and are therefore unlikely to be comparable to similar measures presented by other issuers. The calculation of these measures is set out in the following table. Net debt is one component of a ratio used to determine compliance with certain debt covenants.
| As at, or for the 12-month periods ended, September 30 ($ in millions) | Objective | 2024 | 2023 | |||||||||
| Components of debt and coverage ratios | ||||||||||||
| Net debt 1 | $ | 28,109 | $ | 26,719 | ||||||||
| EBITDA – excluding restructuring and other costs 2 | $ | 7,340 | $ | 6,995 | ||||||||
| Net interest cost 3 (Note 9) | $ | 1,370 | $ | 1,218 | ||||||||
| Debt ratio | ||||||||||||
| Net debt to EBITDA – excluding restructuring and other costs | 2.20 – 2.70 4 | 3.83 | 3.82 | |||||||||
| Coverage ratios | ||||||||||||
| Earnings coverage 5 | 1.9 | 1.9 | ||||||||||
| EBITDA – excluding restructuring and other costs interest coverage 6 | 5.4 | 5.7 | ||||||||||
| 1 | Net debt and total managed capitalization are calculated as follows: |
| As at September 30 | Note | 2024 | 2023 | |||||||||
| Long-term debt | 26 | $ | 28,000 | $ | 27,833 | |||||||
| Debt issuance costs netted against long-term debt | 124 | 122 | ||||||||||
| Derivative (assets) liabilities used to manage interest rate and currency risks associated with U.S. dollar-denominated long-term debt, net | 78 | (90 | ) | |||||||||
| Accumulated other comprehensive income amounts arising from financial instruments used to manage interest rate and currency risks associated with U.S. dollar-denominated long-term debt – excluding tax effects | (204 | ) | (46 | ) | ||||||||
| Cash and temporary investments, net | (814 | ) | (1,204 | ) | ||||||||
| Short-term borrowings | 22 | 925 | 104 | |||||||||
| Net debt | 28,109 | 26,719 | ||||||||||
| Common equity | 15,771 | 16,317 | ||||||||||
| Non-controlling interests | 1,156 | 1,189 | ||||||||||
| Less: accumulated other comprehensive income amounts included above in common equity and non-controlling interests | (27 | ) | (88 | ) | ||||||||
| Total managed capitalization | $ | 45,009 | $ | 44,137 | ||||||||
| 2 | EBITDA – excluding restructuring and other costs is calculated as follows: |
| EBITDA (Note 5) |
Restructuring and other costs (Note 16) |
EBITDA – excluding restructuring and other costs |
||||||||||
| Add | ||||||||||||
| Nine-month period ended September 30, 2024 | $ | 5,070 | $ | 425 | $ | 5,495 | ||||||
| Year ended December 31, 2023 | 6,431 | 717 | 7,148 | |||||||||
| Deduct | ||||||||||||
| Nine-month period ended September 30, 2023 | (4,726 | ) | (577 | ) | (5,303 | ) | ||||||
| EBITDA – excluding restructuring and other costs | $ | 6,775 | $ | 565 | $ | 7,340 | ||||||
| 3 | Net interest cost is defined as financing costs, excluding employee defined benefit plans net interest, unrealized changes in virtual power purchase agreements forward element, recoveries on long-term debt prepayment premium and repayment of debt, calculated on a 12-month trailing basis (expenses recorded for long-term debt prepayment premium, if any, are included in net interest cost) (see Note 9). |
* EBITDA is not a standardized financial measure under IFRS-IASB and might not be comparable to similar measures disclosed by other issuers; we define EBITDA as operating revenues and other income less goods and services purchased and employee benefits expense. We report EBITDA because it is a key measure that management uses to evaluate the performance of our business, and it is also utilized to determine compliance with certain debt covenants.
|
|
September 30, 2024 | |
| notes to condensed interim consolidated financial statements | (unaudited) |
| 4 | Our long-term objective range for this ratio is 2.20 – 2.70 times. The ratio as at September 30, 2024, is outside the long-term objective range. We may permit, and have permitted, this ratio to go outside the objective range (for long-term investment opportunities), but we will endeavour to return this ratio to circa 2.70 times in the medium term (following the spectrum auctions in 2021 and 2023, and the mmWave spectrum auction upcoming), consistent with our long-term strategy. We are in compliance with the leverage ratio covenant in our credit facilities, which states that we may not permit our net debt to operating cash flow ratio to exceed 4.25:1.00 (see Note 26(d)); the calculation of the debt ratio is substantially similar to the calculation of the leverage ratio covenant in our credit facilities. |
| 5 | Earnings coverage is defined in Canadian Securities Administrators National Instrument 41-101 as net income before borrowing costs and income tax expense, divided by borrowing costs (interest on long-term debt; interest on short-term borrowings and other; long-term debt prepayment premium), and adding back capitalized interest, all such amounts excluding those attributable to non-controlling interests. |
| 6 | EBITDA – excluding restructuring and other costs interest coverage is defined as EBITDA – excluding restructuring and other costs, divided by net interest cost. This measure is substantially similar to the coverage ratio covenant in our credit facilities. |
Net debt to EBITDA – excluding restructuring and other costs was 3.83 times as at September 30, 2024, compared to 3.82 times one year earlier. The effect of the increase in net debt levels, primarily due to spectrum acquisitions and business acquisitions, was approximately equal to the effect of growth in EBITDA – excluding restructuring and other costs; net debt levels were already elevated in the current and comparative periods due to our spectrum acquisitions and business acquisitions.
The earnings coverage ratio for the twelve-month period ended September 30, 2024, was 1.9 times, unchanged from 1.9 times one year earlier. An increase in income before borrowing costs and income taxes raised the ratio by 0.3 and an increase in borrowing costs lowered the ratio by 0.3. The EBITDA – excluding restructuring and other costs interest coverage ratio for the twelve-month period ended September 30, 2024, was 5.4 times, down from 5.7 times one year earlier. Growth in EBITDA – excluding restructuring and other costs increased the ratio by 0.3 and an increase of $152 million in net interest costs decreased the ratio by 0.6.
TELUS Corporation Common Share dividend payout ratio
So as to be consistent with the way we manage our business, our TELUS Corporation Common Share dividend payout ratio is presented as a historical measure calculated as the sum of the dividends declared in the most recent four quarters for TELUS Corporation Common Shares, as recorded in the financial statements, net of dividend reinvestment plan effects (see Note 13), divided by the sum of free cash flow* amounts for the most recent four quarters for interim reporting periods (divided by annual free cash flow if the reported amount is in respect of a fiscal year). The historical measure for the twelve-month period ended September 30, 2024, is presented for illustrative purposes in evaluating our target guideline.
| For the 12-month periods ended September 30 | Objective | 2024 | 2023 | |||||||||
| Determined using most comparable IFRS-IASB measures | ||||||||||||
| Ratio of TELUS Corporation Common Share dividends declared to cash provided by operating activities – less capital expenditures | 92 | % | 151 | % | ||||||||
| Determined using management measures | ||||||||||||
| TELUS Corporation Common Share dividend payout ratio – net of dividend reinvestment plan effects | 60%–75% 1 | 77 | % | 88 | % | |||||||
| 1 | Our objective range for the TELUS Corporation Common Share dividend payout ratio is 60%-75% of free cash flow on a prospective basis. |
| For the 12-month periods ended September 30 (millions) | 2024 | 2023 | ||||||
| TELUS Corporation Common Share dividends declared | $ | 2,259 | $ | 2,063 | ||||
| Amount of TELUS Corporation Common Share dividends declared reinvested in TELUS Corporation Common Shares | (697 | ) | (748 | ) | ||||
| TELUS Corporation Common Share dividends declared – net of dividend reinvestment plan effects | $ | 1,562 | $ | 1,315 | ||||
* Free cash flow is not a standardized financial measure under IFRS-IASB and might not be comparable to similar measures presented by other issuers; we define free cash flow as EBITDA (operating revenues and other income less goods and services purchased and employee benefits expense) excluding items that we consider to be of limited predictive value, including certain working capital changes (such as trade receivables and trade payables), proceeds from divested assets, and other sources and uses of cash, as found in the consolidated statements of cash flows. We have issued guidance on, and report, free cash flow because it is a key performance measure that management and investors use to evaluate the performance of our business.
|
|
|
| notes to condensed interim consolidated financial statements | (unaudited) |
Our calculation of free cash flow, and its reconciliation to cash provided by operating activities, is as follows:
| For the 12-month periods ended September 30 (millions) | Note | 2024 | 2023 | ||||||||
| EBITDA | 5 | $ | 6,775 | $ | 6,324 | ||||||
| Restructuring and other costs, net of disbursements | 21 | 272 | |||||||||
| Effects of contract asset, acquisition and fulfilment and TELUS Easy Payment mobile device financing | (146 | ) | (153 | ) | |||||||
| Effect of lease principal | 31(b) | (647 | ) | (523 | ) | ||||||
| Items from the Consolidated statements of cash flows: | |||||||||||
| Share-based compensation, net | 14 | 127 | 124 | ||||||||
| Net employee defined benefit plans expense | 15 | 76 | 71 | ||||||||
| Employer contributions to employee defined benefit plans | (21 | ) | (33 | ) | |||||||
| Loss from equity accounted investments and other | 39 | — | |||||||||
| Interest paid | (1,319 | ) | (1,126 | ) | |||||||
| Interest received | 42 | 17 | |||||||||
| Capital expenditures | 5 | (2,617 | ) | (2,949 | ) | ||||||
| Free cash flow before income taxes | 2,330 | 2,024 | |||||||||
| Income taxes paid, net of refunds | (305 | ) | (532 | ) | |||||||
| Free cash flow | 2,025 | 1,492 | |||||||||
| Add (deduct): | |||||||||||
| Capital expenditures | 5 | 2,617 | 2,949 | ||||||||
| Effect of lease principal | 647 | 523 | |||||||||
| Net change in non-cash operating working capital not included in preceding line items and other individually immaterial items included in net income neither providing nor using cash | (205 | ) | (653 | ) | |||||||
| Cash provided by operating activities | $ | 5,084 | $ | 4,311 | |||||||
|
|
September 30, 2024 | |
| notes to condensed interim consolidated financial statements | (unaudited) |
| 4 | financial instruments |
| (a) | Credit risk |
Excluding credit risk, if any, arising from currency swaps settled on a gross basis, the best representation of our maximum exposure (excluding income tax effects) to credit risk, which is a worst-case scenario and does not reflect results we expect, is set out in the following table.
| As at (millions) | September 30, 2024 |
December 31, 2023 |
||||||
| Cash and temporary investments, net | $ | 814 | $ | 864 | ||||
| Accounts receivable | 4,114 | 4,234 | ||||||
| Contract assets | 690 | 748 | ||||||
| Derivative assets | 21 | 215 | ||||||
| $ | 5,639 | $ | 6,061 | |||||
Cash and temporary investments, net
Credit risk associated with cash and temporary investments is managed by ensuring that these financial assets are placed with: governments; major financial institutions that have been accorded strong investment grade ratings by a primary rating agency; and/or other creditworthy counterparties. An ongoing review evaluates changes in the status of counterparties.
Accounts receivable
Credit risk associated with accounts receivable is inherently managed by the size and diversity of our large customer base, which includes substantially all consumer and business sectors in Canada. We follow a program of credit evaluations of customers and limit the amount of credit extended when we deem it to be necessary. Accounts are considered to be past due (in default) when customers have failed to make the contractually required payments when due, which is generally within 30 days of the billing date. Any late payment charges are levied at an industry-based market rate or a negotiated rate on outstanding non-current customer account balances.
Customer accounts receivable, net of allowance for doubtful accounts
| As at (millions) | Note | Gross | Allowance | Net 1 | ||||||||||
| September 30, 2024 | ||||||||||||||
| Less than 30 days past billing date | $ | 1,088 | $ | (19 | ) | $ | 1,069 | |||||||
| 30-60 days past billing date | 382 | (17 | ) | 365 | ||||||||||
| 61-90 days past billing date | 119 | (19 | ) | 100 | ||||||||||
| More than 90 days past billing date | 234 | (39 | ) | 195 | ||||||||||
| Unbilled customer finance receivables | 1,545 | (33 | ) | 1,512 | ||||||||||
| $ | 3,368 | $ | (127 | ) | $ | 3,241 | ||||||||
| Current 2 | 6(b) | $ | 2,795 | $ | (114 | ) | $ | 2,681 | ||||||
| Non-current 3 | 20 | 573 | (13 | ) | 560 | |||||||||
| $ | 3,368 | $ | (127 | ) | $ | 3,241 | ||||||||
| December 31, 2023 | ||||||||||||||
| Less than 30 days past billing date | $ | 1,077 | $ | (14 | ) | $ | 1,063 | |||||||
| 30-60 days past billing date | 550 | (14 | ) | 536 | ||||||||||
| 61-90 days past billing date | 139 | (17 | ) | 122 | ||||||||||
| More than 90 days past billing date | 193 | (36 | ) | 157 | ||||||||||
| Unbilled customer finance receivables | 1,630 | (36 | ) | 1,594 | ||||||||||
| $ | 3,589 | $ | (117 | ) | $ | 3,472 | ||||||||
| Current 2 | 6(b) | $ | 2,938 | $ | (103 | ) | $ | 2,835 | ||||||
| Non-current 3 | 20 | 651 | (14 | ) | 637 | |||||||||
| $ | 3,589 | $ | (117 | ) | $ | 3,472 | ||||||||
| 1 | Net amounts represent customer accounts receivable for which an allowance had not been made as at the dates of the Consolidated statements of financial position (see Note 6(b)). | |
| 2 | Presented in the Consolidated statements of financial position as Accounts receivable. | |
| 3 | Presented in the Consolidated statements of financial position as Other long-term assets. |
We maintain allowances for lifetime expected credit losses related to doubtful accounts. Current economic conditions (including forward-looking macroeconomic data), historical information (including credit agency reports, if available), reasons for the accounts being past due and the line of business from which the customer accounts receivable arose are all considered when determining whether to make allowances for past-due accounts. The same factors are considered when determining whether to write off amounts charged to the allowance for doubtful accounts against the customer accounts receivable. The doubtful accounts expense is calculated on a specific-identification basis for customer accounts receivable balances above a specific threshold and on a statistically derived allowance basis for the remainder. No customer accounts receivable are written off directly to the doubtful accounts expense, such expense being included in the Consolidated statements of income and other comprehensive income as Goods and services purchased.
|
|
|
| notes to condensed interim consolidated financial statements | (unaudited) |
The following table presents a summary of the activity related to our allowance for doubtful accounts.
| Three months | Nine months | |||||||||||||||
| Periods ended September 30 (millions) | 2024 | 2023 | 2024 | 2023 | ||||||||||||
| Balance, beginning of period | $ | 120 | $ | 107 | $ | 117 | $ | 109 | ||||||||
| Additions (doubtful accounts expense) | 41 | 30 | 113 | 78 | ||||||||||||
| Accounts written off 1 less than recoveries | (39 | ) | (28 | ) | (105 | ) | (83 | ) | ||||||||
| Other | 5 | (1 | ) | 2 | 4 | |||||||||||
| Balance, end of period | $ | 127 | $ | 108 | $ | 127 | $ | 108 | ||||||||
| 1 | For the three-month and nine-month periods ended September 30, 2024, accounts that were written off but were still subject to enforcement activity totalled $63 (2023 – $45) and $179 (2023 – $134), respectively. |
Contract assets
Credit risk associated with contract assets is inherently managed by the size and diversity of our large customer base, which includes substantially all consumer and business sectors in Canada. We follow a program of credit evaluations of customers and limit the amount of credit extended when we deem it to be necessary.
Contract assets, net of impairment allowance
| As at (millions) | Gross | Allowance | Net (Note 6(c)) | |||||||||
| September 30, 2024 | ||||||||||||
| To be billed and thus reclassified to accounts receivable during: | ||||||||||||
| The 12-month period ending one year hence | $ | 582 | $ | (20 | ) | $ | 562 | |||||
| The 12-month period ending two years hence | 237 | (8 | ) | 229 | ||||||||
| Thereafter | 49 | (1 | ) | 48 | ||||||||
| $ | 868 | $ | (29 | ) | $ | 839 | ||||||
| December 31, 2023 | ||||||||||||
| To be billed and thus reclassified to accounts receivable during: | ||||||||||||
| The 12-month period ending one year hence | $ | 616 | $ | (21 | ) | $ | 595 | |||||
| The 12-month period ending two years hence | 259 | (9 | ) | 250 | ||||||||
| Thereafter | 54 | (1 | ) | 53 | ||||||||
| $ | 929 | $ | (31 | ) | $ | 898 | ||||||
We maintain allowances for lifetime expected credit losses related to contract assets. Current economic conditions, historical information (including credit agency reports, if available), and the line of business from which the contract asset arose are all considered when determining impairment allowances. The same factors are considered when determining whether to write off amounts charged to the impairment allowance for contract assets against contract assets.
Derivative assets (and derivative liabilities)
Counterparties to our material foreign exchange derivatives are major financial institutions that have been accorded investment grade ratings by a primary credit rating agency. The total dollar amount of credit exposure under contracts with any one financial institution is limited and counterparties’ credit ratings are monitored. We do not give or receive collateral on swap agreements and hedging items due to our credit rating and those of our counterparties. While we are exposed to the risk of credit losses due to the potential non-performance of our counterparties, we consider this risk remote. Our derivative liabilities do not have credit risk-related contingent features.
| (b) | Liquidity risk |
As a component of our capital structure financial policies, discussed further in Note 3, we manage liquidity risk by:
| · | maintaining a daily cash pooling process that enables us to manage our available liquidity and our liquidity requirements according to our actual needs; |
| · | maintaining a short-term borrowing agreement associated with trade receivables and unbilled customer finance receivables (Note 22), bilateral bank facilities (Note 22), a supply chain financing program (Note 23), a commercial paper program (Note 26(c)) and syndicated credit facilities (Note 26(d),(e)); |
| · | maintaining in-effect shelf prospectuses; |
| · | continuously monitoring forecast and actual cash flows; and |
| · | managing maturity profiles of financial assets and financial liabilities. |
Our debt maturities in future years are disclosed in Note 26(h). As at September 30, 2024, unchanged from December 31, 2023, TELUS Corporation could offer an unlimited amount of securities in Canada, and US$3.5 billion of securities in the United States, qualified pursuant to a Canadian shelf prospectus that is in effect until September 2026 (December 31, 2023 – September 2024). We believe that our investment grade credit ratings contribute to reasonable access to capital markets. TELUS International (Cda) Inc. has a Canadian shelf prospectus that is in effect until June 2026 (December 31, 2023 – May 2024) under which an unlimited amount of debt or equity securities could be offered.
|
|
September 30, 2024 | |
| notes to condensed interim consolidated financial statements | (unaudited) |
We closely match the contractual maturities of our derivative financial liabilities with those of the risk exposures they are being used to manage.
The expected maturities of our undiscounted financial liabilities do not differ significantly from the contractual maturities, other than as noted below. The contractual maturities of our undiscounted financial liabilities, including interest thereon (where applicable), are set out in the accompanying tables.
| Non-derivative | Derivative | |||||||||||||||||||||||||||||||||||
| Composite long-term debt | ||||||||||||||||||||||||||||||||||||
| Non-interest bearing financial |
Short-term | Long-term
debt, excluding leases 1 |
Leases | Currency
swap agreement amounts to be exchanged 2 |
Currency
swap agreement amounts to be exchanged 3 |
|||||||||||||||||||||||||||||||
| As at September 30, 2024 (millions) | liabilities | borrowings 1 | (Note 26) | (Note 26) | (Receive) | Pay | (Receive) | Pay | Total | |||||||||||||||||||||||||||
| 2024 (remainder of year) | $ | 2,609 | $ | 16 | $ | 1,157 | $ | 194 | $ | (961 | ) | $ | 962 | $ | (179 | ) | $ | 179 | $ | 3,977 | ||||||||||||||||
| 2025 | 651 | 48 | 2,386 | 737 | (426 | ) | 411 | (404 | ) | 404 | 3,807 | |||||||||||||||||||||||||
| 2026 | 103 | 48 | 2,532 | 595 | (220 | ) | 207 | — | — | 3,265 | ||||||||||||||||||||||||||
| 2027 | 103 | 945 | 2,568 | 466 | (1,691 | ) | 1,655 | — | — | 4,046 | ||||||||||||||||||||||||||
| 2028 | 71 | — | 4,175 | 316 | (578 | ) | 590 | — | — | 4,574 | ||||||||||||||||||||||||||
| 2029 - 2033 | 10 | — | 11,931 | 626 | (1,737 | ) | 1,662 | — | — | 12,492 | ||||||||||||||||||||||||||
| Thereafter | — | — | 12,634 | 407 | (2,836 | ) | 2,734 | — | — | 12,939 | ||||||||||||||||||||||||||
| Total | $ | 3,547 | $ | 1,057 | $ | 37,383 | $ | 3,341 | $ | (8,449 | ) | $ | 8,221 | $ | (583 | ) | $ | 583 | $ | 45,100 | ||||||||||||||||
| Total (Note 26(h)) | $ | 40,496 | ||||||||||||||||||||||||||||||||||
| 1 | Cash outflows in respect of interest payments on our short-term borrowings, commercial paper and amounts drawn under our credit facilities (if any) have been calculated based upon the interest rates and, if applicable, currency exchange rates, in effect as at September 30, 2024. | |
| 2 | The amounts included in undiscounted non-derivative long-term debt in respect of U.S. dollar-denominated long-term debt, and the corresponding amounts in the long-term debt currency swap receive column, have been determined based upon the currency exchange rates in effect as at September 30, 2024. The hedged U.S. dollar-denominated long-term debt contractual amounts at maturity, in effect, are reflected in the long-term debt currency swap pay column as gross cash flows are exchanged pursuant to the currency swap agreements. | |
| 3 | The amounts included in undiscounted short-term borrowing in respect of U.S. dollar-denominated short-term borrowings, and the corresponding derivative liability amounts, if any, included in the currency swap pay column amounts, have been determined based upon the currency exchange rates in effect as at September 30, 2024. The derivative liability hedging amounts, if any, for the hedged U.S. dollar-denominated short-term borrowings contractual amounts are included in the currency swap pay column amounts as net cash flows are exchanged pursuant to the currency swap agreements. |
| Non-derivative | Derivative | |||||||||||||||||||||||||||||||||||||||
| Composite long-term debt | ||||||||||||||||||||||||||||||||||||||||
| As at December 31, 2023 | Non-interest bearing financial |
Short-term | Long-term debt, excluding leases 1 |
Leases | Currency swap agreement amounts to be exchanged 2 |
Currency swap agreement amounts to be exchanged |
||||||||||||||||||||||||||||||||||
| (millions) | liabilities | borrowings 1 | (Note 26) | (Note 26) | (Receive) | Pay | Other | (Receive) | Pay | Total | ||||||||||||||||||||||||||||||
| 2024 | $ | 3,126 | $ | 111 | $ | 4,408 | $ | 685 | $ | (1,271 | ) | $ | 1,267 | $ | — | $ | (572 | ) | $ | 578 | $ | 8,332 | ||||||||||||||||||
| 2025 | 164 | — | 2,027 | 547 | (219 | ) | 207 | 1 | — | — | 2,727 | |||||||||||||||||||||||||||||
| 2026 | 93 | — | 2,378 | 416 | (215 | ) | 206 | 1 | — | — | 2,879 | |||||||||||||||||||||||||||||
| 2027 | 152 | — | 2,383 | 331 | (1,657 | ) | 1,653 | 1 | — | — | 2,863 | |||||||||||||||||||||||||||||
| 2028 | 43 | — | 3,388 | 202 | (567 | ) | 576 | — | — | — | 3,642 | |||||||||||||||||||||||||||||
| 2029-2033 | — | — | 10,092 | 503 | (1,702 | ) | 1,662 | — | — | — | 10,555 | |||||||||||||||||||||||||||||
| Thereafter | — | — | 12,018 | 323 | (2,778 | ) | 2,734 | — | — | — | 12,297 | |||||||||||||||||||||||||||||
| Total | $ | 3,578 | $ | 111 | $ | 36,694 | $ | 3,007 | $ | (8,409 | ) | $ | 8,305 | $ | 3 | $ | (572 | ) | $ | 578 | $ | 43,295 | ||||||||||||||||||
| Total | $ | 39,597 | ||||||||||||||||||||||||||||||||||||||
| 1 | Cash outflows in respect of interest payments on our short-term borrowings, commercial paper and amounts drawn under our credit facilities (if any) have been calculated based upon the interest rates and, if applicable, currency exchange rates in effect as at December 31, 2023. | |
| 2 | The amounts included in undiscounted non-derivative long-term debt in respect of U.S. dollar-denominated long-term debt, and the corresponding amounts in the long-term debt currency swap receive column, have been determined based upon the currency exchange rates in effect as at December 31, 2023. The hedged U.S. dollar-denominated long-term debt contractual amounts at maturity, in effect, are reflected in the long-term debt currency swap pay column as gross cash flows are exchanged pursuant to the currency swap agreements. |
| (c) | Market risks |
Net income and other comprehensive income for the nine-month periods ended September 30, 2024 and 2023, could have varied if the Canadian dollar: U.S. dollar exchange rate, the U.S. dollar: European euro exchange rate, market interest rates and virtual power purchase agreement forward element valuation varied by reasonably possible amounts from their actual statement of financial position date amounts.
The sensitivity analysis of our exposure to currency risk at the reporting date has been determined based upon a hypothetical change taking place at the relevant statement of financial position date. The U.S. dollar-denominated and European euro-denominated balances and the notional amounts of our derivative financial instruments as at the relevant statement of financial position dates have been used in the calculations.
|
|
|
| notes to condensed interim consolidated financial statements | (unaudited) |
The sensitivity analysis of our exposure to interest rate risk at the reporting date has been determined based upon a hypothetical change taking place at the beginning of the relevant fiscal year and being held constant through to the statement of financial position date. The principal and notional amounts as at the relevant statement of financial position dates have been used in the calculations.
The sensitivity analysis of our exposure to wind discount risk and solar premium risk at the reporting date has been determined based upon a hypothetical change taking place at the relevant statement of financial position date. The notional amounts of the virtual power purchase agreements as at the relevant statement of financial position dates have been used in the calculations.
Income tax expense, which is reflected net in the sensitivity analysis, was determined using the applicable statutory income tax rates for the reporting periods.
| Nine-month periods ended September 30 | Net income | Other comprehensive income |
Comprehensive income | |||||||||||||||||||||
| (increase (decrease) in millions) | 2024 | 2023 | 2024 | 2023 | 2024 | 2023 | ||||||||||||||||||
| Reasonably possible changes in market risks 1 | ||||||||||||||||||||||||
| 10% change in C$: US$ exchange rate | ||||||||||||||||||||||||
| Canadian dollar appreciates | $ | (7 | ) | $ | (7 | ) | $ | 97 | $ | 123 | $ | 90 | $ | 116 | ||||||||||
| Canadian dollar depreciates | $ | 7 | $ | 7 | $ | (97 | ) | $ | (123 | ) | $ | (90 | ) | $ | (116 | ) | ||||||||
| 10% change in US$: € exchange rate | ||||||||||||||||||||||||
| U.S. dollar appreciates | $ | 13 | $ | 11 | $ | (72 | ) | $ | (65 | ) | $ | (59 | ) | $ | (54 | ) | ||||||||
| U.S. dollar depreciates | $ | (13 | ) | $ | (11 | ) | $ | 72 | $ | 65 | $ | 59 | $ | 54 | ||||||||||
| 25 basis point change in interest rates | ||||||||||||||||||||||||
| Interest rates increase | ||||||||||||||||||||||||
| Canadian interest rate | $ | (4 | ) | $ | (8 | ) | $ | 77 | $ | 70 | $ | 73 | $ | 62 | ||||||||||
| U.S. interest rate | $ | — | $ | — | $ | (66 | ) | $ | (67 | ) | $ | (66 | ) | $ | (67 | ) | ||||||||
| Combined | $ | (4 | ) | $ | (8 | ) | $ | 11 | $ | 3 | $ | 7 | $ | (5 | ) | |||||||||
| Interest rates decrease | ||||||||||||||||||||||||
| Canadian interest rate | $ | 4 | $ | 8 | $ | (81 | ) | $ | (72 | ) | $ | (77 | ) | $ | (64 | ) | ||||||||
| U.S. interest rate | $ | — | $ | — | $ | 69 | $ | 70 | $ | 69 | $ | 70 | ||||||||||||
| Combined | $ | 4 | $ | 8 | $ | (12 | ) | $ | (2 | ) | $ | (8 | ) | $ | 6 | |||||||||
| 20 basis point change in wind discount | ||||||||||||||||||||||||
| Wind discount increases | $ | (23 | ) | $ | (35 | ) | $ | — | $ | — | $ | (23 | ) | $ | (35 | ) | ||||||||
| Wind discount decreases | $ | 23 | $ | 35 | $ | — | $ | — | $ | 23 | $ | 35 | ||||||||||||
| 20 basis point change in solar premium | ||||||||||||||||||||||||
| Solar premium increases | $ | 13 | $ | 20 | $ | — | $ | — | $ | 13 | $ | 20 | ||||||||||||
| Solar premium decreases | $ | (13 | ) | $ | (20 | ) | $ | — | $ | — | $ | (13 | ) | $ | (20 | ) | ||||||||
| 1 | These sensitivities are hypothetical and should be used with caution. Changes in net income and/or other comprehensive income generally cannot be extrapolated because the relationship of the change in assumption to the change in net income and/or other comprehensive income may not be linear. In this table, the effect of a variation in a particular assumption on the amount of net income and/or other comprehensive income is calculated without changing any other factors; in reality, changes in one factor may result in changes in another, which might magnify or counteract the sensitivities. |
The sensitivity analysis assumes that we would realize the changes in exchange rates and market interest rates; in reality, the competitive marketplace in which we operate would have an effect on this assumption.
| (d) | Fair values |
General
The carrying values of cash and temporary investments, accounts receivable, short-term obligations, short-term borrowings, accounts payable and certain provisions (including restructuring provisions) approximate their fair values due to the immediate or short-term maturity of these financial instruments. The fair values are determined directly by reference to quoted market prices in active markets.
The fair values of our investment financial assets are based on quoted market prices in active markets or other clear and objective evidence of fair value.
The fair value of our long-term debt, excluding leases, is based on quoted market prices in active markets.
The fair values of the derivative financial instruments we use to manage our exposure to currency risk are estimated based on either quoted market prices in active markets for the same or similar financial instruments or the current rates offered to us for financial instruments of the same maturity, as well as discounted future cash flows determined using current rates for similar financial instruments of similar maturities subject to similar risks (such fair value estimates being largely based on the Canadian dollar: U.S. dollar forward exchange rate as at the statements of financial position dates). The fair values of the derivative financial instruments we use to manage our exposure to price risk associated with the purchase of electrical power are currently estimated using a discounted cash flow approach and are based on industry standard forecasts from EDC Associates Ltd. utilizing observable market data. The significant unobservable inputs used in the fair value measurement of the Level 3 derivative financial instruments were wind discount, reflecting 76% (December 31, 2023 – 77%) of the electrical power pool price, and solar premium, reflecting 108% (December 31, 2023 – 125%) of the electrical power pool price.
|
|
September 30, 2024 | |
| notes to condensed interim consolidated financial statements | (unaudited) |
Derivative
The derivative financial instruments that we measure at fair value on a recurring basis subsequent to initial recognition are set out in the following table.
| September 30, 2024 | December 31, 2023 | |||||||||||||||||||||||||||||||||||
| As at ($ in millions except price or rate) | Designation | Maximum maturity date |
Notional amount |
Fair
value 1 and carrying value |
Price or rate | Maximum maturity date |
Notional amount |
Fair
value 1 and carrying value |
Price or rate | |||||||||||||||||||||||||||
| Current derivative assets 2 | ||||||||||||||||||||||||||||||||||||
| Derivatives used to manage currency risk associated with | ||||||||||||||||||||||||||||||||||||
| U.S. dollar-denominated transactions | HFT 4 | 2025 | $ | 93 | $ | 3 | US$1.00: ₱57 | 2024 | $ | 111 | $ | 2 | US$1.00: ₱56 | |||||||||||||||||||||||
| U.S. dollar-denominated purchases | HFH 3 | 2025 | $ | 94 | — | US$1.00: C$1.38 | 2024 | $ | 47 | — | US$1.00: C$1.31 | |||||||||||||||||||||||||
| U.S. dollar-denominated debt (Notes 22, 26(c)) | HFH 3 | 2024 | $ | 925 | 1 | US$1.00: C$1.35 | 2024 | $ | 118 | 1 | US$1.00: C$1.31 | |||||||||||||||||||||||||
| European euro functional currency operations purchased with U.S. dollar-denominated long-term debt 7 (Note 26(e)) | HFH 5 | 2028 | $ | 46 | 13 | €1.00: US$1.09 | 2027 | $ | 45 | 17 | €1.00: US$1.09 | |||||||||||||||||||||||||
| Derivatives used to manage interest rate risk associated with | ||||||||||||||||||||||||||||||||||||
| Non-fixed rate credit facility amounts drawn (Note 26(e)) | HFH 3 | 2028 | $ | 11 | — | 3.5 | % | 2024 | $ | 11 | 2 | 3.5 | % | |||||||||||||||||||||||
| Derivatives used to manage other price risk associated with | ||||||||||||||||||||||||||||||||||||
| Purchase of electrical power | HFT 4 | — | $ | — | — | — | 2047 | $ | 25 (0.4 TWh 8) |
14 | $30.60/ MWh 8 | |||||||||||||||||||||||||
| $ | 17 | $ | 36 | |||||||||||||||||||||||||||||||||
| Other long-term assets 2 (Note 20) | ||||||||||||||||||||||||||||||||||||
| Derivatives used to manage currency risk associated with | ||||||||||||||||||||||||||||||||||||
| U.S. dollar-denominated long-term debt 6 (Note 26(b)) | HFH 3 | 2027 | $ | 1,586 | $ | 4 | US$1.00: C$1.32 | — | $ | — | $ | — | — | |||||||||||||||||||||||
| Derivatives used to manage other price risk associated with | ||||||||||||||||||||||||||||||||||||
| Purchase of electrical power | HFT 4 | — | $ | — | — | — | 2047 | $ | 672 (6.9 TWh 8) | 179 | $39.52/ MWh 8 | |||||||||||||||||||||||||
| $ | 4 | $ | 179 | |||||||||||||||||||||||||||||||||
| Current derivative liabilities 2 | ||||||||||||||||||||||||||||||||||||
| Derivatives used to manage currency risk associated with | ||||||||||||||||||||||||||||||||||||
| U.S. dollar-denominated transactions | HFT 4 | 2025 | $ | 79 | $ | — | US$1.00: ₱56 | 2024 | $ | 18 | $ | — | US$1.00: ₱55 | |||||||||||||||||||||||
| U.S. dollar-denominated purchases | HFH 3 | 2025 | $ | 317 | 2 | US$1.00: C$1.35 | 2024 | $ | 401 | 7 | US$1.00: C$1.34 | |||||||||||||||||||||||||
| U.S. dollar-denominated debt (Notes 22, 26(c)) | HFH 3 | 2024 | $ | 1,097 | 11 | US$1.00: C$1.36 | 2024 | $ | 943 | 18 | US$1.00: C$1.35 | |||||||||||||||||||||||||
| Derivatives used to manage other price risk associated with | ||||||||||||||||||||||||||||||||||||
| Purchase of electrical power | HFT 4 | 2047 | $ | 7 (0.4 TWh 8) |
2 | $31.37/ MWh 8 | — | $ | — | — | — | |||||||||||||||||||||||||
| $ | 15 | $ | 25 | |||||||||||||||||||||||||||||||||
|
|
|
| notes to condensed interim consolidated financial statements | (unaudited) |
| As at ($ in millions except price or rate) | September 30, 2024 | December 31, 2023 | |||||||||||||||||||||||||||
| Designation | Maximum maturity date |
Notional amount |
Fair
value 1 and carrying value |
Price or rate | Maximum maturity date |
Notional amount |
Fair
value 1 and carrying value |
Price or rate | |||||||||||||||||||||
| Other long-term liabilities 2 (Note 27) | |||||||||||||||||||||||||||||
| Derivatives used to manage currency risk associated with | |||||||||||||||||||||||||||||
| U.S. dollar-denominated long-term debt 6 (Note 26(c)) | HFH 3 | 2049 | $ | 4,919 | $ | 66 | US$1.00: C$1.30 | 2049 | $ | 6,610 | $ | 176 | US$1.00: C$1.31 | ||||||||||||||||
| European euro functional currency operations purchased with U.S. dollar-denominated long-term debt 7 (Note 26(e)) | HFH 5 | 2028 | $ | 574 | 18 | €1.00: US$1.09 | 2027 | $ | 591 | 13 | €1.00: US$1.09 | ||||||||||||||||||
| Derivatives used to manage interest rate risk associated with | |||||||||||||||||||||||||||||
| Non-fixed rate credit facility amounts drawn (Note 26(e)) | HFH 3 | 2028 | $ | 201 | 1 | 3.5 | % | 2028 | $ | 205 | 2 | 3.6 | % | ||||||||||||||||
| Derivatives used to manage other price risk associated with | |||||||||||||||||||||||||||||
| Purchase of electrical power | HFT 4 | 2047 | $ | 137 (6.6 TWh 8) | 33 | $40.14/ MWh 8 | — | $ | — | — | — | ||||||||||||||||||
| $ | 118 | $ | 191 | ||||||||||||||||||||||||||
| 1 | Fair value measured at the reporting date using significant other observable inputs (Level 2), except the fair value of virtual power purchase agreements (which we use to manage the price risk associated with the purchase of electrical power), which is measured at the reporting date using significant unobservable inputs (Level 3). Changes in the fair value of derivative financial instruments classified as Level 3 in the fair value hierarchy were as follows: |
| Nine months | ||||||||
| Periods ended September 30 | 2024 | 2023 | ||||||
| Unrealized changes in virtual power purchase agreements forward element | ||||||||
| Included in net income, excluding income taxes | $ | (228 | ) | $ | (59 | ) | ||
| Balance, beginning of period | 193 | 193 | ||||||
| Balance, end of period | $ | (35) | $ | 134 | ||||
| 2 | Caption reflects Consolidated statement of financial position line item where derivative financial instruments are presented. Derivative financial assets and liabilities are not set off. |
| 3 | Designated as held for hedging (HFH) upon initial recognition (cash flow hedging item); hedge accounting is applied. Unless otherwise noted, hedge ratio is 1:1 and is established by assessing the degree of matching between the notional amounts of hedging items and the notional amounts of the associated hedged items. |
| 4 | Designated as held for trading (HFT) and classified as fair value through net income upon initial recognition; hedge accounting is not applied. |
| 5 | Designated as a hedge of a net investment in a foreign operation; hedge accounting is applied. Hedge ratio is 1:1 and is established by assessing the degree of matching between the notional amounts of hedging items and the notional amounts of the associated hedged items. |
| 6 | We designate only the spot element as the hedging item. As at September 30, 2024, the foreign currency basis spread included in the fair value of the derivative instruments, which is used for purposes of assessing hedge ineffectiveness, was $4 (December 31, 2023 – $163). |
| 7 | We designate only the spot element as the hedging item. As at September 30, 2024, the foreign currency basis spread included in the fair value of the derivative instruments, which is used for purposes of assessing hedge ineffectiveness, was $3 (December 31, 2023 – $3). |
| 8 | Terawatt hours (TWh) are 1x10⁹ kilowatt hours and megawatt hours (MWh) are 1x10³ kilowatt hours. |
Non-derivative
Our long-term debt, which is measured at amortized cost, and the fair value thereof, are set out in the following table.
| As at (millions) | September 30, 2024 | December 31, 2023 | ||||||||||||||
| Carrying value |
Fair value | Carrying value |
Fair value | |||||||||||||
| Long-term debt, excluding leases (Note 26) | $ | 25,297 | $ | 24,721 | $ | 24,735 | $ | 23,853 | ||||||||
| (e) | Recognition of derivative gains and losses |
The following table sets out the gains and losses, excluding income tax effects, arising from derivative instruments that are classified as cash flow hedging items and their location within the Consolidated statements of income and other comprehensive income.
Credit risk associated with such derivative instruments, as discussed further in (a), would be the primary source of hedge ineffectiveness. There was no ineffective portion of the derivative instruments classified as cash flow hedging items for the periods presented.
|
|
September 30, 2024 | |
| notes to condensed interim consolidated financial statements | (unaudited) |
| Amount of gain (loss) recognized in other comprehensive income |
Gain
(loss) reclassified from other comprehensive income to income (effective portion) (Note 11) |
|||||||||||||||||
| (effective portion) (Note 11) | Amount | |||||||||||||||||
| Periods ended September 30 (millions) | 2024 | 2023 | Location | 2024 | 2023 | |||||||||||||
| THREE-MONTH | ||||||||||||||||||
| Derivatives used to manage currency risk associated with | ||||||||||||||||||
| U.S. dollar-denominated purchases | $ | (5) | $ | 10 | Goods and services purchased | $ | 2 | $ | — | |||||||||
| U.S. dollar-denominated debt 1 Notes 22, 26(b)-(c) | (47) | 142 | Financing costs | (79 | ) | 135 | ||||||||||||
| Net investment in a foreign operation 2 | (29) | 26 | Financing costs | 6 | 12 | |||||||||||||
| (81) | 178 | (71 | ) | 147 | ||||||||||||||
| Derivatives used to manage other market risks | ||||||||||||||||||
| Other | (5) | 2 | Financing costs | 1 | (5) | |||||||||||||
| $ | (86) | $ | 180 | $ | (70 | ) | $ | 142 | ||||||||||
| NINE-MONTH | ||||||||||||||||||
| Derivatives used to manage currency risk associated with | ||||||||||||||||||
| U.S. dollar-denominated purchases | $ | 10 | $ | 1 | Goods and services purchased | $ | 6 | $ | 15 | |||||||||
| U.S. dollar-denominated debt 1 Notes 22, 26(b)-(c) | 135 | (9 | ) | Financing costs | 108 | (3 | ) | |||||||||||
| Net investment in a foreign operation 2 | 8 | 5 | Financing costs | 17 | 1 | |||||||||||||
| 153 | (3 | ) | 131 | 13 | ||||||||||||||
| Derivatives used to manage other market risks | ||||||||||||||||||
| Other | 1 | 2 | Financing costs | 3 | (5 | ) | ||||||||||||
| $ | 154 | $ | (1 | ) | $ | 134 | $ | 8 | ||||||||||
| 1 | Amounts recognized in other comprehensive income are net of the change in the foreign currency basis spread (which is used for purposes of assessing hedge ineffectiveness) included in the fair value of the derivative instruments; such amounts for the three-month and nine-month periods ended September 30, 2024, were $(123) (2023 – $48) and $(167) (2023 – $40), respectively. |
| 2 | Amounts recognized in other comprehensive income are net of the change in the foreign currency basis spread (which is used for purposes of assessing hedge ineffectiveness) included in the fair value of the derivative instruments; such amounts for the three-month and nine-month periods ended September 30, 2024, were $NIL (2023 – $NIL and $NIL (2023 – $2), respectively, |
The following table sets out the gains and losses included in Financing costs in the Consolidated statements of income and other comprehensive income that arise from derivative instruments that are classified as held for trading and that are not designated as being in a hedging relationship.
| Gain (loss) on derivatives recognized in income | ||||||||||||||||
| Three months | Nine months | |||||||||||||||
| Periods ended September 30 (millions) | 2024 | 2023 | 2024 | 2023 | ||||||||||||
| Derivatives used to manage currency risk | $ | 3 | $ | (1 | ) | $ | (3 | ) | $ | 4 | ||||||
| Unrealized changes in virtual power purchase agreements forward element | $ | (125 | ) | $ | (33 | ) | $ | (228 | ) | $ | (59 | ) | ||||
|
|
|
| notes to condensed interim consolidated financial statements | (unaudited) |
| 5 | segment information |
General
Operating segments are components of an entity that engage in business activities from which they earn revenues and incur expenses (including revenues and expenses related to transactions with the other component(s)), the operations of which can be clearly distinguished and for which the operating results are regularly reviewed by a chief operating decision-maker to make resource allocation decisions and to assess performance. We have embarked upon the modification of our internal and external reporting processes, systems and internal controls arising from the acquisition and ongoing integration of LifeWorks Inc. and correspondingly we are assessing our segmented reporting structure.
The TELUS technology solutions segment includes: network revenues and equipment sales arising from mobile technologies; data revenues (which include internet protocol; television; hosting, managed information technology and cloud-based services; and home and business security); healthcare services, software and technology solutions (including employee and family assistance programs and benefits administration); agriculture and consumer goods services (software, data management and data analytics-driven smart-food chain and consumer goods technologies); voice and other telecommunications services revenues; and equipment sales.
The TELUS digital experience segment (formerly the digitally-led customer experiences – TELUS International (DLCX) segment), which has the U.S. dollar as its primary functional currency, is comprised of digital customer experience and digital-enablement transformation solutions, including artificial intelligence and content management, provided by our TELUS International (Cda) Inc. subsidiary.
Intersegment sales are recorded at the exchange value, which is the amount agreed to by the parties.
The segment information regularly reported to our Chief Executive Officer (our chief operating decision-maker), and the reconciliations thereof to our products and services view of revenues, other revenues and income before income taxes, are set out in the following table.
|
|
September 30, 2024 | |
| notes to condensed interim consolidated financial statements | (unaudited) |
| Three-month periods | TELUS technology solutions | TELUS digital | |||||||||||||||||||||||||||||||||||||||||||||
| ended September 30 | Mobile | Fixed | Segment total | experience 1 | Eliminations | Total | |||||||||||||||||||||||||||||||||||||||||
| (millions) | 2024 | 2023 | 2024 | 2023 | 2024 | 2023 | 2024 | 2023 | 2024 | 2023 | 2024 | 2023 | |||||||||||||||||||||||||||||||||||
| Operating revenues | |||||||||||||||||||||||||||||||||||||||||||||||
| External revenues | |||||||||||||||||||||||||||||||||||||||||||||||
| Service | $ | 1,790 | $ | 1,792 | $ | 1,945 | $ | 1,890 | $ | 3,735 | $ | 3,682 | $ | 675 | $ | 706 | $ | — | $ | — | $ | 4,410 | $ | 4,388 | |||||||||||||||||||||||
| Equipment | 567 | 518 | 65 | 84 | 632 | 602 | — | — | — | — | 632 | 602 | |||||||||||||||||||||||||||||||||||
| Revenues arising from contracts with customers | $ | 2,357 | $ | 2,310 | $ | 2,010 | $ | 1,974 | 4,367 | 4,284 | 675 | 706 | — | — | 5,042 | 4,990 | |||||||||||||||||||||||||||||||
| Other income (Note 7) | 54 | 18 | 3 | — | — | — | 57 | 18 | |||||||||||||||||||||||||||||||||||||||
| 4,421 | 4,302 | 678 | 706 | — | — | 5,099 | 5,008 | ||||||||||||||||||||||||||||||||||||||||
| Intersegment revenues | 3 | 4 | 219 | 183 | (222 | ) | (187 | ) | — | — | |||||||||||||||||||||||||||||||||||||
| $ | 4,424 | $ | 4,306 | $ | 897 | $ | 889 | $ | (222 | ) | $ | (187 | ) | $ | 5,099 | $ | 5,008 | ||||||||||||||||||||||||||||||
| EBITDA 2 | $ | 1,659 | $ | 1,346 | $ | 109 | $ | 171 | $ | (12 | ) | $ | — | $ | 1,756 | $ | 1,517 | ||||||||||||||||||||||||||||||
| Restructuring and other costs included in EBITDA (Note 16) | 64 | 287 | 22 | 16 | — | — | 86 | 303 | |||||||||||||||||||||||||||||||||||||||
| Adjusted EBITDA 2 | $ | 1,723 | $ | 1,633 | $ | 131 | $ | 187 | $ | (12 | ) | $ | — | $ | 1,842 | $ | 1,820 | ||||||||||||||||||||||||||||||
| Capital expenditures 3 | $ | 650 | $ | 734 | $ | 30 | $ | 35 | $ | (12 | ) | $ | — | $ | 668 | $ | 769 | ||||||||||||||||||||||||||||||
| Adjusted EBITDA less capital expenditures 2 | $ | 1,073 | $ | 899 | $ | 101 | $ | 152 | $ | — | $ | — | $ | 1,174 | $ | 1,051 | |||||||||||||||||||||||||||||||
| Operating revenues – external and other income (above) | $ | 5,099 | $ | 5,008 | |||||||||||||||||||||||||||||||||||||||||||
| Goods and services purchased | 1,868 | 1,858 | |||||||||||||||||||||||||||||||||||||||||||||
| Employee benefits expense | 1,475 | 1,633 | |||||||||||||||||||||||||||||||||||||||||||||
| EBITDA (above) | 1,756 | 1,517 | |||||||||||||||||||||||||||||||||||||||||||||
| Depreciation | 597 | 611 | |||||||||||||||||||||||||||||||||||||||||||||
| Amortization of intangible assets | 371 | 389 | |||||||||||||||||||||||||||||||||||||||||||||
| Operating income | 788 | 517 | |||||||||||||||||||||||||||||||||||||||||||||
| Financing costs | 479 | 352 | |||||||||||||||||||||||||||||||||||||||||||||
| Income before income taxes | $ | 309 | $ | 165 | |||||||||||||||||||||||||||||||||||||||||||
|
|
|
| notes to condensed interim consolidated financial statements | (unaudited) |
| Nine-month periods | TELUS technology solutions | TELUS digital | |||||||||||||||||||||||||||||||||||||||||||||
| ended September 30 | Mobile | Fixed | Segment total | experience 1 | Eliminations | Total | |||||||||||||||||||||||||||||||||||||||||
| (millions) | 2024 | 2023 | 2024 | 2023 | 2024 | 2023 | 2024 | 2023 | 2024 | 2023 | 2024 | 2023 | |||||||||||||||||||||||||||||||||||
| Operating revenues | |||||||||||||||||||||||||||||||||||||||||||||||
| External revenues | |||||||||||||||||||||||||||||||||||||||||||||||
| Service | $ | 5,315 | $ | 5,265 | $ | 5,743 | $ | 5,641 | $ | 11,058 | $ | 10,906 | $ | 2,023 | $ | 2,185 | $ | — | $ | — | $ | 13,081 | $ | 13,091 | |||||||||||||||||||||||
| Equipment | 1,506 | 1,496 | 221 | 262 | 1,727 | 1,758 | — | — | — | — | 1,727 | 1,758 | |||||||||||||||||||||||||||||||||||
| Revenues arising from contracts with customers | $ | 6,821 | $ | 6,761 | $ | 5,964 | $ | 5,903 | 12,785 | 12,664 | 2,023 | 2,185 | — | — | 14,808 | 14,849 | |||||||||||||||||||||||||||||||
| Other income (Note 7) | 112 | 69 | 85 | — | — | — | 197 | 69 | |||||||||||||||||||||||||||||||||||||||
| 12,897 | 12,733 | 2,108 | 2,185 | — | — | 15,005 | 14,918 | ||||||||||||||||||||||||||||||||||||||||
| Intersegment revenues | 9 | 12 | 649 | 528 | (658 | ) | (540 | ) | — | — | |||||||||||||||||||||||||||||||||||||
| $ | 12,906 | $ | 12,745 | $ | 2,757 | $ | 2,713 | $ | (658 | ) | $ | (540 | ) | $ | 15,005 | $ | 14,918 | ||||||||||||||||||||||||||||||
| EBITDA 2 | $ | 4,632 | $ | 4,256 | $ | 472 | $ | 470 | $ | (34 | ) | $ | — | $ | 5,070 | $ | 4,726 | ||||||||||||||||||||||||||||||
| Restructuring and other costs included in EBITDA (Note 16) | 381 | 522 | 44 | 55 | — | — | 425 | 577 | |||||||||||||||||||||||||||||||||||||||
| Equity (income) related to real estate joint venture | — | (1) | — | — | — | — | — | (1 | ) | ||||||||||||||||||||||||||||||||||||||
| Adjusted EBITDA 2 | $ | 5,013 | $ | 4,777 | $ | 516 | $ | 525 | $ | (34 | ) | $ | — | $ | 5,495 | $ | 5,302 | ||||||||||||||||||||||||||||||
| Capital expenditures 3 | $ | 2,020 | $ | 2,200 | $ | 96 | $ | 89 | $ | (32 | ) | $ | — | $ | 2,084 | $ | 2,289 | ||||||||||||||||||||||||||||||
| Adjusted EBITDA less capital expenditures 2 | $ | 2,993 | $ | 2,577 | $ | 420 | $ | 436 | $ | (2 | ) | $ | — | $ | 3,411 | $ | 3,013 | ||||||||||||||||||||||||||||||
| Operating revenues – external and other income (above) | $ | 15,005 | $ | 14,918 | |||||||||||||||||||||||||||||||||||||||||||
| Goods and services purchased | 5,503 | 5,451 | |||||||||||||||||||||||||||||||||||||||||||||
| Employee benefits expense | 4,432 | 4,741 | |||||||||||||||||||||||||||||||||||||||||||||
| EBITDA (above) | 5,070 | 4,726 | |||||||||||||||||||||||||||||||||||||||||||||
| Depreciation | 1,895 | 1,849 | |||||||||||||||||||||||||||||||||||||||||||||
| Amortization of intangible assets | 1,130 |
1,179 | |||||||||||||||||||||||||||||||||||||||||||||
| Operating income | 2,045 | 1,698 | |||||||||||||||||||||||||||||||||||||||||||||
| Financing costs | 1,255 | 995 | |||||||||||||||||||||||||||||||||||||||||||||
| Income before income taxes | $ | 790 | $ | 703 | |||||||||||||||||||||||||||||||||||||||||||
| 1 | The TELUS digital experience segment (formerly the digitally-led customer experiences – TELUS International segment) is comprised of our consolidated TELUS International (Cda) Inc. subsidiary. All of our other international operations are included in the TELUS technology solutions segment. |
| 2 | Earnings before interest, income taxes, depreciation and amortization (EBITDA), both unadjusted and adjusted, are not standardized financial measures under IFRS-IASB and may not be comparable to similar measures disclosed by other issuers (including those disclosed by TELUS International (Cda) Inc.); we define EBITDA as operating revenues and other income less goods and services purchased and employee benefits expense. We calculate adjusted EBITDA to exclude items that do not reflect our ongoing operations and, in our opinion, should not be considered in a long-term valuation metric or included in an assessment of our ability to service or incur debt. We report EBITDA, adjusted EBITDA and adjusted EBITDA less capital expenditures, because they are key measures that management uses to evaluate the performance of our business, and EBITDA is also utilized in determining compliance with certain debt covenants. |
| 3 | See Note 31(a) for a reconciliation of capital asset additions, excluding spectrum licences, to cash payments for capital assets, excluding spectrum licences, reported in the Consolidated statements of cash flows. |
|
|
September 30, 2024 | |
| notes to condensed interim consolidated financial statements | (unaudited) |
| 6 | revenue from contracts with customers |
| (a) | Revenues |
In the determination of the minimum transaction prices in contracts with customers, amounts are allocated to fulfilling, or the completion of fulfilling, future contracted performance obligations. These unfulfilled, or partially unfulfilled, future contracted performance obligations are largely in respect of services to be provided over the duration of the contract. The following table sets out our aggregate estimated minimum transaction prices allocated to remaining unfulfilled, or partially unfulfilled, future contracted performance obligations and the timing of when we might expect to recognize the associated revenues; actual amounts could differ from these estimates due to a variety of factors, including the unpredictable nature of: customer behaviour; industry regulation; the economic environments in which we operate; and competitor behaviour.
| As at (millions) | September 30, 2024 |
December 31, 2023 |
||||||
| Estimated minimum transaction price allocated to remaining unfulfilled, or partially unfulfilled, performance obligations to be recognized as revenue in a future period 1, 2 | ||||||||
| During the 12-month period ending one year hence | $ | 2,344 | $ | 2,576 | ||||
| During the 12-month period ending two years hence | 864 | 1,022 | ||||||
| Thereafter | 118 | 107 | ||||||
| $ | 3,326 | $ | 3,705 | |||||
| 1 | Excludes constrained variable consideration amounts, amounts arising from contracts originally expected to have a duration of one year or less and, as a permitted practical expedient, amounts arising from contracts that are not affected by revenue recognition timing differences arising from transaction price allocation or from contracts under which we may recognize and bill revenue in an amount that corresponds directly with our completed performance obligations. |
| 2 | IFRS-IASB requires the explanation of when we might expect to recognize as revenue the amounts disclosed as the estimated minimum transaction price allocated to remaining unfulfilled, or partially unfulfilled, performance obligations. The estimated amounts disclosed are based upon contractual terms and maturities. Actual minimum transaction price revenues recognized, and the timing thereof, will differ from these estimates primarily due to the frequency with which the actual durations of contracts with customers do not match their contractual maturities. |
| (b) | Accounts receivable |
| As at (millions) | Note | September 30, 2024 | December 31, 2023 | |||||||||
| Customer accounts receivable | $ | 2,795 | $ | 2,938 | ||||||||
| Allowance for doubtful accounts | 4(a) | (114 | ) | (103 | ) | |||||||
| Billed customer accounts receivable, net of allowance for doubtful accounts | 2,681 | 2,835 | ||||||||||
| Accrued receivables – customer | 553 | 480 | ||||||||||
| Billed and unbilled customer accounts receivable, net of allowance for doubtful accounts | 3,234 | 3,315 | ||||||||||
| Accrued receivables – other | 320 | 282 | ||||||||||
| Accounts receivable – current | $ | 3,554 | $ | 3,597 | ||||||||
| (c) | Contract assets |
| Three months | Nine months | |||||||||||||||
| Periods ended September 30 (millions) | 2024 | 2023 | 2024 | 2023 | ||||||||||||
| Balance, beginning of period | $ | 843 | $ | 857 | $ | 898 | $ | 908 | ||||||||
| Net additions arising from operations | 410 | 378 | 1,138 | 1,096 | ||||||||||||
| Amounts billed in the period and thus reclassified to accounts receivable | (410 | ) | (387 | ) | (1,199 | ) | (1,162 | ) | ||||||||
| Change in impairment allowance, net (Note 4(a)) | (2 | ) | 1 | 2 | 3 | |||||||||||
| Other | (2 | ) | 1 | — | 5 | |||||||||||
| Balance, end of period 1 | $ | 839 | $ | 850 | $ | 839 | $ | 850 | ||||||||
| Reconciliation of contract assets presented in the Consolidated statements of financial position – current | ||||||||||||||||
| Gross contract assets | $ | 562 | $ | 570 | ||||||||||||
| Reclassification to contract liabilities of contracts with contract assets less than contract liabilities (Note 24) | (18 | ) | (16 | ) | ||||||||||||
| Reclassification from contract liabilities of contracts with contract liabilities less than contract assets (Note 24) | (131 | ) | (131 | ) | ||||||||||||
| $ | 413 | $ | 423 | |||||||||||||
| 1 | Timing of amounts to be billed and thus reclassified to accounts receivable is set out in Note 4(a). |
|
|
|
| notes to condensed interim consolidated financial statements | (unaudited) |
| 7 | other income |
| Three months | Nine months | |||||||||||||||
| Periods ended September 30 (millions) | 2024 | 2023 | 2024 | 2023 | ||||||||||||
| Government assistance | $ | 1 | $ | 2 | $ | 5 | $ | 12 | ||||||||
| Other sublet revenue (Note 19) | 3 | 1 | 6 | 4 | ||||||||||||
| Investment income (loss), gain (loss) on disposal of assets and other, net | 49 | 13 | 96 | 6 | ||||||||||||
| Interest income (Note 21(a)) | 2 | 1 | 5 | 5 | ||||||||||||
| Changes in provisions related to business combinations (Note 25) | 2 | 1 | 85 | 42 | ||||||||||||
| $ | 57 | $ | 18 | $ | 197 | $ | 69 | |||||||||
| 8 | employee benefits expense |
| Three months | Nine months | |||||||||||||||
| Periods ended September 30 (millions) | 2024 | 2023 | 2024 | 2023 | ||||||||||||
| Employee benefits expense – gross | ||||||||||||||||
| Wages and salaries | $ | 1,396 | $ | 1,424 | $ | 4,186 | $ | 4,436 | ||||||||
| Share-based compensation 1 (Note 14) | 60 | 40 | 144 | 138 | ||||||||||||
| Pensions – defined benefit (Note 15(a)) | 16 | 15 | 50 | 46 | ||||||||||||
| Pensions – defined contribution (Note 15(b)) | 31 | 32 | 90 | 95 | ||||||||||||
| Restructuring costs 1 (Note 16(a)) | 60 | 221 | 259 | 364 | ||||||||||||
| Employee health and other benefits | 73 | 71 | 200 | 208 | ||||||||||||
| 1,636 | 1,803 | 4,929 | 5,287 | |||||||||||||
| Capitalized internal labour costs, net | ||||||||||||||||
| Contract acquisition costs (Note 20) | ||||||||||||||||
| Capitalized | (21 | ) | (22 | ) | (67 | ) | (61 | ) | ||||||||
| Amortized | 23 | 24 | 69 | 70 | ||||||||||||
| Contract fulfilment costs (Note 20) | ||||||||||||||||
| Capitalized | (8 | ) | (7 | ) | (24 | ) | (18 | ) | ||||||||
| Amortized | 1 | 2 | 5 | 3 | ||||||||||||
| Property, plant and equipment | (76 | ) | (91 | ) | (243 | ) | (289 | ) | ||||||||
| Intangible assets subject to amortization | (80 | ) | (76 | ) | (237 | ) | (251 | ) | ||||||||
| (161 | ) | (170 | ) | (497 | ) | (546 | ) | |||||||||
| $ | 1,475 | $ | 1,633 | $ | 4,432 | $ | 4,741 | |||||||||
| 1 | For the three-month and nine-month periods ended September 30, 2024, $NIL (2023 – $1) and $4 (2023 – $1), respectively, of share-based compensation in the TELUS technology solutions segment was included in restructuring costs. |
|
|
September 30, 2024 | |
| notes to condensed interim consolidated financial statements | (unaudited) |
| 9 | financing costs |
| Three months | Nine months | |||||||||||||||
| Periods ended September 30 (millions) | 2024 | 2023 | 2024 | 2023 | ||||||||||||
| Interest expense | ||||||||||||||||
| Long-term debt, excluding lease liabilities – gross | $ | 297 | $ | 282 | $ | 892 | $ | 815 | ||||||||
| Long-term debt, excluding lease liabilities – capitalized 1 | (9 | ) | (1 | ) | (13 | ) | (4 | ) | ||||||||
| Long-term debt, excluding lease liabilities | 288 | 281 | 879 | 811 | ||||||||||||
| Lease liabilities (Note 19) | 42 | 36 | 122 | 95 | ||||||||||||
| Short-term borrowings and other | 14 | 10 | 24 | 22 | ||||||||||||
| Accretion on provisions (Note 25) | 7 | 7 | 22 | 22 | ||||||||||||
| 351 | 334 | 1,047 | 950 | |||||||||||||
| Employee defined benefit plans net interest (Note 15) | 3 | 1 | 7 | 5 | ||||||||||||
| Foreign exchange | 8 | (12 | ) | 2 | (8 | ) | ||||||||||
| Unrealized changes in virtual power purchase agreements forward element | 125 | 33 | 228 | 59 | ||||||||||||
| 487 | 356 | 1,284 | 1,006 | |||||||||||||
| Interest income | (8 | ) | (4 | ) | (29 | ) | (11 | ) | ||||||||
| $ | 479 | $ | 352 | $ | 1,255 | $ | 995 | |||||||||
| Net interest cost (Note 3) | $ | 1,033 | $ | 935 | ||||||||||||
| Interest expense on long-term debt, excluding lease liabilities – capitalized 1 | (13 | ) | (4 | ) | ||||||||||||
| Employee defined benefit plans net interest | 7 | 5 | ||||||||||||||
| Unrealized changes in virtual power purchase agreements forward element | 228 | 59 | ||||||||||||||
| $ | 1,255 | $ | 995 | |||||||||||||
| 1 | Interest on long-term debt, excluding lease liabilities, at a composite rate of 5.3% (2023 – 3.1%) was capitalized to intangible assets with indefinite lives during the period. |
| 10 | income taxes |
Expense composition and rate reconciliation
| Three months | Nine months | |||||||||||||||
| Periods ended September 30 (millions) | 2024 | 2023 | 2024 | 2023 | ||||||||||||
| Current income tax expense | ||||||||||||||||
| For the current reporting period | $ | 190 | $ | 136 | $ | 483 | $ | 401 | ||||||||
| Adjustments recognized in the current period for income taxes of prior periods | (22 | ) | (10 | ) | (28 | ) | (28 | ) | ||||||||
| Pillar Two global minimum tax | 1 | — | 2 | — | ||||||||||||
| 169 | 126 | 457 | 373 | |||||||||||||
| Deferred income tax expense | ||||||||||||||||
| Arising from the origination and reversal of temporary differences | (119 | ) | (85 | ) | (287 | ) | (220 | ) | ||||||||
| Adjustments recognized in the current period for income taxes of prior periods | 2 | (13 | ) | 2 | (7 | ) | ||||||||||
| (117 | ) | (98 | ) | (285 | ) | (227 | ) | |||||||||
| $ | 52 | $ | 28 | $ | 172 | $ | 146 | |||||||||
|
|
|
| notes to condensed interim consolidated financial statements | (unaudited) |
Our income tax expense and effective income tax rate differ from those computed by applying the applicable statutory rates for the following reasons:
| Three-month periods ended September 30 ($ in millions) | 2024 | 2023 | ||||||||||||||
| Income taxes computed at applicable statutory rates | $ | 78 | 25.2 | % | $ | 40 | 23.8 | % | ||||||||
| Adjustments recognized in the current period for income taxes of prior periods | (20 | ) | (6.4 | ) | (23 | ) | (13.9 | ) | ||||||||
| Pillar Two global minimum tax | 1 | 0.3 | — | — | ||||||||||||
| (Non-taxable) non-deductible amounts, net | (6 | ) | (1.9 | ) | (2 | ) | (1.2 | ) | ||||||||
| Withholding and other taxes | 6 | 1.9 | 6 | 3.7 | ||||||||||||
| Losses not recognized | 1 | 0.3 | 9 | 5.5 | ||||||||||||
| Foreign tax differential | (4 | ) | (1.3 | ) | (4 | ) | (2.4 | ) | ||||||||
| Other | (4 | ) | (1.3 | ) | 2 | 1.7 | ||||||||||
| Income tax expense per Consolidated statements of income and other comprehensive income | $ | 52 | 16.8 | % | $ | 28 | 17.2 | % | ||||||||
| Nine-month periods ended September 30 ($ in millions) | 2024 | 2023 | ||||||||||||||
| Income taxes computed at applicable statutory rates | $ | 191 | 24.2 | % | $ | 165 | 23.5 | % | ||||||||
| Adjustments recognized in the current period for income taxes of prior periods | (26 | ) | (3.3 | ) | (35 | ) | (5.0 | ) | ||||||||
| Pillar Two global minimum tax | 2 | 0.3 | — | — | ||||||||||||
| (Non-taxable) non-deductible amounts, net | (13 | ) | (1.7 | ) | (9 | ) | (1.3 | ) | ||||||||
| Withholding and other taxes | 25 | 3.2 | 15 | 2.1 | ||||||||||||
| Losses not recognized | 4 | 0.5 | 17 | 2.4 | ||||||||||||
| Foreign tax differential | (7 | ) | (0.9 | ) | (11 | ) | (1.6 | ) | ||||||||
| Other | (4 | ) | (0.5 | ) | 4 | 0.7 | ||||||||||
| Income tax expense per Consolidated statements of income and other comprehensive income | $ | 172 | 21.8 | % | $ | 146 | 20.8 | % | ||||||||
We are subject to the global minimum top-up income tax under Pillar Two tax legislation. The top-up income tax relates primarily to our operations in Bulgaria and Ireland, where the statutory income tax rates are 10% and 12.5%, respectively. As at September 30, 2024, both Bulgaria and Ireland have enacted global minimum income tax into domestic tax legislation effective January 1, 2024. As a result, our Bulgarian and Irish subsidiaries will be liable for the top-up income tax rather than the ultimate Canadian parent company.During the three-month and nine-month periods ended September 30, 2024, the Company recognized a current income tax expense of $1 million and $2 million, respectively, related to the Pillar Two tax.
We have applied a temporary mandatory relief from deferred income tax accounting for the impacts of the top-up income tax and it is recognized as a current income tax in the period it is incurred.
|
|
September 30, 2024 | |
| notes to condensed interim consolidated financial statements | (unaudited) |
| 11 | other comprehensive income |
| Items that may subsequently be reclassified to income | Item
never reclassified to income |
Item
never reclassified to income |
|||||||||||||||||||||||||||||||||||||||||||||
| Change in unrealized fair value of derivatives designated as cash flow hedges (Note 4(e)) | |||||||||||||||||||||||||||||||||||||||||||||||
| Derivatives used to manage currency risk | Derivatives used to
manage other market risks |
Cumulative | Employee | ||||||||||||||||||||||||||||||||||||||||||||
| (millions) | Gains (losses) arising |
Prior
period (gains) losses reclassified to net income |
Total | Gains
(losses) arising |
Prior
period (gains) losses reclassified to net income |
Total | Total | foreign currency translation adjustment |
Change
in measurement of investment financial assets |
Accumulated other comprehensive income |
defined benefit plan re-measurements |
Other comprehensive income |
|||||||||||||||||||||||||||||||||||
| Balance as at July 1, 2023 | $ | (55 | ) | $ | (3 | ) | $ | (58 | ) | $ | 31 | $ | 82 | $ | 55 | ||||||||||||||||||||||||||||||||
| Other comprehensive income (loss) | |||||||||||||||||||||||||||||||||||||||||||||||
| Amount arising | $ | 178 | $ | (147 | ) | 31 | $ | 2 | $ | 5 | 7 | 38 | 7 | (3 | ) | 42 | $ | 80 | $ | 122 | |||||||||||||||||||||||||||
| Income taxes | $ | 26 | $ | (20 | ) | 6 | $ | 1 | $ | 1 | 2 | 8 | — | 1 | 9 | 20 | 29 | ||||||||||||||||||||||||||||||
| Net | 25 | 5 | 30 | 7 | (4 | ) | 33 | $ | 60 | $ | 93 | ||||||||||||||||||||||||||||||||||||
| Balance as at September 30, 2023 | $ | (30 | ) | $ | 2 | $ | (28 | ) | $ | 38 | $ | 78 | $ | 88 | |||||||||||||||||||||||||||||||||
| Balance as at July 1, 2024 | $ | (129 | ) | $ | 1 | $ | (128 | ) | $ | 77 | $ | 75 | $ | 24 | |||||||||||||||||||||||||||||||||
| Other comprehensive income (loss) | |||||||||||||||||||||||||||||||||||||||||||||||
| Amount arising | $ | (81 | ) | $ | 71 | (10 | ) | $ | (5 | ) | $ | (1 | ) | (6 | ) | (16 | ) | 23 | 2 | 9 | $ | (27 | ) | $ | (18 | ) | |||||||||||||||||||||
| Income taxes | $ | (4 | ) | $ | 11 | 7 | $ | (2 | ) | $ | — | (2 | ) | 5 | — | 1 | 6 | (7 | ) | (1 | ) | ||||||||||||||||||||||||||
| Net | (17 | ) | (4 | ) | (21 | ) | 23 | 1 | 3 | $ | (20 | ) | $ | (17 | ) | ||||||||||||||||||||||||||||||||
| Balance as at September 30, 2024 | $ | (146 | ) | $ | (3 | ) | $ | (149 | ) | $ | 100 | $ | 76 | $ | 27 | ||||||||||||||||||||||||||||||||
|
|
|
| notes to condensed interim consolidated financial statements | (unaudited) |
| Items that may subsequently be reclassified to income | Item
never reclassified to income |
Item
never reclassified to income |
|||||||||||||||||||||||||||||||||||||||||||||
| Derivatives used to manage currency risk | Derivatives used to
manage other market risks |
Cumulative | Employee | ||||||||||||||||||||||||||||||||||||||||||||
| Change in unrealized fair value of derivatives designated as cash flow hedges (Note 4(e)) | |||||||||||||||||||||||||||||||||||||||||||||||
| (millions) | Gains (losses) arising |
Prior
period (gains) losses reclassified to net income |
Total | Gains
(losses) arising |
Prior
period (gains) losses reclassified to net income |
Total | Total | foreign currency translation adjustment |
Change
in measurement of investment financial assets |
Accumulated other comprehensive income |
defined benefit plan re-measurements |
Other comprehensive income |
|||||||||||||||||||||||||||||||||||
| Balance as at January 1, 2023 | $ | (20 | ) | $ | (3 | ) | $ | (23 | ) | $ | 66 | $ | 90 | $ | 133 | ||||||||||||||||||||||||||||||||
| Other comprehensive income (loss) | |||||||||||||||||||||||||||||||||||||||||||||||
| Amount arising | $ | (3 | ) | $ | (13 | ) | (16 | ) | $ | 2 | $ | 5 | 7 | (9 | ) | (28 | ) | (13 | ) | (50 | ) | $ | 79 | $ | 29 | ||||||||||||||||||||||
| Income taxes | $ | (6 | ) | $ | — | (6 | ) | $ | 1 | $ | 1 | 2 | (4 | ) | — | (1 | ) | (5 | ) | 20 | 15 | ||||||||||||||||||||||||||
| Net | (10 | ) | 5 | (5 | ) | (28 | ) | (12 | ) | (45 | ) | $ | 59 | $ | 14 | ||||||||||||||||||||||||||||||||
| Balance as at September 30, 2023 | $ | (30 | ) | $ | 2 | $ | (28 | ) | $ | 38 | $ | 78 | $ | 88 | |||||||||||||||||||||||||||||||||
| Balance as at January 1, 2024 | $ | (158 | ) | $ | (2 | ) | $ | (160 | ) | $ | 36 | $ | 78 | $ | (46 | ) | |||||||||||||||||||||||||||||||
| Other comprehensive income (loss) | |||||||||||||||||||||||||||||||||||||||||||||||
| Amount arising | $ | 153 | $ | (131 | ) | 22 | $ | 1 | $ | (3 | ) | (2 | ) | 20 | 64 | (2 | ) | 82 | $ | 42 | $ | 124 | |||||||||||||||||||||||||
| Income taxes | $ | 28 | $ | (18 | ) | 10 | $ | — | $ | (1 | ) | (1 | ) | 9 | — | — | 9 | 11 | 20 | ||||||||||||||||||||||||||||
| Net | 12 | (1 | ) | 11 | 64 | (2 | ) | 73 | $ | 31 | $ | 104 | |||||||||||||||||||||||||||||||||||
| Balance as at September 30, 2024 | $ | (146 | ) | $ | (3 | ) | $ | (149 | ) | $ | 100 | $ | 76 | $ | 27 | ||||||||||||||||||||||||||||||||
| Attributable to: | |||||||||||||||||||||||||||||||||||||||||||||||
| Common Shares | $ | 7 | |||||||||||||||||||||||||||||||||||||||||||||
| Non-controlling interests | 20 | ||||||||||||||||||||||||||||||||||||||||||||||
| $ | 27 | ||||||||||||||||||||||||||||||||||||||||||||||
|
|
September 30, 2024 | |
| notes to condensed interim consolidated financial statements | (unaudited) |
| 12 | per share amounts |
Basic net income per Common Share is calculated by dividing net income attributable to Common Shares by the total weighted average number of Common Shares outstanding during the period. Diluted net income per Common Share is calculated to give effect to share option awards and restricted share unit awards.
The following table presents reconciliations of the denominators of the basic and diluted per share computations. Net income was equal to diluted net income for all periods presented.
| Three months | Nine months | |||||||||||||||
| Periods ended September 30 (millions) | 2024 | 2023 | 2024 | 2023 | ||||||||||||
| Basic total weighted average number of Common Shares outstanding | 1,492 | 1,454 | 1,483 | 1,447 | ||||||||||||
| Effect of dilutive securities – Restricted share units | 5 | 5 | 5 | 4 | ||||||||||||
| Diluted total weighted average number of Common Shares outstanding | 1,497 | 1,459 | 1,488 | 1,451 | ||||||||||||
For the three-month and nine-month periods ended September 30, 2024 and 2023, no outstanding equity-settled restricted share unit awards were excluded in the calculation of diluted income per Common Share. For the three-month and nine-month periods ended September 30, 2024, approximately 1 million (2023 – NIL) and 1 million (2023 – NIL), respectively, TELUS Corporation share option awards were excluded in the calculation of diluted income per Common Share.
| 13 | dividends per share |
| (a) | TELUS Corporation Common Share dividends declared |
| Nine-month
periods ended September 30 (millions except per share amounts) |
||||||||||||
| TELUS Corporation | Declared | Paid to | ||||||||||
| Common Share dividends | Effective | Per share | shareholders | Total | ||||||||
| 2024 | ||||||||||||
| Quarter 1 dividend | Mar. 11, 2024 | $ | 0.3761 | Apr. 1, 2024 | $ | 554 | ||||||
| Quarter 2 dividend | Jun. 10, 2024 | 0.3891 | July 2, 2024 | 577 | ||||||||
| Quarter 3 dividend | Sept. 10, 2024 | 0.3891 | Oct. 1, 2024 | 578 | ||||||||
| $ | 1.1543 | $ | 1,709 | |||||||||
| Nine-month
periods ended September 30 (millions except per share amounts) |
||||||||||||
| TELUS Corporation | Declared | Paid to | ||||||||||
| Common Share dividends | Effective | Per share | shareholders | Total | ||||||||
| 2023 | ||||||||||||
| Quarter 1 dividend | Mar. 10, 2023 | $ | 0.3511 | Apr. 3, 2023 | $ | 506 | ||||||
| Quarter 2 dividend | June 8, 2023 | 0.3636 | July 4, 2023 | 526 | ||||||||
| Quarter 3 dividend | Sept. 8, 2023 | 0.3636 | Oct. 3, 2023 | 529 | ||||||||
| $ | 1.0783 | $ | 1,561 | |||||||||
On November 7, 2024, the Board of Directors declared a quarterly dividend of $0.4023 per share on issued and outstanding TELUS Corporation Common Shares payable on January 2, 2025, to holders of record at the close of business on December 11, 2024. The final amount of the dividend payment depends upon the number of TELUS Corporation Common Shares issued and outstanding at the close of business on December 11, 2024.
| (b) | Dividend Reinvestment and Share Purchase Plan |
We have a Dividend Reinvestment and Share Purchase Plan under which eligible holders of TELUS Corporation Common Shares may acquire additional TELUS Corporation Common Shares by reinvesting dividends and by making additional optional cash payments to the trustee. Under this plan, we have the option of offering TELUS Corporation Common Shares from Treasury or having the trustee acquire TELUS Corporation Common Shares in the stock market. We may, at our discretion, offer TELUS Corporation Common Shares at a discount of up to 5% from the market price under the plan. Effective with our dividends paid October 1, 2019, we offered TELUS Corporation Common Shares from Treasury at a discount of 2%. In respect of TELUS Corporation Common Shares held by eligible shareholders who have elected to participate in the plan, dividends declared during the three-month and nine-month periods ended September 30, 2024, of $177 million (2023 –$177 million) and $466 million (2023 – $525 million), respectively, were to be reinvested in TELUS Corporation Common Shares.
|
|
|
| notes to condensed interim consolidated financial statements | (unaudited) |
| 14 | share-based compensation |
| (a) | Details of share-based compensation expense |
Included in Employee benefits expense in the Consolidated statements of income and other comprehensive income, and in Cash provided by operating activities in the Consolidated statements of cash flows, are the share-based compensation amounts set out in the accompanying table.
| Periods ended September 30 (millions) | 2024 | 2023 | ||||||||||||||||||||||||
| Note | Employee benefits expense 1 |
Associated operating cash outflows |
Statement of cash flows adjustment |
Employee benefits expense |
Associated operating cash outflows |
Statement of cash flows adjustment |
||||||||||||||||||||
| THREE-MONTH | ||||||||||||||||||||||||||
| Restricted share units | (b) | $ | 51 | $ | (7 | ) | $ | 44 | $ | 31 | $ | (4 | ) | $ | 27 | |||||||||||
| Employee share purchase plan | (c) | 9 | (9 | ) | — | 10 | (10 | ) | — | |||||||||||||||||
| $ | 60 | $ | (16 | ) | $ | 44 | $ | 41 | $ | (14 | ) | $ | 27 | |||||||||||||
| TELUS technology solutions | $ | 40 | $ | (15 | ) | $ | 25 | $ | 36 | $ | (11 | ) | $ | 25 | ||||||||||||
| TELUS digital experience 2 | 20 | (1 | ) | 19 | 5 | (3 | ) | 2 | ||||||||||||||||||
| $ | 60 | $ | (16 | ) | $ | 44 | $ | 41 | $ | (14 | ) | $ | 27 | |||||||||||||
| NINE-MONTH | ||||||||||||||||||||||||||
| Restricted share units | (b) | $ | 123 | $ | (13 | ) | $ | 110 | $ | 105 | $ | (6 | ) | $ | 99 | |||||||||||
| Employee share purchase plan | (c) | 25 | (25 | ) | — | 33 | (33 | ) | — | |||||||||||||||||
| Share option awards | (d) | — | — | — | 1 | — | 1 | |||||||||||||||||||
| $ | 148 | $ | (38 | ) | $ | 110 | $ | 139 | $ | (39 | ) | $ | 100 | |||||||||||||
| TELUS technology solutions | $ | 113 | $ | (33 | ) | $ | 80 | $ | 112 | $ | (35 | ) | $ | 77 | ||||||||||||
| TELUS digital experience 2 | 35 | (5 | ) | 30 | 27 | (4 | ) | 23 | ||||||||||||||||||
| $ | 148 | $ | (38 | ) | $ | 110 | $ | 139 | $ | (39 | ) | $ | 100 | |||||||||||||
| 1 | Within employee benefits expense (see Note 8) for the three-month and nine-month periods ended September 30, 2024, restricted share units expense of $51 (2023 – $30) and $119 (2023 – $104), respectively, is presented as share-based compensation expense and the balance is included in restructuring costs (see Note 16) of the TELUS technology solutions segment. |
| 2 | During the three-month period ended June 30, 2024, the written put options in respect of non-controlling interests associated with the WillowTree acquisition were renegotiated, which resulted in: a change in provisions for business combinations (see Notes 7, 25); the institution of a maximum payout for the non-controlling interests associated with the WillowTree acquisition; and the awarding of share-based compensation. The expense associated with these awards was $10 and $10 for the three-month and nine-month periods ended September 30, 2024. |
| (b) | Restricted share units |
TELUS Corporation restricted share units
We also award restricted share units that largely have the same features as our general restricted share units, but have a variable payout (0% – 200%) that depends upon the achievement of our total customer connections performance condition (with a weighting of 25%) and the total shareholder return on TELUS Corporation Common Shares relative to an international peer group of telecommunications companies (with a weighting of 75%). The grant-date fair value of the notional subset of our restricted share units affected by the total customer connections performance condition equals the fair market value of the corresponding TELUS Corporation Common Shares at the grant date, and thus the notional subset has been included in the presentation of our restricted share units with only service conditions. Reflecting a variable payout, we estimate the fair value of the notional subset of our restricted share units affected by the relative total shareholder return performance condition using a Monte Carlo simulation. Grants of restricted share units in 2024 and 2023 are accounted for as equity-settled, as that was the expected manner of their settlement when granted.
The following table presents a summary of outstanding TELUS Corporation non-vested restricted share units.
| As at | September 30, 2024 | December 31, 2023 | ||||||
| Restricted share units without market performance conditions | ||||||||
| Restricted share units with service conditions only | 9,278,615 | 5,769,038 | ||||||
| Notional subset affected by non-market performance conditions | 741,541 | 429,281 | ||||||
| 10,020,156 | 6,198,319 | |||||||
| Restricted share units with market performance conditions | ||||||||
| Notional subset affected by relative total shareholder return performance condition | 2,040,663 | 1,191,563 | ||||||
| Number of non-vested restricted share units | 12,060,819 | 7,389,882 | ||||||
|
|
September 30, 2024 | |
| notes to condensed interim consolidated financial statements | (unaudited) |
The following table presents a summary of the activity related to TELUS Corporation restricted share units without market performance conditions.
| Number
of restricted share units 1 |
Weighted average grant-date |
|||||||||||
| Non-vested | Vested |
fair value |
||||||||||
| THREE-MONTH PERIOD | ||||||||||||
| Outstanding, July 1, 2024 | ||||||||||||
| Non-vested | 10,083,940 | — | $ | 26.70 | ||||||||
| Vested | — | 33,316 | $ | 28.83 | ||||||||
| Granted | ||||||||||||
| Initial award | 148,210 | — | $ | 22.10 | ||||||||
| In lieu of dividends | 186,361 | 615 | $ | 21.05 | ||||||||
| Vested | (251,472 | ) | 251,472 | $ | 27.09 | |||||||
| Settled – in cash | — | (251,776 | ) | $ | 27.08 | |||||||
| Forfeited | (146,883 | ) | — | $ | 26.62 | |||||||
| Outstanding, September 30, 2024 | ||||||||||||
| Non-vested | 10,020,156 | — | $ | 26.53 | ||||||||
| Vested | — | 33,627 | $ | 28.72 | ||||||||
| NINE-MONTH PERIOD | ||||||||||||
| Outstanding, January 1, 2024 | ||||||||||||
| Non-vested | 6,198,319 | — | $ | 28.68 | ||||||||
| Vested | — | 32,521 | $ | 28.97 | ||||||||
| Granted | ||||||||||||
| Initial award | 4,232,124 | — | $ | 23.99 | ||||||||
| In lieu of dividends | 460,442 | 1,707 | $ | 21.57 | ||||||||
| Vested | (369,458 | ) | 369,458 | $ | 26.33 | |||||||
| Settled – in cash | — | (370,059 | ) | $ | 26.32 | |||||||
| Forfeited | (501,271 | ) | — | $ | 26.49 | |||||||
| Outstanding, September 30, 2024 | ||||||||||||
| Non-vested | 10,020,156 | — | $ | 26.53 | ||||||||
| Vested | — | 33,627 | $ | 28.72 | ||||||||
| 1 | Excluding the notional subset of restricted share units affected by the relative total shareholder return performance condition. |
TELUS International (Cda) Inc. restricted share units
We also award restricted share units that largely have the same features as the TELUS Corporation restricted share units. A subset of the TELUS International (Cda) Inc. restricted share units have a variable payout (0% – 200%) that depends upon TELUS International (Cda) Inc. financial performance (with a weighting of 50%) and the total shareholder return of TELUS International (Cda) Inc. subordinate voting shares relative to an international peer group of customer experience and digital IT services companies (with a weighting of 50%). A second subset of the TELUS International (Cda) Inc. restricted share units have a variable payout (0% – 300%) that depends upon the financial performance of certain TELUS Digital Experience products and services. The grant-date fair value of the notional subset of our restricted share units affected by financial performance conditions equals the fair market value of the corresponding subordinate voting shares at the grant date. Reflecting a variable payout, we estimate the fair value of the notional subset of our restricted share units affected by the relative total shareholder return performance condition using a Monte Carlo simulation. Grants of restricted share units in 2024 and 2023 are accounted for as equity-settled, as that was the expected manner of their settlement when granted.
The following table presents a summary of the activity related to TELUS International (Cda) Inc. restricted share units.
| Number of restricted
share units |
Weighted average grant-date |
|||||||||||
| Non-vested | Vested | fair value | ||||||||||
| THREE-MONTH PERIOD | ||||||||||||
| Outstanding, July 1, 2024 | 13,955,245 | — | US$ | 8.05 | ||||||||
| Granted – initial award | 7,241,699 | 489,118 | US$ | 2.97 | ||||||||
| Vested | (9,601 | ) | 9,601 | US$ | 11.35 | |||||||
| Settled in equity | — | (498,719 | ) | US$ | 3.18 | |||||||
| Forfeited | (343,464 | ) | — | US$ | 6.52 | |||||||
| Outstanding, September 30, 2024 | 20,843,879 | — | US$ | 6.36 | ||||||||
| NINE-MONTH PERIOD | ||||||||||||
| Outstanding, January 1, 2024 | 2,615,746 | — | US$ | 21.36 | ||||||||
| Granted – initial award | 19,836,119 | 528,234 | US$ | 5.30 | ||||||||
| Vested | (797,904 | ) | 797,904 | US$ | 20.48 | |||||||
| Settled in equity | — | (1,326,138 | ) | US$ | 13.69 | |||||||
| Forfeited | (810,082 | ) | — | US$ | 16.19 | |||||||
| Outstanding, September 30, 2024 | 20,843,879 | — | US$ | 6.36 | ||||||||
| (c) | TELUS Corporation employee share purchase plan |
We have an employee share purchase plan under which eligible employees can purchase TELUS Corporation Common Shares through regular payroll deductions. In respect of TELUS Corporation Common Shares held within the employee share purchase plan, dividends declared thereon during the three-month and nine-month periods ended September 30, 2024, of $13 million (2023 –$13 million) and $40 million (2023 – $39 million), respectively, were to be reinvested in TELUS Corporation Common Shares acquired by the trustee from Treasury, with a discount applicable, as set out in Note 13(b).
|
|
|
| notes to condensed interim consolidated financial statements | (unaudited) |
| (d) | Share option awards |
TELUS Corporation share options
Employees may be granted share option awards to purchase TELUS Corporation Common Shares at an exercise price equal to the fair market value at the time of grant. Share option awards granted under the plan may be exercised over specific periods not to exceed seven years from the date of grant.
These share option awards have a net-equity settlement feature. The optionee does not have the choice of exercising the net-equity settlement feature; it is at our option whether the exercise of a share option award is settled as a share option or settled using the net-equity settlement feature.
The following table presents a summary of the activity related to the TELUS Corporation share option plan.
| Periods ended September 30, 2024 | Three months | Nine months | ||||||||||||||
| Number of share options |
Weighted average share option price 1 |
Number of share options |
Weighted average share option price 1 |
|||||||||||||
| Outstanding, beginning of period | 1,621,301 | $ | 22.41 | 1,778,901 | $ | 22.35 | ||||||||||
| Exercised 2 | (19,800 | ) | $ | 21.22 | (84,000 | ) | $ | 21.32 | ||||||||
| Forfeited | (47,200 | ) | $ | 22.33 | (140,600 | ) | $ | 22.09 | ||||||||
| Outstanding, end of period | 1,554,301 | $ | 22.43 | 1,554,301 | $ | 22.43 | ||||||||||
| Exercisable, end of period | 1,554,301 | $ | 22.43 | |||||||||||||
| 1 | The weighted average remaining contractual life is 2.5 years. |
| 2 | For the three-month and nine-month periods ended September 30, 2024, the weighted average price at the dates of exercise were $22.57 and $23.48, respectively. |
TELUS International (Cda) Inc. share options
Employees may be granted equity share options (equity-settled) to purchase TELUS International (Cda) Inc. subordinate voting shares at a price equal to, or a multiple of, the fair market value at the time of grant and/or phantom share options (cash-settled) that provide them with exposure to appreciation in the TELUS International (Cda) Inc. subordinate voting share price. Share option awards granted under the plan may be exercised over specific periods not to exceed ten years from the time of grant. All equity share option awards and most phantom share option awards have a variable payout (0% – 100%) that depends upon the achievement of TELUS International (Cda) Inc. financial performance and non-market quality-of-service performance conditions.
The following table presents a summary of the activity related to the TELUS International (Cda) Inc. share option plan.
| Periods ended September 30, 2024 | Three months | Nine months | ||||||||||||||
| Number of share options |
Weighted
average share option price 1 |
Number of share options |
Weighted
average share option price 1 |
|||||||||||||
| Outstanding, beginning of period | 2,452,934 | US$ | 9.89 | 2,536,783 | US$ | 10.39 | ||||||||||
| Granted | 2,909,788 | US$ | 3.69 | 2,909,788 | US$ | 3.69 | ||||||||||
| Forfeited | — | US$ | - | (83,849 | ) | US$ | 25.00 | |||||||||
| Outstanding, end of period | 5,362,722 | US$ | 6.52 | 5,362,722 | US$ | 6.52 | ||||||||||
| Exercisable, end of period | 2,363,846 | US$ | 9.32 | |||||||||||||
| 1 | For 2,909,788 share options, the price is $3.69 per TELUS International (Cda) Inc. subordinated voting share and the weighted average remaining contractual life is 10 years; for 2,096,582 share options, the range of share option prices is US$4.87 – US$8.95 and the weighted average remaining contractual life is 2.2 years; for the balance of share options, the price is US$25.00 and the weighted average remaining contractual life is 6.4 years. |
The weighted average fair value of the share option awards granted, and the weighted average assumptions used in the fair value at time of grant, calculated using the Black-Scholes model, are as follows:
| Periods ended September 30, 2024 | Three months |
Nine months |
||||||
| Share option award fair value (per share option) | US$ | 1.50 | US$ | 1.50 | ||||
| Risk-free interest rate | 2.7 | % | 2.7 | % | ||||
| Expected lives 1 (years) | 6.5 | 6.5 | ||||||
| Expected volatility | 35.4 | % | 35.4 | % | ||||
| Dividend yield | NIL | % | NIL | % | ||||
| 1 | The maximum contractual term of the share option awards granted in 2024 was ten years. |
|
|
September 30, 2024 | |
| notes to condensed interim consolidated financial statements | (unaudited) |
| 15 | employee future benefits |
| (a) | Defined benefit pension plans – summary |
Amounts in the primary financial statements relating to defined benefit pension plans
| Three-month periods ended September 30 | 2024 | 2023 | ||||||||||||||||||||||||
| (millions) | Note | Plan assets |
Defined
benefit obligations accrued 1 |
Net | Plan assets |
Defined
benefit obligations accrued 1 |
Net | |||||||||||||||||||
| Employee benefits expense | 8 | |||||||||||||||||||||||||
| Benefits earned for current service | $ | — | $ | (19 | ) | $ | — | $ | (18 | ) | ||||||||||||||||
| Benefits earned for past service | — | — | — | — | ||||||||||||||||||||||
| Employees’ contributions | 4 | — | 4 | — | ||||||||||||||||||||||
| Administrative fees | (1 | ) | — | (1 | ) | — | ||||||||||||||||||||
| 3 | (19 | ) | $ | (16 | ) | 3 | (18 | ) | $ | (15 | ) | |||||||||||||||
| Financing costs | 9 | |||||||||||||||||||||||||
| Notional income on plan assets 2 and interest on defined benefit obligations accrued | 105 | (97 | ) | 111 | (100 | ) | ||||||||||||||||||||
| Interest effect on asset ceiling limit | (11 | ) | — | (12 | ) | — | ||||||||||||||||||||
| 94 | (97 | ) | (3 | ) | 99 | (100 | ) | (1 | ) | |||||||||||||||||
| DEFINED BENEFIT (COST) INCLUDED IN NET INCOME 3 | (19 | ) | (16 | ) | ||||||||||||||||||||||
| Other comprehensive income | 11 | |||||||||||||||||||||||||
| Difference between actual results and estimated plan assumptions 4 | 317 | — | (447 | ) | — | |||||||||||||||||||||
| Changes in plan financial assumptions 5 | — | (388 | ) | — | 771 | |||||||||||||||||||||
| Changes in the effect of limiting net defined benefit plan assets to the asset ceiling | 44 | — | (244 | ) | — | |||||||||||||||||||||
| 361 | (388 | ) | (27 | ) | (691 | ) | 771 | 80 | ||||||||||||||||||
| DEFINED BENEFIT (COST) INCLUDED IN COMPREHENSIVE INCOME 3 | $ | (46 | ) | $ | 64 | |||||||||||||||||||||
|
|
|
| notes to condensed interim consolidated financial statements | (unaudited) |
| Nine-month periods ended September 30 | 2024 | 2023 | ||||||||||||||||||||||||
| (millions) | Note | Plan assets |
Defined benefit obligations accrued 1 |
Net | Plan assets |
Defined benefit obligations accrued 1 |
Net | |||||||||||||||||||
| Employee benefits expense | 8 | |||||||||||||||||||||||||
| Benefits earned for current service | $ | — | $ | (59 | ) | $ | — | $ | (56 | ) | ||||||||||||||||
| Benefits earned for past service | — | (1 | ) | — | — | |||||||||||||||||||||
| Employees’ contributions | 13 | — | 13 | — | ||||||||||||||||||||||
| Administrative fees | (3 | ) | — | (3 | ) | — | ||||||||||||||||||||
| 10 | (60 | ) | $ | (50 | ) | 10 | (56 | ) | $ | (46 | ) | |||||||||||||||
| Financing costs | 9 | |||||||||||||||||||||||||
| Notional income on plan assets 2 and interest on defined benefit obligations accrued | 315 | (290 | ) | 330 | (300 | ) | ||||||||||||||||||||
| Interest effect on asset ceiling limit | (32 | ) | — | (35 | ) | — | ||||||||||||||||||||
| 283 | (290 | ) | (7 | ) | 295 | (300 | ) | (5 | ) | |||||||||||||||||
| DEFINED BENEFIT (COST) INCLUDED IN NET INCOME 3 | (57 | ) | (51 | ) | ||||||||||||||||||||||
| Other comprehensive income | 11 | |||||||||||||||||||||||||
| Difference between actual results and estimated plan assumptions 4 | 312 | — | (213 | ) | — | |||||||||||||||||||||
| Changes in plan financial assumptions 5 | — | (61 | ) | — | 571 | |||||||||||||||||||||
| Changes in the effect of limiting net defined benefit plan assets to the asset ceiling | (209 | ) | — | (279 | ) | — | ||||||||||||||||||||
| 103 | (61 | ) | 42 | (492 | ) | 571 | 79 | |||||||||||||||||||
| DEFINED BENEFIT (COST) INCLUDED IN COMPREHENSIVE INCOME 3 | (15 | ) | 28 | |||||||||||||||||||||||
| AMOUNTS INCLUDED IN OPERATING ACTIVITIES CASH FLOWS | ||||||||||||||||||||||||||
| Employer contributions | 16 | — | 16 | 23 | — | 23 | ||||||||||||||||||||
| BENEFITS PAID BY PLANS | (351 | ) | 351 | — | (351 | ) | 351 | — | ||||||||||||||||||
| PLAN ACCOUNT BALANCES 6 | ||||||||||||||||||||||||||
| Change in period | 61 | (60 | ) | 1 | (515 | ) | 566 | 51 | ||||||||||||||||||
| Balance, beginning of period | 8,352 | (8,489 | ) | (137 | ) | 7,990 | (8,075 | ) | (85 | ) | ||||||||||||||||
| Balance, end of period | $ | 8,413 | $ | (8,549 | ) | $ | (136 | ) | $ | 7,475 | $ | (7,509 | ) | $ | (34 | ) | ||||||||||
| FUNDED STATUS – PLAN SURPLUS (DEFICIT) | ||||||||||||||||||||||||||
| Pension plans that have plan assets in excess of defined benefit obligations accrued 7 | 20 | $ | 7,556 | $ | (7,240 | ) | $ | 316 | $ | 6,976 | $ | (6,640 | ) | $ | 336 | |||||||||||
| Pension plans that have defined benefit obligations accrued in excess of plan assets 8 | ||||||||||||||||||||||||||
| Funded | 857 | (1,086 | ) | (229 | ) | 499 | (680 | ) | (181 | ) | ||||||||||||||||
| Unfunded | — | (223 | ) | (223 | ) | — | (189 | ) | (189 | ) | ||||||||||||||||
| 27 | 857 | (1,309 | ) | (452 | ) | 499 | (869 | ) | (370 | ) | ||||||||||||||||
| $ | 8,413 | $ | (8,549 | ) | $ | (136 | ) | $ | 7,475 | $ | (7,509 | ) | $ | (34 | ) | |||||||||||
| 1 | Defined benefit obligations accrued are the actuarial present values of benefits attributed to employee services rendered to a particular date. |
| 2 | The interest income on the plan assets portion of the employee defined benefit plans net interest amount included in Financing costs reflects a rate of return on plan assets equal to the discount rate used in determining the defined benefit obligations accrued at the end of the immediately preceding fiscal year. |
| 3 | Excluding income taxes. |
| 4 | Financial assumptions in respect of plan assets (interest income on plan assets included in Financing costs reflects a rate of return on plan assets equal to the discount rate used in determining the defined benefit obligations accrued) and demographic assumptions in respect of the actuarial present values of the defined benefit obligations accrued, as at the end of the immediately preceding fiscal year for both. |
| 5 | The discount rate used to measure the defined benefit obligations accrued at September 30, 2024, was 4.59% (December 31, 2023 – 4.65%). |
| 6 | Effect of asset ceiling limit at September 30, 2024, was $1,155 (December 31, 2023 – $914). |
| 7 | Presented in the Consolidated statements of financial position as Other long-term assets |
| 8 | Presented in the Consolidated statements of financial position as Other long-term liabilities. |
|
|
September 30, 2024 | |
| notes to condensed interim consolidated financial statements | (unaudited) |
| (b) | Defined contribution plans – expense |
Our total defined contribution pension plan costs included as Employee benefits expense in the Consolidated statements of income and other comprehensive income are the amounts set out as follows:
| Periods ended | Three months | Nine months | ||||||||||||||
| September 30 (millions) | 2024 | 2023 | 2024 | 2023 | ||||||||||||
| Union pension plan and public service pension plan contributions | $ | 4 | $ | 5 | $ | 10 | $ | 13 | ||||||||
| Other defined contribution pension plans | 27 | 27 | 80 | 82 | ||||||||||||
| $ | 31 | $ | 32 | $ | 90 | $ | 95 | |||||||||
| 16 | restructuring and other costs |
| (a) | Details of restructuring and other costs |
With the objective of reducing ongoing costs, we incur associated incremental non-recurring restructuring costs, as discussed further in (b) following. We may also incur atypical charges when undertaking major or transformational changes to our business or operating models or post-acquisition business integration. In other costs, we include incremental atypical external costs incurred in connection with business acquisition or disposition activity; significant litigation costs in respect of losses or settlements; and adverse retrospective regulatory decisions.
Restructuring and other costs are presented in the Consolidated statements of income and other comprehensive income, as set out in the accompanying table.
| Periods ended | Three months | Nine months | ||||||||||||||
| September 30 (millions) | 2024 | 2023 | 2024 | 2023 | ||||||||||||
| Restructuring 1 (b) | ||||||||||||||||
| Goods and services purchased | $ | 25 | $ | 80 | $ | 163 | $ | 131 | ||||||||
| Employee benefits expense | 60 | 221 | 259 | 364 | ||||||||||||
| 85 | 301 | 422 | 495 | |||||||||||||
| Other (c) | ||||||||||||||||
| Goods and services purchased | 1 | 2 | 3 | 8 | ||||||||||||
| Employee benefits expense | — | — | — | 74 | ||||||||||||
| 1 | 2 | 3 | 82 | |||||||||||||
| Total | ||||||||||||||||
| Goods and services purchased | 26 | 82 | 166 | 139 | ||||||||||||
| Employee benefits expense | 60 | 221 | 259 | 438 | ||||||||||||
| $ | 86 | $ | 303 | $ | 425 | $ | 577 | |||||||||
| 1 | For the three-month and nine-month periods ended September 30, 2024, excludes real estate rationalization-related restructuring impairments of property, plant and equipment of $3 (2023 – $13) and $102 (2023 – $65), respectively, which are included in depreciation. |
| (b) | Restructuring provisions |
Employee-related provisions and other provisions, as presented in Note 25, include amounts in respect of restructuring activities. In 2024, restructuring activities included ongoing and incremental efficiency initiatives, some of which involved personnel-related costs and rationalization of real estate. These initiatives were intended to improve our long-term operating productivity and competitiveness.
| (c) | Other |
During the three-month and nine-month periods ended September 30, 2024, incremental external costs were incurred in connection with business acquisitions. In connection with business acquisitions, non-recurring atypical business integration expenditures that would be considered neither restructuring costs nor part of the fair value of the net assets acquired have been included in other costs.
|
|
|
| notes to condensed interim consolidated financial statements | (unaudited) |
| 17 | property, plant and equipment |
| Owned assets | Right-of-use lease assets (Note 19) | |||||||||||||||||||||||||||||||||
| (millions) | Network assets | Buildings and leasehold improvements | Computer hardware and other | Land | Assets under construction | Total | Network assets | Real estate | Other | Total | Total | |||||||||||||||||||||||
| AT COST | ||||||||||||||||||||||||||||||||||
| Balance as at January 1, 2024 | $ | 37,154 | $ | 3,830 | $ | 1,842 | $ | 83 | $ | 689 | $ | 43,598 | $ | 1,308 | $ | 2,386 | $ | 116 | $ | 3,810 | $ | 47,408 | ||||||||||||
| Additions | 694 | 20 | 33 | — | 609 | 1,356 | 360 | 206 | 25 | 591 | 1,947 | |||||||||||||||||||||||
| Additions arising from business acquisitions | — | — | 2 | — | — | 2 | — | 3 | — | 3 | 5 | |||||||||||||||||||||||
| Assets under construction put into service | 361 | 46 | 53 | — | (460 | ) | — | — | — | — | — | — | ||||||||||||||||||||||
| Transfers | 148 | 7 | 45 | — | — | 200 | (200 | ) | — | — | (200 | ) | — | |||||||||||||||||||||
| Dispositions, retirements and other | (1,183 | ) | (144 | ) | (133 | ) | (3 | ) | — | (1,463 | ) | 1 | (37 | ) | (24 | ) | (60 | ) | (1,523 | ) | ||||||||||||||
| Net foreign exchange differences | 3 | 6 | 21 | — | — | 30 | — | 16 | — | 16 | 46 | |||||||||||||||||||||||
| Balance as at September 30, 2024 | $ | 37,177 | $ | 3,765 | $ | 1,863 | $ | 80 | $ | 838 | $ | 43,723 | $ | 1,469 | $ | 2,574 | $ | 117 | $ | 4,160 | $ | 47,883 | ||||||||||||
| ACCUMULATED DEPRECIATION | ||||||||||||||||||||||||||||||||||
| Balance as at January 1, 2024 | $ | 25,254 | $ | 2,404 | $ | 1,226 | $ | — | $ | — | $ | 28,884 | $ | 172 | $ | 1,056 | $ | 48 | $ | 1,276 | $ | 30,160 | ||||||||||||
| Depreciation 1 | 1,177 | 135 | 145 | — | — | 1,457 | 143 | 280 | 15 | 438 | 1,895 | |||||||||||||||||||||||
| Transfers | 58 | 1 | 28 | — | — | 87 | (87 | ) | — | — | (87 | ) | — | |||||||||||||||||||||
| Dispositions, retirements and other | (1,194 | ) | (103 | ) | (76 | ) | — | — | (1,373 | ) | — | (26 | ) | (13 | ) | (39 | ) | (1,412 | ) | |||||||||||||||
| Net foreign exchange differences | 2 | 4 | 19 | — | — | 25 | — | 5 | — | 5 | 30 | |||||||||||||||||||||||
| Balance as at September 30, 2024 | $ | 25,297 | $ | 2,441 | $ | 1,342 | $ | — | $ | — | $ | 29,080 | $ | 228 | $ | 1,315 | $ | 50 | $ | 1,593 | $ | 30,673 | ||||||||||||
| NET BOOK VALUE | ||||||||||||||||||||||||||||||||||
| Balance as at December 31, 2023 | $ | 11,900 | $ | 1,426 | $ | 616 | $ | 83 | $ | 689 | $ | 14,714 | $ | 1,136 | $ | 1,330 | $ | 68 | $ | 2,534 | $ | 17,248 | ||||||||||||
| Balance as at September 30, 2024 | $ | 11,880 | $ | 1,324 | $ | 521 | $ | 80 | $ | 838 | $ | 14,643 | $ | 1,241 | $ | 1,259 | $ | 67 | $ | 2,567 | $ | 17,210 | ||||||||||||
| 1 | For nine-month periods ended September 30, 2024, depreciation includes $100 in respect of impairment of real estate right-of-use lease assets. |
As at September 30, 2024, our contractual commitments for the acquisition of property, plant and equipment totalled $309 million over a period ending December 31, 2027 (December 31, 2023 – $297 million over a period ending December 31, 2027).
|
|
September 30, 2024 | |
| 18 | intangible assets and goodwill |
| (a) | Intangible assets and goodwill, net |
| Intangible assets subject to amortization | Intangible assets with indefinite lives |
|||||||||||||||||||||||||||||||||||||
| (millions) | Note | Customer contracts, related customer relationships and subscriber base |
Software | Access
to rights-of-way, crowdsource assets and other |
Assets
under construction |
Total | Spectrum licences |
Total intangible assets |
Goodwill 1, 2 | Total intangible assets and goodwill |
||||||||||||||||||||||||||||
| AT COST | ||||||||||||||||||||||||||||||||||||||
| Balance as at January 1, 2024 | $ | 5,360 | $ | 7,915 | $ | 582 | $ | 530 | $ | 14,387 | $ | 12,250 | $ | 26,637 | $ | 10,422 | $ | 37,059 | ||||||||||||||||||||
| Additions | 33 | 81 | 38 | 613 | 765 | 919 | 1,684 | — | 1,684 | |||||||||||||||||||||||||||||
| Additions arising from business acquisitions | (b) | 143 | 13 | 3 | — | 159 | — | 159 | 203 | 362 | ||||||||||||||||||||||||||||
| Assets under construction put into service | — | 603 | — | (603 | ) | — | — | — | — | — | ||||||||||||||||||||||||||||
| Dispositions, retirements and other (including capitalized interest) | 9 | (14 | ) | (230 | ) | (6 | ) | — | (250 | ) | 12 | (238 | ) | — | (238 | ) | ||||||||||||||||||||||
| Net foreign exchange differences | 55 | 2 | 6 | — | 63 | — | 63 | 62 | 125 | |||||||||||||||||||||||||||||
| Balance as at September 30, 2024 | $ | 5,577 | $ | 8,384 | $ | 623 | $ | 540 | $ | 15,124 | $ | 13,181 | $ | 28,305 | $ | 10,687 | $ | 38,992 | ||||||||||||||||||||
| ACCUMULATED AMORTIZATION | ||||||||||||||||||||||||||||||||||||||
| Balance as at January 1, 2024 | $ | 1,533 | $ | 5,136 | $ | 247 | $ | — | $ | 6,916 | $ | — | $ | 6,916 | $ | 364 | $ | 7,280 | ||||||||||||||||||||
| Amortization | 354 | 708 | 68 | — | 1,130 | — | 1,130 | — | 1,130 | |||||||||||||||||||||||||||||
| Dispositions, retirements and other | (4 | ) | (257 | ) | (32 | ) | — | (293 | ) | — | (293 | ) | — | (293 | ) | |||||||||||||||||||||||
| Net foreign exchange differences | 14 | 7 | 5 | — | 26 | — | 26 | — | 26 | |||||||||||||||||||||||||||||
| Balance as at September 30, 2024 | $ | 1,897 | $ | 5,594 | $ | 288 | $ | — | $ | 7,779 | $ | — | $ | 7,779 | $ | 364 | $ | 8,143 | ||||||||||||||||||||
| NET BOOK VALUE | ||||||||||||||||||||||||||||||||||||||
| Balance as at December 31, 2023 | $ | 3,827 | $ | 2,779 | $ | 335 | $ | 530 | $ | 7,471 | $ | 12,250 | $ | 19,721 | $ | 10,058 | $ | 29,779 | ||||||||||||||||||||
| Balance as at September 30, 2024 | $ | 3,680 | $ | 2,790 | $ | 335 | $ | 540 | $ | 7,345 | $ | 13,181 | $ | 20,526 | $ | 10,323 | $ | 30,849 | ||||||||||||||||||||
| 1 | Accumulated amortization of goodwill is amortization recorded prior to 2002; there are no accumulated impairment losses in the accumulated amortization of goodwill. |
| 2 | As at September 30, 2024, relevant events and circumstances were such that it was considered appropriate to test the carrying value of the TELUS digital experience cash-generating unit (formerly the Digitally-led customer experiences – TELUS International cash-generating unit) goodwill. As at September 30, 2024, the recoverable amount of the TELUS digital experience cash-generating unit was in excess of its carrying amount by approximately $800 million (approximately 16% of its carrying amount). Such recoverable amount was determined based on a fair value less costs of disposal method (such method categorized as a Level 3 fair value measure) and used a discount rate of 9.3%, a perpetual growth rate of 3.0% and cash flow projections through the end of 2029. We validated the results of the recoverable amount through a market-comparable approach and an analytical review of industry facts and facts that are specific to us. |
The fair value less costs of disposal method uses discounted cash flow projections that employ the following key assumptions: future cash flows and growth projections; associated economic risk assumptions and estimates of the likelihood of achieving key operating metrics and drivers; and the future weighted average cost of capital. Had growth projections declined in the projection period by more than trivial amounts, or if the discount rate increased by more than a trivial amount, the September 30, 2024, estimate of the recoverable amount of the TELUS digital experience cash-generating unit would be less than its carrying amount; we believe that any reasonably possible change in other key assumptions on which our calculation of the recoverable amount of the TELUS digital experience cash-generating unit is based would not cause its carrying value to exceed its recoverable amount. If the future were to adversely differ from management’s best estimates for the key assumptions and associated cash flows were to be materially adversely affected, we could potentially experience future material impairment charges in respect of the TELUS digital experience cash-generating unit’s goodwill.
|
|
|
| notes to condensed interim consolidated financial statements | (unaudited) |
As at September 30, 2024, our contractual commitments for the acquisition of intangible assets totalled $21 million over a period ending December 31, 2026 (December 31, 2023 – $25 million over a period ending December 31, 2026).
The Innovation, Science and Economic Development Canada 3800 MHz band spectrum auction occurred during the period from October 24, 2023, through November 24, 2023. We were the successful auction participant for 1,430 spectrum licences with a total purchase price of $620 million. In accordance with the auction terms, 20% ($124 million) was remitted to Innovation, Science and Economic Development Canada on its due date, January 17, 2024, while the remaining balance was paid on May 29, 2024. Until such time as Innovation, Science and Economic Development Canada determines that we qualify as a radio communications carrier and comply with the Canadian Ownership and Control rules, we may not commercially use the licences.
During the three-month period ended June 30, 2024, we obtained the use of AWS-4 spectrum from the original licensee and we have accounted for it as an intangible asset with an indefinite life; such subordination of licences has been approved by Innovation, Science and Economic Development Canada. The terms of payment for the use of the spectrum are such that an initial amount of $298 million has been accounted for as a long-term liability, as set out in Note 26(f).
| (b) | Business acquisitions |
Individually immaterial transactions
During the nine-month period ended September 30, 2024, we acquired 100% ownership of businesses that were complementary to our existing lines of business. The primary factor that gave rise to the recognition of goodwill was the earnings capacity of the acquired businesses in excess of the net tangible and intangible assets acquired (such excess arising from the low level of tangible assets relative to the earnings capacity of the businesses). A portion of the amounts assigned to goodwill may be deductible for income tax purposes.
Acquisition-date fair values
Acquisition-date fair values assigned to the assets acquired and liabilities assumed are set out in the following table:
| (millions) | Individually immaterial transactions 1 | |||
| Assets | ||||
| Current assets | ||||
| Cash | $ | 8 | ||
| Accounts receivable 2 | 15 | |||
| Other | 10 | |||
| 33 | ||||
| Non-current assets | ||||
| Property plant and equipment | ||||
| Owned assets | 2 | |||
| Right-of-use lease assets | 3 | |||
| Intangible assets subject to amortization 3 | 159 | |||
| 164 | ||||
| Total identifiable assets acquired | 197 | |||
| Liabilities | ||||
| Current liabilities | ||||
| Accounts payable and accrued liabilities | 16 | |||
| Income and other taxes payable | 16 | |||
| Advance billings and customer deposits | 17 | |||
| Provisions | 7 | |||
| Current maturities of long-term debt | 1 | |||
| 57 | ||||
| Non-current liabilities | ||||
| Provisions | 1 | |||
| Long-term debt | 3 | |||
| Deferred income taxes | 29 | |||
| 33 | ||||
| Total liabilities assumed | 90 | |||
| Net identifiable assets acquired | 107 | |||
| Goodwill | 203 | |||
| Net assets acquired | $ | 310 | ||
| Acquisition effected by way of: | ||||
| Cash consideration | $ | 266 | ||
| Accounts payable and accrued liabilities | 5 | |||
| Provisions | 32 | |||
| Issue of TELUS Corporation Common Shares 4 | 7 | |||
| $ | 310 | |||
| 1 | The purchase price allocation, primarily in respect of customer contracts, related customer relationships and deferred income taxes, had not been finalized as of the date of issuance of these consolidated financial statements. As is customary in a business acquisition transaction, until the time of acquisition of control, we did not have full access to the books and records of the acquired businesses. Upon having sufficient time to review the books and records of the acquired businesses, we expect to finalize our purchase price allocations. |
| 2 | The fair value of accounts receivable is equal to the gross contractual amounts receivable and reflects the best estimate at the acquisition date of the contractual cash flows expected to be collected. |
| 3 | Customer contracts and customer relationships (including those related to customer contracts) are generally expected to be amortized over a period of 10-15 years, and other intangible assets are expected to be amortized over a period of 5-15 years. |
| 4 | The fair value of TELUS Corporation Common Shares was measured based upon market prices observed at the date of acquisition of control. |
|
|
September 30, 2024 | |
| notes to condensed interim consolidated financial statements | (unaudited) |
| 19 | leases |
Maturity analyses of lease liabilities are set out in Note 4(b) and Note 26(h); the period interest expense in respect thereof is set out in Note 9. The additions to, the depreciation charges for, and the carrying amounts of, right-of-use lease assets are set out in Note 17. We have not currently elected to exclude low-value and short-term leases from lease accounting.
| Three months | Nine months | |||||||||||||||
| Periods ended September 30 (millions) | 2024 | 2023 | 2024 | 2023 | ||||||||||||
| Income from subleasing right-of-use lease assets | ||||||||||||||||
| Co-location sublet revenue included in Operating revenues – service | $ | 4 | $ | 4 | $ | 13 | $ | 13 | ||||||||
| Other sublet revenue included in Other income (Note 7) | $ | 3 | $ | 1 | $ | 6 | $ | 4 | ||||||||
| Lease payments 1 | $ | 213 | $ | 170 | $ | 626 | $ | 489 | ||||||||
| 1 | In the Consolidated statements of cash flows the principal component of lease payments is included in Cash provided (used) by financing activities (see Note 31(b)) and the interest component of lease payments is included in Interest paid. |
| 20 | other long-term assets |
| As at (millions) | Note | September 30, 2024 | December 31, 2023 | ||||||||
| Pension assets | 15 | $ | 316 | $ | 316 | ||||||
| Unbilled customer finance receivables | 4(a) | 560 | 637 | ||||||||
| Derivative assets | 4(d) | 4 | 179 | ||||||||
| Deferred income taxes | 53 | 38 | |||||||||
| Costs incurred to obtain or fulfill contracts with customers | 274 | 218 | |||||||||
| Real estate joint venture advances | 21(a) | 94 | 94 | ||||||||
| Investments in real estate joint ventures | 21(a) | 182 | 50 | ||||||||
| Investments in associates | 21(b) | 211 | 232 | ||||||||
| Portfolio investments 1 | |||||||||||
| At fair value through net income | 63 | 42 | |||||||||
| At fair value through other comprehensive income | 567 | 502 | |||||||||
| Prepaid maintenance | 41 | 46 | |||||||||
| Refundable security deposits and other | 161 | 139 | |||||||||
| $ | 2,526 | $ | 2,493 | ||||||||
| 1 | Fair value measured at reporting date using significant other observable inputs (Level 2). |
The costs incurred to obtain and fulfill contracts with customers are set out in the following table:
| Costs incurred to | ||||||||||||
| (millions) | Obtain
contracts with customers |
Fulfill
contracts with customers |
Total | |||||||||
| Balance as at July 1, 2024 | $ | 521 | $ | 51 | $ | 572 | ||||||
| Additions | 118 | 9 | 127 | |||||||||
| Amortization | (89 | ) | (2 | ) | (91 | ) | ||||||
| Balance as at September 30, 2024 | $ | 550 | $ | 58 | $ | 608 | ||||||
| Balance as at January 1, 2024 | $ | 476 | $ | 39 | $ | 515 | ||||||
| Additions | 329 | 26 | 355 | |||||||||
| Amortization | (255 | ) | (7 | ) | (262 | ) | ||||||
| Balance as at September 30, 2024 | $ | 550 | $ | 58 | $ | 608 | ||||||
| Current 1 | $ | 318 | $ | 16 | $ | 334 | ||||||
| Non-current | 232 | 42 | 274 | |||||||||
| $ | 550 | $ | 58 | $ | 608 | |||||||
| 1 | Presented in the Consolidated statements of financial position as Prepaid expenses. |
|
|
|
| notes to condensed interim consolidated financial statements | (unaudited) |
| 21 | real estate joint ventures and investments in associates |
| (a) | Real estate joint ventures |
In 2013, we partnered, as equals, with two arm’s-length parties in TELUS Sky, a residential and commercial real estate redevelopment project in Calgary, Alberta. The new-build tower, completed in 2020, was built to the Leadership in Energy and Environmental Design (LEED) Platinum standard for the commercial portion and the Gold standard for the residential portion. During the year ended December 31, 2023, the TELUS Sky real estate joint venture entered into an agreement to sell the income-producing properties and the related net assets to the venture partners; the two arm’s-length parties will purchase the residential parcel and we will purchase the commercial parcel. Timing for the closing of these sales and purchases is dependent upon timing for the subdivision of the parcels, as well as other customary closing conditions.
In 2024 and 2023, we partnered, as equals, with an arm’s-length party in real estate redevelopment projects in British Columbia.
Summarized financial information
| Three months | Nine months | |||||||||||||||
| Periods ended September 30 (millions)1 | 2024 | 2023 | 2024 | 2023 | ||||||||||||
| Revenue | $ | 6 | $ | 7 | $ | 19 | $ | 20 | ||||||||
| Depreciation and amortization 1 | $ | — | $ | 2 | $ | — | $ | 6 | ||||||||
| Interest expense | $ | — | $ | 2 | $ | 5 | $ | 7 | ||||||||
| Net income (loss) and comprehensive income (loss) 2 | $ | (4 | ) | $ | (5 | ) | $ | (11 | ) | $ | (16 | ) | ||||
| 1 | Substantially all information summarized in this table is in respect of operations held for sale. Depreciation and amortization of the TELUS Sky investment property ceased upon its classification as held for sale. |
| 2 | As the real estate joint ventures are partnerships, no provision is made for income taxes in respect of the partners in determining the real estate joint ventures’ net income and comprehensive income. |
| As at (millions) | September 30, 2024 | December 31, 2023 | ||||||
| ASSETS | ||||||||
| Current assets | ||||||||
| Cash and temporary investments, net | $ | 5 | $ | 5 | ||||
| Other | 28 | 29 | ||||||
| 33 | 34 | |||||||
| Non-current assets | ||||||||
| Investment property 1 | 324 | 326 | ||||||
| Investment property under development | 326 | 81 | ||||||
| Promissory notes and other 2 | 318 | 90 | ||||||
| 968 | 497 | |||||||
| $ | 1,001 | $ | 531 | |||||
| LIABILITIES AND OWNERS’ EQUITY | ||||||||
| Current liabilities | ||||||||
| Accounts payable and accrued liabilities | $ | 5 | $ | 8 | ||||
| Construction credit facilities 1 | 282 | 282 | ||||||
| 287 | 290 | |||||||
| Non-current liabilities | ||||||||
| Long-term debt – mortgage | 12 | — | ||||||
| 299 | 290 | |||||||
| Owners’ equity | ||||||||
| TELUS 2 | 338 | 108 | ||||||
| Other partners 3 | 364 | 133 | ||||||
| 702 | 241 | |||||||
| $ | 1,001 | $ | 531 | |||||
| 1 | Classified as held for sale as at September 30, 2024, and December 31, 2023. |
| 2 | Other partners’ equity is gross of $308 (December 31, 2023 – $80) promissory notes issued to the joint ventures by the arm’s-length party in the real estate redevelopment projects in British Columbia; in the event of dissolution or other wind-up of the partnerships, the other partner’s equity will first be reduced by the promissory notes’ amounts outstanding when determining the equity of the joint ventures. The primary intended method of repayment of the promissory notes is through contribution of in-kind development costs, but may optionally include cash payments. |
| 3 | The equity amounts recorded by the real estate joint ventures differ from those recorded by us by the amount of the deferred gains on our real estate contributed and the valuation provision we have recorded in excess of that recorded by the real estate joint venture. |
|
|
September 30, 2024 | |
| notes to condensed interim consolidated financial statements | (unaudited) |
Our real estate joint ventures activity
Our real estate joint ventures investment activity is set out in the following tables.
| (millions) | Loans and receivables 1 | Equity 2 | ||||||
| Balance as at July 1, 2023 | $ | 114 | $ | (8 | ) | |||
| Related to real estate joint ventures’ statements of income and other comprehensive income | ||||||||
| Comprehensive income (loss) attributable to us 3 | — | (2 | ) | |||||
| Related to real estate joint ventures’ statements of financial position | ||||||||
| Items not affecting currently reported cash flows | ||||||||
| Construction credit facilities financing costs charged by us (Note 7) | 1 | — | ||||||
| Reduction in construction credit facility and increase in capital contributed | (20 | ) | 20 | |||||
| Our real estate contributed | — | 20 | ||||||
| Deferred gains on our remaining interests in our real estate contributed | — | (9 | ) | |||||
| Cash flows in the current reporting period | ||||||||
| Construction credit facilities | ||||||||
| Financing costs paid to us | (1 | ) | — | |||||
| Funds we advanced or contributed, excluding construction credit facilities | — | 2 | ||||||
| Balance as at September 30, 2023 | $ | 94 | $ | 23 | ||||
| Balance as at July 1, 2024 | $ | 94 | $ | 117 | ||||
| Related to real estate joint ventures’ statements of income and other comprehensive income | ||||||||
| Comprehensive income (loss) attributable to us 3 | — | (1 | ) | |||||
| Related to real estate joint ventures’ statements of financial position | ||||||||
| Items not affecting currently reported cash flows | ||||||||
| Construction credit facilities financing costs charged by us (Note 7) | 2 | — | ||||||
| Our real estate contributed | — | 111 | ||||||
| Deferred gains on our remaining interests in our real estate contributed | — | (49 | ) | |||||
| Cash flows in the current reporting period | ||||||||
| Construction credit facilities | ||||||||
| Financing costs paid to us | (2 | ) | — | |||||
| Funds we advanced or contributed, excluding construction credit facilities | — | 4 | ||||||
| Balance as at September 30, 2024 | $ | 94 | $ | 182 | ||||
| (millions) | Loans and receivables 1 | Equity 2 | ||||||
| Balance as at January 1, 2023 | $ | 114 | $ | (8 | ) | |||
| Related to real estate joint ventures’ statements of income and other comprehensive income | ||||||||
| Comprehensive income (loss) attributable to us 3 | — | (4 | ) | |||||
| Related to real estate joint ventures’ statements of financial position | ||||||||
| Items not affecting currently reported cash flows | ||||||||
| Construction credit facilities financing costs charged by us (Note 7) | 5 | — | ||||||
| Reduction in construction credit facility and increase in capital contributed | (20 | ) | 20 | |||||
| Our real estate contributed | — | 20 | ||||||
| Deferred gains on our remaining interests in our real estate contributed | — | (9 | ) | |||||
| Cash flows in the current reporting period | ||||||||
| Construction credit facilities | ||||||||
| Financing costs paid to us | (5 | ) | — | |||||
| Funds we advanced or contributed, excluding construction credit facilities | — | 4 | ||||||
| Balance as at September 30, 2023 | $ | 94 | $ | 23 | ||||
| Balance as at January 1, 2024 | $ | 94 | $ | 50 | ||||
| Related to real estate joint ventures’ statements of income and other comprehensive income | ||||||||
| Comprehensive income (loss) attributable to us 3 | — | (3 | ) | |||||
| Related to real estate joint ventures’ statements of financial position | ||||||||
| Items not affecting currently reported cash flows | ||||||||
| Construction credit facilities financing costs charged by us (Note 7) | 5 | — | ||||||
| Our real estate contributed | — | 225 | ||||||
| Deferred gains on our remaining interests in our real estate contributed | — | (100 | ) | |||||
| Cash flows in the current reporting period | ||||||||
| Construction credit facilities | ||||||||
| Financing costs paid to us | (5 | ) | — | |||||
| Funds we advanced or contributed, excluding construction credit facilities | — | 10 | ||||||
| Balance as at September 30, 2024 | $ | 94 | $ | 182 | ||||
| 1 | Loans and receivables are included in our Consolidated statements of financial position as Other long-term assets (see Note 20) and are comprised of advances under construction credit facilities. |
| 2 | We account for our interests in the real estate joint ventures using the equity method of accounting and such interests are included in our Consolidated statements of financial position as Other long-term assets (see Note 20). |
| 3 | As the real estate joint ventures are partnerships, no provision is made for income taxes in respect of the partners in determining the real estate joint ventures’ net income and comprehensive income. |
|
|
|
| notes to condensed interim consolidated financial statements | (unaudited) |
We have entered into lease agreements with the TELUS Sky real estate joint venture. During the three-month and nine-month periods ended September 30, 2024, the TELUS Sky real estate joint venture recognized $2 million (2023 – $3 million) and $6 million (2023 – $7 million), respectively, of revenue from our office tenancy; of this amount, as at the statement of financial position date, one-third was due to our economic interest and two-thirds was due to our partners’ economic interests.
Construction credit facilities
The TELUS Sky real estate joint venture had a credit agreement, maturing December 2, 2024 (December 31, 2023 – July 12, 2025), with Canadian financial institutions and others (as 66-2/3% lenders) and TELUS Corporation (as 33-1/3% lender), that provides $282 million (December 31, 2023 – $282 million) of construction financing for the project. The construction credit facilities contain customary real estate construction financing representations, warranties and covenants and are secured by demand debentures constituting first fixed and floating charge mortgages over the underlying real estate assets. The construction credit facilities are available by way of bankers’ acceptance or prime loan and bear interest at rates in line with similar construction financing facilities.
| (b) | Investments in associates |
As set out in Note 20, our investments in associates are included in our Consolidated statements of financial position as Other long-term assets. As at September 30, 2024, and December 31, 2023, we had an equity interest in Miovision Technologies Incorporated, an associate that is incorporated in Canada and is complementary to, and is viewed to grow, our existing Internet of Things business; our judgment is that we obtained significant influence over the associate concurrent with acquiring our initial equity interest. Miovision Technologies Incorporated is developing a suite of hardware and cloud-based solutions that provide cities with the data and tools they need to reduce traffic congestion, make better urban planning decisions and improve safety on their roads. Our aggregate interests in other individually immaterial associates as at September 30, 2024, totalled $36 million (December 31, 2023 – $48 million).
| Miovision Technologies Incorporated | ||||||||||||
| As at, or for the periods ended, ($ in millions) | September 30, 2024 | September 30, 2023 | December 31, 2023 | |||||||||
| Statement of financial position 1 | ||||||||||||
| Current assets | $ | 84 | $ | 109 | ||||||||
| Non-current assets | $ | 413 | $ | 395 | ||||||||
| Current liabilities | $ | 32 | $ | 40 | ||||||||
| Non-current liabilities | $ | 62 | $ | 43 | ||||||||
| Net assets | $ | 403 | $ | 421 | ||||||||
| Statement of income and other comprehensive income 1 | ||||||||||||
| THREE-MONTH | ||||||||||||
| Revenue and other income | $ | 42 | $ | 35 | ||||||||
| Net income (loss) and comprehensive income (loss) | $ | (6 | ) | $ | (6 | ) | ||||||
| NINE-MONTH | ||||||||||||
| Revenue and other income | $ | 115 | $ | 88 | ||||||||
| Net income (loss) and comprehensive income (loss) | $ | (24 | ) | $ | (22 | ) | ||||||
| Reconciliation of statement of financial position summary financial information to carrying amounts | ||||||||||||
| Net assets (above) | $ | 403 | $ | 421 | ||||||||
| Our interest | 43.4 | % | 43.5 | % | ||||||||
| Our interest in net assets (our carrying amount) | $ | 175 | $ | 184 |
| 1 | As required by IFRS-IASB, this summarized information is not just our share of these amounts. |
| 22 | short-term borrowings |
On May 22, 2024, we entered into an agreement with an arm’s-length securitization trust associated with a major Schedule I bank under which we are currently able to borrow, up to a maximum of $1.6 billion, secured by $2.0 billion of certain trade receivables and unbilled customer finance receivables; the term of this revolving period securitization agreement ends May 22, 2027, and requires minimum cash advances of $920 million. Funding under the agreement may be provided in either Canadian dollars or U.S. dollars. Foreign currency forward contracts are used to manage currency risk associated from funding denominated in U.S. dollars.
|
|
September 30, 2024 | |
| notes to condensed interim consolidated financial statements | (unaudited) |
The new agreement replaced a previous agreement with an arm’s-length securitization trust associated with a major Schedule I bank under which we were able to sell an interest in certain trade receivables up to a maximum of $0.6 billion and which was otherwise due to end December 31, 2024. The previous securitization agreement required minimum cash proceeds of $100 million from monthly sales of interests in certain trade receivables. In the previous agreement, sales of trade receivables in securitization transactions were recognized as collateralized short-term borrowings and thus did not result in our de-recognition of the trade receivables sold. When we sold our trade receivables, we retained reserve accounts, which were retained interests in the securitized trade receivables, and servicing rights. As at December 31, 2023, we had sold to the current trust (but continued to recognize) trade receivables of $121 million.
Short-term borrowings of $0.9 billion (December 31, 2023 – $0.1 billion for the previous trust) are comprised of amounts advanced to us by the arm’s-length securitization trust; all amounts advanced as at September 30, 2024, were denominated in U.S. dollars.
The balance of short-term borrowings (if any) is comprised of amounts drawn on bilateral bank facilities and/or other.
| 23 | accounts payable and accrued liabilities |
| As at (millions) | September 30, 2024 | December 31, 2023 | ||||||
| Trade accounts payable 1 | $ | 1,016 | $ | 996 | ||||
| Accrued liabilities | 1,338 | 1,342 | ||||||
| Payroll and other employee-related liabilities | 691 | 674 | ||||||
| Interest payable | 239 | 235 | ||||||
| Indirect taxes payable and other | 135 | 144 | ||||||
| $ | 3,419 | $ | 3,391 | |||||
| 1 | The composition of trade accounts payable varies due to factors that include suppliers’ invoice timing, our data processing cycle timing and the seasonal nature of some of business activities, as well as whether the statement of financial position date is a business day. Trade accounts payable represent future payments for invoices received in respect of both operating and capital activities, and may include amounts for assessed and self-assessed government remittances. |
Initiated in 2023, we have a supply chain financing program that allows suppliers of qualifying trade accounts payable to choose to be paid in advance of industry-standard payment terms by an arm’s-length third party; in turn, we reimburse the arm’s-length third party for those payments when the trade accounts payable would otherwise have been due.
| 24 | advance billings and customer deposits |
| As at (millions) | September 30, 2024 | December 31,
2023 |
||||||
| Advance billings | $ | 734 | $ | 718 | ||||
| Deferred customer activation and connection fees | 3 | 3 | ||||||
| Customer deposits | 15 | 15 | ||||||
| Contract liabilities | 752 | 736 | ||||||
| Other | 198 | 235 | ||||||
| $ | 950 | $ | 971 | |||||
Contract liabilities represent our future performance obligations to customers in respect of services and/or equipment for which we have received consideration from the customer or for which an amount is due from the customer. Our contract liability balances, and the changes in those balances, are set out in the following table:
|
|
|
| notes to condensed interim consolidated financial statements | (unaudited) |
| Three months | Nine months | |||||||||||||||
| Periods ended September 30 (millions) | 2024 | 2023 | 2024 | 2023 | ||||||||||||
| Balance, beginning of period | $ | 1,049 | $ | 974 | $ | 974 | $ | 914 | ||||||||
| Revenue deferred in previous period and recognized in current period | (667 | ) | (669 | ) | (632 | ) | (625 | ) | ||||||||
| Net additions arising from operations | 627 | 671 | 651 | 680 | ||||||||||||
| Additions arising from business acquisitions | 1 | — | 17 | 7 | ||||||||||||
| Balance, end of period | $ | 1,010 | $ | 976 | $ | 1,010 | $ | 976 | ||||||||
| Current | $ | 901 | $ | 873 | ||||||||||||
| Non-current (Note 27) | ||||||||||||||||
| Deferred revenues | 105 | 97 | ||||||||||||||
| Deferred customer activation and connection fees | 4 | 6 | ||||||||||||||
| $ | 1,010 | $ | 976 | |||||||||||||
| Reconciliation of contract liabilities presented in the Consolidated statements of financial position – current | ||||||||||||||||
| Gross contract liabilities | $ | 901 | $ | 873 | ||||||||||||
| Reclassification to contract assets of contracts with contract liabilities less than contract assets (Note 6(c)) | (131 | ) | (131 | ) | ||||||||||||
| Reclassification from contract assets of contracts with contract assets less than contract liabilities (Note 6(c)) | (18 | ) | (16 | ) | ||||||||||||
| $ | 752 | $ | 726 | |||||||||||||
|
|
September 30, 2024 | |
| notes to condensed interim consolidated financial statements | (unaudited) |
| 25 | provisions |
| (millions) | Note | Asset retirement obligations 1 |
Employee- related 2 |
Written
put options and contingent consideration 3 |
Other 2 | Total | ||||||||||||||||
| Balance as at July 1, 2024 | $ | 380 | $ | 118 | $ | 210 | $ | 269 | $ | 977 | ||||||||||||
| Additions | — | 67 | 8 | 27 | 102 | |||||||||||||||||
| Reversals | — | (7 | ) | (10 | ) | — | (17 | ) | ||||||||||||||
| Uses | (2 | ) | (49 | ) | — | (43 | ) | (94 | ) | |||||||||||||
| Interest effects 4 | 9 | 3 | — | 4 | — | 7 | ||||||||||||||||
| Effects of foreign exchange, net 4 | — | — | (4 | ) | — | (4 | ) | |||||||||||||||
| Balance as at September 30, 2024 | $ | 381 | $ | 129 | $ | 208 | $ | 253 | $ | 971 | ||||||||||||
| Balance as at January 1, 2024 | $ | 378 | $ | 219 | $ | 276 | $ | 188 | $ | 1,061 | ||||||||||||
| Additions | — | 261 | 8 | 203 | 472 | |||||||||||||||||
| Reversals | — | (7 | ) | (92 | ) | (10 | ) | (109 | ) | |||||||||||||
| Uses | (8 | ) | (344 | ) | — | (128 | ) | (480 | ) | |||||||||||||
| Interest effects 4 | 9 | 11 | — | 11 | — | 22 | ||||||||||||||||
| Effects of foreign exchange, net 4 | — | — | 5 | — | 5 | |||||||||||||||||
| Balance as at September 30, 2024 | $ | 381 | $ | 129 | $ | 208 | $ | 253 | $ | 971 | ||||||||||||
| Current | $ | 17 | $ | 124 | $ | 5 | $ | 89 | $ | 235 | ||||||||||||
| Non-current | 364 | 5 | 203 | 164 | 736 | |||||||||||||||||
| Balance as at September 30, 2024 | $ | 381 | $ | 129 | $ | 208 | $ | 253 | $ | 971 | ||||||||||||
| 1 | Additions and reversals for Asset retirement obligations are included in the Consolidated statements of financial position as Property, plant and equipment, net. Uses, to the extent that such items includes a flow of cash, are included net in Cash used by investing activities in the Consolidated statements of cash flows (see Note 31(a)). |
| 2 | Generally, additions and reversals for Employee-related and Other are included in the Consolidated statements of income and other comprehensive income as Employee benefits expense and Goods and services purchased, respectively. Uses, to the extent that such items include a flow of cash, are generally included net in Cash provided by operating activities in the Consolidated statements of cash flows. |
| 3 | Additions and reversals for Written put options and contingent consideration are included in the Consolidated statements of financial position as Goodwill, net, and in the Consolidated statements of income and other comprehensive income as Other income, respectively. Uses, to the extent that such items include a flow of cash, are included in Cash used by investing activities in the Consolidated statements of cash flows. |
| 4 | Interest effects and Effects of foreign exchange, net, are included in the Consolidated statements of income and other comprehensive income as Financing costs. |
Asset retirement obligations
We establish provisions for liabilities associated with the retirement of property, plant and equipment when those obligations result from the acquisition, construction, development and/or normal operation of the assets. We expect that the associated cash outflows in respect of the balance accrued as at the financial statement date will occur proximate to the dates these assets are retired.
Employee-related
Our employee-related provisions are largely in respect of restructuring activities (as discussed further in Note 16(b)). The timing of the associated cash outflows in respect of the balance accrued as at the financial statement date is substantially short-term in nature.
Written put options and contingent consideration
In connection with certain business acquisitions, we have established provisions for written put options in respect of non-controlling interests. Provisions for some written put options are determined based on the net present value of estimated future earnings, and such provisions require us to make key economic assumptions about the future. Similarly, we have established provisions for contingent consideration. No cash outflows in respect of the written put options are expected prior to their initial exercisability, and no cash outflows in respect of contingent consideration are expected prior to completion of the periods during which the contingent consideration can be earned; in some instances, settlement of the provision for written put options may include the use of equity instruments.
Other
The provisions for other include: legal claims; rationalization of real estate and other non-employee-related restructuring activities; and contract termination costs and onerous contracts related to business acquisitions. Other than as set out following, we expect that the associated cash outflows in respect of the balance accrued as at the financial statement date will occur over an indeterminate multi-year period.
|
|
|
| notes to condensed interim consolidated financial statements | (unaudited) |
As discussed further in Note 29, we are involved in a number of legal claims and we are aware of certain other possible legal claims. In respect of legal claims, we establish provisions, when warranted, after taking into account legal assessments, information presently available, and the expected availability of recourse. The timing of cash outflows associated with legal claims cannot be reasonably determined.
In connection with business acquisitions, we have established provisions for contract termination costs and onerous contracts acquired.
| 26 | long-term debt |
| (a) | Details of long-term debt |
| As at (millions) | Note | September 30, 2024 |
December 31, 2023 |
||||||||
| Senior unsecured | |||||||||||
| TELUS Corporation senior notes | (b) | $ | 21,783 | $ | 20,301 | ||||||
| TELUS Corporation commercial paper | (c) | 1,063 | 1,021 | ||||||||
| TELUS Corporation credit facilities | (d) | — | 1,144 | ||||||||
| TELUS Communications Inc. debentures | 200 | 200 | |||||||||
| Secured | |||||||||||
| TELUS International (Cda) Inc. credit facility | (e) | 1,654 | 1,781 | ||||||||
| Other | (f) | 597 | 288 | ||||||||
| 25,297 | 24,735 | ||||||||||
| Lease liabilities | (g) | 2,703 | 2,614 | ||||||||
| Long-term debt | $ | 28,000 | $ | 27,349 | |||||||
| Current | $ | 2,613 | $ | 3,994 | |||||||
| Non-current | 25,387 | 23,355 | |||||||||
| Long-term debt | $ | 28,000 | $ | 27,349 | |||||||
| (b) | TELUS Corporation senior notes |
The notes are senior unsecured and unsubordinated obligations and rank equally in right of payment with all of our existing and future unsecured unsubordinated obligations, are senior in right of payment to all of our existing and future subordinated indebtedness, and are effectively subordinated to all existing and future obligations of, or guaranteed by, our subsidiaries. The indentures governing the notes contain covenants that, among other things, place limitations on our ability, and the ability of certain of our subsidiaries, to: grant security in respect of indebtedness; enter into sale-leaseback transactions; and incur new indebtedness.
Interest is payable semi-annually. The notes require us to make an offer to repurchase them at a price equal to 101% of their principal amount plus accrued and unpaid interest to the date of repurchase upon the occurrence of a change in control triggering event, as defined in the supplemental trust indenture.
At any time prior to the respective maturity dates set out in the table below, the notes issued prior to September 2023 are redeemable at our option, in whole at any time, or in part from time to time, on not fewer than 30 days’ and not more than 60 days’ prior notice; for notes issued subsequent to August 2023, the notice period is not fewer than 10 days’ and not more than 60 days’ prior notice. On or after the respective redemption present value spread cessation dates set out in the table below, the notes issued prior to September 2023 are redeemable at our option, in whole but not in part, on not fewer than 30 days’ and not more than 60 days’ prior notice, at redemption prices equal to 100% of the principal amounts thereof; for notes issued subsequent to August 2023, the notice period is not fewer than 10 days’ and not more than 60 days’ prior notice. In addition, accrued and unpaid interest, if any, will be paid to the date fixed for redemption.
|
|
September 30, 2024 | |
| notes to condensed interim consolidated financial statements | (unaudited) |
| Principal face amount | Redemption
present value spread |
||||||||||||||||
| Series | Issued | Maturity | Issue price | Effective
interest rate 1 |
Originally issued |
Outstanding at financial statement date |
Basis
points 2 |
Cessation date |
|||||||||
| 3.35% Notes, Series CK | April 2013 | April 2024 | $994.35 | 3.41 | % | $1.1 billion | $NIL | 36 | Jan. 2, 2024 | ||||||||
| 3.75% Notes, Series CQ | September 2014 | January 2025 | $997.75 | 3.78 | % | $800 million | $800 million | 38.5 | Oct. 17, 2024 | ||||||||
| 3.75% Notes, Series CV | December 2015 | March 2026 | $992.14 | 3.84 | % | $600 million | $600 million | 53.5 | Dec. 10, 2025 | ||||||||
| 2.75% Notes, Series CZ | July 2019 | July 2026 | $998.73 | 2.77 | % | $800 million | $800 million | 33 | May 8, 2026 | ||||||||
| 2.80% U.S. Dollar Notes 3 | September 2016 | February 2027 | US$991.89 | 2.89 | % | US$600 million | US$600 million | 20 | Nov. 16, 2026 | ||||||||
| 3.70% U.S. Dollar Notes 3 | March 2017 | September 2027 | US$998.95 | 3.71 | % | US$500 million | US$500 million | 20 | June 15, 2027 | ||||||||
| 2.35% Notes, Series CAC | May 2020 | January 2028 | $997.25 | 2.39 | % | $600 million | $600 million | 48 | Nov. 27, 2027 | ||||||||
| 3.625% Notes, Series CX | March 2018 | March 2028 | $989.49 | 3.75 | % | $600 million | $600 million | 37 | Dec. 1, 2027 | ||||||||
| 4.80% Notes, Series CAO | February 2024 | December 2028 | $998.95 | 4.83 | % | $700 million | $700 million | 28 | Nov. 15, 2028 | ||||||||
| 3.30% Notes, Series CY | April 2019 | May 2029 | $991.75 | 3.40 | % | $1.0 billion | $1.0 billion | 43.5 | Feb. 2, 2029 | ||||||||
| 5.00% Notes, Series CAI | September 2022 | September 2029 | $995.69 | 5.07 | % | $350 million | $350 million | 46.5 | July 13, 2029 | ||||||||
| 3.15% Notes, Series CAA | December 2019 | February 2030 | $996.49 | 3.19 | % | $600 million | $600 million | 39.5 | Nov. 19, 2029 | ||||||||
| 5.60% Notes, Series CAM | September 2023 | September 2030 | $998.85 | 5.62 | % | $500 million | $500 million | 46 | July 9, 2030 | ||||||||
| 2.05% Notes, Series CAD | October 2020 | October 2030 | $997.93 | 2.07 | % | $500 million | $500 million | 38 | July 7, 2030 | ||||||||
| 4.95% Notes, Series CAP | February 2024 | February 2031 | $997.07 | 5.00 | % | $600 million | $600 million | 34.5 | Dec. 18, 2030 | ||||||||
| 4.65% Notes, Series CAQ | August 2024 | August 2031 | $999.11 | 4.66% | $700 million | $700 million | 38.5 | June 13, 2031 | |||||||||
| 2.85% Sustainability-Linked Notes, Series CAF | June 2021 | November 2031 | $997.52 | 2.88 | %4 | $750 million | $750 million | 34 | Aug. 13, 2031 | ||||||||
| 3.40% U.S. Dollar Sustainability-Linked Notes 3 | February 2022 | May 2032 | US$997.13 | 3.43 | %4 | US$900 million | US$900 million | 25 | Feb. 13, 2032 | ||||||||
| 5.25% Sustainability-Linked Notes, Series CAG | September 2022 | November 2032 | $996.73 | 5.29 | %4 | $1.1 billion | $1.1 billion | 51.5 | Aug. 15, 2032 | ||||||||
| 4.95% Sustainability-Linked Notes, Series CAJ | March 2023 | March 2033 | $998.28 | 4.97 | %4 | $500 million | $500 million | 54.5 | Dec. 28, 2032 | ||||||||
| 5.75% Sustainability-Linked Notes, Series CAK | September 2023 | September 2033 | $997.82 | 5.78 | %4 | $850 million | $850 million | 52 | June 8, 2033 | ||||||||
| 5.10% Sustainability-Linked Notes, Series CAN | February 2024 | February 2034 | $996.44 | 5.15 | %4 | $500 million | $500 million | 38.5 | Nov. 15, 2033 | ||||||||
| 4.40% Notes, Series CL | April 2013 | April 2043 | $997.68 | 4.41 | % | $600 million | $600 million | 47 | Oct. 1, 2042 | ||||||||
| 5.15% Notes, Series CN | November 2013 | November 2043 | $995.00 | 5.18 | % | $400 million | $400 million | 50 | May 26, 2043 | ||||||||
| 4.85% Notes, Series CP | Multiple 5 | April 2044 | $987.91 5 | 4.93 | % 5 | $500 million 5 | $900 million 5 | 46 | Oct. 5, 2043 | ||||||||
| 4.75% Notes, Series CR | September 2014 | January 2045 | $992.91 | 4.80 | % | $400 million | $400 million | 51.5 | July 17, 2044 | ||||||||
| 4.40% Notes, Series CU | March 2015 | January 2046 | $999.72 | 4.40 | % | $500 million | $500 million | 60.5 | July 29, 2045 | ||||||||
| 4.70% Notes, Series CW | Multiple 6 | March 2048 | $998.06 6 | 4.71 | % 6 | $325 million 6 | $475 million 6 | 58.5 | Sept. 6, 2047 | ||||||||
| 4.60% U.S. Dollar Notes 3 | June 2018 | November 2048 | US$987.60 | 4.68 | % | US$750 million | US$750 million | 25 | May 16, 2048 | ||||||||
| 4.30% U.S. Dollar Notes 3 | May 2019 | June 2049 | US$990.48 | 4.36 | % | US$500 million | US$500 million | 25 | Dec. 15, 2048 | ||||||||
| 3.95% Notes, Series CAB | Multiple 7 | February 2050 | $997.54 7 | 3.97 | % 7 | $400 million 7 | $800 million 7 | 57.5 | Aug. 16, 2049 | ||||||||
| 4.10% Notes, Series CAE | April 2021 | April 2051 | $994.70 | 4.13 | % | $500 million | $500 million | 53 | Oct. 5, 2050 | ||||||||
| 5.65% Notes, Series CAH | September 2022 | September 2052 | $996.13 | 5.68 | % | $550 million | $550 million | 61.5 | Mar. 13, 2052 | ||||||||
| 5.95% Notes, Series CAL | September 2023 | September 2053 | $992.67 | 6.00 | % | $400 million | $400 million | 61.5 | Mar. 8, 2053 | ||||||||
| 1 | The effective interest rate is that which the notes would yield to an initial debt holder if held to maturity and, in respect of sustainability-linked notes, no trigger events or MFN step-ups occur. |
| 2 | For Canadian dollar-denominated notes, the redemption price is equal to the greater of (i) the present value of the notes discounted at the Government of Canada yield plus the redemption present value spread calculated over the period to the redemption present value spread cessation date, or (ii) 100% of the principal amount thereof. |
| For U.S. dollar-denominated notes, the redemption price is equal to the greater of (i) the present value of the notes discounted at the U.S. Adjusted Treasury Rate (at the U.S. Treasury Rate for the 3.40% U.S. Dollar Sustainability-Linked Notes) plus the redemption present value spread calculated over the period to the redemption present value spread cessation date, or (ii) 100% of the principal amount thereof. |
| 3 | We have entered into foreign exchange derivatives (cross currency interest rate exchange agreements) that effectively convert the principal payments and interest obligations to Canadian dollar obligations as follows: |
| Series | Interest rate fixed at |
Canadian dollar equivalent principal |
Exchange rate |
|||||||
| 2.80% U.S. Dollar Notes | 2.95 | % | $792 million | $1.3205 | ||||||
| 3.70% U.S. Dollar Notes | 3.41 | % | $667 million | $1.3348 | ||||||
| 3.40% U.S. Dollar Sustainability-Linked Notes | 3.89 | % | $1,148 million | $1.2753 | ||||||
| 4.60% U.S. Dollar Notes | 4.41 | % | $974 million | $1.2985 | ||||||
| 4.30% U.S. Dollar Notes | 4.27 | % | $672 million | $1.3435 | ||||||
|
|
|
| notes to condensed interim consolidated financial statements | (unaudited) |
| 4 | If we have not obtained a sustainability performance target verification assurance certificate for the fiscal year ended December 31, 2030, the sustainability-linked notes will bear interest at an increased rate from the trigger date through to their individual maturities. The interest rate on certain of the sustainability-linked notes may also increase (MFN step-up) in certain circumstances if we fail to meet additional sustainability and/or environmental, social or governance targets as may be provided for in a sustainability-linked bond; the interest rate on the sustainability-linked notes, however, in no event can exceed the initial rate by more than the aggregate MFN step-up and trigger event limit, whether as a result of not obtaining a sustainability performance target verification assurance certificate and/or any targets provided for in one or more future sustainability-linked bonds. Similarly, if we redeem any of the sustainability-linked notes and we have not obtained a sustainability performance target verification assurance certificate at the end of the fiscal year immediately preceding the date fixed for redemption, the interest accrued (if any) will be determined using the rates set out in the following table: |
| Sustainability performance target verification assurance certificate |
Redemption | |||||||||||||||||
| Series | Fiscal year |
Trigger date |
Post-trigger event interest rate |
Aggregate MFN step-up and trigger event limit |
interest accrual rate if certificate not obtained |
|||||||||||||
| 2.85% Sustainability-Linked Notes, Series CAF | 2030 | Nov. 14, 2030 | 3.85 | % | N/A | 3.85 | % | |||||||||||
| 3.40% U.S. Dollar Sustainability-Linked Notes | 2030 | Nov. 14, 2030 | 4.40 | % | 1.50 | % | 4.40 | % | ||||||||||
| 5.25% Sustainability-Linked Notes, Series CAG | 2030 | Nov. 15, 2030 | 6.00 | % | 1.50 | % | 6.00 | % | ||||||||||
| 4.95% Sustainability-Linked Notes, Series CAJ | 2030 | Mar. 28, 2031 | 5.70 | % | 1.50 | % | 5.70 | % | ||||||||||
| 5.75% Sustainability-Linked Notes, Series CAK | 2030 | Apr. 30, 2031 | 6.35 | % | 1.20 | % | 6.35 | % | ||||||||||
| 5.10% Sustainability-Linked Notes, Series CAN | 2030 | Feb. 15, 2031 | 5.60 | % | 1.00 | % | 5.60 | % | ||||||||||
| 5 | $500 million of 4.85% Notes, Series CP were issued in April 2014 at an issue price of $998.74 and an effective interest rate of 4.86%. This series of notes was reopened in December 2015 and a further $400 million of notes were issued at an issue price of $974.38 and an effective interest rate of 5.02%. |
| 6 | $325 million of 4.70% Notes, Series CW were issued in March 2017 at an issue price of $990.65 and an effective interest rate of 4.76%. This series of notes was reopened in February 2018 and a further $150 million of notes were issued in March 2018 at an issue price of $1,014.11 and an effective interest rate of 4.61%. |
| 7 | $400 million of 3.95% Notes, Series CAB were issued in December 2019 at an issue price of $991.54 and an effective interest rate of 4.00%. This series of notes was reopened in May 2020 and a further $400 million of notes were issued at an issue price of $1,003.53 and an effective interest rate of 3.93%. |
| (c) | TELUS Corporation commercial paper |
TELUS Corporation has an unsecured commercial paper program, which is backstopped by our revolving $2.75 billion syndicated credit facility (see (d)) and is to be used for general corporate purposes, including capital expenditures and investments. This program enables us to issue commercial paper, subject to conditions related to debt ratings, up to a maximum aggregate equivalent amount at any one time of $2.0 billion (US$1.5 billion maximum). Foreign currency forward contracts are used to manage currency risk arising from issuing commercial paper denominated in U.S. dollars. Commercial paper debt is due within one year and is classified as a current portion of long-term debt, as the amounts are fully supported, and we expect that they will continue to be supported, by the revolving credit facility, which has no repayment requirements within the next year. As at September 30, 2024, we had $1.1 billion (December 31, 2023 – $1.0 billion) of commercial paper outstanding, all of which was denominated in U.S. dollars (US$0.8 billion; December 31, 2023 – US$0.8 billion), with an effective average interest rate of 5.5%, maturing through March 2025.
| (d) | TELUS Corporation credit facilities |
As at September 30, 2024, TELUS Corporation had an unsecured revolving $2.75 billion bank credit facility, expiring on July 14, 2028 (unchanged from December 31, 2023), with a syndicate of financial institutions, which is to be used for general corporate purposes, including the backstopping of commercial paper.
As at June 30, 2024, TELUS Corporation had repaid an unsecured, non-revolving, syndicated $1.1 billion bank credit facility, which was to be used for general corporate purposes and that was to mature July 9, 2024; as at December 31, 2023, we had drawn $1.1 billion on the facility.
The TELUS Corporation credit facilities bear interest at prime rate, U.S. Dollar Base Rate, Canadian Overnight Repo Rate Average (CORRA) or term secured overnight financing rate (SOFR) (as such terms are used or defined in the credit facilities), plus applicable margins. The credit facilities contain customary representations, warranties and covenants, including two financial quarter-end ratio tests. These tests are that our leverage ratio must not exceed 4.25:1.00 and our operating cash flow to interest expense ratio must not be less than 2.00:1.00, all as defined in the credit facilities.
Continued access to the TELUS Corporation credit facilities is not contingent upon TELUS Corporation maintaining a specific credit rating.
| As at (millions) | September 30, 2024 | December 31, 2023 | ||||||
| Net available | $ | 1,687 | $ | 1,729 | ||||
| Backstop of commercial paper | 1,063 | 1,021 | ||||||
| Gross available revolving $2.75 billion bank credit facility | $ | 2,750 | $ | 2,750 | ||||
We had $62 million of letters of credit outstanding as at September 30, 2024 (December 31, 2023 – $60 million), issued under various uncommitted facilities; such letter of credit facilities are in addition to the ability to provide letters of credit pursuant to our committed revolving bank credit facility. Further, we had arranged $338 million of incremental letters of credit to allow us to participate in the Innovation, Science and Economic Development Canada 3800 MHz band spectrum auction that was held in October-November 2023, as discussed further in Note 18(a). Concurrent with funding the purchase of the spectrum licences, these incremental letters of credit were extinguished.
|
|
September 30, 2024 | |
| notes to condensed interim consolidated financial statements | (unaudited) |
| (e) | TELUS International (Cda) Inc. credit facility |
As at September 30, 2024, and December 31, 2023, TELUS International (Cda) Inc. had a credit facility, secured by its assets, expiring on January 3, 2028, with a syndicate of financial institutions, including TELUS Corporation. The credit facility is comprised of revolving components totalling US$800 million, with TELUS Corporation as approximately 7.2% lender, and amortizing term loan components totalling US$1.2 billion, with TELUS Corporation as approximately 7.2% lender. The credit facility is non-recourse to TELUS Corporation. The outstanding revolving components and term loan components had a weighted average interest rate of 7.0% as at September 30, 2024.
The TELUS International (Cda) Inc. credit facility bears interest at prime rate, U.S. Dollar Base Rate or term secured overnight financing rate (SOFR) (all such terms as used or defined in the credit facility), plus applicable margins. The credit facility contains customary representations, warranties and covenants, including two financial quarter-end ratio tests: the TELUS International (Cda) Inc. quarter-end net debt to operating cash flow ratio must not exceed 3.75:1.00 through fiscal 2024, and 3.25:1.00 subsequently; and the quarter-end operating cash flow to debt service (interest and scheduled principal repayment) ratio must not be less than 1.50:1.00; all as defined in the credit facility.
The term loan components are subject to amortization schedules which require that 5% of the principal advanced be repaid each year of the term of the agreement, with the balance due at maturity.
| As at (millions) | Revolving components | Term loan components 1 | Total | |||||||||
| September 30, 2024 | ||||||||||||
| Available | US$ | 580 | US$ | — | US$ | 580 | ||||||
| Outstanding | ||||||||||||
| Due to other | 205 | 1,030 | 1,235 | |||||||||
| Due to TELUS Corporation | 15 | 80 | 95 | |||||||||
| US$ | 800 | US$ | 1,110 | US$ | 1,910 | |||||||
| December 31, 2023 | ||||||||||||
| Available | US$ | 492 | US$ | — | US$ | 492 | ||||||
| Outstanding | ||||||||||||
| Due to other | 286 | 1,072 | 1,358 | |||||||||
| Due to TELUS Corporation | 22 | 83 | 105 | |||||||||
| US$ | 800 | US$ | 1,155 | US$ | 1,955 | |||||||
| 1 | Relative to amounts owed to the syndicate of financial institutions, excluding TELUS Corporation, we have entered into foreign exchange derivatives (cross currency interest rate exchange agreements) that effectively convert an amortizing amount of US$415 of the principal payments, and associated interest obligations, to European euro obligations with an effective fixed interest rate of 2.6% and an effective fixed exchange rate of US$1.088:€1.00. These have been accounted for as a net investment hedge in a foreign operation (see Note 4). |
| (f) | Other |
Other liabilities bear interest at 4.4%, are secured by the AWS-4 spectrum licences associated with these other liabilities, and are subject to amortization schedules, so that the principal is repaid over the periods to maturity, the last period ending March 31, 2035.
| (g) | Lease liabilities |
Lease liabilities are subject to amortization schedules, so that the principal is repaid over various periods, including reasonably expected renewals. The weighted average interest rate on lease liabilities was approximately 5.7% as at September 30, 2024.
|
|
|
| notes to condensed interim consolidated financial statements | (unaudited) |
| (h) | Long-term debt maturities |
Anticipated requirements for long-term debt repayments, calculated for long-term debt owing as at September 30, 2024, are as follows:
| Composite long-term debt denominated in | Canadian dollars | U.S. dollars | Other
currencies |
|||||||||||||||||||||||||||||||||||||
| Long-term debt, |
Long-term debt, |
Currency swap agreement
amounts to be exchanged |
||||||||||||||||||||||||||||||||||||||
| Years ending December 31 (millions) | excluding
leases |
Leases (Note 19) |
Total | excluding
leases |
Leases (Note 19) |
(Receive) 1 | Pay | Total | Leases (Note 19) |
Total | ||||||||||||||||||||||||||||||
| 2024 (remainder of year) | $ | 10 | $ | 134 | $ | 144 | $ | 905 | $ | 7 | $ | (894 | ) | $ | 902 | $ | 920 | $ | 14 | $ | 1,078 | |||||||||||||||||||
| 2025 | 1,047 | 514 | 1,561 | 278 | 30 | (234 | ) | 235 | 309 | 53 | 1,923 | |||||||||||||||||||||||||||||
| 2026 | 1,450 | 409 | 1,859 | 75 | 32 | (32 | ) | 32 | 107 | 45 | 2,011 | |||||||||||||||||||||||||||||
| 2027 | 53 | 324 | 377 | 1,560 | 28 | (1,517 | ) | 1,491 | 1,562 | 36 | 1,975 | |||||||||||||||||||||||||||||
| 2028 | 1,955 | 212 | 2,167 | 1,423 | 19 | (461 | ) | 473 | 1,454 | 29 | 3,650 | |||||||||||||||||||||||||||||
| 2029 - 2033 | 7,746 | 383 | 8,129 | 1,215 | 50 | (1,215 | ) | 1,148 | 1,198 | 61 | 9,388 | |||||||||||||||||||||||||||||
| Thereafter | 6,105 | 317 | 6,422 | 1,687 | — | (1,687 | ) | 1,646 | 1,646 | — | 8,068 | |||||||||||||||||||||||||||||
| Future cash outflows in respect of composite long-term debt principal repayments | 18,366 | 2,293 | 20,659 | 7,143 | 166 | (6,040 | ) | 5,927 | 7,196 | 238 | 28,093 | |||||||||||||||||||||||||||||
| Future cash outflows in respect of associated interest and like carrying costs 2 | 9,173 | 502 | 9,675 | 2,701 | 76 | (2,409 | ) | 2,294 | 2,662 | 66 | 12,403 | |||||||||||||||||||||||||||||
| Undiscounted contractual maturities (Note 4(b)) | $ | 27,539 | $ | 2,795 | $ | 30,334 | $ | 9,844 | $ | 242 | $ | (8,449 | ) | $ | 8,221 | $ | 9,858 | $ | 304 | $ | 40,496 | |||||||||||||||||||
| 1 | Where applicable, cash flows reflect foreign exchange rates as at September 30, 2024. |
| 2 | Future cash outflows in respect of associated interest and like carrying costs for commercial paper and amounts drawn under our credit facilities (if any) have been calculated based upon the rates in effect as at September 30, 2024. |
|
|
September 30, 2024 | |
| notes to condensed interim consolidated financial statements | (unaudited) |
| 27 | other long-term liabilities |
| As at (millions) | Note | September 30, 2024 |
December 31, 2023 |
|||||||
| Contract liabilities | 24 | $ | 105 | $ | 84 | |||||
| Other | 2 | 2 | ||||||||
| Deferred revenues | 107 | 86 | ||||||||
| Pension benefit liabilities | 15 | 452 | 453 | |||||||
| Other post-employment benefit liabilities | 83 | 76 | ||||||||
| Derivative liabilities | 4(d) | 118 | 191 | |||||||
| Deferred capital expenditure government grants | 49 | — | ||||||||
| Other | 52 | 57 | ||||||||
| 861 | 863 | |||||||||
| Deferred customer activation and connection fees | 24 | 4 | 4 | |||||||
| $ | 865 | $ | 867 | |||||||
| 28 | owners’ equity |
| (a) | TELUS Corporation Common Share capital – general |
Our authorized share capital is as follows:
| As at | September 30, 2024 |
December 31, 2023 |
||||||
| First Preferred Shares | 1 billion | 1 billion | ||||||
| Second Preferred Shares | 1 billion | 1 billion | ||||||
| Common Shares | 4 billion | 4 billion | ||||||
Only holders of Common Shares may vote at our general meetings, with each holder of Common Shares entitled to one vote per Common Share held at all such meetings so long as not less than 66-2/3% of the issued and outstanding Common Shares are owned by Canadians. With respect to priority in the payment of dividends and in the distribution of assets in the event of our liquidation, dissolution or winding-up, whether voluntary or involuntary, or any other distribution of our assets among our shareholders for the purpose of winding up our affairs, preferences are as follows: First Preferred Shares; Second Preferred Shares; and finally Common Shares.
As at September 30, 2024, approximately 95 million Common Shares were reserved for issuance from Treasury under a dividend reinvestment and share purchase plan (see Note 13(b)); approximately 46 million Common Shares were reserved for issuance from Treasury under a restricted share unit plan (see Note 14(b)); and approximately 12 million Common Shares were reserved for issuance from Treasury under a share option plan (see Note 14(d)).
| (b) | Subsidiary with significant non-controlling interest |
Our TELUS International (Cda) Inc. subsidiary is incorporated under the Business Corporations Act (British Columbia) and has geographically dispersed operations, with its principal places of business located in Asia, Central America, Europe and North America.
Changes in our economic and voting interests during the nine-month periods ended September 30, 2024 and 2023, and which are included in the Consolidated statement of changes in owners’ equity, are set out in the following table.
| Economic interest 1 | Voting interest 1 | |||||||||||||||
| 2024 | 2023 | 2024 | 2023 | |||||||||||||
| Interest in TELUS International (Cda) Inc., beginning of period | 56.0 | % | 56.6 | % | 85.4 | % | 72.4 | % | ||||||||
| Effect of | ||||||||||||||||
| Issue of TELUS International (Cda) Inc. subordinate voting shares as consideration in business acquisition | — | (1.4 | ) | — | (0.2 | ) | ||||||||||
| TELUS Corporation acquisition of shares from non-controlling interests 2 | 2.0 | 0.9 | 0.3 | 1.2 | ||||||||||||
| Share-based compensation and other | (0.3 | ) | (0.1 | ) | — | — | ||||||||||
| Non-controlling interests conversion of multiple voting shares to subordinate voting shares | — | — | 1.3 | — | ||||||||||||
| Interest in TELUS International (Cda) Inc., end of period | 57.7 | % | 56.0 | % | 87.0 | % | 73.4 | % | ||||||||
| 1 | Due to the voting rights associated with the multiple voting shares held by TELUS Corporation, our economic and voting interests differ. |
| 2 | Acquisition of shares from non-controlling interests of $25 million (2023 – $57 million), of which $30 million was credited (2023 – $32 million was charged) to amounts recorded in owners’ equity for contributed surplus and the balance was charged to non-controlling interests. |
|
|
|
| notes to condensed interim consolidated financial statements | (unaudited) |
Summarized financial information
Summarized financial information of our TELUS International (Cda) Inc. subsidiary is set out in the accompanying table.
| As at, or for the periods ended, ($ in millions) 1 | September 30, 2024 |
September 30, 2023 |
December 31, 2023 |
|||||||||
| Statement of financial position 1 | ||||||||||||
| Current assets | $ | 1,330 | $ | 1,122 | ||||||||
| Non-current assets | $ | 5,341 | $ | 5,395 | ||||||||
| Current liabilities | $ | 1,297 | $ | 990 | ||||||||
| Non-current liabilities | $ | 2,604 | $ | 2,829 | ||||||||
| Statement of income and other comprehensive income | ||||||||||||
| THREE-MONTH | ||||||||||||
| Revenue and other income | $ | 897 | $ | 889 | ||||||||
| Net income (loss) | $ | (43 | ) | $ | 11 | |||||||
| Comprehensive income (loss) | $ | (63 | ) | $ | 38 | |||||||
| NINE-MONTH | ||||||||||||
| Revenue and other income | $ | 2,757 | $ | 2,713 | ||||||||
| Net income (loss) | $ | (10 | ) | $ | 21 | |||||||
| Comprehensive income (loss) | $ | 39 | $ | 7 | ||||||||
| Statement of cash flows | ||||||||||||
| THREE-MONTH | ||||||||||||
| Cash provided by operating activities | $ | 122 | $ | 201 | ||||||||
| Cash used by investing activities | $ | (34 | ) | $ | (28 | ) | ||||||
| Cash used by financing activities | $ | (95 | ) | $ | (186 | ) | ||||||
| NINE-MONTH | ||||||||||||
| Cash provided by operating activities | $ | 372 | $ | 344 | ||||||||
| Cash used by investing activities | $ | (106 | ) | $ | (1,231 | ) | ||||||
| Cash provided (used) by financing activities | $ | (238 | ) | $ | 896 | |||||||
| 1 | As required by IFRS-IASB, this summarized financial information excludes inter-company eliminations. |
| 29 | contingent liabilities |
Claims and lawsuits
General
A number of claims and lawsuits (including class actions and intellectual property infringement claims) seeking damages and other relief are pending against us and, in some cases, other mobile carriers and telecommunications service providers. As well, we have received notice of, or are aware of, certain possible claims (including intellectual property infringement claims) against us and, in some cases, other mobile carriers and telecommunications service providers.
It is not currently possible for us to predict the outcome of such claims, possible claims and lawsuits due to various factors, including: the preliminary nature of some claims; uncertain damage theories and demands; an incomplete factual record; uncertainty concerning legal theories and procedures and their resolution by the courts, at both the trial and the appeal levels; and the unpredictable nature of opposing parties and their demands.
However, subject to the foregoing limitations, management is of the opinion, based upon legal assessments and information presently available, that it is unlikely that any liability, to the extent not provided for through insurance or otherwise, would have a material effect on our financial position and the results of our operations, including cash flows, with the exception of the items enumerated following.
Certified class actions
Certified class actions against us include the following:
System access fee class action
In 2004, a class action was brought in Saskatchewan against a number of past and present wireless service providers, including us, which alleged breach of contract, misrepresentation, unjust enrichment and violation of competition, trade practices and consumer protection legislation across Canada in connection with the collection of system access fees. In September 2007, a national opt-in class was certified by the Saskatchewan Court of Queen’s Bench in relation to the unjust enrichment claim only. In February 2008, the Saskatchewan Court of Queen’s Bench granted an order amending the certification order so as to exclude from the class of plaintiffs any customer bound by an arbitration clause with us. After a long period of dormancy, the Plaintiff sought, in 2024, to advance the class action. The defendants have applied to dismiss the class action for want of prosecution.
Per minute billing class action
In 2008, a class action was brought in Ontario against us alleging breach of contract, breach of the Ontario Consumer Protection Act, breach of the Competition Act and unjust enrichment, in connection with our practice of “rounding up” mobile airtime to the nearest minute and charging for the full minute. The action sought certification of a national class. In November 2014, an Ontario class only was certified by the Ontario Superior Court of Justice in relation to the breach of contract, breach of Consumer Protection Act, and unjust enrichment claims; all appeals of the certification decision have now been exhausted. At the same time, the Ontario Superior Court of Justice declined to stay the claims of our business customers, notwithstanding an arbitration clause in our customer service agreements with those customers. This latter decision was appealed and on May 31, 2017, the Ontario Court of Appeal dismissed our appeal. The Supreme Court of Canada granted us leave to appeal this decision and on April 4, 2019, granted our appeal and stayed the claims of business customers. Notice of this certified class action was provided to potential class members in 2022.
|
|
September 30, 2024 | |
| notes to condensed interim consolidated financial statements | (unaudited) |
Call set-up time class actions
In 2005, a class action was brought against us in British Columbia alleging that we have engaged in deceptive trade practices in charging for incoming calls from the moment the caller connects to the network, and not from the moment the incoming call is connected to the recipient. In 2011, the Supreme Court of Canada upheld a stay of all of the causes of action advanced by the plaintiff in this class action, with one exception, based on the arbitration clause that was included in our customer service agreements. The sole exception was the cause of action based on deceptive or unconscionable practices under the British Columbia Business Practices and Consumer Protection Act, which the Supreme Court of Canada declined to stay. In January 2016, the British Columbia Supreme Court certified this class action in relation to the claim under the Business Practices and Consumer Protection Act. The class is limited to residents of British Columbia who contracted mobile services with us in the period from January 21, 1999, to April 2010. We have appealed the certification decision. A companion class action was brought against us in Alberta at the same time as the British Columbia class action. The Alberta class action duplicates the allegations in the British Columbia action, but has not proceeded to date. Subject to a number of conditions, including court approval, we have now settled both the British Columbia and the Alberta class actions.
Uncertified class actions
Uncertified class actions against us include:
9-1-1 class actions
In 2008, a class action was brought in Saskatchewan against us and other Canadian telecommunications carriers alleging that, among other matters, we failed to provide proper notice of 9-1-1 charges to the public, have been deceitfully passing them off as government charges, and have charged 9-1-1 fees to customers who reside in areas where 9-1-1 service is not available. The plaintiffs advance causes of action in breach of contract, misrepresentation and false advertising and seek certification of a national class. A virtually identical class action was filed in Alberta at the same time, but the Alberta Court of Queen’s Bench declared that class action expired against us as of 2009. No steps have been taken in this proceeding since 2016.
Public Mobile class actions
In 2014, class actions were brought against us in Quebec and Ontario on behalf of Public Mobile’s customers, alleging that changes to the technology, services and rate plans made by us contravene our statutory and common law obligations. In particular, the Quebec action alleges that our actions constitute a breach of the Quebec Consumer Protection Act, the Quebec Civil Code, and the Ontario Consumer Protection Act. On June 28, 2021, the Quebec Superior Court approved the discontinuance of this claim against TELUS. The Ontario class action alleges negligence, breach of express and implied warranty, breach of the Competition Act, unjust enrichment, and waiver of tort. No steps have been taken in this proceeding since it was filed and served.
Summary
We believe that we have good defences to the above matters. Should the ultimate resolution of these matters differ from management’s assessments and assumptions, a material adjustment to our financial position and the results of our operations, including cash flows, could result. Management’s assessments and assumptions include that reliable estimates of any such exposure cannot be made considering the continued uncertainty about: the nature of the damages that may be sought by the plaintiffs; the causes of action that are being, or may ultimately be, pursued; and, in the case of the uncertified class actions, the causes of action that may ultimately be certified.
| 30 | related party transactions |
| (a) | Transactions with key management personnel |
Our key management personnel have authority and responsibility for overseeing, planning, directing and controlling our activities and consist of our Board of Directors and our Executive Team.
|
|
|
| notes to condensed interim consolidated financial statements | (unaudited) |
Total compensation expense for key management personnel, and the composition thereof, included in the Consolidated statements of income and other comprehensive income as Employee benefits expense, is as follows:
| Three months | Nine months | |||||||||||||||
| Periods ended September 30 (millions) | 2024 | 2023 | 2024 | 2023 | ||||||||||||
| Short-term benefits | $ | 4 | $ | 5 | $ | 13 | $ | 16 | ||||||||
| Post-employment pension 1 and other benefits | 4 | 5 | 8 | 9 | ||||||||||||
| Share-based compensation 2 | 17 | 8 | 37 | 35 | ||||||||||||
| $ | 25 | $ | 18 | $ | 58 | $ | 60 | |||||||||
| 1 | The members of our Executive Team are members of our Pension Plan for Management and Professional Employees of TELUS Corporation and certain other non-registered, non-contributory supplementary defined benefit and defined contribution pension plans. |
| 2 | We accrue an expense for the notional subset of our restricted share units with market performance conditions using a fair value determined by a Monte Carlo simulation. Restricted share units with an equity settlement feature are accounted for as equity instruments. The expense in respect of restricted share units that do not ultimately vest is reversed against the expense that was previously recorded in their respect. |
As disclosed in Note 14, we made initial awards of share-based compensation in 2024 and 2023 to our key management personnel, as set out in the following table. As most of these awards are cliff-vesting or graded-vesting and have multi-year requisite service periods, the related expense is being recognized rateably over a period of years and thus only a portion of the 2024 and 2023 initial awards is included in the amounts in the table above.
| Nine-month periods ended September 30 ($ in millions) | Number of units |
Notional value 1 |
Grant-date fair value 1 |
|||||||||
| 2024 | ||||||||||||
| TELUS Corporation | ||||||||||||
| Restricted share units | 1,465,459 | $ | 35 | $ | 41 | |||||||
| TELUS International (Cda) Inc. | ||||||||||||
| Restricted share units | 1,054,899 | 12 | 12 | |||||||||
| $ | 47 | $ | 53 | |||||||||
| 2023 | ||||||||||||
| TELUS Corporation | ||||||||||||
| Restricted share units | 1,220,549 | $ | 33 | $ | 35 | |||||||
| TELUS International (Cda) Inc. | ||||||||||||
| Restricted share units | 353,789 | 10 | 10 | |||||||||
| $ | 43 | $ | 45 | |||||||||
| 1 | The notional value of restricted share units is determined by multiplying the equity share price at the time of award by the number of units awarded; the grant-date fair value differs from the notional value because the fair values of some awards have been determined using a Monte Carlo simulation (see Note 14(b)). The notional value of share options has been determined using an option pricing model |
Our Directors’ Deferred Share Unit Plan provides that, in addition to his or her annual equity grant of deferred share units, a director may elect to receive his or her annual retainer and meeting fees in deferred share units, TELUS Corporation Common Shares or cash. Deferred share units entitle directors to a specified number of TELUS Corporation Common Shares. Deferred share units are settled when a director ceases to be a director, for any reason, at a time elected by the director in accordance with the Directors’ Deferred Share Unit Plan. As at September 30, 2024, and December 31, 2023, no share-based compensation awards accounted for as liabilities were outstanding.
Employment agreements with members of the Executive Team typically provide for severance payments if an executive’s employment is terminated without cause: generally, 18 months of base salary, benefits and accrual of pension service in lieu of notice, and 50% of base salary in lieu of an annual cash bonus. In the event of a change in control, Executive Team members are not entitled to treatment any different than that given to our other employees with respect to non-vested share-based compensation.
| (b) | Transactions with defined benefit pension plans |
During the three-month and nine-month periods ended September 30, 2024, we provided our defined benefit pension plans with management and administrative services on a cost recovery basis and actuarial services on an arm’s-length basis; the charges for these services amounted to $2 million (2023 – $2 million) and $7 million (2023 – $7 million), respectively, and are included net in the Consolidated statements of income and other comprehensive income as Goods and services purchased.
| (c) | Transactions with real estate joint ventures and associate |
During the three-month and nine-month periods ended September 30, 2024 and 2023, we had transactions with the real estate joint ventures, which are related parties, as set out in Note 21.
As at September 30, 2024, presented in the Consolidated statements of financial position as Long-term debt, we had recorded lease liabilities of $82 million (December 31, 2023 – $84 million) in respect of our TELUS Sky leases, and monthly cash payments are made in accordance with the lease agreements; as at the statement of financial position date, one-third of those amounts is due to our economic interest in the real estate joint venture.
|
|
September 30, 2024 | |
| notes to condensed interim consolidated financial statements | (unaudited) |
| 31 | additional statement of cash flow information |
| (a) | Statements of cash flows – operating activities and investing activities |
| Three months | Nine months | |||||||||||||||
| Periods ended September 30 (millions) | 2024 | 2023 | 2024 | 2023 | ||||||||||||
| OPERATING ACTIVITIES | ||||||||||||||||
| Net change in non-cash operating working capital | ||||||||||||||||
| Current | ||||||||||||||||
| Accounts receivable | $ | (51 | ) | $ | (124 | ) | $ | 57 | $ | 40 | ||||||
| Inventories | 38 | 30 | (8 | ) | (13 | ) | ||||||||||
| Contract assets | 9 | 4 | 32 | 18 | ||||||||||||
| Prepaid expenses | 104 | 33 | (87 | ) | (153 | ) | ||||||||||
| Unrealized change in held for trading derivatives (Note 4(d)) | (7 | ) | 12 | 15 | 7 | |||||||||||
| Accounts payable and accrued liabilities | 109 | 108 | 76 | (417 | ) | |||||||||||
| Income and other taxes receivable and payable, net | 83 | 33 | 164 | (22 | ) | |||||||||||
| Advance billings and customer deposits (Note 24) | (76 | ) | (5 | ) | (38 | ) | 39 | |||||||||
| Provisions | 11 | 105 | (80 | ) | 179 | |||||||||||
| 220 | 196 | 131 | (322 | ) | ||||||||||||
| Non-current | ||||||||||||||||
| Contract assets | 2 | 10 | 26 | 40 | ||||||||||||
| Unbilled customer finance receivables | 10 | (2 | ) | 77 | (24 | ) | ||||||||||
| Unrealized change in held for trading derivatives (Note 4(d)) | 123 | 23 | 212 | 51 | ||||||||||||
| Costs incurred to obtain or fulfill contracts with customers (Note 20) | (22 | ) | (24 | ) | (56 | ) | (43 | ) | ||||||||
| Prepaid maintenance | 2 | 4 | 5 | 12 | ||||||||||||
| Refundable security deposits and other | (21 | ) | 7 | (22 | ) | (13 | ) | |||||||||
| Provisions | (10 | ) | 5 | (53 | ) | (103 | ) | |||||||||
| Contract liabilities (Note 24) | 2 | 8 | 21 | 15 | ||||||||||||
| Other post-employment benefit liabilities | 3 | 3 | 7 | 8 | ||||||||||||
| Other long-term liabilities | (3 | ) | (9 | ) | (5 | ) | (6 | ) | ||||||||
| 86 | 25 | 212 | (63 | ) | ||||||||||||
| $ | 306 | $ | 221 | $ | 343 | $ | (385 | ) | ||||||||
| INVESTING ACTIVITIES | ||||||||||||||||
| Cash payments for capital assets, excluding spectrum licences | ||||||||||||||||
| Capital asset additions | ||||||||||||||||
| Gross capital expenditures | ||||||||||||||||
| Property, plant and equipment (Note 17) | $ | (621 | ) | $ | (703 | ) | $ | (1,947 | ) | $ | (2,074 | ) | ||||
| Intangible assets subject to amortization (Note 18) | (231 | ) | (246 | ) | (765 | ) | (720 | ) | ||||||||
| (852 | ) | (949 | ) | (2,712 | ) | (2,794 | ) | |||||||||
| Additions arising from leases (Note 17) | 184 | 180 | 591 | 505 | ||||||||||||
| Additions arising from non-monetary transactions | — | — | 37 | — | ||||||||||||
| Capital expenditures (Note 5) | (668 | ) | (769 | ) | (2,084 | ) | (2,289 | ) | ||||||||
| Change in associated non-cash investing working capital | (11 | ) | 24 | (73 | ) | (209 | ) | |||||||||
| $ | (679 | ) | $ | (745 | ) | $ | (2,157 | ) | $ | (2,498 | ) | |||||
|
|
|
| notes to condensed interim consolidated financial statements | (unaudited) |
| (b) | Changes in liabilities arising from financing activities |
| Three-month period ended September 30, 2023 | Three-month period ended September 30, 2024 | |||||||||||||||||||||||||||||||||||||||||||||||
| Statement of cash flows | Non-cash changes | Statement of cash flows | Non-cash changes | |||||||||||||||||||||||||||||||||||||||||||||
| (millions) | Beginning of period |
Issued or received |
Redemptions, repayments or payments |
Foreign exchange movement (Note 4(e)) |
Other | End of period | Beginning of period |
Issued or received |
Redemptions, repayments or payments |
Foreign exchange movement (Note 4(e)) |
Other | End of period | ||||||||||||||||||||||||||||||||||||
| Dividends payable to holders of Common Shares | $ | 526 | $ | — | $ | (526 | ) | $ | — | $ | 529 | $ | 529 | $ | 577 | $ | — | $ | (577 | ) | $ | — | $ | 578 | $ | 578 | ||||||||||||||||||||||
| Dividends reinvested in shares from Treasury | — | — | 188 | — | (188 | ) | — | — | — | 193 | — | (193 | ) | — | ||||||||||||||||||||||||||||||||||
| $ | 526 | $ | — | $ | (338 | ) | $ | — | $ | 341 | $ | 529 | $ | 577 | $ | — | $ | (384 | ) | $ | — | $ | 385 | $ | 578 | |||||||||||||||||||||||
| Short-term borrowings | $ | 594 | $ | 17 | $ | (507 | ) | $ | — | $ | — | $ | 104 | $ | 1,044 | $ | — | $ | (103 | ) | $ | (16 | ) | $ | — | $ | 925 | |||||||||||||||||||||
| Net-settled derivatives used to manage currency risk arising from U.S. dollar-denominated short-term borrowings – liability (asset) | — | — | — | — | — | — | — | — | (15 | ) | 14 | — | (1 | ) | ||||||||||||||||||||||||||||||||||
| $ | 594 | $ | 17 | $ | (507 | ) | $ | — | $ | — | $ | 104 | $ | 1,044 | $ | — | $ | (118 | ) | $ | (2 | ) | $ | — | $ | 924 | ||||||||||||||||||||||
|
|
September 30, 2024 | |
| notes to condensed interim consolidated financial statements | (unaudited) |
| Three-month period ended September 30, 2023 | Three-month period ended September 30, 2024 | |||||||||||||||||||||||||||||||||||||||||||||||
| Statement of cash flows | Non-cash changes | Statement of cash flows | Non-cash changes | |||||||||||||||||||||||||||||||||||||||||||||
| (millions) | Beginning of period |
Issued or received |
Redemptions, repayments or payments |
Foreign exchange movement (Note 4(e)) |
Other | End of period | Beginning of period |
Issued or received |
Redemptions, repayments or payments |
Foreign exchange movement (Note 4(e)) |
Other | End of period | ||||||||||||||||||||||||||||||||||||
| Long-term debt | ||||||||||||||||||||||||||||||||||||||||||||||||
| TELUS Corporation senior notes | $ | 18,564 | $ | 1,750 | $ | — | $ | 91 | $ | (12 | ) | $ | 20,393 | $ | 21,145 | $ | 700 | $ | — | $ | (61 | ) | $ | (1 | ) | $ | 21,783 | |||||||||||||||||||||
| TELUS Corporation commercial paper | 1,944 | 1,008 | (1,576 | ) | 41 | — | 1,417 | 1,760 | 467 | (1,145 | ) | (19 | ) | — | 1,063 | |||||||||||||||||||||||||||||||||
| TELUS Corporation credit facilities | 1,144 | — | — | — | — | 1,144 | — | — | — | — | — | — | ||||||||||||||||||||||||||||||||||||
| TELUS Communications Inc. debentures | 199 | — | — | — | — | 199 | 200 | — | — | — | — | 200 | ||||||||||||||||||||||||||||||||||||
| TELUS International (Cda) Inc. credit facility | 2,023 | 50 | (208 | ) | 43 | 1 | 1,909 | 1,745 | 127 | (194 | ) | (26 | ) | 2 | 1,654 | |||||||||||||||||||||||||||||||||
| Other | 298 | — | (6 | ) | — | — | 292 | 613 | — | (20 | ) | — | 4 | 597 | ||||||||||||||||||||||||||||||||||
| Lease liabilities | 2,416 | — | (135 | ) | 5 | 193 | 2,479 | 2,688 | — | (171 | ) | 5 | 181 | 2,703 | ||||||||||||||||||||||||||||||||||
| Derivatives used to manage currency risk arising from U.S. dollar-denominated long-term debt – liability (asset) | 72 | 1,595 | (1,595 | ) | (161 | ) | (1 | ) | (90 | ) | (7 | ) | 1,164 | (1,163 | ) | 58 | 26 | 78 | ||||||||||||||||||||||||||||||
| 26,660 | 4,403 | (3,520 | ) | 19 | 181 | 27,743 | 28,144 | 2,458 | (2,693 | ) | (43 | ) | 212 | 28,078 | ||||||||||||||||||||||||||||||||||
| To eliminate effect of gross settlement of derivatives used to manage currency risk arising from U.S. dollar-denominated long-term debt | — | (1,595 | ) | 1,595 | — | — | — | — | (1,164 | ) | 1,164 | — | — | — | ||||||||||||||||||||||||||||||||||
| $ | 26,660 | $ | 2,808 | $ | (1,925 | ) | $ | 19 | $ | 181 | $ | 27,743 | $ | 28,144 | $ | 1,294 | $ | (1,529 | ) | $ | (43 | ) | $ | 212 | $ | 28,078 | ||||||||||||||||||||||
|
|
|
| notes to condensed interim consolidated financial statements | (unaudited) |
| Nine-month period ended September 30, 2023 | Nine-month period ended September 30, 2024 | |||||||||||||||||||||||||||||||||||||||||||||||
| Statement of cash flows | Non-cash changes | Statement of cash flows | Non-cash changes | |||||||||||||||||||||||||||||||||||||||||||||
| (millions) | Beginning of period |
Issued or received |
Redemptions, repayments or payments |
Foreign exchange movement (Note 4(e)) |
Other | End of period | Beginning of period |
Issued or received |
Redemptions, repayments or payments |
Foreign exchange movement (Note 4(e)) |
Other | End of period | ||||||||||||||||||||||||||||||||||||
| Dividends payable to holders of Common Shares | $ | 502 | $ | — | $ | (1,534 | ) | $ | — | $ | 1,561 | $ | 529 | $ | 550 | $ | — | $ | (1,681 | ) | $ | — | $ | 1,709 | $ | 578 | ||||||||||||||||||||||
| Dividends reinvested in shares from Treasury | — | — | 558 | — | (558 | ) | — | — | — | 507 | — | (507 | ) | — | ||||||||||||||||||||||||||||||||||
| $ | 502 | $ | — | $ | (976 | ) | $ | — | $ | 1,003 | $ | 529 | $ | 550 | $ | — | $ | (1,174 | ) | $ | — | $ | 1,202 | $ | 578 | |||||||||||||||||||||||
| Short-term borrowings | $ | 104 | $ | 607 | $ | (607 | ) | $ | — | $ | — | $ | 104 | $ | 104 | $ | 1,040 | $ | (203 | ) | $ | (16 | ) | $ | — | $ | 925 | |||||||||||||||||||||
| Net-settled derivatives used to manage currency risk arising from U.S. dollar-denominated short-term borrowings – liability (asset) | — | — | — | — | — | — | — | — | (15 | ) | 14 | — | (1 | ) | ||||||||||||||||||||||||||||||||||
| $ | 104 | $ | 607 | $ | (607 | ) | $ | — | $ | — | $ | 104 | $ | 104 | $ | 1,040 | $ | (218 | ) | $ | (2 | ) | $ | — | $ | 924 | ||||||||||||||||||||||
|
|
September 30, 2024 | |
| notes to condensed interim consolidated financial statements | (unaudited) |
| Nine-month period ended September 30, 2023 | Nine-month period ended September 30, 2024 | |||||||||||||||||||||||||||||||||||||||||||||||
| Statement of cash flows | Non-cash changes | Statement of cash flows | Non-cash changes | |||||||||||||||||||||||||||||||||||||||||||||
| (millions) | Beginning of period |
Issued or received |
Redemptions, repayments or payments |
Foreign exchange movement (Note 4(e)) |
Other | End of period | Beginning of period |
Issued or received |
Redemptions, repayments or payments |
Foreign exchange movement (Note 4(e)) |
Other | End of period | ||||||||||||||||||||||||||||||||||||
| Long-term debt | ||||||||||||||||||||||||||||||||||||||||||||||||
| TELUS Corporation senior notes | $ | 18,660 | $ | 2,250 | $ | (500 | ) | $ | (8 | ) | $ | (9 | ) | $ | 20,393 | $ | 20,301 | $ | 2,500 | $ | (1,100 | ) | $ | 89 | $ | (7 | ) | $ | 21,783 | |||||||||||||||||||
| TELUS Corporation commercial paper | 1,458 | 4,712 | (4,752 | ) | (1 | ) | — | 1,417 | 1,021 | 2,343 | (2,317 | ) | 16 | — | 1,063 | |||||||||||||||||||||||||||||||||
| TELUS Corporation credit facilities | 1,145 | — | — | — | (1 | ) | 1,144 | 1,144 | — | (1,144 | ) | — | — | — | ||||||||||||||||||||||||||||||||||
| TELUS Communications Inc. debentures | 199 | — | — | — | — | 199 | 200 | — | — | — | — | 200 | ||||||||||||||||||||||||||||||||||||
| TELUS International (Cda) Inc. credit facility | 914 | 1,363 | (356 | ) | (14 | ) | 2 | 1,909 | 1,781 | 240 | (405 | ) | 37 | 1 | 1,654 | |||||||||||||||||||||||||||||||||
| Other | 321 | — | (179 | ) | — | 150 | 292 | 288 | — | (27 | ) | — | 336 | 597 | ||||||||||||||||||||||||||||||||||
| Lease liabilities | 2,340 | — | (394 | ) | 11 | 522 | 2,479 | 2,614 | — | (503 | ) | 13 | 579 | 2,703 | ||||||||||||||||||||||||||||||||||
| Derivatives used to manage currency risk arising from U.S. dollar-denominated long-term debt – liability (asset) | (80 | ) | 4,789 | (4,803 | ) | (1 | ) | 5 | (90 | ) | 13 | 2,374 | (2,358 | ) | (109 | ) | 158 | 78 | ||||||||||||||||||||||||||||||
| 24,957 | 13,114 | (10,984 | ) | (13 | ) | 669 | 27,743 | 27,362 | 7,457 | (7,854 | ) | 46 | 1,067 | 28,078 | ||||||||||||||||||||||||||||||||||
| To eliminate effect of gross settlement of derivatives used to manage currency risk arising from U.S. dollar-denominated long-term debt | — | (4,789 | ) | 4,789 | — | — | — | — | (2,374 | ) | 2,374 | — | — | — | ||||||||||||||||||||||||||||||||||
| $ | 24,957 | $ | 8,325 | $ | (6,195 | ) | $ | (13 | ) | $ | 669 | $ | 27,743 | $ | 27,362 | $ | 5,083 | $ | (5,480 | ) | $ | 46 | $ | 1,067 | $ | 28,078 | ||||||||||||||||||||||
|
|
|
Exhibit 99.2
TELUS CORPORATION
Management’s discussion and analysis
2024 Q3

TELUS Corporation – Management’s discussion and analysis – 2024 Q3
Caution regarding forward-looking statements
The terms TELUS, the Company, we, us and our refer to TELUS Corporation and, where the context of the narrative permits or requires, its subsidiaries.
This document contains forward-looking statements about expected events and our financial and operating performance. Forward-looking statements include any statements that do not refer to historical facts. They include, but are not limited to, statements relating to our objectives and our strategies to achieve those objectives, our expectations regarding trends in the telecommunications industry (including demand for data and ongoing subscriber base growth), and our financing plans (including our multi-year dividend growth program). Forward-looking statements are typically identified by the words assumption, goal, guidance, objective, outlook, strategy, target and other similar expressions, or future or conditional verbs such as aim, anticipate, believe, could, expect, intend, may, plan, predict, seek, should, strive and will. These statements are made pursuant to the “safe harbour” provisions of applicable securities laws in Canada and the United States Private Securities Litigation Reform Act of 1995.
By their nature, forward-looking statements are subject to inherent risks and uncertainties and are based on assumptions, including assumptions about future economic conditions and courses of action. These assumptions may ultimately prove to have been inaccurate and, as a result, our actual results or other events may differ materially from expectations expressed in or implied by the forward-looking statements.
The assumptions underlying our forward-looking statements are described in additional detail in Section 9 General trends, outlook and assumptions, and regulatory developments and proceedings and Section 10 Risks and risk management in our 2023 annual Management’s discussion and analysis (MD&A). Those descriptions are incorporated by reference in this cautionary statement. Updates to the assumptions on which our 2024 outlook is based are presented in Section 9 Update to general trends, outlook and assumptions, and regulatory developments and proceedings in this MD&A.
Risks and uncertainties that could cause actual performance or other events to differ materially from the forward-looking statements made herein and in other TELUS filings include, but are not limited to, the following:
| · | Regulatory matters. We operate in a number of highly regulated industries and are therefore subject to a wide variety of laws and regulations domestically and internationally. Policies and practices of elected officials and regulatory decisions, reviews and government activity may have strategic, operational and/or financial implications (including on revenue and free cash flow). |
Risks and uncertainties include:
| o | potential changes to our regulatory regime or the outcomes of proceedings, cases or inquiries relating to its application, including but not limited to those set out in Section 9.1 Communications industry regulatory developments and proceedings in this MD&A. |
| o | our ability to comply with complex and changing regulation of the healthcare, virtual care and medical devices industries in the jurisdictions in which we operate, including as an operator of health clinics; and |
| o | our ability to comply with, or facilitate our clients’ compliance with, numerous, complex and sometimes conflicting legal regimes, both domestically and internationally. |
| · | Competitive environment. Competitor expansion, activity and intensity (pricing, including discounting, bundling), as well as non-traditional competition, disruptive technology and disintermediation, may alter the nature of the markets in which we compete and impact our market share and financial results (including revenue and free cash flow). TELUS Digital Experience, TELUS Health and TELUS Agriculture & Consumer Goods face intense competition in different markets. |
| · | Technology. Consumer adoption of alternative technologies and changing customer expectations have the potential to impact our revenue streams and customer churn rates. |
Risks and uncertainties include:
| o | a declining overall market for TV services; |
| o | disruptive technologies, including software-defined networks in the business market, that may displace or cause us to reprice our existing data services, and self-installed technology solutions; |
| o | any failure to innovate, maintain technological advantages or respond effectively and in a timely manner to changes in technology; |
| o | the roll-out, anticipated benefits and efficiencies, and ongoing evolution of wireless broadband technologies and systems; |
| o | our reliance on wireless network access agreements, which have facilitated our deployment of mobile technologies; |
| o | supplier limitations and concentration and market power for products such as network equipment, TELUS TV and mobile handsets; |
| o | our expected long-term need to acquire additional spectrum capacity through future spectrum auctions and from third parties to address increasing demand for data, and our ability to utilize spectrum we acquire; |
| o | deployment and operation of new fixed broadband network technologies at a reasonable cost and the availability and success of new products and services to be rolled out using such network technologies; and |
| o | our deployment of self-learning tools and automation, which may change the way we interact with customers. |
| · | Security and data protection. Our ability to detect and identify potential threats and vulnerabilities depends on the effectiveness of our security controls in protecting our infrastructure and operating environment, and our timeliness in responding to attacks and recovering business operations. A successful attack may impede the operations of our network or lead to the unauthorized interception, destruction, use or dissemination of customer, team member or business information. |
| · | Generative AI (GenAI). GenAI exposes us to numerous risks including risks related to the responsible use of AI, data privacy and cybersecurity, and the possibility that our use of AI may produce inaccurate or inappropriate content or create negative perceptions among companies and regulators that could affect demand for our services. |
|
|
Page |
TELUS Corporation – Management’s discussion and analysis – 2024 Q3
| · | Climate and the environment. Natural disasters, pandemics, disruptive events and climate change may impact our operations, customer satisfaction and team member experience. |
Our goals to achieve carbon neutrality and reduce our greenhouse gas (GHG) emissions in our operations are subject to our ability to identify, procure and implement solutions to reduce energy consumption and adopt cleaner sources of energy, our ability to identify and make suitable investments in renewable energy, including in the form of virtual power purchase agreements, and our ability to continue to realize significant absolute reductions in energy use and the resulting GHG emissions in our operations.
| · | Operational performance and business combination. Investments and acquisitions present opportunities to expand our operational scope, but may expose us to new risks. We may be unsuccessful in gaining market traction/share and realizing benefits, and integration efforts may divert resources from other priorities. Risks include: |
| o | our reliance on third-party cloud-based computing services to deliver our IT services; and |
| o | economic, political and other risks associated with doing business globally (including war and other geopolitical developments). |
| · | Our systems and processes. Systems and technology innovation, maintenance and management may impact our IT systems and network reliability, as well as our operating costs. |
Risks and uncertainties include:
| o | our ability to maintain customer service and operate our network in the event of human error or human-caused threats, such as cyberattacks and equipment failures that could cause various degrees of network outages; |
| o | technical disruptions and infrastructure breakdowns; |
| o | delays and rising costs, including as a result of government restrictions or trade actions; and |
| o | the completeness and effectiveness of business continuity and disaster recovery plans and responses. |
| · | Our team. The rapidly evolving and highly competitive nature of our markets and operating environment, along with the globalization and evolving demographic profile of our workforce, and the effectiveness of our internal training, development, succession and health and well-being programs, may impact our ability to attract, develop and retain team members with the skills required to meet the changing needs of our customers and our business. There may be greater physical and mental health challenges faced by team members (and their families) as a result of the pandemic and its aftermath, and the effect of other significant change initiatives at the organization may result in the loss of key team members through short-term and long-term disability. |
| · | Suppliers. We may be impacted by supply chain disruptions and lack of resiliency in relation to global or local events. Dependence on a single supplier for products, components, service delivery or support may impact our ability to efficiently meet constantly changing and rising customer expectations while maintaining quality of service. Our suppliers’ ability to maintain and service their product lines could affect the success of upgrades to, and evolution of, technology that we offer. |
| · | Real estate matters. Real estate investments are exposed to possible financing risks and uncertainty related to future demand, occupancy and rental rates, especially following the pandemic. Future real estate developments may not be completed on budget or on time and may not obtain lease commitments as planned. |
| · | Financing, debt and dividends. Our ability to access funding at optimal pricing may be impacted by general market conditions and changing assessments in the fixed-income and equity capital markets regarding our ability to generate sufficient future cash flow to service our debt. Our current intention to pay dividends to shareholders could constrain our ability to invest in our operations to support future growth. |
Risks and uncertainties include:
| o | our ability to use equity as consideration in business acquisitions is impacted by stock market valuations of TELUS Common Shares and TELUS International (Cda) Inc. subordinate voting shares; |
| o | our capital expenditure levels and potential outlays for spectrum licences in auctions or purchases from third parties affect and are affected by: our broadband initiatives; our ongoing deployment of newer mobile technologies; investments in network technology required to comply with laws and regulations relating to the security of cyber systems, including bans on the products and services of certain vendors; investments in network resiliency and reliability; the allocation of resources to acquisitions and future spectrum auctions held by Innovation, Science and Economic Development Canada (ISED). Our capital expenditure levels could be impacted if we do not achieve our targeted operational and financial results or if there are changes to our regulatory environment; and |
| o | lower than planned free cash flow could constrain our ability to invest in operations, reduce leverage or return capital to shareholders. Quarterly dividend decisions are made by our Board of Directors based on our financial position and outlook. There can be no assurance that our dividend growth program will be maintained through 2025 or renewed. |
Factors that may affect TELUS Digital’s financial performance are described in TELUS International (Cda) Inc. public filings available on SEDAR+ and EDGAR. TELUS Digital may choose to publicize targets or provide other guidance regarding its business and it may not achieve such targets. Failure to meet these targets could affect TELUS’ ability to achieve targets for the organization as a whole and could result in a decline in the trading price of the TELUS International (Cda) Inc. subordinate voting shares or the TELUS Common Shares or both.
| · | Tax matters. Complexity of domestic and foreign tax laws, regulations and reporting requirements applying to TELUS and our international operating subsidiaries may impact financial results. International acquisitions and expansion of operations heighten our exposure to multiple forms of taxation. |
|
|
Page |
TELUS Corporation – Management’s discussion and analysis – 2024 Q3
| · | The economy. Changing global economic conditions, including a potential recession and alternating expectations about inflation, as well as our effectiveness in monitoring and revising growth assumptions and contingency plans, may impact the achievement of our corporate objectives, our financial results (including free cash flow), and our defined benefit pension plans. |
| · | Litigation and legal matters. Complexity of, and compliance with, laws, regulations, commitments and expectations may have a financial and reputational impact. Risks include: |
| o | our ability to defend against existing and potential claims or our ability to negotiate and exercise indemnity rights or other protections in respect of such claims; and |
| o | the complexity of legal compliance in domestic and foreign jurisdictions, including compliance with competition, anti-bribery and foreign corrupt practices laws. |
Additional risks and uncertainties that are not currently known to us or that we currently deem to be immaterial may also have a material adverse effect on our financial position, financial performance, cash flows, business or reputation. Except as otherwise indicated in this document, the forward-looking statements made herein do not reflect the potential impact of any non-recurring or special items or any mergers, acquisitions, dispositions or other business combinations or transactions that may be announced or that may occur after the date of this document.
Readers are cautioned not to place undue reliance on forward-looking statements. Forward-looking statements in this document describe our expectations, and are based on our assumptions, as at the date of this document and are subject to change after this date. We disclaim any intention or obligation to update or revise any forward-looking statements except as required by law.
This cautionary statement qualifies all of the forward-looking statements in this MD&A.
|
|
Page |
TELUS Corporation – Management’s discussion and analysis – 2024 Q3
Management’s discussion and analysis (MD&A)
November 8, 2024
Contents
| Section | Page | Subsection | |
| 1. | Introduction | 6 | 1.1 Preparation of the MD&A |
6 |
1.2 The environment in which we operate | ||
| 7 | 1.3 Consolidated highlights | ||
| 2. | Core business and strategy | 10 | |
| 3. | Corporate priorities for 2024 | 10 | |
| 4. | Capabilities | 12 |
4.1 Principal markets addressed and competition |
| 12 | 4.2 Operational resources | ||
| 13 | 4.3 Liquidity and capital resources | ||
| 15 | 4.4 Changes in internal control over financial reporting | ||
| 5. | Discussion of operations | 15 | 5.1 General |
| 16 | 5.2 Summary of consolidated quarterly results and trends | ||
| 17 | 5.3 Consolidated operations | ||
| 21 | 5.4 TELUS technology solutions segment | ||
| 27 | 5.5 TELUS digital experience segment | ||
| 6. | Changes in financial position | 31 | |
| 7. | Liquidity and capital resources | 32 | 7.1 Overview |
| 33 | 7.2 Cash provided by operating activities | ||
| 34 | 7.3 Cash used by investing activities | ||
36 |
7.4 Cash provided (used) by financing activities | ||
37 |
7.5 Liquidity and capital resource measures | ||
| 38 | 7.6 Credit facilities | ||
| 39 | 7.7 Short-term borrowings | ||
| 40 | 7.8 Credit ratings | ||
| 40 | 7.9 Financial instruments, commitments and contingent liabilities | ||
| 40 | 7.10 Outstanding share information | ||
| 41 | 7.11 Transactions between related parties | ||
| 8. | Accounting matters | 41 | 8.1 Critical accounting estimates and judgments |
| 41 | 8.2 Accounting policy developments | ||
| 9. | Update to general trends, outlook and assumptions, and regulatory developments and proceedings | 42 | 9.1 Communications industry regulatory developments and proceedings |
| 10. | Risks and risk management | 47 | |
| 11. | Definitions and reconciliations | 47 |
11.1 Non-GAAP and other specified financial measures |
| 54 | 11.2 Operating indicators | ||
© 2024 TELUS Corporation. All rights reserved. The symbols ™ and ® indicate trademarks owned by TELUS Corporation or its subsidiaries used under license. All other trademarks are the property of their respective owners.
|
|
Page |
TELUS Corporation – Management’s discussion and analysis – 2024 Q3
| 1. | Introduction |
The forward-looking statements in this section, including, for example, estimates regarding economic growth, inflation, unemployment, housing starts and immigration, are qualified by the Caution regarding forward-looking statements at the beginning of this Management’s discussion and analysis (MD&A).
1.1 Preparation of the MD&A
The following sections are a discussion of our consolidated financial position and financial performance for the three-month period and nine-month periods ended September 30, 2024, and should be read together with our September 30, 2024 condensed interim consolidated statements of income and other comprehensive income, statements of financial position, statements of changes in owners’ equity and statements of cash flows, and the related notes (collectively referred to as the interim consolidated financial statements). The generally accepted accounting principles (GAAP) that we use are International Financial Reporting Standards (IFRS) as issued by the International Accounting Standards Board (IASB) and Canadian GAAP. In this MD&A, the term IFRS refers to these standards. In our discussion, we also use certain non-GAAP and other specified financial measures to evaluate our performance, monitor compliance with debt covenants and manage our capital structure. These measures are defined, qualified and reconciled with their nearest GAAP measures, as required by National Instrument 52-112, Non-GAAP and Other Financial Measures Disclosure, in Section 11.1. All currency amounts are in Canadian dollars, unless otherwise specified.
Additional information relating to the Company, including our Annual Information Form and other filings with securities commissions or similar regulatory authorities in Canada, is available on SEDAR+ (sedarplus.com). Our information filed with or furnished to the Securities and Exchange Commission in the United States, including Form 40-F, is available on EDGAR (sec.gov). Additional information about our TELUS International (Cda) Inc. (d.b.a. TELUS Digital Experience) subsidiary, including discussion of its business and results, can be found in its public filings available on SEDAR+ and EDGAR; the legal name of the company remains TELUS International (Cda) Inc.
Our disclosure controls and procedures are designed to provide reasonable assurance that all relevant information is gathered and reported to senior management on a timely basis, so that appropriate decisions can be made regarding public disclosure. This MD&A and the interim consolidated financial statements were reviewed by our Audit Committee and authorized by our Board of Directors (Board) for issuance on November 8, 2024.
In this MD&A, unless otherwise indicated, results for the third quarter of 2024 (three-month period ended September 30, 2024) and the nine-month period ended September 30, 2024 are compared with results for the third quarter of 2023 (three-month period ended September 30, 2023) and the nine-month period ended September 30, 2023.
1.2 The environment in which we operate
The success of our business and the challenges we face can best be understood with reference to the environment in which we operate, including broader economic factors that affect both TELUS and our customers, and the competitive nature of our business operations.
TELUS technology solutions (TTech) segment
Across TTech, we are leveraging our leading technology and social purpose to enable remarkable human outcomes. Our long-standing commitment to put our customers first fuels every aspect of our business across the full range of our solutions spanning mobile, data, IP, voice, TV, entertainment, video and security, delivered over our reliable, expansive, award-winning networks. Leveraging data analytics and artificial intelligence (AI) to enhance our services has made us a distinct leader in customer service excellence and loyalty, reducing already-low customer churn, and is demonstrating our commitment to provide Canadians with access to superior technology that connects us to the people, resources and information that matter most. The healthcare industry continues to move toward the digitization of everyday functions across the healthcare ecosystem. We are helping Canadians and others live healthier lives by leveraging technology and data insights that enable access to health information and deliver improved health outcomes with solutions such as employer-focused healthcare. We are also implementing innovative technology solutions to help feed the world, putting data to work for customers in the agriculture, food and consumer goods sectors. This efficient and effective collaboration helps ensure the quality and safety of food and consumer goods.
TELUS digital experience segment (TELUS Digital) (formerly the digitally-led customer experiences – TELUS International (DLCX) segment)
Technology is transforming the way businesses interact with their customers at an accelerating pace and scale. This transformation is making customer experience (CX) and digital experience critically important competitive differentiators across a wide range of industries and sectors. TELUS Digital clients and their customers have access to more information and more choices than ever before, and their expectations about brand experiences and the speed at which companies must process and respond to customer interactions are changing rapidly. Customers value a consistent and personalized experience across every channel when interacting with the companies that serve them. Businesses face pressure to engage with their customers across digital and human channels, and seek to do so by combining technology with an authentic human experience that demonstrates a genuine commitment to customer satisfaction. Clients need to move at the speed of the customer, which means rapid response and fast resolution with low customer effort, powered by next-generation technology. The opportunities that AI presents for augmenting and enhancing CX are far-reaching.
|
|
Page |
TELUS Corporation – Management’s discussion and analysis – 2024 Q3
Economic estimates
Our estimates regarding our economic and operational environment, including economic growth, inflation, unemployment, housing starts and immigration, serve as important inputs for the assumptions on which our targets are based. The extent of the impact these estimates will have on us, and the timing of that impact, will depend upon the actual future outcomes in specific sectors of the Canadian economy.
| Economic growth | Inflation | Unemployment | Housing starts | Immigration | ||||||||||||||||||||||||||||||||||||||||
| (percentage points) | (percentage points) | (percentage points) | (thousands of units) | (thousands) | ||||||||||||||||||||||||||||||||||||||||
| Estimated gross domestic product (GDP) growth rates |
Our
estimated GDP growth rates1 |
Estimated inflation rates |
Our
estimated annual inflation rates1 |
Unemployment rates | Our
estimated annual unemployment rates1 |
Seasonally
adjusted annual rate of housing starts2 |
Our
estimated annual rate of housing starts on an unadjusted basis1 |
Overall
planned permanent resident admissions3 |
||||||||||||||||||||||||||||||||||||
| For the month of | For the month of | |||||||||||||||||||||||||||||||||||||||||||
| Sept. | Sept. | Sept. | Sept. | |||||||||||||||||||||||||||||||||||||||||
| 2024 | 2024 | 2024 | 2024 | 20244 | 20234 | 2024 | 2024 | 2023 | 2024 | 2024 | ||||||||||||||||||||||||||||||||||
| Canada | 1.2 | 5 | 1.1 | 2.5 | 5 | 2.6 | 6.5 | 5.5 | 6.4 | 224 | 270 | 248 | 485 | |||||||||||||||||||||||||||||||
| B.C. | 1.0 | 6 | 0.9 | 2.7 | 6 | 2.6 | 6.0 | 5.4 | 5.7 | 44 | 40 | 48 | n/a | |||||||||||||||||||||||||||||||
| Alberta | 3.3 | 6 | 1.8 | 3.0 | 6 | 3.0 | 7.5 | 5.7 | 6.8 | 47 | 49 | 44 | n/a | |||||||||||||||||||||||||||||||
| Ontario | 0.3 | 6 | 1.0 | 2.6 | 6 | 2.5 | 6.9 | 6.0 | 6.9 | 65 | 104 | 81 | n/a | |||||||||||||||||||||||||||||||
| Quebec | 0.6 | 6 | 0.9 | 2.8 | 6 | 2.7 | 5.5 | 4.4 | 5.4 | 40 | 53 | 47 | n/a | |||||||||||||||||||||||||||||||
| n/a – not applicable | |
| 1 | Assumptions are as of September 13, 2024 and are based on a composite of estimates from Canadian banks and other sources. |
| 2 | Source: Statistics Canada. Table 34-10-0158-01 Canada Mortgage and Housing Corporation, housing starts, all areas, Canada and provinces, seasonally adjusted at annual rates, monthly (x 1,000). |
| 3 | Source: canada.ca/en/immigration-refugees-citizenship/news/notices/supplementary-immigration-levels-2024-2026.html. Excludes non-permanent residents of Canada. |
| 4 | Source: Statistics Canada Labour Force Survey, September 2024 and September 2023, respectively. |
| 5 | Source: Bank of Canada Monetary Policy Report, October 2024. |
| 6 | Source: British Columbia Ministry of Finance, First Quarterly Report, September 2024; Alberta Ministry of Treasury Board and Finance, 2024 – 25 First Quarter Fiscal Update and Economic Statement, August 2024; Ontario Ministry of Finance, 2024 Budget: Building a Better Ontario, March 26, 2024; and Ministère des Finances du Québec, Budget 2024 – 2025, March 2024, respectively. |
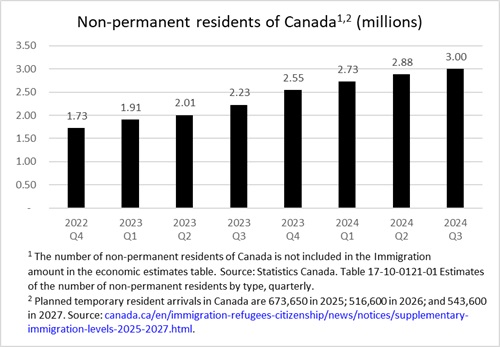
1.3 Consolidated highlights
Long-term debt issue
On August 8, 2024, we announced an offering of $700 million of senior unsecured 4.65% Notes, Series CAQ. The notes were issued on August 13, 2024, and will mature on August 13, 2031. The net proceeds from this offering were used for the repayment of outstanding indebtedness, including the repayment of commercial paper and the reduction of cash amounts outstanding under an arm’s length securitization trust, and for other general corporate purposes.
|
|
Page |
TELUS Corporation – Management’s discussion and analysis – 2024 Q3
Consolidated highlights
| Three-month periods ended September 30 | Nine-month periods ended September 30 | |||||||||||||||||||||||
| ($ millions, except footnotes and unless noted otherwise) | 2024 | 2023 | Change | 2024 | 2023 | Change | ||||||||||||||||||
| Consolidated statements of income | ||||||||||||||||||||||||
| Operating revenues and other income | 5,099 | 5,008 | 1.8 | % | 15,005 | 14,918 | 0.6 | % | ||||||||||||||||
| Operating income | 788 | 517 | 52.4 | % | 2,045 | 1,698 | 20.4 | % | ||||||||||||||||
| Income before income taxes | 309 | 165 | 87.3 | % | 790 | 703 | 12.4 | % | ||||||||||||||||
| Net income | 257 | 137 | 87.6 | % | 618 | 557 | 11.0 | % | ||||||||||||||||
| Net income attributable to Common Shares | 280 | 136 | n/m | 635 | 553 | 14.8 | % | |||||||||||||||||
| Adjusted Net income1 | 413 | 373 | 10.7 | % | 1,169 | 1,032 | 13.3 | % | ||||||||||||||||
| Earnings per share (EPS) ($) | ||||||||||||||||||||||||
| Basic EPS | 0.19 | 0.09 | n/m | 0.43 | 0.38 | 13.2 | % | |||||||||||||||||
| Adjusted basic EPS1 | 0.28 | 0.25 | 12.0 | % | 0.79 | 0.71 | 11.3 | % | ||||||||||||||||
| Diluted EPS | 0.19 | 0.09 | n/m | 0.43 | 0.38 | 13.2 | % | |||||||||||||||||
| Dividends declared per Common Share ($) | 0.3891 | 0.3636 | 7.0 | % | 1.1543 | 1.0783 | 7.0 | % | ||||||||||||||||
| Basic weighted-average Common Shares outstanding (millions) | 1,492 | 1,454 | 2.6 | % | 1,483 | 1,447 | 2.5 | % | ||||||||||||||||
| Consolidated statements of cash flows | ||||||||||||||||||||||||
| Cash provided by operating activities | 1,432 | 1,307 | 9.6 | % | 3,770 | 3,185 | 18.4 | % | ||||||||||||||||
| Cash used by investing activities | (782 | ) | (791 | ) | (1.1 | )% | (3,029 | ) | (4,032 | ) | (24.9 | )% | ||||||||||||
| Acquisitions | (91 | ) | (11 | ) | n/m | (258 | ) | (1,273 | ) | (79.7 | )% | |||||||||||||
| Capital expenditures2 | (668 | ) | (769 | ) | (13.1 | )% | (2,084 | ) | (2,289 | ) | (9.0 | )% | ||||||||||||
| Cash provided (used) by financing activities | (763 | ) | 39 | n/m | (791 | ) | 1,077 | n/m | ||||||||||||||||
| Other highlights | ||||||||||||||||||||||||
| Telecom subscriber connections3 (thousands) | 19,847 | 18,652 | 6.4 | % | ||||||||||||||||||||
| Earnings before interest, income taxes, depreciation and amortization1 (EBITDA) | 1,756 | 1,517 | 15.8 | % | 5,070 | 4,726 | 7.3 | % | ||||||||||||||||
| EBITDA margin1 (%) | 34.4 | 30.3 | 4.1 | pts. | 33.8 | 31.7 | 2.1 | pts. | ||||||||||||||||
| Restructuring and other costs | 86 | 303 | (71.6 | )% | 425 | 577 | (26.3 | )% | ||||||||||||||||
| Adjusted EBITDA1 | 1,842 | 1,820 | 1.3 | % | 5,495 | 5,302 | 3.7 | % | ||||||||||||||||
| Adjusted EBITDA margin1 (%) | 36.1 | 36.3 | (0.2 | ) pts. | 36.6 | 35.5 | 1.1 | pts. | ||||||||||||||||
| Free cash flow1 | 561 | 355 | 58.0 | % | 1,435 | 1,169 | 22.8 | % | ||||||||||||||||
| Net debt to EBITDA – excluding restructuring and other costs1 (times) | 3.83 | 3.82 | 0.01 | |||||||||||||||||||||
| Notations used in MD&A: n/m – not meaningful; pts. – percentage points. | |
| 1 | These are non-GAAP and other specified financial measures. See Section 11.1 Non-GAAP and other specified financial measures. |
| 2 | Capital expenditures include assets purchased, excluding right-of-use lease assets, but not yet paid for, and consequently differ from Cash payments for capital assets, excluding spectrum licences, as reported in the interim consolidated financial statements. Refer to Note 31 of the interim consolidated financial statements for further information. |
| 3 | The sum of active mobile phone subscribers, connected device subscribers, internet subscribers, residential voice subscribers, TV subscribers and security subscribers, measured at the end of the respective periods based on information in billing and other source systems. Effective for the first quarter of 2024, with retrospective application to January 1, 2023, we reduced our mobile phone subscriber base by 283,000 subscribers to remove a subset of our public services customers that are now subject to dynamic pricing auction models. We believe adjusting our base for these low-margin customers provides a more meaningful reflection of the underlying performance of our mobile phone business and our focus on profitable growth. As a result of this change, associated operating statistics (ARPU and churn) have also been adjusted. Effective January 1, 2024, on a prospective basis, we adjusted our TV subscriber base to remove 97,000 subscribers as we have ceased marketing our Pik TV® product. |
|
|
Page |
TELUS Corporation – Management’s discussion and analysis – 2024 Q3
Operating highlights
| · | Consolidated Operating revenues and other income increased by $91 million in the third quarter of 2024 and $87 million in the first nine months of 2024. |
Service revenues increased by $22 million in the third quarter of 2024, reflecting: (i) mobile network, residential internet, TV and security subscriber growth; (ii) health services growth; (iii) agriculture and consumer goods services growth; and (iv) growth in managed, unmanaged and other fixed data services. These factors were partly offset by: (i) rate reductions in mobile network, residential internet, and security services; (ii) lower external revenues in TELUS Digital; and (iii) declines in TV and fixed legacy voice services revenues. Service revenues decreased by $10 million in the first nine months of 2024 due to the same negating factors as the third quarter, partly offset by the same lower growth factors as the third quarter.
Equipment revenues increased by $30 million in the third quarter of 2024, largely driven by higher mobile equipment revenues stemming from higher-value smartphones volume in the sales mix. Equipment revenues decreased by $31 million in the first nine months of 2024, primarily driven by lower mobile equipment revenues due to a reduction in contracted volumes and lower fixed business premises equipment sales, partly offset by higher-value smartphones in the sales mix.
Other income increased by $39 million in the third quarter of 2024, largely due to higher gains on real estate projects resulting from our PureFibre build and copper decommissioning program. Other income increased by $128 million in the first nine months of 2024, due to the same factors as the quarter, in addition to higher reversals of business combination-related provisions.
For additional details on Operating revenues and other income, see Section 5.4 TELUS technology solutions segment and Section 5.5 TELUS digital experience segment.
| · | Operating income increased by $271 million in the third quarter of 2024 and $347 million in the first nine months of 2024. (See Section 5.3 Consolidated operations for additional details.) |
EBITDA increased by $239 million in the third quarter of 2024 and $344 million in the first nine months of 2024. EBITDA includes restructuring and other costs of $86 million in the third quarter of 2024 and $425 million in the first nine months of 2024, and other equity income related to real estate joint ventures.
Adjusted EBITDA, which excludes restructuring and other costs and other equity income related to real estate joint ventures, increased by $22 million in the third quarter of 2024 and $193 million in the first nine months of 2024, reflecting: (i) mobile network, residential internet, TV and security subscriber growth; (ii) broad-based cost reduction efforts, synergies achieved between LifeWorks® and our legacy health business, and an increase in TTech leveraging TELUS Digital, as well as savings in marketing costs; (iii) higher gains on real estate projects and in the first nine months of 2024, higher reversals of business combination-related provisions; (iv) growth in health services margin; (v) higher agriculture and consumer goods margins; and (vi) growth in fixed data services to new and existing business customers. These factors were partly offset by: (i) lower mobile phone ARPU; (ii) lower operational growth in TELUS Digital (excluding other income); (iii) declining TV and fixed legacy voice margins; (iv) lower mobile equipment margins; (v) higher network operations costs; (vi) higher bad debt expense; and (vii) higher costs related to the scaling of our digital capabilities. (See Section 5.3 Consolidated operations for additional details.)
| · | Income before income taxes increased by $144 million in the third quarter of 2024 and $87 million in the first nine months of 2024, resulting from higher operating income partly offset by higher Financing costs. The increase in Financing costs largely resulted from the impact of unrealized changes in virtual power purchase agreements forward element and higher interest expense. (See Financing costs in Section 5.3.) |
| · | Income tax expense increased by $24 million in the third quarter of 2024 and $26 million in the first nine months of 2024. The effective tax rate decreased from 17.2% to 16.8% in the third quarter of 2024, primarily due to lower losses not recognized and withholding and other taxes. In the first nine months of 2024, the effective tax rate increased from 20.8% to 21.8%, largely as a result of lower adjustments recognized in the current period for income taxes of prior periods. |
| · | Net income attributable to Common Shares increased by $144 million in the third quarter of 2024 and $82 million in the first nine months of 2024, reflecting the after-tax impacts of higher Operating income partly offset by higher Financing costs. |
Adjusted Net income excludes the effects of restructuring and other costs, income tax-related adjustments, real estate rationalization-related restructuring impairments, other equity income related to real estate joint ventures and unrealized changes in virtual power purchase agreements forward element. Adjusted Net income increased by $40 million in the third quarter of 2024 and $137 million in the first nine months of 2024.
| · | Basic EPS increased by $0.10 in the third quarter of 2024 and $0.05 in the first nine months of 2024, reflecting the after-tax impacts of higher Operating income partly offset by higher Financing costs, as well as the effect of a higher number of Common Shares outstanding. |
|
|
Page |
TELUS Corporation – Management’s discussion and analysis – 2024 Q3
Adjusted basic EPS excludes the effects of restructuring and other costs, income tax-related adjustments, real estate rationalization-related restructuring impairments, other equity income related to real estate joint ventures and unrealized changes in virtual power purchase agreements forward element. Adjusted basic EPS increased by $0.03 in the third quarter of 2024 and $0.08 in the first nine months of 2024.
| · | Dividends declared per Common Share were $0.3891 in the third quarter of 2024, an increase of 7.0% from one year earlier. On November 7, 2024, the Board declared a fourth quarter dividend of $0.4023 per share on our issued and outstanding Common Shares, payable on January 2, 2025, to shareholders of record at the close of business on December 11, 2024. The fourth quarter dividend increased by $0.0262 per share or 7.0% from the dividend of $0.3761 per share declared one year earlier, consistent with our multi-year dividend growth program described in Section 4.3 Liquidity and capital resources. |
| · | During the 12-month period ended on September 30, 2024, our total telecom subscriber connections increased by 1,195,000 or 6.4%. This reflected growth of 4.2% in mobile phone subscribers, 21.4% in connected device subscribers, 5.1% in internet subscribers, 6.4% in TV subscribers excluding the first quarter 2024 Pik TV subscriber adjustment, and 7.5% in security subscribers, partly offset by a decline of 3.0% in residential voice subscribers. (See Section 5.4 TELUS technology solutions segment for additional details.) |
Liquidity and capital resource highlights
| · | Cash provided by operating activities increased by $125 million in the third quarter of 2024 and $585 million in the first nine months of 2024, primarily driven by EBITDA growth, and for the first nine months of 2024, other working capital changes and lower income taxes paid, net of recoveries received. These factors were partially offset by increased restructuring and other costs disbursements, net of expense, and increased interest paid. (See Section 7.2 Cash provided by operating activities.) |
| · | Cash used by investing activities decreased by $9 million in the third quarter of 2024 largely attributable to lower Cash payments for capital assets, excluding spectrum licences. Cash used by investing activities decreased by $1,003 million in the first nine months of 2024, primarily driven by lower cash payments for business acquisitions and lower cash payments for capital assets, partly offset by greater Cash payments for spectrum licences. Acquisitions decreased by $1,015 million in the first nine months of 2024, mainly reflecting the impact of the WillowTreeTM acquisition in the first quarter of 2023. (See Section 7.3 Cash used by investing activities.) |
| · | Cash used by financing activities increased by $802 million in the third quarter of 2024 primarily reflecting lower issuances of long-term debt. Cash used by financing activities increased by $1,868 million in the first nine months of 2024, largely attributable to lower issuances of long-term debt, partly offset by increased issuances of short-term borrowings, net and lower redemptions and repayment of long-term debt. (See Section 7.4 Cash provided (used) by financing activities.) |
| · | Net debt to EBITDA – excluding restructuring and other costs ratio was 3.83 times at September 30, 2024, up from 3.82 times at September 30, 2023. The effect of the increase in net debt levels, primarily due to spectrum acquisitions and business acquisitions, was approximately equal to the effect of growth in EBITDA – excluding restructuring and other costs; net debt levels were already elevated in the current and comparative periods due to our spectrum acquisitions and business acquisitions. As at September 30, 2024, the acquisition of spectrum licences increased the ratio by approximately 0.56. (See Section 4.3 Liquidity and capital resources and Section 7.5 Liquidity and capital resource measures.) |
| · | Free cash flow increased by $206 million in the third quarter of 2024 and $266 million in the first nine months of 2024, reflecting higher EBITDA and lower capital expenditures. These factors were partly offset by increased interest paid, greater lease payments and for the first nine months of 2024, increased restructuring and other costs disbursements, net of expense. Our definition of free cash flow, for which there is no industry alignment, is unaffected by accounting standards that do not impact cash. |
| 2. | Core business and strategy |
Our core business and our strategic imperatives were described in our 2023 annual MD&A.
| 3. | Corporate priorities for 2024 |
Our annual corporate priorities are used to advance our long-term strategic imperatives and address near-term opportunities and challenges. The following table provides a discussion of activities and initiatives that relate to our 2024 corporate priorities.
|
|
Page |
TELUS Corporation – Management’s discussion and analysis – 2024 Q3
Elevating our customers, communities and social purpose by honouring our brand promise, Let’s make the future friendly™
| · | In August 2024, to support those impacted by the wildfires in Jasper, Alberta, TELUS, our team members, customers and the Foundation have enabled more than $200,000 in cash donations and in-kind contributions. Our assistance included: |
| · | Distributing adult and youth disaster kits at evacuation centers containing essential items such as emergency blankets, reusable water bottles, charging cables and activities for kids. |
| · | Rapidly deploying three cell towers on wheels (COWs) to provide wireless connectivity and support emergency communications along a no-coverage section of Highway 16, to an RCMP checkpoint and one within the town of Jasper. |
| · | Implementing our first ever deployment of a low earth orbit satellite temporary connectivity solution for a cell tower where its fibre connection was destroyed by the fire, thereby allowing access to 9-1-1. |
| · | Continually refuelling back-up generators to keep communication lines safely up and running after a loss of commercial power. |
| · | Working closely with the incident command centre and its membership to protect critical network infrastructure. |
| · | Offering data top-ups and waiving long-distance mobile, home phone, texting and roaming fees for evacuees and those affected. |
| · | Offering a free community crisis support line for emotional support, accessible 24/7 to all Canadians, provided by TELUS Health. |
| · | Supplying free counselling sessions through TELUS Health MyCare™. |
| · | Providing no-cost veterinary technician appointments through TELUS Health MyPet. |
| · | Partnering with the Red Cross to establish a recovery centre, providing tents, site-wide Wi-Fi connectivity and essential care items for returning evacuees. Additionally, our technicians conducted re-entry checks and prioritized service restoration in a strategic manner. |
| · | In October 2024, we received our third consecutive Disaster Recovery Institute Canada (DRI) Response and Recovery Award for crisis management during the 2024 Jasper wildfires, demonstrating outstanding business continuity, disaster recovery, and community and customer support despite concurrent challenges. |
| · | Throughout the first nine months of 2024, we continued to leverage our Connecting for Good® programs to support marginalized individuals by enhancing their access to both technology and healthcare, as well as our TELUS Wise® program to improve digital literacy and online safety knowledge. Since the launch of these programs, they have provided support for 1.3 million individuals. |
| · | During the first nine months of 2024, we welcomed over 6,500 new households to our Internet for Good® program. Since we launched the program in 2016, we have connected close to 62,000 households, resulting in more than 194,000 low-income family members and seniors, persons in need who are living with disabilities, government-assisted refugees and youth leaving foster care with low-cost, high-speed internet service. |
| · | Our Mobility for Good® program offers free or low-cost smartphones and mobility plans to youth aging out of foster care, low-income seniors and low-income families, across Canada. During the first nine months of 2024, we added 6,500 youth, low-income seniors and families, as well as Indigenous women at risk of or surviving violence, government-assisted refugees and other marginalized individuals to the program. Since we launched Mobility for Good in 2017, the program has provided support for 59,000 people. |
| · | Our Health for Good® mobile health clinics facilitated 46,500 patient visits during the first nine months of 2024. Since the program’s inception, we have enabled 246,500 cumulative patient visits in 27 communities across Canada, bringing primary and mental healthcare to individuals experiencing homelessness. |
| · | In September 2024, we increased our overall commitment to the TELUS Health for Good program to over $16 million through 2027 and launched a new mobile health clinic, bringing primary care and harm reduction services directly to people experiencing homelessness across the B.C. Interior. |
| · | During the first nine months of 2024, our Tech for Good® program provided access to personalized assessments, recommendations and training on mobile devices, computers, laptops and related assistive technology and/or access to discounted mobile plans for 2,600 Canadians living with disabilities, helping them improve their independence and quality of life. Since the program’s inception in 2017, we have supported 11,400 individuals in Canada who are living with disabilities through the program and/or the TELUS Wireless Accessibility Discount. |
| · | During the first nine months of 2024, more than 95,700 individuals in Canada and around the world participated in virtual TELUS Wise workshops and events to improve digital literacy and online safety, bringing total cumulative participation to over 775,500 since the program launched in 2013. |
| · | Currently, we have 19 TELUS Community Boards, 13 operating in Canada and six international boards. Our Community Boards entrust local leaders to make recommendations on the allocation of grants in their communities. These grants support registered charities that offer health, education or technology programs to help youth thrive. Since 2005, our 19 TELUS Community Boards and TELUS Friendly Future Foundation® (the Foundation) have supported 33.6 million youth in-need in Canada and around the world, by granting $131 million in cash donations to 10,500 initiatives. |
| · | During the third quarter of 2024, we announced a major milestone in charitable giving in Canada with TELUS’ Community Board program reaching $100 million in donations to local charities across the country since inception in 2005. |
| · | Working in close partnership with our 13 Canadian TELUS Community Boards, the Foundation provides grants to charities that promote education, health and well-being for youth across the country. Additionally, through the TELUS Student Bursary program, the Foundation provides bursaries for post-secondary students who are facing financial barriers and are committed to making a difference in their communities. During the first nine months of 2024, the Foundation supported over 535,500 youth by granting over $7 million to 500 Canadian registered charities. Since its inception in 2018, the Foundation has provided $54 million in cash donations to our communities, helping 15.7 million youth reach their full potential. For more information about the TELUS Student Bursary program, please visit friendlyfuture.com/bursary. |
| · | Throughout the third quarter, we continued to engage our global team to volunteer in their communities, with more than 665,000 hours of service recorded so far, and on track to achieve our annual goal of 1.5 million hours for the second consecutive year. |
|
|
Page |
TELUS Corporation – Management’s discussion and analysis – 2024 Q3
Leveraging TELUS’ world-leading technology to drive superior growth across mobile, home and business services
| · | Through Badal, a recently acquired company providing cloud and data analytics services, in July 2024, we announced a collaboration with the University of Ottawa Heart Institute to successfully deploy advancements to the Sayhut app – a secure, privacy-compliant point-of-care smartphone application that helps to reduce diagnostic time for patients who may be experiencing a heart attack due to a blocked artery. The app improves the speed and accuracy of communication between first responders, emergency doctors and interventional cardiologists at regional cardiac centres, enabling real-time review and decision-making. |
| · | In July 2024, we unveiled the first step in a multi-year strategic partnership with WestJet that will transform the inflight experience for WestJet guests by providing fast and free internet onboard WestJet aircraft, sponsored by TELUS. |
| · | In August 2024, we announced our membership in the National Institute of Standards and Technology’s U.S. Artificial Intelligence (AI) Safety Institute Consortium to support the development and deployment of trustworthy and safe AI, making us the first and currently only Canadian telecom company to join. Our involvement with the consortium underscores our commitment to responsible AI, ensuring that AI is developed and deployed in a trustworthy, ethical manner that is safe and benefits everyone. |
| · | In September 2024, we launched SmartEnergy, helping Canadians to manage and control their home energy usage. Through the SmartHome+ app, subscribers can optimize their connected smart devices to save money on their energy bills, support their community power grids by joining energy-saving events, and reduce their environmental footprint through various initiatives, including the planting of a tree each quarter on their behalf. |
| · | In September 2024, we announced a strategic partnership with Mila - Quebec Artificial Intelligence Institute, to build on both organizations’ efforts to develop AI for the benefit of society. This partnership demonstrates our commitment to bolstering Canada’s technology ecosystem through the development of trustworthy, ethical AI. |
Scaling our innovative digital capabilities in TELUS Health and TELUS Agriculture & Consumer Goods to build assets of consequence
TELUS Health
| · | In July 2024, we announced a collaboration with Nova Scotia Health to enable residents of Nova Scotia to access their primary care information through the YourHealthNS app. This health data interoperability initiative marks the first large-scale effort in Canada to standardize and connect primary care data and empowers people in Nova Scotia to better manage their health and improve health outcomes. |
| · | During the quarter, we acquired international digital health and well-being providers, expanding our global footprint in Europe and Asia. |
TELUS Agriculture & Consumer Goods
| · | The third quarter of 2024 was a notable quarter for bookings growth, leading to a strong increase on a year-to-date basis across all lines of business within TELUS Agriculture & Consumer Goods. |
Scaling our innovative digital capabilities in TELUS Digital Experience (TELUS Digital), to build an asset of consequence
| · | In July 2024, IDC in collaboration with Foundry’s CIO, selected the single point of contact (SPOC) co-pilot that operates on the Fuel iXTM platform at TELUS, as a recipient of a 2024 CIO of the Year Award for Canada. |
| · | In July, we launched Fuel EX, an enterprise-safe generative AI (GenAI) employee assistant to support productivity, creativity and research. Fuel EX gives companies a single point of entry for their employees to access an intuitive GenAI interface where they can select from more than 20 large language models from multiple vendors to help them with everyday tasks including knowledge searches, summarization, copywriting, image generation and code writing. |
| · | In August, we unveiled TELUS Expert Messaging, a GenAI asynchronous messaging solution, part of the My TELUS app, that eliminates wait times associated with traditional phone and live chat queues. This tool lets TELUS customers access human support whenever it is most convenient for them, 24/7, by sending a message from their mobile device and receiving a notification when an expert has responded, often resolving their inquiry in a single message. |
| · | In September, we were named as a Leader in the Everest Group’s PEAK Matrix for Customer Experience Management (the Americas) for the sixth consecutive year. |
| · | In September, we completed the global rebrand from TELUS International to TELUS Digital. The new name reflects TELUS Digital’s commitment to providing a digital-first experience across every service it delivers to clients, ensuring a seamless integration of digital, AI-powered and human interactions that optimize customer journeys and employee experiences. |
| 4. | Capabilities |
The forward-looking statements in this section, including statements regarding our dividend growth program and our financial objectives in Section 4.3, are qualified by the Caution regarding forward-looking statements at the beginning of this MD&A.
4.1 Principal markets addressed and competition
For a discussion of our principal markets and an overview of competition, refer to Section 4.1 in our 2023 annual MD&A.
4.2 Operational resources
TELUS technology solutions (TTech)
From mid-2013 through September 30, 2024, we invested more than $8.1 billion to acquire wireless spectrum licences in spectrum auctions and other private transactions, including the entire $620 million we remitted in the first nine months of 2024 to Innovation, Science and Economic Development Canada (ISED) in connection with our recently licensed 3800 MHz spectrum. Additionally, in the second quarter of 2024, we completed a transaction to obtain the use of AWS-4 spectrum from the original licensee. These investments have more than doubled our national spectrum holdings in support of our top priority to put customers first.
|
|
Page |
TELUS Corporation – Management’s discussion and analysis – 2024 Q3
Mobile data consumption has been increasing rapidly and is expected to continue growing at a fast rate as the industry continues to transition to 5G. We have responded by investing in the coverage, capacity, performance and reliability of our network to ensure we are able to support additional data consumption and growth in our mobile subscriber base in a geographically diverse country, while maintaining the high quality of our network. This includes investments in wireless small cells connected directly to our TELUS PureFibre® technology to improve coverage and capacity utilized in our 5G network.
As at September 30, 2024, our 4G LTE technology covered 99% of Canada’s population, consistent with September 30, 2023. We have continued to invest in the roll-out of our LTE advanced technology, which covered over 95% of Canada’s population at September 30, 2024, consistent with one year earlier. Furthermore, our 5G network covered approximately 87% of Canada’s population at September 30, 2024, up from over 85% at September 30, 2023.
We are continuing to invest in urban and rural communities across B.C., Alberta and Eastern Quebec with commitments to deliver broadband technology capabilities to as many Canadians in these communities as possible, including expanding our PureFibre footprint by connecting more homes and businesses directly to PureFibre. In addition, we have increased broadband internet speeds, expanded our IP TV video-on-demand library and high-definition content, including 4K TV and 4K HDR capabilities, and enhanced the marketing of data products and bundles. This has resulted in improved churn rates. Our PureFibre technology is also an essential component of our wireless access technology and has enabled our 5G deployment. Our home and business security solutions integrate safety and security monitoring with smart devices.
As at September 30, 2024, more than 3.3 million households and businesses in B.C., Alberta and Eastern Quebec were connected to fibre-optic cable. This is up from more than 3.1 million households and businesses in the third quarter of 2023.
Our core areas of focus in the global healthcare and financial well-being marketplace are: employers (small, medium and large enterprise), payors (insurers, third-party payors and third-party administrators, and public sector), providers (clinics and physicians, pharmacists and allied health professionals) and consumer solutions. We offer a variety of integrated health and well-being products, solutions and services including: employee assistance programs (EAP), internet-based cognitive behavioural therapy (iCBT), absence and disability management, executive, premier and occupational health services, corporate reward, training programs, recognition and perks programs, pension and benefits administration solutions, retirement and financial consulting, virtual care (comprehensive primary care, mental health support, wellness offerings for employees and citizens, pet care), remote patient monitoring and personal emergency response services, medication management (virtual pharmacy, pharmacy management systems), health records management (personal health records, electronic medical records (EMR)), claims management solutions, and curation of health content.
Our agriculture and consumer goods solutions include agronomy record-keeping and recommendations, rebate management services, supplier management, order management, index labelling, compliance management, animal agriculture solutions, food traceability and quality assurance, data management solutions and software solutions for trade promotion management, optimization and analytics (TPx), retail execution, supply chain solutions and analytics capabilities.
TELUS digital experience
Our TELUS Digital segment is dedicated to crafting lasting customer experiences through data, technology and a human-centric approach. We support our clients’ entire customer lifecycle with a portfolio of integrated digital customer experience solutions, including digital information technology (IT) services, such as cloud solutions and AI-fuelled automation, trust and safety services, AI data solutions, including computer vision, and front-end digital design and consulting services.
TELUS Digital has built an agile delivery model with global scale to support next-generation, digitally-led customer experiences. Substantially all of the delivery locations are connected through a carrier-grade infrastructure backed by cloud technologies, enabling globally distributed and virtualized teams. The interconnectedness of our TELUS Digital teams and ability to seamlessly shift interactions between physical and digital channels enables our TELUS Digital teams to tailor our delivery strategy to clients’ evolving needs.
4.3 Liquidity and capital resources
Capital structure financial policies
Our objective when managing financial capital is to maintain a flexible capital structure that optimizes the cost and availability of capital at acceptable risk. In our definition of financial capital, we include:
| · | Common equity (excluding Accumulated other comprehensive income); |
| · | Non-controlling interests; |
| · | Long-term debt (including long-term credit facilities, commercial paper backstopped by long-term credit facilities and any hedging assets or liabilities associated with Long-term debt items, net of amounts recognized in Accumulated other comprehensive income); |
| · | Cash and temporary investments; |
| · | Short-term borrowings (including those arising from securitized trade receivables and unbilled customer finance receivables); and |
| · | Other long-term debts. |
|
|
Page |
TELUS Corporation – Management’s discussion and analysis – 2024 Q3
We manage our financial capital structure and make adjustments to it in light of changes in economic conditions and the risk characteristics of our business. In order to maintain or adjust our financial capital structure, we may:
| · | Adjust the amount of dividends paid to holders of Common Shares; |
| · | Purchase Common Shares for cancellation pursuant to normal course issuer bid programs; |
| · | Issue new shares (including Common Shares and TELUS International (Cda) Inc. subordinate voting shares); |
| · | Issue new debt, issue new debt to replace existing debt with different characteristics; and/or |
| · | Increase or decrease the amount of short-term borrowings arising from securitized trade receivables and unbilled customer finance receivables. |
We monitor financial capital utilizing a number of measures, including net debt to EBITDA – excluding restructuring and other costs ratio, coverage ratios and dividend payout ratios. (See definitions in Section 11.1 Non-GAAP and other specified financial measures.)
Financing and capital structure management plans
|
Report on financing and capital structure management plans
|
|
Pay dividends to the holders of the Common Shares of TELUS Corporation under our multi-year dividend growth program
· In May 2022, we announced our intention to target ongoing semi-annual dividend increases, with the annual increase in the range of 7 to 10% from 2023 through to the end of 2025, thereby extending the policy first announced in May 2011. Notwithstanding this target, dividend decisions will continue to be subject to our Board’s assessment and the determination of our financial position and outlook on a quarterly basis. Our long-term Common Share dividend payout ratio guideline is 60 to 75% of free cash flow on a prospective basis. (See Section 7.5 Liquidity and capital resource measures.) There can be no assurance that we will maintain a dividend growth program or that it will be unchanged through 2025. (See Caution regarding forward-looking statements – Financing, debt and dividends and Section 10.15 Financing, debt and dividends in our 2023 annual MD&A.)
· On November 7, 2024, the Board elected to declare a fourth quarter dividend of $0.4023 per share, payable on January 2, 2025, to shareholders of record at the close of business on December 11, 2024. The fourth quarter dividend for 2024 reflects a cumulative increase of $0.0262 per share or 7.0% from the dividend of $0.3761 per share declared one year earlier.
· Our dividend reinvestment and share purchase (DRISP) plan trustee acquired shares from Treasury for the DRISP plan, rather than acquiring Common Shares in the stock market. We may, at our discretion, offer Common Shares at a discount of up to 5% from the market price under the DRISP plan. Effective with the dividends paid beginning on October 1, 2019, we offered Common Shares from Treasury at a discount of 2%. During the third quarter of 2024, for the dividends paid on July 2, 2024, our DRISP plan trustee acquired from Treasury approximately 10 million dividend reinvestment Common Shares for $193 million.
For these dividends, the DRISP participation rate, calculated as the DRISP investment of $193 million (including the employee share purchase plan) as a percentage of gross dividends, was approximately 34%. For the dividends paid on October 1, 2024, the DRISP participation rate, calculated as the DRISP investment of $190 million (including the employee share purchase plan) as a percentage of gross dividends, was approximately 33%.
|
|
Use proceeds from securitized receivables (Short-term borrowings), bank facilities and commercial paper as needed, to supplement free cash flow and meet other cash requirements
· Our issued and outstanding commercial paper was $1.1 billion at September 30, 2024, all of which was denominated in U.S. dollars (US$0.8 billion), compared to $1.0 billion (US$0.8 billion) at December 31, 2023, and $1.4 billion (US$1.0 billion) at September 30, 2023.
· Net draws due to a syndicate of financial institutions (excluding TELUS Corporation) on the TELUS International (Cda) Inc. credit facility were US$1.2 billion at September 30, 2024, compared to US$1.4 billion at December 31, 2023, and US$1.4 billion at September 30, 2023. The TELUS International (Cda) Inc. credit facility is non-recourse to TELUS Corporation.
· Proceeds from securitized trade receivables and unbilled customer finance receivables were $0.9 billion at September 30, 2024 under the new agreement. This is compared to $0.1 billion at both December 31, 2023 and September 30, 2023 under the previous securitization agreement (see Section 7.7). Funding under the 2024 agreement may be provided in either Canadian dollars or U.S. dollars. Foreign currency forward contracts are used to manage currency risk associated from funding denominated in U.S. dollars.
|
|
Maintain compliance with financial objectives
· Maintain investment-grade credit ratings – On November 8, 2024, investment-grade credit ratings from all rating agencies that cover TELUS were in the desired range. (See Section 7.8 Credit ratings.)
· Net debt to EBITDA – excluding restructuring and other costs ratio of 2.20 to 2.70 times – As measured at September 30, 2024, this ratio was 3.83 times, outside of the objective range, primarily due to the acquisition of spectrum licences (as spectrum is our largest indefinite life asset) and business acquisitions. Given the cash demands of the 600 MHz auction in 2019, the 3500 MHz auction in 2021, the 3800 MHz auction in 2023 and the upcoming auction for millimetre wave spectrum, the assessment of the guideline and timing of return to the objective range remains to be determined; however, it is our intent to return to a ratio of circa 2.70 times in the medium term (following the spectrum auctions in 2021 and 2023, and the upcoming auction for millimetre wave spectrum), consistent with our long-term strategy. (See Section 7.5 Liquidity and capital resource measures.)
· Common Share dividend payout ratio of 60 to 75% of free cash flow on a prospective basis – Our objective range is on a prospective basis. The Common Share dividend payout ratio1 we present in this MD&A is a historical measure utilizing the dividends declared in the most recent four quarters, net of dividend reinvestment plan effects, and free cash flow, and is presented on a retrospective basis for illustrative purposes in evaluating our target guideline. As at September 30, 2024, the ratio was 77%, outside of the objective range. We estimate the ratio will be within the objective range on a prospective basis. (See Section 7.5 Liquidity and capital resource measures.)
· Generally maintain a minimum of $1 billion in available liquidity – As at September 30, 2024, our available liquidity1 was approximately $3.2 billion. (See Section 7.6 Credit facilities and Liquidity risk in Section 7.9.) |
| 1 These are non-GAAP and other specified financial measures. See Section 11.1 Non-GAAP and other specified financial measures. |
|
|
Page |
TELUS Corporation – Management’s discussion and analysis – 2024 Q3
4.4 Changes in internal control over financial reporting
For the three-month and nine-month periods ended September 30, 2024, there were no changes in internal control over financial reporting that have materially affected, or are reasonably likely to materially affect, our internal control over financial reporting.
| 5. | Discussion of operations |
This section contains forward-looking statements, including those with respect to mobile phone average revenue per subscriber per month (ARPU) growth, products and services trends regarding loading and retention spending, equipment margins, subscriber growth and various future trends. There can be no assurance that we have accurately identified these trends based on past results or that these trends will continue. See Caution regarding forward-looking statements at the beginning of this MD&A.
5.1 General
Operating segments are components of an entity that engage in business activities from which they earn revenues and incur expenses (including revenues and expenses related to transactions with the other component(s)), the operations of which can be clearly distinguished and for which the operating results, and in particular, Adjusted EBITDA, are regularly reviewed by a chief operating decision-maker to make resource allocation decisions and to assess performance. We have embarked upon the modification of our internal and external reporting processes, systems and internal controls arising from the acquisition and ongoing integration of LifeWorks, and correspondingly we are assessing our segmented reporting structure. Segmented information in Note 5 of the interim consolidated financial statements is regularly reported to our Chief Executive Officer (CEO) (our chief operating decision-maker).
The TELUS technology solutions (TTech) segment includes: network revenues and equipment sales arising from mobile technologies; data revenues (which include internet protocol; television; hosting, managed information technology and cloud-based services; and home and business security); healthcare services, software and technology solutions (including employee and family assistance programs and benefits administration); agriculture and consumer goods services (software, data management and data analytics-driven smart-food chain and consumer goods technologies); voice and other telecommunications services revenues; and equipment sales.
The TELUS digital experience segment (TELUS Digital), which has the U.S. dollar as its primary functional currency, is comprised of digital customer experience and digital-enablement transformation solutions, including artificial intelligence (AI) and content management, provided by our TELUS International (Cda) Inc. subsidiary.
|
|
Page |
TELUS Corporation – Management’s discussion and analysis – 2024 Q3
5.2 Summary of consolidated quarterly results and trends
Summary of quarterly results
| ($ millions, except per share amounts) | 2024 Q3 | 2024 Q2 | 2024 Q1 | 2023 Q4 | 2023 Q3 | 2023 Q2 | 2023 Q1 | 2022 Q4 | ||||||||||||||||||||||||
| Operating revenues and other income | 5,099 | 4,974 | 4,932 | 5,198 | 5,008 | 4,946 | 4,964 | 5,058 | ||||||||||||||||||||||||
| Operating expenses | ||||||||||||||||||||||||||||||||
| Goods and services purchased1 | 1,868 | 1,825 | 1,810 | 2,086 | 1,858 | 1,790 | 1,803 | 2,082 | ||||||||||||||||||||||||
| Employee benefits expense1 | 1,475 | 1,473 | 1,484 | 1,407 | 1,633 | 1,568 | 1,540 | 1,378 | ||||||||||||||||||||||||
| Depreciation and amortization | 968 | 994 | 1,063 | 1,041 | 1,000 | 1,006 | 1,022 | 929 | ||||||||||||||||||||||||
| Total operating expenses | 4,311 | 4,292 | 4,357 | 4,534 | 4,491 | 4,364 | 4,365 | 4,389 | ||||||||||||||||||||||||
| Operating income | 788 | 682 | 575 | 664 | 517 | 582 | 599 | 669 | ||||||||||||||||||||||||
| Financing costs | 479 | 382 | 394 | 278 | 352 | 323 | 320 | 322 | ||||||||||||||||||||||||
| Income before income taxes | 309 | 300 | 181 | 386 | 165 | 259 | 279 | 347 | ||||||||||||||||||||||||
| Income taxes | 52 | 79 | 41 | 76 | 28 | 63 | 55 | 82 | ||||||||||||||||||||||||
| Net income | 257 | 221 | 140 | 310 | 137 | 196 | 224 | 265 | ||||||||||||||||||||||||
| Net income attributable to Common Shares | 280 | 228 | 127 | 288 | 136 | 200 | 217 | 248 | ||||||||||||||||||||||||
| Net income per Common Share: | ||||||||||||||||||||||||||||||||
| Basic earnings per share (EPS) | 0.19 | 0.15 | 0.09 | 0.20 | 0.09 | 0.14 | 0.15 | 0.17 | ||||||||||||||||||||||||
| Adjusted basic EPS2 | 0.28 | 0.25 | 0.26 | 0.24 | 0.25 | 0.19 | 0.27 | 0.24 | ||||||||||||||||||||||||
| Diluted EPS | 0.19 | 0.15 | 0.09 | 0.20 | 0.09 | 0.14 | 0.15 | 0.17 | ||||||||||||||||||||||||
| Dividends declared per Common Share | 0.3891 | 0.3891 | 0.3761 | 0.3761 | 0.3636 | 0.3636 | 0.3511 | 0.3511 | ||||||||||||||||||||||||
| Additional information: | ||||||||||||||||||||||||||||||||
| EBITDA | 1,756 | 1,676 | 1,638 | 1,705 | 1,517 | 1,588 | 1,621 | 1,598 | ||||||||||||||||||||||||
| Restructuring and other costs | 86 | 121 | 218 | 140 | 303 | 115 | 159 | 94 | ||||||||||||||||||||||||
| Other equity losses (income) related to real estate joint ventures | — | — | — | 2 | — | — | (1 | ) | (3 | ) | ||||||||||||||||||||||
| Adjusted EBITDA | 1,842 | 1,797 | 1,856 | 1,847 | 1,820 | 1,703 | 1,779 | 1,689 | ||||||||||||||||||||||||
| Cash provided by operating activities | 1,432 | 1,388 | 950 | 1,314 | 1,307 | 1,117 | 761 | 1,126 | ||||||||||||||||||||||||
| Free cash flow | 561 | 478 | 396 | 590 | 355 | 279 | 535 | 323 | ||||||||||||||||||||||||
| 1 | Goods and services purchased and Employee benefits expense amounts include restructuring and other costs. |
| 2 | See Section 11.1 Non-GAAP and other specified financial measures. |
Trends
For further discussion of trends related to revenues, EBITDA and Adjusted EBITDA, see Section 5.4 TELUS technology solutions segment and Section 5.5 TELUS digital experience segment.
The trend of year-over-year increases in Depreciation and amortization reflects the addition of capital assets acquired in business acquisitions; growth in capital assets in support of the expansion of our broadband footprint, including our generational investment to connect homes and businesses to TELUS PureFibre and 5G technology coverage; and successful internet, TV and security subscriber loading. Investments in our PureFibre technology also support our technology strategy to improve network coverage and capacity, including the ongoing build-out of our 5G network.
The trend of general year-over-year increases in Financing costs reflects greater long-term debt outstanding and increases in effective interest rates attributable to both floating-rate debt and recent fixed-rate issuances, mainly associated with our investments in spectrum and PureFibre technology, as well as business acquisitions. Financing costs are net of capitalized interest related to spectrum licences acquired during the 3500 MHz spectrum auction in 2021 and during the 3800 MHz spectrum auction in 2023. Financing costs also include Interest accretion on provisions (asset retirement obligations and written put options) and Employee defined benefit plans net interest. Additionally, for the eight periods shown, Financing costs include varying amounts of foreign exchange gains or losses, varying amounts of interest income and unrealized changes in virtual power purchase agreements forward element, which contributed to income up to the third quarter of 2022 and to losses thereafter.
|
|
Page |
TELUS Corporation – Management’s discussion and analysis – 2024 Q3
5.3 Consolidated operations
The following is a discussion of our consolidated financial performance. Segment information in Note 5 of the interim consolidated financial statements is regularly reported to our CEO. We discuss the performance of our segments in Section 5.4 TELUS technology solutions segment and Section 5.5 TELUS digital experience segment.
Operating revenues
| Three-month periods ended September 30 | Nine-month periods ended September 30 | |||||||||||||||||||||||
| ($ in millions) | 2024 | 2023 | Change | 2024 | 2023 | Change | ||||||||||||||||||
| Operating revenues | ||||||||||||||||||||||||
| Service | 4,410 | 4,388 | 0.5 | % | 13,081 | 13,091 | (0.1 | )% | ||||||||||||||||
| Equipment | 632 | 602 | 5.0 | % | 1,727 | 1,758 | (1.8 | )% | ||||||||||||||||
| Operating revenues (arising from contracts with customers) | 5,042 | 4,990 | 1.0 | % | 14,808 | 14,849 | (0.3 | )% | ||||||||||||||||
| Other income | 57 | 18 | n/m | 197 | 69 | n/m | ||||||||||||||||||
| Operating revenues and other income | 5,099 | 5,008 | 1.8 | % | 15,005 | 14,918 | 0.6 | % | ||||||||||||||||
Consolidated Operating revenues and other income increased by $91 million in the third quarter of 2024 and increased by $87 million in the first nine months of 2024.
| · | Service revenues increased by $22 million in the third quarter of 2024 largely due to: (i) mobile network, residential internet, TV and security subscriber growth; (ii) growth across multiple lines of business in health services; (iii) higher agriculture and consumer goods service revenues related to business acquisitions and improving organic growth; and (iv) growth in managed, unmanaged and other fixed data services to new and existing business customers. These factors were partly offset by: (i) rate reductions in mobile network, residential internet, and security services; (ii) lower external revenues in TELUS Digital primarily from macroeconomic conditions; and (iii) declines in TV and fixed legacy voice services revenues due to technological substitution. In the first nine months of 2024, Service revenues decreased by $10 million due to the same negating factors as the third quarter, partly offset by the same lower growth factors as the third quarter. |
| · | Equipment revenues increased by $30 million in the third quarter of 2024, largely driven by higher mobile equipment revenues stemming from higher-value smartphones volume in the sales mix, partly offset by a reduction in mobile contracted volumes and lower fixed business premises equipment sales. Equipment revenues decreased by $31 million in the first nine months of 2024, largely driven by lower mobile equipment revenues due to a reduction in contracted volumes and lower fixed business premises equipment sales, partly offset by higher-value smartphones in the sales mix. |
| · | Other income increased by $39 million in the third quarter of 2024, largely due to higher gains on real estate projects resulting from our PureFibre build and copper decommissioning program. In the first nine months of 2024, Other income increased by $128 million, due to the same factors as the quarter, in addition to higher reversals of business combination-related provisions. |
|
|
Page |
TELUS Corporation – Management’s discussion and analysis – 2024 Q3
Operating expenses
| Three-month periods ended September 30 | Nine-month periods ended September 30 | |||||||||||||||||||||||
| ($ in millions) | 2024 | 2023 | Change | 2024 | 2023 | Change | ||||||||||||||||||
| Goods and services purchased | 1,868 | 1,858 | 0.5 | % | 5,503 | 5,451 | 1.0 | % | ||||||||||||||||
| Employee benefits expense | 1,475 | 1,633 | (9.7 | )% | 4,432 | 4,741 | (6.5 | )% | ||||||||||||||||
| Depreciation | 597 | 611 | (2.3 | )% | 1,895 | 1,849 | 2.5 | % | ||||||||||||||||
| Amortization of intangible assets | 371 | 389 | (4.6 | )% | 1,130 | 1,179 | (4.2 | )% | ||||||||||||||||
| Operating expenses | 4,311 | 4,491 | (4.0 | )% | 12,960 | 13,220 | (2.0 | )% | ||||||||||||||||
Consolidated operating expenses decreased by $180 million in the third quarter of 2024 and $260 million in the first nine months of 2024. See Adjusted EBITDA below for further details.
| · | Depreciation decreased by $14 million in the third quarter of 2024 due to lower asset retirement activity, partly offset by higher depreciation on network asset leases. Depreciation increased by $46 million in the first nine months of 2024, primarily due to higher depreciation on network asset leases and increased real estate rationalization. |
| · | Amortization of intangible assets decreased by $18 million in the third quarter of 2024 and $49 million in the first nine months of 2024, primarily due to write-offs of software assets in the prior year largely driven by changes in business strategy. |
Operating income
| Three-month periods ended September 30 | Nine-month periods ended September 30 | |||||||||||||||||||||||
| ($ in millions) | 2024 | 2023 | Change | 2024 | 2023 | Change | ||||||||||||||||||
| TTech EBITDA1 (See Section 5.4) | 1,659 | 1,346 | 23.4 | % | 4,632 | 4,256 | 8.8 | % | ||||||||||||||||
| TELUS Digital EBITDA1 (See Section 5.5) | 109 | 171 | (36.6 | )% | 472 | 470 | 0.5 | % | ||||||||||||||||
| Eliminations2 | (12 | ) | — | n/m | (34 | ) | — | n/m | ||||||||||||||||
| EBITDA | 1,756 | 1,517 | 15.8 | % | 5,070 | 4,726 | 7.3 | % | ||||||||||||||||
| Depreciation and amortization (discussed above) | (968 | ) | (1,000 | ) | (3.2 | )% | (3,025 | ) | (3,028 | ) | (0.1 | )% | ||||||||||||
| Operating income (consolidated earnings before interest and income taxes (EBIT)) | 788 | 517 | 52.4 | % | 2,045 | 1,698 | 20.4 | % | ||||||||||||||||
| 1 | See Section 11.1 Non-GAAP and other specified financial measures. |
| 2 | See Intersegment revenues in Section 5.5 for additional details. |
Operating income increased by $271 million in the third quarter of 2024 and $347 million in the first nine months of 2024, while EBITDA increased by $239 million in the third quarter of 2024 and $344 million in the first nine months of 2024. In addition to the growth drivers discussed within Adjusted EBITDA below, EBITDA also reflects lower restructuring and other costs of $217 million in the third quarter of 2024, primarily related to significant investments in cost efficiency and effectiveness programs, including real estate rationalization, which predominantly took place during the third quarter of 2023. Restructuring and other costs decreased by $152 million in the first nine months of 2024, largely due to the factors listed for the quarter, in addition to one-time amounts recorded in the first nine months of 2023 of $68 million for the ratification of the new collective agreement between the Telecommunications Workers Union, United Steelworkers Local 1944 (TWU) and ourselves.
|
|
Page |
TELUS Corporation – Management’s discussion and analysis – 2024 Q3
Adjusted EBITDA
| Three-month periods ended September 30 | Nine-month periods ended September 30 | |||||||||||||||||||||||
| ($ in millions) | 2024 | 2023 | Change | 2024 | 2023 | Change | ||||||||||||||||||
| TTech Adjusted EBITDA1 (See Section 5.4) | 1,723 | 1,633 | 5.6 | % | 5,013 | 4,777 | 5.0 | % | ||||||||||||||||
| TELUS Digital Adjusted EBITDA1,2 (See Section 5.5) | 131 | 187 | (30.3 | )% | 516 | 525 | (1.7 | )% | ||||||||||||||||
| Eliminations3 | (12 | ) | — | n/m | (34 | ) | — | n/m | ||||||||||||||||
| Adjusted EBITDA1 | 1,842 | 1,820 | 1.3 | % | 5,495 | 5,302 | 3.7 | % | ||||||||||||||||
| 1 | See Section 11.1 Non-GAAP and other specified financial measures. |
| 2 | For certain financial metrics, there are definitional differences between TELUS and TELUS Digital reporting. These differences largely arise from TELUS Digital adopting definitions consistent with practice in its industry. |
| 3 | See Intersegment revenues in Section 5.5 for additional details. |
Adjusted EBITDA increased by $22 million or 1.3% in the third quarter of 2024 and $193 million or 3.7% in the first nine months of 2024, reflecting: (i) mobile network, residential internet, TV and security subscriber growth; (ii) broad-based cost reduction efforts, including workforce reductions, synergies achieved between LifeWorks and our legacy health business, and an increase in TTech leveraging TELUS Digital resulting in competitive benefits given the lower cost structure in TELUS Digital, as well as savings in marketing costs; (iii) higher gains on real estate projects and in the first nine months of 2024, higher reversals of business combination-related provisions; (iv) growth in health services margin; (v) higher agriculture and consumer goods margins; and (vi) growth in fixed data services to new and existing business customers. These factors were partly offset by: (i) lower mobile phone ARPU; (ii) lower operational growth in TELUS Digital (excluding other income) comprised of lower operating revenues from external clients and higher indirect operating expenses; (iii) declining TV and fixed legacy voice margins; (iv) lower mobile equipment margins; (v) higher network operations costs; (vi) higher bad debt expense; and (vii) higher costs related to the scaling of our digital capabilities, inclusive of increased subscription-based licenses and cloud usage costs.
Financing costs
| Three-month periods ended September 30 | Nine-month periods ended September 30 | |||||||||||||||||||||||
| ($ in millions) | 2024 | 2023 | Change | 2024 | 2023 | Change | ||||||||||||||||||
| Interest on long-term debt, excluding lease liabilities – gross | 297 | 282 | 5.3 | % | 892 | 815 | 9.4 | % | ||||||||||||||||
| Interest on long-term debt, excluding lease liabilities – capitalized | (9 | ) | (1 | ) | n/m | (13 | ) | (4 | ) | n/m | ||||||||||||||
| Interest on lease liabilities | 42 | 36 | 16.7 | % | 122 | 95 | 28.4 | % | ||||||||||||||||
| Interest on short-term borrowings and other | 14 | 10 | 40.0 | % | 24 | 22 | 9.1 | % | ||||||||||||||||
| Interest accretion on provisions | 7 | 7 | — | % | 22 | 22 | —% | |||||||||||||||||
| Interest expense | 351 | 334 | 5.1 | % | 1,047 | 950 | 10.2 | % | ||||||||||||||||
| Employee defined benefit plans net interest | 3 | 1 | n/m | 7 | 5 | 40.0 | % | |||||||||||||||||
| Foreign exchange losses (gains) | 8 | (12 | ) | n/m | 2 | (8 | ) | n/m | ||||||||||||||||
| Unrealized changes in virtual power purchase agreements forward element | 125 | 33 | n/m | 228 | 59 | n/m | ||||||||||||||||||
| Interest income | (8 | ) | (4 | ) | 100.0 | % | (29 | ) | (11 | ) | n/m | |||||||||||||
| Financing costs | 479 | 352 | 36.1 | % | 1,255 | 995 | 26.1 | % | ||||||||||||||||
Financing costs increased by $127 million in the third quarter of 2024 and $260 million in the first nine months of 2024, mainly due to the following factors:
| · | Interest expense increased by $17 million in the third quarter of 2024 and $97 million in the first nine months of 2024, largely resulting from: |
| · |
An increase in gross interest expense on long-term debt, excluding lease liabilities, of $15 million in third quarter of 2024 and $77 million in the first nine months of 2024, primarily driven by an increase in average long-term debt balances outstanding, attributable in part to investments in spectrum and PureFibre technology, in addition to an increase in the effective interest rate. Our weighted average interest rate on long-term debt (excluding commercial paper, the revolving components of the TELUS International (Cda) Inc. credit facility, lease liabilities and other long-term debt) was 4.40% at September 30, 2024, compared to 4.33% one year earlier. (See Long-term debt issued and Redemptions and repayments of long-term debt in Section 7.4.) |
|
|
Page |
TELUS Corporation – Management’s discussion and analysis – 2024 Q3
| · | Capitalized long-term debt interest, excluding lease liabilities, is in respect of debt incurred for the purchase of spectrum licences during the 3800 MHz spectrum auction held in October to November 2023 by Innovation, Science and Economic Development Canada (ISED). |
| · | Interest on lease liabilities increased by $6 million in the third quarter of 2024 and $27 million in the first nine months of 2024, resulting from increases in both lease principal and the effective interest rate. |
| · | Unrealized changes in virtual power purchase agreements forward element represent the estimated unrealized amounts recorded from our virtual power purchase agreements (VPPAs) with renewable energy projects as of September 30, 2024. We have entered into VPPAs with renewable energy projects that develop solar and wind power facilities as part of our commitment to reduce our carbon footprint. |
Income taxes
| Three-month periods ended September 30 | Nine-month periods ended September 30 | |||||||||||||||||||||||
| ($ in millions, except tax rates) | 2024 | 2023 | Change | 2024 | 2023 | Change | ||||||||||||||||||
| Income taxes computed at applicable statutory rates (%) | 25.2 | 23.8 | 1.4 | pts. | 24.2 | 23.5 | 0.7 | pts. | ||||||||||||||||
| Adjustments recognized in the current period for income taxes of prior periods (%) | (6.4 | ) | (13.9 | ) | 7.5 | pts. | (3.3 | ) | (5.0 | ) | 1.7 | pts. | ||||||||||||
| Pillar Two global minimum tax (%) | 0.3 | — | 0.3 | pts. | 0.3 | — | 0.3 | pts. | ||||||||||||||||
| (Non-taxable) non-deductible amounts, net (%) | (1.9 | ) | (1.2 | ) | (0.7 | ) pts. | (1.7 | ) | (1.3 | ) | (0.4 | ) pts. | ||||||||||||
| Withholding and other taxes (%) | 1.9 | 3.7 | (1.8 | ) pts. | 3.2 | 2.1 | 1.1 | pts. | ||||||||||||||||
| Losses not recognized (%) | 0.3 | 5.5 | (5.2 | ) pts. | 0.5 | 2.4 | (1.9 | ) pts. | ||||||||||||||||
| Foreign tax differential (%) | (1.3 | ) | (2.4 | ) | 1.1 | pts. | (0.9 | ) | (1.6 | ) | 0.7 | pts. | ||||||||||||
| Other (%) | (1.3 | ) | 1.7 | (3.0 | ) pts. | (0.5 | ) | 0.7 | (1.2 | ) pts. | ||||||||||||||
| Effective tax rate (%) | 16.8 | 17.2 | (0.4 | ) pts. | 21.8 | 20.8 | 1.0 | pt. | ||||||||||||||||
| Income taxes computed at applicable statutory rates | 78 | 40 | 95.0 | % | 191 | 165 | 15.8 | % | ||||||||||||||||
| Adjustments recognized in the current period for income taxes of prior periods | (20 | ) | (23 | ) | (13.0 | )% | (26 | ) | (35 | ) | (25.7 | )% | ||||||||||||
| Pillar Two global minimum tax | 1 | — | n/m | 2 | — | n/m | ||||||||||||||||||
| (Non-taxable) non-deductible amounts, net | (6 | ) | (2 | ) | n/m | (13 | ) | (9 | ) | 44.4 | % | |||||||||||||
| Withholding and other taxes | 6 | 6 | — | % | 25 | 15 | 66.7 | % | ||||||||||||||||
| Losses not recognized | 1 | 9 | (88.9 | )% | 4 | 17 | (76.5 | )% | ||||||||||||||||
| Foreign tax differential | (4 | ) | (4 | ) | — | % | (7 | ) | (11 | ) | (36.4 | )% | ||||||||||||
| Other | (4 | ) | 2 | n/m | (4 | ) | 4 | n/m | ||||||||||||||||
| Income taxes | 52 | 28 | 85.7 | % | 172 | 146 | 17.8 | % | ||||||||||||||||
Total income tax expense increased by $24 million in the third quarter of 2024 and $26 million in the first nine months of 2024. The effective tax rate decreased from 17.2% to 16.8% in the third quarter of 2024, primarily due to lower losses not recognized and withholding and other taxes. In the first nine months of 2024, the effective tax rate increased from 20.8% to 21.8%, largely as a result of lower adjustments recognized in the current period for income taxes of prior periods.
Comprehensive income
| Three-month periods ended September 30 | Nine-month periods ended September 30 | |||||||||||||||||||||||
| ($ in millions) | 2024 | 2023 | Change | 2024 | 2023 | Change | ||||||||||||||||||
| Net income | 257 | 137 | 87.6 | % | 618 | 557 | 11.0 | % | ||||||||||||||||
| Other comprehensive income (net of income taxes): | ||||||||||||||||||||||||
| Items that may be subsequently reclassified to income | 2 | 37 | (94.6 | )% | 75 | (33 | ) | n/m | ||||||||||||||||
| Items never subsequently reclassified to income | (19 | ) | 56 | n/m | 29 | 47 | (38.3 | )% | ||||||||||||||||
| Comprehensive income | 240 | 230 | 4.3 | % | 722 | 571 | 26.4 | % | ||||||||||||||||
Comprehensive income increased by $10 million in the third quarter of 2024, primarily as a result of employee defined benefit plan re-measurement amounts, partly offset by the increase in Net income. Comprehensive income increased by $151 million in the first nine months of 2024, largely driven by the increase in Net income and foreign currency translation adjustment arising from translating financial statements of foreign operations. Items that may subsequently be reclassified to income include changes in the unrealized fair value of derivatives designated as cash flow hedges and foreign currency translation adjustments arising from translating financial statements of foreign operations. Items never subsequently reclassified to income include employee defined benefit plans re-measurement amounts and changes in measurement of investment financial assets.
|
|
Page |
TELUS Corporation – Management’s discussion and analysis – 2024 Q3
5.4 TELUS technology solutions segment
TTech trends and seasonality
The historical trend over the past eight quarters in mobile network revenue improvement primarily reflects growth in our mobile phone subscriber base, as well as an increase in Internet of Things (IoT) connections. Domestic ARPU declines were largely attributable to larger allotments of data for a given price point, as well as more aggressive retail pricing, which has persisted since the second quarter of 2023.
Mobile equipment revenues have been growing largely as a result of the impact of higher-value smartphones in the sales mix. As a partial offset, sales volumes of mobile devices have been slowly declining, attributable to improvements in durability and increases in cost that are causing customers to defer upgrades and increase adopting bring-your-own-device (BYOD) plans. We continue to offer certified pre-owned devices and our Bring-It-Back® program to provide customers with alternative options for handset upgrades, at the same time contributing to a circular economy.
Our spectrum investments and capital expenditures in network improvements increase capacity, reliability and coverage, allowing us to grow revenue through net additions of new mobile phone and connected device subscribers. Growth in our mobile phone subscriber base is attributable to: (i) industry-leading product offerings with continuous improvements in the speed, performance and reliability of our network, coupled with our enhanced digital capabilities; (ii) the success of our promotions, including our bundling of mobility and home services; (iii) our ability to attract a larger proportion of the growing population driven by immigration, and changing demographics such as an increasing number of customers with multiple devices; and (iv) our relatively low churn rate, which reflects our customers first efforts and upgrade volume programs.
Our connected device subscriber base has been growing, primarily in response to our expanded IoT offerings across various industries, including transportation, healthcare, smart buildings and smart cities, energy, retail and agriculture. Our investments in network infrastructure and the expansion of our IoT product portfolio have also allowed us to provide reliable and scalable IoT solutions to our customers.
Growth in our internet subscriber base has been supported by our continued investments in building out our fibre-optic infrastructure, as well as the benefits of our relatively low customer churn rate. Excluding the first quarter 2024 adjustment to remove Pik TV subscribers, our TV subscribers have increased, reflecting net subscriber additions in response to our diverse and flexible product offerings catered towards the changing needs of our consumers. Growth in our security subscriber base is accelerating as a result of organic growth and bundling of mobility and home services. Bundling increases our services per home and positively impacts churn for most services, supported by the effectiveness of our self-install and virtual-install models. Residential voice subscriber losses have remained low, as a result of the success of our bundled services and lower-priced offerings, as well as effective retention efforts to mitigate the ongoing substitution to mobile and internet-based services.
The trend of moderating fixed data services revenue growth is attributable to the growth in our internet and security subscriber bases, bolstered by sustained demand for faster internet speeds and larger bandwidth, as well as home and business security offerings and other advanced applications, which are enabled by investments in our fibre-optic footprint. The trend of declining TV revenues and fixed voice revenues is a result of technological substitution and intensification of competition. However, we are mitigating this trend with our bundled product and lower-priced offerings, product diversification and effective retention efforts. The migration of business product and service offerings to IP platforms and the entry of new competitors have yielded inherently lower margins compared to some legacy business product and service offerings. However, we are continually refining and diversifying our innovative portfolio of business offerings.
The trend of growth in health services revenues has been propelled by the acquisition of LifeWorks in the third quarter of 2022, as well as organic growth in our existing health offerings, which include virtual care, virtual and conventional pharmacy solutions, collaborative health records, health benefits management, personal health monitoring solutions, and employee and family assistance programs and benefits administration. The LifeWorks acquisition immediately enabled our health services business to expand on a global scale through long-standing corporate relationships, with notable areas of focus in employee health and wellness programs, mental and physical health solutions, pensions and benefits management, and retirement solutions. Our diversified virtual care offerings continue to grow to meet the healthcare needs of Canadians and enable better health outcomes, including the accelerated adoption of virtual consultations, which is reflected in the growing number of virtual care members. The growing number of lives covered is largely driven by the expansion of our employee and family assistance programs.
|
|
Page |
TELUS Corporation – Management’s discussion and analysis – 2024 Q3
Previous trends of declining agriculture and consumer goods services were attributed to macroeconomic headwinds that generated customer churn, hampered subscription growth and limited the sales funnel, however agriculture and consumer goods has recently shown improvement. With our global team and cloud-based solutions, we are able to service our diverse client base, including growers, producers, agronomists, advisors, processors and retailers, by enabling more effective and agile decision-making that can address changing consumer demands, improve profitability and generate a better flow of information across the value chain. This improves the safety and sustainability of our outputs and drives efficiencies in the way we produce, distribute and consume food and consumer goods. We also acquired Proagrica® in the first quarter of 2024 to meet the growing demand for digital solutions in the agriculture industry.
TTech operating indicators
| At September 30 | 2024 | 2023 | Change | |||||||||
| Subscriber connections (thousands): | ||||||||||||
| Mobile phone1 | 10,077 | 9,675 | 4.2 | % | ||||||||
| Connected device | 3,535 | 2,911 | 21.4 | % | ||||||||
| Internet | 2,723 | 2,590 | 5.1 | % | ||||||||
| TV2 | 1,362 | 1,371 | (0.7 | )% | ||||||||
| Security | 1,110 | 1,033 | 7.5 | % | ||||||||
| Residential voice | 1,040 | 1,072 | (3.0 | )% | ||||||||
| Total telecom subscriber connections | 19,847 | 18,652 | 6.4 | % | ||||||||
| LTE population coverage3 (millions) | 36.7 | 36.7 | — | % | ||||||||
| 5G population coverage3 (millions) | 32.1 | 31.6 | 1.6 | % | ||||||||
| Three-month periods ended September 30 | Nine-month periods ended September 30 | |||||||||||||||||||||||
| 2024 | 2023 | Change | 2024 | 2023 | Change | |||||||||||||||||||
| Mobile phone gross additions (thousands) | 455 | 455 | — | % | 1,246 | 1,131 | 10.2 | % | ||||||||||||||||
| Subscriber connection net additions (losses) (thousands): | ||||||||||||||||||||||||
| Mobile phone | 130 | 160 | (18.8 | )% | 276 | 317 | (12.9 | )% | ||||||||||||||||
| Connected device | 159 | 179 | (11.2 | )% | 421 | 361 | 16.6 | % | ||||||||||||||||
| Internet | 34 | 37 | (8.1 | )% | 97 | 107 | (9.3 | )% | ||||||||||||||||
| TV | 21 | 20 | 5.0 | % | 65 | 46 | 41.3 | % | ||||||||||||||||
| Security | 12 | 18 | (33.3 | )% | 54 | 55 | (1.8 | )% | ||||||||||||||||
| Residential voice | (9 | ) | (8 | ) | (12.5 | )% | (25 | ) | (24 | ) | (4.2 | )% | ||||||||||||
| Total telecom subscriber connection net additions | 347 | 406 | (14.5 | )% | 888 | 862 | 3.0 | % | ||||||||||||||||
| Mobile phone ARPU, per month1,4 ($) | 58.85 | 60.94 | (3.4 | )% | 58.88 | 60.63 | (2.9 | )% | ||||||||||||||||
| Mobile phone churn, per month1,5 (%) | 1.09 | 1.03 | 0.06 | pts. | 1.10 | 0.96 | 0.14 | pts. | ||||||||||||||||
| Health services (millions) | ||||||||||||||||||||||||
| At September 30 | 2024 | 2023 | Change | |||||||||||||||||||||
| Healthcare lives covered | 76.0 | 69.6 | 9.2 | % | ||||||||||||||||||||
| Virtual care members | 6.5 | 5.5 | 18.2 | % | ||||||||||||||||||||
| Three-month periods ended September 30 | Nine-month periods ended September 30 | |||||||||||||||||||||||
| 2024 | 2023 | Change | 2024 | 2023 | Change | |||||||||||||||||||
| Digital health transactions | 161.5 | 150.6 | 7.2 | % | 483.8 | 452.4 | 6.9 | % | ||||||||||||||||
| 1 | Effective for the first quarter of 2024, with retrospective application to January 1, 2023, we reduced our mobile phone subscriber base by 283,000 subscribers to remove a subset of our public services customers that are now subject to dynamic pricing auction models. We believe adjusting our base for these low-margin customers provides a more meaningful reflection of the underlying performance of our mobile phone business and our focus on profitable growth. As a result of this change, associated operating statistics (ARPU and churn) have also been adjusted. |
| 2 | Effective January 1, 2024, on a prospective basis, we adjusted our TV subscriber base to remove 97,000 subscribers as we have ceased marketing our Pik TV product. |
| 3 | Including network access agreements with other Canadian carriers. |
| 4 | This is an other specified financial measure. See Section 11.1 Non-GAAP and other specified financial measures. This is an industry measure useful in assessing operating performance of a mobile products and services company, but is not a measure defined under IFRS-IASB. |
| 5 | See Section 11.2 Operating indicators. |
|
|
Page |
TELUS Corporation – Management’s discussion and analysis – 2024 Q3
| ● | Mobile phone gross additions were 455,000 in the third quarter of 2024, consistent with the prior year. Mobile phone gross additions were 1,246,000 in the first nine months of 2024, reflecting an increase of 115,000, driven by greater promotional activity, our shift to digital loading, and growth in the Canadian population. |
| ● | Our mobile phone churn rate was 1.09% in the third quarter of 2024 and 1.10% in the first nine months of 2024, compared to 1.03% in the third quarter of 2023 and 0.96% in the first nine months of 2023. These churn rates increased largely as a result of customer switching decisions in response to more aggressive marketing and promotional pricing, in addition to increased adoption of BYOD plans. These factors have been partly mitigated by our continued focus on customer retention through our industry-leading service and network quality, along with successful promotions and bundled offerings. |
| ● | Mobile phone net additions were 130,000 in the third quarter of 2024 and 276,000 in the first nine months of 2024, reflecting decreases of 30,000 for the quarter and 41,000 for the nine-month period, driven by a higher mobile phone churn rate. For the nine-month period, our higher churn rate was partially offset by higher mobile phone gross additions. |
| ● | Mobile phone ARPU was $58.85 in the third quarter of 2024 and $58.88 in the first nine months of 2024, reflecting decreases of $2.09 or 3.4% for the quarter and $1.75 or 2.9% for the nine-month period. These decreases were attributable to the adoption of base rate plans with lower prices in response to more aggressive marketing and promotional pricing targeting both new and existing customers, and a decline in overage and roaming revenues, partly offset by higher IoT revenue. We continue to see increasing adoption of unlimited data and Canada-U.S. plans which provide higher and more stable ARPU on a monthly basis while also giving customers cost certainty in lower roaming fees to the U.S. and lower data overage fees, respectively. |
| ● | Connected device net additions were 159,000 in the third quarter of 2024, reflecting a decrease of 20,000, largely due to one customer decommissioning a subset of their legacy, low-usage IoT connections during the quarter, partly offset by growth in gross additions of IoT connections. Connected device net additions were 421,000 for the nine-month period, reflecting an increase of 60,000, attributable to growth in IoT connections from customers in the transportation, smart buildings and healthcare industries. |
| ● | Internet net additions were 34,000 in the third quarter of 2024 and 97,000 in the first nine months of 2024, reflecting decreases of 3,000 and 10,000, respectively. These decreases were largely attributable to a higher churn rate due to macroeconomic and competitive pressures that have continued to impact consumer purchasing decisions. These factors were partly offset by our success in driving strong gross additions through robust sales strategies and the strength of our fibre optic offering. |
| ● | TV net additions were 21,000 in the third quarter of 2024 and 65,000 in the first nine months of 2024, reflecting increases of 1,000 for the quarter and 19,000 for the nine-month period, attributable to our diverse offerings catered towards the changing needs of our consumers, partly offset by a higher churn rate due to the same factors as internet net additions. |
| ● | Security net additions were 12,000 in the third quarter of 2024, reflecting a decrease of 6,000, primarily due to a higher churn rate related to the same factors as internet net additions. For the first nine months of 2024, security net additions were 54,000, reflecting a decrease of 1,000, attributable to a higher churn rate related to the same factors as the quarter, partly offset by higher demand for our bundled offerings and diverse suite of products and services. |
| ● | Residential voice net losses were 9,000 in the third quarter of 2024 and 25,000 in the first nine months of 2024, reflecting an increase of 1,000 losses for both the quarter and nine-month period. |
| ● | Healthcare lives covered were 76.0 million as of the end of the third quarter of 2024, an increase of 6.4 million over the past 12 months, mainly reflecting robust growth in our employee and family assistance programs from both new and existing clients across all of our regions, in addition to continued demand for virtual solutions. |
| ● | Virtual care members were 6.5 million as of the end of the third quarter of 2024, an increase of 1.0 million over the past 12 months, attributable to the continued adoption of virtual solutions that keep Canadians and others safely connected to health and wellness care. |
| ● | Digital health transactions were 161.5 million in the third quarter of 2024 and 483.8 million in the first nine months of 2024, reflecting increases of 10.9 million for the quarter and 31.4 million for the nine-month period, largely driven by increased paid exchange of healthcare data between our health benefits management system and care providers resulting from higher patient demand for elective health services. |
|
|
Page |
TELUS Corporation – Management’s discussion and analysis – 2024 Q3
Operating revenues and other income – TTech segment
| Three-month periods ended September 30 | Nine-month periods ended September 30 | |||||||||||||||||||||||
| ($ in millions) | 2024 | 2023 | Change | 2024 | 2023 | Change | ||||||||||||||||||
| Mobile network revenue | 1,766 | 1,753 | 0.7 | % | 5,246 | 5,168 | 1.5 | % | ||||||||||||||||
| Mobile equipment and other service revenues | 591 | 557 | 6.1 | % | 1,575 | 1,593 | (1.1 | )% | ||||||||||||||||
| Fixed data services1 | 1,175 | 1,153 | 1.9 | % | 3,492 | 3,427 | 1.9 | % | ||||||||||||||||
| Fixed voice services | 179 | 191 | (6.3 | )% | 536 | 573 | (6.5 | )% | ||||||||||||||||
| Fixed equipment and other service revenues | 117 | 125 | (6.4 | )% | 359 | 384 | (6.5 | )% | ||||||||||||||||
| Health services | 439 | 422 | 4.0 | % | 1,304 | 1,273 | 2.4 | % | ||||||||||||||||
| Agriculture and consumer goods services | 100 | 83 | 20.5 | % | 273 | 246 | 11.0 | % | ||||||||||||||||
| Operating revenues (arising from contracts with customers) | 4,367 | 4,284 | 1.9 | % | 12,785 | 12,664 | 1.0 | % | ||||||||||||||||
| Other income | 54 | 18 | n/m | 112 | 69 | 62.3 | % | |||||||||||||||||
| External Operating revenues and other income | 4,421 | 4,302 | 2.8 | % | 12,897 | 12,733 | 1.3 | % | ||||||||||||||||
| Intersegment revenues | 3 | 4 | (25.0 | )% | 9 | 12 | (25.0 | )% | ||||||||||||||||
| TTech Operating revenues and other income | 4,424 | 4,306 | 2.7 | % | 12,906 | 12,745 | 1.3 | % | ||||||||||||||||
| 1 Excludes health services and agriculture and consumer goods services. |
TTech Operating revenues and other income increased by $118 million in the third quarter of 2024 and $161 million in the first nine months of 2024.
Mobile network revenue increased by $13 million or 0.7% in the third quarter of 2024 and $78 million or 1.5% in the first nine months of 2024, largely due to growth in our mobile phone and an increase in IoT connections, partly offset by lower mobile phone ARPU.
Mobile equipment and other service revenues increased by $34 million in the third quarter of 2024, due to the impact of higher-value smartphones in the sales mix, partly offset by a reduction in contracted volumes attributable to our efforts to match only on profitable offers from more aggressive promotional activity in the current year compared to the prior year, in addition to the growing number of customers taking advantage of BYOD offerings. Mobile equipment and other service revenues decreased by $18 million in the first nine months of 2024 due to the same negating factors as the third quarter, partly offset by the impact of higher-value smartphones in the sales mix.
Fixed data services revenues increased by $22 million in the third quarter of 2024 and $65 million in the first nine months of 2024, driven by an increase in our internet, security and TV subscribers, and growth in our managed, unmanaged and other services to new and existing business customers. These were partly offset by lower TV revenue per customer, reflecting an increased mix of customers selecting smaller TV combination packages and technological substitution, slightly lower internet revenue per customer reflecting competitive pressures, as well as lower security revenue per customer reflecting increased demand for inherently lower-ARPU home automation services.
Fixed voice services revenues decreased by $12 million in the third quarter of 2024 and $37 million in the first nine months of 2024, reflecting the ongoing decline in legacy voice revenues as a result of technological substitution and price plan changes. Declines were partly mitigated by the success of our bundled product offerings and our retention efforts.
Fixed equipment and other service revenues decreased by $8 million in the third quarter of 2024 and $25 million in the first nine months of 2024, largely due to a reduction in business premises equipment sales, as equipment sales tend to be more one-time in nature.
Health services revenues increased by $17 million in the third quarter of 2024 and $31 million in the first nine months of 2024, primarily driven by pharmacy upgrades, virtual pharmacy sales, employee assistance programs, and increased demand for health benefits management services and retirement benefits solutions.
Agriculture and consumer goods services revenues increased by $17 million in the third quarter of 2024 and $27 million in the first nine months of 2024, primarily attributed to business acquisitions and improving organic growth across certain lines of business, including increased subscription and license revenues. These factors were partially offset by an increase of agriculture customer churn and macroeconomic headwinds slowing down subscription growth and sales funnel opportunities.
Other income increased by $36 million in the third quarter of 2024, largely due to gains on real estate projects resulting from our fibre build and copper decommissioning program. In the first nine months of 2024, Other income increased by $43 million, due to the same factors as the quarter, partly offset by the non-recurrence of net reversals of provisions related to business combinations in the prior year.
|
|
Page |
TELUS Corporation – Management’s discussion and analysis – 2024 Q3
Intersegment revenues represent services provided to the TELUS Digital segment that are eliminated upon consolidation, together with the associated TELUS Digital expenses.
Direct contribution – TTech segment
| Mobile products and services | Fixed products and services1 | Total TTech | ||||||||||||||||||||||||||||||||||
| Three-month periods ended September 30 ($ in millions) | 2024 | 2023 | Change | 2024 | 2023 | Change | 2024 | 2023 | Change | |||||||||||||||||||||||||||
| Revenues | ||||||||||||||||||||||||||||||||||||
| Service | 1,790 | 1,792 | (0.1 | )% | 1,945 | 1,890 | 2.9 | % | 3,735 | 3,682 | 1.4 | % | ||||||||||||||||||||||||
| Equipment | 567 | 518 | 9.5 | % | 65 | 84 | (22.6 | )% | 632 | 602 | 5.0 | % | ||||||||||||||||||||||||
| Operating revenues (arising from contracts with customers) | 2,357 | 2,310 | 2.0 | % | 2,010 | 1,974 | 1.8 | % | 4,367 | 4,284 | 1.9 | % | ||||||||||||||||||||||||
| Expenses | ||||||||||||||||||||||||||||||||||||
| Direct expenses | 777 | 707 | 9.9 | % | 660 | 675 | (2.2 | )% | 1,437 | 1,382 | 4.0 | % | ||||||||||||||||||||||||
| Direct contribution | 1,580 | 1,603 | (1.4 | )% | 1,350 | 1,299 | 3.9 | % | 2,930 | 2,902 | 1.0 | % | ||||||||||||||||||||||||
Direct contribution – TTech segment
| Mobile products and services | Fixed products and services1 | Total TTech | ||||||||||||||||||||||||||||||||||
| Nine-month periods ended September 30 ($ in millions) | 2024 | 2023 | Change | 2024 | 2023 | Change | 2024 | 2023 | Change | |||||||||||||||||||||||||||
| Revenues | ||||||||||||||||||||||||||||||||||||
| Service | 5,315 | 5,265 | 0.9 | % | 5,743 | 5,641 | 1.8 | % | 11,058 | 10,906 | 1.4 | % | ||||||||||||||||||||||||
| Equipment | 1,506 | 1,496 | 0.7 | % | 221 | 262 | (15.6 | )% | 1,727 | 1,758 | (1.8 | )% | ||||||||||||||||||||||||
| Operating revenues (arising from contracts with customers) | 6,821 | 6,761 | 0.9 | % | 5,964 | 5,903 | 1.0 | % | 12,785 | 12,664 | 1.0 | % | ||||||||||||||||||||||||
| Expenses | ||||||||||||||||||||||||||||||||||||
| Direct expenses | 2,111 | 2,025 | 4.2 | % | 1,972 | 2,006 | (1.7 | )% | 4,083 | 4,031 | 1.3 | % | ||||||||||||||||||||||||
| Direct contribution | 4,710 | 4,736 | (0.5 | )% | 3,992 | 3,897 | 2.4 | % | 8,702 | 8,633 | 0.8 | % | ||||||||||||||||||||||||
| 1 Includes health services and agriculture and consumer goods services. |
The direct expenses included in the direct contribution calculations in the preceding tables represent components of the Goods and services purchased and Employee benefits expense totals included in the table below and have been calculated in accordance with the accounting policies used to prepare the totals presented in the financial statements. TTech direct contribution increased by $28 million or 1.0% in the third quarter of 2024 and $69 million or 0.8% in the first nine months of 2024.
TTech mobile products and services direct contribution decreased by $23 million in the third quarter of 2024 and $26 million in the first nine months of 2024, largely reflecting the impact of lower mobile phone ARPU, lower mobile equipment margin from lower contracted volume and increased competitor-driven discounting, and higher amortization of deferred commissions attributable to rising retail traffic in the current and prior periods. These were partly offset by mobile phone subscriber growth.
TTech fixed products and services direct contribution increased by $51 million in the third quarter of 2024 and $95 million in the first nine months of 2024, primarily driven by increased health and agriculture and consumer goods revenues and continued subscriber growth. These were partly offset by declines in TV and legacy voice margins attributable to technological substitution.
|
|
Page |
TELUS Corporation – Management’s discussion and analysis – 2024 Q3
Operating expenses – TTech segment
| Three-month periods ended September 30 | Nine-month periods ended September 30 | |||||||||||||||||||||||
| ($ in millions) | 2024 | 2023 | Change | 2024 | 2023 | Change | ||||||||||||||||||
| Goods and services purchased1 | 1,909 | 1,886 | 1.2 | % | 5,640 | 5,516 | 2.2 | % | ||||||||||||||||
| Employee benefits expense1 | 856 | 1,074 | (20.3 | )% | 2,634 | 2,973 | (11.4 | )% | ||||||||||||||||
| TTech operating expenses | 2,765 | 2,960 | (6.6 | )% | 8,274 | 8,489 | (2.5 | )% | ||||||||||||||||
| 1 Includes restructuring and other costs. |
TTech operating expenses decreased by $195 million in the third quarter of 2024 and $215 million in the first nine months of 2024. See TTech Adjusted EBITDA below for further details.
EBITDA – TTech segment
| Three-month periods ended September 30 | Nine-month periods ended September 30 | |||||||||||||||||||||||
| ($ in millions, except margins) | 2024 | 2023 | Change | 2024 | 2023 | Change | ||||||||||||||||||
| EBITDA | 1,659 | 1,346 | 23.4 | % | 4,632 | 4,256 | 8.8 | % | ||||||||||||||||
| Add restructuring and other costs included in EBITDA | 64 | 287 | n/m | 381 | 522 | n/m | ||||||||||||||||||
| Deduct other equity income related to real estate joint ventures | — | — | n/m | — | (1 | ) | n/m | |||||||||||||||||
| Adjusted EBITDA | 1,723 | 1,633 | 5.6 | % | 5,013 | 4,777 | 5.0 | % | ||||||||||||||||
| EBITDA margin1 (%) | 37.5 | 31.3 | 6.2 | pts. | 35.9 | 33.4 | 2.5 | pts. | ||||||||||||||||
| Adjusted EBITDA margin1 (%) | 39.0 | 37.9 | 1.1 | pts. | 38.9 | 37.5 | 1.4 | pts. | ||||||||||||||||
| 1 These are non-GAAP and other specified financial measures. See Section 11.1 Non-GAAP and other specified financial measures. |
TTech EBITDA increased by $313 million or 23.4% in the third quarter of 2024 and $376 million or 8.8% in the first nine months of 2024. In addition to the growth drivers discussed within TTech Adjusted EBITDA below, EBITDA also reflects lower restructuring and other costs of $223 million in the third quarter of 2024, primarily related to significant investments in cost efficiency and effectiveness programs, inclusive of real estate rationalization, which predominantly took place during the third quarter of 2023. Restructuring and other costs decreased by $141 million in the first nine months of 2024, largely due to the factors listed for the quarter, in addition to one-time amounts recorded in the first nine months of 2023 of $68 million for the ratification of the new collective agreement between the TWU and ourselves.
TTech Adjusted EBITDA increased by $90 million or 5.6% in the third quarter of 2024 and $236 million or 5.0% in the first nine months of 2024 reflecting: (i) mobile network, residential internet, TV and security subscriber growth; (ii) broad-based cost reduction efforts, including workforce reductions, synergies achieved between LifeWorks and our legacy health business, and an increase in TTech leveraging TELUS Digital resulting in competitive benefits given the lower cost structure in TELUS Digital, as well as savings in marketing costs; (iii) higher gains on real estate projects; (iv) growth in health services margin; (v) higher agriculture and consumer goods margins; and (vi) growth in fixed data services to new and existing business customers. These factors were partially offset by: (i) lower mobile phone ARPU; (ii) declining TV and fixed legacy voice margins; (iii) lower mobile equipment margins; (iv) higher network operations costs; (v) higher bad debt expense; and (vi) higher costs related to the scaling of our digital capabilities, inclusive of increased subscription-based licenses and cloud usage costs.
TTech Adjusted EBITDA margin increased by 1.1 percentage points in the third quarter of 2024 and 1.4 percentage points in the first nine months of 2024. These improvements were largely driven by our broad-based cost efficiency and effectiveness programs as described above, in addition to higher gains on real estate projects.
|
|
Page |
TELUS Corporation – Management’s discussion and analysis – 2024 Q3
Adjusted EBITDA less capital expenditures – TTech segment
| Three-month periods ended September 30 | Nine-month periods ended September 30 | |||||||||||||||||||||||
| ($ in millions) | 2024 | 2023 | Change | 2024 | 2023 | Change | ||||||||||||||||||
| Adjusted EBITDA | 1,723 | 1,633 | 5.6 | % | 5,013 | 4,777 | 5.0 | % | ||||||||||||||||
| Capital expenditures | (650 | ) | (734 | ) | (11.4 | )% | (2,020 | ) | (2,200 | ) | (8.2 | )% | ||||||||||||
| Adjusted EBITDA less capital expenditures1 | 1,073 | 899 | 19.4 | % | 2,993 | 2,577 | 16.1 | % | ||||||||||||||||
| 1 See Section 11.1 Non-GAAP and other specified financial measures. |
TTech Adjusted EBITDA less capital expenditures increased by $174 million in the third quarter of 2024 and $416 million in the first nine months of 2024. See Section 7.3 for further discussion on capital expenditures.
EBIT – TTech segment
| Three-month periods ended September 30 | Nine-month periods ended September 30 | |||||||||||||||||||||||
| ($ in millions) | 2024 | 2023 | Change | 2024 | 2023 | Change | ||||||||||||||||||
| EBITDA | 1,659 | 1,346 | 23.4 | % | 4,632 | 4,256 | 8.8 | % | ||||||||||||||||
| Depreciation | (551 | ) | (563 | ) | (2.1 | )% | (1,754 | ) | (1,713 | ) | 2.4 | % | ||||||||||||
| Amortization of intangible assets | (308 | ) | (329 | ) | (6.4 | )% | (946 | ) | (993 | ) | (4.7 | )% | ||||||||||||
| EBIT1 | 800 | 454 | 76.2 | % | 1,932 | 1,550 | 24.6 | % | ||||||||||||||||
| 1 See Section 11.1 Non-GAAP and other specified financial measures. |
TTech EBIT increased by $346 million in the third quarter of 2024 and $382 million in the first nine months of 2024, in line with the increases in EBITDA.
5.5 TELUS digital experience segment
TELUS Digital trends
The historical trend over the past eight quarters in TELUS Digital revenue reflects changes in service volume demand from our existing clients, services provided to new clients, and growth from acquisitions, including our acquisition of WillowTree on January 3, 2023. During 2024, we observed a stabilization in service volume demand after experiencing a notable reduction which became more pronounced beginning in the second quarter of 2023, arising from some of our larger technology clients that was more significant than expected, particularly in Europe. At the same time, several of our key clients also began to reduce their costs, which resulted in delays and near-term reductions in spending commitments.
Goods and services purchased and Employee benefits expense increased, reflecting: (i) the expansion of our TELUS Digital team member base to meet the growing service volumes and increased complexity from both existing and new customers, including those arising from our acquisition of WillowTree; (ii) higher average salaries and wages over time; (iii) cost efficiency programs; (iv) changes in external labour requirements to support the growth in our digital services business; (v) changes in our crowdsourced-enabled workforce to support our AI business; (vi) increases in our software licensing costs associated with our growing team member base; and (vii) increases in administrative expenses and facility costs to support overall business growth and acquisitions. Beginning in the second quarter of 2023, Employee benefits expense was positively impacted by employee-related cost efficiency initiatives resulting in decreases in our team member count in certain regions in response to the reduction in service volume demand from some clients, and a favourable mix of labour sourced from lower-cost jurisdictions.
Depreciation and amortization have generally been steady as growth in capital assets to support the expansion of our delivery sites required to serve customer demand have been offset by the timing of full depreciation or amortization of existing capital assets.
|
|
Page |
TELUS Corporation – Management’s discussion and analysis – 2024 Q3
TELUS Digital operating indicators
| Three-month periods ended September 30 | Nine-month periods ended September 30 | |||||||||||||||||||||||
| ($ in millions) | 2024 | 2023 | Change | 2024 | 2023 | Change | ||||||||||||||||||
| Operating revenues by industry vertical | ||||||||||||||||||||||||
| Tech and games | 376 | 404 | (6.9 | )% | 1,127 | 1,191 | (5.4 | )% | ||||||||||||||||
| Communications and media | 223 | 208 | 7.2 | % | 655 | 626 | 4.6 | % | ||||||||||||||||
| eCommerce and fintech | 81 | 95 | (14.7 | )% | 262 | 291 | (10.0 | )% | ||||||||||||||||
| Healthcare | 66 | 51 | 29.4 | % | 196 | 155 | 26.5 | % | ||||||||||||||||
| Banking, financial services and insurance | 56 | 46 | 21.7 | % | 158 | 156 | 1.3 | % | ||||||||||||||||
| All others1 | 92 | 85 | 8.2 | % | 274 | 294 | (6.8 | )% | ||||||||||||||||
| 894 | 889 | 0.6 | % | 2,672 | 2,713 | (1.5 | )% | |||||||||||||||||
| Operating revenues by geographic region | ||||||||||||||||||||||||
| Europe | 263 | 271 | (3.0 | )% | 782 | 841 | (7.0 | )% | ||||||||||||||||
| North America | 242 | 248 | (2.4 | )% | 742 | 786 | (5.6 | )% | ||||||||||||||||
| Asia-Pacific | 202 | 217 | (6.9 | )% | 626 | 638 | (1.9 | )% | ||||||||||||||||
| Central America and others2 | 187 | 153 | 22.2 | % | 522 | 448 | 16.5 | % | ||||||||||||||||
| 894 | 889 | 0.6 | % | 2,672 | 2,713 | (1.5 | )% | |||||||||||||||||
| 1 | All others includes, among others, travel and hospitality, energy and utilities, retail and consumer packaged goods industry verticals. | |
| 2 | Others includes South America and Africa geographic regions. |
Across all of our verticals, the reported rates of revenue growth were positively impacted by the strengthening of both the U.S. dollar and the European euro against the Canadian dollar compared to the same periods in the prior year.
Revenue from our tech and games industry vertical decreased by $28 million in the third quarter of 2024 and $64 million in the first nine months of 2024, primarily due to lower revenue from a leading social media client and certain other technology and gaming clients, partially offset by growth in revenue from other clients within this industry vertical, including Google in the first nine months of 2024. Revenue from our communications and media industry vertical increased by $15 million in the third quarter of 2024 and $29 million in the first nine months of 2024, driven primarily by more services provided to the TTech segment, partially offset by lower service revenue from certain other telecommunication clients. Revenue from our eCommerce and fintech industry vertical decreased by $14 million in the third quarter of 2024 and $29 million in the first nine months of 2024, due to lower service volume demand from a large eCommerce client as well as certain fintech clients. Revenue from our healthcare industry vertical increased by $15 million in the third quarter of 2024 and $41 million in the first nine months of 2024, primarily due to additional services provided to the healthcare business unit of the TTech segment. Revenue from our banking, financial services and insurance industry vertical increased by $10 million in the third quarter of 2024 and $2 million in the first nine months of 2024, due to growth from certain Canadian banks and smaller regional financial services firms in North America, partially offset by lower service volume demand from a global financial institution client. All other verticals increased by $7 million in the third quarter of 2024 due to seasonality and higher service volume demand from certain clients in the travel and hospitality, and retail and consumer packaged goods industry verticals, and decreased by $20 million in the first nine months of 2024, due to lower revenue across various client accounts notably in the travel and hospitality industry vertical.
We serve our clients, who are primarily domiciled in North America and Europe, from multiple delivery locations across various geographic regions. In addition, our AI data solutions business clients are largely supported by crowdsourced contractors that are globally dispersed and not limited to the physical locations of our delivery centres. During the third quarter and first nine months of 2024, the decline in revenue in Europe and Asia-Pacific was primarily due to lower service volume demand from technology clients serviced from these regions, while the decline in revenue in North America was primarily due to lower service volume demand from certain clients served from this region as well as offshoring of certain client services to lower cost regions. The table above presents the revenue generated in each geographic region, based on the location of our delivery centre or where the services were provided from, for the periods presented.
|
|
Page |
TELUS Corporation – Management’s discussion and analysis – 2024 Q3
Operating revenues and other income – TELUS digital experience segment
| Three-month periods ended September 30 | Nine-month periods ended September 30 | |||||||||||||||||||||||
| ($ in millions) | 2024 | 2023 | Change | 2024 | 2023 | Change | ||||||||||||||||||
| Operating revenues (arising from contracts with customers) | 675 | 706 | (4.4 | )% | 2,023 | 2,185 | (7.4 | )% | ||||||||||||||||
| Other income | 3 | — | n/m | 85 | — | n/m | ||||||||||||||||||
| External Operating revenues and other income | 678 | 706 | (4.0 | )% | 2,108 | 2,185 | (3.5 | )% | ||||||||||||||||
| Intersegment revenues | 219 | 183 | 19.7 | % | 649 | 528 | 22.9 | % | ||||||||||||||||
| TELUS Digital Operating revenues and other income | 897 | 889 | 0.9 | % | 2,757 | 2,713 | 1.6 | % | ||||||||||||||||
TELUS Digital Operating revenues and other income increased by $8 million in the third quarter of 2024 and $44 million in the first nine months of 2024.
Our Operating revenues (arising from contracts with customers) decreased by $31 million in the third quarter of 2024 and $162 million in the first nine months of 2024, primarily attributable to: (i) lower revenues from a leading social media client and other technology clients; (ii) a reduction in revenue in other industry verticals, notably among communications (excluding the TTech segment) and eCommerce clients; and (iii) a persistently challenging macroeconomic environment and competitive conditions in the industry. These decreases were partially offset by: (i) growth in services provided to existing clients, including Google during the first nine months of 2024; (ii) new clients added since the same period in the prior year; and (iii) the strengthening of both the U.S. dollar and the European euro against the Canadian dollar, which resulted in a favourable foreign currency impact on our TELUS Digital operating results. Revenues from contracts denominated in U.S. dollars, European euros and other currencies will be affected by changes in foreign exchange rates.
Other income increased by $3 million in the third quarter of 2024 and $85 million in the first nine months of 2024, as we amended the payout structure and terms associated with our provisions for written put options and revised our estimates of certain performance-based criteria, which resulted in a reduction of our provisions for written put options.
Intersegment revenues represent services provided to the TTech segment, including those provided under the TELUS master services agreement. Such revenue is eliminated upon consolidation, together with the associated TTech operating expenses and the TELUS Digital margin on costs capitalized within TTech. Commencing in the first quarter of 2024, new and incremental services have been provided to the TTech segment which are capital expenditures for software and contract acquisition costs that are deferred and amortized.
The increase in intersegment revenues reflects the competitive benefits TELUS derives from the lower cost structure in the TELUS Digital segment and the significant amounts of value-generating digital, customer experience, telecommunications, health and consumer goods solutions TELUS receives, while maintaining control over the quality of the associated services delivered and, on a consolidated basis, retaining the margin that a third-party vendor would otherwise earn.
Operating expenses – TELUS digital experience segment
| Three-month periods ended September 30 | Nine-month periods ended September 30 | |||||||||||||||||||||||
| ($ in millions) | 2024 | 2023 | Change | 2024 | 2023 | Change | ||||||||||||||||||
| Goods and services purchased1 | 169 | 159 | 6.3 | % | 483 | 475 | 1.7 | % | ||||||||||||||||
| Employee benefits expense1 | 619 | 559 | 10.7 | % | 1,802 | 1,768 | 1.9 | % | ||||||||||||||||
| TELUS Digital operating expenses | 788 | 718 | 9.7 | % | 2,285 | 2,243 | 1.9 | % | ||||||||||||||||
| 1 Includes restructuring and other costs. |
TELUS Digital operating expenses increased by $70 million in the third quarter of 2024 and $42 million in the first nine months of 2024. See TELUS Digital Adjusted EBITDA below for further details.
|
|
Page |
TELUS Corporation – Management’s discussion and analysis – 2024 Q3
EBITDA – TELUS digital experience segment
| Three-month periods ended September 30 | Nine-month periods ended September 30 | |||||||||||||||||
| ($ in millions, except margins) | 2024 | 2023 | Change | 2024 | 2023 | Change | ||||||||||||
| EBITDA | 109 | 171 | (36.6 | )% | 472 | 470 | 0.5 | % | ||||||||||
| Add restructuring and other costs included in EBITDA | 22 | 16 | n/m | 44 | 55 | n/m | ||||||||||||
| Adjusted EBITDA1 | 131 | 187 | (30.3 | )% | 516 | 525 | (1.7 | )% | ||||||||||
| EBITDA margin2 (%) | 12.1 | 19.2 | (7.1 | ) pts. | 17.1 | 17.3 | (0.2 | ) pts. | ||||||||||
| Adjusted EBITDA margin2 (%) | 14.5 | 21.0 | (6.5 | ) pts. | 18.7 | 19.3 | (0.6 | ) pts. | ||||||||||
| 1 | For certain metrics, there are definitional differences between TELUS and TELUS Digital reporting. These differences largely arise from TELUS Digital adopting definitions consistent with practice in its industry. |
| 2 | These are non-GAAP and other specified financial measures. See Section 11.1 Non-GAAP and other specified financial measures. |
TELUS Digital EBITDA decreased by $62 million or 36.6% in the third quarter of 2024 and increased by $2 million or 0.5% in the first nine months of 2024. TELUS Digital Adjusted EBITDA decreased by $56 million or 30.3% in the third quarter of 2024 and $9 million or 1.7% in the first nine months of 2024, while Adjusted EBITDA margin decreased by 6.5 percentage points in the third quarter of 2024 and 0.6 percentage points in the first nine months of 2024. The decrease in Adjusted EBITDA in the third quarter and first nine months of 2024 was driven by higher investments in corporate initiatives, such as expansion of our commercial sales team and operational effectiveness programs, as reflected in the increase in salaries and benefits and Goods and services purchased, as well as higher share-based compensation compared to a slight reduction in revenue, which was partially offset by other income arising from the revaluation of our provisions for written put options.
Adjusted EBITDA less capital expenditures – TELUS digital experience segment
| Three-month periods ended September 30 | Nine-month periods ended September 30 | |||||||||||||||||
| ($ in millions) | 2024 | 2023 | Change | 2024 | 2023 | Change | ||||||||||||
| Adjusted EBITDA | 131 | 187 | (30.3 | )% | 516 | 525 | (1.7 | )% | ||||||||||
| Capital expenditures | (30 | ) | (35 | ) | (14.3 | )% | (96 | ) | (89 | ) | 7.9 | % | ||||||
| Adjusted EBITDA less capital expenditures1 | 101 | 152 | (33.6 | )% | 420 | 436 | (3.7 | )% | ||||||||||
| 1 | See Section 11.1 Non-GAAP and other specified financial measures. |
TELUS Digital Adjusted EBITDA less capital expenditures decreased by $51 million in the third quarter of 2024 and $16 million in the first nine months of 2024. See Section 7.3 for further discussion on capital expenditures.
EBIT – TELUS digital experience segment
| Three-month periods ended September 30 | Nine-month periods ended September 30 | |||||||||||||||||
| ($ in millions) | 2024 | 2023 | Change | 2024 | 2023 | Change | ||||||||||||
| EBITDA | 109 | 171 | (36.6 | )% | 472 | 470 | 0.5 | % | ||||||||||
| Depreciation | (46 | ) | (48 | ) | (4.2 | )% | (141 | ) | (136 | ) | 3.7 | % | ||||||
| Amortization of intangible assets | (63 | ) | (60 | ) | 5.0 | % | (184 | ) | (186 | ) | (1.1 | )% | ||||||
| EBIT1 | — | 63 | (100.0 | )% | 147 | 148 | (0.7 | )% | ||||||||||
| 1 | See Section 11.1 Non-GAAP and other specified financial measures. |
TELUS Digital EBIT decreased by $63 million in the third quarter of 2024, in line with the decrease in EBITDA, and $1 million in the first nine months of 2024, as a result of higher depreciation and amortization.
|
|
Page |
TELUS Corporation – Management’s discussion and analysis – 2024 Q3
| 6. | Changes in financial position |
| Financial position at: | Sept. 30 | Dec. 31 | |||||||
| ($ millions) | 2024 | 2023 | Change | Change includes: | |||||
| Current assets | |||||||||
| Cash and temporary investments, net | 814 | 864 | (50 | ) | See Section 7 Liquidity and capital resources | ||||
| Accounts receivable | 3,554 | 3,597 | (43 | ) | A decrease primarily driven by seasonally lower sales volume from our dealer and retail channels and lower TELUS Digital receivables | ||||
| Income and other taxes receivable | 55 | 205 | (150 | ) | Instalments to date are less than the expense | ||||
| Inventories | 492 | 484 | 8 | An increase primarily driven by timing of inventory in transit, and higher average cost of new handsets | |||||
| Contract assets | 413 | 445 | (32 | ) | Refer to description in non-current contract assets | ||||
| Prepaid expenses | 779 | 682 | 97 | An increase mainly driven by seasonality related to the costs incurred to obtain or fulfill contracts with customers, prepayment of maintenance contracts, wireless spectrum license fees, and statutory employee benefits | |||||
| Current derivative assets | 17 | 36 | (19 | ) | A decrease in the notional amount of virtual power purchase agreements driven by a sharp decline in the forecasted Alberta energy rates. | ||||
| Current liabilities | |||||||||
| Short-term borrowings | 925 | 104 | 821 | See Note 22 of the interim consolidated financial statements | |||||
| Accounts payable and accrued liabilities | 3,419 | 3,391 | 28 | An increase associated with trade accounts payable and payroll and other employee-related liabilities, partially offset by indirect taxes payable and other. | |||||
| Income and other taxes payable | 156 | 126 | 30 | Instalments to date are less than the expense | |||||
| Dividends payable | 578 | 550 | 28 | Effects of an increase in the dividend rate and number of shares outstanding | |||||
| Advance billings and customer deposits | 950 | 971 | (21 | ) | A decrease in advance billings primarily due to deferred handset revenue and subsidies. See Note 24 of the interim consolidated financial statements | ||||
| Provisions | 235 | 317 | (82 | ) | A decrease primarily driven by employee-related provisions | ||||
| Current maturities of long-term debt | 2,613 | 3,994 | (1,381 | ) | A decrease driven by the repayment of $1.1 billion of the non-revolving TELUS bank credit facility in June 2024 and maturity of $1.1 billion Notes, Series CK, in April 2024; party offset by the reclassification of long-term debt related to the upcoming maturity of $800 million Notes, Series CQ, in January 2025, and an increase in outstanding commercial paper | ||||
| Current derivative liabilities | 15 | 25 | (10 | ) | A decrease primarily due to a smaller spread between hedged foreign exchange rate and exchange rate at the end of the period. | ||||
| Working capital (Current assets subtracting Current liabilities) |
(2,767 | ) | (3,165 | ) | 398 | TELUS normally has a negative working capital position. See Financing and capital structure management plans in Section 4.3 and Note 4(b) of the interim consolidated financial statements. |
|
|
Page |
TELUS Corporation – Management’s discussion and analysis – 2024 Q3
| Financial position at: | Sept. 30 | Dec. 31 | |||||||
| ($ millions) | 2024 | 2023 | Change | Change includes: | |||||
| Non-current assets | |||||||||
| Property, plant and equipment, net | 17,210 | 17,248 | (38 | ) | See Capital expenditures in Section 7.3 Cash used by investing activities and Depreciation in Section 5.3 Consolidated operations | ||||
| Intangible assets, net | 20,526 | 19,721 | 805 | See Capital expenditures in Section 7.3 Cash used by investing activities and Amortization of intangible assets in Section 5.3 Consolidated operations | |||||
| Goodwill, net | 10,323 | 10,058 | 265 | An increase primarily due to individually immaterial business acquisitions and foreign exchange movements. See Note 18 of the interim consolidated financial statements | |||||
| Contract assets | 277 | 303 | (26 | ) | A decrease driven by lower subsidized devices offset by our Bring-It-Back and TELUS Easy Payment® programs | ||||
| Other long-term assets | 2,526 | 2,493 | 33 | An increase primarily driven by investments in real estate joint ventures and portfolio investments, as well as costs incurred to obtain or fulfill contracts with customers, partly offset by decreases in derivative assets related to virtual power purchase agreements and unbilled customer finance receivables. | |||||
| Non-current liabilities | |||||||||
| Provisions | 736 | 744 | (8 | ) | A decrease primarily driven by a reversal of a written put option, partially offset by continued real estate rationalization | ||||
| Long-term debt | 25,387 | 23,355 | 2,032 | See Section 7.4 Cash provided (used) by financing activities | |||||
| Other long-term liabilities | 865 | 867 | (2 | ) | A decrease primarily due to a decrease in derivative liabilities arising from a change in interest rates and exchange rates largely offset by an increase in deferred capital expenditure government grants. See Note 27 of the interim consolidated financial statements | ||||
| Deferred income taxes | 4,180 | 4,390 | (210 | ) | An overall decrease in temporary differences between the accounting and tax basis of assets and liabilities. | ||||
| Owners’ equity | |||||||||
| Common equity | 15,771 | 16,112 | (341 | ) | See Consolidated statements of changes in owners’ equity in the interim consolidated financial statements | ||||
| Non-controlling interests | 1,156 | 1,190 | (34 | ) | See Consolidated statements of changes in owners’ equity in the interim consolidated financial statements. |
| 7. | Liquidity and capital resources |
This section contains forward-looking statements, including those in respect of our TELUS Corporation Common Share (Common Share) dividend payout ratio and net debt to EBITDA – excluding restructuring and other costs ratio. See Caution regarding forward-looking statements at the beginning of this MD&A.
7.1 Overview
Our capital structure financial policies and financing and capital structure management plans are described in Section 4.3.
|
|
Page |
TELUS Corporation – Management’s discussion and analysis – 2024 Q3
Cash flows
| Three-month periods ended September 30 | Nine-month periods ended September 30 | |||||||||||||||||
| ($ millions) | 2024 | 2023 | Change | 2024 | 2023 | Change | ||||||||||||
| Cash provided by operating activities | 1,432 | 1,307 | 125 | 3,770 | 3,185 | 585 | ||||||||||||
| Cash used by investing activities | (782 | ) | (791 | ) | 9 | (3,029 | ) | (4,032 | ) | 1,003 | ||||||||
| Cash provided (used) by financing activities | (763 | ) | 39 | (802 | ) | (791 | ) | 1,077 | (1,868 | ) | ||||||||
| Increase (decrease) in Cash and temporary investments, net | (113 | ) | 555 | (668 | ) | (50 | ) | 230 | (280 | ) | ||||||||
| Cash and temporary investments, net, beginning of period | 927 | 649 | 278 | 864 | 974 | (110 | ) | |||||||||||
| Cash and temporary investments, net, end of period | 814 | 1,204 | (390 | ) | 814 | 1,204 | (390 | ) | ||||||||||
7.2 Cash provided by operating activities
Analysis of changes in cash provided by operating activities
| Three-month periods ended September 30 | Nine-month periods ended September 30 | |||||||||||||||||
| ($ millions) | 2024 | 2023 | Change | 2024 | 2023 | Change | ||||||||||||
| Operating revenues and other income (see Section 5.3) | 5,099 | 5,008 | 91 | 15,005 | 14,918 | 87 | ||||||||||||
| Goods and services purchased (see Section 5.3) | (1,868 | ) | (1,858 | ) | (10 | ) | (5,503 | ) | (5,451 | ) | (52 | ) | ||||||
| Employee benefits expense (see Section 5.3) | (1,475 | ) | (1,633 | ) | 158 | (4,432 | ) | (4,741 | ) | 309 | ||||||||
| Restructuring and other costs, net of disbursements | 21 | 90 | (69 | ) | 5 | 190 | (185 | ) | ||||||||||
| Share-based compensation expense, net of payments | 44 | 27 | 17 | 110 | 100 | 10 | ||||||||||||
| Net employee defined benefit plans expense | 16 | 15 | 1 | 50 | 46 | 4 | ||||||||||||
| Employer contributions to employee defined benefit plans | (2 | ) | (7 | ) | 5 | (16 | ) | (23 | ) | 7 | ||||||||
| Unrealized changes in virtual power purchase agreements forward element (VPPAs) (see Section 5.3) | 125 | 33 | 92 | 228 | 59 | 169 | ||||||||||||
| Loss from equity accounted investments | 3 | 2 | 1 | 13 | 10 | 3 | ||||||||||||
| Interest paid | (362 | ) | (307 | ) | (55 | ) | (1,011 | ) | (888 | ) | (123 | ) | ||||||
| Interest received | 9 | 4 | 5 | 30 | 11 | 19 | ||||||||||||
| Income taxes paid, net of recoveries received | (63 | ) | (63 | ) | — | (258 | ) | (342 | ) | 84 | ||||||||
| Other operating working capital changes | (115 | ) | (4 | ) | (111 | ) | (451 | ) | (704 | ) | 253 | |||||||
| Cash provided by operating activities | 1,432 | 1,307 | 125 | 3,770 | 3,185 | 585 | ||||||||||||
Cash provided by operating activities increased by $125 million in the third quarter of 2024 and $585 million in the first nine months of 2024.
| · | Restructuring and other costs, net of disbursements, represented a net change of $69 million in the third quarter of 2024 and $185 million in the first nine months of 2024, which was largely related to ongoing and incremental cost efficiency and effectiveness initiatives. In the first quarter of 2024, we paid personnel-related restructuring and other costs that were recorded in the prior year. |
| · | Interest paid increased by $55 million in the third quarter of 2024 and $123 million in the first nine months of 2024, largely due to the issuance of three-tranche notes in the third quarter of 2023, and the issuance of three-tranche notes in the first quarter of 2024 as described in Section 7.4. |
| · | Income taxes paid, net of recoveries received, was unchanged in the third quarter of 2024 and decreased by $84 million in the first nine months of 2024, primarily related to lower required income tax instalments attributable to the prior year’s lower taxable income. |
| · | For a discussion of Other operating working capital changes, see Section 6 Changes in financial position and Note 31(a) of the interim consolidated financial statements. |
|
|
Page |
TELUS Corporation – Management’s discussion and analysis – 2024 Q3
7.3 Cash used by investing activities
Analysis of changes in cash used by investing activities
| Three-month periods ended September 30 | Nine-month periods ended September 30 | |||||||||||||||||
| ($ millions) | 2024 | 2023 | Change | 2024 | 2023 | Change | ||||||||||||
| Cash payments for capital assets, excluding spectrum licences | (679 | ) | (745 | ) | 66 | (2,157 | ) | (2,498 | ) | 341 | ||||||||
| Cash payments for spectrum licences | — | (24 | ) | 24 | (620 | ) | (29 | ) | (591 | ) | ||||||||
| Cash payments for acquisitions, net | (91 | ) | (11 | ) | (80 | ) | (258 | ) | (1,273 | ) | 1,015 | |||||||
| Advances to, and investment in, real estate joint ventures and associates | (7 | ) | (19 | ) | 12 | (12 | ) | (136 | ) | 124 | ||||||||
| Real estate joint venture receipts | 2 | 1 | 1 | 5 | 5 | — | ||||||||||||
| Proceeds on disposition | — | — | — | 21 | 7 | 14 | ||||||||||||
| Investment in portfolio investments and other | (7 | ) | 7 | (14 | ) | (8 | ) | (108 | ) | 100 | ||||||||
| Cash used by investing activities | (782 | ) | (791 | ) | 9 | (3,029 | ) | (4,032 | ) | 1,003 | ||||||||
Cash used by investing activities decreased by $9 million in the third quarter of 2024 and $1,003 million in the first nine months of 2024.
| · | The decrease in Cash payments for capital assets, excluding spectrum licences in both the third quarter of 2024 and first nine months of 2024 was primarily composed of: |
| · | Higher capital expenditure payments of $35 million in the third quarter of 2024 and lower capital expenditure payments of $136 million in the first nine months of 2024 with respect to payment timing differences. |
| · | A decrease in capital expenditures of $101 million in the third quarter of 2024 and $205 million in the first nine months of 2024 (see Capital expenditure measures table and discussion below). |
| · | Cash payments for spectrum licences decreased by $24 million in the third quarter of 2024 as we made cash payments for the acquisition of AWS-1 and broadband radio service (BRS) bands in the prior year. Cash payments for spectrum licences increased by $591 million in the first nine months of 2024 related to the 3800 MHz spectrum auction as further described in Section 1.3 in our 2023 annual MD&A and Note 18(a) of the interim consolidated financial statements. |
| · | Cash payments for spectrum licences excludes the non-cash $298 million of subordinated AWS-4 spectrum licences acquired during the second quarter of 2024 included within indefinite life intangible assets; the subordination resulted in us also recognizing the amount as a long-term liability. See Note 18(a) of the interim consolidated financial statements for further details. |
| · | Cash payments for acquisitions, net, were $80 million higher in the third quarter of 2024 as we made cash payments for individually immaterial business acquisitions that were complementary to our existing lines of business in the third quarter of 2024. Cash payments for acquisitions, net, were $1,015 million lower in the first nine months of 2024 as we made cash payments for the acquisitions of WillowTree and other individually immaterial business acquisitions that were complementary to our existing lines of business in the first nine months of 2023. |
| · | Advances to, and investments in, real estate joint ventures and associates decreased by $12 million in the third quarter of 2024 and $124 million in the first nine months of 2024, as we increased our equity interest in Miovision Technologies Incorporated in the prior periods. See Note 21 of the interim consolidated financial statements for further details. |
| · | Proceeds on disposition were $14 million higher in the first nine months of 2024, resulting from the sale of an associate. |
| · | Investment in portfolio investments and other increased by $14 million in the third quarter of 2024 driven by investments in a larger number of portfolio investments. Investment in portfolio investments and other decreased by $100 million in the first nine months of 2024, primarily as a result of lower capital inventory and investments in a larger number of portfolio investments in the first nine months of 2023. |
|
|
Page |
TELUS Corporation – Management’s discussion and analysis – 2024 Q3
Capital expenditure measures
| Three-month periods ended September 30 | Nine-month periods ended September 30 | |||||||||||||||||
| ($ millions, except capital expenditure intensity) | 2024 | 2023 | Change | 2024 | 2023 | Change | ||||||||||||
| Capital expenditures1 | ||||||||||||||||||
| TELUS technology solutions (TTech) segment | ||||||||||||||||||
| TTech operations | 622 | 712 | (12.6 | )% | 1,955 | 2,161 | (9.5 | )% | ||||||||||
| TTech real estate development | 28 | 22 | 27.3 | % | 65 | 39 | 66.7 | % | ||||||||||
| 650 | 734 | (11.4 | )% | 2,020 | 2,200 | (8.2 | )% | |||||||||||
| TELUS digital experience segment (TELUS Digital) | 30 | 35 | (14.3 | )% | 96 | 89 | 7.9 | % | ||||||||||
| Eliminations2 | (12 | ) | — | n/m | (32 | ) | — | n/m | ||||||||||
| Consolidated | 668 | 769 | (13.1 | )% | 2,084 | 2,289 | (9.0 | )% | ||||||||||
| TTech segment capital expenditure intensity3 (%) | 14 | 17 | (3 | ) pts. | 15 | 17 | (2 | ) pts. | ||||||||||
| TELUS digital experience segment capital expenditure intensity3 (%) | 3 | 4 | (1 | ) pt. | 3 | 3 | — | pts. | ||||||||||
| Consolidated capital expenditure intensity3 (%) | 13 | 15 | (2 | ) pts. | 13 | 15 | (2 | ) pts. | ||||||||||
| 1 | Capital expenditures include assets purchased, excluding right-of-use lease assets, but not yet paid for. Consequently, capital expenditures differ from Cash payments for capital assets, excluding spectrum licences, as reported in the interim consolidated statements of cash flows. Refer to Note 31 of the interim consolidated financial statements for further information. |
| 2 | See Intersegment revenues in Section 5.5 for additional details. |
| 3 | See Section 11.1 Non-GAAP and other specified financial measures. |
Consolidated capital expenditures decreased by $101 million in the third quarter of 2024 and $205 million in the first nine months of 2024. TTech operations drove $90 million of the decrease in the third quarter of 2024 and $206 million in the first nine months of 2024, primarily driven by the planned slowdown of our fibre and wireless network builds and systems development. Our TTech operations’ capital investments have enabled: (i) ongoing growth in our internet, TV and security subscriber bases, as well as the connection of more premises to our fibre network; (ii) the extended coverage of our 5G network; (iii) the expansion of our health product offerings and capabilities, as well as support for business integration; and (iv) enhancement of our product and digital development to increase our system capacity and reliability. By September 30, 2024, our 5G network covered approximately 32.1 million Canadians, representing approximately 87% of the population.
TTech real estate development capital expenditures increased by $6 million in the third quarter of 2024 and $26 million in the first nine months of 2024, reflecting an increase in capital investment to support construction of multi-year development projects, including TELUS OceanTM, TELUS Living residential buildings and other commercial buildings in B.C.
TELUS Digital capital expenditures decreased by $5 million in the third quarter of 2024, primarily due to slower demand for client growth. In the first nine months of 2024, TELUS Digital capital expenditures increased by $7 million, primarily driven by increased software investment in our managed digital solutions business and AI data solutions (software and application development), as well as our continued expansion in Africa.
|
|
Page |
TELUS Corporation – Management’s discussion and analysis – 2024 Q3
7.4 Cash provided (used) by financing activities
Analysis of changes in cash provided (used) by financing activities
| Three-month periods ended September 30 | Nine-month periods ended September 30 | |||||||||||||||||
| ($ millions) | 2024 | 2023 | Change | 2024 | 2023 | Change | ||||||||||||
| Dividends paid to holders of Common Shares | (384 | ) | (338 | ) | (46 | ) | (1,174 | ) | (976 | ) | (198 | ) | ||||||
| Issue (repayment) of short-term borrowings, net | (118 | ) | (490 | ) | 372 | 822 | — | 822 | ||||||||||
| Long-term debt issued | 1,294 | 2,808 | (1,514 | ) | 5,083 | 8,325 | (3,242 | ) | ||||||||||
| Redemptions and repayment of long-term debt | (1,529 | ) | (1,925 | ) | 396 | (5,480 | ) | (6,195 | ) | 715 | ||||||||
| Shares of subsidiary purchased from non-controlling interests, net | (25 | ) | — | (25 | ) | (25 | ) | (57 | ) | 32 | ||||||||
| Other | (1 | ) | (16 | ) | 15 | (17 | ) | (20 | ) | 3 | ||||||||
| Cash provided (used) by financing activities | (763 | ) | 39 | (802 | ) | (791 | ) | 1,077 | (1,868 | ) | ||||||||
Cash used by financing activities increased by $802 million in the third quarter of 2024 and $1,868 million in the first nine months of 2024.
Dividends paid to holders of Common Shares
Our dividend reinvestment and share purchase (DRISP) plan trustee acquired shares from Treasury for the DRISP plan, rather than acquiring Common Shares in the stock market. Effective with the dividends paid on October 1, 2019, we offered Common Shares from Treasury at a discount of 2%. Cash payments for dividends increased by $46 million in the third quarter of 2024 and $198 million in the first nine months of 2024, which reflected higher dividend rates under our dividend growth program (see Section 4.3) and an increase in the number of shares outstanding. During the third quarter of 2024, our DRISP plan trustee acquired Common Shares for $193 million.
In October 2024, we paid dividends of $388 million to the holders of Common Shares and the trustee acquired dividend reinvestment Common Shares from Treasury for $190 million, totalling $578 million.
Issue (repayment) of short-term borrowings, net
In the second quarter of 2024, we entered into an agreement with an arm’s-length securitization trust further described in Section 7.7. In the second quarter of 2024, Short-term borrowings under the current trust were $1.0 billion and the repayment of short-term borrowings under the previous trust was $100 million. In the third quarter of 2024, we repaid $0.1 billion under the current securitization trust.
In the first quarter of 2023, we drew down amounts advanced to us from an arm’s-length securitization for the previous trust to finance working capital. These amounts were repaid in the third quarter of 2023.
Long-term debt issued and Redemptions and repayment of long-term debt
In the third quarter of 2024, long-term debt issued decreased by $1.5 billion, while redemptions and repayment of long-term debt decreased by $0.4 billion. These changes were primarily composed of:
| · | A net decrease in commercial paper outstanding, including foreign exchange effects, of $0.7 billion to a balance of $1.1 billion (US$0.8 billion) at September 30, 2024, from a balance of $1.8 billion (US$1.3 billion) at June 30, 2024. Our commercial paper program, when utilized, provides funds at a lower cost than our revolving credit facility and is fully backstopped by the revolving credit facility (see Section 7.6 Credit facilities). |
| · | A decrease in net draws on the TELUS International (Cda) Inc. credit facility, including foreign exchange effects, of $91 million. As at September 30, 2024, net draws due to a syndicate of financial institutions (excluding TELUS Corporation) were US$1.2 billion, while as at June 30, 2024, net draws were US$1.3 billion. The TELUS International (Cda) Inc. credit facility is non-recourse to TELUS Corporation. |
| · | The August 13, 2024 note issuance of $700 million of senior unsecured 4.65% Notes, Series CAQ, maturing on August 13, 2031. The net proceeds from this offering were used for the repayment of outstanding indebtedness, including the repayment of commercial paper and the reduction of cash amounts outstanding under an arm’s length securitization trust, and for other general corporate purposes. |
For the first nine months of 2024, long-term debt issued decreased by $3.2 billion, while redemptions and repayment of long-term debt deceased by $0.7 billion. In addition to some activity from the third quarter of 2024, the change in balance for the first nine months of 2024 was primarily composed of:
| · | A net increase in commercial paper outstanding, including foreign exchange effects, of $42 million from a balance of $1.0 billion (US$0.8 billion) at December 31, 2023. |
| · | A decrease in net draws on the TELUS International (Cda) Inc. credit facility, including foreign exchange effects, of $127 million. As at December 31, 2023, net draws due to a syndicate of financial institutions (excluding TELUS Corporation) were US$1.4 billion. |
|
|
Page |
TELUS Corporation – Management’s discussion and analysis – 2024 Q3
| · | The February 15, 2024 three-tranche note issuance of $500 million of senior unsecured 5.10% Sustainability-Linked Notes, Series CAN, maturing on February 15, 2034; $700 million of senior unsecured 4.80% Notes, Series CAO, maturing on December 15, 2028; and $600 million of senior unsecured 4.95% Notes, Series CAP, maturing on February 18, 2031. The net proceeds from the three-tranche offering were used for the repayment of outstanding indebtedness, including the repayment of the $1.1 billion of 3.35% Notes, Series CK, upon maturity in April 2024, repayment of commercial paper and for other general corporate purposes, while some proceeds were used for the repayment of the unsecured, non-revolving $1.1 billion bank credit facility. |
| · | The repayment upon maturity of $1.1 billion of 3.35% Notes, Series CK, as previously noted. |
| · | The repayment in the second quarter of 2024 of an unsecured, non-revolving $1.1 billion bank credit facility, which was to be used for general corporate purposes and that was to mature July 9, 2024. |
The average term to maturity of our long-term debt (excluding commercial paper, TELUS bank credit facilities, the revolving components of the TELUS International (Cda) Inc. credit facility, lease liabilities and other long-term debt) was 10.6 years at September 30, 2024, a decrease from 11.3 years at December 31, 2023 and from 11.5 years at September 30, 2023. Additionally, the weighted average cost of our long-term debt (excluding commercial paper, TELUS bank credit facilities, the revolving components of the TELUS International (Cda) Inc. credit facility, lease liabilities and other long-term debt) was 4.40% at September 30, 2024, an increase from 4.33% at December 31, 2023 and from 4.33% at September 30, 2023.
Shares of subsidiary purchased from non-controlling interests, net
In the third quarter of 2024, we acquired 5.4 million subordinate voting shares of TELUS International (Cda) Inc. over the facilities of the Toronto Stock Exchange.
In the second quarter of 2023, we acquired 2.5 million multiple voting shares of TELUS International (Cda) Inc. from a non-controlling interest.
Other
In the third quarter of 2024, we incurred debt issuance costs in connection with our Series CAQ note issuance. This was less than the debt issuance costs in connection with the three-tranche note issuance in the third quarter of 2023.
7.5 Liquidity and capital resource measures
Net debt was $28.1 billion at September 30, 2024, an increase of $1.4 billion compared to one year earlier, resulting mainly from: the first quarter 2024 three-tranche issuance of $1.8 billion of notes and the third quarter 2024 issuance of $700 million of notes as described in Section 7.4; short-term borrowings advanced to us under a new agreement with an arm’s-length securitization trust as described in Section 7.7; and less Cash and temporary investments. These factors were partially offset by: the repayment upon maturity of 3.35% Notes, Series CK in the second quarter of 2024; the repayment of an unsecured, non-revolving bank credit facility in the second quarter of 2024; and a decrease in commercial paper outstanding.
Fixed-rate debt as a proportion of total indebtedness, which excludes lease liabilities and other long-term debt, was 89% as at September 30, 2024, up from 85% one year earlier. The increase was primarily due to: (i) the second quarter 2024 repayment of the unsecured non-revolving syndicated $1.1 billion bank credit facility which was classified as floating-rate debt in this calculation; (ii) the first quarter 2024 three-tranche issuance of $1.8 billion of notes and the third quarter 2024 issuance of $700 million of notes; and (iii) a decrease in commercial paper outstanding, which is classified as floating-rate debt in this calculation. These factors were partially offset by the repayment upon maturity of 3.35% Notes, Series CK in the second quarter of 2024 and the increased draw-down of amounts advanced to us from an arm’s-length securitization trust, which is classified as floating-rate debt in this calculation.
Our Net debt to EBITDA – excluding restructuring and other costs ratio supports our financial objective of maintaining investment-grade credit ratings, which facilitates reasonable access to capital. This ratio was 3.83 times, as measured at September 30, 2024, up from 3.82 times one year earlier. The effect of the increase in net debt levels, primarily due to spectrum acquisitions and business acquisitions, was approximately equal to the effect of growth in EBITDA – excluding restructuring and other costs; net debt levels were already elevated in the current and comparative periods due to our spectrum acquisitions and business acquisitions. As at September 30, 2024, the acquisition of spectrum licences increased the ratio by approximately 0.56. Our recent acquisitions of spectrum licences have increased our national spectrum holdings and represent an investment in building greater network capacity to support continuing growth in demand for data, as well as growth in our mobile subscriber base. Given the cash demands of the 600 MHz auction in 2019, the 3500 MHz auction in 2021, the 3800 MHz auction in 2023 and the upcoming auction for millimetre wave spectrum, the assessment of the guideline and timing of return to the objective range remains to be determined; however, it is our intent to return to a ratio circa 2.70 times in the medium term (following the spectrum auctions in 2021 and 2023, and the upcoming millimetre wave spectrum auction), consistent with our long-term strategy. While this ratio exceeds our long-term objective range, we are well in compliance with the leverage ratio covenant in our credit facilities, which states that we may not permit our leverage ratio to exceed 4.25 to 1.00 at September 30, 2024 (see Section 7.6 Credit facilities).
|
|
Page |
TELUS Corporation – Management’s discussion and analysis – 2024 Q3
Liquidity and capital resource measures
| As at, or for the 12-month periods ended, September 30 | 2024 | 2023 | Change | |||||||||
| Components of debt and coverage ratios ($ millions) | ||||||||||||
| Long-term debt | 28,000 | 27,833 | 167 | |||||||||
| Net debt1 | 28,109 | 26,719 | 1,390 | |||||||||
| Net income | 928 | 822 | 106 | |||||||||
| EBITDA – excluding restructuring and other costs1 | 7,340 | 6,995 | 345 | |||||||||
| Financing costs | 1,533 | 1,317 | 216 | |||||||||
| Net interest cost1 | 1,370 | 1,218 | 152 | |||||||||
| Debt ratios | ||||||||||||
| Fixed-rate debt as a proportion of total indebtedness (excluding lease liabilities and other long-term debt) (%) | 89 | 85 | 4 | pts. | ||||||||
| Average term to maturity of long-term debt (excluding commercial paper, TELUS bank credit facilities, the revolving components of the TELUS International (Cda) Inc. credit facility, lease liabilities and other long-term debt) (years) | 10.6 | 11.5 | (0.9 | ) | ||||||||
| Weighted average interest rate on long-term debt (excluding commercial paper, TELUS bank credit facilities, the revolving components of the TELUS International (Cda) Inc. credit facility, lease liabilities and other long-term debt) (%) | 4.40 | 4.33 | 0.07 | pts. | ||||||||
| Net debt to EBITDA – excluding restructuring and other costs1 (times) | 3.83 | 3.82 | 0.01 | |||||||||
| Coverage ratios1 (times) | ||||||||||||
| Earnings coverage | 1.9 | 1.9 | — | |||||||||
| EBITDA – excluding restructuring and other costs interest coverage | 5.4 | 5.7 | (0.3 | ) | ||||||||
| Other measures1 (%) | ||||||||||||
| Determined using most comparable IFRS-IASB measures | ||||||||||||
| Ratio of Common Share dividends declared to cash provided by operating activities – less capital expenditures | 92 | 151 | (59 | ) pts. | ||||||||
| Determined using management measures | ||||||||||||
| Common Share dividend payout ratio – net of dividend reinvestment plan effects | 77 | 88 | (11 | ) pts. | ||||||||
| 1 | See Section 11.1 Non-GAAP and other specified financial measures. |
Earnings coverage ratio for the 12-month period ended September 30, 2024 was 1.9 times, unchanged from 1.9 times one year earlier. An increase in income before borrowing costs and income taxes raised the ratio by 0.3, while an increase in borrowing costs lowered the ratio by 0.3. Restructuring and other costs lowered the ratio by 0.3.
EBITDA – excluding restructuring and other costs interest coverage ratio for the 12-month period ended September 30, 2024 was 5.4 times, down from 5.7 times one year earlier. Growth in EBITDA – excluding restructuring and other costs increased the ratio by 0.3 and an increase in net interest costs of $152 million decreased the ratio by 0.6.
Common Share dividend payout ratios: Actual Common Share dividend payout decisions will continue to be subject to our Board’s assessment of our financial position and outlook, as well as our long-term Common Share dividend payout objective range of 60 to 75% of prospective free cash flow. So as to be consistent with the way we manage our business, our Common Share dividend payout ratio is presented as a historical measure calculated as the sum of the dividends declared in the most recent four quarters for Common Shares, as recorded in the financial statements, net of dividend reinvestment plan effects, divided by the sum of the most recent four quarters’ free cash flow amounts for interim reporting periods. For fiscal years, the denominator is annual free cash flow. The historical measure for the 12-month period ended September 30, 2024 is presented for illustrative purposes in evaluating our target guideline. As at September 30, 2024, the ratio was outside of the objective range. We estimate the ratio will be within the objective range on a prospective basis.
7.6 Credit facilities
At September 30, 2024, we had approximately $1.7 billion of liquidity available from the TELUS revolving credit facility and $726 million of liquidity available from the TELUS International (Cda) Inc. credit facility with a syndicate of financial institutions (excluding TELUS Corporation). We are well within our objective of generally maintaining at least $1 billion of available liquidity.
TELUS credit facilities
We have a $2.75 billion (or U.S. dollar equivalent) unsecured revolving credit facility with a syndicate of financial institutions, expiring July 14, 2028. The revolving credit facility is to be used for general corporate purposes, including the backstop of commercial paper, as required.
|
|
Page |
TELUS Corporation – Management’s discussion and analysis – 2024 Q3
As at June 30, 2024, we had repaid an unsecured non-revolving, syndicated $1.1 billion bank credit facility, that was to mature July 9, 2024, which was to be used for general corporate purposes.
TELUS revolving credit facility at September 30, 2024
| ($ millions) | Expiry | Size | Drawn | Outstanding undrawn letters of credit |
Backstop for commercial paper program |
Available liquidity | ||||||||||||
| Revolving credit facility1 | July 14, 2028 | 2,750 | — | — | (1,063 | ) | 1,687 |
| 1 | Canadian dollars or U.S. dollar equivalent. |
Our credit facilities contain customary covenants, including a requirement that we not permit our consolidated leverage ratio to exceed 4.25 to 1.00 and that we not permit our consolidated coverage ratio to be less than 2.00 to 1.00 at the end of any financial quarter. As at September 30, 2024, our consolidated leverage ratio was 3.83 to 1.00 and our consolidated coverage ratio was 5.4 to 1.00. These ratios are expected to remain well within the covenants. There are certain minor differences in the calculation of the leverage ratio and coverage ratio under the revolving credit facility, as compared with the calculation of Net debt to EBITDA – excluding restructuring and other costs and EBITDA – excluding restructuring and other costs interest coverage. Historically, the calculations are substantially similar. The covenants are not impacted by revaluation, if any, of Property, plant and equipment, Intangible assets or Goodwill for accounting purposes. Continued access to our credit facilities is not contingent on maintaining a specific credit rating.
Commercial paper
TELUS Corporation has an unsecured commercial paper program, which is backstopped by our revolving credit facility, enabling us to issue commercial paper up to a maximum aggregate equivalent amount at any one time of $2.0 billion (US$1.5 billion maximum) as at September 30, 2024. Foreign currency forward contracts are used to manage currency risk arising from issuing commercial paper denominated in U.S. dollars. The commercial paper program is to be used for general corporate purposes, including, but not limited to, capital expenditures and investments. Our ability to reasonably access the commercial paper market in the United States is dependent on our credit ratings (see Section 7.8 Credit ratings).
TELUS International (Cda) Inc. credit facility
As at September 30, 2024, TELUS International (Cda) Inc. had a credit facility, secured by its assets, expiring on January 3, 2028, with a syndicate of financial institutions, including TELUS Corporation. The credit facility is comprised of revolving components totalling US$800 million (TELUS Corporation as approximately 7.2% lender) and amortizing term loan components totalling US$1.2 billion (TELUS Corporation as approximately 7.2% lender). The credit facility is non-recourse to TELUS Corporation. The outstanding revolving components and term loan components had a weighted average interest rate of 7.0% as at September 30, 2024.
The term loan components are subject to amortization schedules which require that 5% of the principal advanced be repaid each year of the term of the agreement, with the balance due at maturity.
Other letter of credit facilities
At September 30, 2024, we had $62 million of letters of credit outstanding issued under various uncommitted facilities; such letter of credit facilities are in addition to the ability to provide letters of credit pursuant to our committed revolving bank credit facility. Available liquidity under various uncommitted letters of credit facilities was $123 million at September 30, 2024. Further, we had arranged $338 million of incremental letters of credit to allow us to participate in the Innovation, Science and Economic Development Canada 3800 MHz band spectrum auction that was held in October to November 2023, as discussed further in Note 18(a) of the interim consolidated financial statements. Concurrent with funding the purchase of the spectrum licences, these incremental letters of credit were extinguished.
Other long-term debt
Other liabilities bear interest at 4.4%, are secured by the AWS-4 spectrum licences associated with these other liabilities, and are subject to amortization schedules, so that the principal is repaid over the periods to maturity, the last period ending March 31, 2035.
7.7 Short-term borrowings
On May 22, 2024, we entered into an agreement with an arm’s-length securitization trust associated with a major Schedule I bank under which we are currently able to borrow, up to a maximum of $1.6 billion, secured by $2.0 billion of certain trade receivables and unbilled customer finance receivables; the term of this revolving period securitization agreement ends May 22, 2027, and requires minimum cash advances of $920 million. Funding under the 2024 agreement may be provided in either Canadian dollars or U.S. dollars. Foreign currency forward contracts are used to manage currency risk associated from funding denominated in U.S. dollars.
This new agreement replaced a previous agreement with an arm’s-length securitization trust associated with a major Schedule I Canadian bank, under which we were able to sell an interest in certain trade receivables up to a maximum of $600 million and which was otherwise due to end December 31, 2024. Available liquidity under this new agreement was $679 million as at September 30, 2024. (See Note 22 of the interim consolidated financial statements.)
|
|
Page |
TELUS Corporation – Management’s discussion and analysis – 2024 Q3
7.8 Credit ratings
We continued to have investment-grade ratings in the third quarter of 2024 and as at November 8, 2024. We believe adherence to most of our stated financial policies (see Section 4.3), coupled with our efforts to maintain a constructive relationship with banks, investors and credit rating agencies, continues to provide reasonable access to capital markets.
7.9 Financial instruments, commitments and contingent liabilities
Financial instruments
Our financial instruments, their accounting classification and the nature of certain risks that they may be subject to were described in Section 7.9 in our 2023 annual MD&A.
Liquidity risk
As a component of our capital structure financial policies, discussed in Section 4.3 Liquidity and capital resources, we manage liquidity risk by: maintaining a daily cash pooling process that enables us to manage our available liquidity and our liquidity requirements according to our actual needs; maintaining a short-term borrowing agreement associated with trade receivables and unbilled customer finance receivables; maintaining bilateral bank facilities and syndicated credit facilities; maintaining a supply chain financing program; maintaining a commercial paper program; maintaining in-effect shelf prospectuses; continuously monitoring forecast and actual cash flows; and managing maturity profiles of financial assets and financial liabilities.
As at September 30, 2024, TELUS Corporation could offer an unlimited amount of securities in Canada, and US$3.5 billion of securities in the United States, qualified pursuant to a Canadian shelf prospectus that is in effect until September 2026. TELUS International (Cda) Inc. has a Canadian shelf prospectus that is in effect until June 2026 under which an unlimited amount of debt or equity securities could be offered.
As at September 30, 2024, we had approximately $1.7 billion of liquidity available from the TELUS revolving credit facility and $726 million of liquidity available from the TELUS International (Cda) Inc. credit facility with a syndicate of financial institutions (excluding TELUS Corporation) (see Section 7.6 Credit facilities), as well as $679 million available under our trade receivables and unbilled customer finance receivables securitization program (see Section 7.7 Short-term borrowings). Excluding the TELUS International (Cda) Inc. credit facility and including cash and temporary investments of $814 million, we had available liquidity of approximately $3.2 billion at September 30, 2024 (see Section 11.1 Non-GAAP and other specified financial measures). This aligns with our objective of generally maintaining at least $1 billion of available liquidity. We believe that our investment-grade credit ratings contribute to reasonable access to capital markets.
Commitments and contingent liabilities
Purchase obligations
As at September 30, 2024, our contractual commitments related to the acquisition of Property, plant and equipment were $309 million through to December 31, 2027, as compared to $297 million over a period ending December 31, 2027 reported as at December 31, 2023. The increase was primarily due to increased commitments attributable to real estate development initiatives, partly offset by executing on our planned capital investments.
Claims and lawsuits
A number of claims and lawsuits (including class actions and intellectual property infringement claims) seeking damages and other relief are pending against us and, in some cases, other mobile carriers and telecommunications service providers. As well, we have received notice of, or are aware of, certain possible claims (including intellectual property infringement claims) against us and, in some cases, other mobile carriers and telecommunications service providers.
It is not currently possible for us to predict the outcome of such claims, possible claims and lawsuits due to various factors, including: the preliminary nature of some claims; uncertain damage theories and demands; an incomplete factual record; uncertainty concerning legal theories and procedures and their resolution by the courts, at both the trial and the appeal levels; and the unpredictable nature of opposing parties and their demands.
However, subject to the foregoing limitations, management is of the opinion, based upon legal assessments and information presently available, that it is unlikely that any liability, to the extent not provided for through insurance or otherwise, would have a material effect on our financial position and the results of our operations, including cash flows, with the exception of the items disclosed in Note 29 of the interim consolidated financial statements.
7.10 Outstanding share information
| Outstanding shares (millions) | September 30, 2024 | October 31, 2024 | ||||||
| Common Shares | 1,492 | 1,500 | ||||||
| Common Share options | 2 | 2 | ||||||
| Restricted share units and deferred share units – equity-settled | 13 | 13 | ||||||
|
|
Page |
TELUS Corporation – Management’s discussion and analysis – 2024 Q3
7.11 Transactions between related parties
Transactions with key management personnel
Our key management personnel have authority and responsibility for overseeing, planning, directing and controlling our activities and consist of our Board of Directors and our Executive Team. Total compensation expense for key management personnel was $25 million in the third quarter of 2024 and $58 million in the first nine months of 2024 compared to $18 million and $60 million in the respective periods in 2023. The increase in compensation expense for key management personnel in the third quarter of 2024 was primarily due to greater share-based compensation. See Note 30(a) of the interim consolidated financial statements for additional details.
Transactions with defined benefit pension plans
We provided our defined benefit pension plans with management and administrative services on a cost recovery basis and actuarial services on an arm’s-length basis. Charges for these services were immaterial.
Transactions with real estate joint ventures and associate
During the three-month and nine-month periods ended September 30, 2024, we had transactions with real estate joint ventures, which are related parties, as set out in Note 21 of the interim consolidated financial statements.
During the year ended December 31, 2023, the TELUS Sky® real estate joint venture entered into an agreement to sell the income-producing properties and the related net assets to the venture partners; the two arm’s-length parties will purchase the residential parcel and we will purchase the commercial parcel. Timing for the closing of these sales and purchases is dependent upon timing for the subdivision of the parcels, as well as other customary closing conditions. In addition, for the TELUS Sky real estate joint venture, commitments and contingent liabilities include construction financing ($282 million, with Canadian financial institutions and others as 66-2/3% lenders and TELUS as 33-1/3% lender) under a credit agreement maturing December 2 2024. We have entered into lease agreements with the TELUS Sky real estate joint venture.
| 8. | Accounting matters |
8.1 Critical accounting estimates and judgments
Our significant accounting policies are described in Note 1 of the Consolidated financial statements for the year ended December 31, 2023. The preparation of financial statements in conformity with generally accepted accounting principles (GAAP) requires management to make estimates, assumptions and judgments that affect: the reported amounts of assets and liabilities at the date of the financial statements; the disclosure of contingent assets and liabilities at the date of the financial statements; and the reported amounts and classification of income and expense during the reporting period. Actual results could differ from those estimates. Our critical accounting estimates and significant judgments are generally discussed with the Audit Committee each quarter and are described in Section 8.1 in our 2023 annual MD&A, which is hereby incorporated by reference.
8.2 Accounting policy developments
Our accounting policy developments were discussed in Section 8.2 Accounting policy developments in our 2023 annual MD&A. See Note 2 of the interim consolidated financial statements for additional details.
| 9. | Update to general trends, outlook and assumptions, and regulatory developments and proceedings |
This section contains forward-looking statements, which should be read together with the Caution regarding forward-looking statements at the beginning of this MD&A.
The assumptions for our 2024 outlook, as described in Section 9 in our 2023 annual MD&A, remain the same, except for the following:
| · | Our revised estimates for 2024 economic growth in Canada, B.C., Alberta, Ontario and Quebec are 1.1%, 0.9%, 1.8%, 1.0% and 0.9%, respectively (compared to 0.6%, 0.4%, 1.1%, 0.4% and 0.4%, respectively, as reported in our 2023 annual MD&A). |
| · | Our revised estimates for 2024 annual inflation rates in Canada, B.C., Alberta, Ontario and Quebec are 2.6%, 2.6%, 3.0%, 2.5%, and 2.7%, respectively (compared to 2.5%, 2.4%, 2.4%, 2.4%, and 2.5%, respectively, as reported in our 2023 annual MD&A). |
| · | Our revised estimates for 2024 annual unemployment rates in B.C., Alberta, Ontario and Quebec are 5.7%, 6.8%, 6.9% and 5.4%, respectively (compared to 6.1%, 6.3%, 6.7% and 5.5%, respectively, as reported in our 2023 annual MD&A). |
| · | Our revised estimates for 2024 annual rates of housing starts on an unadjusted basis in Canada, B.C., Alberta, Ontario and Quebec are 248,000 units, 48,000 units, 44,000 units, 81,000 units and 47,000 units, respectively (compared to 234,000 units, 42,000 units, 36,000 units, 79,000 units and 46,000 units, respectively, as reported in our 2023 annual MD&A). |
The extent to which these economic estimates affect us and the timing of their impact will depend upon the actual experience of specific sectors of the Canadian economy.
| · | The Effects of contract asset, acquisition and fulfilment and TELUS Easy Payment device financing assumption has been revised to a net cash outflow of approximately $100 million to $200 million from a net cash outflow of approximately $150 million to $250 million. |
|
|
Page |
TELUS Corporation – Management’s discussion and analysis – 2024 Q3
| · | Our restructuring and other costs assumption has been revised to approximately $450 million from approximately $300 million. This was largely driven by new cost efficiency programs implemented to drive EBITDA expansion, margin accretion and accelerated cash flow growth. Approximately $200 million of cash restructuring and other disbursements from our 2023 efficiency program flowed into our 2024 free cash flow guidance, and we expect total cash restructure and other disbursements of approximately $500 million in 2024 from approximately $400 million. |
| · | Our income taxes computed at an applicable statutory rate assumption has been revised downward to 24.0 to 24.6% from 24.5 to 25.1%, and our cash income tax payments assumption has been revised downward to a range of approximately $310 million to $390 million from a range of approximately $370 million to $450 million. The decrease in applicable statutory rate assumption is primarily due to lower income earned in jurisdictions with higher statutory income tax rates. The decrease in our cash income tax payments range is due to excess instalment amounts from the prior period applied to the current period. |
| · | While Innovation, Science and Economic Development Canada (ISED) had initially announced its intention to hold its millimetre wave spectrum auction in 2024, it is possible that the auction may be deferred until after 2024. We do not expect to be materially impacted should the timing of the auction be after 2024. |
| · | We anticipate a 2024 Canadian dollar to U.S. dollar average exchange rate of C$1.35: US$1.00, compared to our original assumption of C$1.32: US$1.00. |
9.1 Communications industry regulatory developments and proceedings
Our telecommunications, broadcasting and radiocommunication services are regulated under federal laws by various authorities, including the Canadian Radio-television and Telecommunications Commission (CRTC), ISED, Canadian Heritage and the Competition Bureau.
The operations of our health business are also subject to various federal and provincial health laws and regulations, as well as policies, guidelines and directives issued by regulatory and administrative bodies. See Section 10.3 Regulatory matters in our 2023 annual MD&A.
The following is a summary of certain significant communications industry regulatory developments and proceedings that are relevant to our telecommunications and broadcasting business and our industry. This summary is not intended to be a comprehensive legal analysis or description of all of the specific issues described. Although we have indicated those issues for which we do not currently expect the outcome of a development or proceeding to be material for us, there can be no assurance that the expected outcome will occur or that our current assessment of its likely impact on us will be accurate. See Section 10.3 Regulatory matters in our 2023 annual MD&A.
Radiocommunication licences and spectrum-related matters
ISED regulates, among other matters, the allocation and use of radio spectrum in Canada and licenses radio apparatus, frequency bands and/or radio channels within various frequency bands to service providers and private users. The department also establishes the terms and conditions that may attach to such radio authorizations, including restrictions on licence transfers, coverage obligations, research and development obligations, annual reporting, and obligations concerning mandated roaming and antenna site sharing with competitors.
Spectrum transfer moratorium and review of the spectrum transfer framework
On March 31, 2023, the Minister of Innovation, Science and Industry announced a moratorium on high-impact transfers of spectrum licences in commercial mobile bands. “High-impact” transfers are those that would have a significant effect on the ability of telecommunications service providers to offer wireless services in Canada. The Minister also directed ISED to launch a comprehensive review of Canada’s spectrum transfer framework, with the moratorium expiring once a new framework comes into effect. No details were released about when the framework review would take place or when a new framework will be implemented. There is a risk that this moratorium could have a material impact on us depending on how long it remains in place.
Millimetre wave (mmWave) spectrum auction to support 5G
On June 5, 2019, ISED released its Decision on Releasing Millimetre Wave Spectrum to Support 5G, repurposing several tranches of mmWave spectrum for mobile use. On June 6, 2022, ISED issued its Consultation on a Policy and Licensing Framework for Spectrum in the 26, 28 and 38 GHz bands, which is the first step in setting the auction framework rules, including competitive measures for these mmWave bands. There is a risk that the auction rules will favour certain carriers over us and impact our ability to acquire an adequate quantity of mmWave spectrum. ISED has not indicated when the mmWave auction will commence.
Regulatory and federal government reviews
The CRTC and the federal government have initiated public proceedings to review various matters. A number of key proceedings are discussed below.
Review of the wholesale high-speed access service framework
On August 13, 2024, the CRTC issued Telecom Regulatory Policy CRTC 2024-180 (TRP 2024-180), Competition in Canada’s Internet service markets. TRP 2024-180 is the CRTC’s final decision further to its consultation on the wholesale high-speed access framework in Canada, which has been ongoing since March 2023. In the March 2023 consultation document, the CRTC sought comment on a number of issues, including whether wholesale access to fibre-to-the-premises (FTTP) service should be offered on an aggregated basis and whether any further regulation, including retail regulation, is warranted.
|
|
Page |
TELUS Corporation – Management’s discussion and analysis – 2024 Q3
In November 2023, the CRTC issued an interim decision imposing an interim wholesale mandate pending the final disposition of the proceeding. The interim order requires Bell to provide aggregated wholesale FTTP access in its incumbent Ontario and Quebec serving territories and requires us to provide the same service in our incumbent serving territory in Quebec. The CRTC did not make any similar order with respect to our incumbent serving territories in British Columbia or Alberta. Bell sought leave to appeal the interim order to the Federal Court of Appeal and a stay of the interim order pending the disposition of its leave application and appeal. Bell has also brought a petition to Cabinet to rescind the interim order and has sought alternative relief that would apply the decision nationwide and could exclude larger carriers from accessing the mandated service. In February 2024, the Federal Court of Appeal allowed Bell’s application for leave to appeal but dismissed its application for a stay. Bell later discontinued its appeal on August 28, 2024. On November 6, 2024, further to Bell’s petition, Cabinet issued an order directing the CRTC to reconsider within 90 days whether TELUS, Bell, and Rogers should be prohibited from using the interim mandated service in Ontario and Quebec. The order relates only to the interim decision, and does not directly affect the CRTC’s final decision in this matter.
In TRP 2024-180, the CRTC ruled that TELUS, Bell, and SaskTel must provide aggregated wholesale access to their FTTP networks, effective February 13, 2025. The interim order will remain in effect until that date. As a result, all companies, including TELUS, will now be permitted to obtain wholesale FTTP access effective February 13, 2025, with two notable restrictions. First, incumbent telephone and cable companies will not be able to access the wholesale framework within their traditional wireline serving territories, but may access it outside those territories. Second, any new FTTP deployed by TELUS, Bell or SaskTel after August 13, 2024 will not be eligible for wholesale access until August 13, 2029. On October 25, 2024, the CRTC set out interim rates for the wholesale aggregated FTTP service. The rates will remain in effect until the CRTC completes its cost study analysis and publishes final rates, likely at some point in 2025.
On September 12, 2024, SaskTel brought two court challenges to TRP 2024-180: an application for leave to appeal the decision pursuant to the Telecommunications Act, and an application for judicial review pursuant to the Federal Courts Act. As of the date of publication, no party has brought a petition to Cabinet that would affect TRP 2024-180, but parties have until November 12, 2024 to do so.
On October 29, 2024, we filed an application to the CRTC requesting an extension to the implementation of wholesale FTTP access in our B.C. and Alberta ILEC territories until June 13, 2025. We are seeking this four-month extension to ensure that we have sufficient time to complete the system requirements for wholesale FTTP access. Interested parties have until November 28, 2024 to comment on our application, after which time we have 10 days to file our reply comments.
Review of mobile wireless services
On April 15, 2021, the CRTC released its decision in the Wireless Regulatory Framework Review. The CRTC determined that TELUS, Bell, Rogers and SaskTel must provide wholesale mobile virtual network operator (MVNO) access to facilities-based regional wireless providers in areas where those providers hold a mobile wireless spectrum licence. MVNO access is based on commercially-negotiated rates and will be phased out after seven years. TELUS, Bell, Rogers and SaskTel each filed tariffs containing proposed MVNO terms and conditions and the Commission granted final tariff approval in Telecom Order 2023-133. TELUS, Bell, Rogers and SaskTel now have the MVNO service operational and available for use.
We appealed two determinations from the Wireless Regulatory Framework Review decision to the Federal Court of Appeal: (i) the requirement for the national mobile carriers, including us, to offer seamless roaming as an additional condition under which the existing mandated wholesale roaming service must be offered; and (ii) the ruling that sections 43 and 44 of the Telecommunications Act do not provide the CRTC with jurisdiction to adjudicate disputes involving mobile wireless transmission facilities. The appeal was heard in December 2022 and was dismissed on April 13, 2023. In December 2023, the Supreme Court of Canada granted us leave to appeal the issue of CRTC jurisdiction over mobile wireless transmission facilities. The matter was heard on October 16, 2024 and is under reserve.
Amendment of the CRTC MVNO mandate to include additional retail market segments
On October 9, 2024, the CRTC issued Telecom Decision CRTC 2024-238, Facilities-based wholesale mobile virtual network operator (MVNO) access tariffs – Expanding the scope to include enterprise and Internet of Things customers. This decision follows a proceeding held in 2023. In the decision, the CRTC amended existing regulations to allow regional wireless carriers to use wholesale MVNO access to serve enterprise and IoT customers. The decision does not affect existing wholesale MVNO access agreements and final offer arbitration decisions, which will remain in effect. Rather, regional wireless carriers are now permitted to seek to negotiate an amendment to existing agreements or to negotiate separate agreements should they wish to do so. Until and unless we sign any such agreements, it is too early to determine the impact of this decision on us.
Amendments to the Telecommunications Act
In June 2024, Parliament passed Bill C-69, the Budget Implementation Act, 2024, No. 1. The Bill makes a number of amendments to the Telecommunications Act, including requirements for providers to offer a self-service option to modify or cancel plans and to provide certain notices in advance of contract expiry. The Bill also prohibits providers from charging activation fees or certain other fees and requires the CRTC to set out details on how providers should comply with these amendments. While the Bill is now law, these provisions will only come into force at a later date, to be fixed by the Governor in Council. Parliament also passed Bill C-288, a private members bill, which requires Canadian carriers to make certain information available in respect of the fixed broadband services that they offer, and obligates the CRTC to hold a public hearing to determine how carriers should comply with these amendments. Until the CRTC makes the determinations to set out the compliance requirements under these amendments, it is too early to determine their impact on us.
|
|
Page |
TELUS Corporation – Management’s discussion and analysis – 2024 Q3
Review of domestic wholesale roaming rates and rate-setting approach
On May 19, 2022, Bragg Communications Inc., Cogeco Communications Inc., Videotron Ltd., Xplornet Communications Inc. and Xplore Mobile Inc. filed a joint application to the CRTC seeking a review of the tariffed rates currently charged by TELUS, Bell and Rogers for domestic wholesale roaming, claiming that the current rates are no longer just and reasonable. The CRTC rendered its decision on October 7, 2024. In its decision, the CRTC moved away from the existing tariffed domestic roaming rates, and instead mandated parties to set rates using commercial negotiation with final offer arbitration. The CRTC directed carriers to negotiate in good faith and conclude negotiations within 60 days of the submission of a wholesale roaming request by a regional carrier. The CRTC also permitted and encouraged regional carriers to negotiate as a group. The CRTC stated that it will publish certain rate benchmarks on an annual basis, including the weighted average retail revenue per gigabyte of data in Canada. Until we negotiate new agreements with regional carriers, it is too early to determine the impact of this decision on us.
In addition, the CRTC released Telecom Notice of Consultation CRTC 2024-235, where it set out a preliminary view that each of TELUS and Bell should be required to provide roaming access for their full national footprint, areas for regional wireless carriers. This would mean, for example, that TELUS would be required to provide domestic roaming in the geographic areas where Bell is responsible for the radio access network, and vice versa. We filed our intervention in this proceeding on November 6, 2024, setting out why we disagree with the CRTC’s preliminary view. Reply comments are due on November 18, 2024. Until the CRTC makes a determination in this proceeding, it is too early to determine its impact on us.
Review of international roaming options
On October 7, 2024, the CRTC sent a letter to TELUS, Bell and Rogers stating that it had conducted a review of roaming fees that Canadians pay when traveling internationally. The letter states that the CRTC found that Canadians lack choice when traveling internationally and that roaming rates are too high. The CRTC directed TELUS, Bell and Rogers to report back to the CRTC by November 4, 2024 on the steps they are taking to address the CRTC’s concerns. The letter states that if the CRTC finds that sufficient action is not taken, it will launch a formal public proceeding. We intend to respond to the CRTC accordingly by November 4, 2024. Unless and until the CRTC launches and completes a formal public proceeding, it is too early to determine the effect of this decision on us.
New draft cybersecurity legislation
On June 14, 2022, the federal government introduced Bill C-26, An Act respecting cyber security, amending the Telecommunications Act and making consequential amendments to other Acts. The legislation would amend the Telecommunications Act, among other things, to allow the Governor in Council to prohibit telecommunications service providers from using equipment from designated companies in their networks. In practice, this will allow the federal government to ban the use of Huawei and ZTE equipment in our network and impose penalties for non-compliance. The Minister of Innovation, Science and Industry stated that the government intends to use its powers under Bill C-26, if passed, to, among other things, require the removal of existing Huawei and ZTE 5G equipment. The legislation would also create a new statute, the Critical Cyber Systems Protection Act (CCSPA). The CCSPA would require designated federally regulated corporations to maintain cybersecurity plans, impose reporting requirements and impose penalties for non-compliance. Bill C-26 received first reading in the Senate on June 20, 2024. If we are ultimately subject to an order requiring us to remove a significant amount of equipment from our network, the effect could be material.
Government of Canada and CRTC activities to improve Canadian network resiliency
On February 22, 2023, the CRTC issued Call for comments – Development of a regulatory framework to improve network reliability and resiliency – Mandatory notification and reporting about major telecommunications service outages, Telecom Notice of Consultation CRTC 2023-39, in which it sought comments on a notification and reporting regime for major service outages. In addition, the Commission mandated the implementation of an interim notification and reporting regime for major service outages while the consultation is ongoing. We implemented the interim regime on March 8, 2023 and are participating in the consultation. ISED is also conducting further steps via the Canadian Security Telecommunications Advisory Committee (CSTAC) to examine network resiliency. We continue to participate in all follow-up initiatives as required. It is too early to determine if these initiatives will have a material impact until they are concluded.
Nova Scotia 911 legislation
In November 2022, Nova Scotia passed amendments to the Emergency 911 Act and the Emergency Management Act that, among other things, require telecommunications service providers to take certain actions to prevent certain outages, to inform stakeholders, and to refund customers in the case of certain outages. These amendments have received royal assent but have not been proclaimed into force. Most of the obligations of telecommunications service providers are to be set out in regulations, which have yet to be made by the Governor in Council. Until the regulations are made, it is too early to determine the impact of this legislation on us.
CRTC proceeding regarding potential barriers to the deployment of broadband-capable networks in underserved areas in Canada
On December 10, 2019, the CRTC issued Call for comments regarding potential barriers to the deployment of broadband-capable networks in underserved areas in Canada, Telecom Notice of Consultation CRTC 2019-406. In this proceeding, the CRTC sought comment on barriers that service providers and communities face in building new facilities, or interconnecting to or accessing existing facilities, and in extending networks into underserved areas in order to offer universal service objective-level services. The CRTC has specifically identified access to affordable transport services and efficient use of support structures as potential barriers. The record of the proceeding is now closed and we anticipate a decision this year. It is too early to determine the impact of the proceeding on us.
|
|
Page |
TELUS Corporation – Management’s discussion and analysis – 2024 Q3
Implementation of next-generation 9-1-1 service
On June 14, 2021, the CRTC issued Telecom Decision CRTC 2021-199, Establishment of new deadlines for Canada’s transition to next-generation 9-1-1 (NG9-1-1), where the CRTC stipulated revised implementation for NG9-1-1 service in Canada. Consistent with the CRTC’s requirements, we are now transiting live NG9-1-1 traffic over our NG9-1-1 network, but full implementation of NG9-1-1 in our NG9-1-1 territory is contingent on interconnections with 9-1-1 call centres and such implementation is dependent upon local government authorities. On January 9, 2024, the national associations of Chiefs of Police, Fire Chiefs and Paramedic Chiefs filed an application seeking an extension to the NG9-1-1 implementation dates, from March 2025 to March 2026. TELUS and Bell supported the request. The outcome of this process is not expected to have a material impact on us as we continue our work to fully implement NG9-1-1.
On October 4, 2023, a group of public safety answering points (PSAPs), the entities that receive 9-1-1 calls and dispatch emergency services, filed an application to the CRTC asking that NG9-1-1 network providers, including us, make available a NG9-1-1 network testing environment for PSAPs. TELUS, Bell and Rogers opposed this application and are awaiting a Commission decision. The outcome of this application is not expected to be material and will not affect our ability to meet our regulatory mandate to implement NG9-1-1.
Development of a network-level blocking framework to limit botnet traffic
On June 23, 2022, the CRTC released Development of a network-level blocking framework to limit botnet traffic and strengthen Canadians’ online safety, Compliance and Enforcement and Telecom Decision CRTC 2022-170. The technical working group, the CRTC Interconnection Steering Committee, has examined the issue and filed a report about how internet service providers (ISPs) can implement network blocking of malicious botnet traffic. A Commission decision on that report is pending. The outcome is not expected to be material.
Federal private sector privacy bill proposes to repeal and replace the Personal Information Protection and Electronic Documents Act
The Digital Charter Implementation Act, 2022 (C-27) proposes to enact the Consumer Privacy Protection Act (replacing the existing private sector privacy legislation and implementing new consumer privacy rights, enhanced enforcement powers and a private right of action), the Personal Information and Data Protection Tribunal Act (a new adjudicative body to provide independent oversight on enforcement activities by the regulator) and the Artificial Intelligence and Data Act (a new regulatory regime for the use of AI in the private sector, supported by extensive enforcement powers). C-27 is currently before the INDU Committee of the House of Commons. The Minister of Innovation, Science and Industry has proposed extensive amendments to all elements of C-27. The bill proposes significant changes to federal privacy legislation in Canada; however, until the bill is passed in its final form, we are unable to determine the materiality of the proposed changes.
Amendments to Quebec’s public and private sector privacy law
On September 22, 2021, the Quebec National Assembly passed An Act to modernize legislative provisions as regards the protection of personal information, which received assent the same day. Extensive new requirements governing the collection, use and disclosure of the personal information of individuals in Quebec have been phased in over three years, with data portability rights being the last phase, coming into force September 22, 2023. The Act also creates a new enforcement regime with significant criminal fines and administrative monetary penalties for certain infractions and a private right of action with minimum statutory punitive damages. We are continuing to implement compliance for products, services and processes that are within the Act’s jurisdiction, as additional guidance is issued by the Quebec government and the provincial regulator.
Federal and Provincial Privacy regulators investigate OpenAI
On May 25, 2023, the privacy authorities for Canada, British Columbia, Alberta and Quebec announced a joint investigation of OpenAI, the company behind artificial intelligence (AI)-powered chatbot ChatGPT. The wide ranging investigation will examine whether OpenAI obtained valid and meaningful consent for the collection, use and disclosure of the personal information of individuals using ChatGPT; its obligations with respect to openness and transparency; and whether it collected, used and/or disclosed personal information for purposes that a reasonable person would consider appropriate. The findings of this investigation could materially impact our use of AI.
CRTC review of telecommunications services to the Far North
On November 2, 2020, the CRTC initiated the first phase of a review of its regulatory framework for Northwestel Inc. and the state of telecommunications services in Canada’s North in Telecom Notice of Consultation CRTC 2020-367. On January 20, 2021, a number of interveners proposed large subsidy increases to Northwestel and other companies providing service in Canada’s North. On June 8, 2022, the CRTC released Telecom Notice of Consultation CRTC 2022-147, initiating the second phase of this review, leaving open the potential for subsidy increases. A hearing was held in Whitehorse, Yukon, from April 17 to 21, 2023. Since then, the CRTC has issued some requests for information that suggested a subsidy of up to $55 million per year (of which we would pay approximately 25%) be created, and we have transferred incumbency in Atlin, British Columbia to Northwestel (along with associated obligations). The proceeding is now closed and we await the CRTC’s decision.
|
|
Page |
TELUS Corporation – Management’s discussion and analysis – 2024 Q3
Consultation regarding small cell access to wireline support structures
The CRTC has initiated a proceeding, Telecom Notice of Consultation CRTC 2024-25, Call for comments – Attachment of wireless facilities on support structures owned or controlled by incumbent local exchange carriers (ILEC), in order to examine the issues surrounding potential placement of wireless facilities on ILEC-owned or -controlled support structures. The consultation includes a consideration of the technical and operational challenges associated with such attachments, as well as CRTC jurisdiction in this area. Comments were submitted on April 5, 2024 and our reply to interventions received was filed on May 6, 2024. Until the CRTC issues a determination in this proceeding, it is too early to determine its impact on us.
Proceeding regarding support structure relocation compensation
On January 16, 2023, we filed a proposed revision to our support structure tariff that allows support structure licensees to negotiate relocation terms and compensation directly with the party forcing the relocation, pursuant to the CRTC’s direction in Telecom Decision CRTC 2022-311, Rogers Communications Canada Inc. and Shaw Cablesystems G.P. – Application regarding compensation for transmission line relocation in British Columbia. Concurrent with the tariff application proceeding, which included requests for information and replies to interventions, on February 28, 2023, British Columbia’s Ministry of Transportation and Infrastructure (MOTI) filed an application with the CRTC to stay the Commission’s directives in the decision, as well as to review and rescind or vary the decision. We responded on March 30, 2023, asking the Commission to dismiss MOTI’s review and vary application (R&V) and on May 16, 2023, the Commission denied MOTI’s request for a stay of the directives but had yet to conclude on the R&V. On June 5, 2024, the CRTC released Telecom Order 2024-122 directing us to file, within 30 days, a proposal to compensate attaching carriers through our Support Structure Tariff. The CRTC also imposed an interim compensation formula effective June 5, 2024, requiring us to compensate attachers by dividing any compensation that we receive from public authorities by the total number of attachers. On July 5, 2024, as directed by the CRTC, we filed a tariff application proposing a formula to compensate attaching carriers. If approved, it is expected that the impact will be limited in practice as it is only applicable when we receive compensation from a public authority requesting a relocation of TELUS-owned poles. Interventions on our tariff application were received on August 8, 2024 and we submitted reply comments on August 19, 2024. On September 12, 2024, the CRTC issued requests for information (RFI) and we filed responses on September 26, 2024. Parties had until October 3, 2024 to file reply comments to our RFI responses and we are now awaiting a Commission decision on the tariff application. On September 19, 2024, the CRTC also officially closed MOTI’s request to review and vary Telecom Order 2022-311, since it had not heard from MOTI if it wished to have the CRTC still consider its application.
Legislation to ban the use of replacement workers during strikes and lockouts
In November 2023, the federal government introduced Bill C-58, which would establish greater limitations on employers in federally regulated industries from using replacement workers during work stoppages related to collective bargaining. Bill C-58 received royal assent in June 2024 but will not come into force until June 2025, at which point it may affect how we continue to provide our services during strikes or lockouts, subject to the applicability of exceptions and limitations provided in the law.
Broadcasting and content-related issues
Regulatory plan to modernize Canada’s broadcasting system
Parliament amended the Broadcasting Act in April 2023 to include online streaming services, and as a response, the CRTC has begun to update its regulatory framework through a multi-phase consultation process and has issued its first decisions on this matter. In September 2023, the CRTC determined that the large streaming companies, as well as traditional broadcasting undertakings like TELUS, must register their online services with the CRTC. In March 2024, the CRTC issued a decision requiring online streaming services to pay a portion of the broadcasting fees collected from the industry to cover the CRTC’s operational expenditures. Because the regulations expand the pool of payors, we can expect our share of overall contributions to decrease. Most recently, on June 4, 2024, the CRTC determined that online undertakings that are not affiliated with traditional Canadian broadcasting undertakings (generally the large streaming companies) will be required to contribute 5% of their Canadian revenues to support the domestic broadcasting system. Online streaming services operated by TELUS and other traditional Canadian services are not subject to this requirement.
The schedule for the remainder of the framework review contemplates a consultation and hearing on structural relationships (including in respect of online streaming) set to launch in the winter of 2024/2025. The CRTC also expects to launch consultations on the definition of Canadian content, and to examine support for news programming in the spring of 2025, while it intends to finalize the contributions that online streaming services and traditional broadcasters will have to make to support Canadian and Indigenous content by late 2025.
Review of the Copyright Act and consultations on copyright reform to address specific issues
The Copyright Act’s last statutorily mandated review was launched in 2017 and resulted in reports from the Standing Committee on Industry, Science and Technology and the Standing Committee on Canadian Heritage being presented to the House of Commons in the summer of 2019. The parliamentary review led to further government consultations launched in 2021 and 2023 to explore specific issues raised during the review, such as how to modernize the copyright framework for online intermediary liability, AI and IoT. The timeline for potential changes to the Copyright Act is uncertain, although the next statutorily mandated review was supposed to be launched in 2022. It is unclear whether and how this might impact the timeline for comprehensive copyright reform legislation or whether such a copyright reform legislation will have a material impact on us. In the meantime, the federal government has made smaller changes to the Copyright Act, such as the inclusion in the 2022 budget of proposed amendments to extend the term of copyright by 20 years, which was required to satisfy Canada’s obligations under the Canada-United States-Mexico Agreement.
|
|
Page |
TELUS Corporation – Management’s discussion and analysis – 2024 Q3
Consultation on the government’s proposed approach to address harmful content online
On July 29, 2021, the government launched a consultation on its proposed approach to address harmful content online. The government’s proposals largely target social media and content platforms, but a few proposals would also have impacted ISPs. Accordingly, we participated in this consultation and filed joint comments with other ISPs on September 25, 2021. Among other things, the joint comments advocated that the legal framework for addressing harmful online content should not create undue obligations or liability for telecommunications carriers, and that requirements to block access to content online or to provide subscriber information should continue to require judicial orders. In March 2022, the government established an expert advisory group on online safety, with a mandate to provide the Minister of Canadian Heritage with advice on how to design the legislative and regulatory framework to address harmful content online and how to best incorporate the feedback received during the national consultation held from July to September 2021. Following the publication of the group’s report, the government conducted further consultations with stakeholder groups regarding the advice it received from the expert advisory group. On February 26, 2024, the government introduced a bill in Parliament, which, if passed, will create a new Online Harms Act, and amend the Criminal Code, the Human Rights Act and existing child pornography reporting legislation. Among other things, the legislation would require large social media providers to integrate safer design features and remove offending content, and would establish a new regulator to administer the legislation and an ombudsperson to address public concerns. The legislation would not hold ISPs liable for merely providing the service used to access the content in question. Until the bill is passed in its final form, it is too early to assess its impact upon us.
| 10. | Risks and risk management |
The principal risks and uncertainties that could affect our future business results and associated risk mitigation activities were described in our 2023 annual MD&A and have not materially changed since December 31, 2023. Reference is made as well to the summary of risks and uncertainties in the Caution regarding forward-looking statements at the beginning of this MD&A.
| 11. | Definitions and reconciliations |
11.1 Non-GAAP and other specified financial measures
We have issued guidance on and report certain non-GAAP measures that are used to evaluate the performance of TELUS, as well as to determine compliance with debt covenants and to manage our capital structure. As non-GAAP measures generally do not have a standardized meaning, they may not be comparable to similar measures presented by other issuers. For certain financial metrics, there are definitional differences between TELUS and TELUS Digital reporting. These differences largely arise from TELUS Digital adopting definitions consistent with practice in its industry. Securities regulations require such measures to be clearly defined, qualified and reconciled with their nearest GAAP measure. Certain of the metrics do not have generally accepted industry definitions.
Adjusted Net income and adjusted basic earnings per share (EPS): These are non-GAAP measures that do not have any standardized meaning prescribed by IFRS-IASB and are therefore unlikely to be comparable to similar measures presented by other issuers. Adjusted Net income excludes the effects of restructuring and other costs, income tax-related adjustments, other equity (income) losses related to real estate joint ventures, long-term debt prepayment premium, unrealized changes in virtual power purchase agreements forward element, and other adjustments (identified in the following tables). Adjusted basic EPS is calculated as adjusted Net income divided by the basic weighted-average number of Common Shares outstanding. These measures are used to evaluate performance at a consolidated level and exclude items that, in management’s view, may obscure underlying trends in business performance or items of an unusual nature that do not reflect our ongoing operations. They should not be considered alternatives to Net income and basic EPS in measuring TELUS’ performance.
|
|
Page |
TELUS Corporation – Management’s discussion and analysis – 2024 Q3
Reconciliation of adjusted Net income
| Three-month
periods ended September 30 |
Nine-month periods
ended September 30 |
|||||||||||||||
| ($ millions) | 2024 | 2023 | 2024 | 2023 | ||||||||||||
| Net income attributable to Common Shares | 280 | 136 | 635 | 553 | ||||||||||||
| Add (deduct) amounts net of amount attributable to non-controlling interests: | ||||||||||||||||
| Restructuring and other costs | 79 | 297 | 409 | 553 | ||||||||||||
| Tax effect of restructuring and other costs | (22 | ) | (71 | ) | (98 | ) | (129 | ) | ||||||||
| Real estate rationalization-related restructuring impairments | 3 | 13 | 102 | 65 | ||||||||||||
| Tax effect of real estate rationalization-related restructuring impairments | (1 | ) | (3 | ) | (27 | ) | (17 | ) | ||||||||
| Income tax-related adjustments | (20 | ) | (23 | ) | (22 | ) | (35 | ) | ||||||||
| Other equity income related to real estate joint ventures | — | — | — | (1 | ) | |||||||||||
| Unrealized changes in virtual power purchase agreements forward element | 125 | 33 | 228 | 59 | ||||||||||||
| Tax effect of unrealized changes in virtual power purchase agreements forward element | (31 | ) | (9 | ) | (58 | ) | (16 | ) | ||||||||
| Adjusted Net income | 413 | 373 | 1,169 | 1,032 | ||||||||||||
Reconciliation of adjusted basic EPS
| Three-month
periods ended September 30 |
Nine-month periods
ended September 30 |
|||||||||||||||
| ($) | 2024 | 2023 | 2024 | 2023 | ||||||||||||
| Basic EPS | 0.19 | 0.09 | 0.43 | 0.38 | ||||||||||||
| Add (deduct) amounts net of amount attributable to non-controlling interests: | ||||||||||||||||
| Restructuring and other costs, per share | 0.05 | 0.20 | 0.27 | 0.38 | ||||||||||||
| Tax effect of restructuring and other costs, per share | (0.01 | ) | (0.05 | ) | (0.06 | ) | (0.09 | ) | ||||||||
| Real estate rationalization-related restructuring impairments, per share | — | — | 0.07 | 0.04 | ||||||||||||
| Tax effect of real estate rationalization-related restructuring impairments, per share | — | — | (0.02 | ) | (0.01 | ) | ||||||||||
| Income tax-related adjustments, per share | (0.01 | ) | (0.01 | ) | (0.01 | ) | (0.02 | ) | ||||||||
| Unrealized changes in virtual power purchase agreements forward element, per share | 0.08 | 0.03 | 0.15 | 0.04 | ||||||||||||
| Tax effect of unrealized changes in virtual power purchase agreements forward element, per share | (0.02 | ) | (0.01 | ) | (0.04 | ) | (0.01 | ) | ||||||||
| Adjusted basic EPS | 0.28 | 0.25 | 0.79 | 0.71 | ||||||||||||
Available liquidity: This is a non-GAAP measure that does not have any standardized meaning prescribed by IFRS-IASB and is therefore unlikely to be comparable to similar measures presented by other issuers. Available liquidity is calculated as the sum of Cash and temporary investments, net, amounts available from the revolving credit facility and amounts available under our trade receivables and unbilled customer finance receivables securitization program measured at the end of the period. We believe this to be a useful measure because it allows us to monitor compliance with our financial objectives. It should not be considered as an alternative to Cash and temporary investments, net in measuring TELUS’ performance.
|
|
Page |
TELUS Corporation – Management’s discussion and analysis – 2024 Q3
Available liquidity reconciliation
| As at September 30 ($ millions) | 2024 | 2023 | ||||||
| Cash and temporary investments, net | 814 | 1,204 | ||||||
| Net amounts available from the TELUS Corporation revolving credit facility | 1,687 | 1,333 | ||||||
| Amounts available under trade receivables and unbilled customer finance receivables securitization program | 679 | — | ||||||
| Amounts available under previous securitization program | — | 500 | ||||||
| Available liquidity | 3,180 | 3,037 | ||||||
Capital expenditure intensity: This measure is calculated as capital expenditures excluding real estate development divided by Operating revenues and other income. It provides a basis for comparing the level of capital expenditures to those of other companies of varying size within the same industry.
Calculation of Capital expenditure intensity
| TTech | TELUS Digital | Eliminations | Total | |||||||||||||||||||||||||||||
| Three-month periods ended September 30 ($ millions, except ratio) | 2024 | 2023 | 2024 | 2023 | 2024 | 2023 | 2024 | 2023 | ||||||||||||||||||||||||
| Numerator – Capital expenditures excluding real estate development | 622 | 712 | 30 | 35 | (12 | ) | — | 640 | 747 | |||||||||||||||||||||||
| Denominator – Operating revenues and other income | 4,424 | 4,306 | 897 | 889 | (222 | ) | (187 | ) | 5,099 | 5,008 | ||||||||||||||||||||||
| Capital expenditure intensity (%) | 14 | 17 | 3 | 4 | n/m | n/m | 13 | 15 | ||||||||||||||||||||||||
Calculation of Capital expenditure intensity
| TTech | TELUS Digital | Eliminations | Total | |||||||||||||||||||||||||||||
| Nine-month periods ended September 30 ($ millions, except ratio) | 2024 | 2023 | 2024 | 2023 | 2024 | 2023 | 2024 | 2023 | ||||||||||||||||||||||||
| Numerator – Capital expenditures excluding real estate development | 1,955 | 2,161 | 96 | 89 | (32 | ) | — | 2,019 | 2,250 | |||||||||||||||||||||||
| Denominator – Operating revenues and other income | 12,906 | 12,745 | 2,757 | 2,713 | (658 | ) | (540 | ) | 15,005 | 14,918 | ||||||||||||||||||||||
| Capital expenditure intensity (%) | 15 | 17 | 3 | 3 | n/m | n/m | 13 | 15 | ||||||||||||||||||||||||
TELUS Corporation Common Share (Common Share) dividend payout ratio: This is a historical measure calculated as the sum of the most recent four quarterly dividends declared, as recorded in the financial statements, net of dividend reinvestment plan effects, divided by the sum of free cash flow amounts for the most recent four quarters for interim reporting periods. For fiscal years, the denominator is annual free cash flow. Our objective range for the annual TELUS Corporation Common Share dividend payout ratio is on a prospective basis, rather than on a trailing basis. (See Section 4.3 Liquidity and capital resources and Section 7.5 Liquidity and capital resource measures.)
Calculation of ratio of Common Share dividends declared to cash provided by operating activities less capital expenditures
Determined using most comparable IFRS-IASB measures
| For the 12-month periods ended September 30 ($ millions, except ratio) | 2024 | 2023 | ||||||
| Numerator – Sum of the last four quarterly dividends declared | 2,259 | 2,063 | ||||||
| Cash provided by operating activities | 5,084 | 4,311 | ||||||
| Less: | ||||||||
| Capital expenditures | (2,617 | ) | (2,949 | ) | ||||
| Denominator – Cash provided by operating activities less capital expenditures | 2,467 | 1,362 | ||||||
| Ratio (%) | 92 | 151 | ||||||
|
|
Page |
TELUS Corporation – Management’s discussion and analysis – 2024 Q3
Calculation of Common Share dividend payout ratio, net of dividend reinvestment plan effects
Determined using management measures
| For the 12-month periods ended September 30 ($ millions, except ratio) | 2024 | 2023 | ||||||
| Sum of the last four quarterly dividends declared | 2,259 | 2,063 | ||||||
| Sum of the amounts of the last four quarterly dividends declared reinvested in Common Shares | (697 | ) | (748 | ) | ||||
| Numerator – Sum of the last four quarterly dividends declared, net of dividend reinvestment plan effects | 1,562 | 1,315 | ||||||
| Denominator – Free cash flow | 2,025 | 1,492 | ||||||
| Ratio (%) | 77 | 88 | ||||||
Earnings coverage: This measure is defined in the Canadian Securities Administrators’ National Instrument 41-101 and related instruments, and is calculated as follows:
Calculation of Earnings coverage
| For the 12-month periods ended September 30 ($ millions, except ratio) | 2024 | 2023 | ||||||
| Net income attributable to Common Shares | 923 | 801 | ||||||
| Income taxes (attributable to Common Shares) | 236 | 235 | ||||||
| Borrowing costs (attributable to Common Shares)1 | 1,289 | 1,125 | ||||||
| Numerator | 2,448 | 2,161 | ||||||
| Denominator – Borrowing costs | 1,289 | 1,125 | ||||||
| Ratio (times) | 1.9 | 1.9 | ||||||
| 1 | Interest on Long-term debt plus Interest on short-term borrowings and other plus long-term debt prepayment premium, adding capitalized interest and deducting borrowing costs attributable to non-controlling interests. |
EBITDA (earnings before interest, income taxes, depreciation and amortization): We have issued guidance on and report EBITDA because it is a key measure used to evaluate performance at a consolidated level. EBITDA is commonly reported and widely used by investors and lending institutions as an indicator of a company’s operating performance and ability to incur and service debt, and as a valuation metric. EBITDA should not be considered as an alternative to Net income in measuring TELUS’ performance, nor should it be used as a measure of cash flow. EBITDA as calculated by TELUS is equivalent to Operating revenues and other income less the total of Goods and services purchased expense and Employee benefits expense.
We calculate EBITDA – excluding restructuring and other costs, as it is a component of the EBITDA – excluding restructuring and other costs interest coverage ratio and the Net debt to EBITDA – excluding restructuring and other costs ratio.
We also calculate Adjusted EBITDA to exclude items of an unusual nature that do not reflect our ongoing operations and should not, in our opinion, be considered in a long-term valuation metric or should not be included in an assessment of our ability to service or incur debt.
EBIT (earnings before interest and income taxes) is calculated for our reportable segments because we believe it is a meaningful indicator of our operating performance, as it represents our earnings from operations before costs of capital structure and income taxes.
EBITDA and Adjusted EBITDA reconciliations
| TTech | TELUS Digital | Eliminations | Total | |||||||||||||||||||||||||||||
| Three-month periods ended September 30 ($ millions) | 2024 | 2023 | 2024 | 2023 | 2024 | 2023 | 2024 | 2023 | ||||||||||||||||||||||||
| Net income | 257 | 137 | ||||||||||||||||||||||||||||||
| Financing costs | 479 | 352 | ||||||||||||||||||||||||||||||
| Income taxes | 52 | 28 | ||||||||||||||||||||||||||||||
| EBIT | 800 | 454 | — | 63 | (12 | ) | — | 788 | 517 | |||||||||||||||||||||||
| Depreciation | 551 | 563 | 46 | 48 | — | — | 597 | 611 | ||||||||||||||||||||||||
| Amortization of intangible assets | 308 | 329 | 63 | 60 | — | — | 371 | 389 | ||||||||||||||||||||||||
| EBITDA | 1,659 | 1,346 | 109 | 171 | (12 | ) | — | 1,756 | 1,517 | |||||||||||||||||||||||
| Add restructuring and other costs included in EBITDA | 64 | 287 | 22 | 16 | — | — | 86 | 303 | ||||||||||||||||||||||||
| EBITDA – excluding restructuring and other costs and Adjusted EBITDA | 1,723 | 1,633 | 131 | 187 | (12 | ) | — | 1,842 | 1,820 | |||||||||||||||||||||||
|
|
Page |
TELUS Corporation – Management’s discussion and analysis – 2024 Q3
EBITDA and Adjusted EBITDA reconciliations
| TTech | TELUS Digital | Eliminations | Total | |||||||||||||||||||||||||||||
| Nine-month periods ended September 30 ($ millions) | 2024 | 2023 | 2024 | 2023 | 2024 | 2023 | 2024 | 2023 | ||||||||||||||||||||||||
| Net income | 618 | 557 | ||||||||||||||||||||||||||||||
| Financing costs | 1,255 | 995 | ||||||||||||||||||||||||||||||
| Income taxes | 172 | 146 | ||||||||||||||||||||||||||||||
| EBIT | 1,932 | 1,550 | 147 | 148 | (34 | ) | — | 2,045 | 1,698 | |||||||||||||||||||||||
| Depreciation | 1,754 | 1,713 | 141 | 136 | — | — | 1,895 | 1,849 | ||||||||||||||||||||||||
| Amortization of intangible assets | 946 | 993 | 184 | 186 | — | — | 1,130 | 1,179 | ||||||||||||||||||||||||
| EBITDA | 4,632 | 4,256 | 472 | 470 | (34 | ) | — | 5,070 | 4,726 | |||||||||||||||||||||||
| Add restructuring and other costs included in EBITDA | 381 | 522 | 44 | 55 | — | — | 425 | 577 | ||||||||||||||||||||||||
| EBITDA – excluding restructuring and other costs | 5,013 | 4,778 | 516 | 525 | (34 | ) | — | 5,495 | 5,303 | |||||||||||||||||||||||
| Other equity income related to real estate joint ventures | — | (1 | ) | — | — | — | — | — | (1 | ) | ||||||||||||||||||||||
| Adjusted EBITDA | 5,013 | 4,777 | 516 | 525 | (34 | ) | — | 5,495 | 5,302 | |||||||||||||||||||||||
Adjusted EBITDA less capital expenditures is calculated for our reportable segments, as it represents a performance measure that may be more comparable to other issuers.
Adjusted EBITDA less capital expenditures reconciliation
| TTech | TELUS Digital | Eliminations | Total | |||||||||||||||||||||||||||||
| Three-month periods ended September 30 ($ millions) | 2024 | 2023 | 2024 | 2023 | 2024 | 2023 | 2024 | 2023 | ||||||||||||||||||||||||
| Adjusted EBITDA | 1,723 | 1,633 | 131 | 187 | (12 | ) | — | 1,842 | 1,820 | |||||||||||||||||||||||
| Capital expenditures | (650 | ) | (734 | ) | (30 | ) | (35 | ) | 12 | — | (668 | ) | (769 | ) | ||||||||||||||||||
| Adjusted EBITDA less capital expenditures | 1,073 | 899 | 101 | 152 | — | — | 1,174 | 1,051 | ||||||||||||||||||||||||
Adjusted EBITDA less capital expenditures reconciliation
| TTech | TELUS Digital | Eliminations | Total | |||||||||||||||||||||||||||||
| Nine-month periods ended September 30 ($ millions) | 2024 | 2023 | 2024 | 2023 | 2024 | 2023 | 2024 | 2023 | ||||||||||||||||||||||||
| Adjusted EBITDA | 5,013 | 4,777 | 516 | 525 | (34 | ) | — | 5,495 | 5,302 | |||||||||||||||||||||||
| Capital expenditures | (2,020 | ) | (2,200 | ) | (96 | ) | (89 | ) | 32 | — | (2,084 | ) | (2,289 | ) | ||||||||||||||||||
| Adjusted EBITDA less capital expenditures | 2,993 | 2,577 | 420 | 436 | (2 | ) | — | 3,411 | 3,013 | |||||||||||||||||||||||
We calculate EBITDA margin and Adjusted EBITDA margin to evaluate the performance of our operating segments and we believe these measures are also used by investors as indicators of a company’s operating performance. We calculate EBITDA margin as EBITDA divided by Operating revenues and other income. Adjusted EBITDA margin is a non-GAAP ratio that does not have any standardized meaning prescribed by IFRS-IASB and is therefore unlikely to be comparable to similar measures presented by other issuers. We calculate Adjusted EBITDA margin as Adjusted EBITDA divided by adjusted Operating revenues and other income.
Calculation of EBITDA margin
| TTech | TELUS Digital | Eliminations | Total | |||||||||||||||||||||||||||||
| Three-month periods ended September 30 ($ millions, except margin) | 2024 | 2023 | 2024 | 2023 | 2024 | 2023 | 2024 | 2023 | ||||||||||||||||||||||||
| Numerator – EBITDA | 1,659 | 1,346 | 109 | 171 | (12 | ) | — | 1,756 | 1,517 | |||||||||||||||||||||||
| Denominator – Operating revenues and other income | 4,424 | 4,306 | 897 | 889 | (222 | ) | (187 | ) | 5,099 | 5,008 | ||||||||||||||||||||||
| EBITDA margin (%) | 37.5 | 31.3 | 12.1 | 19.2 | n/m | n/m | 34.4 | 30.3 | ||||||||||||||||||||||||
|
|
Page |
TELUS Corporation – Management’s discussion and analysis – 2024 Q3
Calculation of EBITDA margin
| TTech | TELUS Digital | Eliminations | Total | |||||||||||||||||||||||||||||
| Nine-month periods ended September 30 ($ millions, except margin) | 2024 | 2023 | 2024 | 2023 | 2024 | 2023 | 2024 | 2023 | ||||||||||||||||||||||||
| Numerator – EBITDA | 4,632 | 4,256 | 472 | 470 | (34 | ) | — | 5,070 | 4,726 | |||||||||||||||||||||||
| Denominator – Operating revenues and other income | 12,906 | 12,745 | 2,757 | 2,713 | (658 | ) | (540 | ) | 15,005 | 14,918 | ||||||||||||||||||||||
| EBITDA margin (%) | 35.9 | 33.4 | 17.1 | 17.3 | n/m | n/m | 33.8 | 31.7 | ||||||||||||||||||||||||
Calculation of Adjusted EBITDA margin
| TTech | TELUS Digital | Eliminations | Total | |||||||||||||||||||||||||||||
| Three-month periods ended September 30 ($ millions, except margin) | 2024 | 2023 | 2024 | 2023 | 2024 | 2023 | 2024 | 2023 | ||||||||||||||||||||||||
| Numerator – Adjusted EBITDA | 1,723 | 1,633 | 131 | 187 | (12 | ) | — | 1,842 | 1,820 | |||||||||||||||||||||||
| Adjusted Operating revenues and other income: | ||||||||||||||||||||||||||||||||
| Denominator – Operating revenues and other income | 4,424 | 4,306 | 897 | 889 | (222 | ) | (187 | ) | 5,099 | 5,008 | ||||||||||||||||||||||
| Adjusted EBITDA margin (%) | 39.0 | 37.9 | 14.5 | 21.0 | n/m | n/m | 36.1 | 36.3 | ||||||||||||||||||||||||
Calculation of Adjusted EBITDA margin
| TTech | TELUS Digital | Eliminations | Total | |||||||||||||||||||||||||||||
| Nine-month periods ended September 30 ($ millions, except margin) | 2024 | 2023 | 2024 | 2023 | 2024 | 2023 | 2024 | 2023 | ||||||||||||||||||||||||
| Numerator – Adjusted EBITDA | 5,013 | 4,777 | 516 | 525 | (34 | ) | — | 5,495 | 5,302 | |||||||||||||||||||||||
| Adjusted Operating revenues and other income: | ||||||||||||||||||||||||||||||||
| Operating revenues and other income | 12,906 | 12,745 | 2,757 | 2,713 | (658 | ) | (540 | ) | 15,005 | 14,918 | ||||||||||||||||||||||
| Other equity income related to real estate joint ventures | — | (1 | ) | — | — | — | — | — | (1 | ) | ||||||||||||||||||||||
| Denominator – Adjusted Operating revenues and other income | 12,906 | 12,744 | 2,757 | 2,713 | (658 | ) | (540 | ) | 15,005 | 14,917 | ||||||||||||||||||||||
| Adjusted EBITDA margin (%) | 38.9 | 37.5 | 18.7 | 19.3 | n/m | n/m | 36.6 | 35.5 | ||||||||||||||||||||||||
EBITDA – excluding restructuring and other costs interest coverage: This measure is defined as EBITDA – excluding restructuring and other costs, divided by Net interest cost, calculated on a 12-month trailing basis. It is similar to the coverage ratio covenant in our credit facilities, as described in Section 7.6 Credit facilities.
Calculation of EBITDA – excluding restructuring and other costs interest coverage
| For the 12-month periods ended September 30 ($ millions, except ratio) | 2024 | 2023 | ||||||
| Numerator – EBITDA – excluding restructuring and other costs | 7,340 | 6,995 | ||||||
| Denominator – Net interest cost | 1,370 | 1,218 | ||||||
| Ratio (times) | 5.4 | 5.7 | ||||||
Free cash flow: We report this measure as a supplementary indicator of our operating performance, and there is no generally accepted industry definition of free cash flow. It should not be considered as an alternative to the measures in the condensed interim consolidated statements of cash flows. Free cash flow excludes certain working capital changes (such as trade receivables and trade payables), proceeds from divested assets and other sources and uses of cash, as found in the condensed interim consolidated statements of cash flows. It provides an indication of how much cash generated by operations is available after capital expenditures that may be used to, among other things, pay dividends, repay debt, purchase shares or make other investments. We exclude impacts of accounting standards that do not impact cash, such as IFRS 15 and IFRS 16. Free cash flow may be supplemented from time to time by proceeds from divested assets or financing activities.
|
|
Page |
TELUS Corporation – Management’s discussion and analysis – 2024 Q3
Free cash flow calculation
| Three-month
periods ended September 30 |
Nine-month periods
ended September 30 |
|||||||||||||||
| ($ millions) | 2024 | 2023 | 2024 | 2023 | ||||||||||||
| EBITDA | 1,756 | 1,517 | 5,070 | 4,726 | ||||||||||||
| Restructuring and other costs, net of disbursements | 21 | 90 | 5 | 190 | ||||||||||||
| Effects of contract asset, acquisition and fulfilment (IFRS 15 impact) and TELUS Easy Payment mobile device financing | (22 | ) | (17 | ) | 29 | 32 | ||||||||||
| Effects of lease principal (IFRS 16 impact) | (171 | ) | (135 | ) | (503 | ) | (394 | ) | ||||||||
| Items from the condensed interim consolidated statements of cash flows: | ||||||||||||||||
| Share-based compensation, net | 44 | 27 | 110 | 100 | ||||||||||||
| Net employee defined benefit plans expense | 16 | 15 | 50 | 46 | ||||||||||||
| Employer contributions to employee defined benefit plans | (2 | ) | (7 | ) | (16 | ) | (23 | ) | ||||||||
| Loss from equity accounted investments and other | 3 | — | 13 | — | ||||||||||||
| Interest paid | (362 | ) | (307 | ) | (1,011 | ) | (888 | ) | ||||||||
| Interest received | 9 | 4 | 30 | 11 | ||||||||||||
| Capital expenditures1 | (668 | ) | (769 | ) | (2,084 | ) | (2,289 | ) | ||||||||
| Free cash flow before income taxes | 624 | 418 | 1,693 | 1,511 | ||||||||||||
| Income taxes paid, net of refunds | (63 | ) | (63 | ) | (258 | ) | (342 | ) | ||||||||
| Free cash flow | 561 | 355 | 1,435 | 1,169 | ||||||||||||
| 1 | Refer to Note 31 of the interim consolidated financial statements for further information. |
The following reconciles our definition of free cash flow with Cash provided by operating activities.
Free cash flow reconciliation with Cash provided by operating activities
| Three-month
periods ended September 30 |
Nine-month periods
ended September 30 |
|||||||||||||||
| ($ millions) | 2024 | 2023 | 2024 | 2023 | ||||||||||||
| Free cash flow | 561 | 355 | 1,435 | 1,169 | ||||||||||||
| Add (deduct): | ||||||||||||||||
| Capital expenditures1 | 668 | 769 | 2,084 | 2,289 | ||||||||||||
| Effect of lease principal | 171 | 135 | 503 | 394 | ||||||||||||
| Net change in non-cash operating working capital not included in preceding line items and other individually immaterial items included in Net income neither providing nor using cash | 32 | 48 | (252 | ) | (667 | ) | ||||||||||
| Cash provided by operating activities | 1,432 | 1,307 | 3,770 | 3,185 | ||||||||||||
| 1 | Refer to Note 31 of the interim consolidated financial statements for further information. |
Mobile phone average revenue per subscriber per month (ARPU) is calculated as network revenue derived from monthly service plan, roaming and usage charges; divided by the average number of mobile phone subscribers on the network during the period, and is expressed as a rate per month.
Net debt: We believe that net debt is a useful measure because it represents the amount of Short-term borrowings and long-term debt obligations that are not covered by available Cash and temporary investments. The nearest IFRS measure to net debt is Long-term debt, including Current maturities of Long-term debt. Net debt is a component of the Net debt to EBITDA – excluding restructuring and other costs ratio.
Net debt to EBITDA – excluding restructuring and other costs: This measure is defined as net debt at the end of the period divided by 12-month trailing EBITDA – excluding restructuring and other costs. (See discussion in Section 7.5 Liquidity and capital resource measures.) This measure is similar to the leverage ratio covenant in our credit facilities, as described in Section 7.6 Credit facilities.
|
|
Page |
TELUS Corporation – Management’s discussion and analysis – 2024 Q3
Calculation of Net debt to EBITDA – excluding restructuring and other costs
| For the 12-month periods ended September 30 ($ millions, except ratio) | 2024 | 2023 | ||||||
| Numerator – Net debt | 28,109 | 26,719 | ||||||
| Denominator – EBITDA – excluding restructuring and other costs | 7,340 | 6,995 | ||||||
| Ratio (times) | 3.83 | 3.82 | ||||||
Net interest cost: This measure is the denominator in the calculation of EBITDA – excluding restructuring and other costs interest coverage. Net interest cost is defined as financing costs, excluding capitalized long-term debt interest, employee defined benefit plans net interest, unrealized changes in virtual power purchase agreements forward element, and recoveries on redemption and repayment of debt, calculated on a 12-month trailing basis. Expenses recorded for the long-term debt prepayment premium, if any, are included in net interest cost.
Calculation of Net interest cost
| For the 12-month periods ended September 30 ($ millions) | 2024 | 2023 | ||||||
| Financing costs | 1,533 | 1,317 | ||||||
| Add (deduct): | ||||||||
| Employee defined benefit plans net interest | (9 | ) | (7 | ) | ||||
| Interest on long-term debt, excluding lease liabilities – capitalized | 15 | 5 | ||||||
| Unrealized changes in virtual power purchase agreements forward element | (169 | ) | (97 | ) | ||||
| Net interest cost | 1,370 | 1,218 | ||||||
11.2 Operating indicators
The following measures are industry metrics that are useful in assessing the operating performance of a mobile and fixed telecommunications entity, but do not have a standardized meaning under IFRS-IASB.
Churn is calculated as the number of subscribers deactivated during a given period divided by the average number of subscribers on the network during the period, and is expressed as a rate per month. Mobile phone churn refers to the aggregate average of both prepaid and postpaid mobile phone churn. A TELUS, Koodo® or Public Mobile® brand prepaid mobile phone subscriber is deactivated when the subscriber has no usage for 90 days following expiry of the prepaid credits.
Connected device subscriber means a subscriber on an active TELUS service plan with a recurring revenue-generating portable unit (e.g. tablets, internet keys, Internet of Things, wearables and connected cars) that is supported by TELUS and is intended for limited or no cellular voice capability.
Mobile phone subscriber means a subscriber on an active TELUS service plan with a recurring revenue-generating portable unit (e.g. feature phones and smartphones) where TELUS provides voice, text and/or data connectivity.
Internet subscriber means a subscriber on an active TELUS internet plan with a recurring revenue-generating unit where TELUS provides internet connectivity.
Residential voice subscriber means a subscriber on an active TELUS phone plan with a recurring revenue-generating unit where TELUS provides voice service.
Security subscriber means a subscriber on an active TELUS security plan with a recurring revenue-generating unit that is connected to the TELUS security and automation platform.
TV subscriber means a subscriber on an active TELUS TV plan with a recurring revenue-generating subscription for video services from a TELUS TV platform.
Healthcare lives covered means the number of users (primary members and their dependents) enrolled in various health programs supported by TELUS Health services (e.g. virtual care, health benefits management, preventative care, personal health security, and employee and family assistance programs). It is probable that some members and their dependents will be a user of multiple TELUS Health services.
Virtual care member means primary enrolment to receive services on an active TELUS Health virtual care plan.
Digital health transactions mean the total number of health claims, dental claims, consultations or other transactions facilitated by TELUS Health products and services.
|
|
Page |