UNITED STATES
SECURITIES AND
EXCHANGE COMMISSION
WASHINGTON, D.C. 20549
FORM 8-K
CURRENT REPORT
Pursuant to Section 13 or 15(d)
of the Securities Exchange Act of 1934
Date of Report (Date of earliest event reported): October 21, 2024
EMPIRE STATE REALTY TRUST, INC.
(Exact Name of Registrant as Specified in its Charter)
| Maryland | 001-36105 | 37-1645259 |
| (State or other Jurisdiction of Incorporation) |
(Commission File Number) |
(I.R.S. Employer Identification No.) |
EMPIRE STATE REALTY OP, L.P.
(Exact Name of Registrant as Specified in its Charter)
| Delaware | 001-36106 | 45-4685158 | ||
|
(State or other Jurisdiction of Incorporation) |
(Commission File Number) |
(I.R.S. Employer Identification No.) |
|
111 West 33rd Street, 12th Floor New York, New York |
10120 |
| (Address of Principal Executive Offices) | (Zip Code) |
Registrant’s telephone number, including area code: (212) 687-8700
n/a
(Former name or former address, if changed from last report)
Check the appropriate box below if the Form 8-K filing is intended to simultaneously satisfy the filing obligation of the registrant under any of the following provisions:
| ☐ | Written communications pursuant to Rule 425 under the Securities Act (17 CFR 230.425) |
| ☐ | Soliciting material pursuant to Rule 14a-12 under the Exchange Act (17 CFR 240.14a-12) |
| ☐ | Pre-commencement communications pursuant to Rule 14d-2(b) under the Exchange Act (17 CFR 240.14d-2(b)) |
| ☐ | Pre-commencement communications pursuant to Rule 13e-4(c) under the Exchange Act (17 CFR 240.13e-4(c)) |
Securities registered pursuant to Section 12(b) of the Act:
| Title of each class | Trading Symbol(s) |
Name of each exchange on which registered |
||
| Empire State Realty Trust, Inc. | ||||
| Class A Common Stock, par value $0.01 per share | ESRT | The New York Stock Exchange |
| Empire State Realty OP, L.P. | ||||
| Series ES Operating Partnership Units | ESBA | NYSE Arca, Inc. | ||
| Series 60 Operating Partnership Units | OGCP | NYSE Arca, Inc. | ||
| Series 250 Operating Partnership Units | FISK | NYSE Arca, Inc. |
Indicate by check mark whether the registrant is an emerging growth company as defined in Rule 405 of the Securities Act of 1933 (§230.405 of this chapter) or Rule 12b-2 of the Securities Exchange Act of 1934 (§240.12b-2 of this chapter).
Emerging growth company ☐
If an emerging growth company, indicate by check mark if the registrant has elected not to use the extended transition period for complying with any new or revised financial accounting standards provided pursuant to Section 13(a) of the Exchange Act. ☐
| Item 2.02. | Results of Operations and Financial Condition. |
On October 21, 2024, Empire State Realty Trust, Inc. (the “Company” or “we”) issued a press release announcing its financial results for the third quarter 2024. The press release referred to certain supplemental information that is available on the Company’s website. The press release and supplemental report are attached hereto as Exhibits 99.1 and 99.2, respectively, and are incorporated by reference herein.
The information in Item 2.02 of this Current Report, including Exhibits 99.1 and 99.2, is being furnished and shall not be deemed “filed” for purposes of Section 18 of the Securities Exchange Act of 1934, as amended (the “Exchange Act”), or otherwise subject to the liabilities of that Section. Such information shall not be incorporated by reference into any registration statement or other document pursuant to the Securities Act of 1933, as amended (the “Securities Act”), or the Exchange Act, unless it is specifically incorporated by reference therein.
| Item 7.01. | Regulation FD Disclosure |
Third Quarter 2024 Earnings
As discussed in Item 2.02 above, the Company issued a press release regarding its financial results for the third quarter 2024 and made available on its website certain supplemental information relating thereto.
The information in Item 7.01 of this Current Report is being furnished and shall not be deemed “filed” for purposes of Section 18 of the Exchange Act, or otherwise subject to the liabilities of that Section. Such information shall not be incorporated by reference into any registration statement or other document pursuant to the Securities Act or the Exchange Act, unless it is specifically incorporated by reference therein.
| Item 9.01. | Financial Statements and Exhibits. |
(d) Exhibits.
| Exhibit No. | Description |
| 99.1 | Press Release announcing financial results for the third quarter 2024 |
| 99.2 | Supplemental report |
| 104 | Cover Page Interactive File (the cover page tags are embedded within the Inline XBRL document). |
Non-GAAP Supplemental Financial Measures
Funds From Operations ("FFO")
We compute FFO in accordance with the “White Paper” on FFO published by the National Association of Real Estate Investment Trusts, or NAREIT, which defines FFO as net income (loss) (determined in accordance with GAAP), excluding impairment write-off of investments in depreciable real estate and investments in in-substance real estate investments, gains or losses from debt restructurings and sales of depreciable operating properties, plus real estate-related depreciation and amortization (excluding amortization of deferred financing costs), less distributions to non-controlling interests and gains/losses from discontinued operations and after adjustments for unconsolidated partnerships and joint ventures. FFO is a widely recognized non-GAAP financial measure for REITs that we believe, when considered with financial statements determined in accordance with GAAP, is useful to investors in understanding financial performance and providing a relevant basis for comparison among REITs. In addition, we believe FFO is useful to investors as it captures features particular to real estate performance by recognizing that real estate has generally appreciated over time or maintains residual value to a much greater extent than do other depreciable assets. Investors should review FFO, along with GAAP net income, when trying to understand an equity REIT’s operating performance. We present FFO because we consider it an important supplemental measure of our operating performance and believe that it is frequently used by securities analysts, investors and other interested parties in the evaluation of REITs. However, because FFO excludes depreciation and amortization and captures neither the changes in the value of our properties that result from use or market conditions nor the level of capital expenditures and leasing commissions necessary to maintain the operating performance of our properties, all of which have real economic effect and could materially impact our results of operations, the utility of FFO as a measure of performance is limited. There can be no assurance that FFO presented by us is comparable to similarly titled measures of other REITs. FFO does not represent cash generated from operating activities and should not be considered as an alternative to net income (loss) determined in accordance with GAAP or to cash flow from operating activities determined in accordance with GAAP. FFO is not indicative of cash available to fund ongoing cash needs, including the ability to make cash distributions. Although FFO is a measure used for comparability in assessing the performance of REITs, as the NAREIT White Paper only provides guidelines for computing FFO, the computation of FFO may vary from one company to another.
Modified Funds From Operations ("Modified FFO")
Modified FFO adds back an adjustment for any above or below-market ground lease amortization to traditionally defined FFO. We believe this a useful supplemental measure in evaluating our operating performance due to the non-cash accounting treatment under GAAP, which stems from the third quarter 2014 acquisition of two option properties following our formation transactions as they carry significantly below market ground leases, the amortization of which is material to our overall results. We present Modified FFO because we believe it is an important supplemental measure of our operating performance in that it adds back the non-cash amortization of below-market ground leases. There can be no assurance that Modified FFO presented by us is comparable to similarly titled measures of other REITs. Modified FFO does not represent cash generated from operating activities and should not be considered as an alternative to net income (loss) determined in accordance with GAAP or to cash flow from operating activities determined in accordance with GAAP. Modified FFO is not indicative of cash available to fund ongoing cash needs, including the ability to make cash distributions.
Core Funds From Operations ("Core FFO")
Core FFO adds back to Modified FFO the following items: loss on early extinguishment of debt, acquisition expenses, severance expenses, IPO litigation expense and interest expense associated with property in receivership. The Company believes Core FFO is an important supplemental measure of its operating performance because it excludes non-recurring items. There can be no assurance that Core FFO presented by the Company is comparable to similarly titled measures of other REITs. Core FFO does not represent cash generated from operating activities and should not be considered as an alternative to net income (loss) determined in accordance with GAAP or to cash flow from operating activities determined in accordance with GAAP. Core FFO is not indicative of cash available to fund ongoing cash needs, including the ability to make cash distributions. In future periods, we may also exclude other items from Core FFO that we believe may help investors compare our results.
Core Funds Available for Distribution (“Core FAD")
In addition to Core FFO, we present Core FAD by (i) adding to Core FFO non-real estate depreciation and amortization, the amortization of deferred financing costs, amortization of debt discounts and non-cash compensation expenses and (ii) deducting straight-line rent, amortization of debt premiums and above/below market rent revenue, and recurring capital improvements such as second generation leasing commissions, tenant improvements, prebuilts, capital expenditures and furniture, fixtures & equipment. Core FAD is presented solely as a supplemental disclosure that we believe provides useful information regarding our ability to fund our dividends. Core FAD does not represent cash generated from operating activities and should not be considered as an alternative to net income (loss) determined in accordance with GAAP or to cash flow from operating activities determined in accordance with GAAP. Core FAD is not indicative of cash available to fund ongoing cash needs, including the ability to make cash distributions. There can be no assurance that Core FAD presented by us is comparable to similarly titled measures of other REITs.
Net Operating Income (“NOI”) and Property Cash NOI In the Company’s analysis of NOI, particularly to make comparisons of NOI between periods meaningful, it is important to provide information for properties that were owned by the Company throughout each period presented.
NOI is a non-GAAP financial measure of performance. NOI is used by our management to evaluate and compare the performance of our properties and to determine trends in earnings and to compute the fair value of our properties as it is not affected by: (i) the cost of funds of the property owner, (ii) the impact of depreciation and amortization expenses as well as gains or losses from the sale of operating real estate assets that are included in net income computed in accordance with GAAP, (iii) acquisition expenses, loss on early extinguishment of debt, impairment charges and loss from derivative financial instruments, or (iv) general and administrative expenses and other gains and losses that are specific to the property owner. The cost of funds is eliminated from NOI because it is specific to the particular financing capabilities and constraints of the owner. The cost of funds is eliminated because it is dependent on historical interest rates and other costs of capital as well as past decisions made by us regarding the appropriate mix of capital which may have changed or may change in the future. Depreciation and amortization expenses as well as gains or losses from the sale of operating real estate assets are eliminated because they may not accurately represent the actual change in value in our office or retail properties that result from use of the properties or changes in market conditions. While certain aspects of real property do decline in value over time in a manner that is reasonably captured by depreciation and amortization, the value of the properties as a whole have historically increased or decreased as a result of changes in overall economic conditions instead of from actual use of the property or the passage of time. Gains and losses from the sale of real property vary from property to property and are affected by market conditions at the time of sale which will usually change from period to period. These gains and losses can create distortions when comparing one period to another or when comparing our operating results to the operating results of other real estate companies that have not made similarly-timed purchases or sales. We believe that eliminating these costs from net income is useful to investors because the resulting measure captures the actual revenue generated and actual expenses incurred in operating our properties as well as trends in occupancy rates, rental rates and operating costs. In some cases, the Company also presents (1) Property Cash NOI, which excludes Observatory NOI and the effects of straight-line rent, fair value lease revenue, and straight-line ground rent expense adjustment, and (2) Property Cash NOI excluding lease termination fees. Property Cash NOI is presented solely as a supplemental disclosure that management believes allows investors to compare NOI performance across periods without taking into account the effect of certain non-cash rental revenues and straight-line ground rent expense adjustment. Similar to depreciation and amortization expense, fair value lease revenues, because of historical cost accounting, may distort operating performance measures at the property level. Additionally, presenting NOI excluding the impact of straight-line rent and straight-line ground rent expense adjustment provides investors with an alternative view of operating performance at the property level that more closely reflects net cash generated in the portfolio. Presenting Property Cash NOI excluding lease termination fees provides investors with additional information that allows them to compare operating performance between periods without taking into account termination fees, which can distort the results for any given period because they generally represent multiple months or years of a tenant’s rental obligations that are paid in a lump sum in connection with a negotiated early termination of the tenant’s lease and are not reflective of the core ongoing operating performance of the Company’s portfolio. However, the usefulness of NOI, Property Cash NOI, and Property Cash NOI excluding lease termination fees is limited because it excludes general and administrative costs, interest expense, depreciation and amortization expense and gains or losses from the sale of properties, and other gains and losses as stipulated by GAAP, the level of capital expenditures and leasing costs necessary to maintain the operating performance of our properties, all of which are significant economic costs. NOI and Property Cash NOI may fail to capture significant trends in these components of net income which further limits its usefulness. NOI and Property Cash NOI are measurements of the operating performance of our properties but do not measure our performance as a whole. These metrics therefore are not substitutes for net income as computed in accordance with GAAP. These measures should be analyzed in conjunction with net income computed in accordance with GAAP. Other companies may use different methods for calculating NOI, Property Cash NOI or similarly titled measures and, accordingly, our measures may not be comparable to similarly titled measures reported by other companies that do not define the measure exactly as we do.
Same Store
The Company refers to properties acquired prior to the beginning of the earliest period presented and owned by the Company through the end of the latest period presented as “Same Store”. Same Store therefore excludes properties acquired after the beginning of the earliest period presented or disposed of prior to the end of the latest period presented. Accordingly, it takes at least one year and one quarter after a property is acquired for that property to be included in Same Store. The Company’s definition of Same Store also excludes properties held-for-sale or those which we otherwise expect to dispose of in the subsequent quarter, properties placed in receivership and our multifamily properties. For mixed-use properties, all same store property NOI is represented in the property category that comprises the majority of that mixed-use property’s NOI. As of September 30, 2024, Same Store excludes the North Sixth Street Collection which was acquired in September 2023 and September 2024, and First Stamford Place, Stamford, CT which was placed into receivership in May 2024.
EBITDA and Adjusted EBITDA
We compute EBITDA as net income plus interest expense, interest expense associated with property in receivership, income taxes and depreciation and amortization. We present EBITDA because we believe that EBITDA, along with cash flow from operating activities, investing activities and financing activities, provides investors with an additional indicator of its ability to incur and service debt. EBITDA should not be considered as an alternative to net income (determined in accordance with GAAP), as an indication of our financial performance, as an alternative to net cash flows from operating activities (determined in accordance with GAAP), or as a measure of its liquidity. For Adjusted EBITDA, we add back impairment charges and (gain) loss on disposition of property.
Net Debt to Adjusted EBITDA
We compute Net Debt to Adjusted EBITDA as the Company’s pro-rata share of gross debt less cash and cash equivalents divided by the Company’s pro-rata share of trailing twelve months Adjusted EBITDA. The Company believes that the presentation of Net Debt to Adjusted EBITDA provides useful information to investors because the Company reviews Net Debt to Adjusted EBITDA as part of the management of its overall financial flexibility, capital structure and leverage based on its percentage ownership interest in all of its assets.
SIGNATURE
Pursuant to the requirements of the Exchange Act, the registrant has duly caused this report to be signed on its behalf by the undersigned hereunto duly authorized.
| EMPIRE STATE REALTY TRUST, INC. | |||
| (Registrant) | |||
| Date: October 21, 2024 | By: | /s/ Stephen V. Horn | |
| Name: | Stephen V. Horn | ||
| Title: | Executive Vice President, Chief Financial Officer & Chief Accounting Officer | ||
Pursuant to the requirements of the Exchange Act, the registrant has duly caused this report to be signed on its behalf by the undersigned hereunto duly authorized.
| EMPIRE STATE REALTY OP, L.P. | |||
| (Registrant) | |||
| By: Empire State Realty Trust, Inc., as general partner | |||
| Date: October 21, 2024 | By: | /s/ Stephen V. Horn | |
| Name: | Stephen V. Horn | ||
| Title: | Executive Vice President, Chief Financial Officer & Chief Accounting Officer | ||
Exhibit 99.1

EMPIRE STATE REALTY TRUST ANNOUNCES THIRD QUARTER 2024 RESULTS
– Net Income Per Fully Diluted Share of $0.08 –
– Core FFO Per Fully Diluted Share of $0.26 –
– Signed 304,000 Rentable Square Feet of Leases –
– Closed on $143 Million of Previously Announced $195 Million Retail Acquisition in Williamsburg, Brooklyn –
– Announces Agreement to Acquire Additional Retail Asset on North 6th Street Williamsburg, Brooklyn–
– Over $0.9 Billion of Liquidity, No Floating Rate Debt Exposure –
– 2024 FFO Guidance Raised –
New York, New York, October 21, 2024 – Empire State Realty Trust, Inc. (NYSE: ESRT) is a NYC-focused REIT that owns and operates a portfolio of modernized, amenitized, and well-located office, retail, and multifamily assets. ESRT’s flagship Empire State Building, the “World's Most Famous Building,” features its iconic Observatory that was declared the #1 Attraction in the World – and the #1 Attraction in the U.S. for the third consecutive year– in Tripadvisor’s 2024 Travelers’ Choice Awards: Best of the Best Things to Do. The Company is the recognized leader in energy efficiency and indoor environmental quality. Today the Company reported its operational and financial results for the third quarter 2024. All per share amounts are on a fully diluted basis, where applicable.
Third Quarter and Recent Highlights
| · | Net Income of $0.08 per share. |
| · | Core Funds From Operations (“Core FFO”) of $0.26 per share, compared to $0.25 per share in the third quarter 2023. Third quarter 2024 Core FFO included $0.02 per share of lease termination fee income. |
| · | Same-Store Property Cash Net Operating Income (“NOI”) increased 5.2% year-over-year, excluding the $0.02 per share of lease termination fees, primarily driven by higher revenues from cash rent commencement inclusive of a net increase of approximately $1.7 million from non-recurring revenue items in the comparable periods, which was partially offset by increases in operating expenses. When adjusted for the non-recurring items, SS Cash NOI increased by approximately 2.6%. |
| · | Manhattan office portfolio leased rate increased by 30bps sequentially and 170bps year-over-year to 93.6%. The total commercial portfolio is 93.0% leased as of September 30, 2024. Manhattan office occupancy increased by 40bps sequentially and 140bps year-over-year to 89.2%. The total commercial portfolio is 88.8% occupied as of September 30, 2024. |
| · | Signed approximately 304,000 rentable square feet of new, renewal and expansion leases. In our Manhattan office portfolio, blended leasing spreads were +2.6%. This is the 13th consecutive quarter of positive leasing spreads. |
| · | Empire State Building Observatory generated $29.7 million of NOI, a 5.6% increase year-over-year. |
| · | Closed on $143 million of the previously announced $195 million acquisition of prime retail assets on North 6th Street in Williamsburg, Brooklyn. The balance is expected to close in the 4th quarter of 2024. |
| · | Entered into an agreement to acquire an additional retail asset located on North 6th Street in Williamsburg, Brooklyn, for approximately $30 million. |
| · | Achieved the highest possible GRESB 5 Star Rating for the fifth consecutive year with a score of 93. ESRT’s overall score ranked first among all listed companies in the Americas for the second year in a row and first in the most competitive peer group within the U.S. |
Property Operations
As of September 30, 2024, the Company’s property portfolio contained 7.8 million rentable square feet of office space, 0.7 million rentable square feet of retail space and 732 residential units, which were occupied and leased as shown below.
| September 30, 20241 |
June 30,
20241 |
September
30, 2023 |
||||||||||
| Percent occupied: | ||||||||||||
| Total commercial portfolio | 88.8 | % | 88.5 | % | 87.0 | % | ||||||
| Total office | 88.6 | % | 88.2 | % | 86.7 | % | ||||||
| Manhattan office | 89.2 | % | 88.8 | % | 87.8 | % | ||||||
| Total retail | 91.1 | % | 92.3 | % | 90.4 | % | ||||||
| Percent leased (includes signed leases not commenced): | ||||||||||||
| Total commercial portfolio | 93.0 | % | 92.6 | % | 90.5 | % | ||||||
| Total office | 92.9 | % | 92.5 | % | 90.5 | % | ||||||
| Manhattan office | 93.6 | % | 93.3 | % | 91.9 | % | ||||||
| Total retail | 94.0 | % | 93.5 | % | 91.5 | % | ||||||
| Total multifamily portfolio | 96.8 | % | 97.9 | % | 97.1 | % | ||||||
1 Occupancy and leased percentages for June 30 and September 30, 2024 exclude First Stamford Place.
Leasing
The tables that follow summarize leasing activity for the three months ended September 30, 2024. During this period, the Company signed 31 leases that totaled 304,210 square feet. Within the Manhattan office portfolio, the Company signed 25 office leases that totaled 289,329 square feet.
Total Portfolio
| Total Portfolio | Total
Leases Executed |
Total
square footage executed |
Average
cash rent psf – leases executed |
Previously
escalated cash rents psf |
%
of new cash rent over/ under previously escalated rents |
|||||||||||||||
| Office | 26 | 291,418 | 70.11 | 68.34 | 2.6 | % | ||||||||||||||
| Retail | 5 | 12,792 | 203.88 | 332.35 | (38.7 | )% | ||||||||||||||
| Total Overall | 31 | 304,210 | 75.74 | 79.44 | (4.7 | )% | ||||||||||||||
Manhattan Office Portfolio
| Manhattan Office Portfolio |
Total
Leases Executed |
Total
square footage executed |
Average
cash rent psf – leases executed |
Previously escalated cash rents psf |
%
of new cash rent over / under previously escalated rents |
|||||||||||||||
| New Office | 12 | 130,688 | 66.07 | 63.21 | 4.5 | % | ||||||||||||||
| Renewal Office | 13 | 158,641 | 73.11 | 72.24 | 1.2 | % | ||||||||||||||
| Total Office | 25 | 289,329 | 69.93 | 68.16 | 2.6 | % | ||||||||||||||
Leasing Activity Highlights
| · | An 11-year 26,782 square foot expansion lease with Hecker Fink LLP at the Empire State Building. |
| · | An 11-year 24,503 square foot new lease with Dynadmic Corporation at 1350 Broadway. |
| · | An 11-year 24,209 square foot new lease with Bloomsbury Publishing at 1359 Broadway. |
Observatory Results
In the third quarter, Observatory revenue was $39.4 million, and expenses were $9.7 million. Observatory NOI was $29.7 million, a 5.6% increase year-over-year. Year-to-date, Observatory NOI was $71.0 million, a 5.7% increase year-over-year.
Balance Sheet
The Company had $0.9 billion of total liquidity as of September 30, 2024, which was comprised of $422 million of cash, plus $500 million available under its revolving credit facility. At September 30, 2024, the Company had total debt outstanding of approximately $2.3 billion, no floating rate debt exposure, and a weighted average interest rate of 4.27%. At September 30, 2024, the Company’s ratio of net debt to adjusted EBITDA was 5.2x.
Portfolio Transaction Activity
In the third quarter, the Company closed on $143 million of the previously announced $195 million all-cash acquisition of prime retail assets on North 6th Street in Williamsburg Brooklyn, with the balance expected to close in the fourth quarter of 2024. In aggregate, the assets comprise approximately 81,000 square feet of retail space that is 90% leased with a weighted average lease term of 7.4 years. Current tenants include Hermes, Nike, Santander Work Café, The North Face, Everlane, Warby Parker, DS Durga, Buck Mason, Chanel, Byredo, and Google. As previously noted, this transaction is consistent with the Company’s strategy to recycle capital and balance sheet capacity from non-core suburban assets into strong NYC assets.
In the third quarter, the Company entered into an agreement to acquire an additional retail asset on North 6th Street in Williamsburg, Brooklyn for approximately $30 million. Due to confidentiality requirements, more details on this transaction will be disclosed upon closing expected to occur in mid-2025.
Share Repurchase
The stock repurchase program began in March 2020, and through October 18, 2024 approximately $293.7 million has been repurchased at a weighted average price of $8.18 per share. There were no share repurchases during the third quarter.
Dividend
On September 30, 2024, the Company paid a quarterly dividend of $0.035 per share or unit, as applicable, for the third quarter of 2024 to holders of the Company’s Class A common stock (NYSE: ESRT) and Class B common stock and to holders of the Series ES, Series 250 and Series 60 partnership units (NYSE Arca: ESBA, FISK and OGCP, respectively) and Series PR partnership units of Empire State Realty OP, L.P., the Company’s operating partnership (the “Operating Partnership”).
On September 30, 2024, the Company paid a quarterly preferred dividend of $0.15 per unit for the third quarter of 2024 to holders of the Operating Partnership’s Series 2014 private perpetual preferred units and a preferred dividend of $0.175 per unit for the third quarter of 2024 to holders of the Operating Partnership’s Series 2019 private perpetual preferred units.
2024 Earnings Outlook
The Company provides 2024 guidance and key assumptions, as summarized in the table below. The Company’s guidance does not include the impact of any significant future lease termination fee income or any unannounced acquisition, disposition or other capital markets activity.
| Key Assumptions | 2024
Updated Guidance (Oct 2024) |
2024
Prior Guidance (July 2024) |
Comments |
| Earnings | |||
| Core FFO Per Fully Diluted Share | $0.92 to $0.94 | $0.90 to $0.94 | • 2024 includes $0.04 from multifamily assets |
| Commercial Property Drivers | |||
| Commercial Occupancy at year-end | 88% to 89% | 87% to 89% | |
| SS
Property Cash NOI (excluding lease termination fees) |
3% to 4% | 0% to 3% | •
Assumes positive revenue growth • Assumes ~8% y/y increase in operating expenses and real estate taxes inclusive of planned additional R&M work, partially offset by higher tenant expense reimbursements |
| Observatory Drivers | |||
| Observatory NOI | $96M to $100M | $94M to $102M | • Reflects average quarterly expenses of ~$9M |
| Low | High | |||||||
| Net Income (Loss) Attributable to Common Stockholders and the Operating Partnership | $ | 0.27 | $ | 0.29 | ||||
| Add: | ||||||||
| Impairment Charge | 0.00 | 0.00 | ||||||
| Real Estate Depreciation & Amortization | 0.67 | 0.67 | ||||||
| Less: | ||||||||
| Preferred Unit Distributions | 0.02 | 0.02 | ||||||
| Gain on Disposal of Real Estate, net | 0.04 | 0.04 | ||||||
| FFO Attributable to Common Stockholders and the Operating Partnership | $ | 0.88 | $ | 0.90 | ||||
| Add: | ||||||||
| Amortization of Below Market Ground Lease | 0.03 | 0.03 | ||||||
| Interest Expense Associated with Property in Receivership | 0.01 | 0.01 | ||||||
| Loss on Early Extinguishment of Debt | 0.00 | 0.00 | ||||||
| Core FFO Attributable to Common Stockholders and the Operating Partnership | $ | 0.92 | $ | 0.94 | ||||
The estimates set forth above may be subject to fluctuations as a result of several factors, including continued impacts of changes in the use of office space and remote work on our business and our market, our ability to complete planned capital improvements in line with budget, costs of integration of completed acquisitions, costs associated with future acquisitions or other transactions, straight-line rent adjustments and the amortization of above and below-market leases. There can be no assurance that the Company’s actual results will not differ materially from the estimates set forth above.
Investor Presentation Update
The Company has posted on the “Investors” section of ESRT’s website the latest investor presentation, which contains additional information on its businesses, financial condition and results of operations.
Webcast and Conference Call Details
Empire State Realty Trust, Inc. will host a webcast and conference call, open to the general public, on Tuesday, October 22, 2024 at 12:00 pm Eastern time.
The webcast will be accessible on the “Investors” section of ESRT’s website. To listen to the live webcast, go to the site at least five minutes prior to the scheduled start time in order to register and download and install any necessary audio software. The conference call can also be accessed by dialing 1-877-407-3982 for domestic callers or 1-201-493-6780 for international callers.
Starting shortly after the call until October 29, 2024, a replay of the webcast will be available on the Company’s website, and a dial-in replay will be available by dialing 1-844-512-2921 for domestic callers or 1-412-317-6671 for international callers. The passcode for this dial-in replay is 13741463.
The Supplemental Report and Investor Presentation are additional components of the quarterly earnings announcement and are now available on the “Investors” section of ESRT’s website.
The Company uses, and intends to continue to use, the “Investors” page of its website, which can be found at www.esrtreit.com, as a means to disclose material nonpublic information and to comply with its disclosure obligations under Regulation FD, including, without limitation, through the posting of investor presentations that may include material nonpublic information. Accordingly, investors should monitor the “Investors” page, in addition to following our press releases, SEC filings, public conference calls, presentations and webcasts. The information contained on, or that may be accessed through, our website is not incorporated by reference into, and is not a part of, this document.
About Empire State Realty Trust
Empire State Realty Trust, Inc. (NYSE: ESRT) is a NYC-focused REIT that owns and operates a portfolio of modernized, amenitized, and well-located office, retail, and multifamily assets. ESRT’s flagship Empire State Building, the “World's Most Famous Building,” features its iconic Observatory that was declared the #1 Attraction in the World – and the #1 Attraction in the U.S. for the third consecutive year – in Tripadvisor’s 2024 Travelers’ Choice Awards: Best of the Best Things to Do. The Company is the recognized leader in energy efficiency and indoor environmental quality. As of September 30, 2024, ESRT’s portfolio is comprised of approximately 7.8 million rentable square feet of office space, 0.7 million rentable square feet of retail space and 732 residential units. More information about Empire State Realty Trust can be found at esrtreit.com and by following ESRT on Facebook, Instagram, TikTok, X, and LinkedIn.

Forward-Looking Statements
This press release includes “forward-looking statements” within the meaning of Section 27A of the Securities Act of 1933, as amended (the “Securities Act"), and Section 21E of the Securities Exchange Act of 1934, as amended (the “Exchange Act”). We intend these forward-looking statements to be covered by the safe harbor provisions for forward-looking statements contained in the Private Securities Litigation Reform Act of 1995 and are including this statement for purposes of complying with those safe harbor provisions. You can identify forward-looking statements by the use of forward-looking terminology such as “aims," "anticipates," "approximately," "believes," "contemplates," "continues," "estimates," "expects," "forecasts," "hope," "intends," "may," "plans," "seeks," "should," "thinks," "will," "would" or the negative of these words and phrases or similar words or phrases. For the avoidance of doubt, any projection, guidance, or similar estimation about the future or future results, performance or achievements is a forward-looking statement.
Forward-looking statements are subject to substantial risks and uncertainties, many of which are difficult to predict and are generally beyond our control, and you should not rely on them as predictions of future events. Forward-looking statements depend on assumptions, data or methods which may be incorrect or imprecise, and we may not be able to realize them. We do not guarantee that the transactions and events described will happen as described (or that they will happen at all).
Many important factors could cause our actual results, performance, achievements, and future events to differ materially from those set forth, implied, anticipated, expected, projected, assumed or contemplated in our forward-looking statements, including, among other things: (i) economic, market, political and social impact of, and uncertainty relating to, any catastrophic events, including pandemics, epidemics or other outbreaks of disease, climate-related risks such as natural disasters and extreme weather events, terrorism and other armed hostilities, as well as cybersecurity threats and technology disruptions; (ii) a failure of conditions or performance regarding any event or transaction described herein; (iii) resolution of legal proceedings involving the Company; (iv) reduced demand for office, multifamily or retail space, including as a result of the changes in the use of office space and remote work; (v) changes in our business strategy; (vi) a decline in Observatory visitors due to changes in domestic or international tourism, including due to health crises, geopolitical events, currency exchange rates, and/or competition from other observatories; (vii) defaults on, early terminations of, or non-renewal of, leases by tenants; (viii) increases in the Company’s borrowing costs as a result of changes in interest rates and other factors; (ix) declining real estate valuations and impairment charges; (x) termination of our ground leases; (xi) limitations on our ability to pay down, refinance, restructure or extend our indebtedness or borrow additional funds; (xii) decreased rental rates or increased vacancy rates; (xiii) difficulties in executing capital projects or development projects successfully or on the anticipated timeline or budget; (xiv) difficulties in identifying and completing acquisitions; (xv) impact of changes in governmental regulations, tax laws and rates and similar matters; (xvi) our failure to qualify as a REIT; (xvii) incurrence of taxable capital gain on disposition of an asset due to failure of compliance with a 1031 exchange program; (xviii) our disclosure controls and internal control over financial reporting, including any material weakness; and (xix) failure to achieve sustainability metrics and goals, including as a result of tenant collaboration, and impact of governmental regulation on our sustainability efforts. For a further discussion of these and other factors that could impact the company's future results, performance, or transactions, see the section entitled “Risk Factors” of our annual report on Form 10-K for the year ended December 31, 2023 and of our quarterly report on Form 10-Q for the quarter ended June 30, 2024 and any additional factors that may be contained in any filing we make with the SEC.
While forward-looking statements reflect the Company's good faith beliefs, they do not guarantee future performance. Any forward-looking statement contained in this press release speaks only as of the date on which it was made, and we assume no obligation to update or revise publicly any forward-looking statement to reflect changes in underlying assumptions or factors, new information, data or methods, future events, or other changes after the date of this press release, except as required by applicable law. Prospective investors should not place undue reliance on any forward-looking statements, which are based only on information currently available to the Company (or to third parties making the forward-looking statements).
Contact: Investors and Media
Empire State Realty Trust Investor Relations
(212) 850-2678
IR@esrtreit.com
Empire Start Realty Trust, Inc.
Condensed Consolidated Statements of Operations
(unaudited and amounts in thousands, except per share data)
| Three Months Ended September 30, | ||||||||
| 2024 | 2023 | |||||||
| Revenues | ||||||||
| Rental revenue | $ | 153,117 | $ | 151,458 | ||||
| Observatory revenue | 39,382 | 37,562 | ||||||
| Lease termination fees | 4,771 | — | ||||||
| Third-party management and other fees | 271 | 268 | ||||||
| Other revenue and fees | 2,058 | 2,238 | ||||||
| Total revenues | 199,599 | 191,526 | ||||||
| Operating expenses | ||||||||
| Property operating expenses | 45,954 | 42,817 | ||||||
| Ground rent expenses | 2,331 | 2,331 | ||||||
| General and administrative expenses | 18,372 | 16,012 | ||||||
| Observatory expenses | 9,715 | 9,471 | ||||||
| Real estate taxes | 31,982 | 32,014 | ||||||
| Depreciation and amortization | 45,899 | 46,624 | ||||||
| Total operating expenses | 154,253 | 149,269 | ||||||
| Total operating income | 45,346 | 42,257 | ||||||
| Other income (expense): | ||||||||
| Interest income | 6,960 | 4,462 | ||||||
| Interest expense | (27,408 | ) | (25,382 | ) | ||||
| Interest expense associated with property in receivership | (1,922 | ) | — | |||||
| Gain on disposition of properties | 1,262 | — | ||||||
| Income before income taxes | 24,238 | 21,337 | ||||||
| Income tax expense | (1,442 | ) | (1,409 | ) | ||||
| Net income | 22,796 | 19,928 | ||||||
| Net (income) loss attributable to non-controlling interests: | ||||||||
| Non-controlling interest in the Operating Partnership | (8,205 | ) | (7,207 | ) | ||||
| Non-controlling interests in other partnerships | — | (111 | ) | |||||
| Preferred unit distributions | (1,050 | ) | (1,050 | ) | ||||
| Net income attributable to common stockholders | $ | 13,541 | $ | 11,560 | ||||
| Total weighted average shares | ||||||||
| Basic | 164,880 | 161,851 | ||||||
| Diluted | 269,613 | 266,073 | ||||||
| Earnings per share attributable to common stockholders | ||||||||
| Basic | $ | 0.08 | $ | 0.07 | ||||
| Diluted | $ | 0.08 | $ | 0.07 | ||||
Empire Start Realty Trust, Inc.
Condensed Consolidated Statements of Operations
(unaudited and amounts in thousands, except per share data)
| Nine Months Ended September 30, | ||||||||
| 2024 | 2023 | |||||||
| Revenues | ||||||||
| Rental revenue | $ | 459,469 | $ | 446,152 | ||||
| Observatory revenue | 98,102 | 93,149 | ||||||
| Lease termination fees | 4,771 | — | ||||||
| Third-party management and other fees | 912 | 1,076 | ||||||
| Other revenue and fees | 7,067 | 6,313 | ||||||
| Total revenues | 570,321 | 546,690 | ||||||
| Operating expenses | ||||||||
| Property operating expenses | 132,530 | 124,380 | ||||||
| Ground rent expenses | 6,994 | 6,994 | ||||||
| General and administrative expenses | 52,364 | 47,795 | ||||||
| Observatory expenses | 27,104 | 25,983 | ||||||
| Real estate taxes | 96,106 | 95,292 | ||||||
| Depreciation and amortization | 139,453 | 140,312 | ||||||
| Total operating expenses | 454,551 | 440,756 | ||||||
| Total operating income | 115,770 | 105,934 | ||||||
| Other income (expense): | ||||||||
| Interest income | 16,230 | 10,396 | ||||||
| Interest expense | (77,859 | ) | (76,091 | ) | ||||
| Interest expense associated with property in receivership | (2,550 | ) | — | |||||
| Loss on early extinguishment of debt | (553 | ) | — | |||||
| Gain on disposition of properties | 12,065 | 29,261 | ||||||
| Income before income taxes | 63,103 | 69,500 | ||||||
| Income tax expense | (1,537 | ) | (923 | ) | ||||
| Net income | 61,566 | 68,577 | ||||||
| Net (income) loss attributable to non-controlling interests: | ||||||||
| Non-controlling interest in the Operating Partnership | (22,138 | ) | (25,424 | ) | ||||
| Non-controlling interests in other partnerships | (4 | ) | (69 | ) | ||||
| Preferred unit distributions | (3,151 | ) | (3,151 | ) | ||||
| Net income attributable to common stockholders | $ | 36,273 | $ | 39,933 | ||||
| Total weighted average shares | ||||||||
| Basic | 164,453 | 160,799 | ||||||
| Diluted | 268,608 | 265,269 | ||||||
| Earnings per share attributable to common stockholders | ||||||||
| Basic | $ | 0.22 | $ | 0.25 | ||||
| Diluted | $ | 0.22 | $ | 0.25 | ||||
Empire State Realty Trust, Inc.
Reconciliation of Net Income to Funds From Operations (“FFO”),
Modified Funds From Operations (“Modified FFO”) and Core Funds From Operations (“Core FFO”)
(unaudited and amounts in thousands, except per share data)
| Three Months Ended September 30, | ||||||||
| 2024 | 2023 | |||||||
| Net income | $ | 22,796 | $ | 19,928 | ||||
| Non-controlling interests in other partnerships | — | (111 | ) | |||||
| Preferred unit distributions | (1,050 | ) | (1,050 | ) | ||||
| Real estate depreciation and amortization | 44,871 | 45,174 | ||||||
| Gain on disposition of properties | (1,262 | ) | — | |||||
| FFO attributable to common stockholders and Operating Partnership units | 65,355 | 63,941 | ||||||
| Amortization of below-market ground leases | 1,958 | 1,957 | ||||||
| Modified FFO attributable to common stockholders and Operating Partnership units | 67,313 | 65,898 | ||||||
| Interest expense associated with property in receivership | 1,922 | — | ||||||
| Core FFO attributable to common stockholders and Operating Partnership units | $ | 69,235 | $ | 65,898 | ||||
| Total weighted average shares and Operating Partnership units | ||||||||
| Basic | 264,787 | 262,756 | ||||||
| Diluted | 269,613 | 266,073 | ||||||
| FFO per share | ||||||||
| Basic | $ | 0.25 | $ | 0.24 | ||||
| Diluted | $ | 0.24 | $ | 0.24 | ||||
| Modified FFO per share | ||||||||
| Basic | $ | 0.25 | $ | 0.25 | ||||
| Diluted | $ | 0.25 | $ | 0.25 | ||||
| Core FFO per share | ||||||||
| Basic | $ | 0.26 | $ | 0.25 | ||||
| Diluted | $ | 0.26 | $ | 0.25 | ||||
Empire State Realty Trust, Inc.
Reconciliation of Net Income to Funds From Operations (“FFO”),
Modified Funds From Operations (“Modified FFO”) and Core Funds From Operations (“Core FFO”)
(unaudited and amounts in thousands, except per share data)
| Nine Months Ended September 30, | ||||||||
| 2024 | 2023 | |||||||
| Net income | $ | 61,566 | $ | 68,577 | ||||
| Non-controlling interests in other partnerships | (4 | ) | (69 | ) | ||||
| Preferred unit distributions | (3,151 | ) | (3,151 | ) | ||||
| Real estate depreciation and amortization | 136,126 | 136,085 | ||||||
| Gain on disposition of properties | (12,065 | ) | (29,261 | ) | ||||
| FFO attributable to common stockholders and Operating Partnership units | 182,472 | 172,181 | ||||||
| Amortization of below-market ground leases | 5,874 | 5,873 | ||||||
| Modified FFO attributable to common stockholders and Operating Partnership units | 188,346 | 178,054 | ||||||
| Interest expense associated with property in receivership | 2,550 | — | ||||||
| Loss on early extinguishment of debt | 553 | — | ||||||
| Core FFO attributable to common stockholders and Operating Partnership units | $ | 191,449 | $ | 178,054 | ||||
| Total weighted average shares and Operating Partnership units | ||||||||
| Basic | 264,675 | 263,379 | ||||||
| Diluted | 268,608 | 265,269 | ||||||
| FFO per share | ||||||||
| Basic | $ | 0.69 | $ | 0.65 | ||||
| Diluted | $ | 0.68 | $ | 0.65 | ||||
| Modified FFO per share | ||||||||
| Basic | $ | 0.71 | $ | 0.68 | ||||
| Diluted | $ | 0.70 | $ | 0.67 | ||||
| Core FFO per share | ||||||||
| Basic | $ | 0.72 | $ | 0.68 | ||||
| Diluted | $ | 0.71 | $ | 0.67 | ||||
Empire State Realty Trust, Inc.
Condensed Consolidated Balance Sheets
(unaudited and amounts in thousands)
| September 30, 2024 | December 31, 2023 | |||||||
| Assets | ||||||||
| Commercial real estate properties, at cost | $ | 3,667,687 | $ | 3,655,192 | ||||
| Less: accumulated depreciation | (1,241,454 | ) | (1,250,062 | ) | ||||
| Commercial real estate properties, net | 2,426,233 | 2,405,130 | ||||||
| Contract asset2 | 168,687 | — | ||||||
| Cash and cash equivalents | 421,896 | 346,620 | ||||||
| Restricted cash | 48,023 | 60,336 | ||||||
| Tenant and other receivables | 34,068 | 39,836 | ||||||
| Deferred rent receivables | 244,448 | 255,628 | ||||||
| Prepaid expenses and other assets | 81,758 | 98,167 | ||||||
| Deferred costs, net | 176,720 | 172,457 | ||||||
| Acquired below market ground leases, net | 315,368 | 321,241 | ||||||
| Right of use assets | 28,257 | 28,439 | ||||||
| Goodwill | 491,479 | 491,479 | ||||||
| Total assets | $ | 4,436,937 | $ | 4,219,333 | ||||
| Liabilities and equity | ||||||||
| Mortgage notes payable, net | $ | 692,989 | $ | 877,388 | ||||
| Senior unsecured notes, net | 1,196,911 | 973,872 | ||||||
| Unsecured term loan facility, net | 268,655 | 389,286 | ||||||
| Unsecured revolving credit facility | 120,000 | — | ||||||
| Debt associated with property in receivership | 177,667 | — | ||||||
| Accrued interest associated with property in receivership | 3,511 | — | ||||||
| Accounts payable and accrued expenses | 81,443 | 99,756 | ||||||
| Acquired below market leases, net | 14,702 | 13,750 | ||||||
| Ground lease liabilities | 28,257 | 28,439 | ||||||
| Deferred revenue and other liabilities | 70,766 | 70,298 | ||||||
| Tenants’ security deposits | 24,715 | 35,499 | ||||||
| Total liabilities | 2,679,616 | 2,488,288 | ||||||
| Total equity | 1,757,321 | 1,731,045 | ||||||
| Total liabilities and equity | $ | 4,436,937 | $ | 4,219,333 | ||||
2 This contract asset represents the amount of obligation we expect to be released upon the final resolution of the foreclosure process on First Stamford Place.
Exhibit 99.2

 |
Third Quarter 2024 |
| Table of Contents | Page | ||
| Summary | |||
| Supplemental Definitions | 3 | ||
| Company Profile | 5 | ||
| Condensed Consolidated Balance Sheets | 6 | ||
| Condensed Consolidated Statements of Operations | 7 | ||
| Highlights | 8 | ||
| Selected Property Data | |||
| Property Summary Net Operating Income | 9 | ||
| Same Store Net Operating Income ("NOI"), Initial Cash Rent Contributing to Cash NOI | 10 | ||
| Leasing Activity | 11 | ||
| Commercial Property Detail | 13 | ||
| Portfolio Expirations and Vacates Summary | 14 | ||
| Tenant Lease Expirations | 15 | ||
| Largest Tenants and Portfolio Tenant Diversification by Industry | 17 | ||
| Capital Expenditures and Redevelopment Program | 18 | ||
| Observatory Summary | 19 | ||
| Financial information | |||
| FFO, Modified FFO, Core FFO, FAD and EBITDA | 20 | ||
| Consolidated Debt Analysis | |||
| Debt Summary | 21 | ||
| Debt Detail | 22 | ||
| Debt Maturities | 23 | ||
| Ground Leases | 23 |
Forward-looking Statements
This presentation includes “forward-looking statements” within the meaning of Section 27A of the Securities Act of 1933, as amended (the “Securities Act"), and Section 21E of the Securities Exchange Act of 1934, as amended (the “Exchange Act”). We intend these forward-looking statements to be covered by the safe harbor provisions for forward-looking statements contained in the Private Securities Litigation Reform Act of 1995 and are including this statement for purposes of complying with those safe harbor provisions. You can identify forward-looking statements by the use of forward-looking terminology such as “aims," "anticipates," "approximately," "believes," "contemplates," "continues," "estimates," "expects," "forecasts," "hope," "intends," "may," "plans," "seeks," "should," "thinks," "will," "would" or the negative of these words and phrases or similar words or phrases. For the avoidance of doubt, any projection, guidance, or similar estimation about the future or future results, performance or achievements is a forward-looking statement.
Forward-looking statements are subject to substantial risks and uncertainties, many of which are difficult to predict and are generally beyond our control, and you should not rely on them as predictions of future events. Forward-looking statements depend on assumptions, data or methods which may be incorrect or imprecise, and we may not be able to realize them. We do not guarantee that the transactions and events described will happen as described (or that they will happen at all).
Many important factors could cause our actual results, performance, achievements, and future events to differ materially from those set forth, implied, anticipated, expected, projected, assumed or contemplated in our forward-looking statements, including, among other things: (i) economic, market, political and social impact of, and uncertainty relating to, any catastrophic events, including pandemics, epidemics or other outbreaks of disease, climate-related risks such as natural disasters and extreme weather events, terrorism and other armed hostilities, as well as cybersecurity threats and technology disruptions; (ii) a failure of conditions or performance regarding any event or transaction described herein; (iii) resolution of legal proceedings involving the Company; (iv) reduced demand for office, multifamily or retail space, including as a result of the changes in the use of office space and remote work; (v) changes in our business strategy; (vi) a decline in Observatory visitors due to changes in domestic or international tourism, including due to health crises, geopolitical events, currency exchange rates, and/or competition from other observatories; (vii) defaults on, early terminations of, or non-renewal of, leases by tenants; (viii) increases in the Company’s borrowing costs as a result of changes in interest rates and other factors; (ix) declining real estate valuations and impairment charges; (x) termination of our ground leases; (xi) limitations on our ability to pay down, refinance, restructure or extend our indebtedness or borrow additional funds; (xii) decreased rental rates or increased vacancy rates; (xiii) difficulties in executing capital projects or development projects successfully or on the anticipated timeline or budget; (xiv) difficulties in identifying and completing acquisitions; (xv) impact of changes in governmental regulations, tax laws and rates and similar matters; (xvi) our failure to qualify as a REIT; (xvii) incurrence of taxable capital gain on disposition of an asset due to failure of compliance with a 1031 exchange program; (xviii) our disclosure controls and internal control over financial reporting, including any material weakness; and (xix) failure to achieve sustainability metrics and goals, including as a result of tenant collaboration, and impact of governmental regulation on our sustainability efforts. For a further discussion of these and other factors that could impact the company's future results, performance, or transactions, see the section entitled “Risk Factors” of our annual report on Form 10-K for the year ended December 31, 2023 and of our quarterly report on Form 10-Q for the quarter ended June 30, 2024 and any additional factors that may be contained in any filing we make with the U.S. Securities and Exchange Commission.
While forward-looking statements reflect the Company's good faith beliefs, they do not guarantee future performance. Any forward-looking statement contained in this presentation speaks only as of the date on which it was made, and we assume no obligation to update or revise publicly any forward-looking statement to reflect changes in underlying assumptions or factors, new information, data or methods, future events, or other changes after the date of this presentation, except as required by applicable law. Prospective investors should not place undue reliance on any forward-looking statements, which are based only on information currently available to the Company (or to third parties making the forward-looking statements).
Page
|
Third
Quarter 2024 Supplemental Definitions |
Funds From Operations ("FFO")
We compute FFO in accordance with the “White Paper” on FFO published by the National Association of Real Estate Investment Trusts, or NAREIT, which defines FFO as net income (loss) (determined in accordance with GAAP), excluding impairment write-off of investments in depreciable real estate and investments in in-substance real estate investments, gains or losses from debt restructurings and sales of depreciable operating properties, plus real estate-related depreciation and amortization (excluding amortization of deferred financing costs), less distributions to non-controlling interests and gains/losses from discontinued operations and after adjustments for unconsolidated partnerships and joint ventures. FFO is a widely recognized non-GAAP financial measure for REITs that we believe, when considered with financial statements determined in accordance with GAAP, is useful to investors in understanding financial performance and providing a relevant basis for comparison among REITs. In addition, we believe FFO is useful to investors as it captures features particular to real estate performance by recognizing that real estate has generally appreciated over time or maintains residual value to a much greater extent than do other depreciable assets. Investors should review FFO, along with GAAP net income, when trying to understand an equity REIT’s operating performance. We present FFO because we consider it an important supplemental measure of our operating performance and believe that it is frequently used by securities analysts, investors and other interested parties in the evaluation of REITs. However, because FFO excludes depreciation and amortization and captures neither the changes in the value of our properties that result from use or market conditions nor the level of capital expenditures and leasing commissions necessary to maintain the operating performance of our properties, all of which have real economic effect and could materially impact our results of operations, the utility of FFO as a measure of performance is limited. There can be no assurance that FFO presented by us is comparable to similarly titled measures of other REITs. FFO does not represent cash generated from operating activities and should not be considered as an alternative to net income (loss) determined in accordance with GAAP or to cash flow from operating activities determined in accordance with GAAP. FFO is not indicative of cash available to fund ongoing cash needs, including the ability to make cash distributions. Although FFO is a measure used for comparability in assessing the performance of REITs, as the NAREIT White Paper only provides guidelines for computing FFO, the computation of FFO may vary from one company to another.
Modified Funds From Operations ("Modified FFO")
Modified FFO adds back an adjustment for any above or below-market ground lease amortization to traditionally defined FFO. We believe this a useful supplemental measure in evaluating our operating performance due to the non-cash accounting treatment under GAAP, which stems from the third quarter 2014 acquisition of two option properties following our formation transactions as they carry significantly below market ground leases, the amortization of which is material to our overall results. We present Modified FFO because we believe it is an important supplemental measure of our operating performance in that it adds back the non-cash amortization of below-market ground leases. There can be no assurance that Modified FFO presented by us is comparable to similarly titled measures of other REITs. Modified FFO does not represent cash generated from operating activities and should not be considered as an alternative to net income (loss) determined in accordance with GAAP or to cash flow from operating activities determined in accordance with GAAP. Modified FFO is not indicative of cash available to fund ongoing cash needs, including the ability to make cash distributions.
Core Funds From Operations ("Core FFO")
Core FFO adds back to Modified FFO the following items: loss on early extinguishment of debt, acquisition expenses, severance expenses, IPO litigation expense and interest expense associated with property in receivership. The Company believes Core FFO is an important supplemental measure of its operating performance because it excludes non-recurring items. There can be no assurance that Core FFO presented by the Company is comparable to similarly titled measures of other REITs. Core FFO does not represent cash generated from operating activities and should not be considered as an alternative to net income (loss) determined in accordance with GAAP or to cash flow from operating activities determined in accordance with GAAP. Core FFO is not indicative of cash available to fund ongoing cash needs, including the ability to make cash distributions. In future periods, we may also exclude other items from Core FFO that we believe may help investors compare our results.
Core Funds Available for Distribution ("Core FAD")
In addition to Core FFO, we present Core FAD by (i) adding to Core FFO non-real estate depreciation and amortization, the amortization of deferred financing costs, amortization of debt discounts and non-cash compensation expenses and (ii) deducting straight-line rent, amortization of debt premiums and above/below market rent revenue, and recurring capital improvements such as second generation leasing commissions, tenant improvements, prebuilts, capital expenditures and furniture, fixtures & equipment. Core FAD is presented solely as a supplemental disclosure that we believe provides useful information regarding our ability to fund our dividends. Core FAD does not represent cash generated from operating activities and should not be considered as an alternative to net income (loss) determined in accordance with GAAP or to cash flow from operating activities determined in accordance with GAAP. Core FAD is not indicative of cash available to fund ongoing cash needs, including the ability to make cash distributions. There can be no assurance that Core FAD presented by us is comparable to similarly titled measures of other REITs.
Net Operating Income ("NOI") and Property Cash NOI
NOI is a non-GAAP financial measure of performance. NOI is used by our management to evaluate and compare the performance of our properties and to determine trends in earnings and to compute the fair value of our properties as it is not affected by: (i) the cost of funds of the property owner, (ii) the impact of depreciation and amortization expenses as well as gains or losses from the sale of operating real estate assets that are included in net income computed in accordance with GAAP, (iii) acquisition expenses, loss on early extinguishment of debt, impairment charges and loss from derivative financial instruments, or (iv) general and administrative expenses and other gains and losses that are specific to the property owner. The cost of funds is eliminated from NOI because it is specific to the particular financing capabilities and constraints of the owner. The cost of funds is eliminated because it is dependent on historical interest rates and other costs of capital as well as past decisions made by us regarding the appropriate mix of capital which may have changed or may change in the future. Depreciation and amortization expenses as well as gains or losses from the sale of operating real estate assets are eliminated because they may not accurately represent the actual change in value in our office or retail properties that result from use of the properties or changes in market conditions. While certain aspects of real property do decline in value over time in a manner that is reasonably captured by depreciation and amortization, the value of the properties as a whole have historically increased or decreased as a result of changes in overall economic conditions instead of from actual use of the property or the passage of time. Gains and losses from the sale of real property vary from property to property and are affected by market conditions at the time of sale which will usually change from period to period. These gains and losses can create distortions when comparing one period to another or when comparing our operating results to the operating results of other real estate companies that have not made similarly-timed purchases or sales. We believe that eliminating these costs from net income is useful to investors because the resulting measure captures the actual revenue generated and actual expenses incurred in operating our properties as well as trends in occupancy rates, rental rates and operating costs. In some cases, the Company also presents (1) Property Cash NOI, which excludes Observatory NOI and the effects of straight-line rent, fair value lease revenue, and straight-line ground rent expense adjustment, and (2) Property Cash NOI excluding lease termination fees. Property Cash NOI is presented solely as a supplemental disclosure that management believes allows investors to compare NOI performance across periods without taking into account the effect of certain non-cash rental revenues and straight-line ground rent expense adjustment. Similar to depreciation and amortization expense, fair value lease revenues, because of historical cost accounting, may distort operating performance measures at the property level. Additionally, presenting NOI excluding the impact of straight-line rent and straight-line ground rent expense adjustment provides investors with an alternative view of operating performance at the property level that more closely reflects net cash generated in the portfolio. Presenting Property Cash NOI excluding lease termination fees provides investors with additional information that allows them to compare operating performance between periods without taking into account termination fees, which can distort the results for any given period because they generally represent multiple months or years of a tenant’s rental obligations that are paid in a lump sum in connection with a negotiated early termination of the tenant’s lease and are not reflective of the core ongoing operating performance of the Company’s portfolio. However, the usefulness of NOI, Property Cash NOI, and Property Cash NOI excluding lease termination fees is limited because it excludes general and administrative costs, interest expense, depreciation and amortization expense and gains or losses from the sale of properties, and other gains and losses as stipulated by GAAP, the level of capital expenditures and leasing costs necessary to maintain the operating performance of our properties, all of which are significant economic costs. NOI and Property Cash NOI may fail to capture significant trends in these components of net income which further limits its usefulness. NOI and Property Cash NOI are measurements of the operating performance of our properties but do not measure our performance as a whole. These metrics therefore are not substitutes for net income as computed in accordance with GAAP. These measures should be analyzed in conjunction with net income computed in accordance with GAAP. Other companies may use different methods for calculating NOI, Property Cash NOI or similarly titled measures and, accordingly, our measures may not be comparable to similarly titled measures reported by other companies that do not define the measure exactly as we do.
Same Store
In the Company’s analysis of NOI, particularly to make comparisons of NOI between periods meaningful, it is important to provide information for properties that were owned by the Company throughout each period presented. The Company refers to properties acquired prior to the beginning of the earliest period presented and owned by the Company through the end of the latest period presented as “Same Store”. Same Store therefore excludes properties acquired after the beginning of the earliest period presented or disposed of prior to the end of the latest period presented. Accordingly, it takes at least one year and one quarter after a property is acquired for that property to be included in Same Store. The Company’s definition of Same Store also excludes properties held-for-sale or those which we otherwise expect to dispose of in the subsequent quarter, properties placed in receivership, and our multifamily properties. For mixed-use properties, all same store property NOI is represented in the property category that comprises the majority of that mixed-use property's NOI. As of September 30, 2024, Same Store excludes the North Sixth Street Collection which was acquired in September 2023 and September 2024, and First Stamford Place, Stamford, CT which was placed into receivership in May 2024.
Page
|
Third
Quarter 2024 Supplemental Definitions |
EBITDA and Adjusted EBITDA
We compute EBITDA as net income plus interest expense, interest expense associated with property in receivership, income taxes and depreciation and amortization. We present EBITDA because we believe that EBITDA, along with cash flow from operating activities, investing activities and financing activities, provides investors with an additional indicator of its ability to incur and service debt. EBITDA should not be considered as an alternative to net income (determined in accordance with GAAP), as an indication of our financial performance, as an alternative to net cash flows from operating activities (determined in accordance with GAAP), or as a measure of its liquidity. For Adjusted EBITDA, we add back impairment charges and (gain) loss on disposition of property.
Net Debt to Adjusted EBITDA
We compute Net Debt to Adjusted EBITDA as the Company’s pro-rata share of gross debt less cash and cash equivalents divided by the Company’s pro-rata share of trailing twelve months Adjusted EBITDA. The Company believes that the presentation of Net Debt to Adjusted EBITDA provides useful information to investors because the Company reviews Net Debt to Adjusted EBITDA as part of the management of its overall financial flexibility, capital structure and leverage based on its percentage ownership interest in all of its assets.
Page
|
Third Quarter 2024 |
COMPANY PROFILE
Empire State Realty Trust, Inc. (NYSE: ESRT) is a NYC-focused REIT that owns and operates a portfolio of modernized, amenitized, and well-located office, retail, and multifamily assets. ESRT’s flagship Empire State Building, the “World's Most Famous Building,” features its iconic Observatory that was declared the #1 Attraction in the World - and the #1 Attraction in the U.S. for the third consecutive year – in Tripadvisor’s 2024 Travelers’ Choice Awards: Best of the Best Things to Do. The Company is the recognized leader in energy efficiency and indoor environmental quality.
BOARD OF DIRECTORS
| Anthony E. Malkin | Chairman and Chief Executive Officer |
| Thomas J. DeRosa | Director, Chair of the Compensation and Human Capital Committee |
| Steven J. Gilbert | Director, Lead Independent Director |
| S. Michael Giliberto | Director, Chair of the Audit Committee |
| Patricia S. Han | Director |
| Grant H. Hill | Director |
| R. Paige Hood | Director, Chair of the Finance Committee |
| James D. Robinson IV | Director, Chair of the Nominating and Corporate Governance Committee |
| Christina Van Tassell | Director |
| Hannah Yang | Director |
EXECUTIVE MANAGEMENT
| Anthony E. Malkin | Chairman and Chief Executive Officer |
| Christina Chiu | President |
| Thomas P. Durels | Executive Vice President, Real Estate |
| Steve Horn | Executive Vice President, Chief Financial Officer & Chief Accounting Officer |
COMPANY INFORMATION
| Corporate Headquarters | Investor Relations | New York Stock Exchange |
| 111 West 33rd Street, 12th Floor | IR@esrtreit.com | Trading Symbol: ESRT |
| New York, NY 10120 | ||
| www.esrtreit.com | ||
| (212) 687-8700 |
RESEARCH COVERAGE
| Bank of America Merrill Lynch | Jeff Spector | (646) 855-1363 | jeff.spector@bofa.com |
| BMO Capital Markets Corp. | John Kim | (212) 885-4115 | jp.kim@bmo.com |
| BTIG | Thomas Catherwood | (212) 738-6140 | tcatherwood@btig.com |
| Citi | Michael Griffin | (212) 816-5871 | michael.a.griffin@citi.com |
| Evercore ISI | Steve Sakwa | (212) 446-9462 | steve.sakwa@evercoreisi.com |
| Green Street Advisors | Dylan Burzinski | (949) 640-8780 | dburzinski@greenstreetadvisors.com |
| KeyBanc Capital Markets | Todd Thomas | (917) 368-2286 | tthomas@key.com |
| Wells Fargo Securities, LLC | Blaine Heck | (443) 263-6529 | blaine.heck@wellsfargo.com |
| Wolfe Research | Andrew Rosivach | (646) 582-9251 | arosivach@wolferesearch.com |
Page
|
Third
Quarter 2024 Condensed Consolidated Balance Sheets (unaudited and dollars in thousands) |
| September
30, 2024 |
June
30, 2024 |
March
31, 2024 |
December
31, 2023 |
September
30, 2023 |
||||||||||||||||
| Assets | ||||||||||||||||||||
| Commercial real estate properties, at cost | $ | 3,667,687 | $ | 3,503,302 | $ | 3,702,317 | $ | 3,655,192 | $ | 3,620,097 | ||||||||||
| Less: accumulated depreciation | (1,241,454 | ) | (1,206,039 | ) | (1,288,519 | ) | (1,250,062 | ) | (1,217,967 | ) | ||||||||||
| Commercial real estate properties, net | 2,426,233 | 2,297,263 | 2,413,798 | 2,405,130 | 2,402,130 | |||||||||||||||
| Contract asset(1) | 168,687 | 166,955 | - | - | - | |||||||||||||||
| Cash and cash equivalents | 421,896 | 535,533 | 333,573 | 346,620 | 353,999 | |||||||||||||||
| Restricted cash | 48,023 | 41,015 | 51,738 | 60,336 | 66,954 | |||||||||||||||
| Tenant and other receivables | 34,068 | 34,665 | 40,137 | 39,836 | 37,651 | |||||||||||||||
| Deferred rent receivables | 244,448 | 242,940 | 257,266 | 255,628 | 254,233 | |||||||||||||||
| Prepaid expenses and other assets | 81,758 | 105,438 | 74,472 | 98,167 | 82,918 | |||||||||||||||
| Deferred costs, net | 176,720 | 172,318 | 180,462 | 172,457 | 175,488 | |||||||||||||||
| Acquired below-market ground leases, net | 315,368 | 317,326 | 319,284 | 321,241 | 323,199 | |||||||||||||||
| Right of use assets | 28,257 | 28,318 | 28,378 | 28,439 | 28,496 | |||||||||||||||
| Goodwill | 491,479 | 491,479 | 491,479 | 491,479 | 491,479 | |||||||||||||||
| Total assets | $ | 4,436,937 | $ | 4,433,250 | $ | 4,190,587 | $ | 4,219,333 | $ | 4,216,547 | ||||||||||
| Liabilities and Equity | ||||||||||||||||||||
| Mortgage notes payable, net | $ | 692,989 | $ | 700,348 | $ | 876,497 | $ | 877,388 | $ | 878,757 | ||||||||||
| Senior unsecured notes, net | 1,196,911 | 1,196,831 | 973,926 | 973,872 | 973,819 | |||||||||||||||
| Unsecured term loan facility, net | 268,655 | 268,580 | 268,503 | 389,286 | 389,158 | |||||||||||||||
| Unsecured revolving credit facility | 120,000 | 120,000 | 120,000 | - | - | |||||||||||||||
| Debt associated with property in receivership | 177,667 | 177,667 | - | - | - | |||||||||||||||
| Accrued interest associated with property in receivership | 3,511 | 1,589 | - | - | - | |||||||||||||||
| Accounts payable and accrued expenses | 81,443 | 90,908 | 91,005 | 99,756 | 83,299 | |||||||||||||||
| Acquired below-market leases, net | 14,702 | 11,872 | 12,798 | 13,750 | 14,703 | |||||||||||||||
| Ground lease liabilities | 28,257 | 28,318 | 28,378 | 28,439 | 28,496 | |||||||||||||||
| Deferred revenue and other liabilities | 70,766 | 61,890 | 69,289 | 70,298 | 75,688 | |||||||||||||||
| Tenants' security deposits | 24,715 | 24,031 | 25,457 | 35,499 | 39,307 | |||||||||||||||
| Total liabilities | 2,679,616 | 2,682,034 | 2,465,853 | 2,488,288 | 2,483,227 | |||||||||||||||
| Total equity | 1,757,321 | 1,751,216 | 1,724,734 | 1,731,045 | 1,733,320 | |||||||||||||||
| Total liabilities and equity | $ | 4,436,937 | $ | 4,433,250 | $ | 4,190,587 | $ | 4,219,333 | $ | 4,216,547 | ||||||||||
(1) This contract asset represents the amount of obligation we expect to be released upon the final resolution of the foreclosure process on First Stamford Place.
Page
 |
Third Quarter 2024 Condensed Consolidated Statements of Operations (unaudited and in thousands, except per share amounts) |
| Three Months Ended | ||||||||||||||||||||
| September 30, 2024 |
June 30, 2024 |
March 31, 2024 |
December 31, 2023 |
September 30, 2023 |
||||||||||||||||
| Revenues | ||||||||||||||||||||
| Rental revenue (1) | $ | 153,117 | $ | 152,470 | $ | 153,882 | $ | 151,167 | $ | 151,458 | ||||||||||
| Observatory revenue | 39,382 | 34,124 | 24,596 | 36,217 | 37,562 | |||||||||||||||
| Lease termination fees | 4,771 | - | - | - | - | |||||||||||||||
| Third-party management and other fees | 271 | 376 | 265 | 275 | 268 | |||||||||||||||
| Other revenue and fees | 2,058 | 2,573 | 2,436 | 5,223 | 2,238 | |||||||||||||||
| Total revenues | 199,599 | 189,543 | 181,179 | 192,882 | 191,526 | |||||||||||||||
| Operating expenses | ||||||||||||||||||||
| Property operating expenses | 45,954 | 41,516 | 45,060 | 42,944 | 42,817 | |||||||||||||||
| Ground rent expenses | 2,331 | 2,332 | 2,331 | 2,332 | 2,331 | |||||||||||||||
| General and administrative expenses | 18,372 | 18,020 | 15,972 | 16,144 | 16,012 | |||||||||||||||
| Observatory expenses | 9,715 | 8,958 | 8,431 | 9,282 | 9,471 | |||||||||||||||
| Real estate taxes | 31,982 | 31,883 | 32,241 | 31,809 | 32,014 | |||||||||||||||
| Depreciation and amortization | 45,899 | 47,473 | 46,081 | 49,599 | 46,624 | |||||||||||||||
| Total operating expenses | 154,253 | 150,182 | 150,116 | 152,110 | 149,269 | |||||||||||||||
| Total operating income | 45,346 | 39,361 | 31,063 | 40,772 | 42,257 | |||||||||||||||
| Other income (expense) | ||||||||||||||||||||
| Interest income | 6,960 | 5,092 | 4,178 | 4,740 | 4,462 | |||||||||||||||
| Interest expense | (27,408 | ) | (25,323 | ) | (25,128 | ) | (25,393 | ) | (25,382 | ) | ||||||||||
| Interest expense associated with property in receivership | (1,922 | ) | (628 | ) | - | - | - | |||||||||||||
| Loss on early extinguishment of debt | - | - | (553 | ) | - | - | ||||||||||||||
| Gain (loss) on disposition of property | 1,262 | 10,803 | - | (2,497 | ) | - | ||||||||||||||
| Income before income taxes | 24,238 | 29,305 | 9,560 | 17,622 | 21,337 | |||||||||||||||
| Income tax (expense) benefit | (1,442 | ) | (750 | ) | 655 | (1,792 | ) | (1,409 | ) | |||||||||||
| Net income | 22,796 | 28,555 | 10,215 | 15,830 | 19,928 | |||||||||||||||
| Net (income) loss attributable to noncontrolling interests: | ||||||||||||||||||||
| Non-controlling interests in the Operating Partnership | (8,205 | ) | (10,433 | ) | (3,500 | ) | (5,670 | ) | (7,207 | ) | ||||||||||
| Non-controlling interests in other partnerships | - | - | (4 | ) | 1 | (111 | ) | |||||||||||||
| Private perpetual preferred unit distributions | (1,050 | ) | (1,051 | ) | (1,050 | ) | (1,050 | ) | (1,050 | ) | ||||||||||
| Net income attributable to common stockholders | $ | 13,541 | $ | 17,071 | $ | 5,661 | $ | 9,111 | $ | 11,560 | ||||||||||
| Weighted average common shares outstanding | ||||||||||||||||||||
| Basic | 164,880 | 164,277 | 163,491 | 161,974 | 161,851 | |||||||||||||||
| Diluted | 269,613 | 268,716 | 267,494 | 267,003 | 266,073 | |||||||||||||||
| Earnings per share attributable to common stockholders | ||||||||||||||||||||
| Basic and diluted | $ | 0.08 | $ | 0.10 | $ | 0.03 | $ | 0.06 | $ | 0.07 | ||||||||||
| Dividends per share | $ | 0.035 | $ | 0.035 | $ | 0.035 | $ | 0.035 | $ | 0.035 | ||||||||||
Note:
| (1) | The following table reflects the components of rental revenue. |
| Three Months Ended | ||||||||||||||||||||
| Rental Revenue | September 30, 2024 |
June 30, 2024 |
March 31, 2024 |
December 31, 2023 |
September 30, 2023 |
|||||||||||||||
| Base rent | $ | 132,492 | $ | 136,328 | $ | 136,557 | $ | 134,467 | $ | 133,228 | ||||||||||
| Billed tenant expense reimbursement | 20,625 | 16,142 | 17,325 | 16,700 | 18,230 | |||||||||||||||
| Total rental revenue | $ | 153,117 | $ | 152,470 | $ | 153,882 | $ | 151,167 | $ | 151,458 | ||||||||||
The preceding table of the components of rental revenue is not, and is not intended to be, a presentation in accordance with GAAP. The Company believes this information is frequently used by management, investors, securities analysts and other interested parties to evaluate the Company’s performance.
Page
|
Third Quarter 2024 Highlights (unaudited and dollars and shares in thousands, except per share amounts) |
| Three Months Ended | ||||||||||||||||||||
| September 30, 2024 |
June 30, 2024 |
March 31, 2024 |
December 31, 2023 |
September 30, 2023 |
||||||||||||||||
| Office and Retail Metrics: | ||||||||||||||||||||
| Total rentable square footage | 8,592,481 | 8,549,496 | 9,332,569 | 9,359,219 | 9,361,656 | |||||||||||||||
| Percent occupied (1) | 88.8 | % | 88.5 | % | 87.6 | % | 86.3 | % | 87.0 | % | ||||||||||
| Percent leased (2) | 93.0 | % | 92.6 | % | 91.1 | % | 90.6 | % | 90.5 | % | ||||||||||
| Same Store Property Cash Net Operating Income (NOI): | ||||||||||||||||||||
| Manhattan office portfolio | $ | 69,840 | $ | 67,165 | $ | 63,911 | $ | 66,897 | $ | 61,985 | ||||||||||
| Greater New York office portfolio | 1,651 | 1,825 | 1,383 | 1,711 | 1,981 | |||||||||||||||
| Retail portfolio | 2,431 | 2,517 | 1,542 | 1,791 | 1,752 | |||||||||||||||
| Total Same Store Property Cash NOI | $ | 73,922 | $ | 71,507 | $ | 66,836 | $ | 70,399 | $ | 65,718 | ||||||||||
| Multifamily Metrics: | ||||||||||||||||||||
| Multifamily Cash NOI (3) | $ | 4,506 | $ | 4,533 | $ | 4,217 | $ | 4,032 | $ | 4,837 | ||||||||||
| Total number of units (4) | 732 | 727 | 727 | 727 | 727 | |||||||||||||||
| Percent occupied (4) | 96.8 | % | 97.9 | % | 97.1 | % | 98.1 | % | 97.1 | % | ||||||||||
| Observatory Metrics: | ||||||||||||||||||||
| Observatory NOI | $ | 29,667 | $ | 25,166 | $ | 16,165 | $ | 26,935 | $ | 28,091 | ||||||||||
| Number of visitors (5) | 727,000 | 648,000 | 485,000 | 711,000 | 743,000 | |||||||||||||||
| Change in visitors year-over-year | (2.2 | )% | (2.7 | )% | 9.5 | % | 7.7 | % | 8.2 | % | ||||||||||
| Ratios at ESRT pro-rata share: (3) | ||||||||||||||||||||
| Debt to Total Market Capitalization (6) | 42.3 | % | 46.4 | % | 44.1 | % | 45.2 | % | 49.7 | % | ||||||||||
| Net Debt to Total Market Capitalization (6) | 37.5 | % | 39.9 | % | 40.2 | % | 41.1 | % | 45.4 | % | ||||||||||
| Debt and Perpetual Preferred Units to Total Market Capitalization (6) | 44.0 | % | 48.2 | % | 45.8 | % | 47.0 | % | 51.7 | % | ||||||||||
| Net Debt and Perpetual Preferred Units to Total Market Capitalization (6) | 39.3 | % | 41.9 | % | 42.0 | % | 43.0 | % | 47.6 | % | ||||||||||
| Debt to Adjusted EBITDA (7) | 6.4 | x | 6.6 | x | 6.2 | x | 6.4 | x | 6.6 | x | ||||||||||
| Net Debt to Adjusted EBITDA (7) | 5.2 | x | 5.1 | x | 5.3 | x | 5.4 | x | 5.5 | x | ||||||||||
| Core FFO Payout Ratio (8) | 14 | % | 15 | % | 17 | % | 14 | % | 14 | % | ||||||||||
| Core FAD Payout Ratio (9) | 21 | % | 30 | % | 109 | % | 35 | % | 23 | % | ||||||||||
| Core FFO per share - diluted | $ | 0.26 | $ | 0.24 | $ | 0.21 | $ | 0.25 | $ | 0.25 | ||||||||||
| Diluted weighted average shares | 269,613 | 268,716 | 267,494 | 267,003 | 266,073 | |||||||||||||||
| Class A common stock price at quarter end | $ | 11.08 | $ | 9.38 | $ | 10.13 | $ | 9.69 | $ | 8.04 | ||||||||||
| Dividends declared and paid per share | $ | 0.035 | $ | 0.035 | $ | 0.035 | $ | 0.035 | $ | 0.035 | ||||||||||
| Dividends per share - annualized | $ | 0.14 | $ | 0.14 | $ | 0.14 | $ | 0.14 | $ | 0.14 | ||||||||||
| Dividend yield (10) | 1.3 | % | 1.5 | % | 1.4 | % | 1.4 | % | 1.7 | % | ||||||||||
| Series 2013 Private Perpetual Preferred Units outstanding ($16.62 liquidation value) | 1,560 | 1,560 | 1,560 | 1,560 | 1,560 | |||||||||||||||
| Series 2019 Private Perpetual Preferred Units outstanding ($13.52 liquidation value) | 4,664 | 4,664 | 4,664 | 4,664 | 4,664 | |||||||||||||||
| Class A common stock | 165,507 | 164,483 | 163,816 | 162,062 | 161,346 | |||||||||||||||
| Class B common stock (11) | 981 | 982 | 982 | 984 | 987 | |||||||||||||||
| Operating partnership units | 107,664 | 108,713 | 109,218 | 107,900 | 108,618 | |||||||||||||||
| Total common stock and operating partnership units outstanding (12) | 274,152 | 274,178 | 274,016 | 270,946 | 270,951 | |||||||||||||||
Notes:
| (1) | Based on leases signed and commenced as of end of period. | |
| (2) | Represents occupancy and includes signed leases not commenced. | |
| (3) | On March 28, 2024, ESRT acquired the non-controlling interest in its other partnerships. The Multifamily Cash NOI presented here reflects ESRT’s pro-rata 90% for the periods prior to this acquisition. Historical ratios remain unchanged, and September 30, 2024, June 30, 2024 and March 31, 2024 debt ratios reflect ESRT’s 100% share of debt and Adjusted EBITDA. | |
| (4) | Multifamily percent occupied excludes 20 units held offline in connection with an application for the extension of the New York State Real Property Tax Law 421-a Program at one of our multifamily properties. Total number of units disclosed does not have this exclusion. | |
| (5) | Reflects the number of visitors who pass through the turnstile, excluding visitors who make a second visit on the same ticket at no additional charge. | |
| (6) | Market capitalization represents the sum of (i) Company’s common stock per share price as of September 30, 2024 multiplied by the total outstanding number of shares of common stock and operating partnership units as of September 30, 2024; (ii) the number of Series 2014 perpetual preferred units at September 30, 2024 multiplied by $16.62, (iii) the number of Series 2019 perpetual preferred units at September 30, 2024 multiplied by $13.52, and (iv) our outstanding indebtedness as of September 30, 2024. | |
| (7) | Calculated based on trailing 12 months Adjusted EBITDA. For the periods ended September 30, 2024 and June 30, 2024 excludes trailing 12 months Adjusted EBITDA of $9 million and $12 million, respectively, relating to First Stamford Place, Stamford CT, which was placed into receivership at the end of May 2024. | |
| (8) | Represents the amount of Core FFO paid out in distributions. | |
| (9) | Beginning in the three months ended December 31, 2023, we have eliminated a deduction of other non-recurring capital improvements from Core FFO to arrive at Core FAD and the related Core FAD Payout Ratio. We made this modification above to the calculation of Core FAD Payout Ratio for the other periods presented; in our previous supplemental reports prior to this change, the Core FAD Payout Ratios was 27% for the three months ended September 30, 2023. | |
| (10) | Based on the closing price per share of Class A common stock on September 30, 2024. | |
| (11) | We have two classes of common stock as a means to give our OP Unit holders voting rights in the public company that correspond to their economic interest in the combined entity. A one-time option was created at our formation transactions for any pre-IPO OP Unit holder to exchange one OP Unit out of every 50 OP Units they owned for one Class B share, and such Class B share carries 50 votes to the extent such holder continnues to hold 49 OP units for every Class B share. | |
| (12) | Represents fully diluted common stock and operating partnership units as it includes unvested restricted stock and unvested LTIP units. |
Page
|
Third Quarter 2024 Property Summary - Same Store Net Operating Income (“NOI”) by Quarter (unaudited and dollars in thousands) |
| Three Months Ended | ||||||||||||||||||||
| September 30, 2024 |
June 30, 2024 |
March 31, 2024 |
December 31, 2023 |
September 30, 2023 |
||||||||||||||||
| Same Store Portfolio(1) | ||||||||||||||||||||
| Revenues | $ | 145,501 | $ | 140,763 | $ | 140,147 | $ | 139,865 | $ | 137,854 | ||||||||||
| Operating expenses | (75,596 | ) | (68,762 | ) | (71,486 | ) | (68,923 | ) | (69,574 | ) | ||||||||||
| Same store property NOI | 69,905 | 72,001 | 68,661 | 70,942 | 68,280 | |||||||||||||||
| Straight-line rent | (2,184 | ) | (1,887 | ) | (3,218 | ) | (1,967 | ) | (3,924 | ) | ||||||||||
| Above/below-market rent revenue amortization | (528 | ) | (565 | ) | (565 | ) | (534 | ) | (595 | ) | ||||||||||
| Below-market ground lease amortization | 1,958 | 1,958 | 1,958 | 1,958 | 1,957 | |||||||||||||||
| Total same store property cash NOI - excluding lease termination fees | $ | 69,151 | $ | 71,507 | $ | 66,836 | $ | 70,399 | $ | 65,718 | ||||||||||
| Percent change over prior year | 5.2 | % | 7.4 | % | 12.3 | % | 11.3 | % | 8.8 | % | ||||||||||
| Total same store property cash NOI - excluding lease termination fees | $ | 69,151 | $ | 71,507 | $ | 66,836 | $ | 70,399 | $ | 65,718 | ||||||||||
| Lease termination fees | 4,771 | - | - | - | - | |||||||||||||||
| Total same store property cash NOI | $ | 73,922 | $ | 71,507 | $ | 66,836 | $ | 70,399 | $ | 65,718 | ||||||||||
| Same Store Manhattan Office(1), (2) | ||||||||||||||||||||
| Revenues | $ | 138,060 | $ | 133,180 | $ | 133,919 | $ | 133,207 | $ | 130,888 | ||||||||||
| Operating expenses | (72,287 | ) | (65,473 | ) | (68,173 | ) | (65,750 | ) | (66,294 | ) | ||||||||||
| Same store property NOI | 65,773 | 67,707 | 65,746 | 67,457 | 64,594 | |||||||||||||||
| Straight-line rent | (2,134 | ) | (1,935 | ) | (3,228 | ) | (1,984 | ) | (3,971 | ) | ||||||||||
| Above/below-market rent revenue amortization | (528 | ) | (565 | ) | (565 | ) | (534 | ) | (595 | ) | ||||||||||
| Below-market ground lease amortization | 1,958 | 1,958 | 1,958 | 1,958 | 1,957 | |||||||||||||||
| Total same store property cash NOI - excluding lease termination fees | 65,069 | 67,165 | 63,911 | 66,897 | 61,985 | |||||||||||||||
| Lease termination fees | 4,771 | - | - | - | - | |||||||||||||||
| Total same store property cash NOI | $ | 69,840 | $ | 67,165 | $ | 63,911 | $ | 66,897 | $ | 61,985 | ||||||||||
| Same Store Greater New York Metropolitan Area Office(1) | ||||||||||||||||||||
| Revenues | $ | 3,060 | $ | 3,319 | $ | 2,844 | $ | 3,072 | $ | 3,425 | ||||||||||
| Operating expenses | (1,612 | ) | (1,656 | ) | (1,594 | ) | (1,504 | ) | (1,627 | ) | ||||||||||
| Same store property NOI | 1,448 | 1,663 | 1,250 | 1,568 | 1,798 | |||||||||||||||
| Straight-line rent | 203 | 162 | 133 | 143 | 183 | |||||||||||||||
| Above/below-market rent revenue amortization | - | - | - | - | - | |||||||||||||||
| Below-market ground lease amortization | - | - | - | - | - | |||||||||||||||
| Total same store property cash NOI - excluding lease termination fees | 1,651 | 1,825 | 1,383 | 1,711 | 1,981 | |||||||||||||||
| Lease termination fees | - | - | - | - | - | |||||||||||||||
| Total same store property cash NOI | $ | 1,651 | $ | 1,825 | $ | 1,383 | $ | 1,711 | $ | 1,981 | ||||||||||
| Same Store Retail(1) | ||||||||||||||||||||
| Revenues | $ | 4,381 | $ | 4,264 | $ | 3,384 | $ | 3,586 | $ | 3,541 | ||||||||||
| Operating expenses | (1,697 | ) | (1,633 | ) | (1,719 | ) | (1,669 | ) | (1,653 | ) | ||||||||||
| Same store property NOI | 2,684 | 2,631 | 1,665 | 1,917 | 1,888 | |||||||||||||||
| Straight-line rent | (253 | ) | (114 | ) | (123 | ) | (126 | ) | (136 | ) | ||||||||||
| Above/below-market rent revenue amortization | - | - | - | - | - | |||||||||||||||
| Below-market ground lease amortization | - | - | - | - | - | |||||||||||||||
| Total same store property cash NOI - excluding lease termination fees | 2,431 | 2,517 | 1,542 | 1,791 | 1,752 | |||||||||||||||
| Lease termination fees | - | - | - | - | - | |||||||||||||||
| Total same store property cash NOI | $ | 2,431 | $ | 2,517 | $ | 1,542 | $ | 1,791 | $ | 1,752 | ||||||||||
Notes:
| (1) | Revenues include the same-store portion of Rental revenue and Other revenue and fees. Operating expenses include the same-store portion of Property operating expenses, Ground rent expenses, and Real estate taxes. | |
| (2) | Includes 475,744 rentable square feet of retail space in the Company’s nine Manhattan office properties. |
Page
|
Third Quarter 2024 Same Store Net Operating Income (“NOI”), Initial Cash Rent Contributing to Cash NOI (unaudited and dollars in thousands) |
| Three Months Ended | ||||||||||||||||||||
| September 30, 2024 |
June 30, 2024 |
March 31, 2024 |
December 31, 2023 |
September 30, 2023 |
||||||||||||||||
| Reconciliation of Net Income to Cash NOI and Same Store Cash NOI | ||||||||||||||||||||
| Net income | $ | 22,796 | $ | 28,555 | $ | 10,215 | $ | 15,830 | $ | 19,928 | ||||||||||
| Add: | ||||||||||||||||||||
| General and administrative expenses | 18,372 | 18,020 | 15,972 | 16,144 | 16,012 | |||||||||||||||
| Depreciation and amortization | 45,899 | 47,473 | 46,081 | 49,599 | 46,624 | |||||||||||||||
| Interest expense | 27,408 | 25,323 | 25,128 | 25,393 | 25,382 | |||||||||||||||
| Interest expense associated with property in receivership | 1,922 | 628 | - | - | - | |||||||||||||||
| Loss on early extinguishment of debt | - | - | 553 | - | - | |||||||||||||||
| Income tax expense (benefit) | 1,442 | 750 | (655 | ) | 1,792 | 1,409 | ||||||||||||||
| Less: | ||||||||||||||||||||
| (Gain) loss on disposition of property | (1,262 | ) | (10,803 | ) | - | 2,497 | - | |||||||||||||
| Third-party management and other fees | (271 | ) | (376 | ) | (265 | ) | (275 | ) | (268 | ) | ||||||||||
| Interest income | (6,960 | ) | (5,092 | ) | (4,178 | ) | (4,740 | ) | (4,462 | ) | ||||||||||
| Net operating income | 109,346 | 104,478 | 92,851 | 106,240 | 104,625 | |||||||||||||||
| Straight-line rent | (2,277 | ) | (1,900 | ) | (3,061 | ) | (2,133 | ) | (5,015 | ) | ||||||||||
| Above/below-market rent revenue amortization | (476 | ) | (513 | ) | (514 | ) | (483 | ) | (554 | ) | ||||||||||
| Below-market ground lease amortization | 1,958 | 1,958 | 1,958 | 1,958 | 1,957 | |||||||||||||||
| Total cash NOI - including Observatory and lease termination fees | 108,551 | 104,023 | 91,234 | 105,582 | 101,013 | |||||||||||||||
| Less: Observatory NOI | (29,667 | ) | (25,166 | ) | (16,165 | ) | (26,935 | ) | (28,091 | ) | ||||||||||
| Less: cash NOI from non-Same Store properties | (4,962 | ) | (7,350 | ) | (8,233 | ) | (8,248 | ) | (7,204 | ) | ||||||||||
| Total Same Store property cash NOI - including lease termination fees | 73,922 | 71,507 | 66,836 | 70,399 | 65,718 | |||||||||||||||
| Less: Lease termination fees | (4,771 | ) | - | - | - | - | ||||||||||||||
| Total Same Store property cash NOI - excluding Observatory and lease termination fees | $ | 69,151 | $ | 71,507 | $ | 66,836 | $ | 70,399 | $ | 65,718 | ||||||||||
| Multifamily NOI(1) | ||||||||||||||||||||
| Revenues | $ | 9,140 | $ | 9,161 | $ | 8,472 | $ | 8,345 | $ | 8,581 | ||||||||||
| Operating expenses | (4,623 | ) | (4,578 | ) | (4,209 | ) | (4,268 | ) | (3,683 | ) | ||||||||||
| NOI | 4,517 | 4,583 | 4,263 | 4,077 | 4,898 | |||||||||||||||
| Straight-line rent | (69 | ) | (109 | ) | (102 | ) | (102 | ) | (103 | ) | ||||||||||
| Above/below-market rent revenue amortization | 58 | 59 | 56 | 57 | 42 | |||||||||||||||
| Cash NOI | $ | 4,506 | $ | 4,533 | $ | 4,217 | $ | 4,032 | $ | 4,837 | ||||||||||
Initial Cash Rent Contributing to Cash NOI in the Following Years From Burn-off of Free Rent and Signed Leases not Commenced (2)
| Initial | ||||||||||||||||||||||||||||
| Square | Annual | Initial Cash Rent Contributing to Cash NOI in the Following Years | ||||||||||||||||||||||||||
| Expected Cash Commencement | Feet | Cash Rent | 2024 | 2025 | 2026 | 2027 | 2028 | |||||||||||||||||||||
| Fourth quarter 2024 | 90,065 | $ | 4,661 | $ | 362 | $ | 4,661 | $ | 4,661 | $ | 4,541 | $ | 3,866 | |||||||||||||||
| First quarter 2025 | 97,780 | 6,113 | - | 4,491 | 5,295 | 5,295 | 5,295 | |||||||||||||||||||||
| Second quarter 2025 | 128,014 | 8,275 | - | 5,188 | 8,275 | 8,275 | 8,275 | |||||||||||||||||||||
| Third quarter 2025 | 69,029 | 3,918 | - | 1,180 | 3,918 | 3,918 | 3,918 | |||||||||||||||||||||
| Fourth quarter 2025 | 51,526 | 4,722 | - | 389 | 4,722 | 4,722 | 4,722 | |||||||||||||||||||||
| First quarter 2026 | 35,862 | 2,199 | - | - | 2,061 | 2,199 | 2,199 | |||||||||||||||||||||
| Second quarter 2026 | 141,240 | 9,779 | - | - | 6,514 | 9,779 | 9,779 | |||||||||||||||||||||
| Third quarter 2026 | 32,028 | 5,739 | - | - | 1,258 | 2,508 | 2,508 | |||||||||||||||||||||
| Fourth quarter 2026 | 119,981 | 4,275 | - | - | 1,535 | 7,507 | 7,507 | |||||||||||||||||||||
| Second quarter 2027 | 9,030 | 677 | - | - | - | 453 | 677 | |||||||||||||||||||||
| First quarter 2028 | 25,132 | 1,784 | - | - | - | - | 1,784 | |||||||||||||||||||||
| 799,687 | $ | 52,142 | $ | 362 | $ | 15,909 | $ | 38,239 | $ | 49,197 | $ | 50,530 | ||||||||||||||||
| Incremental | Initial | |||||||||||||||||||||||||||
| Annual | Annual | Initial Cash Rent Contributing to Cash NOI in the Following Years | ||||||||||||||||||||||||||
| 3Q 2024 | Cash Rent (3) | Cash Rent | 2024 | 2025 | 2026 | 2027 | 2028 | |||||||||||||||||||||
| Commenced leases in free rent period | $ | 20,470 | $ | 21,517 | $ | 362 | $ | 12,581 | $ | 18,300 | $ | 20,578 | $ | 19,903 | ||||||||||||||
| Signed leases not commenced | 24,080 | 30,625 | - | 3,328 | 19,939 | 28,619 | 30,627 | |||||||||||||||||||||
| $ | 44,550 | $ | 52,142 | $ | 362 | $ | 15,909 | $ | 38,239 | $ | 49,197 | $ | 50,530 | |||||||||||||||
Notes:
| (1) | On March 28, 2024 we acquired the non-controlling interest in ESRT’s joint venture properties. Beginning in the three months ended June 30, 2024, Multifamily NOI figures are presented at 100% ownership. Prior periods disclose ESRT’s pro-rata 90% share. | |
| (2) | Excludes signed leases not commenced and commenced leases in free rent period at our First Stamford Place property. | |
| (3) | Reflects initial annual cash rent less annual cash rent from existing tenant in the space. |
Page
|
Third Quarter 2024 Property Summary - Leasing Activity by Quarter (unaudited) |
| Three Months Ended | ||||||||||||||||||||
| September 30, 2024 |
June 30, 2024 |
March 31, 2024 |
December 31, 2023 |
September 30, 2023 |
||||||||||||||||
| Total Office and Retail Portfolio(1) | ||||||||||||||||||||
| Total leases executed | 31 | 35 | 25 | 20 | 22 | |||||||||||||||
| Weighted average lease term | 7.0 years | 7.0 years | 7.9 years | 10.4 years | 8.4 years | |||||||||||||||
| Average free rent period | 5.2 months | 7.4 months | 7.9 months | 11.9 months | 10.2 months | |||||||||||||||
| Office | ||||||||||||||||||||
| Total square footage executed | 291,418 | 262,991 | 367,262 | 177,406 | 252,562 | |||||||||||||||
| Average starting cash rent psf - leases executed | $ | 70.11 | $ | 66.60 | $ | 64.03 | $ | 64.54 | $ | 66.53 | ||||||||||
| Previously escalated cash rents psf | $ | 68.34 | $ | 65.31 | $ | 61.08 | $ | 61.17 | $ | 60.28 | ||||||||||
| Percentage of new cash rent over previously escalated rents | 2.6 | % | 2.0 | % | 4.8 | % | 5.5 | % | 10.4 | % | ||||||||||
| Retail | ||||||||||||||||||||
| Total square footage executed | 12,792 | 8,990 | 2,458 | 7,452 | 3,187 | |||||||||||||||
| Average starting cash rent psf - leases executed | $ | 203.88 | $ | 91.14 | $ | 400.00 | $ | 189.20 | $ | 169.44 | ||||||||||
| Previously escalated cash rents psf | $ | 332.35 | $ | 75.03 | $ | 378.97 | $ | 288.16 | $ | 169.31 | ||||||||||
| Percentage of new cash rent over previously escalated rents | (38.7 | )% | 21.5 | % | 5.5 | % | (34.3 | )% | 0.1 | % | ||||||||||
| Total Office and Retail Portfolio | ||||||||||||||||||||
| Total square footage executed | 304,210 | 271,981 | 369,720 | 184,858 | 255,749 | |||||||||||||||
| Average starting cash rent psf - leases executed | $ | 75.74 | $ | 67.41 | $ | 66.27 | $ | 70.32 | $ | 67.81 | ||||||||||
| Previously escalated cash rents psf | $ | 79.44 | $ | 65.63 | $ | 63.20 | $ | 71.71 | $ | 61.64 | ||||||||||
| Percentage of new cash rent over previously escalated rents | (4.7 | )% | 2.7 | % | 4.9 | % | (1.9 | )% | 10.0 | % | ||||||||||
| Leasing commission costs per square foot | $ | 19.67 | $ | 18.87 | $ | 21.01 | $ | 26.88 | $ | 18.99 | ||||||||||
| Tenant improvement costs per square foot | 42.90 | 65.69 | 64.98 | 85.60 | 88.50 | |||||||||||||||
| Total LC and TI per square foot(2) | $ | 62.57 | $ | 84.56 | $ | 85.99 | $ | 112.48 | $ | 107.49 | ||||||||||
| Total LC and TI per square foot per year of weighted average lease term(3) | $ | 8.94 | $ | 12.14 | $ | 10.92 | $ | 10.80 | $ | 12.84 | ||||||||||
| Occupancy | 88.8 | % | 88.5 | % | 87.6 | % | 86.3 | % | 87.0 | % | ||||||||||
| Manhattan Office Portfolio | ||||||||||||||||||||
| Total leases executed | 25 | 31 | 22 | 15 | 19 | |||||||||||||||
| Office - New Leases | ||||||||||||||||||||
| Total square footage executed | 130,688 | 162,655 | 201,580 | 96,341 | 78,305 | |||||||||||||||
| Average starting cash rent psf - leases executed | $ | 66.07 | $ | 67.44 | $ | 59.70 | $ | 62.26 | $ | 65.59 | ||||||||||
| Previously escalated cash rents psf | $ | 63.21 | $ | 64.36 | $ | 55.66 | $ | 59.54 | $ | 59.89 | ||||||||||
| Percentage of new cash rent over previously escalated rents | 4.5 | % | 4.8 | % | 7.3 | % | 4.6 | % | 9.5 | % | ||||||||||
| Office - Renewal Leases(1) | ||||||||||||||||||||
| Current Renewals | 53,622 | 43,895 | 34,084 | 38,676 | 157,133 | |||||||||||||||
| Early Renewals | 105,019 | 54,761 | 121,612 | 20,962 | 7,270 | |||||||||||||||
| Total square footage executed | 158,641 | 98,656 | 155,696 | 59,638 | 164,403 | |||||||||||||||
| Average starting cash rent psf - leases executed | $ | 73.11 | $ | 65.50 | $ | 70.30 | $ | 68.61 | $ | 68.42 | ||||||||||
| Previously escalated cash rents psf | $ | 72.24 | $ | 67.09 | $ | 68.19 | $ | 64.26 | $ | 61.62 | ||||||||||
| Percentage of new cash rent over previously escalated rents | 1.2 | % | (2.4 | )% | 3.1 | % | 6.8 | % | 11.0 | % | ||||||||||
| Total Manhattan Office Portfolio | ||||||||||||||||||||
| Total square footage executed | 289,329 | 261,311 | 357,276 | 155,979 | 242,708 | |||||||||||||||
| Average starting cash rent psf - leases executed | $ | 69.93 | $ | 66.71 | $ | 64.32 | $ | 64.69 | $ | 67.50 | ||||||||||
| Previously escalated cash rents psf | $ | 68.16 | $ | 65.40 | $ | 61.12 | $ | 61.34 | $ | 61.06 | ||||||||||
| Percentage of new cash rent over previously escalated rents | 2.6 | % | 2.0 | % | 5.2 | % | 5.5 | % | 10.6 | % | ||||||||||
| Leasing commission costs per square foot | $ | 17.40 | $ | 18.13 | $ | 19.87 | $ | 26.37 | $ | 18.01 | ||||||||||
| Tenant improvement costs per square foot | 42.82 | 68.02 | 63.31 | 89.42 | 90.21 | |||||||||||||||
| Total LC and TI per square foot(2) | $ | 60.22 | $ | 86.15 | $ | 83.18 | $ | 115.79 | $ | 108.22 | ||||||||||
| Total LC and TI per square foot per year of weighted average lease term(3) | $ | 8.67 | $ | 12.49 | $ | 10.59 | $ | 10.56 | $ | 12.90 | ||||||||||
| Occupancy | 89.2 | % | 88.8 | % | 88.9 | % | 87.3 | % | 87.8 | % | ||||||||||
(Table continued on next page)
Page
|
Third Quarter 2024 Property Summary - Leasing Activity by Quarter - (Continued) (unaudited) |
| Three Months Ended | ||||||||||||||||||||
| September
30, 2024 |
June 30,
2024 |
March 31,
2024 |
December
31, 2023 |
September
30, 2023 |
||||||||||||||||
| Greater New York Metropolitan Area Office Portfolio | ||||||||||||||||||||
| Total leases executed | 1 | 1 | 2 | 2 | 2 | |||||||||||||||
| Total square footage executed | 2,089 | 1,680 | 9,986 | 21,427 | 9,854 | |||||||||||||||
| Average starting cash rent psf - leases executed | $ | 95.09 | $ | 50.00 | $ | 53.75 | N/A | (4) | $ | 42.53 | ||||||||||
| Previously escalated cash rents psf | $ | 92.64 | $ | 52.25 | $ | 59.64 | N/A | (4) | $ | 41.00 | ||||||||||
| Percentage of new cash rent over previously escalated rents | 2.6 | % | (4.3 | )% | (9.9 | )% | N/A | (4) | 3.7 | % | ||||||||||
| Leasing commission costs per square foot | $ | - | $ | 9.95 | $ | 19.29 | $ | 16.38 | $ | 9.35 | ||||||||||
| Tenant improvement costs per square foot | - | 3.50 | 128.47 | 80.55 | 34.49 | |||||||||||||||
| Total LC and TI per square foot(2) | $ | - | $ | 13.45 | $ | 147.76 | $ | 96.93 | $ | 43.84 | ||||||||||
| Total LC and TI per square foot per year of weighted average lease term(3) | $ | - | $ | 4.04 | $ | 18.59 | $ | 13.35 | $ | 7.92 | ||||||||||
| Occupancy | 70.7 | % | 70.7 | % | 76.8 | % | 76.6 | % | 79.3 | % | ||||||||||
| Retail Portfolio | ||||||||||||||||||||
| Total leases executed | 5 | 3 | 1 | 3 | 1 | |||||||||||||||
| Total square footage executed | 12,792 | 8,990 | 2,458 | 7,452 | 3,187 | |||||||||||||||
| Average starting cash rent psf - leases executed | $ | 203.88 | $ | 91.14 | $ | 400.00 | $ | 189.20 | $ | 169.44 | ||||||||||
| Previously escalated cash rents psf | $ | 332.35 | $ | 75.03 | $ | 378.97 | $ | 288.16 | $ | 169.31 | ||||||||||
| Percentage of new cash rent over previously escalated rents | (38.7 | )% | 21.5 | % | 5.5 | % | (34.3 | )% | 0.1 | % | ||||||||||
| Leasing commission costs per square foot | $ | 74.25 | $ | 41.87 | $ | 193.06 | $ | 67.66 | $ | 123.73 | ||||||||||
| Tenant improvement costs per square foot | 51.72 | 9.45 | 50.00 | 20.18 | 125.00 | |||||||||||||||
| Total LC and TI per square foot(2) | $ | 125.97 | $ | 51.32 | $ | 243.06 | $ | 87.84 | $ | 248.73 | ||||||||||
| Total LC and TI per square foot per year of weighted average lease term(3) | $ | 14.73 | $ | 5.33 | $ | 23.15 | $ | 10.88 | $ | 15.55 | ||||||||||
| Occupancy | 91.1 | % | 92.3 | % | 89.8 | % | 90.4 | % | 90.4 | % | ||||||||||
| Multifamily Portfolio | ||||||||||||||||||||
| Percent occupied(5) | 96.8 | % | 97.9 | % | 97.1 | % | 98.1 | % | 97.1 | % | ||||||||||
| Total number of units(5) | 732 | 727 | 727 | 727 | 727 | |||||||||||||||
| Notes: | |
| (1) | Added in the quarter ended June 30, 2024, for all comparative periods we include "Early Renewals", defined as leases which were signed over two years prior to the lease expiration. Amounts listed as "Total Renewals" in prior periods have been renamed to "Current Renewals" above. Amounts for total leases executed, weighted average lease term, average free rent period, total square footage executed, average starting cash rent psf - leases executed, previously escalated cash rents psf, percentage of new cash rent over previously escalated rents, leasing commission costs per square foot, tenant improvement costs per square foot and total LC and TI per square foot for the quarters ended March 31, 2024, December 31, 2023 and September 30, 2023 have been adjusted to include the impact of the early renewals for those same prior quarters. |
| (2) | Presents all tenant improvement and leasing commission costs as if they were incurred in the period in which the lease was signed, which may be different than the period in which they were actually paid. |
| (3) | Added in the quarter ended June 30, 2024, for all comparative periods and is calculated by dividing the total LC and TI per square foot by the weighted average lease term. |
| (4) | Leases on spaces that have been vacant for more than two years are not included in the calculation of leasing spreads. The average starting cash rent psf for these two leases was $42.06. |
| (5) | Multifamily percent occupied excludes 20 units held offline in connection with an application for the extension of the New York State Real Property Tax Law 421-a Program at one of our multifamily properties. Total number of units disclosed does not have this exclusion. |
Page
|
Third Quarter 2024 Commercial Property Detail (unaudited) |
| Property Name | Location or Sub-Market | Rentable Square Feet (1) |
Percent Occupied (2) |
Percent Leased (3) |
Annualized
Rent (4) |
Annualized Rent per Occupied Square Foot (5) |
Number
of Leases (6) |
|||||||||||||||||||
| Office - Manhattan | ||||||||||||||||||||||||||
| The Empire State Building | Penn Station -Times Sq. South | 2,710,937 | 91.2 | % | 94.2 | % | $ | 165,471,743 | $ | 66.96 | 148 | |||||||||||||||
| One Grand Central Place | Grand Central | 1,231,342 | 86.3 | % | 92.0 | % | 70,122,062 | 65.97 | 144 | |||||||||||||||||
| 1400 Broadway (7) | Penn Station -Times Sq. South | 917,281 | 88.7 | % | 96.1 | % | 49,810,950 | 61.25 | 19 | |||||||||||||||||
| 111 West 33rd Street (8) | Penn Station -Times Sq. South | 639,595 | 97.7 | % | 100.0 | % | 43,217,450 | 69.19 | 22 | |||||||||||||||||
| 250 West 57th Street | Columbus Circle - West Side | 474,790 | 83.4 | % | 84.6 | % | 26,235,190 | 66.29 | 30 | |||||||||||||||||
| 1359 Broadway | Penn Station -Times Sq. South | 456,508 | 81.6 | % | 90.7 | % | 23,264,340 | 62.49 | 30 | |||||||||||||||||
| 501 Seventh Avenue | Penn Station -Times Sq. South | 454,788 | 90.5 | % | 90.5 | % | 22,376,790 | 54.39 | 18 | |||||||||||||||||
| 1350 Broadway (9) | Penn Station -Times Sq. South | 384,225 | 82.9 | % | 96.5 | % | 19,431,860 | 60.98 | 50 | |||||||||||||||||
| 1333 Broadway | Penn Station -Times Sq. South | 296,349 | 94.4 | % | 94.4 | % | 16,337,012 | 58.38 | 13 | |||||||||||||||||
| Office - Manhattan | 7,565,815 | 89.2 | % | 93.6 | % | 436,267,397 | 64.63 | 474 | ||||||||||||||||||
| Office - Greater New York Metropolitan Area | ||||||||||||||||||||||||||
| Metro Center | Stamford, CT | 281,985 | 70.7 | % | 73.3 | % | 11,330,301 | 56.79 | 19 | |||||||||||||||||
| Office - Greater New York Metropolitan Area | 281,985 | 70.7 | % | 73.3 | % | 11,330,301 | 56.79 | 19 | ||||||||||||||||||
| Total/Weighted Average Office Properties | 7,847,800 | 88.6 | % | 92.9 | % | 447,597,698 | 64.41 | 493 | ||||||||||||||||||
| Retail Properties | ||||||||||||||||||||||||||
| 112 West 34th Street (8) | Penn Station -Times Sq. South | 93,057 | 100.0 | % | 100.0 | % | 25,078,377 | 269.49 | 4 | |||||||||||||||||
| The Empire State Building | Penn Station -Times Sq. South | 88,445 | 77.4 | % | 78.7 | % | 7,800,847 | 113.91 | 11 | |||||||||||||||||
| One Grand Central Place | Grand Central | 70,810 | 100.0 | % | 100.0 | % | 7,864,545 | 111.07 | 12 | |||||||||||||||||
| 1333 Broadway | Penn Station -Times Sq. South | 67,001 | 100.0 | % | 100.0 | % | 10,188,331 | 152.06 | 4 | |||||||||||||||||
| North Sixth Street Collection | Williamsburg - Brooklyn | 65,210 | 87.1 | % | 87.1 | % | 7,829,266 | 137.81 | 14 | |||||||||||||||||
| 250 West 57th Street | Columbus Circle - West Side | 63,443 | 93.8 | % | 93.8 | % | 8,782,849 | 147.59 | 6 | |||||||||||||||||
| 10 Union Square | Union Square | 58,006 | 91.9 | % | 91.9 | % | 8,326,772 | 156.22 | 10 | |||||||||||||||||
| 1542 Third Avenue | Upper East Side | 56,211 | 95.0 | % | 95.0 | % | 2,511,068 | 47.03 | 3 | |||||||||||||||||
| 1010 Third Avenue | Upper East Side | 38,235 | 100.0 | % | 100.0 | % | 3,424,150 | 89.56 | 2 | |||||||||||||||||
| 1359 Broadway | Penn Station -Times Sq. South | 29,247 | 82.5 | % | 99.4 | % | 1,660,466 | 68.86 | 4 | |||||||||||||||||
| 501 Seventh Avenue | Penn Station -Times Sq. South | 27,213 | 73.1 | % | 89.4 | % | 1,433,160 | 72.08 | 6 | |||||||||||||||||
| 77 West 55th Street | Midtown | 25,388 | 100.0 | % | 100.0 | % | 2,083,627 | 82.07 | 3 | |||||||||||||||||
| 1350 Broadway (9) | Penn Station -Times Sq. South | 19,511 | 44.0 | % | 100.0 | % | 2,161,613 | 251.94 | 4 | |||||||||||||||||
| 1400 Broadway (7) | Penn Station -Times Sq. South | 17,017 | 82.2 | % | 82.2 | % | 1,670,565 | 119.50 | 6 | |||||||||||||||||
| 561 10th Avenue | Hudson Yards | 11,822 | 100.0 | % | 100.0 | % | 1,618,301 | 136.89 | 2 | |||||||||||||||||
| 298 Mulberry Street | NoHo | 10,365 | 100.0 | % | 100.0 | % | 1,981,708 | 191.19 | 1 | |||||||||||||||||
| 345 East 94th Street | Upper East Side | 3,700 | 100.0 | % | 100.0 | % | 254,444 | 68.77 | 1 | |||||||||||||||||
| Total/Weighted Average Retail Properties | 744,681 | 91.1 | % | 94.0 | % | 94,670,089 | 139.54 | 93 | ||||||||||||||||||
| Portfolio Total | 8,592,481 | 88.8 | % | 93.0 | % | $ | 542,267,787 | $ | 71.09 | 586 | ||||||||||||||||
| Notes: | |
| (1) | Excludes (i) 195,410 square feet of space across the Company's portfolio attributable to building management use and tenant amenities, (ii) 85,334 square feet of space attributable to the Company's Observatory, (iii) square footage related to the Company's residential units. |
| (2) | Based on leases signed and commenced as of September 30, 2024. |
| (3) | Includes occupied space plus leases signed but not commenced as of September 30, 2024. |
| (4) | Represents annualized base rent and current reimbursement for operating expenses and real estate taxes. |
| (5) | Represents annualized rent under leases commenced as of September 30, 2024 divided by occupied square feet. |
| (6) | Represents the number of leases at each property or on a portfolio basis. If a tenant has more than one lease, whether or not at the same property, but with different expirations, the number of leases is calculated equal to the number of leases with different expirations. |
| (7) | Denotes a ground leasehold interest in the property with a remaining term, including unilateral extension rights available to the Company, of approximately 39 years (expiring December 31, 2063). |
| (8) | Denotes a ground leasehold interest in the property with a remaining term, including unilateral extension rights available to the Company, of approximately 53 years (expiring June 10, 2077). |
| (9) | Denotes a ground leasehold interest in the property with a remaining term, including unilateral extension rights available to the Company, of approximately 26 years (expiring July 31, 2050). |
Page
|
Third Quarter 2024 Total Portfolio Expirations and Vacates Summary (unaudited and in square feet) |
| Actual | Forecast (1) | Forecast (1) | Forecast (1) | Forecast (1) | Forecast (1) | Forecast (1) | ||||||||||||||||||||||
| Three Months Ended | ||||||||||||||||||||||||||||
| Total Office and Retail Portfolio (2) | September
30, 2024 |
December
31, 2024 |
March 31, 2025 | June 30, 2025 | September
30, 2025 |
December
31, 2025 |
Full
Year 2025 |
|||||||||||||||||||||
| Total expirations | 118,518 | 190,672 | 135,073 | 105,753 | 65,034 | 228,413 | 534,273 | |||||||||||||||||||||
| Less: broadcasting | (511 | ) | (906 | ) | - | - | (511 | ) | - | (511 | ) | |||||||||||||||||
| Office and retail expirations | 118,007 | 189,766 | 135,073 | 105,753 | 64,523 | 228,413 | 533,762 | |||||||||||||||||||||
| Renewals & relocations (3) | 13,202 | 40,468 | 24,714 | 33,376 | 20,533 | 34,966 | 113,589 | |||||||||||||||||||||
| New leases (4) | 29,200 | 33,520 | - | 8,187 | - | 119,226 | 127,413 | |||||||||||||||||||||
| Vacates (5) | 75,605 | 107,159 | 100,674 | 17,162 | 12,158 | 30,080 | 160,074 | |||||||||||||||||||||
| Unknown (6) | 8,619 | 9,685 | 47,028 | 31,832 | 44,141 | 132,686 | ||||||||||||||||||||||
| Total Office and Retail Portfolio expirations and vacates | 118,007 | 189,766 | 135,073 | 105,753 | 64,523 | 228,413 | 533,762 | |||||||||||||||||||||
| Manhattan Office Portfolio | ||||||||||||||||||||||||||||
| Total expirations | 118,105 | 188,132 | 120,643 | 103,813 | 52,674 | 215,227 | 492,357 | |||||||||||||||||||||
| Less: broadcasting | (511 | ) | (906 | ) | - | - | (511 | ) | - | (511 | ) | |||||||||||||||||
| Office expirations | 117,594 | 187,226 | 120,643 | 103,813 | 52,163 | 215,227 | 491,846 | |||||||||||||||||||||
| Renewals & relocations (3) | 13,202 | 40,468 | 24,714 | 33,376 | 13,252 | 30,988 | 102,330 | |||||||||||||||||||||
| New leases (4) | 29,200 | 33,520 | - | 8,187 | - | 119,226 | 127,413 | |||||||||||||||||||||
| Vacates (5) | 75,192 | 107,159 | 86,244 | 15,222 | 12,158 | 30,080 | 143,704 | |||||||||||||||||||||
| Unknown (6) | 6,079 | 9,685 | 47,028 | 26,753 | 34,933 | 118,399 | ||||||||||||||||||||||
| Total expirations and vacates | 117,594 | 187,226 | 120,643 | 103,813 | 52,163 | 215,227 | 491,846 | |||||||||||||||||||||
| Greater New York Metropolitan Area Office Portfolio | ||||||||||||||||||||||||||||
| Office expirations | - | 2,540 | - | - | 12,360 | 8,855 | 21,215 | |||||||||||||||||||||
| Renewals & relocations (3) | - | - | - | - | 7,281 | - | 7,281 | |||||||||||||||||||||
| New leases (4) | - | - | - | - | - | - | - | |||||||||||||||||||||
| Vacates (5) | - | - | - | - | - | - | - | |||||||||||||||||||||
| Unknown (6) | - | 2,540 | - | - | 5,079 | 8,855 | 13,934 | |||||||||||||||||||||
| Total expirations and vacates | - | 2,540 | - | - | 12,360 | 8,855 | 21,215 | |||||||||||||||||||||
| Retail Portfolio | ||||||||||||||||||||||||||||
| Retail expirations | 413 | - | 14,430 | 1,940 | - | 4,331 | 20,701 | |||||||||||||||||||||
| Renewals & relocations (3) | - | - | - | - | - | 3,978 | 3,978 | |||||||||||||||||||||
| New leases (4) | - | - | - | - | - | - | - | |||||||||||||||||||||
| Vacates (5) | 413 | - | 14,430 | 1,940 | - | - | 16,370 | |||||||||||||||||||||
| Unknown (6) | - | - | - | - | - | 353 | 353 | |||||||||||||||||||||
| Total expirations and vacates | 413 | - | 14,430 | 1,940 | - | 4,331 | 20,701 | |||||||||||||||||||||
| Notes: | |
| (1) | These forecasts, which are subject to change, are based on management's current expectations, including, among other things, discussions with and other information provided by tenants as well as management's analyses of past historical trends. |
| (2) | Any lease on month to month or short-term will re-appear in "Actual" in each period until tenant has vacated or renewed, and thus it would be double counted if periods were cumulated. "Forecast" avoids double counting. |
| (3) | For forecasted periods, “Renewals & relocations” includes the following: tenants renew their existing leases in all or a portion of their current spaces; tenants which signed renewal leases for a term of less than six months and reappear in forecast periods in 2024; and tenants who move within a building or within the Company's portfolio. |
| (4) | For forecasted periods, “New Leases” represents leases that have been signed with a new tenant, a subtenant who signed a direct lease or a tenant who expanded. There may be downtime between the lease expiration and the new lease commencement. |
| (5) | For forecasted periods, “Vacates” assumes a tenant elects not to renew at the end of their existing lease or exercises an early termination option; leases that the Company decides not to renew at the end of tenants' existing lease due to anticipated future redevelopment or for other reasons. This also may include early lease terminations. |
| (6) | For forecasted periods, "Unknown" represents tenants whose intentions are unknown. |
Page
|
Third Quarter 2024 Tenant Lease Expirations (unaudited) |
| Number
of Leases Expiring(1) |
Rentable Square Feet Expiring (2) |
Percent
of Portfolio Rentable Square Feet Expiring |
Annualized
Rent (3) |
Percent
of Annualized Rent |
Annualized Rent Per Rentable Square Foot |
|||||||||||||||||||
| Total Office and Retail Lease Expirations | ||||||||||||||||||||||||
| Available | - | 602,434 | 7.0 | % | $ | - | 0.0 | % | $ | - | ||||||||||||||
| Signed leases not commenced | 29 | 362,299 | 4.2 | % | - | 0.0 | % | - | ||||||||||||||||
| 3Q 2024 (4) | 7 | 56,456 | 0.7 | % | 2,966,717 | 0.5 | % | 52.55 | ||||||||||||||||
| 4Q 2024 | 33 | 164,276 | 1.9 | % | 9,874,704 | 1.8 | % | 60.11 | ||||||||||||||||
| Total 2024 | 40 | 220,732 | 2.6 | % | 12,841,421 | 2.3 | % | 58.18 | ||||||||||||||||
| 1Q 2025 | 24 | 135,073 | 1.6 | % | 9,554,090 | 1.8 | % | 70.73 | ||||||||||||||||
| 2Q 2025 | 14 | 105,753 | 1.2 | % | 7,267,400 | 1.3 | % | 68.72 | ||||||||||||||||
| 3Q 2025 | 16 | 65,034 | 0.8 | % | 4,161,934 | 0.8 | % | 64.00 | ||||||||||||||||
| 4Q 2025 | 20 | 228,413 | 2.7 | % | 16,009,304 | 3.0 | % | 70.09 | ||||||||||||||||
| Total 2025 | 74 | 534,273 | 6.3 | % | 36,992,728 | 6.9 | % | 69.24 | ||||||||||||||||
| 2026 | 71 | 593,188 | 6.9 | % | 37,046,082 | 6.8 | % | 62.45 | ||||||||||||||||
| 2027 | 91 | 717,483 | 8.4 | % | 48,746,313 | 9.0 | % | 67.94 | ||||||||||||||||
| 2028 | 61 | 942,831 | 11.0 | % | 56,632,374 | 10.4 | % | 60.07 | ||||||||||||||||
| 2029 | 56 | 802,764 | 9.3 | % | 67,510,943 | 12.4 | % | 84.10 | ||||||||||||||||
| 2030 | 48 | 740,558 | 8.6 | % | 55,029,055 | 10.1 | % | 74.31 | ||||||||||||||||
| 2031 | 26 | 200,060 | 2.3 | % | 22,066,222 | 4.1 | % | 110.30 | ||||||||||||||||
| 2032 | 28 | 360,963 | 4.2 | % | 27,165,486 | 5.0 | % | 75.26 | ||||||||||||||||
| 2033 | 31 | 263,973 | 3.1 | % | 20,095,522 | 3.7 | % | 76.13 | ||||||||||||||||
| 2034 | 22 | 331,909 | 3.9 | % | 24,813,958 | 4.6 | % | 74.76 | ||||||||||||||||
| Thereafter | 38 | 1,919,014 | 22.2 | % | 133,327,684 | 24.7 | % | 69.48 | ||||||||||||||||
| Total | 615 | 8,592,481 | 100.0 | % | $ | 542,267,787 | 100.0 | % | $ | 71.09 | ||||||||||||||
| Manhattan Office Properties (5) | ||||||||||||||||||||||||
| Available | - | 482,323 | 6.4 | % | $ | - | 0.0 | % | $ | - | ||||||||||||||
| Signed leases not commenced | 22 | 333,670 | 4.4 | % | - | 0.0 | % | |||||||||||||||||
| 3Q 2024 (4) | 7 | 56,456 | 0.7 | % | 2,966,717 | 0.7 | % | 52.55 | ||||||||||||||||
| 4Q 2024 | 32 | 161,736 | 2.1 | % | 9,811,204 | 2.2 | % | 60.66 | ||||||||||||||||
| Total 2024 | 39 | 218,192 | 2.8 | % | 12,777,921 | 2.9 | % | 58.56 | ||||||||||||||||
| 1Q 2025 | 23 | 120,643 | 1.6 | % | 8,659,430 | 2.0 | % | 71.78 | ||||||||||||||||
| 2Q 2025 | 13 | 103,813 | 1.4 | % | 7,019,926 | 1.6 | % | 67.62 | ||||||||||||||||
| 3Q 2025 | 14 | 52,674 | 0.7 | % | 3,452,299 | 0.8 | % | 65.54 | ||||||||||||||||
| 4Q 2025 | 16 | 215,227 | 2.8 | % | 14,211,537 | 3.3 | % | 66.03 | ||||||||||||||||
| Total 2025 | 66 | 492,357 | 6.5 | % | 33,343,192 | 7.7 | % | 67.72 | ||||||||||||||||
| 2026 | 61 | 492,761 | 6.5 | % | 30,786,647 | 7.1 | % | 62.48 | ||||||||||||||||
| 2027 | 80 | 634,131 | 8.4 | % | 39,157,155 | 9.0 | % | 61.75 | ||||||||||||||||
| 2028 | 54 | 921,547 | 12.2 | % | 54,151,823 | 12.4 | % | 58.76 | ||||||||||||||||
| 2029 | 42 | 655,738 | 8.7 | % | 42,022,420 | 9.6 | % | 64.08 | ||||||||||||||||
| 2030 | 33 | 634,354 | 8.4 | % | 41,539,685 | 9.5 | % | 65.48 | ||||||||||||||||
| 2031 | 16 | 116,840 | 1.5 | % | 8,453,113 | 1.9 | % | 72.35 | ||||||||||||||||
| 2032 | 22 | 329,676 | 4.4 | % | 24,335,406 | 5.6 | % | 73.82 | ||||||||||||||||
| 2033 | 16 | 156,280 | 2.1 | % | 9,850,320 | 2.3 | % | 63.03 | ||||||||||||||||
| 2034 | 16 | 307,701 | 4.1 | % | 21,414,688 | 4.9 | % | 69.60 | ||||||||||||||||
| Thereafter | 29 | 1,790,245 | 23.6 | % | 118,435,027 | 27.1 | % | 66.16 | ||||||||||||||||
| Total Manhattan office properties | 496 | 7,565,815 | 100.0 | % | $ | 436,267,397 | 100.0 | % | $ | 64.63 | ||||||||||||||
(Table continued on next page)
Page
|
Third Quarter 2024 Tenant Lease Expirations (unaudited) |
| Number
of Leases Expiring(1) |
Rentable Square Feet Expiring (2) |
Percent
of Portfolio Rentable Square Feet Expiring |
Annualized Rent (3) |
Percent
of Annualized Rent |
Annualized Rent Per Rentable Square Foot |
|||||||||||||||||||
| Greater New York Metropolitan Area Office Portfolio | ||||||||||||||||||||||||
| Available | - | 75,351 | 26.7 | % | $ | - | 0.0 | % | $ | - | ||||||||||||||
| Signed leases not commenced | 1 | 7,137 | 2.5 | % | - | 0.0 | % | - | ||||||||||||||||
| 3Q 2024 (4) | - | - | 0.0 | % | - | 0.0 | % | - | ||||||||||||||||
| 4Q 2024 | 1 | 2,540 | 0.9 | % | 63,500 | 0.6 | % | 25.00 | ||||||||||||||||
| Total 2024 | 1 | 2,540 | 0.9 | % | 63,500 | 0.6 | % | 25.00 | ||||||||||||||||
| 1Q 2025 | - | - | 0.0 | % | - | 0.0 | % | - | ||||||||||||||||
| 2Q 2025 | - | - | 0.0 | % | - | 0.0 | % | - | ||||||||||||||||
| 3Q 2025 | 2 | 12,360 | 4.4 | % | 709,635 | 6.3 | % | 57.41 | ||||||||||||||||
| 4Q 2025 | 1 | 8,855 | 3.1 | % | 500,505 | 4.4 | % | 56.52 | ||||||||||||||||
| Total 2025 | 3 | 21,215 | 7.5 | % | 1,210,140 | 10.7 | % | 57.04 | ||||||||||||||||
| 2026 | 1 | 23,268 | 8.3 | % | 1,418,307 | 12.5 | % | 60.96 | ||||||||||||||||
| 2027 | 4 | 21,546 | 7.6 | % | 1,214,780 | 10.7 | % | 56.38 | ||||||||||||||||
| 2028 | 2 | 11,480 | 4.1 | % | 639,158 | 5.6 | % | 55.68 | ||||||||||||||||
| 2029 | 2 | 12,183 | 4.3 | % | 703,884 | 6.2 | % | 57.78 | ||||||||||||||||
| 2030 | 3 | 29,062 | 10.3 | % | 1,773,632 | 15.7 | % | 61.03 | ||||||||||||||||
| 2031 | 1 | 15,030 | 5.3 | % | 820,187 | 7.2 | % | 54.57 | ||||||||||||||||
| 2032(6) | 1 | - | 0.0 | % | 6,365 | 0.1 | % | - | ||||||||||||||||
| 2033 | 1 | 63,173 | 22.5 | % | 3,480,348 | 30.7 | % | 55.09 | ||||||||||||||||
| 2034 | - | - | 0.0 | % | - | 0.0 | % | - | ||||||||||||||||
| Thereafter | - | - | 0.0 | % | - | 0.0 | % | - | ||||||||||||||||
| Total greater New York metropolitan area office portfolio | 20 | 281,985 | 100.0 | % | $ | 11,330,301 | 100.0 | % | $ | 56.79 | ||||||||||||||
| Retail Properties | ||||||||||||||||||||||||
| Available | - | 44,760 | 6.0 | % | $ | - | 0.0 | % | $ | - | ||||||||||||||
| Signed leases not commenced | 6 | 21,492 | 2.9 | % | - | 0.0 | % | - | ||||||||||||||||
| 3Q 2024 (4) | - | - | 0.0 | % | - | 0.0 | % | - | ||||||||||||||||
| 4Q 2024 | - | - | 0.0 | % | - | 0.0 | % | - | ||||||||||||||||
| Total 2024 | - | - | 0.0 | % | - | 0.0 | % | - | ||||||||||||||||
| 1Q 2025 | 1 | 14,430 | 1.9 | % | 894,660 | 0.9 | % | 62.00 | ||||||||||||||||
| 2Q 2025 | 1 | 1,940 | 0.3 | % | 247,474 | 0.3 | % | 127.56 | ||||||||||||||||
| 3Q 2025 | - | - | 0.0 | % | - | 0.0 | % | - | ||||||||||||||||
| 4Q 2025 | 3 | 4,331 | 0.6 | % | 1,297,262 | 1.4 | % | 299.53 | ||||||||||||||||
| Total 2025 | 5 | 20,701 | 2.8 | % | 2,439,396 | 2.6 | % | 117.84 | ||||||||||||||||
| 2026 | 9 | 77,159 | 10.4 | % | 4,841,128 | 5.1 | % | 62.74 | ||||||||||||||||
| 2027 | 7 | 61,806 | 8.3 | % | 8,374,378 | 8.8 | % | 135.49 | ||||||||||||||||
| 2028 | 5 | 9,804 | 1.3 | % | 1,841,393 | 1.9 | % | 187.82 | ||||||||||||||||
| 2029 | 12 | 134,843 | 18.1 | % | 24,784,639 | 26.2 | % | 183.80 | ||||||||||||||||
| 2030 | 12 | 77,142 | 10.4 | % | 11,715,738 | 12.4 | % | 151.87 | ||||||||||||||||
| 2031 | 9 | 68,190 | 9.2 | % | 12,792,922 | 13.5 | % | 187.61 | ||||||||||||||||
| 2032 | 5 | 31,287 | 4.2 | % | 2,823,715 | 3.0 | % | 90.25 | ||||||||||||||||
| 2033 | 14 | 44,520 | 6.0 | % | 6,764,855 | 7.1 | % | 151.95 | ||||||||||||||||
| 2034 | 6 | 24,208 | 3.3 | % | 3,399,270 | 3.6 | % | 140.42 | ||||||||||||||||
| Thereafter | 9 | 128,769 | 17.1 | % | 14,892,655 | 15.8 | % | 115.65 | ||||||||||||||||
| Total retail properties | 99 | 744,681 | 100.0 | % | $ | 94,670,089 | 100.0 | % | $ | 139.54 | ||||||||||||||
| Notes: | |
| (1) | If a tenant has more than one lease, whether or not at the same property, but with different expirations, the number of leases is calculated equal to the number of leases with different expirations. |
| (2) | Excludes (i) 195,410 square feet of space across the Company's portfolio attributable to building management use and tenant amenities, (ii) 85,334 square feet of space attributable to the Company's Observatory, and (iii) square footage related to the Company's residential units. |
| (3) | Represents annualized base rent and current reimbursement for operating expenses and real estate taxes. |
| (4) | Represents leases that are included in occupancy as of September 30, 2024 and expire on September 30, 2024. |
| (5) | Excludes (i) retail space in the Manhattan office and (ii) the Empire State Building broadcasting licenses and Observatory operations. |
| (6) | Represents a telecom lease with no square footage. |
Page
 |
Third
Quarter 2024 20 Largest Tenants and Portfolio Tenant Diversification by Industry (unaudited) |
| Weighted | Percent of | |||||||||||||||||||||||
| Average | Total | Portfolio | Percent of | |||||||||||||||||||||
| Remaining | Occupied | Rentable | Portfolio | |||||||||||||||||||||
| Lease | Lease | Square | Square | Annualized | Annualized | |||||||||||||||||||
| 20 Largest Tenants | Property | Expiration (1) | Term(2) | Feet (3) | Feet (4) | Rent (5) | Rent (6) | |||||||||||||||||
| 1. | Empire State Building | Aug. 2036 | 11.9 years | 501,409 | 5.84 | % | $ | 35,423,019 | 6.50 | % | ||||||||||||||
| 2. | Flagstar Bank | 1400 Broadway | Aug. 2039 | 14.9 years | 313,109 | 3.64 | % | 19,132,313 | 3.50 | % | ||||||||||||||
| 3. | Centric Brands Inc. | Empire State Building | Oct. 2028 | 4.1 years | 252,929 | 2.94 | % | 14,006,589 | 2.60 | % | ||||||||||||||
| 4. | PVH Corp. | 501 Seventh Avenue | Oct. 2028 | 4.1 years | 237,281 | 2.76 | % | 13,325,962 | 2.50 | % | ||||||||||||||
| 5. | Sephora USA, Inc. | 112 West 34th Street | Jan. 2029 | 4.3 years | 11,334 | 0.13 | % | 10,559,438 | 1.90 | % | ||||||||||||||
| 6. | Institutional Capital Network, Inc. | One Grand Central Place | Dec. 2039 | 15.3 years | 141,224 | 1.64 | % | 10,299,156 | 1.90 | % | ||||||||||||||
| 7. | Target Corporation | 112 West 34th St., 10 Union Sq. | Jan. 2038 | 13.3 years | 81,340 | 0.95 | % | 9,444,745 | 1.70 | % | ||||||||||||||
| 8. | Coty Inc. | Empire State Building | Jan. 2030 | 5.3 years | 157,892 | 1.84 | % | 9,174,254 | 1.70 | % | ||||||||||||||
| 9. | Macy's | 111 West 33rd Street | May 2030 | 5.7 years | 131,117 | 1.53 | % | 8,803,204 | 1.60 | % | ||||||||||||||
| 10. | Li & Fung | 1359 Broadway, ESB | Oct. 2027 - Oct. 2028 | 3.8 years | 149,061 | 1.73 | % | 8,245,864 | 1.50 | % | ||||||||||||||
| 11. | URBAN OUTFITTERS | 1333 Broadway | Sep. 2029 | 5.0 years | 56,730 | 0.66 | % | 8,180,619 | 1.50 | % | ||||||||||||||
| 12. | Foot Locker, Inc. | 112 West 34th Street | Sep. 2031 | 7.0 years | 34,192 | 0.40 | % | 7,823,823 | 1.40 | % | ||||||||||||||
| 13. | FDIC | Empire State Building | Dec. 2025 | 1.3 years | 119,226 | 1.39 | % | 7,638,979 | 1.40 | % | ||||||||||||||
| 14. | HNTB Corporation | Empire State Building | Nov. 2024 - Sep. 2034 | 7.5 years | 105,143 | 1.22 | % | 7,541,913 | 1.40 | % | ||||||||||||||
| 15. | The Michael J. Fox Foundation | 111 West 33rd Street | Nov. 2029 | 5.2 years | 86,492 | 1.01 | % | 6,519,359 | 1.20 | % | ||||||||||||||
| 16. | Fragomen | 1400 Broadway | Feb. 2035 | 10.4 years | 107,680 | 1.25 | % | 6,383,091 | 1.20 | % | ||||||||||||||
| 17. | Burlington Merchandising Corporation | 1400 Broadway | Jan. 2038 | 13.3 years | 102,898 | 1.20 | % | 6,319,067 | 1.20 | % | ||||||||||||||
| 18. | Shutterstock, Inc. | Empire State Building | Apr. 2029 | 4.6 years | 104,386 | 1.22 | % | 6,223,370 | 1.10 | % | ||||||||||||||
| 19. | ASCAP | 250 West 57th Street | Aug. 2034 | 9.9 years | 87,943 | 1.02 | % | 5,997,648 | 1.10 | % | ||||||||||||||
| 20. | Kohl's Department Stores, Inc. | 1400 Broadway | May 2029 | 4.7 years | 91,775 | 1.07 | % | 4,875,289 | 0.90 | % | ||||||||||||||
| Total | 2,873,161 | 33.4 | % | $ | 205,917,702 | 37.8 | % | |||||||||||||||||
Notes:
| (1) | Expiration dates are per lease and do not assume exercise of renewal or extension options. For tenants with more than two leases, the lease expiration is shown as a range. |
| (2) | Represents the weighted average lease term based on annualized rent. |
| (3) | Based on leases signed and commenced as of September 30, 2024. |
| (4) | Represents the percentage of rentable square feet of the Company's office and retail portfolios in the aggregate. |
| (5) | Represents annualized base rent and current reimbursement for operating expenses and real estate taxes. |
| (6) | Represents the percentage of annualized rent of the Company's office and retail portfolios in the aggregate. |
Portfolio Tenant Diversification by Industry (based on annualized rent)
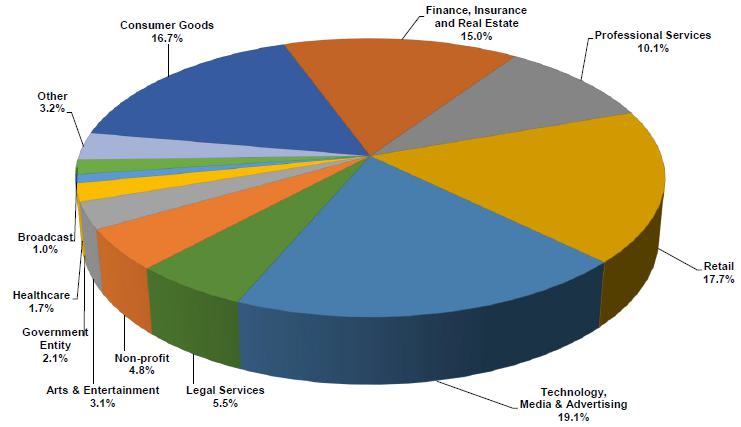
Page
|
|
Third
Quarter 2024 Capital Expenditures and Redevelopment Program and Leasing Opportunity (unaudited and dollars in thousands) |
| Three Months Ended | ||||||||||||||||||||
| Capital expenditures | September
30 2024 |
June
30 2024 |
March
31 2024 |
December
31, 2023 |
September
30, 2023 |
|||||||||||||||
| Tenant improvements - first generation | $ | - | $ | - | $ | - | $ | - | $ | - | ||||||||||
| Tenant improvements - second generation | 17,149 | 25,087 | 27,404 | 28,817 | 18,047 | |||||||||||||||
| Leasing commissions - first generation | 138 | 129 | 35 | 125 | 203 | |||||||||||||||
| Leasing commissions - second generation | 3,753 | 3,807 | 9,730 | 5,706 | 2,319 | |||||||||||||||
| Building improvements - first generation | 128 | - | - | - | - | |||||||||||||||
| Building improvements - second generation | 7,838 | 11,362 | 13,509 | 12,102 | 7,425 | |||||||||||||||
| Non-recurring capital improvements | 2,825 | 5,979 | 6,464 | 4,420 | 5,226 | |||||||||||||||
| Total | $ | 31,831 | $ | 46,364 | $ | 57,142 | $ | 51,170 | $ | 33,220 | ||||||||||
| Leasing Opportunity - Inventory of Current Vacant Space as of September 30, 2024 (in square feet) (1) | ||||||||||||||||||||
| Total Portfolio vacant space | 965,000 | |||||||||||||||||||
| Signed leases not commenced ("SLNC"): | ||||||||||||||||||||
| Manhattan Office Properties SLNC | 334,000 | |||||||||||||||||||
| Greater New York Office Properties SLNC | 7,000 | |||||||||||||||||||
| Retail Properties SLNC | 22,000 | |||||||||||||||||||
| Greater New York Office Properties | 75,000 | |||||||||||||||||||
| Retail Properties | 45,000 | |||||||||||||||||||
| Manhattan Office Properties | 401,000 | |||||||||||||||||||
| Manhattan Office Properties off market | 42,000 | |||||||||||||||||||
| Manhattan Office Properties other | 39,000 | |||||||||||||||||||
| Total | 965,000 | |||||||||||||||||||
Notes:
| (1) | These estimates are based on the Company's current budgets and are subject to change. |
Page
|
|
Third
Quarter 2024 Observatory Summary (unaudited and dollars in thousands) |
| Three Months Ended | ||||||||||||||||||||||||
| Twelve Months to Date |
September
30, 2024 |
June
30, 2024 |
March
31, 2024 |
December
31, 2023 |
September
30, 2023 |
|||||||||||||||||||
| Observatory NOI | ||||||||||||||||||||||||
| Observatory revenue (1) | $ | 134,319 | $ | 39,382 | $ | 34,124 | $ | 24,596 | $ | 36,217 | $ | 37,562 | ||||||||||||
| Observatory expenses | 36,386 | 9,715 | 8,958 | 8,431 | 9,282 | 9,471 | ||||||||||||||||||
| NOI | 97,933 | 29,667 | 25,166 | 16,165 | 26,935 | 28,091 | ||||||||||||||||||
| Intercompany rent expense (2) | 82,053 | 23,461 | 20,980 | 16,067 | 21,545 | 22,113 | ||||||||||||||||||
| NOI after intercompany rent | $ | 15,880 | $ | 6,206 | $ | 4,186 | $ | 98 | $ | 5,390 | $ | 5,978 | ||||||||||||
| Observatory Metrics | ||||||||||||||||||||||||
| Number of visitors (3) | 727,000 | 648,000 | 485,000 | 711,000 | 743,000 | |||||||||||||||||||
| Change in visitors year over year | (2.2 | )% | (2.7 | )% | 9.5 | % | 7.7 | % | 8.2 | % | ||||||||||||||
| Number of bad weather days ("BWD") (4) | 8 | 8 | 17 | 11 | 10 | |||||||||||||||||||
Notes:
| (1) | Observatory revenues include the fixed license fee received from WDFG North America, the Observatory gift shop operator. For the three months ended September 30, 2024, June 30, 2024, March 31, 2024, December 31, 2023, and September 30, 2023, the fixed license fee was $1,855, $1,855, $1,855, $1,807 and $1,807, respectively. |
| (2) | The Observatory pays a market-based rent payment comprised of fixed and percentage rent to the Empire State Building. Intercompany rent is eliminated upon consolidation. |
| (3) | Reflects the number of visitors who pass through the turnstile, excluding visitors who make a second visit on the same ticket at no additional charge. |
| (4) | The Company defines a bad weather day as one in which the top of the Empire State Building is obscured from view for more than 50% of the day. |
Annual Observatory NOI 2018 to 2023
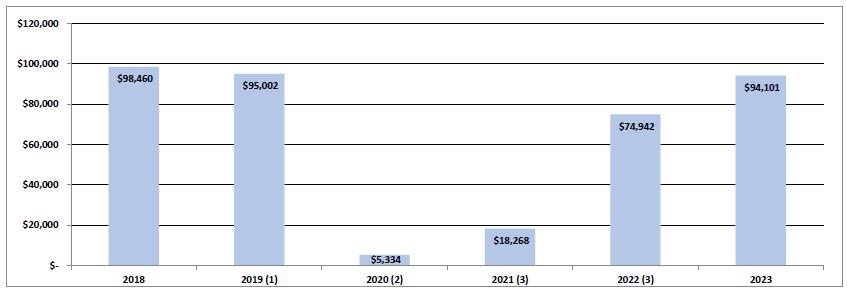
Notes:
| (1) | The 102nd floor Observatory was closed for approximately nine months in 2019 for renovations. |
| (2) | Due to the COVID-19 pandemic, the Observatory was closed on March 16, 2020. The 86th floor Observatory reopened on July 20, 2020 and the 102nd floor Observatory reopened on August 24, 2020. |
| (3) | The Observatory continued to experience a gradual recovery in visitors due to the COVID-19 pandemic. |
Page
|
|
Third
Quarter 2024 Funds from Operations ("FFO"), Modified Funds From Operations ("Modified FFO"), Core Funds from Operations ("Core FFO"), Core Funds Available for Distribution ("Core FAD") and EBITDA (unaudited and in thousands, except per share amounts) |
| Three Months Ended | ||||||||||||||||||||
| September
30, 2024 |
June 30,
2024 |
March 31,
2024 |
December
31, 2023 |
September
30, 2023 |
||||||||||||||||
| Reconciliation of Net Income to FFO, Modified FFO and Core FFO | ||||||||||||||||||||
| Net Income | $ | 22,796 | $ | 28,555 | $ | 10,215 | $ | 15,830 | $ | 19,928 | ||||||||||
| Non-controlling interests in other partnerships | - | - | (4 | ) | 1 | (111 | ) | |||||||||||||
| Preferred unit distributions | (1,050 | ) | (1,051 | ) | (1,050 | ) | (1,050 | ) | (1,050 | ) | ||||||||||
| Real estate depreciation and amortization | 44,871 | 46,398 | 44,857 | 48,548 | 45,174 | |||||||||||||||
| (Gain) loss on dispostion of properties | (1,262 | ) | (10,803 | ) | - | 2,497 | - | |||||||||||||
| FFO attributable to common stockholders and the Operating Partnership | 65,355 | 63,099 | 54,018 | 65,826 | 63,941 | |||||||||||||||
| Amortization of below-market ground lease | 1,958 | 1,958 | 1,958 | 1,958 | 1,957 | |||||||||||||||
| Modified FFO attributable to common stockholders and the Operating Partnership | 67,313 | 65,057 | 55,976 | 67,784 | 65,898 | |||||||||||||||
| Interest expense associated with property in receivership | 1,922 | 628 | - | - | - | |||||||||||||||
| Loss on early extinguishment of debt | - | - | 553 | - | - | |||||||||||||||
| Core FFO attributable to common stockholders and the Operating Partnership | $ | 69,235 | $ | 65,685 | $ | 56,529 | $ | 67,784 | $ | 65,898 | ||||||||||
| Total weighted average shares and Operating Partnership units | ||||||||||||||||||||
| Basic | 264,787 | 264,676 | 264,562 | 262,775 | 262,756 | |||||||||||||||
| Diluted | 269,613 | 268,716 | 267,494 | 267,003 | 266,073 | |||||||||||||||
| FFO attributable to common stockholders and the Operating Partnership per share and unit | ||||||||||||||||||||
| Basic | $ | 0.25 | $ | 0.24 | $ | 0.20 | $ | 0.25 | $ | 0.24 | ||||||||||
| Diluted | $ | 0.24 | $ | 0.23 | $ | 0.20 | $ | 0.25 | $ | 0.24 | ||||||||||
| Modified FFO attributable to common stockholders and the Operating Partnership per share and unit | ||||||||||||||||||||
| Basic | $ | 0.25 | $ | 0.25 | $ | 0.21 | $ | 0.26 | $ | 0.25 | ||||||||||
| Diluted | $ | 0.25 | $ | 0.24 | $ | 0.21 | $ | 0.25 | $ | 0.25 | ||||||||||
| Core FFO attributable to common stockholders and the Operating Partnership per share and unit | ||||||||||||||||||||
| Basic | $ | 0.26 | $ | 0.25 | $ | 0.21 | $ | 0.26 | $ | 0.25 | ||||||||||
| Diluted | $ | 0.26 | $ | 0.24 | $ | 0.21 | $ | 0.25 | $ | 0.25 | ||||||||||
| Reconciliation of Core FFO to Core FAD | ||||||||||||||||||||
| Core FFO | $ | 69,235 | $ | 65,685 | $ | 56,529 | $ | 67,784 | $ | 65,898 | ||||||||||
| Add: | ||||||||||||||||||||
| Amortization of deferred financing costs | 1,110 | 1,050 | 1,019 | 1,075 | 1,089 | |||||||||||||||
| Non-real estate depreciation and amortization | 1,029 | 1,074 | 1,107 | 1,077 | 1,298 | |||||||||||||||
| Amortization of non-cash compensation expense | 5,752 | 6,388 | 3,449 | 5,294 | 4,989 | |||||||||||||||
| Amortization of loss on interest rate derivative | 1,386 | 1,480 | 1,527 | 1,527 | 1,527 | |||||||||||||||
| Deduct: | ||||||||||||||||||||
| Straight-line rental revenues, above/below market rent, and other non-cash adjustments | (3,082 | ) | (2,744 | ) | (3,904 | ) | (3,013 | ) | (5,569 | ) | ||||||||||
| Corporate capital expenditures | (121 | ) | (157 | ) | (238 | ) | (71 | ) | (90 | ) | ||||||||||
| Tenant improvements - second generation | (17,149 | ) | (25,087 | ) | (27,404 | ) | (28,817 | ) | (18,047 | ) | ||||||||||
| Building improvements - second generation | (7,838 | ) | (11,362 | ) | (13,509 | ) | (12,102 | ) | (7,425 | ) | ||||||||||
| Leasing commissions - second generation | (3,753 | ) | (3,807 | ) | (9,730 | ) | (5,706 | ) | (2,319 | ) | ||||||||||
| Core FAD (1) | $ | 46,569 | $ | 32,521 | $ | 8,846 | $ | 27,047 | $ | 41,351 | ||||||||||
| Reconciliation of Net Income to EBITDA and Adjusted EBITDA | ||||||||||||||||||||
| Net income | $ | 22,796 | $ | 28,555 | $ | 10,215 | $ | 15,830 | $ | 19,928 | ||||||||||
| Interest expense | 27,408 | 25,323 | 25,128 | 25,393 | 25,382 | |||||||||||||||
| Interest expense associated with property in receivership | 1,922 | 628 | - | - | - | |||||||||||||||
| Income tax expense (benefit) | 1,442 | 750 | (655 | ) | 1,792 | 1,409 | ||||||||||||||
| Depreciation and amortization | 45,899 | 47,473 | 46,081 | 49,599 | 46,624 | |||||||||||||||
| EBITDA | 99,467 | 102,729 | 80,769 | 92,614 | 93,343 | |||||||||||||||
| (Gain) loss on disposition of properties | (1,262 | ) | (10,803 | ) | - | 2,497 | - | |||||||||||||
| Adjusted EBITDA | $ | 98,205 | $ | 91,926 | $ | 80,769 | $ | 95,111 | $ | 93,343 | ||||||||||
| (1) | Beginning in the three months ended December 31, 2023, we have eliminated a deduction of other non-recurring capital improvements from Core FFO to arrive at Core FAD and the related Core FAD payout ratio. We made this modification to the calculation of Core FAD for the other periods presented; in our previous supplemental reports prior to this change, Core FAD was $35,922 for the three months ended September 30, 2023. |
Page
|
|
Third
Quarter 2024 Debt Summary (unaudited and dollars in thousands) |
| September 30, 2024 | June 30, 2024 | |||||||||||||||||||||||
| Weighted Average | Weighted Average | |||||||||||||||||||||||
| Interest | Maturity | Interest | Maturity | |||||||||||||||||||||
| Debt Summary | Balance | Rate (1) | (Years) | Balance | Rate (1) | (Years) | ||||||||||||||||||
| Mortgage debt | $ | 705,624 | 3.64 | % | 6.1 | $ | 713,177 | 3.64 | % | 5.8 | ||||||||||||||
| Senior unsecured notes | 1,200,000 | 4.69 | % | 5.5 | 1,200,000 | 4.69 | % | 5.8 | ||||||||||||||||
| Unsecured term loan facilities (2) | 270,000 | 4.19 | % | 3.0 | 270,000 | 4.19 | % | 3.3 | ||||||||||||||||
| Unsecured revolving credit facility (3) | 120,000 | 4.04 | % | 4.4 | 120,000 | 4.04 | % | 4.7 | ||||||||||||||||
| Total fixed rate debt | 2,295,624 | 4.27 | % | 5.3 | 2,303,177 | 4.27 | % | 5.4 | ||||||||||||||||
| Unsecured term loan facilities (4) | - | - | - | - | - | - | ||||||||||||||||||
| Unsecured revolving credit facility (4) | - | - | 4.4 | - | - | 4.7 | ||||||||||||||||||
| Total variable rate debt | - | - | 4.4 | - | - | 4.7 | ||||||||||||||||||
| Total debt | 2,295,624 | 4.27 | % | 5.3 | 2,303,177 | 4.27 | % | 5.4 | ||||||||||||||||
| Deferred financing costs, net | (10,691 | ) | (10,844 | ) | ||||||||||||||||||||
| Debt discount | (6,378 | ) | (6,574 | ) | ||||||||||||||||||||
| Total | $ | 2,278,555 | $ | 2,285,759 | ||||||||||||||||||||
| Outstanding at | ||||||||||||||||||||||||
| September 30, | Letters | Available | ||||||||||||||||||||||
| Available Capacity | Facility | 2024 | of Credit | Capacity | ||||||||||||||||||||
| Unsecured revolving credit facility (5) | $ | 620,000 | $ | 120,000 | $ | - | $ | 500,000 | ||||||||||||||||
| Current | In | |||||||||||||||||||||||
| Covenant Summary | Required | Quarter | Compliance | |||||||||||||||||||||
| Maximum Total Leverage(6) | <60 | % | 33.2 | % | Yes | |||||||||||||||||||
| Maximum Secured Leverage (6) | <40 | % | 10.7 | % | Yes | |||||||||||||||||||
| Minimum Fixed Charge Coverage | >1.50 | x | 2.9 | x | Yes | |||||||||||||||||||
| Minimum Unencumbered Interest Coverage | >1.75 | x | 4.7 | x | Yes | |||||||||||||||||||
| Maximum Unsecured Leverage (6) | <60 | % | 26.4 | % | Yes | |||||||||||||||||||
Notes:
| (1) | These reflect the weighted average interest rates comprised of either the fixed coupon of the debt or the rate which are fixed under variable to fixed interest rate swap agreements. |
| (2) | SOFR is fixed at 2.56% for $175 million through maturity and 2.63% for $95 million through March 19, 2025. Subsequent to March 19, 2025, SOFR is fixed at 3.31% for $95 million through maturity. |
| (3) | SOFR is fixed at 2.63% for $120 million through maturity. |
| (4) | As of September 30, 2024, each of our unsecured term loan facilities and the balance drawn on our revolving credit facility are fixed under variable to fixed interest rate swap agreements. |
| (5) | This unsecured revolving credit facility matures in March 2029, inclusive of two additional six-month extension options. |
| (6) | Represents the ratio of total indebtedness to total asset value as determined in accordance with the credit facility agreement. |
Page
|
|
Third
Quarter 2024 Debt Detail (unaudited and dollars in thousands) |
| Stated | ||||||||||||
| Interest | Principal | Maturity | ||||||||||
| Rate (%) | Balance | Date | Amortization | |||||||||
| 10 Union Square | 3.70 | % | $ | 50,000 | 4/1/2026 | Interest only | ||||||
| 1542 Third Avenue | 4.29 | % | 30,000 | 5/1/2027 | Interest only | |||||||
| 1010 Third Avenue & 77 West 55th St. | 4.01 | % | 34,278 | 1/5/2028 | 30 years | |||||||
| Metro Center(1) | 3.59 | % | 72,078 | 11/5/2029 | 30 years | |||||||
| 250 West 57th Street | 2.83 | % | 180,000 | 12/1/2030 | Interest only | |||||||
| 1333 Broadway | 4.21 | % | 160,000 | 2/5/2033 | Interest only | |||||||
| 345 East 94th Street - Series A | 70% of SOFR plus 0.95 | % | 43,600 | 11/1/2030 | Interest only | |||||||
| 345 East 94th Street - Series B | SOFR plus 2.24 | % | 6,676 | 11/1/2030 | 30 years | |||||||
| 561 10th Avenue - Series A | 70% of SOFR plus 1.07 | % | 114,500 | 11/1/2033 | Interest only | |||||||
| 561 10th Avenue - Series B | SOFR plus 2.45 | % | 14,492 | 11/1/2033 | 30 years | |||||||
| Total fixed rate mortgage debt | 705,624 | |||||||||||
| Unsecured term loan facility | SOFR plus 1.50 | % | 175,000 | 12/31/2026 | Interest only | |||||||
| Unsecured term loan facility | SOFR plus 1.50 | % | 95,000 | 3/8/2029 | Interest only | |||||||
| Unsecured revolving credit facility | SOFR plus 1.30 | % | 120,000 | 3/8/2029 | Interest only | |||||||
| Senior unsecured notes: | ||||||||||||
| Series A | 3.93 | % | 100,000 | 3/27/2025 | Interest only | |||||||
| Series B | 4.09 | % | 125,000 | 3/27/2027 | Interest only | |||||||
| Series C | 4.18 | % | 125,000 | 3/27/2030 | Interest only | |||||||
| Series D | 4.08 | % | 115,000 | 1/22/2028 | Interest only | |||||||
| Series E | 4.26 | % | 160,000 | 3/22/2030 | Interest only | |||||||
| Series F | 4.44 | % | 175,000 | 3/22/2033 | Interest only | |||||||
| Series G | 3.61 | % | 100,000 | 3/17/2032 | Interest only | |||||||
| Series H | 3.73 | % | 75,000 | 3/17/2035 | Interest only | |||||||
| Series I | 7.20 | % | 155,000 | 6/17/2029 | Interest only | |||||||
| Series J | 7.32 | % | 45,000 | 6/17/2031 | Interest only | |||||||
| Series K | 7.41 | % | 25,000 | 6/17/2034 | Interest only | |||||||
| Total / weighted average debt | 4.27 | % | 2,295,624 | |||||||||
| Deferred financing costs, net | (10,691 | ) | ||||||||||
| Debt discount | (6,378 | ) | ||||||||||
| Total | $ | 2,278,555 | ||||||||||
Note:
| (1) | On July 1, 2024, this loan was refinanced to mature November 2029, inclusive of a one-year extension option. Effective November 2024, the new principal balance of $72 million is interest only at the same interest rate of 3.59%. |
Page
|
|
Third
Quarter 2024 Debt Maturities and Ground Lease Commitments (unaudited and dollars in thousands) |
| Year | Maturities (1) | Amortization | Total | Percentage of Total Debt |
Weighted Average Interest Rate of Maturing Debt |
|||||||||||||||
| 2024 | $ | - | $ | 1,350 | $ | 1,350 | 0.1 | % | 0.00 | % | ||||||||||
| 2025 | 100,000 | 3,664 | 103,664 | 4.5 | % | 3.93 | % | |||||||||||||
| 2026 | 225,000 | 3,957 | 228,957 | 10.0 | % | 4.06 | % | |||||||||||||
| 2027 | 155,000 | 4,276 | 159,276 | 6.9 | % | 4.13 | % | |||||||||||||
| 2028 | 146,091 | 3,555 | 149,646 | 6.5 | % | 4.06 | % | |||||||||||||
| 2029 | 441,600 | 3,988 | 445,588 | 19.4 | % | 5.12 | % | |||||||||||||
| 2030 | 508,600 | 4,413 | 513,013 | 22.3 | % | 3.67 | % | |||||||||||||
| 2031 | 45,000 | 3,283 | 48,283 | 2.1 | % | 7.32 | % | |||||||||||||
| 2032 | 100,000 | 3,591 | 103,591 | 4.5 | % | 3.61 | % | |||||||||||||
| 2033 | 439,007 | 3,249 | 442,256 | 19.3 | % | 4.20 | % | |||||||||||||
| Thereafter | 100,000 | - | 100,000 | 4.4 | % | 4.65 | % | |||||||||||||
| Total debt | $ | 2,260,298 | $ | 35,326 | 2,295,624 | 100.0 | % | 4.27 | % | |||||||||||
| Deferred financing costs, net | (10,691 | ) | ||||||||||||||||||
| Debt discount | (6,378 | ) | ||||||||||||||||||
| Total | $ | 2,278,555 | ||||||||||||||||||
Debt Maturity Profile
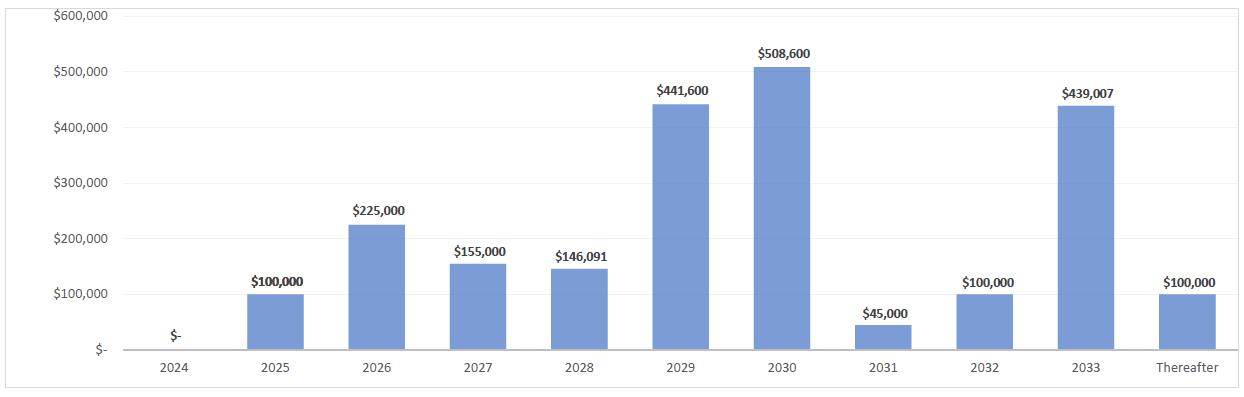
Ground Lease Commitments (2)
| Year | 1350
Broadway (3) |
1400 Broadway (4) |
111
West 33rd Street (5) |
Total | ||||||||||||
| 2024 | $ | 27 | $ | 169 | $ | 184 | $ | 380 | ||||||||
| 2025 | 108 | 675 | 735 | 1,518 | ||||||||||||
| 2026 | 93 | 675 | 735 | 1,503 | ||||||||||||
| 2027 | 72 | 675 | 735 | 1,482 | ||||||||||||
| 2028 | 72 | 675 | 735 | 1,482 | ||||||||||||
| Thereafter | 1,584 | 23,625 | 35,586 | 60,795 | ||||||||||||
| $ | 1,956 | $ | 26,494 | $ | 38,710 | $ | 67,160 | |||||||||
Notes:
| (1) | Assumes extension options are exercised for the 2029 maturities of the term loan, revolving credit facility and Metro Center mortgage. |
| (2) | There are no fair value market resets, no step-ups, and no escalations in the three ground lease commitments. |
| (3) | Expires July 31, 2050 with a remaining term, including unilateral extension rights available to the Company, of approximately 26 years. |
| (4) | Expires December 31, 2063 with a remaining term, including unilateral extension rights available to the Company, of approximately 39 years. |
| (5) | Expires June 10, 2077 with a remaining term, including unilateral extension rights available to the Company, of approximately 53 years. |
Page