UNITED STATES
SECURITIES AND EXCHANGE COMMISSION
WASHINGTON, DC 20549
FORM 8-K
CURRENT REPORT
PURSUANT TO SECTION 13 OR 15(d) OF THE
SECURITIES EXCHANGE ACT OF 1934
Date of report (Date of earliest event reported): September 5, 2024
VERIS RESIDENTIAL, INC.
(Exact Name of Registrant as Specified in Charter)
| Maryland | 1-13274 | 22-3305147 | ||
| (State
or Other Jurisdiction of Incorporation) |
(Commission File Number) | (IRS
Employer Identification No.) |
Harborside 3, 210 Hudson St., Ste. 400
Jersey City, New Jersey 07311
(Address of Principal Executive Offices) (Zip Code)
(732) 590-1010
(Registrant’s telephone number, including area code)
VERIS RESIDENTIAL, L.P.
(Exact Name of Registrant as Specified in Charter)
| Delaware | 333-57103 | 22-3315804 | ||
| (State
or Other Jurisdiction of Incorporation) |
(Commission File Number) | (IRS
Employer Identification No.) |
Harborside 3, 210 Hudson St., Ste. 400
Jersey City, New Jersey 07311
(Address of Principal Executive Offices) (Zip Code)
(732) 590-1010
(Registrant’s telephone number, including area code)
Check the appropriate box below if the Form 8-K filing is intended to simultaneously satisfy the filing obligation of the registrant under any of the following provisions (see General Instruction A.2. below):
| ¨ | Written communications pursuant to Rule 425 under the Securities Act (17 CFR 230.425) |
| ¨ | Soliciting material pursuant to Rule 14a-12 under the Exchange Act (17 CFR 240.14a-12) |
| ¨ | Pre-commencement communications pursuant to Rule 14d-2(b) under the Exchange Act (17 CFR 240.14d-2(b)) |
| ¨ | Pre-commencement communications pursuant to Rule 13e-4(c) under the Exchange Act (17 CFR 240.13e-4(c)) |
Securities Registered Pursuant to Section 12(b) of the Act:
| Title of each class | Trading Symbol(s) | Name of each exchange on which registered |
||
| Common Stock, par value $0.01 | VRE | New York Stock Exchange |
Indicate by check mark whether the registrant is an emerging growth company as defined in Rule 405 of the Securities Act of 1933 (§230.405 of this chapter) or Rule 12b-2 of the Securities Exchange Act of 1934 (§240.12b-2 of this chapter). Emerging growth company ¨
If an emerging growth company, indicate by check mark if the registrant has elected not to use the extended transition period for complying with any new or revised financial accounting standards provided pursuant to Section 13(a) of the Exchange Act. ¨
| Item 7.01 | Regulation FD Disclosure |
Beginning on September 6, 2024, Veris Residential, Inc., a Maryland corporation (the “General Partner”) and the general partner of Veris Residential, L.P. (the “Company,” and together with the General Partner, the “Registrants”), will participate in investor meetings and the Evercore ISI Annual Real Estate Conference and the BofA Securities 2024 Global Real Estate Conference during which members of the General Partner’s management will make presentations to investors. A copy of the General Partner’s investor presentation is furnished herewith as Exhibit 99.1.
Limitation of Incorporation by Reference
In accordance with General Instruction B.2. of Form 8-K, this information, including Exhibit 99.1 furnished herewith, is furnished pursuant to Item 7.01 and shall not be deemed to be “filed” for the purpose of Section 18 of the Securities Exchange Act of 1934, as amended (the “Exchange Act”), or otherwise subject to the liabilities of that section, nor shall it be incorporated by reference into a filing under the Securities Act of 1933, as amended (the “Securities Act”), or the Exchange Act. The information in this Item 7.01 of this Current Report on Form 8-K (including the exhibit hereto) will not be deemed an admission as to the materiality of any information required to be disclosed solely to satisfy the requirements of Regulation FD.
Cautionary Statements
This Current Report on Form 8-K, including the exhibits furnished herewith, contains “forward-looking statements” within the meaning of Section 21E of the Exchange Act. Such forward-looking statements relate to, without limitation, our future economic performance, plans and objectives for future operations and projections of revenue and other financial items. Forward-looking statements can be identified by the use of words such as “may,” “will,” “plan,” “potential,” “project,” “should,” “expect,” “anticipate,” “estimate,” “target,” “continue” or comparable terminology. Forward-looking statements are inherently subject to certain risks, trends and uncertainties, many of which we cannot predict with accuracy and some of which we might not even anticipate. Although we believe that the expectations reflected in such forward-looking statements are based upon reasonable assumptions at the time made, we can give no assurance that such expectations will be achieved. Future events and actual results, financial and otherwise, may differ materially from the results discussed in the forward-looking statements as a result of various factors, including those listed in Exhibit 99.1 on page 2 and incorporated by reference herein. Readers are cautioned not to place undue reliance on these forward-looking statements. Unless required by U.S. federal securities laws, we do not intend to update any of the forward-looking statements to reflect circumstances or events that occur after the statements are made or to conform the statements to actual results. The information contained in this Current Report on Form 8-K, including the exhibit filed herewith, should be viewed in conjunction with the consolidated financial statements and notes thereto appearing in the Registrants’ Annual Reports on Form 10-K and Quarterly Reports on Form 10-Q.
In connection with the foregoing, the Registrants hereby furnishes the following documents:
| Item 9.01 | Financial Statements and Exhibits |
(d) Exhibits
| Exhibit Number | Exhibit Title | |
| 99.1 | Investor Presentation. | |
| 104.1 | The cover page from this Current Report on Form 8-K, formatted in Inline XBRL. |
SIGNATURES
Pursuant to the requirements of the Securities Exchange Act of 1934, as amended, each registrant has duly caused this report to be signed on its behalf by the undersigned hereunto duly authorized.
| VERIS RESIDENTIAL, INC. | |||
| Dated: September 5, 2024 | By: | /s/ Taryn Fielder | |
| Taryn Fielder | |||
| Executive Vice President, General Counsel and Corporate Secretary | |||
| VERIS RESIDENTIAL, L.P. | |||
| By: | Veris Residential, Inc. | ||
| its general partner | |||
| Dated: September 5, 2024 | By: | /s/ Taryn Fielder | |
| Taryn Fielder | |||
| Executive Vice President, General Counsel and Corporate Secretary | |||
|
Corporate Presentation SEPTEMBER 4, 2024 |
|
This Operating and Financial Data should be read in connection with our Quarterly Report on Form 10-Q for the quarter ended June 30, 2024. Statements made in this presentation may be forward-looking statements within the meaning of Section 21E of the Securities Exchange Act of 1934, as amended. Such for-ward-looking statements are intended to be covered by the safe harbor provisions for forward-looking statements contained in Section 21E of such act. Such forward-look-ing statements relate to, without limitation, our future economic performance, plans and objectives for future operations and projections of revenue and other financial items. Forward-looking statements can be identified by the use of words such as “may,” “will,” “plan,” “potential,” “projected,” “should,” “expect,” “anticipate,” “estimate,” “target,” “continue” or comparable terminology. Forward-looking statements are inherently subject to certain risks, trends and uncertainties, many of which we cannot predict with accuracy and some of which we might not even anticipate. Although we believe that the expectations reflected in such forward-looking statements are based upon reasonable assumptions at the time made, we can give no assurance that such expectations will be achieved. Future events and actual results, financial and otherwise, may differ materially from the results discussed in the forward-looking statements. Readers are cautioned not to place undue reliance on these forward-looking statements and are advised to consider the factors listed above together with the additional factors under the heading “Disclosure Regarding Forward-Looking Statements” and “Risk Factors” in our annual reports on Form 10-K, as may be supplemented or amended by our quarterly reports on Form 10-Q, which are incorporated herein by reference. We assume no obligation to update or supplement forward-looking statements that become untrue because of subsequent events, new information or otherwise. FORWARD-LOOKING STATEMENTS |
|
CORPORATE PRESENTATION, SEPTEMBER 4, 2024 | 3 Company Overview | Market Overview | Portfolio Optimization | Capital Allocation | Balance Sheet | ESG COMPANY OVERVIEW OVERVIEW Signature Place, Morris Plains, NJ Company Overview |
|
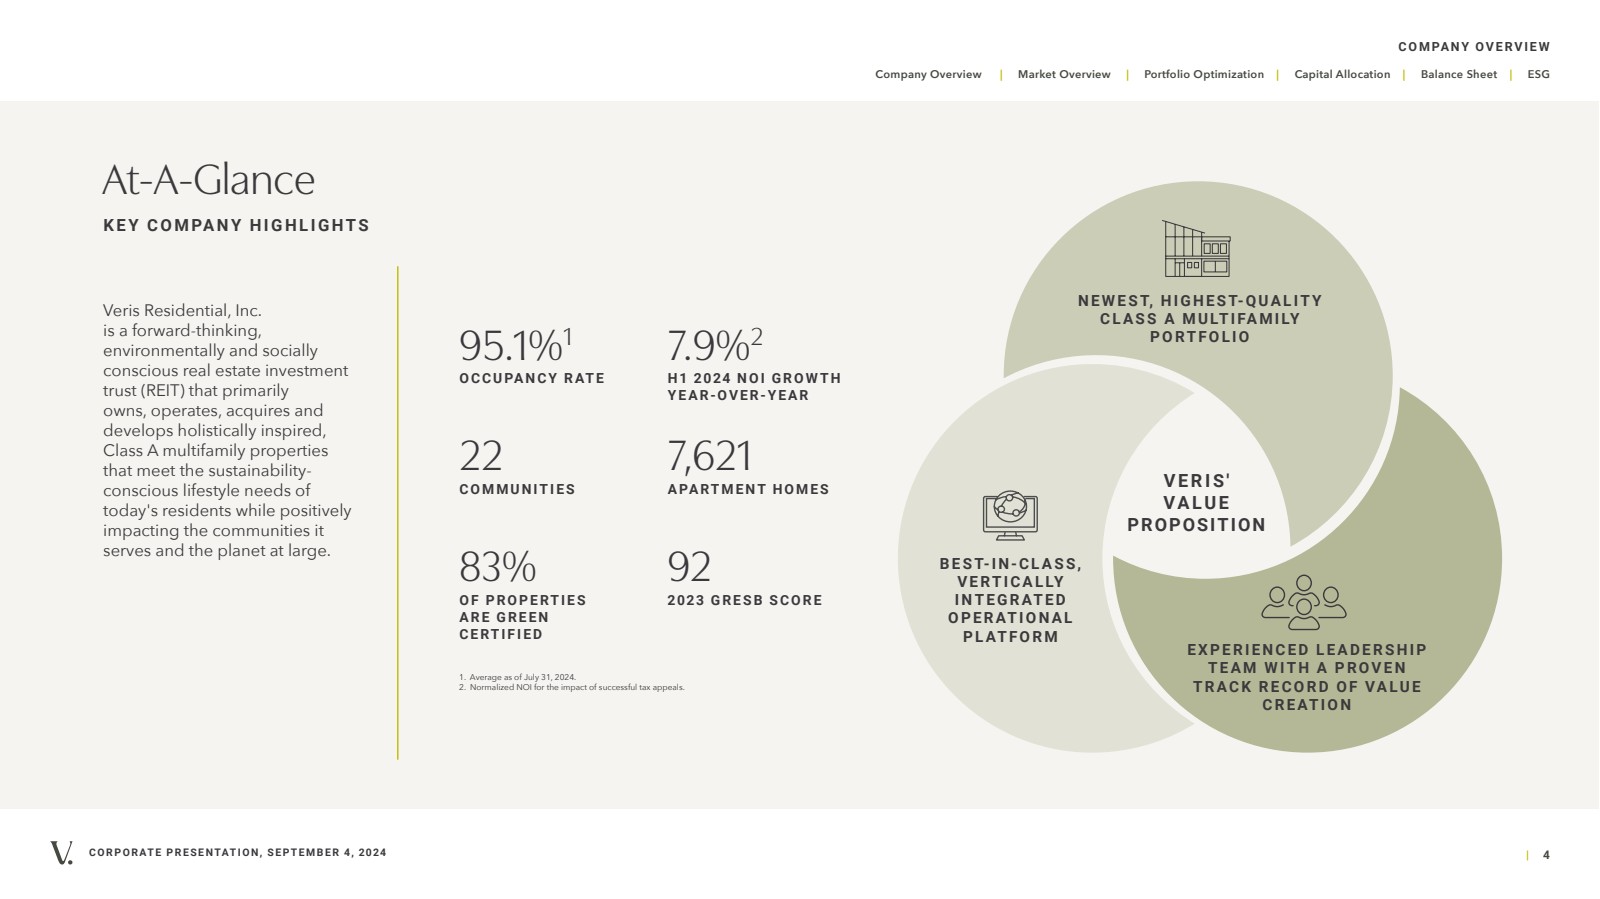
CORPORATE PRESENTATION, SEPTEMBER 4, 2024 | 4 Company Overview | Market Overview | Portfolio Optimization | Capital Allocation | Balance Sheet | ESG COMPANY OVERVIEW E X P E R I E N C E D L E A D E R S H I P T E A M W I T H A P R OV E N T R A C K R E C O R D O F VA LU E CREATION N E W E S T, H I G H E S T- Q U A L I T Y C L A S S A M U LT I FA M I LY PORTFOLIO B E S T- I N - C L A S S , V E RT I C A L LY INTEGRATED O P E R AT I O N A L PLATFORM VERIS' VALUE PROPOSITION At-A-Glance KEY COMPANY HIGHLIGHTS Veris Residential, Inc. is a forward-thinking, environmentally and socially conscious real estate investment trust (REIT) that primarily owns, operates, acquires and develops holistically inspired, Class A multifamily properties that meet the sustainability-conscious lifestyle needs of today's residents while positively impacting the communities it serves and the planet at large. 95.1%1 OCCUPANCY RATE 22 7,621 COMMUNITIES APARTMENT HOMES 83% 92 OF PROPERTIES A R E G R E E N CERTIFIED 2023 GRESB SCORE 1. Average as of July 31, 2024. 2. Normalized NOI for the impact of successful tax appeals. 7.9%2 H1 2024 NOI GROWTH YEAR-OVER-YEAR |
|
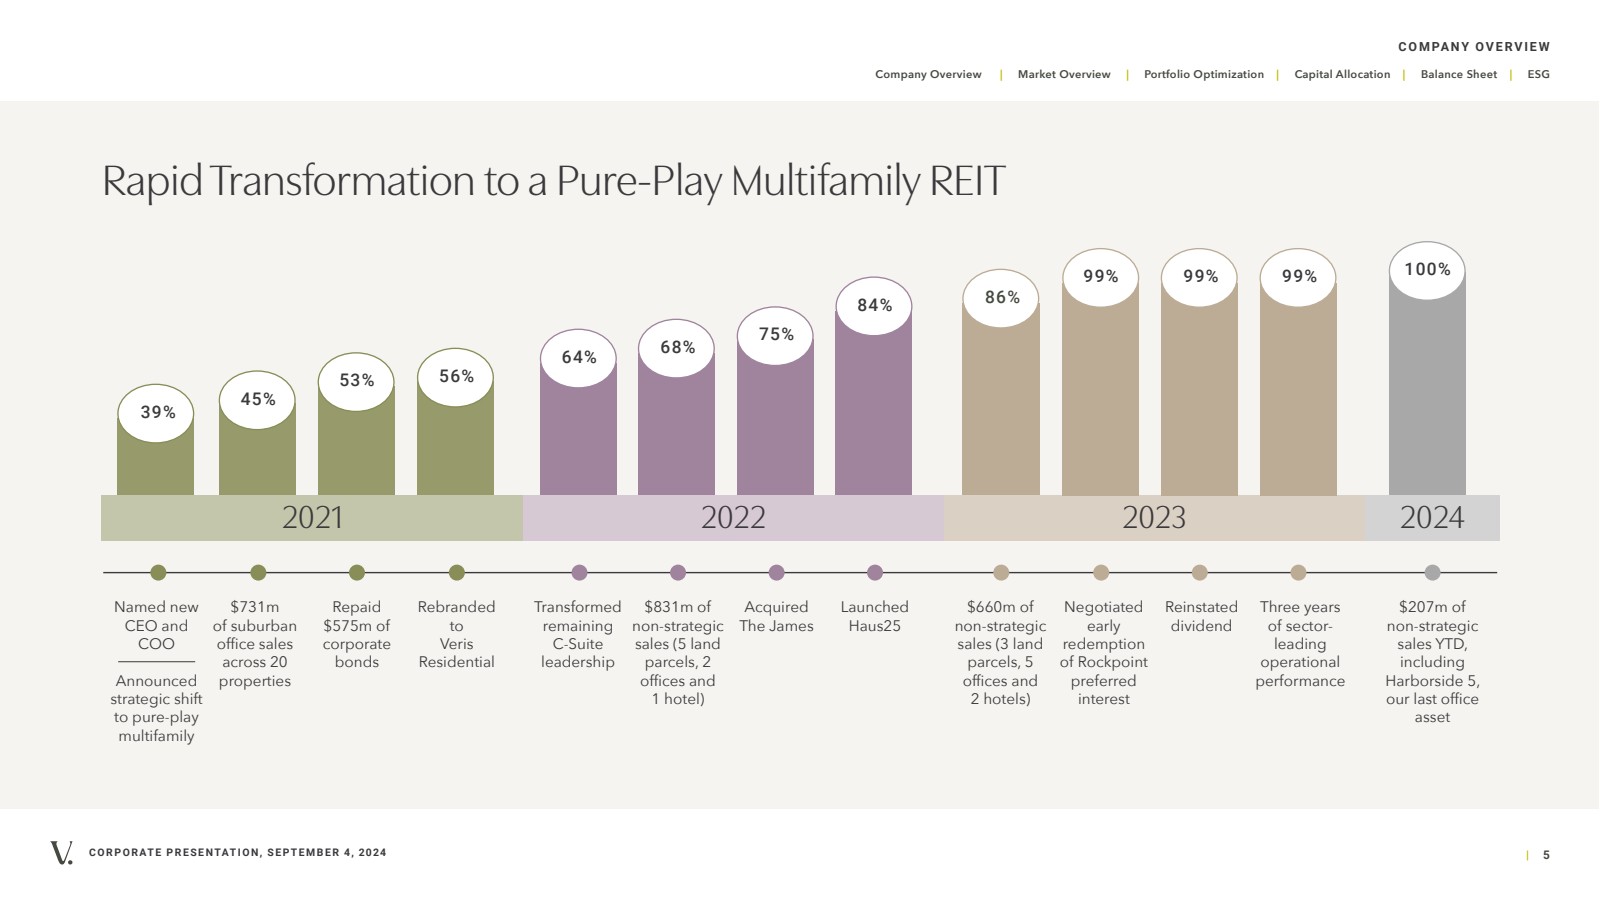
CORPORATE PRESENTATION, SEPTEMBER 4, 2024 | 5 Company Overview | Market Overview | Portfolio Optimization | Capital Allocation | Balance Sheet | ESG 2021 2022 2023 2024 COMPANY OVERVIEW 39% 45% 53% 56% 64% 68% 75% 86% 84% 99% 99% 99% 100% Named new CEO and COO Announced strategic shift to pure-play multifamily Repaid $575m of corporate bonds Rebranded to Veris Residential Reinstated dividend Negotiated early redemption of Rockpoint preferred interest Transformed remaining C-Suite leadership $831m of non-strategic sales (5 land parcels, 2 offices and 1 hotel) Acquired The James $660m of non-strategic sales (3 land parcels, 5 offices and 2 hotels) $207m of non-strategic sales YTD, including Harborside 5, our last office asset $731m of suburban office sales across 20 properties Launched Haus25 Three years of sector-leading operational performance Rapid Transformation to a Pure-Play Multifamily REIT |
|
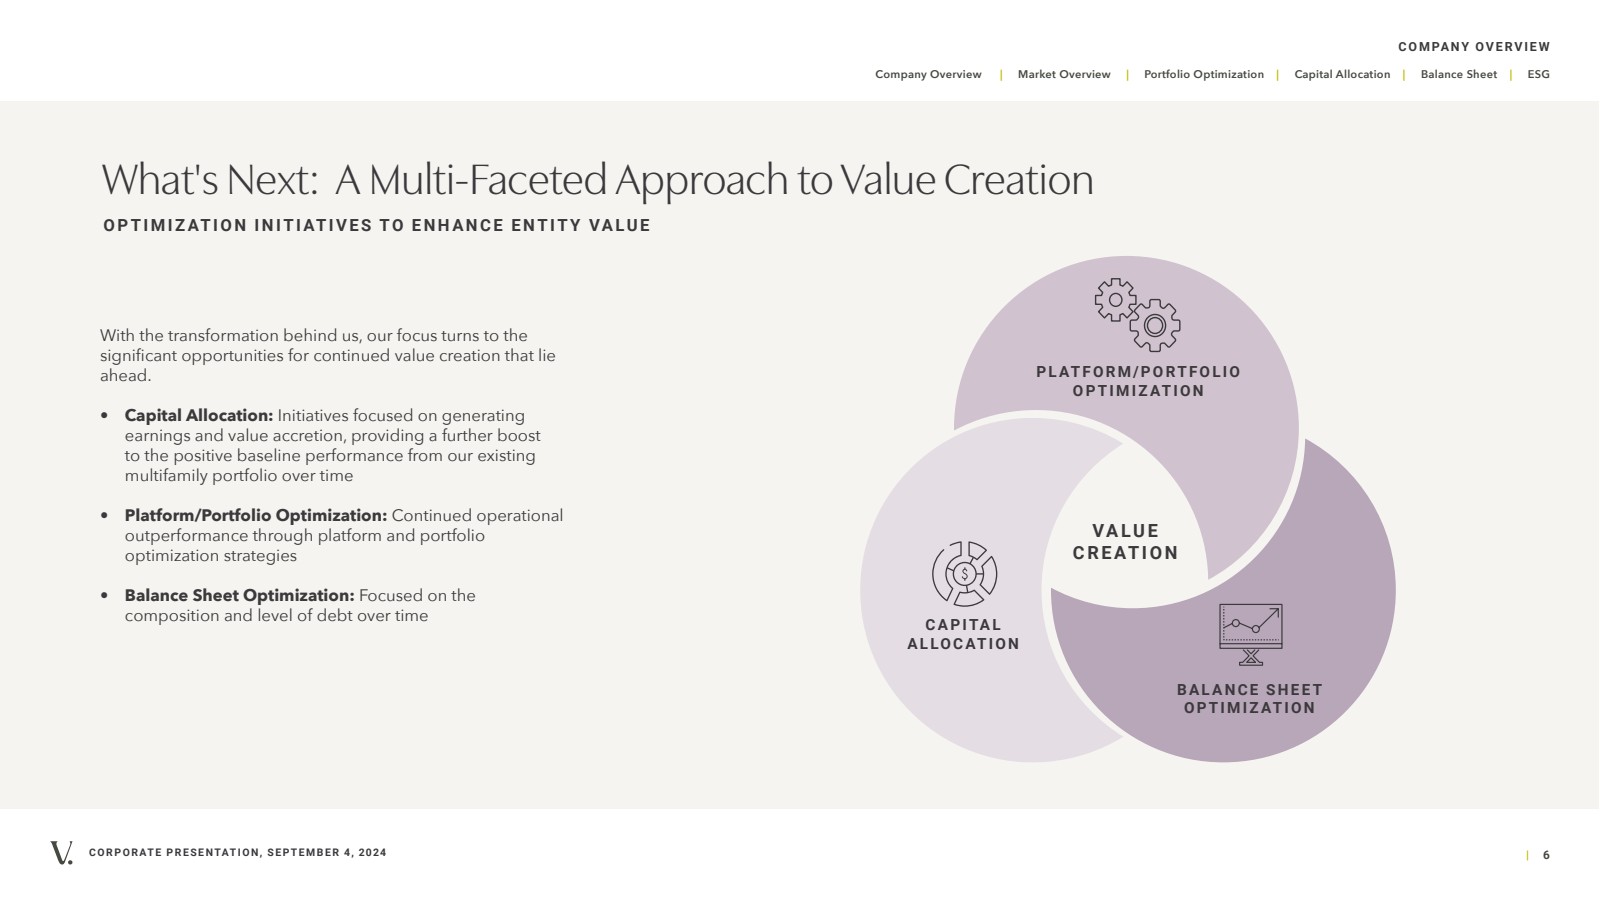
CORPORATE PRESENTATION, SEPTEMBER 4, 2024 | 6 Company Overview | Market Overview | Portfolio Optimization | Capital Allocation | Balance Sheet | ESG COMPANY OVERVIEW VALUE CREATION PLATFORM/PORTFOLIO OPTIMIZATION CAPITAL ALLOCATION BALANCE SHEET OPTIMIZATION What's Next: A Multi-Faceted Approach to Value Creation OPTIMIZATION INITIATIVES TO ENHANCE ENTITY VALUE With the transformation behind us, our focus turns to the significant opportunities for continued value creation that lie ahead. • Capital Allocation: Initiatives focused on generating earnings and value accretion, providing a further boost to the positive baseline performance from our existing multifamily portfolio over time • Platform/Portfolio Optimization: Continued operational outperformance through platform and portfolio optimization strategies • Balance Sheet Optimization: Focused on the composition and level of debt over time |
|
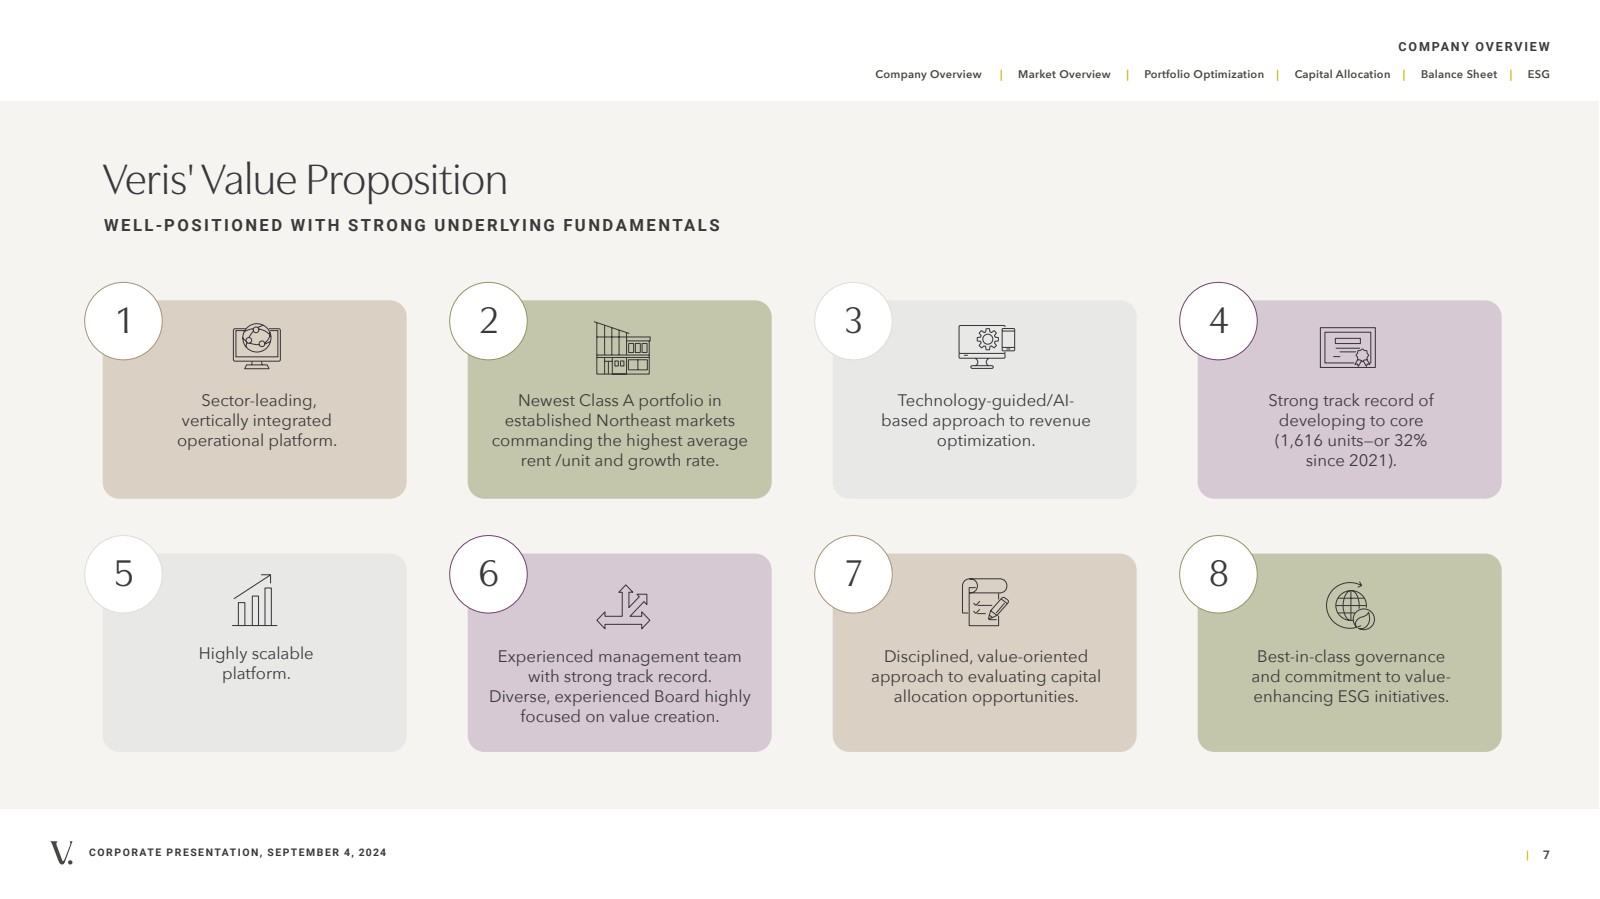
CORPORATE PRESENTATION, SEPTEMBER 4, 2024 | 7 Company Overview | Market Overview | Portfolio Optimization | Capital Allocation | Balance Sheet | ESG COMPANY OVERVIEW 1 2 3 4 5 6 7 8 Veris' Value Proposition W E L L-P O S I T I O N E D W I T H S T R O N G U N D E R LY I N G F U N D A M E N TA L S Sector-leading, vertically integrated operational platform. Strong track record of developing to core (1,616 units—or 32% since 2021). Technology-guided/AI-based approach to revenue optimization. Newest Class A portfolio in established Northeast markets commanding the highest average rent /unit and growth rate. Highly scalable platform. Experienced management team with strong track record. Diverse, experienced Board highly focused on value creation. Best-in-class governance and commitment to value-enhancing ESG initiatives. Disciplined, value-oriented approach to evaluating capital allocation opportunities. |
|
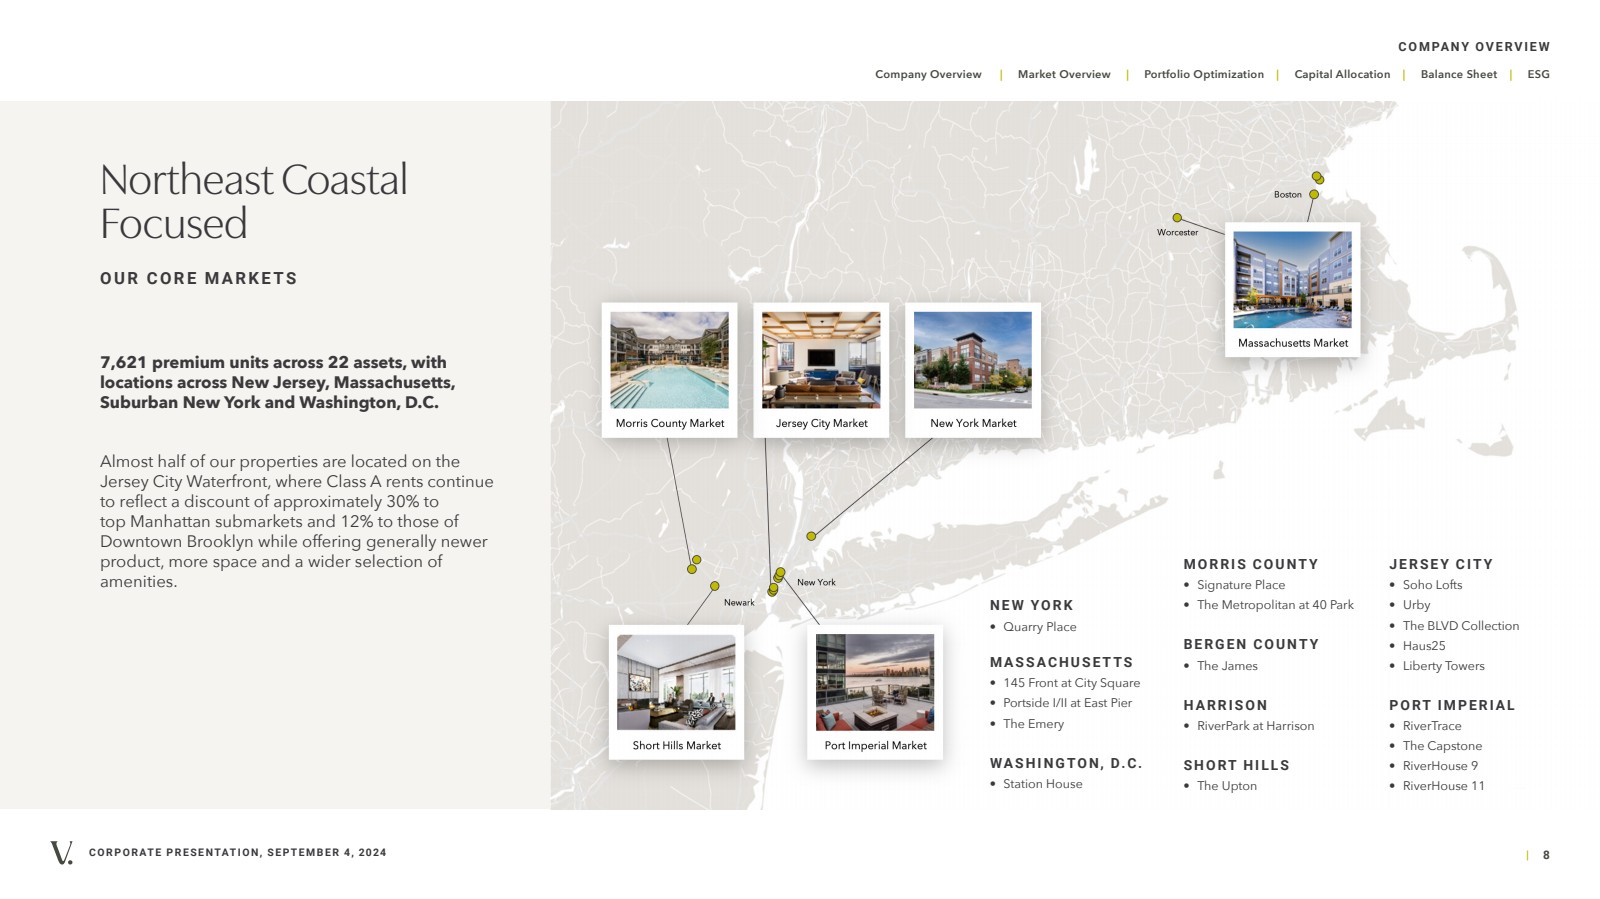
CORPORATE PRESENTATION, SEPTEMBER 4, 2024 | 8 Company Overview | Market Overview | Portfolio Optimization | Capital Allocation | Balance Sheet | ESG COMPANY OVERVIEW MORRIS COUNTY • Signature Place • The Metropolitan at 40 Park BERGEN COUNTY • The James HARRISON • RiverPark at Harrison SHORT HILLS • The Upton JERSEY CITY • Soho Lofts • Urby • The BLVD Collection • Haus25 • Liberty Towers PORT IMPERIAL • RiverTrace • The Capstone • RiverHouse 9 • RiverHouse 11 NEW YORK • Quarry Place MASSACHUSETTS • 145 Front at City Square • Portside I/II at East Pier • The Emery WASHINGTON, D.C. • Station House Northeast Coastal Focused 7,621 premium units across 22 assets, with locations across New Jersey, Massachusetts, Suburban New York and Washington, D.C. Almost half of our properties are located on the Jersey City Waterfront, where Class A rents continue to reflect a discount of approximately 30% to top Manhattan submarkets and 12% to those of Downtown Brooklyn while offering generally newer product, more space and a wider selection of amenities. OUR CORE MARKETS |
|
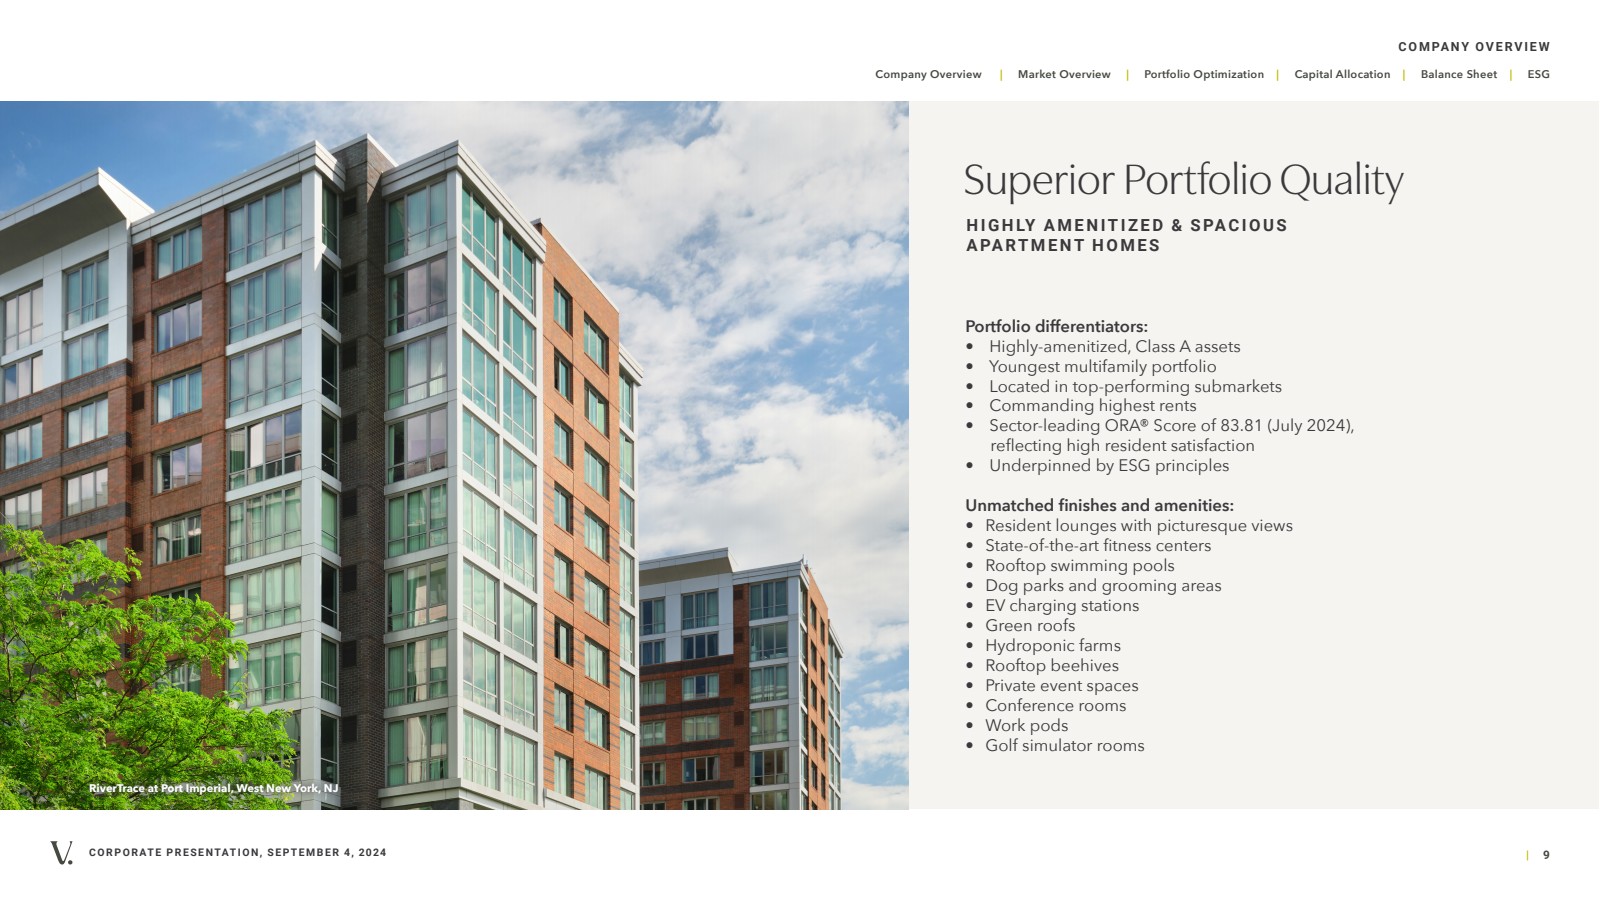
CORPORATE PRESENTATION, SEPTEMBER 4, 2024 | 9 Company Overview | Market Overview | Portfolio Optimization | Capital Allocation | Balance Sheet | ESG COMPANY OVERVIEW Superior Portfolio Quality Portfolio differentiators: • Highly-amenitized, Class A assets • Youngest multifamily portfolio • Located in top-performing submarkets • Commanding highest rents • Sector-leading ORA® Score of 83.81 (July 2024), reflecting high resident satisfaction • Underpinned by ESG principles Unmatched finishes and amenities: • Resident lounges with picturesque views • State-of-the-art fitness centers • Rooftop swimming pools • Dog parks and grooming areas • EV charging stations • Green roofs • Hydroponic farms • Rooftop beehives • Private event spaces • Conference rooms • Work pods • Golf simulator rooms H I G H LY A M E N I T I Z E D & S PA C I O U S APARTMENT HOMES RiverTrace at Port Imperial, West New York, NJ |
|
CORPORATE PRESENTATION, SEPTEMBER 4, 2024 | 10 Company Overview | Market Overview | Portfolio Optimization | Capital Allocation | Balance Sheet | ESG COMPANY OVERVIEW Executive Team Dept. Heads Mahbod Nia Taryn Fielder Amanda Lombard Anna Malhari Jeff Turkanis Chief Executive Officer General Counsel & Secretary Chief Financial Officer Chief Operating Officer Chief Investment Officer Carmen DeGuida Lori Milo Karen Cusmano PJ Lefort CISO & Vice President Information Technology Senior Vice President Human Resources Senior Vice President Sustainability & ESG Senior Vice President Operations Senior Vice President Operations & Asset Mgmt Nicole Jones Senior Vice President Marketing & Comms Jay Minchilli Javairia Waseem Vice President Tax Our Leadership Team PROVEN TRACK RECORD OF VALUE CREATION |
|
CORPORATE PRESENTATION, SEPTEMBER 4, 2024 | 11 Company Overview | Market Overview | Portfolio Optimization | Capital Allocation | Balance Sheet | ESG MARKET OVERVIEW Market Overview The Metropolitan, Morristown, NJ |
|
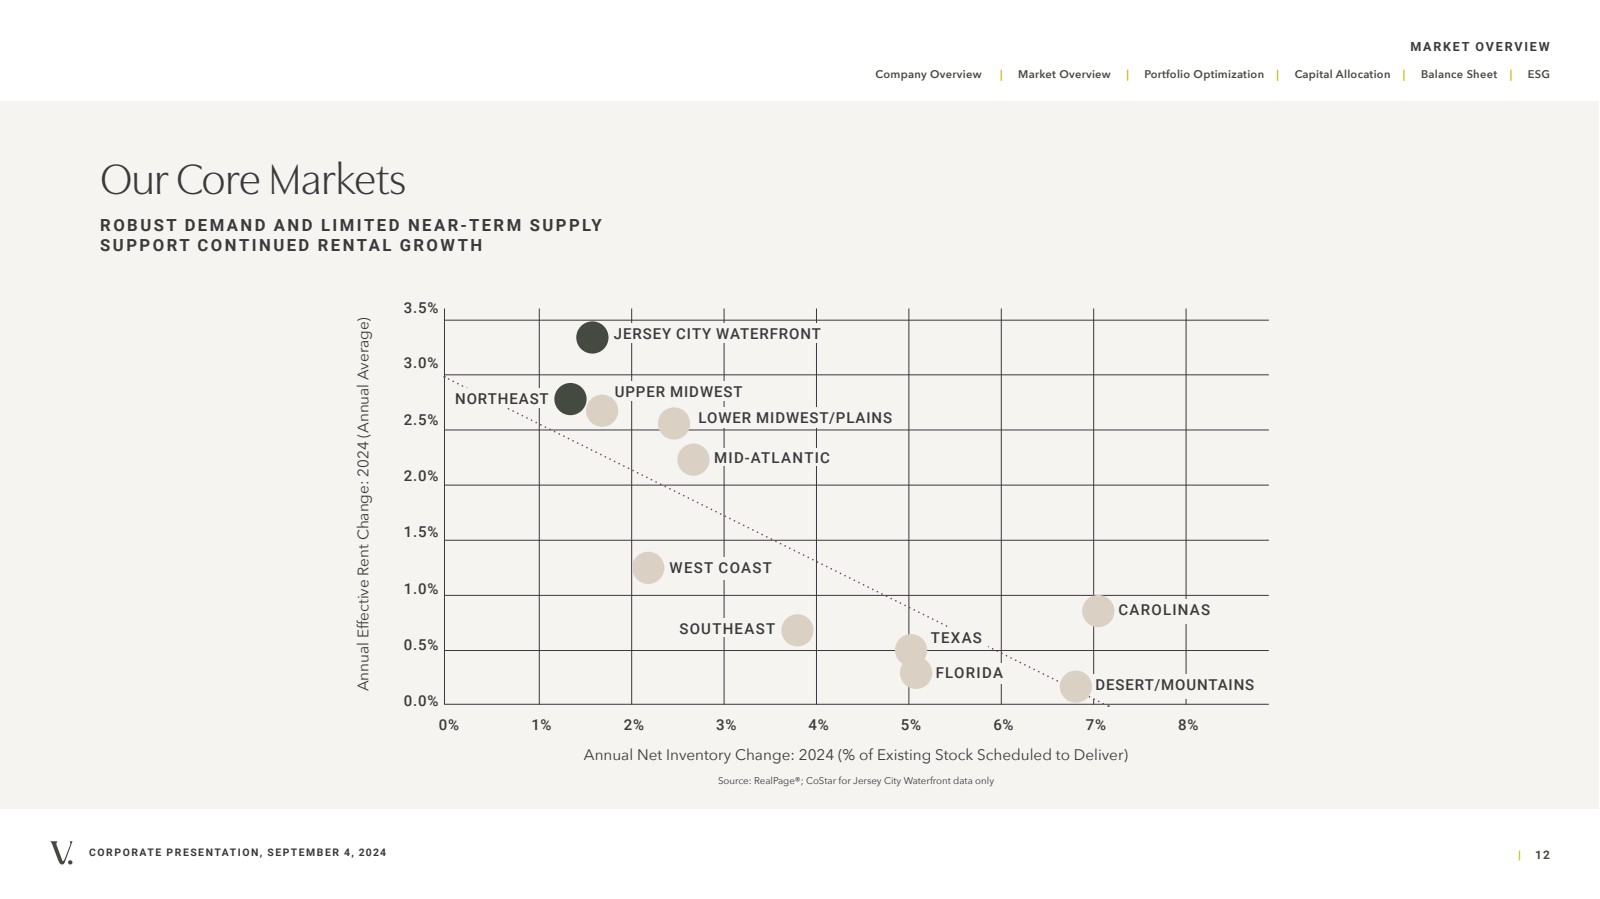
CORPORATE PRESENTATION, SEPTEMBER 4, 2024 | 12 Company Overview | Market Overview | Portfolio Optimization | Capital Allocation | Balance Sheet | ESG MARKET OVERVIEW 0.0% 0.5% 1.0% 1.5% 2.0% 2.5% 3.0% 0% 1% 2% 3% 4% 5% 6% 7% 8% Annual Effective Rent Change: 2024 (Annual Average) UPPER MIDWEST LOWER MIDWEST/PLAINS MID-ATLANTIC DESERT/MOUNTAINS CAROLINAS WEST COAST SOUTHEAST TEXAS FLORIDA Annual Net Inventory Change: 2024 (% of Existing Stock Scheduled to Deliver) NORTHEAST Source: RealPage®; CoStar for Jersey City Waterfront data only JERSEY CITY WATERFRONT 3.5% Our Core Markets R O B U S T D E M A N D A N D L I M I T E D N E A R-T E R M S U P P LY SUPPORT CONTINUED RENTAL GROWTH |
|
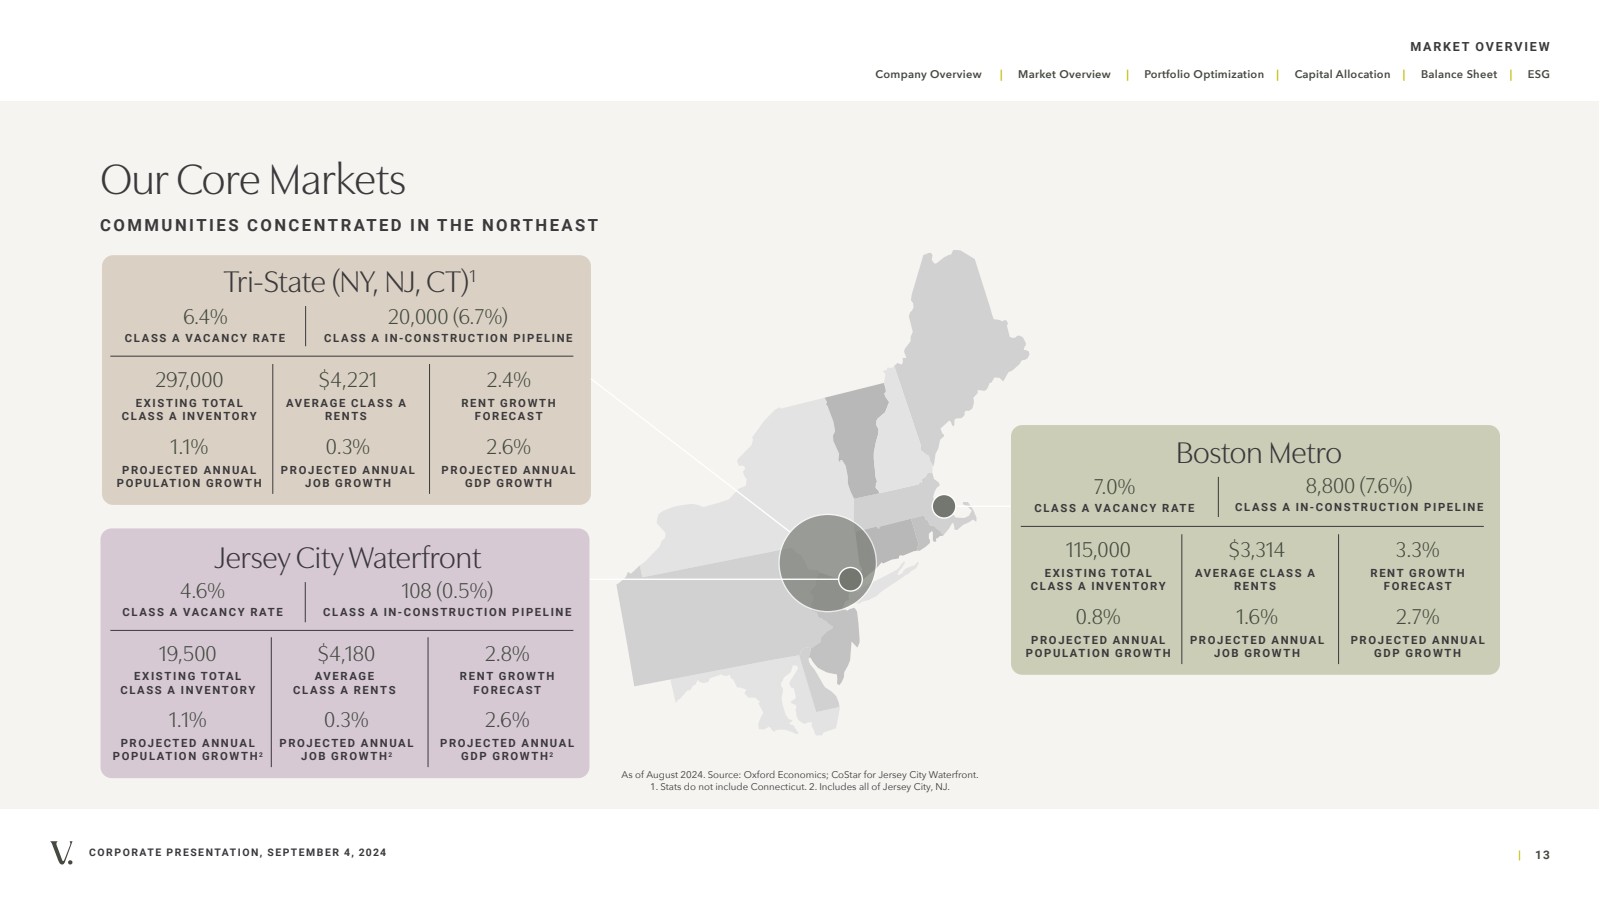
CORPORATE PRESENTATION, SEPTEMBER 4, 2024 | 13 Company Overview | Market Overview | Portfolio Optimization | Capital Allocation | Balance Sheet | ESG MARKET OVERVIEW Tri-State (NY, NJ, CT)1 297,000 EXISTING TOTAL CLASS A INVENTORY 20,000 (6.7%) CLASS A IN-CONSTRUCTION PIPELINE $4,221 AVERAGE CLASS A RENTS 2.4% RENT GROWTH FORECAST 1.1% PROJECTED ANNUAL POPULATION GROWTH 0.3% PROJECTED ANNUAL JOB GROWTH 2.6% PROJECTED ANNUAL GDP GROWTH 6.4% CLASS A VACANCY RATE Jersey City Waterfront 19,500 EXISTING TOTAL CLASS A INVENTORY 4.6% CLASS A VACANCY RATE $4,180 AVERAGE CLASS A RENTS 2.8% RENT GROWTH FORECAST 1.1% PROJECTED ANNUAL POPULATION GROWTH2 0.3% PROJECTED ANNUAL JOB GROWTH2 2.6% PROJECTED ANNUAL GDP GROWTH2 108 (0.5%) CLASS A IN-CONSTRUCTION PIPELINE Boston Metro 115,000 EXISTING TOTAL CLASS A INVENTORY 8,800 (7.6%) CLASS A IN-CONSTRUCTION PIPELINE $3,314 AVERAGE CLASS A RENTS 3.3% RENT GROWTH FORECAST 0.8% PROJECTED ANNUAL POPULATION GROWTH 1.6% PROJECTED ANNUAL JOB GROWTH 2.7% PROJECTED ANNUAL GDP GROWTH 7.0% CLASS A VACANCY RATE As of August 2024. Source: Oxford Economics; CoStar for Jersey City Waterfront. 1. Stats do not include Connecticut. 2. Includes all of Jersey City, NJ. Our Core Markets COMMUNITIES CONCENTRATED IN THE NORTHEAST |
|
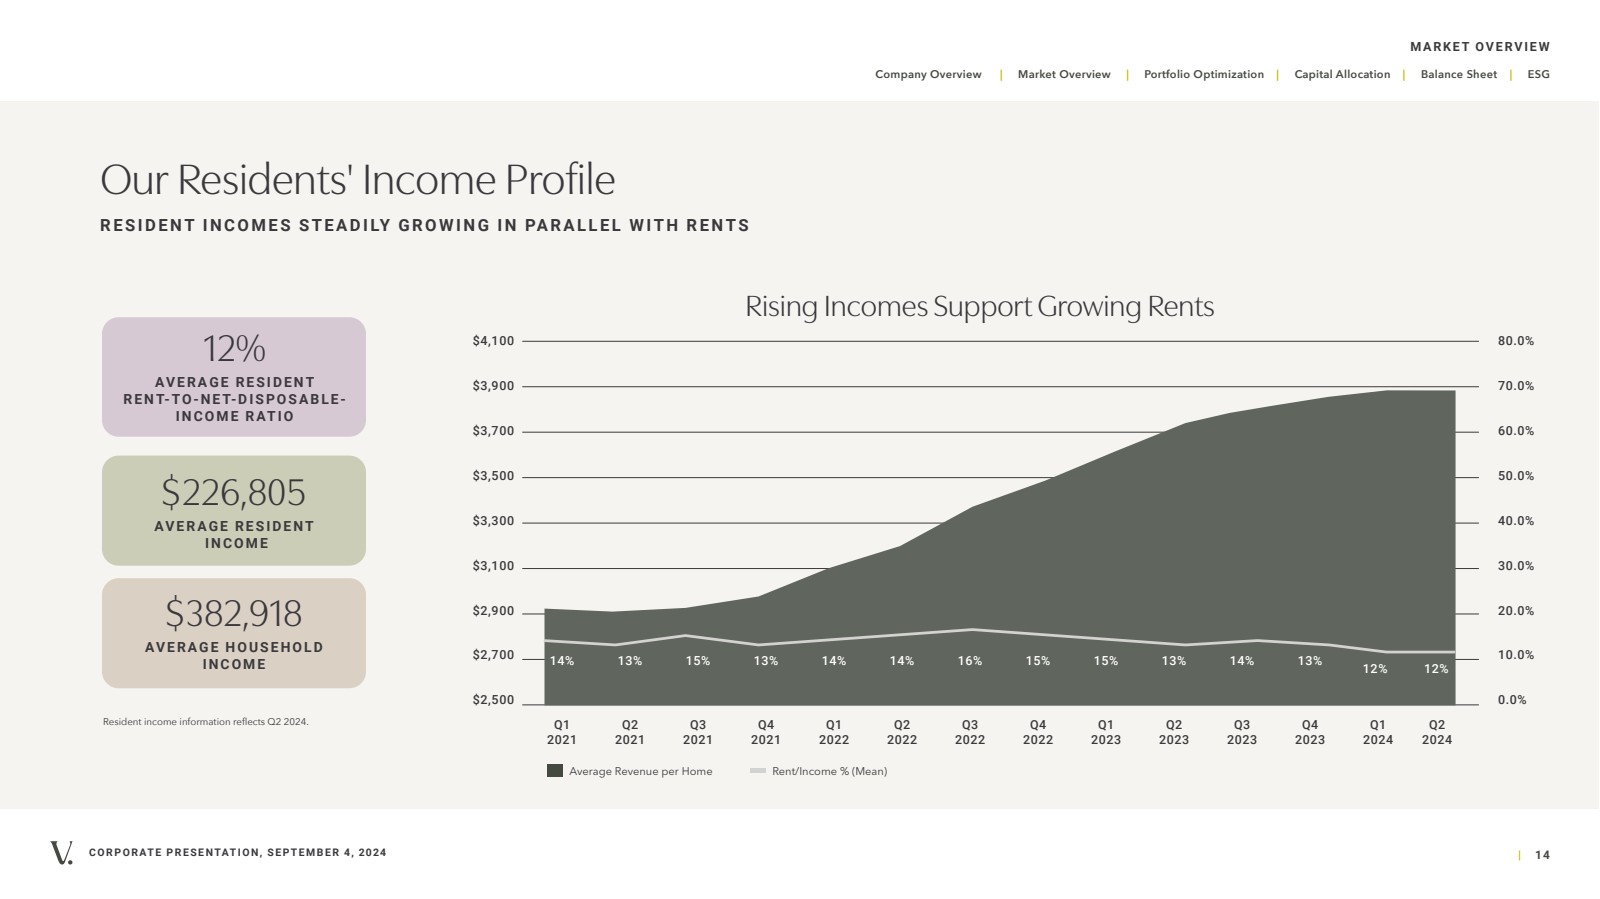
CORPORATE PRESENTATION, SEPTEMBER 4, 2024 | 14 Company Overview | Market Overview | Portfolio Optimization | Capital Allocation | Balance Sheet | ESG MARKET OVERVIEW Rent/Income % (Mean) 14% 13% 15% 13% 14% 14% 16% 15% 15% 13% 14% 13% Q1 2021 Q2 2021 Q3 2021 Q4 2021 Q1 2022 Q2 2022 Q3 2022 Q4 2022 Q1 2023 Q2 2023 Q3 2023 Q4 2023 Average Revenue per Home $4,100 $3,900 $3,700 $3,500 $3,300 $3,100 $2,900 $2,700 $2,500 80.0% 70.0% 60.0% 50.0% 40.0% 30.0% 20.0% 10.0% 0.0% Rising Incomes Support Growing Rents Q1 2024 12% Q2 2024 12% Our Residents' Income Profile R E S I D E N T I N C O M E S S T E A D I LY G R O W I N G I N PA R A L L E L W I T H R E N T S 12% AV E R A G E R E S I D E N T R E N T- T O - N E T- D I S P O S A B L E - INCOME RATIO $226,805 AVERAGE RESIDENT INCOME $382,918 AV E R A G E H O U S E H O L D INCOME Resident income information reflects Q2 2024. |
|
CORPORATE PRESENTATION, SEPTEMBER 4, 2024 | 15 Company Overview | Market Overview | Portfolio Optimization | Capital Allocation | Balance Sheet | ESG PORTFOLIO OPTIMIZATION PORTFOLIO Portfolio Optimization RiverTrace at Port Imperial, West New York, NJ |
|
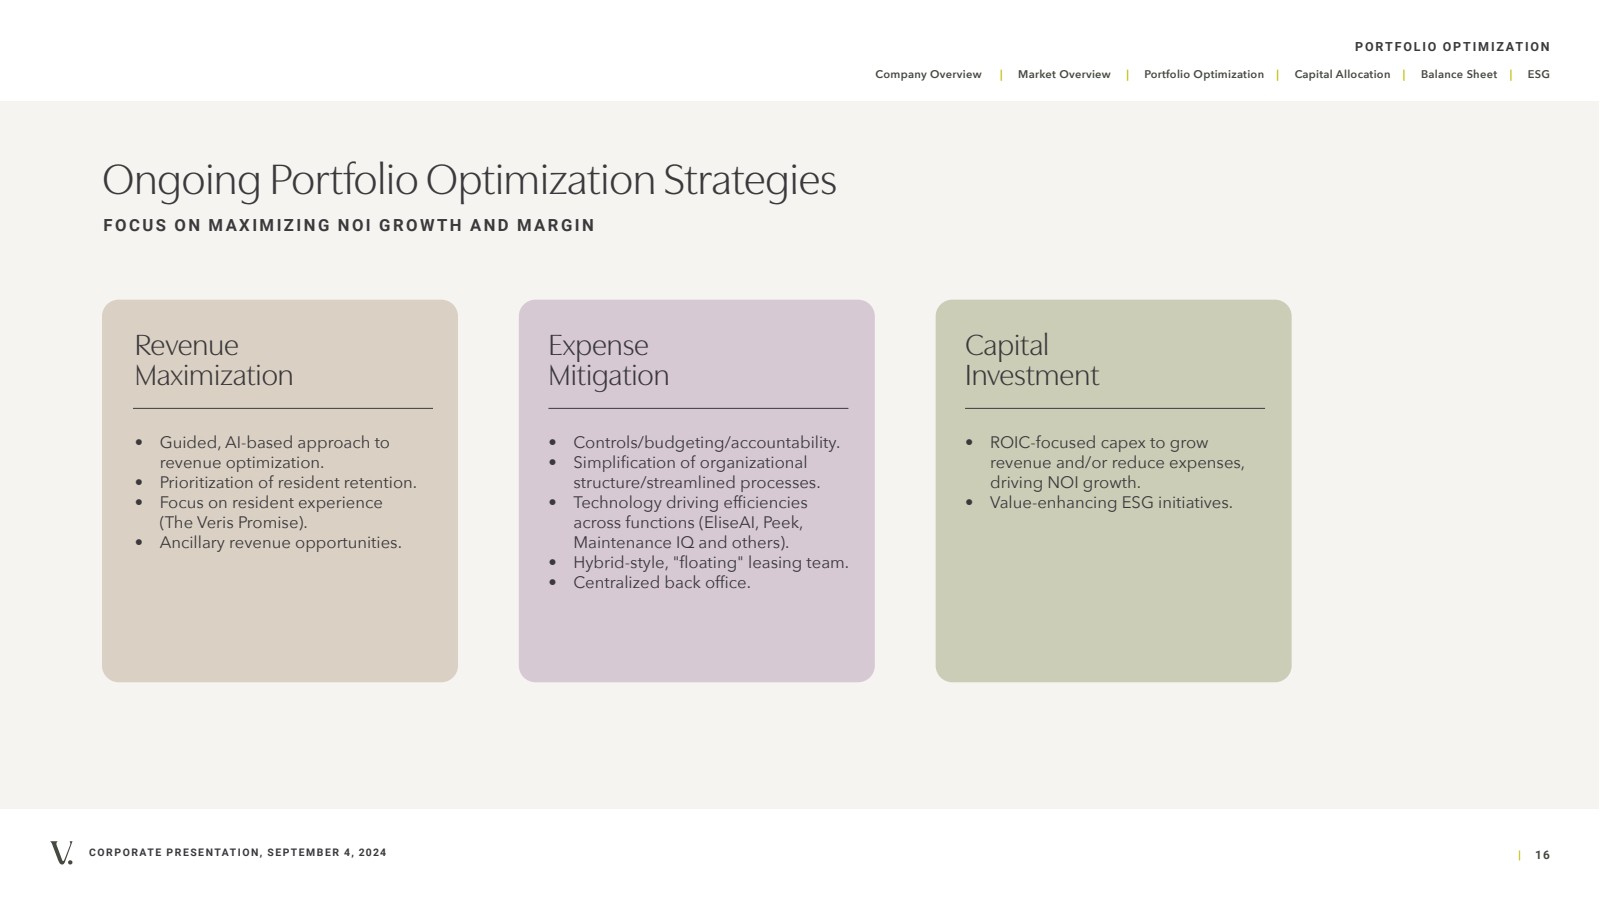
CORPORATE PRESENTATION, SEPTEMBER 4, 2024 | 16 Company Overview | Market Overview | Portfolio Optimization | Capital Allocation | Balance Sheet | ESG PORTFOLIO OPTIMIZATION Ongoing Portfolio Optimization Strategies FOCUS ON MAXIMIZING NOI GROWTH AND MARGIN Revenue Maximization Expense Mitigation Capital Investment • Guided, AI-based approach to revenue optimization. • Prioritization of resident retention. • Focus on resident experience (The Veris Promise). • Ancillary revenue opportunities. • Controls/budgeting/accountability. • Simplification of organizational structure/streamlined processes. • Technology driving efficiencies across functions (EliseAI, Peek, Maintenance IQ and others). • Hybrid-style, "floating" leasing team. • Centralized back office. • ROIC-focused capex to grow revenue and/or reduce expenses, driving NOI growth. • Value-enhancing ESG initiatives. |
|
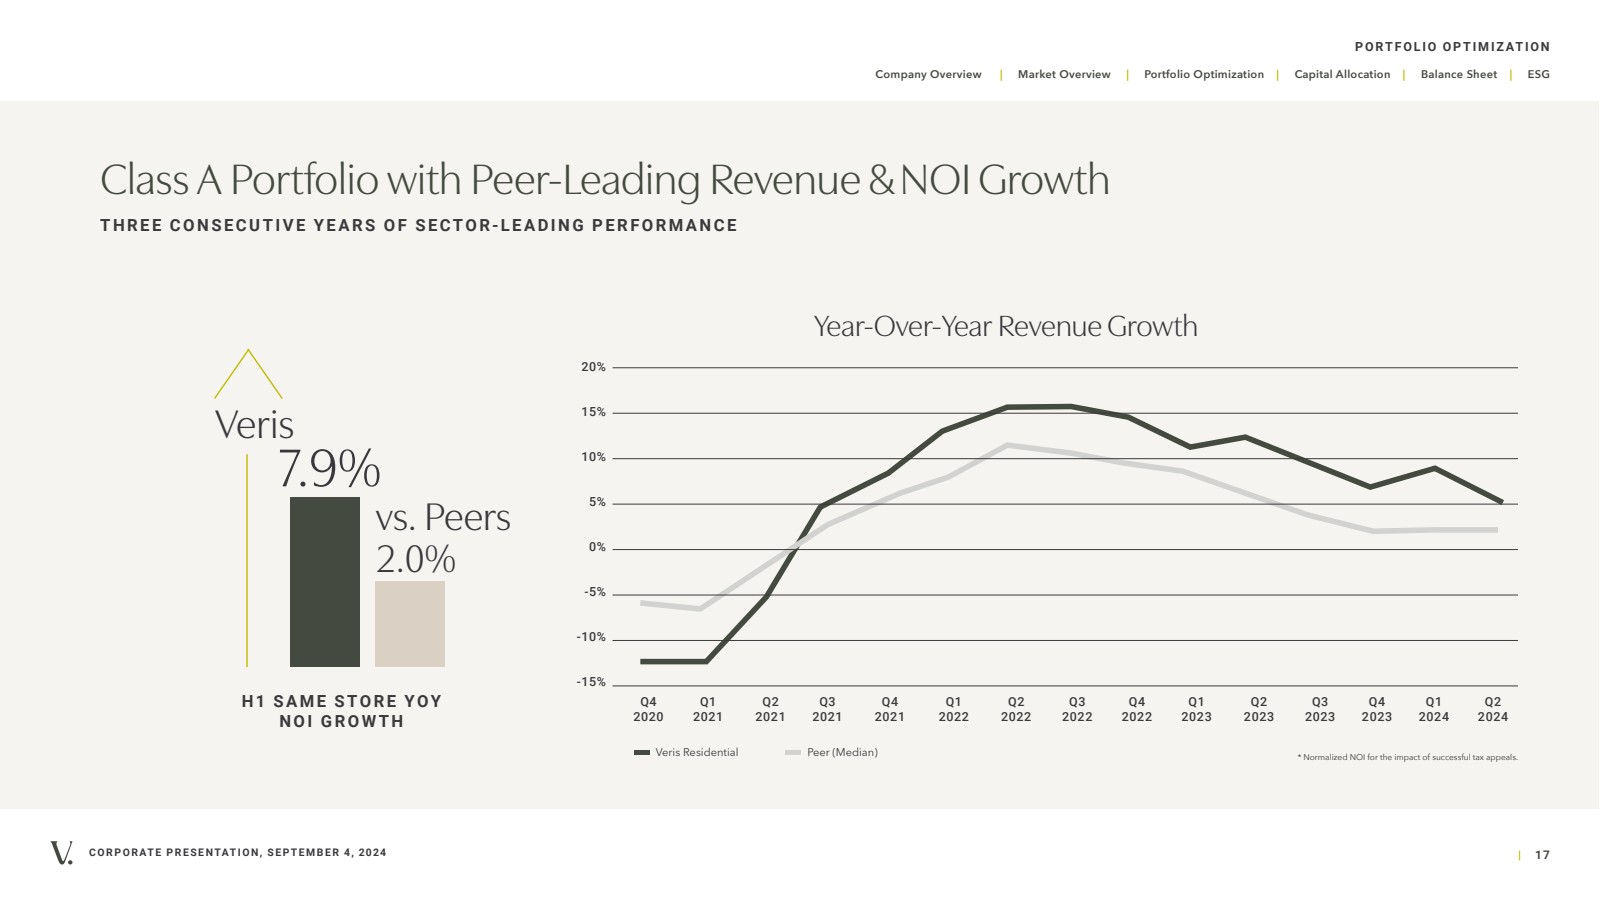
CORPORATE PRESENTATION, SEPTEMBER 4, 2024 | 17 Company Overview | Market Overview | Portfolio Optimization | Capital Allocation | Balance Sheet | ESG PORTFOLIO OPTIMIZATION Peer (Median) Q4 2020 Q1 2021 Q2 2021 Q3 2021 Q4 2021 Q1 2022 Q2 2022 Q3 2022 Q4 2022 Q1 2023 Q2 2023 Q3 2023 Veris Residential 20% 15% 10% 5% 0% -5% -10% -15% Year-Over-Year Revenue Growth Q4 2023 Q1 2024 Q2 2024 * Normalized NOI for the impact of successful tax appeals. Veris 7.9% vs. Peers 2.0% H1 S A M E S TO R E YOY NOI GROWTH Class A Portfolio with Peer-Leading Revenue & NOI Growth THREE CONSECUTIVE YEARS OF SECTOR-LEADING PERFORMANCE |
|
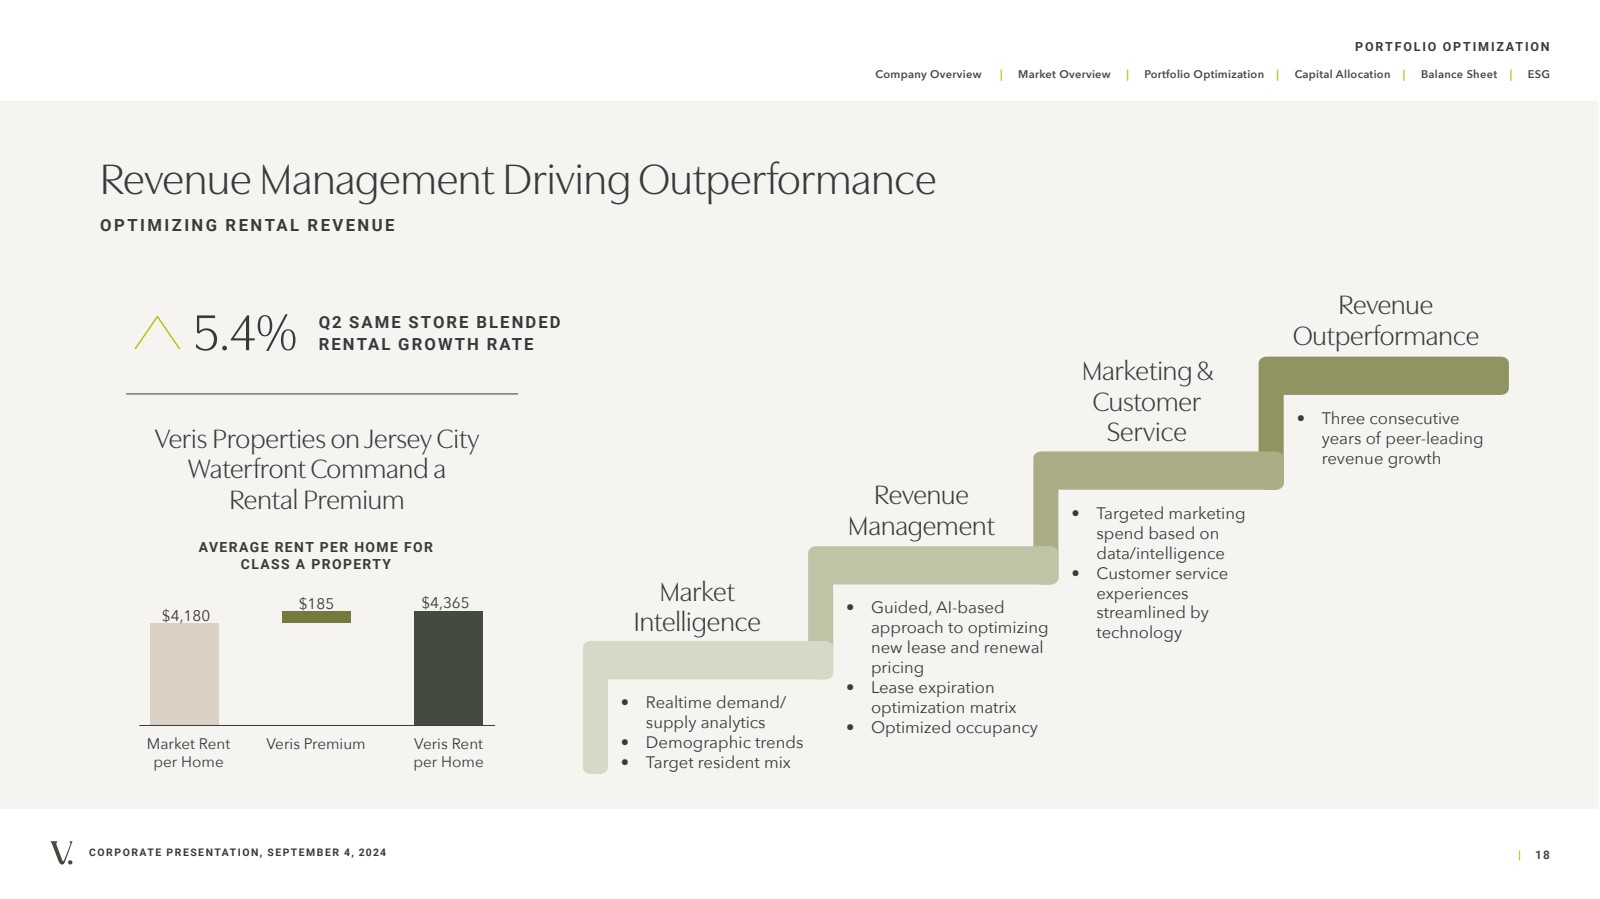
CORPORATE PRESENTATION, SEPTEMBER 4, 2024 | 18 Company Overview | Market Overview | Portfolio Optimization | Capital Allocation | Balance Sheet | ESG PORTFOLIO OPTIMIZATION Revenue Management Driving Outperformance OPTIMIZING RENTAL REVENUE Market Intelligence • Realtime demand/ supply analytics • Demographic trends • Target resident mix Revenue Management • Guided, AI-based approach to optimizing new lease and renewal pricing • Lease expiration optimization matrix • Optimized occupancy Marketing & Customer Service • Targeted marketing spend based on data/intelligence • Customer service experiences streamlined by technology Revenue Outperformance • Three consecutive years of peer-leading revenue growth Veris Properties on Jersey City Waterfront Command a Rental Premium 5.4% Market Rent per Home $4,180 $4,365 Veris Premium Veris Rent per Home AVERAGE RENT PER HOME FOR CLASS A PROPERTY Q2 SAME STORE BLENDED RENTAL GROWTH RATE $185 |
|
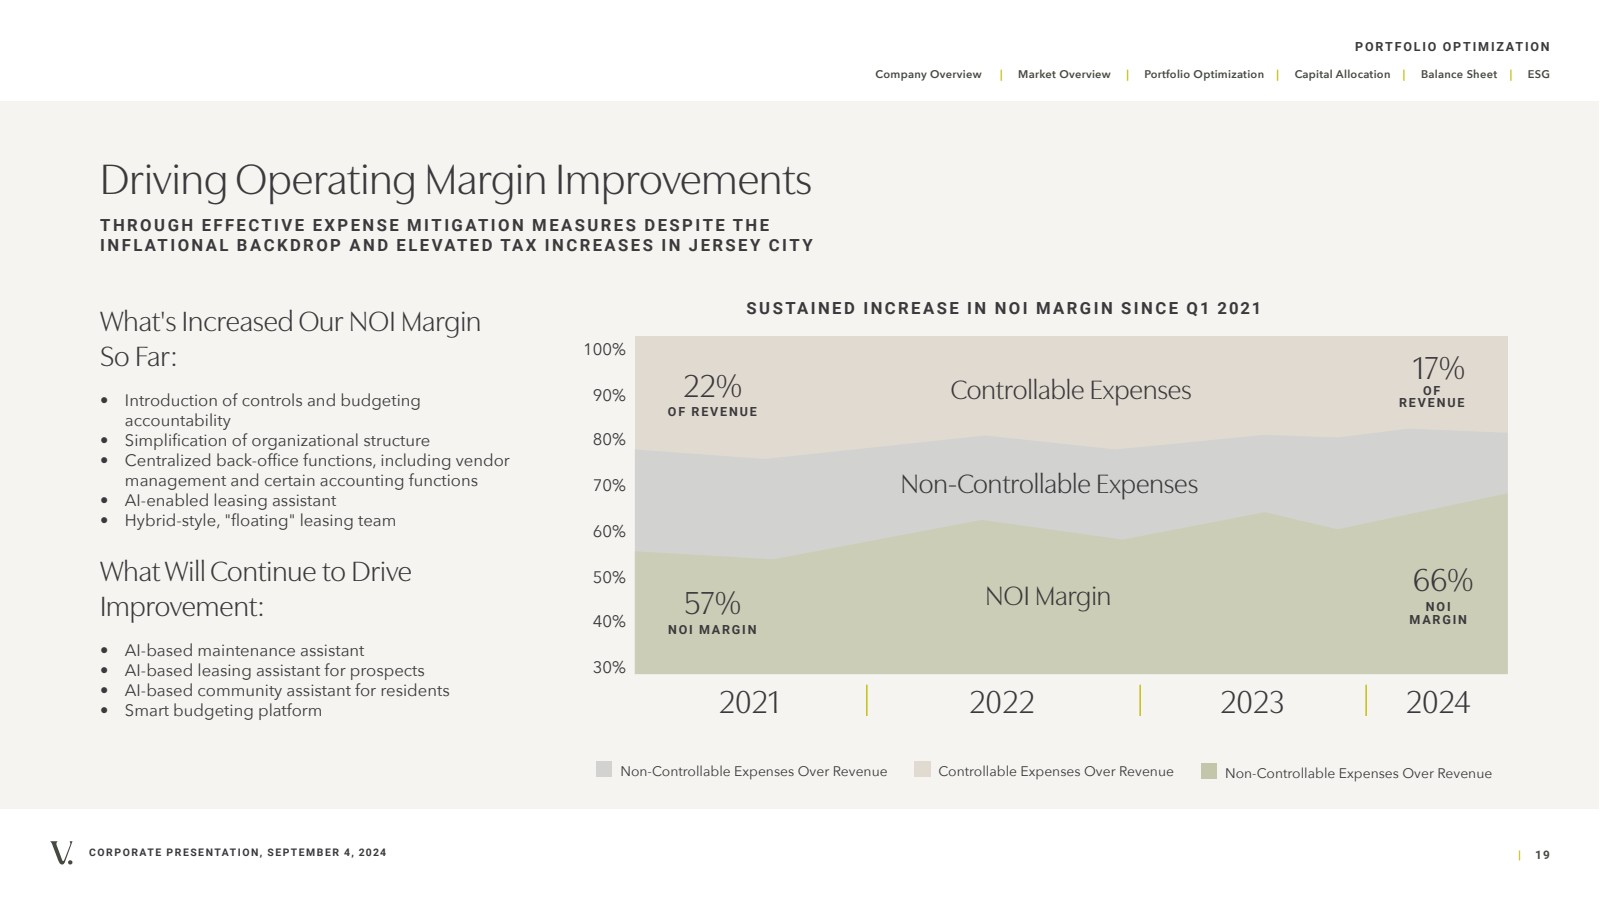
CORPORATE PRESENTATION, SEPTEMBER 4, 2024 | 19 Company Overview | Market Overview | Portfolio Optimization | Capital Allocation | Balance Sheet | ESG PORTFOLIO OPTIMIZATION 30% 40% 50% 60% 70% 80% 90% 100% SUSTAINED INCREASE IN NOI MARGIN SINCE Q1 2021 OF REVENUE 22% NOI MARGIN 57% N O I MARGIN 66% O F REVENUE 17% 2021 2022 2023 Controllable Expenses Non-Controllable Expenses NOI Margin 2024 Non-Controllable Expenses Over Revenue Controllable Expenses Over Revenue Non-Controllable Expenses Over Revenue Driving Operating Margin Improvements T H R O U G H E F F E CT I V E E X P E N S E M I T I G AT I O N M E A S U R E S D E S P I T E T H E INFLATIONAL BACKDROP AND ELEVATED TAX INCREASES IN JERSEY CITY What's Increased Our NOI Margin So Far: • Introduction of controls and budgeting accountability • Simplification of organizational structure • Centralized back-office functions, including vendor management and certain accounting functions • AI-enabled leasing assistant • Hybrid-style, "floating" leasing team What Will Continue to Drive Improvement: • AI-based maintenance assistant • AI-based leasing assistant for prospects • AI-based community assistant for residents • Smart budgeting platform |
|
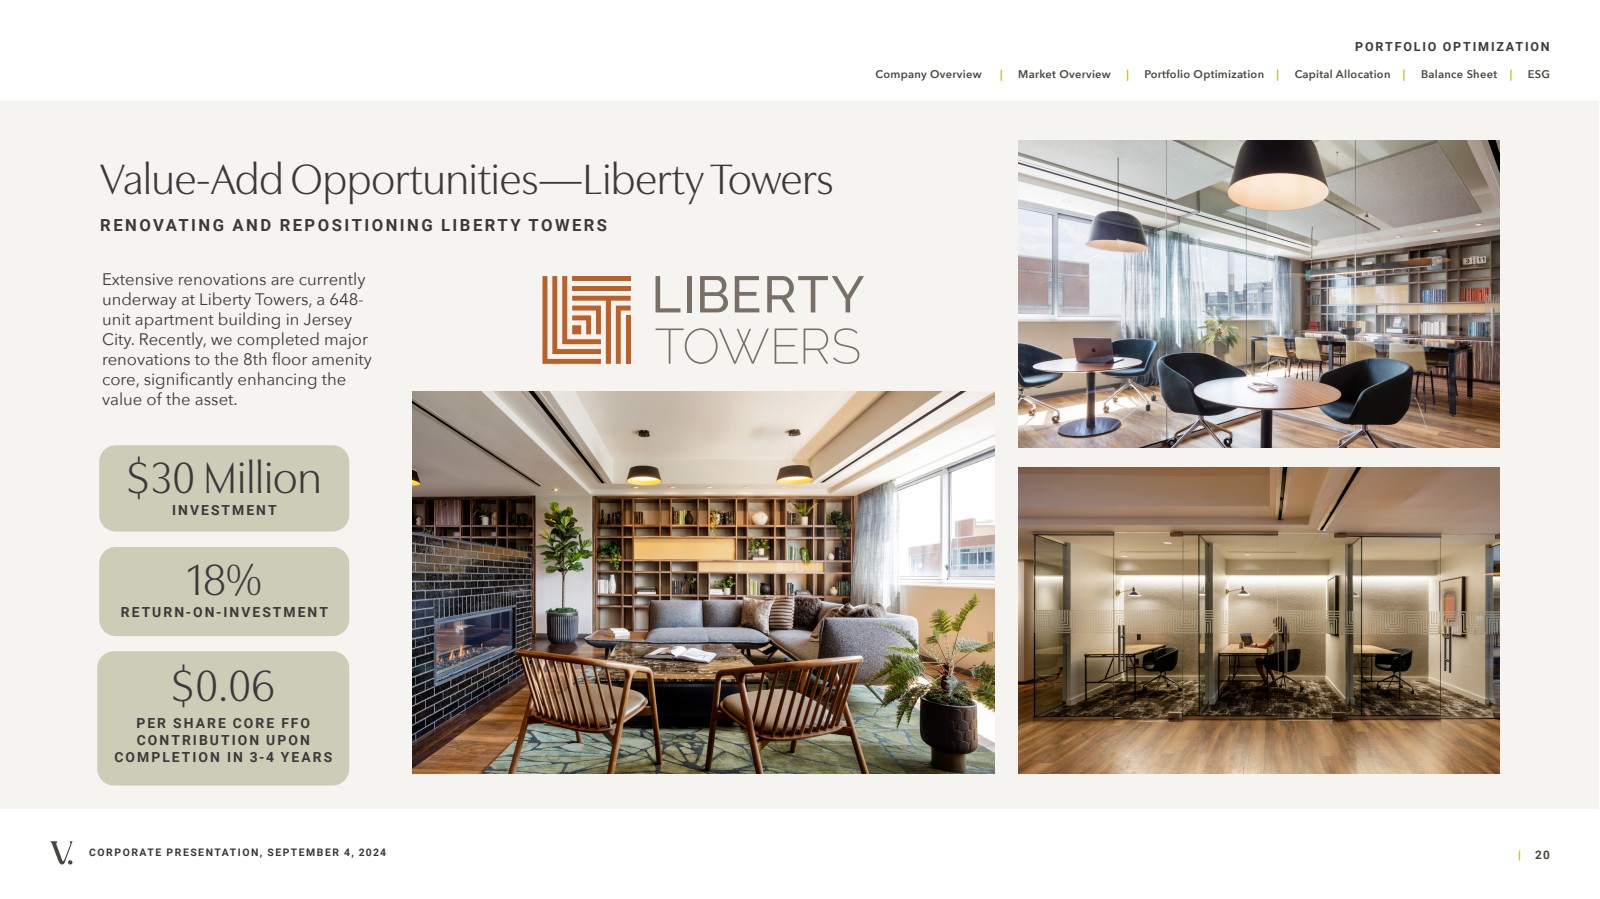
CORPORATE PRESENTATION, SEPTEMBER 4, 2024 | 20 Company Overview | Market Overview | Portfolio Optimization | Capital Allocation | Balance Sheet | ESG PORTFOLIO OPTIMIZATION RENOVATING AND REPOSITIONING LIBERTY TOWERS Extensive renovations are currently underway at Liberty Towers, a 648- unit apartment building in Jersey City. Recently, we completed major renovations to the 8th floor amenity core, significantly enhancing the value of the asset. Value-Add Opportunities—Liberty Towers 18% RETURN-ON-INVESTMENT $0.06 P E R S H A R E C O R E F F O C O N T R I B U T I O N U P O N COMPLETION IN 3-4 YEARS $30 Million INVESTMENT |
|
CORPORATE PRESENTATION, SEPTEMBER 4, 2024 | 21 Company Overview | Market Overview | Portfolio Optimization | Capital Allocation | Balance Sheet | ESG PORTFOLIO OPTIMIZATION Technology—myVeris App ALL-ENCOMPASSING RESIDENT ENGAGEMENT APP Our comprehensive resident mobile application, myVeris, streamlines business operations while offering a convenient, all-in-one solution for residents to: • Pay rent • Request maintenance • Message community management • Reserve amenities • View package deliveries • RSVP to events • Browse community information and resources • Register visitors • Connect with brand partners • Post on a digital community bulletin board Homepage Property events Amenity reservations, including work-from-home areas Partner Promotions, where residents receive exclusive deals from handpicked partners >90% RESIDENT ADOPTION RATE: |
|
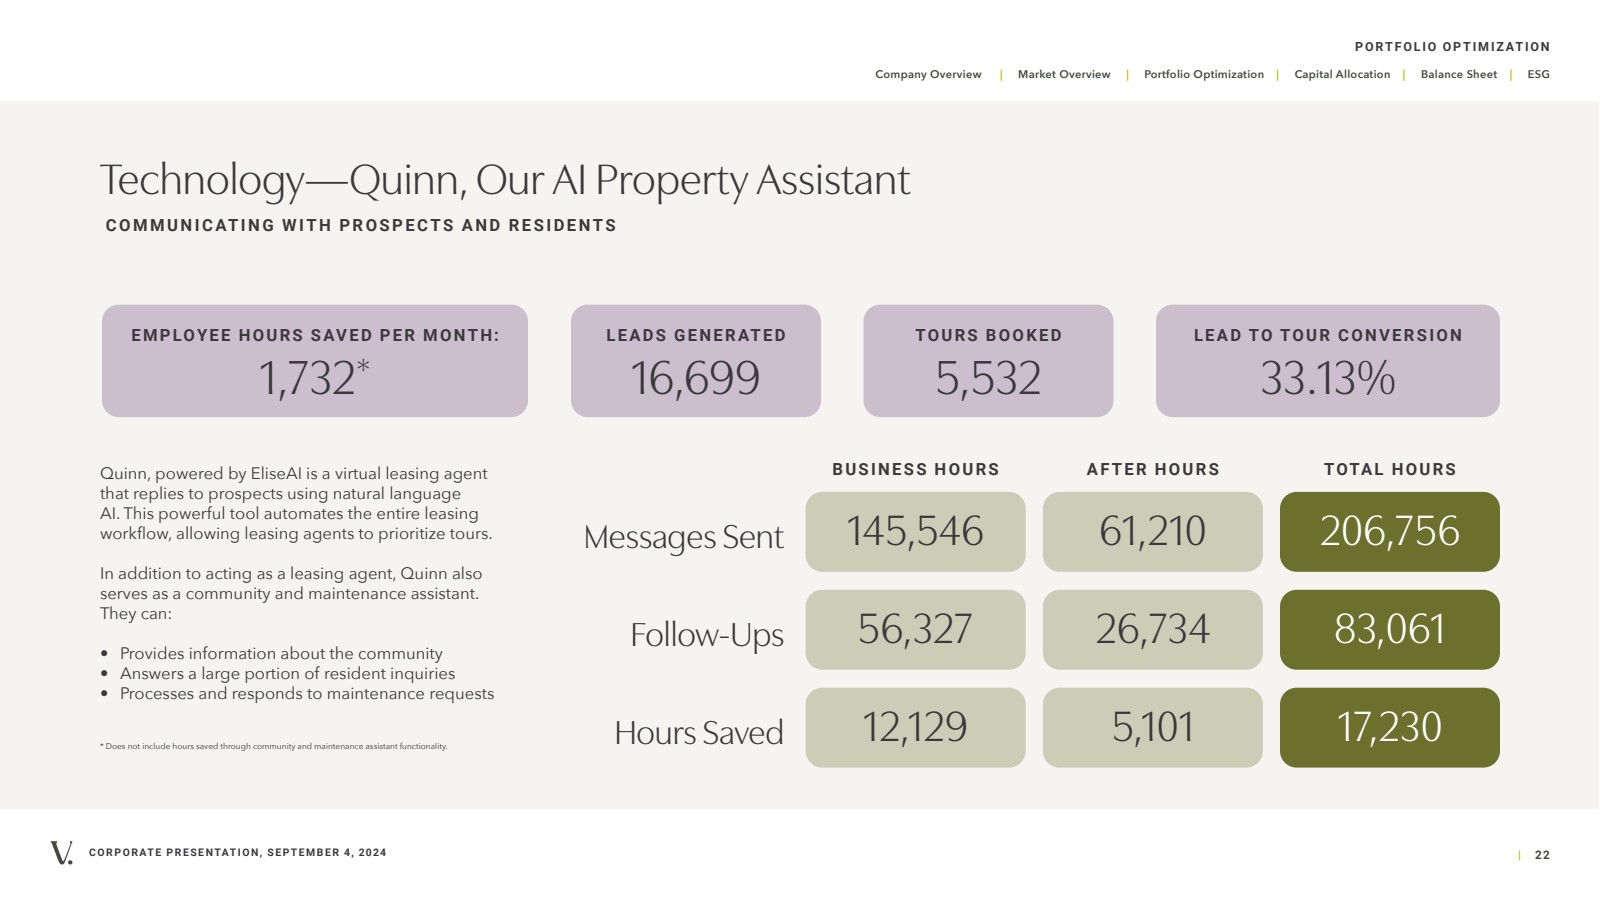
CORPORATE PRESENTATION, SEPTEMBER 4, 2024 | 22 Company Overview | Market Overview | Portfolio Optimization | Capital Allocation | Balance Sheet | ESG PORTFOLIO OPTIMIZATION * Does not include hours saved through community and maintenance assistant functionality. Technology—Quinn, Our AI Property Assistant COMMUNICATING WITH PROSPECTS AND RESIDENTS Quinn, powered by EliseAI is a virtual leasing agent that replies to prospects using natural language AI. This powerful tool automates the entire leasing workflow, allowing leasing agents to prioritize tours. In addition to acting as a leasing agent, Quinn also serves as a community and maintenance assistant. They can: • Provides information about the community • Answers a large portion of resident inquiries • Processes and responds to maintenance requests 1,732* EMPLOYEE HOURS SAVED PER MONTH: 16,699 LEADS GENERATED 5,532 TOURS BOOKED 33.13% LEAD TO TOUR CONVERSION Messages Sent 145,546 Follow-Ups 56,327 Hours Saved 12,129 61,210 26,734 5,101 BUSINESS HOURS AFTER HOURS 206,756 83,061 17,230 TOTAL HOURS |
|
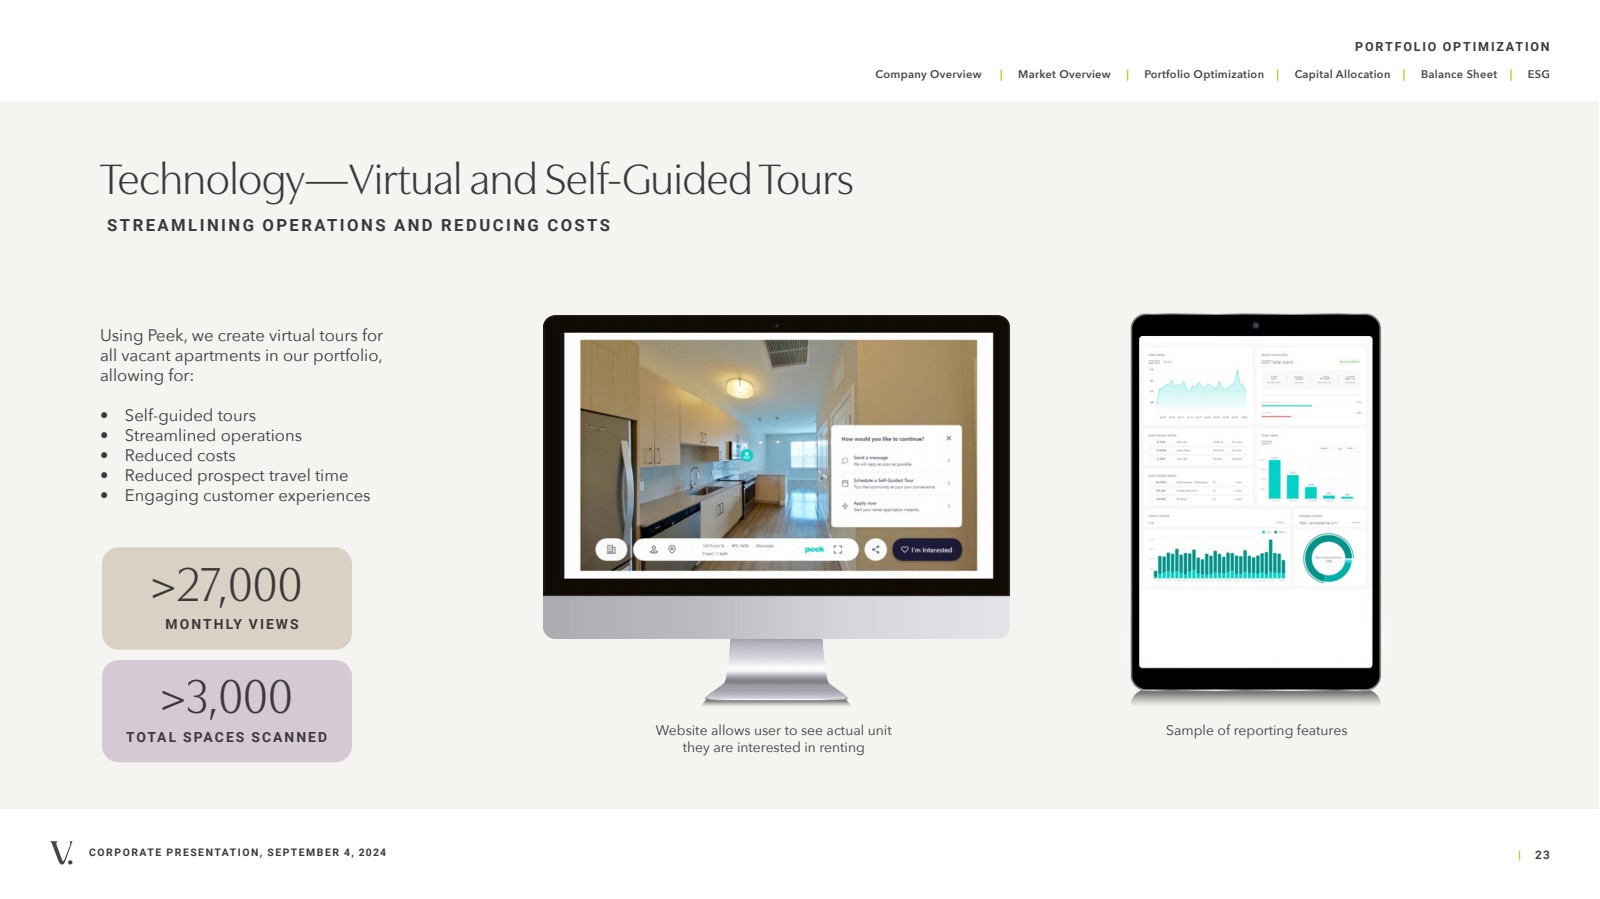
CORPORATE PRESENTATION, SEPTEMBER 4, 2024 | 23 Company Overview | Market Overview | Portfolio Optimization | Capital Allocation | Balance Sheet | ESG PORTFOLIO OPTIMIZATION Technology—Virtual and Self-Guided Tours STREAMLINING OPERATIONS AND REDUCING COSTS Using Peek, we create virtual tours for all vacant apartments in our portfolio, allowing for: • Self-guided tours • Streamlined operations • Reduced costs • Reduced prospect travel time • Engaging customer experiences Website allows user to see actual unit they are interested in renting Sample of reporting features >27,000 M O N T H LY V I E W S >3,000 TOTAL SPACES SCANNED |
|
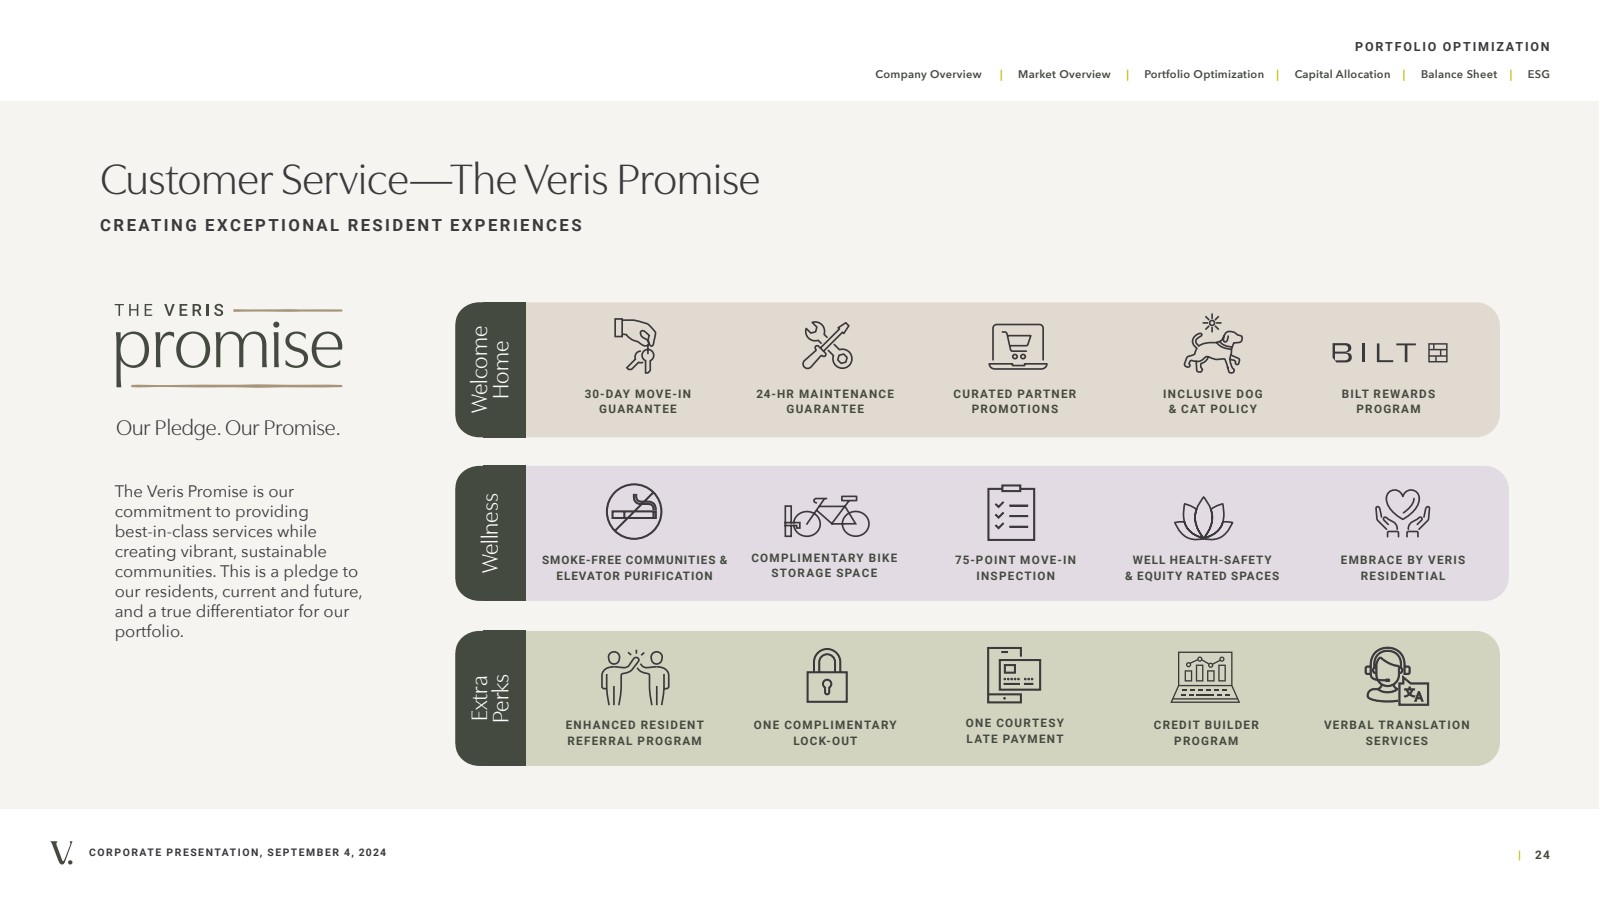
CORPORATE PRESENTATION, SEPTEMBER 4, 2024 | 24 Company Overview | Market Overview | Portfolio Optimization | Capital Allocation | Balance Sheet | ESG PORTFOLIO OPTIMIZATION Customer Service—The Veris Promise CREATING EXCEPTIONAL RESIDENT EXPERIENCES Our Pledge. Our Promise. The Veris Promise is our commitment to providing best-in-class services while creating vibrant, sustainable communities. This is a pledge to our residents, current and future, and a true differentiator for our portfolio. 30-DAY MOVE-IN GUARANTEE 24-HR MAINTENANCE GUARANTEE CURATED PARTNER PROMOTIONS EMBRACE BY VERIS RESIDENTIAL INCLUSIVE DOG Welcome & CAT POLICY Home SMOKE-FREE COMMUNITIES & Wellness ELEVATOR PURIFICATION ONE COMPLIMENTARY LOCK-OUT ONE COURTESY LATE PAYMENT CREDIT BUILDER PROGRAM VERBAL TRANSLATION SERVICES Extra Perks COMPLIMENTARY BIKE STORAGE SPACE 75-POINT MOVE-IN INSPECTION WELL HEALTH-SAFETY & EQUITY RATED SPACES ENHANCED RESIDENT REFERRAL PROGRAM BILT REWARDS PROGRAM |
|
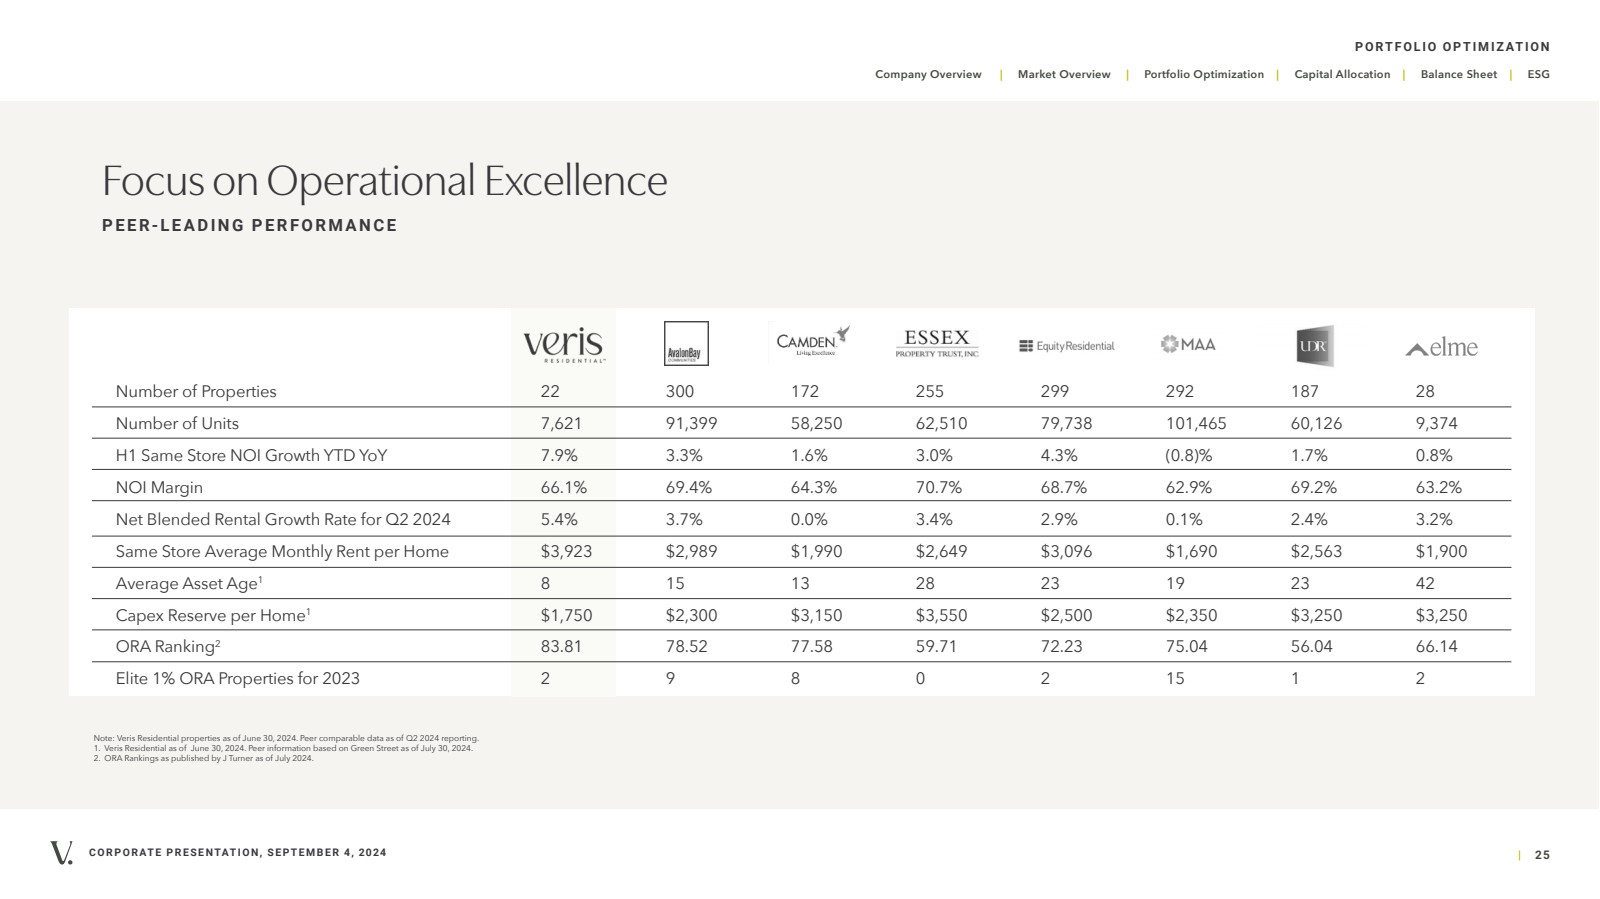
CORPORATE PRESENTATION, SEPTEMBER 4, 2024 | 25 Company Overview | Market Overview | Portfolio Optimization | Capital Allocation | Balance Sheet | ESG PORTFOLIO OPTIMIZATION Number of Properties 22 300 172 255 299 292 187 28 Number of Units 7,621 91,399 58,250 62,510 79,738 101,465 60,126 9,374 H1 Same Store NOI Growth YTD YoY 7.9% 3.3% 1.6% 3.0% 4.3% (0.8)% 1.7% 0.8% NOI Margin 66.1% 69.4% 64.3% 70.7% 68.7% 62.9% 69.2% 63.2% Net Blended Rental Growth Rate for Q2 2024 5.4% 3.7% 0.0% 3.4% 2.9% 0.1% 2.4% 3.2% Same Store Average Monthly Rent per Home $3,923 $2,989 $1,990 $2,649 $3,096 $1,690 $2,563 $1,900 Average Asset Age1 8 15 13 28 23 19 23 42 Capex Reserve per Home1 $1,750 $2,300 $3,150 $3,550 $2,500 $2,350 $3,250 $3,250 ORA Ranking2 83.81 78.52 77.58 59.71 72.23 75.04 56.04 66.14 Elite 1% ORA Properties for 2023 2 9 8 0 2 15 1 2 Note: Veris Residential properties as of June 30, 2024. Peer comparable data as of Q2 2024 reporting. 1. Veris Residential as of June 30, 2024. Peer information based on Green Street as of July 30, 2024. 2. ORA Rankings as published by J Turner as of July 2024. Focus on Operational Excellence PEER-LEADING PERFORMANCE |
|
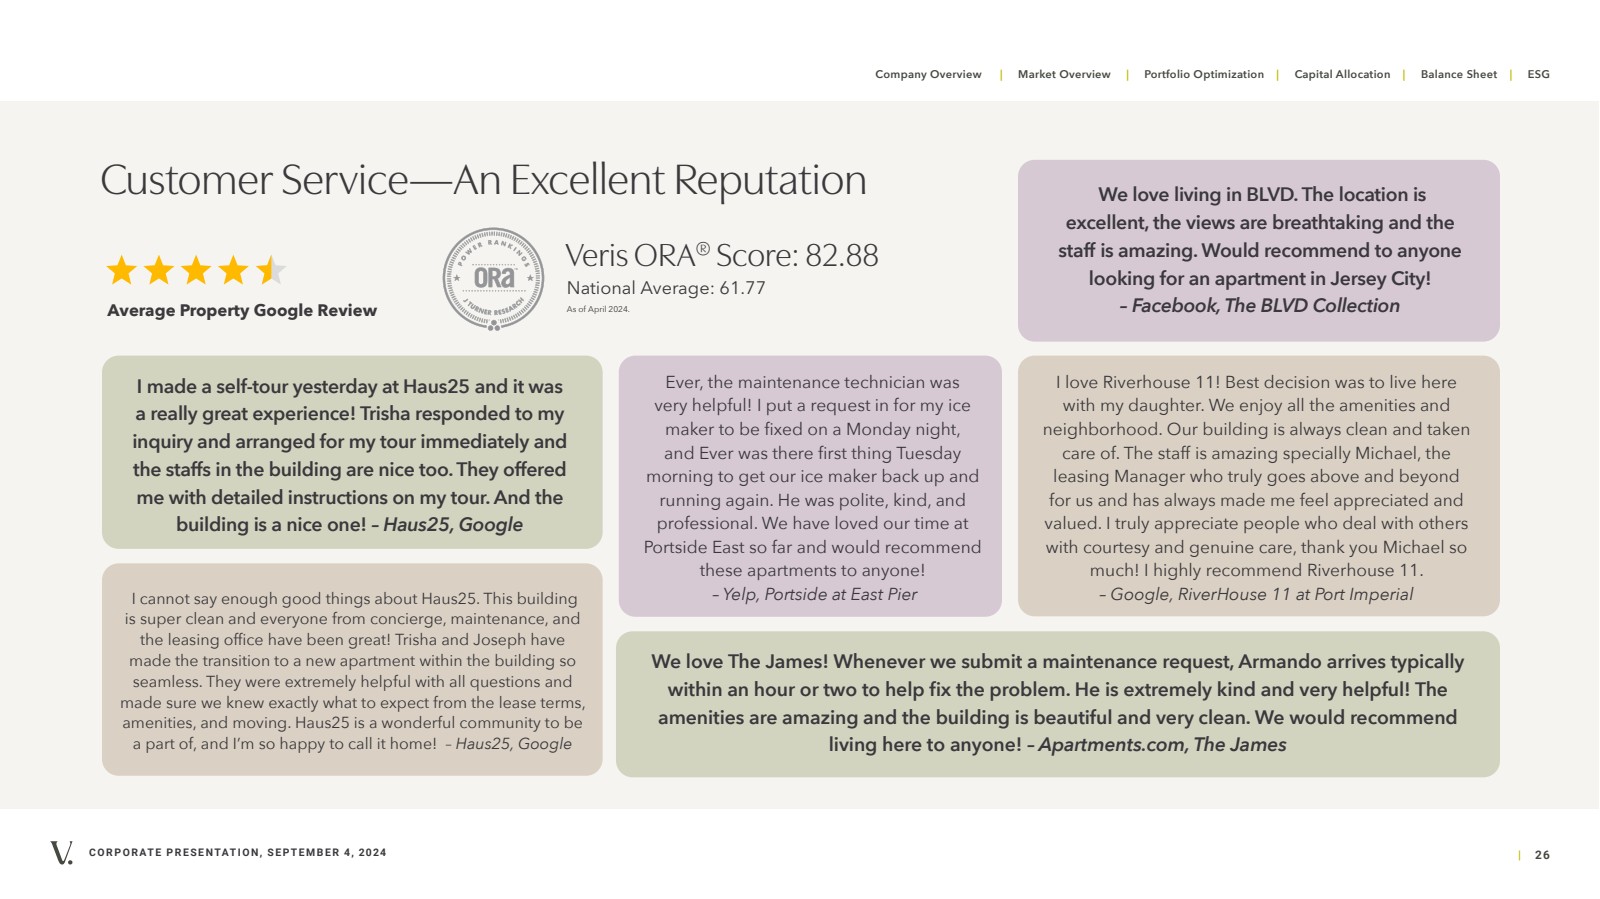
CORPORATE PRESENTATION, SEPTEMBER 4, 2024 | 26 Company Overview | Market Overview | Portfolio Optimization | Capital Allocation | Balance Sheet | ESG Average Property Google Review Ever, the maintenance technician was very helpful! I put a request in for my ice maker to be fixed on a Monday night, and Ever was there first thing Tuesday morning to get our ice maker back up and running again. He was polite, kind, and professional. We have loved our time at Portside East so far and would recommend these apartments to anyone! – Yelp, Portside at East Pier I cannot say enough good things about Haus25. This building is super clean and everyone from concierge, maintenance, and the leasing office have been great! Trisha and Joseph have made the transition to a new apartment within the building so seamless. They were extremely helpful with all questions and made sure we knew exactly what to expect from the lease terms, amenities, and moving. Haus25 is a wonderful community to be a part of, and I’m so happy to call it home! – Haus25, Google We love The James! Whenever we submit a maintenance request, Armando arrives typically within an hour or two to help fix the problem. He is extremely kind and very helpful! The amenities are amazing and the building is beautiful and very clean. We would recommend living here to anyone! – Apartments.com, The James Customer Service—An Excellent Reputation National Average: 61.77 I made a self-tour yesterday at Haus25 and it was a really great experience! Trisha responded to my inquiry and arranged for my tour immediately and the staffs in the building are nice too. They offered me with detailed instructions on my tour. And the building is a nice one! – Haus25, Google Veris ORA® Score: 82.88 As of April 2024. I love Riverhouse 11! Best decision was to live here with my daughter. We enjoy all the amenities and neighborhood. Our building is always clean and taken care of. The staff is amazing specially Michael, the leasing Manager who truly goes above and beyond for us and has always made me feel appreciated and valued. I truly appreciate people who deal with others with courtesy and genuine care, thank you Michael so much! I highly recommend Riverhouse 11. – Google, RiverHouse 11 at Port Imperial We love living in BLVD. The location is excellent, the views are breathtaking and the staff is amazing. Would recommend to anyone looking for an apartment in Jersey City! – Facebook, The BLVD Collection |
|
CORPORATE PRESENTATION, SEPTEMBER 4, 2024 | 27 Company Overview | Market Overview | Portfolio Optimization | Capital Allocation | Balance Sheet | ESG CAPITAL ALLOCATION PORTFOLIO Quarry Place, Tuckahoe, NY Capital Allocation |
|
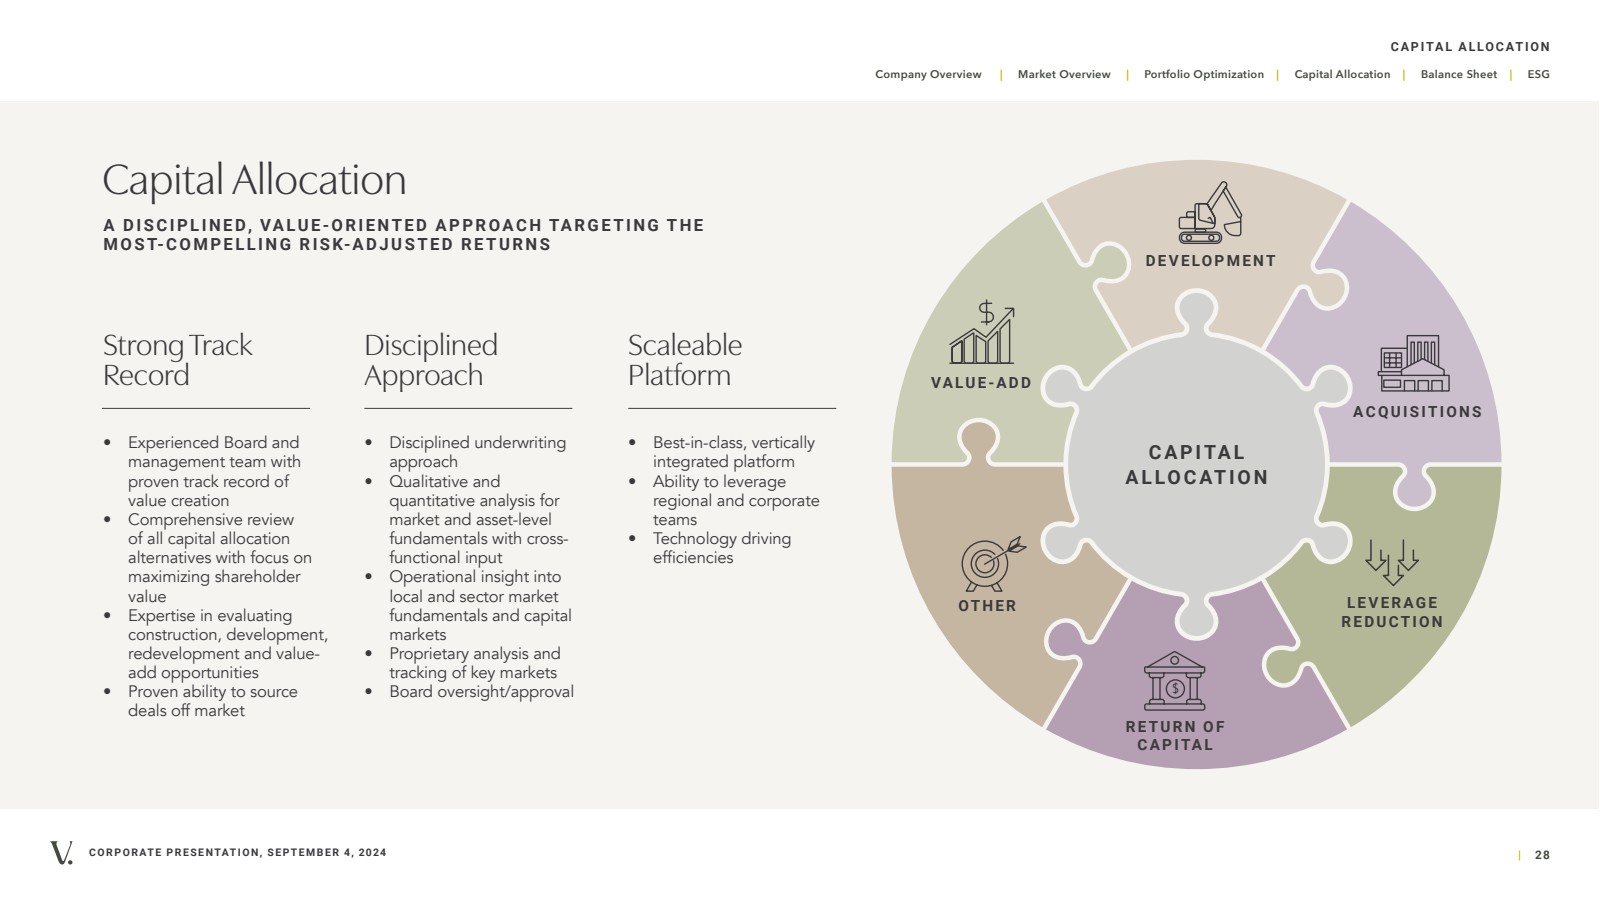
CORPORATE PRESENTATION, SEPTEMBER 4, 2024 | 28 Company Overview | Market Overview | Portfolio Optimization | Capital Allocation | Balance Sheet | ESG CAPITAL ALLOCATION DEVELOPMENT ACQUISITIONS VALUE-ADD CAPITAL ALLOCATION LEVERAGE REDUCTION RETURN OF CAPITAL OTHER $ Capital Allocation A D I S C I P L I N E D, VA LU E-O R I E N T E D A P P R OA C H TA R G E T I N G T H E M O S T- C O M P E L L I N G R I S K- A D J U S T E D R E T U R N S Strong Track Record Disciplined Approach Scaleable Platform • Experienced Board and management team with proven track record of value creation • Comprehensive review of all capital allocation alternatives with focus on maximizing shareholder value • Expertise in evaluating construction, development, redevelopment and value-add opportunities • Proven ability to source deals off market • Disciplined underwriting approach • Qualitative and quantitative analysis for market and asset-level fundamentals with cross-functional input • Operational insight into local and sector market fundamentals and capital markets • Proprietary analysis and tracking of key markets • Board oversight/approval • Best-in-class, vertically integrated platform • Ability to leverage regional and corporate teams • Technology driving efficiencies |
|
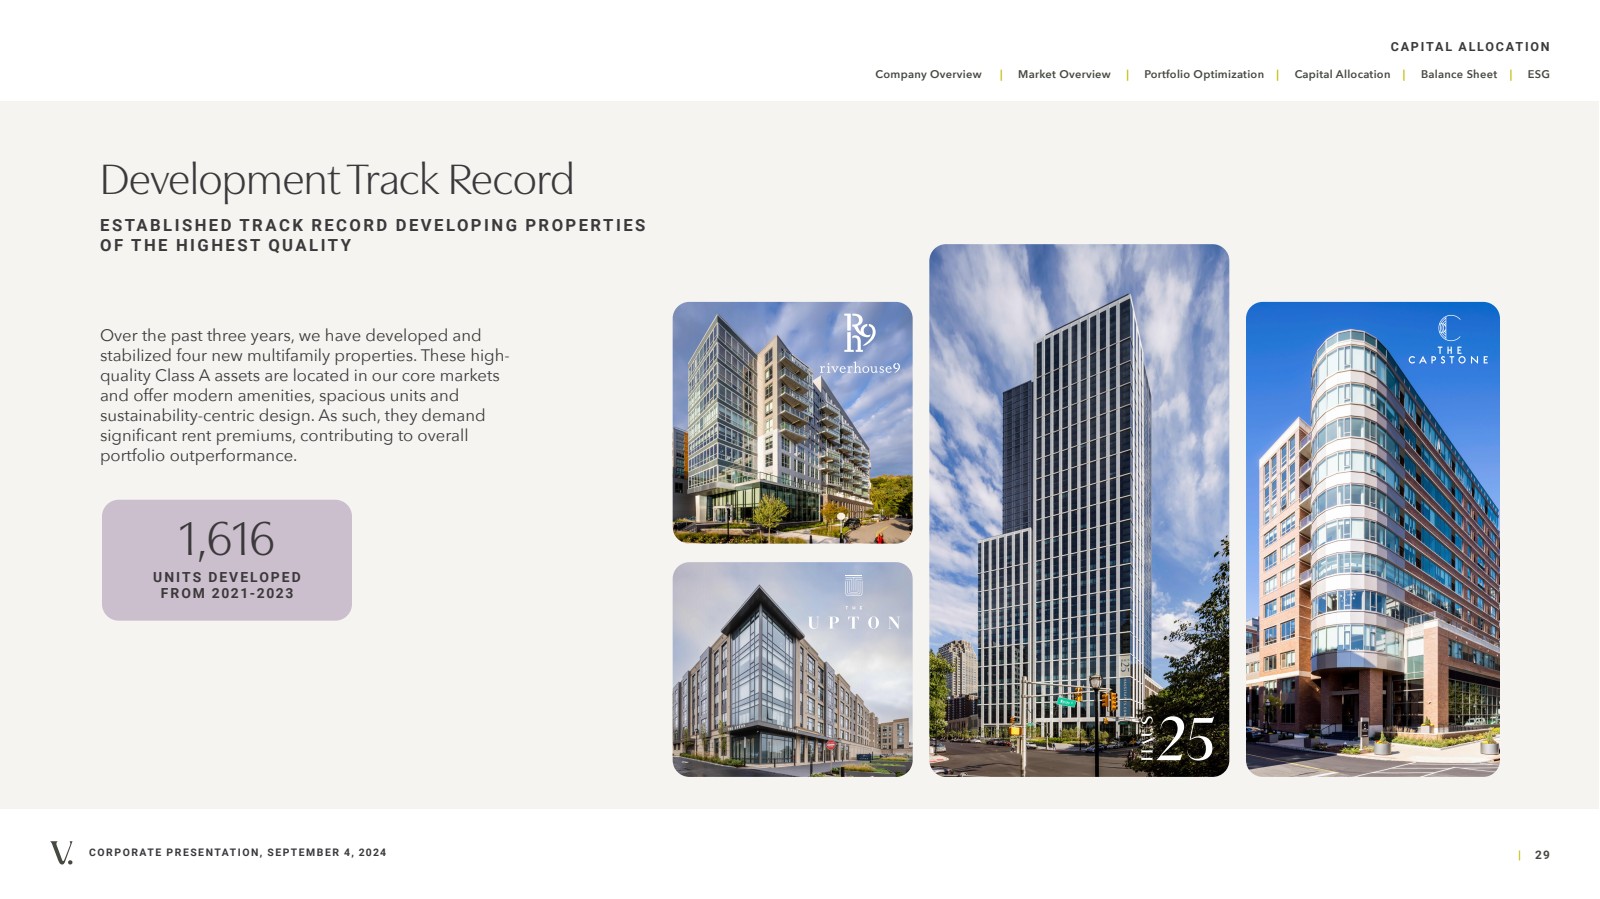
CORPORATE PRESENTATION, SEPTEMBER 4, 2024 | 29 Company Overview | Market Overview | Portfolio Optimization | Capital Allocation | Balance Sheet | ESG CAPITAL ALLOCATION Development Track Record E S TA B L I S H E D T R A C K R E C O R D D E V E LO P I N G P R O P E RT I E S OF THE HIGHEST QUALITY Over the past three years, we have developed and stabilized four new multifamily properties. These high-quality Class A assets are located in our core markets and offer modern amenities, spacious units and sustainability-centric design. As such, they demand significant rent premiums, contributing to overall portfolio outperformance. 1,616 UNITS DEVELOPED FROM 2021-2023 |
|
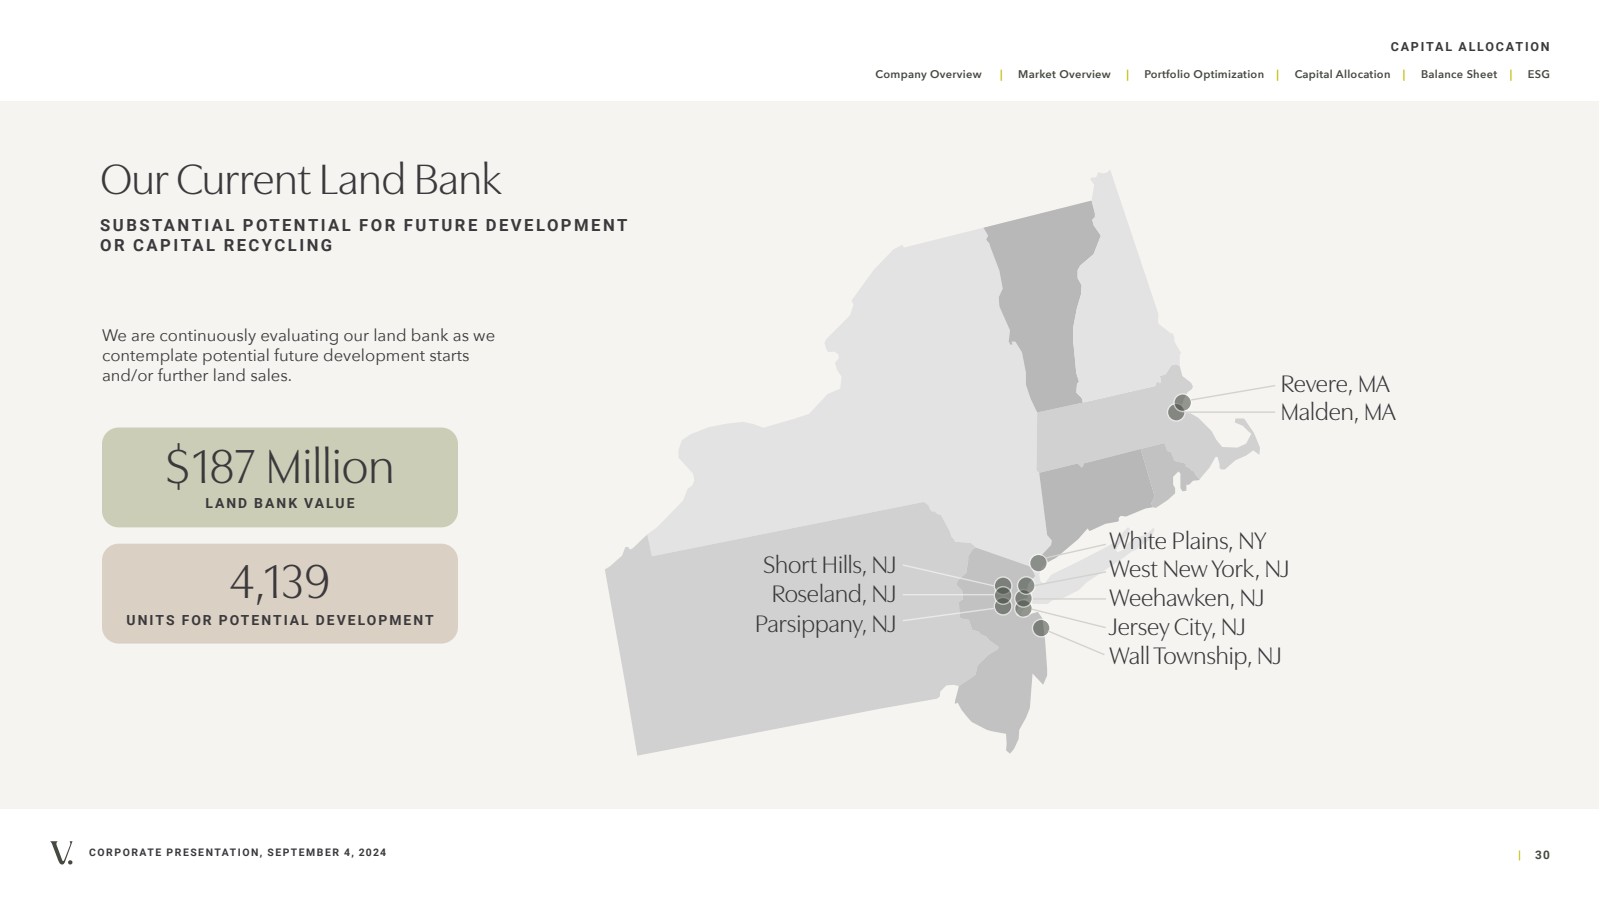
CORPORATE PRESENTATION, SEPTEMBER 4, 2024 | 30 Company Overview | Market Overview | Portfolio Optimization | Capital Allocation | Balance Sheet | ESG Jersey City, NJ Weehawken, NJ Short Hills, NJ West New York, NJ Roseland, NJ Parsippany, NJ White Plains, NY Malden, MA Revere, MA Wall Township, NJ CAPITAL ALLOCATION Our Current Land Bank S U B S TA N T I A L P OT E N T I A L F O R F U T U R E D E V E LO P M E N T OR CAPITAL RECYCLING We are continuously evaluating our land bank as we contemplate potential future development starts and/or further land sales. 4,139 UNITS FOR POTENTIAL DEVELOPMENT $187 Million LAND BANK VALUE |
|
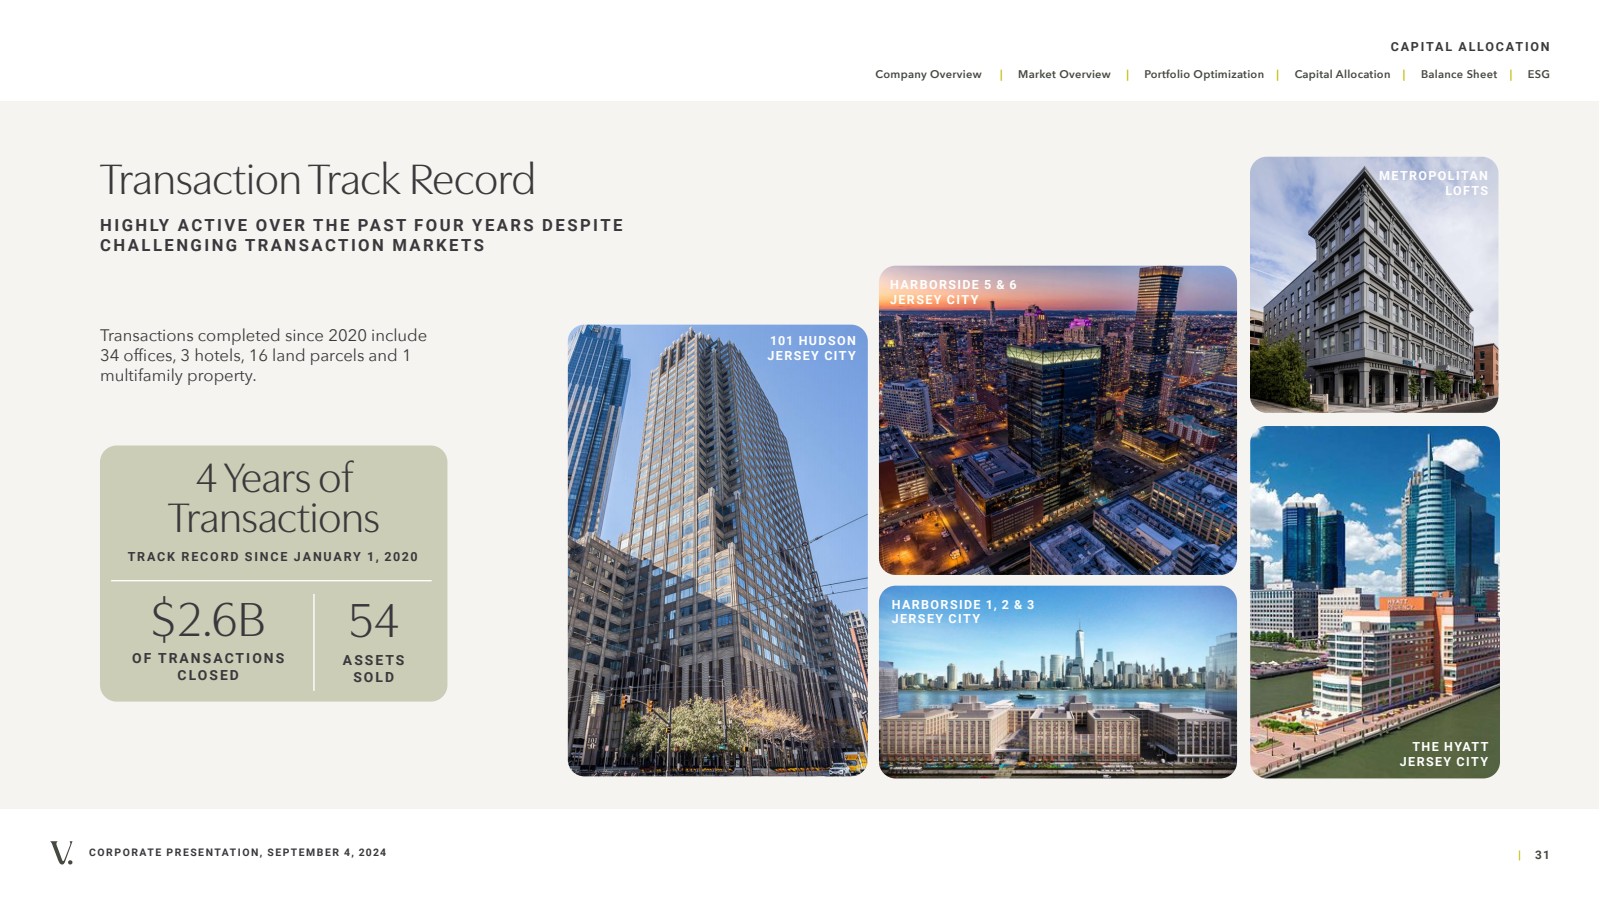
CORPORATE PRESENTATION, SEPTEMBER 4, 2024 | 31 Company Overview | Market Overview | Portfolio Optimization | Capital Allocation | Balance Sheet | ESG CAPITAL ALLOCATION THE HYATT JERSEY CITY HARBORSIDE 1, 2 & 3 JERSEY CITY 101 HUDSON JERSEY CITY HARBORSIDE 5 & 6 JERSEY CITY METROPOLITAN Transaction Track Record LOFTS H I G H LY A CT I V E O V E R T H E PA S T F O U R Y E A R S D E S P I T E CHALLENGING TRANSACTION MARKETS Transactions completed since 2020 include 34 offices, 3 hotels, 16 land parcels and 1 multifamily property. $2.6B OF TRANSACTIONS CLOSED 54 ASSETS SOLD 4 Years of Transactions TRACK RECORD SINCE JANUARY 1, 2020 |
|
CORPORATE PRESENTATION, SEPTEMBER 4, 2024 | 32 Company Overview | Market Overview | Portfolio Optimization | Capital Allocation | Balance Sheet | ESG RiverTrace at Port Imperial, West New York, NJ Balance Sheet Optimization BALANCE SHEET |
|
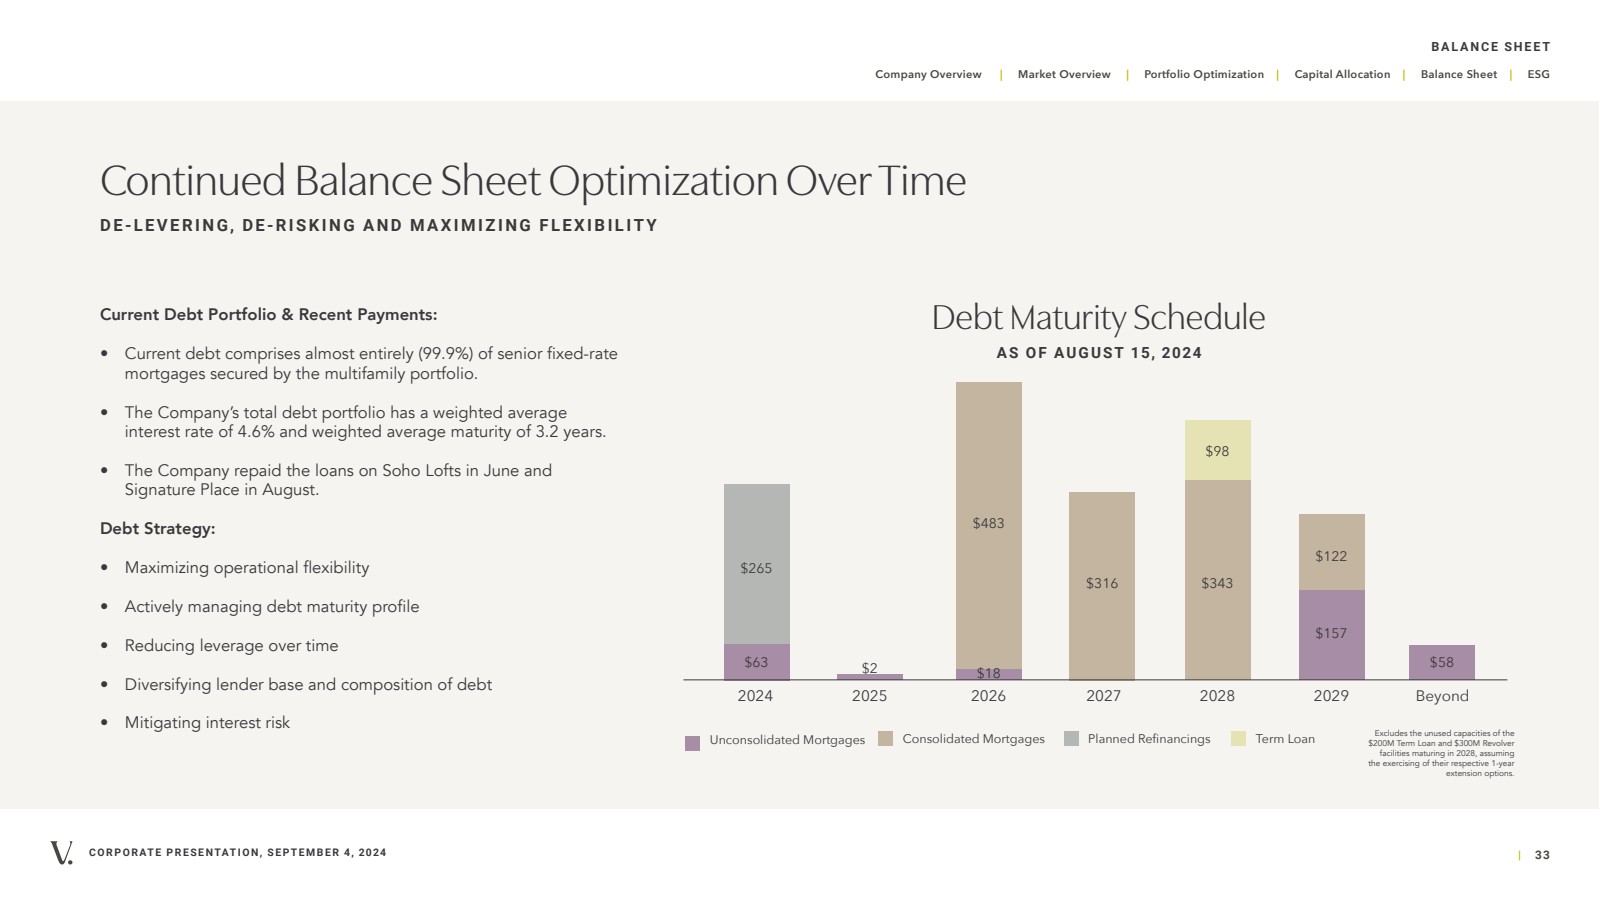
CORPORATE PRESENTATION, SEPTEMBER 4, 2024 | 33 Company Overview | Market Overview | Portfolio Optimization | Capital Allocation | Balance Sheet | ESG BALANCE SHEET Current Debt Portfolio & Recent Payments: • Current debt comprises almost entirely (99.9%) of senior fixed-rate mortgages secured by the multifamily portfolio. • The Company’s total debt portfolio has a weighted average interest rate of 4.6% and weighted average maturity of 3.2 years. • The Company repaid the loans on Soho Lofts in June and Signature Place in August. Debt Strategy: • Maximizing operational flexibility • Actively managing debt maturity profile • Reducing leverage over time • Diversifying lender base and composition of debt • Mitigating interest risk Debt Maturity Schedule AS OF AUGUST 15, 2024 2024 Unconsolidated Mortgages Consolidated Mortgages Planned Refinancings $63 $265 $483 $18 $2 $316 $343 $98 $157 $122 $58 2025 2026 2027 2028 2029 Beyond Term Loan Excludes the unused capacities of the $200M Term Loan and $300M Revolver facilities maturing in 2028, assuming the exercising of their respective 1-year extension options. Continued Balance Sheet Optimization Over Time DE-LEVERING, DE-RISKING AND MAXIMIZING FLEXIBILITY |
|
CORPORATE PRESENTATION, SEPTEMBER 4, 2024 | 34 Company Overview | Market Overview | Portfolio Optimization | Capital Allocation | Balance Sheet | ESG ESG Signature Place, Morris Plains, NJ ESG |
|
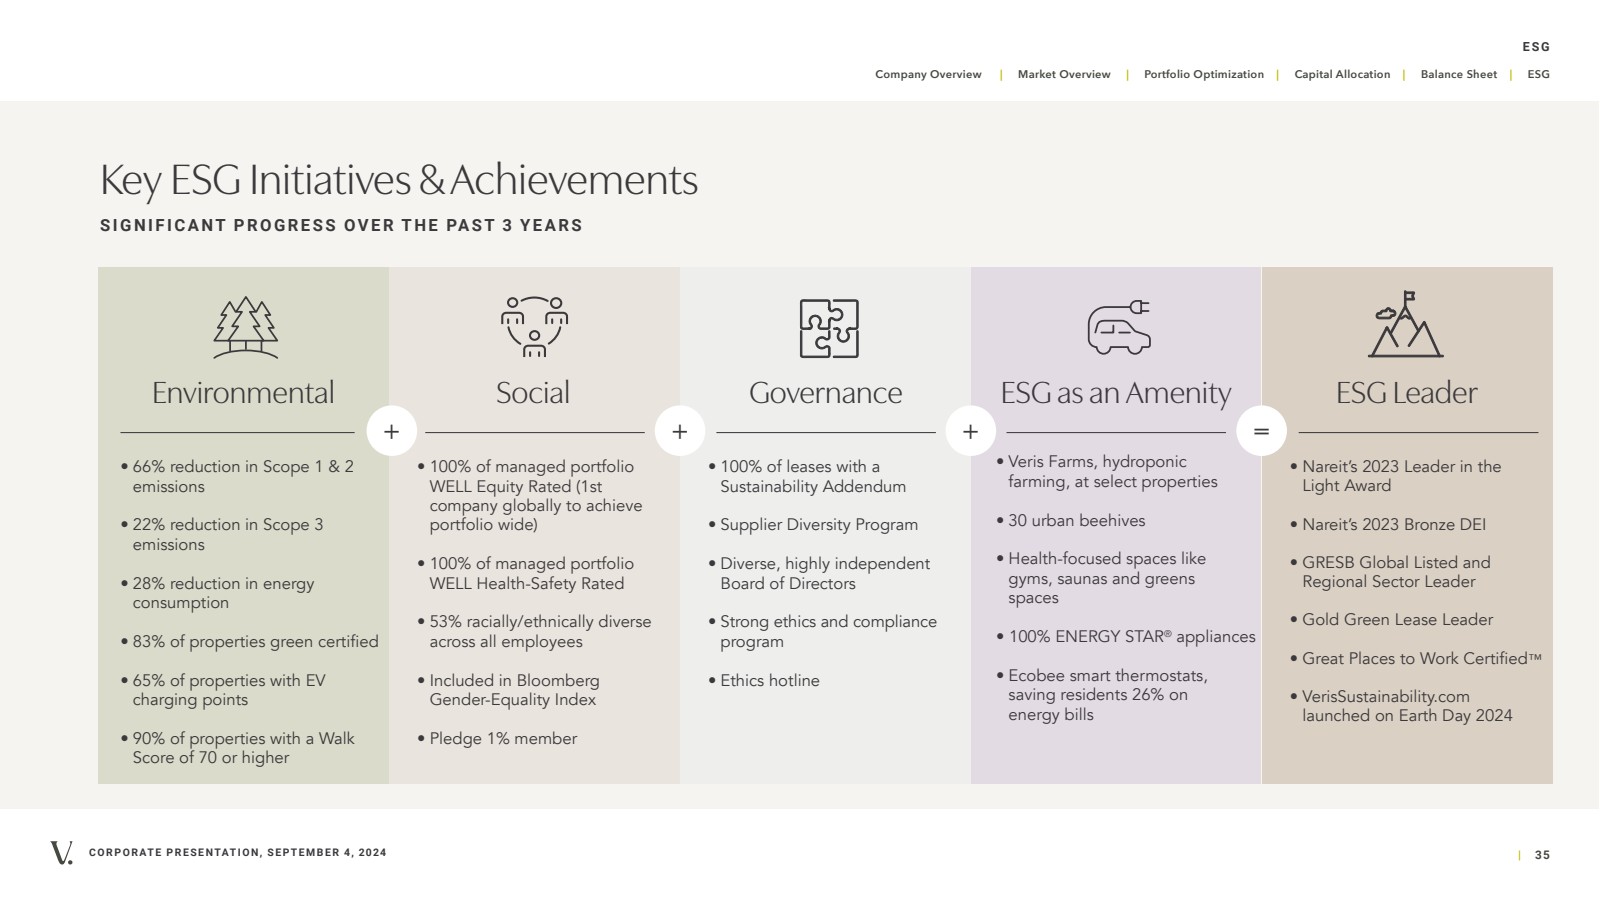
CORPORATE PRESENTATION, SEPTEMBER 4, 2024 | 35 Company Overview | Market Overview | Portfolio Optimization | Capital Allocation | Balance Sheet | ESG + + + = ESG Environmental Social Governance ESG as an Amenity ESG Leader • 66% reduction in Scope 1 & 2 emissions • 22% reduction in Scope 3 emissions • 28% reduction in energy consumption • 83% of properties green certified • 65% of properties with EV charging points • 90% of properties with a Walk Score of 70 or higher • 100% of managed portfolio WELL Equity Rated (1st company globally to achieve portfolio wide) • 100% of managed portfolio WELL Health-Safety Rated • 53% racially/ethnically diverse across all employees • Included in Bloomberg Gender-Equality Index • Pledge 1% member • 100% of leases with a Sustainability Addendum • Supplier Diversity Program • Diverse, highly independent Board of Directors • Strong ethics and compliance program • Ethics hotline • Veris Farms, hydroponic farming, at select properties • 30 urban beehives • Health-focused spaces like gyms, saunas and greens spaces • 100% ENERGY STAR® appliances • Ecobee smart thermostats, saving residents 26% on energy bills • Nareit’s 2023 Leader in the Light Award • Nareit’s 2023 Bronze DEI • GRESB Global Listed and Regional Sector Leader • Gold Green Lease Leader • Great Places to Work Certified™ • VerisSustainability.com launched on Earth Day 2024 Key ESG Initiatives & Achievements SIGNIFICANT PROGRESS OVER THE PAST 3 YEARS |
|
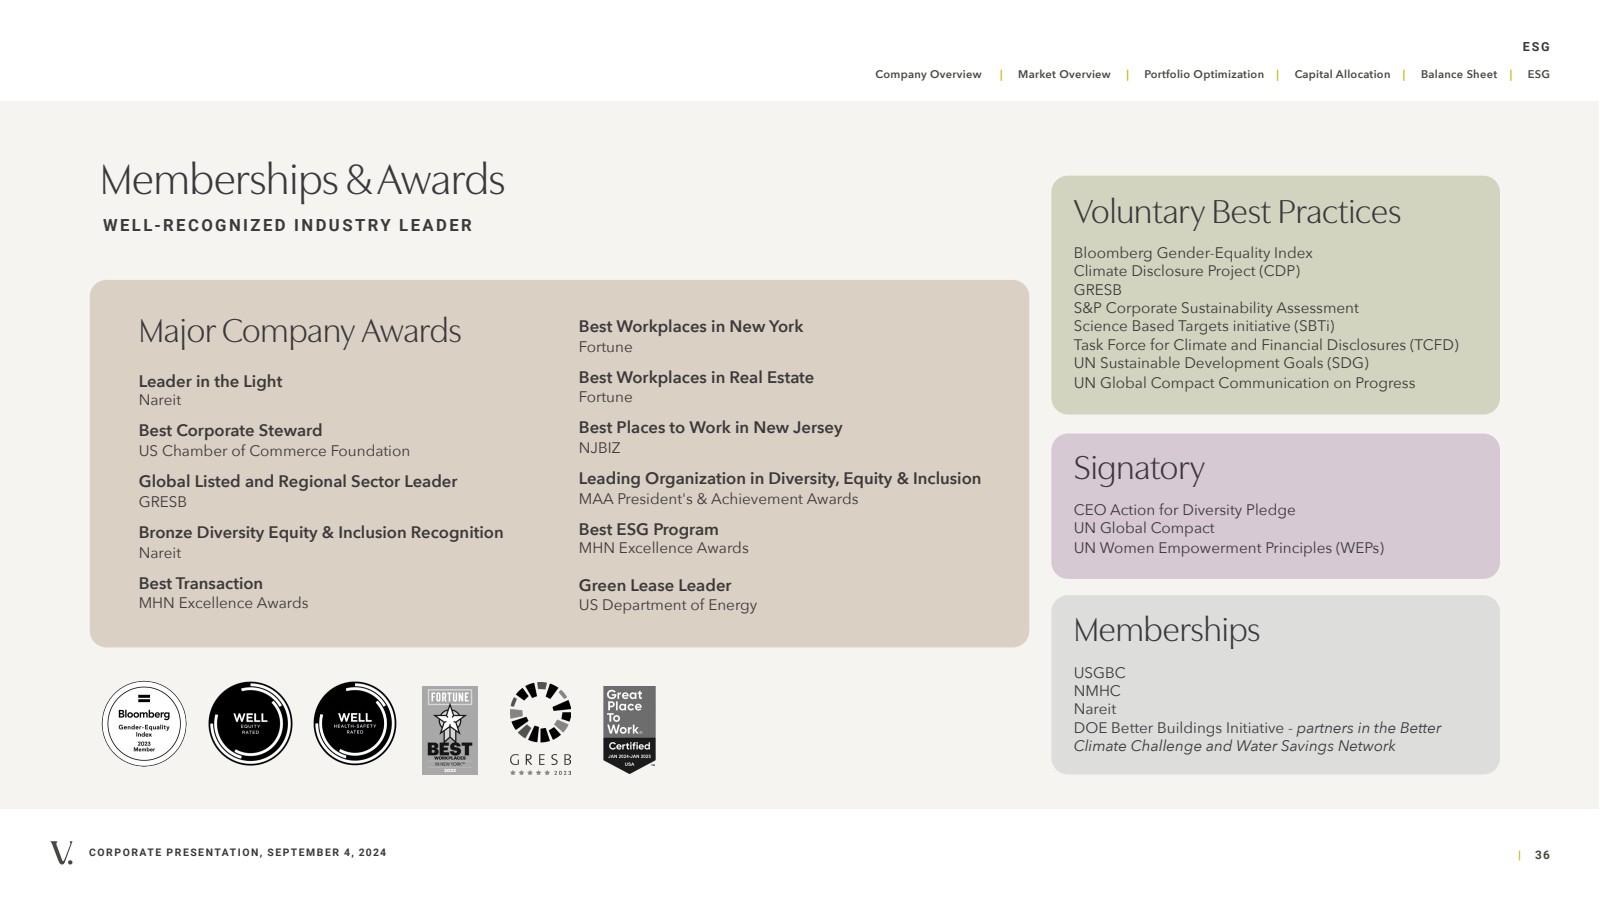
CORPORATE PRESENTATION, SEPTEMBER 4, 2024 | 36 Company Overview | Market Overview | Portfolio Optimization | Capital Allocation | Balance Sheet | ESG ESG Memberships & Awards Bloomberg Gender-Equality Index Climate Disclosure Project (CDP) GRESB S&P Corporate Sustainability Assessment Science Based Targets initiative (SBTi) Task Force for Climate and Financial Disclosures (TCFD) UN Sustainable Development Goals (SDG) UN Global Compact Communication on Progress WELL-RECOGNIZED INDUSTRY LEADER Leader in the Light Nareit Best Corporate Steward US Chamber of Commerce Foundation Global Listed and Regional Sector Leader GRESB Bronze Diversity Equity & Inclusion Recognition Nareit Best Transaction MHN Excellence Awards Best Workplaces in New York Fortune Best Workplaces in Real Estate Fortune Best Places to Work in New Jersey NJBIZ Leading Organization in Diversity, Equity & Inclusion MAA President's & Achievement Awards Best ESG Program MHN Excellence Awards Green Lease Leader US Department of Energy CEO Action for Diversity Pledge UN Global Compact UN Women Empowerment Principles (WEPs) USGBC NMHC Nareit DOE Better Buildings Initiative - partners in the Better Climate Challenge and Water Savings Network Voluntary Best Practices Major Company Awards Signatory Memberships |
|
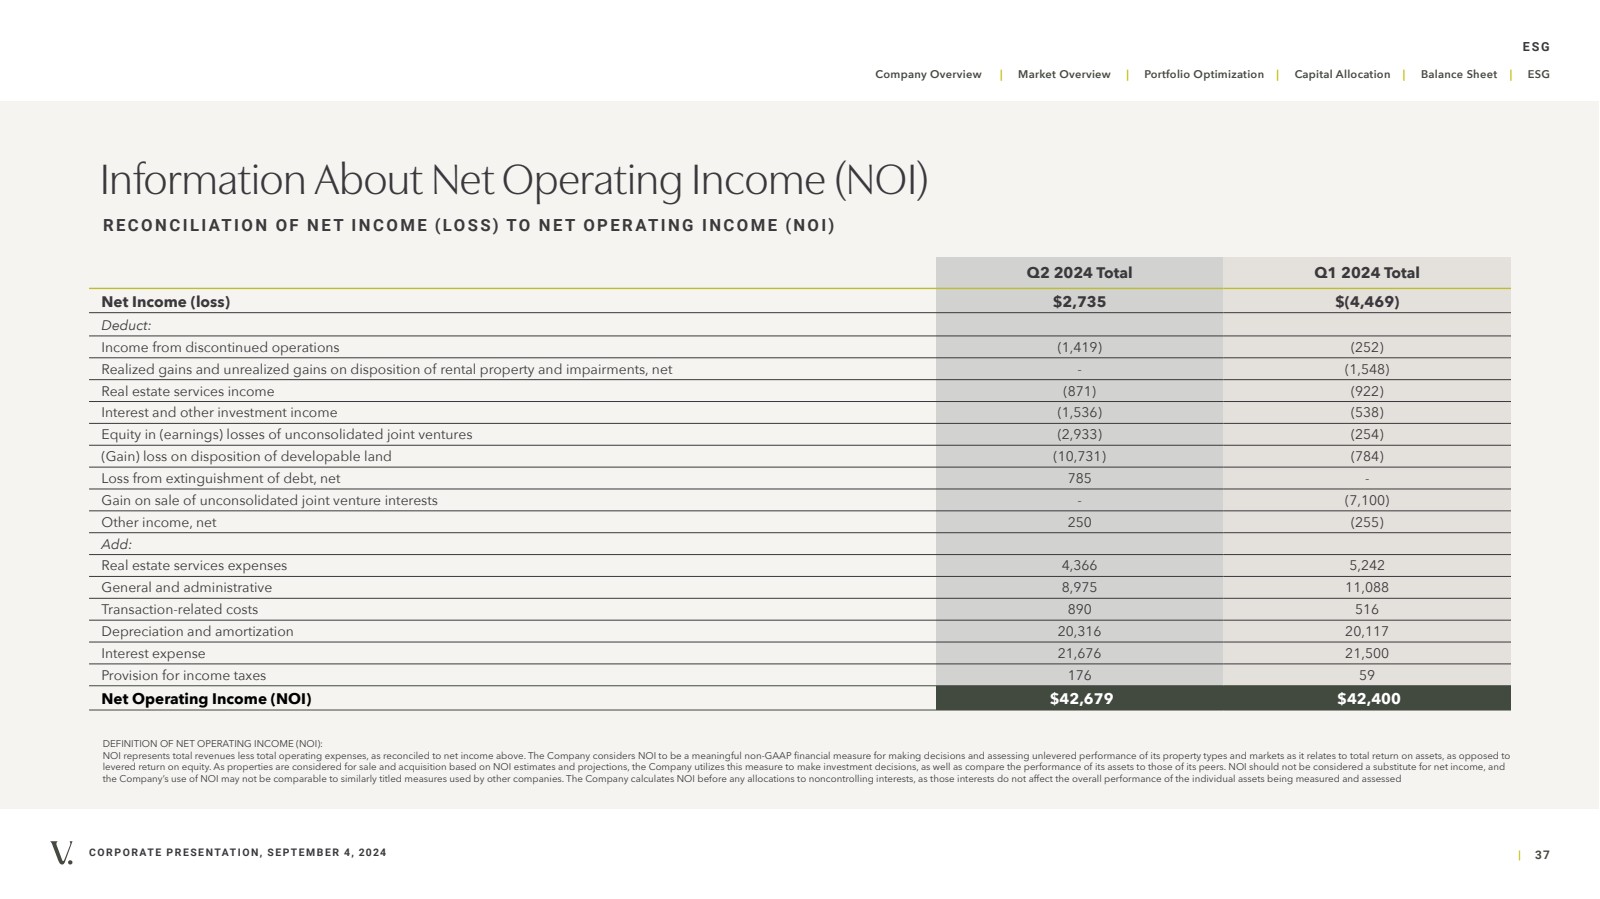
CORPORATE PRESENTATION, SEPTEMBER 4, 2024 | 37 Company Overview | Market Overview | Portfolio Optimization | Capital Allocation | Balance Sheet | ESG ESG Information About Net Operating Income (NOI) RECONCILIATION OF NET INCOME (LOSS) TO NET OPERATING INCOME (NOI) DEFINITION OF NET OPERATING INCOME (NOI): NOI represents total revenues less total operating expenses, as reconciled to net income above. The Company considers NOI to be a meaningful non-GAAP financial measure for making decisions and assessing unlevered performance of its property types and markets as it relates to total return on assets, as opposed to levered return on equity. As properties are considered for sale and acquisition based on NOI estimates and projections, the Company utilizes this measure to make investment decisions, as well as compare the performance of its assets to those of its peers. NOI should not be considered a substitute for net income, and the Company’s use of NOI may not be comparable to similarly titled measures used by other companies. The Company calculates NOI before any allocations to noncontrolling interests, as those interests do not affect the overall performance of the individual assets being measured and assessed Q2 2024 Total Q1 2024 Total Net Income (loss) $2,735 $(4,469) Deduct: Income from discontinued operations (1,419) (252) Realized gains and unrealized gains on disposition of rental property and impairments, net - (1,548) Real estate services income (871) (922) Interest and other investment income (1,536) (538) Equity in (earnings) losses of unconsolidated joint ventures (2,933) (254) (Gain) loss on disposition of developable land (10,731) (784) Loss from extinguishment of debt, net 785 - Gain on sale of unconsolidated joint venture interests - (7,100) Other income, net 250 (255) Add: Real estate services expenses 4,366 5,242 General and administrative 8,975 11,088 Transaction-related costs 890 516 Depreciation and amortization 20,316 20,117 Interest expense 21,676 21,500 Provision for income taxes 176 59 Net Operating Income (NOI) $42,679 $42,400 |
|
CORPORATE PRESENTATION, SEPTEMBER 4, 2024 | 38 Company Overview | Market Overview | Portfolio Optimization | Capital Allocation | Balance Sheet | ESG Definitions Net Blended Rental Growth Rate combines new lease and renewal lease growth rates. New lease growth rate refers to the difference in rent a new occupant of a unit is paying compared to the rent the unit’s previous occupant was paying on a net effective basis. Renewal lease growth rate refers to the increase or decrease in monthly rent in a renewed lease compared to the previous lease on a net effective basis. Net Operating Income (NOI) represents total revenues less total operating expenses, as reconciled to net income above. The Company considers NOI to be a meaningful non-GAAP financial measure for making decisions and assessing unlevered performance of its property types and markets as it relates to total return on assets, as opposed to levered return on equity. As properties are considered for sale and acquisition based on NOI estimates and projections, the Company utilizes this measure to make investment decisions, as well as compare the performance of its assets to those of its peers. NOI should not be considered a substitute for net income, and the Company’s use of NOI may not be comparable to similarly titled measures used by other companies. The Company calculates NOI before any allocations to non-controlling interests, as those interests do not affect the overall performance of the individual assets being measured and assessed. Average Effective Monthly Rent Per Home represents the average effective rent (net of concessions) for in-place leases and the market rent for vacant homes. ORA™ score is an aggregate compilation of a property’s ratings across various review sites. Each month, J Turner Research monitors the online ratings of properties nationwide. Using a statistical model, a single score based on a scale of 0 to 100 is assigned to each property. Elite 1% ORA® is an annual ranking of the properties assessed by ORA® nationally. The top 1% make it to the list, typically requiring a property score above 95. Same Store includes properties that were owned for the entirety of the years being compared and exclude properties under redevelopment or development and properties acquired, sold or classified as held for sale during the years being compared. |
|
Soho Lofts, Jersey City, NJ THIS PRESENTATION HAS BEEN FORMATTED FOR SCREENS. PLEASE CONSIDER THE ENVIRONMENT BEFORE PRINTING. Thank You |