UNITED STATES
SECURITIES AND EXCHANGE COMMISSION
Washington, D.C. 20549
Form 6-K
REPORT OF FOREIGN PRIVATE ISSUER PURSUANT TO RULE 13a-16 OR 15d-16
UNDER THE SECURITIES EXCHANGE ACT OF 1934
For the month of August, 2024
Commission File Number: 001-42008
| BW LPG Limited | |
| (Translation of registrant’s name into English) |
|
c/o BW LPG Holding Pte Ltd 10 Pasir Panjang Road, #17-02 Mapletree Business City, Singapore |
|
| (Address of principal executive office) |
Indicate by check mark whether the registrant files or will file annual reports under cover of Form 20-F or Form 40-F.
Form 20-F x Form 40-F ¨
DOCUMENTS TO BE FURNISHED AS PART OF THIS FORM 6-K
SIGNATURES
Pursuant to the requirements of the Securities Exchange Act of 1934, the registrant has duly caused this report to be signed on its behalf by the undersigned, thereunto duly authorized.
| BW LPG Limited | ||
| By: | /s/ Samantha Xu | |
| Name: | Samantha Xu | |
| Title: | Chief Financial Officer | |
| Date: August 22, 2024 | ||
Exhibit 99.1
BW LPG Limited - Financial Results for Q2 2024
(Singapore, 22 August 2024)
Highlights and Subsequent Events
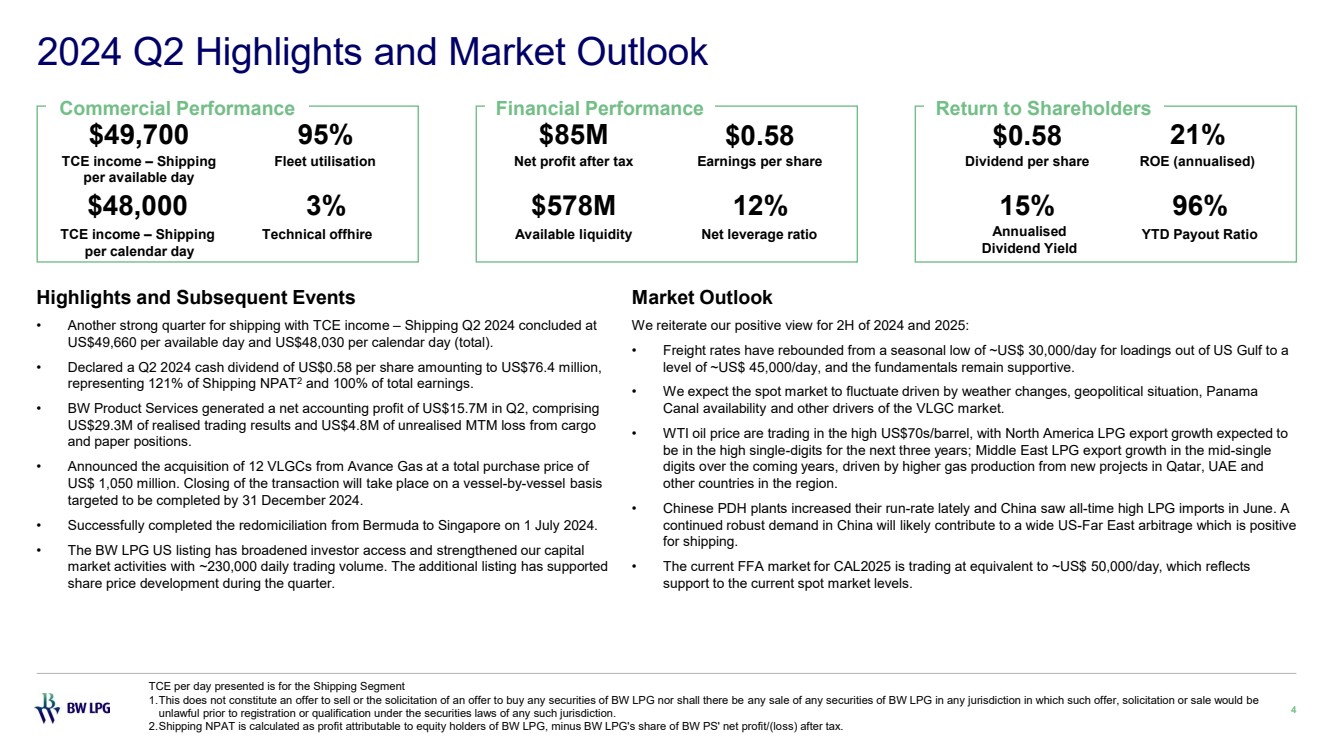
| - | Another strong quarter for shipping with daily TCE of US$ 49,660 per available day and US$ 48,030 per calendar day. |
| - | Generated NPAT of US$ 85 million or earnings per share of US$ 0.58. Declared a Q2 2024 cash dividend of US$0.58 per share amounting to US$76.4 million, representing 121% of Shipping NPAT and 100% of total earnings. |
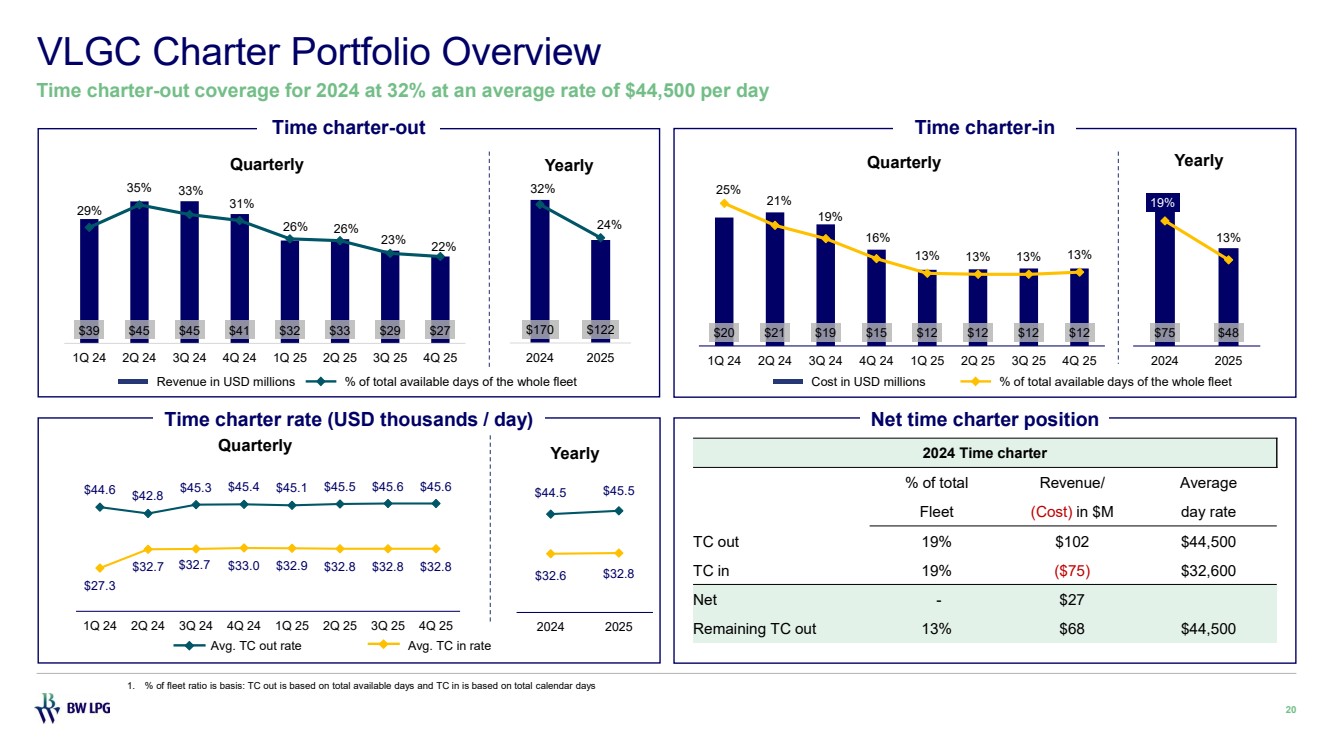
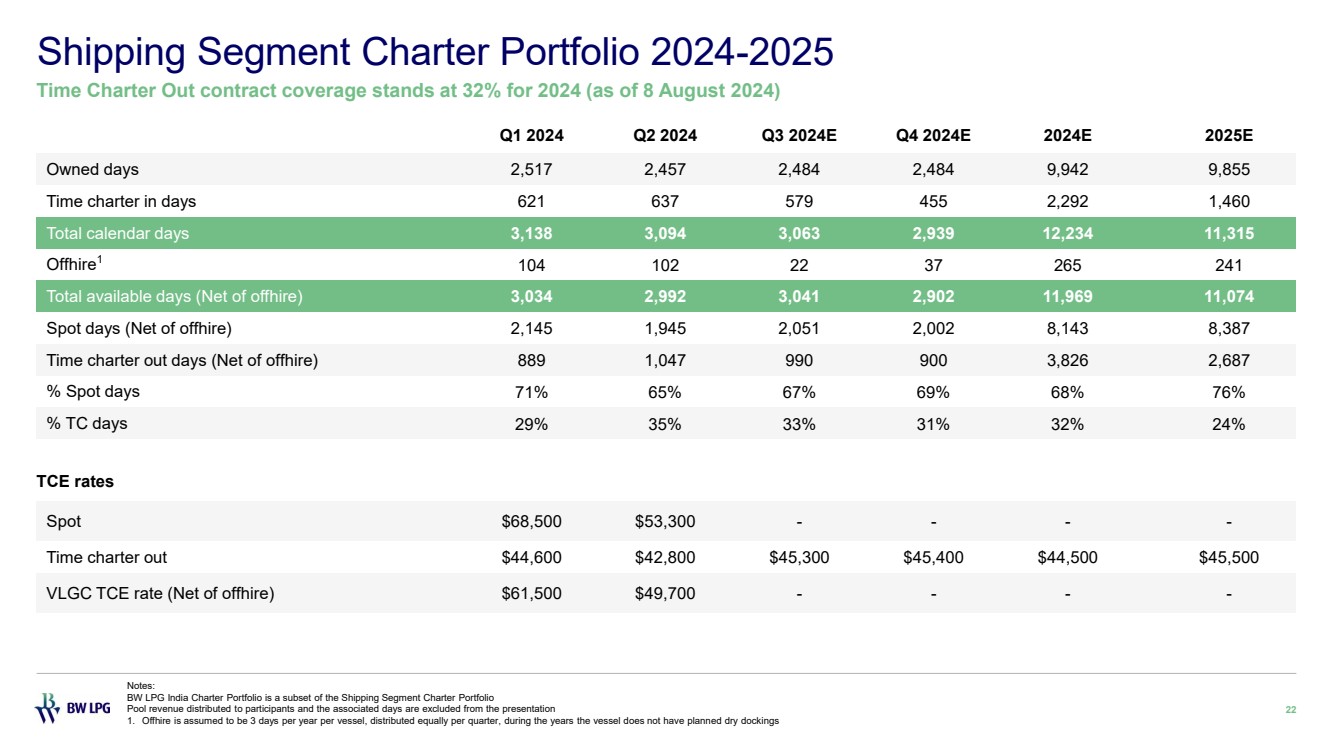
| - | For the third quarter of 2024, we have fixed ~86% at an average rate of ~US$ 43,000 per available day. |
| - | BW Product Services generated a net accounting profit of US$ 15.7 million in Q2 after adjusting for G&A and tax provisions. |
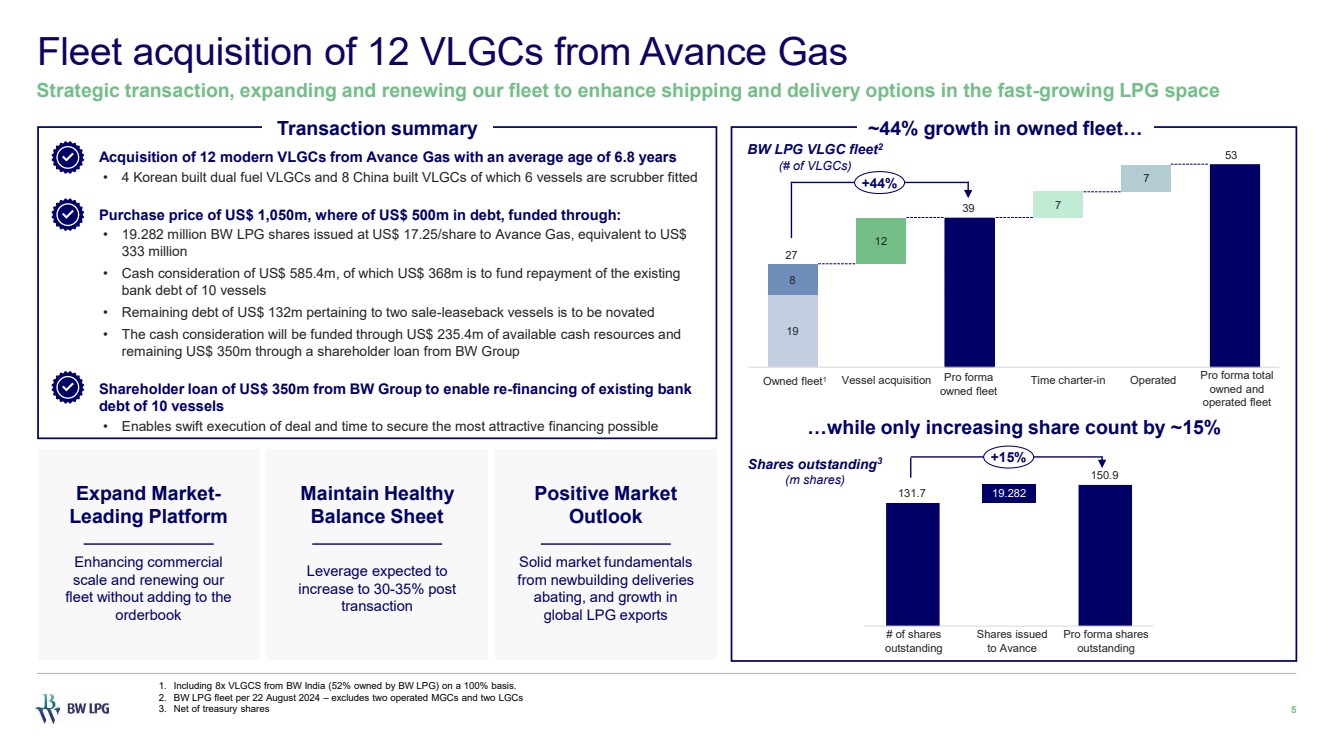
| - | Announced the acquisition of 12 VLGCs from Avance Gas at a total purchase price of US$ 1,050 million. Closing of the transaction will take place on a vessel-by-vessel basis with targeted completed by 31 December 2024. |
| - | Successfully completed the redomiciliation from Bermuda to Singapore on 1 July 2024. |
| - | The BW LPG US listing has broadened investor access and strengthened our capital market activities with ~230,000 daily trading volume. The additional listing has supported share price development during the quarter. |
Financial Performance
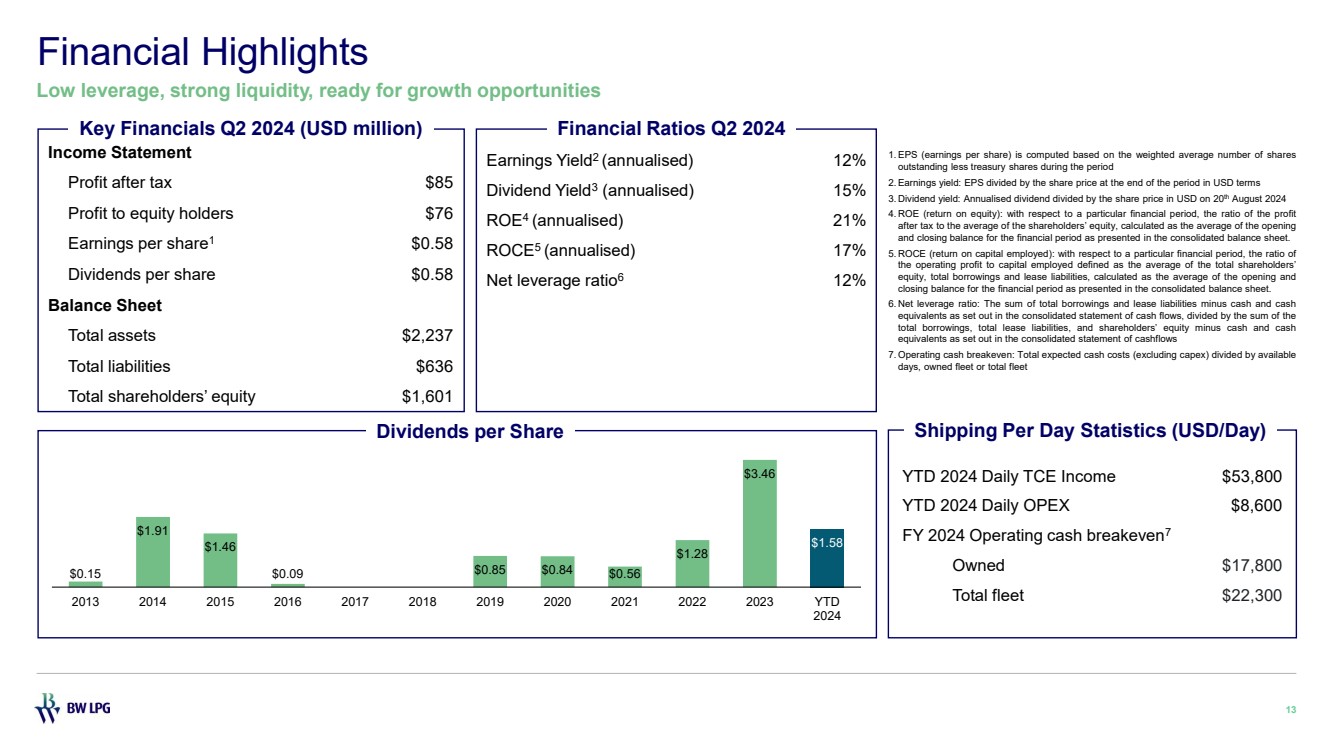
BW LPG Limited (“BW LPG”, the “Company”, NYSE ticker code: “BWLP”, OSE ticker code: “BWLPG.OL”) reported a Q2 2024 Net Profit After Tax (NPAT) of US$ 85 million, yielding an annualised return on equity of 21% with US$53 million free cash flow generated. The Q2 operating profit was US$ 89 million, and earnings per share was US$ 0.58.
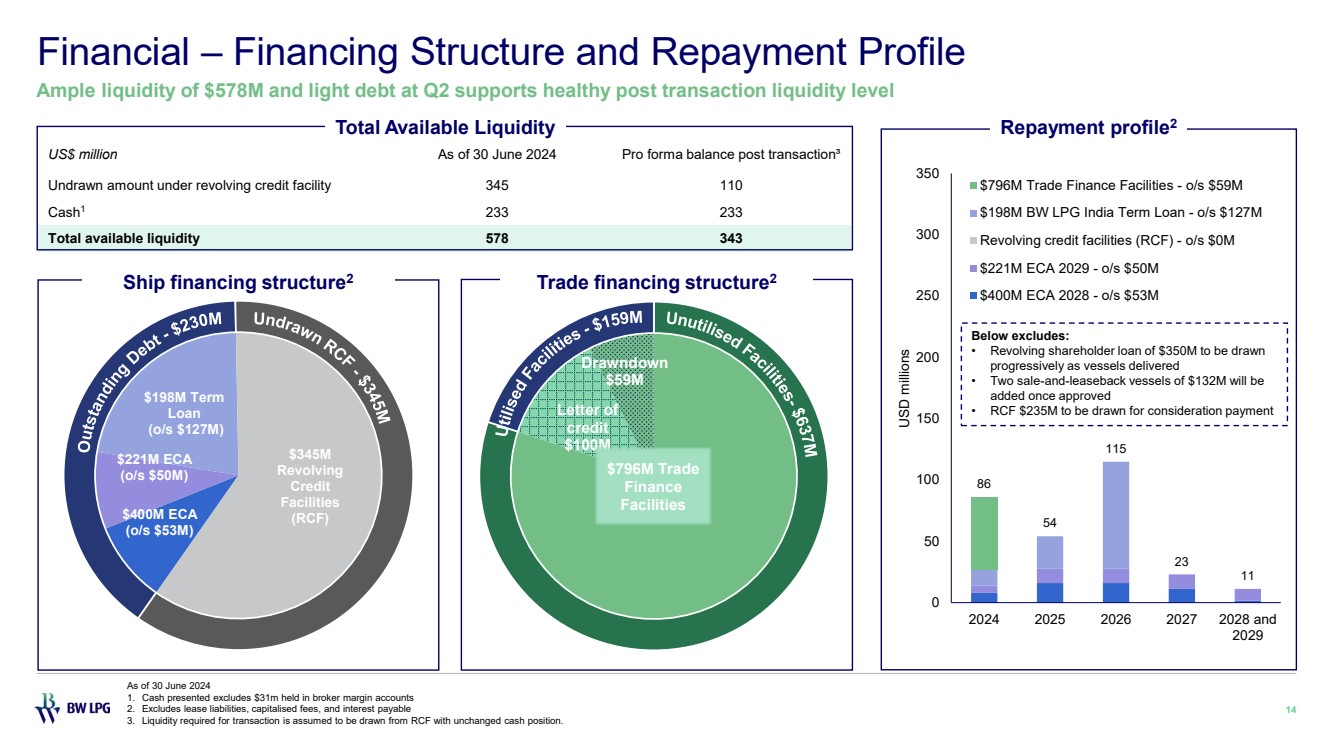
The Company’s net leverage ratio was 12% in Q2 with available liquidity at US$ 578 million at the end of the quarter. On the back of another strong quarter, the Board has declared a cash dividend of US$ 0.58 per share, or a total dividend of US$ 76 million. This represents a 100% earnings payout ratio and an annualised dividend yield of 15%.
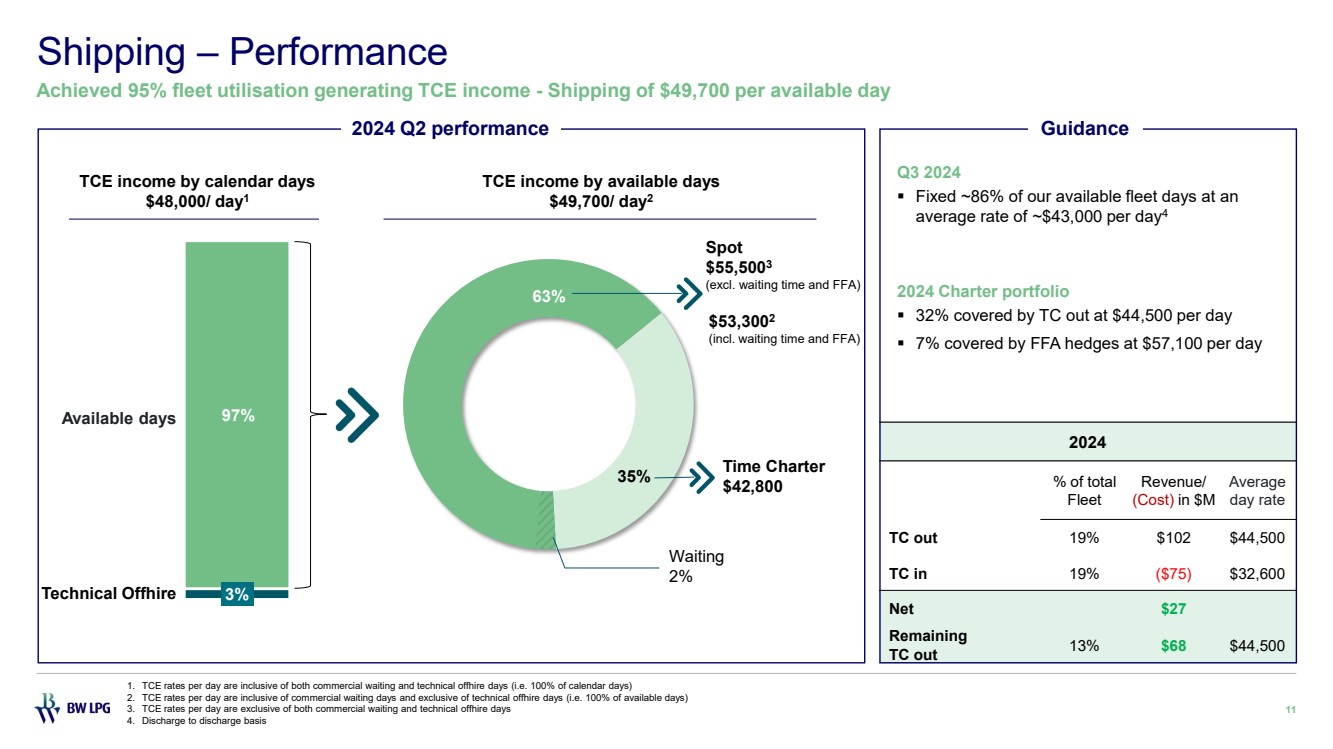
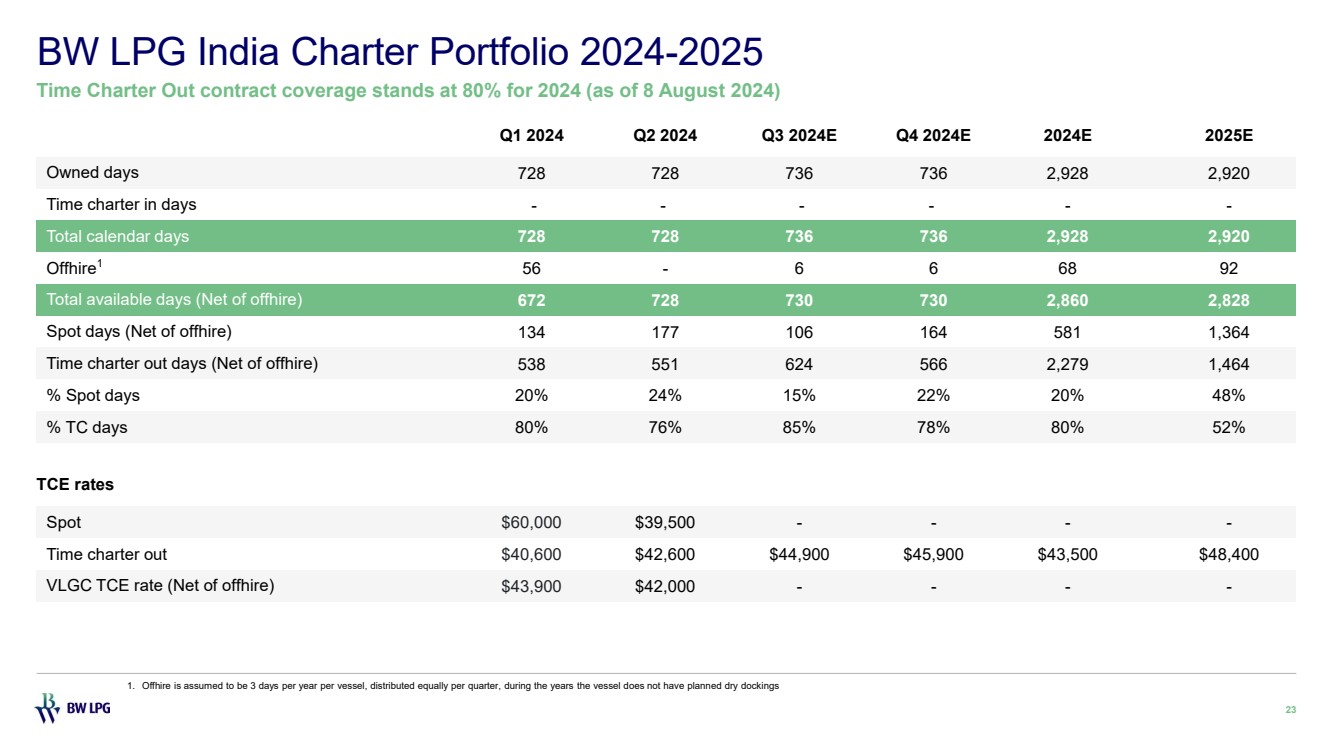
Commercial Performance Shipping – Q2 VLGC freight rates averaged US$ 49,700 per available day or US$ 48,000 per calendar day, with 95% fleet utilisation. Time Charter Equivalent (TCE) income was US$ 148.6 million for the quarter, and our India subsidiary contributed a stable TCE income of US$ 30.6 million for Q2.
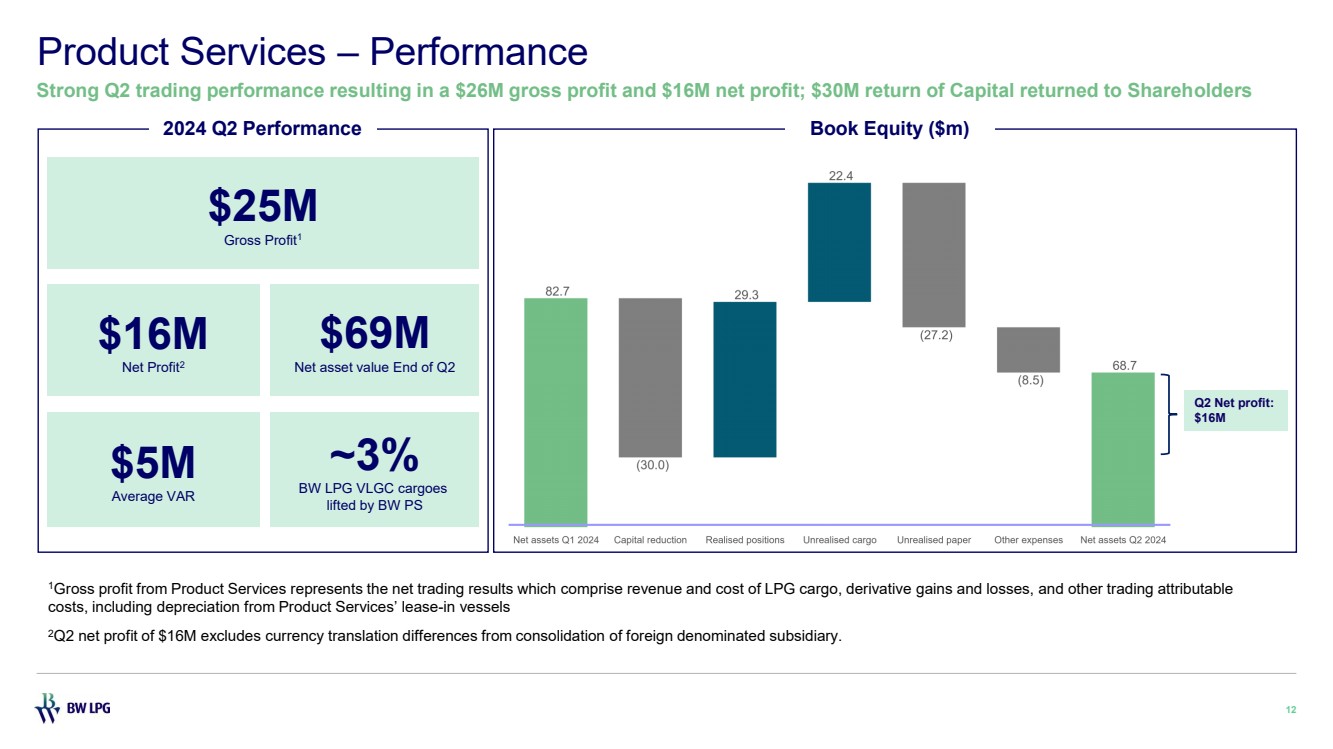
Product Services – Product Services reported a US$ 24.5 million gross profit for Q2. After considering other expenses, comprising mainly of G&A and income tax expenses, Product Services reported a net profit after tax of US$ 15.7 million for the quarter.
Corporate Update
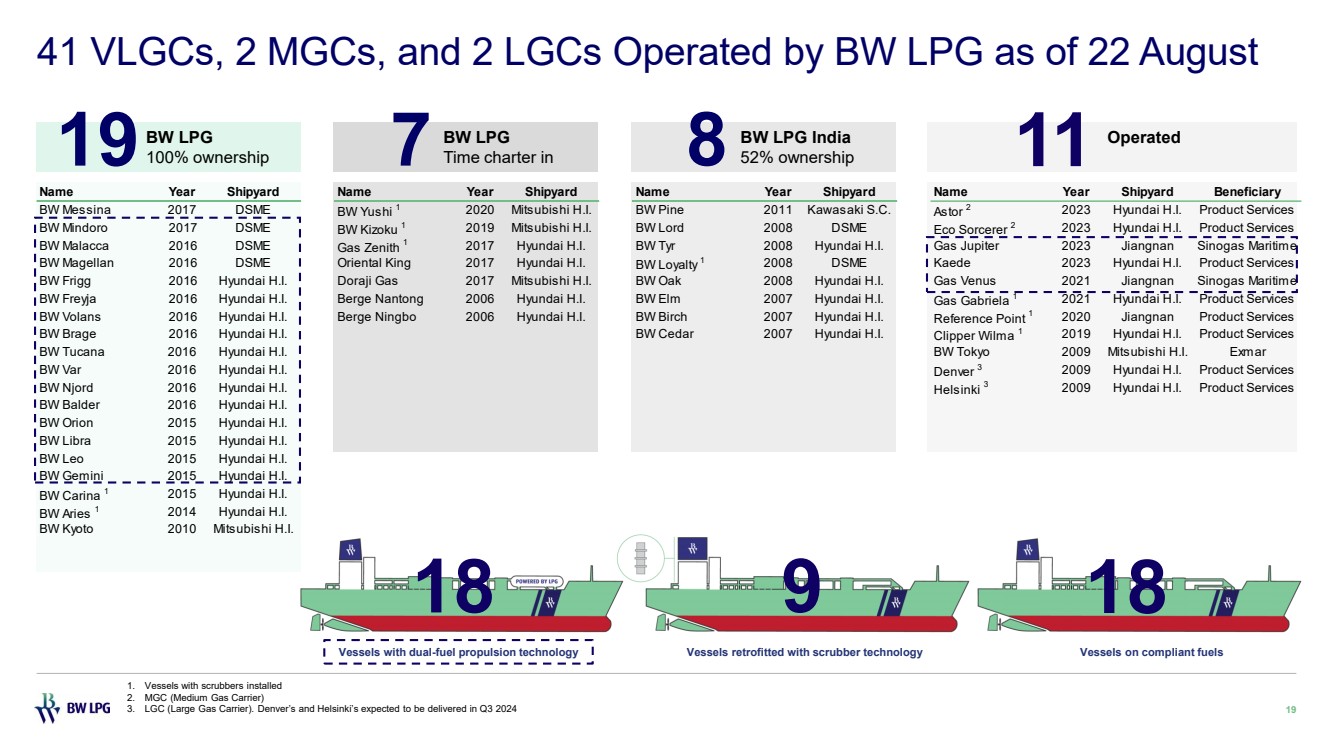
With reference to the press release dated August 15, 2024, BW LPG announced the transaction to acquire 12 Very Large Gas Carriers (VLGCs) from Avance Gas for a total consideration of US$ 1,050 million. This acquisition increases the number of VLGCs owned and operated by BW LPG from 41 to 53, of which 22 are LPG dual-fuel.
This transaction further solidifies BW LPG's position as the world’s leading owner and operator of VLGCs, with the largest number of LPG dual-fuel powered VLGCs. This fleet expansion comes at an opportune time with VLGC newbuild deliveries abating and continued growth in global LPG export volumes.
The strategic transaction will enhance BW LPG's commercial scale and increase its operational leverage in a market expected to remain strong in the coming years, and as such solidify earnings and dividend potential.
The press release can be found at this link: https://www.bwlpg.com/media/press-release/bw-lpg-acquires-12-very-large-gas-carriers-from-avance-gas/.
Market Update
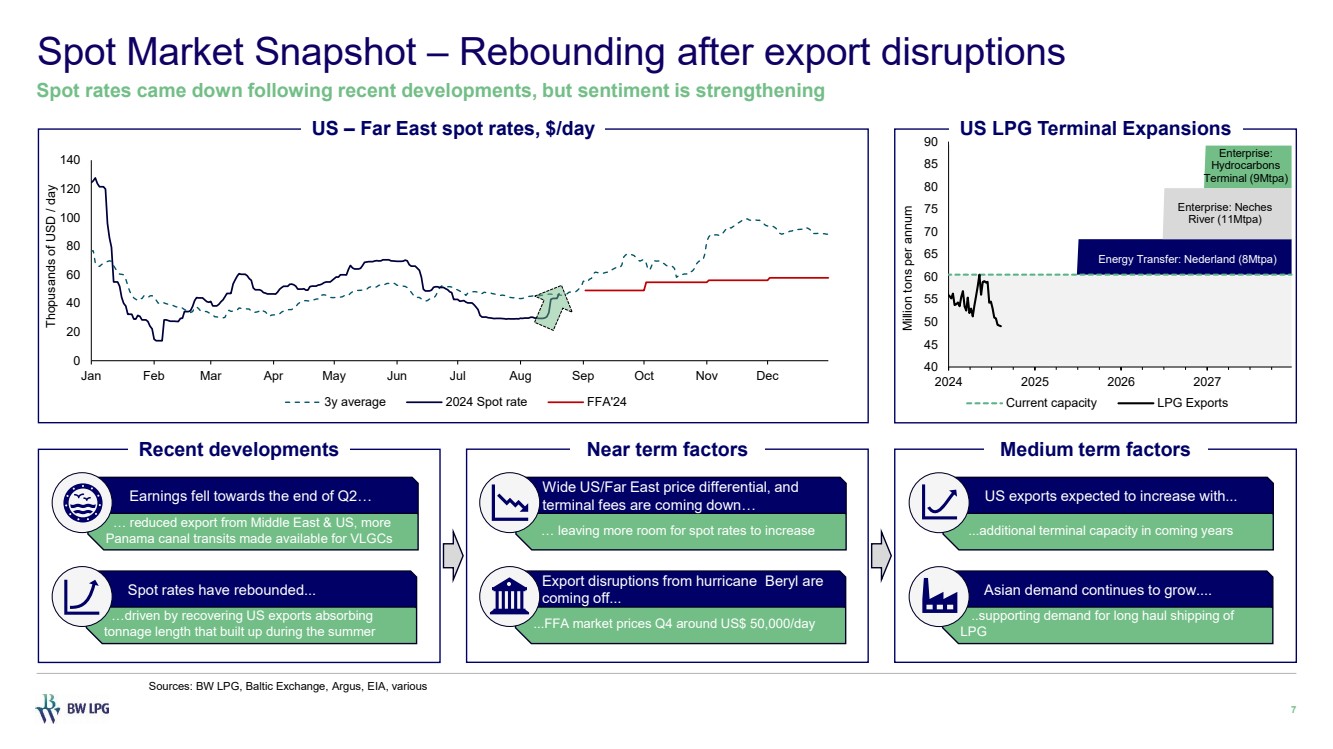
The first half of 2024 was marked by significant volatility in freight rates. In January, spot rates for the Houston – Chiba route began printing above US$120,00 per day, before a cold snap in the US temporarily curtailed production and exports of LPG. This resulted in spot rates falling sharply to around OPEX levels.
Subsequently, earnings recovered alongside LPG production in the US, and from mid-February to the latter half of June, spot cargoes were fixed at rates above the seasonal average level. In early June, the Panama Canal Authority announced another increase in maximum allowed draft and available slots for transiting the canal, as the water level in Lake Gatun normalised. This had a negative impact on the VLGC market balance, as fewer VLGCs elected to sail the longer route around Cape of Good Hope on their way to the Far East.
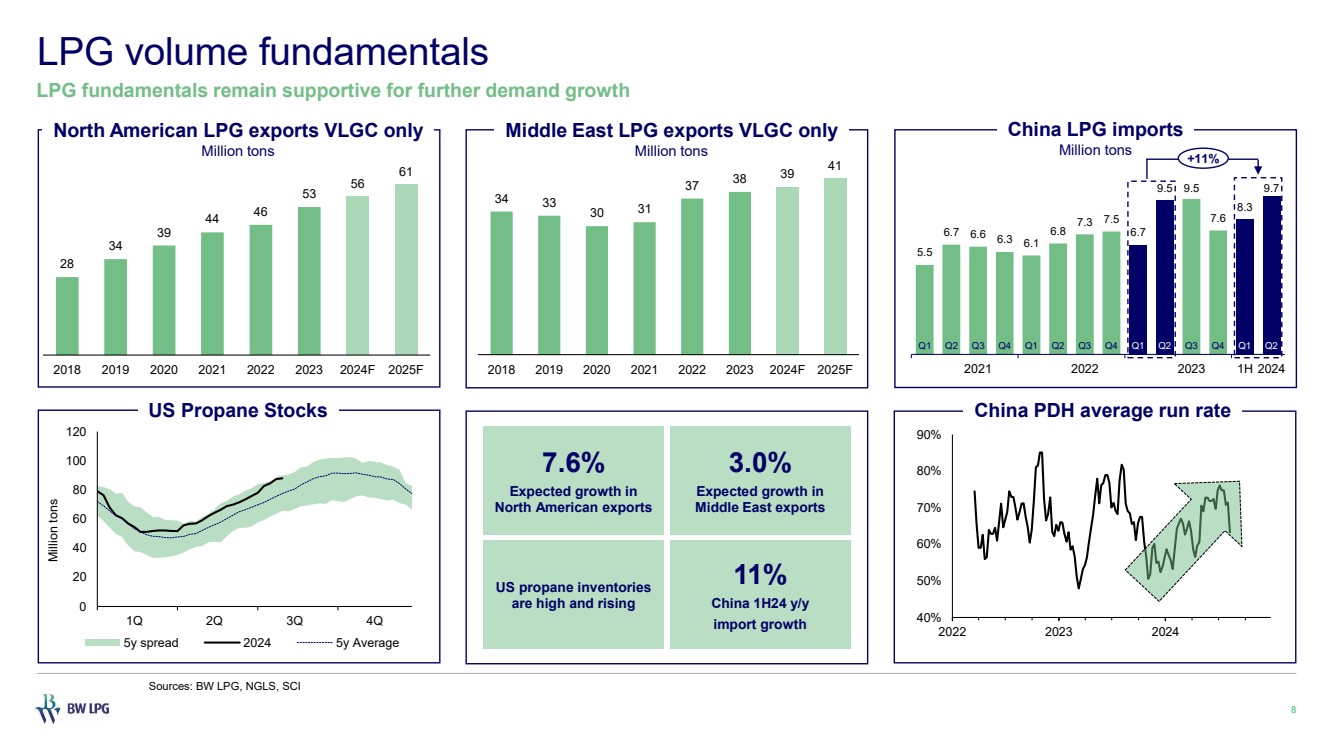
Furthermore, in early July, Hurricane Beryl made landfall in Texas, and causing widespread damage. This has had a negative impact on the number of LPG cargoes available for export and ultimately spot rates for VLGCs. Despite these disruptions however, export volumes on VLGCs out of North America still grew 3.7% in the first half of 2024, compared to the same period in 2023.
In the Middle East, export growth was flat, in part due to the continuation of the OPEC+ production cuts, and also some maintenance taking place towards the end of Q2. Export volumes on VLGCs out of Middle East were down 1.6% in the first half of 2024, compared to the first half of 2023.
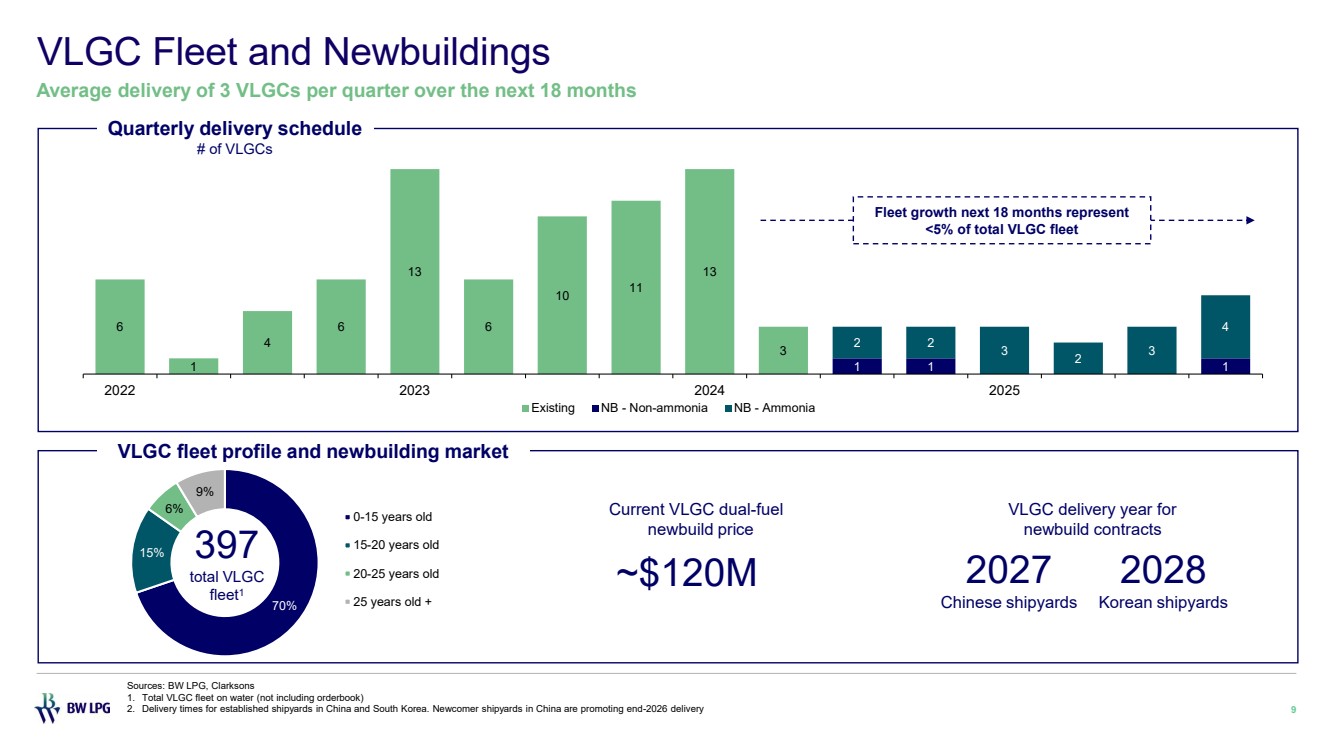
Fleet Capacity
Year-to-date, 16 new VLGC vessels have been delivered, and there are plans for the delivery of 6 more throughout the remaining months of 2024, and 13 VLGCs for delivery in 2025. Established shipbuilders are indicating deliveries no earlier than 2027 for new VLGC orders.
VLGC Freight Market Summary
Freight rates have rebounded from a seasonal low of approximately US$30,000 per day for loadings out of US Gulf to a level of approximately US$45,000 per day, and the fundamentals remain supportive.
We expect the spot market to fluctuate driven by weather changes, geopolitical situation, Panama Canal availability and other drivers of the VLGC market.
The WTI oil price is trading in the high US$70s per barrel, and expectations for North American LPG export growth are in the high single-digits for the next three years while Middle East LPG exports are expected to grow in the mid-single digits over the coming years, driven by higher gas production from new projects in Qatar, UAE and other countries in the region.
Furthermore, Chinese PDH plants have increased their run-rates lately and China saw all-time high LPG imports in June. A continued robust demand side in China will likely contribute to a wide US-Far East arbitrage which is positive for shipping.
The current FFA market for CAL2025 is trading at equivalent to approximately US$50,000 per day, which reflects support to the current spot market levels.
Q2 2024 Earnings Presentation and Interim Financial Report
Please see the attachments for the Q2 2024 Earnings Presentation and Interim Financial Report.
| - | BW LPG Q2 2024 Earnings Presentation |
| - | BW LPG Q2 2024 Interim Financial Report |
BW LPG will present its financial results at 14:00hrs CET today. The presentation will be hosted by Kristian Sørensen (CEO) and Samantha Xu (CFO).
The Presentation will be held live via Zoom. Please register at the link below:
https://bit.ly/BWLPGQ22024EP
A presentation recording will also be available after the event on the Company’s website at: https://www.investor.bwlpg.com.
For further information, please contact:
Kristian Sørensen, CEO
Samantha Xu, CFO
E-mail: investor.relations@bwlpg.com
About BW LPG
BW LPG is the world’s leading owner and operator of LPG vessels, owning and operating Very Large Gas Carriers (VLGC) with a total carrying capacity of over 3 million CBM. With five decades of operating experience in LPG shipping, an in-house LPG trading division and a growing presence in LPG terminal infrastructure and distribution, BW LPG offers an integrated, flexible, and reliable service to customers along the LPG value chain. More information about BW LPG can be found at https://www.bwlpg.com.
BW LPG is associated with BW Group, a leading global maritime company involved in shipping, floating infrastructure, deepwater oil & gas production, and new sustainable technologies. Founded in 1955 by Sir YK Pao, BW controls a fleet of over 450 vessels transporting oil, gas and dry commodities, with its 200 LNG and LPG ships constituting the largest gas fleet in the world. In the renewables space, the group has investments in solar, wind, batteries, biofuels and water treatment.
This information is subject to disclosure requirements pursuant to Section 5-12 of the Norwegian Securities Trading Act.
Exhibit 99.2
BW LPG Limited
Interim Financial Report (Unaudited)
Q2 2024 and H1 2024
FORWARD-LOOKING STATEMENTS
Matters discussed in this unaudited interim financial report may constitute “forward-looking statements”. The Private Securities Litigation Reform Act of 1995 provides safe harbor protections for forward-looking statements in order to encourage companies to provide prospective information about their business. Forward-looking statements include statements concerning plans, objectives, goals, strategies, future events or performance, and underlying assumptions and other statements, which are other than statements of historical facts or present facts and circumstances. We desire to take advantage of the safe harbor provisions of the Private Securities Litigation Reform Act of 1995 and are including this cautionary statement in connection with this safe harbor legislation. This unaudited interim financial report and any other written or oral statements made by us or on our behalf may include forward-looking statements, which reflect our current views with respect to future events and financial and operational performance.
These forward-looking statements may be identified by the use of forward-looking terminology, such as the terms “anticipates”, “assumes”, “believes”, “can”, “continue”, “could”, “estimates”, “expects”, “forecasts”, “intends”, “likely”, “may”, “might”, “plans”, “should”, “potential”, “projects”, “seek”, “will”, “would” or, in each case, their negative, or other variations or comparable terminology. They include statements regarding BW LPG’s intentions, beliefs or current expectations concerning, among other things, the financial strength and position of the Group, operating results, liquidity, prospects, growth, the implementation of strategic initiatives, as well as other statements relating to the Group’s future business development, financial performance and the industry in which the Group operates.
Prospective investors in BW LPG are cautioned that forward-looking statements are not guarantees of future performance and that the Group’s actual financial position, operating results and liquidity, and the development of the industry and potential market in which the Group may operate in the future, may differ materially from those made in, or suggested by, the forward-looking statements contained in this unaudited interim financial report. BW LPG cannot guarantee that the intentions, beliefs or current expectations upon which its forward-looking statements are based, will occur.
By their nature, forward-looking statements involve, and are subject to, known and unknown risks, uncertainties and assumptions as they relate to events and depend on circumstances that may or may not occur in the future. Actual results may differ materially from those expressed or implied in the forward-looking statements due to various factors including, but not limited to:
| · | general economic, political and business conditions; | |
| · | general LPG market conditions, including changes in LPG freight rates, charter rates, vessel values and bunker fuel prices and other operating costs; | |
| · | changes in demand in the LPG shipping industry; | |
| · | any adverse developments in the maritime LPG transportation business; | |
| · | changes in, and the Group’s compliance with, governmental, tax, environmental, safety, data protection and privacy and other laws and regulations; | |
| · | failure in the management of climate and environmental risks and delivery and performance of management environmental objectives; | |
| · | changes in competition rules and regulations for the shipping industry; | |
| · | failure to manage disruptions, including due to climate change, abnormal weather conditions, pandemics, piracy, strikes and boycotts, political instability, sanctions and breaches of IT systems; | |
| · | failure to implement the Group’s business strategy or manage the Group’s growth; | |
| · | damages or breakdowns of the Group’s vessels, including due to weather conditions, mechanical failures, wars or other circumstances and events; | |
| · | failure to obtain new customers or the loss of any existing major customers; | |
| · | failure to maintain sufficient cash reserves to make capital expenditures necessary for the Group’s vessels’ maintenance; | |
| · | failure to attract and retain key management personnel, technically skilled officers and other employees; | |
| · | default by third parties with whom the Group has entered into chartered-in arrangements; | |
| · | failure of the Group’s third-party technical managers or other counterparties to meet their obligations; | |
| · | the ageing of the Group’s fleet which could result in increased operating costs; |
BW LPG Limited
Interim Financial Report (Unaudited)
Q2 2024 and H1 2024
FORWARD-LOOKING STATEMENTS (continued)
| · | delays in deliveries of or cost overruns in relation to newbuilds (if any); | |
| · | failure to integrate assets or businesses acquired from third parties; | |
| · | failure to identify or take advantage of arbitrage opportunities, effectively implement the Products Services division’s hedging strategy and source LPG from third-party suppliers; | |
| · | loss of major tax disputes or successful tax challenges to the Group’s operating structure or to the Group’s tax payments; | |
| · | the availability of and the Group’s ability to obtain financing to fund capital expenditures, acquisitions and other general corporate activities, the terms of such financing and the Group’s ability to comply with the restrictions and other covenants set forth in the Group’s existing and future debt agreements and financing arrangements; |
Additional information about material risk factors that could cause actual results to differ materially from expectations and about material factors or assumptions applied in making forward-looking statements may be found under “Item 3. Key Information – 3.D. Risk Factors” of BW LPG’s Registration Statement on Form 20-F, filed with the U.S. Securities and Exchange Commission on 8 April 2024.
BW LPG Limited
Interim Financial Report (Unaudited)
Q2 2024 and H1 2024
SELECTED KEY FINANCIAL INFORMATION
| Statement of Comprehensive Income | Q2 2024 US$ million |
Q2 2023 US$ million |
Increase/ (Decrease) % |
H1 2024 US$ million |
H1 2023 US$ million |
Increase/ (Decrease) % |
||||||||||||||||||
| Profit after tax | 84.9 | 78.2 | 9 | 234.7 | 208.9 | 12 | ||||||||||||||||||
| Profit attributable to equity holders of the Company | 76.8 | 78.3 | (2 | ) | 218.8 | 205.5 | 6 | |||||||||||||||||
| TCE income - Shipping1 | 148.6 | 167.0 | (11 | ) | 335.1 | 367.4 | (9 | ) | ||||||||||||||||
| Gross profit/(loss) - Product Services1 | 24.5 | (28.2 | ) | N.M | 57.8 | (21.0 | ) | N.M | ||||||||||||||||
| (US$ per share) | ||||||||||||||||||||||||
| Basic and diluted EPS2 | 0.58 | 0.59 | (2 | ) | 1.65 | 1.54 | 7 | |||||||||||||||||
| Dividend per share | 0.58 | 0.81 | (28 | ) | 1.58 | 1.76 | (10 | ) | ||||||||||||||||
| Balance Sheet | 30 June 2024 US$ million |
31 December 2023 US$ million |
Increase/ (Decrease) % |
|||||||||
| Cash and cash equivalents | 264.3 | 287.5 | (8 | ) | ||||||||
| Total assets | 2,237.0 | 2,520.5 | (11 | ) | ||||||||
| Total liabilities | 636.1 | 934.3 | (32 | ) | ||||||||
| Total shareholders’ equity | 1,600.9 | 1,586.2 | 1 | |||||||||
| Cash flow | Q2 2024 US$ million |
Q2 2023 US$ million |
Increase/ (Decrease) % |
H1 2024 US$ million |
H1 2023 US$ million |
Increase/ (Decrease) % |
||||||||||||||||||
| Net cash from operating activities | 52.8 | 149.7 | (65 | ) | 458.4 | 273.7 | 67 | |||||||||||||||||
| Capital expenditure | 0.4 | 45.2 | (99 | ) | 63.3 | 91.2 | (31 | ) | ||||||||||||||||
| Adjusted free cash flow3 | 53.2 | 194.9 | (73 | ) | 521.7 | 364.9 | 43 |
| Financial Ratios | Q2 2024 % | Q2 2023 % | Increase/ (Decrease) % |
30 June 2024 % |
30 June 2023 % | Increase/ (Decrease) % |
||||||||||||||||||
| ROE4 (annualised) | 20.9 | 19.4 | 8 | 29.4 | 26.4 | 11 | ||||||||||||||||||
| ROCE5 (annualised) | 17.2 | 15.2 | 13 | 23.5 | 19.5 | 21 | ||||||||||||||||||
| Net leverage ratio6 | 11.9 | 19.0 | (37 | ) | 11.9 | 19.0 | (37 | ) | ||||||||||||||||
| Other Information | 30 June 2024 | 31 December 2023 | Increase/ (Decrease) % |
|||||||||
| Shares – end of period (shares) | 140,000,000 | 140,000,000 | - | |||||||||
| Treasury shares – end of period (shares) | 8,247,446 | 8,926,105 | (8 | ) | ||||||||
| Share price (NOK) | 198.3 | 151.3 | 31 | |||||||||
| Market cap (NOK million) | 27,762.0 | 21,182.0 | 31 | |||||||||
| Market cap (USD million) | 2,599.2 | 2,076.2 | 25 | |||||||||
| [1] | TCE income and gross profit/(loss) reflect the Shipping and Product Services segments’ performance, respectively. |
| [2] | Basic and diluted EPS (earnings per share) is computed based on Q2 2024: 132.8 million (H1 2024: 132.7 million) shares, the weighted average number of shares outstanding less treasury shares during the period. |
| [3] | Adjusted free cash flow is a non-IFRS measure and is computed as net cash from operating activities minus cash outflows for additions in property, plant and equipment and additions in intangible assets, sale of assets held-for-sale and sale of vessels. See page 27 for a reconciliation of adjusted free cash flow to the nearest IFRS measure. |
| [4] | ROE (return on equity) is computed as, with respect to a particular period, the ratio of the profit after tax for such period to the average of the shareholders’ equity, calculated as the average of the opening and closing balance for the period as presented in the consolidated balance sheet. |
| [5] | ROCE (return on capital employed) is a non-IFRS measure and is computed, with respect to a particular period, as the ratio of the operating profit for such period to capital employed defined as the average of the total shareholders’ equity, total borrowings and total lease liabilities, calculated as the average of the opening and closing balance for such period as presented in the consolidated balance sheet. See page 28 for a reconciliation of ROCE to the nearest IFRS measure. |
| [6] | Net leverage ratio is computed as the sum of total borrowings and total lease liabilities minus cash and cash equivalents as set out in the consolidated statement of cash flows, divided by the sum of total borrowings, total lease liabilities and total shareholders’ equity minus cash and cash equivalents as set out in the consolidated statement of cash flows. |
BW LPG Limited
Interim Financial Report (Unaudited)
Q2 2024 and H1 2024
HIGHLIGHTS AND SUBSEQUENT EVENTS – Q2 2024
| · | Q2 2024 profit attributable to equity holders of the Company ended at US$76.8 million or an earnings per share of US$0.58 or NOK6.24. |
| · | TCE income – Shipping Q2 2024 concluded at US$49,660 per available day1 and US$48,030 per calendar day (total)1. |
| · | The Company declared a Q2 2024 cash dividend of US$0.58 per share amounting to US$76.4 million, which translates to a 100% payout ratio as a percentage of total profit attributable to equity holders for the quarter. |
| · | Announced the acquisition of 12 VLGCs from Avance Gas at a total purchase price of US$1,050 million. Closing of the transaction will take place on a vessel-by-vessel basis targeted to be completed by 31 December 2024. |
| · | The Company successfully completed the redomiciliation from Bermuda to Singapore on 1 July 2024. |
PERFORMANCE REVIEW – Q2 2024 and H1 2024
Q2 2024
Profit after tax was US$84.9 million for Q2 2024 (Q2 2023: US$78.2 million). The increase in profit after tax was mainly due to an increase of US$8.4 million in operating profit, a decrease in net finance expenses of US$2.8 million, which were partially offset by higher income tax expense of US$4.4 million.
Time Charter Equivalent (“TCE”) income for the Shipping segment was US$148.6 million for Q2 2024 (Q2 2023: US$167.0 million). The decrease of US$18.4 million was mainly due to lower LPG spot rates of US$53,340 per available day and lower available fleet days, which decreased by 8% and 6%, respectively when compared with Q2 2023. IFRS 15 adjustments had an insignificant impact to TCE for both Q2 2024 and Q2 2023. Our India subsidiary continues to contribute stable TCE income of US$30.6 million for Q2 2024 mainly from fixed rate time charters.
Product Services achieved a US$24.5 million gross profit for Q2 2024 (Q2 2023: gross loss of US$28.2 million). The increase of US$52.7 million was mainly due to an increase of US$43.3 million in realised and unrealised gains from trading activities, and a decrease in depreciation of US$9.5 million. Net of other expenses, comprising mainly general and administrative expenses of US$5.2 million and income tax expense of US$3.6 million, Product Services recorded a net profit after tax of US$15.7 million for Q2 2024 (Q2 2023: net loss of US$30.8 million).
H1 2024
Profit after tax was US$234.7 million for H1 2024 (H1 2023: US$208.9 million). The increase in profit after tax was mainly due to a higher operating profit of US$28.3 million, a reduction in net finance expenses of US$6.2 million, which were partially offset by higher income tax expense of US$8.7 million.
Time Charter Equivalent (“TCE”) income for the Shipping segment was US$335.1 million for H1 2024 (H1 2023: US$367.4 million) contributed by lower LPG spot rates of US$61,290 per available day and lower available fleet days, representing a decrease of 6% and 7%, respectively when compared with H1 2023. IFRS 15 adjustments amounted to positive US$26.3 million for H1 2024 (H1 2023: positive US$16.3 million), where spot voyages are accounted for on a load-to-discharge basis. Our India subsidiary continues to contribute stable TCE income of US$60.0 million for H1 2024 (H1 2023: US$52.0 million) mainly from fixed rate time charters.
Product Services achieved a US$57.8 million gross profit for H1 2024 (H1 2023: gross loss of US$21.0 million). The increase of US$78.8 million was mainly due to a higher realised and unrealised gains of US$59.4 million from trading activities, and a decrease in depreciation of US$19.3 million. Net of other expenses, comprising mainly general and administrative expenses of US$13.3 million and income tax expense of US$7.7 million, Product Services recorded a net profit after tax of US$36.7 million for H1 2024 (H1 2023: net loss of US$27.7 million).
1 TCE income – Shipping per available and calendar day (total) are non-IFRS measures and are computed as TCE income – Shipping divided by available days and calendar days (total), respectively. See pages 25 and 26 for a reconciliation of TCE income – Shipping per available day and calendar day (total) to the nearest IFRS measure.
2 BW LPG Product Services Pte. Ltd.’s net profit/(loss) after tax. See page 24.
BW LPG Limited
Interim Financial Report (Unaudited)
Q2 2024 and H1 2024
BALANCE SHEET
As of 30 June 2024, BW LPG controls a fleet of 41 VLGCs, including eight vessels which are owned and operated by our subsidiary operating in India. Total assets amounted to US$2,237.0 million (31 December 2023: US$2,520.5 million), of which US$1,408.1 million (31 December 2023: US$1,457.1 million) represented the carrying value of the vessels (including dry docking), and US$126.0 million (31 December 2023: US$151.8 million) represented the carrying value of right-of-use assets (vessels). Inventories as of 30 June 2024 decreased to US$70.5 million as compared to US$188.6 million largely due to the decrease in numbers of LPG cargoes traded in transit.
Cash and cash equivalents amounted to US$264.3 million as of 30 June 2024 (31 December 2023: US$287.5 million). Cash flow from operating activities generated a net cash surplus of US$458.4 million in H1 2024 (H1 2023: US$273.7 million), of which US$141.2 million (H1 2023: net cash outflow of US$12.1 million) related to changes in working capital. Investing activities generated a positive cash flow of US$48.9 million in H1 2024 (H1 2023: US$100.1 million) mainly due to sale of one vessel in Q1 2024, partially offset by a US$30.2 million investment in a minority stake of Confidence Petroleum India Limited. The cash generated was used to repay US$98.3 million of bank borrowings, interest on bank borrowings, US$250.1 million of dividend payments, and for other capital expenditure during first half of 2024.
Net leverage ratio decreased from 20.5% as at 31 December 2023, to 11.9% as at 30 June 2024 mainly due to repayment of term loan, decrease in restricted cash held for derivative margin requirements and a decrease in short term Product Services trade finance lines drawn as at 30 June 2024.
BW LPG Limited
Interim Financial Report (Unaudited)
Q2 2024 and H1 2024
MARKET UPDATE
The first half of 2024 was marked by significant volatility in freight rates. In January, spot rates for the Houston – Chiba route began printing above US$120,00 per day, before a cold snap in the US temporarily curtailed production and exports of LPG. This resulted in spot rates falling sharply to around OPEX levels.
Subsequently, earnings recovered alongside LPG production in the US, and from mid-February to the latter half of June, spot cargoes were fixed at rates above the seasonal average level. In early June, the Panama Canal Authority announced another increase in maximum allowed draft and available slots for transiting the canal, as the water level in Lake Gatun normalised. This had a negative impact on the VLGC market balance, as fewer VLGCs elected to sail the longer route around Cape of Good Hope on their way to the Far East.
Furthermore, in early July, Hurricane Beryl made landfall in Texas, and causing widespread damage. This has had a negative impact on the number of LPG cargoes available for export and ultimately spot rates for VLGCs. Despite these disruptions however, export volumes on VLGCs out of North America still grew 3.7% in the first half of 2024 compared to the same period in 2023.
In the Middle East, export growth was flat, in part due to the continuation of the OPEC+ production cuts, and also some maintenance taking place towards the end of Q2. Export volumes on VLGCs out of Middle East were down 1.6% in the first half of 2024 compared to the first half of 2023.
Fleet Capacity
Year-to-date, 16 new VLGC vessels have been delivered, and there are plans for the delivery of 6 more throughout the remaining months of 2024, and 13 VLGCs for delivery in 2025. Established shipbuilders are indicating deliveries no earlier than 2027 for new VLGC orders.
VLGC Freight Market Summary
Freight rates have rebounded from a seasonal low of approximately US$30,000 per day for loadings out of US Gulf to a level of approximately US$45,000 per day, and the fundamentals remain supportive.
We expect the spot market to fluctuate driven by weather changes, geopolitical situation, Panama Canal availability and other drivers of the VLGC market.
The WTI oil price is trading in the high US$70s per barrel, and expectations for North American LPG export growth are in the high single-digits for the next three years while Middle East LPG exports are expected to grow in the mid-single digits over the coming years, driven by higher gas production from new projects in Qatar, UAE and other countries in the region.
Furthermore, Chinese PDH plants have increased their run-rates lately and China saw all-time high LPG imports in June. A continued robust demand side in China will likely contribute to a wide US-Far East arbitrage which is positive for shipping.
The current FFA market for CAL2025 is trading at equivalent to approximately US$50,000 per day, which reflects support to the current spot market levels.
BW LPG Limited
Interim Financial Report (Unaudited)
Q2 2024 and H1 2024
RISK FACTORS
BW LPG’s results are largely dependent on the worldwide market for transportation of LPG. Market conditions for shipping activities are typically volatile and, as a consequence, the results may vary considerably from year to year. The market in broad terms is dependent on the following factors: the supply of vessels, U.S. and Middle East LPG export volumes and the demand for LPG. The supply of vessels depends on the number of newbuildings entering the market, the demolition of older tonnage and legislation that limits the use of older vessels or sets new standards for vessels used in specific trades. The demand side depends mainly on developments in the global economy. In the recent periods, the efficiency of Panama Canal transit also impacts results significantly.
BW LPG is also exposed to risk in respect of fuel oil costs. Fuel oil prices are affected by the global political and economic environment. This risk is managed by pricing contracts of affreightment with fuel oil adjustment clauses, or by entering into forward fuel oil contracts. Other risks that Management takes into account are interest rate risk, credit risk, liquidity risk and capital risk. Management does not expect the exposure to these risks to change materially and cause a significant impact on the performance of BW LPG in the rest of 2024.
The success of the Group’s trading activities through Product Services depend largely on its ability to identify and exploit arbitrage opportunities, which allow profit to be generated by sourcing and transporting LPG. A lack of such opportunities, or the inability to take advantage of such opportunities when they present themselves could have a material adverse effect on Product Services’ business and results.
Product Services is exposed to fluctuations in LPG prices in order to meet forward priced contract obligations and forward priced purchase or sale contracts. Although Product Services has a policy to mitigate the risks of its trading activities related to LPG price fluctuations by hedging substantially all of its trading inventory through futures and swap commodity derivative contracts, it also may take unhedged positions within pre-determined and approved Group limits based on its understanding of market dynamics and expectation of future price movements. These derivative contracts are subject to daily mark-to-market and margining requirements and could lead to significant cash demands.
BW LPG Limited
Interim Financial Report (Unaudited)
Q2 2024 and H1 2024
Statements to the Interim Financial Information
We confirm to the best of our knowledge that the Interim Financial Information for the six-month period ended 30 June 2024 has been prepared in accordance with IAS 34 – Interim Financial Reporting, and gives a true and fair view of BW LPG Limited’s consolidated assets, liabilities, financial position and income statement as a whole. We also confirm to the best of our knowledge, that the Interim Financial Information includes a fair review of important events that have taken place during the six-month period ended 30 June 2024 and their impact on the Interim Financial Information, and accounts properly for the principal risks and uncertainties for the remaining half year of 2024, as well as major related party transactions.
| 22 August 2024 | ||||
| Andreas Sohmen-Pao | Anne Grethe Dalane | Luc Gillet | ||
| Chairman | Director | Director | ||
| Andrew E. Wolff | Sonali Chandmal | Sanjiv Misra | ||
| Director | Director | Director |
BW LPG Limited
Interim Financial Report (Unaudited)
Q2 2024 and H1 2024
REPORT ON REVIEW OF CONDENSED CONSOLIDATED INTERIM FINANCIAL INFORMATION
Board of Directors
BW LPG Limited
Introduction
We have reviewed the accompanying condensed consolidated interim financial information of BW LPG Limited (“the Company”) and its subsidiaries (“the Group”), which comprises:
| · | the condensed consolidated balance sheet as at 30 June 2024; |
| · | the condensed consolidated statements of comprehensive income and cash flows for the three-month and six-month periods ended 30 June 2024; |
| · | the condensed consolidated statement of changes in equity for the six-month period ended 30 June 2024; and |
| · | notes to the condensed consolidated interim financial information |
(“condensed consolidated interim financial information”).
Management is responsible for the preparation and presentation of this condensed consolidated Interim Financial Information in accordance with International Accounting Standard (“IAS”) 34 Interim Financial Reporting. Our responsibility is to express a conclusion on this condensed consolidated Interim Financial Information based on our review.
Scope of review
We conducted our review in accordance with International Standard on Review Engagements (ISRE) 2410, “Review of Interim Financial Information Performed by the Independent Auditor of the Entity”. A review of interim financial information consists of making inquiries, primarily of persons responsible for financial and accounting matters, and applying analytical and other review procedures. A review is substantially less in scope than an audit conducted in accordance with International Standards on Auditing and consequently does not enable us to obtain assurance that we would become aware of all significant matters that might be identified in an audit. Accordingly, we do not express an audit opinion.
Conclusion
Based on our review, nothing has come to our attention that causes us to believe that the accompanying condensed consolidated Interim Financial Information is not prepared, in all material respects, in accordance with IAS 34 Interim Financial Reporting.
KPMG LLP
Public Accountants and
Chartered Accountants
Singapore
22 August 2024
BW LPG Limited
Interim Financial Report (Unaudited)
Q2 2024 and H1 2024
CONDENSED CONSOLIDATED STATEMENT OF COMPREHENSIVE INCOME (UNAUDITED)
| Q2 2024 | Q2 2023 | H1 2024 | H1 2023 | |||||||||||||
| US$’000 | US$’000 | US$’000 | US$’000 | |||||||||||||
| Revenue - Shipping | 262,382 | 290,846 | 558,448 | 579,049 | ||||||||||||
| Revenue - Product Services | 614,107 | 168,110 | 1,356,532 | 773,027 | ||||||||||||
| Cost of cargo and delivery expenses - Product Services | (591,444 | ) | (171,073 | ) | (1,280,833 | ) | (726,300 | ) | ||||||||
| Voyage expenses - Shipping | (104,835 | ) | (132,520 | ) | (226,311 | ) | (245,149 | ) | ||||||||
| Vessel operating expenses | (20,501 | ) | (22,327 | ) | (42,471 | ) | (44,560 | ) | ||||||||
| Time charter contracts (non-lease components) | (5,090 | ) | (5,209 | ) | (9,776 | ) | (11,013 | ) | ||||||||
| General and administrative expenses | (17,863 | ) | (11,029 | ) | (34,596 | ) | (22,076 | ) | ||||||||
| Charter hire expenses | (1,709 | ) | (7,792 | ) | (2,214 | ) | (16,709 | ) | ||||||||
| Fair value (loss)/gain from equity financial asset | (89 | ) | - | 1,326 | - | |||||||||||
| Finance lease income | 177 | 79 | 197 | 178 | ||||||||||||
| Other operating income/(expense) - net | 1,158 | (1,481 | ) | 2,363 | (2,737 | ) | ||||||||||
| Depreciation | (46,772 | ) | (53,382 | ) | (95,517 | ) | (108,054 | ) | ||||||||
| Amortisation of intangible assets | (209 | ) | (189 | ) | (419 | ) | (351 | ) | ||||||||
| Gain on disposal of vessels | - | 26,610 | 20,391 | 43,199 | ||||||||||||
| Gain on derecognition of right-of-use assets (vessels) | - | 319 | - | 319 | ||||||||||||
| Operating profit | 89,312 | 80,962 | 247,120 | 218,823 | ||||||||||||
| Foreign currency exchange gain/(loss) - net | 252 | 1,657 | (1,524 | ) | 806 | |||||||||||
| Interest income | 4,686 | 3,308 | 9,226 | 4,768 | ||||||||||||
| Interest expense | (4,150 | ) | (7,084 | ) | (8,911 | ) | (13,345 | ) | ||||||||
| Other finance expenses | (733 | ) | (615 | ) | (1,363 | ) | (1,020 | ) | ||||||||
| Finance income/(expenses) – net | 55 | (2,734 | ) | (2,572 | ) | (8,791 | ) | |||||||||
| Profit before tax | 89,367 | 78,228 | 244,548 | 210,032 | ||||||||||||
| Income tax expense | (4,460 | ) | (15 | ) | (9,874 | ) | (1,139 | ) | ||||||||
| Profit after tax | 84,907 | 78,213 | 234,674 | 208,893 | ||||||||||||
| Other comprehensive (loss)/income: | ||||||||||||||||
| Items that will not be reclassified to profit or loss: | ||||||||||||||||
| Equity investments at FVOCI | ||||||||||||||||
| - fair value loss | (2,400 | ) | - | (2,400 | ) | - | ||||||||||
| Items that may be reclassified subsequently to profit or loss: | ||||||||||||||||
| Cash flow hedges | ||||||||||||||||
| - fair value (loss)/gain | (5,073 | ) | (30,728 | ) | 52,328 | (39,718 | ) | |||||||||
| - reclassification to profit or loss | (1,045 | ) | 7,807 | (3,305 | ) | 11,548 | ||||||||||
| Currency translation reserve | 396 | 590 | (438 | ) | 546 | |||||||||||
| Other comprehensive (loss)/income, net of tax | (8,122 | ) | (22,331 | ) | 46,185 | (27,624 | ) | |||||||||
| Total comprehensive income | 76,785 | 55,882 | 280,859 | 181,269 | ||||||||||||
| Profit attributable to: | ||||||||||||||||
| Equity holders of the Company | 76,831 | 78,287 | 218,755 | 205,509 | ||||||||||||
| Non-controlling interests | 8,076 | (74 | ) | 15,919 | 3,384 | |||||||||||
| 84,907 | 78,213 | 234,674 | 208,893 | |||||||||||||
| Total comprehensive income: | ||||||||||||||||
| Equity holders of the Company | 68,650 | 55,867 | 265,008 | 177,803 | ||||||||||||
| Non-controlling interests | 8,135 | 15 | 15,851 | 3,466 | ||||||||||||
| 76,785 | 55,882 | 280,859 | 181,269 | |||||||||||||
| Earnings per share attributable to the equity holders of the Company: | ||||||||||||||||
| (expressed in US$ per share) | ||||||||||||||||
| Basic/Diluted earnings per share | 0.58 | 0.59 | 1.65 | 1.54 | ||||||||||||
BW LPG Limited
Interim Financial Report (Unaudited)
Q2 2024 and H1 2024
CONDENSED CONSOLIDATED BALANCE SHEET (UNAUDITED)
|
30 June 2024 |
31 December 2023 |
|||||||
| US$’000 | US$’000 | |||||||
| Intangible assets | 1,059 | 1,242 | ||||||
| Investment in joint venture | 301 | 301 | ||||||
| Equity financial assets, at fair value | 27,762 | - | ||||||
| Derivative financial instruments | 11,222 | 11,002 | ||||||
| Other receivables | 10,253 | 13,206 | ||||||
| Finance lease receivables | 7,091 | - | ||||||
| Deferred tax assets | 6,632 | 6,855 | ||||||
| Total other non-current assets | 63,261 | 31,364 | ||||||
| Vessels and dry docking | 1,408,103 | 1,457,086 | ||||||
| Right-of-use assets (vessels) | 126,026 | 151,784 | ||||||
| Other property, plant and equipment | 206 | 277 | ||||||
| Property, plant and equipment | 1,534,335 | 1,609,147 | ||||||
| Total non-current assets | 1,598,655 | 1,641,753 | ||||||
| Inventories | 70,537 | 188,592 | ||||||
| Trade and other receivables | 261,799 | 315,238 | ||||||
| Equity financial assets, at fair value | 2,769 | 3,271 | ||||||
| Derivative financial instruments | 30,916 | 37,083 | ||||||
| Finance lease receivables | 8,019 | 2,684 | ||||||
| Assets held-for-sale | - | 44,296 | ||||||
| Cash and cash equivalents | 264,294 | 287,545 | ||||||
| Total current assets | 638,334 | 878,709 | ||||||
| Total assets | 2,236,989 | 2,520,462 | ||||||
| Share capital | 1,400 | 1,400 | ||||||
| Share premium | 285,853 | 285,853 | ||||||
| Treasury shares | (51,536 | ) | (56,438 | ) | ||||
| Contributed surplus | 685,913 | 685,913 | ||||||
| Other reserves | (10,378 | ) | (56,494 | ) | ||||
| Retained earnings | 575,931 | 609,479 | ||||||
| 1,487,183 | 1,469,713 | |||||||
| Non-controlling interests | 113,709 | 116,447 | ||||||
| Total shareholders’ equity | 1,600,892 | 1,586,160 | ||||||
| Borrowings | 173,270 | 199,917 | ||||||
| Lease liabilities | 70,976 | 78,363 | ||||||
| Derivative financial instruments | 569 | 679 | ||||||
| Total non-current liabilities | 244,815 | 278,959 | ||||||
| Borrowings | 132,072 | 212,432 | ||||||
| Lease liabilities | 73,807 | 79,476 | ||||||
| Derivative financial instruments | 21,239 | 90,214 | ||||||
| Current income tax liabilities | 7,309 | 8,121 | ||||||
| Trade and other payables | 156,855 | 265,100 | ||||||
| Total current liabilities | 391,282 | 655,343 | ||||||
| Total liabilities | 636,097 | 934,302 | ||||||
| Total equity and liabilities | 2,236,989 | 2,520,462 | ||||||
BW LPG Limited
Interim Financial Report (Unaudited)
Q2 2024 and H1 2024
CONDENSED CONSOLIDATED STATEMENT OF CHANGES IN EQUITY (UNAUDITED)
| Attributable to equity holders of the Company | |||||||||||||||||||||||||||
| Share capital |
Share premium |
Treasury shares |
Contributed surplus |
Capital reserve |
Hedging reserve |
Share- based payment reserve |
Currency translation reserve |
Other reserves |
Retained earnings |
Total | Non- controlling interests |
Total equity |
|||||||||||||||
| US$’000 | US$’000 | US$’000 | US$’000 | US$’000 | US$’000 | US$’000 | US$’000 | US$’000 | US$’000 | US$’000 | US$’000 | US$’000 | |||||||||||||||
| Balance at 1 January 2024 | 1,400 | 285,853 | (56,438 | ) | 685,913 | (36,259 | ) | (27,542 | ) | 3,905 | 419 | 2,983 | 609,479 | 1,469,713 | 116,447 | 1,586,160 | |||||||||||
| Profit after tax | - | - | - | - | - | - | - | - | - | 218,755 | 218,755 | 15,919 | 234,674 | ||||||||||||||
| Other comprehensive income/(loss) for the financial period | - | - | - | - | - | 49,023 | - | (370 | ) | (2,400 | ) | - | 46,253 | (68 | ) | 46,185 | |||||||||||
| Total comprehensive income/(loss) for the financial period | - | - | - | - | - | 49,023 | - | (370 | ) | (2,400 | ) | 218,755 | 265,008 | 15,851 | 280,859 | ||||||||||||
| Share-based payment reserve - Value of employee services | - | - | - | - | - | - | 1,072 | - | - | - | 1,072 | - | 1,072 | ||||||||||||||
| Share capital reduction of subsidiary | - | - | - | - | - | - | - | - | - | - | - | (4,500 | ) | (4,500 | ) | ||||||||||||
| Purchases of treasury shares | - | - | (100 | ) | - | - | - | - | - | - | - | (100 | ) | - | (100 | ) | |||||||||||
| Transfer of treasury shares | 1,091 | - | - | - | - | - | - | - | 1,091 | - | 1,091 | ||||||||||||||||
| Share options exercised | - | - | 3,911 | - | - | - | (1,209 | ) | - | - | (2,164 | ) | 538 | - | 538 | ||||||||||||
| Dividend paid | - | - | - | - | - | - | - | - | - | (250,139 | ) | (250,139 | ) | (14,089 | ) | (264,228 | ) | ||||||||||
| Total transactions with owners, recognised directly in equity | - | - | 4,902 | - | - | - | (137 | ) | - | - | (252,303 | ) | (247,538 | ) | (18,589 | ) | (266,127 | ) | |||||||||
| Balance at 30 June 2024 | 1,400 | 285,853 | (51,536 | ) | 685,913 | (36,259 | ) | 21,481 | 3,768 | 49 | 583 | 575,931 | 1,487,183 | 113,709 | 1,600,892 | ||||||||||||
BW LPG Limited
Interim Financial Report (Unaudited)
Q2 2024 and H1 2024
CONDENSED CONSOLIDATED STATEMENT OF CHANGES IN EQUITY (UNAUDITED) (continued)
| Attributable to equity holders of the Company | |||||||||||||||||||||||||||
| Share capital |
Share premium |
Treasury shares |
Contributed surplus |
Capital reserve |
Hedging reserve |
Share- based payment reserve |
Currency translation reserve |
Other reserves |
Retained earnings |
Total | Non- controlling interests |
Total equity |
|||||||||||||||
| US$’000 | US$’000 | US$’000 | US$’000 | US$’000 | US$’000 | US$’000 | US$’000 | US$’000 | US$’000 | US$’000 | US$’000 | US$’000 | |||||||||||||||
| Balance at 1 January 2023 | 1,419 | 289,812 | (47,631 | ) | 685,913 | (36,259 | ) | 24,777 | 2,141 | (761 | ) | 325 | 556,996 | 1,476,732 | 119,858 | 1,596,590 | |||||||||||
| Profit after tax | - | - | - | - | - | - | - | - | - | 205,509 | 205,509 | 3,384 | 208,893 | ||||||||||||||
| Other comprehensive (loss)/income for the financial period | - | - | - | - | - | (28,170 | ) | - | 464 | - | - | (27,706 | ) | 82 | (27,624 | ) | |||||||||||
| Total comprehensive (loss)/income for the financial period | - | - | - | - | - | (28,170 | ) | - | 464 | - | 205,509 | 177,803 | 3,466 | 181,269 | |||||||||||||
| Share-based payment reserve - Value of employee services | - | - | - | - | - | - | 1,145 | - | - | - | 1,145 | - | 1,145 | ||||||||||||||
| Purchases of treasury shares | - | - | (20,047 | ) | - | - | - | - | - | - | - | (20,047 | ) | - | (20,047 | ) | |||||||||||
| Share options exercised | - | - | 1,466 | - | - | - | 68 | - | 1,833 | (2,533 | ) | 834 | - | 834 | |||||||||||||
| Dividend paid | - | - | - | - | - | - | - | - | - | (194,465 | ) | (194,465 | ) | - | (194,465 | ) | |||||||||||
| Others | - | - | - | - | - | - | - | - | 11 | - | 11 | - | 11 | ||||||||||||||
| Total transactions with owners, recognised directly in equity | - | - | (18,581 | ) | - | - | - | 1,213 | - | 1,844 | (196,998 | ) | (212,522 | ) | - | (212,522 | ) | ||||||||||
| Balance at 30 June 2023 | 1,419 | 289,812 | (66,212 | ) | 685,913 | (36,259 | ) | (3,393 | ) | 3,354 | (297 | ) | 2,169 | 565,507 | 1,442,013 | 123,324 | 1,565,337 | ||||||||||
BW LPG Limited
Interim Financial Report (Unaudited)
Q2 2024 and H1 2024
CONDENSED CONSOLIDATED STATEMENT OF CASH FLOWS (UNAUDITED)
| Q2 2024 | Q2 2023 | H1 2024 | H1 2023 | |||||||||
| US$’000 | US$’000 | US$’000 | US$’000 | |||||||||
| Cash flows from operating activities | ||||||||||||
| Profit before tax | 89,367 | 78,228 | 244,548 | 210,032 | ||||||||
| Adjustments for: | ||||||||||||
| - amortisation of intangible assets | 209 | 189 | 419 | 351 | ||||||||
| - depreciation charge | 46,772 | 53,382 | 95,517 | 108,054 | ||||||||
| - gain on disposal of vessels | - | (26,610 | ) | (20,391 | ) | (43,199 | ) | |||||
| - fair value loss/(gain) from equity financial assets | 89 | - | (1,326 | ) | - | |||||||
| - interest income | (4,686 | ) | (3,308 | ) | (9,226 | ) | (4,768 | ) | ||||
| - interest expenses | 5,038 | 7,884 | 11,521 | 14,906 | ||||||||
| - other finance expenses | 1,001 | 462 | 1,889 | 867 | ||||||||
| - share-based payments | 409 | 862 | 1,072 | 1,145 | ||||||||
| - finance lease income | (177 | ) | (79 | ) | (197 | ) | (178 | ) | ||||
| - gain on derecognition of right-of-use assets | - | (319 | ) | - | (319 | ) | ||||||
| 138,022 | 110,691 | 323,826 | 286,891 | |||||||||
| Changes in working capital: | ||||||||||||
| - inventories | 25,997 | 37,244 | 118,055 | 56,895 | ||||||||
| - trade and other receivables | (84,644 | ) | 195,763 | 51,538 | 67,144 | |||||||
| - trade and other payables | (1,441 | ) | (170,342 | ) | (105,032 | ) | (134,467 | ) | ||||
| - derivative financial instruments | (3,122 | ) | 19,727 | (17,489 | ) | 63,125 | ||||||
| - margin account held with broker | (17,246 | ) | (42,481 | ) | 94,086 | (64,822 | ) | |||||
| Total changes in working capital | (80,456 | ) | 39,911 | 141,158 | (12,125 | ) | ||||||
| Taxes paid | (4,717 | ) | (856 | ) | (6,555 | ) | (1,025 | ) | ||||
| Net cash from operating activities | 52,849 | 149,746 | 458,429 | 273,741 | ||||||||
| Cash flows from investing activities | ||||||||||||
| Additions in property, plant and equipment | 415 | (67,867 | ) | (1,821 | ) | (75,990 | ) | |||||
| Additions in intangible assets | - | (496 | ) | (237 | ) | (590 | ) | |||||
| Proceeds from sale of vessels | - | 113,538 | 65,337 | 167,804 | ||||||||
| Purchase of equity financial assets | - | - | (30,162 | ) | - | |||||||
| Repayment of finance lease receivables | 1,960 | 1,950 | 3,970 | 3,882 | ||||||||
| Interest received | 4,701 | 3,387 | 9,423 | 4,946 | ||||||||
| Sale of equity financial assets, at fair value | - | - | 2,343 | - | ||||||||
| Net cash from investing activities | 7,076 | 50,512 | 48,853 | 100,052 |
BW LPG Limited
Interim Financial Report (Unaudited)
Q2 2024 and H1 2024
CONDENSED CONSOLIDATED STATEMENT OF CASH FLOWS (UNAUDITED) (continued)
| Q2 2024 | Q2 2023 | H1 2024 | H1 2023 | |||||||||
| US$’000 | US$’000 | US$’000 | US$’000 | |||||||||
| Cash flows from financing activities | ||||||||||||
| Proceeds from borrowings | 3,676 | - | 17,076 | - | ||||||||
| Repayments of bank borrowings | (17,204 | ) | (15,002 | ) | (98,338 | ) | (30,012 | ) | ||||
| Payment of lease liabilities | (22,273 | ) | (23,205 | ) | (48,293 | ) | (46,748 | ) | ||||
| Interest paid | (6,757 | ) | (7,374 | ) | (11,948 | ) | (14,424 | ) | ||||
| Other finance expense paid | (1,001 | ) | (402 | ) | (1,889 | ) | (809 | ) | ||||
| Purchase of treasury shares | - | (14,015 | ) | (100 | ) | (20,047 | ) | |||||
| Sale of treasury shares | 1,091 | - | 1,091 | - | ||||||||
| Drawdown of trust receipts | 516,627 | 49,076 | 1,076,844 | 456,026 | ||||||||
| Repayment of trust receipts | (472,842 | ) | (103,946 | ) | (1,102,162 | ) | (493,357 | ) | ||||
| Dividend payment | (131,752 | ) | (125,734 | ) | (250,139 | ) | (194,465 | ) | ||||
| Dividend payment to non-controlling interests | (6,092 | ) | - | (14,089 | ) | - | ||||||
| Capital return to non-controlling interests | (4,500 | ) | - | (4,500 | ) | - | ||||||
| Net cash used in financing activities | (141,027 | ) | (240,602 | ) | (436,447 | ) | (343,836 | ) | ||||
| Net (decrease)/increase in cash and cash equivalents | (81,102 | ) | (40,344 | ) | 70,835 | 29,957 | ||||||
| Cash and cash equivalents at beginning of the financial period | 313,974 | 291,216 | 162,037 | 220,915 | ||||||||
| Cash and cash equivalents at end of the financial period | 232,872 | 250,872 | 232,872 | 250,872 |
For the purpose of presenting the consolidated statement of cash flows, cash and cash equivalents comprise the following:
30
June |
30 June 2023 |
|||||
| US$’000 | US$’000 | |||||
| Cash and cash equivalents per consolidated balance sheet | 264,294 | 330,930 | ||||
| Less: Margin account held with broker | (31,422 | ) | (80,058 | ) | ||
| Cash and cash equivalents per consolidated statement of cash flows | 232,872 | 250,872 |
BW LPG Limited
Interim Financial Report (Unaudited)
Q2 2024 and H1 2024
NOTES TO THE CONDENSED CONSOLIDATED INTERIM FINANCIAL INFORMATION (UNAUDITED)
These notes form an integral part of and should be read in conjunction with the accompanying condensed consolidated financial information.
| 1. | General information |
BW LPG Limited (the “Company”) is listed on the Oslo and New York Stock Exchange. It was incorporated and domiciled in Bermuda, but was redomiciled to Singapore with effect from 1 July 2024. The address of its registered office is 10 Pasir Panjang Road, #17-02, Mapletree Business City, Singapore 117438.
The principal activity of the Company is that of investment holding. The principal activities of its subsidiaries are shipowning, chartering and LPG trading.
This condensed consolidated interim financial information (“Interim Financial Information”) was authorised for issue by the Board of Directors of the Company on 22 August 2024.
| 2. | Material accounting policies |
Basis of preparation
The Interim Financial Information for the three-month and six-month periods ended 30 June 2024 has been prepared in accordance with IAS 34, ‘Interim Financial Reporting’. The Interim Financial Information should be read in conjunction with the annual audited financial statements for the year ended 31 December 2023, which have been prepared in accordance with International Financial Reporting Standards (“IFRS”). The Interim Financial Information does not include all the information required for a complete set of financial statements prepared in accordance with IFRS standards. However, selected explanatory notes are included to explain events and transactions that are significant to an understanding of the changes in the Group’s financial position and performance since the last annual financial statements.
In the preparation of this set of Interim Financial Information, the same accounting policies have been applied as those used in the preparation of the annual financial statements for the year ended 31 December 2023, except as set out below.
Equity Investments
Equity investments are initially recognised at its fair value. Transaction costs are expensed in profit of loss.
| (i) | The Group subsequently measures all its equity investments at their fair values. At initial recognition, the Group has made an irrevocable election to present in other comprehensive income subsequent changes in the fair value of an investment in an equity instrument that is not held for trading. For other equity instruments where the election has not been made, they are classified as fair value through profit or loss (“FVTPL”) with movements in their fair values recognised in profit or loss in the period in which the changes arise. |
| (ii) | Dividends from equity investments are recognised in profit or loss as “dividend income”. |
| (iii) | On disposal, the difference between the carrying amount and sales proceed of a FVTPL equity investment is recognised in profit or loss. The amounts presented in other comprehensive income for equity investments through other comprehensive income shall be transferred within equity on disposal. |
BW LPG Limited
Interim Financial Report (Unaudited)
Q2 2024 and H1 2024
| 2. | Material accounting policies (continued) |
Critical accounting estimates, assumptions and judgements
The preparation of the Interim Financial Information requires Management to make judgements, estimates and assumptions that affect the application of accounting policies and the reported amounts of assets, liabilities, income and expenses. Actual results may differ from these estimates.
In preparing this Interim Financial Information, the judgements made by Management in applying the Group’s accounting policies and the key sources of estimation uncertainty are the same as those that applied to the consolidated financial statements for the year ended 31 December 2023.
| 3. | Derivative financial instruments |
| 30 June 2024 | 31 December 2023 | |||||||||||
| Assets | Liabilities | Assets | Liabilities | |||||||||
| US$’000 | US$’000 | US$’000 | US$’000 | |||||||||
| Interest rate swaps | 11,764 | - | 11,002 | - | ||||||||
| Forward freight agreements and related bunker swaps | 7,303 | (1,433 | ) | 2,188 | (46,391 | ) | ||||||
| Commodity contracts and derivatives | 22,989 | (20,375 | ) | 34,821 | (44,234 | ) | ||||||
| Forward foreign exchange contracts | 82 | - | 74 | (268 | ) | |||||||
| 42,138 | (21,808 | ) | 48,085 | (90,893 | ) | |||||||
| Non-current | 11,222 | (569 | ) | 11,002 | (679 | ) | ||||||
| Current | 30,916 | (21,239 | ) | 37,083 | (90,214 | ) | ||||||
| 42,138 | (21,808 | ) | 48,085 | (90,893 | ) | |||||||
As at 30 June 2024, the Group has interest rate swaps with total notional principal amounting to US$198.6 million (31 December 2023: US$218.1 million). The Group’s interest rate swaps mature between 2025 to 2029.
Interest rate swaps were transacted to hedge the interest rate risk on bank borrowings. After taking into account the effects of these contracts, for part of the bank borrowings, the Group would effectively pay fixed interest rates ranging from 1.9% per annum to 2.9% per annum and would receive a variable rate based on US$ SOFR. Hedge accounting was adopted for these contracts.
Forward freight agreements and related bunker swaps were transacted to hedge freight rates and bunker price risks. Hedge accounting was adopted for these contracts.
Commodity contracts and derivatives comprise physical buy and sell commodity contracts measured at fair value through profit or loss, and commodity derivative contracts. The Group did not adopt hedge accounting for these contracts.
Forward foreign exchange contracts were transacted to hedge foreign exchange risks. The Group did not adopt hedge accounting for these contracts.
| 4. | Finance lease receivables |
Finance lease receivables pertain to a back-to-back time charter contract where the sublease was accounted for as finance lease under IFRS 16 and resulted in the recognition of net investment in the sublease as finance lease receivables of US$15.1 million as at 30 June 2024 (31 December 2023: US$2.7 million).
BW LPG Limited
Interim Financial Report (Unaudited)
Q2 2024 and H1 2024
| 5. | Property, plant and equipment |
|
Vessels |
Dry docking |
Furniture and fixtures |
Right-of-use assets (Vessels) |
Total |
|||||||||||
| US$’000 | US$’000 | US$’000 | US$’000 | US$’000 | |||||||||||
| At 30 June 2024 | |||||||||||||||
| Cost | 1,932,783 | 53,527 | 910 | 329,539 | 2,316,759 | ||||||||||
| Accumulated depreciation and impairment charge | (547,665 | ) | (30,542 | ) | (704 | ) | (203,513 | ) | (782,424 | ) | |||||
| Net book value | 1,385,118 | 22,985 | 206 | 126,026 | 1,534,335 |
|
Vessels |
Dry docking |
Furniture and fixtures |
Right-of-use assets (Vessels) |
Total |
|||||||||||
| US$’000 | US$’000 | US$’000 | US$’000 | US$’000 | |||||||||||
| At 31 December 2023 | |||||||||||||||
| Cost | 1,932,413 | 52,074 | 910 | 325,883 | 2,311,280 | ||||||||||
| Accumulated depreciation and impairment charge | (503,740 | ) | (23,661 | ) | (633 | ) | (174,099 | ) | (702,133 | ) | |||||
| Net book value | 1,428,673 | 28,413 | 277 | 151,784 | 1,609,147 |
| (a) | Vessels with an aggregate carrying amount of US$964.9 million as at 30 June 2024 (31 December 2023: US$1,000 million) are secured on bank borrowings (note 7). |
| (b) | For owned assets, the assessment of the recoverable amounts of the vessels are based on the higher of fair value less cost to sell and value-in-use calculation, with each vessel being regarded as one cash generating unit. The recoverable amount of each vessel is estimated predominantly based on independent third party valuation reports, which made reference to comparable transaction prices of similar vessels. These are regarded as Level 2 fair values under the fair value hierarchy of IFRS 13 Fair value measurement that is also applicable for financial assets/liabilities. |
| (c) | In January 2024, the Group signed a new time charter-in VLGC over a two-year lease term which amounted to US$18.8 million of additions to Right-of-use assets (vessels). In February 2024, upon the expiry of a time charter-in VLGC, the Group derecognised US$15.2 million of Right-of-use assets (vessels) cost, and accumulated depreciation, respectively. |
| (d) | The sale and delivery of a VLGC, which was reclassified to Assets held-for-sale as at 31 December 2023, was completed in February 2024, generating US$65.3 million in proceeds and a net book gain of US$20.4 million. |
BW LPG Limited
Interim Financial Report (Unaudited)
Q2 2024 and H1 2024
| 6. | Treasury shares |
| Number of shares | Cost of shares | |||||||||||
|
30 June 2024 |
30 June 2023 |
30 June 2024 |
30 June 2023 |
|||||||||
| ‘000 | ‘000 | US$’000 | US$’000 | |||||||||
| At beginning of the financial period | 8,926 | 8,558 | 56,438 | 47,631 | ||||||||
| Purchases of treasury shares | 9 | 2,423 | 100 | 20,047 | ||||||||
| Sale/Transfer of treasury shares | (90 | ) | (470 | ) | (1,091 | ) | (1,466 | ) | ||||
| Share options exercised | (598 | ) | - | (3,911 | ) | - | ||||||
| At end of the financial period | 8,247 | 10,511 | 51,536 | 66,212 | ||||||||
Pursuant to the Company’s Long-term Management Share Option Plan (“LTIP 2017”) announced on 21 April 2017, participants of the LTIP 2017 exercised vested options granted under LTIP 2017 during Q1 2024; 597,767 shares were transferred at an average strike price of US$0.90 (NOK 9.17) per share.
During H1 2024, the Company purchased 9,006 shares as part of the share buy-back programme announced on 23 May 2023, and sold 89,898 shares at market price of US$12.14 per share.
As at 30 June 2023, the Company purchased 1,466,684 and 956,222 shares as part of the share buy-back programme announced on 8 December 2021, and a tender offer launched in June 2023, respectively. 470,000 shares were transferred to certain members in settlement of their exercising of certain vested options granted under LTIP 2017.
| 7. | Borrowings and lease liabilities |
|
30 June 2024 |
31 December 2023 |
|||||
| US$’000 | US$’000 | |||||
| Borrowings | ||||||
| Bank borrowings | 244,061 | 324,902 | ||||
| Trust receipts | 58,945 | 84,263 | ||||
| Interest payable | 2,336 | 3,184 | ||||
| 305,342 | 412,349 | |||||
| Borrowings | ||||||
| Non-current | 173,270 | 199,917 | ||||
| Current | 132,072 | 212,432 | ||||
| 305,342 | 412,349 | |||||
| Lease liabilities | ||||||
| Non-current | 70,976 | 78,363 | ||||
| Current | 73,807 | 79,476 | ||||
| 144,783 | 157,839 |
BW LPG Limited
Interim Financial Report (Unaudited)
Q2 2024 and H1 2024
| 7. | Borrowings and lease liabilities (continued) |
Movements in borrowings and lease liabilities are analysed as follows:
| Borrowings | Lease liabilities |
Total | ||||||||||
| US$’000 | US$’000 | US$’000 | ||||||||||
| At 1 January 2024 | 412,349 | 157,839 | 570,188 | |||||||||
| Drawdown of trust receipts | 1,076,844 | - | 1,076,844 | |||||||||
| Additions | 17,076 | 18,841 | 35,917 | |||||||||
| Interest expense | 7,981 | 3,540 | 11,521 | |||||||||
| Lease modifications | - | 16,396 | 16,396 | |||||||||
| Less: Interest paid | (8,408 | ) | (3,540 | ) | (11,948 | ) | ||||||
| Less: Principal repayment | (98,338 | ) | (48,293 | ) | (146,631 | ) | ||||||
| Less: Repayment of trust receipts | (1,102,162 | ) | - | (1,102,162 | ) | |||||||
| At 30 June 2024 | 305,342 | 144,783 | 450,125 | |||||||||
| Borrowings | Lease Liabilities |
Total | ||||||||||
| US$’000 | US$’000 | US$’000 | ||||||||||
| At 1 January 2023 | 478,373 | 242,672 | 721,045 | |||||||||
| Drawdown of trust receipts | 456,026 | - | 456,026 | |||||||||
| Additions | - | 16,095 | 16,095 | |||||||||
| Interest expense | 11,015 | 3,891 | 14,906 | |||||||||
| Lease modifications | - | (3,897 | ) | (3,897 | ) | |||||||
| Less: Interest paid | (10,533 | ) | (3,891 | ) | (14,424 | ) | ||||||
| Less: Principal repayment | (30,012 | ) | (46,748 | ) | (76,760 | ) | ||||||
| Less: Repayment of trust receipts | (493,357 | ) | - | (493,357 | ) | |||||||
| At 30 June 2023 | 411,512 | 208,122 | 619,634 | |||||||||
As at 30 June 2024, bank borrowings amounting to US$227.0 million (31 December 2023: US$311.0 million) are secured by mortgages on a number of vessels of the Group (note 5). These bank borrowings are interest bearing at SOFR plus a margin. The carrying amounts of non-current and current borrowings approximate their fair values because interest rates are repriced on a regular basis.
| 8. | Related party transactions |
In addition to the information disclosed elsewhere in the Interim Financial Information, the following transactions took place between the Group and related parties during the financial period at terms agreed between the parties:
| (a) | Services |
| Q2 2024 | Q2 2023 | H1 2024 | H1 2023 | |||||||||||||
| US$’000 | US$’000 | US$’000 | US$’000 | |||||||||||||
| Charter hire expense charged by related party* | - | 250 | - | 1,278 | ||||||||||||
| Corporate service fees charged by related parties* | 1,396 | 1,711 | 3,318 | 3,386 | ||||||||||||
| Ship management fees charged by related parties* | 201 | 317 | 402 | 631 | ||||||||||||
| Corporate service fees charged to related parties* | - | 70 | - | 126 | ||||||||||||
* “Related parties” refer to corporations controlled by a shareholder of the Company.
BW LPG Limited
Interim Financial Report (Unaudited)
Q2 2024 and H1 2024
| 8. | Related party transactions (continued) |
| (b) | Key management’s remuneration |
| Q2 2024 | Q2 2023 | H1 2024 | H1 2023 | |||||||||||||
| US$’000 | US$’000 | US$’000 | US$’000 | |||||||||||||
| Salaries and other short-term employee benefits | 542 | 521 | 1,944 | 1,573 | ||||||||||||
| Post-employment benefits - contributions to defined contribution plans and share-based payment | 423 | 869 | 706 | 1,158 | ||||||||||||
| Directors’ fees | 187 | 94 | 250 | 188 | ||||||||||||
| 1,152 | 1,484 | 2,900 | 2,919 | |||||||||||||
| 9. | Financial risk management |
The Interim Financial Information does not include all financial risk management information and disclosures required in the annual financial statements; they should be read in conjunction with the Group’s annual financial statements as at 31 December 2023. There have been no major changes in any risk management policies or processes since the previous year end.
| (a) | Financial instruments by category |
The aggregate carrying amounts of the Group’s financial instruments are as follows:
| 30 June 2024 |
31 December 2023 | |||||||
| US$’000 | US$’000 | |||||||
| Equity financial assets, at fair value | 30,531 | 3,271 | ||||||
| Net derivative assets/(liabilities) measured at fair value | 20,330 | (42,808 | ) | |||||
| Financial assets at amortised cost | 470,752 | 497,401 | ||||||
| Financial liabilities at amortised cost | (453,879 | ) | (663,609 | ) | ||||
In Q1 2024, the Group completed an investment amounting to US$30.0 million into Confidence Petroleum India Limited (“Confidence”), a company listed on the NSE India, through a preferential allotment of equity shares. These shares constitute 8.5 percent of the issued and paid-up share capital of Confidence on a fully diluted basis. The Group elected to account for this equity investment as an Equity financial asset, fair value through other comprehensive income.
BW LPG Limited
Interim Financial Report (Unaudited)
Q2 2024 and H1 2024
| 9. | Financial risk management (continued) |
| (b) | Estimation of fair value |
IFRS 13 established a fair value hierarchy that prioritises inputs used to measure fair value. The three levels of the fair value input hierarchy defined by IFRS 13 are as follows:
| (i) | quoted prices (unadjusted) in active markets for identical assets or liabilities (Level 1); |
| (ii) | inputs other than quoted prices included within Level 1 that are observable for the asset or liability, either directly (i.e. as prices) or indirectly (i.e. derived from prices) (Level 2); and |
| (iii) | inputs for the asset or liability that are not based on observable market data (unobservable inputs) (Level 3). |
Derivative financial assets and liabilities
The Group’s financial derivative instruments primarily relate to interest rate swaps, forward freight agreements, bunker swaps and commodity contracts measured at fair value and are within Level 2 of the fair value hierarchy. The fair values of financial derivative instruments that are not traded in an active market are determined by using valuation techniques. The fair values of interest rate swaps are calculated at the present value of estimated future cash flows based on observable yield curves. The fair values of forward freight agreements, bunker swaps and commodity contracts measured at fair value are determined using quoted forward commodity indices at the balance sheet date.
Non-derivative non-current financial assets and liabilities
The carrying amount of non-derivative non-current financial assets and liabilities which bear floating interest rates are assumed to approximate their fair value because of the short repricing period. There are no non-current financial assets and liabilities which do not bear floating interest rates.
Non-derivative current financial assets and liabilities
The carrying amounts of financial assets and liabilities with a maturity of less than one year are assumed to approximate their fair value because of the short period to maturity.
| 10. | Segment information |
The executive management team (“EMT”) is the Group’s chief operating decision-maker. The Group identifies segments on the basis of those components of the Group that the EMT regularly reviews. The Group considers the business from each individual business segment perspective which comprises the Shipping and Product Services segments.
The reported measure of segment performance is gross profit, which the EMT uses to assess the performance of the operating segments. For the Shipping segment, gross profit is reflected as TCE income - Shipping. Operating segment disclosures are consistent with the information reviewed by the Management.
BW LPG Limited
Interim Financial Report (Unaudited)
Q2 2024 and H1 2024
| 10. | Segment information (continued) |
Segment performance is presented below:
| Shipping | Product Services |
Inter- segment elimination |
Total | |||||||||||||
| US$’000 | US$’000 | US$’000 | US$’000 | |||||||||||||
| Q2 2024 | ||||||||||||||||
| Revenue from spot voyages | 217,534 | - | - | 217,534 | ||||||||||||
| Inter-segment revenue | 5,409 | - | (5,409 | ) | - | |||||||||||
| Voyage expenses | (104,835 | ) | - | - | (104,835 | ) | ||||||||||
| Inter-segment expense | (14,362 | ) | - | 14,362 | - | |||||||||||
| Net income from spot voyages | 103,746 | - | 8,953 | 112,699 | ||||||||||||
| Revenue from time charter voyages | 44,848 | - | - | 44,848 | ||||||||||||
| TCE income - Shipping 1 | 148,594 | - | 8,953 | 157,547 | ||||||||||||
| Revenue from Product Services | - | 614,107 | - | 614,107 | ||||||||||||
| Inter-segment revenue | - | 14,362 | (14,362 | ) | - | |||||||||||
| Cost of cargo and delivery expenses | - | (591,444 | ) | - | (591,444 | ) | ||||||||||
| Inter-segment cost | - | (5,409 | ) | 5,409 | - | |||||||||||
| Depreciation | - | (7,102 | ) | - | (7,102 | ) | ||||||||||
| Gross profit - Product Services 2 | - | 24,514 | (8,953 | ) | 15,561 | |||||||||||
| Segment results | 148,594 | 24,514 | - | 173,108 | ||||||||||||
| H1 2024 | ||||||||||||||||
| Revenue from spot voyages | 474,558 | - | - | 474,558 | ||||||||||||
| Inter-segment revenue | 36,303 | - | (36,303 | ) | - | |||||||||||
| Voyage expenses | (226,311 | ) | - | - | (226,311 | ) | ||||||||||
| Inter-segment expense | (33,878 | ) | - | 33,878 | - | |||||||||||
| Net income from spot voyages | 250,672 | - | (2,425 | ) | 248,247 | |||||||||||
| Revenue from time charter voyages | 83,890 | - | - | 83,890 | ||||||||||||
| Inter-segment revenue | 562 | - | (562 | ) | - | |||||||||||
| TCE income - Shipping 1 | 335,124 | - | (2,987 | ) | 332,137 | |||||||||||
| Revenue from Product Services | - | 1,356,532 | - | 1,356,532 | ||||||||||||
| Inter-segment revenue | - | 33,878 | (33,878 | ) | - | |||||||||||
| Cost of cargo and delivery expenses | - | (1,280,833 | ) | - | (1,280,833 | ) | ||||||||||
| Inter-segment cost | - | (36,865 | ) | 36,865 | - | |||||||||||
| Depreciation | - | (14,951 | ) | - | (14,951 | ) | ||||||||||
| Gross profit - Product Services 2 | - | 57,761 | 2,987 | 60,748 | ||||||||||||
| Segment results | 335,124 | 57,761 | - | 392,885 | ||||||||||||
1 “TCE income” denotes “time charter equivalent income” which represents revenue from time charters and voyage charters less voyage expenses comprising primarily fuel oil, port charges and commission.
2 Gross profit from Product Services represents the net trading results which comprise revenue and cost of LPG cargo, derivative gains and losses, and other trading attributable costs, including depreciation from Product Services’ leased in vessels.
BW LPG Limited
Interim Financial Report (Unaudited)
Q2 2024 and H1 2024
| 10. | Segment information (continued) |
| Shipping | Product Services |
Inter- segment elimination |
Total | |||||||||||||
| US$’000 | US$’000 | US$’000 | US$’000 | |||||||||||||
| Q2 2023 | ||||||||||||||||
| Revenue from spot voyages | 244,106 | - | - | 244,106 | ||||||||||||
| Inter-segment revenue | 33,578 | - | (33,578 | ) | - | |||||||||||
| Voyage expenses | (132,520 | ) | - | - | (132,520 | ) | ||||||||||
| Inter-segment expense | (24,873 | ) | - | 24,873 | - | |||||||||||
| Net income from spot voyages | 120,291 | - | (8,705 | ) | 111,586 | |||||||||||
| Revenue from time charter voyages | 46,740 | - | - | 46,740 | ||||||||||||
| TCE income - Shipping 1 | 167,031 | - | (8,705 | ) | 158,326 | |||||||||||
| Revenue from Product Services | - | 168,110 | - | 168,110 | ||||||||||||
| Inter-segment revenue | - | 24,873 | (24,873 | ) | - | |||||||||||
| Cost of cargo and delivery expenses | - | (171,073 | ) | - | (171,073 | ) | ||||||||||
| Inter-segment cost | - | (33,578 | ) | 33,578 | - | |||||||||||
| Depreciation | - | (16,555 | ) | - | (16,555 | ) | ||||||||||
| Gross loss - Product Services 2 | - | (28,223 | ) | 8,705 | (19,518 | ) | ||||||||||
| Segment results | 167,031 | (28,223 | ) | - | 138,808 | |||||||||||
| H1 2023 | ||||||||||||||||
| Revenue from spot voyages | 491,435 | - | - | 491,435 | ||||||||||||
| Inter-segment revenue | 76,226 | - | (76,226 | ) | - | |||||||||||
| Voyage expenses | (245,149 | ) | - | - | (245,149 | ) | ||||||||||
| Inter-segment expense | (42,760 | ) | - | 42,760 | - | |||||||||||
| Net income from spot voyages | 279,752 | - | (33,466 | ) | 246,286 | |||||||||||
| Revenue from time charter voyages | 87,614 | - | - | 87,614 | ||||||||||||
| TCE income - Shipping 1 | 367,366 | - | (33,466 | ) | 333,900 | |||||||||||
| Revenue from Product Services | - | 773,027 | - | 773,027 | ||||||||||||
| Inter-segment revenue | - | 42,760 | (42,760 | ) | - | |||||||||||
| Cost of cargo and delivery expenses | - | (726,300 | ) | - | (726,300 | ) | ||||||||||
| Inter-segment cost | - | (76,226 | ) | 76,226 | - | |||||||||||
| Depreciation | - | (34,279 | ) | - | (34,279 | ) | ||||||||||
| Gross (loss)/profit - Product Services 2 | - | (21,018 | ) | 33,466 | 12,448 | |||||||||||
| Segment results | 367,366 | (21,018 | ) | - | 346,348 | |||||||||||
1 “TCE income” denotes “time charter equivalent income” which represents revenue from time charters and voyage charters less voyage expenses comprising primarily fuel oil, port charges and commission.
2 Gross profit from Product Services represents the net trading results which comprise revenue and cost of LPG cargo, derivative gains and losses, and other trading attributable costs, including depreciation from Product Services’ leased in vessels.
BW LPG Limited
Interim Financial Report (Unaudited)
Q2 2024 and H1 2024
| 10. | Segment information (continued) |
Reconciliation of segment results:
| Q2 2024 | Q2 2023 | H1 2024 | H1 2023 | |||||||||||||
| US$’000 | US$’000 | US$’000 | US$’000 | |||||||||||||
| Total segment results for reportable segments | 173,108 | 138,808 | 392,885 | 346,348 | ||||||||||||
| Vessel operating expenses | (20,501 | ) | (22,327 | ) | (42,471 | ) | (44,560 | ) | ||||||||
| Time charter contracts (non-lease components) | (5,090 | ) | (5,209 | ) | (9,776 | ) | (11,013 | ) | ||||||||
| General and administrative expenses | (17,863 | ) | (11,029 | ) | (34,596 | ) | (22,076 | ) | ||||||||
| Charter hire expenses | (1,709 | ) | (7,792 | ) | (2,214 | ) | (16,709 | ) | ||||||||
| Fair value (loss)/gain from equity financial asset | (89 | ) | - | 1,326 | - | |||||||||||
| Finance lease income | 177 | 79 | 197 | 178 | ||||||||||||
| Other operating income/(expense) - net | 1,158 | (1,481 | ) | 2,363 | (2,737 | ) | ||||||||||
| Depreciation - Shipping segment | (39,670 | ) | (36,827 | ) | (80,566 | ) | (73,775 | ) | ||||||||
| Amortisation | (209 | ) | (189 | ) | (419 | ) | (351 | ) | ||||||||
| Gain on disposal of vessels | - | 26,610 | 20,391 | 43,199 | ||||||||||||
| Gain on derecognition of right-of-use assets (vessels) | - | 319 | - | 319 | ||||||||||||
| Finance income/(expenses) – net | 55 | (2,734 | ) | (2,572 | ) | (8,791 | ) | |||||||||
| Income tax expense | (4,460 | ) | (15 | ) | (9,874 | ) | (1,139 | ) | ||||||||
| Profit after tax | 84,907 | 78,213 | 234,674 | 208,893 | ||||||||||||
| 11. | Investment in subsidiaries |
Set out below are the summarised financial information for BW LPG India Pte. Ltd. (“BW India”) and BW LPG Product Services Pte. Ltd (“BW Product Services”), which have non-controlling interest that are material to the Group. These are presented before inter-company eliminations.
Summarised balance sheet:
| BW India | BW Product Services | |||||||||||||||
|
30 June 2024 |
31 December 2023 |
30 June 2024 |
31 December 2023 |
|||||||||||||
| US$’000 | US$’000 | US$’000 | US$’000 | |||||||||||||
| Assets | ||||||||||||||||
| Current assets | 27,156 | 27,935 | 278,545 | 431,420 | ||||||||||||
| Includes | ||||||||||||||||
| Cash and cash equivalents | 14,239 | 15,882 | 70,454 | 77,980 | ||||||||||||
| Non-current assets | 325,329 | 347,933 | 60,492 | 75,727 | ||||||||||||
| Liabilities | ||||||||||||||||
| Current liabilities | 33,701 | 33,901 | 236,579 | 402,789 | ||||||||||||
| Includes | ||||||||||||||||
| Borrowings | 27,710 | 27,929 | 97,379 | 138,380 | ||||||||||||
| Non-current liabilities (Borrowings) | 99,457 | 112,473 | 33,725 | 40,815 | ||||||||||||
| Net assets | 219,327 | 229,494 | 68,733 | 63,543 | ||||||||||||
BW LPG Limited
Interim Financial Report (Unaudited)
Q2 2024 and H1 2024
| 11. | Investment in subsidiaries (continued) |
Summarised statement of comprehensive income:
| BW India | Product Services | |||||||||||||||
| Q2 2024 | Q2 2023 | Q2 2024 | Q2 2023 | |||||||||||||
| US$’000 | US$’000 | US$’000 | US$,000 | |||||||||||||
| TCE income – Shipping | 30,578 | 27,917 | - | - | ||||||||||||
| Revenue from Product Services | - | - | 628,469 | 192,983 | ||||||||||||
| Cost of cargo and delivery expenses | - | - | (596,853 | ) | (204,651 | ) | ||||||||||
| Vessel operating expense | (5,663 | ) | (5,508 | ) | - | - | ||||||||||
| Depreciation and amortisation | (8,778 | ) | (8,497 | ) | (7,128 | ) | (16,569 | ) | ||||||||
| Finance expense | (2,767 | ) | (2,723 | ) | 587 | (1,462 | ) | |||||||||
| Other expenses – net | (1,364 | ) | (1,645 | ) | (9,332 | ) | (1,092 | ) | ||||||||
| Net profit after tax | 12,006 | 9,544 | 15,743 | (30,791 | ) | |||||||||||
| Other comprehensive loss (currency translation effects) | - | - | 396 | 590 | ||||||||||||
| Total comprehensive income | 12,006 | 9,544 | 16,139 | (30,201 | ) | |||||||||||
| Total comprehensive income allocated to non-controlling interests | 5,715 | 4,543 | 2,421 | (4,530 | ) | |||||||||||
| BW India | Product Services | |||||||||||||||
| H1 2024 | H1 2023 | H1 2024 | H1 2023 | |||||||||||||
| US$’000 | US$’000 | US$’000 | US$,000 | |||||||||||||
| TCE income – Shipping | 60,035 | 51,961 | - | - | ||||||||||||
| Revenue from Product Services | - | - | 1,390,410 | 815,787 | ||||||||||||
| Cost of cargo and delivery expenses | - | - | (1,317,698 | ) | (802,526 | ) | ||||||||||
| Vessel operating expense | (11,813 | ) | (11,316 | ) | - | - | ||||||||||
| Depreciation and amortisation | (18,039 | ) | (16,044 | ) | (15,003 | ) | (34,293 | ) | ||||||||
| Finance (expense)/income - net | (5,066 | ) | (5,415 | ) | 96 | (2,070 | ) | |||||||||
| Other expenses – net | (3,253 | ) | (3,355 | ) | (21,060 | ) | (4,599 | ) | ||||||||
| Net profit after tax | 21,864 | 15,831 | 36,745 | (27,701 | ) | |||||||||||
| Other comprehensive (loss)/income (currency translation effects) | - | - | (438 | ) | 546 | |||||||||||
| Total comprehensive income | 21,864 | 15,831 | 36,307 | (27,155 | ) | |||||||||||
| Total comprehensive income allocated to non-controlling interests | 10,407 | 7,536 | 5,446 | (4,073 | ) | |||||||||||
| 12. | Dividends paid |
An interim dividend of US$131.8 million (US$1.00 per share) was paid in June 2024 respect of Q1 2024. In the corresponding period last year, an interim dividend of US$125.7 million (US$0.95 per share) was paid in June 2023 in respect of Q1 2023.
| 13. | Subsequent events |
The Company successfully completed the redomiciliation from Bermuda to Singapore on 1 July 2024.
In August 2024, the Group announced the acquisition of 12 VLGCs from Avance Gas at a total purchase price of US$1,050 million. Closing of the transaction will take place on a vessel-by-vessel basis targeted to be completed by 31 December 2024.
BW LPG Limited
Interim Financial Report (Unaudited)
Q2 2024 and H1 2024
APPENDIX - Non-IFRS financial measures
This interim financial report contains a number of non-IFRS financial measures that Management uses to monitor and analyse the performance of the Group’s business. Non-IFRS financial measures exclude amounts that are included in, or include amounts that are excluded from, the most directly comparable measure calculated and presented in accordance with IFRS, or are calculated using measures that are not calculated in accordance with IFRS. Non-IFRS financial measures may be considered in addition to, but not as a substitute for or superior to, information presented in accordance with IFRS.
The Group believes that these non-IFRS financial measures, in addition to IFRS measures, provide an enhanced understanding of the Group’s results and related trends, therefore increasing transparency and clarity of the Group’s results and business.
There are no generally accepted accounting principles governing the calculation of these measures and the criteria upon which these measures are based can vary from company to company. The non-IFRS financial measures presented in this interim financial report may not be comparable to other similarly titled measures used by other companies, have limitations as analytical tools and should not be considered in isolation or as a substitute for analysis of the Group’s operating results as reported under IFRS. The Group encourages investors and analysts not to rely on any single financial measure but to review the Group’s financial and non-financial information in its entirety.
The following non-IFRS measures are presented in this interim financial report.
TCE income – Shipping per calendar day (total)
The Group defines TCE income - Shipping per calendar day (total) as TCE income - Shipping divided by calendar days (total).
The Group defines calendar days (total) as the total number of days in a period during which vessels are owned or chartered-in is in its possession, including technical off-hire days and waiting days. Calendar days (total) are an indicator of the size of the fleet over a period and affect both the amount of revenue and the amount of expense that the Group records during that period.
The Group defines waiting days as the number of days its vessels are unemployed for market reasons, excluding technical off-hire days. Ballast voyages, positioning voyages prior to deliveries on time charters and time spent on cleaning of tanks when vessels are switching from one cargo type to another are not considered waiting time. Waiting days per vessel are calculated as total waiting days for owned and chartered-in vessels divided by the number of owned and chartered-in vessels (not weighted by ownership share in each vessel).
The Group defines technical off-hire as the time lost due to off-hire days associated with major repairs, drydockings or special or intermediate surveys. Technical off-hire per vessel is calculated as an average for owned, bareboat and chartered-in vessels (not weighted by ownership share in each vessel).
The Group believes TCE income - Shipping per calendar day (total) is meaningful to investors because it is a measure of how well the Company manages the fleet technically and commercially.
The reconciliation of TCE income - Shipping per calendar day (total) to TCE income - Shipping for the period ended 30 June 2024 is provided below.
| Q2 2024 | Q2 2023 | H1 2024 | H1 2023 | |||||||||||||
| TCE income – Shipping (US$’000) | 148,594 | 167,031 | 335,124 | 367,366 | ||||||||||||
| Calendar days (total) | 3,094 | 3,238 | 6,232 | 6,648 | ||||||||||||
| TCE income – Shipping per calendar day (total) (US$) | 48,030 | 51,580 | 53,770 | 55,260 | ||||||||||||
BW LPG Limited
Interim Financial Report (Unaudited)
Q2 2024 and H1 2024
APPENDIX - Non-IFRS financial measures (continued)
TCE income – Shipping per available day
The Group defines TCE income – Shipping per available day as TCE income – Shipping divided by available days.
The Group defines available days as the total number of days (including waiting time) in a period during which each vessel is owned or chartered-in, net of technical off-hire days. The Group uses available days to measure the number of days in a period during which vessels actually generate or are capable of generating revenue.
The Group defines waiting days as the number of days its vessels are unemployed for market reasons, excluding technical off-hire days. Ballast voyages, positioning voyages prior to deliveries on time charters and time spent on cleaning of tanks when vessels are switching from one cargo type to another are not considered waiting time. Waiting days per vessel are calculated as total waiting days for owned and chartered-in vessels divided by the number of owned and chartered-in vessels (not weighted by ownership share in each vessel).
The Group defines technical off-hire as the time lost due to off-hire days associated with major repairs, drydockings or special or intermediate surveys. Technical off-hire per vessel is calculated as an average for owned, bareboat and chartered-in vessels (not weighted by ownership share in each vessel).
The Group believes TCE income – Shipping per available day is meaningful to investors because it is a measure of how well the Group manages the fleet commercially.
The reconciliation of TCE income – Shipping per available day to TCE income – Shipping for the period ended 30 June 2024 is provided below.
| Q2 2024 | Q2 2023 | H1 2024 | H1 2023 | |||||||||||||
| TCE income – Shipping (US$’000) | 148,594 | 167,031 | 335,124 | 367,366 | ||||||||||||
| Available days | 2,992 | 3,182 | 6,026 | 6,473 | ||||||||||||
| TCE income – Shipping per available days (US$) | 49,660 | 52,490 | 55,610 | 56,750 | ||||||||||||
Adjusted free cash flow
The Group defines adjusted free cash flow as net cash from operating activities minus cash outflows for additions in property, plant and equipment and additions in intangible assets, sale of assets held-for-sale and sale of vessels.
The Group believes adjusted free cash flow is meaningful to investors because it is the measure of the funds generated by the Group available for distribution of dividends, repayment of debt or to fund the Group’s strategic initiatives, including acquisitions. The purpose of presenting adjusted free cash flow is to indicate the ongoing cash generation within the control of the Group after taking account of the necessary cash expenditures for maintaining the operating structure of the Group (in the form of capital expenditure).
The reconciliation of adjusted free cash flow to net cash inflow from operating activities for the periods ended 30 June 2024 and 2023 is provided below.
Q2
2024 |
Q2 2023 US$’000 |
H1
2024 |
H1 2023 US$’000 |
|||||||||||||
| Net cash from operating activities | 52,849 | 149,746 | 458,429 | 273,741 | ||||||||||||
| Additions in property, plant and equipment | 415 | (67,867 | ) | (1,821 | ) | (75,990 | ) | |||||||||
| Additions in intangible assets | - | (496 | ) | (237 | ) | (590 | ) | |||||||||
| Proceeds from sale of vessels | - | 113,538 | 65,337 | 167,804 | ||||||||||||
| Adjusted free cash flow | 53,264 | 194,921 | 521,708 | 364,965 | ||||||||||||
BW LPG Limited
Interim Financial Report (Unaudited)
Q2 2024 and H1 2024
APPENDIX - Non-IFRS financial measures (continued)
Return on capital employed (ROCE)
The Group defines return on capital employed (“ROCE”) as, with respect to a particular financial period, the ratio of the operating profit for such period to capital employed defined as the average of the total shareholders’ equity, total borrowings and total lease liabilities, calculated as the average of the opening and closing balance for such period as presented in the consolidated balance sheet.
The Group believes ROCE is meaningful to investors because it measures the Group’s financial efficiency and its ability to create future growth in value.
The reconciliation of ROCE to operating profit for the periods ended 30 June 2024 and 2023 is provided below.
| Q2 2024 | Q2 2023 | H1 2024 | H1 2023 | |||||||||||||
| Operating profit (US$’000) | 89,312 | 80,962 | 247,120 | 218,823 | ||||||||||||
| Average of the total shareholders’ equity (US$’000)(1) | 1,633,172 | 1,605,362 | 1,593,776 | 1,580,964 | ||||||||||||
| Average of the total borrowings (US$’000)(1) | 290,189 | 343,274 | 358,846 | 444,943 | ||||||||||||
| Average of the total lease liabilities (US$’000)(1) | 157,163 | 188,833 | 151,311 | 217,803 | ||||||||||||
| Capital employed (US$’000) | 2,080,524 | 2,137,469 | 2,103,933 | 2,243,710 | ||||||||||||
| ROCE | 4.3 | % | 3.8 | % | 11.7 | % | 9.8 | % | ||||||||
| ROCE (annualised) | 17.2 | % | 15.2 | % | 23.5 | % | 19.5 | % | ||||||||
(1) Calculated as the average of the opening and closing balances for the period as presented in the consolidated balance sheet
Rounding of figures
Certain financial information presented in tables in this interim financial report has been rounded to the nearest whole number or the nearest decimal place. Therefore, the sum of the numbers in a column may not conform exactly to the total figure given for that column. In addition, certain percentages presented in the tables in this interim financial report reflect calculations based upon the underlying information prior to rounding, and, accordingly, may not conform exactly to the percentages that would be derived if the relevant calculations were based upon the rounded numbers.
|
Earnings Presentation Q2 2024 22 August 2024 ● BW LPG Earnings Presentation |
|
Disclaimer and Forward-Looking Statements NOT FOR RELEASE, PUBLICATION, DISTRIBUTION OR FORWARDING, IN WHOLE OR IN PART, DIRECTLY OR INDIRECTLY, IN OR IN TO ANY JURISDICTION IN WHICH THE SAME WOULD BE UNLAWFUL. BY ATTENDING THE MEETING WHERE THIS PRESENTATION IS MADE, OR BY READING THE PRESENTATION SLIDES, YOU ACKNOWLEDGE AND AGREE TO COMPLY WITH THE FOLLOWING RESTRICTIONS. This presentation has been produced by BW LPG Limited (“BW LPG”) exclusively for information purposes. This presentation may not be reproduced or redistributed, in whole or in part, to any other person. Matters discussed in this presentation and any materials distributed in connection with this presentation may constitute or include forward–looking statements. Forward–looking statements are statements that are not historical facts and may be identified by words such as “anticipates”, “believes”, “continues”, “estimates”, “expects”, “intends”, “may”, “should”, “will” and similar expressions, such as “going forward”. These forward–looking statements reflect BW LPG’s reasonable beliefs, intentions and current expectations concerning, among other things, BW LPG’s results of operations, financial condition, liquidity, prospects, growth and strategies. Forward–looking statements include statements regarding: objectives, goals, strategies, outlook and growth prospects; future plans, events or performance and potential for future growth; liquidity, capital resources and capital expenditures; economic outlook and industry trends; developments of BW LPG’s markets; the impact of regulatory initiatives; and the strength of BW LPG’s competitors. Forward–looking statements involve risks and uncertainties because they relate to events and depend on circumstances that may or may not occur in the future. The forward–looking statements in this presentation are based upon various assumptions, many of which are based, in turn, upon further assumptions, including without limitation, management’s examination of historical operating trends, data contained in BW LPG’s records and other data available from Fourth parties. Although BW LPG believes that these assumptions were reasonable when made, these assumptions are inherently subject to significant known and unknown risks, uncertainties, contingencies and other important factors which are difficult or impossible to predict and are beyond its control. Forward–looking statements are not guarantees of future performance and such risks, uncertainties, contingencies and other important factors could cause the actual results of operations, financial condition and liquidity of BW LPG or the industry to differ materially from those results expressed or implied in this presentation by such forward–looking statements. No representation is made that any of these forward–looking statements or forecasts will come to pass or that any forecast result will be achieved and you are cautioned not to place any undue influence on any forward–looking statement. 2 No representation, warranty or undertaking, express or implied, is made by BW LPG, its affiliates or representatives as to, and no reliance should be placed on, the fairness, accuracy, completeness or correctness of the information or the opinions contained herein, for any purpose whatsoever. Neither BW LPG nor any of its affiliates or representatives shall have any responsibility or liability whatsoever (for negligence or otherwise) for any loss whatsoever and howsoever arising from any use of this presentation or its contents or otherwise arising in connection with this presentation. All information in this presentation is subject to updating, revision, verification, correction, completion, amendment and may change materially and without notice. In giving this presentation, none of BW LPG, its affiliates or representatives undertakes any obligation to provide the recipient with access to any additional information or to update this presentation or any information or to correct any inaccuracies in any such information. The information contained in this presentation should be considered in the context of the circumstances prevailing at the time and has not been, and will not be, updated to reflect material developments which may occur after the date of the presentation. The contents of this presentation are not to be construed as legal, business, investment or tax advice. Each recipient should consult its own legal, business, investment or tax adviser as to legal, business, investment or tax advice. By attending this presentation you acknowledge that you will be solely responsible for your own assessment of the market and the market position of BW LPG and that you will conduct your own analysis and be solely responsible for forming your own view on the potential future performance of the business of BW LPG. This presentation must be read in conjunction with the recent financial information and the disclosures therein. Neither this presentation nor anything contained herein shall form the basis of, or be relied upon in connection with, any offer or purchase whatsoever in any jurisdiction and shall not constitute or form part of an offer to sell or the solicitation of an offer to buy any securities in the United States or in any other jurisdiction. The securities referred to herein may not be offered or sold in the United States absent registration with the United States Securities and Exchange Commission or an exemption from registration under the U.S. Securities Act of 1933, as amended (the “Securities Act”). BW LPG does not intend to register any part of any offering in the United States or to conduct a public offering in the United States of the shares to which this presentation relates. In the EEA Member States, with the exception of Norway (each such EEA Member State, a “Relevant State“), this presentation and the information contained herein are intended only for and directed to qualified investors as defined in Article 2(e) of Regulation (EU) 2017/1129 of the European Parliament and of the Council of 14 June 2017 (the “Prospectus Regulation”). The securities mentioned in this presentation are not intended to be offered to the public in any Relevant State and are only available to qualified investors except in accordance with exceptions in the Prospectus Regulation. Persons in any Relevant State who are not qualified investors should not take any actions based on this presentation, nor rely on it. In the United Kingdom, this presentation is directed only at, and communicated only to, persons who are qualified investors within the meaning of Article 2(e) of the Prospectus Regulation as it forms part of domestic law in the United Kingdom by virtue of the European Union (Withdrawal) Act 2018 who are (i) persons who fall within the definition of "investment professional" in Article 19(5) of the Financial Services and Markets Act 2000 (Financial Promotion) Order 2005, as amended (the “Order”), or (ii) persons who fall within Article 49(2)(a) to (d) of the Order, or (iii) persons to whom it may otherwise be lawfully communicated (all such persons referred to in (i), (ii) and (iii) above together being referred to as “Relevant Persons”). This presentation must not be acted on or relied on by persons in the United Kingdom who are not Relevant Persons. |
|
Agenda 01 Highlights 02 Market 03 Performance 04 Q&A |
|
2024 Q2 Highlights and Market Outlook Highlights and Subsequent Events • Another strong quarter for shipping with TCE income – Shipping Q2 2024 concluded at US$49,660 per available day and US$48,030 per calendar day (total). • Declared a Q2 2024 cash dividend of US$0.58 per share amounting to US$76.4 million, representing 121% of Shipping NPAT2 and 100% of total earnings. • BW Product Services generated a net accounting profit of US$15.7M in Q2, comprising US$29.3M of realised trading results and US$4.8M of unrealised MTM loss from cargo and paper positions. • Announced the acquisition of 12 VLGCs from Avance Gas at a total purchase price of US$ 1,050 million. Closing of the transaction will take place on a vessel-by-vessel basis targeted to be completed by 31 December 2024. • Successfully completed the redomiciliation from Bermuda to Singapore on 1 July 2024. • The BW LPG US listing has broadened investor access and strengthened our capital market activities with ~230,000 daily trading volume. The additional listing has supported share price development during the quarter. 4 Market Outlook We reiterate our positive view for 2H of 2024 and 2025: • Freight rates have rebounded from a seasonal low of ~US$ 30,000/day for loadings out of US Gulf to a level of ~US$ 45,000/day, and the fundamentals remain supportive. • We expect the spot market to fluctuate driven by weather changes, geopolitical situation, Panama Canal availability and other drivers of the VLGC market. • WTI oil price are trading in the high US$70s/barrel, with North America LPG export growth expected to be in the high single-digits for the next three years; Middle East LPG export growth in the mid-single digits over the coming years, driven by higher gas production from new projects in Qatar, UAE and other countries in the region. • Chinese PDH plants increased their run-rate lately and China saw all-time high LPG imports in June. A continued robust demand in China will likely contribute to a wide US-Far East arbitrage which is positive for shipping. • The current FFA market for CAL2025 is trading at equivalent to ~US$ 50,000/day, which reflects support to the current spot market levels. TCE per day presented is for the Shipping Segment 1.This does not constitute an offer to sell or the solicitation of an offer to buy any securities of BW LPG nor shall there be any sale of any securities of BW LPG in any jurisdiction in which such offer, solicitation or sale would be unlawful prior to registration or qualification under the securities laws of any such jurisdiction. 2.Shipping NPAT is calculated as profit attributable to equity holders of BW LPG, minus BW LPG's share of BW PS' net profit/(loss) after tax. $49,700 TCE income – Shipping per available day 95% Fleet utilisation $48,000 TCE income – Shipping per calendar day 3% Technical offhire Commercial Performance Financial Performance Return to Shareholders $85M Net profit after tax $578M Available liquidity $0.58 Earnings per share 12% Net leverage ratio $0.58 Dividend per share 21% ROE (annualised) YTD Payout Ratio 15% 96% Annualised Dividend Yield |
|
Fleet acquisition of 12 VLGCs from Avance Gas 5 Strategic transaction, expanding and renewing our fleet to enhance shipping and delivery options in the fast-growing LPG space 1. Including 8x VLGCS from BW India (52% owned by BW LPG) on a 100% basis. 2. BW LPG fleet per 22 August 2024 – excludes two operated MGCs and two LGCs 3. Net of treasury shares 19 8 12 7 7 Owned fleet1 Vessel acquisition Pro forma owned fleet Time charter-in Operated Pro forma total owned and operated fleet 27 39 53 +44% ~44% growth in owned fleet… …while only increasing share count by ~15% # of shares outstanding Shares issued to Avance Pro forma shares outstanding 131.7 150.9 19.282 Shares outstanding3 (m shares) +15% BW LPG VLGC fleet2 (# of VLGCs) Transaction summary ✓ Acquisition of 12 modern VLGCs from Avance Gas with an average age of 6.8 years • 4 Korean built dual fuel VLGCs and 8 China built VLGCs of which 6 vessels are scrubber fitted ✓ Purchase price of US$ 1,050m, where of US$ 500m in debt, funded through: • 19.282 million BW LPG shares issued at US$ 17.25/share to Avance Gas, equivalent to US$ 333 million • Cash consideration of US$ 585.4m, of which US$ 368m is to fund repayment of the existing bank debt of 10 vessels • Remaining debt of US$ 132m pertaining to two sale-leaseback vessels is to be novated • The cash consideration will be funded through US$ 235.4m of available cash resources and remaining US$ 350m through a shareholder loan from BW Group ✓ Shareholder loan of US$ 350m from BW Group to enable re-financing of existing bank debt of 10 vessels • Enables swift execution of deal and time to secure the most attractive financing possible Positive Market Outlook Solid market fundamentals from newbuilding deliveries abating, and growth in global LPG exports Expand Market-Leading Platform Enhancing commercial scale and renewing our fleet without adding to the orderbook Maintain Healthy Balance Sheet Leverage expected to increase to 30-35% post transaction |
|
Market 6 02 |
|
Energy Transfer: Nederland (8Mtpa) Enterprise: Neches River (11Mtpa) Enterprise: Hydrocarbons Terminal (9Mtpa) 40 45 50 55 60 65 70 75 80 85 90 2024 2025 2026 2027 Million tons per annum Current capacity LPG Exports Spot Market Snapshot – Rebounding after export disruptions 7 Spot rates came down following recent developments, but sentiment is strengthening US – Far East spot rates, $/day Recent developments Near term factors Medium term factors US LPG Terminal Expansions Sources: BW LPG, Baltic Exchange, Argus, EIA, various 0 20 40 60 80 100 120 140 Jan Feb Mar Apr May Jun Jul Aug Sep Oct Nov Dec Thopusands of USD / day 3y average 2024 Spot rate FFA'24 …driven by recovering US exports absorbing tonnage length that built up during the summer … leaving more room for spot rates to increase Wide US/Far East price differential, and terminal fees are coming down… ...additional terminal capacity in coming years US exports expected to increase with... Spot rates have rebounded... … reduced export from Middle East & US, more Panama canal transits made available for VLGCs Earnings fell towards the end of Q2… ...FFA market prices Q4 around US$ 50,000/day Export disruptions from hurricane Beryl are coming off... ..supporting demand for long haul shipping of LPG Asian demand continues to grow.... |
|
40% 50% 60% 70% 80% 90% 2022 2023 2024 LPG volume fundamentals 8 LPG fundamentals remain supportive for further demand growth 28 34 39 44 46 53 56 61 2018 2019 2020 2021 2022 2023 2024F 2025F North American LPG exports VLGC only Million tons 34 33 30 31 37 38 39 41 2018 2019 2020 2021 2022 2023 2024F 2025F Middle East LPG exports VLGC only Million tons 5.5 6.7 6.6 6.3 6.1 6.8 7.3 7.5 6.7 9.5 9.5 7.6 8.3 9.7 2021 2022 2023 1H 2024 China LPG imports Million tons China PDH average run rate Sources: BW LPG, NGLS, SCI 0 20 40 60 80 100 120 1Q 2Q 3Q 4Q Million tons 5y spread 2024 5y Average US Propane Stocks 7.6% Expected growth in North American exports 3.0% Expected growth in Middle East exports 11% China 1H24 y/y import growth US propane inventories are high and rising +11% Q1 Q2 Q3 Q4 Q1 Q2 Q3 Q4 Q1 Q2 Q3 Q4 Q1 Q2 |
|
VLGC Fleet and Newbuildings 9 Average delivery of 3 VLGCs per quarter over the next 18 months Sources: BW LPG, Clarksons 1. Total VLGC fleet on water (not including orderbook) 2. Delivery times for established shipyards in China and South Korea. Newcomer shipyards in China are promoting end-2026 delivery Quarterly delivery schedule # of VLGCs 6 1 4 6 13 6 10 11 13 3 1 1 1 2 2 3 2 3 4 2022 2023 2024 2025 Existing NB - Non-ammonia NB - Ammonia Fleet growth next 18 months represent <5% of total VLGC fleet VLGC fleet profile and newbuilding market 70% 15% 6% 9% 0-15 years old 15-20 years old 20-25 years old 25 years old + 397 total VLGC fleet1 ~$120M VLGC delivery year for newbuild contracts 2028 Korean shipyards 2027 Chinese shipyards Current VLGC dual-fuel newbuild price |
|
Performance 10 03 |
|
2024 % of total Fleet Revenue/ (Cost) in $M Average day rate TC out 19% $102 $44,500 TC in 19% ($75) $32,600 Net $27 Remaining TC out 13% $68 $44,500 Shipping – Performance 11 Achieved 95% fleet utilisation generating TCE income - Shipping of $49,700 per available day 2024 Q2 performance Q3 2024 ▪ Fixed ~86% of our available fleet days at an average rate of ~$43,000 per day4 Guidance 2024 Charter portfolio ▪ 32% covered by TC out at $44,500 per day ▪ 7% covered by FFA hedges at $57,100 per day 3% 97% TCE income by calendar days $48,000/ day1 Technical Offhire Available days 35% 63% TCE income by available days $49,700/ day2 $53,3002 (incl. waiting time and FFA) Spot $55,5003 (excl. waiting time and FFA) Time Charter $42,800 Waiting 2% 1. TCE rates per day are inclusive of both commercial waiting and technical offhire days (i.e. 100% of calendar days) 2. TCE rates per day are inclusive of commercial waiting days and exclusive of technical offhire days (i.e. 100% of available days) 3. TCE rates per day are exclusive of both commercial waiting and technical offhire days 4. Discharge to discharge basis |
|
Q2 Net profit: $16M 1Gross profit from Product Services represents the net trading results which comprise revenue and cost of LPG cargo, derivative gains and losses, and other trading attributable costs, including depreciation from Product Services’ lease-in vessels 2Q2 net profit of $16M excludes currency translation differences from consolidation of foreign denominated subsidiary. 12 Product Services – Performance 2024 Q2 Performance Book Equity ($m) Strong Q2 trading performance resulting in a $26M gross profit and $16M net profit; $30M return of Capital returned to Shareholders $25M Gross Profit1 $16M Net Profit2 $69M Net asset value End of Q2 $5M Average VAR ~3% BW LPG VLGC cargoes lifted by BW PS |
|
$0.15 $1.91 $1.46 $0.09 $0.85 $0.84 $0.56 $1.28 $3.46 $1.58 2013 2014 2015 2016 2017 2018 2019 2020 2021 2022 2023 YTD 2024 Financial Highlights 13 Low leverage, strong liquidity, ready for growth opportunities Earnings Yield2 (annualised) 12% Dividend Yield3 (annualised) 15% ROE4 (annualised) 21% ROCE5 (annualised) 17% Net leverage ratio6 12% 1. EPS (earnings per share) is computed based on the weighted average number of shares outstanding less treasury shares during the period 2. Earnings yield: EPS divided by the share price at the end of the period in USD terms 3. Dividend yield: Annualised dividend divided by the share price in USD on 20th August 2024 4. ROE (return on equity): with respect to a particular financial period, the ratio of the profit after tax to the average of the shareholders’ equity, calculated as the average of the opening and closing balance for the financial period as presented in the consolidated balance sheet. 5. ROCE (return on capital employed): with respect to a particular financial period, the ratio of the operating profit to capital employed defined as the average of the total shareholders’ equity, total borrowings and lease liabilities, calculated as the average of the opening and closing balance for the financial period as presented in the consolidated balance sheet. 6. Net leverage ratio: The sum of total borrowings and lease liabilities minus cash and cash equivalents as set out in the consolidated statement of cash flows, divided by the sum of the total borrowings, total lease liabilities, and shareholders’ equity minus cash and cash equivalents as set out in the consolidated statement of cashflows 7. Operating cash breakeven: Total expected cash costs (excluding capex) divided by available days, owned fleet or total fleet Financial Ratios Q2 2024 Income Statement Profit after tax $85 Profit to equity holders $76 Earnings per share1 $0.58 Dividends per share $0.58 Balance Sheet Total assets $2,237 Total liabilities $636 Total shareholders’ equity $1,601 Dividends per Share YTD 2024 Daily TCE Income $53,800 YTD 2024 Daily OPEX $8,600 FY 2024 Operating cash breakeven7 Owned $17,800 Total fleet $22,300 Shipping Per Day Statistics (USD/Day) Key Financials Q2 2024 (USD million) |
|
$400M ECA (o/s $53M) $221M ECA (o/s $50M) $198M Term Loan (o/s $127M) $345M Revolving Credit Facilities (RCF) Undrawn RCF - $345M O utstanding Debt - $230M US$ million As of 30 June 2024 Pro forma balance post transaction³ Undrawn amount under revolving credit facility 345 110 Cash1 233 233 Total available liquidity 578 343 Financial – Financing Structure and Repayment Profile 14 Ample liquidity of $578M and light debt at Q2 supports healthy post transaction liquidity level Trade financing structure2 Total Available Liquidity As of 30 June 2024 1. Cash presented excludes $31m held in broker margin accounts 2. Excludes lease liabilities, capitalised fees, and interest payable 3. Liquidity required for transaction is assumed to be drawn from RCF with unchanged cash position. Ship financing structure2 86 54 115 23 11 0 50 100 150 200 250 300 350 2024 2025 2026 2027 2028 and 2029 USD millions $796M Trade Finance Facilities - o/s $59M $198M BW LPG India Term Loan - o/s $127M Revolving credit facilities (RCF) - o/s $0M $221M ECA 2029 - o/s $50M $400M ECA 2028 - o/s $53M Repayment profile2 Letter of credit $100M Drawndown $59M $796M Trade Finance Facilities Unutilised Facilities- $637 U M tilised Facilities - $159M Below excludes: • Revolving shareholder loan of $350M to be drawn progressively as vessels delivered • Two sale-and-leaseback vessels of $132M will be added once approved • RCF $235M to be drawn for consideration payment |
|
Q&A 15 04 |
|
Q&A CEO Kristian Sørensen CFO Samantha Xu |
|
Contact Us Investor Relations investor.relations@bwlpg.com Ticker (OSE) / Ticker (NYSE) BWLPG / BWLP LinkedIn linkedin.com/company/bwlpg Telephone +65 6705 5588 Website https://investor.bwlpg.com Address 10 Pasir Panjang Road Mapletree Business City #17 -02 Singapore 117438 17 |
|
Appendices 18 05 |
|
1. Vessels with scrubbers installed 2. MGC (Medium Gas Carrier) 3. LGC (Large Gas Carrier). Denver’s and Helsinki’s expected to be delivered in Q3 2024 41 VLGCs, 2 MGCs, and 2 LGCs Operated by BW LPG as of 22 August 19 BW LPG 19100% ownership BW LPG 7 Time charter in BW LPG India 52% ownership Operated 8 11 18 Vessels with dual-fuel propulsion technology Vessels retrofitted with scrubber technology Vessels on compliant fuels 9 18 Name Year Shipyard Name Year Shipyard Name Year Shipyard Name Year Shipyard Beneficiary BW Messina 2017 DSME BW Yushi 1 2020 Mitsubishi H.I. BW Pine 2011 Kawasaki S.C. Astor 2 2023 Hyundai H.I. Product Services BW Mindoro 2017 DSME BW Kizoku 1 2019 Mitsubishi H.I. BW Lord 2008 DSME Eco Sorcerer 2 2023 Hyundai H.I. Product Services BW Malacca 2016 DSME Gas Zenith 1 2017 Hyundai H.I. BW Tyr 2008 Hyundai H.I. Gas Jupiter 2023 Jiangnan Sinogas Maritime BW Magellan 2016 DSME Oriental King 2017 Hyundai H.I. BW Loyalty 1 2008 DSME Kaede 2023 Hyundai H.I. Product Services BW Frigg 2016 Hyundai H.I. Doraji Gas 2017 Mitsubishi H.I. BW Oak 2008 Hyundai H.I. Gas Venus 2021 Jiangnan Sinogas Maritime BW Freyja 2016 Hyundai H.I. Berge Nantong 2006 Hyundai H.I. BW Elm 2007 Hyundai H.I. Gas Gabriela 1 2021 Hyundai H.I. Product Services BW Volans 2016 Hyundai H.I. Berge Ningbo 2006 Hyundai H.I. BW Birch 2007 Hyundai H.I. Reference Point 1 2020 Jiangnan Product Services BW Brage 2016 Hyundai H.I. BW Cedar 2007 Hyundai H.I. Clipper Wilma 1 2019 Hyundai H.I. Product Services BW Tucana 2016 Hyundai H.I. BW Tokyo 2009 Mitsubishi H.I. Exmar BW Var 2016 Hyundai H.I. Denver 3 2009 Hyundai H.I. Product Services BW Njord 2016 Hyundai H.I. Helsinki 3 2009 Hyundai H.I. Product Services BW Balder 2016 Hyundai H.I. BW Orion 2015 Hyundai H.I. BW Libra 2015 Hyundai H.I. BW Leo 2015 Hyundai H.I. BW Gemini 2015 Hyundai H.I. BW Carina 1 2015 Hyundai H.I. BW Aries 1 2014 Hyundai H.I. BW Kyoto 2010 Mitsubishi H.I. |
|
1. % of fleet ratio is basis: TC out is based on total available days and TC in is based on total calendar days VLGC Charter Portfolio Overview 20 Time charter-out coverage for 2024 at 32% at an average rate of $44,500 per day Revenue in USD millions % of total available days of the whole fleet Cost in USD millions % of total available days of the whole fleet Avg. TC out rate Avg. TC in rate Time charter-out Time charter rate (USD thousands / day) Time charter-in Net time charter position 2024 Time charter % of total Revenue/ Average Fleet (Cost) in $M day rate TC out 19% $102 $44,500 TC in 19% ($75) $32,600 Net - $27 Remaining TC out 13% $68 $44,500 $20 $21 $19 $15 $12 $12 $12 $12 25% 21% 19% 16% 13% 13% 13% 13% 1Q 24 2Q 24 3Q 24 4Q 24 1Q 25 2Q 25 3Q 25 4Q 25 Quarterly $75 $48 19% 13% 2024 2025 Yearly $44.6 $42.8 $45.3 $45.4 $45.1 $45.5 $45.6 $45.6 $27.3 $32.7 $32.7 $33.0 $32.9 $32.8 $32.8 $32.8 1Q 24 2Q 24 3Q 24 4Q 24 1Q 25 2Q 25 3Q 25 4Q 25 Quarterly $44.5 $45.5 $32.6 $32.8 2024 2025 Yearly $39 $45 $45 $41 $32 $33 $29 $27 29% 35% 33% 31% 26% 26% 23% 22% 1Q 24 2Q 24 3Q 24 4Q 24 1Q 25 2Q 25 3Q 25 4Q 25 Quarterly $170 $122 32% 24% 2024 2025 Yearly |
|
0.16 0.16 0.16 0.32 0.16 0.16 0.17 0.35 0.52 0.52 0.52 0.52 0.00 0.00 0.00 0.16 0.16 0.16 0.17 0.35 0.52 0.52 0.52 0.52 Jul-23 Aug-23 Sep-23 Oct-23 Nov-23 Dec-23 Jan-24 Feb-24 Mar-24 Apr-24 May-24 Jun-24 Fleet Safety Statistics 21 Safety and Zero Harm onboard remain our key focus. No incidents in Q2, KPI takes time to taper off Total Recordable Case Frequency (TRCF): Work-related fatalities and injuries per one million hours worked Lost Time Injury Frequency (LTIF): Work-related fatalities and injuries per one million hours worked that leads to lost work time TRCF 12 Month Rolling Average (MRA) LTIF 12 Month Rolling Average (MRA) Data as of 30th June 2024 |
|
Q1 2024 Q2 2024 Q3 2024E Q4 2024E 2024E 2025E Owned days 2,517 2,457 2,484 2,484 9,942 9,855 Time charter in days 621 637 579 455 2,292 1,460 Total calendar days 3,138 3,094 3,063 2,939 12,234 11,315 Offhire1 104 102 22 37 265 241 Total available days (Net of offhire) 3,034 2,992 3,041 2,902 11,969 11,074 Spot days (Net of offhire) 2,145 1,945 2,051 2,002 8,143 8,387 Time charter out days (Net of offhire) 889 1,047 990 900 3,826 2,687 % Spot days 71% 65% 67% 69% 68% 76% % TC days 29% 35% 33% 31% 32% 24% TCE rates Spot $68,500 $53,300 - - - - Time charter out $44,600 $42,800 $45,300 $45,400 $44,500 $45,500 VLGC TCE rate (Net of offhire) $61,500 $49,700 - - - - Shipping Segment Charter Portfolio 2024-2025 22 Time Charter Out contract coverage stands at 32% for 2024 (as of 8 August 2024) Notes: BW LPG India Charter Portfolio is a subset of the Shipping Segment Charter Portfolio Pool revenue distributed to participants and the associated days are excluded from the presentation 1. Offhire is assumed to be 3 days per year per vessel, distributed equally per quarter, during the years the vessel does not have planned dry dockings |
|
BW LPG India Charter Portfolio 2024-2025 23 Time Charter Out contract coverage stands at 80% for 2024 (as of 8 August 2024) 1. Offhire is assumed to be 3 days per year per vessel, distributed equally per quarter, during the years the vessel does not have planned dry dockings Q1 2024 Q2 2024 Q3 2024E Q4 2024E 2024E 2025E Owned days 728 728 736 736 2,928 2,920 Time charter in days - - - - - - Total calendar days 728 728 736 736 2,928 2,920 Offhire1 56 - 6 6 68 92 Total available days (Net of offhire) 672 728 730 730 2,860 2,828 Spot days (Net of offhire) 134 177 106 164 581 1,364 Time charter out days (Net of offhire) 538 551 624 566 2,279 1,464 % Spot days 20% 24% 15% 22% 20% 48% % TC days 80% 76% 85% 78% 80% 52% TCE rates Spot $60,000 $39,500 - - - - Time charter out $40,600 $42,600 $44,900 $45,900 $43,500 $48,400 VLGC TCE rate (Net of offhire) $43,900 $42,000 - - - - |
Exhibit 99.4
BW LPG Limited – Key information relating to the cash dividend for Q2 2024
(Singapore, 22 August 2024)
BW LPG Limited (“BW LPG" or the "Company", OSE ticker code: "BWLPG.OL", NYSE ticker code "BWLP") provides the following key information relating to the Company's cash dividend for Q2 2024:
The Board has approved a dividend of US$0.58 on 21 August 2024. Dividends payable to shares registered with Euronext VPS will be distributed in NOK, with the exchange rate made available on the day of payment.
Record date: 10 September 2024
Shares registered with Euronext VPS Oslo Stock Exchange
Last trading day including the right to receive this dividend: 6 September 2024
Ex-date: 9 September 2024
Dividend payment date: On or about 30 September 2024
Shares registered with Depository Trust Company
Last trading day including the right to receive this dividend: 9 September 2024
Ex-date: 10 September 2024
Dividend payment date: On or about 25 September 2024
For further information, please contact:
Samantha Xu
Chief Financial Officer
E-mail: investor.relations@bwlpg.com
About BW LPG
BW LPG is the world’s leading owner and operator of LPG vessels, owning and operating Very Large Gas Carriers (VLGC) with a total carrying capacity of over 3 million CBM. With five decades of operating experience in LPG shipping, an in-house LPG trading division and a growing presence in LPG terminal infrastructure and distribution, BW LPG offers an integrated, flexible, and reliable service to customers along the LPG value chain. More information about BW LPG can be found at https://www.bwlpg.com.
BW LPG is associated with BW Group, a leading global maritime company involved in shipping, floating infrastructure, deepwater oil & gas production, and new sustainable technologies. Founded in 1955 by Sir YK Pao, BW controls a fleet of over 450 vessels transporting oil, gas and dry commodities, with its 200 LNG and LPG ships constituting the largest gas fleet in the world. In the renewables space, the group has investments in solar, wind, batteries, biofuels and water treatment.
This information is subject to disclosure requirements pursuant to Section 5-12 of the Norwegian Securities Trading Act.