SECURITIES AND EXCHANGE COMMISSION
Washington, D.C. 20549
FORM 6-K
REPORT OF FOREIGN PRIVATE ISSUER
Pursuant to Rule 13a-16 or 15d-16 of the
Securities Exchange Act of 1934
For the month of July 2024
Commission file number: 001-32749
FRESENIUS MEDICAL CARE AG
(Translation of registrant's name into English)
Else-Kröner Strasse 1
61346 Bad Homburg
Germany
(Address of principal executive offices)
Indicate by check mark whether the registrant files or will file annual reports under cover of Form 20-F or Form 40-F.
| Form 20-F x | Form 40-F ¨ |
On July 30, 2024, Fresenius Medical Care AG (the “Company”) issued a Press Release announcing its second quarter results for the period ending June 30, 2024. A copy of the Press Release is furnished as Exhibit 99.1 and the corresponding financial figures as Exhibit 99.2.
The attached Press Release contains non-GAAP financial measures. For purposes of Regulation G, a non-GAAP financial measure is a numerical measure of a company’s performance, financial position, or cash flows that either excludes or includes amounts that are not normally excluded or included in the most directly comparable measure calculated and presented in accordance with generally accepted accounting principles. To supplement our second quarter 2024 consolidated financial results presented in accordance with International Financial Reporting Standards, or IFRS, we have used non-GAAP financial measures, including (a) EBITDA, or operating income excluding interest, taxes, depreciation and amortization, (b) free cash flow, (c) net leverage ratio (ratio of net debt to adjusted EBITDA) and (d) results presented in constant currency and as adjusted for special items identified in the Press Release and associated tables. These non-GAAP measures are provided to enhance the user’s overall understanding of our current financial performance and our prospects for the future. In addition, because we have historically reported certain non-GAAP financial measures in our financial results, we believe the inclusion of these non-IFRS financial measures provides consistency and comparability in our financial reporting to prior periods for which these non-GAAP financial measures were previously reported. These non-GAAP financial measures should not be used as a substitute for or be considered superior to GAAP financial measures. Reconciliation of the non-GAAP financial measures to the most comparable IFRS financial measures are included in the attached Financial Statements. As the reconciliation of amounts stated in Constant Currency is inherent in the disclosure included in the Press Release, we believe that a separate reconciliation would not provide any additional benefit.
The Exhibits attached hereto, shall not be deemed “filed” for purposes of Section 18 of the Securities and Exchange Act of 1934 (the “Exchange Act”) or otherwise subject to the liabilities of that section, nor shall they be deemed incorporated by reference in any filing under the Securities Act of 1933 or the Exchange Act, regardless of any general incorporation language in such filing.
EXHIBITS
The following exhibits are being furnished with this Report:
| Exhibit 99.1 | Press release issued on July 30, 2024. |
| Exhibit 99.2 | Complete overview of the second quarter 2024 and first six months 2024. |
SIGNATURES
Pursuant to the requirements of the Securities Exchange Act of 1934, the Registrant has duly caused this report to be signed on its behalf by the undersigned thereunto duly authorized.
DATE: July 30, 2024
| Fresenius Medical Care AG |
| By: | /s/ Helen Giza | |
| Name: | Helen Giza | |
| Title: | Chief Executive Officer and Chair of the Management Board |
| By: | /s/ Martin Fischer | |
| Name: | Martin Fischer | |
| Title: | Chief Financial Officer and member of the Management Board |
Exhibit 99.1

| Press Release |
Media contact Christine Peters T +49 160 60 66 770 christine.peters@freseniusmedicalcare.com
Contact for analysts and investors Dr. Dominik Heger T +49 6172 609-2601 dominik.heger@freseniusmedicalcare.com
www.freseniusmedicalcare.com |
Fresenius Medical Care delivers continued operating income improvements in the second quarter of 2024
| • | Organic revenue growth of +2.3% supported by both segments Care Delivery and Care Enablement |
| • | Operating income1 and operating income margin1 increase driven by Care Enablement |
| • | Additional FME25 savings of EUR 57 million achieved and on track to reach the upper end of the full year savings target range |
| • | Further divestitures closed as execution of portfolio optimization program continues |
| • | Net financial debt and net leverage ratio further improved |
| • | FY 2024 outlook confirmed |
Bad Homburg (July 30, 2024) – “In the second quarter, we further improved our financial performance while executing against our strategic plan and the company transformation. This quarter is another important proof point for the operational turnaround as we remain focused to deliver on our targets”, said Helen Giza, Chief Executive Officer of Fresenius Medical Care AG. “Our operating income margin progressed toward our 2025 margin target band, as Care Enablement increased its profitability. In Care Delivery, U.S. same market treatment growth improved sequentially despite continued elevated mortality. In both segments, we accelerated FME25 savings against plan and are now on track to reach the upper end of our FME25 savings target range for 2024.” Giza added: “In light of the developments in the first half year, we confirm our financial outlook for the full year 2024.”
| 1 | Revenue and operating income outlook, as referred to in the 2024 outlook, are both at constant currency, excluding special items as well as the business impact from closed divestitures in 2023 and the settlement agreement with the U.S. government (Tricare) in Q4 2023. For FY 2023 and 2024, special items include costs related to the FME25 program, the Humacyte remeasurements, the legal form conversion costs and effects from legacy portfolio optimization. For further details please see the reconciliation attached to the Press Release. |
Page
Key figures (unaudited)
| Q2 2024 | Q2 2023 | Growth | Growth | H1 2024 | H1 2023 | Growth | Growth | |||||||||||||||||||||||||
| EUR m | EUR m | yoy | yoy, cc | EUR m | EUR m | yoy | yoy, cc | |||||||||||||||||||||||||
| Revenue | 4,766 | 4,825 | -1 | % | -2 | % | 9,491 | 9,529 | 0 | % | 0 | % | ||||||||||||||||||||
| on outlook base1 | 4,743 | 4,741 | 0 | % | 9,565 | 9,360 | +2 | % | ||||||||||||||||||||||||
| Operating income | 425 | 357 | +19 | % | +21 | % | 671 | 618 | +9 | % | +10 | % | ||||||||||||||||||||
| on outlook base1 | 433 | 400 | +8 | % | 849 | 738 | +15 | % | ||||||||||||||||||||||||
| Net income2 | 187 | 140 | +33 | % | +34 | % | 258 | 227 | +14 | % | +15 | % | ||||||||||||||||||||
| on outlook base1 | 207 | 176 | +18 | % | 405 | 322 | +26 | % | ||||||||||||||||||||||||
| Basic EPS (EUR) | 0.64 | 0.48 | +33 | % | +34 | % | 0.88 | 0.77 | +14 | % | +15 | % | ||||||||||||||||||||
| on outlook base1 | 0.70 | 0.60 | +18 | % | 1.38 | 1.10 | +26 | % | ||||||||||||||||||||||||
yoy = year-on-year, cc = at constant currency, EPS = earnings per share
Focused execution against the strategic plan
In the second quarter, the FME25 transformation program continued its momentum, delivering EUR 57 million additional sustainable savings while related one-time costs amounted to EUR 40 million. With the progress in the second quarter, Fresenius Medical Care is on track to reach the upper end of the targeted additional sustainable savings range of EUR 100 to 150 million by year end 2024, totaling to EUR 650 million by year end 2025.
Moreover, Fresenius Medical Care is executing its portfolio optimization plan to exit non-core and dilutive assets. During the second quarter, the company closed the divestment of Cura Day Hospitals Group, Australia, and of its dialysis clinic networks in Chile, Ecuador, Sub-Saharan Africa and Turkiye. The divestitures of clinic operations in Curacao, Guatemala and Peru were closed in July. Special items associated with portfolio optimization amounted to negative EUR 15 million in the second quarter.
All transactions that are currently signed as part of Fresenius Medical Care’s portfolio optimization plan are estimated to negatively impact operating income by around EUR 250 million in the full year 2024 and will be treated as special items. These transactions are expected to generate cash proceeds of around EUR 650 million upon closing, thereof approx. EUR 500 million have been received by the end of the second quarter.
| 2 | Net income attributable to shareholders of Fresenius Medical Care AG |
Page
Revenue development impacted by execution against portfolio optimization plan
Revenue decreased by 1% to EUR 4,766 million in the second quarter (-2% at constant currency, +2% organic). Revenue on outlook base1 grew by 0.1% compared to prior year. Divestitures realized during 2023 and during the second quarter 2024 negatively impacted the revenue development.
Care Delivery revenue decreased by 3% to EUR 3,771 million (-3% at constant currency, +2% organic) and by 1% on outlook base1.
In Care Delivery U.S., revenue increased by 1% (0% at constant currency, +1% organic) and by 1% on outlook base1. A growing value-based care business, reimbursement rate increases and a favorable payor mix had a positive impact. Effects from elevated mortality continued to weigh on U.S. same market treatment growth in a year-over-year comparison, while sequential trends remain encouraging. Adjusted for the exit from less profitable acute care contracts (-0.2%), U.S. same market treatment growth came in flat (-0.1%).
In Care Delivery International, revenue decreased by 18% (-18% at constant currency, +3% organic) and by 12% on outlook base1. This negative development was strongly driven by divestments closed during the second quarter and partially offset by organic growth. International same market treatment growth was positive at 1.9%.
Care Enablement revenue grew by 3% to EUR 1,363 million (+3% at constant currency, +3% organic) and by 3% on outlook base1 as positive pricing momentum continues.
Within Inter-segment eliminations, revenue for products transferred between the operating segments at fair market value decreased by 1% to a deduction of EUR 368 million (-2% at constant currency).3
In the first half, revenue remained virtually unchanged at EUR 9,491 million (0% at constant currency, +3% organic) and on outlook base1 increased by 2%. Care Delivery revenue decreased by 1% to EUR 7,559 million (0% at constant currency, +4% organic), with Care Delivery U.S. growing by 2% (+2% at constant currency, +4% organic) and Care Delivery International decreasing by 14% (-11% at constant currency, +3% organic). Care Enablement revenue increased by 1% to EUR 2,660 million (+2% at constant currency, + 2% organic). Inter-segment eliminations decreased by 1% to a deduction of EUR 728 million (0% at constant currency).
| 3 | The company transfers products between segments at fair market value. The associated internal revenues and expenses and all other consolidation of transactions are included within “Inter-segment eliminations”. |
Page
Operating margin improvement driven by Care Enablement
Operating income increased by 19% to EUR 425 million in the second quarter (+21% at constant currency), resulting in a margin of 8.9% (Q2 2023: 7.4%). Operating income on outlook base1 increased by 8% to EUR 433 million, resulting in a margin of 9.1% (Q2 2023: 8.4%). Divestitures realized during the second quarter had a neutral effect on operating income.
Operating income in Care Delivery decreased by 14% to EUR 332 million (-13% at constant currency), resulting in a margin of 8.8% (Q2 2023: 9.9%). Operating income on outlook base1 decreased by 7%, resulting in a margin1 of 9.9% (Q2 2023: 10.6%). In-line with expectations, the development was mainly driven by higher personnel expenses and inflationary cost increases. Business growth and savings from the FME25 program contributed positively to the earnings development.
Operating income
in Care Enablement strongly increased to EUR 68 million (Q2 2023:
EUR 2 million), resulting in a margin of 5.0% (Q2 2023: 0.1%). Operating income on outlook base1 quadrupled compared
to prior year, resulting in a margin1 of 5.1% (Q2 2023: 1.3%). The strong increase was driven by business growth and savings
from the FME25 program, compensating inflationary cost increases and a negative impact from foreign currency transaction.
Operating income for Corporate amounted to EUR 30 million (Q2 2023: EUR -25 million). Operating income on outlook base1 amounted to EUR 0 million (Q2 2023: EUR -13 million).
In the first half, operating income increased by 9% up to EUR 671 million (10% at constant currency), resulting in a margin of 7.1% (H1 2023: 6.5%). Divestitures realized during the first half had a slightly positive impact on operating income. Operating income on outlook base1 increased by 15% up to EUR 849 million, resulting in a margin of 8.9% (H1 2023: 7.9%). In Care Delivery, operating income declined by 22% to EUR 521 million (-22% at constant currency), resulting in a margin of 6.9% (H1 2023: 8.8%). Operating income margin on outlook base1 improved to 9.6% (H1 2023: 9.2%). In Care Enablement, operating income strongly increased to EUR 138 million (H1 2023: EUR -23 million), resulting in a margin of 5.2% (H1 2023: -0.9%). Operating income margin on outlook base1 improved strongly to 5.5% (H1 2023: 3.1%). Operating income for Corporate amounted to EUR 17 million (H1 2023: -15 million).
Net income2 increased by 33% to EUR 187 million in the second quarter (+34% at constant currency). Net income on outlook base1 increased by 18%.
In the first half, net income2 increased by 14% to EUR 258 million (+15% at constant currency). Net income on outlook base1 increased by 26%.
Basic earnings per share (EPS) increased by 33% to EUR 0.64 (+34% at constant currency). EPS on outlook base1 increased by 18% to EUR 0.70.
In the first half, EPS increased by 14% to EUR 0.88 (+15% at constant currency). EPS on outlook base1 increased by 26% to EUR 1.38 .
Page
Lower net financial debt and further improved net leverage ratio
In the second quarter, Fresenius Medical Care generated EUR 442 million of operating cash flow (Q2 2023: EUR 1,007 million), resulting in a margin of 9.3% (Q2 2023: 20.9%). The operating cash flow development was negatively impacted by EUR 407 million, primarily as a result of changing vendors post the cyber incident at Change Healthcare. This negative cash impact is expected to be recovered in Q3 2024. Additionally, the phasing of federal income tax payments in the U.S. negatively impacted the development.
In the first half, operating cashflow amounted to EUR 570 million (H1 2023: EUR 1,150 million), resulting in a margin of 6.0% (H1 2023: 12.1%).
Free cash flow4 amounted to EUR 289 million in the second quarter (Q2 2023: EUR 852 million), resulting in a margin of 6.1% (H1 2023: 17.7%). In the first half, Fresenius Medical Care generated free cash flow of EUR 287 million (H1 2023: EUR 854 million), resulting in a margin of 3.0% (H1 2023: 9.0%).
Total net debt and lease liabilities were further reduced to EUR 10,658 million (Q2 2023: EUR 11,714 million). At 3.1x, the corresponding net leverage ratio (net debt/EBITDA) further decreased towards the lower end of our self-imposed target corridor.
Outlook
Fresenius Medical Care confirms its outlook for fiscal 2024 and expects revenue to grow by a low- to mid-single digit percent rate compared to prior year. The company expects operating income to grow by a mid- to high-teens percent rate compared to prior year.
The expected growth rates for 2024 are at constant currency, excluding special items as well as the business impacts from closed divestitures in 2023 and the settlement agreement with the U.S. government (Tricare) in Q4 2023. The 2023 basis for the revenue outlook is EUR 19,049 million and for the operating income outlook is EUR 1,540 million.
The company also reconfirms its targets to achieve an operating income margin of 10% to 14% by 2025. This excludes impacts from portfolio changes.
Patients, clinics and employees
As of June 30, 2024, Fresenius Medical Care treated 311,037 patients in 3,757 dialysis clinics worldwide and had 113,639 employees (headcount) globally, compared to 117,128 employees as of March 31, 2024.
| 4 | Net cash provided by / used in operating activities, after capital expenditures, before acquisitions/divestitures, investments, and dividends |
Page
Media conference call
Fresenius Medical Care will host a media conference call to discuss the results of the second quarter and first half of 2024 earnings today, July 30, 2024, at 09:30 a.m. CEST / 3:30 a.m. EDT. The media conference call is for journalists who can register vial the following link: Registration. Details on the media conference call are also available on the Fresenius Medical Care website in the “Media” section: media call. Attendees who would like to follow the presentation parallel to the conference call, you can register here for the webcast. The webcast will only be broadcasted in “listen only” mode.
Investor conference call
Fresenius Medical Care will host a conference call to discuss the results of the second quarter and first half of 2024 today, July 30, 2024, at 2:00 p.m. CEST / 8:00 a.m. EDT. Details are available on the Fresenius Medical Care website in the “Investors” section. A replay will be available shortly after the call.
Please refer to our statement of earnings included at the end of this news and to the attachments as separate PDF files for a complete overview of the results of the second quarter and first half of 2024. Our 6-K disclosure provides more details.
About Fresenius Medical Care:
Fresenius Medical Care is the world's leading provider of products and services for individuals with renal diseases of which around 4.1 million patients worldwide regularly undergo dialysis treatment. Through its network of 3,757 dialysis clinics, Fresenius Medical Care provides dialysis treatments for approx. 311,000 patients around the globe. Fresenius Medical Care is also the leading provider of dialysis products such as dialysis machines or dialyzers. Fresenius Medical Care is listed on the Frankfurt Stock Exchange (FME) and on the New York Stock Exchange (FMS).
For more information visit the company’s website at www.freseniusmedicalcare.com.
Disclaimer:
This release contains forward-looking statements that are subject to various risks and uncertainties. Actual results could differ materially from those described in these forward-looking statements due to various factors, including, but not limited to, changes in business, economic and competitive conditions, legal changes, regulatory approvals, impacts related to the COVID-19 pandemic results of clinical studies, foreign exchange rate fluctuations, uncertainties in litigation or investigative proceedings, and the availability of financing. These and other risks and uncertainties are detailed in Fresenius Medical Care’s reports filed with the U.S. Securities and Exchange Commission. Fresenius Medical Care does not undertake any responsibility to update the forward-looking statements in this release.
Page
Page
Page
Page
Exhibit 99.2

Fresenius Medical Care AG
COMPLETE OVERVIEW OF THE SECOND QUARTER AND FIRST HALF YEAR 2024
July 30, 2024
Investor Relations
phone: +49 6172 609 2525
email: ir@freseniusmedicalcare.com
Content:
| Statement of earnings | page 2 | |
| Segment information | page 3 | |
| Balance sheet | page 4 | |
| Cash flow | page 5 | |
| Revenue development by segment | page 6 | |
| Key metrics | page 7 | |
| Reconciliation results (outlook base) | page 8 | |
| Outlook 2024 | page 9 |
Disclaimer
This release contains forward-looking statements that are subject to various risks and uncertainties. Actual results could differ materially from those described in these forward-looking statements due to various factors, including, but not limited to, changes in business, economic and competitive conditions, legal changes, regulatory approvals, impacts related to COVID-19, results of clinical studies, foreign exchange rate fluctuations, uncertainties in litigation or investigative proceedings, and the availability of financing. These and other risks and uncertainties are detailed in Fresenius Medical Care AG’s reports filed with the U.S. Securities and Exchange Commission. Fresenius Medical Care AG does not undertake any responsibility to update the forward-looking statements in this release.
Rounding adjustments applied to individual numbers and percentages may result in these figures differing immaterially from their absolute values. Furthermore, totals and subtotals in tables may differ slightly from unrounded figures due to rounding in accordance with commercial rounding conventions.
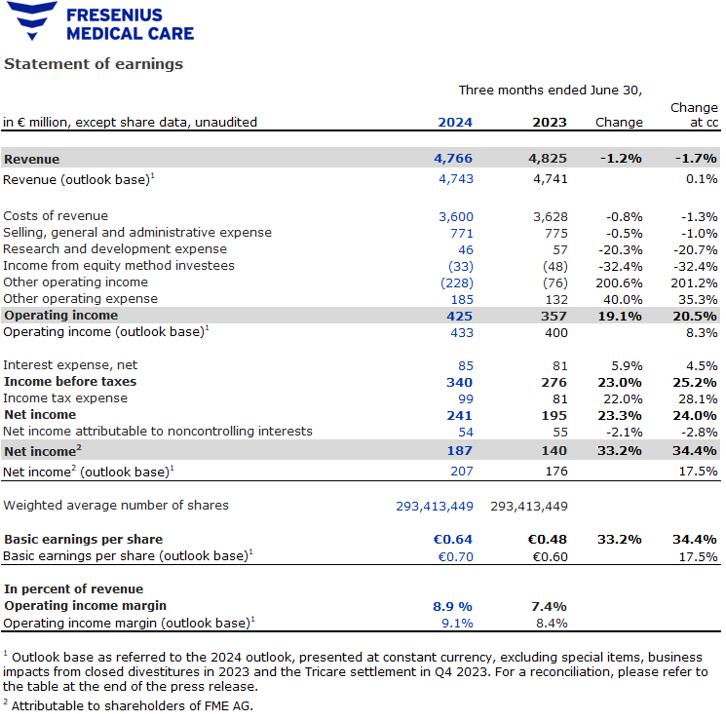
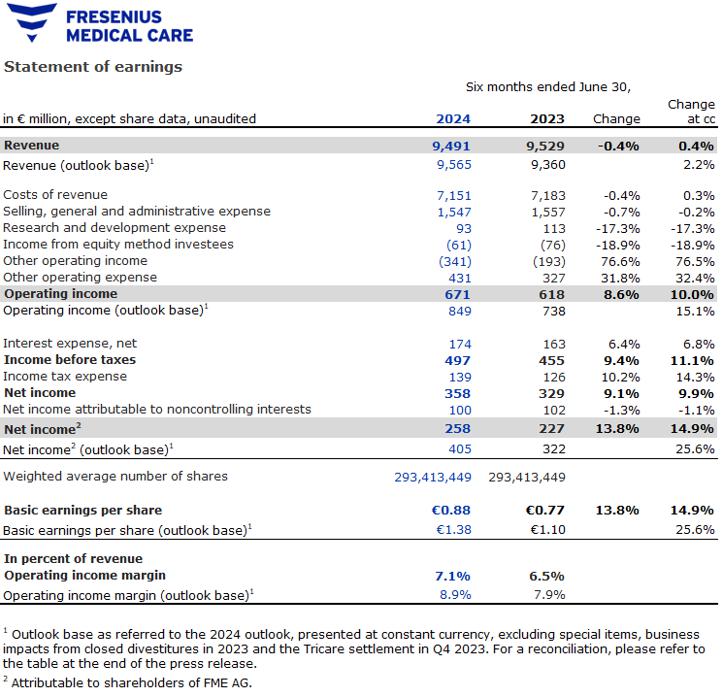
Statement of earnings
| Three months ended June 30, | Six months ended June 30, | |||||||||||||||||||||||||||||||
| in € million, except share data, unaudited | 2024 | 2023 | Change | Change at cc | 2024 | 2023 | Change | Change at cc | ||||||||||||||||||||||||
| Total revenue | 4,766 | 4,825 | -1.2 | % | -1.7 | % | 9,491 | 9,529 | -0.4 | % | 0.4 | % | ||||||||||||||||||||
| Total revenue (outlook base) 1 | 4,743 | 4,741 | 0.1 | % | 9,565 | 9,360 | 2.2 | % | ||||||||||||||||||||||||
| Costs of revenue | 3,600 | 3,628 | -0.8 | % | -1.3 | % | 7,151 | 7,183 | -0.4 | % | 0.3 | % | ||||||||||||||||||||
| Selling, general and administrative expense | 771 | 775 | -0.5 | % | -1.0 | % | 1,547 | 1,557 | -0.7 | % | -0.2 | % | ||||||||||||||||||||
| Research and development expense | 46 | 57 | -20.3 | % | -20.7 | % | 93 | 113 | -17.3 | % | -17.3 | % | ||||||||||||||||||||
| Income from equity method investees | (33 | ) | (48 | ) | -32.4 | % | -32.4 | % | (61 | ) | (76 | ) | -18.9 | % | -18.9 | % | ||||||||||||||||
| Other operating income | (228 | ) | (76 | ) | 200.6 | % | 201.2 | % | (341 | ) | (193 | ) | 76.6 | % | 76.5 | % | ||||||||||||||||
| Other operating expense | 185 | 132 | 40.0 | % | 35.3 | % | 431 | 327 | 31.8 | % | 32.4 | % | ||||||||||||||||||||
| Operating income | 425 | 357 | 19.1 | % | 20.5 | % | 671 | 618 | 8.6 | % | 10.0 | % | ||||||||||||||||||||
| Operating income (outlook base) 1 | 433 | 400 | 8.3 | % | 849 | 738 | 15.1 | % | ||||||||||||||||||||||||
| Interest income | (18 | ) | (24 | ) | -26.5 | % | -26.0 | % | (33 | ) | (36 | ) | -7.7 | % | -5.0 | % | ||||||||||||||||
| Interest expense | 103 | 105 | -1.5 | % | -2.6 | % | 207 | 199 | 3.8 | % | 4.7 | % | ||||||||||||||||||||
| Interest expense, net | 85 | 81 | 5.9 | % | 4.5 | % | 174 | 163 | 6.4 | % | 6.8 | % | ||||||||||||||||||||
| Income before income taxes | 340 | 276 | 23.0 | % | 25.2 | % | 497 | 455 | 9.4 | % | 11.1 | % | ||||||||||||||||||||
| Income tax expense | 99 | 81 | 22.0 | % | 28.1 | % | 139 | 126 | 10.2 | % | 14.3 | % | ||||||||||||||||||||
| Net income | 241 | 195 | 23.3 | % | 24.0 | % | 358 | 329 | 9.1 | % | 9.9 | % | ||||||||||||||||||||
| Net income attributable to noncontrolling interests | 54 | 55 | -2.1 | % | -2.8 | % | 100 | 102 | -1.3 | % | -1.1 | % | ||||||||||||||||||||
| Net income attributable to shareholders of FME AG | 187 | 140 | 33.2 | % | 34.4 | % | 258 | 227 | 13.8 | % | 14.9 | % | ||||||||||||||||||||
| Net income attributable to shareholders of FME AG (outlook base) 1 | 207 | 176 | 17.5 | % | 405 | 322 | 25.6 | % | ||||||||||||||||||||||||
| Weighted average number of shares | 293,413,449 | 293,413,449 | 293,413,449 | 293,413,449 | ||||||||||||||||||||||||||||
| Basic earnings per share | € | 0.64 | € | 0.48 | 33.2 | % | 34.4 | % | € | 0.88 | € | 0.77 | 13.8 | % | 14.9 | % | ||||||||||||||||
| Basic earnings per ADS | € | 0.32 | € | 0.24 | 33.2 | % | 34.4 | % | € | 0.44 | € | 0.39 | 13.8 | % | 14.9 | % | ||||||||||||||||
| Operating income | 425 | 357 | 19.1 | % | 20.5 | % | 671 | 618 | 8.6 | % | 10.0 | % | ||||||||||||||||||||
| Depreciation, amortization and impairment loss | 387 | 434 | -10.9 | % | -12.9 | % | 899 | 872 | 3.1 | % | 4.0 | % | ||||||||||||||||||||
| EBITDA | 812 | 791 | 2.7 | % | 2.2 | % | 1,570 | 1,490 | 5.4 | % | 6.5 | % | ||||||||||||||||||||
| In percent of revenue | ||||||||||||||||||||||||||||||||
| Operating income margin | 8.9 | % | 7.4 | % | 7.1 | % | 6.5 | % | ||||||||||||||||||||||||
| Operating income margin (outlook base) 1 | 9.1 | % | 8.4 | % | 8.9 | % | 7.9 | % | ||||||||||||||||||||||||
| EBITDA margin | 17.0 | % | 16.4 | % | 16.5 | % | 15.6 | % | ||||||||||||||||||||||||
1 Outlook base as referred to the 2024 outlook, presented at constant currency, excluding special items, business impacts from closed divestitures in 2023 and the Tricare settlement in Q4 2023. For a reconciliation, please refer to the table on page 8.
| Statement of earnings | page |
July 30, 2024 |
Segment information
| Three months ended June 30, | Six months ended June 30, | |||||||||||||||||||||||||||||||
| unaudited | 2024 | 2023 | Change | Change at cc | 2024 | 2023 | Change | Change at cc | ||||||||||||||||||||||||
| Total | ||||||||||||||||||||||||||||||||
| Revenue in € million | 4,766 | 4,825 | -1.2 | % | -1.7 | % | 9,491 | 9,529 | -0.4 | % | 0.4 | % | ||||||||||||||||||||
| Revenue in € million (outlook base) 1 | 4,743 | 4,741 | 0.1 | % | 9,565 | 9,360 | 2.2 | % | ||||||||||||||||||||||||
| Operating income in € million | 425 | 357 | 19.1 | % | 20.5 | % | 671 | 618 | 8.6 | % | 10.0 | % | ||||||||||||||||||||
| Operating income in € million (outlook base) 1 | 433 | 400 | 8.3 | % | 849 | 738 | 15.1 | % | ||||||||||||||||||||||||
| Operating income margin | 8.9 | % | 7.4 | % | 7.1 | % | 6.5 | % | ||||||||||||||||||||||||
| Operating income margin (outlook base) 1 | 9.1 | % | 8.4 | % | 8.9 | % | 7.9 | % | ||||||||||||||||||||||||
| Days sales outstanding (DSO) 2 | 76 | 68 | ||||||||||||||||||||||||||||||
| Employees (headcount) | 113,639 | 124,295 | ||||||||||||||||||||||||||||||
| Care Delivery segment | ||||||||||||||||||||||||||||||||
| Revenue in € million | 3,771 | 3,873 | -2.6 | % | -3.3 | % | 7,559 | 7,628 | -0.9 | % | -0.3 | % | ||||||||||||||||||||
| Revenue in € million (outlook base) 1 | 3,743 | 3,786 | -1.1 | % | 7,602 | 7,455 | 2.0 | % | ||||||||||||||||||||||||
| Operating income in € million | 332 | 384 | -13.5 | % | -12.6 | % | 521 | 669 | -22.1 | % | -21.5 | % | ||||||||||||||||||||
| Operating income in € million (outlook base) 1 | 372 | 400 | -7.0 | % | 729 | 687 | 6.2 | % | ||||||||||||||||||||||||
| Operating income margin | 8.8 | % | 9.9 | % | 6.9 | % | 8.8 | % | ||||||||||||||||||||||||
| Operating income margin (outlook base) 1 | 9.9 | % | 10.6 | % | 9.6 | % | 9.2 | % | ||||||||||||||||||||||||
| Days sales outstanding (DSO) 2 | 72 | 61 | ||||||||||||||||||||||||||||||
| Care Enablement segment | ||||||||||||||||||||||||||||||||
| Revenue in € million | 1,363 | 1,325 | 2.9 | % | 3.1 | % | 2,660 | 2,635 | 1.0 | % | 2.3 | % | ||||||||||||||||||||
| Revenue in € million (outlook base) 1 | 1,365 | 1,322 | 3.3 | % | 2,695 | 2,625 | 2.7 | % | ||||||||||||||||||||||||
| Operating income in € million | 68 | 2 | 4309.3 | % | 4277.6 | % | 138 | (23 | ) | n.a. | n.a. | |||||||||||||||||||||
| Operating income in € million (outlook base) 1 | 69 | 17 | 308.2 | % | 149 | 82 | 81.4 | % | ||||||||||||||||||||||||
| Operating income margin | 5.0 | % | 0.1 | % | 5.2 | % | -0.9 | % | ||||||||||||||||||||||||
| Operating income margin (outlook base) 1 | 5.1 | % | 1.3 | % | 5.5 | % | 3.1 | % | ||||||||||||||||||||||||
| Days sales outstanding (DSO) 2 | 94 | 97 | ||||||||||||||||||||||||||||||
| Inter-segment eliminations 3 | ||||||||||||||||||||||||||||||||
| Revenue in € million | (368 | ) | (373 | ) | -1.0 | % | -2.0 | % | (728 | ) | (734 | ) | -0.7 | % | -0.3 | % | ||||||||||||||||
| Revenue in € million (outlook base) 1 | (365 | ) | (367 | ) | -0.6 | % | (732 | ) | (720 | ) | 1.6 | % | ||||||||||||||||||||
| Operating income in € million | (5 | ) | (4 | ) | 36.9 | % | 32.6 | % | (5 | ) | (13 | ) | -65.9 | % | -76.7 | % | ||||||||||||||||
| Operating income in € million (outlook base) 1 | (8 | ) | (4 | ) | 111.2 | % | (10 | ) | (13 | ) | -18.9 | % | ||||||||||||||||||||
| Corporate | ||||||||||||||||||||||||||||||||
| Operating income in € million | 30 | (25 | ) | n.a. | n.a. | 17 | (15 | ) | n.a. | n.a. | ||||||||||||||||||||||
| Operating income in € million (outlook base) 1 | 0 | (13 | ) | n.a. | (19 | ) | (18 | ) | 4.1 | % | ||||||||||||||||||||||
1 Outlook base as referred to the 2024 outlook, presented at constant currency, excluding special items, business impacts from closed divestitures in 2023 and the Tricare settlement in Q4 2023. For a reconciliation, please refer to the table on page 8.
2 Includes receivables related to assets held for sale.
3 The Company transfers products between segments at fair market value. The associated internal revenues and expenses and all other consolidation of transactions are included within “Inter-segment eliminations”.
cc = constant currency. Changes in revenue, operating income and net income attributable to shareholders of FME AG include the impact of changes in foreign currency exchange rates. We calculate and present these financial measures using both IFRS Accounting Standards and at constant exchange rates to show changes in these metrics and other items without giving effect to period-to-period currency fluctuations. Under IFRS Accounting Standards, amounts received in local (non-euro) currency are translated into euro at the average exchange rate for the period presented. Once we translate the local currency for the constant currency, we then calculate the change, as a percentage, of the current period using the prior period exchange rates versus the prior period. The single quarter results are calculated as the variance between the current year-to-date results less the preceding quarter’s year-to-date which makes the single quarter subject to further foreign exchange fluctuation. This resulting percentage is a non-IFRS measure referring to a change as a percentage at constant currency. These currency-adjusted financial measures are identifiable by the designated term "Constant Currency".
| Segment information | page |
July 30, 2024 |
Balance sheet
| June 30, | December 31, | |||||||
| in € million, except for net leverage ratio, unaudited | 2024 | 2023 | ||||||
| Assets | ||||||||
| Cash and cash equivalents | 1,090 | 1,403 | ||||||
| Trade accounts and other receivables from unrelated parties | 4,025 | 3,471 | ||||||
| Inventories | 2,227 | 2,179 | ||||||
| Other current assets | 1,348 | 1,648 | ||||||
| Goodwill and intangible assets | 16,162 | 16,012 | ||||||
| Right-of-use assets | 3,612 | 3,671 | ||||||
| Other non-current assets | 5,432 | 5,546 | ||||||
| Total assets | 33,896 | 33,930 | ||||||
| Liabilities and equity | ||||||||
| Accounts payable to unrelated parties | 784 | 762 | ||||||
| Other current liabilities | 5,152 | 5,350 | ||||||
| Non-current liabilities | 12,773 | 12,991 | ||||||
| Total equity | 15,187 | 14,827 | ||||||
| Total liabilities and equity | 33,896 | 33,930 | ||||||
| Equity/assets ratio | 45 | % | 44 | % | ||||
| Debt and lease liabilities | ||||||||
| Short-term debt from unrelated parties | 322 | 457 | ||||||
| Current portion of long-term debt | 481 | 487 | ||||||
| Current portion of lease liabilities from unrelated parties | 592 | 593 | ||||||
| Current portion of lease liabilities from related parties | 25 | 24 | ||||||
| Long-term debt, less current portion | 6,854 | 6,960 | ||||||
| Lease liabilities from unrelated parties, less current portion | 3,378 | 3,419 | ||||||
| Lease liabilities from related parties, less current portion | 101 | 110 | ||||||
| Debt and lease liabilities included within liabilities directly associated with assets held for sale | 17 | 137 | ||||||
| Total debt and lease liabilities | 11,770 | 12,187 | ||||||
| Minus: Cash and cash equivalents1 | (1,112 | ) | (1,427 | ) | ||||
| Total net debt and lease liabilities | 10,658 | 10,760 | ||||||
| Reconciliation of annualized adjusted EBITDA and net leverage ratio to the most directly comparable IFRS Accounting Standards financial measures | ||||||||
| Net income | 762 | 732 | ||||||
| Income tax expense | 314 | 301 | ||||||
| Interest income | (85 | ) | (88 | ) | ||||
| Interest expense | 432 | 424 | ||||||
| Depreciation and amortization | 1,566 | 1,613 | ||||||
| Adjustments2 | 423 | 409 | ||||||
| Annualized adjusted EBITDA | 3,412 | 3,391 | ||||||
| Net leverage ratio | 3.1 | 3.2 | ||||||
1 Includes cash and cash equivalents included within assets held for sale.
2 Acquisitions and divestitures made for the last twelve months with a purchase price above a €50 M threshold as defined in the Syndicated Credit Facility (2024: -€49 M; 2023: -€35 M), non-cash charges, primarily related to pension expense (2024: €57 M; 2023: €56 M), impairment loss (2024: €213 M; 2023: €139 M) and special items, including costs related to the FME25 Program (2024: €128 M; 2023: €106 M), Legal Form Conversion Costs (2024: €27 M; 2023: €30 M), Legacy Portfolio Optimization (2024: €108 M; 2023: €128 M) and Humacyte Remeasurements (2024: -€61 M; 2023: -€15 M).
| Balance sheet | page |
July 30, 2024 |
Cash flow statement
| Three months ended June 30, | Six months ended June 30, | |||||||||||||||
| in € million, unaudited | 2024 | 2023 | 2024 | 2023 | ||||||||||||
| Operating activities | ||||||||||||||||
| Net income | 241 | 195 | 358 | 329 | ||||||||||||
| Depreciation, amortization and impairment loss | 387 | 434 | 899 | 872 | ||||||||||||
| Change in trade accounts and other receivables from unrelated parties | (23 | ) | 326 | (692 | ) | (80 | ) | |||||||||
| Change in inventories | (15 | ) | (22 | ) | (56 | ) | (111 | ) | ||||||||
| Change in other working capital and non-cash items | (148 | ) | 74 | 61 | 140 | |||||||||||
| Net cash provided by (used in) operating activities | 442 | 1,007 | 570 | 1,150 | ||||||||||||
| In percent of revenue | 9.3 | % | 20.9 | % | 6.0 | % | 12.1 | % | ||||||||
| Investing activities | ||||||||||||||||
| Purchases of property, plant and equipment and capitalized development costs | (159 | ) | (155 | ) | (293 | ) | (298 | ) | ||||||||
| Proceeds from sale of property, plant and equipment | 6 | 0 | 10 | 2 | ||||||||||||
| Capital expenditures, net | (153 | ) | (155 | ) | (283 | ) | (296 | ) | ||||||||
| Free cash flow | 289 | 852 | 287 | 854 | ||||||||||||
| In percent of revenue | 6.1 | % | 17.7 | % | 3.0 | % | 9.0 | % | ||||||||
| Acquisitions and investments, net of cash acquired, and purchases of intangible assets | (6 | ) | (10 | ) | (6 | ) | (14 | ) | ||||||||
| Investments in debt securities | 0 | (17 | ) | 0 | (63 | ) | ||||||||||
| Proceeds from divestitures | 461 | 13 | 501 | 25 | ||||||||||||
| Proceeds from sale of debt securities | 21 | 36 | 42 | 51 | ||||||||||||
| Free cash flow after investing activities | 765 | 874 | 824 | 853 | ||||||||||||
| Cash flow | page |
July 30, 2024 |
Revenue development by segment
| Same market | ||||||||||||||||||||||||
| Change | Organic | treatment | ||||||||||||||||||||||
| in € million, unaudited | 2024 | 2023 | Change | at cc | growth | growth 1 | ||||||||||||||||||
| Three months ended June 30, | ||||||||||||||||||||||||
| Total revenue | 4,766 | 4,825 | -1.2 | % | -1.7 | % | 2.3 | % | ||||||||||||||||
| Care Delivery segment | 3,771 | 3,873 | -2.6 | % | -3.3 | % | 1.7 | % | 0.4 | % | ||||||||||||||
| Thereof: U.S. | 3,157 | 3,120 | 1.2 | % | 0.1 | % | 1.4 | % | -0.3 | % | ||||||||||||||
| Thereof: International | 614 | 753 | -18.4 | % | -17.8 | % | 3.2 | % | 1.9 | % | ||||||||||||||
| Care Enablement segment | 1,363 | 1,325 | 2.9 | % | 3.1 | % | 3.2 | % | ||||||||||||||||
| Inter-segment eliminations | (368 | ) | (373 | ) | -1.0 | % | -2.0 | % | ||||||||||||||||
| Six months ended June 30, | ||||||||||||||||||||||||
| Total revenue | 9,491 | 9,529 | -0.4 | % | 0.4 | % | 3.4 | % | ||||||||||||||||
| Care Delivery segment | 7,559 | 7,628 | -0.9 | % | -0.3 | % | 3.6 | % | 0.1 | % | ||||||||||||||
| Thereof: U.S. | 6,259 | 6,123 | 2.2 | % | 2.3 | % | 3.8 | % | -0.5 | % | ||||||||||||||
| Thereof: International | 1,300 | 1,505 | -13.6 | % | -11.1 | % | 2.7 | % | 1.3 | % | ||||||||||||||
| Care Enablement segment | 2,660 | 2,635 | 1.0 | % | 2.3 | % | 2.4 | % | ||||||||||||||||
| Inter-segment eliminations | (728 | ) | (734 | ) | -0.7 | % | -0.3 | % | ||||||||||||||||
1 Same market treatment growth = organic growth less price effects
Health care services and health care products revenue by segment
| 2024 | 2023 | |||||||||||||||||||||||||||||||
| Care | Care | Inter- | Care | Care | Inter- | |||||||||||||||||||||||||||
| Delivery | Enablement | segment | Delivery | Enablement | segment | |||||||||||||||||||||||||||
| in € million, unaudited | segment | segment | eliminations | Total | segment | segment | eliminations | Total | ||||||||||||||||||||||||
| Three months ended June 30, | ||||||||||||||||||||||||||||||||
| Health care services revenue | 3,722 | — | — | 3,722 | 3,829 | — | — | 3,829 | ||||||||||||||||||||||||
| Health care products revenue | 49 | 995 | — | 1,044 | 44 | 952 | — | 996 | ||||||||||||||||||||||||
| Inter-segment revenue | — | 368 | (368 | ) | — | — | 373 | (373 | ) | — | ||||||||||||||||||||||
| Revenue | 3,771 | 1,363 | (368 | ) | 4,766 | 3,873 | 1,325 | (373 | ) | 4,825 | ||||||||||||||||||||||
| Six months ended June 30, | ||||||||||||||||||||||||||||||||
| Health care services revenue | 7,470 | — | — | 7,470 | 7,541 | — | — | 7,541 | ||||||||||||||||||||||||
| Health care products revenue | 89 | 1,932 | — | 2,021 | 87 | 1,901 | — | 1,988 | ||||||||||||||||||||||||
| Inter-segment revenue | — | 728 | (728 | ) | — | — | 734 | (734 | ) | — | ||||||||||||||||||||||
| Revenue | 7,559 | 2,660 | (728 | ) | 9,491 | 7,628 | 2,635 | (734 | ) | 9,529 | ||||||||||||||||||||||
| Revenue development by segment | page |
July 30, 2024 |
Key metrics Care Delivery segment
| Six months ended June 30, 2024 | ||||||||||||||||||||||||||||
| Growth | Growth | Growth | ||||||||||||||||||||||||||
| in % | Net change | in % | in % | |||||||||||||||||||||||||
| unaudited | Clinics | yoy | in clinics 1 | Patients | yoy | Treatments | yoy | |||||||||||||||||||||
| Total | 3,757 | -7 | % | (168 | ) | 311,037 | -10 | % | 24,119,809 | -7 | % | |||||||||||||||||
| Thereof: U.S. | 2,628 | 0 | % | 13 | 206,306 | 0 | % | 15,412,884 | -1 | % | ||||||||||||||||||
| Thereof: International | 1,129 | -20 | % | (181 | ) | 104,731 | -24 | % | 8,706,925 | -15 | % | |||||||||||||||||
1 Net change in clinics (acquired, de novo, combined, closed and sold) in comparison to December 31, 2023.
yoy = year-on-year
| Key metrics | page |
July 30, 2024 |
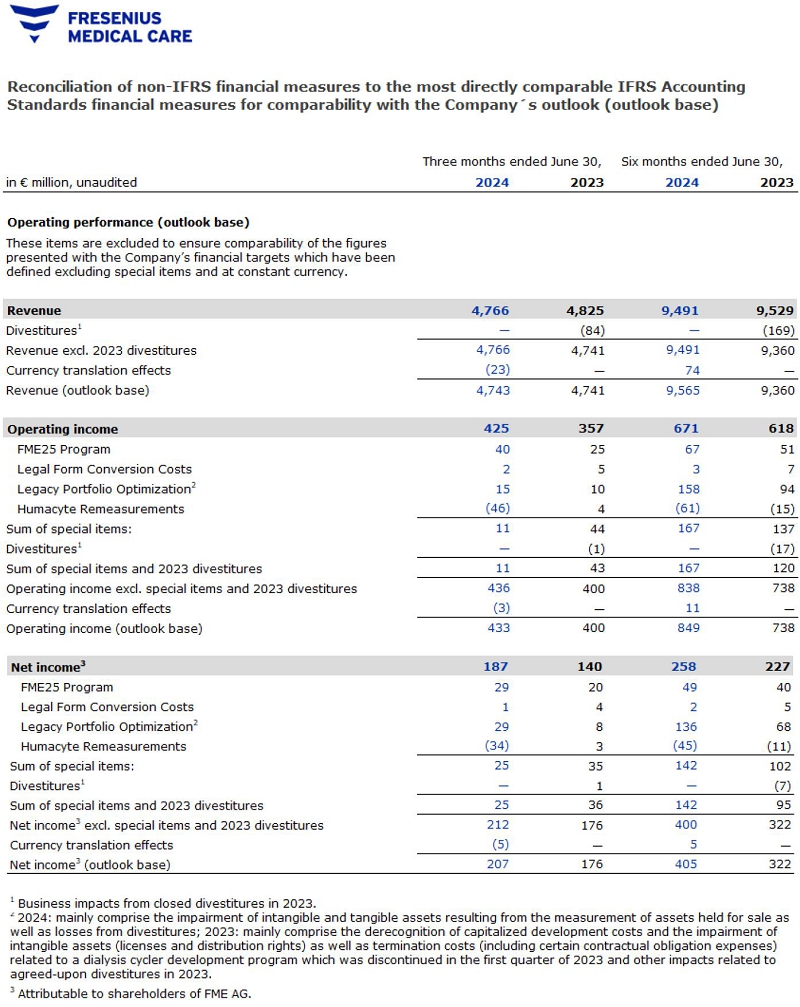
Reconciliation of non-IFRS financial measures to the most directly comparable IFRS Accounting Standards financial measures for comparability with the Company´s outlook (outlook base)
| Special items | Results | Special items | Sum of | |||||||||||||||||||||||||||||||||||||||||||||||||||||||||||||||||||||
| in € million, | Legal | Legacy | Sum | 2024 | Results | Legal | Legacy | special | Results | Change | ||||||||||||||||||||||||||||||||||||||||||||||||||||||||||||||
| except | Form | Portfolio | Humacyte | of | excl. | Currency | 2024 | Form | Portfolio | Humacyte | items | 2023 | at cc | |||||||||||||||||||||||||||||||||||||||||||||||||||||||||||
| share data, | Results | FME25 | Conversion | Optimiza- | Remeasure- | special | special | translation | (outlook | Results | FME25 | Conversion | Optimiza- | Remeasure- | and | (outlook | (outlook | |||||||||||||||||||||||||||||||||||||||||||||||||||||||
| unaudited | 2024 | Program | Costs | tion1 | ments | items | items | effects | base) | 2023 | Program | Costs | tion1 | ments | Divestitures2 | divestitures | base) | base) | ||||||||||||||||||||||||||||||||||||||||||||||||||||||
| Three months ended June 30, | ||||||||||||||||||||||||||||||||||||||||||||||||||||||||||||||||||||||||
| Total revenue | 4,766 | — | — | — | — | — | 4,766 | (23 | ) | 4,743 | 4,825 | — | — | — | — | (84 | ) | (84 | ) | 4,741 | 0.1 | % | ||||||||||||||||||||||||||||||||||||||||||||||||||
| Care Delivery segment | 3,771 | — | — | — | — | — | 3,771 | (28 | ) | 3,743 | 3,873 | — | — | — | — | (87 | ) | (87 | ) | 3,786 | -1.1 | % | ||||||||||||||||||||||||||||||||||||||||||||||||||
| Thereof: U.S. | 3,157 | — | — | — | — | — | 3,157 | (33 | ) | 3,124 | 3,120 | — | — | — | — | (38 | ) | (38 | ) | 3,082 | 1.4 | % | ||||||||||||||||||||||||||||||||||||||||||||||||||
| Thereof: International | 614 | — | — | — | — | — | 614 | 5 | 619 | 753 | — | — | — | — | (49 | ) | (49 | ) | 704 | -12.1 | % | |||||||||||||||||||||||||||||||||||||||||||||||||||
| Care Enablement segment | 1,363 | — | — | — | — | — | 1,363 | 2 | 1,365 | 1,325 | — | — | — | — | (3 | ) | (3 | ) | 1,322 | 3.3 | % | |||||||||||||||||||||||||||||||||||||||||||||||||||
| Inter-segment eliminations | (368 | ) | — | — | — | — | — | (368 | ) | 3 | (365 | ) | (373 | ) | — | — | — | — | 6 | 6 | (367 | ) | -0.6 | % | ||||||||||||||||||||||||||||||||||||||||||||||||
| EBITDA | 812 | 34 | 2 | 23 | (46 | ) | 13 | 825 | (4 | ) | 821 | 791 | 14 | 5 | 11 | 4 | (2 | ) | 32 | 823 | -0.3 | % | ||||||||||||||||||||||||||||||||||||||||||||||||||
| Total operating income | 425 | 40 | 2 | 15 | (46 | ) | 11 | 436 | (3 | ) | 433 | 357 | 25 | 5 | 10 | 4 | (1 | ) | 43 | 400 | 8.3 | % | ||||||||||||||||||||||||||||||||||||||||||||||||||
| Care Delivery segment | 332 | 16 | — | 28 | — | 44 | 376 | (4 | ) | 372 | 384 | 8 | — | 10 | — | (2 | ) | 16 | 400 | -7.0 | % | |||||||||||||||||||||||||||||||||||||||||||||||||||
| Care Enablement segment | 68 | 24 | 0 | (11 | ) | (12 | ) | 1 | 69 | 0 | 69 | 2 | 17 | — | 0 | — | (2 | ) | 15 | 17 | 308.2 | % | ||||||||||||||||||||||||||||||||||||||||||||||||||
| Inter-segment eliminations | (5 | ) | — | — | (3 | ) | — | (3 | ) | (8 | ) | 0 | (8 | ) | (4 | ) | — | — | — | — | — | — | (4 | ) | 111.2 | % | ||||||||||||||||||||||||||||||||||||||||||||||
| Corporate | 30 | 0 | 2 | 1 | (34 | ) | (31 | ) | (1 | ) | 1 | 0 | (25 | ) | 0 | 5 | — | 4 | 3 | 12 | (13 | ) | n.a. | |||||||||||||||||||||||||||||||||||||||||||||||||
| Interest expense, net | 85 | — | — | — | — | — | 85 | (1 | ) | 84 | 81 | — | — | — | — | 1 | 1 | 82 | 3.2 | % | ||||||||||||||||||||||||||||||||||||||||||||||||||||
| Income tax expense | 99 | 11 | 1 | (14 | ) | (12 | ) | (14 | ) | 85 | 4 | 89 | 81 | 5 | 1 | 2 | 1 | 0 | 9 | 90 | -1.1 | % | ||||||||||||||||||||||||||||||||||||||||||||||||||
| Net income attributable to noncontrolling interests | 54 | — | — | — | — | — | 54 | (1 | ) | 53 | 55 | — | — | 0 | — | (3 | ) | (3 | ) | 52 | 1.5 | % | ||||||||||||||||||||||||||||||||||||||||||||||||||
| Net income3 | 187 | 29 | 1 | 29 | (34 | ) | 25 | 212 | (5 | ) | 207 | 140 | 20 | 4 | 8 | 3 | 1 | 36 | 176 | 17.5 | % | |||||||||||||||||||||||||||||||||||||||||||||||||||
| Basic earnings per share | € | 0.64 | € | 0.10 | € | 0.00 | € | 0.10 | € | (0.12 | ) | € | 0.08 | € | 0.72 | € | (0.02 | ) | € | 0.70 | € | 0.48 | € | 0.07 | € | 0.01 | € | 0.02 | € | 0.01 | € | 0.01 | € | 0.12 | € | 0.60 | 17.5 | % | ||||||||||||||||||||||||||||||||||
| Six months ended June 30, | ||||||||||||||||||||||||||||||||||||||||||||||||||||||||||||||||||||||||
| Total revenue | 9,491 | — | — | — | — | — | 9,491 | 74 | 9,565 | 9,529 | — | — | — | — | (169 | ) | (169 | ) | 9,360 | 2.2 | % | |||||||||||||||||||||||||||||||||||||||||||||||||||
| Care Delivery segment | 7,559 | — | — | — | — | — | 7,559 | 43 | 7,602 | 7,628 | — | — | — | — | (173 | ) | (173 | ) | 7,455 | 2.0 | % | |||||||||||||||||||||||||||||||||||||||||||||||||||
| Thereof: U.S. | 6,259 | — | — | — | — | — | 6,259 | 4 | 6,263 | 6,123 | — | — | — | — | (80 | ) | (80 | ) | 6,043 | 3.6 | % | |||||||||||||||||||||||||||||||||||||||||||||||||||
| Thereof: International | 1,300 | — | — | — | — | — | 1,300 | 39 | 1,339 | 1,505 | — | — | — | — | (93 | ) | (93 | ) | 1,412 | -5.2 | % | |||||||||||||||||||||||||||||||||||||||||||||||||||
| Care Enablement segment | 2,660 | — | — | — | — | — | 2,660 | 35 | 2,695 | 2,635 | — | — | — | — | (10 | ) | (10 | ) | 2,625 | 2.7 | % | |||||||||||||||||||||||||||||||||||||||||||||||||||
| Inter-segment eliminations | (728 | ) | — | — | — | — | — | (728 | ) | (4 | ) | (732 | ) | (734 | ) | — | — | — | — | 14 | 14 | (720 | ) | 1.6 | % | |||||||||||||||||||||||||||||||||||||||||||||||
| EBITDA | 1,570 | 60 | 3 | 50 | (61 | ) | 52 | 1,622 | 15 | 1,637 | 1,490 | 36 | 7 | 71 | (15 | ) | (18 | ) | 81 | 1,571 | 4.2 | % | ||||||||||||||||||||||||||||||||||||||||||||||||||
| Total operating income | 671 | 67 | 3 | 158 | (61 | ) | 167 | 838 | 11 | 849 | 618 | 51 | 7 | 94 | (15 | ) | (17 | ) | 120 | 738 | 15.1 | % | ||||||||||||||||||||||||||||||||||||||||||||||||||
| Care Delivery segment | 521 | 27 | — | 175 | — | 202 | 723 | 6 | 729 | 669 | 24 | — | 11 | — | (17 | ) | 18 | 687 | 6.2 | % | ||||||||||||||||||||||||||||||||||||||||||||||||||||
| Care Enablement segment | 138 | 40 | 0 | (11 | ) | (22 | ) | 7 | 145 | 4 | 149 | (23 | ) | 28 | — | 83 | — | (6 | ) | 105 | 82 | 81.4 | % | |||||||||||||||||||||||||||||||||||||||||||||||||
| Inter-segment eliminations | (5 | ) | — | — | (6 | ) | — | (6 | ) | (11 | ) | 1 | (10 | ) | (13 | ) | — | — | — | — | — | — | (13 | ) | -18.9 | % | ||||||||||||||||||||||||||||||||||||||||||||||
| Corporate | 17 | 0 | 3 | 0 | (39 | ) | (36 | ) | (19 | ) | 0 | (19 | ) | (15 | ) | (1 | ) | 7 | — | (15 | ) | 6 | (3 | ) | (18 | ) | 4.1 | % | ||||||||||||||||||||||||||||||||||||||||||||
| Interest expense, net | 174 | — | — | — | — | — | 174 | 0 | 174 | 163 | — | — | — | — | 1 | 1 | 164 | 6.0 | % | |||||||||||||||||||||||||||||||||||||||||||||||||||||
| Income tax expense | 139 | 18 | 1 | 22 | (16 | ) | 25 | 164 | 5 | 169 | 126 | 11 | 2 | 25 | (4 | ) | (5 | ) | 29 | 155 | 9.0 | % | ||||||||||||||||||||||||||||||||||||||||||||||||||
| Net income attributable to noncontrolling interests | 100 | — | — | — | — | — | 100 | 1 | 101 | 102 | — | — | 1 | — | (6 | ) | (5 | ) | 97 | 5.0 | % | |||||||||||||||||||||||||||||||||||||||||||||||||||
| Net income3 | 258 | 49 | 2 | 136 | (45 | ) | 142 | 400 | 5 | 405 | 227 | 40 | 5 | 68 | (11 | ) | (7 | ) | 95 | 322 | 25.6 | % | ||||||||||||||||||||||||||||||||||||||||||||||||||
| Basic earnings per share | € | 0.88 | € | 0.16 | € | 0.01 | € | 0.46 | € | (0.15 | ) | € | 0.48 | € | 1.36 | € | 0.02 | € | 1.38 | € | 0.77 | € | 0.14 | € | 0.02 | € | 0.23 | € | (0.04 | ) | € | (0.02 | ) | € | 0.33 | € | 1.10 | 25.6 | % | |||||||||||||||||||||||||||||||||
1 2024: mainly comprise the impairment of intangible and tangible assets resulting from the measurement of assets held for sale as well as losses from divestitures; 2023: mainly comprise the derecognition of capitalized development costs and the impairment of intangible assets (licenses and distribution rights) as well as termination costs (including certain contractual obligation expenses) related to a dialysis cycler development program which was discontinued in the first quarter of 2023 and other impacts related to agreed-upon divestitures in 2023.
2 Business impacts from closed divestitures in 2023.
3 Attributable to shareholders of FME AG.
| Reconciliation results (outlook base) | page |
July 30, 2024 |
Outlook 2024
| Outlook 2024 | ||||
| Results 2023 | (at Constant Currency) | |||
| Revenue1 | €19,049 M | Low to mid-single digit percentage rate growth | ||
| Operating income1 | €1,540 M | Mid to high-teens percentage rate growth |
1 Outlook 2024 is based on the assumptions outlined in the earnings release for the fourth quarter and full year of 2023 and excludes special items. Special items include the costs related to the FME25 Program, the Legal Form Conversion Costs, the impacts from Legacy Portfolio Optimization, the Humacyte Remeasurements and other effects that are unusual in nature and have not been foreseeable or not foreseeable in size or impact at the time of providing the outlook. The growth rates are based on the results 2023 excluding the costs related to the FME25 Program (€153 M for operating income), the Legal Form Conversion Costs (€30 M for operating income), the impacts from Legacy Portfolio Optimization (€204 M for operating income) and the Humacyte Remeasurements (-€15 M for operating income). Additionally, the results 2023 were adjusted for the Tricare settlement (-€191 M for revenue and -€181 M for operating income) and for the business impacts from closed divestitures in 2023 (-€214 M for revenue and -€20 M for operating income).
| Outlook 2024 | page |
July 30, 2024 |