UNITED STATES
SECURITIES AND EXCHANGE COMMISSION
Washington, D.C. 20549
Form 8-K
CURRENT REPORT
PURSUANT TO SECTION 13 OR 15(d) OF THE
SECURITIES EXCHANGE ACT OF 1934
Date of Report (Date of earliest event reported): July 23, 2024
NABORS INDUSTRIES LTD.
(Exact name of registrant as specified in its charter)
| Bermuda | 001-32657 | 98-0363970 | ||
| (State or Other Jurisdiction of Incorporation or Organization) |
(Commission File Number) | (I.R.S. Employer Identification No.) |
| Crown House 4 Par-la-Ville Road Second Floor Hamilton, HM08 Bermuda |
N/A | |
| (Address of principal executive offices) | (Zip Code) |
(441) 292-1510
(Registrant’s telephone number, including area code)
N/A
(Former name or former address, if changed since last report.)
Check the appropriate box below if the Form 8-K filing is intended to simultaneously satisfy the filing obligation of the registrant under any of the following provisions:
| ¨ | Written communications pursuant to Rule 425 under the Securities Act (17 CFR 230.425) |
| ¨ | Soliciting material pursuant to Rule 14a-12 under the Exchange Act (17 CFR 240.14a-12) |
| ¨ | Pre-commencement communications pursuant to Rule 14d-2(b) under the Exchange Act (17 CFR 240.14d-2(b)) |
| ¨ | Pre-commencement communications pursuant to Rule 13e-4(c) under the Exchange Act (17 CFR 240.13e-4(c)) |
| Title of each class | Trading Symbol(s) | Name of exchange on which registered |
||
| Common shares | NBR | NYSE |
Indicate by check mark whether the registrant is an emerging growth company as defined in Rule 405 of the Securities Act of 1933 (§230.405 of this chapter) or Rule 12b-2 of the Securities Exchange Act of 1934 (§240.12b-2 of this chapter).
Emerging growth company ¨
If an emerging growth company, indicate by check mark if the registrant has elected not to use the extended transition period for complying with any new or revised financial accounting standards provided pursuant to Section 13(a) of the Exchange Act. ¨
Item 2.02 Results of Operations and Financial Condition.
On July 23, 2024, Nabors Industries Ltd. (“Nabors”) issued a press release announcing its results of operations for the three months ended June 30, 2024. A copy of that release is furnished herewith as Exhibit 99.1 and is incorporated herein by reference.
On July 24, 2024, Nabors will hold a conference call at 10:00 a.m. Central Time, regarding the Company’s financial results for the quarter ended June 30, 2024. Information about the call - including dial-in information, recording and replay of the call, and supplemental information - is available on the Investor Relations page of www.nabors.com.
The information in this Item 2.02, including Exhibits 99.1 and 99.2, shall not be deemed “filed” for purposes of Section 18 of the Securities Exchange Act, of 1934 or otherwise subject to liabilities of that Section or Sections 11 and 12(a)(2) of the Securities Act of 1933.
Item 9.01 Financial Statements and Exhibits.
(d) Exhibits.
|
Exhibit No. |
Description | |
| 99.1 | Press Release | |
| 99.2 | Investor Information | |
| 104 | Cover Page Interactive Data File (embedded within the Inline XBRL document) |
SIGNATURES
Pursuant to the requirements of the Securities Exchange Act of 1934, the Registrant has duly caused this report to be signed on its behalf by the undersigned hereunto duly authorized.
| NABORS INDUSTRIES LTD. | ||
| Date: July 23, 2024 | By: | /s/ Mark D. Andrews |
| Name: Mark D. Andrews | ||
| Title: Corporate Secretary | ||
Exhibit 99.1
 |
NEWS RELEASE |
Nabors Announces Second Quarter 2024 Results
HAMILTON, Bermuda, July 23, 2024 /PRNewswire/ - Nabors Industries Ltd. (“Nabors” or the “Company”) (NYSE: NBR) today reported second quarter 2024 operating revenues of $735 million, compared to operating revenues of $734 million in the first quarter. The net loss attributable to Nabors shareholders for the quarter was $32 million, compared to a net loss of $34 million in the first quarter. This equates to a loss of $4.29 per diluted share, compared to a loss per diluted share of $4.54 in the first quarter. Second quarter adjusted EBITDA was $218 million, compared to $221 million in the previous quarter.
Highlights
| o | Nabors Lower 48 rigs continued to set the standard for performance on challenging wells. A major operator in the Delaware Basin drilled its fastest four-mile lateral, utilizing a Nabors PACE®-X rig and a package of NDS technology. A second large operator, in the Eagle Ford, drilled a single-run, four-mile lateral in 14 days, using a Nabors PACE®-M1000 rig. |
| o | A large operator in the Bakken committed to Nabors’ full automation suite across all of its rigs, including SmartDRILL™ and SmartSLIDE®. With these installations, NDS will reach record penetration of its automated directional drilling solution on Nabors rigs. |
| o | A major operator committed funding to support the next generation of Nabors’ RZR red zone robotics drillfloor automation module. This includes an installation on one of this client’s rigs in the Permian, and the opportunity to scale up from there. |
| o | Kuwait Oil Company formally awarded multiyear contracts for three high-specification rigs. The Company plans to deploy existing in-country rigs for this opportunity. |
Anthony G. Petrello, Nabors Chairman, CEO and President, commented, “Our second quarter operating results were better than we expected. This performance was driven by growth and higher average daily margins in our International Drilling segment, as well as stronger performance in our Drilling Solutions and Rig Technologies segments.
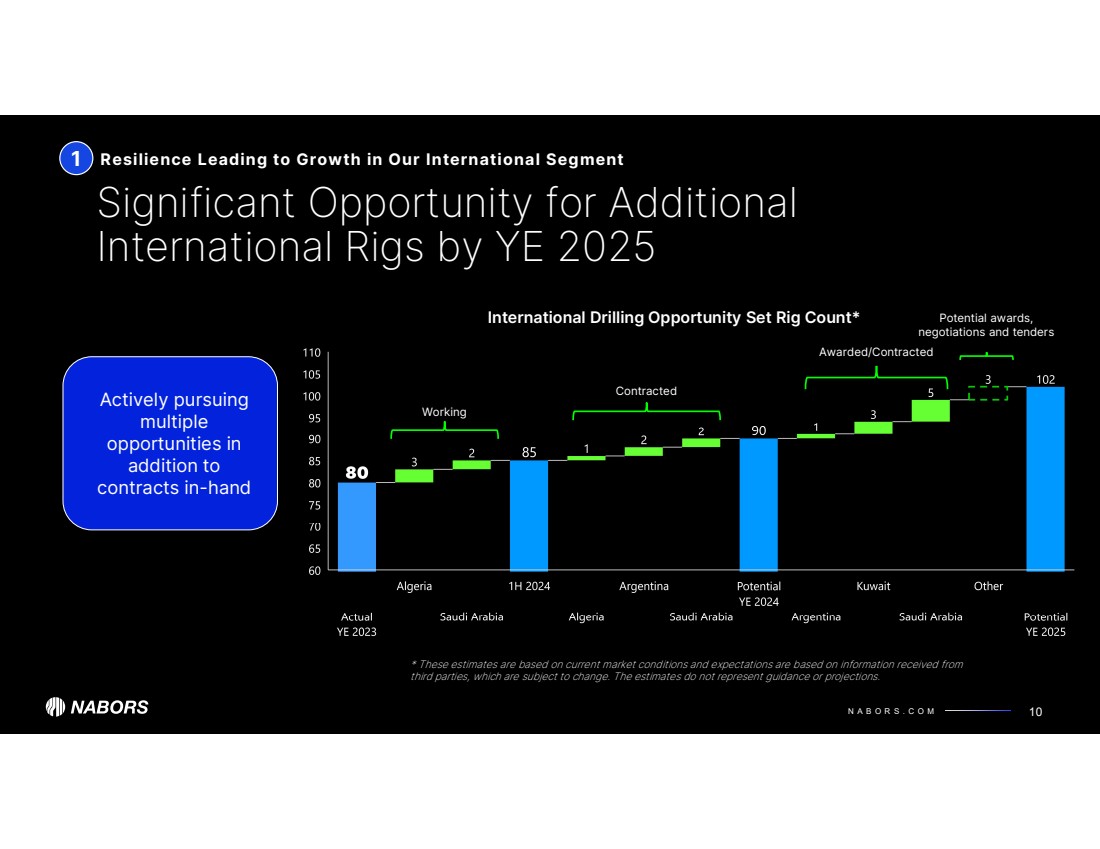
“Rig count continued to grow in our International segment, as we started up previously awarded rigs. With a substantial number of additional rig awards already in hand, across the Middle East and Latin America, we have a well-defined trajectory for international expansion over the next couple of years. We have scheduled 19 deployments over the next 18 months. We also have identified additional opportunities that could extend this growth path.
“Stable pricing supported our results in the Lower 48 market. Our average rig count decreased somewhat compared to the prior quarter, essentially in line with our expectation. Activity declines in the Northeast and South Texas were partially offset by increases in North Dakota and our Western region. Results in our Drilling Solutions segment were above our target, reflecting growth in our International markets as well as on third party rigs in the U.S.”
|
NEWS RELEASE |
Segment Results
The U.S. Drilling segment reported second quarter adjusted EBITDA of $114.0 million, compared to $120.4 million in the first quarter. Nabors’ second quarter Lower 48 average rig count totaled 69, versus 72 in the first quarter. Daily adjusted gross margin in that market averaged $15,600, down 2% as compared to the prior quarter.
International Drilling adjusted EBITDA totaled $106.4 million, compared to $102.5 million in the first quarter. Average rig count increased to 84 from 81, driven by rig additions in Algeria and Saudi Arabia. Daily adjusted gross margin for the second quarter averaged $16,050, essentially in line with the prior quarter.
Drilling Solutions adjusted EBITDA was $32.5 million, compared to $31.8 million in the first quarter. This increase was essentially driven by revenue growth on third-party Lower 48 and international rigs of 22% and 18%, respectively.
In Rig Technologies, adjusted EBITDA increased to $7.3 million, versus $6.8 million in the first quarter. The increase was spread across business lines including capital equipment, OEM repair, and energy transition.
Adjusted Free Cash Flow
Adjusted free cash flow was $57 million in the second quarter. Capital expenditures totaled $138 million, which included $56 million supporting the newbuilds in Saudi Arabia. This compares to $112 million in the first quarter, including $35 million supporting the newbuilds.
William Restrepo, Nabors CFO, stated, “Our overall results exceeded outlook. The emerging international market strength we saw last year is now manifesting in rig additions for our International drilling segment. We expect our pipeline of scheduled international deployments to drive an increase in rig count of at least 20% from the end of 2023 through the end of 2025. This includes rigs in Algeria, Argentina, Kuwait, and Saudi Arabia. On top of these, we have multiple attractive opportunities. Our approach to these opportunities will remain disciplined, ensuring they are consistent with our free cash flow commitments over the next few years.
“In the U.S., our Lower 48 results were supported by continued high utilization of high-spec rigs and strong pricing. As we look ahead, we see opportunities to add rigs and offset some of the attrition in the natural gas focused markets. We expect our rig count to increase moderately for the balance of the year.
“We achieved significant milestones to solidify our capital structure. During the second quarter, we increased the amount on our revolving credit facility and extended it until 2029. More recently, we placed $550 million of notes due in 2031. With these proceeds, we intend to retire the similar notes due in 2026. Once completed, our next maturity comes in mid-2027.
“The strong results drove our cash generation. Adjusted free cash flow for the first half of the year reached $65 million. This performance supports our previous full-year 2024 adjusted free cash flow target of $100-$200 million.”
|
NEWS RELEASE |
Outlook
Nabors expects the following metrics for the third quarter of 2024:
U.S. Drilling
| o | Lower 48 average rig count of approximately 70 rigs |
| o | Lower 48 daily adjusted gross margin of $15,100-$15,200 |
| o | Alaska and Gulf of Mexico combined adjusted EBITDA of approximately $20 million |
International
| o | Average rig count up by approximately one rig versus the second quarter average |
| o | Daily adjusted gross margin of $16,200-$16,300 |
Drilling Solutions
| o | Adjusted EBITDA up sequentially by approximately 6% |
Rig Technologies
| o | Adjusted EBITDA up sequentially by approximately $1.5 million |
Capital Expenditures
| o | Capital expenditures of $190-$200 million, with $80-$85 million for the newbuilds in Saudi Arabia |
| o | Full-year capital expenditures of approximately $590 million, including funding for the recent rig awards |
Adjusted Free Cash Flow
| o | Full year adjusted free cash flow of $100-$200 million |
Mr. Petrello concluded, “These results, and our outlook, illustrate the success of our strategy. We remain committed to deploying the global drilling industry’s leading technology. The growing adoption of these innovations by our client base across the globe gives us confidence that we are on the right track. And as I’ve stated before, we expect the extraordinary strength of the international markets to continue driving our growth over the coming years.”
About Nabors Industries
Nabors Industries (NYSE: NBR) is a leading provider of advanced technology for the energy industry. With presence in more than 20 countries, Nabors has established a global network of people, technology and equipment to deploy solutions that deliver safe, efficient and responsible energy production. By leveraging its core competencies, particularly in drilling, engineering, automation, data science and manufacturing, Nabors aims to innovate the future of energy and enable the transition to a lower-carbon world. Learn more about Nabors and its energy technology leadership: www.nabors.com.
|
NEWS RELEASE |
Forward-looking Statements
The information included in this press release includes forward-looking statements within the meaning of the Securities Act of 1933 and the Securities Exchange Act of 1934. Such forward-looking statements are subject to a number of risks and uncertainties, as disclosed by Nabors from time to time in its filings with the Securities and Exchange Commission. As a result of these factors, Nabors' actual results may differ materially from those indicated or implied by such forward-looking statements. The forward-looking statements contained in this press release reflect management's estimates and beliefs as of the date of this press release. Nabors does not undertake to update these forward-looking statements.
Non-GAAP Disclaimer
This press release presents certain “non-GAAP” financial measures. The components of these non-GAAP measures are computed by using amounts that are determined in accordance with accounting principles generally accepted in the United States of America (“GAAP”). Adjusted operating income (loss) represents income (loss) from continuing operations before income taxes, interest expense, investment income (loss), and other, net. Adjusted EBITDA is computed similarly, but also excludes depreciation and amortization expenses. In addition, adjusted EBITDA and adjusted operating income (loss) exclude certain cash expenses that the Company is obligated to make. Net debt is calculated as total debt minus the sum of cash, cash equivalents and short-term investments.
Adjusted free cash flow represents net cash provided by operating activities less cash used for capital expenditures, net of proceeds from sales of assets. Management believes that adjusted free cash flow is an important liquidity measure for the company and that it is useful to investors and management as a measure of the company’s ability to generate cash flow, after reinvesting in the company for future growth, that could be available for paying down debt or other financing cash flows, such as dividends to shareholders. Management believes that this non-GAAP measure is useful information to investors when comparing our cash flows with the cash flows of other companies.
Each of these non-GAAP measures has limitations and therefore should not be used in isolation or as a substitute for the amounts reported in accordance with GAAP. However, management evaluates the performance of its operating segments and the consolidated Company based on several criteria, including Adjusted EBITDA, adjusted operating income (loss), net debt, and adjusted free cash flow, because it believes that these financial measures accurately reflect the Company’s ongoing profitability and performance. Securities analysts and investors also use these measures as some of the metrics on which they analyze the Company’s performance. Other companies in this industry may compute these measures differently. Reconciliations of consolidated adjusted EBITDA and adjusted operating income (loss) to income (loss) from continuing operations before income taxes, net debt to total debt, and adjusted free cash flow to net cash provided by operations, which are their nearest comparable GAAP financial measures, are included in the tables at the end of this press release. We do not provide a forward-looking reconciliation of our outlook for Segment Adjusted EBITDA, Segment Gross Margin or Adjusted Free Cash Flow, as the amount and significance of items required to develop meaningful comparable GAAP financial measures cannot be estimated at this time without unreasonable efforts. These special items could be meaningful.
Investor Contacts: William C. Conroy, CFA, Vice President of Corporate Development & Investor Relations, +1 281-775-2423 or via e-mail william.conroy@nabors.com, or Kara Peak, Director of Corporate Development & Investor Relations, +1 281-775-4954 or via email kara.peak@nabors.com. To request investor materials, contact Nabors' corporate headquarters in Hamilton, Bermuda at +441-292-1510 or via e-mail mark.andrews@nabors.com CONDENSED CONSOLIDATED STATEMENTS OF INCOME (LOSS)
NABORS INDUSTRIES LTD. AND SUBSIDIARIES
(Unaudited)
| Three Months Ended | Six Months Ended | |||||||||||||||||||
| June 30, | March 31, | June 30, | ||||||||||||||||||
| (In thousands, except per share amounts) | 2024 | 2023 | 2024 | 2024 | 2023 | |||||||||||||||
| Revenues and other income: | ||||||||||||||||||||
| Operating revenues | $ | 734,798 | $ | 767,067 | $ | 733,704 | $ | 1,468,502 | $ | 1,546,206 | ||||||||||
| Investment income (loss) | 8,181 | 11,743 | 10,201 | 18,382 | 21,609 | |||||||||||||||
| Total revenues and other income | 742,979 | 778,810 | 743,905 | 1,486,884 | 1,567,815 | |||||||||||||||
| Costs and other deductions: | ||||||||||||||||||||
| Direct costs | 440,225 | 455,531 | 437,077 | 877,302 | 917,860 | |||||||||||||||
| General and administrative expenses | 62,154 | 63,232 | 61,751 | 123,905 | 124,962 | |||||||||||||||
| Research and engineering | 14,362 | 13,281 | 13,863 | 28,225 | 28,355 | |||||||||||||||
| Depreciation and amortization | 160,141 | 159,698 | 157,685 | 317,826 | 322,729 | |||||||||||||||
| Interest expense | 51,493 | 46,164 | 50,379 | 101,872 | 91,305 | |||||||||||||||
| Other, net | 12,079 | (1,775 | ) | 16,108 | 28,187 | (44,150 | ) | |||||||||||||
| Total costs and other deductions | 740,454 | 736,131 | 736,863 | 1,477,317 | 1,441,061 | |||||||||||||||
| Income (loss) before income taxes | 2,525 | 42,679 | 7,042 | 9,567 | 126,754 | |||||||||||||||
| Income tax expense (benefit) | 15,554 | 26,448 | 16,044 | 31,598 | 49,463 | |||||||||||||||
| Net income (loss) | (13,029 | ) | 16,231 | (9,002 | ) | (22,031 | ) | 77,291 | ||||||||||||
| Less: Net (income) loss attributable to noncontrolling interest | (19,226 | ) | (11,620 | ) | (25,331 | ) | (44,557 | ) | (23,456 | ) | ||||||||||
| Net income (loss) attributable to Nabors | $ | (32,255 | ) | $ | 4,611 | $ | (34,333 | ) | $ | (66,588 | ) | $ | 53,835 | |||||||
| Earnings (losses) per share: | ||||||||||||||||||||
| Basic | $ | (4.29 | ) | $ | (0.31 | ) | $ | (4.54 | ) | $ | (8.83 | ) | $ | 4.05 | ||||||
| Diluted | $ | (4.29 | ) | $ | (0.31 | ) | $ | (4.54 | ) | $ | (8.83 | ) | $ | 3.79 | ||||||
| Weighted-average number of common shares outstanding: | ||||||||||||||||||||
| Basic | 9,207 | 9,195 | 9,176 | 9,191 | 9,178 | |||||||||||||||
| Diluted | 9,207 | 9,195 | 9,176 | 9,191 | 10,141 | |||||||||||||||
| Adjusted EBITDA | $ | 218,057 | $ | 235,023 | $ | 221,013 | $ | 439,070 | $ | 475,029 | ||||||||||
| Adjusted operating income (loss) | $ | 57,916 | $ | 75,325 | $ | 63,328 | $ | 121,244 | $ | 152,300 | ||||||||||
1-
NABORS INDUSTRIES LTD. AND SUBSIDIARIES
CONDENSED CONSOLIDATED BALANCE SHEETS
(Unaudited)
| June 30, | March 31, | December 31, | ||||||||||
| (In thousands) | 2024 | 2024 | 2023 | |||||||||
| ASSETS | ||||||||||||
| Current assets: | ||||||||||||
| Cash and short-term investments | $ | 473,608 | $ | 425,560 | $ | 1,070,178 | ||||||
| Accounts receivable, net | 368,550 | 416,873 | 347,837 | |||||||||
| Other current assets | 235,632 | 231,926 | 227,663 | |||||||||
| Total current assets | 1,077,790 | 1,074,359 | 1,645,678 | |||||||||
| Property, plant and equipment, net | 2,813,148 | 2,841,294 | 2,898,728 | |||||||||
| Other long-term assets | 724,755 | 729,319 | 733,559 | |||||||||
| Total assets | $ | 4,615,693 | $ | 4,644,972 | $ | 5,277,965 | ||||||
| LIABILITIES AND EQUITY | ||||||||||||
| Current liabilities: | ||||||||||||
| Current debt | $ | - | $ | - | $ | 629,621 | ||||||
| Trade accounts payable | 331,468 | 319,436 | 294,442 | |||||||||
| Other current liabilities | 259,454 | 282,982 | 289,918 | |||||||||
| Total current liabilities | 590,922 | 602,418 | 1,213,981 | |||||||||
| Long-term debt | 2,514,169 | 2,512,175 | 2,511,519 | |||||||||
| Other long-term liabilities | 247,587 | 256,956 | 271,380 | |||||||||
| Total liabilities | 3,352,678 | 3,371,549 | 3,996,880 | |||||||||
| Redeemable noncontrolling interest in subsidiary | 761,415 | 750,600 | 739,075 | |||||||||
| Equity: | ||||||||||||
| Shareholders' equity | 250,371 | 286,338 | 326,614 | |||||||||
| Noncontrolling interest | 251,229 | 236,485 | 215,396 | |||||||||
| Total equity | 501,600 | 522,823 | 542,010 | |||||||||
| Total liabilities and equity | $ | 4,615,693 | $ | 4,644,972 | $ | 5,277,965 | ||||||
1-
NABORS INDUSTRIES LTD. AND SUBSIDIARIES
SEGMENT REPORTING
(Unaudited)
The following tables set forth certain information with respect to our reportable segments and rig activity:
| Three Months Ended | Six Months Ended | |||||||||||||||||||
| June 30, | March 31, | June 30, | ||||||||||||||||||
| (In thousands, except rig activity) | 2024 | 2023 | 2024 | 2024 | 2023 | |||||||||||||||
| Operating revenues: | ||||||||||||||||||||
| U.S. Drilling | $ | 259,723 | $ | 314,830 | $ | 271,989 | $ | 531,712 | $ | 665,482 | ||||||||||
| International Drilling | 356,733 | 337,650 | 349,359 | 706,092 | 657,698 | |||||||||||||||
| Drilling Solutions | 82,961 | 76,855 | 75,574 | 158,535 | 151,898 | |||||||||||||||
| Rig Technologies (1) | 49,546 | 63,565 | 50,156 | 99,702 | 122,044 | |||||||||||||||
| Other reconciling items (2) | (14,165 | ) | (25,833 | ) | (13,374 | ) | (27,539 | ) | (50,916 | ) | ||||||||||
| Total operating revenues | $ | 734,798 | $ | 767,067 | $ | 733,704 | $ | 1,468,502 | $ | 1,546,206 | ||||||||||
| Adjusted EBITDA: (3) | ||||||||||||||||||||
| U.S. Drilling | $ | 114,020 | $ | 141,446 | $ | 120,403 | $ | 234,423 | $ | 297,935 | ||||||||||
| International Drilling | 106,371 | 98,331 | 102,498 | 208,869 | 186,939 | |||||||||||||||
| Drilling Solutions | 32,468 | 32,756 | 31,787 | 64,255 | 64,670 | |||||||||||||||
| Rig Technologies (1) | 7,330 | 6,408 | 6,801 | 14,131 | 11,362 | |||||||||||||||
| Other reconciling items (4) | (42,132 | ) | (43,918 | ) | (40,476 | ) | (82,608 | ) | (85,877 | ) | ||||||||||
| Total adjusted EBITDA | $ | 218,057 | $ | 235,023 | $ | 221,013 | $ | 439,070 | $ | 475,029 | ||||||||||
| Adjusted operating income (loss): (5) | ||||||||||||||||||||
| U.S. Drilling | $ | 45,085 | $ | 75,408 | $ | 50,529 | $ | 95,614 | $ | 161,277 | ||||||||||
| International Drilling | 23,672 | 10,407 | 22,476 | 46,148 | 12,364 | |||||||||||||||
| Drilling Solutions | 27,319 | 28,351 | 26,893 | 54,212 | 55,489 | |||||||||||||||
| Rig Technologies (1) | 4,860 | 5,052 | 4,209 | 9,069 | 8,746 | |||||||||||||||
| Other reconciling items (4) | (43,020 | ) | (43,893 | ) | (40,779 | ) | (83,799 | ) | (85,576 | ) | ||||||||||
| Total adjusted operating income (loss) | $ | 57,916 | $ | 75,325 | $ | 63,328 | $ | 121,244 | $ | 152,300 | ||||||||||
| Rig activity: | ||||||||||||||||||||
| Average Rigs Working: (7) | ||||||||||||||||||||
| Lower 48 | 68.7 | 81.6 | 71.9 | 70.3 | 87.4 | |||||||||||||||
| Other US | 6.3 | 7.0 | 6.8 | 6.5 | 7.0 | |||||||||||||||
| U.S. Drilling | 75.0 | 88.6 | 78.7 | 76.8 | 94.4 | |||||||||||||||
| International Drilling | 84.4 | 77.1 | 81.0 | 82.7 | 76.8 | |||||||||||||||
| Total average rigs working | 159.4 | 165.7 | 159.7 | 159.5 | 171.2 | |||||||||||||||
| Daily Rig Revenue: (6),(8) | ||||||||||||||||||||
| Lower 48 | $ | 35,334 | $ | 36,751 | $ | 35,468 | $ | 35,402 | $ | 36,593 | ||||||||||
| Other US | 68,008 | 65,860 | 64,402 | 66,135 | 68,263 | |||||||||||||||
| U.S. Drilling (10) | 38,076 | 39,049 | 37,968 | 38,020 | 38,940 | |||||||||||||||
| International Drilling | 46,469 | 48,106 | 47,384 | 46,917 | 47,319 | |||||||||||||||
| Daily Adjusted Gross Margin: (6),(9) | ||||||||||||||||||||
| Lower 48 | $ | 15,598 | $ | 16,890 | $ | 16,011 | $ | 15,809 | $ | 16,784 | ||||||||||
| Other US | 38,781 | 35,932 | 35,184 | 36,912 | 36,520 | |||||||||||||||
| U.S. Drilling (10) | 17,544 | 18,394 | 17,667 | 17,607 | 18,246 | |||||||||||||||
| International Drilling | 16,050 | 16,276 | 16,061 | 16,056 | 15,754 | |||||||||||||||
1-
| (1) | Includes our oilfield equipment manufacturing activities. |
| (2) | Represents the elimination of inter-segment transactions related to our Rig Technologies operating segment. |
| (3) | Adjusted EBITDA represents net income (loss) before income tax expense (benefit), investment income (loss), interest expense, other, net and depreciation and amortization. Adjusted EBITDA is a non-GAAP financial measure and should not be used in isolation or as a substitute for the amounts reported in accordance with GAAP. In addition, adjusted EBITDA excludes certain cash expenses that the Company is obligated to make. However, management evaluates the performance of its operating segments and the consolidated Company based on several criteria, including adjusted EBITDA and adjusted operating income (loss), because it believes that these financial measures accurately reflect the Company’s ongoing profitability and performance. Securities analysts and investors use this measure as one of the metrics on which they analyze the Company’s performance. Other companies in this industry may compute these measures differently. A reconciliation of this non-GAAP measure to net income (loss), which is the most closely comparable GAAP measure, is provided in the table set forth immediately following the heading "Reconciliation of Non-GAAP Financial Measures to Net Income (Loss)". |
| (4) | Represents the elimination of inter-segment transactions and unallocated corporate expenses. |
| (5) | Adjusted operating income (loss) represents net income (loss) before income tax expense (benefit), investment income (loss), interest expense and other, net. Adjusted operating income (loss) is a non-GAAP financial measure and should not be used in isolation or as a substitute for the amounts reported in accordance with GAAP. In addition, adjusted operating income (loss) excludes certain cash expenses that the Company is obligated to make. However, management evaluates the performance of its operating segments and the consolidated Company based on several criteria, including adjusted EBITDA and adjusted operating income (loss), because it believes that these financial measures accurately reflect the Company’s ongoing profitability and performance. Securities analysts and investors use this measure as one of the metrics on which they analyze the Company’s performance. Other companies in this industry may compute these measures differently. A reconciliation of this non-GAAP measure to net income (loss), which is the most closely comparable GAAP measure, is provided in the table set forth immediately following the heading "Reconciliation of Non-GAAP Financial Measures to Net Income (Loss)". |
| (6) | Rig revenue days represents the number of days the Company's rigs are contracted and performing under a contract during the period. These would typically include days in which operating, standby and move revenue is earned. |
| (7) | Average rigs working represents a measure of the average number of rigs operating during a given period. For example, one rig operating 45 days during a quarter represents approximately 0.5 average rigs working for the quarter. On an annual period, one rig operating 182.5 days represents approximately 0.5 average rigs working for the year. Average rigs working can also be calculated as rig revenue days during the period divided by the number of calendar days in the period. |
| (8) | Daily rig revenue represents operating revenue, divided by the total number of revenue days during the quarter. |
| (9) | Daily adjusted gross margin represents operating revenue less direct costs, divided by the total number of rig revenue days during the quarter. |
| (10) | The U.S. Drilling segment includes the Lower 48, Alaska, and Gulf of Mexico operating areas. |
1-
NABORS INDUSTRIES LTD. AND SUBSIDIARIES
Reconciliation of Earnings per Share
(Unaudited)
| Three Months Ended | Six Months Ended | |||||||||||||||||||
| June 30, | March 31, | June 30, | ||||||||||||||||||
| (in thousands, except per share amounts) | 2024 | 2023 | 2024 | 2024 | 2023 | |||||||||||||||
| BASIC EPS: | ||||||||||||||||||||
| Net income (loss) (numerator): | ||||||||||||||||||||
| Income (loss), net of tax | $ | (13,029 | ) | $ | 16,231 | $ | (9,002 | ) | $ | (22,031 | ) | $ | 77,291 | |||||||
| Less: net (income) loss attributable to noncontrolling interest | (19,226 | ) | (11,620 | ) | (25,331 | ) | (44,557 | ) | (23,456 | ) | ||||||||||
| Less: distributed and undistributed earnings allocated to unvested shareholders | — | — | — | — | (1,869 | ) | ||||||||||||||
| Less: accrued distribution on redeemable noncontrolling interest in subsidiary | (7,283 | ) | (7,436 | ) | (7,283 | ) | (14,566 | ) | (14,790 | ) | ||||||||||
| Numerator for basic earnings per share: | ||||||||||||||||||||
| Adjusted income (loss), net of tax - basic | $ | (39,538 | ) | $ | (2,825 | ) | $ | (41,616 | ) | $ | (81,154 | ) | $ | 37,176 | ||||||
| Weighted-average number of shares outstanding - basic | 9,207 | 9,195 | 9,176 | 9,191 | 9,178 | |||||||||||||||
| Earnings (losses) per share: | ||||||||||||||||||||
| Total Basic | $ | (4.29 | ) | $ | (0.31 | ) | $ | (4.54 | ) | $ | (8.83 | ) | $ | 4.05 | ||||||
| DILUTED EPS: | ||||||||||||||||||||
| Adjusted income (loss) from continuing operations, net of tax - basic | $ | (39,538 | ) | $ | (2,825 | ) | $ | (41,616 | ) | $ | (81,154 | ) | $ | 37,176 | ||||||
| Add: after tax interest expense of convertible notes | — | — | — | — | 1,272 | |||||||||||||||
| Add: effect of reallocating undistributed earnings of unvested shareholders | — | — | — | — | 10 | |||||||||||||||
| Adjusted income (loss), net of tax - diluted | $ | (39,538 | ) | $ | (2,825 | ) | $ | (41,616 | ) | $ | (81,154 | ) | $ | 38,458 | ||||||
| Weighted-average number of shares outstanding - basic | 9,207 | 9,195 | 9,176 | 9,191 | 9,178 | |||||||||||||||
| Add: if converted dilutive effect of convertible notes | — | — | — | — | 918 | |||||||||||||||
| Add: dilutive effect of potential common shares | — | — | — | — | 45 | |||||||||||||||
| Weighted-average number of shares outstanding - diluted | 9,207 | 9,195 | 9,176 | 9,191 | 10,141 | |||||||||||||||
| Earnings (losses) per share: | ||||||||||||||||||||
| Total Diluted | $ | (4.29 | ) | $ | (0.31 | ) | $ | (4.54 | ) | $ | (8.83 | ) | $ | 3.79 | ||||||
1-
NABORS INDUSTRIES LTD. AND SUBSIDIARIES
NON-GAAP FINANCIAL MEASURES
RECONCILIATION OF ADJUSTED EBITDA BY SEGMENT TO ADJUSTED OPERATING INCOME (LOSS) BY SEGMENT
(Unaudited)
(In thousands)
| Three Months Ended June 30, 2024 | ||||||||||||||||||||||||
| U.S. Drilling |
International Drilling |
Drilling Solutions |
Rig Technologies |
Other reconciling items |
Total | |||||||||||||||||||
| Adjusted operating income (loss) | $ | 45,085 | $ | 23,672 | $ | 27,319 | $ | 4,860 | $ | (43,020 | ) | $ | 57,916 | |||||||||||
| Depreciation and amortization | 68,935 | 82,699 | 5,149 | 2,470 | 888 | 160,141 | ||||||||||||||||||
| Adjusted EBITDA | $ | 114,020 | $ | 106,371 | $ | 32,468 | $ | 7,330 | $ | (42,132 | ) | $ | 218,057 | |||||||||||
| Three Months Ended June 30, 2023 | ||||||||||||||||||||||||
| U.S. Drilling |
International Drilling |
Drilling Solutions |
Rig Technologies |
Other reconciling items |
Total | |||||||||||||||||||
| Adjusted operating income (loss) | $ | 75,408 | $ | 10,407 | $ | 28,351 | $ | 5,052 | $ | (43,893 | ) | $ | 75,325 | |||||||||||
| Depreciation and amortization | 66,038 | 87,924 | 4,405 | 1,356 | (25 | ) | 159,698 | |||||||||||||||||
| Adjusted EBITDA | $ | 141,446 | $ | 98,331 | $ | 32,756 | $ | 6,408 | $ | (43,918 | ) | $ | 235,023 | |||||||||||
| Three Months Ended March 31, 2024 | ||||||||||||||||||||||||
| U.S. Drilling |
International Drilling |
Drilling Solutions |
Rig Technologies |
Other reconciling items |
Total | |||||||||||||||||||
| Adjusted operating income (loss) | $ | 50,529 | $ | 22,476 | $ | 26,893 | $ | 4,209 | $ | (40,779 | ) | $ | 63,328 | |||||||||||
| Depreciation and amortization | 69,874 | 80,022 | 4,894 | 2,592 | 303 | 157,685 | ||||||||||||||||||
| Adjusted EBITDA | $ | 120,403 | $ | 102,498 | $ | 31,787 | $ | 6,801 | $ | (40,476 | ) | $ | 221,013 | |||||||||||
| Six Months Ended June 30, 2024 | ||||||||||||||||||||||||
| U.S. Drilling |
International Drilling |
Drilling Solutions |
Rig Technologies |
Other reconciling items |
Total | |||||||||||||||||||
| Adjusted operating income (loss) | $ | 95,614 | $ | 46,148 | $ | 54,212 | $ | 9,069 | $ | (83,799 | ) | $ | 121,244 | |||||||||||
| Depreciation and amortization | 138,809 | 162,721 | 10,043 | 5,062 | 1,191 | 317,826 | ||||||||||||||||||
| Adjusted EBITDA | $ | 234,423 | $ | 208,869 | $ | 64,255 | $ | 14,131 | $ | (82,608 | ) | $ | 439,070 | |||||||||||
| Six Months Ended June 30, 2023 | ||||||||||||||||||||||||
| U.S. Drilling |
International Drilling |
Drilling Solutions |
Rig Technologies |
Other reconciling items |
Total | |||||||||||||||||||
| Adjusted operating income (loss) | $ | 161,277 | $ | 12,364 | $ | 55,489 | $ | 8,746 | $ | (85,576 | ) | $ | 152,300 | |||||||||||
| Depreciation and amortization | 136,658 | 174,575 | 9,181 | 2,616 | (301 | ) | 322,729 | |||||||||||||||||
| Adjusted EBITDA | $ | 297,935 | $ | 186,939 | $ | 64,670 | $ | 11,362 | $ | (85,877 | ) | $ | 475,029 | |||||||||||
1-
NABORS INDUSTRIES LTD. AND SUBSIDIARIES
NON-GAAP FINANCIAL MEASURES
RECONCILIATION OF ADJUSTED GROSS MARGIN BY SEGMENT TO ADJUSTED OPERATING INCOME (LOSS) BY SEGMENT
(Unaudited)
| Three Months Ended | Six Months Ended | |||||||||||||||||||
| June 30, | March 31, | June 30, | ||||||||||||||||||
| (In thousands) | 2024 | 2023 | 2024 | 2024 | 2023 | |||||||||||||||
| Lower 48 - U.S. Drilling | ||||||||||||||||||||
| Adjusted operating income (loss) | $ | 32,841 | $ | 60,496 | $ | 39,264 | $ | 72,105 | $ | 134,567 | ||||||||||
| Plus: General and administrative costs | 4,390 | 5,209 | 4,823 | 9,213 | 10,264 | |||||||||||||||
| Plus: Research and engineering | 909 | 1,189 | 964 | 1,873 | 2,708 | |||||||||||||||
| GAAP Gross Margin | 38,140 | 66,894 | 45,051 | 83,191 | 147,539 | |||||||||||||||
| Plus: Depreciation and amortization | 59,332 | 58,533 | 59,733 | 119,065 | 118,041 | |||||||||||||||
| Adjusted gross margin | $ | 97,472 | $ | 125,427 | $ | 104,784 | $ | 202,256 | $ | 265,580 | ||||||||||
| Other - U.S. Drilling | ||||||||||||||||||||
| Adjusted operating income (loss) | $ | 12,244 | $ | 14,912 | $ | 11,265 | $ | 23,509 | $ | 26,710 | ||||||||||
| Plus: General and administrative costs | 306 | 323 | 325 | 631 | 668 | |||||||||||||||
| Plus: Research and engineering | 45 | 132 | 47 | 92 | 259 | |||||||||||||||
| GAAP Gross Margin | 12,595 | 15,367 | 11,637 | 24,232 | 27,637 | |||||||||||||||
| Plus: Depreciation and amortization | 9,602 | 7,504 | 10,142 | 19,744 | 18,616 | |||||||||||||||
| Adjusted gross margin | $ | 22,197 | $ | 22,871 | $ | 21,779 | $ | 43,976 | $ | 46,253 | ||||||||||
| U.S. Drilling | ||||||||||||||||||||
| Adjusted operating income (loss) | $ | 45,085 | $ | 75,408 | $ | 50,529 | $ | 95,614 | $ | 161,277 | ||||||||||
| Plus: General and administrative costs | 4,696 | 5,532 | 5,148 | 9,844 | 10,932 | |||||||||||||||
| Plus: Research and engineering | 954 | 1,321 | 1,011 | 1,965 | 2,967 | |||||||||||||||
| GAAP Gross Margin | 50,735 | 82,261 | 56,688 | 107,423 | 175,176 | |||||||||||||||
| Plus: Depreciation and amortization | 68,934 | 66,037 | 69,875 | 138,809 | 136,657 | |||||||||||||||
| Adjusted gross margin | $ | 119,669 | $ | 148,298 | $ | 126,563 | $ | 246,232 | $ | 311,833 | ||||||||||
| International Drilling | ||||||||||||||||||||
| Adjusted operating income (loss) | $ | 23,672 | $ | 10,407 | $ | 22,476 | $ | 46,148 | $ | 12,364 | ||||||||||
| Plus: General and administrative costs | 15,434 | 14,089 | 14,415 | 29,849 | 28,424 | |||||||||||||||
| Plus: Research and engineering | 1,404 | 1,821 | 1,508 | 2,912 | 3,606 | |||||||||||||||
| GAAP Gross Margin | 40,510 | 26,317 | 38,399 | 78,909 | 44,394 | |||||||||||||||
| Plus: Depreciation and amortization | 82,700 | 87,924 | 80,022 | 162,722 | 174,576 | |||||||||||||||
| Adjusted gross margin | $ | 123,210 | $ | 114,241 | $ | 118,421 | $ | 241,631 | $ | 218,970 | ||||||||||
Adjusted gross margin by segment represents adjusted operating income (loss) plus general and administrative costs, research and engineering costs and depreciation and amortization.
1-
NABORS INDUSTRIES LTD. AND SUBSIDIARIES
RECONCILIATION OF NON-GAAP FINANCIAL MEASURES TO NET INCOME (LOSS)
(Unaudited)
| Three Months Ended | Six Months Ended | |||||||||||||||||||
| June 30, | March 31, | June 30, | ||||||||||||||||||
| (In thousands) | 2024 | 2023 | 2024 | 2024 | 2023 | |||||||||||||||
| Net income (loss) | $ | (13,029 | ) | $ | 16,231 | $ | (9,002 | ) | $ | (22,031 | ) | $ | 77,291 | |||||||
| Income tax expense (benefit) | 15,554 | 26,448 | 16,044 | 31,598 | 49,463 | |||||||||||||||
| Income (loss) from continuing operations before income taxes | 2,525 | 42,679 | 7,042 | 9,567 | 126,754 | |||||||||||||||
| Investment (income) loss | (8,181 | ) | (11,743 | ) | (10,201 | ) | (18,382 | ) | (21,609 | ) | ||||||||||
| Interest expense | 51,493 | 46,164 | 50,379 | 101,872 | 91,305 | |||||||||||||||
| Other, net | 12,079 | (1,775 | ) | 16,108 | 28,187 | (44,150 | ) | |||||||||||||
| Adjusted operating income (loss) (1) | 57,916 | 75,325 | 63,328 | 121,244 | 152,300 | |||||||||||||||
| Depreciation and amortization | 160,141 | 159,698 | 157,685 | 317,826 | 322,729 | |||||||||||||||
| Adjusted EBITDA (2) | $ | 218,057 | $ | 235,023 | $ | 221,013 | $ | 439,070 | $ | 475,029 | ||||||||||
(1) Adjusted operating income (loss) represents net income (loss) before income tax expense (benefit), investment income (loss), interest expense, and other, net. Adjusted operating income (loss) is a non-GAAP financial measure and should not be used in isolation or as a substitute for the amounts reported in accordance with GAAP. In addition, adjusted operating income (loss) excludes certain cash expenses that the Company is obligated to make. However, management evaluates the performance of its operating segments and the consolidated Company based on several criteria, including adjusted EBITDA and adjusted operating income (loss), because it believes that these financial measures accurately reflect the Company’s ongoing profitability and performance. Securities analysts and investors use this measure as one of the metrics on which they analyze the Company’s performance. Other companies in this industry may compute these measures differently.
(2) Adjusted EBITDA represents net income (loss) before income tax expense (benefit), investment income (loss), interest expense, other, net and depreciation and amortization. Adjusted EBITDA is a non-GAAP financial measure and should not be used in isolation or as a substitute for the amounts reported in accordance with GAAP. In addition, adjusted EBITDA excludes certain cash expenses that the Company is obligated to make. However, management evaluates the performance of its operating segments and the consolidated Company based on several criteria, including adjusted EBITDA and adjusted operating income (loss), because it believes that these financial measures accurately reflect the Company’s ongoing profitability and performance. Securities analysts and investors use this measure as one of the metrics on which they analyze the Company’s performance. Other companies in this industry may compute these measures differently.
1-
NABORS INDUSTRIES LTD. AND SUBSIDIARIES
RECONCILIATION OF NET DEBT TO TOTAL DEBT
(Unaudited)
| June 30, | March 31, | December 31, | ||||||||||
| (In thousands) | 2024 | 2024 | 2023 | |||||||||
| Current debt | $ | - | $ | - | $ | 629,621 | ||||||
| Long-term debt | 2,514,169 | 2,512,175 | 2,511,519 | |||||||||
| Total Debt | 2,514,169 | 2,512,175 | 3,141,140 | |||||||||
| Less: Cash and short-term investments | 473,608 | 425,560 | 1,070,178 | |||||||||
| Net Debt | $ | 2,040,561 | $ | 2,086,615 | $ | 2,070,962 | ||||||
1-
NABORS INDUSTRIES LTD. AND SUBSIDIARIES
RECONCILIATION OF ADJUSTED FREE CASH FLOW TO
NET CASH PROVIDED BY OPERATING ACTIVITIES
(Unaudited)
| Three Months Ended | Six Months Ended | |||||||||||
| June 30, | March 31, | June 30, | ||||||||||
| (In thousands) | 2024 | 2024 | 2024 | |||||||||
| Net cash provided by operating activities | $ | 181,659 | $ | 107,239 | $ | 288,898 | ||||||
| Add: Capital expenditures, net of proceeds from sales of assets | (125,010 | ) | (99,125 | ) | (224,135 | ) | ||||||
| Adjusted free cash flow | $ | 56,649 | $ | 8,114 | $ | 64,763 | ||||||
Adjusted free cash flow represents net cash provided by operating activities less cash used for capital expenditures, net of proceeds from sales of assets. Management believes that adjusted free cash flow is an important liquidity measure for the company and that it is useful to investors and management as a measure of the company’s ability to generate cash flow, after reinvesting in the company for future growth, that could be available for paying down debt or other financing cash flows, such as dividends to shareholders. Adjusted free cash flow does not represent the residual cash flow available for discretionary expenditures. Adjusted free cash flow is a non-GAAP financial measure that should be considered in addition to, not as a substitute for or superior to, cash flow from operations reported in accordance with GAAP.
1-
|
NABORS INDUSTRIES LTD. July 24, 2024 2Q 2024 Earnings Presentation |
|
N A B O R S . C O M We often discuss expectations regarding our future markets, demand for our products and services, and our performance in our annual, quarterly, and current reports, press releases, and other written and oral statements. Such statements, including statements in this document that relate to matters that are not historical facts, are “forward-looking statements” within the meaning of the safe harbor provisions of Section 27A of the U.S. Securities Act of 1933 and Section 21E of the U.S. Securities Exchange Act of 1934. These “forward-looking statements” are based on our analysis of currently available competitive, financial and economic data and our operating plans. They are inherently uncertain, and investors should recognize that events and actual results could turn out to be significantly different from our expectations. Factors to consider when evaluating these forward-looking statements include, but are not limited to: • geopolitical events, pandemics (including COVID-19) and other macro-events and their respective and collective impact on our operations as well as oil and gas markets and prices; • fluctuations and volatility in worldwide prices of and demand for oil and natural gas; • fluctuations in levels of oil and natural gas exploration and development activities; • fluctuations in the demand for our services; • competitive and technological changes and other developments in the oil and gas and oilfield services industries; • our ability to renew customer contracts in order to maintain competitiveness; • the existence of operating risks inherent in the oil and gas and oilfield services industries; • the possibility of the loss of one or a number of our large customers; • the amount and nature of our future capital expenditures and how we expect to fund our capital expenditures; • The occurrence of cybersecurity incidents, attacks and other breaches to our information technology systems; • the impact of long-term indebtedness and other financial commitments on our financial and operating flexibility; • our access to and the cost of capital, including the impact of a further downgrade in our credit rating, covenant restrictions, availability under our revolving credit facility, and future issuances of debt or equity securities and the global interest rate environment; • our dependence on our operating subsidiaries and investments to meet our financial obligations; Forward Looking Statements NABORS INDUSTRIES 2 • our ability to retain skilled employees; • our ability to complete, and realize the expected benefits of, strategic transactions; • changes in tax laws and the possibility of changes in other laws and regulation; • the possibility of changes to U.S. trade policies and regulations including the imposition of trade embargoes or sanctions; and • global views on and the regulatory environment related to energy transition and our ability to implement our energy transition initiatives; • potential long-lived asset impairments • the possibility of changes to U.S. trade policies and regulations including the imposition of trade embargoes, sanctions or tariffs; and • general economic conditions, including the capital and credit markets. Our businesses depend, to a large degree, on the level of spending by oil and gas companies for exploration, development and production activities. Therefore, sustained lower oil or natural gas prices that have a material impact on exploration, development or production activities could also materially affect our financial position, results of operations and cash flows. The above description of risks and uncertainties is by no means all-inclusive but is designed to highlight what we believe are important factors to consider. For a discussion of these factors and other risks and uncertainties, please refer to our filings with the Securities and Exchange Commission ("SEC"), including those contained in our Annual Reports on Form 10-K and Quarterly Reports on Form 10-Q, which are available at the SEC's website at www.sec.gov. We undertake no obligation to publicly update or revise any forward-looking statement as a result of new information, future events or otherwise, except as otherwise required by law. Non-GAAP Financial Measures This presentation refers to certain “non-GAAP” financial measures, such as adjusted EBITDA, net debt, adjusted gross margin and adjusted free cash flow. The components of these non-GAAP measures are computed by using amounts that are determined in accordance with accounting principles generally accepted in the United States of America (“GAAP”). Reconciliations of non-GAAP measures to the most comparable GAAP measures are provided in the Appendix at the end of this presentation. |
|
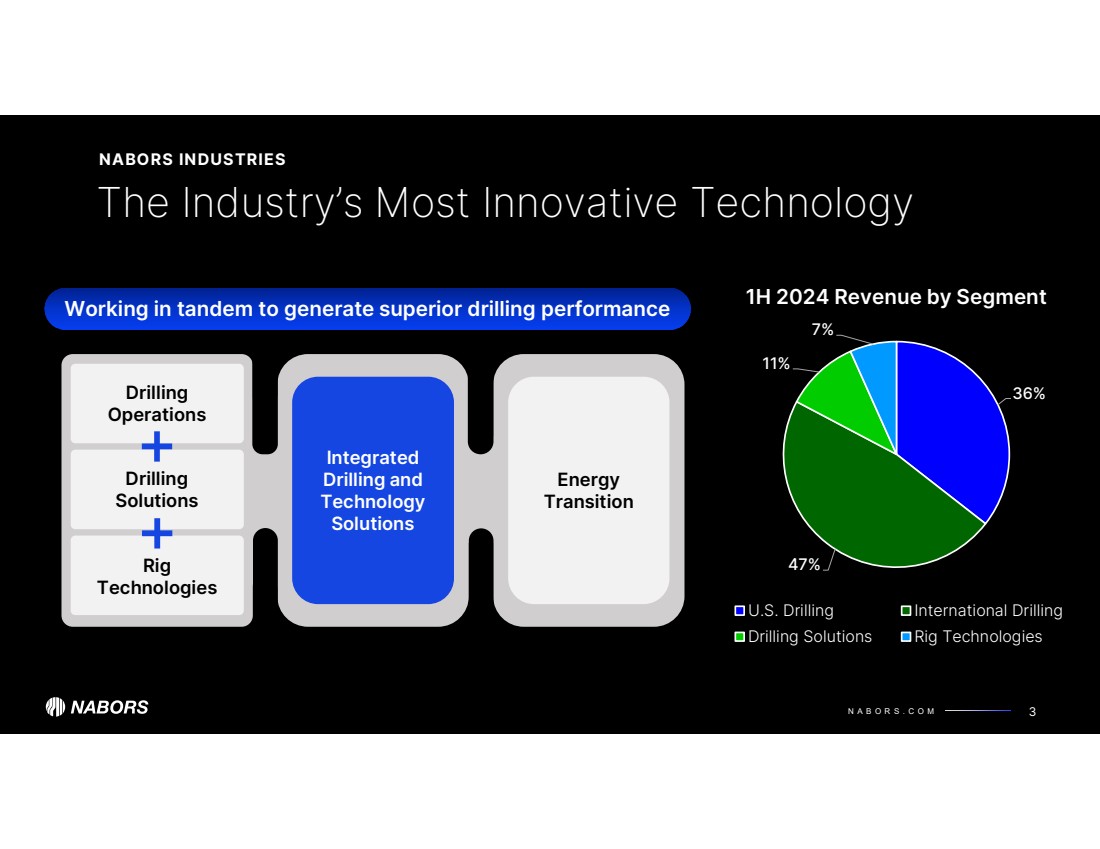
N A B O R S . C O M 36% 47% 11% 7% 1H 2024 Revenue by Segment U.S. Drilling International Drilling Drilling Solutions Rig Technologies 3 The Industry’s Most Innovative Technology NABORS INDUSTRIES Integrated Drilling and Technology Solutions Drilling Operations Drilling Solutions Rig Technologies Energy Transition Working in tandem to generate superior drilling performance |
|
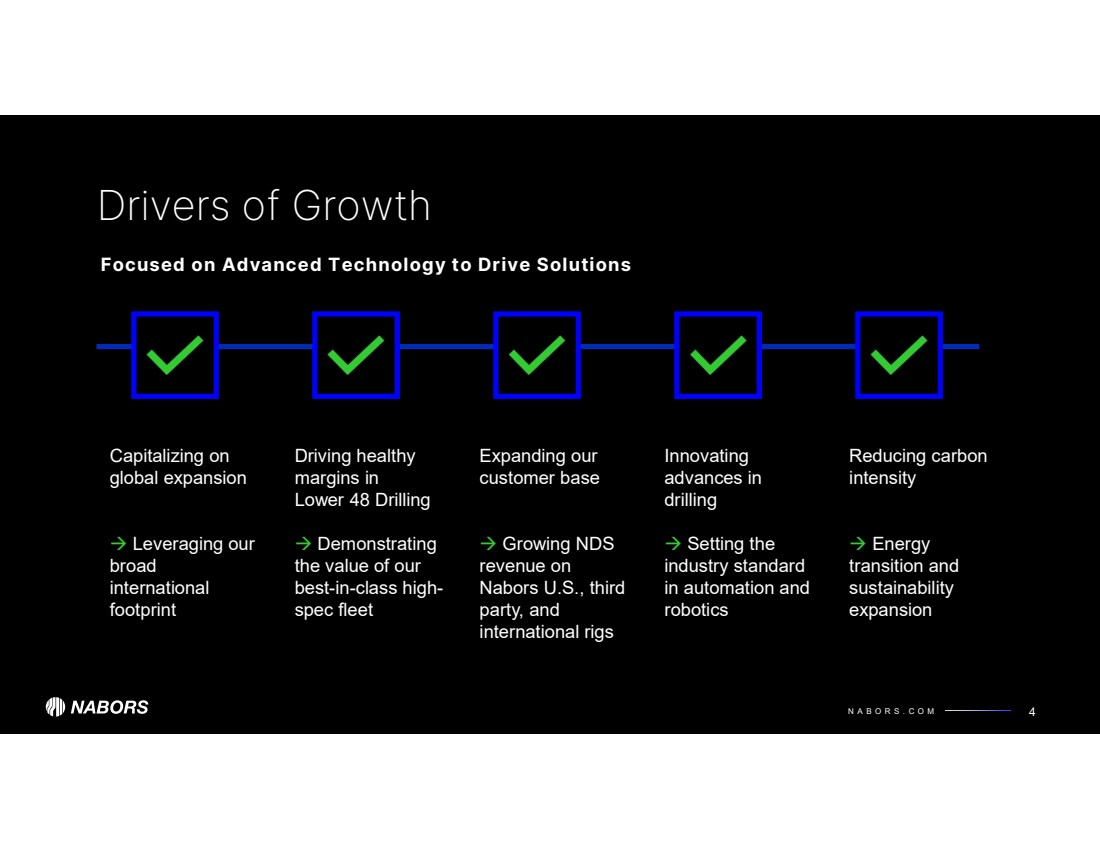
N A B O R S . C O M 4 Drivers of Growth Capitalizing on global expansion Leveraging our broad international footprint Expanding our customer base Growing NDS revenue on Nabors U.S., third party, and international rigs Driving healthy margins in Lower 48 Drilling Demonstrating the value of our best-in-class high-spec fleet Reducing carbon intensity Energy transition and sustainability expansion Innovating advances in drilling Setting the industry standard in automation and robotics Focused on Advanced Technology to Drive Solutions |
|
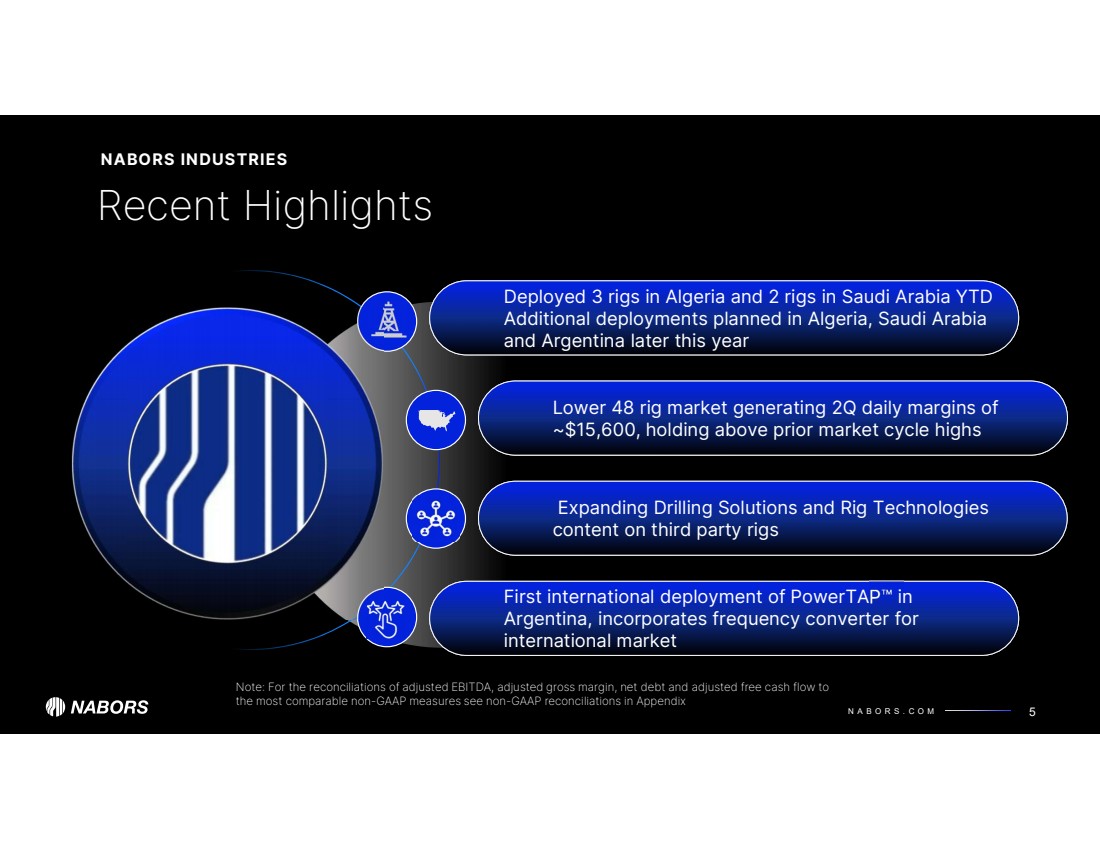
N A B O R S . C O M Recent Highlights NABORS INDUSTRIES 5 Expanding Drilling Solutions and Rig Technologies content on third party rigs Deployed 3 rigs in Algeria and 2 rigs in Saudi Arabia YTD Additional deployments planned in Algeria, Saudi Arabia and Argentina later this year Lower 48 rig market generating 2Q daily margins of ~$15,600, holding above prior market cycle highs Nabors First international deployment of PowerTAP in Argentina, incorporates frequency converter for international market Note: For the reconciliations of adjusted EBITDA, adjusted gross margin, net debt and adjusted free cash flow to the most comparable non-GAAP measures see non-GAAP reconciliations in Appendix |
|
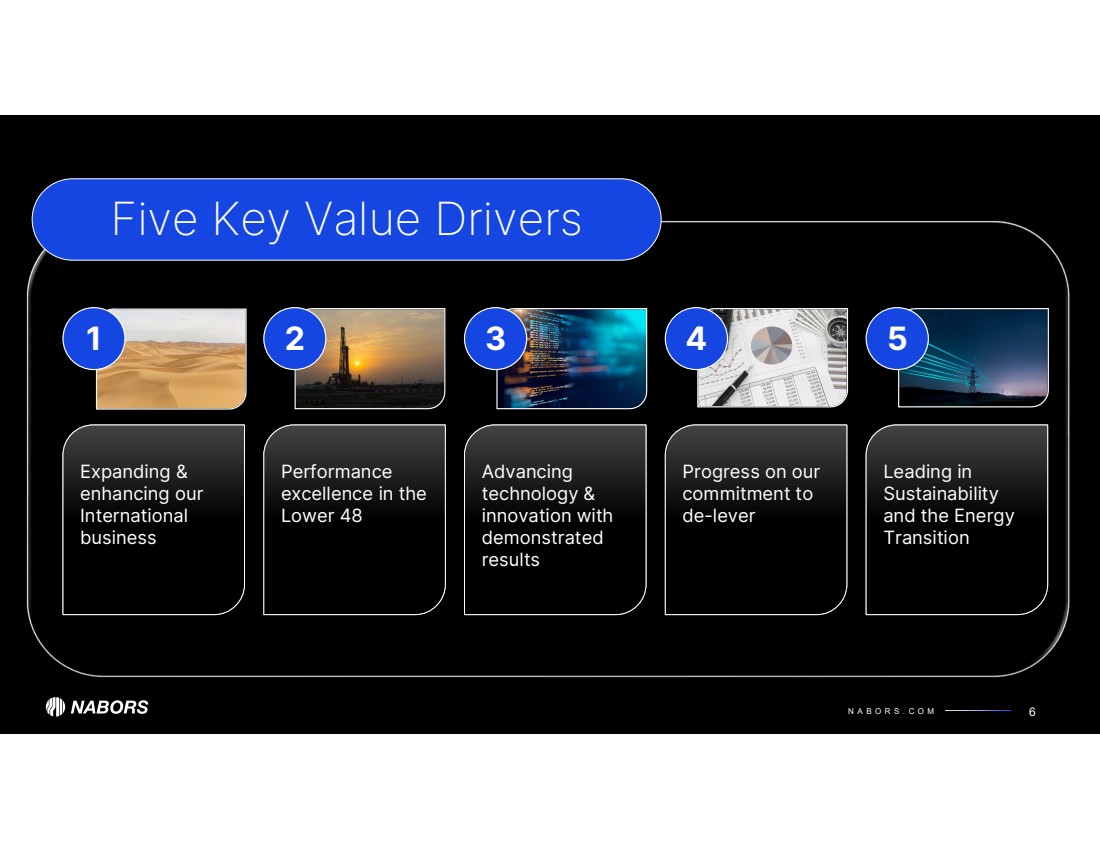
N A B O R S . C O M Performance excellence in the Lower 48 6 Expanding & enhancing our International business Five Key Value Drivers 1 Advancing technology & innovation with demonstrated results Progress on our commitment to de-lever 2 3 Leading in Sustainability and the Energy Transition 4 5 |
|
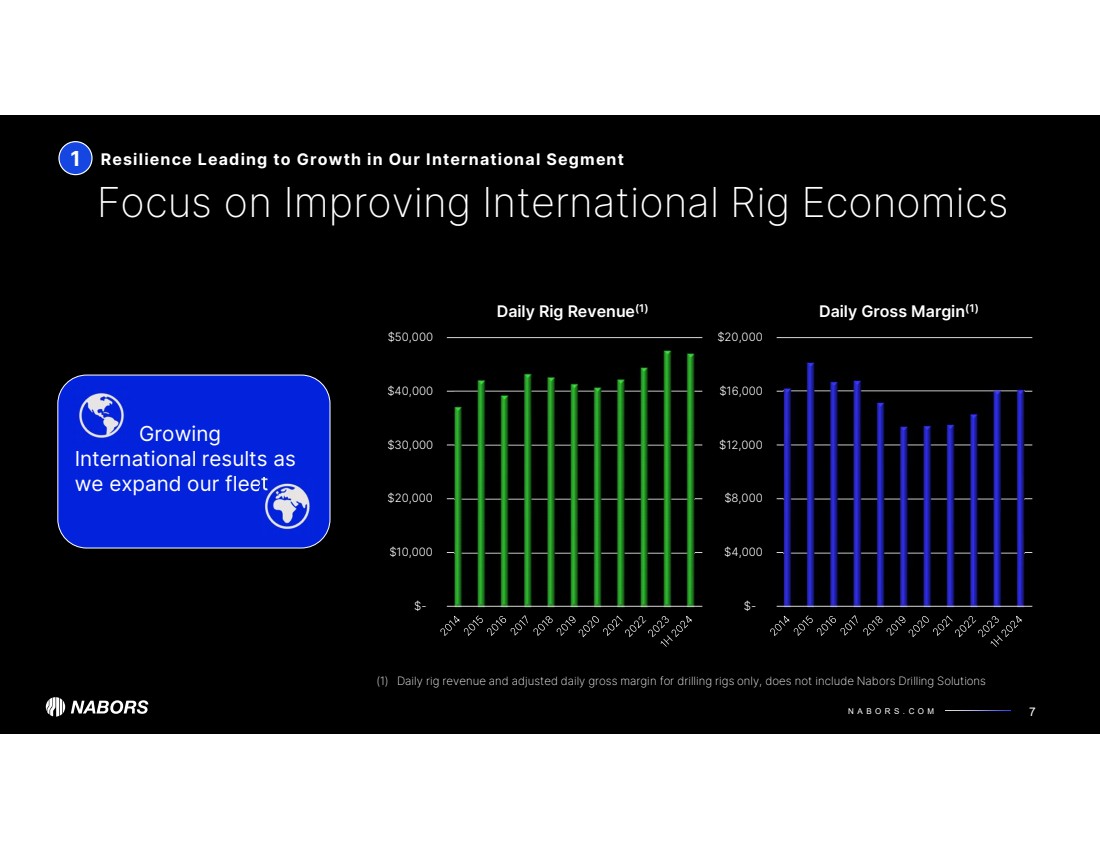
N A B O R S . C O M $- $4,000 $8,000 $12,000 $16,000 $20,000 Daily Gross Margin(1) $- $10,000 $20,000 $30,000 $40,000 $50,000 Daily Rig Revenue(1) 1 Growing International results as we expand our fleet Focus on Improving International Rig Economics Resilience Leading to Growth in Our International Segment 7 (1) Daily rig revenue and adjusted daily gross margin for drilling rigs only, does not include Nabors Drilling Solutions |
|
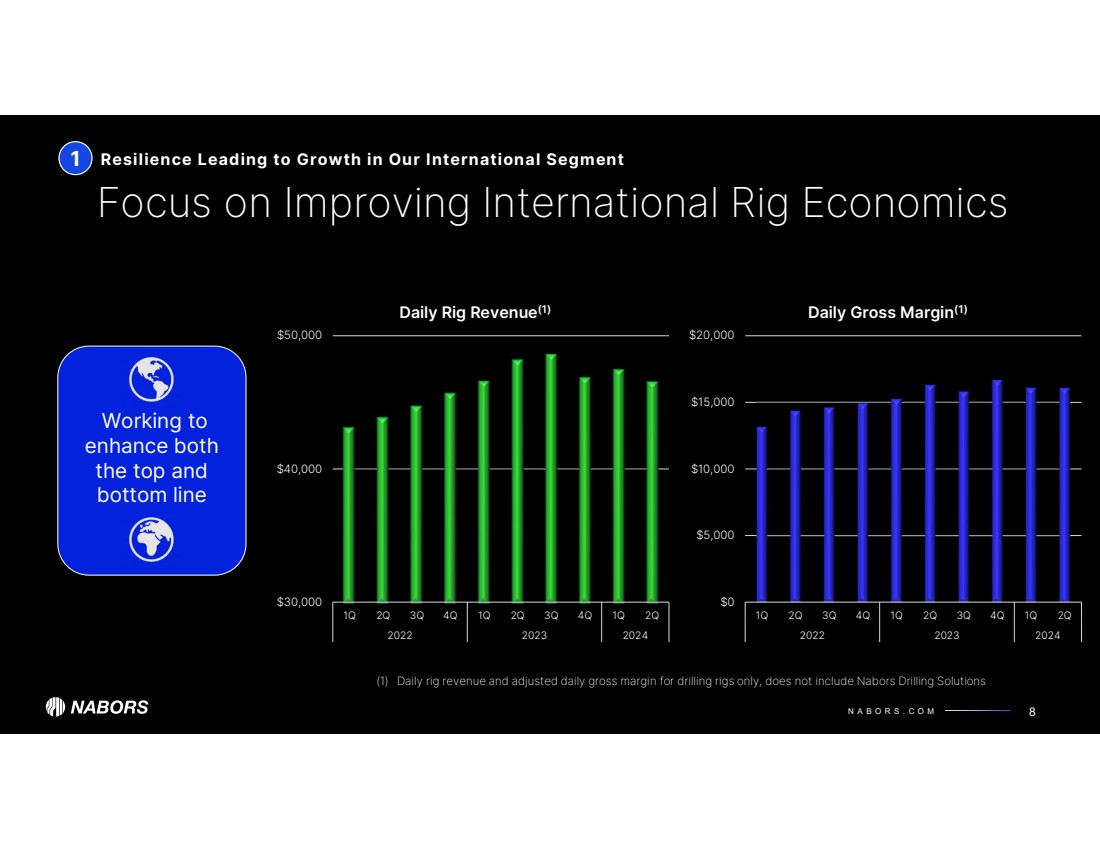
N A B O R S . C O M $0 $5,000 $10,000 $15,000 $20,000 1Q 2Q 3Q 4Q 1Q 2Q 3Q 4Q 1Q 2Q 2022 2023 2024 Daily Gross Margin(1) $30,000 $40,000 $50,000 1Q 2Q 3Q 4Q 1Q 2Q 3Q 4Q 1Q 2Q 2022 2023 2024 Daily Rig Revenue(1) 1 Working to enhance both the top and bottom line Focus on Improving International Rig Economics Resilience Leading to Growth in Our International Segment 8 (1) Daily rig revenue and adjusted daily gross margin for drilling rigs only, does not include Nabors Drilling Solutions |
|
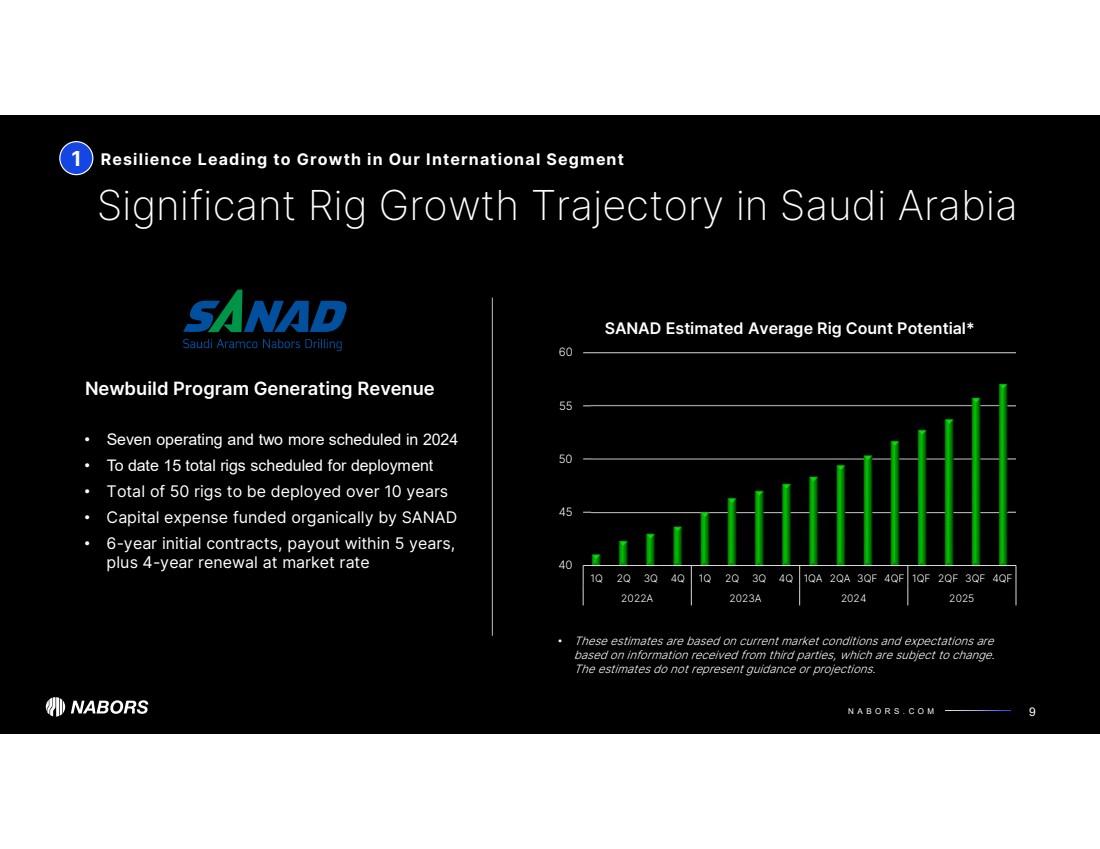
N A B O R S . C O M 1 40 45 50 55 60 1Q 2Q 3Q 4Q 1Q 2Q 3Q 4Q 1QA 2QA 3QF 4QF 1QF 2QF 3QF 4QF 2022A 2023A 2024 2025 SANAD Estimated Average Rig Count Potential* Significant Rig Growth Trajectory in Saudi Arabia Resilience Leading to Growth in Our International Segment 9 • Seven operating and two more scheduled in 2024 • To date 15 total rigs scheduled for deployment • Total of 50 rigs to be deployed over 10 years • Capital expense funded organically by SANAD • 6-year initial contracts, payout within 5 years, plus 4-year renewal at market rate Newbuild Program Generating Revenue • These estimates are based on current market conditions and expectations are based on information received from third parties, which are subject to change. The estimates do not represent guidance or projections. |
|
N A B O R S . C O M 1 Significant Opportunity for Additional International Rigs by YE 2025 10 Actively pursuing multiple opportunities in addition to contracts in-hand * These estimates are based on current market conditions and expectations are based on information received from third parties, which are subject to change. The estimates do not represent guidance or projections. Resilience Leading to Growth in Our International Segment Contracted Potential awards, negotiations and tenders Awarded/Contracted International Drilling Opportunity Set Rig Count* Working |
|
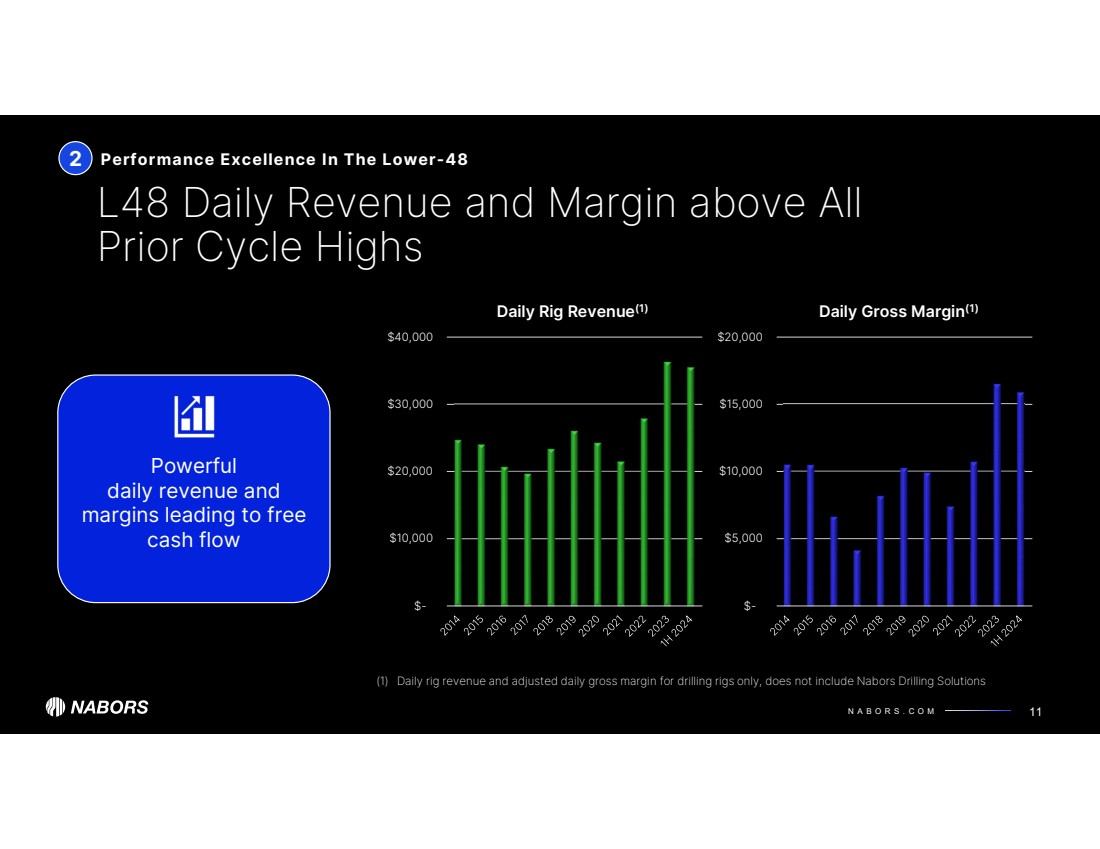
N A B O R S . C O M $- $5,000 $10,000 $15,000 $20,000 Daily Gross Margin(1) $- $10,000 $20,000 $30,000 $40,000 Daily Rig Revenue(1) 2 L48 Daily Revenue and Margin above All Prior Cycle Highs Performance Excellence In The Lower-48 11 Powerful daily revenue and margins leading to free cash flow (1) Daily rig revenue and adjusted daily gross margin for drilling rigs only, does not include Nabors Drilling Solutions |
|
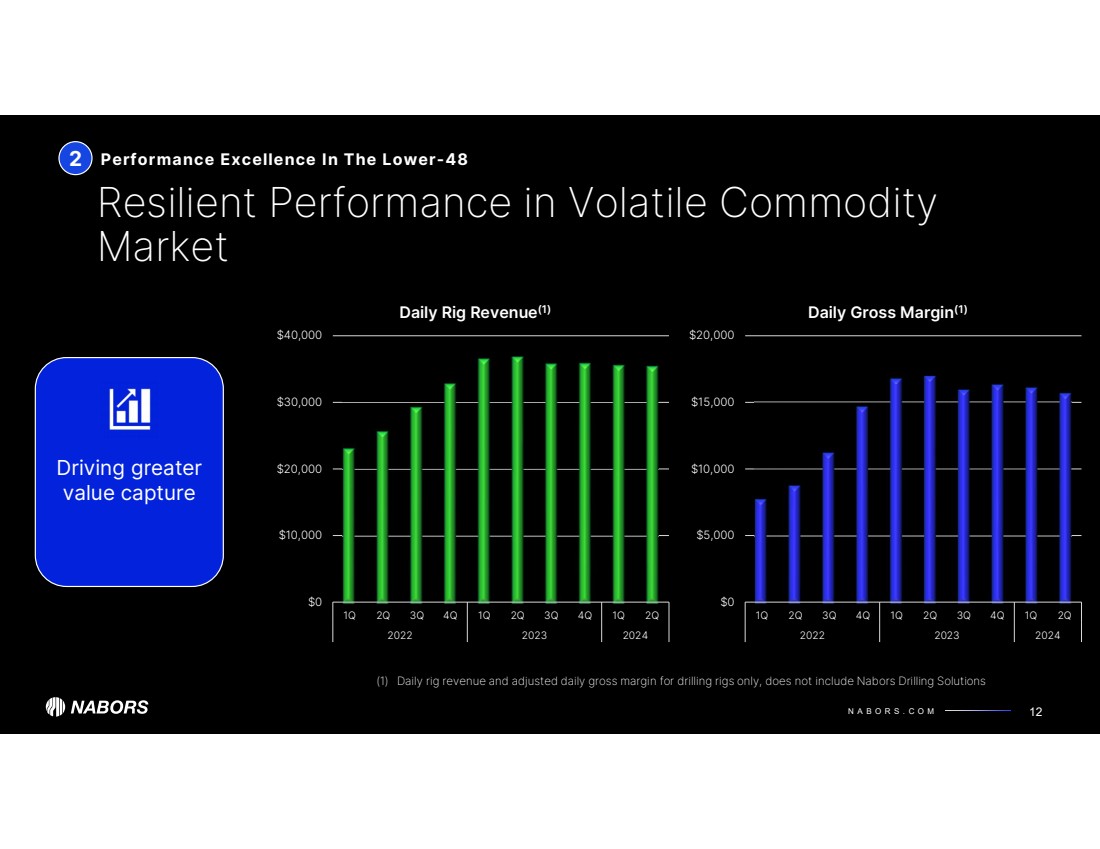
N A B O R S . C O M $0 $5,000 $10,000 $15,000 $20,000 1Q 2Q 3Q 4Q 1Q 2Q 3Q 4Q 1Q 2Q 2022 2023 2024 Daily Gross Margin(1) $0 $10,000 $20,000 $30,000 $40,000 1Q 2Q 3Q 4Q 1Q 2Q 3Q 4Q 1Q 2Q 2022 2023 2024 Daily Rig Revenue(1) 2 Resilient Performance in Volatile Commodity Market Performance Excellence In The Lower-48 12 Driving greater value capture (1) Daily rig revenue and adjusted daily gross margin for drilling rigs only, does not include Nabors Drilling Solutions |
|
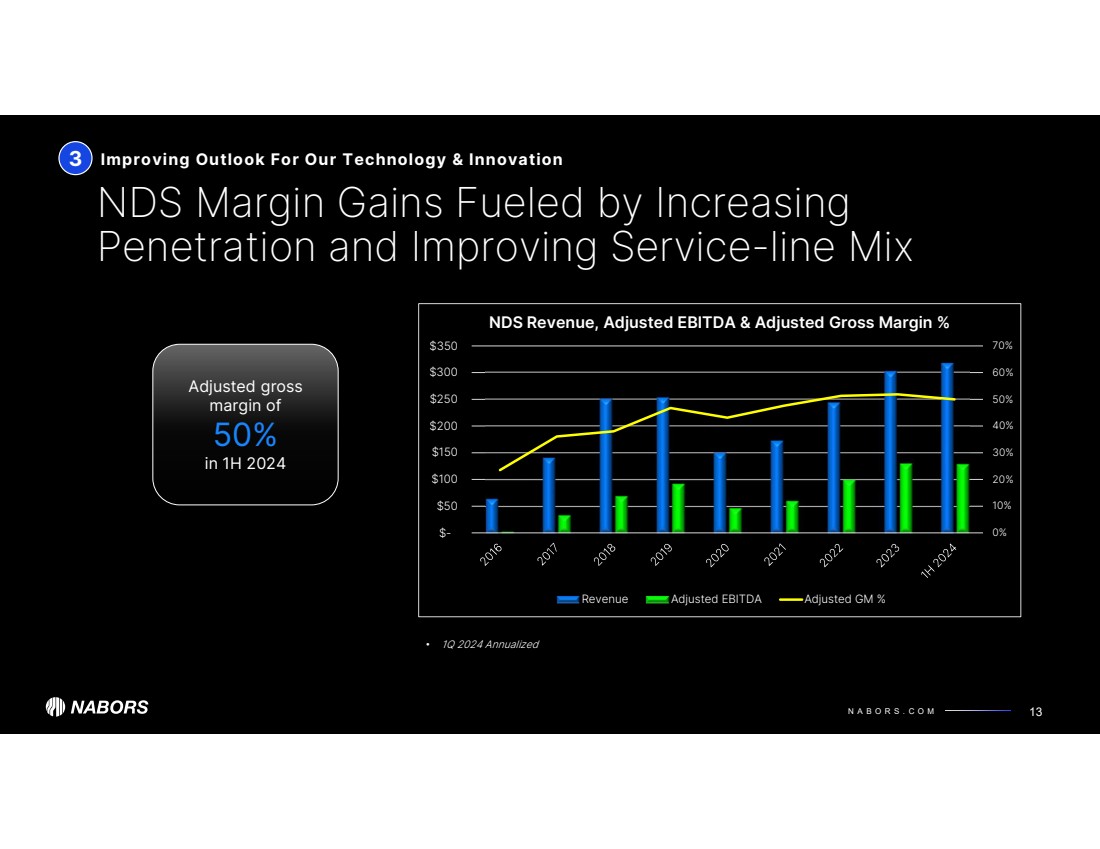
N A B O R S . C O M 0% 10% 20% 30% 40% 50% 60% 70% $- $50 $100 $150 $200 $250 $300 $350 NDS Revenue, Adjusted EBITDA & Adjusted Gross Margin % Revenue Adjusted EBITDA Adjusted GM % NDS Margin Gains Fueled by Increasing Penetration and Improving Service-line Mix Improving Outlook For Our Technology & Innovation 13 Adjusted gross margin of 50% in 1H 2024 3 • 1Q 2024 Annualized |
|
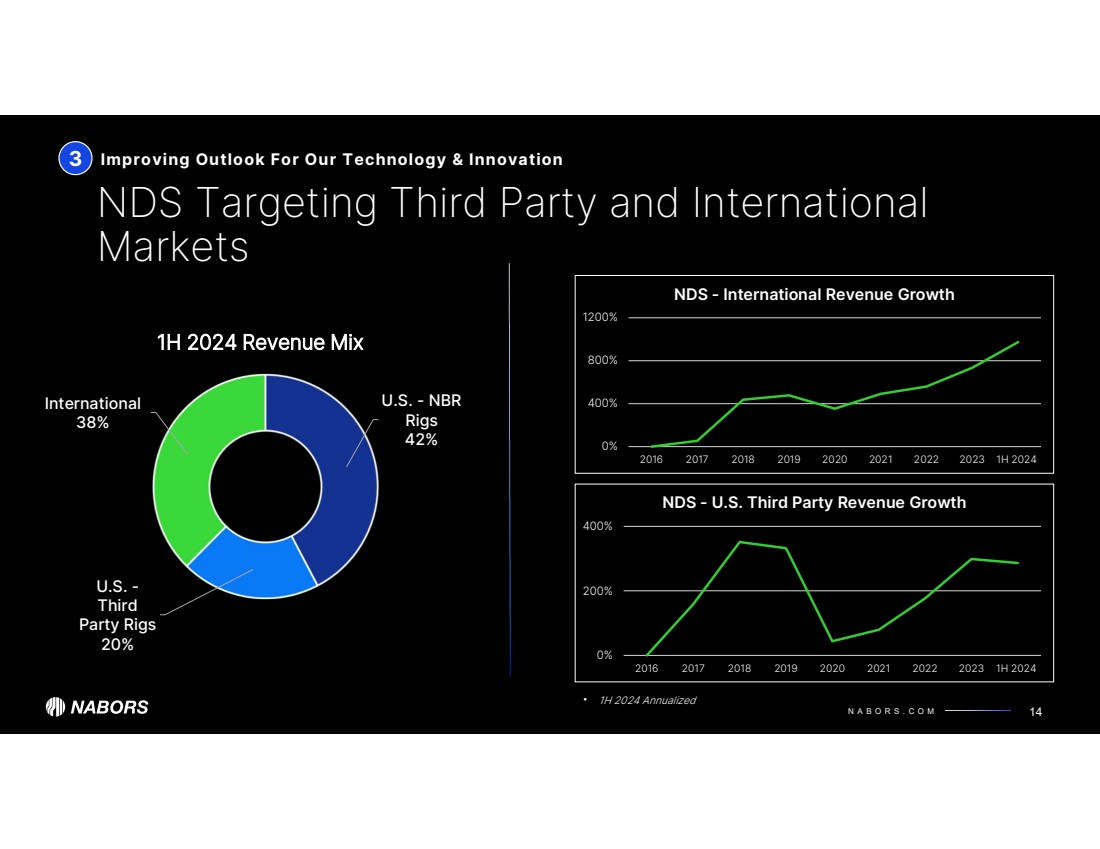
N A B O R S . C O M U.S. - NBR Rigs 42% U.S. - Third Party Rigs 20% International 38% 1H 2024 Revenue Mix 0% 200% 400% 2016 2017 2018 2019 2020 2021 2022 2023 1H 2024 NDS - U.S. Third Party Revenue Growth 0% 400% 800% 1200% 2016 2017 2018 2019 2020 2021 2022 2023 1H 2024 NDS - International Revenue Growth NDS Targeting Third Party and International Markets Improving Outlook For Our Technology & Innovation 14 3 • 1H 2024 Annualized |
|
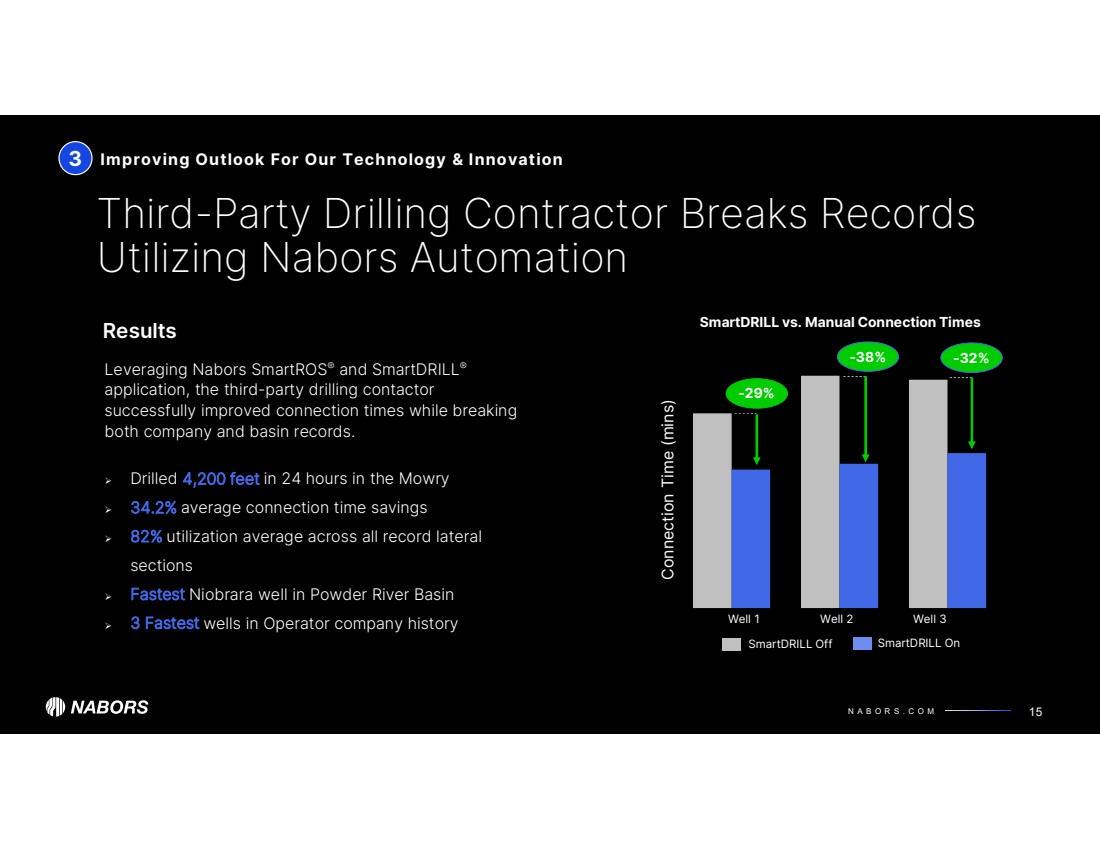
N A B O R S . C O M Third-Party Drilling Contractor Breaks Records Utilizing Nabors Automation Improving Outlook For Our Technology & Innovation 15 Leveraging Nabors SmartROS® and SmartDRILL® application, the third-party drilling contactor successfully improved connection times while breaking both company and basin records. Drilled 4,200 feet in 24 hours in the Mowry 34.2% average connection time savings 82% utilization average across all record lateral sections Fastest Niobrara well in Powder River Basin 3 Fastest wells in Operator company history Results 3 Well 1 Well 2 Well 3 SmartDRILL Off SmartDRILL On SmartDRILL vs. Manual Connection Times Connection Time (mins) -29% -38% -32% |
|
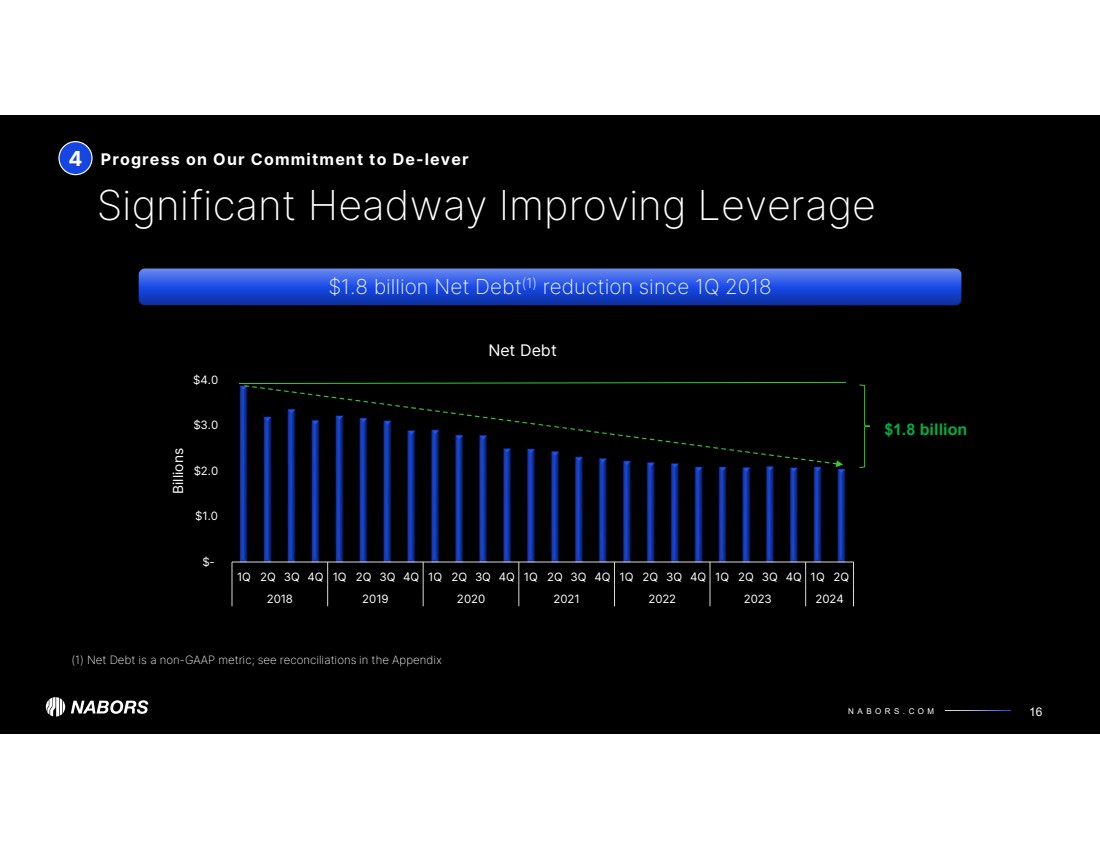
N A B O R S . C O M $- $1.0 $2.0 $3.0 $4.0 1Q 2Q 3Q 4Q 1Q 2Q 3Q 4Q 1Q 2Q 3Q 4Q 1Q 2Q 3Q 4Q 1Q 2Q 3Q 4Q 1Q 2Q 3Q 4Q 1Q 2Q 2018 2019 2020 2021 2022 2023 2024 Billions Net Debt Significant Headway Improving Leverage Progress on Our Commitment to De-lever 16 $1.8 billion Net Debt(1) reduction since 1Q 2018 $1.8 billion (1) Net Debt is a non-GAAP metric; see reconciliations in the Appendix 4 |
|
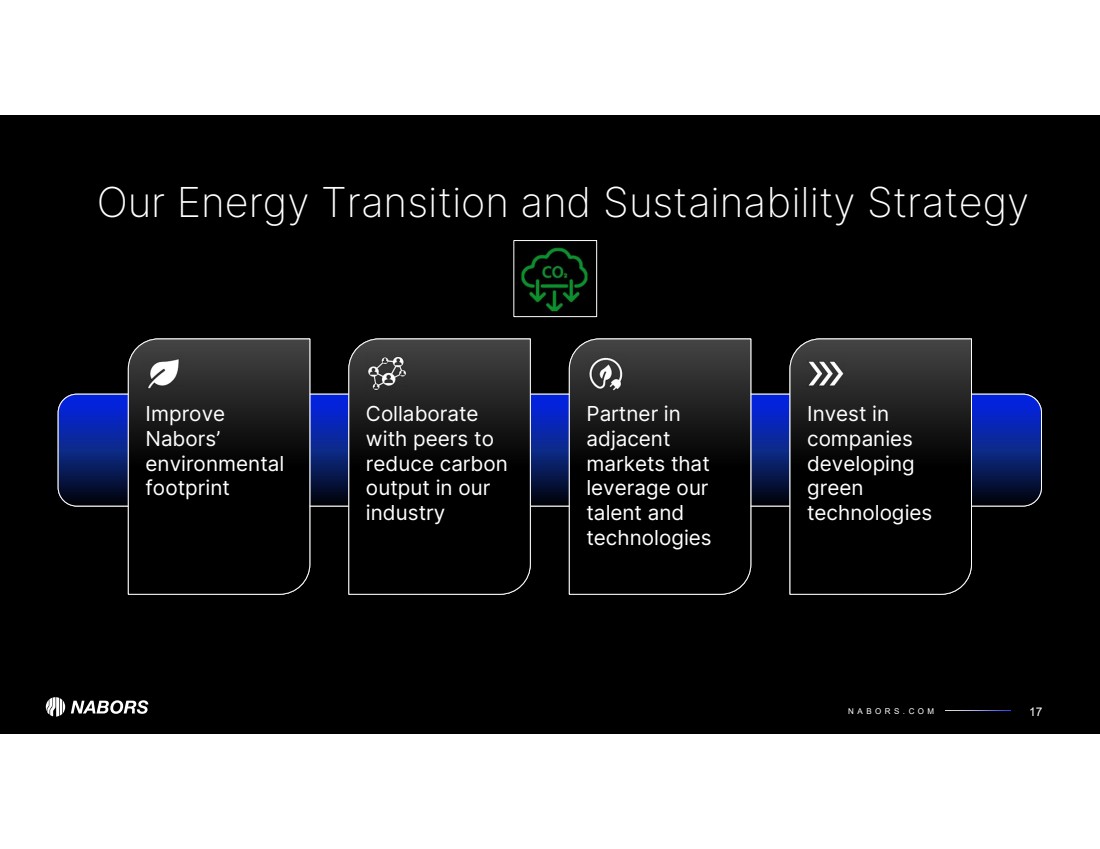
N A B O R S . C O M Our Energy Transition and Sustainability Strategy 17 Improve Nabors’ environmental footprint Collaborate with peers to reduce carbon output in our industry Partner in adjacent markets that leverage our talent and technologies Invest in companies developing green technologies |
|
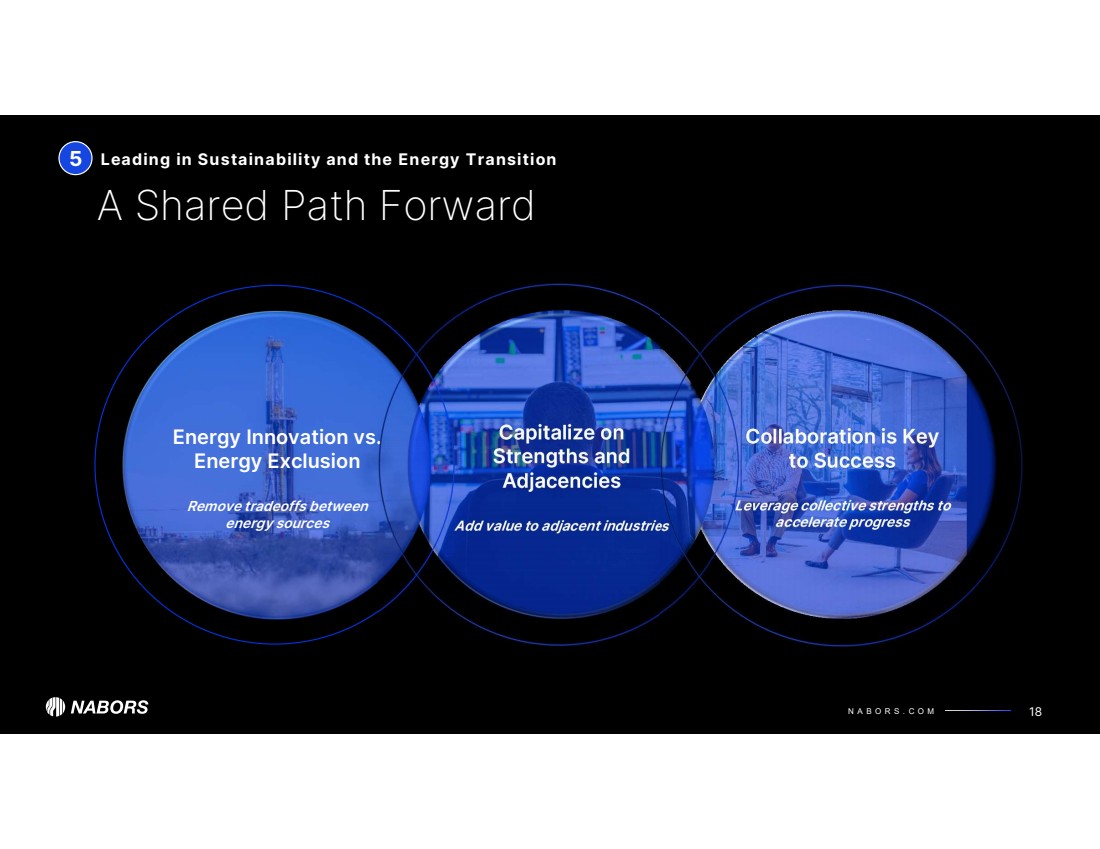
N A B O R S . C O M Leading in Sustainability and the Energy Transition Energy Innovation vs. Energy Exclusion Remove tradeoffs between energy sources A Shared Path Forward Leading in Sustainability and the Energy Transition 18 Capitalize on Strengths and Adjacencies Add value to adjacent industries Collaboration is Key to Success Leverage collective strengths to accelerate progress 5 |
|
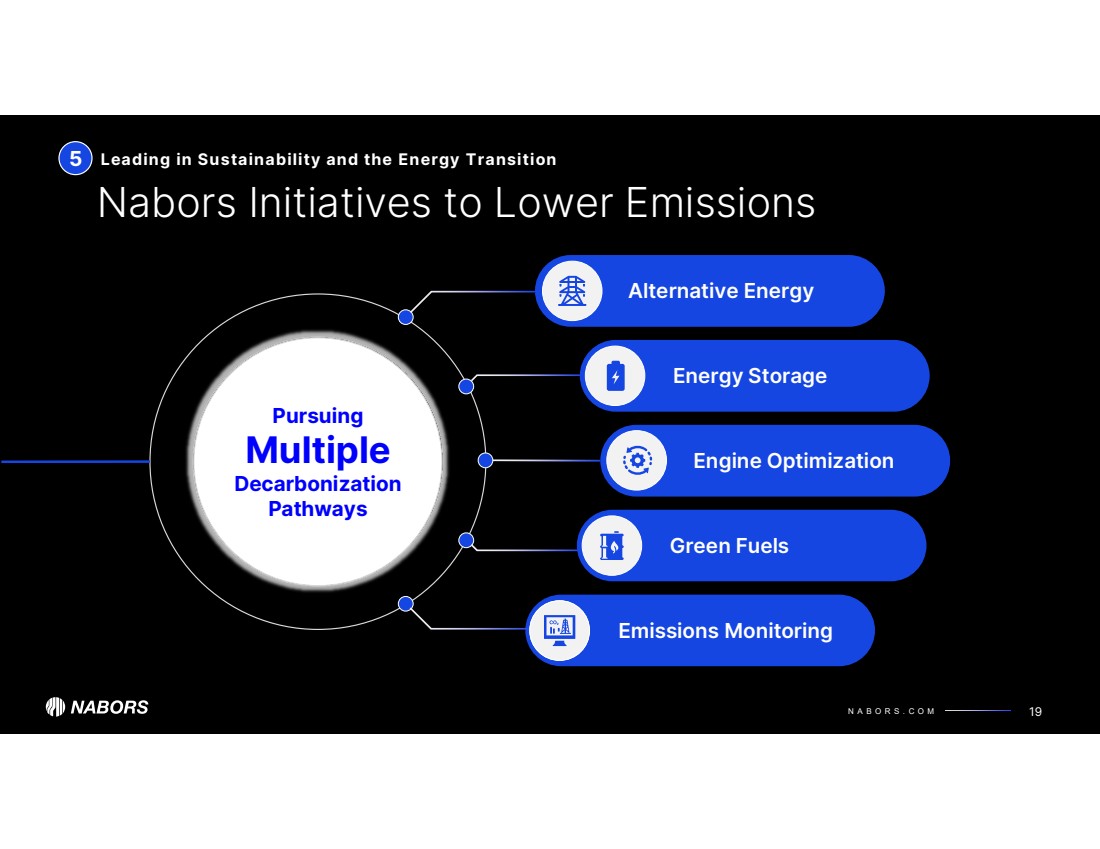
N A B O R S . C O M Alternative Energy Emissions Monitoring Pursuing Multiple Decarbonization Pathways Green Fuels Energy Storage Leading in Sustainability and the Energy Transition Nabors Initiatives to Lower Emissions 19 Engine Optimization 5 |
|
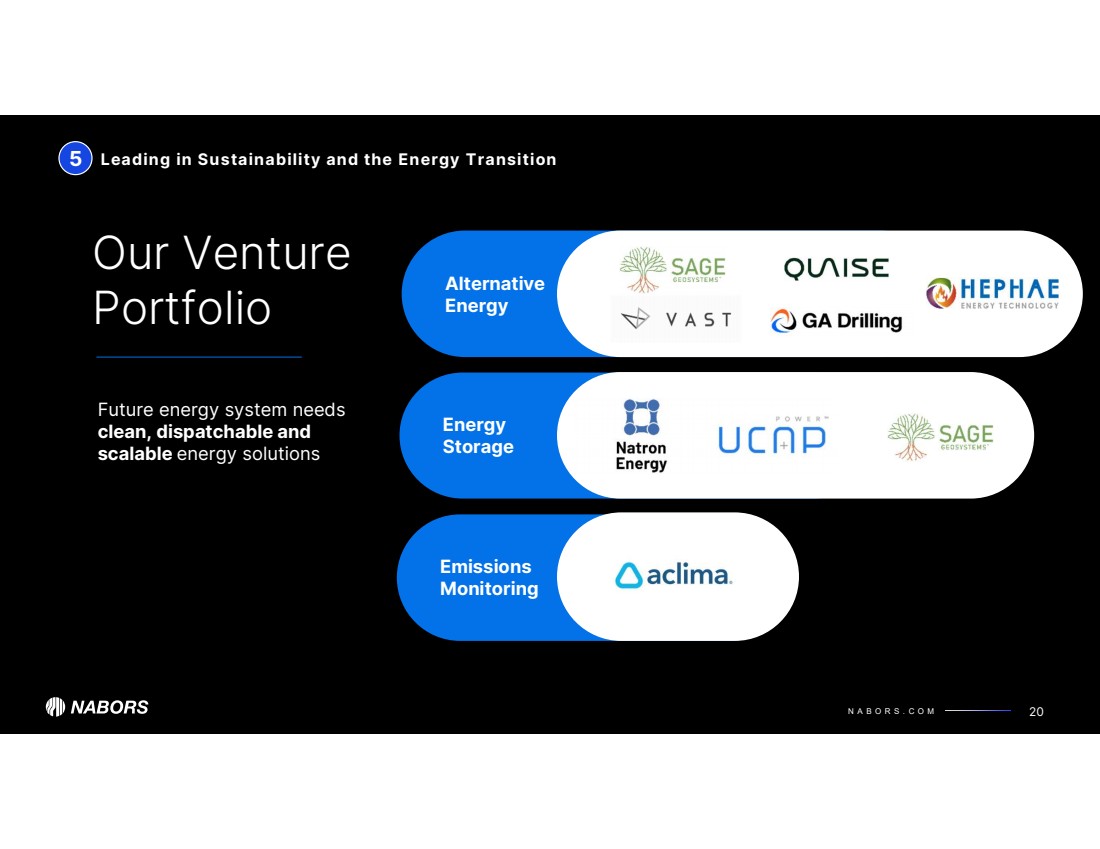
N A B O R S . C O M Leading in Sustainability and the Energy Transition Emissions Monitoring Energy Storage Alternative Energy Our Venture Portfolio Future energy system needs clean, dispatchable and scalable energy solutions 20 5 Leading in Sustainability and the Energy Transition |
|
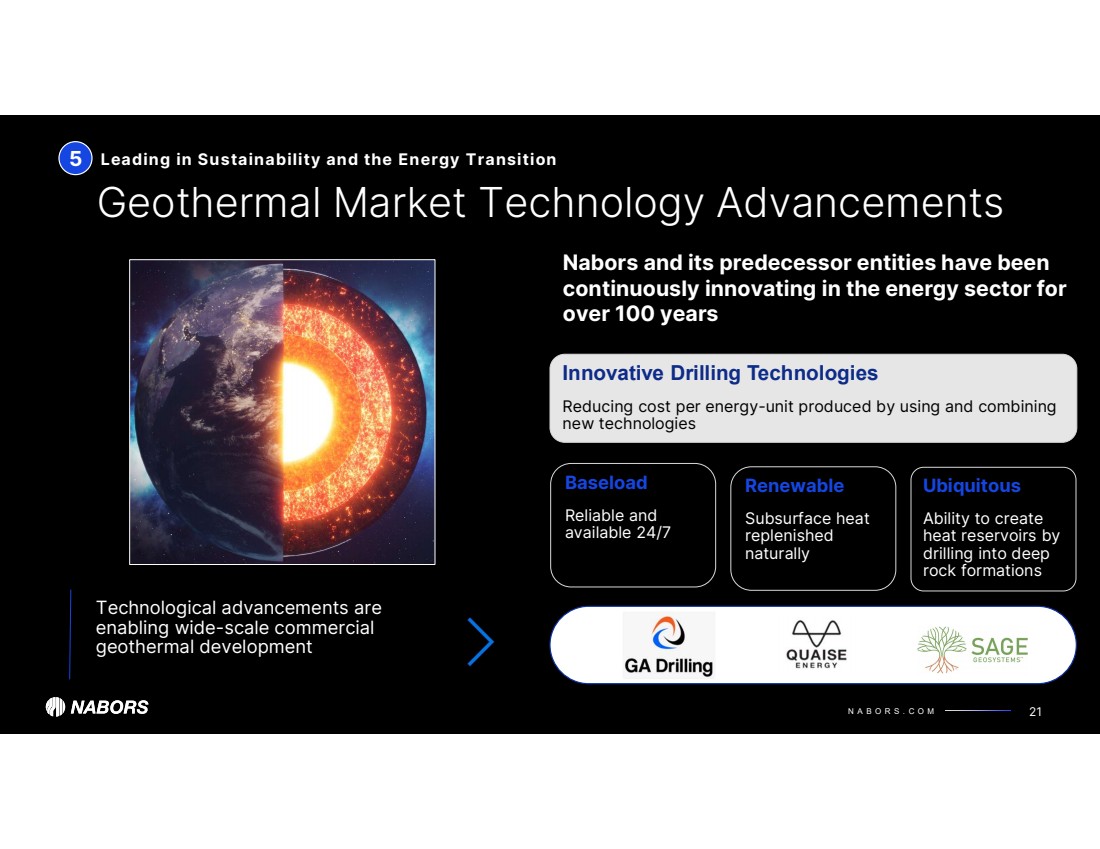
N A B O R S . C O M 21 Ubiquitous Ability to create heat reservoirs by drilling into deep rock formations Innovative Drilling Technologies Reducing cost per energy-unit produced by using and combining new technologies Baseload Reliable and available 24/7 Renewable Subsurface heat replenished naturally Nabors and its predecessor entities have been continuously innovating in the energy sector for over 100 years Technological advancements are enabling wide-scale commercial geothermal development Leading in Sustainability and the Energy Transition Geothermal Market Technology Advancements 5 |
|
Appendix 22 |
|
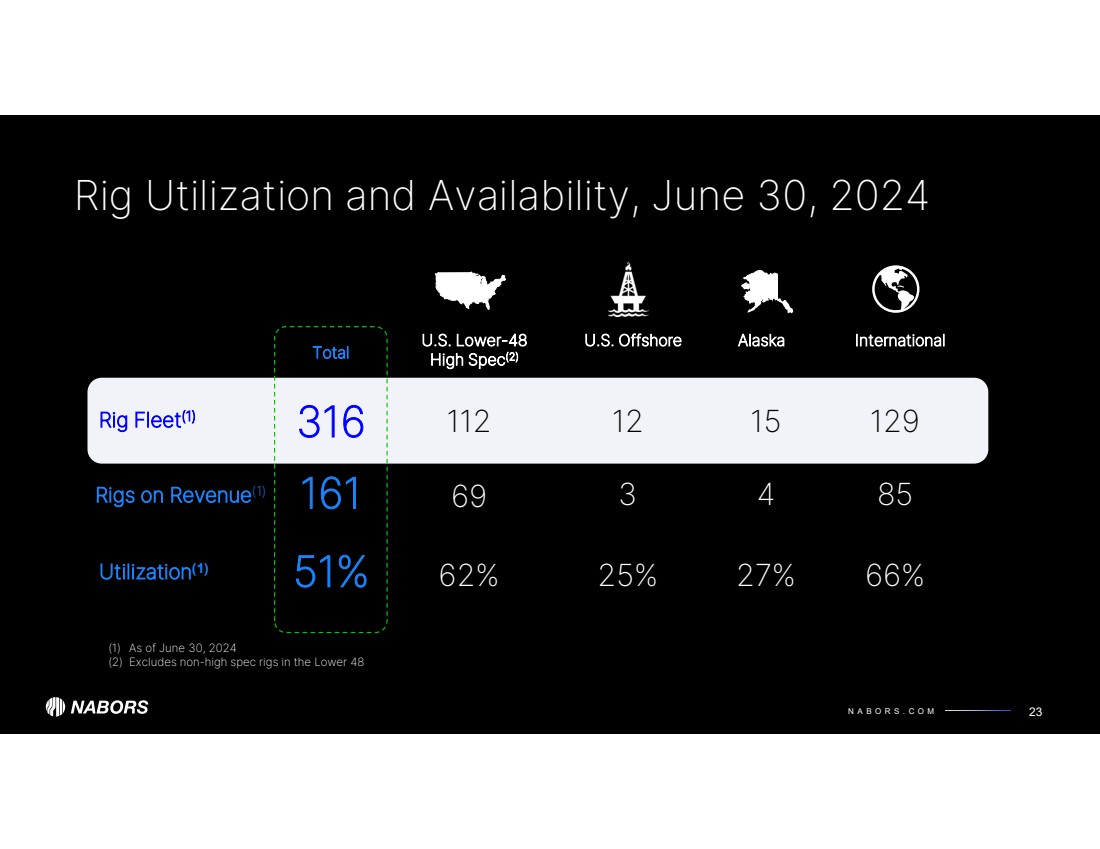
N A B O R S . C O M Rig Utilization and Availability, June 30, 2024 23 Rig Fleet(1) 316 Rigs on Revenue(1) 161 Utilization(1) 51% Total U.S. Offshore 12 3 25% 15 4 27% Alaska International 129 85 66% 112 69 62% U.S. Lower-48 High Spec(2) (1) As of June 30, 2024 (2) Excludes non-high spec rigs in the Lower 48 |
|
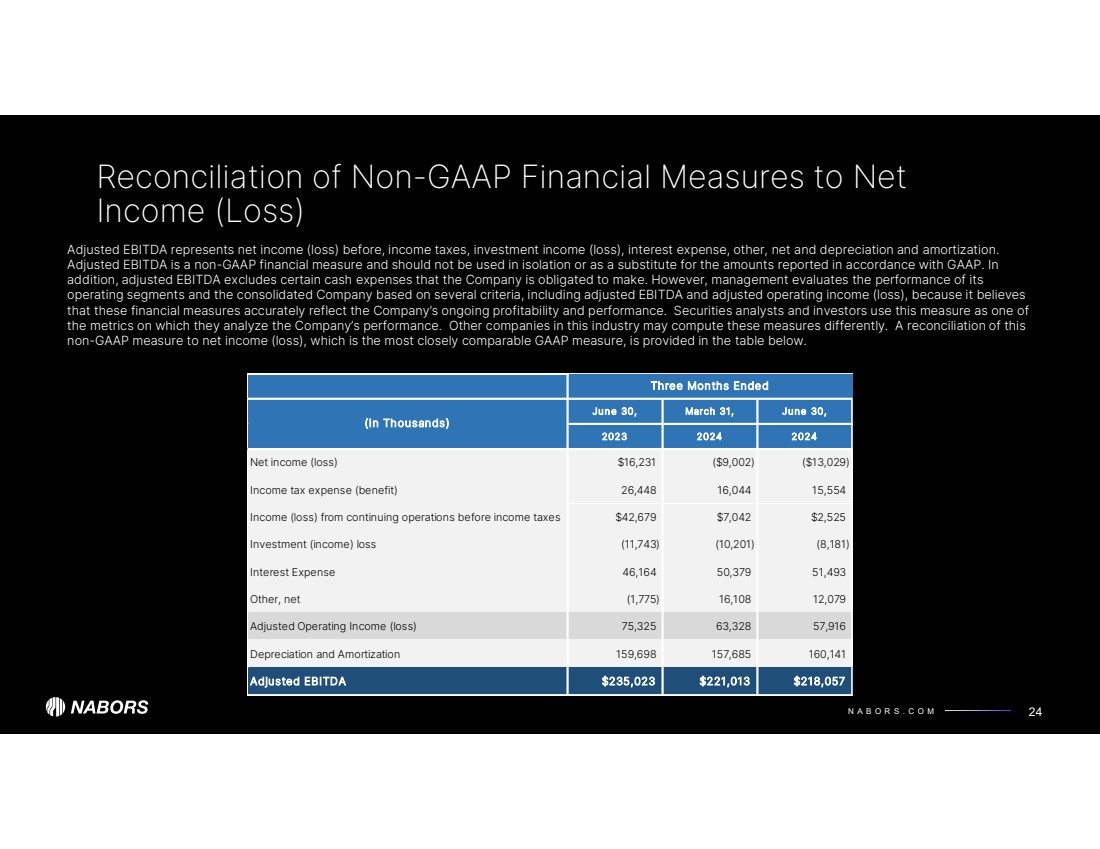
N A B O R S . C O M June 30, March 31, June 30, 2023 2024 2024 Net income (loss) $16,231 ($9,002) ($13,029) Income tax expense (benefit) 26,448 16,044 15,554 Income (loss) from continuing operations before income taxes $42,679 $7,042 $2,525 Investment (income) loss (11,743) (10,201) (8,181) Interest Expense 46,164 50,379 51,493 Other, net (1,775) 16,108 12,079 Adjusted Operating Income (loss) 75,325 63,328 57,916 Depreciation and Amortization 159,698 157,685 160,141 Adjusted EBITDA $235,023 $221,013 $218,057 (In Thousands) Three Months Ended Reconciliation of Non-GAAP Financial Measures to Net Income (Loss) 24 Adjusted EBITDA represents net income (loss) before, income taxes, investment income (loss), interest expense, other, net and depreciation and amortization. Adjusted EBITDA is a non-GAAP financial measure and should not be used in isolation or as a substitute for the amounts reported in accordance with GAAP. In addition, adjusted EBITDA excludes certain cash expenses that the Company is obligated to make. However, management evaluates the performance of its operating segments and the consolidated Company based on several criteria, including adjusted EBITDA and adjusted operating income (loss), because it believes that these financial measures accurately reflect the Company’s ongoing profitability and performance. Securities analysts and investors use this measure as one of the metrics on which they analyze the Company’s performance. Other companies in this industry may compute these measures differently. A reconciliation of this non-GAAP measure to net income (loss), which is the most closely comparable GAAP measure, is provided in the table below. |
|
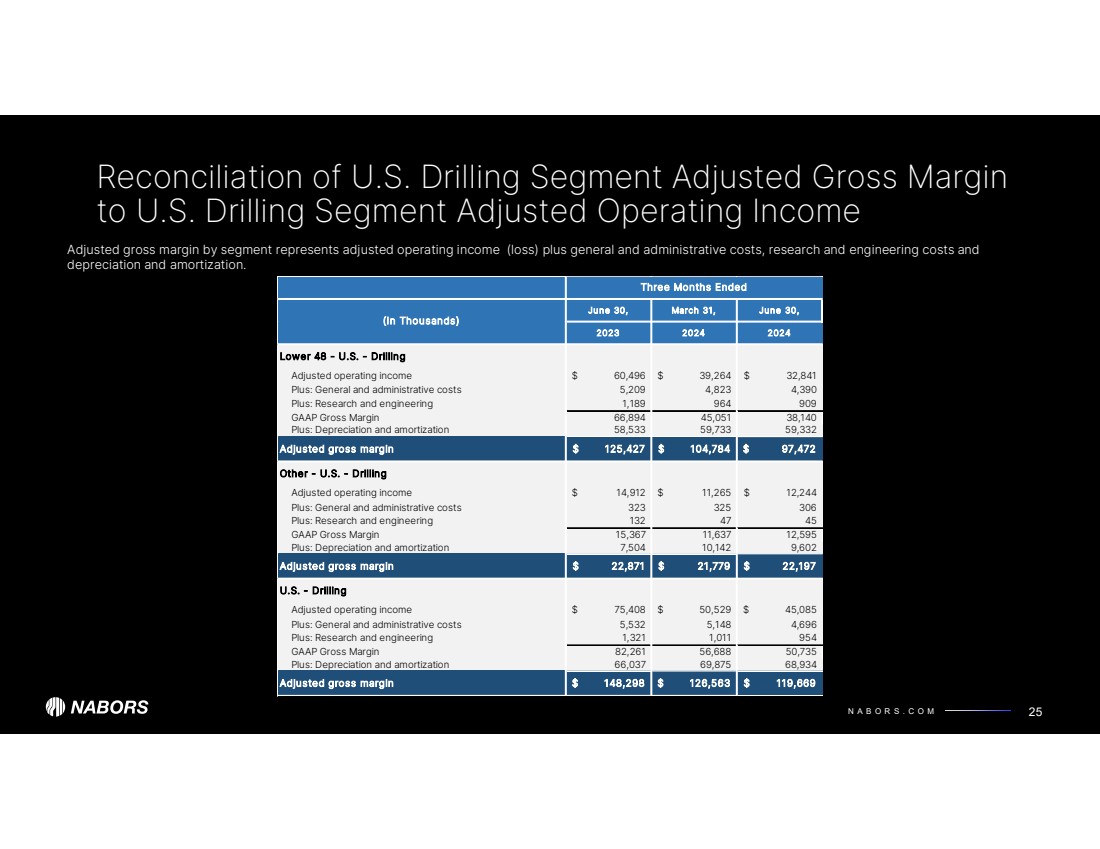
N A B O R S . C O M June 30, March 31, June 30, 2023 2024 2024 Lower 48 - U.S. - Drilling Adjusted operating income 60,496 $ 39,264 $ 32,841 $ Plus: General and administrative costs 5,209 4,823 4,390 Plus: Research and engineering 1,189 964 909 GAAP Gross Margin 66,894 45,051 38,140 Plus: Depreciation and amortization 58,533 59,733 59,332 Adjusted gross margin 125,427 $ 104,784 $ 97,472 $ Other - U.S. - Drilling Adjusted operating income 14,912 $ 11,265 $ 12,244 $ Plus: General and administrative costs 323 325 306 Plus: Research and engineering 132 47 45 GAAP Gross Margin 15,367 11,637 12,595 Plus: Depreciation and amortization 7,504 10,142 9,602 Adjusted gross margin 22,871 $ 21,779 $ 22,197 $ U.S. - Drilling Adjusted operating income 75,408 $ 50,529 $ 45,085 $ Plus: General and administrative costs 5,532 5,148 4,696 Plus: Research and engineering 1,321 1,011 954 GAAP Gross Margin 82,261 56,688 50,735 Plus: Depreciation and amortization 66,037 69,875 68,934 Adjusted gross margin 148,298 $ 126,563 $ 119,669 $ (In Thousands) Three Months Ended Reconciliation of U.S. Drilling Segment Adjusted Gross Margin to U.S. Drilling Segment Adjusted Operating Income 25 Adjusted gross margin by segment represents adjusted operating income (loss) plus general and administrative costs, research and engineering costs and depreciation and amortization. |
|
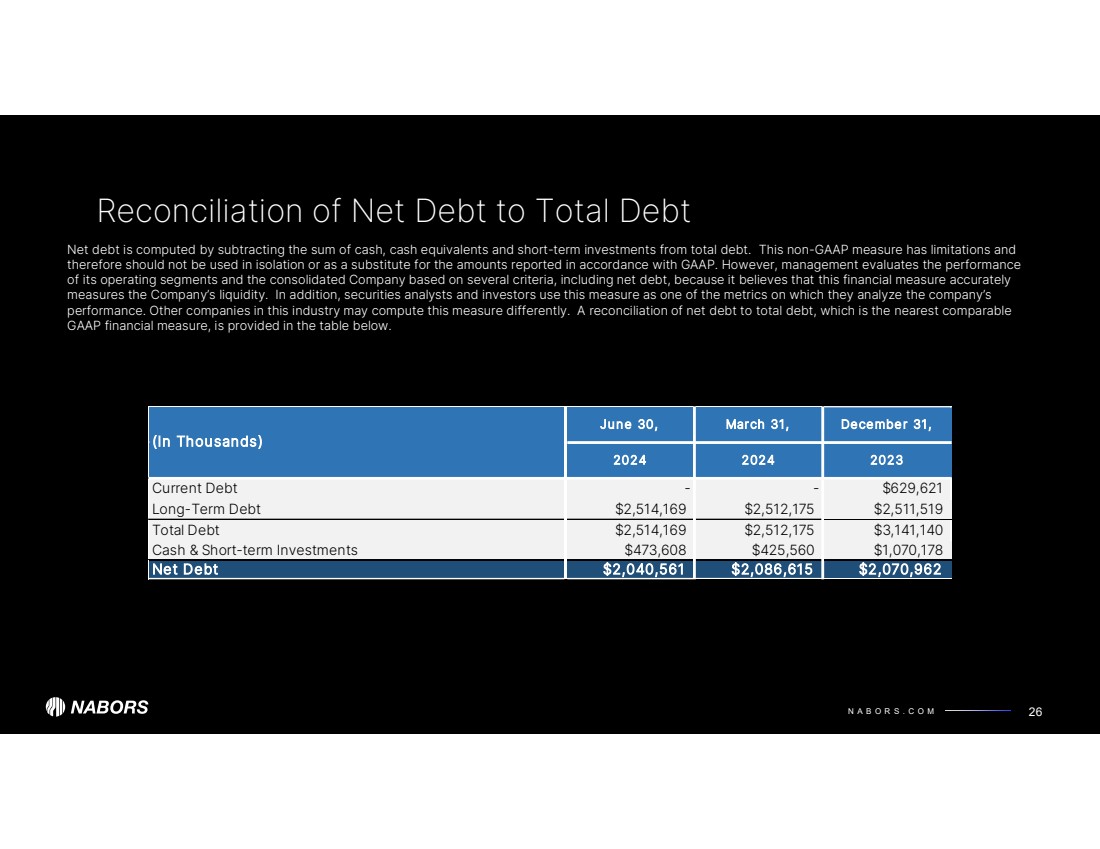
N A B O R S . C O M June 30, March 31, December 31, 2024 2024 2023 Current Debt - - $629,621 Long-Term Debt $2,514,169 $2,512,175 $2,511,519 Total Debt $2,514,169 $2,512,175 $3,141,140 Cash & Short-term Investments $473,608 $425,560 $1,070,178 Net Debt $2,040,561 $2,086,615 $2,070,962 (In Thousands) Reconciliation of Net Debt to Total Debt 26 Net debt is computed by subtracting the sum of cash, cash equivalents and short-term investments from total debt. This non-GAAP measure has limitations and therefore should not be used in isolation or as a substitute for the amounts reported in accordance with GAAP. However, management evaluates the performance of its operating segments and the consolidated Company based on several criteria, including net debt, because it believes that this financial measure accurately measures the Company’s liquidity. In addition, securities analysts and investors use this measure as one of the metrics on which they analyze the company’s performance. Other companies in this industry may compute this measure differently. A reconciliation of net debt to total debt, which is the nearest comparable GAAP financial measure, is provided in the table below. |
|
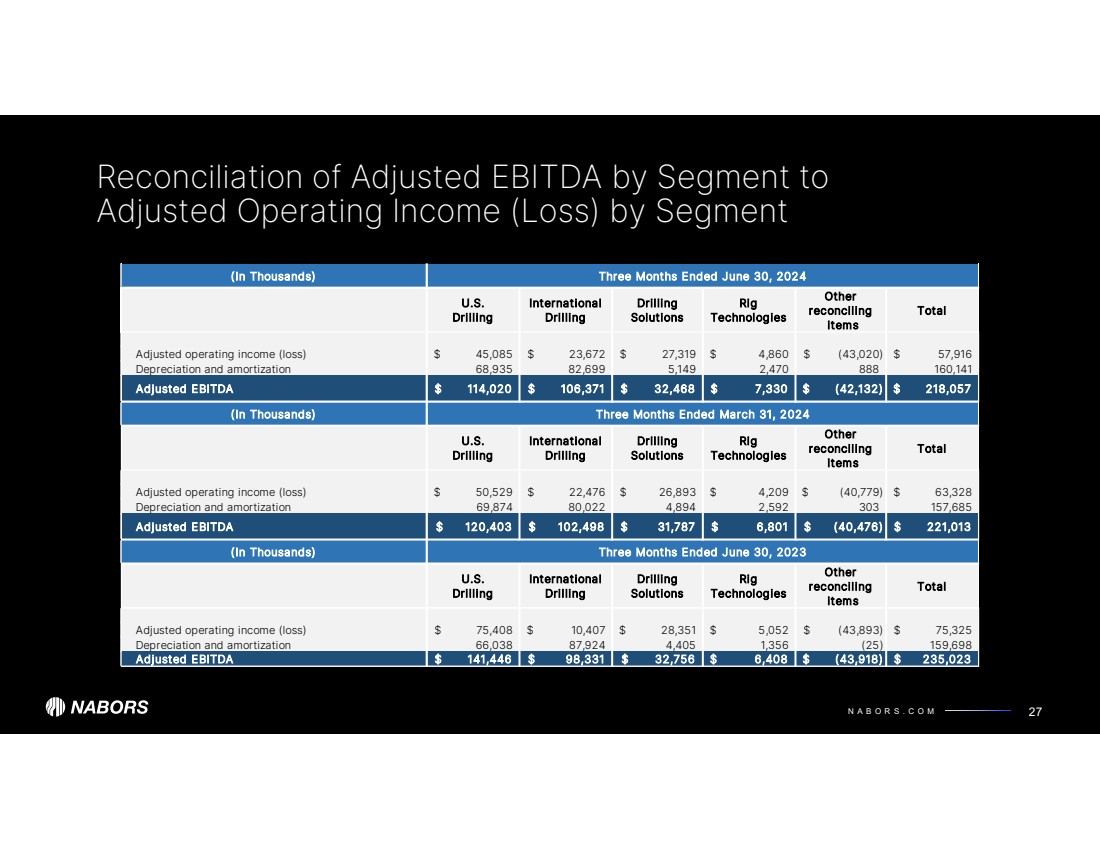
N A B O R S . C O M (In Thousands) Three Months Ended June 30, 2024 U.S. Drilling International Drilling Drilling Solutions Rig Technologies Other reconciling items Total Adjusted operating income (loss) 45,085 $ 23,672 $ 27,319 $ 4,860 $ (43,020) $ 57,916 $ Depreciation and amortization 68,935 82,699 5,149 2,470 888 160,141 Adjusted EBITDA 114,020 $ 106,371 $ 32,468 $ 7,330 $ (42,132) $ 218,057 $ (In Thousands) Three Months Ended March 31, 2024 U.S. Drilling International Drilling Drilling Solutions Rig Technologies Other reconciling items Total Adjusted operating income (loss) 50,529 $ 22,476 $ 26,893 $ 4,209 $ (40,779) $ 63,328 $ Depreciation and amortization 69,874 80,022 4,894 2,592 303 157,685 Adjusted EBITDA 120,403 $ 102,498 $ 31,787 $ 6,801 $ (40,476) $ 221,013 $ (In Thousands) Three Months Ended June 30, 2023 U.S. Drilling International Drilling Drilling Solutions Rig Technologies Other reconciling items Total Adjusted operating income (loss) 75,408 $ 10,407 $ 28,351 $ 5,052 $ (43,893) $ 75,325 $ Depreciation and amortization 66,038 87,924 4,405 1,356 (25) 159,698 Adjusted EBITDA 141,446 $ 98,331 $ 32,756 $ 6,408 $ (43,918) $ 235,023 $ Reconciliation of Adjusted EBITDA by Segment to Adjusted Operating Income (Loss) by Segment 27 Adjusted EBITDA by segment represents adjusted income (loss) plus depreciation and amortization. |
|
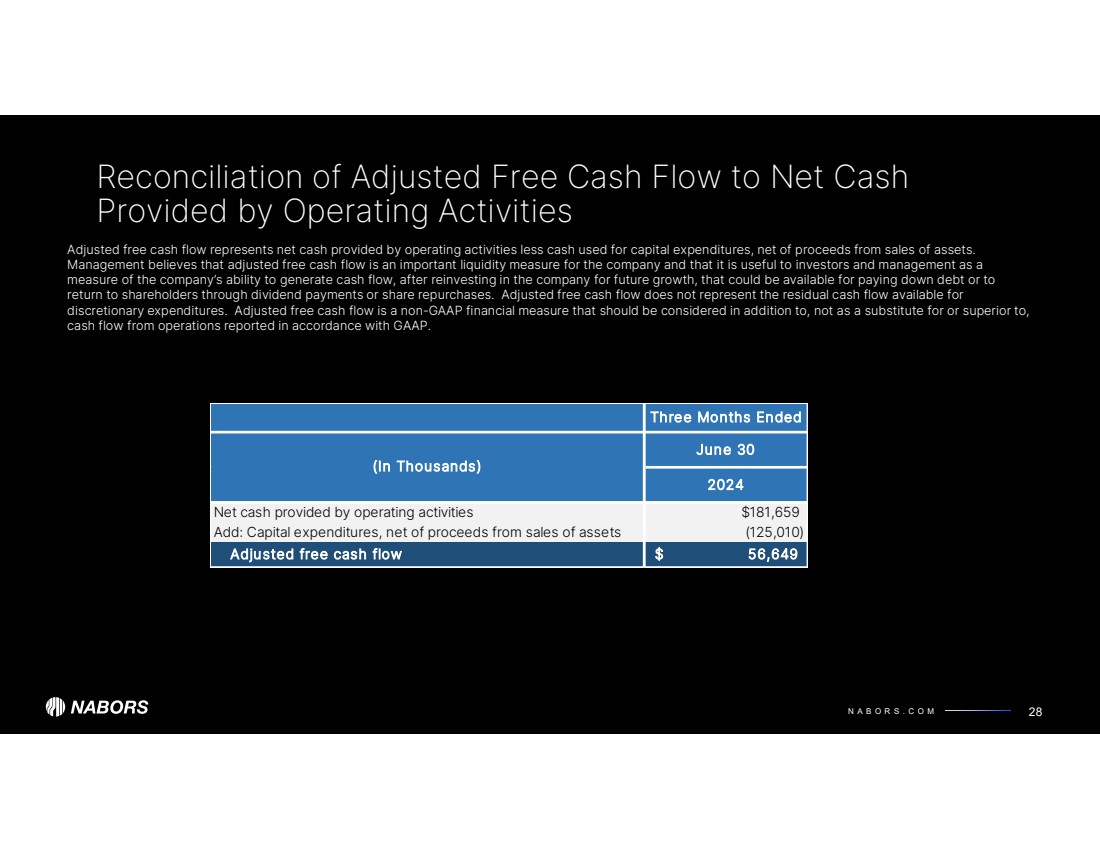
N A B O R S . C O M Three Months Ended June 30 2024 Net cash provided by operating activities $181,659 Add: Capital expenditures, net of proceeds from sales of assets (125,010) Adjusted free cash flow 56,649 $ (In Thousands) Reconciliation of Adjusted Free Cash Flow to Net Cash Provided by Operating Activities 28 Adjusted free cash flow represents net cash provided by operating activities less cash used for capital expenditures, net of proceeds from sales of assets. Management believes that adjusted free cash flow is an important liquidity measure for the company and that it is useful to investors and management as a measure of the company’s ability to generate cash flow, after reinvesting in the company for future growth, that could be available for paying down debt or to return to shareholders through dividend payments or share repurchases. Adjusted free cash flow does not represent the residual cash flow available for discretionary expenditures. Adjusted free cash flow is a non-GAAP financial measure that should be considered in addition to, not as a substitute for or superior to, cash flow from operations reported in accordance with GAAP. |
|
NABORS INDUSTRIES LTD. NABORS.COM NABORS CORPORATE SERVICES 515 W. Greens Road Suite 1200 Houston, TX 77067-4525 @ n a b o r s g l o b a l Contact Us: William C. Conroy, CFA VP - Corporate Development and Investor Relations William.Conroy@nabors.com Kara K. Peak Director - Corporate Development and Investor Relations Kara.Peak@nabors.com |