UNITED STATES
SECURITIES AND EXCHANGE COMMISSION
Washington, D.C. 20549
FORM 6-K
REPORT OF FOREIGN PRIVATE ISSUER
PURSUANT TO RULE 13A-16 OR 15D-16
UNDER THE SECURITIES EXCHANGE ACT OF 1934
For the month of July 2024
Commission File Number 333-275005
ABOVE FOOD INGREDIENTS INC.
(Exact name of Registrant as specified in its charter)
N/A
(Translation of Registrant’s name)
2305 Victoria Avenue #001
Regina, Saskatchewan, S4P 0S7
(306) 779-2268
(Address and telephone number of registrant’s principal executive offices)
Indicate by check mark whether the registrant files or will file annual reports under cover of Form 20-F or Form 40-F:
Form 20-F x Form 40-F ¨
INFORMATION CONTAINED IN THIS FORM 6-K REPORT
On July 19, 2024, Above Food Ingredients Inc. (the “Company”) made available an investor presentation through the “Investors” section of its website, www.abovefood.com/investors. A copy of the investor presentation is furnished herewith as Exhibit 99.1.
The fact that this presentation is being made available and furnished herewith should not be deemed an admission as to the materiality of any information contained in the materials. The information contained in the presentation is being provided as of July 19, 2024, and the Company does not undertake any obligation to update the presentation in the future or to update forward-looking statements to reflect subsequent actual results.
DOCUMENTS INCLUDED AS PART OF THIS REPORT
| Exhibit | ||
| 99.1 | Corporate Presentation for July 2024 |
SIGNATURES
Pursuant to the requirements of the Securities Exchange Act of 1934, the registrant has duly caused this report to be signed on its behalf by the undersigned, thereunto duly authorized.
| Above Food Ingredients Inc. | |||
| Date: July 19, 2024 | By: | /s/ Lionel Kambeitz | |
| Name: | Lionel Kambeitz | ||
| Title: | Chief Executive Officer | ||
|
Investor Presentation NASDAQ: ABVE JULY 2024 © 2024 Above Food Corp. The Regenerative Ingredient Company Breaking Boundaries & Disrupting Tradition |
|
FORWARD-LOOKING STATEMENTS This Presentation includes “forward-looking statements” within the meaning of the “safe harbor” provisions of the United States private Securities Litigation Reform Act of 1995. Forward-looking statements may be identified by the use of words such as “estimate,” “plan,” “project,” “forecast,” “intend,” “will,” “expect,” “anticipate,” “believe,” “seek,” “target”, or negatives of these terms or other similar expressions that predict or indicate future events or trends or that are not statements of historical matters. These forward-looking statements include, but are not limited to, statements regarding estimates and forecasts of other financial and performance metrics, and projections of market opportunity and market share. These statements are based on various assumptions, whether or not identified in this Presentation, and on the current expectations of Above Food Ingredients Inc. and its subsidiaries (the “Company”) and its management and are not predictions of actual performance. These forward-looking statements are provided for illustrative purposes only and are not intended to serve as, and must not be relied on by any investor as, a guarantee, an assurance, a prediction or a definitive statement of fact or probability. Actual events and circumstances are difficult or impossible to predict and will differ from assumptions. Many actual events and circumstances are beyond the control of the Company. These statements are neither promises nor guarantees and involve known and unknown risks, uncertainties and other important factors that may cause actual results, performance or achievements to be materially different from what is expressed or implied by the forward-looking statements, including, but not limited to: risks related to the uncertainty of the Company's projected financial information; the ability of the Company to implement business plans, forecasts, and other expectations following the completion of its business combination between Above Food Corp. and Bite Acquisition Corp., and the ability of the Company to identify and realize additional opportunities; changes in the competitive industries in which the Company operates and variations in operating performance across competitors; the ability of the Company to retain existing customers and attract new customers; the potential inability of the Company to manage growth effectively; the enforceability of the Company's intellectual property rights, including its copyrights, patents, trademarks and trade secrets, and the potential infringement on the intellectual property rights of others; the Company's dependence on senior management and other key employees; the Company's ability to execute its planned acquisition strategy, including to successfully integrate completed acquisitions and realize anticipated synergies; the ability of the Company to issue equity or equity-linked securities in the future; the Company's substantial indebtedness; and other important factors discussed in the section titled “Risk Factors” in the Company's Proxy Statement/Prospectus filed on April 8, 2024, as any such factors may be updated from time to time in the Company's other filings with the SEC, accessible on the SEC's website at www.sec.gov and the Company's investor relations site at https://abovefood.com/investors/. Forward-looking statements speak only as of the date they are made and, except as may be required under applicable law, the Company undertakes no obligation to update or revise any forward-looking statements, whether as a result of new information, future events or otherwise. INDUSTRY AND MARKET DATA This Presentation has been prepared by the Company and includes market data and other statistical information from third-party sources, including independent industry publications, governmental publications and other published independent sources. Some data is also based on the estimates of the Company, which are derived from their review of internal sources as well as the third-party sources described above. None of the Company or any of their respective representatives or affiliates has independently verified the information and cannot guarantee its accuracy and completeness. FINANCIAL INFORMATION; NON-GAAP FINANCIAL MEASURES The financial information and data contained herein have been prepared on the basis of a fiscal year ending on January 31 of each year. For example fiscal year ended 2021 ended on January 31, 2021 and fiscal year 2022 ended on January 31, 2022, and as such may not be comparable with the financial information and data of other companies, including our competitors, who do not use the same fiscal year end. TRADEMARKS AND TRADE NAMES The Company owns or has rights to various trademarks, service marks, trade names and copyrights that they use in connection with the operation of their respective businesses. This Presentation also contains trademarks, service marks and trade names of third parties, which are the property of their respective owners. The use or display of third parties’ trademarks, service marks, trade names or products in this Presentation is not intended to, and does not imply, a relationship with the Company, or an endorsement or sponsorship by or the Company. Solely for convenience, the trademarks, service marks and trade names referred to in this Presentation may appear without the ©, TM or SM symbols, but such references are not intended to indicate, in any way, that the Company or the applicable rights owner will not assert, to the fullest extent under applicable law, their rights or the right of the applicable licensor to these trademarks, service marks and trade names. Disclaimer 2 |
|
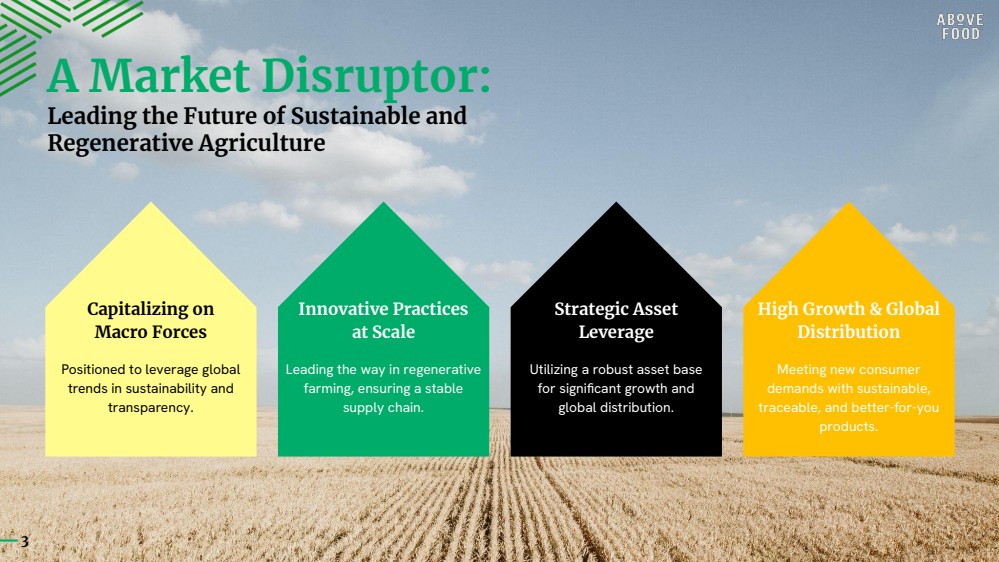
A Market Disruptor: Leading the Future of Sustainable and Regenerative Agriculture Capitalizing on Macro Forces Positioned to leverage global trends in sustainability and transparency. Innovative Practices at Scale Leading the way in regenerative farming, ensuring a stable supply chain. Strategic Asset Leverage Utilizing a robust asset base for significant growth and global distribution. High Growth & Global Distribution Meeting new consumer demands with sustainable, traceable, and better-for-you products. 3 |
|
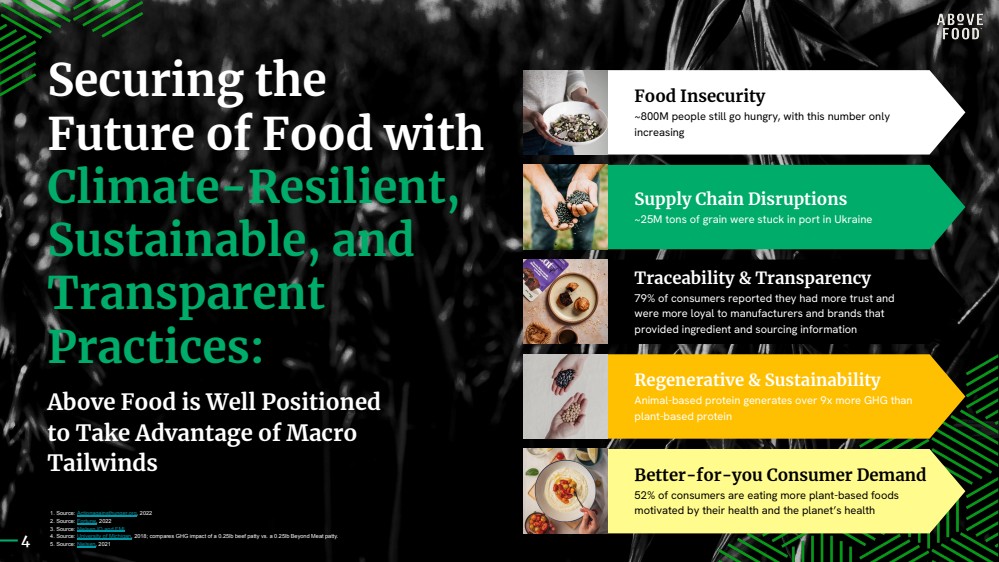
Securing the Future of Food with Climate-Resilient, Sustainable, and Transparent Practices: Above Food is Well Positioned to Take Advantage of Macro Tailwinds Food Insecurity ~800M people still go hungry, with this number only increasing Supply Chain Disruptions ~25M tons of grain were stuck in port in Ukraine 79% of consumers reported they had more trust and were more loyal to manufacturers and brands that provided ingredient and sourcing information Regenerative & Sustainability Animal-based protein generates over 9x more GHG than plant-based protein Traceability & Transparency Better-for-you Consumer Demand 52% of consumers are eating more plant-based foods motivated by their health and the planet’s health 4 1. Source: Actionagainsthunger.org, 2022 2. Source: Fortune, 2022 3. Source: Nielsen IQ and FMI 4. Source: University of Michigan, 2018; compares GHG impact of a 0.25lb beef patty vs. a 0.25lb Beyond Meat patty. 5. Source: Nielsen, 2021 |
|
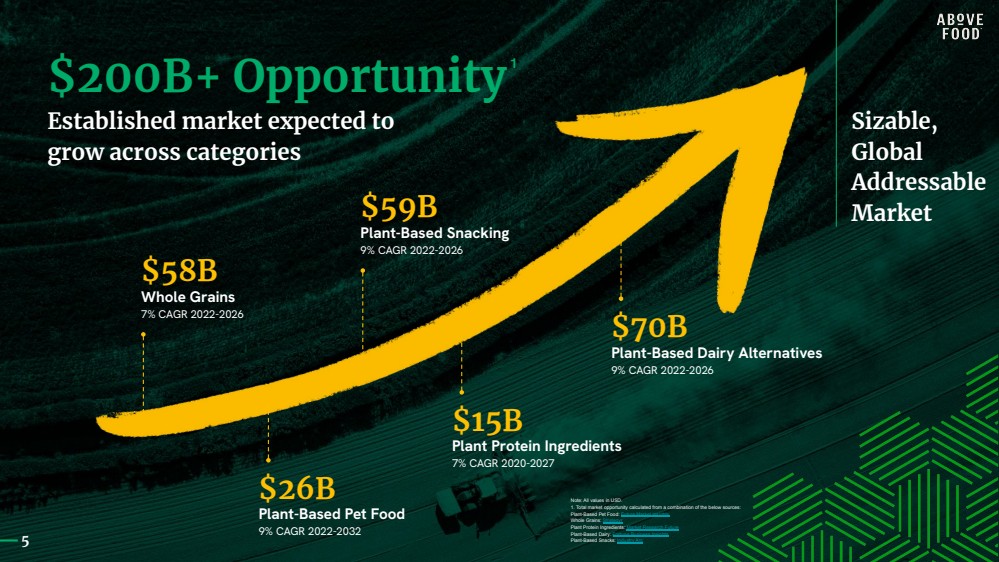
$200B+ Opportunity Sizable, Global Addressable Market Established market expected to grow across categories $58B Whole Grains 7% CAGR 2022-2026 $59B Plant-Based Snacking 9% CAGR 2022-2026 $26B Plant-Based Pet Food 9% CAGR 2022-2032 $15B Plant Protein Ingredients 7% CAGR 2020-2027 $70B Plant-Based Dairy Alternatives 9% CAGR 2022-2026 5 Note: All values in USD. 1. Total market opportunity calculated from a combination of the below sources: Plant-Based Pet Food: Future Market Insights Whole Grains: Strategyr Plant Protein Ingredients: Market Research Future Plant-Based Dairy: Fortune Business Insights Plant-Based Snacks: Industry Arc 1 |
|
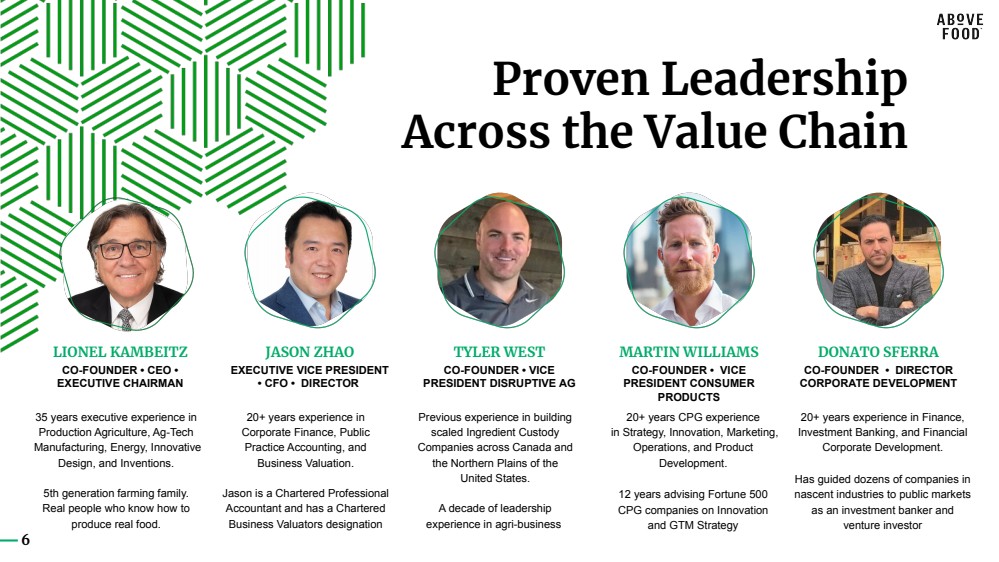
Proven Leadership Across the Value Chain LIONEL KAMBEITZ CO-FOUNDER • CEO • EXECUTIVE CHAIRMAN 35 years executive experience in Production Agriculture, Ag-Tech Manufacturing, Energy, Innovative Design, and Inventions. 5th generation farming family. Real people who know how to produce real food. JASON ZHAO EXECUTIVE VICE PRESIDENT • CFO • DIRECTOR 20+ years experience in Corporate Finance, Public Practice Accounting, and Business Valuation . Jason is a Chartered Professional Accountant and has a Chartered Business Valuators designation TYLER WEST CO-FOUNDER • VICE PRESIDENT DISRUPTIVE AG Previous experience in building scaled Ingredient Custody Companies across Canada and the Northern Plains of the United States . A decade of leadership experience in agri-business MARTIN WILLIAMS CO-FOUNDER • VICE PRESIDENT CONSUMER PRODUCTS 20+ years CPG experience in Strategy, Innovation, Marketing, Operations, and Product Development . 12 years advising Fortune 500 CPG companies on Innovation and GTM Strategy DONATO SFERRA CO-FOUNDER • DIRECTOR CORPORATE DEVELOPMENT 20+ years experience in Finance, Investment Banking, and Financial Corporate Development. Has guided dozens of companies in nascent industries to public markets as an investment banker and venture investor 6 |
|
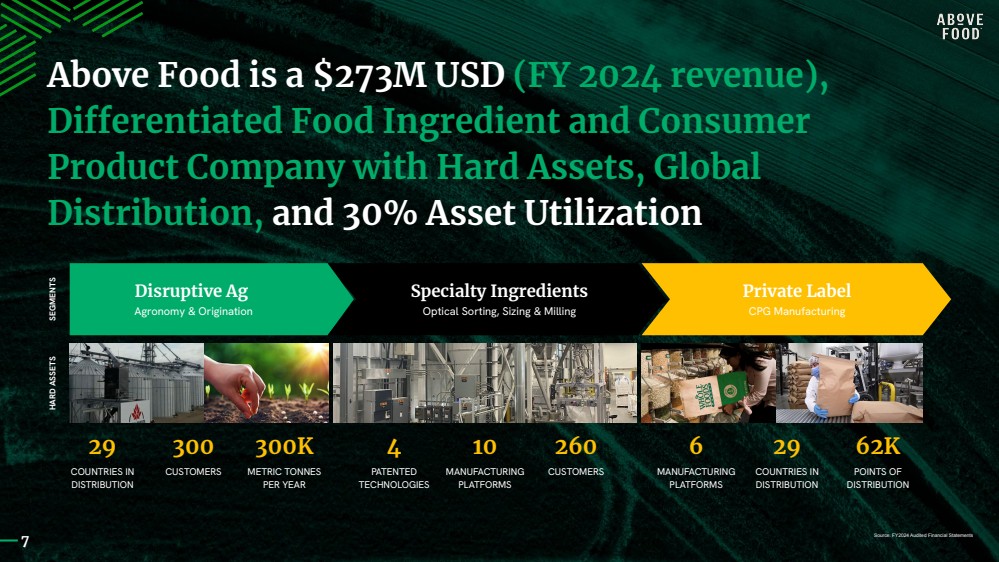
Above Food is a $273M USD (FY 2024 revenue), Differentiated Food Ingredient and Consumer Product Company with Hard Assets, Global Distribution, and 30% Asset Utilization Disruptive Ag Agronomy & Origination Specialty Ingredients Optical Sorting, Sizing & Milling Private Label CPG Manufacturing 6 MANUFACTURING PLATFORMS 29 COUNTRIES IN DISTRIBUTION 62K POINTS OF DISTRIBUTION HARD ASSETS SEGMENTS 4 PATENTED TECHNOLOGIES 10 MANUFACTURING PLATFORMS 260 CUSTOMERS 29 COUNTRIES IN DISTRIBUTION 300 CUSTOMERS 300K METRIC TONNES PER YEAR 7 Source: FY2024 Audited Financial Statements |
|
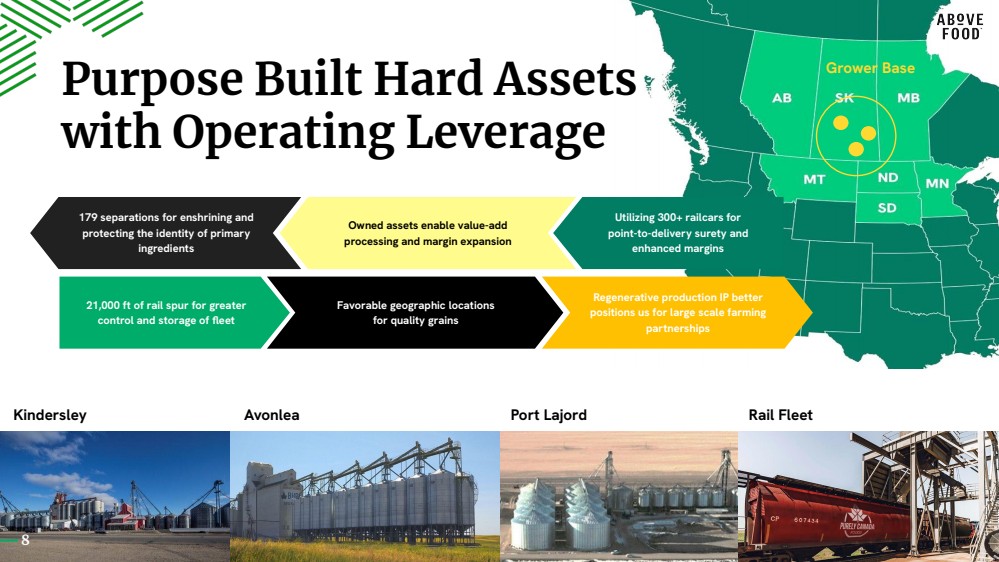
Purpose Built Hard Assets with Operating Leverage Favorable geographic locations for quality grains Regenerative production IP better positions us for large scale farming partnerships 21,000 ft of rail spur for greater control and storage of fleet Owned assets enable value-add processing and margin expansion Utilizing 300+ railcars for point-to-delivery surety and enhanced margins 179 separations for enshrining and protecting the identity of primary ingredients Kindersley Avonlea Port Lajord Rail Fleet Grower Base 8 |
|
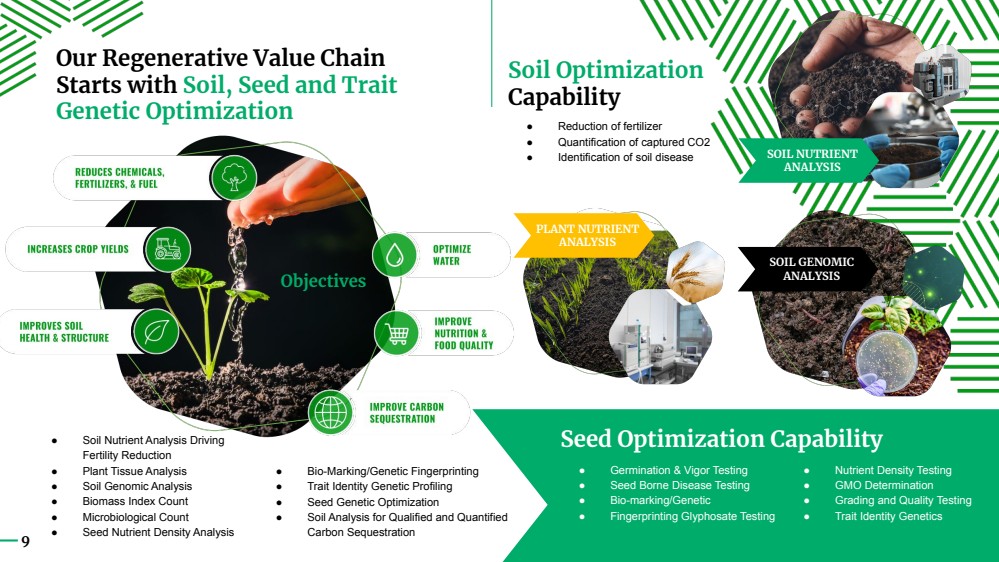
Our Regenerative Value Chain Starts with Soil, Seed and Trait Genetic Optimization ● Soil Nutrient Analysis Driving Fertility Reduction ● Plant Tissue Analysis ● Soil Genomic Analysis ● Biomass Index Count ● Microbiological Count ● Seed Nutrient Density Analysis ● Bio-Marking/Genetic Fingerprinting ● Trait Identity Genetic Profiling ● Seed Genetic Optimization ● Soil Analysis for Qualified and Quantified Carbon Sequestration Objectives Soil Optimization Capability ● Reduction of fertilizer ● Quantification of captured CO2 ● Identification of soil disease PLANT NUTRIENT ANALYSIS SOIL NUTRIENT ANALYSIS SOIL GENOMIC ANALYSIS Seed Optimization Capability ● Germination & Vigor Testing ● Seed Borne Disease Testing ● Bio-marking/Genetic ● Fingerprinting Glyphosate Testing ● Nutrient Density Testing ● GMO Determination ● Grading and Quality Testing ● Trait Identity Genetics 9 |
|
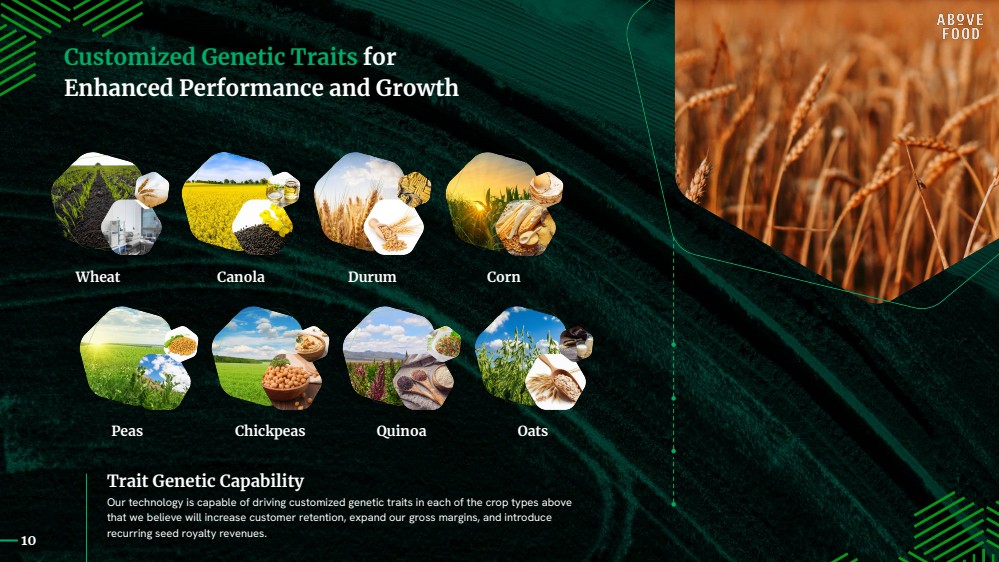
Trait Genetic Capability Our technology is capable of driving customized genetic traits in each of the crop types above that we believe will increase customer retention, expand our gross margins, and introduce recurring seed royalty revenues. Wheat Canola Durum Corn Peas Chickpeas Quinoa Oats Customized Genetic Traits for Enhanced Performance and Growth 10 |
|
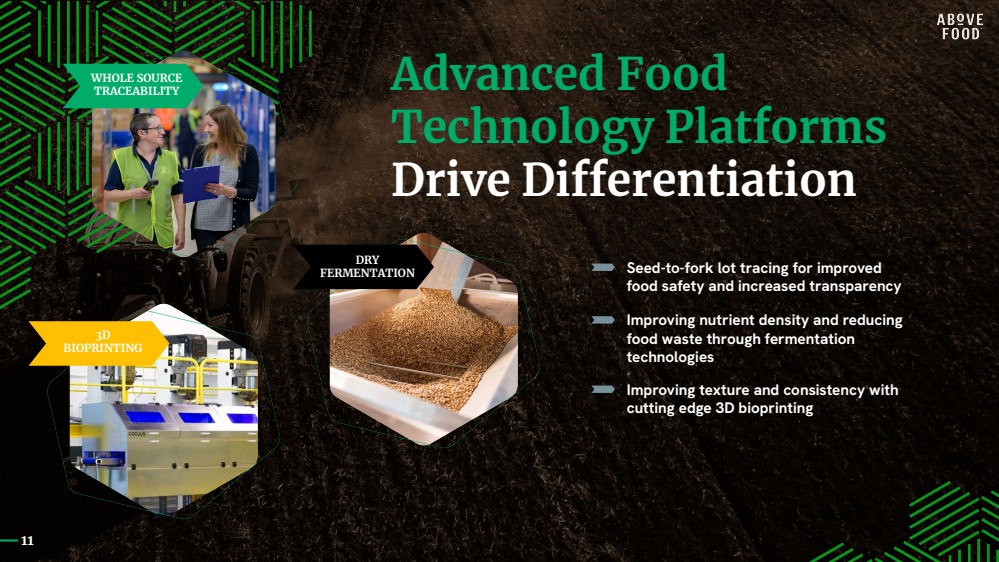
Advanced Food Technology Platforms Drive Differentiation DRY FERMENTATION 3D BIOPRINTING Seed-to-fork lot tracing for improved food safety and increased transparency Improving nutrient density and reducing food waste through fermentation technologies Improving texture and consistency with cutting edge 3D bioprinting WHOLE SOURCE TRACEABILITY 11 |
|
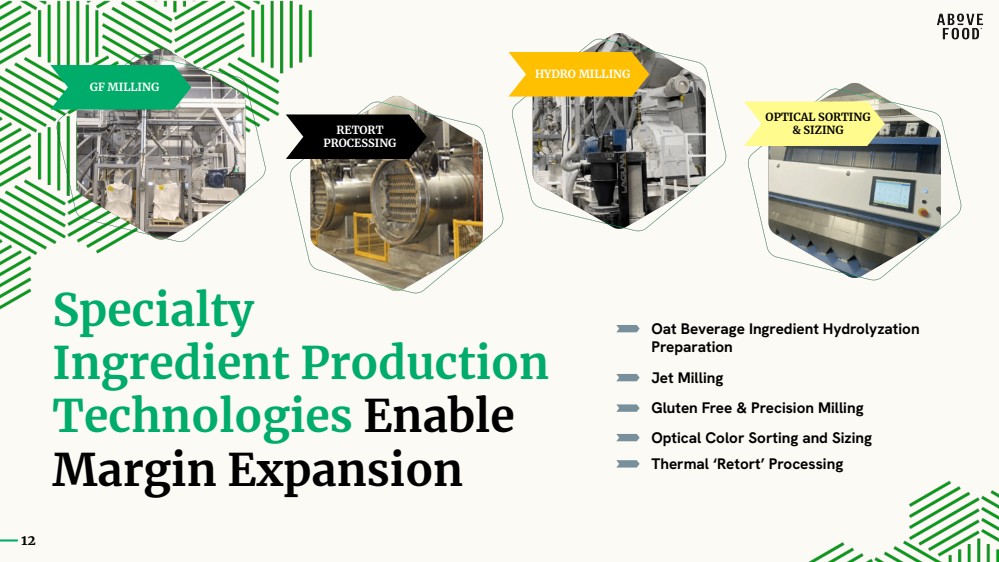
Specialty Ingredient Production Technologies Enable Margin Expansion GF MILLING RETORT PROCESSING HYDRO MILLING OPTICAL SORTING & SIZING Oat Beverage Ingredient Hydrolyzation Preparation Jet Milling Gluten Free & Precision Milling Optical Color Sorting and Sizing Thermal ‘Retort’ Processing 12 |
|
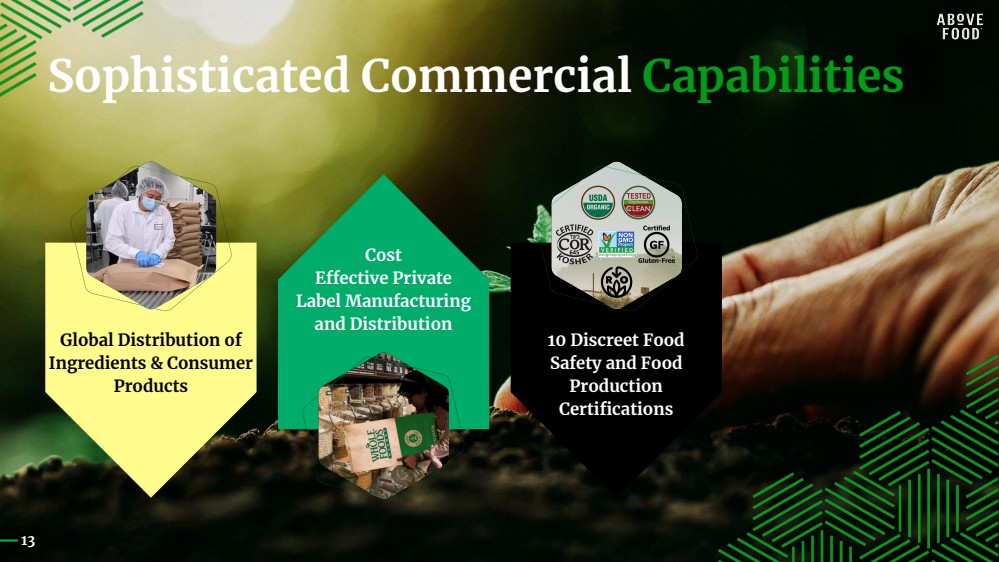
Sophisticated Commercial Capabilities Global Distribution of Ingredients & Consumer Products Cost Effective Private Label Manufacturing and Distribution 10 Discreet Food Safety and Food Production Certifications 13 |
|
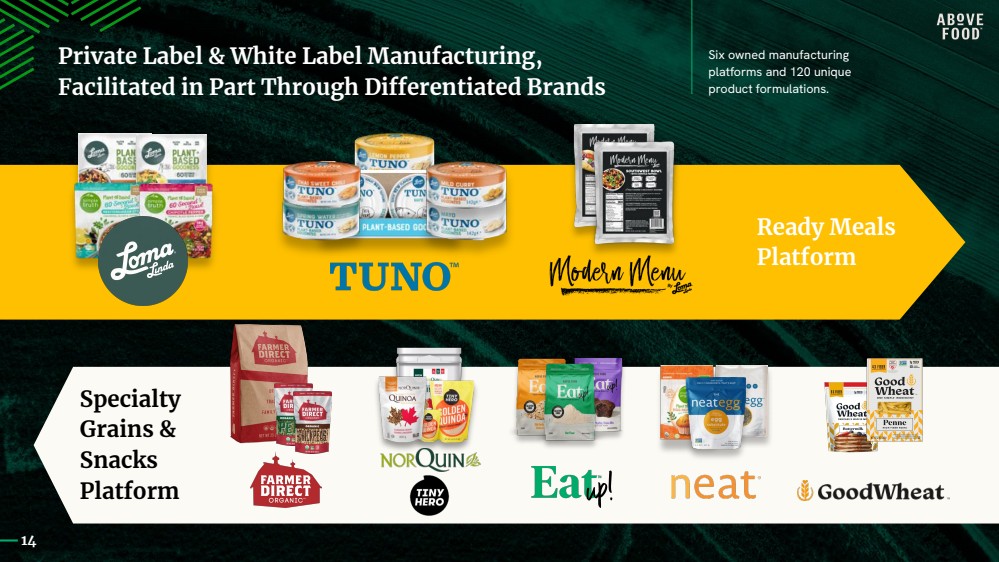
Private Label & White Label Manufacturing, Facilitated in Part Through Differentiated Brands Ready Meals Platform Specialty Grains & Snacks Platform Six owned manufacturing platforms and 120 unique product formulations. 14 |
|
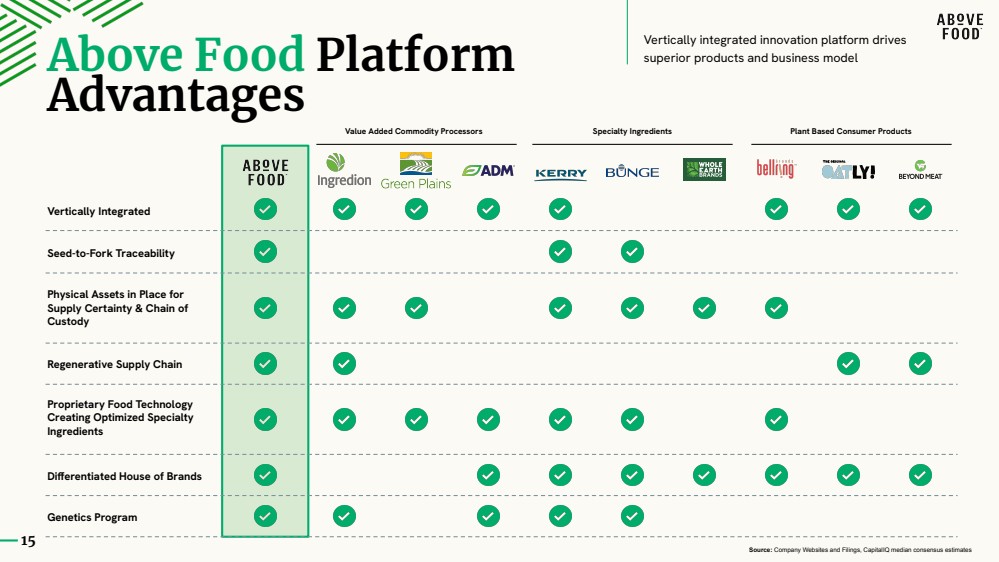
Above Food Platform Advantages Vertically integrated innovation platform drives superior products and business model Vertically Integrated Seed-to-Fork Traceability Physical Assets in Place for Supply Certainty & Chain of Custody Regenerative Supply Chain Proprietary Food Technology Creating Optimized Specialty Ingredients Differentiated House of Brands Genetics Program Value Added Commodity Processors Specialty Ingredients Plant Based Consumer Products 15 Source: Company Websites and Filings, CapitalIQ median consensus estimates |
|
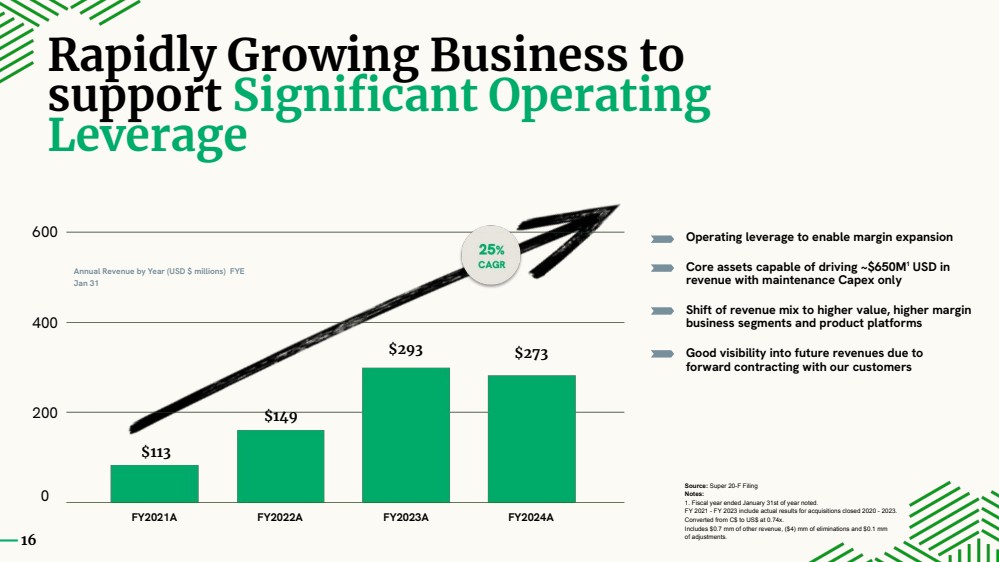
Operating leverage to enable margin expansion Core assets capable of driving ~$650M USD in revenue with maintenance Capex only Shift of revenue mix to higher value, higher margin business segments and product platforms Rapidly Growing Business to support Significant Operating Leverage Good visibility into future revenues due to forward contracting with our customers Annual Revenue by Year (USD $ millions) FYE Jan 31 16 $113 $149 $293 $273 FY2021A FY2022A FY2023A FY2024A 0 200 400 600 Source: Super 20-F Filing Notes: 1. Fiscal year ended January 31st of year noted. FY 2021 - FY 2023 include actual results for acquisitions closed 2020 - 2023. Converted from C$ to US$ at 0.74x. Includes $0.7 mm of other revenue, ($4) mm of eliminations and $0.1 mm of adjustments. 1 |
|
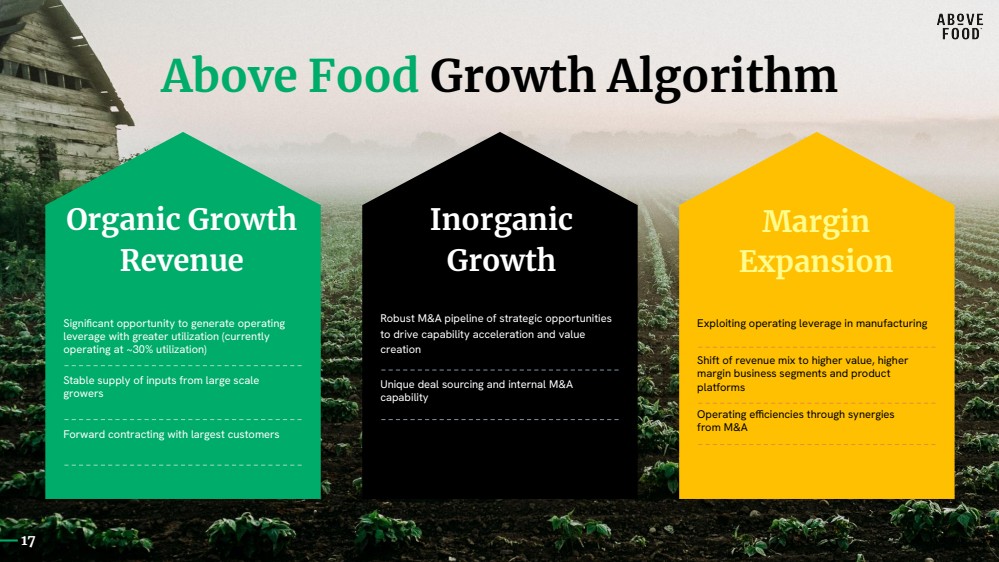
Above Food Growth Algorithm Organic Growth Revenue Significant opportunity to generate operating leverage with greater utilization (currently operating at ~30% utilization) Stable supply of inputs from large scale growers Forward contracting with largest customers Inorganic Growth Robust M&A pipeline of strategic opportunities to drive capability acceleration and value creation Unique deal sourcing and internal M&A capability Margin Expansion Exploiting operating leverage in manufacturing Shift of revenue mix to higher value, higher margin business segments and product platforms Operating efficiencies through synergies from M&A 17 |
|
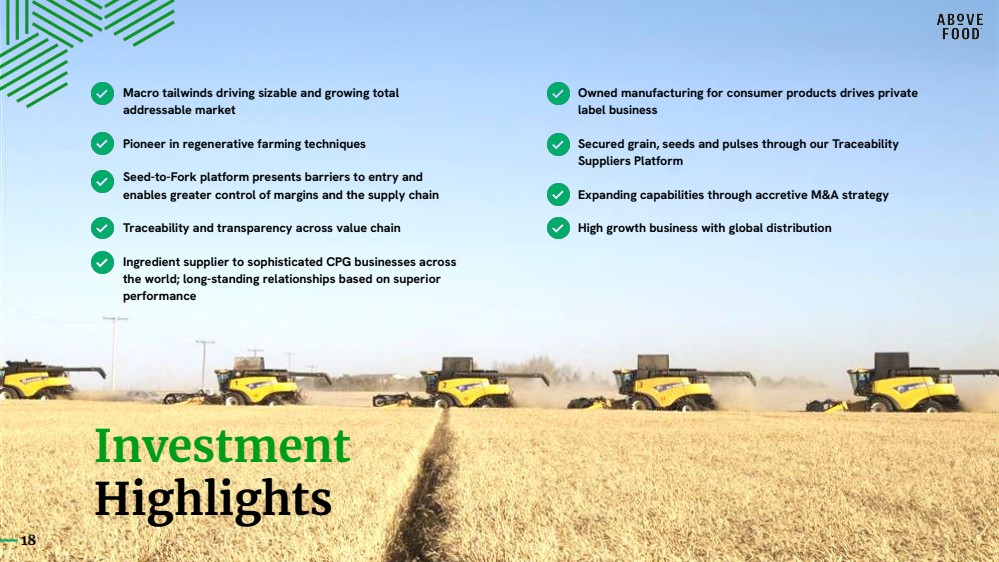
Investment Highlights Seed-to-Fork platform presents barriers to entry and enables greater control of margins and the supply chain Pioneer in regenerative farming techniques Macro tailwinds driving sizable and growing total addressable market Owned manufacturing for consumer products drives private label business Ingredient supplier to sophisticated CPG businesses across the world; long-standing relationships based on superior performance Traceability and transparency across value chain Secured grain, seeds and pulses through our Traceability Suppliers Platform Expanding capabilities through accretive M&A strategy High growth business with global distribution 18 |
|
19 Martin Williams Martin@abovefood.com © 2024 Above Food Corp. The Regenerative Ingredient Company Get in Touch 19 |
|
Appendix 20 |
|
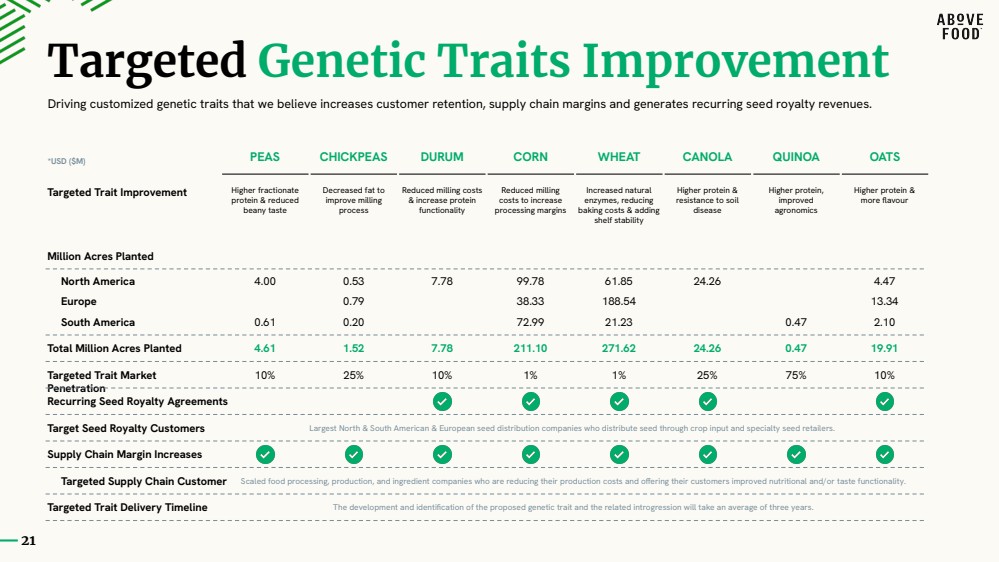
Targeted Genetic Traits Improvement Million Acres Planted PEAS CHICKPEAS DURUM CORN WHEAT CANOLA Targeted Trait Improvement Higher fractionate protein & reduced beany taste Decreased fat to improve milling process Reduced milling costs & increase protein functionality Reduced milling costs to increase processing margins Increased natural enzymes, reducing baking costs & adding shelf stability Higher protein & resistance to soil disease Total Million Acres Planted 4.61 1.52 7.78 211.10 271.62 24.26 Targeted Trait Market Penetration 10% 25% 10% 1% 1% 25% Recurring Seed Royalty Agreements *USD ($M) QUINOA OATS Higher protein, improved agronomics Higher protein & more flavour 0.47 19.91 75% 10% North America 4.00 0.53 7.78 99.78 61.85 24.26 4.47 Europe 0.79 38.33 188.54 13.34 South America 0.61 0.20 72.99 21.23 0.47 2.10 Target Seed Royalty Customers Largest North & South American & European seed distribution companies who distribute seed through crop input and specialty seed retailers. Supply Chain Margin Increases Targeted Supply Chain Customer Scaled food processing, production, and ingredient companies who are reducing their production costs and offering their customers improved nutritional and/or taste functionality. Targeted Trait Delivery Timeline The development and identification of the proposed genetic trait and the related introgression will take an average of three years. Driving customized genetic traits that we believe increases customer retention, supply chain margins and generates recurring seed royalty revenues. 21 |