UNITED STATES
SECURITIES AND EXCHANGE COMMISSION
Washington, D.C. 20549
Form 6-K
REPORT OF FOREIGN PRIVATE ISSUER PURSUANT TO RULE 13a-16 OR 15d-16
UNDER THE SECURITIES EXCHANGE ACT OF 1934
For the month of May, 2024
Commission File Number: 001-42008
| BW LPG Limited | |
| (Translation of registrant’s name into English) |
|
c/o BW LPG Holding Pte Ltd 10 Pasir Panjang Road, #17-02 Mapletree Business City, Singapore 117438 |
|
| (Address of principal executive office) |
Indicate by check mark whether the registrant files or will file annual reports under cover of Form 20-F or Form 40-F.
Form 20-F x Form 40-F ¨
DOCUMENTS TO BE FURNISHED AS PART OF THIS FORM 6-K
SIGNATURES
Pursuant to the requirements of the Securities Exchange Act of 1934, the registrant has duly caused this report to be signed on its behalf by the undersigned, thereunto duly authorized.
| BW LPG Limited | ||
| By: | /s/ Samantha Xu | |
| Name: | Samantha Xu | |
| Title: | Chief Financial Officer | |
| Date: May 30, 2024 | ||
Exhibit 99.1
BW LPG Limited - Financial Results for Q1 2024
(Singapore, 30 May 2024)
Highlights and Subsequent Events
| - | Strong quarterly performance with daily TCE of USD 61,500 per available day and USD 59,400 per calendar day. |
| - | Generated NPAT of USD 150 million or earnings per share of USD 1.07. Declared a Q1 cash dividend of USD 1.00 per share which represents 106% of earnings from the shipping activity and 93% of total earnings in the quarter. |
| - | For the second quarter of 2024, we have fixed 84% at an average rate of ~USD 49,000 per available day |
| - | BW Product Services generated a net accounting profit of USD 21 million in Q1 after adjusting for G&A and tax provisions. |
| - | BW Product Services is pleased to announce a multi-year cargo contract with Enterprise Product Partners, with optionality to double the current cargo volume in the US Gulf. This will significantly improve the combined shipping and cargo trading flexibility. |
| - | Delivered one VLGC to new owners for further trading in February 2024, generating USD 65 million in proceeds. |
| - | BW LPG successfully listed on the New York Stock Exchange (NYSE) on 29 April 2024. |
Financial Performance
BW LPG Limited (“BW LPG”, the “Company”, NYSE ticker code: “BWLP”, OSE ticker code: “BWLPG.OL”) reported a Q1 2024 Net Profit After Tax (NPAT) of USD 150 million, yielding an annualised return on equity of 37% with USD 468.5 million free cash flow generated. The Q1 operating profit was USD 157.8 million, and earnings per share was USD 1.07.
The net leverage ratio was at an all-time low at 7% in Q1 with available liquidity at USD 661 million at the end of the quarter. On the back of another strong quarter, the Board has declared a cash dividend of USD 1.00 per share, or a total dividend of USD 132 million. This represents a 93% earnings payout ratio and an annualised dividend yield of 22%.
Commercial Performance
Shipping – Q1 VLGC freight rates averaged USD 61,500 per available day or USD 59,400 per calendar day, with 95% fleet utilisation. Time Charter Equivalent (TCE) income was USD 186.5 million for the quarter, and our India subsidiary contributed a stable TCE income of USD 10 million for Q1.
BW LPG delivered BW Princess (2008-built, Hyundai Heavy Industries, Korea) in February 2024 to new owners for further trading. Her sale generated USD 65 million in proceeds and a net book gain of USD 20 million.
Product Services – Product Services reported a USD 33 million gross profit for Q1. After considering other expenses, comprising mainly of G&A and income tax expenses, Product Services reported a net profit after tax of USD 21 million for the quarter.
Corporate Update
BW LPG successfully listed on the New York Stock Exchange (NYSE) on 29 April 2024, while maintaining the current listing on the Oslo Stock Exchange (OSE). The Company thanks all stakeholders and shareholders for their support and looks forward to increasing the presence in the largest capital market in the world.
The Company is in the process of redomiciling from Bermuda to Singapore. A Scheme Meeting will be held in Bermuda on 12 June. More information is available in the press release dated 21 May 2024 “BW LPG Limited – Notice of Scheme meeting regarding redomiciling to Singapore”.
Market Outlook
At the start of 2024, VLGC spot rates for the US/Far East route soared to nearly $140,000/day.
However, as in previous years during January and February, a cold snap in the US increased domestic demand for LPG and temporarily reduced production, leading to a significant rise in US LPG prices. Concurrently, demand in the Far East declined resulting in falling LPG prices in Asia. Following a decrease in fixing activity and a rapid collapse of the US/Far East LPG price arbitrage during January and early February, spot rates fell by approximately 90% during that period.
After spot rates bottomed out around OPEX levels in early February, the market experienced a significant recovery, driven by recalibrated product prices and strong US LPG export growth. The EIA reports that YTD average net propane exports from the US have increased by 14% compared to the same period in 2023. The demand side also picked up, and China’s imports of LPG delivered on VLGCs grew by 6% in the first quarter of 2024 compared to the same period last year. By the end of May, spot rates reached the high $60,000s/day.
The futures market reflects continued strength in spot earnings, trading in the low to mid $60,000s/day for the remainder of 2024.
Transit restrictions in the Panama Canal changed more rapidly than anticipated in January, allowing more VLGCs to transit through the Canal. By the end of the first quarter, the number of daily slots had normalized to levels seen in the summer of 2023. However, we anticipate that congestion may occur from time to time, depending on usage by container and LNG vessels, and the canal’s water level.
At the beginning of 2024, the global VLGC fleet stood at 378 vessels. Since then, 16 VLGCs have been added, bringing the current fleet to 394. Over the next 18 months, we observe a sharply abating number of newbuildings for delivery, with six additional VLGCs to be added for the remainder of 2024 and 13 scheduled for delivery in 2025.
Q1 2024 Earnings Presentation and Interim Financial Report
Please see the attachments for the Q1 2024 Earnings Presentation and Interim Financial Report.
| - | BW LPG Q1 2024 Earnings Presentation |
| - | BW LPG Q1 2024 Interim Financial Report |
BW LPG will present its financial results at 13:00hrs CET today. The presentation will be hosted by Kristian Sørensen (CEO) and Samantha Xu (CFO).
With reference to the press release dated 16 May 2024, please note the change in dial-in details for the Presentation. The Presentation will be held live via Zoom. Please register at the link below:
https://bit.ly/BWLPGQ12024EP
A presentation recording will also be available after the event on
the Company’s website at:
https://www.investor.bwlpg.com.
For further information, please contact:
Kristian Sørensen, CEO
Samantha Xu, CFO
E-mail: investor.relations@bwlpg.com
About BW LPG
BW LPG is the world’s leading owner and operator of LPG vessels, owning and operating Very Large Gas Carriers (VLGC) with a total carrying capacity of over 3 million CBM. With five decades of operating experience in LPG shipping, experienced employees and an in-house LPG trading division, BW LPG offers an integrated, flexible, and reliable service to customers. More information about BW LPG can be found at www.bwlpg.com.
BW LPG is associated with BW Group, a leading global maritime company involved in shipping, floating infrastructure, deepwater oil & gas production, and new sustainable technologies. Founded in 1955 by Sir YK Pao, BW controls a fleet of over 490 vessels transporting oil, gas and dry commodities, with its 200 LNG and LPG ships constituting the largest gas fleet in the world. In the renewables space, the group has investments in solar, wind, batteries, biofuels and water treatment.
This information is subject to disclosure requirements pursuant to Section 5-12 of the Norwegian Securities Trading Act.
Exhibit 99.2
BW LPG Limited
Interim Financial Report
Q1 2024 (unaudited)
SELECTED KEY FINANCIAL INFORMATION
|
Statement of Comprehensive Income |
Q1 2024 US$ million |
Q1 2023 US$ million |
Increase/ (Decrease) % |
|||
|
Profit after tax |
149.8 |
130.7 |
15 |
|||
| TCE income – Shipping1 | 186.5 | 200.3 | (7) | |||
| Gross profit - Product Services1 | 33.2 | 7.2 | 361 | |||
| (US$ per share) | ||||||
| Basic and diluted EPS2 | 1.07 | 0.95 | 13 | |||
| Dividend per share | 1.00 | 0.95 | 5 | |||
|
Balance Sheet |
31 March 2024 US$ million |
31 December 2023 US$ million |
Increase/ (Decrease) % |
|||
| Cash and cash equivalents | 328.2 | 287.5 | 14 | |||
| Total assets | 2,304.9 | 2,520.5 | (9) | |||
| Total liabilities | 639.9 | 934.3 | (33) | |||
| Total shareholders’ equity | 1,665.0 | 1,586.2 | 5 | |||
|
Cash flow |
Q1 2024 US$ million |
Q1 2023 US$ million |
Increase/ (Decrease) % |
|||
| Net cash from operating activities | 405.6 | 125.2 | 224 | |||
| Capital expenditure | 62.9 | 46.0 | 37 | |||
| Adjusted free cash flow3 | 468.5 | 171.2 | 174 | |||
|
Financial Ratios |
Q1 2024 % |
Q1 2023 % |
Increase/ (Decrease) % |
|||
|
ROE4 (annualised) |
36.9 | 32.9 | 12 | |||
| ROCE5 (annualised) | 29.6 | 23.7 | 25 | |||
| Net leverage ratio6 | 7.3 | 20.8 | (65) | |||
|
Other Information |
31 March 2023
|
31 December 2023
|
Increase/ (Decrease) % |
|||
|
Shares – end of period (shares) |
140,000,000 |
140,000,000 |
- | |||
| Treasury shares – end of period (shares) | 8,337,344 | 8,926,105 | (7) | |||
| Share price (NOK) | 121.0 | 151.3 | (20) | |||
| Market cap (NOK million) | 16,940 | 21,182.0 | (20) | |||
| Market cap (USD million) | 1,660.4 | 2,076.2 | (20) |
| [1] | TCE income and gross profit/(loss) reflect the Shipping and Product Services segments’ performance respectively. | |
| [2] | Basic and diluted EPS (earnings per share) is computed based on Q1 2024: 132.0 million shares, the weighted average number of shares outstanding less treasury shares during the period. | |
| [3] | Adjusted free cash flow is a non-IFRS measure and is computed as net cash from operating activities minus cash outflows for additions in property, plant and equipment and additions in intangible assets, plus cash inflows from progress payments for vessel upgrades and dry docks, sale of assets held-for-sale and sale of vessels. See page 15 for a reconciliation of adjusted free cash flow to the nearest IFRS measure. | |
| [4] | ROE (return on equity) is computed as, with respect to a particular period, the ratio of the profit after tax for such period to the average of the shareholders’ equity, calculated as the average of the opening and closing balance for the period as presented in the consolidated balance sheet. | |
| [5] | ROCE (return on capital employed) is a non-IFRS measure and is computed, with respect to a particular period, as the ratio of the operating profit for such period to capital employed defined as the average of the total shareholders’ equity, total borrowings and total lease liabilities, calculated as the average of the opening and closing balance for such period as presented in the consolidated balance sheet. See page 15 for a reconciliation of ROCE to the nearest IFRS measure. | |
| [6] | Net leverage ratio is computed as the sum of total borrowings and total lease liabilities minus cash and cash equivalents as set out in the consolidated statement of cash flows, divided by the sum of total borrowings, total lease liabilities and total shareholders’ equity minus cash and cash equivalents as set out in the consolidated statement of cash flows. |
BW LPG Limited
Interim Financial Report
Q1 2024 (unaudited)
HIGHLIGHTS AND SUBSEQUENT EVENTS – Q1 2024
| · | Achieved Q1 2024 TCE income – Shipping of US$61,500 per available day1 and US$59,440 per calendar day (total)1. |
| · | Generated Q1 2024 profit after tax of US$149.8 million or an earnings per share of US$1.07 or NOK 11.33. |
| · | Declared a Q1 2024 cash dividend of US$1.00 per share amounting to US$131.7 million, which translates to a 93% payout ratio as a percentage of total profit attributable to equity holders for the quarter. |
| · | Concluded the sale and delivery of BW Princess in February 2024, generating US$65.3 million in proceeds and a net book gain of US$20.4 million. |
| · | On 29 April 2024, the Company successfully listed its common shares on the New York Stock Exchange, while maintaining the current listing on the Oslo Stock Exchange. |
PERFORMANCE REVIEW – Q1 2024
Profit after tax was US$149.8 million for Q1 2024 (Q1 2023: US$130.7 million). The increase in profit after tax was mainly due to an increase of US$19.9 million in operating profit, a decrease in net finance expenses of US$3.4 million, which were partially offset by higher income tax expense of US$4.3 million.
Time Charter Equivalent (“TCE”) income for the Shipping segment was US$186.5 million for Q1 2024 (Q1 2023: US$200.3 million). The decrease of US$13.8 million was mainly due to lower LPG spot rates, fleet utilisation and available fleet days. This was partially offset by higher time charter rates and the positive reversal of IFRS 15 adjustments amounting to US$26.3 million, where spot voyages that straddle the quarter-end are accounted for on a load-to-discharge basis. Our India subsidiary continues to contribute stable TCE income of US$29.5 million for Q1 2024 mainly from fixed rate time charters.
Product Services reported a US$33.2 million gross profit for Q1 2024 (Q1 2023: US$7.2 million). The increase of US$26.0 million from the same quarter last year was mainly due to an increase of US$16.1 million in realised and unrealised gains from trading activities, and a decrease in depreciation of US$9.9 million. After taking into account other expenses, comprising mainly G&A expenses accrual of US$7.6 million for Q1 2024 and income tax expense of US$4.1 million for Q1 2024, Product Services reported a net profit after tax of US$21.0 million for Q1 20242 (Q1 2023: US$3.0 million).
1 TCE income – Shipping per available day and calendar day (total) are non-IFRS measures and are computed as TCE income – Shipping divided by available days and calendar days (total) respectively. See page 14 for a reconciliation of TCE income – Shipping per available day and calendar day (total) to the nearest IFRS measure.
2 BW LPG Product Services Pte. Ltd.’s Net profit/(loss) after tax. See page 16.
BW LPG Limited
Interim Financial Report
Q1 2024 (unaudited)
BALANCE SHEET
As of 31 March 2024, BW LPG controls a fleet of 44 VLGCs, including eight vessels which are owned and operated by our subsidiary operating in India. Total assets amounted to US$2,304.9 million (31 December 2023: US$2,520.5 million), of which US$1,433.1 million (31 December 2023: US$1,457.1 million) represented the carrying value of the vessels (including dry docking), and US$148.2 million (31 December 2023: US$151.8 million) represented the carrying value of right-of-use assets (vessels).
Cash and cash equivalents amounted to US$328.2 million as at 31 March 2024 (31 December 2023: US$287.5 million). Cash flow from operating activities generated a net cash surplus of US$405.6 million as of 31 March 2024, of which US$221.6 million related to changes in working capital. Investing activities generated a positive cash flow of US$41.8 million as at 31 March 2024 mainly due to proceeds from sale of one vessel in Q1 2024, partially offset by a US$30.0 million investment for a minority stake in Confidence Petroleum India Limited. The cash generated was used to repay bank borrowings, interest on bank borrowings, dividend payments, and for scheduled capital expenditure.
Net leverage ratio decreased from 20.5% as at 31 December 2023, to 7.3% as at 31 March 2024 mainly due to repayment of term loan, decrease in restricted cash held for derivative margin requirements and decrease in short term Product Services trade finance lines drawn as at 31 March 2024.
We continued our share buy-back programme announced on 23 May 2023 and bought back 9,000 shares amounting to approximately US$100,000 in Q1 2024.
BW LPG Limited
Interim Financial Report
Q1 2024 (unaudited)
CONDENSED CONSOLIDATED STATEMENT OF COMPREHENSIVE INCOME
| Q1 2024 | Q1 2023 | ||
| US$’000 | US$’000 | ||
| Revenue - Shipping | 296,066 | 288,203 | |
| Revenue - Product Services | 742,425 | 604,917 | |
| Cost of cargo and delivery expenses - Product Services | (689,389) | (555,227) | |
| Voyage expenses - Shipping | (121,476) | (112,629) | |
| Vessel operating expenses | (21,970) | (22,233) | |
| Time charter contracts (non-lease components) | (4,686) | (5,804) | |
| General and administrative expenses | (16,733) | (11,047) | |
| Charter hire expenses | (505) | (8,917) | |
| Fair value gain from equity financial asset | 1,415 | - | |
| Finance lease income | 20 | 99 | |
| Other operating income/(expense) - net | 1,205 | (1,256) | |
| Depreciation | (48,745) | (54,672) | |
| Amortisation of intangible assets | (210) | (162) | |
| Gain on disposal of vessels | 20,391 | - | |
| Loss on derecognition of right-of-use assets (vessels) | - | 16,589 | |
| Operating profit | 157,808 | 137,861 | |
|
Foreign currency exchange loss - net |
(1,776) | (851) | |
| Interest income | 4,540 | 1,460 | |
| Interest expense | (4,761) | (6,261) | |
| Other finance expenses | (631) | (405) | |
| Finance expenses - net | (2,628) | (6,057) | |
| Profit before tax | 155,180 | 131,804 | |
| Income tax expense | (5,414) | (1,124) | |
| Profit after tax | 149,766 | 130,680 | |
| Other comprehensive (loss)/income: | |||
|
Items that may be reclassified subsequently to profit or loss: |
|||
| Cash flow hedges | |||
| - fair value (loss)/gain | 57,401 | (8,990) | |
| - reclassification to profit or loss | (2,260) | 3,741 | |
| Currency translation reserve | (832) | (44) | |
| Other comprehensive income, net of tax | 54,309 | (5,293) | |
| Total comprehensive income | 204,075 | 125,387 | |
|
Profit attributable to: Equity holders of the Company |
141,923 | 127,222 | |
| Non-controlling interests | 7,843 | 3,458 | |
| 149,766 | 130,680 | ||
|
Total comprehensive income: |
|||
| Equity holders of the Company | 196,357 | 121,935 | |
| Non-controlling interests | 7,718 | 3,452 | |
| 204,075 | 125,387 | ||
|
Earnings per share attributable to the equity holders of the Company: (expressed in US$ per share) |
|||
| Basic/Diluted earnings per share | 1.07 | 0.95 |
BW LPG Limited
Interim Financial Report
Q1 2024 (unaudited)
CONDENSED CONSOLIDATED BALANCE SHEET
|
|
31 March 2024 |
31 December 2023 |
|
| US$’000 | US$’000 | ||
| Intangible assets | 1,269 | 1,242 | |
| Investment in joint venture | 301 | 301 | |
| Equity financial assets, at fair value | 30,162 | - | |
| Derivative financial instruments | 11,427 | 11,002 | |
| Other receivables | 13,184 | 13,206 | |
| Finance lease receivables | 9,145 | - | |
| Deferred tax assets | 6,700 | 6,855 | |
| Total other non-current assets | 70,919 | 31,364 | |
| Vessels and dry docking | 1,433,072 | 1,457,086 | |
| Right-of-use assets (vessels) | 148,175 | 151,784 | |
| Other property, plant and equipment | 235 | 277 | |
| Property, plant and equipment | 1,581,482 | 1,609,147 | |
| Total non-current assets | 1,653,670 | 1,641,753 | |
| Inventories | 96,534 | 188,592 | |
| Trade and other receivables | 179,078 | 315,238 | |
| Equity financial assets, at fair value | 2,343 | 3,271 | |
| Derivative financial instruments | 36,508 | 37,083 | |
| Finance lease receivables | 8,600 | 2,684 | |
| Assets held-for-sale | - | 44,296 | |
| Cash and cash equivalents | 328,150 | 287,545 | |
| Total current assets | 651,213 | 878,709 | |
| Total assets | 2,304,883 | 2,520,462 | |
| Share capital | 1,400 | 1,400 | |
| Share premium | 285,853 | 285,853 | |
| Treasury shares | (52,627) | (56,438) | |
| Contributed surplus | 685,913 | 685,913 | |
| Other reserves | (2,606) | (56,494) | |
| Retained earnings | 630,851 | 609,479 | |
| 1,548,784 | 1,469,713 | ||
| Non-controlling interests | 116,168 | 116,447 | |
| Total shareholders’ equity | 1,664,952 | 1,586,160 | |
| Borrowings | 186,593 | 199,917 | |
| Lease liabilities | 84,990 | 78,363 | |
| Derivative financial instruments | - | 679 | |
| Total non-current liabilities | 271,583 | 278,959 | |
| Borrowings | 88,442 | 212,432 | |
| Lease liabilities | 84,553 | 79,476 | |
| Derivative financial instruments | 24,608 | 90,214 | |
| Current income tax liabilities | 11,882 | 8,121 | |
| Trade and other payables | 158,863 | 265,100 | |
| Total current liabilities | 368,348 | 655,343 | |
| Total liabilities | 639,931 | 934,302 | |
| Total equity and liabilities | 2,304,883 | 2,520,462 |
BW LPG Limited
Interim Financial Report
Q1 2024 (unaudited)
CONDENSED CONSOLIDATED STATEMENT OF CHANGES IN EQUITY
| Attributable to equity holders of the Company | |||||||||||||
|
Share capital |
Share premium |
Treasury shares |
Contributed surplus |
Capital reserve |
Hedging reserve |
Share- based payment reserve |
Currency translation reserve |
Other reserves |
Retained earnings |
Total |
Non- interests |
Total equity |
|
| US$’000 | US$’000 | US$’000 | US$’000 | US$’000 | US$’000 | US$’000 | US$’000 | US$’000 | US$’000 | US$’000 | US$’000 | US$’000 | |
| Balance at 1 January 2024 | 1,400 | 285,853 | (56,438) | 685,913 | (36,259) | (27,542) | 3,905 | 419 | 2,983 | 609,479 | 1,469,713 | 116,447 | 1,586,160 |
| Profit after tax | - | - | - | - | - | - | - | - | - | 141,923 | 141,923 | 7,843 | 149,766 |
| Other comprehensive (loss)/income for the financial period | - | - | - | - | - | 55,141 | - | (707) |
- |
- |
54,434 |
(125) |
54,309 |
| Total comprehensive (loss)/income for the financial period | - | - | - | - | - | 55,141 | - | (707) |
- |
141,923 |
196,357 |
7,718 | 204,075 |
| Share-based payment reserve | |||||||||||||
| - Value of employee services | - | - | - | - | - | - | 663 | - | - | - | 663 | - | 663 |
| Purchases of treasury shares | - | - | (100) | - | - | - | - | - | - | - | (100) | - | (100) |
| Share options exercised | - | - | 3,911 | - | - | - | (1,209) | - | - | (2,164) | 538 | - | 538 |
| Dividend paid | - | - | - | - | - | - | - | - | - | (118,387) | (118,387) | (7,997) | (126,384) |
| Total transactions with owners, recognised directly in equity | - | - | 3,811 | - | - | - | (546) | - |
- |
(120,551) |
(117,286) |
(7,997) |
(125,283) |
| Balance at 31 March 2024 | 1,400 | 285,853 | (52,627) | 685,913 | (36,259) | 27,599 | 3,359 | (288) | 2,983 | 630,851 | 1,548,784 | 116,168 | 1,664,952 |
BW LPG Limited
Interim Financial Report
Q1 2024 (unaudited)
CONDENSED CONSOLIDATED STATEMENT OF CHANGES IN EQUITY (CONTINUED)
| Attributable to equity holders of the Company | |||||||||||||
|
Share capital |
Share premium |
Treasury shares |
Contributed surplus |
Capital reserve |
Hedging reserve |
Share- based payment reserve |
Currency translation reserve |
Other reserves |
Retained earnings |
Total |
Non- interests |
Total equity |
|
| US$’000 | US$’000 | US$’000 | US$’000 | US$’000 | US$’000 | US$’000 | US$’000 | US$’000 | US$’000 | US$’000 | US$’000 | US$’000 | |
| Balance at 1 January 2023 | 1,419 | 289,812 | (47,631) | 685,913 | (36,259) | 24,777 | 2,141 | (761) | 325 | 556,996 | 1,476,732 | 119,858 | 1,596,590 |
| Profit after tax | - | - | - | - | - | - | - | - | - | 469,957 | 469,957 | 23,042 | 492,999 |
| Other comprehensive (loss)/income for the financial period | - | - | - | - | - | (52,319) | - | 1,180 | - | - | (51,139) | 1,154 | (49,985) |
| Total comprehensive (loss)/income for the financial period | - | - | - | - | - | (52,319) | - | 1,180 | - | 469,957 | 418,818 | 24,196 | 443,014 |
| Share-based payment reserve | |||||||||||||
| - Value of employee services | - | - | - | - | - | - | 1,696 | - | - | - | 1,696 | - | 1,696 |
| Purchases of treasury shares | - | - | (23,698) | - | - | - | - | - | - | - | (23,698) | - | (23,698) |
| Share options exercised | - | - | 2,676 | - | - | - | 68 | - | 1,833 | (2,919) | 1,658 | - | 1,658 |
| Shares cancellation | (19) | (3,959) | 12,215 | - | - | - | - | - | - | (8,237) | - | - | - |
| Dividend paid | - | - | - | - | - | - | - | - | - | (405,493) | (405,493) | (27,607) | (433,100) |
| Others | - | - | - | - | - | - | - | - | 825 | (825) | - | - | - |
| Total transactions with owners, recognised directly in equity | (19) | (3,959) | (8,807) | - | - | - | 1,764 | - | 2,658 | (417,474) | (425,837) | (27,607) | (453,444) |
| Balance at 31 December 2023 | 1,400 | 285,853 | (56,438) | 685,913 | (36,259) | (27,542) | 3,905 | 419 | 2,983 | 609,479 | 1,469,713 | 116,447 | 1,586,160 |
BW LPG Limited
Interim Financial Report
Q1 2024 (unaudited)
CONDENSED CONSOLIDATED STATEMENT OF CASH FLOWS
| Q1 2024 | Q1 2023 | ||
| US$’000 | US$’000 | ||
| Cash flows from operating activities | |||
| Profit before tax | 155,180 | 131,804 | |
| Adjustments for: | |||
| - amortisation of intangible assets | 210 | 162 | |
| - depreciation charge | 48,745 | 54,673 | |
| - loss/(gain) on disposal of vessels | (20,391) | (16,589) | |
| - fair value gain from equity financial assets | (1,415) | - | |
| - interest income | (4,540) | (1,460) | |
| - interest expenses | 6,483 | 7,022 | |
| - other finance expenses | 888 | 405 | |
| - share-based payments | 663 | 283 | |
| - finance lease income | (20) | (99) | |
| 185,803 | 176,201 | ||
| Changes in working capital: | |||
| - inventories | 92,058 | 19,651 | |
| - trade and other receivables | 136,182 | (128,619) | |
| - trade and other payables | (103,590) | 37,053 | |
| - derivative financial instruments | (14.367) | 43,398 | |
| - margin account held with broker | 111,332 | (22,341) | |
| Total changes in working capital | 221,615 | (50,858) | |
| Taxes paid | (1,838) | (169) | |
| Net cash from operating activities | 405,580 | 125,174 | |
| Cash flows from investing activities | |||
| Additions in property, plant and equipment | (2,236) | (8,123) | |
| Additions in intangible assets | (237) | (94) | |
| Proceeds from sale of vessels | 65,337 | 54,266 | |
| Purchase of equity financial assets | (30,162) | - | |
| Repayment of finance lease receivables | 2,010 | 1,932 | |
| Interest received | 4,722 | 1,559 | |
| Sale of equity financial assets, at fair value | 2,343 | - | |
| Net cash from investing activities | 41,777 | 112,549 |
BW LPG Limited
Interim Financial Report
Q1 2024 (unaudited)
CONDENSED CONSOLIDATED STATEMENT OF CASH FLOWS
| Q1 2024 | Q1 2023 | ||
| US$’000 | US$’000 | ||
| Cash flows from financing activities | |||
| Repayments of bank borrowings | (67,734) | (15,010) | |
| Payment of lease liabilities | (26,020) | (23,543) | |
| Interest paid | (5,191) | (7,050) | |
| Other finance expense paid | (888) | (1,586) | |
| Purchase of treasury shares | (100) | (6,032) | |
| Drawdown of trust receipts | 560,217 | 406,950 | |
| Repayment of trust receipts | (629,320) | (389,411) | |
| Dividend payment | (118,387) | (68,731) | |
| Dividend payment to non-controlling interests | (7,997) | - | |
| Net cash used in financing activities | (295,420) | (104,413) | |
| Net increase in cash and cash equivalents | 151,937 | 70,301 | |
|
Cash and cash equivalents at beginning of the financial Period |
162,037 | 220,915 | |
| Cash and cash equivalents at end of the financial period | 313,974 | 291,216 |
For the purpose of presenting the consolidated statement of cash flows, cash and cash equivalents comprise the following:
|
31 March 2024 |
31 March 2023 |
|
| US$’000 | US$’000 | |
| Cash and cash equivalents per consolidated balance sheet | 328,150 | 328,793 |
| Less: Margin account held with broker | (14,176) | (37,577) |
| Cash and cash equivalents per consolidated statement of cash flows | 313,974 | 291,216 |
BW LPG Limited
Interim Financial Report
Q1 2024 (unaudited)
Segment information
The executive management team (“EMT”) is the Group’s chief operating decision-maker. The Group identifies segments on the basis of those components of the Group that the EMT regularly reviews. The Group considers the business from each individual business segment perspective which comprises the Shipping and Product Services segments.
The reported measure of segment performance is gross profit, which the EMT uses to assess the performance of the operating segments. For the Shipping segment, gross profit is reflected as TCE income - Shipping. Operating segment disclosures are consistent with the information reviewed by the Management.
Segment performance is presented below:
|
Shipping |
Product Services |
Inter-segment elimination | Total | |
| US$’000 | US$’000 | US$’000 | US$’000 | |
| Q1 2024 | ||||
| Revenue from spot voyages | 257,024 | - | - | 257,024 |
| Inter-segment revenue | 30,894 | - | (30,894) | - |
| Voyage expenses | (121,476) | - | - | (121,476) |
| Inter-segment expense | (19,516) | - | 19,516 | - |
| Net income from spot voyages | 146,926 | - | (11,378) | 135,548 |
| Revenue from time charter voyages | 39,042 | - | - | 39,042 |
| Inter-segment revenue | 562 | (562) | - | |
| TCE income - Shipping 1 | 186,530 | - | (11,940) | 174,590 |
| Revenue from Product Services | - | 742,425 | - | 742,425 |
| Inter-segment revenue | - | 19,516 | (19,516) | - |
| Cost of cargo and delivery expenses | - | (689,389) | - | (689,389) |
| Inter-segment cost | - | (31,456) | 31,456 | - |
| Depreciation | - | (7,849) | - | (7,849) |
| Gross profit - Product Services 2 | - | 33,247 | 11,940 | 45,187 |
|
Segment results |
186,530 | 33,247 | - | 219,777 |
|
Q1 2023 |
||||
| Revenue from spot voyages | 247,329 | - | - | 247,329 |
| Inter-segment revenue | 42,648 | - | (42,648) | - |
| Voyage expenses | (112,629) | - | - | (112,629) |
| Inter-segment expense | (17,887) | - | 17,887 | - |
| Net income from spot voyages | 159,461 | - | (24,761) | 134,700 |
| Revenue from time charter voyages | 40,874 | - | - | 40,874 |
| TCE income - Shipping 1 | 200,335 | - | (24,761) | 175,574 |
| Revenue from Product Services | - | 604,917 | - | 604,917 |
| Inter-segment revenue | - | 17,887 | (17,887) | - |
| Cost of cargo and delivery expenses | - | (555,227) | - | (555,227) |
| Inter-segment cost | - | (42,648) | 42,648 | - |
| Depreciation | - | (17,724) | - | (17,724) |
| Gross profit - Product Services 2 | - | 7,205 | 24,761 | 31,966 |
|
Segment results |
200,335 | 7,205 | - | 207,540 |
1 TCE income” denotes “time charter equivalent income” which represents revenue from time charters and voyage charters less voyage expenses comprising primarily fuel oil, port charges and commission.
2 Gross profit from Product Services represents the net trading results which comprise revenue and cost of LPG cargo, derivative gains and losses, and other trading attributable costs, including depreciation from Product Services’ leased in vessels.
BW LPG Limited
Interim Financial Report
Q1 2024 (unaudited)
Segment information (continued)
Reconciliation of segment results:
| Q1 2024 | Q1 2023 | ||
| US$’000 | US$’000 | ||
| Total segment results for reportable segments | 219,777 | 207,540 | |
| Vessel operating expenses | (21,970) | (22,233) | |
| Time charter contracts (non-lease components) | (4,686) | (5,804) | |
| General and administrative expenses | (16,733) | (11,047) | |
| Charter hire expenses | (505) | (8,917) | |
| Fair value gain from equity financial asset | 1,415 | - | |
| Finance lease income | 20 | 99 | |
| Other operating income/(expense) - net | 1,205 | (1,256) | |
| Depreciation - Shipping segment | (40,896) | (36,948) | |
| Amortisation | (210) | (162) | |
| Gain on disposal of vessels | 20,391 | - | |
| Loss on derecognition of right-of-use assets (vessels) | - | 16,589 | |
| Finance expenses - net | (2,628) | (6,057) | |
| Income tax expense | (5,414) | (1,124) | |
| Profit after tax | 149,766 | 130,680 |
Investment in subsidiaries
Set out below are the summarised financial information for BW LPG India Pte. Ltd. (“BW India”) and BW LPG Product Services Pte. Ltd (“BW Product Services”), which have non-controlling interest that are material to the Group. These are presented before inter-company eliminations.
Summarised balance sheet:
| BW India | BW Product Services | |||
|
31 March 2024 |
31 Dec 2023 |
31 March 2024 |
31 Dec 2023 |
|
| US$’000 | US$’000 | US$’000 | US$’000 | |
| Assets | ||||
| Current assets | 29,215 | 27,935 | 223,948 | 431,420 |
| Includes | ||||
| Cash and cash equivalents | 16,696 | 15,882 | 79,374 | 77,980 |
| Non-current assets | 341,983 | 347,933 | 67,687 | 75,727 |
| Liabilities | ||||
| Current liabilities | 40,144 | 33,901 | 172,122 | 402,789 |
| Includes | ||||
| Borrowings | 27,892 | 27,929 | 57,429 | 138,380 |
| Non-current liabilities (Borrowings) | 105,965 | 112,473 | 36,919 | 40,815 |
| Net assets | 225,089 | 229,494 | 82,594 | 63,543 |
BW LPG Limited
Interim Financial Report
Q1 2024 (unaudited)
Investment in subsidiaries (continued)
Summarised statement of comprehensive income:
| BW India | Product Services | |||
| Q1 2024 | Q1 2023 | Q1 2024 | Q1 2023 | |
| US$’000 | US$’000 | US$’000 | US$,000 | |
| TCE income - Shipping | 29,457 | 24,044 | - | |
| Revenue from Product Services | - | - | 761,941 | 622,804 |
| Cost of cargo and delivery expenses | - | - | (720,845) | (597,875) |
| Vessel operating expense | (6,150) | (5,808) | - | - |
| Depreciation and amortisation | (9,261) | (7,547) | (7,849) | (17,724) |
| Finance expense | (2,299) | (2,692) | (491) | (569) |
| Other expenses - net | (1,889) | (1,710) | (11,754) | (3,492) |
| Net profit after tax | 9,858 | 6,287 | 21,002 | 3,104 |
| Other comprehensive loss (currency translation effects) | - | - | (832) | (44) |
| Total comprehensive income | 9,858 | 6,287 | 20,170 | 3,060 |
|
Total comprehensive income allocated to non-controlling interests |
4,692 |
2,993 |
3,026 |
459 |
BW LPG Limited
Interim Financial Report
Q1 2024 (unaudited)
Non-IFRS financial measures
This interim financial report contains a number of non-IFRS financial measures that Management uses to monitor and analyse the performance of the Group’s business. Non-IFRS financial measures exclude amounts that are included in, or include amounts that are excluded from, the most directly comparable measure calculated and presented in accordance with IFRS, or are calculated using measures that are not calculated in accordance with IFRS. Non-IFRS financial measures may be considered in addition to, but not as a substitute for or superior to, information presented in accordance with IFRS.
The Group believes that these non-IFRS financial measures, in addition to IFRS measures, provide an enhanced understanding of the Group’s results and related trends, therefore increasing transparency and clarity of the Group’s results and business.
There are no generally accepted accounting principles governing the calculation of these measures and the criteria upon which these measures are based can vary from company to company. The non-IFRS financial measures presented in this interim financial report may not be comparable to other similarly titled measures used by other companies, have limitations as analytical tools and should not be considered in isolation or as a substitute for analysis of the Group’s operating results as reported under IFRS. The Group encourages investors and analysts not to rely on any single financial measure but to review the Group’s financial and non-financial information in its entirety.
The following non-IFRS measures are presented in this interim financial report.
TCE income – Shipping per calendar day (total)
The Group defines TCE income - Shipping per calendar day (total) as TCE income - Shipping divided by calendar days (total).
The Group defines calendar days (total) as the total number of days in a period during which vessels are owned or chartered-in is in its possession, including technical off-hire days and waiting days. Calendar days (total) are an indicator of the size of the fleet over a period and affect both the amount of revenue and the amount of expense that the Group records during that period.
The Group defines waiting days as the number of days its vessels are unemployed for market reasons, excluding technical off-hire days. Ballast voyages, positioning voyages prior to deliveries on time charters and time spent on cleaning of tanks when vessels are switching from one cargo type to another are not considered waiting time. Waiting days per vessel are calculated as total waiting days for owned and chartered-in vessels divided by the number of owned and chartered-in vessels (not weighted by ownership share in each vessel).
The Group defines technical off-hire as the time lost due to off-hire days associated with major repairs, drydockings or special or intermediate surveys. Technical off-hire per vessel is calculated as an average for owned, bareboat and chartered-in vessels (not weighted by ownership share in each vessel).
The Group believes TCE income - Shipping per calendar day (total) is meaningful to investors because it is a measure of how well the Group manages the fleet technically and commercially.
The reconciliation of TCE income - Shipping per calendar day (total) to TCE income - Shipping for the period ended 31 March 2024 is provided below.
| Q1 2024 | Q1 2023 | |
| TCE income – Shipping (US$’000) | 186,530 | 200,335 |
| Calendar days (total) | 3,138 | 3,410 |
| TCE income – Shipping per calendar day (total) (US$) | 59,440 | 58.750 |
BW LPG Limited
Interim Financial Report
Q1 2024 (unaudited)
TCE income – Shipping per available day
The Group defines TCE income - Shipping per available day as TCE income - Shipping divided by available days.
The Group defines available days as the total number of days (including waiting time) in a period during which each vessel is owned or chartered-in, net of technical off-hire days. The Group uses available days to measure the number of days in a period during which vessels actually generate or are capable of generating revenue.
The Group defines waiting days as the number of days its vessels are unemployed for market reasons, excluding technical off-hire days. Ballast voyages, positioning voyages prior to deliveries on time charters and time spent on cleaning of tanks when vessels are switching from one cargo type to another are not considered waiting time. Waiting days per vessel are calculated as total waiting days for owned and chartered-in vessels divided by the number of owned and chartered-in vessels (not weighted by ownership share in each vessel).
The Group defines technical off-hire as the time lost due to off-hire days associated with major repairs, drydockings or special or intermediate surveys. Technical off-hire per vessel is calculated as an average for owned, bareboat and chartered-in vessels (not weighted by ownership share in each vessel).
The Group believes TCE income - Shipping per available day is meaningful to investors because it is a measure of how well the Group manages the fleet commercially.
The reconciliation of TCE income - Shipping per available day to TCE income - Shipping for the period ended 31 March 2024 is provided below.
| Q1 2024 | Q1 2023 | |
| TCE income – Shipping (US$’000) | 186,530 | 200,335 |
| Calendar days (total) | 3,033 | 3,292 |
| TCE income – Shipping per available day (US$) | 61,500 | 60,860 |
Adjusted free cash flow
The Group defines adjusted free cash flow as net cash from operating activities minus cash outflows for additions in property, plant and equipment and additions in intangible assets, plus cash inflows from progress payments for vessel upgrades and dry docks, sale of assets held-for-sale and sale of vessels.
The Group believes adjusted free cash flow is meaningful to investors because it is the measure of the funds generated by the Group available for distribution of dividends, repayment of debt or to fund the Group’s strategic initiatives, including acquisitions. The purpose of presenting adjusted free cash flow is to indicate the ongoing cash generation within the control of the Group after taking account of the necessary cash expenditures for maintaining the operating structure of the Group (in the form of capital expenditure).
The reconciliation of adjusted free cash flow to net cash inflow from operating activities for the periods ended 31 March 2024 and 2023 is provided below.
|
Q1 2024 US$’000 |
Q1 2023 US$’000 |
|
| Net cash from operating activities | 405,580 | 125,174 |
| Additions in property, plant and equipment | (2,236) | (8,123) |
| Additions in intangible assets | (237) | (94) |
| Proceeds from sale of vessels | 65,337 | 54,266 |
| Adjusted free cash flow | 468,444 | 171,223 |
Return on capital employed (ROCE)
The Group defines return on capital employed (“ROCE”) as, with respect to a particular financial period, the ratio of the operating profit for such period to capital employed defined as the average of the total shareholders’ equity, total borrowings and total lease liabilities, calculated as the average of the opening and closing balance for such period as presented in the consolidated balance sheet.
The Group believes ROCE is meaningful to investors because it measures the Group’s financial efficiency and its ability to create future growth in value.
The reconciliation of ROCE to operating profit for the periods ended 31 March 2024 and 2023 is provided below.
| Q1 2024 | Q1 2023 | |
| Operating profit (US$’000) | 157,808 | 137,861 |
| Average of the total shareholders’ equity (US$’000)(1) | 1,625,556 | 1,614,275 |
| Average of the total borrowings (US$’000)(1) | 343,692 | 479,624 |
| Average of the total lease liabilities (US$’000)(1) | 163,691 | 231,354 |
| Capital employed (US$’000) | 2,132,939 | 2,325,253 |
| ROCE | 7.4% | 5.9% |
| ROCE (annualised) | 29.6% | 23.7% |
(1) Calculated as the average of the opening and closing balances for the period as presented in the consolidated balance sheet
Rounding of figures
Certain financial information presented in tables in this interim financial report has been rounded to the nearest whole number or the nearest decimal place. Therefore, the sum of the numbers in a column may not conform exactly to the total figure given for that column. In addition, certain percentages presented in the tables in this interim financial report reflect calculations based upon the underlying information prior to rounding, and, accordingly, may not conform exactly to the percentages that would be derived if the relevant calculations were based upon the rounded numbers.
|
Earnings Presentation Q1 2024 30 May 2024 ● BW LPG Earnings Presentation |
|
Disclaimer and Forward-Looking Statements This presentation has been produced by BW LPG Limited (“BW LPG”) exclusively for information purposes. This presentation may not be reproduced or redistributed, in whole or in part, to any other person. Matters discussed in this presentation and any materials distributed in connection with this presentation may constitute or include forward–looking statements. Forward–looking statements are statements that are not historical facts and may be identified by words such as “anticipates”, “believes”, “continues”, “estimates”, “expects”, “intends”, “may”, “should”, “will” and similar expressions, such as “going forward”. These forward–looking statements reflect BW LPG’s reasonable beliefs, intentions and current expectations concerning, among other things, BW LPG’s results of operations, financial condition, liquidity, prospects, growth and strategies. Forward–looking statements include statements regarding: objectives, goals, strategies, outlook and growth prospects; future plans, events or performance and potential for future growth; liquidity, capital resources and capital expenditures; economic outlook and industry trends; developments of BW LPG’s markets; the impact of regulatory initiatives; and the strength of BW LPG’s competitors. Forward–looking statements involve risks and uncertainties because they relate to events and depend on circumstances that may or may not occur in the future. The forward–looking statements in this presentation are based upon various assumptions, many of which are based, in turn, upon further assumptions, including without limitation, management’s examination of historical operating trends, data contained in BW LPG’s records and other data available from Fourth parties. Although BW LPG believes that these assumptions were reasonable when made, these assumptions are inherently subject to significant known and unknown risks, uncertainties, contingencies and other important factors which are difficult or impossible to predict and are beyond its control. Forward–looking statements are not guarantees of future performance and such risks, uncertainties, contingencies and other important factors could cause the actual results of operations, financial condition and liquidity of BW LPG or the industry to differ materially from those results expressed or implied in this presentation by such forward–looking statements. No representation is made that any of these forward–looking statements or forecasts will come to pass or that any forecast result will be achieved and you are cautioned not to place any undue influence on any forward–looking statement. 2 No representation, warranty or undertaking, express or implied, is made by BW LPG, its affiliates or representatives as to, and no reliance should be placed on, the fairness, accuracy, completeness or correctness of the information or the opinions contained herein, for any purpose whatsoever. Neither BW LPG nor any of its affiliates or representatives shall have any responsibility or liability whatsoever (for negligence or otherwise) for any loss whatsoever and howsoever arising from any use of this presentation or its contents or otherwise arising in connection with this presentation. All information in this presentation is subject to updating, revision, verification, correction, completion, amendment and may change materially and without notice. In giving this presentation, none of BW LPG, its affiliates or representatives undertakes any obligation to provide the recipient with access to any additional information or to update this presentation or any information or to correct any inaccuracies in any such information. The information contained in this presentation should be considered in the context of the circumstances prevailing at the time and has not been, and will not be, updated to reflect material developments which may occur after the date of the presentation. The contents of this presentation are not to be construed as legal, business, investment or tax advice. Each recipient should consult its own legal, business, investment or tax adviser as to legal, business, investment or tax advice. By attending this presentation you acknowledge that you will be solely responsible for your own assessment of the market and the market position of BW LPG and that you will conduct your own analysis and be solely responsible for forming your own view on the potential future performance of the business of BW LPG. This presentation must be read in conjunction with the recent financial information and the disclosures therein. A number of measures are used to report the performance of our business, which are non-IFRS measures, such as TCE income – Shipping per available day, TCE income – Shipping per calendar day and Return on capital employed (ROCE). These measures are defined and reconciliations to the nearest IFRS measure are available in BW LPG’s Q1 2024 Interim Financial Report and BW LPG’s Registration Statement on Form 20-F. This presentation and the information contained herein are not an offer of securities for sale in the United States and are not for publication or distribution to persons in the United States (within the meaning of Regulation S under the U.S. Securities Act of 1933, as amended (the “Securities Act”)). The securities referred to herein have not been and will not be registered under the Securities Act and may not be offered or sold in the United States except pursuant to an exemption from the registration requirements of the Securities Act. Any failure to comply with this restriction may constitute a violation of United States securities laws. BW LPG has not registered and does not intend to register its securities in the United States or to conduct a public offering of shares in the United States. Copies of this presentation are not being made and may not be distributed or sent, directly or indirectly, in or into the United States, Canada, Australia or Japan, or any other jurisdiction in which such distribution would be unlawful or would require registration or other measures. In the EEA Member States, with the exception of Norway (each such EEA Member State, a “Relevant State“), this presentation and the information contained herein are intended only for and directed to qualified investors as defined in Article 2(e) of Regulation (EU) 2017/1129 of the European Parliament and of the Council of 14 June 2017 (the “Prospectus Regulation”). The securities mentioned in this presentation are not intended to be offered to the public in any Relevant State and are only available to qualified investors except in accordance with exceptions in the Prospectus Regulation. Persons in any Relevant State who are not qualified investors should not take any actions based on this presentation, nor rely on it. In the United Kingdom, this presentation is directed only at, and communicated only to, persons who are qualified investors within the meaning of Article 2(e) of the Prospectus Regulation as it forms part of domestic law in the United Kingdom by virtue of the European Union (Withdrawal) Act 2018 who are (i) persons who fall within the definition of "investment professional" in Article 19(5) of the Financial Services and Markets Act 2000 (Financial Promotion) Order 2005, as amended (the “Order”), or (ii) persons who fall within Article 49(2)(a) to (d) of the Order, or (iii) persons to whom it may otherwise be lawfully communicated (all such persons referred to in (i), (ii) and (iii) above together being referred to as “Relevant Persons”). This presentation must not be acted on or relied on by persons in the United Kingdom who are not Relevant Persons. |
|
Agenda 01 Highlights 02 Market 03 Performance 04 Q&A |
|
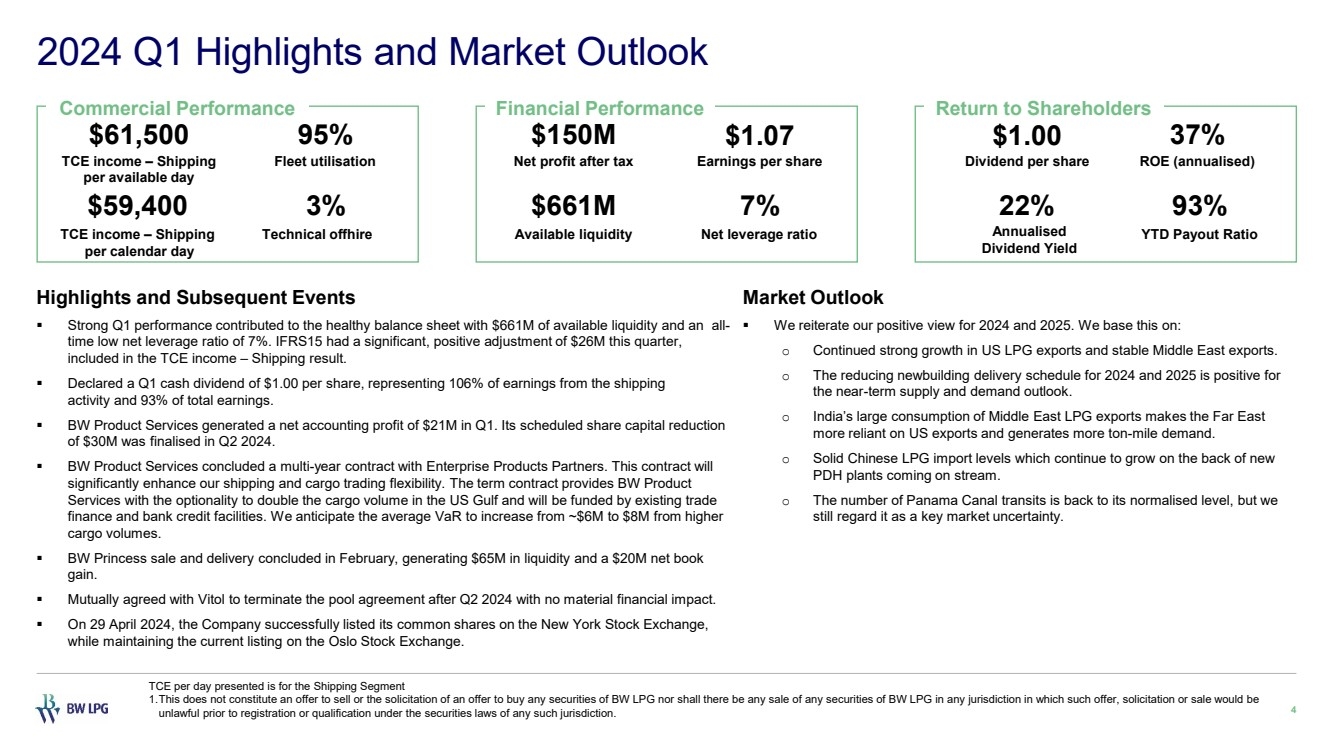
2024 Q1 Highlights and Market Outlook Highlights and Subsequent Events Strong Q1 performance contributed to the healthy balance sheet with $661M of available liquidity and an all-time low net leverage ratio of 7%. IFRS15 had a significant, positive adjustment of $26M this quarter, included in the TCE income – Shipping result. Declared a Q1 cash dividend of $1.00 per share, representing 106% of earnings from the shipping activity and 93% of total earnings. BW Product Services generated a net accounting profit of $21M in Q1. Its scheduled share capital reduction of $30M was finalised in Q2 2024. BW Product Services concluded a multi-year contract with Enterprise Products Partners. This contract will significantly enhance our shipping and cargo trading flexibility. The term contract provides BW Product Services with the optionality to double the cargo volume in the US Gulf and will be funded by existing trade finance and bank credit facilities. We anticipate the average VaR to increase from ~$6M to $8M from higher cargo volumes. BW Princess sale and delivery concluded in February, generating $65M in liquidity and a $20M net book gain. Mutually agreed with Vitol to terminate the pool agreement after Q2 2024 with no material financial impact. On 29 April 2024, the Company successfully listed its common shares on the New York Stock Exchange, while maintaining the current listing on the Oslo Stock Exchange. 4 Market Outlook We reiterate our positive view for 2024 and 2025. We base this on: o Continued strong growth in US LPG exports and stable Middle East exports. o The reducing newbuilding delivery schedule for 2024 and 2025 is positive for the near-term supply and demand outlook. o India’s large consumption of Middle East LPG exports makes the Far East more reliant on US exports and generates more ton-mile demand. o Solid Chinese LPG import levels which continue to grow on the back of new PDH plants coming on stream. o The number of Panama Canal transits is back to its normalised level, but we still regard it as a key market uncertainty. TCE per day presented is for the Shipping Segment 1.This does not constitute an offer to sell or the solicitation of an offer to buy any securities of BW LPG nor shall there be any sale of any securities of BW LPG in any jurisdiction in which such offer, solicitation or sale would be unlawful prior to registration or qualification under the securities laws of any such jurisdiction. $61,500 TCE income – Shipping per available day 95% Fleet utilisation $59,400 TCE income – Shipping per calendar day 3% Technical offhire Commercial Performance Financial Performance Return to Shareholders $150M Net profit after tax $661M Available liquidity $1.07 Earnings per share 7% Net leverage ratio $1.00 Dividend per share 37% ROE (annualised) YTD Payout Ratio 22% 93% Annualised Dividend Yield |
|
Market 5 02 |
|
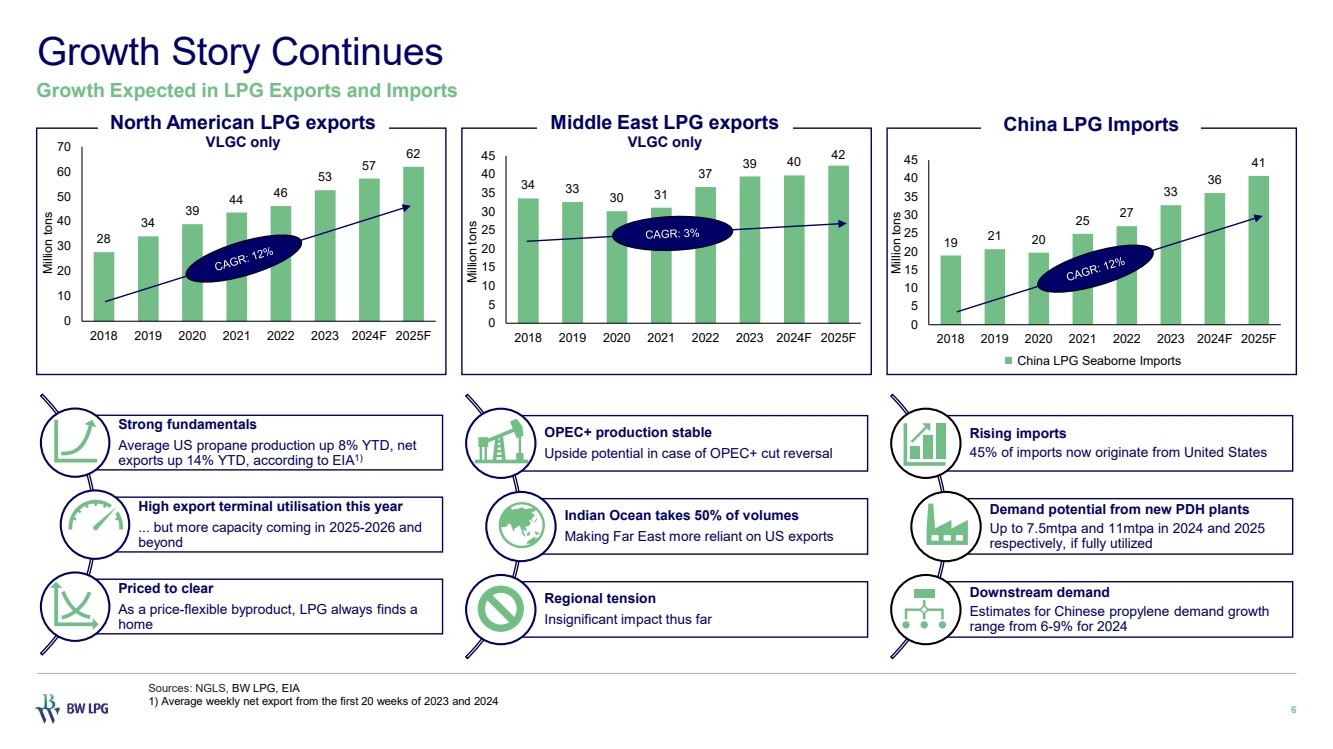
19 21 20 25 27 33 36 41 0 5 10 15 20 25 30 35 40 45 2018 2019 2020 2021 2022 2023 2024F 2025F Million tons China LPG Seaborne Imports 34 33 30 31 37 39 40 42 0 5 10 15 20 25 30 35 40 45 2018 2019 2020 2021 2022 2023 2024F 2025F Million tons 28 34 39 44 46 53 57 62 0 10 20 30 40 50 60 70 2018 2019 2020 2021 2022 2023 2024F 2025F Million tons Growth Story Continues 6 Growth Expected in LPG Exports and Imports North American LPG exports VLGC only Middle East LPG exports VLGC only China LPG Imports Strong fundamentals Average US propane production up 8% YTD, net exports up 14% YTD, according to EIA1) High export terminal utilisation this year ... but more capacity coming in 2025-2026 and beyond Priced to clear As a price-flexible byproduct, LPG always finds a home OPEC+ production stable Upside potential in case of OPEC+ cut reversal Indian Ocean takes 50% of volumes Making Far East more reliant on US exports Regional tension Insignificant impact thus far Rising imports 45% of imports now originate from United States Demand potential from new PDH plants Up to 7.5mtpa and 11mtpa in 2024 and 2025 respectively, if fully utilized Downstream demand Estimates for Chinese propylene demand growth range from 6-9% for 2024 Sources: NGLS, BW LPG, EIA 1) Average weekly net export from the first 20 weeks of 2023 and 2024 |
|
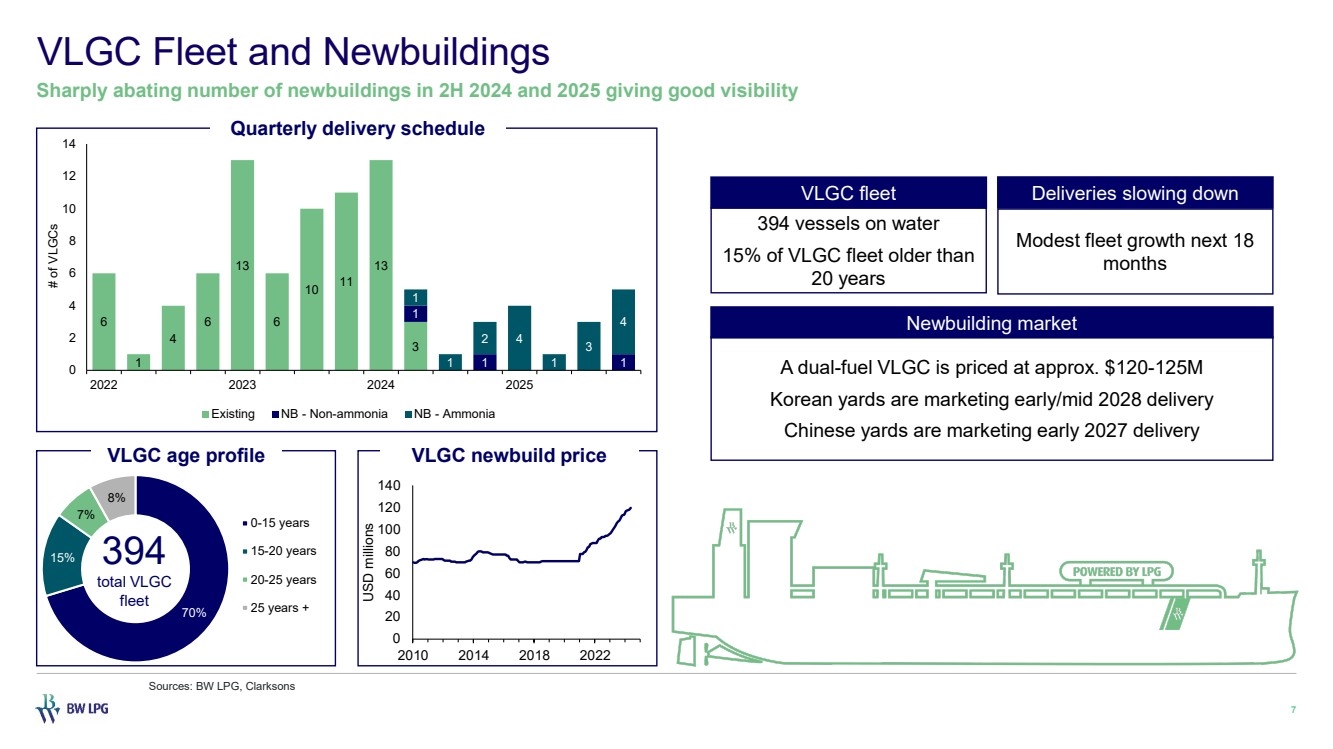
70% 15% 7% 8% 0-15 years 15-20 years 20-25 years 25 years + VLGC Fleet and Newbuildings 7 Sharply abating number of newbuildings in 2H 2024 and 2025 giving good visibility Sources: BW LPG, Clarksons Quarterly delivery schedule 0 20 40 60 80 100 120 140 2010 2014 2018 2022 USD millions VLGC age profile VLGC newbuild price 394 vessels on water 15% of VLGC fleet older than 20 years VLGC fleet A dual-fuel VLGC is priced at approx. $120-125M Korean yards are marketing early/mid 2028 delivery Chinese yards are marketing early 2027 delivery Newbuilding market Modest fleet growth next 18 months Deliveries slowing down 394 total VLGC fleet 6 1 4 6 13 6 10 11 13 3 1 1 1 1 1 2 4 1 3 4 0 2 4 6 8 10 12 14 2022 2023 2024 2025 # of VLGCs Existing NB - Non-ammonia NB - Ammonia |
|
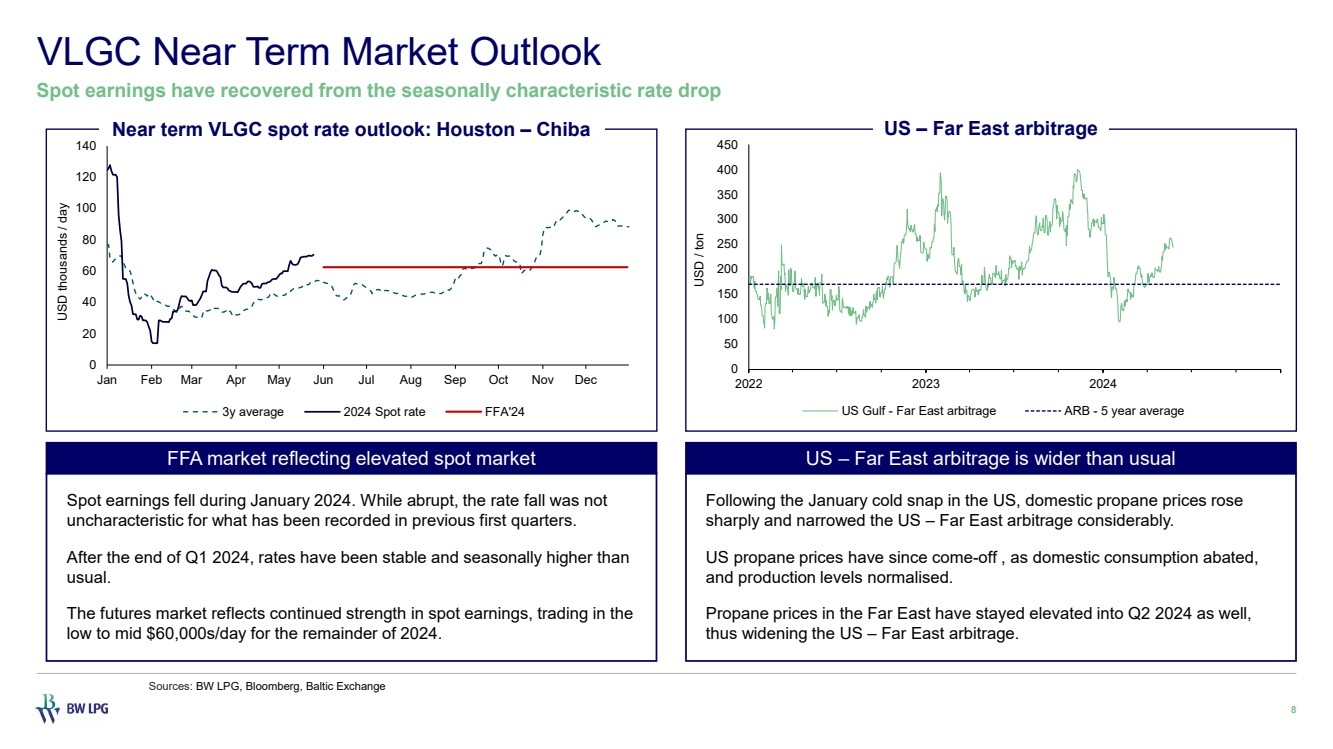
0 20 40 60 80 100 120 140 Jan Feb Mar Apr May Jun Jul Aug Sep Oct Nov Dec USD thousands / day 3y average 2024 Spot rate FFA'24 0 50 100 150 200 250 300 350 400 450 2022 2023 2024 USD / ton US Gulf - Far East arbitrage ARB - 5 year average VLGC Near Term Market Outlook 8 Spot earnings have recovered from the seasonally characteristic rate drop Spot earnings fell during January 2024. While abrupt, the rate fall was not uncharacteristic for what has been recorded in previous first quarters. After the end of Q1 2024, rates have been stable and seasonally higher than usual. The futures market reflects continued strength in spot earnings, trading in the low to mid $60,000s/day for the remainder of 2024. Sources: BW LPG, Bloomberg, Baltic Exchange Near term VLGC spot rate outlook: Houston – Chiba US – Far East arbitrage Following the January cold snap in the US, domestic propane prices rose sharply and narrowed the US – Far East arbitrage considerably. US propane prices have since come-off , as domestic consumption abated, and production levels normalised. Propane prices in the Far East have stayed elevated into Q2 2024 as well, thus widening the US – Far East arbitrage. FFA market reflecting elevated spot market US – Far East arbitrage is wider than usual |
|
Performance 9 03 |
|
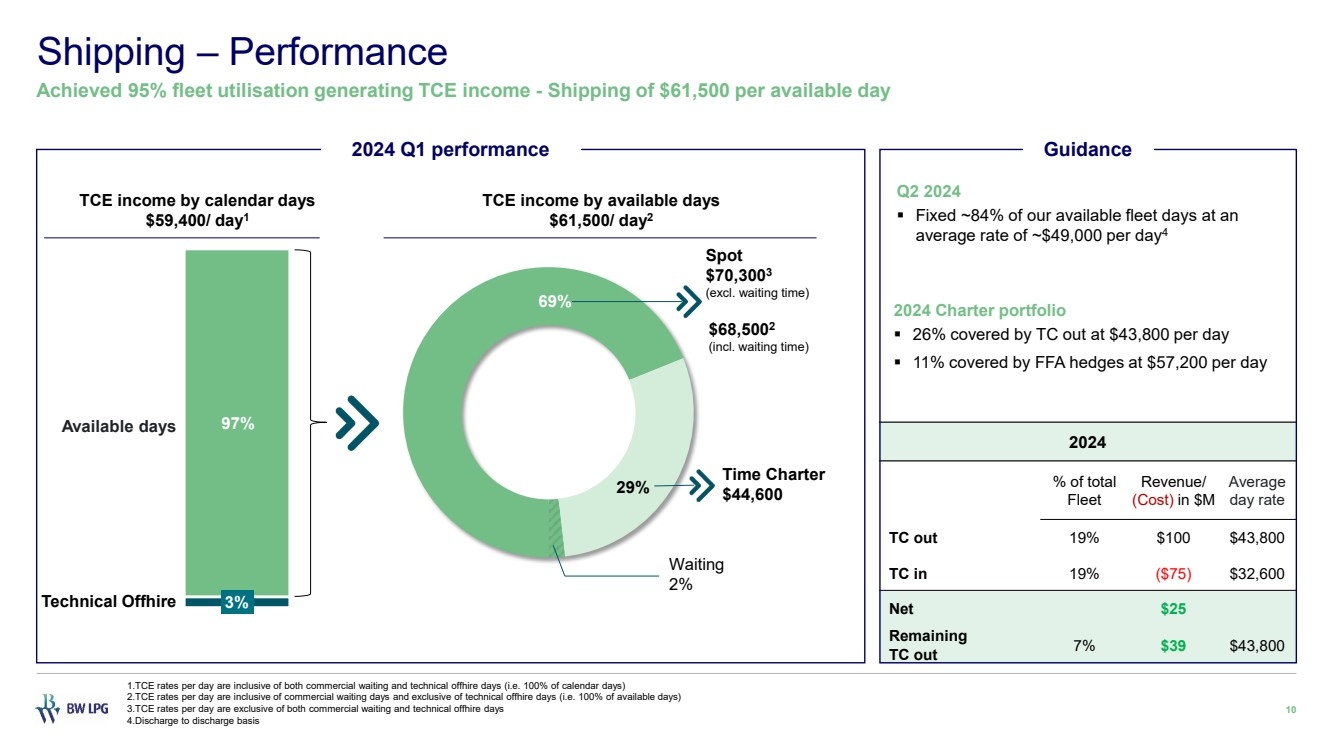
2024 % of total Fleet Revenue/ (Cost) in $M Average day rate TC out 19% $100 $43,800 TC in 19% ($75) $32,600 Net $25 Remaining TC out 7% $39 $43,800 Shipping – Performance 10 Achieved 95% fleet utilisation generating TCE income - Shipping of $61,500 per available day 2024 Q1 performance Q2 2024 Fixed ~84% of our available fleet days at an average rate of ~$49,000 per day4 Guidance 2024 Charter portfolio 26% covered by TC out at $43,800 per day 11% covered by FFA hedges at $57,200 per day 3% 97% TCE income by calendar days $59,400/ day1 Technical Offhire Available days 29% 69% TCE income by available days $61,500/ day2 $68,5002 (incl. waiting time) Spot $70,3003 (excl. waiting time) Time Charter $44,600 Waiting 2% 1.TCE rates per day are inclusive of both commercial waiting and technical offhire days (i.e. 100% of calendar days) 2.TCE rates per day are inclusive of commercial waiting days and exclusive of technical offhire days (i.e. 100% of available days) 3.TCE rates per day are exclusive of both commercial waiting and technical offhire days 4.Discharge to discharge basis |
|
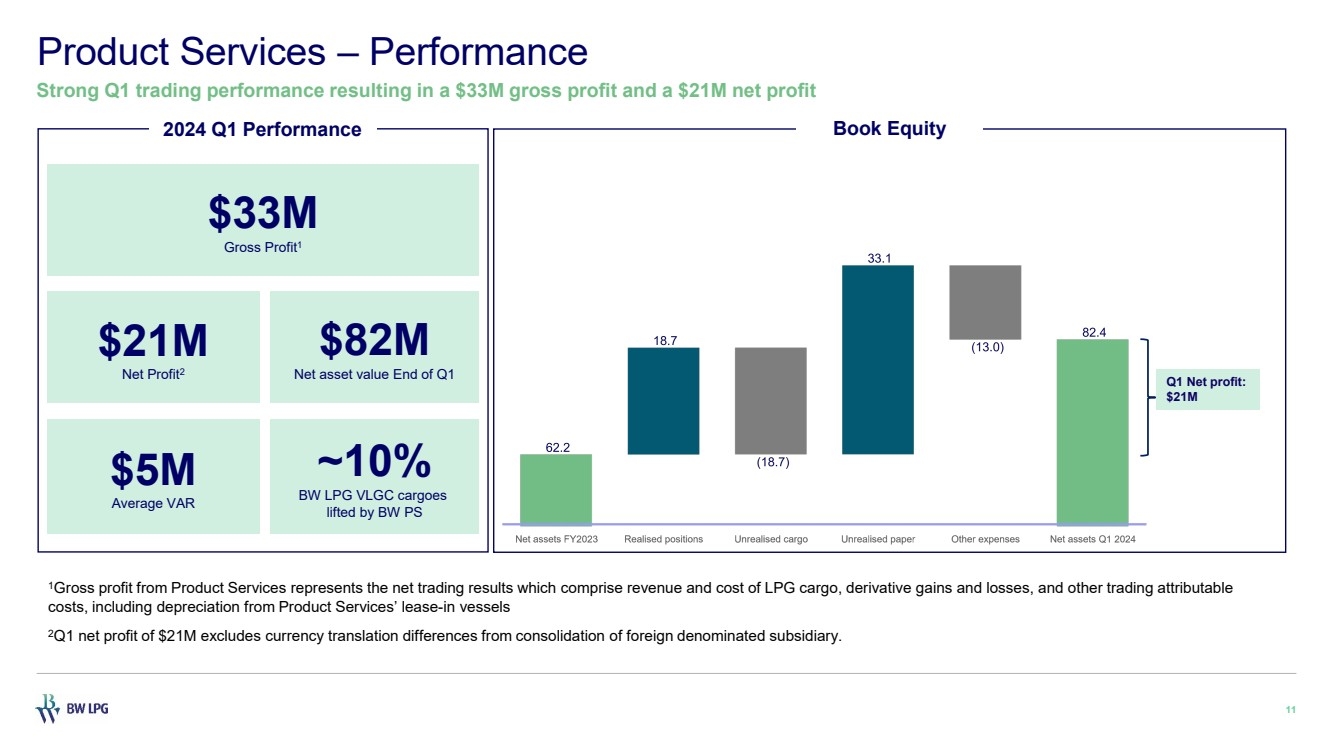
1Gross profit from Product Services represents the net trading results which comprise revenue and cost of LPG cargo, derivative gains and losses, and other trading attributable costs, including depreciation from Product Services’ lease-in vessels 2Q1 net profit of $21M excludes currency translation differences from consolidation of foreign denominated subsidiary. 11 Product Services – Performance $33M Gross Profit1 $21M Net Profit2 $82M Net asset value End of Q1 $5M Average VAR ~10% BW LPG VLGC cargoes lifted by BW PS 2024 Q1 Performance Book Equity Strong Q1 trading performance resulting in a $33M gross profit and a $21M net profit Q1 Net profit: $21M |
|
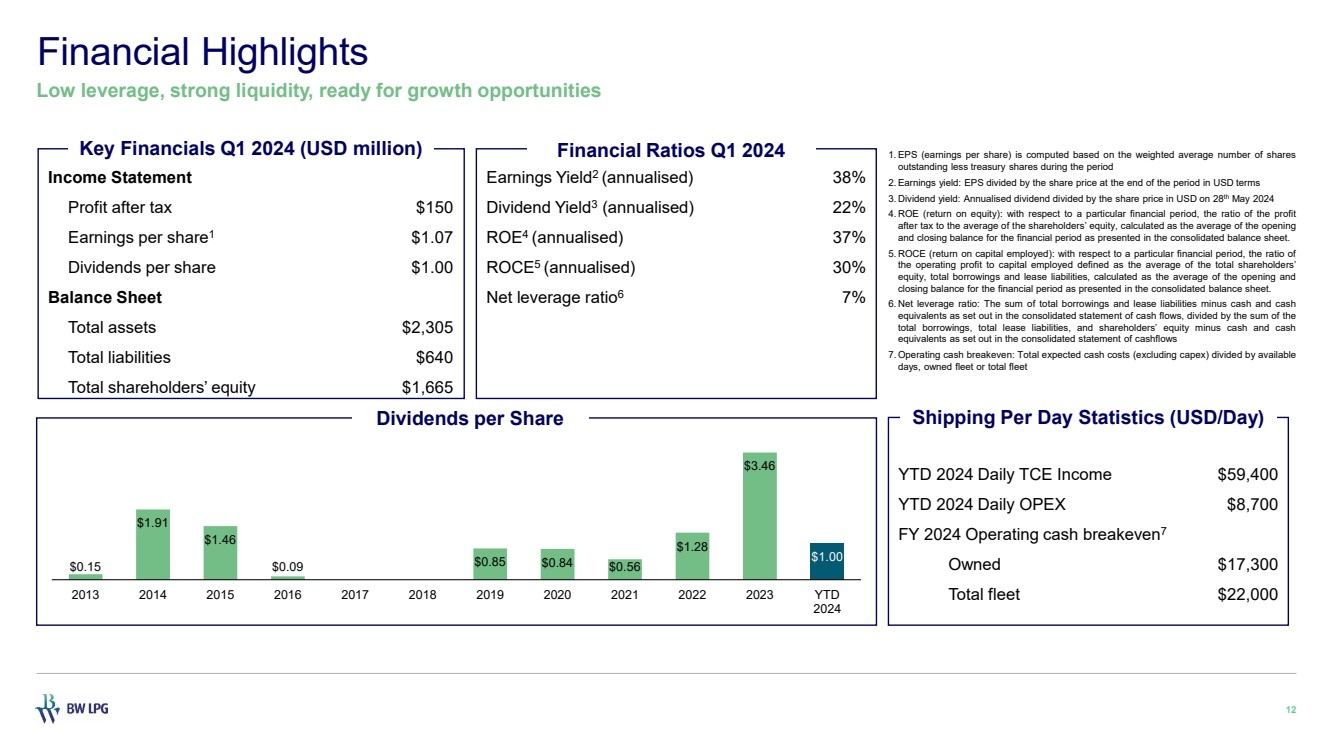
$0.15 $1.91 $1.46 $0.09 $0.85 $0.84 $0.56 $1.28 $3.46 $1.00 2013 2014 2015 2016 2017 2018 2019 2020 2021 2022 2023 YTD 2024 Financial Highlights 12 Low leverage, strong liquidity, ready for growth opportunities Earnings Yield2 (annualised) 38% Dividend Yield3 (annualised) 22% ROE4 (annualised) 37% ROCE5 (annualised) 30% Net leverage ratio6 7% 1. EPS (earnings per share) is computed based on the weighted average number of shares outstanding less treasury shares during the period 2. Earnings yield: EPS divided by the share price at the end of the period in USD terms 3. Dividend yield: Annualised dividend divided by the share price in USD on 28th May 2024 4. ROE (return on equity): with respect to a particular financial period, the ratio of the profit after tax to the average of the shareholders’ equity, calculated as the average of the opening and closing balance for the financial period as presented in the consolidated balance sheet. 5. ROCE (return on capital employed): with respect to a particular financial period, the ratio of the operating profit to capital employed defined as the average of the total shareholders’ equity, total borrowings and lease liabilities, calculated as the average of the opening and closing balance for the financial period as presented in the consolidated balance sheet. 6. Net leverage ratio: The sum of total borrowings and lease liabilities minus cash and cash equivalents as set out in the consolidated statement of cash flows, divided by the sum of the total borrowings, total lease liabilities, and shareholders’ equity minus cash and cash equivalents as set out in the consolidated statement of cashflows 7. Operating cash breakeven: Total expected cash costs (excluding capex) divided by available days, owned fleet or total fleet Key Financials Q1 2024 (USD million) Financial Ratios Q1 2024 Income Statement Profit after tax $150 Earnings per share1 $1.07 Dividends per share $1.00 Balance Sheet Total assets $2,305 Total liabilities $640 Total shareholders’ equity $1,665 Dividends per Share YTD 2024 Daily TCE Income $59,400 YTD 2024 Daily OPEX $8,700 FY 2024 Operating cash breakeven7 Owned $17,300 Total fleet $22,000 Shipping Per Day Statistics (USD/Day) |
|
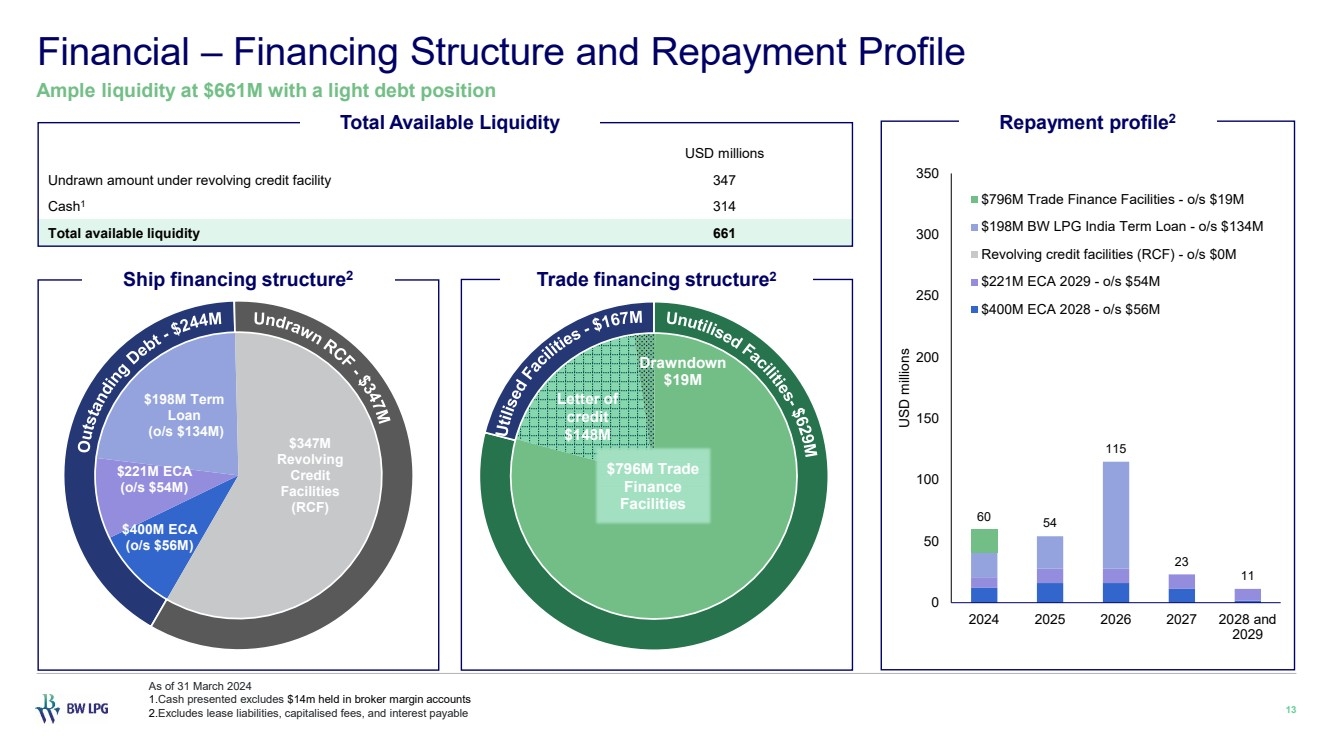
$400M ECA (o/s $56M) $221M ECA (o/s $54M) $198M Term Loan (o/s $134M) $347M Revolving Credit Facilities (RCF) USD millions Undrawn amount under revolving credit facility 347 Cash1 314 Total available liquidity 661 Financial – Financing Structure and Repayment Profile 13 Ample liquidity at $661M with a light debt position Trade financing structure2 Total Available Liquidity As of 31 March 2024 1.Cash presented excludes $14m held in broker margin accounts 2.Excludes lease liabilities, capitalised fees, and interest payable Ship financing structure2 60 54 115 23 11 0 50 100 150 200 250 300 350 2024 2025 2026 2027 2028 and 2029 USD millions $796M Trade Finance Facilities - o/s $19M $198M BW LPG India Term Loan - o/s $134M Revolving credit facilities (RCF) - o/s $0M $221M ECA 2029 - o/s $54M $400M ECA 2028 - o/s $56M Repayment profile2 Letter of credit $148M Drawndown $19M $796M Trade Finance Facilities |
|
Q&A 14 04 |
|
Q&A CEO and Interim Head of Commercial Kristian Sørensen CFO Samantha Xu |
|
Contact Us Investor Relations investor.relations@bwlpg.com Ticker (OSE) / Ticker (NYSE) BWLPG / BWLP LinkedIn linkedin.com/company/bwlpg Telephone +65 6705 5588 Website https://investor.bwlpg.com Address 10 Pasir Panjang Road Mapletree Business City #17 -02 Singapore 117438 16 |
|
Appendices 17 05 |
|
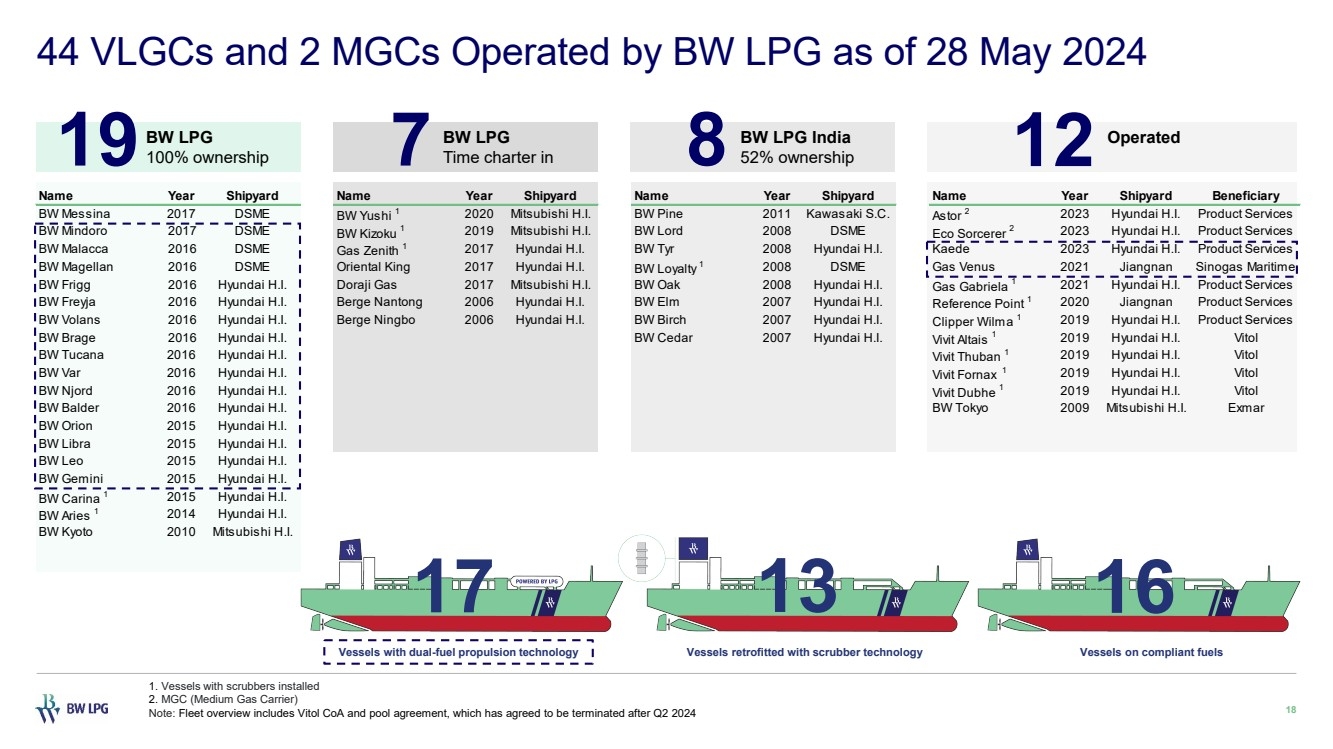
44 VLGCs and 2 MGCs Operated by BW LPG as of 28 May 2024 18 BW LPG 19100% ownership BW LPG 7 Time charter in BW LPG India 52% ownership Operated 8 12 17 Vessels with dual-fuel propulsion technology Vessels retrofitted with scrubber technology Vessels on compliant fuels 13 16 1. Vessels with scrubbers installed 2. MGC (Medium Gas Carrier) Note: Fleet overview includes Vitol CoA and pool agreement, which has agreed to be terminated after Q2 2024 Name Year Shipyard Name Year Shipyard Name Year Shipyard Name Year Shipyard Beneficiary BW Messina 2017 DSME BW Yushi 1 2020 Mitsubishi H.I. BW Pine 2011 Kawasaki S.C. Astor 2 2023 Hyundai H.I. Product Services BW Mindoro 2017 DSME BW Kizoku 1 2019 Mitsubishi H.I. BW Lord 2008 DSME Eco Sorcerer 2 2023 Hyundai H.I. Product Services BW Malacca 2016 DSME Gas Zenith 1 2017 Hyundai H.I. BW Tyr 2008 Hyundai H.I. Kaede 2023 Hyundai H.I. Product Services BW Magellan 2016 DSME Oriental King 2017 Hyundai H.I. BW Loyalty 1 2008 DSME Gas Venus 2021 Jiangnan Sinogas Maritime BW Frigg 2016 Hyundai H.I. Doraji Gas 2017 Mitsubishi H.I. BW Oak 2008 Hyundai H.I. Gas Gabriela 1 2021 Hyundai H.I. Product Services BW Freyja 2016 Hyundai H.I. Berge Nantong 2006 Hyundai H.I. BW Elm 2007 Hyundai H.I. Reference Point 1 2020 Jiangnan Product Services BW Volans 2016 Hyundai H.I. Berge Ningbo 2006 Hyundai H.I. BW Birch 2007 Hyundai H.I. Clipper Wilma 1 2019 Hyundai H.I. Product Services BW Brage 2016 Hyundai H.I. BW Cedar 2007 Hyundai H.I. Vivit Altais 1 2019 Hyundai H.I. Vitol BW Tucana 2016 Hyundai H.I. Vivit Thuban 1 2019 Hyundai H.I. Vitol BW Var 2016 Hyundai H.I. Vivit Fornax 1 2019 Hyundai H.I. Vitol BW Njord 2016 Hyundai H.I. Vivit Dubhe 1 2019 Hyundai H.I. Vitol BW Balder 2016 Hyundai H.I. BW Tokyo 2009 Mitsubishi H.I. Exmar BW Orion 2015 Hyundai H.I. BW Libra 2015 Hyundai H.I. BW Leo 2015 Hyundai H.I. BW Gemini 2015 Hyundai H.I. BW Carina 1 2015 Hyundai H.I. BW Aries 1 2014 Hyundai H.I. BW Kyoto 2010 Mitsubishi H.I. |
|
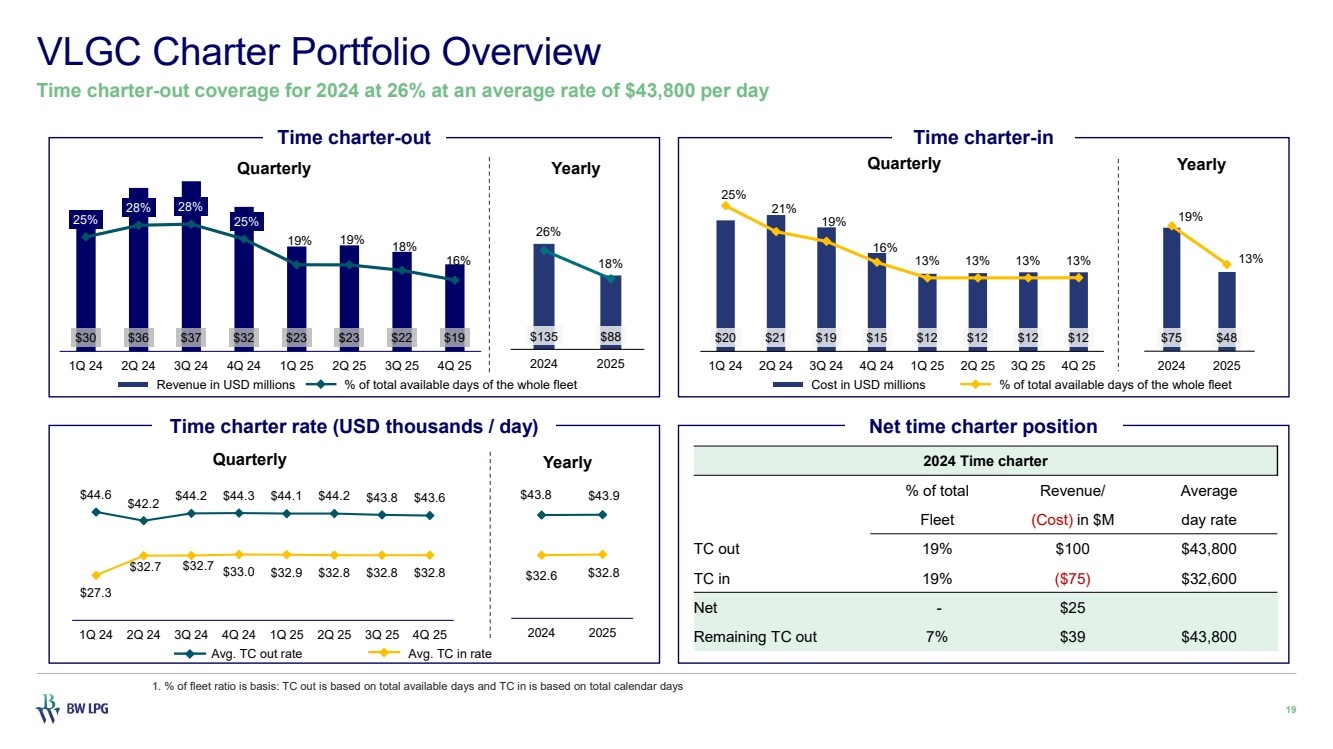
1. % of fleet ratio is basis: TC out is based on total available days and TC in is based on total calendar days VLGC Charter Portfolio Overview 19 Time charter-out coverage for 2024 at 26% at an average rate of $43,800 per day Revenue in USD millions % of total available days of the whole fleet Cost in USD millions % of total available days of the whole fleet Avg. TC out rate Avg. TC in rate Time charter-out Time charter rate (USD thousands / day) Time charter-in Net time charter position 2024 Time charter % of total Revenue/ Average Fleet (Cost) in $M day rate TC out 19% $100 $43,800 TC in 19% ($75) $32,600 Net - $25 Remaining TC out 7% $39 $43,800 $135 $88 26% 18% 2024 2025 Yearly $20 $21 $19 $15 $12 $12 $12 $12 25% 21% 19% 16% 13% 13% 13% 13% 1Q 24 2Q 24 3Q 24 4Q 24 1Q 25 2Q 25 3Q 25 4Q 25 Quarterly $75 $48 19% 13% 2024 2025 Yearly $30 $36 $37 $32 $23 $23 $22 $19 25% 28% 28% 25% 19% 19% 18% 16% 1Q 24 2Q 24 3Q 24 4Q 24 1Q 25 2Q 25 3Q 25 4Q 25 Quarterly $44.6 $42.2 $44.2 $44.3 $44.1 $44.2 $43.8 $43.6 $27.3 $32.7 $32.7 $33.0 $32.9 $32.8 $32.8 $32.8 1Q 24 2Q 24 3Q 24 4Q 24 1Q 25 2Q 25 3Q 25 4Q 25 Quarterly $43.8 $43.9 $32.6 $32.8 2024 2025 Yearly |
|
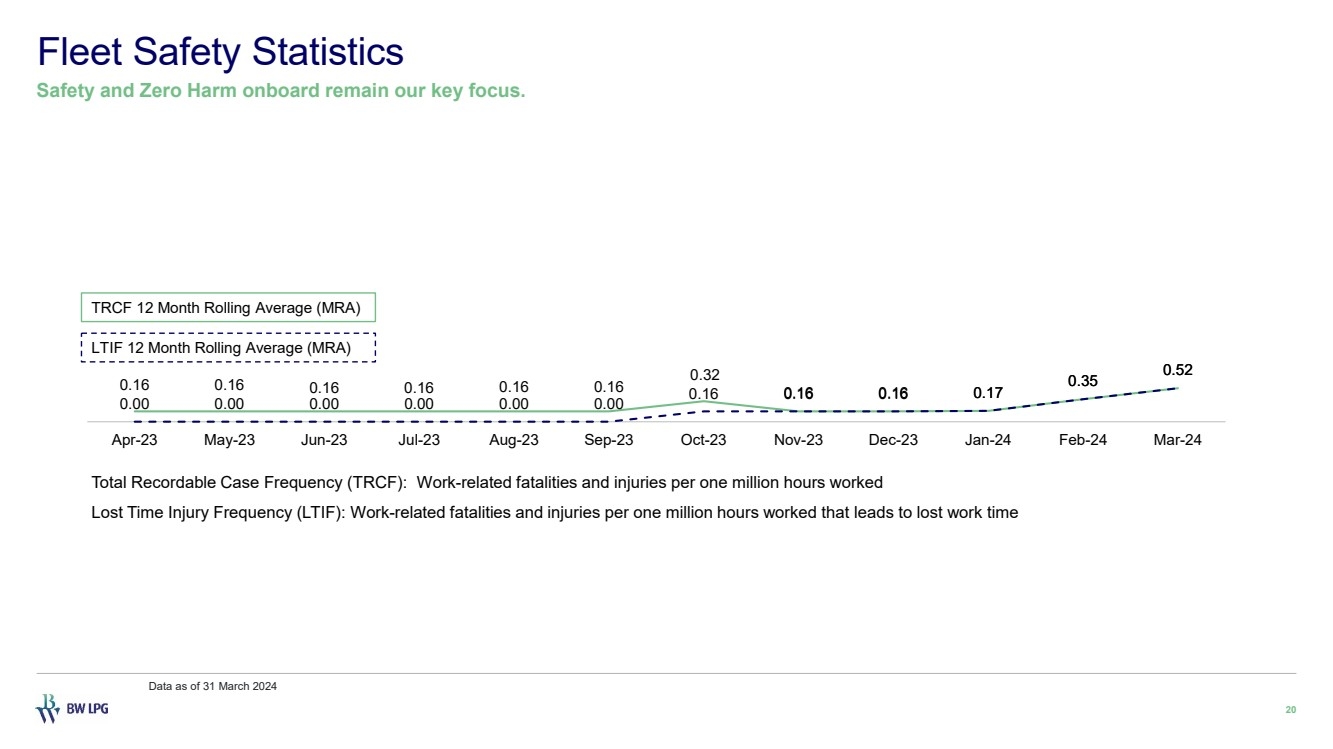
0.16 0.16 0.16 0.16 0.16 0.16 0.32 0.16 0.16 0.17 0.35 0.52 0.00 0.00 0.00 0.00 0.00 0.00 0.16 0.16 0.16 0.17 0.35 0.52 Apr-23 May-23 Jun-23 Jul-23 Aug-23 Sep-23 Oct-23 Nov-23 Dec-23 Jan-24 Feb-24 Mar-24 Fleet Safety Statistics 20 Safety and Zero Harm onboard remain our key focus. Total Recordable Case Frequency (TRCF): Work-related fatalities and injuries per one million hours worked Lost Time Injury Frequency (LTIF): Work-related fatalities and injuries per one million hours worked that leads to lost work time TRCF 12 Month Rolling Average (MRA) LTIF 12 Month Rolling Average (MRA) Data as of 31 March 2024 |
|
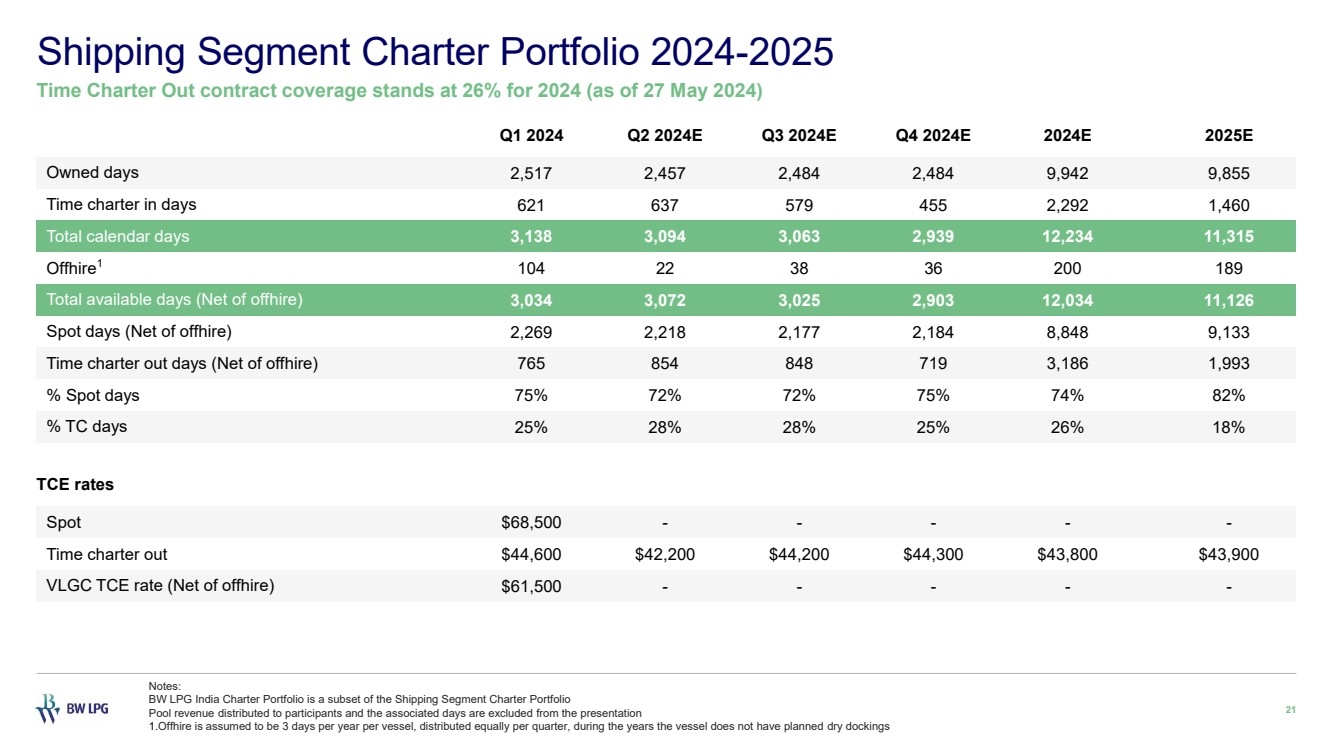
Shipping Segment Charter Portfolio 2024-2025 21 Time Charter Out contract coverage stands at 26% for 2024 (as of 27 May 2024) Q1 2024 Q2 2024E Q3 2024E Q4 2024E 2024E 2025E Owned days 2,517 2,457 2,484 2,484 9,942 9,855 Time charter in days 621 637 579 455 2,292 1,460 Total calendar days 3,138 3,094 3,063 2,939 12,234 11,315 Offhire1 104 22 38 36 200 189 Total available days (Net of offhire) 3,034 3,072 3,025 2,903 12,034 11,126 Spot days (Net of offhire) 2,269 2,218 2,177 2,184 8,848 9,133 Time charter out days (Net of offhire) 765 854 848 719 3,186 1,993 % Spot days 75% 72% 72% 75% 74% 82% % TC days 25% 28% 28% 25% 26% 18% TCE rates Spot $68,500 - - - - - Time charter out $44,600 $42,200 $44,200 $44,300 $43,800 $43,900 VLGC TCE rate (Net of offhire) $61,500 - - - - - Notes: BW LPG India Charter Portfolio is a subset of the Shipping Segment Charter Portfolio Pool revenue distributed to participants and the associated days are excluded from the presentation 1.Offhire is assumed to be 3 days per year per vessel, distributed equally per quarter, during the years the vessel does not have planned dry dockings |
|
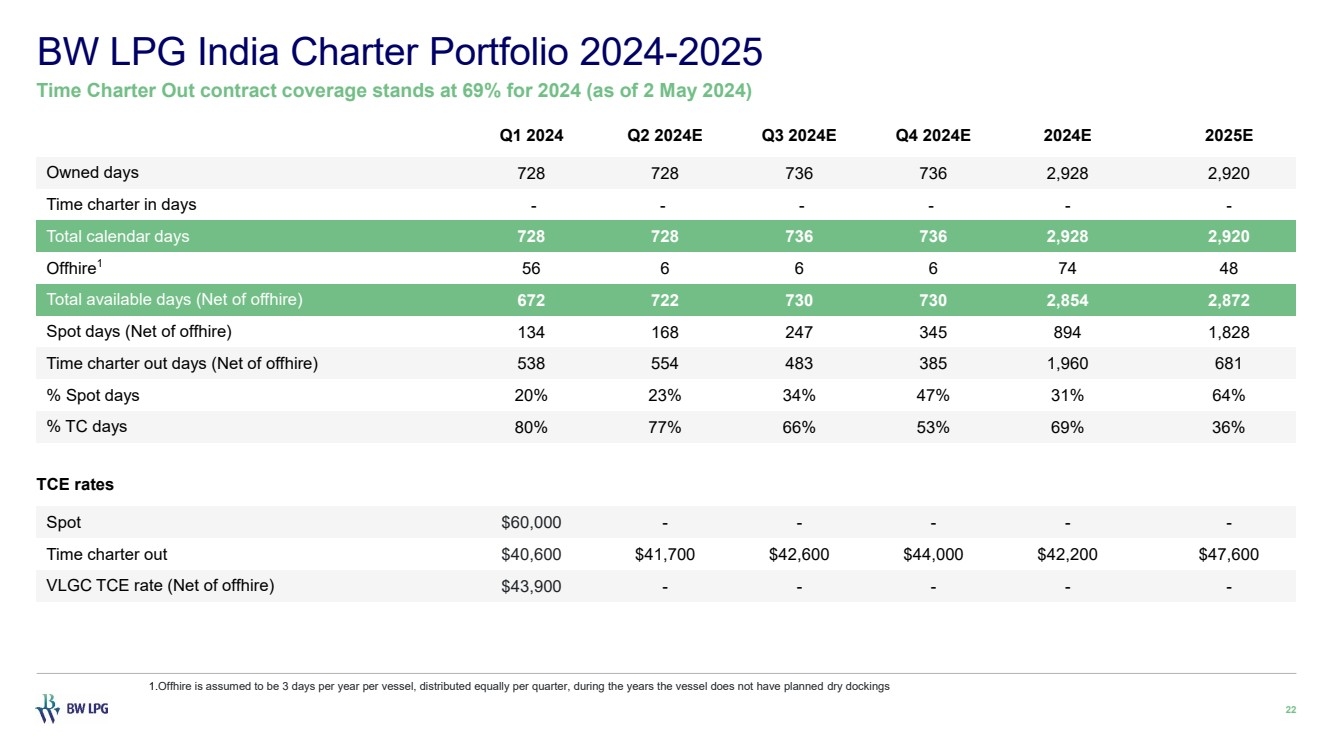
BW LPG India Charter Portfolio 2024-2025 22 Time Charter Out contract coverage stands at 69% for 2024 (as of 2 May 2024) 1.Offhire is assumed to be 3 days per year per vessel, distributed equally per quarter, during the years the vessel does not have planned dry dockings Q1 2024 Q2 2024E Q3 2024E Q4 2024E 2024E 2025E Owned days 728 728 736 736 2,928 2,920 Time charter in days - - - - - - Total calendar days 728 728 736 736 2,928 2,920 Offhire1 56 6 6 6 74 48 Total available days (Net of offhire) 672 722 730 730 2,854 2,872 Spot days (Net of offhire) 134 168 247 345 894 1,828 Time charter out days (Net of offhire) 538 554 483 385 1,960 681 % Spot days 20% 23% 34% 47% 31% 64% % TC days 80% 77% 66% 53% 69% 36% TCE rates Spot $60,000 - - - - - Time charter out $40,600 $41,700 $42,600 $44,000 $42,200 $47,600 VLGC TCE rate (Net of offhire) $43,900 - - - - - |
Exhibit 99.4
BW LPG Limited – Key information relating to the cash dividend for Q1 2024
(Singapore, 30 May 2024)
BW LPG Limited (“BW LPG" or the "Company", OSE ticker code: "BWLPG.OL", NYSE ticker code "BWLP") provides the following key information relating to the Company's cash dividend for Q1 2024:
Dividend amount: USD 1.00 per share. Dividends payable to shares registered with Euronext VPS will be distributed in NOK.
Date of approval: 29 May 2024
Record date: 10 June 2024
Shares registered with Euronext VPS Oslo Stock Exchange
===============================
Last trading day including the right to receive this dividend: 6 June 2024
Ex-date: 7 June 2024
Dividend payment date: On or about 28 June 2024
Shares registered with Depository Trust Company
===============================
Last trading day including the right to receive this dividend: 7 June 2024
Ex-date: 10 June 2024
Dividend payment date: On or about 25 June 2024
For further information, please contact:
Samantha Xu
Chief Financial Officer
E-mail: investor.relations@bwlpg.com
About BW LPG
BW LPG is the world’s leading owner and operator of LPG vessels, owning and operating Very Large Gas Carriers (VLGC) with a total carrying capacity of over 3 million CBM. With five decades of operating experience in LPG shipping, experienced employees and an in-house LPG trading division, BW LPG offers an integrated, flexible, and reliable service to customers. More information about BW LPG can be found at https://www.bwlpg.com.
BW LPG is associated with BW Group, a leading global maritime company involved in shipping, floating infrastructure, deepwater oil & gas production, and new sustainable technologies. Founded in 1955 by Sir YK Pao, BW controls a fleet of over 490 vessels transporting oil, gas and dry commodities, with its 200 LNG and LPG ships constituting the largest gas fleet in the world. In the renewables space, the group has investments in solar, wind, batteries, biofuels and water treatment.
This information is subject to disclosure requirements pursuant to Section 5-12 of the Norwegian Securities Trading Act.