UNITED STATES
SECURITIES AND EXCHANGE COMMISSION
WASHINGTON, DC 20549
FORM 8-K
CURRENT REPORT
Pursuant to Section 13 or 15(d) of the
Securities Exchange Act of 1934
Date of report (Date of earliest event reported): May 14, 2024
ASTRANA HEALTH, INC.
(Exact Name of Registrant as Specified in Charter)
| Delaware | 001-37392 | 95-4472349 |
| (State or Other Jurisdiction | (Commission | (I.R.S. Employer |
| of Incorporation) | File Number) | Identification No.) |
1668 S. Garfield Avenue, 2nd Floor, Alhambra, California 91801
(Address of Principal Executive Offices) (Zip Code)
(626) 282-0288
Registrant’s Telephone Number, Including Area Code
(Former Name or Former Address, if Changed Since Last Report)
Check the appropriate box below if the Form 8-K filing is intended to simultaneously satisfy the filing obligation of the registrant under any of the following provisions:
| ¨ | Written communications pursuant to Rule 425 under the Securities Act (17 CFR 230.425) |
| ¨ | Soliciting material pursuant to Rule 14a-12 under the Exchange Act (17 CFR 240.14a-12) |
| ¨ | Pre-commencement communications pursuant to Rule 14d-2(b) under the Exchange Act (17 CFR 240.14d-2(b)) |
| ¨ | Pre-commencement communications pursuant to Rule 13e-4(c) under the Exchange Act (17 CFR 240.13e-4(c)) |
Securities registered pursuant to Section 12(b) of the Act:
| Title of each class | Trading Symbol(s) | Name of each exchange on which registered |
| Common Stock | ASTH | The Nasdaq Stock Market LLC |
Indicate by check mark whether the registrant is an emerging growth company as defined in Rule 405 of the Securities Act of 1933 (§230.405 of this chapter) or Rule 12b-2 of the Securities Exchange Act of 1934 (§240.12b-2 of this chapter).
Emerging growth company ¨
If an emerging growth company, indicate by check mark if the registrant has elected not to use the extended transition period for complying with any new or revised financial accounting standards provided pursuant to Section 13(a) of the Exchange Act. ¨
| Item 7.01 | Regulation FD Disclosure. |
Attached as Exhibit 99.1 to this Current Report on Form 8-K is a series of slides reflecting financial information about Astrana Health, Inc. (the “Company”) for use by the Company in connection with potential meetings with investors and/or analysts. The Company does not undertake to update the information contained in the attached presentation materials.
The information contained in this Current Report on Form 8-K, including the exhibit referenced herein, is being furnished and shall not be deemed “filed” for purposes of Section 18 of the Securities Exchange Act of 1934, as amended (the “Exchange Act”), or otherwise subject to the liabilities of that section. Such information shall not be incorporated by reference into any filing under the Securities Act of 1933, as amended, or the Exchange Act, whether made before or after the date hereof, regardless of any general incorporation language in such filing. The furnishing of this information will not be deemed an admission as to the materiality of any information contained herein.
| Item 9.01 | Financial Statements and Exhibits. |
(d) Exhibits.
| Exhibit No. | Description | |
| 99.1 | Investor Presentation (May 2024). | |
| 104 | Cover Page Interactive Data File (the cover page XBRL tags are embedded within the inline XBRL document). |
Forward-Looking Statements
This Current Report on Form 8-K contains forward-looking statements within the meaning of Section 27A of the Securities Act of 1933, as amended, and Section 21E of the Exchange Act. These statements include words such as “forecast,” “guidance,” “projects,” “estimates,” “anticipates,” “believes,” “expects,” “intends,” “may,” “plans,” “seeks,” “should,” or “will,” or the negative of these words or similar words. Forward-looking statements involve certain risks and uncertainties, and actual results may differ materially from those discussed in each such statement. A number of important factors could cause actual results to differ materially from those included within or contemplated by the forward-looking statements, including, but not limited to, the factors described in the Company’s filings with the Securities and Exchange Commission, including the Company’s Annual Report on Form 10-K for the year ended December 31, 2023 and subsequent quarterly reports on Form 10-Q. The Company does not undertake any responsibility to update any of these factors or to announce publicly any revisions to any of the forward-looking statements contained in this or any other document, whether as a result of new information, future events, or otherwise.
SIGNATURES
Pursuant to the requirements of the Securities Exchange Act of 1934, the registrant has duly caused this report to be signed on its behalf by the undersigned hereunto duly authorized.
| ASTRANA HEALTH, INC. | ||
| Date: May 14, 2024 | By: | /s/ Brandon Sim |
| Name: | Brandon Sim | |
| Title: | Chief Executive Officer and President | |
|
May 2024 Powered by Technology. Built by Doctors. For Patients. |
|
2 Forward Looking Statements This presentation contains forward-looking statements within the meaning of the Private Securities Litigation Reform Act of 1995, Section 27A of the Securities Act and Section 21E of the Exchange Act. Forward-looking statements include any statements about the Company's business, financial condition, operating results, plans, objectives, expectations and intentions, expansion plans, estimates of our total addressable market, integration of acquired companies and any projections of earnings, revenue, EBITDA, Adjusted EBITDA or other financial items, such as the Company's projected capitation and future liquidity, and may be identified by the use of forward-looking terms such as “anticipate,” “could,” “can,” “may,” “might,” “potential,” “predict,” “should,” “estimate,” “expect,” “project,” “believe,” “plan,” “envision,” “intend,” “continue,” “target,” “seek,” “will,” “would,” and the negative of such terms, other variations on such terms or other similar or comparable words, phrases or terminology. Forward-looking statements reflect current views with respect to future events and financial performance and therefore cannot be guaranteed. Such statements are based on the current expectations and certain assumptions of the Company’s management, and some or all of such expectations and assumptions may not materialize or may vary significantly from actual results. Actual results may also vary materially from forward-looking statements due to risks, uncertainties and other factors, known and unknown, including the risk factors described from time to time in the Company’s reports to the U.S. Securities and Exchange Commission (the “SEC”), including without limitation the risk factors discussed in the Company's Annual Report on Form 10-K/A for the year ended December 31, 2022, and subsequent Quarterly Reports on Form 10-Q. Because the factors referred to above could cause actual results or outcomes to differ materially from those expressed or implied in any forward-looking statements, you should not place undue reliance on any such forward-looking statements. Any forward-looking statements speak only as of the date of this presentation and, unless legally required, the Company does not undertake any obligation to update any forward-looking statement, as a result of new information, future events or otherwise. Use of Non-GAAP Financial Measures This presentation contains the non-GAAP financial measures EBITDA and Adjusted EBITDA, of which the most directly comparable financial measure presented in accordance with U.S. generally accepted accounting principles (“GAAP”) is net income. These measures are not in accordance with, or alternatives to, GAAP, and may be calculated differently from similar non-GAAP financial measures used by other companies. The Company uses Adjusted EBITDA as a supplemental performance measure of our operations, for financial and operational decision-making, and as a supplemental means of evaluating period-to-period comparisons on a consistent basis. Adjusted EBITDA is calculated as earnings before interest, taxes, depreciation, and amortization, excluding income or loss from equity method investments, non-recurring transactions, stock-based compensation, and APC excluded assets costs. Beginning in the third quarter ended September 30, 2022, the Company has revised the calculation for Adjusted EBITDA to exclude provider bonus payments and losses from recently acquired IPAs, which it believes to be more reflective of its business. The Company believes the presentation of these non-GAAP financial measures provides investors with relevant and useful information, as it allows investors to evaluate the operating performance of the business activities without having to account for differences recognized because of non-core or non-recurring financial information. When GAAP financial measures are viewed in conjunction with non-GAAP financial measures, investors are provided with a more meaningful understanding of the Company’s ongoing operating performance. In addition, these non-GAAP financial measures are among those indicators the Company uses as a basis for evaluating operational performance, allocating resources, and planning and forecasting future periods. Non-GAAP financial measures are not intended to be considered in isolation, or as a substitute for, GAAP financial measures. Other companies may calculate both EBITDA and Adjusted EBITDA differently, limiting the usefulness of these measures for comparative purposes. To the extent this Presentation contains historical or future non-GAAP financial measures, the Company has provided corresponding GAAP financial measures for comparative purposes. The reconciliation between certain GAAP and non-GAAP measures is provided in the Appendix. The Company has not provided a quantitative reconciliation of applicable non-GAAP measures, such as EBITDA margin targets, to the most comparable GAAP measure, such as net income, on a forward-looking basis within this presentation because the Company is unable, without unreasonable efforts, to provide reconciling information with respect to certain line items that cannot be calculated. These items, which could materially affect the computation of forward-looking GAAP net income, are inherently uncertain and depend on various factors, some of which are outside of the Company’s control. |
|
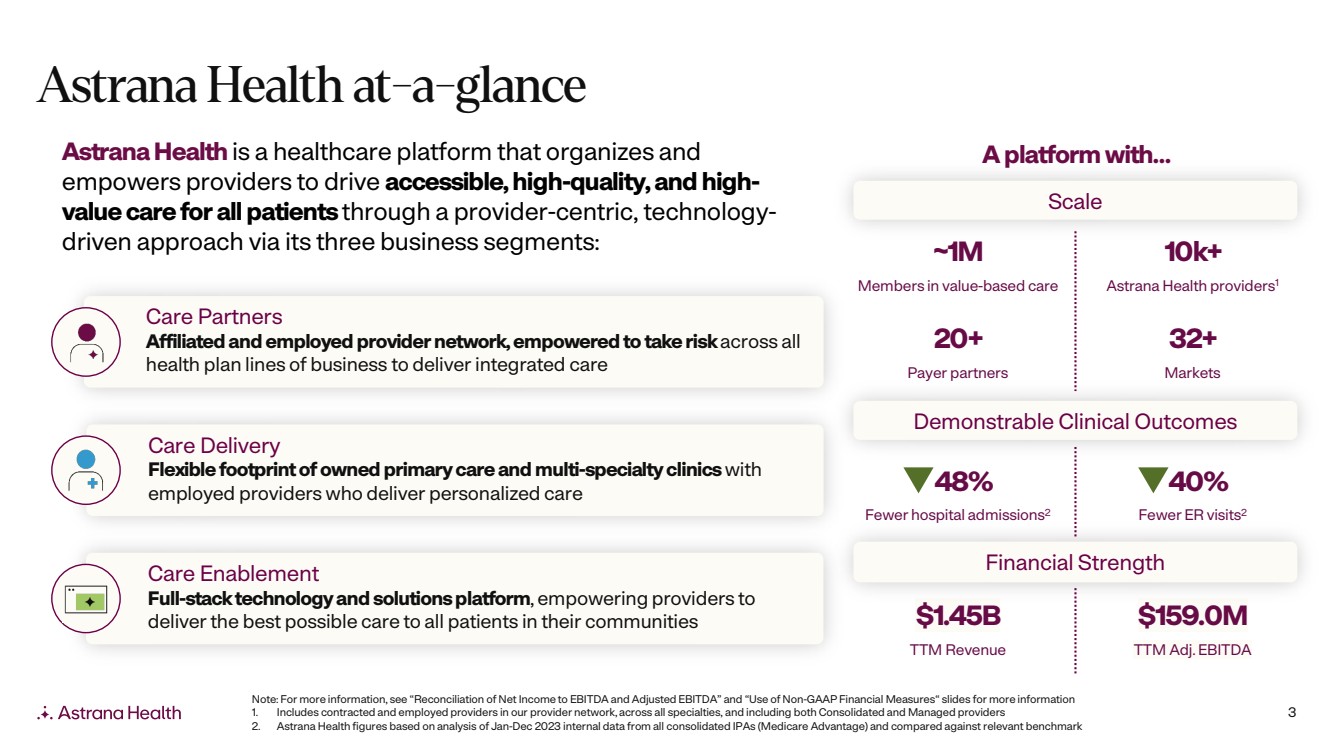
3 Care Enablement Full-stack technology and solutions platform, empowering providers to deliver the best possible care to all patients in their communities Care Delivery Flexible footprint of owned primary care and multi-specialty clinics with employed providers who deliver personalized care Care Partners Affiliated and employed provider network, empowered to take risk across all health plan lines of business to deliver integrated care Astrana Health at-a-glance AstranaHealth is a healthcare platform that organizes and empowers providers to drive accessible, high-quality, and high-value care for all patientsthrough a provider-centric, technology-driven approach via its three business segments: 10k+ Astrana Health providers1 ~1M Members in value-based care 32+ Markets 20+ Payer partners $159.0M TTM Adj. EBITDA $1.45B TTM Revenue Note: For more information, see “Reconciliation of Net Income to EBITDA and Adjusted EBITDA” and “Use of Non-GAAP Financial Measures“ slides for more information 1. Includes contracted and employed providers in our provider network, across all specialties, and including both Consolidated and Managed providers 2. Astrana Health figures based on analysis of Jan-Dec 2023 internal data from all consolidated IPAs (Medicare Advantage) and compared against relevant benchmark Financial Strength A platform with… Demonstrable Clinical Outcomes Scale 48% Fewer hospital admissions2 40% Fewer ER visits2 |
|
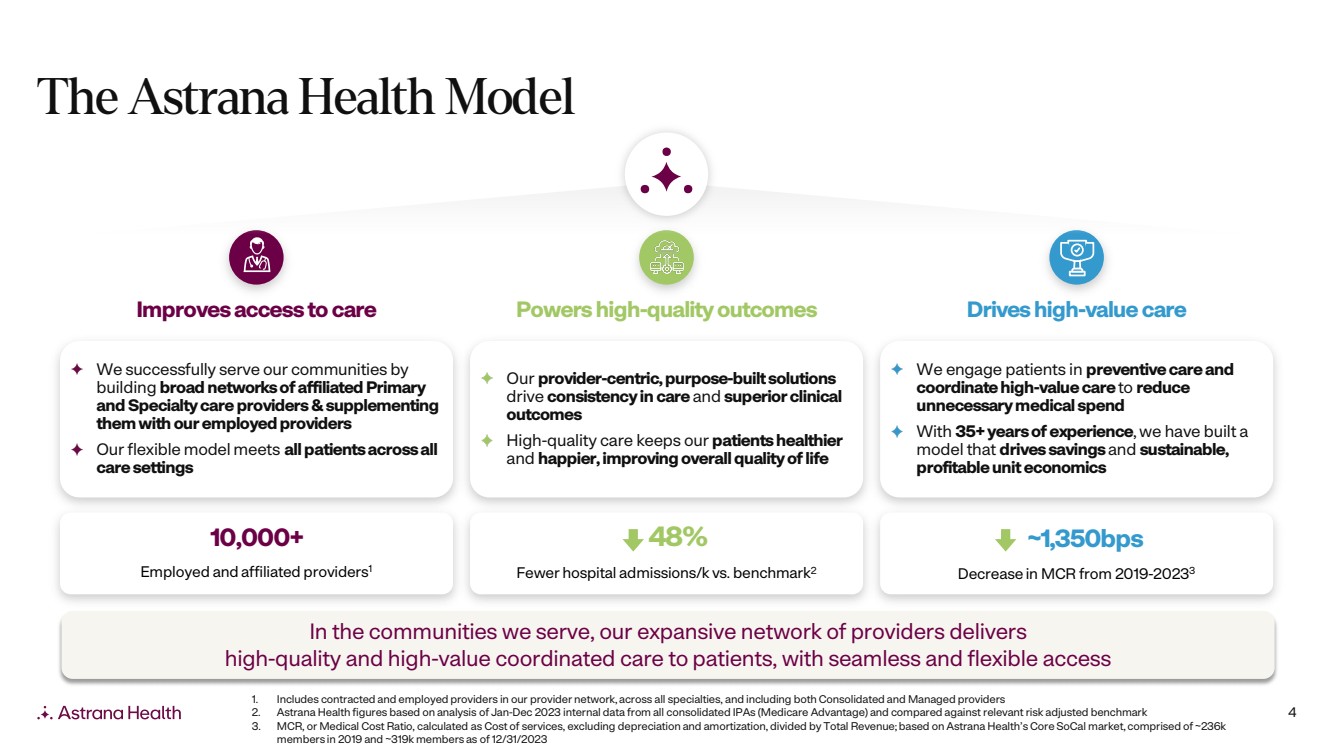
4 The Astrana Health Model 1. Includes contracted and employed providers in our provider network, across all specialties, and including both Consolidated and Managed providers 2. Astrana Health figures based on analysis of Jan-Dec 2023 internal data from all consolidated IPAs (Medicare Advantage) and compared against relevant risk adjusted benchmark 3. MCR, or Medical Cost Ratio, calculated as Cost of services, excluding depreciation and amortization, divided by Total Revenue; based on Astrana Health’s Core SoCal market, comprised of ~236k members in 2019 and ~319k members as of 12/31/2023 Improves access to care Powers high-quality outcomes Drives high-value care We successfully serve our communities by building broad networks of affiliated Primary and Specialty care providers &supplementing them with our employed providers Our flexible model meets all patients across all care settings Our provider-centric, purpose-built solutions drive consistency in care and superior clinical outcomes High-quality care keeps our patients healthier and happier, improving overall quality of life We engage patients in preventive care and coordinate high-value care to reduce unnecessary medical spend With 35+ years of experience, we have built a model that drives savings and sustainable, profitable unit economics ~1,350bps Decrease in MCR from 2019-20233 10,000+ Employed and affiliated providers1 48% Fewer hospital admissions/k vs. benchmark2 In the communities we serve, our expansive network of providers delivers high-quality and high-value coordinated care to patients, with seamless and flexible access |
|
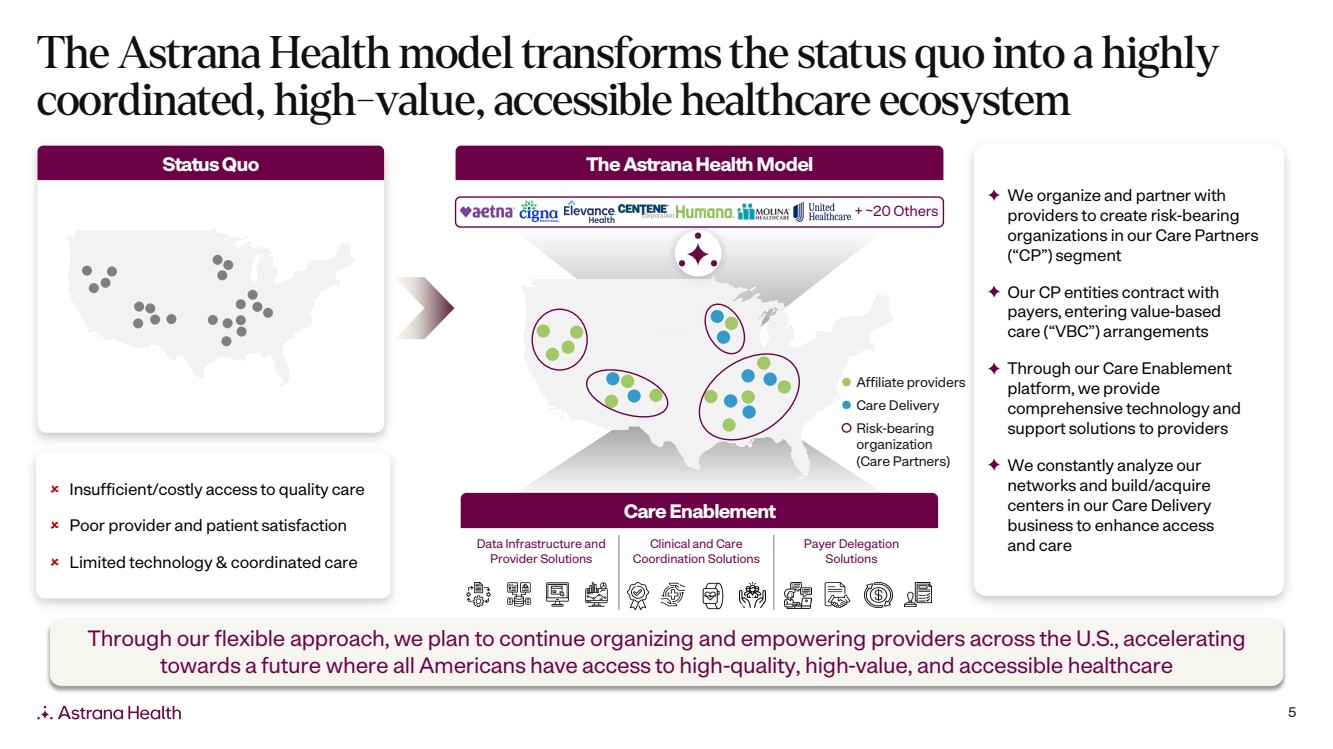
5 The Astrana Health model transforms the status quo into a highly coordinated, high-value, accessible healthcare ecosystem We organize and partner with providers to create risk-bearing organizations in our Care Partners (“CP”) segment Our CP entities contract with payers, entering value-based care (“VBC”) arrangements Through our Care Enablement platform, we provide comprehensive technology and support solutions to providers We constantly analyze our networks and build/acquire centers in our Care Delivery business to enhance access and care Insufficient/costly access to quality care Poor provider and patient satisfaction Limited technology & coordinated care Status Quo Clinical and Care Coordination Solutions Data Infrastructure and Provider Solutions Payer Delegation Solutions Care Enablement Care Delivery Affiliate providers The AstranaHealth Model + ~20 Others Risk-bearing organization (Care Partners) Through our flexible approach, we plan to continue organizing and empowering providers across the U.S., accelerating towards a future where all Americans have access to high-quality, high-value, and accessible healthcare |
|
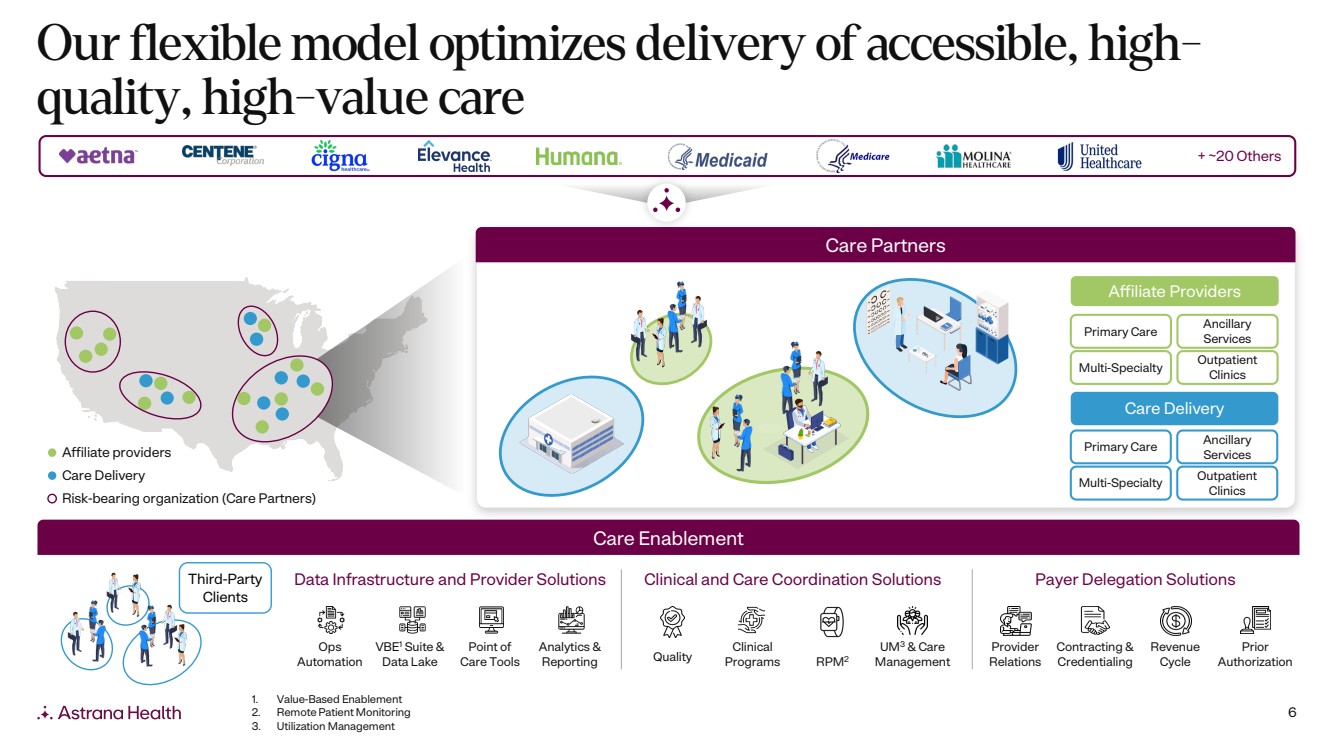
6 Our flexible model optimizes delivery of accessible, high-quality, high-value care + ~20 Others Care Partners Care Enablement Data Infrastructure and Provider Solutions Clinical and Care Coordination Solutions Payer Delegation Solutions Ops Automation VBE1 Suite & Data Lake Point of Care Tools Analytics & Reporting Quality Clinical Programs RPM2 UM3 & Care Management Provider Relations Contracting & Credentialing Revenue Cycle Prior Authorization Third-Party Clients Care Delivery Primary Care Ancillary Services Outpatient Clinics Multi-Specialty Affiliate Providers Primary Care Ancillary Services Outpatient Clinics Multi-Specialty 1. Value-Based Enablement 2. Remote Patient Monitoring 3. Utilization Management Care Delivery Affiliate providers Risk-bearing organization (Care Partners) |
|
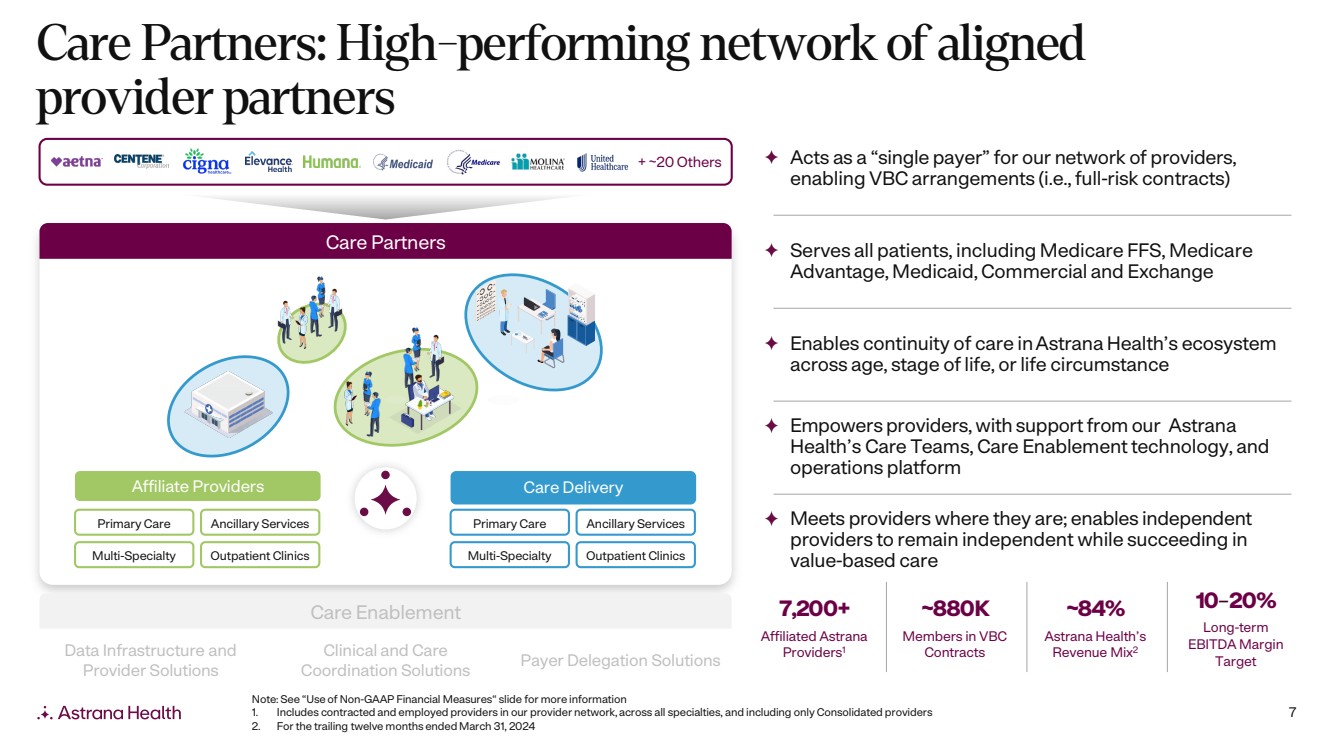
7 Care Partners: High-performing network of aligned provider partners Care Enablement Care Partners + ~20 Others Care Delivery Primary Care Ancillary Services Multi-Specialty Outpatient Clinics Affiliate Providers Primary Care Ancillary Services Multi-Specialty Outpatient Clinics 7,200+ Affiliated Astrana Providers1 ~880K Members in VBC Contracts ~84% Astrana Health’s Revenue Mix2 10–20% Long-term EBITDA Margin Target Acts as a “single payer” for our network of providers, enabling VBC arrangements (i.e., full-risk contracts) Serves all patients, including Medicare FFS, Medicare Advantage, Medicaid, Commercial and Exchange Enables continuity of care in Astrana Health’s ecosystem across age, stage of life, or life circumstance Empowers providers, with support from our Astrana Health’s Care Teams, Care Enablement technology, and operations platform Meets providers where they are; enables independent providers to remain independent while succeeding in value-based care Note: See “Use of Non-GAAP Financial Measures“ slide for more information 1. Includes contracted and employed providers in our provider network, across all specialties, and including only Consolidated providers 2. For the trailing twelve months ended March 31, 2024 Clinical and Care Coordination Solutions Data Infrastructure and Provider Solutions Payer Delegation Solutions |
|
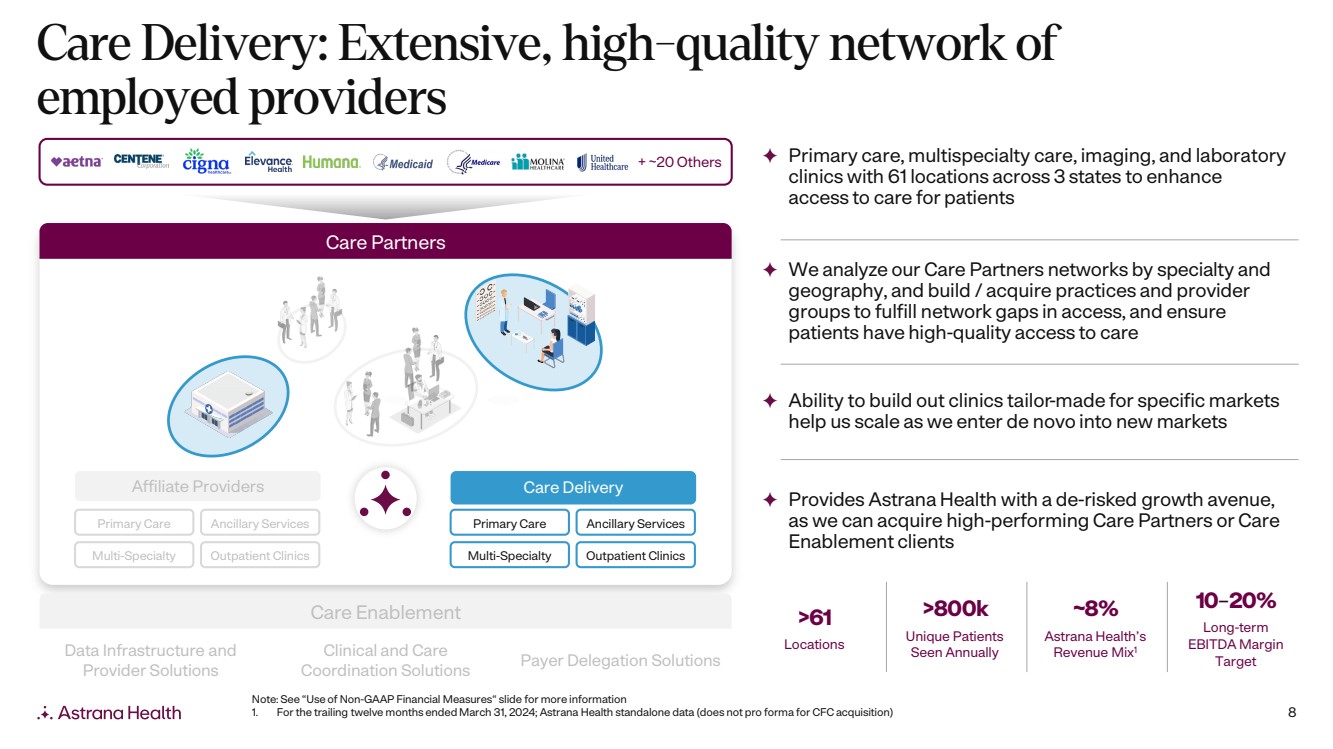
8 Care Delivery: Extensive, high-quality network of employed providers Clinical and Care Coordination Solutions Data Infrastructure and Provider Solutions Payer Delegation Solutions Care Enablement Care Partners Care Delivery Primary Care Ancillary Services Multi-Specialty Outpatient Clinics Affiliate Providers Primary Care Ancillary Services Multi-Specialty Outpatient Clinics >61 Locations >800k Unique Patients Seen Annually ~8% Astrana Health’s Revenue Mix1 10–20% Long-term EBITDA Margin Target Primary care, multispecialty care, imaging, and laboratory clinics with 61 locations across 3 states to enhance access to care for patients We analyze our Care Partners networks by specialty and geography, and build / acquire practices and provider groups to fulfill network gaps in access, and ensure patients have high-quality access to care Ability to build out clinics tailor-made for specific markets help us scale as we enter de novo into new markets Provides Astrana Health with a de-risked growth avenue, as we can acquire high-performing Care Partners or Care Enablement clients Note: See “Use of Non-GAAP Financial Measures“ slide for more information 1. For the trailing twelve months ended March 31, 2024; Astrana Health standalone data (does not pro forma for CFC acquisition) + ~20 Others |
|
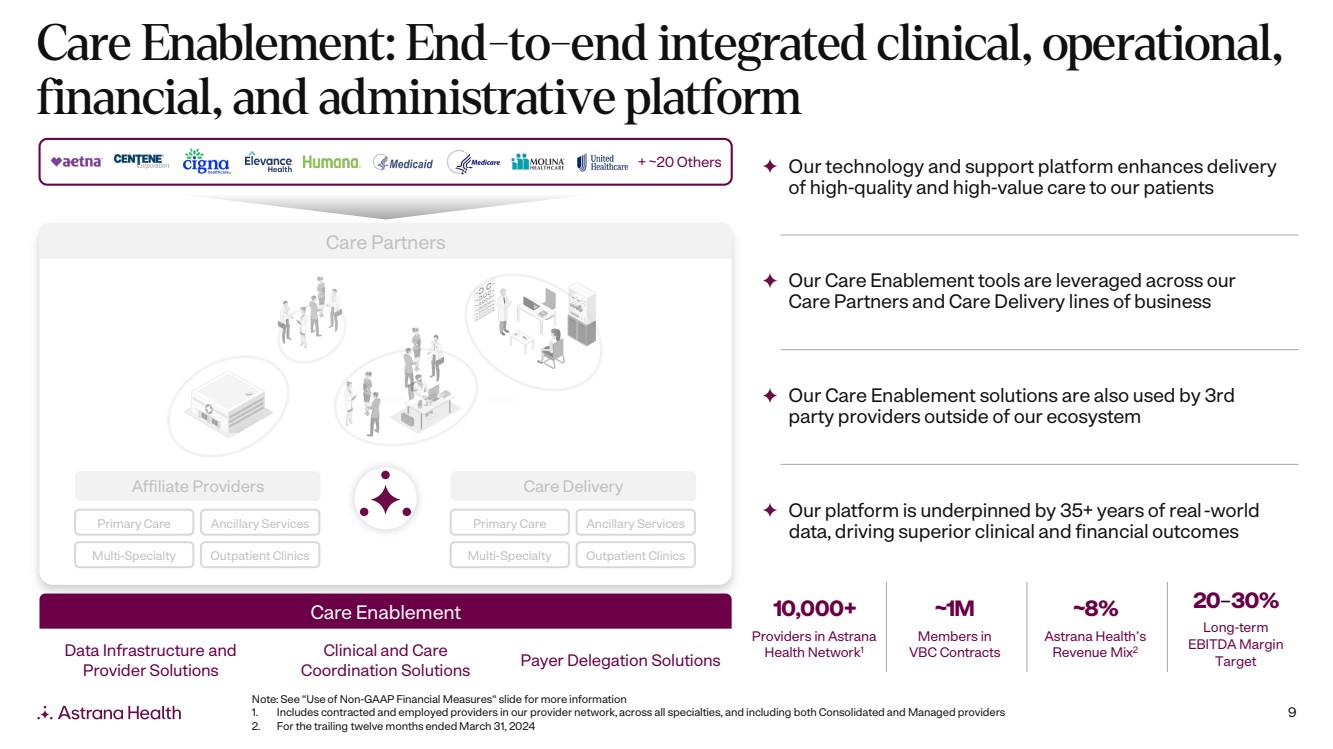
9 Care Enablement: End-to-end integrated clinical, operational, financial, and administrative platform Clinical and Care Coordination Solutions Data Infrastructure and Provider Solutions Payer Delegation Solutions Care Enablement Care Partners Care Delivery Primary Care Ancillary Services Multi-Specialty Outpatient Clinics Affiliate Providers Primary Care Ancillary Services Multi-Specialty Outpatient Clinics 10,000+ Providers in Astrana Health Network1 ~1M Members in VBC Contracts ~8% Astrana Health’s Revenue Mix2 20–30% Long-term EBITDA Margin Target Our technology and support platform enhances delivery of high-quality and high-value care to our patients Our Care Enablement tools are leveraged across our Care Partners and Care Delivery lines of business Our Care Enablement solutions are also used by 3rd party providers outside of our ecosystem Our platform is underpinned by 35+ years of real-world data, driving superior clinical and financial outcomes Note: See “Use of Non-GAAP Financial Measures“ slide for more information 1. Includes contracted and employed providers in our provider network, across all specialties, and including both Consolidated and Managed providers 2. For the trailing twelve months ended March 31, 2024 + ~20 Others |
|
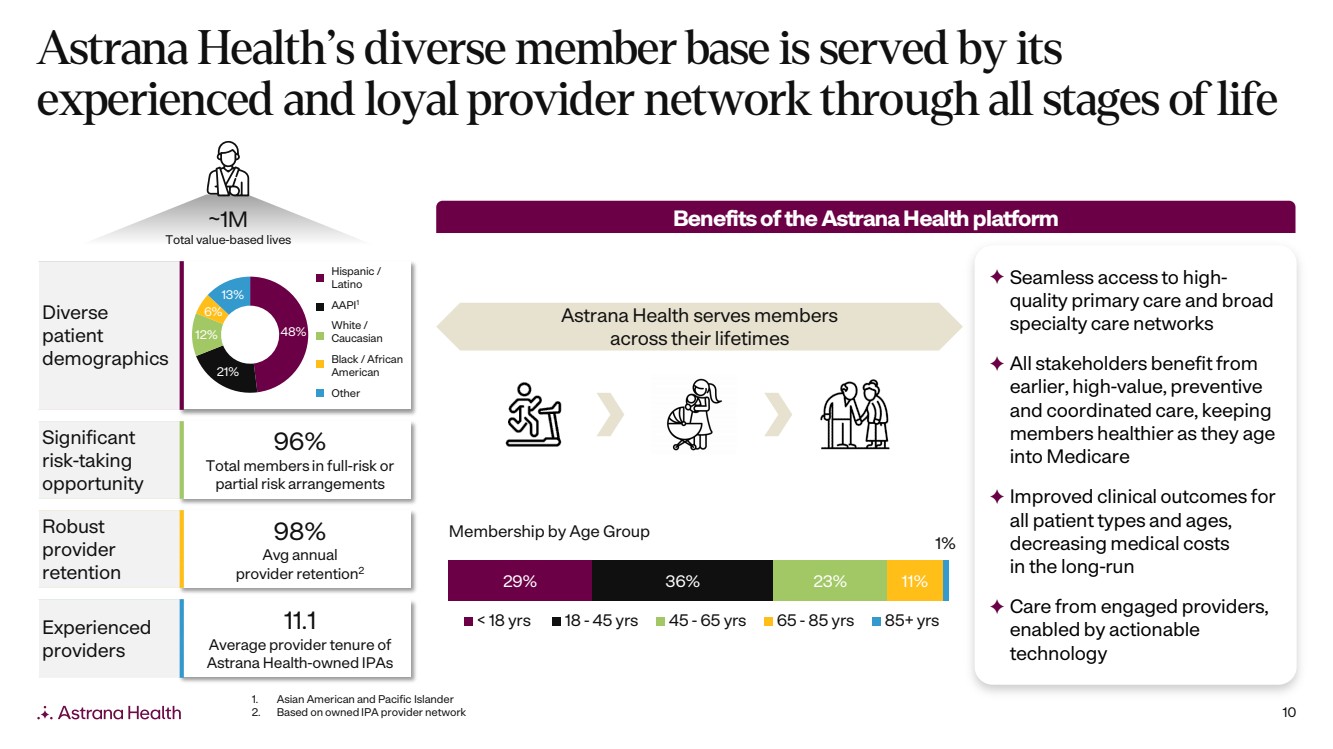
10 Astrana Health’s diverse member base is served by its experienced and loyal provider network through all stages of life ~1M Total value-based lives Diverse patient demographics 96% Total members in full-risk or partial risk arrangements Significant risk-taking opportunity 98% Avg annual provider retention2 Robust provider retention 11.1 Average provider tenure of Astrana Health-owned IPAs Experienced providers Hispanic / Latino Black / African American AAPI1 White / Caucasian Other 29% 36% 23% 11% 1% < 18 yrs 18 - 45 yrs 45 - 65 yrs 65 - 85 yrs 85+ yrs Benefits of the AstranaHealth platform Seamless access to high-quality primary care and broad specialty care networks All stakeholders benefit from earlier, high-value, preventive and coordinated care, keeping members healthier as they age into Medicare Improved clinical outcomes for all patient types and ages, decreasing medical costs in the long-run Care from engaged providers, enabled by actionable technology Astrana Health serves members across their lifetimes Membership by Age Group 1. Asian American and Pacific Islander 2. Based on owned IPA provider network 48% 21% 12% 6% 13% |
|
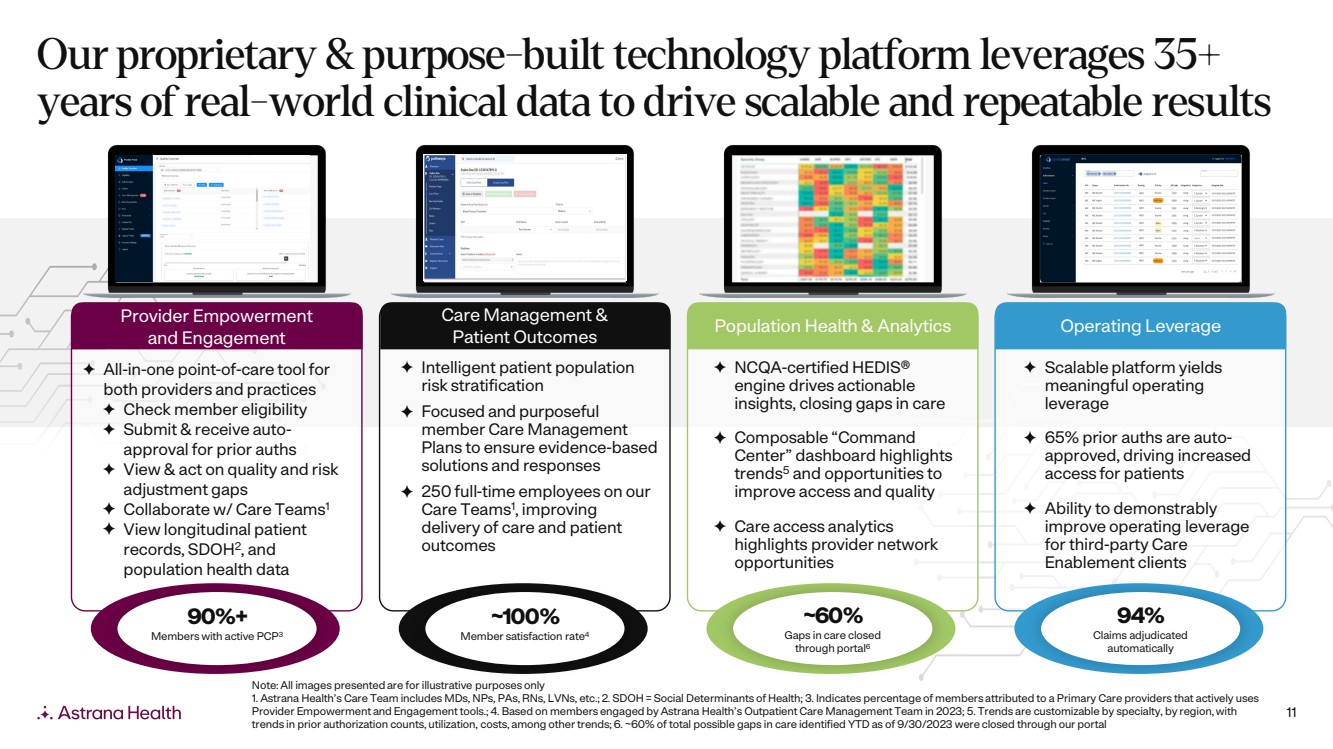
11 Provider Empowerment and Engagement All-in-one point-of-care tool for both providers and practices Check member eligibility Submit & receive auto-approval for prior auths View & act on quality and risk adjustment gaps Collaborate w/ Care Teams1 View longitudinal patient records, SDOH2, and population health data 90%+ Members with active PCP3 Care Management & Patient Outcomes Intelligent patient population risk stratification Focused and purposeful member Care Management Plans to ensure evidence-based solutions and responses 250 full-time employees on our Care Teams1 , improving delivery of care and patient outcomes ~100% Member satisfaction rate4 Population Health & Analytics NCQA-certified HEDIS® engine drives actionable insights, closing gaps in care Composable “Command Center” dashboard highlights trends5 and opportunities to improve access and quality Care access analytics highlights provider network opportunities ~60% Gaps in care closed through portal6 Operating Leverage Scalable platform yields meaningful operating leverage 65% prior auths are auto-approved, driving increased access for patients Ability to demonstrably improve operating leverage for third-party Care Enablement clients 94% Claims adjudicated automatically Note: All images presented are for illustrative purposes only 1. Astrana Health’s Care Team includes MDs, NPs, PAs, RNs, LVNs, etc.; 2. SDOH = Social Determinants of Health; 3. Indicates percentage of members attributed to a Primary Care providers that actively uses Provider Empowerment and Engagement tools.; 4. Based on members engaged by Astrana Health’s Outpatient Care Management Team in 2023; 5. Trends are customizable by specialty, by region, with trends in prior authorization counts, utilization, costs, among other trends; 6. ~60% of total possible gaps in care identified YTD as of 9/30/2023 were closed through our portal Our proprietary & purpose-built technology platform leverages 35+ years of real-world clinical data to drive scalable and repeatable results |
|
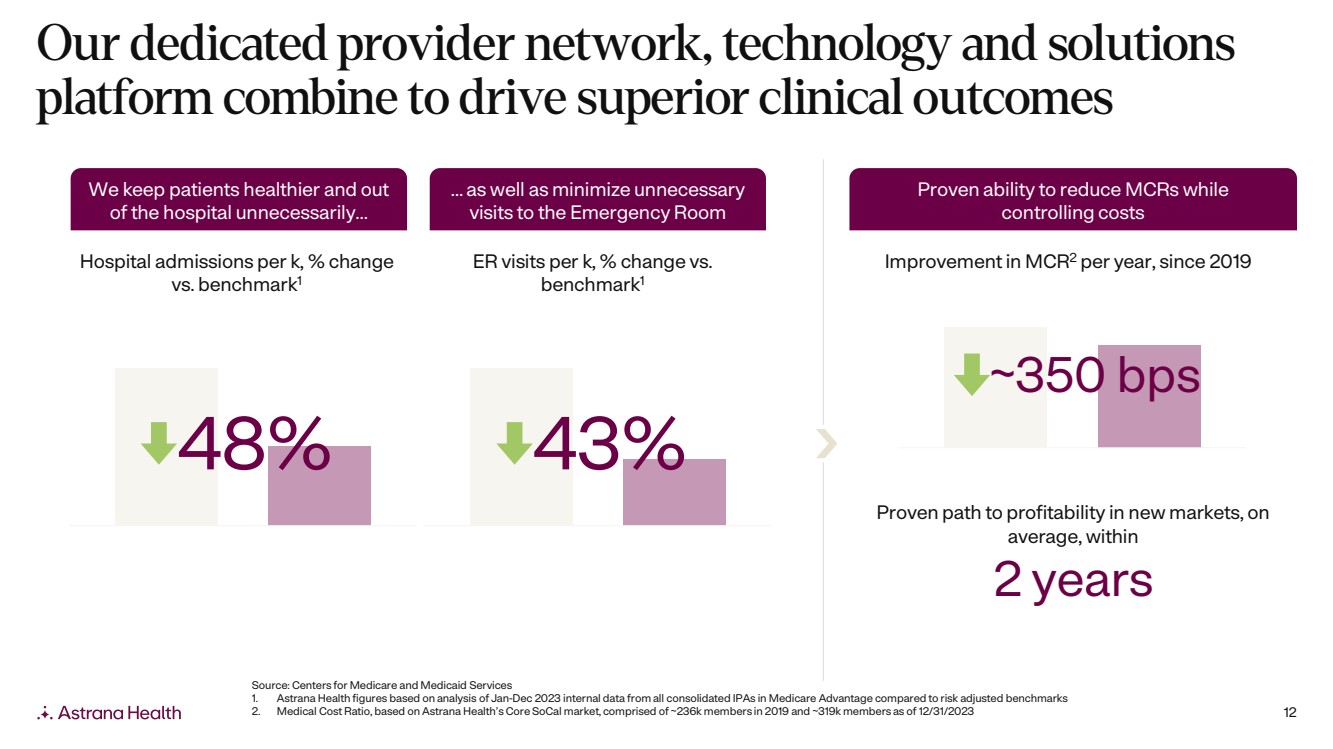
12 Our dedicated provider network, technology and solutions platform combine to drive superior clinical outcomes 48% 43% Hospital admissions per k, % change vs. benchmark1 ER visits per k, % change vs. benchmark1 Improvement in MCR2 per year, since 2019 We keep patients healthier and out of the hospital unnecessarily… … as well as minimize unnecessary visits to the Emergency Room 2 years Proven path to profitability in new markets, on average, within ~350 bps Proven ability to reduce MCRs while controlling costs Source: Centers for Medicare and Medicaid Services 1. Astrana Health figures based on analysis of Jan-Dec 2023 internal data from all consolidated IPAs in Medicare Advantage compared to risk adjusted benchmarks 2. Medical Cost Ratio, based on Astrana Health’s Core SoCal market, comprised of ~236k members in 2019 and ~319k members as of 12/31/2023 |
|
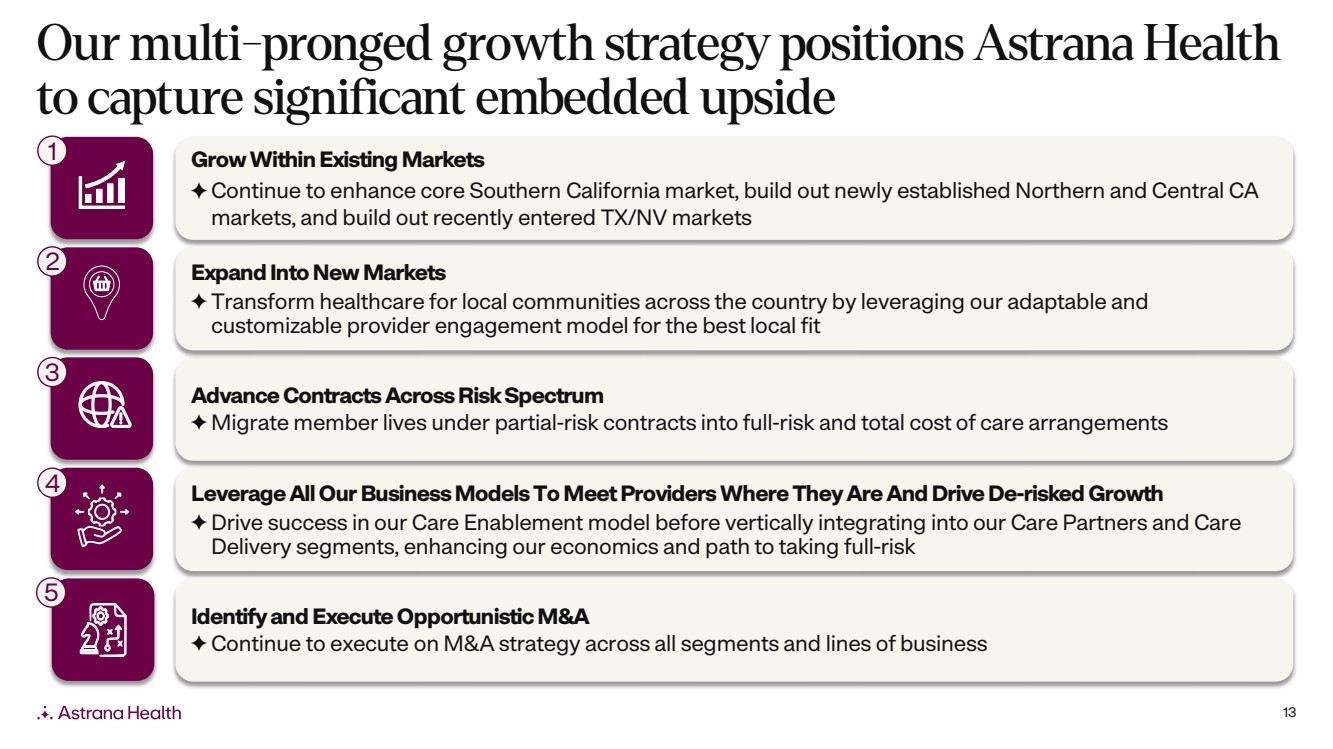
13 Our multi-pronged growth strategy positions Astrana Health to capture significant embedded upside Advance Contracts Across Risk Spectrum Migrate member lives under partial-risk contracts into full-risk and total cost of care arrangements Grow Within Existing Markets Continue to enhance core Southern California market, build out newly established Northern and Central CA markets, and build out recently entered TX/NV markets Expand Into New Markets Transform healthcare for local communities across the country by leveraging our adaptable and customizable provider engagement model for the best local fit Leverage All Our Business Models To Meet Providers Where They Are And Drive De-risked Growth Drive success in our Care Enablement model before vertically integrating into our Care Partners and Care Delivery segments, enhancing our economics and path to taking full-risk Identify and Execute Opportunistic M&A Continue to execute on M&A strategy across all segments and lines of business 3 4 1 2 5 |
|
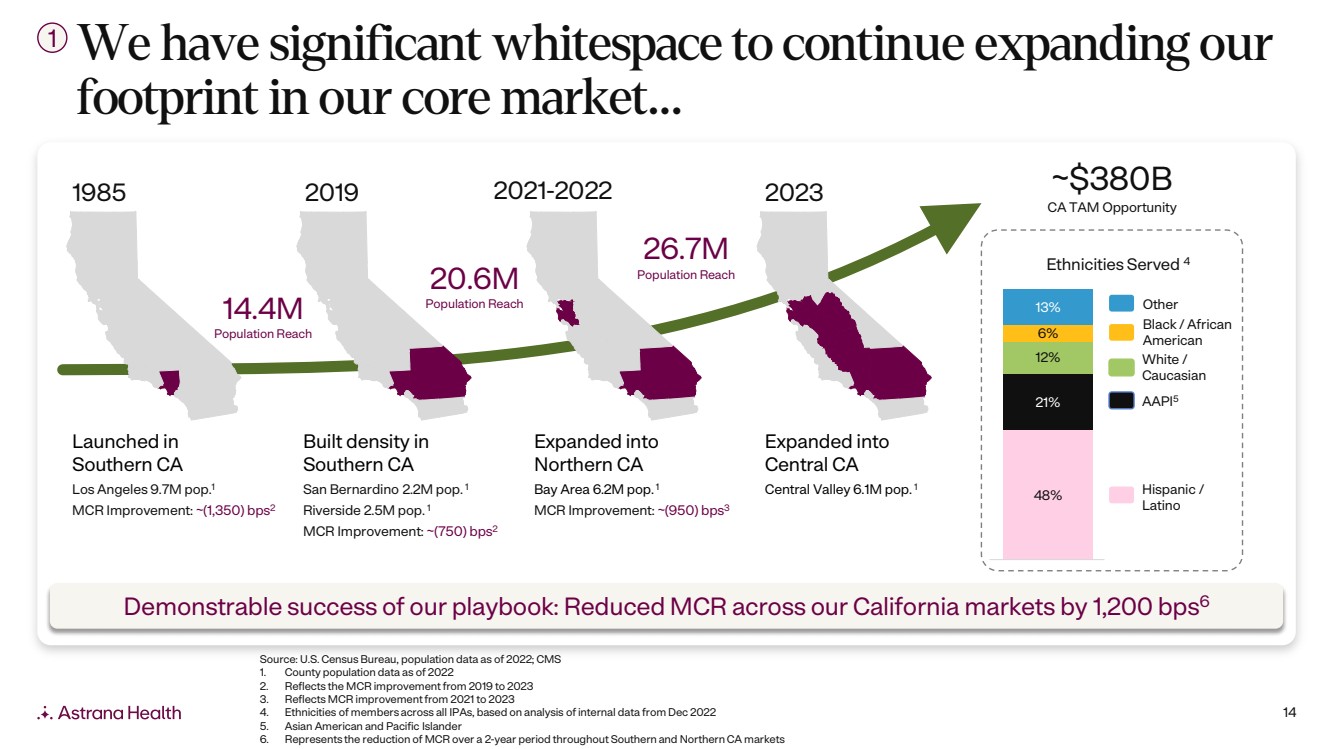
14 We have significant whitespace to continue expanding our footprint in our core market… Demonstrable success of our playbook: Reduced MCR across our California markets by 1,200 bps6 1985 2019 2021-2022 2023 Built density in Southern CA San Bernardino 2.2M pop. 1 Riverside 2.5M pop. 1 MCR Improvement: ~(750) bps2 Expanded into Northern CA Bay Area 6.2M pop. 1 MCR Improvement: ~(950) bps3 Expanded into Central CA Central Valley 6.1M pop. 1 Launched in Southern CA Los Angeles 9.7M pop.1 MCR Improvement: ~(1,350) bps2 14.4M Population Reach 20.6M Population Reach 26.7M Population Reach ~$380B CA TAM Opportunity 48% 21% 12% 6% 13% Ethnicities Served 4 Other Black / African American White / Caucasian Hispanic / Latino AAPI5 Source: U.S. Census Bureau, population data as of 2022; CMS 1. County population data as of 2022 2. Reflects the MCR improvement from 2019 to 2023 3. Reflects MCR improvement from 2021 to 2023 4. Ethnicities of members across all IPAs, based on analysis of internal data from Dec 2022 5. Asian American and Pacific Islander 6. Represents the reduction of MCR over a 2-year period throughout Southern and Northern CA markets 1 |
|
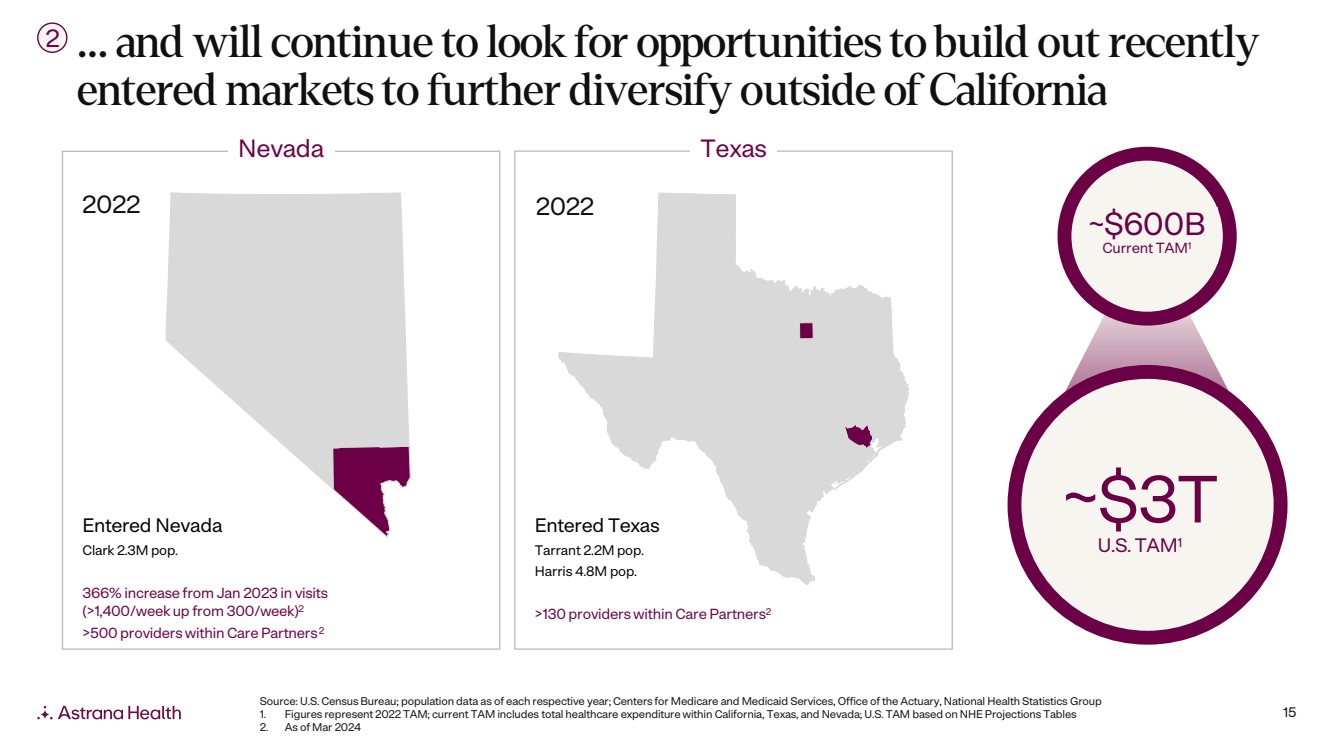
15 … and will continue to look for opportunities to build out recently entered markets to further diversify outside of California Source: U.S. Census Bureau; population data as of each respective year; Centers for Medicare and Medicaid Services, Office ofthe Actuary, National Health Statistics Group 1. Figures represent 2022 TAM; current TAM includes total healthcare expenditure within California, Texas, and Nevada; U.S. TAM based on NHE Projections Tables 2. As of Mar 2024 2 Nevada Texas Entered Nevada Clark 2.3M pop. 366% increase from Jan 2023 in visits (>1,400/week up from 300/week)2 >500 providers within Care Partners2 Entered Texas Tarrant 2.2M pop. Harris 4.8M pop. >130 providers within Care Partners2 2022 2022 ~$600B Current TAM1 ~$3T U.S. TAM1 |
|
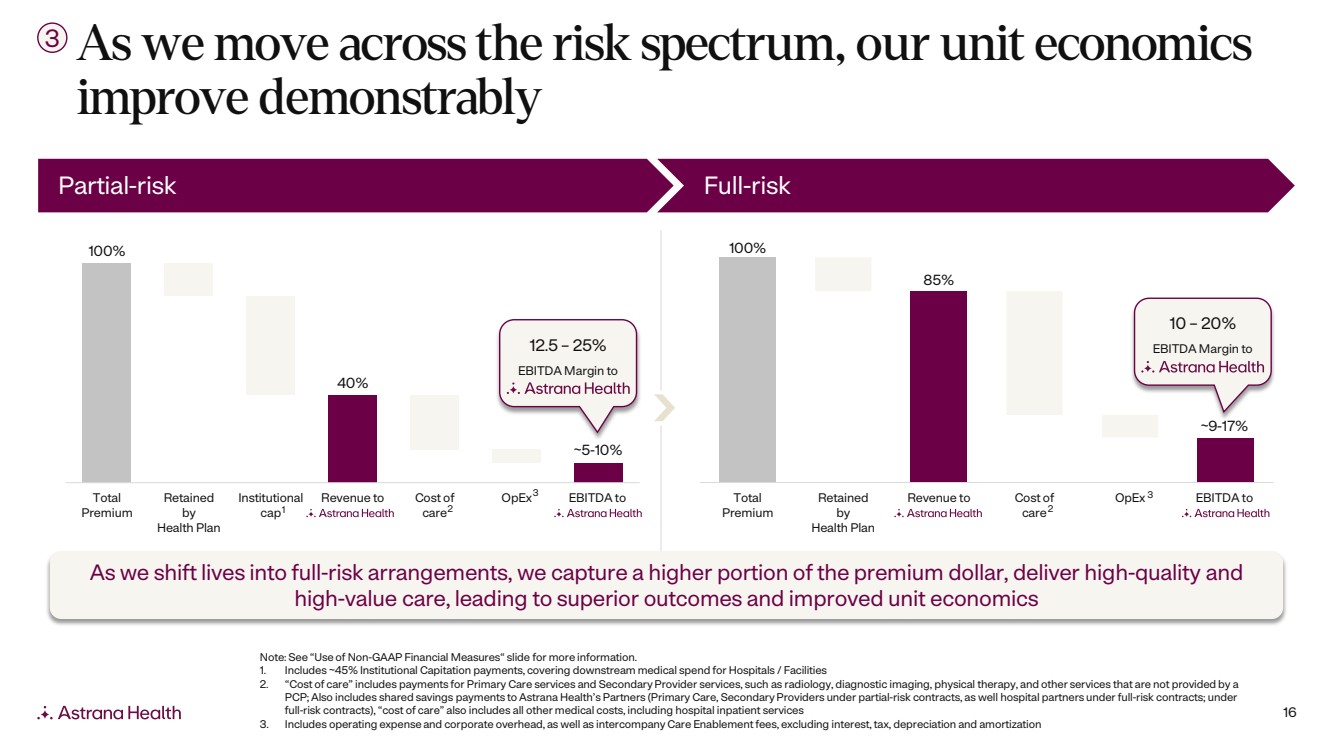
16 As we move across the risk spectrum, our unit economics improve demonstrably 3 100% 40% Total Premium Retained by Health Plan Institutional cap Revenue to Cost of care OpEx EBITDA to 100% 85% Total Premium Retained by Health Plan Revenue to Cost of care OpEx EBITDA to 2 3 ~9-17% 2 3 ~5-10% Partial-risk Full-risk 12.5 – 25% EBITDA Margin to 10 – 20% EBITDA Margin to 1 Note: See “Use of Non-GAAP Financial Measures“ slide for more information. 1. Includes ~45% Institutional Capitation payments, covering downstream medical spend for Hospitals / Facilities 2. “Cost of care” includes payments for Primary Care services and Secondary Provider services, such as radiology, diagnostic imaging, physical therapy, and other services that are not provided by a PCP; Also includes shared savings payments to Astrana Health’s Partners (Primary Care, Secondary Providers under partial-risk contracts, as well hospital partners under full-risk contracts; under full-risk contracts), “cost of care” also includes all other medical costs, including hospital inpatient services 3. Includes operating expense and corporate overhead, as well as intercompany Care Enablement fees, excluding interest, tax, depreciation and amortization As we shift lives into full-risk arrangements, we capture a higher portion of the premium dollar, deliver high-quality and high-value care, leading to superior outcomes and improved unit economics |
|
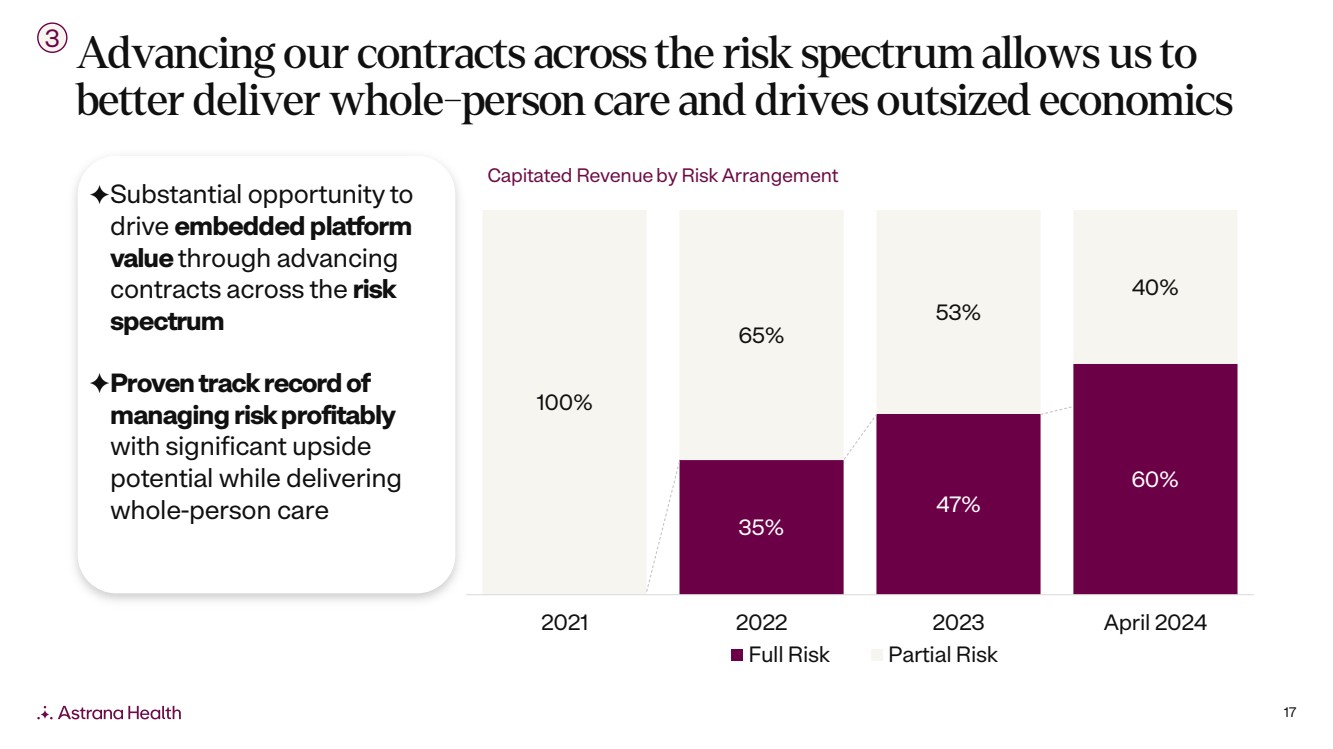
17 Advancing our contracts across the risk spectrum allows us to better deliver whole-person care and drives outsized economics 3 Substantial opportunity to drive embedded platform value through advancing contracts across the risk spectrum Proven track record of managing risk profitably with significant upside potential while delivering whole-person care 35% 47% 60% 100% 65% 53% 40% 2021 2022 2023 April 2024 Full Risk Partial Risk Capitated Revenueby Risk Arrangement |
|
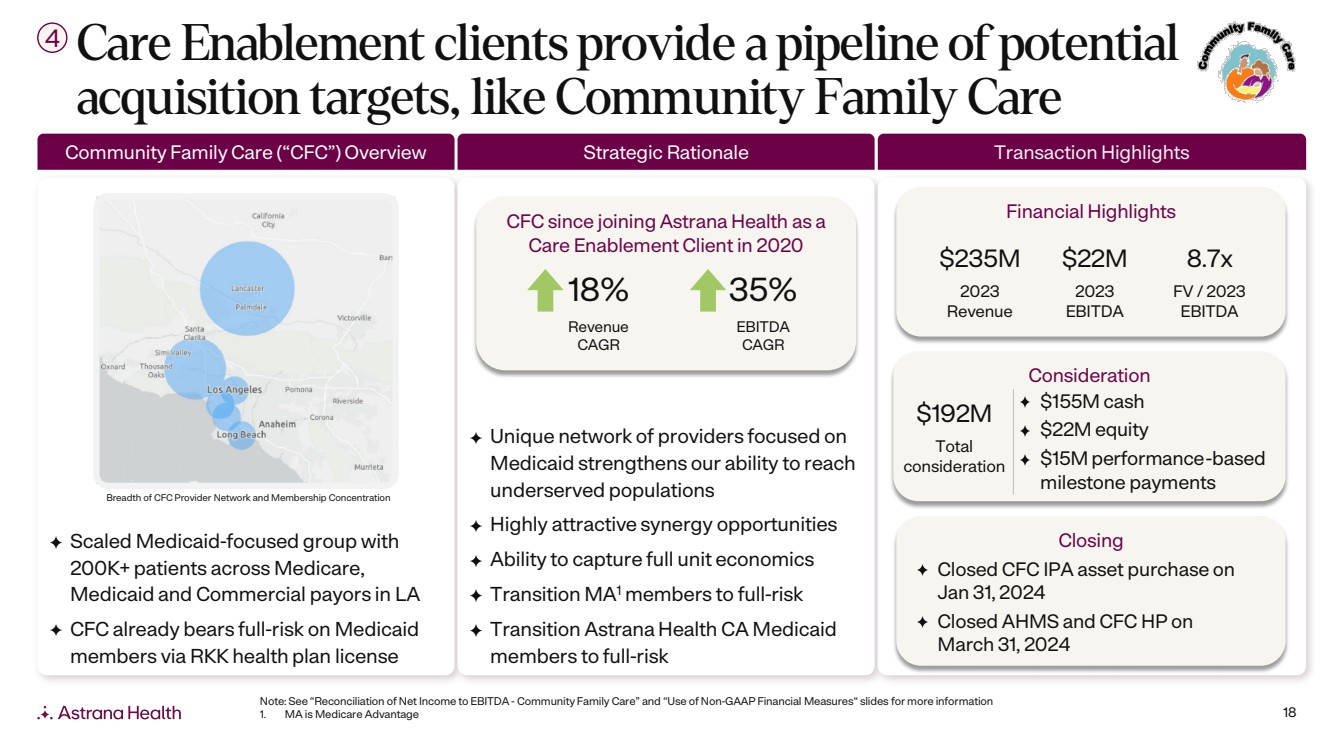
18 Scaled Medicaid-focused group with 200K+ patients across Medicare, Medicaid and Commercial payors in LA CFC already bears full-risk on Medicaid members via RKK health plan license Unique network of providers focused on Medicaid strengthens our ability to reach underserved populations Highly attractive synergy opportunities Ability to capture full unit economics Transition MA1 members to full-risk Transition Astrana Health CA Medicaid members to full-risk Care Enablement clients provide a pipeline of potential acquisition targets, like Community Family Care 4 Breadth of CFC Provider Network and Membership Concentration Closing Closed CFC IPA asset purchase on Jan 31, 2024 Closed AHMS and CFC HP on March 31, 2024 Financial Highlights $235M 2023 Revenue $22M 2023 EBITDA 8.7x FV / 2023 EBITDA Consideration $192M Total consideration $155M cash $22M equity $15M performance-based milestone payments Community Family Care (“CFC”) Overview Strategic Rationale Transaction Highlights CFC since joining Astrana Health as a Care Enablement Client in 2020 18% Revenue CAGR 35% EBITDA CAGR Note: See “Reconciliation of Net Income to EBITDA - Community Family Care” and “Use of Non-GAAP Financial Measures“ slides for more information 1. MA is Medicare Advantage |
|
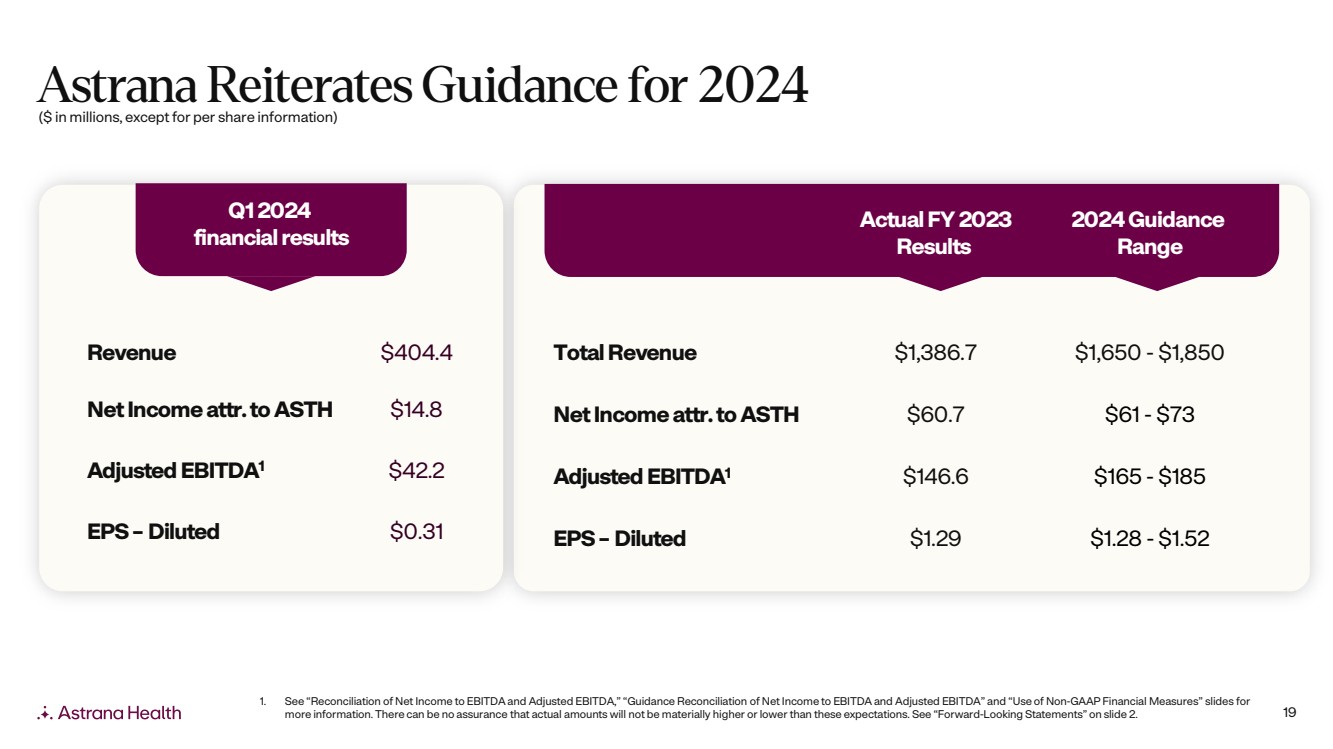
19 Astrana Reiterates Guidance for 2024 Q1 2024 financial results Revenue $404.4 Net Incomeattr. to ASTH $14.8 Adjusted EBITDA1 $42.2 EPS – Diluted $0.31 1. See “Reconciliation of Net Income to EBITDA and Adjusted EBITDA,” “Guidance Reconciliation of Net Income to EBITDA and Adjusted EBITDA” and “Use of Non-GAAP Financial Measures” slides for more information. There can be no assurance that actual amounts will not be materially higher or lower than these expectations. See “Forward-Looking Statements” on slide 2. Actual FY 2023 Results 2024 Guidance Range Total Revenue $1,386.7 $1,650 - $1,850 Net Incomeattr. to ASTH $60.7 $61 - $73 Adjusted EBITDA1 $146.6 $165 - $185 EPS – Diluted $1.29 $1.28 - $1.52 ($ in millions, except for per share information) |
|
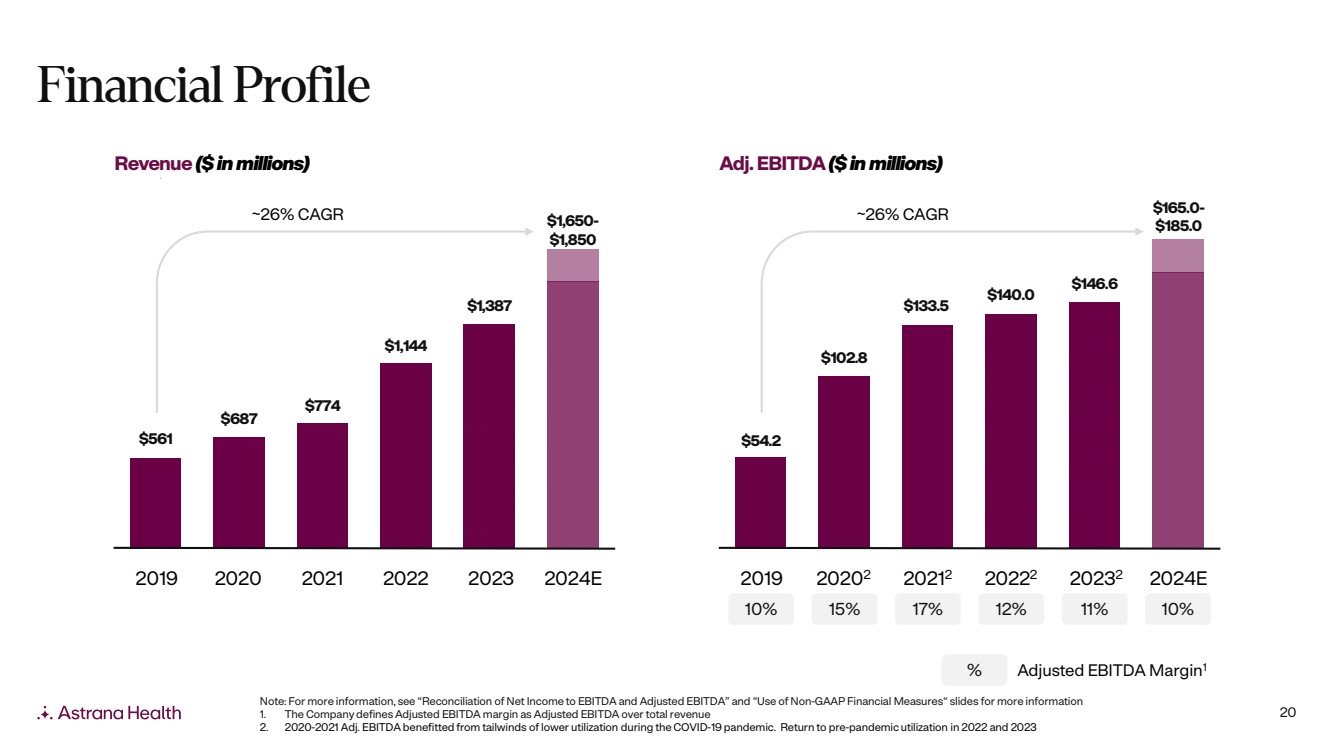
20 Financial Profile Note: For more information, see “Reconciliation of Net Income to EBITDA and Adjusted EBITDA” and “Use of Non-GAAP Financial Measures“ slides for more information 1. The Company defines Adjusted EBITDA margin as Adjusted EBITDA over total revenue 2. 2020-2021 Adj. EBITDA benefitted from tailwinds of lower utilization during the COVID-19 pandemic. Return to pre-pandemic utilization in 2022 and 2023 % Adjusted EBITDA Margin1 Revenue ($ in millions) Adj. EBITDA ($ in millions) $561 $687 $774 $1,144 $1,387 $1,650- $1,850 2019 2020 2021 2022 2023 ~26% CAGR 2024E 10% 15% 17% 12% 11% 10% $54.2 $102.8 $133.5 $140.0 $146.6 $165.0- $185.0 2019 20202 20212 20222 20232 2024E ~26% CAGR |
|
21 Astrana Health Leadership Team Brandon Sim, MS Chan Basho, MBA Dinesh Kumar, MD Jeremy Jackson, MD Jaime Melkonoff, MBA President & CEO Chief Operating & Financial Officer Chief Medical Officer Chief Quality Officer President, Texas & SVP, Corporate Development |
|
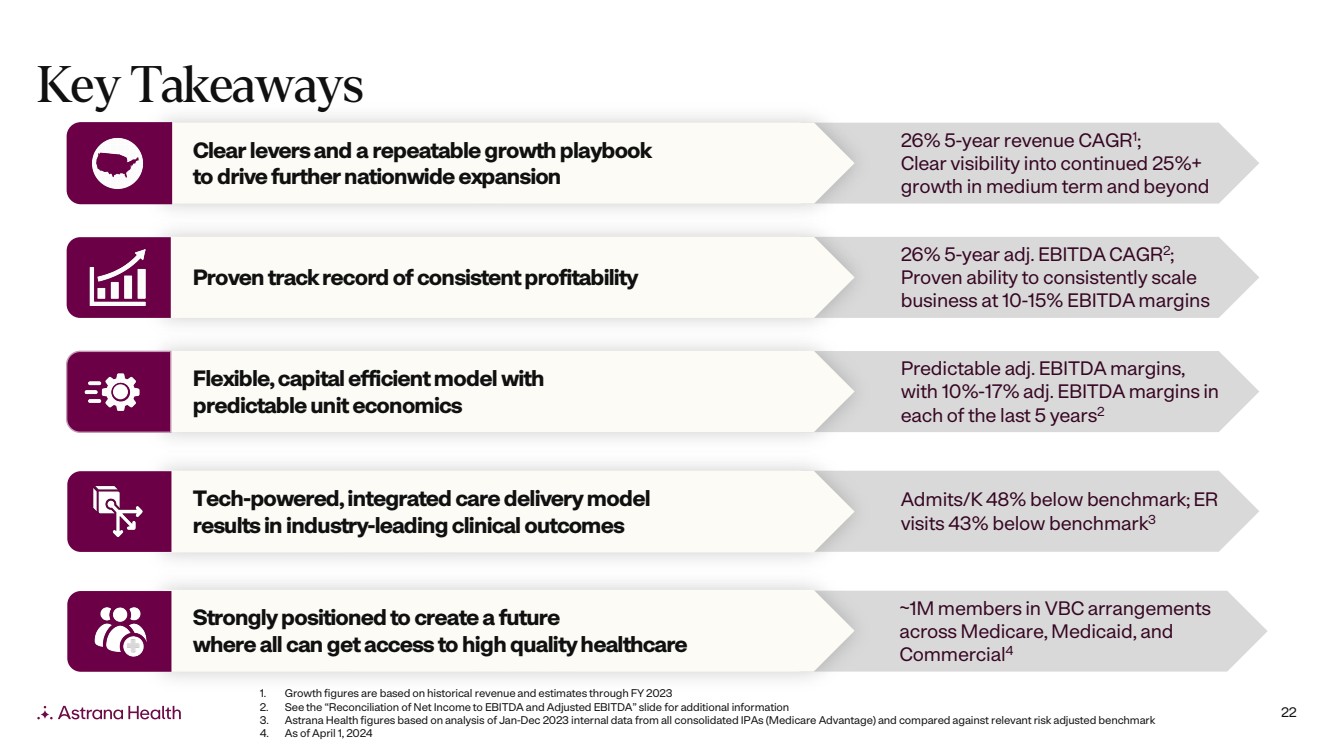
22 Key Takeaways Admits/K 48% below benchmark; ER visits 43% below benchmark3 Tech-powered, integrated care delivery model results in industry-leading clinical outcomes 26% 5-year adj. EBITDA CAGR2; Proven ability to consistently scale business at 10-15% EBITDA margins Proven track record of consistent profitability ~1M members in VBC arrangements across Medicare, Medicaid, and Commercial4 Strongly positioned to create a future where all can get access to high quality healthcare 26% 5-year revenue CAGR1 ; Clear visibility into continued 25%+ growth in medium term and beyond Clear levers and a repeatable growth playbook to drive further nationwide expansion Predictable adj. EBITDA margins, with 10%-17% adj. EBITDA margins in each of the last 5 years2 Flexible, capital efficient model with predictable unit economics 1. Growth figures are based on historical revenue and estimates through FY 2023 2. See the “Reconciliation of Net Income to EBITDA and Adjusted EBITDA” slide for additional information 3. Astrana Health figures based on analysis of Jan-Dec 2023 internal data from all consolidated IPAs (Medicare Advantage) and compared against relevant risk adjusted benchmark 4. As of April 1, 2024 |
|
|
24 Appendix |
|
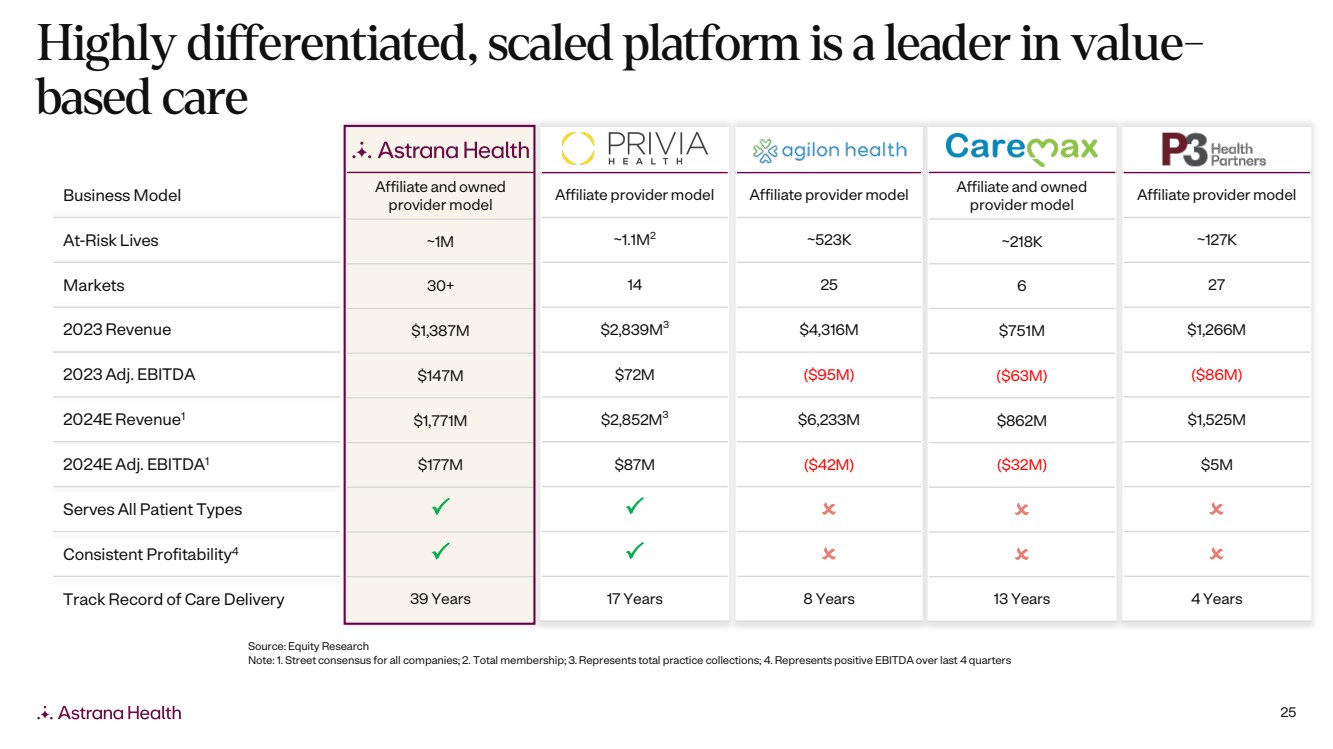
25 Highly differentiated, scaled platform is a leader in value-based care Affiliate and owned provider model ~1M 30+ $1,387M $147M $1,771M $177M 39 Years Affiliate provider model ~523K 25 $4,316M ($95M) $6,233M ($42M) 8 Years Affiliate provider model ~127K 27 $1,266M ($86M) $1,525M $5M 4 Years Affiliate and owned provider model ~218K 6 $751M ($63M) $862M ($32M) 13 Years Affiliate provider model ~1.1M2 14 $2,839M3 $72M $2,852M3 $87M 17 Years Business Model At-Risk Lives Markets 2023 Revenue 2023 Adj. EBITDA 2024E Revenue1 2024E Adj. EBITDA1 Serves All Patient Types Consistent Profitability4 Track Record of Care Delivery Source: Equity Research Note: 1. Street consensus for all companies; 2. Total membership; 3. Represents total practice collections; 4. Represents positive EBITDA over last 4 quarters |
|
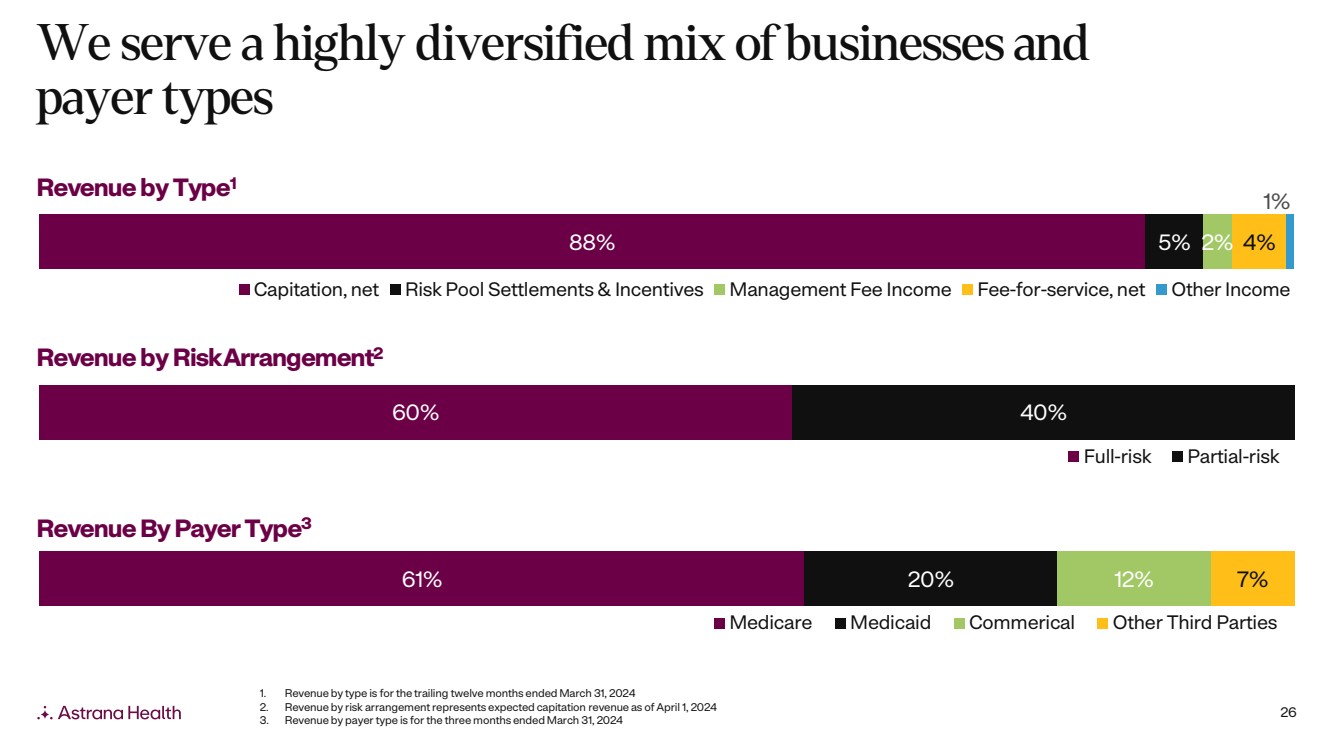
26 61% 20% 12% 7% Medicare Medicaid Commerical Other Third Parties 88% 5% 2% 4% 1% Capitation, net Risk Pool Settlements & Incentives Management Fee Income Fee-for-service, net Other Income 60% 40% Full-risk Partial-risk We serve a highly diversified mix of businesses and payer types Revenue by RiskArrangement2 Revenue by Type1 Revenue By Payer Type3 1. Revenue by type is for the trailing twelve months ended March 31, 2024 2. Revenue by risk arrangement represents expected capitation revenue as of April 1, 2024 3. Revenue by payer type is for the three months ended March 31, 2024 |
|
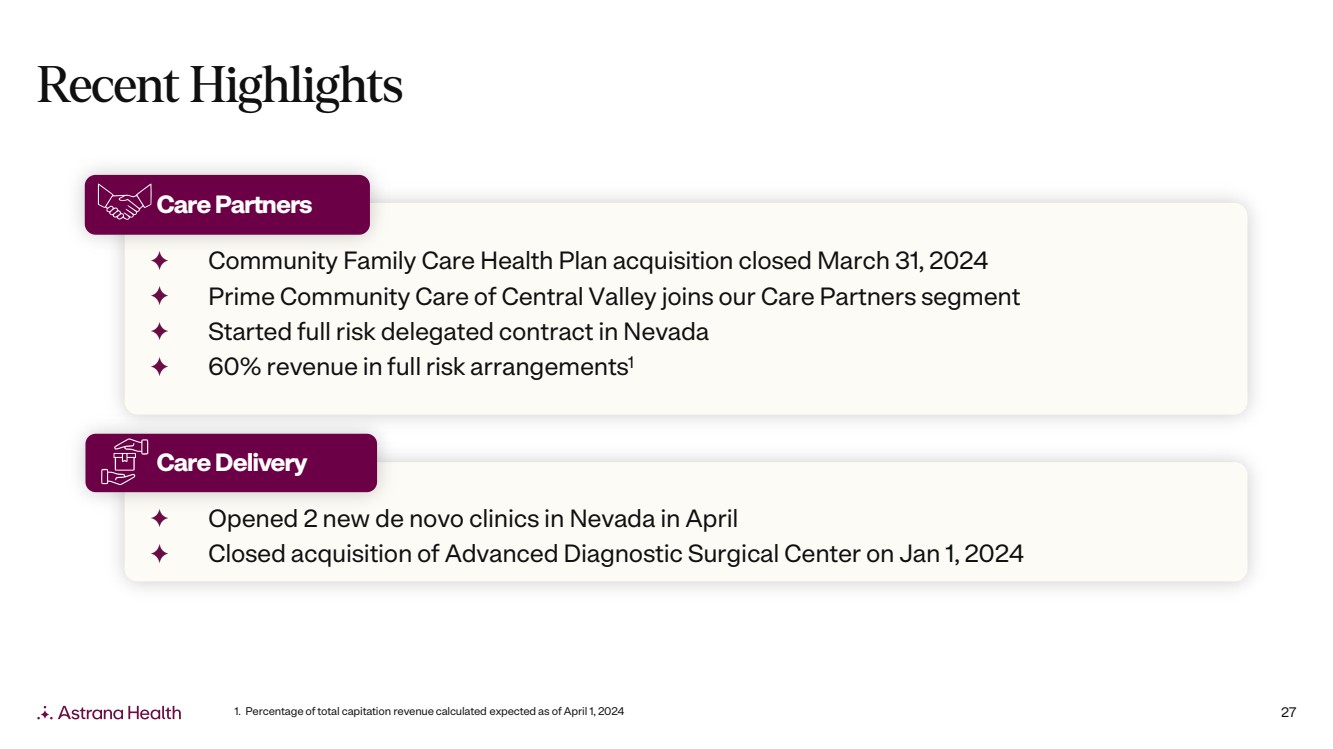
27 Recent Highlights Opened 2 new de novo clinics in Nevada in April Closed acquisition of Advanced Diagnostic Surgical Center on Jan 1, 2024 Care Delivery Community Family Care Health Plan acquisition closed March 31, 2024 Prime Community Care of Central Valley joins our Care Partners segment Started full risk delegated contract in Nevada 60% revenue in full risk arrangements1 Care Partners 1. Percentage of total capitation revenue calculated expected as of April 1, 2024 |
|
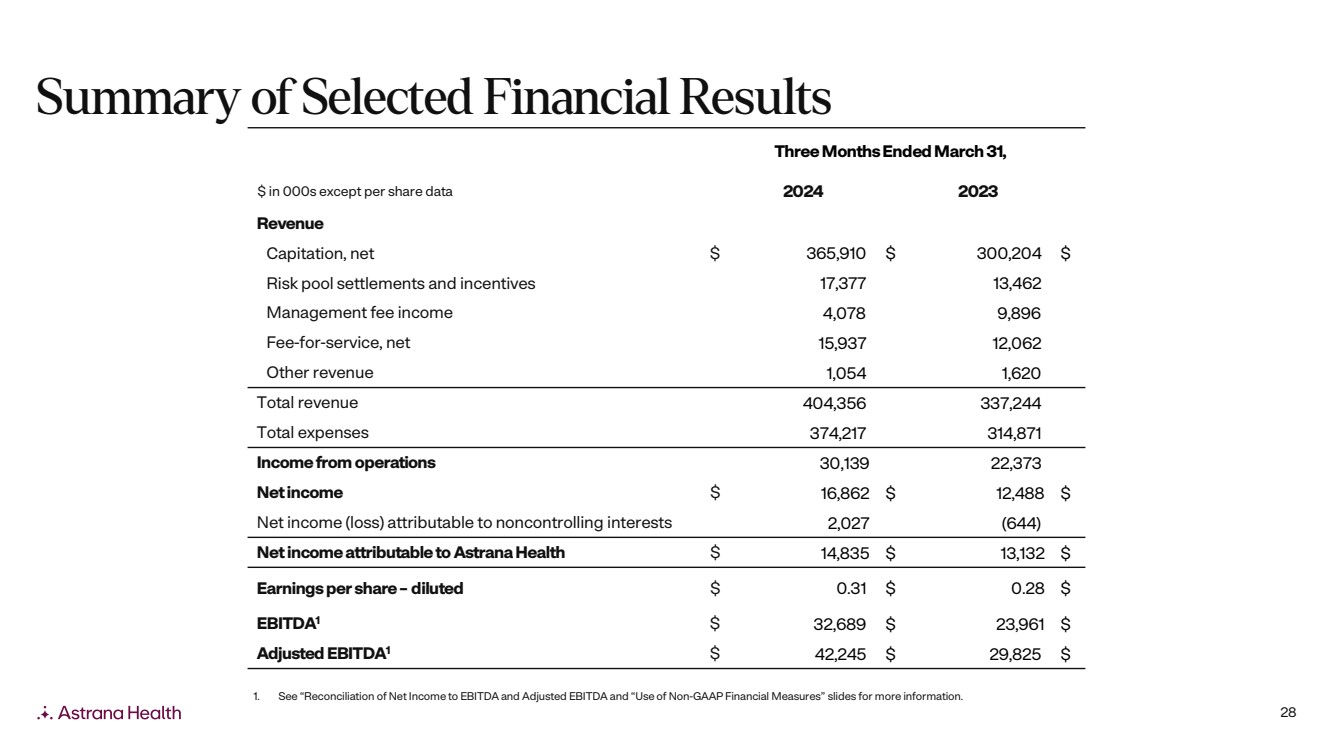
28 Three Months Ended March 31, $ in 000s except per share data 2024 2023 Revenue Capitation, net $ 365,910 $ 300,204 $ Risk pool settlements and incentives 17,377 13,462 Management fee income 4,078 9,896 Fee-for-service, net 15,937 12,062 Other revenue 1,054 1,620 Total revenue 404,356 337,244 Total expenses 374,217 314,871 Income from operations 30,139 22,373 Net income $ 16,862 $ 12,488 $ Net income (loss) attributable to noncontrolling interests 2,027 (644) Net income attributable to Astrana Health $ 14,835 $ 13,132 $ Earnings per share – diluted $ 0.31 $ 0.28 $ EBITDA1 $ 32,689 $ 23,961 $ Adjusted EBITDA1 $ 42,245 $ 29,825 $ Summary of Selected Financial Results 1. See “Reconciliation of Net Income to EBITDA and Adjusted EBITDA and “Use of Non-GAAP Financial Measures” slides for more information. |
|
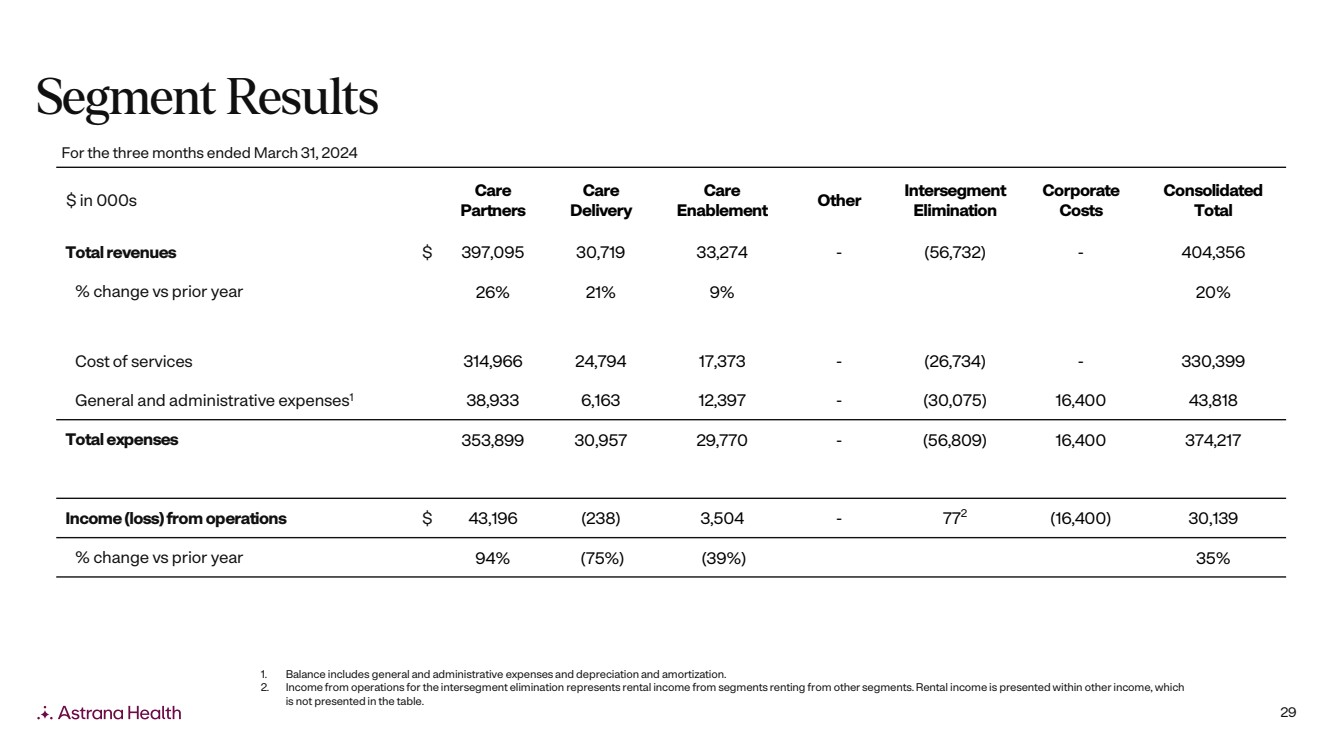
29 $ in 000s Care Partners Care Delivery Care Enablement Other Intersegment Elimination Corporate Costs Consolidated Total Total revenues $ 397,095 30,719 33,274 - (56,732) - 404,356 % change vs prior year 26% 21% 9% 20% Cost of services 314,966 24,794 17,373 - (26,734) - 330,399 General and administrative expenses1 38,933 6,163 12,397 - (30,075) 16,400 43,818 Total expenses 353,899 30,957 29,770 - (56,809) 16,400 374,217 Income (loss) from operations $ 43,196 (238) 3,504 - 772 (16,400) 30,139 % change vs prior year 94% (75%) (39%) 35% For the three months ended March 31, 2024 1. Balance includes general and administrative expenses and depreciation and amortization. 2. Income from operations for the intersegment elimination represents rental income from segments renting from other segments. Rental income is presented within other income, which is not presented in the table. Segment Results |
|
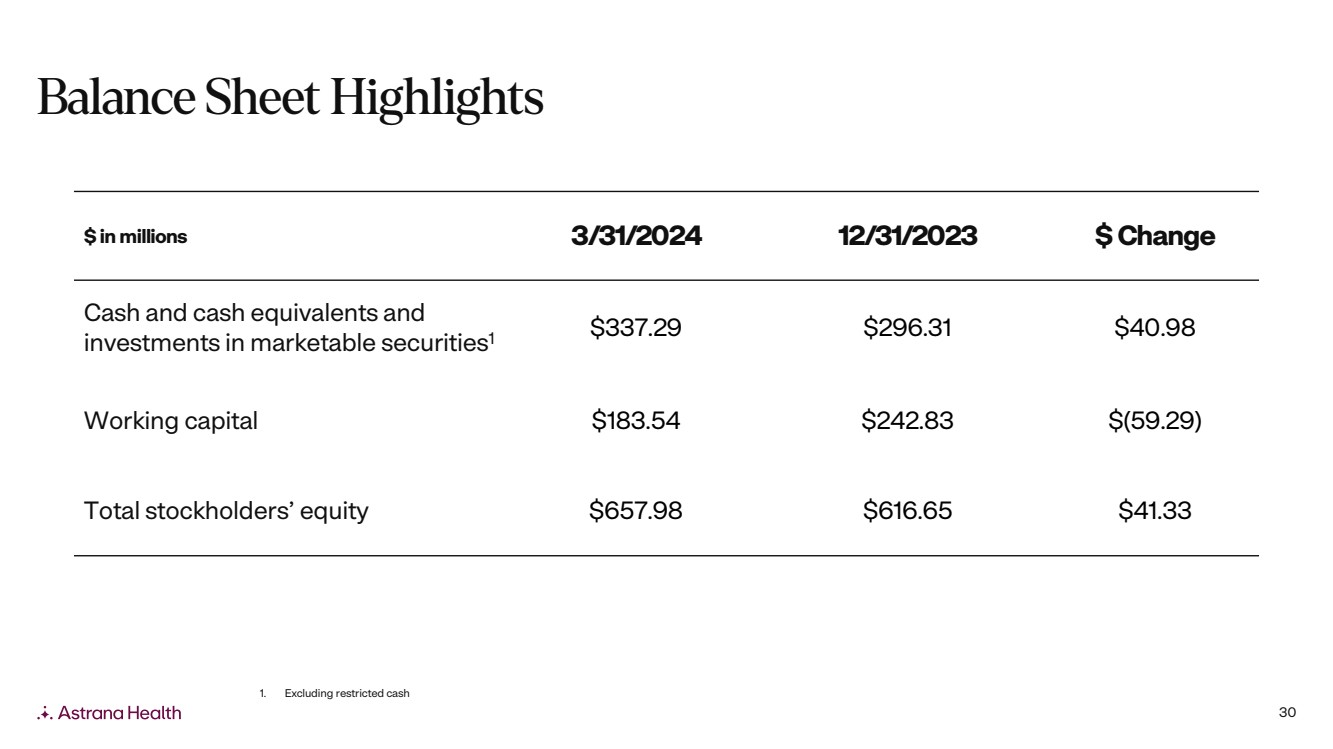
30 $ in millions 3/31/2024 12/31/2023 $ Change Cash and cash equivalents and investments in marketable securities1 $337.29 $296.31 $40.98 Working capital $183.54 $242.83 $(59.29) Total stockholders’ equity $657.98 $616.65 $41.33 1. Excluding restricted cash Balance Sheet Highlights |
|
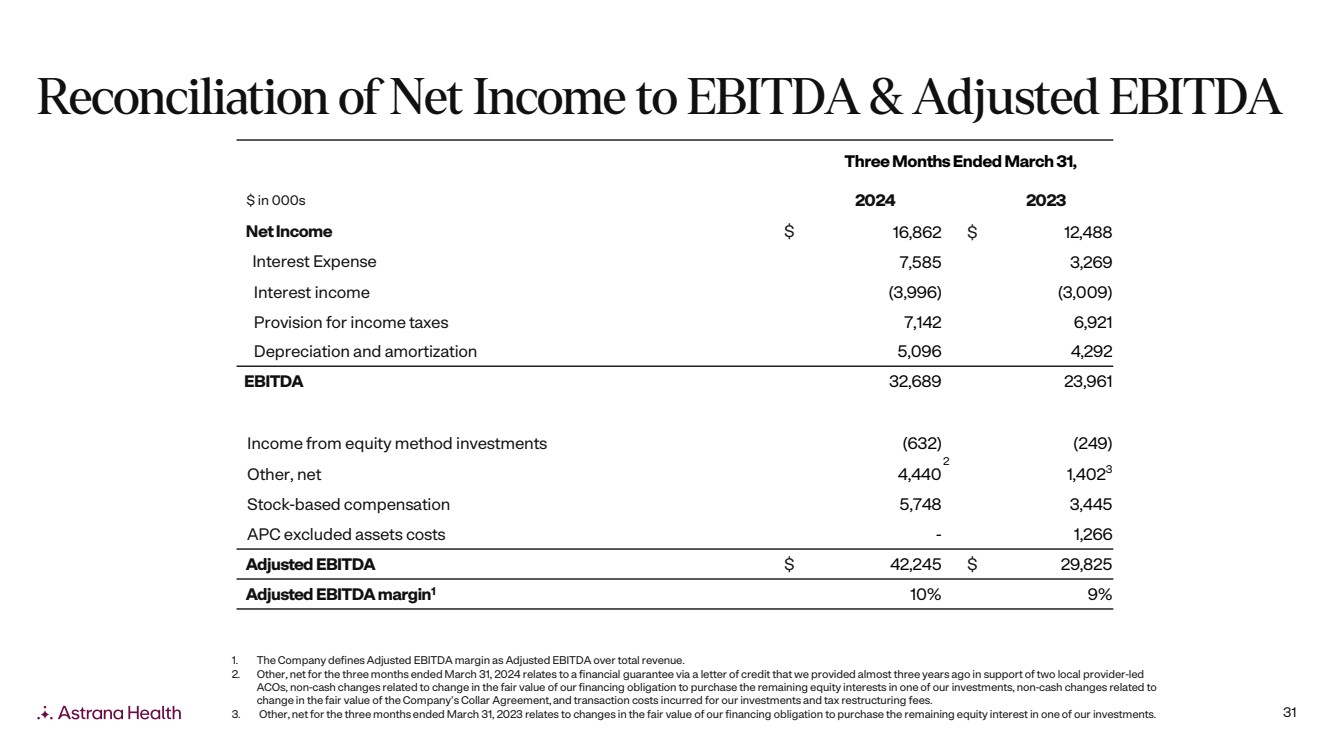
31 Three Months Ended March 31, $ in 000s 2024 2023 Net Income $ 16,862 $ 12,488 Interest Expense 7,585 3,269 Interest income (3,996) (3,009) Provision for income taxes 7,142 6,921 Depreciation and amortization 5,096 4,292 EBITDA 32,689 23,961 Income from equity method investments (632) (249) Other, net 4,440 2 1,4023 Stock-based compensation 5,748 3,445 APC excluded assets costs - 1,266 Adjusted EBITDA $ 42,245 $ 29,825 Adjusted EBITDA margin1 10% 9% 1. The Company defines Adjusted EBITDA margin as Adjusted EBITDA over total revenue. 2. Other, net for the three months ended March 31, 2024 relates to a financial guarantee via a letter of credit that we provided almost three years ago in support of two local provider-led ACOs, non-cash changes related to change in the fair value of our financing obligation to purchase the remaining equity interests in one of our investments, non-cash changes related to change in the fair value of the Company’s Collar Agreement, and transaction costs incurred for our investments and tax restructuring fees. 3. Other, net for the three months ended March 31, 2023 relates to changes in the fair value of our financing obligation to purchase the remaining equity interest in one of our investments. Reconciliation of Net Income to EBITDA & Adjusted EBITDA |
|
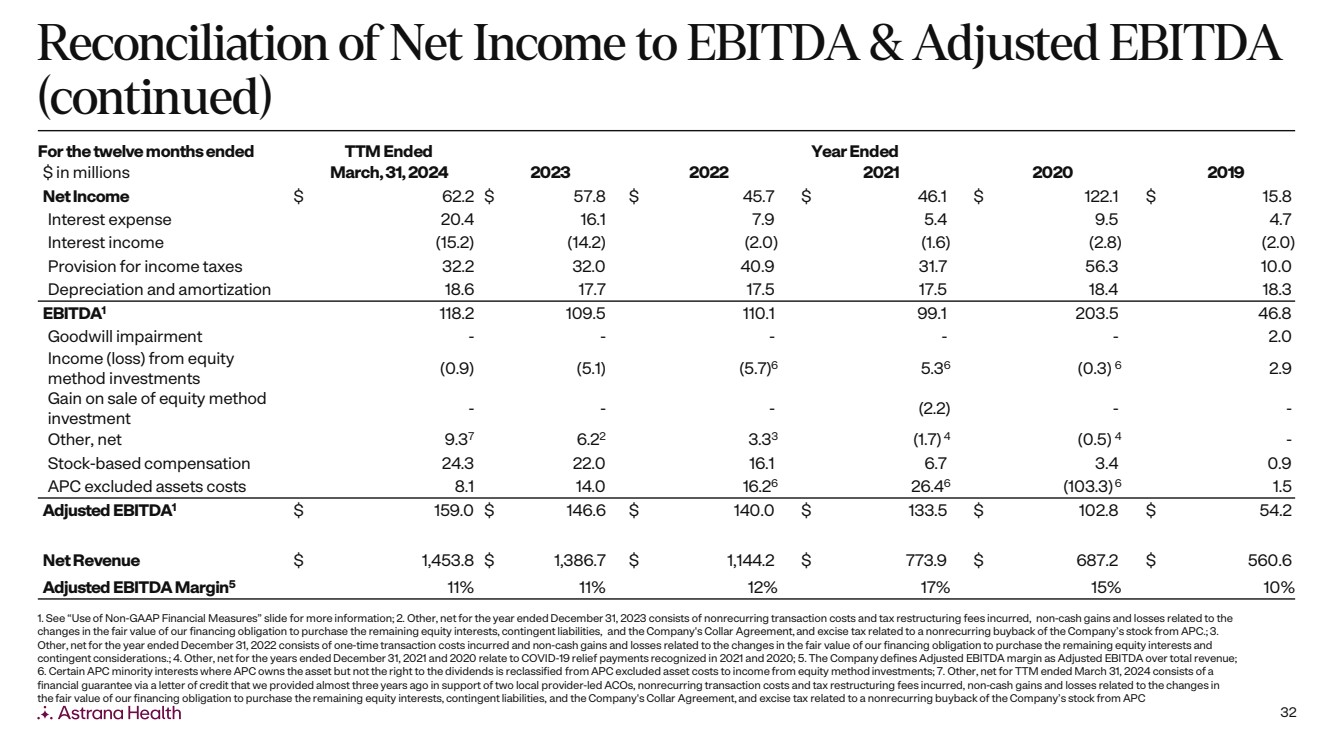
32 For the twelve months ended TTM Ended Year Ended $ in millions March, 31, 2024 2023 2022 2021 2020 2019 Net Income $ 62.2 $ 57.8 $ 45.7 $ 46.1 $ 122.1 $ 15.8 Interest expense 20.4 16.1 7.9 5.4 9.5 4.7 Interest income (15.2) (14.2) (2.0) (1.6) (2.8) (2.0) Provision for income taxes 32.2 32.0 40.9 31.7 56.3 10.0 Depreciation and amortization 18.6 17.7 17.5 17.5 18.4 18.3 EBITDA1 118.2 109.5 110.1 99.1 203.5 46.8 Goodwill impairment - - - - - 2.0 Income (loss) from equity method investments (0.9) (5.1) (5.7)6 5.36 (0.3) 6 2.9 Gain on sale of equity method investment - - - (2.2) - - Other, net 9.37 6.22 3.33 (1.7) 4 (0.5) 4 - Stock-based compensation 24.3 22.0 16.1 6.7 3.4 0.9 APC excluded assets costs 8.1 14.0 16.26 26.46 (103.3)6 1.5 Adjusted EBITDA1 $ 159.0 $ 146.6 $ 140.0 $ 133.5 $ 102.8 $ 54.2 Net Revenue $ 1,453.8 $ 1,386.7 $ 1,144.2 $ 773.9 $ 687.2 $ 560.6 Adjusted EBITDA Margin5 11% 11% 12% 17% 15% 10% 1. See “Use of Non-GAAP Financial Measures” slide for more information; 2. Other, net for the year ended December 31, 2023 consists of nonrecurring transaction costs and tax restructuring fees incurred, non-cash gains and losses related to the changes in the fair value of our financing obligation to purchase the remaining equity interests, contingent liabilities, and the Company's Collar Agreement, and excise tax related to a nonrecurring buyback of the Company’s stock from APC.; 3. Other, net for the year ended December 31, 2022 consists of one-time transaction costs incurred and non-cash gains and losses related to the changes in the fair value of our financing obligation to purchase the remaining equity interests and contingent considerations.; 4. Other, net for the years ended December 31, 2021 and 2020 relate to COVID-19 relief payments recognized in 2021 and 2020; 5. The Company defines Adjusted EBITDA margin as Adjusted EBITDA over total revenue; 6. Certain APC minority interests where APC owns the asset but not the right to the dividends is reclassified from APC excluded asset costs to income from equity method investments; 7. Other, net for TTM ended March 31, 2024 consists of a financial guarantee via a letter of credit that we provided almost three years ago in support of two local provider-led ACOs, nonrecurring transaction costs and tax restructuring fees incurred, non-cash gains and losses related to the changes in the fair value of our financing obligation to purchase the remaining equity interests, contingent liabilities, and the Company's Collar Agreement, and excise tax related to a nonrecurring buyback of the Company’s stock from APC Reconciliation of Net Income to EBITDA & Adjusted EBITDA (continued) |
|
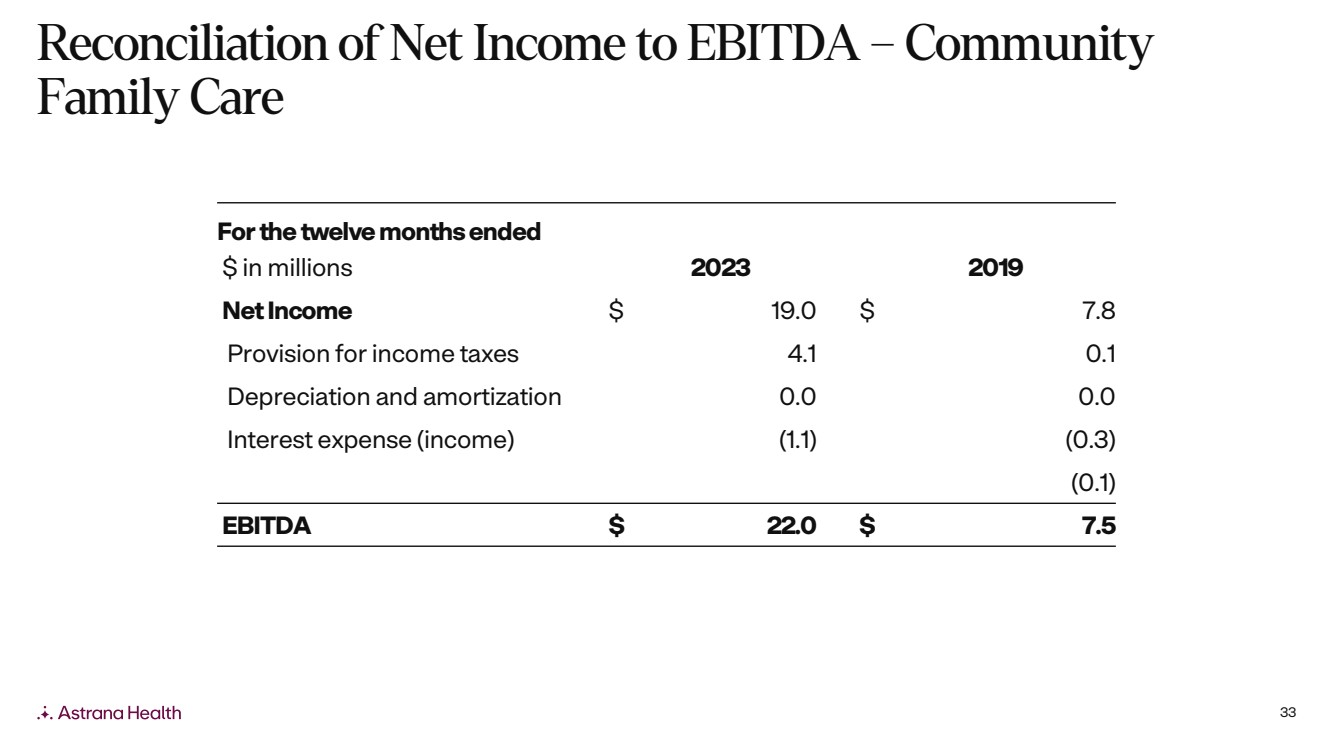
33 For the twelve months ended $ in millions 2023 2019 Net Income $ 19.0 $ 7.8 Provision for income taxes 4.1 0.1 Depreciation and amortization 0.0 0.0 Interest expense (income) (1.1) (0.3) (0.1) EBITDA $ 22.0 $ 7.5 Reconciliation of Net Income to EBITDA – Community Family Care |
|
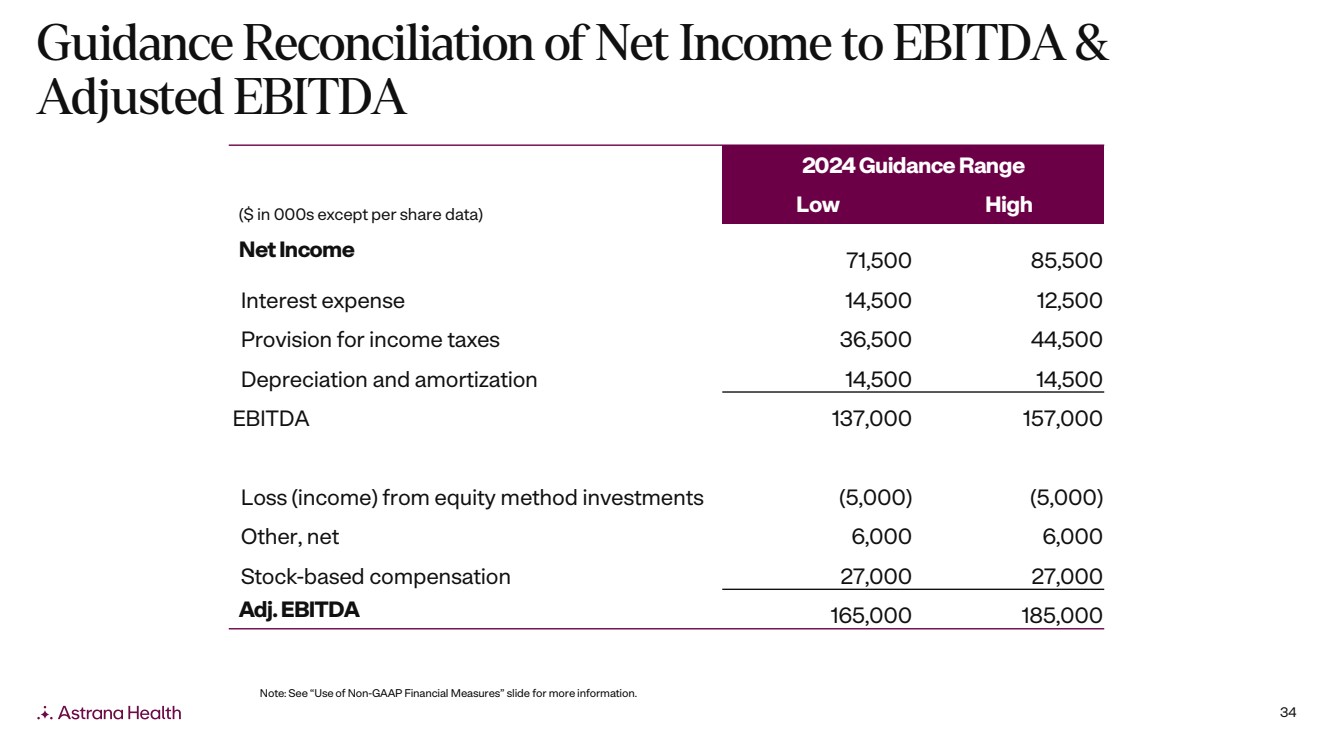
34 Note: See “Use of Non-GAAP Financial Measures” slide for more information. 2024 Guidance Range ($ in 000s except per share data) Low High Net Income 71,500 85,500 Interest expense 14,500 12,500 Provision for income taxes 36,500 44,500 Depreciation and amortization 14,500 14,500 EBITDA 137,000 157,000 Loss (income) from equity method investments (5,000) (5,000) Other, net 6,000 6,000 Stock-based compensation 27,000 27,000 Adj. EBITDA 165,000 185,000 Guidance Reconciliation of Net Income to EBITDA & Adjusted EBITDA |