United States
Securities and Exchange Commission
Washington, D.C. 20549
Form 8-K
Current Report
Pursuant to Section 13 or 15(d) of the Securities Exchange Act of 1934
Date of Report (Date of earliest event reported): May 2, 2024
CLARUS CORPORATION
(Exact name of registrant as specified in its charter)
|
Delaware (State or other jurisdiction of incorporation) |
001-34767 (Commission File Number) |
58-1972600 (IRS Employer Identification Number) |
|
2084 East 3900 South, Salt Lake City, Utah (Address of principal executive offices) |
84124 (Zip Code) |
Registrant’s telephone number, including area code: (801) 278-5552
N/A
(Former name or former address, if changed since last report.)
Check the appropriate box below if the Form 8-K filing is intended to simultaneously satisfy the filing obligation of the registrant under any of the following provisions:
| ¨ | Written communications pursuant to Rule 425 under the Securities Act (17 CFR 230.425) |
| ¨ | Soliciting material pursuant to Rule 14a-12 under the Exchange Act (17 CFR 240.14a-12) |
| ¨ | Pre-commencement communications pursuant to Rule 14d-2(b) under the Exchange Act (17 CFR 240.14d-2(b)) |
| ¨ | Pre-commencement communications pursuant to Rule 13e-4(c) under the Exchange Act (17 CFR 240.13e-4(c)) |
Indicate by check mark whether the registrant is an emerging growth company as defined in Rule 405 of the Securities Act of 1933 (§230.405 of this chapter) or Rule 12b-2 of the Securities Exchange Act of 1934 (§240.12b-2 of this chapter).
| ¨ | Emerging growth company |
If an emerging growth company, indicate by check mark if the registrant has elected not to use the extended transition period for complying with any new or revised financial accounting standards provided pursuant to Section 13(a) of the Exchange Act. ¨
Securities registered pursuant to Section 12(b) of the Act:
| Title of each class | Trading Symbol | Name
of each exchange on which registered |
||
| Common Stock, par value $.0001 per share | CLAR | NASDAQ Global Select Market |
Item 2.02 Results of Operations and Financial Condition
On May 2, 2024, Clarus Corporation (the “Company”) issued a press release announcing results for the first quarter ended March 31, 2024 (the “Press Release”). A copy of the Press Release is furnished as Exhibit 99.1 and incorporated herein by reference. Attached hereto as Exhibit 99.2 and incorporated herein by reference is a presentation regarding the Company’s financial results for the first quarter ended March 31, 2024 (the “Presentation”).
The Press Release and Presentation contains the non-GAAP measures: (i) adjusted gross margin and adjusted gross profit, (ii) adjusted (loss) income from continuing operations and related earnings (loss) per diluted share, (iii) earnings before interest, taxes, other income or expense, depreciation and amortization (“EBITDA”), EBITDA margin, adjusted EBITDA, and adjusted EBITDA margin, (iv) segment EBITDA and adjusted segment EBITDA, and (v) free cash flow (defined as net cash provided by operating activities less capital expenditures). The Company believes the presentation of these non-GAAP measures provides useful information for the understanding of its ongoing operations and enables investors to focus on period-over-period operating performance, and thereby enhances the user’s overall understanding of the Company’s current financial performance relative to past performance and provides, along with the nearest GAAP measures, a baseline for modeling future earnings expectation. The non-GAAP measures are reconciled to comparable GAAP financial measures within the Press Release and the Presentation. The Company cautions that non-GAAP measures should be considered in addition to, but not as a substitute for, the Company's reported GAAP results. Additionally, the Company notes that there can be no assurance that the above referenced non-GAAP financial measures are comparable to similarly titled financial measures used by other publicly traded companies.
The information in Item 2.02 of this Current Report on Form 8-K (including Exhibits 99.1 and 99.2) shall not be deemed “filed” for purposes of Section 18 of the Securities Act of 1934, as amended, nor shall it be deemed incorporated by reference in any filing under the Securities Act of 1933, as amended, except as shall be expressly set forth by specific reference in such filing.
Item 9.01. Financial Statements and Exhibits
(d) Exhibits.
| Exhibit | Description |
| 99.1 | Press Release dated May 2, 2024 (furnished only). |
| 99.2 | Slide Presentation for Conference Call held on May 2, 2024 (furnished only) |
| 104 | Cover Page Interactive Data File (embedded within the Inline XBRL document). |
SIGNATURES
Pursuant to the requirements of the Securities Exchange Act of 1934, as amended, the Company has duly caused this report to be signed on its behalf by the undersigned hereunto duly authorized.
Dated: May 2, 2024
| CLARUS CORPORATION | ||
| By: | /s/ Michael J. Yates | |
| Name: Michael J. Yates | ||
| Title: Chief Financial Officer | ||
Exhibit 99.1

Clarus Reports First Quarter 2024 Results
Increased Quarterly Adventure Sales 27%
Reduced Apparel Inventory at Outdoor 38%
Reaffirms Full Year Guidance
SALT LAKE CITY, May 2, 2024 (GLOBE NEWSWIRE) -- Clarus Corporation (NASDAQ: CLAR)
(“Clarus” and/or the “Company”), a global company focused on the outdoor enthusiast markets, reported financial results for the first quarter ended March 31, 2024.
First Quarter 2024 Financial Summary vs. Same Year-Ago Quarter (adjusted to reflect the reclassification of the Precision Sport segment as discontinued operations)
| · | Sales of $69.3 million compared to $70.3 million. |
| · | Gross margin was 35.9% compared to 36.3%; adjusted gross margin of 36.9% compared to 36.3%. |
| · | Net income, which includes the impact of discontinued operations, of $21.9 million, or $0.57 per diluted share, compared to $1.6 million, or $0.04 per diluted share. |
| · | Loss from continuing operations of $6.5 million, or $(0.17) per diluted share, compared to loss from continuing operations of $2.0 million, or $(0.05) per diluted share. |
| · | Adjusted EBITDA from continuing operations of $2.0 million with an adjusted EBITDA margin of 2.9% compared to $1.1 million with an adjusted EBITDA margin of 1.6%. |
Management Commentary
“We entered 2024 with a strong balance sheet and an experienced leadership team focused on initiating our strategic plan for our next phase as a pure-play, ESG-friendly outdoor business,” said Warren Kanders, Clarus’ Executive Chairman. “We are pleased with our execution in the first quarter, prioritizing simplification and right-sizing in Outdoor, along with the launch of compelling new products and expansion beyond the home market in Adventure. Based on our results to date, we have reaffirmed our full-year guidance and believe we have laid the foundation to drive increased profitability and unlock new growth opportunities going forward.”
Mr. Kanders added, “During the quarter, we saw evidence that our strategic initiatives are yielding incremental near-term benefits. Specifically, at Outdoor, we made progress on our inventory reduction initiatives, highlighted by a decline in apparel inventory of nearly 38% year-over-year. Overall, while we saw continued stabilization of the North American wholesale market, Europe and our independent global distributor markets still face difficult conditions. Building on the momentum we generated in the second half of last year, Adventure sales increased 27% in Q1 driven by strength in OEM customer demand. We are committed to establishing a best-in-class product ecosystem across the Adventure segment, while remaining intensely focused on enhanced product margins as we scale.”
First Quarter 2024 Financial Results
Sales in the first quarter were $69.3 million compared to $70.3 million in the same year-ago quarter. This decrease was primarily driven by softness in the European wholesale market at Outdoor, partly offset by strength at the Adventure segment due to continued success with new product launches and OEM customers.
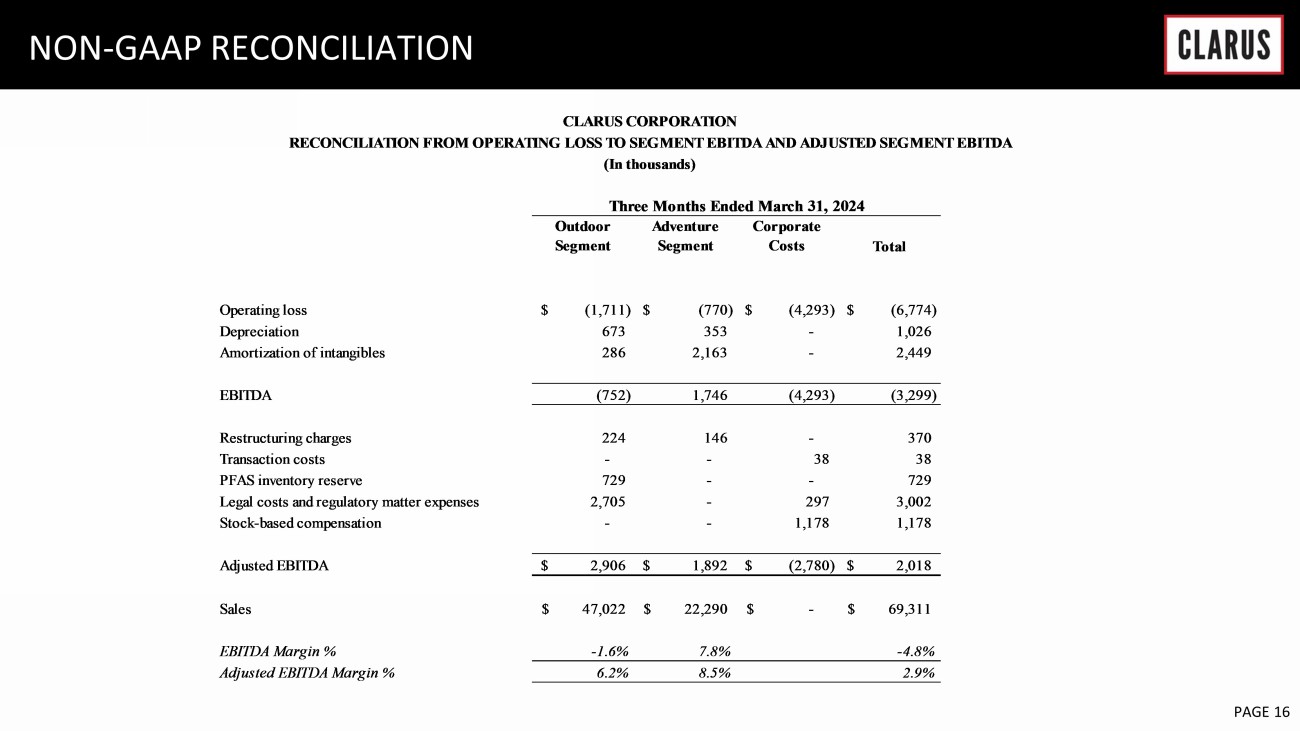
Sales in the Adventure segment increased 27% to $22.3 million, or $23.0 million on a constant currency basis, compared to $17.5 million in the year-ago quarter, reflecting higher demand from OEM customers and the impact of the TRED Outdoors acquisition. Sales in the Outdoor segment were $47.0 million, or $46.7 million on a constant currency basis, compared to $52.8 million in the year-ago quarter. The decline primarily reflects weakness in European and independent global distributor markets, partially offset by growth in the North American wholesale channel.
Gross margin in the first quarter was 35.9% compared to 36.3% in the year-ago quarter. The decrease in gross margin was primarily due to promotional pricing at the Outdoor segment, the increase in PFAS related inventory reserves, as well as unfavorable channel mix at the Adventure segment. Adjusted gross margin in the first quarter was 36.9% compared to 36.3% in the year-ago quarter.
Selling, general and administrative expenses in the first quarter were $28.2 million compared to $29.4 million in the same year-ago quarter. The decrease was attributable to expense reduction initiatives in the Outdoor segment to manage costs, as well as lower intangible amortization and lower stock compensation expenses. The decrease was partially offset by higher investment in marketing initiatives in the Adventure segment.
The loss from continuing operations in the first quarter of 2024 was $6.5 million, or $(0.17) per diluted share, compared to loss from continuing operations of $2.0 million, or $(0.05) per diluted share in the year-ago quarter. Loss from continuing operations in the first quarter included $3.0 million of charges relating to legal cost and regulatory matter expenses and $0.7 million of PFAS inventory reserve.
Adjusted loss from continuing operations in the first quarter of 2024 was $0.1 million, or $(0.00) per diluted share, compared to adjusted income from continuing operations of $0.4 million, or $0.01 per diluted share, in the year-ago quarter. Adjusted (loss) income from continuing operations excludes legal cost and regulatory matters expenses, PFAS inventory reserves, restructuring charges and transaction costs, as well as non-cash items for intangible amortization and stock-based compensation.
Adjusted EBITDA from continuing operations in the first quarter was $2.0 million, or an adjusted EBITDA margin of 2.9%, compared to $1.1 million, or an adjusted EBITDA margin of 1.6%, in the same year-ago quarter.
Net cash used in operating activities for the three months ended March 31, 2024, was $16.4 million compared to net cash generated of $3.2 million in the prior year quarter. Capital expenditures in the first quarter of 2024 were $1.9 million compared to $1.5 million in the prior year quarter. Free cash flow for the first quarter of 2024 was an outflow of $18.3 million compared to positive free cash flow of $1.7 million in the prior year quarter. Free cash flow was significantly lower because of a significant reduction in accounts payable.
Liquidity at March 31, 2024 vs. December 31, 2023
| · | Cash and cash equivalents totaled $47.5 million compared to $11.3 million. |
| · | Total debt of $0.1 million compared to $119.8 million. |
| · | On February 29, 2024, approximately $135.0 million of long-term debt, interest and fees were repaid and the credit agreement was terminated. |
Sale of Precision Sport / Discontinued Operations
On December 29, 2023, the Company announced the sale of its Precision Sport segment for $175 million. As the disposition was completed on February 29, 2024, we recognized a gain of $40.6 million, pending customary working capital adjustments, on the disposition during the three months ending March 31, 2024. The activities of the Precision Sport segment have been segregated and reported as discontinued operations for all periods presented.
2024 Outlook
The Company continues to expect fiscal year 2024 sales to range between $270 million to $280 million and adjusted EBITDA of approximately $16 million to $18 million, or an adjusted EBITDA margin of 6.2% at the mid-point of revenue and adjusted EBITDA. In addition, capital expenditures are expected to range between $4 million to $5 million and free cash flow is expected to range between $18 million to $20 million for the full year 2024.
Net Operating Loss (NOL)
The Company has net operating loss carryforwards (“NOLs”) for U.S. federal income tax purposes of $7.7 million. None of the NOLs expire until December 31, 2029.
Conference Call
The Company will hold a conference call today at 5:00 p.m. Eastern time to discuss its first quarter 2024 results.
Date: Thursday, May 2, 2024
Time: 5:00 p.m. Eastern time (3:00 p.m. Mountain time)
Registration Link: https://register.vevent.com/register/BIcdb6a4a884d64ac9a3bcfbb6965a71f6
To access the call by phone, please register via the live call registration link above and you will be provided with dial-in instructions and details. The conference call will be broadcast live and available for replay here and on the Company’s website at www.claruscorp.com.
About Clarus Corporation
Headquartered in Salt Lake City, Utah, Clarus Corporation is a global leading designer, developer, manufacturer and distributor of best-in-class outdoor equipment and lifestyle products focused on the outdoor enthusiast markets. Each of our brands has a long history of continuous product innovation for core and everyday users alike. The Company’s products are principally sold globally under the Black Diamond®, Rhino-Rack®, MAXTRAX®, TRED Outdoors® brand names through outdoor specialty and online retailers, our own websites, distributors, and original equipment manufacturers. Our portfolio of iconic brands is well-positioned for sustainable, long-term growth underpinned by powerful industry trends across the outdoor and adventure sport end markets. For additional information, please visit www.claruscorp.com or the brand websites at www.blackdiamondequipment.com, www.rhinorack.com, www.maxtraxus.com / www.maxtrax.com.au, www.tredoutdoors.com, or www.pieps.com.
Use of Non-GAAP Measures
The Company reports its financial results in accordance with U.S. generally accepted accounting principles (“GAAP”). This press release contains the non-GAAP measures: (i) adjusted gross margin and adjusted gross profit, (ii) adjusted (loss) income from continuing operations and related earnings (loss) per diluted share, (iii) earnings before interest, taxes, other income or expense, depreciation and amortization (“EBITDA”), EBITDA margin, adjusted EBITDA, and adjusted EBITDA margin, and (iv) free cash flow (defined as net cash provided by operating activities less capital expenditures). The Company believes that the presentation of certain non-GAAP measures, i.e.: (i) adjusted gross margin and adjusted gross profit, (ii) adjusted (loss) income from continuing operations and related earnings (loss) per diluted share , (iii) EBITDA, EBITDA margin, adjusted EBITDA and adjusted EBITDA margin, and (iv) free cash flow, provide useful information for the understanding of its ongoing operations and enables investors to focus on period-over-period operating performance, and thereby enhances the user's overall understanding of the Company's current financial performance relative to past performance and provides, along with the nearest GAAP measures, a baseline for modeling future earnings expectations. Non-GAAP measures are reconciled to comparable GAAP financial measures within this press release. We do not provide a reconciliation of the non-GAAP guidance measures Adjusted EBITDA and/or Adjusted EBITDA Margin for the fiscal year 2024 to net income for the fiscal year 2024, the most comparable GAAP financial measure, due to the inherent difficulty of forecasting certain types of expenses and gains, without unreasonable effort, which affect net income but not Adjusted EBITDA and/or Adjusted EBITDA Margin. The Company cautions that non-GAAP measures should be considered in addition to, but not as a substitute for, the Company's reported GAAP results. Additionally, the Company notes that there can be no assurance that the above referenced non-GAAP financial measures are comparable to similarly titled financial measures used by other publicly traded companies.
Forward-Looking Statements
Please note that in this press release we may use words such as “appears,” “anticipates,” “believes,” “plans,” “expects,” “intends,” “future,” and similar expressions which constitute forward-looking statements within the meaning of the safe harbor provisions of the Private Securities Litigation Reform Act of 1995. Forward-looking statements are made based on our expectations and beliefs concerning future events impacting the Company and therefore involve a number of risks and uncertainties. We caution that forward-looking statements are not guarantees and that actual results could differ materially from those expressed or implied in the forward-looking statements. Potential risks and uncertainties that could cause the actual results of operations or financial condition of the Company to differ materially from those expressed or implied by forward-looking statements in this press release, include, but are not limited to, those risks and uncertainties more fully described from time to time in the Company's public reports filed with the Securities and Exchange Commission, including under the section titled “Risk Factors” in the Company's Annual Report on Form 10-K, and/or Quarterly Reports on Form 10-Q, as well as in the Company’s Current Reports on Form 8-K. All forward-looking statements included in this press release are based upon information available to the Company as of the date of this press release and speak only as of the date hereof. We assume no obligation to update any forward- looking statements to reflect events or circumstances after the date of this press release.
Company Contact:
Michael J. Yates
Chief Financial Officer
mike.yates@claruscorp.com
Investor Relations:
The IGB Group
Leon Berman / Matt Berkowitz
Tel 1-212-477-8438 / 1-212-227-7098
lberman@igbir.com / mberkowitz@igbir.com
CLARUS CORPORATION
CONDENSED CONSOLIDATED BALANCE SHEETS
(Unaudited)
(In thousands, except per share amounts)
| March 31, 2024 | December 31, 2023 | |||||||
| Assets | ||||||||
| Current assets | ||||||||
| Cash | $ | 47,484 | $ | 11,324 | ||||
| Accounts receivable, less allowance for | ||||||||
| credit losses of $1,394 and $1,412 | 51,954 | 53,971 | ||||||
| Inventories | 88,630 | 91,409 | ||||||
| Prepaid and other current assets | 7,966 | 4,865 | ||||||
| Income tax receivable | 930 | 892 | ||||||
| Assets held for sale | - | 137,284 | ||||||
| Total current assets | 196,964 | 299,745 | ||||||
| Property and equipment, net | 16,345 | 16,587 | ||||||
| Other intangible assets, net | 37,526 | 41,466 | ||||||
| Indefinite-lived intangible assets | 56,897 | 58,527 | ||||||
| Goodwill | 38,300 | 39,320 | ||||||
| Deferred income taxes | 16,280 | 22,869 | ||||||
| Other long-term assets | 14,664 | 16,824 | ||||||
| Total assets | $ | 376,976 | $ | 495,338 | ||||
| Liabilities and Stockholders’ Equity | ||||||||
| Current liabilities | ||||||||
| Accounts payable | $ | 12,772 | $ | 20,015 | ||||
| Accrued liabilities | 22,441 | 24,580 | ||||||
| Income tax payable | 816 | 805 | ||||||
| Current portion of long-term debt | 44 | 119,790 | ||||||
| Liabilities held for sale | - | 5,744 | ||||||
| Total current liabilities | 36,073 | 170,934 | ||||||
| Long-term debt, net | 37 | - | ||||||
| Deferred income taxes | 17,324 | 18,124 | ||||||
| Other long-term liabilities | 13,167 | 14,160 | ||||||
| Total liabilities | 66,601 | 203,218 | ||||||
| Stockholders’ Equity | ||||||||
| Preferred stock, $0.0001 par value per share; 5,000 shares authorized; none issued | - | - | ||||||
| Common stock, $0.0001 par value per share; 100,000 shares authorized; 42,878 and 42,761 issued and 38,236 and 38,149 outstanding, respectively | 4 | 4 | ||||||
| Additional paid in capital | 692,381 | 691,198 | ||||||
| Accumulated deficit | (329,811 | ) | (350,739 | ) | ||||
| Treasury stock, at cost | (33,114 | ) | (32,929 | ) | ||||
| Accumulated other comprehensive loss | (19,085 | ) | (15,414 | ) | ||||
| Total stockholders’ equity | 310,375 | 292,120 | ||||||
| Total liabilities and stockholders’ equity | $ | 376,976 | $ | 495,338 | ||||
CLARUS CORPORATION
CONDENSED CONSOLIDATED STATEMENTS OF INCOME
(Unaudited)
(In thousands, except per share amounts)
| Three Months Ended | ||||||||
| March 31, 2024 | March 31, 2023 | |||||||
| Sales | ||||||||
| Domestic sales | $ | 28,284 | $ | 24,197 | ||||
| International sales | 41,027 | 46,081 | ||||||
| Total sales | 69,311 | 70,278 | ||||||
| Cost of goods sold | 44,460 | 44,770 | ||||||
| Gross profit | 24,851 | 25,508 | ||||||
| Operating expenses | ||||||||
| Selling, general and administrative | 28,215 | 29,354 | ||||||
| Restructuring charges | 370 | - | ||||||
| Transaction costs | 38 | 37 | ||||||
| Contingent consideration benefit | - | (1,565 | ) | |||||
| Legal costs and regulatory matter expenses | 3,002 | 128 | ||||||
| Total operating expenses | 31,625 | 27,954 | ||||||
| Operating loss | (6,774 | ) | (2,446 | ) | ||||
| Other (expense) income | ||||||||
| Interest income, net | 370 | 5 | ||||||
| Other, net | (909 | ) | 76 | |||||
| Total other (expense) income, net | (539 | ) | 81 | |||||
| Loss before income tax | (7,313 | ) | (2,365 | ) | ||||
| Income tax benefit | (851 | ) | (334 | ) | ||||
| Loss from continuing operations | (6,462 | ) | (2,031 | ) | ||||
| Discontinued operations, net of tax | 28,346 | 3,629 | ||||||
| Net income | $ | 21,884 | $ | 1,598 | ||||
| Loss from continuing operations per share: | ||||||||
| Basic | $ | (0.17 | ) | $ | (0.05 | ) | ||
| Diluted | (0.17 | ) | (0.05 | ) | ||||
| Net income per share: | ||||||||
| Basic | $ | 0.57 | $ | 0.04 | ||||
| Diluted | 0.57 | 0.04 | ||||||
| Weighted average shares outstanding: | ||||||||
| Basic | 38,208 | 37,137 | ||||||
| Diluted | 38,208 | 37,137 | ||||||
CLARUS CORPORATION
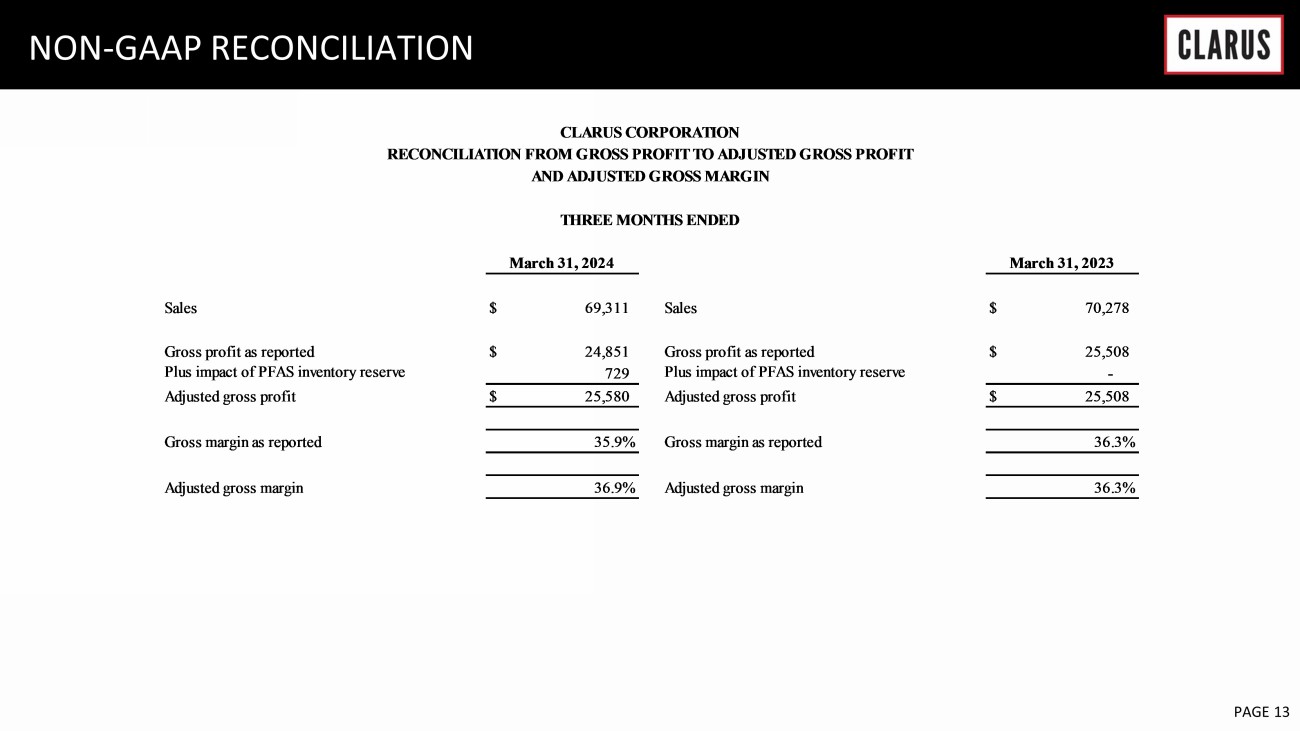
RECONCILIATION FROM GROSS PROFIT TO ADJUSTED GROSS PROFIT
AND ADJUSTED GROSS MARGIN
| March 31, 2024 | March 31, 2023 | |||||||||
| Sales | $ | 69,311 | Sales | $ | 70,278 | |||||
| Gross profit as reported | $ | 24,851 | Gross profit as reported | $ | 25,508 | |||||
| Plus impact of PFAS inventory reserve | 729 | Plus impact of PFAS inventory reserve | - | |||||||
| Adjusted gross profit | $ | 25,580 | Adjusted gross profit | $ | 25,508 | |||||
| Gross margin as reported | 35.9 | % | Gross margin as reported | 36.3 | % | |||||
| Adjusted gross margin | 36.9 | % | Adjusted gross margin | 36.3 | % | |||||
CLARUS CORPORATION
RECONCILIATION FROM LOSS FROM CONTINUING OPERATIONS TO ADJUSTED (LOSS) INCOME FROM CONTINUING OPERATIONS AND RELATED EARNINGS PER DILUTED SHARE
(In thousands, except per share amounts)
| Three Months Ended March 31, 2024 | ||||||||||||||||||||||||||||
| Total | Gross | Operating | Income tax (benefit) |
Tax | Loss from continuing |
Diluted | ||||||||||||||||||||||
| sales | profit | expenses | expense | rate | operations | EPS (1) | ||||||||||||||||||||||
| As reported | $ | 69,311 | $ | 24,851 | $ | 31,625 | $ | (851 | ) | (11.6 | )% | $ | (6,462 | ) | $ | (0.17 | ) | |||||||||||
| Amortization of intangibles | - | - | (2,449 | ) | 617 | 1,832 | ||||||||||||||||||||||
| Restructuring charges | - | - | (370 | ) | 59 | 311 | ||||||||||||||||||||||
| Transaction costs | - | - | (38 | ) | 6 | 32 | ||||||||||||||||||||||
| PFAS inventory reserve | - | 729 | - | 114 | 615 | |||||||||||||||||||||||
| Legal costs and regulatory matter expenses | - | - | (3,002 | ) | 461 | 2,541 | ||||||||||||||||||||||
| Stock-based compensation | - | - | (1,178 | ) | 181 | 997 | ||||||||||||||||||||||
| As adjusted | $ | 69,311 | $ | 25,580 | $ | 24,588 | $ | 587 | 129.6 | % | $ | (134 | ) | $ | (0.00 | ) | ||||||||||||
(1) Potentially dilutive securities are excluded from the computation of diluted earnings (loss) per share if their effect is anti-dilutive to the loss from continuing operations. Reported loss from continuing operations per share and adjusted loss from continuing operations per share are both calculated based on 38,208 basic and diluted weighted average shares of common stock.
| Three Months Ended March 31, 2023 | ||||||||||||||||||||||||||||
| Total | Gross | Operating | Income tax (benefit) |
Tax | (Loss) income
from continuing |
Diluted | ||||||||||||||||||||||
| sales | profit | expenses | expense | rate | operations | EPS (1) | ||||||||||||||||||||||
| As reported | $ | 70,278 | $ | 25,508 | $ | 27,954 | $ | (334 | ) | (14.1 | )% | $ | (2,031 | ) | $ | (0.05 | ) | |||||||||||
| Amortization of intangibles | - | - | (2,768 | ) | 278 | 2,490 | ||||||||||||||||||||||
| Transaction costs | - | - | (37 | ) | 6 | 31 | ||||||||||||||||||||||
| Contingent consideration (benefit) expense | - | - | 1,565 | (335 | ) | (1,230 | ) | |||||||||||||||||||||
| Legal costs and regulatory matter expenses | - | - | (128 | ) | 2 | 126 | ||||||||||||||||||||||
| Stock-based compensation | - | - | (1,286 | ) | 277 | 1,009 | ||||||||||||||||||||||
| As adjusted | $ | 70,278 | $ | 25,508 | $ | 25,300 | $ | (106 | ) | (36.7 | )% | $ | 395 | $ | 0.01 | |||||||||||||
(1) Potentially dilutive securities are excluded from the computation of diluted earnings (loss) per share if their effect is anti-dilutive to the loss from continuing operations. Reported loss from continuing operations per share is calculated based on 37,137 basic and diluted weighted average shares of common stock. Adjusted income from continuing operations per share is calculated based on 38,109 diluted shares of common stock.
CLARUS CORPORATION
RECONCILIATION FROM LOSS FROM CONTINUING OPERATIONS TO EARNINGS BEFORE INTEREST, TAXES, DEPRECIATION, AND AMORTIZATION (EBITDA), EBITDA MARGIN, ADJUSTED EBITDA, AND ADJUSTED EBITDA MARGIN
(In thousands)
| Three Months Ended | ||||||||
| March 31, 2024 | March 31, 2023 | |||||||
| Loss from continuing operations | $ | (6,462 | ) | $ | (2,031 | ) | ||
| Income tax benefit | (851 | ) | (334 | ) | ||||
| Other, net | 909 | (76 | ) | |||||
| Interest income, net | (370 | ) | (5 | ) | ||||
| Operating loss | (6,774 | ) | (2,446 | ) | ||||
| Depreciation | 1,026 | 939 | ||||||
| Amortization of intangibles | 2,449 | 2,768 | ||||||
| EBITDA | (3,299 | ) | 1,261 | |||||
| Restructuring charges | 370 | - | ||||||
| Transaction costs | 38 | 37 | ||||||
| Contingent consideration benefit | - | (1,565 | ) | |||||
| PFAS inventory reserve | 729 | - | ||||||
| Legal costs and regulatory matter expenses | 3,002 | 128 | ||||||
| Stock-based compensation | 1,178 | 1,286 | ||||||
| Adjusted EBITDA | $ | 2,018 | $ | 1,147 | ||||
| Sales | $ | 69,311 | $ | 70,278 | ||||
| EBITDA margin | -4.8 | % | 1.8 | % | ||||
| Adjusted EBITDA margin | 2.9 | % | 1.6 | % | ||||
Exhibit 99.2

Q1 EARNINGS PRESENTATION MA Y 2 , 2024

6 February 2023 PAGE 2 Forward - Looking Statements Please note that in this presentation we may use words such as “appears,” “anticipates,” “believes,” “plans,” “expects,” “int end s,” “future,” and similar expressions which constitute forward - looking statements within the meaning of the safe harbor provisions of the Private Securities Litigation Reform Act of 1995. Forward - looking statem ents are made based on our expectations and beliefs concerning future events impacting the Company and therefore involve a number of risks and uncertainties. We caution that forward - looking statements are not guarantees and that actual results could differ materially from those expressed or implied in the forward - looking statements. Potential risks and uncertainties that could cause the actual results of operations or financial condition of the Company to differ materially from those expressed or implied by forward - looking statements in this presentation, include, but are not limited to, those risks and uncert ainties more fully described from time to time in the Company's public reports filed with the Securities and Exchange Commission, including under the section titled “Risk Factors” in the Company's Annual Report on Form 10 - K, and/or Quarterly Reports on Form 10 - Q, as well as in the Company’s Current Reports on Form 8 - K. All forward - looking statements included in this presentation are based upon information available t o the Company as of the date of this presentation and speak only as of the date hereof. We assume no obligation to update any forward - looking statements to reflect events or circumstances after the date of t his presentation. Non - GAAP Financial Measures The Company reports its financial results in accordance with U.S. generally accepted accounting principles (“GAAP”). This pre sen tation contains the non - GAAP measures: ( i ) adjusted gross margin and adjusted gross profit, (ii) adjusted (loss) income from continuing operations and related earnings (loss) per diluted share, (iii) ear nin gs before interest, taxes, other income or expense, depreciation and amortization (“EBITDA”), EBITDA margin, adjusted EBITDA, and adjusted EBITDA margin, and (iv) free cash flow (defined as net cash provided by operating activities less capital expenditures). The Company believes that the presentation of certain non - GAAP measures, i.e.: ( i ) adjusted gross margin and adjusted gross profit, (ii) adjusted (loss) income from continuing operations and related earning s ( loss) per diluted share , (iii) EBITDA, EBITDA margin, adjusted EBITDA and adjusted EBITDA margin, and (iv) free cash flow, provide useful information for the unders tan ding of its ongoing operations and enables investors to focus on period - over - period operating performance, and thereby enhances the user's overall understanding of the Company's current financial perfor man ce relative to past performance and provides, along with the nearest GAAP measures, a baseline for modeling future earnings expectations. Non - GAAP measures are reconciled to comparable GAAP financial me asures herein. The Company cautions that non - GAAP measures should be considered in addition to, but not as a substitute for, the Company's reported GAAP results. Additionally, the Company notes tha t there can be no assurance that the above referenced non - GAAP financial measures are comparable to similarly titled financial measures used by other publicly traded companies. Market and Industry Data The market and industry data used throughout this presentation was obtained from various sources, including the Company’s own re search and estimates, surveys or studies conducted by third parties and industry or general publications and forecasts. Industry publications, surveys and forecasts generally state that they have o bta ined information from sources believed to be reliable, but there can be no assurance as to the accuracy and completeness of such information. While the Company believes that each of these surveys, studies, publ ica tions and forecasts is reliable, it has not independently verified such data and the Company is not making any representation as to the accuracy of such information. Similarly, the Company believes its internal re search and estimates are reliable but it has not been verified by any independent sources. In addition, while the Company believes that the industry and market information included herein is generally reliab le, such information is inherently imprecise. While the Company is not aware of any misstatements regarding the industry and market data presented herein, its estimates involve risks and uncertainties and are sub ject to change based on various factors, including those discussed under the heading “Forward - Looking Statements” above. DISCLAIMER Warren Kanders EXECUTIVE CHAIRMAN Clarus TODAY’S PRESENTERS Mike Yates CFO Clarus Neil Fiske PRESIDENT Black Diamond Equipment Mat Hayward MANAGING DIRECTOR Adventure


6 February 2023 PAGE 4 THE NEW CLARUS: Q1 2024 Positioned for long - term growth as pure - play outdoor business Q1 execution consistent with strategic objectives Black Diamond Objective : Simplify and focus on the core Cathedral specialty, regional and national wholesale accounts stabilizing; SKU rationalization on track Adventure Objective: Invest to scale Global investment in marketing programs yielding better brand awareness; additional investment in personnel Strong balance sheet/ p rudent capital allocation Debt - free with $47.5 million of cash on the balance sheet at 3/31 Solid foundation in place, driven by momentum in Adventure and operational progress in Outdoor $ 69.3m $22.3 m $47.0 m 36.9 % $ 2.0m Revenue - 1 % Y/Y Adventure Revenue + 27% Y/Y Outdoor Revenue - 11% Y/Y Adj.

Gross Margin + 60 BPS Y/Y Adj. EBITDA + 76% Y/Y Q1 RESULTS AT A GLANCE Adventure Adj. EBITDA: $1.9m Outdoor Adj. EBITDA: $2.9m 6 February 2023 PAGE 6 ADVENTURE - STRATEGIC PRIORITIES: Q1 2024 HIGHLIGHTS • Q1 2024 represents first phase of our 3 - year strategic plan • Sales increased 27% supported by two primary drivers: 1.

In Wholesale, strong key account performance across Australia/New Zealand, combined with a new key account in US & driving into key season 2.

Strong OEM customer demand • Q1 margins affected by product & channel mix • New product launces across Q1 – primarily 4 new products for US market, new accessories globally, including roof top tents • Committed to establishing best - in - class product ecosystem, while remaining intensely focused on enhanced product margins as we scale • US growth focus supported by management changes, investment into talent and brand MANAGEMENT COMMENTARY BUILDINGS BLOCKS IN FOCUS INVESTMENT INTO US INVESTMENT INTO BRAND PRODUCT PLAN 6 February 2023 PAGE 7 OUTDOOR - STRATEGIC PRIORITIES: Q1 2024 HIGHLIGHTS • Strategic initiatives beginning to yield incremental near - term benefits, driving Q1 results in line with expectations • North American wholesale channel grew 15% y/y • Continued focus on rationalizing product lines under the direction of “fewer, bigger, better” • Operating costs down 8.3% y/y with continued improvement expected over the course of 2024 • Significant progress on inventory reduction initiatives, highlighted by decline in apparel inventory of ~38% y/y • Geographically: continued stabilization of the North American wholesale market, while Europe and independent global distributor markets still face difficult conditions • L ess promotional than the overall market in North America and Europe MANAGEMENT COMMENTARY BUILDINGS BLOCKS IN FOCUS SIMPLIFICATION EXECUTION PRODUCT LEADERSHIP FEWER, BIGGER, BETTER 6 February 2023 PAGE 8 NET SALES Q1 2024 FINANCIAL RESULTS Q1 202 4 Q1 2023 ADJ. GROSS MARGIN ADJ. NET INCOME ADJ. EBITDA ADJ. EBITDA % • 2024 guidance reaffirmed base d on Q 1 execution and in - line results 2.9% $ 2.0 M ($6.5M) 36.9% $69.3M 1.6% $1.1M ($2.0M) 36.3% $70.3M


6 February 2023 PAGE 9 NET SALES 2024 GUIDANCE CORP. COSTS (EXCL. NON - CASH) ADJ. EBITDA MID - POINT ADJ. EBITDA % CAPEX CASH FLOWS $270M - $280M $4M - $5M $16M - $18M 6.2% $(11)M $18M - $20M 2024 • Consistent with historical seasonal pattern, Q 2 decelerates versus Q 1 • Q 2 guidance : net sales between $ 58 - $ 62 million ; adj . EBITDA between $ 0 - $ 0 .

APPENDIX

5 million 6 February 2023 PAGE 11 BALANCE SHEET Assets Current assets Cash $ 47,484 $ 11,324 Accounts receivable, less allowance for credit losses of $1,394 and $1,412 51,954 53,971 Inventories 88,630 91,409 Prepaid and other current assets 7,966 4,865 Income tax receivable 930 892 Assets held for sale - 137,284 Total current assets 196,964 299,745 Property and equipment, net 16,345 16,587 Other intangible assets, net 37,526 41,466 Indefinite-lived intangible assets 56,897 58,527 Goodwill 38,300 39,320 Deferred income taxes 16,280 22,869 Other long-term assets 14,664 16,824 Total assets $ 376,976 $ 495,338 Liabilities and Stockholders’ Equity Current liabilities Accounts payable $ 12,772 $ 20,015 Accrued liabilities 22,441 24,580 Income tax payable 816 805 Current portion of long-term debt 44 119,790 Liabilities held for sale - 5,744 Total current liabilities 36,073 170,934 Long-term debt, net 37 - Deferred income taxes 17,324 18,124 Other long-term liabilities 13,167 14,160 Total liabilities 66,601 203,218 Stockholders’ Equity Preferred stock, $0.0001 par value per share; 5,000 shares authorized; none issued - - Common stock, $0.0001 par value per share; 100,000 shares authorized; 42,878 and 42,761 issued and 38,236 and 38,149 outstanding, respectively 4 4 Additional paid in capital 692,381 691,198 Accumulated deficit (329,811) (350,739) Treasury stock, at cost (33,114) (32,929) Accumulated other comprehensive loss (19,085) (15,414) Total stockholders’ equity 310,375 292,120 Total liabilities and stockholders’ equity $ 376,976 $ 495,338 March 31, 2024 December 31, 2023 CLARUS CORPORATION CONDENSED CONSOLIDATED BALANCE SHEETS (Unaudited) (In thousands, except per share amounts)

6 February 2023 PAGE 12 INCOME STATEMENT Sales Domestic sales $ 28,284 $ 24,197 International sales 41,027 46,081 Total sales 69,311 70,278 Cost of goods sold 44,460 44,770 Gross profit 24,851 25,508 Operating expenses Selling, general and administrative 28,215 29,354 Restructuring charges 370 - Transaction costs 38 37 Contingent consideration benefit - (1,565) Legal costs and regulatory matter expenses 3,002 128 Total operating expenses 31,625 27,954 Operating loss (6,774) (2,446) Other (expense) income Interest income, net 370 5 Other, net (909) 76 Total other (expense) income, net (539) 81 Loss before income tax (7,313) (2,365) Income tax benefit (851) (334) Loss from continuing operations (6,462) (2,031) Discontinued operations, net of tax 28,346 3,629 Net income $ 21,884 $ 1,598 Loss from continuing operations per share: Basic $ (0.17) $ (0.05) Diluted (0.17) (0.05) Net income per share: Basic $ 0.57 $ 0.04 Diluted 0.57 0.04 Weighted average shares outstanding: Basic 38,208 37,137 Diluted 38,208 37,137 March 31, 2024 March 31, 2023 CLARUS CORPORATION CONDENSED CONSOLIDATED STATEMENTS OF INCOME (Unaudited) (In thousands, except per share amounts) Three Months Ended 6 February 2023 PAGE 13 NON - GAAP RECONCILIATION Sales $ 69,311 Sales $ 70,278 Gross profit as reported $ 24,851 Gross profit as reported $ 25,508 Plus impact of PFAS inventory reserve 729 Plus impact of PFAS inventory reserve - Adjusted gross profit $ 25,580 Adjusted gross profit $ 25,508 Gross margin as reported 35.9% Gross margin as reported 36.3% Adjusted gross margin 36.9% Adjusted gross margin 36.3% CLARUS CORPORATION RECONCILIATION FROM GROSS PROFIT TO ADJUSTED GROSS PROFIT AND ADJUSTED GROSS MARGIN THREE MONTHS ENDED March 31, 2024 March 31, 2023

6 February 2023 PAGE 14 NON - GAAP RECONCILIATION As reported $ 69,311 $ 24,851 $ 31,625 $ (851) (11.6) % $ (6,462) $ (0.17) Amortization of intangibles - - (2,449) 617 1,832 Restructuring charges - - (370) 59 311 Transaction costs - - (38) 6 32 PFAS inventory reserve - 729 - 114 615 Legal costs and regulatory matter expenses - - (3,002) 461 2,541 Stock-based compensation - - (1,178) 181 997 As adjusted $ 69,311 $ 25,580 $ 24,588 $ 587 129.6 % $ (134) $ (0.00) As reported $ 70,278 $ 25,508 $ 27,954 $ (334) (14.1) % $ (2,031) $ (0.05) Amortization of intangibles - - (2,768) 278 2,490 Transaction costs - - (37) 6 31 Contingent consideration (benefit) expense - - 1,565 (335) (1,230) Legal costs and regulatory matter expenses - - (128) 2 126 Stock-based compensation - - (1,286) 277 1,009 As adjusted $ 70,278 $ 25,508 $ 25,300 $ (106) (36.7) % $ 395 $ 0.01 CLARUS CORPORATION RECONCILIATION FROM LOSS FROM CONTINUING OPERATIONS TO ADJUSTED (LOSS) INCOME FROM CONTINUING OPERATIONS AND RELATED EARNINGS PER DILUTED SHARE (In thousands, except per share amounts) Three Months Ended March 31, 2024 Total Gross Operating Income tax Tax Loss from Diluted sales profit expenses (benefit) expense rate continuing operations EPS (1) (1) Potentially dilutive securities are excluded from the computation of diluted earnings (loss) per share if their effect is anti-dilutive to the loss from continuing operations. Reported loss from continuing operations per share and adjusted loss from continuing operations per share are both calculated based on 38,208 basic and diluted weighted average shares of common Three Months Ended March 31, 2023 Total Gross Operating Income tax continuing operations EPS (1) (1) Potentially dilutive securities are excluded from the computation of diluted earnings (loss) per share if their effect is anti-dilutive to the loss from continuing operations. Reported loss from continuing operations per share is calculated based on 37,137 basic and diluted weighted average shares of common stock. Adjusted income from continuing operations per share is calculated based on 38,109 diluted shares of common stock. Tax (Loss) income from Diluted sales profit expenses (benefit) expense rate

6 February 2023 PAGE 15 NON - GAAP RECONCILIATION Loss from continuing operations $ (6,462) $ (2,031) Income tax benefit (851) (334) Other, net 909 (76) Interest income, net (370) (5) Operating loss (6,774) (2,446) Depreciation 1,026 939 Amortization of intangibles 2,449 2,768 EBITDA (3,299) 1,261 Restructuring charges 370 - Transaction costs 38 37 Contingent consideration benefit - (1,565) PFAS inventory reserve 729 - Legal costs and regulatory matter expenses 3,002 128 Stock-based compensation 1,178 1,286 Adjusted EBITDA $ 2,018 $ 1,147 Sales $ 69,311 $ 70,278 EBITDA margin -4.8% 1.8% Adjusted EBITDA margin 2.9% 1.6% March 31, 2024 March 31, 2023 CLARUS CORPORATION RECONCILIATION FROM LOSS FROM CONTINUING OPERATIONS TO EARNINGS BEFORE INTEREST, TAXES, DEPRECIATION, AND AMORTIZATION (EBITDA), EBITDA MARGIN, ADJUSTED EBITDA, AND ADJUSTED EBITDA (In thousands) Three Months Ended
6 February 2023 PAGE 15 NON - GAAP RECONCILIATION Loss from continuing operations $ (6,462) $ (2,031) Income tax benefit (851) (334) Other, net 909 (76) Interest income, net (370) (5) Operating loss (6,774) (2,446) Depreciation 1,026 939 Amortization of intangibles 2,449 2,768 EBITDA (3,299) 1,261 Restructuring charges 370 - Transaction costs 38 37 Contingent consideration benefit - (1,565) PFAS inventory reserve 729 - Legal costs and regulatory matter expenses 3,002 128 Stock-based compensation 1,178 1,286 Adjusted EBITDA $ 2,018 $ 1,147 Sales $ 69,311 $ 70,278 EBITDA margin -4.8% 1.8% Adjusted EBITDA margin 2.9% 1.6% March 31, 2024 March 31, 2023 CLARUS CORPORATION RECONCILIATION FROM LOSS FROM CONTINUING OPERATIONS TO EARNINGS BEFORE INTEREST, TAXES, DEPRECIATION, AND AMORTIZATION (EBITDA), EBITDA MARGIN, ADJUSTED EBITDA, AND ADJUSTED EBITDA (In thousands) Three Months Ended