UNITED STATES
SECURITIES AND EXCHANGE COMMISSION
WASHINGTON, D.C. 20549
FORM 6-K
REPORT OF FOREIGN PRIVATE ISSUER
PURSUANT TO RULE 13a-16 OR 15d-16
UNDER THE SECURITIES EXCHANGE ACT OF 1934
For the month of April 2024
Commission File Number: 001-41339
Swvl Holdings Corp
The Offices 4, One Central
Dubai World Trade Centre
Dubai, United Arab Emirates
(Address of principal executive office)
Indicate by check mark whether the registrant files or will file annual reports under cover of Form 20-F or Form 40-F.
Form 20-F x Form 40-F ¨
Indicate by check mark if the registrant is submitting the Form 6-K in paper as permitted by Regulation S-T Rule 101(b)(1): ¨
Indicate by check mark if the registrant is submitting the Form 6-K in paper as permitted by Regulation S-T Rule 101(b)(7): ¨
CONTENTS
On April 30, 2024, Swvl Holdings Corp (“Swvl”) issued a press release titled, “Swvl Reports 2023 Financial Results.” A copy of the press release is attached hereto as Exhibit 99.1 and incorporated herein by reference.
This Report of Foreign Private Issuer on Form 6-K also consists of Swvl’s presentation that was posted to its website on April 30, 2024, and which is attached hereto as Exhibit 99.2.
The first, second and fourth paragraphs and the sections titled “Financial Highlights for Fiscal Year Ended December 31, 2023” and “Forward-Looking Statements” in the press release attached as Exhibit 99.1 is incorporated by reference into Swvl’s Registration Statement on Form S-8 (Registration No. 333-265464), filed with the SEC, to be a part thereof from the date on which this Report is submitted, to the extent not superseded by documents or reports subsequently filed or furnished.
EXHIBIT INDEX
| Exhibit | Description of Exhibit | |
| 99.1 | Press release dated April 30, 2024 | |
| 99.2 | Investor presentation | |
SIGNATURE
Pursuant to the requirements of the Securities Exchange Act of 1934, the registrant has duly caused this report to be signed on its behalf by the undersigned, thereunto duly authorized.
| SWVL HOLDINGS CORP | ||
| Date: April 30, 2024 | By: | /s/ Mostafa Kandil |
| Name: | Mostafa Kandil | |
| Title: | Chief Executive Officer | |
Exhibit 99.1
Swvl Records $3.1m Net Profit, 13% Net Margin, and
an Eightfold Growth in Gross Profit
8x Gross Profit growth year on year to $4.1 million
Achieved cash flow positivity, with self-funded growth
Profitable growth drove earnings per share from continuing operations to $0.61
Strong balance sheet with no debt and more than doubled the positive equity value compared to 2022
April 30, 2024 at 6:00 AM EST
DUBAI, United Arab Emirates, April 30, 2024 (GLOBE NEWSWIRE) -- Swvl Holdings Corp (“Swvl” or the “Company”) (Nasdaq: SWVL), a technology provider for enterprise and government mobility solutions with a global footprint, announces a significant achievement in its financial performance for the fiscal year 2023. The Company has successfully delivered positive net profit and cashflow for the full year.
Continuing the positive momentum established in the initial half of the fiscal year, Swvl completed the path to profitability program initiated in 2022. The Company is committed to boosting profitability further while concurrently resuming strategic expansions into high-revenue markets.
Financial Highlights for Fiscal Year Ended December 31, 2023:
| ● | Net Profit: $3.1 million, a turnaround from a net loss of $123.6 million in 2022 | |
| ● | Gross Profit: Increased more than eightfold to $4.1 million from $0.5 million in 2022 | |
| ● | Operating Profit: $12.1 million, compared to an operating loss of $80.2 million in 2022 | |
| ● | Earnings Per Share: Profitable growth boosted basic earnings per share from continuing operations to $0.61 | |
| ● | Balance Sheet Strength: Ended the year with a strong balance sheet, no debt, and an equity value more than double that of the prior year, at $5.9 million | |
| ● | Equity Book Value: Total equity book value of $5.9 million as of December 31, 2023, compared to $2.6 million as of December 31, 2022 |
This result marks Swvl’s swift transition to profitability, highlighting a focus on financial stability and operational efficiency, and the effective implementation of profitability strategies during the fiscal year. The Company’s continuous efforts to maintain positive cash flow and profitability support its upcoming planned expansion into high-revenue markets.
Mostafa Kandil, CEO of Swvl, stated, “In 2023, our team demonstrated exceptional skill and dedication, achieving profitability. As we advance, our commitment to innovation will be marked by the launch of a wide range of products slated for the upcoming year and for our new potential markets. Additionally, in the meantime, we are expanding our strategic partnerships into more Gulf Cooperation Council (GCC) countries. Our focus today remains towards improving profitability while resuming our high paced growth.”
Post December 31, 2023, Swvl continued to make strides to further solidify its financial position, focusing on increasing margins and maintaining efficient operations. Swvl remains focused on sustaining this positive momentum, further strengthening its financial position, and continuing to deliver enhanced value to its shareholders and stakeholders in the future of the mobility landscape.
For detailed financial information, please see Appendix A for the consolidated financial statements. This press release, along with complete financial statements and the investor presentation, can be found in the Investor Relations section of Swvl’s website at https://www.swvl.com Swvl is a global technology provider for enterprise and government mobility solutions.
About Swvl
The company’s platform provides alternatives to public transportation for individuals who cannot access or afford private options. Every day, Swvl’s parallel mass transit systems empower individuals to go where they want, when they want – making mobility safer, more efficient, accessible, and environmentally friendly. Customers can book their rides on an easy-to-use proprietary app with varied payment options and access to high-quality private buses and vans.
For additional information about Swvl, please visit www.Swvl.com.
Forward Looking Statements
This press release contains “forward-looking statements'' relating to future events. Forward-looking statements generally are accompanied by words such as “believe,” “may,” “will,” “estimate,” “continue,” “anticipate,” “intend,” “expect,” “should,” “would,” “plan,” “predict,” “potential,” “seem,” “seek,” “future,” “outlook” and similar expressions that predict or indicate future events or trends or that are not statements of historical matters. These forward-looking statements include, but are not limited to, statements regarding future events and other statements that are not historical facts. For example, Swvl is using forward looking statements when it discusses its commitment to boosting profitability further while concurrently resuming strategic expansions into high-revenue markets, its intention to launch of a wide range of products slated for the upcoming year, its intention to expand strategic partnerships into more GCC countries, and that its focus remains towards improving profitability while resuming its high paced growth. These statements are based on the current expectations of Swvl’s management and are not predictions of actual performance. These forward-looking statements are provided for illustrative purposes only and are not intended to serve as, and must not be relied on, by any investor as a guarantee, an assurance, a prediction or a definitive statement of fact or probability. Actual events and circumstances are difficult or impossible to predict and will differ from assumptions. Many actual events and circumstances are beyond the control of Swvl. These statements are subject to a number of risks and uncertainties regarding Swvl’s business, and actual results may differ materially. In addition, forward-looking statements provide Swvl’s expectations, plans or forecasts of future events and views as of the date of this communication. Swvl anticipates that subsequent events and developments could cause Swvl’s assessments and projections to change. However, while Swvl may elect to update these forward-looking statements in the future, Swvl specifically disclaims any obligation to do so. These forward-looking statements should not be relied upon as representing Swvl’s assessments as of any date subsequent to the date of this communication. Accordingly, undue reliance should not be placed upon any forward-looking statements. Except as otherwise required by law, Swvl undertakes no obligation to publicly release any revisions to these forward-looking statements to reflect events or circumstances after the date hereof or to reflect the occurrence of unanticipated events. More detailed information about the risks and uncertainties affecting the Company is contained under the heading “Risk Factors” in the Company’s annual report on Form 20-F for the fiscal year ended December 31, 2023 filed with the U.S. Securities and Exchange Commission (the “SEC”), which is available on the SEC’s website, www.sec.gov, and in subsequent SEC filings.
Contact
Investor.relations@Swvl.com
Consolidated statement of financial position – As of 31 December 2023
(All amounts are shown in USD unless otherwise stated)
| 2023 | 2022 | |||||||
| ASSETS | ||||||||
| Non-current assets | ||||||||
| Property and equipment | 751,693 | 1,270,838 | ||||||
| Intangible assets | 225,776 | 10,534,278 | ||||||
| Right-of-use assets | 484,362 | 815,646 | ||||||
| Sublease receivables | - | 553,029 | ||||||
| Deferred tax assets | 9,468,808 | 18,708,988 | ||||||
| 10,930,639 | 31,882,779 | |||||||
| Current assets | ||||||||
| Trade and other receivables | 5,327,877 | 14,815,432 | ||||||
| Prepaid expenses and other current assets | 2,142,194 | 3,298,377 | ||||||
| Sublease receivables | 571,022 | 648,523 | ||||||
| Cash and cash equivalents | 2,922,755 | 1,538,347 | ||||||
| 10,963,848 | 20,300,679 | |||||||
| Assets classified as held for sale | 1,261 | 5,279,098 | ||||||
| Total assets | 21,895,748 | 57,462,556 | ||||||
| EQUITY AND LIABILITIES | ||||||||
| EQUITY | ||||||||
| Share capital | 16,979 | 13,903 | ||||||
| Share premium | 347,295,152 | 343,435,529 | ||||||
| Employee share scheme reserve | 507,677 | 773,666 | ||||||
| Foreign currency translation reserve | (11,466,066 | ) | (4,347,257 | ) | ||||
| Reserve of disposal groups classified as held for sale | 2,106,737 | (492,474 | ) | |||||
| Accumulated losses | (329,506,304 | ) | (332,562,780 | ) | ||||
| Equity attributable to equity holders of the Parent Company | 8,954,175 | 6,820,587 | ||||||
| Non-controlling interests | (3,039,317 | ) | (4,191,394 | ) | ||||
| Total equity | 5,914,858 | 2,629,193 | ||||||
| LIABILITIES | ||||||||
| Non-current liabilities | ||||||||
| Provision for employees’ end of service benefits | - | 267,751 | ||||||
| Derivative warrant liabilities | 106,420 | 1,317,091 | ||||||
| Deferred purchase price | - | 194,093 | ||||||
| Accounts payable, accruals and other payables | 83,961 | - | ||||||
| Lease liabilities | 1,021,716 | 1,592,111 | ||||||
| 1,212,097 | 3,371,046 | |||||||
| Current liabilities | ||||||||
| Deferred purchase price | 1,207,682 | 7,425,488 | ||||||
| Accounts payable, accruals and other payables | 7,829,837 | 33,418,502 | ||||||
| Current tax liabilities | 627,068 | 1,027,404 | ||||||
| Due to related party | 131,523 | - | ||||||
| Lease liabilities | 640,695 | 751,015 | ||||||
| 10,436,805 | 42,622,409 | |||||||
| Liabilities directly associated with assets classified as held for sale | 4,331,988 | 8,839,908 | ||||||
| Total liabilities | 15,980,890 | 54,833,363 | ||||||
| Total equity and liabilities | 21,895,748 | 57,462,556 | ||||||
Consolidated statement of comprehensive loss - For the year ended 31 December 2023
(All amounts are shown in USD unless otherwise stated)
| 2023 | 2022 | 2021 | ||||||||||
| Continuing operations | ||||||||||||
| Revenue | 22,852,263 | 44,099,610 | 25,563,945 | |||||||||
| Cost of sales | (18,741,277 | ) | (43,581,963 | ) | (31,349,979 | ) | ||||||
| Gross income/(loss) | 4,110,986 | 517,647 | (5,786,034 | ) | ||||||||
| General and administrative expenses | (10,226,561 | ) | (62,918,437 | ) | (69,029,507 | ) | ||||||
| Selling and marketing expenses | (93,431 | ) | (17,520,448 | ) | (12,190,989 | ) | ||||||
| Provision for expected credit losses | (535,340 | ) | (873,442 | ) | (1,101,614 | ) | ||||||
| Other income/(expenses), net | 18,834,177 | 548,823 | (807 | ) | ||||||||
| Operating profit / (loss) | 12,089,831 | (80,245,857 | ) | (88,108,951 | ) | |||||||
| Finance income | 97,553 | 209,434 | 126,449 | |||||||||
| Loss on disposal of subsidiaries | (8,285,250 | ) | - | - | ||||||||
| Change in fair value of financial liabilities | 1,210,671 | 109,720,648 | (44,330,400 | ) | ||||||||
| Change in fair value of deferred purchase price | 727,134 | 31,844,346 | - | |||||||||
| Change in fair value of employee share compensation schemes | (1,636,738 | ) | 36,155,857 | - | ||||||||
| Recapitalization cost | - | (139,609,424 | ) | - | ||||||||
| Impairment of financial assets | - | (10,000,880 | ) | - | ||||||||
| Impairment of assets | - | (46,381,441 | ) | - | ||||||||
| Finance cost | (129,355 | ) | (3,666,643 | ) | (1,494,693 | ) | ||||||
| Profit / (loss) before tax from continuing operations | 4,073,846 | (101,973,960 | ) | (133,807,595 | ) | |||||||
| Income tax benefit | 41,305 | 3,225,251 | 4,718,036 | |||||||||
| Profit / (loss) for the year from continuing operations | 4,115,151 | (98,748,709 | ) | (129,089,559 | ) | |||||||
| Discontinued operations | ||||||||||||
| Loss for the year from discontinued operations | (1,058,675 | ) | (24,830,739 | ) | (12,399,838 | ) | ||||||
| Profit / (loss) for the year | 3,056,476 | (123,579,448 | ) | (141,489,397 | ) | |||||||
| Attributable to: | ||||||||||||
| Equity holders of the Parent Company | 3,056,476 | (116,496,525 | ) | (141,416,132 | ) | |||||||
| Non-controlling interests | - | (7,082,923 | ) | (73,265 | ) | |||||||
| 3,056,476 | (123,579,448 | ) | (141,489,397 | ) | ||||||||
| Profit / (loss) per share attributable to equity holders of the Parent Company | ||||||||||||
| Basic | 0.45 | (18.28 | ) | (20.92 | ) | |||||||
| Diluted | 0.28 | (18.28 | ) | (20.92 | ) | |||||||
| Profit / (loss) per share attributable to equity holders of the Parent Company for continuing operations | ||||||||||||
| Basic | 0.61 | (14.61 | ) | (19.10 | ) | |||||||
| Diluted | 0.37 | (14.61 | ) | (19.10 | ) | |||||||
| Other comprehensive income | ||||||||||||
| Items that may be reclassified subsequently to profit or loss: | ||||||||||||
| Exchange differences on translation of foreign operations, net of tax | (5,299,295 | ) | (5,290,594 | ) | (409,511 | ) | ||||||
| Total comprehensive loss for the year | (2,242,819 | ) | (128,870,042 | ) | (141,898,908 | ) | ||||||
| Attributable to: | ||||||||||||
| Equity holders of the Parent Company | (2,242,819 | ) | (121,787,119 | ) | (141,825,643 | ) | ||||||
| Non-controlling interests | - | (7,082,923 | ) | (73,265 | ) | |||||||
| (2,242,819 | ) | (128,870,042 | ) | (141,898,908 | ) | |||||||
Consolidated statement of cash flows - For the year ended 31 December 2023
(All amounts are shown in USD unless otherwise stated)
| 2023 | 2022 | 2021 | ||||||||||
| Profit / (loss) before tax from continued operations | 4,073,846 | (101,973,960 | ) | (133,807,595 | ) | |||||||
| Loss before tax from discontinued operations | (1,058,675 | ) | (24,830,739 | ) | (12,399,838 | ) | ||||||
| Profit / (loss) for the year before tax | 3,015,171 | (126,804,699 | ) | (146,207,433 | ) | |||||||
| Adjustments to reconcile profit before tax to net cash flows: | ||||||||||||
| Depreciation of property and equipment | 356,288 | 604,304 | 182,402 | |||||||||
| Depreciation of right-of-use assets | 364,116 | 1,216,495 | 541,218 | |||||||||
| Amortization of intangible assets | 32,375 | 2,455,243 | 15,963 | |||||||||
| Provision for expected credit losses | 535,340 | 873,442 | 1,327,104 | |||||||||
| Loss from sale of subsidiaries | 8,285,250 | - | - | |||||||||
| Other income | (18,834,177 | ) | - | - | ||||||||
| Gain on recognition of sublease receivable | - | (87,026 | ) | - | ||||||||
| Sublease income | (37,706 | ) | (8,340 | ) | - | |||||||
| Provision for employees’ end of service benefits, net of reversals | - | (171,447 | ) | 704,614 | ||||||||
| Finance cost | 12,192 | 3,466,593 | 1,400,067 | |||||||||
| Listing costs | - | 139,609,424 | - | |||||||||
| Change in fair value of deferred purchase price | (727,134 | ) | (31,844,346 | ) | - | |||||||
| Change in fair value of financial liabilities | (1,210,671 | ) | (109,720,648 | ) | 44,330,400 | |||||||
| Impairment of assets | - | 46,381,441 | - | |||||||||
| Impairment of financial assets | - | 10,000,880 | - | |||||||||
| Employee share-based payments charges / (reversals) | 285,651 | (36,155,857 | ) | 33,611,231 | ||||||||
| (7,923,305 | ) | (100,184,541 | ) | (64,094,434 | ) | |||||||
| Changes in working capital: | ||||||||||||
| Trade and other receivables | 3,917,812 | (11,489,377 | ) | (4,825,451 | ) | |||||||
| Prepaid expenses and other current assets | 995,660 | (2,584,987 | ) | (868,620 | ) | |||||||
| Accounts payable, accruals and other payables | (6,471,125 | ) | (3,571,712 | ) | 8,259,002 | |||||||
| Current tax liabilities | 244,206 | 793,105 | (635,821 | ) | ||||||||
| Due to related parties | 131,523 | - | 36,091 | |||||||||
| (9,105,229 | ) | (117,037,512 | ) | (62,129,233 | ) | |||||||
| Payment of employees’ end of service benefits | - | (635,314 | ) | (5,507 | ) | |||||||
| Net cash flows used in operating activities | (9,105,229 | ) | (117,672,826 | ) | (62,134,740 | ) | ||||||
| Cash flows from an investing activity | ||||||||||||
| Purchase of property and equipment | (17,237 | ) | (817,586 | ) | (319,471 | ) | ||||||
| Proceeds from disposal of subsidiaries | 8,400,000 | - | - | |||||||||
| Purchase of financial assets | - | - | (10,000,880 | ) | ||||||||
| Payment for acquisition of subsidiary, net of cash acquired | - | (743,292 | ) | (823,446 | ) | |||||||
| Sublease rentals received | 668,236 | 138,410 | - | |||||||||
| Purchase of financial assets | - | (5,000,010 | ) | - | ||||||||
| Purchase of intangible assets | (258,151 | ) | (1,666,934 | ) | (2,222 | ) | ||||||
| Net cash flows generated from / (used in) investing activities | 8,792,848 | (8,089,412 | ) | (11,146,019 | ) | |||||||
| Cash flows from financing activities | ||||||||||||
| Proceeds from issuance of share capital | 789,462 | 60,787,038 | - | |||||||||
| Proceeds from issuance of convertible notes | - | 26,336,000 | 73,206,415 | |||||||||
| Proceed from PIPE subscription | - | 39,664,000 | - | |||||||||
| Payments of external loan | - | (134,830 | ) | - | ||||||||
| Repayment of loan from related party | - | (195,270 | ) | - | ||||||||
| Finance cost paid | - | (543,432 | ) | (2,653 | ) | |||||||
| Finance lease liabilities paid, net of accretion | (445,571 | ) | (850,773 | ) | (482,389 | ) | ||||||
| Net cash flows generated from financing activities | 343,891 | 125,062,733 | 72,721,373 | |||||||||
| Net increase / (decrease) in cash and cash equivalents | 31,510 | (699,505 | ) | (559,386 | ) | |||||||
| Cash and cash equivalents at the beginning of the year | 2,696,276 | 9,529,723 | 10,348,732 | |||||||||
| Effects of exchange rate changes on cash and cash equivalents | 196,230 | (6,133,942 | ) | (259,623 | ) | |||||||
| Cash and cash equivalents at the end of the year | 2,924,016 | 2,696,276 | 9,529,723 | |||||||||
| Non-cash financing and investing activities: | ||||||||||||
| Settlement of deferred purchase price | 5,377,829 | - | - | |||||||||
| Issuance of shares during the year | 3,073,237 | 3,432,493 | - | |||||||||
| Fair value of shares earnouts | - | (75,550,455 | ) | - | ||||||||
| Acquisitions of non-controlling interests | - | (3,036,641 | ) | - | ||||||||
| Costs attributable to the issuance of shares | - | 8,467,766 | - | |||||||||
| Conversion of convertible notes | - | 145,952,505 | - | |||||||||
| Property and equipment additions through acquisition of business | - | (586,452 | ) | - | ||||||||
| Intangible assets additions through acquisition of business | - | (20,580,000 | ) | - | ||||||||
|
Building the world’sleading smart bus platform for organizations September 2021 |
|
|
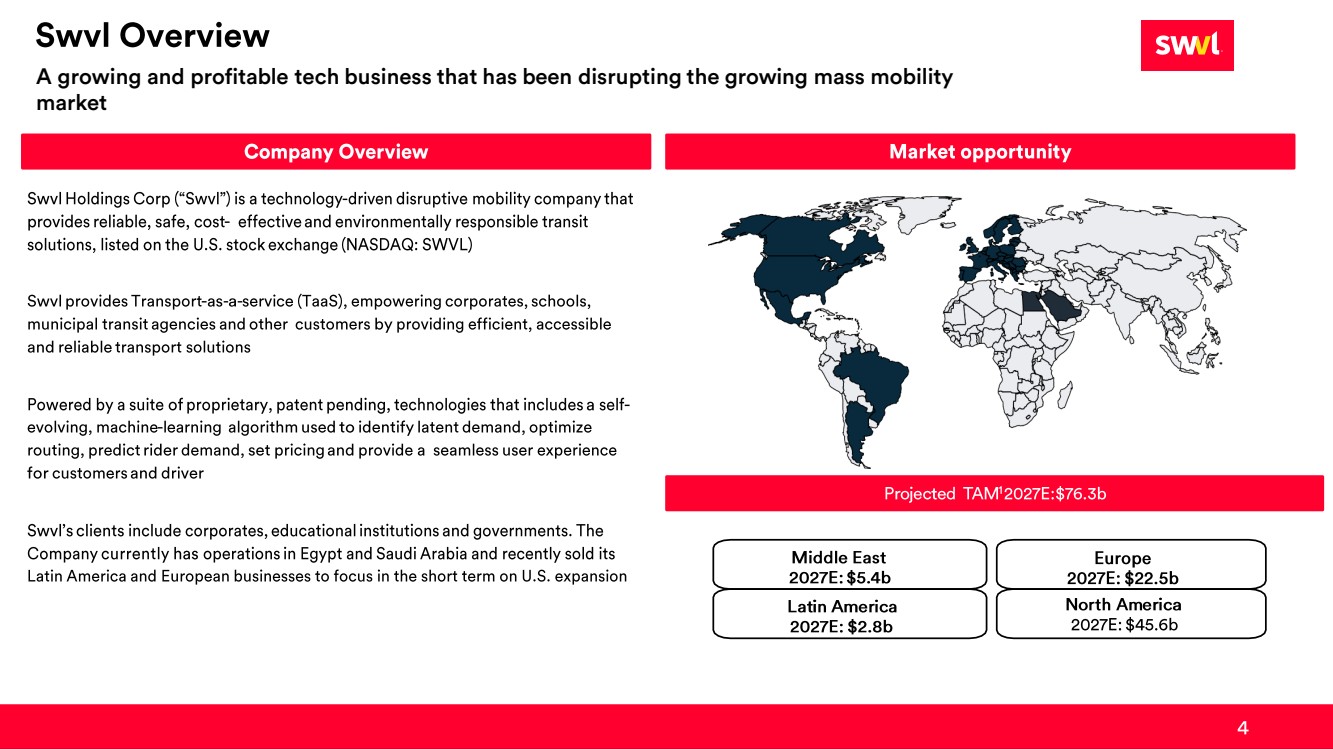
Company Overview |
|
A growing and profitable tech business that has been disrupting the growing mass mobility market |
|
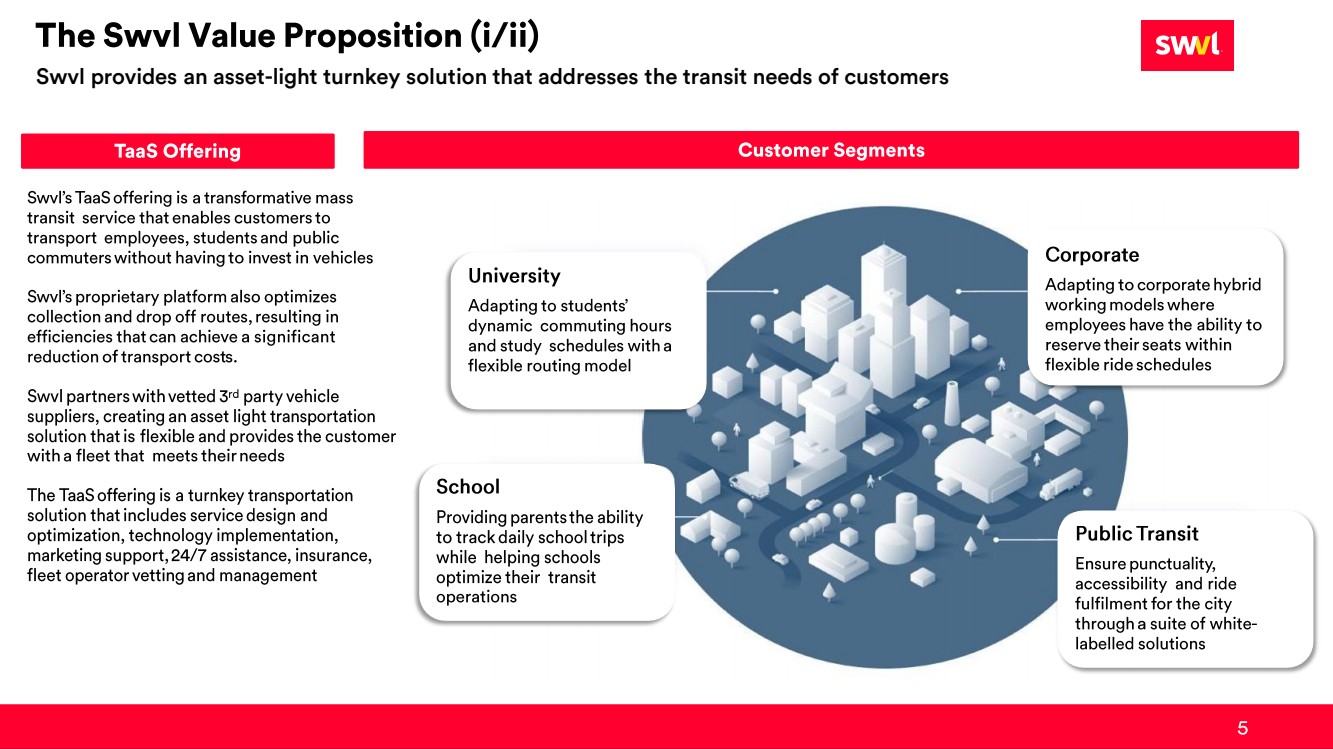
Swvl provides an asset-light turnkey solution that addresses the transit needs of customers |
|
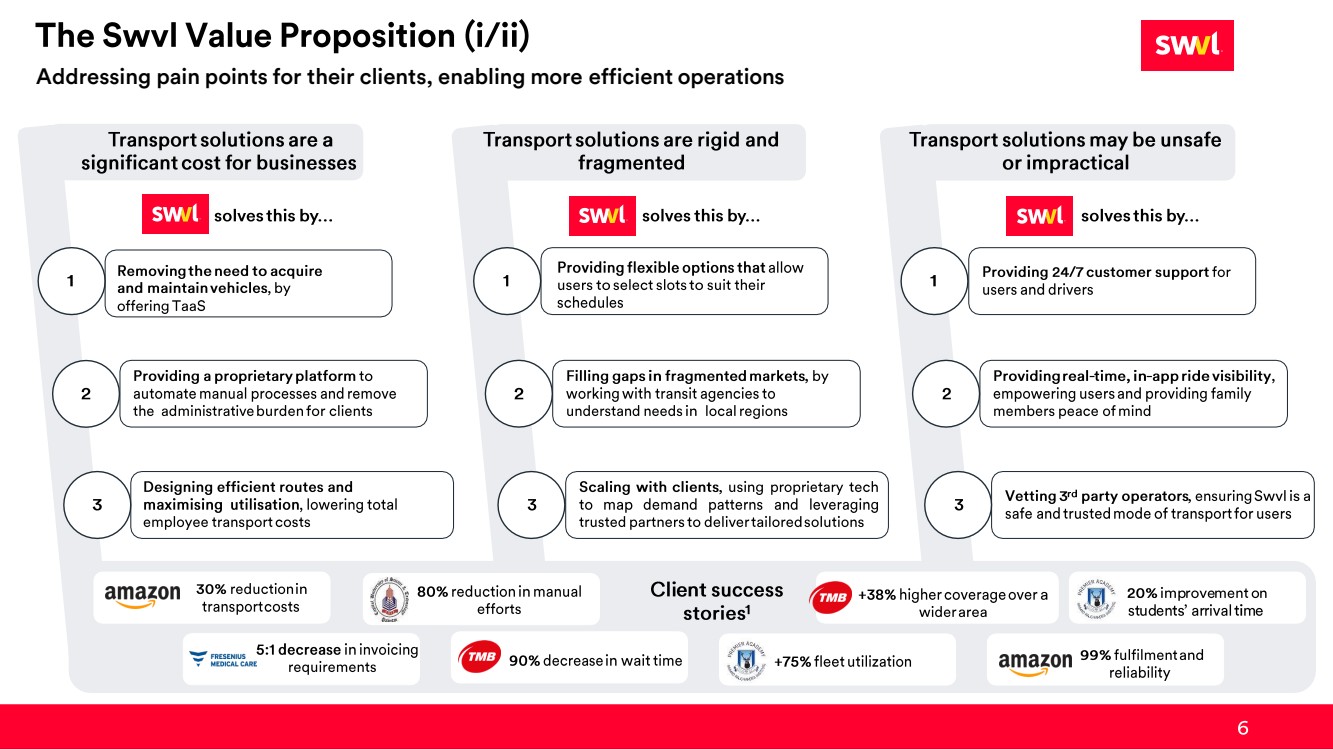
Addressing pain points for their clients, enabling more efficient operations |
|
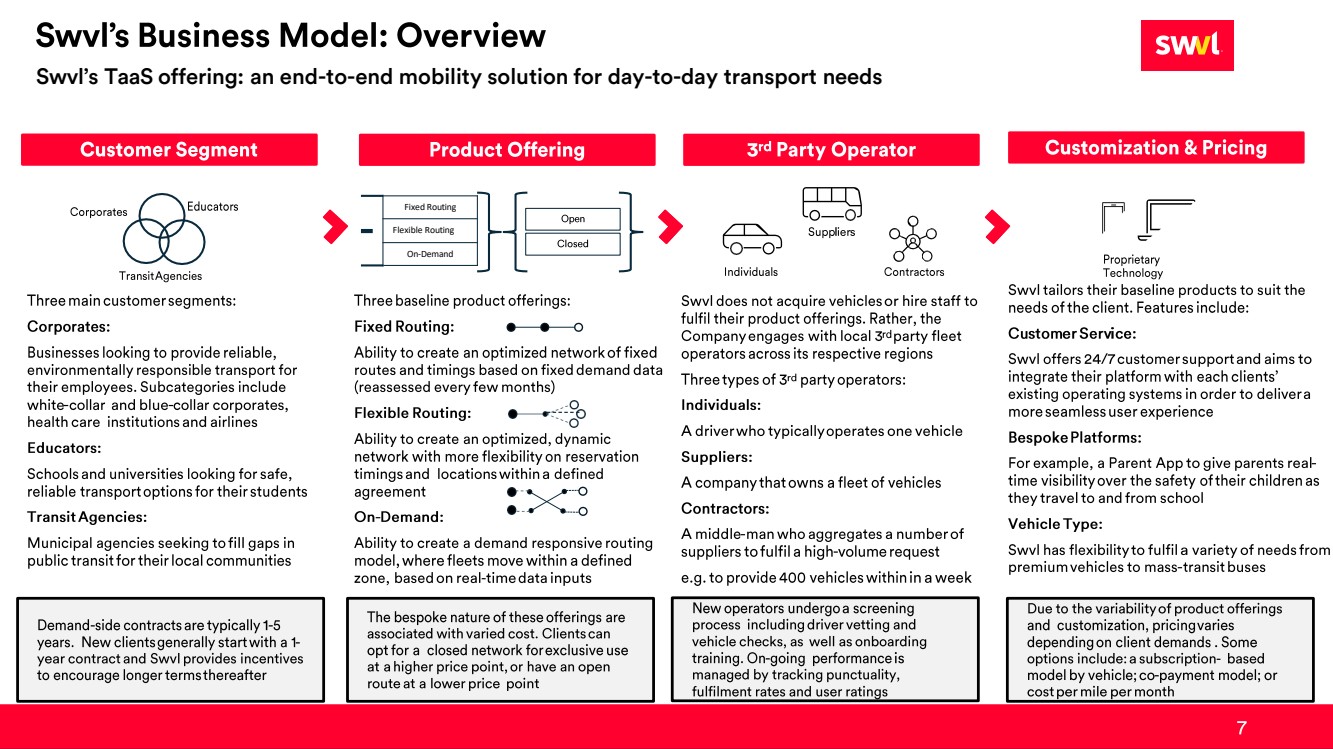
Swvl’s TaaS offering: an end-to-end mobility solution for day-to-day transport needs Fixed Routing Flexible Routing On-Demand |
|
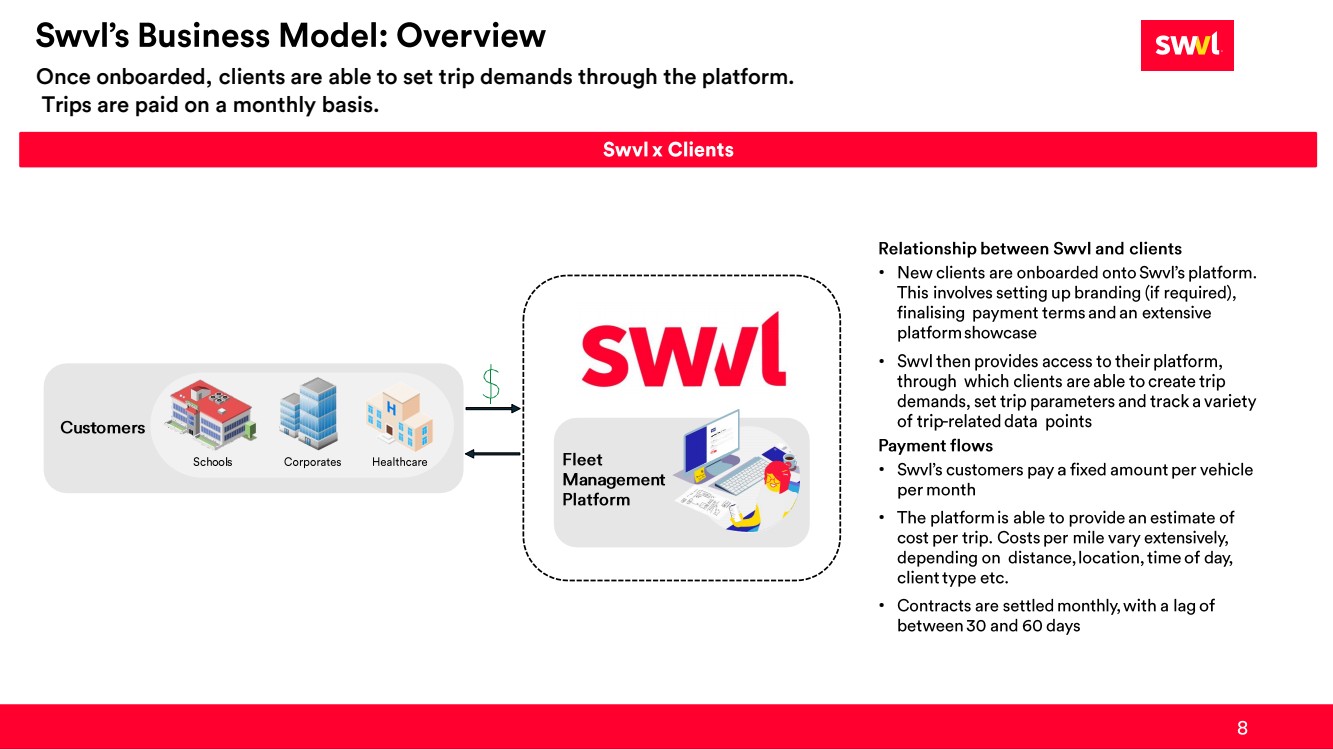
Once onboarded, clients are able to set trip demands through the platform. Trips are paid on a monthly basis. • • • • • |
|
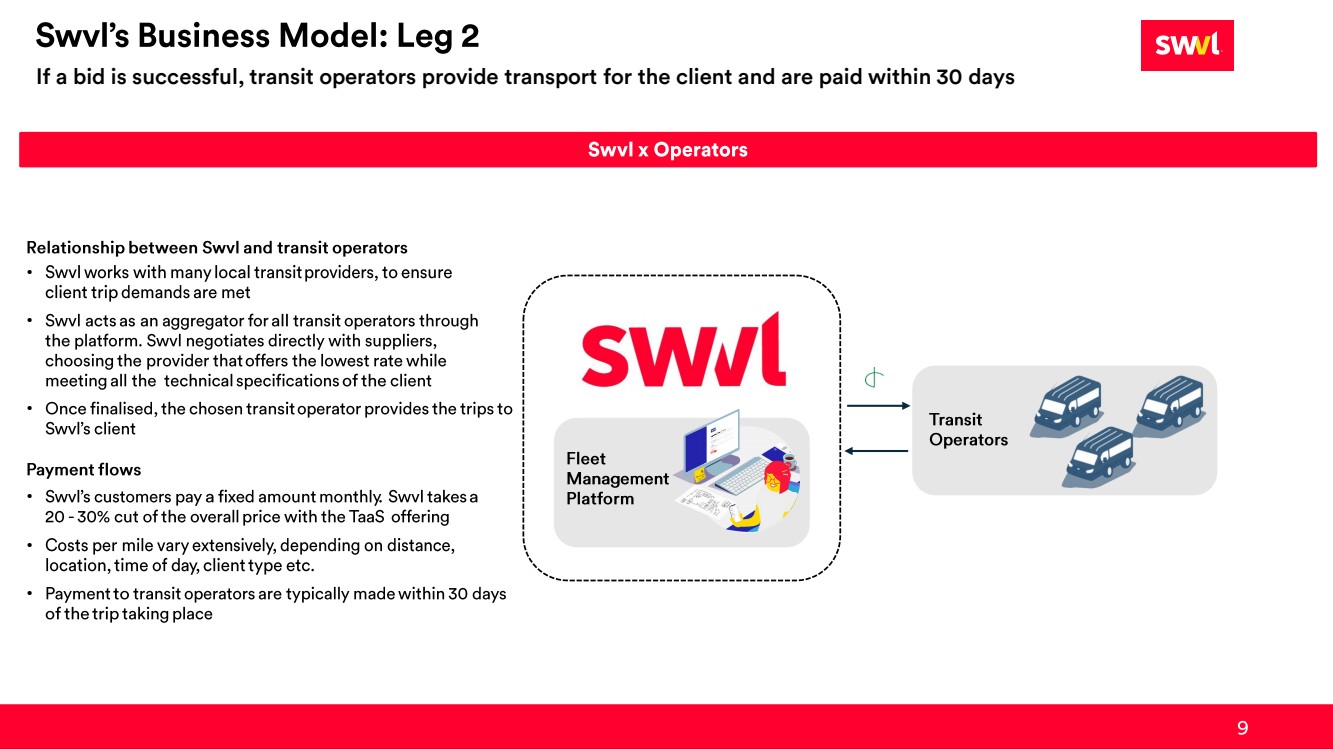
If a bid is successful, transit operators provide transport for the client and are paid within 30 days • • • • • • |
|
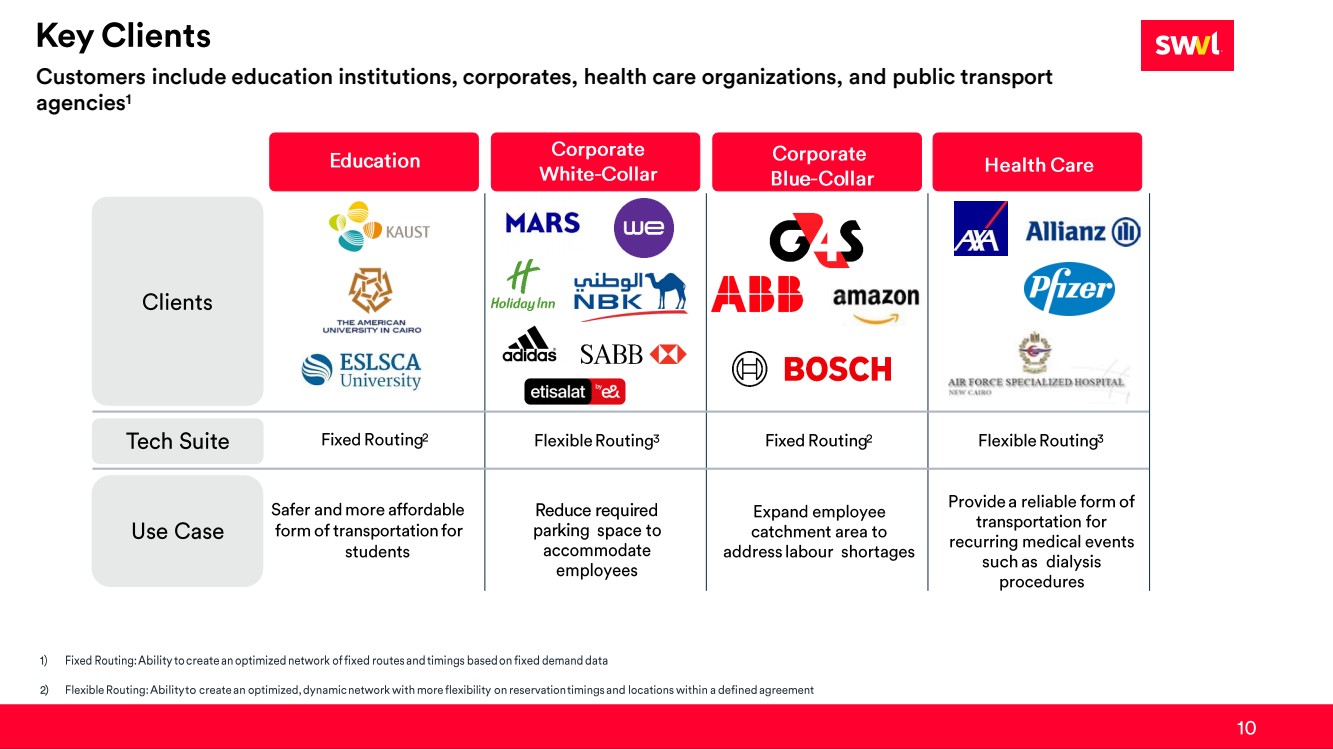
Customers include education institutions, corporates, health care organizations, and public transport agencies1 Clients |
|
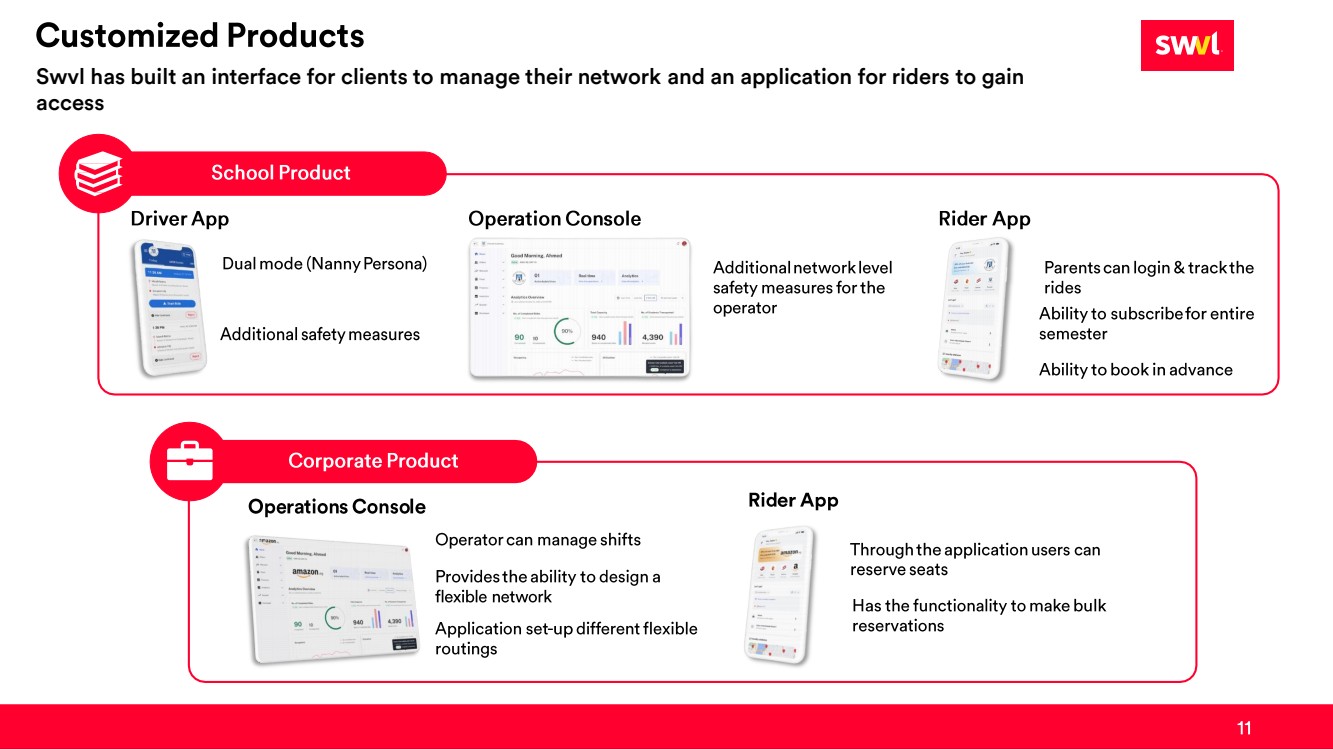
Swvl has built an interface for clients to manage their network and an application for riders to gain access |
|
Company Overview |
|
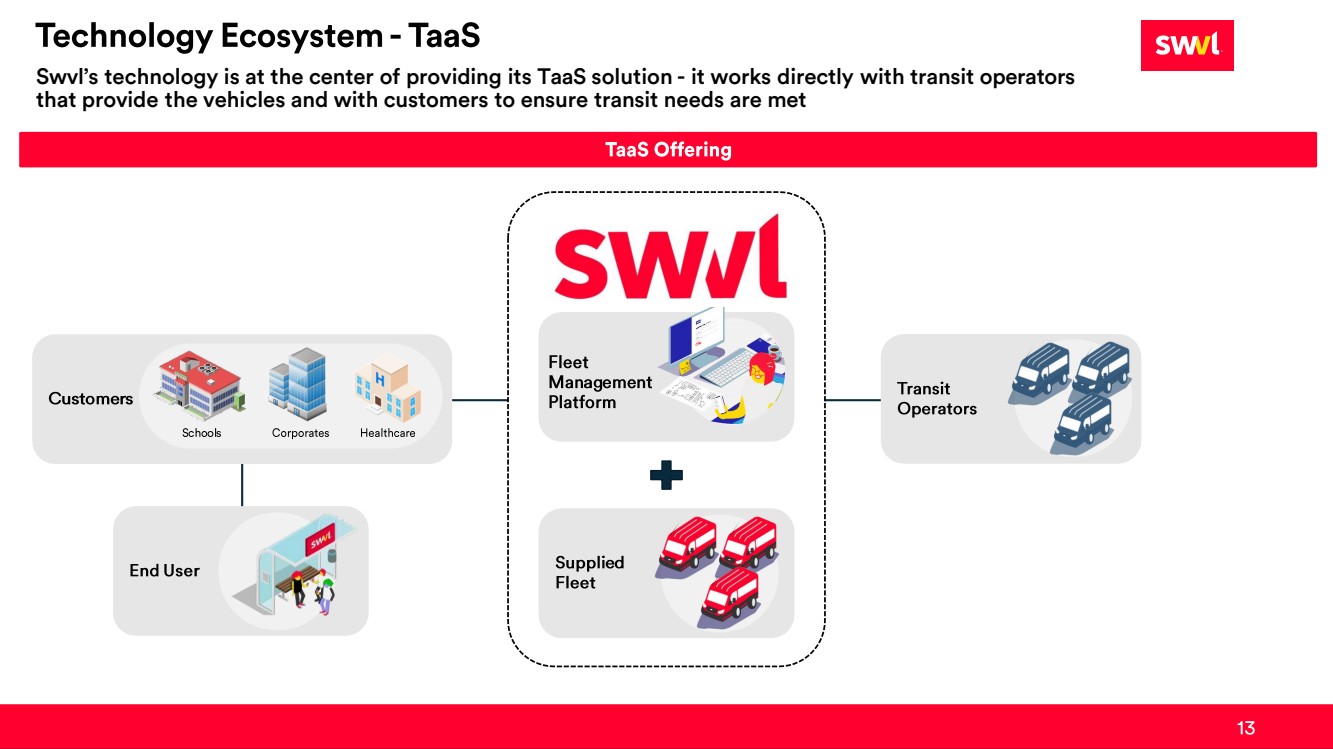
Swvl’s technology is at the center of providing its TaaS solution - it works directly with transit operators that provide the vehicles and with customers to ensure transit needs are met |
|
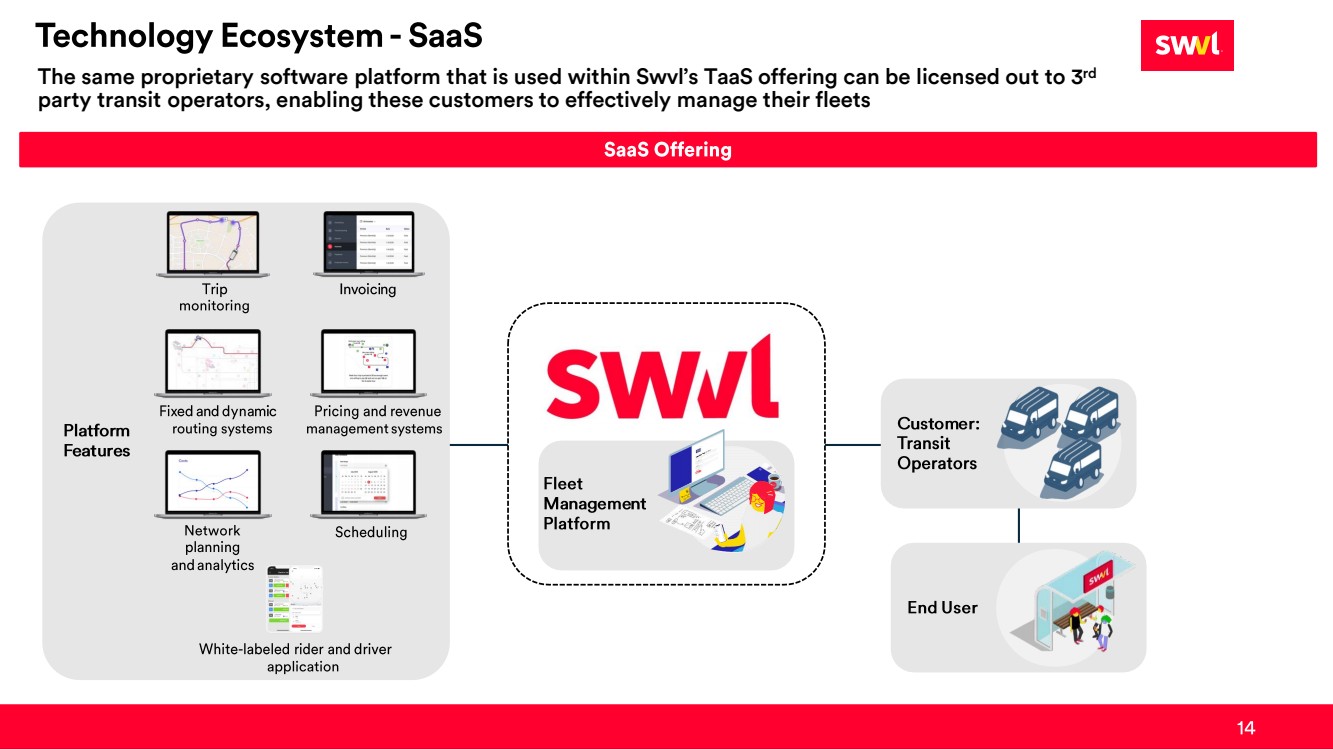
The same proprietary software platform that is used within Swvl’s TaaS offering can be licensed out to 3rd party transit operators, enabling these customers to effectively manage their fleets |
|
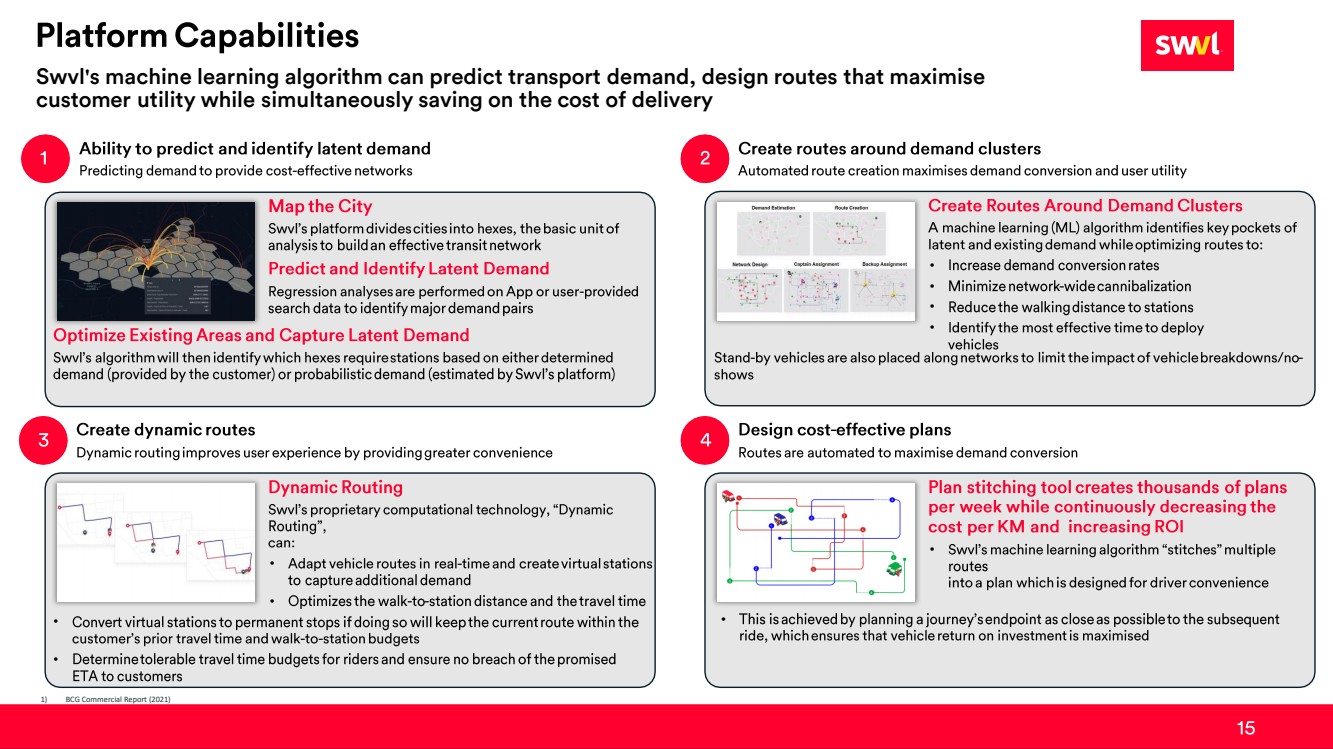
Swvl's machine learning algorithm can predict transport demand, design routes that maximise customer utility while simultaneously saving on the cost of delivery • • • • • • • • • • 1) BCG Commercial Report (2021) |
|
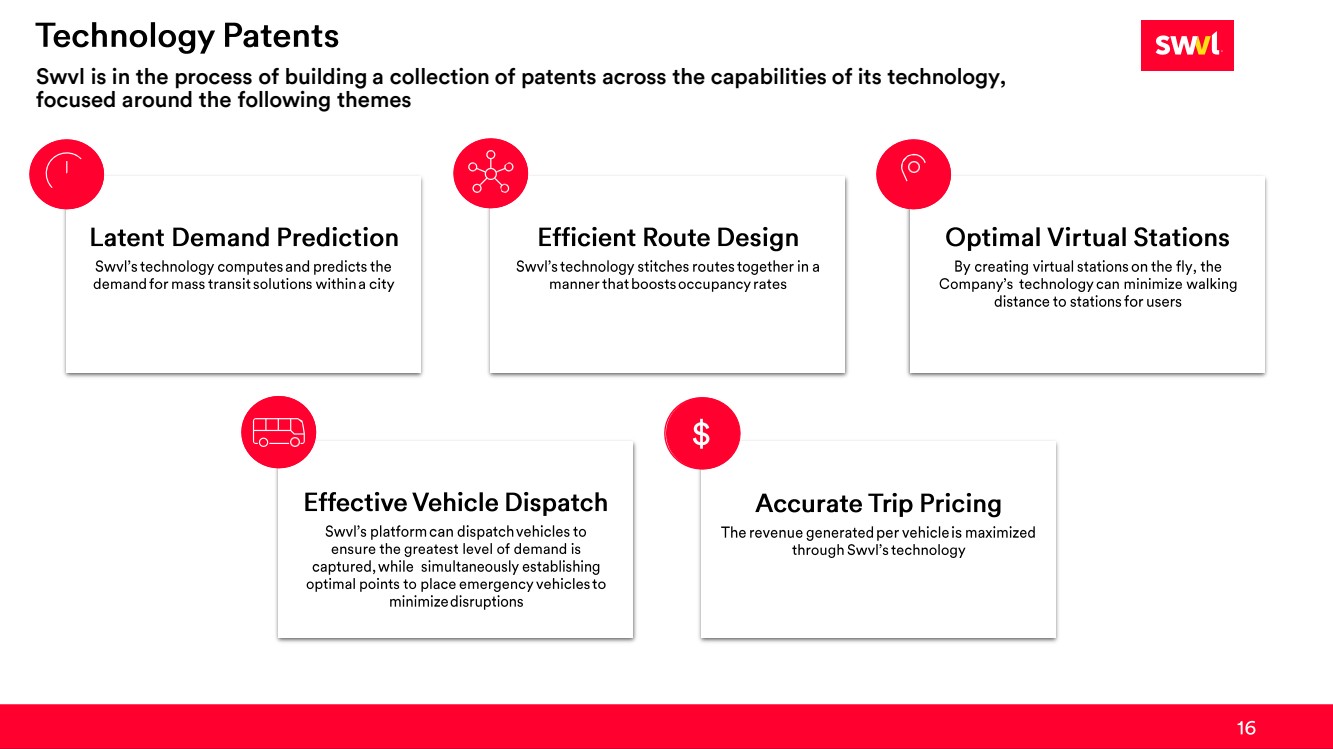
Swvl is in the process of building a collection of patents across the capabilities of its technology, focused around the following themes |
|
Building the world’sleading smart bus platform for organizations September 2021 |