UNITED STATES
SECURITIES AND EXCHANGE COMMISSION
Washington, D.C. 20549
Form 6-K
REPORT OF FOREIGN PRIVATE ISSUER PURSUANT TO RULE 13a-16 OR 15d-16 UNDER
THE
SECURITIES EXCHANGE ACT OF 1934
For the month of April 2024.
Commission File Number 33-65728
CHEMICAL AND MINING COMPANY OF CHILE INC.
(Translation of registrant’s name into English)
El Trovador 4285, Santiago, Chile (562) 2425-2000
(Address of principal executive office)
Indicate by check mark whether the registrant files or will file annual reports under cover of Form 20-F or Form 40-F.
SQM FILES TECHNICAL REPORT SUMMARIES
Form 20-F: x Form 40-F Santiago, Chile, April 5, 2024 – Sociedad Química y Minera de Chile S.A. ( SQM or the “Company”) issued technical report summary for the Salar de Atacama property (the “Technical Report Summary”). The Technical Report Summary is filed as Exhibit 96.1 to this Report on Form 6-K and incorporated herein by reference.
Exhibits
SIGNATURES
Pursuant to the requirements of the Securities Exchange Act of 1934, the registrant has duly caused this report to be signed on its behalf by the undersigned, thereunto duly authorized.
| CHEMICAL AND MINING COMPANY OF CHILE INC. | |
| (Registrant) | |
| Date: April 5, 2024 | /s/ Gerardo Illanes |
| By: Gerardo Illanes | |
| CFO |
Exhibit 23.1
CONSENT OF QUALIFIED PERSON
I, Juan Becerra , state that I am responsible for preparing or supervising the preparation of part(s) of the technical report summary titled "Technical Report Summary, Operation Report, Salar de Atacama" with an effective date of April 5, 2024, as signed, and certified by me (the “Technical Report Summary”).
Furthermore, I state that:
| a. | I consent to the public filing of the Technical Report Summary by Sociedad Química y Minera de Chile S.A. (the “Company”) as an exhibit to Form 6-K of the Company (the “Form 6-K”); |
| b. | the document that the Technical Report Summary supports is the Company’s Annual Report on Form 20-F for the year ended December 31, 2023, and any existing amendments or supplements and/or exhibits thereto (the "Form 20-F") (the Form 6-K and Form 20-F, collectively the “Document”); |
| c. | I consent to the use of my name in the Document, to any quotation from or summarization in the Document of the parts of the Technical Report Summary for which I am responsible, and to the incorporation by reference of the Technical Report Summary into Form 20-F; and |
| d. | I confirm that I have read the Document, and that the Document fairly and accurately reflects, in the form and context in which it appears, the information in the parts of the Technical Report Summary for which I am responsible. |
| By | /s/ Juan Becerra | |
| Juan Becerra | ||
| Superintendent of Geology | ||
| SQM |
Dated at Santiago, Chile on April 5, 2024
Exhibit 23.2
CONSENT OF QUALIFIED PERSON
I, Rodrigo Riquelme Tapia , state that I am responsible for preparing or supervising the preparation of part(s) of the technical report summary titled "Technical Report Summary, Operation Report, Salar de Atacama" with an effective date of April 5, 2024, as signed, and certified by me (the “Technical Report Summary”).
Furthermore, I state that:
| a. | I consent to the public filing of the Technical Report Summary by Sociedad Química y Minera de Chile S.A. (the “Company”) as an exhibit to Form 6-K of the Company (“Form 6-K”); |
| b. | the document that the Technical Report Summary supports is the Company’s Annual Report on Form 20-F for the year ended December 31, 2023, and any existing amendments or supplements and/or exhibits thereto (the "Form 20-F") (the Form 6-K and Form 20-F, collectively the “Document”); |
| c. | I consent to the use of my name in the Document, to any quotation from or summarization in the Document of the parts of the Technical Report Summary for which I am responsible, and to the incorporation by reference of the Technical Report Summary into Form 20-F; and |
| d. | I confirm that I have read the Document, and that the Document fairly and accurately reflects, in the form and context in which it appears, the information in the parts of the Technical Report Summary for which I am responsible. |
| By | /s/ Rodrigo Riquelme Tapia | |
| Rodrigo Riquelme Tapia | ||
| CEO | ||
| GeoInnova |
Dated at Santiago, Chile on April 5, 2024
Exhibit 96.1
Technical Report Summary
OPERATION REPORT
SALAR DE ATACAMA
Sociedad Química y Minera de Chile

April 5, 2024
TECHNICAL REPORT SUMMARY
OPERATION REPORT
SALAR DE ATACAMA
Sociedad Química y Minera de Chile
April 5, 2024
TABLE OF CONTENTS
| 1.1 Property and Mineral Rights | 1 | |
| 1.2 Geology and Mineralization | 1 | |
| 1.3 Mineral Resource Estimate | 2 | |
| 1.4 Mineral Reserve Estimate | 3 | |
| 1.5 Mining Method | 4 | |
| 1.6 Metallurgy and Mineral Processing | 4 | |
| 1.7 Capital Costs, Operating Costs, and Financial Analysis | 5 | |
| 1.8 Conclusions | 8 | |
| 2.1 Terms of Reference and Purpose of the Report | 9 | |
| 2.2 Source of Data and Information | 13 | |
| 2.3 Details of Inspection | 13 | |
| 2.4 Previous Reports on Project | 13 | |
| 3.1 Property Location | 14 | |
| 3.2 Lease Agreement and Mineral Rights | 16 | |
| 3.3 Environmental Impacts and Permitting | 16 | |
| 3.4 Other Significant Factors and Risks | 16 | |
| 3.5 Royalties and Agreements | 17 | |
| 4.1 Topography, Elevation, and Vegetation | 18 | |
| 4.2 Accessibility and Transportation to the Property | 18 | |
| 4.3 Climate | 18 | |
| 4.4 Infrastructure Availability and Sources | 18 | |
| 6.1 Regional Geology | 22 | |
| 6.2 Local Geology | 22 | |
| 6.3 Property Geology | 24 | |
| 6.4 Deposit Types | 28 | |
| 7.1 Geophysical Surveys | 30 | |
| 7.2 Exploration Drilling | 32 | |
| 7.3 Conceptual Hydrogeology | 37 | |
| 7.4 Qualified Person’s Opinion | 43 | |
| 7.5 Geotechnical Considerations | 44 | |
| 8.1 Methods, Splitting and Reduction, and Security Measures | 45 | |
| 8.2 Sample Preparation, Assaying and Analytical Procedures | 46 | |
| 8.3 Opinion of Adequacy | 55 | |
| 9.1 Data Verification Procedures | 56 | |
| 9.2 Data Management | 56 | |
| 9.3 Technical Procedures | 56 | |
| 9.4 Quality Control Procedures | 56 | |
| 9.5 Precision Evaluation | 56 | |
| 9.6 Accuracy Evaluation | 57 | |
| 9.7 Pollution Evaluation | 57 | |
| 9.8 Qualified Person’s Opinion of Data Adequacy | 57 | |
| 10.1 Test Procedures | 58 | |
| 10.2 Analytical and Testing Laboratories | 71 | |
| 10.3 Sample Representativeness | 72 | |
| 10.4 Testing and Relevant Results | 73 | |
| 10.5 Significant Risk Factors | 77 | |
| 10.6 Qualified Person´s Opinion | 78 | |
| 11.1 Estimation Methods, Parameters, and Assumptions | 80 | |
| 11.2 Cut-off Grades | 97 | |
| 11.3 Mineral Resource Classification | 98 | |
| 11.4 Mineral Resource Statement | 102 | |
| 11.5 Uncertainty | 103 | |
| 11.6 Opinion and Recommendations | 103 | |
| 12.1 Numerical Model Design | 104 | |
| 12.2 Numerical Model Calibration | 112 | |
| 12.3 Projected Model Simulation | 117 | |
| 12.4 Mineral Reserves | 120 | |
| 12.5 Uncertainty | 126 | |
| 12.6 Opinion and Recommendations | 127 | |
| 13.1 Brine Extraction: Geotechnical and Hydrological Models, and Other Relevant Parameters | 128 | |
| 13.2 Production Rates, Expected Mine Life, Mining Unit Dimensions, And Mining Dilution and Recovery Factors | 129 | |
| 13.3 Requirements for Stripping, Underground Development, and Backfilling | 129 | |
| 13.4 Required Mining Equipment Fleet, Machinery, and Personnel | 129 | |
| 13.5 Final Mine Outline | 131 | |
| 14.1 Process Description | 134 | |
| 14.2 Process Specifications and Efficiencies | 146 | |
| 14.3 Process Requirements | 151 | |
| 14.4 Qualified Person´s Opinion | 157 | |
| 15.1 Access to Production Areas, Storage, and Port Shipping | 161 | |
| 15.2 Productive Areas and Infrastructure | 162 | |
| 15.3 Communications | 169 | |
| 15.4 Power Supply | 169 | |
| 15.5 Supply of Fuels | 170 | |
| 15.6 Water Supply | 171 | |
| 16.1 Material Contracts for Salar de Atacama | 172 | |
| 16.2 Lithium and its Derivatives, Market, Competition, Products, Customers | 173 | |
| 16.3 Supply | 175 | |
| 16.4 Demand | 175 | |
| 16.5 Balance | 176 | |
| 16.6 Lithium Price | 177 | |
| 16.7 Potassium | 178 | |
| 17.1 Environmental Studies | 181 | |
| 17.2 Environmental Management Plan | 194 | |
| 17.3 Environmental Monitoring | 195 | |
| 17.4 Permitting | 209 | |
| 17.5 Social and Community Aspect | 224 | |
| 17.6 Mine closure | 229 | |
| 17.7 Qualified Person´s Opinion | 232 | |
| 18.1 Capital Costs | 233 | |
| 18.2 Operating Costs | 243 | |
| 19.1 Production and Revenues | 247 | |
| 19.2 Production Costs | 247 | |
| 19.3 Capital Investments | 249 | |
| 19.4 Discounted Cashflow Analysis | 249 | |
| 19.5 Sensitivity Analysis | 250 | |
| 22.1 Conclusions | 255 | |
| 22.2 Risks | 259 | |
TABLES
| Table 1-1. SQM’s Salar de Atacama Lithium and Potassium Mineral Resources, Exclusive of Mineral Reserves (Effective December 31, 2022) | 2 |
| Table 1-2. SQM’s Salar de Atacama Lithium and Potassium Mineral Reserves, Factoring Process Recoveries (Effective December 31, 2023) | 3 |
| Table 1-3. Capital Costs for Lithium and Potassium Operations | 6 |
| Table 1-4. Assumptions for the Base Case Economic Analysis | 7 |
| Table 1-5. Projected Sales of Lithium and Potassium Products | 7 |
| Table 1-6. Estimated Cashflow Analysis | 8 |
| Table 2-1. Acronyms and Abbreviations | 10 |
| Table 2-2. Site visits | 13 |
| Table 3-1. Payment Agreements with CORFO | 17 |
| Table 7-1. Summary of the Conducted Geophysical Datasets | 31 |
| Table 7-2. Summary of the Conducted Borehole Geophysics | 31 |
| Table 7-3. Summary of Boreholes with Porosity Measurements | 33 |
| Table 7-4. Hydrogeological Unit Descriptions | 38 |
| Table 7-5. Hydraulic Conductivity Ranges for each Hydrogeological Unit | 40 |
| Table 8-1. Evaluation of Analytical and Field Duplicates in Lab SA | 47 |
| Table 8-2. Summary of Possible Pollution Ratios of Blank Samples during Analysis. | 50 |
| Table 8-3. Summary of Possible Pollution Ratios of Blank Samples during Analysis. | 51 |
| Table 8-4. Duplicate Sample Evaluation in the Porosity Lab | 53 |
| Table 10-1. List of Laboratory Facilities Available for Analysis in Salar de Atacama | 60 |
| Table 10-2. List of Installations Available for Analysis at PQC | 61 |
| Table 10-3. Categorization of Brine Samples from Wells | 62 |
| Table 10-4. List of Analyses for the Chemical Characterization | 65 |
| Table 10-5. Mean Annual Evaporation Rates for each Subsystem in the 2020-2023 Period | 67 |
| Table 10-6. List of Requested Analyses for Plant Control | 69 |
| Table 10-7. Analysis of Products (Li2CO3/LiOH) | 70 |
| Table 10-8. List of Laboratory Facilities Available for Analysis in Salar de Atacama | 71 |
| Table 11-1. Total Number of Wells used for Construction of the Geological Model | 80 |
| Table 11-2. Total Number of Drillholes used to Estimate the Brine Volume | 80 |
| Table 11-3. Total Number of Wells used for the Chemistry Interpolation | 81 |
| Table 11-4. Block Model Discretization | 81 |
| Table 11-5. Conditions and Assumptions for Filtering Cells in the Block Model | 82 |
| Table 11-6. Summary of Assigned Pe Values | 83 |
| Table 11-7. Effective Porosity Estimation Domains, Brine Volume Estimate | 84 |
| Table 11-8. Search Radius Parameters, Effective Porosity Estimate (SQM, 2021a) | 86 |
| Table 11-9. Variogram Model Parameters, Effective Porosity Estimate (SQM, 2021a) | 86 |
| Table 11-10. Effective Porosity (%) Interpolation Summary | 87 |
| Table 11-11. Equivalence between Hydrogeological Units and Brine Chemistry Domains | 90 |
| Table 11-12. Search Radius Parameters, Li and K Interpolation (SQM, 2021a) | 92 |
| Table 11-13. Variogram Model Parameters, Li and K Interpolation (SQM, 2021a) | 93 |
| Table 11-14. Average Li and K Concentrations after Interpolation, OMA Extraction Area | 94 |
| Table 11-15. Univariate Statistics of Density Weighted by Sample Length | 95 |
| Table 11-16. Variogram Model Parameters for the Brine Density Interpolation (SQM, 2021a) | 96 |
| Table 11-17. Brine Chemistry Domains and Level of Hydrogeological Characterization | 99 |
| Table 11-18. Categorization of Measured, Indicated, and Inferred Mineral Resources | 100 |
| Table 11-19. SQM’s Salar de Atacama Lithium and Potassium Resource Statement, Exclusive of Mineral Reserves (Effective December 31, 2022) | 102 |
| Table 12-1. Grid Specifics and Layers | 104 |
| Table 12-2. Average Simulated Water Balance Components, 2015-2020 Calibration Period | 107 |
| Table 12-3. Summary of Assigned Model Parameters | 111 |
| Table 12-4. Numerical model verification | 116 |
| Table 12-5. Simulated Li and LCE Extraction by Year | 121 |
| Table 12-6. Simulated K and KCl Extraction by Year | 122 |
| Table 12-7. SQM’s Salar de Atacama Lithium Mineral Reserve Estimate, Considering Process Recoveries (Effective December 31, 2023) | 123 |
| Table 12-8. SQM’s Salar de Atacama Potassium Reserve Estimate Considering Process Recoveries (Effective December 31, 2023) | 124 |
| Table 14-1. Facilities Available for Production | 133 |
| Table 14-2. Products of the Salar de Atacama | 136 |
| Table 14-3. Nominal Production Capacity per Process Plant | 146 |
| Table 14-4. Production Data for 2019 to 2022 | 147 |
| Table 14-5. Average Volume of Brine Extracted and Re-injected per Year | 147 |
| Table 14-6. Global Yield and IGS Yield for 2019 and 2021 | 148 |
| Table 14-7. Projected Yield Increase in the Lithium Production System Based on the Yield Increase Plan | 149 |
| Table 14-8. Industrial Plan for 2023 to 2030 for the Salar de Atacama and PQC Operations | 150 |
| Table 14-9. Summary of Energy Consumption per Year | 151 |
| Table 14-10. Annual Industrial Water Extraction from Wells | 152 |
| Table 14-11. Drinking water consumption per year at the Salar de Atacama | 152 |
| Table 14-12. Personnel required by area/activity | 154 |
| Table 14-13. Personnel by area | 154 |
| Table 14-14. Process Reagents and Consumption rates per year | 155 |
| Table 14-15. Consumption of Material and Generation of RIL/RIS on Carmen Lithium Chemical Plant (PQC)from 2022 to 2030 | 156 |
| Table 16-1. Potassium Chloride and Potassium Sulfate Volume and Revenues | 179 |
| Table 17-1. Hydrological Zones Defined in Salar Basin | 183 |
| Table 17-2 Land use units observed in the project area (USDA, 2001) | 187 |
| Table 17-3. Species Richness by Faunal Environment | 189 |
| Table 17-4. Systems to be Protected | 201 |
| Table 17-5. Summary of Incidents Associated with the Hydrogeological Component, Year 2023 | 202 |
| Table 17-6. Industrial Water Extraction | 205 |
| Table 17-7: Brine Extraction period August 2022 to August 2023 and Approved in RCA N°226/2006 | 207 |
| Table 17-8. Historical EIAs/DIAs, carried out in the Salar de Atacama and the Salar del Carmen Plant, Sent to the Competent Authority (SEIA) | 210 |
| Table 17-9. Facts Considered (Charges) | 214 |
| Table 17-10. Status of execution of PdC Actions | 216 |
| Table 17-11. Closure measures and actions of the Closure Plan for the Salar de Atacama Mine | 230 |
| Table 17-12. Post-closure measures of the Closure Plan of the Salar de Atacama Mine | 230 |
| Table 17-13. Salar De Atacama Mine Site Closure Costs | 230 |
| Table 17-14. Salar De Atacama Mining Site Post-Closure Costs | 231 |
| Table 17-15. Guarantee Update of the Salar de Atacama Plant Closure Plan (referential table) | 231 |
| Table 18-1. Capital Costs | 233 |
| Table 18-2. Lithium Plant Investments | 235 |
| Table 18-3. Investment in the Lithium Carbonate Plant | 236 |
| Table 18-4. Investments in the Lithium Hydroxide Plant | 237 |
| Table 18-5. Investments in the Lithium Sulfate Plant | 238 |
| Table 18-6. Main Investments in Evaporation and Harvest Ponds | 239 |
| Table 18-7. Main Investments in MOP I and MOP II Ponds | 240 |
| Table 18-8. Main Investments in SOP Ponds | 240 |
| Table 18-9. Main Investments in Lithium Ponds | 240 |
| Table 18-10. Main Investments in Wet Plants | 240 |
| Table 18-11. Detailed Investments in Wet Plants | 241 |
| Table 18-12. Main Investments in Brine Extraction Wells | 241 |
| Table 18-13. Detailed Investments in Brine Extraction Wells | 241 |
| Table 18-14. Projects in Execution (2022 to 2024 Period) | 242 |
| Table 18-15. Distribution of Operating Costs | 243 |
| Table 18-16. Payment Agreements with CORFO | 244 |
| Table 19-1. Projected Sales of Lithium and KCl | 247 |
| Table 19-2. Revenues of Lithium and KCl | 247 |
| Table 19-3. Main Costs of Lithium and KCl production | 247 |
| Table 19-4. Operating Costs | 248 |
| Table 19-5. Estimated Capital Investments | 249 |
| Table 19-6. Estimated Cashflow Analysis | 249 |
| Table 19-7. Estimated Sum Of Payments to CORFO And Other Agreements and Taxes (2024-2030) | 250 |
| Table 19-8. Assumptions for the Base Case | 250 |
| Table 19-9. Lithium Carbonate Price Sensitivity at 250 ktpy | 251 |
| Table 19-10. Cost Sensitivities | 251 |
| Table 19-11. KCl Price Sensitivities | 251 |
| Table 19-12. CORFO Rights and other Agreements Sensitivities | 252 |
| Table 19-13. Tax Sensitivities | 252 |
| Table 19-14. Contribution to the State of Chile (Taxes, CORFO Rights and Others) | 252 |
| Table 25-1. Information Provided by the Registrant (SQM) | 266 |
FIGURES
| Figure 3-1. Location of SQM’s Salar de Atacama Project | 15 |
| Figure 6-1. Local Geology Map of Salar de Atacama | 23 |
| Figure 6-2. Geological Cross Sections | 27 |
| Figure 6-3. Stratigraphic Columns of the Western and Eastern Blocks | 28 |
| Figure 6-4. Mature and Immature Salt Flats (Houston et al., 2011) | 29 |
| Figure 7-1. Seismic Reflection Survey (AguaEx, 2020) | 31 |
| Figure 7-2. Distribution of Wells that provide Geological and Hydrogeological Information for the Project (SQM, 2020) | 32 |
| Figure 7-3. Distribution of Boreholes with Porosity Measurements | 34 |
| Figure 7-4. Effective Porosity (%) Histogram of the Upper Halite, Intermediate Halite, and Halite with Organic Matter | 34 |
| Figure 7-5. Distribution of Boreholes with Brine Chemistry Measurements | 36 |
| Figure 7-6. Histogram of Li and K Concentrations (%) | 36 |
| Figure 7-7. Hydraulic Testing Locations, OMA Exploration | 39 |
| Figure 7-8. W – E Hydrogeological Cross Section from the Hydrogeological Model | 41 |
| Figure 7-9. SW - NE Hydrogeological Cross Section from the Hydrogeological Model | 42 |
| Figure 8-1. Error Ratio Plots, Analytical Duplicates | 48 |
| Figure 8-2. Error Ratio Plots, Field Duplicates | 48 |
| Figure 8-3. Accuracy Plots, Reference Materials | 51 |
| Figure 8-4. Contamination Plots, Blank Samples | 52 |
| Figure 8-5. Scatter Plot for Pairs Analyzed with Accupyc | 54 |
| Figure 8-6. Scatter Plot for pairs analyzed with Geopyc | 54 |
| Figure 10-1. Determination of In-situ Brine Parameters at Pumping Wells | 63 |
| Figure 10-2. Improved Treatment Scheme for Bischofite Platforms | 75 |
| Figure 10-3. Improved Treatment Scheme for Harvested Salts | 75 |
| Figure 11-1. Mineral Resource Estimate General Flowchart | 79 |
| Figure 11-2. Variograms of Effective Porosity Domain 1 (Upper Halite) | 84 |
| Figure 11-3. Variograms of Effective Porosity Domain 3 (Intermediate Halite) | 85 |
| Figure 11-4. Block Model with Pe Domains and Interpolated Values, OMA Extraction Zone | 7 |
| Figure 11-5. Swath Plots of Effective Porosity within the 4 Estimation Domains | 88 |
| Figure 11-6. Lithium Variograms of Brine Chemistry Domain 1 | 91 |
| Figure 11-7. Potassium Variograms of Brine Chemistry Domain 1 | 91 |
| Figure 11-8. Interpolated Li (wt %) in the Block Model, Saturated Area of the OMA Zone (Modified from (SQM, 2021a)) | 94 |
| Figure 11-9. Box Plots of Measured Sample Values versus estimated Block Model Values, Li and K | 95 |
| Figure 11-10. Density Histogram and Spatial Distribution | 96 |
| Figure 11-11. Density Estimate Variogram | 97 |
| Figure 11-12. Resource Categorization in 3 Dimensions | 101 |
| Figure 12-1. Numerical Model Domain and Grid | 105 |
| Figure 12-2. Direct Recharge and Lateral Recharge Zones | 108 |
| Figure 12-3. Evaporation Zones in the Numerical Model | 109 |
| Figure 12-4. Representative Hydraulic Conductivity (Kh) and Specific Yield - Effective Porosity (Sy -Pe) Distribution in Numerical Model | 111 |
| Figure 12-5. Head Observation Targets and Simulated Water Table for the End of the Calibration Period | 113 |
| Figure 12-6. Head Calibration Results | 114 |
| Figure 12-7. Extracted Concentration Fit during the Calibration Period (2015 – 2020) | 115 |
| Figure 12-8. Lithium Concentration (%) Distribution following the Calibration Period | 117 |
| Figure 12-9. SQM’s Future Brine Pumping and Voluntary Reduction | 118 |
| Figure 12-10. Simulated SQM Pumping Rates, Reserve Simulation | 119 |
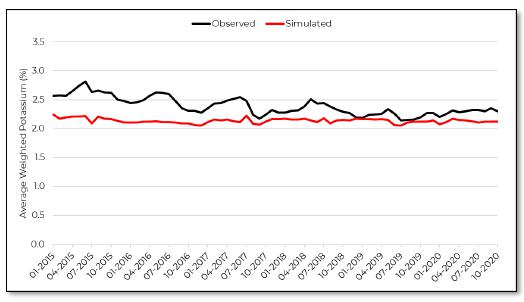
| Figure 12-11. Average Weighted Concentrations Extracted from SQM’s Production Wells, Reserve Simulation | 119 |
| Figure 12-12. Predicted Cumulative Annual LCE Production (Considering Process Recoveries) | 121 |
| Figure 12-13. Predicted Annual KCl Production (Considering Process Recoveries) | 122 |
| Figure 12-14. SQM’s Salar de Atacama Lithium Mineral Reserve Estimate Considering Process Recoveries (Effective December 31, 2023) | 124 |
| Figure 12-15. SQM’s Salar de Atacama Potassium Reserve Estimate Considering Process Recoveries (Effective December 31, 2023 | 125 |
| Figure 13-1. Field Pictures of a Typical Salar de Atacama Brine Production Well, Pipe, and Gathering Pond | 130 |
| Figure 13-2. Final Mine Outline | 131 |
| Figure 14-1. Simplified Process Flowsheet for the Salar de Atacama | 133 |
| Figure 14-2. General Block Process Diagram for Lithium Salts Products | 134 |
| Figure 14-3. General Block Process Diagram for Potassium Salts Products | 137 |
| Figure 14-4. Map of the location of the Brine extraction area. SQM Salar de Atacama | 138 |
| Figure 14-5. Location of solar evaporation ponds (light blue zone) and salt deposits (green zone). Salar de Atacama | 140 |
| Figure 14-6. Block process diagram of PQC’s Operations | 143 |
| Figure 14-7. Properties Adjacent to SQM’s Concessions, Salar de Atacama | 158 |
| Figure 15-1. General Location Salar de Atacama Site | 160 |
| Figure 15-2. SOP and MOP Plants | 164 |
| Figure 15-3. Location SOP and MOP Plants | 164 |
| Figure 15-4. Facilities MOP | 165 |
| Figure 15-5. Facilities SOP | 165 |
| Figure 15-6. Main Facilities of the Salar del Carmen | 168 |
| Figure 16-1. Lithium Feedstock, supply forecast | 175 |
| Figure 16-2. Lithium Chemical Supply Breakdown | 176 |
| Figure 16-3. Lithium Carbonate and Hydroxide demand | 177 |
| Figure 16-4. Lithium historic Price Evolution | 177 |
| Figure 16-5. Lithium Chemical Price Forecast | 178 |
| Figure 16-6. Potassium Quarterly Sales Volumes and Average Prices | 180 |
| Figure 17-1. Ramsar Site, Soncor Hydrogeological System and Reserva Nacional Los Flamencos Protected Area boundaries. | 182 |
| Figure 17-2: Salar de Atacama Morphometrics Zones | 184 |
| Figure 17-3. Hydrographic Network of the Salar de Atacama Basin | 185 |
| Figure 17-4: Environmental Monitoring Zones RCA226/2006 | 186 |
| Figure 17-5. Faunal Environments | 188 |
| Figure 17-6. Sectors in the Area of Influence (AI) of Inland Aquatic Ecosystems | 191 |
| Figure 17-7. Salar de Atacama’s Human Environment | 192 |
| Figure 17-8. Schematic location of the Environmental Systems and Sectors of the Hydrogeological PES. | 198 |
| Figure 17-9. PES Schematic Location | 199 |
| Figure 17-10. Annual and Daily Extractions of Water Industrial Wells | 205 |
| Figure 17-11 Annual Net Extraction in Units of L/S Each Calendar Year (January 1 to December 31) | 208 |
| Figure 18-1. Capital Cost of Lithium Operations | 234 |
| Figure 18-2. Capital Costs for Lithium Plants | 235 |
| Figure 18-3. Capital Cost for the Lithium Carbonate Plant | 236 |
| Figure 18-4. Capital Costs for the Lithium Hydroxide Plant | 237 |
| Figure 18-5. Capital Cost Lithium Sulfate Plant | 238 |
| Figure 18-6. Capital Cost Evaporation and Harvest Ponds | 239 |
| Figure 20-1. Properties Adjacent to SQM’s Concessions, Salar de Atacama | 254 |
| 1 | EXECUTIVE SUMMARY |
This Technical Report Summary (TRS) was prepared on behalf of the Sociedad Química y Minera de Chile (SQM) for their operations in the Salar de Atacama (the “Project”). Since the previously filed TRS (2022), it is the QPs’ opinion that there have been no material changes related to exploration, the Mineral Resource, or the Mineral Reserve.
| 1.1 | Property and Mineral Rights |
The Project is located in the Antofagasta Region of Chile which covers the Loa Province and San Pedro de Atacama commune. The Salar de Atacama mine tenements are owned by the Corporación de Fomento de la Producción (CORFO) of Chile which grants special operating contracts, or administrative leases, to private companies for the extraction of brine over a certain period. SQM has a lease agreement with CORFO, signed in 1993, to extract and generate lithium (Li) and potassium (K) products from brines in the Salar de Atacama deposit.
In 2018, SQM and CORFO performed a reconciliation process that modified the pre-existing lease and Project contracts. The expiration date of the current SQM-CORFO lease agreement is December 31, 2030, and SQM holds leases for a total area of approximately 1,400 square kilometers (km2) with permission to extract brines from an area of approximately 820 km2.
| 1.2 | Geology and Mineralization |
The general geology of the Salar de Atacama Basin is characterized by Paleozoic to Holocene igneous and sedimentary rocks as well as recent, unconsolidated clastic deposits and evaporitic sequences. The salt flat resides in a tectonic basin, where important subsidence and sediment deposition have historically occurred. Over time, the process of evaporation has precipitated salts, and at depth, evaporitic, clastic, and volcanic ash deposits host brine. Several structural blocks and fault systems have been identified, where displacement and deformation of the geological units have occurred.
According to Houston et. al. (2011), the Salar de Atacama is a mature salt flat with mineralization characterized by Li- and K-rich brine, residing in the porous media of the subsurface reservoir along with elevated concentrations of other dissolved constituents (e.g., boron and sulfate). The explored reservoir covers an area of 1,100 km2 and depth of up to 900 meters (m), where a thick section of halite (> 90%) and sulfate can be found in addition to a minor percentage of clastic sediments, volcanic ash, and interbedded evaporites (Bevacqua, 1992; Xterrae, 2011). The arithmetic mean concentrations of Li and K from all brine samples (and all units) correspond to 0.187 weight percent (wt.%) and 1.867 wt.%, respectively.
| 1.3 | Mineral Resource Estimate |
This sub-section contains forward-looking information related to Mineral Resource estimates for the Project. The material factors that could cause actual results to differ materially from the conclusions, estimates, designs, forecasts, or projections in the forward-looking information include any significant differences from one or more of the material factors or assumptions that were set forth in this sub-section including geological and grade interpretations, as well as controls, assumptions, and forecasts associated with establishing the prospects for economic extraction.
SQM’s Mineral Resource estimate for the Salar de Atacama comprises in-situ Li- and K- enriched brine situated below the surface of the salt flat. The Mineral Resource estimates include consideration of brine concentration, reservoir geometry, and drainable, interconnected pore volume. Within SQM’s leased mining concessions, the Mineral Resource is supported by extensive exploration and a large dataset of depth-specific brine and porosity samples from each unit. A geological model was developed, using Leapfrog Geo software, from which the block model was constructed, and the Mineral Resource was estimated using Leapfrog Edge.
The Mineral Resource was classified into Measured, Indicated, and Inferred categories, according to the amount of information from the hydrogeological units as well as geostatistical criteria. Hydrogeological knowledge was prioritized based on exploration, monitoring, and historical production data, while geostatistical variables were used as secondary criteria.
The in-situ Li and K Mineral Resource estimate, exclusive of Mineral Reserves (without processing losses), is summarized in Table 1-1. Mean Li and K grades are reported above the designated cut-off grades of 0.05 wt.% for Li and 1.0 wt.% for K. This indicates that the prospective extraction of the Mineral Resource is economically feasible (see Section 11.2 of this Technical Report Summary [TRS] for additional discussion on the cut-off grades).
Table 1-1. SQM’s Salar de Atacama Lithium and Potassium Mineral Resources, Exclusive of Mineral Reserves (Effective December 31, 2023)
| Brine Volume | Mean Grade (wt. %) | Mass (Million tonnes) | ||||||||||||||||||
| Resource Classification | (Mm3) | K | Li | K | Li | |||||||||||||||
| Measured | 2,254 | 1.80 | 0.20 | 49.8 | 5.4 | |||||||||||||||
| Indicated | 1,435 | 1.70 | 0.16 | 30.0 | 2.8 | |||||||||||||||
| Measured + Indicated | 3,689 | 1.77 | 0.18 | 79.8 | 8.2 | |||||||||||||||
| Inferred | 1,614 | 1.77 | 0.13 | 34.9 | 2.6 | |||||||||||||||
| Total | 5,303 | 1.77 | 0.17 | 114.7 | 10.8 | |||||||||||||||
Notes:
(1) Mineral Resources are not Mineral Reserves and do not have demonstrated economic viability. There is no certainty that all or any part of the Mineral Resource will be converted into Mineral Reserves upon the application of modifying factors.
(2) Mineral Resources are reported as in-situ and exclusive of Mineral Reserves, where the estimated Mineral Reserve without processing losses during the reported LOM (Chapter 12) and real declared extraction from 2021 were subtracted from the Mineral Resource inclusive of Mineral Reserves. A direct correlation between Proven Reserves and Measured Resources, as well as Probable Reserves and Indicated Resources was assumed.
(3) Compared to the previously filed TRS (2022), mining occurred in 2023 and the end of the LOM (year 2030) has not changed. Given the acceptable reserve model fit to real 2023 production (see Chapter 12), there is no change in the Mineral Resource exclusive of Mineral Reserves since December 31, 2022 (SQM, 2023).
(4) Effective porosity was utilized to estimate the drainable brine volume based on the measurement techniques of the SQM porosity laboratory (Gas Displacement Pycnometer). Although specific yield is not used for the estimate, the QP considers that the high frequency sampling of effective porosity, its large dataset, and general lack of material where specific retention can be dominant permits effective porosity to be a reasonable parameter for the Mineral Resource estimate.
(5) The conversion of brine volume to Li and K tonnes considered the estimated brine density in each block model cell.
(6) Comparisons of values may not add due to the rounding of numbers and differences caused by use of averaging methods.
(7) The Mineral Resource estimate considers a 0.05 wt.% cut-off grade for Li based on the cost of generating Li product, lithium carbonate sales, and the respective cost margin. Based on historical lithium prices from 2010 and the forecast to 2040, a projected lithium carbonate price of $ 11,000 USD/tonnes with the corresponding cost and profit margin are considered with a small increase to accommodate the evaporation area and use of additives. A similar pricing basis and analysis was undertaken for K, where the cut-off grade of 1 wt.% was set by SQM based on respective costs, sales, and margin (Section 16 and Section 19).
| 1.4 | Mineral Reserve Estimate |
This sub-section contains forward-looking information related to Mineral Reserve estimates for the Project. The material factors that could cause actual results to differ materially from the conclusions, estimates, designs, forecasts or projections in the forward-looking information include any significant differences from one or more of the material factors or assumptions that were set forth in this sub-section including Mineral Resource model tonnes and grade, modifying factors including pumping and recovery factors, production rate and schedule, equipment and plant performance, commodity market and prices, and projected operating and capital costs.
A groundwater flow and solute transport model was developed using the Groundwater Vistas interface and Modflow-USG code to evaluate the extraction of Li and K-rich brine from pumping wells during the 7-year life-of-mine (LOM). The numerical model was constructed based on the geometry of the geological and resource block model parameters. The transfer of relevant resource estimate parameters (concentrations and effective porosity) was performed to ensure consistency between the Resource and Reserve model properties. To confirm sufficient calibration of the aquifer parameters (e.g., hydraulic conductivity) and representation of the water balance components in the salt flat nucleus, the numerical model was calibrated to observed brine levels and extracted brine concentrations during the 2015 to 2020 period. Extracted mass was subsequently verified for the 2021 to 2023 period.
The Mineral Reserve estimate considers the modifying factors of converting Mineral Resources to Mineral Reserves, including the production wellfield design and efficiency (e.g., location and screen of the production wells), environmental considerations (e.g., pumping schedule), and recovery factors for Li and K. The simulated mass of extracted Li and K after 7 years of pumping is summarized in Table 1-2. The table considers process recovery factors, where the model extracted mass at the production wellheads, was multiplied by a pond recovery factor associated with the type of extracted brine. Thus, the reserve was estimated from the point of reference of processed brine after passing through the evaporation ponds (rather than at the production wellheads).
The Mineral Reserve was classified into Proven and Probable Reserves based on industry standards for brine projects, the Qualified Person’s (QP’s) experience, and the confidence generated by SQM’s historical production in the Salar de Atacama. A majority of the extracted mass is sourced from Measured Resources; nonetheless, Proven Reserves were specified by the QP for the first 3 years given the adequate model calibration during the 2015-2020 period and overall verification of simulated production in 2021, 2022 and 2023. Probable Reserves were conservatively assigned for the last 4 years of the LOM considering that the numerical model will be continually improved and recalibrated in the future due to potential changes to neighboring pumping, hydraulic parameters, and the water balance, among other factors.
Table 1-2. SQM’s Salar de Atacama Lithium and Potassium Mineral Reserves, Factoring Process Recoveries (Effective December 31, 2023)
| Extracted Mass | Extracted Mass | |||||||||||||||||||||||||||
| Classification | Brine Volume (Mm3) Pumped | Average Extracted Lithium Grade (wt.%) |
Li (Million tonnes) |
LCE (Million tonnes) |
Average Extracted Potassium Grade (wt.%) |
K (Million tonnes) |
KCl (Million tonnes) |
|||||||||||||||||||||
| Proven Reserves | 104 | 0.200 | 0.13 | 0.70 | 2.31 | 2.20 | 4.20 | |||||||||||||||||||||
| Probable Reserves | 107 | 0.200 | 0.14 | 0.75 | 2.16 | 2.12 | 4.04 | |||||||||||||||||||||
| Total | 211 | 0.200 | 0.27 | 1.44 | 2.24 | 4.32 | 8.24 | |||||||||||||||||||||
(1) The process efficiency of SQM is summarized in Section 12.4.1; based on the type of extracted brine at each well over the course of the simulation, the average process efficiency is approximately 52% for Li and approximately 75% for K.
(2) Lithium carbonate equivalent (“LCE”) is calculated using mass of LCE = 5.323 multiplied by the mass of lithium metal and potassium chloride equivalent (“KCl”) is calculated using mass of KCl = 1.907 multiplied by the mass of potassium metal.
(3) The values in the columns for “Li” and “LCE”, as well as “K” and “KCl”, above are expressed as total contained metals.
(4) The average lithium and potassium concentration is weighted by the simulated extraction rates in each well, and it is subsequently weighted by pumping over the indicated period.
(5) Comparisons of values may not add due to the rounding of numbers and differences caused by averaging.
(6) The Mineral Reserve estimate considers a 0.05 wt.% cut-off grade for Li based on the cost of generating Li product, lithium carbonate sales, and the respective cost margin. Based on historical lithium prices, a projected lithium carbonate price of $ 11,000 USD/tonnes with the corresponding cost and profit margin is considered with a small increase to accommodate the evaporation area and use of additives. A similar pricing basis and analysis was undertaken for K where the cut-off grade of 1 wt.% has been set by SQM based on respective costs, sales, and margin (Section 16 and Section 19).
(7) This Reserve estimate differs from the in-situ base Reserve previously reported (SQM, 2020) and considers the modifying factors of converting mineral resources to Mineral Reserves, including the production wellfield design and efficiency, as well as environmental and process recovery factors.
It is the QP’s opinion that the declared Reserve estimate and corresponding methods conform with the SEC regulations. Furthermore, the reserve classification is believed to be conservative, given that SQM’s brine production has been ongoing for decades. The presented analysis includes a detailed calibration process and time-based reserve classification to account for potential future changes in hydraulic parameters (with more field data and testing), the water balance, and neighboring pumping, among other factors.
| 1.5 | Mining Method |
In the Salar de Atacama, SQM’s mining method corresponds to brine extraction. Production is characterized by the construction of pumping wells capable of extracting brine from different reservoirs of interest. Subsequently, the brine extracted from each of the production wells is accumulated in gathering ponds for distribution to evaporation ponds and metallurgical plants.
Due to limitations of the SQM-CORFO lease agreement, the current mine life ends on December 31, 2030. Until this date, the expected brine production had been evaluated with a decreasing total brine extraction rate from 1,159 L/s (2024) to 822 L/s (2030).
| 1.6 | Metallurgy and Mineral Processing |
| 1.6.1 | Metallurgical Testing |
The developed test work is aimed at estimating the response of different brines by concentration, via solar evaporation, and overall metallurgical recoveries of the process plants, in addition to assessing raw material treatability for finished lithium and potassium products.
SQM employees regularly collect brine samples and complement this by considering temporal, geological, spatial, and operational criteria of the wells, with an emphasis on maintaining an updated and accurate dataset of brine chemistry characteristics. The Salar de Atacama laboratory, through its facilities, generates metallurgical assay databases which include the chemical composition, density, and porosity test results, among other assays which allow for process control and planning.
Historically, SQM has analyzed the different plant and/or pilot scale tests through its Research and Development Area, allowing them to improve the recovery process and product quality. Currently, there is a plan to increase yield at the Salar de Atacama which consists of a series of operational improvement initiatives, development and expansion projects, as well as new process evaluations to recover a greater amount of lithium in the LiCl production system.
| 1.6.2 | Brine and Salt Processing |
SQM has developed a process model to convert the brine extracted from available salt properties containing potassium, lithium, sulfates, boron, and magnesium into commercial potassium and lithium salts products. The process follows industry standards, considering the stages of brine pumping from the reservoirs to concentrate it by sequential evaporation, treating the harvested potassium salts to obtain refined salts, and treating the brine concentrate in a plant to produce high quality lithium carbonate and lithium derivatives.
Thus, the objective of the Project is to produce potassium salts, such as potassium chloride (KCl) and potassium sulfate (K2SO4), as well as lithium salts such as lithium carbonate (Li2CO3) and lithium hydroxide (LiOH). There are two production lines, one focused on obtaining potassium products (SQM Salar de Atacama process plants), and another concentrated on the production of lithium carbonate and hydroxide (SQM Carmen Lithium Chemical Plant), both of which are two facilities that make up SQM’s Salar de Atacama operations.
SQM's production process is characterized by being integrated (i.e., exchanging raw materials and products with each other). The Carmen Lithium Chemical Plant (PQC), located near Antofagasta, has production facilities that comprise a Lithium Carbonate Plant and a Lithium Hydroxide Plant. The production capacity of the lithium carbonate plant at PQC until the year 2021 was 120,000 tonnes per year (Mtpy), and at that time, it was projected to increase production to 180,000 tonnes per year (Mtpy). Additionally, the lithium hydroxide plant had a production capacity of 21,500 tonnes per year (Mtpy), with plans to increase production capacity to 30,000 (Mtpy). However, the current production is now 150,000 (Mtpy), with plans to increase production to 210,000 Mtpy. Furthermore, the lithium hydroxide plant has a production capacity of 24,500 Mtpy, with plans to increase production capacity to 32,500 Mtpy.
| 1.7 | Capital Costs, Operating Costs, and Financial Analysis |
| 1.7.1 | Capital and Operating Costs |
This section contains forward-looking information related to capital and operating cost estimates for the Project. The material factors that could cause actual results to differ materially from the conclusions, estimates, designs, forecasts or projections in the forward-looking information include any significant differences from one or more of the material factors or assumptions that were set forth in this section. These include prevailing economic conditions which continue in a manner that the unit costs are as estimated, projected labor and equipment productivity levels are maintained, and that contingency is sufficient to account for changes in material factors or assumptions.
SQM is the world’s largest producer of potassium nitrate and iodine, and one of the world’s largest lithium producers. It also generates specialty plant nutrients, iodine derivatives, lithium derivatives, potassium chloride, potassium sulfate, and certain industrial chemicals (including industrial nitrates and solar salts). The products are sold in approximately 110 countries through SQM’s worldwide distribution network, with more than 90% of the sales derived from countries outside of Chile.
The facilities for lithium and potassium production operations include brine extraction wells, evaporation and harvest ponds, lithium carbonate and lithium hydroxide production plants, dry plants and wet plants for potassium chloride and sulfate, as well as other minor facilities. Offices and services include common areas, hydrogeological assets, water resources, supply areas, powerhouse, laboratories, and research areas.
At the end of 2020, the capital cost that had been invested (reposition cost) in these facilities was close to 2,300 million dollars. The cost of capital distributed in the areas related to lithium and chloride and sulfate potassium production is shown in Table 1-3. As indicated, the main investments in lithium and potassium production are the “Lithium Carbonate and Lithium Hydroxide Plants”, as well as the “Evaporation and Harvest Ponds”, accounting for about 55% of the total investment.
Table 1-3. Capital Costs for Lithium and Potassium Operations
| Capital Cost | |||||
| Lithium and Potassium Operations | % | ||||
| 1 | Lithium Carbonate and Lithium Hydroxide plants | 28 | % | ||
| 2 | Evaporation and harvest ponds | 27 | % | ||
| 3 | Wet Plants | 17 | % | ||
| 4 | Brine extraction wells | 13 | % | ||
| 5 | Dry Plants | 7 | % | ||
| 6 | Offices, services, warehouses, others | 8 | % | ||
The main investment in the lithium carbonate plant, which represents about 81% of the lithium plants, are in buildings, mechanical equipment, such as filters, pumps, valves, pipes, ponds, and drying equipment. For the Evaporation and Harvest Ponds, the main investments are in the MOP (Muriate of Potash) I and II, and SOP (Sulfate of Potash) ponds, accounting for 83% of the total investment in the ponds.
SQM has plans to continue the capacity expansion of its plants, complying with the CORFO quota agreements. As mentioned in Chapter 1.6.2, the production capacity and projected production increase until the year 2021 of the lithium carbonate plant in PQC were 120,000 tons per year and 180,000 tons per year, respectively. Also, for the same year, the lithium hydroxide plant had a production capacity and a projected production capacity increase of 21,500 tons per year and 30,000 tons per year, respectively.
The highest operating cost is in the CORFO rights and other agreements, representing about 79% during 2022. The other major item in raw material and consumables, employee benefit expenses, depreciation expense, and contractor works, representing 18% of the operating cost.
During the first 9 months of 2022, the operating cost that has been spent to produce lithium and potassium chloride and sulphate at the Salar de Atacama and Salar del Carmen plants was close to 2,900 million dollars.
| 1.7.2 | Economic Analysis |
This section contains forward-looking information related to economic analysis for the Project. The material factors that could cause actual results to differ materially from the conclusions, estimates, designs, forecasts, or projections in the forward-looking information include any significant differences from one or more of the material factors or assumptions that were set forth in this sub-section including estimated capital and operating costs, project schedule and approvals timing, availability of funding, projected commodities markets, and prices.
The Economic Analysis considers the actual concession agreement with CORFO, as it is at the end of 2023, where the Project Agreement expires on December 31, 2030. SQM declares that, on December 27, 2023, SQM and Codelco, Chilean state-owned company which had been mandated by the Chilean Government to negotiate its participation in the lithium operations in the Salar de Atacama, signed a memorandum of understanding (MoU), which, among other matters, established the ground terms and conditions for the definitive agreements which will allows SQM Salar to exploit mineral resources in the Salar de Atacama until 2060. The full text of the MoU is referenced in the Exhibit 94.4 of the Report on Form 20-F. See also “— Risks Relating to Chile — The new National Lithium Strategy announced by the Chilean government in April 2023 has created and may continue to create uncertainty in the Chilean lithium industry, which could have a material adverse effect on our business performance or the value of our shares and ADSs.” The definitive agreements are subject to negotiation and we cannot guarantee that said agreements will be implemented.”
To obtain an income flow in relation to the production of Li2CO3, LiOH, and KCl for the period of 2024 to 2030 with the investments projected for a 210 ktpy carbonate plant and 100 ktpy hydroxide plant expansion have been considered. In the case of the long-term price of Li2CO3, a base value of 12,110 USD/tonne has been considered with a long-term KCl price of 300 USD/ton. The price of LiOH was assumed to be 5% higher than the price of Li2CO3. As it is shown in Figure 16 4, it is important to note that lithium prices have had an unexpected behavior: at the end of 2022 and 2023, the lithium price was close to 78,000 and 13,500 USD/tonne respectively. For this analysis, a conservative scenario is assumed, based in the market study described in chapter 16, where the long term lithium carbonate price at 12,110 USD/tonne will be required to sustain new project development. Table 1-4 shows the main assumptions taken for the base case.
Table 1-4. Assumptions for the Base Case Economic Analysis
| Base Case | ||||
| Assumptions | Units | Quantity | ||
| Production Plant | ktpy | 210 | ||
| Lithium Carbonate Price | US$/tonne |
12,110 (2024-2030) |
||
| Lithium Hydroxide Price | US$/tonne | 5% over Lithium Carbonate Price | ||
| Potassium Chloride Price* | US$/tonne | 300 | ||
| Estimated Cost + CORFO Rights and other agreements | US$/tonne | 5,700 + calculate (18.1% of Revenues for 12,110) | ||
| Taxes | % | 27 | ||
| Discount rate | % | 10 | ||
(*) Price of K defined according to the application of its products and derivatives.
The projected sales of lithium carbonate, lithium hydroxide and potassium chloride for the LOM until 2030 is presented in Table 1-5.
Table 1-5. Projected Sales of Lithium and Potassium Products
| 2024 | 2025 | 2026 | 2027 | 2028 | 2029 | 2030 | |||||||||||||||||
| Lithium Carbonate | ktpy | 170 | 140 | 110 | 110 | 110 | 110 | 110 | |||||||||||||||
| Lithium Hydroxide | ktpy | 40 | 70 | 100 | 100 | 100 | 100 | 70 | |||||||||||||||
| Potassium Chloride | ktpy | 1,200 | 1,200 | 1,200 | 1,200 | 1,200 | 1,200 | 1,200 | |||||||||||||||
Note: Reserves of Chapter 12 are declared based on brine recovery factors associated with the evaporation ponds (i.e. the point of reference being after passing through the evaporation ponds), while the final sales product is presented here; note that values are rounded if comparing totals.
The Net Present Value (NPV) estimates for Salar de Atacama and PQC production are provided in Table 1-6.
Table 1-6. Estimated Cashflow Analysis
| 2024 | 2025 | 2026 | 2027 | 2028 | 2029 | 2030 | ||||||||||||||||
| Lithium Carbonate Sales | ktpy | 170 | 140 | 110 | 110 | 110 | 110 | 110 | ||||||||||||||
| Lithium Hydroxide Sales | ktpy | 40 | 70 | 100 | 100 | 100 | 100 | 70 | ||||||||||||||
| Potassium Chloride Sales | ktpy | 1,200 | 1,200 | 1,200 | 1,200 | 1,200 | 1,200 | 1,200 | ||||||||||||||
| Lithium Carbonate Price | USD/tonne | 12,110 | 12,110 | 12,110 | 12,110 | 12,110 | 12,110 | 12,110 | ||||||||||||||
| Lithium Hydroxide Price | USD/tonne | 12,716 | 12,716 | 12,716 | 12,716 | 12,716 | 12,716 | 12,716 | ||||||||||||||
| Potassium Chloride Price | USD/tonne | 300 | 300 | 300 | 300 | 300 | 300 | 300 | ||||||||||||||
| Lithium Revenues | M US$ | 2,567 | 2,585 | 2,604 | 2,604 | 2,604 | 2,604 | 2,604 | ||||||||||||||
| KCI Revenues | M US$ | 360 | 360 | 360 | 360 | 360 | 360 | 360 | ||||||||||||||
| 1.8 | Conclusions |
This study concludes that the Salar de Atacama Project in operation for the treatment of brines to obtain Li and K salts is economically feasible, according to financial and reserve parameters. Furthermore, SQM has vast experience in the treatment of brines and salts. Their track record includes knowledge of the Mineral Resources and raw materials during the different processing stages, including operational data on reagent consumption and costs.
All reported categories were prepared in accordance with the resource classification pursuant to the SEC's new mining rules under subpart 1300 and Item 601(96)(B)(iii) of Regulation S-K (the "New Mining Rules").
| 2 | INTRODUCTION AND TERMS OF REFERENCE |
This Technical Report Summary (TRS) was prepared for the Sociedad Química y Minera de Chile (SQM) and its aim is to provide investors with a comprehensive understanding of the mining property based on the requirements of Regulation S-K, Subpart 1300 of the United States Securities Exchange Commission (SEC), which hereafter is referred to as the SK-1300.
| 2.1 | Terms of Reference and Purpose of the Report |
SQM produces a wide variety of commercial chemicals from the naturally occurring brines in the Salar de Atacama salt crust found in northern Chile. Products derived from the brines include potassium nitrate, lithium derivatives, iodine derivatives, potash, and other industrial chemicals.
This TRS provides technical information to support Mineral Resource and Mineral Reserve estimates for the operations of SQM in the Salar de Atacama (the Project). It also details related brine processing information in the Carmen Lithium Chemical Plant (PQC).
The effective date of this TRS Report is April 8, 2023, while the effective date of the Mineral Resource and Mineral Reserve estimates is December 31, 2023. It is the QP’s opinion that there are no known material changes impacting the Mineral Resource and Mineral Reserve estimates between December 31, 2023, and April 8, 2024.
This TRS uses English spelling and Metric units of measure. Grades are presented in weight percent (wt.%). Costs are presented in constant US Dollars (USD), as of December 31, 2022.
Except where noted, coordinates in this TRS are presented in Metric units, using the World Geodetic System (WGS) 1984 Universal Transverse Mercator (UTM) ZONE 19 South (19S).
The purpose of this TRS is to report Mineral Resources and Mineral Reserves for SQM’s Salar de Atacama operation.
Table 2-1 details the acronyms and abbreviations used in this TRS.
Table 2-1. Acronyms and Abbreviations
| Abbreviation/Acronym | Definition |
| °C | degrees Celsius |
| AA | atomic absorption |
| AAE | Authorized Areas of Extraction |
| AAS | Atomic Absorption Spectrometry |
| acQuire | acQuire |
| ADI | Indigenous Location Area |
| ADUP | Analytical duplicates |
| AR | average |
| B | boron |
| BLK | blanks |
| CCHEN | Chilean Nuclear Energy Commission |
| CCTV | closed-circuit TV |
| CM | counter sample |
| CONAMA | Comisión Nacional del Medio Ambiente |
| COREMA | Comisión Regional del Medio Ambiente |
| CORFO | Corporación de Fomento de la Producción |
| DDH | diamond drill hole |
| DICTUC | Dirección de Investigaciones Científicas y Tecnológicas de la UC |
| DPS | salt deposit |
| EDA | exploratory data analysis |
| ER | error ratio |
| ERT | Electrical Resistivity Tomography |
| ETS | Evapotranspiration Segments |
| ETFA | Enforcement Technical Entity |
| FDUP | Field Duplicates |
| GHS | SQM’s Hydrogeology Department |
| GHS | Gerencia Hidrogeología Salar |
| GPS | Salar de Atacama Production Management |
| GU | geological units |
| Ha (with capital H) | Recent Alluvial and Fluvial Deposits |
| Ha | hectare |
| ICP | inductively coupled plasma analysis |
| IGS | specific yield (processing and recovery methods) |
| IIG | Instituto de Investigaciones Geológicas |
| K | potassium |
| K2SO4 | potassium sulfate |
| KCL | potassium chloride or potassium chloride equivalent |
| Kh | hydraulic conductivity |
| km2 | square kilometer |
| Kt | kilotonnes |
| Ktpy | kilotonnes per year |
| Abbreviation/Acronym | Definition |
| kV | kilovolt |
| Kv/Kh | vertical-horizontal anisotropy |
| KvA | kilovolt amperes |
| L/s | liter per second |
| Lab POR | Laboratorio de Porosidad del Salar de Atacama |
| Lab SA | Laboratorio Salar de Atacama |
| Lab UA | laboratory of the University of Antofagasta |
| LCE | Lithium carbonate equivalent |
| LFP | Lithium Ferro Phosphate |
| Li | lithium |
| Li2CO3 | lithium carbonate |
| LIMS | laboratory information management system |
| LiOH | lithium hydroxide |
| LNG | Natural gas |
| LOM | life-of-mine |
| LPG | Liquefied gas |
| LSC | Salar del Carmen Laboratory |
| M | meter |
| mE | meters East (coordinates) |
| mS | meters South (coordinates) |
| M | million |
| m/d | meters per day |
| m2 | square meter |
| m3 | cubic meter |
| Mm3 | million cubic meters |
| Masl | meters above sea level |
| MINSAL | Sociedad Minera Salar de Atacama Limitada |
| mL | milliliter |
| Mm | millimeters |
| mm3 | cubic millimeters |
| MMBTU | million British thermal unit |
| MOP | muriato de potasio (potassium chloride product) |
| MT | Magnetotelluric |
| Mt | Metric ton |
| Mtpy | Metric ton per year |
| MW | megawatt |
| MWh | megawatt hour |
| Na2CO3 | Sodium Carbonate |
| NCM | Nickel, Cadmium and Manganese |
| NMR/BMR | Natural Gamma, and Borehole Nuclear Magnetic Resonance |
| NNW-SSE | north-northwest-south-southeast |
| Nobody's Land | Tierra de Nadie |
| Abbreviation/Acronym | Definition |
| NPV | Net Present Value |
| NW | northwest |
| OK | Ordinary Kriging |
| OMA Exploration | SQM’s distinct areas of exploration |
| OMA Extraction | SQM’s distinct areas of extraction |
| PCA | Environmental control points |
| PdC | compliance program |
| Pe | Effective Porosity |
| PlHa | Alluvial Deposits |
| PlHs | Salar de Atacama Saline Deposits |
| PPR | Possible Pollution Ratios |
| PQC | Carmen Lithium Chemical Plant |
| PSA | Environmental monitoring plan |
| QA/QC | quality assurance and quality control |
| QC | duplicate samples |
| QP | Qualified Person |
| RC | reverse circulation |
| RCA | Resolución de Calificación Ambiental |
| RIL | liquid waste |
| RIS | solid waste |
| RM | reference materials |
| RMS | Root Mean Square |
| RS | Reference Samples |
| Salar | Salar |
| SCL | Sociedad Chilena de Litio |
| SEC | Securities Exchange Commission |
| SERNAGEOMIN | Servicio Nacional de Geología y Minería |
| SING | Sistema Interconectado Norte Grande |
| S-K 1300 | Subpart 1300 of the United States Securities Exchange Commission |
| SMA | Enforcement Authority |
| SOC | Samples Out of Control |
| SOP | sulfato de potasio (potassium sulfate product) |
| SQM | Sociedad Química y Minera de Chile |
| SQM Salar | SQM subsidiary SQM Salar S.A |
| SRK | SRK Consulting (U.S.), Inc. |
| Ss | specific storage |
| SW | southwest |
| Sy | specific yield |
| t/h | tonnes per hour |
| t/y | tonnes per year |
| TEM | transient electromagnetic method |
| Thousand United States Dollars | KUSD |
| TRS | Technical Report Summary |
| UA | Unit A |
| UB | Unit B |
| USD | United States Dollars |
| USD/t | United States Dollars per tonne |
| UTM | Universal Transverse Mercator |
| V | volt |
| WGS | World Geodetic System |
| wt.% | weight percent or % |
| ZAE | Zona Autorizada de Extracción, or Authorized Extraction Zone |
| 2.2 | Source of Data and Information |
This TRS is based on information provided by SQM. All the utilized information is cited throughout this TRS and is referenced in Chapter 24 (References) at the end of this Report.
| 2.3 | Details of Inspection |
The details of the site inspections by the QPs are summarized in Table 2-2.
Table 2-2. Site visits
| Qualified Person (QP) | Relation to Registrant and their Role | Company | Date of Site Visit | Detail of Visit | Years of Relevant Experience | Responsible for disclosure of |
| Juan Becerra | Superintendent of Geology. Resource QP |
SQM S.A. | Several visits between 2017 - 2023 | Operations, extraction wells, evaporation ponds, processing plants | 14 | Sections 1.1, 1.6, 1.2, 1.3, 1.8, 2, 3, 4, 5, 6, 7, 8, 9, 10 11, 14, 15, 17, 20, 21, 22, 23, 24 & 25 |
| Rodrigo Riquelme | M.A. Economics Georgetown University. Reserve QP |
Geoinnova Consultores Ltda. | February 28, 2023 | Operations, extraction wells, evaporation ponds, processing plants | +20 | Sections 1.4, 1.5, 1.7, 1.8 12, 13, 16, 18, 19, 21, 22, 23, 24 & 25 |
During the various site visits, the QPs toured the general areas of mineralization, the historical and current mine, as well as the drill sites. The group also reviewed existing infrastructure, evaporation ponds, processing plants, wells, drill cores, and project data files with SQM technical staff.
| 2.4 | Previous Reports on Project |
This is the second TRS prepared for SQM's Salar de Atacama brine deposit. This TRS is an update of a previously filed TRS (2022).
| 3 | PROPERTY DESCRIPTION |
| 3.1 | Property Location |
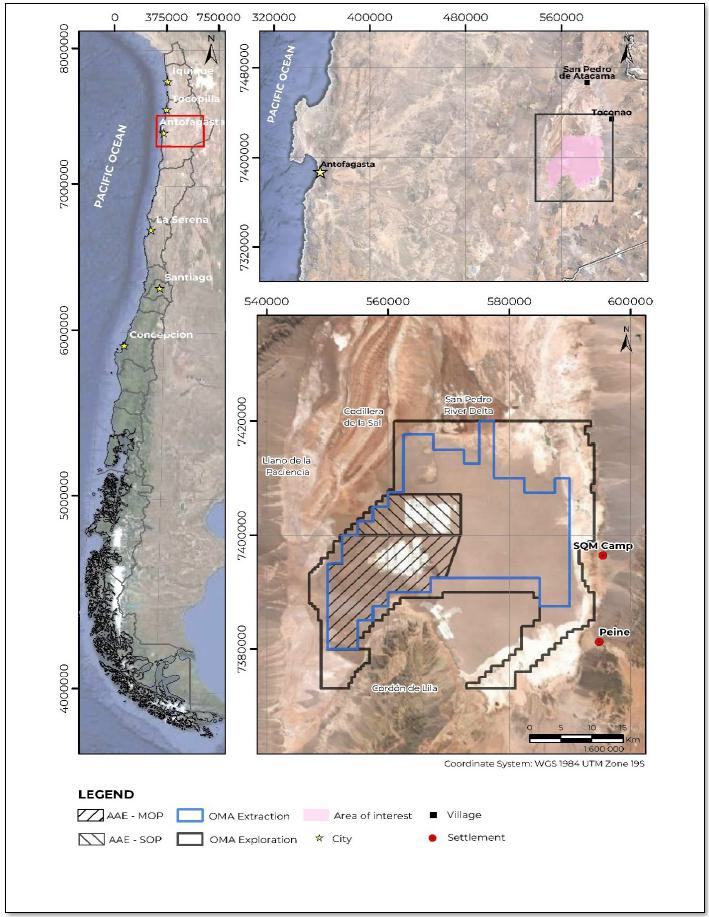
The Salar de Atacama Basin is located in the El Loa Province, within the Antofagasta Region of northern Chile, between 548,420 mE and 589,789 mE and 7,394,040 mS and 7,393,788 mS (Coordinate Reference System WGS84, UTM 19S). As shown on Figure 3-1, the mining property operated by SQM extends between approximately 550,000 mE and 593,000 mE, and 7,371,000 mS and 7,420,000 mS (Coordinate Reference System WGS84, UTM 19S). SQM’s distinct areas of exploration (OMA Exploration) and extraction (OMA Extraction) are detailed in the following subsection.
Figure 3-1. Location of SQM’s Salar de Atacama Project
| 3.2 | Lease Agreement and Mineral Rights |
In 1993, SQM entered a lease agreement with the Corporación de Fomento de la Producción or Production Development Corporation of Chile (CORFO), the governmental agency that owns the mineral rights in the Salar de Atacama. The lease between CORFO and SQM will last until December 31, 2030, granting SQM exclusive rights to Mineral Resources beneath 140,000 hectares (ha) (28,054 mineral concessions) of the Salar de Atacama. SQM is permitted to extract minerals from a subset of 81,920 ha (16,384 mineral concessions), corresponding to 59.5% of the total area of the leased land. The 140,000 ha of land leased by CORFO to SQM are referred to as the “OMA” concessions, a name devised by CORFO in 1977. SQM refers to the 81,920-ha subset, where extraction can occur as the “OMA Extracción” (OMA Extraction) Area. The remaining 58,350 ha are termed the “OMA Exploración” (OMA Exploration) Area, where only mineral exploration can occur. The terms of the agreement established that CORFO will not allow any other entity aside from SQM to explore or exploit any Mineral Resource in the indicated 140,000 ha area of the Salar de Atacama.
In 2018, SQM and CORFO undertook a reconciliation process that modified the pre-existing lease and project contracts. As part of this Arbitration Agreement, SQM generated additional resources for the state and local communities of Antofagasta as well as for research and development. The expiration date of the lease (December 31, 2030) was not modified. Regarding brine production, in the lease agreement, Comisión Chilena de Energía Nuclear, or Chilean Nuclear Energy Commission (CCHEN) established a total accumulated sales limit of up to 349,553 tonnes of metallic lithium (1,860,670 tonnes of lithium carbonate equivalent) in addition to approximately 64,816 tonnes of metallic lithium (345,015 tonnes of lithium carbonate equivalent) remaining from the originally authorized quantity of the CORFO Arbitration Agreement of 2018.
| 3.3 | Environmental Impacts and Permitting |
The environmental permit, “Resolución de Calificación Ambiental, RCA N° 226/2006,” issued on October 19, 2006, by the Comisión Regional del Medio Ambiente, or Regional Environmental Commission (COREMA), authorizes SQM to extract brines via pumping wells from a specific portion of the OMA Exploration Area. SQM refers to these brine extraction areas as Áreas Autorizadas para la Extracción, or Authorized Areas of Extraction (AAE) zones, and they are further divided based on the products historically generated in each sector (Figure 3-1). The northern portion is denominated the AAE-SOP, where “SOP” signifies sulfato de potasio (potassium sulfate product) and covers a surface area of 10,512 ha equivalent to 29.27% of the total AAE area. The southern portion is referred to as AAE-MOP, where “MOP” indicates muriato de potasio (potassium chloride product), covering a surface area of 25,399 ha equivalent to 70.73% of the total AAE area.
The water that SQM uses for its mineral production in the Salar de Atacama is obtained from wells located in the alluvial aquifer on the eastern edge of the salt flat, for which the company has rights and the corresponding environmental authorization (RCA 226/2006) to use groundwater. As part of the voluntary sustainability commitment assumed by SQM in 2020, the company will reduce its water consumption by up to 50% in 2030 (SQM I, 2021).
| 3.4 | Other Significant Factors and Risks |
SQM’s operations are subject to certain risk factors that may affect the business, financial conditions, cashflow, or SQM’s operational results. Potential risk factors are summarized below:
| · | The potential inability to extend, or renew, mineral exploitation rights in the Salar de Atacama beyond the defined expiration date (December 31, 2030) in the CORFO-SQM lease agreement. |
| · | Risks related to being a company based in Chile; potential political risks and changes in legislation may affect development plans, production levels, and costs. |
| · | Risks related to financial markets. |
| 3.5 | Royalties and Agreements |
SQM made payments to the Chilean government for the exploration and exploitation concessions, including those which are leased from CORFO of approximately US $ 7.9 million in 2019 and US $ 6.5 million in 2020. These payments do not include those made directly to CORFO by virtue of the lease agreement, according to the established percentages related to the sale value of the resulting products of brine exploitation (Table 3-1)
SQM does not have contracts that require other payments for: licenses, franchises, or royalties (not contemplated in the Royalty Law of Chile). SQM carries out its own operations through mining rights, production facilities, as well as transportation and storage facilities.
Table 3-1. Payment Agreements with CORFO
Payments 1
| Li2CO3 | LiOH | ||
| US$/MT | % | US$/MT | % |
| <4,000 | 6.80 | <5,000 | 6.80 |
| 4,000-5,000 | 8.00 | 5,000-6,000 | 8.00 |
| 5,000-6,000 | 10.00 | 6,000-7,000 | 10.00 |
| 6,000-7,000 | 17.00 | 7,000-10,000 | 17.00 |
| 7,000-10,000 | 25.00 | 10,000-12,000 | 25.00 |
| >10,000 | 40.00 | >12,000 | 40.00 |
Source Company
(1) Effective as of April 10, 2018
(2) % of final sale price
(3) % of FOB price
| 4 | ACCESSIBILITY, CLIMATE, LOCAL RESOURCES, INFRASTRUCTURE AND PHYSIOGRAPHY |
| 4.1 | Topography, Elevation, and Vegetation |
The Salar de Atacama salt crust covers an area of approximately 2,200 km2 with a greater north-south distance of 85 km and maximum west-east width of 50 km. The average elevation of the salt flat nucleus is approximately 2,300 meters above sea level (masl).
Vegetation is mainly found along the marginal zone of the basin and is associated with a desert ecosystem and low-precipitation environment (SRK, 2020). There are four main vegetation types in the basin which correspond to crops, vegas, tamarugos, and bofedales.
| 4.2 | Accessibility and Transportation to the Property |
The SQM facilities of Salar de Atacama Project are located 35.6 km from Peine and at 57.4 km from Toconao. The closest cities are Calama, located 160 km to the west of the basin, and Antofagasta, which is located 230 km to the west.
It is possible to travel to site by plane, via the Loa Airport, or Andrés Sabella Airport, located in Calama and Antofagasta, respectively. From Calama, the road to the site is through Route R-23 over 220 km, and from Antofagasta, it is via Route B-385 for 272 km. It is also possible to access the area through two public roads, Route B-355 that runs from Toconao to Peine, as well as Route B-385 which connects Baquedano to the Salar de Atacama.
| 4.3 | Climate |
Recorded temperatures at the SQM station Campamento Andino vary between -6 degrees Celsius (°C) and 33°C, with an annual average lower than 18°C, which is characteristic of a cold desert environment.
Precipitation is registered both in the winter and summer, with a majority of the precipitation occurring in summer (December, January, and February). Maximum values range between 29.3 mm (KCL Station, March 2002) and 88 mm (Toconao Station, February 2012). Operations occur year-round (continuously), with higher evaporation rates in the summer and lower rates in winter.
| 4.4 | Infrastructure Availability and Sources |
Since 2017, the operations at Salar de Atacama are connected to the national electrical system that provides energy to most of the cities and industries in Chile. Most energy needs are covered by the Electric Power Supply Agreement which was enacted with AES Gener S.A. on December 31, 2012. For natural gas, SQM has a five-year contract with Engie since 2019, and liquid gas is supplied by Lipigas. The freshwater supply for the Salar de Atacama is obtained from nearby freshwater wells in the basin for which the company has the corresponding rights and environmental authorization.
| 5 | HISTORY |
Between 1994 and 1999, SQM invested in the development of the Salar de Atacama Project to produce potassium chloride, and lithium carbonate among other products (SQM, 2020). Prior to SQM’s involvement in the Project, numerous historical studies were completed in the Salar de Atacama Basin to investigate the geology, surface and groundwater hydrology, hydrogeochemistry, and water and brine resources. The most relevant technical studies, previous operations, and relevant exploration and development work are summarized below:
| · | Brüggen (1942): General description of the geology setting of the Atacama salt flats and their surroundings. |
| · | Dingman (1965): Surface geological mapping of the Salar de Atacama Basin. |
| · | Dingman (1967): In collaboration with the IIG and CORFO, the first published analysis of brines in the nucleus of the Salar de Atacama which reported the high concentrations of potassium and lithium. |
| · | Díaz del Río et al. (1972): Evaluation of the brine resource and the groundwaters to the east and north of the salt flat nucleus for the IIG and CORFO. |
| · | Moraga et al. (1974): Built on the work of Díaz del Río et al. (1972), including: (a) the preparation of an economic evaluation of the brine resource; and (b) the development of topographic cartography of the Salar de Atacama Basin at a 1:250,000 scale. |
| · | Ide (1978): University of Chile Thesis for the degree of Mining Engineer (sponsored by CORFO), which provided an estimate of the mass of the various crystalline salts within the nucleus of the Salar de Atacama and presented a brine resource characterization based on the analysis of over 400 samples. |
| · | Harza Engineering Company Ltd (1978): Water Resources Evaluation, including the completion of hydrogeological investigation wells in the marginal zone to the east and north of the nucleus of the Salar de Atacama. Study associated with the United Nations Project CHI-69/535 titled, “Desarrollo de los Recursos Hídricos en el Norte Grande de Chile” (Development of the Water Resources of the Norte Grande of Chile). |
| · | Dalannais (1979): Católica del Norte University, Antofagasta, Chile. Thesis for the degree of Geologist titled, “Hidrogeología del Borde Oriental del Salar de Atacama” (Hydrogeology of the Eastern Border of the Salar de Atacama). |
| · | During the 1980s, the Chilean National Petroleum Company, or Empresa Nacional del Petróleo (ENAP), conducted seismic reflection surveys in the Salar de Atacama Basin. This data was subsequently analyzed and interpreted by several groups that concluded that the data demonstrated good lateral continuity of the deposited sediment and evaporite units in the Salar de Atacama Basin over the last 23 million years, between the Miocene Epoch and present day. |
| · | Ramírez & Gardeweg (1982): SERNAGEOMIN geological map of the Salar de Atacama Basin at 1:250,000 scale with an accompanying 117-page Memorandum (Carta Geológica de Chile, Serie Geología Básica, N° 54, Hoja Toconao). |
| · | Hydrotechnica (1987). Evaluation of Brine Reserves in the Salar de Atacama. Report that summarizes a drilling campaign, hydraulic test, and drainable porosity studies to characterize hydraulic parameters in the nucleus of Salar de Atacama as well as the reserves. |
| · | Bevacqua (1992): Universidad Católica del Norte, Antofagasta, Chile. Geology thesis titled, “Geomorfología del Salar de Atacama y Estratigrafía de su Núcleo y Delta” (Geomorphology of the Salar de Atacama and Stratigraphy of its Nucleus and Delta). |
| · | Includes the evaluation of hydraulic parameters of the salt flat nucleus based on data from field campaigns, conducted by Sociedad Minera Salar de Atacama Ltda. (MINSAL S.A.) and CORFO. Information analyzed includes diamond core data, pumping test results, and drainable porosity estimates. |
| · | SQM (1993): In 1993, based on an agreement with MINSAL S.A., SQM implemented a project to produce potassium chloride from the Salar de Atacama for use in fertilizer production. A pilot production wellfield began brine extraction in 1994, and was expanded in 1996, with technical support provided by the consulting firm, Water Management Consultants (WMC). |
| · | Water Management Consultants. (1993). Salar de Atacama. Southwest Corner Investigation. 1150/2, Prepared for Minsal S.A. Geological and hydrogeological characterization of the southeast corner of Salar de Atacama. Includes drainable porosity characterization. |
| · | Alonso & Risacher (1996): Evaluation of the water balance and geochemistry of the Salar de Atacama Basin. |
| · | Carmona (2002): Doctoral thesis that further develops the evaluation of the water balance and geochemistry of the Salar de Atacama Basin. |
| · | EIA (2005): EIA submitted by SQM in January 2005 in support of the project titled, “Cambios y Mejoras de la Operación Minera en el Salar de Atacama” (Changes and Improvements of the Mining Operation in the Salar de Atacama). SQM received the corresponding environmental approval (RCA 226/2006) for the project in October 2006. A numerical model was developed to evaluate how the hydrological system of the Salar de Atacama would react over time due to the extraction of (a) brine from the salt flat nucleus for mineral extraction; and (b), fresh groundwater from the marginal zone to supply SQM’s mining operation. |
| · | Jordan et al. (2002; 2007), and Arriagada et al. (2006): Evaluation of seismic reflection data obtained out by ENAP during the 1980s. The analysis identified compressive deformation and a correlation between sediment deposition and tectonic events. |
| · | Geohidrología Consultores (2007): Supervision of the construction of monitoring wells in accordance with the conditions of the environmental permit awarded with respect to the 2005 EIA. |
| · | AMPHOS 21 Consulting (2008): Hydrogeological analysis of data collected during the 2007 monitoring well construction campaign, and development of a hydrogeological model to support the hydrogeological evaluation of the Soncor wetland system in the marginal zone to the northeast of the nucleus of the Salar de Atacama. |
| · | Xterrae Geología (2011): Preparation of a digital model of the 3D distribution of hydrogeological units of the Salar de Atacama Basin based on field and laboratory data compiled by SQM. Model prepared by Xterrae Geología, a consulting firm based in Santiago, Chile. |
| · | Niemeyer (2013): Geological mapping of the high ground of the Cordón de Lila, to the south of the nucleus of the Salar de Atacama, at a scale of 1: 100,000. |
| · | Becerra et al. (2014): “Geología del área Salar de Atacama, región de Antofagasta. Servicio Nacional de Geología y Minería” (Geology of the Salar de Atacama Area, Antofagasta Region, SERNAGEOMIN). Conducted a geological survey of the Salar de Atacama areas (scale 1: 100,000). |
| · | Xterrae Geología (2015): Update of the model of the 3D distribution of hydrogeological units of the Salar de Atacama Basin, incorporating field and laboratory data compiled by SQM since completion of the 2011 model. |
| · | SQM (2018): Updated estimate of the Salar de Atacama brine resource, supported by the development of a detailed model of the hydrogeological stratigraphy within the salt flat nucleus. |
| · | SQM (2019): Update of the model of the 3D distribution of hydrogeological units of the Salar de Atacama Basin, incorporating field and laboratory data compiled by SQM since the 2015 update of the model by Xterrae Geología. The data set for this update includes information from SQM drilling campaigns up until January 2019 and the local detailed model of the hydrogeological stratigraphy within the nucleus of the salt flat developed by SQM in 2018. |
| 6 | GEOLOGICAL SETTING, MINERALIZATION, AND DEPOSIT |
The focus of the mineralization for the Project is lithium and potassium bearing brine, occurring within the aquifer in SQM’s mining concessions of the Salar de Atacama. The following subsections summarize the regional, local, and property geology as well as the mineralized zones and deposit type.
| 6.1 | Regional Geology |
The general geology in the vicinity of the Project is characterized by Paleozoic to Holocene igneous and sedimentary rocks, as well as recent unconsolidated clastic deposits and evaporitic sequences. The salt flat itself resides in a tectonic basin of important subsidence and recent compressive-transpressive behavior. It is bounded by high angle reverse and strike-slip faults that have affected the Paleozoic basement to current cover (Jordan et al., 2002; Mpodozis et al., 2005; Arriagada et al., 2006; Jordan et al., 2007). Toward the south of the salt flat, the Cordón de Lila igneous-sedimentary complex is found; and in the north-central portion, surficial sediments are present that are associated with the San Pedro River Delta.
Since the Mesozoic Era, the space generated from regional faults movements has controlled the deposition of the distinct geological formations in the area, as well as current morphology (Mpodozis et al., 2005; Arriagada et al., 2006). The basement rock represents the oldest consolidated units of the Salar de Atacama Basin that outcrop in the higher peaks of the Cordillera de Domeyko and Cordón de Lila. It is constituted by Paleozoic to Paleocene intrusive rocks, Paleozoic fluvial and marine deltaic sequences, as well as Paleozoic to Cretaceous continental and volcanic sequences. These outcrops are partially covered by continental sedimentary sequences.
Consolidated ash flows from ignimbrite deposits of the Miocene age to present day unconformably overlie basement rock and cover large areas of the Cordillera Occidental and slopes of the Cordón de Lila. Furthermore, Oligocene to Holocene unconsolidated deposits of alluvial, fluvial, and eolian origin outcrop Llano de la Paciencia, west of Cordillera de la Sal, as well as along the slopes of Cordón de Lila.
| 6.2 | Local Geology |
The surficial geology in the Salar de Atacama area comprises recent evaporitic deposits, where over time, the process of evaporation has precipitated salts, as well as unconsolidated surficial sediments along the salt flat margins (Figure 6-1). The salt crust principally comprises halite, sulfates, and occasional organic matter. With depth, evaporitic, clastic, and thin volcanic ash deposits host brine delimitated and cut by local fault systems. Several structural blocks were identified due to observed displacement and deformation of the geological units (Chapter 7).
The north-northwest-south-southeast (NNW-SSE) trending Salar Fault System is the most important structural system, spanning from the southern limit of the San Pedro River Delta and deepening toward the north (Arriagada, 2009). Within the Salar de Atacama, the high angle reverse Salar Fault represents the most important structural feature with significant displacement of the lithologic units on either side, defining two main structural domains, the West Block and East Block (Figure 6-1). Another important fault system in the salt flat that corresponds to the Cabeza de Caballo Fault System that extends from the Lila Mountain to the north. Several other NNW-SSE trending faults systems were also identified.
Figure 6-1. Local Geology Map of Salar de Atacama
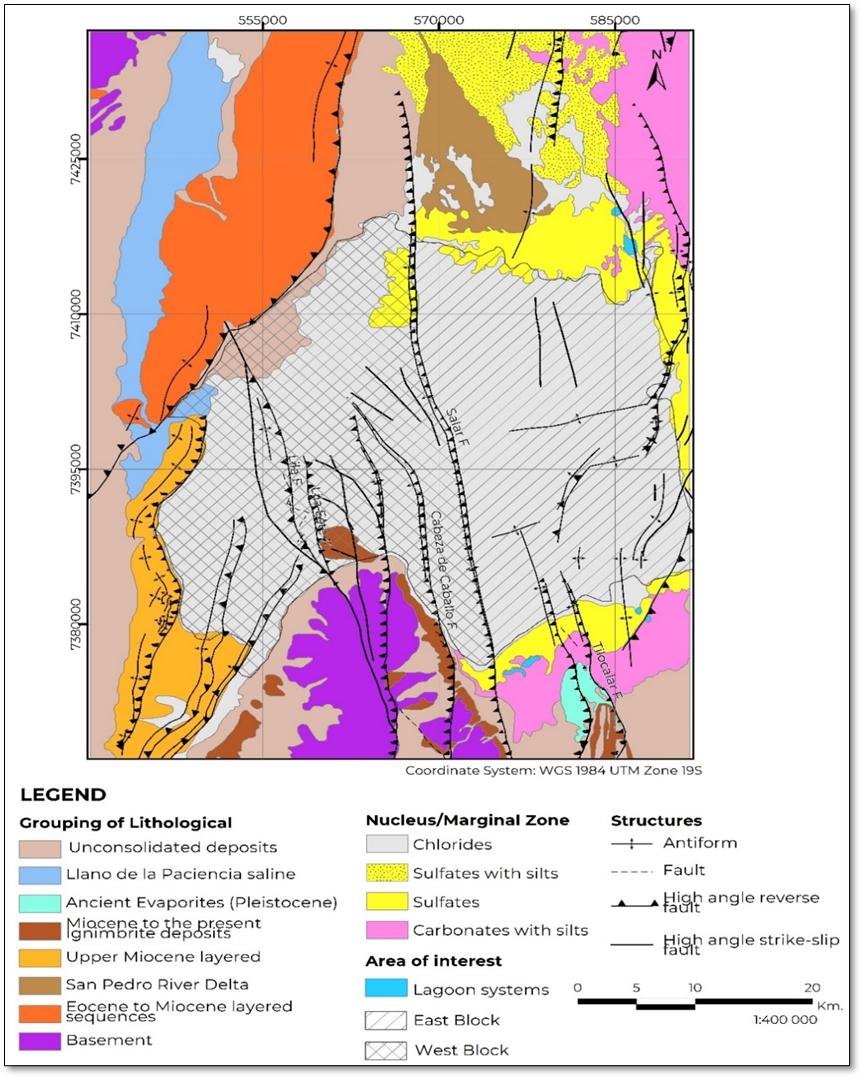
| 6.3 | Property Geology |
The stratigraphic units within the property are briefly described and presented below from youngest to oldest (SQM, 2021). The following sub-section presents geological cross sections through the property geology and the general stratigraphic sequence (Figure 6-2 and Figure 6-3).
| 6.3.1 | Upper Halite |
This unit comprises pure halite and halite with clastic sedimentary material and/or gypsum. The clastic sedimentary material comprises clay, silt, and sand, which are more abundant near surface and decrease with increasing depth. The Upper Halite has a mean thickness of 17 m in the West Block and 23 m in the East Block. In the West Block, the Upper Halite is underlain by clay, gypsum, or carbonate units, depending on the specific area. In the East Block, the Upper Halite overlies halite with organic matter.
| 6.3.2 | Clastic and Upper Evaporites |
Clastic and evaporitic unit underlying the Upper Halite, which is mainly constituted by plastic clays, evaporites (halite and gypsum) and carbonates. This unit is mainly recognized in the West Block, and it presents a variable thickness between 0.3 m and 16 m, with a mean thickness of 1 m. This unit also includes two clay layers located in the SW and NW areas of the West Block.
| 6.3.3 | Halite, Gypsum, and Carbonates with Organic Matter |
This unit is mainly constituted by halite with interbedded gypsum, carbonates, and organic matter (black to gray colored). It is found in the East Block, with a minimum thickness of 3 m near the Salar Fault and maximum thickness of 242 m along the eastern edge of the salt flat (with a mean thickness of 64 m throughout the area). This unit separates the Upper Halite unit from the Intermediate Halite Unit in the East Bock.
| 6.3.4 | Intermediate Halite |
The Intermediate Halite is divided into three distinct blocks according to observed spatial differences: (i) Northwest Block from the coordinate 7,385,626 5 m S, (ii) Southwest Block from the coordinate 7,385,626 m S, and the East Block. The three blocks are characterized by pure halite and halite with clastic sedimentary material and/or gypsum, with less than 25% of intercrystallite and intracrystalline content. In the East Block, minor traces of organic matter and carbonates are also present.
The Intermediate Halite unit thickness differs between the West Block and East Block: in the northwest (West Block), its maximum thickness is 25 m, while in the East Block, its maximum thickness reaches 429 m (with a mean thickness of 238 m).
| 6.3.5 | Evaporites and Intermediate Volcanoclastics |
The Evaporite and Intermediate Volcanoclastic Unit represents an erosional unconformity and is composed of interbedded gypsum, tuff, and reworked volcanoclastic material. In total, at least 10 tuff layers are found in this unit that are affected by local wedging, folding, and truncation. Toward the north of the salt flat, a change of facies is present where the gypsum grades to halite and the thickness increases (to the north) and is wedged to the south.
In the western block, this sequence has a recognized thickness of between 0 and 157 m and a mean thickness of 84 m. Its top, on average, is located at a depth of 51 m below the surface of the salt flat. Between the Salar and Cabeza de Caballo Faults, a sequence of sediments and evaporites called Sequence 1 is found which composed mainly of clay, halite, and gypsum. This sequence decreases towards the south and towards the Salar Fault, with thickness ranging from 7 to 36 m and a mean thickness of 20 m, where its greatest thickness is observed in the SOP deposit.
In the East Block, the Intermediate Evaporitic and Volcanoclastic unit is similar in composition to that described in the West Block. The only difference is that its mean thickness is on the order of 100 m, and the top of this unit is located at a mean depth of 318 m below surface.
| 6.3.6 | Lower Halite |
The Lower Halite comprises pure halite, halite with clasitic sedimentary material and/or gypsum, as well as halite with clay and/or sand. The halite generally presents a mosaic texture, and the clastic sedimentary material represent less than 25% of the rock, and they are clays, silt, and brown to red sands. The gypsum content represents less than 10% of the unit.
This unit is recognized in both West and East Blocks; in the West Block it has a variable thickness with a mean of 69 m in the West Block.
| 6.3.7 | Regional Clays |
A deep layer of clays, with a minimum depth below land surface of 60 m (West Block) and maximum depth below land surface of 400 m (East Block). This unit represents an erosional unconformity according to the seismic profile interpretation (Arriagada et al, 2006 ).
Underlaying the shallower sections of the Regional Clays, a deep tuff layer can be found with a mean thickness of 5 m. It consists of a thin crystalline - pumice tuff with abundant biotite, feldspars, and sparse quartz.
| 6.3.8 | Geological Sections and the Stratigraphic Column |
Two cross sections of the geological units that intersect the SQM properties are shown in Figure 6-2; this geological model was built using the Leapfrog Geo software and is based on well lithologic logs as well as geophysical sections (Chapter 7; SQM, 2020). In the referenced figures, the various lithologic units are displayed with depth.
As a result of fault displacement and deformation, the East and the West blocks of the Salar de Atacama present important differences in the depths of the lithologic contacts. The west-east cross section highlights the displacement of the units due to the Salar and Cabeza de Caballo faults and shows the deepening of the units in the East Block. In the north-south cross section, the gypsum grades to halite toward the north, and its thickness increases 60 m.
Figure 6-2. Geological Cross Sections
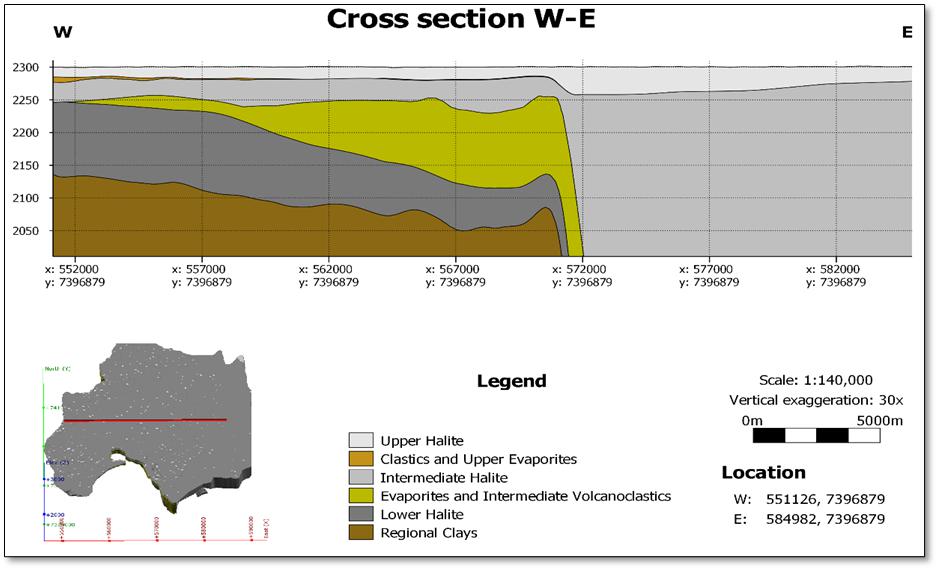
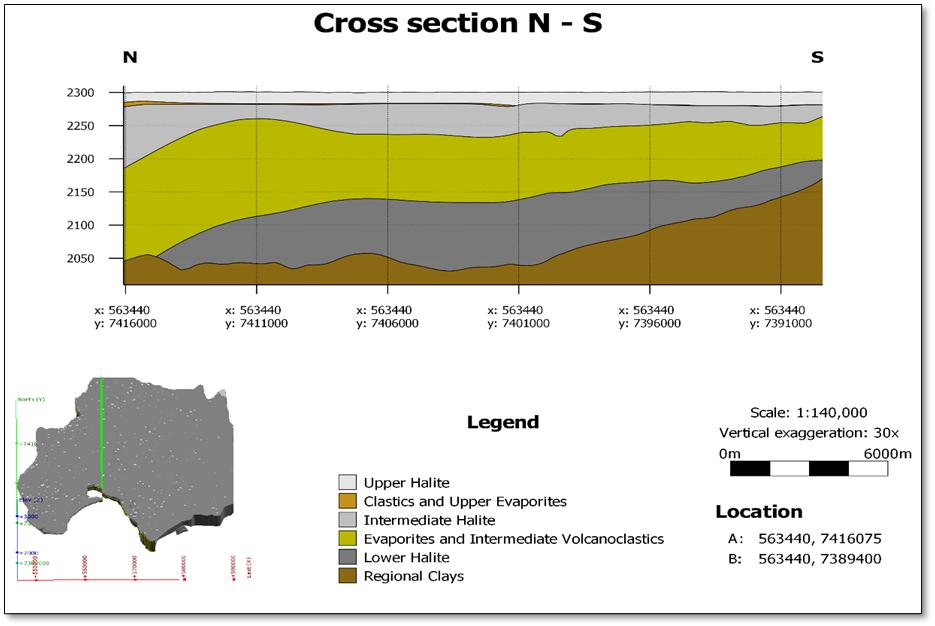
Two stratigraphic columns representing the West and East blocks are also presented in Figure 6-3. The most recently characterized type column for the East and West blocks were developed in 2018 by the Hydrogeology Department of SQM (i.e., GHS) using lithologic information from diamond drillholes.
Figure 6-3. Stratigraphic Columns of the Western and Eastern Blocks
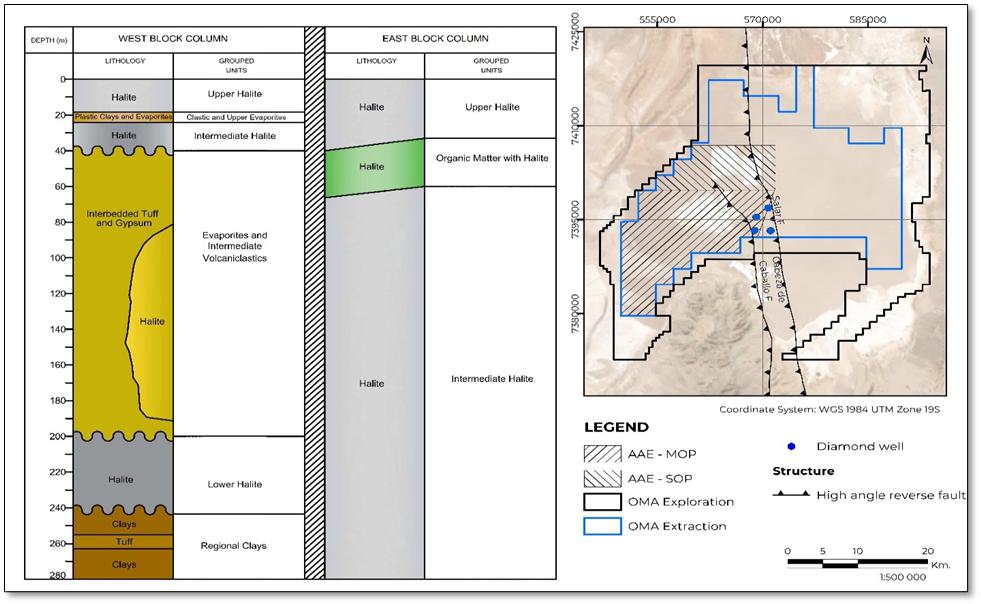
| 6.4 | Deposit Types |
The Salar de Atacama brine deposit is contained within porous media filled with interstitial brine rich in Li, K, and boron among other ions. Houston et al. (2011) defined two types of salt flats, mature and immature salt flats:
| · | Mature Salt Flats: “Dry” salt flats have a lower moisture flux and well-defined halite nucleus. They are characterized by the development of a relatively uniform sequence of deposited halite in subaqueous to subaerial conditions. Brines are normally found above the saturation point of halite and solute concentrations are generally higher than those of immature salt flats. |
| · | Immature Salt Flats: “Wet” salt flats which are characterized by a sequence of alternating fine clastic sediments and evaporites (halite, ulexite, and/or gypsum). The contained brines rarely reach halite saturation, suggesting the absence of a hyper arid climate during their formation. Immature salt flats tend to be more frequent at higher elevations and toward the wetter northern and eastern portions of the Altiplano-Puna region. |
Figure 6-4 shows the different distribution of facies and main lithological components in both mature and immature salt flats classifications.
The Salar de Atacama nucleus is constituted by a thick section of evaporites over a surface area of 1,100 square km and up to a depth of 900 m (Bevacqua, 1992; Xterrae, 2011). (Arriagada, 2009). It is surrounded by a marginal zone of clastic sediments over an area of about 2,000 square km of extension (Díaz del Río et al., 1972). The nucleus is mainly constituted by halite (>90%) with sulfate and a minor percentage of clastic sediments as well as some interbedded clay sediments and sulfates. Therefore, the Salar de Atacama is classified as a mature salt flat, according to the site geology and Houston, et al. (2011) classification.
Figure 6-4. Mature and Immature Salt Flats (Houston et al., 2011)
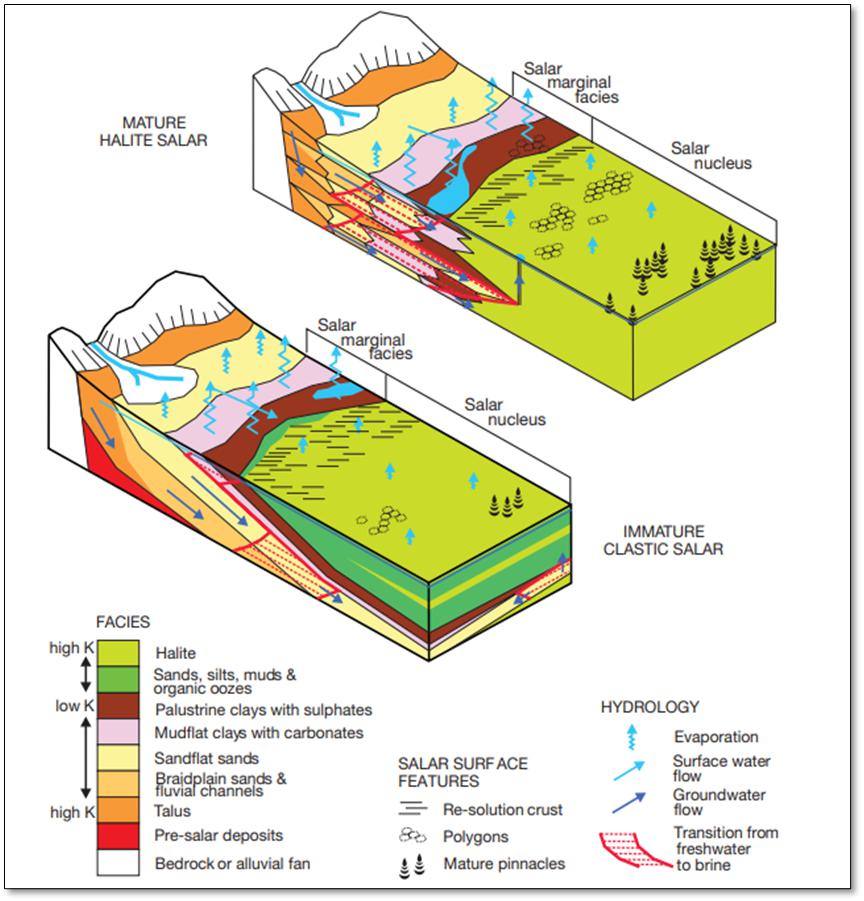
| 7 | EXPLORATION |
This chapter provides an overview of exploration work that has contributed to the development of the geological and hydrogeological conceptual models of the Project.
| 7.1 | Geophysical Surveys |
Geophysical information collected and utilized by SQM includes data obtained from surface survey lines and downhole geophysical instruments deployed in wells. The surface geophysical dataset is comprised of data collected by the transient electromagnetic method (TEM), nanoTEM, Electrical Resistivity Tomography (ERT), Magnetotelluric method (MT), and seismic reflection. The downhole geophysical dataset complements the geological, stratigraphical, and hydrogeological logging of wells, providing guidance for the cross correlation of stratigraphic units between holes to facilitate the continual improvement of the 3D stratigraphic, structural, and hydrogeological models of the salt flat. Downhole logs routinely run by SQM in the drilled wells include Caliper logs, Natural Gamma, and Borehole Nuclear Magnetic Resonance (NMR/BMR, Vista Clara Inc). Each layer (stratigraphic unit) presents a characteristic combination of responses to these three logs, assisting in the cross-correlation of stratigraphy.
Seismic reflection surveys in the salt flat nucleus have contributed to a better understanding of the layering of the reservoir, its depth, and the influence of the structural features present. Figure 7-1. presents the latest seismic reflection interpretation (AguaEx SPA, 2020), highlighting the ductile deformation of the stratigraphic units due to displacement of the Cabeza de Caballo and Salar faults (eastern portion of the section). Resistivity methods (e.g., TEM and nanoTEM) were undertaken, mainly along the marginal areas of the Salar de Atacama, aiding in delineating the brine-freshwater interface and lithologic changes with depth.
Figure 7-1. Seismic Reflection Survey (AguaEx, 2020)
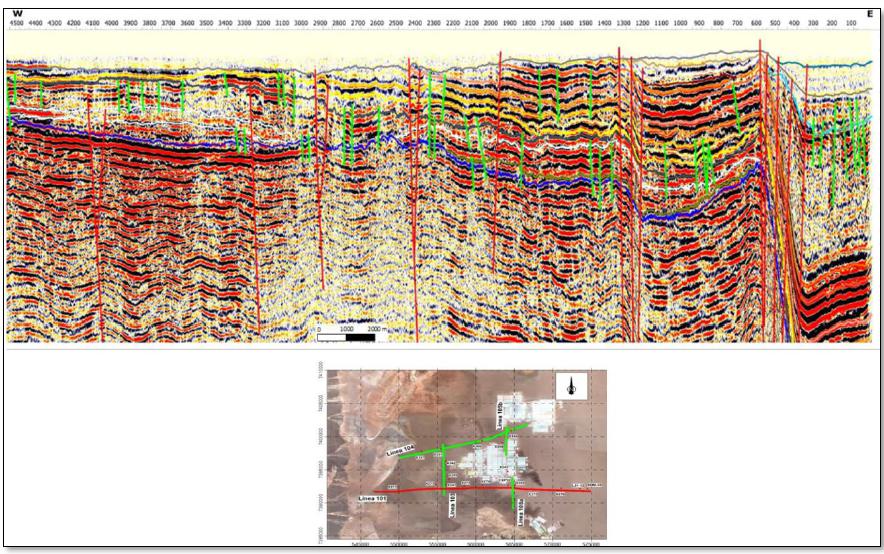
Note: The lines on the map indicate the seismic profile locations. The red line indicates the location of the profile shown in Figure 7-1..
Table 7-1 summarizes the surface geophysical dataset utilized by SQM. Table 7-2 shows the quantity and length of all downhole logs reviewed by SQM.
Table 7-1. Summary of the Conducted Geophysical Datasets
| Surface geophysical method | Number of survey lines | Total length of survey lines |
| TEM | 120 lines | 643 km |
| TEM & NanoTEM | 9 lines | 54 km |
| MT | 5 lines | 67 km |
| ERT | 6 lines | 7.3 km |
| Seismic Reflection | 6 lines | 76.8 km |
| Total | 146 lines | 848.1 km |
Table 7-2. Summary of the Conducted Borehole Geophysics
| Borehole geophysical method | Number of borehole logs | Total length of logs |
| Caliper Log, NMR, or BMR | 566 logs | 49.3 km |
| 7.2 | Exploration Drilling |
The Salar de Atacama nucleus is densely covered by wells that provide geological, hydrogeological, geophysical and hydrogeochemical data. A total of 2,725 wells (more details in Chapter 11, Table 11-1), covering an approximate total drill length of 164 km, were used to construct the geological conceptual model for the Project. Figure 7-2 shows the well distribution in the OMA Exploration Area of the Salar de Atacama nucleus. The well data is stored and managed by SQM in an acQuire™ database. Tableau™ is used as a front-end process to facilitate the review and analysis of well data held in the acQuire database.
Figure 7-2. Distribution of Wells that provide Geological and Hydrogeological Information for the Project (SQM, 2020)
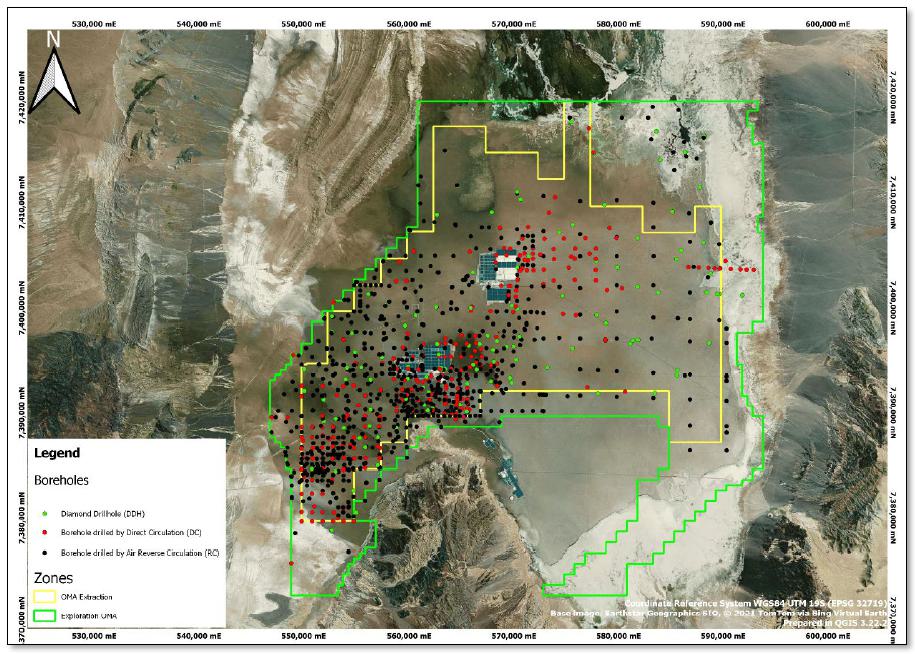
| 7.2.1 | Porosity Characterization |
The total porosity of an earth material is the percentage of its total volume that corresponds to fluid-filled voids. Pumpable brine is hosted in the network of interconnected pores of the geological material that hosts the brine. This interconnected network of drainable, or pumpable, pore space comprises the effective porosity of the material.
The volume of water that will drain naturally under gravity at atmospheric pressure from the effective porosity as a water table descends through the geological medium is termed the drainable porosity or specific yield. The fraction of the water that is retained in the interconnected pore space by capillary forces is termed the specific retention. Isolated (non-connected) pores form a minor part of the total porosity of the system. These pores will not drain under gravity and are non-pumpable.
SQM’s brine volume estimate in the nucleus of the Salar de Atacama is based on over 14,500 porosity measurements in over 100 wells (Table 7-3 and Figure 7-3) evenly distributed across the surface of the salt flat nucleus. Figure 7-4 summarizes the distribution of effective porosity in the Upper Halite, Intermediate Halite, and Halite with Organic Matter units.
Table 7-3. Summary of Boreholes with Porosity Measurements
| Porosity measured by | Quantity of wells | Porosity measurements | Measurements | |
| n | % (of total) | |||
| CORFO (1977) | 8 | 85 | 0.6% | Total porosity & effective porosity |
| Hydrotechnica (1987) | 37 | 3,625 | 24.9% | Effective porosity & drainable porosity |
| Water Management Consultants (1993) | 6 | 375 | 2.6% | Effective porosity & drainable porosity |
| SQM (2011 to 2019) | 56 | 10,496 | 72.0% | Effective porosity |
| Total | 107 | 14,581 | 100% | |
Figure 7-3. Distribution of Boreholes with Porosity Measurements
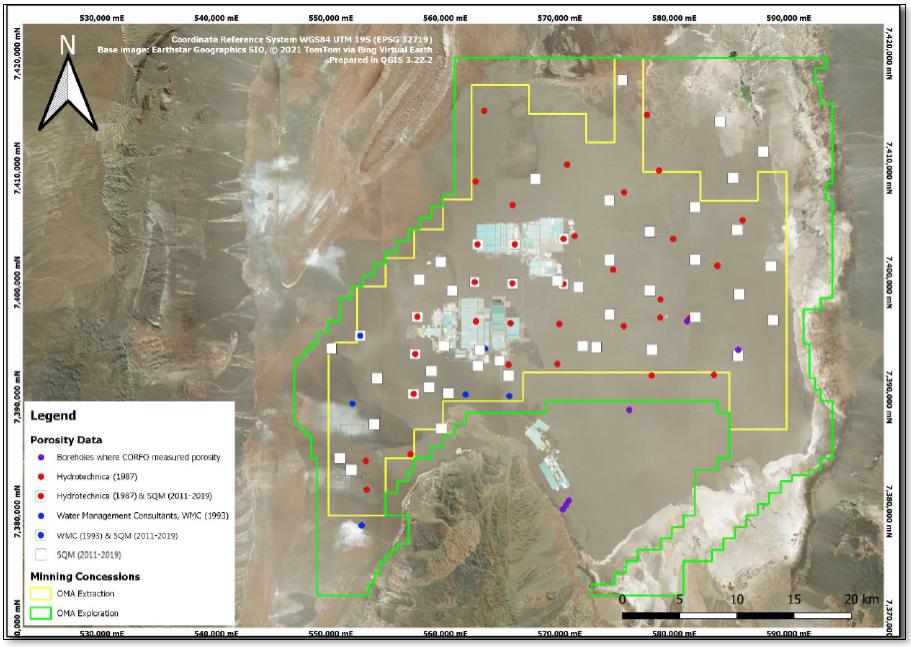
Figure 7-4. Effective Porosity (%) Histogram of the Upper Halite, Intermediate Halite, and Halite with Organic Matter
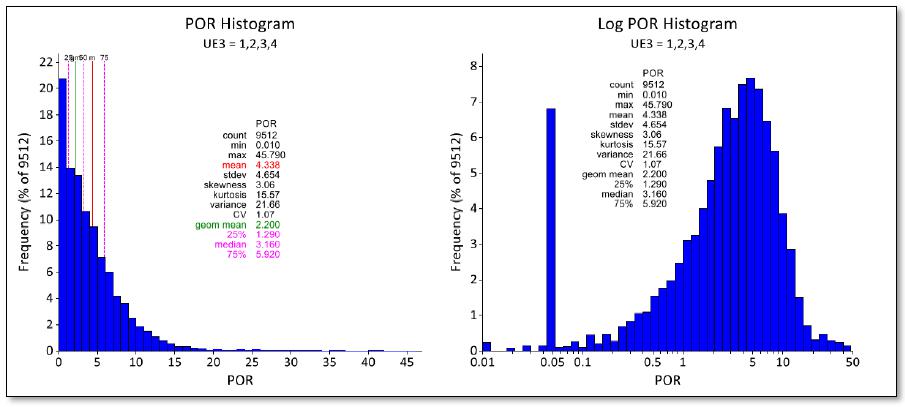
| 7.2.2 | Brine Sampling |
In the Salar de Atacama, SQM’s operational wells are constantly sampled. Wells can also be monitored in areas where production wells are not allowed (OMA Exploration). In all, brine chemistry sampling from wells has been performed using:
| · | Pumping Tests |
| · | Chemical sampling during drilling |
| · | Bailer sampling |
| · | Sampling during packer tests |
Chemical samples are collected under field standards and procedures followed by the SQM field team. In general, the sampling of each chemical record consists of the collection of brine in two plastic bottles, a 125 milliliter (mL) bottle for chemical analysis and a 250 mL bottle for density analysis. A third sample is taken to verify the analysis, or original sample. The analyzed chemical constituents correspond to:
| · | K |
| · | Na |
| · | Mg |
| · | Li |
| · | Ca |
| · | SO4 |
| · | H3BO3 (Boric Acid) |
| · | Cl |
| · | Density |
Potassium is analyzed by inductively coupled plasma (ICP) analysis, and Li is analyzed by atomic absorption spectroscopy (AA). During this process, several quality assurance and quality control (QA/QC) standards are followed before and during the analysis (Chapter 8), and then during data reporting.
Figure 7-5 shows the spatial distribution of the utilized brine chemistry measurements. As shown, the brine chemistry distribution is considerably dense and most samples come from pumping wells, increasing the confidence in the brine chemistry distribution and its representativeness of the reservoir chemistry.
Figure 7-5. Distribution of Boreholes with Brine Chemistry Measurements
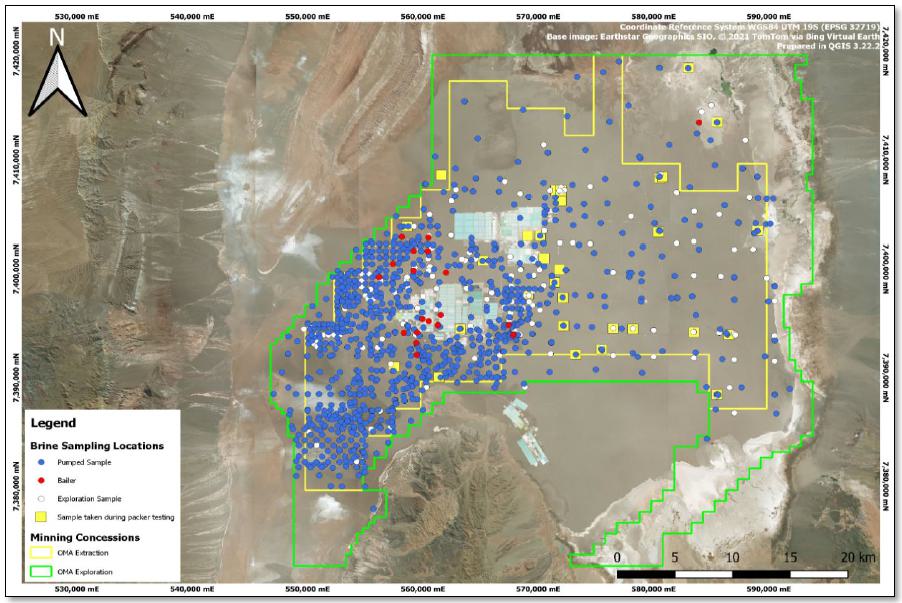
Figure 7-6 shows the histograms of the brine chemistry dataset for Li and K after filtering the data for potential anomalies and errors. Mean, minimum (min), and maximum (max) concentrations for each analyzed solute are also included (Figure 7-6) from the extensive dataset of nearly 5,000 brine samples.
Figure 7-6. Histogram of Li and K Concentrations (%)
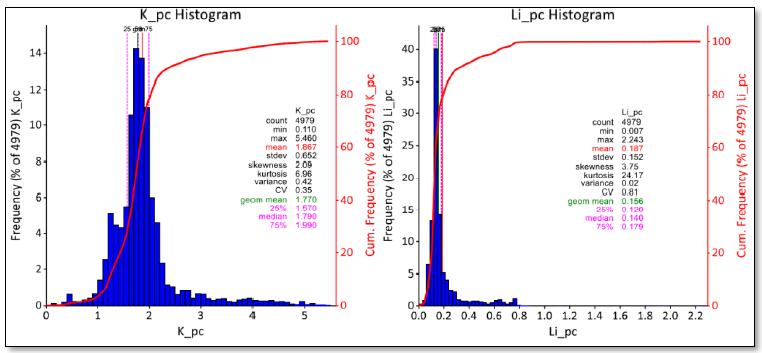
| 7.3 | Conceptual Hydrogeology |
In the Salar de Atacama nucleus, SQM has its own equipment and personnel to carry out hydraulic tests, allowing for relevant information to be continuously generated on the reservoir permeability. All these tests are constantly supervised in the field by SQM's team of geologists and hydrogeologists under standardized procedures that are updated every year.
Transmissivity1 was estimated from two types of hydraulic tests, pumping tests and packer tests. The former tends to be more representative, since they can pump high flow rates (up to 100 L/s, depending on the screened unit), and usually last for four days, or more. Packer tests allow for more representative results of select lithologies (pumping sections between 1.5 m and 9 m). In general, the conducted packer tests are of short duration and lower flow rates (less than 1 L/s for less than 24 hours).
| 7.3.1 | Hydrogeological Units |
The current hydrogeological conceptual model of the Salar de Atacama considers ten “grouped” hydrogeological units described in Table 7-4. The third column of Table 7-4 indicates the hydraulic character of the unit. HU1, Unit A (UA), is characterized as an unconfined brine unit, while the HU3, Unit B (UB), is characterized as a confined brine system due to massive halite of generally low porosity. In the case of the UB, the hydraulic confinement in certain sectors is due to the overlying aquitard (low permeability layer) of the interbedded halite and gypsum with organic sediments of HU2, Aquitard UAB. Unit UC is confined and comprises thin, but permeable tuffs and interbedded gypsum of low permeability. Unit UD is also confined and is characterized by a low permeability. The other units (UH6 to UH9) correspond to marginal facies along the boundaries of the salt flat nucleus.
The description in the fifth column of Table 7-4 highlights the importance of the structural control and tectonics on the Atacama Basin. Units that exist to east of the Salar Fault (East Block) have a significantly greater thicknesses when compared to the west of the Salar Fault (West Block). The majority of brine extraction wells operated by SQM and Albemarle are located in the West Block.
1 The term transmissivity (T) is used to describe an aquifer’s capacity to transmit water. Transmissivity is equal to the product of the aquifer thickness (m) and hydraulic conductivity (K).
Table 7-4. Hydrogeological Unit Descriptions
| ID | Geological Unit(s) | Hydrogeological Unit | Reservoir type | Description |
| HU1 | Upper Halite | UA | Unconfined | Porous halite extending throughout the entire nucleus with secondary porosity. Ranges in thickness from 15 to 45 m, with the thickest portion to the east of the Salar Fault. May be locally cavernous at the upper limit of the unit, where K may locally attain values of several thousands of m/d & Sy may be up to 40%. |
| HU2 | Clastic and Evaporitic Unit with Halite and Organic Material | UAB | Aquitard forming a confined unit | Halite and gypsum with organic material that extends throughout the entire nucleus. Reaches thicknesses in the range of 100 - 150 m to the east of the Salar Fault but only 1 to 5 m to the west of the Salar Fault. Characterized as an aquitard which hydraulically confines the brine system in the Deep Nucleus. |
| HU3 | Intermediate Halite | UB | Confined | Massive halite of generally low porosity. The base of this unit is delimited by a layer of tuff (volcanic ash) |
| HU4 | Evaporites and Intermediate Volcanoclastics | UC | Confined | Interbedded gypsum and ash plus reworked volcanoclastic levels with lateral gradation to halite (towards the north of the salt flat). Reaches thicknesses in the range of 0 -160 m. |
| HU5 | Regional Clays and Deep Halite | UD | Confined | Massive halite and deep clay that is assumed to have a very low permeability. |
| HU6 | Sulfates and Carbonates with Silt | Marginal Zone | Leaky layered unit exhibiting a semiconfined behavior | Thin layers & lenses of gypsum & calcite with interbedded organic material and terrigenous clays & silts. This unit attains thicknesses of between 100 m & 200 m, with the thickest located to the east & north. The uppermost part of the unit may locally exhibit secondary porosity (voids). |
| HU7 | Sulfates and Sulfates with silt | Eastern Transition Zone | Leaky layered unit exhibiting a semiconfined behavior | Layered halite & gypsum sequence. Includes interbedded lenses of fine sands and silts deposited from the San Pedro River Delta and the Soncor wetland during infrequent flood events. This unit is between 20 to 30 m thick, with the greatest thickness towards its southern limit. |
| HU8 | Unconsolidated Deposits | Alluvial Zone | Unconfined freshwater system | Coarser sediments (gravels & coarser sands) are predominant in higher elevation areas; fine sands and silts dominate towards the salt flat nucleus (where topographic gradients are shallower and surface runoff velocities would have been lower at the time of deposition). The thickness of this unit ranges from 25 to 300 m. |
| HU9 | San Pedro River Delta | San Pedro River Delta | Aquiclude | Silts and clays. The thickness of the unit is at least 100 m. |
| HU10 | Igneous Rock | Hydraulic Basement | Assumed non aquifer | Deepest unit characterized by very low permeability rocks which are assumed to represent a no-flow boundary. |
For the ten hydrogeological units, Table 7-5 shows the conceptual ranges of hydraulic conductivity (K), a parameter used to measure how easily groundwater can flow through the aquifer. These values are based primarily on the dataset built by SQM over the years from (a) pumping tests and other hydraulic tests conducted by SQM in the set of boreholes that it manages in the Salar de Atacama Basin, particularly the nucleus; and (b), peer-reviewed values published by third parties, or otherwise made available in the public domain, (e.g., within the context of environmental impact assessments of third-party projects). Figure 7-7. Hydraulic Testing Locations, OMA Exploration shows the distribution of the hydraulic tests conducted within the OMA Exploration Area.
Figure 7-7. Hydraulic Testing Locations, OMA Exploration
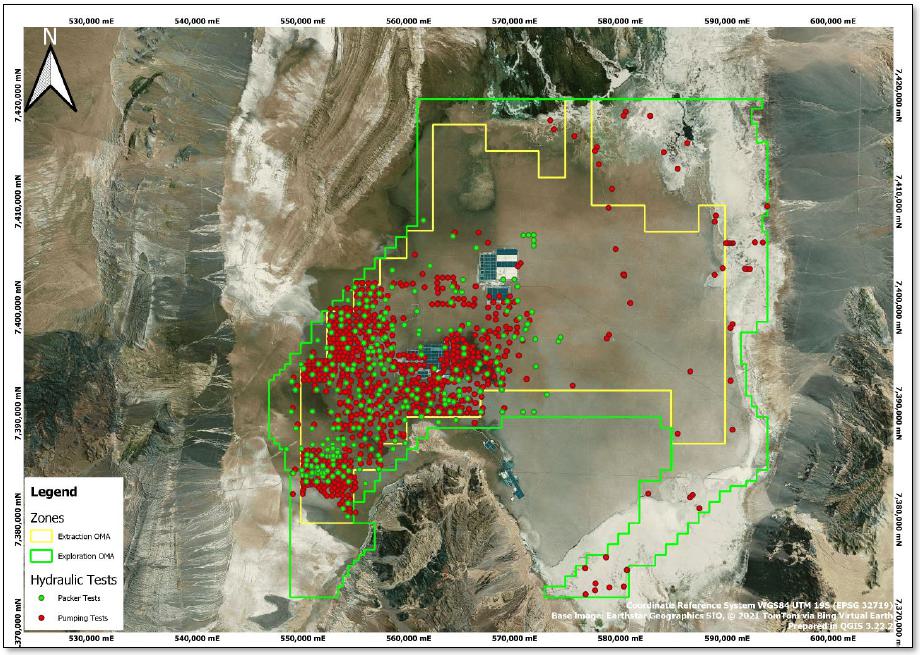
Table 7-5. Hydraulic Conductivity Ranges for each Hydrogeological Unit
| ID | Hydrogeological Unit | Hydraulic conductivity, K (m/d) | |
| From | From | ||
| HU1 | UA | 1E-02 | 5E+03 |
| HU2 | UAB | 6E-04 | 2E+00 |
| HU3 | UB | 2E-03 | 1E+02 |
| HU4 | UC | 1E-07 | 2E+02 |
| HU5 | UD | 1E-07(1) | 1E-05(1) |
| HU6 | Marginal Zone | 1E-03 | 1E+01 |
| HU7 | Eastern Transition Zone | 1E-03 | 2E+03 |
| HU8 | Alluvial Zone | 1E-01 | 1E+02 |
| HU9 | San Pedro River Delta | 8E-05 | 4E-04 |
| HU10 | Hydraulic Basement | 1E-09(1) | 1E-09(1) |
(1)Note: Estimated values based on the lithology
Figure 7-8 and Figure 7-9 present hydrogeological cross sections in the Zona Autorizada de Extracción, or Authorized Extraction Zone (ZAE), with their locations in plan view. The structural control exerted by the faults, particularly by the Salar Fault and the Cabeza de Caballo Fault, are evident.
Figure 7-8. W – E Hydrogeological Cross Section from the Hydrogeological Model
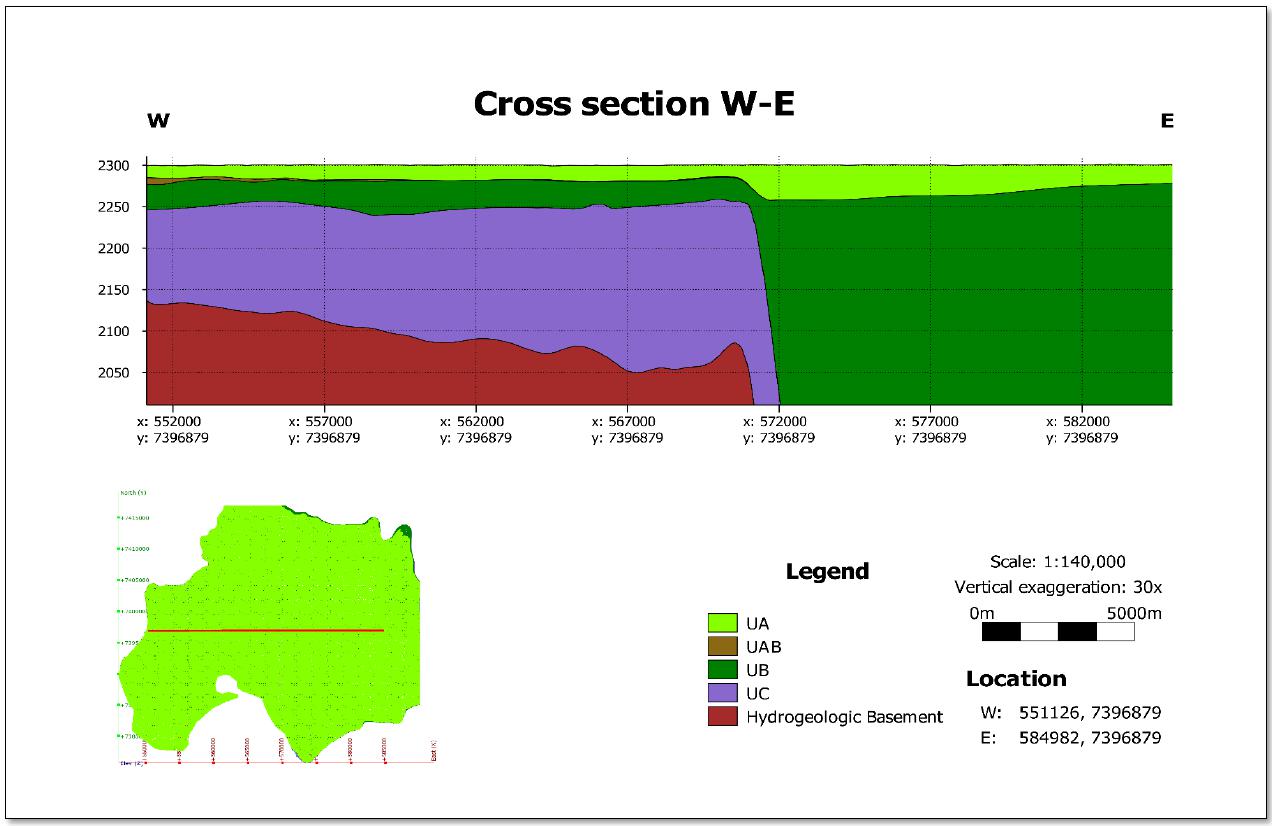
Figure 7-9. SW - NE Hydrogeological Cross Section from the Hydrogeological Model
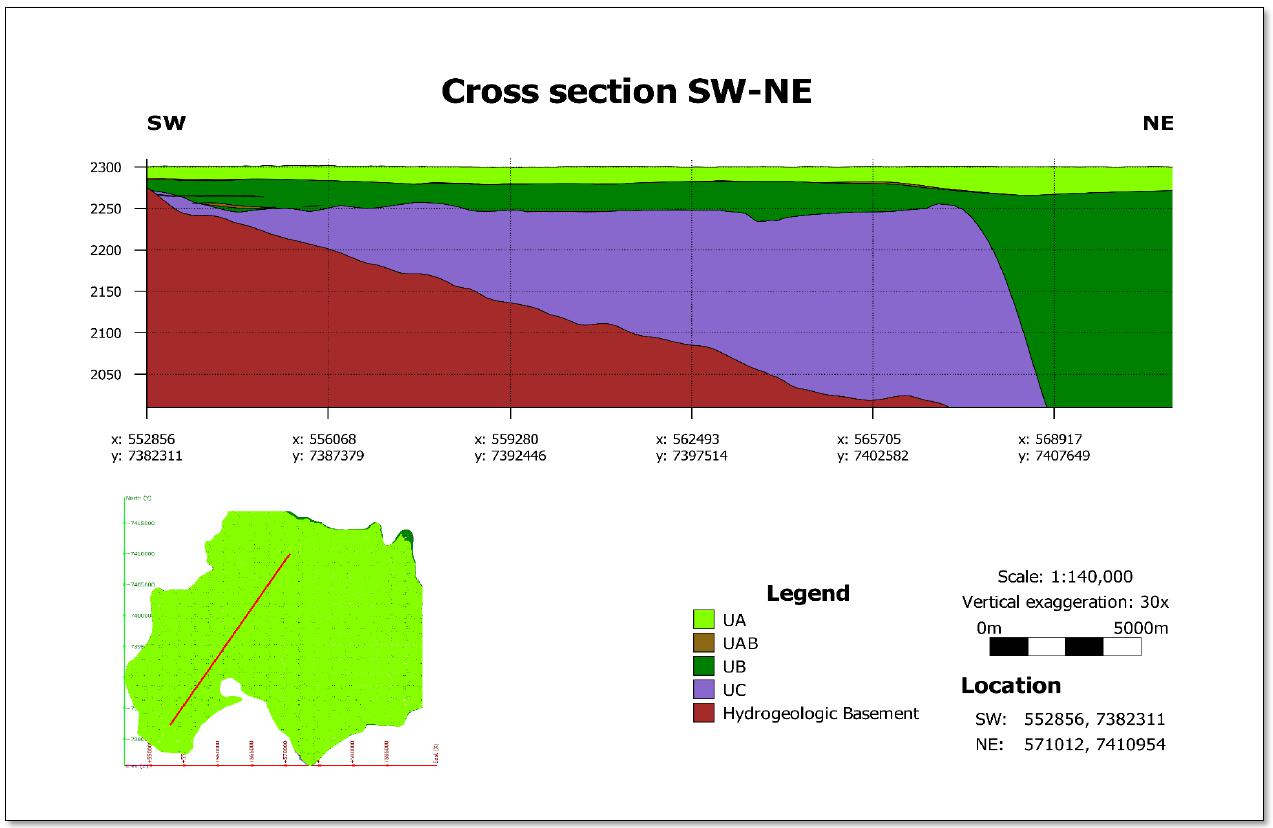
| 7.3.2 | Conceptual Water Balance |
The Salar de Atacama represents a hydrological discharge zone, where incoming freshwater recharge from high-elevation areas approaches the salt flat margin and discharges to the surface, mainly due to water density differences. Flow directions are predominantly from surrounding high-elevation areas toward the salt flat margin and nucleus, where active evapotranspiration is present.
A conceptual water balance was developed by SRK (2020) and updated by SQM (2021), which considers discharges from different points of the Salar de Atacama basin through three zones to include the upper, middle, and lower zones. In this system, contributions of direct recharge from the upper to middle, and middle to lower zones are mainly dominated by evapotranspiration at the surface. In the lower zone, brine is present and includes the nucleus plus the part of the marginal zone that lies towards the bottom of the interface (called the marginal zone - brine). Recently, lateral recharge was updated by WSP (2022), in order to incorporate new information provided by SQM.
The conceptual water balance considers all main input and output components that are summarized below:
Inputs:
| · | Direct recharge, which has been estimated through methods for arid zones (DGA – DIHA PUC, 2009) that consider infiltration and runoff coefficients linked to the hydraulic characteristics of the hydrogeological units. |
| · | Lateral recharge from other zones, consisting of underflow from adjacent areas and runoff over low permeability units, is produced by precipitation and potential infiltration of lower density water in outlying areas of the basin. |
| · | Surface runoff, which is generated by the liquid precipitation and streams. |
Outputs:
| · | Surface water evaporation, related to natural discharge due to evaporation of the free water surface (water bodies and springs). |
| · | Groundwater evaporation, corresponding to natural discharge of shallow groundwater. This component is related to the extinction depth, water density, as well as the properties of the soil surface materials. |
| · | Brine extraction from SQM’s mining operations that occurs in the lower zone, and also Albemarle pumping that represents an additional hydrological discharge in the salt flat. |
| 7.4 | Qualified Person’s Opinion |
It is the resources QP's opinion that the hydrogeological characterization, hydraulic testing, sampling, and laboratory methods meet the standards for a lithium project and operation of this developmental status. Furthermore, the amount of data obtained from exploration and testing is considerable when compared to other lithium brine projects. It is believed that the characterization of the brine reservoir is at the level of detail needed to support the lithium brine Mineral Resource and Mineral Reserve estimates presented in this TRS.
| 7.5 | Geotechnical Considerations |
SQM operates a production wellfield, with discrete vertical wells, that extracts brine largely from massive evaporitic deposits in the Salar de Atacama. Since the mining operation does not involve the excavation of open pits, or underground mine workings, to access the mineral deposit; and because a compact lithology is prevalent in many areas of the Project, it is not necessary to develop a detailed characterization of the geotechnical behavior of the earth materials over the spatial extent of this mining property.
| 8 | SAMPLE PREPARATION, ANALYSIS, AND SECURITY |
The utilized sampling methods in the Salar de Atacama are related to the different drilling and pumping methodologies performed in the distinct field campaigns. Diamond drilling is used by SQM to obtain core samples for porosity analysis. This method allows for the collection of rock cores from which samples are selected and prepared for analysis. Subsequently, collected brine samples for chemical and density analysis are taken during and after the drilling of each well. The sampling by pumping, drilling (for exploration chemistry), and bailer and packer tests are used for obtaining brine samples from wells. The main ions analyzed, regardless of sampling method, include:
| · | Ca |
| · | Cl |
| · | H3BO3 (Boric Acid) |
| · | K |
| · | Li |
| · | Mg |
| · | Na |
| · | SO4 |
A traceable control system is implemented for the different sampling methods (brine and core), allowing for the monitoring of a sample from collection through to its entry in the database. During each step in the sampling and analytical process, a record of what has been done is documented, and the samples delivered/received follow the procedures and instructions created through a physical document called the “Chain of Custody”.
The QA/QC processes implemented by SQM provide reliability in the precision and accuracy of the data used for the estimation of Mineral Resources; therefore, the precision ranges in the brine sampling of the different operations are defined within the plant. Similarly, the parameters of precision and accuracy are designated in the chemical analysis process of the Analytical Laboratory of the Salar de Atacama (Lab SA), as well as for porosity in the Salar de Atacama Porosity Laboratory (Lab POR).
| 8.1 | Methods, Splitting and Reduction, and Security Measures |
| 8.1.1 | Brine Samples |
Samples are collected in 125-mL bottles for chemical analysis and 250-mL bottles for density analysis. They are previously rinsed with the same brine from the well to be monitored, filled to the top, and then sealed and labeled with a code per sample (both bottles have the same code, but refer to different analyses). As the last stage, brine samples are recorded on a control sheet. However, a third sample can be drawn as a “counter sample” (CM) for exploration and pumping test samples, and it is kept for two months. This sample is used to corroborate that the sample collection and analysis was correctly undertaken. Brine samples are sent to the QA/QC laboratory (Lab QA/QC) to centralize the reception activities of the brine samples from all areas, prepare shipments, prepare, and insert quality control samples, and send the samples for chemical and density analysis at the Lab SA.
| 8.1.2 | Effective Porosity Samples |
The wells with effective porosity samples come from diamond exploration campaigns with core recovery. The methodology of sampling and preparation of the samples for the estimation of porosity consists of an internal, rigorous and standardized SQM process, including the determination of the sampling frequency during drilling (currently, one sample every 1 m), the regularization and lithological description of the core sample (established every 10 cm in length), determination of analyzed samples, selection of samples for porosity, lithological description of the sample, labeling of samples (with a unique sample code), and recording of samples in the database.
Before conducting the porosity analysis, the samples go through a documentation review process and are measured to record their mass, diameter, and length. They are then photographed and analyzed.
| 8.2 | Sample Preparation, Assaying and Analytical Procedures |
| 8.2.1 | Brine Samples |
All samples go through a process that involves both SQM’s Hydrogeology Department (GHS) and Lab SA of the Salar de Atacama Production Management (GPS). The GHS oversees sampling, preparation of dispatch, entry into systems, shipment of samples to laboratory, importing, interpreting, and uploading of the results to the database. The SA Lab is responsible for the analysis of the samples and publication of the results in the system for import. The process of preparing samples for laboratory analysis goes through a treatment that spans the determination of the calibration curve, dissolution of salt precipitates, and weightings until the matrix is prepared for chemical analysis. Each sample is analyzed by different processes. Different equipment is used, depending on the requested analyte. Different matrices are prepared for each sample with different dilutions. Potassium is analyzed by inductively coupled plasma analysis (ICP). Li is analyzed by AA Spectroscopy.
| 8.2.1.1 | Laboratories |
Lab SA and Lab QAQC are internal to support production and are currently not accredited. Nevertheless, SQM completed a round robin analysis for four laboratories, three of which were external laboratories (LSA of the Universidad Católica del Norte, Geo Assay Group, Universidad de Antofagasta Asistencia Técnica S.A.). The evaluation of accuracy was undertaken for the different certified analytes and standards.
| 8.2.2 | Effective Porosity Samples |
Historically, in the Salar de Atacama, different direct methods were used to estimate the porosity of the samples. Since 2011, SQM has used pycnometers to measure the grain volume of rock samples and apparent density. These pycnometers are found in the SQM Porosity Laboratory, located in the Salar de Atacama. Through a double-chamber helium pycnometer (Accupyc), and according to Boyle's Law, the volume of grains in the sample is obtained. The volume of the envelope is calculated using a Geopyc, which determines the volume and density of the rock by displacement of a solid medium of small and rigid spheres with a high degree of fluidity (Dry Flo), wrapping the analyzed object without invading its pores. The Salar de Atacama Porosity Laboratory is internal to support production, and it is currently not accredited.
| 8.2.3 | Quality Control procedures and Quality Assurance |
SQM has implemented standardized protocols for both for the analysis of brine chemistry, as well as for the analysis of effective porosity to ensure good practices when determining both the evolution of brine chemistry and the porosities of the different units present in the Salar.
For brines, a QA/QC program was implemented to maintain an orderly data flow, providing monitoring from sample collection to the entry of the results into the database. Comparisons are made between duplicate and original (primary) samples, taking triplicate samples both in original and duplicate samples. Assays are performed with reference materials to monitor accuracy, and analytical blanks are included to determine potential contamination during sample collection.
In the case of effective porosity analysis, as with brines, there is a QA/QC program that generates standardization throughout the process, including the insertion of control duplicates. In addition, to ensure correct quality control, three stages are implemented for the general process to include calibration of the equipment during the analysis of the samples, validation, and exclusion of data after entering the database in acQuire.
| 8.2.3.1 | Brine Chemistry |
The SQM brine chemistry QA/QC program was created for the implementation of good practices for the utilized protocols. They range from the brine sampling activities to the receipt of samples, dispatch preparation, laboratory analysis, and receipt and review of results.
The systematic inclusion of QC samples is carried out to monitor the precision, accuracy, and potential contamination of analytical processes and conducted sampling. This monitoring is based on the following:
1) Inserting duplicates for precision monitoring:
| · | Analytical duplicates (ADUP). |
| · | Field Duplicates (FDUP). |
2) Inserting reference materials (standards or RM’s) for accuracy monitoring:
| · | High-grade lithium standard. |
| · | Lithium average grade standard. |
| · | Low-grade lithium standard. |
3) Inserting blanks (BLK) for monitoring potential contamination:
| · | Analytical blanks |
In October 2023, SQM increased the shipment of QC samples once again, aiming to standardize 17.5% of the total samples in the dispatch. Each one of these dispatches consists of 40 samples in total; however, this percentage depends on the sampling behavior with the daily duplicate sampling, as well as the RM and analytical targets inserted in the QA/QC Lab. In addition, a protocol is considered for the insertion of QC samples in the dispatches, for which their location is known in relation to the primary samples.
With the processing of 804 analytical duplicates and 522 field duplicates analyzed at Lab SA, the Max-Min graphs were made for Li and K considering an error ratio (ER) acceptance limit of 10% (SQM, 2020). The errors of Li and K for the analytical and field duplicates are shown in Table 8-1. Figure 8-1 and Figure 8-2 shows the plots for the evaluation of analytical and field duplicates, respectively.
Table 8-1. Evaluation of Analytical and Field Duplicates in Lab SA
| Duplicate Type | Analyte | Pairs | Failures | Error Ratio (%) | ||||||||||
|
Analytical Duplicates |
K | 804 | 15 | 1.9 | ||||||||||
| Li | 804 | 8 | 1.0 | |||||||||||
| Field Duplicate | K | 522 | 4 | 0.8 | ||||||||||
| Li | 522 | 3 | 0.6 | |||||||||||
*This table includes analytical, and field duplicates up until the end of 2020
Figure 8-1. Error Ratio Plots, Analytical Duplicates.
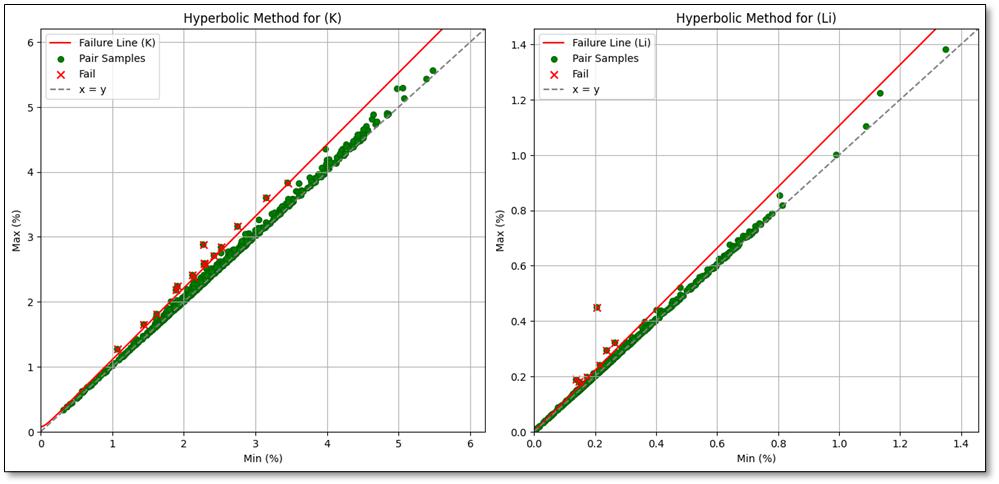
Figure 8-2. Error Ratio Plots, Field Duplicates.
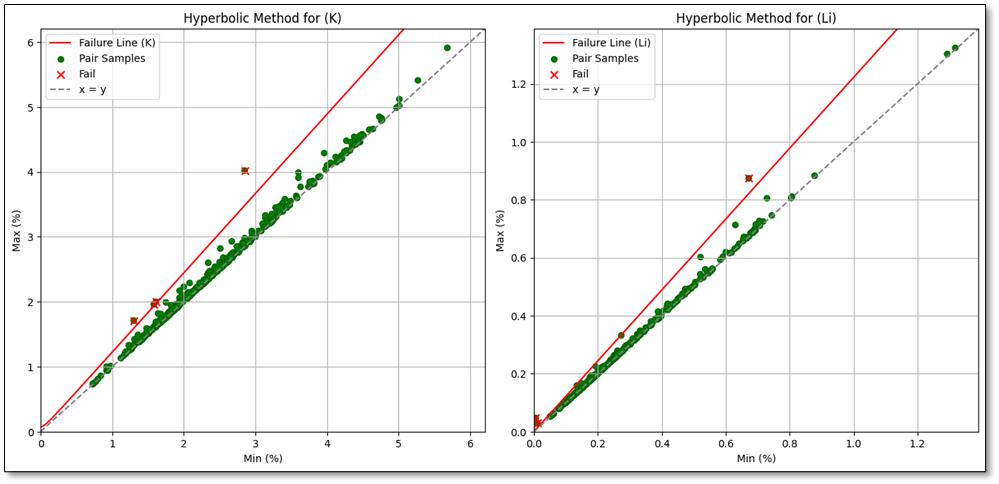
The conventionally accepted maximum ER is 10%. Therefore, it is concluded that the analytical precision and that of the sampling of the elements evaluated until the end of 2023 in Lab SA were, in practical terms, within acceptable limits, and that the sampling and analysis methods were adequate for the brine samples.
Standards are included in shipments sent to the primary laboratory to evaluate the variability and stability of the RM’s. Control Charts are prepared to check, identify, and exclude any Out-of-Control samples (SOC). 1,900 samples of these RM’s were sent to Lab SA throughout the period for their respective chemical analysis. The standard shipment process consists of daily extraction of the necessary reference material samples, which are placed in 125 mL containers, labeled, and inserted anonymously in the dispatch for analysis at Lab SA.
In 2023, the Bias was assessed through the curve of regression Reduced Major Axis (RMA) between the values reported by Lab SA and the Best Value (BV) for each RM’s, extracted from the Round Robin interlaboratories. For this analysis, 12 standards were prepared and sent to 4 different laboratories each trimester of 2023 (January, April, July, October), of which 3 are external laboratories (LSA of the Universidad Católica del Norte, Geo Assay Goup and Universidad de Antofagasta Asistencia Técnica S.A.) and 1 internal laboratory (Laboratorio Analytical of the Salar de Atacama); Each sample underwent 3 analyzes, and then carried out the determination of the average per standard of each laboratory, with which the Round Robin analysis and determination of BV. The table below summarizes the results for accuracy.
Table 8-2. Summary of Possible Pollution Ratios of Blank Samples during Analysis.
Summary for Accuracy
| Analyte | Quantity | Unit | Lab SA | BV Labs | Global Bias | |||||||||||||||
| K | 12 | % | 4.57 | 4.45 | 10.4 | |||||||||||||||
| 2.71 | 2.67 | |||||||||||||||||||
| 2.06 | 2.09 | |||||||||||||||||||
| 4.58 | 4.23 | |||||||||||||||||||
| 2.80 | 2.52 | |||||||||||||||||||
| 2.20 | 2.06 | |||||||||||||||||||
| 4.24 | 3.85 | |||||||||||||||||||
| 4.09 | 3.53 | |||||||||||||||||||
| 2.19 | 2.13 | |||||||||||||||||||
| 3.51 | 3.97 | |||||||||||||||||||
| 2.63 | 2.51 | |||||||||||||||||||
| 1.65 | 1.95 | |||||||||||||||||||
| Li | 12 | % | 0.65 | 0.67 | -0.4 | |||||||||||||||
| 0.34 | 0.35 | |||||||||||||||||||
| 0.16 | 0.16 | |||||||||||||||||||
| 0.66 | 0.66 | |||||||||||||||||||
| 0.34 | 0.34 | |||||||||||||||||||
| 0.16 | 0.15 | |||||||||||||||||||
| 0.68 | 0.68 | |||||||||||||||||||
| 0.35 | 0.35 | |||||||||||||||||||
| 0.14 | 0.14 | |||||||||||||||||||
| 0.68 | 0.68 | |||||||||||||||||||
| 0.34 | 0.34 | |||||||||||||||||||
| 0.16 | 0.16 |
Figure 8-3. Accuracy Plots, Reference Materials
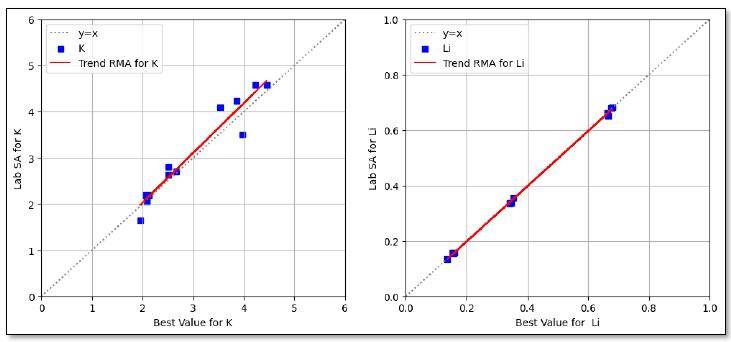
For 2023, the Li results support Lab SA's excellent performance for accuracy in brine chemical analyses, without presenting issues related to bias, which are below the recommended 10%. The results for K showed values slightly above the recommended 10%.
The insertion of analytical blanks in the shipments sent to the primary laboratory aids in determining if there is any degree of contamination in the laboratory analysis process. The blank is composed only of deionized water and was analyzed in the primary laboratory.
In Table 8-3. Summary of Possible Pollution Ratios of Blank Samples during Analysis.the Possible Pollution Ratios (PPR) for 794 analytical blank results for validated samples, the PPR were low in Li (2.1%), and the K presents rates slightly above 5% (6.9%). These results correspond to the samples after having extracted the errors due to misallocation of labels. K results present rates slightly higher than 5% apparent contamination, which is possibly related to the low precision for very low concentration for K, and not with actual contamination. In general, the results for potassium and lithium do not present contamination problems.
Table 8-3. Summary of Possible Pollution Ratios of Blank Samples during Analysis.
| Summary for analytical blanks | ||||||||||||||||||||
| Analyte | Quantity | Unit | Max Blank | Contaminated | Possible contamination ratio (%) | |||||||||||||||
| K | 794 | % | 0.44 | 55 | 6.9 | |||||||||||||||
| Li | 794 | % | 0.06 | 17 | 2.1 | |||||||||||||||
Figure 8-4. Contamination Plots, Blank Samples
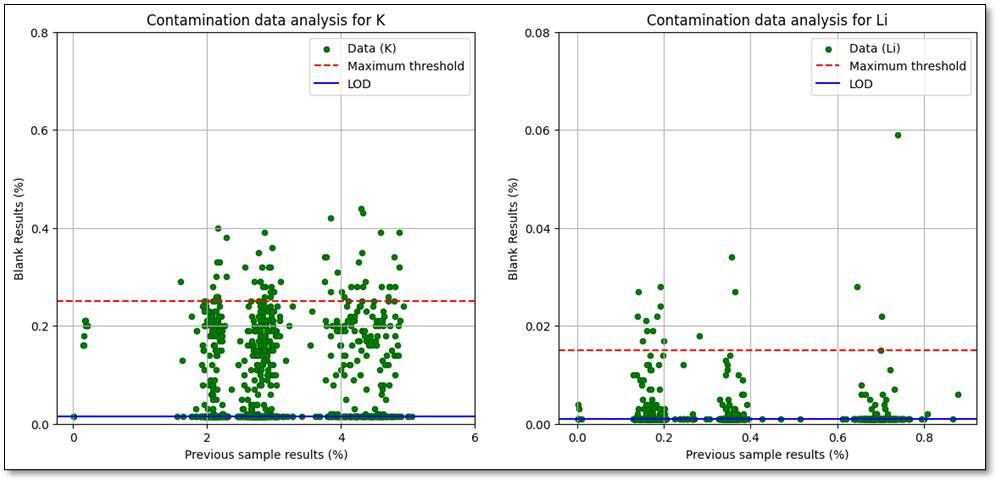
| 8.2.3.2 | Effective Porosity |
QA/QC is implemented in three different stages of the general process, including in the equipment during the analysis of the samples, after entering the results in the database, and through scatter charts for the control and analysis of the precision of the process.
Stage 1: In the equipment during analysis of the samples
The precision of an assay is validated by both instruments (Geopyc and Accupyc), using a range acceptance of the results, where results are guaranteed to be within this range, or the analysis is repeated. Through the software for each instrument, different processes of calibration, and review of their accuracy is undertaken using manufacturer standards.
Stage 2: After entering results in the database
The purpose of this system is to establish parameters for validation and exclusion of samples automatically when entering the data in the acQuire database, leaving these flagged and included/excluded from the dataset for estimation, if applicable. Of the 18,878 total samples registered in the GHS database, 3,019 samples were excluded using QA/QC parameters after data entry into acQuire (16.0% of the total population), resulting in 15,859 validated samples (84.0% of the total population) for the brine volume estimation dataset.
Stage 3: Through scatter charts for the control and analysis of the process precision
This control measure is based on the systematic insertion of duplicate samples (QC) in analysis for porosity that are later analyzed using scatter charts displayed directly in acQuire. For 2023, 3,008 samples were registered in the database for porosity results and have been obtained from 2,838 primary samples and 170 duplicate samples, for 5.7% of controls.
Table 8-4 Table 8-4. Duplicate Sample Evaluation in the Porosity Labshows the duplicate sample evaluation and summarizes the error ration in the porosity lab. Figure 8-5 and Figure 8-6 shows the scatter plots of the pairs analyzed with Accupyc and Geopyc, respectively.
Table 8-4. Duplicate Sample Evaluation in the Porosity Lab
| Equipment | Analysis | Duplicates | Failures | Error Ratio (%) | ||||||||||
| Accupyc | Grain Volume | 170 | 0 | 0.0 | ||||||||||
| Geopyc | Envelope Volume | 163 | 0 | 0.0 | ||||||||||
Figure 8-5. Scatter Plot for Pairs Analyzed with Accupyc.
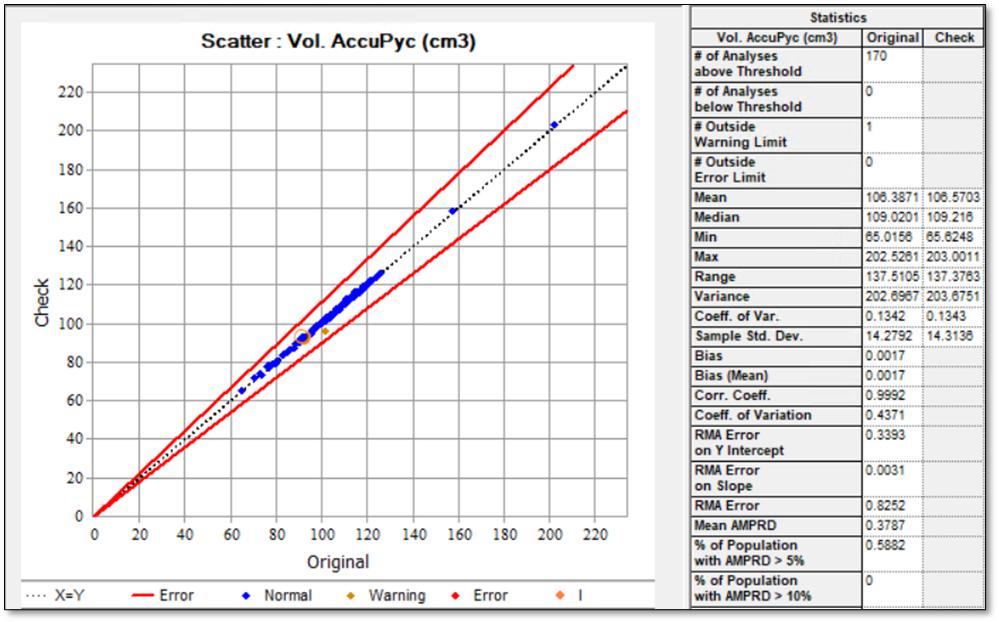
Figure 8-6. Scatter Plot for pairs analyzed with Geopyc
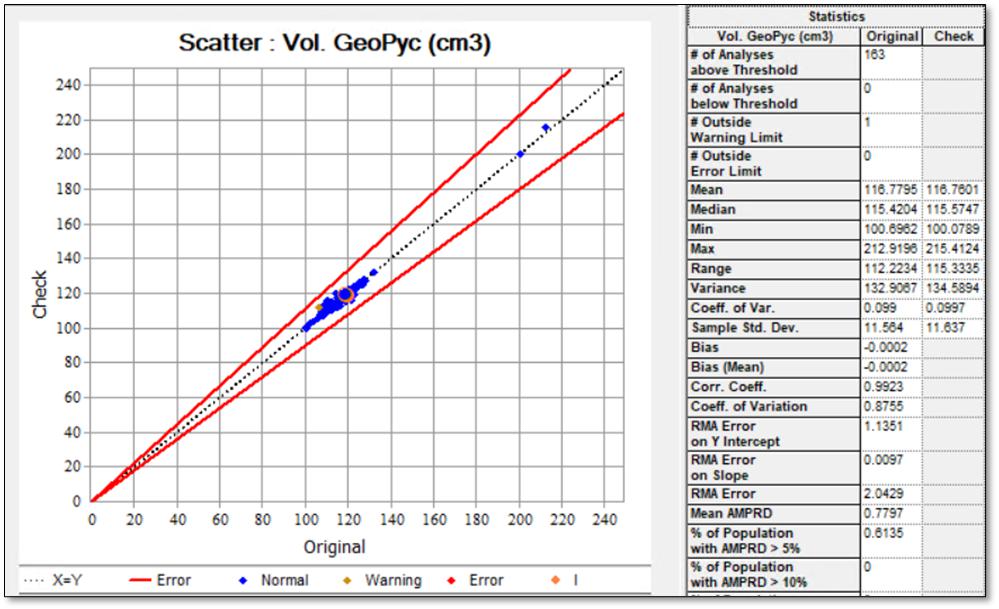
The conventionally accepted maximum ER is 10%. Therefore, it is concluded that the analytical precision of the elements evaluated during this period in the POR Lab was within acceptable limits. Further, the rock sampling method and volume analysis were adequate for the samples of porosity.
| 8.3 | Opinion of Adequacy |
In the QP's opinion, sample preparation, sample safety, and analytical procedures used by SQM in the Salar de Atacama follow industry standards with no relevant issues that suggest insufficiency. SQM has detailed procedures that allow for the viable execution of the necessary activities, both in the field and in the laboratory, for an adequate assurance of the results.
| 9 | DATA VERIFICATION |
| 9.1 | Data Verification Procedures |
Verification by the QP covered field exploration, drilling and hydraulic testing procedures, (including descriptions of drill core and cuttings), laboratory results for effective porosity and chemical analyses, QA/QC results, review of surface and borehole geophysical surveys, and review of the data entry and data storage systems.
Based on the review of SQM’s procedures and standards, it is the QP’s opinion that SQM has data verification standards capable of ensuring good control and quality of the data obtained during drilling as well as from hydraulic and geophysical testing. Based on the review of the QA/QC data during the period, the QP considers the sampling procedures as well as those of preparation and analysis for K and Li in the primary laboratory adequate for the brine and rock samples. Further the QP considers the resulting analytical data to be sufficiently accurate.
There are no limitations on the review, analysis, and verification of the data supporting Mineral Resource estimates within this TRS. It is the opinion of the QP that the geologic, chemical, and hydrogeologic data presented in this TRS are of appropriate quality and meet industry standards of data adequacy for the Mineral Resource and Mineral Reserve estimates.
| 9.2 | Data Management |
Since 2021, SQM has used acQuire, a world class geoscientific information management software. This has allowed SQM to centralize data management and avoid the use of data sheets, such as Excel, that can lead to a greater possibility of error. This software implements a series of rules to assure the quality control of data entry, preventing common mistakes, such as out-of-range values, incomplete data, etc.
| 9.3 | Technical Procedures |
The QP reviewed the data collection procedures associated with drilling, hydraulic tests, and geophysics surveys. SQM has a set of technical procedures for each of its field activities. These procedures seek to establish a technical and security standard that allow for field data to be optimally obtained while also guaranteeing the safety of workers.
| 9.4 | Quality Control Procedures |
The QP reviewed SQM’s data collection and QC procedures. Regarding the analysis of brines, these procedures are considered adequate. It is evident that they used adequate insertion rates for different controls.
As for porosity tests, the SQM QC protocol considers the analysis of duplicate samples that are repeated adequately for this type of control.
| 9.5 | Precision Evaluation |
The QP reviewed the error rates of K and Li as well as the rates of analytical duplicates and field duplicates in brines. It was found that they remained within limits conventionally considered acceptable (under 10.0%). Error rates for both Accupyc and Geopyc analyzes for porosity were also within conventional limits and were considered acceptable (under 10.0%).
The QP concludes that the sampling, preparation, and analysis procedures of brine samples as well as rock and analysis of volumes for porosity to be adequate for the evaluated period.
| 9.6 | Accuracy Evaluation |
SQM performs a round robin analysis at five laboratories. Four of the laboratories are external (ALS Patagonia S.A., LSA of the Universidad Católica del Norte, Andes Analytical Assay, and the Geo Assay Group). The fifth is an internal laboratory (Analytical Laboratory of the Salar de Atacama). SQM uses these laboratories to evaluate bias for the different certified analytes and standards. Additionally, external control of the results is carried out in the laboratory of the University of Antofagasta (Lab UA).
The QP considers that this evaluation supports the accuracy of the brine chemistry data for the purpose of its use in preparing geological models and estimating Mineral Resources and Mineral Reserves.
| 9.7 | Pollution Evaluation |
During the data review for the period that the samples were evaluated, there was no significant contamination of any of the analytes evaluated for brines during primary laboratory analysis. However, Li results presented rates slightly higher than 5% of apparent contamination. This is possibly related to the elevated content of the targets used and not due to contamination.
| 9.8 | Qualified Person’s Opinion of Data Adequacy |
It is the QP’s opinion that the analytical results of the geologic, chemical, and hydrogeologic data presented in this TRS are of appropriate quality and are sufficiently reliable to meet industry standards of data adequacy for the Mineral Resource and Mineral Reserve estimates.
| 10 | MINERAL PROCESSING AND METALLURGICAL TESTING |
This sub-section contains forward-looking information related to recoveries for the Project. The material factors that could cause actual results to differ materially from the conclusions, estimates, designs, forecasts or projections in the forward-looking information include any significant differences from one or more of the material factors or assumptions that were set forth in this sub-section including actual brine characteristics that are different from the historical operations or from samples tested to date, equipment and operational performance that yield different results from the historical operations, and historical and current test work results.
Brine chemistry exploration in the Salar de Atacama was the first step in designing a lithium recovery process, and this was followed by the planning and confirmation of the Project’s operational success. The basis of the process methods was tested and supported by laboratory evaporation as well as historical metallurgical response tests. Since 2015, additional research and projects were implemented to improve yield and recovery, and they have also continuously improved the accuracy of lithium and potassium salt recovery modeling for each of the brine extraction well areas.
Historical test development has allowed for the differentiation of main categories for brine types based on composition and proportion between species. Such tests have been designed to optimize the extraction processes and ensure that customer product specifications are achieved. Furthermore, these tests ensure that deleterious elements remain below the established limits.
Summaries of the analytical and experimental procedures as well as the main test results are presented in the following subsections.
| 10.1 | Test Procedures |
Testing has been conducted to estimate how different brines respond to concentration via solar evaporation and overall metallurgical recoveries from the process plant. Testing also aims to evaluate treatability of the raw material for finished lithium and potassium products. Laboratory tests generate data for the characterization and recovery baselines.
The tests detailed below have the following objectives:
| · | Determine if analyzed material is reasonably amenable to concentration by established in-plant separation and recovery methods. |
| · | Optimize processes to ensure a recovery that will be intrinsically linked to both the chemical and physical characterization of the treated brine. |
| · | Determine deleterious elements and establish mechanisms to keep such elements below limits which guarantee a certain product quality. |
The testing program requires that SQM staff collect brine samples from wells on a regular basis for testing. Sample collection takes place throughout the year with specific campaigns defined in an annual plan. Once each sampling program is completed, the samples are sent to internal labs for chemical analysis. Complementary sampling then considers the temporal, hydrogeological, spatial, and operational criteria of the wells. The chemical concentrations of the wells are also updated. In all, this process generates data that provides accuracy in the estimation of brine chemistry.
It should be noted that SQM's Salar de Atacama brine exploitation system focuses on detecting, differentiating, and segregating brine wells based on their concentration. If the criteria are met, the brine is directed directly into the well system, but if not, it goes into the collector system. This approach helps to prevent dilution of the brine grade by mixing with brines that are lower in potassium and lithium or contain higher levels of magnesium, calcium, boron, and sulfate. The analytical laboratories at Salar de Atacama support this well categorization approach, making the system more efficient in terms of resource utilization and well availability.
The Salar de Atacama laboratories, via its three sub-facilities (Table 10-1), i.e., Laboratory QA/QC, analytical laboratory, and metallurgical laboratory, produce metallurgical test databases which include results for:
| · | Chemical composition (brines and salts) |
| · | Density |
| · | Evaporation rate based on brine chemical composition. |
The metallurgical tests are designed to estimate the distinct responses of brine and salt when exposed to productive treatment and their also evaluate the most appropriate route for treatability. The internal laboratories oversee support for these operations, providing data from tests to create a database of characterization of feed salts and production performance. For this purpose, samples are collected and subject to chemical and mineralogical analysis.
Historically, SQM has conducted these tests at the plant and/or pilot scale through its research and development department, allowing for (i) an improved recovery process and product quality, (ii) lithium recovery from lithium carnallite, (iii) increased LiOH.H2O production capacity, and (iv) increased Li2CO3 production capacity.
Samples for metallurgical testing are obtained through well sampling, pond sampling, and salt sampling campaigns. Quality Control is implemented at all stages to ensure and verify that the collection process occurs successfully and remains representative. Laboratory facilities available to analyze samples are located at the Salar de Atacama Mine and PQC. In the following subsections, a discussion is provided on brine sampling, preparation, and characterization procedures as well as monitoring activities at the PQC and Salar de Atacama.
Table 10-1. List of Laboratory Facilities Available for Analysis in Salar de Atacama
| Laboratory name | Location | Analyses performed | Description |
| Laboratory QA/QC (Lab QA/QC) | Salar de Atacama | --- | Brine sample centralization, QC sample insertion, Data Base dispatch registers. |
| Analytical Laboratory of the Salar de Atacama (Lab SA) | Salar de Atacama | Ca, Cl, H3BO3, K, Li, Mg, Na, SO4 and density. | ICP-OES: based on vaporization, dissociation, ionization and excitation of various chemical elements of a sample inside a plasma. |
| FAAS: Atomic absorption spectroscopy is based on radiation absorption at a specific wavelength. | |||
| Mg volumetry: Magnesium determination is an electro-analytical technique to determine the concentration of an electroactive species in a solution using a reference electrode and working electrode. | |||
| Determination of chlorides by volumetry: This method is used to determine chloride ions by precipitation titration, where chloride ion precipitates as AgCl (silver chloride). | |||
| Gravimetry: This is a quantitative analytical method, i.e., it determines quantity of substance by measuring the weight of the substance by gravity. | |||
| Metallurgical Laboratory | Salar de Atacama | Sample Preparation, Moisture Determination, Particle Size Analysis, Solids Percentage | Sample Preparation is an essential stage in analytical processes. Sample procedure and preparation will produce a homogeneous sub-sample that is representative of the total sample through an alternating paddle. |
| Moisture is determined by a gravimetric method with constant weight where the sample is reduced by the alternating paddle technique and then is transferred to an oven. | |||
| Granulometric Analysis: Evaluation of granulometric distribution of different salts in the system, by means of a master sizer and magnetic stirrer. | |||
| Solids Percentage: The solid/liquid separation of pulps from different processes, where the amount of solids in the sample is determined. |
SQM's new initiatives to improve the recovery of lithium from the LiCl production process are supported by internal laboratories in Salar de Atacama, which carry out chemical analysis of brines and salts. Further information on these initiatives can be found in section 10.4.1.
With regards to the production of lithium carbonate and lithium hydroxide, the Salar del Carmen Laboratory (LSC) in PQC conducts quality control tests on liquid and solid samples, as well as finished products (see Table 10-2).
Table 10-2. List of Installations Available for Analysis at PQC
| Laboratory | Location | Analyses Performed | Description |
| Salar del Carmen Laboratory (LSC) | Carmen Lithium Chemical Plant (PQC) | Chloride, sulfate, sodium, potassium, calcium, magnesium, iron, nickel, copper, lead, aluminum, manganese, chromium, zinc, silicon, insoluble, lithium carbonate, boron, moisture pH, magnetic particle density |
Chemical and physical analysis of finished products. Chemical analysis of solution and solid samples. |
The following subsections discuss brine sampling, preparation, and characterization procedures, as well as monitoring activities at the PQC and Salar de Atacama.
| 10.1.1 | Wells Sampling and Sample Preparation |
In the Salar de Atacama, wells involved in the Project’s operation are constantly sampled. Well sampling for brine operations is determined through planning and production management, according to internal requirements.
Samples for the chemical characterization of brine are taken from the wells involved in the Project’s operation, which together with other samples from the database, are used for the evaluation of Mineral Reserves. Brine samples from pumping are collected for chemical and density analysis. These wells are called "Operational", while those wells which are used for exploration are called "Non-operational". The latter are sampled to assist in mine planning for future extraction scheduling. Brine sampling, obtained by pumping a well and enabled in one or more reservoirs, is categorized according to the status of the well, as detailed in Table 10-3.
Table 10-3. Categorization of Brine Samples from Wells
| Category/Status | Type | Detail |
| Operational | Operating well | Sample taken from a production well |
| Operating well in detention | Sample obtained from a production well that is stopped at the time of sampling | |
| Non-operational (exploratory) | Short pumping sampling | Sample obtained from a non-production well, after pumping, which can last from 5 to 30 minutes. |
| Pumping test | Brine sample taken during a pumping test to evaluate aquifer parameters. A preliminary pumping test is undertaken to detect anomalous transmissivities that could invalidate a production well. |
Pumping well sampling and measurements are aimed to reach a maximum dynamic level, take brine samples, and measure basic parameters, such as level, flow, viscosity (Marsh funnel determination), clarity, and presence of fine sediments (by measuring both parameters in an Imhoff cone) as well as temperature, pH, and electric conductivity using a multiparametric probe (Figure 10-1).
Sampling is executed in a plastic jug, directly from the well head (at the pump outlet), by opening a tap placed for that purpose. Before taking the sample, fresh brine is added to the jug in order to remove any residue from a previous sample. This procedure is repeated each time a sample is taken or transferred to sample containers.
The final brine sample is discharged into a receptacle from which samples are drawn for chemical analysis, covering a range of dissolved metals, including lithium and brine density (125 mL for chemical analysis and 250 mL for brine density analysis); after each container is primed and fully filled. Containers for samples are properly identified with self-adhesive labels with barcodes.
Figure 10-1. Determination of In-situ Brine Parameters at Pumping Wells
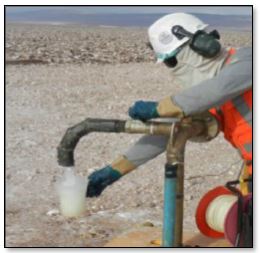 |
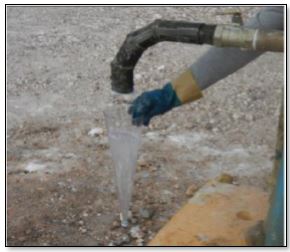 |
||
| a) Sampling | b) Clarity and fine sediment measurement | ||
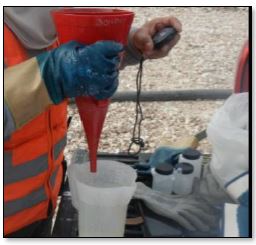 |
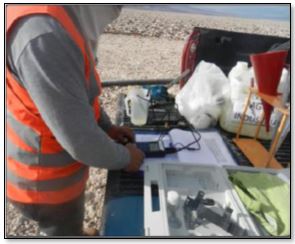 |
||
| c) Viscosity measurement. | d) pH, temperature, and conductivity measurement | ||
Brines are not exposed to any preparation, or acid preservation, as a pre-treatment before being submitted for chemical analysis at the destination facilities. Brine sampling operation quality control includes taking field duplicates every 15 samples (through repetition of the sampling procedure) and analytical duplicates (by taking a duplicate from the same jar). The operations outlined above are implemented depending on sampling requests and operational capacity.
It must be noted that brine in the salt flat acts as a "mobile resource;" and in some cases, where formation permeability is low, it is not possible to collect a brine sample after a waiting period. For sampling campaigns, some factors that make sampling impossible must be considered, such as the following:
| · | Temporary well blockage |
| · | Dry well at the time of the static water level measurement. |
| · | Interruption of brine pumping due to brine depletion in the well, before, or during, sampling |
It should also be noted that to obtain more representative samples from the wells, bailer sampling is not performed in operating wells in detention, considering that when the well is no longer operative its chemistry might be stratified. As improvement measures, in disassembled wells samples are taken with stratified bailers, while shutdown wells are turned on and operated until the well volume is renewed three times, before samples are taken.
Internal laboratories involved in brine sampling, analysis, and testing are listed in Table 10-8, and they are also detailed in the following subsections.
| 10.1.2 | Sampling in Brine Build-up Pools |
This task is carried out by mine operation staff. At the pumping station, samples are regularly taken from the pond outlet to the brine treatment plant, allowing for improved verification, adjustment, and planning. Samples are taken by a device installed in the pond outlet line behind the pumps, allowing 8 ml to be extracted from the lines every 7 minutes to form a brine composite. Chemical composition measurements of this brine feed are described in the following subsection.
| 10.1.3 | Chemical Characterization of Brines |
Analytical methods for the determination of lithium, potassium, magnesium, and calcium concentrations in solution are applied using Atomic Absorption Spectrometry (AAS) and ICP techniques. The latter analysis is generally used on a broad set of elements (multi-elemental analysis), including the detection of trace metals. The analytes K, SO4 and H3BO3 are analyzed by ICP mass spectrometry. Li is analyzed by AA spectroscopy in conjunction with the determination methodology. Analysis, methodology and the equipment used in the determinations are indicated in Table 10-4.
Sample preparation process for laboratory analysis goes through a treatment that includes calibration curve determination, dissolution of precipitated salts, and weighing to matrix preparation for chemical analysis. Each sample is analyzed by means of different processes and equipment. Depending on the analyte required, different matrices with different dilutions are prepared for each sample.
Protocols used for each sample are documented in relation to materials, equipment, procedures, and control measures. Brine samples collected are analyzed by testing of specially prepared blanks and standards inserted as blind control samples in the analytical chain.
Regarding quality assurance checks of results, the following criteria was established:
| · | Analyze QC results, according to insertion rate per analysis (blanks, standards and duplicates) and verify that the observed error is within ±2% in AA and ±5% in ICP. |
| · | Analyze control sample (MC) every 10 samples and verify that error is within ±2% of initial. |
| · | Calibration curve with R2 = 0.999. |
Table 10-4. List of Analyses for the Chemical Characterization.
| Analysis | Method | Standard Method |
| Temperature (°C) | Thermometry | APHA 2550 |
| pH | Potentiometry | APHA 4500 H+ B. |
| Conductivity(mS/cm) | Electrometric method | APHA 2510 B. |
| Total suspended solids | Solids Dried at 103-105°C | APHA 2540 D |
| %Li |
ICP-OES or Atomic Absorption Spectrophotometry with direct air-acetyleneflame aspiration |
NCh3349:2020 Brines-Determination of alkali metals by flame atomic absorption spectrometry. ASTM D3561-16: Standard test method for lithium, potassium and sodium ions in brackish water, seawater and brines by atomic absorption spectrophotometry. |
| %K |
ICP-OES or Atomic Absorption Spectrophotometry with direct air-acetylene flame aspiration |
NCh3349:2020 Brines-Determination of alkali metals by flame atomic absorption spectrometry. ASTM D3561-16: Standard test method for lithium, potassium and sodium ions in brackish water, seawater and brines by atomic absorption spectrophotometry. |
| %Mg |
ICP-OES or Atomic Absorption Spectrophotometry with direct air-acetylene flame aspiration |
NCh3349:2020 Brines-Determination of alkali metals by flame atomic absorption spectrometry. |
| %SO4 | Determination of Sulfate with residue drying | SM 45002-C/D (Drying of Residue) |
| %Ca |
Atomic Absorption Spectrophotometry with direct aspiration of nitrous oxide-acetylene flame. |
NCh3349:2020 Brines-Determination of alkali metals by flame atomic absorption spectrometry. |
| %Cl | Argentometric method | SM 4500-Cl-B |
| %Na |
ICP-OES or Atomic Absorption Spectrophotometry with direct air-acetylene flame aspiration |
SM 3111 B |
| %H3BO3 |
Acid-base volumetry. Determination of boric acid content - Volumetric method. |
NCh3358:2020 Brines-Determination of boron by acid-base potentiometric titration. |
| 10.1.4 | Brine Density Determination |
For the determination of brine density, a representative sample is taken by filling a 16-mL plastic vial and placing it in a sampler, where each vial is introduced into a DMA4500 automatic densimeter which registers the density. This measurement is reported through the LIMS laboratory system, which is an integrated data management software, where reports are created.
Quality assurance controls include equipment status checks, analysis of a reagent blank together with the samples, verification of the titrant concentration, and a repeated analysis for a standard together with the set of samples to confirm its value.
The reference methods followed by the in-house laboratories for the determination of certain analytes ensure a certain degree of reliability of the determination methodology and results. The chemical characterization of the samples takes as reference the methods indicated in:
| · | American Public Health Association (APHA) Standard Methods for the Examination of Water and Wastewater. |
| · | Chilean Standard (NCh) 3349:2020 for the determination of alkali metals. |
Standard Methods (SM) produced by the American Public Health Association (APHA), the American Water Works Association (AWWA), and the Water Environment Federation (WEF).For precipitated salts in the ponds, the same chemical analysis parameters (Li, K, Na, Ca, Mg, SO4, H3BO3, Cl) are determined according to the methodology described in the Table 10-4, for their characterization and evaluation of the evaporation-concentration process.
| 10.1.5 | Calculated Evaporation Rate |
Evaporation monitoring represents an important factor in well management and production scheduling; however it is complex due to the extreme conditions faced by solutions, producing potential errors. Therefore, to validate evaporation well data, calculations were conducted using supplementary meteorological parameters collected at stations installed in the Salar de Atacama. Solar radiation, humidity, wind speed, and temperature represent the dominant processes controlling evaporation. Salt composition effects are also considered, so that evaporation is modeled empirically, with consideration ofmagnesium and lithium concentration in the free brine, as well as SQM weather station data on-site.
Evaporation estimates are obtained by correlating water evaporation at a weather station (variable by seasonality) with well area/shape and well activity over a given period. To estimate evaporation, the equations (correlations of J.A. Lukes & G.C. Lukes [1993]) are applied to the wells. Lukes equation (1993) is applied to ponds with brine (free brine height). The equations relate evaporation area and evaporative activity associated with magnesium, sulfate, lithium, and potassium concentration.
As an exercise, according to the operational statistics reviewed, Table 10-5 summarizes the evaporation rate calculated by the production system (with emphasis on lithium and potassium), which are associated by the type of pond in period 2020-2022.
Table 10-5. Mean Annual Evaporation Rates for each Subsystem in the 2020-2023 Period
| Brine evaporation rate | Minimum
rate (mm/year) |
Maximum rate (mm/year) |
Average
rate (mm/year) |
|||||
| 2020 | ||||||||
| Productive Lithium | Halite | 873 | 4,296 | 2,805 | ||||
| Sylvinite | 1,641 | 7,544 | 4,068 | |||||
| Carnallite | 775 | 2,920 | 1,690 | |||||
| Bischofite | 604 | 2,181 | 1,330 | |||||
| Lithium Carnallite | 526 | 1,619 | 1,090 | |||||
| Productive Potassium | Halite | 949 | 6,372 | 3,642 | ||||
| SX | 1,895 | 10,261 | 6,649 | |||||
| CX | 393 | 2,212 | 1,281 | |||||
| 2021 | ||||||||
| Productive Lithium | Halite | 1,103 | 5,075 | 2,735 | ||||
| Sylvinite | 2,153 | 8,219 | 5,349 | |||||
| Carnallite | 858 | 4,007 | 1,994 | |||||
| Bischofite | 502 | 2,199 | 1,231 | |||||
| Lithium Carnallite | 580 | 1,749 | 1,203 | |||||
| Productive Potassium | Halite | 834 | 4,721 | 2,485 | ||||
| SX | 1,919 | 7,685 | 4,377 | |||||
| CX | 556 | 1,892 | 1,070 | |||||
| 2022 | ||||||||
| Productive Lithium | Halite | 1,198 | 4,852 | 2,634 | ||||
| Sylvinite | 2,790 | 8,591 | 5,076 | |||||
| Carnallite | 1,230 | 5,352 | 2,594 | |||||
| Bischofite | 527 | 1,961 | 1,118 | |||||
| Lithium Carnallite | 792 | 3,009 | 1,457 | |||||
| Productive Potassium | Halite | 751 | 4,651 | 2,173 | ||||
| SX | 1,563 | 6,545 | 3,429 | |||||
| CX | 252 | 2,264 | 856 | |||||
| 2023 | ||||||||
| Productive Lithium | Halite | 915 | 4,623 | 2,398 | ||||
| Sylvinite | 2,604 | 8,309 | 5,078 | |||||
| Carnallite | 1,474 | 4,840 | 2,980 | |||||
| Bischofite | 805 | 2,870 | 1,499 | |||||
| Lithium Carnallite | 807 | 2,608 | 1,646 | |||||
| Productive Potassium | Halite | 976 | 4,239 | 2,454 | ||||
| SX | 1,766 | 5,199 | 3,572 | |||||
| CX | 774 | 3,870 | 1,991 | |||||
| 10.1.6 | Control Procedures |
Currently, QC procedures for the brine production operation and finished products are in place. These procedures include monitoring efforts from input brine characterization to brine sampling and concentration characterization. These QC procedures also apply to products obtained from the MOP, SOP, and lithium chemical processing plants.
In this regard, the involved laboratories support operations to ensure that the system’s treatment requirements are effective.
| 10.1.6.1 | Salar de Atacama Control Laboratory |
The operation of solar evaporation wells is based on controlling the chemical balance of the solutions to be extracted and by verifying ion levels that are part of the product (Li, K) as well as the ions which can affect (positively or negatively) their recovery (SO4, Ca, Mg). For this reason, mine programs are focused on obtaining solutions with concentration parameters that meet solar well operational requirements in its two lines to include MOP wells (focused on concentrated lithium solution production) and SOP wells (focused on varieties of potassium production). These requirements are fulfilled through the determination of direct delivery of solutions, or through a mixture of brines with complementary chemical characteristics to produce a mixture that complies with feed specifications (maximum ranges of ion concentration fed to each production line) and well systems.
During brine concentration, sequential salts precipitate in the pond system and are harvested, while others are discarded as impurities. For the lithium-focused system, sodium chloride (NaCl) precipitation occurs followed immediately by potassium chloride (KCl) salts, resulting in a brine that is sent to the solar evaporation ponds to concentrate the solution to ~6% lithium concentration. These ponds are the so-called Lithium System.
Once the pond systems are in operation, sampling and test procedures for evaporation tests are as follows:
| · | Collection of brine samples on a regular basis to measure brine properties, such as chemical analysis, density, brine activity, etc. |
| · | Collection of precipitated salts from the ponds for chemical analysis to assess evaporation pathways, brine evolution, as well as salt physical and chemical properties. |
Laboratory determination of the brine and salt concentration is then used to perform a material balance of the evaporation and crystallization circuits based on this composition of feed, transfers, harvests, and discards. These results are then used to estimate evaporation rates (and hence salt concentrations) reached at each stage. The following subsection details the estimation of the evaporation rate per concentration pool according to the composition of the brine.
As such, samples taken from each production pond that will feed the solar evaporation ponds are continuously monitored. The solutions from each stage of the ponds are also monitored to ensure efficient operational control.
Concentration control in each of the ponds of the lithium system (MOP) are also maintained within the range established for optimum performance and compliance with production plans.
| 10.1.6.2 | Carmen Lithium Chemical Plant (PQC) Control Laboratory |
The Carmen Lithium Chemical Plant aims to refine lithium-rich brines from remaining impurities and also perform lithium carbonate synthesis. A part of the carbonate is then used for the synthesis of lithium hydroxide.
Customer requirements for lithium products require lithium carbonate to be 99.5% pure with a maximum concentration of magnetic particles which is less than 500 ppb, and a maximum concentration of sodium, magnesium, and calcium ≤0.05%. The requirements also specify that lithium hydroxide has maximum trace levels of iron, chromium, copper, and zinc no greater than 1 ppm.
The analyses performed for product QC are related to each of the following purification stages:
| · | Boron removal. |
| · | Magnesium removal. |
| · | Calcium removal. |
| · | Carbonation. |
Analytical methodologies identify deleterious elements (boron, magnesium, calcium, and sulphate) to establish mechanisms in the operation to keep such elements below acceptable limits and also ensure product quality. Table 10-6 lists the basic set of analyses requested from laboratories as well as the methodologies used in determining solutions and solids.
Table 10-6. List of Requested Analyses for Plant Control
| Parameter | Method |
| Liquid Sample Analysis | |
| Lithium | Atomic Absorption |
| Calcium and Magnesium | Atomic Absorption/Volumetry |
| Carbonate and Boron | Volumetry |
| Silicon | ICP |
| pH | pH meter |
| Sulfate | UV visible |
| Solid Sample Analysis | |
| Chloride | UV visible |
| Sodium, Magnesium, Calcium, Sulfate, Silicon and Boron | ICP |
| Humidity | Stove |
| D50 | Mastersizer |
Chemical and physical parameters are evaluated, and the finished product then undergoes strict QC. Methodologies used for determining the chemical and physical parameters are recorded in Table 10-7.
Table 10-7. Analysis of Products (Li2CO3/LiOH)
| Parameter | Method |
| Chemical Analysis | |
| Chloride | UV visible |
|
Sulfate, Sodium, Potassium, Calcium, Magnesium, Iron, Nickel, Copper Lead, Aluminium, Manganese, Chromium, Zinc, Silicon |
ICP |
| Insoluble | Stove |
| LOI | Muffle |
| LiOH | Volumetry |
| Physical Analysis | |
| Magnetic particles | ICP |
| #60 mesh | Rotap/Air jet |
| Density | FFD / Tap density |
| D50 | Mastersizer /Rotap |
| 10.2 | Analytical and Testing Laboratories |
Salar de Atacama's metallurgical test work program requires that samples are sent to internal laboratories located on-site. Table 10-8 details the name, location, and analysis conducted.
Table 10-8. List of Laboratory Facilities Available for Analysis in Salar de Atacama
| Laboratory name |
Location | Analyses performed | Description |
| Laboratory QA/QC (Lab QA/QC) | Salar de Atacama | --- | Brine sample centralization, QC sample insertion, Data Base dispatch registers. |
| Analitical Laboratory of the Salar de Atacama (Lab SA) | Salar de Atacama | Ca, Cl, H3BO3, K, Li, Mg, Na, SO4 and density. | ICP-OES: based on vaporization, dissociation, ionization and excitation of various chemical elements of a sample inside a plasma. |
| FAAS: Atomic absorption spectroscopy is based on radiation absorption at a specific wavelength. | |||
| Mg volumetry: Magnesium determination is an electro-analytical technique to determine the concentration of an electroactive species in a solution using a reference electrode and working electrode. | |||
| Determination of chlorides by volumetry: This method is used to determine chloride ions by precipitation titration, where chloride ion precipitates as AgCl (silver chloride). | |||
| Gravimetry: This is a quantitative analytical method, i.e., it determines quantity of substance by measuring the weight of the substance by gravity. | |||
| Metallurgical Laboratory | Salar de Atacama | Sample Preparation, Moisture Determination, Particle Size Analysis, Solids Percentage | Sample Preparation is an essential stage in analytical processes. Sample procedure and preparation will produce a homogeneous sub-sample that is representative of the total sample through an alternating paddle. |
| Moisture is determined by a gravimetric method with constant weight where the sample is reduced by the alternating paddle technique and then is transferred to an oven. | |||
| Granulometric Analysis: Evaluation of granulometric distribution of different salts in the system, by means of a master sizer and magnetic stirrer. | |||
| Solids Percentage: The solid/liquid separation of pulps from different processes, where the amount of solids in the sample is determined. |
The Lab SA is not certified by the International Standards Organization (ISO), but it specializes in chemical analysis of brines and inorganic salts with extensive experience since 1995. It should be noted that none of the three internal laboratory facilities owned by SQM and operated by company personnel are certified by ISO standards.
The Lab QA/QC is in charge of sample custody regarding the reception of brine samples from all areas. The Lab is also in charge of dispatching arrangements, preparation and insertion of QC samples and sending them for chemical analysis to the Lab SA. From there, the Lab QA/QC publishes the results. The QA/QC and traceability control program is detailed in the Section Error! Reference source not found..
The Lab SA services are needed in several areas, including exploration, operation, pumping, and monitoring. Samples arriving undergo a preliminary filtering process to eliminate solid materials that remain in suspension.
The Salar de Atacama laboratories continuously improve their procedures with visits from expert advisors and round robin testing. The interlaboratory comparison seeks to share experiences and results with external laboratories that have similar experience in analysis development and implementation. The purpose of this process is to continuously improve the techniques and procedures employed as well as to detect gaps. Therefore, samples are sent to both SQM's external and independent analytical laboratories which are accredited and/or certified by the ISO:
| · | Andes Analytical Assay (AAA) (ISO 9001 Certification). |
| · | Geo Assay Group (IISO 9001 Certification). |
| · | LSA of the Universidad Católica del Norte (Accreditation with the international standard ISO/IEC 17025). |
With interlaboratory comparison, a bias evaluation is conducted for different analytes and certified standards. To provide a measure of accuracy, an external control of the results is in process through the University of Antofagasta laboratory. During round robin tests, no significant contamination of any of the analytes evaluated for the brines was detected during the analysis, demonstrating that.:
| 1. | The sampling, preparation and analysis procedures of the brine samples are adequate. |
| 2. | The quality control and analytical procedures used in the laboratory are of high quality and similar to those used by ISO certified laboratories specialized in brine and inorganic salt analysis. |
At PQC and according to sampling and analysis protocols provided, adequate procedural management in both activities was identified. Staff responsible for executing the procedures are properly instructed, trained, and aware of handling the materials and equipment to be used. The staff relies on clearly defined roles in order to comply with the standards defined for each procedure. This includes prior verifications and reporting in case deficiencies are detected, or irregularities in sampling as well as reporting problems with the samples and equipment.
| 10.3 | Sample Representativeness |
The characterization approach and sample collection procedures used by the most recent explorations program have demonstrated the sampling methodology and documentation procedures. Metallurgical test development is developed by teams of specialized professionals with extensive experience in mining and metallurgy.
Samples selected for testing and/or assays are taken by qualified laboratory personnel and correspond to areas indicated in the sampling plan along the production chain. The samples used to generate metallurgical data are sufficiently representative to support planning yield estimates and are adequate for the purposes of estimating recovery of raw materials from different processing sectors of the company.
QA/QC measures include written field procedures and checks, such as monitoring, to detect and correct any errors identified in the project during drilling, prospecting, sampling, preparation and testing, data management, or database integrity checks. This ensures that reliable data is used for Resource and Reserve estimates.
SQM applies a protocol that requires the laboratory to receive brine samples from all areas developed in accordance with the campaign, address and arrange the dispatch together with shipment documentation of samples and prepare and insert quality controls to confirm the precision and accuracy of the results. By chemical species analysis, an insertion rate of standard, or standard QA/QC samples, blanks, and duplicates is established. Details are provided in Chapter 8 of this Report.
| 10.4 | Testing and Relevant Results |
| 10.4.1 | Salar de Atacama Testwork |
At Salar de Atacama, the testwork has focused on increasing the quality and optimizing the yield of brine product. The specific objectives include the following:
| · | Establish a balance between efficiency and the maximum allowable lithium concentration. |
| · | Determine brine purification conditions and recovery of valuable species from impregnated salts. |
| · | Investigate process equipment and operating conditions for the removal of impurities and maximization of production. |
The Salar de Atacama’s yield enhancement plan includes a set of operational improvement initiatives, project development and scale-up initiatives, as well as new process evaluation initiatives with an objective to recover more lithium from the LiCl production system.
Currently, the following initiatives are underway:
| 1. | Bischofite platforms: Focused on recovering losses due to impregnation. |
| 2. | Improved harvesting: The aim is to reduce impregnation losses by improving the recovery of impregnated brine. |
| 3. | Miscellaneous improvements and Repair of the pond floor: reduce infiltration losses. |
| 4. | CK platforms: recovery of brine impregnated in salt harvests. |
| 5. | Li2SO4 project: Processes and purifies lithium sulfate salt for use in refined lithium production processes. |
| 6. | Calcium Source: Eliminate losses due to lithium sulfate precipitation. |
| 7. | Improved C-Li recovery: Optimization of lithium carnallite leaching process. |
All measures/ initiatives are focused on optimizing the Salar de Atacama's operations to capture brine product which could be lost due to infiltration, impregnation, and precipitation. Each measure occurs at different stages of development according to each case.
A brief description of the experimental procedures and relevant or expected results of the initiatives include:
| · | Bischofite platforms |
| · | Improved harvesting |
| · | Potassium Carnallite Platforms |
| · | Calcium Source |
| 10.4.1.1 | Bischofite Platforms |
For lithium recovery from impregnated salts, experimental work was designed using a squeeze platform concept to treat bischofite. In the final stages of concentration, impregnated salts from the well system are placed on an impermeable sloping platform, as the brine has a higher concentration and generates a significant amount of salt.
Figure 10-2 shows the displacement of the impregnated brine through the bischofite salts mounted on a squeeze platform.
Different operating conditions were evaluated to account for the height or slope, water/brine irrigation, and duration of each irrigation cycle. Based on the recovery obtained, the relevant results of the work are:
| · | A high Li grade salt is generated. |
| · | The recovered brine has a composition which allows it to return to the Bischofite and Lithium Carnalite system. |
| · | The methodology allows for a lithium yield increase of 3%. |
The first phase of the project was evaluated and developed in 2018 based on laboratory and pilot tests. The results of these tests show that it is technically and economically feasible to recover impregnation. Due to this notion and result of the plant, the company decided to realize platforms with a total area of 320,000 m2 for squeezing of the bischofite salts. Thus, by the end of 2021, five (5) platforms had been implemented and during 2022, two (2) more platforms were implemented. The company plans to build and put into operation two additional platforms to treat bischofite from the MOP-I system by 2023.
Figure 10-2. Improved Treatment Scheme for Bischofite Platforms
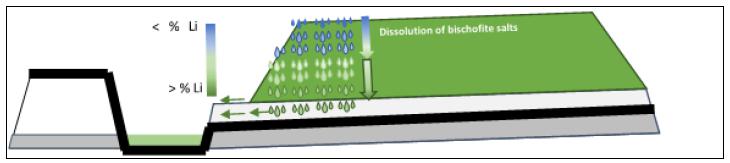
According to information provided by the company's Research and Development team, it is estimated that 8,942 tons of LCE will be recovered, which will increase the lithium yield of the production operation by 3.0%.
| 10.4.1.2 | Improvement in Salt Harvesting |
The salt harvesting initiative is focused on reducing loss due to impregnation and improving impregnated brine recovery in the harvesting process of different subsystems.
However, for the time being, the company is focused on reducing the impregnation of the Halite, Sylvinite and Potassium Carnallite subsystems.
The harvesting process includes four main stages, as highlighted below (Figure 10-3):
| · | Drying and formation |
| · | Trenching |
| · | Sealing |
| · | Stockpiling |
Figure 10-3. Improved Treatment Scheme for Harvested Salts
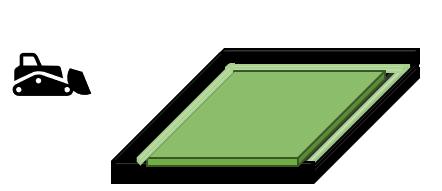 |
 |
| a) Ponds scheme during drying and formation stage. | b) Ponds scheme during trenching and cordoning stage. |
 |
 |
| c) Ponds scheme during sealeing stage. | d) Mineral stockpiling, final stage of the harvesting process. |
Improvements in the harvesting process that will recover more impregnated brine per subsystem are listed below:
| · | Halite: Recovery ditch generation and increase drainage ditches. |
| · | Silvinite: impregnated brine extraction, re-stringing of salts, generation of recovery ditch. |
| · | Potassium Carnallite: A brine recovery harvesting plan will be generated. |
Based on all this information, it is estimated that 1,091 tonnes of LCE will be recovered, increasing the lithium yield of the productive operation by 0.4%. The improved harvesting initiative is in the process of being implemented in the 3 subsystems mentioned above. Consequently, the estimation and evaluation of partial impacts will be carried out for each subsystem during its operation. These impact values are expected to be reported in the next update of this report.
| 10.4.1.3 | Potassium Carnallite Platforms |
Due to the success of Phase 1 of the bischofite platform project as well as the extension to the whole bischofite subsystem, the platforms are also being considered for the potassium carnallite subsystem. The same concept for bischofite platforms is proposed and extrapolated to potassium carnallite salts to minimize impregnation losses. This testwork is focused on brine recovery impregnated in salt harvests, aiming to recover the remaining loss of the improved harvest.
Conceptually, this process is the same of bischofite platforms. After impregnation and the reduction of Potassium Carnalite subsystem, the brine will be recovered in squeeze platforms. The recovered brine at this stage is expected to be dispatched with a 55% yield. With this detail, a recovery of 6,250 tonnes of LCE equivalent is estimated to dispatch, increasing the yield of the operation by 2.1 % for the lithium productive system.
During 2021 and 2022, laboratory and pilot scale tests were developed for carnallite squeezing platforms. The tests have been successfully completed and validated the expected performance. Considering this, the company's plans are to conduct industrial scale testing and platform construction upon completion of the bischofite squeezing system. Work is currently underway on the industrial testing program.
| 10.4.1.4 | Calcium Source |
During the evaporation process, different salts precipitate sequentially in the ponds, including lithium sulfate (Li2SO4). One strategy to increase yield is to avoid lithium losses from lithium sulfate precipitation and to purify the sulfate brine by adding a calcium source.
To avoid and/or reduce lithium losses by precipitation as lithium sulfate in the concentration system (solar evaporation), sulfate in the brines is abated with calcium chloride to form the alternative calcium sulfate precipitate. This will lead to increased lithium availability in the concentrated brine.
Of the salts generated 270,000 [tonnes/year] contain precipitated Li2SO4 with a grade of 1.17 %Li. If precipitation of this solid is avoided in the LiCl production line, an estimated 9,100 [tonnes LCE/year] can be recovered. It has been estimated that this strategy can be successfully integrated with a yield of 3.1% for the lithium system.
Using these concepts, a testwork program will be developed using the natural brine and a brine treated with CaCl2. The aim is to obtain a dose of CaCl2 that results in the most efficient and cost-effective removal of sulfate ions. Concentrated brine and precipitated salts in both tests will provide information regarding crystallized salts throughout the different stages of an evaporation process.
The successful results motivated the development of two sulfate abatement lines: 1) Rapid implementation in wells from January 2023 and 2) Development of basic engineering for implementation of the process in plant by 2024.
| 10.4.2 | Carmen Lithium Chemical Plant (PQC) Testing |
The processes of obtaining refined lithium products were developed over a long period. Operational experience and constant search for operational improvements has led to testwork with the following objectives:
| · | Complete testing and design of the boron solvent extraction facility with a performance guarantee provided by the equipment supplier. |
| · | Determine reagent consumption and brine purification conditions. |
| · | Investigate process equipment and operational conditions for impurity removal. |
| · | Determine lithium carbonate conditions to produce a high purity product. |
As such, tests are being developed to increase Li2CO3 and LiOH.H2O production capacity mainly using the proven design of production trains, which allows a rapid upscaling of production capacity. Industrial scale tests are being conducted in this way for each incorporated train to verify and establish a balance between performance and maximum allowable lithium concentration along the production train. This is achieved by reviewing conditions at each stage. The following is a brief example of the verifications made by the operating train incorporated for the carbonate line:
| · | The raw material conditioning review (dilution) stage involves an increase in brine ion activity (due to a dilution process) by adding water or mother liquor. |
| · | During the lime check stage, lime is added (also known as lime milk, a mixture of lime and water). |
| · | Carbonate doses: in the first stage, Sodium Carbonate (Na2CO3) is added to the above solution and the system is heated to operative temperature by checking output concentrations. |
| · | Filtering: Once Li2CO3 has been obtained by filtering, the precipitate is washed and separated in order to verify the operational capabilities of the process equipment. |
In the same way, controls are checked for conditioning, dosing, and obtained product for the hydroxide line. Samples taken from these trains are subjected to the chemical and physical analyses described above.
| 10.5 | Significant Risk Factors |
The most significant risk considerations regarding brine processing as well as the factors detrimental to recovery, or quality of the obtained product, are the potentially present deleterious elements. Harmful elements, especially magnesium, can impede recoveries, as well as affect product quality and selling prices. Brines can be used to produce battery chemicals, however, produced Li2CO3 can be of poor quality (both the grade and with deleterious elements). Raw material risks factors are insoluble material and carnallite content.
Information has been provided in this report regarding conducted tests to process input and output streams, such as salts and brine, as well as finished potassium and lithium products, for elements such as magnesium and other impurities. This shows the continued attention to improve the operation and obtain the best product, as well as an interest to develop or incorporate a new stage, process, or technology to mitigate the impact of risk factors.
There are other elements that must be removed during brine processing which are deleterious and mainly consist of magnesium, sulfate, and calcium; these are represented by the Mg/Li, Ca/Li, and SO4/Li ratios. Furthermore, elevated carnallite causes elevated magnesium levels in the brine. Having then elevated magnesium causes lower KCl concentrations in the brine, reducing plant efficiency and recovery.
Plant control systems analyze carnallite grades and ensure that they will not affect brine KCl concentration and plant performance. When brines with high magnesium concentrations are used, they can be mixed with lower magnesium brines to keep magnesium levels in the plant feed within acceptable limits.
| 10.6 | Qualified Person´s Opinion |
The current QP, as well as previous QPs responsible for this section, is of the opinion that:
| · | The key to good recovery of ions participating in SQM's products lies in managing the complex salt balance of the Salar de Atacama. Hydrogeological modeling which incorporates information on brine chemistry at different stages has improved yields from the historical amounts of around 45-50% (due to precipitation, entrainment, and impregnation of lithium solutions in the precipitated crystals) to closer to 60% (see Section 14). |
| · | The Salar de Atacama's brine analysis plan, procedures, QA/QC protocols, sample and data custody are considered suitable for operational purposes, both in the production of potassium chloride and concentrated lithium solutions. |
| · | Physical and chemical metallurgical testwork to date has been adequate to establish suitable processing routes for the extracted brine. |
| · | Samples used to generate metallurgical data have been representative and support estimates of future throughput. Metallurgical test data for the extracted brine which is planned to be processed in the projected production plan to 2030 indicates that the recovery methods are adequate. |
| · | The concept of optimizing the lithium production system is directly linked to the concentration and purification of the brine, aiming at the reduction of Mg, Ca, B and SO4 to allow optimal operation of the process plant. |
| · | Although there are processing factors where some deleterious elements may have an impact at some stage during brine extraction and processing, verified expert work by process and operations control teams serves to avoid significant disruption to economic extraction. |
| · | Three different research units cover topics such as the chemical process design, phase chemistry, chemical analysis methodologies, and physical properties of the finished products. |
| 11 | MINERAL RESOURCE ESTIMATE |
This section contains forward-looking information related to Mineral Resource estimates for the Project. The material factors that could cause actual results to differ materially from the conclusions, estimates, designs, forecasts, or projections in the forward-looking information include any significant differences from one or more of the material factors or assumptions that were set forth in this sub-section including geological and grade interpretations and controls and assumptions and forecasts associated with establishing the prospects for economic extraction.
This section describes the Mineral Resource estimate for Li and K in SQM’s tenements of the Salar de Atacama (OMA properties), which is based on the in-situ brine concentrations in the subsurface and drainable interconnected pore volume. The Mineral Resource was estimated by SQM and was subsequently verified by the QP; although SO4 and B Mineral Resources were previously reported (SQM, 2020), only Li and K Mineral Resources are declared in this TRS given their expected economic viability. The Mineral Resource estimation process can be summarized in four major stages, as shown in Figure 11-1.
Figure 11-1. Mineral Resource Estimate General Flowchart
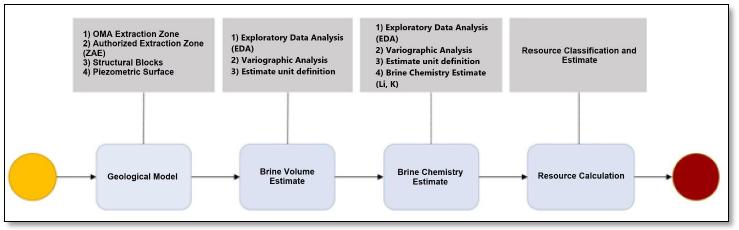
The OMA properties in the salt flat nucleus have been characterized by SQM using various methods that include the installation of exploration and production wells, shallow brine sampling, and geophysics. Given the continuity and subhorizontal disposition of the distinct geological units and aquifers which make up the reservoir (supported in part by previous work done in the salt flat with seismic reflection; see Chapter 7), the vertical direction of the drilling perpendicular to the stratigraphic units is optimal for the representation of the main characteristics of the deposit and it is thus emphasized in this analysis.
| 11.1 | Estimation Methods, Parameters, and Assumptions |
This sub-section contains forward-looking information related to density and grade for the Project. The material factors that could cause actual results to differ materially from the conclusions, estimates, designs, forecasts or projections in the forward-looking information include any significant differences from one or more of the material factors or assumptions that were set forth in this sub-section including actual in-situ characteristics that are different from the samples collected and tested to date, equipment and operational performance that yield different results from current test work results.
The Mineral Resource was estimated based on the lithology, effective porosity, and concentration distributions within the OMA Extraction Zone limited to the nucleus of the Salar de Atacama. The Mineral Resource was estimated, as discussed below.
Construction of the Geological Model: lithologic information as well as available drillhole geophysics were utilized to generate geologic unit volumes in three dimensions using the software Leapfrog Geo. The geological model was also used as a basis to construct the block model utilized for the Resource Estimate. The total number of wells and boreholes used for the construction of the geological model is summarized in Table 11-1; the total combined drill length corresponds to approximately 164 km.
Table 11-1. Total Number of Wells used for Construction of the Geological Model
| Wells and Drillholes | N° | |||
| Trial pits | 23 | |||
| Piezometers | 285 | |||
| Collector wells | 294 | |||
| Brine production wells | 1,125 | |||
| Air reverse circulation (RC) drillholes | 850 | |||
| Direct circulation drillholes | 8 | |||
| Diamond drillholes (DDH) | 137 | |||
| Other mixed drillholes (RC+DDH) | 3 | |||
| Total | 2,725 | |||
Calculation of the Brine Volume: a block model was constructed using the Leapfrog Edge software. The effective porosity of the cell was estimated by ordinary kriging (OK) or by assignment of the geometric mean, depending on the number of measured data points from each geological unit. Only the saturated volume was considered based on the most recent water table elevation. The total number of wells used to calculate the brine volume is summarized in Table 11-2.
Table 11-2. Total Number of Drillholes used to Estimate the Brine Volume.
| Drillholes | N° | |||
| Diamond drillholes (DDH) | 85 | |||
Interpolation of Brine Concentrations: in the block model, concentrations of the ion of interest were estimated for each cell using ordinary kriging and the Leapfrog Edge software; the estimated ions (in wt.%) for the declared resource include K and Li. Brine density was also estimated by ordinary kriging using the complete dataset and a single estimation domain. The total number of wells used for the brine chemistry estimation is summarized in Table 11-3.
Table 11-3. Total Number of Wells used for the Chemistry Interpolation.
| Wells and Drillholes | N° | |||
| Diamond drillholes (DDH) | 21 | |||
| Air reverse circulation (RC) drillholes | 493 | |||
| Brine production wells | 439 | |||
| Piezometers | 406 | |||
| Collector Wells | 60 | |||
| Direct circulation drillholes | 10 | |||
| Other mixed drillholes (RC+DDH) | 4 | |||
| Total | 1,433 | |||
Resource Estimate: Once the block model was built with the reservoir units, porosity, chemistry and brine density, the mass of the chemical element inside of a defined brine volume was estimated using the following formula:
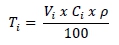
Where:
 =
Metric ton (tonne) of K or Li in cell i.
=
Metric ton (tonne) of K or Li in cell i.
 = Drainable interconnected pore volume in cell i
 = Li or K concentration in cell i (in wt.%).
 = density in cell i (in g/cm3)
| 11.1.1 | Estimation Parameters |
| 11.1.1.1 | Block Model Definition |
A block model was defined whose limits and cell sizes are presented in Table 11-4. The total number of cells in the block model is 19,048,848. This block count is necessary to adequately represent vertical variations in concentration and effective porosity.
Table 11-4. Block Model Discretization
| Model Limit | Min (m) | Max (m) | Block Spacing (m) | |||||||||
| East (x) | 544,832.3 | 593,830.3 | 250 | |||||||||
| North (y) | 7,376,161.5 | 7,420,660.7 | 250 | |||||||||
| Elevation (z) | 1,800 | 2,346 | 1 | |||||||||
*Coordinate System: WGS 84 / UTM Zone 19S In total, the block model covers the OMA Extraction Zone of 81,920 hectares which is designated for the exploration and exploitation of K and Li brines by SQM. A series of cells were conservatively not considered in the estimation domain due to the reasons listed in Table 11-5.
Table 11-5. Conditions and Assumptions for Filtering Cells in the Block Model
| Excluded Cells in the Block Model | Reason | |
| 1 | Hydrogeologic basement (Regional Clays). | Less exploration information at that depth |
| 2 | Cells below a depth of 300 m. | Less exploration information at that depth |
| 3 | Cells within Lower Halites are only considered for depths greater than 100 m below the surface and in Brine Chemistry Domain 4. | Less exploration information at that depth |
| 4 | Cells outside of the OMA or Authorized Extraction zones. | Restrictions to explore and pump outside of the OMA and Authorized Extraction zones |
| 11.1.1.2 | Effective Porosity and Brine Volume Determination |
The effective porosity (Pe) is defined as the drainable interconnected pore volume of the aquifer material (Hains, D. H., 2012). SQM uses this parameter instead of specific yield to estimate the brine volume due to the measurement techniques of their porosity laboratory (Gas Displacement Pycnometer). Although specific yield was not used for the estimate, the QP considers that the high frequency sampling of Pe, large dataset, and general lack of fine-grained sediments in the subsurface OMA Zone such as clay2 (where specific retention can be dominant) permits Pe to be a reasonable parameter for the Resource Estimate.
Methodology and Estimation of Effective Porosity (Pe)
For the brine volume estimate, two separate methodologies were used according to the characteristics of each geological unit as well the representativeness of the effective porosity data. The utilized methodologies include:
| · | Interpolated Pe: Used for units with a low variability in their lithologies and adequate data distribution: Upper Halites, Intermediate Halites, and Halites with Organic Matter. The interpolation method corresponds to Ordinary Kriging. |
| · | Assigned Pe: Used for units with high variability in their lithologies and a good to poor data distribution. As such, the geometric mean of available data was assigned to the Evaporitic and Volcanoclastic, and Lower Halite units. |
Based on the characterization above, the validated dataset was selected under a series of restrictions according to the lithologies of each geological unit and acceptable porosity values (e.g., positive values, no duplicates, and non-overlapping values). The final dataset with these restrictions applied for the brine volume estimate corresponds to 10,395 samples.
Furthermore, the sample data collected by SQM is complemented by two external studies in the salt flat: Hydrotechnica (1987) and Water Management Consultants (1993). These studies were considered to improve the data distribution along the whole exploration area.
2 Fine-grained sediments are principally found on the surface of the geological model and present a low thickness (1 m average). Additionally, the regional clay unit is found below the base of the resource block model.
Exploratory Data Analysis - Pe
To increase confidence in the resource estimation, an exploratory data analysis (EDA) stage was first undertaken to identify effective porosity trends as a function of the geological units. The EDA of the effective porosity involved the univariate statistics of the samples using histogram, box plots and probability plots. Figure 7-4 shows the statistics of the effective porosity data considered to interpolate UG the Upper Halite, Intermediate Halite, and Halite with Organic Matter units; 9,512 data points were considered, and the x-axes are presented in %.
From analysis of the data, the distributions of the Upper Halite and Intermediate Halite can be summarized as follows:
| · | Upper Halites: 2,049 effective porosity data points with a normal distribution and low positive bias; its range varies between 0.01% and 33.26%, with an average value of 6.85%. |
| · | Intermediate Halites: 6,273 effective porosity data points with a log-normal distribution and low positive bias; its range varies between 0.01% and 40.13%, with an average value of 3.09%. |
Due to low data counts for the Evaporitic and Volcanoclastic Unit and Lower Halite Unit, assigned effective porosity values were applied. The assigned values of the effective porosity for the Evaporitic and Volcanoclastic Unit and Lower Halite Unit are presented in Table 11-6:
Table 11-6. Summary of Assigned Pe Values
| Grouped Unit (Chapter 6.3) | Specific Geological Unit |
Number of Data Points |
Assigned Pe Value: Geometric Mean (%) of Measured |
|||||||
| Lower Halite | Halite #1 | 437 | 1.77 | |||||||
|
Evaporites and Intermediate Volcaniclastics |
Tuff #2 | 5 | 16.17 | |||||||
| Halite #2 | 149 | 1.87 | ||||||||
| Gypsum #1 | 59 | 1.73 | ||||||||
| Tuff #3 | 2 | 18.94 | ||||||||
| Gypsum #2 | 196 | 2.62 | ||||||||
| Tuff #4 | 15 | 23.76 | ||||||||
| Gypsum #3 | 86 | 9.09 | ||||||||
| Tuff #5 | 2 | 10.98 | ||||||||
| Gypsum #4 | 35 | 5.43 | ||||||||
| Tuff #5.1 | 4 | 19.74 | ||||||||
| Gypsum #5 | 84 | 10.78 | ||||||||
| Tuff #6 | 14 | 10.64 | ||||||||
| Gypsum #6 | 28 | 11.80 | ||||||||
| Tuff #7 | 5 | 22.29 | ||||||||
| Gypsum #7 | 2 | 5.38 | ||||||||
Table 11-7 summarizes the distinct effective porosity domains and each estimation method employed.
Table 11-7. Effective Porosity Estimation Domains, Brine Volume Estimate
| Effective Porosity Domain |
Grouped Unit (Chapter 6.3) | Estimation Method | Number of Data Points (field samples) |
||||||
| 1 | Upper Halite | Ordinary Kriging | 2,049 | ||||||
| 2 | Halite with Organic Material and Clastic and Evaporitic | Ordinary Kriging | 1,190 | ||||||
| 3 | Intermediate Halite | Ordinary Kriging | 4,624 | ||||||
| 4 | Intermediate Halite | Ordinary Kriging | 1,649 | ||||||
| -1* | Lower Halite / Evaporites and Intermediate Volcaniclastics, Lower Halites | Assigned Drainable Porosity Values |
1,123 | ||||||
Note: *Not used to as an effective porosity domain for the interpolation of values
Variography and Pe Estimation
The validated dataset was compared with the geological units (GU) and Pe domains. A spatial continuity analysis is made for every estimation unit in the XY plane and in the perpendicular (z) direction, defining the variogram models and search radius used for the interpolations. The effective porosity shows an important horizontal anisotropy and exhibits continuities in the XY plane several orders of magnitude higher than the vertical direction. The variograms of the estimation domains with the most samples (estimation domains #1 and #3) are presented in Figure 11-2 and Figure 11-3. Additionally, the search radius and variogram parameters for the effective porosity estimate are summarized in Table 11-8 and Table 11-9.
Figure 11-2. Variograms of Effective Porosity Domain 1 (Upper Halite).
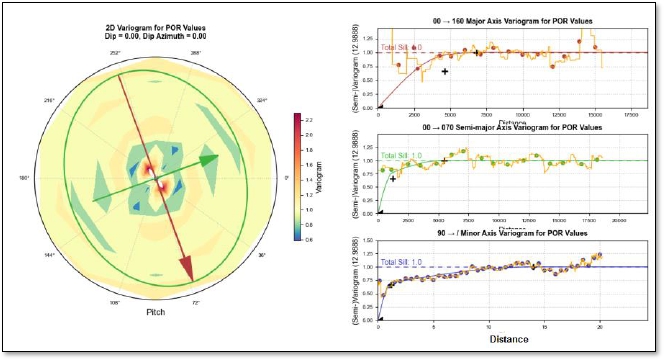
Figure 11-3. Variograms of Effective Porosity Domain 3 (Intermediate Halite).
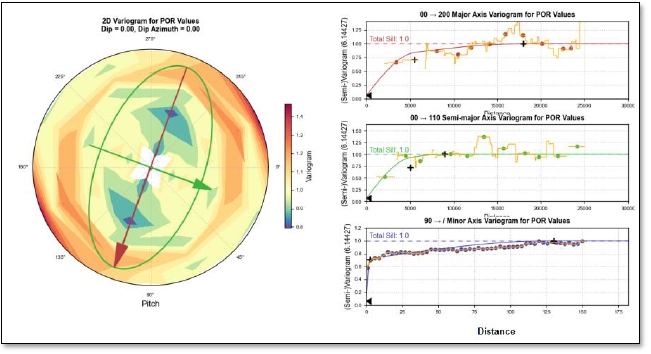
Table 11-8. Search Radius Parameters, Effective Porosity Estimate (SQM, 2021a)
| Effective Porosity Domain |
X (m) | Y (m) | Z (m) | Dip | Dip Az | Pitch | Min 1 | Max 1 | Factor 2nd Vol |
Min 2 | Max 2 | Factor 3rd Vol (XY) |
Z 3er Vol. | Min 3 | Max 3 | Min
Oct Vol1- Vol2/Vol3 |
Max Sample per Oct |
Max
per DH |
|||||||||||||||||||||||||||||||||||||
| 1 | 4,000 | 3,000 | 3 | 0 | 0 | 70 | 3 | 15 | 2 | 3 | 20 | 5 | 50 | 2 | 20 | 4/1 | 7 | 5 | |||||||||||||||||||||||||||||||||||||
| 2 | 4,000 | 3,000 | 3 | 0 | 0 | 0 | 3 | 15 | 2 | 3 | 20 | 5 | 60 | 2 | 20 | 4/1 | 7 | 5 | |||||||||||||||||||||||||||||||||||||
| 3 | 4,000 | 3,000 | 3 | 0 | 0 | 110 | 3 | 15 | 2 | 3 | 20 | 5 | 50 | 2 | 20 | 4/1 | 7 | 5 | |||||||||||||||||||||||||||||||||||||
| 4 | 4,000 | 3,000 | 3 | 0 | 0 | 110 | 3 | 15 | 2 | 3 | 20 | 5 | 50 | 2 | 20 | 4/1 | 7 | 5 |
Table 11-9. Variogram Model Parameters, Effective Porosity Estimate (SQM, 2021a)
| Effective Porosity Domain |
Dip | Dip Az | Pitch | Nugget | ST1Par1 | ST1Par2 | ST1Par3 | ST1Par4 | ST2Par2 | ST2Par3 | ST2Par4 | |||||||||||||||||||||||
| 1 | 0 | 0 | 100 | 0.001 | 4,600 | 1,200 | 1.2 | 0.659 | 5,500 | 14 | 0.3401 | |||||||||||||||||||||||
| 2 | 0 | 0 | 0 | 0.1245 | 8,500 | 6,000 | 2.2 | 0.3354 | 7,000 | 37 | 0.5401 | |||||||||||||||||||||||
| 3 | 0 | 0 | 110 | 0.06472 | 5,500 | 5,000 | 2.2 | 0.6485 | 9,000 | 130 | 0.2867 | |||||||||||||||||||||||
| 4 | 0 | 0 | 110 | 0.06472 | 2,600 | 2,600 | 1.1 | 0.6108 | 5,500 | 15 | 0.3245 |
The interpolation results of Pe are summarized in Table 11-10.
Table 11-10. Effective Porosity (%) Interpolation Summary
| Effective Porosity Domain |
Brine Volume [Mm3] |
Count | Min | Max | Mean | Standard Deviation |
Median | |||||||||||||||
| All | 12,741 | 4,877,573 | 0 | 37.523 | 4.179 | 3.941 | 3.036 | |||||||||||||||
| 1 | 2,106 | 471,201 | 0 | 25.679 | 7.153 | 2.171 | 7.001 | |||||||||||||||
| 2 | 4,773 | 872,074 | 0 | 37.523 | 8.758 | 6.241 | 6.144 | |||||||||||||||
| 3 | 5,057 | 3,191,470 | 0 | 28.036 | 2.535 | 1.539 | 2.301 | |||||||||||||||
| 4 | 804 | 342,828 | 0.068 | 21.85 | 3.752 | 1.602 | 3.634 |
Figure 11-4 shows the block model with the Pe domains and interpolated Pe values in OMA Extraction Zone.
Figure 11-4. Block Model with Pe Domains and Interpolated Values, OMA Extraction Zone
The resulting Pe values are consistent with the response of the reservoir units to pumping and are reasonable based on the QP’s experience. It is important to highlight that the values are also conservative considering that normally core samples used for the Pe measurements are recovered in more compact zones, compared to more porous and disaggregated zones which have a lower recovery rate.
Brine Volume Validation
The validation of brine volume was made for those hydrogeological units whose porosity value was estimated using ordinary kriging. For those units where the drainable porosity was assigned, no validation was needed.
The comparison between the dataset distribution and estimate indicates that the distribution is respected with a slight decrease of the variance due to the kriging interpolation. It is observed that in general the main trends are respected in all directions and the interpolation properly reproduces the variability in the vertical direction (Figure 11-5). Given that the difference in general is less than ∼10% and that the variability with depth is respected, the Pe interpolation within the estimation domains is considered adequate.
Figure 11-5. Swath Plots of Effective Porosity within the 4 Estimation Domains.
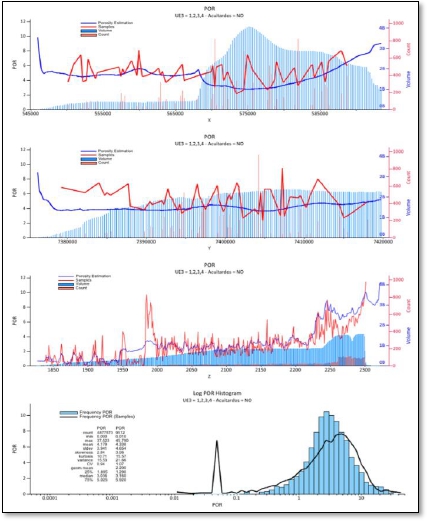
| 11.1.1.3 | Brine Chemistry Interpolation |
Methodology and Estimation
The data used for the brine chemistry interpolation was analyzed in the Chemical Laboratory of the Salar de Atacama. This laboratory receives the chemical samples as well as the respective control samples. Utilized chemistry values were taken from bailer, packer, pumping, and exploration (RC borehole) samples between January 2011 and January 2021. A total of 1,433 wells and 4,979 samples were selected for the brine chemistry interpolation. Once the dataset was defined, exploratory and variography analyses were performed. Subsequently, the interpolation was made using OK.
Exploratory Data Analysis
The hydrochemical units were grouped into brine chemistry estimation units, or domains, according to the similarity of their statistical parameters and lithologies (see Hydrogeological Units in Section 7 of this TRS). This allows for a greater continuity for the interpolation, an improved variographic analysis, and well-defined estimation parameters. From this analysis, the following brine chemistry domains were defined:
| · | Domain 1: Brine from hydrogeological unit UA for every structural block in the Salar de Atacama and low K brine from UB. This estimation unit is characterized by lithium concentration between 0.007 and 1.945 wt.%, with an average of 0.141 wt.%. |
| · | Domain 2: Brine from hydrogeological unit UB with high K concentrations. It is characterized by Li concentration between 0.020 and 2.243 wt.%. |
| · | Domain 3: Brine from hydrogeological unit UC, with high Li located between the Salar Fault System and Lila Este Fault System. It is characterized by high Li concentrations with a range between 0.06 and 0.84 wt.%. |
| · | Domain 4: Brine from the UC and UD, limited to the west by the Lila Este fault system. It is characterized by a low content of SO4 and high Ca. Lithium concentrations vary between 0.12 and 0.62 wt.%. |
| · | Domain 5: Brine from UC between the Salar Fault System and Lila Este fault system. This unit is characterized by a low Li content between 0.018 and 0.740 wt.%. |
Table 11-11 summarizes the equivalence between the brine estimation domains and hydrogeological units.
Table 11-11. Equivalence between Hydrogeological Units and Brine Chemistry Domains
| Brine Chemistry Domain |
Hydrogeological Unit (Chapter 7) |
Grouped Geological Unit (Chapter 6.3) |
General Characteristics |
N°
Data Points |
|||||||
| 1 | UA + UB Type 2 | Intermediate Halite and Upper Halite | Low K | 3,026 | |||||||
| 2 | UB Type 1 | Intermediate Halite | High K | 643 | |||||||
| 3 | UC Type 1 | Evaporites and Volcanoclastics | High Li | 265 | |||||||
| 4 | UC Type 2 + UD | Evaporites and Volcanoclastics with Lower Halite | High Ca | 75 | |||||||
| 5 | UC Type 3 | Evaporites and Volcanoclastics | High SO4 | 970 | |||||||
Variography and Brine Chemistry Estimation
The variography analysis was made in two directions: horizontal (XY surface) and vertical (Z axis). For the horizontal direction, the RC borehole samples were excluded (except for Domains 4 and 5) to avoid bias in the wells with more available data from that specific sampling type. For the vertical direction, measured field data have a high resolution over small distances. For some ions and units, capping was applied to eliminate the effect of outliers such as re-injected brines in the upper aquifer and to better represent the continuity of the most relevant population within a domain (in the case of multimodal distributions).
The search ellipse was divided into octants, and restrictions were applied to the minimum and maximum number of samples per well and sector. No compositing of the samples was undertaken. Variograms of Li and K for the Brine Chemistry Domain 1 (the domain with the largest number of field samples) are presented Figure 11-6 and Figure 11-7, and the search radius and variogram parameters are also summarized in Table 11-12 and Table 11-13. Interpolation for all brine chemistry domains was subsequently done using ordinary kriging; an image of the brine chemistry interpolation result for Li is shown in Figure 11-8 and the average Li and K concentrations in each estimation domain are shown in Table 11-14.
Figure 11-6. Lithium Variograms of Brine Chemistry Domain 1.
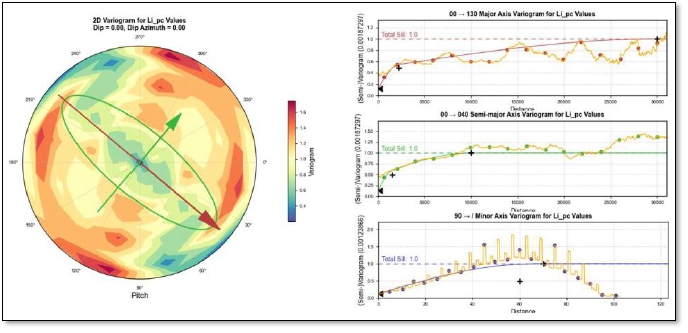
Figure 11-7. Potassium Variograms of Brine Chemistry Domain 1.
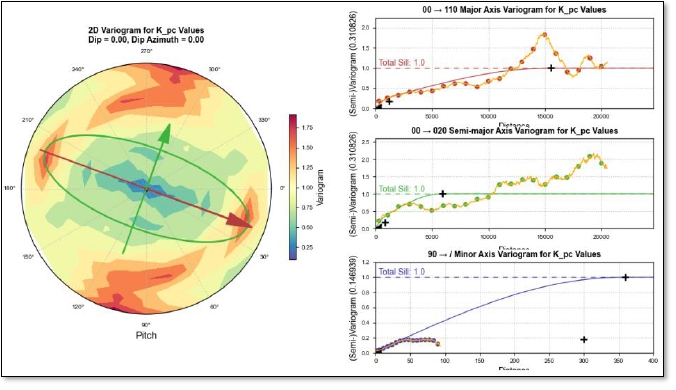
Table 11-12. Search Radius Parameters, Li and K Interpolation (SQM, 2021a).
| Element | Brine Chemistry Domain |
Max (m) |
Int (m) | Min (m) | Dip | Pitch | N° Min. 1st |
N° Max 1st |
Max per Oct 1st |
Min Number of Octant Required 1st |
Max per DH 1st |
2nd Vol Fact or |
N° Min. 2nd |
N° Max. 2nd |
% Of Search 2nd |
Value Threshold 2nd |
Max per Oct 2nd |
Min Number of Octant Required 2nd |
Max per DH 2nd |
||||||||||||||||||||
| Li | 1 | 3,000 | 2,500 | 10 | 0 | 40 | 6 | 18 | 5 | 4 | 4 | 2 | 4 | 18 | 0.5 | 0.4 | 5 | 4 | 4 | ||||||||||||||||||||
| Li | 2 | 3,000 | 2,500 | 10 | 0 | 135 | 6 | 18 | 5 | 4 | 4 | 2 | 4 | 18 | 0.5 | 0.55 | 5 | 4 | 4 | ||||||||||||||||||||
| Li | 3 | 2,500 | 1,500 | 10 | 0 | 70 | 6 | 18 | 5 | 4 | 4 | 2 | 4 | 18 | 0.5 | 0.67 | 5 | 4 | 4 | ||||||||||||||||||||
| Li | 4 | 3,000 | 2,500 | 10 | 0 | 155 | 6 | 18 | 5 | 4 | 4 | 2 | 4 | 18 | 0.5 | 0.5 | 5 | 4 | 4 | ||||||||||||||||||||
| Li | 5 | 1,500 | 1,500 | 10 | 0 | 0 | 6 | 18 | 5 | 4 | 4 | 2 | 4 | 18 | - | - | 5 | 4 | 4 | ||||||||||||||||||||
| K | 1 | 3,000 | 2,500 | 10 | 0 | 20 | 6 | 18 | 5 | 4 | 4 | 2 | 4 | 18 | - | - | 5 | 4 | 4 | ||||||||||||||||||||
| K | 2 | 3,000 | 2,500 | 10 | 0 | 155 | 6 | 18 | 5 | 4 | 4 | 2 | 4 | 18 | - | - | 5 | 4 | 4 | ||||||||||||||||||||
| K | 3 | 2,500 | 1,500 | 10 | 0 | 30 | 6 | 18 | 5 | 4 | 4 | 2 | 4 | 18 | - | - | 5 | 4 | 4 | ||||||||||||||||||||
| K | 4 | 3,000 | 2,500 | 10 | 0 | 155 | 6 | 18 | 5 | 4 | 4 | 2 | 4 | 18 | - | - | 5 | 4 | 4 | ||||||||||||||||||||
| K | 5 | 1,500 | 1,500 | 10 | 0 | 0 | 6 | 18 | 5 | 4 | 4 | 2 | 4 | 18 | - | - | 5 | 4 | 4 |
Table 11-13. Variogram Model Parameters, Li and K Interpolation (SQM, 2021a).
| Elem. | Estimation Unit |
Transform | Lower Cap | Upper Cap | Dip | DipAz | Pitch | Nugget | ST1 | Maj1 | |||||||||||
| Li | 1 | - | 0.05 | 0.2 | 0 | 0 | 40 | 0.127 | Spherical | 2,200 | |||||||||||
| Li | 2 | - | 0.05 | 0.35 | 0 | 0 | 135 | 0.01133 | Spherical | 2,000 | |||||||||||
| Li | 3 | - | 0.4 | - | 0 | 0 | 70 | 0.02 | Spherical | 1,050 | |||||||||||
| Li | 4 | - | - | 0.4 | 0 | 0 | 155 | 0.01 | Spherical | 2,200 | |||||||||||
| Li | 5 | - | - | 0.25 | 0 | 0 | 0 | 0.002 | Spherical | 2,100 | |||||||||||
| K | 1 | - | 0.5 | 3 | 0 | 0 | 20 | 0.02 | Spherical | 1,200 | |||||||||||
| K | 2 | - | 0.5 | 3 | 0 | 0 | 155 | 0.005 | Spherical | 1,600 | |||||||||||
| K | 3 | - | - | 3.5 | 0 | 0 | 30 | 0.02 | Spherical | 1,150 | |||||||||||
| K | 4 | - | - | 3.5 | 0 | 0 | 155 | 0.01 | Spherical | 10,000 | |||||||||||
| K | 5 | - | 1 | 3 | 0 | 0 | 0 | 0.02 | Spherical | 7,00 | |||||||||||
| Elem. | Estimation Unit |
SMaj1 | Min1 | Var1 | ST2 | Maj2 | SMaj2 | Min2 | Var2 | ||||||||||||
| Li | 1 | 1,500 | 60 | 0.3636 | Spherical | 30,000 | 30,000 | 70 | 0.5094 | ||||||||||||
| Li | 2 | 1,200 | 90 | 0.365 | Spherical | 5,500 | 5,500 | 90 | 0.6237 | ||||||||||||
| Li | 3 | 600 | 320 | 0.6008 | Spherical | 3,100 | 3,100 | 330 | 0.3792 | ||||||||||||
| Li | 4 | 1,300 | 150 | 0.492 | Spherical | 12,000 | 12,000 | 200 | 0.498 | ||||||||||||
| Li | 5 | 2,100 | 2,100 | 0.7643 | Spherical | 3,500 | 3,500 | 3,500 | 0.2337 | ||||||||||||
| K | 1 | 800 | 300 | 0.16 | Spherical | 5,900 | 15,500 | 360 | 0.82 | ||||||||||||
| K | 2 | 1,200 | 500 | 0.2949 | Spherical | 6,000 | 8,500 | 600 | 0.7001 | ||||||||||||
| K | 3 | 500 | 600 | 0.217 | Spherical | 1,600 | 2,600 | 600 | 0.763 | ||||||||||||
| K | 4 | 3,500 | 1,000 | 0.99 | - | - | - | - | - | ||||||||||||
| K | 5 | 700 | 25 | 0.06 | Spherical | 2,200 | 2,200 | 2,200 | 0.92 |
Note: ST: Variogram structure type; Maj: Major axis ellipsoid; SMaj: Semi-major axis ellipsoid; Min: Minor axis ellipsoid; Var: variance.
Figure 11-8. Interpolated Li (wt %) in the Block Model, Saturated Area of the OMA Zone (Modified from (SQM, 2021a)).
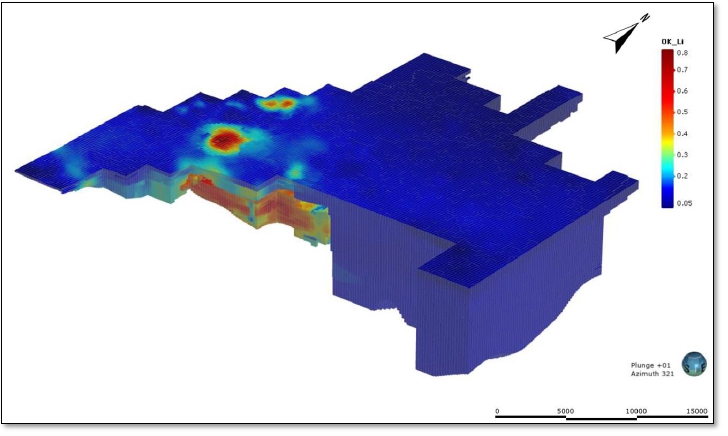
Table 11-14. Average Li and K Concentrations after Interpolation, OMA Extraction Area
| Brine Chemistry Domain |
Average Interpolated Li (wt.%) |
Average Interpolated K (wt.%) |
||||||
| 1 | 0.127 | 1.70 | ||||||
| 2 | 0.232 | 2.80 | ||||||
| 3 | 0.476 | 1.79 | ||||||
| 4 | 0.261 | 2.29 | ||||||
| 5 | 0.153 | 1.68 | ||||||
Validation of the Brine Chemistry Estimate
To corroborate the effectiveness of the estimate, visual inspections, cross-statistical validation, comparison of distributions and disaggregated means, and derivative analyses were carried out. For each chemical estimation domain, the difference between the estimate and ungrouped mean of the samples was less than 10% for Li and K, indicating that the interpolation is considered valid within the estimation domains. Comparative box and whisker plots of Li and K are provided in Figure 11-9 showing that a good agreement or lower (conservative) values were obtained for most brine chemistry domains (x-axis).
Figure 11-9. Box Plots of Measured Sample Values versus estimated Block Model Values, Li and K.
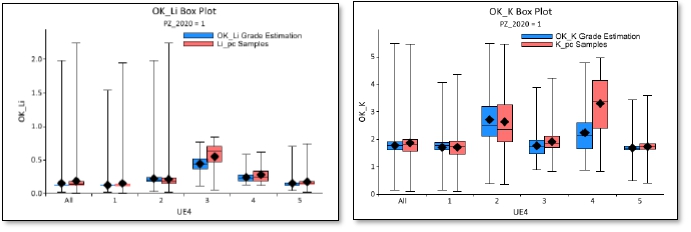
| 11.1.1.4 | Brine Density Interpolation |
The density estimate was made using OK over a single domain (Table 11-15) due to the unimodal distribution and symmetric population of the mean and median (Figure 11-10). The statistical summary of the density values is shown on Table 11-15.
Table 11-15. Univariate Statistics of Density Weighted by Sample Length
| Parameter | Value | |||
| Number of Samples | 4,945 | |||
| Total Length [m] | 27,602.7 | |||
| Average [g/cm3] | 1.225 | |||
| St. Deviation [g/cm3] | 0.008 | |||
| Min [g/cm3] | 1.114 | |||
| Q1 [g/cm3] | 1.220 | |||
| Median [g/cm3] | 1.225 | |||
| Q3 [g/cm3] | 1.230 | |||
| Max [g/cm3] | 1.350 | |||
Figure 11-10. Density Histogram and Spatial Distribution
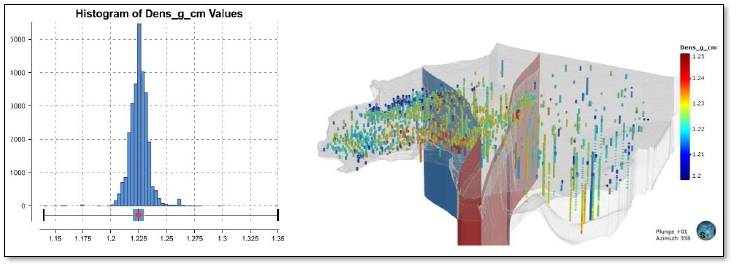
The variography analysis was performed in the horizontal (XY) and vertical (Z) directions. Capping was applied to remove the effect of the extreme values of the distribution on the variogram (Table 11-16). A maximum continuity (NE orientation) was observed with ranges of approximate 10,000, 6,000 and 150 m (major, semi-major and minor axis, respectively), resulting in a horizontal anisotropy ratio close to 1.6 and vertical ratio greater than 60 (Figure 11-11). Two search radii were defined: the first with the ranges and direction of the variogram, and the second being double of the first (Table 11-16) which was enough to populate the area of interest.
Table 11-16. Variogram Model Parameters for the Brine Density Interpolation (SQM, 2021a)
| Elem. | Estimation Unit |
Transform | Lower Cap |
Upper Cap |
Dip | DipAz | Pitch | Nugget | ST1 | |||||||||||||||||||||||||||
| Density | - | - | 1.2 | 1.25 | 0 | 0 | 110 | 0.123 | Spherical | |||||||||||||||||||||||||||
| Elem. | Maj1 | SMaj2 | Min1 | Var1 | ST2 | Maj2 | SMaj2 | Min2 | Var2 | |||||||||||||||||||||||||||
| Density | 260 | 260 | 70 | 0.4679 | Spherical | 9,500 | 5,900 | 150 | 0.409 | |||||||||||||||||||||||||||
Note: ST: Variogram structure type; Maj: Major axis ellipsoid; SMaj: Semi-major axis ellipsoid; Min: Minor axis ellipsoid; Var: variance.
Figure 11-11. Density Estimate Variogram
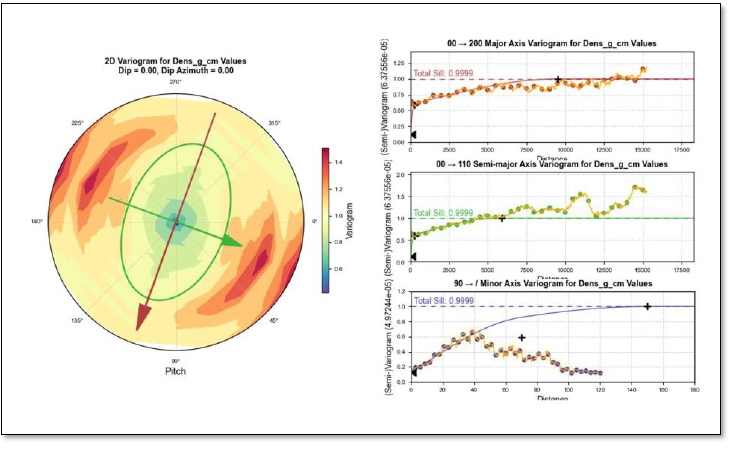
Furthermore, a validation process of the density estimate was made to confirm the overall validity of the obtained results, and it shows that brine density is adequately represented in the resource block model.
| 11.2 | Cut-off Grades |
This sub-section contains forward-looking information related to establishing the prospects of economic extraction for Mineral Resources for the Project. The material factors that could cause actual results to differ materially from the conclusions, estimates, designs, forecasts or projections in the forward-looking information include any significant differences from one or more of the material factors or assumptions that were set forth in this sub-section including cut-off grade assumptions, costing forecasts, and product pricing forecasts.
As of the effective date of this Mineral Resource estimate (December 31, 2023), the cut-off grade for Li was set by SQM at 0.05 wt.% based on the cost of generating Li product, lithium carbonate sales (Chapter 16), and the respective cost margin. Based on historical lithium prices from 2010 and the forecast to 2040 (Figure 16-5), a projected lithium carbonate price of $ 11,000 USD/metric tonne with the corresponding cost and profit margin was considered (Chapter 19). A small increase from the current cost was utilized to better accommodate the evaporation area (allowing for the required Li concentration to be reached) and allow for the use of additives to maintain the quality of the brine feeding the plant.
A similar pricing basis and analysis was undertaken for K, where the cut-off grade of 1.0 wt.% has been set by SQM based on respective costs, sales, and margins (Chapter 16 and Chapter 19). This considers only MOP-S as a low-margin scenario, using a brine as raw material diluted with more contaminants and performance at the lower end of the range (approximately 52% recovery). In this scenario, and considering the current market conditions and recent years, the cost of MOP production remains competitive.
Resource block model cell concentrations of Li and K were compared with the specified cut-off grades and a sensitivity analysis was performed with distinct product prices, costs, and cut-off values. The QP believes that the designated cut-off grades of 0.05 wt.% Li and 1.0 wt.% K are appropriate and do not have any material effect on the estimated Mineral Resource. Block model concentrations greatly exceed those cut-off values within the OMA Extraction Zone.
| 11.3 | Mineral Resource Classification |
This sub-section contains forward-looking information related to Mineral Resource classification for the Project. The material factors that could cause actual results to differ materially from the conclusions, estimates, designs, forecasts or projections in the forward-looking information include any significant differences from one or more of the material factors or assumptions that were set forth in this sub-section including geological and grade continuity analysis and assumptions.
The Mineral Resource was classified into three categories to include Measured, Indicated, and Inferred based on industry standards for brine projects inclusive of the level of characterization of the hydrogeological units (Table 11-17) as well as geostatistical criteria. The level of hydrogeological characterization was prioritized as the first classification based on exploration, monitoring, and historical production data. Geostatistical variables were used as a secondary criterion.
Units were characterized based on pumping tests, Pe measurements from retrieved cores, the distribution of the Pe and chemistry data, and the representativeness of the brine samples. Table 11-17 summarizes the distinct brine chemistry domains that were classified based on the level of hydrogeological understanding.
Table 11-17. Brine Chemistry Domains and Level of Hydrogeological Characterization
| Chemical Estimation Domain |
Method of determining Pe | Historical production? | Level of hydrogeological characterization |
| 1 | Interpolation | Since 1994: MOP wellfield and sampling campaigns | Unit well characterized from 2,200 masl upward. Below, it is considered to be partially characterized. Also partially characterized in areas with the presence of brine reinjection. |
| 2 | Interpolation | Since 2010 | Unit well characterized. Partially characterized in areas with presence of reinjection solutions. |
| 3 | Assigned geometric mean | Since 2004 | Unit well characterized. |
| 4 | Assigned geometric mean | Since 2020 | Unit partially characterized; however, it is considered well characterized in the productive zone. |
| 5 | Assigned geometric mean | - | Partially characterized. |
In addition to the hydrogeological characterization criterion (Table 11-17), the following geostatistical factors were considered:
| · | Search Volume: Given that the evaluated ions generally have a large spatial continuity, the Li-ion search radius was used to analyze the reliability of the estimate. It is considered as a Measured Mineral Resource up to the second search radius and Indicated and Inferred Mineral Resources up to the third search radius. |
| · | Presence of Reinjection Brines: Measured Mineral Resource zones in the shallow aquifer units (UA, UB, UE4: 1 and 2) with high Li levels associated with reinjected brine were conservatively downgraded to Indicated Mineral Resources. |
| · | Exclusion of high effective porosity areas associated with marginal facies: a sector of high uncertainty in the effective porosity of the East Block (hydrogeological unit UAB; to the east of the X coordinate: 584,625 m) was classified as Inferred Mineral Resources. |
The above factors were combined to establish the Measured, Indicated and Inferred Mineral Resources (Table 11-18).
Table 11-18. Categorization of Measured, Indicated, and Inferred Mineral Resources
| Resource Category | Criteria |
| Measured |
· Chemical Estimation Domains 1, 2, and 3, within the first and second Li search radius for Domain 1 and 2, and within the first Li search radius for Domain 3. · For Chemical Estimation Domain 1, the cells are required to be above elevation 2,200 masl. · For Chemical Estimation Domain 4, the first Li search radius. |
| Indicated |
· For the partially characterized Chemical Estimation Domain 4: inside of the second search radius for Li. · In the well characterized Chemical Estimation Domains 1, 2 and 3: inside of the third search radius for Li. · For Chemical Estimation Domain 1, the cells are required to be above an elevation of 2,100 masl. · Lithium concentrations above 0.4% wt.% are considered in this category based on the reinjection solutions for Chemical Estimation Domain 1 and 2. · For Chemical Estimation Domain 5, for the first and second search radius. · For Chemical Estimation Domain 1, within the hydrogeological unit UAB, between the X coordinates 584,500 and 587,500, above 2,200 masl for the first search radius. |
| Inferred |
· Chemical Estimation Domain 4 is considered in this category for the third search radius. · Chemical Estimation Domain 5 is considered in this category for the third search radius. · The sector east of X coordinate: 584,500 m (in the UAB hydrogeological unit) with a high uncertainty in Pe values. |
Note: *See Table 11-17 for explanations of the Chemical Estimation Domain Figure 11-12 displays the zones of Measured, Indicated, and Inferred Mineral Resources in the block model.
Figure 11-12. Resource Categorization in 3 Dimensions
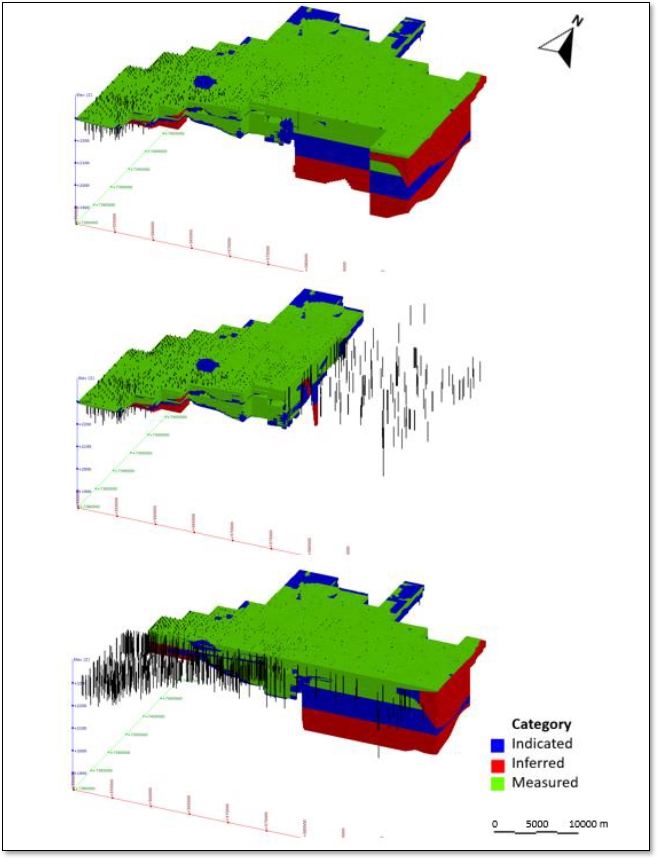
| 11.4 | Mineral Resource Statement |
This sub-section contains forward-looking information related to Mineral Resource estimates for the Project. The material factors that could cause actual results to differ materially from the conclusions, estimates, designs, forecasts, or projections in the forward-looking information include any significant differences from one or more of the material factors or assumptions that were set forth in this sub-section including geological and grade interpretations and controls and assumptions and forecasts associated with establishing the prospects for economic extraction.
Table 11-19 presents the Mineral Resources in-situ exclusive of Mineral Reserves (Section 12) without processing losses. When calculating Mineral Resources exclusive of Mineral Reserves, the QP assumed a direct correlation between Measured Mineral Resources and Proven Mineral Reserves as well as Indicated Mineral Resources and Probable Mineral Reserves.
Table 11-19. SQM’s Salar de Atacama Lithium and Potassium Resource Statement, Exclusive of Mineral Reserves (Effective December 31, 2023)
| Resource Classificationa | Brine Volume (Mm3) |
Mean Grade (wt. %) | Mass (Million tonnes) | |||||||||||||||||
| K | Li | K | Li | |||||||||||||||||
| Measured | 2254 | 1.80 | 0.20 | 49.8 | 5.4 | |||||||||||||||
| Indicated | 1435 | 1.70 | 0.16 | 30.0 | 2.8 | |||||||||||||||
| Measured + Indicated | 3689 | 1.77 | 0.18 | 79.8 | 8.2 | |||||||||||||||
| Inferred | 1614 | 1.77 | 0.13 | 34.9 | 2.6 | |||||||||||||||
| Total | 5303 | 1.77 | 0.17 | 114.7 | 10.8 | |||||||||||||||
Notes:
(1) Mineral Resources are not Mineral Reserves and do not have demonstrated economic viability. There is no certainty that all or any part of the Mineral Resource will be converted into Mineral Reserves upon the application of modifying factors.
(2) Mineral Resources are reported as in-situ and exclusive of Mineral Reserves, where the estimated Mineral Reserve without processing losses during the reported LOM (Chapter 12) and real declared extraction from 2021 were subtracted from the Mineral Resource inclusive of Mineral Reserves. A direct correlation between Proven Reserves and Measured Resources, as well as Probable Reserves and Indicated Resources was assumed.
(3) Compared to the previously filed TRS (2022), mining occurred in 2023 and the end of the LOM (year 2030) has not changed. Given the acceptable reserve model fit to real 2023 production (see Chapter 12), there is no change in the Mineral Resource exclusive of Mineral Reserves since December 31, 2022 (SQM, 2023).
(4) Effective porosity was utilized to estimate the drainable brine volume based on the measurement techniques of the SQM porosity laboratory (Gas Displacement Pycnometer). Although specific yield is not used for the estimate, the QP considers that the high frequency sampling of effective porosity, its large dataset, and general lack of material where specific retention can be dominant permits effective porosity to be a reasonable parameter for the Mineral Resource estimate.
(5) The conversion of brine volume to Li and K tonnes considered the estimated brine density in each block model cell.
(6) Comparisons of values may not add due to rounding of numbers and the differences caused by use of averaging methods.
(7) The mineral resource estimate considers a 0.05 wt.% cut-off grade for Li based on the cost of generating Li product, lithium carbonate sales, and the respective cost margin. Based on historical lithium prices from 2010 and the updated forecast to 2040, a projected lithium carbonate price of $ 11,000 USD/tonnes with the corresponding cost and profit margin is considered with a small increase to accommodate the evaporation area and use of additives. A similar pricing basis and analysis was undertaken for K, where the cut-off grade of 1 wt.% was set by SQM based on respective costs, sales, and margin (Section 16 and Section 19).
| 11.5 | Uncertainty |
The QP considered the following sources of uncertainty in the Li and K Resource estimate:
| · | The use of effective porosity versus specific yield could result in an overestimation of the estimated brine volume if fine-grained sediments are present. However, based on the geological and hydrogeological characterization of the OMA (Chapters 6 and 7), the reservoir does not present significant volumes of fine-grained material, such as clay, where specific retention can be significant (when compared to specific yield). Thus, the effective porosity is considered to be an adequate parameter for the brine volume estimate. It should be noted that the reservoir is also characterized by presence of caverns and karstic areas that were not considered in the brine volume estimation which would probably increase the estimation. This is because current field sampling methods do not allow to take representative samples of this type of geological features for subsequent laboratory analysis. |
| · | SQM’s brine chemistry and porosity labs are not accredited; however, a round robin analysis was performed for brine samples to confirm that the QA/QC procedures and overall accuracy and precision. To further mitigate this uncertainty, various QA/QC procedures are in place for measured brine chemistry and effective porosity (Chapters 8 and 9). |
| · | Near the ponds, potential infiltration could have affected the reservoir chemistry, however those areas were conservatively categorized as less certain (e.g., Indicated instead of Measured). |
| 11.6 | Opinion and Recommendations |
It is the resources QP’s opinion that the Mineral Resources were estimated in compliance with the S-K 1300 regulations. Compared to other reported mineral resource estimates for brine deposits as well as related guidelines that are typically cited (Houston, Butcher, & Ehren, 2011), the QP believes that the declared Mineral Resource estimate is reliable given; (i), the large amount of wells and field information in the OMA Extraction Zone when compared to other lithium brine projects; (ii), SQM’s historical brine production that increases certainty in the reservoir characterization and potential; (iii), utilized effective porosity values are generally low compared to specific yield/effective porosity values of other projects; and (iv), the Mineral Resource categorization integrates two separate methodologies (exploration/historical production and geostatistical parameters).
Future recommendations to increase the Mineral Resource and certainty of the Mineral Resource estimate include the utilization of a separate methodology on collected core (e.g., relative brine release capacity testing) to confirm the estimated brine volume.
| 12 | MINERAL RESERVE ESTIMATE |
This sub-section contains forward-looking information related to the key assumptions, parameters and methods for the Mineral Reserve estimates for the Project. The material factors that could cause actual results to differ materially from the conclusions, estimates, designs, forecasts or projections in the forward-looking information include any significant differences from one or more of the material factors or assumptions that were set forth in this sub-section including Mineral Resource model tonnes and grade.
Mineral Reserves for the Project were estimated considering the modifying factors for converting Mineral Resources to Mineral Reserves. The projection of future brine extraction was simulated using a groundwater flow and solute transport model; specifically, the Modflow USG-Transport code (Panday, 2021) and Groundwater Vistas interface (ESI, 2020) were utilized. Numerical modeling was supported by hydrogeological, geological, and hydrochemical data, and parameters utilized are consistent with the stated Mineral Resource estimate (Section 11). The following subsections describe the model parameters, calibration to field data, and projected results over the LOM.
| 12.1 | Numerical Model Design |
The numerical groundwater model was constructed based on the resource block model (Section 11) and defined hydrogeological units (Section 7). The area of the active numerical model domain corresponds to 1,421.3 square kilometers. A constant brine density was assumed based on the model limit (confined to the salt flat nucleus) as well as the near constant brine density measurements from pumping and observations wells.
In total, the numerical model is characterized by 430,057 active numerical cells with 9 layers, covering all hydrogeological units included in the Resource model (see Table 12-1 and Figure 12-1). Using the quadtree capabilities of Modflow-USG, horizontal cell lengths range from 100 m to 400 m. The most refined portion of the numerical model grid corresponds to the locations of current wellfields to properly simulate the hydraulic gradient as well as to limit the number of pumping and observation wells in the same cells (Figure 12-1). The top of layer 1 of the model was built based on the interpolation of well elevations from a topographic survey.
Table 12-1. Grid Specifics and Layers
| Model Layer |
Hydrogeological Unit | Layer
Thickness (meters) |
General Unit Description |
| 1 | Unit A | 4-6 | Upper nucleus, chlorides (unconfined) |
| 2 | 2-37 | ||
| 3 | Unit AB | 2-237 | Evaporites with organic matter (aquitard) |
| 4 | Unit B | 2-188 | Lower chlorides (largely confined) |
| 5 | 2-172 | ||
| 6 | Unit C | 2-69 | Evaporites with volcanoclastics (confined) |
| 7 | 2-69 | ||
| 8 | 2-59 | ||
| 9 | Unit D | 2-260 | Deeper halites (confined with limited permeability) |
Figure 12-1. Numerical Model Domain and Grid
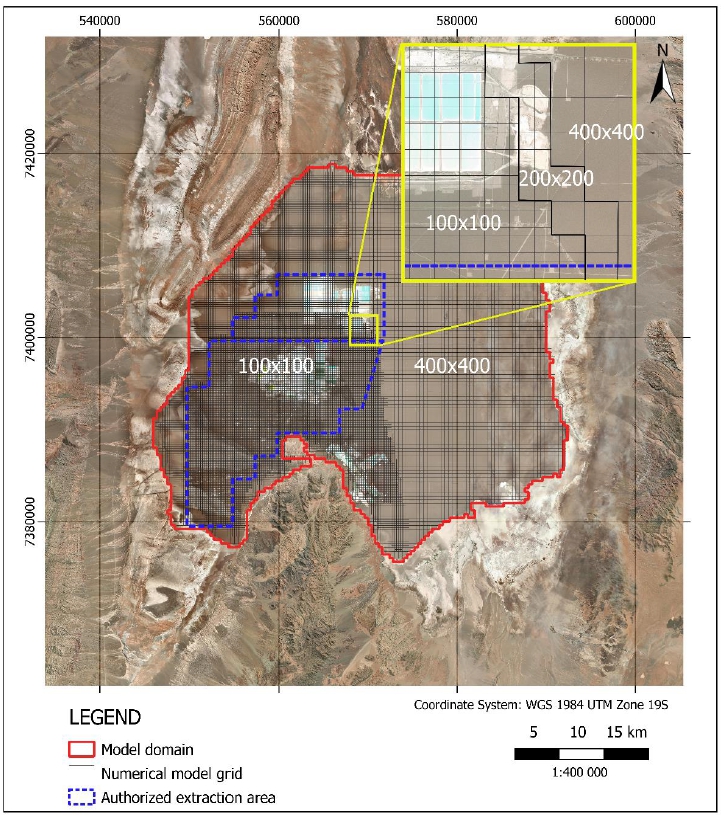
| 12.1.1 | Boundary Conditions and Water Balance |
To simulate site conditions, the following boundary conditions were assigned in the numerical model with monthly stress periods:
| · | Direct recharge: using the recharge “RCH” package, monthly direct recharge from precipitation on the salt flat nucleus was applied in different zones based on the recharge estimated by SRK (2020) and SQM (2021). Figure 12-2 shows the zones of recharge due to natural precipitation with assigned concentrations of 0. Also, direct recharge due to infiltration from existing evaporation ponds in both SOP and MOP areas was applied during the calibration period (years 2015-2020), with the corresponding concentrations, based on information provided by SQM. |
| · | Underflow: using the “WELL” package, brine inflow, originally sourced from adjacent watersheds and subsequently evapo-concentrated, was assigned along most limits of the numerical model using injection wells in layer 1; this shallow underflow was conceptualized and assigned in the shallowest layer because it is the most permeable unit. The lateral recharge zones are illustrated in Figure 12-2. Rates of groundwater inflow were defined based on the water balance study developed by SRK (2020) which was subsequently updated by SQM (2021). Incoming concentrations were specified based on average measured concentrations in observation wells located near the model boundaries. |
| · | No-flow boundaries: certain limits, such as the east boundary, were specified as no-flow limits where brine was conservatively assumed to not enter the model domain. Assigned no-flow limits (Figure 12-2) were consistent with the conceptual water balance study of the brine zone (SRK, 2020). |
| · | Evaporation: Evaporation from shallow groundwater (brine) in the salt flat nucleus was represented using the “ETS” (Evapotranspiration Segments) package of Modflow. It was utilized to simulate evaporation from different zones within the active domain, which were delineated based on areas defined in the water balance study (SRK, 2020). Evaporation decay curves estimated for each zone, were represented in the model by several linear segments (up to four). Figure 12-3 shows the distinct evaporation zones represented in the model; no evaporation from the aquifer was assumed where the ponds are located. |
| · | Production wells: pumping was simulated using the “CLN” package of Modflow-USG, allowing for more precise responses to pumping, skin factors, and flow reduction in the case that the dynamic pumping level reaches the bottom of the screened layer. SQM and Albemarle pumping was simulated during the calibration period (2015 -2020) using available provided data. |
During the 2015 to 2020 period, the simulated water balance of hydrologic inflows (e.g., recharge) and outflows (e.g., evaporation and pumping) is given in Table 12-2. It can be observed that the storage inflow term is important due to production pumping, and the error (i.e., difference between the simulated inflows and outflows) is only 0.1%, indicating that mass is properly conserved. Furthermore, the total inflows and outflows of the model are consistent with the conceptual basin recharge defined by SRK (2020) during the operational period (from 1994 onward) as well as with the recent Hydrogeological Conceptual model (SQM, 2021).
Table 12-2. Average Simulated Water Balance Components, 2015-2020 Calibration Period
| Component | Average Volumetric Flow (L/s) | |||
| Total brine extraction in the salt flat nucleus | 2,059 | |||
| Evaporation from the salt flat nucleus | 400 | |||
| Storage outflow | 742 | |||
| TOTAL OUTFLOW | 3,201 | |||
| All direct recharge in the salt flat nucleus | 707 | |||
| All brine underflow from adjacent areas | 466 | |||
| Storage inflow | 2,024 | |||
| TOTAL INFLOW | 3,197 | |||
| Error (%) | 0.1 | % | ||
Figure 12-2. Direct Recharge and Lateral Recharge Zones
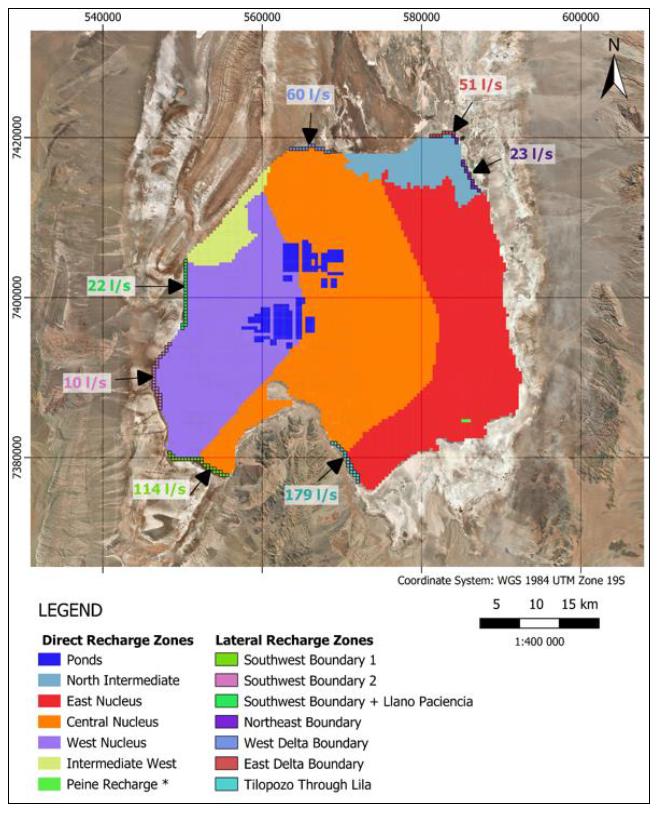
Note: * Conceptual lateral recharge in Peine was modeled as a direct recharge zone of 7 L/s *Indicated evaporation rates correspond to the maximum (surface) rates
Figure 12-3. Evaporation Zones in the Numerical Model
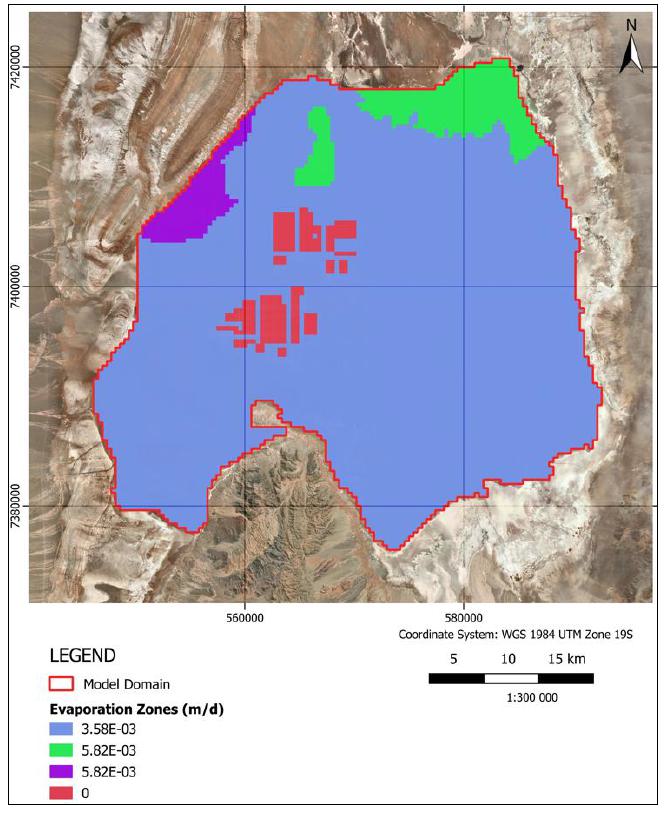
| 12.1.2 | Numerical Model Hydraulic Properties |
Hydraulic properties of the numerical model inherent to the brine reservoir correspond to hydraulic conductivity (K), specific storage (Ss), specific yield (Sy), and effective porosity (Pe). These parameters were largely defined based on lithology type. For example, the spatial distribution of Sy and Pe was assigned based on the resource block model (Section 11), and hydraulic conductivity was calibrated based on lithology to properly constrain the range of values. Dispersion was considered for simulating the spreading of solutes. Each hydraulic property is described below:
| · | Hydraulic conductivity: representative model sections of the K zone distribution are shown in Figure 12-4 and utilized model values are presented in Table 12-3. The horizontal hydraulic conductivity (Kh) ranges between 1E-5 m/d to 5,000 m/d depending on the lithology with the wide range explained by the presence of caverns and structures. While K ranges were aimed to be consistent with the conceptual range for each hydrogeological unit defined by SQM (2020 b,c,d), the general trend of each unit with depth is consistent with the lithology type and presence/absence of secondary porosity (geometric mean of Table 12-3). The vertical-horizontal anisotropy (Kv/Kh) was also set during the calibration (Table 12-3) and justified by the type of deposition of each unit. |
| · | Effective porosity/Specific yield: Effective porosity values were transferred from the resource block model (Section 11) and were obtained by averaging block model centroids within the corresponding numerical model cells. In areas with information gaps, the value of the nearest neighbor of calculated cells was adopted. Effective porosity was assumed to be equivalent to Sy due to the general lack of fine grain material (e.g. clay) in the nucleus (Sections 6, 7, and 11). Representative sections of Pe are also shown in Figure 12-4 |
| · | Specific storage: The distribution of Ss was set based on the type of lithology and hydraulic conductivity zonation, where less permeable units are assumed to have a lower compressibility. |
| · | Dispersion: Dispersion controls the rate of solute spreading and the following values were specified: 10 m for longitudinal dispersion, 1 m for transverse dispersion, and 0.1 m for vertical dispersion. Molecular diffusion was not included in the numerical model, because it is assumed to be negligible in large-scale models, and the active domain covers an extensive area (Section 12.1). |
Table 12-3. Summary of Assigned Model Parameters
| Horizontal
Hydraulic Conductivity (Kh) (m/d) |
Anisotropy (Kv/Kh) |
Specific
Storage (Ss) (1/m) |
Specific
Yield (Sy) and Effective Porosity (Pe) (2) |
||||||||||||||||||||||||||
| Layer(s) | Hydrogeological Unit (HU) |
Geometric mean (1) |
Min | Max | Min | Max | Min | Max | |||||||||||||||||||||
| 1 and 2 | UA | 190 | 0.05 | 10 | 1E-05 | 1E-02 | 0.02 | 0.136 | |||||||||||||||||||||
| 3 | UAB | 0.05 | 0.05 | 10 | 3.1E-05 | 5E-03 | 0.02 | 0.134 | |||||||||||||||||||||
| 4 and 5 | UB | 1.7 | 0.01 | 1 | 1E-05 | 5E-03 | 0.016 | 0.09 | |||||||||||||||||||||
| 6, 7, and 8 | UC | 0.02 | 0.0003 | 58.6 | 1E-07 | 5E-03 | 0.015 | 0.24 | |||||||||||||||||||||
| 9 | UD | 1.6E-05 | 0.1 | 1 | 1E-06 | 0.0177 | |||||||||||||||||||||||
Notes:
(2) Within the AAE
Figure 12-4. Representative Hydraulic Conductivity (Kh) and Specific Yield - Effective Porosity (Sy -Pe) Distribution in Numerical Model
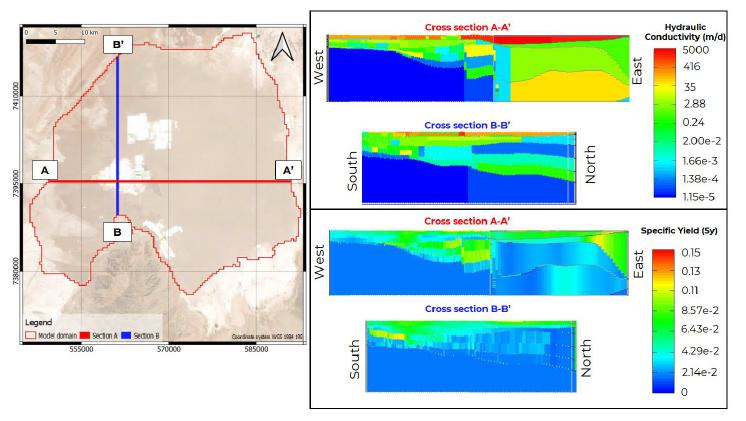
| 12.2 | Numerical Model Calibration |
(1)Within the most refined quadtree zone The numerical groundwater model was calibrated to transient conditions during the period of January 2015 to the end of December 2020 using the available brine level measurements for on-site shallow and deep wells (see Head Calibration Targets in Figure 12-5), as well as extracted Li and K concentrations from SQM’s production wells.
| 12.2.1 | Initial Conditions (Calibration) |
Initial conditions for hydraulic head were based on piezometric contours from the beginning of the year 2015. Initial conditions for transport include Li and K; their assignment was based on block model concentrations and transfer of values to the numerical model cells.
| 12.2.2 | Head Calibration |
Simulated brine levels were obtained from the numerical model based on composite heads from the screened well layers, and they were compared with registered brine levels from observation wells (Figure 12-5) that span the model domain and various hydrogeological units. A simulated piezometric contour map at the end of December 2020 is shown on Figure 12-5.
Figure 12-5. Head Observation Targets and Simulated Water Table for the End of the Calibration Period
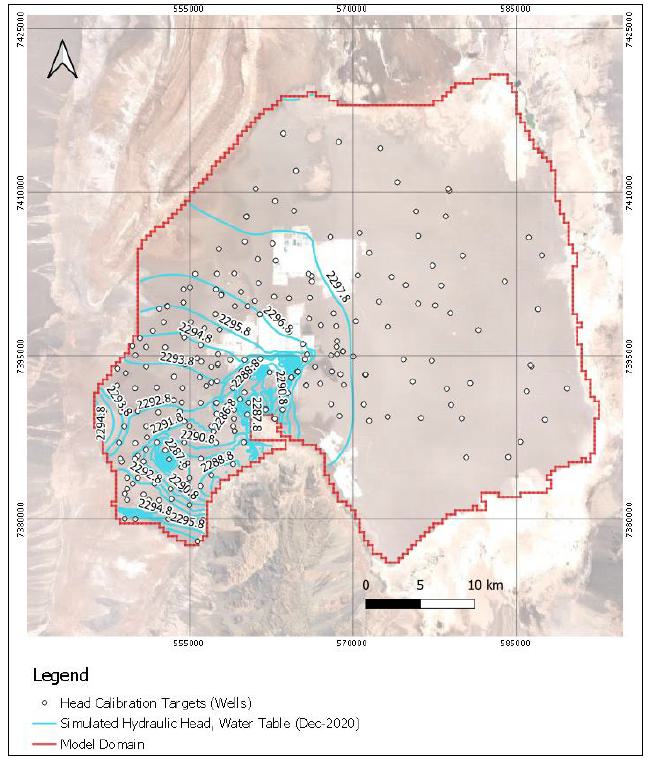
Regarding head calibration statistics, results for the entire model include a mean residual of 0.18 m and RMS of 1.05 m, with most residuals within the range of -0.5 m to 0.5 m (see Figure 12-6). The Scaled Absolute Residual Mean and Scaled Root Mean Square (RMS) error for the transient calibration were 2.5% and 4.0%, respectively. This is deemed acceptable based on international modeling guidelines ([Reilly and Harbaugh, 2004 ]; [Anderson y Woessner 2015]) as well as the QP´s judgement.
Figure 12-6. Head Calibration Results
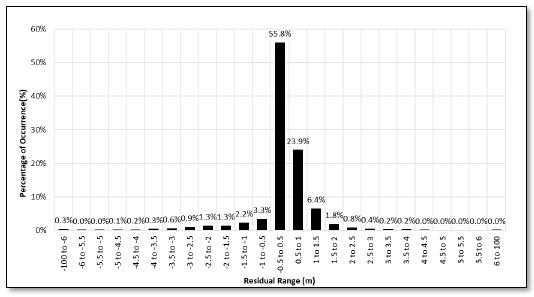
a) Brine level residual histogram |
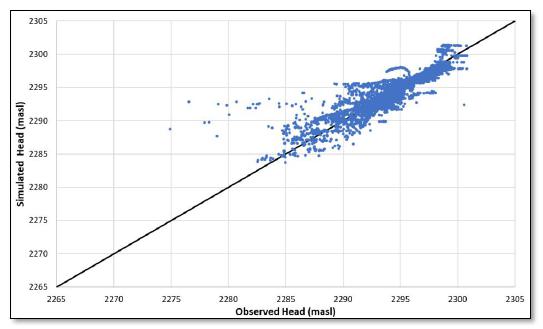
b) Simulated versus observed brine levels |
| 12.2.3 | Transport Calibration |
During the calibration period, monthly Li and K concentration values for each production well were extracted during the simulation and compared to actual extracted values pumped from SQM’s production wells. Figure 12-7 shows the monthly average weighted values for the model simulation and observed average weighted Li and K values. The average Li concentrations extracted from the model adequately match the field extracted values. Both averages were weighted by the individual pumping rates of each production well. In the case of K, the results indicate an underestimation of the weighted average mainly due to an underestimation of the initial concentrations of K. In general, the QP believes that the transport calibration is adequate for the reserve estimate, given that Li is well calibrated, and K is slightly underpredicted (conservative).
Figure 12-7. Extracted Concentration Fit during the Calibration Period (2015 – 2020)
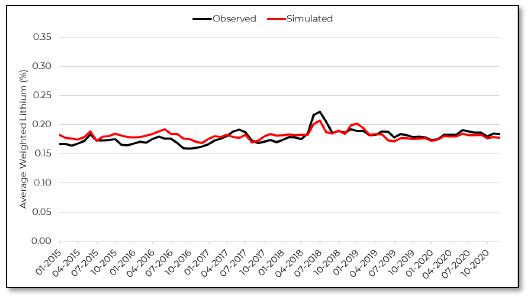
a) Extracted Li (weighted average) |
|
b) Extracted K (weighted average) |
| 12.2.4 | Model verification |
Following the numerical model calibration (2015 to 2020 period), simulated results in 2021, 2022 and 2023 were compared with field production data to further support the model predictions. Table 12-4 shows a comparison of model simulated production and real production. In 2021, 2022 and 2023, the QP believes that the differences simulated by the numerical model and real production data are acceptable (about 10% maximum in the case of potassium production).
Table 12-4. Numerical model verification
| Extracted Mass | Average | Extracted Mass | |||||||||||||||||||||||
| Comparison | Average
Extracted Lithium Concentration (%) |
Li (Million metric tonnes) |
LCE (Million metric tonnes) |
Extracted Potassium Concentration (%) |
K (Million metric tonnes) |
KCl (Million metric tonnes) |
|||||||||||||||||||
| January to December 2021 | |||||||||||||||||||||||||
| Real | 0.201 | 0.100 | 0.534 | 2.282 | 1.137 | 2.169 | |||||||||||||||||||
| Simulated | 0.203 | 0.100 | 0.535 | 2.440 | 1.207 | 2.301 | |||||||||||||||||||
| Difference | 0.002 | 0.000 | 0.001 | 0.158 | 0.070 | 0.132 | |||||||||||||||||||
| January to December 2022 | |||||||||||||||||||||||||
| Real | 0.207 | 0.099 | 0.528 | 2.237 | 1.073 | 2.046 | |||||||||||||||||||
| Simulated | 0.201 | 0.099 | 0.529 | 2.404 | 1.187 | 2.264 | |||||||||||||||||||
| Difference | -0.006 | 0.000 | 0.001 | 0.167 | 0.114 | 0.218 | |||||||||||||||||||
| January to December 2023 | |||||||||||||||||||||||||
| Real | 0.208 | 0.101 | 0.538 | 2.188 | 1.063 | 2.028 | |||||||||||||||||||
| Simulated | 0.201 | 0.095 | 0.503 | 2.372 | 1.117 | 2.130 | |||||||||||||||||||
| Difference | -0.007 | -0.006 | -0.035 | 0.184 | 0.054 | 0.102 | |||||||||||||||||||
| 2021 Difference (%) | 1.0 | % | 0.0 | % | 0.2 | % | 6.9 | % | 6.2 | % | 6.1 | % | |||||||||||||
| 2022 Difference (%) | -2.9 | % | 0.0 | % | 0.2 | % | 7.5 | % | 10.6 | % | 10.7 | % | |||||||||||||
| 2023 Difference (%) | -3.4 | % | -5.9 | % | -6.5 | % | 8.4 | % | 5.1 | % | 5.0 | % | |||||||||||||
| 12.3 | Projected Model Simulation |
Projected brine extraction was simulated during the 7-year LOM (2024 to 2030 period). Modifying factors related to extraction, potential brine mixing and dilution, and processing factors were considered in the predictive pumping simulation.
| 12.3.1 | Initial Conditions (Reserve Simulation) |
At the start of the simulations, initial conditions for flow correspond to the hydraulic head solution at the end of 2020. For transport modeling, Li and K concentrations from the resource block model were assigned to the numerical model grid, as initial conditions, to ensure consistency between the Resource and Reserve. Sulfate was also simulated to determine the process efficiency associated with the type of extracted brine in each pumping well over the course of the simulation. In addition, the initial distribution of SO4 was also taken from the block model. Given their distinct horizontal and vertical cell sizes, the specific process of transferring concentrations from the resource block model to the numerical model involved calculating mean values and searching nearest neighbors in all numerical model cells. The consistency of concentrations within the resource model was reviewed and deemed acceptable by the QP. Figure 12-8 shows the concentration distribution of Li (%) in the numerical model after the calibration period.
Figure 12-8. Lithium Concentration (%) Distribution following the Calibration Period
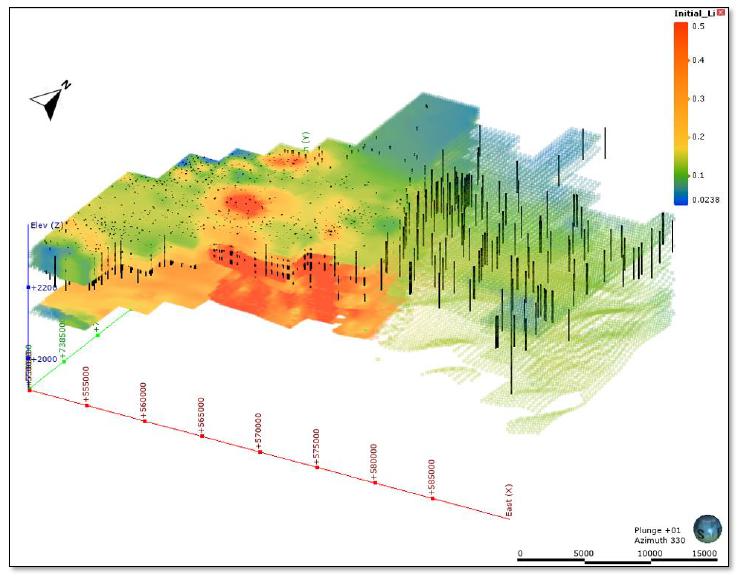
| 12.3.2 | Predictive Model Specifics |
The reserve model’s hydraulic properties are based on the calibrated numerical model (Section 12.2). Aside from pumping and direct pond recharge, the water balance specifics and lateral concentration boundary conditions over the LOM are assumed to be comparable to the calibration period given its relatively short duration. To avoid artificial solute mass in the reservoir system, direct infiltration recharge from the evaporation ponds was conservatively assumed have concentrations of 0 during the LOM, and future recharge rates from the ponds were set to be negligible (<0.1% of the total recharge).
During the reserve simulation, pumping is restricted by SQM’s voluntary reduction in annual brine extraction, which in turn, reduces production. The average annual brine extraction considered for the 2024 to 2030 period is given in Figure 12-9. The model simulated pumping depends on the simulated hydraulic head and bottom screened layer elevation (Option AutoFlowReduce of Modflow-USG). Therefor Figure 12-8).
Figure 12-9. SQM’s Future Brine Pumping and Voluntary Reduction
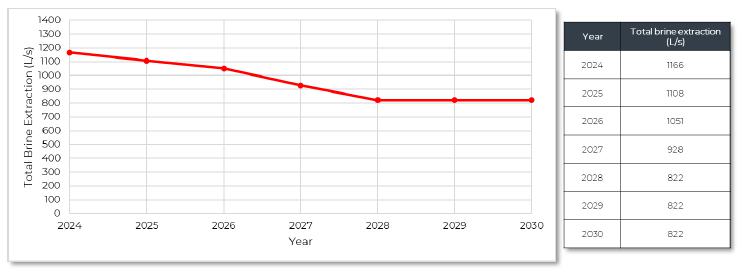
The simulated wellfields were configured based on the pumping wells of SQM and Albemarle. To consider the potential influence of neighboring pumping, it was conservatively assumed that the current Albemarle wellfield pumps a total of 442 L/s during the LOM. (maximum allowed based on their latest Environmental Assessment and confirmed in their recent SEC Technical Report Summary of 2023)
The simulated SQM wellfield pumping was based on the current pumping schedule implemented by the company and does not consider the installation of new wells in the future. The pumping scheme and rates were assigned by SQM’s Production Well Ranking that takes into account the Li grade and process indicators (e.g., according to SO4 concentrations). This internal system has allowed SQM to identify and optimize the brine chemistry of every production well as a function of the flow rates and dynamic brine levels. Given that the total allowable pumping is reduced every year (Figure 12-9), only current wells that have a low to medium SO4 content were set to remain active for optimizing the Reserve estimate (considering process recovery factors). Figure 13-2 presents a plan view map of SQM’s simulated pumping wells during the final year of the LOM.
Figure 12-10 shows the monthly results for the simulated pumping rates during the simulation period as well as SQM’s voluntary reduction in total brine extraction over the LOM. Note that seasonal pumping (with higher rates in the austral summer) occurs due to greater evaporation rates in the ponds during that period and vice-versa.
Figure 12-10. Simulated SQM Pumping Rates, Reserve Simulation
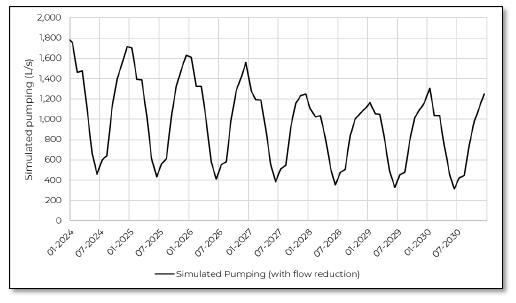
| 12.3.3 | Extracted Concentrations |
Figure 12-11 presents the average weighted Li and K concentrations extracted from all of SQM’s production wells. No significant change in the extracted Li concentration occur over time except for seasonal pumping changes. In the case of K, there is a slight reduction over the LOM (-1.3% annually). The averages of all simulations are 0.20 and 2.19%, for Li and K, respectively. Compared to the calibration period (2015 to 2020, Figure 12-7), an increase in the maximum weighted average of Li is observed during the projected LOM (2024 to 2030, Figure 12-11), because the projected extraction plan was also optimized to keep production wells with high Li and low SO4 active with the reduction of pumping.
Figure 12-11. Average Weighted Concentrations Extracted from SQM’s Production Wells, Reserve Simulation
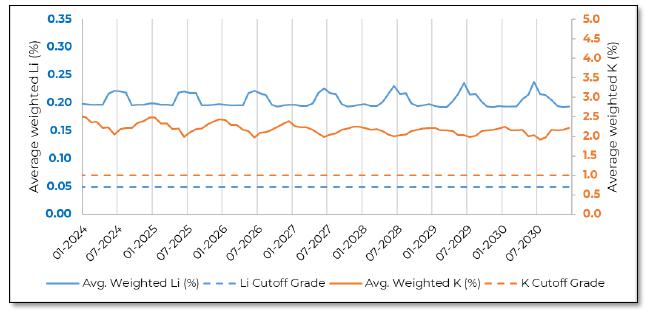
| 12.4 | Mineral Reserves |
While the Mineral Resource (Section 11) represents the amount of in-situ brine in the reservoir, only a certain portion can be extracted under the proposed wellfield configuration, pumping scheme, and authorized timeframe of the SQM-CORFO lease contract (until December 31st, 2030). The Mineral Reserve estimate considers the modifying factors of converting Measured and Indicated Mineral Resources to Mineral Reserves, including the production wellfield design and efficiency (e.g., location and screen), environmental considerations (e.g., pumping scheme), and recovery factors for Li and K.
Numerical model results from the predictive simulation were used to calculate the amount of extracted Li and K. The pumped mass of metallic Li and K was multiplied by a conversion factor of 5.32 and 1.907 to compute lithium carbonate equivalent (LCE) and potassium chloride equivalent (KCl), respectively. The resulting values from each production well were then summed for each production year to determine the predicted annual LCE and KCl.
This sub-section contains forward-looking information related to the key assumptions, parameters and methods for the Mineral Reserve estimates for the Project. The material factors that could cause actual results to differ materially from the conclusions, estimates, designs, forecasts or projections in the forward-looking information include any significant differences from one or more of the material factors or assumptions that were set forth in this sub-section including Mineral Resource model tonnes and grade and process parameters.
| 12.4.1 | Process Recovery Factors |
To estimate the reserve from a reference point of already processed brine, after passing through the evaporation ponds (rather than from the production wellheads), extracted mass was multiplied by a process efficiency factor, as determined by SQM through testing of their processing method (see Chapter 14). The recovery factor depends on the extracted brine type and SO4 content. The distinct processing efficiencies for each classified brine type are characterized below. Note that over 99% of all projected SQM pumping occurs from the MOP area; therefore, the MOP recovery factors are representative of the extracted brine in the reserve simulation:
| · | Lithium, low SO4 brine: 60% recovery |
| · | Lithium, medium SO4 brine: 52.5% recovery |
| · | Lithium, high SO4 brine: no recovery |
| · | Potassium, low SO4 brine: 71.6% recovery |
| · | Potassium, medium SO4 brine: 76.8% recovery |
| · | Potassium, high SO4 brine: 64.1% recovery |
| 12.4.2 | Extracted Lithium |
The extracted Li and LCE mass is summarized in Table 12-5. and Figure 12-12 During the 7-year LOM, results indicate that the total produced LCE, considering process recovery factors, corresponds to 1,444 kilotonnes (rounded to 1.44 million tonnes; Table 12-5. and Table 12-7).
Table 12-5. Simulated Li and LCE Extraction by Year
Period (year) |
Cumulative |
Average
Extracted |
Cumulative Mass (without process losses) |
Cumulative Mass (considering process recoveries) |
||||||||||||||||||||||
|
Li (Million tonnes) |
LCE (Million tonnes) |
Li (Million tonnes) |
LCE (Million |
|||||||||||||||||||||||
| 2024 | 36.64 | 0.201 | 0.09 | 0.48 | 0.05 | 0.24 | ||||||||||||||||||||
| 2025 | 71.48 | 0.201 | 0.18 | 0.94 | 0.09 | 0.47 | ||||||||||||||||||||
| 2026 | 104.49 | 0.200 | 0.26 | 1.37 | 0.13 | 0.70 | ||||||||||||||||||||
| 2027 | 133.66 | 0.200 | 0.33 | 1.75 | 0.17 | 0.90 | ||||||||||||||||||||
| 2028 | 159.61 | 0.201 | 0.39 | 2.09 | 0.20 | 1.08 | ||||||||||||||||||||
| 2029 | 185.43 | 0.200 | 0.46 | 2.43 | 0.24 | 1.27 | ||||||||||||||||||||
| 2030 | 211.33 | 0.200 | 0.52 | 2.76 | 0.27 | 1.44 | ||||||||||||||||||||
Notes:
(1) The process recovery factors of SQM are summarized in Section 12.4.1. Based on the type of extracted brine at each well over the course of the simulation, the average process recovery factor is approximately 52%.
(2) Lithium carbonate equivalent (“LCE”) is calculated using mass of LCE = 5.322785 multiplied by the mass of lithium metal.
(3) The values in the columns for “Li” and “LCE” above are expressed as total contained metals.
(4) The average lithium concentration is weighted by the simulated extraction rates in each well and is subsequently weighted by the volume pumped from each month.
(5) Values may not add due to rounding and differences caused by averaging; comparisons of values may not add due to the rounding of numbers and differences caused by averaging.
Figure 12-12. Predicted Cumulative Annual LCE Production (Considering Process Recoveries)
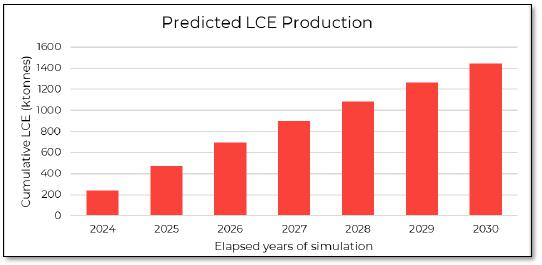 |
| 12.4.3 | Extracted Potassium |
The extracted K and KCl over time are summarized in Table 12-6 and Figure 12-13 The total KCl over the course of the 7-year LOM, considering process recovery factors, sums to 8,241 kilotonnes (rounded to 8.24 million tonnes; Table 12-6 and Table 12-8).
Table 12-6. Simulated K and KCl Extraction by Year
|
Period (year) |
Cumulative Brine |
Average |
Cumulative Mass (without process losses) |
Cumulative Mass (considering process recoveries) |
||||||||||||||||||||||
| K
(Million tonnes) |
KCl (Million tonnes) | K
(Million tonnes) |
KCl
(Million tonnes) |
|||||||||||||||||||||||
| 2024 | 36.64 | 2.34 | 1.05 | 2.01 | 0.78 | 1.49 | ||||||||||||||||||||
| 2025 | 71.48 | 2.31 | 2.04 | 3.89 | 1.52 | 2.89 | ||||||||||||||||||||
| 2026 | 104.49 | 2.27 | 2.96 | 5.65 | 2.20 | 4.20 | ||||||||||||||||||||
| 2027 | 133.66 | 2.20 | 3.75 | 7.15 | 2.79 | 5.32 | ||||||||||||||||||||
| 2028 | 159.61 | 2.16 | 4.43 | 8.45 | 3.30 | 6.30 | ||||||||||||||||||||
| 2029 | 185.43 | 2.14 | 5.11 | 9.75 | 3.81 | 7.27 | ||||||||||||||||||||
| 2030 | 211.33 | 2.15 | 5.80 | 11.05 | 4.32 | 8.24 | ||||||||||||||||||||
Notes:
(1) The process recovery factors of SQM are summarized in Section 12.4.1; based on the type of extracted brine at each well over the course of the simulation. The average process recovery factor is approximately 75%.
(2) Potassium chloride equivalent (KCl) is calculated using the mass of KCl = 1.907 multiplied by the mass of potassium metal.
(3) The values in the columns for K and KCl above are expressed as total contained metals.
(4) The average potassium concentration is weighted by the simulated extraction rates at each well and is subsequently weighted by the volume pumped from each month.
(5) Values may not add due to rounding and differences caused by averaging; comparisons of values may not add due to the rounding of numbers and differences caused by averaging.
Figure 12-13. Predicted Annual KCl Production (Considering Process Recoveries)
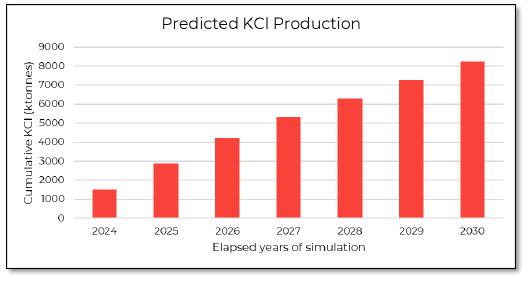 |
| 12.4.4 | Proven and Probable Reserves |
This sub-section contains forward-looking information related to Mineral Reserve estimates for the Project. The material factors that could cause actual results to differ materially from the conclusions, estimates, designs, forecasts or projections in the forward-looking information include any significant differences from one or more of the material factors or assumptions that were set forth in this sub-section including Mineral Reserve model tonnes and grade, modifying factors including pumping and recovery factors, production rate and schedule, equipment and plant performance, commodity market and prices and projected operating and capital costs.
Table 12-7, Table 12-8 and Figure 12-14, Figure 12-15 present the categorized Li and K Mineral Reserves, respectively, which are declared from a point of reference of processed brine, after passing through the evaporation ponds (Section 12.4.1).
Table 12-7. SQM’s Salar de Atacama Lithium Mineral Reserve Estimate, Considering Process Recoveries (Effective December 31, 2023)
| Average Extracted | Mass | |||||||||||||||
| Classification | Brine Volume (Mm3) Pumped | Lithium
Grade (wt.%) |
Li (Million tonnes) |
LCE (Million tonnes) |
||||||||||||
| Proven Reserves | 104 | 0.20 | 0.13 | 0.70 | ||||||||||||
| Probable Reserves | 107 | 0.20 | 0.14 | 0.75 | ||||||||||||
| Total | 211 | 0.20 | 0.27 | 1.44 | ||||||||||||
Notes:
(1) The process recovery factors of SQM are summarized in Section 12.4.1; based on the type of extracted brine at each well over the course of the simulation, the average process recovery factor is approximately 52%.
(2) Lithium carbonate equivalent (“LCE”) is calculated using mass of LCE = 5.322785 multiplied by the mass of lithium metal.
(3) The values in the columns for “Li” and “LCE” above are expressed as total contained metals.
(4) The average lithium concentration was weighted by the simulated extraction rates in each well and was subsequently weighted by the volume pumped from each month.
(5) Comparisons of values may not add due to the rounding and differences caused by averaging.
(6) The mineral reserve estimate considers a 0.05 wt.% cut-off grade for Li based on the cost of generating Li product, lithium carbonate sales, and the respective cost margin. Based on historical lithium prices a projected lithium carbonate price of $ 11,000 USD/tonnes with the corresponding cost and profit margin is considered with a small increase to accommodate the evaporation area and use of additives.
(7) This Mineral Reserve estimate differs from the in-situ base reserve previously reported (SQM, 2020) and considers the modifying factors of converting Mineral Resources to Mineral Reserves, including the production wellfield design and efficiency, as well as environmental and process recovery factors.
Figure 12-14. SQM’s Salar de Atacama Lithium Mineral Reserve Estimate Considering Process Recoveries (Effective December 31, 2023)
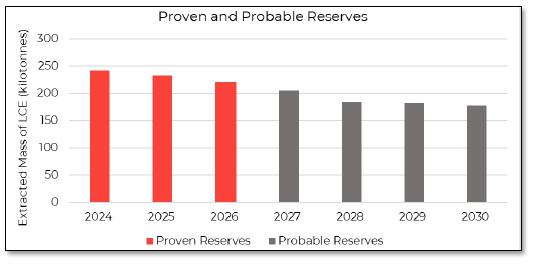
Table 12-8. SQM’s Salar de Atacama Potassium Reserve Estimate Considering Process Recoveries (Effective December 31, 2023)
| Average Extracted | Mass | |||||||||||||||
| Classification | Brine Volume (Mm3) Pumped | Potassium
Grade (wt.%) |
K (Million tonnes) |
KCl (Million tonnes) |
||||||||||||
| Proven Reserves | 104 | 2.31 | 2.20 | 4.20 | ||||||||||||
| Probable Reserves | 107 | 2.16 | 2.12 | 4.04 | ||||||||||||
| Total | 211 | 2.24 | 4.32 | 8.24 | ||||||||||||
(1) The process recovery factors of SQM are summarized in Section 12.4.1; based on the type of extracted brine at each well over the course of the simulation, the average process recovery factor is approximately 75%.
(2) Potassium chloride equivalent (“KCl”) is calculated using mass of KCl = 1.907 multiplied by the mass of potassium metal.
(3) The values in the columns for “K” and “KCl” above are expressed as total contained metals.
(4) The average potassium concentration was weighted by per well simulated extraction rates and was subsequently weighted by the volume pumped from each month.
(5) Comparisons of values may not add due to the rounding of numbers and differences caused by averaging.
(6) The Mineral Reserve estimate considers a 1 wt.% cut-off grade for K has been set by SQM based on respective costs, sales, and margin (Chapter 16 and Chapter 19).
(7) This Mineral Reserve estimate differs from the in-situ base reserve previously reported (SQM, 2020) and considers the modifying factors of converting Mineral Resources to Mineral Reserves, including the production wellfield design and efficiency, as well as environmental and process recovery factors.
Figure 12-15. SQM’s Salar de Atacama Potassium Reserve Estimate Considering Process Recoveries (Effective December 31, 2023
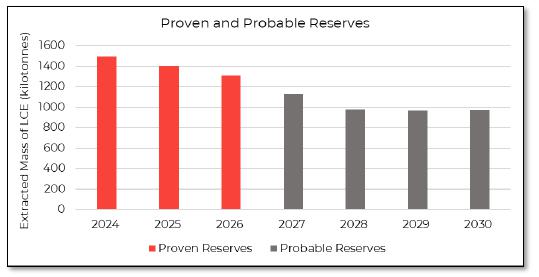
| 12.4.5 | Classification and Criteria |
This sub-section contains forward-looking information related to the Mineral Reserve classification for the Project. The material factors that could cause actual results to differ materially from the conclusions, estimates, designs, forecasts or projections in the forward-looking information include any significant differences from one or more of the material factors or assumptions that were set forth in this sub-section including Mineral Resource model tonnes, grade, and classification.
The Mineral Reserve was classified by the QP based on industry standards for brine projects, as well as the confidence of the model predictions and potential future factors that could affect the estimation. SQM’s production well locations are based on the Measured and Indicated Mineral Resource zones (Section 11.3). While the brine reserve simulation is dynamic, and mixing occurs over time due to production pumping, numerical model results indicate that a majority of the total extracted mass is derived from Measured Resources. Furthermore, certainty in the Mineral Reserve is increased because historical production has occurred for decades by SQM in the Salar de Atacama. The QP believes that the Proven and Probable Mineral Reserves are adequately categorized, as summarized below:
| · | Proven Reserves were specified for the first 3 years of the LOM given that the model is adequately calibrated to the 2015 to 2020 period (Section 12.2) with an overall verification of simulated production in 2021, 2022 and 2023. In addition, the initial portion of the projected LOM has higher confidence due to less expected short-term changes in pumping, conceptual hydraulic parameters, and the water balance, among other factors. |
| · | Probable Reserves were conservatively assigned for the last 4 years of the LOM considering that the numerical model will be continually improved and recalibrated in the future due to potential medium to long term changes in neighboring pumping, conceptual hydraulic parameters, and the water balance, among other factors. These future improvements will increase certainty in the final years of the model prediction. |
| 12.4.6 | Cut-off Grades |
Consistent with the declared resource estimate (Section 11.4), the cut-off grade for Li has been set by SQM at 0.05 wt.% based on the cost of generating Li product, lithium carbonate sales, and the respective cost margin (Chapter 16 and Chapter 19). Based on historical lithium prices (Figure 16-5), a projected lithium carbonate price of $ 11,000 USD/tonne with the corresponding cost and profit margin is considered (Chapter 19). A small increase from the current cost was utilized to better accommodate the evaporation area (allowing for the required Li concentration to be reached) and the use of additives employed to maintain the quality of the brine that feeds the plant.
A similar pricing basis and analysis was undertaken for K, where the cut-off grade of 1 wt.% has been set by SQM based on respective costs, sales, and margin (Chapter 16 and Chapter 19). This considers only MOP-S as a low-margin scenario, using a brine as raw material diluted with more contaminants and performance at the lower end of the range (approximately 53% recovery). In this scenario, and considering the current market conditions and recent years, the cost of MOP production remains competitive.
A sensitivity analysis was performed with distinct product prices, costs, and cut-off grades. The QP believes that the designated cut-off grades of 0.05 wt.% Li and 1 wt.% K to be appropriate and do not have any material effect on the declared Mineral Reserve, as brine extracted from the production wells is transported to the evaporation ponds, where individual brine sources are mixed to form a composite solution. As such, the weighted average concentrations extracted from the production wells were compared with the cut-off grades (Figure 12-11). The results show that the average weighted concentrations pumped from SQM’s wells far exceed the designated cut-off grades for Li and K, signifying that their extraction is economically viable.
| 12.5 | Uncertainty |
The QP considered the following sources of uncertainty in the Li and K Mineral Reserve estimate and corresponding numerical model, and certain measures were taken to minimize those uncertainties:
| · | Potential brine dilution can vary over time due to lateral inflows. To address this, representative historical concentrations were assigned for modeled lateral inflows and direct recharge concentrations during the LOM were set to 0. |
| · | Density driven flow could impact the hydraulic gradient; however, the model limit is set within the salt flat nucleus, where brine density does not vary significantly based on measured values. |
| · | Potential pond infiltration represents an additional source of uncertainty, and it was conservatively not modeled to avoid introducing an “artificial” source of Li and K in the reserve estimate. |
| · | Hydraulic parameters were calibrated based on available site information. Future exploration and testing could improve the assigned model parameters and the water balance specifics could also be changed to alleviate this uncertainty. Probable Reserves were conservatively specified for the last 4 years of the LOM, even though SQM production has occurred historically for decades. |
| · | A steady-state model calibration was not conducted given the long period of SQM’s historical production; however, a comprehensive flow and transport calibration was undertaken for the 2015 to 2020 (inclusive) period. |
| · | Future Albemarle pumping is unknown; however, a maximum rate of 442 L/s was conservatively assumed for the entire LOM based on their latest environmental assessment and confirmed in their recent SEC Technical Report Summary of 2023. |
| · | The potential dissolution of lithologies resulting from brine pumping, and its impact on chemical concentrations as well as permeability, have not been studied due to the complexity of this phenomenon. |
| 12.6 | Opinion and Recommendations |
The opinion of the QP of reserves is that the declared Mineral Reserve estimate and corresponding methods conform to S-K 1300 regulations. Furthermore, the reserve classification is believed to be conservative, given that brine production has already been occurring historically by SQM for decades. The presented analysis includes a detailed calibration process and time-based reserve classification to account for potential future changes in hydraulic parameters (with more field data and testing), the water balance, and neighboring Albemarle pumping, among other future uncertainties (Section 12.5).
Future recommendations to improve certainty in the reserve estimate include; (i), conducting a sensitivity analysis of key model parameters and specifics, such as the aquifer parameters; (ii), variable Albemarle pumping rates; and (iii), extension of the model’s calibration period annually and continually improve the model parameters based on new field data and hydraulic testing.
| 13 | MINING METHODS |
SQM’s mining operation at Salar de Atacama utilizes brine extraction from pumping wells. Brine extraction is characterized by the construction of vertical pumping wells capable of extracting brine from the subsurface reservoir. The brine is accumulated in different gathering ponds for distribution to the evaporation ponds and metallurgical plants.
This method of brine extraction was authorized by the Environmental Resolution N° 226/2006 (RCA 226/2006). In November 2021 (Res. 2389/2021), the SMA ordered provisional procedural measures, among others, to restrict the annual maximum (total) brine pumping rate to 1,280 L/s. Furthermore, the current lease contract between SQM and CORFO permits brine extraction until December 31, 2030 (Section 3.2).
This sub-section contains forward-looking information related to brine extraction for the Project. The material factors that could cause actual results to differ materially from the conclusions, estimates, designs, forecasts, or projections in the forward-looking information include any significant differences from one or more of the material factors or assumptions that were set forth in this sub-section including geotechnical and hydrological, pumping and production rates.
| 13.1 | Brine Extraction: Geotechnical and Hydrological Models, and Other Relevant Parameters |
The utilized mining method of brine extraction by pumping wells does not require the development of geotechnical studies, because operations are executed without significant excavation. Furthermore, the dominant lithology in the salt flat nucleus (massive evaporites) is typically stable from a geotechnical perspective. However, the mining process includes some salt dumps. These salt dumps have a maximum height of 30 m (environmental restriction). SQM undertook a geotechnical analysis, concluding that the design of the dumps is stable according to the current operating conditions.
Hydrological studies developed by SQM for the purposes of this TRS have focused on the hydrogeological evaluation of natural recharge to the brine aquifer. The mining methods in this deposit and setting do not require runoff-rainfall models or a surficial water management plan to characterize peak flows for different return periods. Hydrogeological parameters, well specifics, and the pond locations are mainly considered when defining the brine production wellfield (see Section 12).
| 13.2 | Production Rates, Expected Mine Life, Mining Unit Dimensions, And Mining Dilution and Recovery Factors |
The expected mine life of SQM’s Salar de Atacama Project is 7 years, from the start of 2024 to the end of 2030. As of 2021, SQM’s evaporation pond area was approximately 3,227 ha, and the OMA Extraction Area covered a total of 81,920 hectares. SQM brine extraction by pumping wells reached an average flow of 1,256 L/s during 2023 (39.6 Mm³ of brine per year up to December 2023).
The current LOM ends on December 31, 2030. Until this date, the expected total brine production was evaluated in the numerical model (Section 12) to be 211 Mm³ for the 2024 to 2030 period, with decreasing pumping rates from 2024 (1,159 L/s) to 2030 (822 L/s) (Figure 12-9). The predicted Li concentration and K concentrations did not change substantially during the LOM (Figure 12-11) and the average process recovery factors (from the numerical model simulation; Chapter 12) were approximately 52% for Li and 75% for K based on the type of extracted brine at each production well and SO4 content over time (Section 12.4.1).
The hydrogeological analysis related to evaluation of Li and K reserves in the Salar de Atacama (see Section 12) considers brine pumping that is restricted to the salt flat nucleus. As such, there are no significant dilution expected of the brine from lateral recharge of freshwater. Based on historical measurements from monitoring wells, the brine density of the Salar de Atacama nucleus does not vary because of pumping due to the large distance between the SQM wellfield and salt flat margins. However, in contrast to traditional mining methods, the mining process to extract brine by pumping wells implies that only a fraction of the total declared resource can be extracted due to efficiency factors of the wellfield, location and screening of the production wells, potential retention of brine in the porous media, and environmental restrictions (reduction in pumping over time).
| 13.3 | Requirements for Stripping, Underground Development, and Backfilling |
At Salar de Atacama, requirements for stripping, underground development, and backfilling do not apply, because the exploitation system involves pumping wells that extract brine from the reservoir.
| 13.4 | Required Mining Equipment Fleet, Machinery, and Personnel |
The process used by SQM for brine extraction includes different types of drilling equipment, or rigs, to obtain geological samples, conduct hydrogeological tests, and build pumping wells. Pumping and piping systems are used to extract and direct the brine to the homogenization ponds prior to the concentration process of Lithium and Potassium Chloride (KCl) in the evaporation ponds (Figure 13-1).
To obtain geological samples, SQM uses a diamond drill rig (DDH) rig mounted on a truck (MASSENZA fu Giuseppe MI-6). SQM has implemented specific procedures for the operation of this rig. To execute and build the vertical pumping wells, SQM use three different Reverse Circulation (RC) rigs, specifically the Prominas model R-4H, Comacchio GE O900 GT, and the MASSENZA fu Giuseppe MI-28. For each rig, SQM has implemented an operational procedure to install vertical wells (injection and pumping wells). After drilling the wells and before installing the PVC casing (including the PVC-slotted screen), SQM executes various geophysical logs.
The procedure used for the pumping well construction includes a 5 ½-inch pilot well to obtain samples (brine every 3 m drilled and core every 1 m drilled). The final well is constructed with a diameter of 12 inches. Widening (reaming) of the pilot hole occurs to install the PVC casing and screen (diameter of 10 inches) as well as the annular seal without a gravel-filter pack.
The high salinity of the brine can result in production well efficiency problems as a consequence of chemical clogging and encrustation processes. Clogging reduces the hydraulic efficiency of the well and increases the energy required for pumping. In case this occurs, programs and treatment plans for rehabilitation, complemented by continual monitoring programs, are implemented. SQM typically employs a combination of mechanical and chemical treatments to maintain and improve the operational performance of the production brine wells and pipping systems to the gathering ponds.
Figure 13-1. Field Pictures of a Typical Salar de Atacama Brine Production Well, Pipe, and Gathering Pond
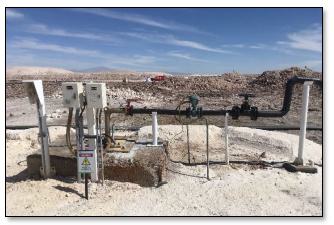 |
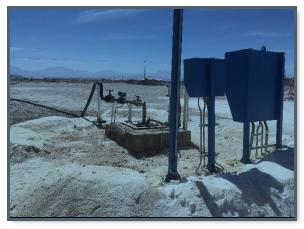 |
| a) Brine production wells with surface equipment | b) General view - production brine well and HDPE pipe for directing brine to the homogenization ponds |
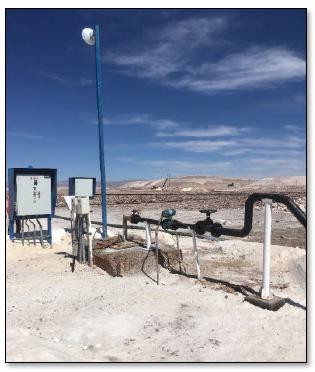 |
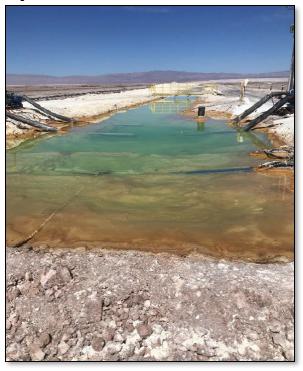 |
| c) General view of a production brine well with an additional system for monitoring and control (telemetry) | d) Gathering ponds |
| 13.5 | Final Mine Outline |
Figure 13-2 shows the simulated SQM production wellfield in December 2030 (see Section 12), considering the end of the SQM-CORFO contract on December 31, 2030 (Section 3). The simulated SQM wellfield contains current (pre-existing) production wells without newly installed (prospective) wells with a reduction of the total flow rate applied over time (Figure 12-10). Certain current wells remain active as the LOM progresses to optimize the Reserve estimate based on the type of extracted brine over time and corresponding process efficiency. During the last year of the LOM (2030), SQM expects to pump a total of 822 L/s of brine.
Figure 13-2. Final Mine Outline
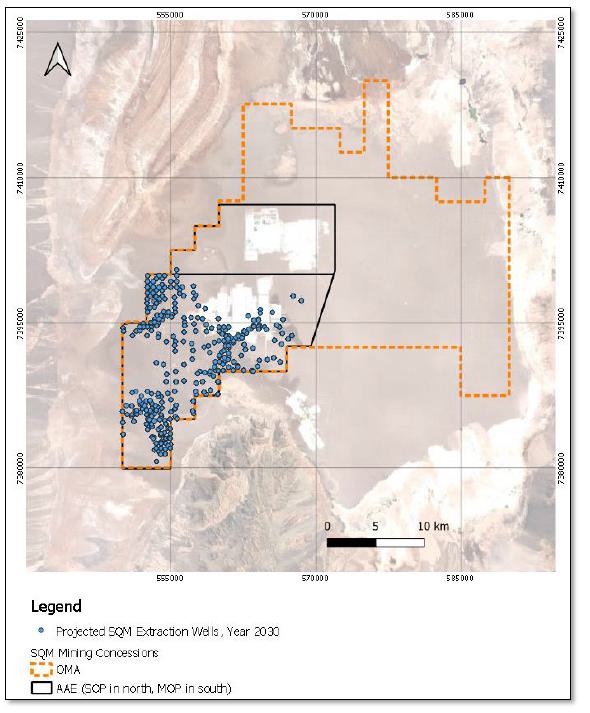
| 14 | PROCESSING AND RECOVERY METHODS |
This sub-section contains forward-looking information related to the pumping and process throughput and design, equipment characteristics, and specifications for the Project. The material factors that could cause actual results to differ substantially from the conclusions, estimates, designs, forecasts or projections in the forward-looking information include any significant differences from one or more of the material factors or assumptions that were set forth in this sub-section, including actual brine characteristics that are different from the historical operations or from samples tested to date, equipment and operational performance that yield different results from the historical operations, historical and current test work results, as well as recovery factors.
The purpose of the Project is to produce potassium chloride (KCl), potassium sulfate (K2SO4), lithium carbonate (Li2CO3), and lithium hydroxide (LiOH). The raw material for both processes is brine extracted from available salt properties, containing potassium, lithium, sulfates, boron, and magnesium. Evaporation ponds are fed with brines, where different salts are precipitated. As a result of the evaporation step, brine enriched in Li+ ions is obtained. This lithium-rich brine is fed into a lithium carbonate production plant, which consists of purification stages to remove boron, calcium, and magnesium, a lithium carbonate precipitation stage, and a solid/liquid separation stage. Finally, one part is diverted to a drying, micronization, and packaging stage, and another part is diverted for lithium hydroxide production.
SQM's production process is characterized by being integrated (i.e., exchanging raw materials and products with each other). The processes involved in the Project’s production are managed at two facilities:
| 1. | SQM’s Salar de Atacama facilities: potassium chloride, potassium sulfate, and lithium brine are obtained after a series of processes. |
| 2. | SQM’s PQC, near Antofagasta, Chile: complementary production occurs through its chemical plants, where lithium carbonate and lithium hydroxide are produced from brines. |
The simplified and global process flow diagram for potassium salts is shown in Figure 14-1.
Figure 14-1. Simplified Process Flowsheet for the Salar de Atacama.
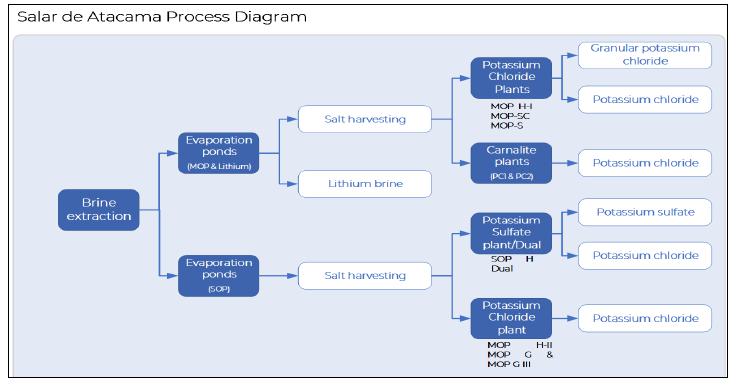
To produce a lithium-rich solution that is processed in chemical plants and transformed into lithium salt and potassium salt, the Project has the features and installations indicated in Table 14-1.
Table 14-1. Facilities Available for Production.
| Production Area | Available Facilities | |
| Salar de Atacama Mine |
- Mine (brine) and industrial water supply - Solar evaporation ponds - MOP H-I plant - SOP (SOP H and DUAL) and (MOP HII) plants |
- MOP-SC and MOP Standard Plant - Carnallite plants (PC1-PC2) - Plant SOP-SC - MOP-G/MOP G-III - Salt storage |
| Carmen Lithium Chemical Plant (PQC) | Carbonate Plant | Hydroxide Plant |
|
- Brine reception and storage - Boron removal plant - Magnesium and calcium removal plant - Carbonation plant |
- Feed and reaction area - Clarification and filtration area - Decanting and centrifuge areas - Evaporation and crystallization area - Centrifuge area - Drying and cooling area |
Figure 14-2 details the PQC's production system for lithium products from brine produced at the Salar de Atacama.
A description of the process is also provided in the following sections.
Figure 14-2. General Block Process Diagram for Lithium Salts Products.
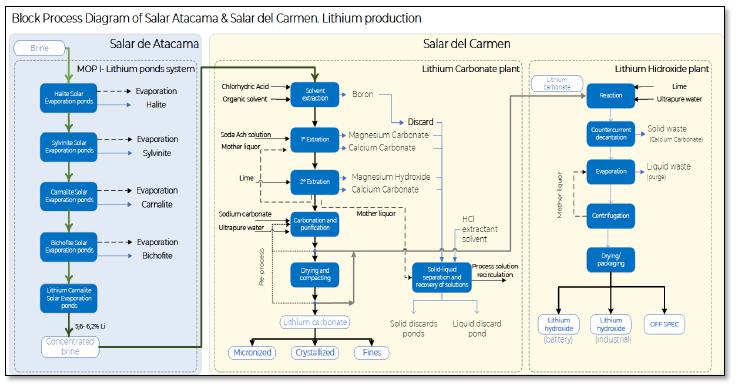
| 14.1 | Process Description |
SQM has developed a process model to convert lithium brine into lithium carbonate based on evaporation and metallurgical tests. This process is in line with industry standards and follows these general steps:
| · | Pumping of brine from the reservoir. |
| · | Concentration of brine through sequential evaporation. |
| · | Treatment of brine concentrate in a plant to produce lithium carbonate and high-quality lithium derivatives. |
| · | Treatment of potassium salts harvested during sequential evaporation to obtain refined salts. |
In the Salar de Atacama, potassium- and lithium-rich brines are pumped and handled to produce potassium chloride, potassium sulfate, lithium sulfate, magnesium chloride (bischofite), and lithium chloride solutions. Refined finished products such as lithium carbonate and lithium hydroxide are produced at the PQC process plant (located close to the city of Antofagasta, Chile) based on solutions brought from Salar de Atacama. The production capacity to the year 2023 of the lithium carbonate at PQC plant was 195,000 tonnes per year, meanwhile, the lithium hydroxide plant has a production capacity of 26,000 tonnes per year, with potential to increase production capacity to 30,000 tonnes per year.
The production process begins with the exploitation of natural resources, which are brines from the Salar de Atacama salt flats containing potassium, lithium, sulfates, boron, and magnesium. The brines are pumped from two different areas of the Salar (MOP Sector and SOP Sector) to solar evaporation ponds and salt harvesting sectors. The harvested salts are processed in on-site plants to produce potassium chloride, potassium sulfate, and lithium brine.
The concentrated lithium chloride solution, obtained from lithium system, is transported by tanker truck to the PQC plant. This process at the PQC plant starts with boron removal by solvent extraction, while a second stage is magnesium removal by chemical precipitation. Magnesium carbonate, magnesium hydroxide, and calcium carbonate residues are repulped using the plant’s mother liquor and are then sent to waste ponds. Subsequently, the boron- and magnesium-free brine is treated with soda ash to precipitate lithium carbonate. Finally, some of it is filtered, washed, dried, packaged and exported, and some of it is used in the production of lithium hydroxide. In the hydroxide plant, lithium carbonate is repulped in water and pumped to a battery of reactor ponds, where it is mixed and reacted with a slaked-lime solution to produce a mixture of lithium hydroxide and calcium carbonate.
The following sub-section presents the treatment and production processes performed at the Salar de Atacama and PQC sites.
| 14.1.1 | Salar De Atacama Production Process |
The production units of the Salar de Atacama correspond to:
| · | Mine and water supply |
| · | Solar evaporation ponds: |
| § | Sulfate of potash (SOP) sector |
| § | Muriate of potash (MOP) sector |
| · | SOP Sector: |
| § | Sulfate of potash plant SOP (SOP H and Dual) |
| § | Muriate of potash plant (MOP-H II) |
| § | Sulfate of potash drying and compacting plant (SOP - SC) |
| § | Potassium Chloride Drying and Compaction Plant (MOP G / MOP G III) |
| · | MOP Sector: |
| § | Potassium chloride KCl plant (MOP H I) |
| § | Potassium chloride drying and compaction plant (MOP SC) |
| § | Potassium Chloride Drying Plant (MOP Standard) |
| § | Carnallite plants (PC1-PC2) |
Potassium plants at Salar de Atacama are fed with salts from potassium salts precipitation subsystems (sylvinite, potassium carnalites, and schoenite) of both production processes. Sylvinites are reduced in size through a crushing and grinding process, where after the particles of interest are released, they enter into the flotation system. The flotation system is comprised of a 4-stage flotation circuit (rougher, cleaner, scavenger, and pneumatic), and with the aid of a collector that is selective of potassium, these salts are floated, and a concentrate with a high-potassium grade is obtained. The rougher flotation and pneumatic flotation tails, which are mainly oversize particles that could not be floated, go through a regrinding stage that is part of the same flotation circuit, and then re-enter into the system to recover as much potassium as possible.
Once these wet potassium products are concentrated, they go through a leaching stage in order to reach technical grade for the final product. Then, a solid-liquid separation is realized, by means of filtration in a disc filter, and the solid part is compacted and dispatched as a final potassium product. The liquid phase of this separation goes through a thickening stage, where part of the brine used in the process is recovered and returned to flotation system. Solid phase recovered in thickening stage is taken to a salt deposit (DPS). This system is shown in detail in Table 14-3 SQM Salar de Atacama's production process generates solid and liquid waste, called RIS and RIL, respectively.
The RIS includes salts with no commercial purpose that are discarded and disposed of in stockpiles. RIL corresponds to impregnated brines, derived from the solar evaporation process, that have accumulated in the pond salt. The products of the Salar de Atacama are brines, harvested salts and refined potassium products, which are detailed in Table 14-2 the according to the production units.
Table 14-2. Products of the Salar de Atacama
| Production Unit | Products | |
| Solar evaporation ponds | Brines |
-Pre-concentrated brine sent to the lithium production system. -Remaining brine sent for re-injection. -Concentrated lithium brine for dispatch to PQC. |
| Harvested salts |
-SOP sector potassium sulfate, potassium chloride is obtained. -MOP sector produces potassium chloride and lithium-rich brine. |
|
| SOP sector | Potassium sulfate |
-Wet Potassium Sulfate of Potash (SOP H). -Sulfate of Potash Granular (SOP G). -Standard Sulfate of Potash (SOP S). -Soluble Sulfate of Potash (SOP WS). |
| MOP sector | Potassium chloride |
-Wet Potassium Chloride Potassium (MOP H). -Potassium Chloride Granular (MOP G). -Standard Potassium Chloride Standard (MOP S). |
Figure 14-3 shows each of the brine treatment stages required to achieve potassium products through the SOP and MOP lines. In the diagram, it is possible to differentiate the nomenclature MOP BS and SOP-MOP AS. MOP BS corresponds to a system of evaporation ponds that due to their chemical quality have a productive focus of lithium (to produce lithium-concentrated brine dispatched to the PQC). While SOP-MOP AS corresponds to the denomination of the evaporation ponds system focused on the production of potassium salts (mainly KCl).
The following is a description of the operations involved in the treatment of natural brine and production of concentrated brine and potassium salts:
| · | Mine and water supply |
| · | Solar evaporation ponds |
| · | SOP Sector |
| · | MOP Sector |
Figure 14-3. General Block Process Diagram for Potassium Salts Products
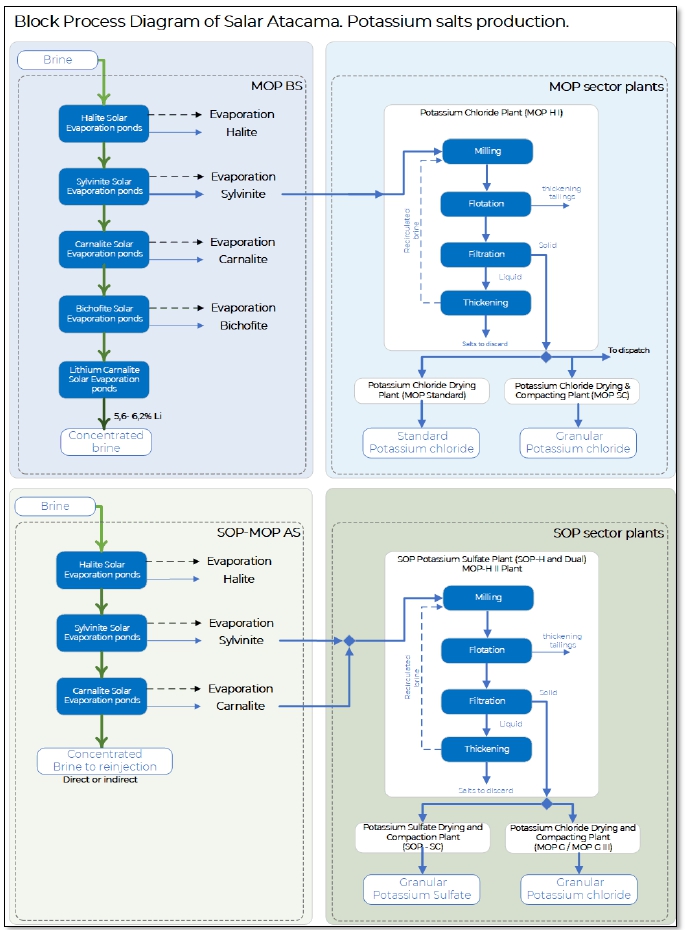
| 14.1.1.1 | Mine and Industrial Water Supply |
The first stage of the process considers brine extraction at a rate of up to 1,223 L/s. For brine pumping, two areas are defined to extract brine from wells. These include a MOP sector, where potassium chloride and lithium-rich brine is produced, and SOP sector, where potassium sulfate is produced (Figure 14-4)
The MOP area is located farther south in the core of the Salar de Atacama and possesses a surface area of approximately 25,399 ha. The SOP area is located farther north, in the center of the Salar de Atacama, possessing a surface area of approximately 10,512 ha.
Figure 14-4. Map of the location of the Brine extraction area. SQM Salar de Atacama
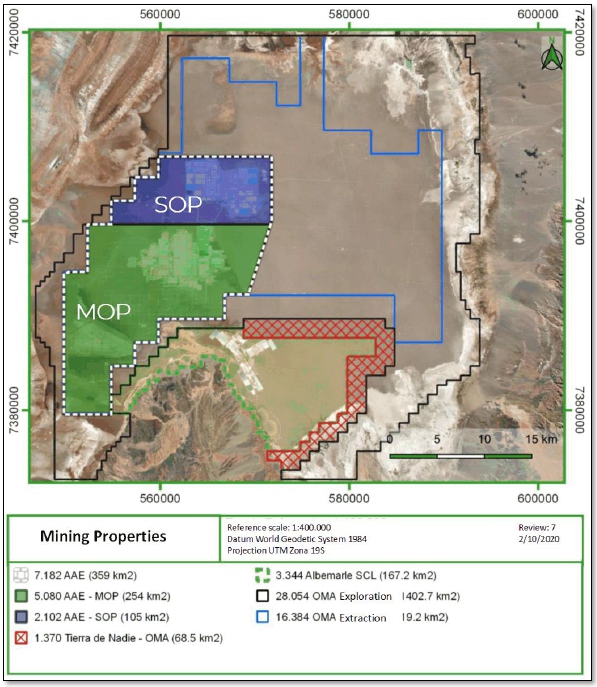
Compliance with project requirements is dependent on the hydrogeological properties of the soils in which the wells will be constructed. Wells have an approximate useful life of 10 years. There are currently 320 brine extraction wells in operation.
During the QP site visit, the team was able to note that the brine exploitation system, with a lithium productive focus, has a differentiation of low chloride brine wells and lithium concentration of around 0.6%. With this differentiation of wells, direct entry into the system of evaporation wells after the halite precipitation stage is promoted. This differentiation allows for an efficient use of resources and significant improvement in terms of well availability in the pumping system, and consequently, for all operational tasks.
Well discharge is pumped into collection troughs, where it is sampled, and the target well system is confirmed. This check makes it possible to keep feed as stable as possible in accordance with the established brine treatment ranges determined for each well system. The check also ensures production continuity and brine product quality. In order to be closely monitored, pipelines are equipped with online sampling.
For industrial water supply, there are 5 groundwater extraction wells that are environmentally approved by RCA 226/2006. For the extraction, impulsion and transport of water, there is an infrastructure composed of HDPE lines, pumping stations and generators that allow for its distribution to the different facilities where required.
| 14.1.1.2 | Solar Evaporation Ponds |
Solar evaporation ponds are located in the core of Salar de Atacama and involve a set of ponds and solution transfer pumps between facilities. There are different types of ponds that vary in size depending on their function. Precipitated salts in ponds are harvested and transported by earthmoving equipment and trucks to the process plant sector.
The ponds are located in two sectors (SOP and MOP) with five areas of evaporation ponds in the SOP sector, and nine areas of evaporation in the MOP sector, as shown in the Figure 14-2. All ponds are built under the same procedure with each possessing a geomembrane and geotextile basal lining.
The evaporation ponds system is categorized by productive approach: lithium production system and KCl production systems. Lithium production system refers to an evaporation well system that aims to produce lithium-concentrated dispatch brine to the PQC (Lithium Chemical Plant) for Li2CO3 and LiOH production. This system is composed of evaporation ponds that receive brines from the MOP area that are low in sulfate (MOP: Muriate of potassium; BS: low sulfate; MOP I BS and MOP III BS). Fractional crystallization takes place in evaporation ponds where halites, sylvinites, carnallites (CK), bischofites (BX), and lithium carnallites (C-Li) precipitate.
KCl production systems is composed of evaporations ponds that receive brines from MOP and SOP area that are focused on the production of potassium salts (mainly KCl) which are high in sulfate. The designation of these systems is MOP II, MOP I AS, MOP III AS and SOP.
Once brine is fed into the respective evaporation ponds, it follows a normal process of salt concentration and precipitation to obtain dispatched brine, or potassium salts, to feed process plants. SQM has been able to maximize salt production by sectoring solar evaporation circuits, according to brine chemistry composition by establishing sulfate (SO4), calcium (Ca+2), lithium (Li+), magnesium (Mg+2), and potassium (K+) ion ratios in brine from a particular well. The principal indicators used to determine objective brine chemistry in evaporation ponds are based on ion ratios, such as sulfate-magnesium (SO4/Mg), potassium-magnesium (K/Mg), sulfate-calcium (SO4/Ca), and lithium-magnesium (Li/Mg).
For the collection of salts from ponds, SQM has implemented a technology that warns the shovel collector systems about the distance to the deck, avoiding breakage of the shovels. An infiltration detection system has also been implemented. Discarded salt produced from this process are disposed of in salt discard deposits, located in the core of Salar de Atacama, near solar evaporation ponds Figure 14-5, as well as in others close to the process plants. Each deposit will reach a maximum of 30 meters. The Project is divided into two sectors, SOP and MOP, where the first sector has 9 salt deposits, and the second sector has 13 deposits.
Figure 14-5. Location of solar evaporation ponds (light blue zone) and salt deposits (green zone). Salar de Atacama
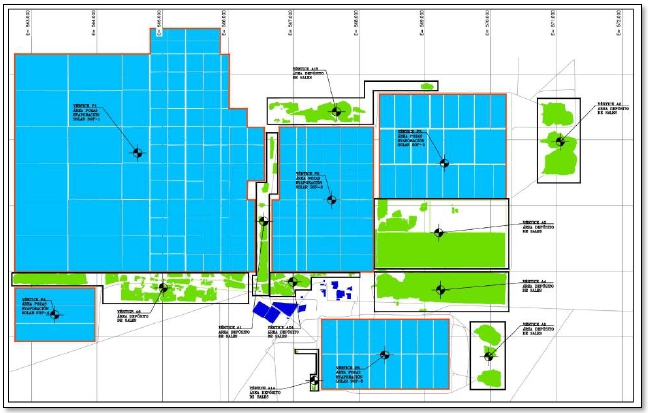
a) SOP sector
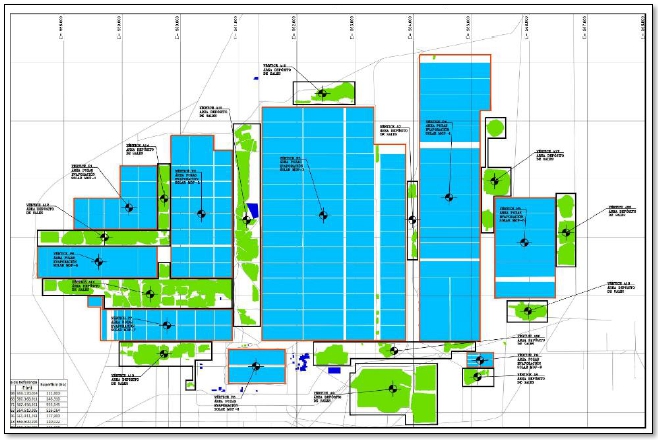
b) MOP sector
| 14.1.1.3 | SOP Sector |
SOP and MOP H- II Plant
After sequential evaporation from brine with favorable concentrations of sulfate and additional potassium, sulfate and potassium salts precipitate in different concentrations that are harvested and sent to be processed at the potassium sulfate plant SOP (SOP H and Dual) and MOP H II. The purpose of the plants is to simultaneously produce potassium sulfate and potassium chloride, or only potassium chloride, through the different stages that include grinding, schoenite flotation, crystallization, and flotation of KCl, flotation and leaching, regrinding, crushing, and tailings processing. These stages are equipped with impact crushers, thickeners, flotation cells, solid liquid separation equipment, vibratory dewaterers, thickeners, hydrocyclones, crushers, cell banks, mills, and screeners.
The production capacity of potassium sulfate plant is approximately 340,000 tonnes per year. In the dual plant, production alternates, to a certain extent, between potassium chloride and potassium sulfate. As such, 95,000 tonnes are potassium chloride obtained as a by-product of potassium sulfate production process. In the dual plant, production alternates to a certain extent between potassium chloride and potassium sulfate.
Main by-products of potassium sulfate production include: (i), sodium chloride, which is deposited in stockpiles near production plant; and (ii), remaining solutions, which are re-injected into the Salar de Atacama or returned to the evaporation pond.
Potassium Sulfate Drying and Compacting Plant (SOP - SC)
This plant, intended for drying and compacting, allows for the processing of potassium sulfate or potassium chloride. These stages are undertaken with equipment such as feed hoppers, drying ovens, chutes and screws, conveyor belts, and bucket elevators.
Existing equipment include:
| · | Feed hopper |
| · | Horizontal and inclined conveyor belts |
| · | Chutes |
| · | Screws and bucket elevator |
| · | Dryer |
Potassium Chloride Drying and Compacting Plant (MOP G / MOP G III)
This plant is intended for the drying and compacting of potassium chloride in different stages such as: drying and heating, compacting, grinding and classification, as well as the conditioning stage.
These stages are equipped with conveyor belts, dryers, hood elevators, chain conveyors, stackers, blowers, pumps, dust collectors, cyclones, mixers, ponds, compacting lines, mills, screens, and rotating drums.
| 14.1.1.4 | MOP sector |
Potassium chloride plant (MOP H-I)
From the second evaporation stage, residual brine from the first stage is sent to the second line of evaporation ponds where it precipitates sylvinite salts (potassium chloride and sodium chloride mixture), which are harvested and then sent to the wet potassium chloride plants. MOP H-I plant is intended to produce high grade Potassium Chloride in different stages such as: wet milling, classification, flotation, leaching, thickener, solid/liquid separation, and additives preparation area. These stages are equipped with grinding equipment, flotation cells, pumping station, adduction ducts, blowers, agitators, and collectors.
Harvested salts with lower potassium and magnesium content are used in cold leaching plants, where magnesium salts are removed, and potassium salts are reused.
Some of the potassium chloride is transported by truck approximately 300 kilometers to Coya Sur's facilities, where it is used in potassium nitrate production. By using potassium chloride at Coya Sur, third party purchases and imports of potassium chloride are avoided, and at the same time, a significant savings in raw material value is captured. Remaining potassium chloride is exported from the Port of Tocopilla in its dry or granular form, where it is mainly used as a specialty fertilizer.
Potassium Chloride Drying and Compacting Plant (MOP-SC)
The Potassium Chloride Drying and Compacting Plant is designed to produce granular potassium chloride, which has a series of facilities that allow for normal operations through different stages. These stages are equipped with equipment such as: dryer, conveying equipment, feeder, conveyor belts, blowers, pumps, stacker, dust collectors, cyclone mixers, compressors, tanks, screws, among others.
Potassium Chloride Drying Plant (Standard MOP)
The Potassium Chloride Drying Plant is designed to produce granular potassium chloride, which has a series of associated installations that allow for normal operations to be executed through different stages. These stages are equipped with equipment such as: dryer, transport equipment, feeder, conveyor belts, blowers, pumps, stacker, dust collectors, cyclone mixers, compressors, and tanks, among others.
Potassium Carnallite Plants (PC1- PC2)
This Potassium Carnallite salt is processed at the Potassium Carnallite Plant (PC1 and PC2), which aims to increase Potassium Chloride (KCl) content in non-saturated brine. This KCl-rich brine is fed to solar evaporation ponds, where sylvinite (KCl and sodium chloride (NaCl) mixture) is precipitated, and then fed into the existing KCl production plant, increasing the overall yield and efficiency of processed brine.
The Potassium Carnallite plant contains several facilities that allow normal operations to run through the different stages, such as leaching and solid-liquid separation stages. These stages are equipped with equipment such as filters, tanks, and reactors, among others.
| 14.1.2 | PQC Production Process |
The concentrated brine is shipped in tanker trucks to PQC's lithium chemical plant near Antofagasta. PQC's facilities produce lithium compounds and consist of a lithium carbonate plant and lithium hydroxide plant. The production process at the lithium chemical plant, which involves lithium carbonate and lithium hydroxide production, is presented in Figure 14-6.
Figure 14-6. Block process diagram of PQC’s Operations.
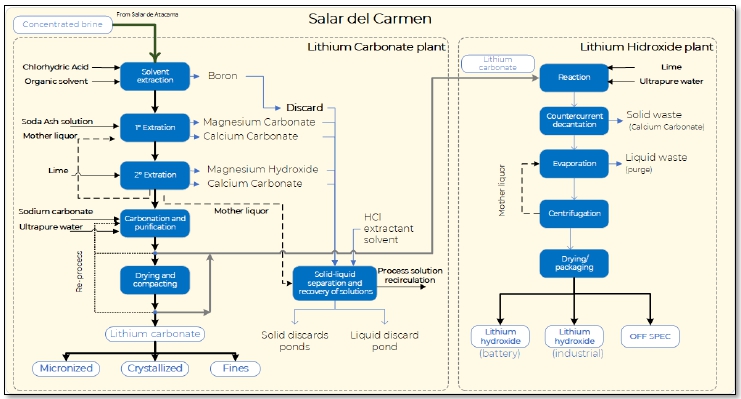
The production plants at this facility include the lithium carbonate plant, with a production capacity of 195,000 tonnes per year, and the lithium hydroxide plant, with a production capacity of 26,000 tonnes per year.
The process generates solid and liquid waste, both abbreviated as RIS-Industrial Solid Residue and RIL-Industrial Liquid Residue, respectively. The process plant has an area for the final disposal of liquid (RIL) and solid (RIS) industrial waste from the process, which currently has 15 disposal pits with an authorized surface area of 537,900 m2. The composition of the process waste is as follows:
| · | Liquid waste: water with boron and mother liquor. |
| · | Solid waste: magnesium carbonate pulp and magnesium hydroxide (processed pulp and ash, also with high boron content). |
For the RISs, it is noted that there is a solid discard control system to manage the evaporation of water still contained in the solids, reduce the size of the pile, and make better use of the storage surface.
As for the RILs that correspond to mother solutions loaded with impurities, these are stored in ponds and a plan has been designed to recover water from this mother liquor to reduce the water that is finally sent as waste. In terms of technological changes, there is a constant search for continuous improvement that is focused on achieving a higher quality of generated products (i.e., by increasing the production quantity of both carbonate and lithium) with a lower generation of out-of-specification products, improving product quality. This continuous improvement has been achieved by integrating operators' knowledge, managers, and the Development and Integration Area, which are responsible for reviewing bottlenecks and new methodologies.
The production units of the PQC correspond to:
| · | Lithium carbonate plant |
| o | Brine reception and supply |
| o | Boron removal plant |
| o | Calcium and magnesium removal plant. |
| o | Carbonation plant |
| · | Lithium hydroxide plant |
Treatment products of the concentrated and purified Lithium Chloride Solution (LiCl) in Lithium Chemical Plants are:
| · | Technical Grade Lithium Carbonate |
| · | Battery Grade Lithium Carbonate |
| · | Lithium Hydroxide Technical Grade |
| · | Lithium Hydroxide Battery Grade |
| 14.1.2.1 | Lithium Carbonate Plant |
The lithium recovery process consists of reacting lithium chloride with sodium carbonate to produce lithium carbonate, which will be dried, compacted, and packaged for shipment and subsequent commercialization. However, prior to the final reaction, it is necessary to purify the brine of contaminants; namely boron, magnesium and calcium content are removed from the brine.
The Production capacity by the end of the year 2023 of the lithium carbonate plant at Carmen Lithium Chemical Plant (PQC) was 190,000 tonnes per year.
Brine reception and storage
The brine reception area (high boron lithium chloride solution) includes four brine storage ponds with a total storage capacity of 5,400 m3.
Boron Removal Plant
This plant removes boron by means an extraction process, via acidification with hydrochloric acid and solvent extraction of boron in mixer-decanter units.
Brine from the salt flat with high lithium chloride and boron content is subjected to a dilution and acidification process prior to entering the solvent extraction units, whereby the action of an extractant and organic solvent extracts the boron to obtain boron-free solution and organic phase enriched in boron. This loaded organic phase is subjected to a regeneration process so that it can be reused again in the process, while the boron-free solution continues its purification process.
Magnesium and calcium removal plant
Magnesium and calcium extraction consists of a two-step process by changing pH of the solution and crystallization of the contaminants. This requires soda ash solution (soda ash) and calcium hydroxide solution (slaked lime), both of which are prepared in the lithium chemical plant (PQC) using powdered solid soda ash in a mixer and quicklime in a stirred reactor as raw materials, with added water.
Carbonation Plant
Lithium chloride solution with low calcium and magnesium content is sent to a final carbonation stage where the solution is heated and sent to a battery of reactors to be mixed with a sodium carbonate solution. In these reactors, the lithium carbonate precipitates under sodium carbonate action and temperature.
Product from precipitation reactors is sent to a hydrocyclones battery where its underflow is passed to belt filters and is separated from the precipitated lithium carbonate. Wet lithium carbonate is sent to final product area where it is dried. This dry product is sent to a compacting area to obtain micronized and fine material released in the screen to be transformed into product. According to market requirements, lithium carbonate is marketed as granular, micronized, crystallized, or fine.
| 14.1.2.2 | Lithium Hydroxide Plant |
Lithium hydroxide is synthesized from lithium carbonate (Li2CO3), which is the main raw material for lithium hydroxide monohydrate production. Lithium carbonate is dissolved in water and pumped into a battery of reactor tanks, where it is mixed with slaked lime to produce a brine of liquid lithium hydroxide (LiOH) and solid calcium carbonate (CaCO3).
The mixture obtained in the reactor is pumped to a clarifier, obtaining a lithium hydroxide solution that is filtered, thus eliminating any traces of calcium carbonate carried over from the previous stages. The filtered lithium hydroxide solution is sent to the evaporation stage to crystallize the lithium hydroxide monohydrate (LiOHxH2O), which is then sent to the centrifugation stage for elimination of entrained chloride and sulfate impurities.
Finally, the lithium hydroxide monohydrate crystals from the centrifuges are dried in a vibrating fluidized bed system and then cooled.
On the other hand, the calcium carbonate pulp obtained from the first stage is conveyed to a countercurrent washing and solid decantation process to recover the entrained lithium hydroxide and obtain a decanted calcium carbonate solid, with very low lithium content.
The main process steps correspond to the following (also see Figure 14-6).
| · | Feed and reaction: during this stage, the lithium carbonate is dissolved in water and pumped to a battery of reactor tanks, where it is then mixed with slaked lime to produce a brine of liquid lithium hydroxide (LiOH) and solid calcium carbonate (CaCO3). |
| · | Clarification and filtration: The mixture obtained in the reactor is pumped to a clarifier, obtaining a lithium hydroxide solution and a calcium carbonate pulp. The lithium hydroxide solution is filtered, thus eliminating any trace of calcium carbonate. |
| · | Decanting and centrifugation: The calcium carbonate pulp is conveyed to a countercurrent washing and solid decantation process to recover the entrained lithium hydroxide and obtain a decanted calcium carbonate solid with very low lithium content. The washed and decanted calcium carbonate pulp is fed to a solid-liquid separation equipment, from which a solid with low moisture content is obtained and discarded. |
| · | Evaporation and crystallization: at this stage, multiple-effect evaporation allows for the crystallization of lithium hydroxide monohydrate (LiOHxH2O). |
| · | Centrifugation area: In this area, the crystals formed from the liquid saturated in lithium hydroxide are separated, eliminating entrained chloride and sulfate impurities. |
| · | Drying and cooling: The lithium hydroxide monohydrate crystals from the centrifuges are dried and subsequently cooled. This process is carried out in totally encapsulated equipment, to avoid any emission that could affect the environment or product, and under controlled temperature and humidity conditions. |
The lithium hydroxide plant has a production capacity of 26,000 tonnes per year.
During 2019 2022, progress was made on the expansion project of a new lithium hydroxide production module with an additional annual capacity of 8,000 tonnes, having a production capacity of 21,500 tonnes per year (Mtpy) by the end of the year 2023.
| 14.2 | Process Specifications and Efficiencies |
The nominal production capacities at Salar de Atacama and PQC facilities are summarized in Table 14-3.
Table 14-3. Nominal Production Capacity per Process Plant
| Mine | Production | 2021-Nominal
Capacity (thousands of tonnes/year) |
2023-Nominal
Capacity (thousands of tonnes/year) |
| Salar de Atacama | Potassium chloride (KCl) | 2680 | 2680 |
| Potassium sulfate (K2SO4) | 245 | 245 | |
| Lithium Sulfate | 45 | 45 | |
| PQC | Lithium carbonate | 160 | 195 |
| Lithium hydroxide | 21,5 | 26 |
The main limiting factors for SQM is the permissible brine extraction rate. The brine extraction permit allows for a maximum of 1,600 L/s. With this flow rate, for a 365-days/year, approximately 72 million tonnes could be extracted from the aquifer. This is equivalent to 669,490 tonnes of LCE, assuming an average lithium concentration of 0.17%.
Lithium yield in the Salar has historically been around 43%, with a global potassium yield of 63%. However, with the implementation of process improvements by SQM's production and research teams, the lithium recovery rate has increased to 56%.
At the PQC lithium chemical plants, current process yields are approximately at a maximum value of 81% and 87% for lithium carbonate and lithium hydroxide production, respectively. Both values are projected to increase to 90% through plant improvements by 2030.
Table 14-4 shows the production data for 2019 through 2022.
Table 14-4. Production Data for 2019 to 2022.
| Salar de Atacama | 2022 | 2021 | 2020 | 2019 | ||||||||||||
| Tonnes of lithium carbonate produced | 152.5 | 108.4 | 72.2 | 62.3 | ||||||||||||
| Tonnes of potassium chloride and potassium sulfate and potassium salts produced | 1,050 | 1,407 | 1,476 | 1,049 | ||||||||||||
The following subsections provide a description of the brine extraction and re-injection values, with the potassium products generated, their yield, and projected production.
| 14.2.1 | General Balance of Solar Evaporation Ponds |
The material balance of solar evaporation ponds is carried out taking into consideration the inflow, outflow and remaining streams of the system:
| · | System inlet brine |
| · | Brine leaving the system. |
| · | Flow of water leaving the subsystem due to solar evaporation |
| · | Brine flow infiltrating into the salt flat. |
| · | Flow of salt leaving the well subsystem |
| · | Remaining brine flowing out of the well subsystem along with harvested salt. |
| · | Brine flow that is reinjected to the Salar, returning this flow to the reservoir. |
| · | Inventory |
The following global balance corresponds to all Solar evaporation Ponds operations (MOP I, MOP II, MOP III and SOP) for the year 2022.
| 14.2.2 | Brine Extraction |
Brine extraction levels from the brine fields are regulated in the lease agreement. SQM is currently in the fourth step of brine extraction at approximately 1,220 L/s, with a commitment to reduce the required brine extraction from the salt flat gradually by 2030 (see Figure 12-9).
The extraction brine information is public and transparent, since it is automatically processed every day and reported online at https://www.sqmsenlinea.com/, where it is possible to find the average daily extraction rates. According to the information provided, the average volumes extracted, the re-injected values for the years 2019 and 2022 are shown in Table 14-5.
Table 14-5. Average Volume of Brine Extracted and Re-injected per Year
| Average monthly Flow (L/s) | 2022 | 2021 | 2020 | 2019 | ||||||||||||
| Gross abstraction | 1,440 | 1,523 | 1,736 | 1,572 | ||||||||||||
| Re-injection | 205 | 271 | 275 | 243 | ||||||||||||
| Net Extraction | 1235 | 1,252 | 1,461 | 1,329 | ||||||||||||
Source: https://www.sqmsenlinea.com/
The net brine extraction complies with the maximum brine extraction limit of 1,700 L/s, as permitted by the RCA for the years 2020-2025.
| 14.2.3 | Plant Throughput and Forecast |
| 14.2.3.1 | Salar de Atacama and PQC Production Yields |
At the Salar de Atacama, two types of yields are managed, which include global and specific yield. Global yield refers to lithium and potassium yields in the lithium-producing and KCl-producing systems. This yield value is lower than the specific, or “IGS yield,” because it considers processes in which lithium enters but is not produced (or is produced in very low quantity), which lowers the yield value. The IGS yield corresponds to the lithium yield, but only for the lithium production system of MOP I BS and MOP III BS.
The values of the overall yield and IGS yields for 2019 through 2021 are shown in Table 14-6.
Table 14-6. Global Yield and IGS Yield for 2019 and 2021
| Yield Type | 2019 | 2020 | 2021 | |||||||||
| Global Yield | 42.98 | % | 42.89 | % | 42.80 | % | ||||||
| IGS Yield | 43.70 | % | 54.50 | % | 50.70 | % | ||||||
For the future, there is a yield enhancement plan at Salar de Atacama that consists of a set of unit operations and improvements in on-site procedures with a goal of being able to recover a greater amount of lithium in the output from the lithium production system. The operations and improvements considered as part of the yield enhancement plan are described in Section 10 and are as follows:
| 1. | Bischofite platforms |
| 2. | Improved harvesting |
| 3. | Miscellaneous improvements |
| 4. | CK platforms |
| 5. | Li2SO4 project |
| 6. | Calcium Source |
| 7. | Improved C-Li recovery |
| 8. | Soil repair |
Yield values considered through the Salar de Atacama enhancement plan only consider IGS yield, and do not consider the global yield. As shown in the plan in Table 14-7 the scale-up strategy focuses on sequential improvements (numbers denote items listed above) by an initiative that allows for staggered growth from 2019 to 2023, and thereafter, a 61.7% IGS yield.
Table 14-7. Projected Yield Increase in the Lithium Production System Based on the Yield Increase Plan
| Ramp-Up | 2023 | 2024 | 2025 | |||||||||
| IGS yield | 61.7 | % | 61.7 | % | 61.7 | % | ||||||
| Initiative 1 | 0.7 | %5 | ||||||||||
| Initiative 2 | 3.1 | %7 | ||||||||||
| Initiative 3 | 0.3 | %8 | ||||||||||
| Initiative 4 | ||||||||||||
| 5. Li2SO4 project 7. Improved C-Li recovery 8. Soil repair |
||||||||||||
As shown in Table 14-7, by the year 2023 improvements included: 5. Li2SO4 project, 7. Improved C-Li recovery, 8. Soil repair.
In the case of lithium processing plants, since the year 2017, a project was initiated to increase lithium carbonate and lithium hydroxide production capacity at the PQC mine to 70,000 tonnes/year and 32,000 tonnes/year, respectively, by means of new facilities, improvements in production processes, and waste management. Increased production of lithium carbonate from lithium concentrate solution is achieved by optimization or technological improvements to production processes that consider the replacement of existing equipment with higher capacity and better technology, such as:
| · | Solid-liquid separation systems which will optimize and provide more efficient cleaning processes at all stages. |
| · | Heating systems that will improve conversion and reaction in all processes. |
| · | Increased processing capacity of fluid transport systems and existing general equipment. |
| · | Operational control by improving field instrumentation. |
| · | Upgrading of technology and related changes to major equipment. |
| · | Upgrading of operational control systems, including ongoing staff training. |
| · | Improvements to existing operational systems to improve overall plant performance and efficiency. |
By the year 2020, PQC's lithium carbonate and lithium hydroxide production capacity was 70,000 tonnes/year and 13,500 tonnes/year, respectively. Overall plant throughput against a concentrated brine feed averages 77.9% (maximum 81%) for carbonate production and 85.7% (maximum 86.9%) for hydroxide production. By 2021, the production expansion of the carbonate plant, and optimizations and technological improvements was completed, allowing a production of 190 ktonnes per year during 2023 and 210 ktonnes by 2025. The expansion project was developed in stages. The project for lithium hydroxide production has reached a total capacity of 26,000 tonnes/year in 2023.
Staged implemented has been defined and will depend on current market conditions linked to product demand generated by the Project’s operations.
| 14.2.3.2 | Production Forecast |
In 2020, a sustainable development plan was announced that includes the voluntary expansion of monitoring systems, encouraging conversations with neighboring communities, carbon neutral state, and reduction of water use to 120 L/s and brine extraction by 50% in 2030. The production program evaluated in this Reserve Estimate includes all improvements, strategies, and investments (Table 14-8).
Table 14-8. Industrial Plan for 2023 to 2030 for the Salar de Atacama and PQC Operations
| Year | Unit | 2023 | 2024 | 2025 | 2026 | 2027 | 2028 | 2029 | 2030 | ||||||||||||||||||
| Total, Net Extraction | L/s | 1,223 | 1,166 | 1,108 | 1,051 | 994 | 937 | 879 | 822 | ||||||||||||||||||
| Total, Gross Extraction | L/s | 1,287 | 1,224 | 1,172 | 1,113 | 1,047 | 982 | 915 | 847 | ||||||||||||||||||
| Total Water | L/s | 240 | 240 | 240 | 240 | 240 | 240 | 240 | 240 | ||||||||||||||||||
| Sustainability Strategy (Reduction) | % | 42 | % | 43 | % | 44 | % | 46 | % | 47 | % | 48 | % | 49 | % | 50 | % | ||||||||||
| Sustainability Strategy | L/s | 139 | 136 | 133 | 131 | 128 | 125 | 123 | 120 |
For the period between 2023 and 2030, the production plan considers:
| · | Global potassium yield in the ponds between 65% and 66%. Considering only the MOP Sector, recovery factors vary between approximately 64% and 77% depending on the brine type (differentiated into low, high, and medium sulfate), as discussed in Section 12.4.1. |
| · | Global lithium yields in ponds vary between 53% and 65%, with increased recovery over time. Considering only the MOP Sector, recovery factors for year 2022 corresponded to 52.5% to 54.5% for medium and low sulfate brine respectively, which is improved over time, allowing for increases of up to 60% during the 2023-2030 period (depending on the brine type). Regarding the lithium yield by brine type, they are differentiated based on low, high, and medium sulfate content, as indicated in Section 12.4.1. |
| · | By 2023, KCl salts shipped to Coya Sur has increased by 15% over 2022 (483 ktonnes KCl 95% Eq) and by 2030, production will be 79% higher than this value (866 ktonnes KCl 95% Eq). |
| · | Average lithium grade in concentrated brine corresponds to 5.78%. |
| · | Sequential annual increase in the carbonate plant's yield ranges from 87% to 90%, while the lithium hydroxide plant is expected to increase from 88% to 90%. |
| · | By 2023, 26 ktonnes of lithium hydroxide was produced (Annual Fresh Production). For the period 2024-2030, it is expanding the capacity to produce 30 Ktonnes per year. |
| 14.3 | Process Requirements |
This sub-section contains forward-looking information related to the projected requirements for energy, water, process materials and personnel for the Project. The material factors that could cause actual results to differ materially from the conclusions, estimates, designs, forecasts, or projections in the forward-looking information include any significant differences from one or more of the material factors or assumptions that were set forth in this sub-section including actual requirements that yield different results from the historical operations.
The current needs of the lithium and potassium salt process, such as energy, water, labor and supplies are met as it is a mature operation with many years of production supported by the current project infrastructure. In terms of planned requirements, mining operations have a 2030 planning horizon, which will be described at the end of this section.
| 14.3.1 | Power and Fuel Requirements |
The power supply comes from installations of permanent power lines to each worksite. The power supply system has to supply electricity to the industrial areas for their operations and adduction system specifically through existing substations. The Salar de Atacama operations require 178,661 MWh/year, while PQC operations require 44,725 MWh/year. Total electricity consumption is 223,386 MWh/year. The operation will require the consumption of 12,660 m3/year of diesel and 1,067,715 MMBTU/year of fuel oil N°6. It will be supplied by authorized refueling trucks. Diesel fuel is also used in generator equipment for power and as a backup in case of outages.
The principal energy sources used in PQC’s operation are electricity and gas (LNG, liquefied natural gas, and LPG, liquefied petroleum gas). LNG consumption at PQC is 481,775 MBTU/year and LPG is 2,592 MBTU/year. The values indicated are shown in the following Table 14-9.
Table 14-9. Summary of Energy Consumption per Year
| Electric energy |
Diesel | LNG, liquefied natural gas |
LPG, liquefied petroleum gas |
Fuel | ||||||||||||||||||
| Site | Process lant | MWh/ Year |
m3/
Year |
MMBTU/ Year |
Tonne/
Year |
MMBTU/ Year |
||||||||||||||||
| Salar de Atacama | All plants | 178,661 | 12,660 | - | - | 467,636 | ||||||||||||||||
| Lithium carbonate | 31,973 | - | 225,419 | 2,592 | 343,724 | |||||||||||||||||
| PQC | Lithium hydroxide | 12,752 | - | 256,356 | - | 256,356 | ||||||||||||||||
| All plants | 44,725 | - | 481,775 | 2,592 | 600,080 | |||||||||||||||||
| Total | 223,386 | 12,660 | 481,775 | 2,592 | 1,067,715 | |||||||||||||||||
| 14.3.2 | Water Supply and Consumption |
| 14.3.2.1 | Water Supply System |
Water supplies are covered for basic consumption to meet the essential needs of personnel working in the process plants (drinking water and sanitation), drinking water consumption (treated and available in water drums, dispensed by an external supplier), and that which is required for industrial quality work.
There are 4 groundwater extraction wells considered as sources of industrial water in the Salar de Atacama, namely: Socaire, CA-2015, Allana, and Mullay.
For water extraction, pumping, and transport, there is a line that connects wells to pumping stations, allowing it to be transported and distributed to the different points. The water is tested for quality control, which is recorded by the internal laboratory. Storage takes place in 5 ponds, with a total retention capacity of 23,000 m3.
Water extraction will not exceed the committed rate of sequential reduction to 120 L/s by 2030. The extraction information is public and reported online at https://www.sqmsenlinea.com/, where it’s possible to find the average daily extraction and consumption flow. Table 14-10 shows water extraction records for the period of 2019 to 2023.
Table 14-10. Annual Industrial Water Extraction from Wells
| Year | 2023 | 2022 | 2021 | 2020 | 2019 | |||||||||||||||
| Industrial water extraction (L/s) | 115,4 | 108.5 | 111.8 | 110.0 | 155.1 | |||||||||||||||
In PQC's case, industrial water requirements are supplied by authorized third-party water trucks.
| 14.3.2.2 | Water Consumption |
Drinking water
Drinking water is essential for operation to cover all consumption needs and sanitary facilities for all workers. Drinking water (100 L/person/day, of which 2 L/person/day is drinking water) will be supplied to worksites and cafeterias in jerry cans and/or bottles provided by companies Annual drinking water consumption by 2020 in the Salar de Atacama was 31,142 m3. Table 14-11 summarizes the amount of treated water and consumed drinking water at the Salar de Atacama.
Table 14-11. Drinking water consumption per year at the Salar de Atacama.
| Year |
Generation (m3) |
Consumption (m3) | |||||||
| 2019 | 21,855 | 20,050 | |||||||
| 2020 | 33,945 | 31,142 | |||||||
Given that at PQC, there is an average of 455 workers required to operate per month, the total amount of required potable water will be 45.5 m3/day.
Industrial Water
In the Salar de Atacama, total water consumption in operations will reach approximately 3,399,320 m3/year. This comes from the water extraction system from wells and will be stored in the reception pond.
Industrial water consumption reported for 2023 had an average of 110,85 l/s, approximately 3,495,656 m3/year.
It should be noted that "PQC Solutions Recovery Plant" project aims to reduce water consumption at its mine site, in line with its environmental commitment under RCA057, by recovering 154 m3/h of ultrapure water, mostly from the carbonate plant mother liquor and other secondary RIL flows.
| 14.3.3 | Employee Requirements |
During operation of the years 2020 and 2021, an average workforce of 1,876 workers was considered between the Salar de Atacama and PQC. A summary of the requirements by operation activity is shown in the Table 14-12.
Table 14-12. Personnel required by area/activity
| Personnel per year | 2020 | 2021 | ||||||||||
| N° of employees per area | Dec. | Average | Dec. | Average | ||||||||
| Salar Production Management | 998 | 998 | 981 | 1,014 | ||||||||
| Lithium Production Management | 445 | 427 | 342 | 341 | ||||||||
| Environmental Management | 18 | 18 | 13 | 12 | ||||||||
| Salar Hydrogeology Management | 219 | 219 | 206 | 233 | ||||||||
| Supply Chain Management | 195 | 191 | 171 | 152 | ||||||||
| Development Manager | 14 | 14 | 12 | 13 | ||||||||
| Innovation and Development Manager | 9 | 9 | 11 | 22 | ||||||||
| Total, Operations of Potassium and Lithium | 1,898 | 1,876 | 1,736 | 1,787 | ||||||||
In addition, Table 14-13 presents the average workforce for 2023 for the PQC Executive VP.
Table 14-13. Personnel by area
| Personnel per year | 2023 | ||
| N° of employees per area | Average | ||
| Operations Management, Salar | 1,111 | ||
| Operations Management, PQC | 612 | ||
| Supply Chain Management | 332 | ||
| Research and Development Management, PQC | 268 | ||
| Services & Sustainability VP, PQC | 235 | ||
| Hydrogeology Management | 197 | ||
| Potassium Projects VP, PQC | 196 | ||
| Energy and Automatization Management | 98 | ||
| Accounting & Management | 83 | ||
| Commercial VP, PQC | 58 | ||
| Strategy and M&A VP, PQC | 38 | ||
| Studies and Planification | 22 | ||
| Design and Planning Area | 18 | ||
| Lithium – Potassium Business Division | 1 | ||
| Total, Executive VP | 3,269 |
| 14.3.4 | Process Plant Consumables |
The main consumables in the MOP and SOP are flotation agents, HCl, vegetable oil, iron oxide, anti-caking / anti-dust. In the case of the PQC, the main inputs for its production are soda ash, lime, HCl, and water.
Reagents to be used in this process, which includes concentration at which reagents will be required, are shown in Table 14-14.
Table 14-14. Process Reagents and Consumption rates per year.
| Process Plant |
Process area | Reagent & Consumables | Units | Consumption | |||||||
| MOP-H I; MOP-H II; SOP-H | Flotation Agent KCl | Tonnes | 379 | ||||||||
| MOP-H I; MOP-H II; SOP-H | HCl | Tonnes | 138 | ||||||||
| Salar de Atacama | MOP-G3 | Vegetable Oil | m3 | 2,180 | |||||||
| MOP-G3 | Iron Oxide | Tonnes | 104 | ||||||||
| MOP-S | Anti-caking agent/Antipowder | Tonnes | 267 | ||||||||
| SOP-S/C | Anti-caking agent/Antipowder | Tonnes | 32 | ||||||||
| Soda Ash | Tonnes | 144,402 | |||||||||
| Lithium carbonate | Lime | Tonnes | 2.536 | ||||||||
| Chlorhydric acid | m3 | 11,259 | |||||||||
| Ultra-pure Water | m3 | 797,259 | |||||||||
| PQC | Lime | Tonnes | 11,779 | ||||||||
| Ultra-pure Water | m3 | 70,524 | |||||||||
| Lithium hydroxide | Sulfuric acid | Tonnes | 561.1 | ||||||||
| Scaid | Tonnes | 82.37 | |||||||||
| Alcohol | Tonnes | 38 | |||||||||
| 14.3.5 | Consumption and Waste Projection |
According to the industrial plans of the lithium chemical facilities, Table 14-15 shows a projection of raw material consumption, such as concentrated lithium brine, lithium carbonate, and process agents that include soda ash, lime, HCl (32%), scaid (diluent), exxal (extractant), H2SO4, NaOH, and filter earth. The fuel consumption (Natural Gas [LNG], Liquefied Gas [LPG], Petroleum Diesel), water consumption, and waste generation per year for the period of 2023 to 2030 is also indicated.
Table 14-15. Consumption of Material and Generation of RIL/RIS on Carmen Lithium Chemical Plant (PQC)from 2022 to 2030
| Lithium Carbonate Plant | Unit | 2022* | 2023* | 2024* | 2025* | 2026* | 2027* | 2028* | 2029* | 2030* | |||||||||||||||||||
| Soda Ash | Tonnes | 381,600 | 381,600 | 381,600 | 381,600 | 381,600 | 381,600 | 381,600 | 381,600 | 381,600 | |||||||||||||||||||
| Lime | Tonnes | 15,300 | 15,300 | 15,300 | 15,300 | 15,300 | 15,300 | 15,300 | 15,300 | 15,300 | |||||||||||||||||||
| HCl (32%) | m3 | 32,180 | 32,180 | 32,180 | 32,180 | 32,180 | 32,180 | 32,180 | 32,180 | 32,180 | |||||||||||||||||||
| Scaid (Diluent) | L | 10,437 | 10,437 | 10,437 | 10,437 | 10,437 | 10,437 | 10,437 | 10,437 | 10,437 | |||||||||||||||||||
| Exxal (Extractant) | L | 2,719 | 2,719 | 2,719 | 2,719 | 2,719 | 2,719 | 2,719 | 2,719 | 2,719 | |||||||||||||||||||
| H2SO4 | Tonnes | 6,045 | 6,045 | 6,045 | 6,045 | 6,045 | 6,045 | 6,045 | 6,045 | 6,045 | |||||||||||||||||||
| NaOH | Tonnes | 39,600 | 39,600 | 39,600 | 39,600 | 39,600 | 39,600 | 39,600 | 39,600 | 39,600 | |||||||||||||||||||
| Filter Earth | Tonnes | 10,800 | 10,800 | 10,800 | 10,800 | 10,800 | 10,800 | 10,800 | 10,800 | 10,800 | |||||||||||||||||||
| Natural Gas (LNG) | MMBTU | 39,795 | 39,795 | 39,795 | 39,795 | 39,795 | 39,795 | 39,795 | 39,795 | 39,795 | |||||||||||||||||||
| Liquefied Gas (LPG) | MMBTU | 33,948 | 33,948 | 33,948 | 33,948 | 33,948 | 33,948 | 33,948 | 33,948 | 33,948 | |||||||||||||||||||
| Petroleum Diesel | MMBTU | 22,852 | 22,852 | 22,852 | 22,852 | 22,852 | 22,852 | 22,852 | 22,852 | 22,852 | |||||||||||||||||||
| Consumed Water | m3 | 900,000 | 900,000 | 900,000 | 900,000 | 900,000 | 900,000 | 900,000 | 900,000 | 900,000 | |||||||||||||||||||
| RIL | Tonnes | 959,805 | 959,805 | 959,805 | 959,805 | 959,805 | 959,805 | 959,805 | 959,805 | 959,805 | |||||||||||||||||||
| RIS | Ton | 765,339 | 765,339 | 765,339 | 765,339 | 765,339 | 765,339 | 765,339 | 765,339 | 765,339 | |||||||||||||||||||
| Lithium Hydroxide Plant | Unit | 2022* | 2023* | 2024* | 2025* | 2026* | 2027* | 2028* | 2029* | 2030* | |||||||||||||||||||
| Lime | Tonnes | 41,050 | 41,050 | 41,050 | 41,050 | 41,050 | 41,050 | 41,050 | 41,050 | 41,050 | |||||||||||||||||||
| H2SO4 | Tonnes | 1,546 | 1,546 | 1,546 | 1,546 | 1,546 | 1,546 | 1,546 | 1,546 | 1,546 | |||||||||||||||||||
| Filter Earth | Tonnes | 352 | 352 | 352 | 352 | 352 | 352 | 352 | 352 | 352 | |||||||||||||||||||
| Natural Gas (LNG) | MMBTU | 47,546 | 47,546 | 47,546 | 47,546 | 47,546 | 47,546 | 47,546 | 47,546 | 47,546 | |||||||||||||||||||
| Liquefied Petroleum Gas (LPG) | MMBTU | 36,277 | 36,277 | 36,277 | 36,277 | 36,277 | 36,277 | 36,277 | 36,277 | 36,277 | |||||||||||||||||||
| Petroleum Diesel | MMBTU | 39,270 | 39,270 | 39,270 | 39,270 | 39,270 | 39,270 | 39,270 | 39,270 | 39,270 | |||||||||||||||||||
| Consumed Water | m3 | 278,080 | 278,080 | 278,080 | 278,080 | 278,080 | 278,080 | 278,080 | 278,080 | 278,080 | |||||||||||||||||||
| RIL | Tonnes | 59,805 | 59,805 | 59,805 | 59,805 | 59,805 | 59,805 | 59,805 | 59,805 | 59,805 | |||||||||||||||||||
| RIS | Tonnes | 11,961 | 11,961 | 11,961 | 11,961 | 11,961 | 11,961 | 11,961 | 11,961 | 11,961 | |||||||||||||||||||
| *According to RCA 057/110 | |||||||||||||||||||||||||||||
Source: SQM (2021) l.
| 14.4 | Qualified Person´s Opinion |
The QP in charge of metallurgy and resource treatment, has the following opinions that were also stated by previous QPs:
Recently, the company has been intensively searching for new technologies to improve lithium recovery from brines. Focusing on the chemistry of brine processing, sustainability of the process, as well as the environmental commitments, the company has developed a plan to improve the overall lithium production yield as well as new recovery methodologies to minimize impregnation losses.
A significant methodology that has been implemented successfully is the “Bischofite Platform”, where the lithium recovery is realized from impregnated salts. This initiative allows for a 3% increase in yield.
Another methodology proposed is the depletion of sulfate in the brine, an activity known as "calcium sourcing". To reduce or eliminate lithium losses by precipitation, the sulfate in the brine is abated with calcium chloride, thus preventing the lithium from precipitating as lithium sulfate. However, this measure competes almost exclusively with another alternative, which recovers lithium from precipitated salts as lithium sulfate. The "Li2SO4 Project", which aims to recover the lithium that precipitates as lithium sulfate in the MOP and SOP systems. It is recommended to review both alternatives, the "Li2SO4 Project" and "calcium sourcing", in terms of performance and cost impact.
Because the removal of CaCl2 per Tonnes of sulfate can be significantly costly, it is necessary to consider a liming process with an alternative calcium source. Alternatives should be evaluated by laboratory testing to allow for scalability to operating ponds.
Resource variability in ratios of ions such as sulfate-magnesium (SO4/Mg), potassium-magnesium (K/Mg), sulfate-calcium (SO4/Ca) and lithium-magnesium (Li/Mg) must be studied and projected into the production plan since the ratios can directly impact compliance. The control of these parameters is of such importance that they can determine the decision to carry out engineering works for operational continuity.
If studies confirm the variability of chemical composition of brines with a decrease of a specific species or ratio (e.g. sulfate-calcium), engineering studies should be carried out for early incorporation of the process to prevent any unfavorable, or detrimental, effects.
Figure 14-7. Properties Adjacent to SQM’s Concessions, Salar de Atacama.
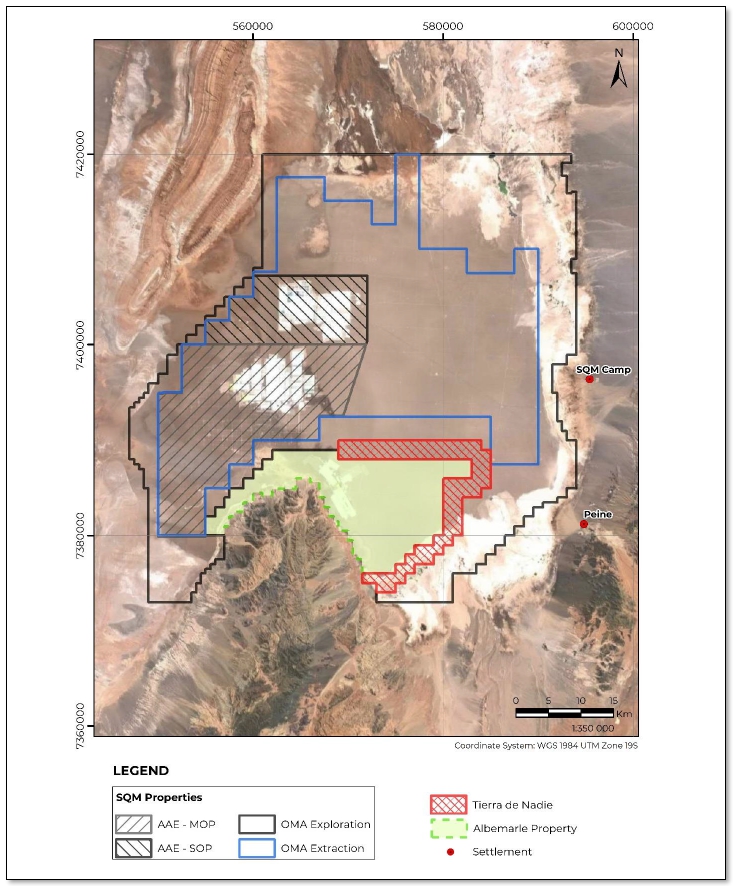
| 15 | INFRASTRUCTURE |
This section contains forward-looking information related to the locations and designs of facilities comprising infrastructure for the Project. The material factors that could cause actual results to differ materially from the conclusions, estimates, designs, forecasts,0 or projections in the forward-looking information include any significant differences from one or more of the material factors or assumptions that were set forth in this sub-section including Project development plan and schedule, available routes and facilities sites with the characteristics described, facilities design criteria, access and approvals timing.
The analysis of the infrastructure in the Salar de Atacama has been developed considering the existing facilities and requirements associated with future projects. This section describes existing facilities and planned expansion projects.
The Salar de Atacama is located in the Antofagasta Region, province of El Loa, commune of San Pedro de Atacama. Figure 15-1 shows the geographical location of SQM's production areas, including the Salar de Atacama, Salar del Carmen, Coya Sur, and Nueva Victoria sites.
Figure 15-1. General Location Salar de Atacama Site
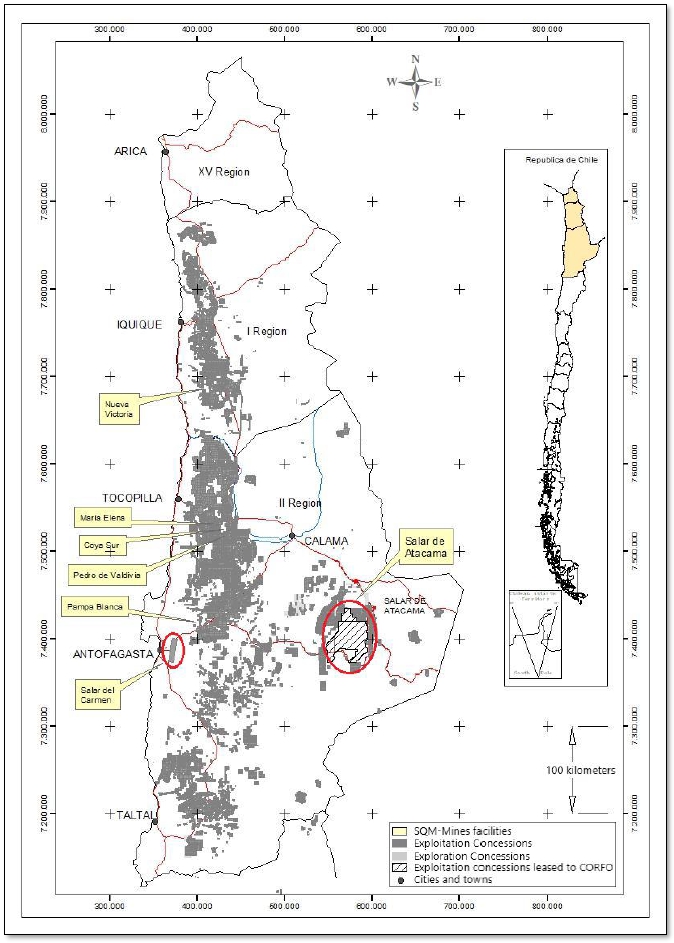
The Salar de Atacama production area is located within the salt flat, 270 km east of the city of Antofagasta and 190 km southeast of María Elena; it includes sectors for the extraction of brine and industrial water, sectors for solar evaporation ponds and salt harvesting, potassium chloride plants, potassium sulfate plants, a boric acid plant, and drying and compacting plants.
The harvested salts are processed in the plants located at the site for the production of potassium chloride, potassium sulfate, boric acid, and lithium carbonate brine. Potassium chloride and lithium-rich brine are obtained in the MOP sector. Potassium chloride, potassium sulfate and boric scid are obtained in the SOP sector. The plant has the installed capacity to produce 2,680,000 tonnes/year of potassium chloride, 245,000 tonnes/year of potassium sulfate, and 15,000 tonnes/year of boric acid.
The Salar del Carmen production area is located approximately 255 km from the Salar de Atacama, and includes the area where the lithium carbonate and lithium hydroxide production plants are located. The concentrated lithium chloride brine comes from the Salar de Atacama which is transported via cistern trucks to the Salar del Carmen.
The Salar del Carmen site is located approximately 20 km east of the city of Antofagasta. The production plants of this site include the lithium carbonate plant, with a current capacity to produce 195,000 tonnes/year as of 2023, and lithium hydroxide plant, with a current capacity to produce 26,000 tonnes/year as of 2023. The main energy sources used in the Salar del Carmen operation are electricity and natural gas.
The finished products of the Salar del Carmen (Lithium Carbonate and Lithium Hydroxide) are packed in large bags and later consolidated in containers, which are transported by trucks mainly to the ports of Antofagasta (15 km west of the Salar del Carmen), Mejillones (80 km north of the Salar del Carmen via the Route 1 or Route 5 and B-400 highways), or Iquique (430 km north of the Salar del Carmen via the Route 1 or Route 5 highway).
| 15.1 | Access to Production Areas, Storage, and Port Shipping |
The finished products, which are provided in bulk from the Salar de Atacama for export, are transported by trucks to the Port of Tocopilla (owned by SQM) which is 370 km from the Salar de Atacama. Alternatively, the Port of Mejillones is used, which 310 km from the Salar de Atacama to the north of Antofagasta.
Another important recipient of finished products from the Salar de Atacama is the Coya Sur Nitrates Plant, owned by SQM, which is located 315 km northwest of the Salar de Atacama.
The potassium chloride produced at the Salar de Atacama facilities is transported by truck, either to the port of Tocopilla, Coya Sur, or to an alternative port (Mejillones), for shipment. The product transported to Tocopilla represents the final product for shipment to the end customer, or subsidiary.
The lithium chloride solution high in boron, produced at the Salar de Atacama facilities, is transported via route B-385 to the lithium carbonate plant in the Salar del Carmen area where the finished lithium carbonate product is made.
SQM's products and raw materials are transported by trucks operated by third parties through long-term contracts on a dedicated basis, using bischofite, or standard highway routes. The Salar de Atacama area has accessibility through the B-385 road that connects to the Route 5 highway. This standard highway (the main highway in the country) leads to the Salar del Carmen, Port of Tocopilla, and Coya Sur. In addition, routes B-367, 23, 24, or 25 can be used that connect to the north, through Route 5, as an alternative route to the three destinations indicated above. The maintenance of Route B-385 (Baquedano-Salar) is the responsibility of the local government; however, SQM has a road repair crew, Excon, from km 22 to km 150, for machinery in the Salar de Atacama area. The maintenance of Route B-367 is also the responsibility of the local government. Interior work roads of the Salar de Atacama and the road to the Andean camp are maintained by the same road repair crew, Excon.
The Port of Tocopilla (186 km north of Antofagasta) is owned by SQM and covers an area of 22 ha. It is the main facility for the storage and shipment of finished, bulk, and packaged products of nitrates and potassium chloride as well as for the handling of consumable materials.
The Salar del Carmen Plants are located 20 km from the city of Antofagasta, close to the Route 5 highway, and serves as a route to its main destination (Tocopilla Port). Some of the lithium carbonate feeds the adjacent lithium hydroxide plant, where finished lithium hydroxide is produced.
These two products, from the Salar del Carmen, are stored in the same facilities or external warehouses. Subsequently, they are consolidated in containers which are transported by truck to a transit warehouse or directly to port terminals for subsequent shipment. The terminals currently used are those suitable for receiving container ships located in Antofagasta, Mejillones, and Iquique.
The facilities of the Terminal of the Port of Tocopilla allow for the loading of bulk products to ships, shipment of packaged products to ships (it has a 40-ton capacity crane) and nitrate mixing unit for finished products.
The storage facilities consist of a system of six silos, with a total storage capacity of 55,000 tonnes, and a mixed shed and open storage area of approximately 250,000 tonnes. In addition, to meet future storage needs, the subsidiary will continue to make investments in accordance with the investment plan drawn up by management. The products are also bagged at the Tocopilla port facilities, where the bagging capacity is provided by two bagging machines, one for polypropylene bags and bulk bags, and one for FFS polyethylene. What is packaged in Tocopilla can be later shipped in the same port, or it can also be consolidated in trucks, or containers for later dispatch to clients by land, sea, or via container from other ports, namely Antofagasta, Mejillones, and Iquique.
For bulk product transportation, the conveyor belt system extends over the shoreline to deliver products directly into bulk cargo ship hatches. The rated load capacity of this shipping system is 1,200 tonnes per hour. The transport of the packaged product is carried out in the same bulk carriers using barges without motors that are located on the dock and loaded through the 40-tonne crane of the Port of Tocopilla Terminal. These are later towed and unloaded by means of ships cranes into the corresponding holds.
Bulk cargo ships are typically hired to transfer product from the Port of Tocopilla Terminal to hubs around the world, or to direct customers which in certain instances use their own chartered ships for delivery.
| 15.2 | Productive Areas and Infrastructure |
The main facilities of the Salar de Atacama production area correspond to:
| · | Mine and water supply |
| · | SOP Sector (sulfate of potash, producer of potassium chloride and potassium sulfate) (see Figure 15-2, Figure 15-3 and Figure 15-5): |
| o | Evaporation ponds |
| o | SOP Potassium Sulfate Plant (Wet and Dual SOP) |
| o | MOP-Wet Plant II |
| o | Potassium Sulfate Drying and Compacting Plant (SOP – SC) |
| o | Potassium Chloride Drying and Compacting Plant (MOP G / MOP G III) |
| o | Boric Acid Plant (ABO) |
| o | Auxiliary facilities |
| · | MOP Sector (muriate of potash, lithium concentrated brine producer) (see Figure 15-2, Figure 15-3 and Figure 15-4): |
| o | Evaporation ponds |
| o | Potassium Chloride KCl Plant (MOP H I) |
| o | Potassium Chloride Drying and Compacting Plant (MOP SC) |
| o | Potassium Chloride Drying Plant (Standard MOP) |
| o | Carnallite Plants (PC1-PC2) |
| o | Auxiliary facilities |
| · | “Cañón del Diablo” Non-Hazardous Industrial Waste Landfill |
| · | Hazardous Waste Storage Yard |
Figure 15-2. SOP and MOP Plants
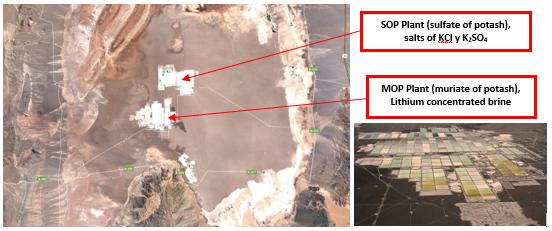
Figure 15-3. Location SOP and MOP Plants
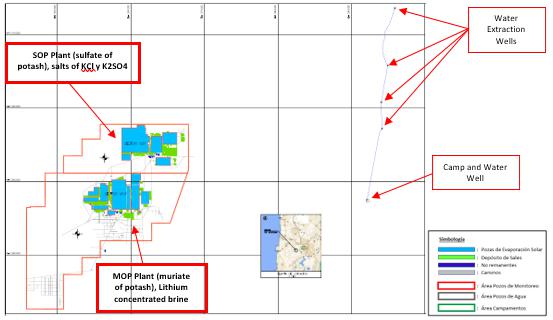
Figure 15-4. Facilities MOP
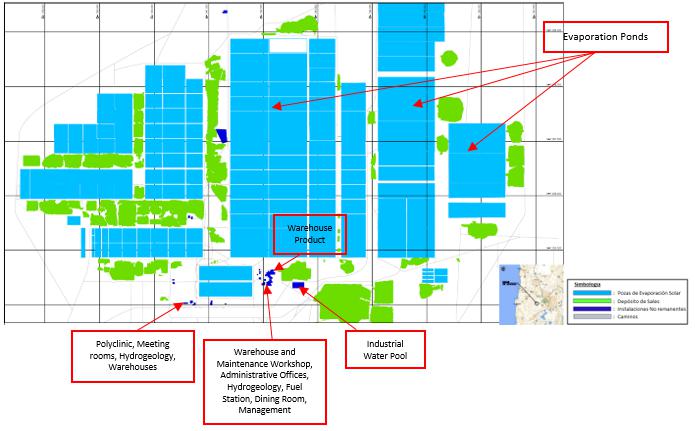
Figure 15-5. Facilities SOP
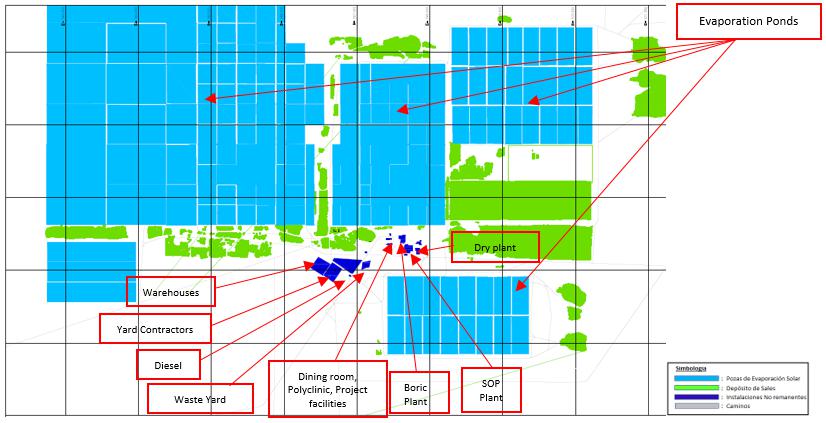
The Salar de Atacama facilities can be summarized as follows:
| ● | Extraction Wells: |
| o | Operating Wells 2023: 438 Operating Wells / Average Depth: 45.2 m each. |
| o | Wells Out of Offer 2023: 13 |
| o | 45 pumps in SDD, (19 are stand-by pumps) |
| o | 438 Submersible Well Pumps (Each operating well has 1 pump) |
| o | HDPE pipe |
| ● | Evaporation ponds: |
| o | 2,555 ha distributed in a total area of 4,992 ha. |
| o | 1,033-ha halite ponds (evaporation and removal of Sodium Chloride). |
| o | 986-ha sylvinite ponds (evaporation and removal of potassium chloride, potassium sulfate, and sodium chloride). |
| o | 536-ha evaporation ponds to remove carnallite, bischofite and lithium chloride. |
| o | Currently, there are about 360 evaporation ponds with a wall height close to 3 m on average. |
| ● | Process Plants: |
| o | PC1 (Old Carnalite Plant) |
| o | PC2 (Carnalite Plant in disuse) |
| o | PC3 (Extended PC1 Carnallite Plant) |
| o | SOP H (Potassium Sulfate Wet Plant or Dual Plant) |
| o | MOP H (Potassium Chloride Wet Plant) |
| o | MOP H – II (Potassium Chloride Wet Plant 2) |
| o | MOP-S (Potassium Chloride Drying Plant) |
| o | MOP G (Granular Potassium Chloride Plant) |
| o | SOP S/C (Potassium Sulfate Drying/Compacting Plant). |
| ● | Storage areas for intermediate or discarded products: |
| o | Halites discard salts |
| o | Sylvinite stockpile |
| o | Carnallite stockpile |
| o | Bischofite stockpile |
| o | Carnallite lithium stockpile |
| o | Potassium sulfate plant stockpile |
| ● | Product storage areas for sale or dispatch |
| ● | Machinery and equipment in product handling areas (stockpiling, discarding, and dispatch): |
| o | MOP-H Plant I Stockpile Feeding: 1 Loader and 1 Excon Bulldozer |
| o | Removal of Stacker MOP-H I and power supply MOP-S: 1 Excon Charger |
| o | Removal of Stacker MOP-S and Product Dispatch: 1 Excon Charger |
| o | Sylvinite Dispatch: 1 Excon Charger |
| o | Plant PC- I Feeding and Stacker removal: 1-2 Excon charger, depending on feed rate. |
| o | MOP-H II Plant Stockpiling Feeding: 1 Loader and 1 Excon Bulldozer |
| o | Plant SOP-H Stockpiling Feeding: 1 Excon Loader |
| o | Removal of Stacker MOP-H II and SOP-H: 1 Excon Charger |
| o | MOP-G III Power Plant: 1 Excon Charger |
| o | Planta MOP-G III Alimentación: 1 Cargador Excon |
| o | Removal Stacker MOP-G III: 1 Astudillo Charger |
| o | MOP/SOP Sales Deposit: 2 Excon Excavators |
| ● | Camp (facilities and services): simultaneous capacity of 1,321 users |
| ● | Offices |
| ● | Workshops: |
| o | Mine Maintenance |
| § | Thermofusion equipment workshop |
| § | Lathe workshop |
| § | Welding shop (2) |
| § | Main maintenance workshop |
| o | Plants Maintenance |
| § | Turner store - (MOP H-I) |
| § | Welding workshop ((MOP H-I)) |
| § | Electric Store |
| § | Mechanical store |
| ● | Laboratories: |
| o | Chemical Laboratory |
| o | Metallurgical Laboratory |
| ● | Inner Roads. |
| a) | The main facilities of the Salar del Carmen production area correspond to (see Figure 15-6): |
| ● | Storage Areas for Lithium Chloride and Raw Materials |
| ● | Product storage areas for sale or dispatch |
| ● | Process Plants: |
| o | Lithium Carbonate Plant |
| § | Boron SX |
| § | Purification (removal of Ca and Mg) |
| § | Carbonization |
| o | Lithium Hydroxide Plant |
| ● | Offices |
| ● | Workshops and Laboratories |
| ● | Common areas (casinos, exchange house, polyclinic, interior roads) |
Figure 15-6. Main Facilities of the Salar del Carmen
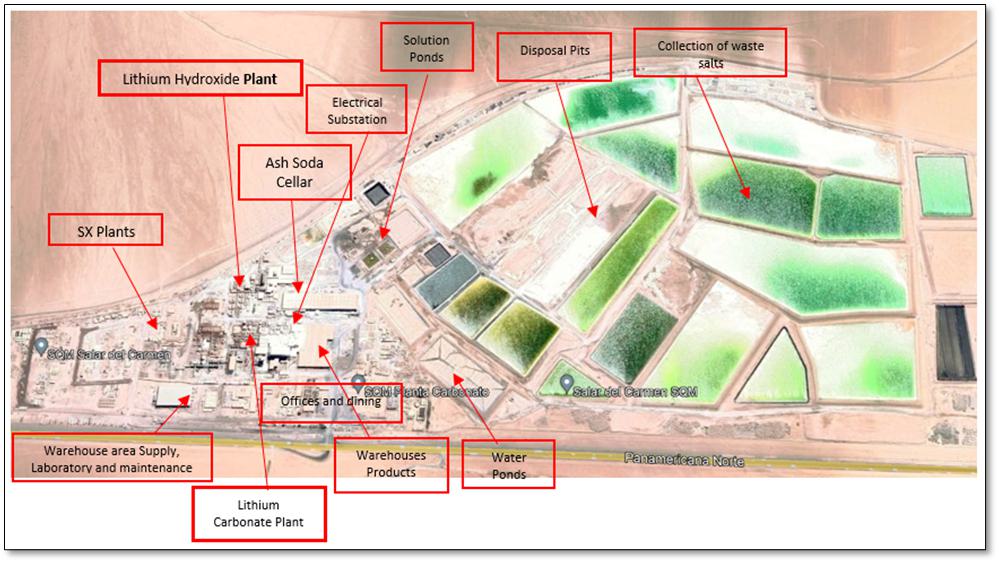
Infrastructure and main equipment in Lithium Carbonate Plant:
| ● | Buildings (offices, casino, supply warehouses, laboratories, maintenance, soda ash warehouse, product warehouse and other minors) // Filters // Disposal wells // Water pools // Stockpiles of discarded salts // Centrifuges // Piping // Ponds (TK) // Drying equipment // Electrical equipment installations) // Laboratory equipment // Exchanger // Valves // Pumps // Instrumentation equipment // Boiler // Warehouse // Microfiltration System |
Infrastructure and main equipment in Lithium Hydroxide Plant:
| ● | Crystalizer // Buildings // Drying Equipment // Thickener |
Infrastructure and main equipment Powerhouse:
| ● | Transformer // Electrical equipment facilities |
Infrastructure and main equipment in stockpiling and dispatch:
| ● | Truck loading station // Trucks // Equipments // Scales, washing and sampling // Dumps. |
| 15.3 | Communications |
| 15.3.1 | Salar de Atacama and Salar del Carmen: |
The Salar de Atacama facilities have telephone, internet and television services via satellite link. The Salar del Carmen facilities have telephone, internet, and television services through fiber optics supplied by an external provider.
Communication for operations personnel is via communication radios with the same frequency. The communication for the control system, CCTV, internal telephony, energy and data monitoring is carried out through its own optical fiber, which communicates between the process plants and control rooms.
| 15.4 | Power Supply |
The facilities are connected to the National Electric System. The electrical system in the north of the country is called “Sistema Interconectado Norte Grande,” or SING.
| 15.4.1 | Salar de Atacama |
A 110-kV, high-voltage line reaches the Salar de Atacama. This line is called Minsal 110 kV – H3 Tap off West Line – Minsal, whose owner is the company AES Andes (former AES Gener S.A.), which in the Minsal substation lowers the voltage from 110 kV to 23 kV through a transformer. There is currently an electricity supply contract with the company AES Andes (formerly AES Gener S.A., which is one of the main electricity producers in Chile).
The supplied energy that is distributed by the facilities passes through an electrical transformer that allows it to be transformed to voltages lower than 380 V, which is required by the equipment of the facilities. The facilities also have diesel generators to serve as backup power, or to generate power during peak-rate hours:
| ● | 53 prime mode generators with capacities from 10 to 250 kVA, located in industrial water wells, brine wells, wells. |
| ● | 33 stand-by mode generators to support power outages, from 15 to 1,000 kVA located in facilities, plants, wells, accumulation systems, powerhouse SW-34. |
Additionally, for the generation of electricity, there are solar panels which are distributed as follows:
| ● | 31 solar panels on grid system mine maintenance workshop |
| ● | 45 solar panels well W-UB-53 |
| ● | 10 solar panels in 5 wells with PV power on GPRS boards |
| ● | 32 solar panels in industrial water wells |
| ● | 7 solar panels in well flowmeters |
During the year 2023, the consumption of electrical energy for each site was as follows:
| ● | Salar de Atacama: 162,633MWh |
| ● | Salar del Carmen: 132,258MWh |
| 15.5 | Supply of Fuels |
| 15.5.1 | Salar de Atacama |
The facilities require:
| ● | Diesel: During 2023, 445,872 MBTUs were consumed for extraction wells and production plant operations. Currently, there is a supply contract with the local supplier company (COPEC). |
| ● | Liquefied Petroleum Gas (LPG): For its granular MOP operations. During 2023, 252,062 MBTU/year were consumed. Currently, there is a supply contract with a supplier of this supply. |
| 15.5.2 | Salar del Carmen |
The facilities require:
| ● | Liquefied Petroleum Gas (LPG): For its lithium carbonate and hydroxide operations. During 2023, 344,203 MBTU/year were consumed. Currently, there is a supply contract with an external supplier. |
| ● | Liquefied Natural Gas (LNG): For its lithium carbonate operations. During 2023, 1,061,692 MBTU/year were consumed. Currently, there is a supply contract with the company Engie. |
| ● | Diesel: For its lithium carbonate and lithium hydroxide operations. During 2023, 61,597 MBTU/year were consumed. Currently, there is a supply contract with the local supplier company (COPEC). |
LPG is received through cistern trucks and is stored in two tanks, located in the central sector of the site (to the south of the Superintendent offices).
LNG is received through the Mejillones gas pipeline and is not stored inside the site.
| 15.6 | Water Supply |
| 15.6.1 | Salar de Atacama |
Drinking water is obtained through a treatment process by reverse osmosis plants, which are fed from freshwater wells, with a subsequent stage of drinking water. There is currently a contract with the Oservim company, which operates the Reverse Osmosis plant and the TAS plants and is valid until August 2025.. During 2023 there was a drinking water consumption of 39,209 m3/year (~1.24 L/s).
| 15.6.2 | Salar del Carmen |
At the Carmen site, the industrial water supplied comes from the wastewater treatment processes of the city of Antofagasta; currently there is a contract with the company Sembcorp (until August 2024), which has allowed for the supply of almost 73% of the industrial water consumption required by the site. The remaining consumption is supplied through the purchase of water, from desalinated seawater, currently a purchase contract is maintained with the company AES Gener. Industrial water is currently stored in two storage pools with a combined maximum capacity of ~60 m3.
| 16 | MARKET STUDIES |
This section contains forward-looking information related to commodity demand and prices for the Project. The material factors that could cause actual results to differ materially from the conclusions, estimates, designs, forecasts or projections in the forward-looking information include any significant differences from one or more of the material factors or assumptions that were set forth in this section including prevailing economic conditions, commodity demand and prices are as forecast over the LOM period.
SQM is the world’s largest producer of potassium nitrate, iodine and lithium. It also produces specialty plant nutrients, iodine derivatives, lithium derivatives, potassium chloride, potassium sulfate and certain industrial chemicals (including industrial nitrates and solar salts). The products are sold in approximately 110 countries through SQM worldwide distribution network, with more than 90% of the sales derived from countries outside of Chile.
The products are mainly derived from mineral deposits found in northern Chile, including mined and processed caliche ore as well as brine deposits. The brine deposits of the Salar de Atacama, a salt-encrusted depression in the Atacama Desert in northern Chile, contain high concentrations of lithium and potassium as well as significant concentrations of sulfate and boron.
In the Salar de Atacama, SQM extracts brines rich in potassium, lithium, sulfate and boron in order to produce potassium chloride, potassium sulfate, lithium solutions and bischofite (magnesium chloride). It produces lithium carbonate and lithium hydroxide in its plant near the city of Antofagasta (Salar del Carmen), Chile, from the solutions brought from the Salar de Atacama. It markets all these products through an established worldwide distribution network.
The SQM´s products are divided into six categories that include specialty plant nutrients, iodine and its derivatives, lithium and its derivatives, potassium chloride and potassium sulfate, industrial chemicals, and other commodity fertilizers.
Lithium and its derivatives are mainly used in batteries, greases, and frits for production of ceramics. Potassium chloride is a commodity fertilizer that is produced and sold all over the world. Potassium sulfate is a specialty fertilizer used primarily in crops such as vegetables, fruits, and industrial crops. The Salar de Atacama produces mainly lithium and its derivatives as well as potassium chloride and potassium sulfate.
| 16.1 | Material Contracts for Salar de Atacama |
SQM subsidiary SQM Salar S.A. (“SQM Salar”), as the leaseholder, holds exclusive and temporary rights to exploit mineral resources in the Salar de Atacama in northern Chile. These rights are owned by CORFO, a Chilean government entity, and leased to SQM Salar pursuant to 1993 lease agreement over mining exploitation concessions between SQM Salar and CORFO. The Lease Agreement expires on December 31, 2030.
| 16.2 | Lithium and its Derivatives, Market, Competition, Products, Customers |
SQM is a leading producer of lithium carbonate, which is used in a variety of applications, including electrochemical materials for batteries used in electric vehicles, portable computers, tablets, cellular telephones and electronic apparatus, frits for the ceramic and enamel industries, heat-resistant glass (ceramic glass), air conditioning chemicals, continuous casting powder for steel extrusion, pharmaceuticals, and lithium derivatives. It is also a leading supplier of lithium hydroxide, which is primarily used as an input for the lubricating greases industry and for cathodes for high energy capacity batteries.
In 2022, SQM revenues from lithium sales amounted to US$8,152.9 million, representing 76.1% of our total revenues. The lithium chemicals’ sales volumes accounted for approximately 20% of the global sales volumes.
| 16.2.1 | Lithium: Market |
The lithium market can be divided into:
| I. | lithium minerals for direct use (currently, SQM does not participate directly in this market) |
| II. | basic lithium chemicals, which include lithium carbonate and lithium hydroxide (as well as lithium chloride, from which lithium carbonate may be made), and |
| III. | inorganic and organic lithium derivatives, which include numerous compounds produced from basic lithium chemicals (in which SQM does not participate directly). |
Lithium carbonate and lithium hydroxide are principally used to produce the cathodes for rechargeable batteries, which take advantage of lithium’s extreme electrochemical potential and low density. Batteries are the leading application for lithium, accounting for approximately 90% of total lithium demand, including batteries for electric vehicles, which account for approximately 70% of total lithium demand. There are many other applications both for basic lithium chemicals and lithium derivatives, such as lubricating greases, heat-resistant or ceramic glass, chips for the ceramics and glaze industry, chemicals for air conditioning, and many others, including pharmaceutical synthesis and metal alloys.
| 16.2.2 | Lithium: Products |
The annual production capacity of the Lithium Carbonate Plant at the Salar del Carmen is 195,000 tonnes per year. SQM is in the process of increasing the production capacity to 210,000 tonnes per year. Utilized technologies, together with the high concentrations of lithium and the characteristics of the Salar de Atacam (such as high evaporation rate and concentration of other minerals), allow SQM to be one of the lowest cost producers worldwide.
The lithium hydroxide facility has a production capacity of 26,000 tonnes per year and SQM is in the process of increasing this production capacity to 100,000 tonnes per year.
| 16.2.3 | Lithium: Marketing and Customers |
In 2022, SQM sold lithium products in 41 countries to 198 customers, and most of the sales were to customers outside of Chile. SQM made lease payments to CORFO which are associated with the sale of different products produced in the Salar de Atacama, including lithium carbonate, lithium hydroxide, and potassium chloride. During 2022, 93% of SQM sales of lithium were in Asia. One customer accounted for approximately 19% of our lithium revenue in 2022. Our ten largest customers accounted in the aggregate for approximately 60% of revenues. One supplier accounted for 10% of the cost of sales of this business line, representing approximately 80% of the cost of sales of this business line. SQM lease payments to Corfo which are associated with the sale of different products produced in the Salar de Atacama, including lithium carbonate, lithium hydroxide and potassium chloride.
| 16.2.4 | Lithium: Competition |
Lithium is produced mainly from two sources: concentrated brines and ) minerals. During 2022, the main lithium brines producers were Chile, Argentina and China, while the main lithium mineral producers were Australia and China. With total sales of approximately 169,000 metric tons of lithium carbonate and hydroxide, SQM’s market share of lithium chemicals was approximately 18% in 2023. The main competitors in the lithium market with their estimated market share are: Albemarle (16%), Tianqi Lithium Corp. (7%), Jiangxi Ganfeng Lithium Co (6%), Livent Corporation (3%), and Allkem (4%).
Tianqi is also a major shareholder of ours, holding approximately 22.90% of our shares as of December 31, 2022. It is expected that future lithium production will continue to increase in response to an elevated demand. A number of new projects to develop lithium deposits has been announced recently, some of which are already in the advanced stages of development and others which could materialize in the medium term.
| 16.3 | Supply |
According to Benchmark Mineral Intelligence “Q3 2021 Forecast”, the 2021 mine supply has been revised up to 458.6 kt LCE. It is estimated that 136.3kt of lithium hydroxide and 283kt of lithium carbonate will be produced in 2021. This increase is unlikely to meet the rising demand, placing both chemicals in a deficit position and reflecting the strong demand-pull for feedstocks in China (see Figure 16-1).
Figure 16-1. Lithium Feedstock, supply forecast
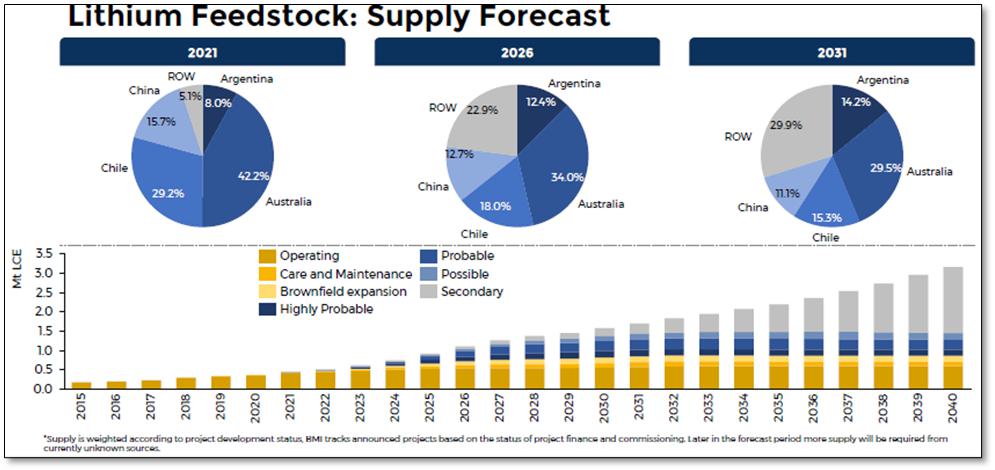
Source: SQM-Benchmark Mineral Intelligence Lithium Forecast Q3 2021
China is expected to produce approximately 153kt LCE of lithium carbonate and 110kt LCE of lithium hydroxide in 2021. The majority of feedstock is imported. Most lithium chemical production in China is produced from Australian spodumene, in addition to a very small amount imported from Brazil. Supplementing this, and largely feeding directly into battery demand is 41kt LCE of lithium carbonate imported from Chile and Argentina in 1H21.
In Australia, there are four spodumene producers currently operating, with around 191kt LCE of spodumene concentrates expected to be produced in 2021.
In Argentina, there are currently two lithium producers: Livent and Orocobre. These producers operate from the Salar del Hombre Muerto and Salar de Olaroz, respectively. Expectations on output for 2021 remains unchanged during this quarter, with both operating at or close to production capacity.
SQM is expected to produce, in 2024, 210kt LCE of lithium carbonate at Salar del Carmen. Output is expected to reach the 210kt LCE capacity during the first half of 2024.
| 16.4 | Demand |
Demand estimates for lithium in LFP (Lithium Ferro Phosphate) cathodes is expected to increase in 2023. Medium and long-term demand has also been revised upwards as cell manufacturers continue to bring new LFP capacity into production.
Increased demand for LFP cathodes comes at the expense of NCM (Nickel, Cadmium and Manganese) cathodes. LFP cathode market share is expected to make up roughly 22% of the cathode demand in 2030, while NCM has been downgraded to 60% of the market (see Figure 16-2)
Figure 16-2. Lithium Chemical Supply Breakdown
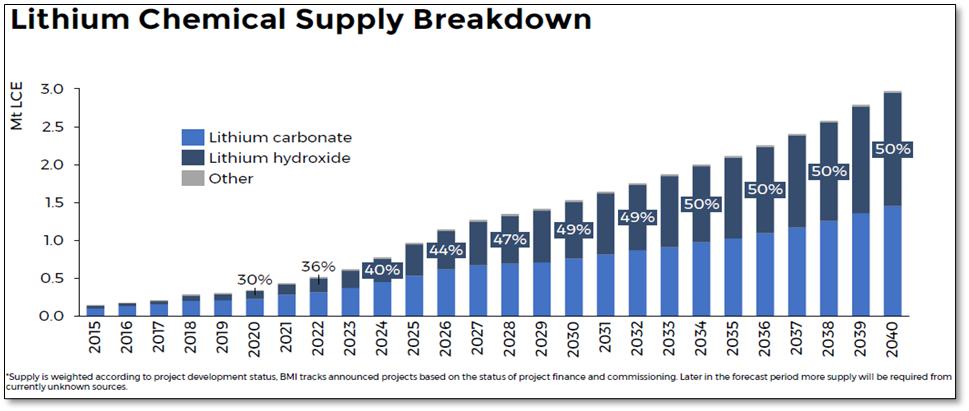
Source: SQM-Benchmark Mineral Intelligence Lithium Forecast Q3 2021
| 16.5 | Balance |
| 16.5.1 | Medium to Long Term Market Dynamics |
| ● | 2023 is expected to be in a significant deficit position despite the restart of various idled operations. |
| ● | Due to the ramp-up time and investment required to bring new projects online, there is little chance that the market will move into surplus before 2025. |
| ● | In the extremely unlikely event that all projects to enter production on or before 2025, the market has the potential to balance from that year until 2029. However, in this case, it would be likely that demand would enter an upside scenario, placing the market back into a deficit. |
| ● | It is likely in the medium-long term that PEV penetration will be limited by material supply, rather than demand (Figure 16-3). |
Figure 16-3. Lithium Carbonate and Hydroxide demand
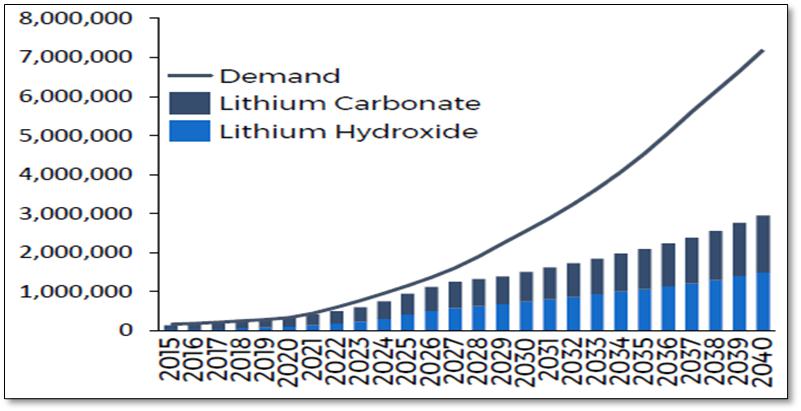
Source: SQM-Benchmark Mineral Intelligence Lithium Forecast Q3 2021
| 16.6 | Lithium Price |
| 16.6.1 | Historical Price Evolution (in Chinese Yuan) |
Figure 16-4. Lithium historic Price Evolution
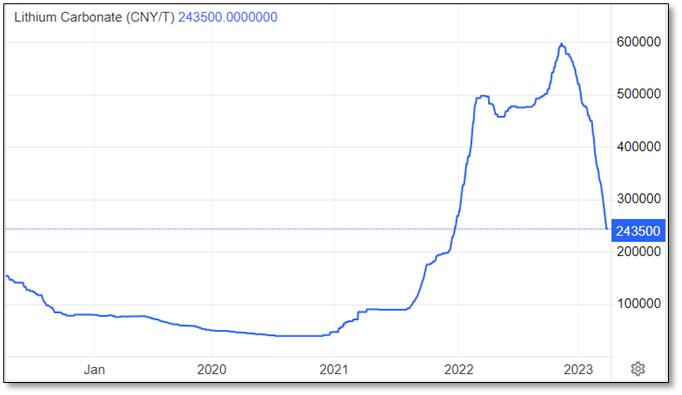
Source: https://tradingeconomics.com/commodity/lithium
Short term
| ● | In the near-term, prices are expected to continue to rise as demand outstrips supply, with no additional tonnage available to ease market tightness in the coming months. |
Long term
| ● | Prices are expected to increase but likely to be unsustainable at $16,000-18,000 USD/tonne. Even in the case where supply cannot meet demand, prices will likely stay high but fall back to a sustainably higher price which is able to provide incentive for new supply. While the chemicals industry in China seems to have little barrier to ramping up, supply bottlenecks at the mine-site level exist and will need to be solved. |
| ● | Long-term price incentives: it remains that long-term incentive price for lithium carbonate of $12,110 USD/tonne will be required to sustain new project development post-2030. |
Figure 16-5. Lithium Chemical Price Forecast
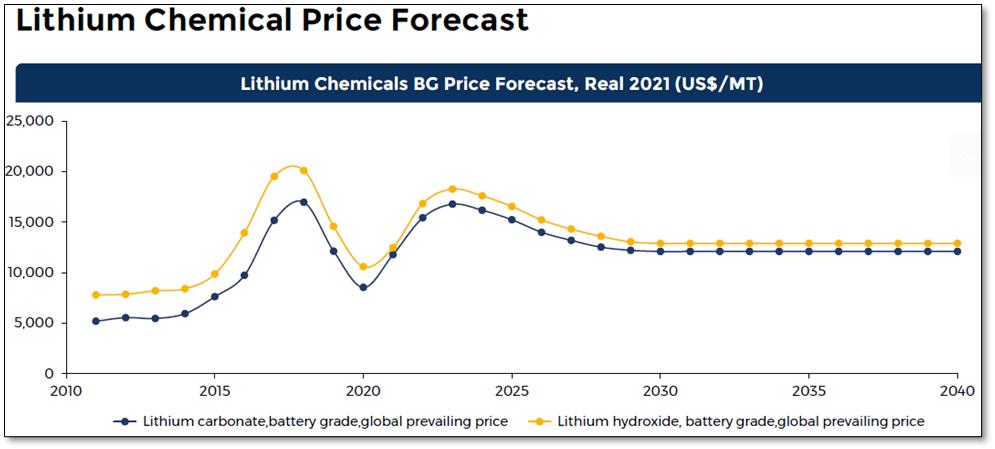
Source: SQM-Benchmark Mineral Intelligence Lithium Forecast Q3 2021
| 16.7 | Potassium |
SQM produces potassium chloride and potassium sulfate from brines extracted from the Salar de Atacama. Potassium chloride is a commodity fertilizer used for a variety of crops including corn, rice, sugar, soybean, and wheat. Potassium sulfate is a specialty fertilizer used mainly in crops such as vegetables, fruits, and industrial crops.
In 2023, SQM potassium chloride and potassium sulfate revenues amounted to US$279 million, representing 4% of total revenues and a 36% decrease compared to 2022, as a result of decreased average prices. We estimate that we accounted for less than 1% of global sales of potassium chloride in 2023.
| 16.7.1 | Potassium: Market |
During the last decade, the growth in demand for potassium chloride, and for fertilizers in general, has been driven by several key factors such as a growing world population, higher demand for protein-based diets, and less arable land. All these factors contribute to fertilizer demand growth because of efforts to maximize crop yields and use resources more efficiently. For the last ten years, the compound annual growth for the global potassium chloride market was approximately 2 to 3%.
| 16.7.2 | Potassium: Products |
Potassium chloride differs from the specialty plant nutrition products because it is a commodity fertilizer and contains chloride. SQM offers potassium chloride in two grades: standard and compacted. Potassium sulfate is considered a specialty fertilizer and SQM offer this product in soluble grades.
The sales volume in 2023 was US$279 million, a 36% decrease compared with 2022; this is due to significantly lower prices and higher sales volumes during the year. SQM’s sales volumes in 2023 were approximately 13% higher than the sales volumes reported during 2022.
Potash prices started to decrease during 3Q22 as a result of weaker demand and high inventory across the markets.
Potassium volume and revenues are shown in Table 16-1.
Table 16-1. Potassium Chloride and Potassium Sulfate Volume and Revenues
12M2023 |
12M2022 |
2023/2022 |
|||
| Potassium Volume | Th. MT | Potassium Volume | Th. MT | Potassium Volume | Th. MT |
| Potassium Revenues | MUS$ | Potassium Revenues | MUS$ | Potassium Revenues | MUS$ |
Source: SQM Reports Earnings for third Quarter of 2023
Figure 16-6. Potassium Quarterly Sales Volumes and Average Prices
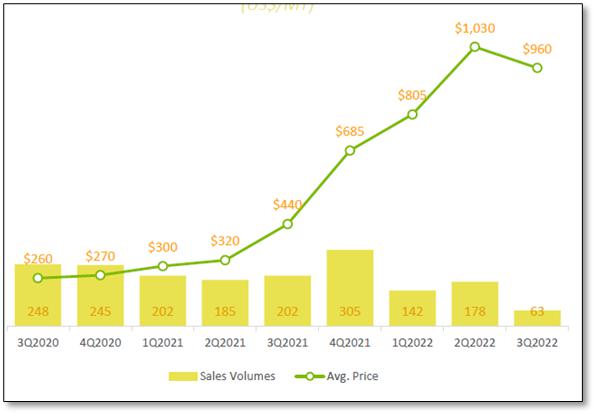
Source: SQM Third Quarter 2021 Results
| 16.7.3 | Potassium: Marketing and Customers |
In 2022, SQM sold potassium chloride and potassium sulfate to approximately 543 customers in 38 countries. One individual customer accounted for more than 10% of the revenues of potassium chloride and potassium sulfate in 2021. SQM sends about 10% of its production to another SQM facility (Coya Sur) as raw material for production of nitrates. SQM makes lease payments to CORFO which are associated with the sale of different products made from the Salar de Atacama, including lithium carbonate, lithium hydroxide, and potassium chloride.
| 16.7.4 | Potassium: Competition |
SQM accounted for approximately 1% of global sales of potassium chloride in 2021. Main competitors are Nutrient, Uralkali, Belaruskali and Mosaic. In 2021, Nutrien accounted for approximately 21%, Belaruskali accounted for approximately 15% of global sales, Uralkali accounted for approximately 15% of global sales, Mosaic accounted for approximately 13% of global sales and Belaruskali accounted for approximately 10% of global sales.
| 17 | ENVIRONMENTAL STUDIES, PERMITTING AND PLANS, NEGOTIATIONS OR AGREEMENT WITH LOCAL INDIVIDUAL OR GROUPS |
This sub-section contains forward-looking information related to environmental permitting requirements, plans and agreements with local individuals or groups as related to the Project. The material factors that could cause actual results to differ materially from the conclusions, estimates, designs, forecasts, or projections in the forward-looking information include any significant differences from one or more of the material factors or assumptions that were set forth in this sub-section.
| 17.1 | Environmental Studies |
The SQM Salar operations are located in the nucleus of Salar de Atacama, sector belonging to the endorheic basin of the same name which showcases high environmental sensitivity, particularly within the Soncor Hydrological System, declared a Ramsar area on December 2nd, 1996, its surface got updated in 2010, which corresponds to a system of permanent brackish lagoons associated to altiplanic salt flats and in the Soncor and Aguas de Quelana sectors. These sectors are also part of the Reserva Nacional Los Flamencos, a protected area created through D.S. No. 50/1990 of the Ministry of Agriculture. In consideration of the above, in the project’s modifications it is relevant to examine the possible applicability of the typology p) of article 10 of Law No. 19,300, on General Bases of the Environment, and in letter p) of article 3 of the RSEIA, relating to the development of projects in national parks, national reserves, national monuments, and any type of official protected area, to the extent that such changes are implemented in or near areas under official protection, or if they are affected.
Figure 17-1 shows the boundaries of the Ramsar area, the Soncor Hydrological System, and the Los Flamencos National Reserve, and their relationship with SQM Salar.
Figure 17-1. Ramsar Site, Soncor Hydrogeological System and Reserva Nacional Los Flamencos Protected Area boundaries.
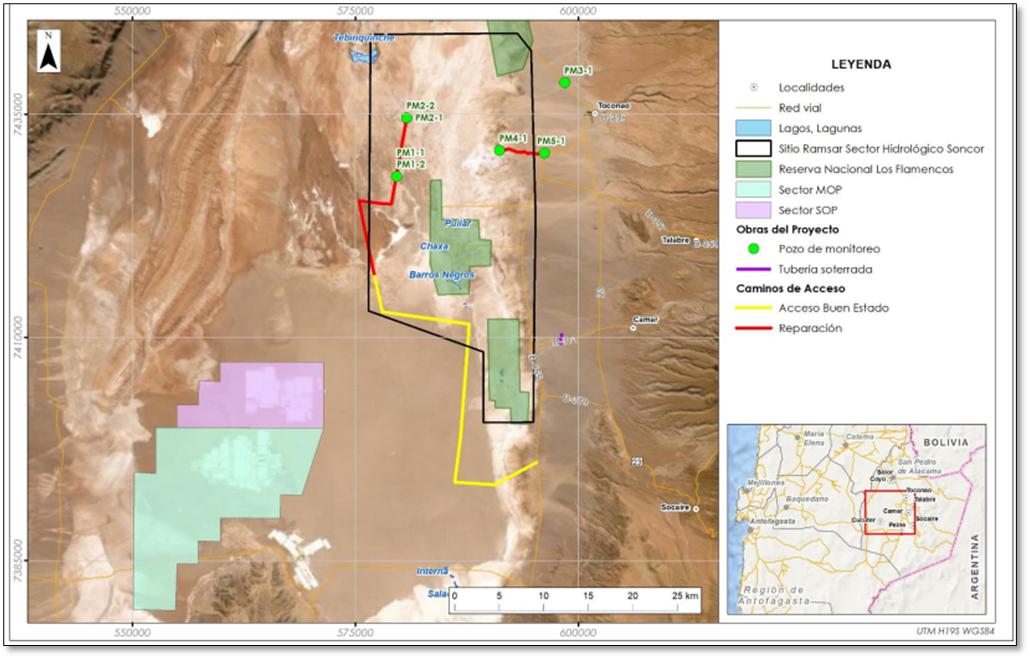
Source: EIA Plan de Reducción de Extracciones en el Salar de Atacama.
| 17.1.1 | Hydrology and Hydrogeology |
The Project’s interference with surface water resources is limited and only involves crossings of works with the official drainage network according to the Military Geographic Institute (IGM). The channels involved do not have permanent runoff and the Project design contemplates the necessary works to avoid altering the eventual runoff that may occur in these watercourses in case of events of very intense and infrequent precipitation.
The Salar de Atacama basin is an endorheic basin, infiltrating much of its feed water as it moves towards the center of the Salar. Rainfall occurs mainly during the months of December to March. In the Salar basin 5 morphometric zones were observed Table 17-1 and Figure 17-2 details each zone.
Table 17-1. Hydrological Zones Defined in Salar Basin
| Zone | Surface (Km2) | Characteristics |
| Núcleo | 1,328.1 | Has a low altitudinal variation, with an almost completely flat surface without surface runoff year-round. The lithology of this area is practically saline-crusted Sodium Chloride. This area is considered to represent the lowest level of the basin. |
| Marginal | 1,648 |
It is characterized by very low topographic gradients, with no surface runoff throughout the year, except for the Burro Muerto Channel, which originates from groundwater emergence.
The lithology of this area is mainly carbonate, sulphated, and chloride, with grain size type fine sand, silt, and clay with organic matter. The moisture contents are visible in a satellite image as a result of shallow levels of groundwater, which in some sectors may justify the presence of lagoon bodies due to the dynamics with the water-brine interface. |
| Aluvial | 2,219.4 | It is characterized by a low to medium topographic gradients, without surface runoff almost year-round, except during flood events. The lithology of this zone is of the alluvial detrital type and in small proportions of the aeolian type. In this zone, runoff from the sub-basins’ seeps, recharging the associated aquifers. |
| Subcuenca | 11,550.4 | It has two domains divided by a north-south axis: the Andean subzone (east) is characterized by medium to high topographic gradients, with permanent or intermittent surface runoff throughout the year. In this subzone there are the streams and rivers that recharge the Salar, whose source comes from the precipitation in the upper and middle zones of the basin. In the Domeyko subzone (west) the gradients are generally high, with no permanent runoff throughout the year, except during significant rainfall events. |
| Arreica | 252.3 | It is characterized by combined topographic and lithological characteristics that prevent them from being grouped in the previous classification and, in turn, do not allow the generation of any type of runoff during the year |
Source: EIA Plan de Reducción de Extracciones en el Salar de Atacama, Chapter 4: Recursos hídricos continentales
Figure 17-2: Salar de Atacama Morphometrics Zones
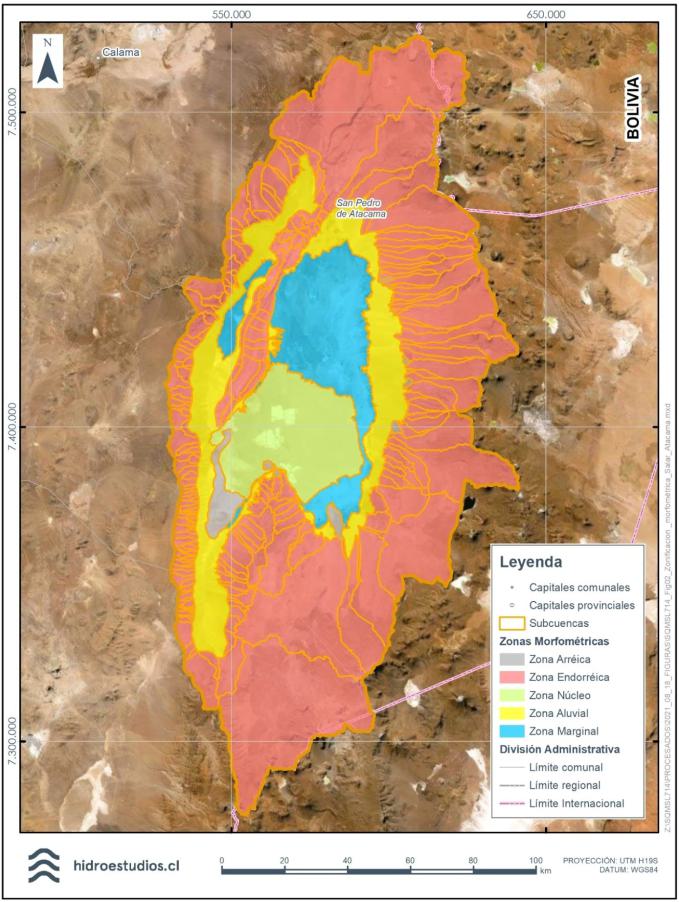
Source: EIA Plan de Reducción de Extracciones en el Salar de Atacama, Chapter 4: Recursos hídricos continentales
The hydrographic network of the Salar de Atacama Basin is composed of the San Pedro and Vilama rivers and numerous streams on the margin of the basin, some of which have a permanent runoff, such as the Zapar, Honar, Potor, Aguas Blancas, Camar, Socaire, Peine, Talabre, and Jerez streams.
In the Marginal Morphometric Zone there are numerous lake systems, including: the Soncor lake system is composed of the Chaxa, Puilar, and Barros Negros lagoons; the Aguas de Quelana system, the Peine system with the Salada and Saladita lagoons, the Punta and Brava lagoons, and the Baltinache and Tebinquinche lagoons (Figure 17-3).
Figure 17-3. Hydrographic Network of the Salar de Atacama Basin
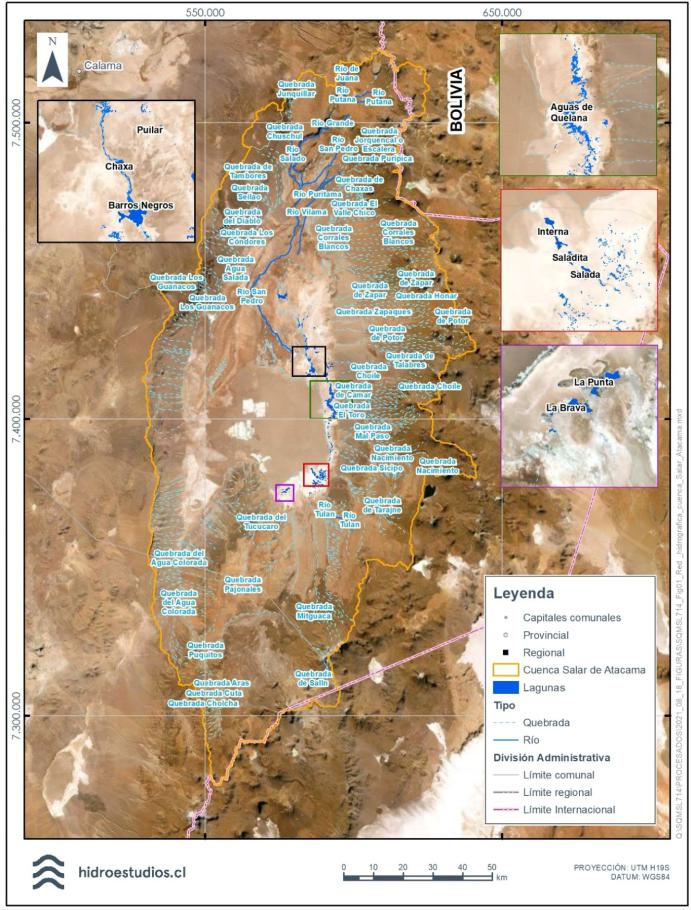
Source: EIA Plan de Reducción de Extracciones en el Salar de Atacama, Chapter 4 Recursos hídricos continentales
RCA 226/2006 establishes as objects of protection the Puilar, Chaxa, and Barros Negros lagoons (Soncor System); the vegetation of the Borde Este system, the lagoon bodies of the Aguas de Quelana system, the Salada, Saladita, and Interna lagoons (Peine system), Vegas de Tilopozo sector and Núcleo of Salar de Atacama. Figure 17-4 shows the systems distribution.
Figure 17-4: Environmental Monitoring Zones RCA226/2006
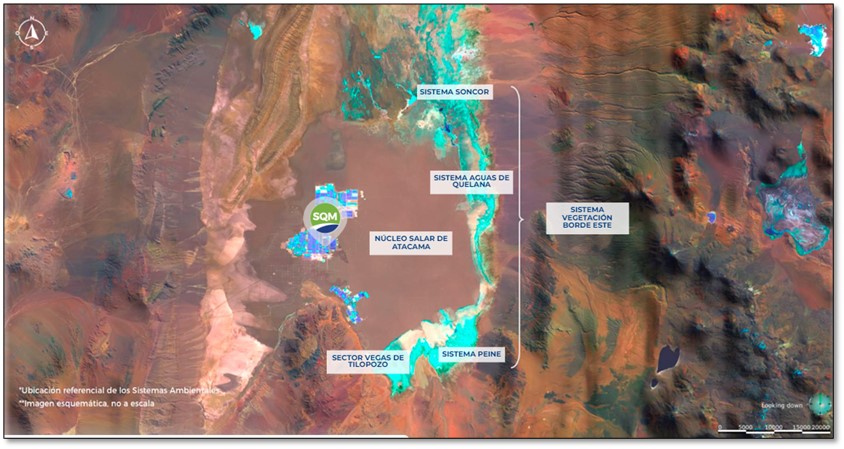
Source: https://www.sqmsenlinea.com/
The baseline study of the hydrogeological component presented in the Environmental Impact Study of the "Plan de Reducción de Extracciones en el Salar de Atacama" Project under evaluation (hereinafter EIA under evaluation) determined that the water level in the core of the salar and the alluvial aquifer system have been affected by the water extraction carried out between 1986 and 2020. Regarding the core of the Salar, the largest declines occurred on the western edge. In the alluvial aquifer system, the drawdown cones of the extraction wells can be seen; however, in the marginal zone, the decrease is insignificant. In consideration of the above, the area of influence of hydrogeology was defined according to the projection of the declines, which depend on the hydraulic and geomorphological characteristics of the system, and on the density of the fluids.
Regarding the hydrogeological component, in the third Consolidated Report of Request for Clarifications, Rectifications and/or Complementary Extensions to the EIA under evaluation, issued on November 22, 2023, the authority requests that the following complementary information be provided (the most relevant is listed):
| ● | Hydrological characterization of the Salar de Atacama basin, given that it is evident that floods from the north of the basin are only partially represented (there is no record for the Vilama River sub-basin), and those from the east are not recorded. |
| ● | To complement the information presented with respect to the seasonal variation of the lagoon surface. |
| ● | To present an analysis of the trend presented in the environmental assessment regarding the decrease in lagoon surface area for the Soncor, Peine (Saladita and internal), Tilopozo, and Aguas de Quelana systems. |
| ● | To present more information on the validation of the methodology used to determine the lagoon surface from satellite images. |
| ● | To make new efforts to obtain level information for the sectors "Desborde Cola de Pez, "Zona de Inundación II", and "Zona de Inundación III", of the Soncor system, so that these subsystems can be fully understood. |
| ● | Complement characterization for the wells in relation to the conceptual and numerical hydrogeological model (subject of analysis). |
| ● | Complement the hydrogeological characterization with boreholes, and the conceptual and numerical model should be reviewed considering the new information to be obtained. At the date of issuance of this report, SQM is preparing a response to this request for additional information, so that the authority has sufficient background information to decide regarding the environmental qualification of the “Plan de Reducción de Extracciones en el Salar de Atacama” project. |
| 17.1.2 | Soil, Climate and land use |
In the area of influence of the project were identified 5 soil units, which are (see Table 17-2).
Soil in old alluvial fans: It is characterized by presenting moderately coarse to very coarse textures on the surface, predominating very coarse textures with the sandy textural class and predominant color in the shade of 7.5YR (Munsell color Notation). The use observed in this unit was seasonal grasslands with very open cover or shrublands with very open to open canopy cover.
Soil in active channels and recent alluvial fans: It is characterized by displaying very coarse textures on the surface with the sandy textural class, and a predominant color in in the shade of 7.5YR The observed use in all the sampling points is of seasonal grasslands with very open cover or shrublands.
Soil in depressive area: It is characterized by presenting fine to coarse textures on the surface, mainly moderately fine and a predominant color the shade of 7.5YR
Soil in evaporitic deposit in transition: It is characterized by presenting variables textures from very fine to very coarse, mainly with moderate textures, and a predominant color in matiz 7.5YR (Munsell color Notation). It is observed covered by shrublands with variable cover between very open to dense.
Soil in evaporitic deposit: Bare soil, characterized by presenting textures in surface from moderately fine to very coarse, mainly with coarse textures with sandy textural class; with predominant color in the shade of 7.5YR.
Table 17-2 Land use units observed in the project area (USDA, 2001)
| Unit | Soil use classification | Surface (ha) | ||||
| Soil in old alluvial fans | VI-VIII | 3.56 | ||||
| Soil in active channels and recent alluvial fans | VII-VIII | 2.18 | ||||
| Soil in depressive area | V | 1,039.02 | ||||
| Soil in evaporitic deposit in transition | VIII | 1.74 | ||||
| Soil in evaporitic deposit | VIII | 8.62 | ||||
The principal land uses are agriculture and livestock pasture.
The Climate, according to the Köppen - Geiger (1936) classification, is mainly cold desert, and desert cold summer, characterized by marked aridity and water scarcity. Rainfall is concentrated in the summer (December to March), when humid air masses from the Atlantic Ocean arrive in the area. There is scarce vegetation, which defines a natural landscape called the Atacama Desert.
| 17.1.3 | Terrestrial fauna |
Within the Project's area of influence, 14 environments used by wildlife species present in the sector were identified, including scrubland formations, grasslands, areas of sparse vegetation with variations in the dominant substrates, areas of crusts typical of the salt flat and bodies of water. The fauna environment that comprises the largest extension within the IA of the Project corresponds to the sparse vegetation zone (62.74%), followed by the Brea scrubland and the marginal salt flat, as shown in Figure 17-5
Figure 17-5. Faunal Environments
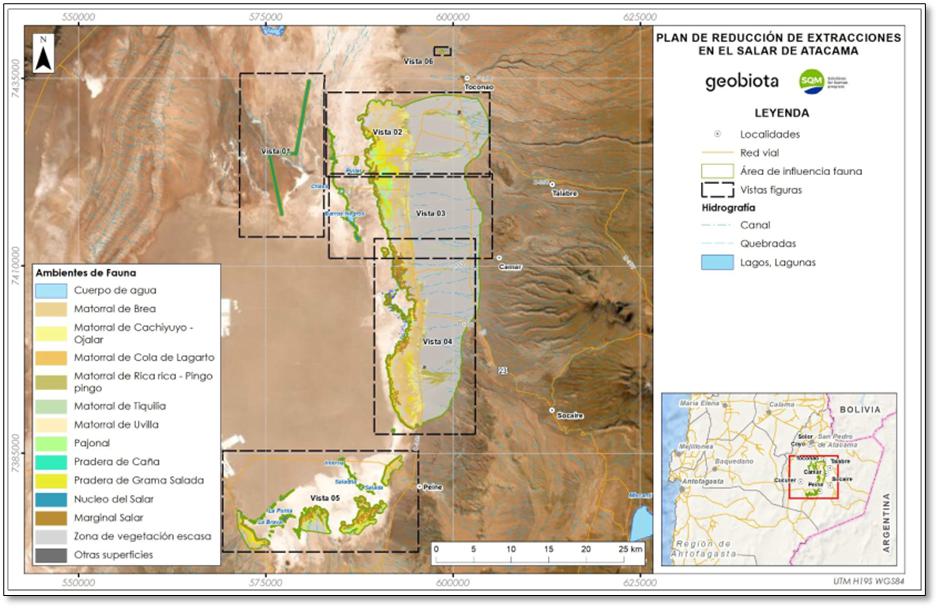
According to the EIA baseline under evaluation, the fauna assemblage comprises a total of 60 species, represented by 1 amphibian species, 4 reptile species, 42 bird species, and 13 mammal species.
Table 17-3 shows their distribution according to the fauna environment in which they were identified.
Table 17-3. Species Richness by Faunal Environment
| Wildlife environment | Amphibians | Reptiles | Birds | Mammals | Total |
| Water body | - | 1 | 15 | - | 16 |
| Watercourse | 1 | - | 1 | 1 | 3 |
| Marginal Salar | - | 3 | 1 | 5 | 9 |
| Brea Scrub | - | 4 | 10 | 9 | 23 |
| Cachiyuyo Scrubland - Ojalar | - | 1 | 11 | 7 | 19 |
| Lizard Tail Thicket | - | 2 | - | 5 | 7 |
| Rica rica scrub - Pingo pingo | - | 2 | 11 | 6 | 19 |
| Tiquilia scrubland | - | 2 | 12 | 3 | 17 |
| Uvilla scrub | - | - | 1 | 3 | 4 |
| Salar Nucleus | - | - | - | - | 0 |
| Pajonal | - | 3 | 9 | 3 | 15 |
| Salt Grass Meadow | - | 3 | 6 | 5 | 14 |
| Area of sparse vegetation | - | 4 |
22 | 12 | 38 |
| Total | 1 | 4 | 42 | 13 | 60 |
Source: EIA Extraction Reduction Plan for the Salar de Atacama, Chapter 4, Baseline Fauna
Of the total number of species observed, 13 species are considered unique, and 10 of them are classified in a threatened conservation category, 3 of them are endemic and 2 of them have populations with restricted distribution. Within this group, the Fabian’s lizard stands out, an endemic and endangered species. There are also 3 types of flamingos, the Chilean flamingo, the large Andean flamingo and the small Andean flamingo, which are threatened.
As part of the observations made in the three Consolidated Reports of Request for Clarifications, Rectifications and/or Amplifications (ICSARA, by its Spanish acronym) made to date, it is requested to inform the conservation category of the registered species of entomofauna of the sector of the Eastern Edge of the Salar de Atacama and its surroundings, due to the presence of at least 7 potential species in the area with conservation category. In addition, SQM is required to carry out monitoring aimed at detecting individuals of the Euathlus spp genus prior to the start of construction of the project, based on the low number of Euathlus species in the area, all of which are categorized as Critically Endangered (CR).
| 17.1.4 | Vegetation |
Approximately 72% of the project's area of influence corresponds to areas with sparse vegetation (less than 5% cover), while the rest is distributed between pure formations (dominance of one biological type), equivalent to 27.1% of the total, and mixed formations (dominance of two biological types), which occupy 1% of the total.
One of the pure formations with the highest participation is scrubland, which occupies 19% of the project area. Of these, 0.7% correspond to xerophytic formations, which originate from the presence of Prosopis alba and Prosopis tamarugo individuals in some vegetation units. In addition, grasslands (8%) and azonal scrub (12%) are identified. Mixed formations correspond exclusively to scrub with herbaceous plants.
In terms of flora in the project area, a total of 35 species have been identified, 14 of which are shrubs, 19 are herbaceous, and 2 are trees. Their distribution throughout the country shows a greater affinity of the floristic elements of the area towards the northernmost distributions, that is, the Tarapacá region and especially the Arica and Parinacota Region. Of the total number of species in the project area, 3 species are recognized as being in the conservation category, namely: Prosopis alba (LC; D.S. Nº13/2013), Prosopis tamarugo (EN; D.S. Nº13/2013), and Nitrophila Atacamensis (EN; D.S Nº23/2019). These species require special authorization for their intervention.
In addition, the area of influence is adjacent to priority sites for the conservation of the biodiversity of Salar de Atacama which includes part of the area under official protection (ABPO), Reserva Nacional Los Flamencos national reserve.
The background information presented in the EIA under evaluation includes, in chapter 5 Prediction and Environmental Impact Assessment, the loss of vegetation coverage due to lower aquifer levels, being requested by the authority in the ICSARAs to complement the following background information in relation to this matter:
| ● | Clearly explain the causes for the decline in azonal vegetation. |
| ● | Indicate the measures or actions that have been implemented and that would be adopted to mitigate this impact on the vegetation. |
| ● | Adequately report the information provided, differentiating between zonal vegetation and azonal vegetation. |
| ● | Provide the information requested for the flora component, indicating the species that have experienced a decrease in surface area and cover, explaining the causes and the measures adopted, when applicable, and that would be adopted to mitigate this type of impact. |
| 17.1.5 | Aquatic Flora and Fauna |
Due to the chemical and hydrological conditions of a salt flat, the aquatic flora and fauna found in the area are mainly microalgae and microinvertebrates that exists in the different lagoons of the sector, which serve as a food source for the flamingo populations.
In the EIA under evaluation, the area of influence was defined as the eastern and southern edge of the Salar de Atacama, divided into 5 sectors (Solor, Soncor, Aguas de Quelana, Peine, and Tilopozo) (See Figure 17-6). These systems showcased shallow silty substrates and sparse vegetation, with fluctuations in dry periods. High values of electrical conductivity were recorded, in accordance with the type of aquatic ecosystem immersed in Salar de Atacama, highlighting the sectors of Soncor and Aguas de Quelana. In relation to the parameters defined for aquatic life, it was concluded that in general, the sectors were within favorable habitat conditions for the development of aquatic biota based on the requirements of the Chilean Official Standard 1.333 Of.78. Some parameters presented values below the thresholds, but this had no biological implications, which is demonstrated by the presence of aquatic biota communities.
Figure 17-6. Sectors in the Area of Influence (AI) of Inland Aquatic Ecosystems
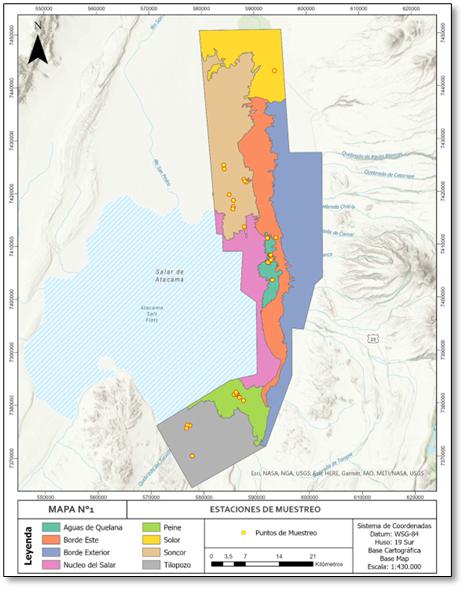
Source: EIA Plan de Reducción de Extracciones en el Salar de Atacama, Chapter 4 Ecosistemas Acuáticos
Regarding the aquatic biota, in all the systems the phytobenthos had the most abundant biotic component. Within the biological indexes, the richness of all the components stands out, it was higher in Aguas de Quelana. Finally, the fish and macrophytes were scarce in these sectors, with fish only being found in the Tambillo plain in the Solor sector.
In the evaluation process of the EIA "Extraction Reduction Plan in the Salar de Atacama", the authority requested to improve the methodology, include fish fauna in the biological matrices, increase the frequency of monitoring of Ichthyofauna in the environmental monitoring associated with the PSAB, which were addressed by SQM in the Addendum and no further information was required in this regard. On the other hand, the applicability of PAS 119 (Permit for research fishing) is ruled out.
| 17.1.6 | Cultural Heritage |
Regarding cultural heritage, the EIA submitted in 2022 did not find any heritage elements or archaeological findings in the area of influence. This is validated by the 1994 MOP cadastre, which rules out the presence of heritage elements protected by Law 17,288 on National Monuments.
However, considering the characteristics and the bibliographic information available of this area, it is not possible to rule out the possibility of unexpected findings during the construction of the works.
Regarding the paleontological component, the presence of Quaternary sedimentary units was confirmed in the field, which correspond to the Salar de Atacama Saline Deposits (PlHs), Alluvial Deposits (PlHa), and Recent Alluvial and Fluvial Deposits (Ha).
In the case of the Alluvial Deposits (PlHa), paleontological findings were made at two control points, that corresponds to ichnofossils, which were granted as Medium to High paleontological potential and a Fossiliferous paleontological category.
On the other hand, the Saline Deposits of the Salar de Atacama unit (PlHs) and Recent Alluvial and Fluvial Deposits unit (Ha) were assigned to a Medium to High paleontological potential and to a Fossiliferous paleontological category.
In this regard, in the consolidated report of request for clarifications, rectifications and/or extensions No. 1, it is requested to incorporate archaeological heritage protection actions in the Environmental Legislation Compliance Plan.
On the other hand, in relation to this issue, it is mentioned that on October 31, 2023 a report was made on the sighting of potential heritage findings at surface level in the southwestern sector of the Camar ravine, in the sector near the intersection of routes B-371 and B-355, information entered into the Environmental Monitoring System of the Superintendence of the Environment by means of (voucher No. 1036371 31-10-2023).
| 17.1.7 | Human Environment Socio-economic conditions |
The area of influence of the EIA was considered according to the potential interactions of human groups with the project, in this sense the towns of Camar, Talabre, Peine, Socaire, and Toconao were considered, in addition to the entities of Coyo, Solor, and Cucuter.
Figure 17-7. Salar de Atacama’s Human Environment
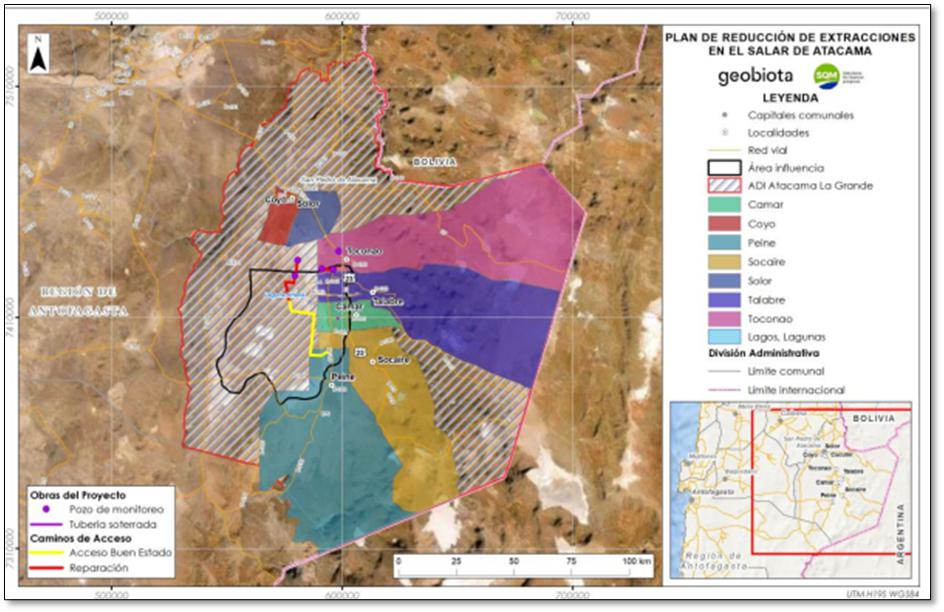
Source: EIA Plan de Reducción de Extracciones en el Salar de Atacama Chapter 4 Medio Humano.
The San Pedro de Atacama commune represents 18.6% of the population of the region. Most of the land is utilized for agricultural activities (87%), being only 13% used for cultivation activities. This is explained by the fact that agriculture and livestock practices continue to be activities recognized as traditional.
It is important to note that 96% of the territory of San Pedro de Atacama corresponds to indigenous people. The project and its area of influence are located within the Atacama La Grande Indigenous Location Area (ADI, by its Spanish acronym), a place historically inhabited by the Atacameño people. Here, they have developed grazing and natural resource gathering activities. The communities are located in the area of Toconao, Talabre, Camar, Socaire, Peine and in the Rural entity of Coyo, Solor, and Cucuter.
In addition to traditional activities, these communities practice work such as mining and quarrying.
SQM has been exploiting lithium reserves since the 1990s and the indigenous communities described have filed various objections in response to the lack of scientific information on the functioning of the ecosystem and the effects of industrial activities on waterfowl habitat, requesting the revocation of operating permits.
Only two communities, Talabre and Camar, agreed to provide information through the preparation of Human Environment Baselines (LBMH, by its Spanish acronym) produced by the communities themselves together with their advisors. While the directives of the communities of Toconao, Socaire, and Solor decided that they did not grant authorization to the owner to collect primary data, nor to provide information to prepare the LBMH; and no response was obtained from the communities of Peine, Coyo, and Cucuter.
The EIA under evaluation considers voluntary commitments associated with the human environment, which correspond to: Participatory Monitoring Program and Communication to the community the results of environmental monitoring. With respect to this, ICSARA N°1 requested additional information regarding its development.
On the other hand, it is requested to extend the area of influence of the human environment, so that it covers all the works, including the monitoring wells and once again carry out a baseline information survey of the human component of the communities of Toconao, Socaire, Peine, Solor, Coyo, and Cucuter. In addition, it is requested to develop the analysis of susceptibility to affect the Human Groups Belonging to Indigenous Peoples.
The Addendum presents the Baselines of the communities of Socaire, Talabre, and Camar prepared by these communities together with their professional advisors, and it is stated that in relation to the communities of Peine, Toconao, Cucuter, Solo, and Coyo, permission was requested to enter their territories to update the Baselines and they were also presented with the option of preparing their baselines with the support of their professional advisors, but no response was obtained for any of the showcased options.
In the environmental evaluation process of the EIA regarding the consolidated reports for the request for clarifications, rectifications, and/or extensions (N°202202103129 of April 26, 2022, and N°20230210394 of March 27, 2023); and addendum 1 of February 13, 2023, and the complementary addendum of October 6, 2023. It is resolved through exempt resolution N°202302101780 to initiate a new process of Citizen Participation within a 30 days term in the Environmental Assessment procedure of the EIA "Extraction Reduction Plan in the Salar de Atacama", based on the provisions of Articles 28 and 29 of Law No. 19300 which states that, "If during the evaluation procedure the Environmental Impact Study had been subject to clarifications, rectifications or extensions in accordance with the provisions of Article 28 and 29 of Law No. 19300, "If during the evaluation procedure the Environmental Impact Study had been subject to clarifications, rectifications or extensions in accordance with the provisions of Article 28 and 29 of Law No. 19300, rectifications or extensions in accordance with the provisions of Articles 38 and 39 of the Regulation, and these substantially modify the project or activity or the environmental impacts it generates or presents, the Evaluation Commission or the Executive Director, as appropriate, shall open a new stage of citizen participation, this time for thirty days, period in which the term of processing of the Environmental Impact Study shall be suspended as of right."
Given that according to what was presented in the environmental assessment of the project "it is configured the generation of the susceptibility of affecting the environmental value of the territory of ancestral occupation of the Indigenous Communities of Toconao, Camar, Talabre, Peine, and Socaire due to the activities of transportation, transfer, displacement and maintenance and/or road improvements", which is evaluated as a significant effect.
In addition, by resolution No. 202302101816 dated December 12, 2023, it is resolved to initiate a Consultation Process with Indigenous Peoples (PCPI), in accordance with the standards contained in ILO Convention No. 169 on Indigenous and Tribal Peoples in Independent Countries in the process of evaluating the EIA of the project "Extraction Reduction Plan in the Salar de Atacama", of the owner SQM Salar S.A., which will be carried out with the Human Groups Belonging to Indigenous Peoples (GHPPI) of the Atacameño Community of Camar; Atacameño Community of Talabre; Atacameño Community of Socaire; Atacameño Community of Peine; and Atacameño Community of Toconao, of the Commune of San Pedro de Atacama, Antofagasta Region.
| 17.2 | Environmental Management Plan |
This sub-section contains forward-looking information related to waste and mineral waste disposal, site monitoring and water management for the Project.
| 17.2.1 | Hazardous, Regulated, and Special wastes |
SQM´s operations generate a wide range of wastes, such as waste oil, capacitors, grease, solids containing hydrocarbons, empty containers, spent batteries, and waste solvent. The management of the hazardous waste is highly regulated by law (DS. N°148/2004) so this waste is deposited temporarily in storages authorized by Resolución Sanitaria N° 107/09, where keep in a period until 6 months and then were moved to an authorized final landfill.
The no hazardous Waste are mainly tires, metals, cleaning cloths, and debris. These types of residues are temporarily storage in Cañón del Diablo dump, located in project area and is authorized by Resolución 4458 of October 18, 2004, by Servicio de Salud de Antofagasta.
In 2021, Sustainable Development Plan SQM set a goal of 50% industrial waste reduction by 2025, including Salar de Atacama operations and implies the management for reuse, recycling, treatment, and disposal inside the Plant, or disposal by special subcontractors.
According to Sustainability Report Q3-2023, in September in Salar de Atacama the generation of residues count for a total of 443 tons of hazard residues and 498 tons of non hazard residues.
| 17.2.2 | Mineral Wastes |
The operations generate mining wastes in the form of inert salts or waste salts, which vary according to the type of product. These salts are transported to certain areas for deposit and laid out on the ground in the form of piles located in the core of the Salar. The area of disposal was approved by the sectorial authority with a total surface of 20.35 km2 divided in 12 areas with a maximum height of 30 m per deposit. Currently the deposit area has a total surface of 17 km2.
Regarding the management of these deposits, it should be noted that the hygroscopic properties of the salts that make up the deposits favor their high capacity for compaction and subsequent cementation.
The storage area does not have a rainwater collection or management system, given that the porosity of the soil in the salt flat area allows rainwater to infiltrate naturally into the ground. Historically, there have been very few episodes of rainfall in the study area that could be considered for a rainwater collection or management solution.
The waste salt deposits are monitored annually to verify that they are in accordance with the design variables.
According to the information presented in the 2022 sustainability report, that year the project generated 28,203,001 tons of exhausted leach piles and 11,621,008 tons of waste salts.
| 17.3 | Environmental Monitoring |
In the Environmental Impact Study for the “Cambios y Mejoras de la Operación Minera en el Salar de Atacama” project, one of the commitments established in the RCA (N°226/2006) corresponds to the implementation of an Environmental Monitoring Plan (Plan de Seguimiento Ambiental), which aims to evaluate the state of the Salar de Atacama systems over time and take actions in case of the detection of new impacts. Some monitoring is performed annually and others bi-annually. The update of the results is presented below in consideration of the latest information available.
| 17.3.1 | Bioetic Environmental Monitoring Plant (PSAB)3 |
The Biotic Environmental Monitoring Plan (PSAB) contained in RCA No. 226 of 2006, is an environmental monitoring program designed to protect the main sensitive environmental systems, such as vegetation, vascular flora, fauna, and aquatic biota of the eastern edge of the Salar de Atacama, in order to identify the temporal evolution of the variables studied. In addition to the field visits, satellite evaluations of the vegetation are carried out in April of each year in order to detect the magnitude of the change at the end of the vegetative growth period of each season.
In the report of campaign 17 corresponding to the monitoring carried out in April 2023, it was determined through the analysis of satellite images of the vegetation of the eastern edge that with respect to vitality, that 82% of the samples were classified in the normal growth category, followed by the exceptionally vigorous category (9%), and the weak category (7.9%). These results are consistent with what has been observed historically, in view of the fact that for all monitoring years the nor-bad growth category is the predominant one in the monitoring stations.
The results obtained in 2023 indicate that the area covered with vegetation in the study area reached 14,100.73 ha and is made up of six vegetation types, with different degrees of cover. The Tessaria absinthioides (pitch) shrubland continues to be the predominant vegetation type in the area, occupying 52.2% of the area covered by vegetation (equivalent to 7. 359.40 ha), followed by Distichlis spicata grassland (Grama salada), occupying 12.77% and Atriplex atacamensis - Atriplex imbricata (Cachiyuyo - Ojalar) scrubland occupying 15.96% of the vegetated area (1,801.89 ha and 2,251.66 ha respectively). In fourth place is the Juncus balticus - Schoenoplectus americanus - Baccharis juncea (Junquillo - Totora - Suncho) meadow, occupying 9.87% of the area with vegetation (1,392.25 ha).
To monitor the vegetation in the vegetation-aquifer connection zone, the dominant species, vegetation cover, vitality, live crown, and phenological stage are evaluated on 19 fixed samples of Tessaria absinthioides (Brea) scrub in the months of January and April, in accordance with the provisions of recital 10.3.2 letter d) of RCA 226/2006. Analyzing the historical data, it is verified that the species composition between January and April 2023 monitoring remains relatively constant, with the presence of Tessaria absinthioides, Distichlis spicata and Atriplex atacamensis, with T. absinthioides being the most frequent and recorded in most of the monitoring points (17 monitoring points), followed by D. spicata (2 monitoring points), and in a smaller proportion by A. atacamensis (present in 9 monitoring points). Based on the results and discussions in this report, the vegetation in the aquifer connection zone is within the ranges observed historically, verifying that there are no effects of the project on this component.
3 PSAB: Plan de Seguimiento Ambiental Biotico In the case of monitoring the carob specimens located in the sectors adjacent to the former Camar-2 pumping well (out of operation for water extraction), of the 71 specimens under study by RCA 226/2006, 14 individuals have been reported as missing in seasons prior to the 2023 campaign, the main cause corresponds to landslides due to the heavy rains of the Altiplano winter. Regarding the vitality status of these individuals, the results for the 2023 period indicate that 49.12% are dry (corresponding to 28 specimens). In the normal category, 42.11% (24 specimens) are reported, 7.02% are in the weak category (4 specimens), and 1.75% are reported as exceptionally vigorous. No specimens were reported in the very weak category. Finally, all live specimens presented some type of deterioration, mostly of the animal type.
The vascular flora of the eastern edge of the Salar de Atacama is located in an area with a marked water deficit, characterized by the episodic incidence of precipitation that tends to develop mainly during the austral summer (December - March). The April 2023 monitoring identified a richness of 23 taxa, of which 15 were observed within the monitoring points and two (6) were recorded outside them, through free collections. These 23 taxa were grouped into 13 families, with Chenopodiaceae having the largest number of records. According to growth habit, it is observed that shrub and perennial herb habit predominates, while the biogeographic origin of the species was mostly native (in 12 taxa) and endemic (in 3 taxa). As in most of the previous monitoring, Nitrophila atacamensis, a species in the "Endangered" category, was detected. It was also possible to confirm that the dominant species in the strip of vegetation on the eastern edge of the Salar have remained stable over time, where the most frequent species in the sampling points correspond to Tessaria absinthioides, Distichlis spicata, and Juncus balticus.
Considering that in the 2006 - 2023 monitoring campaigns the richness and frequency of the vascular flora are stable and do not show changes related to variations in pH and electrical conductivity, it can be stated that there are no effects of the Project on the vascular flora of the study area.
Regarding fauna monitoring, which corresponds to the monitoring of wild animals (reptiles, land birds, mammals) on the eastern edge of the Salar de Atacama in the different habitats identified and aquatic avifauna in the Soncor, Aguas de Quelana and Peine lake systems, a richness of 26 species was determined, corresponding to: 3 reptiles, 17 birds, and 6 mammals. All the species recorded are native, of which one is endemic and belongs to the Reptilia class (L. fabiani); and twelve (12) are classified in conservation categories according to the Species Classification Regulation (RCE) (Process N°18, DS. N°10/2023), of which 6 are in threatened conservation categories.
Regarding the monitoring of the aquatic biota of the hydrological systems of Soncor, Puilar, Aguas de Quelana and Peine. In general terms, there were differences between the Soncor, Aguas de Quelana, Puilar and Peine systems in the structure and composition of the microalgae assemblages (phytobenthos and phytoplankton) present. This result is coincident with the differences in the physicochemical conditions of the lagoons. In the case of the aquatic fauna (zooplankton and zoobenthos), no variations were recorded, being the assemblages characterized by a reduced species richness.
In terms of the historical record, both phytoplankton and phytobenthos have exhibited significant interannual variations in richness and abundance, which could be explained by the variability and dynamism of the different systems studied over time, which is reflected in the great heterogeneity in the values of the community parameters that do not follow a specific pattern.
| 17.3.2 | Hydrogeological Environmental Monitoring Plan |
The Environmental Monitoring Program for hydrogeological variables (PSAH), defined in RCA 226/2006, aims to increase the information on environmentally sensitive systems and their surroundings in order to improve knowledge of their hydrogeological and hydrological dynamics, and on the other hand, to identify deviations and, on this basis, to decide the relevance of implementing corrective measures, as defined in the Contingency Plan. In addition, all the information collected within the framework of the PSAH serves to feed the biennial updates of the Numerical Hydrogeological Model (Modflow) through which the project was evaluated.
The PSAH considers the measurement in six systems of the Salar de Atacama. These systems are representative of the dynamics of the core; of the dynamics of the lake systems located in the periphery of the salar and of the freshwater table that feeds the vegetation of the eastern edge. The PSAH target systems are the following:
| ● | Soncor system (89 monitoring points); |
| ● | Aguas de Quelana system (59 monitoring points); |
| ● | Vegetación Borde Este system (21 monitoring points); |
| ● | Peine system (19 monitoring points); |
| ● | Vegas de Tilopozo system (5 monitoring points), and |
| ● | Núcleo del Salar de Atacama (24 monitoring points). |
Additionally, and as committed in the RCA of reference, the monitoring of the Cuña Salina has been carried out.
The variables considered in this Plan correspond to; phreatic level of the brine, water table level, meteorology (precipitation, evaporation, wind speed, and temperature), lake level and surfaces, physical and chemical characteristics of fresh water and brine, pumping volumes (brine and water), and surface recharge flow to lake systems.
The monitoring frequency is monthly, and the reporting periodicity is every six months.
Figure 17-8. Schematic location of the Environmental Systems and Sectors of the Hydrogeological PES.
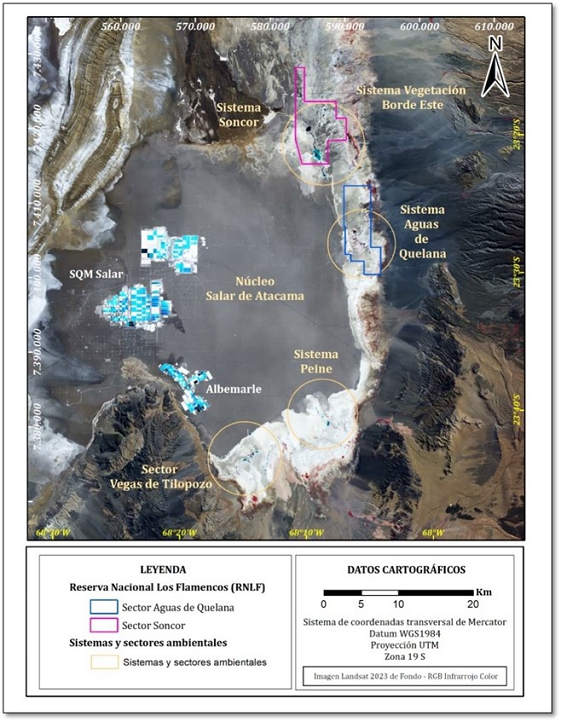
Source: Informe Nº33 Plan de Seguimiento Ambiental Hidrogeológico
It is an extensive monitoring network that includes 225 monitoring points (see Figure 17-9), 196 groundwater monitoring wells; 5 industrial water pumping wells; 18 surface water monitoring rulers; 4 surface water gauging stations; and 2 meteorological stations.
Figure 17-9. PES Schematic Location
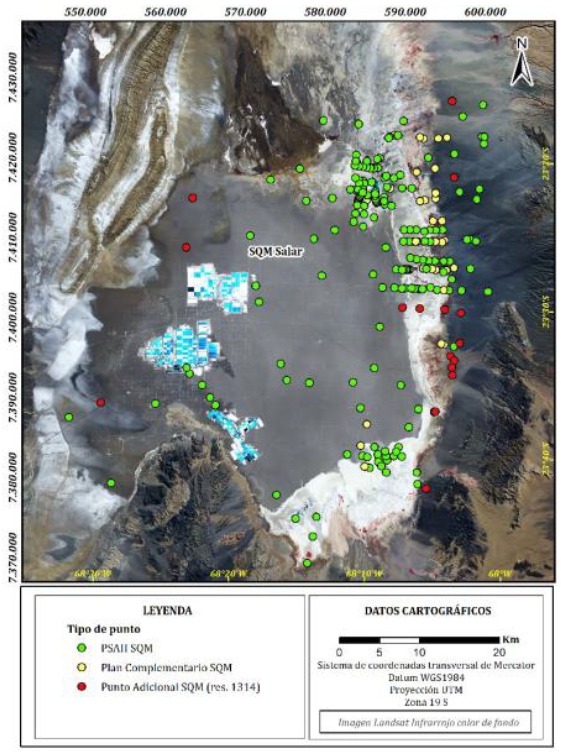
Source: Informe Nº33 Plan de Seguimiento Ambiental Hidrogeológico
The dynamics of the hydrogeological systems of the Salar de Atacama depend mainly on the water balance and anthropic activity in the different aquifer units present in the sector where the project is located. Notwithstanding the above, these dynamics may also be influenced by local phenomena identified in the basin.
Below are the results of the variables monitored in the current audit period, corresponding to the second half of 2022 (campaign No. 32) and the first half of 2023 (campaign No. 33). It is confirmed that they carried out monitoring campaigns of all the points included in the PSAH, according to the established frequency. However, it was not possible to obtain results at several monitoring points due to restrictions on access to Reserva Nacional Los Flamencos for the Soncor and Aguas de Quelana systems, and the community's refusal to authorize access to the sensitive areas of the Peine system.
In the evaluation period, all wells have shown to maintain their groundwater/brine levels according to the expected pattern. The Core Type wells, influenced by the brine drawdown in the core, have shown a pulse of ascent and subsequent recovery (decline) as a result of the rainfall recorded in August (2020). The Alluvial type wells, influenced by the extraction of industrial water, have maintained the rates of decline with respect to the previous semester, except for the points that are influenced by the detention or decrease of the industrial water wells Allana, Mullay-1 and Camar-2.
As for the meteorological variable, evaporation and temperature show an annual oscillation, with increases in evaporation and temperature in the summer. Historical precipitation shows a change in trends over time, differentiating into two periods according to precipitation events. During the first period, between May 2007 and December 2012, few precipitation events were recorded, with a maximum of 7.4 mm on January 14, 2008. After this date, from January 2013 onwards, annual precipitation events of greater magnitude were observed. In the reporting period, a maximum of 2.5 mm was recorded on February 04, and in total, 7.40 mm was accumulated due to the rains that occurred between February 03 and 05, and February 18 and 19, in addition to those that occurred on March 10 and 21, and finally, the precipitation event during April 02, 2023.
Regarding the physical-chemical characteristics of the water and brine, a high ground conductivity of around 230,000 µS/cm (characteristic of brines) was recorded throughout the monitoring period.
| 17.3.2.1 | Contingency plan |
The Early Warning Plans (called "Contingency Plan" in RCA No. 226/2006) are aimed at providing timely response to impacts not foreseen in the EIA, during the operation of the project "Changes and Improvements in the Mining Operation in the Salar de Atacama". In this way, they constitute an environmental management tool associated with the pumping of brine and water, which allows maintaining the lake systems in their historical variation ranges, by means of an operational rule that ensures that the average annual pumping rates do not generate detrimental effects on the systems to be protected. Table 17-4 shows the characteristics of the systems subject to environmental protection considered in the Contingency Plan.
Table 17-4. Systems to be Protected.
| System | Protection objects |
| Soncor | Habitat for biota associated with the lake systems Laguna Chaxa, Laguna Barros Negros, Laguna Puilar |
| Quelana Waters | Habitat for biota associated with dispersed surface water bodies. |
| Comb | Habitat for the biota associated with the Salada and Saladita lagoons and the overflow known as Laguna Interna. |
| Vegetation East Edge |
⮚ Hydromorphic vegetation zone. Located on the western boundary of the system and is composed of species that live where the substrate has high moisture content. ⮚ Brea-Atriplex vegetation zone connected to the aquifer. Corresponds to a part of the Brea-Atriplex formation that may potentially be connected to the East Rim aquifer. |
Source: Report Nº33 Hydrogeological Environmental Monitoring Plan
Regarding the contingency plan in the Soncor System, in the second half of 2022, the activation of Phase II in status indicators L1-5 and L1-G4 Reglilla, which occurred during the first half of 2021 and was reported in PSAH Report No. 29, has been maintained. This activation is linked to the change in the overflow dynamics of the Barros Negros Lagoon, which resulted in the first activation in May 2018. During the first half of 2022, the activation of Phase II of indicator L1-4 was verified, a situation that was maintained throughout the second half of 2022 and was deactivated during the first half of 2023 as a result of the recorded rains. However, during May 2023 Phase I of this indicator is activated again.
In the Quelana Water System, the activation of Phase II of indicator L5-10 occurred in September 2022. The research reports prepared and presented in October 2022 lead to the conclusion that the causes of this decrease are the result of the effect of brine extractions from SQM and to a lesser extent the extractions from Albermale, together with the aggravating factor of the period of low rainfall in the basin that has been occurring between 2020 and 2022. During February 2023, Phases I and II were deactivated; however, Phase I was reactivated in March 2023. Regarding indicator L4-12, Phase I was activated during January 2023 and deactivated during February 2023, remaining in this status until the end of the first half of 2023. The effect of the reductions in water extraction by the industrial water wells on the water indicators (L3-5, L4-8, and L5-8) is noteworthy, where in all cases they have shown a response that leads to stabilization or even strong increases in the level.
For the East Border Hydromorphic Vegetation system, indicators L1-17 and L2-27 activated their Phases I and II between one and three times between 2020 and 2022. In the first half of 2023, the levels were above the thresholds for both Phases I and II, highlighting a series of rainfall events that kept the level at higher elevations, thus closing the first half of 2023 without any of the phases being activated.
In the East Edge Vegetation System - Atriplex Pitch Vegetation, Phases I of the indicators L7-6, L2-7, L1-3, and L2-28 would remain activate throughout the second half of 2022. Indicators L2-7 and L1-3 were deactivated Phase I during this first semester 2023, L1-3 only temporarily and it is expected that indicators L7-6 and L2-28 could be deactivated due to the reduction of industrial water extraction, indicating that in L2-28 Phase I has been deactivated in September 2023 (outside the reported period).
In reference to the Peine System, indicators 1028, L10-11, and L10-4, at the beginning of the first semester 2023 were with Phase I activated and as a result of the recharge due to rainfall during the monitored months, all indicators were deactivated. Three reports of the Verification of Synergistic Effect Tool (HVES) are being prepared, one for each indicator, which will be delivered on the committed date; November 1 (2023) for L10-11, November 30 (2023) for 1028, and December 7 (2023) for L10-4.
The report for the second half of 2023 is in the process of being prepared, so it will be reported in the next audit period.
Table 17-5 presents a summary of the incidents associated with the hydrogeological component recorded during 2023. It shows that SQM Salar is in compliance with recital 11.2.3 of RCA N°226/2006 regarding reporting to the Regional Environmental Commission of the Antofagasta Region (currently the Superintendence of the Environment) the events of activation of Phase I and II of the Contingency Plan. Also, failures of the level sensor of monitoring wells are being reported.
Table 17-5. Summary of Incidents Associated with the Hydrogeological Component, Year 2023
| Well | Type of incident | Date of event | SMA Voucher | |
| N° | Date | |||
| L4-12 | Reports Activation of Phase I of the Contingency Plan - Sistema Aguas de Quelana | 06-01-2023 | 1013065 | 09-01-2023 |
| L7-4 | Reports monitoring well level sensor failure | 04-02-2023 | 1014674 | 04-02-2023 |
| L1-3 | Reports monitoring well level sensor failure | 05-02-2023 | 1014687 | 05-02-2023 |
| L2-16 | Reports failures in the level sensors of the regilla monitoring wells (Barros Negros and Burro Muerto), precipitation sensor of EM Chaxa and in the platform. https://www.sqmsenlinea.com | 06-02-2023 | 1014840 | 08-02-2023 |
| L5-10 | Reports Activation of Phase I of the Contingency Plan - Sistema Aguas de Quelana | 29-03-2023 | 1018565 | 29-03-2023 |
| L1-3 | Reports Activation of Phase I of the Contingency Plan - East Border Vegetation System | 26-04-2023 | 1020715 | 26-04-2023 |
| L10-11 | Phase I Activation Report - Comb System | 02-05-2023 | 1021089 | 02-05-2023 |
| L1-4 | Reports Activation of Phase I of the Contingency Plan - Soncor System | 29-05-2023 | 1022778 | 29-05-2023 |
| 1028 | Phase I Activation Report - Comb System | 31-05-2023 | 1023101 | 01-06-2023 |
| L10-4 | Phase I Activation Report - Comb System | 08-06-2023 | 1023640 | 08-06-2023 |
| L5-10 | Reports Phase I Activation - Quelana Water System | 28-09-2023 | 1034636 | 29-09-2023 |
| L5-10 | Reports Phase II Activation - Quelana Water System | 25-10-2023 | 1036000 | 25-10-2023 |
| L1-4 | Reports Activation of Phase II of the Contingency Plan - Soncor System | 04-12-2023 | 1038461 | 05-12-2023 |
| L2-28 | Phase I Activation Report - Eastern Edge Vegetation System Brea - Atriplex | 01-12-2023 | 1038466 | 05-12-2023 |
| L4-12 | Reports Phase I Activation - Quelana Water System | 12-12-2023 | 1038778 | 14-12-2023 |
| PN-08A | Phase I Activation Report - Comb System | 20-12-2023 | 1039214 | 20-12-2023 |
The following is a summary of the situation of each indicator regarding the activation of the Contingency Plan for the period under analysis in this report (second half of 2022 and first half of 2023), based on what is presented in Table 5 and campaign reports N°32 and N°33:
| ● | L4-12 (Quelana Water System): Activates Phase I during January 2023 and deactivation occurs during February 2023 remaining in this state until the end of the first half of 2023. This indicator was reactivated Phase I during December 2023. |
| ● | L5-10 (Aguas de Quelana System): deactivated Phase II and Phase I during February 2023, however, Phase I was again activated in March and September 2023, switching to Phase II in October 2023. |
| ● | 1028 (Comb System): deactivates Phase I during February 2023, however, re-activates this Phase during May 2023. |
| ● | L10-4 (Comb System): Deactivates Phase I during February 2023, however, re-activates Phase I during June 2023. |
| ● | L10-11 (Comb System): Deactivates Phase I during February 2023, however, re-activates Phase I during May 2023. |
| ● | PN-08 (Peine System): Produced Phase I activation in December 2023. |
| ● | L1-5 (Soncor System): Produced Phase II activation in April 2021 and has remained in the same situation during the reporting period. |
| ● | L1-G4 (Soncor System): Produced Phase II activation in April 2021 and has remained in the same situation during the reporting period. |
| ● | L1-4 (Soncor System): During February 2023, Phase II and Phase I, which had been active since 2022, were deactivated. However, during May 2023, Phase I of this indicator is reactivated and Phase II in December 2023. |
| ● | L7-6 (East Edge System - Atriplex Pitch Vegetation): Activated Phase I in June 2015 and has remained so throughout the reporting period. It should be noted that this point was declared in Phase I, subsequent to the formulation of charges by the SMA although it does not represent an adequate status indicator for the Brea Atriplex vegetation. |
| ● | L1-3 (Sistema Borde Este - Vegetación Brea Atriplex): Activated Phase I in November 2019, deactivating Phase I during March 2023. This indicator reactivated Phase I during May 2023. |
| ● | L2-7 (East Edge System - Atriplex Pitch Vegetation): Activated Phase I in December 2019 and has exited Phase I during February 2023. |
| ● | L2-28 (East Rim System - Atriplex Pitch Vegetation): Activated Phase I in November 2020 and has remained in the same situation during the reporting period. This indicator activated Phase I again during December 2023. |
| 17.3.3 | Plans for Water Management |
| 17.3.3.1 | Project Water Management |
The water supply for the industrial operation is environmentally authorized by RCA 226/2006 for a flow of up to 240 L/s and through 5 intake wells (Mulla-1, Allana-1, Socaire-5, Camar-2 and CA-2015) of which one is already closed (Camar-2).
The Sustainable Development Plan considers a goal reducing freshwater consumption in the processes by 40% by 2030 and 65% by 2040, in aligned to PdC that considers the reduction in extraction of water resources. This compromise was presented in the EIA in evaluation, that consider only the 4 operational wells: Mullay-1, Allana-1, Socaire-5 and CA-2015 with a maximum extraction of 120 L/s.
In Table 17-6 the extraction rates approved in RCA N°226/2006 are detailed, activation extraction from PAT, extraction rate compromised in Plan de Cumplimiento (F-041-2016) and considered in the EIA in evaluación, and the informed extraction rate in SQM online platform for the year 2023.
Table 17-6. Industrial Water Extraction
| RCA N°226/2006 | Projected | Declared extraction | ||||
| Well | Authorized extraction (l/s) | Activación extractaron PAT (l/s) | total extraction (l/s) | in SQM on line 2023 (l/s) | ||
| Mullay-1 | 40 | 20 | 120 | 18.6 | ||
| Allana-1 | 40 | 20 | 0.4 | |||
| Socaire-5 | 65 | 32.5 | 63.3 | |||
| CA-2025 | 35 | 17.5 | 32.7 | |||
| Camar 2 | 60 | N/A | 0 | N/A | ||
Source: Adenda complementaria.
The water extraction has an online monitoring system that is part of the comprised measures in the Compliance Plan, available on the website: https://www.sqmenlínea.com/. In Figure 17-10, the annual and daily water consumption statistics (2023) from industrial water wells are showcased, verifying a reduction in consumption to ~120 l/s, in accordance with the commitment in the PdC.
Figure 17-10. Annual and Daily Extractions of Water Industrial Wells
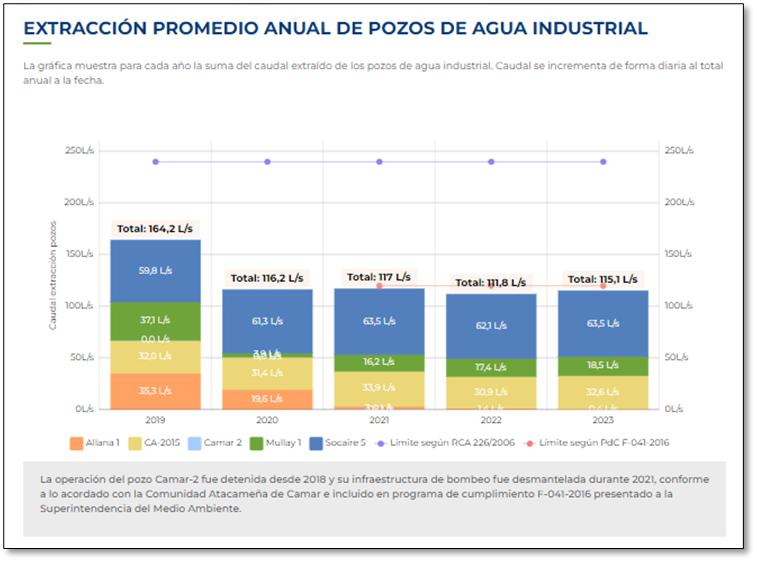
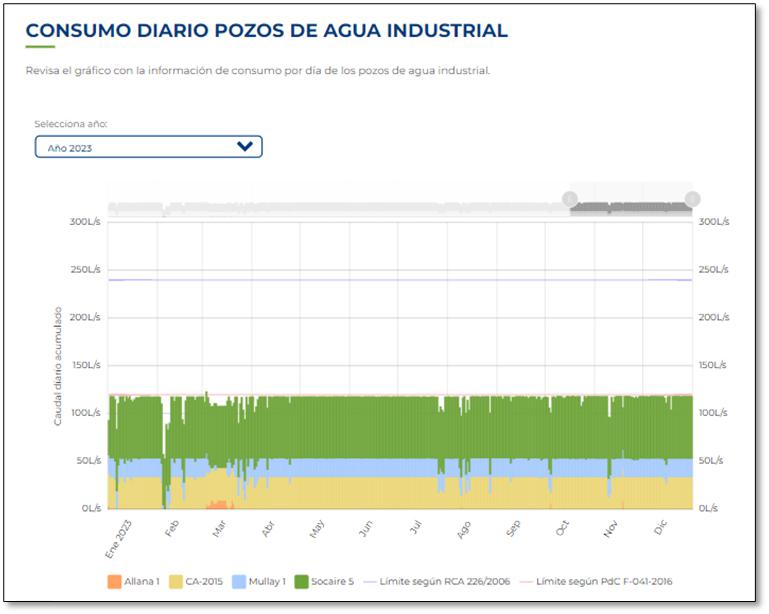
According to the information presented in the sustainability report Q3-2023, during the year 2023 up to September, an average monthly water withdrawal of 115 L/s was recorded.
With respect to this matter, it is also mentioned that:
In 2023 the DGA applied a fine of 265.1 UTM to SQM Salar S.A., after finding that they were not complying with the technical specifications established in the installation of the monitoring system of effective extractions (MEE) of the 5 groundwater wells, which have the respective water use right, (it did not present the visible QR code and in the other 4, the installed flowmeters did not have the corresponding calibration certificate. According to the information provided by SQM, this deficiency was corrected, and it is confirmed that the MEE systems are operational and reporting to the DGA in compliance with D.G.A. Resolution No. 1238 (Exenta) of December 31, 2009. No. 1238 (Exenta) of June 21, 2019: "Determines the technical conditions and deadlines at the national level to comply with obligations to install and maintain a monitoring and transmission system of effective extractions in groundwater intake works" and DGA Exenta Resolution 199 of September 23, 2019 which orders the holders of groundwater exploitation rights whose intake points are located in the different hydrological sectors of common use in the region of Antofagasta, to install and maintain measurement and transmission systems of effective extractions.
Within the framework of the 2023 Annual Audits Program of the DGA of the Antofagasta Region, 5 audit files were opened with respect to each of the water extraction wells CA-2015 (FO-0202-557), Socaire 5 (FO-0202-558), Camar 2 (FO-0202-559), Allana 1 (FO-0202-560) and Mullay 1 (FO-0202-561). On November 10, 2023, by means of exempt resolution No. 297, audit files F0-0202-557, FO-0202-558, FO-0202-559, FO-0202-560 and F0-0202-561 were closed. Due to the fact that the Technical Inspection Report No. 037 of November 8, 2023, of the Inspection and Environment Unit of the D.G.A. Region of Antofagasta, concludes that having not verified extractions over the constituted right of use, in the wells CA-2015, Socaire 5, Allana 1, Mullay 1 and Camar 2, at the time of the inspection, there is no infraction to the Water Code whose responsibility should be investigated.
| 17.3.3.2 | Brine Extraction |
Brine is pumped from wells located within the MOP and SOP extraction zones, as defined in recital 8 (Table 7) of RCA No. 226/2006. As shown in Table 17-7 the brine extraction flow rates declared in the year 2023 comply with those approved according to the operational rule established in recital 8.3.7 of RCA No. 226/2006 for the period 2021 to 2030.
Table 17-7: Brine Extraction period August 2022 to August 2023 and Approved in RCA N°226/2006.
| Period | RCA N°226/2006. | Year 2023 (l/s) | ||
| Total l/s | MOP (l/s) | SOP l/s | ||
| 2021 to 2025 | 1,600 | 950 | 650 | 1,115.2 |
Source: Own elaboration based on Table 2. Brine extraction scenario during the Useful Life of the project, RCA 226/2006.
In relation to brine extraction, it is mentioned that SQM's 2022 Sustainability Plan projects a 50% decrease in brine extraction by 2028, which is in line with the PdC and the EIA under evaluation that considers the progressive reduction of brine extraction from the authorized areas in the core of the Salar (MOP and SOP sectors), reaching a maximum annual average pumping of 822 l/s by 2028, maintaining this rate until the end of the useful life of the operation authorized in RCA N°226/2006.
This reduction implies modifying the Brine Extraction Operating Rule established in recital 8.3.7 of RCA No. 226/2006. The staggered increase up to 1700 l/s (year 20 of operation) is replaced by a progressive decrease up to 822 l/s when reaching the year 2028 and that will be maintained as maximum extraction until the end of the useful life of the operation authorized in RCA N°226/2006 (year 2030).
A record of the annual brine drawdown is presented below (Figure 17-11).
Figure 17-11 Annual Net Extraction in Units of L/S Each Calendar Year (January 1 to December 31)
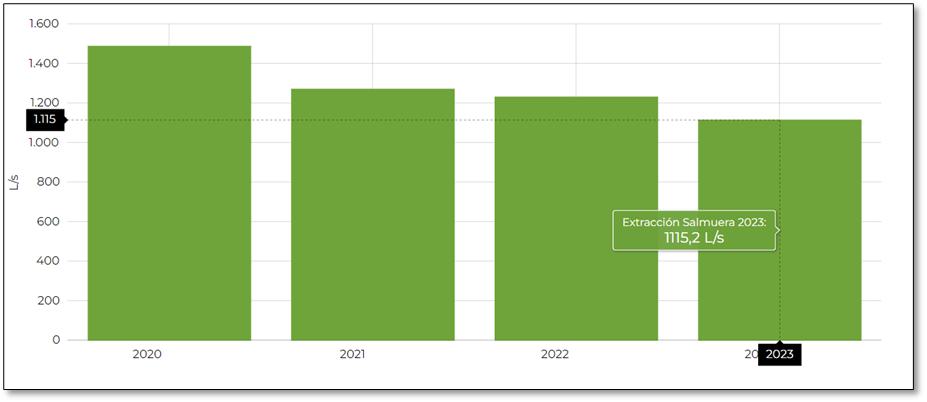
According to the information presented in the XVI Brine Extraction and Reinjection Report for the period 2022-2023 (August 13, 2022 to August 12, 2023), for the evaluation period, gross extraction reached 43,111,279 m3 in the MOP area and 833,720 m3 from the SOP area, totaling 43,944,999 m3, which is equivalent to 1,386.04 l/s and 26.80 l/s of gross extraction4 respectively.
Regarding indirect reinjection, 2,801,970 m3 in the MOP area and 2,665,896 m3 in the SOP area were reinjected, equivalent to 90.08 l/s and 85.71 l/s of the gross reinjection, which is within the range allowed by the RCA of 0-270 l/s. For direct reinjection of brine into the salt flat, during the period 0 m3 was reinjected into the MOP+SOP system, equivalent to 0 l/s.
Consequently, based on the information presented, SQM complies with the net brine pumping approved by the RCA, for the sixteenth year was 1,237.05 l/s, being allowed according to the operational rule to a maximum annual average pumping of 1,600 l/s. Additionally, it is stated in the report that during the period the annual average pumping is reduced to 1,250 l/s due to the activation of the contingency plan in the Soncor and Aguas de Quelana systems occurred on 10-04-2021 and 29-12-2021 respectively and the implementation of the staggered reduction of brine extraction committed under action 8 of the compliance program approved by the SMA through R.E N°38/F-041-2016.
4 Brutal extraction and reinjection correspond to what is actually extracted and re-injected, respectively. By applying the operational rule, the value of net extraction or average annual pumping is obtained.
| 17.4 | Permitting |
This sub-section contains forward-looking information related to permitting requirements for the Project. The material factors that could cause actual results to differ materially from the conclusions, estimates, designs, forecasts or projections in the forward-looking information include any significant differences from one or more of the material factors or assumptions that were set forth in this sub-section including regulatory framework is unchanged for Study period and no unforeseen environmental, social or community events disrupt timely approvals.
| 17.4.1 | Permitting Requirements in Chile |
The Law 19,300/1994 General Bases of the Environment (Law 19.300 or Environmental Law), its modification by Law 20.417/2010 and Supreme Decree N°40/2012 Environmental Impact Assessment System regulations (DS N°40/2012 or RSEIA)) determines how projects that generate some type of environmental impact must be developed, operated, and closed. Regarding mining projects, the art. 10.i of the Environmental Law defines that mining project must be submitted to the Environmental Impact Assessment System (SEIA) before being developed. Also, some of SQM installations are in protected areas so new projects and modifications should be environmentally evaluated regarding the article 10.p of the Environmental Law, which encompasses projects in national parks, national reserves, national monuments, and any kind of official protected area.
| 17.4.2 | Environmental Impact Assessment |
SQM began its participation in the Salar de Atacama in 1993, prior to the entry into force of Supreme Decree No. 30/1997 of the Ministry General Secretariat of the Presidency, Regulation of the Environmental Assessment System (hereinafter S.D. No. 30/1997), the first regulation published to regulate the environmental assessment of projects that could cause environmental impact. Since it was built in the absence of environmental impact assessment regulations, SQM Salar did not need to be environmentally assessed for its construction and operation. However, since 1995, environmental assessment studies have been carried out for expansions and modifications to operations at the Salar, which have been authorized by the Environmental Assessment Service (SEA) of the Ministry of the Environment.
To date, SQM Salar S.A. has 18 Environmental Impact Statements (EIS) and 4 Environmental Impact Studies approved, and one EIA in the process of environmental evaluation. Of these, 15 correspond to the Salar de Atacama and 8 to the Salar del Carmen. The following table details the different evaluations by facility.
Table 17-8. Historical EIAs/DIAs, carried out in the Salar de Atacama and the Salar del Carmen Plant, Sent to the Competent Authority (SEIA)
| Environmental Impact Assessment | DIA/EIA5 | Resolution | Date |
| Salar de Atacama | |||
| 300,000 tons/year of potassium chloride production | EIA | 0403/1995 | 25-09-1995 |
| Potassium sulfate, boric acid production, with expansion of potassium chloride production capacity | EIA | 015/1997 | 07-08-1997 |
| Potassium chloride drying and compacting plant | DIA | 110/1998 | 03-12-1998 |
| Partial replacement of solar evaporation ponds of the project production of potassium sulfate and boric acid | DIA | 0115/1999 | 04-10-1999 |
| Production of potassium chloride from potassium carnallite salts | DIA | 180/2002 | 16-08-2002 |
| Changes and improvements in the mining operation at the Salar de Atacama | EIA | 226/2006 | 19-10-2006 |
| Expansion of potassium chloride production Salar | DIA | 252/2009 | 15-07-2009 |
| Potassium sulfate plant modification | DIA | 271/2009 | 03-08-2009 |
| Increased drying and compacting capacity of potassium chloride | DIA | 294/2009 | 24-08-2009 |
| New potassium chloride drying and compacting plant | DIA | 273/2010 | 15-09-2010 |
| Sulfate of potash plant expansion | DIA | 030/2010 | 06-12-2010 |
| Increase in potassium carnallite processing capacity | DIA | 001/2011 | 05-01-2011 |
| Expansion of potassium chloride drying and compaction plant | DIA | 154/2013 | 20-06-2013 |
| Expansion of lithium carbonate plant to 180,000 tons/year | DIA | 57/2019 | 26-03-2019 |
| Salar del Carmen | |||
| 17,500 tons/year lithium carbonate production project | EIA | 381/1996 | 03-12-1996 |
| Lithium carbonate plant auxiliary waste pit | DIA | 024/1999 | 18-02-1999 |
| Fuel switch to natural gas at lithium carbonate plant | DIA | 109/2002 | 16-05-2002 |
| Expansion of lithium carbonate plant to 32,000 tons/year | DIA | 083/2001 | 02-08-2001 |
| Lithium hydroxide plant | DIA | 018/2004 | 30-01-2004 |
| Expansion of lithium carbonate plant to 48,000 tons/year | DIA | 164/2007 | 31-05-2007 |
| Expansion of the Salar del Carmen mine | DIA | 262/2017 | 31-07-2017 |
| Capacity Increase and Production Optimization Carmen Lithium Plant | DIA | 202202001223/2022 | 16-12-2021 |
5 Preventive evaluation system on the works that are developed in the territory and the impact that these generate on it. DIA: “Declaración de Impacto Ambiental” or Environmental Impact Statement. EIA: “Estudio de Impacto Ambiental” or Environmental impact assessment.
The current operation (brine extraction and water pumping, environmental monitoring, and early warning plans) is governed by Environmental Qualification Resolution (RCA) No. 226/2006, which approves the project "Changes and Improvements to the Mining Operation in the Salar de Atacama". This project contemplates increases in brine pumping up to a maximum flow rate of 1,700 l/s and the extraction of water from five wells with a maximum flow rate of up to 240 l/s. It also contains the Environmental Monitoring Plan to safeguard the sensitive systems of the Salar de Atacama, such as wetlands, lagoons, and fauna and flora, focused on monitoring groundwater (quality and quantity), flora and vegetation, and fauna in six natural systems: Soncor Lake System, Quelana Water System, Peine System, East Edge Vegetation System, and Vegas de Tilopozo Sector.
In May 2020, the EIA for the project "Early Warning and Environmental Monitoring Update Plan, Salar de Atacama" was submitted to the SEIA, with the objective of modifying and updating the Early Warning Plan. However, this project was withdrawn in May 2021 in order to update the baseline studies.
Subsequently, in compliance with the commitments made in the PdC, on January 24, 2022, the Environmental Impact Study (hereinafter EIA under evaluation) "Plan for Reduction of Extractions in the Salar de Atacama" was submitted to the Environmental Impact Assessment Service (Servicio de Evaluación de Impacto Ambiental), admitted for processing on January 31, 2022, which introduces modifications to RCA 226/2006 that approved the Changes and Improvements to the Mining Operation in the Salar de Atacama Project. In particular, the project aims to reduce the maximum amount of brine to be pumped from the authorized extraction zones in the core of the Salar and water to be extracted from wells located in the alluvial zone on the eastern margin of the Salar de Atacama; implement adjustments to the environmental monitoring plan and early warning plans, and adopt measures associated with the loss of Algarrobo specimens in the Camar-2 well sector.
The EIA is currently under evaluation by the authority, specifically in the preparation of the Addendum 3 document in response to the third Consolidated Report of Clarifications, Rectifications or Amplifications (ICSARA), whose response deadline is February 19, 2024.
According to what has been observed in the ICSARAs showcased to date, the main topics addressed correspond to:
| ● | Hydrogeology (determination and justification of the hydrogeological area of influence, conceptual hydrogeological model of the systems Borde Este, Soncor, Aguas de Quelana, Núcleo del Salar, Peine, Tilopozo; and historical variation of the lagoon bodies, among others), |
| ● | Modifications to the Environmental Monitoring Plan (PSA) of RCA 226/2006, |
| ● | Modifications to the Early Warning Plan (TAP) of RCA 226/2006, |
| ● | Extraction Reduction Plan Clarifications, |
| ● | Complement the flora and vegetation baseline with respect to surface areas, history of cover changes, details of losses, differentiating between zonal vegetation and azonal vegetation. |
| ● | Community territorial protection strategies and baseline data collection of the human component of the communities of Toconao, Socaire, Peine, Solor, Coyo and Cucuter; and the Atacameño community of Camar, |
| ● | Susceptibility of affecting the environmental value of the territory of ancestral occupation of the Indigenous Communities of Toconao, Camar, Talabre, Peine and Socaire due to transportation, transfer, displacement and road maintenance and/or habilitation activities, |
| ● | Citizen Participation, |
| ● | Sector environmental permits (PAS), |
| ● | Prediction and evaluation of the environmental impact of the project or activity, |
| ● | Mitigation, remediation and compensation measures plan, |
| ● | Contingency and emergency prevention plan, and |
| ● | Voluntary environmental commitments (VEC), measures and/or requirements. |
As a result of the clarifications, rectifications and extensions made in the Supplementary Addendum, the EIA "Extraction Reduction Plan in the Salar de Atacama" underwent a substantive modification in the environmental assessment process, given that the generation of a new environmental impact was verified corresponding to "Susceptibility of affecting the environmental value of the territory of ancestral occupation of the Indigenous Communities of Toconao, Camar, Talabre, Peine and Socaire due to transport, transfer, displacement and maintenance activities and/or road improvements", Camar, Talabre, Peine, and Socaire due to transportation, transfer, displacement and, road maintenance and/or habilitation activities", being proposed new mitigation measures corresponding to the "Vehicle Traffic Control Plan" and the "Participative Monitoring Program" and the compensation measure "Program to enhance the value of the Indigenous Cultural Heritage". Therefore, Resolution No. 202302101780, dated November 28, 2023, initiates a new stage of citizen participation for a period of 30 working days in the evaluation process of the Environmental Impact Study of the project "Plan de Reducción de Extracciones en el Salar de Atacama" (Extraction Reduction Plan in the Salar de Atacama). Published in the official gazette on December 06, 2023.
In addition, by resolution No. 202302101816 dated December 12, 2023, it is resolved to initiate a Consultation Process with Indigenous Peoples (PCPI), in accordance with the standards contained in ILO Convention No. 169 concerning Indigenous and Tribal Peoples in Independent Countries in the process of evaluating the EIA of the project "Extraction Reduction Plan in the Salar de Atacama", of the owner SQM Salar S.A., which will be carried out with the Human Groups Belonging to Indigenous Peoples (GHPPI) of the Atacameño Community of Camar; Atacameño Community of Talabre; Atacameño Community of Socaire; Atacameño Community of Peine; and Atacameño Community of Toconao, of the Commune of San Pedro de Atacama, Antofagasta Region.
As part of the EIA environmental evaluation process, the following Sector Environmental Permits (PAS) have been considered to date.
| ● | PAS 119 To carry out research fishing (article 119 RSEIA), |
| ● | PAS 132 For archaeological, anthropological, and paleontological excavations (Article 132 RSEIA), |
| ● | PAS 140 For the construction, repair, modification, and expansion of any garbage and waste treatment plant of any kind or for the installation of any place intended for the accumulation, selection, industrialization, trade or final disposal of garbage and waste of any kind (Article 140 RSEIA), |
| ● | PAS 142 For any site intended for the storage of hazardous waste (Article 142 RSEIA), |
| ● | PAS 156 (Pipeline) For channel modifications (Article 156 RSEIA), |
| ● | PAS 156 (Roads) To carry out channel modifications (article 156 RSEIA), and |
| ● | PAS 160 Permit to subdivide and urbanize rural land or for construction outside urban boundaries (Article 160 RSEIA) Soil survey. |
The SAPs must be processed sectorially as soon as the RCA is obtained, these sectorial permits would already be environmentally approved with the RCA, but sectorial approval will be necessary. Likewise, other sectoral permits may appear that are not included in the EIA because they do not have environmental content, but they must be approved in order to continue with the project.
| 17.4.3 | Environmental compliance plan (PdC) |
In 2016, the project was subject to a sanctioning process by the Superintendence of the Environment (SMA) as a result of the infringement of Art.35 of the Organic Law of the Superintendence of the Environment (LOSMA) as a result of six breaches of the conditions, standards and measures established in RCA 226/2006. The infractions formulated by the SMA were the following:
Table 17-9. Facts Considered (Charges)
| N° | Fact | Infringed Instrument |
Infringement (Art.35 LOSMA) |
Classification (Art. 36 LOSMA) |
| 1 | Extraction of brine in excess of that authorized, as described in Consideration No. 27, during the period between August 2013 and August 2015. |
RCA 226/2006 |
a) Failure to comply with the conditions, standards, and measures established in the resolutions of environmental qualification. |
Serious e) Serious non-compliance with the measures to eliminate or minimize the adverse effects of a project or activity, in accordance with the provisions of the respective Environmental Qualification Resolution. |
| 2 | Progressive affectation of the vitality status of carob trees (Prosopis flexuosa) in the area of Camar 2 well, as detailed in Table N° 3, without taking actions to control and mitigate such environmental effect or informing the authority, since 2013 to date. | |||
| 3 | Incomplete information on freshwater extraction, well levels, and vegetation formations, as shown in Table No. 11, which does not meet the objective of having traceable control information that allows the authority to verify the variables mentioned, in the period from 2013 to 2015. |
Slight Fact, acts, or omissions that contravene any mandatory precept or measure and that do not constitute a very serious or grave infraction, in accordance with the provisions of the preceding numbers. |
||
| 4 | The Contingency Plan for the Peine System does not have the same characteristics as the other environmental systems, and therefore does not guarantee the maintenance of the system's natural operating conditions. |
Serious e) Serious non-compliance with the measures to eliminate or minimize the adverse effects of a project or activity, in accordance with the provisions of the respective Environmental Qualification Resolution. |
||
| 5 | Lack of analysis of historical records of local and regional meteorology, monitoring of hydrogeological variables, and other background information from other studies conducted both locally and regionally, to identify the occurrence of variations due to natural factors in the study area (vegetation plots), considering that it was found that the soil pH and salinity variables were significantly affected in 2013, with an increase in 90% of the samples, going from moderately saline to strongly saline soils and an increase in the alkalinity of the pH. |
Slight Fact, acts or omissions that contravene any mandatory precept or measure and that do not constitute a very serious or grave infraction, in accordance with the provisions of the preceding numbers. |
||
| 6 | Modification of the variables considered in the contingency plans, without environmental authorization, according to the following: - Modification of the wells to be monitored, as well as the ground elevations of the monitoring wells for each of the control systems, used in the Contingency Plan, as set forth in Tables N° 4 and 5, respectively. - Alteration of the activation thresholds of phase I and II levels of the Soncor System, as shown in Tables N° 6 and 7, respectively. |
Very serious f) Involve the execution of projects or activities of Article 10 of Law No. 19,300 outside the Environmental Impact Assessment System, and any of the effects, characteristics or circumstances set forth in Article 11 of said law are found in them. |
Source: Exempt Resolution N 38/ROL F-041-2016.
In order to present actions and measures to correct the aforementioned violations a Compliance Program (PdC) was prepared and presented, which was approved through an exempt resolution N°24 of January 7, 2019, however, it was left without effect by the Environmental Court in December 2019 due to the filing of complaints by the Indigenous Communities located around the project and its processing process was restarted.
In November 2020, a new version of the compliance program was presented, addressing the observations made by the Superintendency, which was approved on August 29, 2022 through exempt resolution N°38/ROL F-041-2016, leaving without effect the provisional measures requested through Res. 2389/2021 that considered continuing the application of the PdC, that is, continuing with the operation of the online monitoring system for the extraction of brine and industrial water, applying the activation thresholds of Phase I and II, defined for the Peine System, both in the monitoring of the project qualified by RCA N° 226/2006, and in wells PN-05B and PN-08A of the "Alerta Núcleo" sector of the Early Warning Plan (point 10.18 of RCA N° 21/2016), and the corresponding control measures, where appropriate. Finally, limiting the maximum flow of brine to be pumped to 1280 l/s and the maximum flow of industrial water to be pumped to 120 l/s; and leaving without effect the sanctioning process. The program means a cost of over 50 million dollars, contemplates 52 specific measures, and it must be reported to the Superintendencia del Medio Ambiente (SMA) on a regular and obligatory basis.
The PdC actions proposed by SQM comprise 52 measures, including several related to the communities surrounding the project. Table 17-10 details the level of compliance for the period6 , of the proposed actions and the respective evidence. In reference to commitment N°33, according to SQM, the study will be delivered in the final report of the Compliance Program.
6 Some of the actions must be executed 18 months after the resolution approving the PdC is issued (e.g., Action No. 33, Preparation of an Ethnobotanical Study of the Flora and Vegetation of Camar).
Table 17-10. Status of execution of PdC Actions
| N° | Short-term commitment | Category |
Sub category |
Effective start date | Form of implementation |
| 1 | Reduction of the total net brine extraction flow with respect to the authorized flow by 9,800,922 m3 | Operational variables | Production limitation | 01-06-2018 | The period from June 2018 to May 2020, the total volume of brine extracted was 12,178,604 m3 lower than the total authorized flow for the same period, materializing a reduction greater than the committed reduction (9,800,922 m3). In this way, the present action is considered completed. |
| 2 | Perform a diagnosis of the environmental monitoring information available in the Salar de Atacama Basin. | Diagnosis | Others | 31-08-2021 | In August 2021, the report "Survey of environmental monitoring information in the Salar de Atacama basin" was prepared, through which a comprehensive diagnosis of environmental monitoring by environmental component was developed, with a focus on increasing knowledge of the system from a spatial and temporal perspective, as well as incorporating new monitoring technologies available. |
| 3 | Application of Annual Net Brine Extraction Operational Rule | Transaction variables | Production limitation | 07-12-2016 | The "Procedure for net annual extraction of Permanent Brine" was updated, incorporating the conversion value of 1 l/s equivalent to 31,104 m3 /year. As of December 07, 2016, the operational rule was implemented committing its application during the validity of the PdC. |
| 4 | Brine extraction operator training | Transaction variables | Personnel training | 01-01-2017 | An initial training was conducted in January 2017, which accounted for the update of net brine draw procedures, subsequently monthly trainings have been conducted throughout the life of the PdC. |
| 5 | Increased frequency of monitoring of Contingency Plan and Peine Sector indicators | Follow-up | Surface water monitoring | 30-11-2018 |
Effective December 1, 2018, and throughout the life of the PdC, the monitoring frequency was increased from monthly to daily. During 2023, 4 reports (March, May, August, and November) were submitted to SNIFA, regarding the daily monitoring of all the status indicators of the Contingency Plans of the following systems: Soncor, aguas de Quelana, Vegetación Borde Este, and Peine sector, with the exception of the indicators located within the Reserva Nacional Los Flamencos (monitored as established in CONAF Res Nº56/ 2019), according to situations of access restriction. |
| 6 | Implementation of on-line monitoring system for brine and industrial water extraction | Transaction variables | Production limitation | 03-06-2019 | As of June 03, 2019, an online monitoring and reporting system for brine and industrial water extraction was developed and implemented. As of November 26, 2020, and throughout the life of the PdC, this system has monitored and delivered information to the SMA. |
| N° | Short-term commitment | Category |
Sub category |
Effective start date | Form of implementation |
| 7 | Make available to the community updated information on brine and industrial water extraction and biotic and hydrogeological monitoring through a website with free public access. | Control and mitigation | Others | 07-06-2019 | As of June 07, 2019, a publicly accessible web platform is operational, through the website www.sqmsenlinea.com and it shows the results of brine and industrial water extraction since September 2020. It has biotic and hydrogeological environmental monitoring information, continuous level monitoring data and the indication of activation of the Contingency Plans. In addition, metrics and graphs have been incorporated with the flow of visits received through the website, as well as other background information on the Environmental Monitoring System. |
| 8 | Progressively reduce the maximum brine drawdown rate | Transaction variables | Production limitation | 01-11-2020 | As of November 1, 2020, and throughout the duration of the PdC, the project has progressively reduced the maximum annual average brine drawdown flow rate to a maximum annual average flow rate of 1,187.96 l/s. |
| 9 | Limiting industrial water pumping flow rates | Transaction variables | Production limitation | 01-12-2020 | The reduction of the maximum industrial water flow began in December 2020, considering a 40% reduction of the authorized flow. As of October 1, 2021, the maximum water flow to be extracted is 120 l/s. |
| 10 | Environmental evaluation of the modification of the brine and industrial water extraction operating rule | Environmental assessment | RCA | 19-07-2021 | On January 24, 2022, the EIA for the "Extraction Reduction Plan in the Salar de Atacama" project was submitted to the SEIA, which was admitted for processing on January 31, 2022, in accordance with Exempt Resolution No. 20220200138. |
| 11 | Design and implement a participatory monitoring program for the PSAH. | Control and mitigation |
Others
|
30-09-2022 | During 2023, the following activities have been carried out: training and participatory monitoring with the communities of Talabre and Socaire; activities with the communities of Toconao and Peine (community observers); and the PSAH participatory monitoring plan. In August 2023 the results workshop was held with the community of Socaire, and in September with the community of Talabre. Hydrogeological monitoring training was conducted in November in two (2) instances, both for the Toconao and Talabre communities. |
| N° | Short-term commitment | Category |
Sub category |
Effective start date | Form of implementation |
| 12 | Design and implement a community training program for environmental monitoring. | Transaction variables | Others | 30-09-2022 | Among the activities developed there are: the agreement with the Universidad Católica del Norte (UCN) to support: Community Training Program "Water Education Plan" (presentations, talks, field activities); Education Program "Aula Andina" (certifying skills in water resources) for the communities of Camar, Toconao, Socaire, Peine and Talabre; Program "Aula Salar" (certifying the skills of children and adults in water resources); Dissemination of the Community Training Program. |
| 13 | Install and operate additional hydrometeorological stations in the Salar de Atacama. | Infrastructure | Others | 28-02-2023 | Four hydrometeorological stations are implemented at Domeyko, Llano de la Paciencia, Cerro Cosor and El Tatio. |
| 14 | Increase the frequency of monitoring the vegetation cover of the Salar de Atacama basin using high resolution satellite images. |
Follow-up
|
Flora monitoring | 30-08-2022 | Vegetation cover is monitored quarterly using satellite images. |
| 15 | Conduct an integrated analysis of the hydrogeological environmental monitoring information of the Salar de Atacama basin. |
Follow-up
|
Groundwater monitoring | 30-09-2022 | During the month of September 2023, the preliminary version of the Annual Integrated Analysis Report was delivered for the 2021-2022 study period and was presented in SMA in December 2023. Progress reports will be delivered periodically. |
| 16 | Evaluate and update the PSAH based on the results of the analysis committed to in Action N° 15. |
Follow-up
|
Groundwater monitoring | 31-03-2023 | Since the implementation of Action 16 is subject to the development of Action 15, the PSAH update proposal will be submitted to the SMA for evaluation and validation no later than March 31, 2024. Action reported in a later period. The committed reporting date was 28-05-2023 and the actual reporting date is 28-11-2023. |
| 17 | Report RCA 226/2006 and PdC monitoring variables to the SMA, through online connection. |
Follow-up
|
Others | 29-11-2022 | The SMA continues to report RCA 226/2006 and PdC follow-up variables to the SMA. |
| 18 | Periodic communication of environmental monitoring results to the community and other stakeholders in the territory. | Follow-up | Others | 30-08-2022 | During the period we have reported: Notices of activation and deactivation of the Contingency Plan of RCA 226/2006; Environmental Monitoring Reports (PSAH N°33 of the first half of 2023); PSAB Report N°17 2023; and Annual Monitoring Report Soil Moisture Content (CHS) 2023. |
| 19 | Strengthen the monitoring of the lagoon surface using high-resolution satellite images of the Soncor, Peine and Aguas de Quelana systems. | Follow-up | Surface water monitoring | 30-08-2022 | The frequency of monitoring of the lagoon surfaces of the Soncor and Peine systems was increased from annual to quarterly using satellite images. |
| 20 | Implement a pilot plan for continuous monitoring and on-line transmission of surface water quality in the Barros Negro, Chaxa, Burro Muerto and Saladita sectors. | Follow-up | Surface water monitoring | 30-03-2023 | There are surface water quality monitoring records for the Barros Negros, Chaxa, and Burro Muerto stations. The installation of the fourth station proposed in the Saladita sector is still pending, as it requires the prior consent of the Peine community. |
| N° | Short-term commitment | Category |
Sub category |
Effective start date | Form of implementation |
| 21 | Implement air quality monitoring in the eastern edge of the Salar de Atacama for the parameters MP10, MP2.5 and MPS. | Follow-up | Air quality monitoring | 29-11-2022 | There is continuous monitoring of Particulate Matter (PM10 and PM2.5) at Campamento Andino Station and of Sedimentable Particulate Matter (SPM) at Stations L2-25 and LZA7-2. |
| 22 | Stop pumping water from the Camar 2 well and shut down and dismantle the infrastructure associated with water pumping. |
Infrastructure
|
Removal of infrastructure | 11-01-2018 | In the compliance plan report dated September 23, 2022, it is reported that the activities associated with the suspension of the operation, closure and dismantling of the Camar 2 industrial water well have been completed. |
| 23 | Include in the reports of the Biotic Environmental Monitoring Plan (PSAB), an analysis of the results of the vital and health status of carob trees. |
Follow-up
|
Flora monitoring | 21-03-2019 | The inclusion of the analysis of the results of the vital and sanitary status has been carried out based on Report No. 12 PSAB sent to the SMA dated 21/03/2019. |
| 24 | Implement a monitoring program for the flora and vegetation of Camar Creek. |
Follow-up
|
Flora monitoring | 01-04-2021 | During the month of April 2021, an initial cadaster of carob trees and vegetation formations present in the area surrounding Camar Creek was carried out. A bi-annual report of the Camar Creek Flora and Vegetation Monitoring Program is maintained. |
| 25 | Provide forage to the Camar community to temporarily replace the loss of biomass associated with carob trees. |
Control and mitigation
|
Others | 02-09-2021 |
In the period it is reported that: the delivery of bales corresponding to the 1st semester of 2023 (7,993 bales of fodder, an amount that exceeds the six-month minimum of 600 bales or the compliance indicator for the entire PdC of 75 tons); completion of the construction of the community warehouse (shed) "Centro Agrícola Ganadero Camar", located at the entrance of Camar, whose purpose is to store bales and keep them protected from environmental conditions; delivery of 2,263 bales (September), which were stored in the constructed shed. Construction of a warehouse for the storage of bales inaugurated on October 10, 2023. |
| N° | Short-term commitment | Category |
Sub category |
Effective start date | Form of implementation |
| 26 | Evaluate environmentally necessary measures to mitigate and compensate for the progressive affectation of the vitality of the carob trees in the Camar well sector. |
Environmental Assessment
|
RCA | 19-07-2021 | On January 24, 2022, the EIA for the "Extraction Reduction Plan in the Salar de Atacama" project was submitted to the SEIA, which was admitted for processing on January 31, 2022, in accordance with Exempt Resolution No. 20220200138. |
| 27 | Conduct studies to better understand the irrigation of the carob trees in the Camar 2 well sector. | Diagnosis | Elaboration of Studies | 13-09-2021 | Several studies have been carried out to better understand the irrigation of the carob trees in the Camar 2 well sector. |
| 28 | Implement carob tree irrigation program associated with the monitoring in RCA 226/2006. | Follow-up | Flora monitoring | 30-09-2022 | Irrigation of carob trees is maintained. |
| 29 | Implementation of a forage crop plot in Camar. | Control and mitigation | Others | 30-08-2022 | Among the activities carried out were the implementation of a forage crop plot (approx. 4 ha) in the Camar area. Since the land is located in a protected area, other plots had to be analyzed. On November 17, 2023, the community of Camar approved the selection of the polygon called CB-3B, for the implementation of the forage crop plot. |
| 30 | Incorporation of the Camar community in the implementation of monitoring activities of relevant environmental variables. | Control and mitigation | Others | 30-11-2022 | The activities reported have; integrated the Camar community in training and follow-up through a participatory monitoring program (February to November 2023); Training Program 2023 (hydrogeological and biotic aspects); Hydrogeological Environmental Follow-up Plan Monitoring; Biotic environmental monitoring program (vegetation, flora, fauna, bird life, and aquatic biota associated with RCA N°226/2006); Air Quality monitoring program associated with the Compliance Program (PdC, by its Spanish Acronym). |
| N° | Short-term commitment | Category |
Sub category |
Effective start date | Form of implementation |
| 31 | Implement the Camar Algarrobo de Camar Conservation Plan. | Follow-up | Flora monitoring | 30-08-2022 | The following has been reported for the period: implementation of the Camar Carob Tree Conservation Plan (Carob Tree Production Program and Phytosanitary Control Program), nurseries, genetic studies, and others. |
| 32 | Evaluation of the potential impact of herbivory on the carob tree population in the Camar ravine. | Diagnosis | Elaboration of Studies | 28-02-2022 | On May 26, 2023, the Camar Community and SQM agreed on the work structure for the development of herbivory characterization studies in the Camar Creek. Between October 23 and 27, 2023, the first sampling campaign was carried out, initiating the development of the study on the potential impact of herbivory on the population of carob trees in the Camar ravine. |
| 33 | Elaborate an ethnobotanical study of the flora and vegetation of Camar. | Diagnosis | Elaboration of Studies | - | According to SQM, the study must be submitted in the final report of the Compliance Program. |
| 34 | Inform the sectorial authority about changes in the presentation of vegetation cover data of the Biotic Environmental Monitoring Plan. | Follow-up | Flora monitoring | 30-05-2019 | On January 22, 2019, changes in the submission of PSAB vegetation cover data to the sectoral authority (CONAF) are reported. In addition, on February 7, 2019, a relevance consultation was submitted, which was solved through the Exempt Resolution Nº128 of May 30, 2019, which solved that the optimization of the submission of PSAB vegetation cover data does not require mandatory submission to the SEIA. |
| 35 | Provide tabulated information on net brine extraction, historical information since 2013 and throughout the implementation of the PdC. | Follow-up | Others | 25-07-2018 | Periodic progress reports on consolidated net brine extraction from August 2012 through October 2023 (as observed in the last report submitted). |
| 36 | Provide information regarding freshwater extraction (industrial water) from Mullay, Allana, Camar 2, Socaire and P2 wells. | Follow-up | Others | 07-01-2019 | Semiannual extraction history is presented. |
| 37 | Include in the PSH Report results of the measurement of the level values of wells L4-10, L2-27, and L2-28. |
Follow-up
|
Groundwater monitoring | 07-01-2019 | PSH reports include measurement results from the wells. |
| 38 | Provide information on the percentage variable of vegetation cover associated with the environmental monitoring of RCA 226/2006 and throughout the implementation of the PdC. |
Follow-up
|
Flora monitoring | 25-07-2018 | The annual reports of the Biotic Environmental Monitoring Plan consider information on the percentage variable of vegetation cover. |
| N° | Short-term commitment | Category |
Sub category |
Effective start date | Form of implementation |
| 39 | Deliver to the SMA the missing information requested in the audit of March 27, 2014. |
Follow-up
|
Others | 10-04-2019 | The information is submitted annually to the SMA through the Environmental Monitoring System (SSA). |
| 40 | Define the wells of the Peine System Monitoring Plan. |
Follow-up
|
Groundwater monitoring | 30-06-2018 |
A document is prepared defining the status indicator wells and activation thresholds (phase I and II) associated with the Peine system. In June 2018, the status indicators of the System are defined, assigning thresholds for the adoption of measures to ensure the maintenance of the natural operating conditions of the Peine lake system. |
| 41 | Define control measures to be implemented in case the activation condition of phase I and phase II is verified in the Peine System. |
Control and mitigation
|
Others | 30-11-2020 | In November 2020, a report is prepared that establishes control measures to be implemented in the event of activation of phases I and/or phase II in the Peine System. Subsequently, it was updated in September 2021 with the observations of res. Ex. N/34/ ROL F-41-2016. |
| 42 | Apply the Phase I and/or II activation thresholds defined for the Comb System. | Control and mitigation | Others | 01-10-2018 | Monitoring and recording of field measurements of the Peine System wells are carried out. |
| 43 | Environmentally evaluate an updated Contingency Plan for the Peine System. |
Environmental Assessment
|
RCA | 19-07-2021 | On January 24, 2022, the EIA for the "Extraction Reduction Plan in the Salar de Atacama" project was submitted to the SEIA, which was admitted for processing on January 31, 2022, in accordance with Exempt Resolution No. 20220200138. |
| 44 |
Correlation study of hydrological, hydrogeological, and meteorological variables with pH and salinity. Of the soil. |
Diagnosis
|
Elaboration of Studies | 12-07-2019 | Two correlation studies were conducted (October 2017 and July 2019) to analyze the correlation between pH and salinity variables with respect to natural factors, including meteorological, hydrological series, hydrogeological, and vegetation parameters. |
| N° | Short-term commitment | Category |
Sub category |
Effective start date | Form of implementation |
| 45 | Correlation study of historical meteorological events with microenvironmental variables. |
Diagnosis
|
Elaboration of Studies | 12-04-2019 |
In February 2019, studies are being conducted to identify flora monitoring plots that show a relationship between historical meteorological events and salinity. Based on the results obtained, in March 2019, an analysis of the causal relationship between meteorological events and soil salinity will be carried out in order to define the existence of a causal or random relationship between the two variables. |
| 46 | Implement a protocol for trend analysis of vegetation environmental variables and/or microenvironmental variables. | Follow-up | Others | 12-04-2019 |
Based on the follow-up report of PSAB N°15, the following applies the standardization factor. |
| 47 | Adjust the application of the Contingency Plans so that they are strictly in line with the status indicators (wells and rulers). | Contingency Plan | Implementation of contingency plans | 06-12-2016 | From December 2016 until the end of the PdC report, the evaluation and implementation of the Contingency Plans for the Soncor System, Quelana Waters and Border Vegetation will be carried out in the Hydrogeological Environmental Monitoring Report (PSAH, by its Spanish Acronym). |
| 48 | To apply the activation thresholds included in RCA No. 226/2006, recital 11.2.1 "Status indicators and activation values" (Soncor System). |
Follow-up
|
Groundwater monitoring | 07-12-2016 |
In the semiannual reports of the Follow-up Plan The thresholds (activation values) for each of the phases of the Soncor system contingency plan will be considered. |
| 49 | Update and implement the updated PSH Plan monitoring procedure. |
Follow-up
|
Others | 07-02-2019 | In accordance with the provisions of Action 49, training of SQM Salar personnel is considered regarding the dissemination of the monitoring procedure for hydrogeological follow-up, which are carried out every six months. |
| 50 | Environmentally evaluate adjustments to the Contingency Plans of the project "Changes and Improvements in the Mining Operation of the Salar de Atacama". |
Environmental Assessment
|
RCA | 19-07-2021 | On January 24, 2022, the EIA for the "Extraction Reduction Plan in the Salar de Atacama" project was submitted to the SEIA, which was admitted for processing on January 31, 2022, in accordance with Exempt Resolution No. 20220200138. |
| 51 | Inform the SMA of the reports and means of verification that prove the execution of the actions committed to in the PdC. |
Follow-up
|
Reporting | 13-09-2022 | PdC and follow-up reports uploaded to the SPDC digital system. |
| 17.5 | Social and Community Aspect |
This subsection contains forward-looking information related to plans, negotiations or agreements with local individuals or groups for the Project. Material factors that could cause actual results to differ materially from the conclusions, estimates, designs, forecasts, or projections in the forward-looking information are described in this section. The section considers that the regulatory framework has not changed for the Project, and that eventual environmental, social or community events could affect ongoing procedures.
| 17.5.1 | Social Commitments Defined in the Environmental Instruments |
The Environmental Impact Study (EIA) of the project "Plan de Reducción de Extracciones en el Salar de Atacama.7" is currently undergoing environmental processing in the Environmental Impact Assessment System (SEIA).
In this context, the following measures.8 have been undertaken with regarding the Camar Indigenous Community:
| · | Burial of the Camar Sector Pipe, to mitigate the affectation of carob trees in the Camar Creek. |
| · | Reforestation of carob trees, with the planting of 112 carob trees in the Quebrada de Camar. |
| · | Technical Support Program for Fodder Cultivation, through periodic visits (quarterly). |
| · | Agricultural Development Fund, for initiatives such as: water supply/use; soil, among others. |
| · | Delivery of Fodder, intended for livestock within the territory of the Camar Community. |
Notwithstanding the above, in the environmental processing framework (ICSARA N°2-N°3), some observations have been made on the proposed processes and measures, as follows:
| a) | Existence or non-existence of those effects, characteristics, or circumstances of Article 11 of Law No. 19,300: update table showcased. |
| b) | Dialogue process: present results and means of verification at the end of the process (e.g., impact "ID 30: Susceptibility of affecting the environmental value of the territory of ancestral occupation of the Indigenous Communities of Toconao, Camar, Talabre, Peine, and Socaire due to transportation, transfer, displacement, and maintenance activities and/or road improvements"). |
| c) | Early Warning Plan: present background information to support the exclusion of monitoring points and show that the new thresholds will allow the natural condition to be maintained. |
| d) | Specify and specify measures (indicators, goals, control, and follow-up): MM-3 Participatory Monitoring Program; MM-2: Vehicular Traffic Control Plan; "Veterinary Services Program"; MC-8: Program to enhance the value of indigenous cultural heritage (archaeological sites, induction talks, dissemination of indigenous cultural heritage to new generations). |
7The project is in the first round of consultations by the environmental authority. SQM has requested suspension of the term to address the observations until February 15, 2023.
8Previous environmental procedures associated with the operation of the project do not define specific social commitments, as reported in a previous report.
As shown in Table 10, the Compliance Program (PdC, by its Spanish Acronym) includes the design and implementation of a Participatory Monitoring Program for the Environmental Monitoring Plan, for actions 11 (incorporating the communities of Toconao, Talabre, Socaire, Peine, and Asociación Indígena Consejo de Pueblos Atacameños); and 30 (for the community of Camar), for the biotic variables (actions 23 and 24 of the PdC) and those linked to the PSAH.
In this context, the PdC contemplates a training program focused on the implementation of monitoring techniques, both theoretical and practical, as well as risk prevention. Accordingly, a program was developed for the year 2023, including reinforcement activities, instruction for new stakeholders, and open dissemination to interested communities. The latter was carried out in August 2023. Additionally, three (3) reports were generated on the Participatory Monitoring Program (May, August, and November 2023).
According to the 2022 Sustainability Report, 15% of the actions implemented were achieved and 77% of the actions in progress. The commitments made include implementing participatory monitoring for the Hydrogeological Environmental Monitoring Plan; designing and implementing a community training program associated with environmental monitoring; reducing the maximum brine extraction limit; and reducing the total industrial water flow to 120 l/s, equivalent to a 50% reduction of the authorized flow.
Within the framework of community relations, there is an agreement in place with the Atacameño Indigenous Community of Camar with respect to the Environmental working table.
In relation to the Atacameño Indigenous Community of Toconao, work is underway on participatory monitoring, accompanying the company in the monitoring of the Environmental Monitoring Plan.
The following organizations have joined working groups and agreements in different areas: Working Group with the Atacameño Community of Talabre; Working Group with the Atacameño Indigenous Community of Socaire; Río Grande Working Group; Viticulture Working Group; Environmental Thematic Meetings (Socaire, San Pedro de Atacama, Talabre).
In the area of environmental monitoring, SQM has implemented an online platform for the Salar de Atacama (www.sqmenlines.com), allowing anyone to access the information that the company collects in relation to its commitments in this area.
On the other hand, in the context of the legal citizen participation process, the environmental authority decreed the realization of a new stage of citizen participation for a period of 30 days, from the provisions of Article 28 of Law No. 19,300, regarding clarifications, rectifications and extensions that substantively affect the environmental impacts of the project. Specifically, the conclusion of Article 8 of the RSEIA: "the generation of the susceptibility to affect the environmental value of the territory of ancestral occupation of the Indigenous Communities of Toconao, Camar, Talabre, Peine, and Socaire is configured due to the activities of transportation, transfer, displacement and maintenance, and/or road improvements" (Annex 6-1, Annex 8-1, among others). The practical consequence of the resolution alludes to the extension of the processing timeframes established in the environmental regulations.
In parallel within the framework of the environmental processing of the project, on June 22, 2022, SQM presented a Reversal Appeal to the regional environmental authority, requesting to increase the number of indigenous organizations subject to the Indigenous Consultation process. On August 19, the Antofagasta Region Environmental Assessment Service did not accept the appeal. However, as the environmental assessment process progressed, it was decided to expand the process, including:
| · | Atacameña Community of Camar |
| · | Atacameña Community of Talabre |
| · | Atacameña Community of Socaire |
| · | Atacameña Community of Peine |
| · | Atacama Community of Toconao, in the Commune of San Pedro de Atacama. |
Specifically, the foregoing was taken into consideration with respect to Article 8 of the RSEIA (generation of the susceptibility of affecting the environmental value of the territory of ancestral occupation of the Indigenous Communities of Toconao, Camar, Talabre, Peine and Socaire due to the activities of transport, transfer, displacement and maintenance, and/or habilitation of roads", based on Annex 6-1, Annex 8-2, Annex "Sections 6 and 7", Annex 8-1 of the Supplemental Addendum).
Accordingly, the resolution has the consequence that the project may be delayed, considering that until the consultation process is concluded, the processing deadlines are suspended under the SEIA.
| 17.5.2 | Plans, Negotiations, or Agreements with Individuals or Local Groups |
As indicated in a previous report, on August 2020 the Camar Indigenous Community entered into an out-of-court agreement called “Mutual benefit due diligence, cooperation, and sustainability agreement for a new stage of community relations” with SQM, based on a document with format standard9. According to the background review in secondary sources, there are no observations on its implementation during the period.
Based on the background check, it is understood that the programs are under development, with means of verification related to the 2022 Sustainability Report, highlighting the implementation and start-up of a Community Portal in SQM (questions, complaints, requests, among others online through the page https://portaldecomunidades.sqm.com).
Additionally, in the previous period report, information was found about Multi-stakeholder Roundtable.10 in the Salar de Atacama basin, as a space for dialogue between representatives of organizations, communities, and institutions that carry out productive, social, and/or cultural activities in the Salar de Atacama basin, which aims to resolve information gaps on the basin and generate agreements on priority issues for the participants related to the sustainability of the territory in a collaborative manner. Where SQM actively participates in Technical Committees.
During the year 2023, the Committee carried out a series of activities in the educational field, as well as in seminars, forums, and conferences on water in the Salar de Atacama and in the region, among others:
| · | Contribution to the Rural Drinking Water and Sewerage Committee of San Pedro de Atacama (CAPRA)11 . |
| · | Territorial Information Platform 202312 . |
9Basic contents: general background of the agreement; history of the community relationship; Long-term relationship; validation of agreements; contributions; provision of funds; external audit; work group and operation; obligations of the parties; environmental commitments for the sustainability of the territory; communications between the parties; conflict resolution; agreement review mechanisms; Assignment of rights; anti-corruption clause; other commitments; term of the agreement; address.
10The initiative comes from some companies involved in the battery value chain (Volkswagen Group, Mercedes Benz AG, Daimler Trucks AG, BMW Group, BASF AG and Fairphone. The entity responsible for accompanying and coordinating the process is the GIZ (German Society for International Cooperation). Link: "https://www.mch.cl/2022/09/08/sqm-explica-los-alcances-de-la-mesa-multiactor-en-la-cuenca-del-salar-de-atacama/"
11https://www.mesamultiactor.cl/2023/12/19/mesa-multiactor-concreta-importante-aporte-a-capra/
12https://www.mesamultiactor.cl/2023/12/10/plataforma-de-informacion-territorial-obtiene-premio-arcgis-webapps-2023/
| · | Awards to students from Liceo Likan Antai, according to the "La Puri" audiovisual short film contest13. |
| · | Participation in the seminar on water scarcity of the Municipality of Casablanca "Development opportunities in the face of a water scarcity scenario" 14. |
| · | Organization of "Diálogos del Agua", Plaza de San Pedro de Atacama 15. |
| · | Organization of an educational trip to the Salar de Atacama basin (students from Liceo Likan Antai) 16. |
| · | Exhibition at the Lithium Forum 17. |
| · | Dissemination of digital campaign: "Un viaje por el agua: descubriendo la cuenca del Salar de Atacama" (A journey through water: discovering the Salar de Atacama basin)18. |
| · | Implementation of the educational campaign "La Voz del Agua: historias unidas por una causa" (The Voice of Water: stories united for a cause).19 |
| · | Participation in a discussion on reforms to the Water Code.20 |
Regarding the company's community relations programs, both the 2022 Sustainability Report and the press report on SQM's regular activities, such as support for: neighborhood baby soccer tournaments; kindergartens; seminars (lithium); open houses; agricultural, women's, artisan, Ckunza language, elderly, health (cancer of mothers), culture (Filzic), recycling, inclusion, certifications (IRMA 75) programs. In addition, there are projects such as: Drinking water plant in Camar community; itinerant dental clinics (2) and community pharmacy in San Pedro de Atacama, among others.
Regarding voluntary contributions and social value-sharing programs executed for the commune of San Pedro de Atacama in 2022, the company reports an item of USS 11,605,616.
In relation to the CORFO-SQM lease agreement associated with the Salar de Atacama, the contributions are broken down as follows:
| · | US$ 25.5 million (2021 contribution) for the Regional Government and Municipalities of San Pedro de Atacama, María Elena, and Antofagasta. |
| · | US$ 1.9 million to CORFO for research and development (R&D) activities. |
| · | US$ 10.6 million to the communities that signed an agreement with CORFO. |
With regard to the National Lithium Strategy, in April 2023 - thirteen months into the government's term of office - the President of the Republic announced the National Lithium Strategy, an inter-ministerial work consisting of five axes that seek to give the State control of lithium production, allow private participation and renegotiate the agreements with SQM and Albemarle, the two companies that currently produce lithium, specifically in the Salar de Atacama.
13https://www.mesamultiactor.cl/2023/11/20/mesa-multiactor-premio-a-estudiantes-del-liceo-likan-antai/
14https://www.mesamultiactor.cl/2023/11/09/la-mesa-multiactor-fue-parte-del-seminario-sobre-escasez-hidrica-de-la-municipalidad-de-casablanca/
15https://www.mesamultiactor.cl/2023/10/04/la-musica-y-la-danza-andina-el-conocimiento-academico-y-el-saber-ancestral-le-dieron-vida-a-los-dialogos-del-agua/
16https://www.mesamultiactor.cl/2023/09/13/estudiantes-del-liceo-likan-antai-realizan-un-viaje-por-el-agua/
17https://www.mesamultiactor.cl/2023/09/07/la-mesa-multiactor-expuso-en-el-foro-del-litio/
18https://www.mesamultiactor.cl/2023/08/23/mesa-multiactor-lanza-campana-de-capacitacion-un-viaje-por-el-agua/
19 https://www.mesamultiactor.cl/2023/03/24/con-gran-convocatoria-se-lanzo-la-voz-del-agua/
20https://www.mesamultiactor.cl/2023/01/27/amplia-participacion-en-conversatorio-sobre-reformas-al-codigo-de-aguas/
In response to the announcement, the Council of Atacameño People (CPA), an organization that groups 18 indigenous communities, expressed its rejection of the National Lithium Strategy, accusing the lack of dialogue with the executive and regretting the role of CODELCO as a state-owned company that has shown disrespectful behavior towards the communities.
In December 2023, CODELCO and SQM reached a memorandum of understanding that opens a negotiation stage to finalize in a public-private partnership.
In this context, the Minister of Mining met with CPA, within the framework of the dialogue spaces that have been requested by the indigenous organizations.
| 17.5.3 | Local Hiring Commitments |
In the RCA No. 226/2006 of the " Proyecto Cambios y Mejoras de la Operación Minera en el Salar de Atacama" is stablished the volunteer compromise of annual reporting of local labor contracted for the operation of the project. In based on the check of available in the Project file in the “Sistema Nacional de Información de Fiscalización Ambiental” (SNIFA), there is no information after February 2020, background information provided in the previous report.
Notwithstanding the foregoing, SQM has developed several capacitation and seminaries, informed since November 22 to October 2023 period, based on processes made and raised from the territories. Also, programs aimed at hiring local labor, such as: Employability workshops aimed at improving the situation of the resume and the job interview, or Puerto Cowork, among others.
| 17.5.4 | Social Risk Matrix |
SQM has a Human Rights Risk Matrix, focused on communities and indigenous peoples in the communes of Huara, Pozo Almonte, María Elena, and San Pedro de Atacama, located in the vicinity of the company's operations. In addition, it identifies SQM suppliers and workers.
According to information provided by SQM, by Q1, 2023, have been implemented to date:
| · | Information gathering (Human Rights Impact Assessment (HRIA)) to identify, understand and evaluate potential adverse effects on the human rights of key stakeholders (workers, communities surrounding the project, suppliers). |
| · | Participatory study through surveys and interviews with three stakeholders in the Salar de Atacama (SdA) (communities, workers, and suppliers). |
| · | Survey of controls and action plans that mitigate the identified risks (SoA). |
| · | Consolidation and unification of information to generate the Human Rights Risk Matrix (SoA). |
Accordingly, the next steps refer to:
| · | Conduction of the participatory study for the Carmen Lithium Chemical Plant (PQLC) and Nueva Victoria (NV). |
| · | Development of a Human Rights Risk Matrix for PQLC and NV. |
| 17.6 | Mine closure |
This sub-section contains forward-looking information related to mine closure for the Project. The material factors that could cause actual results to differ materially from the conclusions, estimates, designs, forecasts or projections in the forward-looking information include any significant differences from one or more of the material factors or assumptions that were set forth in this sub-section including prevailing economic conditions continue such that costs are as estimated, projected labor and equipment productivity levels are appropriate at time of closure and estimated infrastructure and mining facilities are appropriate at the time of closure.
| 17.6.1 | Closure, remediation, and reclamation plans |
During the abandonment stage of the Project, the measures established in the Closure Plan Update "Faena Salar de Atacama" approved by the National Geology and Mining Service, through Resolution N°. 1381 of August 09, 2022, will be implemented.
Among the measures to be implemented are the removal of metal structures, equipment, materials, panels and electrical systems, de-energization of facilities, closure of accesses and installation of signage. The activities related to the cessation of operation of the Project will be carried out in full compliance with the legal provisions in force at the date of closure of the Project, especially those related to the protection of workers and the environment.
The Closure Plan Update was approved by the authority, in compliance with the provisions of Law 20.551 that "Regulates the Closure of Mining Sites and Facilities" since 2012. This update includes all closure measures and actions included in the documents of the Environmental Qualification Resolution (RCA) and sectorial Resolutions, including the closure plans Res Exe. N° 768/2009 that approves the project "Planta de Beneficio y Plan de Cierre Faena Salar de Atacama"; Res Exe. N°1909/2012 approving the project "Actualización Planta de Beneficio y Plan de Cierre Faena Salar de Atacama ", and Res Exe. N°1381/2022 approving the Salar de Atacama Mine Closure Plan Update. These actions and measures seek to ensure the physical and chemical stability of the mine after operational cessation.
| 17.6.1.1 | Risk Assessment |
The risk assessment carried out is based on what is indicated in the "Risk Assessment Methodological Guide for the Closure of Mining Works" of March 2014 issued by SERNAGEOMIN. The results of the risk assessment of the remaining facilities indicated that both the evaporation ponds and the waste salt deposits are remaining facilities and will maintain physical and chemical stability. Therefore, the level of risk is low and not significant, so they do not present a risk to people and the environment.
| 17.6.1.2 | Closing Measures |
The following are the closure and post-closure measures for the main or remaining facilities, i.e., those that remain on site after the end of the mine's useful life. In the particular case of lithium mining, the remaining facilities are evaporation ponds (currently 45 km2) and waste salt deposits (currently 17 km2).
Evaporation ponds closure measures include land leveling, road closures, and installation of signage. The waste salts will remain in the disposal areas. Warning signs or signage will be installed, and slopes will be stabilized and shaped to avoid risks to the environment and people.
For the rest of the complementary and auxiliary facilities, the measures also have the objective of protecting the safety of people and animals, and these are basically the removal of structures, road closures, installation of signage, de-energization of facilities and perimeter closures, and land leveling (see Table 17-11).
Table 17-11. Closure measures and actions of the Closure Plan for the Salar de Atacama Mine.
| Facility
Name |
Installation
Type |
Closing Measure | Source | Type of Measure | Means
of Verification |
| Wells | Principal | Land leveling m2 well | Update Closure Plan (Res. Exe. N°1381/2022) | Personal safety | Photographic report |
| Road Closure | Update Closure Plan (Res. Exe. N°1381/2022) | Personal safety | Photographic report | ||
| Signage | Update Closure Plan (Res. Exe. N°1381/2022) | Personal safety | Photographic report | ||
| Salt Deposit | Principal | Slope stabilization and profiling | Risk assessment Closure Plan in process | Personal safety | Photographic report |
| Signage | Risk assessment Closure Plan in process | Personal safety | Photographic report |
Post-closure measures are aimed at ensuring the physical and chemical stability of the facilities, for the care of the environment and people's health. These correspond to maintenance and inspection measures, detailed below (see Table 17-12)
Table 17-12. Post-closure measures of the Closure Plan of the Salar de Atacama Mine.
| Post-closure Measure | Type of Measure | Frequency | Duration of the Measure |
| Maintenance of access closure | Maintenance | Every 5 years | Perpetuity |
| Maintenance of signage | Maintenance | Every 5 years | Perpetuity |
| Inspections | Monitoring | 1 month | Perpetuity |
| 17.6.2 | Closing Costs |
The total amount of the closure of the Salar de Atacama mine site, considering closure and post-closure activities, adds up to 485,807 UF (319,504 UF for closure and 166,303 UF for post-closure). Below is a summary of the costs reported to the authority in the Salar de Atacama Mine Closure Plan Update (see Table 17-13 and Table 17-14).
Table 17-13. Salar De Atacama Mine Site Closure Costs
| Item | Total (UF) | |||
| Total direct closing cost | 153,941 | |||
| Indirect cost and engineering | 69,801 | |||
| Contingencies (20% CD + CI) | 44,749 | |||
| Subtotal | 268,491 | |||
| IVA (19%) | 51,013 | |||
| Closing Plan Amount (UF) | 319,504 | |||
Source: R.E 1381/2022 Closure Plan Update "Faena Salar de Atacama"
Table 17-14. Salar De Atacama Mining Site Post-Closure Costs
| Item | Total (UF) | |||
| Total direct post-closing cost | 101,268 | |||
| Indirect cost and engineering | 15,190 | |||
| Contingencies (20% CD+CI) | 23,292 | |||
| Subtotal | 139,750 | |||
| IVA (19%) | 26,553 | |||
| Post-Closure Plan Amount (UF) | 166,303 | |||
Source: R.E 1381/2022 Closure Plan Update "Faena Salar de Atacama"
The result of the calculation of the useful life for the Salar de Atacama mine in accordance with the provisions of RCA 226/2006 and the Reserves (Annual Report 2019; SQM S.A., 2020) is 22.2 years21. However, the constitution of the guarantees was carried out considering the total cost of the Closure Plan, and a useful life of 8 years, as stated in the Closure Plan. The development of the constitution of guarantees is shown below.
Table 17-15. Guarantee Update of the Salar de Atacama Plant Closure Plan (referential table)
| Period (year) | Amount (UF) | |||||
| 1 | 82,579 | |||||
| 2 | 116,871 | |||||
| 3 | 151,901 | |||||
| 4 | 187,680 | |||||
| 5 | 224,221 | |||||
| 6 | 261,537 | |||||
| 7 | 299,639 | |||||
| 8 | 338,541 | |||||
| 9 | 378,256 | |||||
| 10 | 418,796 | |||||
| 11 | 460,175 | |||||
| 12 | 465,190 | |||||
| 13 | 470,261 | |||||
| 14 | 475,387 | |||||
| 15 | 480,569 | |||||
| 16 | 485,807 | |||||
| 17 | 485,807 | |||||
| 18 | 485,807 | |||||
Source: R.E 1381/2022 Closure Plan Update "Faena Salar de Atacama"
21As of January 2020, the years of remaining useful life begin to be counted.
| 17.7 | Qualified Person´s Opinion |
In terms of environmental studies, permits, plans and relations with local groups, the most relevant situation for SQM's Salar de Atacama mine is that it’s currently undergoing a sanctioning process (Sanctioning File F-041-2016) due to violations detected by the authority during 2016. In this line, SQM has a suitable plan to address this problem that consists of a Refined, Coordinated and Systematized Environmental Compliance Program, which incorporates the observations recorded by the authority, complying with the established contents and criteria and legal requirements to ensure compliance with the infringed requirements, establishing concrete actions to improve knowledge of the environmental systems that make up the Salar de Atacama, recognize the role of the communities and provide greater transparency in the monitoring of environmental variables.
SQM has assumed the need to correct the facts that motivated the initiation of the process in the shortest possible time, and therefore, to date, a significant percentage of the proposed actions have already been implemented or are currently being implemented. Regarding this, a new EIA was submitted to the SEIA in January 2022, to assess the modification to the Contingency Plan, which was one of the infractions detected by the SMA which gave rise to the sanction process.
In addition, however SQM has developed community relations activities, some of the communities existed near the project have shown a high level of opposition to the project. This was observed in the context of the sanction process, where communities have submitted observations and claims against the Compliance Program.
| 18 | CAPITAL AND OPERATING COSTS |
This section contains forward-looking information related to capital and operating cost estimates for the Project. The material factors that could cause actual results to differ materially from the conclusions, estimates, designs, forecasts or projections in the forward-looking information include any significant differences from one or more of the material factors or assumptions that were set forth in this section including prevailing economic conditions continue such that unit costs are as estimated, projected labor and equipment productivity levels, and that contingency is sufficient to account for changes in material factors or assumptions.
As mentioned in previous chapters, SQM is the world’s largest producer of potassium nitrate and iodine and one of the world’s largest lithium producers. It also produces specialty plant nutrients, iodine derivatives, lithium derivatives, potassium chloride, potassium sulfate and certain industrial chemicals (including industrial nitrates and solar salts). The products are sold in approximately 110 countries through SQM worldwide distribution network, with more than 90% of the sales derived from countries outside Chile.
The main facilities to produce lithium and potassium are in the Salar de Atacama and the Salar del Carmen and are distributed in the following areas:
| · | Brine extraction wells |
| · | Evaporation and harvest ponds |
| · | Wet Plants |
| · | Dry plants |
| · | Lithium plants |
| · | Offices, services, warehouses, others |
The investment made in the administrative and operating infrastructure of each of these areas allows for the aggregate capital cost to be known in all the facilities related to lithium and potassium production.
| 18.1 | Capital Costs |
The facilities for lithium and potassium production operations mainly include brine extraction wells, evaporation and harvest ponds, lithium carbonate and lithium hydroxide production plants, dry plants and wet plants for chloride and sulfate potassium, as well as other minor facilities. Offices and services include the following: common areas, hydrogeology assets, water resources, supply areas, powerhouse, laboratories, and research, among others.
At the end of 2020, the capital cost that had been invested in these facilities was close to 2,300 million US dollars. The cost of capital distributed in the areas related to lithium and chloride and sulfate potassium production (see Table 18-1).
Table 18-1. Capital Costs
| Capital Cost | ||||||
| Lithium and Potassium Operations | % | |||||
| 1 | Lithium plants | 28 | % | |||
| 2 | Evaporation and harvest ponds | 27 | % | |||
| 3 | Wet Plants | 17 | % | |||
| 4 | Brine extraction wells | 13 | % | |||
| 5 | Dry Plants | 7 | % | |||
| 6 | Offices, services, warehouses, others | 8 | % | |||
The highest capital cost is invested in “Lithium Production Plants” and “Evaporation and harvest ponds,” which cover about 55% of the capital cost, which when added to the “Wet Plants and Brine Extraction Wells”, covers close to 85% of the entire cost of capital for lithium operations. The main investments are presented in Figure 18-1.
Figure 18-1. Capital Cost of Lithium Operations
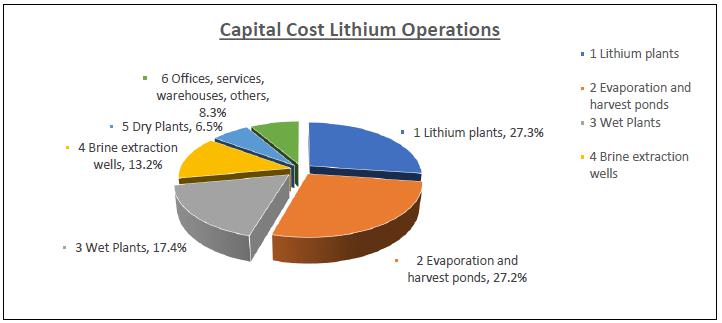
As shown in Figure 18-1, the main investments in lithium and potassium production are “Lithium Carbonate and Lithium Hydroxide Plants”, as well as the “Evaporation and Harvest Ponds. This is followed by the area of “Wet Plants” with 17% and the “Brine Extraction Wells” with 13%.
Over the first 9 months of 2023, the capital investment was close to US$ 440 million, and came mainly from the construction of plants and, in minor degree, for equipment.
| 18.1.1 | Lithium Plants |
SQM produces lithium carbonate at the Salar del Carmen facilities, near Antofagasta, Chile, from highly concentrated lithium chloride made in the Salar de Atacama. The annual production capacity of the lithium carbonate plant at the Salar del Camen is 195,000 tonnes per year, which during the first half of 2024 will reach 210,000 tonnes per year of lithium carbonate.
Regarding the Lithium production plants, the main investments are broken up as shown in Table 18-2 and in Figure 18-2. The lithium carbonate plant covers 81% of the total investment in lithium plants.
Table 18-2. Lithium Plant Investments
| 1 | Lithium Plants | % | ||||
| 1.1 | Lithium Carbonate Plant | 81 | % | |||
| 1.2 | Lithium Hydroxide Plant | 17 | % | |||
| 1.3 | Lithium Sulfate Plant | 2 | % |
Figure 18-2. Capital Costs for Lithium Plants
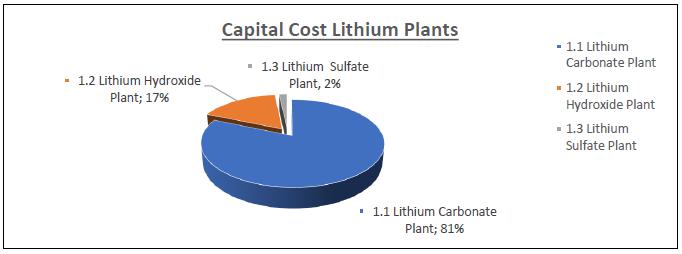
| 18.1.1.1 | Lithium Carbonate Plant |
The main investment in the lithium carbonate plant is in buildings, mechanical equipment (namely filters, centrifugal pumps, other pumps, valves, pipes, ponds, drying equipment, electrical installations and instrumentation and control), as well as warehouses. (Table 18-3 and Figure 18-3).
Table 18-3. Investment in the Lithium Carbonate Plant
| Lithium Carbonate Plant | % | |||
| Buildings | 28 | % | ||
| Filters and microfilter system | 16 | % | ||
| Piping, pumps, valves | 15 | % | ||
| Ponds | 11 | % | ||
| Centrifugal pumps | 8 | % | ||
| Electrical facilities and instrumentation and control | 7 | % | ||
| Tanks (TK) | 5 | % | ||
| Others | 10 | % | ||
Figure 18-3. Capital Cost for the Lithium Carbonate Plant
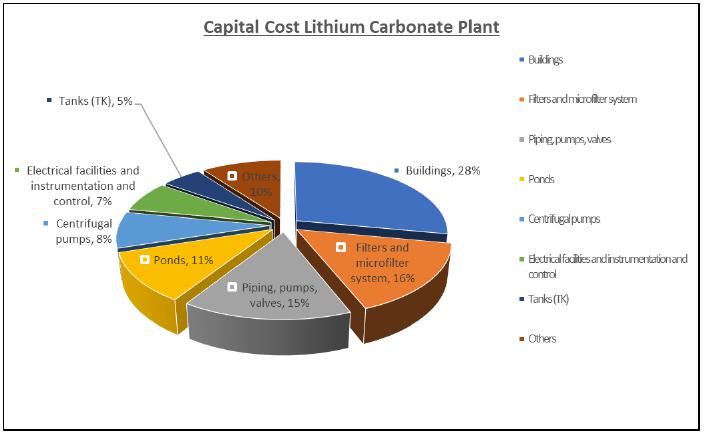
| 18.1.1.2 | Lithium Hydroxide Plant |
The main investments in the lithium hydroxide plant include the crystallizer and buildings (Table 18-4 and Figure 18-4), as well as the drying equipment and thickener.
Table 18-4. Investments in the Lithium Hydroxide Plant
| Lithium Hydroxide Plant | % | |||
| Crystallizer | 52 | % | ||
| Buildings | 28 | % | ||
| Dry Equipment | 12 | % | ||
| Thickener | 8 | % | ||
Figure 18-4. Capital Costs for the Lithium Hydroxide Plant
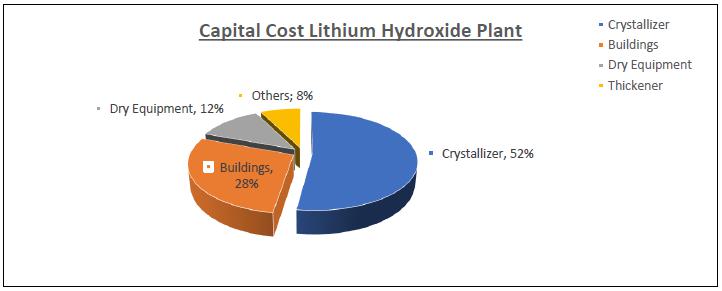
| 18.1.1.3 | Lithium Sulfate Plant |
The main investments in the lithium sulfate plant include buildings and piping, as shown in Table 18-5 and in Figure 18-5.
Table 18-5. Investments in the Lithium Sulfate Plant
| Lithium Sulfate Plant | % | |||
| Buildings | 38 | % | ||
| Piping | 32 | % | ||
| Other fixed assets | 30 | % | ||
Figure 18-5. Capital Cost Lithium Sulfate Plant
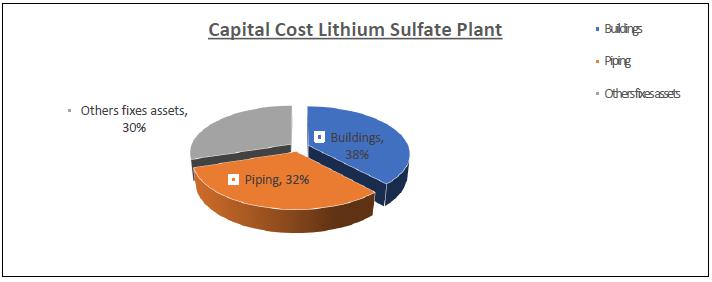
| 18.1.2 | Evaporation and Harvest Ponds |
At the evaporation and harvest ponds, the main investments are in the subareas indicated in Table 18-6 and Figure 18-6. The MOP I and II, and SOP ponds cover 83% of the total investment.
Table 18-6. Main Investments in Evaporation and Harvest Ponds
| Evaporation and harvest ponds | % | |||
| MOP I & MOP II Ponds | 52 | % | ||
| SOP Ponds | 31 | % | ||
| Lithium Ponds | 10 | % | ||
| Others | 7 | % | ||
Figure 18-6. Capital Cost Evaporation and Harvest Ponds
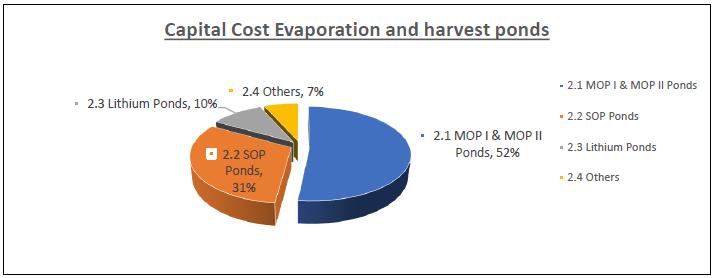
The main investment in the evaporation and harvest ponds is related to the earthworks and pond operation in conjunction with the piping, with little investment in buildings and electrical facilities (see Table 18-7, Table 18-8, and Table 18-9).
Table 18-7. Main Investments in MOP I and MOP II Ponds
| MOP I & MOP II Ponds | % | |||
| Pond | 74 | % | ||
| Piping | 11 | % | ||
| Others | 15 | % | ||
Table 18-8. Main Investments in SOP Ponds
| MOP I & MOP II Ponds | % | |||
| Pond | 74 | % | ||
| Piping | 11 | % | ||
| Others | 15 | % | ||
Table 18-9. Main Investments in Lithium Ponds
| Lithium Ponds | % | |||
| Pond | 71 | % | ||
| Others | 29 | % | ||
| 18.1.3 | Wet Plants |
Regarding the facilities of the wet plants, the main investments are in the subareas shown in Table 18-10. The Muriate of potash, MOP H I, and H II Plants cover 84% of the total investment of wet plants.
Table 18-10. Main Investments in Wet Plants
| Wet Plants | % | |||
| MOP H II Plant | 44 | % | ||
| MOP H I Plant | 40 | % | ||
| SOP H Plant | 10 | % | ||
| PC I | 6 | % | ||
The main investments in the wet plants are found in buildings, pumps, comminution equipment, conveyor belts, filters, flotation equipment and electrical facilities, as shown in Table 18-11.
Table 18-11. Detailed Investments in Wet Plants
| MOP H II Plant / MOP H I Plant / SOP H Plant / PC I | % | |||
| Buildings | 28 | % | ||
| Pumps, Piping & Valves | 11 | % | ||
| Facilities/electrical equipment/Instrumentation/ Engine Control Center/ Electrical Substation | 10 | % | ||
| Comminution equipment | 7 | % | ||
| Filter | 6 | % | ||
| Conveyor Belt | 5 | % | ||
| Flotation equipment | 4 | % | ||
| Other fixed assets | 29 | % | ||
| 18.1.4 | Brine Extraction Wells |
The primary investments in brine extraction wells include the components listed in Table 18-12, with the MOP extraction well area amounting to almost 80% of the total investment.
Table 18-12. Main Investments in Brine Extraction Wells
| Brine Extraction Wells | % | |||
| MOP Wells | 80 | % | ||
| Lithium Wells | 13 | % | ||
| SOP Wells | 7 | % | ||
The main investments in brine extraction wells are found in wells, piping, pumps, and electrical installations (Table 18-13).
Table 18-13. Detailed Investments in Brine Extraction Wells
| MOP Wells / Lithium Wells / SOP Wells | % | |||
| Wells | 35 | % | ||
| Piping and pumps | 35 | % | ||
| Facilities/electrical equipment and autonomous equipment / Engine Control Center / transformer | 13 | % | ||
| Other fixed assets | 16 | % | ||
| 18.1.5 | Dry Plants |
The Muriate of Potash, MOP G III Plant, accounts for 75% of the total investment in the dry plants. The main investments in the dry plants are found in compaction equipment, drying equipment, buildings, and comminution equipment.
| 18.1.6 | Future Investments |
SQM has plans to continue the capacity expansion of its plants, complying with the CORFO quotas agreed. The Lithium Carbonate Plant will be upgraded and expanded to reach a 210 kTonnes in the first half of 2024. Investments in the Lithium Hydroxide plant is on-going to increase its production up to 100 kTonnes per year (expected in 2025).
For the expansion of lithium hydroxide production to 100 kTonnes, an additional investment is anticipated. Part of this investment has been made during 2023 and the construction phase will be completed in 2025.
Projects planned for execution in 2022 through 2024 are presented in Table 18-14. These investments address improving aspects of quality, performance, sustainability, and increased production capacity.
Table 18-14. Projects in Execution (2022 to 2024 Period)
| Projects Grouped by Objective | 2023 | 2024 | Category |
| Well Exploration and Qualification SdA | X | X | Quality and Performance |
| Lithium Well Improvements | X | X | Performance Increase |
| Research Products and Process Optimization SdA | X | X | Performance Increase |
| Lithium Carbonate Plant Quality (70 ktpa) | - | - | Improves Quality |
| Lithium Carbonate Plant Expansion and Quality (120 ktpa) | - | - | Increase Capacity |
| Quality Lithium Carbonate Plant (180 ktpa) | X | - | Improves Quality |
| Evaporation Plant (120-180 ktpa) | - | - | Sustainability |
| Site Facilities (120-250 ktpa) | X | X | Increase Capacity |
| Line 3 Lithium Hydroxide (+ Extensions) | X | - | Increase Capacity |
| Quality and Performance Lithium Hydroxide | - | - | Performance Increase |
| Sustainability and Environment | X | X | Sustainability |
| Plant Support | X | X | Lift |
Major future investments projected in the potassium and lithium operations include:
| 1. | Wells: Future investments in Lithium wells. |
| 2. | Ponds and Harvest: in Lithium Ponds and future investments. |
| 3. | Wet Plants: investment in MOP H I and MOP H II Plants. |
| 4. | Lithium Plants: |
| a) | Lithium Carbonate Plant: current and future investments. |
| b) | Lithium Hydroxide Plant: current and future investments. |
| c) | Lithium Sulfate Plant: current and future investments. |
| 18.2 | Operating Costs |
SQM’s use of up-to-date technology together with the high concentrations of lithium and other characteristics of the Salar de Atacama (e.g., high evaporation rates and concentration of other minerals) allows it to be one of the lowest cost producers in the world. SQM also produces lithium hydroxide at the same plant at the Salar del Carmen, next to the lithium carbonate operation. The lithium hydroxide facility has a production capacity of 26,000 tonnes per year. Currently SQM is in the process of increasing this production capacity to 100,000 tonnes per year.
During the first 9 months of 2022, the operating cost that has been spent to produce lithium and potassium chloride and sulfate at the Salar de Atacama and Salar del Carmen plants was close to 2,540 million dollars. The distribution of the operating cost is presented in Table 18-15.
Table 18-15. Distribution of Operating Costs
| Share | ||||||
| Description of operational cost | % | |||||
| 1 | CORFO rights and other agreements | 72 | % | |||
| 2 | Raw materials and consumables | 10 | % | |||
| 3 | Contractor works | 5 | % | |||
| 4 | Depreciation expense | 4 | % | |||
| 5 | Employee benefit expenses | 3 | % | |||
| 6 | Freight / Transportation cost of products & Export Costs | 3 | % | |||
| 7 | Operation transports | 2 | % | |||
| 8 | Others | 1 | % | |||
The highest operating cost corresponds to Corfo rights, as it has a direct relation with the lithium price.
The following provides additional detail on a few key operating cost items:
| a) | Raw Materials and Consumables |
In the production of the Salar de Atacama, the main inputs in the MOP and SOP are: KCL flotation agents, HCl, vegetable oil, iron oxide, and anti-caking / anti-dust.
In the case of the Salar del Carmen, the main inputs for its production are: soda ash, lime, HCl, and water.
The main raw material to produce potassium chloride, lithium carbonate and potassium sulfate are the brine extracted from the operations in the Salar de Atacama. Other important raw materials and consumables include sodium carbonate (used in the production of lithium carbonate, sulfuric acid, kerosene, anti-caking and anti-dust agents, and ammonium nitrate), bags for the packaging of final products, electricity purchased from electricity generation companies, and gas and oil to generate heat.
| b) | CORFO Rights and Other Agreement Costs |
According to the terms of the Lease Agreement CCHEN established a total accumulated sales limit, as amended by the CORFO Arbitration Agreement in January 2018, of up to 349,553 tonnes of metallic lithium (1,860,670 tonnes of lithium carbonate equivalent). This is in addition to the approximately 64,816 tonnes of metallic lithium (345,015 tonnes of lithium carbonate equivalent) remaining from the originally authorized amount (from the Arbitration Agreement of 2018) in the aggregate for all periods while the Lease Agreement is in force. The Project Agreement expires on December 31, 2030.
There are payment agreements with CORFO that are related to the sale prices of lithium carbonate and lithium hydroxide according to the Table 18-6.
Table 18-16. Payment Agreements with CORFO
Payments 1
| Li2CO3 | LiOH | |||||||||||||
| US$/MT | % | US$/MT | % | |||||||||||
| <4,000 | 6.80 | <5,000 | 6.80 | |||||||||||
| 4,000-5,000 | 8.00 | 5,000-6,000 | 8.00 | |||||||||||
| 5,000-6,000 | 10.00 | 6,000-7,000 | 10.00 | |||||||||||
| 6,000-7,000 | 17.00 | 7,000-10,000 | 17.00 | |||||||||||
| 7,000-10,000 | 25.00 | 10,000-12,000 | 25.00 | |||||||||||
| >10,000 | 40.00 | >12,000 | 40.00 | |||||||||||
Source Company
(1) Effective as of April 10, 2018
(2) % of final sale price
(3) % of FOB price
Table 18-16 shows that in the case of Lithium carbonate, for a price lower than $4,000 USD/tonne, 6.8% of the final sale price is paid to CORFO. In the case of lithium hydroxide, for a price lower than $5,000 USD/tonne, 6.8% of the final sale price is paid to CORFO. The payment to CORFO could be a maximum of 40% of the final sale price, for lithium carbonate prices higher than $10,000 USD/tonne and lithium hydroxide prices greater than $12,000 USD/tonne.
Additionally, there are contribution agreements to development and to the surrounding communities, which are summarized below:
Contribution to the Regional Development and Communities:
| · | Annual contribution of USD 11 to 19 million for Research and development efforts. |
| · | Annual contribution of USD 10 to 15 million to neighboring communities of the Salar de Atacama. |
| · | Annual contribution of 1.7% of SQM Salar´s sales per year to regional development. |
Foregoing accounts for the variation in operational costs depend on the current sales prices for lithium carbonate and lithium hydroxide, as well as the contribution to regional development.
| c) | Contractor Works: |
The majority correspond to costs associated with contractors such as EXCON, “Rent Construction Machinery and ground movements”, which contributes to the rental of machinery for construction and ground movements.
Additionally, there are costs for “Intercompany Corporate Services” that are invoiced between subsidiaries.
The balance refers to many other contractors that complement the workforce for operation of the facilities.
| d) | Employee Benefit Expenses |
This cost is related to the salaries and benefits of about 1,900 SQM employees for operations, that includes: Salar de Atacama, Lithium Production plants in Salar del Carmen, as well as Environment, Hydrogeology, Supply Chain, Development, and Innovation.
| e) | Freight / Product transportation Cost & Export Costs: |
This corresponds to the expenses associated with the sales of finished products from Tocopilla to customers (subsidiaries or third parties) and related export costs.
| f) | Operation Transport Costs: |
This mainly corresponds to costs associated with product transport from the Salar de Atacama Plant to the Port, transportation of brine from the Salar de Atacama to the Salar del Carmen, and to a lesser extent the transportation of personnel on-site.
| 19 | ECONOMIC ANALYSIS |
This section contains forward-looking information related to economic analysis for the Project. The material factors that could cause actual results to differ materially from the conclusions, estimates, designs, forecasts, or projections in the forward-looking information include any significant differences from one or more of the material factors or assumptions that were set forth in this sub-section including estimated capital and operating costs, project schedule and approval timing, availability of funding, projected commodities markets, and prices.
The Economic Analysis considers the actual concession agreement with CORFO, as it is at the end of 2023, where the Project Agreement expires on December 31, 2030. SQM declares that, on December 27, 2023, SQM and Codelco, Chilean state-owned company which had been mandated by the Chilean Government to negotiate its participation in the lithium operations in the Salar de Atacama, signed a memorandum of understanding (MoU), which, among other matters, established the ground terms and conditions for the definitive agreements which will allows SQM Salar to exploit mineral resources in the Salar de Atacama until 2060. The full text of the MoU is referenced in the Exhibit 94.4 of the Report on Form 20-F. See also “— Risks Relating to Chile — The new National Lithium Strategy announced by the Chilean government in April 2023 has created and may continue to create uncertainty in the Chilean lithium industry, which could have a material adverse effect on our business performance or the value of our shares and ADSs.” The definitive agreements are subject to negotiation, and we cannot guarantee that said agreements will be implemented.”
Cashflows related to the production of Li2CO3, LiOH and KCl for the period 2024 to 2030 with the investments projected for a 210 ktpy carbonate plant and 100 ktpy hydroxide plant expansion have been considered, assuming the expansion to 210 ktpy and 100 ktpy as the case base. Revenue from the sale of each of the products is accounted for, as well as the current projection of their prices. In the case of the long-term price of Li2CO3, a base value of 12,110 USD/tonne has been considered with a long-term KCl price of 300 USD/ton. The price of LiOH was assumed to be 5% higher than the price of Li2CO3. As it was shown in Figure 16 4, it is important to note that lithium prices have had an unexpected behavior: at the end of 2022 and 2023, the lithium price was close to 78,000 and 13,500 USD/tonne respectively. For this analysis, a conservative scenario is assumed, based in the market study described in chapter 16, where the long term lithium carbonate price at 12,110 USD/tonne will be required to sustain new project development.
The economic analysis considers operational and non-operational costs addressing raw materials and consumables, salaries and benefits to workers, contractors and others, as well as those related to depreciation, CORFO Rights, and other regional agreements. The after-tax discounted cashflow considers a discount rate of 10% with a tax of around 28%. To calculate the contributions to CORFO, the polynomial in force since April 2018 has been considered (see Table 18-14). Payment agreements with CORFO), which depends on the sale price of Li2CO3. Once the cashflow for the Base Case (250 ktpy) was determined, the sensitivities to sales prices and operating costs were analyzed.
| 19.1 | Production and Revenues |
The estimated sales production of lithium carbonate, lithium hydroxide, and potassium chloride for the LOM until 2030 is presented in Table 19-1
Table 19-1. Projected Sales of Lithium and KCl
| 2024 | 2025 | 2026 | 2027 | 2028 | 2029 | 2030 | ||||||||||||||||||||||||||
| Lithium Carbonate | ktpy | 170 | 140 | 110 | 110 | 110 | 110 | 110 | ||||||||||||||||||||||||
| Lithium Hydroxide | ktpy | 40 | 70 | 100 | 100 | 100 | 100 | 70 | ||||||||||||||||||||||||
| Potassium Chloride | ktpy | 1,200 | 1,200 | 1,200 | 1,200 | 1,200 | 1,200 | 1,200 | ||||||||||||||||||||||||
Note: Reserves of Chapter 12 are declared based on brine recovery factors associated with the evaporation ponds (i.e. the point of reference being after passing through the evaporation ponds), while the final sales product is presented here; note that values are rounded if comparing totals.
It is expected that the sale of the first two products is the same as the production while annual sales of potassium chloride at 1,200 ktpy considers build-up and management of inventory in stockpiles.
The estimated revenues for Lithium and for Potassium Chloride are presented in Table 19-2.
Table 19-2. Revenues of Lithium and KCl
| 2024 | 2025 | 2026 | 2027 | 2028 | 2029 | 2030 | ||||||||||||||||||||||||
| Lithium Carbonate Sales | ktpy | 170 | 140 | 110 | 110 | 110 | 110 | 110 | ||||||||||||||||||||||
| Lithium Hydroxide Sales | ktpy | 40 | 70 | 100 | 100 | 100 | 100 | 70 | ||||||||||||||||||||||
| Potassium Chloride Sales | ktpy | 1,200 | 1,200 | 1,200 | 1,200 | 1,200 | 1,200 | 1,200 | ||||||||||||||||||||||
| Lithium Carbonate Price | USD/tonne | 12,110 | 12,110 | 12,110 | 12,110 | 12,110 | 12,110 | 12,110 | ||||||||||||||||||||||
| Lithium Hydroxide Price | USD/tonne | 12,716 | 12,716 | 12,716 | 12,716 | 12,716 | 12,716 | 12,716 | ||||||||||||||||||||||
| Potassium Chloride Price | USD/tonne | 300 | 300 | 300 | 300 | 300 | 300 | 300 | ||||||||||||||||||||||
| Lithium Revenues | M US$ | 2,567 | 2,585 | 2,604 | 2,604 | 2,604 | 2,604 | 2,604 | ||||||||||||||||||||||
| KCI Revenues | M US$ | 360 | 360 | 360 | 360 | 360 | 360 | 360 | ||||||||||||||||||||||
| 19.2 | Production Costs |
The main costs to produce Lithium and KCL involve the following components: raw materials and consumables, salaries and benefits to workers, depreciation, contractors, CORFO Rights and other Agreements, as well as other factors (including operation transport, freight and transportation, cost of products, export cost, operation lease, insurance, depreciation of assets for right of use (IFRS 16 Contract), investment plan expenses, expenses related to Variable Financial Leasing (IFRS No. 16 contracts), mining concessions, amortization expense, provision of costs for site closure).
The estimate of total costs per item was obtained from approximate estimates of its unit cost (for the 12 months ending 3Q2022), considering a variable part and fixed part. These unit costs are shown in Table 19-3.
Table 19-3. Main Costs of Lithium and KCl production
| Main Cost | Estimated Unit Cost | Estimated % Variable Cost |
| Raw Materials and Consumables | 2,000 USD/tonne | 80% Variable |
| Employee Benefits | 800 USD/tonne | 60% Variable |
| Depreciation | 900 USD/tonne | |
| Contractors | 1,000 USD/tonne | 60% Variable |
| CORFO Rights and other Agreements | Calculated | |
| Others | 1,300 USD/tonne | 15% Variable |
According to the terms of the Lease Agreement, regarding lithium production, CCHEN established a total accumulated sales limit, as amended by the CORFO Arbitration Agreement in January 2018. Additionally, there are payment agreements with CORFO that are related to the sale prices of Lithium Carbonate and Lithium Hydroxide according to what is indicated in chapter 18.2 Operating Costs letter c) "CORFO Rights and other agreements cost".
The estimate of total operational costs at the Salar de Atacama and Salar del Carmen is shown in Table 19-4 for Lithium and KCl.
Table 19-4. Operating Costs
| 2024 | 2025 | 2026 | 2027 | 2028 | 2029 | 2030 | ||||||||||||||||||||||||
| Raw Materials and Consumables | M US$ | 396 | 396 | 396 | 396 | 396 | 396 | 396 | ||||||||||||||||||||||
| Employee Benefits | M US$ | 149 | 149 | 149 | 149 | 149 | 149 | 149 | ||||||||||||||||||||||
| Depreciation | M US$ | 144 | 144 | 144 | 144 | 144 | 144 | 144 | ||||||||||||||||||||||
| Contractors | M US$ | 186 | 186 | 186 | 186 | 186 | 186 | 186 | ||||||||||||||||||||||
| CORFO Rights and other Agreements | M US$ | 544 | 548 | 552 | 552 | 552 | 552 | 552 | ||||||||||||||||||||||
| Others | M US$ | 208 | 208 | 208 | 208 | 208 | 208 | 208 | ||||||||||||||||||||||
| Total Costs M US$ | 1,628 | 1,632 | 1,635 | 1,635 | 1,635 | 1,635 | 1,635 | |||||||||||||||||||||||
| 19.3 | Capital Investments |
SQM produces lithium carbonate at Salar del Carmen facilities, near Antofagasta, Chile, from highly concentrated lithium chloride produced in the Salar de Atacama. To fully utilize the billing quota agreed with CORFO (~ 2 Mtonnes between 2021 - 2030), it will be necessary to expand the Lithium Carbonate plant to 210 ktonnes.
The expansion to 210 kTonnes will be finished during first months of 2024. Additionally, the expansion of the lithium hydroxide plant underway, and it is expected to reach a capacity of 100 kTonnes in 2025. Additionally, there are other projects in execution for improving aspects related to quality, performance, sustainability, and increased production capacity.
The estimated investments during the period of 2023 to 2030 are presented in Table 19-5.
Table 19-5. Estimated Capital Investments
| 2024 | 2025 | 2026 | 2027 | 2028 | 2029 | 2030 | ||||||||||||||||||||||||
| Investments | M US$ | 628 | 735 | 60 | 60 | 60 | 60 | 60 | ||||||||||||||||||||||
| 19.4 | Discounted Cashflow Analysis |
The key assumptions used in the economic model consider a discount rate of 10% and tax rate of 27%. The estimated Net Present Value (NPV), before and after financial costs and taxes, is presented in Table 19-6 for the LOM. CORFO payments are included in Costs.
Table 19-6. Estimated Cashflow Analysis
| 2024 | 2025 | 2026 | 2027 | 2028 | 2029 | 2030 | ||||||||||||||||||||||||||||
| Revenues | M US$ | - | 2.927 | 2.945 | 2.964 | 2.964 | 2.964 | 2.964 | 2.964 | |||||||||||||||||||||||||
| Costs | M US$ | - | -1.628 | -1.632 | -1.635 | -1.635 | -1.635 | -1.635 | -1.635 | |||||||||||||||||||||||||
| Investments | M US$ | - | -628 | -735 | -60 | -60 | -60 | -60 | -60 | |||||||||||||||||||||||||
| Depreciation | M US$ | - | 144 | 144 | 144 | 144 | 144 | 144 | 144 | |||||||||||||||||||||||||
| Cashflow before Financial Costs and Taxes | M US$ | - | 815 | 723 | 1.412 | 1.412 | 1.412 | 1.412 | 1.412 | |||||||||||||||||||||||||
| Financial Costs (FC) | M US$ | - | -40 | -40 | -40 | -40 | -40 | -40 | -40 | |||||||||||||||||||||||||
| Taxes | - | 27 | % | -209 | -184 | -371 | -371 | -371 | -371 | -371 | ||||||||||||||||||||||||
| Cashflow after Financial Costs and Taxes | M US$ | - | 566 | 498 | 1.002 | 1.002 | 1.002 | 1.002 | 1.002 | |||||||||||||||||||||||||
| Net Present Value (NPV) before Financial Cost & Taxes. (M US$) | 10 | % | $ | 5,763 | ||||||||||||||||||||||||||||||
| Net Present Value (NPV) after Financial Cost & Taxes. (M US$) | 10 | % | $ | 4,065 | ||||||||||||||||||||||||||||||
The summary estimate of payment sums to CORFO as well as other agreements and taxes in the period is as follows:
Table 19-7. Estimated Sum Of Payments to CORFO And Other Agreements and Taxes (2024-2030)
| CORFO Rights and other Agreements | Sum in M US$ | 3,851 | ||||
| Taxes | Sum in M US$ | 2,256 | ||||
| Total CORFO Rights and other Agreements and taxes | 6,097 |
| 19.5 | Sensitivity Analysis |
Sensitivity analysis provides insight into the key components that have the biggest impact on the Project. Table 19-8shows the assumptions for the Base Case.
Table 19-8. Assumptions for the Base Case
| Base Case | ||||||||
| Assumptions | Unit | Quantity | ||||||
| Production Plant | ktpy | 210 | ||||||
| Lithium Carbonate Price | US$/tonne |
12,110 (2024-2030) |
||||||
| Lithium Hydroxide Price | US$/tonne | 5% over Lithium Carbonate Price | ||||||
| Potassium Chloride Price | US$/tonne | 300 | ||||||
| Estimated Cost + CORFO Rights and other Agreements | US$/tonne | 5,700 + calculate (18.1% of Revenues for 12,110) | ||||||
| Taxes | % | 27 | ||||||
| Discount rate | % | 10 | ||||||
| 19.5.1 | Lithium Carbonate Price |
Lithium carbonate long term price sensitivities were analyzed with variations from USD 10,000 / tonne to 16,000 USD / tonne. As 2022 reached new highs in prices and during 2023 the prices went close to the market study, the base case of 12,110 USD/ tonne was considered. The pessimistic (conservative) case considered 10,000 USD/ tonne, while the optimistic case assumed 16,000. The remaining assumptions of the base case were maintained, and results are shown in Table 19-9.
Table 19-9. Lithium Carbonate Price Sensitivity at 250 ktpy
Price
Sensitivities |
Lithium Carbonate Sensitivity | Net Present Value
(NPV) after FC & Taxes (M US$) |
NPV Variation (M US$) | |||||||||||||||||||||||||||||||||||||
| Scenarios | Unit | Base | Pessimistic | Optimistic | Base | Pessimistic | Optimistic | Base | Pessimistic | Optimistic | ||||||||||||||||||||||||||||||
| Lithium Carbonate Price | USD/tonne | 12,110 | 10,000 | 16,000 | 4,065 | 3,112 | 5,770 | 0 | -953 | 1,705 | ||||||||||||||||||||||||||||||
| 19.5.2 | Operational Cost Sensitivities |
Increases in costs related to Raw Materials and Consumables, Employee Benefits, Contractors, and Others affect the NPV to be earned. The following table shows the variations in NPV considering a 20% increase and 20% decrease in the costs indicated above, maintaining the rest of the base case assumptions.
Table 19-10. Cost Sensitivities
| Costs Sensitivities | Net
Present Value (NPV) after FC & Taxes |
NPV Variation (M | |||||||
| Scenarios | Unit | Sensitivity | (M US$) | US$) | |||||
| Lithium Carbonate to 250 ktpy | USD/tonne | 12,110 | 4,065 | 0 | |||||
| Lithium Carbonate to 250 ktpy & 20% increase costs | USD/tonne | 12,110 | 3,396 | -669 | |||||
| Lithium Carbonate to 250 ktpy & 20% decrease costs | USD/tonne | 12,110 | 4,733 | 668 | |||||
| 19.5.3 | Potassium Chloride Price |
Table 19-11 shows the variations in NPV considering a 20% decrease and 20% increase in the KCl sales prices, maintaining the rest of the base case assumptions. Values are presented in millions of USD and the NPV is after taxes.
Table 19-11. KCl Price Sensitivities
| Price Sensitivities | KCl Sensitivity | Net Present
Value (NPV) after FC & Taxes (M US$) |
NPV Variation (M US$) | |||||||||||||||||||||||||||||||||||||
| Scenarios | Unit | Base | Pessimistic | Optimistic | Base price |
Pessimistic -20% price |
Optimistic +20% price |
Base | Pessimistic | Optimistic | ||||||||||||||||||||||||||||||
| price KCI | KCI | KCl | KCl | |||||||||||||||||||||||||||||||||||||
| Assuming a Lithium Carbonate at 210 ktpy | USD/tonne | 300 | 240 | 360 | 4,064 | 3,813 | 4,316 | 0 | -252 | 251 | ||||||||||||||||||||||||||||||
| 19.5.4 | CORFO Rights and Other Agreement Sensitivities |
Variations in the production of lithium carbonate, as well as in its prices, affect the contributions that must be paid to CORFO and other regional agreements. Table 19-12 shows the variation in contributions according to the change in production and variation in prices. The remaining assumptions of the base case are maintained.
Table 19-12. CORFO Rights and other Agreements Sensitivities
| CORFO Rights and other Agreements Sensitivities |
Sensitivity | Payments to CORFO
an Agreements (M US$) |
Payments Variation (M US$) | |||||||||||||||||||||||||||||||||||||
| Scenarios | Unit | Base | Pessimistic | Optimistic | Base | Pessimistic | Optimistic | Base | Pessimistic | Optimistic | ||||||||||||||||||||||||||||||
| Lithium Carbonate Price to 250 ktpy | USD/tonne | 12,110 | 10,000 | 16,000 | 3,851 | 2,564 | 6,326 | 0 | -1,287 | 2,475 | ||||||||||||||||||||||||||||||
| 19.5.5 | Tax Sensitivities |
Variations in the price of lithium carbonate affect the contributions that must be paid to the State for taxes.
Table 19-13 shows the differences in tax payments according to the variation in price. The rest of the assumptions of the base case are maintained.
Table 19-13. Tax Sensitivities
| Tax Sensitivities | Sensitivity | Taxes (MUSD) | Taxes Variation (MUSD) | |||||||||||||||||||||||||||||||||||||
| Scenarios | Unit | Base | Pessimistic | Optimistic | Base | Pessimistic | Optimistic | Base | Pessimistic | Optimistic | ||||||||||||||||||||||||||||||
| Lithium Carbonate Price to 250 ktpy | USD/tonne | 12,110 | 10,000 | 16,000 | 2,246 | 1,739 | 3,154 | 0 | -507 | 908 | ||||||||||||||||||||||||||||||
The sum of the contribution to the State of Chile for Taxes and for CORFO Rights and Others is shown in Table 19-14 considering the production cases of 210 ktpy with Li2CO3 prices of 10,000, 12,110, and 16,000 USD/tonne.
Table 19-14. Contribution to the State of Chile (Taxes, CORFO Rights and Others)
| CORFO Rights and other Agreements Sensitivities + Taxes Sensitivities |
Sensitivity | CORFO Rights and
other Agreements Sensitivities + Taxes (MUSD) |
CORFO Rights and
other Agreements Sensitivities +Taxes - Variation (MUSD) |
|||||||||||||||||||||||||||||||||||||
| Scenarios | Unit | Base | Pessimistic | Optimistic | Base | Pessimistic | Optimistic | Base | Pessimistic | Optimistic | ||||||||||||||||||||||||||||||
| Lithium Carbonate Price to 250 ktpy | USD/tonne | 12,110 | 10,000 | 16,000 | 6,097 | 4,302 | 9,480 | 0 | -1,795 | 3,383 | ||||||||||||||||||||||||||||||
| 20 | ADJACENT PROPERTIES |
Outside of SQM’s properties of the Salar de Atacama, Albemarle has a lease agreement with CORFO to extract and produce lithium from the brines stored in the salt flat deposit. Albemarle is a North American mining company (former Rockwood and former Sociedad Chilena del Litio, SCL) that rents an area of 137 km2 and operates in the southeastern portion of the salt flat. Their operation is dedicated to the extraction of lithium at a fixed extraction quota of 200,000 tonnes until 2043, however in 2017, a new agreement was made between Albemarle and CORFO which authorizes a tripling of the production of technical-grade and battery-grade lithium salts. On January 28, 2022, Albemarle in conjunction with SRK Consulting (U.S.), Inc., prepared a SEC TRS for a Pre-Feasibility Study; this report contains details of Albemarle’s estimated resource and reserve over a projected period of 21 years, as well as relevant processing, environmental, and financial information. An updated TRS was prepared on February 14, 2023.
There are additionally 1,370 OMA belongings, called Nobody's Land (Tierra de Nadie), which is a protection strip for the extraction area of the Chilean Lithium Society (currently Albermarle), whose patents are protected by Albemarle (Figure 20-1).
The QP has been unable to verify the information relating to adjacent properties and cautions that the information relating to the adjacent properties is not necessarily indicative of the mineralization on the SQM’s Salar de Atacama Project.
Figure 20-1. Properties Adjacent to SQM’s Concessions, Salar de Atacama.
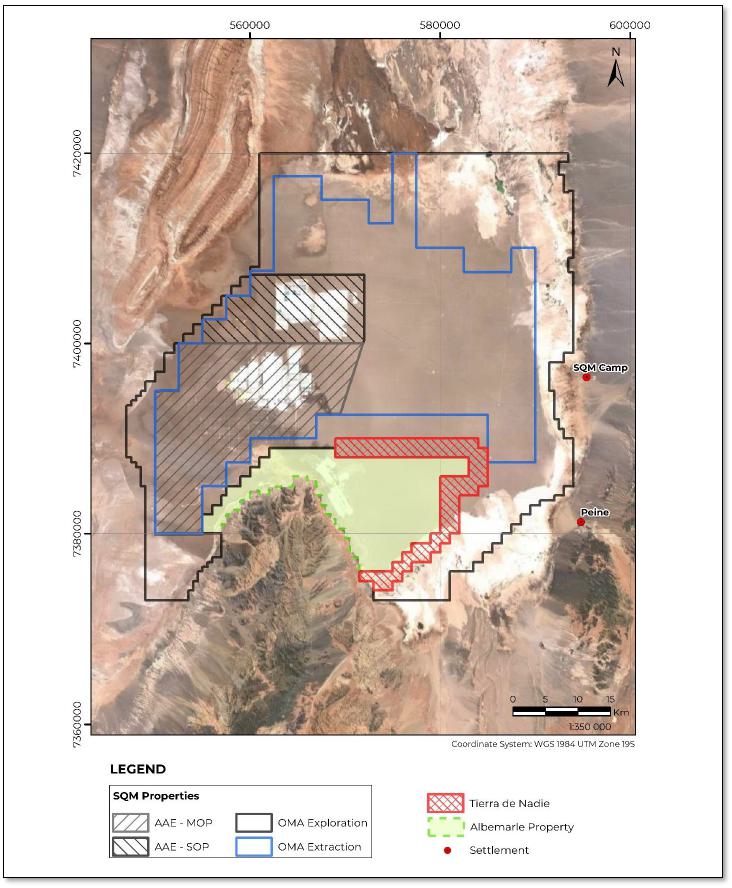
| 21 | OTHER RELEVANT DATA AND INFORMATION |
The QPs are not aware of any other relevant data or information to disclose in this TRS.
| 22 | INTERPRETATION AND CONCLUSIONS |
This section contains forward-looking information related to the Project. The material factors that could cause actual results to differ materially from the conclusions, estimates, designs, forecasts or projections in the forward-looking information include any significant differences from one or more of the material factors or assumptions that were forth in this sub-section including geology and Mineral Resources, and Mining and Mineral Reserves.
Based on the results of this study, it has been concluded that the Salar de Atacama Project in operation for the treatment of brines to obtain lithium and potassium salts is economically viable according to financial and reserve parameters.
SQM has vast experience in the treatment of brines and salts; their track record includes vast knowledge of the mineral resources and raw materials during the different processing stages, including operational data on reagent consumption and costs.
The QP considers that the exploration data accumulated by the Company is reliable and adequate for the purpose of the declared mineral resource and reserve estimates. All reported categories were prepared in accordance with the resource classification pursuant to the SEC's new mining rules under subpart 1300 and Item 601(96)(B)(iii) of Regulation S-K (the "New Mining Rules").
| 22.1 | Conclusions |
Geology and Mineral Resources
| · | The Salar de Atacama nucleus is mainly constituted by evaporite deposits which include chlorides, sulfates, with occasional organic matter and a minor percentage of clastic sediments and thin tuff layers; local fault systems and related displacement have contributed to deformation of the various geological units. |
| · | The drilling and sampling procedures, as well as the analysis and verification of data comply with industry norms and are adequate for the mineral resource estimation. The described procedures are in accordance with SEC's new mining rules. |
| · | Geophysical information utilized by SQM includes both data obtained from surface survey lines and downhole geophysical instruments deployed in boreholes. It includes data obtained by SQM as well as other organizations and companies. |
| · | The large database of drilled wells with lithologic and brine chemistry information are sufficient to determine Measured, Indicated, and Inferred resources. |
| · | As of December 31, 2023, the Measured + Indicated Mineral Resources (exclusive of Mineral Reserves) of SQM are 8.2 million tonnes of lithium and 79.8 million tonnes of potassium, while the Inferred Mineral Resources are 2.6 million tonnes of lithium and 34.9 million tonnes of potassium. For the Measured + Indicated, the mean grade of lithium and potassium is 0.18% and 1.77%, respectively. |
| · | The average Mineral Resource concentrations are above the cut-off grades of 0.05% lithium and 1% potassium, reflecting that the potential extraction is economically viable. |
In the QP’s opinion, the Mineral Resource was estimated in accordance with industry standards for brine projects, and the Mineral Resource categorization conservatively utilizes two separate methods (geostatistical parameters and the hydrogeological understanding of each unit).
Mining and Mineral Reserves
| · | The geological and hydrogeological interpretations, metallurgical hypotheses, and extensive field data are sufficient to define and declare Proven and Probable Reserves within SQM’s concessions of the Salar de Atacama. It is the QP's opinion that the hydrogeological characterization, hydraulic testing, sampling, and laboratory methods meet the standards for a lithium project of this development status. Additionally, the amount of data obtained from exploration and testing is considerable compared to other lithium brine projects. The characterization of the brine deposit is believed to have the level of detail necessary to support the Reserve Estimate declared in this report. |
| · | It is the QP’s opinion that the preparation of the samples and the analytical procedures used by SQM in the Salar de Atacama follows general accepted industry standards and practices that supports the analysis and results provided in this TRS. |
| · | The process of brine extraction in the Salar de Atacama by pumping wells is limited by the location of the wellfield, well efficiency, extraction rates, and specific retention of the porous media (among other factors), implying that only a proportion of the Resource can be extracted. |
| · | Predicted pumping weighted concentrations from the extraction wells are above the specified cut-off grades of lithium (0.05%) and potassium (1%), and numerical model results show that a majority of the total extracted mass during the LOM comes from Measured Resources. |
| · | The current mine life ends on December 31, 2030, and the predicted brine production is approximately 210 Mm³ for the 2024-2030 period, with a decreasing total flow rate from 2024 (1,166 L/s) to 2030 (822 L/s). |
During the first 3 years of the LOM, the Proven Reserves correspond to 0.70 million tonnes of LCE and 4.20 million tonnes of KCl. During the last 4 years of the LOM, the Probable Reserves correspond to 0.75 million tonnes of LCE and 4.04 million tonnes of KCl. These estimates consider process losses of Li and K after extraction from the production wellfield, as the reserves are estimated for processed brine, after passing through the evaporation ponds.
Metallurgy and Mineral Processing
According to the QP in charge of metallurgy and resource treatment:
| · | The physical, chemical metallurgical test work performed to date has been adequate to establish appropriate processing routes for the resource. |
| · | Metallurgical test data for the resources planned to be processed in the projected 2030 production plan indicate that the recovery methods are reasonable and optimizable. |
| · | The samples used to generate the metallurgical data are representative and support the estimates of future performance. |
| · | The effluent treatment requirements for impregnated brine and reinjected brine are considered adequate, since there is a brine management plan for optimized recovery of lithium for the former and a plan to reduce total brine extraction for the latter. |
| · | There is a high degree of interaction with process and operations management that has leveraged staff expertise and ideas generated by the research and development team to move quickly from experimental phases to direct plant application. |
| · | The optimization of operations and maintenance activities are carried out under the Lean management methodologies approach (called M1 in SQM), which has successfully penetrated in the different levels. This fact was confirmed during field visits to the different operations of the company. |
Infrastructure
| · | SQM’s production processes are carried out in two key facilities: Salar de Atacama and Salar del Carmen. High production facilities are supported by requisite supplies and infrastructure elements such as administration buildings, laboratories, warehouses, roads, power lines, water wells and water lines, reagent storage and other auxiliary facilities. |
| · | The installed infrastructure is operational and provides all necessary support for ongoing operations, as summarized in this report. |
Environment/Social Aspects/Closure
| · | According to the information presented, compliance with the reporting and follow-up commitments established in the environmental instruments was observed, including the Hydrogeological Environmental Follow-up reports, Biotic Environmental Follow-up, brine and water extraction monitoring, surface water monitoring, production limitation, personnel training, implementation of community training programs for environmental monitoring, habilitation of more hydrometeorological stations, increased monitoring frequency, updating of plans and procedures, among others, which are available in the Environmental Monitoring System22 and Compliance Programs23 of the National System of Environmental Monitoring Information, as well as on SQM's website24 . |
| · | In relation to the EIA under evaluation, it is noted that the OAECAS25 throughout the process have requested the submission of more background information mainly with respect to: the determination and justification of the area of influence of the environmental components, especially with the hydrogeology component, the conceptual hydrogeological models of the Borde Este, Soncor, Aguas de Quelana, Núcleo del Salar, Peine, Tilopozo systems; and historical variation of the lagoon bodies, complement the baselines of vegetation and flora, report information differentiating between zonal vegetation and azonal vegetation, more background on the prediction and evaluation of the environmental impact of the project or activity, clarification of the Extraction Reduction Plan, implementation of mitigation measures associated with the evaluated impacts presented in the modifications of the Environmental Monitoring Plan (PSA) and the Early Warning Plan (PAT) of RCA 226/2006, and the Plan of mitigation, remediation and compensation measures. |
22 https://snifa.sma.gob.cl/UnidadFiscalizable/Ficha/839
23 https://snifa.sma.gob.cl/ProgramaCumplimiento/Ficha/975
24 https://www.sqmsenlinea.com/
25 Bodies of the State Administration with environmental authority
| · | Regarding the social and environmental aspects related to the Project, it should be noted that the environmental procedures carried out previously do not define specific commitments. A similar situation is observed with the current evaluation of the Environmental Impact Study (EIA) of the project "Plan for the Reduction of Extractions in the Salar de Atacama". |
| · | The company has agreements with some of the indigenous communities close to the Project for different aspects related to commitments defined in the different environmental authorizations and with programs associated with corporate guidelines for community relations. These activities are reported in the annual sustainability reports. |
| · | During 2022, the fourth version of the Compliance Program (PdC) was approved. The information on the follow-up of the actions associated to community aspects can be founded on the SNIFA platform of the Superintendence of the Environment (SMA). |
| · | SQM has a Human Rights Risk Matrix and an Ethical Sustainability and Human Rights Policy. The company does not have a specific Social Risk Matrix. There have been initiatives to evaluate these aspects, however, progress is unknown. |
Cost and Economic Analysis
| · | By the end of 2020, the distributed capital cost in the invested areas related to lithium and potassium chloride and potassium sulfate production is close to US$2.3 billion. |
| · | The largest capital cost is invested in the "Lithium Production Plants" and in the "Evaporation and Collection Ponds", together covering about 55% of the capital cost, which added to the "Wet Plants and Brine Extraction Wells", covers about 85% of the entire capital cost of the lithium operations. |
| · | SQM has plans to continue expanding the capacity of its plants. The lithium carbonate plant will be upgraded and expanded to reach 210 kTon and investments in the lithium hydroxide plant are underway to increase production to 30 kTon per year. |
| · | The highest operating cost is in raw materials and consumables, employee benefit expenses, depreciation expenses, contractor works, CORFO rights and other agreements, operational transports, freight, and transportation costs of products, covering 96% of the operating cost. |
| · | Production sensitivities, sales prices, and operating costs have been calculated for the revenue stream for the Base Case. This allows estimating revenues in situations other than the Base Case, which have a certain probability of occurring during operation between 2024 and 2030. |
| 22.2 | Risks |
Mineral Resource Estimate
| · | The use of effective porosity versus specific yield could result in an overestimation of the estimated brine volume, however based on the geological and hydrogeological characterization of the OMA (Chapters 6 and 7), the site does not present significant volumes of material, such as clay, where specific retention can be significant (when compared to specific yield). This implies that effective porosity is believed to be an adequate parameter for the brine volume estimate. |
| · | SQM’s brine chemistry and porosity labs are not accredited, however a Round-Robin analysis was performed for brine samples to confirm the QA/QC procedures and overall accuracy and precision. To further mitigate this uncertainty, various QA/QC procedures are in place for measured brine chemistry and effective porosity (Chapters 8 and 9). |
| · | Near the ponds, and reinjection points, potential infiltration could have affected the natural reservoir chemistry, however those areas were conservatively categorized as less certain (e.g., Measured Resource to Indicated Resource). |
Mineral Reserve Estimate
| · | Potential brine dilution can occur over time due to lateral inflows. To address this, representative historical concentrations were assigned for modeled lateral inflows and direct recharge concentrations during the LOM were specified as 0. |
| · | Density driven flow could impact the hydraulic gradient near environmental sensitive areas, however the numerical model limit is set within the salt flat nucleus where brine density does not vary significantly based on measured values, and therefore does not take this into account. |
| · | Potential pond infiltration represents an additional source of uncertainty, and it was intentionally not modeled to avoid introducing an “artificial” source of lithium and potassium in the reserve estimate. |
| · | Hydraulic parameters were calibrated based on available information, however future exploration and testing could improve the assigned model parameters and updated water balance; to alleviate this uncertainty, Probable Reserves were specified for the last 4 years of the LOM. |
| · | A steady-state model calibration was not conducted given the long period of SQM’s historical production; however, a comprehensive flow and transport calibration was conducted for the 2015 to 2020 (inclusive) period and a validation period was also analyzed between 2021, 2022 and 2023. |
| · | Future Albemarle pumping is unknown; however, a maximum rate of 442 L/s was conservatively assumed for the entire LOM based on their recent environmental assessment. |
Metallurgy and Mineral Processing
| · | There is a risk that the process, as currently defined, will not produce the expected quantity and/or quality required due to the mobile nature of the Salar de Atacama brine mineral resource. In this sense, monitoring and studying the variability of key species concentrations and their ratio (Mg/Li, SO4/Ca) is essential and relevant for production and engineering development decisions. |
| · | A relevant aspect is the projection of the SO4/Ca ratio which impacts the overall efficiency levels of the lithium production system. This ratio must be controlled and forecasted for the 2023-2030 production period in order to identify the need to incorporate a liming plant to supply calcium, during the sequential evaporation process in the ponds, in adequate quantity to avoid lithium sulfate precipitation. |
| · | Another risk arises from the new recovery methodologies that underpin the plan to increase the lithium system's performance. It is possible that the expected results, so far estimated, may be lower than the markers for various factors and therefore, the target of stepwise yield increase may be difficult to achieve. |
Operating Permits/Environment
| · | With respect to the EIA under evaluation, its environmental approval is subject to satisfactory responses to the observations made by the authority in ICSARA 3, whose presentation is due on February 19, 2024. It should be noted that the activation of the Indigenous Consultation Process will delay the closure of the project's environmental assessment process, given that this process is not time limited. |
| · | For the PdC, the risk of non-compliance could imply applicable sanctions such as revoking of the RCA, closure of the project, or fines for infraction. Also, this can be reclaimed by the community generating conflicts. |
| · | Changes in policies involving the exploitation of natural resources, taxes, and other matters related to the industry may adversely affect the business, financial condition and results of operations. |
| · | Possible latent risks are observed related with social aspects that could hinder SQM’s operations. Specifically, those referring to the public policies associated with the lithium extraction that commit agreements with the State, as well as the times associated with obtaining environmental permits that could delay the execution and implementation of the projects in the pipeline. Regarding the latter, the expansion of the citizen participation and the Indigenous Consultations Processes (PCI, in Spanish) of the current Project submitted to environmental processing. |
Cost and Economic Analysis
| · | The technical and economic evaluation presented in this TRS are reasonable. However, it is also recognized that the results are subject to many risks, including, but not limited to the following: raw material and currency assumptions, and unforeseen inflation of capital or operating costs. Production sensitivities, sales prices, and operating costs have been calculated for the revenue stream for the Base Case. This allows for the estimation of revenue in situations other than the Base Case, which have a certain probability of occurring during operation between 2024 and 2030. |
| 23 | RECOMMENDATIONS |
Mineral Resource Estimate
| · | Utilize an independent methodology on collected core (e.g., Relative Brine Release Capacity testing) to confirm the estimated porosity values. |
| · | Confirm the accuracy and precision of SQM internal laboratory implementing an external QA/QC check with a representative number of brine samples as a routine procedure. |
Mineral Reserve Estimate
| · | Conduct a sensitivity analysis of key model parameters such as K, Sy, recharge rates and Albemarle Pumping scheme, and evaluate the differences compared to the base case scenario. |
| · | Extend the model calibration period annually and continually to improve the model parameters based on new field data and hydraulic testing. |
| · | Recently, subsidence phenomena have been observed in the vicinity of the KCL plant. For this reason, SQM has been recommended to assess potential security risks and impact on critical production infrastructure. |
Metallurgy and Mineral Processing
| · | During operations, level control and careful monitoring of deleterious elements in the solutions will be required to minimize impacts and maximize recoveries. |
| · | For an optimization of lithium recovery operations, there are several technologies that should be studied to evaluate the capability of each as an alternative to ensure the company's long-term future production. In particular, membrane filtration technology processes, which are driven by pressure gradient, electric or thermal field, as well as new processes under development, such as ionic filtration (LIS), have received considerable attention recently due to multiple advantages shown by available studies, therefore it would be advisable to study the possibility of using them for lithium recovery by evaluating costs, energy efficiency, achieved performance, selectivity and environmental impact. |
| · | In reference to the tests on the use of a calcium source to avoid and/or reduce losses due to lithium sulfate precipitation, it is first necessary to carry out a projection study of the variation of the calcium content in the brines throughout the useful life of the mine. |
| · | In addition to the above, it is recommended to carry out a comparative study of two or more calcium sources, other than CaCl2, to have alternative reagent alternatives to control the eventual precipitation of lithium sulfate. |
| · | Variability impact studies of ionic ratios such as sulfate-magnesium (SO4/Mg), potassium-magnesium (K/Mg), sulfate-calcium (SO4/Ca) and lithium-magnesium (Li/Mg) are recommended to evaluate different scenarios and the success of the operations. In addition, a study of this type will inform the decision to carry out engineering works for operational continuity and to optimize the performance of the operations in the future. |
Environment/Social Aspects/Closure
| · | Continue and/or adapt the execution of the actions committed in the Compliance Program (PdC), in matters related to community compromises. |
All the above recommendations are considered within the context of the estimated CAPEX/OPEX in this TRS and do not imply additional costs for their execution.
| 24 | REFERENCES |
AguaEx SPA. (2020). Interpretación Sísmica Avanzada de Alta Resolución: Caracterización del subsuelo mediante un método de sísmica de reflexión . SQM Salar S.A.
Alonso, H., & Risacher, F. (1996). Geoquímica del Salar de Atacama, parte 1: origen de los componentes y balance salino. Revista Geológica de Chile, 23, 2, p. 113-122.
AMEC. (2020). Guidelines for resource and reserve estimation for brines. Association of Mining and Exploration Companies. 5 pág.
Anderson; Woessner. (2015). Applied Groundwater Modeling: Simulation of Flow and Advective Transport. Elsevier.
Arriagada, C. (2009). Estudio geológico-estructural de la cuenca del Salar de Atacama. Informe Inédito para SQM Salar S.A.
Arriagada, C.; Cobbold, P.; Roperch, P. (2006). Salar de Atacama basin: A record of compressional tectonics in the central Andes since the mid-Cretaceous. Tectonics 25 (TC1008): 1-19.
Becerra, J., Henriquez, S., & Arriagada, C. (2014). Geología del área Salar de Atacama, región de Antofagasta. Servicio Nacional de Geología y Minería.
Bevacqua, P. (1992). Geomorfología del salar de Atacama y estratigrafía de su núcleo y delta, Región de Antofagasta, Chile. Universidad Católica del Norte, Facultad de Ingeniería y Ciencias Geológicas, Antofagasta, 284 p.
Bruggen, J. (1942). Geología de la Puna de San Pedro de Atacama y sus formaciones de areniscas y arcillas rojas. Santiago.
Carmona, V. (2002). Gènesi i funcionament hidroquímic del Salar d'Atacama (N. de Xile). Tesis para optar al Grado de Doctor en Ciencias, Universidad de Barcelona, España.
Comisión Minera Chile. (2021). Guía complementaria al código CH 20235 para informar sobre recursos y reservas minerales en salmueras.
CRIRSCO. (2013). International Reporting Template for the public reporting of exploration results, mineral resources and mineral reserves. Committee for mineral reserves international reporting standards. 41 pág.
CRIRSCO. (2019). International Reporting Template for the public reporting of exploration results, mineral resources and mineral reserves. Committee for mineral reserves international reporting standars. 79 pág.
Dalannais. (1979). Hidrogeología del borde oriental del salar de Atacama. Antofagasta. Tesis de Grado, Universidad del Norte, Departamento de Geología, 157p.
Díaz del Río, G., Bonilla, R., & Peralta, F. (1972). Geología de superficie, sub-superficie y geoquímica del salar de Atacama. Santiago. Informe Inédito para CORFO, Departamento de Recursos Hidráulicos, 162p.
DICTUC & TESAM HARTLEY S.A. (1995). Proyecto para producción de 300.000 toneladas anuales de cloruro de potasio. Antofagasta: Informe EIA ordenado por MINSAL S.A. para su evaluación ante COREMA (Aprobado).
Dingman. (1965). Cuadrángulo San Pedro de Atacama: Provincia de Antofagasta. escala 1:50.000. IIG, Carta Geológica de Chile (n.14): 29 p., ils., 1 mapa, Santiago. Coordenadas: 22º45' - 23º00' / 68º15' - 68º00'. Escala: 1:50.000.
Dingman. (1967). Geology and Ground-Water Resources of the Northern Part of the Salar de Atacama, Antofagasta Province, Chile. U.S.Geological Survey Bulletin (n.1219): pp.49.
ESI. (2020). Groundwater Vistas Version 8.
Geobiota. (2013). Ampliación planta de secado y compactado de cloruro de potasio. Antofagasta: Informe DIA ordenado por SQM SALAR S.A. para su evaluación ante SEA (Aprobado).
Geohidrología Consultores. (2007). Plan Minero 2006: Caracterización geológica e hidrogeológica de pozos de exploración y producción. Informe Inédito para SQM Salar 44 páginas.
Hains, D. H. (2012). CIM Best practice guidelines for reporting lithium brine resources and reserves. Ontario: Canadian Institute of Mining, Metallurgy and Petroleum. 10 pág.
Harza. (1978). Desarrollo de los recursos de agua en el norte grande, Chile / Por HARZA Engineering Company International; con el Proyecto CHI-69/535 CORFO-D.G.A-CCC-P.N.U.D. para las Naciones Unidas. Por ONU, HARZA Engineering Company International.
Houston, J., Butcher, A., & Ehren, P. (2011). The Evaluation of Brine Prospects and the Requirement of Modifications to Filing Standards. Economic Geology.
Hurlbert, S., & Keith, J. (1979). Distribution and spatial patterning of flamingos in the Andean altiplano. Auk 96; 328-342.
Hydrotechnica. (1987). Evaluation of Brines Reserves in the Salar de Atacama. Santiago: Volume II, Boreholes Logs.
Ide. (1978). Cubicación del yacimiento salar de Atacama. Memoria para optar al título de Ingeniero Civil de Minas. Universidad de Chile, Facultad de Ciencias Físicas y Matemáticas, Departamento de Minas, Santiago, 144p.
IGSA Consultores. (2001). Ampliación de planta de carbonato de litio a 32.000 ton/año. Antofagasta: Informe DIA ordenado por SQM SALAR S.A. para su evaluación ante COREMA (Aprobado).
IGSA Consultores. (2002). Cambio de combustible a gas natural en planta de carbonato de litio. Antofagasta: Informe DIA ordenado por SQM SALAR S.A. para su evaluación ante COREMA (Aprobado).
IGSA Consultores. (2002). Producción de cloruro de potasio a partir de sales de carnalita de potasio. Antofagasta: Informe DIA ordenado por SQM SALAR S.A. para su evaluación ante COREMA (Aprobado).
IGSA Consultores. (2004). Planta de hidróxido de litio. Antofagasta: Informe DIA ordenado por SQM SALAR S.A. para su evaluación ante COREMA (Aprobado).
IGSA Consultores. (2005). Cambios y mejoras de la operación minera en el Salar de Atacama. Antofagasta: Informe EIA ordenado por SQM SALAR S.A. para su evaluación ante COREMA (Aprobado).
Jaime Illanes & Asociados. (2017). Ampliación faena Salar del Carmen. Antofagasta: Informe DIA ordenado por SQM SALAR S.A. para su evaluación ante SEA (Aprobado).
Jaime Illanes & Asociados. (2019). Ampliación de la Planta de Carbonato de Litio a 180.000 ton/año. Antofagasta: Informe DIA ordenado por SQM SALAR S.A. para su evaluación ante SEA (Aprobado).
Jaime Illanes & Asociados. (2021). Aumento de Capacidad y Optimización Producción Planta de Litio Carmen. Antofagasta: Informe DIA ordenado por SQM SALAR S.A. para su evaluación ante SEA (Aprobado).
Jordan, T. E., Mpodozis, C., Muñoz, N., Blanco, P., Pananont, M., & Gardeweg, M. (2007). Cenozoic subsurface stratigraphy and structure of the Salar de Atacama basin, northern Chile. Journal of South American Earth Sciences 23: 122-146.
Jordan, T., Muñoz, N., Hein, M., Lowenstein, T., Godfrey, L., & Yu, J. (2002). Active faulting and folding without topographic expression in an evaporitic basin, Chile. Geol. Soc. Am. Bulletin, 114(11), 1406–1421.
Köppen. (1936). Handbuch der klimatologie, das geographische System der Klimate. Berlin.
Moraga, A., Chong, G., Fortt, M., & Henríquez, H. (1974). Estudio geológico del Salar de Atacama, provincia de Antofagasta. IIG, Boletín (n.29): 56 p.
Mpodozis, C., Blanco, N., Jordan, T., & Gardeweg, M. (2005). Estratigrafía y deformación del Cenozoico tardío en la región norte de la cuenca del Salar de Atacama: La zona de Vilama-Pampa Vizcachitas. Proceedings 9th Congreso Geológico Chileno, Puerto Varas, 2, 598–603.
Niemeyer, H. (2013). Geología del área de Cerro Lila-Peine, Región de Antofagasta. Servicio Nacional de Geología y Minería, Carta Geológica de Chile, ISSN 0717-7283.
Noncontrol Chile S.A. (2011). Aumento de Capacidad de Procesamiento de Carnalita de Potasio. Antofagasta: Informe DIA ordenado por SQM SALAR S.A. para su evaluación ante SEA (Aprobado).
Norcontrol Chile S.A. (2009). Aumento de capacidad de secado y compactado de cloruro de potasio. Antofagasta: Informe DIA ordenado por SQM SALAR S.A. para su evaluación ante SEA (Aprobado).
Norcontrol Chile S.A. (2009). Modificación planta sulfato de potasio. Antofagasta: Informe DIA ordenado por SQM SALAR S.A. para su evaluación ante SEA (Aprobado).
Norcontrol Chile S.A. (2010). Ampliación planta sulfato de potasio. Antofagasta: Informe DIA ordenado por SQM SALAR S.A. para su evaluación ante SEA (Aprobado).
Norcontrol Chile S.A. (2010). Nueva planta de secado y compactado de cloruro de potasio. Antofagasta: Informe DIA ordenado por SQM SALAR S.A. para su evaluación ante SEA (Aprobado).
Panday, S. (2021). Block-Centered Transport (BCT) Process for Modflow-USG, v 1.8.0.
Parada, M. (1990). Flamencos en el norte de Chile. Distribución, abundancia y fluctuaciones estacionales del número. En: Parada M, J Rottmann & C Guerra (eds). I Taller Internacional de Especialistas en Flamencos Sudamericanos, Corporación Nacional Forestal-Chile y New York Zoological Society, pp. 52-66.
Pramar Ambiental Consultores. (2007). Ampliación de planta de carbonato de litio a 48.000 ton/año. Antofagasta: Informe DIA ordenado por SQM SALAR S.A. para su evaluación ante SEA (Aprobado).
Pramar Ambiental Consultores. (2009). Ampliación producción cloruro de potasio Salar. Antofagasta: Informe DIA ordenado por SQM SALAR S.A. para su evaluación ante SEA (Aprobado).
Ramírez, C., & Gardeweg, M. (1982). Hoja Toconao, Región de Antofagasta: Santiago. Servicio Nacional de Geología y Minería, Carta Geológica de Chile No58 (1:250.000), p. 1-121, Santiago.
Reilly, T. E.; Harbaugh, A. W. (2004). Guidelines for Evaluating Groundwater Flow Models. US Geological Survey Scientific Investigations Report 2004-5038 USGS. Reston, Virginia.
S&P Ingeniería Ambiental Ltda. (1998). Planta de secado y compactado de cloruro de potasio. Antofagasta: Informe DIA ordenado por SQM SALAR S.A. para su evaluación ante COREMA (Aprobado).
S&P Ingeniería Ambiental Ltda. (1999). Poza auxiliar de descarte planta de carbonato de litio. Antofagasta: Informe EIA ordenado por MINSAL S.A. para su evaluación ante COREMA (Aprobado).
S&P Ingeniería Ambiental Ltda. (1999). Reemplazo parcial de pozas de evaporación solar del proyecto de producción de sulfato de potasio y ácido bórico. Antofagasta: Informe DIA ordenado por SQM SALAR S.A. para su evaluación ante COREMA (Aprobado).
Servicio Nacional de Geología y Minería (SERNAGEOMIN). (2014). GUIA METODOLOGICA DE EVALUACIÓN DE RIESGOS PARA EL CIERRE DE FAENAS MINERAS. Santiago de Chile: Versión 01.
SQM. (2020). FORM 20-F. Washington, D.C.: United States Securities and Exchange Commision.
SQM. (2021). Modelo Conceptual Operacional Salar de Atacama.
SQM. (2021a). Estimación de Química de Salmuera (Tomo 4). Actualización para Informe 20F 2020.
SQM. (2021e). Informe de Metodología, Procedimientos y Clasificación de Recursos y Reservas. Santiago.
SQM. (2022). Technical Report Summary: Operation Report, Salar de Atacama. Sociedad Química y Minera de Chile.
SRK. (2020). Estudio Hidrogeológico Salar de Atacama. Informe preparado para SQM Salar S.A.
Susana Henriquez, J. B. (2014). Geología del Área San Pedro de Atacama, Región de Antofagasta. Servicio Nacional de Geología y Minería, Carta Geológica de Chile.
TESAM HARTLEY S.A. (1996). Proyecto producción de 17.500 ton/año de carbonato de litio. Antofagasta: Informe EIA ordenado por SQM SALAR S.A. para su evaluación ante COREMA (Aprobado).
TESAM HARTLEY S.A. (1997). Producción de sulfato de potasio, ácido bórico, con ampliación de capacidad productiva de cloruro de potasio. Antofagasta: Informe EIA ordenado por MINSAL S.A. para su evaluación ante COREMA (Aprobado).
USDA. (2001). Guidelines for soil quality assessment in conservation planning. USDA. Natural Rresources Conservation Service. Soil Quality Institute.
Water Management Consultants. (1993). Salar de Atacama. South West Corner Investigation. Santiago: Informe inédito de Water Management Consultants para Minsal S.A. Código 1150/2.
Xterrae. (2011). Modelo Geológico del Salar de Atacama. SQM Salar S.A.
Xterrae. (2015). Soporte a la Exploración y Caracterización de Recursos y Reservas de Salmuera en el Salar de Atacama. SQM Salar S.A.
| 25 | RELIANCE ON INFORMATION PROVIDED BY REGISTRANT |
The qualified person has relied on information provided by the registrant in preparing its findings and conclusions regarding the following aspects of modifying factors:
| 1. | Macroeconomic trends, data, and assumptions, and interest rates. |
| 2. | Projected sales quantities and prices. |
| 3. | Marketing information and plans within the control of the registrant. |
| 4. | Environmental matter outside the expertise of the qualified person, including permissions and environmental authorizations. |
| 5. | Data and Analysis Related to the Exploratory Phases of the Project |
Table 25-1 provides a list of the information provided by the Registrant (SQM) for matters discussed in the Technical Report Summary.
Table 25-1. Information Provided by the Registrant (SQM)
| Classification | Technical Report Summary Section | Reliance |
| Legal Aspects | Section 3 | The QP is not qualified to offer a legal perspective regarding information and documentation on: Mineral titles, surface land agreements, current permitting status, royalties, and other agreements. However, they have summarized this document and have designated SQM personnel as reviewers to confirm the statements contained therein. |
| General Information | Section 4 | Information about The Project was provided by the Registrant (SQM). The information consists of consultant and SQM report, as well as correspondence. The QP performs a review to validate the information provided by the Registrant (SQM). |
| General Information | Section 5 | The historical information was provided by the Registrant (SQM) and others technical studies. |
| General Information | Sections 6 & 7 | Information about The Project was provided by the Registrant (SQM). The information consists of consultant and SQM report, as well as correspondence. The QP performs a review to validate the information provided by the Registrant (SQM) |
| General Information | Sections 8 & 9 | The information about the Project was provided by the Registrant (SQM). The information consists of the chemical analysis process, carried out in the Salar de Atacama Analysis Laboratory (Lab SA), and the porosity analysis, carried out in the Salar de Atacama Porosity Laboratory (Lab POR). The QP performs a review to validate the information and treatment of the data provided by the Registrant (SQM) |
| General Information | Sections 10, 13, 14 & 15 | The Registrant (SQM) provided the QP with the information related to the test procedures, risk factors, operational factors, analytical laboratories and sampling, representative samples, process and recovery factors. The QP performs a review to validate the information provided by the Registrant (SQM) |
| Resource Information | 11 | The Registrant (SQM) provides the QP with all information that complies with S-K-1300 regulations (wellfield location, OMA Extraction Zone information, historical production data, hydraulic parameter values, etc.). The QP is responsible for validating the information provided by the Registrant (SQM). and provide future recommendations based on new measurement methodologies associated with the nature of The Project. |
| Classification | Technical Report Summary Section | Reliance |
| Reserve Information | 12 | The QP is responsible for analyzing the information provided by the Registrant (SQM), conducting a detailed calibration analysis, and creating a temporary reserve classification. The QP validates the information and provides future recommendations based on the changes in the aforementioned factors. |
| Macroeconomic trend | Sections 16, 18 & 19 | The Registrant (SQM) provides documents related to the production capacity of the Project and its expected growth projections, as well as public knowledge documents that argue the Project's competitiveness within the lithium and its derivatives market. It also provides information related to operating costs. The QP validates and determines the feasibility of the Project based on operational costs, revenues, taxes, and other factors. |
| Environmental scope information | Section 17 | It is the responsibility of the Registrant (SQM) to provide the QP with information related to the environmental scope (baseline studies, environmental management and monitoring plans, social risk matrices and community impact implications, permits, remediation plans, mine closure, among others). |