UNITED STATES
SECURITIES AND EXCHANGE COMMISSION
Washington, D.C. 20549
FORM 40-F
◻ REGISTRATION STATEMENT PURSUANT TO SECTION 12 OF THE SECURITIES
EXCHANGE ACT OF 1934
OR
⌧ ANNUAL REPORT PURSUANT TO SECTION 13 (a) OR 15(d) OF THE SECURITIES EXCHANGE ACT
OF 1934
For the fiscal year ended December 31, 2023
Commission file number: 001-13422
AGNICO EAGLE MINES LIMITED
(Exact name of Registrant as specified in its charter)
Ontario, Canada |
|
1040 |
|
98-0357066 |
|
(Province of other jurisdiction of incorporation or organization) |
|
(Primary Standard Industrial Classification Code Number) |
|
(I.R.S. Employer Identification Number) |
145 King Street East, Suite 400
Toronto, Ontario, Canada M5C 2Y7
(416) 947-1212
(Address and telephone number of Registrant's principal executive offices)
Davies Ward Phillips & Vineberg LLP
900 Third Avenue, 24th Floor, New York, New York 10022
Attention: Jeffrey Nadler
(212) 588-5505
(Name, address (including zip code) and telephone number (including area code) of agent for service in the United States)
Securities registered or to be registered pursuant to Section 12(b) of the Act:
Common Shares, without par value |
|
AEM |
|
New York Stock Exchange |
(Title of each class) |
|
(Trading Symbol(s)) |
|
(Name of each exchange on which registered) |
Securities registered or to be registered pursuant to Section 12(g) of the Act:
None
(Title of Class)
Securities for which there is a reporting obligation pursuant to Section 15(d) of the Act:
None
(Title of Class)
For annual reports, indicate by check mark the information filed with this Form:
⌧ Annual information form ⌧ Audited annual financial statements
Indicate the number of outstanding shares of each of the issuer’s classes of capital or common stock as of the close of the period covered by the annual report.
497,299,441 Common Shares as of December 31, 2023
Indicate by check mark whether the Registrant (1) has filed all reports required to be filed by Section 13 or 15(d) of the Exchange Act during the preceding 12 months (or for such shorter period that the Registrant was required to file such reports) and (2) has been subject to such filing requirements for the past 90 days.
Yes ⌧ No ◻
Indicate by check mark whether the Registrant has submitted electronically every Interactive Data File required to be submitted pursuant to Rule 405 of Regulation S-T (§232.405 of this chapter) during the preceding 12 months (or for such shorter period that the Registrant was required to submit such files).
Yes ⌧ No ☐
Indicate by check mark whether the registrant is an emerging growth company as defined in Rule 12b-2 of the Exchange Act.
Emerging growth company ◻
If an emerging growth company that prepares its financial statements in accordance with U.S. GAAP, indicate by check mark if the registrant has elected not to use the extended transition period for complying with any new or revised financial accounting standards† provided pursuant to Section 13(a) of the Exchange Act. ◻
† The term "new or revised financial accounting standard" refers to any update issued by the Financial Accounting Standards Board to its Accounting Standards Codification after April 5, 2012.
Indicate by check mark whether the registrant has filed a report on and attestation to its management's assessment of the effectiveness of its internal control over financial reporting under Section 404(b) of the Sarbanes-Oxley Act (15 U.S.C. 7262(b)) by the registered public accounting firm that prepared or issued its audit report. ⌧
If securities are registered pursuant to Section 12(b) of the Act, indicate by check mark whether the financial statements of the registrant included in the filing reflect the correction of an error to previously issued financial statements. ☐
Indicate by check mark whether any of those error corrections are restatements that required a recovery analysis of incentive-based compensation received by any of the registrant’s executive officers during the relevant recovery period pursuant to §240.10D-1(b). ◻ Agnico Eagle Mines Limited (“Agnico Eagle” or the “Company”) is a Canadian issuer eligible to file its annual report pursuant to Section 13 of the Securities Exchange Act of 1934, as amended (the “Exchange Act”), on Form 40-F pursuant to the multi-jurisdictional disclosure system of the Exchange Act (the “MJDS”).
EXPLANATORY NOTE
The Company is a “foreign private issuer” as defined in Rule 405 under the Securities Act of 1933, as amended. Equity securities of the Company are accordingly exempt from Sections 14(a), 14(b), 14(c), 14(f) and 16 of the Exchange Act pursuant to Rule 3a12-3.
FORWARD-LOOKING INFORMATION
This Annual Report on Form 40-F and the exhibits attached hereto (this “Form 40-F”) contain “forward-looking statements” within the meaning of the United States Private Securities Litigation Reform Act of 1995. These statements relate to, among other things, the Company’s plans, objectives, expectations, estimates, beliefs, strategies and intentions and can generally be identified by the use of words such as “anticipate”, “believe”, “budget”, “could”, “estimate”, “expect”, “forecast”, “intend”, “likely”, “may”, “plan”, “project”, “schedule”, “should”, “target”, “will”, “would” or other variations of these terms or similar words. Forward-looking statements in this Form 40-F include, but are not limited to, the following:
| ● | the Company’s outlook for 2024 and future periods, including estimates of metal production, ore grades, ore tonnage, recovery rates, project timelines, drilling results, life of mine, total cash costs per ounce, all-in sustaining costs per ounce, minesite costs per tonne, other expenses, cash flows; |
| ● | statements regarding future earnings and the sensitivity of earnings to gold and other metal prices; |
| ● | anticipated levels or trends for prices of gold and by-product metals mined by the Company or for exchange rates between currencies in which capital is raised, revenue is generated or expenses are incurred by the Company; |
| ● | estimates of future capital expenditures, exploration expenditures, development expenditures and other cash needs, and expectations as to the funding thereof; |
| ● | estimated timing and conclusions of studies, analyses and evaluations undertaken by the Company or others; |
| ● | statements regarding the projected exploration, development and exploitation of ore deposits, including estimates of the timing of such exploration, development and production or decisions with respect thereto; |
| ● | estimates of mineral reserves and mineral resources and their sensitivities to gold prices and other factors, ore grades and mineral recoveries and statements regarding anticipated future exploration results; |
| ● | anticipated timing of events at the Company’s mines, mine development projects and exploration projects; |
| ● | methods by which ore will be extracted or processed; |
| ● | estimates of future costs and other liabilities for environmental remediation; |
| ● | statements concerning expansion projects, mill throughput, optimization and projected exploration, including costs and other estimates upon which such projections are based; |
| ● | statements regarding the Company's ability to obtain the necessary permits and authorizations in connection with its current or proposed operations and the anticipated timing thereof; |
| ● | statements regarding the sufficiency of the Company's cash resources; |
| ● | statements regarding anticipated legislation and regulations, including with respect to climate change, and estimates of the impact thereof on the Company; |
| ● | other anticipated trends with respect to the Company’s capital resources and results of operations; and |
| ● | statements regarding the impact of pandemics and other health emergencies, and measures taken to reduce the spread of such pandemics or other health emergencies on the Company’s future operations and business. |
Forward-looking statements are necessarily based upon a number of factors and assumptions that, while considered reasonable by Agnico Eagle as of the date of such statements, are inherently subject to significant business, economic and competitive uncertainties and contingencies. The factors and assumptions of Agnico Eagle upon which the forward-looking statements in this Form 40-F are based, and which may prove to be incorrect, include the assumptions set out elsewhere in this Form 40-F as well as: that there are no significant disruptions affecting Agnico Eagle’s operations, whether due to labour disruptions, supply disruptions, damage to equipment, natural or man-made occurrences, pandemics, mining or milling issues, political changes, title issues, community protests, including by First Nations groups, or otherwise; that permitting, development, expansion and the ramp up of operations at each of Agnico Eagle’s mines, mine development projects and exploration projects proceed on a basis consistent with expectations and that Agnico Eagle does not change its exploration or development plans relating to such projects; that the exchange rates between the Canadian dollar, Euro, Australian dollar, Mexican peso and the U.S. dollar will be approximately consistent with current levels or as set out in this Form 40-F and the Company’s management discussion and analysis for the year ended December 31, 2023 (the “Annual MD&A”); that prices for gold, silver, zinc and copper will be consistent with Agnico Eagle’s expectations; that prices for key mining and construction supplies, including labour costs, remain consistent with Agnico Eagle’s expectations; that production meets expectations; that Agnico Eagle’s current estimates of mineral reserves, mineral resources, mineral grades and mineral recoveries are accurate; that there are no material delays in the timing for completion of development projects; that seismic activity at the Company’s operations at LaRonde, Goldex and other properties is as expected by the Company; that the Company’s current plans to optimize production are successful; and that there are no material variations in the current tax and regulatory environments that affect Agnico Eagle; and that governments, the Company or others do not take measures in response to pandemics or other health emergencies or otherwise that, individually or in the aggregate, materially affect the Company’s ability to operate its business; that measures taken in connection with pandemics or other health emergencies do not affect productivity; that measures taken relating to, or other effects of a pandemic or other health emergency do not affect the Company’s ability to obtain necessary supplies and deliver them to its mine sites.
The forward-looking statements in this Form 40-F reflect the Company’s views as at the date hereof and involve known and unknown risks, uncertainties and other factors which could cause the actual results, performance or achievements of the Company or industry results to be materially different from any future results, performance or achievements expressed or implied by such forward-looking statements. Such factors include, the risk factors set out under “Risk Factors” on page 74 of the Company’s annual information form for the year ended December 31, 2023, which is filed as Exhibit 99.1 to this Form 40-F and incorporated by reference herein (the “AIF”). Given these uncertainties, readers are cautioned not to place undue reliance on these forward-looking statements, which speak only as of the date made. Except as otherwise required by law, the Company expressly disclaims any obligation or undertaking to release publicly any updates or revisions to any such statements to reflect any change in the Company’s expectations or any change in events, conditions or circumstances on which any such statement is based. This Form 40-F contains information regarding anticipated total cash costs per ounce, all-in sustaining costs per ounce, minesite costs per tonne sustaining capital expenditures and development capital expenditures and operating margin in respect of the Company or at certain of the Company’s mines and mine development projects. The Company believes that these generally accepted industry measures are realistic indicators of operating performance and are useful in allowing year over year comparisons. Investors are cautioned that this information may not be suitable for other purposes.
CURRENCY
Agnico Eagle presents its consolidated financial statements in United States dollars. All dollar amounts in this Form 40-F are stated in United States dollars (“U.S. dollars”, “$” or “US$”), except where otherwise indicated. On March 18, 2024, the exchange rate (based on the daily average exchange rate as reported by the Bank of Canada) for U.S. dollars into Canadian dollars (“C$”) was US$1.00 equals C$1.3541.
NOTES TO INVESTORS REGARDING THE USE OF MINERAL RESOURCES
The mineral reserve and mineral resource estimates contained in this Form 40-F have been prepared in accordance with the Canadian Security Administrators’ (“CSA”) National Instrument 43-101 Standards of Disclosure for Mineral Projects (“NI 43-101”).
Effective February 25, 2019, the SEC’s disclosure requirements and policies for mining properties are more closely aligned with current industry and global regulatory practices and standards, including NI 43-101. However, Canadian issuers that report in the United States using the MJDS, such as Agnico Eagle, may still use NI 43-101 rather than the SEC’s disclosure requirements when using the SEC’s MJDS registration statement and annual report forms. Accordingly, mineral reserve and mineral resource information contained or incorporated by reference herein may not be comparable to similar information disclosed by U.S. companies.
Investors are cautioned that while the SEC now recognizes “measured mineral resources”, “indicated mineral resources” and “inferred mineral resources”, investors should not assume that any part or all of the mineral deposits in these categories will ever be converted into a higher category of mineral resources or into mineral reserves. These terms have a great amount of uncertainty as to their economic and legal feasibility. Accordingly, investors are cautioned not to assume that any “measured mineral resources”, “indicated mineral resources”, or “inferred mineral resources” that the Company reports in this Form 40-F are or will be economically or legally mineable.
Further, “inferred mineral resources” have a great amount of uncertainty as to their existence and as to their economic and legal feasibility. It cannot be assumed that any part or all of an inferred mineral resource will ever be upgraded to a higher category. Under Canadian regulations, estimates of inferred mineral resources may not form the basis of feasibility or pre-feasibility studies, except in limited circumstances. Investors are cautioned not to assume that all or any part of an inferred mineral resource exists, or is or will ever be economically or legally mineable.
The mineral reserve and mineral resource data contained or incorporated by reference herein are estimates, and no assurance can be given that the anticipated tonnages and grades will be achieved or that the indicated level of recovery will be realized. The Company does not include equivalent gold ounces for by-product metals contained in mineral reserves in its calculation of contained ounces and mineral reserves are not reported as a subset of mineral resources. See “Mineral Reserves and Mineral Resources” in the AIF for additional information.
NOTE TO INVESTORS CONCERNING CERTAIN MEASURES OF PERFORMANCE
This Form 40-F presents certain financial performance measures, including “total cash costs per ounce”, “all-in sustaining costs per ounce”, “minesite costs per tonne”, “adjusted net income”, “adjusted net income per share”, “realized prices”, “sustaining capital expenditures”, “development capital expenditures” and “operating margin” that are not standardized measures under International Financial Reporting Standards (“IFRS”). These measures may not be comparable to similar measures reported by other gold producers. For a reconciliation of these measures to the most directly comparable financial information presented in the consolidated financial statements prepared in accordance with IFRS, and for an explanation of how management uses these measures and why management believes them to be useful to investors, please see the Company’s management’s discussion and analysis for the year ended December 31, 2023, which is filed as Exhibit 99.3 to this Form 40-F and incorporated by reference herein (the “Annual MD&A”). The Company believes that these generally accepted industry measures are realistic indicators of operating performance and are useful in allowing year over year comparisons. However, these non-IFRS measures should be considered together with other data prepared in accordance with IFRS, and these measures, taken by themselves, are not necessarily indicative of operating costs or cash flow measures prepared in accordance with IFRS. This Form 40-F also contains information as to estimated future total cash costs per ounce, all-in sustaining costs per ounce and minesite costs per tonne. The estimates of total cash costs per ounce, all-in sustaining costs per ounce and minesite costs per tonne are based upon the total cash costs per ounce, all-in sustaining costs per ounce and minesite costs per tonne that the Company expects to incur to mine gold at its projects and, consistent with the reconciliation of these actual costs referred to above, do not include production costs attributable to accretion expense and other asset retirement costs, which will vary over time as each project is developed and mined. It is therefore not practicable to reconcile these forward-looking non-IFRS financial measures to the most comparable IFRS measure.
DISCLOSURE CONTROLS AND PROCEDURES
The Company’s management, with the participation of the Company’s Chief Executive Officer and Chief Financial Officer, evaluated the effectiveness of the Company’s disclosure controls and procedures as of December 31, 2023 pursuant to Rule 13a-15 under the Exchange Act. In designing and evaluating the disclosure controls and procedures, management recognizes that any controls and procedures, no matter how well designed and operated, can provide only reasonable assurance of achieving the desired control objectives. In addition, the design of disclosure controls and procedures must reflect the fact that there are resource constraints and that management is required to apply its judgment in evaluating the benefits of possible controls and procedures relative to their costs.
Based on such evaluation, the Company’s Chief Executive Officer and Chief Financial Officer concluded that, as of December 31, 2023, the Company’s disclosure controls and procedures were designed at a reasonable assurance level and were effective to provide reasonable assurance that information the Company is required to disclose in reports that the Company files or submits under the Exchange Act is recorded, processed, summarized and reported within the time periods specified in SEC rules and forms, and that such information is accumulated and communicated to the Company’s management, including the Company’s Chief Executive Officer and Chief Financial Officer, as appropriate, to allow timely decisions regarding required disclosure.
MANAGEMENT’S ANNUAL REPORT ON INTERNAL CONTROL OVER FINANCIAL REPORTING
Management of the Company is responsible for establishing and maintaining adequate internal control over financial reporting. Internal control over financial reporting is a process designed by, or under the supervision of, the Company’s Chief Executive Officer and Chief Financial Officer and effected by the Company’s board of directors (the “Board”), management and other personnel to provide reasonable assurance regarding the reliability of financial reporting and the preparation of financial statements for external purposes in accordance with generally accepted accounting principles.
Because of its inherent limitations, internal control over financial reporting may not prevent or detect misstatements. Also, projections of any evaluation of effectiveness to future periods are subject to risk that controls may become inadequate because of changes in conditions, or that the degree of compliance with the policies or procedures may deteriorate.
The Company’s management, including the Company’s Chief Executive Officer and Chief Financial Officer, assessed the effectiveness of the Company’s internal control over financial reporting as of December 31, 2023. In making this assessment, the Company’s management used the criteria set out by the Committee of Sponsoring Organizations of the Treadway Commission in Internal Control — Integrated Framework (2013). Based upon its assessment, management concluded that, as of December 31, 2023, the Company’s internal control over financial reporting was effective.
Ernst & Young LLP, an independent registered public accounting firm, has audited the Annual Financial Statements and has included its attestation report on management’s assessment of the Company’s internal control over financial reporting, which is found on page 2 of the Annual Financial Statements.
The Company will continue to periodically review its disclosure controls and procedures and internal control over financial reporting and may make modifications from time to time as considered necessary or desirable.
ATTESTATION REPORT OF THE REGISTERED PUBLIC ACCOUNTING FIRM
Ernst & Young LLP’s attestation report on management’s assessment of the Company’s internal control over financial reporting is found on page 6 of the Annual Financial Statements.
CHANGES IN INTERNAL CONTROL OVER FINANCIAL REPORTING
Management regularly reviews its system of internal control over financial reporting and makes changes to the Company’s processes and systems to improve controls and increase efficiency, while ensuring that the Company maintains an effective internal control environment. Changes may include such activities as implementing new, more efficient systems, consolidating activities, and migrating processes.
During the year ended December 31, 2023, there have been no changes in the Company’s internal control over financial reporting that have materially affected, or are reasonably likely to materially affect, the Company’s internal control over financial reporting
NOTICES PURSUANT TO REGULATION BTR
The Company did not send any notices required by Rule 104 of Regulation BTR during the year ended December 31, 2023 concerning any equity security subject to a blackout period under Rule 101 of Regulation BTR.
IDENTIFICATION OF THE AUDIT COMMITTEE
The Board has a separately-designated standing Audit Committee established in accordance with Section 3(a)(58)(A) of the Exchange Act. The Audit Committee is composed of Mr. Jeffrey Parr (Chair), Mr. J. Merfyn Roberts and Mr. Jamie Sokalsky, as described under “Audit Committee — Composition of the Audit Committee” on page 99 of the AIF.
AUDIT COMMITTEE FINANCIAL EXPERT
The Board has determined that the Company has at least one “audit committee financial expert” (as defined in paragraph (8) of General Instruction B to Form 40-F) and that Mr. Jeffrey Parr, Mr. J. Merfyn Roberts and Mr. Jamie Sokalsky are the Company’s “audit committee financial experts” serving on the Audit Committee of the Board. Each of the Audit Committee financial experts is “independent” under applicable listing standards.
PRINCIPAL ACCOUNTANT FEES AND SERVICES
Ernst & Young LLP, Toronto, Canada, PCAOB ID No. 1263, served as the Company’s independent public accountant for each of the fiscal years in the two-year period ended December 31, 2023. For a description of the total amount billed to the Company by Ernst & Young LLP for services performed in the last two fiscal years by category of service (audit fees, audit-related fees, tax fees and all other fees), see “Audit Committee — External Auditor Service Fees” on page 100 of the AIF. No audit-related fees, tax fees or other non-audit fees were approved by the Audit Committee pursuant to paragraph (c)(7)(i)(C) of Rule 2-01 of Regulation S-X.
AUDIT COMMITTEE PRE-APPROVAL POLICIES AND PROCEDURES
For a description of the pre-approval policies and procedures of the Company’s Audit Committee, see “Audit Committee — Pre-Approval Policies and Procedures” on page 100 of the AIF.
CODE OF ETHICS
The Company has a “code of ethics” (as defined in paragraph (9) of General Instruction B to Form 40-F) that applies to its Chief Executive Officer, Chief Financial Officer, principal accounting officer, controller and persons performing similar functions. The Company’s Code of Business Conduct and Ethics is available on the Company’s website at www.agnicoeagle.com or, without charge, upon request from the Corporate Secretary, Agnico Eagle Mines Limited, Suite 400, 145 King Street East, Toronto, Ontario M5C 2Y7 (telephone 416-947-1212).
On July 26, 2023, the Company’s Code of Business Conduct and Ethics was amended with effect from July 26, 2023 to add (i) an addendum concerning conflicts of interests and transparency, (ii) a summary section to the Company’s Code of Business Conduct and Ethics and (iii) references to the Company’s workplace violence, harassment and discrimination policy. In addition to these changes, certain technical, administrative and other non-substantive amendments were made to the Company’s Code of Business Conduct and Ethics. An amended version of the Company’s Code of Business Conduct and Ethics, which reflects the revisions described above, is filed as Exhibit 99.14 to this Form 40-F.
Except as described above, during the fiscal year ended December 31, 2023 there have not been any amendments to, or waivers of, including implicit waivers of, any provision of the Company’s Code of Business Conduct and Ethics which is applicable to the Company’s Chief Executive Officer, Chief Financial Officer, principal accounting officer or controller, or persons performing similar functions and that relates to any element of the code of ethics definition enumerated in paragraph (9)(b) of General Instruction B to Form 40-F.
OFF-BALANCE SHEET ARRANGEMENTS
The Company does not have any off-balance sheet arrangements (as defined in paragraph (11) of General Instruction B to Form 40-F) that have or are reasonably likely to have a current or future effect on the Company’s financial condition, changes in financial condition, revenues or expenses, results of operations, liquidity, capital expenditures or capital resources that is material to investors.
CONTRACTUAL OBLIGATIONS
For tabular disclosure of the Company’s contractual obligations, see page 27 of the Annual MD&A under the heading “Liquidity and Capital Resources — Contractual Obligations”.
MINE SAFETY DISCLOSURE
Not applicable.
CORPORATE GOVERNANCE
The Company is subject to a variety of corporate governance guidelines and requirements enacted by the Toronto Stock Exchange (the ”TSX”), the Canadian securities regulatory authorities, the New York Stock Exchange (the ”NYSE”) and the SEC. The Company is listed on the NYSE and, although the Company is not required to comply with most of the NYSE corporate governance requirements to which the Company would be subject if it were a U.S. corporation, the Company’s governance practices differ from those required of U.S. domestic issuers in only the following respects. The NYSE rules for U.S. domestic issuers require shareholder approval of all equity compensation plans (as defined in the NYSE rules) regardless of whether new issuances, treasury shares or shares that the Company has purchased in the open market are used. The TSX rules require shareholder approval of share compensation arrangements involving new issuances of shares, and of certain amendments to such arrangements, but do not require such approval if the compensation arrangements involve only shares purchased in the open market. The NYSE rules for U.S. domestic issuers also require shareholder approval of certain transactions or series of related transactions that result in the issuance of common shares, or securities convertible into or exercisable for common shares, that have, or will have upon issuance, voting power equal to or in excess of 20% of the voting power outstanding prior to the transaction or if the issuance of common shares, or securities convertible into or exercisable for common shares, are, or will be upon issuance, equal to or in excess of 20% of the number of common shares outstanding prior to the transaction. The TSX rules require shareholder approval of acquisition transactions resulting in dilution in excess of 25%. The TSX also has broad general discretion to require shareholder approval in connection with any issuances of listed securities. The Company complies with the TSX rules described in this paragraph.
RECOVERY OF ERRONEOUSLY AWARDED COMPENSATION
The Company has adopted a compensation recovery policy, most recently amended effective July 26, 2023 (referred to as the “Executive Compensation Clawback Policy”) as required by NYSE listing standards and pursuant to Rule 10D-1 of the Exchange Act. The Executive Compensation Clawback Policy is filed as Exhibit 97 to this Form 40-F. At no time during or after the fiscal year ended December 31, 2023 (as of the date of this Form 40-F), was the Company required to prepare an accounting restatement that required recovery of erroneously awarded compensation pursuant to the Executive Compensation Clawback Policy and, as of December 31, 2023, there was no outstanding balance of erroneously awarded compensation to be recovered from the application of the Executive Compensation Clawback Policy to a prior restatement.
DISCLOSURE PURSUANT TO SECTION 13(r) OF THE EXCHANGE ACT
In accordance with Section 13(r) of the Exchange Act, the Company is required to include certain disclosures in its periodic reports if it or any of its affiliates knowingly engaged in certain specified activities during the period covered by the report. Neither the Company nor its affiliates have knowingly engaged in any transaction or dealing reportable under Section 13(r) of the Exchange Act during the year ended December 31, 2023.
UNDERTAKING
Agnico Eagle undertakes to make available, in person or by telephone, representatives to respond to inquiries made by the SEC staff, and to furnish promptly, when requested to do so by the SEC staff, information relating to: the securities in relation to which the obligation to file an annual report on Form 40-F arises; or transactions in said securities.
CONSENT TO SERVICE OF PROCESS
Any change to the name or address of the Company’s agent for service shall be communicated promptly to the SEC by amendment to the Form F-X referencing the file number of the Company.
INCORPORATION BY REFERENCE
This Form 40-F, which includes the exhibits filed herewith (other than the section of the AIF entitled “Ratings”), is incorporated by reference into the Company’s Registration Statements on Form F-3 (File No. 333-271854) and Form S-8 (File Nos. 333-130339 and 333-152004).
EXHIBIT INDEX
Exhibit |
|
Description |
97 |
|
|
99.1 |
|
Annual Information Form of the Company for the year ended December 31, 2023 |
99.2 |
|
|
99.3 |
|
Management’s Discussion and Analysis for the year ended December 31, 2023 |
99.4 |
|
|
99.5 |
|
|
99.6 |
|
|
99.7 |
|
|
99.8 |
|
|
99.9 |
|
|
99.10 |
|
|
99.11 |
|
|
99.12 |
|
|
99.13 |
|
|
99.14 |
|
|
101.INS |
|
XBRL Instance |
101.SCH |
|
XBRL Taxonomy Extension Schema |
101.CAL |
|
XBRL Taxonomy Extension Calculation Linkbase |
101.DEF |
|
XBRL Taxonomy Extension Definition Linkbase |
101.LAB |
|
XBRL Taxonomy Extension Label Linkbase |
101.PRE |
|
XBRL Taxonomy Extension Presentation Linkbase |
SIGNATURES
Pursuant to the requirements of the Exchange Act, the Company certifies that it meets all of the requirements for filing on Form 40-F and has duly caused this annual report to be signed on its behalf by the undersigned, thereto duly authorized.
Toronto, Canada |
|
AGNICO EAGLE MINES LIMITED |
|
March 22, 2024 |
|
|
|
|
|
by |
/s/ Jamie Porter |
|
|
|
|
|
|
|
Jamie Porter |
|
|
|
Executive Vice-President, Finance and |
|
|
|
Chief Financial Officer |
Exhibit 97
AGNICO EAGLE MINES LIMITED
EXECUTIVE INCENTIVE COMPENSATION RECOUPMENT POLICY
I. |
INTRODUCTION |
1. |
Purpose |
The board of directors (the “Board”) of Agnico Eagle Mines Limited (together with its affiliates, the “Corporation”) believes that it is in the best interests of the Corporation to adopt this executive compensation clawback policy (the “Policy”) to enhance the Corporation’s alignment with good compensation governance practices and to assist the Corporation in managing its reputation and compensation related risk. Among other things, this Policy is intended to comply with (i) Section 304 of the United States Sarbanes-Oxley Act of 2002 (see Part II below) and (ii) Section 10D of the United States Securities Exchange Act of 1934, as amended (the “Exchange Act”), Rule 10D-1 promulgated under the Exchange Act (“Rule 10D-1”) and Section 303A.14 of the New York Stock Exchange Listed Corporation Manual (the “NYSE Listing Standards”) (see Part III below).
2. |
Authority |
Except as specifically set forth herein, the Policy shall be administered by the Compensation Committee of the Board of Directors (the “Administrator”). The Administrator is authorized to interpret and construe the Policy and to make all determinations necessary, appropriate or advisable for the administration of the Policy. Any determinations made by the Administrator shall be final and binding on all affected individuals.
In the administration of the Policy, the Administrator is authorized and directed to consult with the full Board or such other committees of the Board as may be necessary or appropriate as to matters within the scope of such other committee’s responsibility and authority. Subject to any limitation at applicable law, the Administrator may authorize and empower any officer or employee of the Corporation to take any and all actions necessary or appropriate to carry out the purpose and intent of the Policy (other than with respect to any recovery under the Policy involving such officer or employee).
3. |
Amendment; Termination |
The Board may amend, modify, supplement, rescind or replace all or any portion of the Policy at any time and from time to time in its discretion, and shall amend the Policy as it deems necessary to comply with applicable law or any rules or standards adopted by a securities exchange on which the Corporation’s securities are listed.
4. |
Severability |
If any provision of the Policy or its application shall be adjudicated to be invalid, illegal or unenforceable in any respect, such invalidity, illegality or unenforceability shall not affect any other provisions of the Policy, and the invalid, illegal or unenforceable provisions shall be deemed amended to the minimum extent necessary to render any such provision or application enforceable.
5. |
Other Recoupment Rights |
The Board intends that the Policy shall be applied to the fullest extent permitted by law. Any right of recoupment under the Policy is in addition to, and not in lieu of, any other remedies or rights of recoupment that may be available to the Corporation under applicable law, rules or regulations with respect to the claw back or recoupment of erroneously awarded compensation or pursuant to the terms of any employment agreement, equity award agreement, or similar agreement. To the extent that the Corporation, the Board, or any committee of the Board is required to comply with any such laws, rules or regulations, the Policy shall be read to incorporate such requirements to the extent applicable.
6. |
Other Claims |
Nothing contained in the Policy, and no recoupment or recovery as contemplated by the Policy, shall limit any claims, damages or other legal remedies the Corporation or any of its affiliates may have against any person arising out of or resulting from any actions or omissions by such person.
7. |
Absence of Conflicts |
Subject to Section 5(b) of Part III of the Policy, the application of the Policy by the Administrator may result in recoupment of compensation pursuant to Part II or Part III of the Policy or both Part II and Part III of the Policy, as determined to be necessary, appropriate and advisable.
8. |
Successors |
The Policy shall be binding and enforceable against all persons subject thereto and their beneficiaries, heirs, executors, administrators or other legal representatives.
9. |
Disclosure Requirements |
The Corporation shall file all disclosures with respect to the Policy required by applicable laws and regulations, including applicable rules of the United States Securities and Exchange Commission (“SEC”).
II. |
SARBANES-OXLEY CLAWBACK |
Part II of the Policy is designed to comply with, and shall be interpreted in a manner consistent with, the provisions of Section 304 of the United States Sarbanes-Oxley Act of 2002.
1. |
Definitions |
As used in this Part II of the Policy, the following capitalized terms have the meanings set out below:
"Executives" means each officer or employee of the Corporation at the level of "Executive Vice President" or above, including, without limitation, the Executive Chair, the Chief Executive and Chief Financial Officer, and "Executive" means any one of the Executives.
"Incentive Compensation" means compensation relating to the achievement of financial or performance goals or similar conditions, any award or payment under the Corporation's annual incentive plan or long term incentive plan and any bonus payment, stock options, performance share unit, restricted share unit or other award of equity based compensation whether vesting is based on the achievement of performance conditions, the passage of time or both.
"Overcompensation Amount" has the meaning set out below in Section 3 of Part II of this Policy.
"Part II Effective Date" means January 1, 2015.
"Restatement" means an accounting restatement or the correction of a material error due to the Corporation's material non-compliance with any applicable financial reporting requirement, other than as a result of a change or amendment in accounting principles or securities laws.
"Restatement Date" means the date upon which the Corporation is required to prepare a Restatement.
"Wrongful Conduct" shall mean fraud, gross negligence or intentional misconduct.
2. |
Application |
Part II of the Policy applies to all persons who are or become Executives on or after the Part II Effective Date and applies to all Incentive Compensation awarded, granted or paid to an Executive on or after the Part II Effective Date. The right of recoupment survives the cessation of an Executive's employment in such capacity.
3. |
Determination of Overcompensation Amounts |
If (i) the Corporation is required to prepare a Restatement; or (ii) the Board determines that an Executive has engaged in Wrongful Conduct, the Board will review all Incentive Compensation paid or granted to Executives on the basis of having met or exceeded specific performance targets for performance periods during the time period covered by the Restatement or in which the Wrongful Conduct occurred, as applicable. Any determination made by the Board under Part II of the Policy shall be final, binding and conclusive on all parties.
To the extent permitted by applicable law and taking into account all factors considered relevant by the Board in its sole discretion, the Board may seek to recoup Incentive Compensation paid or granted to any current or former Executive in the three (3) year period preceding the date of the Restatement or the Wrongful Conduct, if and to the extent that (i) the amount or the granting of Incentive Compensation was calculated based upon the achievement of certain financial results or performance targets that were subsequently reduced or otherwise determined not to have been properly achieved due to a Restatement or the Wrongful Conduct, and (ii) the amount or the granting of Incentive Compensation that would have been paid or granted to the Executive had the financial results been properly reported or the performance targets been properly determined would have been lower than the amount actually paid or granted (the difference between the amounts determined in (i) and (ii) being the "Overcompensation Amount").
4. |
Recoupment of Overcompensation Amounts |
To the extent that an Executive received an Overcompensation Amount, the Board shall be entitled:
(a)to the extent the Overcompensation Amount has been paid, transferred or otherwise made available to the Executive, require, by written demand, the Executive to reimburse the Corporation for all or part of the Overcompensation Amount;
(b)to the extent the Overcompensation Amount has not been paid, transferred or otherwise made available to the Executive by the Corporation, the right of the Executive to the Overcompensation Amount shall be immediately forfeited by the Executive and/or cancelled by the Corporation, to the extent required such that, if recalculated following such forfeiture or cancellation, the Overcompensation Amount is equal to zero; and
(c)to the extent the Overcompensation Amount is not immediately recovered upon demand from the Executive, or forfeited and/or cancelled, require any compensation owing by the Corporation to the Executive including any salary or any unvested or unexercised Incentive Compensation, be immediately withheld and/or irrevocably cancelled by the Corporation to compensate for the Overcompensation Amount or any unrecovered portion thereof, and to bring any other actions against the Executive which they may deem necessary or advisable to recover the Overcompensation Amount.
The Corporation may recover the Overcompensation Amount from the Executive (i) in the case of a Restatement, for three years from the Restatement Date, and (ii) in the case of Wrongful Conduct, if the Wrongful Conduct has been discovered by the Corporation within 36 months from the date on which the Wrongful Conduct occurred. Recoupment of Overcompensation Amounts under Part II of the Policy shall be initiated by the Corporation at the request of the Board, and all amounts recoverable or payable hereunder shall be paid to the Corporation or as otherwise directed by the Board.
5. |
Effective Date of Part II of the Policy |
This Part II of the Policy is intended to replace the Agnico Eagle Mines Limited Executive Incentive Compensation Recoupment Policy, as of March 2021, and shall apply to all Incentive Compensation awarded, granted or paid to an Executive on or after January 1, 2015.
III. |
DODD-FRANK CLAWBACK |
Part III of the Policy is intended to comply with, and shall be interpreted to be consistent with, Section 10D of the Exchange Act, Rule 10D-1 and Section 303A.14 of the NYSE Listing Standards.
1. |
Definitions |
As used in this Part III of the Policy, the following capitalized terms have the meanings set out below:
“Accounting Restatement” means an accounting restatement due to the material noncompliance of the Corporation with any financial reporting requirement under securities laws, including any required accounting restatement to correct an error in previously issued financial statements that is material to the previously issued financial statements (a “Big R” restatement), or that would result in a material misstatement if the error were corrected in the current period or left uncorrected in the current period (a “little r” restatement).
“Applicable Period” means the three completed fiscal years immediately preceding the date on which the Corporation is required to prepare an Accounting Restatement, as well as any transition period (that results from a change in the Corporation’s fiscal year) within or immediately following those three completed fiscal years (except that a transition period that comprises a period of at least nine months shall count as a completed fiscal year).
The “date on which the Corporation is required to prepare an Accounting Restatement” is the earlier to occur of (a) the date the Board, a committee of the Board, or the officer or officers of the Corporation authorized to take such action (if Board action is not required) concludes, or reasonably should have concluded, that the Corporation is required to prepare an Accounting Restatement or (b) the date a court, regulator or other legally authorized body directs the Corporation to prepare an Accounting Restatement, in each case regardless of if or when the restated financial statements are filed.
“Erroneously Awarded Compensation” has the meaning set forth in Section 4 of this Part III of the Policy.
“Executives” means the Corporation’s current and former executive chair, president, chief executive officer, principal financial officer, principal accounting officer (or, if there is no such accounting officer, the controller), any vice-president of the Corporation in charge of a principal business unit, division or function (such as sales, administration or finance), any other executive who performs a policy-making function, or any other person who performs similar policy-making functions for the Corporation, as determined by the Administrator in accordance with the definition of executive officer set forth in Rule 10D-1 and the NYSE Listing Standards.
“Financial Reporting Measure” means measures that are determined and presented in accordance with the accounting principles used by the Corporation in preparing its financial statements, and all other measures that are derived wholly or in part from such measures. Share price and total shareholder return (and any measures that are derived wholly or in part from share price or total shareholder return) shall, for purposes of this Part III of the Policy, be considered Financial Reporting Measures. For the avoidance of doubt, a Financial Reporting Measure need not be presented within the Corporation’s financial statements or included in a filing with any securities regulatory authority, including the SEC.
“Incentive-Based Compensation” means any compensation that is granted, earned or vested based wholly or in part upon the attainment of a Financial Reporting Measure.
Incentive-Based Compensation is “received” for purposes of this Part III of the Policy in the Corporation’s fiscal period during which the Financial Reporting Measure specified in the Incentive-Based Compensation award is attained, even if the payment or grant of such Incentive-Based Compensation occurs after the end of that period.
2. |
Covered Executives; Incentive-Based Compensation |
Part III of the Policy applies to Incentive-Based Compensation received by an Executive (i) after beginning services as an Executive; (ii) if the Executive served as an Executive at any time during the performance period for such Incentive-Based Compensation; and (iii) while the Corporation has (or had) a class of securities listed on the New York Stock Exchange (“NYSE”) or any other U.S. national securities exchange.
3. |
Recoupment of Erroneously Awarded Compensation in the Event of an Accounting Restatement |
If the Corporation is required to prepare an Accounting Restatement, the Corporation shall promptly recoup the amount of any Erroneously Awarded Compensation received by any Executive during the Applicable Period as calculated pursuant to Section 4 of this Part III of the Policy.
4. |
Erroneously Awarded Compensation: Amount Subject to Recovery |
The amount of Erroneously Awarded Compensation subject to recovery under this Part III of the Policy, as determined by the Administrator, is the amount of Incentive-Based Compensation received by the Executive that exceeds the amount of Incentive Based-Compensation that would have been received by the Executive had it been determined based on the restated amounts.
Erroneously Awarded Compensation shall be computed by the Administrator without regard to any taxes paid by the Executive in respect of the Erroneously Awarded Compensation.
For Incentive-Based Compensation based on share price or total shareholder return, where the amount of Erroneously Awarded Compensation is not subject to mathematical recalculation directly from the information in the applicable Accounting Restatement:
(a) |
the Administrator shall determine the amount of Erroneously Awarded Compensation based on a reasonable estimate of the effect of the Accounting Restatement on the share price or total shareholder return upon which the Incentive-Based Compensation was received; and |
(b) |
the Corporation shall maintain documentation of the determination of that reasonable estimate and provide such documentation to the NYSE. |
5. |
Method of Recoupment |
(a) |
The Administrator shall have discretion to determine the appropriate means of recouping Erroneously Awarded Compensation based on the particular facts and circumstances. Notwithstanding the foregoing, except as set forth in Section 6 of this Part III of the Policy, in |
no event may the Corporation accept an amount that is less than the amount of Erroneously Awarded Compensation in satisfaction of an Executive’s obligations hereunder.
(b) |
To the extent that the Executive reimburses the Corporation for any Incentive-Based Compensation received that constitutes Erroneously Awarded Compensation under any duplicative recovery obligation established by the Corporation in the Policy or otherwise, or pursuant to applicable law, any such reimbursed amount may be credited to the amount of Erroneously Awarded Compensation that is subject to recovery under this Part III of the Policy. |
(c) |
To the extent that an Executive fails to repay all Erroneously Awarded Compensation to the Corporation when due, the Corporation shall take all actions reasonable and appropriate to recover such Erroneously Awarded Compensation from the applicable Executive. The applicable Executive shall be required to reimburse the Corporation for any and all expenses reasonably incurred (including legal fees) by the Corporation in recovering such Erroneously Awarded Compensation in accordance with the immediately preceding sentence. |
6. |
Exceptions to Recovery |
The Corporation will recover Erroneously Awarded Compensation in compliance with this Part III of the Policy unless any of the following conditions are met and the Administrator determines that recovery would be impracticable:
(a) |
The direct expense paid to a third party to assist in enforcing this Part III of the Policy would exceed the amount to be recovered. Before concluding that it would be impracticable to recover any amount of Erroneously Awarded Compensation based on the expense of enforcement, the Corporation must make a reasonable attempt to recover such Erroneously Awarded Compensation, document such reasonable attempt(s) to recover, and provide that documentation to the NYSE. |
(b) |
Recovery would violate applicable Canadian federal or provincial law (provided that law was adopted prior to November 28, 2022). Before concluding that it would be impracticable to recover any amount of Erroneously Awarded Compensation based on violation of Canadian federal or provincial law, the Corporation shall obtain an opinion of Canadian counsel, acceptable to the NYSE, that recovery would result in such a violation, and must provide such opinion to the NYSE. |
(c) |
Recovery would likely cause an otherwise tax-qualified retirement plan, under which benefits are broadly available to employees of the Corporation, to fail to meet the requirements of Section 401(a)(13) or 411(a) of the United States Internal Revenue Code and the regulations thereunder. |
7. |
No indemnification of Executives |
The Corporation shall not insure or indemnify any Executive against (i) the loss of any Erroneously Awarded Compensation that is repaid, returned or recovered pursuant to the terms of this Part III of the Policy, or (ii) any claims relating to the Corporation’s enforcement of its rights under this Part III of the Policy. The Corporation shall not enter into any agreement that exempts any Incentive-Based Compensation that is granted, paid or awarded to an Executive from the application of this Part III of the Policy or that waives the Corporation’s right to recovery of any
Erroneously Awarded Compensation, and this Part III of the Policy shall supersede any such agreement (whether entered into before, on or after the Effective Date of this Part III of the Policy).
8. |
Effective Date; Retroactive Application |
Part III of the Policy shall be effective as of October 2, 2023 (the “Part III Effective Date”). The terms of Part III of the Policy shall apply to any Incentive-Based Compensation that is received by Executives on or after the Part III Effective Date, even if such Incentive-Based Compensation was approved, awarded, granted or paid to Executives prior to the Part III Effective Date. Without limiting the generality of Section 5 of this Part III of the Policy, and subject to applicable law, the Administrator may affect recovery under this Part III of the Policy from any amount of compensation approved, awarded, granted, payable or paid to the Executive prior to, on or after the Part III Effective Date.
[TO BE SIGNED BY AGNICO EXECUTIVES:]
Acknowledgment of the Agnico Eagle Mining Limited Executive Incentive Compensation Recoupment Policy
I, the undersigned, agree and acknowledge that I have read, and that I am fully bound by, and subject to, all of the terms and conditions of the Agnico Eagle Mining Limited Executive Incentive Compensation Recoupment Policy (as such policy may be amended, restated, supplemented or otherwise modified from time to time, the “Policy”). Any capitalized terms used in this Acknowledgment without definition shall have the meaning set forth in the Policy.
If there is any inconsistency between the Policy and the terms of any employment agreement to which I am a party, or the terms of any compensation plan, program or agreement under which any compensation has been granted, awarded, earned or paid, the terms of the Policy shall govern. If it is determined by the Administrator that any amounts granted, awarded, earned or paid to me must be forfeited or reimbursed to the Corporation, I will promptly take any action necessary to effectuate such forfeiture and/or reimbursement.
By: |
|
|
|
[Name] |
|
|
[Title] |
|
Date: |
|
|
![[MISSING IMAGE: lg_agnicoeagle-bw.jpg]](/disclosures/0001104659-24-037982/asset?file=lg_agnicoeagle-bw.jpg&lang=en)
| | | | | | | | |
| | | |
Page
|
| |||
| INTRODUCTORY NOTES | | | | | ii | | |
| | | | | ii | | | |
| | | | | ii | | | |
| | | | | iv | | | |
| | | | | iv | | | |
| | | | | v | | | |
| SELECTED FINANCIAL DATA | | | | | 1 | | |
| GLOSSARY OF SELECTED MINING TERMS | | | | | 2 | | |
| CORPORATE STRUCTURE | | | | | 3 | | |
| DESCRIPTION OF THE BUSINESS | | | | | 5 | | |
| GENERAL DEVELOPMENT OF THE BUSINESS | | | | | 7 | | |
| OPERATIONS & PRODUCTION | | | | | 12 | | |
| | | | | 12 | | | |
| | | | | 54 | | | |
| | | | | 55 | | | |
| | | | | 69 | | | |
| | | | | 69 | | | |
| | | | | 70 | | | |
| | | | | 70 | | | |
| | | | | 71 | | | |
| | | | | 71 | | | |
| | | | | 72 | | | |
| | | | | 73 | | | |
| RISK FACTORS | | | | | 74 | | |
| DIVIDENDS | | | | | 93 | | |
| | | | | | | | |
| | | |
Page
|
| |||
| DESCRIPTION OF CAPITAL STRUCTURE | | | | | 93 | | |
| RATINGS | | | | | 93 | | |
| MARKET FOR SECURITIES | | | | | 94 | | |
| | | | | 95 | | | |
| | | | | 95 | | | |
| | | | | 97 | | | |
| | | | | 97 | | | |
| | | | | 98 | | | |
| | | | | 98 | | | |
| | | | | 99 | | | |
| AUDIT COMMITTEE | | | | | 99 | | |
| | | | | 99 | | | |
| | | | | 100 | | | |
| | | | | 100 | | | |
| | | | | 100 | | | |
| LEGAL PROCEEDINGS AND REGULATORY ACTIONS | | | | | 101 | | |
| | | | | 101 | | | |
| TRANSFER AGENT AND REGISTRAR | | | | | 101 | | |
| MATERIAL CONTRACTS | | | | | 101 | | |
| INTERESTS OF EXPERTS | | | | | 103 | | |
| ADDITIONAL INFORMATION | | | | | 104 | | |
| SCHEDULE “A” AUDIT COMMITTEE CHARTER OF THE COMPANY | | | | | A-1 | | |
| | | | | B-1 | | | |
| | | |
Year Ended December 31,
|
| |||||||||||||||||||||||||||
| | | |
2023
|
| |
2022
|
| |
2021
|
| |
2020
|
| |
2019
|
| |||||||||||||||
| High | | | | | 1.3875 | | | | | | 1.3858 | | | | | | 1.2942 | | | | | | 1.4496 | | | | | | 1.3600 | | |
| Low | | | | | 1.3128 | | | | | | 1.2451 | | | | | | 1.2040 | | | | | | 1.2718 | | | | | | 1.2988 | | |
| End of Period | | | | | 1.3226 | | | | | | 1.3544 | | | | | | 1.2678 | | | | | | 1.2732 | | | | | | 1.2988 | | |
| Average | | | | | 1.3497 | | | | | | 1.3013 | | | | | | 1.2535 | | | | | | 1.3415 | | | | | | 1.3269 | | |
| | | |
2024
|
| |
2023
|
| ||||||||||||||||||||||||||||||||||||
| | | |
March
(to March 18) |
| |
February
|
| |
January
|
| |
December
|
| |
November
|
| |
October
|
| |
September
|
| |||||||||||||||||||||
| High | | | | | 1.3582 | | | | | | 1.3574 | | | | | | 1.3522 | | | | | | 1.3599 | | | | | | 1.3875 | | | | | | 1.3871 | | | | | | 1.3674 | | |
| Low | | | | | 1.3472 | | | | | | 1.3404 | | | | | | 1.3316 | | | | | | 1.3205 | | | | | | 1.3581 | | | | | | 1.3591 | | | | | | 1.3423 | | |
| End of Period | | | | | 1.3541 | | | | | | 1.3570 | | | | | | 1.3397 | | | | | | 1.3226 | | | | | | 1.3582 | | | | | | 1.3871 | | | | | | 1.3520 | | |
| Average | | | | | 1.3520 | | | | | | 1.3501 | | | | | | 1.3425 | | | | | | 1.3431 | | | | | | 1.3709 | | | | | | 1.3717 | | | | | | 1.3535 | | |
| | | |
Year Ended December 31,
|
| |||||||||||||||||||||||||||
| | | |
2023
|
| |
2022
|
| |
2021*
|
| |
2020
|
| |
2019
|
| |||||||||||||||
| | | |
(in thousands of U.S. dollars, other than share and per share information)
|
| |||||||||||||||||||||||||||
| Income Statement Data | | | | | | | | | | | | | | | | | | | | | | | | | | | | | | | |
| Revenues from mining operations | | | | | 6,626,909 | | | | | | 5,741,162 | | | | | | 3,869,625 | | | | | | 3,138,113 | | | | | | 2,494,892 | | |
| Production | | | | | 2,933,263 | | | | | | 2,643,321 | | | | | | 1,773,121 | | | | | | 1,424,152 | | | | | | 1,247,705 | | |
| Exploration and corporate development | | | | | 215,781 | | | | | | 271,117 | | | | | | 152,514 | | | | | | 113,492 | | | | | | 104,779 | | |
| Amortization of property, plant and mine development | | | | | 1,491,771 | | | | | | 1,094,691 | | | | | | 738,129 | | | | | | 631,101 | | | | | | 546,057 | | |
| General and administrative | | | | | 208,451 | | | | | | 220,861 | | | | | | 142,003 | | | | | | 116,288 | | | | | | 120,987 | | |
| Impairment loss on equity securities | | | | | — | | | | | | — | | | | | | — | | | | | | — | | | | | | — | | |
| (Gain) Loss on derivative financial instruments | | | | | -68,432 | | | | | | 90,692 | | | | | | 11,103 | | | | | | -107,873 | | | | | | -17,124 | | |
| Finance costs | | | | | 130,087 | | | | | | 82,935 | | | | | | 92,042 | | | | | | 95,134 | | | | | | 105,082 | | |
| Other expenses (income) | | | | | 63,557 | | | | | | 130,891 | | | | | | 21,742 | | | | | | 48,234 | | | | | | -13,169 | | |
| Environmental remediation | | | | | 2,712 | | | | | | 10,417 | | | | | | 576 | | | | | | 27,540 | | | | | | 2,804 | | |
| Foreign currency translation (gain) loss | | | | | -328 | | | | | | -16,081 | | | | | | 5,672 | | | | | | 22,480 | | | | | | 4,850 | | |
| Care and maintenance | | | | | 47,392 | | | | | | 41,895 | | | | | | — | | | | | | — | | | | | | — | | |
| Income (loss) before income and mining taxes | | | | | 2,359,069 | | | | | | 1,115,423 | | | | | | 932,723 | | | | | | 767,565 | | | | | | 738,742 | | |
| Income and mining taxes expense | | | | | 417,762 | | | | | | 445,174 | | | | | | 370,778 | | | | | | 255,958 | | | | | | 265,576 | | |
| Net income (loss) for the year | | | | | 1,941,307 | | | | | | 670,249 | | | | | | 561,945 | | | | | | 511,607 | | | | | | 473,166 | | |
| Net income (loss) per share – basic | | | | | 3.97 | | | | | | 1.53 | | | | | | 2.31 | | | | | | 2.12 | | | | | | 2.00 | | |
| Net income (loss) per share – diluted | | | | | 3.95 | | | | | | 1.53 | | | | | | 2.30 | | | | | | 2.10 | | | | | | 1.99 | | |
| Weighted average number of common shares outstanding – basic | | | | | 488,722,676 | | | | | | 437,678,131 | | | | | | 243,707,991 | | | | | | 241,508,347 | | | | | | 236,933,791 | | |
| Weighted average number of common shares outstanding – diluted | | | | | 489,912,686 | | | | | | 438,533,089 | | | | | | 244,732,372 | | | | | | 243,072,085 | | | | | | 238,229,593 | | |
| Cash dividends declared per common share | | | | | 1.6 | | | | | | 1.6 | | | | | | 1.4 | | | | | | 0.95 | | | | | | 0.55 | | |
| Balance Sheet Data (at end of period) | | | | | | | | | | | | | | | | | | | | | | | | | | | | | | | |
| Property, plant and mine development | | | | | 21,221,905 | | | | | | 18,459,400 | | | | | | 7,675,595 | | | | | | 7,325,418 | | | | | | 7,003,665 | | |
| Total assets | | | | | 28,684,949 | | | | | | 23,494,808 | | | | | | 10,216,090 | | | | | | 9,614,755 | | | | | | 8,789,885 | | |
| Long-term debt | | | | | 1,843,086 | | | | | | 1,342,070 | | | | | | 1,565,223 | | | | | | 1,565,241 | | | | | | 1,724,108 | | |
| Reclamation provision | | | | | 1,073,504 | | | | | | 901,836 | | | | | | 729,996 | | | | | | 667,053 | | | | | | 439,801 | | |
| Net assets | | | | | 19,422,915 | | | | | | 16,241,345 | | | | | | 5,999,771 | | | | | | 5,683,213 | | | | | | 5,111,514 | | |
| Common shares | | | | | 18,334,869 | | | | | | 16,251,221 | | | | | | 5,863,512 | | | | | | 5,751,479 | | | | | | 5,589,352 | | |
| Shareholders’ equity | | | | | 19,422,915 | | | | | | 16,241,345 | | | | | | 5,999,771 | | | | | | 5,683,213 | | | | | | 5,111,514 | | |
| Total common shares outstanding | | | | | 497,299,441 | | | | | | 456,465,296 | | | | | | 245,001,857 | | | | | | 242,884,314 | | | | | | 239,619,035 | | |
| |
AGNICO EAGLE
ANNUAL INFORMATION FORM
|
| |
1
|
|
| |
2
|
| |
AGNICO EAGLE
ANNUAL INFORMATION FORM
|
|
| |
AGNICO EAGLE
ANNUAL INFORMATION FORM
|
| |
3
|
|
![[MISSING IMAGE: fc_miningterms-bwlr.jpg]](/disclosures/0001104659-24-037982/asset?file=fc_miningterms-bwlr.jpg&lang=en)
| |
4
|
| |
AGNICO EAGLE
ANNUAL INFORMATION FORM
|
|
| | | |
Date of
Acquisition(1) |
| |
Date of
Commencement of Construction(1) |
| |
Date of achieving
Commercial Production(1) |
| |
Estimated
Mine Life(2) |
|
|
LaRonde mine
|
| |
1992
|
| |
1985
|
| |
1988
|
| |
2034
|
|
|
LaRonde Zone 5 mine
|
| |
2003
|
| |
2017
|
| |
June 2018
|
| |
2032
|
|
| Canadian Malartic Complex(3) | | |
June 2014
|
| |
n/a
|
| |
n/a
|
| |
2042
|
|
| Goldex mine(4) | | |
December 1993
|
| |
July 2012
|
| |
October 2013
|
| |
2031
|
|
| Meadowbank Complex(5) | | |
April 2007
|
| |
Pre-April 2007
|
| |
March 2010
|
| |
2028
|
|
|
Meliadine mine
|
| |
July 2010
|
| |
2017
|
| |
May 2019
|
| |
2032
|
|
| Detour Lake mine(6) | | |
February 2022
|
| |
n/a
|
| |
n/a
|
| |
2052
|
|
| Macassa mine(6) | | |
February 2022
|
| |
n/a
|
| |
n/a
|
| |
2030
|
|
|
Kittila mine
|
| |
November 2005
|
| |
June 2006
|
| |
May 2009
|
| |
2035
|
|
| Fosterville mine(6) | | |
February 2022
|
| |
n/a
|
| |
n/a
|
| |
2033
|
|
|
Pinos Altos mine
|
| |
March 2006
|
| |
August 2007
|
| |
November 2009
|
| |
2028
|
|
|
La India mine
|
| |
November 2011
|
| |
September 2012
|
| |
February 2014
|
| |
2024
|
|
| |
AGNICO EAGLE
ANNUAL INFORMATION FORM
|
| |
5
|
|
| |
6
|
| |
AGNICO EAGLE
ANNUAL INFORMATION FORM
|
|
| | | |
2021 Capital Expenditures(1)
(thousands of $) |
| |||||||||||||||||||||
| | | | | | | | | | | | | | | |
Capitalized Exploration
|
| |||||||||
| | | |
Sustaining
|
| |
Development
|
| |
Sustaining
|
| |
Non-sustaining
|
| ||||||||||||
| LaRonde Complex | | | | | 72,749 | | | | | | 45,914 | | | | | | – | | | | | | 10,699 | | |
| Canadian Malartic Complex (50%) | | | | | 28,582 | | | | | | 14,668 | | | | | | 2,435 | | | | | | 4,005 | | |
| Goldex mine | | | | | 37,312 | | | | | | 77,175 | | | | | | 5,320 | | | | | | – | | |
| Kittila mine | | | | | 48,917 | | | | | | 5,820 | | | | | | – | | | | | | 3,823 | | |
| Meadowbank Complex (including Amaruq) | | | | | 48,446 | | | | | | 168,291 | | | | | | 1,895 | | | | | | 5,993 | | |
| Meliadine mine | | | | | 39,109 | | | | | | 6,969 | | | | | | 5,051 | | | | | | 913 | | |
| Pinos Altos mine | | | | | 21,615 | | | | | | 23,777 | | | | | | 601 | | | | | | – | | |
| La India mine | | | | | 10,000 | | | | | | 9,383 | | | | | | 117 | | | | | | – | | |
| Other | | | | | – | | | | | | 11,105 | | | | | | – | | | | | | 866 | | |
| Total Capital Expenditures | | | | | 414,963 | | | | | | 416,257 | | | | | | 17,580 | | | | | | 26,299 | | |
| |
AGNICO EAGLE
ANNUAL INFORMATION FORM
|
| |
7
|
|
| | | |
2022 Capital Expenditures(1)
(thousands of $) |
| |||||||||||||||||||||
| | | | | | | | | | | | | | | |
Capitalized Exploration
|
| |||||||||
| | | |
Sustaining
|
| |
Development
|
| |
Sustaining
|
| |
Non-sustaining
|
| ||||||||||||
| LaRonde Complex | | | | $ | 100,111 | | | | | $ | 72,020 | | | | | | 2,068 | | | | | | – | | |
| Canadian Malartic Complex (50%) | | | | | 69,137 | | | | | | 115,997 | | | | | | – | | | | | | 12,554 | | |
| Goldex mine | | | | | 23,480 | | | | | | 35,136 | | | | | | 1,645 | | | | | | 3,944 | | |
| Detour Lake mine | | | | | 214,060 | | | | | | 148,672 | | | | | | – | | | | | | 31,400 | | |
| Fosterville mine | | | | | 56,131 | | | | | | 9,876 | | | | | | 213 | | | | | | 28,492 | | |
| Kittila mine | | | | | 43,803 | | | | | | 50,315 | | | | | | 4,996 | | | | | | 2,449 | | |
| Macassa mine | | | | | 29,393 | | | | | | 70,468 | | | | | | 905 | | | | | | 21,707 | | |
| Meadowbank Complex (including Amaruq) | | | | | 86,435 | | | | | | 53,393 | | | | | | – | | | | | | – | | |
| Meliadine mine | | | | | 58,485 | | | | | | 90,859 | | | | | | 3,601 | | | | | | 2,949 | | |
| Pinos Altos mine | | | | | 25,664 | | | | | | 26,749 | | | | | | 837 | | | | | | – | | |
| La India mine | | | | | 8,955 | | | | | | 6,129 | | | | | | 8 | | | | | | – | | |
| Other | | | | | 3,291 | | | | | | 16,289 | | | | | | 328 | | | | | | 3,956 | | |
| Total Capital Expenditures | | | | $ | 718,945 | | | | | $ | 695,903 | | | | | $ | 14,601 | | | | | $ | 107,451 | | |
| |
8
|
| |
AGNICO EAGLE
ANNUAL INFORMATION FORM
|
|
| | | |
2023 Capital Expenditures(1)
(thousands of $) |
| |||||||||||||||||||||
| | | | | | | | | | | | | | | |
Capitalized Exploration
|
| |||||||||
| | | |
Sustaining
|
| |
Development
|
| |
Sustaining
|
| |
Non-sustaining
|
| ||||||||||||
| LaRonde Complex | | | | $ | 81,043 | | | | | $ | 68,930 | | | | | $ | 2,038 | | | | | $ | – | | |
| Canadian Malartic Complex(2) | | | | | 91,028 | | | | | | 160,513 | | | | | | – | | | | | | 9,447 | | |
| Goldex mine(3) | | | | | 25,908 | | | | | | 56,977 | | | | | | 1,295 | | | | | | 2,459 | | |
| Detour Lake mine | | | | | 249,765 | | | | | | 140,388 | | | | | | – | | | | | | 32,515 | | |
| Fosterville mine | | | | | 33,751 | | | | | | 33,575 | | | | | | 895 | | | | | | 19,218 | | |
| Kittila mine | | | | | 47,355 | | | | | | 26,410 | | | | | | 2,184 | | | | | | 5,053 | | |
| Macassa mine | | | | | 43,333 | | | | | | 75,125 | | | | | | 1,696 | | | | | | 26,105 | | |
| Meadowbank Complex | | | | | 121,653 | | | | | | 80 | | | | | | – | | | | | | – | | |
| Meliadine mine | | | | | 67,947 | | | | | | 106,953 | | | | | | 7,328 | | | | | | 11,927 | | |
| Pinos Altos mine | | | | | 28,449 | | | | | | 4,196 | | | | | | 1,692 | | | | | | 1,101 | | |
| Other | | | | | 247 | | | | | | 11,449 | | | | | | – | | | | | | 840 | | |
| Total Capital Expenditures | | | | $ | 790,479 | | | | | $ | 684,596 | | | | | $ | 17,128 | | | | | $ | 108,665 | | |
| |
AGNICO EAGLE
ANNUAL INFORMATION FORM
|
| |
9
|
|
| | | |
2024 Capital Expenditures (Expected)(1)
(thousands of $) |
| |||||||||||||||||||||||||||
| | | |
Capital Expenditures
|
| |
Capitalized Exploration
|
| ||||||||||||||||||||||||
| | | |
Sustaining
|
| |
Development
|
| |
Sustaining
|
| |
Non-sustaining
|
| |
Total
|
| |||||||||||||||
| LaRonde Complex | | | | $ | 86,100 | | | | | $ | 68,200 | | | | | $ | 2,300 | | | | | $ | – | | | | |
$
|
156,600
|
| |
| Canadian Malartic Complex | | | | | 135,900 | | | | | | 167,500 | | | | | | – | | | | | | 7,100 | | | | |
|
310,500
|
| |
| Goldex mine | | | | | 52,800 | | | | | | 7,700 | | | | | | 2,900 | | | | | | – | | | | |
|
63,400
|
| |
| Detour Lake mine | | | | | 274,800 | | | | | | 201,100 | | | | | | – | | | | | | 20,300 | | | | |
|
496,200
|
| |
| Macassa mine | | | | | 59,400 | | | | | | 97,800 | | | | | | 2,100 | | | | | | 32,900 | | | | |
|
192,200
|
| |
| Meliadine mine | | | | | 70,200 | | | | | | 82,400 | | | | | | 5,500 | | | | | | 13,200 | | | | |
|
171,300
|
| |
| Meadowbank Complex | | | | | 94,000 | | | | | | – | | | | | | – | | | | | | – | | | | |
|
94,000
|
| |
| Fosterville mine | | | | | 35,800 | | | | | | 41,100 | | | | | | – | | | | | | 11,000 | | | | |
|
87,900
|
| |
| Kittila mine | | | | | 87,200 | | | | | | 2,900 | | | | | | 1,900 | | | | | | 5,400 | | | | |
|
97,400
|
| |
| Pinos Altos mine | | | | | 19,800 | | | | | | 15,400 | | | | | | 1,800 | | | | | | 500 | | | | |
|
37,500
|
| |
| San Nicolas project | | | | | – | | | | | | 17,000 | | | | | | – | | | | | | – | | | | |
|
17,000
|
| |
| Other | | | | | – | | | | | | 35,900 | | | | | | – | | | | | | 1,700 | | | | |
|
37,600
|
| |
| Total Capital Expenditures | | | | $ | 916,000 | | | | | $ | 737,000 | | | | | $ | 16,500 | | | | | $ | 92,100 | | | | | $ | 1,761,600 | | |
| |
10
|
| |
AGNICO EAGLE
ANNUAL INFORMATION FORM
|
|
| |
AGNICO EAGLE
ANNUAL INFORMATION FORM
|
| |
11
|
|
| |
12
|
| |
AGNICO EAGLE
ANNUAL INFORMATION FORM
|
|
![[MISSING IMAGE: mp_larondecomplex-4c.jpg]](/disclosures/0001104659-24-037982/asset?file=mp_larondecomplex-4c.jpg&lang=en)
| |
AGNICO EAGLE
ANNUAL INFORMATION FORM
|
| |
13
|
|
![[MISSING IMAGE: mp_abitibiregionproperti-4c.jpg]](/disclosures/0001104659-24-037982/asset?file=mp_abitibiregionproperti-4c.jpg&lang=en)
![[MISSING IMAGE: mp_surfacelaronde-4c.jpg]](/disclosures/0001104659-24-037982/asset?file=mp_surfacelaronde-4c.jpg&lang=en)
| |
14
|
| |
AGNICO EAGLE
ANNUAL INFORMATION FORM
|
|
| |
AGNICO EAGLE
ANNUAL INFORMATION FORM
|
| |
15
|
|
| | | | | | |
Copper
Concentrate 2,578 tonnes produced |
| |
Zinc
Concentrate 7,702 tonnes produced |
| | | | | | | ||||||
| | | |
Head
Grades |
| |
Grade
|
| |
Recovery
|
| |
Grade
|
| |
Recovery
|
| |
Overall
Metal Recoveries |
| |
Payable
Production |
|
|
Gold
|
| |
3.83 g/t
|
| |
321.2
|
| |
59.37%
|
| |
24.08 g/t
|
| |
4.30%
|
| |
93.59%
|
| |
306,648 oz
|
|
|
Silver
|
| |
9.12 g/t
|
| |
768.3
|
| |
45.98%
|
| |
147.54 g/t
|
| |
9.76%
|
| |
85.73%
|
| |
587,556 oz
|
|
|
Copper
|
| |
0.13%
|
| |
18.62%
|
| |
80.78%
|
| |
–
|
| |
–
|
| |
80.78%
|
| |
2,578 t
|
|
|
Zinc
|
| |
0.44%
|
| |
3.58%
|
| |
4.42%
|
| |
52.88%
|
| |
76.77%
|
| |
76.77%
|
| |
7,702 t
|
|
| |
16
|
| |
AGNICO EAGLE
ANNUAL INFORMATION FORM
|
|
| |
AGNICO EAGLE
ANNUAL INFORMATION FORM
|
| |
17
|
|
| |
18
|
| |
AGNICO EAGLE
ANNUAL INFORMATION FORM
|
|
| |
AGNICO EAGLE
ANNUAL INFORMATION FORM
|
| |
19
|
|
| |
20
|
| |
AGNICO EAGLE
ANNUAL INFORMATION FORM
|
|
![[MISSING IMAGE: mp_surfacemalarticmine-4c.jpg]](/disclosures/0001104659-24-037982/asset?file=mp_surfacemalarticmine-4c.jpg&lang=en)
| |
AGNICO EAGLE
ANNUAL INFORMATION FORM
|
| |
21
|
|
| | | |
Head
Grade |
| |
Overall
Metal Recovery |
| |
Payable
Production |
|
| Gold | | |
1.17 g/t
|
| |
92.8%
|
| |
603,955 oz
|
|
| Silver | | |
0.80 g/t
|
| |
72.3%
|
| |
310,494 oz
|
|
| |
22
|
| |
AGNICO EAGLE
ANNUAL INFORMATION FORM
|
|
| |
AGNICO EAGLE
ANNUAL INFORMATION FORM
|
| |
23
|
|
| |
24
|
| |
AGNICO EAGLE
ANNUAL INFORMATION FORM
|
|
| |
AGNICO EAGLE
ANNUAL INFORMATION FORM
|
| |
25
|
|
| |
26
|
| |
AGNICO EAGLE
ANNUAL INFORMATION FORM
|
|
![[MISSING IMAGE: mp_meadowbankcomplex-4c.jpg]](/disclosures/0001104659-24-037982/asset?file=mp_meadowbankcomplex-4c.jpg&lang=en)
| |
AGNICO EAGLE
ANNUAL INFORMATION FORM
|
| |
27
|
|
| |
28
|
| |
AGNICO EAGLE
ANNUAL INFORMATION FORM
|
|
![[MISSING IMAGE: mp_surfacemeadowbank-4c.jpg]](/disclosures/0001104659-24-037982/asset?file=mp_surfacemeadowbank-4c.jpg&lang=en)
| |
AGNICO EAGLE
ANNUAL INFORMATION FORM
|
| |
29
|
|
![[MISSING IMAGE: mp_surfaceamaruqsatellit-4c.jpg]](/disclosures/0001104659-24-037982/asset?file=mp_surfaceamaruqsatellit-4c.jpg&lang=en)
| |
30
|
| |
AGNICO EAGLE
ANNUAL INFORMATION FORM
|
|
| |
AGNICO EAGLE
ANNUAL INFORMATION FORM
|
| |
31
|
|
| | | |
Head
Grade |
| |
Overall
Metal Recovery |
| |
Payable
Production |
|
| Gold | | |
3.86 g/t
|
| |
90.56%
|
| |
431,666 oz
|
|
| |
32
|
| |
AGNICO EAGLE
ANNUAL INFORMATION FORM
|
|
| |
AGNICO EAGLE
ANNUAL INFORMATION FORM
|
| |
33
|
|
| |
34
|
| |
AGNICO EAGLE
ANNUAL INFORMATION FORM
|
|
![[MISSING IMAGE: mp_meliadinemine-4c.jpg]](/disclosures/0001104659-24-037982/asset?file=mp_meliadinemine-4c.jpg&lang=en)
| |
AGNICO EAGLE
ANNUAL INFORMATION FORM
|
| |
35
|
|
![[MISSING IMAGE: mp_surfacemeliadine-4c.jpg]](/disclosures/0001104659-24-037982/asset?file=mp_surfacemeliadine-4c.jpg&lang=en)
| |
36
|
| |
AGNICO EAGLE
ANNUAL INFORMATION FORM
|
|
| | | |
Head
Grade |
| |
Overall
Metal Recovery |
| |
Payable
Production |
|
| Gold | | |
6.11 g/t
|
| |
96.6%
|
| |
364,141 oz
|
|
| |
AGNICO EAGLE
ANNUAL INFORMATION FORM
|
| |
37
|
|
| |
38
|
| |
AGNICO EAGLE
ANNUAL INFORMATION FORM
|
|
| |
AGNICO EAGLE
ANNUAL INFORMATION FORM
|
| |
39
|
|
| |
40
|
| |
AGNICO EAGLE
ANNUAL INFORMATION FORM
|
|
![[MISSING IMAGE: mp_detourlakemine-4c.jpg]](/disclosures/0001104659-24-037982/asset?file=mp_detourlakemine-4c.jpg&lang=en)
|
Property
|
| |
NSR Amount
|
| |
NSR Holder
|
| |
Buy-Out Option
|
| ||||||
| Blocks A through E | | | | | 2% | | | |
Franco-Nevada Corporation
|
| | | | n/a | | |
| Mine Property | | | | | 2% | | | |
Franco-Nevada Corporation
|
| | | | n/a | | |
| Purchased claims (individual) | | | | | 2% | | | |
Individual Prospector
|
| | | | n/a | | |
| Gowest | | | | | 1% | | | |
Franco-Nevada Corporation
|
| | | C$ | 750,000 | | |
| |
AGNICO EAGLE
ANNUAL INFORMATION FORM
|
| |
41
|
|
![[MISSING IMAGE: mp_surfacedetourlake-4c.jpg]](/disclosures/0001104659-24-037982/asset?file=mp_surfacedetourlake-4c.jpg&lang=en)
| |
42
|
| |
AGNICO EAGLE
ANNUAL INFORMATION FORM
|
|
| | | |
Head
Grade |
| |
Overall
Metal Recovery |
| |
Payable
Production |
|
| Gold | | |
0.91 g/t
|
| |
90.9%
|
| |
677,446 oz
|
|
| |
AGNICO EAGLE
ANNUAL INFORMATION FORM
|
| |
43
|
|
| |
44
|
| |
AGNICO EAGLE
ANNUAL INFORMATION FORM
|
|
| |
AGNICO EAGLE
ANNUAL INFORMATION FORM
|
| |
45
|
|
| |
46
|
| |
AGNICO EAGLE
ANNUAL INFORMATION FORM
|
|
![[MISSING IMAGE: mp_goldexmine-4c.jpg]](/disclosures/0001104659-24-037982/asset?file=mp_goldexmine-4c.jpg&lang=en)
| |
AGNICO EAGLE
ANNUAL INFORMATION FORM
|
| |
47
|
|
![[MISSING IMAGE: mp_macassamine-4c.jpg]](/disclosures/0001104659-24-037982/asset?file=mp_macassamine-4c.jpg&lang=en)
| |
48
|
| |
AGNICO EAGLE
ANNUAL INFORMATION FORM
|
|
![[MISSING IMAGE: mp_kittilamine-4c.jpg]](/disclosures/0001104659-24-037982/asset?file=mp_kittilamine-4c.jpg&lang=en)
| |
AGNICO EAGLE
ANNUAL INFORMATION FORM
|
| |
49
|
|
| |
50
|
| |
AGNICO EAGLE
ANNUAL INFORMATION FORM
|
|
![[MISSING IMAGE: mp_fostervillemine-4c.jpg]](/disclosures/0001104659-24-037982/asset?file=mp_fostervillemine-4c.jpg&lang=en)
| |
AGNICO EAGLE
ANNUAL INFORMATION FORM
|
| |
51
|
|
![[MISSING IMAGE: mp_pinosaltosmine-4c.jpg]](/disclosures/0001104659-24-037982/asset?file=mp_pinosaltosmine-4c.jpg&lang=en)
| |
52
|
| |
AGNICO EAGLE
ANNUAL INFORMATION FORM
|
|
| |
AGNICO EAGLE
ANNUAL INFORMATION FORM
|
| |
53
|
|
![[MISSING IMAGE: mp_laindiamine-4c.jpg]](/disclosures/0001104659-24-037982/asset?file=mp_laindiamine-4c.jpg&lang=en)
| |
54
|
| |
AGNICO EAGLE
ANNUAL INFORMATION FORM
|
|
| |
AGNICO EAGLE
ANNUAL INFORMATION FORM
|
| |
55
|
|
| | | |
Metal Prices for Mineral Reserve Estimation(1)
|
| |||||||||||||||||||||
| | | |
Gold
(US$/oz) |
| |
Silver
(US$/oz) |
| |
Copper
(US$/lb) |
| |
Zinc
(US$/lb) |
| ||||||||||||
| | | | | $ | 1,400 | | | | | | 18.00 | | | | | | 3.50 | | | | | | 1.00 | | |
| | | |
Metal Prices for Mineral Resource Estimation(1)
|
| |||||||||||||||||||||
| | | |
Gold
(US$/oz) |
| |
Silver
(US$/oz) |
| |
Copper
(US$/lb) |
| |
Zinc
(US$/lb) |
| ||||||||||||
| | | | | $ | 1,650 | | | | | | 22.50 | | | | | | 3.75 | | | | | | 1.25 | | |
| | | |
Exchange rates
|
| |||||||||||||||||||||
| | | |
C$ per
US$1.00 |
| |
Mexican
peso per US$1.00 |
| |
AUD per
US$1.00 |
| |
EURO per
US$1.00 |
| ||||||||||||
| | | | | C$ | 1.30 | | | | | | MXP18.00 | | | | | | AUD1.36 | | | | | € | 0.909 | | |
| |
56
|
| |
AGNICO EAGLE
ANNUAL INFORMATION FORM
|
|
|
OPERATION / PROJECT
|
| |
PROVEN
|
| |
PROBABLE
|
| |
PROVEN & PROBABLE
|
| ||||||||||||||||||||||||||||||||||||||||||||||||||||||
|
GOLD
|
| |
Mining
Method* |
| |
000
Tonnes |
| |
g/t
|
| |
000 Oz
Au |
| |
000
Tonnes |
| |
g/t
|
| |
000 Oz
Au |
| |
000
Tonnes |
| |
g/t
|
| |
000 Oz
Au |
| |
Recovery
%** |
| ||||||||||||||||||||||||||||||
| LaRonde mine(1) | | |
U/G
|
| | | | 2,342 | | | | | | 4.98 | | | | | | 375 | | | | | | 8,568 | | | | | | 6.79 | | | | | | 1,870 | | | | | | 10,910 | | | | | | 6.40 | | | | | | 2,244 | | | | | | 94.7 | | |
| LaRonde Zone 5(2) | | |
U/G
|
| | | | 4,450 | | | | | | 2.11 | | | | | | 301 | | | | | | 4,523 | | | | | | 2.30 | | | | | | 334 | | | | | | 8,972 | | | | | | 2.20 | | | | | | 636 | | | | | | 94.7 | | |
| LaRonde Complex Total | | | | | 6,791 | | | | | | 3.10 | | | | | | 676 | | | | | | 13,091 | | | | | | 5.24 | | | | | | 2,204 | | | | | | 19,882 | | | | | | 4.51 | | | | | | 2,880 | | | | | | | | | |||
| Canadian Malartic(3) | | |
O/P
|
| | | | 45,474 | | | | | | 0.58 | | | | | | 852 | | | | | | 45,332 | | | | | | 1.09 | | | | | | 1,584 | | | | | | 90,806 | | | | | | 0.83 | | | | | | 2,436 | | | | | | 89.0 | | |
| East Gouldie(4) | | |
U/G
|
| | | | − | | | | | | − | | | | | | − | | | | | | 47,005 | | | | | | 3.42 | | | | | | 5,173 | | | | | | 47,005 | | | | | | 3.42 | | | | | | 5,173 | | | | | | 94.6 | | |
| Odyssey deposits(5) | | |
U/G
|
| | | | 17 | | | | | | 2.25 | | | | | | 1 | | | | | | 4,422 | | | | | | 2.17 | | | | | | 308 | | | | | | 4,440 | | | | | | 2.17 | | | | | | 310 | | | | | | 95.3 | | |
| Canadian Malartic Complex Total | | | | | 45,491 | | | | | | 0.58 | | | | | | 853 | | | | | | 96,760 | | | | | | 2.27 | | | | | | 7,065 | | | | | | 142,251 | | | | | | 1.73 | | | | | | 7,919 | | | | | | | | | |||
| Goldex(6) | | |
U/G
|
| | | | 797 | | | | | | 2.60 | | | | | | 66 | | | | | | 16,873 | | | | | | 1.54 | | | | | | 834 | | | | | | 17,669 | | | | | | 1.59 | | | | | | 901 | | | | | | 85.8 | | |
| Akasaba West(7) | | |
O/P
|
| | | | 203 | | | | | | 0.84 | | | | | | 5 | | | | | | 4,823 | | | | | | 0.89 | | | | | | 138 | | | | | | 5,025 | | | | | | 0.89 | | | | | | 143 | | | | | | 77.1 | | |
| Quebec Total | | | | | | | | 53,282 | | | | | | 0.93 | | | | | | 1,601 | | | | | | 131,546 | | | | | | 2.42 | | | | | | 10,242 | | | | | | 184,828 | | | | | | 1.99 | | | | | | 11,843 | | | | | | | | |
|
Detour Lake (At or above 0.5 g/t)
|
| |
O/P
|
| | | | 70,048 | | | | | | 1.14 | | | | | | 2,565 | | | | | | 484,633 | | | | | | 0.90 | | | | | | 14,029 | | | | | | 554,681 | | | | | | 0.93 | | | | | | 16,594 | | | | | | 91.9 | | |
|
Detour Lake (Below 0.5 g/t)
|
| |
O/P
|
| | | | 48,656 | | | | | | 0.43 | | | | | | 666 | | | | | | 215,712 | | | | | | 0.38 | | | | | | 2,669 | | | | | | 264,368 | | | | | | 0.39 | | | | | | 3,335 | | | | | | 90.0 | | |
| Detour Lake Total(8) | | | | | | | | 118,703 | | | | | | 0.85 | | | | | | 3,230 | | | | | | 700,346 | | | | | | 0.74 | | | | | | 16,698 | | | | | | 819,049 | | | | | | 0.76 | | | | | | 19,928 | | | | | | | | |
| Macassa mine(9) | | |
U/G
|
| | | | 248 | | | | | | 16.17 | | | | | | 129 | | | | | | 3,959 | | | | | | 14.34 | | | | | | 1,825 | | | | | | 4,207 | | | | | | 14.45 | | | | | | 1,954 | | | | | | 97.4 | | |
|
Macassa Near Surface(10)
|
| |
U/G
|
| | | | 2 | | | | | | 4.23 | | | | | | − | | | | | | 117 | | | | | | 5.96 | | | | | | 22 | | | | | | 119 | | | | | | 5.93 | | | | | | 23 | | | | | | 95.0 | | |
| AK deposit(11) | | |
U/G
|
| | | | − | | | | | | − | | | | | | − | | | | | | 742 | | | | | | 6.69 | | | | | | 160 | | | | | | 742 | | | | | | 6.69 | | | | | | 160 | | | | | | 95.0 | | |
| Macassa Total | | | | | | | | 249 | | | | | | 16.10 | | | | | | 129 | | | | | | 4,818 | | | | | | 12.96 | | | | | | 2,007 | | | | | | 5,067 | | | | | | 13.11 | | | | | | 2,136 | | | | | | | | |
| Upper Beaver(12) | | |
U/G
|
| | | | − | | | | | | − | | | | | | − | | | | | | 7,992 | | | | | | 5.43 | | | | | | 1,395 | | | | | | 7,992 | | | | | | 5.43 | | | | | | 1,395 | | | | | | 95.0 | | |
| Hammond Reef(13) | | |
O/P
|
| | | | − | | | | | | − | | | | | | − | | | | | | 123,473 | | | | | | 0.84 | | | | | | 3,323 | | | | | | 123,473 | | | | | | 0.84 | | | | | | 3,323 | | | | | | 89.2 | | |
| Ontario Total | | | | | | | | 118,952 | | | | | | 0.88 | | | | | | 3,359 | | | | | | 836,629 | | | | | | 0.87 | | | | | | 23,424 | | | | | | 955,581 | | | | | | 0.87 | | | | | | 26,783 | | | | | | | | |
| Amaruq | | |
O/P
|
| | | | 3,010 | | | | | | 1.58 | | | | | | 153 | | | | | | 9,469 | | | | | | 3.76 | | | | | | 1,146 | | | | | | 12,479 | | | | | | 3.24 | | | | | | 1,299 | | | | | | 91.7 | | |
| Amaruq | | |
U/G
|
| | | | 49 | | | | | | 5.96 | | | | | | 9 | | | | | | 2,829 | | | | | | 5.81 | | | | | | 528 | | | | | | 2,878 | | | | | | 5.81 | | | | | | 538 | | | | | | 91.7 | | |
| Meadowbank Complex Total(14) | | | | | 3,059 | | | | | | 1.65 | | | | | | 162 | | | | | | 12,298 | | | | | | 4.23 | | | | | | 1,674 | | | | | | 15,357 | | | | | | 3.72 | | | | | | 1,837 | | | | | | | | | |||
| Meliadine | | |
O/P
|
| | | | 266 | | | | | | 4.27 | | | | | | 37 | | | | | | 4,632 | | | | | | 4.46 | | | | | | 664 | | | | | | 4,898 | | | | | | 4.45 | | | | | | 700 | | | | | | 94.7 | | |
| Meliadine | | |
U/G
|
| | | | 1,514 | | | | | | 7.57 | | | | | | 369 | | | | | | 11,846 | | | | | | 6.30 | | | | | | 2,398 | | | | | | 13,360 | | | | | | 6.44 | | | | | | 2,767 | | | | | | 96.3 | | |
| Meliadine Total(15) | | | | | | | | 1,780 | | | | | | 7.08 | | | | | | 405 | | | | | | 16,478 | | | | | | 5.78 | | | | | | 3,062 | | | | | | 18,258 | | | | | | 5.91 | | | | | | 3,467 | | | | | | | | |
| Hope Bay(16) | | |
U/G
|
| | | | 93 | | | | | | 6.77 | | | | | | 20 | | | | | | 16,123 | | | | | | 6.51 | | | | | | 3,377 | | | | | | 16,216 | | | | | | 6.52 | | | | | | 3,397 | | | | | | 87.5 | | |
| Nunavut Total | | | | | | | | 4,932 | | | | | | 3.71 | | | | | | 588 | | | | | | 44,899 | | | | | | 5.62 | | | | | | 8,113 | | | | | | 49,831 | | | | | | 5.43 | | | | | | 8,701 | | | | | | | | |
| |
AGNICO EAGLE
ANNUAL INFORMATION FORM
|
| |
57
|
|
|
OPERATION / PROJECT
|
| |
PROVEN
|
| |
PROBABLE
|
| |
PROVEN & PROBABLE
|
| ||||||||||||||||||||||||||||||||||||||||||||||||||||||
|
GOLD
|
| |
Mining
Method* |
| |
000
Tonnes |
| |
g/t
|
| |
000 Oz
Au |
| |
000
Tonnes |
| |
g/t
|
| |
000 Oz
Au |
| |
000
Tonnes |
| |
g/t
|
| |
000 Oz
Au |
| |
Recovery
%** |
| ||||||||||||||||||||||||||||||
| Fosterville(17) | | |
U/G
|
| | | | 679 | | | | | | 12.52 | | | | | | 273 | | | | | | 7,897 | | | | | | 5.55 | | | | | | 1,409 | | | | | | 8,576 | | | | | | 6.10 | | | | | | 1,682 | | | | | | 95.0 | | |
| Australia Total | | | | | | | | 679 | | | | | | 12.52 | | | | | | 273 | | | | | | 7,897 | | | | | | 5.55 | | | | | | 1,409 | | | | | | 8,576 | | | | | | 6.10 | | | | | | 1,682 | | | | | | | | |
| Kittila(18) | | |
U/G
|
| | | | 984 | | | | | | 4.11 | | | | | | 130 | | | | | | 25,943 | | | | | | 4.14 | | | | | | 3,454 | | | | | | 26,926 | | | | | | 4.14 | | | | | | 3,584 | | | | | | 86.9 | | |
| Europe Total | | | | | | | | 984 | | | | | | 4.11 | | | | | | 130 | | | | | | 25,943 | | | | | | 4.14 | | | | | | 3,454 | | | | | | 26,926 | | | | | | 4.14 | | | | | | 3,584 | | | | | | | | |
| Pinos Altos | | |
O/P
|
| | | | 24 | | | | | | 1.21 | | | | | | 1 | | | | | | 2,363 | | | | | | 1.21 | | | | | | 92 | | | | | | 2,387 | | | | | | 1.21 | | | | | | 93 | | | | | | 94.4 | | |
| Pinos Altos | | |
U/G
|
| | | | 2,386 | | | | | | 2.14 | | | | | | 164 | | | | | | 4,150 | | | | | | 2.17 | | | | | | 290 | | | | | | 6,536 | | | | | | 2.16 | | | | | | 454 | | | | | | 94.2 | | |
| Pinos Altos Total(19) | | | | | | | | 2,410 | | | | | | 2.13 | | | | | | 165 | | | | | | 6,514 | | | | | | 1.82 | | | | | | 381 | | | | | | 8,924 | | | | | | 1.90 | | | | | | 546 | | | | | | | | |
| San Nicolás (50%)(20) | | |
O/P
|
| | | | 23,858 | | | | | | 0.41 | | | | | | 314 | | | | | | 28,761 | | | | | | 0.39 | | | | | | 358 | | | | | | 52,619 | | | | | | 0.40 | | | | | | 672 | | | | | | 17.6 | | |
| Mexico Total | | | | | | | | 26,268 | | | | | | 0.57 | | | | | | 479 | | | | | | 35,275 | | | | | | 0.65 | | | | | | 739 | | | | | | 61,543 | | | | | | 0.62 | | | | | | 1,219 | | | | | | | | |
| Total Gold | | | | | | | | 205,096 | | | | | | 0.98 | | | | | | 6,430 | | | | | | 1,082,188 | | | | | | 1.36 | | | | | | 47,380 | | | | | | 1,287,284 | | | | | | 1.30 | | | | | | 53,811 | | | | | | | | |
| |
SILVER
|
| |
Mining
Method* |
| |
000
Tonnes |
| |
g/t
|
| |
000 Oz
Ag |
| |
000
Tonnes |
| |
g/t
|
| |
000 Oz
Ag |
| |
000
Tonnes |
| |
g/t
|
| |
000 Oz
Ag |
| |
Recovery
%** |
| ||||||||||||||||||||||||||||||
| | LaRonde | | |
U/G
|
| | | | 2,342 | | | | | | 14.32 | | | | | | 1,078 | | | | | | 8,568 | | | | | | 21.60 | | | | | | 5,950 | | | | | | 10,910 | | | | | | 20.04 | | | | | | 7,028 | | | | | | 74.9 | | |
| | Pinos Altos | | |
O/P
|
| | | | 24 | | | | | | 43.30 | | | | | | 33 | | | | | | 2,363 | | | | | | 36.35 | | | | | | 2,762 | | | | | | 2,387 | | | | | | 36.42 | | | | | | 2,796 | | | | | | 44.5 | | |
| | Pinos Altos | | |
U/G
|
| | | | 2,386 | | | | | | 40.03 | | | | | | 3,070 | | | | | | 4,150 | | | | | | 47.41 | | | | | | 6,326 | | | | | | 6,536 | | | | | | 44.71 | | | | | | 9,396 | | | | | | 49.3 | | |
| | Pinos Altos Total | | | | | | | | 2,410 | | | | | | 40.06 | | | | | | 3,104 | | | | | | 6,514 | | | | | | 43.40 | | | | | | 9,088 | | | | | | 8,924 | | | | | | 42.50 | | | | | | 12,192 | | | | | | | | |
| | San Nicolás (50%)(20)(21) | | |
O/P
|
| | | | 23,858 | | | | | | 23.93 | | | | | | 18,356 | | | | | | 28,761 | | | | | | 20.91 | | | | | | 19,333 | | | | | | 52,619 | | | | | | 22.28 | | | | | | 37,689 | | | | | | 38.6 | | |
| | Total Silver | | | | | | | | 28,609 | | | | | | 24.50 | | | | | | 22,538 | | | | | | 43,843 | | | | | | 24.38 | | | | | | 34,371 | | | | | | 72,453 | | | | | | 24.43 | | | | | | 56,909 | | | | | | | | |
| |
COPPER
|
| |
Mining
Method* |
| |
000
Tonnes |
| |
%
|
| |
tonnes
Cu |
| |
000
Tonnes |
| |
%
|
| |
tonnes
Cu |
| |
000
Tonnes |
| |
%
|
| |
tonnes
Cu |
| |
Recovery
%** |
| ||||||||||||||||||||||||||||||
| | LaRonde | | |
U/G
|
| | | | 2,342 | | | | | | 0.19 | | | | | | 4,558 | | | | | | 8,568 | | | | | | 0.30 | | | | | | 25,341 | | | | | | 10,910 | | | | | | 0.27 | | | | | | 29,899 | | | | | | 83.6 | | |
| | Akasaba West | | |
O/P
|
| | | | 203 | | | | | | 0.44 | | | | | | 890 | | | | | | 4,823 | | | | | | 0.50 | | | | | | 24,262 | | | | | | 5,025 | | | | | | 0.50 | | | | | | 25,153 | | | | | | 83.6 | | |
| | Upper Beaver | | |
U/G
|
| | | | − | | | | | | − | | | | | | − | | | | | | 7,992 | | | | | | 0.25 | | | | | | 19,980 | | | | | | 7,992 | | | | | | 0.25 | | | | | | 19,980 | | | | | | 90.0 | | |
| | San Nicolás (50%)(21) | | |
O/P
|
| | | | 23,858 | | | | | | 1.26 | | | | | | 299,809 | | | | | | 28,761 | | | | | | 1.01 | | | | | | 291,721 | | | | | | 52,619 | | | | | | 1.12 | | | | | | 591,530 | | | | | | 78.2 | | |
| | Total Copper | | | | | | | | 26,402 | | | | | | 1.16 | | | | | | 305,258 | | | | | | 50,144 | | | | | | 0.72 | | | | | | 361,305 | | | | | | 76,546 | | | | | | 0.87 | | | | | | 666,562 | | | | | | | | |
| |
ZINC
|
| |
Mining
Method* |
| |
000
Tonnes |
| |
%
|
| |
tonnes
Zn |
| |
000
Tonnes |
| |
%
|
| |
tonnes
Zn |
| |
000
Tonnes |
| |
%
|
| |
tonnes
Zn |
| |
Recovery
%** |
| ||||||||||||||||||||||||||||||
| | LaRonde | | |
U/G
|
| | | | 2,342 | | | | | | 0.62 | | | | | | 14,424 | | | | | | 8,568 | | | | | | 1.08 | | | | | | 92,164 | | | | | | 10,910 | | | | | | 0.98 | | | | | | 106,588 | | | | | | 69.2 | | |
| | San Nicolás (50%)(21) | | |
O/P
|
| | | | 23,858 | | | | | | 1.61 | | | | | | 383,313 | | | | | | 28,761 | | | | | | 1.37 | | | | | | 394,115 | | | | | | 52,619 | | | | | | 1.48 | | | | | | 777,428 | | | | | | 80.9 | | |
| | Total Zinc | | | | | | | | 26,199 | | | | | | 1.52 | | | | | | 397,736 | | | | | | 37,330 | | | | | | 1.30 | | | | | | 486,280 | | | | | | 63,529 | | | | | | 1.39 | | | | | | 884,016 | | | | | | | | |
| |
58
|
| |
AGNICO EAGLE
ANNUAL INFORMATION FORM
|
|
| |
AGNICO EAGLE
ANNUAL INFORMATION FORM
|
| |
59
|
|
|
OPERATION / PROJECT
|
| |
MEASURED
|
| |
INDICATED
|
| |
MEASURED &
INDICATED |
| |
INFERRED
|
| ||||||||||||||||||||||||||||||||||||||||||||||||||||||||||||||||||
|
GOLD
|
| |
Mining
Method* |
| |
000
Tonnes |
| |
g/t
|
| |
000
Oz Au |
| |
000
Tonnes |
| |
g/t
|
| |
000
Oz Au |
| |
000
Tonnes |
| |
g/t
|
| |
000
Oz Au |
| |
000
Tonnes |
| |
g/t
|
| |
000
Oz Au |
| |||||||||||||||||||||||||||||||||||||||
| LaRonde | | | | | U/G | | | | | | − | | | | | | − | | | | | | − | | | | | | 6,424 | | | | | | 3.06 | | | | | | 632 | | | | | | 6,424 | | | | | | 3.06 | | | | | | 632 | | | | | | 1,569 | | | | | | 5.67 | | | | | | 286 | | |
| LaRonde Zone 5 | | | | | U/G | | | | | | − | | | | | | − | | | | | | − | | | | | | 10,594 | | | | | | 2.27 | | | | | | 774 | | | | | | 10,594 | | | | | | 2.27 | | | | | | 774 | | | | | | 10,437 | | | | | | 3.38 | | | | | | 1,134 | | |
| LaRonde Complex Total | | | | | | | | | | | − | | | | | | − | | | | | | − | | | | | | 17,018 | | | | | | 2.57 | | | | | | 1,407 | | | | | | 17,018 | | | | | | 2.57 | | | | | | 1,407 | | | | | | 12,006 | | | | | | 3.68 | | | | | | 1,420 | | |
| Canadian Malartic | | | | | O/P | | | | | | − | | | | | | − | | | | | | − | | | | | | − | | | | | | − | | | | | | − | | | | | | − | | | | | | − | | | | | | − | | | | | | 8,171 | | | | | | 0.81 | | | | | | 214 | | |
| Odyssey | | | | | U/G | | | | | | − | | | | | | − | | | | | | − | | | | | | 1,372 | | | | | | 1.71 | | | | | | 75 | | | | | | 1,372 | | | | | | 1.71 | | | | | | 75 | | | | | | 19,700 | | | | | | 2.29 | | | | | | 1,453 | | |
| East Malartic | | | | | U/G | | | | | | − | | | | | | − | | | | | | − | | | | | | 11,134 | | | | | | 2.04 | | | | | | 731 | | | | | | 11,134 | | | | | | 2.04 | | | | | | 731 | | | | | | 65,748 | | | | | | 2.12 | | | | | | 4,480 | | |
| East Gouldie | | | | | U/G | | | | | | − | | | | | | − | | | | | | − | | | | | | 4,853 | | | | | | 1.56 | | | | | | 244 | | | | | | 4,853 | | | | | | 1.56 | | | | | | 244 | | | | | | 45,239 | | | | | | 2.29 | | | | | | 3,331 | | |
| Odyssey Project Total | | | | | | | | | | | − | | | | | | − | | | | | | − | | | | | | 17,358 | | | | | | 1.88 | | | | | | 1,050 | | | | | | 17,358 | | | | | | 1.88 | | | | | | 1,050 | | | | | | 130,687 | | | | | | 2.20 | | | | | | 9,263 | | |
| Canadian Malartic Total | | | | | | | | | | | − | | | | | | − | | | | | | − | | | | | | 17,358 | | | | | | 1.88 | | | | | | 1,050 | | | | | | 17,358 | | | | | | 1.88 | | | | | | 1,050 | | | | | | 138,858 | | | | | | 2.12 | | | | | | 9,477 | | |
| Goldex | | | | | U/G | | | | | | 12,360 | | | | | | 1.86 | | | | | | 739 | | | | | | 18,837 | | | | | | 1.50 | | | | | | 907 | | | | | | 31,197 | | | | | | 1.64 | | | | | | 1,646 | | | | | | 16,154 | | | | | | 1.68 | | | | | | 871 | | |
| Akasaba West | | | | | O/P | | | | | | − | | | | | | − | | | | | | − | | | | | | 4,044 | | | | | | 0.70 | | | | | | 91 | | | | | | 4,044 | | | | | | 0.70 | | | | | | 91 | | | | | | − | | | | | | − | | | | | | − | | |
| Wasamac | | | | | U/G | | | | | | − | | | | | | − | | | | | | − | | | | | | 27,850 | | | | | | 2.43 | | | | | | 2,173 | | | | | | 27,850 | | | | | | 2.43 | | | | | | 2,173 | | | | | | 9,232 | | | | | | 2.66 | | | | | | 789 | | |
| Quebec Total | | | | | | | | | | | 12,360 | | | | | | 1.86 | | | | | | 739 | | | | | | 85,109 | | | | | | 2.06 | | | | | | 5,628 | | | | | | 97,468 | | | | | | 2.03 | | | | | | 6,367 | | | | | | 176,249 | | | | | | 2.22 | | | | | | 12,558 | | |
| Detour Lake | | | | | O/P | | | | | | 30,861 | | | | | | 1.45 | | | | | | 1,434 | | | | | | 697,821 | | | | | | 0.74 | | | | | | 16,520 | | | | | | 728,681 | | | | | | 0.77 | | | | | | 17,955 | | | | | | 58,317 | | | | | | 0.62 | | | | | | 1,156 | | |
| Detour Lake | | | | | U/G | | | | | | − | | | | | | − | | | | | | − | | | | | | − | | | | | | − | | | | | | − | | | | | | − | | | | | | − | | | | | | − | | | | | | 21,811 | | | | | | 2.23 | | | | | | 1,561 | | |
| Detour Lake Zone 58N | | | | | U/G | | | | | | − | | | | | | − | | | | | | − | | | | | | 2,868 | | | | | | 5.80 | | | | | | 534 | | | | | | 2,868 | | | | | | 5.80 | | | | | | 534 | | | | | | 973 | | | | | | 4.35 | | | | | | 136 | | |
| Detour Lake Total | | | | | | | | | | | 30,861 | | | | | | 1.45 | | | | | | 1,434 | | | | | | 700,688 | | | | | | 0.76 | | | | | | 17,055 | | | | | | 731,549 | | | | | | 0.79 | | | | | | 18,489 | | | | | | 81,101 | | | | | | 1.09 | | | | | | 2,853 | | |
| Macassa | | | | | U/G | | | | | | 258 | | | | | | 10.32 | | | | | | 86 | | | | | | 1,910 | | | | | | 8.35 | | | | | | 512 | | | | | | 2,168 | | | | | | 8.58 | | | | | | 598 | | | | | | 3,692 | | | | | | 9.21 | | | | | | 1,094 | | |
| Macassa Near Surface | | | | | U/G | | | | | | − | | | | | | − | | | | | | − | | | | | | 65 | | | | | | 6.14 | | | | | | 13 | | | | | | 65 | | | | | | 6.14 | | | | | | 13 | | | | | | 133 | | | | | | 6.62 | | | | | | 28 | | |
| AK Project | | | | | U/G | | | | | | − | | | | | | − | | | | | | − | | | | | | 163 | | | | | | 6.95 | | | | | | 37 | | | | | | 163 | | | | | | 6.95 | | | | | | 37 | | | | | | 282 | | | | | | 5.69 | | | | | | 52 | | |
| Macassa Total | | | | | | | | | | | 258 | | | | | | 10.32 | | | | | | 86 | | | | | | 2,138 | | | | | | 8.17 | | | | | | 562 | | | | | | 2,396 | | | | | | 8.40 | | | | | | 647 | | | | | | 4,106 | | | | | | 8.89 | | | | | | 1,173 | | |
| Aquarius | | | | | O/P | | | | | | − | | | | | | − | | | | | | − | | | | | | 23,112 | | | | | | 1.49 | | | | | | 1,106 | | | | | | 23,112 | | | | | | 1.49 | | | | | | 1,106 | | | | | | 502 | | | | | | 0.87 | | | | | | 14 | | |
| Holt Complex | | | | | U/G | | | | | | 5,806 | | | | | | 4.29 | | | | | | 800 | | | | | | 5,884 | | | | | | 4.75 | | | | | | 898 | | | | | | 11,690 | | | | | | 4.52 | | | | | | 1,699 | | | | | | 9,097 | | | | | | 4.48 | | | | | | 1,310 | | |
| Anoki-McBean | | | | | U/G | | | | | | − | | | | | | − | | | | | | − | | | | | | 3,919 | | | | | | 2.77 | | | | | | 349 | | | | | | 3,919 | | | | | | 2.77 | | | | | | 349 | | | | | | 867 | | | | | | 3.84 | | | | | | 107 | | |
| Upper Beaver | | | | | U/G | | | | | | − | | | | | | − | | | | | | − | | | | | | 3,636 | | | | | | 3.45 | | | | | | 403 | | | | | | 3,636 | | | | | | 3.45 | | | | | | 403 | | | | | | 8,688 | | | | | | 5.07 | | | | | | 1,416 | | |
| Upper Canada | | | | | O/P | | | | | | − | | | | | | − | | | | | | − | | | | | | 2,006 | | | | | | 1.62 | | | | | | 104 | | | | | | 2,006 | | | | | | 1.62 | | | | | | 104 | | | | | | 1,020 | | | | | | 1.44 | | | | | | 47 | | |
| Upper Canada | | | | | U/G | | | | | | − | | | | | | − | | | | | | − | | | | | | 8,433 | | | | | | 2.28 | | | | | | 618 | | | | | | 8,433 | | | | | | 2.28 | | | | | | 618 | | | | | | 17,588 | | | | | | 3.21 | | | | | | 1,816 | | |
| Upper Canada Total | | | | | | | | | | | − | | | | | | − | | | | | | − | | | | | | 10,439 | | | | | | 2.15 | | | | | | 722 | | | | | | 10,439 | | | | | | 2.15 | | | | | | 722 | | | | | | 18,608 | | | | | | 3.11 | | | | | | 1,863 | | |
| Hammond Reef | | | | | O/P | | | | | | 47,063 | | | | | | 0.54 | | | | | | 819 | | | | | | 86,304 | | | | | | 0.53 | | | | | | 1,478 | | | | | | 133,367 | | | | | | 0.54 | | | | | | 2,298 | | | | | | − | | | | | | − | | | | | | − | | |
| Ontario Total | | | | | | | | | | | 83,988 | | | | | | 1.16 | | | | | | 3,140 | | | | | | 836,119 | | | | | | 0.84 | | | | | | 22,574 | | | | | | 920,107 | | | | | | 0.87 | | | | | | 25,713 | | | | | | 122,968 | | | | | | 2.21 | | | | | | 8,736 | | |
| Amaruq | | | | | O/P | | | | | | − | | | | | | − | | | | | | − | | | | | | 4,758 | | | | | | 2.62 | | | | | | 401 | | | | | | 4,758 | | | | | | 2.62 | | | | | | 401 | | | | | | 236 | | | | | | 2.87 | | | | | | 22 | | |
| Amaruq | | | | | U/G | | | | | | − | | | | | | − | | | | | | − | | | | | | 8,544 | | | | | | 4.37 | | | | | | 1,199 | | | | | | 8,544 | | | | | | 4.37 | | | | | | 1,199 | | | | | | 3,938 | | | | | | 4.75 | | | | | | 602 | | |
| Amaruq Total | | | | | | | | | | | − | | | | | | − | | | | | | − | | | | | | 13,302 | | | | | | 3.74 | | | | | | 1,600 | | | | | | 13,302 | | | | | | 3.74 | | | | | | 1,600 | | | | | | 4,173 | | | | | | 4.65 | | | | | | 623 | | |
| Meadowbank Complex Total | | | | | | | | | | | − | | | | | | − | | | | | | − | | | | | | 13,302 | | | | | | 3.74 | | | | | | 1,600 | | | | | | 13,302 | | | | | | 3.74 | | | | | | 1,600 | | | | | | 4,173 | | | | | | 4.65 | | | | | | 623 | | |
| Meliadine | | | | | O/P | | | | | | 3 | | | | | | 3.17 | | | | | | − | | | | | | 4,613 | | | | | | 3.14 | | | | | | 466 | | | | | | 4,615 | | | | | | 3.14 | | | | | | 466 | | | | | | 1,135 | | | | | | 4.45 | | | | | | 162 | | |
| Meliadine | | | | | U/G | | | | | | 422 | | | | | | 4.64 | | | | | | 63 | | | | | | 7,626 | | | | | | 4.49 | | | | | | 1,100 | | | | | | 8,047 | | | | | | 4.49 | | | | | | 1,163 | | | | | | 9,986 | | | | | | 6.42 | | | | | | 2,060 | | |
| Meliadine Total | | | | | | | | | | | 424 | | | | | | 4.63 | | | | | | 63 | | | | | | 12,238 | | | | | | 3.98 | | | | | | 1,566 | | | | | | 12,663 | | | | | | 4.00 | | | | | | 1,629 | | | | | | 11,120 | | | | | | 6.22 | | | | | | 2,222 | | |
| |
60
|
| |
AGNICO EAGLE
ANNUAL INFORMATION FORM
|
|
|
OPERATION / PROJECT
|
| |
MEASURED
|
| |
INDICATED
|
| |
MEASURED &
INDICATED |
| |
INFERRED
|
| ||||||||||||||||||||||||||||||||||||||||||||||||||||||||||||||||||
|
GOLD
|
| |
Mining
Method* |
| |
000
Tonnes |
| |
g/t
|
| |
000 Oz
Au |
| |
000
Tonnes |
| |
g/t
|
| |
000
Oz Au |
| |
000
Tonnes |
| |
g/t
|
| |
000
Oz Au |
| |
000
Tonnes |
| |
g/t
|
| |
000
Oz Au |
| |||||||||||||||||||||||||||||||||||||||
| Hope Bay | | | | | U/G | | | | | | − | | | | | | − | | | | | | − | | | | | | 10,734 | | | | | | 3.64 | | | | | | 1,255 | | | | | | 10,734 | | | | | | 3.64 | | | | | | 1,255 | | | | | | 12,110 | | | | | | 5.41 | | | | | | 2,108 | | |
| Nunavut Total | | | | | | | | | | | 424 | | | | | | 4.63 | | | | | | 63 | | | | | | 36,274 | | | | | | 3.79 | | | | | | 4,421 | | | | | | 36,699 | | | | | | 3.80 | | | | | | 4,485 | | | | | | 27,404 | | | | | | 5.62 | | | | | | 4,953 | | |
| Fosterville | | | | | O/P | | | | | | 820 | | | | | | 2.81 | | | | | | 74 | | | | | | 1,771 | | | | | | 3.87 | | | | | | 220 | | | | | | 2,591 | | | | | | 3.53 | | | | | | 294 | | | | | | 326 | | | | | | 2.72 | | | | | | 29 | | |
| Fosterville | | | | | U/G | | | | | | 262 | | | | | | 3.99 | | | | | | 34 | | | | | | 8,758 | | | | | | 4.20 | | | | | | 1,184 | | | | | | 9,019 | | | | | | 4.20 | | | | | | 1,218 | | | | | | 9,693 | | | | | | 4.60 | | | | | | 1,433 | | |
| Fosterville Total | | | | | | | | | | | 1,082 | | | | | | 3.10 | | | | | | 108 | | | | | | 10,528 | | | | | | 4.15 | | | | | | 1,404 | | | | | | 11,610 | | | | | | 4.05 | | | | | | 1,512 | | | | | | 10,019 | | | | | | 4.54 | | | | | | 1,461 | | |
| Northern Territory | | | | | O/P | | | | | | 269 | | | | | | 3.65 | | | | | | 32 | | | | | | 16,416 | | | | | | 1.42 | | | | | | 749 | | | | | | 16,685 | | | | | | 1.46 | | | | | | 781 | | | | | | 13,536 | | | | | | 1.75 | | | | | | 762 | | |
| Northern Territory | | | | | U/G | | | | | | − | | | | | | − | | | | | | − | | | | | | 5,115 | | | | | | 5.39 | | | | | | 887 | | | | | | 5,115 | | | | | | 5.39 | | | | | | 887 | | | | | | 4,284 | | | | | | 4.45 | | | | | | 613 | | |
| Northern Territory Total | | | | | | | | | | | 269 | | | | | | 3.65 | | | | | | 32 | | | | | | 21,531 | | | | | | 2.36 | | | | | | 1,636 | | | | | | 21,800 | | | | | | 2.38 | | | | | | 1,668 | | | | | | 17,820 | | | | | | 2.40 | | | | | | 1,376 | | |
| Australia Total | | | | | | | | | | | 1,351 | | | | | | 3.21 | | | | | | 139 | | | | | | 32,059 | | | | | | 2.95 | | | | | | 3,040 | | | | | | 33,410 | | | | | | 2.96 | | | | | | 3,180 | | | | | | 27,839 | | | | | | 3.17 | | | | | | 2,837 | | |
| Kittilä | | | | | O/P | | | | | | − | | | | | | − | | | | | | − | | | | | | − | | | | | | − | | | | | | − | | | | | | − | | | | | | − | | | | | | − | | | | | | 373 | | | | | | 3.89 | | | | | | 47 | | |
| Kittilä | | | | | U/G | | | | | | 4,299 | | | | | | 2.91 | | | | | | 402 | | | | | | 13,632 | | | | | | 2.93 | | | | | | 1,285 | | | | | | 17,931 | | | | | | 2.93 | | | | | | 1,687 | | | | | | 6,192 | | | | | | 5.13 | | | | | | 1,020 | | |
| Kittilä Total | | | | | | | | | | | 4,299 | | | | | | 2.91 | | | | | | 402 | | | | | | 13,632 | | | | | | 2.93 | | | | | | 1,285 | | | | | | 17,931 | | | | | | 2.93 | | | | | | 1,687 | | | | | | 6,565 | | | | | | 5.06 | | | | | | 1,067 | | |
| Barsele | | | | | O/P | | | | | | − | | | | | | − | | | | | | − | | | | | | 3,178 | | | | | | 1.08 | | | | | | 111 | | | | | | 3,178 | | | | | | 1.08 | | | | | | 111 | | | | | | 2,260 | | | | | | 1.25 | | | | | | 91 | | |
| Barsele | | | | | U/G | | | | | | − | | | | | | − | | | | | | − | | | | | | 1,158 | | | | | | 1.77 | | | | | | 66 | | | | | | 1,158 | | | | | | 1.77 | | | | | | 66 | | | | | | 13,552 | | | | | | 2.10 | | | | | | 914 | | |
| Barsele Total | | | | | | | | | | | − | | | | | | − | | | | | | − | | | | | | 4,335 | | | | | | 1.27 | | | | | | 176 | | | | | | 4,335 | | | | | | 1.27 | | | | | | 176 | | | | | | 15,811 | | | | | | 1.98 | | | | | | 1,005 | | |
| Europe Total | | | | | | | | | | | 4,299 | | | | | | 2.91 | | | | | | 402 | | | | | | 17,967 | | | | | | 2.53 | | | | | | 1,461 | | | | | | 22,266 | | | | | | 2.60 | | | | | | 1,863 | | | | | | 22,376 | | | | | | 2.88 | | | | | | 2,072 | | |
| Pinos Altos | | | | | O/P | | | | | | − | | | | | | − | | | | | | − | | | | | | 1,266 | | | | | | 1.03 | | | | | | 42 | | | | | | 1,266 | | | | | | 1.03 | | | | | | 42 | | | | | | 445 | | | | | | 1.27 | | | | | | 18 | | |
| Pinos Altos | | | | | U/G | | | | | | − | | | | | | − | | | | | | − | | | | | | 10,394 | | | | | | 1.92 | | | | | | 643 | | | | | | 10,394 | | | | | | 1.92 | | | | | | 643 | | | | | | 1,431 | | | | | | 1.87 | | | | | | 86 | | |
| Pinos Altos Total | | | | | | | | | | | − | | | | | | − | | | | | | − | | | | | | 11,659 | | | | | | 1.83 | | | | | | 685 | | | | | | 11,659 | | | | | | 1.83 | | | | | | 685 | | | | | | 1,876 | | | | | | 1.73 | | | | | | 104 | | |
| La India | | | | | O/P | | | | | | 4,478 | | | | | | 0.52 | | | | | | 74 | | | | | | 814 | | | | | | 0.54 | | | | | | 14 | | | | | | 5,292 | | | | | | 0.52 | | | | | | 88 | | | | | | 66 | | | | | | 0.40 | | | | | | 1 | | |
| San Nicolás (50%) | | | | | O/P | | | | | | 261 | | | | | | 0.08 | | | | | | 1 | | | | | | 3,037 | | | | | | 0.20 | | | | | | 19 | | | | | | 3,297 | | | | | | 0.19 | | | | | | 20 | | | | | | 2,468 | | | | | | 0.13 | | | | | | 10 | | |
| Tarachi | | | | | O/P | | | | | | − | | | | | | − | | | | | | − | | | | | | 19,290 | | | | | | 0.58 | | | | | | 361 | | | | | | 19,290 | | | | | | 0.58 | | | | | | 361 | | | | | | 242 | | | | | | 0.52 | | | | | | 4 | | |
| Chipriona | | | | | O/P | | | | | | − | | | | | | − | | | | | | − | | | | | | 10,983 | | | | | | 0.92 | | | | | | 326 | | | | | | 10,983 | | | | | | 0.92 | | | | | | 326 | | | | | | 976 | | | | | | 0.66 | | | | | | 21 | | |
| El Barqueño Gold | | | | | O/P | | | | | | − | | | | | | − | | | | | | − | | | | | | 8,834 | | | | | | 1.16 | | | | | | 331 | | | | | | 8,834 | | | | | | 1.16 | | | | | | 331 | | | | | | 9,628 | | | | | | 1.13 | | | | | | 351 | | |
| Santa Gertrudis | | | | | O/P | | | | | | − | | | | | | − | | | | | | − | | | | | | 19,267 | | | | | | 0.91 | | | | | | 563 | | | | | | 19,267 | | | | | | 0.91 | | | | | | 563 | | | | | | 9,819 | | | | | | 1.36 | | | | | | 429 | | |
| Santa Gertrudis | | | | | U/G | | | | | | − | | | | | | − | | | | | | − | | | | | | − | | | | | | − | | | | | | − | | | | | | − | | | | | | − | | | | | | − | | | | | | 9,079 | | | | | | 3.44 | | | | | | 1,004 | | |
| Santa Gertrudis Total | | | | | | | | | | | − | | | | | | − | | | | | | − | | | | | | 19,267 | | | | | | 0.91 | | | | | | 563 | | | | | | 19,267 | | | | | | 0.91 | | | | | | 563 | | | | | | 18,898 | | | | | | 2.36 | | | | | | 1,433 | | |
| Total Mexico | | | | | | | | | | | 4,739 | | | | | | 0.49 | | | | | | 75 | | | | | | 73,884 | | | | | | 0.97 | | | | | | 2,299 | | | | | | 78,623 | | | | | | 0.94 | | | | | | 2,373 | | | | | | 34,154 | | | | | | 1.75 | | | | | | 1,923 | | |
| Total Gold | | | | | | | | | | | 107,161 | | | | | | 1.32 | | | | | | 4,558 | | | | | | 1,081,412 | | | | | | 1.13 | | | | | | 39,423 | | | | | | 1,188,573 | | | | | | 1.15 | | | | | | 43,981 | | | | | | 410,990 | | | | | | 2.50 | | | | | | 33,080 | | |
| |
AGNICO EAGLE
ANNUAL INFORMATION FORM
|
| |
61
|
|
|
OPERATION / PROJECT
|
| |
MEASURED
|
| |
INDICATED
|
| |
MEASURED &
INDICATED |
| |
INFERRED
|
| ||||||||||||||||||||||||||||||||||||||||||||||||||||||||||||||||||
|
SILVER
|
| |
Mining
Method* |
| |
000
Tonnes |
| |
g/t
|
| |
000 Oz
Ag |
| |
000
Tonnes |
| |
g/t
|
| |
000 Oz
Ag |
| |
000
Tonnes |
| |
g/t
|
| |
000 Oz
Ag |
| |
000
Tonnes |
| |
g/t
|
| |
000 Oz
Ag |
| |||||||||||||||||||||||||||||||||||||||
| LaRonde | | | | | U/G | | | | | | − | | | | | | − | | | | | | − | | | | | | 6,424 | | | | | | 11.98 | | | | | | 2,474 | | | | | | 6,424 | | | | | | 11.98 | | | | | | 2,474 | | | | | | 1,569 | | | | | | 12.25 | | | | | | 618 | | |
| Pinos Altos | | | | | O/P | | | | | | − | | | | | | − | | | | | | − | | | | | | 1,266 | | | | | | 21.60 | | | | | | 879 | | | | | | 1,266 | | | | | | 21.6 | | | | | | 879 | | | | | | 445 | | | | | | 31.74 | | | | | | 454 | | |
| Pinos Altos | | | | | U/G | | | | | | − | | | | | | − | | | | | | − | | | | | | 10,394 | | | | | | 50.99 | | | | | | 17,040 | | | | | | 10,394 | | | | | | 50.99 | | | | | | 17,040 | | | | | | 1,431 | | | | | | 36.19 | | | | | | 1,665 | | |
| Pinos Altos Total | | | | | | | | | | | − | | | | | | − | | | | | | − | | | | | | 11,659 | | | | | | 47.80 | | | | | | 17,919 | | | | | | 11,659 | | | | | | 47.8 | | | | | | 17,919 | | | | | | 1,876 | | | | | | 35.13 | | | | | | 2,120 | | |
| La India | | | | | O/P | | | | | | 4,478 | | | | | | 2.72 | | | | | | 391 | | | | | | 814 | | | | | | 2.61 | | | | | | 68 | | | | | | 5,292 | | | | | | 2.7 | | | | | | 460 | | | | | | 66 | | | | | | 2.18 | | | | | | 5 | | |
| San Nicolás (50%) | | | | | O/P | | | | | | 261 | | | | | | 6.40 | | | | | | 54 | | | | | | 3,037 | | | | | | 11.86 | | | | | | 1,158 | | | | | | 3,297 | | | | | | 11.43 | | | | | | 1,211 | | | | | | 2,468 | | | | | | 9.26 | | | | | | 735 | | |
| Chipriona | | | | | O/P | | | | | | − | | | | | | − | | | | | | − | | | | | | 10,983 | | | | | | 100.72 | | | | | | 35,566 | | | | | | 10,983 | | | | | | 100.72 | | | | | | 35,566 | | | | | | 976 | | | | | | 86.77 | | | | | | 2,722 | | |
| El Barqueño Silver | | | | | O/P | | | | | | − | | | | | | − | | | | | | − | | | | | | − | | | | | | − | | | | | | − | | | | | | − | | | | | | − | | | | | | − | | | | | | 4,393 | | | | | | 124.06 | | | | | | 17,523 | | |
| El Barqueño Gold | | | | | O/P | | | | | | − | | | | | | − | | | | | | − | | | | | | 8,834 | | | | | | 4.73 | | | | | | 1,343 | | | | | | 8,834 | | | | | | 4.73 | | | | | | 1,343 | | | | | | 9,628 | | | | | | 16.86 | | | | | | 5,218 | | |
| Santa Gertrudis | | | | | O/P | | | | | | − | | | | | | − | | | | | | − | | | | | | 19,267 | | | | | | 3.66 | | | | | | 2,269 | | | | | | 19,267 | | | | | | 3.66 | | | | | | 2,269 | | | | | | 9,819 | | | | | | 1.85 | | | | | | 585 | | |
| Santa Gertrudis | | | | | U/G | | | | | | − | | | | | | − | | | | | | − | | | | | | − | | | | | | − | | | | | | − | | | | | | − | | | | | | − | | | | | | − | | | | | | 9,079 | | | | | | 23.31 | | | | | | 6,803 | | |
| Santa Gertrudis Total | | | | | | | | | | | − | | | | | | − | | | | | | − | | | | | | 19,267 | | | | | | 3.66 | | | | | | 2,269 | | | | | | 19,267 | | | | | | 3.66 | | | | | | 2,269 | | | | | | 18,898 | | | | | | 12.16 | | | | | | 7,389 | | |
| Total Silver | | | | | | | | | | | 4,739 | | | | | | 2.92 | | | | | | 445 | | | | | | 61,018 | | | | | | 30.99 | | | | | | 60,796 | | | | | | 65,757 | | | | | | 28.97 | | | | | | 61,240 | | | | | | 39,874 | | | | | | 28.34 | | | | | | 36,328 | | |
| | | ||||||||||||||||||||||||||||||||||||||||||||||||||||||||||||||||||||||||||||||
| COPPER | | | | |
Mining Method* |
| | | | |
000 Tonnes |
| | | | | % | | | |
Tonnes
Cu |
| | | |
000 Tonnes |
| | | | | % | | | | | |
Tonnes Cu |
| | | | |
000 Tonnes |
| | | | | % | | | | | |
Tonnes Cu |
| | | | |
000 Tonnes |
| | | | | % | | | | | |
Tonnes Cu |
| | |||
| LaRonde | | | | | U/G | | | | | | − | | | | | | − | | | | | | − | | | | | | 6,424 | | | | | | 0.13 | | | | | | 8,613 | | | | | | 6,424 | | | | | | 0.13 | | | | | | 8,613 | | | | | | 1,569 | | | | | | 0.28 | | | | | | 4,371 | | |
| Akasaba West | | | | | O/P | | | | | | − | | | | | | − | | | | | | − | | | | | | 4,044 | | | | | | 0.43 | | | | | | 17,270 | | | | | | 4,044 | | | | | | 0.43 | | | | | | 17,270 | | | | | | − | | | | | | − | | | | | | − | | |
| Upper Beaver | | | | | U/G | | | | | | − | | | | | | − | | | | | | − | | | | | | 3,636 | | | | | | 0.14 | | | | | | 5,135 | | | | | | 3,636 | | | | | | 0.14 | | | | | | 5,135 | | | | | | 8,688 | | | | | | 0.20 | | | | | | 17,284 | | |
| San Nicolás (50%) | | | | | O/P | | | | | | 261 | | | | | | 1.35 | | | | | | 3,526 | | | | | | 3,037 | | | | | | 1.17 | | | | | | 35,489 | | | | | | 3,297 | | | | | | 1.18 | | | | | | 39,015 | | | | | | 2,468 | | | | | | 0.94 | | | | | | 23,144 | | |
| Chipriona | | | | | O/P | | | | | | − | | | | | | − | | | | | | − | | | | | | 10,983 | | | | | | 0.16 | | | | | | 17,291 | | | | | | 10,983 | | | | | | 0.16 | | | | | | 17,291 | | | | | | 976 | | | | | | 0.12 | | | | | | 1,174 | | |
| El Barqueño Gold | | | | | O/P | | | | | | − | | | | | | − | | | | | | − | | | | | | 8,834 | | | | | | 0.19 | | | | | | 16,400 | | | | | | 8,834 | | | | | | 0.19 | | | | | | 16,400 | | | | | | 9,628 | | | | | | 0.22 | | | | | | 21,152 | | |
| El Barqueño Silver | | | | | O/P | | | | | | − | | | | | | − | | | | | | − | | | | | | − | | | | | | − | | | | | | − | | | | | | − | | | | | | − | | | | | | − | | | | | | 4,393 | | | | | | 0.04 | | | | | | 1,854 | | |
| Total Copper | | | | | | | | | | | 261 | | | | | | 1.35 | | | | | | 3,526 | | | | | | 36,958 | | | | | | 0.27 | | | | | | 100,198 | | | | | | 37,218 | | | | | | 0.28 | | | | | | 103,724 | | | | | | 27,721 | | | | | | 0.25 | | | | | | 68,980 | | |
| | | ||||||||||||||||||||||||||||||||||||||||||||||||||||||||||||||||||||||||||||||
| ZINC | | | | |
Mining Method* |
| | | | |
000 Tonnes |
| | | | | % | | | | | |
Tonnes Zn |
| | | | |
000 Tonnes |
| | | | | % | | | |
Tonnes
Zn |
| | | |
000 Tonnes |
| | | | | % | | | | | |
Tonnes Zn |
| | | | |
000 Tonnes |
| | | | | % | | | | | |
Tonnes Zn |
| | |||
| LaRonde | | | | | U/G | | | | | | − | | | | | | − | | | | | | − | | | | | | 6,424 | | | | | | 0.74 | | | | | | 47,404 | | | | | | 6,424 | | | | | | 0.74 | | | | | | 47,404 | | | | | | 1,569 | | | | | | 0.36 | | | | | | 5,600 | | |
| San Nicolás (50%) | | | | | O/P | | | | | | 261 | | | | | | 0.39 | | | | | | 1,012 | | | | | | 3,037 | | | | | | 0.71 | | | | | | 21,618 | | | | | | 3,297 | | | | | | 0.69 | | | | | | 22,630 | | | | | | 2,468 | | | | | | 0.62 | | | | | | 15,355 | | |
| Chipriona | | | | | O/P | | | | | | − | | | | | | − | | | | | | − | | | | | | 10,983 | | | | | | 0.83 | | | | | | 91,637 | | | | | | 10,983 | | | | | | 0.83 | | | | | | 91,637 | | | | | | 976 | | | | | | 0.73 | | | | | | 7,073 | | |
| Total Zinc | | | | | | | | | | | 261 | | | | | | 0.39 | | | | | | 1,012 | | | | | | 20,444 | | | | | | 0.79 | | | | | | 160,659 | | | | | | 20,704 | | | | | | 0.78 | | | | | | 161,671 | | | | | | 5,012 | | | | | | 0.56 | | | | | | 28,029 | | |
| |
62
|
| |
AGNICO EAGLE
ANNUAL INFORMATION FORM
|
|
| |
AGNICO EAGLE
ANNUAL INFORMATION FORM
|
| |
63
|
|
| | | |
As at December 31,
|
| |||
| | | |
2023
|
| |||
| Gold | | | | | | | |
|
Proven mineral reserves – tonnes
|
| | | | 2,342,000 | | |
|
Average grade – gold grams per tonne
|
| | | | 4.98 | | |
|
Probable mineral reserves – tonnes
|
| | | | 8,568,000 | | |
|
Average grade – gold grams per tonne
|
| | | | 6.79 | | |
| Total proven and probable mineral reserves – tonnes | | | | | 10,910,000 | | |
| Average grade – gold grams per tonne | | | | | 6.40 | | |
| Total contained gold ounces | | | | | 2,244,000 | | |
| | | |
Proven
|
| |
Probable
|
| |
Total
|
| |||||||||
| December 31, 2022 – thousand tonnes | | | |
|
2,809
|
| | | |
|
9,497
|
| | | |
|
12,306
|
| |
| Processed in 2023 – thousand tonnes | | | | | (1,501) | | | | | | − | | | | | | (1,501) | | |
| Revision – thousand tonnes | | | | | 1,034 | | | | | | (929) | | | | | | 105 | | |
| December 31, 2023 – thousand tonnes | | | | | 2,342 | | | | | | 8,568 | | | | | | 10,910 | | |
| |
64
|
| |
AGNICO EAGLE
ANNUAL INFORMATION FORM
|
|
| | | |
As at December 31,
|
| |||
| | | |
2023
|
| |||
| Gold | | | | | | | |
|
Proven mineral reserves – tonnes
|
| | | | 4,450,000 | | |
|
Average grade – gold grams per tonne
|
| | | | 2.11 | | |
|
Probable mineral reserves – tonnes
|
| | | | 4,523,000 | | |
|
Average grade – gold grams per tonne
|
| | | | 2.30 | | |
| Total proven and probable mineral reserves – tonnes | | | | | 8,972,000 | | |
| Average grade – gold grams per tonne | | | | | 2.20 | | |
| Total contained gold ounces | | | | | 636,000 | | |
| | | |
Proven
|
| |
Probable
|
| |
Total
|
| |||||||||
| December 31, 2022 – thousand tonnes | | | |
|
4,904
|
| | | |
|
5,490
|
| | | |
|
10,394
|
| |
| Processed in 2023 – thousand tonnes | | | | | (1,157) | | | | | | − | | | | | | (1,157) | | |
| Revision – thousand tonnes | | | | | 703 | | | | | | (967) | | | | | | (264) | | |
| December 31, 2023 – thousand tonnes | | | | | 4,450 | | | | | | 4,523 | | | | | | 8,972 | | |
| |
AGNICO EAGLE
ANNUAL INFORMATION FORM
|
| |
65
|
|
| | | |
As at December 31,
|
| |||
| | | |
2023
|
| |||
| Gold | | | | | | | |
|
Proven mineral reserves – tonnes
|
| | | | 45,491,000 | | |
|
Average grade – gold grams per tonne
|
| | | | 0.58 | | |
|
Probable mineral reserves – tonnes
|
| | | | 96,760,000 | | |
|
Average grade – gold grams per tonne
|
| | | | 2.27 | | |
| Total proven and probable mineral reserves – tonnes | | | | | 142,251,000 | | |
| Average grade – gold grams per tonne | | | | | 1.73 | | |
| Total contained gold ounces | | | | | 7,919,000 | | |
| | | |
Proven
|
| |
Probable
|
| |
Total
|
| |||||||||
| December 31, 2022 – thousand tonnes | | | | | 25,802 | | | | | | 27,564 | | | | | | 53,366 | | |
| Processed in 2023 – thousand tonnes | | | | | (17,333) | | | | | | − | | | | | | (17,333) | | |
| Revision – thousand tonnes | | | | | 37,022 | | | | | | 69,196 | | | | | | 106,218 | | |
| December 31, 2023 – thousand tonnes | | | | | 45,491 | | | | | | 96,760 | | | | | | 142,251 | | |
| |
66
|
| |
AGNICO EAGLE
ANNUAL INFORMATION FORM
|
|
| | | |
As at December 31,
|
| |||
| | | |
2023
|
| |||
| Gold | | | | | | | |
|
Proven mineral reserves – tonnes
|
| | | | 3,059,000 | | |
|
Average grade – gold grams per tonne
|
| | | | 1.65 | | |
|
Probable mineral reserves – tonnes
|
| | | | 12,298,000 | | |
|
Average grade – gold grams per tonne
|
| | | | 4.23 | | |
| Total proven and probable mineral reserves – tonnes | | | | | 15,357,000 | | |
| Average grade – gold grams per tonne | | | | | 3.72 | | |
| Total contained gold ounces | | | | | 1,837,000 | | |
| | | |
Proven
|
| |
Probable
|
| |
Total
|
| |||||||||
| December 31, 2022 – thousand tonnes | | | |
|
1,892
|
| | | |
|
14,718
|
| | | |
|
16,610
|
| |
| Processed in 2023 – thousand tonnes | | | | | (3,843) | | | | | | − | | | | | | (3,843) | | |
| Revision – thousand tonnes | | | | | 5,010 | | | | | | (2,420) | | | | | | 2,590 | | |
| December 31, 2023 – thousand tonnes | | | | | 3,059 | | | | | | 12,298 | | | | | | 15,357 | | |
| |
AGNICO EAGLE
ANNUAL INFORMATION FORM
|
| |
67
|
|
| | | |
As at December 31,
|
| |||
| | | |
2023
|
| |||
| Gold | | | | | | | |
|
Proven mineral reserves – tonnes
|
| | | | 1,780,000 | | |
|
Average grade – gold grams per tonne
|
| | | | 7.08 | | |
|
Probable mineral reserves – tonnes
|
| | | | 16,478,000 | | |
|
Average grade – gold grams per tonne
|
| | | | 5.78 | | |
| Total proven and probable mineral reserves – tonnes | | | | | 18,258,000 | | |
| Average grade – gold grams per tonne | | | | | 5.91 | | |
| Total contained gold ounces | | | | | 3,467,000 | | |
| | | |
Proven
|
| |
Probable
|
| |
Total
|
| |||||||||
| December 31, 2022 – thousand tonnes | | | |
|
1,015
|
| | | |
|
18,449
|
| | | |
|
19,464
|
| |
| Processed in 2023 – thousand tonnes | | | | | (1,918) | | | | | | − | | | | | | (1,918) | | |
| Revision – thousand tonnes | | | | | 2,683 | | | | | | (1,971) | | | | | | 712 | | |
| December 31, 2023 – thousand tonnes | | | | | 1,780 | | | | | | 16,478 | | | | | | 18,258 | | |
| |
68
|
| |
AGNICO EAGLE
ANNUAL INFORMATION FORM
|
|
| | | |
As at December 31,
|
| |||
| | | |
2023
|
| |||
| Gold | | | | | | | |
|
Proven mineral reserves – tonnes
|
| | | | 118,703,000 | | |
|
Average grade – gold grams per tonne
|
| | | | 0.85 | | |
|
Probable mineral reserves – tonnes
|
| | | | 700,346,000 | | |
|
Average grade – gold grams per tonne
|
| | | | 0.74 | | |
| Total proven and probable mineral reserves – tonnes | | | | | 819,049,000 | | |
| Average grade – gold grams per tonne | | | | | 0.76 | | |
| Total contained gold ounces | | | | | 19,928,000 | | |
| | | |
Proven
|
| |
Probable
|
| |
Total
|
| |||||||||
| December 31, 2022 – thousand tonnes | | | |
|
107,622
|
| | | |
|
742,795
|
| | | |
|
850,417
|
| |
| Processed in 2023 – thousand tonnes | | | | | (25,435) | | | | | | − | | | | | | (25,435) | | |
| Revision – thousand tonnes | | | | | 36,519 | | | | | | (42,449) | | | | | | (5,933) | | |
| December 31, 2023 – thousand tonnes | | | | | 118,703 | | | | | | 700,346 | | | | | | 819,049 | | |
| |
AGNICO EAGLE
ANNUAL INFORMATION FORM
|
| |
69
|
|
| |
70
|
| |
AGNICO EAGLE
ANNUAL INFORMATION FORM
|
|
| |
AGNICO EAGLE
ANNUAL INFORMATION FORM
|
| |
71
|
|
| |
72
|
| |
AGNICO EAGLE
ANNUAL INFORMATION FORM
|
|
| |
AGNICO EAGLE
ANNUAL INFORMATION FORM
|
| |
73
|
|
| |
74
|
| |
AGNICO EAGLE
ANNUAL INFORMATION FORM
|
|
| | | |
2024
(to March 18) |
| |
2023
|
| |
2022
|
| |
2021
|
| |
2020
|
| |
2019
|
| ||||||||||||||||||
| High price ($ per ounce) | | | | | 2,180 | | | | | | 2,078 | | | | | | 2,039 | | | | | | 1,943 | | | | | | 2,067 | | | | | | 1,546 | | |
| Low price ($ per ounce) | | | | | 1,985 | | | | | | 1,811 | | | | | | 1,629 | | | | | | 1,684 | | | | | | 1,474 | | | | | | 1,270 | | |
| Average price ($ per ounce) | | | | | 2,054 | | | | | | 1,941 | | | | | | 1,800 | | | | | | 1,799 | | | | | | 1,770 | | | | | | 1,393 | | |
|
Operations(1)
|
| |
Percentage of Gold
Production % |
| |
Percentage of Company’s
operating margin % |
| ||||||
| LaRonde Complex | | | | | 9 | | | | | | 9 | | |
| Canadian Malartic Complex | | | | | 18 | | | | | | 18 | | |
| Meliadine mine | | | | | 11 | | | | | | 10 | | |
| Meadowbank Complex | | | | | 13 | | | | | | 9 | | |
| Detour Lake mine | | | | | 20 | | | | | | 22 | | |
| |
AGNICO EAGLE
ANNUAL INFORMATION FORM
|
| |
75
|
|
| |
76
|
| |
AGNICO EAGLE
ANNUAL INFORMATION FORM
|
|
| |
AGNICO EAGLE
ANNUAL INFORMATION FORM
|
| |
77
|
|
| |
78
|
| |
AGNICO EAGLE
ANNUAL INFORMATION FORM
|
|
| |
AGNICO EAGLE
ANNUAL INFORMATION FORM
|
| |
79
|
|
| |
80
|
| |
AGNICO EAGLE
ANNUAL INFORMATION FORM
|
|
| |
AGNICO EAGLE
ANNUAL INFORMATION FORM
|
| |
81
|
|
| |
82
|
| |
AGNICO EAGLE
ANNUAL INFORMATION FORM
|
|
| |
AGNICO EAGLE
ANNUAL INFORMATION FORM
|
| |
83
|
|
| |
84
|
| |
AGNICO EAGLE
ANNUAL INFORMATION FORM
|
|
| |
AGNICO EAGLE
ANNUAL INFORMATION FORM
|
| |
85
|
|
| |
86
|
| |
AGNICO EAGLE
ANNUAL INFORMATION FORM
|
|
| |
AGNICO EAGLE
ANNUAL INFORMATION FORM
|
| |
87
|
|
| |
88
|
| |
AGNICO EAGLE
ANNUAL INFORMATION FORM
|
|
| |
AGNICO EAGLE
ANNUAL INFORMATION FORM
|
| |
89
|
|
| |
90
|
| |
AGNICO EAGLE
ANNUAL INFORMATION FORM
|
|
| |
AGNICO EAGLE
ANNUAL INFORMATION FORM
|
| |
91
|
|
| |
92
|
| |
AGNICO EAGLE
ANNUAL INFORMATION FORM
|
|
| |
AGNICO EAGLE
ANNUAL INFORMATION FORM
|
| |
93
|
|
| | | |
TSX
|
| |
NYSE
|
| ||||||||||||||||||||||||||||||
| | | |
High
(C$) |
| |
Low
(C$) |
| |
Average
Daily Volume |
| |
High
($) |
| |
Low
($) |
| |
Average
Daily Volume |
| ||||||||||||||||||
| 2023 | | | | | | | | | | | | | | | | | | | | | | | | | | | | | | | | | | | | | |
| January | | | | | 77.52 | | | | | | 73.06 | | | | | | 1,843,904 | | | | | | 57.91 | | | | | | 53.56 | | | | | | 2,702,339 | | |
| February | | | | | 76.00 | | | | | | 61.47 | | | | | | 3,170,326 | | | | | | 57.20 | | | | | | 45.39 | | | | | | 3,289,355 | | |
| March | | | | | 71.04 | | | | | | 61.79 | | | | | | 3,196,174 | | | | | | 52.24 | | | | | | 44.77 | | | | | | 3,372,330 | | |
| April | | | | | 79.06 | | | | | | 70.54 | | | | | | 2,431,814 | | | | | | 59.28 | | | | | | 52.53 | | | | | | 3,062,306 | | |
| May | | | | | 81.75 | | | | | | 68.31 | | | | | | 2,004,747 | | | | | | 60.40 | | | | | | 50.26 | | | | | | 2,827,755 | | |
| June | | | | | 70.37 | | | | | | 64.23 | | | | | | 1,796,960 | | | | | | 52.35 | | | | | | 48.48 | | | | | | 2,262,601 | | |
| July | | | | | 70.87 | | | | | | 64.26 | | | | | | 1,629,662 | | | | | | 53.84 | | | | | | 48.21 | | | | | | 2,025,666 | | |
| August | | | | | 67.26 | | | | | | 62.17 | | | | | | 1,847,763 | | | | | | 50.61 | | | | | | 45.93 | | | | | | 1,965,533 | | |
| September | | | | | 67.68 | | | | | | 61.03 | | | | | | 2,259,623 | | | | | | 50.24 | | | | | | 45.18 | | | | | | 2,328,041 | | |
| October | | | | | 68.31 | | | | | | 59.62 | | | | | | 1,780,046 | | | | | | 49.80 | | | | | | 43.39 | | | | | | 2,943,474 | | |
| November | | | | | 72.85 | | | | | | 64.40 | | | | | | 1,919,279 | | | | | | 53.70 | | | | | | 46.67 | | | | | | 2,641,808 | | |
| December | | | | | 74.02 | | | | | | 68.37 | | | | | | 2,306,206 | | | | | | 56.04 | | | | | | 50.30 | | | | | | 2,805,482 | | |
| 2024 | | | | | | | | | | | | | | | | | | | | | | | | | | | | | | | | | | | | | |
| January | | | | | 72.05 | | | | | | 66.08 | | | | | | 1,613,200 | | | | | | 54.05 | | | | | | 48.95 | | | | | | 2,595,363 | | |
| February | | | | | 67.76 | | | | | | 61.03 | | | | | | 2,435,197 | | | | | | 50.61 | | | | | | 44.98 | | | | | | 3,358,863 | | |
| March (to March 18) | | | | | 75.78 | | | | | | 67.28 | | | | | | 3,089,496 | | | | | | 56.22 | | | | | | 49.62 | | | | | | 3,865,154 | | |
| |
94
|
| |
AGNICO EAGLE
ANNUAL INFORMATION FORM
|
|
| |
AGNICO EAGLE
ANNUAL INFORMATION FORM
|
| |
95
|
|
| |
96
|
| |
AGNICO EAGLE
ANNUAL INFORMATION FORM
|
|
| |
AGNICO EAGLE
ANNUAL INFORMATION FORM
|
| |
97
|
|
| |
98
|
| |
AGNICO EAGLE
ANNUAL INFORMATION FORM
|
|
| |
AGNICO EAGLE
ANNUAL INFORMATION FORM
|
| |
99
|
|
| | | |
Year Ended
December 31 |
| |||||||||
| | | |
2023
|
| |
2022
|
| ||||||
| | | |
(C$ thousands)
|
| |||||||||
| Audit fees | | | | | 7,866 | | | | | | 5,892 | | |
| Audit-related fees(1) | | | | | 262 | | | | | | 442 | | |
| Tax fees(2) | | | | | 549 | | | | | | 864 | | |
| All other fees(3) | | | | | 52 | | | | | | 455 | | |
| Total(4) | | | |
|
8,729
|
| | | |
|
7,653
|
| |
| |
100
|
| |
AGNICO EAGLE
ANNUAL INFORMATION FORM
|
|
| |
AGNICO EAGLE
ANNUAL INFORMATION FORM
|
| |
101
|
|
| |
102
|
| |
AGNICO EAGLE
ANNUAL INFORMATION FORM
|
|
| |
AGNICO EAGLE
ANNUAL INFORMATION FORM
|
| |
103
|
|
| |
104
|
| |
AGNICO EAGLE
ANNUAL INFORMATION FORM
|
|
| |
AGNICO EAGLE
ANNUAL INFORMATION FORM
|
| |
A-1
|
|
| |
A-2
|
| |
AGNICO EAGLE
ANNUAL INFORMATION FORM
|
|
| |
AGNICO EAGLE
ANNUAL INFORMATION FORM
|
| |
A-3
|
|
| |
A-4
|
| |
AGNICO EAGLE
ANNUAL INFORMATION FORM
|
|
| |
AGNICO EAGLE
ANNUAL INFORMATION FORM
|
| |
A-5
|
|
| |
“alteration”
|
| |
Any physical or chemical change in the mineral composition of a rock subsequent to its formation, generally produced by weathering or hydrothermal solutions. Milder and more localized than metamorphism.
|
|
| |
“anastomosing”
|
| | A network of branching and rejoining fault or vein surfaces or surface traces. | |
| |
“assay”
|
| |
To analyze the proportions of metals in an ore; to test an ore or mineral for composition, purity, weight or other properties of commercial interest.
|
|
| |
“brecciated”
|
| |
A rock in which angular rock fragments are surrounded by a mass of fine-grained minerals.
|
|
| |
“brittle”
|
| |
Of minerals, proneness to fracture under low stress. A quality affecting behaviour during comminution of ore, whereby one species fractures more readily than others in the material being crushed.
|
|
| |
“by-product”
|
| | A secondary metal or mineral product recovered from the processing of rock. | |
| |
“carbon-in-leach” or “CIL”
|
| |
A precious metals recovery step in the mill. Gold and silver are leached from the ground ore and at the same time adsorbed onto granules of activated carbon, which is then separated by screening and processed to remove the precious metals.
|
|
| |
“carbon-in-pulp” or “CIP”
|
| |
A precious metals recovery step in the mill. After gold and silver have been leached from ground ore, they are adsorbed onto granules of activated carbon, which is then separated by screening and processed to remove the precious metals. A CIP circuit comprises a series of tanks through which leached slurry flows. Gold is captured onto captive activated carbon that will periodically be moved counter- currently from tank to tank. Head tank carbon is extracted periodically to further recover adsorbed gold before being returned to the circuit tails tank.
|
|
| |
“chalcopyrite”
|
| | A sulphide mineral of copper and iron. | |
| |
“concentrate”
|
| | The clean product recovered by froth flotation in the plant. | |
| |
“conglomerate”
|
| |
A coarse-grained sedimentary rock composed of rounded fragments set in a fine- grained cemented matrix.
|
|
| |
“contact”
|
| | A plane or irregular surface between two types or ages of rock. | |
| |
“crosscut”
|
| |
An underground passage driven from a shaft, ramp or drift towards the ore, at (or near) right angles to the strike of a vein or other orebody.
|
|
| |
“cut-off grade”
|
| | The minimum metal grade in an ore that can be mined economically. | |
| |
“cyanidation”
|
| |
A method of extracting exposed gold or silver grains from crushed or ground ore by dissolving (leaching) it in a weak cyanide solution. May be carried out in tanks inside a mill or in heaps of ore out of doors (heap leach).
|
|
| |
“deposit”
|
| |
A natural occurrence of mineral or mineral aggregate, in such quantity and quality to invite exploitation.
|
|
| |
“development”
|
| |
The preparation of a mining property or area so that an orebody can be analyzed and its tonnage and quality estimated. Development is an intermediate stage between exploration and mining.
|
|
| |
“diamond drill”
|
| |
A drilling machine with a rotating, hollow, diamond-studded bit that cuts a circular channel around a core, which can be recovered to provide a more-or-less continuous and complete columnar sample of the rock penetrated.
|
|
| |
“dike”
|
| |
An earthen embankment, as around a drill sump or tank, or to impound a body of water or mill tailings. Also, a tabular body of igneous rock that cuts across the structure of adjacent rocks.
|
|
| |
B-1
|
| |
AGNICO EAGLE
ANNUAL INFORMATION FORM
|
|
| |
“dilution”
|
| |
The contamination of ore with barren wall rock in stoping, increasing tonnage mined and lowering the overall ore grade.
|
|
| |
“dip”
|
| |
The angle at which a vein, structure or rock bed is inclined from the horizontal as measured at right angles to the strike.
|
|
| |
“disseminated”
|
| |
Said of a mineral deposit (especially of metals) in which the desired minerals occur as scattered particles in the rock, but in sufficient quantity to make the deposit an ore. Some disseminated deposits are very large.
|
|
| |
“dore”
|
| |
Unrefined gold and silver bullion bars, which will be further refined to almost pure metal.
|
|
| |
“drift”
|
| |
A horizontal opening in or near an orebody and parallel to the long dimension of the orebody, as opposed to a crosscut that crosses the orebody.
|
|
| |
“electrowinning”
|
| |
An electrochemical process in which a metal dissolved within an electrolyte is plated onto an electrode. Used to recover metals such as copper and gold from solution in the leaching of concentrates.
|
|
| |
“envelope”
|
| |
1.
The outer or covering part of a fold, especially of a folded structure that includes some sort of structural break.
2.
A metamorphic rock surrounding an igneous intrusion.
3.
In a mineral, an outer part different in origin from an inner part.
|
|
| |
“fault”
|
| |
A fracture or a fracture zone in crustal rocks along which there has been displacement of the two sides relative to one another parallel to the fracture. The displacement may be a few inches or many kilometres long.
|
|
| |
“feasibility study”
|
| |
A comprehensive technical and economic study of the selected development option for a mineral project that includes appropriately detailed assessments of realistically assumed mining, processing, metallurgical, economic, marketing, legal, environmental, social and governmental considerations, together with any other relevant operational factors and a detailed financial analysis, that are necessary to demonstrate at the time of reporting that extraction is reasonably justified (economically mineable). The results of the study may reasonably serve as the basis for a final decision by a proponent or financial institution to proceed with, or finance, the development of the project. The confidence level of the study will be higher than that of a pre-feasibility study.
|
|
| |
“felsic”
|
| |
A term used to describe light-coloured rocks containing feldspar, feldspathoids and silica.
|
|
| |
“flotation”
|
| |
The method of mineral separation in which a froth created by a variety of reagents floats some finely crushed minerals, whereas other minerals sink. The metal-rich flotation concentrate is then skimmed off the surface.
|
|
| |
“foliation”
|
| |
A general term for a planar arrangement of features in any type of rock, especially the planar structure that results in a metamorphic rock.
|
|
| |
“footwall”
|
| | The rock beneath an inclined vein or ore deposit (opposite of a hanging wall). | |
| |
“fracture”
|
| |
Any break in a rock, whether or not it causes displacement, due to mechanical failure by stress; includes cracks, joints and faults.
|
|
| |
“free gold”
|
| | Gold not combined with other substances. | |
| |
“grade”
|
| |
The relative quantity or the percentage of metal content of an orebody (e.g., grams of gold per tonne of rock or percent copper).
|
|
| |
“greenstone belt”
|
| |
An area underlain by metamorphosed volcanic and sedimentary rocks, usually in a continental shield.
|
|
| |
“hanging wall”
|
| | The rock on the upper side of a vein or ore deposit. | |
| |
AGNICO EAGLE
ANNUAL INFORMATION FORM
|
| |
B-2
|
|
| |
“igneous rock”
|
| |
Rock formed by the solidification of molten material that originated within the Earth.
|
|
| |
“indicated mineral resource”
|
| |
That part of a mineral resource for which quantity, grade or quality, densities, shape and physical characteristics can be estimated with a level of confidence sufficient to allow the appropriate application of technical and economic parameters to support mine planning and evaluation of the economic viability of the deposit. The estimate is based on detailed and reliable exploration and testing information gathered through appropriate techniques from locations such as outcrops, trenches, pits, workings and drill holes that are spaced closely enough for geological and grade continuity to be reasonably assumed.
While this term is recognized and required by Canadian regulations, the SEC does not recognize it. Investors are cautioned not to assume that any part or all of the mineral deposits in this category will ever be converted into mineral reserves.
|
|
| |
“inferred mineral resource”
|
| |
That part of a mineral resource for which quantity and grade or quality can be estimated on the basis of geological evidence and limited sampling and reasonably assumed, but not verified, geological and grade continuity. The estimate is based on limited information and sampling gathered through appropriate techniques from locations such as outcrops, trenches, pits, workings and drill holes.
While this term is recognized and required by Canadian regulations, the SEC does not recognize it. Investors are cautioned not to assume that any part or all of the mineral deposits in this category will ever be upgraded to a higher category. Investors are cautioned not to assume that part of or all of an inferred mineral resource exists, or is economically or legally mineable.
|
|
| |
“intrusive”
|
| |
A body of igneous rock formed by the consolidation of magma intruded below surface into other rocks, in contrast to lava, which is extruded upon the Earth’s surface.
|
|
| |
“iron formation”
|
| |
A chemical sedimentary rock, typically thin-bedded or finely laminated, containing at least 15% iron of sedimentary origin and commonly containing layers of chert.
|
|
| |
“leaching”
|
| |
A chemical process for the extraction of valuable minerals from ore; also, a natural process by which ground waters dissolve minerals.
|
|
| |
“lens”
|
| |
A geological deposit that is thick in the middle and tapers towards the ends, resembling a convex lens.
|
|
| |
“lode”
|
| | A mineral deposit consisting of a zone of veins, veinlets or disseminations. | |
| |
“longitudinal retreat”
|
| |
An underground mining method where the ore is excavated in horizontal slices along the orebody and the stoping starts below and advances upwards. The ore is recovered underneath in the stope.
|
|
| |
“mafic”
|
| |
Igneous rocks composed mostly of dark, iron- and magnesium-rich silicate minerals.
|
|
| |
“massive”
|
| |
Said of a mineral deposit, especially of sulphides, characterized by a great concentration of ore in one place, as opposed to a disseminated or vein-like deposit. Said of any rock that has a homogeneous texture or fabric over a large area, with an absence of layering or any similar directional structure.
|
|
| |
“matrix”
|
| | The fine-grained rock material in which a larger mineral is embedded. | |
| |
B-3
|
| |
AGNICO EAGLE
ANNUAL INFORMATION FORM
|
|
| |
“measured mineral resource”
|
| |
That part of a mineral resource for which quantity, grade or quality, densities, shape and physical characteristics are so well established that they can be estimated with confidence sufficient to allow the appropriate application of technical and economic parameters to support production planning and evaluation of the economic viability of the deposit. The estimate is based on detailed and reliable exploration, sampling and testing information gathered through appropriate techniques from locations such as outcrops, trenches, pits, workings and drill holes that are spaced closely enough to confirm both geological and grade continuity.
While this term is recognized and required by Canadian regulations, the SEC does not recognize it. Investors are cautioned not to assume that any part or all of the mineral deposits in this category will ever be converted into mineral reserves.
|
|
| |
“metamorphism”
|
| |
The process by which the form or structure of sedimentary or igneous rocks is changed by heat and pressure.
|
|
| |
“mill”
|
| |
A mineral treatment plant in which crushing, wet grinding and further treatment of ore is conducted; also a revolving drum used for the grinding of ore in preparation for treatment.
|
|
| |
“mineral reserve”
|
| |
The economically mineable part of a measured or indicated mineral resource demonstrated by at least a preliminary feasibility study. This study must include adequate information on mining, processing, metallurgical, economic and other relevant factors that demonstrate, at the time of reporting, that economic extraction can be justified. A mineral reserve includes diluting materials and allowances for losses that may occur when the material is mined.
|
|
| |
“mineral resource”
|
| |
A concentration or occurrence of diamonds, natural solid inorganic material or natural solid fossilized organic material including base and precious metals, coal and industrial minerals in or on the Earth’s crust in such form and quantity and of such a grade or quality that it has reasonable prospects for economic extraction. The location, quantity, grade, geological characteristics and continuity of a mineral resource are known, estimated or interpreted from specific geological evidence and knowledge. Investors are cautioned not to assume that any part or all of the mineral deposits in any category of resources will ever be converted into mineral reserves.
|
|
| |
“muck”
|
| | Finely blasted rock (ore or waste) underground. | |
| |
“net smelter return royalty”
|
| |
A royalty payment made by a producer of metals based on the proceeds from the sale of mineral products after deducting off-site processing and distribution costs including smelting, refining, transportation and insurance costs.
|
|
| |
“ounce”
|
| |
A measurement of weight, especially used for gold, silver and platinum group metals. 1 troy ounce = 31.1035 grams.
|
|
| |
“outcrop”
|
| | The part of a rock formation that appears at the surface of the Earth. | |
| |
“oxidation”
|
| |
A chemical reaction caused by exposure to oxygen, which results in a change in the chemical composition of a mineral.
|
|
| |
“pillarless” mining
|
| |
A mining method whereby stopes are mined sequentially which remove the usage of temporary pillars. This method is distinct from primary-secondary stope mining method.
|
|
| |
“plunge”
|
| |
The inclination of a fold axis or other linear structure from a horizontal plane, measured in the vertical plane.
|
|
| |
“polydeformed”
|
| |
A rock that has been subjected to more than one instance of folding, faulting, shearing, compression or extension as a result of various tectonic forces.
|
|
| |
“porphyritic”
|
| |
Rock texture in which one or more minerals has a larger grain size than the accompanying minerals.
|
|
| |
AGNICO EAGLE
ANNUAL INFORMATION FORM
|
| |
B-4
|
|
| |
“porphyry”
|
| |
Any igneous rock in which relatively large crystals are set in a fine-grained groundmass.
|
|
| |
“preliminary feasibility study” or “pre-feasibility study”
|
| |
A comprehensive study of a range of options for the technical and economic viability of a mineral project that has advanced to a stage where a preferred mining method (in the case of underground mining) or the pit configuration (in the case of an open pit) is established, and an effective method of mineral processing is determined. It includes a financial analysis based on reasonable assumptions on mining, processing, metallurgical, economic, marketing, legal, environmental, social and governmental considerations and the evaluation of any other relevant factors which are sufficient for a qualified person, acting reasonably, to determine if all or part of the mineral resource may be classified as a mineral reserve.
|
|
| |
“probable mineral reserve”
|
| |
The economically mineable part of an indicated and, in some circumstances, a measured mineral resource demonstrated by at least a preliminary feasibility study.
|
|
| |
“proven mineral reserve”
|
| |
The economically mineable part of a measured mineral resource demonstrated by at least a preliminary feasibility study.
|
|
| |
“pyrite”
|
| |
A yellow iron sulphide mineral, FeS2, normally of little value. It is sometimes referred to as “fool’s gold”.
|
|
| |
“recovery”
|
| |
The percentage of valuable metal in the ore that is recovered by metallurgical treatment.
|
|
| |
“rock burst”
|
| |
A sudden and often violent breaking of a mass of rock from the walls of a mine, caused by failure of highly stressed rock and the rapid release of accumulated strain energy.
|
|
| |
“sandstone”
|
| | A sedimentary rock consisting of grains of sand cemented together. | |
| |
“schist”
|
| |
A strongly foliated crystalline rock that can be readily split into thin flakes or slabs due to the well-developed parallelism of more than 50% of the minerals present in it, such as mica or hornblende.
|
|
| |
“sedimentary rocks”
|
| |
Rocks resulting from the consolidation of loose sediment that has accumulated in layers. Examples are limestone, shale and sandstone.
|
|
| |
“semi-autogenous grinding” or “SAG”
|
| |
A method of grinding rock whereby larger chunks of the rock itself and steel balls form the grinding media.
|
|
| |
“shear” or “shearing”
|
| |
The deformation of rocks by lateral movement along innumerable parallel planes, generally resulting from pressure and producing metamorphic structures such as cleavage and schistosity.
|
|
| |
“shear zone”
|
| |
A tabular zone of rock that has been crushed and brecciated by many parallel fractures due to shear stress. Such an area is often mineralized by ore-forming solutions.
|
|
| |
“slurry”
|
| | Fine rock particles in circulating water in a treatment plant. | |
| |
“stope”
|
| |
1.
Any excavation in a mine, other than development workings, made for the purpose of extracting ore.
2.
To excavate ore in an underground mine.
|
|
| |
“strike”
|
| |
The direction, or bearing from true north, of a horizontal line on a vein or rock formation at right angles to the dip.
|
|
| |
“stringers”
|
| |
Mineral veinlets or filaments occurring in a discontinuous subparallel pattern in a host rock.
|
|
| |
“sulphide”
|
| |
A mineral characterized by the linkage of sulphur with a metal, such as pyrite, FeS2.
|
|
| |
B-5
|
| |
AGNICO EAGLE
ANNUAL INFORMATION FORM
|
|
| |
“tabular”
|
| |
Said of a feature having two dimensions that are much larger or longer than the third, such as a dike.
|
|
| |
“tailings”
|
| |
Material discharged from a mill after the economically and technically recoverable valuable minerals have been extracted.
|
|
| |
“tailings dam” or “tailings impoundment” or “tailings pond”
|
| |
Area closed at the lower end by a constraining wall or dam to which tailings are sent, the prime function of which is to allow enough time for metals to settle out or for cyanide to be naturally destroyed before the water is returned to the mill or discharged into the local watershed.
|
|
| |
“tenement”
|
| |
The right to enter, develop and work a mineral deposit. Includes a mining claim or a mining lease. A synonym of mineral title.
|
|
| |
“thickener”
|
| |
A vessel for reducing the proportion of water in a pulp by means of sedimentation.
|
|
| |
“thickness”
|
| |
The distance at right angles between the hanging wall and the footwall of a lode or lens.
|
|
| |
“tonne”
|
| |
A metric measurement of mass. 1 tonne = 1,000 kilograms = 2,204.6 pounds = 1.1 tons.
|
|
| |
“transverse open stoping”
|
| |
An underground mining method in which the ore is excavated in horizontal slices perpendicular to the orebody length and the stoping starts below and advances upwards. The ore is recovered underneath the stope through a drawpoint system.
|
|
| |
“trench”
|
| |
A narrow excavation dug through overburden, or blasted out of rock, to expose a vein or ore structure for sampling or observation.
|
|
| |
“vein”
|
| | A mineral filling of a fault or other fracture in a host rock. | |
| |
“wacke”
|
| |
A “dirty” sandstone that consists of a mixture of poorly sorted mineral and rock fragments in an abundant matrix of clay and fine silt.
|
|
| |
“winze”
|
| | An internal mine shaft. | |
| |
“Zadra elution circuit”
|
| |
The process in this part of a gold mill strips gold and silver from carbon granules and puts them into solution.
|
|
| |
“zone”
|
| | An area of distinct mineralization (i.e., a deposit). | |
| |
AGNICO EAGLE
ANNUAL INFORMATION FORM
|
| |
B-6
|
|
Exhibit 99.2
Annual Audited
Consolidated
Financial Statements
(Prepared in accordance with International
Financial Reporting Standards)

Management Report On Internal Control Over Financial Reporting
Management of Agnico Eagle Mines Limited (“Agnico Eagle” or the “Company”) is responsible for establishing and maintaining adequate internal control over financial reporting. Internal control over financial reporting is a process designed by, or under the supervision of, the Company’s Chief Executive Officer and Chief Financial Officer and effected by the Company’s Board, management and other personnel, to provide reasonable assurance regarding the reliability of financial reporting and the preparation of financial statements for external purposes in accordance with generally accepted accounting principles. Because of its inherent limitations, internal control over financial reporting may not prevent or detect misstatements. Also, projections of any evaluation of effectiveness to future periods are subject to the risk that controls may become inadequate because of changes in conditions, or that the degree of compliance with the policies or procedures may deteriorate.
The Company’s management, including the Company’s Chief Executive Officer and Chief Financial Officer, assessed the effectiveness of the Company’s internal control over financial reporting as of December 31, 2023. In making this assessment, the Company’s management used the criteria outlined by the Committee of Sponsoring Organizations of the Treadway Commission in Internal Control – Integrated Framework issued in 2013. Based on its assessment, management concluded that, as of December 31, 2023, the Company’s internal control over financial reporting was effective.
The effectiveness of the Company’s internal control over financial reporting as of December 31, 2023 has been audited by Ernst & Young LLP, an independent registered public accounting firm, as stated in their report that appears herein.
Toronto, Canada |
By |
/s/ Ammar Al-Joundi |
March 22, 2024 |
|
Ammar Al-Joundi |
|
|
President and Chief Executive Officer |
|
|
|
|
By |
/s/ Jamie Porter |
|
|
Jamie Porter |
|
|
Executive Vice-President, Finance and |
|
|
Chief Financial Officer |
2
Report of Independent Registered Public Accounting Firm
To the Shareholders and the Board of Directors of Agnico Eagle Mines Limited
Opinion on the Consolidated Financial Statements
We have audited the accompanying consolidated balance sheets of Agnico Eagle Mines Limited (the “Company”) as of December 31, 2023, and 2022, the related consolidated statements of income, comprehensive income, equity and cash flows for the years then ended, and the related notes (collectively referred to as the “consolidated financial statements”). In our opinion, the consolidated financial statements present fairly, in all material respects, the financial position of the Company at December 31, 2023 and 2022, and the results of its operations and its cash flows for the years then ended in conformity with International Financial Reporting Standards as issued by the International Accounting Standards Board.
We also have audited, in accordance with the standards of the Public Company Accounting Oversight Board (United States) (the “PCAOB”), the Company’s internal control over financial reporting as of December 31, 2023, based on the criteria established in Internal Control – Integrated Framework issued by the Committee of Sponsoring Organizations of the Treadway Commission (2013 framework), and our report dated March 22, 2024, expressed an unqualified opinion thereon.
Basis for Opinion
These consolidated financial statements are the responsibility of the Company’s management. Our responsibility is to express an opinion on the Company’s consolidated financial statements based on our audits. We are a public accounting firm registered with the PCAOB and are required to be independent with respect to the Company in accordance with the U.S. federal securities laws and the applicable rules and regulations of the Securities and Exchange Commission and the PCAOB.
We conducted our audits in accordance with the standards of the PCAOB. Those standards require that we plan and perform the audit to obtain reasonable assurance about whether the consolidated financial statements are free of material misstatement, whether due to error or fraud. Our audits included performing procedures to assess the risks of material misstatement of the consolidated financial statements, whether due to error or fraud, and performing procedures that respond to those risks. Such procedures included examining, on a test basis, evidence regarding the amounts and disclosures in the consolidated financial statements. Our audits also included evaluating the accounting principles used and significant estimates made by management, as well as evaluating the overall presentation of the consolidated financial statements. We believe that our audits provide a reasonable basis for our opinion.
Critical Audit Matters
The critical audit matters communicated below are matters arising from the current period audit of the financial statements that were communicated or required to be communicated to the audit committee and that: (1) relate to accounts or disclosures that are material to the financial statements and (2) involved our especially challenging, subjective, or complex judgments. The communication of the critical audit matters does not alter in any way our opinion on the consolidated financial statements, taken as a whole, and we are not, by communicating the critical audit matters below providing a separate opinion on the critical audit matters or on the accounts or disclosures to which they relate.
3
|
|
Acquisition of Canadian assets of Yamana Gold Inc., including Canadian Malartic Complex |
Description of the Matter |
|
As discussed in Note 5 to the financial statements, on March 31, 2023, the Company completed the acquisition of the Canadian Assets of Yamana Gold Inc, including 50% of the Canadian Malartic Complex and a 100% interest in the Wasamac project for total consideration of $5,557.1 million. The transaction was accounted for as a business combination. In determining the fair value of assets acquired and liabilities assumed, the Company ascribed a value of $3,765.5 million to property, plant and mine development assets acquired and $2,882.2 million to goodwill. The company also recognized a re-measurement gain through net income of $1,543.4 million. Significant assumptions used to estimate the value of mineral interests included in property, plant and mine development assets included long-term commodity prices, discount rates, estimated quantities of mineralization to be valued using the income approach, and estimates of future operating and capital costs. The Company discloses significant judgments, estimates and assumptions in respect of the business combination in Note 4 to the consolidated financial statements and the results of their analysis in Note 5. This matter was identified as a critical audit matter due to the significant estimation uncertainty and judgment required by management to determine the fair value of mineral interests which comprise a portion of the property, plant and mine development acquired. The significant estimation was primarily due to the complexity of inputs and assumptions to the valuation model prepared by management to measure the fair value and the sensitivity of the fair values to the significant underlying assumptions. |
How We Addressed the Matter in Our Audit |
|
Our procedures included obtaining an understanding, evaluating the design, and testing the operating effectiveness of controls over the Company’s business combination process, including the controls related to establishing the fair value of property, plant and mine development acquired. Our procedures also included, among others, involving professionals with specialized skills and knowledge to evaluate the discount rate against current industry and economic trends and company-specific risk premiums, comparing long-term commodity prices against market data, including a range of analyst forecasts, and performed sensitivity analyses over these assumptions to assess the impact on the fair value of property, plant and mine development acquired. We tested the completeness, accuracy, and relevance of underlying data used in the Company’s models. We assessed the estimated quantities of mineralization and operating and capital cost estimates that form the basis of cash flow estimates by comparing to information developed by management’s specialists. We involved our mining specialists in obtaining an understanding of the procedures performed by management’s specialists to estimate and characterize known mineralization, and to determine the extent of mineralization for which value should be ascribed within the purchase accounting. We also involved our mining specialists in evaluating the methods and assumptions employed by management’s specialists to develop operating and capital cost inputs that form the basis of cash flow estimates. |
|
|
Impairment assessment for Goodwill and Long-Lived Assets |
4
Description of the Matter |
|
At December 31, 2023, the carrying value of property, plant and mine development was $21,221.9 million and the carrying value of goodwill was $4,157.7 million. The Company’s impairment tests required management to make significant assumptions in determining the recoverable amount of cash generating units, such as gold price, discount rate, estimated quantities of mineralization, estimates of future operating and capital costs and Net Asset Value (NAV) multiples. The Company discloses significant judgements, estimates and assumptions in respect of impairment in Note 4 to the consolidated financial statements and the results of their analysis in Note 24. This matter was identified as a critical audit matter due to the significant estimation uncertainty and judgement applied by management in determining the recoverable amount, primarily due to the sensitivity of the underlying significant assumptions to the future cash flows and the effect changes in these assumptions would have on the recoverable amount. |
How We Addressed the Matter in Our Audit |
|
Our procedures included obtaining an understanding, evaluating the design, and testing the operating effectiveness of controls over the Company’s impairment process. Our procedures also included, among other things, involving professionals with specialized skills and knowledge to evaluate the discount rate against current industry and economic trends, comparing gold prices against market data including a range of analyst forecasts, comparing NAV multiples, where applicable, to the market information including analyst estimates, considering the characteristics of the assets, and performing sensitivity analyses over certain assumptions to assess the impact on the recoverable amounts. We tested the completeness, accuracy, and relevance of underlying data used in the Company’s models. We assessed the estimated quantities of mineralization and operating and capital cost estimates that form the basis of cash flow estimates by comparing to information developed by management’s specialists. We involved our mining specialists in obtaining an understanding of the procedures performed by management’s specialists to estimate and characterize known mineralization, and to determine the extent of mineralization for which value should be ascribed within the estimated recoverable amount of cash generating units. We also involved our mining specialists in evaluating the methods and assumptions employed by management’s specialists to develop operating and capital cost inputs that form the basis of cash flow estimates. |
/s/ Ernst & Young LLP |
|
Chartered Professional Accountants |
|
Licensed Public Accountants |
|
We have served as the Company’s auditor since 1983.
Toronto, Canada
March 22, 2024
5
Report of Independent Registered Public Accounting Firm
To the Shareholders and the Board of Directors of Agnico Eagle Mines Limited
Opinion on Internal Control over Financial Reporting
We have audited Agnico Eagle Mines Limited’s internal control over financial reporting as of December 31, 2023, based on criteria established in Internal Control—Integrated Framework issued by the Committee of Sponsoring Organizations of the Treadway Commission (2013 framework) (the “COSO criteria”). In our opinion, Agnico Eagle Mines Limited (the “Company”) maintained, in all material respects, effective internal control over financial reporting as of December 31, 2023, based on the COSO criteria.
We also have audited, in accordance with the standards of the Public Company Accounting Oversight Board (United States) (“PCAOB”), the consolidated balance sheets of the Company as of December 31, 2023 and 2022, and the related consolidated statements of income, comprehensive income, equity and cash flows for the years then ended, and the related notes and our report dated March 22, 2024 expressed an unqualified opinion thereon.
Basis for Opinion
The Company’s management is responsible for maintaining effective internal control over financial reporting and for its assessment of the effectiveness of internal control over financial reporting included in the accompanying Management’s Report on Internal Control over Financial Reporting. Our responsibility is to express an opinion on the Company’s internal control over financial reporting based on our audit. We are a public accounting firm registered with the PCAOB and are required to be independent with respect to the Company in accordance with the U.S. federal securities laws and the applicable rules and regulations of the Securities and Exchange Commission and the PCAOB.
We conducted our audit in accordance with the standards of the PCAOB. Those standards require that we plan and perform the audit to obtain reasonable assurance about whether effective internal control over financial reporting was maintained in all material respects.
Our audit included obtaining an understanding of internal control over financial reporting, assessing the risk that a material weakness exists, testing and evaluating the design and operating effectiveness of internal control based on the assessed risk, and performing such other procedures as we considered necessary in the circumstances. We believe that our audit provides a reasonable basis for our opinion.
Definition and Limitations of Internal Control Over Financial Reporting
A company’s internal control over financial reporting is a process designed to provide reasonable assurance regarding the reliability of financial reporting and the preparation of financial statements for external purposes in accordance with International Financial Reporting Standards as issued by the International Accounting Standards Board. A company’s internal control over financial reporting includes those policies and procedures that (1) pertain to the maintenance of records that, in reasonable detail, accurately and fairly reflect the transactions and dispositions of the assets of the company; (2) provide reasonable assurance that transactions are recorded as necessary to permit preparation of financial statements in accordance with International Financial Reporting Standards as issued by the International Accounting Standards Board, and that receipts and expenditures of the company are being made only in accordance with authorizations of management and directors of the company; and (3) provide reasonable assurance regarding prevention or timely detection of unauthorized acquisition, use, or disposition of the company’s assets that could have a material effect on the financial statements.
Because of its inherent limitations, internal control over financial reporting may not prevent or detect misstatements. Also, projections of any evaluation of effectiveness to future periods are subject to the risk that controls may become inadequate because of changes in conditions, or that the degree of compliance with the policies or procedures may deteriorate.
/s/ Ernst & Young LLP |
|
Chartered Professional Accountants |
|
Licensed Public Accountants |
|
|
|
Toronto, Canada |
|
March 22, 2024 |
|
6
AGNICO EAGLE MINES LIMITED
CONSOLIDATED BALANCE SHEETS
(thousands of United States dollars, except share amounts)
|
|
As at |
|
As at |
||
|
|
December 31, |
|
December 31, |
||
|
|
2023 |
|
2022 |
||
ASSETS |
|
|
|
|
|
|
Current assets: |
|
|
|
|
|
|
Cash and cash equivalents |
|
$ |
338,648 |
|
$ |
658,625 |
Trade receivables (Notes 6 and 19) |
|
|
8,148 |
|
|
8,579 |
Inventories (Note 7) |
|
|
1,418,941 |
|
|
1,209,075 |
Income taxes recoverable (Note 25) |
|
|
27,602 |
|
|
35,054 |
Fair value of derivative financial instruments (Notes 6 and 21) |
|
|
50,786 |
|
|
8,774 |
Other current assets (Note 8A) |
|
|
347,027 |
|
|
259,952 |
Total current assets |
|
|
2,191,152 |
|
|
2,180,059 |
Non-current assets: |
|
|
|
|
|
|
Goodwill (Notes 23 and 24) |
|
|
4,157,672 |
|
|
2,044,123 |
Property, plant and mine development (Notes 9 and 13) |
|
|
21,221,905 |
|
|
18,459,400 |
Investments (Notes 6, 10 and 21) |
|
|
345,257 |
|
|
332,742 |
Deferred income and mining tax asset (Note 25) |
|
|
53,796 |
|
|
11,574 |
Other assets (Note 8B) |
|
|
715,167 |
|
|
466,910 |
Total assets |
|
$ |
28,684,949 |
|
$ |
23,494,808 |
|
|
|
|
|
|
|
LIABILITIES |
|
|
|
|
|
|
Current liabilities: |
|
|
|
|
|
|
Accounts payable and accrued liabilities (Note 11) |
|
$ |
750,380 |
|
$ |
672,503 |
Share based liabilities (Notes 6 and 17) |
|
|
24,316 |
|
|
15,148 |
Interest payable |
|
|
14,226 |
|
|
16,496 |
Income taxes payable (Note 25) |
|
|
81,222 |
|
|
4,187 |
Current portion of long-term debt (Note 14) |
|
|
100,000 |
|
|
100,000 |
Reclamation provision (Note 12) |
|
|
24,266 |
|
|
23,508 |
Lease obligations (Note 13) |
|
|
46,394 |
|
|
36,466 |
Fair value of derivative financial instruments (Notes 6 and 21) |
|
|
7,222 |
|
|
78,114 |
Total current liabilities |
|
|
1,048,026 |
|
|
946,422 |
Non-current liabilities: |
|
|
|
|
|
|
Long-term debt (Note 14) |
|
|
1,743,086 |
|
|
1,242,070 |
Reclamation provision (Note 12) |
|
|
1,049,238 |
|
|
878,328 |
Lease obligations (Note 13) |
|
|
115,154 |
|
|
114,876 |
Share based liabilities (Notes 6 and 17) |
|
|
11,153 |
|
|
17,277 |
Deferred income and mining tax liabilities (Note 25) |
|
|
4,973,271 |
|
|
3,981,875 |
Other liabilities (Notes 5 and 15) |
|
|
322,106 |
|
|
72,615 |
Total liabilities |
|
|
9,262,034 |
|
|
7,253,463 |
|
|
|
|
|
|
|
EQUITY |
|
|
|
|
|
|
Common shares (Note 16): |
|
|
|
|
|
|
Outstanding — 497,970,524 common shares issued, less 671,083 shares held in trust |
|
|
18,334,869 |
|
|
16,251,221 |
Stock options (Notes 16 and 17) |
|
|
201,755 |
|
|
197,430 |
Contributed surplus |
|
|
22,074 |
|
|
23,280 |
Retained earnings (deficit) |
|
|
963,172 |
|
|
(201,580) |
Other reserves (Note 18) |
|
|
(98,955) |
|
|
(29,006) |
Total equity |
|
|
19,422,915 |
|
|
16,241,345 |
Total liabilities and equity |
|
$ |
28,684,949 |
|
$ |
23,494,808 |
|
|
|
|
|
|
|
Commitments and contingencies (Note 27) |
|
|
|
|
|
|
On behalf of the Board:
|
|
Ammar Al-Joundi, Director |
Jeffrey Parr, Director |
See accompanying notes
7
AGNICO EAGLE MINES LIMITED
CONSOLIDATED STATEMENTS OF INCOME
(thousands of United States dollars, except per share amounts)
|
|
Year Ended December 31, |
||||
|
|
2023 |
|
2022 |
||
|
|
|
|
|
|
|
REVENUES |
|
|
|
|
|
|
Revenues from mining operations (Note 19) |
|
$ |
6,626,909 |
|
$ |
5,741,162 |
COSTS, INCOME AND EXPENSES |
|
|
|
|
|
|
Production(i) |
|
|
2,933,263 |
|
|
2,643,321 |
Exploration and corporate development |
|
|
215,781 |
|
|
271,117 |
Amortization of property, plant and mine development (Note 9) |
|
|
1,491,771 |
|
|
1,094,691 |
General and administrative |
|
|
208,451 |
|
|
220,861 |
Finance costs (Note 14) |
|
|
130,087 |
|
|
82,935 |
(Gain) loss on derivative financial instruments (Note 21) |
|
|
(68,432) |
|
|
90,692 |
Impairment loss (Note 24) |
|
|
787,000 |
|
|
55,000 |
Foreign currency translation gain |
|
|
(328) |
|
|
(16,081) |
Care and maintenance |
|
|
47,392 |
|
|
41,895 |
Revaluation gain (Note 5) |
|
|
(1,543,414) |
|
|
— |
Other expenses (Note 22) |
|
|
66,269 |
|
|
141,308 |
Income before income and mining taxes |
|
|
2,359,069 |
|
|
1,115,423 |
Income and mining taxes expense (Note 25) |
|
|
417,762 |
|
|
445,174 |
Net income for the year |
|
$ |
1,941,307 |
|
$ |
670,249 |
Net income per share — basic (Note 16) |
|
$ |
3.97 |
|
$ |
1.53 |
Net income per share — diluted (Note 16) |
|
$ |
3.95 |
|
$ |
1.53 |
Cash dividends declared per common share |
|
$ |
1.60 |
|
$ |
1.60 |
Note:
| (i) | Exclusive of amortization, which is shown separately. |
See accompanying notes
8
AGNICO EAGLE MINES LIMITED
CONSOLIDATED STATEMENTS OF COMPREHENSIVE INCOME
(thousands of United States dollars)
|
|
Year Ended December 31, |
||||
|
|
2023 |
|
2022 |
||
|
|
|
|
|
|
|
Net income for the year |
|
$ |
1,941,307 |
|
$ |
670,249 |
|
|
|
|
|
|
|
Other comprehensive income: |
|
|
|
|
|
|
Items that may be subsequently reclassified to net income: |
|
|
|
|
|
|
Derivative financial instruments (Note 18): |
|
|
|
|
|
|
Reclassified from the cash flow hedge reserve to net income |
|
|
1,176 |
|
|
1,176 |
Income tax impact |
|
|
— |
|
|
1,125 |
|
|
|
1,176 |
|
|
2,301 |
Items that will not be subsequently reclassified to net income: |
|
|
|
|
|
|
Pension benefit obligations: |
|
|
|
|
|
|
Remeasurement gain (loss) on pension benefit obligations (Note 15) |
|
|
1,641 |
|
|
(194) |
Income tax impact |
|
|
166 |
|
|
230 |
Equity securities (Note 18): |
|
|
|
|
|
|
Net change in fair value of equity securities |
|
|
(73,865) |
|
|
(95,457) |
Income tax impact |
|
|
695 |
|
|
9,874 |
|
|
|
(71,363) |
|
|
(85,547) |
Other comprehensive loss for the year |
|
|
(70,187) |
|
|
(83,246) |
Comprehensive income for the year |
|
$ |
1,871,120 |
|
$ |
587,003 |
See accompanying notes
9
AGNICO EAGLE MINES LIMITED
CONSOLIDATED STATEMENTS OF EQUITY
(thousands of United States dollars, except share and per share amounts)
|
|
Common Shares |
|
|
|
|
|
|
|
Retained |
|
|
|
|
|
|||||
|
|
Outstanding |
|
Stock |
|
Contributed |
|
Earnings |
|
Other |
|
Total |
||||||||
|
|
Shares |
|
Amount |
|
Options |
|
Surplus |
|
(Deficit) |
|
Reserves |
|
Equity |
||||||
Balance at December 31, 2021 |
|
245,001,857 |
|
$ |
5,863,512 |
|
$ |
191,112 |
|
$ |
37,254 |
|
$ |
(146,383) |
|
$ |
54,276 |
|
$ |
5,999,771 |
Net income |
|
— |
|
|
— |
|
|
— |
|
|
— |
|
|
670,249 |
|
|
— |
|
|
670,249 |
Other comprehensive income (loss) |
|
— |
|
|
— |
|
|
— |
|
|
— |
|
|
36 |
|
|
(83,282) |
|
|
(83,246) |
Total comprehensive income (loss) |
|
— |
|
|
— |
|
|
— |
|
|
— |
|
|
670,285 |
|
|
(83,282) |
|
|
587,003 |
Transactions with owners: |
|
|
|
|
|
|
|
|
|
|
|
|
|
|
|
|
|
|
|
|
Shares issued under employee stock option plan (Notes 16 and 17A) |
|
944,989 |
|
|
51,310 |
|
|
(9,465) |
|
|
— |
|
|
— |
|
|
— |
|
|
41,845 |
Shares issued on acquisition of Kirkland Lake Gold Ltd. (“Kirkland”), net of share issuance costs (Note 5) |
|
209,274,263 |
|
|
10,268,160 |
|
|
— |
|
|
— |
|
|
— |
|
|
— |
|
|
10,268,160 |
Stock options (Notes 16 and 17A) |
|
— |
|
|
— |
|
|
15,783 |
|
|
— |
|
|
— |
|
|
— |
|
|
15,783 |
Shares issued under incentive share purchase plan (Note 17B) |
|
615,069 |
|
|
30,285 |
|
|
— |
|
|
— |
|
|
— |
|
|
— |
|
|
30,285 |
Shares issued under dividend reinvestment plan |
|
2,459,599 |
|
|
117,252 |
|
|
— |
|
|
— |
|
|
— |
|
|
— |
|
|
117,252 |
Share repurchases (Note 16) |
|
(1,569,620) |
|
|
(55,926) |
|
|
— |
|
|
(13,974) |
|
|
— |
|
|
— |
|
|
(69,900) |
Dividends declared ($1.60 per share) |
|
— |
|
|
— |
|
|
— |
|
|
— |
|
|
(725,482) |
|
|
— |
|
|
(725,482) |
Restricted Share Unit plan, Performance Share Unit plan, and Long Term Incentive Plan (Notes 16 and 17C, D) |
|
(260,861) |
|
|
(23,372) |
|
|
— |
|
|
— |
|
|
— |
|
|
— |
|
|
(23,372) |
Balance at December 31, 2022 |
|
456,465,296 |
|
$ |
16,251,221 |
|
$ |
197,430 |
|
$ |
23,280 |
|
$ |
(201,580) |
|
$ |
(29,006) |
|
$ |
16,241,345 |
Net income |
|
— |
|
|
— |
|
|
— |
|
|
— |
|
|
1,941,307 |
|
|
— |
|
|
1,941,307 |
Other comprehensive income (loss) |
|
— |
|
|
— |
|
|
— |
|
|
— |
|
|
1,807 |
|
|
(71,994) |
|
|
(70,187) |
Total comprehensive income (loss) |
|
— |
|
|
— |
|
|
— |
|
|
— |
|
|
1,943,114 |
|
|
(71,994) |
|
|
1,871,120 |
Transfer of loss on disposal of equity securities to deficit (Note 10) |
|
— |
|
|
— |
|
|
— |
|
|
— |
|
|
(2,045) |
|
|
2,045 |
|
|
— |
Transactions with owners: |
|
|
|
|
|
|
|
|
|
|
|
|
|
|
|
|
|
|
|
|
Shares issued under employee stock option plan (Notes 16 and 17A) |
|
940,921 |
|
|
48,155 |
|
|
(7,778) |
|
|
— |
|
|
— |
|
|
— |
|
|
40,377 |
Shares issued pursuant to Yamana Transaction (Note 5) |
|
36,177,931 |
|
|
1,858,219 |
|
|
— |
|
|
— |
|
|
— |
|
|
— |
|
|
1,858,219 |
Stock options (Notes 16 and 17A) |
|
— |
|
|
— |
|
|
12,103 |
|
|
— |
|
|
— |
|
|
— |
|
|
12,103 |
Shares issued under incentive share purchase plan (Note 17B) |
|
885,842 |
|
|
44,818 |
|
|
— |
|
|
— |
|
|
— |
|
|
— |
|
|
44,818 |
Shares issued under dividend reinvestment plan |
|
2,905,726 |
|
|
137,737 |
|
|
— |
|
|
— |
|
|
— |
|
|
— |
|
|
137,737 |
Share repurchases (Note 16) |
|
(100,000) |
|
|
(3,569) |
|
|
— |
|
|
(1,206) |
|
|
— |
|
|
— |
|
|
(4,775) |
Dividends declared ($1.60 per share) |
|
— |
|
|
— |
|
|
— |
|
|
— |
|
|
(776,317) |
|
|
— |
|
|
(776,317) |
Restricted Share Unit plan, Performance Share Unit plan, and Long Term Incentive Plan (Notes 16 and 17C,D) |
|
23,725 |
|
|
(1,712) |
|
|
— |
|
|
— |
|
|
— |
|
|
— |
|
|
(1,712) |
Balance at December 31, 2023 |
|
497,299,441 |
|
$ |
18,334,869 |
|
$ |
201,755 |
|
$ |
22,074 |
|
$ |
963,172 |
|
$ |
(98,955) |
|
$ |
19,422,915 |
See accompanying notes
10
AGNICO EAGLE MINES LIMITED
CONSOLIDATED STATEMENTS OF CASH FLOWS
(thousands of United States dollars)
|
|
Year Ended |
||||
|
|
December 31, |
||||
|
|
2023 |
|
2022 |
||
OPERATING ACTIVITIES |
|
|
|
|
|
|
Net income for the year |
|
$ |
1,941,307 |
|
$ |
670,249 |
Add (deduct) adjusting items: |
|
|
|
|
|
|
Amortization of property, plant and mine development (Note 9) |
|
|
1,491,771 |
|
|
1,094,691 |
Revaluation gain (Note 5) |
|
|
(1,543,414) |
|
|
— |
Deferred income and mining taxes (Note 25) |
|
|
52,041 |
|
|
168,098 |
Unrealized (gain) loss on currency and commodity derivatives (Note 21) |
|
|
(112,904) |
|
|
59,556 |
Unrealized loss on warrants (Note 21) |
|
|
11,198 |
|
|
9,820 |
Stock-based compensation (Note 17) |
|
|
71,553 |
|
|
48,570 |
Impairment loss (Note 24) |
|
|
787,000 |
|
|
55,000 |
Foreign currency translation gain |
|
|
(328) |
|
|
(16,081) |
Other |
|
|
49,734 |
|
|
25,965 |
Changes in non-cash working capital balances: |
|
|
|
|
|
|
Trade receivables |
|
|
7,458 |
|
|
12,110 |
Income taxes |
|
|
103,850 |
|
|
(35,010) |
Inventories |
|
|
(169,168) |
|
|
(46,236) |
Other current assets |
|
|
(88,389) |
|
|
(10,756) |
Accounts payable and accrued liabilities |
|
|
2,778 |
|
|
59,460 |
Interest payable |
|
|
(2,925) |
|
|
1,200 |
Cash provided by operating activities |
|
|
2,601,562 |
|
|
2,096,636 |
INVESTING ACTIVITIES |
|
|
|
|
|
|
Additions to property, plant and mine development (Note 9) |
|
|
(1,654,129) |
|
|
(1,538,237) |
Yamana Transaction, net of cash and cash equivalents (Note 5) |
|
|
(1,000,617) |
|
|
— |
Contributions for acquisition of mineral assets (Note 5) |
|
|
(10,950) |
|
|
— |
Cash and cash equivalents acquired in Kirkland acquisition (Note 5) |
|
|
— |
|
|
838,732 |
Purchases of equity securities and other investments |
|
|
(104,738) |
|
|
(47,364) |
Proceeds from loan repayment |
|
|
— |
|
|
40,000 |
Other investing activities |
|
|
9,651 |
|
|
(3,589) |
Cash used in investing activities |
|
|
(2,760,783) |
|
|
(710,458) |
FINANCING ACTIVITIES |
|
|
|
|
|
|
Proceeds from Credit Facility (Note 14) |
|
|
1,300,000 |
|
|
100,000 |
Repayment of Credit Facility (Note 14) |
|
|
(1,300,000) |
|
|
(100,000) |
Proceeds from Term Loan Facility, net of financing costs (Note 14) |
|
|
598,958 |
|
|
— |
Repayment of Senior Notes (Note 14) |
|
|
(100,000) |
|
|
(225,000) |
Repayment of lease obligations |
|
|
(47,589) |
|
|
(33,701) |
Dividends paid |
|
|
(638,642) |
|
|
(608,307) |
Repurchase of common shares (Notes 16 and 17) |
|
|
(47,003) |
|
|
(109,955) |
Proceeds on exercise of stock options (Note 17A) |
|
|
40,377 |
|
|
41,845 |
Common shares issued (Note 16) |
|
|
29,941 |
|
|
20,265 |
Cash used in financing activities |
|
|
(163,958) |
|
|
(914,853) |
Effect of exchange rate changes on cash and cash equivalents |
|
|
3,202 |
|
|
1,514 |
Net (decrease) increase in cash and cash equivalents during the year |
|
|
(319,977) |
|
|
472,839 |
Cash and cash equivalents, beginning of year |
|
|
658,625 |
|
|
185,786 |
Cash and cash equivalents, end of year |
|
$ |
338,648 |
|
$ |
658,625 |
|
|
|
|
|
|
|
SUPPLEMENTAL CASH FLOW INFORMATION |
|
|
|
|
|
|
Interest paid |
|
$ |
104,845 |
|
$ |
67,510 |
Income and mining taxes paid |
|
$ |
290,525 |
|
$ |
316,743 |
See accompanying notes
11
AGNICO EAGLE MINES LIMITED
NOTES TO CONSOLIDATED FINANCIAL STATEMENTS
(thousands of United States dollars, except share and per share amounts, unless otherwise indicated)
December 31, 2023
1.CORPORATE INFORMATION
Agnico Eagle Mines Limited (“Agnico Eagle” or the “Company”) is principally engaged in the production and sale of gold, as well as related activities such as exploration and mine development. The Company’s mining operations are located in Canada, Australia, Finland and Mexico and the Company has exploration activities in Canada, Europe, Latin America, Australia and the United States. Agnico Eagle is a public company incorporated under the laws of the Province of Ontario, Canada with its head and registered office located at 145 King Street East, Suite 400, Toronto, Ontario, M5C 2Y7. The Company’s common shares are listed on the Toronto Stock Exchange and the New York Stock Exchange. Agnico Eagle sells its gold production into the world market.
2.BASIS OF PRESENTATION
A)Statement of Compliance
The accompanying consolidated financial statements of Agnico Eagle have been prepared in accordance with International Financial Reporting Standards (“IFRS”) as issued by the International Accounting Standards Board (“IASB”).
These consolidated financial statements were authorized for issuance by the Board of Directors of the Company (the “Board”) on March 22, 2024.
B)Basis of Presentation
Overview
These consolidated financial statements were prepared on a going concern basis under the historical cost method except for certain financial assets and liabilities which are measured at fair value. The consolidated financial statements are presented in US dollars and all values are rounded to the nearest thousand, except where otherwise indicated.
Subsidiaries
These consolidated financial statements include the accounts of Agnico Eagle and its consolidated subsidiaries. All intercompany balances, transactions, income and expenses and gains or losses have been eliminated on consolidation. Subsidiaries are consolidated where Agnico Eagle has the ability to exercise control. Control of an investee exists when Agnico Eagle is exposed to variable returns from the Company’s involvement with the investee and has the ability to affect those returns through its power over the investee. The Company reassesses whether or not it controls an investee if facts and circumstances indicate that there are changes to one or more of the elements of control.
12
AGNICO EAGLE MINES LIMITED
NOTES TO CONSOLIDATED FINANCIAL STATEMENTS (Continued)
(thousands of United States dollars, except share and per share amounts, unless otherwise indicated)
December 31, 2023
2.BASIS OF PRESENTATION (Continued)
Joint Arrangements
A joint arrangement is defined as an arrangement in which two or more parties have joint control and is classified as either a joint operation or a joint venture. A joint operation is a joint arrangement whereby the parties have joint control of the arrangement and have rights to the assets and obligations for the liabilities relating to the arrangement. These consolidated financial statements include the Company’s interests in the assets, liabilities, revenues and expenses of joint operations from the date that joint control commenced. Agnico Eagle’s 50% interest in each of Canadian Malartic Corporation (“CMC”) and Canadian Malartic GP (the “Partnership”), the general partnership that held the Canadian Malartic complex located in Quebec, were accounted for as a joint operation until the remaining 50% was acquired on March 31, 2023 (Note 5).
On April 6, 2023, Agnico and Teck Resources Limited (“Teck”) entered into a joint venture shareholders agreement in respect of the San Nicolás copper-zinc development project. The agreement provides that Agnico, through a wholly-owned Mexican subsidiary, will subscribe for a 50% interest in Minas de San Nicolás, S.A.P.I. de C.V. (“MSN”) for $580.0 million, to be contributed as study and development costs are incurred by MSN, though for governance purposes, the agreement treats Agnico Eagle as a 50% shareholder of MSN regardless of the number of shares that have been issued to Agnico Eagle or its affiliates, except in certain circumstances of default. The Company accounts for its 50% interest in the joint venture as a joint operation (Note 5).
3. MATERIAL ACCOUNTING POLICIES
A)Business Combinations
In a business combination, the acquisition method of accounting is used, whereby the purchase consideration is allocated to the fair value of identifiable assets acquired and liabilities assumed at the date of acquisition. Where the cost of the acquisition exceeds the fair values of the identifiable net assets acquired, the difference is recorded as goodwill. Preliminary fair values allocated at a reporting date are finalized as soon as the relevant information is available, within a period not to exceed twelve months from the acquisition date with retroactive restatement of the impact of adjustments to those preliminary fair values effective as at the acquisition date. Acquisition related costs are expensed as incurred.
B)Foreign Currency Translation
The functional currency of the Company, for each subsidiary and for joint arrangements, is the currency of the primary economic environment in which it operates. The functional currency of all of the Company’s operations is the US dollar.
Once the Company determines the functional currency of an entity, it is not changed unless there is a significant change in the relevant underlying transactions, events and circumstances.
At the end of each reporting period, the Company translates foreign currency balances as follows:
| ● | monetary items are translated at the closing rate in effect at the consolidated balance sheet date; |
| ● | non-monetary items that are measured in terms of historical cost are translated using the exchange rate at the date of the transaction. Items measured at fair value are translated at the exchange rate in effect at the date the fair value was measured; and |
| ● | revenue and expense items are translated using the average exchange rate during the period. |
13
AGNICO EAGLE MINES LIMITED
NOTES TO CONSOLIDATED FINANCIAL STATEMENTS (Continued)
(thousands of United States dollars, except share and per share amounts, unless otherwise indicated)
December 31, 2023
3. MATERIAL ACCOUNTING POLICIES (Continued)
C)Cash and Cash Equivalents
The Company’s cash and cash equivalents include cash on hand and short-term investments in money market instruments with remaining maturities of three months or less at the date of purchase. The Company places its cash and cash equivalents and short-term investments in high quality securities issued by government agencies, financial institutions and major corporations and attempts to limit the amount of credit exposure by diversifying its holdings. Cash and cash equivalents are classified as financial assets measured at amortized cost.
D)Inventories
Inventories consist of ore stockpiles, concentrates, dore bars and supplies. Inventories are carried at the lower of cost and net realizable value (“NRV”). Cost is determined using the weighted average basis and includes all costs of purchase, costs of conversion and other costs incurred in bringing the inventories to their present location and condition. Cost of inventories include direct costs of materials and labour related directly to mining and processing activities, including production phase stripping costs, amortization of property, plant and mine development directly involved in the related mining and production process, amortization of any stripping costs previously capitalized and directly attributable overhead costs. When interruptions to production occur, an adjustment is made to the costs included in inventories, such that they reflect normal capacity. Abnormal costs are expensed in the period they are incurred.
The current portion of ore stockpiles, ore on leach pads and inventories is determined based on the amounts expected to be processed within the next twelve months. Ore stockpiles, ore on leach pads and inventories not expected to be processed or used within the next twelve months are classified as long-term.
NRV is estimated by calculating the net selling price less costs to be incurred in converting the relevant inventories to saleable product and delivering it to a customer. Costs to complete are based on management’s best estimate as at the consolidated balance sheet date. An NRV impairment may be reversed in a subsequent period if the circumstances that triggered the impairment no longer exist.
E)Financial Instruments
The Company’s financial assets and liabilities (financial instruments) include cash and cash equivalents, trade receivables, loans receivable, equity securities, share purchase warrants, accounts payable and accrued liabilities, long-term debt and derivative financial instruments. Financial instruments are recorded at fair value and classified at initial recognition and subsequently measured at amortized cost, fair value through other comprehensive income (“FVOCI”), or fair value through profit or loss (“FVPL”). Subsequent to initial recognition, financial instruments classified as cash and cash equivalents, loans receivable, accounts payable and accrued liabilities and long-term debt are measured at amortized cost using the effective interest method. Other financial instruments are recorded at fair value subsequent to initial recognition.
Equity Securities
The Company’s equity securities consist primarily of investments in common shares of entities in the mining industry recorded using trade date accounting. On initial recognition of an equity investment, the Company may irrevocably elect to measure the investment at FVOCI where changes in the fair value of equity securities are permanently recognized in other comprehensive income and will not be reclassified to profit or loss. The realized gain or loss is reclassified from other comprehensive income to retained earnings when the asset is de-recognized. The election is made on an investment-by-investment basis.
14
AGNICO EAGLE MINES LIMITED
NOTES TO CONSOLIDATED FINANCIAL STATEMENTS (Continued)
(thousands of United States dollars, except share and per share amounts, unless otherwise indicated)
December 31, 2023
3. MATERIAL ACCOUNTING POLICIES (Continued)
Derivative Instruments and Hedge Accounting
The Company uses derivative financial instruments (primarily option and forward contracts) to manage exposure to fluctuations in by-product metal prices, interest rates and foreign currency exchange rates and may use such means to manage exposure to certain input costs.
The Company recognizes all derivative financial instruments in the consolidated financial statements at fair value and they are classified based on contractual maturity. Derivative instruments are classified as either hedges of highly probable forecast transactions (cash flow hedges) or non-hedge derivatives. Derivatives designated as a cash flow hedge that are expected to be highly effective in achieving offsetting changes in cash flows are assessed on an ongoing basis to determine that they have actually been highly effective throughout the financial reporting periods for which they were designated. Derivative assets and derivative liabilities are shown separately in the consolidated balance sheets unless there is a legal right to offset and intent to settle on a net basis.
The effective portion of changes in the fair value of derivatives that are designated and qualify as cash flow hedges is recognized in other comprehensive income. The gain or loss relating to the ineffective portion is recognized in the gain or loss on derivative financial instruments line item in the consolidated statements of income. Amounts deferred in other comprehensive income are reclassified when the hedged transaction has occurred.
Derivative instruments that do not qualify for hedge accounting are recorded at fair value at the balance sheet date, with changes in fair value recognized in the gain or loss on derivative financial instruments line item in the consolidated statements of income (FVPL).
The Company also holds share purchase warrants of certain publicly traded entities where it has an investment in equity securities. Share purchase warrants are accounted for as derivative financial instruments and presented as part of investments in the consolidated balance sheets.
Expected Credit Loss Impairment Model
An assessment of the expected credit loss related to a financial asset is undertaken upon initial recognition and at the end of each reporting period based on the credit quality of the debtor and any changes that impact the risk of impairment.
F)Goodwill
Goodwill is recognized in a business combination if the cost of the acquisition exceeds the fair values of the identifiable net assets acquired. Goodwill is then allocated to the cash generating unit (“CGU”) or group of CGUs that are expected to benefit from the synergies of the combination. A CGU is the smallest identifiable group of assets that generates cash inflows which are largely independent of the cash inflows from other assets or groups of assets.
The Company performs goodwill impairment tests on an annual basis as at December 31 each year. In addition, the Company assesses for indicators of impairment at each reporting period-end and, if an indicator of impairment is identified, goodwill is tested for impairment at that time. If the carrying value of the CGU or group of CGUs to which goodwill is assigned exceeds its recoverable amount, an impairment loss is recognized. Goodwill impairment losses are recorded in the consolidated statements of income and they are not subsequently reversed.
The recoverable amount of a CGU or group of CGUs is measured as the higher of value in use and fair value less costs of disposal.
15
AGNICO EAGLE MINES LIMITED
NOTES TO CONSOLIDATED FINANCIAL STATEMENTS (Continued)
(thousands of United States dollars, except share and per share amounts, unless otherwise indicated)
December 31, 2023
3. MATERIAL ACCOUNTING POLICIES (Continued)
G)Mining Properties, Plant and Equipment and Mine Development Costs
Mining Properties
The cost of mining properties includes the fair value attributable to proven and probable mineral reserves and mineral resources acquired in a business combination or asset acquisition, underground mine development costs, deferred stripping, capitalized exploration and evaluation costs and capitalized borrowing costs.
Significant payments related to the acquisition of land and mineral rights are capitalized as mining properties at cost. If a mineable ore body is discovered, such costs are amortized to income when commercial production commences, using the units-of-production method, based on estimated proven and probable mineral reserves and the mineral resources included in the current life of mine plan. If no mineable ore body is discovered, such costs are expensed in the period in which it is determined that the property has no future economic value. Cost components of a specific project that are included in the capital cost of the asset include salaries and wages directly attributable to the project, supplies and materials used in the project and incremental overhead costs that can be directly attributable to the project.
Assets under construction are not amortized until the earlier of the end of the construction period or once commercial production is achieved. Upon achieving the production stage, the capitalized construction costs are transferred to the appropriate category within property, plant and mine development. The estimated fair value attributed to certain mineral resources at the time of acquisition is not subject to depreciation until the resources are considered in use, which is the point at which they are incorporated into the current LOM plan.
Plant and Equipment
Expenditures for new facilities and improvements that can extend the useful lives of existing facilities are capitalized as plant and equipment at cost. The cost of an item of plant and equipment includes: its purchase price, including import duties and non-refundable purchase taxes, after deducting trade discounts and rebates; any costs directly attributable to bringing the asset to the location and condition necessary for it to be capable of operating in the manner intended by management; and the estimate of the costs of dismantling and removing the item and restoring the site on which it is located other than costs that arise as a consequence of having used the item to produce inventories during the period.
An item of property, plant and equipment is derecognized upon disposal or when no future economic benefits are expected from its use or disposal. Any gain or loss arising on derecognition of the asset (calculated as the difference between the net disposal proceeds and the carrying amount of the asset) is included in the consolidated statements of income when the asset is derecognized.
Amortization of an asset begins when the asset is in the location and condition necessary for it to operate in the manner intended by management. Amortization ceases at the earlier of the date the asset is classified as held for sale or the date the asset is derecognized. Assets under construction are not amortized until the earlier of the end of the construction period or once commercial production is achieved. Amortization is charged according to either the units-of-production method or on a straight line basis, according to the pattern in which the asset’s future economic benefits are expected to be consumed. Amortization does not cease when an asset becomes idle or is retired from active use unless the asset is fully amortized; however, under the units-of-production method of amortization, the amortization charge can be zero when there is no production. The amortization method applied to an asset is reviewed at least annually.
16
AGNICO EAGLE MINES LIMITED
NOTES TO CONSOLIDATED FINANCIAL STATEMENTS (Continued)
(thousands of United States dollars, except share and per share amounts, unless otherwise indicated)
December 31, 2023
3. MATERIAL ACCOUNTING POLICIES (Continued)
Useful lives of property, plant and equipment are based on the lesser of the estimated mine lives as determined by proven and probable mineral reserves and the mineral resources included in the current life of mine plan and the estimated useful life of the asset. Remaining mine lives at December 31, 2023 range from an estimated one to 29 years.
The following table sets out the useful lives of certain assets:
|
|
Useful Life |
Buildings |
|
5 to 29 years |
Leasehold Improvements |
|
15 years |
Software and IT Equipment |
|
1 to 10 years |
Furniture and Office Equipment |
|
3 to 5 years |
Machinery and Equipment |
|
1 to 29 years |
Mine Development Costs
Mine development costs incurred after the commencement of commercial production are capitalized when they are expected to have a future economic benefit. Activities that are typically capitalized include costs incurred to build shafts, drifts, ramps and access corridors which enables the Company to extract ore underground.
The Company records amortization on underground mine development costs on a units-of-production basis based on the estimated tonnage of proven and probable mineral reserves and the mineral resources included in the current life of mine plan of the identified component of the ore body. The units-of-production method defines the denominator as the total tonnage of proven and probable mineral reserves and the mineral resources included in the current life of mine plan.
Deferred Stripping
In open pit mining operations, it is necessary to remove overburden and other waste materials to access ore from which minerals can be extracted economically. The process of mining overburden and waste materials is referred to as stripping.
During the development stage of the mine, stripping costs are capitalized as part of the cost of building, developing and constructing the mine and are amortized once the mine has entered the production stage.
During the production stage of a mine, stripping costs are recorded as a part of the cost of inventories unless these costs are expected to provide a future economic benefit and, in such cases, are capitalized to property, plant and mine development.
Production stage stripping costs provide a future economic benefit when:
| ● | It is probable that the future economic benefit (e.g., improved access to the ore body) associated with the stripping activity will flow to the Company; |
| ● | The Company can identify the component of the ore body for which access has been improved; and |
| ● | The costs relating to the stripping activity associated with that component can be measured reliably. |
Capitalized production stage stripping costs are amortized over the expected useful life of the identified component of the ore body that becomes more accessible as a result of the stripping activity.
17
AGNICO EAGLE MINES LIMITED
NOTES TO CONSOLIDATED FINANCIAL STATEMENTS (Continued)
(thousands of United States dollars, except share and per share amounts, unless otherwise indicated)
December 31, 2023
3. MATERIAL ACCOUNTING POLICIES (Continued)
Borrowing Costs
Borrowing costs are capitalized to qualifying assets. Qualifying assets are assets that take a substantial period of time to prepare for the Company’s intended use, which includes projects that are in the exploration and evaluation, development or construction stages.
Borrowing costs attributable to the acquisition, construction or production of qualifying assets are added to the cost of those assets until such time as the assets are substantially ready for their intended use. All other borrowing costs are recognized as finance costs in the period in which they are incurred. Where the funds used to finance a qualifying asset form part of general borrowings, the amount capitalized is calculated using a weighted average of rates applicable to the relevant borrowings during the period.
H)Leases
At inception of a contract, the Company assesses whether a contract is, or contains, a lease. A contract contains a lease if the contract conveys the right to control the use of an identified asset for a period of time in exchange for consideration. The Company assesses whether:
| ● | The contract involves the use of an explicitly or implicitly identified asset; |
| ● | The Company has the right to obtain substantially all of the economic benefits from the use of the asset throughout the contract term; and |
| ● | The Company has the right to direct the use of the asset. |
The Company recognizes a right-of-use asset and a lease obligation at the commencement date of the lease (i.e. the date the underlying asset is available for use).
Right-of-use assets are measured at cost, less any accumulated depreciation and impairment losses, and adjusted for any remeasurement of lease obligations. The cost of right-of-use assets includes the initial amount of lease obligations recognized, initial direct costs incurred and lease payments made at or before the commencement date less any lease incentives received.
Unless the Company is reasonably certain to obtain ownership of the leased asset at the end of the lease term, the right-of-use assets are depreciated on a straight-line basis over the shorter of the estimated useful life and the lease term. Right-of-use assets are subject to impairment.
At the commencement date of the lease, the Company recognizes lease obligations measured at the present value of lease payments to be made over the lease term, discounted using the interest rate implicit in the lease or, if that rate cannot be readily determined, the Company’s incremental borrowing rate. The lease payments include fixed payments, variable lease payments that depend on an index or a rate, amounts expected to be paid under residual value guarantees and the exercise price of a purchase option reasonably certain to be exercised by the Company.
After the commencement date, the amount of lease obligations is increased to reflect the accretion of interest and reduced for the lease payments made. In addition, the carrying amount of lease obligations is remeasured if there is a modification, a change in the lease term, a change in the fixed lease payments, changes based on an index or rate or a change in the assessment to purchase the underlying asset.
18
AGNICO EAGLE MINES LIMITED
NOTES TO CONSOLIDATED FINANCIAL STATEMENTS (Continued)
(thousands of United States dollars, except share and per share amounts, unless otherwise indicated)
December 31, 2023
3. MATERIAL ACCOUNTING POLICIES (Continued)
The Company presents right-of-use assets in the property, plant and mine development line item on the consolidated balance sheets and lease obligations in the lease obligations line item on the consolidated balance sheets.
The Company has elected not to recognize right-of-use assets and lease obligations for leases that have a lease term of 12 months or less and do not contain a purchase option, for leases related to low value assets, or for leases with variable lease payments. Payments on short-term leases, leases of low value assets and leases with variable payment amounts are recognized as an expense in the consolidated statements of income.
I)Development Stage Expenditures
Development stage expenditures are costs incurred to obtain access to proven and probable mineral reserves or mineral resources and provide facilities for extracting, treating, gathering, transporting and storing the minerals. The development stage of a mine commences when the technical feasibility and commercial viability of extracting the mineral resource has been determined. Costs that are directly attributable to mine development are capitalized as property, plant and mine development to the extent that they are necessary to bring the property to commercial production.
Abnormal costs are expensed as incurred. Indirect costs are included only if they can be directly attributed to the area of interest. General and administrative costs are capitalized as part of the development expenditures when the costs are directly attributed to a specific mining development project.
Commercial Production
A mine construction project is considered to have entered the production stage when the mine construction assets are available for use. In determining whether mine construction assets are considered available for use, the criteria considered include, but are not limited to, the following:
| ● | completion of a reasonable period of testing mine plant and equipment; |
| ● | ability to produce minerals in saleable form (within specifications); and |
| ● | ability to sustain ongoing production of minerals. |
When a mine construction project moves into the production stage, amortization commences, the capitalization of certain mine construction costs ceases and expenditures are either capitalized to inventories or expensed as incurred. Exceptions include costs incurred for additions or improvements to property, plant and mine development and open-pit stripping activities.
J)Impairment and Impairment Reversal of Long-lived Assets
At the end of each reporting period the Company assesses whether there is any indication that long-lived assets other than goodwill may be impaired. If an indicator of impairment exists, the recoverable amount of the asset is calculated in order to determine if any impairment loss is required. If it is not possible to estimate the recoverable amount of the individual asset, assets are grouped at the CGU level for the purpose of assessing the recoverable amount. An impairment loss is recognized for any excess of the carrying amount of the CGU over its recoverable amount. If the CGU includes goodwill, the impairment loss related to a CGU is first allocated to goodwill and the remaining loss is allocated to the remaining long-lived assets of the CGU based on their carrying amounts. Impairment losses are recorded in the consolidated statements of income in the period in which they occur.
19
AGNICO EAGLE MINES LIMITED
NOTES TO CONSOLIDATED FINANCIAL STATEMENTS (Continued)
(thousands of United States dollars, except share and per share amounts, unless otherwise indicated)
December 31, 2023
3. MATERIAL ACCOUNTING POLICIES (Continued)
Any impairment charge that is taken on a long-lived asset other than goodwill is reversed if there are subsequent changes in the estimates or significant assumptions that were used to recognize the impairment loss that result in an increase in the recoverable amount of the CGU. If an indicator of impairment reversal has been identified, the recoverable amount of the asset is calculated in order to determine if any impairment reversal is required. A recovery is recognized to the extent the recoverable amount of the asset exceeds its carrying amount. The amount of the reversal is limited to the difference between the current carrying amount and the amount which would have been the carrying amount had the earlier impairment not been recognized and amortization of that carrying amount had continued. The impairment reversal is allocated on a pro-rata basis to the existing long-lived assets of the CGU based on their carrying amounts. Impairment reversals are recorded in the consolidated statements of income in the period in which they occur.
K)Debt
Debt is initially recorded at fair value, net of financing costs incurred. Debt is subsequently measured at amortized cost. Any difference between the amounts received and the redemption value of the debt is recognized in the consolidated statements of income over the period to maturity using the effective interest rate method.
L)Reclamation Provisions
Asset retirement obligations (“AROs”) arise from the acquisition, development and construction of mining properties and plant and equipment due to government controls and regulations that protect the environment on the closure and reclamation of mining properties. The major parts of the carrying amount of AROs relate to tailings and heap leach pad closure and rehabilitation, demolition of buildings and mine facilities, ongoing water treatment and ongoing care and maintenance of closed mines. The Company recognizes an ARO at the time the environmental disturbance occurs or a constructive obligation is determined to exist based on the Company’s best estimate of the timing and amount of expected cash flows expected to be incurred. When the ARO provision is recognized, the corresponding cost is capitalized to the related item of property, plant and mine development. Reclamation provisions that result from disturbance in the land to extract ore in the current period is included in the cost of inventories.
The timing of the actual environmental remediation expenditures is dependent on a number of factors such as the life and nature of the asset, the operating licence conditions and the environment in which the mine operates. Reclamation provisions are measured at the expected value of future cash flows discounted to their present value using a risk-free interest rate. AROs are adjusted each period to reflect the passage of time (accretion). Accretion expense is recorded in finance costs each period. Upon settlement of an ARO, the Company records a gain or loss if the actual cost differs from the carrying amount of the ARO. Settlement gains or losses are recorded in the consolidated statements of income.
Expected cash flows are updated to reflect changes in facts and circumstances. The principal factors that can cause expected cash flows to change are the construction of new processing facilities, changes in the quantities of material in mineral reserves and mineral resources and a corresponding change in the life of mine plan, changing ore characteristics that impact required environmental protection measures and related costs, changes in water quality that impact the extent of water treatment required and changes in laws and regulations governing the protection of the environment.
Each reporting period, provisions for AROs are remeasured to reflect any changes to significant assumptions, including the amount and timing of expected cash flows and risk-free interest rates. Changes to the reclamation provision resulting from changes in estimate are added to or deducted from the cost of the related asset, except where the reduction of the reclamation provision exceeds the carrying value of the related assets in which case the asset is reduced to nil and the remaining adjustment is recognized in the consolidated statements of income.
20
AGNICO EAGLE MINES LIMITED
NOTES TO CONSOLIDATED FINANCIAL STATEMENTS (Continued)
(thousands of United States dollars, except share and per share amounts, unless otherwise indicated)
December 31, 2023
3. MATERIAL ACCOUNTING POLICIES (Continued)
Environmental remediation liabilities (“ERLs”) are differentiated from AROs in that ERLs do not arise from environmental contamination in the normal operation of a long-lived asset or from a legal or constructive obligation to treat environmental contamination resulting from the acquisition, construction or development of a long-lived asset. The Company is required to recognize a liability for obligations associated with ERLs arising from past acts. ERLs are measured by discounting the expected related cash flows using a risk-free interest rate. The Company prepares estimates of the timing and amount of expected cash flows when an ERL is incurred. Each reporting period, the Company assesses cost estimates and other assumptions used in the valuation of ERLs to reflect events, changes in circumstances and new information available. Changes in these cost estimates and assumptions have a corresponding impact on the value of the ERL. Any change in the value of ERLs results in a corresponding charge or credit to the consolidated statements of income. Upon settlement of an ERL, the Company records a gain or loss if the actual cost differs from the carrying amount of the ERL in the consolidated statements of income.
M)Post-employment Benefits
In Canada, the Company maintains a defined contribution plan covering all of its employees (the ”Basic Plan”). The Basic Plan is funded by Company contributions based on a percentage of income for services rendered by employees. In addition, the Company has a supplemental plan for designated executives at the level of Vice-President or above (the ”Supplemental Plan”). Under the Supplemental Plan, an additional 10.0% of the designated executives’ income is contributed by the Company.
The Company provides a defined benefit retirement program (the “Retirement Program”) for certain eligible employees that provides a lump-sum payment upon retirement. The payment is based on age and length of service at retirement. An eligible employee is entitled to a benefit if they have completed more than 10 years as a permanent employee and have attained a minimum age of 57. The Retirement Program is not funded.
The Company also provides a non-registered supplementary executive retirement defined benefit plan for certain current and former senior officers (the ”Executives Plan”). The Executives Plan benefits are generally based on the employee’s years of service and level of compensation. Pension expense related to the Executives Plan is the net of the cost of benefits provided (including the cost of any benefits provided for past service), the net interest cost on the net defined liability/asset and the effects of settlements and curtailments related to special events. Pension fund assets are measured at their current fair values. The costs of pension plan improvements are recognized immediately in expense when they occur. Remeasurements of the net defined benefit liability are recognized immediately in other comprehensive income and are subsequently transferred to retained earnings.
The Company provides three defined benefit retirement plans for certain eligible employees in Mexico (the “Mexico Plans”) that provide a lump-sum payment upon retirement. The payment is based on age and length of service at retirement. Eligible employees are entitled to a benefit if they have completed 15 years of service as a permanent employee and are 60 years of age or older. The Mexico Plans are not funded.
Defined Contribution Plan
The Company recognizes the contributions payable to a defined contribution plan in exchange for services rendered by employees as an expense, unless another policy requires or permits the inclusion of the contribution in the cost of an asset. After deducting contributions already paid, a liability is recorded throughout each period to reflect unpaid but earned contributions. If the contribution paid exceeds the contribution due for the service before the end of the reporting period, the Company recognizes that excess as an asset to the extent that the prepayment will lead to a reduction in future payments or a cash refund.
21
AGNICO EAGLE MINES LIMITED
NOTES TO CONSOLIDATED FINANCIAL STATEMENTS (Continued)
(thousands of United States dollars, except share and per share amounts, unless otherwise indicated)
December 31, 2023
3. MATERIAL ACCOUNTING POLICIES (Continued)
Defined Benefit Plan
Plan assets are measured at their fair value at the consolidated balance sheet date and are deducted from the present value of plan liabilities to arrive at a net defined benefit liability/asset. The defined benefit obligation reflects the expected future payments required to settle the obligation resulting from employee service in the current and prior periods.
Current service cost represents the actuarially calculated present value of the benefits earned by the active employees in each period and reflects the economic cost for each period based on current market conditions. The current service cost is based on the most recent actuarial valuation. The net interest on the net defined benefit liability/asset is the change during the period in the defined benefit liability/asset that arises from the passage of time.
Past service cost represents the change in the present value of the defined benefit obligation resulting from a plan amendment or curtailment. Past service costs from plan amendments that increase or decrease vested or unvested benefits are recognized immediately in net income at the earlier of when the related plan amendment occurs or when the entity recognizes related restructuring costs or termination benefits.
Gains or losses on plan settlements are measured as the difference in the present value of the defined benefit obligation and settlement price. This results in a gain or loss being recognized when the benefit obligation settles. Actuarial gains and losses are recorded on the consolidated balance sheets as part of the benefit plan’s funded status. Gains and losses are recognized immediately in other comprehensive income and are subsequently transferred to retained earnings and are not recognized in net income.
N)Contingent Liabilities and Other Provisions
Provisions are recognized when a present obligation exists (legal or constructive), as a result of a past event, for which it is probable that an outflow of resources will be required to settle the obligation and a reliable estimate can be made of the amount of the obligation. The amount recognized as a provision is the best estimate of the expenditure required to settle the obligation at the consolidated balance sheet date, measured using the expected cash flows discounted for the time value of money. The increase in provision due to the passage of time (accretion) is recognized as a finance cost in the consolidated statements of income.
Contingent liabilities are possible obligations whose existence will be confirmed only on the occurrence or non-occurrence of uncertain future events outside the entity’s control, or present obligations that are not recognized because it is not probable that an outflow of economic benefits would be required to settle the obligation or the amount cannot be measured reliably. Contingent liabilities are not recognized but are disclosed and described in the notes to the consolidated financial statements, including an estimate of their potential financial effect and uncertainties relating to the amount or timing of any outflow, unless the possibility of settlement is remote. In assessing loss contingencies related to legal proceedings that are pending against the Company or unasserted claims that may result in such proceedings, the Company, with assistance from its legal counsel, evaluates the perceived merits of any legal proceedings or unasserted claims as well as the perceived merits of the amount of relief sought or expected to be sought.
O)Stock-based Compensation
The Company offers stock - based compensation awards (the employee stock option plan, incentive share purchase plan, restricted share unit plan and performance share unit plan) to certain employees, officers and directors of the Company.
22
AGNICO EAGLE MINES LIMITED
NOTES TO CONSOLIDATED FINANCIAL STATEMENTS (Continued)
(thousands of United States dollars, except share and per share amounts, unless otherwise indicated)
December 31, 2023
3. MATERIAL ACCOUNTING POLICIES (Continued)
Employee Stock Option Plan (“ESOP”)
The Company’s ESOP provides for the granting of options to directors, officers, employees and service providers to purchase common shares. Options have exercise prices equal to the market price on the day prior to the date of grant. The fair value of these options is recognized in the consolidated statements of income or in the consolidated balance sheets if capitalized as part of property, plant and mine development over the applicable vesting period as a compensation cost. Any consideration paid by employees on exercise of options or purchase of common shares is credited to share capital.
Fair value is determined using the Black-Scholes option valuation model, which requires the Company to estimate the expected volatility of the Company’s share price and the expected life of the stock options. Limitations with existing option valuation models and the inherent difficulties associated with estimating these variables create difficulties in determining a reliable single measure of the fair value of stock option grants. The cost is recorded over the vesting period of the award to the same expense category as the award recipient’s payroll costs and the corresponding entry is recorded in equity. Equity-settled awards are not remeasured subsequent to the initial grant date. The dilutive impact of stock option grants is factored into the Company’s reported diluted net income per share. The stock option expense incorporates an expected forfeiture rate, estimated based on expected employee turnover.
Incentive Share Purchase Plan (“ISPP”)
Under the ISPP, directors (excluding non-executive directors), officers and employees (the ”Participants”) of the Company may contribute up to 10.0% of their basic annual salaries and the Company contributes an amount equal to 50.0% of each Participant’s contribution. All common shares subscribed for under the ISPP are issued by the Company.
The Company records an expense equal to its cash contribution to the ISPP. No forfeiture rate is applied to the amounts accrued. Where an employee leaves prior to the vesting date, any accrual for contributions by the Company during the vesting period related to that employee is reversed.
Restricted Share Unit (“RSU”) Plan
The RSU plan is open to directors and certain employees, including senior executives, of the Company. Common shares are purchased and held in a trust until the RSU has vested. The cost is recorded over the vesting period of the award to the same expense category as the award recipient’s payroll costs. The cost of the RSUs is recorded within equity until settled. Equity-settled awards are not remeasured subsequent to the initial grant date.
Performance Share Unit (“PSU”) Plan
The PSU plan is open to senior executives of the Company. PSUs are subject to vesting requirements based on specific performance measurements by the Company. PSUs awarded to eligible executives are settled in cash. They are measured at fair value at the grant date. The fair value of the estimated number of PSUs awarded that are expected to vest is recognized as share based compensation expense over the vesting period of the PSUs with a corresponding amount recorded to share based liabilities until the liability is settled through a cash payment. At each reporting date and on settlement, the share based liability is remeasured, with any changes in fair value recorded as compensation expense.
23
AGNICO EAGLE MINES LIMITED
NOTES TO CONSOLIDATED FINANCIAL STATEMENTS (Continued)
(thousands of United States dollars, except share and per share amounts, unless otherwise indicated)
December 31, 2023
3. MATERIAL ACCOUNTING POLICIES (Continued)
P)Revenue from Contracts with Customers
Gold and Silver
The Company sells gold and silver to customers in the form of bullion and dore bars.
The Company recognizes revenue from these sales when control of the gold or silver has transferred to the customer. This is generally at the point in time when the gold or silver is credited to the metal account of the customer. Once the gold or silver has been credited to the customer’s metal account, the customer has legal title to, physical possession of, and the risks and rewards of ownership of the gold or silver; therefore, the customer is able to direct the use of and obtain substantially all of the remaining benefits from the gold or silver.
Under certain contracts with customers, the transfer of control may occur when the gold or silver is in transit from the mine to the refinery. At this point in time, the customer has legal title to and the risk and rewards of ownership of the gold or silver; therefore, the customer is able to direct the use of and obtain substantially all of the remaining benefits from the gold or silver.
Revenue is measured at the transaction price agreed under the contract. Payment of the transaction price is due immediately when control of the gold or silver is transferred to the customer.
Generally, all of the gold and silver in the form of dore bars recovered in the Company’s milling process is sold in the period in which it is produced.
Metal Concentrates
The Company sells concentrate from certain of its mines to third-party smelter customers. These concentrates predominantly contain zinc and copper, along with quantities of gold and silver.
The Company recognizes revenue from these concentrate sales when control of the concentrate has transferred to the customer, which is the point in time that the concentrate is delivered to the customer. Upon delivery, the customer has legal title to, physical possession of, and the risks and rewards of ownership of the concentrate. The customer is also committed to accept and pay for the concentrates once delivered; therefore, the customer is able to direct the use of and obtain substantially all of the remaining benefits from the concentrate.
The final prices for metals contained in the concentrate are generally determined based on the prevailing spot market metal prices on a specific future date, which is established as of the date the concentrate is delivered to the customer. Upon transfer of control at delivery, the Company measures revenue under these contracts based on forward prices at the time of delivery and the most recent determination of the quantity of contained metals less smelting and refining charges charged by the customer. This reflects the best estimate of the transaction price expected to be received at final settlement. A receivable is recognized for this amount and subsequently measured at fair value to reflect variability associated with the embedded derivative for changes in the market metal prices. These changes in the fair value of the receivable are adjusted through revenue from other sources at each subsequent financial statement date.
Under certain contracts with customers, the sale of gold contained in copper concentrate occurs once the metal has been processed into refined gold and is sold separately similar to the gold and silver dore bar terms described above. The transaction price for the sale of gold contained in concentrate is determined based on the spot market price upon delivery and provisional pricing does not apply.
24
AGNICO EAGLE MINES LIMITED
NOTES TO CONSOLIDATED FINANCIAL STATEMENTS (Continued)
(thousands of United States dollars, except share and per share amounts, unless otherwise indicated)
December 31, 2023
3. MATERIAL ACCOUNTING POLICIES (Continued)
Q)Exploration and Evaluation Expenditures
Exploration and evaluation expenditures are the costs incurred in the initial search for mineral deposits with economic potential or in the process of obtaining more information about existing mineral deposits. Exploration expenditures typically include costs associated with prospecting, sampling, mapping, diamond drilling and other work involved in searching for ore. Evaluation expenditures are the costs incurred to establish the technical and commercial viability of developing mineral deposits identified through exploration activities or by acquisition.
Exploration and evaluation expenditures are expensed as incurred unless it can be demonstrated that the project will generate future economic benefit. When it is determined that a project can generate future economic benefit the costs are capitalized in the property, plant and mine development line item in the consolidated balance sheets.
The exploration and evaluation phase ends when the technical feasibility and commercial viability of extracting the mineral is demonstrable.
R)Net Income Per Share
Basic net income per share is calculated by dividing net income for a given period by the weighted average number of common shares outstanding during that same period. Diluted net income per share reflects the potential dilution that could occur if holders with rights to convert instruments to common shares exercise these rights. The weighted average number of common shares used to determine diluted net income per share includes an adjustment, using the treasury stock method, for stock options outstanding. Under the treasury stock method:
| ● | the exercise of options is assumed to occur at the beginning of the period (or date of issuance, if later); |
| ● | the proceeds from the exercise of options plus the future period compensation expense on options granted are assumed to be used to purchase common shares at the average market price during the period; and |
| ● | the incremental number of common shares (the difference between the number of shares assumed issued and the number of shares assumed purchased) is included in the denominator of the diluted net income per share calculation. |
S)Income Taxes
Current and deferred tax expenses are recognized in the consolidated statements of income except to the extent that they relate to a business combination, or to items recognized directly in equity or in other comprehensive income.
Current tax expense is based on substantively enacted statutory tax rates and laws at the consolidated balance sheet date.
Deferred tax is recognized in respect of temporary differences between the carrying amounts of assets and liabilities for financial reporting purposes and the tax basis of such assets and liabilities measured using tax rates and laws that are substantively enacted at the consolidated balance sheet date and effective for the reporting period when the temporary differences are expected to reverse.
Deferred taxes are not recognized in the following circumstances:
| ● | where a deferred tax liability arises from the initial recognition of goodwill; |
25
AGNICO EAGLE MINES LIMITED
NOTES TO CONSOLIDATED FINANCIAL STATEMENTS (Continued)
(thousands of United States dollars, except share and per share amounts, unless otherwise indicated)
December 31, 2023
3. MATERIAL ACCOUNTING POLICIES (Continued)
| ● | where a deferred tax asset or liability arises on the initial recognition of an asset or liability in a transaction which is not a business combination and, at the time of the transaction, affects neither net income nor taxable profits; and |
| ● | for temporary differences relating to investments in subsidiaries and jointly controlled entities to the extent that the Company can control the timing of the reversal of the temporary difference and it is probable that the temporary difference will not reverse in the foreseeable future. |
Deferred tax assets are recognized for unused tax losses and tax credits carried forward and deductible temporary differences to the extent that it is probable that future taxable profits will be available against which they can be utilized except as noted above.
At each reporting period, previously unrecognized deferred tax assets are reassessed to determine whether it has become probable that future taxable profits will allow the deferred tax assets to be recovered.
T)Comparative Figures
Certain figures in the consolidated financial statements have been reclassified from statements previously presented to conform to the presentation of these financial statements as at and for the year ended December 31, 2023.
Recently Adopted Accounting Pronouncement
Disclosure of Accounting Policies – Amendments to IAS 1 and IFRS Practice Statement 2
The amendments to IAS 1 and IFRS Practice Statement 2 Making Materiality Judgments provide guidance and examples to help entities apply materiality judgments to accounting policy disclosures. The amendments aim to help entities provide accounting policy disclosures that are more useful by replacing the requirement for entities to disclose their ‘significant’ accounting policies with a requirement to disclose their ‘material’ accounting policies and adding guidance on how entities apply the concept of materiality in making decisions about accounting policy disclosures.
The amendments have had an impact on the Company’s disclosures of accounting policies, but not on the measurement, recognition or presentation of any items in the Company’s consolidated financial statements.
4.SIGNIFICANT JUDGMENTS, ESTIMATES AND ASSUMPTIONS
The preparation of these consolidated financial statements in conformity with IFRS requires management to make judgments, estimates and assumptions that affect the amounts reported in the consolidated financial statements and accompanying notes. Management believes that the estimates used in the preparation of the consolidated financial statements are reasonable; however, actual results may differ materially from these estimates. The key areas where significant judgments, estimates and assumptions have been made are summarized below.
26
AGNICO EAGLE MINES LIMITED
NOTES TO CONSOLIDATED FINANCIAL STATEMENTS (Continued)
(thousands of United States dollars, except share and per share amounts, unless otherwise indicated)
December 31, 2023
4.SIGNIFICANT JUDGMENTS, ESTIMATES AND ASSUMPTIONS (Continued)
Impairment and Impairment Reversals
The Company evaluates each asset or CGU (excluding goodwill, which is assessed for impairment annually regardless of indicators and is not eligible for impairment reversals) in each reporting period to determine if any indicators of impairment or impairment reversal exist. The Company considers both external and internal sources of information for indications of potential impairment of non-current assets or goodwill. When completing an impairment test, the Company calculates the estimated recoverable amount of CGUs, which requires management to make estimates and assumptions with respect to items such as future production levels, future operating and capital costs, long-term commodity prices, future foreign exchange rates, discount rates, amounts of recoverable reserves, mineral resources and exploration potential and closure and environmental remediation costs. These estimates and assumptions are subject to risk and uncertainty, particularly in circumstances where there is limited operating history of the asset or CGU. Judgment is also required in determining the appropriate valuation method for mineralization, ascribing anticipated economics to mineralization in cases where only limited or no comprehensive economic study has been completed and selection of an appropriate NAV multiple. Therefore, there is a possibility that changes in circumstances will have an impact on these projections, which may impact the recoverable amount of assets or CGUs. Accordingly, it is possible that some or the entire carrying amount of the assets or CGUs may be further impaired or the impairment charge reversed with the impact recognized in the consolidated statements of income.
Mineral Reserve and Mineral Resource Estimates and Life of Mine Plans
Mineral reserves and mineral resources are estimates of the amount of ore that can be extracted from the Company’s mining properties. The estimates are based on information compiled by “qualified persons” as defined under the Canadian Securities Administrators’ National Instrument 43-101 – Standards of Disclosure for Mineral Projects (“NI 43-101”). Such an analysis relating to the geological and technical data on the size, depth, shape and grade of the ore body and suitable production techniques and recovery rates requires complex geological judgments to interpret the data. The estimation of mineral reserves and mineral resources is based upon factors such as estimates of commodity prices, future capital requirements and production costs, geological and metallurgical assumptions and judgments made in estimating the size and grade of the ore body and foreign exchange rates.Estimates of the quantities of proven and probable mineral reserves and mineral resources form the basis for our life of mine plans, which are used for several important business and accounting purposes, including:
| ● | The carrying value of the Company’s property, plant and mine development and goodwill may be affected due to changes in estimated future cash flows; |
| ● | Amortization charges in the consolidated statements of income may change where such charges are determined using the units-of-production method or where the useful life of the related assets change; |
| ● | Capitalized stripping costs recognized in the consolidated balance sheets as either part of mining properties or as part of inventories or charged to income may change due to changes in the ratio of ore to waste extracted; |
| ● | The classification of the Company’s stockpiles as current or non - current may be affected due to changes in the nature and size of the ore body and changes in life of mine plans; |
| ● | Reclamation provisions may change where changes to the mineral reserve and mineral resource estimates affect expectations about when such activities will occur and the associated cost of these activities; and |
| ● | Mineral reserve and mineral resource estimates are used to calculate the estimated recoverable amounts of CGUs for impairment tests of goodwill and non-current assets. |
27
AGNICO EAGLE MINES LIMITED
NOTES TO CONSOLIDATED FINANCIAL STATEMENTS (Continued)
(thousands of United States dollars, except share and per share amounts, unless otherwise indicated)
December 31, 2023
4.SIGNIFICANT JUDGMENTS, ESTIMATES AND ASSUMPTIONS (Continued)
Reclamation Provisions
Environmental remediation costs will be incurred by the Company at the end of the operating life of the Company’s mining properties. Management assesses its reclamation provision each reporting period and when new information becomes available. The ultimate environmental remediation costs are uncertain and cost estimates can vary in response to many factors, including estimates of the extent and costs of reclamation activities, technological changes, regulatory changes, cost increases as compared to the inflation rate and changes in discount rates. These uncertainties may result in future actual expenditures differing from the amount of the current provision. As a result, there could be significant adjustments to the provisions established that would affect future financial results. The reclamation provision at each reporting date represents management’s best estimate of the present value of the future environmental remediation costs required.
Business Combinations
Business combinations are accounted for using the acquisition method of accounting. The allocation of the purchase price requires estimates as to the fair value of acquired assets and liabilities. The information necessary to measure the fair values as at the acquisition date of assets acquired and liabilities assumed requires management to make certain judgments and estimates, including but not limited to the most appropriate valuation methodology, estimates of mineral reserves and mineral resources and exploration potential of the assets acquired, value of resources outside LOM plans including assumptions for market values per ounce, future production levels, future operating costs, capital expenditures and closure costs, discount rates, future metal prices and long term foreign exchange rates. Changes to the preliminary measurements of assets and liabilities acquired may be retrospectively adjusted when new information is obtained until the final measurements are determined within one year of the acquisition date. Refer to Note 5 for further details on acquisitions.
Income and Mining Taxes
Management is required to make estimates regarding the tax basis of assets and liabilities and related deferred income and mining tax assets and liabilities, amounts recorded for uncertain tax positions, the measurement of income and mining tax expense and estimates of the timing of repatriation of income. Several of these estimates require management to make assessments of future taxable profit and, if actual results are significantly different than the Company’s estimates, the ability to realize any deferred income and mining tax assets recorded on the consolidated balance sheets could be affected.
28
AGNICO EAGLE MINES LIMITED
NOTES TO CONSOLIDATED FINANCIAL STATEMENTS (Continued)
(thousands of United States dollars, except share and per share amounts, unless otherwise indicated)
December 31, 2023
4.SIGNIFICANT JUDGMENTS, ESTIMATES AND ASSUMPTIONS (Continued)
Joint Arrangements
Judgment is required to determine when the Company has joint control of a contractual arrangement, which requires a continuous assessment of the relevant activities and when the decisions in relation to those activities require unanimous consent. Judgment is also continually required to classify a joint arrangement as either a joint operation or a joint venture when the arrangement has been structured through a separate vehicle. Classifying the arrangement requires the Company to assess its rights and obligations arising from the arrangement. Specifically, the Company considers the legal form of the separate vehicle, the terms of the contractual arrangement and other relevant facts and circumstances. This assessment often requires significant judgment, and a different conclusion on joint control, or whether the arrangement is a joint operation or a joint venture, may have a material impact on the accounting treatment.
In 2014, management evaluated its joint arrangement with Yamana Gold Inc. to each acquire 50% of the Canadian Malartic complex and certain other assets through the acquisition of the shares of Osisko Gold Corporation (subsequently renamed Canadian Malartic Corporation (“CMC”)) under the principles of IFRS 11 – Joint Arrangements (“IFRS 11”). The Company concluded that the arrangement qualified as a joint operation, upon considering the following significant factors:
| ● | The joint operators are required to purchase all output from the investee and investee restrictions on selling the output to any third party; |
| ● | The parties to the arrangement are substantially the only source of cash flow contributing to the continuity of the arrangement; and |
| ● | If the selling price drops below cost, the joint operators are required to cover any obligations the Partnership cannot satisfy. |
The remaining 50% of the Canadian Malartic complex and certain other of Yamana’s Canadian assets were acquired on March 31, 2023 (Note 5), at which point Management began to fully consolidate the results of the Canadian Malartic complex and the results of the other Canadian assets acquired from Yamana.
On April 6, 2023, Agnico Eagle entered into a joint venture shareholders’ agreement defined above under which it agreed to subscribe for a 50% interest in MSN, which is the entity that holds the San Nicolás copper-zinc project (Note 5). Management concluded that joint control exists, evaluated the joint arrangement under the principles of IFRS 11 and determined that the arrangement qualified as a joint operation upon considering the following significant factors:
| ● | While the San Nicolás deposit is not currently a producing asset, upon entering commercial production the joint operators are required to purchase all output from MSN and MSN is restricted from selling the output to any third party; and |
| ● | The joint operators are substantially the only source of cash flow contributing to the continuity of the arrangement indicating that the joint operators assume the risk associated with the activities of the arrangement and are obligated to continuously settle the liabilities of the joint arrangement. |
29
AGNICO EAGLE MINES LIMITED
NOTES TO CONSOLIDATED FINANCIAL STATEMENTS (Continued)
(thousands of United States dollars, except share and per share amounts, unless otherwise indicated)
December 31, 2023
5.ACQUISITIONS
Acquisition of Investment in San Nicolás Joint Arrangement
On April 6, 2023, Agnico Eagle and Teck entered into a joint venture shareholders’ agreement in respect of the San Nicolás copper - zinc development project located in Zacatecas, Mexico. The agreement provides that Agnico Eagle, through a wholly - owned Mexican subsidiary, will subscribe for a 50% interest in MSN for $580.0 million, to be contributed as study and development costs are incurred by MSN. For governance purposes, the agreement treats Agnico Eagle as a 50% shareholder in MSN regardless of the number of shares that have been issued to Agnico Eagle or its affiliates, except in certain circumstances of default. Under IFRS 11, Agnico Eagle jointly controls MSN as both parties have the ability to make decisions relating to the relevant activities of MSN through their equal representation on the Board of Directors and corresponding 50/50 voting rights. As a joint operation, the Company accounts for its interest in MSN by recognizing its share of the respective assets, liabilities, revenues, expenses and cash flows.
On closing of the transaction, the Company recorded the initial acquisition of the mineral property and a $265.1 million liability representing the minimum unavoidable obligation under the agreement (Note 15).
For the year ended December 31, 2023, the Company has recorded contributions of $11.0 million against the obligation.
Acquisition of the Canadian Assets of Yamana Gold Inc. (“Yamana”)
On March 31, 2023, the Company completed a transaction (the “Yamana Transaction”) under an arrangement agreement entered into with Yamana and Pan American Silver Corp. (“Pan American”) pursuant to which Pan American acquired all of the issued and outstanding common shares of Yamana and Yamana sold the subsidiaries and partnerships that held Yamana’s interests in its Canadian assets to Agnico Eagle, including the remaining 50% of the Canadian Malartic complex that the Company did not then hold, a 100% interest in the Wasamac project located in the Abitibi region of Quebec and several other exploration properties located in Ontario and Manitoba. The acquisition increased the Company’s production, mineral reserves and cash flow.
The Company determined that the acquisition represented a business combination under IFRS 3- Business Combinations (“IFRS 3”), with Agnico Eagle identified as the acquirer and, as such, was accounted for using the acquisition method of accounting in accordance with IFRS 3.
Prior to the Yamana Transaction, Agnico Eagle’s 50% interests in CMC and the Partnership were jointly controlled with Yamana and met the definition of a joint operation under IFRS 11, with Agnico Eagle recognizing its share of the assets, liabilities, revenues and expenses in its consolidated results. As of March 31, 2023, Agnico Eagle controlled 100% of CMC and the Partnership and, upon applying the requirements under IFRS 3 for a business combination achieved in stages, the Company re - measured its previously held 50% interest in CMC and the Partnership to fair value on acquisition date. The acquisition date fair value of the previously held 50% interest was determined to be $2,697.6 million, resulting in the recognition of a re - measurement gain through net earnings of $1,543.4 million. The fair value of $2,697.6 million forms part of the total consideration transferred under the Yamana Transaction as reflected in the table below. The fair value of common shares issued was calculated based on 36,177,931 common shares issued at the closing share price immediately prior to the closing of the Yamana Transaction.
30
AGNICO EAGLE MINES LIMITED
NOTES TO CONSOLIDATED FINANCIAL STATEMENTS (Continued)
(thousands of United States dollars, except share and per share amounts, unless otherwise indicated)
December 31, 2023
5.ACQUISITIONS (Continued)
The aggregate purchase consideration for the acquired assets, net of the assumed liabilities is as follows:
Fair value of common shares issued |
|
$ |
1,858,219 |
Cash |
|
|
1,001,291 |
Fair value of previously held 50% interest |
|
|
2,697,604 |
|
|
$ |
5,557,114 |
The final estimates of fair value have been adjusted retrospectively to the acquisition date. Certain previously reported financial statement line items were updated to reflect the impact of the adjusted final estimates of fair value of assets acquired and liabilities assumed related to the Yamana Transaction.
The following table sets out the final allocation of the purchase price to the assets acquired and liabilities assumed based on management’s estimates of fair value.
|
|
Preliminary(i) |
|
Adjustments |
|
Final |
|||
Cash and cash equivalents |
|
$ |
1,049 |
|
$ |
— |
|
$ |
1,049 |
Inventories |
|
|
165,423 |
|
|
— |
|
|
165,423 |
Other current assets |
|
|
29,890 |
|
|
— |
|
|
29,890 |
Property, plant and mine development |
|
|
4,949,392 |
|
|
(1,183,876) |
|
|
3,765,516 |
Goodwill |
|
|
2,078,562 |
|
|
803,666 |
|
|
2,882,228 |
Other assets |
|
|
330,215 |
|
|
(96,940) |
|
|
233,275 |
Accounts payable and accrued and other liabilities |
|
|
(117,905) |
|
|
— |
|
|
(117,905) |
Reclamation provision |
|
|
(203,341) |
|
|
(4,950) |
|
|
(208,291) |
Deferred income and mining tax liabilities |
|
|
(1,646,500) |
|
|
482,100 |
|
|
(1,164,400) |
Other liabilities |
|
|
(29,671) |
|
|
— |
|
|
(29,671) |
Total assets acquired, net of liabilities assumed |
|
$ |
5,557,114 |
|
$ |
— |
|
$ |
5,557,114 |
Note:
(i) Estimates of the fair value of assets acquired and liabilities assumed are presented as reported in the Company’s condensed interim consolidated financial statements as at March 31, 2023.
Goodwill represents items including the expected value of additional exploration potential arising from the acquisition. None of the goodwill is expected to be deductible for income and mining tax purposes.
The Company incurred $18.4 million of acquisition-related costs in the year ended December 31, 2023. Acquisition-related costs are recorded in the other expenses line of the consolidated statements of income.
The results of operations, cash flows and net assets acquired in the Yamana Transaction have been consolidated with those of the Company from March 31, 2023. For the year ended December 31, 2023, the Yamana Transaction contributed revenue of $493.8 million and earnings before income and mining taxes of $108.2 million.
Total consolidated revenue and earnings before income and mining taxes of the Company for the year ended December 31, 2023 were $6,626.9 million and $2,359.1 million, respectively. If the Yamana transaction had taken place on January 1, 2023, pro forma total consolidated revenue and income before income and mining taxes for the Company would have been approximately $6,765.3 million and $2,408.3 million, respectively, for the year ended December 31, 2023.
31
AGNICO EAGLE MINES LIMITED
NOTES TO CONSOLIDATED FINANCIAL STATEMENTS (Continued)
(thousands of United States dollars, except share and per share amounts, unless otherwise indicated)
December 31, 2023
5.ACQUISITIONS (Continued)
Kirkland
On February 8, 2022, the Company acquired all of the issued and outstanding shares of Kirkland in exchange for the issuance of Agnico Eagle common shares to former Kirkland shareholders pursuant to a plan of arrangement under the Business Corporations Act (Ontario) (the “Merger”). Each Kirkland shareholder received 0.7935 of a common share of Agnico Eagle as consideration for each Kirkland share, which resulted in the issuance of 209,274,263 Agnico Eagle common shares. Prior to the Merger, Kirkland owned and operated the Detour Lake and Macassa mines in Canada and the Fosterville mine in Australia, and also owned exploration properties in Canada and Australia. The acquisition of Kirkland increased the Company’s production, mineral reserves and cash flow.
The Company determined that the Merger represented a business combination under IFRS 3, with Agnico Eagle identified as the acquirer and, as such, the Merger was accounted for using the acquisition method of accounting in accordance with IFRS 3.
The aggregate purchase consideration for the acquired assets, net of the assumed liabilities is as follows:
Fair value of common shares issued |
|
$ |
10,268,584 |
Fair value of replacement share based compensation issued |
|
|
14,522 |
|
|
$ |
10,283,106 |
The final estimates of fair value have been adjusted retrospectively to the acquisition date. Certain previously reported financial statement line items were updated to reflect the impact of the adjusted final estimates of fair value of assets acquired and liabilities assumed related to the Merger.
The following table sets out the final allocation of the purchase price to the assets acquired and liabilities assumed in the Merger based on management’s previously reported preliminary estimates and adjusted final estimates of fair value.
|
|
Preliminary(i) |
|
Adjustments |
|
Final |
|||
Cash and cash equivalents |
|
$ |
838,732 |
|
$ |
— |
|
$ |
838,732 |
Inventories |
|
|
384,678 |
|
|
(35,402) |
|
|
349,276 |
Other current assets |
|
|
100,094 |
|
|
— |
|
|
100,094 |
Property, plant and mine development |
|
|
10,086,336 |
|
|
341,935 |
|
|
10,428,271 |
Goodwill |
|
|
1,804,459 |
|
|
(168,128) |
|
|
1,636,331 |
Other assets |
|
|
143,415 |
|
|
(1,628) |
|
|
141,787 |
Accounts payable and accrued and other liabilities |
|
|
(235,778) |
|
|
— |
|
|
(235,778) |
Reclamation provision |
|
|
(175,839) |
|
|
(52,289) |
|
|
(228,128) |
Deferred income and mining tax liabilities |
|
|
(2,639,353) |
|
|
(84,488) |
|
|
(2,723,841) |
Other liabilities |
|
|
(23,638) |
|
|
— |
|
|
(23,638) |
Total assets acquired, net of liabilities assumed |
|
$ |
10,283,106 |
|
$ |
— |
|
$ |
10,283,106 |
Note:
(i) Estimates of the fair value of assets acquired and liabilities assumed are presented as reported in the Company’s condensed interim consolidated financial statements as at March 31, 2022.
Goodwill represents the expected value of operational synergies and additional exploration potential arising from the Merger. None of the goodwill is expected to be deductible for income and mining tax purposes.
The Company incurred acquisition-related and severance costs of $95.0 million in the year ended December 31, 2022 which are recorded in the other expenses line of the consolidated statements of income.
32
AGNICO EAGLE MINES LIMITED
NOTES TO CONSOLIDATED FINANCIAL STATEMENTS (Continued)
(thousands of United States dollars, except share and per share amounts, unless otherwise indicated)
December 31, 2023
5.ACQUISITIONS (Continued)
The results of operations, cash flows and net assets of Kirkland have been consolidated with those of the Company from February 8, 2022. For the year ended December 31, 2022, Kirkland contributed revenue of $2,161.1 million and earnings before income and mining taxes of $799.2 million. Total consolidated revenue and earnings before income and mining taxes of the Company for the year ended December 31, 2022, were $5,741.2 million and $1,115.4 million, respectively. If the acquisition of Kirkland had taken place on January 1, 2022, pro forma total consolidated revenue and income before income and mining taxes for the Company would have been approximately $5,795.1 million and $1,131.1 million, respectively, for the year ended December 31, 2022.
6.FAIR VALUE MEASUREMENT
Fair value is the price that would be received to sell an asset or paid to transfer a liability in an orderly transaction between market participants at the measurement date. All assets and liabilities for which fair value is measured or disclosed in the consolidated financial statements are categorized within the fair value hierarchy, described, as follows, based on the lowest-level input that is significant to the fair value measurement as a whole:
Level 1 - Unadjusted quoted prices in active markets that are accessible at the measurement date for identical, unrestricted assets or liabilities;
Level 2 - Quoted prices in markets that are not active or inputs that are observable, either directly or indirectly, for substantially the full term of the asset or liability; and
Level 3 - Prices or valuation techniques that require inputs that are both significant to the fair value measurement and unobservable (supported by little or no market activity).
The fair value hierarchy gives the highest priority to Level 1 inputs and the lowest priority to Level 3 inputs.
Assets and Liabilities Measured at Fair Value on a Recurring Basis
For items that are recognized at fair value on a recurring basis, the Company determines whether transfers have occurred between levels in the hierarchy by reassessing their classification at the end of each reporting period.
During the year ended December 31, 2023, there were no transfers between Level 1 and Level 2 fair value measurements, and no transfers into or out of Level 3 fair value measurements.
The fair values of cash and cash equivalents and accounts payable and accrued liabilities approximate their carrying values due to their short-term nature.
33
AGNICO EAGLE MINES LIMITED
NOTES TO CONSOLIDATED FINANCIAL STATEMENTS (Continued)
(thousands of United States dollars, except share and per share amounts, unless otherwise indicated)
December 31, 2023
6.FAIR VALUE MEASUREMENT (Continued)
The following table sets out the Company’s financial assets and liabilities measured at fair value on a recurring basis as at December 31, 2023 using the fair value hierarchy:
|
|
Level 1 |
|
Level 2 |
|
Level 3 |
|
Total |
||||
Financial assets: |
|
|
|
|
|
|
|
|
|
|
|
|
Trade receivables (Note 19) |
|
$ |
— |
|
$ |
8,148 |
|
$ |
— |
|
$ |
8,148 |
Equity securities (FVOCI) (Note 10) |
|
|
293,145 |
|
|
30,566 |
|
|
— |
|
|
323,711 |
Share purchase warrants (FVPL) (Note 10) |
|
|
— |
|
|
21,546 |
|
|
— |
|
|
21,546 |
Fair value of derivative financial instruments (Note 21) |
|
|
— |
|
|
50,786 |
|
|
— |
|
|
50,786 |
Total financial assets |
|
$ |
293,145 |
|
$ |
111,046 |
|
$ |
— |
|
$ |
404,191 |
Financial liabilities: |
|
|
|
|
|
|
|
|
|
|
|
|
Share based liabilities (Note 17D) |
|
$ |
35,469 |
|
$ |
— |
|
$ |
— |
|
$ |
35,469 |
Fair value of derivative financial instruments (Note 21) |
|
|
— |
|
|
7,222 |
|
|
— |
|
|
7,222 |
Total financial liabilities |
|
$ |
35,469 |
|
$ |
7,222 |
|
$ |
— |
|
$ |
42,691 |
The following table sets out the Company’s financial assets and liabilities measured at fair value on a recurring basis as at December 31, 2022 using the fair value hierarchy:
|
|
Level 1 |
|
Level 2 |
|
Level 3 |
|
Total |
||||
Financial assets: |
|
|
|
|
|
|
|
|
|
|
|
|
Trade receivables (Note 19) |
|
$ |
— |
|
$ |
8,579 |
|
$ |
— |
|
$ |
8,579 |
Equity securities (FVOCI) (Note 10) |
|
|
279,303 |
|
|
25,315 |
|
|
— |
|
|
304,618 |
Share purchase warrants (FVPL) (Note 10) |
|
|
— |
|
|
28,124 |
|
|
— |
|
|
28,124 |
Fair value of derivative financial instruments (Note 21) |
|
|
— |
|
|
8,774 |
|
|
— |
|
|
8,774 |
Total financial assets |
|
$ |
279,303 |
|
$ |
70,792 |
|
$ |
— |
|
$ |
350,095 |
Financial liabilities: |
|
|
|
|
|
|
|
|
|
|
|
|
Share based liabilities (Note 17D) |
|
$ |
32,425 |
|
$ |
— |
|
$ |
— |
|
$ |
32,425 |
Fair value of derivative financial instruments (Note 21) |
|
|
— |
|
|
78,114 |
|
|
— |
|
|
78,114 |
Total financial liabilities |
|
$ |
32,425 |
|
$ |
78,114 |
|
$ |
— |
|
$ |
110,539 |
Valuation Techniques
Trade Receivables
Trade receivables from provisional invoices for concentrate sales are valued using quoted forward rates derived from observable market data based on the month of expected settlement (classified within Level 2 of the fair value hierarchy) (Note 19).
Equity securities
Equity securities representing shares of publicly traded entities are recorded at fair value using quoted market prices (classified within Level 1 of the fair value hierarchy). Equity securities representing shares of non-publicly traded entities are recorded at fair value using external broker-dealer quotations corroborated by option pricing models (classified within Level 2 of the fair value hierarchy) (Note 10).
34
AGNICO EAGLE MINES LIMITED
NOTES TO CONSOLIDATED FINANCIAL STATEMENTS (Continued)
(thousands of United States dollars, except share and per share amounts, unless otherwise indicated)
December 31, 2023
6.FAIR VALUE MEASUREMENT (Continued)
Derivative Financial Instruments and Warrants
The Company holds share purchase warrants of certain publicly traded entities. Share purchase warrants are accounted for as derivative financial instruments and are presented as part of investments in the consolidated balance sheet. Derivative financial instruments classified within Level 2 of the fair value hierarchy are recorded at fair value using external broker-dealer quotations corroborated by option pricing models or option pricing models that utilize a variety of inputs that are a combination of quoted prices and market-corroborated inputs (Notes 10 and 21).
Share Based Liabilities
Share based liabilities are recorded at fair value using quoted market prices (classified within Level 1 of the fair value hierarchy) (Note 17D).
Fair Value of Financial Assets and Liabilities Not Measured and Recognized at Fair Value
Long-term debt is recorded on the consolidated balance sheets at December 31, 2023 at amortized cost. The fair value of long-term debt is determined by applying a discount rate, reflecting the credit spread based on the Company’s credit rating to future related cash flows which is categorized within Level 2 of the fair value hierarchy. As at December 31, 2023, the Company’s long-term debt had a fair value of $1,797.9 million (2022 - $1,261.5 million) (Note 14).
The committed subscription proceeds for the San Nicolás project is recorded on the consolidated balance sheets at December 31, 2023 at amortized cost. The fair value of the San Nicolás liability is determined by discounting the minimum unavoidable obligation under the joint venture shareholders’ agreement between Agnico Eagle and Teck at a discount rate that reflects the Company’s credit rating. The fair value of the San Nicolás liability is not materially different from the carrying amount as a result of the difference between the discount rate used at the initial recognition date and the current market rates at December 31, 2023 (Note 15).
Lease obligations are recorded on the consolidated balance sheets at December 31, 2023 at amortized cost. The fair value of lease obligations is the present value of the future lease payments discounted at the Company’s current incremental borrowing rate. It is remeasured when there is a change in the lease term, future lease payments or changes in the assessment of whether the Company will exercise a purchase, extension or termination option. The fair value of lease obligations is not materially different from the carrying amounts as a result of the difference between the incremental borrowing rates used at the initial recognition date and the current market rates at December 31, 2023 (Note 13).
Non-current loans receivable and other receivables are included in the other asset line item in the consolidated balance sheets at amortized cost. The fair value of loans and other receivables is the present value of future cash inflows discounted at a market interest rate. The fair value of these financial assets is not materially different from the carrying amounts as at December 31, 2023 (Note 8B).
35
AGNICO EAGLE MINES LIMITED
NOTES TO CONSOLIDATED FINANCIAL STATEMENTS (Continued)
(thousands of United States dollars, except share and per share amounts, unless otherwise indicated)
December 31, 2023
7.INVENTORIES
|
|
As at |
|
As at |
||
|
|
December 31, |
|
December 31, |
||
|
|
2023 |
|
2022 |
||
Ore in stockpiles and on leach pads |
|
$ |
238,197 |
|
$ |
208,014 |
Concentrates and dore bars |
|
|
237,805 |
|
|
184,841 |
Supplies |
|
|
942,939 |
|
|
816,220 |
Total current inventories |
|
$ |
1,418,941 |
|
$ |
1,209,075 |
Non-current ore in stockpiles and on leach pads (Note 8B) |
|
|
632,049 |
|
|
405,988 |
Total inventories |
|
$ |
2,050,990 |
|
$ |
1,615,063 |
During the year ended December 31, 2023, a charge of $2.7 million (December 31, 2022 - $62.4 million) was recorded within production costs to reduce the carrying value of inventories to their net realizable value.
8.OTHER ASSETS
A)Other Current Assets
|
|
As at |
|
As at |
||
|
|
December 31, |
|
December 31, |
||
|
|
2023 |
|
2022 |
||
Federal, provincial and other sales taxes receivable |
|
$ |
149,153 |
|
$ |
100,267 |
Prepaid expenses |
|
|
151,741 |
|
|
110,649 |
Short term investments |
|
|
10,199 |
|
|
9,896 |
Other |
|
|
35,934 |
|
|
39,140 |
Total other current assets |
|
$ |
347,027 |
|
$ |
259,952 |
B)Other Assets
|
|
As at |
|
As at |
||
|
|
December 31, |
|
December 31, |
||
|
|
2023 |
|
2022 |
||
Non-current ore in stockpiles and on leach pads |
|
$ |
632,049 |
|
$ |
405,988 |
Non-current prepaid expenses |
|
|
53,191 |
|
|
26,102 |
Non-current loans receivable |
|
|
10,108 |
|
|
3,939 |
Intangible asset |
|
|
— |
|
|
13,318 |
Investment in associate |
|
|
10,865 |
|
|
10,732 |
Other |
|
|
8,954 |
|
|
6,831 |
Total other assets |
|
$ |
715,167 |
|
$ |
466,910 |
36
AGNICO EAGLE MINES LIMITED
NOTES TO CONSOLIDATED FINANCIAL STATEMENTS (Continued)
(thousands of United States dollars, except share and per share amounts, unless otherwise indicated)
December 31, 2023
9.PROPERTY, PLANT AND MINE DEVELOPMENT
|
|
|
|
|
|
|
|
Mine |
|
|
|
|
|
|
Mining |
|
Plant and |
|
Development |
|
|
||||
|
|
Properties |
|
Equipment |
|
Costs |
|
Total |
||||
As at December 31, 2021 |
|
$ |
2,124,035 |
|
$ |
3,267,566 |
|
$ |
2,283,994 |
|
$ |
7,675,595 |
Additions |
|
|
409,562 |
|
|
506,102 |
|
|
691,167 |
|
|
1,606,831 |
Acquisition (Note 5) |
|
|
7,582,824 |
|
|
2,845,447 |
|
|
— |
|
|
10,428,271 |
Impairment loss (Note 24) |
|
|
(55,000) |
|
|
— |
|
|
— |
|
|
(55,000) |
Disposals |
|
|
(6) |
|
|
(25,964) |
|
|
— |
|
|
(25,970) |
Amortization |
|
|
(394,652) |
|
|
(603,671) |
|
|
(172,004) |
|
|
(1,170,327) |
Transfers between categories |
|
|
1,542 |
|
|
264,948 |
|
|
(266,490) |
|
|
— |
As at December 31, 2022 |
|
$ |
9,668,305 |
|
$ |
6,254,428 |
|
$ |
2,536,667 |
|
$ |
18,459,400 |
Additions |
|
|
408,439 |
|
|
419,072 |
|
|
962,095 |
|
|
1,789,606 |
Acquisitions(i) (Note 5) |
|
|
749,498 |
|
|
946,754 |
|
|
1,320,855 |
|
|
3,017,107 |
Impairment loss (Note 24) |
|
|
(282,030) |
|
|
— |
|
|
(84,083) |
|
|
(366,113) |
Disposals |
|
|
— |
|
|
(39,248) |
|
|
— |
|
|
(39,248) |
Amortization |
|
|
(648,052) |
|
|
(757,949) |
|
|
(232,846) |
|
|
(1,638,847) |
Transfers between categories |
|
|
3,348 |
|
|
446,804 |
|
|
(450,152) |
|
|
— |
As at December 31, 2023 |
|
|
9,899,508 |
|
$ |
7,269,861 |
|
|
4,052,536 |
|
$ |
21,221,905 |
|
|
|
|
|
|
|
|
|
|
|
|
|
As at December 31, 2022 |
|
|
|
|
|
|
|
|
|
|
|
|
Cost |
|
$ |
11,872,806 |
|
$ |
10,490,684 |
|
$ |
3,714,370 |
|
$ |
26,077,860 |
Accumulated amortization and impairments |
|
|
(2,204,501) |
|
|
(4,236,256) |
|
|
(1,177,703) |
|
|
(7,618,460) |
Carrying value - December 31, 2022 |
|
$ |
9,668,305 |
|
$ |
6,254,428 |
|
$ |
2,536,667 |
|
$ |
18,459,400 |
|
|
|
|
|
|
|
|
|
|
|
|
|
As at December 31, 2023 |
|
|
|
|
|
|
|
|
|
|
|
|
Cost |
|
$ |
14,359,568 |
|
$ |
12,458,000 |
|
$ |
5,652,853 |
|
$ |
32,470,421 |
Accumulated amortization and impairments |
|
|
(4,460,060) |
|
|
(5,188,139) |
|
|
(1,600,317) |
|
|
(11,248,516) |
Carrying value - December 31, 2023 |
|
|
9,899,508 |
|
$ |
7,269,861 |
|
|
4,052,536 |
|
$ |
21,221,905 |
(i) Acquisitions include all re-measurement gains on the Company’s previously owned property, plant and mine development in CMC and the Partnership at the date of the Yamana Transaction in addition to the acquisition of property, plant and mine development that the Company did not previously own. Acquisitions also include property, plant and mine development acquired as part of the San Nicolás project.
During the year ended December 31, 2023, net additions to Plant and Equipment included $50.6 million of right-of-use assets for lease arrangements entered into during the year (December 31, 2022 - $59.6 million).
As at December 31, 2023, major assets under construction, and therefore not yet being depreciated, included in the carrying value of property, plant and mine development was $868.7 million (December 31, 2022 - $1,277.7 million).
During the year ended December 31, 2023, the Company disposed of property, plant and mine development with a carrying value of $39.2 million (December 31, 2022 - $25.9 million). The net loss on disposal of $26.8 million (2022 - $8.8 million) was recorded in the other expenses line item in the consolidated statements of income (Note 22).
37
AGNICO EAGLE MINES LIMITED
NOTES TO CONSOLIDATED FINANCIAL STATEMENTS (Continued)
(thousands of United States dollars, except share and per share amounts, unless otherwise indicated)
December 31, 2023
9.PROPERTY, PLANT AND MINE DEVELOPMENT (Continued)
Geographic Information:
|
|
As at |
|
As at |
||
|
|
December 31, |
|
December 31, |
||
|
|
2023 |
|
2022 |
||
Canada |
|
$ |
17,900,132 |
|
$ |
15,228,426 |
Australia |
|
|
1,173,090 |
|
|
1,188,301 |
Finland |
|
|
1,446,548 |
|
|
1,447,399 |
Sweden |
|
|
13,812 |
|
|
13,812 |
Mexico |
|
|
682,572 |
|
|
573,922 |
United States |
|
|
5,751 |
|
|
7,540 |
Total property, plant and mine development |
|
$ |
21,221,905 |
|
$ |
18,459,400 |
10.INVESTMENTS
|
|
As at December 31, |
|
As at December 31, |
||
|
|
2023 |
|
2022 |
||
Equity securities |
|
$ |
323,711 |
|
$ |
304,618 |
Share purchase warrants |
|
|
21,546 |
|
|
28,124 |
Total investments |
|
$ |
345,257 |
|
$ |
332,742 |
The following tables set out details of the Company’s largest equity investments by carrying value:
|
|
As at December 31, 2023 |
|||||||
|
|
|
|
Share purchase |
|
|
|
||
|
|
Equity securities |
|
warrants |
|
Total |
|||
Orla Mining Ltd. |
|
$ |
90,158 |
|
$ |
15,093 |
|
$ |
105,251 |
Rupert Resources Ltd. |
|
|
88,505 |
|
|
— |
|
|
88,505 |
Canada Nickel |
|
|
16,894 |
|
|
1,830 |
|
|
18,724 |
Other(i) |
|
|
128,154 |
|
|
4,623 |
|
|
132,777 |
Total investments |
|
$ |
323,711 |
|
$ |
21,546 |
|
$ |
345,257 |
|
|
As at December 31, 2022 |
|||||||
|
|
|
|
Share purchase |
|
|
|
||
|
|
Equity securities |
|
warrants |
|
Total |
|||
Rupert Resources Ltd. |
|
$ |
105,324 |
|
$ |
— |
|
$ |
105,324 |
Orla Mining Ltd. |
|
|
95,548 |
|
|
27,152 |
|
|
122,700 |
Wallbridge Mining Company Ltd. |
|
|
11,499 |
|
|
— |
|
|
11,499 |
White Gold Corp. |
|
|
9,823 |
|
|
6 |
|
|
9,829 |
Other(i) |
|
|
82,424 |
|
|
966 |
|
|
83,390 |
Total investments |
|
$ |
304,618 |
|
$ |
28,124 |
|
$ |
332,742 |
Note:
(i) The balance is comprised of 48 (2022 — 43) equity investments none of which are individually material.
38
AGNICO EAGLE MINES LIMITED
NOTES TO CONSOLIDATED FINANCIAL STATEMENTS (Continued)
(thousands of United States dollars, except share and per share amounts, unless otherwise indicated)
December 31, 2023
10.INVESTMENTS (Continued)
Disposal of Equity Securities
During the year ended December 31, 2023 the Company sold its interest in certain equity securities. The fair value at the time of sale was $0.5 million and the Company recognized a cumulative net loss on disposal of $2.9 million ($2.2 million, net of tax), which was transferred from other reserves to retained earnings in the consolidated balance sheets. There were no disposals of equity securities in the year ended December 31, 2022.
11.ACCOUNTS PAYABLE AND ACCRUED LIABILITIES
|
|
As at |
|
As at |
||
|
|
December 31, |
|
December 31, |
||
|
|
2023 |
|
2022 |
||
Trade payables |
|
$ |
317,888 |
|
$ |
259,002 |
Accrued liabilities |
|
|
253,806 |
|
|
250,894 |
Wages payable |
|
|
94,368 |
|
|
99,972 |
Other liabilities |
|
|
84,318 |
|
|
62,635 |
Total accounts payable and accrued liabilities |
|
$ |
750,380 |
|
$ |
672,503 |
In 2023 and 2022, the other liabilities balance consisted primarily of various employee benefits, employee payroll tax withholdings and other payroll taxes.
12.RECLAMATION PROVISION
Agnico Eagle’s reclamation provision includes both asset retirement obligations and environmental remediation liabilities. Reclamation provision estimates are based on current legislation, third party estimates, management’s estimates and feasibility study calculations. Assumptions based on current economic conditions, which the Company believes are reasonable, have been used to estimate the reclamation provision. However, actual reclamation costs will ultimately depend on future economic conditions and costs for the necessary reclamation work. Changes in reclamation provision estimates during the period reflect changes in cash flow estimates as well as assumptions including discount and inflation rates. The discount rates used in the calculation of the reclamation provision at December 31, 2023 ranged between 2.69% and 4.27% (2022 – between 3.16% and 4.34%).
The following table reconciles the beginning and ending carrying amounts of the Company’s asset retirement obligations. The settlement of the obligation is estimated to occur through to 2142.
|
|
As at |
|
As at |
||
|
|
December 31, |
|
December 31, |
||
|
|
2023 |
|
2022 |
||
Asset retirement obligations - non-current, beginning of year |
|
$ |
865,319 |
|
$ |
706,958 |
Asset retirement obligations - current, beginning of year |
|
|
22,127 |
|
|
4,547 |
Current year additions and changes in estimate, net(i) |
|
|
127,413 |
|
|
217,506 |
Current year accretion |
|
|
32,906 |
|
|
15,951 |
Liabilities settled |
|
|
(9,085) |
|
|
(16,850) |
Foreign exchange revaluation |
|
|
23,893 |
|
|
(40,666) |
Reclassification from non-current to current, end of year |
|
|
(22,570) |
|
|
(22,127) |
Asset retirement obligations - non-current, end of year |
|
$ |
1,040,003 |
|
$ |
865,319 |
Note:
(i) Current year additions include $110.6 million related to the Yamana Transaction.
39
AGNICO EAGLE MINES LIMITED
NOTES TO CONSOLIDATED FINANCIAL STATEMENTS (Continued)
(thousands of United States dollars, except share and per share amounts, unless otherwise indicated)
December 31, 2023
12.RECLAMATION PROVISION (Continued)
The following table reconciles the beginning and ending carrying amounts of the Company’s environmental remediation liability. The settlement of the obligation is estimated to occur through to 2031.
|
|
As at |
|
As at |
||
|
|
December 31, |
|
December 31, |
||
|
|
2023 |
|
2022 |
||
Environmental remediation liability - non-current, beginning of year |
|
$ |
13,009 |
|
$ |
15,491 |
Environmental remediation liability - current, beginning of year |
|
|
1,381 |
|
|
3,000 |
Liabilities settled |
|
|
(3,737) |
|
|
(3,058) |
Foreign exchange revaluation |
|
|
278 |
|
|
(1,043) |
Reclassification from non-current to current, end of year |
|
|
(1,696) |
|
|
(1,381) |
Environmental remediation liability - non-current, end of year |
|
$ |
9,235 |
|
$ |
13,009 |
13.LEASES
The Company is party to a number of contracts that contain a lease, most of which include office facilities, storage facilities and various plant and equipment. Leases of low value assets, short term leases and leases with variable payments proportional to the rate of use of the underlying asset do not give rise to a lease obligation and a right-of-use asset. The expenses associated with such leases are included in operating costs in the consolidated statements of income.
The following table sets out the carrying amounts of right-of-use assets included in property, plant and mine development in the consolidated balance sheets and the movements during the period:
|
|
As at December 31, |
|
As at December 31, |
||
|
|
2023 |
|
2022 |
||
Balance, beginning of year |
|
$ |
165,708 |
|
$ |
134,022 |
Additions and modifications, net of disposals |
|
|
50,644 |
|
|
59,598 |
Amortization |
|
|
(34,046) |
|
|
(27,912) |
Balance, end of year |
|
$ |
182,306 |
|
$ |
165,708 |
The following table sets out the lease obligations included in the consolidated balance sheets:
|
|
As at December 31, |
|
As at December 31, |
||
|
|
2023 |
|
2022 |
||
Current |
|
$ |
46,394 |
|
$ |
36,466 |
Non-current |
|
|
115,154 |
|
|
114,876 |
Total lease obligations |
|
$ |
161,548 |
|
$ |
151,342 |
40
AGNICO EAGLE MINES LIMITED
NOTES TO CONSOLIDATED FINANCIAL STATEMENTS (Continued)
(thousands of United States dollars, except share and per share amounts, unless otherwise indicated)
December 31, 2023
13.LEASES (Continued)
Future minimum lease payments required to meet obligations that have initial or remaining non-cancellable lease terms are set out in the table below. Because leases with variable lease payments do not give rise to fixed minimum lease payments, no amounts are included below for such leases.
|
|
As at December 31, |
|
As at December 31, |
||
|
|
2023 |
|
2022 |
||
Within 1 year |
|
$ |
47,600 |
|
$ |
38,012 |
Between 1 — 3 years |
|
|
40,261 |
|
|
43,439 |
Between 3 — 5 years |
|
|
24,904 |
|
|
21,637 |
Thereafter |
|
|
55,498 |
|
|
54,258 |
Total undiscounted lease obligations |
|
$ |
168,263 |
|
$ |
157,346 |
The Company recognized the following amounts in the consolidated statements of income with respect to leases:
|
|
Year Ended December 31, |
||||
|
|
2023 |
|
2022 |
||
Amortization of right-of-use assets |
|
$ |
34,046 |
|
$ |
27,912 |
Interest expense on lease obligations |
|
$ |
4,350 |
|
$ |
2,919 |
Variable lease payments not included in the measurement of lease obligations |
|
$ |
115,467 |
|
$ |
115,890 |
Expenses relating to short-term leases |
|
$ |
6,598 |
|
$ |
11,081 |
Expenses relating to leases of low value assets, excluding short-term leases of low value assets |
|
$ |
3,114 |
|
$ |
1,663 |
During the year ended December 31, 2023, the Company recognized $275.2 million (2022 — $242.5 million) in the consolidated statements of cash flows with respect to leases.
14.LONG-TERM DEBT
|
|
As at |
|
As at |
||
|
|
December 31, |
|
December 31, |
||
|
|
2023 |
|
2022 |
||
Old Credit Facility(i)(ii) |
|
$ |
(2,323) |
|
$ |
(3,115) |
Term Loan Facility(i)(iii) |
|
|
599,333 |
|
|
— |
2020 Notes(i)(iii) |
|
|
198,945 |
|
|
198,798 |
2018 Notes(i)(iii) |
|
|
348,657 |
|
|
348,487 |
2017 Notes(i)(iii) |
|
|
299,103 |
|
|
298,886 |
2016 Notes(i)(iii) |
|
|
249,530 |
|
|
349,316 |
2015 Note(i)(iii) |
|
|
49,886 |
|
|
49,821 |
2012 Notes(i)(iii) |
|
|
99,955 |
|
|
99,877 |
Total debt |
|
$ |
1,843,086 |
|
$ |
1,342,070 |
Less: current portion |
|
|
100,000 |
|
|
100,000 |
Total long-term debt |
|
$ |
1,743,086 |
|
$ |
1,242,070 |
Notes:
| (i) | Inclusive of unamortized deferred financing costs. |
| (ii) | There were no amounts outstanding under the Old Credit Facility (as defined below) as at December 31, 2023 and December 31, 2022. The December 31, 2023 and December 31, 2022 balances relate to deferred financing costs which are being amortized on a straight-line basis until the maturity date of December 22, 2026 (2022 — December 22, 2026). |
| (iii) | The Term Loan Facility, 2020 Notes, 2018 Notes, 2017 Notes, 2016 Notes, 2015 Note and 2012 Notes are defined below. |
41
AGNICO EAGLE MINES LIMITED
NOTES TO CONSOLIDATED FINANCIAL STATEMENTS (Continued)
(thousands of United States dollars, except share and per share amounts, unless otherwise indicated)
December 31, 2023
14.LONG-TERM DEBT (Continued)
Scheduled Debt Principal Repayments
|
|
|
|
|
|
|
|
|
|
|
|
|
|
|
|
|
|
|
|
|
|
|
|
2024 |
|
2025 |
|
2026 |
|
2027 |
|
2028 |
|
Thereafter |
|
Total |
|||||||
Term Loan Facility |
|
$ |
— |
|
$ |
600,000 |
|
$ |
— |
|
$ |
— |
|
$ |
— |
|
$ |
— |
|
$ |
600,000 |
2020 Notes |
|
|
— |
|
|
— |
|
|
— |
|
|
— |
|
|
— |
|
|
200,000 |
|
|
200,000 |
2018 Notes |
|
|
— |
|
|
— |
|
|
— |
|
|
— |
|
|
45,000 |
|
|
305,000 |
|
|
350,000 |
2017 Notes |
|
|
— |
|
|
40,000 |
|
|
— |
|
|
100,000 |
|
|
— |
|
|
160,000 |
|
|
300,000 |
2016 Notes |
|
|
— |
|
|
— |
|
|
200,000 |
|
|
— |
|
|
50,000 |
|
|
— |
|
|
250,000 |
2015 Note |
|
|
— |
|
|
50,000 |
|
|
— |
|
|
— |
|
|
— |
|
|
— |
|
|
50,000 |
2012 Notes |
|
|
100,000 |
|
|
— |
|
|
— |
|
|
— |
|
|
— |
|
|
— |
|
|
100,000 |
Total |
|
$ |
100,000 |
|
$ |
690,000 |
|
$ |
200,000 |
|
$ |
100,000 |
|
$ |
95,000 |
|
$ |
665,000 |
|
$ |
1,850,000 |
Old Credit Facility
On December 22, 2021, the Company amended its $1.2 billion unsecured revolving bank credit facility (the ”Old Credit Facility”) to, among other things, extend the maturity date from June 22, 2023 to December 22, 2026 and amend pricing terms. The amendment also increased the amount of the uncommitted accordion facility available to the Company from $300 million to $600 million. On June 30, 2023, the Company further amended the Old Credit Facility to update the benchmark rate from LIBOR to the Secured Overnight Financing Rate (“SOFR”) and Canadian Overnight Repo Rate Average (“CORRA”).
As at December 31, 2023 and December 31, 2022, no amounts were outstanding under the Old Credit Facility. As at December 31, 2023, $1,198.9 million was available for future drawdown under the Old Credit Facility (December 31, 2022 - $1,199.1 million). Availability under the Old Credit Facility was reduced by outstanding letters of credit which were $1.1 million as at December 31, 2023 (December 31, 2022 – $0.9 million). During the year ended December 31, 2023, Old Credit Facility drawdowns totaled $1,300.0 million and repayments totaled $1,300.0 million. During the year ended December 31, 2022, Old Credit Facility drawdowns totaled $100.0 million and repayments totaled $100.0 million.
The Old Credit Facility was available in multiple currencies through prime rate and base rate advances, priced at the applicable rate plus a margin that ranged from 0.00% to 1.00%, through SOFR and CORRA advances, bankers’ acceptances and financial letters of credit, priced at the applicable rate plus a margin that ranges from 1.00% to 2.00% and through performance letters of credit, priced at the applicable rate plus a margin that ranged from 0.60% to 1.20%. The lenders under the Old Credit Facility were each paid a standby fee at a rate that ranged from 0.09% to 0.25% of the undrawn portion of the facility. In each case, the applicable margin or standby fees vary depended on the Company’s credit rating.
On February 12, 2024, the Company entered into the New Credit Facility (as defined below) and terminated the Old Credit Facility (Note 29).
Term Loan Facility
On April 20, 2023, the Company entered into a credit agreement with two financial institutions that provides a $600.0 million unsecured term credit facility (the “Term Loan Facility”). The Company drew the full amount of the Term Loan Facility on April 28, 2023. The Term Loan Facility matures and all indebtedness thereunder is due and payable on April 21, 2025. The Term Loan Facility is available as a single advance in US dollars through SOFR and base rate advances, priced at the applicable rate plus a margin that ranges from 0.00% to 2.00%, depending on the Company’s credit rating.
42
AGNICO EAGLE MINES LIMITED
NOTES TO CONSOLIDATED FINANCIAL STATEMENTS (Continued)
(thousands of United States dollars, except share and per share amounts, unless otherwise indicated)
December 31, 2023
14.LONG-TERM DEBT (Continued)
On February 12, 2024, the Company and the lenders under the Term Loan Facility amended the Term Loan Facility in connection with the Company’s entry into the New Credit Facility to, among other things, release the subsidiary guarantees previously provided to the lenders under the facility (Note 29).
2020 Notes
On April 7, 2020, the Company closed a $200.0 million private placement of guaranteed senior unsecured notes (the “2020 Notes”) with a weighted average maturity of 11 years and weighted average yield of 2.83%.
The following table sets out details of the individual series of the 2020 Notes:
|
|
Principal |
|
Interest Rate |
|
Maturity Date |
|
Series A |
|
$ |
100,000 |
|
2.78 |
% |
4/7/2030 |
Series B |
|
|
100,000 |
|
2.88 |
% |
4/7/2032 |
Total |
|
$ |
200,000 |
|
|
|
|
2018 Notes
On April 5, 2018, the Company closed a $350.0 million private placement of guaranteed senior unsecured notes (the “2018 Notes”).
The following table sets out details of the individual series of the 2018 Notes:
|
|
Principal |
|
Interest Rate |
|
Maturity Date |
|
Series A |
|
$ |
45,000 |
|
4.38 |
% |
4/5/2028 |
Series B |
|
|
55,000 |
|
4.48 |
% |
4/5/2030 |
Series C |
|
|
250,000 |
|
4.63 |
% |
4/5/2033 |
Total |
|
$ |
350,000 |
|
|
|
|
2017 Notes
On June 29, 2017, the Company closed a $300.0 million private placement of guaranteed senior unsecured notes (the “2017 Notes”).
The following table sets out details of the individual series of the 2017 Notes:
|
|
Principal |
|
Interest Rate |
|
Maturity Date |
|
Series A |
|
$ |
40,000 |
|
4.42 |
% |
6/29/2025 |
Series B |
|
|
100,000 |
|
4.64 |
% |
6/29/2027 |
Series C |
|
|
150,000 |
|
4.74 |
% |
6/29/2029 |
Series D |
|
|
10,000 |
|
4.89 |
% |
6/29/2032 |
Total |
|
$ |
300,000 |
|
|
|
|
2016 Notes
On June 30, 2016, the Company closed a $350.0 million private placement of guaranteed senior unsecured notes (the “2016 Notes”). On June 30, 2023, the Company repaid $100.0 million of the Series A 4.54% Notes at maturity.
43
AGNICO EAGLE MINES LIMITED
NOTES TO CONSOLIDATED FINANCIAL STATEMENTS (Continued)
(thousands of United States dollars, except share and per share amounts, unless otherwise indicated)
December 31, 2023
14.LONG-TERM DEBT (Continued)
The following table sets out details of the remaining series of the 2016 Notes:
|
|
Principal |
|
Interest Rate |
|
Maturity Date |
|
Series B |
|
$ |
200,000 |
|
4.84 |
% |
6/30/2026 |
Series C |
|
|
50,000 |
|
4.94 |
% |
6/30/2028 |
Total |
|
$ |
250,000 |
|
|
|
|
2015 Note
On September 30, 2015, the Company closed a private placement of a $50.0 million guaranteed senior unsecured note (the “2015 Note”) with a September 30, 2025 maturity date and a yield of 4.15%.
2012 Notes
On July 24, 2012, the Company closed a $200.0 million private placement of guaranteed senior unsecured notes (the “2012 Notes “) and, together with the 2020 Notes, 2018 Notes, the 2017 Notes, the 2016 Notes and the 2015 Note, the “Notes”). The 2012 Notes consisted of a $100.0 million tranche of 4.87% notes due July 25, 2022 and a $100.0 million tranche of 5.02% notes due July 23, 2024.
On July 25, 2022, the Company repaid $100.0 million of the 2012 Series A 4.87% Notes at maturity. As at December 31, 2023, $100.0 million of the 2012 Series B 5.02% Notes remained outstanding with a maturity date of July 23, 2024.
Covenants
Payment and performance of Agnico Eagle’s obligations under the Old Credit Facility, Term Loan Facility, and the Notes were guaranteed by each of its material subsidiaries and certain of its other subsidiaries (the ”Guarantors”). However, in connection with the Company’s entry into the New Credit Facility on February 12, 2024, the subsidiary guarantees provided in connection with the Term Loan Facility and the Notes were released.
Each of the Old Credit Facility and the New Credit Facility contains covenants that limit, among other things, the ability of the Company to incur additional indebtedness, make distributions in certain circumstances and sell material assets.
The covenants in the Term Loan Facility were amended such that they limit the actions of the Company in the same manner and to the same extent as the limitations under the New Credit Facility.
The note purchase agreements pursuant to which the Notes were issued (the ”Note Purchase Agreements”) contain covenants that restrict, among other things, the ability of the Company to amalgamate or otherwise transfer its assets, sell material assets, carry on a business other than one related to mining and the ability of the Guarantors to incur indebtedness.
The New Credit Facility, Term Loan Facility and Note Purchase Agreements also require the Company to maintain a total net debt to capitalization ratio below a specified maximum value and the Note Purchase Agreements (other than the 2018 and 2020 Notes) require the Company to maintain a minimum tangible net worth.
The Company was in compliance with all covenants contained in the Old Credit Facility, Term Loan Facility and Note Purchase Agreements throughout the years-ended and as at December 31, 2023 and 2022.
44
AGNICO EAGLE MINES LIMITED
NOTES TO CONSOLIDATED FINANCIAL STATEMENTS (Continued)
(thousands of United States dollars, except share and per share amounts, unless otherwise indicated)
December 31, 2023
14.LONG-TERM DEBT (Continued)
Finance Costs
Total finance costs consist of the following:
|
|
Year Ended December 31, |
||||
|
|
2023 |
|
2022 |
||
Interest on Notes |
|
$ |
57,192 |
|
$ |
64,481 |
Interest on Term Loan Facility |
|
|
26,273 |
|
|
— |
Interest on Old Credit Facility |
|
|
10,928 |
|
|
536 |
Old Credit Facility fees |
|
|
6,374 |
|
|
3,859 |
Amortization of credit and term loan financing and note issuance costs |
|
|
3,290 |
|
|
3,042 |
Accretion expense on reclamation provisions |
|
|
32,906 |
|
|
15,951 |
Interest on lease obligations and other interest expense (income) |
|
|
(3,699) |
|
|
(1,290) |
Interest capitalized to assets under construction |
|
|
(3,177) |
|
|
(3,644) |
Total finance costs |
|
$ |
130,087 |
|
$ |
82,935 |
Borrowing costs were capitalized to assets under construction during the year ended December 31, 2023 at a weighted average capitalization rate of 1.28% (2022 — 1.16%).
15.OTHER LIABILITIES
Other liabilities consist of the following:
|
|
As at |
|
As at |
||
|
|
December 31, |
|
December 31, |
||
|
|
2023 |
|
2022 |
||
Committed subscription proceeds for San Nicolás project |
|
$ |
229,950 |
|
$ |
— |
Pension benefit obligations |
|
|
56,255 |
|
|
53,024 |
Deferred income |
|
|
24,046 |
|
|
13,955 |
Other |
|
|
11,855 |
|
|
5,636 |
Total other liabilities |
|
$ |
322,106 |
|
$ |
72,615 |
The committed subscription proceeds represent the minimum unavoidable obligation under the joint venture shareholders’ agreement between Agnico Eagle and Teck. As at December 31, 2023, cumulative contributions of $11.0 million were recorded against the obligation (Note 5). The current portion of the remaining obligation is recorded on the accounts payable and accrued liabilities line item of the consolidated financial statements (Note 11).
Defined Benefit Obligations
The Company provides the Executives Plan for certain current and former senior officers, the Retirement Program for eligible employees in Canada and the Mexico Plans for eligible employees in Mexico, each of which are considered defined benefit plans under IAS 19 - Employee Benefits. The funded status of the plans are based on actuarial valuations performed as at December 31, 2023. The plans operate under similar regulatory frameworks and generally face similar risks.
45
AGNICO EAGLE MINES LIMITED
NOTES TO CONSOLIDATED FINANCIAL STATEMENTS (Continued)
(thousands of United States dollars, except share and per share amounts, unless otherwise indicated)
December 31, 2023
15.OTHER LIABILITIES (Continued)
The funded status of the Company’s defined benefit obligations for 2023 and 2022, is as follows:
|
|
Year Ended December 31, |
||||
|
|
2023 |
|
2022 |
||
Reconciliation of plan assets: |
|
|
|
|
|
|
Plan assets, beginning of year |
|
$ |
2,835 |
|
$ |
2,905 |
Employer contributions |
|
|
5,936 |
|
|
1,713 |
Benefit payments |
|
|
(5,727) |
|
|
(1,473) |
Administrative expenses |
|
|
(105) |
|
|
(120) |
Interest on assets |
|
|
145 |
|
|
87 |
Net return on assets excluding interest |
|
|
(145) |
|
|
(87) |
Effect of exchange rate changes |
|
|
70 |
|
|
(190) |
Plan assets, end of year |
|
$ |
3,009 |
|
$ |
2,835 |
|
|
|
|
|
|
|
Reconciliation of defined benefit obligation: |
|
|
|
|
|
|
Defined benefit obligation, beginning of year |
|
$ |
46,733 |
|
$ |
44,844 |
Current service cost |
|
|
3,660 |
|
|
2,976 |
Benefit payments |
|
|
(5,727) |
|
|
(1,473) |
Interest cost |
|
|
3,176 |
|
|
1,797 |
Actuarial losses (gains) arising from changes in economic assumptions |
|
|
975 |
|
|
(7,028) |
Actuarial (gains) losses arising from changes in demographic assumptions |
|
|
(276) |
|
|
772 |
Actuarial (gains) losses arising from Plan experience |
|
|
(2,485) |
|
|
6,363 |
Effect of exchange rate changes |
|
|
724 |
|
|
(1,518) |
Defined benefit obligation, end of year |
|
|
46,780 |
|
|
46,733 |
Net defined benefit liability, end of year |
|
$ |
43,771 |
|
$ |
43,898 |
The components of Agnico Eagle’s pension expense recognized in the consolidated statements of income relating to the defined benefit plans are as follows:
|
|
Year Ended December 31, |
||||
|
|
2023 |
|
2022 |
||
Current service cost |
|
$ |
3,660 |
|
$ |
2,976 |
Administrative expenses |
|
|
105 |
|
|
120 |
Interest cost on defined benefit obligation |
|
|
3,176 |
|
|
1,797 |
Interest on assets |
|
|
(145) |
|
|
(87) |
Pension expense |
|
$ |
6,796 |
|
$ |
4,806 |
The remeasurements of the net defined benefit liability recognized in other comprehensive income relating to the Company’s defined benefit plans are as follows:
|
|
Year Ended December 31, |
||||
|
|
2023 |
|
2022 |
||
Actuarial (gains) losses relating to the defined benefit obligation |
|
$ |
(1,786) |
|
$ |
107 |
Net return on assets excluding interest |
|
|
145 |
|
|
87 |
Total remeasurements of the net defined benefit liability |
|
$ |
(1,641) |
|
$ |
194 |
46
AGNICO EAGLE MINES LIMITED
NOTES TO CONSOLIDATED FINANCIAL STATEMENTS (Continued)
(thousands of United States dollars, except share and per share amounts, unless otherwise indicated)
December 31, 2023
15.OTHER LIABILITIES (Continued)
In 2024, the Company expects to make contributions of $4.2 million and benefit payments of $4.2 million, in aggregate, related to the defined benefit plans. The weighted average duration of the Company’s defined benefit obligation in Canada is 12.6 years at December 31, 2023 (December 31, 2022 — 13.0 years). The weighted average duration of the Company’s defined benefit obligation for the Mexico Plans is 3.9 years at December 31, 2023 (December 31, 2022 — 4.9 years).
The following table sets out significant assumptions used in measuring the Company’s Executives Plan defined benefit obligations:
|
|
As at December 31, |
|
As at December 31, |
|
|
|
2023 |
|
2022 |
|
Assumptions: |
|
|
|
|
|
Discount rate - beginning of year |
|
5.0 |
% |
3.0 |
% |
Discount rate - end of year |
|
4.8 |
% |
5.0 |
% |
The following table sets out significant assumptions used in measuring the Company’s Retirement Program defined benefit obligations:
|
|
As at December 31, |
|
As at December 31, |
|
|
|
2023 |
|
2022 |
|
Assumptions: |
|
|
|
|
|
Discount rate - beginning of year |
|
5.0 |
% |
2.5 |
% |
Discount rate - end of year |
|
4.5 |
% |
5.0 |
% |
Range of mine closure dates |
|
2027 — 2034 |
|
2026 — 2036 |
|
Termination of employment per annum |
|
2.0% — 10.0 |
% |
2.0% — 10.0 |
% |
The following table sets out significant assumptions used in measuring the Company’s defined benefit obligations for the Mexico Plans:
|
|
As at December 31, |
|
As at December 31, |
|
|
|
2023 |
|
2022 |
|
Assumptions: |
|
|
|
|
|
Discount rate |
|
9.5 |
% |
9.5 |
% |
Range of mine closure dates |
|
2024 — 2027 |
|
2024 — 2027 |
|
Other significant actuarial assumptions used in measuring the Company’s Retirement Program defined benefit obligations as at December 31, 2023 and December 31, 2022 include assumptions of the expected retirement age of participants.
The following table sets out the effect of changes in significant actuarial assumptions on the Company’s defined benefit obligations:
|
|
As at |
|
|
|
December 31, |
|
|
|
2023 |
|
Change in assumption: |
|
|
|
0.5% increase in discount rate |
|
$ |
(1,607) |
0.5% decrease in discount rate |
|
$ |
1,718 |
The summary of the effect of changes in significant actuarial assumptions was prepared using the same methods and actuarial assumptions as those used for the calculation of the Company’s defined benefit obligation related to the Executives Plan, the Retirement Program and the Mexico Plans as at the end of the fiscal year, except for the change in the single actuarial assumption being evaluated. The modification of several actuarial assumptions at the same time could lead to different results.
47
AGNICO EAGLE MINES LIMITED
NOTES TO CONSOLIDATED FINANCIAL STATEMENTS (Continued)
(thousands of United States dollars, except share and per share amounts, unless otherwise indicated)
December 31, 2023
15.OTHER LIABILITIES (Continued)
Other Plans
In addition to its defined benefit pension plans, the Company maintains two defined contribution plans - the Basic Plan and the Supplemental Plan. Under the Basic Plan, Agnico Eagle contributes 5.0% of certain employees’ base employment compensation to a defined contribution plan. In 2023, $20.0 million (2022 — $18.6 million) was contributed to the Basic Plan, $0.2 million of which related to contributions for key management personnel (2022 — $0.3 million). The Company also maintains the Supplemental Plan for designated executives at the level of Vice-President or above. The Supplemental Plan is funded by the Company through notional contributions equal to 10.0% of the designated executive’s earnings for the year (including salary and short-term bonus). In 2023, the Company made $1.8 million (2022 — $2.0 million) in notional contributions to the Supplemental Plan, all of which of which related to contributions for key management personnel (2022 — $1.4 million). The Company’s liability related to the Supplemental Plan is $10.7 million at December 31, 2023 (2022 — $10.3 million). At retirement date, the notional account balance is converted to a pension payable in five annual installments.
16. EQUITY
Common Shares
The Company’s authorized share capital includes an unlimited number of common shares with no par value. As at December 31, 2023, Agnico Eagle’s issued common shares totaled 497,970,524 (December 31, 2022 – 457,160,104), of which 671,083 common shares are held in trusts as described below (2022 — 694,808).
The common shares held in trusts relate to the Company’s RSU plan, PSU plan and Long Term Incentive Plan (“LTIP”). The trusts have been evaluated under IFRS 10 - Consolidated Financial Statements and are consolidated in the accounts of the Company, with shares held in trust offset against the Company’s issued shares in its consolidated financial statements. The common shares purchased and held in trusts are excluded from the basic net income per share calculations until they have vested. All of the non-vested common shares held in trusts are included in the diluted net income per share calculations, unless the impact is anti-dilutive.
On April 28, 2022, the Company received approval from the Toronto Stock Exchange to establish a normal course issuer bid (“NCIB”). The Company has authorized purchases under the NCIB of the lesser of (i) 5% of the issued and outstanding common shares on the date of commencement or renewal of the NCIB, as the case may be, and (ii) such number of common shares that may be purchased for an aggregate purchase price, excluding commissions, of $500.0 million from the commencement or renewal of the NCIB as the case may be. On May 2, 2023, the Company received approval from the Toronto Stock Exchange to renew the NCIB until May 3, 2024.
During the year ended December 31, 2023, the Company repurchased and cancelled 100,000 common shares (2022 - 1,569,620) for aggregate consideration of $4.8 million (2022 - $69.9 million) at an average price of $47.74 (2022 - $44.53) under the NCIB. The book value of the cancelled shares was $3.6 million (2022 - $55.9 million) and was treated as a reduction to common share capital. The portion of the consideration paid for the repurchased shares in excess of their book value, $1.2 million (2022 - $14.0 million), was treated as a reduction from contributed surplus.
48
AGNICO EAGLE MINES LIMITED
NOTES TO CONSOLIDATED FINANCIAL STATEMENTS (Continued)
(thousands of United States dollars, except share and per share amounts, unless otherwise indicated)
December 31, 2023
16. EQUITY (Continued)
The following table sets out the maximum number of common shares that would be outstanding if all dilutive instruments outstanding as at December 31, 2023 were exercised:
Common shares outstanding at December 31, 2023 |
|
497,299,441 |
Employee stock options |
|
4,646,412 |
Common shares held in trusts in connection with the RSU plan (Note 17C), PSU plan (Note 17D) and LTIP |
|
671,083 |
Total |
|
502,616,936 |
Net Income Per Share
The following table sets out the weighted average number of common shares used in the calculation of basic and diluted net income per share:
|
|
Year Ended December 31, |
||||
|
|
2023 |
|
2022 |
||
Net income for the year - basic |
|
$ |
1,941,307 |
|
$ |
670,249 |
Add: Dilutive impact of cash settling stock-based compensation |
|
|
(4,736) |
|
|
— |
Net income for the year - diluted |
|
|
1,936,571 |
|
|
670,249 |
Weighted average number of common shares outstanding — basic (in thousands) |
|
|
488,723 |
|
|
437,678 |
Add: Dilutive impact of common shares related to the RSU plan, PSU plan and LTIP |
|
|
1,174 |
|
|
738 |
Add: Dilutive impact of employee stock options |
|
|
16 |
|
|
117 |
Weighted average number of common shares outstanding — diluted (in thousands) |
|
|
489,913 |
|
|
438,533 |
Net income per share — basic |
|
$ |
3.97 |
|
$ |
1.53 |
Net income per share — diluted |
|
$ |
3.95 |
|
$ |
1.53 |
Diluted net income per share has been calculated using the treasury stock method. In applying the treasury stock method, outstanding employee stock options with an exercise price greater than the average quoted market price of the common shares for the period outstanding are not included in the calculation of diluted net income per share as the impact would be anti-dilutive.
For the year ended December 31, 2023, 3,323,122 (2022 — 4,194,765) employee stock options were excluded from the calculation of diluted net income per share as their impact would have been anti-dilutive.
17.STOCK-BASED COMPENSATION
A) |
Employee Stock Option Plan (“ESOP”) |
The Company’s ESOP provides for the grant of stock options to directors, officers, employees and service providers to purchase common shares. Under the ESOP, stock options are granted at the fair market value of the underlying shares on the day prior to the date of grant. The number of common shares that may be reserved for issuance to any one person pursuant to stock options (under the ESOP or otherwise), warrants, share purchase plans or other arrangements may not exceed 5.0% of the Company’s common shares issued and outstanding at the date of grant.
On April 24, 2021, the Compensation Committee of the Board adopted a policy pursuant to which stock options granted after that date have a maximum term of five years. In 2021, the shareholders approved a resolution to increase the number of common shares reserved for issuance under the ESOP to 38,700,000 common shares.
49
AGNICO EAGLE MINES LIMITED
NOTES TO CONSOLIDATED FINANCIAL STATEMENTS (Continued)
(thousands of United States dollars, except share and per share amounts, unless otherwise indicated)
December 31, 2023
17.STOCK-BASED COMPENSATION (Continued)
Of the stock options granted under the ESOP, 25% vest within 30 days of the grant date and the remaining stock options vest in equal installments on the next three anniversary dates of the grant. Upon the exercise of stock options under the ESOP, the Company issues common shares from treasury to settle the obligation.
The following table sets out activity with respect to Agnico Eagle’s outstanding stock options:
|
|
Year Ended |
|
Year Ended |
||||||
|
|
December 31, 2023 |
|
December 31, 2022 |
||||||
|
|
|
|
Weighted |
|
|
|
Weighted |
||
|
|
Number of |
|
Average |
|
Number of |
|
Average |
||
|
|
Stock |
|
Exercise |
|
Stock |
|
Exercise |
||
|
|
Options |
|
Price |
|
Options |
|
Price |
||
Outstanding, beginning of year |
|
4,976,636 |
|
C$ |
75.04 |
|
4,482,941 |
|
C$ |
74.43 |
Granted |
|
873,950 |
|
|
70.36 |
|
1,643,801 |
|
|
67.10 |
Exercised |
|
(940,921) |
|
|
57.68 |
|
(944,989) |
|
|
57.68 |
Forfeited |
|
(240,603) |
|
|
78.03 |
|
(205,117) |
|
|
78.08 |
Expired |
|
(22,650) |
|
|
71.95 |
|
— |
|
|
— |
Outstanding, end of year |
|
4,646,412 |
|
C$ |
77.54 |
|
4,976,636 |
|
C$ |
75.04 |
Options exercisable, end of year |
|
2,950,555 |
|
C$ |
80.18 |
|
2,706,334 |
|
C$ |
73.76 |
The average share price of Agnico Eagle’s common shares during the year ended December 31, 2023 was C$68.94 (2022 — C$64.87).
The weighted average grant date fair value of stock options granted in 2023 was C$17.00 (2022 — C$11.09). The following table sets out information about Agnico Eagle’s stock options outstanding and exercisable as at December 31, 2023:
|
|
Stock Options Outstanding |
|
Stock Options Exercisable |
||||||||||
|
|
|
|
Weighted |
|
|
|
|
|
|
Weighted |
|
|
|
|
|
|
|
Average |
|
Weighted |
|
|
|
Average |
|
|
|
|
|
|
|
|
Remaining |
|
Average |
|
|
|
Remaining |
|
Weighted |
||
|
|
Number |
|
Contractual |
|
Exercise |
|
Number |
|
Contractual |
|
Average |
||
Range of Exercise Prices |
|
Outstanding |
|
Life |
|
Price |
|
Exercisable |
|
Life |
|
Exercise Price |
||
C$55.10 - C$67.19 |
|
1,323,290 |
|
2.96 years |
|
C$ |
66.96 |
|
594,093 |
|
2.89 years |
|
C$ |
66.68 |
C$70.36 - C$89.59 |
|
3,323,122 |
|
2.16 years |
|
|
81.75 |
|
2,356,462 |
|
1.70 years |
|
|
83.58 |
C$55.10 - C$89.59 |
|
4,646,412 |
|
2.39 years |
|
C$ |
77.54 |
|
2,950,555 |
|
1.94 years |
|
C$ |
80.18 |
The Company has reserved for issuance 4,646,412 common shares in the event that these stock options are exercised.
The number of common shares available for the grant of stock options under the ESOP as at December 31, 2023 was 3,019,367.
50
AGNICO EAGLE MINES LIMITED
NOTES TO CONSOLIDATED FINANCIAL STATEMENTS (Continued)
(thousands of United States dollars, except share and per share amounts, unless otherwise indicated)
December 31, 2023
17.STOCK-BASED COMPENSATION (Continued)
Agnico Eagle estimated the fair value of stock options under the Black-Scholes option pricing model using the following weighted average assumptions:
|
|
Year Ended |
|
||
|
|
December 31, |
|
||
|
|
2023 |
|
2022 |
|
Risk-free interest rate |
|
4.26 |
% |
1.65 |
% |
Expected life of stock options (in years) |
|
2.5 |
|
2.4 |
|
Expected volatility of Agnico Eagle’s share price |
|
36.0 |
% |
30.0 |
% |
Expected dividend yield |
|
3.6 |
% |
2.9 |
% |
The Company uses historical volatility to estimate the expected volatility of Agnico Eagle’s share price. The expected term of stock options granted is derived from historical data on employee exercise and post-vesting employment termination experience.
Compensation expense related to the ESOP amounted to $12.1 million for the year ended December 31, 2023 (2022 — $15.8 million).
Subsequent to the year ended December 31, 2023, 1,021,400 stock options were granted under the ESOP, of which 255,350 stock options vested within 30 days of the grant date. The remaining stock options, all of which expire in 2029, vest in equal installments on each anniversary date of the grant over a three-year period.
B)Incentive Share Purchase Plan (“ISPP”)
In 2023, 885,842 common shares were subscribed for under the ISPP (2022 – 615,069) for a value of $44.8 million (2022 — $30.3 million). Eligible participants under the ISPP may contribute up to 10% of their basic annual salaries to subscribe for common shares of the Company and the Company will contribute an amount equal to 50.0% of each participant’s contribution. All common shares subscribed for under the ISPP are issued by the Company. In April 2022, the Company’s shareholders approved an increase in the maximum number of common shares reserved for issuance under the ISPP to 9,600,000 from 8,100,000 . As at December 31, 2023, Agnico Eagle has reserved for issuance 371,691 common shares(2022 — 1,257,533) under the ISPP.
The total compensation cost recognized in 2023 related to the ISPP was $14.9 million (2022 — $10.1 million).
C)Restricted Share Unit (“RSU”) Plan
In 2009, the Company implemented the RSU plan for certain employees. Effective January 1, 2012, the RSU plan was amended to include directors and senior executives of the Company as eligible participants.
A deferred compensation balance is recorded for the total grant date value on the date of each RSU plan grant. The deferred compensation balance is recorded as a reduction of equity and is amortized as compensation expense over the vesting period of up to three years.
51
AGNICO EAGLE MINES LIMITED
NOTES TO CONSOLIDATED FINANCIAL STATEMENTS (Continued)
(thousands of United States dollars, except share and per share amounts, unless otherwise indicated)
December 31, 2023
17.STOCK-BASED COMPENSATION (Continued)
In 2023, 595,004 (2022 — 656,091) RSUs were granted with a grant date fair value of $54.50 (2022 — $46.84). In 2023, the Company funded the RSU plan by transferring $32.0 million (2022 — $31.6 million) to an employee benefit trust that then purchased common shares of the Company in the open market. The grant date fair value of the RSUs generally approximates the cost of purchasing the shares in the open market. Once vested, the common shares in the trust are distributed to settle the obligation along with a cash payment reflecting the accumulated amount that would have been paid as dividends had the common shares been outstanding. On February 8, 2022, all outstanding Kirkland restricted share units were converted to 324,884 Agnico RSUs in connection with the Merger (Note 5). These RSUs are accounted for as cash-settled share based liabilities. At each reporting date, and on settlement, the share based liabilities are remeasured, with changes in fair value recognized as compensation expense in the period.
Compensation expense related to the RSU plan was $38.1 million in 2023 (2022 — $27.5 million). Compensation expense related to the RSU plan is included in the production and general and administrative line items, as applicable, in the consolidated statements of income.
Subsequent to the year ended December 31, 2023, 179,176 RSUs were granted under the RSU plan.
D)Performance Share Unit (“PSU”) Plan
Beginning in 2016, the Company adopted a PSU plan for senior executives of the Company. PSUs are subject to vesting requirements over a three-year period based on specific performance measurements established by the Company. The Company has historically settled awards under the PSU plan with equity and accounted for them accordingly, however granted units that vested in 2022 were subsequently settled in cash, resulting in a change in their accounting to cash-settled share based liabilities. In 2022, the fair value of the share based liability recognized on modification of $17.9 million was recognized as a direct charge to shareholders’ equity on the date of modification. All remaining and future grants under the PSU plan will be accounted for as cash-settled awards. At each reporting date and on settlement, the share based liabilities are remeasured, with changes in fair value recognized as share based compensation expense in the period.
In 2023, 154,000 PSUs were granted (2022 — 157,500). The value of a PSU at the grant date approximates the market price of a common share of the Company on that date. The PSUs are accounted for as cash-settled share based liabilities. At each reporting date, and on settlement, the share based liabilities are remeasured, with changes in fair value recognized as compensation expense in the period. On February 8, 2022, all outstanding Kirkland performance share units were converted to 324,308 Agnico PSUs in connection with the Merger (Note 5). These are accounted for as cash-settled share based liabilities.
Compensation expense related to the PSU plan was $15.5 million in 2023 (2022 — $16.3 million). Compensation expense related to the PSU plan is included in the production and general and administrative line items, as applicable, in the consolidated statements of income.
52
AGNICO EAGLE MINES LIMITED
NOTES TO CONSOLIDATED FINANCIAL STATEMENTS (Continued)
(thousands of United States dollars, except share and per share amounts, unless otherwise indicated)
December 31, 2023
18.OTHER RESERVES
The following table sets out the movements in other reserves for the years ended December 31, 2023 and 2022:
|
|
Equity |
|
Cash flow |
|
|
|
||
|
|
securities |
|
hedge |
|
|
|
||
|
|
reserve |
|
reserve |
|
Total |
|||
Balance at December 31, 2021 |
|
$ |
65,065 |
|
$ |
(10,789) |
|
$ |
54,276 |
Net change in cash flow hedge reserve |
|
|
— |
|
|
2,301 |
|
|
2,301 |
Net change in fair value of equity securities |
|
|
(85,583) |
|
|
— |
|
|
(85,583) |
Balance at December 31, 2022 |
|
$ |
(20,518) |
|
$ |
(8,488) |
|
$ |
(29,006) |
Net change in cash flow hedge reserve |
|
|
— |
|
|
1,176 |
|
|
1,176 |
Transfer of net loss on disposal of equity securities to retained earnings |
|
|
2,045 |
|
|
— |
|
|
2,045 |
Net change in fair value of equity securities |
|
|
(73,170) |
|
|
— |
|
|
(73,170) |
Balance at December 31, 2023 |
|
$ |
(91,643) |
|
$ |
(7,312) |
|
$ |
(98,955) |
The cash flow hedge reserve represents the settlement of an interest rate derivative related to the Senior Notes issued in 2020. The reserve will be amortized over the term of the Notes. Amortization of the reserve is included in the finance costs line item in the consolidated statements of income.
19.REVENUES FROM MINING OPERATIONS AND TRADE RECEIVABLES
Agnico Eagle is a gold mining company with mining operations in Canada, Australia, Finland and Mexico. The Company earns a significant proportion of its revenues from the production and sale of gold in both dore bar and concentrate form. The remainder of revenue and cash flow is generated by the production and sale of by-product metals. The revenue from by-product metals is primarily generated by production at the LaRonde mine in Canada (silver, zinc and copper) and the Pinos Altos mine in Mexico (silver).
The cash flow and profitability of the Company’s operations are significantly affected by the market price of gold and, to a lesser extent, silver, zinc and copper. The prices of these metals can fluctuate significantly and are affected by numerous factors beyond the Company’s control.
During the year ended December 31, 2023, three customers each contributed more than 10.0% of total revenues from mining operations for a combined total of approximately 71.7% of revenues from mining operations. However, because gold can be sold through numerous gold market traders worldwide, the Company is not economically dependent on a limited number of customers for the sale of its product.
The following table sets out sales to individual customers that exceeded 10.0% of revenues from mining operations:
|
|
Year Ended December 31, |
|
||||
|
|
2023 |
|
2022 |
|
||
Customer 1 |
|
$ |
1,858,921 |
|
$ |
1,468,563 |
|
Customer 2 |
|
|
1,574,546 |
|
|
1,159,679 |
|
Customer 3 |
|
|
1,319,800 |
|
|
948,686 |
|
Customer 4 (i) |
|
|
— |
|
|
760,648 |
|
Customer 5 (i) |
|
|
— |
|
|
645,088 |
|
Total sales to customers exceeding 10.0% of revenues from mining operations |
|
$ |
4,753,267 |
|
$ |
4,982,664 |
|
Percentage of total revenues from mining operations |
|
|
71.7 |
% |
|
86.8 |
% |
Note:
(i) Sales to these customers did not exceed 10% of revenues from mining operations for the year ended December 31, 2023.
53
AGNICO EAGLE MINES LIMITED
NOTES TO CONSOLIDATED FINANCIAL STATEMENTS (Continued)
(thousands of United States dollars, except share and per share amounts, unless otherwise indicated)
December 31, 2023
19.REVENUES FROM MINING OPERATIONS AND TRADE RECEIVABLES (Continued)
Trade receivables are recognized once the transfer of control for the metals sold has occurred and reflect the amounts owing to the Company in respect of its sales of concentrates to third parties prior to the satisfaction in full of the payment obligations of the third parties. As at December 31, 2023, the Company had $8.1 million (December 31, 2022 — $8.6 million) in receivables relating to provisionally priced concentrate sales.
The Company has recognized the following amounts relating to revenue in the consolidated statements of income:
|
|
Year Ended December 31, |
||||
|
|
2023 |
|
2022 |
||
Revenue from contracts with customers |
|
$ |
6,628,073 |
|
$ |
5,742,768 |
Provisional pricing adjustments on concentrate sales |
|
|
(1,164) |
|
|
(1,606) |
Total revenues from mining operations |
|
$ |
6,626,909 |
|
$ |
5,741,162 |
The following table sets out the disaggregation of revenue by metal:
|
|
Year Ended December 31, |
||||
|
|
2023 |
|
2022 |
||
Revenues from contracts with customers: |
|
|
|
|
|
|
Gold |
|
$ |
6,539,273 |
|
$ |
5,656,741 |
Silver |
|
|
63,666 |
|
|
54,944 |
Zinc |
|
|
6,557 |
|
|
10,880 |
Copper |
|
|
18,577 |
|
|
20,203 |
Total revenues from contracts with customers |
|
$ |
6,628,073 |
|
$ |
5,742,768 |
In 2023, precious metals (gold and silver) accounted for 99.6% of Agnico Eagle’s revenues from mining operations (2022 – 99.5%). The remaining revenues from mining operations consisted of net by-product metal revenues from non-precious metals.
20.CAPITAL AND FINANCIAL RISK MANAGEMENT
The Company’s activities expose it to a variety of financial risks: market risk (including interest rate risk, commodity price risk and foreign currency risk), credit risk and liquidity risk. The Company’s overall risk management policy is to support the delivery of the Company’s financial targets while minimizing the potential adverse effects on the Company’s performance.
Risk management is carried out by a centralized treasury department under policies approved by the Board. The Company’s financial activities are governed by policies and procedures and its financial risks are identified, measured and managed in accordance with its policies and risk tolerance.
| A) | Market Risk |
Market risk is the risk that changes in market factors, such as interest rates, commodity prices and foreign exchange rates, will affect the value of Agnico Eagle’s financial instruments. The Company can choose to either accept market risk or mitigate it through the use of derivatives and other economic hedging strategies.
i.Interest Rate Risk
Interest rate risk is the risk that the fair value of future cash flows of a financial instrument will fluctuate as a result of changes in market interest rates. The Company’s exposure to the risk of changes in market interest rates relates primarily to the Company’s long-term debt obligations that have floating interest rates.
54
AGNICO EAGLE MINES LIMITED
NOTES TO CONSOLIDATED FINANCIAL STATEMENTS (Continued)
(thousands of United States dollars, except share and per share amounts, unless otherwise indicated)
December 31, 2023
20.CAPITAL AND FINANCIAL RISK MANAGEMENT (Continued)
There is no significant impact on income before income and mining taxes or on equity of a 1.0% increase or decrease in interest rates, based on financial instruments in place as at December 31, 2023.
ii.Commodity Price Risk
a.Metal Prices
Agnico Eagle’s revenues from mining operations and net income are sensitive to metal prices. Changes in the market price of gold may be attributed to factors such as demand, global mine production levels, central bank purchases and sales and investor sentiment. Changes in the market prices of by-product metals (silver, zinc and copper) may be attributed to factors such as demand and global mine production levels.
In order to mitigate the impact of fluctuating by-product metal prices, the Company occasionally enters into derivative financial instrument contracts under its Board-approved Risk Management Policies and Procedures. The Company has a long-standing policy of no long-term forward gold sales. However, the policy does allow the Company to use other economic hedging strategies, where appropriate, to mitigate by-product metal pricing risks. The Company’s policy does not allow speculative trading. As at December 31, 2023, there were no metal derivative positions.
b.Fuel
To mitigate the risks associated with fluctuating diesel fuel prices, the Company uses derivative financial instruments as economic hedges of the price risk on a portion of its diesel fuel costs (see Note 21 for further details on the Company’s derivative financial instruments).
iii.Foreign Currency Risk
The Company receives payment for all of its metal sales in US dollars and pays most of its operating and capital costs in Canadian and Australian dollars, Euros, or Mexican pesos. This gives rise to significant foreign currency risk exposure. The Company enters into currency economic hedging transactions under the Board-approved Foreign Exchange Risk Management Policies and Procedures to hedge part of its foreign currency exposure. The policy does not permit the hedging of translation exposure (that is, the gains and losses that arise from the accounting translation of non-US dollar denominated assets and liabilities into US dollars), which does not give rise to cash exposure. The Company’s foreign currency derivative financial instrument strategy includes (but is not limited to) the use of purchased puts, sold calls, collars and forwards that are not held for speculative purposes (see Note 21 for further details on the Company’s derivative financial instruments).
55
AGNICO EAGLE MINES LIMITED
NOTES TO CONSOLIDATED FINANCIAL STATEMENTS (Continued)
(thousands of United States dollars, except share and per share amounts, unless otherwise indicated)
December 31, 2023
20.CAPITAL AND FINANCIAL RISK MANAGEMENT (Continued)
The following table sets out the translation impact, based on financial instruments in place as at December 31, 2023, on income before income and mining taxes and on equity for the year ended December 31, 2023 of a 10.0% weakening in the exchange rate of the US dollar relative to the Canadian dollar, Australian dollar, Euro and Mexican peso, with all other variables held constant. A 10.0% strengthening of the US dollar against the foreign currencies would have had the equal but opposite effect as at December 31, 2023.
|
|
Positive (negative) impact on |
|
|
|
Income before Income and |
|
|
|
Mining Taxes and on Equity |
|
Canadian dollar |
|
$ |
(55,097) |
Australian dollar |
|
$ |
(3,361) |
Euro |
|
$ |
(10,891) |
Mexican peso |
|
$ |
970 |
B)Credit Risk
Credit risk is the risk that a third party might fail to fulfill its obligations under the terms of a financial instrument. Credit risk arises from cash and cash equivalents, short-term investments, trade receivables, loan receivable and certain derivative financial instruments. The Company holds its cash and cash equivalents and short-term investments in highly rated financial institutions which it believes results in a low level of credit risk. For trade receivables and derivative financial instruments, historical levels of default have been negligible, which the Company believes results in a low level of credit risk. The Company mitigates credit risk by dealing with what it believes to be credit-worthy counterparties and limiting concentration risk. For derivative financial instrument liabilities, the Company assumes no credit risk when the fair value of an instrument is negative. The maximum exposure to credit risk is equal to the carrying amount of the instruments as follows:
|
|
As at |
|
As at |
||
|
|
December 31, |
|
December 31, |
||
|
|
2023 |
|
2022 |
||
Cash and cash equivalents |
|
$ |
338,648 |
|
$ |
658,625 |
Trade receivables (Notes 6 and 19) |
|
|
8,148 |
|
|
8,579 |
Fair value of derivative financial instruments (Notes 6 and 21) |
|
|
50,786 |
|
|
8,774 |
Short-term investments (Note 8A) |
|
|
10,199 |
|
|
9,896 |
Non-current loans receivable (Note 8B) |
|
|
10,108 |
|
|
3,939 |
Total |
|
$ |
417,889 |
|
$ |
689,813 |
C)Liquidity Risk
Liquidity risk is the risk that the Company will encounter difficulty in meeting obligations associated with financial liabilities that are settled by delivering cash or another financial asset. The Company monitors its risk of a shortage of funds by monitoring its credit rating and projected cash flows taking into account the maturity dates of existing debt and other payables. The Company manages exposure to liquidity risk by maintaining cash balances, having access to undrawn credit facilities and access to public debt markets. Contractual maturities relating to lease obligations are set out in Note 13 and contractual maturities relating to long-term debt are set out in Note 14. Other financial liabilities have maturities within one year of December 31, 2023.
56
AGNICO EAGLE MINES LIMITED
NOTES TO CONSOLIDATED FINANCIAL STATEMENTS (Continued)
(thousands of United States dollars, except share and per share amounts, unless otherwise indicated)
December 31, 2023
20.CAPITAL AND FINANCIAL RISK MANAGEMENT (Continued)
D)Capital Risk Management
The Company’s primary capital management objective is to maintain an optimal capital structure to support current and long-term business activities and to provide financial flexibility in order to maximize value for equity holders.
Agnico Eagle’s capital structure comprises a mix of lease financing, long-term debt and total equity as follows:
|
|
As at |
|
As at |
||
|
|
December 31, |
|
December 31, |
||
|
|
2023 |
|
2022 |
||
Lease obligations (Note 13) |
|
$ |
161,548 |
|
$ |
151,342 |
Long-term debt (Note 14) |
|
|
1,843,086 |
|
|
1,342,070 |
Total equity |
|
|
19,422,915 |
|
|
16,241,345 |
Total |
|
$ |
21,427,549 |
|
$ |
17,734,757 |
The Company manages its capital structure and makes adjustments to it based on changes in economic conditions and the requirements of financial covenants. To effectively manage its capital requirements, Agnico Eagle has in place a rigorous planning, budgeting and forecasting process with the goal of ensuring it has the appropriate liquidity to meet its operating and growth objectives. The Company has the ability to adjust its capital structure by various means.
See Note 14 for details related to Agnico Eagle’s compliance with its long-term debt covenants.
E)Changes in liabilities arising from financing activities
|
|
As at |
|
Changes from |
|
|
|
|
|
|
As at |
||||
|
|
December 31, |
|
Financing Cash |
|
Foreign |
|
|
|
|
December 31, |
||||
|
|
2022 |
|
Flows |
|
Exchange |
|
Other(i) |
|
2023 |
|||||
Long-term debt |
|
$ |
1,342,070 |
|
|
498,958 |
|
|
— |
|
|
2,058 |
|
$ |
1,843,086 |
Lease obligations |
|
|
151,342 |
|
|
(47,589) |
|
|
7,151 |
|
|
50,644 |
|
|
161,548 |
Total liabilities from financing activities |
|
$ |
1,493,412 |
|
|
451,369 |
|
|
7,151 |
|
|
52,702 |
|
$ |
2,004,634 |
Note:
| (i) | Includes the amortization of deferred financing costs on long-term debt reflected in finance costs and lease obligation additions. |
57
AGNICO EAGLE MINES LIMITED
NOTES TO CONSOLIDATED FINANCIAL STATEMENTS (Continued)
(thousands of United States dollars, except share and per share amounts, unless otherwise indicated)
December 31, 2023
21.DERIVATIVE FINANCIAL INSTRUMENTS
Currency Risk Management
The Company uses foreign exchange economic hedges to reduce the variability in expected future cash flows arising from changes in foreign currency exchange rates. The Company is primarily exposed to currency fluctuations relative to the US dollar as a significant portion of the Company’s operating costs and capital expenditures are denominated in foreign currencies, primarily the Canadian dollar, the Australian dollar, the Euro and the Mexican peso. These potential currency fluctuations increase the volatility of, and could have a significant impact on, the Company’s production costs and capital expenditures. The economic hedges relate to a portion of the foreign currency denominated cash outflows arising from foreign currency denominated expenditures.
As at December 31, 2023, the Company had outstanding derivative contracts related to $3,324.7 million of 2024 and 2025 expenditures (December 31, 2022 — $2,907.9 million). The Company recognized mark-to-market adjustments in the (gain) loss on derivative financial instruments line item in the consolidated statements of income. The Company did not apply hedge accounting to these arrangements.
Mark-to-market gains and losses related to foreign exchange derivative financial instruments are recorded at fair value based on broker-dealer quotations corroborated by option pricing models that utilize period-end forward pricing of the applicable foreign currency to calculate fair value.
The Company’s other foreign currency derivative strategies in 2023 and 2022 consisted mainly of writing US dollar call options with short maturities to generate premiums that would, in essence, enhance the spot transaction rate received when exchanging US dollars for foreign currencies. All of these derivative transactions expired prior to period-end such that no derivatives were outstanding as at December 31, 2023 or December 31, 2022. The call option premiums were recognized in the (gain) loss on derivative financial instruments line item in the consolidated statements of income.
Commodity Price Risk Management
To mitigate the risks associated with fluctuating diesel fuel prices, the Company uses derivative financial instruments as economic hedges of the price risk on a portion of diesel fuel costs associated primarily with its Canadian operations’ diesel fuel exposure. There were derivative financial instruments outstanding as at December 31, 2023 relating to 15.0 million gallons of heating oil (December 31, 2022 — 19.0 million). The related mark-to-market adjustments prior to settlement were recognized in the (gain) loss on derivative financial instruments line item in the consolidated statements of income. The Company did not apply hedge accounting to these arrangements.
Mark-to-market gains and losses related to heating oil derivative financial instruments are based on broker-dealer quotations that utilize period-end forward pricing to calculate fair value.
58
AGNICO EAGLE MINES LIMITED
NOTES TO CONSOLIDATED FINANCIAL STATEMENTS (Continued)
(thousands of United States dollars, except share and per share amounts, unless otherwise indicated)
December 31, 2023
21.DERIVATIVE FINANCIAL INSTRUMENTS (Continued)
Share Purchase Warrants
The Company holds warrants to acquire equity securities of certain issuers in the mining industry. These warrants are not part of the Company’s core operations, and accordingly, gains and losses from these investments are not representative of the Company’s performance during the year.
The following table sets out a summary of the amounts recognized in the (gain) loss on derivative financial instruments line item in the consolidated statements of income.
|
|
Year Ended December 31, |
||||
|
|
2023 |
|
2022 |
||
Premiums realized on written foreign exchange call options |
|
$ |
(181) |
|
$ |
(859) |
Unrealized loss on warrants |
|
|
11,198 |
|
|
9,820 |
Realized loss on currency and commodity derivatives |
|
|
33,455 |
|
|
22,175 |
Unrealized (gain) loss on currency and commodity derivatives |
|
|
(112,904) |
|
|
59,556 |
(Gain) loss on derivative financial instruments |
|
$ |
(68,432) |
|
$ |
90,692 |
22.OTHER EXPENSES
The following table sets out amounts recognized in the other expenses line item in the consolidated statements of income:
|
|
Year Ended December 31, |
||||
|
|
2023 |
|
2022 |
||
Loss on disposal of property, plant and mine development (Note 9) |
|
$ |
26,759 |
|
$ |
8,754 |
Interest income |
|
|
(7,959) |
|
|
(9,820) |
Temporary suspension and other costs due to COVID-19 |
|
|
— |
|
|
11,275 |
Acquisition costs (Note 5) |
|
|
21,503 |
|
|
95,035 |
Environmental remediation |
|
|
2,712 |
|
|
10,417 |
Other costs |
|
|
23,254 |
|
|
25,647 |
Total other expenses |
|
$ |
66,269 |
|
$ |
141,308 |
During the year ended December 31, 2023, the Company incurred $18.4 million of transaction costs in connection with the Yamana Transaction (Note 5) and $3.1 million of transaction costs in connection with the acquisition of the San Nicolás project (Note 5). During the year ended December 31, 2022, the Company incurred $95.0 million of transaction and severance costs in connection with the Merger (Note 5).
In the year ended December 31, 2023, other costs comprised primarily of $15.3 million related to ore sorting projects and $5.8 million in payments to First Nations communities. In the year ended December 31, 2022, other costs comprised primarily of $6.7 million in write-offs of prepaid deposits and supplies, $6.5 million in losses incurred on an insurance claim related to a fire at Meadowbank, $3.5 million in legal claims and $2.3 million in property tax reassessments.
59
AGNICO EAGLE MINES LIMITED
NOTES TO CONSOLIDATED FINANCIAL STATEMENTS (Continued)
(thousands of United States dollars, except share and per share amounts, unless otherwise indicated)
December 31, 2023
23.SEGMENTED INFORMATION
The Company identifies its operating segments as those operations whose operating results are reviewed by the Chief Operating Decision Maker (“CODM”), the Chief Executive Officer, for the purpose of allocating resources and assessing performance. Each of the Company’s operating mines and significant projects are considered to be separate operating segments. Reportable operating segments represent more than 10.0% of the combined revenue from mining operations, income or loss or total assets of all operating segments. Certain operating segments that do not meet the quantitative thresholds are still disclosed where the Company believes that the information is useful. The CODM also reviews segment income (defined as revenues from mining operations less production costs, exploration and corporate development expenses and impairment losses and reversals) on a mine-by-mine basis. Revenues from mining operations and production costs for the reportable segments are reported net of intercompany transactions. Corporate and other assets and specific income and expense items are not allocated to reportable segments.
The Company has adjusted its operating segments as a result of the Yamana Transaction on March 31, 2023 (Note 5). The Company has reclassified exploration expenses from the Canadian Malartic Complex segment to the Exploration segment and comparative information has been restated to reflect this change.
|
|
Year Ended December 31, 2023 |
|||||||||||||
|
|
Revenues from |
|
|
|
|
Exploration and |
|
|
|
|
|
Segment |
||
|
|
Mining |
|
Production |
|
Corporate |
|
Impairment |
|
|
Income |
||||
|
|
Operations |
|
Costs |
|
Development |
|
Loss |
|
|
(Loss) |
||||
LaRonde mine |
|
$ |
483,065 |
|
$ |
(218,020) |
|
$ |
— |
|
$ |
— |
|
$ |
265,045 |
LaRonde Zone 5 mine |
|
|
130,711 |
|
|
(81,624) |
|
|
— |
|
|
— |
|
|
49,087 |
Canadian Malartic complex |
|
|
1,124,480 |
|
|
(465,814) |
|
|
— |
|
|
— |
|
|
658,666 |
Goldex mine |
|
|
272,801 |
|
|
(112,022) |
|
|
— |
|
|
— |
|
|
160,779 |
Meliadine mine |
|
|
697,431 |
|
|
(343,650) |
|
|
— |
|
|
— |
|
|
353,781 |
Meadowbank complex |
|
|
858,209 |
|
|
(524,008) |
|
|
— |
|
|
— |
|
|
334,201 |
Kittila mine |
|
|
448,719 |
|
|
(205,857) |
|
|
— |
|
|
— |
|
|
242,862 |
Detour Lake mine |
|
|
1,262,839 |
|
|
(453,498) |
|
|
— |
|
|
— |
|
|
809,341 |
Macassa mine |
|
|
431,827 |
|
|
(155,046) |
|
|
— |
|
|
(675,000) |
|
|
(398,219) |
Fosterville mine |
|
|
552,468 |
|
|
(131,298) |
|
|
— |
|
|
— |
|
|
421,170 |
Pinos Altos mine |
|
|
212,876 |
|
|
(145,936) |
|
|
— |
|
|
(112,000) |
|
|
(45,060) |
La India mine |
|
|
151,483 |
|
|
(96,490) |
|
|
— |
|
|
— |
|
|
54,993 |
Exploration |
|
|
— |
|
|
— |
|
|
(215,781) |
|
|
— |
|
|
(215,781) |
Segment totals |
|
$ |
6,626,909 |
|
$ |
(2,933,263) |
|
$ |
(215,781) |
|
$ |
(787,000) |
|
$ |
2,690,865 |
Total segments income |
|
|
|
|
|
|
|
|
|
|
|
|
|
$ |
2,690,865 |
Corporate and other: |
|
|
|
|
|
|
|
|
|
|
|
|
|
|
|
Amortization of property, plant and mine development |
|
|
|
|
|
|
|
|
|
|
|
|
|
|
(1,491,771) |
General and administrative |
|
|
|
|
|
|
|
|
|
|
|
|
|
|
(208,451) |
Finance costs |
|
|
|
|
|
|
|
|
|
|
|
|
|
|
(130,087) |
Gain on derivative financial instruments |
|
|
|
|
|
|
|
|
|
|
|
|
|
|
68,432 |
Foreign currency translation gain |
|
|
|
|
|
|
|
|
|
|
|
|
|
|
328 |
Care and maintenance |
|
|
|
|
|
|
|
|
|
|
|
|
|
|
(47,392) |
Revaluation gain |
|
|
|
|
|
|
|
|
|
|
|
|
|
|
1,543,414 |
Other expenses |
|
|
|
|
|
|
|
|
|
|
|
|
|
|
(66,269) |
Income before income and mining taxes |
|
|
|
|
|
|
|
|
|
|
|
|
|
$ |
2,359,069 |
60
AGNICO EAGLE MINES LIMITED
NOTES TO CONSOLIDATED FINANCIAL STATEMENTS (Continued)
(thousands of United States dollars, except share and per share amounts, unless otherwise indicated)
December 31, 2023
23.SEGMENTED INFORMATION (Continued)
|
|
Year Ended December 31, 2022 |
|||||||||||||
|
|
Revenues from |
|
|
|
|
Exploration and |
|
|
|
|
Segment |
|||
|
|
Mining |
|
Production |
|
Corporate |
|
Impairment |
|
Income |
|||||
|
|
Operations |
|
Costs |
|
Development |
|
Loss |
|
(Loss) |
|||||
LaRonde mine |
|
$ |
553,931 |
|
$ |
(213,393) |
|
$ |
— |
|
$ |
— |
|
$ |
340,538 |
LaRonde Zone 5 mine |
|
|
129,569 |
|
|
(72,096) |
|
|
— |
|
|
— |
|
|
57,473 |
Canadian Malartic complex |
|
|
575,938 |
|
|
(235,735) |
|
|
— |
|
|
— |
|
|
340,203 |
Goldex mine |
|
|
250,512 |
|
|
(103,830) |
|
|
— |
|
|
— |
|
|
146,682 |
Meliadine mine |
|
|
677,713 |
|
|
(318,141) |
|
|
— |
|
|
— |
|
|
359,572 |
Meadowbank complex |
|
|
645,021 |
|
|
(442,681) |
|
|
— |
|
|
— |
|
|
202,340 |
Kittila Mine |
|
|
407,669 |
|
|
(210,661) |
|
|
— |
|
|
— |
|
|
197,008 |
Detour Lake mine |
|
|
1,188,741 |
|
|
(489,703) |
|
|
— |
|
|
— |
|
|
699,038 |
Macassa mine |
|
|
327,028 |
|
|
(129,774) |
|
|
— |
|
|
— |
|
|
197,254 |
Fosterville mine |
|
|
645,371 |
|
|
(204,649) |
|
|
— |
|
|
— |
|
|
440,722 |
Pinos Altos mine |
|
|
199,830 |
|
|
(144,489) |
|
|
— |
|
|
— |
|
|
55,341 |
Creston Mascota mine |
|
|
4,476 |
|
|
(1,943) |
|
|
— |
|
|
— |
|
|
2,533 |
La India mine |
|
|
135,219 |
|
|
(76,226) |
|
|
— |
|
|
(55,000) |
|
|
3,993 |
Exploration |
|
|
144 |
|
|
— |
|
|
(271,117) |
|
|
— |
|
|
(270,973) |
Segment totals |
|
$ |
5,741,162 |
|
$ |
(2,643,321) |
|
$ |
(271,117) |
|
$ |
(55,000) |
|
$ |
2,771,724 |
Total segments income |
|
|
|
|
|
|
|
|
|
|
|
|
|
$ |
2,771,724 |
Corporate and other: |
|
|
|
|
|
|
|
|
|
|
|
|
|
|
|
Amortization of property, plant and mine development |
|
|
|
|
|
|
|
|
|
|
|
|
|
|
(1,094,691) |
General and administrative |
|
|
|
|
|
|
|
|
|
|
|
|
|
|
(220,861) |
Finance costs |
|
|
|
|
|
|
|
|
|
|
|
|
|
|
(82,935) |
Loss on derivative financial instruments |
|
|
|
|
|
|
|
|
|
|
|
|
|
|
(90,692) |
Foreign currency translation gain |
|
|
|
|
|
|
|
|
|
|
|
|
|
|
16,081 |
Care and maintenance |
|
|
|
|
|
|
|
|
|
|
|
|
|
|
(41,895) |
Other expenses |
|
|
|
|
|
|
|
|
|
|
|
|
|
|
(141,308) |
Income before income and mining taxes |
|
|
|
|
|
|
|
|
|
|
|
|
|
$ |
1,115,423 |
The following table sets out revenues from mining operations by geographic area(i):
|
|
Year Ended December 31, |
||||
|
|
2023 |
|
2022 |
||
Canada |
|
$ |
5,261,363 |
|
$ |
4,348,597 |
Australia |
|
|
552,468 |
|
|
645,371 |
Mexico |
|
|
364,359 |
|
|
339,525 |
Finland |
|
|
448,719 |
|
|
407,669 |
Total revenues from mining operations |
|
$ |
6,626,909 |
|
$ |
5,741,162 |
Note:
(i) Based on the location of the mine from which the product originated.
61
AGNICO EAGLE MINES LIMITED
NOTES TO CONSOLIDATED FINANCIAL STATEMENTS (Continued)
(thousands of United States dollars, except share and per share amounts, unless otherwise indicated)
December 31, 2023
23.SEGMENTED INFORMATION (Continued)
The following table sets out total assets by segment:
|
|
Total Assets as at |
||||
|
|
December 31, |
|
December 31, |
||
|
|
2023 |
|
2022 |
||
LaRonde mine |
|
$ |
1,031,331 |
|
$ |
987,821 |
LaRonde Zone 5 mine |
|
|
133,531 |
|
|
115,404 |
Canadian Malartic complex |
|
|
6,898,179 |
|
|
1,582,406 |
Goldex mine |
|
|
401,573 |
|
|
339,390 |
Meliadine mine |
|
|
2,356,234 |
|
|
2,323,873 |
Meadowbank complex |
|
|
1,346,911 |
|
|
1,387,335 |
Kittila mine |
|
|
1,685,400 |
|
|
1,647,353 |
Detour Lake mine |
|
|
9,353,435 |
|
|
9,120,416 |
Macassa mine |
|
|
1,638,864 |
|
|
2,266,891 |
Fosterville mine |
|
|
976,221 |
|
|
1,224,645 |
Pinos Altos mine |
|
|
406,834 |
|
|
463,823 |
Creston Mascota mine |
|
|
3,819 |
|
|
4,864 |
La India mine |
|
|
113,736 |
|
|
150,967 |
Exploration |
|
|
1,253,334 |
|
|
821,718 |
Corporate and other |
|
|
1,085,547 |
|
|
1,057,902 |
Total assets |
|
$ |
28,684,949 |
|
$ |
23,494,808 |
The following table sets out non-current assets by geographic area:
|
|
As at December 31, |
|
As at December 31, |
||
|
|
2023 |
|
2022 |
||
Canada |
|
$ |
23,049,670 |
|
$ |
18,068,878 |
Australia |
|
|
1,174,789 |
|
|
1,148,932 |
Mexico |
|
|
774,154 |
|
|
600,954 |
Finland |
|
|
1,471,378 |
|
|
1,469,917 |
Sweden |
|
|
14,970 |
|
|
14,970 |
United States |
|
|
8,836 |
|
|
11,098 |
Total non-current assets |
|
$ |
26,493,797 |
|
$ |
21,314,749 |
62
AGNICO EAGLE MINES LIMITED
NOTES TO CONSOLIDATED FINANCIAL STATEMENTS (Continued)
(thousands of United States dollars, except share and per share amounts, unless otherwise indicated)
December 31, 2023
23.SEGMENTED INFORMATION (Continued)
The following table sets out the carrying amount of goodwill by segment for the years ended December 31, 2023 and December 31, 2022:
|
|
|
|
|
|
|
|
Canadian |
|
|
|
|
|
|
|
|
|
|
|
|
|
|
|
Malartic |
|
|
|
|
|
|
|
|
|
Detour |
|
Macassa |
|
Complex |
|
Exploration |
|
Total |
|||||
Cost: |
|
|
|
|
|
|
|
|
|
|
|
|
|
|
|
Balance at December 31, 2022 |
|
$ |
1,215,444 |
|
$ |
420,887 |
|
$ |
597,792 |
|
$ |
60,000 |
|
$ |
2,294,123 |
Derecognition of previously held interest in joint operation |
|
|
— |
|
|
— |
|
|
(597,792) |
|
|
— |
|
|
(597,792) |
Acquisition (Note 5) |
|
|
— |
|
|
— |
|
|
2,882,228 |
|
|
— |
|
|
2,882,228 |
Balance at December 31, 2023 |
|
$ |
1,215,444 |
|
$ |
420,887 |
|
$ |
2,882,228 |
|
$ |
60,000 |
|
$ |
4,578,559 |
|
|
|
|
|
|
|
|
|
|
|
|
|
|
|
|
Accumulated impairment: |
|
|
|
|
|
|
|
|
|
|
|
|
|
|
|
Balance at December 31, 2022 |
|
$ |
— |
|
$ |
— |
|
$ |
(250,000) |
|
$ |
— |
|
$ |
(250,000) |
Derecognition of previously held interest in joint operation |
|
|
— |
|
|
— |
|
|
250,000 |
|
|
— |
|
|
250,000 |
Impairment of goodwill (Note 24) |
|
|
— |
|
|
(420,887) |
|
|
— |
|
|
— |
|
|
(420,887) |
Balance at December 31, 2023 |
|
$ |
— |
|
$ |
(420,887) |
|
$ |
— |
|
$ |
— |
|
$ |
(420,887) |
|
|
|
|
|
|
|
|
|
|
|
|
|
|
|
|
Carrying amount at December 31, 2022 |
|
$ |
1,215,444 |
|
$ |
420,887 |
|
$ |
347,792 |
|
$ |
60,000 |
|
$ |
2,044,123 |
Carrying amount at December 31, 2023 |
|
$ |
1,215,444 |
|
$ |
— |
|
$ |
2,882,228 |
|
$ |
60,000 |
|
$ |
4,157,672 |
The following table sets out capital expenditures by segment:
|
|
Year Ended December 31, |
||||
|
|
2023 |
|
2022 |
||
LaRonde mine |
|
$ |
122,917 |
|
$ |
152,584 |
LaRonde Zone 5 mine |
|
|
38,930 |
|
|
22,893 |
Canadian Malartic complex |
|
|
263,151 |
|
|
195,413 |
Goldex mine |
|
|
87,001 |
|
|
61,401 |
Meliadine mine |
|
|
191,011 |
|
|
155,100 |
Meadowbank complex |
|
|
128,063 |
|
|
141,451 |
Kittila mine |
|
|
82,301 |
|
|
106,369 |
Detour Lake mine |
|
|
422,668 |
|
|
394,132 |
Macassa mine |
|
|
146,259 |
|
|
122,473 |
Fosterville mine |
|
|
87,439 |
|
|
94,712 |
Pinos Altos mine |
|
|
36,498 |
|
|
53,270 |
La India mine |
|
|
266 |
|
|
16,391 |
Exploration |
|
|
27,316 |
|
|
14,332 |
Corporate and other |
|
|
20,309 |
|
|
7,716 |
Total capital expenditures |
|
$ |
1,654,129 |
|
$ |
1,538,237 |
63
AGNICO EAGLE MINES LIMITED
NOTES TO CONSOLIDATED FINANCIAL STATEMENTS (Continued)
(thousands of United States dollars, except share and per share amounts, unless otherwise indicated)
December 31, 2023
24.IMPAIRMENT
Impairment of Long Lived Assets
Recoverable amounts are determined on the basis of fair value less costs to dispose (“FVLCD") and are calculated by discounting the estimated future net cash flows of the respective mines and certain exploration projects within the respective CGUs. Certain mineralization outside of the discounted cashflow models is calculated by reference to comparable market transactions. The discounted cash flow approach uses significant unobservable inputs and is therefore considered a Level 3 fair value measurement under the fair value hierarchy. The key assumptions used in this assessment are consistent with the Company’s testing of goodwill impairment, as listed below.
Pinos Altos
In the fourth quarter of 2023, the Company determined that there was an indicator of impairment at the Pinos Altos CGU primarily due to an increase in its carrying value, increasing costs due to inflation, additional ground support required at the underground mine and the strengthening of the Mexican peso. The recoverable amount was calculated to be less than the carrying amount and an impairment loss of $112.0 million ($73.4 million net of tax) was recognized against the property, plant and mine development costs. After giving effect to the impairment, the carrying value of the Pinos Altos CGU was $299.5 million, as at December 31, 2023.
La India
In the fourth quarter of 2022, the Company determined that there was an indicator of impairment at the La India CGU primarily due to the depletion of the mineral reserves and resources as the project nears the end of its life, combined with rising input costs due to inflationary pressures and higher estimated costs to build and operate adjacent exploration projects. As at December 31, 2022, an impairment of $55.0 million ($52.7 million net of tax) was recognized on the property, plant and mine development costs at the La India CGU. After giving effect to the impairment, the carrying value of the La India CGU was $134.3 million, as at December 31, 2022.
Goodwill impairment tests
In the fourth quarter of 2023, the Company performed the annual goodwill impairment test as required by IAS 36. The estimated recoverable amount of each CGU was calculated under the FVLCD basis and compared to the carrying amount. The estimated recoverable amounts were calculated by discounting the estimated future net cash flows over the estimated life of the mine and, in certain circumstances, by reference to comparable market transactions.
Macassa
The recoverable amount as at December 31, 2023 for the Macassa CGU was calculated to be less than the carrying amount primarily due to an increase in its carrying value. As at December 31, 2023, an impairment loss of $675.0 million ($594.0 million net of tax) was recognized, of which $420.9 million was recognized against goodwill and $254.1 million ($173.2 million net of tax) was recognized against property, plant and mine development costs. After giving effect to the impairment, the carrying value of the Macassa CGU was $1,595.3 million, as at December 31, 2023.
64
AGNICO EAGLE MINES LIMITED
NOTES TO CONSOLIDATED FINANCIAL STATEMENTS (Continued)
(thousands of United States dollars, except share and per share amounts, unless otherwise indicated)
December 31, 2023
24.IMPAIRMENT (Continued)
Key Assumptions
The determination of the recoverable amount within level 3 of the fair value hierarchy, includes the following key applicable assumptions:
| ● | Discount rates were based on each asset group’s weighted average cost of capital (“WACC”), of which the two main components are the cost of equity and the after-tax cost of debt. Cost of equity was calculated based on the capital asset pricing model, incorporating the risk-free rate of return based on local government marketable bond yields as at the valuation date, the Company’s beta coefficient adjustment to the market equity risk premium based on the volatility of the Company’s return in relation to that of a comparable market portfolio, plus a size premium and Company-specific risk factors for each mine or project. Cost of debt was determined by applying an appropriate market indication of the Company’s borrowing capabilities and the corporate income tax rate applicable to each asset group’s jurisdiction; |
| ● | Gold price estimates were determined using forecasts of future prices prepared by industry analysts, which were available as at or close to the valuation date; |
| ● | Foreign exchange estimates are based on a combination of currency forward curves and estimates that reflect the outlooks of major global financial institutions; |
| ● | Estimated production levels, and future operating and capital costs are based on detailed life of mine plans and also take into account management’s expected development plans; |
| ● | Estimates of the fair value attributable to mineralization in excess of life of mine plans are based on various assumptions, including determination of the appropriate valuation method for mineralization and ascribing anticipated economics to mineralization in cases where only limited economic study has been completed; and |
| ● | Market participants may utilize a net asset value (“NAV”) multiple when companies trade at a market capitalization greater than the net present value (“NPV”) of their expected cash flows. The NAV multiple takes into account a variety of additional value factors such as the exploration potential of the mineral property to find and produce more metal than what is currently included in the LOM plan or reserve and resource estimates and the benefit of gold price optionality. The Company applied NAV multiples to the NPV of CGU’s that it judged to be appropriate. |
The range of key assumptions used in the impairment tests are summarized as set out below:
|
|
As at December 31, |
|
||
|
|
2023 |
|
2022 |
|
Gold price per oz |
|
$1,750 - $1,950 |
|
$1,700 - $1,800 |
|
WACC |
|
6.3% - 8.9 |
% |
5.8% - 9.7 |
% |
NAV multiple |
|
1.00x - 1.66x |
|
1.06x - 1.21x |
|
Foreign exchange rates |
|
US$0.77:C$1.00 to US$0.80:C$1.00 |
|
US$0.75:C$1.00 to US$0.80:C$1.00 |
|
Inflation |
|
2.0 |
% |
2.0 |
% |
65
AGNICO EAGLE MINES LIMITED
NOTES TO CONSOLIDATED FINANCIAL STATEMENTS (Continued)
(thousands of United States dollars, except share and per share amounts, unless otherwise indicated)
December 31, 2023
25.INCOME AND MINING TAXES
Income and mining taxes expense is made up of the following components:
|
|
Year Ended December 31, |
||||
|
|
2023 |
|
2022 |
||
Current income and mining taxes |
|
$ |
365,721 |
|
$ |
277,076 |
Deferred income and mining taxes: |
|
|
|
|
|
|
Origination and reversal of temporary differences |
|
|
52,041 |
|
|
168,098 |
Total income and mining taxes expense |
|
$ |
417,762 |
|
$ |
445,174 |
The income and mining taxes expense is different from the amount that would have been calculated by applying the Canadian statutory income tax rate as a result of the following:
|
|
Year Ended December 31, |
|
||||
|
|
2023 |
|
2022 |
|
||
Combined federal and composite provincial tax rates |
|
|
26 |
% |
|
26 |
% |
Expected income tax expense at statutory income tax rate |
|
$ |
613,358 |
|
$ |
290,010 |
|
Increase (decrease) in income and mining taxes resulting from: |
|
|
|
|
|
|
|
Mining taxes |
|
|
101,433 |
|
|
121,404 |
|
Impact of foreign tax rates and change in future tax rates |
|
|
23,460 |
|
|
(5,106) |
|
Permanent differences |
|
|
(300,567) |
|
|
32,231 |
|
Impact of foreign exchange on deferred income tax balances |
|
|
(45,412) |
|
|
6,635 |
|
Other |
|
|
25,490 |
|
|
— |
|
Total income and mining taxes expense |
|
$ |
417,762 |
|
$ |
445,174 |
|
The following table sets out the components of Agnico Eagle’s deferred income tax assets:
|
|
As at |
|
As at |
||
|
|
December 31, 2023 |
|
December 31, 2022 |
||
Mining properties |
|
$ |
28,388 |
|
$ |
(26,627) |
Net operating loss carry forwards |
|
|
— |
|
|
13,466 |
Mining taxes |
|
|
6,098 |
|
|
1,995 |
Reclamation provisions and other liabilities |
|
|
19,310 |
|
|
22,740 |
Total deferred income tax assets |
|
$ |
53,796 |
|
$ |
11,574 |
The following table sets out the components of Agnico Eagle’s deferred income and mining tax liabilities:
|
|
As at |
|
As at |
||
|
|
December 31, 2023 |
|
December 31, 2022 |
||
Mining properties |
|
$ |
4,960,289 |
|
$ |
4,115,221 |
Net operating and capital loss carry forwards |
|
|
(77,247) |
|
|
(49,394) |
Mining taxes |
|
|
308,157 |
|
|
195,249 |
Reclamation provisions and other liabilities |
|
|
(217,928) |
|
|
(279,201) |
Total deferred income and mining tax liabilities |
|
$ |
4,973,271 |
|
$ |
3,981,875 |
66
AGNICO EAGLE MINES LIMITED
NOTES TO CONSOLIDATED FINANCIAL STATEMENTS (Continued)
(thousands of United States dollars, except share and per share amounts, unless otherwise indicated)
December 31, 2023
25.INCOME AND MINING TAXES (Continued)
Changes in net deferred tax assets and liabilities for the years ended December 31, 2023 and 2022 are as follows:
|
|
As at |
|
As at |
||
|
|
December 31, 2023 |
|
December 31, 2022 |
||
Net deferred income and mining tax liabilities - beginning of year |
|
$ |
3,970,301 |
|
$ |
1,089,520 |
Income and mining tax impact recognized in net income |
|
|
52,041 |
|
|
168,109 |
Income tax impact recognized in other comprehensive income and equity |
|
|
984 |
|
|
(11,169) |
Deferred income tax liability acquired on Yamana Transaction (Note 6) |
|
|
896,149 |
|
|
— |
Deferred income tax liability acquired on the purchase of Kirkland (Note 6) |
|
|
— |
|
|
2,723,841 |
Net deferred income and mining tax liabilities - end of year |
|
$ |
4,919,475 |
|
$ |
3,970,301 |
The Company operates in different jurisdictions and, accordingly, it is subject to income and other taxes under the various tax regimes in the countries in which it operates. The tax rules and regulations in many countries are highly complex and subject to interpretation. The Company may be subject, in the future, to a review of its historic income and other tax filings and, in connection with such reviews, disputes can arise with the taxing authorities over the interpretation or application of certain tax rules and regulations to the Company’s business conducted within the country involved.
The deductible temporary differences in respect of which a deferred tax asset has not been recognized in the consolidated balance sheets are as follows:
|
|
As at |
|
As at |
||
|
|
December 31, 2023 |
|
December 31, 2022 |
||
Other deductible temporary differences |
|
$ |
1,485,481 |
|
$ |
1,012,924 |
The Company has $433.5 million (2022 — $962.0 million) of taxable temporary differences associated with its investments in subsidiaries for which deferred income tax has not been recognized, as the Company is able to control the timing of the reversal of the taxable temporary differences and it is probable that they will not reverse in the foreseeable future.
The Company is subject to taxes in Canada, Australia, Finland and Mexico, each with varying statutes of limitations. Prior taxation years generally remain subject to examination by applicable taxation authorities.
The Company is within the scope of the OECD Pillar Two model rules. As at December 31, 2023, Pillar Two legislation was enacted in some of the jurisdictions in which the Company’s entities are incorporated. The Pillar Two legislation in these jurisdictions came into effect from January 1, 2024. Since the Pillar Two legislation was not effective at the reporting date, the Company has no related current tax exposure.
The Company applies the exception to recognizing and disclosing information about deferred tax assets and liabilities related to Pillar Two income taxes, as provided in the amendments to IAS 12 issued in May 2023.
Under the legislation, the Company is liable to pay a top-up tax for the difference between their Global Anti-Base Erosion effective tax rate per jurisdiction and the 15% minimum rate. No material top-up tax is expected for the Company for fiscal years after December 31, 2023.
67
AGNICO EAGLE MINES LIMITED
NOTES TO CONSOLIDATED FINANCIAL STATEMENTS (Continued)
(thousands of United States dollars, except share and per share amounts, unless otherwise indicated)
December 31, 2023
26.EMPLOYEE BENEFITS AND COMPENSATION OF KEY MANAGEMENT PERSONNEL
During the year ended December 31, 2023, employee benefits expense recognized in the consolidated statements of income was $1,269.6 million (2022 — $1,113.9 million). In 2023 and 2022, there were no related party transactions other than compensation of key management personnel. Key management personnel include the members of the Board and the senior leadership team.
The following table sets out the compensation of key management personnel:
|
|
Year Ended December 31, |
||||
|
|
2023 |
|
2022 |
||
Salaries, short-term incentives and other benefits |
|
$ |
14,273 |
|
$ |
28,841 |
Post-employment benefits |
|
|
2,474 |
|
|
2,198 |
Share-based payments |
|
|
28,355 |
|
|
26,567 |
Total |
|
$ |
45,102 |
|
$ |
57,606 |
27.COMMITMENTS AND CONTINGENCIES
As part of its ongoing business and operations, the Company has been required to provide assurance in the form of letters of credit for environmental and site restoration costs, custom credits, government grants and other general corporate purposes. As at December 31, 2023, the total amount of these guarantees was $991.7 million.
Certain of the Company’s properties are subject to royalty arrangements. Set out below are the Company’s most significant royalty arrangements related to operating mines:
| ● | The Company has a royalty agreement with the Finnish government relating to the Kittila mine. Starting 12 months after the Kittila mine’s operations commenced, the Company has been required to pay 2.0% net smelter return royalty, defined as revenue less processing costs. |
| ● | The Company is committed to pay a royalty on production or metal sales from certain Canadian Malartic properties in Quebec, Canada. The type of royalty agreements include, but are not limited to, net smelter return royalties, with percentages ranging from 1.5% to 5.0%. |
| ● | The Company is committed to pay a 5.0% net profits interest royalty on production from the Terrex property at the LaRonde mine in Quebec, Canada. |
| ● | The Company is committed to pay a 2.0% net smelter return royalty on the metal sales from the LaRonde Zone 5 mine in Quebec, Canada. |
| ● | The Company is committed to pay a 1.2% net smelter return royalty on sales from the Meliadine mine in Nunavut, Canada. |
| ● | The Company is committed to two royalty arrangements on production from the Amaruq satellite deposit at the Meadowbank Complex in Nunavut, Canada; a 1.4% net smelter return royalty and a 12.0% net profits interest royalty. |
| ● | The Company is committed to three royalty arrangements on production from the Hope Bay property in Nunavut, Canada; two 1% net smelter return royalties and a 12% net profit interest royalty. |
68
AGNICO EAGLE MINES LIMITED
NOTES TO CONSOLIDATED FINANCIAL STATEMENTS (Continued)
(thousands of United States dollars, except share and per share amounts, unless otherwise indicated)
December 31, 2023
27.COMMITMENTS AND CONTINGENCIES (Continued)
| ● | The Company is committed to pay a royalty on production from certain properties in Mexico. The type of royalty agreements include, but are not limited to, net smelter return royalties, with percentages ranging from 2.5% to 3.5% at the Pinos Altos and Creston Mascota mines, and with percentages ranging from 2.0% to 3.0% at the La India mine. |
| ● | The Company is committed to various royalties on production from the Macassa mine in Ontario, Canada. The type of royalty agreements include, but are not limited to, net smelter return royalties, with percentages ranging from 0.5% to 1.5%. |
| ● | The Company is committed to various royalty arrangements at the Detour mine in Ontario, Canada, including a 0.5% and 2.0% net smelter return royalty on the gold sales and royalties based on gold price and annual revenues payable to relevant First Nations communities. |
| ● | The Company is committed to two royalty agreements on gold sales from the Fosterville mine in Victoria, Australia, comprising of a 2% net smelter return royalty and a 2.75% net smelter return royalty payable to the Victorian government. |
The Company also has certain payments associated with First Nation collaboration agreements at the Canadian Malartic and LaRonde complexes.
The Company regularly enters into various earn-in and shareholder agreements, often with commitments to pay net smelter return and other royalties.
The Company had the following contractual commitments as at December 31, 2023, of which $115.7 million related to capital expenditures:
|
|
Contractual |
|
|
|
Commitments |
|
2024 |
|
$ |
159,078 |
2025 |
|
|
18,747 |
2026 |
|
|
20,327 |
2027 |
|
|
6,452 |
2028 |
|
|
4,340 |
Thereafter |
|
|
7,063 |
Total |
|
$ |
216,007 |
In addition to the above, the Company has $290.0 million of committed subscription proceeds related to the San Nicolás project. (Note 5).
69
AGNICO EAGLE MINES LIMITED
NOTES TO CONSOLIDATED FINANCIAL STATEMENTS (Continued)
(thousands of United States dollars, except share and per share amounts, unless otherwise indicated)
December 31, 2023
28.ONGOING LITIGATION
Kirkland
Effective as of February 8, 2022, the Company acquired all the issued and outstanding shares of Kirkland in the Merger (Note 5). Kirkland had previously disclosed the existence of certain contingent liabilities relating to outstanding litigation matters involving Kirkland and/or its wholly owned subsidiaries, some of which were amalgamated as part of a pre-closing corporate reorganization completed in early February 2022. One litigation matter remains outstanding as at December 31, 2023. Management believes that the claim has no merit and intends to defend it vigorously. No amounts have been recorded for any potential liability and the Company believes that the likelihood of loss is undeterminable at this point.
Kirkland is the defendant in two putative class action complaints filed on June 29, 2020 and July 17, 2020 (and subsequently amended) in the United States District Court for the Southern District of New York (the “Court”). The complaints allege that during the period from January 8, 2018 to November 25, 2019, Kirkland and Kirkland’s former chief executive officer violated the United States securities laws by misrepresenting or failing to disclose material information regarding Kirkland’s acquisition of Detour Gold Corporation, which closed in January 2020.
Following motions filed by both individual complainants, the Court entered an order on September 24, 2020 appointing one lead plaintiff and one lead counsel. On January 22, 2021, Kirkland filed a motion to dismiss. On September 30, 2021, the Court dismissed certain of the plaintiff’s claims against Kirkland. Since then, the litigation has been proceeding through the customary litigation processes including discovery and class certification, which was heard in early October 2023, and no decision has been issued yet. The Company continues to believe that the one outstanding claim is without merit.
Kittila permits
In May 2020, the Regional State Administrative Agency of Northern Finland (the “RSAA”) granted Agnico Eagle Finland Oy (“Agnico Finland”) environmental and water permits that allowed Agnico Finland to enlarge its second carbon-in-leach (“CIL2”) tailings storage facility, expand the operations of the Kittila mine to 2.0 Mtpa and build a new discharge waterline. The permits were subsequently appealed by a third party to the Vaasa Administrative Court (the “VAC”). In July 2022, the appeals were granted, in part, with the result that the permits were returned for reconsideration to the RSAA.
In August 2022, Agnico Finland appealed the decisions of the VAC to the Supreme Administrative Court of Finland (the “SAC”) and requested that the SAC restore the permits through an interim decision pending the ultimate result of Agnico Finland’s appeal.
On November 1, 2022, the SAC issued an interim decision upholding the initial CIL2 tailings storage facility permit and restoring permitted nitrogen emission levels for the year 2022. However, the SAC interim decision didn’t uphold the permit for the expansion of the mine to 2.0 Mtpa. The VAC decision was valid until a final decision was issued by the SAC (see below).
On October 27, 2023, the SAC issued a decision that restored Kittila’s operating permits. As a result, the environmental and water permits granted to the Company in 2020 remain valid and production was able to continue at a rate of 2.0 Mtpa in accordance with the permit. The decision of the SAC is not subject to further appeal.
70
AGNICO EAGLE MINES LIMITED
NOTES TO CONSOLIDATED FINANCIAL STATEMENTS (Continued)
(thousands of United States dollars, except share and per share amounts, unless otherwise indicated)
December 31, 2023
29.SUBSEQUENT EVENTS
Dividends Declared
On February 15, 2024, Agnico Eagle announced that the Board approved the payment of a quarterly cash dividend of $0.40 per common share (a total value of approximately $198.9 million), payable on March 15, 2024 to holders of record of the common shares of the Company on March 1, 2024.
New Credit Facility
On February 12, 2024, the Company entered into the New Credit Facility with a group of financial institutions that provides the Company a $2.0 billion unsecured revolving credit facility. On the same day, the Company drew $200.0 million on the New Credit Facility and used the proceeds of such draw to repay the Old Credit Facility. The New Credit Facility matures and all indebtedness thereunder is due and payable on February 12, 2029. The New Credit Facility is available in US dollars through SOFR and base rate advances, or in Canadian dollars through CORRA and prime rate advances, priced at the applicable rate plus a margin that ranges from 0.00% to 2.00%. The New Credit Facility also provides for the issuance of letters of credit, priced at the applicable rate plus a margin that varies from 0.60% to 2.00%. The lenders under the New Credit Facility are each paid a standby fee at a rate that ranges from 0.09% to 0.25% of the undrawn portion of the New Credit Facility. In each case, the applicable margin or standby fees vary depending on the Company’s credit rating. The Company’s payment and performance of its obligations under the New Credit Facility are not guaranteed by any of its subsidiaries, however the Company must provide guarantees from certain of its subsidiaries if any existing indebtedness of the Company benefits from guarantees and the Company no longer maintains an investment grade credit rating, or if the Company incurs new indebtedness for borrowed money and provides guarantees of such new indebtedness from any of its subsidiaries. The New Credit Facility contains customary covenants limiting certain actions of the Company and its material subsidiaries, and customary events of default for a borrower with the Company’s credit profile. The Company is also required to maintain a total net debt to capitalization ratio below a specified maximum value.
Amendment to the Term Loan Facility
Contemporaneous with the execution of the New Credit Facility, the Company amended and restated its $600.0 million unsecured Term Loan Facility. The Term Loan Facility was amended to release the guarantees that had previously been delivered by certain of the Company’s subsidiaries, to provide that guarantees may be required in the future under the same conditions as noted above for the New Credit Facility, and to align the covenants, including the net debt to capitalization ratio, and the events of default with the more favourable covenants and events of default under the New Credit Facility. The Term Loan Facility matures and all indebtedness thereunder remains due and payable on April 21, 2025.
71
Exhibit 99.3
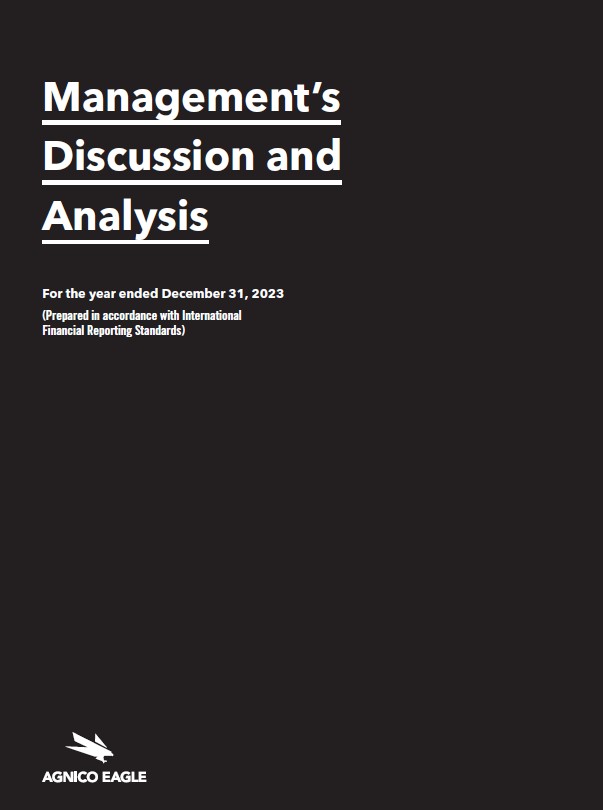
This Management’s Discussion and Analysis (“MD&A”) dated March 22, 2024 of Agnico Eagle Mines Limited (“Agnico Eagle” or the “Company”) should be read in conjunction with the Company’s consolidated annual financial statements for the year ended December 31, 2023 that were prepared in accordance with International Financial Reporting Standards (“IFRS”) as issued by the International Accounting Standards Board (“IASB”) (the “Annual Financial Statements”). The Annual Financial Statements and this MD&A are presented in United States dollars (“US dollars”, “$” or “US$”) and all units of measurement are expressed using the metric system unless otherwise specified. Certain information in this MD&A is presented in Canadian dollars (“C$”), Mexican pesos, European Union euros (“Euros” or “€”) or Australian dollars (“A$”). Additional information relating to the Company, including the Company’s Annual Information Form for the year ended December 31, 2023 (the “AIF”), is available on the Canadian Securities Administrators’ (the “CSA”) SEDAR website at www.sedarplus.ca and the Form 40-F is on file with the Securities and Exchange Commission (“SEC”) at www.sec.gov/edgar.
Certain statements contained in this MD&A, referred to herein as “forward-looking statements”, constitute “forward-looking information” under the provisions of Canadian provincial securities laws and constitute “forward-looking statements” within the meaning of the United States Private Securities Litigation Reform Act of 1995. See “Forward-Looking Statements” in this MD&A.
This MD&A discloses certain financial performance measures, including “total cash costs per ounce”, “all-in sustaining costs per ounce” (also referred to as “AISC per ounce”), “minesite costs per tonne”, “adjusted net income”, “adjusted net income per share”, “earnings before interest, taxes, depreciation and amortization” (also referred to as “EBITDA”), “adjusted earnings before interest, taxes, depreciation and amortization” (also referred to as “adjusted EBITDA”), “free cash flow”, “free cash flow before changes in non-cash components of working capital”, “sustaining capital expenditures”, “development capital expenditures” and “operating margin” that are not standardized measures under IFRS. These measures may not be comparable to similar measures reported by other gold producers. For a discussion of the composition and usefulness of these measures and reconciliation of each of them to the most directly comparable financial information presented in the annual consolidated financial statements prepared in accordance with IFRS, see “Non-GAAP Financial Performance Measures” in this MD&A.
This MD&A also contains information as to estimated future total cash costs per ounce, AISC per ounce and minesite costs per tonne. The estimates are based upon the total cash costs per ounce, AISC per ounce and minesite costs per tonne that the Company expects to incur to mine gold at its mines and projects and, consistent with the reconciliation of these actual costs referred to below under “Non-GAAP Financial Performance Measures”, do not include production costs attributable to accretion expense and other asset retirement costs, which will vary over time as each project is developed and mined. It is therefore not practicable to reconcile these forward-looking non-GAAP financial measures to the most comparable IFRS measure.
Payable production (a non-GAAP non-financial performance measure) is the quantity of mineral produced during a period contained in products that have been or will be sold by the Company, whether such products are sold during the period or held as inventories at the end of the period. Unless otherwise stated per ounce measures such as “production costs per ounce”, “total cash costs per ounce” and “AISC per ounce” are reported on a “per ounce of gold produced” basis.
The mineral reserve and mineral resource estimates contained in this MD&A have been prepared in accordance with the Canadian Securities Administrators’ (the “CSA”) National Instrument 43-101 “Standards of Disclosure for Mineral Projects” (“NI 43-101”). See “Note to Investors Concerning Estimates of Mineral Reserves and Mineral Resources”.
Meaning of ‘‘including’’ and ‘‘such as’’: When used in this MD&A the terms ‘‘including’’ and ‘‘such as’’ mean including and such as, without limitation.
Agnico Eagle is a senior Canadian gold mining company that has produced precious metals since its formation in 1972. The Company’s mines are located in Canada, Australia, Finland and Mexico, with exploration and development activities in these countries as well as the United States. The Company and its shareholders have full exposure to gold prices due to the Company’s long-standing policy of no forward gold sales. Agnico Eagle has declared a cash dividend every year since 1983.
Agnico Eagle earns a significant proportion of its revenue and cash flow from the production and sale of gold in both dore bar and concentrate form. The remainder of revenue and cash flow is generated by the production and sale of by-product metals, primarily silver, zinc and copper. In 2023, Agnico Eagle recorded production costs per ounce of $853 and total cash costs per ounce(i) of $865 on a by-product basis and $893 on a co-product basis on payable production of 3,439,654 ounces of gold. The average realized price of gold increased by 8.3% from $1,797 per ounce in 2022 to $1,946 per ounce of payable production in 2023.
Agnico Eagle’s operating mines and development projects are located in what the Company believes to be politically stable countries that are supportive of the mining industry. The political stability of the regions in which Agnico Eagle operates helps to provide confidence in its current and future prospects and profitability. This is important for Agnico Eagle as it believes that many of its new mines and recently acquired mining projects have long-term mining potential.
Highlights
| ● | On March 31, 2023, the Company completed the acquisition (the “Yamana Transaction”) of all of Yamana Gold Inc.’s (“Yamana”) Canadian assets under a plan of arrangement pursuant to which Pan American Silver Corp. (“Pan American”) acquired all of the common shares of Yamana and Yamana sold all of its Canadian assets to the Company. The assets acquired included the 50% of the Canadian Malartic complex that the Company did not own, a 100% interest in the Wasamac project, located in the Abitibi region of Quebec, and several other exploration properties located in Ontario and Manitoba. |
| ● | On April 6, 2023, Agnico Eagle and Teck Resources Limited (“Teck”) entered into a joint venture shareholders' agreement in respect of the San Nicolás copper-zinc development project located in Zacatecas, Mexico. |
| ● | On October 27, 2023, the Supreme Administrative Court of Finland (“SAC”) issued a decision that restored Kittila's operating permits. As a result, the environmental and water permits granted to the Company in 2020 remain valid and production was able to continue at a rate of 2.0 million tonnes per annum (“mtpa”) in accordance with the permit. |
| ● | Strong operational performance with payable production of 3,439,654 ounces of gold and production costs per ounce of gold of $853 during 2023. |
| ● | Total cash costs per ounce in 2023 of $865 on a by-product basis and $893 on a co-product basis. |
| ● | All-in sustaining costs(ii) in 2023 of $1,179 on a by-product basis and $1,207 on a co-product basis. |
| ● | Proven and probable gold mineral reserves totaled 53.8 million ounces at December 31, 2023, a 10.5% increase compared with 48.7 million ounces at December 31, 2022. |
| ● | In 2023, the Company recognized an impairment loss (net of tax) of $667.4 million, of which $594.0 million related to the Macassa mine and $73.4 million related to the Pinos Altos mine. |
Notes:
| (i) | Total cash costs per ounce on both a by-product and co-product basis are non-GAAP measures that are not standardized financial measures under IFRS. For a reconciliation to production costs see “Non-GAAP Financial Performance Measures” below. Unless otherwise stated, in this MD&A, total cash costs per ounce is reported on a by-product basis. |
| (ii) | All-in sustaining costs per ounce is a non-GAAP measure that is not a standardized financial measure under IFRS. For a reconciliation to production costs and a discussion of the composition and usefulness of this non-GAAP measure see “Non-GAAP Financial Performance Measures”. Unless otherwise stated, in this MD&A, all-in sustaining cost per ounce is reported on a by-product basis. |
1
| ● | As at December 31, 2023, Agnico Eagle had strong liquidity with $348.8 million in cash and cash equivalents and short-term investments along with approximately $1.2 billion in undrawn credit lines. |
| ● | The Company’s operations are located in mining-friendly regions that the Company believes have low political risk and long-term mining potential. |
| ● | The Company continues to maintain its investment grade credit rating and believes it has adequate financial flexibility to finance capital requirements at its mines and development projects from operating cash flow, cash and cash equivalents, short-term investments and undrawn credit lines. |
| ● | In February 2024, the Company replaced its $1.2 billion unsecured revolving bank credit facility with a new $2.0 billion unsecured revolving bank credit facility, including an increased uncommitted accordion feature of $1.0 billion, and having a maturity date of February 12, 2029. |
| ● | As at December 31, 2023 and March 15, 2024, the Company’s issued and outstanding common shares were 497,970,524 and 498,940,643, respectively. |
| ● | In February 2024, the Company declared a quarterly cash dividend of $0.40 per common share. Agnico Eagle has declared a cash dividend every year since 1983. |
Agnico Eagle’s ability to consistently execute its business strategy has provided a solid foundation for growth.
The Company’s goals are to:
| ● | Deliver on performance and growth expectations: Ensure our existing portfolio delivers on expectations, lowers operational risk and generates free cash flow; |
| ● | Build and maintain a high-quality project pipeline: Ensure we develop a best-in-class project pipeline to replenish reserves and production, while maintaining the quality, manageability and fit of our future portfolio; |
| ● | Develop our people: Develop and provide growth opportunities for our people and provide the skills infrastructure to support the development of our operations and projects; |
| ● | Operate in a safe, socially and environmentally responsible manner: Create value for our shareholders while operating in a safe, socially and environmentally responsible manner, as we contribute to the prosperity of our people, their families and the communities in which we operate. |
The three pillars - performance, pipeline, people - form the basis of Agnico Eagle’s success and competitive advantage. By delivering on these pillars, the Company strives to continue to build its production base and generate increased value for shareholders, while operating in a safe, socially and environmentally responsible manner, as we contribute to the prosperity of our people, their families and the communities in which we operate.
2
2023 Developments
Acquisition of the Canadian Assets of Yamana
On March 31, 2023, the Company closed the Yamana Transaction under an arrangement agreement with Yamana and Pan American pursuant to which Pan American acquired all of the issued and outstanding common shares of Yamana and Yamana sold the subsidiaries and partnerships that held Yamana’s interests in its Canadian assets to Agnico Eagle, including the 50% of the Canadian Malartic complex that the Company did not own, a 100% interest in the Wasamac project, located in the Abitibi region of Quebec; and several other exploration properties located in Ontario and Manitoba. The consideration paid by the Company in the Yamana Transaction consisted of approximately US$1.0 billion in cash and 36,177,931 common shares of Agnico Eagle. The acquisition increased the Company’s production, mineral reserves and cash flow. The results of operations, cash flows and net assets of the Canadian assets of Yamana have been consolidated with those of the Company from March 31, 2023 onward.
San Nicolás Copper-Zinc Project Joint Arrangement
On April 6, 2023, Agnico Eagle and Teck entered into a joint venture shareholders agreement in respect of the San Nicolás copper-zinc development project located in Zacatecas, Mexico. The agreement provides that Agnico Eagle, through a wholly-owned Mexican subsidiary, will subscribe for a 50% interest in Minas de San Nicolás, S.A.P.I. de C.V. (“MSN”) for $580.0 million, to be contributed as study and development costs are incurred by MSN. For governance purposes, the agreement treats Agnico Eagle as a 50% shareholder of MSN regardless of the number of shares that have been issued to Agnico Eagle or its affiliates, except in certain circumstances of default. On closing of the transaction, the Company recorded the initial acquisition of the mineral property and a $265.1 million liability representing the minimum unavoidable obligation under the agreement. For the year ended December 31, 2023, the Company has recorded contributions of $11.0 million against the $290.0 million obligation. MSN submitted an Environmental Impact Assessment and permit application for the San Nicolas project in January 2024 and is targeting completion of a feasibility study in 2025.
Normal Course Issuer Bid
On May 2, 2023, the Company received approval from the Toronto Stock Exchange (“TSX”) to renew its normal course issuer bid (the “NCIB”), pursuant to which the Company may purchase up to $500.0 million of its common shares subject to a maximum of 5% of its issued and outstanding common shares. Under the NCIB, the Company may purchase such common shares on the open market at its discretion, during the period commencing on May 4, 2023 and ending on May 3, 2024. Purchases under the NCIB will be made through the facilities of the TSX, the NYSE or other designated exchanges and alternative trading systems in Canada and the United States in accordance with applicable regulatory requirements. All common shares purchased under the NCIB will be cancelled. Shareholders may obtain a copy of the notice of intention to make an NCIB, without charge, by contacting the Company.
Term Loan Facility
On April 20, 2023, the Company entered into a credit agreement with two financial institutions that provides a $600.0 million unsecured term credit facility (the “Term Loan Facility”). The Company drew the full amount of the Term Loan Facility on April 28, 2023. The Term Loan Facility matures and all indebtedness thereunder is due and payable on April 21, 2025. The Term Loan Facility is available as a single advance in US dollars through Secured Overnight Financing Rate (“SOFR”) and base rate advances, priced at the applicable rate plus a margin that ranges from 0.00% to 2.00%, depending on the Company’s credit rating. Payment and performance of the Company’s obligations under the Term Loan Facility are guaranteed by certain of its material subsidiaries (the “Guarantors” and, together with the Company, each an “Obligor”).
The Term Loan Facility contained covenants that limit the actions of an Obligor in the same manner and to the same extent as the Obligors are limited under the Company’s previous $1.2 billion unsecured revolving credit facility (the “Old Credit Facility”). The Company was also required to maintain a total net debt to EBITDA ratio below a specified maximum value. The events of default under the Term Loan Facility were the same as the events of default under the Old Credit Facility.
On February 12, 2024, the Term Loan Facility was amended to align the covenants, including the net debt to EBITDA ratio covenant, and the events of default with those of the New Credit Facility (defined below).
3
New Credit Facility
On February 12, 2024, the Company entered into a credit agreement with a group of financial institutions that provides a $2.0 billion unsecured revolving credit facility (the “New Credit Facility”). On the same day, the Company drew $200.0 million on the New Credit Facility and used the proceeds of such draw to repay and terminate the Old Credit Facility. The New Credit Facility matures and all indebtedness thereunder is due and payable on February 12, 2029. See “Liquidity and Capital Resources - Financing Activities”.
Canada - LaRonde Complex
The 100% owned LaRonde complex in northwestern Quebec includes the LaRonde mine and the LaRonde Zone 5 mine (“LZ5”). The LaRonde mine is the Company’s oldest operating mine and achieved commercial production in 1988. In 2003, the Company acquired LZ5, which lies adjacent to and west of the LaRonde mine and was an open pit operation under a previous owner. The LZ5 mine achieved commercial production in June 2018 as an underground operation with ore processed at the LaRonde complex’s processing facilities.
Ore is processed at the LaRonde mill, which includes copper and zinc flotation circuits as well as precious metals recovery and refining facilities. The mill produces doré bars containing gold and silver, as well as zinc and copper concentrates with additional gold and silver. The plant has a daily capacity of 7,000 tonnes of ore and has been expanded four times since it opened in 1988. In addition, a dedicated 2,000-tonnes/day carbon-in-leach (“CIL”) processing facility has the capacity to treat ore and refine concentrates into doré bars.
LaRonde Mine
The LaRonde mine extension, the portion of the mine below level 245, achieved commercial production in December 2011, and under current mine plans is expected to be in production through 2034. Access to LaRonde’s underground mining operation is through the 2,250-metre-deep Penna Shaft, which was completed in 2000. An internal winze is used to hoist materials from depth to facilities on level 215, approximately 2,150 metres below surface.
The LaRonde mine has gradually been implementing automation for its production activities and is increasingly relying on automated technology.
The risk of more frequent and larger seismic events has increased as the Company mines deeper at LaRonde. The Company continues to adjust its mining methods, ground support and protocols to address seismic activity in the deeper portions of the mine, refer to the operations outlook section below for additional details.
The LaRonde mine’s proven and probable mineral reserves were approximately 2.2 million ounces at December 31, 2023.
LaRonde Zone 5 Mine
In 2003, the Company acquired the Bousquet property, which adjoins the LaRonde mine to the west and hosts the Bousquet Zone 5 deposit. Commercial production at LZ5 was achieved in June 2018 and, under current mine plans, is expected to be in production through 2032. LZ5 is mined from underground ramp access.
The LZ5 mine has gradually been implementing automation for its production activities and is increasingly relying on automated technology.
The LZ5 mine’s proven and probable mineral reserves were approximately 0.6 million ounces at December 31, 2023.
4
Canada - Canadian Malartic Complex
The 100% owned Canadian Malartic complex is located within the town of Malartic, Quebec, approximately 25 kilometres west of the City of Val-d’Or and 80 kilometres east of City of Rouyn-Noranda. In 2014, Agnico Eagle acquired 50% of the Canadian Malartic complex, which was held jointly with Yamana through the Canadian Malartic General Partnership. On March 31, 2023, following the completion of the Yamana Transaction, Agnico Eagle now owns 100% of the Canadian Malartic complex.
The Canadian Malartic complex is comprised of the open-pit Canadian Malartic mine and the underground Odyssey mine and a processing plant.
Under current mine plans, the Company expects the complex will be in production through 2042.
Canadian Malartic has historically been a large open-pit operation using large-scale excavators and trucks. The Canadian Malartic pit was depleted in 2023 and open pit operations continue at the Barnat pit. Mining at the Odyssey project will be done using underground methods. The mine design at the Odyssey project includes a 1,800 metre deep production-services shaft with an expected capacity of approximately 20,000 tonnes of ore per day once commissioned. During the second quarter of 2023, production using the ramp at the Odyssey South deposit commenced.
Ore is processed at the Canadian Malartic mineral processing complex, which has a 60,000 tonnes per day nominal throughput capacity.
Agnico Eagle’s proven and probable mineral reserves at December 31, 2023 at the Canadian Malartic complex were approximately 7.9 million ounces, including 5.2 million ounces at the East Gouldie deposit.
Canada - Goldex Mine
The 100% owned Goldex mine is located in the city of Val d’Or in northwestern Quebec, approximately 60 kilometres and 25 kilometres east of the Company’s LaRonde and Canadian Malartic complexes, respectively, and achieved commercial production from the M and E satellite zones in October 2013. The Deep 1 Zone achieved commercial production in July 2017. Production from the Deep 1 Zone is expected to extend Goldex’s mine life through 2031 under current mine plans.
Ore from the Goldex mine is treated using a two-stage crushing process, followed by a two-stage grinding circuit that consists of a semi-autogenous grinding mill and a ball mill.
During the second quarter of 2022, the Company approved the development of the Akasaba West project. The Akasaba West project is located approximately 30 kilometres from the Goldex mine and is expected to contribute approximately 1,500 tonnes of ore per day to throughput at the mill. Shipment of ore for processing commenced during the fourth quarter of 2023. Ore from the Akasaba West project will be processed at the Goldex mill.
The Goldex mine’s proven and probable mineral reserves were approximately 0.9 million ounces at December 31, 2023. The Akasaba West project’s proven and probable mineral reserves were approximately 0.1 million ounces at December 31, 2023.
Canada – Meliadine Mine
In 2010, Agnico Eagle acquired its 100% interest in the Meliadine mine project in Nunavut, Canada through its acquisition of Comaplex Minerals Corp. The Meliadine mine is located near the western shore of Hudson Bay in the Kivalliq region of Nunavut, approximately 25 kilometres north of the hamlet of Rankin Inlet and 290 kilometres southeast of the Meadowbank complex.
Commercial production was achieved at the Meliadine mine in May 2019. In 2020, the Company’s Board of Directors (‘‘Board’’) approved the Phase 2 expansion at Meliadine which accelerated the development of the Tiriganiaq open pit, where commercial production was achieved in 2021. Under current mine plans, the Meliadine mine is expected to be in production through 2032.
5
Over the course of its planned operations, mining at Meliadine will be carried out through ten open pits and two underground mining operations. Underground access is by decline, with long-hole mining methods. The mill employs a conventional gold circuit comprising crushing, grinding, gravity separation and cyanide leaching with a carbon-in-leach circuit, followed by cyanide destruction and filtration of the tailings for dry stacking. In 2023, milling rates averaged 5,255 tonnes per day. The Phase 2 mill expansion project, with targeted completion in mid-2024, is expected to increase throughput to 6,000 tonnes per day.
The Meliadine mine’s proven and probable mineral reserves were approximately 3.5 million ounces at December 31, 2023.
Canada - Meadowbank Complex
In 2007, the Company acquired Cumberland Resources Ltd., which held a 100% interest in the Meadowbank gold project in Nunavut, Canada. Commercial production was achieved at the Meadowbank mine in March 2010. Mining operations at the Meadowbank site ceased in 2019, but the Meadowbank mill and other infrastructure remain active in support of operations at the Amaruq deposit.
The 100% owned Amaruq deposit is located approximately 50 kilometres northwest of the Meadowbank mine and was approved for development in 2016. A 64-kilometre road from the Meadowbank site to the Amaruq deposit was completed in August 2017 and it was widened for ore haulage in November 2018. Ore from the Amaruq satellite deposit is hauled to the Meadowbank mill using long haul off-road type trucks. Commercial production was achieved at the Amaruq satellite deposit in September 2019 and at the Amaruq underground deposit in August 2022. Under current mine plans, the Amaruq deposit is expected to be in production through 2028.
The Amaruq mining operation uses the existing infrastructure at the Meadowbank mine, including the mill, tailings facilities, camp and airstrip. The process design at the Meadowbank mill consists of two-stage crushing, grinding, gravity concentration, cyanide leaching and gold recovery in a carbon-in-pulp circuit with a current capacity of 9,840 tonnes processed per day.
The Meadowbank complex’s proven and probable mineral reserves were approximately 1.8 million ounces at December 31, 2023.
Canada - Hope Bay Project
On February 2, 2021, Agnico Eagle completed the acquisition of TMAC Resources Inc. (“TMAC”) comprising a 100% interest in the Hope Bay property, which is located in the Kitikmeot region of Nunavut. The 80-kilometre long Hope Bay greenstone belt hosts three gold deposits (Doris, Madrid and Boston), with historical mineral reserves and mineral resources and over 90 regional exploration targets.
In late September 2021 and again in mid-October 2021, there were a significant number of COVID-19 cases identified at site. As a precautionary measure, the Company decided to suspend mining and milling operations. The Company started to ramp-up exploration and underground activities in mid-November 2021. However, with increasing cases of COVID-19 in December 2021, the Company again reduced all activities at site to essential services only.
The Company suspended production activities at the Hope Bay project in February 2022 and since that time the Company’s primary focus on the project is to accelerate exploration activities and the evaluation of larger production scenarios.
The Hope Bay project’s proven and probable mineral reserves were approximately 3.4 million ounces at December 31, 2023.
Finland - Kittila Mine
The 100% owned Kittila mine in northern Finland was added to the Company’s portfolio through the acquisition of Riddarhyttan Resources AB in 2005. The Kittila mine is located in the Lapland region of northern Finland, approximately 900 kilometres north of Helsinki and 150 kilometres north of the Arctic Circle. Construction at the Kittila mine was completed in 2008 and commercial production was achieved in May 2009. Under current mine plans, the Kittila mine is expected to be in production through 2035.
Ore is treated by grinding, flotation, pressure oxidation, and carbon-in-leach circuits. Ore is processed in a surface processing plant with a current capacity of 6,000 tonnes per day.
6
In February 2018, the Board approved an expansion to increase throughput rates at Kittila to 2.0 mtpa from the current rate of 1.6 mtpa. This expansion includes the construction of a 1,044-metre deep shaft, a processing plant expansion as well as other infrastructure and service upgrades.
Shaft sinking was completed in the third quarter of 2022, the construction and commissioning of a nitrogen removal plant was completed in the fourth quarter of 2022. The installation and commissioning of the production and service hoists was completed in the third quarter of 2023.
In 2020, Agnico Eagle Finland Oy (“Agnico Finland”) was granted environmental and water permits necessary to enlarge the CIL2 tailings storage facility, expand the operations to 2.0 mtpa and build a new discharge waterline. These permits were subsequently appealed to various levels of superior courts but, in October 2023, were ultimately found to be valid by the Supreme Administrative Court of Finland (“SAC”). Prior to the SAC’s final decision, the Company reduced its underground production levels to comply with the mining volume requirements, operating under the previous mining permit at a 1.6 mtpa rate though maintaining operational flexibility to reach the 2.0 mtpa volume if permitted. On October 27, 2023, the SAC confirmed that the permits granted to Agnico Finland were valid and production could proceed at a rate of 2.0 mtpa in accordance with the permit. The mining rate for the full year of 2023 was 2.0 mtpa.
Proven and probable mineral reserves at the Kittila mine were approximately 3.6 million ounces at December 31, 2023.
Canada - Detour Lake Mine
The Detour Lake mine is located in northeastern Ontario, approximately 300 kilometres northeast of Timmins and 185 kilometres by road northeast of Cochrane, within the northernmost portion of the Abitibi Greenstone Belt. The Company acquired its 100% interest in the Detour Lake mine on February 8, 2022 as a result of the merger of equals (the “Merger”) by way of plan of arrangement with Kirkland Lake Gold Ltd., and, under current mine plans, it is expected to be in production through 2052.
Conventional truck-shovel open pit mining methods are used to mine the Detour Lake deposit, using large scale equipment. The milling operation uses a conventional crushing, grinding, gravity, cyanidation and carbon-in-pulp processing facility currently operating at approximately 24 million tonnes per year, with the Company targeting increasing this rate to 28 million tonnes per year late in the second half of 2024.
The West Detour project is a proposed expansion of the Detour Lake mine. The project is intended to provide additional ore to feed the existing Detour Lake processing plant by developing two satellite open pits and the additional westward expansion of the currently operating open pit.
The Detour Lake mine’s proven and probable mineral reserves were approximately 19.9 million ounces at December 31, 2023.
Canada - Macassa Mine
The 100% owned Macassa mine, located in the historic gold mining region of Kirkland Lake, Ontario, was acquired as a result of the Merger. Production at Macassa first commenced in 1933, with the mine being operated continuously until 1999, when operations were suspended due to low gold prices. Production resumed in 2002 and in 2005, the South Mine Complex (“SMC”) was discovered. The SMC is a high-grade zone that resulted in significant grade improvement at the mine and an increase in production levels above historic averages. Macassa was among the first mines globally to introduce battery-electric vehicles. Under current mine plans, the Macassa mine is expected to be in production through 2030.
Macassa is primarily mined from underground shaft access. In 2023, as part of the optimization efforts, the Company incorporated the sourcing of additional production from near surface deposits at Macassa and the neighbouring Amalgamated Kirkland deposits to its production profile and guidance. Both of these areas are accessible from a shallow ramp at the Macassa mine.
7
During the first quarter of 2023, the Company completed the commissioning of Shaft#4, a 21.5-foot diameter, concrete-lined shaft that is expected to, among other things, enable more effective underground exploration to the east of the SMC, improve ventilation and general working conditions in the mine, and support higher levels of production and lower unit costs. The new four-compartment shaft will have a total hoisting capacity of 4,000 tonnes per day (ore and waste) and is an important component of the plan to increase production at Macassa.
Ore is processed on-site at the Macassa mill which has capacity to process 1,650 tonnes of ore per day.
The Macassa mine’s proven and probable mineral reserves were approximately 2.1 million ounces at December 31, 2023.
Canada - Kirkland Lake Project
The Company acquired 50% of the Kirkland Lake project in 2014 as part of its initial acquisition of the Canadian Malartic complex and, in 2018, acquired the remaining 50% that it did not already own, resulting in Agnico Eagle’s 100% ownership of the project.
The Kirkland Lake project is comprised of the Upper Canada and Upper Beaver properties. The Upper Beaver deposit is located approximately 27 kilometres from the Macassa mine. The Upper Canada deposit lies approximately 6 kilometres southwest of the Upper Beaver property, and 1.6 kilometres north of the main Larder Lake-Cadillac Deformation Zone, within a 300 to 400-metre-wide strongly altered deformation corridor. The properties lie within the southern Abitibi Greenstone Belt of the Superior Province of the Canadian Shield, approximately 110 kilometres west of Agnico Eagle’s LaRonde mine.
The Upper Beaver deposit’s proven and probable mineral reserves were approximately 1.4 million ounces at December 31, 2023. No proven and probable mineral reserves have been declared at the Upper Canada project.
Canada - Hammond Reef Project
The Company acquired 50% of the Hammond Reef project in 2014 as part of its initial acquisition of the Canadian Malartic complex and, in 2018, acquired the remaining 50% that it did not already own, resulting in Agnico Eagle’s 100% ownership of the project. The property covers approximately 32,070 hectares and is located in Northwestern Ontario approximately 260 kilometres west of Thunder Bay. The property is accessible via secondary gravel roads from the town of Atikokan, which is located approximately 30 kilometres to the southwest.
The Hammond Reef deposit is a high tonnage, low grade gold deposit that is primarily hosted in variably sheared and altered granitoid rocks. Gold mineralization is typically associated with fine grained pyrite mineralization that is often associated with fractures, veinlets and veins filled with various combinations of chlorite, calcite and quartz.
In January 2020, the Company purchased a 2% net smelter royalty (“NSR”) on the Hammond Reef project from Kinross Gold Corporation for $12.0 million. The property remains subject to a 2% NSR held by Osisko Royalties.
The Hammond Reef deposit’s proven and probable mineral reserves were approximately 3.3 million ounces at December 31, 2023.
Australia - Fosterville Mine
The Fosterville mine is located approximately 20 kilometres northeast of the city of Bendigo and 130 kilometres north of the city of Melbourne in Victoria, Australia. The Company acquired its 100% interest in the Fosterville mine on February 8, 2022 as a result of the Merger and, under current mine plans, it is expected to be in production through 2033.
The mine is located in an area with well-developed infrastructure and is accessible by paved roads. Access to the underground workings is through two portals, located in the Ellesmere and Falcon open pits. Underground mining is conducted using a conventional fleet including jumbo trucks, production drills, loaders, trucks and ancillary equipment. Ore is processed at the Fosterville mill which has a capacity of 2,275 tonnes per day.
The Fosterville property includes approximately 1,400 sq. kilometres of additional land package with numerous brownfield and greenfield exploration targets that are a key aspect of the Company’s ongoing exploration efforts.
8
The Fosterville mine’s proven and probable mineral reserves were approximately 1.7 million ounces at December 31, 2023.
Mexico - Pinos Altos Mine
In 2006, the Company completed the acquisition of the Pinos Altos property in northern Mexico, which was then an advanced stage exploration property. Commercial production was achieved at the Pinos Altos mine in November 2009 and, under current mine plans, the mine is expected to be in production through 2028. A shaft sinking project was completed in June 2016 at the Pinos Altos mine and during 2018, the site transitioned into being a predominantly underground mining operation.
In 2020, the Company started underground and open pit production at Sinter, located approximately 2 kilometres northwest of the Pinos Altos minesite and depleted the Bravo pit at Creston Mascota in the third quarter of 2020, with residual gold leaching continuing through 2023.
Initial production at the Cubiro satellite deposit is expected in the second half of 2024. Once production commences, Cubiro is expected to provide additional production flexibility to the Pinos Altos operations.
At Reyna de Plata, open pit pre-stripping activities at Pit 1 were completed in the fourth quarter of 2022 and ore production commenced as planned.
Ore from the Pinos Altos mine is treated by one of two processes: conventional processing in a mill for higher-grade ore; and heap-leaching for lower grade ore. The conventional, 5,500 tonnes per day processing plant includes circuits for crushing, grinding, gravity concentration and agitated leaching followed by counter-current decantation.
The Pinos Altos mine’s proven and probable mineral reserves (including satellite deposits) were approximately 0.5 million ounces at December 31, 2023.
Mexico - La India Mine
Agnico Eagle acquired 100% of La India project, which is located approximately 70 kilometres northwest of the Pinos Altos mine and approximately 200 kilometres east of Hermosillo in Sonora, northern Mexico in January 2012. Commercial production was achieved in February 2014. Mining operation ceased during the fourth quarter of 2023 and processing activities of ore currently stacked on the heap leach pads is expected to continue through 2024.
The La India mine’s proven and probable mineral reserves (including satellite deposits) were fully mined as of December 31, 2023 and residual gold is expected to be produced from ore currently stacked on the heap leach pads.
The key drivers of financial performance for Agnico Eagle for the year-ended December 31, 2023 include:
| ● | the spot price of gold, silver, zinc and copper; |
| ● | production volumes; |
| ● | production costs; and |
| ● | US dollar/Canadian dollar, US dollar/Australian dollar, US dollar/Euro and US dollar/Mexican peso exchange rates. |
Details on future drivers of financial performance are discussed in the Outlook section of this MD&A.
9
Spot Price of Gold, Silver, Zinc and Copper
GOLD ($ per ounce)
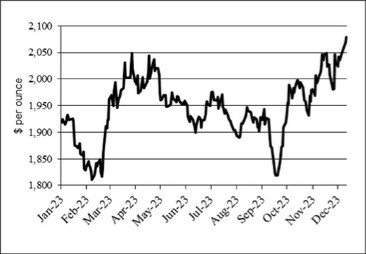
|
|
2023 |
|
2022 |
|
% Change |
|
||
High price |
|
$ |
2,078 |
|
$ |
2,039 |
|
1.9 |
% |
Low price |
|
$ |
1,811 |
|
$ |
1,629 |
|
11.2 |
% |
Average market price |
|
$ |
1,941 |
|
$ |
1,800 |
|
7.8 |
% |
Average realized price |
|
$ |
1,946 |
|
$ |
1,797 |
|
8.3 |
% |
In 2023, the average market price per ounce of gold was 7.8% higher than in 2022. The Company’s average realized price per ounce of gold in 2023 was 8.3% higher than in 2022.
SILVER ($ per ounce)
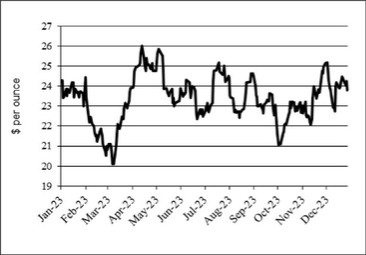
|
|
2023 |
|
2022 |
|
% Change |
|
||
High price |
|
$ |
26.07 |
|
$ |
26.18 |
|
(0.4) |
% |
Low price |
|
$ |
20.09 |
|
$ |
17.77 |
|
13.1 |
% |
Average market price |
|
$ |
23.35 |
|
$ |
21.73 |
|
7.5 |
% |
Average realized price |
|
$ |
23.72 |
|
$ |
21.63 |
|
9.7 |
% |
10
In 2023, the average market price per ounce of silver was 7.5% higher than in 2022. The Company’s average realized price per ounce of silver in 2023 was 9.7% higher than in 2022.
Agnico Eagle’s average realized price year-over-year for zinc decreased by 21.5% and the average realized price year-over-year for copper increased by 1.9%.
By-product metals are mainly produced at the LaRonde complex (silver, zinc and copper) and the Pinos Altos mine (silver). Net by-product (primarily silver, zinc and copper) revenue is treated as a reduction of production costs in calculating total cash costs per ounce of gold produced on a by-product basis and all-in sustaining costs per ounce of gold produced on a by-product basis.
Production Volumes and Costs
Changes in production volumes have a direct impact on the Company’s financial results. Payable production of gold was 3,439,654 ounces in 2023, an increase of 9.7% compared with 3,135,007 ounces in 2022. The increase was primarily due to the contribution of production volumes from the Canadian Malartic complex following the Yamana Transaction, which closed on March 31, 2023, and increased production at the Meadowbank complex and the Macassa, Detour Lake and Kittila mines. Partially offsetting the overall increase in gold production was a decrease in gold production at the Fosterville mine and LaRonde complex.
Production costs are discussed in detail in the Results of Operations section below.
Foreign Exchange Rates (Ratio to US$)
The exchange rate of the Canadian dollar, Australian dollar, Euro and Mexican peso relative to the US dollar is an important financial driver for the Company for the following reasons:
| ● | all revenues are earned in US dollars; |
| ● | a significant portion of operating costs at the LaRonde, Canadian Malartic and Meadowbank complexes and the Detour Lake, Macassa, Meliadine and Goldex mines are incurred in Canadian dollars; |
| ● | a significant portion of operating costs at the Fosterville mine are incurred in Australian dollars; |
| ● | a significant portion of operating costs at the Kittila mine are incurred in Euros, and |
| ● | a significant portion of operating costs at the Pinos Altos and La India mines are incurred in Mexican pesos. |
11
The Company mitigates part of its foreign currency exposure by using currency hedging strategies.
On average, the Canadian dollar and Australian dollar weakened relative to the US dollar in 2023 compared to 2022, decreasing costs denominated in local currency when translated to US dollars for reporting purposes. The Euro and Mexican Peso strengthened relative to the US dollar in 2023 compared with 2022, increasing costs denominated in the local currency when translated into US dollars for reporting purposes.
On March 31, 2023, Agnico Eagle completed the Yamana Transaction. Accordingly, contributions from the 100% interest in the Canadian Malartic complex have been included in the consolidated statements of income for the year ended December 31, 2023 since that time while the comparative periods reflect the previously held 50% interest in the Canadian Malartic complex.
On February 8, 2022, Agnico Eagle completed the Merger with Kirkland Lake Gold Ltd. (“Kirkland”). Accordingly, the contributions from the Detour Lake, Macassa and Fosterville mines included in the comparative periods only includes results from February 8, 2022.
Agnico Eagle reported net income of $1,941.3 million, or $3.97 per share, in 2023 compared with net income of $670.2 million, or $1.53 per share, in 2022 and net income of $561.9 million, or $2.31 per share in 2021. Agnico Eagle reported adjusted net income(i) of $1,095.9 million, or $2.24 per share(i), in 2023 compared with adjusted net income of $1,003.6 million, or $2.29 per share, in 2022 and adjusted net income of $608.0 million, or $2.49 per share in 2021. In 2023, operating margin(ii) increased to $3,693.6 million from $3,097.8 million in 2022. In 2021, operating margin was $2,096.5 million.
12
Revenues from Mining Operations
Revenues from mining operations, net of selling costs, increased by $885.7 million, or 15.4%, to $6,626.9 million in 2023 from $5,741.2 million in 2022 primarily due to a 6.8% increase in the sales volume of gold(iii) and higher gold prices. The increased contribution of gold sales volume from the Canadian Malartic complex following the Yamana Transaction, the Meadowbank complex and the Macassa mine, partially offset by lower sales volume from the Fosterville mine and the LaRonde complex and the Meliadine mine. Revenues from mining operations were $3,869.6 million in 2021.
Sales of precious metals (gold and silver) accounted for 99.6% of revenues from mining operations in 2023, similar to the 99.5% in 2022. Sales of precious metals (gold and silver) accounted for 99.0% of revenues in 2021.
The table below sets out revenues from mining operations, payable production volumes and sales volumes by metal:
|
|
2023 |
|
2022 |
|
2021 |
|||
|
|
(thousands of United States dollars) |
|||||||
Revenues from mining operations: |
|
|
|
|
|
|
|
|
|
Gold |
|
$ |
6,540,077 |
|
$ |
5,656,201 |
|
$ |
3,760,821 |
Silver |
|
|
63,544 |
|
|
55,212 |
|
|
69,694 |
Zinc |
|
|
4,736 |
|
|
9,390 |
|
|
16,304 |
Copper |
|
|
18,552 |
|
|
20,359 |
|
|
22,806 |
Total revenues from mining operations |
|
$ |
6,626,909 |
|
$ |
5,741,162 |
|
$ |
3,869,625 |
Payable production: |
|
|
|
|
|
|
|
|
|
Gold (ounces) |
|
|
3,439,654 |
|
|
3,135,007 |
|
|
2,086,405 |
Silver (thousands of ounces) |
|
|
2,408 |
|
|
2,292 |
|
|
2.607 |
Zinc (tonnes) |
|
|
7,702 |
|
|
8,195 |
|
|
8,837 |
Copper (tonnes) |
|
|
2,617 |
|
|
2,901 |
|
|
2,955 |
Payable metal sold(iii): |
|
|
|
|
|
|
|
|
|
Gold (ounces) |
|
|
3,364,132 |
|
|
3,148,593 |
|
|
2,080,631 |
Silver (thousands of ounces) |
|
|
2,354 |
|
|
2,354 |
|
|
2.609 |
Zinc (tonnes) |
|
|
8,526 |
|
|
6,727 |
|
|
10,803 |
Copper (tonnes) |
|
|
2,630 |
|
|
2,916 |
|
|
2,973 |
Revenues from gold, net of selling costs, increased by $883.9 million or 15.6% in 2023 compared with 2022 primarily due to a higher gold price and increase in the sales volume of gold(iii) which was the result of increased contribution of gold sales volume from the Canadian Malartic complex following the Yamana Transaction, the Meadowbank complex and the Macassa mine, partially offset by lower sales volume from the Fosterville, LaRonde and Meliadine mines. The Company’s average realized price of gold increased by 8.3% to $1,946 in 2023 compared to $1,797 in 2022, and the sales volume of gold increased by 6.9% to 3,364,132 ounces in 2023 compared to 3,148,593 ounces in 2022.
Revenues from silver, net of selling costs, increased by $8.3 million or 15.1% in 2023 compared with 2022 primarily due to a 9.7% increase in the average realized price of silver between periods. Revenues from zinc, net of selling costs, decreased by $4.7 million or 49.6% in 2023 compared with 2022 primarily due to a 21.5% decrease in the realized price of zinc between periods. Revenues from copper, net of selling costs, decreased by $1.8 million or 8.9% in 2023 compared with 2022 primarily due to a 9.8% decrease in the volume of copper tonnes sold between periods.
Notes:
| (i) | Adjusted net income and adjusted net income per share are non-GAAP measures that are not standardized financial measures under IFRS. For a reconciliation to net income and net income per share and discussion of the composition and usefulness of these non-GAAP measure see “Non-GAAP Financial Performance Measures”. |
| (ii) | Operating margin is a non-GAAP measure that is not a standardized financial measure under IFRS. For a discussion of the composition and usefulness of this non-GAAP measure see “Non-GAAP Financial Performance Measures”. |
| (iii) | Payable metals sold excludes ounces from pre-commercial production for the years ended December 31, 2021. |
13
Production costs increased to $2,933.3 million in 2023 compared with $2,643.3 million in 2022 primarily due to the contribution from the Canadian Malartic complex following the Yamana Transaction, the recognition in 2023 of fair value adjustments to inventory due to the Yamana Transaction and higher production costs at the Meadowbank complex and the Meliadine, La India and Macassa mines. These increases were partially offset by lower production costs at the Fosterville and Detour Lake mines primarily caused by the recognition in the 2022 comparative period of fair value adjustments to inventory at those mines. Production costs were $1,773.1 million in 2021.
The table below sets out production costs by mine:
|
|
2023 |
|
2022 |
|
2021 |
|||
|
|
(thousands of United States dollars) |
|||||||
LaRonde mine |
|
$ |
218,020 |
|
$ |
213,393 |
|
$ |
232,392 |
LaRonde Zone 5 mine |
|
|
81,624 |
|
|
72,096 |
|
|
56,380 |
LaRonde complex |
|
|
299,644 |
|
|
285,489 |
|
|
288,772 |
Canadian Malartic complex(i) |
|
|
465,814 |
|
|
235,735 |
|
|
242,589 |
Goldex mine |
|
|
112,022 |
|
|
103,830 |
|
|
96,181 |
Meliadine mine |
|
|
343,650 |
|
|
318,141 |
|
|
250,822 |
Meadowbank complex |
|
|
524,008 |
|
|
442,681 |
|
|
408,863 |
Hope Bay project |
|
|
— |
|
|
— |
|
|
83,118 |
Kittila mine |
|
|
205,857 |
|
|
210,661 |
|
|
192,742 |
Detour Lake mine(ii) |
|
|
453,498 |
|
|
489,703 |
|
|
— |
Macassa mine(ii) |
|
|
155,046 |
|
|
129,774 |
|
|
— |
Fosterville mine(ii) |
|
|
131,298 |
|
|
204,649 |
|
|
— |
Pinos Altos mine |
|
|
145,936 |
|
|
144,489 |
|
|
141,488 |
Creston Mascota mine |
|
|
— |
|
|
1,943 |
|
|
8,165 |
La India mine |
|
|
96,490 |
|
|
76,226 |
|
|
60,381 |
Total production costs |
|
$ |
2,933,263 |
|
$ |
2,643,321 |
|
$ |
1,773,121 |
Note:
| (i) | The information set out in this table reflects the Company’s 50% interest in the Canadian Malartic complex up to and including March 30, 2023 and 100% interest thereafter. |
| (ii) | The information set out in this table reflects the Company’s acquisition of the Detour Lake, Macassa and Fosterville mines in the Merger, following its closing on February 8, 2022. |
Production costs at the LaRonde mine were $218.0 million in 2023, a 2.2% increase compared with 2022 production costs of $213.4 million. The increase was primarily due to higher underground maintenance costs associated with supplemental ground support activities, partially offset by the weakening of the Canadian dollar relative to the US dollar between periods. During 2023, the LaRonde mine processed an average of 4,112 tonnes of ore per day compared with 4,575 tonnes of ore per day during 2022. Production costs per tonne increased to C$196 in 2023 compared with C$166 in 2022 primarily due to fewer tonnes processed resulting from lower development rates in the underground mine related to increased supplemental ground support requirements at the East mine and revised seismic protocols, partially offset by lower milling costs. Minesite costs per tonne(i) increased to C$201 in 2023 compared with C$162 in 2022 due to lower throughput and higher production costs.
Note:
| (i) | Minesite costs per tonne is a non-GAAP measures that is not a standardized financial measure under IFRS. For a reconciliation to production costs and a discussion of the composition and usefulness of this measure see “Non-GAAP Financial Performance Measures”. |
14
Production costs at the LZ5 mine were $81.6 million in 2023, a 13.2% increase compared with $72.1 million in 2022 primarily due to higher underground mining and maintenance costs partially offset by the weakening of the Canadian dollar relative to the US dollar between periods. During 2023, the LZ5 mine processed an average of 3,170 tonnes of ore per day compared with 3,140 tonnes of ore per day during 2022. Production costs per tonne increased to C$95 in 2023 compared with C$82 in 2022 primarily due to higher production costs as noted above. Minesite costs per tonne increased to C$91 in 2023 compared with C$81 in 2022 primarily due to higher production costs.
Attributable production costs at the Canadian Malartic complex were $465.8 million in 2023, a 97.6% increase compared with 2022 production costs of $235.7 million. This increase was primarily due to the impact of the change in ownership percentage between periods as a result of the Yamana Transaction and the recognition of fair value adjustments to inventory resulting from the Yamana Transaction and the consumption of stockpiles, partially offset by the weakening of the Canadian dollar relative to the US dollar between periods. During 2023, the Canadian Malartic complex processed an average of 53,685 tonnes of ore per day on a 100% basis compared with 53,534 tonnes of ore per day in 2022. Production costs per tonne increased to C$36 in 2023 compared with C$31 in 2022, primarily due to fair value adjustments to inventory due to the Yamana Transaction and the consumption of stockpiles. Minesite costs per tonne increased to C$39 in 2023 compared with C$35 in 2022 primarily due to the consumption of stockpiles.
Production costs at the Goldex mine were $112.0 million in 2023, a 7.9% increase compared with $103.8 million in 2022 primarily due to higher underground mining and maintenance costs, partially offset by the weakening of the Canadian dollar relative to the US dollar between periods. During 2023, the Goldex mine processed an average of 7,910 tonnes of ore per day compared with 8,055 tonnes of ore per day during 2022. Production costs per tonne increased to C$52 in 2023 compared with C$46 in 2022 primarily due to higher production costs and lower throughput. Minesite costs per tonne increased to C$53 in 2023 compared with C$47 in 2022 for the same reasons as described above for the increase in production costs per tonne.
Production costs at the Meliadine mine were $343.7 million in 2023, a 8.0% increase compared with 2022 production costs of $318.1 million primarily due to higher mining, milling and logistics costs and the timing of inventory sales, partially offset by an increase in capitalized deferred stripping costs and the weakening of the Canadian dollar relative to the US dollar between periods. During 2023, the Meliadine mine processed an average of 5,255 tonnes per day compared with 4,814 tonnes of ore per day during 2022. Production costs per tonne increased to C$241 in 2023 compared with C$232 in 2022, primarily due to higher production costs, partially offset by higher throughput. Minesite costs per tonne increased to C$249 in 2023 compared with C$234 in 2022 for the same reasons as described above for the increase in production costs per tonne.
Production costs at the Meadowbank complex were $524.0 million in 2023, a 18.4% increase compared with 2022 production costs of $442.7 million, primarily due to an increase in milling and mining costs, partially offset by an increase in capitalized deferred stripping costs, timing of inventory sales and the weakening of the Canadian dollar relative to the US dollar between periods. During 2023, the Meadowbank complex processed an average of 10,529 tonnes of ore per day compared with 10,244 tonnes of ore per day during 2022. Production costs per tonne increased to C$183 in 2023 compared with C$154 in 2022 primarily due to higher production costs, partially offset by an increase in throughput. Minesite costs per tonne increased to C$179 in 2023 compared with C$157 in 2022 for the same reasons as described above for the increase in production costs per tonne.
The Company completed the acquisition of TMAC, which previously owned the Hope Bay project, on February 2, 2021. Due to a significant number of COVID-19 cases in the fourth quarter of 2021, the Company reduced all activities at site to essential services only. In 2022 and 2023, production activities remained suspended and the primary focus is on accelerating exploration and the evaluation of potentially larger production scenarios.
Production costs at the Kittila mine were $205.9 million in 2023, a 2.3% decrease compared with 2022 production costs of $210.7 million, primarily due to the timing of inventory sales, partially offset by higher underground maintenance costs. During 2023, the Kittila mine processed an average of 5,353 tonnes of ore per day compared with 5,274 tonnes of ore per day during 2022. Production costs per tonne decreased to €98 in 2023 compared with €103 in 2022, primarily due to lower production costs and higher throughput in 2023. Minesite costs per tonne decreased to €99 in 2023 compared with €101 in 2022 due to for the same reasons described above for the decrease in production costs per tonne.
15
Production costs at the Detour Lake mine were $453.5 million in 2023, a 7.4% decrease compared with 2022 production costs of $489.7 million, primarily due to the recognition, in 2022, of fair value adjustments to inventory and the weakening of the Canadian dollar relative to the US dollar between periods, partially offset by higher mining costs. During 2023, the Detour Lake mine processed an average of 69,685 tonnes of ore per day compared with 69,667 tonnes of ore per day during 2022. Production costs per tonne decreased to C$24 compared with C$28 in 2022 for the same reasons as described above for the decrease in production costs and the higher throughput in 2023. Minesite costs per tonne increased to C$26 in 2023 compared with C$25 in 2022,primarily due to higher maintenance costs for mobile equipment and spare parts during the period, partially offset by higher throughput. The Company acquired the Detour Lake mine on February 8, 2022 as a result of the Merger.
Production costs at the Macassa mine were $155.0 million in 2023, a 19.5% increase compared with 2022 production costs of $129.8 million, primarily due to higher mining costs as result of higher input prices and increased operational volumes, partially offset by the weakening of the Canadian dollar relative to the US dollar between periods. During 2023, the Macassa mine processed an average of 1,211 tonnes of ore per day compared with 856 tonnes of ore per day during 2022. Production costs per tonne decreased to C$475 compared with C$602 in 2022 primarily due to higher throughput, partially offset by the increase in production costs. Minesite costs per tonne decreased to C$503 in 2023 compared with C$577 in 2022 for the same reasons described above for the decrease in production costs per tonne. The Company acquired the Macassa mine on February 8, 2022 as a result of the Merger.
Production costs at the Fosterville mine were $131.3 million in 2023, a 35.8% decrease compared with 2022 production costs of $204.6 million, primarily due to the recognition, in 2022, of fair value adjustments to inventory with no comparative in 2023, and the weakening of the Australian dollar relative to the US dollar between periods. During 2023, the Fosterville mine processed an average of 1,784 tonnes of ore per day compared with 1,602 tonnes of ore per day during 2022. Production costs per tonne decreased to A$304 compared with A$561 in 2022 primarily due to higher throughput and lower production costs. Minesite costs per tonne decreased to A$301 in 2023 compared with A$356 in 2022 for the same reasons described above for the decrease in production costs per tonne. The Company acquired the Fosterville mine on February 8, 2022 as a result of the Merger.
Production costs at the Pinos Altos mine were $145.9 million in 2023, a 1.0% increase compared with 2022 production costs of $144.5 million, primarily due to higher processing costs and the strengthening of the Mexican Peso relative to the US dollar between periods. During 2023, the Pinos Altos mine processed an average of 4,537 tonnes of ore per day compared with 4,137 tonnes of ore per day during 2022. Production costs per tonne decreased to $88 in 2023 compared with $96 in 2022, primarily due to the higher throughput. Minesite costs per tonne decreased to $88 in 2023 compared to $94 in 2022 for the same reasons described above for the decrease in production costs per tonne.
At Creston Mascota mine, gold production during 2023, 2022 and 2021 was the result of residual leaching. No additional ore was stacked on the heap leach and therefore no production costs per tonne or minesite costs per tonne were reported in 2023, 2022 and 2021.
Production costs at the La India mine were $96.5 million in 2023, a 26.6% increase compared with 2022 production costs of $76.2 million primarily due to timing of inventory sales and the strengthening of the Mexican peso relative to the US dollar between periods. During 2023, the La India mine processed an average of 8,247 tonnes of ore per day compared with 13,978 tonnes of ore per day during 2022. During 2023, the La India mine stacked approximately 3.0 million tonnes of ore on the leach pad compared with approximately 5.1 million tonnes of ore stacked in 2022. The decrease in tonnage of ore stacked was primarily due to the cessation of mining activities at the El Realito pit. Production costs per tonne and minesite costs per tonne increased to $32 in 2023 compared with $15 in 2022 primarily due to a decrease in tonnes of ore stacked on the heap leach pad. Minesite costs per tonne increased to $32 in 2023 compared with $16 in 2022 for the same reasons described above for the increase in production costs per tonne.
16
Total Production Costs by Category 2023
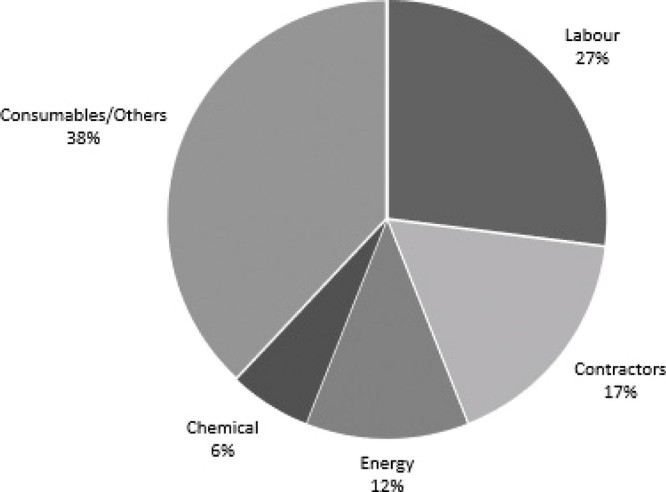
Production costs per ounce, representing the weighted average of all of the Company’s producing mines, increased to $853 in 2023 compared with $843 in 2022 and decreased from $861 in 2021. Total cash costs per ounce on a by-product basis increased to $865 in 2023 compared with $793 in 2022. Total cash costs per ounce on a by-product basis was $770 in 2021. Total cash costs per ounce on a co-product basis increased to $893 in 2023 compared with $825 in 2022. Total cash costs per ounce on a co-product basis was $829 in 2021. Set out below is an analysis of the change in production costs per ounce and total cash costs per ounce at each of the Company’s mining operations.
| ● | At the LaRonde mine, production costs per ounce increased to $924 in 2023 compared with $749 in 2022 primarily due to a 17.1% decrease in gold production and higher underground maintenance costs associated with supplemental ground support activities which resulted in lower throughput, partially offset by the weakening of the Canadian dollar relative to the US dollar between periods. Total cash costs per ounce on a by-product basis increased to $840 in 2023 compared with $623 in 2022 primarily due to the factors described in production costs per ounce combined with lower by-product revenues. Total cash costs per ounce on a co-product basis increased to $1,067 in 2023 compared with $850 in 2022 due to the same factors described above for the increase in production costs per ounce. |
| ● | At the LZ5 mine, production costs per ounce increased to $1,155 in 2023 compared with $1,008 in 2022, primarily due to higher mining costs and the timing of inventory sales, partially offset by the weakening of the Canadian dollar relative to the US dollar between periods. Total cash costs per ounce on a by-product basis increased to $1,148 in 2023 compared with $1,021 in 2022 due to the factors described in production costs per ounce. Total cash costs per ounce on a co-product basis increased to $1,158 in 2023 compared with $1,025 in 2022 due to the factors described above for the increase in production costs per ounce. |
| ● | At the Canadian Malartic complex, production costs per ounce increased to $771 in 2023 compared with $716 in 2022 primarily due to the recognition in 2023 of fair value adjustments to inventory due to the Yamana Transaction, the timing of inventory sales and lower deferred stripping adjustment, partially offset by the weakening of the Canadian dollar relative to the US dollar between periods. Total cash costs per ounce on a by-product basis increased to $824 in 2023 compared with $787 in 2022 due to the timing of inventory sales and lower deferred stripping adjustment, partially offset by the weakening of the Canadian dollar relative to the US dollar between periods as described above. Total cash costs per ounce on a co-product basis increased to $835 in 2023 compared with $803 in 2022 due to the factors described above for the increase in production costs per ounce. |
17
| ● | At the Goldex mine, production costs per ounce increased to $795 in 2023 compared with $734 in 2022, primarily due to higher underground mining and maintenance costs, partially offset by the weakening of the Canadian dollar relative to the US dollar between periods. Total cash costs per ounce on a by-product basis increased to $820 in 2023 compared with $765 in 2022 due to the factors described in production costs per ounce, partially offset by higher by-product revenue. Total cash costs per ounce on a co-product basis increased to $822 to in 2023 compared with $765 in 2022 due to the factors described above for the increase in production costs per ounce. |
| ● | At the Meliadine mine, production costs per ounce increased to $944 in 2023 compared with $853 in 2022 primarily due to higher milling and logistics costs and the timing of inventory sales, partially offset by the weakening of the Canadian dollar relative to the US dollar between periods. Total cash costs per ounce on a by-product basis increased to $980 in 2023 compared with $863 in 2022 due to the factors described above for the increase in production costs per ounce. Total cash costs per ounce on a co-product basis increased to $981 in 2023 compared with $865 in 2022 due to the factors described above for the increase in production costs per ounce. |
| ● | At the Meadowbank complex, production costs per ounce increased to $1,214 in 2023 compared with $1,184 in 2022 primarily due to higher mining, milling and logistics costs and timing of inventory sales, partially offset by a 15.5% increase in gold production and the weakening of the Canadian dollar relative to the US dollar between periods. Total cash costs per ounce on a by-product basis decreased to $1,176 in 2023 compared with $1,210 in 2022 primarily due to the higher volume of gold produced, partially offset by the timing of inventory sales and higher milling costs. Total cash costs per ounce on a co-product basis decreased to $1,183 in 2023 compared with $1,216 in 2022 due to the factors described above for the increase in production costs per ounce. |
| ● | At the Kittila mine, production costs per ounce decreased to $878 in 2023 compared with $971 in 2022 primarily due to timing of inventory sales and a 8% increase in gold production. Total cash costs per ounce on a by-product basis decreased to $871 in 2023 compared with $980 in 2022 due to the factors described in production costs per ounce. Total cash costs per ounce on a co-product basis decreased to $872 in 2023 compared with $981 in 2022 due to the factors described above for the decrease in production costs per ounce. |
| ● | At the Detour Lake mine, production costs per ounce decreased to $669 in 2023 compared with $752 in 2022 primarily due to a 4% increase in gold production, fair value adjustments to inventory on the purchase price allocation recognized in 2022 with no comparative recognition occurring in 2023, and the weakening of the Canadian dollar relative to the US dollar between periods. Total cash costs per ounce on a by-product basis increased to $735 in 2023 compared with $657 in 2022 due to higher mining, maintenance and milling costs caused by higher fuel and electricity prices and lower gold grades, partially offset by the weaker Canadian dollar relative to the U.S. dollar. Total cash costs per ounce on a co-product basis increased to $738 in 2023 compared with $663 in 2022 due to the factors described in production costs per ounce on a by-product basis. |
| ● | At the Macassa mine, production costs per ounce decreased to $678 in 2023 compared with $718 in 2022 primarily due to a 26% increase in gold production, fair value adjustments to inventory on the purchase price allocation recognized in 2022 and the weakening of the Canadian dollar relative to the US dollar between periods. Total cash costs per ounce on a by-product basis increased to $731 in 2023 compared with $683 in 2022 due to higher mining costs, partially offset by an increase in the number of ounces produced in the period and the weaker Canadian dollar relative to the U.S. dollar. Total cash costs per ounce on a co-product basis increased to $733 in 2023 compared with $684 in 2022 due to the factors described above for the increase in production costs per ounce. |
| ● | At the Fosterville mine, production costs per ounce decreased to $473 in 2023 compared with $605 in 2022 primarily due to due to fair value adjustments to inventory on the purchase price allocation recognized in 2022 as well as the effect of the weaker Australian dollar relative to the U.S. dollar, partially offset by fewer ounces produced in the period due to lower gold grades. Total cash costs per ounce of gold produced on a by-product basis increased to $488 in 2023 compared with $378 in 2022 primarily due to fewer ounces of gold produced in the current period as a result of lower gold grades, partially offset by the weaker Australian dollar relative to the U.S. dollar. Total cash costs per ounce of gold produced on a co-product basis increased to $489 in 2023 compared with $379 in 2022 due to the factors described above for the increase in production costs per ounce on a by-product basis. |
18
| ● | At the Pinos Altos mine, production costs per ounce decreased to $1,495 in 2023 compared with $1,497 in 2022, primarily due to lower underground mining costs and an increase in the number of ounces of gold produced in the current period, partially offset by higher open pit mining and milling costs and the strengthening of the Mexican peso relative to the US dollar. Total cash costs per ounce on a by-product basis decreased to $1,229 in 2023 compared with $1,249 in 2022, for the same reasons described above for production costs per ounce, higher by-product revenues and higher inventory adjustments. Total cash costs per ounce on a co-product basis increased to $1,509 in 2023 compared with $1,477 in 2022 due to higher inventory adjustments. |
| ● | At the La India mine, production costs per ounce increased to $1,271 in 2023 compared with $1,021 in 2022 primarily due to higher heap leach costs and the strengthening of the Mexican peso relative to the US dollar. Total cash costs per ounce on a by-product basis increased to $1,241 in 2023 compared with $1,056 in 2022 due to the factors described in production costs per ounce. Total cash costs per ounce on a co-product basis increased to $1,261 in 2023 compared with $1,078 in 2022 primarily due to the factors described above for the increase in production costs per ounce. |
Exploration and Corporate Development Expense
Exploration and corporate development expense decreased by 20.4% to $215.8 million in 2023 from $271.1 million in 2022. Exploration and corporate development expense was $152.5 million in 2021.
A summary of the Company’s significant 2023 exploration and corporate development activities is set out below:
| ● | Exploration expenses at various mine sites decreased by 10.5% to $56.5 million in 2023 compared with $63.1 million in 2022 primarily due to lower expensed exploration at the Detour Lake and Macassa mines and at the underground portion of Hope Bay, partially offset by higher expensed exploration expenses at the Canadian Malartic complex following the Yamana Transaction. |
| ● | Exploration expenses in Canada decreased by 25.9% to $79.5 million in 2023 compared with $107.3 million in 2022 primarily due to lower expensed exploration drilling at Amalgamated Kirkland and Upper Beaver, partially offset by higher expenses at Hope Bay. |
| ● | Exploration expenses in Latin America decreased by 43.7% to $13.6 million in 2023 compared with $24.1 million in 2022 primarily due to reduced exploration at Santa Gertudis and other regional targets in Mexico. |
| ● | Exploration expenses in the United States decreased by 28.1% to $4.2 million in 2023 compared with $5.8 million in 2022 primarily due to reduced exploration at the Gryphon Gold project. |
| ● | Exploration expenses in Europe decreased by 49.8% to $5.0 million in 2023 compared with $9.9 million in 2022 primarily due to reduced regional exploration expenses around the proximity of the Kittila mine and surface exploration targets at the Kittila mine. |
| ● | Exploration expenses in Australia decreased by 4.2% to $4.0 million in 2023 compared with $4.2 million in 2022. |
| ● | Corporate development and project evaluation expenses decreased by 6.4% to $53.0 million in 2023 compared with $56.6 million in 2022 primarily due to reduced project evaluation expenses at projects in Canada. |
19
The table below sets out exploration expense by region and total corporate development expense:
|
|
2023 |
|
2022 |
|
2021 |
|||
|
|
(thousands of United States dollars) |
|||||||
Minesites |
|
$ |
56,475 |
|
$ |
63,066 |
|
$ |
34,188 |
Canada |
|
|
79,509 |
|
|
107,305 |
|
|
49,819 |
Latin America |
|
|
13,585 |
|
|
24,147 |
|
|
25,600 |
United States |
|
|
4,177 |
|
|
5,807 |
|
|
7,518 |
Europe |
|
|
4,986 |
|
|
9,939 |
|
|
7,801 |
Australia |
|
|
4,033 |
|
|
4,212 |
|
|
— |
Corporate development and project evaluation expenses |
|
|
53,016 |
|
|
56,641 |
|
|
27,588 |
Total exploration and corporate development expense |
|
$ |
215,781 |
|
$ |
271,117 |
|
$ |
152,514 |
Amortization of Property, Plant and Mine Development
Amortization of property, plant and mine development expense increased to $1,491.8 million in 2023 compared with $1,094.7 million in 2022 and $738.1 million in 2021. The increase in amortization of property, plant and mine development between 2023 and 2022 was primarily due to the increased amortization at the Canadian Malartic complex following the Yamana transaction and the increased amortization at the Meadowbank complex and the Macassa, Meliadine and Fosterville mines.
General and Administrative Expense
General and administrative expenses decreased to $208.5 million in 2023 compared with $220.9 million in 2022 primarily due to non-recurring costs attributable to the Merger. General and administrative expenses were $142.0 million in 2021.
Finance costs increased to $130.1 million in 2023 compared with $82.9 million in 2022 and $92.0 million in 2021. The increase between 2023 and 2022 was primarily due to interest incurred on the $600.0 million Term Loan Facility, higher levels of accretion on the Company’s reclamation provisions and additional interest incurred on drawdowns of the Company’s revolving credit facility. The drawdowns were incurred to finance the Yamana Transaction. The increase caused by these factors was partially offset by a decrease in interest expense on the Company’s guaranteed senior unsecured notes (the “Notes”) as $100.0 million of the 2016 Series A Notes was repaid in June 2023.
The decrease between 2022 and 2021 was primarily due to decreased interest expense on the Notes as $125.0 million of the 2010 Series C Notes were repaid in April 2022 and $100.0 million of the 2012 Series A Notes were repaid in July 2022. The aggregate outstanding principal of the Notes was $1,250.0 million at December 31, 2023 and $1,350.0 million at December 31, 2022.
The table below sets out the components of finance costs:
|
|
2023 |
|
2022 |
|
2021 |
|||
|
|
(thousands of United States dollars) |
|||||||
Interest on Notes |
|
$ |
57,192 |
|
$ |
64,481 |
|
$ |
72,795 |
Interest on Term Loan Facility |
|
|
26,273 |
|
|
— |
|
|
— |
Interest on Old Credit Facility |
|
|
10,928 |
|
|
536 |
|
|
1,549 |
Old Credit Facility fees |
|
|
6,374 |
|
|
3,859 |
|
|
5,546 |
Amortization of credit and term loan facilities financing and note issuance costs |
|
|
3,290 |
|
|
3,042 |
|
|
3,778 |
Accretion expense on reclamation provisions |
|
|
32,906 |
|
|
15,951 |
|
|
6,554 |
Interest on lease obligations and other interest expense (income) |
|
|
(3,699) |
|
|
(1,290) |
|
|
5,329 |
Interest capitalized to assets under construction |
|
|
(3,177) |
|
|
(3,644) |
|
|
(3,509) |
Total finance costs |
|
$ |
130,087 |
|
$ |
82,935 |
|
$ |
92,042 |
See Note 14 in the consolidated annual financial statements for details on the Company’s $1.2 billion unsecured revolving bank credit facility, the Term Loan Facility and Notes referenced above.
20
Derivative Financial Instruments
Gain on derivative financial instruments was $68.4 million in 2023 compared to a loss on derivative financial instruments of $90.7 million in 2022 and a loss of $11.1 million in 2021. The change between 2023 and 2022 was primarily due to unrealized gains on foreign exchange and fuel hedges of $112.9 million in 2023 compared to an unrealized loss on foreign exchange and fuel hedges of $59.6 million in 2022, partially offset by a $11.3 million increase in realized losses on foreign exchange and fuel hedges between periods.
As at December 31, 2023, the Company completed its goodwill impairment testing and its review of indicators of potential impairment of the Company’s cash generating units (“CGUs”). The Company identified indicators of potential impairment for the Company’s Pinos Altos mine. As a result of the identification of these indicators, the Company estimated the recoverable amount of this CGU and the recoverable amount was calculated to be less than the carrying amount. The Company recognized an impairment loss of $112.0 million ($73.4 million net of tax) against property, plant and mine development. The Company completed its goodwill impairment testing and the recoverable amount for the Macassa CGU was calculated to be less than the carrying amount. An impairment loss of $675.0 million ($594.0 million net of tax) was recognized against the Macassa CGU, of which $420.9 million was recognized against goodwill and $254.1 million ($173.1 million net of tax) was recognized against property, plant and mine development costs.
As at December 31, 2022, the Company completed its goodwill impairment test and its review of indicators of potential impairment of the Company’s CGUs. The Company identified indicators of potential impairment for the Company’s La India mine. As a result of the identification of these indicators, the Company estimated the recoverable amount of this CGU and concluded that the carrying amounts exceeded its recoverable amount. The Company recorded an impairment of $55.0 million ($52.7 million net of tax) at the La India mine.
As at December 31, 2021, the Company completed its review of indicators of potential impairment and no indicators of impairment were identified.
Management’s estimates of recoverable amounts are subject to risk and uncertainties. Therefore, it is reasonably possible that changes could occur which may affect the recoverability of the Company’s long-lived assets and goodwill. This may have a material effect on the Company’s future financial results.
See Note 24 in the annual consolidated financial statements for further details on impairment losses.
Foreign Currency Translation (Gain) Loss
The Company’s operating results and cash flow are significantly affected by changes in the exchange rate between the US dollar and each of the Canadian dollar, Australian dollar, Euro and Mexican peso as all of the Company’s revenues are earned in US dollars while a significant portion of its operating and capital costs are incurred in such other currencies. During the period from January 1, 2023 through December 31, 2023, the daily US dollar closing exchange rate per US$1.00 fluctuated between C$1.31 and C$1.39 as reported by the Bank of Canada, A$1.40 and A$1.59 as reported by the Reserve Bank of Australia, €0.89 and €0.96 as reported by the European Central Bank and 16.69 and 19.49 Mexican pesos as reported by the Central Bank of Mexico.
A foreign currency translation gain of $0.3 million was recorded in 2023 compared with a $16.1 million gain in 2022 and a $5.7 million loss in 2021. On average in 2023, the US dollar strengthened relative to both the Canadian dollar and the Australian dollar but weakened relative to both the Euro and the Mexican peso. As at December 31, 2023, the US dollar weakened relative to the Canadian dollar, Australian dollar, Euro and the Mexican peso as compared to December 31, 2022. The net foreign currency translation gain in 2023 was primarily due to the translation impact of the Company’s net monetary liabilities denominated in foreign currencies between periods.
Other expenses decreased to $66.3 million in the year ended December 31, 2023 compared with $141.3 million in the year ended December 31, 2022, primarily due to non-recurring severance and acquisition costs associated with the Merger in 2022. Other expenses amounted to $22.3 million in the year ended December 31, 2021, which included a gain on the sale of certain non-strategic exploration properties.
21
Income and Mining Taxes Expense
In 2023, the Company recorded income and mining taxes expense of $417.8 million on income before income and mining taxes of $2,359.1 million at an effective tax rate of 17.7%. In 2022, the Company recorded income and mining taxes expense of $445.2 million on income before income and mining taxes of $1,115.4 million at an effective tax rate of 39.9%. The Company’s 2023 effective tax rate is lower than the applicable statutory tax rate of 26.0% due to the non-taxable accounting gain on the acquisition of Yamana’s interests in its Canadian assets. The Company’s 2022 effective tax rate is higher than the applicable statutory tax rate of 26.0% due to the impact of mining taxes. In 2021, the Company recorded income and mining taxes expense of $370.8 million on income before income and mining taxes of $932.7 million at an effective tax rate of 39.8%.
(thousands of United States dollars) |
|
As at December 31, 2023 |
|
As at December 31, 2022 |
|
As at December 31, 2021 |
|||
Current assets |
|
$ |
2,191,152 |
|
$ |
2,180,059 |
|
$ |
1,302,388 |
Non-current assets |
|
|
26,493,797 |
|
|
21,314,749 |
|
|
8,913,702 |
Total assets |
|
$ |
28,684,949 |
|
$ |
23,494,808 |
|
$ |
10,216,090 |
Current liabilities |
|
$ |
1,048,026 |
|
$ |
946,422 |
|
$ |
761,813 |
Non-current liabilities |
|
|
8,214,008 |
|
|
6,307,041 |
|
|
3,454,506 |
Total liabilities |
|
$ |
9,262,034 |
|
$ |
7,253,463 |
|
$ |
4,216,319 |
Total assets at December 31, 2023 of $28.7 billion increased by 22.1%, or $5.2 billion compared with total assets of $23.5 billion at December 31, 2022. The Company’s total assets are primarily comprised of non-current assets such as property, plant and mine development and goodwill.
Total liabilities at December 31, 2023 of $9.3 billion increased by 27.7%, or $2.0 billion compared with total liabilities of $7.3 billion at December 31, 2022. The Company’s total liabilities are primarily comprised of non-current liabilities such as deferred income and mining tax liabilities, long-term debt and reclamation provisions.
Both total assets and total liabilities at December 31, 2023 increased compared with total assets and total liabilities at December 31, 2022 primarily due to the assets acquired and liabilities assumed as part of the Yamana Transaction.
Total assets and total liabilities at December 31, 2022 increased compared with total assets and total liabilities at December 31, 2021 primarily due to the assets acquired and liabilities assumed as part of the Merger in 2022.
While the Company occasionally enters into contracts to limit the risk associated with decreased by-product metal prices, increased foreign currency costs (including capital expenditures) and input costs, the contracts act as economic hedges of underlying exposure and are not held for speculative purposes. Agnico Eagle does not use complex derivative contracts to hedge exposure. During the year ended December 31, 2023, the Company increased its currency and diesel hedge positions to mitigate the effect of price inflation on its key input costs. As at December 31, 2023, the Company had outstanding currency derivative contracts in respect of $3,324.7 million of 2024 and 2025 anticipated expenditures (December 31, 2022 — $2,907.9 million) and diesel fuel derivative contracts in respect of 15.0 million gallons of heating oil (December 31, 2022 — 19.0 million).
22
Liquidity and Capital Resources
As at December 31, 2023, the Company’s cash and cash equivalents totaled $338.6 million compared with $658.6 million as at December 31, 2022. The Company’s policy is to invest excess cash in what the Company believes to be highly liquid investments of high credit quality to reduce risks associated with these investments. Such investments with remaining maturities of greater than three months and less than one year at the time of purchase are classified as short-term investments. Investments with remaining maturities of less than three months at the time of purchase are classified as cash equivalents. The Company’s decisions regarding the length of maturities it holds are based on cash flow requirements, rates of return and various other factors.
Working capital (current assets less current liabilities) decreased to $1,143.1 million as at December 31, 2023, compared with $1,233.6 million as at December 31, 2022, primarily due a $320.0 million decrease in cash and cash equivalents, a $77.0 million increase in current taxes payable and a $77.9 million increase in accounts payable and accrued liabilities, partially offset by an increase of $209.9 million in inventories, an increase of $112.9 in the fair value of derivative financial instrument assets (net of derivative financial instrument liabilities) and a $87.0 million increase in other current assets.
Subject to various risks and uncertainties, including those set in this MD&A and in the Company’s AIF, the Company believes it will generate sufficient cash flow from operations and has adequate cash and debt facilities available to finance its current operations, working capital requirements, contractual obligations, debt maturities, planned capital expenditure and exploration programs. While the Company believes its capital resources will be sufficient to satisfy all its mandatory and discretionary commitments, the Company may choose to decrease certain of its discretionary expenditure commitments, which include certain capital expenditures and exploration and corporate development expenses, should unexpected financial circumstances arise in the future. See “Risk Profile” in this MD&A for further details.
Cash provided by operating activities increased by $504.9 million to $2,601.6 million in 2023 compared with $2,096.6 million in 2022. The increase in cash provided by operating activities was primarily due to a 6.8% increase in the sales volume of gold and a decrease in exploration and corporate development and other expenses, partially offset by an increase in production costs and less favourable working capital movements between periods. Cash provided by operating activities of $2,096.6 million in 2022 was $751.3 million higher compared with $1,345.3 million in 2021 primarily due to a 51.3% increase in the sales volume of gold and more favourable working capital movements. This was partially offset by an increase in production costs and exploration and corporate development expenses between periods.
23
Cash used in investing activities increased to $2,760.8 million in 2023 compared to $710.5 million in 2022. The increase in cash used in investing activities between periods was primarily due to $1,000.6 million in net cash consideration paid by the Company in the Yamana Transaction, $838.7 million in non-recurring cash acquired in 2022 due to the Merger, a $115.9 million increase in capital expenditures and a $57.3 million increase in purchases of equity securities and other investments discussed below. Cash used in investing activities was $1,264.0 million in 2021, which included $340.9 million in non-recurring cash payments related to the acquisition of TMAC and the Hope Bay royalty and $897.0 million in capital expenditures.
In 2023, the Company invested cash of $1,654.1 million in projects and sustaining capital expenditures compared with $1,538.2 million in 2022. Capital expenditures in 2023 included $422.7 million at the Detour Lake mine, $263.2 million at the Canadian Malartic complex, $191.0 million at the Meliadine mine, $146.3 million at the Macassa mine, $128.1 million at the Meadowbank complex, $122.9 million at the LaRonde mine, $87.4 million at the Fosterville mine, $87.0 million at the Goldex mine, $82.3 million at the Kittila mine, $36.5 million at the Pinos Altos mine, $38.9 million at the LaRonde Zone 5 mine, $0.3 million at the La India mine, and $47.6 million at the Company’s other projects. The $115.9 million increase in capital expenditures between 2023 and 2022 was primarily due to additional capital expenditures from the Canadian Malartic complex following the Yamana Transaction and at the Meliadine mine.
In 2023, the Company purchased $104.7 million of equity securities and other investments compared with $47.4 million in 2022 and $39.9 million in 2021. The Company’s investments in equity securities consist primarily of investments in common shares of entities in the mining industry.
On April 27, 2021, Orla Mining Ltd. (“Orla”) completed a drawdown of $16.0 million under a loan agreement dated December 18, 2019 between, among others, Orla and the Company. The loan agreement related to a five-year credit facility to provide Orla financing for an aggregate principal amount of $125.0 million, of which the Company’s aggregate financing commitment is $40.0 million. On April 29, 2022, Orla repaid the loan in full. As at December 31, 2023, the Company owned 27,602,589 Orla common shares and 10,400,000 warrants to purchase Orla common shares, representing approximately 8.78% of the issued and outstanding common shares on a non-diluted basis and 11.70% of the issued and outstanding common shares on a partially-diluted basis.
24
Cash used in financing activities decreased to $164.0 million in 2023 compared to $914.9 million in 2022 primarily due to $599.0 million in net proceeds received from the Term Loan Facility that were used to partially repay the revolving credit facility following the Yamana Transaction, a reduction of $125.0 million in senior note repayments and a $63.0 million decrease in repurchases of common shares between periods, partially offset by a $30.3 million increase in dividends paid. Cash used in financing activities was $297.2 million in 2021.
The Company issued common shares for net proceeds of $70.3 million in 2023 compared to $62.1 million in 2022, attributable to employee stock option plan exercises, issuances under the incentive share purchase plan and the dividend reinvestment plan. Net proceeds from the issuance of common shares were $40.1 million in 2021.
On April 28, 2022, the Company received approval from the TSX to establish an NCIB. On May 2, 2023, the Company received approval from the TSX to renew its NCIB, pursuant to which the Company may purchase up to $500.0 million of its common shares subject to a maximum of 5% of its issued and outstanding common shares. Under the NCIB, the Company may purchase such common shares for cancellation, on the open market at its discretion, during the period starting on May 4, 2023 and ending on May 3, 2024.
During the year ended December 31, 2023, the Company repurchased 100,000 common shares for $4.8 million at an average price of $47.74 under the NCIB. During the year ended December 31, 2022, the Company repurchased 1,569,620 common shares for $69.9 million at an average price of $44.53 under the NCIB.
In 2023, the Company declared dividends of $1.60 per share and paid cash dividends of $638.6 million, compared with dividends declared of $1.60 per share and cash dividends paid of $608.3 million in 2022. In 2021, the Company declared dividends of $1.40 per share and paid cash dividends of $275.2 million. Agnico Eagle has declared a cash dividend every year since 1983. Although the Company expects to continue paying dividends, future dividends will be at the discretion of the Board and will be subject to factors such as income, financial condition and capital requirements.
On April 20, 2023, the Company entered into a credit agreement with a group of financial institutions that provides a $600.0 million Term Loan Facility. The Company drew the full amount of the Term Loan Facility on April 28, 2023. The Term Loan Facility matures and all indebtedness thereunder is due and payable on April 21, 2025. On February 12, 2024, the Term Loan Facility was amended to align with the Company’s New Credit Facility.
On December 22, 2021, the Company amended its Old Credit Facility to improve pricing, increase the uncommitted accordion feature from $300.0 million to $600.0 million and extend the maturity date from June 22, 2023 to December 22, 2026. On June 30, 2023, the Company further amended the Old Credit Facility to update the benchmark rate from LIBOR to SOFR and the Canadian Overnight Repo Rate Average (“CORRA”). In 2023, the Company drew down and repaid an aggregation of $1.3 billion from the Old Credit Facility. The repayment was partially funded by a $600.0 million drawdown on the Term Loan Facility. In 2022, the Company drew down and repaid $100.0 million from the Old Credit Facility primarily to facilitate operating requirements. As at December 31, 2023, the Company’s outstanding balance under the Old Credit Facility was nil. Credit Facility availability is reduced by outstanding letters of credit which were $1.1 million as of December 31, 2023, resulting in $1,198.9 million available for future drawdown.
On February 12, 2024, the Company replaced its $1.2 billion unsecured revolving credit facility with the New Credit Facility. The New Credit Facility is available in US dollars through SOFR and base rate advances, or in Canadian dollars through CORRA and prime rate advances, priced at the applicable rate plus a margin that ranges from 0.00% to 2.00%. The New Credit Facility also provides for the issuance of letters of credit, priced at the applicable rate plus a margin that varies from 0.60% to 2.00%. The lenders under the New Credit Facility are each paid a standby fee at a rate that ranges from 0.09% to 0.25% of the undrawn portion of the New Credit Facility. In each case, the applicable margin or standby fees vary depending on the Company’s credit rating. The Company’s subsidiaries are not required to guarantee the payment and performance of its obligations under the New Credit Facility, however the Company must provide guarantees from certain of its subsidiaries if any existing indebtedness of the Company benefits from guarantees and the Company no longer maintains an investment grade credit rating, or if the Company incurs new indebtedness for borrowed money and provides guarantees of such new indebtedness from any of its subsidiaries. The Credit Facility contains customary covenants limiting certain actions of the Company and its material subsidiaries, and customary events of default for a borrower with the Company’s credit profile. The Company is also required to maintain a total net debt to capitalization ratio below a specified maximum value.
25
Effective September 20, 2022, the Company amended its credit agreement with a financial institution relating to an uncommitted letter of credit facility (as amended, the “First LC Facility”) to increase the amount available to C$400.0 million. The First LC Facility may be used to support the reclamation obligations or non-financial or performance obligations of the Company or its subsidiaries. As at December 31, 2023, the aggregate undrawn face amount of letters of credit under the First LC Facility is $300.7 million.
Effective September 16, 2021, the Company amended its uncommitted standby letter of credit facility (as amended, the “Second LC Facility”) to increase the amount available to C$200.0 million. Payment and performance of the Company’s obligations under the Second LC Facility are supported by an account performance security guarantee issued by Export Development Canada in favour of the lender. The Second LC Facility may be used by the Company to support the reclamation obligations of the Company, its subsidiaries or any entity in which the Company has a direct or indirect interest or the performance obligations (other than with respect to indebtedness for borrowed money) of the Company, its subsidiaries or any entity in which the Company has a direct or indirect interest that are not directly related to reclamation obligations. As at December 31, 2023, the aggregate undrawn face amount of letters of credit under the Second LC Facility is nil.
Effective May 25, 2023, the Company amended its uncommitted standby letter of credit facility with a financial institution (the “Third LC Facility”) to increase the amount available to C$200.0 million. Letters of credit issued under the Third LC Facility may be used to support the reclamation obligations or non-financial or performance obligations of the Company or its subsidiaries; however the subsidiary guarantees were released in connection with the entry into the New Credit Facility. As at December 31, 2023, the aggregate undrawn face amount of letters of credit under the Third LC Facility was $70.1 million.
In October 2021, the Company entered into a $75.0 million uncommitted standby letter of credit facility (the “Fourth LC Facility”) with a financial institution. Letters of credit issued under the Fourth LC Facility may be used to support the reclamation obligations or non-financial or performance obligations of the Company or its subsidiaries. As at December 31, 2023, the aggregate undrawn face amount of letters of credit under the Fourth LC Facility was $70.7 million.
In January 2022, the Company entered into a C$100.0 million uncommitted standby letter of credit facility (the “Fifth LC Facility” and, together with the First LC Facility, the Second LC Facility, the Third LC Facility and the Fourth LC Facility, the “LC Facilities”) with a financial institution. Upon the acquisition of Kirkland in February 2022, the Company acquired a standby letter of credit facility with the same financial institution providing for an additional C$120.0 million uncommitted letter of credit facility for the Kirkland subsidiary. Effective September 2022, an amended and restated standby letter of facility combined these facilities and the amount available under the amended and restated facility was increased to C$320.0 million. Letters of credit issued under the Fifth LC Facility may be used to support the reclamation obligations or non-financial or performance obligations of the Company or its subsidiaries. As at December 31, 2023, the aggregate undrawn face amount of letters of credit under the Fifth LC Facility was $216.2 million.
The obligations of the Company under each of the LC Facilities other than then Second LC Facility were guaranteed by certain of its subsidiaries. In connection with the Company’s entry into the New Credit Facility, these subsidiary guarantees were released.
In February 2022, upon the acquisition of Kirkland, the Company acquired a standby letter of guarantee facility (the “Guarantee Facility”) with a financial institution providing for a $25.0 million uncommitted letter of guarantee facility. Guarantees issued under the Guarantee Facility may be used to support the reclamation obligations or non-financial or performance obligations of certain subsidiaries of the Company. The obligations of the Company under this Guarantee Facility were guaranteed by certain of its subsidiaries; however the subsidiary guarantees were released in connection with the entry into the New Credit Facility. As at December 31, 2023, the aggregate undrawn face amount of guarantees under this facility was $12.8 million.
As at December 31, 2023, the Company has indemnity agreements with three companies for the issuance of surety bonds of which $315.7 million of such surety bonds have been issued under these agreements.
The Company was in compliance with all covenants contained in the Old Credit Facility, Term Loan Facility, the LC Facilities, the Guarantee Facility and the Notes as at December 31, 2023.
26
Off-Balance Sheet Arrangements
The Company’s off-balance sheet arrangements as at December 31, 2023 include outstanding letters of credit for environmental and site restoration costs, custom credits, government grants and other general corporate purposes of $991.7 million under the Old Credit Facility and the LC Facilities (see Note 27 to the consolidated annual financial statements). If the Company were to terminate these off-balance sheet arrangements, the Company’s liquidity position (as outlined in the table below) is sufficient to satisfy any related penalties or obligations.
Agnico Eagle’s contractual obligations as at December 31, 2023 are set out below:
|
|
Total |
|
2024 |
|
2025-2026 |
|
2027-2028 |
|
Thereafter |
|||||
|
|
(millions of United States dollars) |
|||||||||||||
Reclamation provisions(i) |
|
$ |
1,068.6 |
|
$ |
25.6 |
|
$ |
116.8 |
|
$ |
92.7 |
|
$ |
833.5 |
Contractual commitments(ii) |
|
|
216.0 |
|
|
159.1 |
|
|
39.1 |
|
|
10.8 |
|
|
7.0 |
Pension obligations(iii) |
|
|
105.5 |
|
|
4.5 |
|
|
9.4 |
|
|
8.3 |
|
|
83.3 |
Lease obligations |
|
|
168.3 |
|
|
47.6 |
|
|
40.3 |
|
|
24.9 |
|
|
55.5 |
Long-term debt - principal(iv) |
|
|
1,850.0 |
|
|
100.0 |
|
|
890.0 |
|
|
195.0 |
|
|
665.0 |
Long-term debt - interest(iv) |
|
|
281.0 |
|
|
54.9 |
|
|
92.6 |
|
|
63.1 |
|
|
70.4 |
Total(v) |
|
$ |
3,689.4 |
|
$ |
391.7 |
|
$ |
1,188.2 |
|
$ |
394.8 |
|
$ |
1,714.7 |
Notes:
| (i) | Mining operations are subject to environmental regulations that require companies to reclaim and remediate land disturbed by mining operations. The Company has submitted closure plans to the appropriate governmental agencies which estimate the nature, extent and costs of reclamation for each of its mining properties. Expected reclamation cash flows are presented above on an undiscounted basis. Reclamation provisions recorded in the Company’s consolidated financial statements are measured at the expected value of future cash flows discounted to their present value using a risk-free interest rate. |
| (ii) | Purchase commitments include contractual commitments for the acquisition of property, plant and mine development. In addition to the above, the Company has $290.0 million of committed subscription proceeds related to the San Nicolas project. |
| (iii) | Agnico Eagle provides defined benefit plans for certain current and former senior officers and certain employees. The benefits are generally based on the employee’s years of service, age and level of compensation. The data included in this table have been actuarially determined. |
| (iv) | The Company has assumed that repayment of its long-term debt obligations will occur on each instrument’s respective maturity date. |
| (v) | The Company’s future operating cash flows are expected to be sufficient to satisfy its contractual obligations. |
27
2024 Liquidity and Capital Resources Analysis
The Company believes that it has sufficient capital resources to satisfy its 2024 mandatory expenditure commitments (including the contractual obligations set out above) and discretionary expenditure commitments. The following table sets out expected capital requirements and resources for 2024:
|
|
Amount |
|
|
|
(millions of United States dollars) |
|
2024 Mandatory Commitments: |
|
|
|
Contractual obligations, including capital expenditures (see table above) |
|
$ |
391.7 |
Accounts payable and accrued liabilities (as at December 31, 2023) |
|
|
750.4 |
Total 2024 mandatory expenditure commitments |
|
$ |
1,142.1 |
2024 Discretionary Commitments: |
|
|
|
Expected capital expenditures |
|
$ |
1,761.6 |
Expected exploration and corporate development expenses |
|
|
227.0 |
Total 2024 discretionary expenditure commitments |
|
|
1,988.6 |
Total 2024 mandatory and discretionary expenditure commitments |
|
$ |
3,130.7 |
As of December 31, 2023, the Company believes it had adequate capital resources available to satisfy its commitments, which include cash, cash equivalents and short-term investments of $348.8 million, working capital (excluding cash, cash equivalents and short-term investments) of $794.3 million and $1,198.9 billion of available credit under its Old Credit Facility. On February 12, 2024, the Company replaced the Old Credit Facility with the New Credit Facility (See “Liquidity and Capital Resources - Financing Activities”). In addition, the Company anticipates funding its commitments through cash provided by operating activities.
While the Company believes its capital resources will be sufficient to satisfy all 2024 commitments (mandatory and discretionary), the Company may choose to decrease certain of its discretionary expenditure commitments, which include certain capital expenditures and exploration and corporate development expenses, should unexpected financial circumstances arise in the future. The Company believes that it will continue to have sufficient capital resources available to satisfy its planned development and growth activities.
On April 7, 2023, Moody’s upgraded its credit rating outlook for the Company to “positive” from “stable”, while affirming the credit rating at Baa2. On June 20, 2023, Fitch Ratings affirmed its credit rating for Agnico Eagle at BBB+ with a Stable Outlook. These investment grade credit ratings reflect the Company’s strong business and credit profile, while maintaining low leverage and conservative financial policies and recognizing the benefits of the Company’s size and scale and operations in favorable mining jurisdictions.
For the Company’s detailed 2023 and 2022 quarterly financial and operating results see “Summarized Quarterly Data” in this MD&A.
Fourth Quarter 2023 vs. Fourth Quarter 2022
Revenues from mining operations, net of selling costs, increased by 26.9% to $1,756.6 million in the fourth quarter of 2023 compared with $1,384.7 million in the fourth quarter of 2022, primarily due to a 10.9% increase in gold sales volume and 14.7% increase in average realized price of gold between periods. The higher gold sales volume was driven by the additional contribution of the Canadian Malartic complex at 100% ownership level following the Yamana Transaction and higher sales volume at Meadowbank complex and the Macassa mine, partially offset by lower gold sales volume at the Fosterville mine and the LaRonde complex.
Production costs increased by 16.6% to $777.5 million in the fourth quarter of 2023 compared with production costs of $666.9 million in the fourth quarter of 2022, primarily due to the additional contribution of the Canadian Malartic complex at 100% ownership following the Yamana Transaction and the contribution from the Meadowbank complex and the Meliadine and Macassa mines, partially offset by the weakening of the Canadian dollar and Australian dollar relative to the US dollar between periods.
28
Exploration and corporate development expenses decreased by 35.1% to $46.0 million in the fourth quarter of 2023 compared with $70.9 million in the fourth quarter of 2022, primarily due to lower expenses at the Hope Bay and Amalgamated Kirkland properties and the Meadowbank complex between the two periods.
Amortization of property, plant and mine development increased by 37.0% to $391.6 million in the fourth quarter of 2023 compared with $285.7 million in the fourth quarter of 2022 primarily due to the additional contribution of amortization from the Canadian Malartic complex at 100% ownership level following the Yamana transaction and the contributions from the Meadowbank and LaRonde complexes and the Macassa, Meliadine and Fosterville mines.
Net loss of $381.0 million was recorded in the fourth quarter of 2023 after income and mining taxes expense of $56.9 million compared with net income of $194.1 million in the fourth quarter of 2022 after income and mining taxes expense of $68.8 million. The net loss in the fourth quarter of 2023 is primarily due to impairment loss of $787.0 million ($667.4 million net of tax) in the period compared to impairment loss of $55.0 million ($52.0 million net of tax) in the fourth quarter of 2022.
Cash provided by operating activities increased by 91.3% to $727.9 million in the fourth quarter of 2023 compared with $380.5 million in the fourth quarter of 2022. The increase in cash provided by operating activities is primarily due to the additional contribution of gold sales from the Canadian Malartic complex at 100% ownership level following the Yamana Transaction.
Fourth Quarter 2023 vs. Third Quarter 2023
Revenues from mining operations, net of selling costs, increased by 7.0% to $1,756.6 million in the fourth quarter of 2023 compared with $1,642.4 million in the third quarter of 2023, primarily due to a 3.7% increase in the sales volume of gold and a 2.8% higher average realized price of gold between periods. Higher gold sales volume was driven by higher sales volumes at the Detour Lake and Macassa mines and the Meadowbank complex, partially offset by lower sales volumes at the Fosterville mine and the LaRonde complex.
Production costs increased by 2.4% to $777.5 million in the fourth quarter of 2023 compared with production costs of $759.4 million in the third quarter of 2023, primarily due to higher production costs at the Canadian Malartic and Meadowbank complexes and the Detour Lake and Macassa mines, partially offset by lower production costs at the LaRonde complex and the weakening of the Canadian dollar and Australian dollar relative to the US dollar between periods.
Exploration and corporate development expenses decreased by 25.3% to $46.0 million in the fourth quarter of 2023 compared with $61.6 million in the third quarter of 2023. The decrease in exploration and corporate development expenses between periods is primarily due to lower expenditure at the Canadian Malartic complex and the Hope Bay project.
Amortization of property, plant and mine development decreased 5.6% to $391.6 million in the fourth quarter of 2023 compared with amortization of property, plant and mine development of $415.0 million in the third quarter of 2023, primarily due to the contribution of lower amortization at the Detour Lake mine, partially offset by higher amortization expenses at the Canadian Malartic and LaRonde complexes between the periods.
Net loss of $381.0 million was recorded in the fourth quarter of 2023 after income and mining taxes expense of $56.9 million compared with net income of $178.6 million in the third quarter of 2023 after income and mining taxes expense of $92.7 million. The net loss in the fourth quarter of 2023 is primarily due to impairment loss of $787.0 million ($667.4 million net of tax).
Cash provided by operating activities increased by 45.0% to $727.9 million in the fourth quarter of 2023 compared with $502.1 million in the third quarter of 2023. The increase in cash provided by operating activities is primarily due to a $114.2 million increase in revenues from mining operations and more favourable working capital movements between periods.
The following section contains ‘‘forward-looking statements’’ and ‘‘forward-looking information’’ within the meaning of applicable securities laws. See “Note to Investors Concerning Forward-Looking Information” in this MD&A for a discussion of assumptions and risks relating to such statements.
29
Payable gold production is forecasted to be between 3.35 to 3.55 million ounces in 2024, between 3.40 and 3.60 million ounces in 2025 and between 3.40 and 3.60 million ounces in 2026.
2023 Results Comparison to 2023 Outlook
Gold Production and Costs
Payable gold production for the full year 2023 was 3,439,654 ounces, which was at the top end of the previous guidance range of 3,240,000 and 3,440,000 ounces. Total cash costs per ounce on a by-product basis for the full year 2023 was $865, which was at the mid-point of the previous guidance range of approximately $840 to $890.
Capital Expenditures and All-In Sustaining Costs per Ounce
Total capital expenditures (including sustaining capital) for the full year 2023 were $1,600.9 million, compared to the previous guidance of approximately $1,539.0 million, which included capitalized exploration. The increase in capital expenditures compared to the previous guidance is primarily related to additional spending at the Detour Lake mine and the LaRonde, Meadowbank and Canadian Malartic complexes, which was partially offset by a decrease in capital expenditures at the Macassa and Kittila mines.
All-in sustaining costs per ounce on a by-product basis for the full year 2023 were $1,179, which was within the previous guidance range of approximately $1,140 to $1,190.
Exploration and Corporate Development Expense
Previous guidance for exploration and corporate development expense was $205.0 million. Based on positive results at Detour Lake, Meliadine and Kittila mines and the Hope Bay project, a supplemental exploration budget of $32.0 million was approved by the Board. Exploration and corporate development expense for the full year 2023 was $215.8 million, lower than the updated previous guidance of approximately $237.5 million.
Amortization of Property, Plant and Mine Development
Amortization of property, plant and mine development expense for the full year 2023 was $1,491.8 million in 2023, which was higher than the previous guidance range of approximately $1,360.0 million to $1,410.0 million primarily due to adjustments to the purchase price allocation on on the assets acquired on the Yamana Transaction.
General and Administrative Expense
General and administrative expenses for the full year 2023 were $208.5 million, which was higher than the range in previous guidance of approximately $130.0 to $140.0 million, primarily due to non-cash re-valuation of stock-based compensation.
LaRonde Complex
In 2023, the LaRonde complex produced 306,648 ounces of gold at total cash costs per ounce of $911. In 2024, the Company expects production at the LaRonde complex to be between 285,000 and 305,000 ounces at total cash costs per ounce of approximately $931.
The LaRonde mine consists of the East and West mines. The mining at both mines extends below three kilometres from surface where the in-situ stress contributes to influence the ground conditions surrounding the excavations. Seismicity is a significant aspect of the operation and a team of rock mechanics experts has been engaged to attempt to manage the seismic related challenges. The Company’s objective remains to address the seismic risk by continuously improving mitigation measures to keep a safe work environment while maintaining reasonable production rates. These mitigation measures include non-entry protocols, dynamic ground support and, increasingly, remote operation from surface.
30
The mining sequence is also designed to attempt to push the stress away from the orebody to reduce the seismic risk. For the lower levels at the LaRonde mine, the transverse open stoping method, combined with a primary-secondary stope mining sequence, is almost exclusively used to address the deep and high stress conditions. In the primary-secondary stope mining sequence, primary stopes are mined out first and backfilled with pastefill, leaving secondary stopes as temporary pillars. Secondary stopes are mined once the pastefill in the primary stopes has cured. Secondary stopes are backfilled with waste rock or pastefill.
With the deepening of the mine, the Company has changed the mining sequence in the East mine attempting to reduce the stress levels on the secondary stopes, reduce seismic risk and promote sustainability of the operation in the long run. At the LaRonde mine, longitudinal and transverse longhole open stoping are the main mining methods used for the extraction of the orebody. In 2023, the LaRonde mine transitioned to “pillarless” mining and an adjusted development plan to manage seismicity within the mine, resulting in a lower mining rate when compared to the prior year. In addition, the design of the ramp in the East mine has been adjusted to be further away from the geological structures. Pillarless mining, combined with an adjusted development plan, results in a longer cycle time to extract stopes, resulting in a reduced mining rate.
Production from the 11-3 Zone at LaRonde continued in the fourth quarter of 2023 at a mining rate of approximately 950 tpd. The 11-3 Zone is expected to continue to add additional flexibility to the LaRonde mine production plan.
In 2024, the Company plans to evaluate the potential to bring new sources of ore into production, including the LZ5 deep, Ellison and Fringe zones.
The LZ5 processing facility is expected to be in care and maintenance until the second half of 2024 as the company completes an upgrade to the CIL tanks. The Company expects to restart the LZ5 mill in the second half of 2024 to process ore from LZ5 mine and the AK deposit at Macassa. An overhaul of the facility’s leach tanks is planned for the downtime period.
Canadian Malartic Complex
In 2023, the Canadian Malartic complex produced 603,955 ounces of gold at total cash costs per ounce of $824. In 2024, the Company expects production at the Canadian Malartic complex to be between 615,000 and 645,000 ounces at total cash costs per ounce of approximately $926.
Mining activities in the Canadian Malartic pit continued until the pit was mined out in the first half for 2023 as planned. Upon depletion of the Canadian Malartic pit, preparation work for in-pit tailings disposal started, which is expected to be completed in the second half of 2024. The Barnat pit remains operational and in 2024, production is expected to be sourced from the Barnat pit and the Odyssey underground mine.
In the fourth quarter of 2023, the Odyssey project continued to advance on schedule. At Odyssey South, the design mining rate of 3,500 tpd was reached in October 2023 and sustained through the fourth quarter of 2023.
Advancing the main ramp remains the development priority for the Odyssey project. Shaft sinking activities continued to ramp-up through the fourth quarter of 2024 and the Company still expects to complete excavation of the shaft in 2027.
Surface construction progressed as planned and on budget in the fourth quarter of 2023 and approximately 65% of the project surface construction was completed as at December 31, 2023. The service hoist is expected to be operational to a temporary loading station at Level 102 (1,050 metres below surface) by 2025. The paste backfill plant operated above design capacity of 4,000 tpd in the fourth quarter of 2023 and the conceptual engineering for the second phase of the paste plant has been initiated. In the second phase, which is expected to be completed in 2027, the paste backfill plant will be expanded to a capacity of approximately 20,000 tpd.
Goldex Mine
In 2023, Goldex produced 140,983 ounces of gold at cash costs per ounce of $820. In 2024, the Company expects to produce between 125,000 and 135,000 ounces of gold at the Goldex mine at cash costs per ounce of $871.
Goldex had solid operational performance throughout the year with record annual tonnes hoisted during 2023.
31
The Akasaba West project remains on schedule and budget with work on upgrading the Goldex mill that is used to process the Akasaba West ore completed in the fourth quarter of 2023. The first ore from the project was processed in November 2023 and achievement of commercial production is expected to occur in the first quarter of 2024.
Meliadine Mine
In 2023, the Meliadine mine produced 364,141 ounces of gold at total cash costs per ounce of $980. In 2024, the Company expects production at the Meliadine mine to be between 360,000 and 380,000 ounces at total cash costs per ounce of approximately $960.
The processing plant processed record tonnage in both fourth quarter and full year 2023. The Phase 2 mill expansion is expected to be completed in mid-2024 and the processing rate ramp-up is expected to increase throughput to 6,000 tpd by late 2024. In the fourth quarter of 2023, work on the Phase 2 mill expansion continued as mechanical piping and electrical work was ongoing at the carbon in leach building, the power plant and secondary grinding building, which is now fully enclosed.
The waterline installation is underway and expected to be completed in 2024, allowing for utilization in the summer of 2025.
The Meliadine Phase 2 expansion is progressing as planned and mill throughput is expected to increase to 6,000 tpd late in 2024 and to 6,250 tpd in 2026.
The Company previously submitted an amendment to the existing permit for the Meliadine mine to include future underground mining and associated saline water management infrastructure at the Pump, F-Zone and Discovery deposits (the “Extension Project”) and would allow for the potential extension of the mine life at Meliadine by 11 years beyond the current mine life of 2032.
In the fourth quarter of 2023, the Nunavut Impact Review Board (“NIRB”) provided a recommendation against the Meliadine Extension Project which also included a wind farm project. In December 2023, Agnico Eagle decided to withdraw the application for the amendment to the Meliadine mine’s permit for the Extension Project. Some of the components included in the Extension Project proposal, which have already been approved under the existing permit (approved in 2014), still need to be added to the Type A Water licence to support the current Meliadine mining plan. In order to avoid further delays that could be caused by the NIRB’s report and its regulatory framework, Agnico Eagle decided to submit these components to the Nunavut Water Board (NWB) separately.
Meadowbank Complex
The Meadowbank complex achieved record annual production in 2023, increasing annual mill throughput by over 400,000 tonnes. In 2023, the Meadowbank complex produced 431,666 ounces of gold at total cash costs per ounce of $1,176. In 2024, the Company expects production at the Meadowbank complex to be between 480,000 and 500,000 ounces at total cash costs per ounce of approximately $1,029.
Despite the delays related to an extended caribou migration and poor weather conditions, the open pit operation continued to deliver solid performance during the fourth quarter of 2023. Production at Amaruq continued also to benefit from positive reconciliation on tonnes and grade.
The Company has approved an extension to the Amaruq life of mine to 2028 (compared to 2026 previously), which includes additional stopes from underground, re-sequencing the IVR open pit and additional ounces from positive grade reconciliation.
Kittila Mine
In 2023, Kittila produced 234,402 ounces of gold at cash costs per ounce of $871. In 2024, the Company expects to produce between 220,000 to 240,000 ounces of gold at the Kittla mine at cash costs per ounce of $954.
At the mine, the production hoist ramp up was completed in December 2023, and 100% of ore was hoisted through the shaft.
In 2023, several environmental initiatives were implemented, including the nitrogen removal plant which improved Kittila’s environmental performance.
32
Detour Lake Mine
In 2023, the Detour Lake mine produced 677,446 ounces of gold at cash costs per ounce of $735. In 2024, the Company expects production at the Detour Lake mine to be between 675,000 and 705,000 ounces at total cash costs per ounce of approximately $734.
A temporary transformer failure during the third quarter of 2023 affected the operations at the mill, however the issue was resolved during the third quarter and operations were back to normal levels at the end of September. Mill performance during the fourth quarter of 2023 averaged 72,000 tonnes per day.
As a result of progress on the mill optimization projects, the Company expects to reach and sustain throughput levels of 77,000 tonnes per day (equivalent to an annualized mill throughput of 28 Mtpa), late in the second half of 2024.
During the fourth quarter of 2023, the construction of the second cell, stage four of the tailings management area was completed on schedule and on budget.
An upgrade of the 230kV main substation is planned to improve the power quality at the mine. In addition, the upgrade will improve the site readiness for future power expansion for potential projects such as the trolley assist mine haulage system. Approximately 70% of the engineering was completed and all lead items had been ordered as at December 31, 2023. The upgrades related to power quality are expected to be completed in 2024 and those related to improve site readiness for future expansions in 2025.
Macassa Mine
In 2023, the Macassa mine produced 228,535 ounces of gold at cash costs per ounce of $731. In 2024, the Company expects production at the Macassa mine to be between 265,000 and 285,000 ounces at total cash costs per ounce of approximately $856.
The Amalgamated Kirkland deposit has been added to the mining profile starting 2024 with ore forecast to be trucked and processed at the LZ5 mill circuit at the LaRonde complex starting in the second half of 2024.
The construction of the enclosure of the surface fans continued according to schedule in the fourth quarter of 2023. The overall ventilation system upgrade is currently on track for completion in the first quarter of 2024, when both fans are anticipated to reach full capacity.
The Macassa mine achieved a 171% replacement of its mining depletion in 2023 with an underground infill drilling campaign that resulted in a net mineral reserves addition totaling 115,000 ounces of gold.
Fosterville Mine
In 2023, the Fosterville mine produced 277,694 ounces of gold at cash costs per ounce of $488. In 2024, the Company expects production at the Fosterville mine to be between 200,000 and 220,000 ounces at total cash costs per ounce of approximately $698.
Production profile has been negatively affected by grade reconciliation in the remaining portions of the high grade Swan zone and the depletion of the zone is expected by late 2024. With the completion of the primary ventilation upgrade planned for late 2024, the mining rate is forecast to increase by approximately 10% in 2025 and 2026, partially offsetting the lower average grade.
The Company is currently upgrading the primary ventilation system to sustain the mining rate in the Lower Phoenix zones in future years. In the fourth quarter of 2023, the Company completed the priority development related to the ventilation upgrade on schedule and commenced the reaming of the first ventilation raise. The Company expects the project to be completed by early 2025.
During the fourth quarter of 2023, the Company continued to give priority to the key underground development in Robbins Hill district and the Lower Phoenix exploration drive.
In 2023, the Fosterville mine successfully replaced mining depletion through continued exploration success in the Robbins Hill and Lower Phoenix areas and improved mining parameters.
33
Pinos Altos Mine
In 2023, the Pinos Altos mine produced 97,642 ounces of gold at total cash costs per ounce of $1,229. In 2024, the Company expects production at the Pinos Altos mine to be between 100,000 and 105,000 ounces at total cash costs per ounce of approximately $1,268.
The Company expects that production from the Cubiro satellite deposit will start on the second half of 2024.
La India Mine
In 2023, the La India mine produced 75,904 ounces of gold at total cash costs per ounce of $1,241. In 2024, the Company expects production at the La India mine to be between 25,000 and 30,000 ounces at total cash costs per ounce of approximately $1,365.
The El Realito pit was mined out in the fourth quarter of 2023 as planned and gold production in 2024 will come from the residual leaching of the heap leach pads.
Production Summary
The Company has six cornerstone production assets (the LaRonde, Meadowbank and Canadian Malartic complexes and the Detour Lake, Macassa and Meliadine mines) each with annual production rates in 2024 expected to be in excess of 250,000 ounces of gold. In 2023, payable gold production was 3,439,654 ounces. As the Company optimizes this expanded production platform, it expects to continue to deliver on its vision and strategy. The Company expects that the main contributors to achieving the targeted levels of payable gold production, mineral reserves and mineral resources in the near term will include:
| ● | continued mill and mine plan optimization; |
| ● | continued ramp-up of the Nunavut operations; and |
| ● | continued conversion of current mineral resources to mineral reserves. |
The following section contains ‘‘forward-looking statements’’ and ‘‘forward-looking information’’ within the meaning of applicable securities laws. See “Notes to Investor Concerning Forward-Looking Statements” in this MD&A for a discussion of assumptions and risks relating to such statements.
Revenue from Mining Operations and Production Costs
In 2024, the Company expects to continue to generate solid cash flow with payable production of approximately 3,350,000 to 3,550,000 ounces of gold which is comparable with 3,439,654 ounces in 2023.
The table below sets out expected payable production in 2024 and actual payable production in 2023:
|
|
2024 |
|
2023 |
|
|
Forecast |
|
Actual |
Gold (ounces) |
|
3,350,000 - 3,550,000 |
|
3,439,654 |
Silver (thousands of ounces) |
|
2,684 |
|
2,408 |
Zinc (tonnes) |
|
9,117 |
|
7,702 |
Copper (tonnes) |
|
5,021 |
|
2,617 |
34
In 2024, the Company expects total cash costs per ounce on a by-product basis to be between $875 and $925. At the LaRonde complex total cash costs per ounce on a by-product basis is expected to be approximately $931 compared with $911 in 2023. In calculating expectations of total cash costs per ounce on a by-product basis for the LaRonde mine, net silver, zinc and copper by-product revenue offsets production costs. Therefore, production and price assumptions for by-product metals play an important role in the LaRonde complex’s expected total cash costs per ounce on a by-product basis. The Pinos Altos mine also generates significant silver by-product revenue. An increase in by-product metal prices above forecast levels would result in improved total cash costs per ounce on a by-product basis at these mines. Total cash costs per ounce on a co-product basis are expected to be approximately $931 in 2024 at the LaRonde complex compared with $1,088 in 2023.
As production costs at the LaRonde, Canadian Malartic and Meadowbank complexes as well as the Detour Lake, Macassa, Meliadine and Goldex mines are incurred primarily in Canadian dollars, production costs at the Fosterville mine are incurred primarily in Australian dollars, production costs at the Kittila mine are incurred primarily in Euros, and a portion of the production costs at the Pinos Altos and La India mines are incurred in Mexican pesos, the US dollar/Canadian dollar, US dollar/Australian dollar, US dollar/Euro, and US dollar/Mexican peso exchange rates also affect the Company’s expectations for the total cash costs per ounce both on a by-product and co-product basis.
The table below sets out the metal price and exchange rate assumptions used in deriving the expected 2024 total cash costs per ounce on a by-product basis (forecast production for each metal is shown in the table above) as well as the actual market average closing prices for each variable for the period of January 1, 2024 through February 29, 2024:
|
|
|
|
|
Actual |
|
|
|
|
|
|
Market Average |
|
|
|
2024 |
|
(January 1, 2024 - |
||
|
|
Assumptions |
|
February 29, 2024) |
||
Silver (per ounce) |
|
$ |
23.00 |
|
$ |
22.82 |
Zinc (per tonne) |
|
$ |
2,425 |
|
$ |
2,443 |
Copper (per tonne) |
|
$ |
8,378 |
|
$ |
8,323 |
Diesel ($per litre) |
|
$ |
0.80 |
|
$ |
0.72 |
US$/C$exchange rate (C$) |
|
$ |
1.34 |
|
$ |
1.35 |
US$/Euro exchange rate (Euros) |
|
€ |
1.10 |
|
€ |
1.09 |
US$/Mexican peso exchange rate (Mexican pesos) |
Mex |
$ |
16.50 |
Mex |
$ |
17.08 |
US$/A$ exchange rate (A$) |
|
$ |
1.45 |
|
$ |
1.52 |
See Risk Profile - Commodity Prices and Foreign Currencies in this MD&A for the expected impact on forecast 2024 total cash costs per ounce on a by-product basis of certain changes in commodity prices and exchange rate assumptions.
Exploration and Corporate Development Expenditures
In 2024, Agnico Eagle expects to incur exploration and corporate development expenses of to be between $220.0 million and $240.0 million compared with $215.8 million in 2023.
The Company’s objective is to build on recent exploration success and identify additional mineral resources and convert mineral resources into mineral reserves. This is part of the strategy to develop the full potential of existing operations and key projects in the Company’s pipeline.
The Company’s exploration focus remains on extending mine life at existing operations, testing near-mine opportunities and advancing its key value driver projects. Exploration priorities for 2024 include drilling the western and deep extension of the Detour Lake deposit to assist in the optimization of the open pit operations and to further advance a potential underground mining scenario, growing the underground mineral reserve and mineral resource at the Odyssey mine and continuing large exploration programs at the Hope Bay project and other operating assets.
Amortization of Property, Plant and Mine Development
Amortization of property, plant and mine development expense is expected to be between $1,560.0 million and $1,610.0 million in 2024 compared with $1,491.8 million in 2023.
35
Other Expenses
General and administrative expenses are expected to be between $135.0 million and $145.0 million in 2024 compared with $208.5 million in 2023. In 2024, the Company expects additional expenses to be between $75.0 million and $90.0 million. This includes $60.0 to $65.0 million related to site maintenance costs primarily at Hope Bay and Northern Territory in Australia, $5.0 to $10.0 million related to the ore sorting project at Detour Lake and $10.0 to $15.0 million related to sustainable development activities.
Capital Expenditures
Capital expenditures, including sustaining capital, construction and development costs and capitalized exploration costs, are expected to total approximately $1,761.6 million in 2024. The Company expects to fund its 2024 capital expenditures through operating cash flow from the sale of its gold production and the associated by-product metals. Significant components of the expected 2024 capital expenditures program include the following:
| ● | $916 million in sustaining capital expenditures(i) relating to the Detour Lake mine ($274.8 million), Canadian Malartic complex ($135.9 million), Meadowbank complex ($94.0 million), Kittila mine ($87.2 million), LaRonde complex ($86.1 million), Meliadine mine ($70.2 million), Macassa mine ($59.4 million), Goldex mine ($52.8 million), Fosterville mine ($35.8 million), Pinos Altos mine ($19.8 million); |
| ● | $737.0 million in development capital expenditures(i) relating to the Detour Lake mine ($201.1 million), Canadian Malartic complex ($167.5 million), Macassa mine ($97.8 million), Meliadine mine ($82.4 million), LaRonde complex ($68.2 million), Fosterville mine ($41.1 million), San Nicolás ($17.0 million), Pinos Altos mine ($15.4 million), Goldex mine ($7.7 million), Kittila mine ($2.9 million), other projects ($35.9 million); |
| ● | $108.6 million in capitalized exploration expenditures. |
The Company continues to examine other possible corporate development opportunities which may result in the acquisition of companies or assets using the Company’s securities, cash or a combination thereof. If cash is used to fund acquisitions, Agnico Eagle may be required to issue debt or securities to satisfy cash payment requirements.
All-in Sustaining Costs per Ounce of Gold Produced
The Company calculates all-in sustaining costs per ounce of gold produced on a by-product basis as the aggregate of total cash costs per ounce on a by-product basis, sustaining capital expenditures (including capitalized exploration), general and administrative expenses (including stock option expense), lease payments related to sustaining assets and reclamation expenses, and then dividing by the number of ounces of gold produced. The all-in sustaining costs per ounce of gold produced on a co-product basis is calculated in the same manner as the all-in sustaining costs per ounce of gold on a by-product basis, except that the total cash costs per ounce on a co-product basis is used, meaning no adjustment is made for by-product metal revenues.
Agnico Eagle’s all-in sustaining costs per ounce of gold produced on a by-product basis are expected to be approximately $1,200 to $1,250 in 2024 compared with $1,179 in 2023.
(i) Sustaining capital expenditure and development capital expenditures are non-GAAP measures that are not standardized financial measures under the financial reporting framework used to prepare the Company’s financial statements. For a reconciliation to total capital expenditures and a discussion of the composition and usefulness of these non-GAAP measures, see “Non-GAAP Financial Performance Measures” below.
The Company is subject to significant risks due to the inherent nature of the business of exploration, development and mining of properties with precious metals. The risks described below are not the only ones facing the Company. The risk factors below may include details of how the Company seeks to mitigate these risks where possible. For a more comprehensive discussion of these inherent risks, see “Risk Factors” in our most recent Form 40-F/AIF on file with the SEC and Canadian provincial securities regulatory authorities.
36
The Company’s principal financial liabilities are comprised of accounts payable and accrued liabilities, long-term debt and derivative financial instruments. The Company uses these financial instruments to manage its cash flows which are used to support ongoing operations and future growth.
The Company’s principal financial assets are comprised of cash and cash equivalents, trade receivables, equity securities and derivative financial instruments, including share purchase warrants. Cash and cash equivalents and trade receivables are generated by the Company’s operations. Equity securities and share purchase warrants are generally strategic investments made in other mining companies.
Using financial instruments exposes the Company to a variety of financial risks: credit risk, liquidity risk and market risk (including interest rate risk, commodity price risk and foreign currency risk, as discussed below).
Credit risk is the risk that the counterparties to financial contracts will fail to perform on an obligation to the Company. Credit risk is partially mitigated by dealing with what the Company believes to be high quality counterparties such as major banks and limiting concentration risk.
Liquidity risk is the risk that the Company will encounter difficulty in meeting obligations associated with financial liabilities that are settled by delivering cash or another financial asset. The Company attempts to mitigate liquidity risk primarily by monitoring its debt rating and the maturity dates of existing debt and other payables.
Market risk is the risk that changes in market factors, such as interest rates, commodity prices and foreign exchange rates, will affect the value of Agnico Eagle’s financial instruments.
The following table sets out a summary of the Company’s financial instruments(i) as at December 31, 2023:
Financial Instrument |
|
Carrying Value |
|
Associated Risks |
Cash and cash equivalents |
|
338,648 |
|
Credit, Market |
Short-term investments |
|
10,199 |
|
Credit, Market |
Trade receivables |
|
8,148 |
|
Credit, Market |
Loans receivable |
|
10,108 |
|
Credit, Market |
Equity securities |
|
323,711 |
|
Liquidity, Market |
Share purchase warrants |
|
21,546 |
|
Liquidity, Market |
Fair value of derivative financial instruments |
|
50,786 |
|
Credit, Market |
Accounts payable and accrued liabilities |
|
(750,380) |
|
Liquidity, Market |
Fair value of derivative financial instruments |
|
(7,222) |
|
Market |
Long-term debt |
|
(1,843,086) |
|
Liquidity, Market |
Lease obligations |
|
(161,548) |
|
Liquidity, Market |
Note:
| (i) | See Note 6 and Note 20 in the consolidated annual financial statements for details on the Company’s financial instruments, fair value measurements and financial risk management. |
37
The Company’s current exposure to market risk for changes in interest rates relates primarily to drawdowns on its credit facilities, Term Loan Facility and its investment portfolio. Drawdowns on the credit facilities are used primarily to fund a portion of the capital expenditures related to the Company’s development projects and working capital requirements. As at December 31, 2023, there were no amounts outstanding on the Company’s Old Credit Facility. Drawdowns on the Term Loan Facility were used to fund the Yamana Transaction. As at December 31, 2023, the Company had fully drawn down its $600.0 million Term Loan Facility. In addition, the Company invests its cash in investments with short maturities or with frequent interest reset terms and a credit rating of R1-High or better. As a result, the Company’s interest income fluctuates with short-term market conditions. As at December 31, 2023, short-term investments were $10.2 million.
Amounts drawn under the credit facilities and Term Loan Facility are subject to floating interest rates based on SOFR and CORRA benchmark rates. In the past, the Company has entered into derivative instruments to hedge against unfavourable changes in interest rates. The Company monitors its interest rate exposure and may enter into such agreements to manage its exposure to fluctuating interest rates.
Commodity Prices and Foreign Currencies
Agnico Eagle’s net income is sensitive to metal prices and the US dollar/Canadian dollar, US dollar/Australian dollar, US dollar/Euro and US dollar/Mexican peso exchange rates.
Changes in the market price of gold may be attributed to numerous factors such as demand, global mine production levels, central bank purchases and sales and investor sentiment. Changes in the market prices of other metals may be attributed to factors such as demand and global mine production levels. Changes in the market price of diesel may be attributed to factors such as supply and demand. Changes in exchange rates may be attributed to factors such as supply and demand for currencies and economic conditions in each country or currency area. In 2023, the ranges of metal prices, diesel prices and exchange rates were as follows:
| ● | Gold: $1,811 - $2,078 per ounce, averaging $1,941 per ounce; |
| ● | Silver: $20.09 – $26.07 per ounce, averaging $23.35 per ounce; |
| ● | Zinc: $2,222 – $3,509 per tonne, averaging $2,650 per tonne; |
| ● | Copper: $7,790 – $9,436 per tonne, averaging $8,487 per tonne; |
| ● | Diesel: $0.57 – $0.95 per litre, averaging $0.74 per litre; |
| ● | US dollar/Canadian dollar: C$1.31– C$1.39 per $1.00, averaging C$1.35 per $1.00; |
| ● | US dollar/Australian dollar: A$1.40 – A$1.59 per $1.00, averaging A$1.51 per $1.00. |
| ● | US dollar/Euro: €0.89 – €0.96 per $1.00, averaging €0.92 per $1.00; and |
| ● | US dollar/Mexican peso: 16.69 – 19.49 Mexican pesos per $1.00, averaging 17.75 Mexican pesos per $1.00 |
In order to mitigate the impact of fluctuating by-product metal prices, the Company occasionally enters into derivative financial instrument contracts under its Board-approved Risk Management Policies and Procedures. The Company has a long-standing policy of no forward gold sales. However, the Risk Management Policies and Procedures does allow the Company to use other hedging strategies where appropriate to mitigate foreign exchange and by-product metal pricing risks. The Company occasionally buys put options, enters into price collars and enters into forward contracts to protect minimum by-product metal prices while maintaining full exposure to the price of gold. The Risk Management Committee has approved the strategy of using short-term call options in an attempt to enhance realized by-product metal prices. The Company’s policy does not allow speculative trading.
38
The Company receives payment for all of its metal sales in US dollars and pays most of its operating and capital costs in Canadian dollars, Australian dollars, Euros, or Mexican pesos. This gives rise to significant currency risk exposure. The Company enters into currency hedging transactions under its Board-approved Foreign Exchange Risk Management Policies and Procedures to hedge part of its foreign currency exposure. The policy does not permit the hedging of translation exposure (that is, the gains and losses that arise from the accounting translation into US dollars of assets and liabilities denominated in other currencies), as it does not give rise to cash exposure. The Company’s foreign currency derivative financial instrument strategy includes the use of purchased puts, written calls, collars and forwards that are not held for speculative purposes. As at December 31, 2023, there were foreign exchange derivatives outstanding related to $3,324.7 million of 2024 and 2025 expenditures. During the year ended December 31, 2023 the Company recognized a gain of $80.3 million on foreign exchange derivatives in the (gain) loss on derivative financial instruments line item of the consolidated statements of income.
The Company considers, and may enter into, risk management strategies to mitigate price risk on certain consumables, including diesel fuel. These strategies may include longer term purchasing contracts and financial and derivative instruments. As at December 31, 2023, there were derivative financial instruments outstanding relating to 15.0 million gallons of heating oil. During the year ended December 31, 2023 the Company recognized a loss of $0.9 million on heating oil derivatives in the (gain) loss on derivative financial instruments line item of the consolidated statements of income.
The Detour Lake mine, Canadian Malartic complex and Meadowbank complex were the Company’s most significant contributors in 2023 to the Company’s payable production of gold at 19.7%, 17.6% and 12.5%, respectively, and are expected to account for a significant portion of the Company’s payable production of gold in the future.
Mining is a complex and unpredictable business and, therefore, actual payable production of gold ounces may differ from expectations. Adverse conditions affecting mining or milling may have a material adverse impact on the Company’s financial performance and results of operations. The Company anticipates using revenue generated by its operations to finance the capital expenditures required at its mine projects.
The Company’s mining and mineral processing operations, exploration activities and properties are subject to the laws and regulations of federal, provincial, state and local governments in the jurisdictions in which the Company operates. These laws and regulations are extensive and govern prospecting, exploration, development, production, exports, taxes, labour standards, occupational health and safety, waste disposal, tailings management, toxic substances, environmental protection, greenhouse gases, mine safety, reporting of payments to governments and other matters. Compliance with such laws and regulations increases the costs of planning, designing, drilling, developing, constructing, operating, managing, closing, reclaiming and rehabilitating mines and other facilities. New laws or regulations, amendments to current laws and regulations governing operations and activities on mining properties or more stringent implementation or interpretation thereof could have a material adverse effect on the Company, increase costs, cause a reduction in levels of production and delay or prevent the development of new mining properties. Regulatory enforcement, in the form of compliance or infraction notices, has occurred at some of the Company’s mines and, while the current risks related to such enforcement are not expected to be material, the risk of material fines or corrective action cannot be ruled out in the future.
The Company’s management is responsible for establishing and maintaining adequate internal control over financial reporting (‘‘ICFR’’) and disclosure controls and procedures (‘‘DC&P’’).
ICFR is a framework designed to provide reasonable assurance regarding the reliability of financial reporting and the preparation of financial statements for external purposes in accordance with IFRS. Management has used the Internal Control – Integrated Framework issued by the Committee of Sponsoring Organizations of the Treadway Commission (2013 framework) in order to assess the effectiveness of the Company’s ICFR.
39
DC&P form a broader framework designed to provide reasonable assurance that information required to be disclosed by the Company in its annual and interim filings and other reports filed under securities legislation is recorded, processed, summarized and reported within the time frame specified in securities legislation and includes controls and procedures designed to ensure that information required to be disclosed by the Company in its annual and interim filings and other reports submitted under securities legislation is accumulated and communicated to the Company’s management to allow timely decisions regarding required disclosure.
Together, the ICFR and DC&P frameworks provide internal control over financial reporting and disclosure. The Company maintains disclosure controls and procedures that are designed to provide reasonable assurance that information which is required to be disclosed in the Company’s annual and interim filings and other reports filed under securities legislation is accumulated and communicated in a timely fashion. Due to their inherent limitations, the Company acknowledges that, no matter how well designed, ICFR and DC&P can provide only reasonable assurance of achieving the desired control objectives and as such may not prevent or detect all misstatements. Further, the effectiveness of ICFR is subject to the risk that controls may become inadequate because of changes in conditions or that the degree of compliance with policies or procedures may change.
There have been no material changes in our internal controls during the year ended December 31, 2023 that have materially affected, or are reasonably likely to materially affect, internal control over financial reporting.
The Company’s management, under the supervision of the Company’s Chief Executive Officer and Chief Financial Officer, has evaluated the effectiveness of its ICFR and DC&P as at December 31, 2023. Based on this evaluation, management concluded that the Company’s ICFR and DC&P were effective as at December 31, 2023.
The following table sets out the maximum number of common shares that would be outstanding if all dilutive instruments outstanding at March 15, 2024 were exercised:
Common shares outstanding |
|
498,940,643 |
Employee stock options |
|
5,493,987 |
Common shares held in a trust in connection with the Restricted Share Unit plan, Performance Share Unit plan and Long Term Incentive Plan |
|
692,738 |
Total |
|
505,127,368 |
Critical IFRS Accounting Policies and Accounting Estimates
The Company’s consolidated annual financial statements are prepared in accordance with International Financial Reporting Standards (‘‘IFRS’’) as issued by the International Accounting Standards Board. Agnico Eagle’s material accounting policies including a summary of current and future changes in accounting policies are disclosed in Note 3 in the consolidated annual financial statements.
The preparation of the consolidated annual financial statements in accordance with IFRS requires management to make estimates and judgments that affect the reported amounts of assets, liabilities, revenues and expenses. Critical accounting estimates have a reasonable likelihood that materially different amounts could be reported under different conditions or using different assumptions. In making judgments about the carrying value of assets and liabilities, the Company uses estimates based on historical experience and assumptions that are considered reasonable in the circumstances. Although the Company evaluates its accounting estimates on an ongoing basis using the most current information available, actual results may differ from these estimates. The critical judgments and key sources of estimation uncertainties in the application of accounting policies during the year ended December 31, 2023 are disclosed in Note 4 to the consolidated annual financial statements.
Management has discussed the development and selection of critical accounting policies and estimates with the Audit Committee which has reviewed the Company’s disclosure included or incorporated by reference in this MD&A.
40
The scientific and technical information contained in this MD&A other than regarding mineral reserves and mineral resources, relating to Nunavut, Quebec and Finland operations has been approved by Dominique Girard, Eng., Executive Vice President & Chief Operating Officer – Nunavut, Quebec & Europe; relating to Ontario, Australia and Mexico operations has been approved by Natasha Vaz, Executive Vice President & Chief Operating Officer – Ontario, Australia & Mexico; and relating to exploration has been approved by Guy Gosselin, Eng. and P.Geo., Executive Vice President, Exploration, each of whom is a “Qualified Person” for the purposes of NI 43-101.
The scientific and technical information relating to Agnico Eagle’s mineral reserves and mineral resources contained herein (other than the Canadian Malartic complex) has been approved by Dyane Duquette, P.Geo., Vice President, Mineral Resources Management; relating to mineral reserves and mineral resources at the Canadian Malartic complex, has been approved by Patrick Fiset, Eng., Technical Services Manager at Canadian Malartic Corporation (for engineering open-pit), Sylvie Lampron, Eng., Senior Project Mine Engineer at Canadian Malartic Corporation (for engineering underground) and Pascal Lehouiller, P.Geo., Senior Resource Geologist at Canadian Malartic Corporation (for geology), each of whom is a “Qualified Person” for the purposes of NI 43-101.
The assumptions used for the mineral reserve estimates at all mines and advanced projects held by Agnico Eagle on December 31, 2023 (except the Detour Lake mine, Hope Bay project, Hammond Reef project, Upper Beaver project and San Nicolas project) are $1,400 per ounce gold, $18.00 per ounce silver, $1.00 per pound zinc and $3.50 per pound copper as at December 31, 2023. Mineral reserve estimates at the Detour Lake mine assumed $1,300 per ounce of gold. Mineral reserve estimates at the Hope Bay project and Hammond Reef project assumed $1,350 per ounce gold. Mineral reserves estimates at the Upper Beaver project assumed $1,200 per ounce of gold and $2.75 per pound of copper. Mineral reserve estimates at the San Nicolas project assumed US$1,300 per ounce of gold, US$20.00 per ounce of silver, US$3.00 per pound of copper and US$1.10 per pound of zinc. Foreign exchange rates assumptions of C$1.30 per US$1.00, A$1.36 per US$1.00, €0.90 per US$1.00, and 18.00 Mexican pesos per US$1.00 were used for all mines and projects, except for CAD$1.25 per US$1.00 used for Upper Beaver, Upper Canada, the Holt complex and Detour Zone 58N; US$1.00 per EUR $1.15 used for Barsele.
41
The following table sets out the proven and probable mineral reserves for properties held by Agnico Eagle as of December 31, 2023:
|
|
|
|
Gold Grade |
|
Contained |
|
|
|
|
(Grams per |
|
Gold |
Proven and Probable Mineral Reserves by Property(i)(ii) |
|
Tonnes |
|
Tonne) |
|
(Ounces)(iii) |
|
|
(thousands) |
|
|
|
(thousands) |
Proven Mineral Reserves |
|
|
|
|
|
|
LaRonde mine |
|
2,342 |
|
4.98 |
|
375 |
LaRonde Zone 5 mine |
|
4,450 |
|
2.11 |
|
301 |
Canadian Malartic complex |
|
45,491 |
|
0.58 |
|
853 |
Goldex mine |
|
797 |
|
2.60 |
|
66 |
Akasaba West project |
|
203 |
|
0.84 |
|
5 |
Detour Lake mine |
|
118,703 |
|
0.85 |
|
3,230 |
Macassa mine |
|
249 |
|
16.10 |
|
129 |
Meadowbank complex |
|
3,059 |
|
1.65 |
|
162 |
Meliadine mine |
|
1,780 |
|
7.08 |
|
405 |
Hope Bay project |
|
93 |
|
6.77 |
|
20 |
Fosterville mine |
|
679 |
|
12.52 |
|
273 |
Kittila mine |
|
984 |
|
4.11 |
|
130 |
Pinos Altos mine |
|
2,410 |
|
2.13 |
|
165 |
San Nicolás project (50%) |
|
23,858 |
|
0.41 |
|
314 |
Total Proven Mineral Reserves |
|
205,096 |
|
0.98 |
|
6,430 |
Probable Mineral Reserves |
|
|
|
|
|
|
LaRonde mine |
|
8,568 |
|
6.79 |
|
1,870 |
LaRonde Zone 5 mine |
|
4,523 |
|
2.30 |
|
334 |
Canadian Malartic complex |
|
96,760 |
|
2.27 |
|
7,065 |
Goldex mine |
|
16,873 |
|
1.54 |
|
834 |
Akasaba West project |
|
4,823 |
|
0.89 |
|
138 |
Detour Lake mine |
|
700,346 |
|
0.74 |
|
16,698 |
Macassa mine |
|
4,818 |
|
12.96 |
|
2,007 |
Upper Beaver project |
|
7,992 |
|
5.43 |
|
1,395 |
Hammond Reef project |
|
123,473 |
|
0.84 |
|
3,323 |
Meadowbank complex |
|
12,298 |
|
4.23 |
|
1,674 |
Meliadine mine |
|
16,478 |
|
5.78 |
|
3,062 |
Hope Bay project |
|
16,123 |
|
6.51 |
|
3,377 |
Fosterville mine |
|
7,897 |
|
5.55 |
|
1,409 |
Kittila mine |
|
25,943 |
|
4.14 |
|
3,454 |
Pinos Altos mine |
|
6,514 |
|
1.82 |
|
381 |
San Nicolás project (50%) |
|
28,761 |
|
0.39 |
|
358 |
Total Probable Mineral Reserves |
|
1,082,188 |
|
1.36 |
|
47,380 |
Total Proven and Probable Mineral Reserves |
|
1,287,284 |
|
1.30 |
|
53,811 |
Notes:
| (i) | Amounts presented in this table have been rounded to the nearest thousand and therefore totals may differ slightly from the addition of the numbers. |
| (ii) | Complete information on the verification procedures, quality assurance program, quality control procedures, parameters and methods and other factors that may materially affect scientific and technical information presented in this MD&A and definitions of certain terms used herein may be found in: the AIF under the heading ‘‘Information on Mineral Reserves and Mineral Resources of the Company’’; the Technical Report on the 2005 LaRonde Mineral Resource & Mineral Reserve Estimate filed with Canadian securities regulatory authorities on SEDAR on March 23, 2005; the Technical Report on the Mineral Resources and Mineral Reserves at Meadowbank Gold Complex including the Amaruq satellite deposit, Nunavut, Canada as at December 31, 2017 filed with Canadian securities regulatory authorities on SEDAR on February 14, 2018; the Updated Technical Report on the Meliadine Gold Project, Nunavut, Canada dated February 11, 2015 filed with Canadian securities regulatory authorities on SEDAR on March 12, 2015; the Technical Report on the Mineral Resource and Mineral Reserve Estimates for the Canadian Malartic property with an effective date of December 31, 2020 filed with the Canadian securities regulatory authorities on SEDAR on March 25, 2021; the Technical Report on the Mineral Resource and Mineral Reserve Estimates for the Detour Lake Operation as at July 26, 2021 filed with Canadian securities regulatory authorities on October 15, 2021, with an amended and restated date of October 19, 2021; and the Technical Report on the Mineral Resource and Mineral Reserve Estimates for the Fosterville Gold Mine in the State of Victoria, Australia as at December 31, 2018 filed on April 1, 2019. |
42
| (iii) | Total contained gold ounces does not include equivalent gold ounces for the by-product metals contained in the mineral reserves. |
Non-GAAP Financial Performance Measures
This MD&A presents certain financial performance measures, including adjusted net income, adjusted net income per share, earnings before interest, taxes, depreciation and amortization (“EBITDA”), adjusted EBITDA, total cash costs per ounce of gold produced (on both a by-product and co-product basis), minesite costs per tonne, all-in sustaining costs per ounce of gold produced (on both a by-product and co-product basis), operating margin, sustaining capital expenditures and development capital expenditures, that are not recognized measures under IFRS. These measures may not be comparable to similar measures reported by other gold producers. Non-GAAP financial performance measures should be considered together with other data prepared in accordance with IFRS.
Adjusted Net Income and Adjusted Net Income Per Share
Adjusted net income takes the net income as recorded in the consolidated statements of income and adjusts for the effects of certain non-recurring, unusual and other items that the Company believes are not reflective of the Company’s underlying performance for the reporting period. Adjusted net income is calculated by adjusting net income for foreign currency translation gains or losses, realized and unrealized gains or losses on derivative financial instruments, impairment loss charges and reversals, environmental remediation charges, severance and transaction costs related to acquisitions, integration costs, purchase price allocations to inventory, revaluation gain, self-insurance losses, gains on the sale of non-strategic exploration properties, gains and losses on disposal of assets, multi-year health care donations, income and mining taxes adjustments as well as other items (which include payments that relate to prior years and disposals of supplies inventory at non-operating sites). Adjusted net income per share is calculated by dividing adjusted net income by the number of shares outstanding at the end of the period on a basic and diluted basis.
The Company believes that adjusted net income and adjusted net income per share are useful to investors in that they allow for the evaluation of the results of continuing operations and in making comparisons between periods. These generally accepted industry measures are intended to provide investors with information about the Company’s continuing income generating capabilities from its core mining business, excluding the above adjustments, which the Company believes are not reflective of operational performance. Management uses this measure to, and believes it is helpful to investors so they can, understand and monitor for the operating performance of the Company in conjunction with other data prepared in accordance with IFRS.
43
The following table sets out the calculation of adjusted net income and adjusted net income per share for the years ended December 31, 2023, December 31, 2022 and December 31, 2021.
|
|
2023 |
|
2022 |
|
2021 |
|||
|
|
(thousands of United States dollars) |
|||||||
Net income for the year(i) - basic |
|
$ |
1,941,307 |
|
$ |
670,249 |
|
$ |
561,945 |
Dilutive impact of cash settling LTIP |
|
|
(4,736) |
|
|
— |
|
|
— |
Net income for the year(i) - diluted |
|
|
1,936,571 |
|
|
670,249 |
|
|
561,945 |
Foreign currency translation (gain) loss |
|
|
(328) |
|
|
(16,081) |
|
|
5,672 |
(Gain) loss on derivative financial instruments |
|
|
(68,432) |
|
|
90,692 |
|
|
11,103 |
Impairment loss |
|
|
787,000 |
|
|
55,000 |
|
|
— |
Environmental remediation |
|
|
2,712 |
|
|
10,417 |
|
|
576 |
Severance and transaction costs related to acquisitions |
|
|
21,503 |
|
|
95,035 |
|
|
12,943 |
Integration costs |
|
|
— |
|
|
956 |
|
|
— |
Purchase price allocation to inventory(ii) |
|
|
26,477 |
|
|
158,510 |
|
|
— |
Revaluation gain on Yamana Transaction |
|
|
(1,543,414) |
|
|
— |
|
|
— |
Penna self-insurance for Meadowbank fire |
|
|
— |
|
|
6,500 |
|
|
— |
Gain on sale of non-strategic exploration properties |
|
|
— |
|
|
— |
|
|
(10,000) |
Net loss on disposal of property, plant and equipment |
|
|
26,759 |
|
|
8,754 |
|
|
9,451 |
Multi-year health care donation |
|
|
— |
|
|
— |
|
|
7,952 |
Other(iii) |
|
|
3,262 |
|
|
3,258 |
|
|
— |
Income and mining taxes adjustments(iv) |
|
|
(100,910) |
|
|
(79,737) |
|
|
8,368 |
Adjusted net income for the year - basic |
|
$ |
1,095,936 |
|
$ |
1,003,553 |
|
$ |
608,010 |
Adjusted net income for the year - diluted |
|
$ |
1,091,200 |
|
$ |
1,003,553 |
|
$ |
608,010 |
Net income per share - basic |
|
$ |
3.97 |
|
$ |
1.53 |
|
$ |
2.31 |
Net income per share - diluted |
|
$ |
3.95 |
|
$ |
1.53 |
|
$ |
2.30 |
Adjusted net income per share - basic |
|
$ |
2.24 |
|
$ |
2.29 |
|
$ |
2.49 |
Adjusted net income per share - diluted |
|
$ |
2.23 |
|
$ |
2.28 |
|
$ |
2.48 |
Notes:
| (i) | Net income for the year ended December 31, 2021 has been restated to reflect the retrospective application of IAS 16. |
| (ii) | As part of the purchase price allocation in a business combination, the Company is required to determine the fair value of net assets acquired. The fair value of inventory acquired is estimated based on the selling cost less costs to be incurred plus a profit margin on those costs resulting in a fair value increase to the carrying value of inventories acquired. The revalued inventory sold during the year ended December 31, 2023 resulted in additional production costs of approximately $26.5 million ($15.9 million after tax). The revalued inventory sold during the year ended December 31, 2022 resulted in additional production costs of $158.5 million ($109.8 million after tax). These non-cash fair value adjustments which increased the cost of inventory sold during the period and are not representative of ongoing operations, were normalized from net income per share. |
| (iii) | Other adjustments are comprised of payments that relate to prior years, disposals of supplies inventory at non-operating sites and other unusual items that management considers are not reflective of the Company’s underlying performance in the period. |
| (iv) | Income and mining taxes adjustments reflect items such as foreign currency translation recorded to the income and mining taxes expense, the impact of income and mining taxes on adjusted items, recognition of previously unrecognized capital losses, the result of income and mining taxes audits, impact of changes in tax laws and adjustments to prior period tax filings. |
44
EBITDA and Adjusted EBITDA
EBITDA is calculated by adjusting the net income as recorded in the consolidated statements of income for finance costs, income and mining tax expense and amortization of property, plant and mine development line items as reported in the consolidated statements of income. Adjusted EBITDA removes the effects of certain non-recurring, unusual and other items that the Company believes are not reflective of the Company’s underlying performance for the reporting period. Adjusted EBITDA is calculated by adjusting the EBITDA calculation for foreign currency translation gains or losses, realized and unrealized gains or losses on derivative financial instruments, impairment loss charges and reversals, environmental remediation, severance and transaction costs related to acquisitions, integration costs, purchase price allocations to inventory, revaluation gain, self-insurance losses, gains on the sale of non-strategic exploration properties, gains and losses on disposal of assets, multi-year health care donations as well as other items (which includes payments that relate to prior years and disposals of supplies inventory at non-operating sites).
The Company believes that EBITDA and Adjusted EBITDA are useful in that they allow for the evaluation of the cash generating capability of the Company to fund its working capital, capital expenditure and debt repayments. These generally accepted industry measures are intended to provide investors with information about the Company’s continuing cash generating capability from its core mining business, excluding the above adjustments, which management believes are not reflective of operational performance. Management uses these measures to, and believes it is helpful to investors so they can, understand and monitor for the cash generating capability of the Company in conjunction with other data prepared in accordance with IFRS.
The following table sets out the calculation of EBITDA and Adjusted EBITDA for the year ended December 31, 2023, December 31, 2022 and December 31, 2021.
|
|
Year Ended December 31, |
|||||||
(thousands of United States dollars) |
|
2023 |
|
2022 |
|
2021(i) |
|||
Net income for the period |
|
$ |
1,941,307 |
|
$ |
670,249 |
|
$ |
561,945 |
Finance costs |
|
|
130,087 |
|
|
82,935 |
|
|
92,042 |
Income and mining tax expense |
|
|
417,762 |
|
|
445,174 |
|
|
370,778 |
Amortization of property, plant and mine development |
|
|
1,491,771 |
|
|
1,094,691 |
|
|
738,129 |
EBITDA |
|
|
3,980,927 |
|
|
2,293,049 |
|
|
1,762,894 |
Foreign currency translation (gain) loss |
|
|
(328) |
|
|
(16,081) |
|
|
5,672 |
(Gain) loss on derivative financial instruments |
|
|
(68,432) |
|
|
90,692 |
|
|
11,103 |
Impairment loss |
|
|
787,000 |
|
|
55,000 |
|
|
— |
Environmental remediation |
|
|
2,712 |
|
|
10,417 |
|
|
576 |
Severance and transaction costs related to acquisitions |
|
|
21,503 |
|
|
95,035 |
|
|
12,943 |
Integration costs |
|
|
— |
|
|
956 |
|
|
— |
Purchase price allocation to inventory(ii) |
|
|
26,477 |
|
|
158,510 |
|
|
— |
Revaluation gain on Yamana Transaction |
|
|
(1,543,414) |
|
|
— |
|
|
— |
Penna self-insurance for Meadowbank fire |
|
|
— |
|
|
6,500 |
|
|
— |
Gain on sale of non-strategic exploration properties |
|
|
— |
|
|
— |
|
|
(10,000) |
Net loss on disposal of property. plant and equipment |
|
|
26,759 |
|
|
8,754 |
|
|
9,451 |
Multi-year health care donation |
|
|
— |
|
|
— |
|
|
7,952 |
Other(iii) |
|
|
3,262 |
|
|
3,258 |
|
|
— |
Adjusted EBITDA |
|
$ |
3,236,466 |
|
$ |
2,706,090 |
|
$ |
1,800,591 |
Notes:
| (i) | Net income for the year ended December 31, 2021 has been restated to reflect the retrospective application of IAS 16. |
| (ii) | As part of the purchase price allocation in a business combination, the Company is required to determine the fair value of net assets acquired. The fair value of inventory acquired is estimated based on the selling cost less costs to be incurred plus a profit margin on those costs resulting in a fair value increase to the carrying value of inventories acquired. The revalued inventory sold during the year ended December 31, 2023 resulted in additional production costs of approximately $26.5 million ($15.9 million after tax). The revalued inventory sold during the year ended December 31, 2022 resulted in additional production costs of $158.5 million ($109.8 million after tax). These non-cash fair value adjustments which increased the cost of inventory sold during the period and are not representative of ongoing operations, were normalized from net income per share. |
45
| (iii) | Other adjustments are comprised of payments that relate to prior years, disposals of supplies inventory at non-operating sites and other unusual items that management considers are not reflective of the Company’s underlying performance in the period. |
Free Cash Flow and Free Cash Flow before Changes in Non-Cash Components of Working Capital
Free cash flow is calculated by deducting additions to property, plant and mine development from the cash provided by operating activities line item as recorded in the consolidated statements of cash flows. Free cash flow before changes in non-cash components of working capital is calculated by excluding the effect of changes in non-cash components of working capital from free cash flow such as trade receivables, income taxes, inventory, other current assets, accounts payable and accrued liabilities and interest payable.
The Company believes that free cash flow and free cash flow before changes in non-cash components of working capital are useful in that they allow for the evaluation of the Company’s ability to repay creditors and return cash to shareholders without relying on external sources of funding. These generally accepted industry measures also provide investors with information about the Company’s financial position and its ability to generate cash to fund operational and capital requirements as well as return cash to shareholders. Management uses these measures in conjunction with other data prepared in accordance with IFRS to, and believes it is helpful to investors so they can, understand and monitor the cash generating capability of the Company.
The following table sets out the calculation of free cash flow and free cash flow before changes in non-cash components of working capital for the years ended December 31, 2023, December 31, 2022 and December 31, 2021.
(thousands of United States dollars) |
|
2023 |
|
2022 |
|
2021 |
|||
|
|
|
|
|
|
|
|
|
|
Cash provided by operating activities |
|
$ |
2,601,562 |
|
$ |
2,096,636 |
|
$ |
1,345,308 |
Additions to property, plant and mine development |
|
|
(1,654,129) |
|
|
(1,538,237) |
|
|
(896,998) |
Free cash flow |
|
|
947,433 |
|
|
558,399 |
|
|
448,310 |
Changes in trade receivables |
|
$ |
(7,458) |
|
$ |
(12,110) |
|
$ |
1,678 |
Changes in income taxes |
|
|
(103,850) |
|
|
35,010 |
|
|
62,424 |
Changes in inventory |
|
|
169,168 |
|
|
46,236 |
|
|
185,090 |
Changes in other current assets |
|
|
88,389 |
|
|
10,756 |
|
|
31,354 |
Changes in accounts payable and accrued liabilities |
|
|
(2,778) |
|
|
(59,460) |
|
|
75 |
Changes in interest payable |
|
|
2,925 |
|
|
(1,200) |
|
|
583 |
Free cash flow before changes in non-cash components of working capital |
|
$ |
1,093,829 |
|
$ |
577,631 |
|
$ |
729,514 |
Total Cash Costs per Ounce of Gold Produced and Minesite Costs per Tonne
Total cash costs per ounce of gold produced (also referred to as “total cash costs per ounce”) is reported on both a by-product basis (deducting by-product metal revenues from production costs) and co-product basis (without deducting by-product metal revenues). Total cash costs per ounce of gold produced on a by-product basis is calculated by adjusting production costs as recorded in the consolidated statements of (loss) income for by-product revenues, inventory production costs, the impact of purchase price allocation in connection with mergers and acquisitions on inventory accounting, realized gains and losses on hedges of production costs, operational care and maintenance costs due to COVID-19 and other adjustments, which include the costs associated with a 5% in-kind royalty paid in respect of certain portions of the Canadian Malartic complex, a 2% in-kind royalty paid in respect of the Detour Lake mine, a 1.5% in-kind royalty paid in respect of the Macassa mine, as well as smelting, refining and marketing charges and then dividing by the number of ounces of gold produced. Given the nature of the fair value adjustment on inventory related to mergers and acquisitions and the use of the total cash costs per ounce measures to reflect the cash generating capabilities of the Company’s operations, the calculations of total cash costs per ounce for the Detour Lake, Macassa and Fosterville mines have been adjusted for this purchase price allocation in the comparative period data and for the Canadian Malartic complex in year ended December 31, 2023. Investors should note that total cash costs per ounce are not reflective of all cash expenditures, as they do not include income tax payments, interest costs or dividend payments. Total cash costs per ounce of gold produced on a co-product basis is calculated in the same manner as the total cash costs per ounce of gold produced on a by-product basis, except that no adjustment is made for by-product metal revenues. Accordingly, the calculation of total cash costs per ounce of gold produced on a co-product basis does not reflect a reduction in production costs or smelting, refining and marketing charges associated with the production and sale of by-product metals.
46
Total cash costs per ounce of gold produced is intended to provide investors information about the cash-generating capabilities of the Company’s mining operations. Management also uses these measures to, and believes they are helpful to investors so investors can, understand and monitor the performance of the Company’s mining operations. The Company believes that total cash costs per ounce is useful to help investors understand the costs associated with producing gold and the economics of gold mining. As market prices for gold are quoted on a per ounce basis, using the total cash costs per ounce of gold produced on a by-product basis measure allows management and investors to assess a mine’s cash-generating capabilities at various gold prices. Management is aware, and investors should note, that these per ounce measures of performance can be affected by fluctuations in exchange rates and, in the case of total cash costs per ounce of gold produced on a by-product basis, by-product metal prices. Management compensates for these inherent limitations by using, and investors should also consider using, these measures in conjunction with data prepared in accordance with IFRS and minesite costs per tonne as these measures are not necessarily indicative of operating costs or cash flow measures prepared in accordance with IFRS. Management also performs sensitivity analyses in order to quantify the effects of fluctuating metal prices and exchange rates.
Agnico Eagle’s primary business is gold production and the focus of its current operations and future development is on maximizing returns from gold production, with other metal production being incidental to the gold production process. Accordingly, all metals other than gold are considered by-products.
In this MD&A, unless otherwise indicated, total cash costs per ounce of gold produced is reported on a by-product basis. Total cash costs per ounce of gold produced is reported on a by-product basis because (i) the majority of the Company’s revenues are from gold, (ii) the Company mines ore, which contains gold, silver, zinc, copper and other metals, (iii) it is not possible to specifically assign all costs to revenues from the gold, silver, zinc, copper and other metals the Company produces, (iv) it is a method used by management and the Board to monitor operations, and (v) many other gold producers disclose similar measures on a by-product rather than a co-product basis. Minesite costs per tonne are calculated by adjusting production costs as recorded in the consolidated statements of (loss) income for inventory production costs, operational care and maintenance costs due to COVID-19 and other adjustments, and then dividing by tonnage of ore processed. As the total cash costs per ounce of gold produced can be affected by fluctuations in by–product metal prices and foreign exchange rates, management believes that minesite costs per tonne is useful to investors in providing additional information regarding the performance of mining operations, eliminating the impact of varying production levels. Management also uses this measure to determine the economic viability of mining blocks. As each mining block is evaluated based on the net realizable value of each tonne mined, in order to be economically viable the estimated revenue on a per tonne basis must be in excess of the minesite costs per tonne. Management is aware, and investors should note, that this per tonne measure of performance can be affected by fluctuations in processing levels. This inherent limitation may be partially mitigated by using this measure in conjunction with production costs and other data prepared in accordance with IFRS.
47
The following tables set out a reconciliation of total cash costs per ounce of gold produced (on both a by-product basis and co-product basis) and minesite costs per tonne to production costs, exclusive of amortization, as presented in the consolidated statements of income in accordance with IFRS.
Total Production Costs by Mine
|
|
Year Ended |
|
Year Ended |
|
Year Ended |
|||
|
|
December 31, 2023 |
|
December 31, 2022 |
|
December 31, 2021 |
|||
(thousands of United States dollars) |
|
|
|
|
|
|
|
|
|
LaRonde mine |
|
$ |
218,020 |
|
$ |
213,393 |
|
$ |
232,392 |
LaRonde Zone 5 mine |
|
|
81,624 |
|
|
72,096 |
|
|
56,380 |
LaRonde complex |
|
|
299,644 |
|
|
285,489 |
|
|
288,772 |
Canadian Malartic complex(i) |
|
|
465,814 |
|
|
235,735 |
|
|
242,589 |
Goldex mine |
|
|
112,022 |
|
|
103,830 |
|
|
96,181 |
Meliadine mine |
|
|
343,650 |
|
|
318,141 |
|
|
250,822 |
Meadowbank complex |
|
|
524,008 |
|
|
442,681 |
|
|
408,863 |
Hope Bay project |
|
|
— |
|
|
— |
|
|
83,118 |
Kittila mine |
|
|
205,857 |
|
|
210,661 |
|
|
192,742 |
Detour Lake mine(vii) |
|
|
453,498 |
|
|
489,703 |
|
|
— |
Macassa mine(vii) |
|
|
155,046 |
|
|
129,774 |
|
|
— |
Fosterville mine(vii) |
|
|
131,298 |
|
|
204,649 |
|
|
— |
Pinos Altos mine |
|
|
145,936 |
|
|
144,489 |
|
|
141,488 |
Creston Mascota mine |
|
|
— |
|
|
1,943 |
|
|
8,165 |
La India mine |
|
|
96,490 |
|
|
76,226 |
|
|
60,381 |
Production costs per the consolidated statements of income |
|
$ |
2,933,263 |
|
$ |
2,643,321 |
|
$ |
1,773,121 |
Reconciliation of Production Costs to Total Cash Costs per Ounce of Gold Produced by Mine and Reconciliation of Production Costs to Minesite Costs per Tonne by Mine
(thousands of United States dollars, except as noted)
LaRonde Mine |
|
Year Ended |
|
Year Ended |
|
Year Ended |
||||||||||||
Per Ounce of Gold Produced |
|
December 31, 2023 |
|
December 31, 2022 |
|
December 31, 2021 |
||||||||||||
Gold production (ounces) |
|
|
|
|
|
235,991 |
|
|
|
|
|
284,780 |
|
|
|
|
|
308,946 |
|
|
(thousands) |
|
($ per ounce) |
|
(thousands) |
|
|
($ per ounce) |
|
|
(thousands) |
|
($ per ounce) |
||||
Production costs |
|
$ |
218,020 |
|
$ |
924 |
|
$ |
213,393 |
|
$ |
749 |
|
$ |
232,392 |
|
$ |
752 |
Inventory adjustments(ii) |
|
|
13,448 |
|
|
57 |
|
|
6,569 |
|
|
23 |
|
|
(19,807) |
|
|
(64) |
Realized gains and losses on hedges of production costs |
|
|
2,966 |
|
|
13 |
|
|
6,879 |
|
|
24 |
|
|
(9,923) |
|
|
(32) |
Other adjustments(viii) |
|
|
17,478 |
|
|
73 |
|
|
15,331 |
|
|
54 |
|
|
18,905 |
|
|
61 |
Total cash costs (co-product basis) |
|
$ |
251,912 |
|
$ |
1,067 |
|
$ |
242,172 |
|
$ |
850 |
|
$ |
221,567 |
|
$ |
717 |
By-product metal revenues |
|
|
(53,694) |
|
|
(227) |
|
|
(64,654) |
|
|
(227) |
|
|
(74,499) |
|
|
(241) |
Total cash costs (by-product basis) |
|
$ |
198,218 |
|
$ |
840 |
|
$ |
177,518 |
|
$ |
623 |
|
$ |
147,068 |
|
$ |
476 |
LaRonde Mine |
|
Year Ended |
|
Year Ended |
|
Year Ended |
||||||||||||
Per Tonne |
|
December 31, 2023 |
|
December 31, 2022 |
|
December 31, 2021 |
||||||||||||
Tonnes of ore milled (thousands of tonnes) |
|
|
|
|
|
1,501 |
|
|
|
|
|
1,670 |
|
|
|
|
|
1,837 |
|
|
(thousands) |
|
($ per tonne) |
|
(thousands) |
|
($ per tonne) |
|
(thousands) |
|
($ per tonne) |
||||||
Production costs |
|
$ |
218,020 |
|
$ |
145 |
|
$ |
213,393 |
|
$ |
128 |
|
$ |
232,392 |
|
$ |
127 |
Production costs (C$) |
|
C$ |
293,627 |
|
C$ |
196 |
|
C$ |
278,014 |
|
C$ |
166 |
|
C$ |
291,681 |
|
C$ |
159 |
Inventory adjustments (C$)(iii) |
|
|
20,501 |
|
|
14 |
|
|
5,360 |
|
|
3 |
|
|
(21,969) |
|
|
(12) |
Other adjustments (C$)(viii) |
|
|
(12,990) |
|
|
(9) |
|
|
(12,208) |
|
|
(7) |
|
|
(11,921) |
|
|
(7) |
Minesite costs (C$) |
|
C$ |
301,138 |
|
C$ |
201 |
|
C$ |
271,166 |
|
C$ |
162 |
|
C$ |
257,791 |
|
C$ |
140 |
48
LaRonde Zone 5 Mine |
|
Year Ended |
|
Year Ended |
|
Year Ended |
||||||||||||
Per Ounce of Gold Produced |
|
December 31, 2023 |
|
December 31, 2022 |
|
December 31, 2021 |
||||||||||||
Gold production (ounces) |
|
|
|
|
|
70,657 |
|
|
|
|
|
71,557 |
|
|
|
|
|
70,788 |
|
|
(thousands) |
|
($ per ounce) |
|
(thousands) |
|
($ per ounce) |
|
(thousands) |
|
($ per ounce) |
||||||
Production costs |
|
$ |
81,624 |
|
$ |
1,155 |
|
$ |
72,096 |
|
$ |
1,008 |
|
$ |
56,380 |
|
$ |
796 |
Inventory adjustments(ii) |
|
|
(3,494) |
|
|
(49) |
|
|
(503) |
|
|
(7) |
|
|
2,009 |
|
|
28 |
Realized gains and losses on hedges of production costs |
|
|
988 |
|
|
14 |
|
|
1,602 |
|
|
22 |
|
|
(2,346) |
|
|
(32) |
Other adjustments(viii) |
|
|
2,705 |
|
|
38 |
|
|
136 |
|
|
2 |
|
|
171 |
|
|
2 |
Total cash costs (co-product basis) |
|
$ |
81,823 |
|
$ |
1,158 |
|
$ |
73,331 |
|
$ |
1,025 |
|
$ |
56,214 |
|
$ |
794 |
By-product metal revenues |
|
|
(711) |
|
|
(10) |
|
|
(259) |
|
|
(4) |
|
|
(288) |
|
|
(4) |
Total cash costs (by-product basis) |
|
$ |
81,112 |
|
$ |
1,148 |
|
$ |
73,072 |
|
$ |
1,021 |
|
$ |
55,926 |
|
$ |
790 |
LaRonde Zone 5 Mine |
|
Year Ended |
|
Year Ended |
|
Year Ended |
||||||||||||
Per Tonne |
|
December 31, 2023 |
|
December 31, 2022 |
|
December 31, 2021 |
||||||||||||
Tonnes of ore milled (thousands of tonnes) |
|
|
|
|
|
1,157 |
|
|
|
|
|
1,146 |
|
|
|
|
|
1,124 |
|
|
(thousands) |
|
($ per tonne) |
|
(thousands) |
|
($ per tonne) |
|
(thousands) |
|
($ per tonne) |
||||||
Production costs |
|
$ |
81,624 |
|
$ |
71 |
|
$ |
72,096 |
|
$ |
63 |
|
$ |
56,380 |
|
$ |
50 |
Production costs (C$) |
|
C$ |
109,991 |
|
C$ |
95 |
|
C$ |
93,655 |
|
C$ |
82 |
|
C$ |
70,770 |
|
C$ |
63 |
Inventory adjustments (C$)(iii) |
|
|
(4,717) |
|
|
(4) |
|
|
(289) |
|
|
(1) |
|
|
2,447 |
|
|
2 |
Minesite costs (C$) |
|
C$ |
105,274 |
|
C$ |
91 |
|
C$ |
93,366 |
|
C$ |
81 |
|
C$ |
73,217 |
|
C$ |
65 |
LaRonde complex |
|
Year Ended |
|
Year Ended |
|
Year Ended |
||||||||||||
Per Ounce of Gold Produced |
|
December 31, 2023 |
|
December 31, 2022 |
|
December 31, 2021 |
||||||||||||
Gold production (ounces) |
|
|
|
|
|
306,648 |
|
|
|
|
|
356,337 |
|
|
|
|
|
379,734 |
|
|
(thousands) |
|
($ per ounce) |
|
(thousands) |
|
($ per ounce) |
|
(thousands) |
|
($ per ounce) |
||||||
Production costs |
|
$ |
299,644 |
|
$ |
977 |
|
$ |
285,489 |
|
$ |
801 |
|
$ |
288,772 |
|
$ |
760 |
Inventory adjustments(ii) |
|
|
9,954 |
|
|
32 |
|
|
6,066 |
|
|
17 |
|
|
(17,798) |
|
|
(47) |
Realized gains and losses on hedges of production costs |
|
|
3,954 |
|
|
13 |
|
|
8,481 |
|
|
24 |
|
|
(12,269) |
|
|
(32) |
Other adjustments(viii) |
|
|
20,183 |
|
|
66 |
|
|
15,467 |
|
|
43 |
|
|
19,076 |
|
|
51 |
Total cash costs (co-product basis) |
|
$ |
333,735 |
|
$ |
1,088 |
|
$ |
315,503 |
|
$ |
885 |
|
$ |
277,781 |
|
$ |
732 |
By-product metal revenues |
|
|
(54,405) |
|
|
(177) |
|
|
(64,913) |
|
|
(182) |
|
|
(74,787) |
|
|
(197) |
Total cash costs (by-product basis) |
|
$ |
279,330 |
|
$ |
911 |
|
$ |
250,590 |
|
$ |
703 |
|
$ |
202,994 |
|
$ |
535 |
LaRonde complex |
|
Year Ended |
|
Year Ended |
|
Year Ended |
||||||||||||
Per Tonne |
|
December 31, 2023 |
|
December 31, 2022 |
|
December 31, 2021 |
||||||||||||
Tonnes of ore milled (thousands of tonnes) |
|
|
|
|
|
2,658 |
|
|
|
|
|
2,816 |
|
|
|
|
|
2,961 |
|
|
(thousands) |
|
($ per tonne) |
|
(thousands) |
|
($ per tonne) |
|
(thousands) |
|
($ per tonne) |
||||||
Production costs |
|
$ |
299,644 |
|
$ |
113 |
|
$ |
285,489 |
|
$ |
101 |
|
$ |
288,772 |
|
$ |
98 |
Production costs (C$) |
|
C$ |
403,618 |
|
C$ |
152 |
|
C$ |
371,669 |
|
C$ |
132 |
|
C$ |
362,451 |
|
C$ |
122 |
Inventory adjustments (C$)(iii) |
|
|
15,784 |
|
|
6 |
|
|
5,071 |
|
|
1 |
|
|
(19,522) |
|
|
(6) |
Other adjustments (C$)(viii) |
|
|
(12,990) |
|
|
(5) |
|
|
(12,208) |
|
|
(4) |
|
|
(11,921) |
|
|
(4) |
Minesite costs (C$) |
|
C$ |
406,412 |
|
C$ |
153 |
|
C$ |
364,532 |
|
C$ |
129 |
|
C$ |
331,008 |
|
C$ |
112 |
Canadian Malartic complex |
|
Year Ended |
|
Year Ended |
|
Year Ended |
||||||||||||
Per Ounce of Gold Produced(i) |
|
December 31, 2023 |
|
December 31, 2022 |
|
December 31, 2021 |
||||||||||||
Gold production (ounces) |
|
|
|
|
|
603,955 |
|
|
|
|
|
329,396 |
|
|
|
|
|
357,392 |
|
|
(thousands) |
|
($ per ounce) |
|
(thousands) |
|
($ per ounce) |
|
(thousands) |
|
($ per ounce) |
||||||
Production costs |
|
$ |
465,814 |
|
$ |
771 |
|
$ |
235,735 |
|
$ |
716 |
|
$ |
242,589 |
|
$ |
679 |
Inventory adjustments(ii) |
|
|
4,738 |
|
|
8 |
|
|
(1,867) |
|
|
(6) |
|
|
1,213 |
|
|
3 |
Realized gains and losses on hedges of production costs |
|
|
— |
|
|
— |
|
|
— |
|
|
— |
|
|
(78) |
|
|
— |
Purchase price allocation to inventory(vi) |
|
|
(26,447) |
|
|
(44) |
|
|
— |
|
|
— |
|
|
— |
|
|
— |
In-kind royalties and other adjustments(viii) |
|
|
60,149 |
|
|
100 |
|
|
30,568 |
|
|
93 |
|
|
557 |
|
|
2 |
Total cash costs (co-product basis) |
|
$ |
504,254 |
|
$ |
835 |
|
$ |
264,436 |
|
$ |
803 |
|
$ |
244,281 |
|
$ |
684 |
By-product metal revenues |
|
|
(6,732) |
|
|
(11) |
|
|
(5,087) |
|
|
(16) |
|
|
(7,233) |
|
|
(21) |
Total cash costs (by-product basis) |
|
$ |
497,522 |
|
$ |
824 |
|
$ |
259,349 |
|
$ |
787 |
|
$ |
237,048 |
|
$ |
663 |
49
Canadian Malartic complex |
|
Year Ended |
|
Year Ended |
|
Year Ended |
||||||||||||
Per Tonne(i) |
|
December 31, 2023 |
|
December 31, 2022 |
|
December 31, 2021 |
||||||||||||
Tonnes of ore milled (thousands of tonnes) |
|
|
|
|
|
17,333 |
|
|
|
|
|
9,770 |
|
|
|
|
|
11,130 |
|
|
(thousands) |
|
($ per tonne) |
|
(thousands) |
|
($per tonne) |
|
(thousands) |
|
($ per tonne) |
||||||
Production costs |
|
$ |
465,814 |
|
$ |
27 |
|
$ |
235,735 |
|
$ |
24 |
|
$ |
242,589 |
|
$ |
22 |
Production costs (C$) |
|
C$ |
627,946 |
|
C$ |
36 |
|
C$ |
302,734 |
|
C$ |
31 |
|
C$ |
307,005 |
|
C$ |
28 |
Inventory adjustments (C$)(iii) |
|
|
6,919 |
|
|
— |
|
|
902 |
|
|
— |
|
|
2,042 |
|
|
— |
Purchase price allocation to inventory(C$)(vi) |
|
|
(34,555) |
|
|
(2) |
|
|
— |
|
|
— |
|
|
— |
|
|
— |
In-kind royalties and other adjustments (C$)(viii) |
|
|
79,962 |
|
|
5 |
|
|
35,981 |
|
|
4 |
|
|
— |
|
|
— |
Minesite costs (C$) |
|
C$ |
680,272 |
|
C$ |
39 |
|
C$ |
339,617 |
|
C$ |
35 |
|
C$ |
309,047 |
|
C$ |
28 |
Goldex Mine |
|
Year Ended |
|
Year Ended |
|
Year Ended |
||||||||||||
Per Ounce of Gold Produced |
|
December 31, 2023 |
|
December 31, 2022 |
|
December 31, 2021 |
||||||||||||
Gold production (ounces) |
|
|
|
|
|
140,983 |
|
|
|
|
|
141,502 |
|
|
|
|
|
134,053 |
|
|
(thousands) |
|
($ per ounce) |
|
(thousands) |
|
($ per ounce) |
|
(thousands) |
|
($ per ounce) |
||||||
Production costs |
|
$ |
112,022 |
|
$ |
795 |
|
$ |
103,830 |
|
$ |
734 |
|
$ |
96,181 |
|
$ |
717 |
Inventory adjustments(ii) |
|
|
1,650 |
|
|
11 |
|
|
1,227 |
|
|
9 |
|
|
(264) |
|
|
(2) |
Realized gains and losses on hedges of production costs |
|
|
1,944 |
|
|
14 |
|
|
3,048 |
|
|
21 |
|
|
(4,407) |
|
|
(33) |
Other adjustments(viii) |
|
|
336 |
|
|
2 |
|
|
199 |
|
|
1 |
|
|
206 |
|
|
2 |
Total cash costs (co-product basis) |
|
$ |
115,952 |
|
$ |
822 |
|
$ |
108,304 |
|
$ |
765 |
|
$ |
91,716 |
|
$ |
684 |
By-product metal revenues |
|
|
(378) |
|
|
(2) |
|
|
(48) |
|
|
— |
|
|
(42) |
|
|
— |
Total cash costs (by-product basis) |
|
$ |
115,574 |
|
$ |
820 |
|
$ |
108,256 |
|
$ |
765 |
|
$ |
91,674 |
|
$ |
684 |
|
|
|
|
|
|
|
|
|
|
|
|
|
|
|
|
|
|
|
Goldex Mine |
|
Year Ended |
|
Year Ended |
|
Year Ended |
||||||||||||
Per Tonne |
|
December 31, 2023 |
|
December 31, 2022 |
|
December 31, 2021 |
||||||||||||
Tonnes of ore milled (thousands of tonnes) |
|
|
|
|
|
2,887 |
|
|
|
|
|
2,940 |
|
|
|
|
|
2,874 |
|
|
(thousands) |
|
($ per tonne) |
|
(thousands) |
|
($ per tonne) |
|
(thousands) |
|
($ per tonne) |
||||||
Production costs |
|
$ |
112,022 |
|
$ |
39 |
|
$ |
103,830 |
|
$ |
35 |
|
$ |
96,181 |
|
$ |
33 |
Production costs (C$) |
|
C$ |
151,185 |
|
C$ |
52 |
|
C$ |
135,084 |
|
C$ |
46 |
|
C$ |
120,667 |
|
C$ |
42 |
Inventory adjustments (C$)(iii) |
|
|
2,189 |
|
|
1 |
|
|
1,818 |
|
|
1 |
|
|
(374) |
|
|
— |
Minesite costs (C$) |
|
C$ |
153,374 |
|
C$ |
53 |
|
C$ |
136,902 |
|
C$ |
47 |
|
C$ |
120,293 |
|
C$ |
42 |
|
|
|
|
|
|
|
|
|
|
|
|
|
|
|
|
|
|
|
Meliadine Mine |
|
Year Ended |
|
Year Ended |
|
Year Ended |
||||||||||||
Per Ounce of Gold Produced(ix) |
|
December 31, 2023 |
|
December 31, 2022 |
|
December 31, 2021 |
||||||||||||
Gold production (ounces) |
|
|
|
|
|
364,141 |
|
|
|
|
|
372,874 |
|
|
|
|
|
367,630 |
|
|
(thousands) |
|
($ per ounce) |
|
(thousands) |
|
($ per ounce) |
|
(thousands) |
|
($ per ounce) |
||||||
Production costs |
|
$ |
343,650 |
|
$ |
944 |
|
$ |
318,141 |
|
$ |
853 |
|
$ |
250,822 |
|
$ |
682 |
Inventory adjustments(ii) |
|
|
11,898 |
|
|
33 |
|
|
653 |
|
|
2 |
|
|
9,686 |
|
|
26 |
Realized gains and losses on hedges of production costs |
|
|
1,682 |
|
|
4 |
|
|
3,500 |
|
|
9 |
|
|
(12,674) |
|
|
(34) |
IAS 16 amendments(v) |
|
|
— |
|
|
— |
|
|
— |
|
|
— |
|
|
(14,059) |
|
|
(38) |
Other adjustments(viii) |
|
|
128 |
|
|
— |
|
|
313 |
|
|
1 |
|
|
252 |
|
|
1 |
Total cash costs (co-product basis) |
|
$ |
357,358 |
|
$ |
981 |
|
$ |
322,607 |
|
$ |
865 |
|
$ |
234,027 |
|
$ |
637 |
By-product metal revenues |
|
|
(630) |
|
|
(1) |
|
|
(753) |
|
|
(2) |
|
|
(808) |
|
|
(3) |
Total cash costs (by-product basis) |
|
$ |
356,728 |
|
$ |
980 |
|
$ |
321,854 |
|
$ |
863 |
|
$ |
233,219 |
|
$ |
634 |
|
|
|
|
|
|
|
|
|
|
|
|
|
|
|
|
|
|
|
Meliadine Mine |
|
Year Ended |
|
Year Ended |
|
Year Ended |
||||||||||||
Per Tonne(x) |
|
December 31, 2023 |
|
December 31, 2022 |
|
December 31, 2021 |
||||||||||||
Tonnes of ore milled (thousands of tonnes) |
|
|
|
|
|
1,918 |
|
|
|
|
|
1,757 |
|
|
|
|
|
1,501 |
|
|
(thousands) |
|
($ per tonne) |
|
(thousands) |
|
($ per tonne) |
|
(thousands) |
|
($ per tonne) |
||||||
Production costs |
|
$ |
343,650 |
|
$ |
179 |
|
$ |
318,141 |
|
$ |
181 |
|
$ |
250,822 |
|
$ |
167 |
Production costs (C$) |
|
C$ |
462,052 |
|
C$ |
241 |
|
C$ |
407,871 |
|
C$ |
232 |
|
C$ |
315,720 |
|
C$ |
210 |
Inventory adjustments (C$)(iii) |
|
|
16,188 |
|
|
8 |
|
|
2,510 |
|
|
2 |
|
|
11,784 |
|
|
7 |
IAS 16 amendments (C$)(v) |
|
|
— |
|
|
— |
|
|
— |
|
|
— |
|
|
(17,706) |
|
|
(11) |
Minesite costs (C$) |
|
C$ |
478,240 |
|
C$ |
249 |
|
C$ |
410,381 |
|
C$ |
234 |
|
C$ |
309,798 |
|
C$ |
206 |
50
|
|
|
|
|
|
|
|
|
|
|
|
|
|
|
|
|
|
|
Meadowbank complex |
|
Year Ended |
|
Year Ended |
|
Year Ended |
||||||||||||
Per Ounce of Gold Produced(xi) |
|
December 31, 2023 |
|
December 31, 2022 |
|
December 31, 2021 |
||||||||||||
Gold production (ounces) |
|
|
|
|
|
431,666 |
|
|
|
|
|
373,785 |
|
|
|
|
|
322,852 |
|
|
(thousands) |
|
($ per ounce) |
|
(thousands) |
|
($ per ounce) |
|
(thousands) |
|
($ per ounce) |
||||||
Production costs |
|
$ |
524,008 |
|
$ |
1,214 |
|
$ |
442,681 |
|
$ |
1,184 |
|
$ |
408,863 |
|
$ |
1,266 |
Inventory adjustments(ii) |
|
|
(12,021) |
|
|
(28) |
|
|
14,807 |
|
|
40 |
|
|
(548) |
|
|
(2) |
Realized gains and losses on hedges of production costs |
|
|
(1,205) |
|
|
(3) |
|
|
(1,691) |
|
|
(4) |
|
|
(14,256) |
|
|
(44) |
Operational care and maintenance due to COVID-19(iv) |
|
|
— |
|
|
— |
|
|
(1,436) |
|
|
(4) |
|
|
(2,612) |
|
|
(8) |
IAS 16 amendments(v) |
|
|
— |
|
|
— |
|
|
— |
|
|
— |
|
|
(2,374) |
|
|
(7) |
Other adjustments(viii) |
|
|
(19) |
|
|
— |
|
|
34 |
|
|
— |
|
|
1,117 |
|
|
4 |
Total cash costs (co-product basis) |
|
$ |
510,763 |
|
$ |
1,183 |
|
$ |
454,395 |
|
$ |
1,216 |
|
$ |
390,190 |
|
$ |
1,209 |
By-product metal revenues |
|
|
(2,958) |
|
|
(7) |
|
|
(2,127) |
|
|
(6) |
|
|
(2,414) |
|
|
(8) |
Total cash costs (by-product basis) |
|
$ |
507,805 |
|
$ |
1,176 |
|
$ |
452,268 |
|
$ |
1,210 |
|
$ |
387,776 |
|
$ |
1,201 |
|
|
|
|
|
|
|
|
|
|
|
|
|
|
|
|
|
|
|
Meadowbank complex |
|
Year Ended |
|
Year Ended |
|
Year Ended |
||||||||||||
Per Tonne(xii) |
|
December 31, 2023 |
|
December 31, 2022 |
|
December 31, 2021 |
||||||||||||
Tonnes of ore milled (thousands of tonnes) |
|
|
|
|
|
3,843 |
|
|
|
|
|
3,739 |
|
|
|
|
|
3,556 |
|
|
(thousands) |
|
($ per tonne) |
|
(thousands) |
|
($ per tonne) |
|
(thousands) |
|
($ per tonne) |
||||||
Production costs |
|
$ |
524,008 |
|
$ |
136 |
|
$ |
442,681 |
|
$ |
118 |
|
$ |
408,863 |
|
$ |
115 |
Production costs (C$) |
|
C$ |
702,879 |
|
C$ |
183 |
|
C$ |
574,895 |
|
C$ |
154 |
|
C$ |
515,800 |
|
C$ |
145 |
Inventory adjustments (C$)(iii) |
|
|
(15,934) |
|
|
(4) |
|
|
12,203 |
|
|
3 |
|
|
(982) |
|
|
— |
Operational care and maintenance due to COVID-19 (C$)(iv) |
|
|
— |
|
|
— |
|
|
(1,793) |
|
|
— |
|
|
(3,326) |
|
|
(1) |
IAS 16 amendments (C$)(v) |
|
|
— |
|
|
— |
|
|
— |
|
|
— |
|
|
(2,995) |
|
|
(1) |
Minesite costs (C$) |
|
C$ |
686,945 |
|
C$ |
179 |
|
C$ |
585,305 |
|
C$ |
157 |
|
C$ |
508,497 |
|
C$ |
143 |
|
|
|
|
|
|
|
|
|
|
|
|
|
|
|
|
|
|
|
Hope Bay Project |
|
Year Ended |
|
Year Ended |
|
Year Ended |
||||||||||||
Per Ounce of Gold Produced |
|
December 31, 2023 |
|
December 31, 2022 |
|
December 31, 2021 |
||||||||||||
Gold production (ounces) |
|
|
|
|
|
— |
|
|
|
|
|
— |
|
|
|
|
|
56,229 |
|
|
(thousands) |
|
($per ounce) |
|
(thousands) |
|
($per ounce) |
|
(thousands) |
|
($per ounce) |
||||||
Production costs |
|
$ |
— |
|
$ |
— |
|
$ |
— |
|
$ |
— |
|
$ |
83,118 |
|
$ |
1,478 |
Inventory adjustments(ii) |
|
|
— |
|
|
— |
|
|
— |
|
|
— |
|
|
(13,713) |
|
|
(244) |
Operational care and maintenance due to COVID-19(iv) |
|
|
— |
|
|
— |
|
|
— |
|
|
— |
|
|
(9,964) |
|
|
(177) |
Other adjustments(viii) |
|
|
— |
|
|
— |
|
|
— |
|
|
— |
|
|
374 |
|
|
7 |
Total cash costs (co-product basis) |
|
$ |
— |
|
$ |
— |
|
$ |
— |
|
$ |
— |
|
$ |
59,815 |
|
$ |
1,064 |
By-product metal revenues |
|
|
— |
|
|
— |
|
|
— |
|
|
— |
|
|
(46) |
|
|
(1) |
Total cash costs (by-product basis) |
|
$ |
— |
|
$ |
— |
|
$ |
— |
|
$ |
— |
|
$ |
59,769 |
|
$ |
1,063 |
Hope Bay Project |
|
Year Ended |
|
Year Ended |
|
Year Ended |
||||||||||||
Per Tonne |
|
December 31, 2023 |
|
December 31, 2022 |
|
December 31, 2021 |
||||||||||||
Tonnes of ore milled (thousands of tonnes) |
|
|
|
|
|
— |
|
|
|
|
|
— |
|
|
|
|
|
228 |
|
|
(thousands) |
|
|
($ per tonne) |
|
(thousands) |
|
($ per tonne) |
|
(thousands) |
|
($ per tonne) |
|||||
Production costs |
|
$ |
— |
|
$ |
— |
|
$ |
— |
|
$ |
— |
|
$ |
83,118 |
|
$ |
365 |
Production costs (C$) |
|
C$ |
— |
|
C$ |
— |
|
C$ |
— |
|
C$ |
— |
|
C$ |
104,291 |
|
C$ |
457 |
Inventory adjustments (C$)(iii) |
|
|
— |
|
|
— |
|
|
— |
|
|
— |
|
|
(17,801) |
|
|
(78) |
Operational care and maintenance due to COVID-19 (C$)(iv) |
|
|
— |
|
|
— |
|
|
— |
|
|
— |
|
|
(12,304) |
|
|
(53) |
Minesite costs (C$) |
|
C$ |
— |
|
C$ |
— |
|
C$ |
— |
|
C$ |
— |
|
C$ |
74,186 |
|
C$ |
326 |
|
|
|
|
|
|
|
|
|
|
|
|
|
|
|
|
|
|
|
Kittila Mine |
|
Year Ended |
|
|
Year Ended |
|
Year Ended |
|||||||||||
Per Ounce of Gold Produced |
|
December 31, 2023 |
|
December 31, 2022 |
|
December 31, 2021 |
||||||||||||
Gold production (ounces) |
|
|
|
|
|
234,402 |
|
|
|
|
|
216,947 |
|
|
|
|
|
239,240 |
|
|
(thousands) |
|
($ per ounce) |
|
(thousands) |
|
($ per ounce) |
|
(thousands) |
|
($ per ounce) |
||||||
Production costs |
|
$ |
205,857 |
|
$ |
878 |
|
$ |
210,661 |
|
$ |
971 |
|
$ |
192,742 |
|
$ |
806 |
Inventory adjustments(ii) |
|
|
2,958 |
|
|
13 |
|
|
(5,349) |
|
|
(25) |
|
|
5,908 |
|
|
25 |
Realized gains and losses on hedges of production costs |
|
|
(2,999) |
|
|
(13) |
|
|
7,329 |
|
|
34 |
|
|
577 |
|
|
2 |
Other adjustments(viii) |
|
|
(1,338) |
|
|
(6) |
|
|
274 |
|
|
1 |
|
|
705 |
|
|
3 |
Total cash costs (co-product basis) |
|
$ |
204,478 |
|
$ |
872 |
|
$ |
212,915 |
|
$ |
981 |
|
$ |
199,932 |
|
$ |
836 |
By-product metal revenues |
|
|
(358) |
|
|
(1) |
|
|
(295) |
|
|
(1) |
|
|
(249) |
|
|
(1) |
Total cash costs (by-product basis) |
|
$ |
204,120 |
|
$ |
871 |
|
$ |
212,620 |
|
$ |
980 |
|
$ |
199,683 |
|
$ |
835 |
51
Kittila Mine |
|
Year Ended |
|
Year Ended |
|
Year Ended |
||||||||||||
Per Tonne |
|
December 31, 2023 |
|
December 31, 2022 |
|
December 31, 2021 |
||||||||||||
Tonnes of ore milled (thousands of tonnes) |
|
|
|
|
|
1,954 |
|
|
|
|
|
1,925 |
|
|
|
|
|
2,052 |
|
|
(thousands) |
|
($ per tonne) |
|
(thousands) |
|
($ per tonne) |
|
(thousands) |
|
($ per tonne) |
||||||
Production costs |
|
$ |
205,857 |
|
$ |
105 |
|
$ |
210,661 |
|
$ |
109 |
|
$ |
192,742 |
|
$ |
94 |
Production costs (€) |
|
€ |
191,023 |
|
€ |
98 |
|
€ |
198,484 |
|
€ |
103 |
|
€ |
163,165 |
|
€ |
80 |
Inventory adjustments (€)(iii) |
|
|
2,112 |
|
|
1 |
|
|
(3,853) |
|
|
(2) |
|
|
5,330 |
|
|
2 |
Minesite costs (€) |
|
€ |
193,135 |
|
€ |
99 |
|
€ |
194,631 |
|
€ |
101 |
|
€ |
168,495 |
|
€ |
82 |
Detour Lake Mine |
|
Year Ended |
|
Year Ended |
|
Year Ended |
||||||||||||
Per Ounce of Gold Produced |
|
December 31, 2023 |
|
December 31, 2022(vii) |
|
December 31, 2021 |
||||||||||||
Gold production (ounces) |
|
|
|
|
|
677,446 |
|
|
|
|
|
651,182 |
|
|
|
|
|
— |
|
|
(thousands) |
|
($ per ounce) |
|
(thousands) |
|
($ per ounce) |
|
(thousands) |
|
($ per ounce) |
||||||
Production costs |
|
$ |
453,498 |
|
$ |
669 |
|
$ |
489,703 |
|
$ |
752 |
|
$ |
— |
|
$ |
— |
Inventory adjustments(ii) |
|
|
8,232 |
|
|
12 |
|
|
(8,195) |
|
|
(13) |
|
|
— |
|
|
— |
Realized gains and losses on hedges of production costs |
|
|
4,867 |
|
|
8 |
|
|
— |
|
|
— |
|
|
— |
|
|
— |
Purchase price allocation to inventory(vi) |
|
|
— |
|
|
— |
|
|
(74,509) |
|
|
(113) |
|
|
— |
|
|
— |
In-kind royalties and other adjustments(viii) |
|
|
33,149 |
|
|
49 |
|
|
24,483 |
|
|
37 |
|
|
— |
|
|
— |
Total cash costs (co-product basis) |
|
$ |
499,746 |
|
$ |
738 |
|
$ |
431,482 |
|
$ |
663 |
|
$ |
— |
|
$ |
— |
By-product metal revenues |
|
|
(2,073) |
|
|
(3) |
|
|
(3,712) |
|
|
(6) |
|
|
— |
|
|
— |
Total cash costs (by-product basis) |
|
$ |
497,673 |
|
$ |
735 |
|
$ |
427,770 |
|
$ |
657 |
|
$ |
— |
|
$ |
— |
Detour Lake Mine |
|
Year Ended |
|
Year Ended |
|
Year Ended |
||||||||||||
Per Tonne |
|
December 31, 2023 |
|
December 31, 2022(vii) |
|
December 31, 2021 |
||||||||||||
Tonnes of ore milled (thousands of tonnes) |
|
|
|
|
|
25,435 |
|
|
|
|
|
22,782 |
|
|
|
|
|
— |
|
|
(thousands) |
|
($ per tonne) |
|
(thousands) |
|
($ per tonne) |
|
(thousands) |
|
($ per tonne) |
||||||
Production costs |
|
$ |
453,498 |
|
$ |
18 |
|
$ |
489,703 |
|
$ |
21 |
|
$ |
— |
|
$ |
— |
Production costs (C$) |
|
C$ |
611,244 |
|
C$ |
24 |
|
C$ |
637,567 |
|
C$ |
28 |
|
C$ |
— |
|
C$ |
— |
Inventory adjustments (C$)(iii) |
|
|
11,038 |
|
|
— |
|
|
(8,782) |
|
|
— |
|
|
— |
|
|
— |
Purchase price allocation to inventory (C$)(vi) |
|
|
— |
|
|
— |
|
|
(95,791) |
|
|
(4) |
|
|
— |
|
|
— |
In-kind royalties and other adjustments (C$)(viii) |
|
|
39,323 |
|
|
2 |
|
|
31,917 |
|
|
1 |
|
|
— |
|
|
— |
Minesite costs (C$) |
|
C$ |
661,605 |
|
C$ |
26 |
|
C$ |
564,911 |
|
C$ |
25 |
|
C$ |
— |
|
C$ |
— |
Macassa Mine |
|
Year Ended |
|
Year Ended |
|
Year Ended |
||||||||||||
Per Ounce of Gold Produced |
|
December 31, 2023 |
|
December 31, 2022(vii) |
|
December 31, 2021 |
||||||||||||
Gold production (ounces) |
|
|
|
|
|
228,535 |
|
|
|
|
|
180,833 |
|
|
|
|
|
— |
|
|
(thousands) |
|
($ per ounce) |
|
(thousands) |
|
($ per ounce) |
|
|
(thousands) |
|
($ per ounce) |
|||||
Production costs |
|
$ |
155,046 |
|
$ |
678 |
|
$ |
129,774 |
|
$ |
718 |
|
$ |
— |
|
$ |
— |
Inventory adjustments(ii) |
|
|
1,382 |
|
|
6 |
|
|
38 |
|
|
— |
|
|
— |
|
|
— |
Realized gains and losses on hedges of production costs |
|
|
3,127 |
|
|
14 |
|
|
— |
|
|
— |
|
|
— |
|
|
— |
Purchase price allocation to inventory(vi) |
|
|
— |
|
|
— |
|
|
(10,326) |
|
|
(57) |
|
|
— |
|
|
— |
In-kind royalties and other adjustments(viii) |
|
|
8,041 |
|
|
35 |
|
|
4,237 |
|
|
23 |
|
|
— |
|
|
— |
Total cash costs (co-product basis) |
|
$ |
167,596 |
|
$ |
733 |
|
$ |
123,723 |
|
$ |
684 |
|
$ |
— |
|
$ |
— |
By-product metal revenues |
|
|
(649) |
|
|
(2) |
|
|
(298) |
|
|
(1) |
|
|
— |
|
|
— |
Total cash costs (by-product basis) |
|
$ |
166,947 |
|
$ |
731 |
|
$ |
123,425 |
|
$ |
683 |
|
$ |
— |
|
$ |
— |
Macassa Mine |
|
Year Ended |
|
Year Ended |
|
Year Ended |
||||||||||||
Per Tonne |
|
December 31, 2023 |
|
December 31, 2022(vii) |
|
December 31, 2021 |
||||||||||||
Tonnes of ore milled (thousands of tonnes) |
|
|
|
|
|
442 |
|
|
|
|
|
280 |
|
|
|
|
|
— |
|
|
(thousands) |
|
($ per tonne) |
|
(thousands) |
|
($ per tonne) |
|
(thousands) |
|
($ per tonne) |
||||||
Production costs |
|
$ |
155,046 |
|
$ |
351 |
|
$ |
129,774 |
|
$ |
463 |
|
$ |
— |
|
$ |
— |
Production costs (C$) |
|
C$ |
209,928 |
|
C$ |
475 |
|
C$ |
168,400 |
|
C$ |
602 |
|
C$ |
— |
|
C$ |
— |
Inventory adjustments (C$)(iii) |
|
|
1,836 |
|
|
4 |
|
|
533 |
|
|
2 |
|
|
— |
|
|
— |
Purchase price allocation to inventory (C$)(vi) |
|
|
— |
|
|
— |
|
|
(13,248) |
|
|
(47) |
|
|
— |
|
|
— |
In-kind royalties and other adjustments (C$)(viii) |
|
|
10,517 |
|
|
24 |
|
|
5,538 |
|
|
20 |
|
|
— |
|
|
— |
Minesite costs (C$) |
|
C$ |
222,281 |
|
C$ |
503 |
|
C$ |
161,223 |
|
C$ |
577 |
|
C$ |
— |
|
C$ |
— |
52
|
|
|
|
|
|
|
|
|
|
|
|
|
|
|
|
|
|
|
Fosterville Mine |
|
Year Ended |
|
Year Ended |
|
Year Ended |
||||||||||||
Per Ounce of Gold Produced |
|
December 31, 2023 |
|
December 31, 2022(vii) |
|
December 31, 2021 |
||||||||||||
Gold production (ounces) |
|
|
|
|
|
277,694 |
|
|
|
|
|
338,327 |
|
|
|
|
|
— |
|
|
(thousands) |
|
($ per ounce) |
|
(thousands) |
|
($ per ounce) |
|
(thousands) |
|
($ per ounce) |
||||||
Production costs |
|
$ |
131,298 |
|
$ |
473 |
|
$ |
204,649 |
|
$ |
605 |
|
$ |
— |
|
$ |
— |
Inventory adjustments(ii) |
|
|
1,345 |
|
|
5 |
|
|
(2,691) |
|
|
(8) |
|
|
— |
|
|
— |
Realized gains and losses on hedges of production costs |
|
|
3,097 |
|
|
11 |
|
|
— |
|
|
— |
|
|
— |
|
|
— |
Purchase price allocation to inventory(vi) |
|
|
— |
|
|
— |
|
|
(73,674) |
|
|
(218) |
|
|
— |
|
|
— |
Other adjustments(viii) |
|
|
52 |
|
|
— |
|
|
— |
|
|
— |
|
|
— |
|
|
— |
Total cash costs (co-product basis) |
|
$ |
135,792 |
|
$ |
489 |
|
$ |
128,284 |
|
$ |
379 |
|
$ |
— |
|
$ |
— |
By-product metal revenues |
|
|
(397) |
|
|
(1) |
|
|
(527) |
|
|
(1) |
|
|
— |
|
|
— |
Total cash costs (by-product basis) |
|
$ |
135,395 |
|
$ |
488 |
|
$ |
127,757 |
|
$ |
378 |
|
$ |
— |
|
$ |
— |
|
|
|
|
|
|
|
|
|
|
|
|
|
|
|
|
|
|
|
Fosterville Mine |
|
Year Ended |
|
Year Ended |
|
Year Ended |
||||||||||||
Per Tonne |
|
December 31, 2023 |
|
December 31, 2022(vii) |
|
December 31, 2021 |
||||||||||||
Tonnes of ore milled (thousands of tonnes) |
|
|
|
|
|
651 |
|
|
|
|
|
524 |
|
|
|
|
|
— |
|
|
(thousands) |
|
($ per tonne) |
|
(thousands) |
|
($ per tonne) |
|
(thousands) |
|
($ per tonne) |
||||||
Production costs |
|
$ |
131,298 |
|
$ |
202 |
|
$ |
204,649 |
|
$ |
391 |
|
$ |
— |
|
$ |
— |
Production costs (A$) |
|
A$ |
197,921 |
|
A$ |
304 |
|
A$ |
293,875 |
|
A$ |
561 |
|
A$ |
— |
|
A$ |
— |
Inventory adjustments (A$)(iii) |
|
|
(2,155) |
|
|
(3) |
|
|
(3,045) |
|
|
(6) |
|
|
— |
|
|
— |
Purchase price allocation to inventory (A$)(vi) |
|
|
— |
|
|
— |
|
|
(104,507) |
|
|
(199) |
|
|
— |
|
|
— |
Minesite costs (A$) |
|
A$ |
195,766 |
|
A$ |
301 |
|
A$ |
186,323 |
|
A$ |
356 |
|
A$ |
— |
|
A$ |
— |
Pinos Altos Mine |
|
Year Ended |
|
Year Ended |
|
Year Ended |
||||||||||||
Per Ounce of Gold Produced |
|
December 31, 2023 |
|
December 31, 2022 |
|
December 31, 2021 |
||||||||||||
Gold production (ounces) |
|
|
|
|
|
97,642 |
|
|
|
|
|
96,522 |
|
|
|
|
|
126,932 |
|
|
(thousands) |
|
($per ounce) |
|
(thousands) |
|
($per ounce) |
|
(thousands) |
|
($per ounce) |
||||||
Production costs |
|
$ |
145,936 |
|
$ |
1,495 |
|
$ |
144,489 |
|
$ |
1,497 |
|
$ |
141,488 |
|
$ |
1,115 |
Inventory adjustments(ii) |
|
|
2,979 |
|
|
31 |
|
|
(2,295) |
|
|
(24) |
|
|
241 |
|
|
2 |
Realized gains and losses on hedges of production costs |
|
|
(2,819) |
|
|
(29) |
|
|
(879) |
|
|
(9) |
|
|
(2,515) |
|
|
(20) |
Other adjustments(viii) |
|
|
1,248 |
|
|
12 |
|
|
1,235 |
|
|
13 |
|
|
1,627 |
|
|
13 |
Total cash costs (co-product basis) |
|
$ |
147,344 |
|
$ |
1,509 |
|
$ |
142,550 |
|
$ |
1,477 |
|
$ |
140,841 |
|
$ |
1,110 |
By-product metal revenues |
|
|
(27,339) |
|
|
(280) |
|
|
(21,983) |
|
|
(228) |
|
|
(31,965) |
|
|
(252) |
Total cash costs (by-product basis) |
|
$ |
120,005 |
|
$ |
1,229 |
|
$ |
120,567 |
|
$ |
1,249 |
|
$ |
108,876 |
|
$ |
858 |
|
|
|
|
|
|
|
|
|
|
|
|
|
|
|
|
|
|
|
Pinos Altos Mine |
|
Year Ended |
|
Year Ended |
|
Year Ended |
||||||||||||
Per Tonne |
|
December 31, 2023 |
|
December 31, 2022 |
|
December 31, 2021 |
||||||||||||
Tonnes of ore processed (thousands of tonnes) |
|
|
|
|
|
1,656 |
|
|
|
|
|
1,510 |
|
|
|
|
|
1,899 |
|
|
(thousands) |
|
($per tonne) |
|
(thousands) |
|
($per tonne) |
|
(thousands) |
|
($per tonne) |
||||||
Production costs |
|
$ |
145,936 |
|
$ |
88 |
|
$ |
144,489 |
|
$ |
96 |
|
$ |
141,488 |
|
$ |
75 |
Inventory adjustments(iii) |
|
|
160 |
|
|
— |
|
|
(2,295) |
|
|
(2) |
|
|
241 |
|
|
— |
Minesite costs |
|
$ |
146,096 |
|
$ |
88 |
|
$ |
142,194 |
|
$ |
94 |
|
$ |
141,729 |
|
$ |
75 |
|
|
|
|
|
|
|
|
|
|
|
|
|
|
|
|
|
|
|
Creston Mascota Mine |
|
Year Ended |
|
Year Ended |
|
Year Ended |
||||||||||||
Per Ounce of Gold Produced |
|
December 31, 2023 |
|
December 31, 2022 |
|
December 31, 2021 |
||||||||||||
Gold production (ounces) |
|
|
|
|
|
638 |
|
|
|
|
|
2,630 |
|
|
|
|
|
12,801 |
|
|
(thousands) |
|
($per ounce) |
|
(thousands) |
|
($per ounce) |
|
(thousands) |
|
($per ounce) |
||||||
Production costs |
|
$ |
— |
|
$ |
— |
|
$ |
1,943 |
|
$ |
739 |
|
$ |
8,165 |
|
$ |
638 |
Inventory adjustments(ii) |
|
|
— |
|
|
— |
|
|
222 |
|
|
84 |
|
|
(349) |
|
|
(27) |
Other adjustments(viii) |
|
|
— |
|
|
— |
|
|
78 |
|
|
30 |
|
|
327 |
|
|
25 |
Total cash costs (co-product basis) |
|
$ |
— |
|
$ |
— |
|
$ |
2,243 |
|
$ |
853 |
|
$ |
8,143 |
|
$ |
636 |
By-product metal revenues |
|
|
— |
|
|
— |
|
|
(158) |
|
|
(60) |
|
|
(2,914) |
|
|
(228) |
Total cash costs (by-product basis) |
|
$ |
— |
|
$ |
— |
|
$ |
2,085 |
|
$ |
793 |
|
$ |
5,229 |
|
$ |
408 |
53
|
|
|
|
|
|
|
|
|
|
|
|
|
|
|
|
|
|
|
Creston Mascota Mine |
|
Year Ended |
|
Year Ended |
|
Year Ended |
||||||||||||
Per Tonne(xiii) |
|
December 31, 2023 |
|
December 31, 2022 |
|
December 31, 2021 |
||||||||||||
Tonnes of ore processed (thousands of tonnes) |
|
|
|
|
|
— |
|
|
|
|
|
— |
|
|
|
|
|
— |
|
|
(thousands) |
|
($per tonne) |
|
(thousands) |
|
($per tonne) |
|
(thousands) |
|
($per tonne) |
||||||
Production costs |
|
$ |
— |
|
$ |
— |
|
$ |
1,943 |
|
$ |
— |
|
$ |
8,165 |
|
$ |
— |
Inventory adjustments(ii) |
|
|
— |
|
|
— |
|
|
222 |
|
|
— |
|
|
(349) |
|
|
— |
Other adjustments(viii) |
|
|
— |
|
|
— |
|
|
(2,165) |
|
|
— |
|
|
(7,816) |
|
|
— |
Minesite costs |
|
$ |
— |
|
$ |
— |
|
$ |
— |
|
$ |
— |
|
$ |
— |
|
$ |
— |
La India Mine |
|
Year Ended |
|
Year Ended |
|
Year Ended |
||||||||||||
Per Ounce of Gold Produced |
|
December 31, 2023 |
|
December 31, 2022 |
|
December 31, 2021 |
||||||||||||
Gold production (ounces) |
|
|
|
|
|
75,904 |
|
|
|
|
|
74,672 |
|
|
|
|
|
63,529 |
|
|
(thousands) |
|
($ per ounce) |
|
(thousands) |
|
($ per ounce) |
|
(thousands) |
|
($ per ounce) |
||||||
Production costs |
|
$ |
96,490 |
|
$ |
1,271 |
|
$ |
76,226 |
|
$ |
1,021 |
|
$ |
60,381 |
|
$ |
950 |
Inventory adjustments(ii) |
|
|
(1,335) |
|
|
(18) |
|
|
3,598 |
|
|
48 |
|
|
98 |
|
|
2 |
Other adjustments(viii) |
|
|
584 |
|
|
8 |
|
|
699 |
|
|
9 |
|
|
458 |
|
|
7 |
Total cash costs (co-product basis) |
|
$ |
95,739 |
|
$ |
1,261 |
|
$ |
80,523 |
|
$ |
1,078 |
|
$ |
60,937 |
|
$ |
959 |
By-product metal revenues |
|
|
(1,566) |
|
|
(20) |
|
|
(1,689) |
|
|
(22) |
|
|
(1,298) |
|
|
(20) |
Total cash costs (by-product basis) |
|
$ |
94,173 |
|
$ |
1,241 |
|
$ |
78,834 |
|
$ |
1,056 |
|
$ |
59,639 |
|
$ |
939 |
La India Mine |
|
Year Ended |
|
Year Ended |
|
Year Ended |
||||||||||||
Per Tonne |
|
December 31, 2023 |
|
December 31, 2022 |
|
December 31, 2021 |
||||||||||||
Tonnes of ore processed (thousands of tonnes) |
|
|
|
|
|
3,010 |
|
|
|
|
|
5,102 |
|
|
|
|
|
6,018 |
|
|
(thousands) |
|
($per tonne) |
|
(thousands) |
|
($per tonne) |
|
(thousands) |
|
($per tonne) |
||||||
Production costs |
|
$ |
96,490 |
|
$ |
32 |
|
$ |
76,226 |
|
$ |
15 |
|
$ |
60,381 |
|
$ |
10 |
Inventory adjustments(iii) |
|
|
(1,335) |
|
|
— |
|
|
3,598 |
|
|
1 |
|
|
98 |
|
|
— |
Minesite costs |
|
$ |
95,155 |
|
$ |
32 |
|
$ |
79,824 |
|
$ |
16 |
|
$ |
60,479 |
|
$ |
10 |
Notes:
| (i) | The information set out in this table reflects the Company’s 50% interest in the Canadian Malartic complex up to and including March 30, 2023 and 100% interest thereafter. |
| (ii) | Under the Company’s revenue recognition policy, revenue from contracts with customers is recognized upon the transfer of control over metals sold to the customer. As the total cash costs per ounce of gold produced are calculated on a production basis, an inventory adjustment is made to reflect the portion of production not yet recognized as revenue. |
| (iii) | This inventory adjustment reflects production costs associated with the portion of production still in inventory. |
| (iv) | This adjustment reflects the costs associated with the temporary suspension of mining activities at the Company’s Nunavut mine sites in response to the COVID-19 pandemic and primarily includes payroll and other incidental costs associated with maintaining the sites and properties and payroll costs associated with employees who were not working during the period of reduced or suspended operations. These expenses also include payroll costs of employees who could not work following the period of temporary suspension or reduced operations due to the Company’s effort to prevent or curtail community transmission of COVID-19. |
| (v) | Amendments to IAS 16 issued by the IASB in 2020 clarified that entities were prohibited from deducting amounts received from selling items produced from the cost of property, plant and mine development while the Company is preparing the asset for its intended use. Instead, sales proceeds and the cost of producing these items must be recognized in the consolidated statements of income. The amendments are effective for annual reporting periods beginning on or after January 1, 2022. The amendments apply retrospectively, but only to assets brought to the location and condition necessary for them to be capable of operating in the manner intended by management on or after the beginning of the earliest period presented in the financial statements in which the Company first applies the amendments. The Company adopted the standard on the effective date and applied it retrospectively to the fiscal year beginning January 1, 2021. For the year ended December 31, 2021, the Company has made an adjustment for these IAS 16 amendments to calculations of total cash costs per ounce of gold produced (on both a by-product and co-product basis) and minesite costs per tonne of ore to ensure the measures for this year are comparable to the measures as calculated for prior years. No adjustment for the IAS 16 amendments were made in respect of these measures for the years ended December 31, 2022 and 2023. |
| (vi) | On February 8, 2022, the Company completed the Merger and this adjustment reflects the fair value allocated to inventory at the Detour Lake, Macassa and Fosterville mines as part of the purchase price allocation. On March 31, 2023, the Company completed Yamana Transaction and this adjustment reflects the fair value allocated to inventory on Canadian Malartic complex as part of the purchase price allocation. |
54
| (vii) | On February 8, 2022, the Company completed the Merger. Accordingly, the contributions from the Detour Lake, Macassa and Fosterville mines for the year ended December 31, 2022 reflects the period from February 8 to December 31, 2022. |
| (viii) | Other adjustments consists of costs associated with a 5% in-kind royalty paid in respect of the Canadian Malartic complex, a 2% in-kind royalty paid in respect of the Detour Lake mine, a 1.5% in-kind royalty paid in respect of the Macassa mine and smelting, refining, and marketing charges to production costs. For the year ended December 31, 2021, in-kind royalties for the Canadian Malartic complex were included in production costs. |
| (ix) | The Meliadine mine’s total cash cost per ounce of gold produced for the year ended December 31, 2021 excludes 24,057 ounces of payable production of gold which were produced prior to the achievement of commercial production at the Tiriganiaq open pit deposit on August 15, 2021. |
| (x) | The Meliadine mine’s minesite cost per tonne for the year ended December 31, 2021 excludes 213,867 tonnes of ore which were processed prior to the achievement of commercial production at the Tiriganiaq open pit deposit on August 15, 2021. |
| (xi) | The Meadowbank Complex’s total cash cost per ounce of gold produced for the year ended December 31, 2021 excludes 1,956 ounces of payable production of gold which were produced prior to the achievement of commercial production at the Amaruq underground project on August 1, 2022. |
| (xii) | The Meadowbank Complex’s minesite cost per tonne for the year ended December December 31, 2021 excludes 14,299 tonnes of ore which were processed prior to the achievement of commercial production at the Amaruq underground project on August 1, 2022. |
| (xiii) | The Creston Mascota mine’s total cash cost per tonne for the year ended December 31, 2022 excludes approximately $2.2 million of production costs incurred during the year ended December 31, 2022 following the cessation of mining activities at the Bravo pit. The Creston Mascota mine’s minesite costs per tonne for the year ended December 31, 2021 excludes approximately $7.8 million of production costs incurred during the three months ended December 31, 2021 following the cessation of mining activities at the Bravo pit during the third quarter of 2020. |
All-in Sustaining Costs per Ounce of Gold Produced
All-in sustaining costs per ounce of gold produced (also referred to as “all-in sustaining costs per ounce” or “AISC per ounce”) on a by-product basis is calculated as the aggregate of total cash costs on a by-product basis, sustaining capital expenditures (including capitalized exploration), general and administrative expenses (including stock options), lease payments related to sustaining assets and reclamation expenses, and then dividing by the number of ounces of gold produced. These additional costs reflect the additional expenditures that are required to be made to maintain current production levels. AISC per ounce on a co-product basis is calculated in the same manner as AISC per ounce on a by-product basis, except that the total cash costs on a co-product basis are used, meaning no adjustment has been made for by-product metal revenues. Investors should note that AISC per ounce is not reflective of all cash expenditures as it does not include income tax payments, interest costs or dividend payments, nor does it include non-cash expenditures, such as depreciation and amortization. In this MD&A, unless otherwise indicated, all-in sustaining costs per ounce of gold produced is reported on a byproduct basis (see “Non-GAAP measures - Total cash costs per ounce of gold produced” for a discussion of regarding the Company’s use of by-product basis reporting).
Management believes that AISC per ounce is helpful to investors as it reflects total sustaining expenditures of producing and selling an ounce of gold while maintaining current operations and, as such, provides helpful information about operating performance. Management is aware, and investors should note, that these per ounce measures of performance can be affected by fluctuations in foreign exchange rates and, in the case of AISC per ounce on a by-product basis, by-product metal prices. Management compensates for these inherent limitations by using, and investors should also consider using, these measures in conjunction with data prepared in accordance with IFRS and minesite costs per tonne, as AISC per ounce is not necessarily indicative of operating costs or cash flow measures prepared in accordance with IFRS.
The Company follows the guidance on calculation of AISC per ounce released by the World Gold Council (“WGC”) in 2018. The WGC is a non-regulatory market development organization for the gold industry that has worked closely with its member companies to develop guidance in respect of relevant non-GAAP measures. Notwithstanding the Company’s adoption of the WGC’s guidance, AISC per ounce of gold produced reported by the Company may not be comparable to data reported by other gold mining companies.
55
The following tables set out a reconciliation of production costs to all-in sustaining costs per ounce of gold produced for the years ended December 31, 2023, December 31, 2022, and December 31, 2021 on both a by-product basis (deducting by-product metal revenues from production costs) and co-product basis (without deducting by-product metal revenues).
Reconciliation of Production Costs to All-in Sustaining Costs per Ounce of Gold Produced
|
|
Year Ended |
|
Year Ended |
|
Year Ended |
|||
|
|
December 31, |
|
December 31, |
|
December 31, |
|||
(United States dollars per ounce of gold produced, except where noted) |
|
2023 |
|
2022 |
|
2021 |
|||
Production costs per the consolidated statements of income (thousands of United States dollars) |
|
$ |
2,933,263 |
|
$ |
2,643,321 |
|
$ |
1,773,121 |
Gold production (ounces)(i)(ii) |
|
|
3,439,654 |
|
|
3,135,007 |
|
|
2,060,392 |
Production costs per ounce of gold production |
|
$ |
853 |
|
$ |
843 |
|
$ |
861 |
Adjustments: |
|
|
|
|
|
|
|
|
|
Inventory adjustments(iii) |
|
|
9 |
|
|
2 |
|
|
(8) |
Purchase price allocation to inventory(iv) |
|
|
(8) |
|
|
(51) |
|
|
— |
IAS 16 amendments(v) |
|
|
— |
|
|
— |
|
|
(8) |
Realized gains and losses on hedges of production costs |
|
|
3 |
|
|
6 |
|
|
(22) |
Operational care and maintenance costs due to COVID-19(vi) |
|
|
— |
|
|
— |
|
|
(6) |
Other(vii) |
|
|
36 |
|
|
25 |
|
|
12 |
Total cash costs per ounce of gold produced (co-product basis)(viii) |
|
$ |
893 |
|
$ |
825 |
|
$ |
829 |
By-product metal revenues |
|
|
(28) |
|
|
(32) |
|
|
(59) |
Total cash costs per ounce of gold produced (by-product basis)(viii) |
|
$ |
865 |
|
$ |
793 |
|
$ |
770 |
Adjustments: |
|
|
|
|
|
|
|
|
|
Sustaining capital expenditures (including capitalized exploration) |
|
|
235 |
|
|
232 |
|
|
207 |
General and administrative expenses (including stock option expense) |
|
|
61 |
|
|
70 |
|
|
69 |
Non-cash reclamation provision and sustaining leases(ix) |
|
|
18 |
|
|
14 |
|
|
13 |
All-in sustaining costs per ounce of gold produced (by-product basis) |
|
$ |
1,179 |
|
$ |
1,109 |
|
$ |
1,059 |
By-product metal revenues |
|
|
28 |
|
|
32 |
|
|
59 |
All-in sustaining costs per ounce of gold produced (co-product basis) |
|
$ |
1,207 |
|
$ |
1,141 |
|
$ |
1,118 |
Notes:
| (i) | Gold production for the year ended December 31, 2021 excludes 24,057 ounces of payable production of gold at the Meliadine mine which were produced prior to the achievement of commercial production at the Tiriganiaq open pit deposit on August 15, 2021. |
| (ii) | Gold production for the year ended December 31, 2021 excludes 1,956 ounces of payable production of gold at the Meadowbank complex which were produced prior to the achievement of commercial production at the Amaruq underground project on August 1, 2022. |
| (iii) | Under the Company’s revenue recognition policy, revenue from contracts with customers is recognized upon the transfer of control over metals sold to the customer. As the total cash costs per ounce of gold produced are calculated on a production basis, an inventory adjustment is made to reflect the portion of production not yet recognized as revenue. |
| (iv) | On February 8, 2022, the Company completed the Merger and this adjustment reflects the fair value allocated to inventory at the Detour Lake, Macassa and Fosterville mines as part of the purchase price allocation. On March 31, 2023, the Company completed Yamana Transaction and this adjustment reflects the fair value allocated to inventory on Canadian Malartic complex as part of the purchase price allocation. |
| (v) | Certain previously reported line items have been restated to reflect the retrospective application of IAS 16. This adjustment eliminates the effects of the retrospective application of the IAS 16 amendments on the total cash costs per ounce of gold produced (by-product and co-product) as well as all-in sustaining costs (by-product and co-product). |
| (vi) | This adjustment reflects the costs associated with the temporary suspension of mining activities at the Company’s mine sites in response to the COVID-19 pandemic which primarily includes payroll and other incidental costs associated with maintaining the sites and properties, and payroll costs associated with employees who were not working during the period of reduced or suspended operations. These expenses also include payroll costs of employees who could not work following the period of temporary suspension or reduced operations due to the Company’s effort to prevent or curtail community transmission of COVID-19. |
| (vii) | Other adjustments consists of in-kind royalties, smelting, refining and marketing charges to production costs. |
56
| (viii) | The total cash costs per ounce of gold produced is not a recognized measure under IFRS and this data may not be comparable to data reported by other gold producers. See “Non-GAAP Financial Performance Measures — Total Cash Costs per Ounce of Gold Produced and Minesite Costs per Tonne” for more information on the Company’s use of total cash cost per ounce of gold produced. |
| (ix) | Sustaining leases are lease payments related to sustaining assets. |
Operating Margin
Operating margin is calculated by deducting production costs from revenue from mining operations. In order to reconcile operating margin to net income as recorded in the consolidated financial statements, the Company adds the following items to the operating margin: income and mining taxes expense; other expenses (income); care and maintenance expenses; foreign currency translation (gain) loss; environmental remediation costs; gain (loss) on derivative financial instruments; finance costs; general and administrative expenses; amortization of property, plant and mine development; exploration and corporate development expenses; revaluation gain and impairment losses (reversals). The Company believes that operating margin is a useful measure to investors as it reflects the operating performance of its individual mines associated with the ongoing production and sale of gold and by-product metals without allocating Company-wide overhead, such as exploration and corporate development expenses, amortization of property, plant and mine development, general and administrative expenses, finance costs, gain and losses on derivative financial instruments, environmental remediation costs, foreign currency translation gains and losses, other expenses and income and mining tax expenses. Management uses this measure internally to plan and forecast future operating results. Management believes this measure is helpful to investors as it provides them with additional information about the Company’s underlying operating results, though it should be evaluated in conjunction with other data prepared in accordance with IFRS. For a reconciliation of operating margin to revenue from operations, see “Three Year Financial and Operating Summary”.
Sustaining and Development Capital Expenditures by Mine
Capital expenditures are classified into sustaining capital expenditures and development capital expenditures. Sustaining capital expenditures are expenditures incurred during the production phase to sustain and maintain existing assets so they can achieve constant expected levels of production from which the Company will derive economic benefits. Sustaining capital expenditures include expenditure for assets to retain their existing productive capacity as well as to enhance performance and reliability of the operations. Development capital expenditures represent the spending at new projects and/or expenditures at existing operations that are undertaken with the intention to increase production levels or mine life above the current plans. Management uses these measures in the capital allocation process and to assess the effectiveness of its investments. Management believes these measures are useful so investors can assess the purpose and effectiveness of the capital expenditures split between sustaining and development in each reporting period. The classification between sustaining and development capital expenditures does not have a standardized definition in accordance with IFRS and other companies may classify expenditures in a different manner.
57
Reconciliation of Sustaining and Development Capital Expenditures to the Statements of Cash Flows
|
|
|
|
|
|
|
|
|
|
|
|
|
|
|
|
|
|
|
|
|
Three Months Ended December 31, |
|
Year Ended December 31, |
||||||||||||||
(thousands of United States dollars) |
|
2023 |
|
2022 |
|
2021 |
|
2023 |
|
2022 |
|
2021 |
||||||
LaRonde mine |
|
$ |
21,890 |
|
$ |
26,247 |
|
$ |
30,301 |
|
$ |
72,828 |
|
$ |
92,921 |
|
$ |
96,299 |
LaRonde Zone 5 mine |
|
|
3,368 |
|
|
2,272 |
|
|
4,338 |
|
|
10,253 |
|
|
9,258 |
|
|
14,095 |
Canadian Malartic complex(ii) |
|
|
18,809 |
|
|
18,858 |
|
|
18,978 |
|
|
91,028 |
|
|
69,137 |
|
|
72,749 |
Goldex mine |
|
|
12,267 |
|
|
7,125 |
|
|
7,789 |
|
|
27,203 |
|
|
25,125 |
|
|
31,017 |
Meliadine mine(i) |
|
|
21,244 |
|
|
19,392 |
|
|
13,567 |
|
|
75,275 |
|
|
62,086 |
|
|
50,341 |
Meadowbank complex |
|
|
21,297 |
|
|
40,872 |
|
|
11,729 |
|
|
121,653 |
|
|
86,435 |
|
|
48,917 |
Hope Bay project |
|
|
— |
|
|
15 |
|
|
9,447 |
|
|
147 |
|
|
3,620 |
|
|
44,160 |
Kittila mine |
|
|
16,514 |
|
|
14,503 |
|
|
15,144 |
|
|
49,539 |
|
|
48,799 |
|
|
42,632 |
Detour Lake mine(iii) |
|
|
67,123 |
|
|
58,546 |
|
|
— |
|
|
249,765 |
|
|
214,060 |
|
|
— |
Macassa mine(iii) |
|
|
15,888 |
|
|
9,558 |
|
|
— |
|
|
45,029 |
|
|
30,298 |
|
|
— |
Fosterville mine(iii) |
|
|
9,322 |
|
|
19,525 |
|
|
— |
|
|
34,646 |
|
|
56,343 |
|
|
— |
Pinos Altos mine |
|
|
7,041 |
|
|
8,333 |
|
|
8,395 |
|
|
30,141 |
|
|
26,500 |
|
|
22,216 |
La India mine |
|
|
(6) |
|
|
1,793 |
|
|
4,237 |
|
|
100 |
|
|
8,963 |
|
|
10,117 |
Sustaining capital expenditures |
|
$ |
214,757 |
|
$ |
227,039 |
|
$ |
123,925 |
|
$ |
807,607 |
|
$ |
733,545 |
|
$ |
432,543 |
LaRonde mine |
|
$ |
12,401 |
|
$ |
11,870 |
|
$ |
11,872 |
|
$ |
44,862 |
|
$ |
54,829 |
|
$ |
48,373 |
LaRonde Zone 5 mine |
|
|
5,236 |
|
|
6,787 |
|
|
1,999 |
|
|
24,068 |
|
|
17,191 |
|
|
4,782 |
Canadian Malartic complex(ii) |
|
|
50,509 |
|
|
42,649 |
|
|
23,207 |
|
|
169,960 |
|
|
128,551 |
|
|
56,613 |
Goldex mine |
|
|
2,850 |
|
|
9,952 |
|
|
4,761 |
|
|
24,491 |
|
|
29,628 |
|
|
18,673 |
Akasaba mine |
|
|
7,880 |
|
|
7,757 |
|
|
— |
|
|
34,945 |
|
|
9,453 |
|
|
— |
Meliadine mine(i) |
|
|
25,990 |
|
|
21,023 |
|
|
21,403 |
|
|
118,880 |
|
|
93,808 |
|
|
103,995 |
Meadowbank complex |
|
|
(279) |
|
|
(1,379) |
|
|
932 |
|
|
(279) |
|
|
9 |
|
|
9,643 |
Amaruq Underground Project |
|
|
2 |
|
|
2,993 |
|
|
22,712 |
|
|
359 |
|
|
53,385 |
|
|
99,603 |
Hope Bay project |
|
|
128 |
|
|
4,034 |
|
|
384 |
|
|
4,426 |
|
|
13,168 |
|
|
7,882 |
Kittila mine |
|
|
5,177 |
|
|
15,918 |
|
|
21,272 |
|
|
31,463 |
|
|
52,764 |
|
|
77,175 |
Detour Lake mine(iii) |
|
|
66,671 |
|
|
63,824 |
|
|
— |
|
|
172,903 |
|
|
180,072 |
|
|
— |
Macassa mine(iii) |
|
|
26,120 |
|
|
27,998 |
|
|
— |
|
|
101,230 |
|
|
92,175 |
|
|
— |
Fosterville mine(iii) |
|
|
16,591 |
|
|
7,399 |
|
|
— |
|
|
52,793 |
|
|
38,368 |
|
|
— |
Pinos Altos mine |
|
|
(635) |
|
|
6,682 |
|
|
8,622 |
|
|
5,297 |
|
|
26,749 |
|
|
23,777 |
La India mine |
|
|
— |
|
|
338 |
|
|
3,219 |
|
|
— |
|
|
6,129 |
|
|
9,383 |
Other |
|
|
3,263 |
|
|
2,290 |
|
|
1,481 |
|
|
7,863 |
|
|
7,076 |
|
|
11,971 |
Development capital expenditures |
|
$ |
221,904 |
|
$ |
230,135 |
|
$ |
121,864 |
|
$ |
793,261 |
|
$ |
803,355 |
|
$ |
471,870 |
Total capital expenditures |
|
$ |
436,661 |
|
$ |
457,174 |
|
$ |
245,789 |
|
$ |
1,600,868 |
|
$ |
1,536,900 |
|
$ |
904,413 |
Working capital adjustments |
|
|
(10,919) |
|
|
(56,343) |
|
|
(8,500) |
|
|
53,261 |
|
|
1,337 |
|
|
(7,415) |
Additions to property, plant and mine development per the consolidated statements of cash flows |
|
$ |
425,742 |
|
$ |
400,831 |
|
$ |
237,289 |
|
$ |
1,654,129 |
|
$ |
1,538,237 |
|
$ |
896,998 |
Notes:
(i) |
Certain previously reported line items have been restated to reflect the retrospective application of IAS 16. |
(ii) |
The information set out in this table reflects the Company’s 50% interest in the Canadian Malartic complex up to and including March 30, 2023 and 100% interest thereafter. |
(iii) |
On February 8, 2022, the Company completed the Merger. Accordingly, the contributions from the Detour Lake, Macassa and Fosterville mines for the year ended December 31, 2022 reflects the period from February 8 to December 31, 2022. |
58
AGNICO EAGLE MINES LIMITED
SUMMARIZED QUARTERLY DATA
(thousands of United States dollars, except where noted)
|
|
Three Months Ended |
|
|
|
||||||||||
|
|
March 31, |
|
June 30, |
|
September 30, |
|
December 31, |
|
Total |
|||||
Operating margin(i): |
|
2023 |
|
2023 |
|
2023 |
|
2023 |
|
2023 |
|||||
Revenues from mining operations |
|
$ |
1,509,661 |
|
$ |
1,718,197 |
|
$ |
1,642,411 |
|
$ |
1,756,640 |
|
$ |
6,626,909 |
Production costs |
|
|
653,144 |
|
|
743,253 |
|
|
759,411 |
|
|
777,455 |
|
|
2,933,263 |
Total operating margin(i) |
|
|
856,517 |
|
|
974,944 |
|
|
883,000 |
|
|
979,185 |
|
|
3,693,646 |
Impairment loss |
|
|
— |
|
|
— |
|
|
— |
|
|
787,000 |
|
|
787,000 |
Amortization of property, plant and mine development |
|
|
303,959 |
|
|
381,262 |
|
|
414,994 |
|
|
391,556 |
|
|
1,491,771 |
Revaluation gain |
|
|
(1,543,414) |
|
|
— |
|
|
— |
|
|
— |
|
|
(1,543,414) |
Exploration, corporate and other |
|
|
150,473 |
|
|
127,342 |
|
|
196,694 |
|
|
124,711 |
|
|
599,220 |
Income (loss) before income and mining taxes |
|
|
1,945,499 |
|
|
466,340 |
|
|
271,312 |
|
|
(324,082) |
|
|
2,359,069 |
Income and mining taxes |
|
|
128,608 |
|
|
139,519 |
|
|
92,706 |
|
|
56,929 |
|
|
417,762 |
Net income (loss) for the period |
|
$ |
1,816,891 |
|
$ |
326,821 |
|
$ |
178,606 |
|
$ |
(381,011) |
|
$ |
1,941,307 |
Net income (loss) per share — basic |
|
$ |
3.87 |
|
$ |
0.66 |
|
$ |
0.36 |
|
$ |
(0.77) |
|
$ |
3.97 |
Net income (loss) per share — diluted |
|
$ |
3.86 |
|
$ |
0.66 |
|
$ |
0.36 |
|
$ |
(0.77) |
|
$ |
3.95 |
Cash flows: |
|
|
|
|
|
|
|
|
|
|
|
|
|
|
|
Cash provided by operating activities |
|
$ |
649,613 |
|
$ |
722,000 |
|
$ |
502,088 |
|
$ |
727,861 |
|
$ |
2,601,562 |
Realized prices: |
|
|
|
|
|
|
|
|
|
|
|
|
|
|
|
Gold (per ounce) |
|
$ |
1,892 |
|
$ |
1,975 |
|
$ |
1,928 |
|
$ |
1,982 |
|
$ |
1,946 |
Silver (per ounce) |
|
$ |
22.95 |
|
$ |
24.43 |
|
$ |
23.55 |
|
$ |
23.88 |
|
$ |
23.72 |
Zinc (per tonne) |
|
$ |
3,169 |
|
$ |
2,343 |
|
$ |
2,360 |
|
$ |
2,700 |
|
$ |
2,705 |
Copper (per tonne) |
|
$ |
10,113 |
|
$ |
7,898 |
|
$ |
8,223 |
|
$ |
7,828 |
|
$ |
8,282 |
Payable production(iii): |
|
|
|
|
|
|
|
|
|
|
|
|
|
|
|
Gold (ounces) |
|
|
|
|
|
|
|
|
|
|
|
|
|
|
|
LaRonde mine |
|
|
59,533 |
|
|
58,635 |
|
|
49,303 |
|
|
68,520 |
|
|
235,991 |
LaRonde Zone 5 mine |
|
|
20,074 |
|
|
18,145 |
|
|
15,193 |
|
|
17,245 |
|
|
70,657 |
Canadian Malartic complex(ii) |
|
|
80,685 |
|
|
177,755 |
|
|
177,243 |
|
|
168,272 |
|
|
603,955 |
Goldex mine |
|
|
34,023 |
|
|
37,716 |
|
|
35,880 |
|
|
33,364 |
|
|
140,983 |
Meliadine mine |
|
|
90,467 |
|
|
87,682 |
|
|
89,707 |
|
|
96,285 |
|
|
364,141 |
Meadowbank complex |
|
|
111,110 |
|
|
94,775 |
|
|
116,555 |
|
|
109,226 |
|
|
431,666 |
Kittila mine |
|
|
63,692 |
|
|
50,130 |
|
|
59,408 |
|
|
61,172 |
|
|
234,402 |
Detour Lake mine |
|
|
161,857 |
|
|
169,352 |
|
|
152,762 |
|
|
193,475 |
|
|
677,446 |
Macassa mine |
|
|
64,115 |
|
|
57,044 |
|
|
46,792 |
|
|
60,584 |
|
|
228,535 |
Fosterville mine |
|
|
86,558 |
|
|
81,813 |
|
|
59,790 |
|
|
49,533 |
|
|
277,694 |
Pinos Altos mine |
|
|
24,134 |
|
|
22,159 |
|
|
25,386 |
|
|
25,963 |
|
|
97,642 |
Creston Mascota mine |
|
|
244 |
|
|
165 |
|
|
141 |
|
|
88 |
|
|
638 |
La India mine |
|
|
16,321 |
|
|
17,833 |
|
|
22,269 |
|
|
19,481 |
|
|
75,904 |
Total gold (ounces) |
|
|
812,813 |
|
|
873,204 |
|
|
850,429 |
|
|
903,208 |
|
|
3,439,654 |
Silver (thousands of ounces) |
|
|
545 |
|
|
619 |
|
|
589 |
|
|
655 |
|
|
2,408 |
Zinc (tonnes) |
|
|
2,287 |
|
|
2,611 |
|
|
1,420 |
|
|
1,384 |
|
|
7,702 |
Copper (tonnes) |
|
|
530 |
|
|
746 |
|
|
659 |
|
|
682 |
|
|
2,617 |
59
AGNICO EAGLE MINES LIMITED
SUMMARIZED QUARTERLY DATA
(thousands of United States dollars, except where noted)
|
|
Three Months Ended |
|
|
||||||
|
|
March 31, |
|
June 30, |
|
September 30, |
|
December 31, |
|
Total |
Payable metal sold: |
|
2023 |
|
2023 |
|
2023 |
|
2023 |
|
2023 |
|
|
|
|
|
|
|
|
|
|
|
Gold (ounces) |
|
|
|
|
|
|
|
|
|
|
LaRonde mine |
|
48,162 |
|
61,920 |
|
62,413 |
|
54,043 |
|
226,538 |
LaRonde Zone 5 mine |
|
15,461 |
|
18,923 |
|
17,748 |
|
16,042 |
|
68,174 |
Canadian Malartic complex(ii)(iv) |
|
71,809 |
|
168,257 |
|
164,974 |
|
165,518 |
|
570,558 |
Goldex mine |
|
35,917 |
|
37,114 |
|
35,517 |
|
31,692 |
|
140,240 |
Meliadine mine |
|
89,586 |
|
79,153 |
|
93,426 |
|
96,320 |
|
358,485 |
Meadowbank complex |
|
110,025 |
|
98,980 |
|
108,579 |
|
121,831 |
|
439,415 |
Kittila mine |
|
60,720 |
|
51,800 |
|
58,540 |
|
59,000 |
|
230,060 |
Detour Lake mine |
|
163,294 |
|
160,281 |
|
149,747 |
|
177,083 |
|
650,405 |
Macassa mine |
|
62,928 |
|
57,102 |
|
44,400 |
|
58,100 |
|
222,530 |
Fosterville mine |
|
89,000 |
|
85,500 |
|
60,750 |
|
49,000 |
|
284,250 |
Pinos Altos mine |
|
24,236 |
|
22,355 |
|
24,543 |
|
25,000 |
|
96,134 |
La India mine |
|
16,420 |
|
17,463 |
|
22,460 |
|
21,000 |
|
77,343 |
Total gold (ounces) |
|
787,558 |
|
858,848 |
|
843,097 |
|
874,629 |
|
3,364,132 |
Silver (thousands of ounces) |
|
552 |
|
597 |
|
571 |
|
634 |
|
2,354 |
Zinc (tonnes) |
|
2,131 |
|
2,743 |
|
2,108 |
|
1,544 |
|
8,526 |
Copper (tonnes) |
|
568 |
|
713 |
|
657 |
|
692 |
|
2,630 |
60
AGNICO EAGLE MINES LIMITED
SUMMARIZED QUARTERLY DATA
(thousands of United States dollars, except where noted)
|
|
|
|
|
|
|
|
|
|
|
|
|
|
|
|
|
|
Three Months Ended |
|
|
|
||||||||||
|
|
March 31, |
|
June 30, |
|
September 30, |
|
December 31, |
|
Total |
|||||
|
|
2022(v) |
|
2022(v) |
|
2022(v) |
|
2022(v) |
|
2022 |
|||||
|
|
|
|
|
|
|
|
|
|
|
|
|
|
|
|
Operating margin(i): |
|
|
|
|
|
|
|
|
|
|
|
|
|
|
|
Revenues from mining operations |
|
$ |
1,325,688 |
|
$ |
1,581,058 |
|
$ |
1,449,697 |
|
$ |
1,384,719 |
|
$ |
5,741,162 |
Production costs |
|
|
661,735 |
|
|
657,636 |
|
|
657,073 |
|
|
666,877 |
|
|
2,643,321 |
Total operating margin(i) |
|
|
663,953 |
|
|
923,422 |
|
|
792,624 |
|
|
717,842 |
|
|
3,097,841 |
Impairment loss |
|
|
— |
|
|
— |
|
|
— |
|
|
55,000 |
|
|
55,000 |
Amortization of property, plant and mine development |
|
|
255,644 |
|
|
269,891 |
|
|
283,486 |
|
|
285,670 |
|
|
1,094,691 |
Exploration, corporate and other |
|
|
228,638 |
|
|
196,680 |
|
|
293,149 |
|
|
114,260 |
|
|
832,727 |
Income before income and mining taxes |
|
|
179,671 |
|
|
456,851 |
|
|
215,989 |
|
|
262,912 |
|
|
1,115,423 |
Income and mining taxes |
|
|
60,595 |
|
|
166,462 |
|
|
149,311 |
|
|
68,806 |
|
|
445,174 |
Net income for the period |
|
$ |
119,076 |
|
$ |
290,389 |
|
$ |
66,678 |
|
$ |
194,106 |
|
$ |
670,249 |
Net income per share — basic |
|
$ |
0.31 |
|
$ |
0.64 |
|
$ |
0.15 |
|
$ |
0.43 |
|
$ |
1.53 |
Net income per share — diluted |
|
$ |
0.31 |
|
$ |
0.63 |
|
$ |
0.15 |
|
$ |
0.43 |
|
$ |
1.53 |
Cash flows: |
|
|
|
|
|
|
|
|
|
|
|
|
|
|
|
Cash provided by operating activities |
|
$ |
507,432 |
|
$ |
633,266 |
|
$ |
575,438 |
|
$ |
380,500 |
|
$ |
2,096,636 |
Realized prices: |
|
|
|
|
|
|
|
|
|
|
|
|
|
|
|
Gold (per ounce) |
|
$ |
1,880 |
|
$ |
1,866 |
|
$ |
1,726 |
|
$ |
1,728 |
|
$ |
1,797 |
Silver (per ounce) |
|
$ |
24.11 |
|
$ |
22.21 |
|
$ |
18.68 |
|
$ |
21.51 |
|
$ |
21.63 |
Zinc (per tonne) |
|
$ |
3,480 |
|
$ |
3,947 |
|
$ |
3,435 |
|
$ |
2,979 |
|
$ |
3,440 |
Copper (per tonne) |
|
$ |
10,243 |
|
$ |
8,953 |
|
$ |
5,674 |
|
$ |
8,206 |
|
$ |
8,381 |
Payable production(iii): |
|
|
|
|
|
|
|
|
|
|
|
|
|
|
|
Gold (ounces) |
|
|
|
|
|
|
|
|
|
|
|
|
|
|
|
LaRonde mine |
|
|
87,549 |
|
|
70,736 |
|
|
63,573 |
|
|
62,922 |
|
|
284,780 |
LaRonde Zone 5 mine |
|
|
17,488 |
|
|
17,774 |
|
|
19,048 |
|
|
17,247 |
|
|
71,557 |
Canadian Malartic complex(ii) |
|
|
80,509 |
|
|
87,186 |
|
|
75,262 |
|
|
86,439 |
|
|
329,396 |
Goldex mine |
|
|
34,445 |
|
|
36,877 |
|
|
33,889 |
|
|
36,291 |
|
|
141,502 |
Meliadine mine |
|
|
80,704 |
|
|
97,572 |
|
|
91,201 |
|
|
103,397 |
|
|
372,874 |
Meadowbank complex |
|
|
59,765 |
|
|
96,698 |
|
|
122,994 |
|
|
94,328 |
|
|
373,785 |
Kittila mine |
|
|
45,508 |
|
|
64,814 |
|
|
61,901 |
|
|
44,724 |
|
|
216,947 |
Detour Lake mine |
|
|
100,443 |
|
|
195,515 |
|
|
175,487 |
|
|
179,737 |
|
|
651,182 |
Macassa mine |
|
|
24,488 |
|
|
61,262 |
|
|
51,775 |
|
|
43,308 |
|
|
180,833 |
Fosterville mine |
|
|
81,827 |
|
|
86,065 |
|
|
81,801 |
|
|
88,634 |
|
|
338,327 |
Pinos Altos mine |
|
|
25,170 |
|
|
23,020 |
|
|
23,041 |
|
|
25,291 |
|
|
96,522 |
Creston Mascota mine |
|
|
1,006 |
|
|
635 |
|
|
538 |
|
|
451 |
|
|
2,630 |
La India mine |
|
|
21,702 |
|
|
20,016 |
|
|
16,285 |
|
|
16,669 |
|
|
74,672 |
Total gold (ounces) |
|
|
660,604 |
|
|
858,170 |
|
|
816,795 |
|
|
799,438 |
|
|
3,135,007 |
Silver (thousands of ounces) |
|
|
609 |
|
|
588 |
|
|
553 |
|
|
542 |
|
|
2,292 |
Zinc (tonnes) |
|
|
1,069 |
|
|
2,568 |
|
|
2,108 |
|
|
2,450 |
|
|
8,195 |
Copper (tonnes) |
|
|
769 |
|
|
778 |
|
|
653 |
|
|
701 |
|
|
2,901 |
61
AGNICO EAGLE MINES LIMITED
SUMMARIZED QUARTERLY DATA
(thousands of United States dollars, except where noted)
|
|
Three Months Ended |
|
|
||||||
|
|
March 31, |
|
June 30, |
|
September 30, |
|
December 31, |
|
Total |
Payable metal sold (iv): |
|
2022 |
|
2022 |
|
2022 |
|
2022 |
|
2022 |
Gold (ounces) |
|
|
|
|
|
|
|
|
|
|
LaRonde mine |
|
70,967 |
|
61,296 |
|
89,667 |
|
59,565 |
|
281,495 |
LaRonde Zone 5 mine |
|
17,595 |
|
13,538 |
|
22,304 |
|
18,747 |
|
72,184 |
Canadian Malartic complex(ii) |
|
72,268 |
|
85,160 |
|
75,067 |
|
84,697 |
|
317,192 |
Goldex mine |
|
33,884 |
|
36,681 |
|
34,019 |
|
34,946 |
|
139,530 |
Meliadine mine |
|
87,772 |
|
97,354 |
|
89,652 |
|
102,933 |
|
377,711 |
Meadowbank complex |
|
48,755 |
|
93,737 |
|
119,531 |
|
99,434 |
|
361,457 |
Hope Bay project |
|
98 |
|
— |
|
— |
|
— |
|
98 |
Kittila mine |
|
51,615 |
|
64,378 |
|
63,813 |
|
46,560 |
|
226,366 |
Detour Lake mine |
|
131,837 |
|
188,517 |
|
164,300 |
|
174,803 |
|
659,457 |
Macassa mine |
|
29,530 |
|
58,050 |
|
50,739 |
|
43,197 |
|
181,516 |
Fosterville mine |
|
101,950 |
|
93,177 |
|
79,458 |
|
81,750 |
|
356,335 |
Pinos Altos mine |
|
24,787 |
|
24,730 |
|
23,436 |
|
26,080 |
|
99,033 |
Creston Mascota mine |
|
855 |
|
599 |
|
650 |
|
240 |
|
2,344 |
La India mine |
|
21,009 |
|
19,306 |
|
17,610 |
|
15,950 |
|
73,875 |
Total gold (ounces) |
|
692,922 |
|
836,523 |
|
830,246 |
|
788,902 |
|
3,148,593 |
Silver (thousands of ounces) |
|
612 |
|
559 |
|
598 |
|
585 |
|
2,354 |
Zinc (tonnes) |
|
1,034 |
|
1,679 |
|
2,099 |
|
1,915 |
|
6,727 |
Copper (tonnes) |
|
766 |
|
783 |
|
647 |
|
720 |
|
2,916 |
Notes:
| (i) | Operating margin (a non-GAAP measure) is calculated as revenues from mining operations less production costs. Details by minesite are disclosed in the “Three Year Financial and Operating Summary” below. For a discussion of the composition and usefulness of operating margin, see “Non-GAAP Financial Performance Measures”. |
| (ii) | The information set out in this table reflects the Company’s 50% interest in the Canadian Malartic complex up to and including March 30, 2023 and 100% interest thereafter. |
| (iii) | Payable production (a non-GAAP non-financial performance measure) is the quantity of mineral produced during a period contained in products that are or will be sold by the Company, whether such products are sold during the period or held as inventories at the end of the period. |
| (iv) | The Canadian Malartic complex’s payable metal sold excludes the 5.0% net smelter return royalty, a 2% in-kind royalty paid in respect of the Detour Lake mine, a 1.5% in-kind royalty paid in respect of the Macassa mine. |
| (v) | Certain previously reported line items for quarters ended in 2022 have been restated to reflect the final purchase price allocation of the Merger. |
62
AGNICO EAGLE MINES LIMITED
SUMMARIZED QUARTERLY DATA
(thousands of United States dollars, except where noted)
|
|
2023 |
|
2022 |
|
2021 |
|||
|
|
|
|
|
|
|
|
|
|
Revenues from mining operations |
|
|
|
|
|
|
|
|
|
LaRonde mine |
|
$ |
483,065 |
|
$ |
553,931 |
|
$ |
654,577 |
LaRonde Zone 5 mine |
|
|
130,711 |
|
|
129,569 |
|
|
121,236 |
LaRonde complex |
|
|
613,776 |
|
|
683,500 |
|
|
775,813 |
Canadian Malartic complex(ii) |
|
|
1,124,480 |
|
|
575,938 |
|
|
645,607 |
Goldex mine |
|
|
272,801 |
|
|
250,512 |
|
|
241,404 |
Meliadine mine |
|
|
697,431 |
|
|
677,713 |
|
|
678,766 |
Meadowbank complex |
|
|
858,209 |
|
|
645,021 |
|
|
592,835 |
Hope Bay project |
|
|
— |
|
|
144 |
|
|
115,439 |
Kittila mine |
|
|
448,719 |
|
|
407,669 |
|
|
414,656 |
Detour Lake mine |
|
|
1,262,839 |
|
|
1,188,741 |
|
|
— |
Macassa mine |
|
|
431,827 |
|
|
327,028 |
|
|
— |
Fosterville mine |
|
|
552,468 |
|
|
645,371 |
|
|
— |
Pinos Altos mine |
|
|
212,876 |
|
|
199,830 |
|
|
259,446 |
Creston Mascota mine |
|
|
— |
|
|
4,476 |
|
|
27,784 |
La India mine |
|
|
151,483 |
|
|
135,219 |
|
|
117,875 |
Revenues from mining operations |
|
|
6,626,909 |
|
|
5,741,162 |
|
|
3,869,625 |
Production costs |
|
|
2,933,263 |
|
|
2,643,321 |
|
|
1,773,121 |
Operating margin(i) |
|
|
3,693,646 |
|
|
3,097,841 |
|
|
2,096,504 |
Impairment loss |
|
|
787,000 |
|
|
55,000 |
|
|
— |
Amortization of property, plant and mine development |
|
|
1,491,771 |
|
|
1,094,691 |
|
|
738,129 |
Revaluation gain |
|
|
(1,543,414) |
|
|
— |
|
|
— |
Exploration, corporate and other |
|
|
599,220 |
|
|
832,727 |
|
|
425,652 |
Income before income and mining taxes |
|
|
2,359,069 |
|
|
1,115,423 |
|
|
932,723 |
Income and mining taxes |
|
|
417,762 |
|
|
445,174 |
|
|
370,778 |
Net income for the year |
|
$ |
1,941,307 |
|
$ |
670,249 |
|
$ |
561,945 |
Net income per share — basic |
|
$ |
3.97 |
|
$ |
1.53 |
|
$ |
2.31 |
Net income per share — diluted |
|
$ |
3.95 |
|
$ |
1.53 |
|
$ |
2.30 |
Cash provided by operating activities |
|
$ |
2,601,562 |
|
$ |
2,096,636 |
|
$ |
1,345,308 |
Cash used in investing activities |
|
$ |
(2,760,783) |
|
$ |
(710,458) |
|
$ |
(1,264,003) |
Cash used in financing activities |
|
$ |
(163,958) |
|
$ |
(914,853) |
|
$ |
(297,242) |
Dividends declared per share |
|
$ |
1.60 |
|
$ |
1.60 |
|
$ |
1.40 |
Capital expenditures per Consolidated Statements of Cash Flows |
|
$ |
1,654,129 |
|
$ |
1,538,237 |
|
$ |
896,998 |
Realized price per ounce of gold |
|
$ |
1,946 |
|
$ |
1,797 |
|
$ |
1,794 |
Realized price per ounce of silver |
|
$ |
23.72 |
|
$ |
21.63 |
|
$ |
25.07 |
Realized price per tonne of zinc |
|
$ |
2,705 |
|
$ |
3,440 |
|
$ |
2,947 |
Realized price per tonne of copper |
|
$ |
8,282 |
|
$ |
8,381 |
|
$ |
9,724 |
Weighted average number of common shares outstanding - basic (thousands) |
|
|
488,723 |
|
|
437,678 |
|
|
243,708 |
Total assets |
|
$ |
28,684,949 |
|
$ |
23,494,808 |
|
$ |
10,216,090 |
Long-term debt |
|
$ |
1,743,086 |
|
$ |
1,242,070 |
|
$ |
1,340,223 |
Shareholders’ equity |
|
$ |
19,422,915 |
|
$ |
16,241,345 |
|
$ |
5,999,771 |
63
AGNICO EAGLE MINES LIMITED
THREE YEAR FINANCIAL AND OPERATING SUMMARY
(thousands of United States dollars, except where noted)
|
|
|
|
|
|
|
|
|
|
Operating Summary |
|
2023 |
|
2022 |
|
2021 |
|||
LaRonde Mine |
|
|
|
|
|
|
|
|
|
Revenues from mining operations |
|
$ |
483,065 |
|
$ |
553,931 |
|
$ |
654,577 |
Production costs |
|
|
218,020 |
|
|
213,393 |
|
|
232,392 |
Operating margin(i) |
|
$ |
265,045 |
|
$ |
340,538 |
|
$ |
422,185 |
Amortization of property, plant and mine development |
|
|
101,016 |
|
|
79,067 |
|
|
89,697 |
Tonnes of ore milled |
|
|
1,501,481 |
|
|
1,669,900 |
|
|
1,837,310 |
Gold — grams per tonne |
|
|
5.23 |
|
|
5.62 |
|
|
5.50 |
Gold production — ounces |
|
|
235,991 |
|
|
284,780 |
|
|
308,946 |
Silver production — thousands of ounces |
|
|
575 |
|
|
609 |
|
|
724 |
Zinc production — tonnes |
|
|
7,663 |
|
|
8,195 |
|
|
8,837 |
Copper production — tonnes |
|
|
2,543 |
|
|
2,901 |
|
|
2,955 |
Production costs per ounce of gold produced ($ per ounce basis) |
|
$ |
924 |
|
$ |
749 |
|
$ |
752 |
Total cash costs per ounce of gold produced - co-product basis(ii) |
|
$ |
1,067 |
|
$ |
850 |
|
$ |
717 |
By-product metal revenues |
|
|
(227) |
|
|
(227) |
|
|
(241) |
Total cash costs per ounce of gold produced - by-product basis(ii) |
|
$ |
840 |
|
$ |
623 |
|
$ |
476 |
Production costs per tonne |
|
C$ |
196 |
|
C$ |
166 |
|
C$ |
159 |
Minesite costs per tonne(iii) |
|
C$ |
201 |
|
C$ |
162 |
|
C$ |
140 |
LaRonde Zone 5 Mine |
|
|
|
|
|
|
|
|
|
Revenues from mining operations |
|
$ |
130,711 |
|
$ |
129,569 |
|
$ |
121,236 |
Production costs |
|
|
81,624 |
|
|
72,096 |
|
|
56,380 |
Operating margin(i) |
|
$ |
49,087 |
|
$ |
57,473 |
|
$ |
64,856 |
Amortization of property, plant and mine development |
|
|
13,333 |
|
|
8,927 |
|
|
7,635 |
Tonnes of ore milled |
|
|
1,156,915 |
|
|
1,145,788 |
|
|
1,124,014 |
Gold — grams per tonne |
|
|
2.01 |
|
|
2.05 |
|
|
2.07 |
Gold production — ounces |
|
|
70,657 |
|
|
71,557 |
|
|
70,788 |
Silver production — thousands of ounces |
|
|
13 |
|
|
13 |
|
|
14 |
Production costs per ounce of gold produced ($ per ounce basis) |
|
$ |
1,155 |
|
$ |
1,008 |
|
$ |
796 |
Total cash costs per ounce of gold produced - co-product basis(ii) |
|
$ |
1,158 |
|
$ |
1,025 |
|
$ |
794 |
By-product metal revenues |
|
|
(10) |
|
|
(4) |
|
|
(4) |
Total cash costs per ounce of gold produced - by-product basis(ii) |
|
$ |
1,148 |
|
$ |
1,021 |
|
$ |
790 |
Production costs per tonne |
|
C$ |
95 |
|
C$ |
82 |
|
C$ |
63 |
Minesite costs per tonne(iii) |
|
C$ |
91 |
|
C$ |
81 |
|
C$ |
65 |
64
AGNICO EAGLE MINES LIMITED
THREE YEAR FINANCIAL AND OPERATING SUMMARY
(thousands of United States dollars, except where noted)
LaRonde complex |
|
2023 |
|
2022 |
|
2021 |
|||
Revenues from mining operations |
|
$ |
613,777 |
|
$ |
683,499 |
|
$ |
775,813 |
Production costs |
|
|
299,644 |
|
|
285,489 |
|
|
288,772 |
Operating margin(i) |
|
$ |
314,133 |
|
$ |
398,010 |
|
$ |
487,041 |
Amortization of property, plant and mine development |
|
|
114,349 |
|
|
87,994 |
|
|
97,332 |
Tonnes of ore milled |
|
|
2,658,396 |
|
|
2,815,688 |
|
|
2,961,324 |
Gold — grams per tonne |
|
|
3.83 |
|
|
4.17 |
|
|
4.20 |
Gold production — ounces |
|
|
306,648 |
|
|
356,337 |
|
|
379,734 |
Silver production — thousands of ounces |
|
|
588 |
|
|
622 |
|
|
738 |
Zinc production — tonnes |
|
|
7,663 |
|
|
8,195 |
|
|
8,837 |
Copper production — tonnes |
|
|
2,543 |
|
|
2,901 |
|
|
2,955 |
Production costs per ounce of gold produced ($ per ounce basis) |
|
$ |
977 |
|
$ |
801 |
|
$ |
760 |
Total cash costs per ounce of gold produced - co-product basis(ii) |
|
$ |
1,088 |
|
$ |
885 |
|
$ |
732 |
By-product metal revenues |
|
|
(177) |
|
|
(182) |
|
|
(197) |
Total cash costs per ounce of gold produced - by-product basis(ii) |
|
$ |
911 |
|
$ |
703 |
|
$ |
535 |
Production costs per tonne |
|
C$ |
152 |
|
C$ |
132 |
|
C$ |
122 |
Minesite costs per tonne(iii) |
|
C$ |
153 |
|
C$ |
129 |
|
C$ |
112 |
Canadian Malartic Complex(iv) |
|
|
|
|
|
|
|
|
|
Revenues from mining operations |
|
$ |
1,124,480 |
|
$ |
575,938 |
|
$ |
645,607 |
Production costs |
|
|
465,814 |
|
|
235,735 |
|
|
242,589 |
Operating margin(i) |
|
$ |
658,666 |
|
$ |
340,203 |
|
$ |
403,018 |
Amortization of property, plant and mine development |
|
|
340,737 |
|
|
127,842 |
|
|
167,157 |
Tonnes of ore milled |
|
|
17,332,886 |
|
|
9,769,942 |
|
|
11,130,195 |
Gold — grams per tonne |
|
|
1.17 |
|
|
1.15 |
|
|
1.11 |
Gold production — ounces |
|
|
603,955 |
|
|
329,396 |
|
|
357,392 |
Silver production — thousands of ounces |
|
|
311 |
|
|
245 |
|
|
290 |
Production costs per ounce of gold produced ($ per ounce basis) |
|
$ |
771 |
|
$ |
716 |
|
$ |
679 |
Total cash costs per ounce of gold produced - co-product basis(ii) |
|
$ |
835 |
|
$ |
803 |
|
$ |
684 |
By-product metal revenues |
|
|
(11) |
|
|
(16) |
|
|
(21) |
Total cash costs per ounce of gold produced - by-product basis(ii) |
|
$ |
824 |
|
$ |
787 |
|
$ |
663 |
Production costs per tonne |
|
C$ |
36 |
|
C$ |
31 |
|
C$ |
28 |
Minesite costs per tonne(iii) |
|
C$ |
39 |
|
C$ |
35 |
|
C$ |
28 |
65
AGNICO EAGLE MINES LIMITED
THREE YEAR FINANCIAL AND OPERATING SUMMARY
(thousands of United States dollars, except where noted)
Goldex Mine |
|
2023 |
|
2022 |
|
2021 |
|||
Revenues from mining operations |
|
$ |
272,801 |
|
$ |
250,512 |
|
$ |
241,404 |
Production costs |
|
|
112,022 |
|
|
103,830 |
|
|
96,181 |
Operating margin(i) |
|
$ |
160,779 |
|
$ |
146,682 |
|
$ |
145,223 |
Amortization of property, plant and mine development |
|
|
39,069 |
|
|
42,160 |
|
|
37,432 |
Tonnes of ore milled |
|
|
2,886,927 |
|
|
2,940,103 |
|
|
2,873,589 |
Gold — grams per tonne |
|
|
1.74 |
|
|
1.68 |
|
|
1.60 |
Gold production — ounces |
|
|
140,983 |
|
|
141,502 |
|
|
134,053 |
Production costs per ounce of gold produced ($ per ounce basis) |
|
$ |
795 |
|
$ |
734 |
|
$ |
717 |
Total cash costs per ounce of gold produced - co-product basis(ii) |
|
$ |
822 |
|
$ |
765 |
|
$ |
684 |
By-product metal revenues |
|
|
(2) |
|
|
— |
|
|
— |
Total cash costs per ounce of gold produced - by-product basis(ii) |
|
$ |
820 |
|
$ |
765 |
|
$ |
684 |
Production costs per tonne |
|
C$ |
52 |
|
C$ |
46 |
|
C$ |
42 |
Minesite costs per tonne(iii) |
|
C$ |
53 |
|
C$ |
47 |
|
C$ |
42 |
Meliadine Mine |
|
|
|
|
|
|
|
|
|
Revenues from mining operations |
|
$ |
697,431 |
|
$ |
677,713 |
|
$ |
678,766 |
Production costs |
|
|
343,650 |
|
|
318,141 |
|
|
250,822 |
Operating margin(i) |
|
$ |
353,781 |
|
$ |
359,572 |
|
$ |
427,944 |
Amortization of property, plant and mine development |
|
|
182,530 |
|
|
155,482 |
|
|
110,819 |
Tonnes of ore milled |
|
|
1,918,143 |
|
|
1,756,971 |
|
|
1,714,892 |
Gold — grams per tonne |
|
|
6.11 |
|
|
6.83 |
|
|
7.37 |
Gold production — ounces |
|
|
364,141 |
|
|
372,874 |
|
|
391,687 |
Silver production — thousands of ounces |
|
|
27 |
|
|
35 |
|
|
30 |
Production costs per ounce of gold produced ($ per ounce basis) |
|
$ |
944 |
|
$ |
853 |
|
$ |
682 |
Total cash costs per ounce of gold produced - co-product basis(ii)(v) |
|
$ |
981 |
|
$ |
865 |
|
$ |
637 |
By-product metal revenues |
|
|
(1) |
|
|
(2) |
|
|
(3) |
Total cash costs per ounce of gold produced - by-product basis(ii)(v) |
|
$ |
980 |
|
$ |
863 |
|
$ |
634 |
Production costs per tonne |
|
C$ |
241 |
|
C$ |
232 |
|
C$ |
210 |
Minesite costs per tonne(iii)(vi) |
|
C$ |
249 |
|
C$ |
234 |
|
C$ |
206 |
66
AGNICO EAGLE MINES LIMITED
THREE YEAR FINANCIAL AND OPERATING SUMMARY
(thousands of United States dollars, except where noted)
Meadowbank complex |
|
2023 |
|
2022 |
|
2021 |
|||
Revenues from mining operations |
|
$ |
858,209 |
|
$ |
645,021 |
|
$ |
592,835 |
Production costs |
|
|
524,008 |
|
|
442,681 |
|
|
408,863 |
Operating margin(i) |
|
$ |
334,201 |
|
$ |
202,340 |
|
$ |
183,972 |
Amortization of property, plant and mine development |
|
|
192,509 |
|
|
117,068 |
|
|
111,508 |
Tonnes of ore milled |
|
|
3,842,649 |
|
|
3,739,419 |
|
|
3,570,491 |
Gold — grams per tonne |
|
|
3.86 |
|
|
3.40 |
|
|
3.07 |
Gold production — ounces |
|
|
431,666 |
|
|
373,785 |
|
|
324,808 |
Silver production — thousands of ounces |
|
|
125 |
|
|
103 |
|
|
94 |
Production costs per ounce of gold produced ($ per ounce basis) |
|
$ |
1,214 |
|
$ |
1,184 |
|
$ |
1,266 |
Total cash costs per ounce of gold produced - co-product basis(ii)(vii) |
|
$ |
1,183 |
|
$ |
1,216 |
|
$ |
1,209 |
By-product metal revenues |
|
|
(7) |
|
|
(6) |
|
|
(8) |
Total cash costs per ounce of gold produced - by-product basis(ii)(vii) |
|
$ |
1,176 |
|
$ |
1,210 |
|
$ |
1,201 |
Production costs per tonne |
|
C$ |
183 |
|
C$ |
154 |
|
C$ |
145 |
Minesite costs per tonne(iii)(viii) |
|
C$ |
179 |
|
C$ |
157 |
|
C$ |
143 |
Hope Bay Project |
|
|
|
|
|
|
|
|
|
Revenues from mining operations |
|
$ |
— |
|
$ |
144 |
|
$ |
115,439 |
Production costs |
|
|
— |
|
|
— |
|
|
83,118 |
Operating margin(i) |
|
$ |
— |
|
$ |
144 |
|
$ |
32,321 |
Amortization of property, plant and mine development |
|
|
— |
|
|
— |
|
|
11,238 |
Tonnes of ore milled |
|
|
— |
|
|
— |
|
|
227,739 |
Gold — grams per tonne |
|
|
— |
|
|
— |
|
|
8.42 |
Gold production — ounces |
|
|
— |
|
|
— |
|
|
56,229 |
Silver production — thousands of ounces |
|
|
— |
|
|
— |
|
|
4 |
Production costs per ounce of gold produced ($ per ounce basis) |
|
$ |
— |
|
$ |
— |
|
$ |
1,478 |
Total cash costs per ounce of gold produced - co-product basis(ii) |
|
$ |
— |
|
$ |
— |
|
$ |
1,064 |
By-product metal revenues |
|
|
— |
|
|
— |
|
|
(1) |
Total cash costs per ounce of gold produced - by-product basis(ii) |
|
$ |
— |
|
$ |
— |
|
$ |
1,063 |
Production costs per tonne |
|
C$ |
— |
|
C$ |
— |
|
C$ |
457 |
Minesite costs per tonne(iii) |
|
C$ |
— |
|
C$ |
— |
|
C$ |
326 |
67
AGNICO EAGLE MINES LIMITED
THREE YEAR FINANCIAL AND OPERATING SUMMARY
(thousands of United States dollars, except where noted)
Kittila Mine |
|
2023 |
|
2022 |
|
2021 |
|||
Revenues from mining operations |
|
$ |
448,719 |
|
$ |
407,669 |
|
$ |
414,656 |
Production costs |
|
|
205,857 |
|
|
210,661 |
|
|
192,742 |
Operating margin(i) |
|
$ |
242,862 |
|
$ |
197,008 |
|
$ |
221,914 |
Amortization of property, plant and mine development |
|
|
102,686 |
|
|
96,975 |
|
|
90,715 |
Tonnes of ore milled |
|
|
1,954,215 |
|
|
1,924,784 |
|
|
2,051,918 |
Gold — grams per tonne |
|
|
4.48 |
|
|
4.13 |
|
|
4.19 |
Gold production — ounces |
|
|
234,402 |
|
|
216,947 |
|
|
239,240 |
Silver production — thousands of ounces |
|
|
15 |
|
|
13 |
|
|
11 |
Production costs per ounce of gold produced ($ per ounce basis) |
|
$ |
878 |
|
$ |
971 |
|
$ |
806 |
Total cash costs per ounce of gold produced - co-product basis(ii) |
|
$ |
872 |
|
$ |
981 |
|
$ |
836 |
By-product metal revenues |
|
|
(1) |
|
|
(1) |
|
|
(1) |
Total cash costs per ounce of gold produced - by-product basis(ii) |
|
$ |
871 |
|
$ |
980 |
|
$ |
835 |
Production costs per tonne |
|
€ |
98 |
|
€ |
103 |
|
€ |
80 |
Minesite costs per tonne(iii) |
|
€ |
99 |
|
€ |
101 |
|
€ |
82 |
Detour Lake Mine |
|
|
|
|
|
|
|
|
|
Revenues from mining operations |
|
$ |
1,262,839 |
|
$ |
1,188,741 |
|
$ |
— |
Production costs |
|
|
453,498 |
|
|
489,703 |
|
|
— |
Operating margin(i) |
|
$ |
809,341 |
|
$ |
699,038 |
|
$ |
— |
Amortization of property, plant and mine development |
|
|
161,819 |
|
|
200,360 |
|
|
— |
Tonnes of ore milled |
|
|
25,434,854 |
|
|
22,781,511 |
|
|
— |
Gold — grams per tonne |
|
|
0.91 |
|
|
0.97 |
|
|
— |
Gold production — ounces |
|
|
677,446 |
|
|
651,182 |
|
|
— |
Silver production — thousands of ounces |
|
|
79 |
|
|
125 |
|
|
— |
Production costs per ounce of gold produced ($ per ounce basis) |
|
$ |
669 |
|
$ |
752 |
|
$ |
— |
Total cash costs per ounce of gold produced - co-product basis(ii) |
|
$ |
738 |
|
$ |
663 |
|
$ |
— |
By-product metal revenues |
|
|
(3) |
|
|
(6) |
|
|
— |
Total cash costs per ounce of gold produced - by-product basis(ii) |
|
$ |
735 |
|
$ |
657 |
|
$ |
— |
Production costs per tonne |
|
C$ |
24 |
|
C$ |
28 |
|
C$ |
— |
Minesite costs per tonne(iii) |
|
C$ |
26 |
|
C$ |
25 |
|
C$ |
— |
68
AGNICO EAGLE MINES LIMITED
THREE YEAR FINANCIAL AND OPERATING SUMMARY
(thousands of United States dollars, except where noted)
Macassa Mine |
|
2023 |
|
2022 |
|
2021 |
|||
Revenues from mining operations |
|
$ |
431,827 |
|
$ |
327,028 |
|
$ |
— |
Production costs |
|
|
155,046 |
|
|
129,774 |
|
|
— |
Operating margin(i) |
|
$ |
276,781 |
|
$ |
197,254 |
|
$ |
— |
Amortization of property, plant and mine development |
|
|
155,944 |
|
|
83,780 |
|
|
— |
Tonnes of ore milled |
|
|
441,588 |
|
|
280,012 |
|
|
— |
Gold — grams per tonne |
|
|
16.47 |
|
|
20.47 |
|
|
— |
Gold production — ounces |
|
|
228,535 |
|
|
180,833 |
|
|
— |
Silver production — thousands of ounces |
|
|
21 |
|
|
17 |
|
|
— |
Production costs per ounce of gold produced ($ per ounce basis) |
|
$ |
678 |
|
$ |
718 |
|
$ |
— |
Total cash costs per ounce of gold produced - co-product basis(ii) |
|
$ |
733 |
|
$ |
684 |
|
$ |
— |
By-product metal revenues |
|
|
(2) |
|
|
(1) |
|
|
— |
Total cash costs per ounce of gold produced - by-product basis(ii) |
|
$ |
731 |
|
$ |
683 |
|
$ |
— |
Production costs per tonne |
|
C$ |
475 |
|
C$ |
602 |
|
C$ |
— |
Minesite costs per tonne(iii) |
|
C$ |
503 |
|
C$ |
577 |
|
C$ |
— |
Fosterville Mine |
|
|
|
|
|
|
|
|
|
Revenues from mining operations |
|
$ |
552,468 |
|
$ |
645,371 |
|
$ |
— |
Production costs |
|
|
131,298 |
|
|
204,649 |
|
|
— |
Operating margin(i) |
|
$ |
421,170 |
|
$ |
440,722 |
|
$ |
— |
Amortization of property, plant and mine development |
|
|
88,044 |
|
|
65,074 |
|
|
— |
Tonnes of ore milled |
|
|
650,666 |
|
|
524,007 |
|
|
— |
Gold — grams per tonne |
|
|
13.61 |
|
|
20.41 |
|
|
— |
Gold production — ounces |
|
|
277,694 |
|
|
338,327 |
|
|
— |
Silver production — thousands of ounces |
|
|
20 |
|
|
32 |
|
|
— |
Production costs per ounce of gold produced ($ per ounce basis) |
|
$ |
473 |
|
$ |
605 |
|
$ |
— |
Total cash costs per ounce of gold produced - co-product basis(ii) |
|
$ |
489 |
|
$ |
379 |
|
$ |
— |
By-product metal revenues |
|
|
(1) |
|
|
(1) |
|
|
— |
Total cash costs per ounce of gold produced - by-product basis(ii) |
|
$ |
488 |
|
$ |
378 |
|
$ |
— |
Production costs per tonne |
|
A$ |
304 |
|
A$ |
561 |
|
A$ |
— |
Minesite costs per tonne(iii) |
|
A$ |
301 |
|
A$ |
356 |
|
A$ |
— |
69
AGNICO EAGLE MINES LIMITED
THREE YEAR FINANCIAL AND OPERATING SUMMARY
(thousands of United States dollars, except where noted)
Pinos Altos Mine |
|
2023 |
|
2022 |
|
2021 |
|||
Revenues from mining operations |
|
$ |
212,876 |
|
$ |
199,830 |
|
$ |
259,446 |
Production costs |
|
|
145,936 |
|
|
144,489 |
|
|
141,488 |
Operating margin(i) |
|
$ |
66,940 |
|
$ |
55,341 |
|
$ |
117,958 |
Amortization of property, plant and mine development |
|
|
63,125 |
|
|
57,459 |
|
|
61,268 |
Tonnes of ore processed |
|
|
1,656,466 |
|
|
1,510,393 |
|
|
1,899,477 |
Gold — grams per tonne processed at the mill |
|
|
1.92 |
|
|
2.07 |
|
|
2.20 |
Gold production — ounces |
|
|
97,642 |
|
|
96,522 |
|
|
126,932 |
Silver production — thousands of ounces |
|
|
1,153 |
|
|
1,014 |
|
|
1,285 |
Production costs per ounce of gold produced ($ per ounce basis) |
|
$ |
1,495 |
|
$ |
1,497 |
|
$ |
1,115 |
Total cash costs per ounce of gold produced - co-product basis(ii) |
|
$ |
1,509 |
|
$ |
1,477 |
|
$ |
1,110 |
By-product metal revenues |
|
|
(280) |
|
|
(228) |
|
|
(252) |
Total cash costs per ounce of gold produced - by-product basis(ii) |
|
$ |
1,229 |
|
$ |
1,249 |
|
$ |
858 |
Production costs per tonne |
|
$ |
88 |
|
$ |
96 |
|
$ |
75 |
Minesite costs per tonne(iii) |
|
$ |
88 |
|
$ |
94 |
|
$ |
75 |
Creston Mascota Mine |
|
|
|
|
|
|
|
|
|
Revenues from mining operations |
|
$ |
— |
|
$ |
4,476 |
|
$ |
27,784 |
Production costs |
|
|
— |
|
|
1,943 |
|
|
8,165 |
Operating margin(i) |
|
$ |
— |
|
$ |
2,533 |
|
$ |
19,619 |
Amortization of property, plant and mine development |
|
|
— |
|
|
— |
|
|
334 |
Tonnes of ore processed |
|
|
— |
|
|
— |
|
|
— |
Gold — grams per tonne |
|
|
— |
|
|
— |
|
|
— |
Gold production — ounces |
|
|
638 |
|
|
2,630 |
|
|
12,801 |
Silver production — thousands of ounces |
|
|
1 |
|
|
7 |
|
|
105 |
Production costs per ounce of gold produced ($ per ounce basis) |
|
$ |
— |
|
$ |
739 |
|
$ |
638 |
Total cash costs per ounce of gold produced - co-product basis(ii) |
|
$ |
— |
|
$ |
853 |
|
$ |
636 |
By-product metal revenues |
|
|
— |
|
|
(60) |
|
|
(228) |
Total cash costs per ounce of gold produced - by-product basis(ii) |
|
$ |
— |
|
$ |
793 |
|
$ |
408 |
Production costs per tonne |
|
$ |
— |
|
$ |
— |
|
$ |
— |
Minesite costs per tonne(iii)(ix) |
|
$ |
— |
|
$ |
— |
|
$ |
— |
70
AGNICO EAGLE MINES LIMITED
THREE YEAR FINANCIAL AND OPERATING SUMMARY
(thousands of United States dollars, except where noted)
La India Mine |
|
2023 |
|
2022 |
|
2021 |
|||
Revenues from mining operations |
|
$ |
151,483 |
|
$ |
135,219 |
|
$ |
117,875 |
Production costs |
|
|
96,490 |
|
|
76,226 |
|
|
60,381 |
Operating margin(i) |
|
$ |
54,993 |
|
$ |
58,993 |
|
$ |
57,494 |
Amortization of property, plant and mine development |
|
|
37,140 |
|
|
49,373 |
|
|
45,910 |
Tonnes of ore processed |
|
|
3,009,922 |
|
|
5,101,814 |
|
|
6,018,341 |
Gold — grams per tonne |
|
|
0.87 |
|
|
0.59 |
|
|
0.56 |
Gold production — ounces |
|
|
75,904 |
|
|
74,672 |
|
|
63,529 |
Silver production — thousands of ounces |
|
|
66 |
|
|
77 |
|
|
48 |
Production costs per ounce of gold produced ($ per ounce basis) |
|
$ |
1,271 |
|
$ |
1,021 |
|
$ |
950 |
Total cash costs per ounce of gold produced - co-product basis(ii) |
|
$ |
1,261 |
|
$ |
1,078 |
|
$ |
959 |
By-product metal revenues |
|
|
(20) |
|
|
(22) |
|
|
(20) |
Total cash costs per ounce of gold produced - by-product basis(ii) |
|
$ |
1,241 |
|
$ |
1,056 |
|
$ |
939 |
Production costs per tonne |
|
$ |
32 |
|
$ |
15 |
|
$ |
10 |
Minesite costs per tonne(iii) |
|
$ |
32 |
|
$ |
16 |
|
$ |
10 |
Notes:
| (i) | Operating margin is calculated as revenues from mining operations less production costs. Operating margin is not a recognized measure under IFRS and may not be comparable to data reported by other gold producers. Refer to “Non-GAAP Financial Performance Measures - Operating Margin” in this MD&A for additional details. |
| (ii) | The total cash costs per ounce of gold produced is not a recognized measure under IFRS and this data may not be comparable to data reported by other gold producers. Refer to “Non-GAAP Financial Performance Measures” and “Non-GAAP Financial Performance Measures - Total Cash Costs Per Ounce of Gold Produced and Minesite Costs per Tonne” in this MD&A for additional details. |
| (iii) | Minesite costs per tonne is not a recognized measure under IFRS and this data may not be comparable to data reported by other gold producers. Refer to “Non-GAAP Financial Performance Measures” and “Non-GAAP Financial Performance Measures - Total Cash Costs Per Ounce of Gold Produced and Minesite Costs per Tonne” in this MD&A for additional details. |
| (iv) | The information set out in this table for the yeare ended December 31, 2023 reflects the Company’s 50% interest in the Canadian Malartic complex up to and including March 30, 2023 and 100% interest thereafter. The information set out in this table for the year ended December 31, 2022 reflects the contributions from the Detour Lake, Macassa and Fosterville mines for the year ended December 31, 2022 reflects the period from February 8 to December 31, 2022. |
| (v) | The Meliadine mine’s total cash cost per ounce of gold produced for the year ended December 31, 2021 excludes 24,057 ounces of payable gold production which were produced prior to the achievement of commercial production at the Tiriganiaq open pit deposit on August 15, 2021. |
| (vi) | The Meliadine mine’s minesite cash cost per tonne for the year ended December 31, 2021 excludes 213,867 tonnes of ore from the Tiriganiaq open pit deposit which were processed prior to the achievement of commercial production at the Tiriganiaq open pit deposit on August 15, 2021. |
| (vii) | The Meadowbank complex’s total cash cost per ounce of gold produced for the year ended December 31, 2021 excludes 1,956 ounces of payable production of gold which were produced prior to the achievement of commercial production at the Amaruq Underground project on August 1, 2022. |
| (viii) | The Meadowbank complex’s minesite cost per tonne for the year ended December 31, 2021 excludes 14,299 tonnes of ore which were processed prior to the achievement of commercial production at the Amaruq Underground project on August 1, 2022. |
| (ix) | The Creston Mascota mine’s minesite costs per tonne for the year ended December 31, 2022 excludes approximately $2.2 million of production costs incurred during the three months ended December 31, 2022 following the cessation of mining activities at the Bravo pit during the third quarter of 2020. The Creston Mascota mine’s minesite costs per tonne calculation for the year ended December 31, 2021 excludes approximately $7.8 million of production costs incurred during the three months ended December 31, 2021 following the cessation of mining activities at the Bravo pit during the third quarter of 2020. |
71
AGNICO EAGLE MINES LIMITED
SUMMARIZED QUARTERLY DATA
(thousands of United States dollars, except where noted)
NOTE TO INVESTORS CONCERNING FORWARD-LOOKING INFORMATION
Certain statements in this MD&A, referred to herein as “forward-looking statements”, constitute “forward-looking information” under the provisions of Canadian provincial securities laws and constitute “forward-looking statements” within the meaning of the United States Private Securities Litigation Reform Act of 1995. These statements relate to, among other things, the Company’s plans, objectives, expectations, estimates, beliefs, strategies and intentions and can generally be identified by the use of words such as “anticipate”, “believe”, “budget”, “could”, “estimate”, “expect”, “forecast”, “likely”, “may”, “plan”, “project”, “schedule”, “should”, “target”, “will”, “would” or other variations of these terms or similar words. Forward-looking statements in this MD&A include the following:
| ● | the Company’s outlook for 2024 and future periods, including estimates of metal production, ore grades, ore tonnage, recovery rates, project timelines, drilling results, life of mine, total cash costs per ounce, all-in sustaining costs per ounce, minesite costs per tonne, other expenses, cash flows; |
| ● | statements regarding future earnings and the sensitivity of earnings to gold and other metal prices; |
| ● | anticipated levels or trends for prices of gold and by-product metals mined by the Company or for exchange rates between currencies in which capital is raised, revenue is generated or expenses are incurred by the Company; |
| ● | estimates of future capital expenditures, exploration expenditures, development expenditures and other cash needs, and expectations as to the funding thereof; |
| ● | estimated timing and conclusions of studies, analyses and evaluations undertaken by the Company or others; |
| ● | statements regarding the projected exploration, development and exploitation of ore deposits, including estimates of the timing of such exploration, development and production or decisions with respect thereto; |
| ● | estimates of mineral reserves and mineral resources and their sensitivities to gold prices and other factors, ore grades and mineral recoveries and statements regarding anticipated future exploration results; |
| ● | anticipated timing of events at the Company’s mines, mine development projects and exploration projects; |
| ● | methods by which ore will be extracted or processed; |
| ● | estimates of future costs and other liabilities for environmental remediation; |
| ● | statements concerning expansion projects, mill throughput, optimization and projected exploration, including costs and other estimates upon which such projections are based; |
| ● | statements regarding the Company's ability to obtain the necessary permits and authorizations in connection with its current or proposed operations and the anticipated timing thereof; |
| ● | statements regarding the sufficiency of the Company's cash resources; |
| ● | statements regarding anticipated legislation and regulations, including with respect to climate change, and estimates of the impact thereof on the Company; |
| ● | other anticipated trends with respect to the Company’s capital resources and results of operations; and |
72
| ● | statements regarding the impact of pandemics and other health emergencies, and measures taken to reduce the spread of such pandemics or other health emergencies on the Company’s future operations and business. |
Forward-looking statements are necessarily based upon a number of factors and assumptions that, while considered reasonable by Agnico Eagle as of the date of such statements, are inherently subject to significant business, economic and competitive uncertainties and contingencies. The factors and assumptions of Agnico Eagle upon which the forward-looking statements in this MD&A are based, and which may prove to be incorrect, include the assumptions set out elsewhere in this MD&A as well as: that there are no significant disruptions affecting Agnico Eagle’s operations, whether due to labour disruptions, supply disruptions, damage to equipment, natural or man-made occurrences, pandemics, mining or milling issues, political changes, title issues, community protests, including by First Nations groups, or otherwise; that permitting, development, expansion and the ramp up of operations at each of Agnico Eagle’s mines, mine development projects and exploration projects proceed on a basis consistent with expectations and that Agnico Eagle does not change its exploration or development plans relating to such projects; that the exchange rates between the Canadian dollar, Euro, Australian dollar, Mexican peso and the U.S. dollar will be approximately consistent with current levels or as set out in this MD&A; that prices for gold, silver, zinc and copper will be consistent with Agnico Eagle’s expectations; that prices for key mining and construction supplies, including labour costs, remain consistent with Agnico Eagle’s expectations; that production meets expectations; that Agnico Eagle’s current estimates of mineral reserves, mineral resources, mineral grades and mineral recoveries are accurate; that there are no material delays in the timing for completion of development projects; that seismic activity at the Company’s operations at LaRonde, Goldex and other properties is as expected by the Company; that the Company’s current plans to optimize production are successful; and that there are no material variations in the current tax and regulatory environments that affect Agnico Eagle; and that governments, the Company or others do not take measures in response to pandemics or otherwise that, individually or in the aggregate, materially affect the Company’s ability to operate its business; that measures taken in connection with pandemics do not affect productivity; that measures taken relating to, or other effects of, pandemics do not affect the Company’s ability to obtain necessary supplies and deliver them to its mine sites.
The forward-looking statements in this MD&A reflect the Company’s views as at the date of this MD&A and involve known and unknown risks, uncertainties and other factors which could cause the actual results, performance or achievements of the Company or industry results to be materially different from any future results, performance or achievements expressed or implied by such forward-looking statements. Such factors include, the risk factors set out in our most recent 40-F/AIF on file with the SEC and Canadian provincial securities regulatory authorities. Given these uncertainties, readers are cautioned not to place undue reliance on these forward-looking statements, which speak only as of the date made. Except as otherwise required by law, the Company expressly disclaims any obligation or undertaking to release publicly any updates or revisions to any such statements to reflect any change in the Company’s expectations or any change in events, conditions or circumstances on which any such statement is based.
Meaning of “including” and “such as”: When used in this MD&A the terms “including” and “such as” mean including and such as, without limitation.
73
NOTE TO INVESTORS CONCERNING ESTIMATES OF MINERAL RESERVES AND MINERAL RESOURCES
The mineral reserve and mineral resource estimates contained in this MD&A have been prepared in accordance with the Canadian securities administrators’ (the “CSA”) National Instrument 43-101 – Standards of Disclosure for Mineral Projects (“NI 43-101”).
Effective February 25, 2019, the United States Securities and Exchange Commission’s (the “SEC”) disclosure requirements and policies for mining properties were amended to more closely align with current industry and global regulatory practices and standards, including NI 43-101. However, Canadian issuers that report in the United States using the Multijurisdictional Disclosure System (“MJDS”), such as the Company, may still use NI 43-101 rather than the SEC disclosure requirements when using the SEC’s MJDS registration statement and annual report forms. Accordingly, mineral reserve and mineral resource information contained in this MD&A may not be comparable to similar information disclosed by U.S. companies.
Investors are cautioned that while the SEC now recognizes “measured mineral resources”, “indicated mineral resources” and “inferred mineral resources”, investors should not assume that any part or all of the mineral deposits in these categories will ever be converted into a higher category of mineral resources or into mineral reserves. These terms have a great amount of uncertainty as to their economic and legal feasibility. Accordingly, investors are cautioned not to assume that any “measured mineral resources”, “indicated mineral resources”, or “inferred mineral resources” that the Company reports in this MD&A are or will be economically or legally mineable.
Further, “inferred mineral resources” have a great amount of uncertainty as to their existence and as to their economic and legal feasibility. It cannot be assumed that any part or all of an inferred mineral resource will ever be upgraded to a higher category. Under Canadian regulations, estimates of inferred mineral resources may not form the basis of feasibility or pre-feasibility studies, except in limited circumstances. Investors are cautioned not to assume that all or any part of an inferred mineral resource exists or is or will ever be economically or legally mineable.
The mineral reserve and mineral resource data set out in this MD&A are estimates, and no assurance can be given that the anticipated tonnages and grades will be achieved or that the indicated level of recovery will be realized. The Company does not include equivalent gold ounces for by-product metals contained in mineral reserves in its calculation of contained ounces and mineral reserves are not reported as a subset of mineral resources. See “Operations & Production – Mineral Reserves and Mineral Resources” in the AIF for additional information.
74
Exhibit 99.4
Rule 13a-14(a) or Rule 15d-14(a) Certification — CEO
I, Ammar Al-Joundi, certify that:
| 1. | I have reviewed this annual report on Form 40-F of Agnico Eagle Mines Limited; |
| 2. | Based on my knowledge, this report does not contain any untrue statement of a material fact or omit to state a material fact necessary to make the statements made, in light of the circumstances under which such statements were made, not misleading with respect to the period covered by this report; |
| 3. | Based on my knowledge, the financial statements, and other financial information included in this report, fairly present in all material respects the financial condition, results of operations and cash flows of the issuer as of, and for, the periods presented in this report; |
| 4. | The issuer’s other certifying officer and I are responsible for establishing and maintaining disclosure controls and procedures (as defined in Exchange Act Rules 13a-15(e) and 15d-15(e)) and internal control over financial reporting (as defined in Exchange Act Rules 13a-15(f) and 15d-15(f)) for the issuer and have: |
| a) | Designed such disclosure controls and procedures, or caused such disclosure controls and procedures to be designed under our supervision, to ensure that material information relating to the issuer, including its consolidated subsidiaries, is made known to us by others within those entities, particularly during the period in which this report is being prepared; |
| b) | Designed such internal control over financial reporting, or caused such internal control over financial reporting to be designed under our supervision, to provide reasonable assurance regarding the reliability of financial reporting and the preparation of financial statements for external purposes in accordance with generally accepted accounting principles; |
| c) | Evaluated the effectiveness of the issuer's disclosure controls and procedures and presented in this report our conclusions about the effectiveness of the disclosure controls and procedures, as of the end of the period covered by this report based on such evaluation; and |
| d) | Disclosed in this report any change in the issuer's internal control over financial reporting that occurred during the period covered by the annual report that has materially affected, or is reasonably likely to materially affect, the issuer's internal control over financial reporting; and |
| 5. | The issuer’s other certifying officer and I have disclosed, based on our most recent evaluation of internal control over financial reporting, to the issuer's auditors and the audit committee of the issuer's board of directors (or persons performing the equivalent functions): |
| (a) | All significant deficiencies and material weaknesses in the design or operation of internal control over financial reporting which are reasonably likely to adversely affect the issuer’s ability to record, process, summarize and report financial information; and |
| (b) | Any fraud, whether or not material, that involves management or other employees who have a significant role in the issuer’s internal control over financial reporting. |
Toronto, Canada
March 22, 2024
|
/s/ Ammar Al-Joundi |
|
|
|
Ammar Al-Joundi President & Chief Executive Officer |
Exhibit 99.5
Rule 13a-14(a) or Rule 15d-14(a) Certification — CFO
I, Jamie Porter, certify that:
| 1. | I have reviewed this annual report on Form 40-F of Agnico Eagle Mines Limited; |
| 2. | Based on my knowledge, this report does not contain any untrue statement of a material fact or omit to state a material fact necessary to make the statements made, in light of the circumstances under which such statements were made, not misleading with respect to the period covered by this report; |
| 3. | Based on my knowledge, the financial statements, and other financial information included in this report, fairly present in all material respects the financial condition, results of operations and cash flows of the issuer as of, and for, the periods presented in this report; |
| 4. | The issuer’s other certifying officer and I are responsible for establishing and maintaining disclosure controls and procedures (as defined in Exchange Act Rules 13a-15(e) and 15d-15(e)) and internal control over financial reporting (as defined in Exchange Act Rules 13a-15(f) and 15d-15(f)) for the issuer and have: |
| a) | Designed such disclosure controls and procedures, or caused such disclosure controls and procedures to be designed under our supervision, to ensure that material information relating to the issuer, including its consolidated subsidiaries, is made known to us by others within those entities, particularly during the period in which this report is being prepared; |
| b) | Designed such internal control over financial reporting, or caused such internal control over financial reporting to be designed under our supervision, to provide reasonable assurance regarding the reliability of financial reporting and the preparation of financial statements for external purposes in accordance with generally accepted accounting principles; |
| c) | Evaluated the effectiveness of the issuer's disclosure controls and procedures and presented in this report our conclusions about the effectiveness of the disclosure controls and procedures, as of the end of the period covered by this report based on such evaluation; and |
| d) | Disclosed in this report any change in the issuer's internal control over financial reporting that occurred during the period covered by the annual report that has materially affected, or is reasonably likely to materially affect, the issuer's internal control over financial reporting; and |
| 5. | The issuer’s other certifying officer and I have disclosed, based on our most recent evaluation of internal control over financial reporting, to the issuer's auditors and the audit committee of the issuer's board of directors (or persons performing the equivalent functions): |
| (a) | All significant deficiencies and material weaknesses in the design or operation of internal control over financial reporting which are reasonably likely to adversely affect the issuer’s ability to record, process, summarize and report financial information; and |
| (b) | Any fraud, whether or not material, that involves management or other employees who have a significant role in the issuer’s internal control over financial reporting. |
Toronto, Canada
March 22, 2024
|
/s/ Jamie Porter |
|
Jamie Porter Executive Vice-President, Finance and Chief Financial Officer |
Exhibit 99.6
Rule 13a-14(b) Certification — CEO
In connection with the annual report of Agnico Eagle Mines Limited (the “Company”) on Form 40-F for the fiscal year ended December 31, 2023 as filed with the Securities and Exchange Commission on the date hereof (the “Report”), I, Ammar Al-Joundi, the President & Chief Executive Officer of the Company, certify, pursuant to 18 U.S.C. §1350, as adopted pursuant to Section 906 of the Sarbanes-Oxley Act of 2002, that:
| 1. | The Report fully complies with the requirements of Section 13(a) or 15(d) of the Securities Exchange Act of 1934, as amended; and |
| 2. | The information contained in the Report fairly presents, in all material respects, the financial condition and results of operations of the Company. |
Toronto, Canada
March 22, 2024
|
/s/ Ammar Al-Joundi |
|
|
|
Ammar Al-Joundi President & Chief Executive Officer |
Exhibit 99.7
Rule 13a-14(b) Certification — CFO
In connection with the annual report of Agnico Eagle Mines Limited (the “Company”) on Form 40-F for the fiscal year ended December 31, 2023 as filed with the Securities and Exchange Commission on the date hereof (the “Report”), I, Jamie Porter, the Executive Vice-President, Finance and Chief Financial Officer of the Company, certify, pursuant to 18 U.S.C. §1350, as adopted pursuant to Section 906 of the Sarbanes-Oxley Act of 2002, that:
| 1. | The Report fully complies with the requirements of Section 13(a) or 15(d) of the Securities Exchange Act of 1934, as amended; and |
| 2. | The information contained in the Report fairly presents, in all material respects, the financial condition and results of operations of the Company. |
Toronto, Canada
March 22, 2024
|
/s/ Jamie Porter |
|
|
|
Jamie Porter Executive Vice-President, Finance and Chief Financial Officer |
Exhibit 99.8
CONSENT OF INDEPENDENT REGISTERED PUBLIC ACCOUNTING FIRM
We consent to the reference to our Firm under the caption “Interests of Experts” in the Annual Information Form of Agnico Eagle Mines Limited for the year ended December 31, 2023, which is included in this Annual Report on Form 40-F. We also consent to the incorporation by reference in the following Registration Statements:
of Agnico Eagle Mines Limited, and to the use in this Annual Report on Form 40-F, of our reports dated March 22, 2024 with respect to the consolidated balance sheets as of December 31, 2023 and 2022, and the consolidated statements of income, comprehensive income, equity and cash flows for the years then ended, and the effectiveness of internal control over financial reporting of Agnico Eagle Mines Limited as of December 31, 2023 included in this Annual Report on Form 40-F.
Toronto, Canada
March 22, 2024
|
/s/ Ernst & Young LLP |
|
ERNST & YOUNG LLP |
|
Chartered Professional Accountants Licensed Public Accountants |
Exhibit 99.9
CONSENT OF DYANE DUQUETTE
I consent to the inclusion in the Annual Report on Form 40-F of Agnico Eagle Mines Limited for the year ended December 31, 2023 filed with the Securities and Exchange Commission on March 22, 2024 (the “Annual Report”) of my name and the information that I have approved of as a “qualified person” under the Canadian Securities Administrators National Instrument 43-101 in the Annual Information Form of Agnico Eagle Mines Limited dated March 22, 2024 (the “AIF”) filed as part of the Annual Report.
I also consent to the incorporation by reference in the Registration Statements on Form F-3D (registration no. 333-271854) and Form S-8 (registration nos. 333-130339 and 333-152004) of the reference to my name and the above- mentioned information in the AIF.
March 22, 2024
|
/s/ Dyane Duquette |
|
Dyane Duquette, P.Geo. Vice President, Mineral Resources Management |
Exhibit 99.10
CONSENT OF GUY GOSSELIN
I consent to the inclusion in the Annual Report on Form 40-F of Agnico Eagle Mines Limited for the year ended December 31, 2023 filed with the Securities and Exchange Commission on March 22, 2024 (the “Annual Report”) of my name and the information that I have approved of as a “qualified person” under the Canadian Securities Administrators National Instrument 43-101 in the Annual Information Form of Agnico Eagle Mines Limited dated March 22, 2024 (the “AIF”) filed as part of the Annual Report.
I also consent to the incorporation by reference in the Registration Statements on Form F-3D (registration no. 333-271854) and Form S-8 (registration nos. 333-130339 and 333-152004) of the reference to my name and the above- mentioned information in the AIF.
March 22, 2024
|
/s/ Guy Gosselin |
|
Guy Gosselin, Eng., P.Geo Executive Vice President, Exploration |
Exhibit 99.11
CONSENT OF CAROL PLUMMER
I consent to the inclusion in the Annual Report on Form 40-F of Agnico Eagle Mines Limited for the year ended December 31, 2023 filed with the Securities and Exchange Commission on March 22, 2024 (the “Annual Report”) of my name and the information that I have approved of as a “qualified person” under the Canadian Securities Administrators National Instrument 43-101 in the Annual Information Form of Agnico Eagle Mines Limited dated March 22, 2024 (the “AIF”) filed as part of the Annual Report.
I also consent to the incorporation by reference in the Registration Statements on Form F-3D (registration no. 333-271854) and Form S-8 (registration nos. 333-130339 and 333-152004) of the reference to my name and the above- mentioned information in the AIF.
March 22, 2024
|
/s/ Carol Plummer |
|
Carol Plummer, Eng. Executive Vice President, Operational Excellence |
Exhibit 99.12
CONSENT OF DOMINIQUE GIRARD
I consent to the inclusion in the Annual Report on Form 40-F of Agnico Eagle Mines Limited for the year ended December 31, 2023 filed with the Securities and Exchange Commission on March 22, 2024 (the “Annual Report”) of my name and the information that I have approved of as a “qualified person” under the Canadian Securities Administrators National Instrument 43-101 in the Annual Information Form of Agnico Eagle Mines Limited dated March 22, 2024 (the “AIF”) filed as part of the Annual Report.
I also consent to the incorporation by reference in the Registration Statements on Form F-3D (registration no. 333-271854) and Form S-8 (registration nos. 333-130339 and 333-152004) of the reference to my name and the above- mentioned information in the AIF.
March 22, 2024
|
/s/ Dominique Girard |
|
Dominique Girard, Eng. |
|
Chief Operating Officer – Nunavut, Quebec and Europe |
Exhibit 99.13
CONSENT OF NATASHA VAZ
I consent to the inclusion in the Annual Report on Form 40-F of Agnico Eagle Mines Limited for the year ended December 31, 2023 filed with the Securities and Exchange Commission on March 22, 2024 (the “Annual Report”) of my name and the information that I have approved of as a “qualified person” under the Canadian Securities Administrators National Instrument 43-101 in the Annual Information Form of Agnico Eagle Mines Limited dated March 22, 2024 (the “AIF”) filed as part of the Annual Report.
I also consent to the incorporation by reference in the Registration Statements on Form F-3D (registration no. 333-271854) and Form S-8 (registration nos. 333-130339 and 333-152004) of the reference to my name and the above- mentioned information in the AIF.
March 22, 2024
|
/s/ Natasha Vaz |
|
Natasha Vaz, P.Eng. |
|
Chief Operating Officer – Ontario, Australia & Mexico |
Exhibit 99.14

AGNICO EAGLE MINES LIMITED
CODE OF BUSINESS CONDUCT AND ETHICS
Introduction
This Code of Business Conduct and Ethics (the “Code of Ethics”) embodies the commitment of Agnico Eagle Mines Limited (the “Corporation”) and its subsidiaries to conduct our business in accordance with all applicable laws, rules and regulations and the highest ethical standards. All officers, directors and employees of the Corporation are expected to adhere to those principles and procedures of this Code of Ethics that apply to them.
Compliance and Reporting
Any officer, director or employee who becomes aware of any existing or potential violation of this Code of Ethics may notify the Primary or Secondary Contact, as such terms are defined in, and in accordance with the procedures set out in, the Confidential Anonymous Complaint Reporting Policy (the “Reporting Policy”) for guidance and direction on the topic. All reports will be treated confidentially where requested and it is the Corporation’s policy not to allow retaliation against anyone for reports of misconduct made in good faith.
Conflicts of Interest & Related Party Transactions
A “conflict of interest” occurs when an individual’s personal interest improperly interferes with the interests of the Corporation. Conflicts of interest are prohibited as a matter of policy, unless they have been approved by the Corporation. In particular, an officer, director or employee must never use or attempt to use his or her position at the Corporation to obtain any improper personal benefit for himself or herself, for his or her family members or for any other person. A conflict of interest can also be apparent. An apparent conflict of interest is one which a reasonable person would think that the person’s judgment is likely to be compromised. An apparent conflict of interest involves a situation that may develop into an actual conflict of interest.
Related party transactions are a subset of conflicts of interest. A related party transaction is a transaction between the Corporation and a person that is a related party of the Corporation at the time the transaction is agreed to. A related party transaction includes transactions between an entity over which you or a family member (which includes (i) spouse, children and/or other family members living in the same household as you; (ii) a parent, stepparent, sibling, mother-in-law, father-in-law, son-in-law, daughter-in-law, brother-in-law or sister-in-law; or (iii) any other extended relative, if, in your judgment, any of those individuals are in a position to have control or influence on you, or to be controlled or influenced by you) exerts control (the possession, direct or indirect, of the power to direct or cause the direction of the management and policies of an entity through ownership, by contract or otherwise) or significant influence (the ability to prevent an entity from fully pursuing its own separate interests).
Code of Business Conduct and Ethics – Last reviewed July 26, 2023 |
1 |
Any officer, director or employee who is aware of any situation that is or could reasonably be expected to give rise to a conflict of interest or who is aware of a related party transaction must discuss the matter promptly with the Primary or Secondary Contact, as specified in the Reporting Policy.
See also the Conflicts of Interest & Related Party Transactions Certification, “Code of Business Conduct and Ethics, Addendum: Conflicts of Interests and Transparency” and the “Code of Business Conduct and Ethics – Summary”, which are attached as Schedules A through C.
Outside Interests
While the Corporation recognizes and respects officer’s, director’s and employee’s rights to take part in financial, business and other activities outside their roles with the Corporation, these activities must be free of conflict with their responsibilities to the Corporation. Officers, directors and employees must avoid acquiring any interests or participating in any activities that might reasonably be regarded as:
i. |
creating an obligation or distraction, or the appearance of an obligation or distraction, which would affect their judgement or ability to act solely in the Corporation’s best interests; or |
ii. |
depriving the Corporation of the time or attention required to perform their duties properly. |
Officers and employees must disclose to their supervisor, in writing, all business, commercial or financial interests or activities which might reasonably be regarded as creating an actual or potential conflict with their duties to the Corporation. Directors must disclose to the corporate governance committee of the board of directors, in writing, all business, commercial or financial interests or activities which might reasonably be regarded as creating an actual or potential conflict with their duties to the Corporation.
Each officer and employee of the Corporation who has executive or supervisory responsibility is required to see that actions taken and decisions made within his or her jurisdiction are free from the influence of any interests that might reasonably be regarded as conflicting with those of the Corporation.
Any officer, director or employee who wishes to serve on the board of directors of another public company must first seek the permission of the corporate governance committee of the board of directors in accordance with the Corporation’s Outside Board Participation Policy. A copy of such policy is available from the Primary Contact.
Public Disclosure
Information in the Corporation’s public communications, including securities commission filings and communications with shareholders, must be full, fair, accurate, timely and understandable. All officers, directors and employees who are involved in the Corporation’s disclosure process are expected to act in furtherance of this policy. In particular, these individuals are required to be familiar with the disclosure requirements for the Corporation and are prohibited from knowingly misrepresenting, omitting or causing others to misrepresent or omit, material facts about the Corporation to others, whether within or outside the Corporation, including the Corporation’s independent auditors. Additionally, any officer, director or employee with a supervisory role in the Corporation’s disclosure process is required to discharge his or her responsibilities diligently. For further guidance, officers, directors and employees should refer to the Corporation’s Corporate Disclosure Controls, Procedures and Policies.
Code of Business Conduct and Ethics – Last reviewed July 26, 2023 |
2 |
Compliance with Laws, Rules and Regulations
Compliance with all applicable governmental laws, rules and regulations is essential to conducting our business. Each officer, director and employee is expected to adhere to the standards and restrictions imposed by those laws, rules and regulations. For greater certainty, fraud, bribery (either providing a bribe or receiving a bribe) and sexual misconduct or harassment is against the law and is strictly prohibited.
Accountability
Officers, directors and employees will be held accountable for their adherence to this Code of Ethics. Failure to observe the terms of this Code of Ethics may result in disciplinary action, including termination of employment or removal from the board of directors. Violations of this Code of Ethics may also constitute violations of law and may result in civil or criminal penalties for officers, directors, employees and the Corporation.
Corporate Opportunities
Officers, directors and employees are expected to advance the Corporation’s legitimate business interests when the opportunity to do so arises. Officers, directors and employees may not take for themselves (or direct to a third party) a business opportunity that is discovered through the use of the Corporation’s property, information or position, unless the Corporation has already been offered the opportunity and turned it down. More generally, officers, directors and employees are prohibited from using corporate property, information or position to compete with the Corporation.
The line between personal benefits and those of the Corporation is often difficult to draw and sometimes both personal benefits and benefits to the Corporation may be derived from certain activities. If an officer, director or employee has any questions that the personal use of the Corporation’s property or services may not solely be for the benefit of the Corporation, he or she should discuss the matter with the Primary or Secondary Contact.
Confidentiality
In carrying out the Corporation’s business, officers, directors and employees often learn confidential or proprietary information about the Corporation, its customers, suppliers, business partners or other third parties. Officers, directors and employees must respect and support the confidentiality of such information, except when disclosure is authorized or legally mandated. Confidential or proprietary information includes, among other things, any non-public information concerning the Corporation, including its businesses, financial performance, results or prospects, and any non-public information provided by a third party with the expectation that the information will be kept confidential and used solely for the business purpose for which it was conveyed. Officers, directors and employees should refer to the policies set forth in the Corporation’s Corporate Disclosure Controls, Procedures and Policies under “Disclosure of Material Information”, “Rumours”, “Quiet Periods” and “Maintaining Confidentiality” for more detailed guidance on this topic.
Mineral Reserves and Mineral Resources
The estimation of mineral reserves and mineral resources is to be made in a manner consistent with applicable laws and the Corporation’s policies and procedures. Mineral reserve and mineral resource estimates are considered confidential until made public in accordance with the Corporation’s Corporate Disclosure Controls, Procedures and Policies. Compliance with all
Code of Business Conduct and Ethics – Last reviewed July 26, 2023 |
3 |
legal requirements for the delineation of, and disclosure with respect to, mineral reserves and mineral resources is critical.
Mineral reserves and mineral resources are one of the primary bases for the valuation of the Corporation’s securities. Accurate and timely disclosure of mineral reserve and mineral resource data is critical to the integrity of the Corporation within the investment community.
Public Relations
The Corporation’s Chief Executive Officer (“CEO”), President, Chief Financial Officer (“CFO”), General Counsel, Vice President of Investor Relations and Corporate Director (responsible for Communications) are primarily responsible for all public relations, including all contact with the media, shareholders, analysts and other members of the investment community. For further guidance on this topic, please refer to the Corporation’s Corporate Disclosure Controls, Procedures and Policies and the Corporation’s policies and practices with respect to lobbying activities.
IT Usage
The Corporation provides its officers, directors and employees with Information Technology services and equipment to be used as business tools that will assist them in performing their functions. Officers, directors and employees are to use these tools and services in a professional, lawful and ethical manner and in accordance to this Code of Ethics and the Corporation’s Information Technology Usage Policy. In turn, this will allow the Corporation to secure its intellectual data, protect the confidentiality of corporate information and maintain a professional corporate image.
Giving Gifts or Benefits
Officers, directors and employees must not offer or give on behalf of the Corporation extravagant gifts or excessive entertainment or benefits to others.
Modest gifts and reasonable entertainment may be given for business purposes by appropriate officers, directors and employees, where legally permitted and in accordance with local business practices, to persons or entities doing business or seeking to do business with the Corporation. No gift or entertainment should be of such value as to constitute a real personal enrichment of the recipient or to be perceived as such. Cash or cash value vouchers are not to be given. Gifts or entertainment given on behalf of the Corporation should be of a nature and amount that avoid embarrassment and would not reflect unfavourably on the Corporation or the recipient, if subjected to public scrutiny.
Receiving Gifts or Benefits
Officers, directors and employees must not use their position to obtain personal gain or benefit from those doing or seeking to do business with the Corporation. Officers, directors and employees must not seek any gifts, payments, services, loans or other benefits.
Officers, directors and employees are required to select and deal with suppliers, customers and others doing or seeking to do business with the Corporation in a completely impartial manner and reasonably be perceived by others to be acting in an impartial manner, without favour or preference based upon any considerations other than the best interests of the Corporation. Modest gifts and reasonable entertainment may be received from business associates of the Corporation. No gift, favour or entertainment shall be of such a nature as might
Code of Business Conduct and Ethics – Last reviewed July 26, 2023 |
4 |
affect, or reasonably be perceived to affect, an officer’s, director’s or employee’s judgment or conduct in matters involving the Corporation. Cash or cash value vouchers are not to be accepted. Gifts or benefits of a more substantial nature from customers or suppliers are not encouraged. However, occasionally there may be special circumstances that may apply and, in such cases, permission must be obtained from the Primary or Secondary Contact.
For more details on gift giving and gift receiving, and dealings with government officials and representatives, please see the Corporation’s Anti-Corruption and Anti-Bribery Policy.
Fair Dealing
We seek to outperform our competition fairly and honestly. We seek competitive advantages through superior performance, never through illegal or unethical business practices. Stealing proprietary information, possessing or using trade secrets obtained without the owners consent, or inducing such disclosures by past or present employees of other companies is prohibited.
Each officer, director and employee is expected to deal fairly with the Corporation’s service providers, suppliers, competitors and employees. No officer, director or employee should take unfair advantage of anyone through manipulation, concealment, abuse of privileged information, misrepresentation of material facts or any other unfair dealing practice.
Restriction on Corporate Political Donations
Political donations shall not be made in the name of the Corporation. Officers, directors and employees may make political donations (in compliance with applicable laws) as individuals; the Corporation shall not reimburse any individual for such donations.
Equal Employment Opportunity and Harassment
Our personnel decisions are made on the basis of merit and contribution to the Corporation’s success. Concern for the personal dignity and individual worth of every person is an indispensable element in our standard of conduct. The Corporation affords equal employment opportunity to all qualified persons without regard to any impermissible criterion or circumstance. This means equal opportunity in regard to each individual’s terms and conditions of employment and in regard to any other matter that affects in any way the working environment of the employee. We do not tolerate or condone any type of discrimination prohibited by law, including harassment. Employees who experience or observe work-related discrimination, harassment or similar problems are urged to report them to the Primary or Secondary Contact.
For more details on the Corporation’s commitment to provide a safe work environment and to ensure that all individuals are treated with respect and dignity, free from violence, harassment, discrimination, bullying and retaliation, please see the Corporation’s Workplace Violence, Harassment and Discrimination Policy.
Insider Trading
Securities legislation in Canada requires the Corporation to disclose material information in a timely manner. It also seeks to protect the public from abuse of material information by insiders of the Corporation before it is generally disclosed by imposing sanctions for such abuse. These sanctions may be imposed on officers, directors and employees of the Corporation and other persons who have access to undisclosed material information about the Corporation as a result of that person’s relationship with the Corporation (or an insider of the Corporation). They
Code of Business Conduct and Ethics – Last reviewed July 26, 2023 |
5 |
could, for example, be imposed on employees, family members of the Corporation’s employees and on other persons who learn of undisclosed material information through the Corporation’s employees.
It is both illegal and against this Code of Ethics for any officer, director or employee who is aware of material non-public information relating to the Corporation, any of its customers, suppliers, service providers or other business partners, or any other company to buy or sell any securities of those issuers or to pass on the information to anyone else except in the necessary course of business. Accordingly, officers, directors and employees with knowledge of confidential or material information about the Corporation, or counter-parties in negotiations of material potential transactions, are prohibited from trading shares in the Corporation or any counter-party until the confidential or material information has been fully disclosed and a reasonable period of time has passed for such information to be widely disseminated.
Material information is information that would reasonably be expected to result in a significant change in, or to have a significant effect on, the market price or the value of a corporation’s securities or which could affect the decision of a reasonable investor to invest in a corporation’s securities. Examples include:
| ● | significant changes in capital or corporate structure; |
| ● | changes in ownership of shares that may affect control of the Corporation; |
| ● | significant changes in anticipated mineral reserves and mineral resources, production or earnings; |
| ● | significant acquisitions or dispositions of assets; |
| ● | significant litigation; |
| ● | significant cyber security incidents; |
| ● | entering into, loss of or breach of significant contracts; |
| ● | changes in senior management; |
| ● | events relating to the Corporation’s securities, including defaults on debt securities, calls of securities for redemption, stock splits or changes in dividends and changes to the rights of security holders; |
| ● | major labour disputes or disputes with major contractors or suppliers; or |
| ● | bankruptcy or receivership. |
This is not an exhaustive list and other information may also constitute material information.
To prevent insider trading violations and avoid embarrassing situations both for the Corporation and officers, directors and employees, all officers, directors and certain senior employees of the Corporation are prohibited from selling or buying securities of the Corporation at frequent intervals and all officers, directors and employees are prohibited from selling such securities short at any time or otherwise trading in derivatives based upon the Corporation’s securities (other than the exercise of options issued pursuant to the Corporation’s stock option plan).
Purchases of the Corporation’s securities should be made for long term investment rather than for speculative purposes. In addition, officers, directors and certain senior employees (as determined from time to time by the CEO, CFO and General Counsel) of the Corporation
Code of Business Conduct and Ethics – Last reviewed July 26, 2023 |
6 |
(collectively, the “Restricted Individuals”) must consult in writing with and obtain clearance in writing from the Corporation’s legal department before buying or selling securities of the Corporation or exercising any of the Corporation’s options, other than pursuant to the Corporation’s Incentive Share Purchase Plan or Dividend Reinvestment Plan. Unless it is clear that there is no undisclosed material information concerning the Corporation, clearance to complete a proposed trade will be denied. The Corporation’s policy is to be cautious and conservative when granting or denying trading clearance in recognition of the fact that trades that create notoriety, even if they are ultimately found to be proper, can tarnish the Corporation’s goodwill and reputation, especially among its shareholders and analysts. Approvals for a proposed transaction will be effective for five business days, unless revoked prior to the expiration of such period. No shares of the Corporation may be purchased or sold or options exercised after that five business day period ends unless the approval is renewed.
Trading blackout periods will apply to the Restricted Individuals during periods when financial statements are being prepared but results have not yet been publicly disclosed. The blackout period commences on the first day of the month following the end of an interim quarter and ends at the end of the second business day following the issuance of a news release disclosing quarterly results. At December 31st only, the blackout period commences on January 15th of the following year, and ends at the end of the second business day following the issuance of a news release disclosing the audited year end results. The Corporation will not permit the establishment of an automatic securities disposition plan during a blackout period.
Blackout periods may be prescribed from time to time by the Disclosure Committee as a result of special circumstances relating to the Corporation pursuant to which insiders of the Corporation would be precluded from trading in securities of the Corporation. All parties with knowledge of such special circumstances are covered by the blackout. Such parties may include external advisors such as legal counsel, investment bankers, auditors and counter-parties in negotiations of material potential transactions. The trading blackout periods do not apply to purchases made pursuant to the Corporation’s Incentive Share Purchase Plan or Dividend Reinvestment Plan.
Transactions that may be necessary or justifiable for independent reasons, including emergency expenditures and transactions planned before the officer, director or employee learned the material information, are not exceptions to the foregoing trading restrictions. Even the appearance of an improper transaction must be avoided to prevent any potential risk to the Corporation or the individual. Violations of insider trading laws may be punishable by fines or imprisonment and may result in disciplinary action, including termination of employment or removal from the board of directors.
The Corporation maintains a “Restricted List” of certain companies with which it has either investments, a strategic interest or an active confidentiality agreement. Officers, directors and certain senior employees (as determined from time to time by the CEO, CFO and General Counsel) of the Corporation are restricted from trading in securities of companies on the Restricted List.
Certain “insiders” are obliged to file reports for all trades made by them in the Corporation’s securities. The persons subject to this obligation include:
| ● | directors and officers of the Corporation; |
| ● | directors and officers of the Corporation’s significant subsidiaries; and |
| ● | beneficial owners of more than 10% of the votes attached to the voting securities of the Corporation as well as the directors and officers of such shareholders. |
Code of Business Conduct and Ethics – Last reviewed July 26, 2023 |
7 |
These insiders must file reports with various securities commissions in Canada. In order to ensure that insider trading reports are filed on a timely basis in all applicable jurisdictions, all approved transactions once completed must be reported immediately in writing by insiders to the Corporation’s legal department at head office who will co-ordinate with such insiders the preparation and filing of all necessary insider trading reports. Notwithstanding such co-ordination, ultimate responsibility for the filing of the necessary insider trading reports lies with the insider.
Financial Controls and Records
Accounting and financial records must be maintained which accurately reflect all of the Corporation’s transactions. Each operating unit is responsible for the design, implementation and maintenance of adequate systems of internal accounting and administrative controls.
The Corporation’s accounting and financial records must reflect, in an accurate, complete and timely manner, all transactions affecting the Corporation in order to meet statutory requirements and to ensure proper preparation of the Corporation’s financial statements in accordance with the applicable generally accepted accounting principles. Transactions must be properly authorized and approved and recorded in accordance with both the applicable generally accepted accounting principles and the highest standards of integrity. Accounting and financial records must be adequately protected from destruction or tampering.
While the management style adopted by the Corporation gives employees considerable discretion in their duties, all employees are responsible for establishing and maintaining an effective system of accounting and administrative controls in their area of responsibility. The objective of these controls is to provide assurance that all assets are adequately protected, properly used and the financial records accurately reflect the assets and liabilities of the Corporation. Management of the relevant operating unit is responsible for knowing what can go wrong in their area of responsibility, and to be alert for symptoms of wrongdoing, loss or errors. Notwithstanding this, regional Controllers or their equivalent are responsible for the overall integrity of the financial systems and controls in their regions. Accordingly, they are expected and authorized to intervene to investigate and take action in situations at operations within their region where they believe financial controls are not meeting standards or are at risk of being circumvented.
No person may conceal information from management, the Corporation’s internal or external auditors or internal or external legal counsel.
Internal control provides the Corporation with a system of “checks and balances” to assist in ensuring that accounting and administrative policies are complied with throughout the Corporation. This is not only a good business practice, but also ensures compliance with the various securities and tax laws to which the Corporation is subject.
Waivers Of The Code Of Ethics
The Corporation may waive certain provisions of this Code of Ethics when deemed appropriate under the circumstances. Any officer, director or employee who believes that a waiver may be called for should discuss the matter with the Primary or Secondary Contact. Waivers for executive management (including senior financial management) or directors of the Corporation may be made only by the Board of Directors or a committee of the Board. Waivers will be disclosed as required under applicable securities laws and stock exchange rules.
Code of Business Conduct and Ethics – Last reviewed July 26, 2023 |
8 |
SCHEDULE A
Acknowledgement
I, (insert name) hereby acknowledge having reviewed this Code of Ethics and that I understand its provisions and will respect this Code of Ethics and its intent at all times.
I further acknowledge that I have received and reviewed all sections of this Code of Ethics and related policies listed below:
1)CODE OF BUSINESS CONDUCT AND ETHICS
2)CONFLICTS OF INTEREST & RELATED PARTY TRANSACTIONS CERTIFICATION
3)CONFIDENTIAL ANONYMOUS COMPLAINT REPORTING POLICY
4)INFORMATION TECHNOLOGY USAGE POLICY
5)ANTI-CORRUPTION AND ANTI-BRIBERY POLICY
6)WORKPLACE VIOLENCE, HARASSMENT AND DISCRIMINATION POLICY
Signature |
|
Date |
Code of Business Conduct and Ethics – Last reviewed July 26, 2023 |
9 |
Conflicts of Interest & Related Party Transactions Certification
As described in the Code of Business Conduct and Ethics including the addendum on Conflicts of Interests and Transparency, a “conflict of interest” occurs when an individual’s personal interest improperly interferes with the interests of the Corporation. An officer, director or employee must never use or attempt to use his or her position at the Corporation to obtain any improper personal benefit for himself or herself, for his or her family members or for any other person. A conflict of interest can also be apparent. An apparent conflict of interest is one which a reasonable person would think that the person’s judgment is likely to be compromised. An apparent conflict of interest involves a situation that may develop into an actual conflict of interest.
Please list any actual or apparent Conflicts of Interest you may have or are aware of, with a detailed description of the Conflict below. Please use an attachment if necessary.
Conflict of Interest |
Description of Conflict |
A related party transaction is a transaction between the Corporation and a person that is a related party of the Corporation at the time the transaction is agreed to. A related party transaction includes transactions between an entity over which you or a family member (which includes (i) spouse, children and/or other family members living in the same household as you; (ii) a parent, stepparent, sibling, mother-in-law, father-in-law, son-in-law, daughter-in-law, brother-in-law or sister-in-law; or (iii) any other extended relative, if, in your judgment, any of those individuals are in a position to have control or influence on you, or to be controlled or influenced by you) exerts control (the possession, direct or indirect, of the power to direct or cause the direction of the management and policies of an entity through ownership, by contract or otherwise) or significant influence (the ability to prevent an entity from fully pursuing its own separate interests).
Please list any Related Party Transaction that you are aware of, with a detailed description of the Related Party Transaction below:
Related Party |
Description of the Related Party Transaction |
Code of Business Conduct and Ethics – Last reviewed July 26, 2023 |
10 |
SCHEDULE B
Code of Business Conduct and Ethics, Addendum: Conflicts of Interests and Transparency
(see attached)
Code of Business Conduct and Ethics – Last reviewed July 26, 2023 |
11 |
|
Agnico Eagle Mines Limited |
|
CODE OF BUSINESS CONDUCT AND ETHICS |
Addendum: Conflict of Interest and Transparency |
I. |
Purpose |
I.01. |
The purpose of this document is to provide further guidance to employees in relation to the issue of “conflicts of interest” and the need for transparency. |
II. |
Code of Business Conduct and Ethics |
II.01. |
The current Agnico Code of Business Conduct and Ethics contains the following paragraph on the topic of “Conflicts of Interest”: A “conflict of interest” occurs when an individual’s personal interest improperly interferes with the interests of the Corporation. Conflicts of interest are prohibited as a matter of policy, unless they have been approved by the Corporation. In particular, a director, officer, or employee must never use or attempt to use his or her position at the Corporation to obtain any improper personal benefit for himself or herself, for his or her family members or for any other person. In addition, at the end of the document, individuals are asked to: 1) acknowledge they have reviewed this Code and that the understand its provisions and will respect this Code and its intent at all times; and 2) list any Conflicts of Interest with a detailed description of the Conflict. This exercise has resulted in virtually no disclosure. Despite this lack of disclosure, Agnico understands that conflicts of interest are likely to arise in the ordinary course of business. Therefore, Agnico has determined to implement these additional policies to ensure that there is transparency and that all conflicts of interest and potential conflicts of interest are fully disclosed. |
III. |
Conflicts of Interest |
III.01. |
Conflicts of interest occur when someone is asked to make a decision, makes a decision or performs a task on behalf of Agnico, but has a personal interest in the outcome of the decision or performance of the task (or even just appears to have an interest in the outcome of the decision or performance of the task). Personal interests in the outcome of a decision or performance of a task can be direct (for example, a financial benefit) or indirect (for example, a financial benefit to someone close to a person, such as a spouse, parent, child or other close relative). Some common examples where conflicts of interest could arise are: |
|
i.A person responsible for using or managing an Agnico asset (for example, money, supplies, equipment) is in a position to use the asset for their benefit or for the benefit of someone close to them. ii.An Agnico manager responsible for the performance of a function or operation is in a position to prepare or to alter or to direct others to prepare or to alter Agnico records to inaccurately describe the manager’s or the operation’s performance. |
Code of Business Conduct and Ethics – Last reviewed July 26, 2023 |
12 |
SCHEDULE C
Code of Business Conduct and Ethics – Summary
(see attached)
Code of Business Conduct and Ethics – Last reviewed July 26, 2023 |
13 |
AGNICO EAGLE MINES LIMITED
CODE OF BUSINESS CONDUCT AND ETHICS
SUMMARY
Note: This is a summary only – please read the
Code of Business Conduct and Ethics (the “Code”) for full details
| ● | The Code applies to all directors, officers and employees of Agnico Eagle Mines Limited (“Agnico”) |
| ● | Never use your position with Agnico to obtain a benefit for yourself, a family member or for any other person. |
| ● | Your outside/personal interests should not interfere with your work for Agnico |
| ● | Comply with all laws, rules and regulations (including – no bribery, sexual harassment or insider trading) |
| ● | Comply with the Code – you are responsible for your actions; if you do not comply, you could be disciplined (or even fired) |
| ● | Do not compete with Agnico (see the Conflicts of Interest & Related Party Transactions Certification) |
| ● | Keep Agnico information confidential; keep information you learn in the course of your duties with respect to third parties confidential |
| ● | Do not talk with the media, analysts, investors etc. about Agnico business – refer these people to the Investor Relations department in Toronto |
| ● | Only use information technology services and equipment in a professional, lawful and ethical manner |
| ● | Do not give cash or excessive gifts or benefits to others doing business, or seeking to do business, with Agnico – giving bribes is strictly forbidden (see the Anti-Corruption and Anti-Bribery Policy attached to Code) |
| ● | Do not accept cash or excessive gifts or benefits from those doing business, or seeking to do business, with Agnico – receiving bribes is strictly forbidden |
| ● | Always act fairly and honestly |
| ● | Discrimination, sexual harassment or inappropriate behavior will not be tolerated |
| ● | Do not buy or sell Agnico securities when you are aware of material information (something which would increase or decrease the Agnico share price) which has not been made public yet; do not short sell or trade in derivatives of Agnico securities |
| ● | Complete and accurate financial and accounting records must be kept – fraud will not be tolerated |
| ● | Vendor selection must be fair and beneficial to Agnico |
| ● | Please report violations of the Code to Chris Vollmershausen (chris.vollmershausen@agnicoeagle.com; 647-260-3771) or Jamie Porter (jamie.porter@agnicoeagle.com; 416-847-8669); or any of the additional secondary contacts (including Division Contacts) listed in the Code. |
| ● | Complaints may also be filed under the Confidential Anonymous Complaint Reporting Hotline by calling 877-333-2675 (within North America); 770-776-5607 (collect call outside North America); or online at agnicoeagle.ethicspoint.com. |
Code of Business Conduct and Ethics – Last reviewed July 26, 2023 |
14 |