UNITED STATES
SECURITIES AND EXCHANGE COMMISSION
Washington, D.C. 20549
FORM 8-K
CURRENT REPORT
Pursuant to Section 13
or 15(d) of the Securities Exchange Act of 1934
March 19, 2024
Date of Report
(Date of earliest event reported)
The RMR Group Inc.
(Exact Name of Registrant as Specified in Its Charter)
Maryland
(State or Other Jurisdiction of Incorporation)
| 001-37616 | 8742 | 47-4122583 |
| (Commission File Number) | (Primary Standard Industrial | (IRS Employer |
| Classification Code Number) | Identification Number) |
Two Newton Place, 255 Washington Street,
Suite 300, Newton, MA, 02458-1634
(Address of principal executive offices, including zip code)
(617) 796-8230
(Registrant’s telephone number, including area code)
Check the appropriate box below if the Form 8-K filing is intended to simultaneously satisfy the filing obligation of the registrant under any of the following provisions.
¨ Written communications pursuant to Rule 425 under the Securities Act (17 CFR 230.425)
¨ Soliciting material pursuant to Rule 14a-12 under the Exchange Act (17 CFR 240.14a-12)
¨ Pre-commencement communications pursuant to Rule 14d-2(b) under the Exchange Act (17 CFR 240.14d-2(b))
¨ Pre-commencement communications pursuant to Rule 13e-4(c) under the Exchange Act (17 CFR 240.13e-4(c))
Securities registered pursuant to Section 12(b) of the Act:
| Title Of Each Class | Trading Symbol | Name
Of Each Exchange On Which Registered |
||
| Class A common stock, $0.001 par value per share | RMR | The Nasdaq Stock Market LLC
(Nasdaq Capital Market) |
Indicate by check mark whether the registrant is an emerging growth company as defined in Rule 405 of the Securities Act of 1933 (§230.405 of this chapter) or Rule 12b-2 of the Securities Exchange Act of 1934 (§240.12b-2 of this chapter).
¨ Emerging growth company
If an emerging growth company, indicate by check mark if the registrant has elected not to use the extended transition period for complying with any new or revised financial accounting standards provided pursuant to Section 13(a) of the Exchange Act. ¨
Item 7.01 Regulation FD Disclosure.
On March 19, 2024, The RMR Group Inc. (the “Company”) posted to its website an investor presentation, a copy of which is furnished as Exhibit 99.1 to this Current Report on Form 8-K. The Company undertakes no obligation to update, supplement or amend the materials attached as Exhibit 99.1.
The information in this Item 7.01, including Exhibit 99.1, is being furnished and shall not be deemed “filed” for purposes of Section 18 of the Securities Exchange Act of 1934, as amended (the “Exchange Act”), or otherwise subject to the liabilities of that section, nor shall it be deemed incorporated by reference in any filing under the Securities Act of 1933, as amended, or the Exchange Act, except as expressly set forth by specific reference in such filing.
Item 9.01 Financial Statements and Exhibits.
(d) Exhibits
| 99.1 | Investor Presentation (Furnished herewith) |
| 104 | Cover Page Interactive Data File (formatted as Inline XBRL) |
SIGNATURE
Pursuant to the requirements of the Securities Exchange Act of 1934, the Registrant has duly caused this report to be signed on its behalf by the undersigned hereunto duly authorized.
| THE RMR GROUP INC. | ||
| Date: March 19, 2024 | By: | /s/ Matthew P. Jordan |
| Matthew P. Jordan | ||
|
Executive Vice President, Chief Financial Officer and Treasurer |
||
|
1 Investor Presentation March 2024 |
|
2 This presentation contains information about Service Properties Trust, Diversified Healthcare Trust, Office Properties Income Trust, Industrial Logistics Properties Trust and Seven Hills Realty Trust (together, the REITs). The information regarding each REIT (each, a company) has been provided solely by that company. No company guarantees the accuracy or completeness of information herein about another company. Each company’s filings with the securities and exchange commission (SEC) are available at the SEC’s website at www.sec.gov. This presentation contains forward-looking statements within the meaning of the Private Securities Litigation Reform Act of 1995 and other securities laws that are subject to risks and uncertainties. These statements may include words such as “believe”, “expect”, “anticipate”, “intend”, “plan”, “estimate”, “will”, “may” and negatives or derivatives of these or similar expressions. These forward-looking statements include, among others, statements about: executing the REITs' strategic plans and related benefits; commercial real estate market conditions; and RMR’s liquidity and its position to capitalize on additional growth opportunities in the current market environment. Forward-looking statements reflect RMR’s current expectations and those of the REITs, are based on judgments and assumptions, are inherently uncertain and are subject to risks, uncertainties and other factors, which could cause actual results, performance or achievements to differ materially from expected future results, performance or achievements expressed or implied in those forward-looking statements. Forward looking statements are not guaranteed to occur and may not occur. Some of the risks, uncertainties and other factors that may cause actual results, performance or achievements to differ materially from those expressed or implied by forward-looking statements include, but are not limited to, the following: The dependence of RMR's revenues on a limited number of clients; the variability of its revenues; risks related to supply chain constraints, commodity pricing and inflation, including inflation impacting wages and employee benefits; changing market conditions, practices and trends, which may adversely impact its clients and the fees RMR receives from them; potential terminations of the management agreements with its clients; increases in or sustained high market interest rates, which may significantly reduce RMR's revenues or impede its growth; RMR's dependence on the growth and performance of its clients; its ability to obtain or create new clients for its business and other circumstances beyond RMR's control; the ability of RMR's clients to operate their businesses profitably, optimize their capital structures and to grow and increase their market capitalizations and total shareholder returns; RMR's ability to successfully provide management services to its clients; RMR's ability to maintain or increase the distributions RMR pays to its shareholders; RMR's ability to successfully pursue and execute capital allocation strategies; RMR's ability to prudently invest in its business to enhance its operations, services and competitive positioning; and RMR's ability to successfully integrate acquired businesses and realize the expected returns on its investments; risk that cost savings and synergies anticipated to be realized by the acquisition of MPC Partnership Holdings LLC may not be fully realized or may take longer to realize than expected; changes to RMR's operating leverage or client diversity; litigation risks; risks related to acquisitions, dispositions and other activities by or among its clients; allegations, even if untrue, of any conflicts of interest arising from RMR's management activities; its ability to retain the services of its managing directors and other key personnel; RMR's and its clients’ risks associated with RMR's and its clients' costs of compliance with laws and regulations, including securities regulations, exchange listing standards and other laws and regulations affecting public companies; and other matters. These risks, uncertainties and other factors are not exhaustive and should be read in conjunction with other cautionary statements that are included in RMR's and each company’s periodic filings. The information contained in RMR’s and each company’s filings with the SEC, including under the caption “Risk Factors” in its periodic reports, or incorporated therein, identifies important factors that could cause differences from the forward-looking statements in this presentation. RMR’s and each company’s filings with the SEC are available on the SEC’s website at www.sec.gov. You should not place undue reliance on forward-looking statements. Except as required by law, RMR and the applicable companies do not intend to update or change any forward-looking statements as a result of new information, future events or otherwise. Unless otherwise expressly noted, all data presented are as of or for the fiscal year ended September 30. This presentation may contain or refer to third party reports and other information relating to the REITs or other persons. The author and source of any third party information and the date of its publication are clearly and prominently identified. No company has communicated with the providers of this information in this presentation. The REITs have not independently verified any of the third party information, have not assisted in the preparation of the third party information, cannot guarantee the accuracy, completeness or availability of the third party information and do not explicitly or implicitly endorse or approve such information. Warning Regarding Forward-Looking Statements and Disclaimers 2 |
|
3 Introduction to The RMR Group (Nasdaq: RMR) |
|
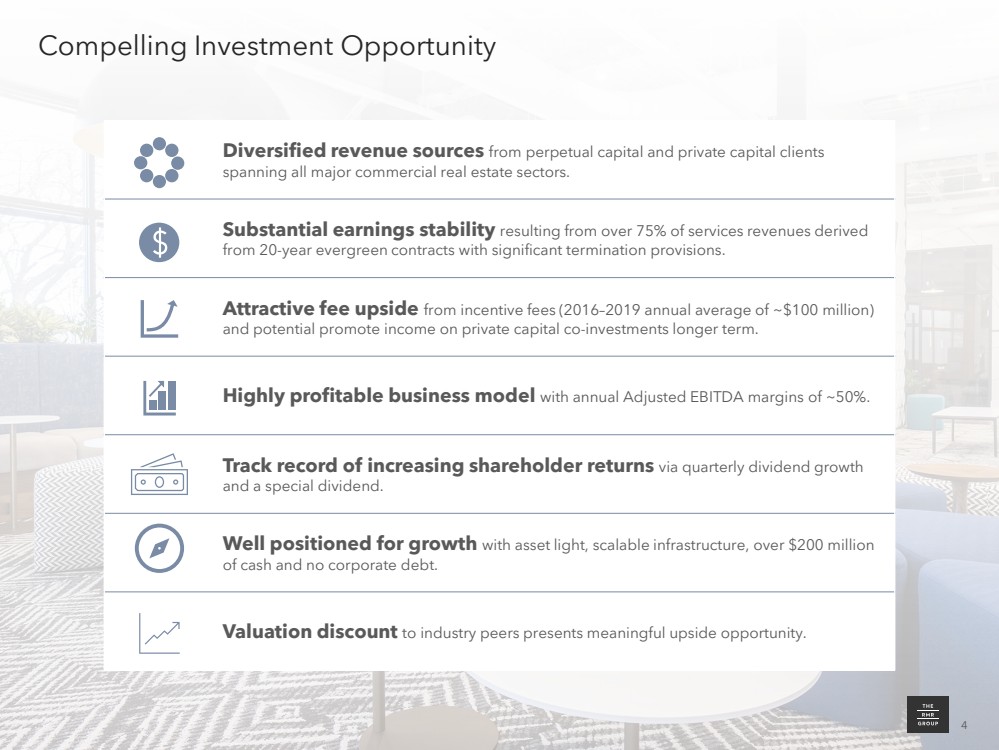
4 Diversified revenue sources from perpetual capital and private capital clients spanning all major commercial real estate sectors. Substantial earnings stability resulting from over 75% of services revenues derived from 20-year evergreen contracts with significant termination provisions. Attractive fee upside from incentive fees (2016–2019 annual average of ~$100 million) and potential promote income on private capital co-investments longer term. Highly profitable business model with annual Adjusted EBITDA margins of ~50%. Track record of increasing shareholder returns via quarterly dividend growth and a special dividend. Well positioned for growth with asset light, scalable infrastructure, over $200 million of cash and no corporate debt. Valuation discount to industry peers presents meaningful upside opportunity. Compelling Investment Opportunity 4 |
|
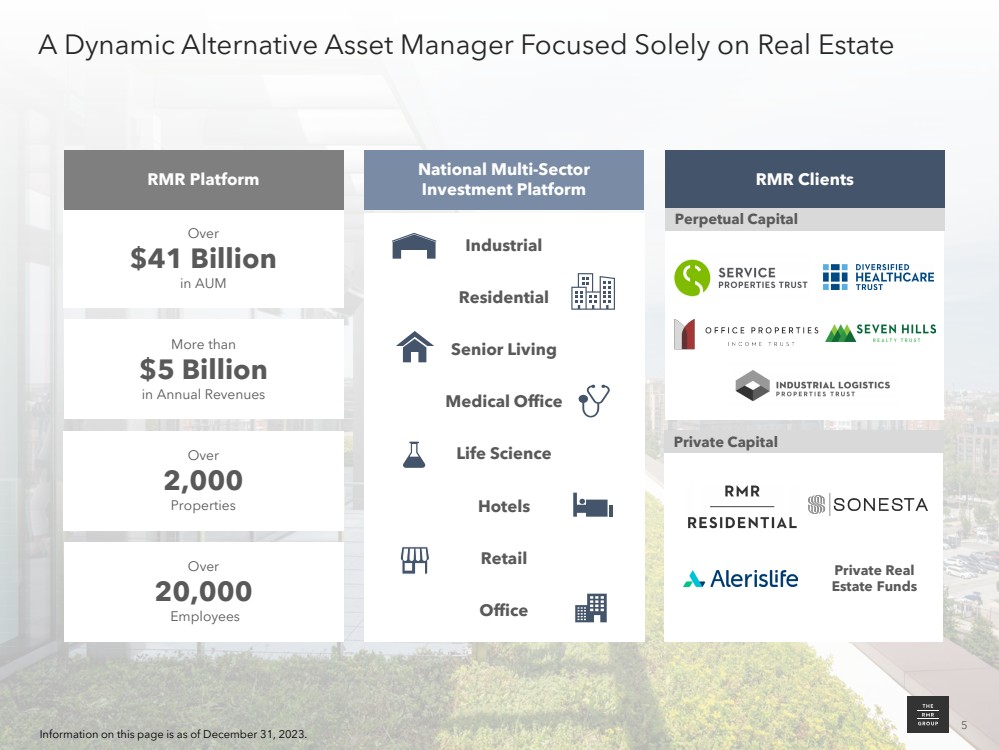
5 Private Clients A Dynamic Alternative Asset Manager Focused Solely on Real Estate Over $41 Billion in AUM RMR Platform More than $5 Billion in Annual Revenues Over 20,000 Employees Over 2,000 Properties National Multi-Sector Investment Platform Industrial Residential Senior Living Medical Office Life Science Hotels Retail Office RMR Clients Perpetual Capital Private Real Estate Funds Private Capital 5 Information on this page is as of December 31, 2023. |
|
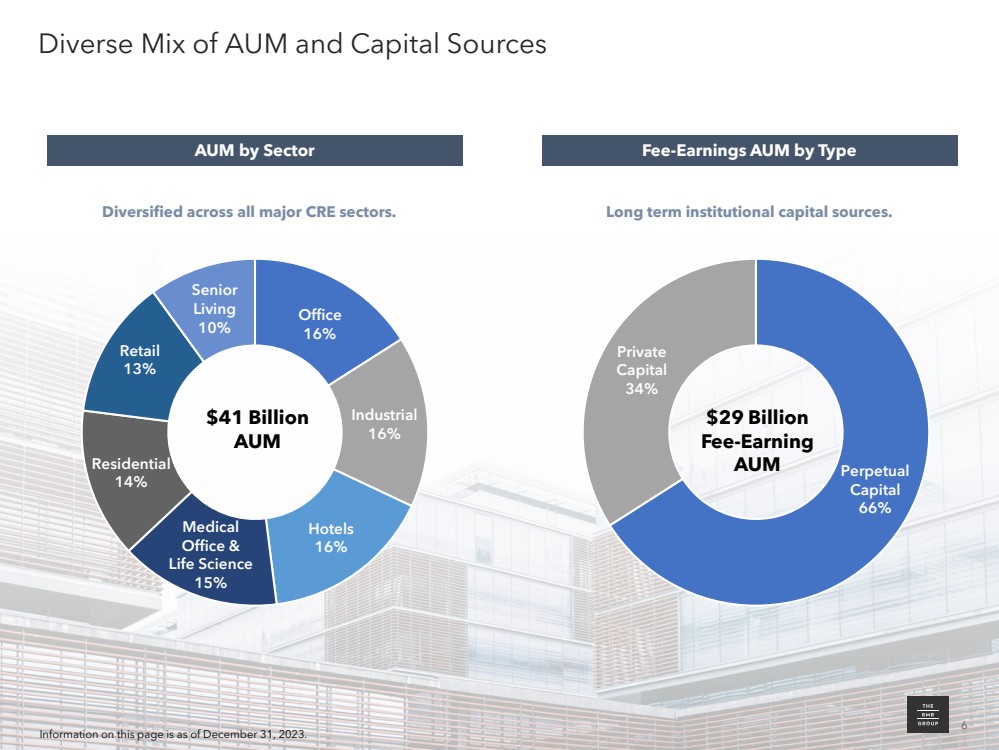
6 Diverse Mix of AUM and Capital Sources Office 16% Industrial 16% Hotels 16% Medical Office & Life Science 15% Residential 14% Retail 13% Senior Living 10% AUM by Sector Fee-Earnings AUM by Type Diversified across all major CRE sectors. Perpetual Capital 66% Private Capital 34% Long term institutional capital sources. $41 Billion AUM $29 Billion Fee-Earning AUM 6 Information on this page is as of December 31, 2023. |
|
7 National Vertically Integrated Real Estate Operating Platform is a Differentiator and Competitive Advantage RMR Shared Services Accounting Marketing Human Resources Investor Relations Property Management Development Finance Legal Information Technology Project Management Tax Portfolio Management Transactions Asset Management |
|
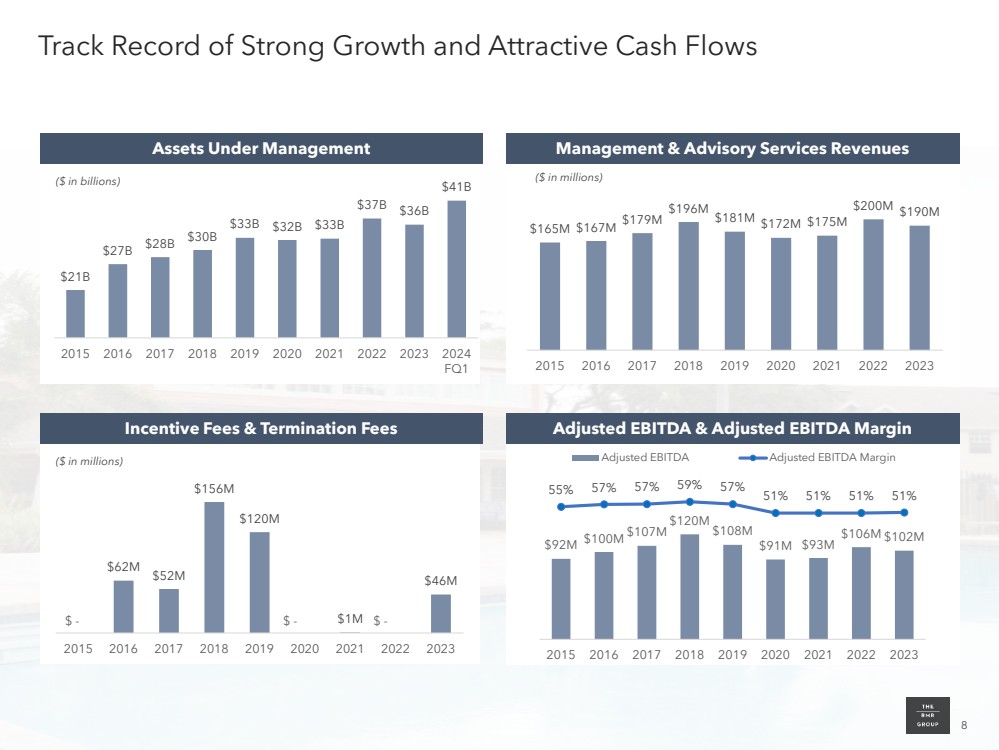
8 $165M $167M $179M $196M $181M $172M $175M $200M $190M 2015 2016 2017 2018 2019 2020 2021 2022 2023 Track Record of Strong Growth and Attractive Cash Flows Assets Under Management Management & Advisory Services Revenues $21B $27B $28B $30B $33B $32B $33B $37B $36B $41B 2015 2016 2017 2018 2019 2020 2021 2022 2023 2024 FQ1 ($ in billions) ($ in millions) Incentive Fees & Termination Fees Adjusted EBITDA & Adjusted EBITDA Margin $62M $52M $156M $120M $1M $46M 2015 2016 2017 2018 2019 2020 2021 2022 2023 ($ in millions) ($ in millions) $ - $ - $ - $92M $100M $107M $120M $108M $91M $93M $106M $102M 55% 57% 57% 59% 57% 51% 51% 51% 51% -40% -30% -20% -10% 0% 10% 20% 30% 40% 50% 60% $0 $20 $40 $60 $80 $100 $120 $140 $160 2015 2016 2017 2018 2019 2020 2021 2022 2023 Adjusted EBITDA Adjusted EBITDA Margin |
|
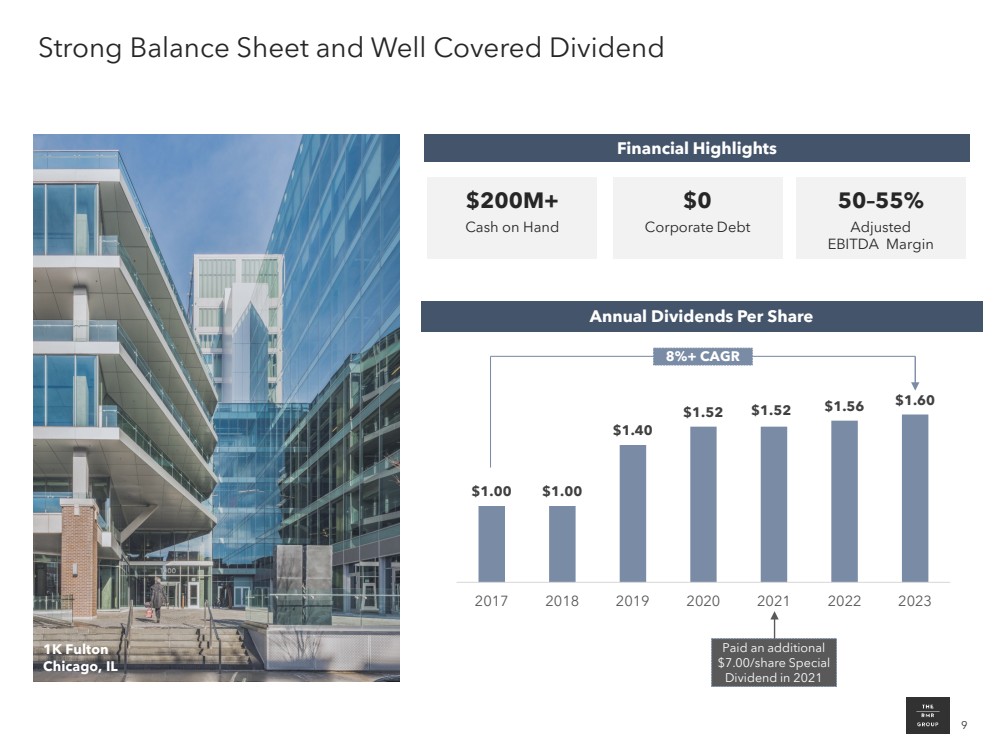
9 Strong Balance Sheet and Well Covered Dividend Financial Highlights 50–55% Adjusted EBITDA Margin $200M+ Cash on Hand $0 Corporate Debt Annual Dividends Per Share $1.00 $1.00 $1.40 $1.52 $1.52 $1.56 $1.60 2017 2018 2019 2020 2021 2022 2023 Paid an additional $7.00/share Special Dividend in 2021 1K Fulton Chicago, IL 8%+ CAGR |
|
10 Client Information 10 |
|
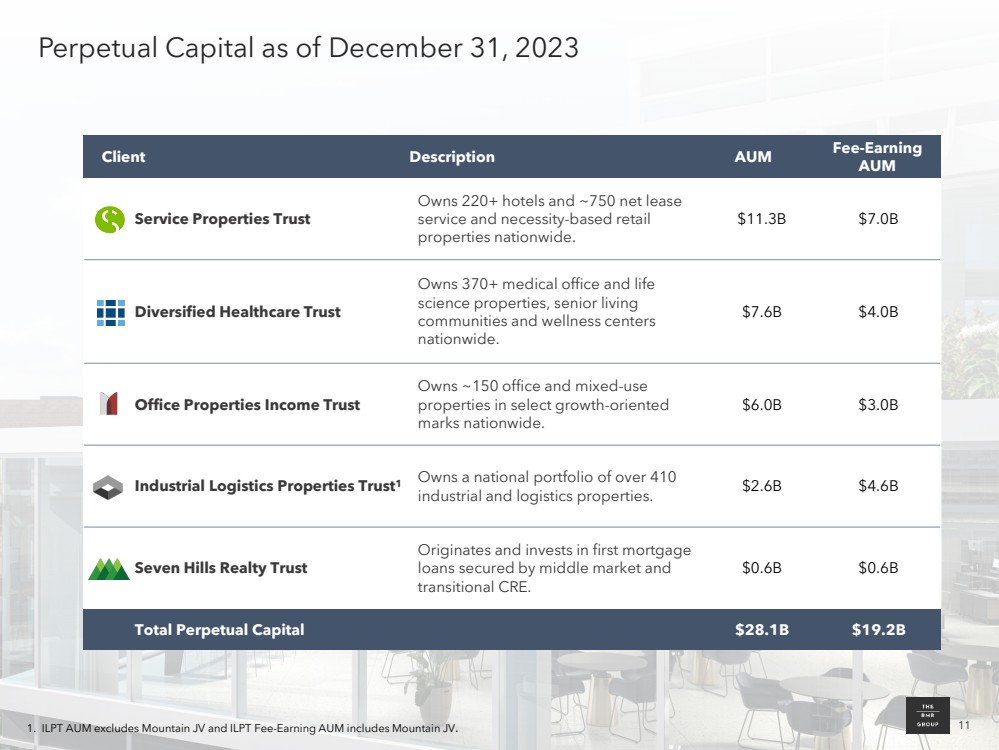
11 Perpetual Capital as of December 31, 2023 Service Properties Trust Owns 220+ hotels and ~750 net lease service and necessity-based retail properties nationwide. $11.3B $7.0B Diversified Healthcare Trust Owns 370+ medical office and life science properties, senior living communities and wellness centers nationwide. $7.6B $4.0B Office Properties Income Trust Owns ~150 office and mixed-use properties in select growth-oriented marks nationwide. $6.0B $3.0B Industrial Logistics Properties Trust1 Owns a national portfolio of over 410 industrial and logistics properties. $2.6B $4.6B Seven Hills Realty Trust Originates and invests in first mortgage loans secured by middle market and transitional CRE. $0.6B $0.6B Total Perpetual Capital $28.1B $19.2B 1. ILPT AUM excludes Mountain JV and ILPT Fee-Earning AUM includes Mountain JV. Client Description AUM Fee-Earning AUM 11 |
|
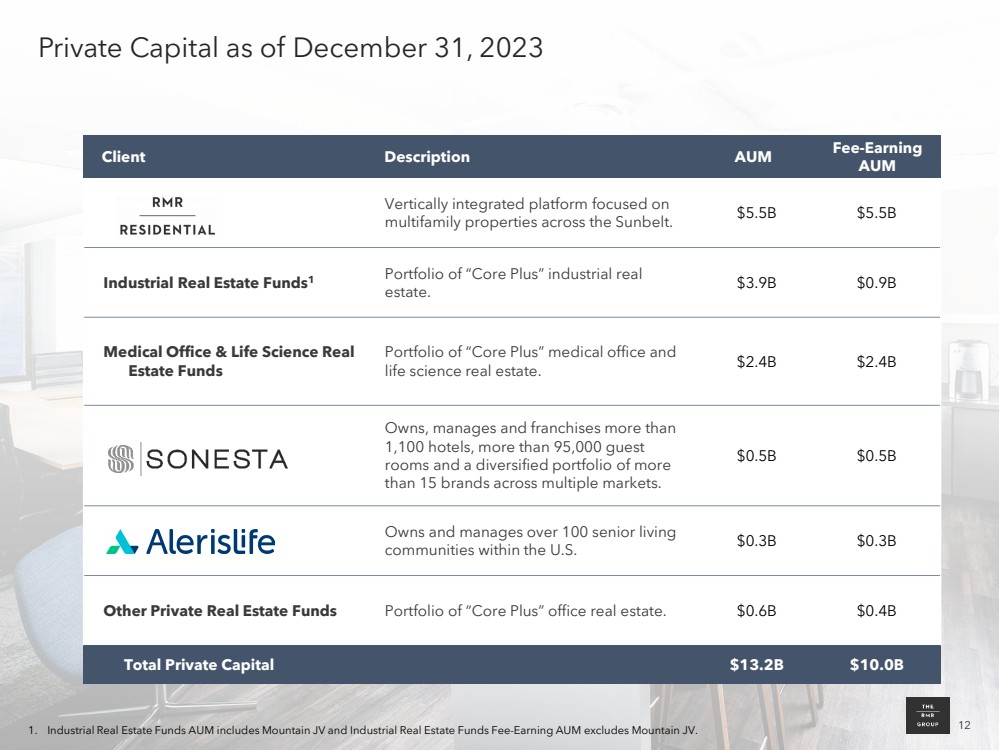
12 Private Capital as of December 31, 2023 Vertically integrated platform focused on multifamily properties across the Sunbelt. $5.5B $5.5B Industrial Real Estate Funds1 Portfolio of “Core Plus” industrial real estate. $3.9B $0.9B Medical Office & Life Science Real Estate Funds Portfolio of “Core Plus” medical office and life science real estate. $2.4B $2.4B Owns, manages and franchises more than 1,100 hotels, more than 95,000 guest rooms and a diversified portfolio of more than 15 brands across multiple markets. $0.5B $0.5B Owns and manages over 100 senior living communities within the U.S. $0.3B $0.3B Other Private Real Estate Funds Portfolio of “Core Plus” office real estate. $0.6B $0.4B Total Private Capital $13.2B $10.0B Client Description AUM Fee-Earning AUM 1. Industrial Real Estate Funds AUM includes Mountain JV and Industrial Real Estate Funds Fee-Earning AUM excludes Mountain JV. 12 |
|
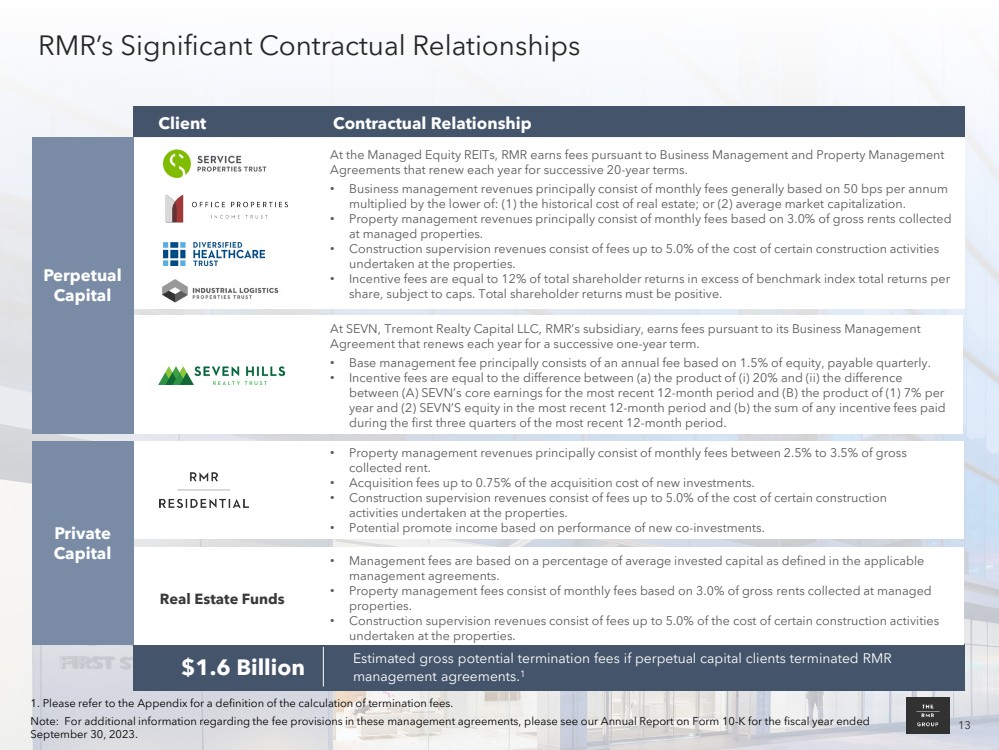
13 At the Managed Equity REITs, RMR earns fees pursuant to Business Management and Property Management Agreements that renew each year for successive 20-year terms. • Business management revenues principally consist of monthly fees generally based on 50 bps per annum multiplied by the lower of: (1) the historical cost of real estate; or (2) average market capitalization. • Property management revenues principally consist of monthly fees based on 3.0% of gross rents collected at managed properties. • Construction supervision revenues consist of fees up to 5.0% of the cost of certain construction activities undertaken at the properties. • Incentive fees are equal to 12% of total shareholder returns in excess of benchmark index total returns per share, subject to caps. Total shareholder returns must be positive. RMR’s Significant Contractual Relationships 1. Please refer to the Appendix for a definition of the calculation of termination fees. Note: For additional information regarding the fee provisions in these management agreements, please see our Annual Report on Form 10-K for the fiscal year ended September 30, 2023. • Property management revenues principally consist of monthly fees between 2.5% to 3.5% of gross collected rent. • Acquisition fees up to 0.75% of the acquisition cost of new investments. • Construction supervision revenues consist of fees up to 5.0% of the cost of certain construction activities undertaken at the properties. • Potential promote income based on performance of new co-investments. • Management fees are based on a percentage of average invested capital as defined in the applicable management agreements. • Property management fees consist of monthly fees based on 3.0% of gross rents collected at managed properties. • Construction supervision revenues consist of fees up to 5.0% of the cost of certain construction activities undertaken at the properties. Estimated gross potential termination fees if perpetual capital clients terminated RMR management agreements. $1.6 Billion 1 Client Contractual Relationship 13 Real Estate Funds At SEVN, Tremont Realty Capital LLC, RMR’s subsidiary, earns fees pursuant to its Business Management Agreement that renews each year for a successive one-year term. • Base management fee principally consists of an annual fee based on 1.5% of equity, payable quarterly. • Incentive fees are equal to the difference between (a) the product of (i) 20% and (ii) the difference between (A) SEVN’s core earnings for the most recent 12-month period and (B) the product of (1) 7% per year and (2) SEVN’S equity in the most recent 12-month period and (b) the sum of any incentive fees paid during the first three quarters of the most recent 12-month period. Perpetual Capital Private Capital |
|
14 Positioned for Growth 14 |
|
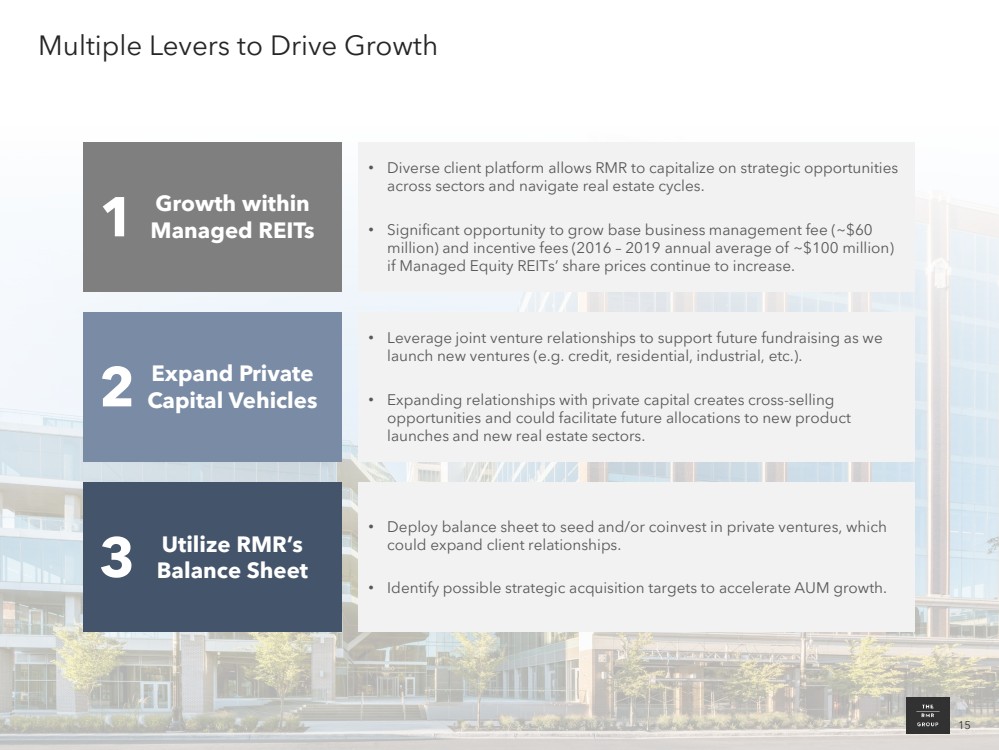
15 Multiple Levers to Drive Growth • Diverse client platform allows RMR to capitalize on strategic opportunities across sectors and navigate real estate cycles. • Significant opportunity to grow base business management fee (~$60 million) and incentive fees (2016 – 2019 annual average of ~$100 million) if Managed Equity REITs’ share prices continue to increase. • Leverage joint venture relationships to support future fundraising as we launch new ventures (e.g. credit, residential, industrial, etc.). • Expanding relationships with private capital creates cross-selling opportunities and could facilitate future allocations to new product launches and new real estate sectors. • Deploy balance sheet to seed and/or coinvest in private ventures, which could expand client relationships. • Identify possible strategic acquisition targets to accelerate AUM growth. Growth within Managed REITs Expand Private Capital Vehicles 1 2 Utilize RMR’s 3 Balance Sheet 15 |
|
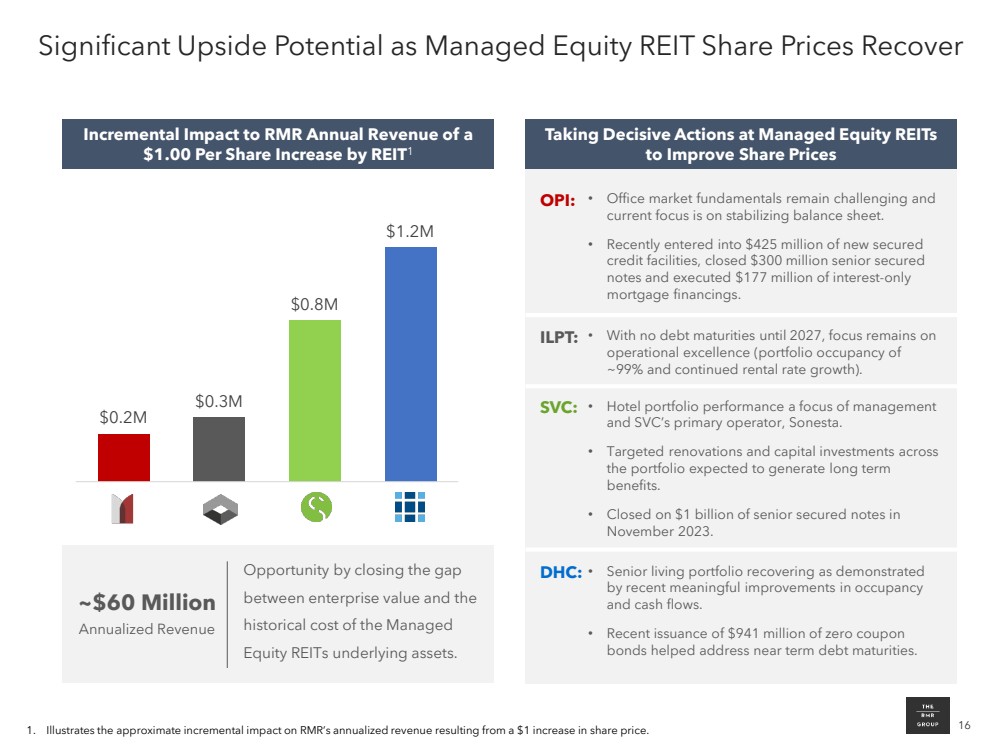
16 Significant Upside Potential as Managed Equity REIT Share Prices Recover 1. Illustrates the approximate incremental impact on RMR’s annualized revenue resulting from a $1 increase in share price. $0.2M $0.3M $0.8M $1.2M OPI ILPT SVC DHC Opportunity by closing the gap between enterprise value and the historical cost of the Managed Equity REITs underlying assets. ~$60 Million Annualized Revenue OPI: • Office market fundamentals remain challenging and current focus is on stabilizing balance sheet. • Recently entered into $425 million of new secured credit facilities, closed $300 million senior secured notes and executed $177 million of interest-only mortgage financings. ILPT: • With no debt maturities until 2027, focus remains on operational excellence (portfolio occupancy of ~99% and continued rental rate growth). SVC: • Hotel portfolio performance a focus of management and SVC’s primary operator, Sonesta. • Targeted renovations and capital investments across the portfolio expected to generate long term benefits. • Closed on $1 billion of senior secured notes in November 2023. DHC: • Senior living portfolio recovering as demonstrated by recent meaningful improvements in occupancy and cash flows. • Recent issuance of $941 million of zero coupon bonds helped address near term debt maturities. Incremental Impact to RMR Annual Revenue of a $1.00 Per Share Increase by REIT1 Taking Decisive Actions at Managed Equity REITs to Improve Share Prices |
|
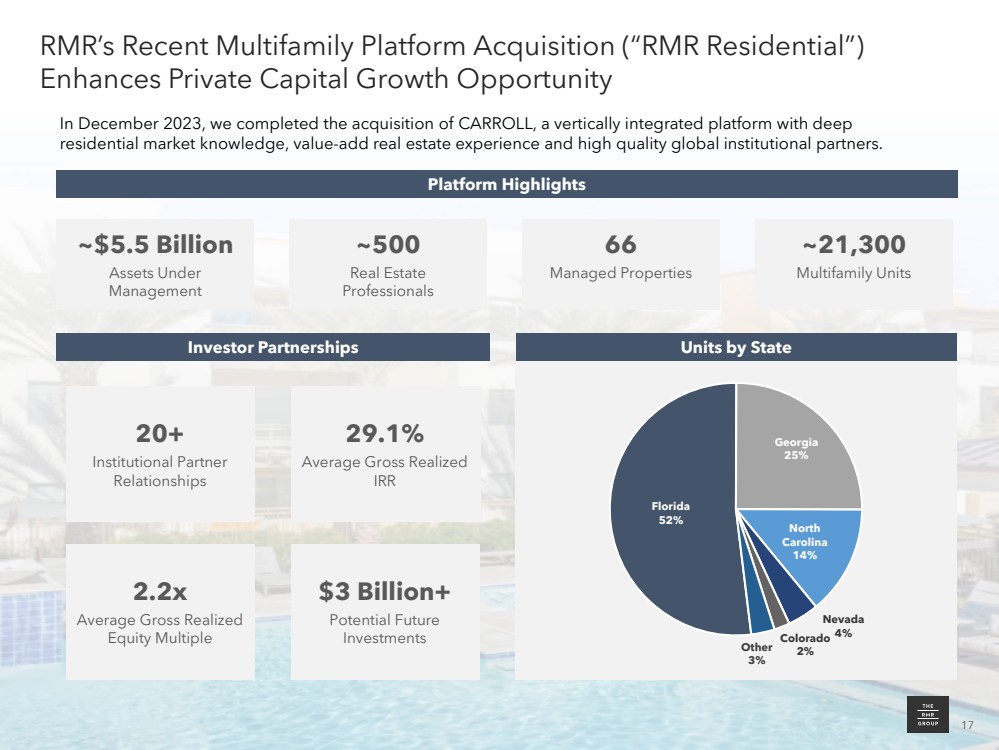
17 Florida 52% Georgia 25% North Carolina 14% Nevada 4% Colorado Other 2% 3% Platform Highlights ~$5.5 Billion Assets Under Management ~500 Real Estate Professionals 66 Managed Properties ~21,300 Multifamily Units Investor Partnerships Units by State RMR’s Recent Multifamily Platform Acquisition (“RMR Residential”) Enhances Private Capital Growth Opportunity In December 2023, we completed the acquisition of CARROLL, a vertically integrated platform with deep residential market knowledge, value-add real estate experience and high quality global institutional partners. 2.2x Average Gross Realized Equity Multiple $3 Billion+ Potential Future Investments 29.1% Average Gross Realized IRR 2.2x Average Gross Realized Equity Multiple 20+ Institutional Partner Relationships 17 |
|
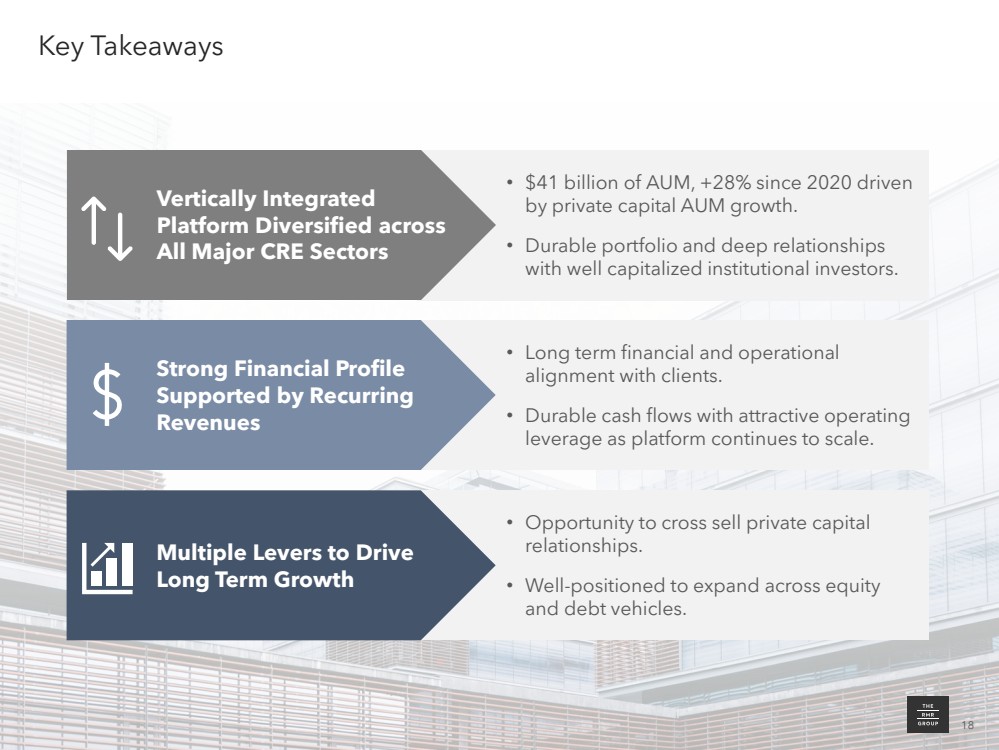
18 • Long term financial and operational alignment with clients. • Durable cash flows with attractive operating leverage as platform continues to scale. • Opportunity to cross sell private capital relationships. • Well-positioned to expand across equity and debt vehicles. Key Takeaways • $41 billion of AUM, +28% since 2020 driven by private capital AUM growth. • Durable portfolio and deep relationships with well capitalized institutional investors. Vertically Integrated Platform Diversified across All Major CRE Sectors Strong Financial Profile Supported by Recurring Revenues Multiple Levers to Drive Long Term Growth 18 |
|
19 Appendix |
|
20 Governed by a Highly Skilled Board of Directors Ann Logan Independent Director Rosen Plevneliev Lead Independent Director Walter C. Watkins, Jr. Independent Director Jonathan Veitch Independent Director Adam Portnoy Managing Director Jennifer Clark Managing Director 50% Female and Members of Underrepresented Communities 66% Independent 7 Years Average Tenure 20 |
|
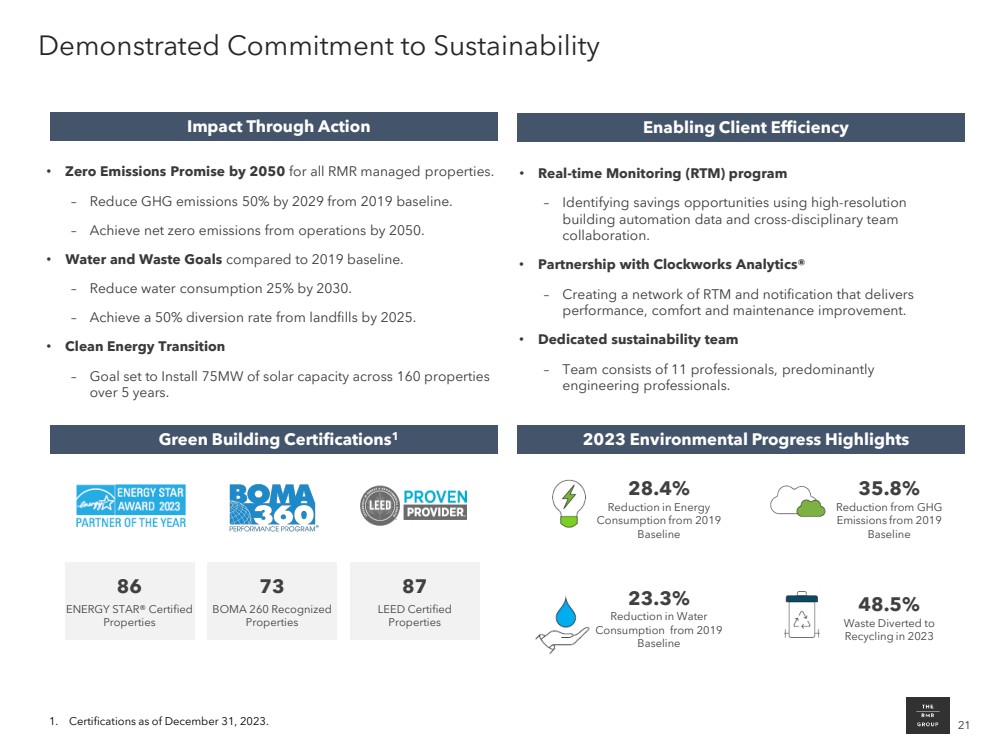
21 Demonstrated Commitment to Sustainability 1. Certifications as of December 31, 2023. • Zero Emissions Promise by 2050 for all RMR managed properties. – Reduce GHG emissions 50% by 2029 from 2019 baseline. – Achieve net zero emissions from operations by 2050. • Water and Waste Goals compared to 2019 baseline. – Reduce water consumption 25% by 2030. – Achieve a 50% diversion rate from landfills by 2025. • Clean Energy Transition – Goal set to Install 75MW of solar capacity across 160 properties over 5 years. 86 ENERGY STAR® Certified Properties 73 BOMA 260 Recognized Properties 87 LEED Certified Properties Impact Through Action Enabling Client Efficiency • Real-time Monitoring (RTM) program – Identifying savings opportunities using high-resolution building automation data and cross-disciplinary team collaboration. • Partnership with Clockworks Analytics® – Creating a network of RTM and notification that delivers performance, comfort and maintenance improvement. • Dedicated sustainability team – Team consists of 11 professionals, predominantly engineering professionals. Green Building Certifications1 2023 Environmental Progress Highlights 28.4% Reduction in Energy Consumption from 2019 Baseline 35.8% Reduction from GHG Emissions from 2019 Baseline 23.3% Reduction in Water Consumption from 2019 Baseline 48.5% Waste Diverted to Recycling in 2023 |
|
22 Annual Sustainability Report 2023 Annual Sustainability Report expected in April. To access sustainability reports, visit RMR’s website at www.rmrgroup.com/corporate-sustainability |
|
23 Financials |
|
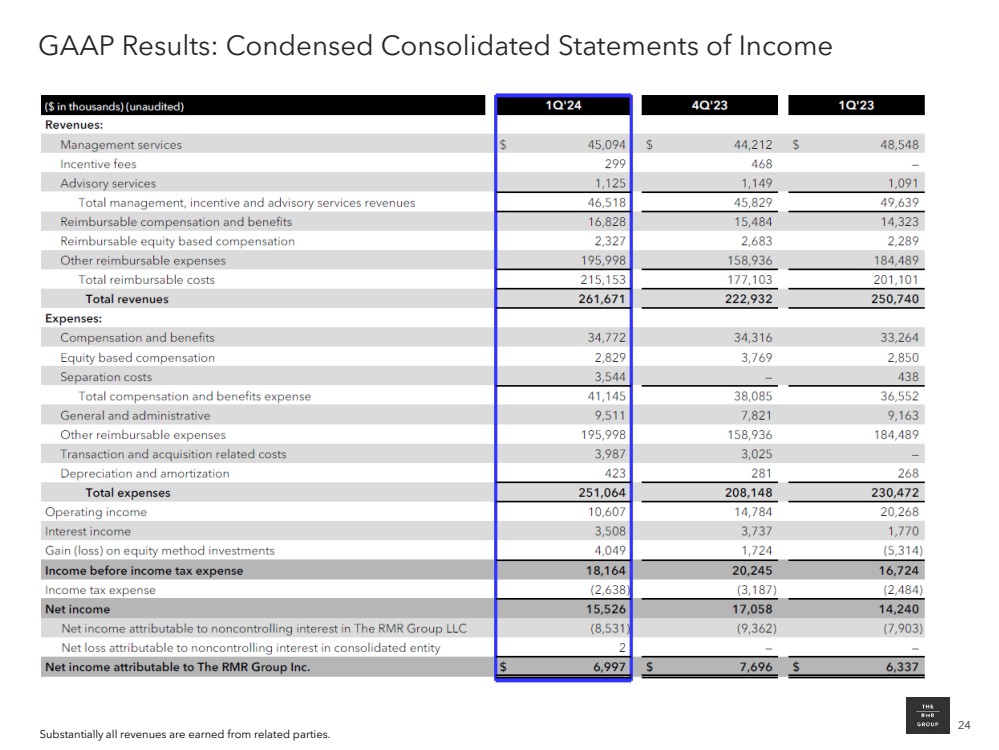
24 GAAP Results: Condensed Consolidated Statements of Income Substantially all revenues are earned from related parties. |
|
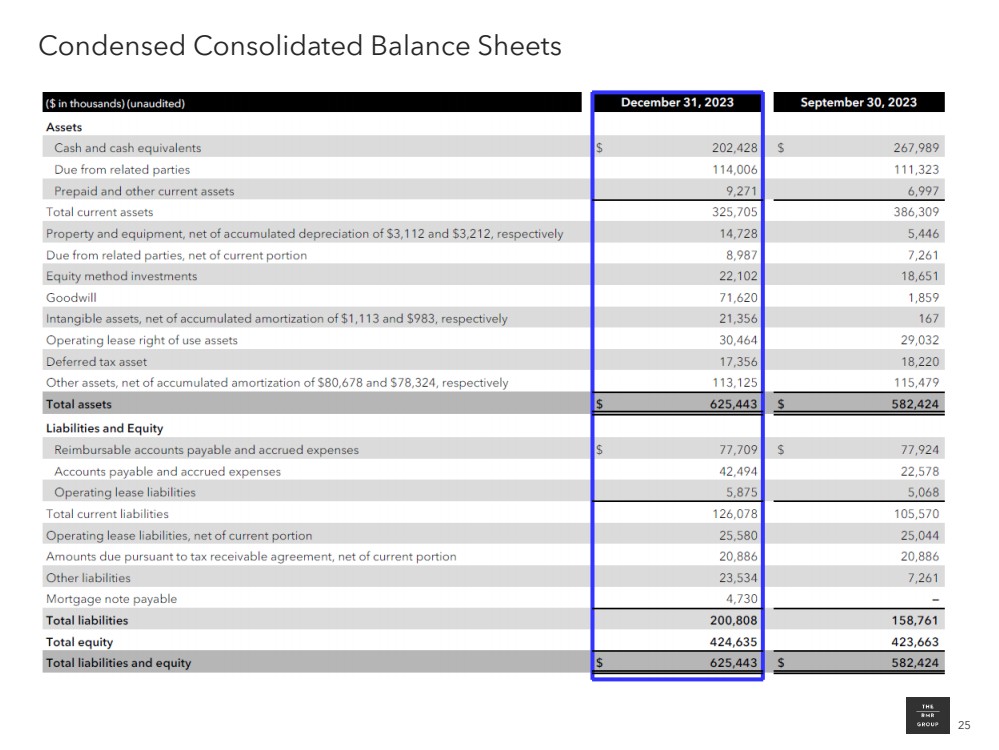
25 Condensed Consolidated Balance Sheets |
|
26 Definitions |
|
27 Definitions • Assets Under Management (AUM) All references in this presentation to AUM on, or as of, a date are calculated at a point in time. • AUM is calculated as: (i) the historical cost of real estate and related assets, excluding depreciation, amortization, impairment charges or other non-cash reserves, of the Managed Equity REITs and certain Private Capital clients, plus (ii) the gross book value of real estate assets, property and equipment of AlerisLife, Sonesta and until May 15, 2023, TA, excluding depreciation, amortization, impairment charges or other non-cash reserves, plus (iii) the carrying value of loans held for investment and real estate owned by SEVN, plus (iv) the fair value of RMR Residential, both owned and third-party managed assets. Upon deconsolidation from a Managed Equity REIT, the respective real estate and related assets are characterized as Private Capital and their historical cost represents the fair value of the real estate at the time of deconsolidation. • Fee-Earning AUM is calculated (i) monthly for the Managed Equity REITs, based upon the lower of the average historical cost of each REIT's properties and its average market capitalization, plus (ii) for all other clients, Fee-Earning AUM equals AUM and includes amounts that may differ from the measures used for purposes of calculating fees under the terms of the respective management agreements. For additional information on the calculation of AUM for purposes of the fee provisions of the business management agreements, see RMR's Annual Report on Form 10-K for the fiscal year ended September 30, 2023, filed with the SEC. RMR's SEC filings are available at the SEC website: www.sec.gov. • Managed Equity REITs include Diversified Healthcare Trust (DHC), Industrial Logistics Properties Trust (ILPT), Office Properties Income Trust (OPI) and Service Properties Trust (SVC). • Mountain JV refers to Mountain Industrial REIT LLC, a joint venture in which ILPT owns a majority interest (and accordingly is presented in ILPT’s consolidated results). • Perpetual Capital refers to capital with an indefinite duration, which may be terminated under certain conditions, and includes the Managed Equity REITs, Seven Hills Realty Trust (SEVN), and until it was acquired by BP Products North America Inc. on May 15, 2023, TravelCenters of America Inc. (TA). • Private Capital consists of AlerisLife Inc. (AlerisLife), Sonesta International Hotels Corporation (Sonesta), residential real estate we manage from our acquisition of MPC Partnership Holdings LLC (RMR Residential) and other private capital vehicles including ABP Trust and other private entities that own commercial real estate. Some of the Managed Equity REITs own minority interests in certain of these entities. AlerisLife was a publicly traded company until March 20, 2023 when it was acquired by a subsidiary of ABP Trust. As a result, amounts for AlerisLife are characterized as Private Capital for all periods presented. Continued on next page. |
|
28 Definitions (Continued) Non-GAAP Measures: RMR presents certain “non-GAAP financial measures” within the meaning of the applicable rules of the SEC, including EBITDA, Adjusted EBITDA and Adjusted EBITDA Margin. The GAAP financial measure that is most directly comparable to EBITDA and Adjusted EBITDA is net income and the GAAP financial measure that is most directly comparable to Adjusted EBITDA Margin is Net Income Margin, which represents net income divided by total management and advisory services revenues. These non-GAAP financial measures do not represent net income, net income attributable to The RMR Group Inc. or cash generated by operating activities determined in accordance with GAAP, and should not be considered alternatives to net income, net income attributable to The RMR Group Inc. or net income margin determined in accordance with GAAP, as indicators of RMR’s financial performance or as measures of its liquidity. Other asset management businesses may calculate these non-GAAP measures differently than RMR does. Several non-GAAP measures are referenced in this presentation, including EBITDA, Adjusted EBITDA, Distributable Earnings and Adjusted EBITDA Margin. The RMR Group Inc. considers EBITDA, Adjusted EBITDA, Distributable Earnings and Adjusted EBITDA Margin to be appropriate supplemental measures of its operating performance, along with net income, net income attributable to The RMR Group Inc. and net income margin. These measures should be considered in conjunction with net income and net income attributable to The RMR Group Inc. as presented in The RMR Group Inc.’s consolidated statements of income. • EBITDA, Adjusted EBITDA and Adjusted EBITDA Margin are supplemental measures used to assess operating performance, along with net income, net income attributable to The RMR Group Inc. and net income margin. RMR believes that EBITDA, Adjusted EBITDA and Adjusted EBITDA Margin provide useful information to investors because by excluding the effects of certain amounts, such as non-cash items or non-recurring gains and losses, EBITDA, Adjusted EBITDA and Adjusted EBITDA Margin may facilitate a comparison of current operating performance with RMR’s historical operating performance and with the performance of other asset management businesses. RMR also believes that providing Adjusted EBITDA Margin may help investors assess RMR’s performance of its business by providing the margin that Adjusted EBITDA represents to its contractual management and advisory fees (excluding incentive business management fees, if any). Termination Fee Calculation: The $1.6 billion total estimated termination fee is the sum of the termination fees calculated under each of the applicable business and property management agreements based on the following assumptions: (a) assumed termination date of September 30, 2023; (b) for the Managed Equity REITs, monthly future fees were based on actual fees earned by RMR over the 12 months preceding the assumed termination date divided by twelve and, for purposes of determining present value, the monthly future fees were discounted using a rate equal to 1/12th of the sum of the applicable Treasury Rate for that future month plus 300bps. Additionally, in the event the management agreement is terminated by SEVN without a cause event or by Tremont Realty Capital LLC for a material breach, SEVN will be required to pay Tremont Realty Capital LLC a termination fee equal to (a) three times the sum of (i) the average annual base management fee and (ii) the average annual incentive fee, in each case paid or payable to Tremont Realty Capital LLC during the 24 month period immediately preceding the most recently completed calendar quarter prior to the date of termination or, if such termination occurs within 24 months of its initial commencement, the base management fee and the incentive fee will be annualized for such two year period based on such fees earned by Tremont Realty Capital LLC during such period, plus (b) $1.6 million. In addition, the initial organizational costs related to Tremont Mortgage Trust's formation and the costs of its initial public offering and the concurrent private placement that Tremont Mortgage Trust had paid pursuant to its management agreement with Tremont Realty Capital LLC will be included in the “Termination Fee” under and as defined in SEVN’s management agreement with Tremont Realty Capital LLC. No termination fee will be payable if the management agreement is terminated by SEVN for a cause event or by Tremont Realty Capital LLC without SEVN’s material breach. The estimated termination fee is presented for illustrative purposes only based on the assumptions described. Any actual termination fee may be higher or lower than the estimate depending on the actual calculation at the time, including then applicable fees, the then applicable discount rate and other factors. |
|
29 Investor Presentation March 2024 Two Newton Place 255 Washington Street, Suite 300 Newton, MA 02458 RMRGROUP.COM |