UNITED STATES
SECURITIES AND EXCHANGE COMMISSION
Washington, D.C. 20549
FORM 6-K
REPORT OF FOREIGN PRIVATE ISSUER
PURSUANT TO SECTION 13a-16 OR 15d-16
UNDER THE SECURITIES EXCHANGE ACT OF 1934
March 8, 2024
Commission File Number: 001-14251
SAP SE
(Exact name of registrant as specified in its charter)
SAP EUROPEAN COMPANY
(Translation of registrant’s name into English)
Dietmar-Hopp-Allee 16
69190 Walldorf
Federal Republic of Germany
(Address of principal executive office)
Indicate by check mark whether the registrant files or will file annual reports under cover of Form 20-F or Form 40-F.
Form 20-F x Form 40-F ¨
SAP SE
FORM 6-K
On Feb 29, 2024, SAP SE, a European company (Societas Europaea, SE) organized under the laws of Germany and the European Union (“SAP”), issued its Integrated Report 2023. The Integrated Report 2023 is attached as Exhibit 99.1 hereto and incorporated by reference herein.
Any statements contained in this report that are not historical facts are forward-looking statements as defined in the U.S. Private Securities Litigation Reform Act of 1995. Words such as “anticipate,” “believe,” “estimate,” “expect,” “forecast,” “intend,” “may,” “plan,” “project,” “predict,” “should” and “will” and similar expressions as they relate to SAP are intended to identify such forward-looking statements. SAP undertakes no obligation to publicly update or revise any forward-looking statements. All forward-looking statements are subject to various risks and uncertainties that could cause actual results to differ materially from expectations. The factors that could affect SAP’s future financial results are discussed more fully in SAP's filings with the U.S. Securities and Exchange Commission (the “SEC”), including SAP’s most recent Annual Report on Form 20-F filed with the SEC. Readers are cautioned not to place undue reliance on these forward-looking statements, which speak only as of their dates.
The information furnished herewith in this report shall not be deemed “filed” for purposes of Section 18 of the Securities Exchange Act of 1934, as amended, (the “Exchange Act”) or otherwise subject to the liabilities of that section, and shall not be deemed to be incorporated by reference in any filing under the Securities Act of 1933, as amended, whether made before or after the date of this report, regardless of any general incorporation by reference language in such filing.
| Exhibit No. | Description | |
| 99.1 | Integrated Report 2023 issued on Feb 29, 2024 |
SIGNATURES
Pursuant to the requirements of the Securities Exchange Act of 1934, as amended, the registrant has duly caused this report to be signed on its behalf by the undersigned hereunto duly authorized.
| SAP SE | |||
| (Registrant) | |||
| By: | /s/ Christopher Sessar | ||
| Name: | Dr. Christopher Sessar | ||
| Title: | Chief Accounting Officer | ||
| By: | /s/ Julia Zicke | ||
| Name: | Dr. Julia Zicke | ||
| Title: | Head of External Reporting and Accounting Technology | ||
Date: March 8, 2024
EXHIBIT INDEX
| Exhibit No. | Exhibit | |
| 99.1 | Integrated Report 2023 issued on February 29, 2024 |
Exhibit 99.1
 |
SAP Integrated Report 2023 | |||||
About This Report
Content
The SAP Integrated Report 2023 presents our annual financial, social, and environmental performance in a single integrated report (“SAP Integrated Report”) available at www.sapintegratedreport.com.
We report on our contribution to the UN Sustainable Development Goals (SDGs) and have embedded the recommended disclosures of the Task Force on Climate-Related Financial Disclosures (TCFD), of the Sustainability Accounting Standards Board (SASB) standards, and of the World Economic Forum (WEF) stakeholder capitalism metrics.
Basis of Presentation
Our combined management report is prepared in accordance with the German Commercial Code and the relevant German Accounting Standards.
The report encompasses SAP SE and all subsidiaries which we control and, hence, include in our consolidated financial statement according to IFRS. Joint arrangements and associates are not included in the sustainability reporting. Any further deviations for the sustainability reporting are specifically mentioned in the respective chapters. Our executive management has confirmed the effectiveness of our internal controls over financial reporting.
The social and environmental data and information included in the SAP Integrated Report is prepared in accordance with the Global Reporting Initiative (GRI) Standards, which require a report to provide a comprehensive picture of its material topics and related impacts and how these are managed. We apply the GRI principles (sustainability context, stakeholder inclusiveness, materiality, and completeness) for defining report content. We also report on SDGs identified as material to our strategy.
Greenhouse gas data is prepared based on the Greenhouse Gas Protocol.
Data
All financial and non-financial data and information for the reporting period is reported utilizing SAP software solutions and sourced from the responsible business units.
The reporting period is fiscal year 2023. The report encompasses SAP SE and all subsidiaries of the SAP Group. To make this report as current as possible, we have included relevant information available up to the auditor’s opinion dated February 21, 2024. The report is available in English and German.
Independent Audit and Assurance
BDO AG Wirtschaftsprüfungsgesellschaft (BDO) has audited our consolidated financial statements and our combined management report. Information relating to the non-financial statement included in SAP’s management report has been audited with limited assurance by BDO. Additionally, BDO has provided assurance on selected sustainability information in accordance with the International Standard on Assurance Engagements (ISAE) 3000, a pertinent standard for the assurance of sustainability reporting. The Independent Auditor’s Report and the Assurance Reports of BDO for the non-financial statement and selected sustainability information are available in the Independent Auditor’s Report section, in the Independent Auditor’s Report on a Limited Assurance Engagement of the Combined Non-Financial Statement, and in the Independent Auditor’s Report on a Limited Assurance Engagement on Sustainability Information section.
|
SAP Integrated Report 2023 | |||||
Concept and Realization
This report was designed by SAP and created with SAP S/4HANA software and the SAP Disclosure Management application.
Contents
| To Our Stakeholders | 4 |
| Combined Management Report | 46 |
| Consolidated Financial Statements IFRS | 154 |
| Further Information about Sustainability | 262 |
| Additional Information | 319 |
|
SAP Integrated Report 2023 | |||||
| To
Our Stakeholders |
Combined
Management Report |
Consolidated
Financial Statements IFRS |
Further
Information about Sustainability |
Additional Information |
||
To Our Stakeholders
| Letter from the CEO | 5 |
| SAP Executive Board | 8 |
| Investor Relations | 10 |
| Report by the Supervisory Board | 15 |
| Responsibility Statement | 28 |
| Independent Auditor’s Report | 29 |
| Independent Auditor’s Report on a Limited Assurance Engagement of the Combined Non-Financial Statement | 40 |
| Independent Auditor’s Report on a Limited Assurance Engagement on Sustainability Information | 43 |
|
SAP Integrated Report 2023 | |||||
| To
Our Stakeholders |
Combined
Management Report |
Consolidated
Financial Statements IFRS |
Further
Information about Sustainability |
Additional Information |
||
Letter from the CEO
Dear Fellow Shareholders,
2023 was another year of exponential developments around the globe. Looking at the geopolitical landscape, new crises surfaced as old ones had not yet settled, and conflicts in multiple regions kept the world on edge. Looking at the climate, record global temperatures and extreme weather events underlined the urgency to accelerate climate action. At the same time, change continued to be the only constant in the tech industry. The year saw incredible leaps especially in generative artificial intelligence (GenAI), and consumer applications rapidly captured the imagination of the global public. It also became clear, though, that the true value of this seminal technology lies in its application to the business world. GenAI will be a powerful tool to transform companies and to make the world economy more sustainable, resilient, and fair overall. At a time when humanity’s challenges become ever more complex, GenAI promises to drastically expand our capacity to find solutions – and to do more with less.
All these global developments have a direct relevance for SAP. Our solutions touch 87% of global commerce and help keep companies, economies, and global business resilient in volatile times. Our sustainability offering enables customers to systematically track key metrics, including carbon emissions, and to take effective action. Meanwhile, SAP is increasingly embedding business AI in all our solutions. We’re doing our part to make the technology a powerful, readily accessible tool for organizations to become more efficient, more sustainable, and more innovative.
Today, SAP is stronger and more relevant than ever. And this is also visible in our business results: In 2023, we met or exceeded our outlook in all key metrics. Current Cloud Backlog surpassed €13.7 billion, growing 27%1, while Cloud Revenue went up 23%1 to €13.7 billion.
|
SAP Integrated Report 2023 | |||||
| To
Our Stakeholders |
Combined
Management Report |
Consolidated
Financial Statements IFRS |
Further
Information about Sustainability |
Additional Information |
||
Non-IFRS operating profit expanded by 13%1, exceeding our guidance range. What is more, Total Cloud Backlog increased 39%1 to €44 billion, fostering the Company’s resilience for the years to come.
Our strong portfolio, tightly integrated in both technological and commercial terms, is at the heart of our Company’s growth formula. Hundreds of leading global companies choose “RISE with SAP” every year to move their business processes to the cloud. In March 2023, we introduced “GROW with SAP,” an offering to support the cloud conversion of medium-sized companies. GROW with SAP, too, is proving to be a major success, with over 700 customers signing up in just nine months. In September, then, we launched Joule, SAP’s generative AI co-pilot, to the public. Joule will be infused throughout our cloud portfolio. It will deliver insights from across SAP solutions and beyond, and it will enable users and companies to quickly reach relevant, reliable outcomes in a fast and responsible manner. Strong partnerships and collaborations with leading AI companies – including Nvidia, Microsoft, and OpenAI, as well as Google – will help SAP to further expand the capabilities of our business AI solutions and to maximize their benefit for our customers.
With portfolio transactions, we additionally rounded out our offering. In June, we closed the sale of Qualtrics, aiming to focus our portfolio and to direct investments where they have the biggest impact. And in November, SAP finalized the acquisition of LeanIX, whose enterprise architecture management (EAM) solutions will help ensure that processes, systems, and data yield the right outcome for every SAP customer. In their combination, SAP LeanIX solutions, the SAP Signavio portfolio, and the SAP Cloud ALM solution for application life cycle management form a unique business transformation suite.
Driven by the Company’s excellent results and an overall positive market mood, particularly for tech companies, SAP’s stock soared in 2023. Towards the end of the year that also marked the 25th anniversary of our U.S. stock market listing, SAP stock reached a new all-time high at €148.18 per share. The share price increased 43.2% in total over the course of 2023 – more than double the development of the DAX, which gained 19.1%. The Nasdaq-100 appreciated by 54.9% in the same time frame. SAP also regained its position as the most valuable company among the DAX 40 in February 2023, and ended the year with a market capitalization of €171 billion on December 31, 2023.
Shareholders will additionally profit from SAP’s strong performance by means of an attractive dividend. Based on the Company’s strong performance in 2023, SAP intends to propose a dividend of €2.202 per share at the annual general meeting in May – up approximately 7% compared to the preceding year. What is more, we announced a €5 billion share repurchase program to be conducted through the end of 2025. In addition to returning capital to shareholders, the program will help to balance out dilution related to employee share programs.
Beyond the convincing financial performance, SAP also met its non-financial goals. In 2023, SAP achieved carbon neutrality in its own operations and continues to focus on achieving net zero by 2030 along our value chain. Further, we intend to make an even bigger contribution to sustainability by helping our customers accelerate their respective journeys. Roughly 1,000 new customers chose SAP’s sustainability solutions in 2023 alone.
Our Customer Net Promoter Score (NPS) improved 2 points year over year to 9 in 2023, reflecting that customers are increasingly satisfied with our solutions. Meanwhile, our Employee Engagement Index remained stable at 80% and came in at the upper end of our target range, indicating high levels of employee motivation, affinity towards SAP, and excitement about the Company’s future. The proportion of women in management roles increased to 29.7% (2022: 29.4%) and reached 35.2% in the workforce overall.
On behalf of the entire Executive Board, I would like to thank all SAP colleagues for these excellent achievements in a challenging environment. We had promised to quickly turn SAP into a cloud company – a company with double-digit profit growth – and we can comfortably say: we delivered.
As we move into the future, we’re determined to keep leading the way as a top Enterprise Application company and we’re determined to become the #1 Business AI company as well. This is
1 At constant currencies
2 Pending approval of Annual General Meeting of Shareholders
|
SAP Integrated Report 2023 | |||||
| To
Our Stakeholders |
Combined
Management Report |
Consolidated
Financial Statements IFRS |
Further
Information about Sustainability |
Additional Information |
||
why, out of a very strong position, we are accelerating SAP’s development. Over the next two years, we’re going to invest almost €1 billion to develop powerful AI use cases for our customers. And, with a dedicated transformation program, we intend to further intensify the shift of resources to business AI, in line with the significant growth potential we see for SAP. The planned program will also include a restructuring component focusing on reskilling and voluntary exits. A decision affecting colleagues this way is never easy – but we truly believe it is the right next step for the company. We’re setting up SAP for a strong, competitive future that all stakeholders will benefit from.
I would like to thank you, dear fellow shareholders, for your trust in SAP in 2023 – and I am excited about the great opportunities and promising future that lie ahead.
Sincerely,
Christian Klein
CEO, SAP SE
|
SAP Integrated Report 2023 | |||||
| To
Our Stakeholders |
Combined
Management Report |
Consolidated
Financial Statements IFRS |
Further
Information about Sustainability |
Additional Information |
||
SAP Executive Board
 |
Christian
Klein
Joined
SAP: 1999
Other
board memberships: |
 |
Dominik
Asam
Joined
SAP: 2023
Other board memberships: Supervisory Board, Bertelsmann Management SE and Bertelsmann SE & Co. KGaA, Gütersloh, Germany (not publicly listed) |
 |
Dr.-Ing.
Juergen Mueller
Joined
SAP: 2013 |
|
SAP Integrated Report 2023 | |||||
| To
Our Stakeholders |
Combined
Management Report |
Consolidated
Financial Statements IFRS |
Further
Information about Sustainability |
Additional Information |
||
 |
Scott
Russell
Joined
SAP: 2010
Other board memberships: Board of Directors, Qualtrics International Inc, Provo, UT, USA |
 |
Thomas
Saueressig
Joined
SAP: 2004
Other
board memberships: |
 |
Gina
Vargiu-Breuer
Joined
SAP: 2024 |
 |
Julia
White
Joined
SAP: 2021 |
|
SAP Integrated Report 2023 | |||||
| To
Our Stakeholders |
Combined
Management Report |
Consolidated
Financial Statements IFRS |
Further
Information about Sustainability |
Additional Information |
||
Investor Relations
Global Economy Without Momentum but Inflationary Pressure Easing Slowly
According to a statement by the German Federal Ministry of Economics and Climate Protection (BMWK), there are increasing signs that the global economy is facing a prolonged phase of below-average growth. The medium-term prospects for economic growth are lower than they have been for decades. After a strong start to 2023, the global economy showed a significant slowdown over the summer. This was mainly due to weak industrial production and the sharp rise in interest rates in most regions of the world. Another dampening factor was the subdued development in China. The economic situation is assessed very similarly by international organizations such as the International Monetary Fund (IMF) and the Organisation for Economic Co-operation and Development (OECD).
Inflation, however, has fallen from last year’s multiyear high. The IMF expects inflation rates to fall from 6.9% in 2023 to 5.8% in 2024, with most countries not coming close to their central banks’ targets before 2025. The OECD expects an average inflation rate of at least 2% in 2024 for both the United States and the euro area and is even forecasting 2.1% for Japan.
Stock Markets Stimulated by Falling Interest Rates
The stock market year 2023 was nevertheless more successful than many had expected in advance: The German blue-chip index DAX ended the year with a rise of over 19% and most stock markets worldwide were also up. The recent slowdown in inflation raised hopes of a looser monetary policy, which had a price-driving effect. The S&P500 index rose 22.8% and the Nasdaq-100 technology index exceeded all expectations with a gain of 53.8%.
SAP Stock Reaches New All-Time High
The SAP share price continued to improve throughout 2023. Shortly after SAP announced its good results for financial year 2022 at the end of January, the SAP share price rose more than 7% in a single week to €112.58. The successful execution of SAP’s cloud transformation and the resulting improvement in profitability sent clear signals to the market. The positive sentiment solidified over the course of the following months, lifting SAP stock to €115.60 by the time the results for the first quarter were announced. The Q1 numbers and outlook for the full year were once again convincing and pushed the share a further 7% higher to €123.62 within a week. The market already had high expectations for the half-year results at the end of July due to SAP’s performance in the previous quarters, and these expectations were met with the announcement, albeit without providing any further strong stimulus.
With the results for the crucial third quarter, which once again confirmed the successful execution of SAP’s strategy in terms of order entry, sales revenue, and operating profit, SAP stock began a remarkable upward trend. Within six weeks, the share price climbed to a new all-time high of €148.18 on December 8, 2023, in a supportive market environment. The share ended the trading year on December 29 at a closing price of €139.48, representing an increase of 43.1% compared to the previous year’s closing price. SAP’s market capitalization at the end of December was €171.3 billion, making it once again the most valuable company in the German share index. With our intensified Investor Relations activities in North America, we could drive a strong increase in trading volume of the SAP ADR at the New York Stock Exchange. Additionally, SAP was ranked 61st among the 100 most valuable companies in the world according to a study by the management consulting firm EY.
|
SAP Integrated Report 2023 | |||||
| To
Our Stakeholders |
Combined
Management Report |
Consolidated
Financial Statements IFRS |
Further
Information about Sustainability |
Additional Information |
||
SAP Stock Versus Major Indices (January 2, 2023, to December 29, 2023)
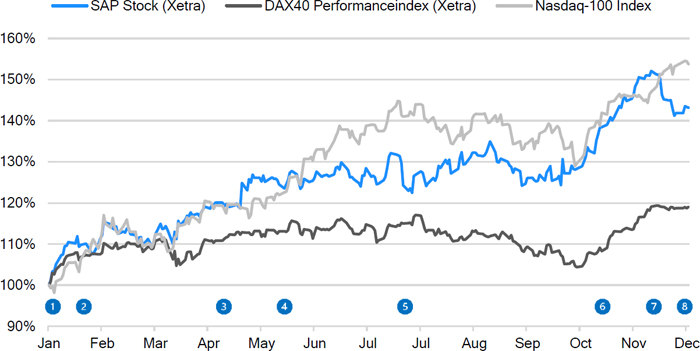
| 1. | January 2 – Opening price – €97.42 | 5. | July 20 – Financial results Q2 and Half-Year 2023 |
| 2. | January 26 – Financial results Q4 and Full year 2022 | 6. | October 18 – Financial results Q3 2023 |
| 3. | April 21 – Financial results Q1 2023 | 7. | December 18 – Annual High 2023 – €148.18 |
| 4. | May 16 – Dividend payment – €2.05 | 8. | December 29 – Closing price – €139.48 |
Continuous Engagement with the Investment Community
SAP continued its strong engagement with the investment community in 2023. Throughout the year, members of the Executive Board of SAP SE and the Investor Relations (IR) team discussed our latest strategy, its execution and business development, and how SAP was helping customers meet the many challenges faced by companies today, with institutional investors, analysts, and private investors worldwide.
Our event analysis showed that most of the conferences attended consisted of participants with longer investment time horizon and high purchase potential. 85% of the SAP engagements were with asset managers with an investment horizon of 1+ years. The number of days SAP engaged with the buy-side exceeded the industry benchmark and SAP IR interacted with 75% of the Top 100 shareholders throughout the year.
In summary, the IR team, together with senior management, held more than 300 meetings in 2023 to maintain the dialogue with investors and analysts, including one-on-one phone calls, video conferences, and road shows. Members of the Executive Board and the IR team attended more than 20 conferences across an expanded geographical mix. In May, we hosted the Financial Analyst Conference as a part of our SAP® Sapphire® event in Orlando, Florida, United States. In 2023, for the first time since 2020, SAP held the Annual General Meeting of Shareholders (AGM) with physical presence again in Mannheim, Germany.
We continued our dialogue with investors, focusing on environmental, social, and governance (ESG) topics and providing them with insights into our sustainability policies and products. SAP’s leadership in this area has been recognized by leading sustainability rating organizations.
SAP representatives engaged with retail shareholders at virtual and physical events. The IR team and the Treasury team also maintained regular communication with the debt investor community.
We provide a wide range of information online about SAP and its stock. Our communications channels include the LinkedIn channel SAP Investor Relations and the SAP INVESTOR magazine.
|
SAP Integrated Report 2023 | |||||
| To
Our Stakeholders |
Combined
Management Report |
Consolidated
Financial Statements IFRS |
Further
Information about Sustainability |
Additional Information |
||
Shareholders can reach the IR team directly by telephone hotline and by e-mail at investor@sap.com. We also publish an overview of the latest analyst consensus on the Investor Relations Web site.
In addition, we provide a Webcast for all key investor events at which members of our Executive Board speak, and we post all relevant presentations on the Investor Relations Web site.
Key Facts About SAP Stock/SAP ADRs
| Listings | |
| Germany | Berlin, Frankfurt, Stuttgart |
| United States (ADRs) | New York Stock Exchange |
| IDs and symbols | |
| WKN/ISIN | 716460/DE0007164600 |
| NYSE (ADRs) | 803054204 (CUSIP) |
| Reuters | SAPG.F or .DE |
| Bloomberg | SAP GR |
| Weight (%) in indexes as at 12/29/20221 | |
| DAX 40 | 9.41 |
| Prime All Share | 9.85 |
| CDAX | 10.50 |
| HDAX | 9.40 |
| TecDax | 9.13 |
| Dow Jones STOXX 50 | 2.90 |
| Dow Jones EURO STOXX 50 | 4.44 |
| 1 Source: STOXX | |
Return on SAP Common Stock — WKN 716460/ISIN DE007164600
| Percent, unless otherwise stated | |||
| Initial investment €10,000 | |||
| Date of investment | 12/31/2013 | 12/31/2018 | 12/31/2022 |
| Period of investment | 10 years | 5 years | 1 year |
| Value as at 12/31/20231 (in €) | 22,385 | 16,045 | 14,470 |
| Average annual return | 8.4% | 9.9% | 44.7% |
| Performance comparators | |||
| DAX 40 Performance — total return index | 5.8% | 9.7% | 20.3% |
| Nasdaq-100 index | 16.7% | 21.6% | 53.8% |
| REX General Bond — total return index | -0.4% | -2.1% | 1.3% |
| S&P 500 Composite — total return index | 12.4% | 14.6% | 20.5% |
| S&P North American Technology Software Index | 20.2% | 22.2% | 55.1% |
| 1 Source: Bloomberg, Dividends reinvested | |||
|
SAP Integrated Report 2023 | |||||
| To
Our Stakeholders |
Combined
Management Report |
Consolidated
Financial Statements IFRS |
Further
Information about Sustainability |
Additional Information |
||
Return on SAP ADRs — 803054204 (CUSIP)
| Percent, unless otherwise stated | |||
| Initial investment US$10,000 | |||
| Date of investment | 12/31/2013 | 12/31/2018 | 12/31/2022 |
| Period of investment | 10 years | 5 years | 1 year |
| Value at 12/31/20231 (in US$) | 17,740 | 15,529 | 14,981 |
| Average annual return | 5.9% | 9.2% | 49.8% |
| Performance comparators | |||
| S&P 500 Composite — total return index | 9.9% | 13.7% | 24.2% |
| NASDAQ100 index | 16.7% | 21.6% | 53.8% |
| 1 Source: Bloomberg, Dividends reinvested | |||
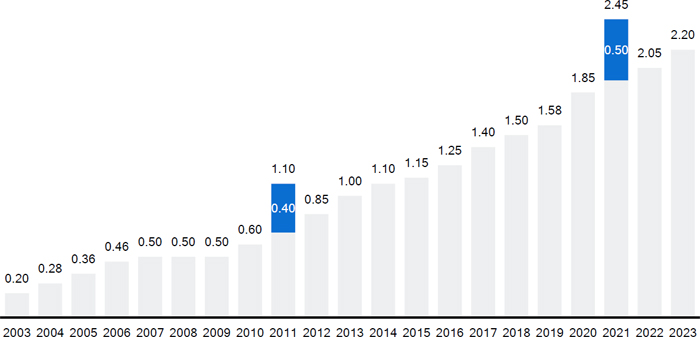
Dividend of €2.20 Proposed
It is our policy to pay a dividend totaling 40% or more of IFRS profit after tax.
At the 2024 Annual General Meeting of Shareholders, the Executive Board and the Supervisory Board of SAP SE will recommend a total dividend for fiscal year 2023 of €2.20 (2022: €2.05) representing an increase of €0.15, or 7.3% compared to the dividend paid for fiscal year 2022. The payout ratio would be 43.1%.
Capital Stock Unchanged
SAP’s capital stock as at December 31, 2023, was €1,228,504,232 (2022: €1,228,504,232). It is issued as 1,228,504,232 no-par shares, each with an attribute value of €1 in relation to capital stock.
|
SAP Integrated Report 2023 | |||||
| To
Our Stakeholders |
Combined
Management Report |
Consolidated
Financial Statements IFRS |
Further
Information about Sustainability |
Additional Information |
||
Shareholder Structure
Applying the definition accepted on the Frankfurt Stock Exchange, which excludes treasury stock from the free float, as at December 31, 2023, the free float stood at 83.6% (December 31, 2022: 83.3%).
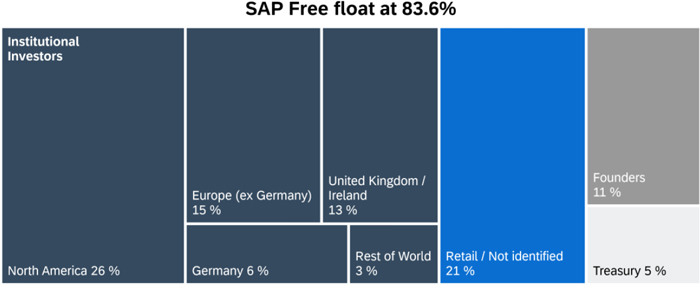
41% of institutional investors are classified as ESG investors.
|
SAP Integrated Report 2023 | |||||
| To
Our Stakeholders |
Combined
Management Report |
Consolidated
Financial Statements IFRS |
Further
Information about Sustainability |
Additional Information |
||
Report by the Supervisory Board
Dear Shareholders,
In the following, we would like to inform you about the work of the Supervisory Board in the fiscal year 2023.
Collaboration Between the Supervisory Board and the Executive Board
In the past fiscal year, the Supervisory Board of SAP SE discharged the duties imposed on it by the law and by the Company’s Articles of Incorporation. It advised the Executive Board on an ongoing basis with regard to the running of the Company and it scrutinized and monitored the work of management.
The Supervisory Board received regular, full, and timely reports from the Executive Board, both from members in person and in written documents. The Supervisory Board was also in regular exchange with senior internal officers through its various committees. This ensured that we were always up to date, even between meetings, on the Company’s strategy, planning, business performance, risks, risk management, compliance (in other words, adherence to laws, to the Company’s Articles of Incorporation, and to internal policies), and on transactions of special significance for SAP. In its reports, the Executive Board also informed us in particular where business deviated from plan or target, and why. We questioned and probed the Executive Board’s reports to satisfy ourselves that the information it gave us was plausible. The Executive Board fully met our requirements when it came to providing information.
In addition, the Supervisory Board chairperson and the CEO were in continuous contact, which meant the Supervisory Board chairperson was always apprised without delay of all important events that were significant for assessing SAP’s situation and progress or for the management and governance of the Company. Moreover, the chairperson of the Supervisory Board and the CEO regularly discussed matters related to SAP’s strategy, business performance, risk position, risk management, and compliance. In preparation for the upcoming handover of the Supervisory Board chair position, the deputy chairperson representing the shareholder representatives was increasingly included in these discussions.
Transactions that were submitted to us because they required the approval of the Supervisory Board whether by law, the Articles of Incorporation, or the Supervisory Board’s list of transactions requiring its consent, were approved by us after detailed examination and discussion with the Executive Board.
Supervisory Board Meetings and Resolutions
In the past fiscal year, the Supervisory Board of SAP SE held four ordinary meetings and three extraordinary meetings at which we deliberated and resolved on all matters of relevance to the Company. Our plenary meetings and committee meetings were held as physical meetings, as video or telephone conferences, or as hybrid sessions, where some members attended physically and the remainder online. We also adopted 15resolutions by correspondence vote. The following table provides an overview of the individual members’ attendance at the Supervisory Board’s plenary sessions and committee meetings in the year under review. This report also contains a table that shows which meetings of the Supervisory Board and its committees were held as a physical meeting, as a video or telephone conference, or as a hybrid session.
|
SAP Integrated Report 2023 | |||||
| To
Our Stakeholders |
Combined
Management Report |
Consolidated
Financial Statements IFRS |
Further
Information about Sustainability |
Additional Information |
||
Meeting Participation of SAP Supervisory Board Members During Fiscal Year 2023
| Plenum | Committees | All Meetings | |||||
| Supervisory Board Members | Meetings | Participation | Meetings | Participation | Meetings | Participation | Participation in % |
| Prof. Dr. h. c. Hasso Plattner | 7 | 7 | 21 | 18 | 28 | 25 | 89% |
| Manuela Asche-Holstein | 7 | 6 | 19 | 18 | 26 | 24 | 92% |
| Aicha Evans | 7 | 6 | 20 | 18 | 27 | 24 | 89% |
| Prof. Dr. Gesche Joost (until 5/11/2023) | 3 | 3 | 5 | 4 | 8 | 7 | 88% |
| Margret Klein-Magar | 7 | 7 | 31 | 30 | 38 | 37 | 97% |
| Monika Kovachka-Dimitrova | 7 | 7 | 16 | 16 | 23 | 23 | 100% |
| Lars Lamadé | 7 | 6 | 16 | 14 | 23 | 20 | 87% |
| Peter Lengler | 7 | 7 | 23 | 23 | 30 | 30 | 100% |
| Jennifer Xin-Zhe Li | 7 | 7 | 24 | 22 | 31 | 29 | 94% |
| Dr. Qi Lu | 7 | 7 | 14 | 12 | 21 | 19 | 90% |
| Gerhard Oswald | 7 | 7 | 26 | 26 | 33 | 33 | 100% |
| Dr. h. c. Punit Renjen (from 5/11/2023) | 4 | 4 | 7 | 7 | 11 | 11 | 100% |
| Christine Regitz | 7 | 7 | 21 | 21 | 28 | 28 | 100% |
| Dr. Friederike Rotsch | 7 | 7 | 23 | 21 | 30 | 28 | 93% |
| Heike Steck | 7 | 7 | 22 | 21 | 29 | 28 | 97% |
| Helmut Stengele1 | 7 | 4 | 0 | 0 | 7 | 4 | 57% |
| Dr. Rouven Westphal | 7 | 7 | 25 | 25 | 32 | 32 | 100% |
| Gunnar Wiedenfels | 7 | 6 | 24 | 18 | 31 | 24 | 77% |
| James Wright | 7 | 7 | 28 | 28 | 35 | 35 | 100% |
1 Currently not a member of any Supervisory Board committee
The Supervisory Board and its committees also regularly convened wholly or partly without the Executive Board as necessary to deliberate on matters that pertained to the Executive Board, required internal discussion among Supervisory Board members alone or did not require the Executive Board’s presence, or to facilitate discussion between the Supervisory Board or its respective committee and the auditor without the Executive Board present. This was the case in three of the plenary sessions and in eight committee meetings in 2023. In addition, the shareholder representatives and the employee representatives independently discussed, at times with the CEO, the topics on the respective agenda before each ordinary meeting. Said deliberations similarly took place as required prior to the extraordinary meetings or prior to circular correspondence votes. The Supervisory Board addressed the following key topics during the year:
Artificial intelligence
One of the main focuses of our discussions with the Executive Board was the topic of artificial intelligence (“AI”). SAP is working intensively to integrate AI in its software solutions to allow customers to reap the enormous potential of using AI. The Supervisory Board supports and continually monitors this process and the measures associated with it. At our meeting on February 22, 2023, for example, the Technology and Strategy Committee reported on how the Executive Board had explained SAP’s AI strategy and its bearing on SAP’s product portfolio to it. When the Supervisory Board met on April 13, 2023, the Executive Board presented the Company’s innovation plans in the field of AI and outlined how SAP would integrate certain AI applications into its products. Our plenary session and committee meetings in July 2023 were held in San Martin, California, USA. These sessions and the supporting program likewise dealt with AI, and included expert presentations covering various aspects of this technology. When the Technology and Strategy Committee met in July 2023, it reviewed the implementation of SAP’s enterprise AI strategy and examined the framework conditions for data consumption by AI applications.
|
SAP Integrated Report 2023 | |||||
| To
Our Stakeholders |
Combined
Management Report |
Consolidated
Financial Statements IFRS |
Further
Information about Sustainability |
Additional Information |
||
SAP’s AI strategy was also the subject of intense debate at the plenary meeting in July 2023. Among other things, our discussions focused on the go-to-market strategy and SAP’s current and future investments to expand its AI portfolio. In addition, management explained to us its plans for building up additional AI expertise among SAP’s workforce. The Go-to-Market and Operations Committee analyzed the success of the go-to-market measures for AI at its October meeting.
Cloud Transformation
SAP’s transformation to a cloud company continued to be the subject of ongoing dialog between the Executive Board and Supervisory Board in 2023. We consulted in-depth with the Executive Board on the key initiatives and measures in the Company’s cloud transformation strategy and monitored its implementation. In our April meeting, we examined the challenges in public cloud. When it met in October, the Finance and Investment Committee reviewed SAP’s strategy to realign the product and service portfolio and discussed the cloud gross margin with the Executive Board. The Go-To-Market and Operations Committee likewise dealt with the cloud transformation in the reporting year, specifically the go-to-market strategy and related sales model. In our plenary session on October 26, 2023, the full Supervisory Board and the Executive Board reviewed in-depth the planned second phase of the cloud transformation, including the related goals and implementation measures. In this connection, we also discussed with the Executive Board its proposals for a new Executive Board structure, which it deemed necessary to ensure the successful implementation of the next phase of the transformation and the proposed efficiency measures. The Supervisory Board places great importance on being fully informed about the further cloud transformation, so that it can constructively support its implementation.
New Government Security Committee
The rise in legal requirements in the context of national security and geopolitical developments are becoming increasingly important for SAP as a software provider for the public sector and as an operator of critical infrastructures. The Supervisory Board discussed, on several occasions in 2023, matters relating to the national security of states in which SAP is subject to corresponding regulations. From the Supervisory Board’s perspective, it was essential that a committee on government security be set up to reflect SAP’s business activities in these security-sensitive areas. The Supervisory Board will therefore, in accordance with the legal framework, accompany and monitor these specific Company activities by means of a dedicated committee going forward. The Personnel and Governance Committee discussed the formation of and rules of procedure for this committee at its April 12 and July 26, 2023, meetings and thereafter reported on its deliberations to the full Supervisory Board. The new six-member Government Security Committee was subsequently established, its rules of procedure adopted, and its members elected during the October meeting of the Supervisory Board. The Committee began its work in January 2024.
Sustainability
Due to the comprehensive strategic importance that sustainability has for SAP and its customers, the Supervisory Board addressed the sustainability aspects that are relevant to SAP numerous times throughout the fiscal year 2023. It is important to note here that SAP promotes sustainability in two different ways: by offering solutions that empower SAP customers to become more sustainable enterprises, and by aligning its own business activities with ESG (environmental, social, and governance) goals and targets. The entire spectrum of SAP’s sustainability efforts and sustainability solutions is a cross topic that is monitored and covered by several committees. That is why the Supervisory Board has not formed a pure ESG or sustainability committee. By continuously addressing sustainability issues both in plenary sessions and in the committees, we have been able to build extensive expertise in this area: specifically, the Audit and Compliance Committee monitored the sustainability reporting and the way the reports are created and managed, and the Personnel and Governance Committee dealt with sustainability targets relevant to Executive Board compensation. The Technology and Strategy Committee, meanwhile, concerned itself with sustainability-related products and software as well as IT security, whereas the People and Culture Committee addressed sustainability as it relates to social issues.
|
SAP Integrated Report 2023 | |||||
| To
Our Stakeholders |
Combined
Management Report |
Consolidated
Financial Statements IFRS |
Further
Information about Sustainability |
Additional Information |
||
On top of this, the full Supervisory Board was updated on SAP’s current sustainability portfolio and the planned expansion of this product range at its meeting in April. As part of the October meeting, the Supervisory Board had the opportunity to examine the topic of sustainability at SAP based on a detailed meeting document that highlighted, in particular, SAP’s goal to emit zero greenhouse gas emissions from 2030 onwards, general human rights topics, the German Supply Chain Due Diligence Act, and best practices for responsible AI.
Other key topics addressed at our meetings in 2023 notably included the following:
Meeting in February (Meeting to Discuss the Financial Statements)
At our ordinary Supervisory Board meeting on February 22, 2023, we adopted the resolutions required under the current Executive Board compensation package for fiscal 2022 and 2023. To this end, we first determined performance against the defined target for the short-term incentive (STI) 2022, and then set the performance targets for the STI 2023. In addition, we resolved the individual allocation amount for the 2023 tranche of the long-term incentive (LTI) 2020. Finally, we evaluated the appropriateness of the Executive Board members’ compensation for 2022, and in each case found it to be appropriate in terms of amount, structure, objective criteria, and reasonable and appropriate in relation to the Company’s circumstances, also in regard to its profit and outlook. We referred in this regard to a certificate obtained beforehand from an independent compensation consultant. For more information about the STI 2022 and 2023, the LTI 2020, and the other compensation elements for Executive Board members, see the Compensation Report.
We also discussed the upcoming reappointments of, and thus renewals of the contracts with, Julia White, Sabine Bendiek, and Scott Russell at this meeting. In this connection, the Supervisory Board chairperson reported that Sabine Bendiek would not be standing for a further term of office. We thereafter resolved to offer both Scott Russell and Julia White reappointment and renewal of their Executive Board contracts by a further three years until 2027, and to negotiate new contracts with them. We also concerned ourselves with succession planning for Sabine Bendiek.
Next, we passed the proposed resolutions for the SAP SE Annual General Meeting of Shareholders on May 11, 2023. In particular, these proposals included the proposed election of Punit Renjen as a new Supervisory Board member with the intention of establishing him as a successor to the Supervisory Board chair, and the re-election of Jennifer Li and Qi Lu. The auditor for the 2023 financial year had already been elected by the Annual General Meeting of Shareholders on May 18, 2022, in view of the upcoming change of auditor, which is why there was no proposal for a resolution in this regard. Further, we received an Executive Board report on business in 2022 and adopted the budget for 2023 after discussing same extensively with the Executive Board. In addition, the Supervisory Board turned its attention to the SAP SE financial statements and the consolidated financial statements for 2022. On recommendation of the Audit and Compliance Committee, we approved the audit and gave our consent to the financial statements and the consolidated financial statements for 2022.,In addition, we endorsed the Executive Board’s proposal concerning the appropriation of retained earnings for 2022, and approved the compensation report for fiscal 2022. Beyond this, the Executive Board gave us an overview of SAP’s equity investments and donation activities in 2022.
Extraordinary Meeting in March
We held an extraordinary meeting on March 12, 2023, to discuss the sale already underway of SAP’s interest in Qualtrics International Inc. (“Qualtrics”), a U.S.-listed company. The Executive Board and the Finance and Investment Committee explained the economic background of this move to us. In preparation for this meeting, we obtained written answers to questions the Supervisory Board members had submitted in advance regarding the sale of Qualtrics. We ultimately approved the divestiture on recommendation of the Finance and Investment Committee.
|
SAP Integrated Report 2023 | |||||
| To
Our Stakeholders |
Combined
Management Report |
Consolidated
Financial Statements IFRS |
Further
Information about Sustainability |
Additional Information |
||
Meeting in April
On April 13, 2023, we discussed the aforementioned key topics as well as business in the first quarter, the Executive Board reporting particularly on SAP’s competitive position and on the current tasks in the individual Executive Board portfolios.
Extraordinary Meeting in May
The Supervisory Board held an extraordinary meeting following the Annual General Meeting of Shareholders on May 11, 2023. After welcoming the newly-elected member Punit Renjen, we appointed him as second deputy chairperson of the Supervisory Board and, due to the new election or re-election of the Supervisory Board members concerned, approved the proposed changes to the composition of the committees. The Executive Board then explained to us the planned adjustments to the Company’s 2025 financial ambition, which was announced at the SAP Sapphire customer event in Orlando, and the expectations of investors in this regard. Next, the Executive Board presented its proposal to establish a €5 billion share buyback program that would run until the end of 2025. According to the proposal, the program would be carried out on the basis of the appropriate authorization by the Annual General Meeting, and various intra-group financing measures would be undertaken to implement it. After joint deliberation, we approved the Executive Board’s proposal. As the last item on the agenda, we discussed how to deal with potential fines against SAP in connection with ongoing compliance investigations, when it came to the compensation of the Executive Board members currently in office. We particularly took into account that the compliance incidents in question had occurred before the current members of the Executive Board were appointed. The Supervisory Board’s investigations into these compliance incidents therefore do not pertain to current Executive Board members.
Meeting in July
As previously mentioned above, AI was a key topic in our July meeting. The Executive Board also reported on business in the second quarter, and we discussed with management potential markets to focus on in future and various marketing-related matters. Next, an analyst from a U.S. investment management company explained the difference between SAP and other major software companies from his perspective as an analyst and the main criteria he used to arrive at this opinion. Based on this information, the Supervisory Board and the Executive Board then discussed the strategic direction of the Company with the goal of better meeting the capital markets’ expectations. In addition, the Audit and Compliance Committee and the law firm tasked by the Supervisory Board updated us on the ongoing compliance matters, particularly the negotiations with the U.S. Department of Justice and the U.S. Securities and Exchange Commission (SEC), and informed us on how to proceed. We also approved an amendment of the Rules of Procedure of the Supervisory Board to include rules on dealing with conflicts of interests, and passed two resolutions on Executive Board compensation serving to neutralize the impact of the Qualtrics sale on the key performance indicators (KPIs) for the STI 2023 and for the 2021, 2022, and 2023 tranches of the LTI 2020.
Meeting in October
At our meeting on October 26, 2023, the individual Executive Board members first reported on business performance in the third quarter for their respective Board area. Next, we took an in-depth look at SAP’s transformation, focusing on the goals, the measures planned by the Executive Board to improve the process, and the new structure of responsibilities at Executive Board level. The Supervisory Board thereafter discussed various HR and compensation matters without the Executive Board being present. Topics notably included the adjustment of Executive Board service contracts to the new compensation system, and the adoption of a clawback policy, which standardizes the cases in which the Company can reclaim variable compensation already paid out to certain top executives, including members of the Executive Board. SAP was required to adopt and implement this directive by December 31, 2023, due to new regulations of the SEC and the New York Stock Exchange (NYSE). Going forward, the new clawback policy will complement the clawback provisions that already exist in the Executive Board contracts. We then dealt with the regular review of the independence of the shareholder representatives on the Supervisory Board.
|
SAP Integrated Report 2023 | |||||
| To
Our Stakeholders |
Combined
Management Report |
Consolidated
Financial Statements IFRS |
Further
Information about Sustainability |
Additional Information |
||
Based on the findings from our own examination, we determined that all shareholder representatives were independent in the meaning of the German Corporate Governance Code (GCGC) and were therefore to be named as such in the Corporate Governance Statement. We also ascertained –in accordance with the recommendations in the GCGC – that more than half of the shareholder representatives are independent from the Company and the Executive Board. Thereafter, we resolved on what we believe to be the appropriate number of independent shareholder representative members, and determined that the Supervisory Board has an appropriate number of independent members in the meaning of the GCGC, also when the shareholder structure is taken into account. Lastly, the Supervisory Board adopted the regular declaration of compliance and approved an amendment to the non-IFRS definition for the financial year 2024.
Extraordinary Meeting in December
An extraordinary Supervisory Board meeting was held on December 10, 2023, during which the Supervisory Board focused on the forthcoming settlement agreements with the U.S. Department of Justice (U.S. DOJ), the SEC, and the South Africa National Prosecution Authority in relation to the compliance violations in South Africa and other countries. The Supervisory Board gave its consent to the detailed content of the settlement agreements negotiated with the said authorities at the meeting.
Resolutions by Correspondence Vote
We adopted, besides the above resolutions, several resolutions by correspondence which the relevant Committees had deliberated on in advance and recommended to us, as follows:
| – | February: Approval of the Corporate Governance Statement for 2022 |
| – | March: Reappointment of Scott Russell and Julia White for a further three years until the end of January 2027 and February 2027, respectively, and agreement to the terms and conditions of their new Executive Board appointment contracts |
| – | May: a) Resolution on the appropriation of retained earnings as amended for fiscal year 2022; b) Approval of a lump-sum payment into Julia White’s U.S. pension plan, on recommendation of the Personnel and Governance Committee |
| – | July: Resolution to increase the volume of a Group-internal financing measure adopted by the Supervisory Board at its meeting in May 2023 |
| – | August: a) Resolution on the new conditions of the Directors and Officers Insurance (DSO); b) Resolution on the appointment of Gina Vargiu-Breuer to the Executive Board and as new head of HR as of February 2, 2024; c) Consent to changes to the SAP Executive Board portfolios |
| – | September: a) Consent to the planned acquisition of LeanIX; b) Resolution on how to handle the effect of potential fines on Executive Board members’ compensation; c) Resolution on the associated declaration of compliance for 2022; d) Resolutions on changes to the composition of the Nomination Committee and the Go-To-Market and Operations Committee |
| – | October: Approval of a long-term collaboration contract as part of SAP’s sponsoring activities |
| – | November: Resolution on applying a new non-IFRS definition to Executive Board compensation as of January 1, 2024, whereby the still-pending LTI tranches 2022 and 2023 remain unaffected and are to be calculated according to the previous non-IFRS definition. |
| – | December: Resolution to eliminate the impact of the LeanIX acquisition on the KPIs for the STI 2023 and for the tranches 2021, 2022, and 2023 of the LTI 2020 |
|
SAP Integrated Report 2023 | |||||
| To
Our Stakeholders |
Combined
Management Report |
Consolidated
Financial Statements IFRS |
Further
Information about Sustainability |
Additional Information |
||
Format of Meetings in Fiscal 2023
| Committees | ||||||||
| Plenum | Personnel
and Governance |
Audit
and Compliance |
Technology
and Strategy |
Nomination | People
and Culture |
Finance
and Investment |
Go-To- Market and Operations |
|
| Total number of meetings | 7 | 6 | 14 | 6 | 4 | 4 | 10 | 4 |
| Thereof physical meetings | 1 | 0 | 1 | 0 | 0 | 0 | 3 | 0 |
| Thereof hybrid sessions | 5 | 5 | 71, 2 | 61 | 0 | 0 | 42 | 4 |
| Thereof telephone/video conferences | 1 | 1 | 6 | 0 | 4 | 4 | 3 | 0 |
1 Thereof two joint meetings between the Technology and Strategy Committee and the Audit and Compliance Committee
2 Thereof two joint meetings between the Finance and Investment Committee and the Audit and Compliance Committee
The Work of the Supervisory Board Committees
The committees made a key contribution to the work of the Supervisory Board in 2023, notably by preparing relevant agenda items and resolutions for Supervisory Board meetings, by approving resolution proposals, and by regularly reporting on their deliberations and on their decisions taken. The following committees were in place in the year under review:
Personnel and Governance Committee, Audit and Compliance Committee, Finance and Investment Committee, Technology and Strategy Committee, People and Culture Committee, Nomination Committee, Go-To-Market and Operations Committee
Each of the aforementioned committees was active in 2023. For more information about the Supervisory Board committees, particularly their respective composition, tasks, and responsibilities, see the Corporate Governance Statement and the Corporate Governance section of SAP’s Web site.
Besides the matters described above, the committees focused primarily on the following topics in 2023:
| – |
The Personnel and Governance Committee held six meetings in the reporting year. In particular, the Committee, in fulfillment of the tasks assigned to it, extensively prepared the Supervisory Board’s deliberations and resolutions described above on Executive Board compensation and on the new Government Security Committee, and approved resolution proposals. The Committee adopted a total of three resolutions by correspondence vote. In two sessions in January 2023, the Committee dealt with the renewal of Scott Russell and Julia White’s Executive Board contracts, and with the introduction of compensation for the Lead Independent Director after it had become apparent that this role involves considerable additional time and effort. In addition, the Committee consented to the secondary employment of an Executive Board member and examined the German Federal Labor Court’s ruling on SAP’s Employee Involvement Agreement. The Committee approved, by way of correspondence vote, the conclusion of a consulting contract by Luka Mucic. Following his departure from the SAP Supervisory Board at the end of March 2023, Luka Mucic was to remain a member of the Qualtrics Executive Board until SAP had fully divested Qualtrics. The consulting contract was to serve as the legal basis for this membership. When it met in April, the Committee resolved an update to the contractual non-compete clause in Executive Board contracts that was to be introduced in connection with the conversion of those contracts to the new compensation system. In addition, the Committee dealt with the search for candidates to replace Sabine Bendiek as head of the Executive Board’s HR portfolio. The Committee subsequently agreed on the candidate proposed by the Supervisory Board for this portfolio when it met in July. As well as discussing various compensation matters, the Committee’s |
|
SAP Integrated Report 2023 | |||||
| To
Our Stakeholders |
Combined
Management Report |
Consolidated
Financial Statements IFRS |
Further
Information about Sustainability |
Additional Information |
||
| October 25, 2023, meeting focused particularly on a change in the non-IFRS definition for fiscal 2024 and on the creation of a new Supervisory Board office. The Committee also held an extraordinary meeting on December 6, 2023, to deliberate on the candidate to be proposed to the Supervisory Board as a new Executive Board member for the Product & Engineering area. It came to the conclusion that Muhammad Alam was its favorite candidate. In January 2024, the Committee prepared the Supervisory Board’s resolution to elect Muhammad Alam to the Executive Board effective April 1, 2024, once the details of his Executive Board contract had been negotiated. The proposed resolution took into account the new SAP Executive Board structure that was announced on January 9, 2024. |
| – | The Audit and Compliance Committee held 12 meetings in 2023 – two of which jointly with the Finance and Investment Committee and two jointly with the Technology and Strategy Committee. Said schedule included one telephone conference per quarter to vote on the quarterly reporting, and one session per quarter to address regular and topical agenda items. In addition, in November and December 2023, the Committee resolved both times internally on the System and Organization Controls (SOC). The SOC involves software-related certifications and risk analyses that enable companies to conduct an impartial investigation in accordance with a framework established by the American Institute of Certified Public Accountants (AICPA), which the companies and their customers both require in the context of their financial reporting. In its ordinary meetings, the Committee also had the opportunity to engage with the auditor without the Executive Board present, which was an integral part of the meeting agenda. The Committee comprehensively prepared the resolutions of the Supervisory Board for all topics assigned to it, as described above. Regular agenda items included the course of business in the respective quarter, the accounting processes, the preparation of end-of-quarter closings, and the quarterly reports due for publication. In addition, the Committee chairperson was in regular contact with the auditor. Other recurring meeting topics included the monitoring of SAP’s risk management system, internal control system, non-financial reporting, and compliance system (including specific compliance issues, the status of corresponding SAP-internal investigations, and case-related collaboration with authorities). The Committee also dealt regularly with the monitoring of SAP’s cybersecurity processes that the Executive Board had established and continually optimizes to ensure compliance of all activities in this area. At its February 2023 meeting, the Committee prepared the Supervisory Board’s resolutions on the financial statements of SAP SE and the SAP Group for 2022 in the run-up to the Annual General Meeting of Shareholders, which were adopted by the Supervisory Board at the audit meeting. Other material topics dealt with by the Committee beyond the regular meeting topics in its ordinary meetings and those described in the “Sustainability” section of this report included quarter-specific matters and the amendments to the non-IFRS definition for fiscal 2024. Further, the Committee monitored the progress of selected lawsuits involving SAP. The Audit and Compliance Committee also received regular updates on how BDO AG Wirtschaftsprüfungsgesellschaft (BDO) was performing its tasks as the new auditor for SAP’s financial statements and consolidated financial statements. In addition, the Committee continually monitored the quality of the auditor and the management report. To this end – in addition to evaluating satisfaction surveys for the prior year’s audit by the previous auditor – the Committee obtained and referred to the report from the current auditor on its internal quality assurance standards and to any material findings from internal quality audits, external quality controls, and peer reviews, and from any investigations conducted by the government or regulators into the auditor’s audits. At its meeting in July, the Committee discussed the audit focus for 2023 with the auditor. As reported in more detail below, the Committee also held two joint meetings with the Finance and Investment Committee in February and December 2023 to discuss the Group annual plan for 2023 and the preliminary Group annual plan for 2024. The joint meetings with the Technology and Strategy Committee in April and October focused on SAP’s cybersecurity framework, which had been enhanced based on the results of the assessment by NIST (National Institute of Standards and Technology, a department of the U.S. Department of Commerce). Beyond this, the Committees reviewed the status of the SOC certifications for fiscal 2023, and the Audit and Compliance Committee approved the certification services to be provided by BDO. The auditor attended the Audit and Compliance Committee meetings except for the joint meetings with the Finance and Investment Committee |
|
SAP Integrated Report 2023 | |||||
| To
Our Stakeholders |
Combined
Management Report |
Consolidated
Financial Statements IFRS |
Further
Information about Sustainability |
Additional Information |
||
| and the Technology and Strategy Committee, and reported in depth on its audit work and on its quarterly reviews of selected cloud and software agreements. |
| – | The Finance and Investment Committee held four regular meetings and four extraordinary meetings in 2023. In addition, it held a joint meeting with the Audit and Compliance Committee in February 2023 and again in December 2023. The Committee devoted considerable time at several meetings to discussing business development and investor relations, and to discussing an analysis of management efficiency. At an extraordinary meeting in January 2023, the Committee and the Executive Board examined the different options for selling SAP’s interest in Qualtrics. In the joint meeting with the Audit and Compliance Committee in February 2023, the members of both Committees discussed the annual budget for 2023 and recommended its approval to the Supervisory Board. In the Finance and Investment Committee meeting that followed, the members were updated on the Group’s liquidity situation and on productivity in the development organization. The Committee held an extraordinary meeting in March where, after careful consideration, it resolved to recommend the divestiture of Qualtrics to the Supervisory Board. At its meeting in April, the Committee and the Executive Board discussed selected capital market topics. In addition, the Committee was updated on the investments in the venture capital area, which were being carried out in cooperation with the fund manager Sapphire Ventures, and the strategic aspects of these activities. It also reviewed SAP’s product strategy and the management of SAP’s product portfolio. In July, the Committee discussed SAP’s global strategy for the use and expansion of its data centers, as well as SAP’s sovereign cloud offerings and share-based compensation plans. Beyond this, the Executive Board reported on selected RISE with SAP contracts as well as the strategy to extend existing customer contracts, and gave the Committee members advance notice of the Company’s plans to acquire LeanIX, a provider of cloud-based IT management software. The Committee deliberated on this acquisition at length at its meeting in September, where it subsequently resolved its recommendation to the Supervisory Board. At its October meeting, the Committee discussed key treasury topics. In December 2023, the Committee held a second joint meeting with the Audit and Compliance Committee, at which the Executive Board presented the preliminary Group annual plan for 2024. This meeting was held in preparation for the Supervisory Board meeting in February 2024, at which the full Supervisory Board resolved to approve the Group annual plan for 2024. |
| – | The Technology and Strategy Committee held six meetings in 2023, which included two joint meetings with the Audit and Compliance Committee as described above. The Committee discussed the outlook for key technology trends in the software industry in the years to come and SAP’s corporate and product strategies. At the February meeting, the Executive Board presented management’s strategy for the Customer Experience product segment – which encompasses everything an organization does to deliver superior customer outcomes – placing particular focus on customer relationship management (CRM) and SAP’s various analytics applications in this domain. In April, the Committee turned its attention to SAP’s solutions for business network growth areas, business process optimization, and sustainability. In October 2023, the Committee dealt with matters related to data integration and data management, and reviewed the Company’s innovation strategy for SAP Datasphere and the product’s generative AI capabilities. At their joint meeting in October 2023, the Finance and Investment Committee and the Technology and Strategy Committee deliberated on cybersecurity and the priorities to be set for it. |
| – |
The People and Culture Committee met four times in the reporting year. At its February meeting, the Committee deliberated at length on the results of the employee survey that had been conducted in the fall of 2022, notably those relating to employee engagement, as well as feedback about management, and discussed the measures to be derived from this insight as a result. Beyond this, it focused on SAP’s training business, which had undergone a radical transformation since 2021 aimed at reaching one million active users by the end of 2023. In March, the Committee looked at the progress made in the initiative to promote a standardized performance management concept that supports the envisioned performance-based compensation and incentive system and integrated planning of annual targets for employees. In July 2023, the managers responsible for the People Compliance process at SAP introduced themselves to the Committee and, after explaining that the focus of their efforts was on |
|
SAP Integrated Report 2023 | |||||
| To
Our Stakeholders |
Combined
Management Report |
Consolidated
Financial Statements IFRS |
Further
Information about Sustainability |
Additional Information |
||
| preventing employee misconduct vis-à-vis others, gave an in-depth overview of the underlying compliance processes and related information. Another topic of interest at this meeting was the progress being made in strategic personnel planning. The Committee was presented in this regard with a detailed overview of the past and expected demographic development of the SAP SE workforce, and discussed the skills and expertise the Company would require of employees in the future. When it met in October, the Committee revisited the topic of performance management, particularly in view of the upcoming global rollout of the new concept. Moreover, the Committee discussed SAP’s plans to require more in-office presence of its staff. |
| – | The Nomination Committee met five times in 2023. On January 15, 2023, for example, the Committee discussed potential candidates for election to the Supervisory Board by the Annual General Meeting of Shareholders in May 2023. In particular, the Committee members discussed the potential successor to Hasso Plattner as Supervisory Board chairperson, ultimately deciding that Punit Renjen was their preferred candidate. When it met again on January 25, the Committee resolved its final recommendation to the Supervisory Board to elect Jennifer Li, Qi Lu, and Punit Renjen to the Supervisory Board. Since four Supervisory Board members will reach the end of their term of office in 2024, the Committee spent its August 2023 meeting deliberating on candidates for re-election or election as new members. It also discussed the skills that Hasso Plattner’s successor should possess, and agreed that the person should have extensive technology knowledge. Based on the process it had agreed upon in August for nominating candidates, the Committee met again in October 2023 to agree on how to approach the ones they had shortlisted. On December 6, 2023, the Committee agreed on the candidates to be proposed to the Annual General Meeting of Shareholders in May 2024 for the Supervisory Board seat being vacated by the departing Hasso Plattner. |
| – | The Go-To-Market and Operations Committee likewise met four times in the reporting year. At the Committee’s meeting in February, the Executive Board presented its marketing plans for SAP S/4HANA Cloud, public edition as well as its planned changes to the internal go-to-market concept for 2023 target achievement, particularly with regard to roles and incentives. In April 2023, the Executive Board presented a plan designed to further improve the measurable usage of our software by customers and simultaneously increase demand, especially in the cloud environment. In addition, the largest planned events for the remainder of the year were presented. When the Committee met in July 2023, the Executive Advisory Board, an advisory body comprised of managers from more than 20 SAP customers from various regions and industries, presented feedback on the customer journey – that is, on the individual phases that a customer goes through before the purchase and until after the delivery of a product. In addition, the Executive Board presented a growth plan aimed at boosting growth and ensuring constant pipeline population – that is, the number of software sales that are lined up. The last item discussed at this meeting was a status report presented on new customer acquisition, also in comparison to SAP’s peers. The Committee’s meeting in October reviewed an update on the growth plan presented to it in July and discussed the further expansion of SAP’s partner network. |
The work of the committees and their regular reports in the plenary sessions ensured that we were kept fully informed of all matters covered by the committees and were able to discuss them thoroughly.
Conflicts of Interest
Members of the Supervisory Board and of the Executive Board had no conflicts of interest that recommendations E.1 and E.2 of the CGCG require to be disclosed to the Supervisory Board. Rather, they were avoided by the Supervisory Board member concerned not taking part in the relevant discussions or voting on the matter in question in the event of a possible, selective conflict of interest. Insofar as Supervisory Board members hold executive positions in companies or have material equity in companies that currently have business dealings with SAP, we do not see any impairment of their independence. The scope of the business relationships in question is relatively small and, moreover, the transactions take place at arm’s length.
|
SAP Integrated Report 2023 | |||||
| To
Our Stakeholders |
Combined
Management Report |
Consolidated
Financial Statements IFRS |
Further
Information about Sustainability |
Additional Information |
||
Training and Professional Development
The members of the Supervisory Board were once again offered various training and professional development opportunities throughout the year, with appropriate support from the Company. Where it made sense, presentations and training offerings were recorded and placed on a specially configured training platform to enable the remaining Supervisory Board members to take part in them as well. The members of the Audit and Compliance Committee were invited to a short seminar in April 2023 on “Current aspects of non-financial reporting.” In May 2023, a course on “Innovation at SAP” was offered that focused on AI, large language models (models that are trained on huge data volumes), and on the metaverse, a digital space that is created by interacting with virtual, augmented, and physical reality. In November, several Supervisory Board members took part in a virtual deep dive on Customer Experience at SAP. On-boarding courses and leaflets are available for new Supervisory Board members to familiarize themselves with their tasks and responsibilities when they assume office. New members also have the opportunity to meet individually with members of the Executive Board to discuss the topics relevant to their new portfolio.
SAP SE and Consolidated Financial Reports for 2023
BDO audited the SAP SE and consolidated financial reports for 2023. The Annual General Meeting of Shareholders on May 18, 2022, elected BDO as the SAP SE and SAP Group auditor for fiscal year 2023. The Supervisory Board had proposed the appointment of BDO on the recommendation of the Audit and Compliance Committee. Prior to the proposed resolution being put to the Annual General Meeting of Shareholders, BDO had confirmed to the chairperson of the Supervisory Board and the Audit and Compliance Committee that circumstances did not exist that might prejudice or raise any doubt concerning its independence as the Company’s auditor. In that connection, BDO informed us of the volume of the services that were not part of the audit which it had either provided to the Group in the past year or was engaged to provide in the year to come. The Supervisory Board has agreed with BDO that the auditor should report to the Supervisory Board and record in the auditor’s report any fact found during the audit that is inconsistent with the declaration given by the Executive Board and the Supervisory Board concerning implementation of the German Corporate Governance Code. BDO examined the SAP SE financial statements prepared in accordance with the German Commercial Code, the consolidated financial statements prepared in accordance with International Financial Reporting Standards (IFRSs) as required by the German Commercial Code, section 315e, and the combined SAP Group and SAP SE management report prepared in accordance with the German Commercial Code, and certified them without qualification. The auditor thus confirmed that, in its opinion and based on its audit in accordance with the applicable accounting principles, the SAP SE and consolidated financial statements give a true and fair view of the net assets, financial position, and results of operations of SAP SE and the SAP Group. The auditor also confirmed that the combined SAP SE and SAP Group management report is consistent with the corresponding financial statements and as a whole gives a suitable view of the position of SAP SE and the SAP Group and of foreseeable opportunities and risks. In accordance with section 317 (3a) of the German Commercial Code, the auditor also examined and confirmed that the renderings of the financial statements, the management report, the consolidated financial statements, and the combined management report contained in the files submitted on an electronic data carrier, which can be accessed by the issuer on the secure client portal, and prepared for the purposes of disclosure comply in all material respects with the requirements of section 328 (1) of the German Commercial Code regarding the electronic reporting format (“ESEF format”). BDO had completed its audit of SAP’s internal control over financial reporting and certified without qualification that it complies with the applicable U.S. standards. The auditor stated in its opinion that it considers SAP’s internal controls with respect to the consolidated financial statements to be effective in all material respects. Additionally, it provided assurance on the non-financial declaration and the disclosures contained therein on the topics identified as material – namely, the environment, employees, human rights, corruption and bribery, customer loyalty, and data privacy and data security – in the combined management report, and on the separate examination of the compensation report and review of selected qualitative and quantitative sustainability disclosures outside of the financial statements and management report. All Audit and Compliance Committee members and Supervisory Board members received – initially in the form of drafts that were identical to the final documents – the documents concerning the financial statements mentioned above, the audit reports prepared by BDO, and the Executive Board’s proposal concerning the appropriation of retained earnings in good time.
|
SAP Integrated Report 2023 | |||||
| To
Our Stakeholders |
Combined
Management Report |
Consolidated
Financial Statements IFRS |
Further
Information about Sustainability |
Additional Information |
||
On February 21, 2024, the Executive Board prepared the financial accounts of SAP SE and the SAP Group for 2023, comprising the SAP SE financial statements, the consolidated financial statements, and the combined management report, and submitted them without delay to the Supervisory Board.
The Executive Board explained the financial statements of SAP SE and the SAP Group and its proposal concerning the appropriation of retained earnings at the meeting of the Audit and Compliance Committee on February 21, 2024 (based on the drafts identical to the final documents) and at the meeting of the Supervisory Board on February 21, 2024. Members of the Executive Board answered questions from the Committee and the Supervisory Board. At the Audit and Compliance Committee meeting, they also explained the compensation report and the Annual Report on Form 20-F prepared in accordance with the applicable U.S. standards.
After the Executive Board had explained them, the Audit and Compliance Committee and the Supervisory Board reviewed the financial statement documents (based on drafts identical to the final documents), taking BDO’s audit reports (or the drafts identical to the final documents) into account. The Audit and Compliance Committee then passed the compensation report on to the Supervisory Board for release. The representative of the auditor who attended presented full reports on the audit and the results of the audit to the Audit and Compliance Committee and Supervisory Board meetings and explained its audit reports (or final drafts thereof). The auditor also reported that it had not identified any material weaknesses in SAP’s internal control and risk-management systems for financial reporting. Both the Audit and Compliance Committee and the Supervisory Board asked detailed questions about the form, scope, and results of the audit. The Audit and Compliance Committee reported to the Supervisory Board on its own review of the financial statements of SAP SE and the SAP Group, its discussions with the Executive Board and with the auditor, and its supervision of the financial reporting process. It confirmed that, as part of its supervisory work, it had addressed the SAP Group’s internal control, risk management, and internal auditing systems, and found the systems to be effective.
The Committee also reported that BDO had told it that no circumstances had arisen that might give cause for concern about BDO’s impartiality, and informed us about the services BDO had provided that were not part of the audit. The Committee reported that it had examined the auditor’s independence, taking the non-audit services it had rendered into consideration, and stated that, in the Committee’s opinion, the auditor possessed the required degree of independence and professional qualification.
The Audit and Compliance Committee and the Supervisory Board satisfied themselves that BDO had conducted the audit properly. In particular, they concluded that both the audit reports and the audit itself fulfilled the legal requirements. Based on the report and the Audit and Compliance Committee’s recommendation, the Supervisory Board approved the results of the audit and, since there were no findings from our own examination, we gave our consent to the SAP SE financial statements, the consolidated financial statements, the combined Group management report, and adopted the compensation report pursuant to the German Stock Corporation Act, section 162. The financial statements and combined management report were thus formally adopted upon approval by the Supervisory Board. The Supervisory Board’s opinion of the Company and the Group coincided with that of the Executive Board as set out in the combined management report. The Supervisory Board considered the proposal presented by the Executive Board concerning the appropriation of retained earnings. We had regard to the requirements of dividends policy, the effects on the liquidity of SAP SE and the SAP Group, and the interests of the shareholders. We also discussed these matters with the auditor. We then endorsed the Executive Board’s proposal concerning the appropriation of retained earnings, in accordance with the Audit and Compliance Committee’s recommendation. The corporate governance statement pursuant to the German Commercial Code, sections 315d and 289f was approved for publication by the Supervisory Board by way of correspondence vote prior to the meeting to discuss the financial statements. Finally, we approved this present Report.
|
SAP Integrated Report 2023 | |||||
| To
Our Stakeholders |
Combined
Management Report |
Consolidated
Financial Statements IFRS |
Further
Information about Sustainability |
Additional Information |
||
Changes on the Executive Board and Supervisory Board in 2023
Dominik Asam took office as SAP’s new CFO on March 7, 2023, succeeding Luka Mucic who retired from the SAP Executive Board at the end of March 2023. The Supervisory Board would like to thank Luka Mucic for his invaluable contribution for the benefit of the Company. Sabine Bendiek’s Executive Board post was not renewed at her own request and ended on December 31, 2023. The Supervisory Board thanks Sabine Bendiek for her outstanding work and her remarkable contribution to the transformation of SAP.
The Supervisory Board bade farewell in 2023 to Gesche Joost, whose term of office on the Supervisory Board ended at the close of the Annual General Meeting of Shareholders on May 11, 2023. We thank Gesche Joost for her commitment to SAP. On May 11, 2023, the Annual General Meeting of Shareholders elected Punit Renjen to the Supervisory Board as her successor. In addition, the Annual General Meeting of Shareholders elected to extend the Supervisory Board mandates of Jennifer Li and Qi Lu for a further four years.
The Supervisory Board thanks the members of the Executive Board and all SAP employees for their great commitment and dedication to SAP.
For the Supervisory Board
Professor Hasso Plattner
(Chairperson)
|
SAP Integrated Report 2023 | |||||
| To
Our Stakeholders |
Combined
Management Report |
Consolidated
Financial Statements IFRS |
Further
Information about Sustainability |
Additional Information |
||
Responsibility Statement
To the best of our knowledge, and in accordance with the applicable reporting principles, the Consolidated Financial Statements give a true and fair view of the assets, finances, and operating results of the SAP Group, and the management report of the Group and SAP SE includes a fair review of the development and performance of the business and the position of the Group and SAP SE, together with a description of the principal opportunities and risks associated with the expected development of the Group and SAP SE.
Walldorf, February 21, 2024
SAP SE
Walldorf, Germany
Executive Board of SAP SE
| Christian Klein | Dominik Asam | Dr. Jürgen Müller |
| Scott Russell | Thomas Saueressig | Gina Vargiu-Breuer |
Julia White
|
SAP Integrated Report 2023 | |||||
| To
Our Stakeholders |
Combined
Management Report |
Consolidated
Financial Statements IFRS |
Further
Information about Sustainability |
Additional Information |
||
Independent Auditor’s Report
To SAP SE, Walldorf
REPORT ON THE AUDIT OF THE CONSOLIDATED FINANCIAL STATEMENTS AND OF THE COMBINED GROUP MANAGEMENT REPORT
AUDIT OPINIONS
We have audited the consolidated financial statements of SAP SE, Walldorf, and its subsidiaries (the Group), which comprise the consolidated statements of financial position as at December 31, 2023, and the consolidated income statements, consolidated statements of comprehensive income, consolidated statements of changes in equity and consolidated statements of cash flows for the financial year from January 1, 2023 to December 31, 2023, and notes to the consolidated financial statements, including a summary of significant accounting policies.
In addition, we have audited the combined group management report (report on the position of the company and of the group) of SAP SE for the financial year January 1, 2023 to December 31, 2023. In accordance with the German legal requirements, we have not audited the content of those parts of the combined group management report listed in section “OTHER INFORMATION”.
In our opinion, on the basis of the knowledge obtained in the audit,
| – | the accompanying consolidated financial statements comply, in all material respects, with the IFRSs as issued by the International Accounting Standards Board as well as adopted by the EU, and the additional requirements of German commercial law pursuant to § 315e (1) HGB [Handelsgesetzbuch: German Commercial Code] and, in compliance with these requirements, give a true and fair view of the assets, liabilities and financial position of the group as at December 31, 2023 and of its financial performance for the financial year from January 1, 2023 to December 31, 2023 and |
| – | the accompanying combined group management report as a whole provides an appropriate view of the group’s position. In all material respects, this combined group management report is consistent with the consolidated financial statements, complies with German legal requirements and appropriately presents the opportunities and risks of future development. Our opinion on the combined group management report does not cover the content of those parts of the combined group management report listed in section “OTHER INFORMATION”. |
Pursuant to § 322 (3) sentence 1 HGB (German Commercial Code), we declare that our audit has not led to any reservations relating to the legal compliance of the consolidated financial statements and of the combined group management report.
BASIS FOR THE AUDIT OPINIONS
We conducted our audit of the consolidated financial statements and of the combined group management report in accordance with § 317 HGB and the EU Audit Regulation (No. 537/2014, referred to subsequently as “EU Audit Regulation”) and in compliance with German Generally Accepted Standards for Financial Statement Audits promulgated by the Institut der Wirtschaftsprüfer [Institute of Public Auditors in Germany] (IDW). We conducted our audit of the consolidated financial statements in supplementary compliance with the International Standards on Auditing (ISAs). Our responsibilities under those requirements, principles and standards are further described in the “AUDITOR’S RESPONSIBILITIES FOR THE AUDIT OF THE CONSOLIDATED FINANCIAL STATEMENTS AND OF THE COMBINED GROUP MANAGEMENT REPORT” section of our auditor’s report.
|
SAP Integrated Report 2023 | |||||
| To
Our Stakeholders |
Combined
Management Report |
Consolidated
Financial Statements IFRS |
Further
Information about Sustainability |
Additional Information |
||
We are independent of the group entities in accordance with the requirements of European law and German commercial and professional law, and we have fulfilled our other German professional responsibilities in accordance with these requirements.
In addition, in accordance with Article 10 (2) letter (f) of the EU Audit Regulation, we declare that we have not provided non-audit services prohibited under Article 5 (1) of the EU Audit Regulation.
We believe that the audit evidence we have obtained is sufficient and appropriate to provide a basis for our audit opinions on the consolidated financial statements and on the combined group management report.
KEY AUDIT MATTERS IN THE AUDIT OF THE CONSOLIDATED FINANCIAL STATEMENTS
Key audit matters are those matters that, in our professional judgment, were of most significance in our audit of the consolidated financial statements for the financial year from January 1, 2023 to December 31, 2023. These matters were addressed in the context of our audit of the consolidated financial statements as a whole, and in forming our audit opinion thereon; we do not provide a separate audit opinion on these matters.
We have identified the following matters as key audit matters to be disclosed in our auditor’s report:
| 1. | Cloud revenue recognition |
| 2. | Assessment of the Group’s uncertain tax treatments |
| 3. | Measurement of unlisted equity securities |
CLOUD REVENUE RECOGNITION
Matter
The Group generated revenue in 2023 of EUR 31,207 million, of which EUR 13,664 million relate to cloud revenues from fees earned from providing customers a cloud offering with software as a service, platform as a service, infrastructure as a service and/or premium cloud support through subscriptions for use of the Group’s cloud solutions. For most of the Group’s cloud offerings, measured both in volume and number, the customer is entitled to continuously access and use one or more cloud solutions for a specified term, therefore cloud revenue is recognized based on time elapsed and thus ratably over the term of access. However, some cloud business models are provisioned on a consumption basis where a customer commits to a fixed value of spend on cloud services throughout the contract term, but with the discretion to call off cloud services on an as needed basis. For those arrangements cloud revenue is recognized based on consumption as it best reflects the measure towards satisfaction of the performance obligation(s).
The evaluation of cloud revenue contracts bears an inherent risk of errors due to the complex nature of certain contracts. SAP defined detailed accounting policy guidelines in line with the applicable accounting standards and has established uniform processes throughout the group to manage the accounting for its cloud contracts. Applying them often requires significant management judgement, in particular with respect to whether certain agreements with the same customer are economically linked and need to be combined, whether the various services that are owed by the Group according to the contract qualify as separate performance obligations, the allocation of the transaction price of a customer contract to the performance obligations in the contract based on standalone-selling prices and the point in time at which the provision of services by the Group for the specific performance obligation commences.
Cloud revenue recognition is a key audit matter due to the significance of the cloud revenue and the high degree of complex judgement required.
The respective cloud revenue disclosures of the Group are contained in section “A.1 Revenue” of the notes to the consolidated financial statements.
|
SAP Integrated Report 2023 | |||||
| To
Our Stakeholders |
Combined
Management Report |
Consolidated
Financial Statements IFRS |
Further
Information about Sustainability |
Additional Information |
||
Auditor’s Response and Observations
We evaluated the design and we tested the operating effectiveness of certain internal controls related to the revenue process, including controls related to the identification of certain economically linked agreements and separate performance obligations, the allocation of the transaction price to the performance obligations in certain contracts, and the point in time at which the provisioning of service commenced. We tested a sample of underlying contractual agreements and other related documents to evaluate the Group’s assessment of whether certain agreements were economically linked, the identified performance obligations, the allocation of the transaction price and the point in time at which the provision of service for the performance obligations identified commenced. We tested key contractual terms and conditions from the respective contracts to evaluate the identified performance obligations and the point in time at which the provision of service for the identified performance obligations commenced.
Based on the audit procedures we performed, we have found management’s judgements used for revenue recognition of cloud contracts, particularly in the area of assessing whether certain contracts are economically linked and need to be combined, identifying separate performance obligations, allocating the transaction price to the performance obligation, and assessing the point in time at which the provision of services commenced, acceptable.
ASSESSMENT OF THE GROUP’S UNCERTAIN TAX TREATMENTS
Matter
The Group disclosed contingent liabilities relating to tax uncertainties of EUR 1,815 million. The Group operates in multiple tax jurisdictions which continually revise, change, and implement tax laws with complexities and uncertainties due to different interpretations of these tax laws, especially relating to transfer pricing and intercompany transactions for the use of intellectual property. The identification, recognition, measurement and disclosure of certain income tax risks specifically from transfer pricing and intercompany transactions for the use of intellectual property requires significant management judgement in determining key assumptions to be applied to the interpretation of tax laws, related regulations, case laws and mutual agreement procedures across multiple jurisdictions. Significant management judgement is also required to determine whether a transfer pricing tax position is more-likely-than-not to be sustained and to assess whether intercompany transactions are based on the arm’s length principle. These management judgements demand a high degree of expertise, for which the Group regularly engages external experts to provide tax opinions to support their own risk assessment.
The respective disclosures regarding uncertain tax positions of the Group are contained in section “C.5 Income Taxes” of the notes to the consolidated financial statements.
Auditor’s Response and Observations
We involved internal experts with specialized skills and knowledge in taxation to evaluate the appropriateness of management’s methods and key assumptions used to estimate certain uncertain tax positions. We verified our understanding of the relevant facts by evaluating certain of the Group’s transfer pricing documentation and we assessed whether the Group’s processes and guidelines in connection with certain intercompany transactions support an arm’s length position. For certain group business activities, we evaluated the reasonableness and consistency of management’s judgments (including application of tax regulations and interpretations), key assumptions and processes. We assessed the overall reasonableness of conclusions reached regarding the identification, recognition, measurement and disclosure of certain uncertain tax positions from transfer pricing and intercompany transactions for the use of intellectual property.
Based on the audit procedures we performed, we have found management’s judgements related to the estimation of uncertain tax positions, specifically from transfer pricing and intercompany transactions for the use of intellectual property, acceptable.
|
SAP Integrated Report 2023 | |||||
| To
Our Stakeholders |
Combined
Management Report |
Consolidated
Financial Statements IFRS |
Further
Information about Sustainability |
Additional Information |
||
MEASUREMENT OF UNLISTED EQUITY SECURITIES
Matter
The Group holds unlisted equity securities held at fair value of EUR 4,811 million as of December 31, 2023, primarily relating to Sapphire Ventures investments. These investments in unlisted equity securities are classified as financial instruments at fair value through profit and loss requiring a recurring fair value measurement using significant unobservable inputs. The measurement of the fair value of certain investments is complex and, with regard to the assumptions made, highly dependent on management’s estimates and judgments. This applies particularly to the significant measurement uncertainty associated with the fair value of such investments relating to significant unobservable inputs used, such as the selection of appropriate comparable company data, in deriving revenue multiples as well as forecasted performance of the investees.
The respective disclosures regarding the fair value measurement of unlisted equity securities of the Group are contained in sections “D.6 Equity Investments” and “F.2 Fair Value Disclosures on Financial Instruments” of the notes to the consolidated financial statements.
Auditor’s Response and Observations
We involved internal experts with specialized skills and knowledge in valuation to assist in assessing and evaluating the appropriateness of the valuation technique used for a selection of certain investments in unlisted equity securities relating to Sapphire Ventures investments. We tested the appropriateness of the valuation technique selected by comparing it to our expectation based on industry experience and knowledge of the investment. We assessed the source, reliability and relevance of evidence used in determining significant unobservable inputs and we evaluated the significant unobservable inputs considered in the recurring measurement of fair value by comparing them to historical and market information. In addition, we developed an independent range of acceptable fair value estimates utilizing available market information from third party sources to assess whether managements estimates are reasonable.
Based on the audit procedures we performed, we have found management’s judgements related to the fair value measurement of unlisted equity securities acceptable.
OTHER INFORMATION
The Executive Board and the Supervisory Board are responsible for the other information. The other information comprises:
| – | the combined non-financial statement provided in section “Non-Financial Statement Including Information on Sustainable Activities” of the combined group management report, |
| – | the separately published corporate governance statement, to which reference is made in section “Corporate Governance Fundamentals” of the combined group management report, |
| – | the information extraneous to the combined group management report and marked as unaudited, and |
| – | the annual report on Form 20-F and the other parts of the annual report, except for the audited financial statements and combined management report as well as our auditor’s report. |
Our audit opinions on the consolidated financial statements and on the combined group management report do not cover the other information, and consequently we do not express an opinion or any other form of assurance conclusion thereon.
In connection with our audit, our responsibility is to read the other information and thereby acknowledge whether the other information
| – | is materially inconsistent with the consolidated financial statements, with the combined group management report, or our knowledge obtained in the audit or |
| – | otherwise appears to be materially misstated. |
If, based on the work we have performed, we conclude that there is a material misstatement of this other information, we are required to report that fact. We have nothing to report in this regard.
|
SAP Integrated Report 2023 | |||||
| To
Our Stakeholders |
Combined
Management Report |
Consolidated
Financial Statements IFRS |
Further
Information about Sustainability |
Additional Information |
||
In addition, we were engaged to perform an independent assurance engagement on selected qualitative and quantitative sustainability disclosures, which is also other information of the integrated report 2023. In regard to the nature, extent and conclusions of this independent assurance engagement for specific other information we refer to our independent assurance report dated February 21, 2024.
RESPONSIBILITIES OF THE EXECUTIVE BOARD AND THE SUPERVISORY BOARD FOR THE CONSOLIDATED FINANCIAL STATEMENTS AND THE COMBINED GROUP MANAGEMENT REPORT
The Executive Board is responsible for the preparation of the consolidated financial statements that comply, in all material respects, with IFRSs as adopted by the EU and the additional requirements of German commercial law pursuant to § 315e (1) HGB as well as the IFRSs as issued by the International Accounting Standards Board and that the consolidated financial statements, in compliance with these requirements, give a true and fair view of the assets, liabilities, financial position and financial performance of the group. In addition, the Executive Board is responsible for such internal control as the Executive Board has determined necessary to enable the preparation of consolidated financial statements that are free from material misstatement, whether due to fraud (i.e. fraudulent financial reporting and misappropriation of assets) or error.
In preparing the consolidated financial statements, the Executive Board is responsible for assessing the group’s ability to continue as a going concern. The Executive Board also has the responsibility for disclosing, as applicable, matters related to going concern. In addition, the Executive Board is responsible for financial reporting based on the going concern basis of accounting unless there is an intention to liquidate the group or to cease operations, or there is no realistic alternative but to do so.
Furthermore, the Executive Board is responsible for the preparation of the combined group management report that, as a whole, provides an appropriate view of the group’s position and is, in all material respects, consistent with the consolidated financial statements, complies with German legal requirements, and appropriately presents the opportunities and risks of future development. In addition, the Executive Board is responsible for such arrangements and measures (systems) as the Executive Board has considered necessary to enable the preparation of a combined group management report that is in accordance with the applicable German legal requirements, the German Accounting Standard number 20 (GAS 20) and the IFRS Practice Statement Management Commentary and to be able to provide sufficient appropriate evidence for the assertions in the combined group management report.
The Supervisory Board is responsible for overseeing the group’s financial reporting process for the preparation of the consolidated financial statements and of the combined group management report.
AUDITOR’S RESPONSIBILITIES FOR THE AUDIT OF THE CONSOLIDATED FINANCIAL STATEMENTS AND OF THE COMBINED GROUP MANAGEMENT REPORT
Our objectives are to obtain reasonable assurance about whether the consolidated financial statements as a whole are free from material misstatement, whether due to fraud or error, and whether the combined group management report as a whole provides an appropriate view of the group’s position and, in all material respects, is consistent with the consolidated financial statements and the knowledge obtained in the audit, complies with the German legal requirements and appropriately presents the opportunities and risks of future development, as well as to issue an auditor’s report that includes our opinions on the consolidated financial statements and on the combined group management report.
Reasonable assurance is a high level of assurance, but is not a guarantee that an audit conducted in accordance with § 317 HGB and the EU Audit Regulation and in compliance with German Generally Accepted Standards for Financial Statement Audits promulgated by the Institut der Wirtschaftsprüfer (IDW) and supplementary compliance with the ISAs and standards of the PCAOB will always detect a material misstatement.
|
SAP Integrated Report 2023 | |||||
| To
Our Stakeholders |
Combined
Management Report |
Consolidated
Financial Statements IFRS |
Further
Information about Sustainability |
Additional Information |
||
Misstatements can arise from fraud or error and are considered material if, individually or in the aggregate, they could reasonably be expected to influence the economic decisions of users taken on the basis of these consolidated financial statements and this combined group management report.
We exercise professional judgment and maintain professional skepticism throughout the audit. We also
| – | identify and assess the risks of material misstatement of the consolidated financial statements and of the combined group management report, whether due to fraud or error, design and perform audit procedures responsive to those risks, and obtain audit evidence that is sufficient and appropriate to provide a basis for our audit opinions. The risk of not detecting a material misstatement resulting from fraud is higher than the risk of not detecting a material misstatement resulting from error, as fraud may involve collusion, forgery, intentional omissions, misrepresentations, or the override of internal controls. |
| – | obtain an understanding of internal control relevant to the audit of the consolidated financial statements and of arrangements and measures (systems) relevant to the audit of the combined group management report in order to design audit procedures that are appropriate in the circumstances. |
| – | evaluate the appropriateness of accounting policies used by the Executive Board and the reasonableness of estimates made by the Executive Board and related disclosures. |
| – | conclude on the appropriateness of the Executive Boards’ use of the going concern basis of accounting and, based on the audit evidence obtained, whether a material uncertainty exists related to events or conditions that may cast significant doubt on the group’s ability to continue as a going concern. If we conclude that a material uncertainty exists, we are required to draw attention in the auditor’s report to the related disclosures in the consolidated financial statements and in the combined group management report or, if such disclosures are inadequate, to modify our respective audit opinions. Our conclusions are based on the audit evidence obtained up to the date of our auditor’s report. However, future events or conditions may cause the group to cease to be able to continue as a going concern. |
| – | evaluate the overall presentation, structure and content of the consolidated financial statements, including the disclosures, and whether the consolidated financial statements present the underlying transactions and events in a manner that the consolidated financial statements give a true and fair view of the assets, liabilities, financial position and financial performance of the group in compliance with IFRSs as adopted by the EU as well as with IFRSs as issued by the International Accounting Standards Board and the additional requirements of German commercial law pursuant to § 315e (1) HGB. |
| – | obtain sufficient appropriate audit evidence regarding the financial information of the entities or business activities within the group to express audit opinions on the consolidated financial statements and on the combined group management report. We are responsible for the direction, supervision and performance of the group audit. We remain solely responsible for our audit opinions. |
| – | evaluate the consistency of the combined group management report with the consolidated financial statements, its conformity with German law, and the view of the group’s position it provides. |
| – | perform audit procedures on the prospective information presented by the Executive Board in the combined group management report. On the basis of sufficient appropriate audit evidence we evaluate, in particular, the significant assumptions used by the Executive Board as a basis for the prospective information, and evaluate the proper derivation of the prospective information from these assumptions. We do not express a separate opinion on the prospective information and on the assumptions used as a basis. There is a substantial unavoidable risk that future events will differ materially from the prospective information. |
|
SAP Integrated Report 2023 | |||||
| To
Our Stakeholders |
Combined
Management Report |
Consolidated
Financial Statements IFRS |
Further
Information about Sustainability |
Additional Information |
||
We communicate with those charged with governance regarding, among other matters, the planned scope and timing of the audit and significant audit findings, including any significant deficiencies in internal control that we identify during our audit.
We also provide those charged with governance with a statement that we have complied with the relevant independence requirements and communicate with them all relationships and other matters that may reasonably be thought to bear on our independence, and, where applicable, the actions taken or safeguards applied to eliminate independence threats.
From the matters communicated with those charged with governance, we determine those matters that were of most significance in the audit of the consolidated financial statements of the current period and are therefore the key audit matters. We describe these matters in our auditor’s report unless law or regulation precludes public disclosure about the matter.
|
SAP Integrated Report 2023 | |||||
| To
Our Stakeholders |
Combined
Management Report |
Consolidated
Financial Statements IFRS |
Further
Information about Sustainability |
Additional Information |
||
OTHER LEGAL AND REGULATORY REQUIREMENTS
REPORT ON INTERNAL CONTROL OVER FINANCIAL REPORTING IN THE CONSOLIDATED FINANCIAL STATEMENTS PURSUANT TO PCAOB
Opinion on Internal Control over Financial Reporting in the Consolidated Financial Statements
We have audited SAP SE’s internal control over financial reporting as of December 31, 2023, based on criteria established in Internal Control – Integrated Framework (2013) issued by the Committee of Sponsoring Organizations of the Treadway Commission (the “COSO criteria”). In our opinion, SAP SE maintained, in all material respects, effective internal control over financial reporting as of December 31, 2023, based on the COSO criteria.
Executive Board’s and Supervisory Board’s Responsibility for the Internal Control over Financial Reporting in the Consolidated Financial Statements
The Executive Board is responsible for maintaining effective internal control over financial reporting and for its assessment of the effectiveness of internal control over financial reporting, included in Management’s Annual Report on Internal Control over Financial Reporting in the Consolidated Financial Statements.
A company’s internal control over financial reporting is a process designed to provide reasonable assurance regarding the reliability of financial reporting and the preparation of financial statements for external purposes in accordance with generally accepted accounting principles. A company’s internal control over financial reporting includes those policies and procedures that (1) pertain to the maintenance of records that, in reasonable detail, accurately and fairly reflect the transactions and dispositions of the assets of the company; (2) provide reasonable assurance that transactions are recorded as necessary to permit preparation of financial statements in accordance with generally accepted accounting principles, and that receipts and expenditures of the company are being made only in accordance with authorizations of management and directors of the company; and (3) provide reasonable assurance regarding prevention or timely detection of unauthorized acquisition, use, or disposition of the company’s assets that could have a material effect on the financial statements.
Because of its inherent limitations, internal control over financial reporting may not prevent or detect misstatements. Also, projections of any evaluation of effectiveness to future periods are subject to the risk that controls may become inadequate because of changes in conditions, or that the degree of compliance with the policies or procedures may deteriorate.
The Supervisory Board is responsible for overseeing SAP SE’s internal control over financial reporting in the consolidated financial statements.
Auditor’s Responsibility for the Internal Control over Financial Reporting in the Consolidated Financial Statements
Our responsibility is to express an opinion on SAP SE’s internal control over financial reporting based on our audit. We are a public accounting firm registered with the PCAOB and are required to be independent with respect to the Company in accordance with U.S. federal securities laws and the applicable rules and regulations of the Securities and Exchange Commission and the PCAOB.
We conducted our audit of internal control over financial reporting in accordance with the standards of the PCAOB. Those standards require that we plan and perform the audit to obtain reasonable assurance about whether effective internal control over financial reporting was maintained in all material respects. Our audit included obtaining an understanding of internal control over financial reporting, assessing the risk that a material weakness exists, and testing and evaluating the design and operating effectiveness of internal control based on the assessed risk. Our audit also included performing such other procedures as we considered necessary in the circumstances.
|
SAP Integrated Report 2023 | |||||
| To
Our Stakeholders |
Combined
Management Report |
Consolidated
Financial Statements IFRS |
Further
Information about Sustainability |
Additional Information |
||
We believe that our audit provides a reasonable basis for our opinion.
REPORT ON THE ASSURANCE ON THE ELECTRONIC RENDERING OF THE CONSOLIDATED FINANCIAL STATEMENTS AND THE COMBINED GROUP MANAGEMENT REPORT, PREPARED FOR PUBLICATION PURPOSES IN ACCORDANCE WITH § 317 (3A) HGB
Assurance Opinion
We have performed assurance work in accordance with § 317 (3a) HGB to obtain reasonable assurance as to whether the rendering of the consolidated financial statements and the combined group management report (hereinafter the “ESEF documents”) contained in the electronic file “sap-2023-12-31-DE.zip” and prepared for publication purposes complies in all material respects with the requirements of § 328 (1) HGB for the electronic reporting format (“ESEF format”). In accordance with German legal requirements, this assurance work extends only to the conversion of the information contained in the consolidated financial statements and the combined group management report into the ESEF format and therefore relates neither to the information contained within these renderings nor to any other information contained in the file identified above.
In our opinion, the rendering of the consolidated financial statements and the combined group management report contained in the electronic file identified above and prepared for publication purposes complies in all material respects with the requirements of § 328 (1) HGB for the electronic reporting format. Beyond this assurance opinion and our audit opinion on the accompanying consolidated financial statements and the accompanying combined group management report for the financial year from January 1, 2023 to December 31, 2023, contained in the “Report on the audit of the consolidated financial statements and of the combined group management report” above, we do not express any assurance opinion on the information contained within these renderings or on the other information contained in the file identified above.
Basis for the Assurance Opinion
We conducted our assurance work on the rendering of the consolidated financial statements and the combined group management report contained in the file identified above in accordance with § 317 (3a) HGB and the IDW Assurance Standard: Assurance Work on the Electronic Rendering of Financial Statements and Management Reports, Prepared for Publication Purposes in Accordance with § 317 (3a) HGB (IDW AsS 410 (06.2022). Our responsibility in accordance therewith is further described in the “Auditor’s Responsibilities for the Assurance Work on the ESEF Documents” section. Our audit firm has applied the requirements of the IDW Quality Management Standards, which implement the IAASB’s International Standards on Quality Management.
Responsibilities of the Executive Board and the Supervisory Board for the ESEF Documents
The Executive Board of the company is responsible for the preparation of the ESEF documents with the electronic renderings of the consolidated financial statements and the combined group management report in accordance with § 328 (1) sentence 4 No. 1 HGB and for the tagging of the consolidated financial statements in accordance with § 328 (1) sentence 4 No. 2 HGB.
In addition, the Executive Board of the company is responsible for such internal controls that they have considered necessary to enable the preparation of ESEF documents that are free from material intentional or unintentional non-compliance with the requirements of § 328 (1) HGB for the electronic reporting format.
The Supervisory Board is responsible for overseeing the process for preparing the ESEF documents as part of the financial reporting process.
Auditor’s Responsibilities for the Assurance Work on the ESEF documents
Our objective is to obtain reasonable assurance about whether the ESEF documents are free from material intentional or unintentional non-compliance with the requirements of § 328 (1) HGB. We exercise professional judgment and maintain professional skepticism throughout the assurance work. We also
|
SAP Integrated Report 2023 | |||||
| To
Our Stakeholders |
Combined
Management Report |
Consolidated
Financial Statements IFRS |
Further
Information about Sustainability |
Additional Information |
||
| – | identify and assess the risks of material intentional or unintentional non-compliance with the requirements of § 328 (1) HGB, design and perform assurance procedures responsive to those risks, and obtain assurance evidence that is sufficient and appropriate to provide a basis for our assurance opinion. |
| – | obtain an understanding of internal control relevant to the assurance on the ESEF documents in order to design assurance procedures that are appropriate in the circumstances, but not for the purpose of expressing an assurance opinion on the effectiveness of these controls. |
| – | evaluate the technical validity of the ESEF documents, i.e. whether the file containing the ESEF documents meets the requirements of the Delegated Regulation (EU) 2019/815, in the version in force at the date of the financial statements, on the technical specification for this electronic file. |
| – | evaluate whether the ESEF documents provide an XHTML rendering with content equivalent to the audited consolidated financial statements and to the audited combined group management report. |
| – | evaluate whether the tagging of the ESEF documents with Inline XBRL technology (iXBRL) in accordance with the requirements of Articles 4 and 6 of the Delegated Regulation (EU) 2019/815, in the version in force at the date of the financial statements, enables an appropriate and complete machine-readable XBRL copy of the XHTML rendering. |
FURTHER INFORMATION PURSUANT TO ARTICLE 10 OF THE EU AUDIT REGULATION
We were elected as group auditor by the annual general meeting on May 18, 2022. We were engaged by the chairperson of the Audit and Compliance Committee on November 30, 2023. We have been the group auditor of SAP SE without interruption since the financial year 2023.
We declare that the audit opinions expressed in this auditor’s report are consistent with the additional report to the audit committee pursuant to Article 11 of the EU Audit Regulation (long-form audit report).
In addition to the financial statement audit of SAP SE, we have performed various financial statement audits at subsidiaries and have provided to group entities the following services that are not disclosed in the consolidated financial statements or in the combined group management report for the audited entity or its controlled entities:
| – | assurance engagement on selected qualitative and quantitative sustainability disclosures of the Integrated Report 2023, |
| – | assurance engagement on the combined non-financial statement according to §§ 315c HGB in conjunction with §§ 289c to 289e HGB, |
| – | service organization attestation procedures, |
| – | audit of the compensation report including related disclosures of SAP SE pursuant to the requirements of section 162 of the German Stock Corporation Act [AktG]. |
OTHER MATTER — USE OF THE AUDITOR’S REPORT
Our auditor’s report must always be read together with the audited consolidated financial statements and the audited combined group management report as well as the assured ESEF documents. The consolidated financial statements and the combined group management report converted to the ESEF format — including the versions to be published in the German Federal Gazette — are merely electronic renderings of the audited consolidated financial statements and the audited combined group management report and do not take their place. In particular, the ESEF report and our assurance opinion contained therein are to be used solely together with the assured ESEF documents provided in electronic form.
|
SAP Integrated Report 2023 | |||||
| To
Our Stakeholders |
Combined
Management Report |
Consolidated
Financial Statements IFRS |
Further
Information about Sustainability |
Additional Information |
||
German Public Auditor Responsible for the Engagement
The German Public Auditor responsible for the engagement is Dr. Jens Freiberg.
Frankfurt am Main, February 21, 2024
BDO
AG
Wirtschaftsprüfungsgesellschaft
| Dr. Jens Freiberg | Klaus Eckmann |
| Wirtschaftsprüfer | Wirtschaftsprüfer |
| German Public Auditor | German Public Auditor |
|
SAP Integrated Report 2023 | |||||
| To
Our Stakeholders |
Combined
Management Report |
Consolidated
Financial Statements IFRS |
Further
Information about Sustainability |
Additional Information |
||
Independent Auditor’s Report on a Limited Assurance Engagement of the Combined Non-Financial Statement
To the Supervisory Board of SAP SE, Walldorf
We have performed a limited assurance engagement on the combined non-financial statement published in the Combined Group Management Report (hereinafter referred to as the “combined non-financial statement”) published by SAP SE, Walldorf, (hereinafter referred to as “SAP” or the “Group”) for the period from January 1 to December 31, 2023.
Responsibility of the Executive Directors
The executive directors of the Group are responsible for the preparation of the combined non-financial statement in accordance with §§ 315c in conjunction with 289c to 289e HGB [“Handelsgesetzbuch”: German Commercial Code] and Article 8 of REGULATION (EU) 2020/852 OF THE EUROPEAN PARLIAMENT AND OF THE COUNCIL of 18 June 2020 on establishing a framework to facilitate sustainable investment and amending Regulation (EU) 2019/2088 (hereinafter the “EU Taxonomy Regulation”) and the Delegated Acts adopted thereunder, as well as for making their own interpretation of the wording and terms contained in the EU Taxonomy Regulation and the Delegated Acts adopted thereunder, as set out in section “Sustainable Finance: EU Taxonomy Disclosures” of the combined non-financial statement.
This responsibility of the executive directors includes the selection and application of appropriate non-financial reporting methods and making assumptions and estimates about individual non-financial disclosures of the group that are reasonable in the circumstances. Furthermore, the executive directors are responsible for such internal control as the executive directors consider necessary to enable the preparation of a combined non-financial statement that is free from material misstatement, whether due to fraud or error.
The EU Taxonomy Regulation and the Delegated Acts issued thereunder contain wording and terms that are still subject to considerable interpretation uncertainties and for which clarifications have not yet been published in every case. Therefore, the executive directors have disclosed their interpretation of the EU Taxonomy Regulation and the Delegated Acts adopted thereunder in section “Sustainable Finance: EU Taxonomy Disclosures” of the combined non-financial statement. They are responsible for the defensibility of this interpretation. Due to the immanent risk that indeterminate legal terms may be interpreted differently, the legal conformity of the interpretation is subject to uncertainties.
Independence and Quality Assurance of the Assurance Practitioner’s Firm
We have complied with the German professional requirements on independence as well as other professional conduct requirements.
|
SAP Integrated Report 2023 | |||||
| To
Our Stakeholders |
Combined
Management Report |
Consolidated
Financial Statements IFRS |
Further
Information about Sustainability |
Additional Information |
||
Our audit firm applies the national legal requirements and professional pronouncements - in particular the By-laws Regulating the Rights and Duties of Wirtschaftsprüfer and vereidigte Buchprüfer in the exercise of their Profession and the Standards on Quality Management issued by the Institute of Public Auditors in Germany (IDW), and accordingly maintains a comprehensive quality management system that includes documented policies and procedures with regard to compliance with professional ethical requirements, professional standards as well as relevant statutory and other legal requirements.
Responsibility of the Assurance Practitioner
Our responsibility is to express a conclusion with limited assurance on the combined non-financial statement based on our assurance engagement.
We conducted our assurance engagement in accordance with International Standard on Assurance Engagements (ISAE) 3000 (Revised): “Assurance Engagements other than Audits or Reviews of Historical Financial Information” issued by the IAASB. This standard requires that we plan and perform the assurance engagement to obtain limited assurance about whether any matters have come to our attention that cause us to believe that the combined non-financial financial statement for the period of January 1 to December 31, 2023, is not prepared, in all material respects, in accordance with §§ 315c in conjunction with 289c to 289e HGB and the EU Taxonomy Regulation and the Delegated Acts issued thereunder as well as the interpretation by the executive directors disclosed in section “Sustainable Finance: EU Taxonomy Disclosures” of the combined non-financial statement.
In a limited assurance engagement, the procedures performed are less extensive than in a reasonable assurance engagement, and accordingly, a substantially lower level of assurance is obtained. The selection of the assurance procedures is subject to the professional judgment of the assurance practitioner.
In the course of our assurance engagement we have, among other things, performed the following assurance procedures and other activities:Gain an understanding of the structure of the sustainability organization and stakeholder engagement
| – | Inquiries of the management and relevant employees responsible for the materiality analysis in order to gain an understanding of the procedure for identifying material topics and corresponding reporting boundaries of SAP |
| – | Assessing the design and implementation of systems and processes for identifying, handling and monitoring information on environmental, employee and social matters, respect for human rights and combatting corruption and bribery, including the consolidation of data |
| – | Inquiries of personnel responsible for determining the disclosures relating to concepts, due diligence processes, results and risks, performing internal control procedures and consolidating the disclosures |
| – | Identification of areas in the combined non-financial statement where material misstatements are likely to arise |
| – | Analytical procedures on selected quantitative data |
| – | Evaluation of local data collection and reporting processes and reliability of reported data via a sampling survey at Walldorf and (remote) Bangalore (India) |
| – | Reconciliation of selected data used in the calculation of the selected sustainability information with internal and external documents |
| – | Inquiries of the management and relevant employees of SAP to obtain an understanding of the approach to identify relevant economic activities in accordance with EU taxonomy |
| – | Assessing the design and implementation of systems and procedures for identifying, processing and monitoring information on turnover, capital expenditures and operating expenditures for the taxonomy-relevant economic activities |
| – | Evaluation of the data collection, validation and reporting processes as well as the reliability of reported data for taxonomy-aligned economic activities in connection with the assessment of the technical screening criteria and the documentation of the minimum safeguards |
|
SAP Integrated Report 2023 | |||||
| To
Our Stakeholders |
Combined
Management Report |
Consolidated
Financial Statements IFRS |
Further
Information about Sustainability |
Additional Information |
||
| – | Assessment of the overall presentation of the disclosures |
In determining the disclosures in accordance with Article 8 of the EU Taxonomy Regulation, the executive directors are required to interpret undefined legal terms. Due to the immanent risk that undefined legal terms may be interpreted differently, the legal conformity of their interpretation and, accordingly, our assurance engagement thereon are subject to uncertainties.
Assurance Opinion
Based on the assurance procedures performed and the evidence obtained, nothing has come to our attention that causes us to believe that the combined non-financial statement of SAP SE, Walldorf for the period from January 1 to December 31, 2023 is not prepared, in all material respects, in accordance with §§ 315c in conjunction with 289c to 289e HGB and the EU Taxonomy Regulation and the Delegated Acts issued thereunder as well as the interpretation by the executive directors as disclosed in section “Sustainable Finance: EU Taxonomy Disclosures” of the combined non-financial statement.
Restriction of Use
We draw attention to the fact that the assurance engagement was conducted for the Group’s purposes and that the report is intended solely to inform the Group about the result of the assurance engagement. Consequently, it may not be suitable for any other purpose than the aforementioned. Accordingly, the report is not intended to be used by third parties for making (financial) decisions based on it. Our responsibility is to the Group alone. We do not accept any responsibility to third parties. Our assurance opinion is not modified in this respect.
General Engagement Terms
This engagement is based on the “Special Engagement Terms and Conditions of BDO AG Wirtschaftsprüfungsgesellschaft” of March 1, 2021, agreed with the Group as well as the “General Engagement Terms and Conditions for Auditors and Auditing Firms” of January 1, 2017, issued by the IDW (www.bdo.de/auftragsbedingungen).
February 21, 2024
BDO AG Wirtschaftsprüfungsgesellschaft
| Dr. Jens Freiberg | Carmen Auer |
Wirtschaftsprüfer
(German Public Auditor)
|
SAP Integrated Report 2023 | |||||
| To
Our Stakeholders |
Combined
Management Report |
Consolidated
Financial Statements IFRS |
Further
Information about Sustainability |
Additional Information |
||
Independent Auditor’s Report on a Limited Assurance Engagement on Sustainability Information
To the Executive Board of SAP SE, Walldorf
We have performed an independent assurance engagement on selected qualitative and quantitative sustainability disclosures as well as on selected quantitative sustainability indicators included in the Integrated Report 2023 (hereinafter referred to as “Report”) for the period from January 1 to December 31, 2023 of SAP SE, Walldorf (hereinafter referred to as “SAP” or the “Group”).
For the selected quantitative sustainability indicators Business Health Culture Index, Employee Engagement Index, Employee Retention Rate, Ratio of Women in Management, Ratio of Women in Executive Roles, Total Gross and Net Greenhouse Gas Emissions (Scope 1, Scope 2 and selected Scope 3 emissions), Renewable Energy Certificates (Energy Attribute Certificates), Total Energy Consumption and Customer Net Promoter Score including the explanatory notes supplementing these indicators (hereinafter referred to as “sustainability indicators”) a reasonable assurance engagement was performed.
For selected qualitative and quantitative sustainability disclosures included in “Further Information on Economic, Environmental, and Social Performance” (sections: About This Further Information on Economic, Environmental, and Social Performance; Sustainability Management; Stakeholder Engagement; Materiality; Social Investments; Sustainable Procurement; Waste and Water; Public Policy; Non-Financial Notes: Environmental Performance; and GRI Content Index excluding quantitative and qualitative information in relation to GRI 207 Tax) and the chapter “About This Report” (hereinafter referred to as “sustainability disclosures”) a limited assurance engagement was performed.
Responsibility of the Executive Directors
The executive directors of the Group are responsible for the preparation of the Report in accordance with the principles stated in the Sustainability Reporting Standards of the Global Reporting Initiative and in accordance with the Corporate Accounting and Reporting Standard, the Greenhouse Gas Protocol Scope 2 Guidance and the Corporate Value Chain (Scope 3) Accounting and Reporting Standard of the Greenhouse Gas Protocol Initiative by the World Resources Institute and the World Business Council for Sustainable Development in combination with internal guidelines as described in the “Non-Financial Notes: Environmental Performance” (hereinafter: “Reporting Criteria”) and for the selection of the disclosures to be assessed.
This responsibility of the executive directors includes the selection and application of appropriate sustainability reporting methods and making assumptions and estimates about individual non-financial disclosures that are reasonable in the circumstances. Furthermore, the executive directors are responsible for such internal controls as executive directors determine to enable the preparation of the Report that is free from material misstatement, whether due to fraud or error.
|
SAP Integrated Report 2023 | |||||
| To
Our Stakeholders |
Combined
Management Report |
Consolidated
Financial Statements IFRS |
Further
Information about Sustainability |
Additional Information |
||
Independence and Quality Assurance of the Assurance Practitioner’s Firm
We have complied with the German professional regulations on independence as well as other professional conduct requirements.
Our audit firm applies the national legal requirements and professional pronouncements - in particular the By-laws Regulating the Rights and Duties of Wirtschaftsprüfer and vereidigte Buchprüfer in the exercise of their Profession and the Standards on Quality Management issued by the Institute of Public Auditors in Germany (IDW), and accordingly maintains a comprehensive quality management system that includes documented policies and procedures with regard to compliance with professional ethical requirements, professional standards as well as relevant statutory and other legal requirements.
Practitioner’s Responsibility
Our responsibility is to express a conclusion based on our work performed within the assurance engagement on the sustainability indicators and the sustainability disclosures described above. We conducted our work in accordance with the International Standard on Assurance Engagements (ISAE) 3000 (Revised): “Assurance Engagements other than Audits or Reviews of Historical Financial Information”, published by IAASB.
Accordingly, we have to comply with our professional duties and to plan and perform the assurance engagement in such a way that we, respecting the principle of materiality, reach our conclusion with a reasonable level of assurance on the above-mentioned sustainability indicators. The assurance of the sustainability indicators encompasses the performance of assurance procedures to obtain evidence for the information included in the Report. The choice of assurance procedures is subject to the professional judgement of the assurance practitioner.
This Standard requires that we plan and perform the assurance engagement to obtain limited assurance about whether any matters have come to our attention that cause us to believe that the above-mentioned sustainability disclosures in the Report of the Group for the period from January 1 to December 31, 2023 are not prepared, in all material respects, in accordance with the relevant Reporting Criteria. This does not imply that a separate conclusion is expressed on each of the disclosures. In a limited assurance engagement, the procedures performed are less extensive than in a reasonable assurance engagement, and accordingly, a significantly lower level of assurance is obtained. The procedures selected depend on the assurance practitioner’s professional judgment.
In the course of our assurance engagement we have, among other things, performed the following assurance procedures and other activities:Gain an understanding of the structure of the sustainability organization and stakeholder engagement
| – | Inquiries of the executive directors and relevant employees responsible for the materiality analysis in order to gain an understanding of the procedure for identifying material topics and corresponding reporting boundaries of SAP |
| – | Inquiries of the executive directors and relevant employees involved in the determination of the sustainability information about the preparation process and about the internal control system related to this process |
| – | Assessment of the suitability of the internal guidelines and the internally developed definitions for the selected sustainability information |
| – | Identification of areas in the selected sustainability information where material misstatements are likely to arise |
| – | Analytical procedures on selected quantitative sustainability information |
| – | Evaluation of local data collection and reporting processes and reliability of reported data via a sampling survey at Walldorf and (remote) Bangalore (India) |
|
SAP Integrated Report 2023 | |||||
| To
Our Stakeholders |
Combined
Management Report |
Consolidated
Financial Statements IFRS |
Further
Information about Sustainability |
Additional Information |
||
| – | Reconciliation of selected data used in the calculation of the selected sustainability information with internal and external documents |
| – | Recalculation for mathematical accuracy of selected quantitative sustainability information |
| – | Assessment of the overall presentation of the selected sustainability information |
In addition, we conducted the following procedures to obtain reasonable assurance:
| – | Evaluation of the design, implementation and operating effectiveness of the systems and methods used to collect and process the data reported for the selected information, including the aggregation of the data into the indicators as presented in the Report |
| – | Auditing the 2023 data using internal and external documentation in order to determine in detail whether the data corresponds to the information in the relevant underlying sources, and whether all the relevant information contained in such underlying sources has been included in the Report |
| – | Evaluation of local information management systems and reliability of reported data via a sampling survey at Walldorf and (remote) Bangalore (India) |
Assurance Opinion
In our opinion the above-mentioned selected quantitative sustainability indicators in the Report, including the explanatory notes supplementing these indicators, of SAP SE, Walldorf for the business year from January 1 to December 31, 2023 are presented, in all material respects, in accordance with the Reporting Criteria.
Based on the assurance procedures performed and the evidence obtained for the limited assurance, nothing has come to our attention that causes us to believe that the above-mentioned selected qualitative and quantitative sustainability disclosures in the Report of SAP SE, Walldorf for the period from January 1 to December 31, 2023 are not prepared, in all material respects, in accordance with the Reporting Criteria.
Restriction of Use
We draw attention to the fact that the assurance engagement was conducted for the Group’s purposes and that the report is intended solely to inform the Group about the result of the assurance engagement. Consequently, it may not be suitable for any other purpose than the aforementioned. Accordingly, the report is not intended to be used by third parties for making (financial) decisions based on it. Our responsibility is to the Group alone. We do not accept any responsibility to third parties. Our assurance opinion is not modified in this respect.
General Engagement Terms
This engagement is based on the “Special Engagement Terms and Conditions of BDO AG Wirtschaftsprüfungsgesellschaft” of March 1, 2021, agreed with the Group as well as the “General Engagement Terms and Conditions for Auditors and Auditing Firms” of January 1, 2017, issued by the IDW (www.bdo.de/auftragsbedingungen).
February 21, 2024
BDO AG Wirtschaftsprüfungsgesellschaft
| Dr. Jens Freiberg | Carmen Auer |
Wirtschaftsprüfer
(German Public Auditor)
|
SAP Integrated Report 2023 | |||||
| To
Our Stakeholders |
Combined
Management Report |
Consolidated
Financial Statements IFRS |
Further
Information about Sustainability |
Additional Information |
||
Combined Management Report
| General Information About This Combined Management Report | 47 |
| Strategy and Business Model | 49 |
| Performance Management System | 59 |
| Financial Performance: Review and Analysis | 68 |
| Non-Financial Statement Including Information on Sustainable Activities | 92 |
| Security, Cloud Compliance, Data Protection and Privacy | 101 |
| Employees | 105 |
| Energy and Emissions | 112 |
| Corporate Governance Fundamentals | 118 |
| Business Conduct | 121 |
| Human Rights | 125 |
| Risk Management and Risks | 128 |
| Expected Developments and Opportunities | 145 |
| Responsibility Statement | 153 |
|
SAP Integrated Report 2023 | |||||
| To
Our Stakeholders |
Combined
Management Report |
Consolidated
Financial Statements IFRS |
Further
Information about Sustainability |
Additional Information |
||
General Information About This Combined Management Report
Basis of Presentation
This combined management report by the SAP Group (collectively, “we,” “us,” “our,” “SAP,” “Group,” or “Company”) and the management report of SAP SE have been prepared in accordance with sections 289, 289a, 289b, 289f, 298, 315, 315a, 315b, and 315d of the German Commercial Code and German Accounting Standard (GAS) No. 20.
For more information about SAP SE and its results of operations, financial position, and net assets, see the Report on the Economic Position of SAP SE.
Our
auditor, BDO AG Wirtschaftsprüfungsgesellschaft (BDO), audited SAP’s combined management report, except for
some information that relates to the Non-Financial Statement Including Information
About Sustainable Activities that was not subject to the statutory audit of our combined management report, but on
which a limited assurance engagement was performed. The Security, Data Protection,
and Privacy, Employees; Energy
and Emissions; Business Conduct; and Human
Rights sections comprising the Non-Financial Statement also include information that was not subject to the statutory
audit of our combined management report, but on which a limited assurance engagement was performed. These sections contain further
explanations about the audit scope in an info box at the end of the respective section, marked by the symbol  .
.
For more information about the scope of the assurance and the underlying reporting criteria, see BDO’s Independent Auditor’s Report, the Limited Assurance Report of the Independent Auditor Regarding the Combined Non-Financial Statement, and the Assurance Report of the Independent Auditor Regarding Sustainability Information.
Unless otherwise stated, all of the information in this report relates to the situation as at December 31, 2023, or the fiscal year ended on that date. Furthermore, all financial numbers in this combined management report are based on continuing operations (unless otherwise noted). Non-financial information has not been adjusted. For more information, including the results from discontinued operations, see the Notes to the Consolidated Financial Statements, Note (D.1).
Because the numbers presented throughout this report are rounded, they may not add up exactly to the totals we provide, and percentages may not precisely reflect the absolute amounts.
Forward-Looking Statements
This combined management report contains forward-looking statements and information based on the beliefs of, and assumptions made by, SAP management using information currently available to them. Any statements contained in this report that are not historical facts are forward-looking statements as defined in the U.S. Private Securities Litigation Reform Act of 1995. We have based these forward-looking statements on our current expectations, assumptions, and projections about future conditions and events. As a result, our forward-looking statements and information are subject to uncertainties and risks, many of which are beyond our control. If one or more of these uncertainties or risks materializes, or if management’s underlying assumptions prove incorrect, our actual results could differ materially from those described in or inferred from our forward-looking statements and information. We describe these risks and uncertainties in the Risk Management and Risks section.
The words “aim,” “anticipate,” “assume,” “believe,” “continue,” “could,” “counting on,” “is confident,” “development,” “estimate,” “expect,” “forecast,” “future trends,” “guidance,” “intend,” “may,” “might,”
|
SAP Integrated Report 2023 | |||||
| To
Our Stakeholders |
Combined
Management Report |
Consolidated
Financial Statements IFRS |
Further
Information about Sustainability |
Additional Information |
||
“outlook,” “plan,” “predict,” “project,” “seek,” “should,” “strategy,” “want,” “will,” “would,” and similar expressions as they relate to us are intended to identify such forward-looking statements. Such statements include, for example, those made in the Operating Results subsection; our quantitative and qualitative disclosures about market risk pursuant to the International Financial Reporting Standards (IFRS), namely IFRS 7 and related statements in our Notes to the Consolidated Financial Statements; Expected Developments and Opportunities and Risk Management and Risks sections; and other forward-looking information appearing in other parts of this report.
To fully consider the factors that could affect our future financial results, both this report and our Annual Report on Form 20-F should be considered, as well as all of our other filings with the U.S. Securities and Exchange Commission (SEC). Readers are cautioned not to place undue reliance on these forward-looking statements, which speak only as of the date specified or the date of this report. We undertake no obligation to publicly update or revise any forward-looking statements as a result of new information that we receive about conditions that existed upon issuance of this report, future events, or otherwise, unless we are required to do so by law.
This report includes statistical data about the IT industry and global economic trends that comes from information published by sources including International Data Corporation (IDC), Gartner, the European Central Bank (ECB), and the International Monetary Fund (IMF). This type of data represents only the estimates of IDC, Gartner, the ECB, the IMF, and other sources of industry data. SAP does not adopt or endorse any of the statistical information provided by sources such as IDC, Gartner, the ECB, the IMF, or other similar sources that is contained in this report. The data from these sources is subject to risks and uncertainties, and subject to change based on various factors, including those described above, in the Risk Management and Risks section, and elsewhere in this report. These and other factors could cause our results to differ materially from those expressed in the estimates made by third parties and SAP. We caution readers not to place undue reliance on this data.
|
SAP Integrated Report 2023 | |||||
| To
Our Stakeholders |
Combined
Management Report |
Consolidated
Financial Statements IFRS |
Further
Information about Sustainability |
Additional Information |
||
Strategy and Business Model
Overview of SAP
Founded in 1972, SAP is a global company headquartered in Walldorf, Germany. Our legal corporate name is SAP SE. SAP has been recognized as a market share leader in the following areas worldwide: enterprise applications software,3 enterprise resource management applications,4 supply chain management applications,5 procurement applications software,6 travel and expense management software,7 and enterprise resource planning software,8 among others. SAP Business Technology Platform comprises market-leading capabilities in key platform areas such as integration,9 planning10 and analytics,11 data quality,12 and process automation.13 The SAP Group has a global presence and employed more than 107,000 people as at December 31, 2023.
Our ordinary shares are listed on the Frankfurt Stock Exchange. American Depositary Receipts (ADRs) representing SAP SE ordinary shares are listed on the New York Stock Exchange (NYSE). SAP is a member of Germany’s DAX and TecDAX, the Dow Jones EURO STOXX 50, the Dow Jones Sustainability Index World, and the Dow Jones Sustainability Index Europe. As at December 31, 2023, SAP was the most valuable company in the DAX based on market capitalization and has been ranked under the top 5% of S&P Global ESG Scores in the S&P Global Corporate Sustainability Assessment.
Our Purpose
Our purpose at SAP remains steadfast: to “help the world run better and improve people’s lives.” We strive to achieve this by focusing on the challenges of current markets, the global environment, and by using the transformative power of artificial intelligence (AI) in business. SAP combines generative AI with business data. We are committed to providing AI solutions that are integral to our customers’ critical business processes, and ensuring that they are embedded in our portfolio, relevant, reliable, and responsible. Our products and services aim to help our customers meet the challenges as well as take advantage of the opportunities presented by today’s rapidly changing world.
In addition, we want our own business operations and practices to be sustainable and inclusive. SAP is committed to the goal set by the Paris Agreement of limiting global warming to 1.5 degrees Celsius in comparison to preindustrial levels. SAP has committed to achieve net-zero emissions along our entire value chain by 2030. We also support the United Nations Sustainable Development Goals (UN SDGs). Together with our customers and partners, we engage in several initiatives across the UN SDGs.
3 IDC, Worldwide Enterprise Applications Software Market Shares, 2022: Cloud Is the Digital World Foundational Choice, Doc #US51040223, July 2023
4 IDC, Worldwide Semiannual Software Tracker, 2023H1, October 2023
5 IDC, Worldwide Semiannual Software Tracker, 2023H1, October 2023
6 IDC, Worldwide Semiannual Software Tracker, 2023H1, October 2023
7 IDC, Worldwide Travel and Expense Management Software Market Shares, 2022: Evolving Travel Models Pushing Digital Transformation, Doc #US49194223, September 2023
8 IDC, Worldwide Semiannual Software Tracker, 2023H1, October 2023
9 Gartner, Inc., Magic Quadrant for Data Integration Tools, Doc G00777860, December 2023
10 Gartner, Inc., Magic Quadrant for Financial Planning Software, Doc G00784792, December 2023
11 Gartner, Inc., Magic Quadrant for Analytics and Business Intelligence Platforms, Doc G00768632, April 2023
12 Gartner, Inc., Magic Quadrant for Data Quality Solutions, Doc G00759931, November 2022
13 Gartner, Inc., Magic Quadrant for Process Mining Tools, Doc G00774746, March 2023
|
SAP Integrated Report 2023 | |||||
| To
Our Stakeholders |
Combined
Management Report |
Consolidated
Financial Statements IFRS |
Further
Information about Sustainability |
Additional Information |
||
Our Vision
SAP’s vision is to bring out the best in every business. In our pursuit of this vision, we focus on three areas:
Agility at Scale
In a rapidly changing landscape, the need for business agility is paramount to maintaining competitiveness. We facilitate this through data insights that help organizations adapt to market conditions. Our cloud ERP solutions and SAP Business AI capabilities are integrated, providing agility and empowering organizations to pivot, whether to strategic shifts or unexpected market scenarios.
Achieve More Across the Value Chain
We help organizations leverage the collective intelligence that SAP provides to optimize performance across their value chain. By connecting core processes – from finance to supply chains and human resources to customer relations – we support efficient growth throughout businesses. Our solutions go beyond internal systems, linking businesses across enterprises and digitalizing transactions to foster transparent, resilient, and sustainable value chains.
Sustainability at Your Core
We have evolved beyond mere sustainability aspirations to actionable, sustainable outcomes. SAP’s green ledger initiative provides auditable sustainability practices as an extension of business operations. This approach enables organizations to record real impacts, report audit-ready ESG metrics, and act with ESG principles integrated into business processes, supporting data-driven sustainability management.
At SAP, our journey is one of continuous innovation and transformation, and we are committed to delivering solutions that are not only relevant and reliable but also responsible.
Our Business Model
Our business model, through which we implement our vision and strategy, can be summarized as follows:
We create value by first identifying the business needs of our customers and then developing and delivering cloud solutions, software, services, and support that address these needs. By proactively obtaining customer feedback on a regular basis, we strive to continuously improve our solutions, identify further business needs, and deliver enhanced value to our customers across the entire lifecycle – and thus continually improve the customer experience.
We derive revenue from fees charged to our customers for subscriptions to use our cloud solutions. Software licenses, on-premise support, consulting, development, training, and other services also contribute significant revenue.
For an overview of our product portfolio, see the Our Product Strategy section.
Subsidiaries, Acquisitions, and Joint Ventures
Subsidiaries
SAP SE is the parent company of the SAP Group. As at December 31, 2023, the SAP Group comprised 236 companies.
For a list of our subsidiaries, associates, and other equity investments, see the Notes to the Consolidated Financial Statements, Note (G.9).
|
SAP Integrated Report 2023 | |||||
| To
Our Stakeholders |
Combined
Management Report |
Consolidated
Financial Statements IFRS |
Further
Information about Sustainability |
Additional Information |
||
Material Acquisitions
We continue to focus on organic investments in technology and innovations that should ensure sustainable growth of our product portfolio. Additionally, we may make targeted acquisitions to complement our solution offerings and improve coverage in key strategic markets.
The acquisition of LeanIX closed on November 7, 2023. LeanIX is a market leader in enterprise architecture management (EAM) software that drives the modernization of IT landscapes and continuous business transformation. The combined offering with SAP can provide a foundation for process optimization enabled by AI.
For more information about LeanIX, see the Notes to the Consolidated Financial Statements, Note (D.1).
Divestitures
Qualtrics
On March 13, resulting from a process that was initiated on January 26, 2023, SAP announced it had agreed to sell all of its 423 million shares in Qualtrics International Inc. as part of the acquisition of Qualtrics by funds affiliated with Silver Lake and Canada Pension Plan Investment Board at a purchase price of US$18.15 in cash per share. The sale closed on June 28, 2023. SAP remains a close go-to-market and technology partner with Qualtrics.
For more information about Qualtrics, see the Notes to the Consolidated Financial Statements, Note (D.1).
Sapphire Ventures
In addition to our investments in organic growth and acquisitions, SAP also supports entrepreneurs that aspire to build industry-leading businesses through venture capital funds managed by Sapphire Ventures. Sapphire Ventures manages more than US$10 billion (over €9 billion) and has invested in more than 200 companies. It pursues opportunities in which it can help fuel enterprise growth by adding expertise, relationships, geographic reach, and capital. It places a particular focus on companies in Europe, Israel, the United Kingdom, and the United States. Sapphire Ventures has committed to investing more than US$1 billion in the next generation of AI-powered enterprise technology startups.
Our Product Strategy
SAP’s product portfolio allows enterprises to manage their resources, spend, employees, and customer relationships. SAP Business Technology Platform (SAP BTP) is the platform for SAP, our customers, and our ecosystem to build, integrate, and extend solutions, and to manage enterprise data. It also serves as a central place for SAP Business AI technology.
SAP Business AI refers to artificial intelligence (AI) capabilities available across SAP’s suite of enterprise applications and SAP BTP. SAP offers a range of AI-powered use cases built into core business processes across finance, supply chain, procurement, sales, marketing, human resources, and IT. By using these AI capabilities, customers can benefit from automation, recommendations, forecasting, and natural human-machine interaction. In addition, SAP BTP provides business-specific AI services that empower our partners and customers to implement AI into their SAP applications and extensions while reducing data science effort, integration, and operational complexity.
In September 2023, we launched Joule, a copilot built directly into our solutions.
In November 2023, we introduced the new AI Foundation on SAP BTP group of technologies, new vector capabilities on SAP HANA to leverage AI, and SAP Build Code, an AI-powered solution set to make professional coders more productive.
|
SAP Integrated Report 2023 | |||||
| To
Our Stakeholders |
Combined
Management Report |
Consolidated
Financial Statements IFRS |
Further
Information about Sustainability |
Additional Information |
||
In December 2023, we introduced Cloud ERP Suite as a clustering of our strategic cloud solutions. The following offerings are currently part of our Cloud ERP Suite: SAP S/4HANA Cloud as part of Cloud ERP, SAP BTP, core solutions for HR and payroll, spend management, commerce, customer data solutions, business process transformation, and working capital management. With SAP S/4HANA Cloud and SAP BTP as key elements and foundation of those offerings, we strive for an expansion of our commercial models, with increased focus on packaged suite deals and flexible consumption models, such as RISE Premium Plus. Further, we aim to drive the adoption of multi-cloud solutions across the mentioned offerings.
Further, SAP strives to help customers grow their businesses profitably, while at the same time minimizing the risks. To this end, SAP has two offerings, RISE with SAP and GROW with SAP, which cater to different customer objectives and requirements.
RISE with SAP is a business transformation solution aimed at helping customers migrate their ERP system to the cloud and accelerate their digital transformation. It is a tailored offering that targets SAP’s existing customer base running on other SAP solutions, or net-new customers with large or complex business requirements. RISE with SAP aims to provide enhanced productivity by means of automated processes, with the option of running technology operations as a service with SAP or in the customer’s own data center.
GROW with SAP is a commercial offering designed specifically to help grow midmarket companies that do not yet use an ERP system from SAP and aspire to go live within a short period of time without extensive customization. With GROW with SAP, customers can use predefined best-practice processes that are available for different industries, and can benefit from predictable costs, the continuous provision of technical innovations, and scalability. It is designed so that companies can grow according to their needs, without significantly increasing the complexity for business processes and management.
As the IT landscape continues to rapidly evolve, SAP is seeing a clear shift in customer preferences together with a growing demand for flexibility, agility, scalability, and cost-effectiveness. Understanding the importance of helping customers embrace digital technologies to thrive in today’s dynamic business environment, SAP has committed to a forward-thinking cloud strategy. SAP acknowledges that every organization’s experience with the cloud can be unique and can therefore be challenging, yet many customers who have made the shift to a cloud strategy can use the benefits that today’s business environments require, such as the ability to redistribute resources previously required for managing internal IT teams, and remote global accessibility from any location through an Internet connection regardless of where teams are located around the world. This strategy-shift to the cloud allows SAP to address these new market opportunities and requirements.
The strategic pillars of SAP’s product strategy and our development and innovations are presented below.
Cloud ERP
SAP S/4HANA Cloud provides software capabilities mainly for finance, risk management, project management, procurement, manufacturing, supply chain management, asset management, and research and development. It also includes platform capabilities such as a database (SAP HANA), data management, AI, and application lifecycle management, as well as cloud ERP solutions, which our customers consume as part of their transformation to SAP S/4HANA Cloud. These cloud ERP solutions help customers adopt new business models, such as subscription.
Human Capital Management
SAP SuccessFactors solutions for human experience management aim to empower organizations to create an agile and future-ready workforce in a rapidly changing workplace. Customers can use new offers such as skills ontology, personal growth framework for employees, and dynamic teams to work across traditional organizational structures. The portfolio includes core HR and payroll, talent management, employee experience management, and people and workforce analytics.
|
SAP Integrated Report 2023 | |||||
| To
Our Stakeholders |
Combined
Management Report |
Consolidated
Financial Statements IFRS |
Further
Information about Sustainability |
Additional Information |
||
Spend Management
SAP’s spend management solutions aim to provide a more unified view of a customer’s spending to reduce costs, mitigate risks, improve collaboration, and make sure every spend decision is aligned with the business strategy. They cover direct and indirect spend, travel and expense, and external workforce management. Our SAP Ariba solutions combine industry-leading cloud-based applications to help companies discover and collaborate with a global network of partners. Our SAP Concur portfolio contains the world’s leading solutions for integrated travel, expense, and invoice management.
Customer Experience
SAP Customer Experience solutions aim to deliver a personalized view across customers and business partners, connecting the front- and back office with solutions spanning from point-of-sale to manufacturing, logistics, customer experience, and returns management.
SAP Business Technology Platform
SAP Business Technology Platform (SAP BTP) is our business-centric, and open platform consisting of market-leading technologies infused with AI that enables SAP development, customers, and the partner ecosystem to unlock innovation across the enterprise. SAP BTP enables customers and partners to build, integrate, and automate applications while leveraging insights from business data on a trusted enterprise-grade environment.
Key capabilities of SAP BTP include: SAP Build and SAP Build Code tools, and the ABAP Cloud development model, which provides an intuitive, modern development environment for IT and citizen developers; SAP HANA Cloud, SAP Datasphere, and SAP Analytics Cloud solutions which offer database, data management, analysis, and planning capabilities that utilize the value of data; SAP Integration Suite for enterprise iPaaS and API management to connect and automate business processes; and AI Foundation on SAP BTP, which has a rich toolset including access to a broad range of large language models (LLMs) from third-party providers and vector database capabilities to enable developers to create AI- and generative-AI-powered extensions and applications.
Industry Cloud
SAP’s industry cloud solutions offer SAP and our partners the opportunity to extend our core of business software with modular solutions addressing industry-specific functions built on SAP BTP.
Business Network
SAP Business Network is a business-to-business collaboration platform trusted by companies in 190 countries. The network helps digitalize key business processes across the supply chain and enables communication between trading partners beyond the four walls of an organization. This enables buyers and suppliers to find each other and execute end-to-end transactions, and helps businesses be transparent, resilient, and sustainable.
Business Process Transformation
Our SAP Signavio solutions help enable our customers to discover, analyze, and understand their business process operations. By benchmarking current process landscapes against best practices and allowing them to act on change recommendations, customers can define a target state and adapt as-is processes accordingly, while measuring whether realized outcomes match strategic goals.
In November 2023, SAP acquired LeanIX, a market leader in enterprise architecture management (EAM) which is designed to enable customers to visualize, assess, and manage the transition towards their target IT architectures. LeanIX solutions can help customers drive updates to their IT landscapes and, together with the SAP Signavio portfolio, enable continuous business transformation.
|
SAP Integrated Report 2023 | |||||
| To
Our Stakeholders |
Combined
Management Report |
Consolidated
Financial Statements IFRS |
Further
Information about Sustainability |
Additional Information |
||
Working Capital Management
Taulia solutions for working capital management help enable customers to mitigate the effects of inflation by providing visibility into working capital and access to liquidity. The Taulia Cash Flow Acceleration Platform is designed to accelerate cash flow and create supply chain resilience. Taulia also embeds sustainability functions into core processes by offering financing to stimulate the supply base to impact its ESG (environmental, social, and governance) credentials.
Sustainability Management
SAP offers sustainability solutions and services that can help customers drive sustainable practices not only inside their organization but across the entire value chain. SAP Cloud for Sustainable Enterprises is a flexible solution portfolio that aims to enable businesses to manage sustainability holistically. The portfolio includes the following offerings: SAP Sustainability Control Tower for holistic steering and reporting across ESG metrics and SAP Sustainability Data Exchange for sharing standardized sustainability data across supply chains.
Partners and Ecosystem
Our worldwide ecosystem of more than 25,000 partners delivers not only services and support for our customers but also partner innovations that extend our solutions and ideally are built on SAP BTP.
Services and Support
We have reimagined our cloud services and support portfolio to focus on customer adoption and consumption.
The Services and Support portfolio includes SAP Enterprise Support, which provides foundational tools and services, curated content, and mission-critical support. It can be enhanced with incremental success plans such as SAP Preferred Success and SAP Cloud Application Services as well as success services and consulting services to address specific objectives, timelines, and plans. When customers pursue enterprise-wide transformational change, SAP offers SAP MaxAttention and SAP ActiveAttention plans for tailored, long-term strategic engagement.
Our Customers
Vision and Strategy
Focusing on Customer Success
We aim to maximize the value our customers derive from their investment in, and relationship with, SAP at every touchpoint in their experience with us over the engagement lifecycle. Our customer-facing teams – across solutions, sales, services, customer engagement, ecosystem, and others – work together along an operating model that aims to harmonize internal processes with the goal of delivering improved outcomes for our customers.
Company-Wide Global Experience Program
To further address and improve customer feedback, we have a Company-Wide Global Experience (XM) Program in place. This program aims to achieve a consistent end-to-end experience for our customers by standardizing experience initiatives and methodologies to help identify and close experience gaps across SAP.
Due Diligence
Governance
The head of Customer Success leads all customer-facing functions across sales, services, partner, and cloud engagements for SAP’s businesses globally. The Chief Marketing and Solutions Officer leads the development of our solution value propositions to provide clarity on SAP’s core differentiators.
|
SAP Integrated Report 2023 | |||||
| To
Our Stakeholders |
Combined
Management Report |
Consolidated
Financial Statements IFRS |
Further
Information about Sustainability |
Additional Information |
||
The People & Operations Board area is responsible for the Company-Wide XM Program, including conducting the Customer Net Promoter Score (NPS) survey.
Customer NPS is a KPI in the short-term incentive component of Executive Board remuneration. For more information about the Customer NPS, see the Performance Management System section.
Guidelines and Policies
Policies such as the Global Code of Ethics and Business Conduct for Employees and applicable General Terms and Conditions for our product govern our relationships with our customers.
How We Measure and Manage Our Performance
We use the Customer NPS as a feedback mechanism to measure customer loyalty. This and other results from the customer survey allow us to directly understand the customer experience and identify key pain points for action. Because of the importance of our customers to SAP, Customer NPS is one of our main non-financial KPIs.
In 2023, our Customer NPS increased 2 points year over year to 9 (2022: 714), which is within our target range of 8 to 12. The increase was driven by feedback regarding our comprehensive and robust SAP solutions, established value to customers’ business, and relationships with account teams. The Company-Wide XM Program ensures that the feedback received is heard by the responsible organizations within SAP so they can act to continually improve the customer experience.
For 2024, we expect a Customer NPS of 9 to 13. Further, we aim to see continuous improvements and to increase the score steadily in the medium term.
Related Risks for SAP
For related financial risks, see Sales and Services in the Risk Management and Risks section.
Our Investments in Innovation
SAP’s strong commitment to research and development (R&D) is reflected in our expenditures:
Research & Development (IFRS)1,2
€ millions | change since previous year

1 The
numbers for 2023, 2022, and 2021 reflect continuing operations as a result of the divestiture of Qualtrics.
2 In 2023, SAP updated its cost allocation
policy. R&D numbers for 2020 and 2019 have not been retrospectively adjusted. For more information, see the Notes to the Consolidated
Financial Statements, Note (IN.1).
In 2023, our IFRS R&D ratio, reflecting R&D expenses as a portion of total revenue, decreased 0.3 percentage points (pp) to 20.3% (2022: 20.6%). Our non-IFRS R&D ratio decreased 1.1 pp to
14 Recalculated score according to 2023 methodology. Reported number for 2022 based on prior methodology was 3. Guidance for 2023 was based on the recalculated score of 7. For more information about Customer NPS calculation methodology, see Performance Management System.
|
SAP Integrated Report 2023 | |||||
| To
Our Stakeholders |
Combined
Management Report |
Consolidated
Financial Statements IFRS |
Further
Information about Sustainability |
Additional Information |
||
18.0% year over year (2022: 19.1%). At the end of 2023, our total full-time equivalent (FTE) headcount in development was 36,444 (2022: 35,280). Measured in FTEs, our R&D headcount increased 1 pp to 34% of total headcount (2022: 33%).
Total R&D expense not only includes our own personnel costs but also the external costs of work and services from the providers and cooperation partners we work with to deliver and enhance our products. We also incur external costs for the following:
| – | Translating, localizing, and testing products |
| – | Obtaining certification for products in different markets |
| – | Patent attorney services and fees |
| – | Consulting related to our product strategy |
| – | Professional development of our R&D workforce |
Patents
Our investment in R&D has resulted in numerous patents. As at December 31, 2023, SAP held a total of close to 13,000 (2022: close to 13,000) validated patents worldwide. Of these, more than 650 (2022: more than 800) were granted and validated in 2023.
While our intellectual property is important to our success, we believe our business as a whole is not dependent on any particular patent or a combination of patents.
Competitive Intangibles
The majority of (intangible) resources that are the basis for our current as well as future success does not appear in the book value of equity in our Consolidated Financial Statements. This is apparent from a comparison of the market capitalization of SAP SE (based on all issued shares), which was €171.4 billion at the end of 2023 (2022: €118.4 billion), with the book value of our equity in the Consolidated Financial Statements, which was €43.4 billion (2022: €42.8 billion). This means that the market capitalization of our equity is more than three times higher than the book value.
Measuring Our Success
We use the following financial and non-financial objectives to steer our company:
| – | Growth |
| – | Profitability |
| – | Customer loyalty |
| – | Employee engagement |
| – | Carbon impact |
|
SAP Integrated Report 2023 | |||||
| To
Our Stakeholders |
Combined
Management Report |
Consolidated
Financial Statements IFRS |
Further
Information about Sustainability |
Additional Information |
||
Outlook and Results for 2023
| Strategic Objective | KPI | 2023 Outlook* | 2023 Results |
| Growth | Cloud revenue2 | €14.0 billion to €14.2 billion | €14.06 billion |
| Cloud and software revenue2 | €27.0 billion to €27.4 billion | €27.64 billion | |
| Profitability | Operating profit1,2 | €8.65 billion to €8.95 billion | €9.04 billion |
| Free cash flow | Approx. €4.9 billion | €5.09 billion | |
| Customer Loyalty | Customer Net Promoter Score | 8 to 12 | 9 |
| Employee Engagement | Employee Engagement Index | 76% to 80% | 80% |
| Carbon Impact | Net carbon emissions | 0 kt | 0 kt |
* The 2023 outlook was communicated in January 2023. It was updated twice during the year: in April to reflect the divestiture of Qualtrics, and again in July 2023. The 2023 outlook numbers above reflect the updated outlook from July 2023.
1 Non-IFRS.
2 At constant currencies.
Note: For a reconciliation of non-IFRS results to IFRS equivalents, see the Performance Management System section.
|
SAP Integrated Report 2023 | |||||
| To
Our Stakeholders |
Combined
Management Report |
Consolidated
Financial Statements IFRS |
Further
Information about Sustainability |
Additional Information |
||
Outlook for 2024
| Strategic Objective | KPI | 2023 Results | 2024 Outlook |
| Growth | Cloud revenue | €13.66 billion | €17.0 billion to €17.3 billion2 |
| Cloud and software revenue | €26.92 billion | €29.0 billion to €29.5 billion2 | |
| Profitability | Operating
profit (2024 methodology)1,3 |
€6.51 billion | €7.6 billion to €7.9 billion1,2 |
| Operating
profit (2023 methodology) |
€8.72 billion | --- | |
| Free cash flow | €5.09 billion | Approx. €3.50 billion | |
| Customer Loyalty | Customer Net Promoter Score | 9 | 9 to 13 |
| Employee Engagement | Employee Engagement Index | 80% | 76% to 80% |
| Climate
Performance: Net zero by 2030 |
Gross greenhouse gas emissions | 6.9 million tons gross carbon emissions | Steady decrease of our greenhouse gas emissions across the relevant value chain in line with our net-zero target |
| Women in Executive Roles | % of women in GET / SET / ET job levels out of the combined total of men, women, and other genders at the 3 job levels.4 | 22.2% | 25% in end of year 2027: Steady increase |
1 Non-IFRS. The outlook for 2024 has been prepared in accordance with our updated non-IFRS definition applicable from 2024. For more information, see the Performance Management System section.
2 At constant currencies.
3 Based on the updated non-IFRS operating profit definition and excluding gains and losses from less material divestitures.
Note: For a reconciliation of non-IFRS results to IFRS equivalents, see the Performance Management System section.
4 GET: Global Executive Teams; SET: Senior Executive Teams; ET: Executive Teams.
Ambition for 2025
| Strategic Objective | KPI | 2025 Ambition |
| Growth | Cloud revenue | More than €21.5 billion |
| Total revenue | More than €37.5 billion | |
| Profitability | Cloud gross profit1 | Approximately €16.2 billion |
| Operating profit1 | Approximately €10.0 billion | |
| Free cash flow | Approximately €8.0 billion | |
| Customer Loyalty | Customer Net Promoter Score | Steady increase |
| Employee Engagement | Employee Engagement Index | Steady increase |
| Climate Performance: Net zero by 2030 | Gross greenhouse gas emissions | Archiving net zero across the value chain by 2030 |
| Women in Executive Roles | % of women in GET / SET / ET job levels out of the combined total of men, women, and other genders at the 3 job levels | 25% in end of year 2027 |
1 Non-IFRS. Our Ambition for 2025 has been adjusted in accordance with our updated non-IFRS definition applicable from 2024. For more information, see the Performance Management System section.
Note: For a reconciliation of non-IFRS results to IFRS equivalents, see the Performance Management System section.
|
SAP Integrated Report 2023 | |||||
| To
Our Stakeholders |
Combined
Management Report |
Consolidated
Financial Statements IFRS |
Further
Information about Sustainability |
Additional Information |
||
Performance Management System15
In the reporting year, we used various performance measures to manage our performance with regard to our primary financial objectives, which are growth and profitability, and our primary non-financial objectives, which are customer loyalty, employee engagement, and carbon impact. We view growth and profitability as indicators of our current performance, while we see customer loyalty, employee engagement, and carbon impact as indicators of our future performance.
Measures to Manage Our Financial Performance
Measures to Manage Our Operating Financial Performance
In the reporting year, we used cloud revenue, cloud and software revenue, share of more predictable revenue, current cloud backlog, and operating profit (non-IFRS) as our key measures to manage our operating financial performance. In addition to these, we used several supporting measures to provide further insight into our financial performance:
Cloud revenue: This revenue driver comprises the main revenues of our cloud business. Revenue from cloud is derived from fees earned from providing customers with software as a service (SaaS), platform as a service (PaaS), and infrastructure as a service (IaaS). We measure cloud revenue at actual and constant currencies.
For more information about the composition of cloud revenue, and for a description of these services, see the Notes to the Consolidated Financial Statements, Note (A.1).
Cloud and software revenue: We use cloud and software revenue expressed in both actual currencies and constant currencies to measure our product growth. Our cloud and software revenue includes cloud revenue plus software license revenue and software support revenue. Cloud revenue and software support revenue are our two largest revenue streams. Customers that purchase software licenses also enter into related support contracts that generate recurring support revenue after the software sale.
SAP S/4HANA Cloud revenue: We used SAP S/4HANA Cloud revenue expressed in both actual currencies and constant currencies as an additional metric to measure our cloud core ERP growth. SAP offers a choice of SAP S/4HANA Cloud deployments – as a public cloud or private cloud SaaS offering.
Starting in 2024, SAP S/4HANA Cloud revenue will be replaced by the Cloud ERP Suite revenue metric.
Cloud ERP Suite revenue: We use Cloud ERP Suite revenue expressed in both actual currencies and constant currencies as a metric to measure the growth of our portfolio of strategic cloud solutions. Cloud ERP Suite references those offerings that are tightly integrated with our core ERP solutions and are included in key commercial packages, such as RISE with SAP. The following offerings currently contribute to Cloud ERP Suite revenue: SAP S/4HANA Cloud, SAP Business Technology Platform, and core solutions for HR and payroll, spend management, commerce, customer data solutions, business process transformation, and working capital management.
Total revenue: We use total revenue to measure our growth at both actual currencies and constant currencies.
15 Unless otherwise stated, all performance measures are based on our continuing operations.
|
SAP Integrated Report 2023 | |||||
| To
Our Stakeholders |
Combined
Management Report |
Consolidated
Financial Statements IFRS |
Further
Information about Sustainability |
Additional Information |
||
Share of more predictable revenue: We use share of more predictable revenue as a measure to provide additional insight into our sustained business success. The total of cloud revenue and support revenue divided by total revenue is the share of more predictable revenue.
Cloud backlog: We use the following measures, in both actual and at constant currencies, to measure our forward-looking cloud performance:
| – | Total cloud backlog (TCB) |
| – | Current cloud backlog (CCB) |
| – | SAP S/4HANA CCB (to be discontinued in 2024) |
As of a specific key date, the TCB is the total contractually committed cloud revenue we expect to recognize and the CCB is the contractually committed cloud revenue we expect to recognize over the upcoming 12 months. Thus, they are subcomponents of our overall remaining performance obligations following IFRS 15.120. For our committed cloud business, we believe the TCB and the CCB are valuable indicators of our go-to-market success, as they reflect both new contracts won and existing contracts renewed. For more information on how we calculate these numbers, see the Notes to the Consolidated Financial Statements, Note (A.1).
As an additional metric, we used SAP S/4HANA CCB to measure the contractually committed cloud core ERP revenue we expect to recognize over the upcoming 12 months as of a specific key date. Starting in 2024, we will no longer disclose SAP S/4HANA CCB.
Cloud gross profit (non-IFRS): We use cloud gross profit (non-IFRS) expressed in both actual currencies and constant currencies to measure the process efficiency and performance of our cloud business.
Operating profit (non-IFRS): We use operating profit (non-IFRS) expressed in both actual currencies and constant currencies to measure our overall operational process efficiency and overall business performance.
Cloud gross margin (non-IFRS): We use our cloud gross margin (non-IFRS) to measure our process efficiency in our cloud business. Cloud gross margin (non-IFRS) is the ratio of our cloud gross profit (non-IFRS) to cloud revenue, expressed as a percentage.
Operating margin (non-IFRS): We use operating margin (non-IFRS) to measure our overall operational process efficiency. Operating margin (non-IFRS) is the ratio of our operating profit (non-IFRS) to total revenue, expressed as a percentage.
Measures to Manage Our Non-Operating Financial Performance
We used the following supporting measure to provide insight into our non-operating financial performance:
Financial income, net (IFRS and non-IFRS): This measure provides insight into the return on liquid assets and capital investments, and the cost of borrowed funds. To manage our financial income, net, we focus on cash flow, the composition of our liquid assets and capital investment portfolio, and the average rate of interest at which liquid assets and capital investments are invested. We also monitor average outstanding borrowings and associated finance costs.
Measures to Manage Overall Financial Performance
We used free cash flow as the key measure to manage our overall financial performance. In addition to that, we used several supporting measures to provide further insight into our overall financial performance:
Earnings per share (EPS) (IFRS and non-IFRS)16: EPS (basic and diluted) measures our overall performance because it captures all operating and non-operating elements of profit as well as income tax expense. It represents the portion of profit after tax attributable to equity holders of
16 We report earnings per share for our continuing operations, and total earnings per share for our continuing and discontinued operations.
|
SAP Integrated Report 2023 | |||||
| To
Our Stakeholders |
Combined
Management Report |
Consolidated
Financial Statements IFRS |
Further
Information about Sustainability |
Additional Information |
||
SAP SE allocable to each SAP share outstanding. EPS is influenced not only by our operating and non-operating business and income taxes but also by the number of shares outstanding.
Effective tax rate (IFRS and non-IFRS): We define our effective tax rate as the ratio of income tax expense to profit before tax, expressed as a percentage.
Operating, investing, and financing cash flows and free cash flow: Our consolidated statements of cash flows provide insight into how we generated and used cash and cash equivalents. When applied in conjunction with the other primary financial statements, it provides information that helps us evaluate the changes in our net assets, our financial structure (including our liquidity and solvency), and our ability to affect the amounts and timing of cash flows to adapt to changing circumstances and opportunities. We use our free cash flow measure to determine the cash flow remaining after all expenditures required to maintain or expand our organic business have been paid off. This measure provides management with supplemental information to assess our liquidity needs. We calculate free cash flow as net cash from operating activities minus purchases (other than purchases made in connection with business combinations) of intangible assets and property, plant, and equipment, as well as payments of lease liabilities.
Measures to Manage Our Non-Financial Performance
In the reporting year, we used the Customer Net Promoter Score (NPS), Employee Engagement Index, and net carbon emissions as our key measures to manage our non-financial performance. In addition to these, we used the Leadership Trust NPS as a supporting measure to provide further insight into our non-financial performance:
Customer NPS: The annual assessment of customer loyalty is based on a survey that includes the Customer NPS metric. The Customer NPS score is calculated based on the “Likelihood to Recommend” question with its proprietary scoring, identified on a scale of 0–10. We use this measure because we believe that we can only achieve our financial goals when our customers are loyal to, and satisfied with, SAP and our solutions. To derive the Customer NPS, we start with the percentage of “promoters” of SAP, that is, those giving us a score of 9 or 10 on a scale of 0–10. We then subtract the percentage of “detractors,” that is, those giving us a score of 0–6. The method ignores “passives,” that is, those giving us a score of 7 or 8. Consequently, the range of achievable scores is –100 to +100, with the latter being the best achievable score for customer loyalty as measured by the Customer NPS methodology. Starting in 2023, we made adjustments to the survey to further improve data quality and to align the sample more closely with SAP’s business priorities. We have excluded incomplete responses and responses from respondents who report that they have no influence over purchasing decisions, and we have restricted the number of eligible responses from Concur.
We determine the Employee Engagement Index and the Leadership Trust NPS as the average of the scores retrieved in each of the surveys we run within a fiscal year. Our engagement survey program “#Unfiltered” runs according to a “continuously listening” approach that includes multiple data collections throughout the year. The average scores provide an assessment, for the full year, of our employees’ engagement and trust level.
We measure both the Employee Engagement Index and the Leadership Trust NPS to get insights on the following:
| – | Employee Engagement Index: We use this index to measure the satisfaction and commitment of our employees, how proud they are of our company, and how strongly they identify with SAP. Applying this measure is recognition that our growth strategy depends on engaged employees. The index is measured as a percentage of favorable responses using five questions from our #Unfiltered engagement survey program. |
| – | Leadership Trust NPS: We use this score to further enhance accountability and to measure our collective effort to foster a work environment based on trust. It is derived from a question in our surveys that gauges employees’ trust in our leaders. Based on the Customer NPS methodology, the Leadership Trust NPS is calculated as a percentage of “promoters” (a score of 9 or 10 on a 10-point scale) minus the percentage of “detractors” (a score of 1 through 6). The method |
|
SAP Integrated Report 2023 | |||||
| To
Our Stakeholders |
Combined
Management Report |
Consolidated
Financial Statements IFRS |
Further
Information about Sustainability |
Additional Information |
||
| ignores “passives” (a score of 7 or 8). Consequently, the value range of the NPS is –100 to +100, with the latter being the best achievable score. |
Women in Executive Roles (WiER): Starting in 2024, we will use this KPI to measure the ratio of women to all genders in the three executive levels below the SAP Executive Board, namely the Global Executive Team, the Senior Executive Team, and the Executive Team.
SAP is dedicated to promoting gender equality in the workplace and is working toward achieving gender balance at all levels of the organization.
Our priority, with the help of this KPI, is to monitor how the Company is progressing on this commitment, especially at the most senior levels of the organization.
Greenhouse gas emissions: We use the following metrics to measure our progress toward our ambitious short-term and long-term climate targets (in kilotons of CO2 equivalents, rounded to the nearest kiloton). We define, measure, and report our greenhouse gas emissions according to the Greenhouse Gas (GHG) Protocol.
| – | Net carbon emissions: We used this metric to measure our progress toward our ambition to become carbon neutral in our own operations by 2023. The net carbon emissions (scope 1, scope 2, and selected scope 3 emissions) are calculated by deducting self-produced renewable energy, renewable energy certificates, and carbon offsets from our gross carbon emissions. The net carbon emissions metric will be discontinued from 2024 and replaced by the Gross greenhouse gas emissions metric. |
| – | Gross greenhouse gas emissions: Starting in 2024, we will use this metric to measure greenhouse gas emissions along the value chain (scope 1, scope 2, and scope 3 emissions relevant for SAP’s business model) as part of our Net Zero by 2030 commitment. We apply a market-based approach. Renewable energies, for example in the form of self-generated renewable electricity, investments in certified renewable energy certificates, long-term green electricity contracts (power purchase agreements), or renewable electricity purchased by our suppliers and customers can be counted toward the reduction of greenhouse gas emissions. |
Value-Based Management
Our holistic view of the performance measures described above, and the associated analyses, are together the foundation of our value-based management. We use planning and control processes to manage the compilation of these key measures and their availability to our decision-makers across various management levels.
SAP’s long-term strategic plans are the point of reference for our short- and medium-term planning and controlling processes. We initially identify future growth and profitability drivers at a highly aggregated level for the entire SAP Group. In a first step, the financial plan’s growth ambition is determined by its comprehensive product portfolio which is grouped into solution areas, with profitability drivers allocated to functions such as development, marketing, sales, delivery, and administration. In a second step, the planned total revenues and total expenses are generally allocated to the operating segments and the areas of functional responsibility of the individual members of the Executive Board (“Board area”). If a Board area represents not only a functional department but also has responsibility for operating segments within this Board area, the allocation is done at the lower segment level. Budget adjustments may be applied during the year to reflect changes in priorities, to achieve efficiency targets, and to reflect endogenous and exogenous factors. Such budget adjustments, and the assessment of performance, are handled at Board area level if the Board area is part of a segment, or at segment level if the Board area comprises several segments. It is then the individual Executive Board member’s responsibility to break down the allocated budget adjustments within the segment budget boundary. Based on an integrated portfolio process running in parallel to the budgeting process, we ensure aligned investment behavior across Board areas with regard to specific solution and/or subsolution areas. In a final step, customer-facing revenue targets and cost-of-sales and marketing targets are broken down into sales regions and market units.
|
SAP Integrated Report 2023 | |||||
| To
Our Stakeholders |
Combined
Management Report |
Consolidated
Financial Statements IFRS |
Further
Information about Sustainability |
Additional Information |
||
Based on our detailed annual plans, we determine the budget for the respective fiscal year. We also have processes in place to forecast revenue and profit on a quarterly basis, to quantify whether we expect to realize our financial targets, and to identify any deviations from plan. We continuously monitor the affected operating segments and Board areas in the SAP Group to analyze their developments and define any appropriate actions. Our entire network of planning, control, and reporting processes is implemented in integrated planning and information systems, based on SAP software, across all organizational units so that we can conduct the evaluations and analyses needed to make informed decisions.
Non-IFRS Financial Measures Cited in This Report
Explanation of Non-IFRS Measures
We disclose certain financial measures that are not prepared in accordance with IFRS and are therefore considered non-IFRS financial measures. Our non-IFRS financial measures may not correspond to non-IFRS financial measures that other companies report. The non-IFRS financial measures that we report should only be considered in addition to, and not as substitutes for, nor as superior to, our IFRS financial measures.
We believe that the disclosed supplemental historical and prospective non-IFRS financial information provides useful information to investors, because management uses this information, in addition to financial data prepared in accordance with IFRS, to attain a more transparent understanding of our past performance and our anticipated future results.
We use these non-IFRS measures consistently in our internal planning and forecasting, reporting, and compensation, as well as in our external communications, as follows:
| – | Our management primarily uses these non-IFRS measures rather than IFRS measures as the basis for making financial, strategic, and operating decisions. |
| – | The variable components of our Executive Board members’ and employees’ remuneration are based on non-IFRS numbers such as operating profit (non-IFRS) and operating margin (non-IFRS) rather than the respective IFRS measures. An additional variable component used is CCB. In September 2023, the SAP Supervisory Board decided that although expenses and corresponding releases for provisions for regulatory compliance matters are eliminated from operating profit (non-IFRS), they will affect the compensation paid to Executive Board members from fiscal year 2025 onward. This amendment does not apply to 2023 or 2024, to ensure that the Executive Board members’ current compensation is not affected by conduct that took place in performance periods prior to their appointment to the Executive Board. |
| – | The annual budgeting process for all management units is based on operating profit (non-IFRS) numbers rather than the respective IFRS financial measure. |
| – | All forecast and performance reviews with all senior managers globally are based on these non-IFRS measures, rather than the respective IFRS financial measures. |
| – | Both our internal performance targets and the guidance we provide to the capital markets are based on profit (non-IFRS) measures rather than the respective IFRS financial measures. |
Our non-IFRS financial measures reflect adjustments based on the items below, as well as adjustments for the related income tax effects.
Operating Expense (Non-IFRS)
Numbers that are identified as operating expenses (non-IFRS) have been adjusted by excluding the following expenses:
| – | Acquisition-related charges |
| ■ | Amortization expense/impairment charges for intangibles acquired in business combinations, including goodwill, and certain stand-alone acquisitions of intellectual property (including |
|
SAP Integrated Report 2023 | |||||
| To
Our Stakeholders |
Combined
Management Report |
Consolidated
Financial Statements IFRS |
Further
Information about Sustainability |
Additional Information |
||
| purchased in-process research and development) as well as sale/disposal gains and losses for these intangibles |
| ■ | Settlements of preexisting business relationships in connection with a business combination |
| ■ | Acquisition-related third-party expenses |
| – | Share-based payment expenses (applicable only until 2023) |
| – | Restructuring expenses in accordance with IFRS |
| – | Expenses for regulatory compliance matters associated with the provision for (potential) penalties arising from certain ongoing governmental investigations into our business operations, which are described in the Notes to the Consolidated Financial Statements 2023, Note (G.3), and are limited to the scope of IAS 37. |
We exclude certain acquisition-related expenses for the purpose of calculating operating profit (non-IFRS) and operating margin (non-IFRS) when evaluating SAP’s continuing operational performance, because these expenses generally cannot be changed or influenced by management after the relevant acquisition other than by disposing of the acquired assets. Since management at levels below the Executive Board does not influence these expenses, we generally do not consider these expenses for the purpose of evaluating the performance of management units. For similar reasons, until 2023 we excluded share-based payment expenses, as these costs are impacted by share price developments and other factors beyond our control. We also exclude restructuring expenses because they are volatile and generally cannot be influenced by management at levels below the Executive Board. We exclude expenses related to regulatory compliance matters, as these expenses are non-recurring and relate to conduct that took place in prior performance periods, and so that users of our consolidated financial statements and the combined management report can see the information that our management uses to manage the business.
In recent years, SAP has replaced many of its cash-settled share-based compensation plans with equity-settled plans. Having most of these plans as equity-settled reduces the impact of share price fluctuations and of other factors outside of our control. For these reasons, SAP has decided that, from 2024, it will no longer exclude share-based payment expenses from its operating profit (non-IFRS).
Financial Income, Net (Non-IFRS)
Starting in 2024, numbers that are identified as financial income, net (non-IFRS) will be adjusted by excluding the following gains and losses:
| – | Gains and losses from equity securities, net |
| ■ | Includes realized and unrealized effects from the disposal of equity securities, ongoing mark-to-market adjustments on marketable equity investments, changes in fair value of non-marketable equity securities, and others. |
Excluding gains and losses from equity securities, net, improves the period-over-period comparability, because there is less volatility caused by share price fluctuation, market developments, and other factors beyond our control.
Constant Currencies Information
We believe it is important for investors to have information that provides insight into the development of our sales. Revenue measures determined under IFRS provide information that is useful in this regard. However, both sales volume and currency effects impact period-over-period changes in sales revenue. We do not sell standardized units of products and services so we cannot provide relevant information on sales volume by providing data on the changes in product and service units sold. To provide additional information that may be useful to investors in breaking down and evaluating changes in sales volume, we present information about our revenue and various values and components relating to operating profit that are adjusted for foreign currency effects. We calculate constant currency measures by translating foreign currencies using the average exchange rates from the comparative period instead of the current period. Constant currency measures on CCB use the closing exchange rate from the previous year’s corresponding key date instead of the average exchange rate.
|
SAP Integrated Report 2023 | |||||
| To
Our Stakeholders |
Combined
Management Report |
Consolidated
Financial Statements IFRS |
Further
Information about Sustainability |
Additional Information |
||
Free Cash Flow
Among other measures, we use free cash flow to manage our overall financial performance. We define free cash flow as net cash from operating activities minus purchases of intangible assets and property, plant and equipment, and payments of lease liabilities.
Reconciliation of Operating Cash Flow from Continuing Operations to Free Cash Flow
| € millions | 2023 | 2022 | ∆ in % |
| Net cash flows from operating activities – continuing operations | 6,210 | 5,675 | 9 |
| Purchase of intangible assets and property, plant, and equipment | –785 | –877 | –11 |
| Payments of lease liabilities | –332 | –410 | –19 |
| Free cash flow | 5,093 | 4,388 | 16 |
Usefulness of Non-IFRS Measures
We believe that our non-IFRS measures are useful to investors for the following reasons:
| – | Our expense (non-IFRS), and profit (non-IFRS) measures, along with the CCB measure (see above), provide investors with insight into management’s decision-making because management uses these measures to run our business and make financial, strategic, and operating decisions. We exclude the expense adjustments outlined above when making decisions to allocate resources. In addition, we use these non-IFRS measures to facilitate comparisons of SAP’s operating performance from period to period. |
| – | The non-IFRS measures provide investors with additional information that enables a comparison of year-over-year operating performance by eliminating certain direct effects of acquisitions, share-based compensation plans, restructuring plans, and regulatory compliance matters. |
| – | Non-IFRS and non-GAAP (Generally Accepted Accounting Principles) measures are widely used in the software industry. In many cases, inclusion of our non-IFRS measures may facilitate comparison with our competitors’ corresponding non-IFRS and non-GAAP measures. |
Limitations of Non-IFRS Measures
Without being analyzed in conjunction with the corresponding IFRS measures, the non-IFRS measures are not indicative of our present and future performance primarily for the following reasons:
| – | While our profit (non-IFRS) numbers reflect the elimination of certain acquisition-related expenses, no eliminations are made for the additional revenue or other income that results from the acquisitions. |
| – | The acquisition-related amortization expense that we eliminate in deriving our profit (non-IFRS) numbers is a recurring expense that will impact our financial performance in future years. |
| – | The remaining acquisition-related charges that we eliminate in deriving our profit (non-IFRS) numbers are likely to recur should SAP enter into business combinations in the future. Similarly, the restructuring expenses that we eliminate in deriving our profit (non-IFRS) numbers are likely to recur should SAP perform restructurings in the future. |
| – | The expense adjustment for acquisition-related charges does not arise from a common conceptual basis. This is because the expense adjustment aims to improve the comparability between post-acquisition periods and pre-acquisition periods. This should particularly be considered when evaluating our operating profit (non-IFRS) and operating margin (non-IFRS) numbers, as these combine our revenue and expenses (non-IFRS) despite the absence of a common conceptual basis. |
|
SAP Integrated Report 2023 | |||||
| To
Our Stakeholders |
Combined
Management Report |
Consolidated
Financial Statements IFRS |
Further
Information about Sustainability |
Additional Information |
||
| – | Our restructuring charges resulted in significant cash outflows in the past and could do so in the future. |
| – | In the past, we have issued share-based payment awards to our employees every year and we intend to continue doing so in the future. Thus, our share-based payment expenses are recurring, although the amounts usually change from period to period. |
| – | Expenses ascribed to the regulatory compliance matters may include penalties and legal costs, all of which would impact the operating cash flows of the business. |
We believe that constant currency measures have limitations, particularly as the currency effects that are eliminated constitute a significant element of our revenue and expenses and could materially impact our performance. Therefore, we limit our use of constant currency measures to the analysis of changes in volume as one element of the full change in a financial measure. We do not evaluate our results and performance without considering operating profit (non-IFRS) at both nominal and constant currencies on the one hand, and changes in operating expenses, operating profit, or other measures of financial performance prepared in accordance with IFRS on the other. We caution the readers of our financial reports to follow a similar approach by considering actual and constant currency non-IFRS measures only in addition to, and not as a substitute for or superior to, changes in revenue, operating expenses, operating profit, or other measures of financial performance prepared in accordance with IFRS.
Despite these limitations, we believe that the presentation of our non-IFRS measures and the corresponding IFRS measures, together with the relevant reconciliations, provide useful information to management and investors regarding present and future business trends relating to our financial condition and results of operations.
Reconciliation of IFRS to Non-IFRS Financial Measures for 2023 and 2022
Reconciliation of Non-IFRS Revenue
| € millions, unless otherwise stated | 2023 | 2022 | ||
| IFRS |
Currency Impact |
Non-IFRS Constant Currency |
IFRS | |
| Revenue Numbers | ||||
| Cloud | 13,664 | 394 | 14,058 | 11,426 |
| Software licenses | 1,764 | 37 | 1,801 | 2,056 |
| Software support | 11,496 | 286 | 11,782 | 11,909 |
| Software licenses and support | 13,261 | 323 | 13,584 | 13,965 |
| Cloud and software | 26,924 | 717 | 27,641 | 25,391 |
| Services | 4,283 | 109 | 4,392 | 4,128 |
| Total revenue | 31,207 | 826 | 32,033 | 29,520 |
Reconciliation of Non-IFRS Operating Expenses
| € millions, unless otherwise stated | 2023 | 2022 | ||||||
| IFRS | Adj. | Non-IFRS |
Currency Impact |
Non-IFRS Constant Currency |
IFRS | Adj. | Non-IFRS | |
| Operating Expense Numbers | ||||||||
| Cost of cloud | –3,884 | 135 | –3,749 | –3,499 | 108 | –3,391 | ||
| Cost of software licenses and support | –1,383 | 64 | –1,318 | –1,384 | 82 | –1,302 | ||
| Cost of cloud and software | –5,267 | 200 | –5,067 | –4,883 | 190 | –4,694 | ||
| Cost of services | –3,407 | 378 | –3,029 | –3,155 | 250 | –2,904 | ||
| Total cost of revenue | –8,674 | 577 | –8,096 | –8,038 | 440 | –7,598 | ||
| Gross profit | 22,534 | 577 | 23,111 | 21,482 | 440 | 21,922 | ||
| Research and development | –6,324 | 711 | –5,613 | –6,080 | 451 | –5,629 | ||
| Sales and marketing | –8,828 | 1,246 | –7,581 | –7,946 | 789 | –7,157 | ||
| General and administration | –1,364 | 186 | –1,178 | –1,289 | 146 | –1,143 | ||
| Restructuring | –215 | 215 | 0 | –138 | 138 | 0 | ||
| Other operating income/expense, net | –16 | 0 | –16 | 60 | –65 | –5 | ||
| Total operating expenses | –25,420 | 2,935 | –22,485 | –504 | –22,989 | –23,429 | 1,898 | –21,531 |
|
SAP Integrated Report 2023 | |||||
| To
Our Stakeholders |
Combined
Management Report |
Consolidated
Financial Statements IFRS |
Further
Information about Sustainability |
Additional Information |
||
Reconciliation of Non-IFRS Profit Numbers, Income Tax, and Key Ratios
| € millions, unless otherwise stated | 2023 | 2022 | ||||||
| IFRS | Adj. | Non-IFRS |
Currency Impact |
Non-IFRS Constant Currency |
IFRS | Adj. | Non-IFRS | |
| Profit Numbers | ||||||||
| Operating profit (loss) | 5,787 | 2,935 | 8,722 | 322 | 9,044 | 6,090 | 1,898 | 7,989 |
| Profit (loss) before tax from continuing operations | 5,341 | 2,935 | 8,276 | 4,513 | 1,898 | 6,412 | ||
| Income tax expense | –1,741 | –685 | –2,426 | –1,446 | –450 | –1,895 | ||
| Profit (loss) after tax from continuing operations | 3,600 | 2,250 | 5,850 | 3,068 | 1,449 | 4,517 | ||
| Attributable to owners of parent | 3,634 | 2,246 | 5,880 | 3,277 | 1,442 | 4,719 | ||
| Attributable to non-controlling interests | –33 | 4 | –29 | –210 | 7 | –202 | ||
| Profit (loss) after tax1 | 5,964 | 2,032 | 7,995 | 1,708 | 2,837 | 4,545 | ||
| Attributable to owners of parent1 | 6,139 | 2,093 | 8,232 | 2,284 | 2,489 | 4,773 | ||
| Attributable to non-controlling interests1 | –175 | –62 | –236 | –576 | 348 | –228 | ||
| Key Ratios | ||||||||
| Operating margin (in %) | 18.5 | 28.0 | 28.2 | 20.6 | 27.1 | |||
| Effective tax rate (in %) | 32.6 | 29.3 | 32.0 | 29.6 | ||||
| Earnings per share, basic (in €) from continuing operations | 3.11 | 5.04 | 2.80 | 4.03 | ||||
| Earnings per share, basic (in €)1 | 5.26 | 7.05 | 1.95 | 4.08 | ||||
1 From continuing and discontinued operations
Non-IFRS Adjustments by Functional Areas
| € millions | 2023 | 2022 | ||||||||||
| IFRS |
Acquisition- Related |
SBP¹ | Restructuring | RCM2 | Non-IFRS | IFRS |
Acquisition- Related |
SBP¹ | Restructuring | RCM2 | Non-IFRS | |
| Cost of cloud | –3,884 | 42 | 94 | 0 | 0 | –3,749 | –3,499 | 54 | 53 | 0 | 0 | –3,391 |
| Cost of software licenses and support | –1,383 | 26 | 38 | 0 | 0 | –1,318 | –1,384 | 34 | 48 | 0 | 0 | –1,302 |
| Cost of services | –3,407 | 2 | 375 | 0 | 0 | –3,029 | –3,155 | 1 | 250 | 0 | 0 | –2,904 |
| Research and development | –6,324 | 7 | 703 | 0 | 0 | –5,613 | –6,080 | 11 | 440 | 0 | 0 | –5,629 |
| Sales and marketing | –8,828 | 257 | 834 | 0 | 155 | –7,581 | –7,946 | 286 | 503 | 0 | 0 | –7,157 |
| General and administration | –1,364 | 11 | 175 | 0 | 0 | –1,178 | –1,289 | 9 | 137 | 0 | 0 | –1,143 |
| Restructuring | –215 | 0 | 0 | 215 | 0 | 0 | –138 | 0 | 0 | 138 | 0 | 0 |
| Other operating income/expense, net | –16 | 0 | 0 | 0 | 0 | –16 | 60 | –65 | 0 | 0 | 0 | –5 |
| Total operating expenses | –25,420 | 345 | 2,220 | 215 | 155 | –22,485 | –23,429 | 330 | 1,431 | 138 | 0 | –21,531 |
1 Share-based payments 2 Regulatory compliance matters The global economy expanded at a moderate but steady pace in 2023, describes the European Central Bank (ECB) in its most recent Economic Bulletin.1 It attributes this development to strong private consumption and the support of resilient labor markets.
|
SAP Integrated Report 2023 | |||||
| To
Our Stakeholders |
Combined
Management Report |
Consolidated
Financial Statements IFRS |
Further
Information about Sustainability |
Additional Information |
||
Financial Performance: Review and Analysis
Economy and the Market
Concerning the EMEA (Europe, Middle East, Africa) region, the euro area economy grew minimally over the first half of 2023, reports the ECB. In the second half of the year, real GDP contracted slightly, mostly due to a decline in inventories but also because of subdued confidence, low competitiveness, renewed geopolitical tensions, and tighter financing conditions. However, services activity grew modestly and contributed positively to growth in the second half of the year.
In the Americas region, U.S. economic growth showed more resilience than previously anticipated. Despite significant tightening of monetary policy, the United States showed a solid domestic demand and a strong labor market and, with significant government spending, reached a robust growth, states the ECB.
As for the APJ (Asia Pacific Japan) region, Chinese economic activity stabilized in 2023, driven by stronger consumer spending. The lifting of COVID-19 restrictions at the beginning of the year and a broader recovery in private consumption compensated for weakness in the Chinese residential sector. In Japan, however, real GDP growth contracted in 2023, as high inflation weighed on activity and consumption. However, growth returned to a slightly positive yet modest territory in the fourth quarter, states the ECB.
The IT Market
“The digital business era has arrived. Spending on digital technologies is growing while traditional, nondigital spending is stagnating or even slightly dropping. The demand for digital experiences from customers, employees, partners, and suppliers has shifted to an expectation. Companies looking to sustain and grow are seeking digital revenue streams while looking to digitize operations to reduce costs and increase efficiency.”2 This is how International Data Corporation (IDC), a U.S.-based market research firm, summarizes the current IT market situation. Therefore, reports IDC, “in the post-pandemic environment, digital-first strategies have moved from being a competitive advantage to being the basic standard needed for survival. Legacy systems are increasingly proving to be bottlenecks, hindering real-time data access and agile response mechanisms. In contrast, businesses that have embraced digital transformation are reaping the benefits of adaptability and more insightful data-driven decision-making.”3
In particular, IDC finds that “the technology within a digital business platform is essential for driving the innovation and new revenue streams that companies are looking for in the digital business era” and that “more digitally mature organizations with established digital business platforms are better able to compete in an increasingly digital world.”2 That is because these “autonomous business processes evolve the nature of information from intelligence to insights to immediate decisive actions. These advances, when utilized, give organizations a competitive advantage in speed, scale, and agility and will transform them into truly digital businesses.”3
“Today’s SaaS and cloud-enabled applications are packed with generative AI (GenAI), artificial intelligence, machine learning (ML), microservices, APIs, and automated workflows,”3 explains IDC, and elaborates: “The convergence of AI, automation, and analytics signals a transformative era in digital business. As these technologies have matured, they offer organizations unprecedented capabilities to drive innovation, optimize processes, and uncover actionable insights. This isn’t just about adopting new tools; it’s a major shift toward ‘deep intelligence’ and automation, bringing agility and an insight-driven approach to the center of digital enterprises.”4
|
SAP Integrated Report 2023 | |||||
| To
Our Stakeholders |
Combined
Management Report |
Consolidated
Financial Statements IFRS |
Further
Information about Sustainability |
Additional Information |
||
A major topic, according to IDC, is sustainability: “ESG factors are swiftly emerging as critical determinants of a company’s long-term value. In today’s business climate, ESG considerations are no longer just a checklist. […] These are factoring in and becoming integral components to a company’s strategic plans.”4 In IDC’s view, therefore, “sustainability is increasingly linked to digital business […]. Digital technology spending can be both directly and indirectly dedicated to sustainability initiatives, either by specifically addressing corporate-sponsored endeavors or by establishing the platform necessary to eventually carry out sustainability goals.”2 IDC assesses that “organizations are increasingly turning to applications that can help them meticulously monitor and report their activities as well as achieve real-world sustainability milestones.”3
1 European Central Bank, Economic Bulletin, Issue 8/2023, Publication Date: January 11, 2024.
2 IDC FutureScape: Worldwide Digital Business Strategies 2024 Predictions, Doc #US50120323, October 2023.
3 IDC FutureScape: Worldwide Intelligent ERP 2024 Predictions, Doc #US51300923, October 2023.
4 IDC FutureScape: Worldwide CIO Agenda 2024 Predictions, Doc #US51294523, October 2023.
Impact on SAP
Despite macroeconomic uncertainties and geopolitical tensions, SAP again showed high resilience and all regions contributed positively to the results. The wind-down of business operations in Russia and Belarus was nearly completed in the first quarter of 2023 and remaining contract obligations were reduced to a non-material volume by the end of the year.
After two years of significant investments to accelerate SAP’s transition to the cloud (the so-called phase one), the second phase of our cloud transformation started in January 2023 with the publication of our results for the fourth quarter and full year 2022. At that time, SAP showed the passing of the tipping point towards positive profitability (non-IFRS), as planned and predicted in the strategy update that was communicated in October 2020.
Continuous execution along the midterm ambition and forthcoming positive results over the remaining quarters in 2023 underpinned SAP’s commitment to the corporate strategy. The focus on efficiencies and disciplined spending resulted in a significant expansion of its cloud gross margins (non-IFRS) throughout the year.
SAP has been an early adopter of AI technology. During the SAP Sapphire conference in May, the Company showcased the use of AI in various products. At the beginning of the second half of 2023, the Company announced strategic direct investments in three leading generative AI companies. The investments underscore SAP’s open ecosystem approach to AI, which is aimed at leveraging the best technology to embed AI across SAP’s portfolio. The Company anticipates significant possibilities for market expansion through these technologies and new premium offerings.
Overall Financial Position
Executive Board’s Assessment
Given the macroeconomic environment outlined above, the course of business was again favorable for SAP in 2023.
Noteworthy is the strong momentum in our cloud business: cloud revenue was up 20%, reaching €13.7 billion. SAP’s current cloud backlog (CCB) exceeded €13.7 billion, an increase of 25%. Total revenue increased 6% to €31.2 billion, and IFRS operating profit decreased slightly to €5.8 billion. Non-IFRS operating profit increased 9% to €8.7 billion. Free cash flow increased 16% to €5.1 billion.
Regarding SAP’s non-financial performance, we met our initial outlook ranges for all three of our most important non-financial performance indicators: the Customer Net Promoter Score increased 6 points to 9 (initial outlook: 8 to 12), the Employee Engagement Index remained unchanged at 80% (initial outlook: 76% to 80%), and our net carbon emissions continued to decrease, dropping 85 kt to 0 kt (initial outlook: 0 kt).
|
SAP Integrated Report 2023 | |||||
| To
Our Stakeholders |
Combined
Management Report |
Consolidated
Financial Statements IFRS |
Further
Information about Sustainability |
Additional Information |
||
On this basis, we are confident we can deliver on our financial and non-financial outlook for 2024 and on our updated 2025 ambition.
Performance Against Our Outlook for 2023 (Non-IFRS)
As in previous years, our 2023 operating profit-related goals and published outlook were based on our non-IFRS financial measures at constant currencies. For this reason, in the following section we discuss performance against our outlook in terms of non-IFRS numbers, unless otherwise stated, (at constant currencies) derived from IFRS measures. The subsequent section about International Financial Reporting Standards (IFRS) operating results discusses numbers only in terms of IFRS, so the numbers in that section are not expressly identified as IFRS numbers.
Outlook for 2023 (Non-IFRS)
The initial outlook for 2023, including Qualtrics (for more information, see the table Comparison of Outlook and Results for 2023), expected full-year cloud revenue to range between €15.3 billion and €15.7 billion, and cloud and software revenue to range between €28.2 billion and €28.7 billion, with more predictable revenue anticipated to make up 83% of this result. Furthermore, we expected operating profit (non-IFRS) to range between €8.8 billion and €9.1 billion and a free cash flow of approximately €5.0 billion. We expected a full-year 2023 effective tax rate (IFRS) of 28.0% to 32.0% (2022: 32.0%) and an effective tax rate (non-IFRS) of 26.0% to 28.0% (2022: 29.6%), strongly depending on the development of Sapphire Ventures’ investments. This initial outlook reflected SAP executing on its cloud strategy, which is driving the accelerated cloud growth through both new business and cloud adoption by existing customers, scaling SAP’s cloud momentum towards its midterm ambition.
In April 2023, we adjusted our outlook for continuing operations, reflecting the expected Qualtrics divestiture. We thereafter expected cloud revenue to range between €14.0 billion and €14.4 billion, cloud and software revenue to range between €26.9 billion and €27.4 billion, and operating profit (non-IFRS) to range between €8.6 billion and €8.9 billion. Furthermore, we adjusted the anticipated share of more predictable revenue to 82% and thereafter expected a free cash flow of approximately €4.9 billion.
In July 2023, to reflect then-current market development, we updated and tightened our ranges slightly. We lowered our expectations for cloud revenue to a range between €14.0 billion and €14.2 billion, and for cloud and software revenue to a range between €27.0 billion and €27.4 billion, but increased the range slightly for our expected operating profit (non-IFRS) to between €8.65 billion and €8.95 billion.
In October 2023, SAP reaffirmed its July 2023 outlook.
|
SAP Integrated Report 2023 | |||||
| To
Our Stakeholders |
Combined
Management Report |
Consolidated
Financial Statements IFRS |
Further
Information about Sustainability |
Additional Information |
||
2023 Actual Revenue and Profit Performance Compared to Outlook (Non-IFRS)
Cloud revenue is within the range of our revised 2023 outlook, with the combined cloud and software and operating profit exceeding the upper end of our outlook range.
Comparison of Outlook and Results for 2023
| Results for 20221 |
Outlook
for 2023 (Integrated Report 2022) |
Revised
Outlook for 2023 (Q1 Quarterly Statement) |
Revised
Outlook for 2023 (Half-Year Report) |
Outlook
for 2023 (Q3 Quarterly Statement) |
Results for 2023 |
|
| Cloud
revenue (non-IFRS, at constant currencies) |
€10.67 billion | €15.3
billion to €15.7 billion |
€14.0
billion to €14.4 billion |
€14.0
billion to €14.2 billion |
€14.0
billion to €14.2 billion |
€14.06 billion |
| Cloud
and software revenue (non-IFRS, at constant currencies) |
€24.01 billion | €28.2
billion to €28.7 billion |
€26.9
billion to €27.4 billion |
€27.0
billion to €27.4 billion |
€27.0
billion to €27.4 billion |
€27.64 billion |
| Operating
profit (non-IFRS, at constant currencies) |
€7.67 billion | €8.8
billion to €9.1 billion |
€8.6
billion to €8.9 billion |
€8.65
billion to €8.95 billion |
€8.65
billion to €8.95 billion |
€9.04 billion |
| Share of predictable revenue | 79% | 83% | 82% | 82% | 82% | 81% |
| Free cash flow | €4.39 billion | approx. €5.0 billion | approx. €4.9 billion | approx. €4.9 billion | approx. €4.9 billion | €5.08 billion |
| Effective
tax rate (IFRS) |
32.0% | 28.0%
to 32.0% |
28.0% to 32.0% |
28.0% to 32.0% |
28.0% to 32.0% |
32.6% |
| Effective
tax rate (non-IFRS) |
29.6% | 26.0% to 28.0% |
26.0% to 28.0% |
26.0% to 28.0% |
26.0% to 28.0% |
29.3% |
1 Results for 2022 have been adjusted for continuing operations to reflect the divestiture of Qualtrics.
In the current global economic climate shaped by continuously high asset prices and disrupted by international conflicts, coupled with an increasing demand for artificial intelligence and data warehousing, the demand for our cloud solutions and services confirms our revised expectations, reflecting the strong business performance which is expected to continue to accelerate cloud revenue growth.
Our current cloud backlog (contractually committed cloud revenue that we expect to recognize over the upcoming 12 months) reached €13.75 billion at actual currencies (€14.04 billion at constant currencies; 2022: €11.73 billion at constant currencies). This was an increase of 25% (27% on a constant currency basis; 2022: 24%). The growth rate of our current cloud backlog is in line with our guidance from the year before to achieve a growth rate similar to 2022, while at a larger scale.
On December 31, 2023, total cloud backlog was up 37% to €44.25 billion (up 39% to €45.09 billion at constant currencies).
At constant currencies, the resulting cloud revenue grew from €10.67 billion in 2022 to €14.06 billion in 2023, in line with our guidance range of €14.0 billion to €14.2 billion. That represented an increase of 23% at constant currencies.
Cloud and software revenue grew 9% at constant currencies to €27.64 billion (2022: €24.01 billion), and thus ended higher than our revised outlook range forecasted for 2023 of €27.0 billion to €27.4 billion.
Thanks to the strong increase in cloud business, we were able to increase the share of more predictable revenue 2pp to 81% (2022: 79%), which is 1pp below our revised outlook.
Total revenue on a constant currency basis grew 9% in 2023 to €32.03 billion (2022: €27.90 billion).
|
SAP Integrated Report 2023 | |||||
| To
Our Stakeholders |
Combined
Management Report |
Consolidated
Financial Statements IFRS |
Further
Information about Sustainability |
Additional Information |
||
Operating expenses (non-IFRS) on a constant currency basis increased 7% in 2023 to €22.99 billion (2022: €20.23 billion).
Our expense base in 2023 was impacted by our transformation to a fast-growing cloud business. The cloud gross margin (non-IFRS) for 2023 was 72.6%, increasing 2.2pp at constant currencies year over year. Our cloud margin benefitted from an increase in cloud revenue and significantly lower investments in the Next-Generation Cloud Delivery initiative (modernization of our cloud delivery to enable a more resilient and scalable cloud infrastructure).
Our overall headcount increased by 1,291 full-time equivalents, or FTEs (732 thereof organically), primarily in the functional areas Research and Development and Cloud.
Non-IFRS operating profit in 2023 was €9.04 billion on a constant currency basis (2022: €7.67 billion), reflecting an increase of 13%. Operating profit and margin benefitted from accelerated growth in revenue, completion of the Next Generation Cloud Delivery initiative, and strict cost management.
Thus, non-IFRS operating profit came in above the target range (€8.65 billion to €8.95 billion).
We achieved an effective tax rate (IFRS) of 32.6% and an effective tax rate (non-IFRS) of 29.3%, which is above the outlook of 28.0% to 32.0% (IFRS) and 26.0% to 28.0% (non-IFRS). This mainly resulted from changes in valuation allowances on deferred tax assets.
Operating Results (IFRS)
This section on operating results (IFRS) discusses results only in terms of IFRS measures, so the IFRS numbers are not expressly identified as such.
We break our operations down into three regions: the Europe, Middle East, and Africa (EMEA) region, the Americas region, and the Asia Pacific Japan (APJ) region. We allocate revenue amounts to each region based on where the customer is located. For more information about revenue by geographic region, see the Notes to the Consolidated Financial Statements, Note (A.1).
Revenue
Total Revenue1
€ millions | change since previous year
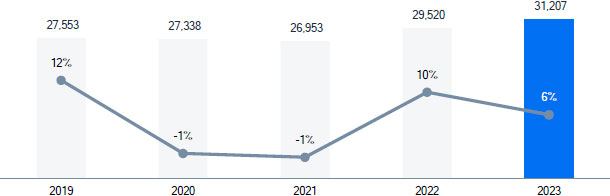
1 The numbers for 2023, 2022, and 2021 reflect continuing operations as a result of the divestiture of Qualtrics.
Total revenue increased from €29,520 million in 2022 to €31,207 million in 2023, representing an increase of €1,688 million, or 6%.
Cloud and software revenue represented 86% of total revenue in 2023 (2022: 86%). Service revenue increased 4% from €4,128 million in 2022 to €4,283 million in 2023, which was 14% of total revenue (2022: 14%).
|
SAP Integrated Report 2023 | |||||
| To
Our Stakeholders |
Combined
Management Report |
Consolidated
Financial Statements IFRS |
Further
Information about Sustainability |
Additional Information |
||
Revenue by Revenue Type
€ millions
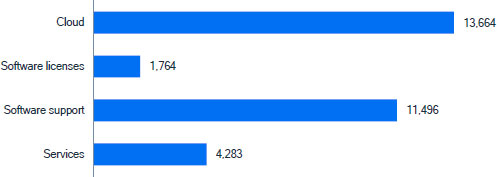
For more information about our regional performance, see the Revenue by Region section.
Cloud revenue refers to the income earned from contracts that permit the customer during the term of its contract with SAP to access specific software solutions hosted by SAP or third parties engaged by SAP. Software licenses revenue results from the fees earned from selling or licensing software to customers. Support revenue represents fees earned from providing customers with technical support services and unspecified software upgrades, updates, and enhancements. For more information about our revenue types, see the Notes to the Consolidated Financial Statements, Note (A.1).
Cloud and Software Revenue1
€ millions | change since previous year
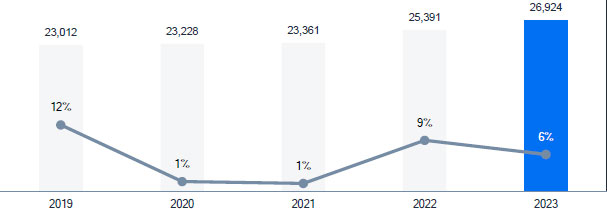
1 The numbers for 2023, 2022, and 2021 reflect continuing operations as a result of the divestiture of Qualtrics.
Cloud and software revenue grew from €25,391 million in 2022 to €26,924 million in 2023, an increase of 6%.
|
SAP Integrated Report 2023 | |||||
| To
Our Stakeholders |
Combined
Management Report |
Consolidated
Financial Statements IFRS |
Further
Information about Sustainability |
Additional Information |
||
Cloud Revenue1
€ millions | change since previous year
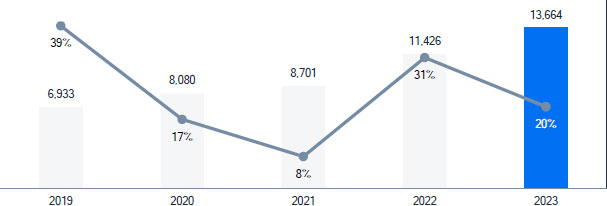
1 The numbers for 2023, 2022, and 2021 reflect continuing operations as a result of the divestiture of Qualtrics.
Cloud revenue increased €2,238 million, or 20%, from €11,426 million in 2022 to €13,664 million in 2023. Cloud revenue growth benefitted from the accelerated transition of our customers to the cloud. The transactional cloud revenue remained approximately at the level of the previous year. Cloud revenue for Cloud ERP Suite increased 29%, or €2,417 million, to €10,626 million in 2023 (2022: €8,209 million). For more information about Cloud ERP Suite, see the Performance Management System section.
The current cloud backlog increased €2,721 million, or 25%, to €13,745 million in 2023 (2022: €11,024 million).
Our software licenses revenue declined €292 million from €2,056 million in 2022 to €1,764 million in 2023.
The demand for SAP software helped us maintain a stable maintenance customer base for software support, resulting in software support revenue of €11,496 million in 2023 (2022: €11,909 million). The slight decline is attributable to the accelerated transition of our customers to the cloud and to unfavorable currency exchange rates. SAP Enterprise Support was the largest contributor to our software support revenue.
Software licenses and software support revenue decreased €705 million, or 5%, from €13,965 million in 2022 to €13,261 million in 2023.
More Predictable Revenue1
€ millions
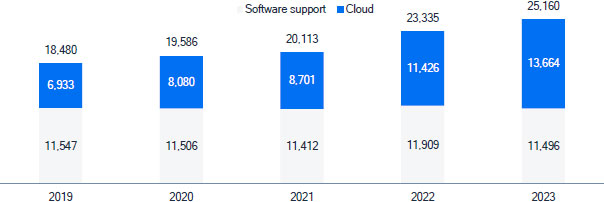
1 The numbers for 2023, 2022, and 2021 reflect continuing operations as a result of the divestiture of Qualtrics.
We define more predictable revenue as the sum of our cloud revenue and our software support revenue. Our more predictable revenue increased from €23,335 million in 2022 to €25,160 million in 2023. Cloud revenue surpassed support revenue in 2023 and drove the growth of 8%. More predictable revenue accounted for 81% of our total revenue in 2023 (2022: 79%), continuing the upward trend from prior years.
|
SAP Integrated Report 2023 | |||||
| To
Our Stakeholders |
Combined
Management Report |
Consolidated
Financial Statements IFRS |
Further
Information about Sustainability |
Additional Information |
||
Services revenue combines revenue from consulting services, premium support services, and other services such as training services. Consulting services primarily relate to the implementation of our cloud and on-premise software products. Our premium support offering consists of high-end support services tailored to customer requirements. For more information, see the Notes to the Consolidated Financial Statements, Note (A.1).
Services revenue increased €155 million, or 4%, from €4,128 million in 2022 to €4,283 million in 2023. This increase was predominantly caused by very strong growth across the entire services portfolio of offerings with accelerated growth in our premium support revenues. At the same time, the revenue development was positively impacted by a year-over-year increase in order entry.
Consulting revenue and premium support revenue increased €165 million, or 4%, from €3,709 million in 2022 to €3,874 million in 2023. In 2023, consulting and premium support revenue contributed 90% of the total services revenue (2022: 90%) and 12% of total revenue (2022: 13%).
Revenue from other services decreased €10 million, or 2%, to €409 million in 2023 (2022: €419 million).
Revenue by Region
Revenue by Region (Based on Customer Location)
€ millions
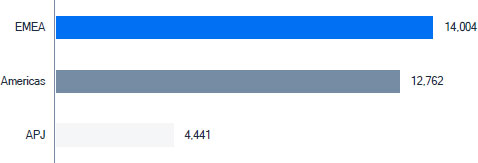
EMEA Region
In 2023, the EMEA region generated €14,004 million in revenue (2022: €12,909 million), which was 45% of total revenue (2022: 44%). Revenue in Germany increased 10% to €4,921 million (2022: €4,469 million). Germany contributed 35% (2022: 35%) of all EMEA region revenue. The remaining revenue in the EMEA region was primarily generated in France, Italy, the Netherlands, Switzerland, and the United Kingdom.
Cloud and Software Revenue (EMEA)1
€ millions
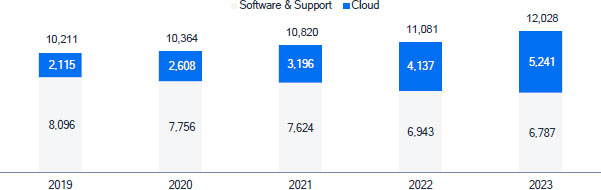
1 The numbers for 2023, 2022, and 2021 reflect continuing operations as a result of the divestiture of Qualtrics.
|
SAP Integrated Report 2023 | |||||
| To
Our Stakeholders |
Combined
Management Report |
Consolidated
Financial Statements IFRS |
Further
Information about Sustainability |
Additional Information |
||
Cloud and software revenue generated in the EMEA region totaled €12,028 million (2022: €11,081 million). That was 86% of all revenue from the region (2022: 86%). Cloud revenue in the EMEA region rose 27% to €5,241 million in 2023 (2022: €4,137 million). Software licenses and software support revenue decreased 2% to €6,787 million in 2023 (2022: €6,943 million).
Americas Region
In 2023, 41% of our total revenue was generated in the Americas region (2022: 41%). Total revenue in the Americas region increased 4% to €12,762 million (2022: €12,227 million). Revenue in the United States increased to €10,204 million (2022: €9,799 million). The United States contributed 80% (2022: 80%) of all revenue generated in the Americas region. In the remaining countries of the Americas region, revenue increased 5% to €2,558 million. Revenue in the remaining countries of the Americas region was generated primarily in Brazil, Canada, and Mexico.
Cloud and Software Revenue (Americas)1
€ millions
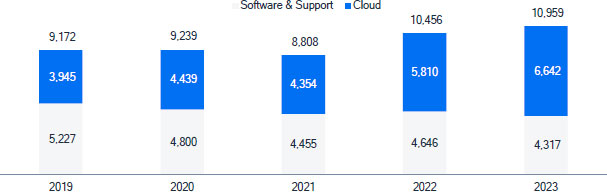
1 The numbers for 2023, 2022, and 2021 reflect continuing operations as a result of the divestiture of Qualtrics.
Cloud and software revenue generated in the Americas region totaled €10,959 million (2022: €10,456 million). That was 86% of all revenue from the region (2022: 86%). Cloud revenue in the Americas region rose 14% to €6,642 million in 2023 (2022: €5,810 million). The United States contributed 81% of cloud revenue generated in the Americas region. Software licenses and software support revenue in the Americas regions amounted to €4,317 million in 2023 (2022: €4,646 million).
APJ Region
In 2023, 14% of our total revenue was generated in the APJ region (2022: 15%). Total revenue in the APJ region increased 1% to €4,441 million (2022: €4,384 million) despite unfavorable changes in currency exchange rates for SAP. Total revenue in Japan increased to €1,243 million (2022: €1,218 million). Revenue from Japan accounted for 28% of all revenue generated in the APJ region (2022: 28%). In the remaining countries of the APJ region, revenue increased 1%. Revenue in the remaining countries of the APJ region was generated primarily in Australia, China, and India.
|
SAP Integrated Report 2023 | |||||
| To
Our Stakeholders |
Combined
Management Report |
Consolidated
Financial Statements IFRS |
Further
Information about Sustainability |
Additional Information |
||
Cloud and Software Revenue (APJ)1
€ millions
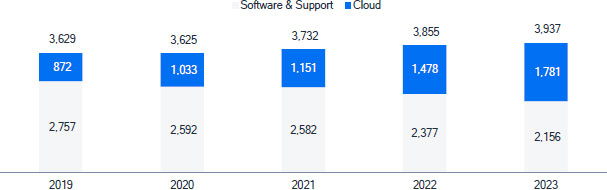
1 The numbers for 2023, 2022, and 2021 reflect continuing operations as a result of the divestiture of Qualtrics.
Cloud and software revenue in the APJ region totaled €3,937 million (2022: €3,855 million). That was 89% of all revenue from the region (2022: 88%). Cloud revenue in the APJ region rose 21% to €1,781 million in 2023 (2022: €1,478 million). Software licenses and software support revenue decreased from €2,377 million in 2022 to €2,156 million in 2023.
Operating Profit and Operating Margin
Operating profit decreased to €5,787 million and operating margin decreased 2.1pp to 18.5%. Operating profit was impacted by a reduced contribution from software licenses revenue and from increased total operating expenses. Share-based payment expenses increased to €2,220 million (2022: €1,431 million), mainly due to an increase in the SAP share price of more than €40 from January 1, 2023, to December 31, 2023 (January 1, 2022, to December 31, 2022: drop in the SAP share price of around €30). A shorter contract life for on-premise support contracts led to accelerated amortization of costs related to these contracts, resulting in higher amortization expenses amounting to €121 million for 2023 (2022: €0 million). Furthermore, higher personnel costs were driven by higher bonus expenses prompted by strong revenue growth and robust attainment of other bonus measures. In addition, the recognition of a provision for fines in regard to anti-bribery matters led to expenses of €155 million in 2023 (2022: €0 million). Operating profit was also impacted by investments in the Next-Generation Cloud Delivery campaign and in other research and development and sales and marketing initiatives to capture current and future growth opportunities. Next-Generation Cloud Delivery from SAP is the modernization of our cloud delivery to enable a more resilient and scalable cloud infrastructure, and ended mid-2023. Additionally, the prior-year operating profit included a disposal gain of €175 million from the sale of the SAP Litmos business.
Operating Profit1
€ millions | change since previous year
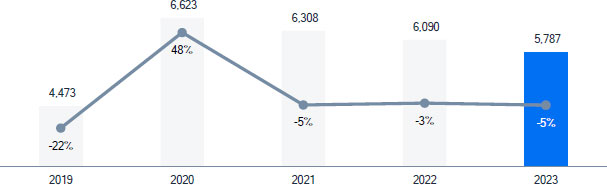
1 The numbers for 2023, 2022, and 2021 reflect continuing operations as a result of the divestiture of Qualtrics.
|
SAP Integrated Report 2023 | |||||
| To
Our Stakeholders |
Combined
Management Report |
Consolidated
Financial Statements IFRS |
Further
Information about Sustainability |
Additional Information |
||
Operating Margin1
Percent | change since previous year
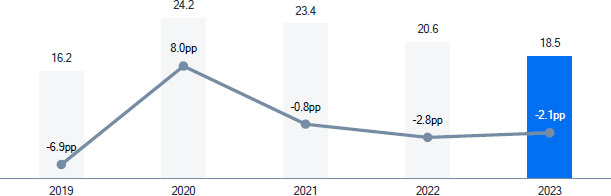
1 The numbers for 2023, 2022, and 2021 reflect continuing operations as a result of the divestiture of Qualtrics.
Changes to the individual elements in our cost of revenue were as follows:
Cost of Cloud and Software
Cost of cloud and software consists primarily of costs for deploying and operating cloud solutions, the cost of developing custom solutions that address customers’ specific business requirements, and customer support costs.
In 2023, the cost of cloud and software increased 8% to €5,267 million (2022: €4,883 million) and our cloud margin increased 2.2pp from 69.4% in 2022 to 71.6% in 2023, based on strong revenue growth paired with a slower growth in cost of cloud due to a scalable cloud infrastructure and operational efficiency. The software licenses and software support margin was 89.6%, 0.5pp below the prior-year level (2022: 90.1%). Software licenses and software support revenue decreased 5% to €13,261 million (2022: €13,965 million), primarily attributable to a 14% decline in software revenue. Software licenses and software support costs remained relatively constant year over year at €1,383 million (2022: €1,384 million).
Cost of Services
Cost of services consists primarily of the cost of consulting, premium services, and training courses, and the cost of bought-in consulting and training resources. The cost of services increased 8% to €3,407 million (2022: €3,155 million), in line with increased demand for project consulting and premium engagement services as well as higher business travel costs as COVID-related travel restrictions further eased around the world. Our gross margin on services, defined as services profit as a percentage of services revenue, decreased 3.1pp to 20.5% (2022: 23.6%). As our services business trends away from traditional software licensing and consulting revenue toward more subscription revenue from cloud solutions, we continue to adjust our service delivery resources to support our cloud offerings.
Research and Development
Our research and development (R&D) expense consists primarily of the personnel cost of our R&D employees, costs incurred for independent contractors whom we retain to assist in our R&D activities, and depreciation of the computer hardware and amortization of the software we use for our R&D activities.
The R&D expense rose 4% to €6,324 million in 2023 from €6,080 million in 2022. This increase was mainly due to higher personnel costs driven by a 3% year-over-year growth in our R&D headcount for additional capacity demands in relation to the increased revenue. The R&D expense was also impacted by several initiatives to capture current and future growth opportunities. R&D expense as a percentage of total revenue decreased to 20.3% in 2023 (2022: 20.6%).
|
SAP Integrated Report 2023 | |||||
| To
Our Stakeholders |
Combined
Management Report |
Consolidated
Financial Statements IFRS |
Further
Information about Sustainability |
Additional Information |
||
For more information, see the Our Investments in Innovation section.
Sales and Marketing Expense
Sales and marketing expense consists mainly of personnel costs, direct sales costs, and the cost of marketing our products and services.
Our sales and marketing expense grew 11% from €7,946 million in 2022 to €8,828 million in 2023. This increase is mainly attributable to higher personnel costs due to higher bonus payments prompted by strong revenue growth. In addition, travel costs for sales teams increased as COVID-related global travel restrictions accelerated to ease.
Accordingly, the ratio of sales and marketing expense to total revenue, expressed as a percentage, increased 1.4pp in 2023 to 28.3% (2022: 26.9%).
General and Administration Expense
Our general and administration expense consists mainly of personnel costs to support our finance and administration, human resource, and corporate functions.
General and administration expense increased 6% from €1,289 million in 2022 to €1,364 million in 2023. This increase is primarily due to higher personnel expenses in 2023, the majority thereof due to higher bonus payments. The ratio of general and administration expense to total revenue was flat year over year at 4.4% (2022: 4.4%).
Segment Information
At the end of 2023, SAP had one reportable segment: Applications, Technology & Services. The segment information for 2023 and the comparative prior periods were restated to conform with the new segment composition.
For more information about our segment reporting and the changes in the composition of our reportable segments in 2023, see the Notes to the Consolidated Financial Statements, Notes (C.1) and (C.2).
Applications, Technology & Services
|
€ millions, unless otherwise stated (non-IFRS) |
2023 | 2022 | ∆ in % | ∆ in % | |
|
Actual Currency |
Constant Currency |
Actual Currency |
Actual
Currency |
Constant Currency |
|
| Cloud revenue – SaaS1 | 9,608 | 9,901 | 7,986 | 20 | 24 |
| Cloud revenue – PaaS2 | 2,182 | 2,236 | 1,533 | 42 | 46 |
| Cloud revenue – IaaS3 | 748 | 766 | 908 | –18 | –16 |
| Cloud revenue | 12,538 | 12,903 | 10,428 | 20 | 24 |
| Thereof SAP S/4HANA cloud revenue4 | 3,495 | 3,599 | 2,088 | 67 | 72 |
| Cloud gross margin – SaaS1 (in %) | 70.1 | 70.5 | 69.0 | 1.1pp | 1.5pp |
| Cloud gross margin – PaaS2 (in %) | 84.7 | 84.8 | 80.9 | 3.9pp | 3.9pp |
| Cloud gross margin – IaaS3 (in %) | 34.3 | 32.5 | 35.2 | –0.9pp | –2.6pp |
| Cloud gross margin (in %) | 70.5 | 70.7 | 67.8 | 2.7pp | 2.9pp |
| Segment revenue | 30,057 | 30,853 | 28,496 | 5 | 8 |
| Segment gross margin (in %) | 73.5 | 73.7 | 73.5 | 0.0pp | 0.1pp |
| Segment profit | 9,811 | 10,129 | 8,824 | 11 | 15 |
| Segment margin (in %) | 32.6 | 32.8 | 31.0 | 1.7pp | 1.9pp |
1 Software as a service: SaaS comprises all other offerings that are not shown as PaaS or IaaS.
2 Platform as a service: PaaS primarily includes SAP Business Technology Platform, the SAP LeanIX portfolio, and SAP Signavio solutions.
3 Infrastructure as a service: A major portion of IaaS comes from SAP HANA Enterprise Cloud.
4 Mainly derived from the Applications, Technology & Services segment.
|
SAP Integrated Report 2023 | |||||
| To
Our Stakeholders |
Combined
Management Report |
Consolidated
Financial Statements IFRS |
Further
Information about Sustainability |
Additional Information |
||
The Applications, Technology & Services segment recorded a strong increase in cloud revenue of 20% in 2023 (24% at constant currencies), supported by SAP Business Technology Platform as well as SAP S/4HANA, whose cloud revenue increased 67% (72% at constant currencies) to €3,495 million. Cost of cloud for the Applications, Technology & Services segment increased 10% (13% at constant currencies), which overall caused the cloud gross margin to widen 2.7pp (2.9pp at constant currencies) to 70.5%. Thereof, PaaS and SaaS cloud gross margins grew 3.9pp and 1.5pp at constant currencies, which resulted in a cloud gross margin of 84.7% and 70.1% respectively. Software support revenue slightly decreased by 3% (1% at constant currencies) to €11,495 million in 2023. Software licenses revenue decreased 14% (12% at constant currencies) mainly due to the shift toward cloud revenue. As such, the segment achieved a total software licenses and support revenue of €13,259 million. Total segment revenue nevertheless rose 5% (8% at constant currencies) and ended 2023 at €30,057 million.
Overall, the share of more predictable revenue within the Applications, Technology & Services segment increased 1.6pp from 78.4% in 2022 to 80.0% in 2023.
Cost of revenue increased 5% (8% at constant currencies) compared to the prior year, ending 2023 at €7,951 million. This development was mainly driven by an increase in cost of cloud.
Consequently, segment profit increased 11% (15% at constant currencies) and reached €9,811 million in 2023, whereas segment margin improved 1.7pp (1.9pp at constant currencies).
Reconciliation of Cloud Revenues and Margins
| € millions, unless otherwise stated | Q1–Q4 2023 | Q1–Q4 2022 | ∆ in % | |||
| Actual Currency |
Currency Impact |
Constant Currency |
Actual Currency |
Actual Currency |
Constant Currency |
|
| Cloud revenue – SaaS1 | 10,734 | 322 | 11,056 | 8,985 | 19 | 23 |
| Cloud revenue – PaaS2 | 2,182 | 54 | 2,236 | 1,533 | 42 | 46 |
| Cloud revenue – IaaS3 | 748 | 18 | 766 | 908 | –18 | –16 |
| Cloud revenue | 13,664 | 394 | 14,058 | 11,426 | 20 | 23 |
| Thereof SAP S/4HANA Cloud revenue4 | 3,495 | 105 | 3,599 | 2,088 | 67 | 72 |
| Cloud gross margin – SaaS1 (in %) | 72.8 | 73.1 | 72.1 | 0.7pp | 1.0pp | |
| Cloud gross margin – PaaS2 (in %) | 84.7 | 84.8 | 80.9 | 3.9pp | 3.9pp | |
| Cloud gross margin – IaaS3 (in %) | 34.3 | 32.5 | 35.2 | –0.9pp | –2.6pp | |
| Cloud gross margin (in %) | 72.6 | 72.7 | 70.3 | 2.2pp | 2.4pp | |
1 Software
as a service: SaaS comprises all other offerings that are not shown as PaaS or IaaS.
2 Platform as a service: PaaS primarily includes SAP Business Technology Platform, the SAP LeanIX portfolio,
and SAP Signavio solutions.
3 Infrastructure as a service: A major portion of IaaS comes from SAP HANA Enterprise Cloud.
4 Mainly derived from the Applications, Technology & Services segment.
Financial Income, Net
Financial income, net, increased to –€456 million (2022: –€1,389 million). Our finance income was €857 million (2022: €811 million) and our finance costs were €1,313 million (2022: €2,200 million).
Finance income primarily consists of interest income on investments in the amount of €486 million (2022: €193 million) and gains from IFRS 9-related fair value adjustments, mainly of Sapphire Ventures investments, and the disposal of equity securities totaling €380 million (2022: €608 million).
Finance costs mainly consist of interest expense on financial liabilities and from derivative instruments (including a forward contract to hedge the USD purchase price from the Qualtrics sale against EUR-USD fluctuations. This forward contract matured in the second quarter of 2023 with a total realized loss of €91 million, of which €106 million was recognized in finance costs) amounting to €639 million (2022: €272 million), and IFRS 9-related fair value adjustments or losses from disposal of Sapphire Ventures investments totaling €525 million (2022: €1,802 million). For more information about financing instruments, see the Notes to the Consolidated Financial Statements, Note (D.1) and Note (E.3).
|
SAP Integrated Report 2023 | |||||
| To
Our Stakeholders |
Combined
Management Report |
Consolidated
Financial Statements IFRS |
Further
Information about Sustainability |
Additional Information |
||
Income Taxes
The effective tax rate in 2023 was 32.6% (2022: 32.0%). The year-over-year increase mainly resulted from changes in valuation allowances on deferred tax assets, in non-deductible expenses and withholding taxes, which were partly compensated by changes in tax-exempt income, mainly related to Sapphire Ventures. For more information about income taxes, see the Notes to the Consolidated Financial Statements, Note (C.5).
Profit After Tax and Earnings per Share
Profit after tax increased to €3,600 million in 2023 (2022: €3,068 million).
Profit After Tax1
€ millions | change since previous year
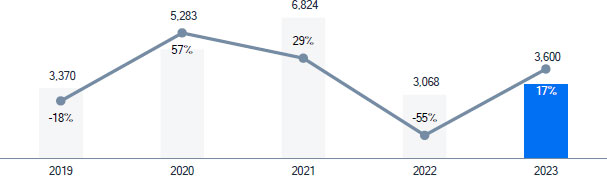
1 The numbers for 2023, 2022, and 2021 reflect continuing operations as a result of the divestiture of Qualtrics.
Basic earnings per share increased to €3.11 (2022: €2.80). The number of shares outstanding decreased to 1,167 million in 2023 (2022: 1,170 million).
Earnings per Share1
€ | change since previous year
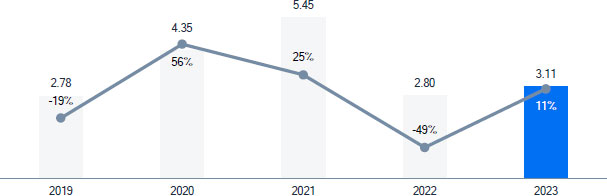
1 The numbers for 2023, 2022, and 2021 reflect continuing operations as a result of the divestiture of Qualtrics.
Dividend
We hold the view that our shareholders should benefit appropriately from the profit the Company made in 2023. Our dividend policy is to pay a dividend totaling 40% or more of profit after tax.
The Executive Board and the Supervisory Board of SAP SE will recommend to the Annual General Meeting of Shareholders in May 2024 a total dividend for 2023 of €2.20 per share (2022: €2.05). Based on this recommendation, the overall dividend payout ratio (which means the total distributed dividend as a percentage of profit after tax based on continued and discontinued operations) would be 43% (2022: 140%).
|
SAP Integrated Report 2023 | |||||
| To
Our Stakeholders |
Combined
Management Report |
Consolidated
Financial Statements IFRS |
Further
Information about Sustainability |
Additional Information |
||
Compared to the total dividend in 2023, the proposed dividend increased by 7%. The payment in 2022 included a special dividend of €0.50 to celebrate SAP’s 50th anniversary.
If the shareholders approve this recommendation, and based on the number of treasury shares as at December 31, 2023, the total amount distributed in dividends will be €2,568 million. The actual amount distributed could be different from this total amount, because the number of shares held as treasury stock might change before the Annual General Meeting of Shareholders. In 2023, we distributed €2,395 million in dividends.
For more information about the development of our profit after tax, see the sections Financial Income, Net, Income Taxes, and Profit after Tax and Earnings per Share.
Dividend per Share
€ | change since previous year
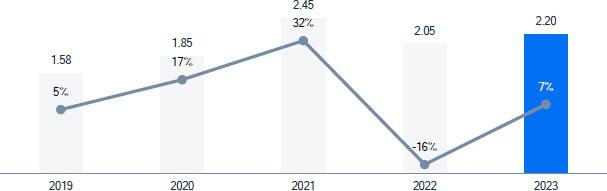
Finances (IFRS)
Overview
Global Financial Management
We use global centralized financial management to control liquid assets and monitor exposure to interest rates and currencies. The primary aim of our financial management is to maintain liquidity in the Group at a level that is adequate to meet our financial obligations at all times. Most SAP entities have their liquidity managed centrally by the Group, so that liquid assets across the Group can be consolidated, monitored, and invested in accordance with Group policy. High levels of liquid assets help keep SAP flexible, sound, and independent. In addition, various credit facilities are currently available for additional liquidity, if required. For more information about these facilities, see the Credit Facilities section.
We manage credit, liquidity, interest rate, equity price, and foreign exchange rate risks on a Group-wide basis. We use selected derivatives exclusively for this purpose and not for speculation, which is defined as entering into a derivative instrument for which we do not have corresponding underlying transactions. The rules for the use of derivatives and other rules and processes concerning the management of financial risks are documented in our Treasury Guideline, which applies globally to all companies in the Group. For more information about the management of each financial risk and about our risk exposure, see the Notes to the Consolidated Financial Statements, Notes (F.1) and (F.2).
Capital Structure Management
The primary objective of our capital structure management is to maintain a strong financial profile for investor, creditor, and customer confidence, and to support the growth of our business. We seek to maintain a capital structure that will enable us to cover our funding requirements through the capital markets at reasonable conditions, and in so doing, ensure a high level of independence, and financial flexibility. For more information about the capital structure and its analysis, see the The long-term credit rating for SAP SE is “A2” by Moody’s (positive outlook) and “A+” by Standard & Poor’s (stable outlook).
|
SAP Integrated Report 2023 | |||||
| To
Our Stakeholders |
Combined
Management Report |
Consolidated
Financial Statements IFRS |
Further
Information about Sustainability |
Additional Information |
||
Analysis of Consolidated Statement of Financial Position section and the Notes to the Consolidated Financial Statements, Note (E.1).
On May 16, 2023, SAP announced a new share repurchase program with an aggregate volume of up to €5 billion and a term until December 31, 2025. As at December 31, 2023, SAP had repurchased 7,563,796 shares at an average price of €125.49, with payouts of approximately €949 million under the program in 2023. Repurchased shares will primarily be used to service future awards granted under the ‘Move SAP’ share-based compensation plan.
Liquidity Management
Our primary source of cash, cash equivalents, and current investments is funds generated from our business operations. Over the past several years, our principal use of cash has been to support operations and our capital expenditure requirements resulting from our growth, to quickly repay financial debt, to acquire businesses, to pay dividends on our shares, and to buy back SAP shares on the open market. On December 31, 2023, our cash, cash equivalents, and current investments were primarily held in euros and U.S. dollars. We generally invest only in the financial assets of issuers or funds with a minimum credit rating of BBB, and pursue a policy of cautious investment characterized by wide portfolio diversification with a variety of counterparties, predominantly short-term investments, and standard investment instruments. Our investments in financial assets of issuers with a credit rating lower than BBB were not material in 2023.
We believe that our liquid assets combined with our undrawn credit facilities are sufficient to meet our operating financing needs in 2024 and, together with expected cash flows from operations, will support debt repayments, currently planned capital expenditure requirements, and capital returns to our shareholders over the near term and medium term. It may also be necessary to enter into financing transactions when additional funds are required that cannot be wholly sourced from free cash flow, to maintain flexibility, and/or limit repayment risk.
Therefore, we continuously monitor funding options available in the capital markets and trends in the availability of funds, as well as the cost of such funding. In recent years, we were able to repay additional debt within a short period of time due to our persistently strong free cash flow. For more information about the financial debt, see the Cash Flows and Liquidity section.
Credit Facilities
Other sources of liquidity are available to us through various credit facilities, if required.
To retain high financial flexibility, we have available a €3.0 billion syndicated revolving credit facility with an end date in March 2028 plus two one-year extension options. A possible future utilization is not subject to any financial covenants. So far, we have not used, and do not currently foresee any need to use, this credit facility.
As at December 31, 2023, SAP SE had additional available credit facilities totaling €550 million. Several other SAP entities have credit facilities available that allow them to borrow funds at prevailing interest rates.
|
SAP Integrated Report 2023 | |||||
| To
Our Stakeholders |
Combined
Management Report |
Consolidated
Financial Statements IFRS |
Further
Information about Sustainability |
Additional Information |
||
Financial Debt
Financial debt is defined as the nominal volume of bank loans, commercial paper, private placements, and bonds.
Maturity Profile of Financial Debts
€ millions
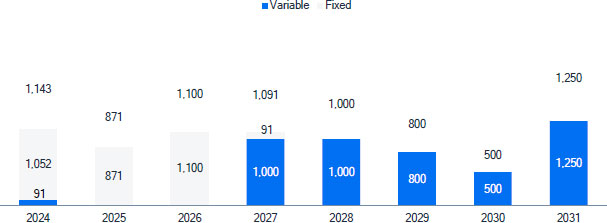
Nominal volume of financial debt on December 31, 2023, included amounts in euros (€7,755 million) and U.S. dollars (€655 million). On December 31, 2023, approximately 60% of the financial debt was held at variable interest rates, partially swapped from fixed into variable using interest rate swaps.
For information about the intended repayments, see the goals for liquidity and finance in the Financial Targets and Prospects section.
Financial Debt by Instrument
Financial Debt
€ millions
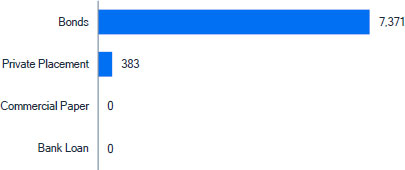
For more information about our financial debt, see the Notes to the Consolidated Financial Statements, Note (E.3).
|
SAP Integrated Report 2023 | |||||
| To
Our Stakeholders |
Combined
Management Report |
Consolidated
Financial Statements IFRS |
Further
Information about Sustainability |
Additional Information |
||
Cash Flows and Liquidity
2023 Actual Cash Flow and Liquidity Performance Compared to Outlook
We met or exceeded the updated outlook for 2023.
| € billions | 2022 Results | 2023 Outlook1 | 2023 Results |
| Capital expenditure | –0.88 | Approximately 0.95 | –0.79 |
| Free cash flow | 4.39 | Approximately 4.9 | 5.09 |
| 1 The 2023 outlook was communicated in January 2023 and updated in April 2023 to reflect the expected Qualtrics divestiture. The 2023 outlook numbers reflect the updated outlook from April 2023. | |||
Group Liquidity and Net Liquidity/Net Debt
| € millions | 2023 | 2022 | ∆ |
| Cash and cash equivalents | 8,124 | 9,008 | –883 |
| Current time deposits and debt securities | 3,151 | 686 | 2,464 |
| Group liquidity | 11,275 | 9,694 | 1,581 |
| Current financial debt | –1,143 | –3,986 | 2,843 |
| Non-current financial debt | –6,612 | –7,778 | 1,166 |
| Financial debt | –7,755 | –11,764 | 4,009 |
| Net liquidity (+)/net debt (–) | 3,521 | –2,070 | 5,590 |
| Lease liabilities | –1,621 | –2,140 | 519 |
| Net debt including lease liabilities | 1,899 | –4,210 | 6,109 |
Group liquidity consists of cash and cash equivalents (for example, cash at banks, money market funds, and time deposits with original maturity of three months or less) and current investments (for example, time deposits and debt securities with original maturities of greater than three months, and remaining maturities of less than one year included in current other financial assets). Group liquidity on December 31, 2023, primarily comprised amounts in euros and U.S. dollars.
The net increase in group liquidity compared to 2022 was mainly due to the Qualtrics divestiture, compensated by the acquisition of LeanIX, the share buyback program, and the repayment of Eurobonds, loans, and commercial paper.
Net liquidity/net debt is group liquidity less financial debt. For more information about our liquidity, see the Notes to the Consolidated Financial Statements, Note (E.3).
For more information about the impact of cash, cash equivalents, current investments, and our financial liabilities on our income statements, see the analysis of our financial income, net, in the Operating Results (IFRS) section.
|
SAP Integrated Report 2023 | |||||
| To
Our Stakeholders |
Combined
Management Report |
Consolidated
Financial Statements IFRS |
Further
Information about Sustainability |
Additional Information |
||
Development of Net Debt
| 20231 | 2022 | |||
| Net debt 12/31/2022 (PY: 12/31/2021) | Free Cash Flow | –2,070 | –1,563 | |
| Net cash flows from operating activities – continuing operations | 5,093 | 6,210 | 5,675 | |
| Capital expenditure | –785 | –877 | ||
| Lease payments | –332 | –410 | ||
| Business combinations | –1,168 | –679 | ||
| Dividends | –2,395 | –2,865 | ||
| Treasury shares | –949 | –1,500 | ||
| Net proceeds from Qualtrics sale | 5,510 | 0 | ||
| Other | –500 | 150 | ||
Net liquidity (+)/net debt (–) 12/31/2023 (PY: 12/31/2022) |
3,521 | –2,070 |
1 Net debt as at 12/31/2022 includes continuing and discontinued operations, net liquidity/net debt as at 12/31/2023 only includes continuing operations.
Analysis of Consolidated Statements of Cash Flow
| € millions | 2023 | 2022 | ∆ in % |
| Net cash flows from operating activities | 6,210 | 5,675 | 9 |
| Net cash flows from investing activities | –4,603 | 699 | <–100 |
| Net cash flows from financing activities | –7,758 | –6,074 | 28 |
In 2023, cash inflows from operating activities increased €535 million to €6,210 million (2022: €5,675 million). This is particularly due to higher profitability, improvements in working capital, lower share-based payments (€1.1 billion in 2023 compared to €1.2 billion in 2022), and higher net interest received (€0.1 billion in 2023 compared to €0.1 billion net interest paid in 2022), which were compensated by higher income tax payments (€2.2 billion in 2023 compared to €1.6 billion in 2022) and higher restructuring payouts (€0.2 billion in 2023 compared to €0.1 billion in 2022). In addition, the decreased volume of trade receivables sold in 2023 amounting to €0.6 billion (€0.9 billion in 2022) affected operating cash flow. Cash collected from customer contracts increased compared to 2022.
Cash outflows from investing activities were €4,603 million in 2023, compared to €699 million cash inflows in 2022. We increased short-term time deposits and debt instruments by €2.5 billion. We paid, net of cash received, a total of €1.2 billion mainly for the LeanIX acquisition in 2023, compared to €0.7 billion mainly for the Taulia and Askdata acquisitions in 2022. We received, net of taxes paid, approximately €5.5 billion for the divestiture of Qualtrics in 2023. Capital expenditure on intangible assets and property, plant, and equipment decreased to €0.8 billion (€0.9 billion in 2022). For more information about current and planned capital expenditures, see the Assets section and the Investment Goals section.
In 2023, free cash flow (for the definition, see the Performance Management System section) increased to €5,093 million (2022: €4,388 million). The free cash flow conversion rate, defined as free cash flow as a percentage of profit after tax, decreased to 141% (2022: 143%).
Net cash outflows from financing activities were €7,758 million in 2023, compared to €6,074 million in 2022. The buyback of treasury shares with a volume of €0.95 billion in 2023 is included herein. Apart from the buyback of treasury shares, cash outflows in 2023 resulted from the repayment of €1.6 billion in Eurobonds, €1.45 billion in loans, and €0.93 billion in commercial paper when they matured. In 2022, we bought back treasury shares with a volume of €1.5 billion. Further cash outflows in 2022 resulted from the repayment of €0.9 billion in Eurobonds and US$0.445 billion in U.S. private placements when they matured.
|
SAP Integrated Report 2023 | |||||
| To
Our Stakeholders |
Combined
Management Report |
Consolidated
Financial Statements IFRS |
Further
Information about Sustainability |
Additional Information |
||
The dividend payment made in 2023 was €2,395 million compared to €2,865 million paid the preceding year.
Assets (IFRS)
Analysis of Consolidated Statements of Financial Position
Total assets decreased 5% year over year to €68,335 million.
Assets
Percent
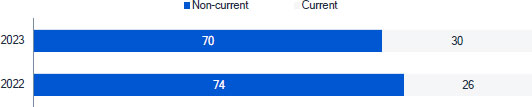
Total current assets increased 11% in 2023 from €18,522 million to €20,571 million, mainly driven by an increase in time deposits in other financial assets.
Total non-current assets decreased 11% to €47,764 million (2022: €53,638 million). Among other effects, this change was mainly due to the divestiture of Qualtrics and the corresponding disposal of goodwill and intangible assets.
Investment in Goodwill, Intangible Assets, and
Property, Plant, and Equipment
(Incl. Additions from Business Combinations)
€ millions | change since previous year
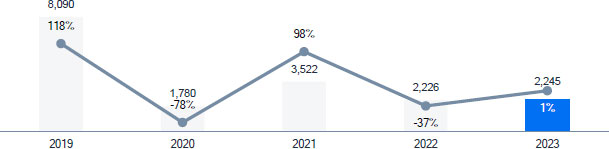
Liabilities
Percent
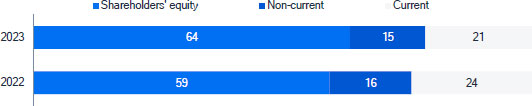
Current liabilities decreased 16% to €14,642 million in 2023 (2022: €17,453 million). This was mainly due to a decrease in loans payable, bonds, and commercial paper in current financial liabilities.
|
SAP Integrated Report 2023 | |||||
| To
Our Stakeholders |
Combined
Management Report |
Consolidated
Financial Statements IFRS |
Further
Information about Sustainability |
Additional Information |
||
Total non-current liabilities decreased 13% to €10,287 million in 2023 compared to the previous year’s figure of €11,858 million. This was mainly due to a decrease in non-current financial liabilities. For more information about our financing activities in 2023, see the Finances (IFRS) section.
The equity ratio (that is, the ratio of shareholders’ equity to total assets) grew 5pp to 64% (2022: 59%).
Equity Ratio
Percent | change since previous year
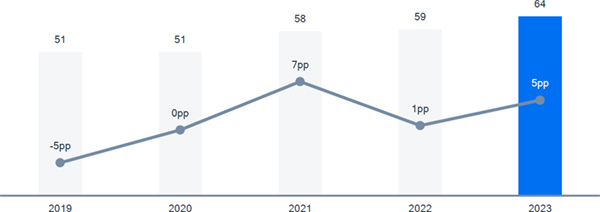
Principal Investments Currently in Progress
In 2023, we finalized various construction projects and continued construction activities in several locations. We plan to finance all of these projects from operating cash flow. Our most important projects are listed below.
Construction Projects
| € millions | |||||
| Country | Location of Facility | Short Description | Estimated
Total Cost |
Costs Incurred as at 12/31/2023 | Estimated Completion Date |
| Germany | Munich | New office building for approx. 740 employees | 99 | 91 | June 2024 |
| Germany | Walldorf | General renovation of headquarters building for approx. 1,600 employees | 225 | 18 | March 2027 |
| India | Bangalore | New office building for approx. 3,500 employees | 86 | 8 | December 2025 |
For more information about our planned investment expenditures, see the Investment Goals section. There were no material divestitures of facilities within the reporting period.
Report on the Economic Position of SAP SE
SAP SE is headquartered in Walldorf, Germany, and is the parent company of the SAP Group, which comprises 235 companies. SAP SE is the Group holding company and employs most of the Group’s Germany-based development and service and support personnel.
As the owner of the intellectual property in most SAP software, SAP SE derives its revenue mainly from software license fees and bears the bulk of the Group-wide research and development expenses.
In 2023, as part of Group-internal restructuring measures, SAP America Inc., Newtown Square, United States, repurchased and withdrew own shares from SAP SE. This resulted in a disposal of the shares in affiliated companies in the amount of €4,244 million and a gain from the disposal of affiliated companies in the amount of €3,749 million, reported under Other operating income.
With effect from January 1, 2023, based on a merger agreement concluded on August 9, 2023, SAP SE took over all assets and liabilities of SAP Portals Europe GmbH, Walldorf, Germany. The merger was conducted at book value.
|
SAP Integrated Report 2023 | |||||
| To
Our Stakeholders |
Combined
Management Report |
Consolidated
Financial Statements IFRS |
Further
Information about Sustainability |
Additional Information |
||
The SAP SE annual financial statements are prepared in accordance with the reporting standards in the German Commercial Code and the German Stock Corporation Act. The full SAP SE annual financial report and unqualified audit report are submitted to the operator of the Unternehmensregister (German Business Register) for publication and inclusion in the Unternehmensregister (German Business Register). It is available from SAP SE on request.
Product revenue and operating profit are defined as the most significant financial performance indicators with regards to SAP SEs standalone financial statements.
Performance Against Our Outlook for 2023
| Results for 2022 | Outlook
for 2023 (Integrated Report 2022) |
Results for 2023 | |
| Product revenue | €13,550 million | slight increase | €14,055 million |
| Operating profit | €739 million | slight decrease | €4,396 million |
While product revenue is within our 2023 outlook, operating profit is well above expectations at €4,396 million. This development is mainly attributable to the €3,749 million gains realized under the intra-Group share buyback.
The course of business for SAP SE was favorable in 2023.
Income
SAP SE’s income statement is classified following the nature of expense method and presents amounts in millions of euros.
SAP SE Income Statement − German Commercial Code (Short Version)
| € millions | 2023 | 2022 |
| Total revenue | 19,018 | 17,786 |
| Other operating income | 4,996 | 1,534 |
| Cost of services and materials | –12,217 | –11,560 |
| Personnel expenses | –3,386 | –2,905 |
| Depreciation and amortization | –686 | –682 |
| Other operating expenses | –3,329 | –3,433 |
| Operating profit | 4,396 | 739 |
| Finance income | 897 | 1,685 |
| Income before taxes | 5,292 | 2,424 |
| Income taxes | –504 | –497 |
| Income after taxes | 4,788 | 1,927 |
| Other taxes | –23 | –14 |
| Net income | 4,766 | 1,912 |
The total revenue of SAP SE in 2023 was €19,018 million (2022: €17,786 million), an increase of 7%. Product revenue increased 4% to €14,055 million (2022: €13,550 million). As in previous years, product revenue was primarily generated from license fees paid by subsidiaries of SAP SE.
Service revenue increased 11% to €1,065 million in 2023 (2022: €958 million), while other revenue increased 19% to €3,898 million (2022: €3,278 million).
SAP SE operating profit increased €3,656 million to €4,396 million (2022: €739 million). Other operating income increased €3,463 million to €4,996 million (2022: €1,534 million). The year-over-year increase is primarily due to €3,749 million in gains from the disposal of affiliated companies as a result of the intra-Group share buyback by SAP America Inc.
|
SAP Integrated Report 2023 | |||||
| To
Our Stakeholders |
Combined
Management Report |
Consolidated
Financial Statements IFRS |
Further
Information about Sustainability |
Additional Information |
||
SAP SE cost of services and materials increased 6% to €12,217 million (2022: €11,560 million). Services received increased €579 million to €10,177 million (2022: €9,599 million), mainly due to increased services received in the context of intra-Group cost allocations. The costs for licenses and commissions increased €93 million to €2,006 million (2022: €1,914 million).
SAP SE personnel expenses, mainly the labor cost of software developers, service and support employees, and administration staff employed by SAP SE, increased 17% to €3,386 million (2022: €2,905 million), primarily due to an increase in stock based compensation expenses and an increased headcount in the reporting year.
Other operating expenses decreased €104 million to €3,329 million (2022: €3,433 million). This decrease is mainly attributable to a €287 million decrease in currency exchange losses and a €36 million decrease in impairment of receivables. The decrease was partly offset by a €114 million increase in services purchased and by a €179 million increase in other expense, mainly attributable to €155 million in regulatory compliance expenses.
Finance income was €897 million (2022: €1,685 million), representing a year-over-year decrease of €788 million. This decrease is primarily due to a €694 million decrease in net interest income, a €79 million decrease in results from profit and loss transfer agreements, and a €84 million increase in write-downs on financial assets. The decrease was partly offset by a €61 million increase in income from investments.
SAP SE income before taxes increased €2,868 million to €5,292 million (2022: €2,424 million). Income taxes increased €7 million to €504 million (2022: €497 million). After deducting taxes, the resulting net income was €4,766 million (2022: €1,912 million), representing a increase of €2,854 million year over year.
Assets and Financial Position
In 2023, SAP SE total assets closed at €47,752 million (2022: €48,996 million).
SAP SE Balance Sheet as at December 31 − German Commercial Code (Short Version)
| € millions | 2023 | 2022 |
| Assets | ||
| Intangible assets | 1,111 | 1,561 |
| Property, plant, and equipment | 1,451 | 1,393 |
| Financial assets | 34,323 | 37,912 |
| Fixed assets | 36,885 | 40,866 |
| Inventories | 1 | 1 |
| Accounts receivable and other assets | 5,712 | 5,469 |
| Marketable securities and liquid assets | 3,778 | 1,423 |
| Short-term assets | 9,491 | 6,892 |
| Prepaid expenses and deferred charges | 774 | 680 |
| Deferred taxes | 602 | 558 |
| Surplus arising from offsetting | 0 | 0 |
| Total assets | 47,752 | 48,996 |
| Equity and liabilities | ||
| Shareholders’ equity | 15,945 | 13,540 |
| Provisions | 2,846 | 2,410 |
| Liabilities | 28,951 | 33,036 |
| Deferred income | 10 | 11 |
| Total shareholders’ equity and liabilities | 47,752 | 48,996 |
|
SAP Integrated Report 2023 | |||||
| To
Our Stakeholders |
Combined
Management Report |
Consolidated
Financial Statements IFRS |
Further
Information about Sustainability |
Additional Information |
||
Intangible assets decreased €450 million year over year to €1,111 million (2022: €1,561 million), mainly due to scheduled depreciations on intangibles.
Financial assets decreased €3,589 million year over year to €34,323 million (2022: €37,912 million). This was mainly due to the disposal of shares in affiliated companies totaling €5,254 million. Of this, €4,244 million was attributable to the share buyback of SAP America Inc., and €929 million was attributable to the SAP Portals Europe GmbH shares canceled as a result of the merger. Additions to the shares in affiliated companies amounting to €1,782 million had an opposite effect. Of this amount, €1,238 million was attributable to the acquisition of LeanIX GmbH, Bonn, Germany, and €493 million was attributable to the shares in SAP Nederland B.V., ’s-Hertogenbosch, Netherlands, taken over as part of the merger of SAP Portals Europe GmbH.
The increase of €243 million in accounts receivable and other assets was primarily the result of a €168 million increase in receivables from affiliated companies and a €77 million increase in other assets.
Marketable securities and liquid assets increased €2,355 million to €3,788 million (2022: €1,423 million).
SAP SE shareholders’ equity increased 18% to €15,945 million (2022: €13,540 million). Against outflows of €2,395 million associated with the payment of the dividend and €960 million for the repurchase of stock in treasury, there was a €4,766 million increase due to net income for 2022 and €995 million from the issuance of treasury stock to serve the share-based payments of employees. The equity ratio (that is, the ratio of shareholders’ equity to total assets) is 33% (2022: 28%).
Provisions increased €436 million to €2,846 million (2022: €2,410 million). Other provisions increased €437 million to €2,091 million (2022: €1,654 million), primarily as a result of an increase in other obligations toward employees and provisions for stock-based compensation. Provisions for tax remained at €741 million (2022: €741 million).
Liabilities decreased €4,084 million to €28,951 million (2022: €33,036 million). This decrease mainly resulted from a decrease in liabilities to financial institutions of €2,380 million due to scheduled repayments of bank loans (€1,450 million) and commercial papers (€930 million), the scheduled repayment of bonds in the total amount of €1,600 million, and a decrease of €218 million in trade payables. In contrast, other payables increased €143 million.
The statements made for the SAP Group in respect to Capital Structure, Capital Expenditures and Liquidity are mainly equally applicable to SAP SE. For more information, see the Finances (IFRS) section and the Assets (IFRS) section.
Opportunities and Risks
SAP SE is subject to essentially the same opportunities and risks as the SAP Group. For more information, see the Risk Management and Risks section and the Expected Developments and Opportunities section.
|
SAP Integrated Report 2023 | |||||
| To
Our Stakeholders |
Combined
Management Report |
Consolidated
Financial Statements IFRS |
Further
Information about Sustainability |
Additional Information |
||
Non-Financial Statement Including Information on Sustainable Activities
With this section and the information referenced to in this section, SAP SE fulfills its duty to produce a non-financial statement (NFS) for the holding company, pursuant to section 289b–e of the German Commercial Code (HGB), and a non-financial group statement, pursuant to section 315b–c in conjunction with section 289c–e of the German Commercial Code (HGB), in the form of a combined non-financial statement. The relevant non-financial matters are referenced in the table below and can be found in the relevant sections of our combined management report.
Additionally, following Article 8 of Regulation 2020/852 of the European Parliament and of the Council of the European Union (EU Taxonomy), we have included information on how and to what extent SAP’s activities are associated with economic activities that qualify as environmentally sustainable under this regulation.
For more information, see the EU Taxonomy Disclosures subsection.
Reporting Framework
The social and environmental data and information included in the SAP Integrated Report have been prepared in accordance with the Global Reporting Initiative (GRI) Standards.
Business Model
SAP’s business model is described in the Strategy and Business Model section of the combined management report. Good governance is a prerequisite for continued success and is described throughout the combined management report. Therefore, we did not include governance as an individual material topic in our materiality assessment and our non-financial statement.
|
SAP Integrated Report 2023 | |||||
| To
Our Stakeholders |
Combined
Management Report |
Consolidated
Financial Statements IFRS |
Further
Information about Sustainability |
Additional Information |
||
Non-Financial Disclosures in SAP’s Combined Management Report
We determine which non-financial information has to be disclosed based on a materiality analysis we perform using internal and external input. For more information, see Materiality in the About This Further Information on Economic, Environmental, and Social Performance section in our SAP Integrated Report.
The individual non-financial aspects to be covered by the non-financial statement are addressed in the following sections of our combined management report if material. No material risks according to section 289c (3) sentence numbers 3 and 4 HGB have been identified.
| Due Diligence; Policies and Guidelines (Concepts) | Measures and Results, Including KPIs Relevant for Steering and Compensation | References to Consolidated Financial Statements | |
| Environmental Matters | Energy
and Emissions: Vision and Strategy; Due Diligence |
KPI: Net carbon emissions Energy
and Emissions: Performance Management System Strategy and Business Model: Measuring Our Success Expected Developments and Opportunities |
|
| Employee Matters |
Employees: Expected
Developments and Opportunities:
|
KPI: Employee Engagement Index Employees: Performance Management System Strategy
and Business Model: Financial
Performance: Expected Developments and Opportunities |
Notes to the Consolidated Financial Statements, Section B – Employees |
| Human Rights | Human
Rights: Vision and Strategy; Due Diligence |
Human
Rights: How We Measure and Manage Our Performance |
|
| Anti-Corruption and Bribery Matters | Business
Conduct: |
Business
Conduct: How We Measure and Manage Our Performance |
Notes to the Consolidated Financial Statements, Note (G.3) |
| Customer Matters | Our
Customers: Vision and Strategy; Due Diligence |
KPI: Customer Net Promoter Score; Revenues Customers: How We Measure and Manage Our Performance Performance Management System Strategy and Business Model: Measuring Our Success Financial
Performance: Expected Developments and Opportunities |
Notes to the Consolidated Financial Statements, Section A – Customers Consolidated Income Statements – Revenue
|
| Security, Data Protection, and Privacy |
Security,
Cloud Compliance, Data Protection, and Privacy:
|
Security,
Cloud Compliance, Data Protection, and Privacy: How We Measure and Manage Our Performance |
|
SAP Integrated Report 2023 | |||||
| To
Our Stakeholders |
Combined
Management Report |
Consolidated
Financial Statements IFRS |
Further
Information about Sustainability |
Additional Information |
||
Sustainable Finance: EU Taxonomy Disclosures
Assessment of Taxonomy Eligibility and Alignment
The EU Taxonomy distinguishes between “Taxonomy-eligible” and “Taxonomy-aligned” economic activities. The eligibility assessment for 2023 is in accordance with the current EU Taxonomy regulation and reflects the changes published in the Environmental Delegated Act as well as the amendments to the Climate Delegated Act. As a result, SAP has identified two activities as relevant for disclosure, and examined whether they qualify as Taxonomy-aligned.
Taxonomy-Eligible Economic Activities of SAP
Activity 8.1 “Data processing, hosting, and related activities” (substantial contribution to climate change mitigation)
In this area of activity, we looked at our data centers and our relevant cloud solutions. The criteria for the Taxonomy alignment of activity 8.1 were not met in financial year 2023. We expect to make progress on the transition from Taxonomy-eligible to Taxonomy-aligned over the next few years as we work toward meeting the technical screening criteria. For instance, under the EU Taxonomy regulation, refrigerants used in data centers must not exceed a certain level of global warming potential. The refrigerants SAP uses do not meet these thresholds yet. Replacing them right away would create toxic waste and generate additional costs. Therefore, we intend to replace the refrigerants according to our regular maintenance schedule over the course of the next few years. Also, SAP’s data center colocations and hyperscalers do not yet fully meet the criteria set out in the Taxonomy regulation. We are working with our providers to evaluate options to reach Taxonomy alignment over the next few years.
Activity 3.3 “Manufacture of low carbon technologies for transport” (substantial contribution to climate change mitigation)
This economic activity includes the vehicles purchased for the SAP car fleet. In 2023, SAP capitalized an amount of €210 million. For most of our electric vehicles, we were able to obtain the proof required for Taxonomy alignment from our suppliers, allowing us to report €51 million as Taxonomy-aligned.
Other activity
In single locations, SAP operates combined heat/cool and power generation facilities using fossil gaseous fuels. However, the associated Taxonomy-eligible and aligned revenues, capital expenditures, and operational expenditures are negligible. No further activities for nuclear or gas are applicable.
Minimum safeguards
SAP has conducted a review of all core topics of the minimum safeguards to ensure compliance. Our global due diligence processes ensure that SAP upholds and meets the requirements under the minimum safeguards.
|
SAP Integrated Report 2023 | |||||
| To
Our Stakeholders |
Combined
Management Report |
Consolidated
Financial Statements IFRS |
Further
Information about Sustainability |
Additional Information |
||
| Revenue | |||||||||||||||||||||
| € millions, unless otherwise stated | |||||||||||||||||||||
| Financial Year | 2023 | Substantial Contribution Criteria | DNSH Criteria (“Does Not Significantly Harm”) | ||||||||||||||||||
| Economic Activities (1) | Code1 (2) | Turnover (3) | Proportion of Turnover 2023 (4) | Climate Change Mitigation (5) | Climate Change Adaptation (6) | Water (7) | Pollution (8) | Circular Economy (9) | Biodiversity (10) | Climate Change Mitigation (11) | Climate Change Adaptation (12) | Water (13) | Pollution (14) | Circular Economy (15) | Biodiversity (16) | Minimum Safeguards (17) | Proportion of Taxonomy-Aligned (A.1) or Eligible (A.2) Turnover 20222 (18) | Category Enabling activity (19) | Category Transitional activity (20) | ||
| Text | € | % | Y;N; N/EL3 | Y;N; N/EL3 | Y;N; N/EL3 | Y;N; N/EL3 | Y;N; N/EL3 | Y;N; N/EL3 | Y/N | Y/N | Y/N | Y/N | Y/N | Y/N | Y/N | % | E | T | |||
| A. Taxonomy-eligible activities | |||||||||||||||||||||
| A.1. Environmentally sustainable activities (Taxonomy-aligned) | |||||||||||||||||||||
| Turnover of environmentally sustainable activities (Taxonomy-aligned) (A.1) | - | - | - | - | - | - | - | - | - | - | - | - | - | - | - | - | |||||
| Of which Enabling | - | - | - | - | - | - | - | - | - | - | - | - | - | - | - | - | E | ||||
| Of which Transitional | - | - | - | - | - | - | - | - | - | - | - | T | |||||||||
| A.2 Taxonomy-eligible but not environmentally sustainable activities (not Taxonomy-aligned activities) | |||||||||||||||||||||
| EL; N/EL4 | EL; N/EL4 | EL; N/EL4 | EL; N/EL4 | EL; N/EL4 | EL; N/EL4 | ||||||||||||||||
| 8.1 Data processing, hosting, and related activities | CCM 8.1 |
13,361 | 43% | EL | - | - | - | - | - | 38% | |||||||||||
| Turnover of Taxonomy-eligible but not environmentally sustainable activities (not Taxonomy-aligned activities) (A.2) | 13,361 | 43% | - | - | - | - | - | - | 38% | ||||||||||||
| A. Turnover of Taxonomy-eligible activities (A.1+A.2) | 13,361 | 43% | - | - | - | - | - | - | 38% | ||||||||||||
| B. Taxonomy-non-eligible activities | |||||||||||||||||||||
| Turnover of Taxonomy-non-eligible activities (B) | 17,846 | 57% | |||||||||||||||||||
| Total (A+B) | 31,207 | 100% | |||||||||||||||||||
| 1
The code is the abbreviation of the relevant objective to which the economic activity is
eligible to make a substantial contribution (for example: CCM – Climate Change Mitigation) plus the section number of the activity
in the EU’s annex to the Taxonomy Regulation. 2 Results for 2022 have been adjusted for continuing operations to reflect the divestiture of Qualtrics. 3 Y – Yes, Taxonomy-aligned with the relevant environmental objective; N – No, Taxonomy-eligible but not Taxonomy-aligned with the relevant environmental objective; N/EL – not eligible, Taxonomy-non-eligible activity for the relevant environmental objective 4 EL – Taxonomy-eligible activity; N/EL – Taxonomy-non-eligible activity |
|||||||||||||||||||||
|
SAP Integrated Report 2023 | |||||
| To
Our Stakeholders |
Combined
Management Report |
Consolidated
Financial Statements IFRS |
Further
Information about Sustainability |
Additional Information |
||
As outlined above, we have identified only one activity as a relevant Taxonomy-eligible economic activity to which revenues can be attributed. We considered materiality aspects in this process. Eligible turnover consists of revenue earned from providing the following services, which comply with the description of activity 8.1:
– Software as a service (SaaS)
– Platform as a service (PaaS)
– Infrastructure as a service (IaaS)
SAP’s cloud revenue results from these services. Revenues that qualify as cloud revenue but cannot be classified as Taxonomy-eligible have been excluded. Total revenue is determined according to IFRS, specifically IFRS 15, and matches total revenue presented in SAP’s Consolidated Income Statements. For more information about how we recognize revenue, and about the components of revenue, see the Notes to the Consolidated Financial Statements, Note A.1.
For a detailed description of the development and key drivers of SAP’s revenue, see the Performance Against Our Outlook for 2023 (Non-IFRS) and the Operating Results (IFRS) sections of the combined management report.
|
SAP Integrated Report 2023 | |||||
| To
Our Stakeholders |
Combined
Management Report |
Consolidated
Financial Statements IFRS |
Further
Information about Sustainability |
Additional Information |
||
| Operational Expenditures | ||||||||||||||||||||||
| € millions, unless otherwise stated | ||||||||||||||||||||||
| Financial Year | 2023 | Substantial Contribution Criteria | DNSH Criteria (“Does Not Significantly Harm”) | |||||||||||||||||||
| Economic Activities (1) | Code1 (2) | OpEx (3) | Proportion of OpEx 2023 (4) | Climate Change Mitigation (5) | Climate Change Adaptation (6) | Water (7) | Pollution (8) | Circular Economy (9) | Biodiversity (10) | Climate Change Mitigation (11) | Climate Change Adaptation (12) | Water (13) | Pollution (14) | Circular Economy (15) | Biodiversity (16) | Minimum Safeguards (17) | Proportion of Taxonomy-Aligned (A.1) or Eligible (A.2) OpEx 20222 (18) | Category Enabling activity(19) | Category Transitional activity (20) | |||
| Text | € | % | Y;N; N/EL3 | Y;N; N/EL3 | Y;N; N/EL3 | Y;N; N/EL3 | Y;N; N/EL3 | Y;N; N/EL3 | Y/N | Y/N | Y/N | Y/N | Y/N | Y/N | Y/N | % | E | T | ||||
| A. Taxonomy-eligible activities | ||||||||||||||||||||||
| A.1. Environmentally sustainable activities (Taxonomy-aligned) | ||||||||||||||||||||||
| OpEx of environmentally sustainable activities (Taxonomy-aligned) (A.1) | - | - | - | - | - | - | - | - | - | - | - | - | - | - | - | - | ||||||
| Of which Enabling | - | - | - | - | - | - | - | - | - | - | - | - | - | - | - | - | E | |||||
| Of which Transitional | - | - | - | - | - | - | - | - | - | - | - | T | ||||||||||
| A.2 Taxonomy-eligible but not environmentally sustainable activities (not Taxonomy-aligned activities) | ||||||||||||||||||||||
| EL; N/EL4 | EL; N/EL4 | EL; N/EL4 | EL; N/EL4 | EL; N/EL4 | EL; N/EL4 | |||||||||||||||||
| 8.1 Data processing, hosting, and related activities | CCM 8.1 |
1,545 | 19% | EL | - | - | - | - | - | 19% | ||||||||||||
| OpEx of Taxonomy-eligible but not environmentally sustainable activities (not Taxonomy-aligned activities) (A.2) | 1,545 | 19% | - | - | - | - | - | - | 19% | |||||||||||||
| A. OpEx of Taxonomy-eligible activities (A.1+A.2) | 1,545 | 19% | - | - | - | - | - | - | 19% | |||||||||||||
| B. Taxonomy-non-eligible activities | ||||||||||||||||||||||
| OpEx of Taxonomy-non-eligible activities (B) | 6,660 | 81% | ||||||||||||||||||||
| Total (A+B) | 8,205 | 100% | ||||||||||||||||||||
| 1
The code is the abbreviation of the relevant objective to which the economic activity is
eligible to make a substantial contribution (for example: CCM – Climate Change Mitigation) plus the section number of the activity
in the EU’s annex to the Taxonomy Regulation. 2 Results for 2022 have been adjusted for continuing operations to reflect the divestiture of Qualtrics. 3 Y – Yes, Taxonomy-aligned with the relevant environmental objective; N – No, Taxonomy-eligible but not Taxonomy-aligned with the relevant environmental objective; N/EL – not eligible, Taxonomy-non-eligible activity for the relevant environmental objective 4 EL – Taxonomy-eligible activity; N/EL – Taxonomy-non-eligible activity |
||||||||||||||||||||||
|
SAP Integrated Report 2023 | |||||
| To
Our Stakeholders |
Combined
Management Report |
Consolidated
Financial Statements IFRS |
Further
Information about Sustainability |
Additional Information |
||
We have designated those costs as Taxonomy-eligible that relate to assets and processes associated with the Taxonomy-eligible activity “8.1 Data processing, hosting, and related activities.” We considered materiality aspects when identifying relevant costs and activities. Most of the costs connected to this activity are leasing expenses for hosting services provided by third parties. To a smaller extent, these costs also include expenses for the maintenance and repair of SAP’s cloud infrastructure.
Total operating expenses according to the EU Taxonomy mainly include the following non-capitalized cost elements: research and development, short-term lease, and maintenance and repairs relating to property, plant, and equipment. Other major expense components in SAP’s Consolidated Income Statement, such as depreciation, utilities (for example, costs for heating and electricity consumption), and most general and administrative cost, restructuring, and sales and marketing cost do not meet the definition of operating expenses in the EU Taxonomy and are therefore excluded.
For a detailed description of the development and key drivers of all operating expenses, see the Performance Against Our Outlook for 2023 (Non-IFRS) and the Operating Profit and Operating Margin sections in our combined management report.
|
SAP Integrated Report 2023 | |||||
| To
Our Stakeholders |
Combined
Management Report |
Consolidated
Financial Statements IFRS |
Further
Information about Sustainability |
Additional Information |
||
| Capital Expenditures | |||||||||||||||||||||
| € millions, unless otherwise stated | |||||||||||||||||||||
| Financial Year | 2023 | Substantial Contribution Criteria | DNSH Criteria (“Does Not Significantly Harm”) | ||||||||||||||||||
| Economic Activities (1) | Code1 (2) | CapEx (3) | Proportion of CapEx 2023 (4) | Climate Change Mitigation (5) | Climate Change Adaptation (6) | Water (7) | Pollution (8) | Circular Economy (9) | Biodiversity (10) | Climate Change Mitigation (11) | Climate Change Adaptation (12) | Water (13) | Pollution (14) | Circular Economy (15) | Biodiversity (16) | Minimum Safeguards (17) | Proportion of Taxonomy-Aligned (A.1) or Eligible (A.2) CapEx 2022 (18) | Category Enabling activity (19) | Category Transitional activity (20) | ||
| Text | € | % | Y;N; N/EL2 | Y;N; N/EL2 | Y;N; N/EL2 | Y;N; N/EL2 | Y;N; N/EL2 | Y;N; N/EL2 | Y/N | Y/N | Y/N | Y/N | Y/N | Y/N | Y/N | % | E | T | |||
| A. Taxonomy-eligible activities | |||||||||||||||||||||
| A.1. Environmentally sustainable activities (Taxonomy-aligned) | |||||||||||||||||||||
| CapEx related to purchase of output of “3.3 Manufacture of low carbon technologies for transport” | CCM 3.3 | 51 | 4% | Y | Y | Y | Y | Y | Y | Y | Y | 0% | E | - | |||||||
| CapEx of environmentally sustainable activities (Taxonomy-aligned) (A.1) | 51 | 4% | 100% | - | - | - | - | - | - | - | - | - | - | - | - | 0% | |||||
| Of which enabling | 51 | 4% | 100% | - | - | - | - | - | Y | Y | Y | Y | Y | Y | Y | 0% | E | ||||
| Of which Transitional | 0 | 0% | 0% | - | - | - | - | - | - | - | 0% | T | |||||||||
| A.2 Taxonomy-eligible but not environmentally sustainable activities (not Taxonomy-aligned activities) | |||||||||||||||||||||
| EL; N/EL3 | EL; N/EL3 | EL; N/EL3 | EL; N/EL3 | EL; N/EL3 | EL; N/EL3 | ||||||||||||||||
| 8.1 Data processing, hosting, and related activities | CCM 8.1 |
160 | 12% | EL | - | - | - | - | - | 14% | |||||||||||
| CapEx related to purchase of output of “3.3 Manufacture of low carbon technologies for transport” | CCM 3.3 |
159 | 11% | EL | - | - | - | - | - | 9% | |||||||||||
| CapEx of Taxonomy-eligible but not environmentally sustainable activities (not Taxonomy-aligned activities) (A.2) | 319 | 23% | - | - | - | - | - | - | 23% | ||||||||||||
| A. CapEx of Taxonomy-eligible activities (A.1+A.2) | 370 | 27% | - | - | - | - | - | - | 23% | ||||||||||||
| B. Taxonomy-non-eligible activities | |||||||||||||||||||||
| CapEx of Taxonomy-non-eligible activities (B) | 1,008 | 73% | |||||||||||||||||||
| Total (A+B) | 1,378 | 100% | |||||||||||||||||||
| 1
The code is the abbreviation of the relevant objective to which the economic activity is
eligible to make a substantial contribution (for example: CCM – Climate Change Mitigation) plus the section number of the activity
in the EU’s annex to the Taxonomy Regulation. 2 Y – Yes, Taxonomy-aligned with the relevant environmental objective; N – No, Taxonomy-eligible but not Taxonomy-aligned with the relevant environmental objective; N/EL – not eligible, Taxonomy-non-eligible activity for the relevant environmental objective 3 EL – Taxonomy-eligible activity; N/EL – Taxonomy-non-eligible activity |
|||||||||||||||||||||
|
SAP Integrated Report 2023 | |||||
| To
Our Stakeholders |
Combined
Management Report |
Consolidated
Financial Statements IFRS |
Further
Information about Sustainability |
Additional Information |
||
In line with the EU Taxonomy regulation, total capital expenditures presented in this section include additions to tangible and intangible assets accounted for based on IAS 16, IAS 38, and IFRS 16, and additions to tangible and intangible assets (excluding additions to goodwill) resulting from business combinations.
Taxonomy-eligible capital expenditures relate to assets and processes that are associated with the economic activity “8.1 Data processing, hosting, and related activities.” These expenses comprise mostly investments in SAP’s cloud infrastructure (IT hardware and software).
Additionally, Taxonomy-eligible capital expenditures include capitalized costs relating to the purchases of vehicles.
Since all activities at SAP contribute only to environmental objective I “Climate protection,” there is no risk of double counting.
 Audit Scope
The content of the non-financial statement
was not subject to the statutory audit of the combined management report. However, our external auditor carried out an independent limited
assurance engagement on the non-financial statement including the EU Taxonomy disclosures. In addition, all non-financial aspects referenced
to in the table Non-Financial Disclosures in SAP’s Combined Management Report
are assured by our external auditor, however on different audit assurance levels (reasonable or limited). The sections containing information
audited with limited assurance include an  Audit Scope box at the end explaining
the audit scope of the disclosures in the respective section.
Audit Scope box at the end explaining
the audit scope of the disclosures in the respective section.
|
SAP Integrated Report 2023 | |||||
| To
Our Stakeholders |
Combined
Management Report |
Consolidated
Financial Statements IFRS |
Further
Information about Sustainability |
Additional Information |
||
Security, Cloud Compliance, Data Protection and Privacy
Vision and Strategy
Every day, organizations around the world trust SAP with their data – either on premise at their physical locations, in the cloud, or when using mobile devices while on the move. Which is why security, cloud compliance, and data protection and privacy are of paramount importance to us. Therefore, the principles set out in the SAP Global Security Policy govern how we keep our data and our customers’ data safe, how we process it in compliance with local legislation, and how we protect it from malicious use. SAP uses the National Standards and Technology’s Cybersecurity Framework (NIST CSF) to assess how well we manage cybersecurity risk in the Company. The cybersecurity governance framework incorporates industry standards and best practices that help guide our understanding of cybersecurity threats, vulnerabilities, and impacts, and how to mitigate these risks using proactive measures.
SAP Global Security and Cloud Compliance
Cloud solutions and services are increasingly important to many companies’ daily operations. Organizations today are facing many risk factors and disruptions, such as war, political unrest, severe weather, pandemics, cyberattacks, and supply chain disruption, making digital solutions critical to organizational resilience. As a result, digital transformation is accelerating and cybersecurity is now even more crucial to IT security professionals, and to leaders in business and government, particularly in those organizations that have moved their core processes to the cloud.
The SAP strategy is focused on helping our customers in their digital transformation. Our SAP Global Security and Cloud Compliance (SGSC) unit supports this journey with the goals of reducing risk and promoting regulatory compliance, and by aligning people, procedures, and technology to protect business processes and data. The organization embraces a security-minded culture that embeds security and compliance in our development and deployment processes and helps secure digital transformation.
SGSC supports key stakeholders across SAP in our lines of business (LoBs), IT, and the presales organization in securing solutions, and drives operational excellence for security and cloud compliance across the enterprise. To protect our organization’s data and assets, and support high-quality risk management and reporting, SGSC regularly reviews and adapts our security policies, standards, and frameworks.
Data Protection
With our product and services portfolio, we aim to protect the rights of individuals involved and to meet relevant local requirements when processing personal data. In addition, we strive to strengthen SAP’s reputation in the long term as a sustainable and trustworthy partner in the market. We have implemented safeguards intended to help protect the fundamental rights of everyone whose data is processed by SAP, whether they are customers, suppliers, partners, prospects, employees, or applicants.
We develop and pursue our global data protection and privacy strategy in accordance with our business strategy. Our global data protection and privacy strategy is to constantly monitor the global regulatory data protection compliance landscape, identify relevant stakeholders, and enable them to take necessary measures. It is also designed to safeguard the processing of personal data. The strategy consists of four pillars to help ensure we comply with applicable data protection laws and regulations. These pillars are our global data protection and privacy policy, mandatory global data protection and privacy trainings for employees, our global data protection and privacy network and global data protection management system and its data protection control framework.
|
SAP Integrated Report 2023 | |||||
| To
Our Stakeholders |
Combined
Management Report |
Consolidated
Financial Statements IFRS |
Further
Information about Sustainability |
Additional Information |
||
Due Diligence for Security and Cloud Compliance Topics
Governance
SGSC is led by a chief security compliance and risk officer and a chief security officer who report directly to the SAP chief technology officer (CTO). SGSC divisions are responsible for areas such as product and application security, cyberdefense, operational security risk management, security compliance, executive protection, physical security, and a Trust Office that supports customers and partners on matters relating to security and compliance.
The SAP Security and Cloud Compliance Governance Model is designed to ensure executive engagement and facilitates shared responsibility in quarterly SAP Security Advisory Board and Security Council meetings and in periodic updates to the Executive Board.
Our commitment to customers is to be open and transparent about security vulnerabilities. To ensure this, we work with several external stakeholder groups, including the SAP user groups for the Americas and for the German-speaking countries.
Guidelines and Policies
The purpose of the SAP Global Security Policy is to provide governance and structure for an appropriate and effective level of information security at SAP and our affiliated businesses. Aligned with the overall SAP corporate strategy and vision, it details management expectations and the strategic goals and objectives for SAP security.
This policy provides high-level requirements for numerous security domains. These include, but are not limited to, access control, physical security, network security management, incident response, and acceptable use. These requirements apply to all SAP employees, contractors, and consultants, and to external parties that are granted access to SAP information and information assets. SAP reviews the policy annually and enacts modifications as deemed appropriate and necessary to protect SAP and our own and our customers’ data and assets where new threats or vulnerabilities are identified. All SAP employees are required to read and adhere to this internal policy. The SAP Security Policy Framework consists of several levels of security documents that support the requirements described in the policy. In addition, the various LoBs at SAP may have supporting policies, standards, procedures, and practices.
Due Diligence for Data Protection Topics
Governance
Within the scope of their responsibilities, our global data protection officer (DPO) monitors the compliance of activities involving the processing of personal data. The DPO reports to our CFO. Within the Executive Board, the SAP CFO is responsible for compliance and enforcement of data protection and privacy. The DPO is responsible for the SAP Global Data Protection and Privacy Policy that addresses SAP’s data protection governance, and regularly informs the CFO about the status of data protection compliance in the SAP Group.
To meet and ensure consistent security and data protection compliance, SAP has implemented a formal governance model that assigns clear responsibilities across the SAP Group. Upon request, the DPO attends steering committee meetings and reports on matters relevant to data protection to the Audit and Compliance Committee of the SAP Supervisory Board.
SAP has established a global network of data protection and privacy coordinators (DPPCs) across all SAP Group entities that process personal data. This DPPC network consists of regional and local DPPCs to ensure data protection and privacy compliance on a local level. The DPPC network sensitizes our employees by conducting local training and monitoring the legal landscape. Where new data protection laws evolve, the DPPC network also helps the Data Protection and Privacy (DPP) team, which acts on behalf of the DPO, identify and analyze them.
|
SAP Integrated Report 2023 | |||||
| To
Our Stakeholders |
Combined
Management Report |
Consolidated
Financial Statements IFRS |
Further
Information about Sustainability |
Additional Information |
||
If this requires compliance activities, they align with the affected LoBs and help drive the relevant implementation. Supported by the DPPC network, the DPP team regularly engages with SAP Government Relations to represent SAP’s interests in the legislative process. In this regard, SAP participates in external working groups aiming at communicating industry-specific interests with respective governments.
SAP has implemented a data protection management system (DPMS) for our organization. The DPMS adheres to the generally recognized standard for data protection management systems as defined in the British Standard BS 10012, which comprises the data protection requirements of the European Union (EU) General Data Protection Regulation (GDPR) since version 10012:2017. Our DPMS covers almost all LoBs and is planned to be implemented in all acquired companies as well. It is designed as a framework covering all aspects of data protection compliance of SAP organizations and employees. The system is used as SAP’s standard methodology to ensure compliance with data protection legislation. The maintenance of the framework is subject to certification by the British Standards Institution (BSI) that confirms data protection compliance annually.
Guidelines and Policies
The SAP Global Data Protection and Privacy Policy sets a Group-wide governance standard and structure for the handling of personal data in accordance with data protection and privacy requirements. It also defines requirements for business processes that involve personal data and assigns clear responsibilities. The data protection principles set out in this policy are generally accepted and enshrined in most data protection laws around the world, including the EU GDPR. These principles provide the general framework in the SAP Group for the processing of personal data. We actively monitor changes to applicable laws and regulations so that we can update our standards on an ongoing basis as necessary to meet data protection compliance. The policy was last updated in 2023.
How We Measure and Manage Our Performance
Security and Cloud Compliance
Compliance processes at SAP adhere to trust-service criteria established by the American Institute of Certified Public Accountants (AICPA). Our security, privacy, confidentiality, and processing integrity controls are designed to achieve the appropriate control objectives. In addition, independent, external auditing partners regularly conduct security compliance audits.
SAP discloses vulnerabilities to customers and provides accompanying patches or instructions when the customer needs to take action. This procedure also applies to the rarer cases where SAP patches to cloud services require customer action. We disclose these instructions using SAP Security Notes published every second Tuesday of the month (Patch Day). By the time any vulnerabilities are disclosed to customers, the patches are already applied on cloud landscapes as a rule. This process is further supported by the publication of Common Vulnerabilities and Exposures (CVE documents) through MITRE that enable integration with the customer’s existing vulnerability and risk management tools. MITRE is a disclosure mechanism that provides customers with authoritative, public information from SAP about SAP software vulnerabilities that can be integrated with their existing risk management processes and tools.
We strive to reduce risk by continuously improving our processes for detecting and remediating attacks and vulnerabilities. To that end, we:
| – | Engage in internal and external audits across SAP globally |
| – | Monitor and support our cloud and IT units with more than 2,800 controls that are audited and tested for design and operational effectiveness |
| – | Offer service organization control (SOC) reports – such as SOC 1 Type II/ISAE 3402 and SOC 2 Type II/ISAE 3000 – to provide insights into the design and operational effectiveness of internal control systems implemented within cloud delivery units |
|
SAP Integrated Report 2023 | |||||
| To
Our Stakeholders |
Combined
Management Report |
Consolidated
Financial Statements IFRS |
Further
Information about Sustainability |
Additional Information |
||
| – | Have external internationally accredited auditors assess and certify our cloud services according to various reporting standards and ISO certifications, such as ISO 9001, ISO 27001, ISO 27017, ISO 27018, ISO 22301, and BS 10012 |
Data Protection
To help ensure necessary knowledge about data protection, global data protection and privacy training is mandatory for SAP employees. The training is conducted every two years, with the latest rolled out in 2023. This training helps our workforce handle personal data with due care and in accordance with the law and to maintain compliance with data protection requirements in their work.
We monitor compliance of data protection-relevant procedures across SAP. We maintain a record of processing activities (“procedure enrollment tool”), in which all procedures that process personal data must be documented. These records contain general information about the procedure according to clearly defined criteria that are necessary to meet proper documentation. The records are reportable and regularly reviewed.
We also track the quality of our data protection compliance level based on the annual recertification of our DPMS by the BSI. SAP has been audited by the BSI annually and awarded certifications according to BS 10012 since 2011. The most recent certification is valid until end of 2025.
SAP’s own quality standards and international regulations require careful selection and monitoring of subprocessors processing personal data on behalf of SAP and SAP customers. With the goal that all subprocessors meet data protection and security requirements for the processing of personal data, SAP has implemented a subprocessor verification process that is part of the overall SAP Third-Party Risk Management framework.
SAP respects the rights of the data subjects to obtain information as to whether personal data concerning them is being processed. All necessary information is made available to the data subjects within the framework of the privacy statements on the respective SAP Web sites.
In 2023, there were two notifiable data protection incidents in accordance with the GDPR for data that SAP processes for its own purposes and were reported to the supervisory authorities.
Related Risks for SAP
For related financial risks, see the Risk Management and Risks section, specifically the Cybersecurity and Security and Data Protection and Privacy subsections.
Audit Scope
The content of the Security, Cloud Compliance, Data Protection and Privacy section was not subject to the statutory audit of our combined management report. However, our external auditor performed an independent limited assurance engagement for the content of this section.
|
SAP Integrated Report 2023 | |||||
| To
Our Stakeholders |
Combined
Management Report |
Consolidated
Financial Statements IFRS |
Further
Information about Sustainability |
Additional Information |
||
Employees
Vision and Strategy
People are at the heart of our organization. Aiming for a highly engaged, diverse, future-fit workforce equipped with the right skills helps SAP attract and retain the best talent.
As part of People & Operations, our People Strategy connects with our go-to-market and product strategies, bringing together the essential fabric of SAP’s transformation: our people, processes, and technology. Since 2020, we have been evolving our annual execution of our People Strategy, which contributes to our business strategy and value generation. It can be summarized across three strategic priorities powered by operational excellence, and showcasing SAP SuccessFactors solutions for human experience management (HXM):
| – | Build SAP’s Skills for the Future by attracting the best and most diverse talent and continuously up-/reskilling our people |
| – | Drive SAP’s Winning and Inclusive Culture by fostering a culture that enables and rewards impact and business outcomes and nurtures inclusion and belonging |
| – | Change the Way We Lead – Do What’s Right by driving accountability and empowerment in an agile, healthy, and inclusive environment |
Due Diligence
Governance
Sabine Bendiek served as Chief People and Operating Officer and Labor Relations Director from January 1, 2021, until her departure from the Company on December 31, 2023. She is succeeded by Gina Vargiu-Breuer, who joined the SAP Executive Board in February 202417. The following functional areas help implement our People Strategy: Future of Work (including Global Health, Safety & Well-Being), Global Diversity & Inclusion, SAP Learning, Talent Attraction, Total Rewards, and our Global People Success Services team, which includes the HR Business Partner organization, People Experience, and Global HR Service Delivery.
Guidelines and Policies
SAP is committed to ensuring the fair and equal treatment of all employees in a sustainable manner. For that reason, we established comprehensive policies that guide us in our daily business. Examples include our SAP Global Antidiscrimination Statement and SAP Health & Safety Commitment Statement.18,19
How We Measure and Manage Our Performance
The impact of our People Strategy is measured by seven KPIs (see table “Our Key People-Related KPIs at a Glance”). Five out of the seven KPIs are based on the results of our engagement survey program #Unfiltered.20 With #Unfiltered, we strengthen our commitment to listen regularly to our employees and act together on their feedback. Our focus in 2023 was on continuing our efforts to
17 As a result of the departure of Sabine Bendiek, as of January 1, 2024, SAP’s HR function has been re-established as an independent Board area named People & Culture.
18 The Commitment Statement, first published in February 2023, is the public version of our internal SAP Global Health & Safety Policy.
19 Both links lead to information that was not part of the statutory audit or the independent limited assurance engagement performed by our external auditor.
20 82,651 employees participated in the #Unfiltered survey in April (response rate: 76%), and 78,041 employees participated in the #Unfiltered survey in October (response rate: 71%). All headcount (HC)-relevant employees and, in addition, in Germany, the non-HC relevant employees on parental leave, on long-term sick leave, with a tenure of more than six months, PhD students, and vocational trainees were invited to take part in the 2023 #Unfiltered survey cycle.
|
SAP Integrated Report 2023 | |||||
| To
Our Stakeholders |
Combined
Management Report |
Consolidated
Financial Statements IFRS |
Further
Information about Sustainability |
Additional Information |
||
further strengthen the excitement about the future of SAP. We gauged the sentiment on employee engagement (which includes excitement for the future of SAP), leadership trust, and health and well-being along with other topics twice in 2023. The average scores from both data collections were used as the full-year Employee Engagement Index and Leadership Trust Net Promoter Score.
Additional people-related KPIs can be found in the Report data Hub.21
Our Key People-Related KPIs at a Glance22
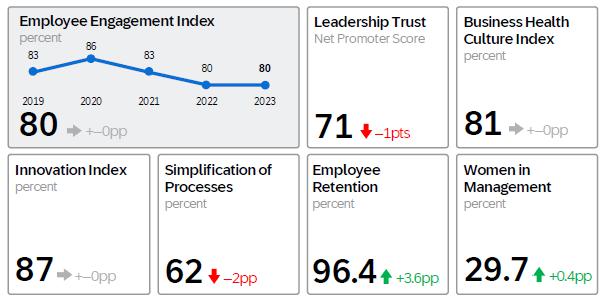
Below is an overview of how we put the three themes of our People Strategy and the KPIs into practice.
Build SAP’s Skills for the Future
SAP is committed to accelerating cloud growth. This requires workforce upskilling and expansion. Attracting, hiring, onboarding, developing, and retaining top talent is vital for our future success. In 2023, we focused on internal roles and strategic investment areas to support our transformation and long-term growth. The competitive talent market underscores the need to further communicate our Employer Value Proposition, encourage employee ambassadorship, and promote referrals. We remain committed to fostering inclusivity across generations, genders, nationalities, and more, to ensure a rich and diverse workforce.
For 2023, it remained our ambition to have 30% of management roles held by women. Our aspiration is to reach gender parity in our workforce at all levels and to retain women leaders.
21 Information was not part of the statutory audit or the independent limited assurance engagement performed by our external auditor.
22 Employee Engagement Index: For more information, see the Performance Management System section. The Employee Engagement Index target range for 2023 was 76% to 80%; this range will also be the target for 2024.
Leadership Trust Net Promoter Score: for more information, see the Performance Management System section.
Business Health Culture Index (BHCI): Indicates the extent to which SAP successfully offers employees a working environment that promotes health, and supports their long-term employability and their active engagement in reaching our corporate goals. The index covers questions concerning how employees rate their personal well-being, the working conditions at SAP, and our leadership culture. The BHCI is calculated based on the results of our #Unfiltered program (April 2023 survey). For 2024 through 2025, our ambition remains to keep the BHCI between 78% and 80%.
Innovation Index: Indicates to what extent we foster an innovation culture. The index is measured by three questions in our #Unfiltered program (April 2023 survey).
Simplification of Processes: Shows the impact of our continued efforts to simplify our processes. The index is measured by nine questions in our #Unfiltered program (October 2023 survey).
Employee Retention: Ratio of the average number of employees minus the employees who left voluntarily, to the average number of employees, taking into account the past 12 months (in full-time equivalents, or FTEs). This ratio puts emphasis on employee-initiated turnover. In other words, we seek to measure how many employees choose to stay with SAP. As opposed to keeping a low turnover rate, we aim to keep our retention rate high. The number of employees who left voluntarily excludes those who left voluntarily as part of restructuring-related departures, for more transparency and precise headcount management purposes.
Women in Management: We define “women in management” as the share of women in management positions as compared to the total number of managers, expressed by the number of individuals and not FTEs. It includes three categories: 1) Managers managing teams: Refers to managing teams of at least one employee or vacant position; 2) Managers managing managers: Refers to managing managers who manage teams; and 3) Executive Board members. For 2023, we kept our ambition to increase the rate of women in management to 30%. Our aspiration is to reach gender parity in our workforce at all levels and to retain women leaders.
|
SAP Integrated Report 2023 | |||||
| To
Our Stakeholders |
Combined
Management Report |
Consolidated
Financial Statements IFRS |
Further
Information about Sustainability |
Additional Information |
||
As part of our strategic pillar “Build SAP’s Skills for the Future,” we focus on the skills transformation of our workforce. We have established one unified skills library, and are working to unify existing skills management tools to implement one single platform, SAP SuccessFactors, for all employees. This will enable greater skills transparency, data-driven workforce planning, and intentional upskilling, as well as enhance our processes from hire to retire.
Our learning strategy is closely aligned with our product and customer strategies to drive cohesive, skill-based development for both our ecosystem and our workforce.
Talent Attraction, Development, and Retention
| External hires |
- 7,187 (FTE) (2022: 12,564) employees, of which 41.5% were women (2022: 38.1%) - Attracting diverse talent is supported by initiatives such as the SAP Returnship program for professionals who have taken a career break for caregiving, relocation, or military service. |
| Early Talent23 hires and pipeline programs |
- Early Talent hires: out of 7,187 hired employees, 37.8% (FTE) (2022: 27.9%) are Early Talents. - Vocational Training / SAP Student Training and Rotation (VT/ STAR) program: average of 1,454 students and apprentices (from Australia, Brazil, China, Germany, Hungary, India, Ireland, Japan, New Zealand, South-East Asia, South Korea, Switzerland, and the United States); conversion rate24 of 82% (2022: 78%) - Cooperation with more than 2,700 academic institutions (events, executive lectures, office visits, competitions) - SAP Internship Experience Program: 1,568 (2022: 1,662) global participants in 22 countries |
| Global onboarding |
- New employees must attend virtual corporate onboarding sessions (a total of 12 hours) that ensure they understand SAP’s strategy, culture, structure, operations, and success metrics. - Around 4,500 new hires completed these sessions in 2023, with a customer satisfaction rate of 4.5.25 - For new hires in customer-facing sales roles, corporate onboarding is complemented by role-based onboarding. In 2023, 1,212 new hires in customer-facing sales roles completed our role-based onboarding program. With each new hire completing at least 80 to 90 hours of learning, total trackable learning was more than 97,000 hours. |
| Continuous learning, upskilling, and engagement |
- Self-paced online and live interactive training, and a peer-to-peer learning portfolio for all employees - Role-based solution upskilling program for customer-facing functions26 (completion rate: 53%)27 - Cloud upskilling program that reached 39,618 employees (2022: 34,233) - High employee-learning participation rate: in 2023, the participation rate was 99%, resulting in more than 2.3 million learning hours (2021: more than 3 million hours; 2022: more than 3.1 million hours with a 98% participation rate)., and 12,057 individuals spent more than 50 hours learning. - More than 1.8 million external learners upskilled on SAP solutions and technologies in 2023 as part of our ambition to upskill 2 million learners annually by 2025, including programs for underrepresented groups to build digital skills. |
| Succession management process | - Succession pipeline defined by supporting targeted development and facilitating Executive Board exposure in roundtables for incumbents and identified successors of executive roles |
| SAP Alumni Network | - 25,559 former employees (2022: 20,054 ); 5,903 current employees (2022: 5,444) |
| Candidate and hiring manager experience |
- It is our goal to differentiate SAP by creating a great experience in every interaction. Qualtrics feedback surveys of candidates and hiring managers help provide the necessary insight to continuously improve our hiring practices. - Candidate Experience:28 4.22; Hiring Manager Experience:29 4.68; Quality of Hire: Score 1: 96%; Score 2: 67%30 |
| Average tenure | - 8.7 years (2022: 8.3 years) |
23 “Early Talents” are defined as having 0 to 3 years of experience in a professional setting when hired into a professional role.
24 Percentage who received permanent contracts after completing the VT/ STAR program
25 Score based on the question: “Overall, how satisfied are you with the Experience SAP session?” (scale: 1 being the lowest, 5 the highest rating).
26 The role-based skill program is mandatory for all SAP employees in Customer Success (CS) – excluding contract employees in CS roles in Germany, where the program is considered “highly recommended.”
27 The role-based skill program consists of the following levels: L100 completion rate: 50%, L200 completion rate: 45%, L300 completion rate: 121%, and Essential Learning completion rate: 53%.
28 The score is based on three questions (scale: 1 being the lowest, 5 the highest rating) about their experience with the recruiter, their ability to represent the Company, and the opportunities there, and their ability to serve as strategic advisor to find the best fit within the Company for the candidate.
29 This is a weighted average of the candidate touchpoint survey: Career Site, Post-Application, Post-Interview, and Post-Decision.
30 Score 1 is based on the question: “Would you hire this employee again?”; Score 2 is based on the question: “Has this employee ‘raised the bar’ for your team?”
|
SAP Integrated Report 2023 | |||||
| To
Our Stakeholders |
Combined
Management Report |
Consolidated
Financial Statements IFRS |
Further
Information about Sustainability |
Additional Information |
||
| Earned employer, learning, and development recognitions |
- 170 (2022: 154); List of Workplace Culture Awards31 - Our approach to upskilling has been recognized by: - The Chief Learning Officer 2023 Learning Elite Awards – Gold Status - SAP being named a leader in three IDC MarketScape reports, the European and U.S. IT Training Services 2021 Vendor Assessment, and APeJ IT Training Services 2022 Vendor Assessment, and issued again in 2023. |
Drive SAP’s Winning and Inclusive Culture
With our performance management approach, we aim to establish a high-performance focus by linking business goals to the impact of individuals and teams. Development opportunities, meaningful reward packages, and a culture of inclusion foster an environment where the full potential of every individual is realized. It is critical that our employees see the link between their individual contribution and SAP’s future success.
Goal Setting and Reward Structure
| Smart
and transparent goal-setting approaches and continuous dialogue |
- SAP’s top leadership sets goals for their organization based on SAP’s and their respective Board area’s strategy and focus areas and make them visible to all employees, kicking off a goal cascade through all required leadership levels, down to team and employee goal setting. In the time from January to April, up to 93% of our workforce documented their performance goals in 2023 (2022: 88%).32 - SAP Talk conversation and check-ins throughout the year are designed to ensure manager and employee dialogue, discuss goals defined according to the SMART33 methodology, agree upon and document these goals, and share feedback. |
|
Holistic Total Rewards |
Our rewards experiences bring value to our people and SAP. For example, we: - Ensure fair pay through annual, global reviews of our pay ranges and pay equity, and centrally-funded pay adjustments, so that all employees are within their pay range and acceptable spread of pay differences with peers. Our approach is agnostic of personal characteristics and recognized as market-leading by The Josh Bersin Company.34 - Follow a “pay-for-performance” approach with broad-based and targeted investments to reward individuals’ unique contribution and impact - Empower managers with a real-time analytics dashboard, powered by SAP, to make impactful rewards decisions - Motivate employees to drive our cloud transformation with short-term incentives using a unified KPI of growth in current cloud backlog (CCB)35 - Drive ownership through our share-based compensation program, Move SAP, which vests quarterly and is share-settled in most countries (2023: 97% of employees eligible) - Ensure ownership is accessible for all employees through our global share purchase plan, Own SAP. Overall participation was 75% in 2023 (2022: 79%) with a collective investment of 6,710,033 shares (2022: 9,183,599). - Increase transparency for employees on their holistic rewards offerings – from pay to benefits and equity. Employees now have transparency into their own pay ranges (99.8% of all employees) and the value of top benefits offerings (66% of all employees). |
For more information, see the Notes to the Consolidated Financial Statements, Note (B.3).
At SAP, we strive to be the world’s most inclusive workplace, aiming to create a unique culture where everyone feels a sense of belonging, and human differences are celebrated and valued.
As a global organization with employees from 160 nationalities, we strive to consider the full spectrum of human differences and promote inclusion for each one of them (for example, inclusion of gender, race, LGBTQ+, generations, disability, and many other diversities). Our Diversity & Inclusion Strategy is built on three pillars:
| – | Workforce Diversity: We believe in leveraging the widest spectrum of human differences that represent a diversity of identities, thoughts, and perspectives to create business outcomes that help the world run better every day. |
| – | Workplace Inclusion: We foster a work environment where colleagues can thrive and engage to their fullest potential in driving SAP’s purpose. Inclusion involves active co-creation of the culture where all experiences lead to a feeling of acceptance and belonging. |
31 Link leads to information that was not part of the statutory audit or the independent limited assurance engagement performed by our external auditor.
32 M&A teams that are not yet using our Success Map tool are excluded.
33 SMART is an acronym that stands for Specific, Measurable, Achievable, Realistic, and Timely.
34 The Josh Bersin Company, SAP Transforms Total Rewards to Accomplish Pay Equity, 2023
35 Used in our sales leadership plans as a primary KPI, in non-quota carrying sales plans as a secondary KPI, and in our revenue-enabling plans as the core basis of evaluating our company success. For a definition of CCB, see the Performance Management System section.
|
SAP Integrated Report 2023 | |||||
| To
Our Stakeholders |
Combined
Management Report |
Consolidated
Financial Statements IFRS |
Further
Information about Sustainability |
Additional Information |
||
| – | Marketplace Leadership: We are aware of the potential impact we can have as one of the largest tech companies in the world, and therefore extend our diversity and inclusion focus to our entire ecosystem. |
Equality and Inclusion in the Workplace
| Gender inclusion, advancement, and equality |
- Women in the overall workforce: 35.2% (2022: 34.9%); women in management roles: 29.7% (2022: 29.3%); women in executive roles:36 22.2% - SAP ranked #3 on Forbes’ list of the World’s Top Companies for Women in 2023, rising from #18 in 2022. - SAP Business Women’s Network impact: 3,300 participants at International Women’s Day and 150 chapter global events - We launched the Global Women’s Development Program for women below managerial levels, which has 263 participants across all Board areas. - The SAP Returnship program, a 20-week internship for mid-career professionals, converted 66% of the returnees into full-time employees and doubled in size. |
| Autism inclusion |
- Celebrating 10 years of success in 2023, our Autism at Work program supported 244 (2022: 215) colleagues on the autism spectrum across 16 (2022: 15) countries. The program was also expanded to the Philippines. - SAP Autism Inclusion Pledge: we continued to support 126 companies with best-practice sharing. - We sponsored the first-ever Autism Inclusion Company of the Year Award in partnership with Disability:IN. - SAP received the HollyRod Foundation’s Corporate Compassion Award. -We created the Sensory Relaxation Room in Prague and the Tranquility Lounge at the SuccessConnect event in Las Vegas as neurodivergent-inclusive spaces. |
| Race and ethnicity |
- SAP continued to be a member of the Equal@Work platform of ENAR, the European Network Against Racism. - We launched a global development program focused on levelling the playing field for underrepresented groups. The program was extended beyond North America to Africa and Brazil. |
| LGBTQ+ inclusion |
- SAP joined the Partnership for Global LGBTIQA+ Equality’s “Pride on the Promenade” initiative at the World Economic Forum. - SAP received the following recognitions: Top rating in the Corporate Equality Index of the Human Rights Campaign in five countries; a gold seal in Uhlala Group’s PRIDE Champion Audit in Germany; gold certification in Japan in the PRIDE Index from Work With Pride for the fourth consecutive year. - SAP sponsored the Out & Equal 2023 Workplace Summit. |
| Workplace accessibility | - We received a 100% score on the Disability Equality Index for the fifth consecutive year. |
| Global Employee Network Groups (ENGs) |
- SAP supports 13 global Employee Network Groups (ENGs), which foster a culture of inclusion and psychological safety in the workplace. - Executive Board members continue to be executive sponsors for ENGs. - Allyship for Inclusion initiative launched globally in 2023 in partnership with ENGs to build a culture of inclusion. |
| Workplace inclusion |
- SAP launched the first global diversity survey to assess workforce representation. - We achieved a 92% workplace equality rating (compared to 91% in 2022) in the #Unfiltered survey. - We launched Intentional Inclusion workshops globally to raise awareness about overcoming unconscious bias. - In 2023, SAP was recognized as a Top Faith-Friendly Company by the Religious Freedom and Business Foundation. |
| Marketplace leadership |
- SAP won 56 diversity and inclusion awards in 2023, more than in any previous year. - We activated the SAP EMEA South partner ecosystem on diversity and inclusion through active engagement with leadership. - We partnered with the World Economic Forum in best-practice sharing. - We enhanced our engagement with customers to advance diversity and inclusion (for example, Tech Day of Pink). - To foster the inclusion of transgender and non-binary people, SAP implemented the pronouns and preferred name functionalities available in the SAP SuccessFactors solutions it deploys internally. - The SAP Design team released accessibility design tools and the inaugural research handbook to enhance product accessibility. |
Change the Way We Lead – Do What’s Right
SAP’s leadership culture is built on our leadership credo: “Do what’s right, make SAP better for generations to come,” which focuses on empowerment of our leaders to make critical decisions and drive change, and on stewardship to bring along the next generation of leaders and employees.
36 We define “women in executive roles” as the percentage of women on the three management levels below the Executive Board out of the combined total of men, women, and other genders at those three levels.
|
SAP Integrated Report 2023 | |||||
| To
Our Stakeholders |
Combined
Management Report |
Consolidated
Financial Statements IFRS |
Further
Information about Sustainability |
Additional Information |
||
Leadership Culture
| Empowering and guiding our leaders |
- We strengthened SAP’s leadership culture, based on the credo, through the creation of a consistent approach to leadership engagement across all levels, including: – Executive strategy forums and clinics – Enabling executives to build high-performing organizations |
| Reinforcing leadership culture |
- Traditional, peer, and experiential learning journeys focus on purpose-driven leadership and on driving high-performing teams and organizations. - We built accountability into critical processes and provided data transparency on leadership KPIs for organizational steering. |
| Consistent enablement of leaders |
Targeted development offerings for each leadership tier, developing the skills to lead SAP into the future: - Enabling courageous conversations, providing feedback, intentional inclusion, and psychological safety - Scaling delivery of our modularized learning and flagship programs - Holding the SAP Leadership Summit - Percentage of leaders37 who have completed at least one relevant learning asset: 44.4% - Percentage of global senior executives who have completed relevant development offerings: 62.2% |
In addition to our leadership culture, one further strategic pillar is that of pursuing an agile, entrepreneurial, healthy, and innovative organization, which is essential in today’s rapidly changing environment.
A Future-Ready, Agile, Healthy, and Innovative Organization
| Future of Work |
- SAP’s holistic approach to the future of work actively addresses trends and developments – including the AI revolution and skills shortage – to reimagine work at its core. We drive this transformation with state-of-the-art people practices and innovative workplace approaches to future-proof our organization in times of unprecedented change. - With our Pledge to Flex initiative, SAP established a new standard for flexible work as the foundation for successful hybrid work - also for the post-pandemic era. Our global “I’m In” campaign, launched in May, reaffirmed our commitment to flex work and recommended working in the office two to three days per week as a good practice for many employees in 2023. We see value in coming together in the office on a regular basis, as it supports camaraderie, team collaboration, productivity, and innovation. - Leveraging advanced technology and new office design concepts in frontrunner locations (London, Montréal, and Zurich) further supports SAP in attracting and retaining top talent in the tech industry. |
| Health, safety, and well-being |
- The health, safety, and well-being of our people is a cornerstone of a sustainable Future of Work. To deliver on the promises outlined in SAP’s business strategy, our people need to run at their best and realize their full potential, while caring for their own health, their colleagues’ and team’s well-being, and their customers’ needs. - A caring culture and compliance with international and local health and safety regulations are integral parts of our business conduct, our duty of care, and our commitment to ethical leadership, as outlined in SAP’s Health & Safety Commitment Statement. - In 2023, for example, we: – Rolled out the revised internal SAP Global Health & Safety Policy with the SAP Global Health Summit and an employee enablement training – Updated SAP’s global health and safety management system in line with the SAP Global Health & Safety Policy – Continued the “Are you OK?” mental well-being initiative for leaders and employees as part of our commitment to a no-stigma working culture – Continued the SAP Global Mindfulness Practice program, supporting employees and customers in bringing mindfulness into daily personal and professional lives to increase their overall well-being and productivity |
| Innovation |
- The SAP.iO programs curate a relevant and diverse startup ecosystem that extends the value of SAP solutions and meets the continuously evolving needs of our customers. The programs provide dedicated support to promising startups as they launch and scale relationships with SAP and our global network of customers, partners, and employees. In 2023, SAP.iO helped 120 startups scale their solutions and expand the SAP ecosystem. - Hasso Plattner Founders’ Award: the highest internal employee recognition at SAP |
Deliver Operational Excellence and Showcase Human Experience Management
Delivering engaging experiences for SAP’s customers starts with our own workforce. A continued emphasis on operational excellence and experience management is key to delivering our human experience management (HXM) solutions and services efficiently, with both empathy and compliance. Examples include:
37 The term “leaders” is inclusive of all SAP colleagues who are in a formal executive or people manager role – either managing a team or managing managers.
|
SAP Integrated Report 2023 | |||||
| To
Our Stakeholders |
Combined
Management Report |
Consolidated
Financial Statements IFRS |
Further
Information about Sustainability |
Additional Information |
||
– SAP runs SAP SuccessFactors solutions to manage global SAP people data, and the SAP Analytics Cloud solution to provide analytics and insights.
– SAP puts processes and tools in place that enable employees to work flexibly from different locations (including working from home or abroad for personal reasons), in line with local flexible work policies.
– The SAP Signavio Process Intelligence solution provides our HR organization with insights on how HR support tickets flow between the various HR support teams. In addition, we are currently leveraging the SAP Build Process Automation solution to further automate processes such as bonus plans and variable pay.
Related Risks for SAP
“Human rights and employee matters” is a risk factor that is assessed as part of SAP’s corporate financial risk management system. No material financial risks were identified through our risk framework as described in the Risk Management and Risks section.
Headcount and Personnel Expense
Numbers disclosed in the Employees section38 are based on headcount (exceptions in FTE are indicated). We define headcount in FTE39 as the number of people on permanent employment contracts, taking into account their staffing percentage. Students, individuals employed by SAP but currently not working for reasons such as maternity/parental leave, and temporary employees on limited contracts of less than six months are excluded from our figures. The number of temporary employees is not material.
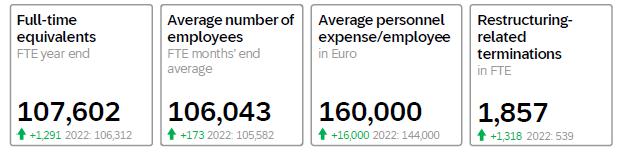
The personnel expense for each employee is defined as the overall personnel expense divided by the average number of employees.
For 2024, we plan a targeted restructuring program in close alignment with social partners, which is expected to affect about 8,000 employees from SAP’s global workforce. For more information, see the Notes to the Consolidated Financial Statements, Note (G.8).
For more information about employee compensation and a breakdown of personnel expense, see the Notes to the Consolidated Financial Statements, Note (B.1) and Note (B.2).
Audit Scope
Except for the quantitative indicators Headcount and Personnel Expense, the content of the Employees section was not subject to the statutory audit of our combined management report. However, our external auditor performed an independent limited assurance engagement for the content of this section. Under this engagement, the quantitative indicators Business Health Culture Index, Employee Engagement Index, Employee Retention, Women in Management, and Women in Executive Roles were audited at a reasonable assurance level.
38 All financial and non-financial numbers in this chapter are based on continuing operations excluding Qualtrics.
39 Thereof acquisitions: 558.
|
SAP Integrated Report 2023 | |||||
| To
Our Stakeholders |
Combined
Management Report |
Consolidated
Financial Statements IFRS |
Further
Information about Sustainability |
Additional Information |
||
Energy and Emissions
Vision and Strategy
For over a decade now, climate action has been at the top of SAP’s corporate sustainability agenda in light of the increasing impacts of climate change and escalating global challenges such as ecosystem degradation and biodiversity loss. As outlined in the Sustainability Management40 section, we aim to take climate action through our dual approach as enabler and exemplar to help pave the way toward a low-carbon future for our customers, partners, and SAP, and create impact within planetary boundaries.
Due Diligence
Governance
As outlined in the Sustainability Management1 section, the Executive Board sponsorship for sustainability lies with the CEO, and for climate action with the CEO and CFO. The ESG Steering Board (formerly Sustainability Council) serves as a governance body to steer SAP’s corporate sustainability performance. The organizational unit and operating segment responsible for sustainability drives SAP’s holistic, cross-company sustainability agenda. The Office of the Chief Sustainability Officer (oCSO) is part of this unit and continues to shape SAP’s response to climate change in close cooperation with other departments. Among other things, the oCSO is responsible for:
| – | Defining the Environmental Policy and determining a global environmental project portfolio to help steer SAP’s impact |
| – | Setting reduction and impact targets and embedding sustainability-related initiatives across SAP (for example, running the cross-board Environmental Management System and net-zero program) |
| – | Evaluating our carbon inventory and monitoring carbon emissions on a quarterly basis |
| – | Assessing and managing climate-related risks through a quarterly risk review |
| – | Managing nature-based investment decisions |
| – | Serving as advisor to our development units to develop solutions |
Sustainability is a company-wide effort, and initiatives are also driven outside this dedicated unit. For example, the global procurement organization aims to ensure that SAP purchases energy-efficient, sustainable products and services. The global real estate and facilities management team designs and operates many SAP facilities based on robust environmental standards such as ISO 14001:2015 and the Leadership in Energy and Environmental Design (LEED) certification program. Our global cloud services organization attends to the optimization of the energy consumption in our data centers, while our SAP IT department encourages employees to use IT equipment and business software responsibly. In addition, to be able to innovate and evolve sustainability further, we regularly engage externally with various stakeholder groups, such as non-governmental organizations (NGOs), investors, customers, and academia. For more information, see the Stakeholder Engagement41 section.
40 Link leads to information that was neither part of the statutory audit nor included in the independent limited assurance engagement performed by our external auditor.
41 Link leads to information that was neither part of the statutory audit nor included in the independent limited assurance engagement performed by our external auditor.
|
SAP Integrated Report 2023 | |||||
| To
Our Stakeholders |
Combined
Management Report |
Consolidated
Financial Statements IFRS |
Further
Information about Sustainability |
Additional Information |
||
Guidelines and Policies
Our Global Environmental Policy42 provides the core framework for how we manage our environmental impact – in our own operations and with our customers. Updated in August 2023 and approved by the CEO, this policy guides our efforts to improve our ecological footprint, provide environmental performance transparency, and demonstrate sustainable leadership through transformational strategies. In addition, it helps us comply with internationally recognized sustainability standards as well as stakeholder expectations, primarily those of customers, investors, and employees.
How We Measure and Manage Our Performance
Our Carbon Reduction Targets
| Target | Base Year | Target Year | Target Description, Status, and Next Steps |
| Carbon neutrality in our own operations by 2023 | 2017: 327 kilotons (kt) net carbon emissions43 | 2023: 0 kilotons (kt) net carbon emissions |
● Net carbon emissions = gross carbon emissions (scope 1, 2, and selected scope 3)44 minus purchased renewable energy certificates (EACs), self-generated renewable energy, and carbon offsets. ● To track progress on our target, we derived annual targets for our internal operational steering. Since the beginning of 2020, these annual targets have been integrated in the Executive Board’s short-term performance-based compensation45. ● Status: Achieved46 |
| 1.5°C-aligned Science-Based Target (SBT) | 2023: 6.9 million tons gross carbon emissions (market-based) | 2030: reduction by 90% (near-term and long-term target) |
● Acceleration of SAP’s science-based target47 (to reach net zero across our value chain in line with a 1.5°C future by 2030, 20 years earlier than originally planned) required a reassessment of the baseline, underlying scopes, calculation methodologies, and the target pathway. ● Status and next steps: ○ In 2023, our original SBT48 was replaced by our commitment to reach net zero by 2030 in line with the SBTi Corporate Net-Zero Standard. ○ In line with the Greenhouse Gas (GHG) Protocol, we revised the baseline, which includes scope 1, scope 2 market-based, and all business-relevant scope 3 value chain emissions. For more information, see the Non-Financial Notes49 section. ○ Next steps: submission to the SBTi in 2024 and publication of target pathway 2024–2030 in the SAP Integrated Report 2024. |
Performance and Measures to Progress50
With our net carbon emissions dropping to 0 kilotons (kt) in 2023 (2022: 85 kt), we have achieved our carbon neutrality commitment within the targeted timeframe. To achieve our target, we continued and expanded existing initiatives and programs to drive efficiency and innovation, following our strategic approach to first avoid, secondly reduce, and thirdly – if no other option is feasible – compensate for residual emissions by investing in high-quality offset projects certified by international standards (for more information, see the section Investing in Carbon Offsets to
42 Link leads to information that was neither part of the statutory audit nor included in the independent limited assurance engagement performed by our external auditor.
43 We account and report all our carbon emissions in CO2 equivalents (CO2e).
44 To see which emission categories are considered in our carbon neutral target, see section Non-Financial Information: Environmental Performance (link leads to information that was neither part of the statutory audit nor included in the independent limited assurance engagement performed by our external auditor).
45 Link leads to information that was part of the compensation report audit of our external auditor (reasonable assurance level).
46 In the Report Data Hub, we provide a carbon emissions breakdown and more details on progress (selected data presented in the linked environmental section were part of the statutory audit or independent limited assurance engagement performed by our external auditor. For more information, see the auditor’s assurance report).
47 Acceleration decision made in 2022 to prevent and mitigate the intensifying adverse effects of climate change.
48 Confirmed by the SBTi in a 2019 reassessment, our original 1.5°C-aligned SBT (first defined in 2017) aimed for a reduction of 85% by 2050 compared to the base-year level 2016 (near-term target: reduction by 40% by 2025).
49 Link leads to information that was neither part of the statutory audit nor included in the independent limited assurance engagement performed by our external auditor.
50 In the Report Data Hub, we provide more details about our environmental data (selected data presented in the linked environmental section was part of the statutory audit or independent limited assurance engagement performed by our external auditor. For more information, see the auditor’s assurance report).
|
SAP Integrated Report 2023 | |||||
| To
Our Stakeholders |
Combined
Management Report |
Consolidated
Financial Statements IFRS |
Further
Information about Sustainability |
Additional Information |
||
Compensate for Our Remaining Emissions). Starting in 2024, we will shift toward reporting on our new leading environmental target of ‘net zero across our entire value chain by 2030.’
Total Net Carbon Emissions
Kilotons CO2e
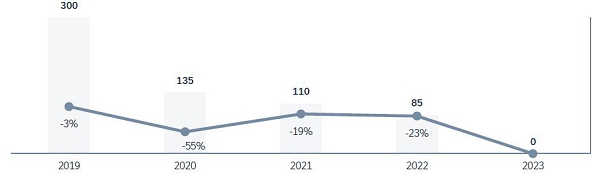
After post-COVID-19 catch-up effects and a corresponding increase in 2022, total energy consumption in our own operations decreased slightly in 2023. Looking at the data center electricity consumption, we continue to see a decrease attributable to a shift toward hyperscale services and the implemented energy efficiency measures taking effect.51 We have continued to reduce all electricity-related emission categories with electricity from renewable energy sources52 (for more information, see the Key Initiatives to Avoid and Reduce Emissions table below).
Total
Energy Consumption
(Scope 1 and Scope 2, excluding hyperscale data centers)
Gigawatt hours (GWh)
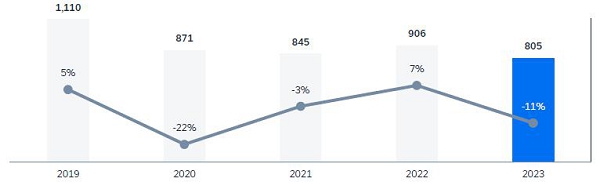
Total
Data Center Electricity Consumption
(Scope 2, excluding hyperscale data centers)
Gigawatt hours (GWh)
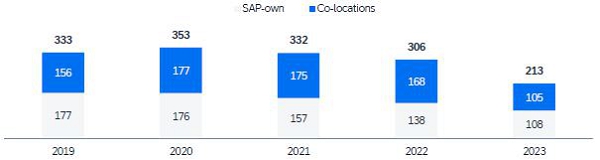
51 In 2023, hyperscaler electricity consumption was more than two times that of our co-locations. For more information about our energy consumption, see section Non-Financial Notes: Environmental Performance.
52 For more information, see section Non-Financial Notes: Environmental Performance.
|
SAP Integrated Report 2023 | |||||
| To
Our Stakeholders |
Combined
Management Report |
Consolidated
Financial Statements IFRS |
Further
Information about Sustainability |
Additional Information |
||
Key Initiatives to Avoid and Reduce Emissions
| Cloud Transformation | |
| SAP’s sustainability software portfolio |
● SAP delivers sustainability management solutions for sustainability reporting, climate action, circular economy, and social responsibility to enable our customers to run sustainable and resilient operations as described in the Product Strategy section.53 ● As co-innovation customers for the Sustainability Control Tower, Sustainability Footprint Management, Sustainability Data Exchange, and Green Ledger, various teams such as the Corporate Sustainability team and Sustainability Controlling team provide input and feedback to the development teams with the aim of leveraging a solution that enables companies to record, report, and act on their sustainability goals. |
| Carbon-neutral cloud solutions and product-in-use emissions |
The vast majority of our overall carbon emissions result from the use of our software. To address this, we aim to help our customers, hardware providers, and others to run more energy-efficient operations. ● By powering all data centers with 100% renewable electricity,54 we offer our customers carbon-neutral55 cloud software solutions and help them reduce their overall carbon emissions (upstream scope 3). ● We started to develop a carbon footprint sizing approach with the aim of enabling our customers to gain transparency on the carbon impact of their SAP applications that run in SAP’s internal and external data centers, answering the question of how much our customers can reduce their environmental footprint while running SAP solutions on SAP’s self-operated or on SAP sourced infrastructure. ● We collaborate with customers to optimize their on-premise landscapes so that they consume less energy (for example, we decommission legacy systems, archive unused data, consolidate business applications, and virtualize their system landscapes). |
| Supply Chain | |
| Environmentally conscious procurement |
● Multi-phased supply chain engagement program: We partner with (top) suppliers to procure low carbon and energy-efficient products and services to reduce their environmental footprint throughout the supply chain. ● We consider environmental requirements in procurement processes and decisions. For more information, see the Sustainable Procurement section. |
| Fostering biodiversity and nature-based solutions to climate change |
● Intact forests help to slow climate change, safeguard biodiversity, and provide critical ecosystem services to people. Thus, reforestation projects are one part of SAP’s climate action plan. ● Since 2012, SAP has helped to plant over 16.3 million trees to support ecosystem restoration and sustainable development. SAP will continue to finance nature-based solutions and is committed to planting 21 million trees by the end of 2025. ● By applying strict quality criteria, SAP aims to support initiatives which restore and protect the right trees in the right places and have a positive impact on the local community, biodiversity, and climate. ● Since 2021, SAP has been part of the 1t.org Corporate Alliance, which mobilizes business leaders to responsibly conserve, restore, and grow trees worldwide while pursuing the 1.5 degrees Celsius science-based target. |
| Operations | |
| Running SAP facilities with 100% renewable electricity |
Since 2014, SAP has been running all its offices and data centers56 with 100% renewable electricity in alignment with our commitment toward the RE100 initiative. For this, we use two strategic levers: ● We invest in high-quality, EKOenergy-certified EACs57 to foster renewable energy generation. ● We produce renewable electricity in selected SAP locations worldwide through solar panels (such as in Palo Alto, CA, in the United States, Bangalore, India, and Mougins, France). At SAP’s headquarters, we are in the process of implementing an on-site Power Purchase Agreement (PPA) solar project with the aim of increasing the share of renewable electricity self-produced on-site and achieving price stability. ● As a potential third lever, we are running a green tariff pilot in Australia to power our local facilities with renewable electricity (bundled EACs). This approach allows us to reduce our entire electricity-consumption-related emissions (2023: 256 kt in total; 161 kt by SAP and 95 kt by suppliers; 2022: 257 kt). Going forward, we aim to expand the usage of Power Purchase Agreements for sourcing renewable electricity. |
| ISO 14001 |
● SAP’s environmental management system (EMS) is implemented in over 45 sites in 26 countries worldwide and certified by the internationally recognized ISO 14001:2015 standard. In 2023, we successfully maintained this certification. ● Target: Increase EMS scope to 100% of SAP’s major company-owned sites by 2025 (2023: 86%). |
| ISO 50001 | ● SAP’s headquarters in Germany and North America and 100% of SAP’s own major data centers (St. Leon-Rot and Walldorf in Germany, and Colorado Springs and Newtown Square in the United States) operate an ISO 50001:2018- |
53 For more insight into our sustainability software portfolio, see SAP’s Website (link leads to information that was neither part of the statutory audit nor the independent limited assurance engagement performed by our external auditor).
54 We achieve this by leveraging 1) investments in high-quality, EKOenergy-certified EACs, and 2) renewables produced on-site. The term “data center” refers to both SAP-owned and external data centers (co-location data centers and hyperscalers).
55 Relating to the electricity consumed by cloud solutions from SAP only.
56 The term “data center” refers to both SAP-owned and external data centers (co-location data centers and hyperscalers).
57 For more information, see section Non-Financial Notes: Environmental Performance.
|
SAP Integrated Report 2023 | |||||
| To
Our Stakeholders |
Combined
Management Report |
Consolidated
Financial Statements IFRS |
Further
Information about Sustainability |
Additional Information |
||
|
certified energy management system. ● Efficient power usage effectiveness (PUE)58 at SAP headquarters in Germany and North America: 1.50 ● Core refurbishment of buildings: starting with building WDF01 at SAP’s headquarters in Germany, which aims to save 42% in final energy used annually compared to the previous construction method. ● Centralization of the cooling distribution system at SAP’s headquarters in Germany will allow the usage of environmentally friendly operating fluids and sector coupling (conversion of surplus energy into cooling energy by absorption chillers and use of heat pumps for room cooling). Electricity for the cooling system will be derived primarily from renewable sources (such as solar). |
|
| Global car fleet: Transition to electric or zero-emission vehicles |
From 2025 onwards, all new company cars for employees are planned to be emission-free.59 At the end of 2023, about 14% of our global car fleet comprised emission-free vehicles. SAP also promotes various incentives to accelerate this change, for example: ● We power all SAP-owned charging stations at SAP locations with 100% renewable electricity. ● For larger vehicle fleets such as in Germany, the Netherlands, and others, we offer employees a subsidy to install a charging point at home, and reimburse them for the electricity consumed. As far as legally possible and factually reasonable, we will offer similar subsidies in all countries. ● In some countries, we offer our employees a discount or a higher budget if they choose an all-electric vehicle. ● We continually expand SAP’s global charging infrastructure (2023: 1,650+ charging stations; 2022: 1,100+ charging stations). |
| Alternative commuting |
To generate a shift in commuting habits and foster inter-/multimodal mobility, we continue to offer various programs, such as: ● Company bicycle leasing programs: Employees can lease bicycles with the option of purchasing them after contract end. Such programs have already been established in Belgium, Germany, and Luxembourg. ● Successful role out of a flexible mobility budget in spring 2023 as a regular mobility alternative in Germany (2023: about 1,950 participants). Participants receive a fixed monthly mobility budget to use any mode of transport to commute to work or in their leisure time (bicycle, e-scooter, rental car, train, bus, and so on). |
| Business flights |
● We avoid business flights by investing in virtual collaboration and communication technologies. ● In 2016, we began charging an internal carbon price for business flights, which we invest in high-quality carbon offset projects to counterbalance the carbon emissions these flights cause. By annually increasing the carbon price per flight ticket that is charged to the organizational cost center, we seek to incentivize the organizational units and employees to fly less or to choose an alternative, sustainable mode of travel. |
Investing in Carbon Offsets to Compensate for Our Remaining Emissions
SAP financed a diverse portfolio of carbon projects60 with a strategic focus on natural carbon sinks to help avoid and remove from the atmosphere the equivalent of the remaining emissions from its own operations (2023: 215 kt, 2022: 97 kt; scope 1, 2, and selected scope 3 emissions).61 All offsets were generated by reforestation, forest protection, rural energy, and agroforestry projects implemented in collaboration with local communities. This voluntary investment in certified carbon offsets helped SAP reach its carbon-neutrality goal in 2023.
58 The PUE is a ratio that describes the efficiency of a data center, with 1.0 being the ideal ratio.
59 “Emission-free” refers to vehicles that do not emit exhaust gas or other pollutants from the onboard source of power. These vehicles will gradually replace out of plug-in hybrid electric vehicles (PHEV) and vehicles with internal combustion engines (ICEV) as company cars.
60 Investments in projects and the corresponding carbon offsets represent a unit of reduced, avoided, or removed GHG emissions.
61 To finance our investments in high-quality carbon offset projects (for example, certified by the Gold Standard) and EACs, we leverage the collected internal air travel fees charged on business flights.
|
SAP Integrated Report 2023 | |||||
| To
Our Stakeholders |
Combined
Management Report |
Consolidated
Financial Statements IFRS |
Further
Information about Sustainability |
Additional Information |
||
Carbon Project Portfolio and Long-Term Commitments
| Offset Provider | Description and Details |
| Livelihoods Carbon Funds (LCF) |
● SAP committed to invest approx. €10 million (accumulated) in the Livelihoods Carbon Funds 1–3 between the years 2013 and 2045. By year end 2023, SAP had invested approximately 42% of the total commitment. ● The funds prefinance community-based ecosystem restoration, agroforestry, biodiversity preservation, and clean energy projects in developing countries. ● Due diligence is ensured by applying strict, recognized (for example, Gold Standard), project management by trusted partners in collaboration with the local non-profit organizations, and joint overseeing of the strategy, project portfolio, and impact by the corporate co-investors and their individual company criteria. ● Offset volume in 2023: 114 kt |
| Carbon Retailers |
● SAP collaborates with an independent third-party carbon rating agency to systematically procure offsets from carbon retailers which are exclusively generated by the highest-rated carbon projects on the market based on the projects’ carbon score, additionality, durability, and co-benefits such as the impact on people and biodiversity. This diligent procurement approach helps SAP mitigate the risk of procuring non-genuine carbon emission reductions while reinforcing our own quality expectations (for more information, see the Non-Financial Notes: Environmental Performance section). ● Offset volume in 2023: 101 kt |
In 2023, we invested for the first time as a pilot in Sustainable Aviation Fuel (SAF), to reduce our business-flight-related emissions compared to emissions generated by using conventional (fossil) aviation fuel.62
Related Risks for SAP
In 2022, we performed a climate risk and vulnerability assessment to identify physical climate risks (acute and chronic) that are material to the SAP-relevant activity ‘data processing and hosting,’ as follows:
| – | Risk screening for all our own and co-location data centers based on a multitude of climate hazards (acute and chronic),63 using global climate models (representative concentration paths (RCPs) 2.6, 4.5, and 8.5). |
| – | Deep-dive exposure analysis for a selected range of climate hazards based on 2°C and 4°C scenarios: heatwaves and extreme precipitation (time horizon: 2021–2050)64 as well as river flooding and water stress (time horizon: 2030 and 2050).65 The hazards were selected based on the risk screening outcome and impact on data centers combined with expert discussions. |
| – | Vulnerability analysis of our own data centers with high exposures helped us identify the impact and risk of a hazard by considering current and past hazard experiences and implemented mitigation actions. |
| – | In 2023, we rolled out a vulnerability and adaptation questionnaire to our own data centers to ensure (on-site) measures are planned and/or in place to address the identified applicable main climate change risk(s). |
‘Climate change and air quality’ is a risk factor that is assessed as part of SAP’s Corporate Financial Risk Management System. No material financial risks were identified through our risk framework as described in the Risk Management and Risks section.
Audit Scope
The content of the Energy and Emissions section was not subject to the statutory audit of our combined management report. However, our external auditor performed an independent limited assurance engagement for the content of this section. Under this engagement, the quantitative indicators carbon emissions (scope 1, scope 2, and scope 3 relevant for SAP’s business model), total energy consumption, and renewable energy certificates were audited at a reasonable assurance level.
62 We have not (yet) counted the emission reductions received towards our carbon targets.
63 Examples of chronic hazards: changing temperature, heat stress, changing wind patterns, rise in sea level, and soil erosion. Examples of acute hazards: wildfires, water stress, droughts, floods, avalanches, and landslides.
64 Usage of Intergovernmental Panel on Climate Change (IPCC) RCP 2.6 and RCP 8.5.
65 Usage of IPCC RCP 4.5 and RCP 8.5.
|
SAP Integrated Report 2023 | |||||
| To
Our Stakeholders |
Combined
Management Report |
Consolidated
Financial Statements IFRS |
Further
Information about Sustainability |
Additional Information |
||
Corporate Governance Fundamentals
Corporate Governance Statement
The German Commercial Code, section 315d in connection with section 289f, requires that, as a listed company, SAP SE publish a corporate governance statement either as part of our management report or on our Web site. The Executive Board and the Supervisory Board of SAP SE issued the Corporate Governance Statement on February 20, 2024, and published it on our Web site at www.sap.com/investors/en/governance.html.
Changes in Management
On August 29, 2023, SAP announced that Gina Vargiu-Breuer had been appointed to the SAP Executive Board as Chief People Officer and labor director, effective February 1, 2024. She succeeded Sabine Bendiek, who left the Company at her own request upon the end of her term on December 31, 2023.
Information Concerning Takeovers
Information required under the German Commercial Code, sections 289a and 315a, with an explanatory report:
Composition of share capital: For information about the composition of SAP SE’s share capital as at December 31, 2023, see the Notes to the Consolidated Financial Statements, Note (E.2). Each share entitles the bearer to one vote. American depositary receipts (ADRs) representing our shares are listed on the New York Stock Exchange (NYSE) in the United States. ADRs are certificates representing non-U.S. shares and are traded on U.S. stock exchanges instead of the underlying shares. One SAP ADR corresponds to one SAP share.
Restrictions applying to share voting rights or transfers: SAP shares are not subject to transfer restrictions. SAP held 61,275,176 treasury shares on December 31, 2023 (see the Notes to the Consolidated Financial Statements, Note (E.2)). Treasury shares do not carry voting rights or dividend rights or other rights. We are not aware of any other restrictions applying to share voting rights or to share transfers.
Shareholdings that exceed 10% of the voting rights: We are not aware of any direct or indirect SAP SE shareholdings that exceed 10% of the voting rights.
Shares with special rights conferring powers of control: No SAP shareholder has special rights conferring powers of control.
Type of control over voting rights applying to employee shareholders who do not directly exercise their control rights: As with other shareholders, employee holders of SAP shares exercise their control rights in accordance with the law and the Articles of Incorporation. In votes on the formal approval of their acts at the Annual General Meeting of Shareholders, employee representatives on the Supervisory Board, as all other members of the Supervisory Board, are prohibited from exercising the voting rights associated with their shares.
Requirements concerning appointments and dismissals of members of the Executive Board and amendments to the Articles of Incorporation: Conditions for the appointment and dismissal of members of the Executive Board and amendments to the Articles of Incorporation reflect the relevant provisions of applicable European and German law, including Council Regulation (EC) No. 2157/2001 on the Statute for a European Company (“SE Regulation”) and the German Stock Corporation Act. Under the Articles of Incorporation, the Executive Board consists of at least two members,
|
SAP Integrated Report 2023 | |||||
| To
Our Stakeholders |
Combined
Management Report |
Consolidated
Financial Statements IFRS |
Further
Information about Sustainability |
Additional Information |
||
who are appointed for a period of not more than five years by the Supervisory Board in accordance with the SE Regulation, articles 39 and 46. The Supervisory Board decides on the number of members of the Executive Board. Executive Board members may be reappointed for, or their term of office extended by, a maximum of five years. A simple majority of the Supervisory Board members is required for Executive Board appointments. In the event of a tie, the chairperson of the Supervisory Board has the deciding vote. The Supervisory Board can appoint a chairperson of the Executive Board and one or more deputy chairpersons from among the members of the Executive Board. The Supervisory Board can revoke appointments to the Executive Board in accordance with the SE Regulation, article 9, and the German Stock Corporation Act, section 84, if compelling reasons exist, such as gross negligence on the part of the Executive Board member. If the Executive Board is short of a required member, one may be appointed in urgent cases by a court in accordance with the SE Regulation, article 9, and the German Stock Corporation Act, section 85. In accordance with the SE Regulation, article 59, and the German Stock Corporation Act, section 179, an amendment of the Articles of Incorporation requires a resolution of the General Meeting of Shareholders with a majority of at least three-quarters of the valid votes cast. For any amendments of the Articles of Incorporation that require a simple majority for stock corporations established under German law, however, the simple majority of the valid votes cast is sufficient if at least half of the subscribed capital is represented or, in the absence of such quorum, the majority prescribed by law (that is, two-thirds of the votes cast, pursuant to article 59 of the SE Regulation) is sufficient. Section 11 (2) of the Articles of Incorporation authorizes the Supervisory Board to amend the Articles of Incorporation where such amendments only concern the wording.
Power to issue and repurchase shares: The Annual General Meeting of Shareholders on May 12, 2021, granted powers to the Executive Board, subject to the consent of the Supervisory Board, to issue convertible and/or warrant-linked bonds, profit-sharing rights and/or income bonds (or combinations of these instruments), and to grant conversion or option rights in respect of SAP SE shares representing a total attributable portion of the share capital of not more than €100 million secured by a corresponding amount of contingent capital. These powers will expire on May 11, 2026. The Executive Board is also authorized until May 19, 2025, to increase the share capital by not more than €250 million by issuing new shares against contributions in cash and to increase the share capital by not more than €250 million by issuing new shares against contributions in cash or in kind. For more information about the different tranches of authorized capital and the aforementioned contingent capital, see the Articles of Incorporation, section 4.
The Annual General Meeting of Shareholders on May 11, 2023, granted a power to the Executive Board in accordance with the German Stock Corporation Act, section 71 (1)(8), to buy back for treasury on or before May 10, 2028, SAP SE shares attributable in total to not more than €120 million of the share capital. This power is subject to the proviso that the shares repurchased, together with any shares that were previously acquired and are still held by SAP in treasury and any other shares controlled by SAP, must not in total exceed 10% of SAP’s share capital. Executive Board powers, such as those described to issue and repurchase stock and to grant rights of conversion and subscription to shares of SAP, are widely followed common practice among German companies such as SAP. These powers give the Executive Board the flexibility it needs, in particular, the option to use SAP shares as consideration in equity investments, raise funds on the financial markets at short notice on favorable terms, or return value to shareholders during the course of the year.
Material agreements with change-of control provisions: SAP SE has concluded the following material agreements with provisions that take effect in the event of a change of control, whether following a takeover bid or otherwise:
The terms of SAP’s syndicated €3 billion revolving credit facility include a change-of-control clause. For more information about this syndicated credit facility, see the Notes to the Consolidated Financial Statements, Note (F.1). This clause obliges SAP SE to notify the banks in case of a change of control. If, on receiving the notification, banks that represent at least two-thirds of the credit volume so require, the banks have the right to cancel the credit facility and demand complete repayment of the outstanding debt. If no continuation agreement is reached, the credit facility would end and the obligation to repay would become effective at an ascertainable time.
|
SAP Integrated Report 2023 | |||||
| To
Our Stakeholders |
Combined
Management Report |
Consolidated
Financial Statements IFRS |
Further
Information about Sustainability |
Additional Information |
||
SAP had bonds totaling €7.1 billion and US$0.3 billion outstanding as at December 31, 2023. For more information about SAP’s bonds, see the Notes to the Consolidated Financial Statements, Note (E.3). Under the terms agreed with the buyers, we are required to notify the buyers, without delay, of any change of control. If there is a change of control and SAP is consequently assigned a lower credit rating within a defined period, buyers are entitled to demand repayment.
Under the terms of our U.S. private placements totaling approximately US$0.42 billion as at December 31, 2023, we are required to offer lenders repayment of outstanding debt if there is a change of control and SAP is consequently assigned a lower credit rating within a defined period. For more information about these private placements, see the Notes to the Consolidated Financial Statements, Note (E.3). Lenders would have up to 30 days to accept the offer.
We have entered into relationships with other companies to jointly develop and market new software products and cloud solutions. These relationships are governed by development and marketing agreements with the respective companies. Some of the agreements include provisions that, in the event of a change of control over one of the parties, give the other party a right to consent to the assignment of the agreement or to terminate it.
Change-of-control provisions in Executive Board compensation agreements: Agreements have been concluded with the members of the Executive Board of SAP SE concerning compensation in the event of a change of control. These agreements, which are customary internationally, are described in the Compensation Report. We have no analogous compensation agreements with our other employees.
|
SAP Integrated Report 2023 | |||||
| To
Our Stakeholders |
Combined
Management Report |
Consolidated
Financial Statements IFRS |
Further
Information about Sustainability |
Additional Information |
||
Business Conduct
Vision and Strategy
In an increasingly complex business environment, making the right decisions and abiding by ethical choices has never been more important. As a company operating in numerous countries across the globe, SAP is required to adhere to strict international legislation that defines acceptable business conduct and practices.
At SAP, we also expect our business practices to not only meet international rules and legal requirements, but to adhere to our internal high standards of ethics and integrity. We understand that our customers expect this as well. SAP’s reputation for doing business the right way is one of our most important assets. By striving to make ethical choices and acting with integrity, we aim to continue to grow SAP in a way that meets both our own and our customers’ high ethical expectations.
Due Diligence
Governance
The Office of Ethics & Compliance (OEC) contributes to SAP’s success by providing trusted advice to SAP managers, leaders, and employees across the entire business. The OEC strives to advance SAP’s business goals by promoting a strong culture of integrity and helping SAP to “Win the Right Way.”
In 2023, our aim to maintain a robust compliance program, based on our corporate values and voluntary commitments, as well as international standards, continued. The OEC team grew for the sixth consecutive year, from 154 employees in 2022 to 157 employees in 2023. The group chief compliance officer (GCCO) continues to report directly to the group CEO.
At SAP, ethical behavior is an integral part of our cultural values that can influence our daily decision-making at every level of the business and in every market. To help nurture this environment, the OEC’s various teams continually provide guidance to SAP colleagues, address compliance challenges, and improve policies, guidelines, systems, and measures related to their implementation.
The OEC has field compliance officers across the globe, in both high- and low-risk jurisdictions. Field compliance officers are often the first point of contact for the business when compliance matters arise. In those high-risk countries in which the OEC is not physically represented and where there might be local language needs, the OEC operates a network of compliance stewards drawn largely from either our legal, finance, or human resources (HR) departments. Compliance stewards support the OEC’s field compliance officers by offering advice on specific and straightforward compliance questions; they work alongside our global network of compliance ambassadors (drawn from all areas of the Company) to amplify compliance messages and provide a further link for local employees to the relevant field compliance officer.
Compliance matters are regularly discussed with Executive and Supervisory Board members at quarterly Audit and Compliance Committee meetings as well as during regular touchpoints with Executive Board and Supervisory Board members. Compliance matters are also discussed by the GCCO in quarterly Global Compliance Governance Committee meetings. Participants at these meetings include members of Global Finance, Customer Success, Global Communications, Global Security, and Global Risks & Assurance Services (GR&AS).
Outside SAP, the OEC regularly exchanges ideas and best practices for compliance processes with relevant peers in the software industry and beyond. SAP is a Corporate Member of the Association of Certified Fraud Examiners (ACFE), and the GCCO is also a member of the European Chief Compliance Officers Forum (ECCIOF) and the UN Global Compact’s Think Lab focused on transformational governance.
|
SAP Integrated Report 2023 | |||||
| To
Our Stakeholders |
Combined
Management Report |
Consolidated
Financial Statements IFRS |
Further
Information about Sustainability |
Additional Information |
||
Guidelines and Policies
SAP’s Global Code of Ethics and Business Conduct (CoEBC) is the primary ethical and legal framework within which SAP conducts business and remains on course for success. It is available in 22 languages and is just one of many global policies that provide clear guidance to employees.
SAP also expects all partners and suppliers to commit to meeting our high standards of integrity. For this reason, we have the SAP Partner Code of Conduct and the SAP Supplier Code of Conduct in place so that partners and suppliers understand what is expected of them.
How We Measure and Manage Our Performance
Enforcing Policies and Guidelines
All employees are bound by the CoEBC; they are required to acknowledge its contents and confirm their commitment to it on an annual basis. In 2023, we continued to monitor employee certification of the CoEBC for employees worldwide, recording a 99.9% certification rate for permanent SAP employees (excluding those from acquired companies).
Communication
The OEC’s dedicated communications team consistently distributes integrity-related communications at all levels of the Company – including to senior leaders, managers, and employees, as well as topic-related content for SAP partners. Executive Board members and senior leaders regularly host global employee meetings as well as leadership team meetings and smaller gatherings, which include integrity-focused topics, demonstrating their dedication to ethical business.
Quarterly OEC newsletters provide all SAP employees with information on a range of compliance-related topics. Additionally, a quarterly newsletter with a focus on leadership and management topics is sent specifically to executive and senior management. Quarterly toolkits provide topic-focused resources to communicators across the Company to further amplify compliance messages in business-owned channels.
Employees can use the SAP One employee portal at any time to access all global policies, guidelines, and additional information. Externally, our Web site sap.com features information and guidance for our external stakeholders.
All Board areas have re-committed their support for the OEC’s Compliance Ambassador Program and have nominated employees to participate in it. In 2023, a sixth cohort was introduced, bringing the number of nominees from over 1,200 in 2022 to over 1,500 in 2023. The program is designed to give employees a further point of contact in the business when compliance matters arise. Ambassadors participate in an extensive curriculum of monthly on-boarding sessions over a 15-month period. They are invited to cascade and transfer information on the importance of compliance and ethics throughout their teams and lines of business. In 2023, the Extended Compliance Ambassador Network was launched, giving compliance ambassadors who have completed the ambassador curriculum an opportunity to meet on a quarterly basis.
Training Offerings
Our training programs cover topics such as anticorruption and antibribery, conflicts of interest, governance for customer commitments, working with public sector customers, and compliant partner engagement.
In addition to our biannual Ethical Fundamentals online training course for all SAP employees, a new Ethical Success workshop was delivered live for all Sales and Presales employees in the Customer Success Board area. We continue to train new hires globally and we continue to hold Ethical Leadership workshops for new people managers.
|
SAP Integrated Report 2023 | |||||
| To
Our Stakeholders |
Combined
Management Report |
Consolidated
Financial Statements IFRS |
Further
Information about Sustainability |
Additional Information |
||
Additionally, our field compliance officers hold live trainings, in person and virtually, according to a risk-based approach for the specific teams and countries they support. These trainings target employees across the organization, from customer-facing staff to individuals in supporting roles, such as finance, marketing, and legal.
Compliance Processes
The OEC also evaluates SAP’s third-party providers to assess whether SAP’s compliance standards are met. New suppliers and third parties seeking a partnership with SAP are scrutinized according to a risk-based compliance due diligence process, which is repeated every two to five years thereafter. Supplier and partner relationships are formally defined in contracts that outline their obligation to abide by SAP’s compliance requirements. In almost all cases, these include a “right to audit” clause. The OEC also has a team dedicated to conducting compliance audits of partners and suppliers to assess adherence to SAP’s requirements and to identify and address compliance risks.
The OEC’s Compliance Monitoring & Analysis (CMA) team monitors the effectiveness of SAP’s compliance processes and controls through regular testing of high-risk transactions, identified using a data analytics tool developed with PricewaterhouseCoopers GmbH (PwC) and through manual sampling. The CMA team also analyzes findings from investigations and partner audit reports to identify potential enterprise-wide process deficiencies and patterns that indicate a compliance risk. The team then conducts root cause analyses on the highest-risk topics and recommends remediation actions to mitigate the risks.
Speak Out at SAP
Speak Out at SAP is SAP’s independently managed whistleblower reporting tool, through which any matters or concerns can be reported easily, and, if desired, anonymously. The tool is available 24 hours a day, seven days a week, both internally to SAP employees and externally to concerned parties, including customers, suppliers, and partners.
Reports may be submitted either directly by the reporter through the Internet-based portal, or by phone, with local language support across the globe in order to maximize accessibility for reporters. In all cases, SAP continues to maintain a strict non-retaliation policy.
Beyond Speak Out at SAP, we provide further reporting channels, including an internal ticketing system, a postal address for written submissions, and local contact persons worldwide.
Investigating Misconduct
The OEC’s investigation team is comprised of dedicated investigators who probe allegations of misconduct within the OEC’s area of responsibility. In recent years, the team has engaged the assistance of an external law firm to examine whistleblower complaints alleging that the business conduct of some former SAP employees within subsidiary SAP companies did not comply with SAP’s policies and procedures or applicable laws. These investigations culminated in January 2024 in a settlement agreement with the U.S. Securities and Exchange Commission (U.S. SEC) and the U.S. Department of Justice (U.S. DOJ), as well as with local authorities in South Africa. SAP fully cooperated with law enforcement authorities, and took immediate steps to discipline the employees involved, including terminating all those implicated in potential law violations. Since these allegations were made, SAP has also significantly strengthened its compliance program and related internal controls in accordance with DOJ and regulatory expectations and requirements.
For more information about the material allegations currently being investigated by the OEC, see the Notes to the Consolidated Financial Statements, Note (G.3).
Related Risks for SAP
The actions and processes to address risks in business conduct are described above. For more information about financial risks, see also Ethical Behavior in the Risk Management and Risks section.
|
SAP Integrated Report 2023 | |||||
| To
Our Stakeholders |
Combined
Management Report |
Consolidated
Financial Statements IFRS |
Further
Information about Sustainability |
Additional Information |
||
Audit Scope
The content of the Business Conduct section was not subject to the statutory audit of the combined management report. However, our external auditor performed an independent limited assurance engagement for the content of this section.
|
SAP Integrated Report 2023 | |||||
| To
Our Stakeholders |
Combined
Management Report |
Consolidated
Financial Statements IFRS |
Further
Information about Sustainability |
Additional Information |
||
Human Rights
Vision and Strategy
SAP is committed to respecting and advancing human rights across our operations, extended supply chain, and product lifecycle, and we are guided by the United Nations (UN) Guiding Principles on Business and Human Rights in doing so. We also expect our employees and business partners to respect human rights and avoid complicity in any abuse.
Due Diligence
Governance
Our cross-company agenda on human rights is driven by SAP’s Human Rights Office that is part of the chief sustainability officer’s organization. At least once a year, the Human Rights Officer reports to the Executive Board on such matters as the status of compliance with the German Supply Chain Act (Lieferkettensorgfaltspflichtengesetz, LkSG). The Human Rights Office works together with a Human Rights Steering Committee comprised of executives from various Board areas who embed human rights due diligence in their areas of responsibility, such as enterprise risk management, people management, or procurement.
Grounded in our commitment to respecting human rights, the Artificial Intelligence (AI) Ethics Steering Committee guides our internal efforts to implement and enforce AI ethics in our operations, solutions, and policies. It comprises SAP executives from relevant Board areas with supervision of topics relevant to guiding and implementing AI ethics. Made up of experts from academia, industry, and public policy, our external AI Ethics Advisory Panel advises us on how to further develop and operationalize SAP’s Guiding Principles for Artificial Intelligence.
Policy Commitment
We support the International Bill of Human Rights; the Organization for Economic Co-operation and Development (OECD) Guidelines for Multinational Enterprises; and the International Labour Organization (ILO) Core Labour Rights Conventions. The SAP Global Code of Ethics and Business Conduct for Employees, and – in a more detailed way – the SAP Global Human Rights Commitment Statement, are our public commitment to respecting and advancing human rights across our value chain. The current version of the Human Rights Commitment Statement is available on our public Web site at www.sap.com/human-rights66, has been updated to meet LkSG requirements, and is approved by our Executive Board.
In addition, our Global AI Ethics Policy helps ensure that our artificial intelligence (AI) software is developed, deployed, and sold in line with the ethical standards laid out in our guiding principles. This policy and guiding principles are available at AI Ethics and Society | SAP.67
How We Measure and Manage Our Performance
Identifying Salient Human Rights Issues
In 2023, we introduced new concepts for identifying human rights impacts across our own operations and our direct supply chain globally to be compliant with increasing legal requirements such as the LkSG. We have complemented this exercise with an analysis of salient issues related to our solutions
66 Information that was neither part of the statutory audit nor the independent limited assurance engagement performed by our external auditor.
67 Information that was neither part of the statutory audit nor the independent limited assurance engagement performed by our external auditor.
|
SAP Integrated Report 2023 | |||||
| To
Our Stakeholders |
Combined
Management Report |
Consolidated
Financial Statements IFRS |
Further
Information about Sustainability |
Additional Information |
||
and customers and with a concept to identify human rights impacts among indirect suppliers (that is, tier 2 to n suppliers). Taking into consideration our business activities as described in the Strategy and Business Model section, we assessed potential impacts based on their severity (scale, scope, remediability) and probability of occurrence as well as our ability to trigger change. While our assessment of salient issues is an ongoing process and not yet finalized for all stages of our entire value chain, we have prioritized the following salient issues:
| – | In our own operations: occupational health and safety and non-discrimination |
| – | In our direct and indirect supply chain: assessment still ongoing |
| – | Related to products, services, and customers: non-discrimination and privacy |
Moreover, we have started to explore the human rights implications of our net-zero efforts.
Human Rights of Our Employees
The salient issues related to health and safety and non-discrimination in our own operations are mitigated through extensive programs for employees as described in the Employees section.
In addition, our employees receive voluntary and mandatory training on human rights issues most relevant to SAP. For example, they are trained on our policies on non-discrimination, health and safety, and data protection and privacy. In 2023, we introduced new training modules for all employees, for example to increase the awareness of our grievance mechanism, and for specific roles in procurement and risk management.
We regularly consulted employee representatives in 2023 to specifically understand their concerns and interests related to the rights protected by the LkSG. The discussions focused on gaining a better understanding of how we identify salient human rights risks and supply chain risks.
Human Rights in Our Extended Supply Chain
We expect suppliers and partners to respect human rights, and our codes of conduct require them to uphold international labor rights and provide a safe and healthy work environment for all employees. We also expect our suppliers to promote these standards across their supply chain.
For more information, see the Sustainable Procurement section.
Human Rights Related to SAP Products, Services, and Customers
We seek to respect human rights throughout the product lifecycle – from design through to development and use. Protection of personal information and non-discrimination are key areas of focus.
For more information about the protection of personal information, see the Security and Privacy section.
Preventing discrimination is currently based on two pillars: First, making our software more accessible is ensured through our own accessibility standards and guidelines that support the possibility for everyone, including people who are differently-abled, to access and use technology and information products. Second, identifying and avoiding bias is a key principle of our Global AI Ethics program. Consequently, we review AI use cases to ensure that bias and discrimination and other ethical risks specified in the Global AI Ethics Policy are mitigated. High-risk AI use cases are approved or rejected by the Global AI Ethics Steering Committee as applicable.
Assessing Human Rights Measures
SAP reviews the effectiveness of its risk management and due diligence processes annually as well as on an ad hoc basis. In 2023, we revised our approach to assess effectiveness so as to better align with the UN Guiding Principles and legal requirements. For example, we piloted IOOI (input – output – outcome – impact) models to get a better understanding of whether our measures have a positive impact on people. This new approach complements existing measures such as the internal audits we have conducted since 2012 to help us verify that subsidiaries adhere to human rights standards and check whether employees feel empowered to raise concerns.
|
SAP Integrated Report 2023 | |||||
| To
Our Stakeholders |
Combined
Management Report |
Consolidated
Financial Statements IFRS |
Further
Information about Sustainability |
Additional Information |
||
Receiving Complaints or Concerns
Through the globally available Speak Out at SAP tool, we encourage all employees and external groups to report conduct that violates our policies. External groups include groups at heightened risk of becoming disadvantaged or marginalized (also called “vulnerable groups”) such as temporary staff. Employees can also reach out to their managers, to HR or compliance officers, and to our Global Ombuds Office which offers confidential, independent, neutral, and informal conflict clarification services and mediation for all employees worldwide.
Related Risks for SAP
“Human rights and employee matters” is a risk factor that is assessed as part of SAP’s corporate risk management system. No financial material risks were identified through our risk framework, which is detailed in the Risk Management and Risks section.
Audit Scope
The content of the Human Rights section was not subject to the statutory audit of the combined management report. However, our external auditor performed an independent limited assurance engagement for the content of this section.
|
SAP Integrated Report 2023 | |||||
| To
Our Stakeholders |
Combined
Management Report |
Consolidated
Financial Statements IFRS |
Further
Information about Sustainability |
Additional Information |
||
Risk Management and Risks
Our Risk Management
Internal Control and Risk Management Systems
As a global company, SAP is exposed to a broad range of risks across our business operations. Consequently, our Executive Board has established comprehensive internal control and risk management structures that enable us to identify and analyze risks early and take appropriate action. Our internal control and risk management systems are designed to identify potential events that could negatively impact the Company and to provide reasonable assurance regarding the operating effectiveness of our internal controls over our financial reporting.
These systems comprise numerous control mechanisms and are an essential element of our corporate decision-making process; they are therefore implemented across the entire Group as an integral part of SAP’s business processes. We have adopted an integrated internal control and risk management approach to help maintain appropriate and effective global risk management while also enabling us to aggregate risks and report on them transparently.
Appropriateness and Effectiveness of SAP’s Entire Internal Control and Risk Management System68
We have a governance model in place across the internal control and risk management systems, as well as a central software solution to store, maintain, and report all risk-relevant information. In the Business Conduct section of our combined management report, we describe in more detail the governance structure as well as the measures and guidelines SAP has implemented to ensure compliance not only with international rules and legal requirements but also with our internal standards of ethics and integrity. Furthermore, SAP monitors risks relating to material sustainability matters. Material non-financial topics are listed in the section Non-Financial Statement Including Information on Sustainable Activities. The governance model, policies, and guidelines as well as the control measures we have implemented relative to these topics are described in the respective chapters in this combined management report. SAP continuously reviews and adjusts its entire internal control and risk management system as well as the policies and guidelines we have implemented regarding the material sustainability topics. We considered the results from external audits, such as the audit of our internal control system for financial reporting and early risk detection system conducted by our auditor BDO, as well as internal sources, such as audit reports from our Global Risk & Assurance Services (GR&AS) team, to evaluate the effectiveness of our internal control and risk management systems. If issues are identified, SAP takes remedial action. While the non-financial internal control system has not yet reached the same maturity level as the financial internal control system, no material indication has come to our attention that SAP’s entire internal control and risk management system is not appropriate or effective.
Legal and Regulatory Requirements
Due to our public listings in both Germany and the United States, we are subject to both German and U.S. regulatory requirements that relate to internal controls and risk management over financial reporting, such as provisions in the German Stock Corporation Act, section 91 (2), the U.S. Sarbanes-Oxley Act (SOX) of 2002, specifically sections 302 and 404, and the German Corporate Governance Code. Hence, our Executive Board has established an early warning system (risk management system) to enable transparent risk disclosures and compliance with applicable regulations.
68 The appropriateness and effectiveness of SAP’s entire internal control and risk management system, except for the internal control system for financial reporting and early risk detection system, was neither part of the statutory audit nor the independent limited assurance engagement performed by our external auditor.
|
SAP Integrated Report 2023 | |||||
| To
Our Stakeholders |
Combined
Management Report |
Consolidated
Financial Statements IFRS |
Further
Information about Sustainability |
Additional Information |
||
Risk Management Policy and Framework
The risk management policy issued by our Executive Board governs how we manage risk in line with the Company’s risk appetite and defines a methodology that is applied uniformly across all parts of the SAP Group.
We have developed and implemented a cybersecurity risk management program intended to protect the confidentiality, integrity, and availability of our critical systems, information, and our customers’ data. Our cybersecurity risk management program and processes are part of our Executive Board-issued risk management policy that governs how we manage risk, and is aligned with the methodologies, reporting channels, and governance processes that apply across our enterprise risk management program to other legal, compliance, strategic, operational, and financial risk areas of the SAP Group.
Risk Management Pillars
Our risk management system is based on the framework published by the Committee of Sponsoring Organizations of the Treadway Commission (COSO) entitled “Enterprise Risk Management – Integrating with Strategy and Performance.” Updated in 2017, this framework is built on four pillars, namely: a global risk management governance framework, a dedicated risk management policy, a global risk management organization, and a standardized risk management methodology.
In accordance with the COSO framework, SAP’s enterprise risk management covers risks in the areas of strategy, operations, finance, and compliance (the latter also covering ethical behavior, corporate governance, and sustainability).
Our Global Risk Management Governance Framework
The risk management governance framework at SAP represents a comprehensive system of approaches and processes to ensure control through a clearly structured risk management system and a supporting risk culture. The risk culture is considered the basis of SAP’s risk management system. Risk culture at SAP comprises a system of values, beliefs, knowledge, attitudes, and understanding concerning risks and risk management as part of our corporate culture. To support and continuously foster SAP’s risk culture, we conduct risk activities for the entire SAP organization such as mandatory training in ethical behavior, code of conduct, and risk management.
Our Executive Board is responsible for ensuring the effectiveness of the internal control system and our risk management system. The effectiveness of both systems and their implementation in the different Board areas is monitored by each Executive Board member. The Audit and Compliance Committee of the Supervisory Board regularly monitors the effectiveness of SAP’s internal control and risk management systems. Our GR&AS organization regularly provides a status update on the internal control and the risk management systems to the Audit and Compliance Committee of the Supervisory Board. Every year, SAP’s external auditors assess whether the SAP Group early-warning system for risk detection is adequate to identify risks that might endanger our ability to continue as a going concern. Additional assurance is obtained through the external audit of the effectiveness of our system of internal controls over financial reporting.
Our Global Risk Management Policy
The risk management policy is reviewed annually and stipulates responsibilities for conducting risk management activities and defines reporting and monitoring structures. Our global SAP risk management policy clearly states that each employee is responsible for active engagement in the risk management process as well as for the continuous identification of risks, based upon clear rules of engagement in adherence to the policy. The risk management system primarily analyzes risks. Opportunities are assessed or analyzed where it is deemed appropriate.
|
SAP Integrated Report 2023 | |||||
| To
Our Stakeholders |
Combined
Management Report |
Consolidated
Financial Statements IFRS |
Further
Information about Sustainability |
Additional Information |
||
Our Global Risk Management Organization
Our global risk management organization is responsible for the implementation of a Group-wide effective risk management system. Furthermore, GR&AS is responsible for the regular maintenance and implementation of our risk management policy, as well as the standardized internal and external risk reporting.
All GR&AS risk managers, working with assigned risk contacts in the relevant business units, identify and assess risks associated with material business operations and monitor the implementation and effectiveness of the measures chosen to mitigate risks.
Further financial risk management activities are performed for example by our Global Treasury and Global Tax departments. General legal risks are managed by the Global Legal department. Sanction and embargo-related risks are managed by the Export Control department, harassment and other HR-related issues by our Global Labor & Employee Relations Office, security-related risks by our SAP Global Security Office, and IP risks by our Global IP Office. Non-financial risks are reported jointly by GR&AS and SAP’s Sustainability and other involved organizations. All risks are tracked, maintained, and reported within SAP’s risk management system.
During the merger and acquisition and post-merger integration phase, newly acquired companies are subject to risk management performed by our Corporate Development Mergers and Acquisitions (M&A) function. Furthermore, for as long as the newly acquired companies are not integrated, existing risk management structures are maintained or enhanced within the acquired companies for the purposes of compliance with legal requirements.
SAP reviews the exposure of its business units to potential compliance risks on a regular basis. Quantitative and qualitative internal data as well as external information, such as Transparency International’s Corruption Perceptions Index, are considered in our wider compliance risk analysis. Based on this information, we perform a detailed assessment for all SAP-relevant high-risk countries and derive local and global mitigations.
The GR&AS unit, led by the Chief Risk Officer (who also acts as Chief Audit Executive), combines internal audit, SOX, internal controls, and global governance, risk, and compliance activities. The Chief Risk Officer reports to our Group CFO and is responsible for SAP’s internal control and risk management programs. Additionally, the Office of Ethics & Compliance (OEC) continuously addresses compliance challenges and improves policies, guidelines, systems, and measures related to their implementation. For more information about SAP’s governance structure in the area of compliance, see section Business Conduct.
Internal Control and Risk Management System for Financial Reporting
The purpose of our system of internal control over financial reporting is to provide reasonable assurance that our financial reporting is reliable and compliant with generally accepted accounting principles. Because of the inherent limitations of internal controls over financial reporting, this system might not prevent or bring to light all potential misstatements in our financial statements.
Our internal control system consists of the internal control and risk management system for financial reporting (ICRMSFR), which also covers the broader business environment and is part of the overall risk management system of SAP. Using the current COSO Internal Control – Integrated Framework of 2013, we have defined and implemented internal controls along the value chain on a process and subprocess level to ensure that sound business objectives are set in line with SAP’s strategic, operational, financial, and compliance goals.
SAP’s ICRMSFR is based on our Group-wide risk management methodology. It includes organizational, control, and monitoring structures designed to ensure that data and information concerning our business is collected, compiled, and analyzed in accordance with applicable laws and properly reflected in our IFRS Consolidated Financial Statements.
Our ICRMSFR also includes policies, procedures, and measures designed to ensure compliance of SAP’s financial reports with applicable laws and regulations. We analyze new statutes, standards, and other pronouncements concerning IFRS accounting and its impact on our financial statements and the ICRMSFR. Failure to adhere to these would present a substantial risk to the compliance of our financial reporting.
|
SAP Integrated Report 2023 | |||||
| To
Our Stakeholders |
Combined
Management Report |
Consolidated
Financial Statements IFRS |
Further
Information about Sustainability |
Additional Information |
||
In addition, the ICRMSFR has both preventive and detective controls, including, for example, automated and non-automated reconciliations, segregated duties with two-person responsibility, authorization concepts in our software systems, and corresponding monitoring measures.
Our Corporate Financial Reporting (CFR) department codifies all accounting and reporting policies in SAP Group Accounting and SAP Global Revenue Recognition guidelines. These policies and corresponding corporate timelines define the closing process. Under this closing process, we prepare, predominately through centralized or external services, the financial statements of all SAP entities for consolidation by CFR. CFR and other corporate departments are responsible for ensuring compliance with Group accounting policies and monitor the accounting work. CFR reviews accounting standards and processes to ensure applicable updates are made to SAP’s financial reporting.
We have outsourced some tasks, such as the valuation of projected benefit obligations and share-based payouts, quarterly tax calculations for most entities, purchase price allocations in the context of asset acquisitions and business combinations, and the local statutory financial statements for a few of our subsidiaries. These outsourced tasks are subject to the same stringent requirements that are mandated for all our internally generated financially relevant information.
Based on an analysis of the design and operating effectiveness of our respective internal controls over financial reporting, a committee with leadership representation from Finance, Compliance, Legal, and IT presents the results of the assessment of the ICRMSFR effectiveness with respect to our IFRS consolidated financial statements as at December 31 each year to our Group CFO. The committee meets regularly to set the annual scope for the test of effectiveness, to assess and evaluate any weaknesses in the controls, and to determine measures to address them in time and adequately. The Audit and Compliance Committee of the Supervisory Board regularly scrutinizes the resulting assessments of the effectiveness of the internal controls over financial reporting with respect to the IFRS consolidated financial statements and corresponding disclosure notes.
The assessment, conducted by SAP and external audit, of the effectiveness of the ICRMSFR related to our IFRS consolidated financial statements concluded that, on December 31, 2023, the Group had an effective internal control system over financial reporting in place.
Additionally, and in compliance with German commercial law requirements, SAP maintains an internal control system beyond financial reporting. This is supported through automated controls (continuous control monitoring) as part of our business processes.
Supporting Software Solution
We use our own risk management software, namely SAP governance, risk, and compliance (GRC) solutions powered by SAP HANA, to support the governance process. GR&AS risk managers record and track identified risks using our risk management software online and in real time to help create transparency across all known risks that exist in the Group, as well as to facilitate risk management and the associated risk reporting. These GRC solutions also support the risk-based approach of the ICRMSFR. Our continuous control monitoring activities are performed utilizing our GRC software as well. This information is available to managers through direct access to our SAP Fiori application for enterprise risk reporting, and in regularly issued reports, and is consolidated and aggregated for the quarterly risk reports to the Executive Board.
|
SAP Integrated Report 2023 | |||||
| To
Our Stakeholders |
Combined
Management Report |
Consolidated
Financial Statements IFRS |
Further
Information about Sustainability |
Additional Information |
||
Risk Factors
The following sections outline our risk categories and risk factors that we have identified and continuously track. To determine which risk factors pose the greatest threat to the viability of the SAP Group, we classify them as high, medium, or low based on 1) the likelihood that a risk factor will occur within the assessment horizon, and 2) the impact the risk factor would likely have on SAP’s business objectives were it to occur.
The scales for measuring these indicators are given in the following tables.
| Probability/Likelihood of Occurrence | Description | Impact Level | Impact Definition | Impact | |
| 1% to 19% | Remote | Insignificant | Negligible negative impact on business, financial position, profit, and/or cash flows | From
€0 to €25 million |
|
| 20% to 39% | Unlikely | Minor | Limited negative impact on business, financial position, profit, and/or cash flows | From
€25 million to €50 million |
|
| 40% to 59% | Likely | Moderate | Some potential negative impact on business, financial position, profit, and/or cash flows | From
€50 million to €100 million |
|
| 60% to 79% | Highly Likely | Major | Considerable negative impact on business, financial position, profit, and/or cash flows | From
€100 million to €500 million |
|
| 80% to 99% | Near Certainty | Business-Critical | Detrimental negative impact on business, financial position, profit, and/or cash flows | From
€500 million |
The combination of the likelihood of a risk factor and its impact on SAP’s reputation, business, financial position, profit, and/or cash flows leads to a subsequent classification as either “high,” “medium,” or “low.”
|
Insignificant (€0
to |
Minor (€25 million
to |
Moderate (€50 million
to |
Major (€100 million
to |
Business-Critical (from |
||||||
| Probability | 80% to 99% | L | M | H | H | H | ||||
| 60% to 79% | L | M | M | H | H | |||||
| 40% to 59% | L | L | M | M | H | |||||
| 20% to 39% | L | L | L | M | M | |||||
| 1% to 19% | L | L | L | L | M | |||||
| Impact | ||||||||||
| L = Low Risk | M = Medium Risk | H = High Risk | ||||||||
To further streamline our integrated report, we disclose material and relevant risk factors and focus on “major” and “business-critical” risk factors as per our assessment. Thus, the following risk factors are not included in the Integrated Report 2023 as they do not currently fall into either the “major” or “business-critical” category: Corporate Governance; Environment and Sustainability; Sales and Revenue Conditions; Liquidity; Use of Accounting Policies and Judgment; Currency, Interest Rate, and Share Price Fluctuation; Insurance and Venture Capital; Unauthorized Disclosure of Information; Investor Relations; Corporate Affairs; Marketing; Portfolio; SAP Strategy; Human Workforce.
|
SAP Integrated Report 2023 | |||||
| To
Our Stakeholders |
Combined
Management Report |
Consolidated
Financial Statements IFRS |
Further
Information about Sustainability |
Additional Information |
||
The following table provides an overview of major and business-critical risk categories (together with the respective risk factors). Therein, risk factors are categorized with their net value (after the implementation of mitigations).
Overview of Risk Factors (Aggregated Statement for 2023)
| Probability | Impact | Risk Level | |
| Economic, Political, Social, and Regulatory Risks | |||
| Global Economic and Political Environment | Likely | Major | Medium |
| International Laws and Regulations | Remote | Business-Critical | Medium |
| Legal and IP | Likely | Major | Medium |
| Data Protection and Privacy | Likely | Major | Medium |
| Corporate Governance and Compliance Risks | |||
| Ethical Behavior | Likely | Major | Medium |
| Operational Business Risks | |||
| Sales and Services | Unlikely | Major | Medium |
| Partner Ecosystem | Unlikely | Major | Medium |
| Cloud Operations | Unlikely | Major | Medium |
| Cybersecurity and Security | Likely | Business-Critical | High |
| Technology and Products | Unlikely | Business-Critical | Medium |
| Strategic Risks | |||
| Market Share and Profit | Unlikely | Business-Critical | Medium |
| Mergers and Acquisitions | Unlikely | Moderate | Low |
| Innovation | Remote | Major | Low |
|
SAP Integrated Report 2023 | |||||
| To
Our Stakeholders |
Combined
Management Report |
Consolidated
Financial Statements IFRS |
Further
Information about Sustainability |
Additional Information |
||
Economic, Political, Social, and Regulatory Risks
Global Economic and Political Environment: Uncertainty in the global economy and/or financial markets, and social and political instability caused by state-based conflicts, terrorist attacks, civil unrest, war, or international hostilities could lead to disruptions in our business.
As a global company, we are influenced by multiple external factors that are difficult to predict, may develop quickly, and are beyond our influence and control. These include, among others: crises affecting credit or liquidity markets; regional or global recessions; sharp fluctuations in commodity prices, currency exchange rates or interest rates; inflation or deflation; sovereign debt and bank debt rating downgrades; restructurings or defaults; adverse geopolitical events (such as Russia’s invasion of Ukraine and the Israel-Hamas conflict); rising military tensions around the world (such as the China-Taiwan tensions) and in particular within Europe’s borders; global policy including in the United States, the European Union (EU), Russia, and China; and global pandemic diseases such as COVID-19.
Any of these events could have an adverse effect on our reputation, business, competitive or financial position, profit, and cash flows.
SAP has established measures intended to address and mitigate the described risks and adverse effects. For example, we increase our share of more predictable revenue streams from cloud subscriptions and software support revenue streams, providing increased stability against financial volatility; and, supported by our global government affairs unit, we continuously monitor and evaluate global and political developments, to share insights and provide guidance to allow for proactive preparation and timely mitigation.
We cannot exclude the possibility that if any one or more of the risks associated with this risk factor were to occur, the impact could be major. We estimate the probability of occurrence to be likely, and classify this risk factor as medium.
International Laws and Regulations: Laws, regulatory requirements and standards in Germany, the United States, and elsewhere continue to be very stringent. Our international business activities and processes expose us to numerous and often conflicting laws and regulations, policies, standards, or other requirements, and sometimes even conflicting regulatory requirements.
The SAP Group has a global presence and operates in most countries of the world. As a European company domiciled in Germany with securities listed in Germany and the United States, we are subject to European, German, U.S., and other governance-related regulatory requirements of the countries we operate in.
Our business is subject to numerous risks inherent to international business operations and associated consequences, such as changes in tax laws, changes in external reporting standards, and the interpretation of the complex tax rules in certain countries, including but not limited to conflict and overlap among tax regimes as well as the introduction of new tax concepts that harm digitalized business models; discriminatory, protectionist, or conflicting fiscal policies and tax laws; import and export regulations and trade sanctions; counter or even conflicting sanctions; embargoes, including but not limited to country-specific software certification requirements; and newly emerging cybersecurity and environmental, social, and governance (ESG) compliance and disclosure laws.
As we expand into new countries and markets or extend our business activities in these markets, including emerging and high-risk markets, these risks could intensify. The application of the respective local laws and regulations to our business is sometimes unclear, subject to change over time, and often conflicting among jurisdictions. Additionally, these laws and government approaches to enforcement continue to change and evolve, just as our products and services continually evolve. Compliance with these varying laws and regulations, including antitrust regulations, could involve significant costs or require changes in our products or business practices. Non-compliance could result in the imposition of penalties or cessation of orders due to alleged non-compliant activity. Governmental authorities could use considerable discretion in applying these statutes and any imposition of sanctions against us could be material.
|
SAP Integrated Report 2023 | |||||
| To
Our Stakeholders |
Combined
Management Report |
Consolidated
Financial Statements IFRS |
Further
Information about Sustainability |
Additional Information |
||
Any of these events could have a material adverse effect on our operations globally or in one or more countries or regions, which could have a material adverse effect on our business, financial position, profit, and cash flows.
SAP has established measures intended to address and mitigate the described risks and adverse effects. For example, we: monitor new and increased regulatory requirements; continuously invest in, improve, and standardize our global processes, procedures, and solutions; proactively assess newly emerging regulatory initiatives; consult external economic and tax advisors, law firms, and authorities in the concerned countries; and take legal action when necessary.
We cannot exclude the possibility that if any one or more of the risks associated with this risk factor were to occur, the impact could be business-critical. We estimate the probability of occurrence to be remote, and classify this risk factor as medium.
Legal and IP: Claims and lawsuits against us, such as for IP infringements, or our inability to obtain or maintain adequate licenses for third-party technology, or if we are unable to protect or enforce our own intellectual property, may result in adverse outcomes.
We have in the past, and believe that we will continue to be subject to, claims and lawsuits, including intellectual property infringement claims, as our solution portfolio grows; as we acquire companies with increased use of third-party code including open source code; as we expand into new industries with our offerings, resulting in greater overlap in the functional scope of offerings; and as non-practicing entities that do not design, manufacture, or distribute products assert intellectual property infringement claims.
Moreover, protecting and defending our intellectual property is crucial to our success. The outcome of litigation and other claims or lawsuits is intrinsically uncertain.
We are subject to risks and associated consequences in the following areas, among others: dependency in the aggregate on third-party technology, including cloud and Web services, that we embed in our products or that we resell to our customers; integration of open source software components from third parties into our software and the implications derived from it; inability to prevent third parties from obtaining, using, or selling without authorization what we regard as our proprietary technology and information; and the possibility that third parties might reverse-engineer or otherwise obtain and use technology and information that we regard as proprietary. Moreover, the laws and courts of certain countries might not offer effective means to enforce our legal or intellectual property rights. Finally, SAP may not be able to collect or otherwise enforce all judgments awarded to it in legal proceedings. The outcome of litigation and other claims or lawsuits is intrinsically uncertain. Management’s view of the litigation might also change in the future. Actual outcomes of litigation and other claims or lawsuits could differ from the assessments made by management in prior periods, which are the basis for our accounting for these litigations and claims under IFRS.
SAP has established measures intended to address and mitigate the described risks and adverse effects. For example, we: have various internal programs, such as internal policies, processes, and monitoring in place to assess and manage the risks associated with open source and third-party intellectual property; endeavor to protect ourselves in the respective third-party software agreements by obtaining certain rights in case such agreements are terminated; and are a party to certain patent cross-license agreements with third parties.
We cannot exclude the possibility that if any one or more of the risks associated with this risk factor were to occur, the impact could be major. We estimate the probability of occurrence to be likely, and classify this risk factor as medium.
Data Protection and Privacy: Non-compliance with increasingly complex and stringent, sometimes even conflicting, applicable data protection and privacy laws, or failure to meet the contractual requirements of SAP’s customers with respect to our products and services, could lead to civil liabilities and fines, as well as loss of customers.
As a global software and service provider, SAP is required to comply with local laws wherever it does business. One of the relevant European data protection laws is the General Data Protection Regulation. International data transfers to third countries that do not provide for an adequate level of data protection require additional safeguards, including transfer risk assessments, to justify a transfer from the EU to a third country under the new EU standard contractual clauses.
|
SAP Integrated Report 2023 | |||||
| To
Our Stakeholders |
Combined
Management Report |
Consolidated
Financial Statements IFRS |
Further
Information about Sustainability |
Additional Information |
||
Furthermore, evolving data protection and privacy laws, regulations, and other standards around the world (such as the California Consumer Privacy Act, the Chinese Personal Information Protection Law including data localization requirements, the EU Digital Services Act, and the EU’s proposed e-Privacy Regulation) are increasingly aimed at protecting individuals’ personal information when it comes to marketing and tracking their online activities. This may impose additional burdens for SAP due to increasing compliance standards that could restrict the use and adoption of SAP’s products and services (in particular cloud services) and make it more challenging and complex to meet customer expectations. These changing criteria also impact the compliant use of new technology, such as machine learning and Artificial Intelligence for product development and deployment of intelligent applications.
Non-compliance with applicable data protection and privacy laws by SAP or any of the subprocessors engaged by SAP within the processing of personal data could lead to risks. These include, among others: mandatory disclosure of breaches to affected individuals, customers, and data protection supervisory authorities; investigations and administrative measures by data protection supervisory authorities, such as the instruction to alter or stop non-compliant data processing activities, including the instruction to stop using non-compliant subprocessors; or the possibility of damage claims by customers and individuals, contract terminations, and potential fines.
In addition, the German Federal Office for the Protection of the Constitution and security industry experts continue to warn of risks related to a globally growing number of cybersecurity attacks aimed at obtaining or violating company data including personal data.
Any of these events could have a material adverse effect on our reputation, business, financial performance, competitive or financial position, profit, and cash flows.
SAP has established measures intended to address and mitigate the described risks and adverse effects. For example, we: have implemented internal processes and measures to enable SAP to comply successfully and sufficiently with applicable data protection requirements; anchor data protection requirements in the mandatory product standards of SAP’s product development lifecycle; continuously review SAP’s existing standards and policies to address changes to applicable laws and regulations; continuously enhance our data center operations worldwide; actively monitor legal developments; engage with political stakeholders and government authorities; and provide clear governance and guidance on data handling, processing standards, and external communication as part of our data management framework, specifically incorporating aspects of new technologies such as those represented in embedded intelligence applications.
We cannot exclude the possibility that if any one or more of the risks associated with this risk factor were to occur, the impact could be major. We estimate the probability of occurrence to be likely, and classify this risk factor as medium.
Corporate Governance and Compliance Risks
Ethical Behavior: Our global business exposes us to risks related to unethical behavior and non-compliance with policies by employees, other individuals, partners, third parties, or entities associated with SAP.
SAP’s leadership position in the global market is founded on the long-term and sustainable trust of our stakeholders worldwide. Our overarching approach is one of corporate transparency, open communication with financial markets, regulators, and authorities, and adherence to recognized standards of business integrity. This commitment to recognized standards of business integrity is formalized in SAP’s CoEBC and supporting guidelines.
We are subject to risks and associated consequences in the following areas, among others: non-compliance with our policies and violation of compliance related rules, regulations, and legal requirements including, but not limited to, antitrust, anticorruption, and antibribery legislation in Germany, the U.S. Foreign Corrupt Practices Act, the UK Bribery Act, and other local laws prohibiting corrupt conduct; unethical and fraudulent behavior leading to criminal charges, fines, and claims by affected parties; collusion with external third parties; fraud and corruption; public sector transactions in territories exposed to a high risk of corruption; or increased exposure and impact on business activities in highly regulated industries.
|
SAP Integrated Report 2023 | |||||
| To
Our Stakeholders |
Combined
Management Report |
Consolidated
Financial Statements IFRS |
Further
Information about Sustainability |
Additional Information |
||
Any of these events could have a material adverse effect on our reputation, business, competitive or financial position, profit, and cash flows. In recent years, the investigation team within SAP’s Office of Ethics & Compliance (OEC), together with the assistance of an external law firm, investigated whistleblower complaints alleging that the business conduct of some former SAP employees within subsidiary SAP companies did not comply with SAP’s policies and procedures or applicable laws. These investigations culminated in January 2024 in a settlement agreement with the U.S. Securities and Exchange Commission (U.S. SEC) and the U.S. Department of Justice (U.S. DOJ), as well as with local authorities in South Africa. SAP fully cooperated with law enforcement authorities, and took immediate steps to discipline the employees involved, including terminating all those implicated in potential law violations. Since these allegations were made, SAP has also significantly strengthened its compliance program and related internal controls in accordance with DOJ and regulatory expectations and requirements.
SAP has encountered situations in the past that required clear messaging and strong action on non-compliance in the context of corrupt behavior that has the potential to harm our business and reputation. SAP is continuing to investigate its dealings with the public sector.
SAP has established measures intended to address and mitigate the described risks and adverse effects. For example, we: continuously evolve our comprehensive compliance program based on the three pillars of prevention, detection, and response; improve associated business processes, to prevent further and future violations; review partner business models, to mitigate risks of corruption while meeting agility requirements; conduct internal audits of our compliance programs related to bribery, corruption, and substantial fraud; annually reconfirm commitment to the CoEBC by SAP’s workforce (except where disallowed by local legal regulations); implement compliance policies and processes aimed at managing third parties and preventing misuse of third-party payments for illegal purposes, including the performance of compliance due diligence activities prior to the engagement of third parties; and launched a Partner Integrity Initiative aimed at examining the compliance programs of partners in SAP’s ecosystem and reviewing the SAP-related deals closed by them. We also introduced a platform called “Speak Out at SAP” for anyone within and outside of SAP to raise confidentially and, if desired, anonymously their concerns on ethics and compliance related to our CoEBC and any law or regulation.
Despite our comprehensive and continuously evolving compliance programs and internal controls, intentional efforts of individuals to circumvent controls or engage in corruption, especially by way of collusion with other involved parties, cannot always be prevented.
We cannot exclude the possibility that if any one or more of the risks associated with this risk factor were to occur, the impact could be major. We estimate the probability of occurrence to be likely, and classify this risk factor as medium.
Operational Business Risks
Sales and Services: Sales and implementation of SAP software and services, including cloud, are subject to several significant risks sometimes beyond our direct control.
A core element of our business is the successful implementation of software and service solutions. The implementation of SAP software and cloud-based service deliveries is led by SAP, by partners, by customers, or by a combination thereof.
We are subject to risks and associated consequences in the following areas, among others: implementation risks caused by insufficient or incorrect information provided by customers, insufficient customer expectation management, including scope, integration capabilities and aspects, and a lack of purposeful selection, implementation, or utilization of SAP solutions; a lack of customer commitments and respective engagements; challenges to achieve a seamlessly integrated, sufficiently automated and aligned service delivery; unrenderable services committed during the sales stage; inadequate contracting and consumption models based on subscription models for services, support, and application management; deviations from standard terms and conditions; or statements concerning solution developments that might be misperceived by customers as commitments on future software functionalities.
|
SAP Integrated Report 2023 | |||||
| To
Our Stakeholders |
Combined
Management Report |
Consolidated
Financial Statements IFRS |
Further
Information about Sustainability |
Additional Information |
||
Any of these events could have an adverse effect on our reputation, business, competitive or financial position, profit, and cash flows.
SAP has established measures intended to address and mitigate the described risks and adverse effects. For example, we: integrate risk management processes into SAP’s project management methods that are intended to safeguard implementations through coordinated risk and quality management programs; conduct ethical scope reviews and monitoring that are adapted as required as part of a clearly defined change request process together with respective project governance, steering, monitoring and controlling activities; and put in place a policy that clearly outlines communication rules on future functionalities as well as legal requirements for commitments to customers.
We cannot exclude the possibility that if any one or more of the risks associated with this risk factor were to occur, the impact could be major. We estimate the probability of occurrence to be unlikely, and classify this risk factor as medium.
Partner Ecosystem: If we are unable to scale, maintain, and enhance an effective partner ecosystem, revenue might not increase as expected.
An open and vibrant partner ecosystem is a fundamental pillar of our success and growth strategy. We have entered into partnership agreements that drive co-innovation on our platforms, profitably expand our routes to market to optimize market coverage, optimize cloud delivery, and provide high-quality services capacity in all market segments. Partners play a key role in driving market adoption of our entire solutions portfolio, by co-innovating on our platforms, embedding our technology, and reselling or implementing our software.
We are subject to risks and associated consequences in the following areas, among others: failure to establish and enable a network of qualified and fully committed partners; failure of partners to develop sufficient innovative solutions and content on our platforms or to provide high-quality products or services to meet customer expectations; failure of partners to embed our solutions sufficiently enough to profitably drive product adoption; failure of partners to adhere to applicable legal and compliance regulations; failure of partners to transform their business model in accordance with the transformation of SAP’s business model in a timely manner; and failure of partners to comply with contract terms in embargoed or high-risk countries.
If any of these risks materialize, this might have an adverse effect on the demand for our products and services as well as the partner’s loyalty and ability to deliver. As a result, we might not be able to scale our business to compete successfully with other vendors, which could have an adverse effect on our reputation, business, competitive or financial position, profit, and cash flows.
SAP has established measures intended to address and mitigate the described risks and adverse effects. For example, we: develop and enhance a wide range of partner programs to retain existing and attract new partners; offer training opportunities for our partners; provide safeguarding services to customers and partners; introduced a partner delivery quality framework; and implemented a certification process for third-party solutions to ensure consistent high-quality and seamless integration.
We cannot exclude the possibility that if any one or more of the risks associated with this risk factor were to occur, the impact could be major. We estimate the probability of occurrence to be unlikely, and classify this risk factor as medium.
Cloud Operations: We may not be able to properly protect and safeguard our critical information and assets, business operations, cloud offerings and portfolio presentation, and related infrastructure against cyberattacks, insufficient infrastructure, disruption, or deficient performance.
SAP is highly dependent on the availability, integrity, and reliability of our infrastructure, including infrastructure provided by third-party business partners, and the software used in our cloud portfolio is inherently complex. Customers using our cloud services rely on the security of our infrastructure to protect the availability of our services and the data that they store on our infrastructure. Threat actors are focused on attacking third-party product and service providers, such as SAP, as a means of compromising our and our downstream customers’ systems and data.
|
SAP Integrated Report 2023 | |||||
| To
Our Stakeholders |
Combined
Management Report |
Consolidated
Financial Statements IFRS |
Further
Information about Sustainability |
Additional Information |
||
We are subject to risks and associated consequences in the following areas, among others: the cloud portfolio or strategic direction of cloud operations may not fully meet customer demands; customers’ cloud service demands may not match our data center capacity or control investments; capacity shortages could affect SAP’s ability to deliver and operate cloud services as expected by or committed to our customers; scalability demands on infrastructure and operation could lead to cost increases and margin impacts; hyperscaler or infrastructure instabilities and the lack of availability or comprehensive contractual agreements could lead to challenges in meeting service level agreement (SLA) commitments; we might lack sufficient “future skills” for delivering and operating hybrid environments; we might lack the automation, standardization, and tools to manage and optimize operations and infrastructure; local legal requirements or changes to data sovereignty may lead to customers relocating their landscapes to a different data center; the loss of the right to use hardware purchased or leased from third parties could affect our ability to provide our cloud applications; disruptions to SAP’s cloud applications portfolio (such as system outages or downtimes, SAP network failure due to human or other errors, security breaches, or variability in user traffic for cloud applications) could affect customer SLAs; hardware failures or system errors might result in data loss or corruption; exploitation by threat actors of known and previously unknown (“zero day”) security vulnerabilities in our or our customers’ systems and software, including as a result of our or our customers’ failure to patch such vulnerabilities in a timely or effective manner; partner co-location of data centers might not adhere to our quality standards; or we might not comply with applicable certification requirements, such as the Payment Card Industry Data Security Standard (PCI DSS).
Any of these events could have a material adverse effect on our reputation, business, competitive or financial position, profit, and cash flows.
SAP has established measures intended to address and mitigate the described risks and adverse effects. For example, we: consolidated and harmonized our data centers and our data protection measures, which included implementing security information and event management solutions as well as enforcing network access control; invest significantly in infrastructure and processes to ensure consistently secure operations of our cloud solutions while continuously improving resistance, resilience, reusability, and scalability towards a standardized and harmonized portfolio; continuously enhance our infrastructure landscape capabilities and deployment options, including harmonized, efficient, and highly repetitive migration services; adhere to stringent SLAs with hyperscalers to ensure a high-quality customer experience; increase transparency through our continuously enhanced and expanded SAP Trust Center, in an effort to provide an appropriate level of information, for example, regarding planned patching activities and associated downtimes; monitor and invest in the continuous enhancement of our disaster recovery and business continuity capabilities; continuously aim for a homogeneous landscape that supports the complex infrastructure, application, and security requirements so that we can deliver the required service level for cloud services in a cost-effective manner; set up physical access control systems at facilities, multilevel access controls, closed-circuit television surveillance, security personnel in all critical areas, and recurring social engineering tests for SAP premises and data centers; control the access to information and information systems using authorization concepts that include managers and employees being regularly sensitized to the issues and given mandatory security and compliance trainings; adapt our cloud service delivery to local or specific market requirements (such as local or regional data centers) and comply with all local legal regulations regarding data protection and privacy as well as data security; establish contracts and SLAs with our public cloud partners to ensure that data security and privacy measures meet local regulatory and compliance standards and SAP’s own standards for data security and privacy; maintain strict internal policies and controls concerning utilization of our partner’s cloud infrastructure, including people, process, and technology standards required to enhance compliance and cyber resilience; closely monitor data center utilization, capacity, and pipeline for subsequent investment planning; regularly conduct risks reviews, disclosure requests, and audits to ensure public cloud providers meet SAP’s data privacy and security standards; ensure PCI-validated compliance through successful PCI DSS audits; invest in training and certifications concerning hyperscaler and related next-generation technologies; and implement best-of-breed tools for IT operations management and automation.
|
SAP Integrated Report 2023 | |||||
| To
Our Stakeholders |
Combined
Management Report |
Consolidated
Financial Statements IFRS |
Further
Information about Sustainability |
Additional Information |
||
We cannot exclude the possibility that if any one or more of the risks associated with this risk factor were to occur, the impact could be major. We estimate the probability of occurrence to be unlikely, and classify this risk factor as medium.
Cybersecurity and Security: Cybersecurity attacks or breaches, and security vulnerabilities in our infrastructure or services or those of our third-party partners could materially impact our business operations, products, and service delivery.
SAP delivers a full portfolio of solutions, hosts or manages elements of our customers’ businesses in the cloud, processes large amounts of data, and provides mobile solutions to users. While SAP executes each of these areas either directly or through partners and other third parties, our industry continues to experience a complex and threatening cybersecurity landscape. The severity of these cybersecurity threats is amplified due to the increasingly sophisticated and malicious global landscape in which we operate. This includes third-party data, products, and services that we incorporate into SAP products and services, and the increasingly advanced obfuscation, control-circumvention, and related techniques and tools – such as artificial intelligence – employed by threat actors targeting IT products, businesses, and the supply chain. When we become aware of unauthorized access to our systems or those of our third-party partners, we have action plans in place intended to identify and remediate the source and impact of such events. Like many companies, we and certain of our third-party partners have experienced and expect to continue to experience cyberattacks and other security incidents that affect our business. While we experience cybersecurity incidents of various kinds in the ordinary course of our business, we are not aware of any such incidents that have had a material impact on our business.
We are subject to risks and associated consequences in many areas including, but not limited to, an increasing number of global threat actor attacks using ransomware as their preferred method of attack as well as exploiting known and unknown bugs, errors and vulnerabilities in our software and systems or those of business partners, customers or other third parties. Given the nature of complex systems, software and services like ours, and the scanning tools that we deploy across our networks and products, we regularly identify and track security vulnerabilities. Security vulnerabilities are prioritized based on known and anticipated risks, and remediation activities aim to patch within the designated timeframes. Although we have standard routine patch management processes, we are unable to comprehensively apply patches or to confirm that mitigating measures are in place to mitigate all such vulnerabilities, or that any patches will be applied before exploitation by a threat actor. In other situations, vulnerabilities persist even after we have issued security patches, because our customers may fail to either apply the patches, update their systems, or authorize service downtime sufficient to allow for patching by SAP. If attackers are able to exploit vulnerabilities before patches are installed or mitigating measures are implemented, significant compromises could impact our and our customers’ systems and data.
We could also experience material exposure to our business operations and service delivery due to disruptions to backups, disaster recovery or business-continuity management processes, or as the result of malicious or inadvertent actions by threat actors, employees, contractors, or a host of other parties. Security threats may also exist due to delayed or insufficient responses to identified issues or other interdependencies such as cloud service providers and those beyond SAP’s cybersecurity infrastructure and protocols. SAP’s and/or its partners’ lack of sufficient security controls or compliance with existing controls could impact SAP’s and/or its partners’ ability to comply with applicable regulations and customer requirements. SAP and/or its partners could unknowingly introduce security threats and vulnerabilities without established security evaluation processes. Additionally, failure to integrate or maintain SAP’s cybersecurity infrastructure and protocols with network systems obtained through acquisitions could result in cyberbreaches, a loss of data confidentiality and integrity, and/or a loss of system availability.
The foregoing types of events could result in a loss of customers or customer opportunities, a diminished reputation in the marketplace, government investigations or enforcement actions, internal investigations, litigation including class actions, fines, or penalties, increased costs associated with remediation or compliance requirements, required changes to our business model or operations, and a host of other costs and losses, any or all of which could have a material adverse effect on our reputation, business, financial performance, competitive or financial position, profit, and cash flows. In response to the cybersecurity risk environment it is experiencing, SAP is continuously enhancing its cybersecurity program, for example by implementing the National Institute of Standards and Technology Cybersecurity Framework (NIST CSF) and establishing a Cyber Fusion Center (CFC).
|
SAP Integrated Report 2023 | |||||
| To
Our Stakeholders |
Combined
Management Report |
Consolidated
Financial Statements IFRS |
Further
Information about Sustainability |
Additional Information |
||
In addition, the Executive Board and Supervisory Board continue to increase their governance of and involvement in cybersecurity matters, for example by focusing on cybersecurity audit and risk management topics. SAP has established measures intended to address the described risks and adverse effects, such as the continuous adaptation, standardization, and modification of our security procedures. This includes, among others: security risk identification, threat modeling, advanced threat defense, application patches and container security enhancements, and security validation of our critical components and services before shipment. We increased our investments and resources, including various internal initiatives to achieve SAP’s objective of ensuring over time that our cybersecurity infrastructure meets or exceeds evolving industry standards. In addition, we enhanced the security capabilities in our hosting environment, cloud platforms, and cloud deployment tools, including improved monitoring to our infrastructure. Disaster recovery and business continuity plans are in place to protect our key IT infrastructure including implementation of data redundancies and backup strategies. In addition, we have set up local and regional crisis management teams to respond and minimize losses in case of crisis situations. Furthermore, we conduct security certifications and attestations (such as ISO/IEC 27001, ISO/IEC 22301, SOC, and PCI) and provide our customers with security white papers, product documentation, and reports from independent auditors and certification bodies. All employees are required to follow the SAP Global Security Policy, security standards, procedures, and good practices reinforced by completion of mandatory security and compliance training. SAP’s third-party risk management process aims to control and achieve governance in SAP’s third-party ecosystem. Besides conducting risk assessments to gauge a third party’s risk level, we increase employee and contractor awareness through cybersecurity campaigns and awareness training. Formalized third-party and partner data privacy and security agreements require adherence to SAP standards. We also engage experts to advise on appropriate cybersecurity protocols to further increase attention and understanding of cybersecurity procedures and protection options. SAP also established the CFC to bring functional teams together and strengthen detection capability. Additionally, the software security development lifecycle with integrated security features and functionalities has been applied to increase coordination across our various lines of business, which in turn improves our ability to detect, identify, and respond to threats in a timely manner.
Despite the foregoing measures, we cannot exclude the possibility that if any one or more of the risks associated with this risk factor were to occur, the impact could be business-critical and materially impact our business and results. We estimate the probability of occurrence to be likely, and classify this risk factor as high.
Technology and Products: Our technology and products may experience undetected defects, coding or configuration errors, may not integrate as expected, or may not meet customer expectations.
We are subject to risks and associated consequences in the following areas, among others: failure of software products and services to fully meet market needs or customer expectations; failure of software products and services from acquired companies to fully comply with SAP quality standards; failure of new products, services, and cloud offerings, including third-party technologies, to comply with local standards and requirements; the possibility that new products, services, and cloud offerings or subsequent versions and updates to existing products, services, and cloud offerings might contain defects or security vulnerabilities, or might not be mature enough from the customer’s point of view for business-critical solutions, or might not be sufficiently secure after release or shipment despite all the due diligence SAP puts into quality; inability of algorithms to correctly adapt to evolving circumstances, which may lead to adverse decision-making processes in the context of AI-related technologies; and the inability to fulfil expectations of customers regarding time and quality in the defect resolution process.
Any of these events could have a material adverse effect on our reputation, business, competitive or financial position, profit, and cash flows.
SAP has established measures to address and mitigate the described risks and adverse effects, such as: a broad range of techniques, including project management, project monitoring, product standards and governance, and rigid and regular quality assurance measures certified to ISO 9001:2015; a holistic testing strategy to validate the state of quality and security for every product before market introduction; the consideration of regular and direct customer feedback; and a comprehensive certification program designed to ensure that relevant third-party solutions are of consistently high quality.
|
SAP Integrated Report 2023 | |||||
| To
Our Stakeholders |
Combined
Management Report |
Consolidated
Financial Statements IFRS |
Further
Information about Sustainability |
Additional Information |
||
We cannot exclude the possibility that if any one or more of the risks associated with this risk factor were to occur, the impact could be business-critical. We estimate the probability of occurrence to be unlikely, and classify this risk factor as medium.
Strategic Risks
Market Share and Profit: Our market share and profit could decline due to increased competition, market consolidation, technological innovation, and new business models in the software industry.
The market for cloud computing is increasingly competitive and is exhibiting strong growth relative to the market for on-premise solutions. To maintain or improve our operating results in the cloud business, it is important that we not only attract new customers but also that our existing customers renew their agreements with us when the initial contract term expires and purchase additional modules or additional capacity. Additionally, we need to bring innovations to the market in line with the demands of our ecosystem and ahead of our competitors, such as solutions to support new data-driven applications and the extension of our suite of intelligent technologies based on SAP Business Technology Platform (SAP BTP).
We are subject to risks and associated consequences in the following areas, among others: inability to deliver fully suitable solution and transformation services to our customers on the cloud transformation journey, both in cloud-only and hybrid scenarios; inability to successfully execute on our hyperscaler strategy; adverse, near-term revenue effects due to increasing cloud business and conversions from on-premise licenses to cloud subscriptions from existing SAP customers, which could have an adverse effect on related maintenance and services revenue; insufficient solution and service adoption together with increased complexity, as well as failures during the execution of our corporate strategy in the context of our portfolio for solutions and services, which could lead to a loss of SAP’s position as a leading cloud company and subsequently to reduced customer adoption; customers and partners being reluctant or unwilling to migrate and adapt to the cloud; customers considering cloud offerings from our competitors; strategic alliances among competitors; price pressure, cost increases, and loss of market share through traditional, new, and cooperating competitors and hyperscalers; and the inability to achieve the planned margin increase in time as planned.
Any of these events could have a material adverse effect on our reputation, business, competitive or financial position, profit, and cash flows.
SAP has established measures intended to address and mitigate the described risks and adverse effects. For example, we: share our overall long-term cloud strategy and our integration road map with our customers; continuously implement improvements to enhance our cloud solutions through our corporate strategy; demonstrate the benefits of our solution and services portfolio; enable and support our customers as they transition from on-premise to the cloud; balance the allocation of our strategic investments by evolving and protecting our core businesses and simultaneously developing new solutions, technologies, and business models; offer broader range of services to support and drive the digital transformation for our customers; continuously drive the solution integration and harmonization of data models to support integrated business processes, applications, and technology while focusing on resilience, profitability, and sustainability; enable our portfolio for hyperscalers to extend customer reach and further meet customer expectations; continue to move SAP HANA Enterprise Cloud towards a full-stack offering; and increase the share of high-value cloud application services to further improve the margin.
We cannot exclude the possibility that if any one or more of the risks associated with this risk factor were to occur, the impact could be business-critical. We estimate the probability of occurrence to be unlikely, and classify this risk factor as medium.
|
SAP Integrated Report 2023 | |||||
| To
Our Stakeholders |
Combined
Management Report |
Consolidated
Financial Statements IFRS |
Further
Information about Sustainability |
Additional Information |
||
Mergers and Acquisitions: We might not acquire, integrate, or divest companies or their components effectively or successfully.
To expand and consolidate our business, we acquire and divest businesses, products, and technologies, and we expect to continue doing so in the future. Over time, some of these acquisitions have increased in size and in strategic importance for SAP. Management negotiation of potential acquisitions and divestures and the integration and carve-out of acquired businesses, products, or technologies demands time, focus, and resources of both management and the workforce, and exposes us to unpredictable operational difficulties.
We are subject to risks and associated consequences in the following areas, among others: incorrect information or assumptions during the due diligence process for acquisitions, divestitures, and other transactions; failure to integrate acquired technologies or solutions successfully and profitably into SAP’s solution portfolio and strategy; failure to successfully integrate acquired entities and their operations; failure to fulfill the needs of the acquired company’s customers or partners; failure to implement, restore, or maintain internal controls, disclosure controls, and procedures and policies within acquired companies; debt incurrence or significant unexpected cash expenditures; impairment of goodwill and other intangible assets acquired in business combinations; and failure of acquired companies to comply with regulatory requirements..
We have in the past, and may in the future, choose to divest certain entities, businesses, or product lines. We may have difficulty obtaining terms acceptable to us. Additionally, we may experience difficulty carving out portions of or entire businesses, we may incur a loss of revenue or experience a negative impact on margins, or we may not achieve the desired strategic and financial benefits. Such potential transactions may also delay achievement of our strategic objectives, cause us to incur additional expenses, disrupt customer, partner, and employee relationships, and may expose us to unanticipated or ongoing obligations and liabilities, including as a result of indemnification obligations. Further, during the pendency of a divestiture, we may be subject to risks such as a decline in the business to be divested, a loss of employees, customers, or suppliers, and the risk that the transaction may not close, any of which could have a material adverse effect on the business to be divested as well as our retained business. If a divestiture is not completed for any reason, we may not be able to find another buyer on the same terms, and we may have incurred significant costs without the corresponding benefit.
Any of these events could have a material adverse effect on our reputation, business, competitive or financial position, profit, and cash flows.
SAP has established measures intended to address and mitigate risks and adverse effects. For example, we: perform technical, operational, financial, and legal due diligence on the company or assets to be acquired or divested; identify, implement, and track risk mitigation measures for material transactions or integration risks; and conduct process, risk, and control analyses that are subsequently integrated into SAP’s processes and control framework and supported by mitigations as required by any specific circumstances to subsequently increase adherence to SAP’s standards and policies.
We cannot exclude the possibility that if any one or more of the risks associated with this risk factor were to occur, the impact could be moderate. We estimate the probability of occurrence to be unlikely, and classify this risk factor as low.
Innovation: We might not be able to compete effectively if we strategize our solution portfolio ineffectively or if we are unable to keep up with rapid technological and product innovations, enhancements, new business models, and changing market expectations.
Our future success depends on our ability to keep pace with technological and process innovations and new business models, as well as on our ability to develop new products and services, enhance and expand our existing products and services portfolio, and integrate products and services we obtain through acquisitions. To be successful, we are required to adapt our products and our go-to-market approach to a cloud-based delivery and consumption model so as to satisfy increasing customer demand and to ensure an appropriate level of adoption, customer satisfaction, and retention.
|
SAP Integrated Report 2023 | |||||
| To
Our Stakeholders |
Combined
Management Report |
Consolidated
Financial Statements IFRS |
Further
Information about Sustainability |
Additional Information |
||
We are subject to risks and associated consequences in the following areas, among others: inability to develop and sell new cloud products spanning various organizations on time and in line with market demands due to complexity in heterogeneous technical environments; inability to anticipate and develop technological improvements or succeed in adapting SAP products, services, processes, and business models to technological change, changing regulatory requirements, or emerging industry standards; a change in requirements of our customers and partners to strengthen the Intelligent Enterprise strategy; the possibility that our product and technology strategy might not be successful, or that our customers and partners might not adopt our technology platforms, applications, or cloud services quickly enough, or that they might consider other competing solutions in the market, or that our strategy might not match customers’ expectations and needs, specifically in the context of expanding the product portfolio into additional markets.
We are integrating AI into a number of our products, including our suite of enterprise applications and SAP BTP, and we expect our use of AI across our portfolio to continue to grow. As with many innovations, AI presents risks and challenges that could affect its adoption and therefore our business. AI algorithms or training methodologies may be flawed. Data sets may be overbroad, insufficient, or contain biased information. Content generated by AI systems may be offensive, illegal, or otherwise harmful. Ineffective or inadequate AI development or deployment practices by SAP or our partners could result in incidents that impair the acceptance of AI solutions or cause harm to individuals, customers, or society, or result in our products and services not working as intended. Human review of certain outputs may be required, which could introduce error or inefficiencies to the intended use of our AI-enabled offerings. As a result of these and other challenges associated with innovative technologies, our implementation of AI systems could subject us to competitive harm, regulatory action, legal liability, and brand or reputational harm.
In particular, there is significant uncertainty surrounding the applications of intellectual property and privacy laws to AI technology. Intellectual property ownership and license rights, including copyright, surrounding AI technology have not been fully addressed by courts or other laws or regulations of the jurisdictions in which we operate, and our use of AI technology or integration of AI technology into our products and services may result in disputes with respect to ownership or intellectual property, or exposure to claims of copyright or other intellectual property misappropriation. In addition, our AI technology may involve the processing of personal and other sensitive data and may be subject to laws, policies, legal obligations, and contractual requirements related to privacy, data protection, and information security. Various privacy laws extend rights to consumers (such as the right to obtain consent or delete certain personal data) and regulate automated decision making. An alleged or actual failure to meet these obligations may lead to regulatory investigations and fines or penalties; may require us to change our business practices or retrain our algorithms; or may prevent or limit our use of AI technology. It is also possible that we are held liable for intellectual property, privacy, or other legal violations of third-party AI technology that we use, and that we may not have full recourse for any damages that we suffer (for example, our use of third-party AI technology may be subject to limitations of liability or provide no liability coverage).
In addition, some AI scenarios present ethical issues or may have broad impacts on society, and there can be no assurance that our Global AI Ethics Policy or similar policies and procedures will be sufficient to address such issues. If we enable or offer AI solutions that have unintended consequences, unintended usage or customization by our customers and partners, or are controversial because of their impact on human rights, privacy, employment, or other social, economic, or political issues, we may experience reputational harm, adversely affecting our business and consolidated financial statements.
Any of these events could have a material adverse effect on our reputation, business, competitive or financial position, profit, and cash flows.
SAP has established measures intended to address and mitigate the described risks and adverse effects. For example, we: continuously align our organization, processes, products, delivery, commercial and consumption models, and services to changing markets and customer and partner demands; continuously benchmark, match, and challenge the entire portfolio; focus all investment decisions related to innovative technologies and solutions on portfolio compatibility and readiness as well as high customer value; explore future trends as well as the latest technologies; conduct wide-ranging market and technology analyses and research or co-innovation projects; and make strategic acquisitions in white spots of our portfolio.
We cannot exclude the possibility that if any one or more of the risks associated with this risk factor were to occur, the impact could be major. We estimate the probability of occurrence to be remote, and classify this risk factor as low.
|
SAP Integrated Report 2023 | |||||
| To
Our Stakeholders |
Combined
Management Report |
Consolidated
Financial Statements IFRS |
Further
Information about Sustainability |
Additional Information |
||
Expected Developments and Opportunities
Future Trends in the Global Economy
Global economic growth will decrease slightly in 2024, mainly reflecting the impact of monetary policy tightening across advanced economies, projects the European Central Bank (ECB) in its most recent Economic Bulletin.1 This means that the global economy will expand but still at a rate below the historical average over the ECB’s projection horizon. With post-COVID-19 growth momentum waning, the services sector, which had previously proven resilient, might also show a greater deceleration in 2024.
Concerning the EMEA region, economic growth in the euro area might remain subdued in the near term, as interest rate increases could tighten financing conditions and dampen demand, but at the same time help push down inflation. However, these effects are likely to fade later on in the projection period because of rising real incomes and improving foreign demand, suggests the ECB. It also expects services activity in the EMEA region to soften in the coming months due to spillovers from weaker industrial activity, fading effects from the reopening of the economy, and the broadening impact of tighter financing conditions.
As for the Americas region, the ECB predicts that while economic growth in the United States could moderate in the near term as tighter monetary policy might restrain spending, the U.S. economy should recover again from the second half of 2024 onward.
For the APJ region, the ECB’s growth outlook remains broadly unrevised with respect to emerging Asia and China. In China, the ECB projects economic growth to gradually decrease over the coming years owing to structural factors such as population ageing. In Japan, economic growth might remain positive but modest in 2024, amid signs of a slight rebound in real consumption levels.
|
SAP Integrated Report 2023 | |||||
| To
Our Stakeholders |
Combined
Management Report |
Consolidated
Financial Statements IFRS |
Further
Information about Sustainability |
Additional Information |
||
Economic Trends – GDP Growth Year Over Year
| Percent | 2023 | 2024p | 2025p |
| World | 3.1 | 3.1 | 3.2 |
| Advanced Economies | 1.6 | 1.5 | 1.8 |
| Emerging Markets and Developing Economies | 4.1 | 4.1 | 4.2 |
| Regions (according to IMF taxonomy) | |||
| Euro Area | 0.5 | 0.9 | 1.7 |
| Germany | -0.3 | 0.5 | 1.6 |
| Emerging and Developing Europe | 2.7 | 2.8 | 2.5 |
| Middle East and Central Asia | 2.0 | 2.9 | 4.2 |
| Sub-Saharan Africa | 3.3 | 3.8 | 4.1 |
| United States | 2.5 | 2.1 | 1.7 |
| Canada | 1.1 | 1.4 | 2.3 |
| Latin America and the Caribbean | 2.5 | 1.9 | 2.5 |
| Japan | 1.9 | 0.9 | 0.8 |
| Emerging and Developing Asia | 5.4 | 5.2 | 4.8 |
| China | 5.2 | 4.6 | 4.1 |
| p = projection | |||
| Source: International Monetary Fund (IMF), World Economic Outlook Update January 2024, Moderating Inflation and Steady Growth Open Path to Soft Landing (https://www.imf.org/-/media/Files/Publications/WEO/2024/Update/January/English/text.ashx), p. 6. | |||
The IT Market: Outlook for 2024 and Beyond
“Organizations that can make smarter investments and better execute on their strategies because of their digital business platforms will find themselves with a major competitive advantage over the next five years, leading them to capture significant portions of the digital market share.”2 That is the assessment of International Data Corporation (IDC), a U.S.-based market research firm. It projects that “spending on digital technology by organizations will grow at 7x the economy in 2024, as companies are compelled by market demands to grow digital business models and strengthen digital capabilities,”2 and finds that “in a scenario where agility is paramount, a continued reliance on legacy systems can be detrimental. As we move closer to 2025, organizations must prioritize this transition not just to be at the forefront of their market but simply to survive.”3
According to IDC, “by early 2025, organizations still on legacy systems will need to modernize their applications immediately to survive and adapt to the digital world already surpassing them.”3 In addition, by 2028, “organizations with established digital business platforms will have 50% higher digital market share with greater abilities to track ROI and execute digital revenue initiatives,”2 and “85% of CIOs will leverage organizational changes to harness AI, automation, and analytics, driving agile, insight-driven digital businesses.”4
Concerning sustainability, IDC expects that “by 2027, G2000 organizations’ business and IT leaders will dedicate at least 20% of their digital tech spending toward sustainability initiatives”, “meeting their digital goals while taking sustainability into account. These types of sustainability initiatives will increase in the next five years as significant parts of digital technology investment strategies.”2
In particular, IDC reports that “tools and technologies that facilitate real-time monitoring and reporting of ESG metrics will be essential” to “mitigate legal risks and enhance their brand and competitive advantage.”4 It predicts, for example, that “applications that enable real-time carbon footprint tracking and integrate seamlessly with green supply chain mechanisms will transition from a nice-to-have to a must-have”3 and that, therefore, “the automation of regulatory compliance will be essential for monitoring, analyzing, and reporting accurate ESG metrics to meet regulatory standards.”4
1 European Central Bank, Economic Bulletin, Issue 8/2023, Publication Date: January 11, 2024.
|
SAP Integrated Report 2023 | |||||
| To
Our Stakeholders |
Combined
Management Report |
Consolidated
Financial Statements IFRS |
Further
Information about Sustainability |
Additional Information |
||
2 IDC FutureScape: Worldwide Digital Business Strategies 2024 Predictions, Doc #US50120323, October 2023.
3 IDC FutureScape: Worldwide Intelligent ERP 2024 Predictions, Doc #US51300923, October 2023.
4 IDC FutureScape: Worldwide CIO Agenda 2024 Predictions, Doc #US51294523, October 2023.
Impact on SAP
The global economy is currently impacted by multiple crises, such as political tensions, wars in Ukraine and the Middle East, disruptions of supply chains, and increasing natural disasters due to climate change. Nevertheless, SAP’s resilience is remarkable and with 83% of our revenue recurring, the Company is able to withstand economic pressure to a large degree. Even so, SAP must continue to evolve and remain agile while continuously adapting to a fast-changing landscape.
In 2024 and beyond, SAP plans to execute along the refined corporate strategy, with increasing focus on key strategic growth areas, such as cloud adoption, SAP Business AI, and value for customers. This makes us confident in our ability to expand our addressable market and deliver sustained topline growth. In addition, given our increased focus on operational efficiency, we are very confident we will be able to achieve our midterm ambition.
Financial Targets and Prospects
Revenue and Operating Profit Targets and Prospects (Non-IFRS)
Outlook 2024
The outlook for 2024 has been prepared in accordance with our updated non-IFRS definition from 2024. For more information, see the Performance Management System section.
For the full year 2024, SAP expects:
| – | €17.0 billion to €17.3 billion in cloud revenue at constant currencies (2023: €13.66 billion), up 24% to 27% at constant currencies |
| – | €29.0 billion to €29.5 billion in cloud and software revenue at constant currencies (2023: €26.92 billion), up 8% to 10% at constant currencies |
| – | €7.6 billion to €7.9 billion non-IFRS operating profit at constant currencies (2023: €6.51 billion, based on the updated non-IFRS operating profit definition and excluding gains and losses from less material divestitures), up 17% to 22% at constant currencies. |
| – | Free cash flow of approximately €3.5 billion (2023: €5.09 billion). This includes a preliminary €2 billion estimate for payouts associated with the program, a €0.2 billion impact from a settlement earlier this year of pre-existing regulatory compliance matters accrued in 2023, and a €0.2 billion adverse impact due to the discontinuation of the SAP-triggered financing program. |
| – | An effective tax rate (non-IFRS) of around 32.0% (2023: 30.3%, based on the updated non-IFRS definition) |
Furthermore, SAP provides the following additional forward-looking information for selected metrics:
| – | CCB: we expect a year-end growth rate similar that of 2023, while at a larger scale. |
| – | Cloud ERP Suite revenue: we expect to sustain the high growth rate in 2024. |
While SAP’s full-year 2024 business outlook is at constant currencies, numbers reported in actual currencies are likely to be impacted by exchange rate fluctuations as the year progresses. See the table below for the expected currency impacts for the full-year 2024. These expectations are based on the December 2023 level.
| In percentage points (pp) | FY/2024 |
| Cloud revenue growth | -2.0pp to 0.0pp |
| Cloud and software revenue growth | -1.5pp to 0.5pp |
| Operating profit growth (non-IFRS) | -2.0pp to 0.0pp |
|
SAP Integrated Report 2023 | |||||
| To
Our Stakeholders |
Combined
Management Report |
Consolidated
Financial Statements IFRS |
Further
Information about Sustainability |
Additional Information |
||
The following table shows the estimates of the items that represent the differences between our non-IFRS financial measures and our IFRS financial measures for operating profit.
| € millions | Estimated
Amounts for 2024 |
Actual
Amounts for 2023 |
| Acquisition-related charges | 305–385 | 345 |
| Restructuring | about 2,000 | 214 |
| Regulatory compliance matters | 0 | 155 |
Furthermore, the differences between free cash flow as our non-IFRS financial measure and operating cash flow as our IFRS financial measure include estimated cash flows in 2024 for leasing and capital expenditures of €1.2 billion (2023: €1.1 billion).
We do not provide an outlook for the effective tax rate (IFRS) due to the uncertainty and potential variability of gains and losses associated with equity investments, which are reconciling items between non-IFRS and IFRS.
Proposed Dividend
In 2024, we intend to pay a dividend of €2.20 per share (subject to shareholder approval at the Annual General Shareholders Meeting in May 2024). For more information, see the Financial Performance: Review and Analysis section.
Ambition 2025
In this section, all numbers (except cloud revenue and total revenue) are based exclusively on non-IFRS measures.
By 2025, SAP now expects:
| – | Non-IFRS cloud gross profit of approximately €16.2 billion, which now includes share-based compensation expenses of approximately €0.1 billion1 |
| – | Non-IFRS operating profit of approximately €10.0 billion, which now includes share-based compensation expenses of approximately €2 billion1 |
| – | Free cash flow of approximately €8.0 billion |
SAP continues to expect:
| – | Cloud revenue of more than €21.5 billion |
| – | Total revenue of more than €37.5 billion |
| – | The share of more predictable revenue to be approximately 86% |
Further, SAP strives for an acceleration of total revenue growth and an expansion of operating margin beyond 2025.
1 Non-IFRS. Our Ambition for 2025 has been adjusted in accordance with our updated non-IFRS definition applicable from 2024. For more information, see the Performance Management System section.
Note: For a reconciliation of non-IFRS results to IFRS equivalents, see the Performance Management System section.
Investment Goals
Our planned investment expenditures for 2024 and 2025, other than for business combinations, consist primarily of the purchase of IT infrastructure and the construction activities described in the Assets (IFRS) section. We expect investments in IT infrastructure to be approximately €400 million and in construction activities to be approximately €350 million in 2024. In 2024, we expect total capital expenditures of approximately €950 million. In 2025, capital expenditures are expected to decrease to approximately €700 million.
|
SAP Integrated Report 2023 | |||||
| To
Our Stakeholders |
Combined
Management Report |
Consolidated
Financial Statements IFRS |
Further
Information about Sustainability |
Additional Information |
||
Goals for Liquidity and Finance
As of December 31, 2023, our net liquidity was €3.5 billion. We believe that our liquid assets combined with our undrawn credit facilities are sufficient to meet our operating financing needs in 2024 as well, and, together with expected cash flows from operations, will support debt repayments and our currently planned capital expenditure requirements over the near and medium term.
In 2024, we expect a free cash flow of approximately €3.5 billion (compared to €5.1 billion in 2023) and of around €8.0 billion in 2025. The decline in free cash flow in 2024 will be driven predominantly by our preliminary €2.0 billion estimated outflow for restructuring, a €200 million outflow for compliance matters, and a €200 million adverse impact due to the discontinuation of the SAP-triggered financing program.
In 2024, we intend to repay €850 million in Eurobonds and US$323 million in U.S. private placements. The ratio of net debt as of December 31, 2023, divided by the total of operating profit (IFRS) plus depreciation and amortization was –0.49x and therefore below our 2023 target of 0.5x.
Non-Financial Goals for 2024 and Ambition for 2025
In addition to our financial goals, we also focus on four non-financial targets: customer loyalty, employee engagement, carbon impact, and women in executive roles.
For 2024, SAP expects employee engagement, measured by the Employee Engagement Index, to be between 76% and 80% (2023: 80%). Through 2025, we aim to achieve a steady increase in our Employee Engagement Index score.
SAP measures customer loyalty using the Customer Net Promoter Score (Customer NPS). We expect the score to be between 9 and 13 for Customer NPS in 2024. SAP expects to steadily increase the Customer NPS through 2025.
In 2024, we expect to steadily decrease carbon emissions across the relevant value chain. Further, SAP has also committed to achieving net-zero along our value chain in line with a 1.5 degrees Celsius future in 2030.
From 2024, SAP will track a new KPI: Women in Executive Roles (WiER). For 2024 and beyond, we are expecting to steadily increase the percentage of women on Global Executive Team, Senior Executive Team, and Executive Team level as we strive to achieve our target of 25% by the end of 2027.
Premises on Which Our Outlook and Prospects Are Based
In preparing our outlook and prospects, we have taken into account all events known to us at the time we prepared this report that could influence SAP’s business going forward.
Outlook for SAP SE
The primary source of revenue for SAP SE is the license fees it charges subsidiaries for the right to market and maintain SAP software solutions. Consequently, the performance of SAP SE in operating terms is closely tied to the cloud and the software revenue of the SAP Group.
Due to the rise, at constant currencies, in non-IFRS cloud and software revenue anticipated for the SAP Group in 2024, we expect a moderate increase in product revenue for SAP SE.
Given the Company-wide restructuring program we announced and the projected restructuring expenses at SAP SE level, and assuming that there are no one-time effects relating to acquisitions or to other non-recurring events, we expect SAP SE’s operating profit to decrease significantly.
We expect that this growth will also result in further revenue and profit growth for SAP SE to the same degree. We expect that SAP SE will continue to receive investment income in the form of profit transfers and dividends from its subsidiaries. The growth we expect for the SAP Group should have a positive effect on this investment income.
|
SAP Integrated Report 2023 | |||||
| To
Our Stakeholders |
Combined
Management Report |
Consolidated
Financial Statements IFRS |
Further
Information about Sustainability |
Additional Information |
||
The outlook for the SAP Group in respect to liquidity, finance, investment, and dividend is equally applicable to SAP SE.
Among the assumptions underlying this outlook are those presented above concerning the economy and our expectations for the performance of the SAP Group.
Opportunities
Our customers choose SAP as a trusted partner for their digital business transformation. We have established a framework for opportunity management by evaluating and analyzing key areas such as current markets, external scenarios, economic conditions, and technological trends. We have also researched customer and product segmentation, growth drivers, and industry-specific factors for success. These combined insights play a key role for the Executive Board in the development of our market strategies. Our shareholder value relies heavily upon a fine balance of risk mitigation and value-driven opportunities. Therefore, our governance model helps ensure that decisions are based on return, investment required, and risk mitigation.
As far as opportunities are likely to occur, we have incorporated them into our business plans, our outlook for 2024, and our medium-term prospects outlined in this report. Therefore, the following section focuses on future trends or events that might result in an uplift of our outlook and medium-term prospects should they develop more positively than anticipated in our forecasts.
SAP SE is the parent company of the SAP Group and earns most of our revenue from subscription fees, software license fees, and dividends paid by affiliates. Consequently, the opportunities described below also apply – directly or indirectly – to SAP SE.
Opportunities from Economic Conditions
Economic conditions clearly influence our business, financial position, profit, and cash flows. Should the global economy recover faster than is reflected in our plans today, our revenue and profit may surpass our current outlook and medium-term prospects. Our medium-term planning considers changes in market conditions as a result of the ongoing geopolitical and macroeconomic environments. Although we continue to be mindful of the negative aspects of this global situation, we take opportunities to further invest into our strategic growth areas.
For more information about future trends in the global economy and the IT market outlook, as well as their potential influence on SAP, see the beginning of this Expected Developments and Opportunities section.
Opportunities Through Innovation
Our continued growth through innovation is based on our ability to leverage research and development (R&D) resources effectively. We are accelerating innovation cycles, especially in our cloud solutions, and engaging even more closely with our customers to enable success. Specifically, we focus on ease of adoption and consumption so customers can receive the benefits from our software solutions, technologies, and platforms at reduced time to value.
Our aim is to bring our customers into a clean core in the cloud based on SAP S/4HANA Cloud and enabled by our SAP Business Technology Platform (SAP BTP), which provides the required extensibilities and thereby creates connectivity between our solutions. This clean core is intended to enable multicloud adoption from our customers and partners.
To address new and critical environmental, economic, and social challenges, SAP embeds SAP Business AI capabilities across our entire portfolio, a step we believe will increase customer demand. In addition, SAP Business AI has the potential to simplify how people interact with SAP solutions, and to increase the addressable user base.
Based on our innovation capabilities, we see opportunities to drive customer value by shaping the future of business processes with next-generation, modular, industry-specific solutions that enhance companies’ existing systems. Designed to drive unprecedented business agility, forge the future of business collaboration, and enable companies to manage operations seamlessly within and beyond organizational boundaries, said solutions are pioneering the future of data-driven decision-making, empowering businesses to act boldly and with greater confidence.
|
SAP Integrated Report 2023 | |||||
| To
Our Stakeholders |
Combined
Management Report |
Consolidated
Financial Statements IFRS |
Further
Information about Sustainability |
Additional Information |
||
These enhancements could also lead to increased demand across our cloud portfolio. For example, the accelerated adoption of technology that helps companies take more sustainable decisions and that we natively build in our SAP S/4HANA Cloud could result in additional upsell opportunities for customers migrating to cloud ERP.
We also see high growth potential in four adjacent innovation areas: sustainability management, working capital management (accelerated through the Taulia portfolio), business networks, business transformation solutions (accelerated through the SAP Signavio portfolio and LeanIX solutions) that help us deliver on our vision and commitments to help customers reach agility at scale, achieve more across the value chain, and become sustainable at their core.
In addition, we continue to expand startup engagement in strategic opportunity areas, focusing on startups as customers and partners.
For more information about future opportunities in research and development for SAP, see the Strategy and Business Model section.
Opportunities from Our Strategy for Profitable Growth
SAP strives to generate profitable growth across our portfolio of products, solutions, and services to keep and improve our market position. Our aim is to continue to expand our addressable market by enhancing our portfolio and our new technologies and innovations. As an industry, we are benefiting from a secular trend toward digitalization, cloud, and the rise of AI, and are strengthening the market’s readiness to consume software in the cloud, including core business process platforms.
To positively affect the profitability of our cloud business, we set clear priorities to optimize efficiency in our cloud operations. Our operational excellence priorities include a focus on adoption and consumption of our product portfolio, leading to more efficient sales and marketing invest; a focused product portfolio leading to more effective R&D investment; more centralized business operations leading to end-to-end-optimization; and an accelerated workforce transformation leading to a future-ready workforce.
SAP seeks to establish new business models and leverage its expanding ecosystem of partners to achieve scale and maximize opportunities. Building on our success with RISE with SAP, we are moving toward expansion and have launched Grow with SAP, a dedicated offering for midmarket companies that is helping us win net-new customers.
New commercial models such as RISE Premium Plus increase the focus on packaged suite sales and flexible consumption, making sure we capture the significant cross-sell potential of our suite while decreasing cost of sales for the acquisition of net-new customers and increasing customer lifetime value with existing customers.
Our strong focus on technical integration between our line-of-business (LoB) solutions and SAP S/4HANA, to provide a seamless and delightful experience for our customers, may uplift the cross-sell potential of our suite portfolio and create operational synergies.
To further drive the aforementioned opportunities, SAP announced a transformation program for 2024 to focus on key strategic growth areas, in particular business AI. Through this program, SAP intends to transform its operational setup to capture organizational synergies and AI-driven efficiencies, and to prepare the Company for highly scalable future revenue growth.
Opportunities from Our Ecosystem
SAP’s ecosystem is defined by the interdependent relationships of our customers, our employees, our suppliers, our partners, and our complementary technology partners. Our ecosystem, which includes more than 25,000 partners with different areas of expertise, carries the SAP brand into global markets and expands our portfolio with their expertise, services, and solutions. Our ecosystem includes partners in four different tracks: partners in the “Build” track develop solutions on top of, or integrate with, SAP technology and platforms; extending the scope and functionality of SAP solutions to address customer requirements; partners in the “Sell” track advise, resell, implement, and support customers of all types and sizes; partners in the “Service” track (systems integrators) provide strategic business consulting, system design, solution integration, and project implementation of SAP solutions; partners in the “Run” track are outsourcing or hosting companies that offer SAP solutions to customers through a private or public cloud.
|
SAP Integrated Report 2023 | |||||
| To
Our Stakeholders |
Combined
Management Report |
Consolidated
Financial Statements IFRS |
Further
Information about Sustainability |
Additional Information |
||
SAP and our partner ecosystem offer solutions to help customers grow their businesses and accelerate their move to the cloud. SAP partners build innovative extensions for SAP applications based on SAP BTP, and in doing so, enhance the customer value offered by SAP. We continue to focus on developing new talent and capacity in the partner ecosystem to support the increased demand for customer cloud transformations. By providing innovations that extend SAP applications, partners can influence the adoption of SAP technologies to support customers’ unique business needs. Thus, customers maximize their SAP investment through partner offerings such as industry-specific solutions, LoB solutions, added functionality, and sustainability offerings.
Partners constantly respond to market needs while raising awareness around strategic offerings, such as RISE with SAP, SAP BTP, and our industry cloud solutions, which drive the transformation in the cloud for our customers. Partners offer customers a vast array of SAP technologies and services specific to their LoB or industry, making it easy for customers to purchase the right combination of products, solutions, and services (such as consulting, implementation, and development) to meet their business needs.
Partners contribute to SAP’s growth by expanding market reach in sales and services, specifically by retaining and increasing sales to existing customers, attracting new customers, accessing new markets, and addressing our joint customers’ requirements with their expertise and solution innovations. Together with all the aforementioned measures, this may positively impact our revenue, profit, cash flows, customer satisfaction and retention, and enable SAP to exceed our stated medium-term prospects.
Opportunities from Our Employees
Our employees drive innovation, provide value to our customers, and consistently enable our growth and profitability. We continuously invest in our people with the aim of retaining their high level of engagement, further strengthening their skills, fostering an agile and innovative organization, and ensuring a healthy, diverse, and inclusive workforce. By doing so, we anticipate improvements in our employee productivity and innovation capabilities.
Our outlook and medium-term prospects are based on certain assumptions regarding employee retention and our Business Health Culture Index. Should these develop at a rate that is better than expected, employee productivity and engagement may increase. A stronger-than-expected increase in the Employee Engagement Index can therefore be an opportunity that could positively impact our revenue, profit, and cash flows, enabling SAP to exceed our stated medium-term prospects.
For more information about future opportunities relating to our employees, see the Employees section.
Executive Board’s Overall Assessment of Opportunities and Risks
In our view, considering their impact level and likelihood of occurrence, the risks described in our aggregated risk report do not individually or cumulatively threaten our ability to continue as a going concern. While individual risks, individual opportunities, and assessments may have changed during 2023, our overall risk profile and overall opportunities profile did not change materially compared to the prior year. Management remains confident that the Group’s earnings strength forms a solid basis for our future business development and provides the necessary resources to pursue the opportunities available to the Group. Based on our structured processes for early risk identification, we are confident that, in 2024, we can continue to counter the challenges arising from the risks in our current risk profile.
|
SAP Integrated Report 2023 | |||||
| To
Our Stakeholders |
Combined
Management Report |
Consolidated
Financial Statements IFRS |
Further
Information about Sustainability |
Additional Information |
||
Responsibility Statement
To the best of our knowledge, and in accordance with the applicable reporting principles, the Consolidated Financial Statements give a true and fair view of the assets, finances, and operating results of the SAP Group, and the management report of the Group and SAP SE includes a fair review of the development and performance of the business and the position of the Group and SAP SE, together with a description of the principal opportunities and risks associated with the expected development of the Group and SAP SE.
Walldorf, February 21, 2024
SAP SE
Walldorf, Germany
Executive Board of SAP SE
| Christian Klein | Dominik Asam | Dr. Jürgen Müller |
| Scott Russell | Thomas Saueressig | Gina Vargiu-Breuer |
Julia White
|
SAP Integrated Report 2023 | |||||
| To
Our Stakeholders |
Combined
Management Report |
Consolidated
Financial Statements IFRS |
Further
Information about Sustainability |
Additional Information |
||
Consolidated Financial Statements IFRS
| Consolidated Income Statements of SAP Group for the Years Ended December 31 | 156 |
| Consolidated Statements of Comprehensive Income of SAP Group for the Years Ended December 31 | 157 |
| Consolidated Statements of Financial Position of SAP Group as at December 31 | 158 |
| Consolidated Statements of Changes in Equity of SAP Group for the Years Ended December 31 | 159 |
| Consolidated Statements of Cash Flows of SAP Group for the Years Ended December 31 | 160 |
| Notes | 161 |
| (IN.1) Basis for Preparation | 161 |
| Section A – Customers | 165 |
| (A.1) Revenue | 165 |
| (A.2) Trade and Other Receivables | 170 |
| (A.3) Capitalized Cost from Contracts with Customers | 171 |
| (A.4) Customer-Related Provisions | 172 |
| Section B – Employees | 174 |
| (B.1) Employee Headcount | 174 |
| (B.2) Employee Benefits Expenses | 174 |
| (B.3) Share-Based Payments | 175 |
| (B.4) Pension Plans and Similar Obligations | 182 |
| (B.5) Other Employee-Related Obligations | 184 |
| (B.6) Restructuring | 184 |
| Section C – Financial Results | 186 |
| (C.1) Results of Segments | 186 |
| (C.2) Reconciliation of Segment Measures to the Consolidated Income Statements | 188 |
| (C.3) Other Non-Operating Income/Expense, Net | 189 |
| (C.4) Financial Income, Net | 189 |
| (C.5) Income Taxes | 189 |
| (C.6) Earnings per Share | 193 |
| Section D – Invested Capital | 194 |
| (D.1) Business Combinations and Divestitures | 194 |
| (D.2) Goodwill | 200 |
| (D.3) Intangible Assets | 205 |
| (D.4) Property, Plant, and Equipment | 207 |
| (D.5) Leases | 207 |
| (D.6) Equity Investments | 208 |
| (D.7) Non-Current Assets by Region | 210 |
| (D.8) Purchase Obligations | 210 |
| (D.9) Income-Related Government Grants | 211 |
|
SAP Integrated Report 2023 | |||||
| To
Our Stakeholders |
Combined
Management Report |
Consolidated
Financial Statements IFRS |
Further
Information about Sustainability |
Additional Information |
||
| Section E – Capital Structure, Financing, and Liquidity | 212 |
| (E.1) Capital Structure Management | 212 |
| (E.2) Total Equity | 213 |
| (E.3) Liquidity | 215 |
| Section F – Management of Financial Risk Factors | 220 |
| (F.1) Financial Risk Factors and Risk Management | 220 |
| (F.2) Fair Value Disclosures on Financial Instruments | 234 |
| Section G – Other Disclosures | 240 |
| (G.1) Prepaid Expenses and Other Tax Assets | 240 |
| (G.2) Other Tax Liabilities | 240 |
| (G.3) Other Litigation, Claims, and Legal Contingencies | 240 |
| (G.4) Board of Directors | 242 |
| (G.5) Executive and Supervisory Board Compensation | 246 |
| (G.6) Related Party Transactions Other Than Board Compensation | 247 |
| (G.7) Principal Accountant Fees and Services | 248 |
| (G.8) Events After the Reporting Period | 248 |
| (G.9) Scope of Consolidation; Subsidiaries and Other Equity Investments | 249 |
| (G.10) German Code of Corporate Governance | 259 |
| Management’s Annual Report on Internal Control over Financial Reporting in the Consolidated Financial Statements | 261 |
|
SAP Integrated Report 2023 | |||||
| To
Our Stakeholders |
Combined
Management Report |
Consolidated
Financial Statements IFRS |
Further
Information about Sustainability |
Additional Information |
||
 |
Consolidated Income Statements of SAP Group for the Years Ended December 31 |
| € millions, unless otherwise stated | Notes | 2023 | 2022 | 2021 |
| Cloud | 13,664 | 11,426 | 8,701 | |
| Software licenses | 1,764 | 2,056 | 3,248 | |
| Software support | 11,496 | 11,909 | 11,412 | |
| Software licenses and support | 13,261 | 13,965 | 14,660 | |
| Cloud and software | 26,924 | 25,391 | 23,361 | |
| Services | 4,283 | 4,128 | 3,592 | |
| Total revenue | (A.1), (C.2) | 31,207 | 29,520 | 26,953 |
| Cost of cloud | –3,884 | –3,499 | –2,881 | |
| Cost of software licenses and support | –1,383 | –1,384 | –1,598 | |
| Cost of cloud and software | –5,267 | –4,883 | –4,479 | |
| Cost of services | –3,407 | –3,155 | –2,740 | |
| Total cost of revenue | –8,674 | –8,038 | –7,219 | |
| Gross profit | 22,534 | 21,482 | 19,734 | |
| Research and development | (D.9) | –6,324 | –6,080 | –5,270 |
| Sales and marketing | –8,828 | –7,946 | –6,856 | |
| General and administration | –1,364 | –1,289 | –1,187 | |
| Restructuring | (B.6) | –215 | –138 | –157 |
| Other operating income/expense, net | –16 | 60 | 44 | |
| Total operating expenses | –25,420 | –23,429 | –20,645 | |
| Operating profit | 5,787 | 6,090 | 6,308 | |
| Other non-operating income/expense, net | (C.3) | 9 | –187 | 19 |
| Finance income | 857 | 811 | 3,123 | |
| Finance costs | –1,313 | –2,200 | –945 | |
| Financial income, net | (C.4) | –456 | –1,389 | 2,178 |
| Profit before tax from continuing operations | (C.2) | 5,341 | 4,513 | 8,505 |
| Income tax expense | (C.5) | –1,741 | –1,446 | –1,682 |
| Profit after tax from continuing operations | 3,600 | 3,068 | 6,824 | |
| Attributable to owners of parent | 3,634 | 3,277 | 6,429 | |
| Attributable to non-controlling interests | –33 | –210 | 395 | |
| Profit (loss) after tax from discontinued operations | (D.1) | 2,363 | –1,359 | –1,447 |
| Profit after tax1 | 5,964 | 1,708 | 5,376 | |
| Attributable to owners of parent1 | 6,139 | 2,284 | 5,256 | |
| Attributable to non-controlling interests1 | –175 | –576 | 121 | |
| Earnings per share, basic (in €) from continuing operations | (C.6) | 3.11 | 2.80 | 5.45 |
| Earnings per share, basic (in €)1 | (C.6) | 5.26 | 1.95 | 4.46 |
| Earnings per share, diluted (in €) from continuing operations | (C.6) | 3.08 | 2.79 | 5.45 |
| Earnings per share, diluted (in €)1 | (C.6) | 5.20 | 1.94 | 4.46 |
The accompanying Notes are an integral part of these Consolidated Financial Statements.
1 From continuing and discontinued operations
|
SAP Integrated Report 2023 | |||||
| To
Our Stakeholders |
Combined
Management Report |
Consolidated
Financial Statements IFRS |
Further
Information about Sustainability |
Additional Information |
||
Consolidated Statements of Comprehensive Income of SAP Group for the Years Ended December 31
| € millions | Notes | 2023 | 2022 | 2021 |
 Profit
after tax1 Profit
after tax1 |
5,964 | 1,708 | 5,376 | |
| Items that will not be reclassified to profit or loss | ||||
| Remeasurements on defined benefit pension plans, before tax | –45 | 71 | 43 | |
| Income taxes relating to remeasurements on defined benefit pension plans | 10 | –15 | –9 | |
| Remeasurements on defined benefit pension plans, net of tax | –36 | 56 | 34 | |
| Other comprehensive income for items that will not be reclassified to profit or loss, net of tax | –36 | 56 | 34 | |
| Items that will be reclassified subsequently to profit or loss | ||||
| Gains (losses) on exchange differences on translation, before tax | –1,631 | 2,190 | 2,825 | |
| Reclassification adjustments on exchange differences on translation, before tax | 12 | 6 | 30 | |
| Exchange differences, before tax | –1,618 | 2,195 | 2,855 | |
| Income taxes relating to exchange differences on translation | 21 | –10 | –9 | |
| Exchange differences, net of tax | (E.2) | –1,597 | 2,186 | 2,846 |
| Gains (losses) on cash flow hedges/cost of hedging, before tax | –11 | 53 | –39 | |
| Reclassification adjustments on cash flow hedges/cost of hedging, before tax | 0 | 0 | 4 | |
| Cash flow hedges/cost of hedging, before tax | (F.1) | –11 | 53 | –35 |
| Income taxes relating to cash flow hedges/cost of hedging | 3 | –14 | 9 | |
| Cash flow hedges/cost of hedging, net of tax | (E.2) | –8 | 39 | –26 |
| Other comprehensive income for items that will be reclassified to profit or loss, net of tax | –1,605 | 2,224 | 2,819 | |
| Other comprehensive income, net of tax | –1,641 | 2,280 | 2,853 | |
| Total comprehensive income | 4,323 | 3,988 | 8,230 | |
| Attributable to owners of parent | 4,670 | 4,385 | 8,058 | |
| Attributable to non-controlling interests | –347 | –396 | 172 | |
| The accompanying Notes are an integral part of these Consolidated Financial Statements. | ||||
| 1 From continuing and discontinued operations | ||||
|
SAP Integrated Report 2023 | |||||
| To
Our Stakeholders |
Combined
Management Report |
Consolidated
Financial Statements IFRS |
Further
Information about Sustainability |
Additional Information |
||
 |
Consolidated Statements of Financial Position of SAP Group as at December 31 |
| € millions | Notes | 2023 | 2022 |
| Cash and cash equivalents | (E.3) | 8,124 | 9,008 |
| Other financial assets | (D.6), (E.3) | 3,344 | 853 |
| Trade and other receivables | (A.2) | 6,322 | 6,236 |
| Other non-financial assets | (A.3), (G.1) | 2,374 | 2,139 |
| Tax assets | 407 | 287 | |
| Total current assets | 20,571 | 18,522 | |
| Goodwill | (D.2) | 29,088 | 33,077 |
| Intangible assets | (D.3) | 2,505 | 3,835 |
| Property, plant, and equipment | (D.4), (D.5), (D.8) | 4,276 | 4,934 |
| Other financial assets | (D.6), (E.3) | 5,543 | 5,626 |
| Trade and other receivables | (A.2) | 203 | 169 |
| Other non-financial assets | (A.3), (G.1) | 3,573 | 3,580 |
| Tax assets | 382 | 323 | |
| Deferred tax assets | (C.5) | 2,193 | 2,095 |
| Total non-current assets | 47,764 | 53,638 | |
| Total assets | 68,335 | 72,159 | |
| Trade and other payables | 1,783 | 2,146 | |
| Tax liabilities | 266 | 283 | |
| Financial liabilities | (E.3), (D.5) | 1,735 | 4,808 |
| Other non-financial liabilities | (B.3), (B.5), (G.2) | 5,648 | 4,818 |
| Provisions | (A.4), (B.6), (G.3) | 235 | 90 |
| Contract liabilities | (A.1) | 4,975 | 5,309 |
| Total current liabilities | 14,642 | 17,453 | |
| Trade and other payables | 39 | 79 | |
| Tax liabilities | 877 | 893 | |
| Financial liabilities | (E.3), (D.5) | 7,941 | 9,547 |
| Other non-financial liabilities | (B.3), (B.5), (G.2) | 698 | 705 |
| Provisions | (A.4), (B.4), (B.6) | 433 | 359 |
| Deferred tax liabilities | (C.5) | 265 | 241 |
| Contract liabilities | (A.1) | 33 | 33 |
| Total non-current liabilities | 10,287 | 11,858 | |
| Total liabilities | 24,928 | 29,311 | |
| Issued capital | 1,229 | 1,229 | |
| Share premium | 1,845 | 3,081 | |
| Retained earnings | 42,457 | 36,418 | |
| Other components of equity | 2,368 | 3,801 | |
| Treasury shares | –4,741 | –4,341 | |
| Equity attributable to owners of parent | 43,157 | 40,186 | |
| Non-controlling interests | (E.2) | 249 | 2,662 |
| Total equity | (E.2) | 43,406 | 42,848 |
| Total equity and liabilities | 68,335 | 72,159 |
The accompanying Notes are an integral part of these Consolidated Financial Statements.
|
SAP Integrated Report 2023 | |||||
| To
Our Stakeholders |
Combined
Management Report |
Consolidated
Financial Statements IFRS |
Further
Information about Sustainability |
Additional Information |
||
Consolidated Statements of Changes in Equity of SAP Group for the Years Ended December 31
| € millions | Equity Attributable to Owners of Parent |
Non- Controlling Interests |
Total Equity | ||||||
| Issued Capital |
Share Premium | Retained Earnings | Other Components of Equity | Treasury Shares | Total | ||||
| Notes | (E.2) | (E.2) | (E.2) | (E.2) | |||||
| 1/1/2021 | 1,229 | 545 | 32,026 | –1,012 | –3,072 | 29,716 | 211 | 29,927 | |
 Profit after
tax1 Profit after
tax1 |
5,256 | 5,256 | 121 | 5,376 | |||||
| Other comprehensive income | 34 | 2,768 | 2,802 | 51 | 2,853 | ||||
| Comprehensive income | 5,290 | 2,768 | 8,058 | 172 | 8,230 | ||||
| Share-based payments | 1,373 | 1,373 | 311 | 1,684 | |||||
| Dividends | –2,182 | –2,182 | –88 | –2,271 | |||||
| Transactions with non-controlling interests | 1,933 | 1,933 | 2,050 | 3,983 | |||||
| Other changes | –44 | –44 | 14 | –30 | |||||
| 12/31/2021 | 1,229 | 1,918 | 37,022 | 1,757 | –3,072 | 38,853 | 2,670 | 41,523 | |
|
Profit after
tax1 |
2,284 | 2,284 | –576 | 1,708 | |||||
| Other comprehensive income | 56 | 2,044 | 2,100 | 180 | 2,280 | ||||
| Comprehensive income | 2,340 | 2,044 | 4,385 | –396 | 3,988 | ||||
| Share-based payments | 1,163 | 1,163 | 325 | 1,488 | |||||
| Dividends | –2,865 | –2,865 | –29 | –2,895 | |||||
| Purchase of treasury shares | –1,500 | –1,500 | –1,500 | ||||||
| Reissuance of treasury shares under share-based payments | 230 | 230 | 230 | ||||||
| Changes in non-controlling interests | –92 | –92 | 90 | –3 | |||||
| Other changes | 13 | 13 | 2 | 15 | |||||
| 12/31/2022 | 1,229 | 3,081 | 36,418 | 3,801 | –4,341 | 40,186 | 2,662 | 42,848 | |
|
Profit after
tax1 |
6,139 | 6,139 | –175 | 5,964 | |||||
| Other comprehensive income | –36 | –1,433 | –1,469 | –172 | –1,641 | ||||
| Comprehensive income | 6,103 | –1,433 | 4,670 | –347 | 4,323 | ||||
| Share-based payments | 1,032 | 1,032 | 121 | 1,153 | |||||
| Dividends | –2,395 | –2,395 | –21 | –2,417 | |||||
| Purchase of treasury shares | –968 | –968 | –968 | ||||||
| Reissuance of treasury shares under share-based payments | 568 | 568 | 568 | ||||||
| Changes in non-controlling interests | –2,268 | 2,197 | –71 | –2,164 | –2,235 | ||||
| Other changes | 135 | 135 | –1 | 134 | |||||
| 12/31/2023 | 1,229 | 1,845 | 42,457 | 2,368 | –4,741 | 43,157 | 249 | 43,406 | |
| The accompanying Notes are an integral part of these Consolidated Financial Statements. | |||||||||
| 1 From continuing and discontinued operations | |||||||||
|
SAP Integrated Report 2023 | |||||
| To
Our Stakeholders |
Combined
Management Report |
Consolidated
Financial Statements IFRS |
Further
Information about Sustainability |
Additional Information |
||
Consolidated Statements of Cash Flows of SAP Group for the Years Ended December 31
| € millions | Notes | 2023 | 2022 | 2021 |
|
Profit
after tax1 |
5,964 | 1,708 | 5,376 | |
| Adjustments to reconcile profit after tax to net cash flow from operating activities: | ||||
|
(Profit)
loss after tax from discontinued operations |
–2,363 | 1,359 | 1,447 | |
| Depreciation and amortization | (D.2)–(D.4) | 1,373 | 1,569 | 1,537 |
| Share-based payment expenses | (B.3) | 2,220 | 1,431 | 1,335 |
|
Income tax
expense |
(C.5) | 1,741 | 1,446 | 1,682 |
|
Financial
income, net |
(C.4) | 456 | 1,389 | –2,178 |
| Decrease/increase in allowances on trade receivables | –10 | 77 | –9 | |
| Other adjustments for non-cash items | 23 | –175 | 15 | |
| Decrease/increase in trade and other receivables | –393 | 196 | 497 | |
| Decrease/increase in other assets | –700 | –1,213 | –645 | |
| Increase/decrease in trade payables, provisions, and other liabilities | 633 | 154 | 429 | |
| Increase/decrease in contract liabilities | 443 | 643 | –59 | |
| Share-based payments | (B.3) | –1,091 | –1,180 | –1,056 |
| Interest paid | –393 | –244 | –198 | |
| Interest received | 469 | 156 | 56 | |
| Income taxes paid, net of refunds2 | –2,161 | –1,642 | –2,047 | |
| Net cash flows from operating activities – continuing operations | 6,210 | 5,675 | 6,182 | |
| Net cash flows from operating activities – discontinued operations | (D.1) | 122 | –29 | 41 |
| Net cash flows from operating activities1 | 6,332 | 5,647 | 6,223 | |
| Cash flows for business combinations, net of cash and cash equivalents acquired | –1,168 | –679 | –1,032 | |
| Proceeds from sales of subsidiaries or other businesses | 0 | 289 | –72 | |
| Cash flows from derivative financial instruments related to the sale of subsidiaries or businesses | –91 | 0 | 0 | |
| Purchase of intangible assets and property, plant, and equipment | –785 | –877 | –701 | |
| Proceeds from sales of intangible assets or property, plant, and equipment | 99 | 95 | 89 | |
| Purchase of equity or debt instruments of other entities | –3,566 | –2,320 | –4,368 | |
| Proceeds from sales of equity or debt instruments of other entities | 907 | 4,190 | 3,229 | |
| Net cash flows from investing activities – continuing operations | –4,603 | 699 | –2,856 | |
| Net cash flows from investing activities – discontinued operations | (D.1) | 5,510 | –32 | –208 |
| Net cash flows from investing activities1 | 906 | 667 | –3,063 | |
| Dividends paid | (E.2) | –2,395 | –2,865 | –2,182 |
| Dividends paid on non-controlling interests | –13 | –12 | –54 | |
| Purchase of treasury shares | (E.2) | –949 | –1,500 | 0 |
| Proceeds from borrowings | (E.3) | 13 | 158 | 1,680 |
| Repayments of borrowings | (E.3) | –4,081 | –1,445 | –1,952 |
| Payments of lease liabilities | –332 | –410 | –375 | |
| Transactions with non-controlling interests | (E.2) | 0 | 0 | –2 |
| Net cash flows from financing activities – continuing operations | –7,758 | –6,074 | –2,885 | |
| Net cash flows from financing activities – discontinued operations | (D.1) | 24 | –263 | 2,828 |
| Net cash flows from financing activities1 | –7,734 | –6,337 | –56 | |
| Effect of foreign currency rates on cash and cash equivalents | –388 | 134 | 484 | |
| Net decrease/increase in cash and cash equivalents | –883 | 109 | 3,587 | |
 Cash
and cash equivalents at the beginning of the period Cash
and cash equivalents at the beginning of the period |
(E.3) | 9,008 | 8,898 | 5,311 |
|
Cash
and cash equivalents at the end of the period |
(E.3) | 8,124 | 9,008 | 8,898 |
| The accompanying Notes are an integral part of these Consolidated Financial Statements. | ||||
| 1 From continuing and discontinued operations | ||||
| 2 Total income taxes paid, net of refunds 2023: –€2,973 million thereof contained in the line item “Net cash flows from investing activities – discontinued operations”: –€815 million. | ||||
|
SAP Integrated Report 2023 | |||||
| To
Our Stakeholders |
Combined
Management Report |
Consolidated
Financial Statements IFRS |
Further
Information about Sustainability |
Additional Information |
||
Notes
(IN.1) Basis for Preparation
General Information
The registered domicile of SAP SE is in Walldorf, Germany (Commercial Register of the Lower Court of Mannheim HRB 719915). The Consolidated Financial Statements for 2023 of SAP SE and its subsidiaries (collectively, “we,” “us,” “our,” “SAP,” “Group,” and “Company”) have been prepared in accordance with International Financial Reporting Standards (IFRS) and the additional requirements set forth in section 315e (1) of the German Commercial Code (HGB).
We have applied all IFRS standards and interpretations that were effective on and endorsed by the European Union (EU) as at December 31, 2023. There were no standards or interpretations as at December 31, 2023, impacting our Consolidated Financial Statements for the years ended December 31, 2023, 2022, and 2021, that were effective but not yet endorsed. Therefore, our Consolidated Financial Statements comply with both, IFRS as issued by the International Accounting Standards Board (IASB) and IFRS as endorsed by the EU.
Our Executive Board approved the Consolidated Financial Statements on February 21, 2024, for submission to our Supervisory Board which approved the Consolidated Financial Statements on the same day.
All amounts included in the Consolidated Financial Statements are reported in millions of euros (€ millions) except where otherwise stated. As figures are rounded, numbers presented throughout this document may not add up precisely to the totals we provide and percentages may not precisely reflect the absolute figures.
Amounts disclosed in the Notes that are
taken directly from our  Consolidated Income
Statements or our
Consolidated Income
Statements or our  Consolidated
Statements of Financial Position are marked with the symbols and ,
respectively.
Consolidated
Statements of Financial Position are marked with the symbols and ,
respectively.
Furthermore, all financial numbers in the Consolidated Financial Statements are based on continuing operations (unless otherwise noted).
Accounting Policies, Management Judgments, and Sources of Estimation Uncertainty
How We Present Our Accounting Policies, Judgments, and Estimates
To ease the understanding of our financial statements, we present the accounting policies, management judgments, and sources of estimation uncertainty (hereafter: accounting policies, judgments, and estimates) on a given subject together with other disclosures related to the same subject in the Note that deals with this subject. Accounting policies, judgments, and estimates that do not relate to a specific subject are presented in the following section.
For easier identification of our accounting policies,
judgments, and estimates, the respective disclosures are marked with the symbol  and highlighted with a light gray box. They focus on the accounting choices made within the framework of the prevailing IFRS and
refrain from repeating the underlying promulgated IFRS guidance, unless we consider it particularly important to the understanding
of a Note’s content.
and highlighted with a light gray box. They focus on the accounting choices made within the framework of the prevailing IFRS and
refrain from repeating the underlying promulgated IFRS guidance, unless we consider it particularly important to the understanding
of a Note’s content.
|
SAP Integrated Report 2023 | |||||
| To
Our Stakeholders |
Combined
Management Report |
Consolidated
Financial Statements IFRS |
Further
Information about Sustainability |
Additional Information |
||
The following table provides an overview of where our accounting policies, management judgments, and estimates are disclosed:
| Note |  |
Accounting Policies, Judgments, and Estimates |
| (IN.1) | Basis for Preparation | |
| (A.1) | Revenue | |
| (A.2) | Trade and Other Receivables | |
| (A.3) | Capitalized Cost from Contracts with Customers | |
| (A.4) | Customer-Related Provisions | |
| (B.3) | Share-Based Payments | |
| (B.4) | Pension Plans and Similar Obligations | |
| (B.5) | Other Employee-Related Obligations | |
| (B.6) | Restructuring | |
| (C.1) | Results of Segments | |
| (C.5) | Income Taxes | |
| (D.1) | Business Combinations and Divestitures | |
| (D.2) | Goodwill | |
| (D.3) | Intangible Assets | |
| (D.4) | Property, Plant, and Equipment | |
| (D.5) | Leases | |
| (D.6) | Equity Investments | |
| (D.9) | Income-Related Government Grants | |
| (E.2) | Total Equity | |
| (E.3) | Liquidity | |
| (F.1) | Financial Risk Factors and Risk Management | |
| (F.2) | Fair Value Disclosures on Financial Instruments | |
| (G.3) | Other Litigation, Claims, and Legal Contingencies | |
| (G.5) | Executive and Supervisory Board Compensation | |
 General
Accounting Policies
General
Accounting Policies
Bases of Measurement
The Consolidated Financial Statements have been prepared on the historical cost basis except for the following:
| – | Derivative financial instruments, liabilities for cash-settled share-based payments, and financial assets with cash flows that are not solely payments of principal or interest are measured at fair value. |
| – | Post-employment benefits are measured at the present value of the defined benefit obligations less the fair value of the plan assets. |
| – | Monetary assets and liabilities denominated in foreign currencies are translated at period-end exchange rates. |
| – | Provisions are recognized at the best estimate of their fulfillment amount when they occur. |
Foreign Currencies
Income and expenses and operating cash flows of our foreign subsidiaries that use a functional currency other than the Euro are translated at average rates of foreign exchange (FX) computed on a monthly basis. Exchange differences resulting from foreign currency transactions are recognized in other non-operating income/expense, net.
|
SAP Integrated Report 2023 | |||||
| To
Our Stakeholders |
Combined
Management Report |
Consolidated
Financial Statements IFRS |
Further
Information about Sustainability |
Additional Information |
||
The exchange rates of key currencies affecting the Company were as follows:
Exchange Rates
| Equivalent to €1 |
Middle Rate as at 12/31 |
Annual Average Exchange Rate | ||||
| 2023 | 2022 | 2023 | 2022 | 2021 | ||
| Australian dollar | AUD | 1.6263 | 1.5693 | 1.6285 | 1.5174 | 1.5747 |
| Canadian dollar | CAD | 1.4642 | 1.4440 | 1.4596 | 1.3703 | 1.4835 |
| Swiss franc | CHF | 0.9260 | 0,9847 | 0.9717 | 1.0052 | 1.0814 |
| Pound sterling | GBP | 0.8691 | 0.8869 | 0.8699 | 0.8526 | 0.8600 |
| Japanese yen | JPY | 156.33 | 140.66 | 151.94 | 138.01 | 129.86 |
| U.S. dollar | USD | 1.1050 | 1.0666 | 1.0816 | 1.0539 | 1.1835 |
Cost Classification
Cost of Cloud and Software
Cost of cloud and software includes the costs incurred in providing the services and producing the goods that generate cloud and software revenue. Consequently, this line item primarily includes employee expenses relating to these services, amortization of acquired intangibles, fees for third-party licenses, depreciation of our property, plant, and equipment (for example, of our data centers in which we host our cloud solutions), and costs for third-party hosting services. For more information about the capitalization of costs from contracts with customers, see Note (A.3).
Updated Cost Allocation Policy
Starting January 1, 2023, all activities related to changes in the code of SAP’s cloud and on-premise solutions are treated as development-related activities. Some of those activities, specifically code corrections, were previously considered as support-related activities. SAP believes that this update aligns SAP’s accounting policy with market standards and increases comparability to its peers.
For the full year 2023, the update of our cost allocation policy led to an increase in the cloud gross profit of approximately €95 million (2022: €88 million, 2021: €61 million), an increase in the software license and support gross profit of approximately €275 million (2022: €310 million, 2021: €326 million), and an increase in our research & development (R&D) expenses of approximately €370 million (2022: €398 million, 2021: €388 million).
Prior periods have been adjusted to reflect the updated cost allocation policy.
Cost of Services
Cost of services includes the costs incurred in providing the services that generate service revenue. Consequently, this line item primarily includes employee expenses and related training, system and system administration costs, and costs for third-party resources.
Research and Development
Research and development includes the costs incurred by activities related to the development of cloud and software solutions including resource and hardware costs for the development systems. The same applies for all activities related to changes in the code of SAP’s cloud and software solutions. For more information about the recognition of internally generated intangible assets from development, see Note (D.3).
Please also note the Updated Cost Allocation Policy above.
|
SAP Integrated Report 2023 | |||||
| To
Our Stakeholders |
Combined
Management Report |
Consolidated
Financial Statements IFRS |
Further
Information about Sustainability |
Additional Information |
||
Sales and Marketing
Sales and marketing includes the costs incurred for the selling activities (such as sales commissions and amortization of capitalized sales commissions) and marketing activities related to our software and cloud solutions and our service portfolio. For more information about the capitalization of costs from contracts with customers, see Note (A.3).
General and Administration
General and administration includes the costs related to finance and administrative functions, human resources, and general management as long as they are not directly attributable to one of the other operating expense line items.
Management
Judgments and Sources of Estimation Uncertainty
The preparation of the Consolidated Financial Statements requires our management to make judgments, estimates, and assumptions that affect the application of accounting policies and the reported amounts of assets, liabilities, revenues, and expenses, as well as disclosure of contingent liabilities.
We base our judgments, estimates, and assumptions on historical and forecast information, and on regional and industry economic conditions in which we or our customers operate. Changes to these conditions could adversely affect our estimates. Although we believe we have made reasonable estimates about the ultimate resolution of the underlying uncertainties, no assurance can be given that the final outcome of these matters will be consistent with what is reflected in our recognized assets, liabilities, revenues, and expenses and disclosed contingent liabilities. Actual results could differ significantly from original estimates.
The accounting policies that most frequently or significantly require us to make judgments, estimates, and assumptions, and therefore are critical to understanding our results of operations, include the following:
| Note |
Material Accounting Policies |
| (A.1) | Revenue recognition |
| (A.2) | Valuation of trade receivables |
| (A.4), (G.3) | Accounting for legal contingencies |
| (B.3) | Accounting for share-based payments |
| (C.5) | Accounting for income taxes |
| (D.1) | Accounting for business combinations |
| (D.2) | Accounting for goodwill |
| (D.3) | Accounting for intangible assets (including recognition of internally generated intangible assets from development) |
| (D.6) | Accounting for equity investments |
Our management periodically discusses these material accounting policies with the Audit and Compliance Committee of our Supervisory Board.
New
Accounting Standards Not Yet Adopted
The IASB has issued various amendments to the IFRS standards (such as IAS 1 (Presentation of Financial Statements), IAS 7 (Statement of Cash Flows), IFRS 7 (Financial Instruments Disclosure), and IFRS 16 (Lease Liability in a Sale and Leaseback Transaction)) that are relevant for SAP but not yet effective. We are currently assessing the impact on SAP, but do not expect material effects on our financial position or profit after tax.
|
SAP Integrated Report 2023 | |||||
| To
Our Stakeholders |
Combined
Management Report |
Consolidated
Financial Statements IFRS |
Further
Information about Sustainability |
Additional Information |
||
Section A – Customers
This section discusses disclosures related to contracts with our customers. These include but are not limited to explanations of how we recognize revenue, revenue disaggregation, and information about our trade receivables and customer-related obligations.
(A.1) Revenue
Accounting
for Revenue from Contracts with Customers
Classes of Revenue
We derive our revenue from fees charged to our customers for the use of our cloud offerings, for licenses to our on-premise software products, and for standardized and premium support services, consulting, customer-specific software developments, training, and other services.
Cloud and software revenue, as presented in our Consolidated Income Statements, is the sum of our cloud revenue, our software license revenue, and our software support revenue.
Cloud revenue represents fees earned from providing customers with any of the following:
Software as a service (SaaS), that is, a right to use software functionality (including standard functionalities and custom cloud applications and extensions) in a cloud-based infrastructure hosted by SAP or third parties engaged by SAP, where the customer does not have the right to terminate the hosting contract and take possession of the software to either run it on its own IT infrastructure or to engage a third-party provider unrelated to SAP to host and manage the software; SaaS also includes transaction and agent fees for transactions that customers execute on our cloud-based transaction platforms.
Platform as a service (PaaS), that is, access to a cloud-based platform to develop, deploy, integrate, and manage applications.
Infrastructure as a service (IaaS), that is, hosting and related application management services for software hosted by SAP or third parties engaged by SAP.
Premium cloud support, that is, support beyond the regular support embedded in the underlying cloud subscription services.
Software license revenue represents fees earned from the sale or license of software to customers for use on the premises owned or fully controlled by the customer, in other words, where the customer has the right to take possession of the software for installation on the customer’s premises or on hardware of third-party hosting providers unrelated to SAP (on-premise software). Software license revenue includes revenue from both the sale of our standard software products and customer-specific on-premise-software development agreements.
Software support revenue represents fees earned from providing customers with standardized support services that comprise unspecified future software updates, upgrades, and enhancements as well as technical product support services for on-premise software products.
Services revenue primarily represents fees earned from professional consulting services, premium support services, and training services.
Identification of Contract
We frequently enter into multiple contracts with the same customer. For accounting purposes, we treat these contracts as a single contract if they are entered into at or near the same time and are economically interrelated. We do not combine contracts with closing days more than three months apart because we do not consider them being entered into near the same time. Judgment is required in evaluating whether various contracts are interrelated, which includes considerations as to whether they were negotiated as a package with a single commercial objective, whether the amount of consideration on one contract is dependent on the performance of the other contract, or if some or all goods in the contracts are a single performance obligation.
|
SAP Integrated Report 2023 | |||||
| To
Our Stakeholders |
Combined
Management Report |
Consolidated
Financial Statements IFRS |
Further
Information about Sustainability |
Additional Information |
||
New arrangements with existing customers can be either a new contract or the modification of prior contracts with the customer. Our judgment in making this determination considers whether there is a connection between the new arrangement and the pre-existing contracts, whether the goods and services under the new arrangement are highly interrelated with the goods and services sold under prior contracts, and how the goods and services under the new arrangement are priced. In determining whether a change in transaction price represents a contract modification or a change in variable consideration, we examine whether the change in price results from changing the contract or from applying unchanged existing contract provisions.
Identification of Performance Obligations
Our customer contracts often include various products and services. Typically, the products and services outlined in the Classes of Revenue section qualify as separate performance obligations and the portion of the contractual fee allocated to them is recognized separately. Judgment is required, however, in determining whether a good or service is considered a separate performance obligation. For our professional services and implementation activities, judgment is required to evaluate whether such services significantly integrate, customize, or modify the on-premise software or cloud service to which they relate. In this context, we consider the nature of the services and their volume relative to the volume of the on-premise software or cloud service to which they relate. In general, the implementation services for our cloud services go beyond pure setup activities and qualify as separate performance obligations. Similarly, our on-premise implementation services and our custom development services typically qualify as separate performance obligations. Non-distinct goods and services are combined into one distinct bundle of goods and services (combined performance obligation).
When selling goods or services, we frequently grant customers options to acquire additional goods or services (for example, renewals of cloud or support arrangements, or additional volumes of purchased cloud solutions or software). We apply judgment in determining whether such options provide a material right to the customer that the customer would not receive without entering into that contract. In this judgment, we consider, for example, whether the options entitle the customer to a discount that exceeds the discount granted for the respective goods or services sold together with the option.
Determination of Transaction Price
We apply judgment in determining the amount to which we expect to be entitled in exchange for transferring promised goods or services to a customer. Generally, variable consideration is estimated based on the most likely amount and is included in the transaction price to the extent that the constraint does not apply. This includes estimates as to whether and to what extent subsequent concessions may be granted to customers and whether the customer is expected to pay the contractual fees. In this judgment, we consider our history with the respective customer or on a portfolio basis.
The recognition constraint is applied to on-premise software transactions that include usage-based or sales-based contingent fees. In contrast, our typical cloud services do not provide the customer with a software license because the customer does not have the right to terminate the hosting contract and take possession of the software. Consequently, variable cloud fees are considered in the transaction price based on estimates, rather than being accounted for as usage-based or sales-based license royalties. If SAP pays consideration to a customer in exchange for a distinct good or service, and such purchase is linked to a customer contract, an estimate of fair value of such goods and services is required to conclude whether or not to account for a reduction in the transaction price of the linked customer contract.
Only very rarely do our contracts include significant financing components. We do not account for financing components if the period between when SAP transfers the promised goods or services to the customer and when the customer pays for those goods or services is one year or less.
|
SAP Integrated Report 2023 | |||||
| To
Our Stakeholders |
Combined
Management Report |
Consolidated
Financial Statements IFRS |
Further
Information about Sustainability |
Additional Information |
||
Allocation of Transaction Price
We have established a hierarchy to identify the standalone selling prices (SSPs) that we use to allocate the transaction price of a customer contract to the performance obligations in the contract.
| – | Where standalone selling prices for an offering are observable and reasonably consistent across customers (that is, not highly variable), our SSP estimates are derived from our respective pricing history. Typically, our standardized support offerings and our professional service offerings follow this approach. |
| – | Where sales prices for an offering are not directly observable or highly variable across customers, we use estimation techniques. For renewable offerings with highly variable pricing across customers, these techniques consider the individual contract’s expected renewal price as far as this price is substantive. Typically, our cloud offerings follow this approach. For non-renewable offerings, these estimations follow a cost-plus-margin approach. |
| – | For offerings that lack renewals, have highly variable pricing, and lack substantial direct costs to estimate based on a cost-plus-margin approach, we allocate the transaction price by applying a residual approach. We use this technique in particular for our standard on-premise software offerings. |
Judgment is required when estimating SSPs. To judge whether the historical pricing of our goods and services is highly variable, we have established thresholds of pricing variability. For judging whether individually negotiated contractual renewal prices are substantive, we have established floor prices based on internal calculation which include a minimum margin that we use as SSPs whenever the contractual renewal prices are below these floor prices. In judging whether contracts are expected to renew at their contractual renewal prices, we rely on our respective renewal history. The SSPs of material right options depend on the probability of option exercise. In estimating these probabilities, we apply judgment considering historical exercise patterns.
We review the SSPs periodically or whenever facts and circumstances change to ensure the most objective input parameters available are used.
Recognition of Revenue
Cloud revenue is recognized over time as the services are performed. For cloud business models where we grant rights to continuously access and use one or more cloud offerings for a certain term, revenue is recognized based on time elapsed and thus ratably over this term. For cloud business models provisioned on a consumption basis where a customer commits to a fixed value of spend on cloud services throughout the contract term, but with the discretion to call off cloud services during the contract term, we recognize revenue based on consumption as it best reflects our measure towards satisfaction of that performance obligation. In limited scenarios where the transaction price is entirely variable and determined by the customer’s consumption, we recognize revenue based on usage in the period in which it was earned.
Software license revenue is recognized at a point in time or over time depending on whether we deliver standard software, customer-specific software, or software subscription contracts that combine the delivery of software and the obligation to deliver, in the future, unspecified software products:
| – | Licenses for our standard on-premise software products are typically delivered by providing the customer with access to download the software. We recognize revenue for these on-premise licenses at the point in time when we grant the license rights to the customer and the customer has access to and thus control over the software. In judging whether our on-premise software offerings grant customers a right to use, rather than a right to access, our intellectual property, we have considered the usefulness of our software without subsequent updates to it. |
| – | Typically, our customer-specific on-premise software development agreements: | |
| ■ Represent software developed for specific needs of individual customers and therefore do not have any use for us | ||
| ■ Provide us with an enforceable right to payment for performance completed to date | ||
| For such development agreements, we recognize revenue over time as the software development progresses. Judgment is required in identifying an appropriate method to measure |
|
SAP Integrated Report 2023 | |||||
| To
Our Stakeholders |
Combined
Management Report |
Consolidated
Financial Statements IFRS |
Further
Information about Sustainability |
Additional Information |
||
| the progress toward complete satisfaction of such performance obligations. We typically measure progress of our development agreements based on the direct costs incurred to date in developing the software as a percentage of the total reasonably estimated direct costs to fully complete the development work (input-based percentage-of-completion method). This method of measuring progress faithfully depicts the transfer of the development services to the customer, as substantially all of these costs are cost of the staff or third parties performing the development work. In estimating the total cost to fully complete the development work, we consider our history with similar projects. |
| – | For agreements that combine the delivery of software and the obligation to deliver, in the future, unspecific software products, we recognize revenue at a point in time for licenses that are made immediately accessible to the customer. We recognize revenue ratably over the term of the software subscription contract for the unspecified software products, as our performance obligation is to stand ready to deliver such products on a when-and-if-available basis. |
Software support revenue is typically recognized based on time elapsed and thus ratably over the term of the support arrangement. Under our standardized support services, our performance obligation is to stand ready to provide technical product support and unspecified updates, upgrades, and enhancements on a when-and-if-available basis. Our customers simultaneously receive and consume the benefits of these support services as we perform.
Service revenue is typically recognized over time. Where we stand ready to provide the service (such as access to learning content), we recognize revenue based on time elapsed and thus ratably over the service period. Consumption-based services (such as separately identifiable consulting services and premium support services and classroom training services) are recognized over time as the services are utilized, typically following the percentage-of-completion method or ratably. When using the percentage-of-completion method, we typically measure the progress toward complete satisfaction of the performance obligation in the same way and with the same reasoning and judgment as we do for customer-specific on-premise software development agreements. We apply judgment in determining whether a service qualifies as a stand-ready service or as a consumption-based service.
Revenue for combined performance obligations is recognized over the longest period of all promises in the combined performance obligation.
Judgment is also required in determining whether revenue is to be recognized at a point in time or over time. For performance obligations satisfied over time, we need to measure progress using the method that best reflects SAP’s performance. When using cost incurred as a measure of progress for recognizing revenue over time, we apply judgment in estimating the total cost to satisfy the performance obligation.
All of the judgments and estimates mentioned above can significantly impact the timing and amount of revenue to be recognized.
Contract Balances
We recognize trade receivables for performance obligations satisfied over time gradually as the performance obligation is satisfied and in full once the invoice is due. Judgment is required in determining whether a right to consideration is unconditional and thus qualifies as a receivable.
Contract liabilities primarily reflect invoices due or payments received in advance of revenue recognition.
Typically, we invoice fees for on-premise standard software on contract closure and software delivery. Periodic fixed fees for cloud subscription services, software support services, and other multi-period agreements are typically invoiced yearly or quarterly in advance. Such fee prepayments account for the majority of our contract liability balance. Fees based on actual transaction volumes for cloud subscriptions and fees charged for non-periodical services are invoiced as the services are delivered. While payment terms and conditions vary by contract type and region, our terms typically require payment within 30 to 60 days.
|
SAP Integrated Report 2023 | |||||
| To
Our Stakeholders |
Combined
Management Report |
Consolidated
Financial Statements IFRS |
Further
Information about Sustainability |
Additional Information |
||
Geographic Information
The amounts for revenue by region in the following tables are based on the location of customers. The regions in the following table are EMEA (Europe, Middle East, and Africa), Americas (North America and Latin America), and APJ (Asia Pacific Japan).
Total Revenue by Region
| € millions | 2023 | 2022 | 2021 |
| Germany | 4,921 | 4,469 | 4,324 |
| Rest of EMEA | 9,083 | 8,440 | 8,135 |
| EMEA | 14,004 | 12,909 | 12,458 |
| United States | 10,204 | 9,799 | 8,235 |
| Rest of Americas | 2,558 | 2,427 | 2,056 |
| Americas | 12,762 | 12,227 | 10,292 |
| Japan | 1,243 | 1,218 | 1,286 |
| Rest of APJ | 3,199 | 3,166 | 2,917 |
| APJ | 4,441 | 4,384 | 4,204 |
 SAP
Group SAP
Group |
31,207 | 29,520 | 26,953 |
Major Revenue Classes by Region
| € millions | Cloud Revenue | Cloud and Software Revenue | ||||
| 2023 | 2022 | 2021 | 2023 | 2022 | 2021 | |
| EMEA | 5,241 | 4,137 | 3,196 | 12,028 | 11,081 | 10,820 |
| Americas | 6,642 | 5,810 | 4,354 | 10,959 | 10,456 | 8,808 |
| APJ | 1,781 | 1,478 | 1,151 | 3,937 | 3,855 | 3,732 |
|
SAP
Group |
13,664 | 11,426 | 8,701 | 26,924 | 25,391 | 23,361 |
For information about the breakdown of revenue by segment and segment revenue by region, see Note (C.1).
Remaining Performance Obligations
Amounts of a customer contract’s transaction price that are allocated to the remaining performance obligations represent contracted revenue that has not yet been recognized. They include amounts recognized as contract liabilities and amounts that are contracted but not yet due.
The transaction price allocated to performance obligations that were unsatisfied or partially unsatisfied as at December 31, 2023, was €58.0 billion (December 31, 2022: €46.9 billion). The transaction price thereof allocated to cloud performance obligations that were unsatisfied or partially unsatisfied (total cloud backlog) as at December 31, 2023, was €44.3 billion (December 31, 2022: €32.4 billion). The remaining amount mostly comprises obligations to provide software support services. The vast majority of software support contracts are contracts in the renewal phase that typically have a one-year contract term, while cloud subscription contracts typically are multiple-year contracts. The portion of remaining performance obligations related to services consists of non-cancelable revenue from contracts for projects with a predefined output.
Overall, almost half of the total remaining performance obligations is expected to be recognized over the next 12 months following the respective balance sheet date. This estimate is based on several factors. For example, for certain cloud business models with a contractually agreed spend volume (consumption-based models), judgment is applied on customers’ deployment of the purchased solutions.
|
SAP Integrated Report 2023 | |||||
| To
Our Stakeholders |
Combined
Management Report |
Consolidated
Financial Statements IFRS |
Further
Information about Sustainability |
Additional Information |
||
The amount of the transaction price allocated to the remaining performance obligations, and changes in this amount over time, are impacted by, among others:
| – | Currency fluctuations |
| – | The contract period of our cloud and software support contracts remaining at the balance sheet date, and thus the timing of contract renewals |
Performance Obligations Satisfied in Previous Years
Revenue recognized in the reporting period for performance obligations satisfied in earlier periods was €78 million (December 31, 2022: €81 million), mainly resulting from changes in estimates of variable considerations and changes in estimates related to percentage-of-completion-based contracts.
Contract Balances
The following table presents the activities impacting contract liabilities balances during the year ended December 31, 2023:
Contract Liabilities
| € billions | 2023 |
 1/1/2023 1/1/2023 |
5.3 |
| Increases resulting from billing and invoices becoming due | 11.4 |
| Decreases resulting from satisfaction of performance obligations | –11.0 |
| Other1 | –0.7 |
|
12/31/2023 |
5.0 |
1 Other includes, for example, the impact of foreign currency translation and business combinations and divestitures.
The amount of revenue recognized in the reporting period that was included in the contract liability balance at the beginning of the reporting period was €4.5 billion (December 31, 2022: €4.1 billion).
(A.2) Trade and Other Receivables
Accounting
for Trade and Other Receivables
Depending on the business model, we measure trade receivables and contract assets from contracts with customers either at amortized cost, or at fair value through other comprehensive income (OCI) less expected credit losses. We account for expected credit losses by recording an allowance on a portfolio basis. We apply the simplified impairment approach. On initial measurement of the receivables, we consider all credit losses that are expected to occur during the lifetime of the receivables. We use a provision matrix to estimate these losses.
Additionally, we recognize allowances for individual receivables if there is objective evidence of credit impairment.
Account balances are written off either partially or in full if we judge that the likelihood of recovery is remote.
For information about how the default risk for trade receivables is analyzed and managed, how the loss rates for the provision matrix are determined, how credit impairment is determined and what our criteria for write-offs are, see the section on credit risk in Note (F.1).
In our Consolidated Income Statements, net gains/losses from expected credit loss allowances are included in Other operating income/expense, net. Gains/losses from foreign currency exchange rate fluctuations are included in Other non-operating income/expense, net.
|
SAP Integrated Report 2023 | |||||
| To
Our Stakeholders |
Combined
Management Report |
Consolidated
Financial Statements IFRS |
Further
Information about Sustainability |
Additional Information |
||
Determining our expected credit loss allowance involves significant judgment. In this judgment, we primarily consider our historical experience with credit losses in the respective provision matrix risk class and current data on overdue receivables. We expect that our historical default rates represent a reasonable approximation for future expected customer defaults. Besides historical data, our judgment used in developing the provision matrix considers reasonable and supportable forward-looking information (for example, changes in country risk ratings, and fluctuations in credit default swaps of the countries in which our customers are located).
The assessment of whether a receivable is collectible involves the use of judgment and requires us to make assumptions about customer defaults that could change significantly.
By applying this judgment, we record an allowance for a specific customer when it is probable that a credit loss has occurred and the amount of the loss is reasonably estimable. Basing the expected credit loss allowance for the remaining receivables primarily on our historical loss experience likewise requires judgment, as history may not be indicative of future development. Also, including reasonable and supportable forward-looking information in the loss rates of the expected credit loss allowance requires judgment, as they may not provide a reliable prediction for future development.
Trade and Other Receivables
| € millions | 2023 | 2022 | ||||
| Current | Non-Current | Total | Current |
Non- Current |
Total | |
| Trade receivables, net | 5,892 | 5 | 5,897 | 5,782 | 0 | 5,782 |
| Other receivables | 429 | 198 | 627 | 454 | 169 | 623 |
|
Total |
6,321 | 203 | 6,524 | 6,236 | 169 | 6,405 |
Contract assets are included in Other receivables in our Statement of Financial Position. Contract assets as at December 31, 2023, were €307 million (December 31, 2022: €343 million).
For more information about financial risk, how we manage credit risk, and details of our trade receivables and contract assets allowances, see Note (F.1).
(A.3) Capitalized Cost from Contracts with Customers
Costs of Obtaining Customer Contracts
Capitalized costs from customer contracts are classified as Other non-financial assets in our Statement of Financial Position.
The capitalized assets for the incremental costs of obtaining a customer contract consist of sales commissions earned by our sales force and partners as well as amounts paid to employees with non-sales roles when the payments meet the definition of being an incremental cost to obtain a contract with a customer. Judgment is required in determining the amounts to be capitalized, particularly where the commissions are based on cumulative targets and where commissions relate to multiple performance obligations in one customer contract. We capitalize such cumulative target commissions for all customer contracts that count towards the cumulative target but only if nothing other than obtaining customer contracts can contribute to achieving the cumulative target. Commissions for contracts with multiple performance obligations or for probable renewals thereof are allocated to these performance obligations and probable renewals relative to the respective standalone selling price.
Our sales commission payments for customer contract renewals are typically not commensurate with the commissions paid for new contracts. Thus, the commissions paid for renewable new contracts also relate to expected renewals of these contracts. Consequently, we amortize sales commissions paid for new customer contracts on a straight-line basis over the expected contract life including probable contract renewals. Judgment is required in estimating these contract lives. In exercising this judgment, we consider our expectation about future contract renewals which we evaluate periodically to confirm that the resulting amortization period properly reflects the expected contract life or if there are potential indicators of impairment.
|
SAP Integrated Report 2023 | |||||
| To
Our Stakeholders |
Combined
Management Report |
Consolidated
Financial Statements IFRS |
Further
Information about Sustainability |
Additional Information |
||
Commensurate payments are amortized over the contract term to which they relate.
The amortization periods range from 18 months to seven years depending on the type of offering. Amortization of the capitalized costs of obtaining customer contracts is classified mainly as sales and marketing expense. We expense the incremental costs of obtaining a customer contract as incurred if we expect an amortization period of one year or less.
The regular review of the amortization periods resulted in a shorter contract life for on-premise support contracts and consequently in an accelerated amortization of costs related to these contracts. This results, for capitalized cost of obtaining customer contracts as of December 31, 2023, in higher amortization expenses amounting to €121 million for 2023 and approximately €80 million for 2024.
Costs
to Fulfill Customer Contracts
Capitalized costs incurred to fulfill customer contracts mainly consist of direct costs for set-up and implementation of cloud products and custom cloud development contracts as far as these costs are not in scope of other accounting standards than IFRS 15. These costs are amortized after completion of the setup and implementation or the development, respectively, on a straight-line basis over the expected life of the cloud subscription contract including expected renewals. For the life of the contract, we consider our expectation about future contract renewals which we evaluate periodically to confirm that the resulting amortization period properly reflects the expected contract life. The amortization periods range from five to eight years depending on the type of offering. In addition, the capitalized costs include third-party license fees which are amortized over the term of the third-party license contract. Judgment is required in evaluating whether costs are directly related to customer contracts and in estimating contract lives.
Amortization of capitalized costs to fulfill contracts for custom cloud applications and extensions is included in the cost of cloud.
Capitalized Cost from Contracts with Customers
| € millions | 2023 | 2022 | ||||
| Current | Non-Current | Total | Current | Non-Current | Total | |
| Capitalized cost of obtaining customer contracts | 1,046 | 2,918 | 3,964 | 871 | 2,812 | 3,684 |
| Capitalized cost to fulfill customer contracts | 199 | 236 | 436 | 164 | 206 | 370 |
| Capitalized contract cost | 1,246 | 3,154 | 4,400 | 1,036 | 3,019 | 4,054 |
|
Other non-financial assets |
2,374 | 3,573 | 5,947 | 2,139 | 3,580 | 5,719 |
|
Capitalized contract cost as % of |
52 | 88 | 74 | 48 | 84 | 71 |
Amortization Expense
| € millions | 2023 | 2022 |
| Capitalized cost of obtaining customer contracts | 1,000 | 725 |
| Capitalized cost to fulfill customer contracts | 327 | 243 |
(A.4) Customer-Related Provisions
Expected
Contract Losses
Customer-related provisions mainly include expected contract losses. We adjust these provisions as further information becomes available and as circumstances change. Non-current provisions are measured at the present value of their expected settlement amounts as at the reporting date.
|
SAP Integrated Report 2023 | |||||
| To
Our Stakeholders |
Combined
Management Report |
Consolidated
Financial Statements IFRS |
Further
Information about Sustainability |
Additional Information |
||
The unit of account for the identification of potential onerous customer contracts is based on the contract definition of IFRS 15 including the contract combination guidance. The economic benefits considered in the assessment comprise the future benefits we are directly entitled to under the contract as well as the anticipated future benefits that are the economic consequence of the contract if these benefits can be reliably determined.
Customer-Related
Litigation and Claims
Customer-related provisions also include obligations resulting from customer-related litigation and claims. We are currently confronted with various claims and legal proceedings, including claims that relate to customers demanding indemnification for proceedings initiated against them based on their use of SAP software, and occasionally claims that relate to customers being dissatisfied with the products and services that we have delivered to them. The obligations arising from customer-related litigation and claims comprise cases in which we indemnify our customers against liabilities arising from a claim that our products infringe a third party’s patent, copyright, trade secret, or other proprietary rights.
Due to uncertainties relating to these matters, provisions are based on the best information available. Significant judgment is required in the determination of whether and when a provision is to be recorded and what the appropriate amount for such provision should be. Notably, judgment is required in the following areas:
| – | Determining whether an obligation exists |
| – | Determining the probability of outflow of economic benefits |
| – | Determining whether the amount of an obligation is reliably estimable |
| – | Estimating the amount of the expenditure required to settle the present obligation |
At the end of each reporting period, we reassess the potential obligations related to our pending claims and litigation and adjust our respective provisions to reflect the current best estimate. In addition, we monitor and evaluate new information that we receive after the end of the respective reporting period, but before the Consolidated Financial Statements are authorized for issue, to determine whether this provides additional information regarding conditions that existed at the end of the reporting period. Changes to the estimates and assumptions underlying our accounting for legal contingencies, and outcomes that differ from these estimates and assumptions, could require material adjustments to the carrying amounts of the respective provisions recorded and additional provisions. The expected timing or amounts of any outflows of economic benefits resulting from these lawsuits and claims are uncertain and not estimable, as they generally depend on the duration of the legal proceedings and settlement negotiations required to resolve the litigation and claims and the unpredictability of the outcomes of legal disputes in several jurisdictions.
Contingent liabilities exist in respect of customer-related litigation and claims for which no provision has been recognized. It is not practicable to estimate the financial impact of these contingent liabilities due to the uncertainties around these lawsuits and claims as outlined above.
|
SAP Integrated Report 2023 | |||||
| To
Our Stakeholders |
Combined
Management Report |
Consolidated
Financial Statements IFRS |
Further
Information about Sustainability |
Additional Information |
||
Section B – Employees
This section provides financial insights into our employee benefit arrangements. It should be read in conjunction with the compensation disclosures for key management personnel in Note (G.5).
(B.1) Employee Headcount
The following table provides an overview of employee headcount, broken down by function and by the regions EMEA (Europe, Middle East, and Africa), Americas (North America and Latin America), and APJ (Asia Pacific Japan).
Employee Headcount by Region and Function
| Full-time equivalents | 12/31/2023 | 12/31/2022 | 12/31/2021 | |||||||||
| EMEA | Americas | APJ | Total | EMEA | Americas | APJ | Total | EMEA | Americas | APJ | Total | |
| Cloud and software1 | 4,389 | 4,266 | 4,426 | 13,080 | 4,178 | 4,025 | 4,538 | 12,740 | 4,551 | 4,191 | 4,406 | 13,148 |
| Services | 8,178 | 5,013 | 5,481 | 18,672 | 8,129 | 5,106 | 5,769 | 19,005 | 8,095 | 5,053 | 5,864 | 19,012 |
| Research and development1 | 18,086 | 5,884 | 12,474 | 36,444 | 17,764 | 5,752 | 11,764 | 35,280 | 16,487 | 5,641 | 11,248 | 33,377 |
|
Sales and marketing |
12,086 | 10,300 | 5,342 | 27,728 | 11,671 | 10,633 | 5,463 | 27,766 | 10,721 | 10,186 | 5,183 | 26,090 |
| General and administration | 3,619 | 1,777 | 1,307 | 6,704 | 3,387 | 1,804 | 1,240 | 6,431 | 3,278 | 1,866 | 1,164 | 6,308 |
| Infrastructure | 2,834 | 1,274 | 867 | 4,975 | 2,795 | 1,382 | 912 | 5,089 | 2,602 | 1,299 | 821 | 4,722 |
| SAP Group (December 31) | 49,191 | 28,515 | 29,897 | 107,602 | 47,924 | 28,702 | 29,686 | 106,312 | 45,734 | 28,236 | 28,687 | 102,658 |
Thereof acquisitions |
421 | 138 | 0 | 558 | 188 | 189 | 8 | 385 | 377 | 44 | 44 | 465 |
| SAP Group (months’ end average) | 48,222 | 28,239 | 29,582 | 106,043 | 47,359 | 28,785 | 29,438 | 105,582 | 44,622 | 27,822 | 28,009 | 100,453 |
1 Due to the updated cost allocation policy described in Note (IN.1), headcount numbers for the comparative period were adjusted accordingly.
(B.2) Employee Benefits Expenses
| € millions | 2023 | 2022 | 2021 |
| Salaries | 12,128 | 11,369 | 10,120 |
| Social security expenses | 1,919 | 1,779 | 1,516 |
| Share-based payment expenses | 2,220 | 1,431 | 1,334 |
| Pension expenses | 438 | 447 | 390 |
| Employee-related restructuring expenses | 222 | 85 | 25 |
| Termination benefits outside of restructuring plans | 64 | 44 | 101 |
| Employee benefits expenses | 16,992 | 15,157 | 13,487 |
|
SAP Integrated Report 2023 | |||||
| To
Our Stakeholders |
Combined
Management Report |
Consolidated
Financial Statements IFRS |
Further
Information about Sustainability |
Additional Information |
||
(B.3) Share-Based Payments
Accounting for Share-Based Payments
Classification in the Income Statement
Share-based payments cover equity-settled and cash-settled awards issued to our employees. The respective expenses are recognized as employee benefits and classified in our Consolidated Income Statements according to the activities that the receiving employees perform.
Valuation, Judgment, and Sources of Estimation Uncertainty
We use certain assumptions in estimating the fair values for our share-based payments, including expected share price volatility and expected dividend yields. In addition, the final number of Performance Share Units (PSUs) vesting also depends on the achievement of performance indicators. Furthermore, the payout for cash-settled share units depends on our share price on the respective vesting dates. Changes to these assumptions and outcomes that differ from these assumptions could require material adjustments to the carrying amount of the liabilities we have recognized for these share-based payments. The fair value of the share units granted under the SAP Long-Term Incentive Program 2020 (LTI 2020) is dependent on our performance against the total shareholder return (TSR) for NASDAQ-100 companies, the volatility, and the expected correlation between the TSR of the NASDAQ-100 companies and our TSR.
Regarding future payout under our cash-settled plans, the SAP share price is the most relevant factor. With respect to our LTI 2020, we believe that future payout will be significantly impacted not only by our share price but also by the relative TSR performance against the NASDAQ-100 companies. Future payouts under our LTI 2020 will also be dependent on meeting non-market-based performance conditions based on SAP’s long-term strategy. The latter, however, is not incorporated into our fair value calculation but leads to adjustments of the quantity of awards granted. Changes in these factors could significantly affect the estimated fair values as calculated by the valuation model, and the future payout.
Under the OWN SAP share purchase plan, we grant our employees discounts on share purchases. As those discounts are not dependent on future services to be provided by our employees, the discount is recognized as an expense when the discounts are granted.
Presentation in the Statements of Cash Flows
We present the payments of our cash-settled share-based payment plans separately in our Statements of Cash Flows under Cash flows from operating activities. As a result, the changes in other assets and in other liabilities presented in the reconciliation of operating cash flow do not consider share-based payment-related assets or liabilities.
The operating expense line items in our income statement include the following share-based payment expenses:
Share-Based Payment Expenses by Functional Area
| € millions | 2023 | 2022 | 2021 |
| Cost of cloud | 94 | 53 | 51 |
| Cost of software licenses and support | 38 | 48 | 49 |
| Cost of services | 375 | 250 | 233 |
| Research and development | 703 | 440 | 402 |
| Sales and marketing | 834 | 503 | 513 |
| General and administration | 175 | 137 | 87 |
| Share-based payment expenses | 2,220 | 1,431 | 1,334 |
| Thereof cash-settled share-based payments | 806 | 356 | 1,136 |
| Thereof equity-settled share-based payments | 1,414 | 1,075 | 199 |
Share-based payment expenses related to the Qualtrics plan are included in the results from discontinued operations (for more information, see Note (D.1)).
|
SAP Integrated Report 2023 | |||||
| To
Our Stakeholders |
Combined
Management Report |
Consolidated
Financial Statements IFRS |
Further
Information about Sustainability |
Additional Information |
||
Our major share-based payment plans are described below.
a) Equity-Settled Share-Based Payments
Equity-Settled Move SAP Plan (Move)
Starting in 2022, we decided to grant share units under Move that we intend to predominantly settle in shares instead of cash. For more information about the terms and conditions of the cash-settled Move, see section b) Cash-Settled Share-Based Payments in this Note (B.3).
Different vesting schedules apply to specific share units. Granted share units will vest in different tranches mainly as follows:
| – | Restricted Stock Units (RSUs) with service condition only |
| - | Over a half-year period, |
| - | Over a three-year period on a quarterly basis after a waiting period of six months, or |
| – | Performance Share Units (PSUs) with service condition and upon achieving certain key performance indicators (KPIs) |
| - | Over a one-year period, |
| - | Over a three-year period on a quarterly basis after a waiting period of 12 months. |
The number of PSUs that will vest under the different tranches is mainly contingent upon achievement of two equally weighted KPIs in the year of grant: Operating profit (non-IFRS at constant currencies) and Cloud revenue (at constant currencies). Depending on the weighted average performance, the number of PSUs vesting ranges between 0% and 200% of the number initially granted. Performance against the KPI target was 112.4% in 2023 (2022: 84.3%).
We intend to settle the share units classified as equity-settled by reissuing treasury shares upon vesting (for more information, see Note (E.2)).
The valuation was based on the following parameters and assumptions:
Fair Value and Parameters Used at Grant Date in 2023
| €, unless otherwise stated |
Move (2022–2023 Tranches) |
| Weighted average fair value as at grant date | 111.23 |
| Information how fair value was measured at grant date | |
| Valuation model used | Other1 |
| Weighted average share price | 114.25 |
| Weighted average expected dividend yield (in %) | 1.79 |
| Weighted average initial life at grant date (in years) | 1.7 |
| Weighted average remaining life of awards outstanding as at 12/31/2023 (in years) | 1.1 |
1 For these awards, the fair value is calculated by subtracting expected future dividends, if any, until maturity of the respective award from the prevailing share price as at the measurement date.
|
SAP Integrated Report 2023 | |||||
| To
Our Stakeholders |
Combined
Management Report |
Consolidated
Financial Statements IFRS |
Further
Information about Sustainability |
Additional Information |
||
Fair Value and Parameters Used at Grant Date in 2022
| €, unless otherwise stated |
Move (2022 Tranches) |
| Weighted average fair value as at grant date | 93.80 |
| Information how fair value was measured at grant date | |
| Valuation model used | Other1 |
| Weighted average share price | 97.61 |
| Weighted average expected dividend yield (in %) | 2.43 |
| Weighted average initial life at grant date (in years) | 1.6 |
| Weighted average remaining life of awards outstanding as at 12/31/2022 (in years) | 1.2 |
1 For these awards, the fair value is calculated by subtracting expected future dividends, if any, until maturity of the respective award from the prevailing share price as at the measurement date.
Changes in Outstanding Awards
| Thousands, unless otherwise stated |
Move (2022–2023 Tranches) |
| 12/31/2021 | NA |
| Granted2 | 15,371 |
| Adjustment based upon KPI target achievement | –139 |
| Exercised | –3,258 |
| Forfeited | –470 |
| 12/31/2022 | 11,504 |
| Granted2 | 13,760 |
| Adjustment based upon KPI target achievement | 115 |
| Exercised | –7,675 |
| Forfeited | –403 |
| Change in settlement2 | –471 |
| 12/31/2023 | 16,830 |
2 We have changed the classification of some share units granted under the Move plan with the initial intention to settle in shares from equity-settled to cash-settled because a cash outflow became probable. Share units with switched classification are considered in the number of granted share units.
The weighted average share price for awards exercised in 2023 was €130.59 (2022: €92.00).
Own SAP Plan (Own)
Under the share purchase plan Own, employees have the opportunity to purchase, on a monthly basis, SAP shares without any required holding period. The investment per each eligible employee is limited to a percentage of the respective employee’s monthly base salary. SAP matches the employee investment by 40% and adds a subsidy of €20 per month for non-executives. As part of SAP’s 50th anniversary celebration, SAP’s contribution was temporarily doubled from 40% to 80% from January to March 2022, contributing to the peak in 2022. This plan is not open to members of the Executive Board.
Numbers of Shares Purchased
| Millions | 2023 | 2022 | 2021 |
| Own | 6.5 | 9.2 | 5.7 |
As a result of Own, we have commitments to grant SAP shares to employees. We have fulfilled and intend to continue to meet these commitments through an agent who administers the equity-settled programs and purchases shares on the open market.
|
SAP Integrated Report 2023 | |||||
| To
Our Stakeholders |
Combined
Management Report |
Consolidated
Financial Statements IFRS |
Further
Information about Sustainability |
Additional Information |
||
Recognized Expense
| € millions | 2023 | 2022 | 2021 |
| Own | 239 | 307 | 200 |
| Move (2022–2023 Tranches) | 1,175 | 768 | NA |
| Total | 1,414 | 1,075 | 200 |
b) Cash-Settled Share-Based Payments
Cash-Settled Move SAP Plan (Move) Including Grow SAP Plan
To retain and engage executives and certain employees, we grant share units under Move representing a contingent right to receive a cash payment determined by the SAP share price and the number of share units that ultimately vest. Since 2022, we intend to settle share units granted from then on predominantly in shares. For more information about the terms and conditions of the equity-settled Move, see section a) Equity-Settled Share-Based Payments in this Note (B.3). Obligations from outstanding share units granted before 2022 will continue to be settled in cash.
From 2020 to 2023, we granted share units under the Grow SAP Plan that we intend to settle in cash. This fixed term plan has broadly the same terms and conditions as Move and recognizes all employees’ commitment to SAP’s success, and deepens their participation in our future company performance.
Different vesting schedules apply to specific share units. Granted share units under the respective plans will vest in different tranches, mainly as follows:
| – | Restricted Stock Units (RSUs) with service condition only |
| ■ | Over a half-year period, |
| ■ | Over a three-year period on annual basis, |
| ■ | Over a three-year period on a quarterly basis after a waiting period of six months, or |
| – | Performance Share Units (PSUs) with service condition and upon achieving certain key performance indicators (KPIs) |
| ■ | Over a three-year period, or |
| ■ | Over a three-year period on a quarterly basis after a waiting period of 12 months. |
The number of PSUs that will vest under the different tranches is mainly contingent upon achievement of two equally weighted KPIs in the year of grant: operating profit (non-IFRS at constant currencies) and cloud revenue (at constant currencies). Depending on the weighted average performance, the number of PSUs vesting ranges between 0% and 200% of the number initially granted. Performance against the KPI target was 112.4% in 2023 (2022: 84.3%, 2021: 130.9%).
The share units classified as cash-settled are paid out in cash upon vesting.
SAP Long-Term Incentive Program 2020 (LTI 2020)
The LTI 2020 is a long-term, multiyear performance-based element of our Executive Board compensation that is granted in annual tranches. The LTI 2020 reflects SAP’s long-term strategy and thus sets uniform incentives to achieve key targets from the long-term strategic plans. The LTI 2020 also serves to reward the Executive Board members for long-term SAP share price performance as compared to the market, thus ensuring that shareholders’ interests are also honored. In addition, the LTI 2020 includes a component to ensure long-term retention of our Executive Board members.
The LTI 2020 is a virtual share program under which annual tranches with a term of approximately four years each are granted. When the individual tranches are granted, a certain grant amount specified in the Executive Board member’s service contract is converted into virtual shares (share units).
|
SAP Integrated Report 2023 | |||||
| To
Our Stakeholders |
Combined
Management Report |
Consolidated
Financial Statements IFRS |
Further
Information about Sustainability |
Additional Information |
||
For this purpose, the grant amount is divided by the price of the SAP share which corresponds to the arithmetic mean of the SAP share price on the 20 trading days after scheduled publication of the preliminary results for the fourth quarter and the year as a whole (grant price). The share units allocated are composed of 1/3 Financial Performance Share Units (FSUs), 1/3 Market Performance Share Units (MSUs), and 1/3 Retention Share Units. All three types of share units have a vesting period of approximately four years. In contrast to Retention Share Units, FSUs and MSUs are subject to changes in quantity. In this context, the following applies:
The number of FSUs initially awarded is multiplied by a performance factor. The performance factor consists of three equally weighted individual performance indicators relating to the three non-IFRS KPIs at constant currencies, derived from SAP’s long-term strategy: total revenue, cloud revenue, and operating income. The performance period throughout which the target achievement for these three KPIs is measured starts at the beginning of the financial year in which the FSUs are awarded and concludes upon the end of the second year following the year in which the share units were awarded. A numerical target value equaling 100% target achievement is set for each KPI. This constitutes, in each case, a cumulative value for the three years of the performance period.
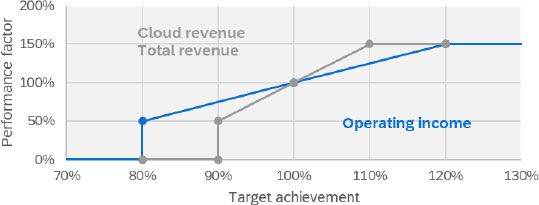
The number of MSUs initially awarded is likewise multiplied by a performance factor. The performance factor depends on the amount of the TSR on the SAP share, measured for an entire performance period of approximately three years, compared to the TSR for NASDAQ-100 companies. If the TSR on the SAP share equals the median, the performance factor will be 100%. If the TSR on the SAP share over the performance period is negative, the maximum performance factor will, however, in deviation from the summary above, be 100%.
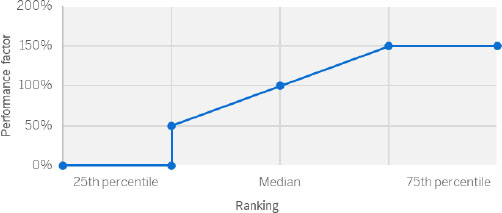
The performance of the share units is linked to the performance of the SAP share price, including dividend payments. Accordingly, an amount is paid out for each share unit which equals the SAP share price plus those dividends disbursed in respect of an SAP share in the period from the beginning of the year in which the share units were awarded until the end of the third year following the year in which the share units were awarded.
|
SAP Integrated Report 2023 | |||||
| To
Our Stakeholders |
Combined
Management Report |
Consolidated
Financial Statements IFRS |
Further
Information about Sustainability |
Additional Information |
||
The arithmetic mean of the SAP share price on the 20 trading days after scheduled publication of the preliminary results for the fourth quarter and the year as a whole will be used as the SAP share price. The payout amount per share unit, including the dividend amounts due on the share units, is capped at 200% of the grant price. The tranche is cash-settled and paid in euros after the Annual General Meeting of Shareholders of the corresponding year.
If an Executive Board member’s service contract is terminated before the end of the third year following the year in which the share units were granted, the Retention Share Units and PSUs are forfeited in whole or in part, depending on the circumstances of the relevant resignation from office or termination of the service contract.
Long-Term Incentive 2016 Plan (LTI 2016 Plan)
The purpose of the LTI 2016 Plan was to reward our Executive Board members for the annual achievement of SAP’s Operating profit (non-IFRS at constant currencies) targets, to ensure long-term retention of our Executive Board members, and to reward them for the long-term SAP share price performance as compared to its main peer group (Peer Group). An LTI tranche was granted annually and had a term of four years (2016–2019 tranches).
All share units granted in this way, comprising 60% PSUs and 40% Retention Share Units, had a vesting period of approximately four years. At the end of the vesting period, the corresponding share units were non-forfeitable. The payout price used for the settlement was the arithmetic mean of the XETRA closing prices of the SAP share on the 20 trading days following the publication of SAP’s fourth-quarter results subsequent to the end of the vesting period. The payout price was capped at 300% of the grant price. The number of PSUs ultimately paid out was dependent on the performance of the SAP share – absolute and relative to the Peer Group Index. The LTI tranche was cash-settled and paid in euros after the Annual General Shareholders’ Meeting of the corresponding year. The last LTI tranche 2019 was paid out in 2023.
The valuation was based on the following parameters and assumptions:
Fair Value and Parameters Used at Year End 2023
| €, unless otherwise stated | LTI 2020 |
Move |
| Weighted average fair value as at 12/31/2023 | 154.24 | 137.98 |
| Information how fair value was measured at measurement date | ||
| Valuation model used | Monte Carlo | Other3 |
| Share price | 139.48 | 139.48 |
| Expected volatility (in %) | 15 to 23 | NA |
| Expected dividend yield (in %) | NA | 1.52 |
| Weighted average remaining life of awards outstanding as at 12/31/2023 (in years) | 1.9 | 0.7 |
3 For these awards, the fair value is calculated by subtracting expected future dividends, if any, until maturity of the respective award from the prevailing share price as at the measurement date.
Fair Value and Parameters Used at Year End 2022
| €, unless otherwise stated | LTI 2020 |
Move |
| Weighted average fair value as at 12/31/2022 | 94.83 | 94.78 |
| Information how fair value was measured at measurement date | ||
| Valuation model used | Monte Carlo | Other3 |
| Share price | 96.39 | 96.39 |
| Expected volatility (in %) | 24 to 31 | NA |
| Expected dividend yield (in %) | NA | 2.03 |
| Weighted average remaining life of awards outstanding as at 12/31/2022 (in years) | 2.3 | 0.8 |
3 For these awards, the fair value is calculated by subtracting expected future dividends, if any, until maturity of the respective award from the prevailing share price as at the measurement date.
|
SAP Integrated Report 2023 | |||||
| To
Our Stakeholders |
Combined
Management Report |
Consolidated
Financial Statements IFRS |
Further
Information about Sustainability |
Additional Information |
||
For the LTI 2020 valuation, the NASDAQ-100 Total Return Index on December 31, 2023, was US$20,158.42 (2022: US$12,994.57). The expected volatility of the NASDAQ-100 companies of 34% to 36% (2022: 36% to 41%), and the expected correlation of SAP and the NASDAQ-100 companies of 24% to 27% (2022: 26% to 32%) are based on historical TSR data for SAP and the NASDAQ-100 companies.
The risk-free interest rate is derived from German government bonds with a similar duration. The SAP dividend yield is based on expected future dividends.
Changes in Outstanding Awards
| Thousands, unless otherwise stated | LTI 2020 |
Move |
| 12/31/2021 | 340 | 18,783 |
| Granted4 | 206 | 2,997 |
| Adjustment based upon KPI target achievement | NA | –36 |
| Exercised | 0 | –8,869 |
| Forfeited | 0 | –1,016 |
| 12/31/2022 | 546 | 11,859 |
| Granted4 | 215 | 1,900 |
| Adjustment based upon KPI target achievement | –64 | –57 |
| Exercised | 0 | –7,234 |
| Forfeited | –91 | –266 |
| Change in settlement4 | NA | 470 |
| 12/31/2023 | 605 | 6,672 |
| Total carrying amount (in € millions) of liabilities as at | ||
| 12/31/2022 | 23 | 752 |
| 12/31/2023 | 59 | 644 |
| Total intrinsic value of vested awards (in € millions) as at | ||
| 12/31/2022 | 3 | 0 |
| 12/31/2023 | 15 | 0 |
| Weighted average share price (in €) for awards exercised in | ||
| 2022 | NA | 97.35 |
| 2023 | NA | 117.86 |
| Total expense (in € millions) recognized in | ||
| 2021 | 9 | 1,139 |
| 2022 | 8 | 346 |
| 2023 | 36 | 764 |
4 We have changed the classification of some share units granted under the Move plan with the initial intention to settle in shares from equity-settled to cash-settled because a cash outflow became probable. Share units with switched classification are considered in the number of granted share units.
|
SAP Integrated Report 2023 | |||||
| To
Our Stakeholders |
Combined
Management Report |
Consolidated
Financial Statements IFRS |
Further
Information about Sustainability |
Additional Information |
||
Share-Based Payment Balances
| € millions | 2023 | 2022 | ||||
| Current | Non-Current | Total | Current | Non-Current | Total | |
| Share-based payment liabilities | 555 | 152 | 707 | 524 | 279 | 803 |
|
Other non-financial liabilities |
5,648 | 698 | 6,346 | 4,818 | 705 | 5,523 |
| Share-based
payment liabilities as % of Other non-financial liabilities |
10 | 22 | 11 | 11 | 40 | 15 |
(B.4) Pension Plans and Similar Obligations
Defined
Contribution Plans
Amounts for domestic and foreign defined contribution plans are based on a percentage of the employees’ salaries or on the amount of contributions made by employees. In Germany and some other countries, we make contributions to public pension schemes that are operated by national or local government or similar institutions. Expenses for such local state pension plans are recognized as short-term employee benefits, that is, social security expenses.
Defined Benefit Pension Plans
The discount rates used in measuring our post-employment benefit assets and liabilities are derived from rates available on high-quality corporate bonds and government bonds for which the timing and amounts of payments match the timing and the amounts of our projected pension payments. Net interest expense and other expenses related to defined benefit plans are recognized as employee benefits expenses and classified in our Consolidated Income Statements according to the activities that the employees owning the awards perform. Since our domestic defined benefit pension plans primarily consist of an employee-financed post-retirement plan that is fully financed with qualifying insurance policies, current service cost may become a credit as a result of adjusting the defined benefit liability’s carrying amount to the fair value of the qualifying plan assets. Such adjustments are recorded in service cost. Total expenses on defined benefit pension plans comprise related current and past service costs as well as interest income and expense.
Total Expense of Pension Plans
| € millions | 2023 | 2022 | 2021 |
| Defined contribution plans | 381 | 425 | 328 |
| Defined benefit pension plans | 57 | 22 | 62 |
| Pension expenses | 438 | 447 | 390 |
Defined Benefit Plans
Present Value of the Defined Benefit Obligations (DBO) and the Fair Value of the Plan Assets
| € millions | Domestic Plans | Foreign Plans | Other Foreign Post-Employment Plans | Total | ||||
| 2023 | 2022 | 2023 | 2022 | 2023 | 2022 | 2023 | 2022 | |
| Present value of the DBO | 1,060 | 949 | 686 | 577 | 256 | 211 | 2,002 | 1,737 |
| Fair value of the plan assets | 1,063 | 953 | 672 | 579 | 98 | 91 | 1,833 | 1,623 |
| Net defined benefit liability (asset)¹ | 0 | 0 | 64 | 57 | 158 | 120 | 222 | 177 |
| Thereof: Net defined benefit asset | 0 | 0 | –17 | –16 | –63 | 0 | –79 | –16 |
| Net defined benefit liability | 0 | 0 | 80 | 73 | 221 | 120 | 301 | 193 |
| Net defined
benefit asset as % of Non-current other financial
assets |
0 | 0 | 0 | 0 | 1 | 0 | 1 | 0 |
| Net defined
benefit liability as % of Non-current provisions |
0 | 0 | 19 | 20 | 51 | 33 | 69 | 54 |
|
SAP Integrated Report 2023 | |||||
| To
Our Stakeholders |
Combined
Management Report |
Consolidated
Financial Statements IFRS |
Further
Information about Sustainability |
Additional Information |
||
¹ After the effects of the asset ceiling Of the present value of the DBO of our domestic plans, €1,006 million (2022: €899 million) relate to plans that provide for lump-sum payments not based on final salary; of the present value of the DBO of our foreign plans, €535 million (2022: €448 million) relate to plans that provide for annuity payments not based on final salary.
The following significant weighted average assumptions were used for the actuarial valuation of our domestic and foreign pension liabilities as well as other post-employment benefit obligations as at the respective measurement date:
Significant Actuarial Assumptions
| Percent | Domestic Plans | Foreign Plans | Other
Foreign Post- Employment Plans |
||||||
| 2023 | 2022 | 2021 | 2023 | 2022 | 2021 | 2023 | 2022 | 2021 | |
| Discount rate | 3.5 | 4.2 | 1.2 | 2.0 | 2.6 | 0.5 | 5.3 | 5.5 | 3.1 |
The sensitivity analysis table below shows how the present value of all defined benefit obligations would have been influenced by reasonably possible changes to significant actuarial assumptions. The sensitivity analysis considers change in discount rate assumptions, holding all other actuarial assumptions constant.
Sensitivity Analysis
| € millions | Domestic Plans | Foreign Plans | Other Foreign Post-Employment Plans | Total | ||||||||
| 2023 | 2022 | 2021 | 2023 | 2022 | 2021 | 2023 | 2022 | 2021 | 2023 | 2022 | 2021 | |
| Present value of all defined benefit obligations if: | ||||||||||||
| Discount rate was 50 basis points higher | 1,015 | 908 | 1,134 | 649 | 505 | 626 | 247 | 203 | 203 | 1,911 | 1,616 | 1,964 |
| Discount rate was 50 basis points lower | 1,108 | 993 | 1,260 | 727 | 562 | 714 | 266 | 219 | 223 | 2,101 | 1,774 | 2,196 |
Investments in Plan Assets
Our investment strategy on domestic benefit plans is to invest all contributions in stable insurance policies.
Our investment strategies for foreign benefit plans vary according to the conditions in the country in which the respective benefit plans are situated. We have adopted a long-term investment horizon for all major foreign benefit plans. Although our policy is to invest in a risk-diversified portfolio consisting of a mix of assets, both the defined benefit obligation and plan assets can fluctuate over time, which exposes the Group to actuarial and market (investment) risks. Depending on the statutory requirements in each country, it might be necessary to reduce any underfunding by addition of liquid assets.
Plan Asset Allocation
| € millions | 2023 | 2022 | ||
|
Quoted in an Active Market |
Not Quoted in an Active Market |
Quoted in an Active Market |
Not Quoted in an Active Market |
|
| Total plan assets | 714 | 1,120 | 611 | 1,012 |
| Thereof: Asset category | ||||
| Equity investments | 190 | 0 | 170 | 0 |
| Corporate bonds | 233 | 0 | 190 | 0 |
| Insurance policies | 59 | 1,120 | 41 | 1,012 |
|
SAP Integrated Report 2023 | |||||
| To
Our Stakeholders |
Combined
Management Report |
Consolidated
Financial Statements IFRS |
Further
Information about Sustainability |
Additional Information |
||
Our expected contribution in 2024 to our domestic and foreign defined benefit pension plans is immaterial. The weighted duration of our defined benefit plans amounted to 10 years as at December 31, 2023 and 2022.
Total future benefit payments from our defined benefit plans as at December 31, 2023, are expected to be €2,707 million (2022: €2,404 million). Of this amount, 76% (2022: 76%) have maturities of over five years, and 55% (2022: 61%) relate to domestic plans.
(B.5) Other Employee-Related Obligations
Accounting Policy
As far as the obligation for long-term employee benefits is secured by pledged reinsurance coverage, it is offset with the relating plan asset.
Other Employee-Related Liabilities
| € millions | 2023 | 2022 | ||||
| Current | Non-Current | Total | Current | Non-Current | Total | |
| Other employee-related liabilities | 4,205 | 546 | 4,751 | 3,632 | 426 | 4,058 |
|
Other non-financial liabilities |
5,648 | 698 | 6,346 | 4,818 | 705 | 5,523 |
| Other employee-related
liabilities as % of Other non-financial liabilities |
74 | 78 | 75 | 75 | 60 | 73 |
Other employee-related liabilities mainly relate to obligations from bonuses and sales commissions, outstanding vacation, time credits accumulated in the working time account, employee-related social security expenses, severance payments outside restructuring programs, and jubilee expenses.
(B.6) Restructuring
Recognition of Restructuring Provisions
We only recognize provisions for restructuring if and when the following occurs:
| – | SAP has designed a program that materially changes the scope of one of our businesses or the manner in which the business is conducted, and |
| – | A detailed and documented restructuring plan has been approved by our Executive Board, a member thereof, or a direct report of an Executive Board member, and |
| – | The program established is planned to start shortly after the program plan is approved and is expected to be completed in a timeframe that makes significant changes to the plan unlikely, and |
| – | The program has been announced to the parties affected or has commenced. |
We consider whether a change in business is material based on the business affected rather than for SAP as a whole. In judging whether a unit qualifies as a business for restructuring purposes, we consider if the unit has its own management team, has access to all inputs and processes necessary to provide outputs, and generates or could generate revenues. The materiality of a change to a business is assessed based on both the size and the nature of the change and therefore does not necessarily involve a material quantitative impact on our financial statements.
|
SAP Integrated Report 2023 | |||||
| To
Our Stakeholders |
Combined
Management Report |
Consolidated
Financial Statements IFRS |
Further
Information about Sustainability |
Additional Information |
||
Restructuring Expenses
| € millions | 2023 | 2022 | 2021 |
| Employee-related restructuring expenses | –222 | –85 | –25 |
| Onerous contract-related restructuring expenses and restructuring-related impairment losses | 8 | –52 | –132 |
|
Restructuring
expenses |
–215 | –138 | –157 |
Most of the restructuring expenses recognized in 2023 relate to the targeted restructuring program in selected areas of the company that SAP announced and launched in the first quarter of 2023 to further focus on its strategic growth areas and accelerated cloud transformation. Restructuring expenses primarily include employee-related benefits such as severance payments. The restructuring costs presented in 2022 mainly include expenses related to the wind-down of business in Russia and Belarus.
If not presented separately in our income statement, restructuring expenses would have been classified in the different expense items in our income statement as follows:
Restructuring Expenses by Functional Area
| € millions | 2023 | 2022 | 2021 |
| Cost of cloud | 7 | 20 | –127 |
| Cost of software licenses and support | –8 | –9 | –6 |
| Cost of services | –31 | –70 | –13 |
| Research and development | –42 | –16 | –12 |
| Sales and marketing | –121 | –58 | 3 |
| General and administration | –19 | –4 | –2 |
|
Restructuring
expenses |
–215 | –138 | –157 |
|
SAP Integrated Report 2023 | |||||
| To
Our Stakeholders |
Combined
Management Report |
Consolidated
Financial Statements IFRS |
Further
Information about Sustainability |
Additional Information |
||
Section C – Financial Results
This section provides insight into the financial results of SAP’s reportable segments and of SAP overall as far as not already covered by previous sections. This includes but is not limited to segment results, income taxes, and earnings per share.
| (C.1) | Results of Segments |
General Information
At year end 2023, SAP had five operating segments that are regularly reviewed by the Executive Board, which is responsible for assessing the performance of the Company and for making resource allocation decisions as our chief operating decision-maker (CODM). The operating segments are largely organized and managed separately according to their product and service offerings. The Applications, Technology & Services (ATS) segment is SAP’s only reportable segment.
In the first quarter of 2023, the non-reportable SAP Signavio segment was dissolved and integrated into the Applications, Technology & Services segment.
At the end of the second quarter of 2023, we sold our stake in Qualtrics, a formerly reportable segment. For more information about the sale of Qualtrics, see Note (D.1).
Due to their size, the following segments are non-reportable:
| – | The Emarsys segment derives its revenues mainly from the sale of cloud-based customer experience offerings and from the sale of related services. |
| – | The Taulia segment derives its revenues mainly from the sale of working capital solutions. |
| – | The Business Network segment combines SAP’s network offerings, covering procurement, logistics, asset management, and industry-specific solutions spanning end-to-end value chains. The segment generates revenues from cloud application subscriptions, transactional fees, and services. |
| – | The Sustainability segment bundles a portfolio of sustainability-related solutions that enables SAP’s customers to record and report financial and non-financial metrics and act on improving their sustainability footprint across all ESG (Environmental, Social, and Governance) dimensions. |
The segment information for 2023 and the comparative prior periods were restated to conform with the new segment composition.
Segment Reporting Policies
Our management reporting system, and hence our segment reporting system, reports our intersegment services as cost reductions and does not track them as internal revenue. Intersegment services mainly represent utilization of human resources of one segment by another segment on a project basis. Intersegment services are charged based on internal cost rates including certain indirect overhead costs but excluding a profit margin.
Most of our depreciation and amortization expense affecting segment profits is allocated to the segments as part of broader infrastructure allocations and is thus not tracked separately on the operating segment level. Other depreciation and amortization expense is directly allocated to the operating segments.
Our management reporting system produces a variety of reports that differ by the currency exchange rates used in the accounting for foreign-currency transactions and operations, where both actual and constant currency numbers are reported to and used by our CODM. Reports based on actual currencies use the same currency rates as are used in our financial statements. Reports based on constant currencies report revenues and expenses using the average exchange rates from the previous year’s corresponding period.
|
SAP Integrated Report 2023 | |||||
| To
Our Stakeholders |
Combined
Management Report |
Consolidated
Financial Statements IFRS |
Further
Information about Sustainability |
Additional Information |
||
We use an operating profit indicator to measure the performance of our operating segments. The accounting policies applied in the measurement of operating segment expenses and profit differ as follows from the IFRS accounting principles used to determine the operating profit measure in our income statement:
The expense measures exclude:
| – | Acquisition-related charges such as amortization expense and impairment charges for intangibles acquired in business combinations, including goodwill impairment charges, and certain stand-alone acquisitions of intellectual property (including purchased in-process research and development) as well as sale/disposal gains and losses for these intangibles, settlements of pre-existing business relationships in connection with a business combination, and acquisition-related third-party expenses | |
| – | Share-based payment expenses | |
| – | Restructuring expenses | |
| – | Regulatory compliance matter expenses |
SAP headquarter functions which are exclusively managed on corporate level, such as finance, accounting, legal, human resources, global business operations, and corporate marketing, are not included in the results of our reportable segments.
Revenues and expenses of our operating but non-reportable segments, and the certain activities managed on corporate level, as outlined above, are presented under the Other revenue and Other expenses items in the reconciliation in Note (C.2).
Information about assets and liabilities and additions to non-current assets by segment is not regularly provided to our Executive Board. Goodwill by segment is disclosed in Note (D.2).
Applications, Technology & Services
| € millions | 2023 | 2022 | 2021 | ||
|
Actual Currency |
Constant
Currency1 |
Actual Currency |
Constant
Currency1 |
Actual Currency |
|
| Cloud | 12,538 | 12,903 | 10,428 | 9,754 | 7,941 |
| Software licenses | 1,764 | 1,801 | 2,056 | 1,972 | 3,248 |
| Software support | 11,495 | 11,781 | 11,908 | 11,363 | 11,411 |
| Software licenses and support | 13,259 | 13,582 | 13,964 | 13,335 | 14,659 |
| Cloud and software | 25,797 | 26,485 | 24,392 | 23,089 | 22,600 |
| Services | 4,260 | 4,369 | 4,104 | 3,872 | 3,570 |
| Total segment revenue | 30,057 | 30,853 | 28,496 | 26,961 | 26,170 |
| Cost of cloud | –3,693 | –3,779 | –3,355 | –3,073 | –2,696 |
| Cost of software licenses and support | –1,277 | –1,299 | –1,331 | –1,248 | –1,431 |
| Cost of cloud and software | –4,971 | –5,078 | –4,686 | –4,322 | –4,127 |
| Cost of services | –2,981 | –3,044 | –2,856 | –2,708 | –2,453 |
| Total cost of revenue | –7,951 | –8,122 | –7,542 | –7,030 | –6,580 |
| Segment gross profit | 22,105 | 22,731 | 20,954 | 19,931 | 19,590 |
| Other segment expenses | –12,294 | –12,602 | –12,130 | –11,459 | –10,282 |
| Segment profit | 9,811 | 10,129 | 8,824 | 8,472 | 9,308 |
1 The 2023 constant currency amounts are only comparable to 2022 actual currency amounts; 2022 constant currency amounts are only comparable to 2021 actual currency amounts.
Directly allocated depreciation and amortization expense in the ATS segment decreased compared to 2022 by 23% (22% at constant currency) from €639 million to €491 million.
|
SAP Integrated Report 2023 | |||||
| To
Our Stakeholders |
Combined
Management Report |
Consolidated
Financial Statements IFRS |
Further
Information about Sustainability |
Additional Information |
||
Segment Revenue by Region
| € millions | EMEA | Americas | APJ | Total Segment Revenue | ||||||||
| 2023 | 2022 | 2023 | 2022 | 2023 | 2022 | 2023 | 2022 | |||||
| Actual
Currency |
Constant Currency |
Actual
Currency |
Actual
Currency |
Constant
Currency |
Actual
Currency |
Actual
Currency |
Constant Currency | Actual
Currency |
Actual
Currency |
Constant Currency | Actual
Currency |
|
| Applications, Technology & Services | 13,645 | 13,736 | 12,610 | 12,091 | 12,493 | 11,606 | 4,320 | 4,624 | 4,280 | 30,057 | 30,853 | 28,496 |
| Total reportable segments | 13,645 | 13,736 | 12,610 | 12,091 | 12,493 | 11,606 | 4,320 | 4,624 | 4,280 | 30,057 | 30,853 | 28,496 |
| € millions | EMEA | Americas | APJ | Total Segment Revenue | ||||||||
| 2022 | 2021 | 2022 | 2021 | 2022 | 2021 | 2022 | 2021 | |||||
| Actual Currency |
Constant
Currency |
Actual
Currency |
Actual
Currency |
Constant Currency |
Actual Currency |
Actual
Currency |
Constant Currency | Actual Currency |
Actual
Currency |
Constant Currency | Actual
Currency |
|
| Applications, Technology & Services | 12,610 | 12,382 | 12,267 | 11,606 | 10,386 | 9,826 | 4,280 | 4,193 | 4,077 | 28,496 | 26,961 | 26,170 |
| Total reportable segments | 12,610 | 12,382 | 12,267 | 11,606 | 10,386 | 9,826 | 4,280 | 4,193 | 4,077 | 28,496 | 26,961 | 26,170 |
For a breakdown of revenue by region for the SAP Group, see Note (A.1).
(C.2) Reconciliation of Segment Measures to the Consolidated Income Statements
| € millions | 2023 | 2022 | 2021 | ||
| Actual Currency |
Constant Currency1 |
Actual Currency |
Constant Currency1 |
Actual Currency |
|
| Total segment revenue for reportable segments | 30,057 | 30,853 | 28,496 | 26,961 | 26,170 |
| Other revenue | 1,150 | 1,180 | 1,024 | 938 | 783 |
| Adjustment for currency impact | 0 | –826 | 0 | 1,620 | 0 |
|
Total
revenue |
31,207 | 31,207 | 29,520 | 29,520 | 26,953 |
| Total segment profit for reportable segments | 9,811 | 10,129 | 8,824 | 8,472 | 9,308 |
| Other revenue | 1,150 | 1,180 | 1,024 | 938 | 783 |
| Other expenses | –2,239 | –2,265 | –1,858 | –1,741 | –1,887 |
| Adjustment for currency impact | 0 | –322 | 0 | 320 | 0 |
| Adjustment for | |||||
| Acquisition-related charges | –345 | –345 | –329 | –329 | –405 |
| Share-based payment expenses | –2,220 | –2,220 | –1,431 | –1,431 | –1,334 |
|
Restructuring |
–215 | –215 | –138 | –138 | –157 |
| Adjustment for regulatory compliance matter expenses | –155 | –155 | 0 | 0 | 0 |
|
Operating
profit |
5,787 | 5,787 | 6,090 | 6,090 | 6,308 |
|
Other
non-operating income/expense, net |
9 | 9 | –187 | –187 | 19 |
|
Financial
income, net |
–456 | –456 | –1,389 | –1,389 | 2,178 |
|
Profit
before tax from continuing operations |
5,341 | 5,341 | 4,513 | 4,513 | 8,505 |
| 1 The 2023 constant currency amounts are only comparable to 2022 actual currency amounts; 2022 constant currency amounts are only comparable to 2021 actual currency amounts. | |||||
|
SAP Integrated Report 2023 | |||||
| To
Our Stakeholders |
Combined
Management Report |
Consolidated
Financial Statements IFRS |
Further
Information about Sustainability |
Additional Information |
||
(C.3) Other Non-Operating Income/Expense, Net
| € millions | 2023 | 2022 | 2021 |
| Foreign currency exchange gain/loss, net | 46 | –144 | 51 |
| Thereof from financial assets at fair value through profit or loss | 571 | 515 | 316 |
| Thereof from financial assets at amortized cost | 56 | 218 | 111 |
| Thereof from financial liabilities at fair value through profit or loss | –514 | –766 | –382 |
| Thereof from financial liabilities at amortized cost | –30 | –88 | –68 |
| Miscellaneous income/expense, net | –36 | –44 | –32 |
|
Other
non-operating income/expense, net |
9 | –187 | 19 |
(C.4) Financial Income, Net
| € millions | 2023 | 2022 | 2021 |
| Finance income | 857 | 811 | 3,123 |
| Thereof interest income from financial assets at amortized cost | 376 | 100 | 29 |
| Thereof gains from financial assets at fair value through profit or loss | 380 | 608 | 3,067 |
| Finance costs | –1,313 | –2,200 | –945 |
| Thereof losses from financial assets at fair value through profit or loss | –525 | –1,802 | –654 |
| Thereof interest expense from financial liabilities at amortized cost | –400 | –203 | –156 |
| Thereof interest expense from financial liabilities at fair value through profit or loss | –239 | –69 | –50 |
|
Financial
income, net |
–456 | –1,389 | 2,178 |
Financial income, net, increased €934 million in 2023, in comparison to 2022, mainly due to:
| – | Lower net losses from the fair valuation of our equity investments (€1,049 million), |
| – | An increase in interest income due to a higher market interest rate level applied to a higher volume of interest-generating investments (€276 million) which is partially offset by an increase in interest expenses on our financial debt (€–197 million) (for more information, see Note (E.3)), and |
| – | An increase in interest expenses from derivatives (€–170 million), mainly from the deal contingent forward held in connection with the Qualtrics disposal (for more information, see Note (F.1)). |
(C.5) Income Taxes
Judgments and Estimates
We are subject to changing tax laws in multiple jurisdictions within the countries in which we operate. Our ordinary business activities also include transactions where the ultimate tax outcome is uncertain due to different interpretations of tax laws, such as those involving transfer pricing and intercompany transactions between SAP Group entities. In addition, the amount of income taxes we pay is generally subject to ongoing audits by domestic and foreign tax authorities. In determining our worldwide income tax provisions, judgment is involved in assessing whether to consider each uncertain tax treatment separately or together with one or more other uncertain tax treatments and whether to reflect the respective effect of uncertainty based on the most likely amount or the expected value. In applying these judgments, we consider the nature and the individual facts and circumstances of each uncertain tax treatment as well as the specifics of the respective jurisdiction, including applicable tax laws and our interpretation thereof.
|
SAP Integrated Report 2023 | |||||
| To
Our Stakeholders |
Combined
Management Report |
Consolidated
Financial Statements IFRS |
Further
Information about Sustainability |
Additional Information |
||
The assessment whether a deferred tax asset is impaired requires judgment, as we need to estimate future taxable profits to determine whether the utilization of the deferred tax asset is probable. In evaluating our ability to utilize our deferred tax assets, we consider all available positive and negative evidence, including the level of historical taxable income and projections for future taxable income over the periods in which the deferred tax assets are recoverable. Our judgment regarding future taxable income is based on assumptions about future market conditions and future profits of SAP.
Judgment is also required in evaluating whether interest or penalties related to income taxes meet the definition of income taxes, and, if not, whether it is of financial nature. In this judgment, we particularly consider applicable local tax laws and interpretations on IFRS by national standard setters in the area of group financial reporting.
Tax Expense by Geographic Location
| € millions | 2023 | 2022 | 2021 |
| Current tax expense | |||
| Germany | 596 | 539 | 603 |
| Foreign | 1,356 | 1,165 | 1,366 |
| Total current tax expense | 1,952 | 1,704 | 1,969 |
| Deferred tax expense/income | |||
| Germany | 74 | 86 | 108 |
| Foreign | –285 | –344 | –395 |
| Total deferred tax income | –211 | –258 | –287 |
|
Total
income tax expense |
1,741 | 1,446 | 1,682 |
Major Components of Tax Expense
| € millions | 2023 | 2022 | 2021 |
| Current tax expense/income | |||
| Tax expense for current year | 1,935 | 1,717 | 1,702 |
| Taxes for prior years | 17 | –13 | 267 |
| Total current tax expense | 1,952 | 1,704 | 1,969 |
| Deferred tax expense/income | |||
| Origination and reversal of temporary differences | –222 | –216 | –311 |
| Unused tax losses, research and development tax credits, and foreign tax credits | 11 | –42 | 24 |
| Total deferred tax income | –211 | –258 | –287 |
|
Total
income tax expense |
1,741 | 1,446 | 1,682 |
Profit Before Tax by Geographic Location
| € millions | 2023 | 2022 | 2021 |
| Germany | 1,201 | 1,814 | 2,057 |
| Foreign | 4,140 | 2,699 | 6,448 |
|
Total |
5,341 | 4,513 | 8,505 |
The following table reconciles the expected income tax expense, computed by applying our combined German tax rate of 26.5% (2022: 26.4%; 2021: 26.4%), to the actual income tax expense. Our 2023 combined German tax rate includes a corporate income tax rate of 15.0% (2022: 15.0%; 2021: 15.0%), plus a solidarity surcharge of 5.5% (2022: 5.5%; 2021: 5.5%) thereon, and trade taxes of 10.7% (2022: 10.6%; 2021: 10.6%).
|
SAP Integrated Report 2023 | |||||
| To
Our Stakeholders |
Combined
Management Report |
Consolidated
Financial Statements IFRS |
Further
Information about Sustainability |
Additional Information |
||
Relationship Between Tax Expense and Profit Before Tax
| € millions, unless otherwise stated | 2023 | 2022 | 2021 |
|
Profit
before tax from continuing operations |
5,341 | 4,513 | 8,505 |
|
Tax expense at applicable tax rate of 26.5% (2022: 26.4%; 2021: 26.4%) |
1,418 | 1,193 | 2,245 |
| Tax effect of: | |||
| Foreign tax rates | –210 | –134 | –143 |
| Non-deductible expenses | 241 | 138 | 141 |
| Tax-exempt income | –77 | 297 | –630 |
| Withholding taxes | 297 | 176 | 199 |
| Research and development and foreign tax credits | –89 | –84 | –73 |
| Prior-year taxes | –8 | 4 | 18 |
| Assessment of deferred tax assets, research and development tax credits, and foreign tax credits | 138 | –124 | –36 |
| Other | 31 | –20 | –39 |
|
Total
income tax expense |
1,741 | 1,446 | 1,682 |
| Effective tax rate (in %) | 32.6 | 32.0 | 19.8 |
Components of Recognized Deferred Tax Assets and Liabilities
| € millions | 2023 | 2022 |
| Deferred tax assets | ||
| Intangible assets | 1,074 | 1,069 |
| Property, plant, and equipment | 37 | 27 |
| Leases | 379 | 503 |
| Other financial assets | 77 | 23 |
| Trade and other receivables | 81 | 81 |
| Pension provisions | 211 | 203 |
| Share-based payments | 267 | 226 |
| Other provisions and obligations | 692 | 753 |
| Contract liabilities | 818 | 994 |
| Carryforwards of unused tax losses | 147 | 180 |
| Research and development and foreign tax credits | 44 | 110 |
| Other | 370 | 134 |
| Total deferred tax assets (gross) | 4,197 | 4,303 |
| Netting | –2,004 | –2,208 |
|
Total
deferred tax assets (net) |
2,193 | 2,095 |
| Deferred tax liabilities | ||
| Intangible assets | 581 | 835 |
| Property, plant, and equipment | 89 | 108 |
| Leases | 341 | 437 |
| Other financial assets | 185 | 170 |
| Trade and other receivables | 761 | 269 |
| Pension provisions | 33 | 35 |
| Other provisions and obligations | 245 | 269 |
| Other | 34 | 326 |
| Total deferred tax liabilities (gross) | 2,269 | 2,449 |
| Netting | –2,004 | –2,208 |
|
Total
deferred tax liabilities (net) |
265 | 241 |
|
SAP Integrated Report 2023 | |||||
| To
Our Stakeholders |
Combined
Management Report |
Consolidated
Financial Statements IFRS |
Further
Information about Sustainability |
Additional Information |
||
The decrease in deferred tax assets for contract liabilities and the decrease in deferred tax liabilities for intangible assets mainly result from the divestiture of Qualtrics.
The increase in deferred tax assets for other in the amount of €236 million (2022: €169 million) and in deferred tax liabilities for trade and other receivables in the amount of €492 million (2022: €288 million), as well as the decrease in deferred tax liabilities for other in the amount of €292 million (2022: €140 million), mainly result from reclassifications, leading to a more consistent presentation of the components of recognized deferred tax assets and liabilities. The presentation for 2022 remains unchanged in this respect.
Items Not Resulting in a Deferred Tax Asset
| € millions | 2023 | 2022 | 2021 |
| Unused tax losses | |||
| Not expiring | 151 | 315 | 430 |
| Expiring in the following year | 28 | 14 | 26 |
| Expiring after the following year | 216 | 344 | 309 |
| Total unused tax losses | 395 | 673 | 765 |
| Deductible temporary differences | 325 | 378 | 602 |
| Unused research and development and foreign tax credits | |||
| Not expiring | 59 | 9 | 28 |
| Expiring after the following year | 5 | 20 | 20 |
| Total unused tax credits | 64 | 29 | 48 |
Of the unused tax losses, €181 million (2022: €276 million; 2021: €183 million) relate to U.S. state tax loss carryforwards.
We have not recognized a deferred tax liability on approximately €22.15 billion (2022: €28.91 billion) for undistributed profits of our subsidiaries, because we are in a position to control the timing of the reversal of the temporary difference and it is probable that such differences will not reverse in the foreseeable future.
Income Tax-Related Litigation
We are subject to ongoing tax audits by domestic and foreign tax authorities. Currently, we are in dispute mainly with the German and only a few foreign tax authorities. The German dispute is in respect of certain secured capital investments, while the few foreign disputes are mainly in respect of the deductibility of intercompany royalty payments and intercompany services. In all cases, we expect that a favorable outcome can only be achieved through litigation. For all of these matters, we have not recorded a provision as we believe that the tax authorities’ claims have no merit and that no adjustment is warranted. If, contrary to our view, the tax authorities were to prevail in their arguments before the court, we would expect to have an additional expense of approximately €1,815 million (2022: €1,607 million) in total (including related interest expenses and penalties of €1,003 million (2022: €881 million)).
Reform of International Taxation Rules
In October 2021, over 135 jurisdictions agreed on a new framework for the international tax system covering the re-allocation of taxing rights and the introduction of a global minimum corporate tax rate. In December 2021, the Organization for Economic Co-operation and Development (OECD) released model rules, which shall ensure that multinational enterprises with revenue above €750 million will be subject to a 15% minimum corporate tax rate.
|
SAP Integrated Report 2023 | |||||
| To
Our Stakeholders |
Combined
Management Report |
Consolidated
Financial Statements IFRS |
Further
Information about Sustainability |
Additional Information |
||
In December 2022, the Member States of the European Union (EU) adopted a directive on a global minimum level of taxation for multinational enterprise groups and large-scale domestic groups in the EU. By the end of 2023, Germany transposed the EU directive into national law, applicable for fiscal years beginning after December 30, 2023. SAP has performed an assessment of its potential exposure to the global minimum tax legislation. This assessment is based on our current understanding of the global minimum taxation rules and on the most recent information available regarding the financial performance of the constituent entities within SAP. Our simulation reveals that SAP should not be materially affected. SAP has applied the temporary mandatory exception to recognizing and disclosing information about deferred tax assets and liabilities related to the global minimum tax.
(C.6) Earnings per Share
| € millions, unless otherwise stated | 2023 | 2022 | 2021 |
| Profit attributable to equity holders of SAP SE | 3,634 | 3,277 | 6,429 |
| Profit attributable to equity holders of SAP SE1 | 6,139 | 2,284 | 5,256 |
| Issued ordinary shares2 | 1,229 | 1,229 | 1,229 |
| Effect of treasury shares2 | –61 | –58 | –49 |
| Weighted average shares outstanding, basic2 | 1,167 | 1,170 | 1,180 |
| Dilutive effect of share-based payments2 | 12 | 5 | 0 |
| Weighted average shares outstanding, diluted2 | 1,180 | 1,175 | 1,180 |
| Earnings per share, basic, attributable to equity holders of SAP SE (in €) from continuing operations | 3.11 | 2.80 | 5.45 |
| Earnings per share, basic, attributable to equity holders of SAP SE (in €)1 | 5.26 | 1.95 | 4.46 |
| Earnings per share, diluted, attributable to equity holders of SAP SE (in €) from continuing operations | 3.08 | 2.79 | 5.45 |
| Earnings per share, diluted, attributable to equity holders of SAP SE (in €)1 | 5.20 | 1.94 | 4.46 |
1 From continuing and discontinued operations 2 Number of shares in millions This section highlights our non-current assets including investments that form the basis of our operating activities.
|
SAP Integrated Report 2023 | |||||
| To
Our Stakeholders |
Combined
Management Report |
Consolidated
Financial Statements IFRS |
Further
Information about Sustainability |
Additional Information |
||
Section D – Invested Capital
Additions to invested capital include separate asset acquisitions or business combinations. Further, we disclose information about purchase obligations and capital contributions.
(D.1) Business Combinations and Divestitures
Measuring Non-Controlling Interests and
Allocation of Consideration Transferred
We decide for each business combination whether to measure the non-controlling interest in the acquiree at fair value or at the proportionate share of the acquiree’s identifiable net assets.
We classify costs related to executing business combinations as general and administration expense.
In our accounting for business combinations, judgment is required in determining whether an intangible asset is identifiable and whether it should be recorded separately from goodwill. Additionally, estimating the acquisition-date fair values of the identifiable assets acquired and liabilities assumed involves considerable judgment. The necessary measurements are based on information available on the acquisition date and are based on expectations and assumptions that have been deemed reasonable by management. These judgments, estimates, and assumptions can materially affect our financial position and profit for several reasons, including the following:
| – | Fair values assigned to assets subject to depreciation and amortization affect the amounts of depreciation and amortization to be recorded in operating profit in the periods following the acquisition. | |
| – | Subsequent negative changes in the estimated fair values of assets may result in additional expense from impairment charges. | |
| – | Subsequent changes in the estimated fair values of liabilities and provisions may result in additional expense (if increasing the estimated fair value) or additional income (if decreasing the estimated fair value). |
We acquire businesses in specific areas of strategic interest to us, particularly to broaden our product and service portfolio.
2023 Acquisitions
LeanIX Acquisition
On September 7, 2023, SAP announced its intent to acquire 100% of the shares of LeanIX GmbH (“LeanIX”), a leader in enterprise architecture management (EAM) software.
The acquisition closed on November 7, 2023, following satisfaction of customary closing conditions and regulatory approvals; the operating results and the assets and liabilities are reflected in our Consolidated Financial Statements starting on that date.
The acquisition is expected to further expand SAP’s business transformation portfolio, giving customers access to the full suite of tools required for continuous business transformation and facilitating AI-enabled process optimization.
Consideration transferred amounted to €1,231 million paid in cash.
|
SAP Integrated Report 2023 | |||||
| To
Our Stakeholders |
Combined
Management Report |
Consolidated
Financial Statements IFRS |
Further
Information about Sustainability |
Additional Information |
||
The following table summarizes the values of identifiable assets acquired and liabilities assumed in connection with the acquisition of LeanIX, as at the acquisition date:
LeanIX Acquisition: Recognized Assets and Liabilities
| € millions | |
| Intangible assets | 476 |
| Other identifiable assets | 102 |
| Total identifiable assets | 578 |
| Other identifiable liabilities | 214 |
| Total identifiable liabilities | 214 |
| Total identifiable net assets | 364 |
| Goodwill | 867 |
| Total consideration transferred | 1,231 |
As we are still obtaining the information necessary to identify and measure certain assets and liabilities, mainly tax-related items, the initial accounting for the LeanIX business combination is still incomplete.
In general, the goodwill arising from our acquisitions consists largely of the synergies and the know-how and skills of the acquired businesses’ workforces.
LeanIX goodwill was attributed to expected synergies from the acquisition, particularly in the following areas:
– Cross-selling to existing SAP customers across all regions, using SAP’s sales organization
– Creating new offerings by combining LeanIX products and SAP products
– LeanIX complements the transformation capabilities of SAP Signavio solutions and will give SAP customers unique clarity on the IT landscapes they need to reap the full benefit of business transformation
The allocation of the goodwill resulting from the LeanIX acquisition to our operating segments depends on how our operating segments actually benefit from the synergies of the LeanIX business combination. For more information, see Note (D.2).
Impact of the Business Combination on Our Financial Statements
The amounts of revenue and profit or loss of the LeanIX business acquired in 2023 since the acquisition date were included in our Consolidated Income Statement for 2023 as follows:
| € millions | 2023 as Reported |
Contribution
of LeanIX |
|
Revenue |
31,207 | 10 |
|
Profit
after tax |
5,964 | –8 |
Had LeanIX been consolidated as at January 1, 2023, our revenue and profit after tax for 2023 would not have been materially different.
2023 Divestitures
Qualtrics Disposal
On March 13, 2023, resulting from a process that was initiated on January 26, 2023, SAP announced it had agreed to sell all of its 423 million shares of Qualtrics International Inc. as part of the acquisition of Qualtrics by funds affiliated with Silver Lake as well as the Canada Pension Plan Investment Board. The sale closed on June 28, 2023, following satisfaction of customary closing conditions and regulatory approvals.
|
SAP Integrated Report 2023 | |||||
| To
Our Stakeholders |
Combined
Management Report |
Consolidated
Financial Statements IFRS |
Further
Information about Sustainability |
Additional Information |
||
At a purchase price of US$18.15 in cash per share, SAP’s stake was acquired for approximately US$7.7 billion. To secure the euro countervalue of the US$7.7 billion purchase price, we hedged an amount of US$7.1 billion by entering into a deal contingent forward applying net investment hedge accounting. For more information, see Note (F.1). At the time that Qualtrics was classified as a discontinued operation (following IFRS 5), there was no indication of an impairment (as the fair value less cost of disposal (calculated based on share prices) significantly exceeded the carrying amount).
SAP is a close go-to-market and technology partner for Qualtrics.
SAP’s financial results present Qualtrics as a discontinued operation as required under IFRS 5. The Qualtrics disposal group was previously included in the Qualtrics reportable segment.
The pre-tax disposal gain included in discontinued operations (€3,562 million) was calculated by adjusting the purchase price less the cost of disposal (€7,003 million) for net assets leaving the SAP Group (€5,800 million, consisting mostly of goodwill (€4,007 million) and other intangible assets (€1,294 million)), the corresponding non-controlling interests (€2,337 million), and amounts of other comprehensive income (€22 million). SAP incurred taxes amounting to €799 million in connection with the transaction.
The cash inflow resulting from the purchase price (€7,068 million) was offset by cash and cash equivalents of €713 million leaving the SAP Group.
SAP continues to provide rental guarantees for certain offices used by Qualtrics. Qualtrics is obligated to indemnify SAP with respect to the guarantees.
Additional financial information relating to Qualtrics is presented in the following tables (revenues and expenses are presented after consolidation of transactions between Qualtrics and SAP’s continuing operations):
| € millions, unless otherwise stated | 2023 | 2022 |
| Consolidated Income Statements | ||
| Cloud revenue | 621 | 1,129 |
| Total revenue | 745 | 1,351 |
| Cost of cloud | –88 | –265 |
| Total cost of revenue | –196 | –499 |
| Total operating expenses (including total cost of revenue) | –1,155 | –2,771 |
| Disposal gain before tax | 3,562 | 0 |
| Operating profit | 3,152 | –1,420 |
| Profit (loss) before tax | 3,162 | –1,423 |
| Income tax expense1 | –799 | 64 |
| Profit (loss) after tax | 2,363 | –1,359 |
| Attributable to owners of parent | 2,505 | –993 |
| Earnings per share, basic (IFRS, in €)2 | 2.15 | –0.85 |
| Earnings per share, diluted (IFRS, in €)2 | 2.12 | –0.85 |
| Consolidated Statements of Cash Flow | ||
| Net operating cash flow | 122 | –29 |
| Net investing cash flow | 5,510 | –32 |
| Net financing cash flow | 24 | –263 |
1 For 2023, €799 million relates to the gain on sale of discontinued operations.
2 For 2023 and 2022, the weighted average number of shares was 1,167 million (diluted: 1.180 million) and 1,170 million (diluted: 1,175 million), respectively (treasury stock excluded).
Total operating expenses includes share-based payment expenses related to Qualtrics’ equity-settled plan of €403 million in 2023 (€1,182 million in 2022).
|
SAP Integrated Report 2023 | |||||
| To
Our Stakeholders |
Combined
Management Report |
Consolidated
Financial Statements IFRS |
Further
Information about Sustainability |
Additional Information |
||
2022 Acquisitions
In 2022, we closed the acquisition of Taulia Inc., San Francisco, California (USA) (“Taulia”) and of INNAAS srl, Rome (Italy).
Taulia Acquisition
On January 27, 2022, SAP announced its intent to acquire a majority stake of Taulia (for information about SAP’s current shareholding percentage, see Note (G.9)), a leading provider of cloud-based working capital management solutions. The acquisition closed on March 9, 2022, following satisfaction of customary closing conditions and regulatory approvals; the operating results and the assets and liabilities are reflected in our consolidated financial statements starting on that date.
Consideration transferred amounted to €705 million.
The following table summarizes the values of identifiable assets acquired and liabilities assumed in connection with the acquisition of Taulia, as at the acquisition date:
Taulia Acquisition: Recognized Assets and Liabilities
| € millions | |
| Intangible assets | 157 |
| Other identifiable assets | 87 |
| Total identifiable assets | 244 |
| Other identifiable liabilities | 88 |
| Total identifiable liabilities | 88 |
| Total identifiable net assets | 156 |
| Goodwill | 549 |
| Total consideration transferred | 705 |
Prior to December 31, 2022, we completed our accounting assessment relating to the supply chain financing (SCF) transactions offered by Taulia. Based on the setup of the compartments and series within which the SCF receivables and liabilities are siloed, and on the related contractual and founding agreements, we concluded that we do not control the receivables and liabilities resulting from the SCF activities under IFRS 10. Thus, we do not include the respective items in our balance sheet and do not show cash flows linked to the SCF transactions in investing/financing cash flow.
In Q1 2023, measurement of tax-related assets and liabilities for the Taulia business combination accounting was completed and resulted in €28 million adjusted to the Other identifiable assets’ opening balance and Goodwill.
In general, the goodwill arising from our acquisitions consists largely of the synergies and the know-how and skills of the acquired businesses’ workforces.
Taulia goodwill was attributed to expected synergies from the acquisition, particularly in the following areas:
| – | Cross-selling to existing SAP customers across all regions, using SAP’s sales organization |
| – | Further expanding the SAP Business Network capabilities and strengthening SAP’s solutions for the CFO office |
| – | Creating new offerings by combining Taulia products and SAP products |
| – | Improving profitability in Taulia sales and operations |
The allocation of the goodwill resulting from the Taulia acquisition to our operating segments depends on how our operating segments actually benefit from the synergies of the Taulia business combination.
|
SAP Integrated Report 2023 | |||||
| To
Our Stakeholders |
Combined
Management Report |
Consolidated
Financial Statements IFRS |
Further
Information about Sustainability |
Additional Information |
||
Impact of the Business Combination on Our Financial Statements
The amounts of revenue and profit or loss of the Taulia business acquired in 2022 since the acquisition date were included in our Consolidated Income Statement for 2022 as follows:
Taulia Acquisition: Impact on SAP’s Financials
| € millions | 20221 as Reported |
Contribution
of Taulia |
|
Revenue |
30,871 | 59 |
|
Profit
after tax |
1,708 | –38 |
1 From continuing and discontinued operations
Had Taulia been consolidated as at January 1, 2022, our revenue and profit after tax for 2022 would not have been materially different.
2022 Divestitures
On August 17, 2022, SAP and Francisco Partners (FP) announced that FP had signed a definitive agreement with SAP America, Inc. under which FP would acquire SAP Litmos from SAP. The transaction closed on December 1, 2022, following satisfaction of applicable regulatory and other approvals.
The disposal gain of €175 million is included in Other operating income/expense, net.
2021 Acquisitions
In 2021, we closed the acquisition of Signavio GmbH, Berlin (Germany) (“Signavio”) and of Clarabridge, Inc., Reston, Virginia (USA) (“Clarabridge”).
Signavio Acquisition
In January 2021, SAP announced it had entered into an agreement to acquire the shares of Signavio, a leader in the enterprise business process intelligence and process management space that enables companies to understand, improve, transform, and manage all their business processes quickly and at scale.
The purchase price was €949 million. The transaction closed on March 5, 2021, following satisfaction of regulatory and other approvals. The Signavio operating results and assets and liabilities are reflected in our consolidated financial statements starting on that date.
The following table summarizes the values of identifiable assets acquired and liabilities assumed in connection with the acquisition of Signavio, as at the acquisition date:
Signavio Acquisition: Recognized Assets and Liabilities
| € millions | |
| Intangible assets | 255 |
| Other identifiable assets | 73 |
| Total identifiable assets | 328 |
| Other identifiable liabilities | 108 |
| Total identifiable liabilities | 108 |
| Total identifiable net assets | 220 |
| Goodwill | 729 |
| Total consideration transferred | 949 |
|
SAP Integrated Report 2023 | |||||
| To
Our Stakeholders |
Combined
Management Report |
Consolidated
Financial Statements IFRS |
Further
Information about Sustainability |
Additional Information |
||
In general, the goodwill arising from our acquisitions consists largely of the synergies and the know-how and skills of the acquired businesses’ workforces.
Signavio goodwill was attributed to expected synergies from the acquisition, particularly in the following areas:
| – | Cross-selling opportunities to existing SAP customers across all regions, using SAP’s sales organization |
| – | The acquisition of Signavio complements SAP’s business process intelligence offerings and will help create new offerings by combining Signavio products and SAP products, but is also expected to result, for example, in increased SAP S/4HANA and RISE with SAP sales. |
| – | Improved profitability in Signavio sales and operations |
The allocation of the goodwill resulting from the Signavio acquisition to our operating segments depends on how our operating segments actually benefit from the synergies of the Signavio business combination.
Clarabridge Acquisition
On October 1, 2021 (after receipt of required regulatory approvals and satisfaction or waiver of other customary closing conditions), Qualtrics completed its previously announced acquisition of Clarabridge, a customer experience management software company headquartered in Reston, Virginia, USA, pursuant to an Agreement and Plan of Reorganization and Merger. The number of Qualtrics class A common stock issued to the sellers was fixed based on a valuation of US$1,125 million (subject to certain adjustments) – the assumed Qualtrics share price was US$37.33. The actual consideration transferred (mainly in shares valued at the acquisition date fair value of the common stock) amounted to US$1,298 million (€1,116 million). This includes €910 million of issued shares, €115 million of assumed awards, and €91 million of cash paid.
Qualtrics has (1) assumed, amended, and restated Clarabridge stock plans, and (2) converted the assumed options to purchase shares of Clarabridge stock outstanding into corresponding Qualtrics options. Qualtrics has granted equity incentive awards to certain continuing employees of Clarabridge and its subsidiaries under its own Qualtrics equity plan at Qualtrics’ sole discretion.
The following table summarizes the values of identifiable assets acquired and liabilities assumed in connection with the acquisition of Clarabridge, as at the acquisition date:
Clarabridge Acquisition: Recognized Assets and Liabilities
| € millions | |
| Intangible assets | 218 |
| Other identifiable assets | 84 |
| Total identifiable assets | 302 |
| Other identifiable liabilities | 107 |
| Total identifiable liabilities | 107 |
| Total identifiable net assets | 195 |
| Goodwill | 921 |
| Total consideration transferred | 1,116 |
In general, the goodwill arising from our acquisitions consists largely of the synergies and the know-how and skills of the acquired businesses’ workforces.
The Clarabridge goodwill consists largely of the synergies that SAP expects to achieve from combining the acquired assets and operations with its existing operations, especially in its Qualtrics subsidiary.
|
SAP Integrated Report 2023 | |||||
| To
Our Stakeholders |
Combined
Management Report |
Consolidated
Financial Statements IFRS |
Further
Information about Sustainability |
Additional Information |
||
Impact of Business Combinations on Our Consolidated Financial Statements
The amounts of revenue and profit or loss of the Signavio and Clarabridge businesses acquired in 2021 since the acquisition date are included in the 2021 consolidated income statements as follows:
2021 Acquisitions: Impact on SAP’s Financials (Signavio and Clarabridge)
| € millions | 20211 as Reported |
Contribution
of 2021 Acquisitions |
|
Revenue |
27,842 | 70 |
|
Profit
after tax |
5,376 | –89 |
1 From continuing and discontinued operations
Had the acquired entities been consolidated as at January 1, 2021, our 2021 revenue and profit after tax would not have been materially different.
2021 Divestitures
On April 13, 2021, SAP and investment company Dediq GmbH, Munich (Germany) (“Dediq”) announced that they had agreed to enter into a partnership in the area of financial services. Following the close of the transaction in September 2021 (after satisfaction of all closing conditions including regulatory approvals), SAP and Dediq jointly own the new SAP Fioneer entity (with SAP owning a minority share).
SAP and SAP Fioneer have executed transition service and go-to-market agreements, among others.
The disposal gain relating to the transfer of the business (predominantly IP and employees) was included in Other operating income/expense, net (€77 million).
(D.2) Goodwill
Goodwill
and Intangible Asset Impairment Testing
The annual goodwill impairment test is performed at the level of our operating segments, since there are no lower levels in SAP at which goodwill is monitored for internal management purposes.
In general, the test is performed at the same time (at the beginning of the fourth quarter) for all operating segments.
In making impairment assessments for our goodwill and intangible assets, the outcome of these tests is highly dependent on management’s assumptions regarding future cash flow projections and economic risks, which require significant judgment and assumptions about future developments. They can be affected by a variety of factors, including:
| – | Changes in business strategy | |
| – | Internal forecasts | |
| – | Estimation of weighted-average cost of capital |
Changes to the assumptions underlying our goodwill and intangible assets impairment assessments could require material adjustments to the carrying amount of our recognized goodwill and intangible assets as well as the amounts of impairment charges recognized in profit or loss.
|
SAP Integrated Report 2023 | |||||
| To
Our Stakeholders |
Combined
Management Report |
Consolidated
Financial Statements IFRS |
Further
Information about Sustainability |
Additional Information |
||
The outcome of goodwill impairment tests may also depend on the allocation of goodwill to our operating segments. This allocation involves judgment as it is based on our estimates regarding which operating segments are expected to benefit from the synergies of business combinations.
Changes in our segment structure result in the reallocation of goodwill with the reallocated goodwill being calculated based on relative values (if a direct allocation is not possible).
Goodwill
| € millions | |
| Historical cost | |
| 1/1/2022 | 31,190 |
| Foreign currency exchange differences | 1,526 |
| Additions from business combinations | 560 |
| Retirements/disposals | –95 |
| 12/31/2022 | 33,181 |
| Foreign currency exchange differences | –849 |
| Additions from business combinations | 867 |
| Retirements/disposals | –4,008 |
| 12/31/2023 | 29,191 |
| Accumulated amortization | |
| 1/1/2022 | 102 |
| Foreign currency exchange differences | 2 |
| 12/31/2022 | 104 |
| Foreign currency exchange differences | –1 |
| 12/31/2023 | 103 |
| Carrying amount | |
| 12/31/2022 | 33,077 |
| 12/31/2023 | 29,088 |
For more information about our segments and the changes in 2023, see Note (C.1).
Throughout 2023, we have – through a qualitative and quantitative analysis – been continuously monitoring whether triggering events exist. We did not identify any triggering events that would indicate or cause the carrying amount of goodwill to exceed the recoverable amount.
For impairment testing purposes, the carrying amount of goodwill is allocated to the operating segments expected to benefit from goodwill as follows:
Goodwill by Operating Segment
| € millions | Applications,
Technology & Services |
Qualtrics1 | Emarsys | Taulia2 | Business Network | Sustainability | Total |
| 12/31/2022 | 27,221 | 4,083 | 395 | 294 | 1,052 | 32 | 33,077 |
| 12/31/2023 | 27,392 | 0 | 395 | 296 | 976 | 29 | 29,088 |
|
1 The Qualtrics segment was dissolved after the divestiture of SAP’s share in Qualtrics International Inc. 2 Taulia goodwill opening balance was adjusted by €28 million in 2023. |
|||||||
Due to the dissolution of the SAP Signavio segment at the beginning of 2023 (for more information, see Note (C.1)), the SAP Signavio goodwill (€410 million) was moved to the Applications, Technology & Services segment. Given the close proximity to the 2022 annual goodwill impairment test and the significant headroom, no formal impairment test was performed on the reallocation date of the SAP Signavio segment.
|
SAP Integrated Report 2023 | |||||
| To
Our Stakeholders |
Combined
Management Report |
Consolidated
Financial Statements IFRS |
Further
Information about Sustainability |
Additional Information |
||
Based on the expected synergies, the goodwill added through the acquisition of LeanIX (€867 million) was provisionally allocated to the Applications, Technology & Services segment on December 31. As the initial accounting for the LeanIX business combination is incomplete (for more information, see Note (D.1)), the allocation is provisional. The goodwill impairment test for the Applications, Technology & Services segment on October 1 resulted in a headroom that is significantly higher than the portion of the goodwill that – at the end of December – was allocated to the segment. Thus, there is no impairment risk resulting from the allocation of the LeanIX goodwill.
Goodwill Impairment Test
The key assumptions on which management based its cash flow projections for the period covered by the underlying business plans are as follows:
| Key Assumption | Basis for Determining Values Assigned to Key Assumption |
| Budgeted revenue growth | Revenue growth rate achieved in the current year, adjusted for an expected increase in SAP’s addressable cloud and database markets; expected growth in the established software applications and analytics markets. Values assigned reflect our past experience and our expectations regarding an increase in the addressable markets. |
| Budgeted operating margin | Operating margin budgeted for a given budget period equals the operating margin achieved in the current year, increased by expected efficiency gains. Values assigned reflect past experience, except for efficiency gains. |
| Discount rates | Our estimated cash flow projections are discounted to present value using discount rates (after-tax rates). Discount rates are based on the weighted average cost of capital (WACC) approach. |
| Terminal growth rate | Our estimated cash flow projections for periods beyond the business plan were extrapolated using segment-specific terminal growth rates. These growth rates do not exceed the long-term average growth rates for the markets in which our segments operate. |
Key Assumptions and Detailed Planning Period
| Percent, unless otherwise stated | Applications,
Technology & Services1 |
Emarsys | Taulia | Business Network | Sustainability | |||||
| 2023 | 2022 | 2023 | 2022 | 2023 | 2022 | 2023 | 2022 | 2023 | 2022 | |
| Budgeted revenue growth (average of the budgeted period) | 12.8 | 11.4 | 13.3 | 13.9 | 22.3 | 24.8 | 12.7 | 14.0 | 31.5 | 34.6 |
| After-tax discount rate | 11.9 | 11.1 | 12.3 | 11.7 | 11.0 | 11.3 | 12.5 | 11.9 | 11.7 | 10.9 |
| Terminal growth rate | 3.0 | 3.0 | 3.0 | 3.0 | 3.0 | 3.0 | 3.0 | 3.0 | 3.0 | 3.0 |
| Detailed planning period (in years) | 5 | 5 | 12 | 12 | 13 | 13 | 10 | 10 | 12 | 12 |
| 1 The 2022 figures relate to the Applications, Technology & Support segment without the reallocation of the SAP Signavio segment. | ||||||||||
On October 1, 2023, we performed a goodwill impairment test for the operating segments.
Applications, Technology & Services Segment
For more information about our 2023 segment changes, see Note (C.1).
The recoverable amount was determined based on a fair value less costs of disposal calculation. The fair value measurement was categorized as a Level 3 fair value based on the inputs used in the valuation. The cash flow projections were based on actual operating results and specific estimates covering a detailed planning period and the terminal growth rate thereafter. The projected results were determined based on management’s estimates and are consistent with the assumptions a market participant would make (a target operating margin of 34.5% (2022: 27.8%) was used in the valuation).
|
SAP Integrated Report 2023 | |||||
| To
Our Stakeholders |
Combined
Management Report |
Consolidated
Financial Statements IFRS |
Further
Information about Sustainability |
Additional Information |
||
We believe that no reasonably possible change in any of the above key assumptions would cause the carrying amount of our Applications, Technology & Services segment to exceed the recoverable amount.
Emarsys Segment
The recoverable amount was determined based on a fair value less costs of disposal calculation. The fair value measurement was categorized as a Level 3 fair value based on the inputs used in the valuation. The cash flow projections were based on actual operating results and specific estimates covering a detailed planning period and the terminal growth rate thereafter. The projected results were determined based on management’s estimates and are consistent with the assumptions a market participant would make (a target operating margin of 33.2% (2022: 29.4%) was used in the valuation).
Given the fact that the Emarsys segment is expected to show disproportionate growth in the coming years and has not yet reached a steady state, we have used a longer detailed planning period than one would apply in a more mature segment.
The recoverable amount exceeded the carrying amount by €618 million (2022: €513 million).
The following table shows the amounts by which the key assumptions would need to change individually (that is, without changing the other key assumptions) for the recoverable amount to be equal to the carrying amount. For budgeted revenue growth sensitivity, the cost structure was not adjusted, hence leading to a modified terminal operating margin:
Sensitivity to Change in Assumptions
| Emarsys | ||
| 2023 | 2022 | |
| Budgeted revenue growth (change in pp) | –2.5 | –2.0 |
| Target operating margin at the end of the budgeted period (change in pp) | –21 | –16 |
Taulia Segment
The recoverable amount was determined based on a fair value less costs of disposal calculation. The fair value measurement was categorized as a Level 3 fair value based on the inputs used in the valuation. The cash flow projections were based on actual operating results and specific estimates covering a detailed planning period and the terminal growth rate thereafter. The projected results were determined based on management’s estimates and are consistent with the assumptions a market participant would make (a target operating margin of 26.5% (2022: 24.9%) was used in the valuation).
Given the fact that the Taulia segment is expected to show disproportionate growth in the coming years and has not yet reached a steady state, we have used a longer detailed planning period than one would apply in a more mature segment.
The recoverable amount exceeded the carrying amount by €567 million (2022: €366 million).
The following table shows the amounts by which the key assumptions would need to change individually (that is, without changing the other key assumptions) for the recoverable amount to be equal to the carrying amount. For budgeted revenue growth sensitivity, the cost structure was not adjusted, hence leading to a modified terminal operating margin:
|
SAP Integrated Report 2023 | |||||
| To
Our Stakeholders |
Combined
Management Report |
Consolidated
Financial Statements IFRS |
Further
Information about Sustainability |
Additional Information |
||
Sensitivity to Change in Assumptions
| Taulia | ||
| 2023 | 2022 | |
| Budgeted revenue growth (change in pp) | –1.6 | –1.1 |
| Target operating margin at the end of the budgeted period (change in pp) | –15 | –11 |
| After-tax discount rate | 5.8 | 3.4 |
Business Network Segment
The recoverable amount was determined based on a fair value less costs of disposal calculation. The fair value measurement was categorized as a Level 3 fair value based on the inputs used in the valuation. The cash flow projections were based on actual operating results and specific estimates covering a detailed planning period and the terminal growth rate thereafter. The projected results were determined based on management’s estimates and are consistent with the assumptions a market participant would make (a target operating margin of 25.2% (2022: 24.2%) was used in the valuation).
Given the fact that the Business Network segment is expected to show disproportionate growth in the coming years and has not yet reached a steady state, we have used a longer detailed planning period than one would apply in a more mature segment.
The recoverable amount exceeded the carrying amount by €2,719 million (2022: €2,821 million).
The following table shows the amounts by which the key assumptions would need to change individually (that is, without changing the other key assumptions) for the recoverable amount to be equal to the carrying amount. For budgeted revenue growth sensitivity, the cost structure was not adjusted, hence leading to a modified terminal operating margin:
Sensitivity to Change in Assumptions
| Business Network | ||
| 2023 | 2022 | |
| Budgeted revenue growth (change in pp) | –3.0 | –2.8 |
| Target operating margin at the end of the budgeted period (change in pp) | –19 | –19 |
Sustainability Segment
The recoverable amount was determined based on a fair value less costs of disposal calculation. The fair value measurement was categorized as a Level 3 fair value based on the inputs used in the valuation. The cash flow projections were based on actual operating results and specific estimates covering a detailed planning period and the terminal growth rate thereafter. The projected results were determined based on management’s estimates and are consistent with the assumptions a market participant would make (a target operating margin of 26.9% (2022: 26.2%) was used in the valuation).
Given the fact that the Sustainability segment is expected to show disproportionate growth in the coming years and has not yet reached a steady state, we have used a longer detailed planning period than one would apply in a more mature segment.
The recoverable amount exceeded the carrying amount by €246 million (2022: €112 million).
The following table shows the amounts by which the key assumptions would need to change individually (that is, without changing the other key assumptions) for the recoverable amount to be equal to the carrying amount. For budgeted revenue growth sensitivity, the cost structure was not adjusted, hence leading to a modified terminal operating margin:
Sensitivity to Change in Assumptions
| Sustainability | ||
| 2023 | 2022 | |
| Budgeted revenue growth (change in pp) | –2.1 | –1.4 |
| Target operating margin at the end of the budgeted period (change in pp) | –19 | –13 |
| After-tax discount rate | 8.3 | 3.9 |
|
SAP Integrated Report 2023 | |||||
| To
Our Stakeholders |
Combined
Management Report |
Consolidated
Financial Statements IFRS |
Further
Information about Sustainability |
Additional Information |
||
(D.3) Intangible Assets
Recognition
of Intangibles
Whereas in general, expenses for internally generated intangibles are expensed as incurred, development expenses incurred on standard-related customer development projects (for which the IAS 38 criteria are met cumulatively) are capitalized on a limited scale with those amounts being amortized over the estimated useful life for the majority of the projects of five to seven years.
Determining whether internally generated intangible assets from development qualify for recognition requires significant judgment, particularly in the following areas:
| – | Determining whether activities should be considered research activities or development activities | |
| – | Determining whether the conditions for recognizing an intangible asset are met requires assumptions about future market conditions, customer demand, and other developments. | |
| – | The term “technical feasibility” is not defined in IFRS, and therefore determining whether the completion of an asset is technically feasible requires judgment and a company-specific approach. | |
| – | Determining the future ability to use or sell the intangible asset arising from the development and the determination of the probability of future benefits from sale or use | |
| – | Determining whether a cost is directly or indirectly attributable to an intangible asset and whether a cost is necessary for completing a development |
These judgments impact the total amount of intangible assets that we present in our balance sheet as well as the timing of recognizing development expenses in profit or loss.
Measurement
of Intangibles
All our purchased intangible assets other than goodwill have finite useful lives. They are initially measured at acquisition cost and subsequently amortized based on the expected consumption of economic benefits over their estimated useful lives ranging from two to 20 years.
Judgment is required in determining the following:
| – | The useful life of an intangible asset, as this is based on our estimates regarding the period over which the intangible asset is expected to generate economic benefits to us | |
| – | The amortization method, as IFRS requires the straight-line method to be used unless we can reliably determine the pattern in which the asset’s future economic benefits are expected to be consumed by us |
Both the amortization period and the amortization method have an impact on the amortization expense that is recorded in each period.
Classification
of Intangibles
We classify intangible assets according to their nature and use in our operations. Software and database licenses consist primarily of technology for internal use, whereas acquired technology consists primarily of purchased software to be incorporated into our product offerings. Customer relationships and other intangibles consist primarily of customer relationships and acquired trademark licenses.
|
SAP Integrated Report 2023 | |||||
| To
Our Stakeholders |
Combined
Management Report |
Consolidated
Financial Statements IFRS |
Further
Information about Sustainability |
Additional Information |
||
Amortization expenses of intangible assets are classified as Cost of cloud, Cost of services, Research and development, Sales and marketing, and General and administration, depending on the use of the respective intangible assets.
Intangible Assets
| € millions | Software
and Database Licenses |
Acquired
Technology |
Customer
Relationships and Other |
Total |
| Historical cost | ||||
| 1/1/2022 | 833 | 2,996 | 6,734 | 10,563 |
| Foreign currency exchange differences | 8 | 170 | 337 | 515 |
| Additions from business combinations | 0 | 65 | 98 | 163 |
| Other additions | 244 | 0 | 65 | 309 |
| Retirements/disposals | –115 | –703 | –92 | –910 |
| Transfers | 87 | –1 | –85 | 1 |
| 12/31/2022 | 1,057 | 2,527 | 7,057 | 10,641 |
| Foreign currency exchange differences | –1 | –65 | –185 | –251 |
| Additions from business combinations | 0 | 121 | 355 | 476 |
| Other additions | 22 | 3 | 59 | 84 |
| Retirements/disposals | –92 | –767 | –2,307 | –3,166 |
| Transfers | 87 | 0 | –87 | 0 |
| 12/31/2023 | 1,073 | 1,819 | 4,892 | 7,784 |
| Accumulated amortization | ||||
| 1/1/2022 | 547 | 2,398 | 3,653 | 6,598 |
| Foreign currency exchange differences | 7 | 137 | 171 | 315 |
| Additions amortization | 99 | 209 | 458 | 766 |
| Retirements/disposals | –109 | –703 | –61 | –873 |
| 12/31/2022 | 544 | 2,041 | 4,221 | 6,806 |
| Foreign currency exchange differences | –1 | –57 | –118 | –176 |
| Additions amortization | 146 | 77 | 305 | 528 |
| Retirements/disposals | –95 | –477 | –1,307 | –1,879 |
| 12/31/2023 | 594 | 1,584 | 3,101 | 5,279 |
| Carrying amount | ||||
| 12/31/2022 | 513 | 486 | 2,836 | 3,835 |
| 12/31/2023 | 479 | 235 | 1,791 | 2,505 |
Significant Intangible Assets
| € millions, unless otherwise stated | Carrying Amount | Remaining
Useful Life (in years) |
|
| 2023 | 2022 | ||
| Concur – Customer relationships | 588 | 704 | 7 to 11 |
| LeanIX - Customer relationships | 345 | 0 | 13 |
| Callidus – Customer relationships | 147 | 181 | 9 |
| Signavio – Customer relationships | 178 | 183 | 13 |
| Total significant intangible assets | 1,258 | 1,068 | |
|
SAP Integrated Report 2023 | |||||
| To
Our Stakeholders |
Combined
Management Report |
Consolidated
Financial Statements IFRS |
Further
Information about Sustainability |
Additional Information |
||
(D.4) Property, Plant, and Equipment
Depreciation
of Property, Plant and Equipment
Property, plant, and equipment are typically depreciated using the straight-line method. Judgment is required in estimating the useful life of the assets. In this assessment we consider, among others, our history with similar assets and current and future changes in technology.
Useful Lives of Property, Plant, and Equipment
| Buildings | Predominantly 25 to 50 years |
| Leased assets and leasehold improvements | Based on the term of the lease contract |
| Information technology equipment | 2 to 6 years |
| Office furniture | 4 to 20 years |
| Automobiles | 4 to 5 years |
Property, Plant, and Equipment
| € millions | Land
and Buildings |
Land
and Buildings Leased |
Other Property, Plant, and Equipment |
Other
Property, Plant, and Equipment Leased |
Advance Payments and Construction in Progress |
Total |
| 12/31/2022 | 1,585 | 1,758 | 1,406 | 43 | 142 | 4,934 |
| 12/31/2023 | 1,430 | 1,320 | 1,309 | 55 | 162 | 4,276 |
| Additions | ||||||
| 12/31/2022 | 46 | 399 | 567 | 30 | 87 | 1,129 |
| 12/31/2023 | 58 | 102 | 470 | 82 | 98 | 810 |
The additions (other than from business combinations) relate primarily to the replacement and purchase of information technology equipment and the construction and leasing of buildings and data centers. For more information about leases, see Note (D.5).
(D.5) Leases
Accounting Policies, Judgments, and Estimates
Under IFRS 16, a contract is or contains a lease if the contract conveys the right to control the use of an identified asset for a period of time in exchange for consideration. As a lessee, SAP recognizes a right-of-use asset representing its right to use the underlying asset and a lease liability representing its obligation to make lease payments. The right-of-use assets are depreciated on a straight-line basis and interest expense is recognized on the lease liabilities. The vast majority of our leases consist of facility and data center leases. Payments for short-term and low-value leases are expensed over the lease term. Extension options are included in the lease term if their exercise is reasonably certain.
|
SAP Integrated Report 2023 | |||||
| To
Our Stakeholders |
Combined
Management Report |
Consolidated
Financial Statements IFRS |
Further
Information about Sustainability |
Additional Information |
||
Leases in the Balance Sheet
| € millions | 12/31/2023 | 12/31/2022 |
| Right-of-use assets | ||
| Right-of-use assets – land and buildings | 1,320 | 1,758 |
| Right-of-use assets – other property, plant, and equipment | 55 | 43 |
| Total right-of-use assets | 1,375 | 1,801 |
|
Property,
plant, and equipment |
4,276 | 4,934 |
| Right-of-use
assets as % of Property, plant, and equipment |
32 | 37 |
| Lease liabilities | ||
| Current lease liabilities | 294 | 349 |
|
Current financial liabilities |
1,735 | 4,808 |
| Current
lease liabilities as % of Current financial liabilities |
17 | 7 |
| Non-current lease liabilities | 1,327 | 1,791 |
|
Non-current
financial liabilities |
7,941 | 9,547 |
| Non-current
lease liabilities as % of Non-current financial liabilities |
17 | 19 |
SAP is committed to future minimum lease payments in the amount of €37 million (2022: €49 million) for facility leases that had not yet commenced as at December 31, 2023.
Leases in the Income Statement
| € millions | 2023 | 2022 |
| Lease expenses within operating profit | ||
| Depreciation of right-of-use assets | 325 | 397 |
For more information about right-of-use asset additions, see Note (D.4), and for a maturity analysis of lease liabilities, see Note (F.1). For more information about the cash flow related to lease liabilities, see the “Reconciliation of Liabilities Arising from Financing Activities” table within Note (E.3).
(D.6) Equity Investments
Accounting
Policies, Judgments, and Estimates
As we do not designate financial assets as “at fair value through profit or loss,” we generally classify financial assets into the following categories: at amortized cost (AC), at fair value through other comprehensive income (FVOCI), and at fair value through profit or loss (FVTPL), depending on the contractual cash flows of and our business model for holding the respective asset.
For equity securities, as the cash flow characteristics are other than solely principal and interest, we take an investment-by-investment decision whether to classify as FVTPL or FVOCI.
The valuation of equity securities of private companies requires judgment because it is typically based on significant unobservable inputs, as no market prices are available and there is inherent lack of liquidity.
We take the most recent qualitative and quantitative information aspects into consideration to determine the fair value estimates of these equity securities.
Considerable judgment and assumptions are involved with regard to the selection of appropriate comparable company data, the assessment of cash requirements of the business, the acceptance of the technology or products in the addressable markets, the actual and forecasted performance, the milestone achievements, the adequacy of price points from financing rounds, the transaction of similar securities of the same company, the rights and preferences of the underlying securities, the selection of adequate equity allocation parameters, the possible exit scenarios and associated weightings.
|
SAP Integrated Report 2023 | |||||
| To
Our Stakeholders |
Combined
Management Report |
Consolidated
Financial Statements IFRS |
Further
Information about Sustainability |
Additional Information |
||
Because all of these assumptions could change significantly, and because valuation is inherently uncertain, our estimated fair values may differ significantly from the values that would have been used had market prices for the investments existed and that will ultimately be realized, and those differences could be material.
Gains/losses on equity securities at FVTPL include gains/losses from fair value fluctuations, from disposals as well as dividends, while gains/losses on equity securities at FVOCI only include dividends, all of which are shown in Financial income, net. Regular way purchases and sales are recorded as at the trade date.
Equity Investments
| € millions | 2023 | 2022 | ||||
| Current | Non-Current | Total | Current | Non-Current | Total | |
| Equity securities | 0 | 4,967 | 4,967 | 0 | 5,138 | 5,138 |
| Investments in associates | 0 | 135 | 135 | 0 | 151 | 151 |
| Equity investments | 0 | 5,102 | 5,102 | 0 | 5,289 | 5,289 |
| Other financial assets | 3,344 | 5,543 | 8,887 | 853 | 5,626 | 6,479 |
| Equity investments as % of Other financial assets | 0 | 92 | 57 | 0 | 94 | 82 |
Investments in Associates
SAP has interests in a number of individually immaterial associates. We own more than 20% of the equity interests or have at least 20% of the voting rights in these entities. Based on these facts and the nature of the relationships, SAP has determined that it has significant influence.
The following table shows, in aggregate, the carrying amount and share of profit of these associates.
| € millions | 2023 | 2022 |
| Carrying amount of interest in associates | 135 | 151 |
| Share of profit and losses from continuing operations | –16 | –4 |
The vast majority of the carrying amount of interest in associates relates to SAP Fioneer GmbH.
For a list of the names of other equity investments, see Note (G.9).
Financial Commitments in Venture Capital Funds
| € millions | 2023 | 2022 |
| Committed investments in venture capital funds | 269 | 303 |
SAP invests and holds interests in unrelated parties that manage investments in venture capital. On December 31, 2023, total commitments to make such investments amounted to €977 million (2022: €957 million), of which €708 million had been drawn (2022: €654 million). By investing in such venture capital funds, we are exposed to the risks inherent in the business areas in which the entities operate. Our maximum exposure to loss is the amount invested plus contractually committed future capital contributions.
Maturities
| € millions | 12/31/2023 |
| Investments in Venture Capital Funds | |
| Due 2024 | 269 |
| Total | 269 |
|
SAP Integrated Report 2023 | |||||
| To
Our Stakeholders |
Combined
Management Report |
Consolidated
Financial Statements IFRS |
Further
Information about Sustainability |
Additional Information |
||
(D.7) Non-Current Assets by Region
The table below shows non-current assets excluding financial instruments, deferred tax assets, post-employment benefit assets, and rights arising under insurance contracts.
Non-Current Assets by Region
| € millions | 2023 | 2022 |
| Germany | 7,125 | 5,897 |
| Rest of EMEA | 5,902 | 5,897 |
| EMEA | 13,027 | 11,794 |
| United States | 25,236 | 32,385 |
| Rest of Americas | 526 | 510 |
| Americas | 25,762 | 32,894 |
| India | 361 | 333 |
| Rest of APJ | 809 | 877 |
| APJ | 1,170 | 1,210 |
| SAP Group | 39,959 | 45,899 |
The decrease in non-current assets in the United States is primarily due to the divestiture of Qualtrics. For more information, see Note (D.1).
For a breakdown of our employee headcount by region, see Note (B.1), and for a breakdown of revenue by region, see Note (A.1).
(D.8) Purchase Obligations
| € millions | 2023 | 2022 |
| Contractual obligations for acquisition of property, plant, and equipment and intangible assets | 164 | 144 |
| Other purchase obligations | 10,377 | 7,491 |
| Purchase obligations | 10,541 | 7,635 |
The contractual obligations for acquisition of property, plant, and equipment and intangible assets relate primarily to the purchase of hardware, software, patents, office equipment, and vehicles. The remaining obligations relate mainly to cloud services, marketing, consulting, maintenance, license agreements, and other third-party agreements. The increase is mainly due to new purchase obligations related to cloud infrastructure services. Historically, the majority of such purchase obligations have been realized.
Maturities
| € millions | 12/31/2023 |
| Purchase Obligations | |
| Due 2024 | 2,286 |
| Due 2025 to 2028 | 7,752 |
| Due thereafter | 503 |
| Total | 10,541 |
|
SAP Integrated Report 2023 | |||||
| To
Our Stakeholders |
Combined
Management Report |
Consolidated
Financial Statements IFRS |
Further
Information about Sustainability |
Additional Information |
||
(D.9) Income-Related Government Grants
Recognition
of Income-Related Government Grants
We recognize Income-Related Government Grants as a reduction of the related expense in the period in which the expense is incurred.
At the end of 2023, we received a grant from the German government to fund research and development expenditures related to cloud infrastructure. The grant will provide reimbursements of up to €329 million for qualifying expenditures through 2026. No material amounts were recognized or reimbursed in 2023.
|
SAP Integrated Report 2023 | |||||
| To
Our Stakeholders |
Combined
Management Report |
Consolidated
Financial Statements IFRS |
Further
Information about Sustainability |
Additional Information |
||
Section E – Capital Structure, Financing, and Liquidity
This section describes how SAP manages its capital structure. Our capital management is based on a high equity ratio, modest financial leverage, a well-balanced maturity profile, and deep debt capacity.
(E.1) Capital Structure Management
The primary objective of our capital structure management is to maintain a strong financial profile for investor, creditor, and customer confidence, and to support the growth of our business. We seek to maintain a capital structure that will allow us to continuously cover our funding requirements through the capital markets on reasonable terms and, in so doing, ensure a high level of independence, confidence, and financial flexibility.
SAP’s prime principle of financial risk management is to safeguard liquidity at a level to be able to meet all our financial obligations. In order to support this goal, SAP’s principal use of cash is focused on:
| – | Capital expenditure |
| – | Quick repayment of financial debt |
| – | Acquisitions and venture activities |
| – | Payment of dividends |
| – | Share buy-backs to return excess cash to shareholders |
SAP SE’s long-term credit rating is “A2” by Moody’s (positive outlook) and “A+” by S&P Global Ratings (stable outlook).
| 12/31/2023 | 12/31/2022 | ∆ in % | |||
| € millions |
% of Total
Equity |
€ millions |
% of Total
Equity |
||
|
Equity |
43,406 | 64 | 42,848 | 59 | 1 |
|
Current
liabilities |
14,642 | 21 | 17,453 | 24 | –16 |
|
Non-current
liabilities |
10,287 | 15 | 11,858 | 16 | –13 |
|
Liabilities |
24,928 | 36 | 29,311 | 41 | –15 |
| Thereof financial debt | 7,755 | 11 | 11,764 | 16 | –34 |
| Thereof lease liabilities | 1,621 | 2 | 2,140 | 3 | –25 |
|
Total
equity and liabilities |
68,335 | 100 | 72,159 | 100 | –5 |
At maturity, we repaid €1,600 million in Eurobonds, €1,450 million in term loans, and €930 million in Commercial Paper in 2023. The ratio of total nominal volume of financial debt to total equity and liabilities decreased 5 pp. Applying IFRS 5, prior-year numbers include amounts attributable to Qualtrics.
|
SAP Integrated Report 2023 | |||||
| To
Our Stakeholders |
Combined
Management Report |
Consolidated
Financial Statements IFRS |
Further
Information about Sustainability |
Additional Information |
||
(E.2) Total Equity
Accounting
for Interests in Subsidiaries
Changes in SAP's interest in a subsidiary that do not result in a loss of control are accounted for as equity transactions. When SAP loses control over the subsidiary, it derecognizes the assets and liabilities of the subsidiary, and any related non-controlling interests (NCI) and other components of equity. Any resulting gain or loss is recognized in profit or loss.
Issued Capital
SAP SE has issued no-par value bearer shares with a calculated nominal value of €1 per share. All of the shares issued are fully paid.
Number of Shares
| Millions | Issued Capital | Treasury Shares |
| 1/1/2021 | 1,228.5 | –48.9 |
| 12/31/2021 | 1,228.5 | –48.9 |
| Purchase of treasury shares | 0 | –15.7 |
| Reissuance of treasury shares under share-based payments | 0 | 3.3 |
| 12/31/2022 | 1,228.5 | –61.4 |
| Purchase of treasury shares | 0 | –7.6 |
| Reissuance of treasury shares under share-based payments | 0 | 7.7 |
| 12/31/2023 | 1,228.5 | –61.3 |
On August 14, 2023, SAP launched a new share repurchase program designed primarily to service future share-based compensation awards. With a total volume of up to €1,250 million, the program will run until February 19, 2024. By December 31, 2023, we had repurchased shares with a total volume of €949 million. In addition, we reissued 7.7 million treasury shares to service share-based payment awards under our Move SAP Plan in 2023.
Authorized Shares
The Articles of Incorporation authorize the Executive Board to increase the issued capital as follows:
| – | By up to a total amount of €250 million by issuing new no-par value bearer shares against contributions in cash until May 19, 2025 (Authorized Capital I). The issuance is subject to the statutory subscription rights of existing shareholders. |
| – | By up to a total amount of €250 million by issuing new no-par value bearer shares against contributions in cash or in kind until May 19, 2025 (Authorized Capital II). Subject to the consent of the Supervisory Board, the Executive Board is authorized to exclude the shareholders’ statutory subscription rights in certain cases. |
Contingent Shares
SAP SE’s share capital is subject to a contingent capital increase, which will be implemented only insofar as the holders or creditors of convertible bonds or stock options issued or guaranteed by SAP SE or any of its directly or indirectly controlled subsidiaries under certain share-based payments exercise their conversion or subscription rights, and no other methods for servicing these rights are used. As at December 31, 2023, €100 million, representing 100 million shares, was still available for issuance (2022: €100 million).
Retained Earnings
Retained earnings mainly comprise profit after tax and dividend payments as well as transactions with non-controlling interests.
|
SAP Integrated Report 2023 | |||||
| To
Our Stakeholders |
Combined
Management Report |
Consolidated
Financial Statements IFRS |
Further
Information about Sustainability |
Additional Information |
||
Other Components of Equity
| € millions | Exchange
Differences |
Cash
Flow Hedges/Cost of Hedging |
Total |
| 1/1/2021 | –1,016 | 4 | –1,012 |
| Other comprehensive income for items that will be reclassified to profit or loss, net of tax | 2,846 | –26 | 2,819 |
| 12/31/2021 | 1,830 | –22 | 1,808 |
| Other comprehensive income for items that will be reclassified to profit or loss, net of tax | 2,186 | 39 | 2,224 |
| 12/31/2022 | 4,015 | 16 | 4,031 |
| Other comprehensive income for items that will be reclassified to profit or loss, net of tax | –1,597 | –8 | –1,605 |
| 12/31/2023 | 2,418 | 9 | 2,426 |
Treasury Shares
By resolution of SAP SE’s Annual General Meeting of Shareholders held on May 11, 2023, the authorization granted by the Annual General Meeting of Shareholders on May 17, 2018, regarding the acquisition of treasury shares was revoked to the extent it had not been exercised at that time, and replaced by a new authorization of the Executive Board of SAP SE to acquire, on or before May 10, 2028, shares of SAP SE representing a pro rata amount of capital stock of up to €120 million in aggregate, provided that the shares purchased under the authorization, together with any other shares in the Company previously acquired and held by, or attributable to, SAP SE do not account for more than 10% of SAP SE’s issued share capital. Although treasury shares are legally considered outstanding, there are no dividend or voting rights associated with them. We may redeem or resell shares held in treasury, or we may use treasury shares for the purpose of servicing option or conversion rights under the Company’s share-based payment plans. Also, we may use shares held in treasury as consideration in connection with mergers with, or acquisitions of, other companies.
Following the above authorization, in May 2023 we announced a new share buyback program with an aggregate volume of up to €5 billion and a term until December 31, 2025. As part of the first tranche of this program, we acquired shares with a volume of €949 million (without incidental acquisition costs) between August 14, 2023, and December 31, 2023.
Distribution Policy and Dividends
Our general intention is to remain in a position to return liquidity to our shareholders by distributing annual dividends totaling 40% or more of our profit after tax and by potentially repurchasing treasury shares in future.
In 2023, we distributed €2,395 million (€2.05 per share) in dividends for 2022, compared to €2,865 million (€2.45 per share, including a special dividend of €0.50 to celebrate SAP’s 50th anniversary) paid in 2022 for 2021 and €2,182 million (€1.85 per share) paid in 2021 for 2020.
The total dividend available for distribution to SAP SE shareholders is based on the profits of SAP SE as reported in its statutory financial statements prepared under the accounting rules in the German Commercial Code (Handelsgesetzbuch). For the year ended December 31, 2023, the Executive Board intends to propose that a dividend of €2.20 per share (that is, an estimated total dividend of €2,568 million), be paid from the profits of SAP SE.
Non-Controlling Interests
Until divestiture in June 2023, Qualtrics issued new shares to serve share-based payment awards under the Qualtrics Omnibus plan, which further reduced SAP’s ownership in Qualtrics to 69% (2022: 71%). In the first half of 2023, a loss of €141 million (2022: €366 million) was attributed to non-controlling interests of Qualtrics. For more information about the divestiture of Qualtrics, see
|
SAP Integrated Report 2023 | |||||
| To
Our Stakeholders |
Combined
Management Report |
Consolidated
Financial Statements IFRS |
Further
Information about Sustainability |
Additional Information |
||
Note (D.1). In 2023, a loss of €33 million (2022: €210 million) was attributed to non-controlling interests of other SAP entities.
(E.3) Liquidity
Accounting
for Non-Derivative Financial Instruments
Classification and Measurement of Non-Derivative Financial Debt Investments
Our non-derivative financial debt investments comprise cash at banks and cash equivalents (highly liquid investments with original maturities of three months or less, such as time deposits and money-market funds), loans and other financial receivables, and acquired debt securities.
We generally classify financial assets as: at amortized cost (AC), at fair value through other comprehensive income (FVOCI), or at fair value through profit or loss (FVTPL), depending on the contractual cash flows of, and our business model for, holding the respective asset. Financial assets having cash flow characteristics other than solely principal and interest such as money market and similar funds are classified as FVTPL. Generally, other financial assets with cash flows consisting solely of principal and interest are held within a business model whose objective is “hold to collect” and are thus classified as AC. Occasionally, such other financial assets are held within a business model whose objective is “hold to collect and sell” in which case they are classified as FVOCI.
Gains/losses on non-derivative financial debt investments at FVTPL are reported in Financial income, net and show interest income/expenses separately from other gains/losses which include gains/losses from fair value fluctuations and disposals. Gains/losses on non-derivative financial debt investments at AC are reported in Financial income, net and show interest income/expenses separately from other gains/losses which include gains/losses on disposals and changes in expected and incurred credit losses. Gains/losses from foreign currency exchange rate fluctuations are included in Other non-operating income/expense, net. Regular way purchases and sales are recorded as at the trade date.
Impairment of Non-Derivative Financial Debt Investments
For these financial assets, we apply considerable judgment by employing the general impairment approach as follows:
| – | For cash at banks, time deposits, and debt securities such as acquired bonds and acquired commercial papers, we apply the low credit risk exception, as it is our policy to invest only in high-quality assets of issuers with a minimum rating of at least investment grade to minimize the risk of credit losses. Thus, these assets are always allocated to stage 1 of the three-stage credit loss model, and we record a loss allowance at an amount equal to 12-month expected credit losses. This loss allowance is calculated based on our exposure at the respective reporting date, the loss given default for this exposure, and the credit default swap spread as a measure for the probability of default. Even though we invest only in assets of at least investment-grade, we also closely observe the development of credit default swap spreads as a measure of market participants’ assessments of the creditworthiness of a debtor to evaluate probable significant increases in credit risk to timely react to changes should these manifest. Among others, we consider cash at banks, time deposits, and debt securities to be in default when the counterparty is unlikely to pay its obligations in full, when there is information about a counterparty’s financial difficulties or if there is a drastic increase in a counterparty’s credit default swap spread for a prolonged time period while the overall market environment remains generally stable. Such financial assets are written off either partially or in full if the likelihood of recovery is considered remote, which might be evidenced, for example, by the bankruptcy of a counterparty of such financial assets. | |
| – | Loans and other financial receivables are monitored based on borrower-specific internal and external information to determine whether there has been a significant increase in credit risk since initial recognition. We consider such assets to be in default if they are significantly beyond their due date or if the borrower is unlikely to pay its obligation. A write-off occurs when the likelihood of recovery is considered remote, for example when bankruptcy proceedings have been finalized or when all enforcement efforts have been exhausted. |
|
SAP Integrated Report 2023 | |||||
| To
Our Stakeholders |
Combined
Management Report |
Consolidated
Financial Statements IFRS |
Further
Information about Sustainability |
Additional Information |
||
Non-Derivative Financial Liabilities
Non-derivative financial liabilities include bank loans, issued bonds, private placements, and other financial liabilities. Other financial liabilities also include customer funding liabilities which are funds we draw from and make payments on behalf of our customers for customers’ employee expense reimbursements, related credit card payments, and vendor payments. We present these funds in cash and cash equivalents and record our obligation to make these expense reimbursements and payments on behalf of our customers as customer funding liabilities.
As we do not designate financial liabilities as FVTPL, we generally classify non-derivative financial liabilities as AC.
Expenses and gains or losses on financial liabilities at AC mainly consist of interest expense which is shown in Financial income, net. Gains/losses from foreign currency exchange rate fluctuations are included in Other non-operating income/expense, net.
Group Liquidity, Financial Debt, and Net Debt
Group liquidity consists of cash at banks, money market and other funds, as well as time deposits and debt securities (both with remaining maturities of less than one year). Financial debt is defined as the nominal volume of bank loans, issued commercial papers, private placements, and bonds. Net debt is group liquidity less financial debt.
Group Liquidity and Net Debt
| € millions | 2023 | 2022 | ∆ |
|
Cash and cash equivalents |
8,124 | 9,008 | –883 |
| Current time deposits and debt securities | 3,151 | 686 | 2,464 |
| Group liquidity | 11,275 | 9,694 | 1,581 |
| Current financial debt | –1,143 | –3,986 | 2,843 |
| Non-current financial debt | –6,612 | –7,778 | 1,166 |
| Financial debt | –7,755 | –11,764 | 4,009 |
| Net debt (–) | 3,521 | –2,070 | 5,590 |
While we continuously monitor the ratios presented in the capital structure table, we actively manage our liquidity and structure of our financial indebtedness based on the ratios group liquidity and net debt.
Cash and Cash Equivalents
| € millions | 2023 | 2022 | ||||
| Current | Non-Current | Total | Current | Non-Current | Total | |
| Cash at banks | 3,369 | 0 | 3,369 | 3,176 | 0 | 3,176 |
| Time deposits | 2,130 | 0 | 2,130 | 2,932 | 0 | 2,932 |
| Money market and other funds | 2,478 | 0 | 2,478 | 2,855 | 0 | 2,855 |
| Debt securities | 150 | 0 | 150 | 47 | 0 | 47 |
| Expected credit loss allowance | –3 | 0 | –3 | –3 | 0 | –3 |
|
Cash
and cash equivalents |
8,124 | 0 | 8,124 | 9,008 | 0 | 9,008 |
|
SAP Integrated Report 2023 | |||||
| To
Our Stakeholders |
Combined
Management Report |
Consolidated
Financial Statements IFRS |
Further
Information about Sustainability |
Additional Information |
||
Non-Derivative Financial Debt Investments
| € millions | 2023 | 2022 | ||||
| Current | Non-Current | Total | Current | Non-Current | Total | |
| Time deposits | 3,028 | 0 | 3,028 | 657 | 0 | 657 |
| Debt securities | 129 | 0 | 129 | 32 | 0 | 32 |
| Financial instruments related to employee benefit plans | 0 | 244 | 244 | 0 | 203 | 203 |
| Loans and other financial receivables | 108 | 192 | 300 | 104 | 129 | 233 |
| Expected credit loss allowance | –7 | 0 | –7 | –3 | 0 | –3 |
| Non-derivative financial debt investments | 3,259 | 436 | 3,695 | 790 | 332 | 1,122 |
|
Other financial assets |
3,344 | 5,543 | 8,887 | 853 | 5,626 | 6,479 |
Non-derivative financial debt investments as % of Other financial assets |
97 | 8 | 42 | 93 | 6 | 17 |
Time deposits with original maturity of three months or less are presented as cash and cash equivalents, and those with original maturities of greater than three months (investments considered in group liquidity) are presented as other financial assets. Debt securities consist of acquired commercial papers and acquired bonds of mainly financial and non-financial corporations and municipalities.
The increase in time deposits presented as cash equivalents and current investments and the increase in money market funds in 2023 are due to the proceeds from the Qualtrics divestiture.
For more information about financial risk and the nature of risk, see Note (F.1).
Financial Debt
| € millions | 2023 | 2022 | ||||||||
| Nominal Volume | Carrying Amount | Nominal Volume | Carrying Amount | |||||||
| Current | Non- Current |
Current | Non- Current |
Total | Current | Non- Current |
Current | Non- Current |
Total | |
| Bonds | 850 | 6,521 | 849 | 5,932 | 6,780 | 1,600 | 7,381 | 1,600 | 6,556 | 8,155 |
| Private placement transactions | 292 | 90 | 294 | 95 | 388 | 0 | 397 | 0 | 405 | 405 |
| Commercial paper | 0 | 0 | 0 | 0 | 0 | 930 | 0 | 928 | 0 | 928 |
| Bank loans | 0 | 0 | 0 | 0 | 0 | 1,456 | 0 | 1,456 | 0 | 1,456 |
| Financial debt | 1,143 | 6,612 | 1,143 | 6,026 | 7,169 | 3,986 | 7,778 | 3,983 | 6,960 | 10,943 |
|
Financial
liabilities1 |
1,735 | 7,941 | 9,676 | 4,808 | 9,547 | 14,354 | ||||
Financial
debt as % of |
66 | 76 | 74 | 83 | 73 | 76 | ||||
1 In 2023, SAP changed the presentation of trade-debtors with a credit balance from Financial liabilities to Trade and other payables. Trade-debtors with credit balances for 2023 are €186 million (2022: €286 million). The presentation for 2022 remains unchanged.
Financial liabilities are unsecured, except for the retention of title and similar rights customary in our industry. Effective interest rates on our financial debt (including the effects from interest rate swaps) were 3.49% in 2023, 1.23% in 2022, and 0.83% in 2021.
For more information about the risk associated with our financial liabilities, see Note (F.1). For more information about fair values, see Note (F.2).
|
SAP Integrated Report 2023 | |||||
| To
Our Stakeholders |
Combined
Management Report |
Consolidated
Financial Statements IFRS |
Further
Information about Sustainability |
Additional Information |
||
Bonds
| 2023 | 2022 | ||||||
| Maturity | Issue Price | Coupon Rate | Effective Interest Rate | Nominal
Volume (in respective currency in millions) |
Carrying Amount (in € millions) |
Carrying Amount (in € millions) |
|
| Eurobond 8 – 2014 | 2023 | 99.478% | 1.125% (fix) | 1.24% | €1,000 | 0 | 1,000 |
| Eurobond 9 – 2014 | 2027 | 99.284% | 1.750% (fix) | 1.87% | €1,000 | 914 | 869 |
| Eurobond 12 – 2015 | 2025 | 99.264% | 1.000% (fix) | 1.13% | €600 | 599 | 598 |
| Eurobond 15 – 2018 | 2026 | 99.576% | 1.000% (fix) | 1.06% | €500 | 499 | 499 |
| Eurobond 16 – 2018 | 2030 | 98.687% | 1.375% (fix) | 1.50% | €500 | 428 | 401 |
| Eurobond 19 – 2018 | 2024 | 99.227% | 0.750% (fix) | 0.89% | €850 | 849 | 848 |
| Eurobond 20 – 2018 | 2028 | 98.871% | 1.250% (fix) | 1.38% | €1,000 | 891 | 843 |
| Eurobond 21 – 2018 | 2031 | 98.382% | 1.625% (fix) | 1.78% | €1,250 | 1,045 | 976 |
| Eurobond 22 – 2020 | 2023 | 99.794% | 0.000% (fix) | 0.07% | €600 | 0 | 600 |
| Eurobond 23 – 2020 | 2026 | 99.200% | 0.125% (fix) | 0.26% | €600 | 598 | 597 |
| Eurobond 24 – 2020 | 2029 | 98.787% | 0.375% (fix) | 0.51% | €800 | 686 | 643 |
| Eurobonds | 6,509 | 7,874 | |||||
| USD bond – 2018 | 2025 | 100.000% | 4.69% (fix) | 4.74% | US$300 | 271 | 281 |
| Bonds | 6,780 | 8,155 | |||||
All of our Eurobonds are listed for trading on the Luxembourg Stock Exchange.
Private Placements
| 2023 | 2022 | |||||
| Maturity | Coupon Rate | Effective
Interest Rate |
Nominal
Volume (in respective currency in millions) |
Carrying Amount (in € millions) |
Carrying Amount (in € millions) |
|
| U.S. private placements | ||||||
| Tranche 8 – 2012 | 2024 | 3.33% (fix) | 3.37% | US$323 | 294 | 306 |
| Tranche 9 – 2012 | 2027 | 3.53% (fix) | 3.57% | US$100 | 95 | 99 |
| Private placements | 388 | 405 | ||||
The U.S. private placement notes were issued by one of our subsidiaries that has the U.S. dollar as its functional currency.
Commercial Paper Program
The net proceeds from our commercial paper (Commercial Paper, or CP) program are being used for general corporate purposes, including dividends and share repurchases. On December 31, 2023, we had no commercial papers outstanding. (December 31, 2022: €928 million carrying amount generally with a maturity of less than six months). The weighted average interest rate of the CP outstanding as of December 31, 2022, was 1.96%.
Loans
In March 2021, SAP drew two short-term bank loans of €950 million and €500 million with original tenors of one year that could be flexibly repaid until September 30, 2023. We repaid both loans in August 2023.
|
SAP Integrated Report 2023 | |||||
| To
Our Stakeholders |
Combined
Management Report |
Consolidated
Financial Statements IFRS |
Further
Information about Sustainability |
Additional Information |
||
Reconciliation of Liabilities Arising from Financing Activities
The changes in our financial debts are reconciled to the cash flows from borrowings included in the cash flow from financing activities.
| € millions | 1/1/2023 | Cash Flows | Business
Combinations |
Foreign
Currency |
Fair
Value Changes |
Other | 12/31/2023 |
| Current financial debt | 3,986 | –3,986 | 0 | 0 | 0 | 1,142 | 1,143 |
| Non-current financial debt | 7,778 | 0 | 0 | –24 | 0 | –1,142 | 6,612 |
| Financial debt (nominal volume) | 11,764 | –3,986 | 0 | –24 | 0 | 0 | 7,755 |
| Basis adjustment | –773 | 0 | 0 | 2 | 221 | 0 | –550 |
| Transaction costs | –47 | 0 | 0 | 0 | 0 | 12 | –35 |
| Financial debt (carrying amount) | 10,943 | –3,986 | 0 | –22 | 221 | 12 | 7,169 |
| Accrued interest and payment to banks | 203 | –83 | 0 | 0 | 0 | –27 | 94 |
| Interest rate swaps | 753 | 0 | 0 | –1 | –215 | 0 | 537 |
| Lease1 | 2,140 | –332 | 0 | 55 | 0 | –241 | 1,621 |
| Total liabilities from financing activities | 14,039 | –4,400 | 0 | 32 | 7 | –256 | 9,421 |
| 1 Other includes new lease liabilities. | |||||||
| € millions | 1/1/2022 | Cash Flows | Business
Combinations |
Foreign
Currency |
Fair
Value Changes |
Other | 12/31/2022 |
| Current financial debt | 3,755 | –1,406 | 0 | 36 | 0 | 1,600 | 3,986 |
| Non-current financial debt | 9,338 | 0 | 0 | 40 | 0 | –1,600 | 7,778 |
| Financial debt (nominal volume) | 13,094 | –1,406 | 0 | 76 | 0 | 0 | 11,764 |
| Basis adjustment | –34 | 0 | 0 | 2 | –741 | 0 | –773 |
| Transaction costs | –55 | 0 | 0 | 0 | 0 | 8 | –47 |
| Financial debt (carrying amount) | 13,005 | –1,406 | 0 | 77 | –741 | 8 | 10,943 |
| Accrued interest | 60 | 119 | 0 | 0 | 0 | 24 | 203 |
| Interest rate swaps | 42 | 0 | 0 | –1 | 711 | 0 | 753 |
| Lease1 | 2,143 | –424 | 0 | 55 | 0 | 366 | 2,140 |
| Total liabilities from financing activities | 15,250 | –1,711 | 0 | 131 | –29 | 398 | 14,039 |
| 1 Other includes new lease liabilities. | |||||||
|
SAP Integrated Report 2023 | |||||
| To
Our Stakeholders |
Combined
Management Report |
Consolidated
Financial Statements IFRS |
Further
Information about Sustainability |
Additional Information |
||
Section F – Management of Financial Risk Factors
This section discusses financial risk factors and risk management regarding foreign currency exchange rate risk, interest rate risk, equity price risk, credit risk, and liquidity risk. Further, it contains information about financial instruments.
(F.1) Financial Risk Factors and Risk Management
Accounting
for Derivative Financial Instruments
We use derivatives to hedge foreign currency risk or interest rate risk and designate them as cash flow or fair value hedges if they qualify for hedge accounting under IFRS 9, which involves judgment.
Derivatives Not Designated as Hedging Instruments in Hedge Accounting Relationships
Many transactions constitute economic hedges, and therefore contribute effectively to the securing of financial risks but do not qualify for hedge accounting under IFRS 9. To hedge currency risks inherent in foreign-currency denominated and recognized monetary assets and liabilities, we do not designate our held-for-trading derivative financial instruments in hedge accounting, because the profits and losses from the underlying transactions are recognized in profit or loss in the same periods as the profits or losses from the derivatives.
In addition, we occasionally have contracts that contain foreign currency embedded derivatives that are required to be accounted for separately.
Fair value fluctuations in the spot component of such derivatives at FVTPL are included in Other non-operating income/expense, net while the forward element is shown in Financial income, net.
Derivatives Designated as Hedging Instruments
a) Cash Flow Hedge
In general, we apply cash flow hedge accounting to the foreign currency risk of highly probable forecasted transactions. With regard to foreign currency risk, hedge accounting relates to the spot price and to the intrinsic values of the derivatives designated and qualifying as cash flow hedges. Accordingly, the effective portion of these components determined on a present value basis is recorded in other comprehensive income. The forward element and time value as well as foreign currency basis spreads excluded from the hedging relationship are recorded as cost of hedging in a separate position in other comprehensive income. As the amounts are not material, they are presented together with the effective portion of the cash flow hedges in our consolidated statements of comprehensive income and consolidated statements of changes in equity. All other components including counterparty credit risk adjustments of the derivative and the ineffective portion are immediately recognized in Financial Income, net in profit or loss. Amounts accumulated in other comprehensive income are reclassified to profit or loss to Other non-operating income/expense, net and Financial income, net in the same period when the hedged item affects profit or loss.
b) Net Investment Hedge
In general, we do not hedge the foreign currency exposure from the net assets of subsidiaries with a functional currency different from the euro, and we do not apply net investment hedge accounting. However, in selected cases we might do so, and we applied net investment hedge accounting in 2023. For more information, see Note (D.1).
The designated component in hedge accounting is the spot price of the derivatives designated and qualifying as net investment hedges. Accordingly, the effective portion of this component determined on a present value basis is recorded in Other comprehensive income. All other not-designated components or ineffective portions are immediately recognized in Financial Income, net in profit or loss.
|
SAP Integrated Report 2023 | |||||
| To
Our Stakeholders |
Combined
Management Report |
Consolidated
Financial Statements IFRS |
Further
Information about Sustainability |
Additional Information |
||
Amounts accumulated in Other comprehensive income are reclassified to profit or loss to Other non-operating income/expense, net in the same period when the foreign operation is partially disposed of or sold.
c) Fair Value Hedge
We apply fair value hedge accounting for certain of our fixed-rate financial liabilities and show the fair value fluctuations in Financial income, net.
d) Valuation and Testing of Effectiveness
At inception of a designated hedging relationship, we document our risk management strategy and the economic relationship between hedged item and hedging instrument. The existence of an economic relationship is demonstrated as well as the effectiveness of the hedging relationship tested prospectively by applying the critical terms match for our foreign currency hedges, since currencies, maturities, and the amounts are closely aligned for the forecasted transactions and for the spot element of the forward exchange rate contract or intrinsic value of the currency options, respectively. For interest rate swaps, effectiveness is tested prospectively using statistical methods in the form of a regression analysis, by which the validity and extent of the relationship between the change in value of the hedged items as the independent variable and the fair value change of the derivatives as the dependent variable is determined. The main sources of ineffectiveness are:
| – | The effect of the counterparty and our own credit risk on the fair value of the forward exchange contracts and interest rate swaps, which is not reflected in the respective hedged item, and |
| – | Differences in the timing of hedged item and hedged transaction in our cash flow hedges. |
We are exposed to various financial risks, such as market risks (that is, foreign currency exchange rate risk, interest rate risk, and equity price risk), credit risk, and liquidity risk.
We manage market risks, credit risk, and liquidity risk on a Group-wide basis through our global treasury department, global risk management, and global credit management. Risk management policies are established to identify risks, to set appropriate risk limits, and to monitor risks. Risk management policies and hedging strategies are laid out in our internal guidelines (for example, treasury guideline and other internal guidelines), and are subject to continuous internal review, analysis, and update to reflect changes in market conditions and our business.
We only purchase derivative financial instruments to reduce risks and not for speculation, which is defined as entering into derivative instruments without a corresponding underlying transaction.
Foreign Currency Exchange Rate Risk
Foreign Currency Exchange Rate Risk Factors
As we are active worldwide, our ordinary operations are subject to risks associated with fluctuations in foreign currencies. Since the Group’s entities mainly conduct their operating business in their own functional currencies, our risk of exchange rate fluctuations from ongoing ordinary operations is not considered significant. However, the Group’s entities occasionally generate foreign currency-denominated receivables, payables, and other monetary items by transacting in a currency other than the respective functional currency. To mitigate the extent of the associated foreign currency exchange rate risk, a significant portion of these transactions is hedged as described below.
In rare circumstances, transacting in a currency other than the functional currency also leads to embedded foreign currency derivatives being separated and measured at fair value through profit or loss.
In addition, the intellectual property (IP) holders in the SAP Group are exposed to risks associated with forecasted intercompany cash flows in foreign currencies. These cash flows arise out of royalty payments from subsidiaries to the respective IP holder. The royalties are linked to the subsidiaries’ external revenue. This arrangement leads to a concentration of the foreign currency exchange rate risk with the IP holders, as the royalties are mostly denominated in the subsidiaries’ local currencies, while the functional currency of the IP holders with the highest royalty volume is the euro.
|
SAP Integrated Report 2023 | |||||
| To
Our Stakeholders |
Combined
Management Report |
Consolidated
Financial Statements IFRS |
Further
Information about Sustainability |
Additional Information |
||
The highest foreign currency exchange rate exposure of this kind relates to the currencies of subsidiaries with significant operations, for example the U.S. dollar, the pound sterling, the Japanese yen, the Swiss franc, and the Australian dollar.
Generally, we are not exposed to any significant foreign currency exchange rate risk with regard to our investing and financing activities, as such activities are normally conducted in the functional currency of the investing or borrowing entity.
Foreign Currency Exchange Rate Risk Management
We continuously monitor our exposure to currency fluctuation risks based on monetary items and forecasted transactions and pursue a Group-wide strategy to manage foreign currency exchange rate risk, using derivative financial instruments, primarily foreign exchange forward contracts, as appropriate, with the primary aim of reducing profit or loss volatility. Most of the hedging instruments are not designated as being in a hedge accounting relationship.
Currency Hedges Designated as Hedging Instruments (Cash Flow Hedges)
We enter into derivative financial instruments, primarily foreign exchange forward contracts, to hedge significant forecasted cash flows (royalties) from foreign subsidiaries denominated in foreign currencies with a hedge ratio of 1:1 and a hedge horizon of up to 12 months, which is also the maximum maturity of the foreign exchange derivatives we use.
For all years presented, no previously highly probable transaction designated as a hedged item in a foreign currency cash flow hedge relationship ceased to be probable. Therefore, we did not discontinue any of our cash flow hedge relationships. Also, ineffectiveness was either not material or non-existent in all years reported. Generally, the cash flows of the hedged forecasted transactions are expected to occur and to be recognized in profit or loss monthly within a time frame of 12 months from the date of the Statement of Financial Position.
Currency Hedges Designated as Hedging Instruments (Net Investment Hedges)
We have hedged part of our net investment in our U.S. subsidiaries which have the U.S. dollar as their functional currency, by entering into a deal contingent forward. The hedged risk is the weakening of the U.S. dollar against the euro. The deal contingent forward is designated as a hedging instrument for the changes in the value of the net investment that is attributable to changes in the U.S. dollar/euro spot rate.
To assess hedge effectiveness, we have determined the economic relationship between the hedging instrument and the hedged item, by comparing changes in the carrying amount of the deal contingent forward that is attributable to a change in the spot rate with changes in the investment in the U.S. subsidiaries due to movements in the spot rate.
The amounts as at December 31, 2023, relating to items designated as hedged items were as follows:
Designated Hedged Items in Foreign Currency Exchange Rate Hedges
| € millions | Forecasted
License Payments |
Net Investment | Forecasted
License Payments |
Net Investment |
| 2023 | 2022 | |||
| Change in value used for calculating hedge ineffectiveness | 19 | –15 | 32 | 0 |
| Cash flow hedge | 19 | 0 | 32 | 0 |
| Cost of hedging | –7 | 0 | –9 | 0 |
| Balances remaining in cash flow hedge reserve for which hedge accounting is no longer applied | 0 | –15 | 0 | 0 |
|
SAP Integrated Report 2023 | |||||
| To
Our Stakeholders |
Combined
Management Report |
Consolidated
Financial Statements IFRS |
Further
Information about Sustainability |
Additional Information |
||
The amounts as at December 31, 2023, designated as hedging instruments were as follows:
Designated Hedging Instruments in Foreign Currency Exchange Rate Hedges
| Forecasted
License Payments in EUR |
Net
Investment in USD |
Forecasted
License Payments in EUR |
Net
Investment in USD |
|
| € millions | 2023 | 2022 | ||
| Nominal amount | 2,390 | 0 | 1,371 | 0 |
| Carrying amount | ||||
| Other financial assets | 33 | 0 | –9 | 0 |
| Other financial liabilities | –20 | 0 | –9 | 0 |
| Change in value recognized in OCI | 19 | 15 | 32 | 0 |
| Hedge ineffectiveness recognized in Finance income, net | 0 | –106 | 0 | 0 |
| Cost of hedging recognized in OCI | –7 | 0 | –9 | 0 |
| Amount reclassified from cash flow hedge in OCI to Other non-operating income, net | 62 | 0 | –42 | 0 |
| Amount reclassified from cost of hedging in OCI to Finance income, net | –9 | 0 | –7 | 0 |
On December 31, 2023, we held the following instruments to hedge exposures to changes in foreign currency:
Details on Hedging Instruments in Foreign Currency Exchange Rate Hedges
| Maturity | ||||
| 2023 | 2022 | |||
| Forward exchange contracts | 1–6 Months | 7–12 Months | 1–6 Months | 7–12 Months |
| Net exposure in € millions | 1,364 | 1,025 | 822 | 550 |
| Average EUR:GBP forward rate | 0.88 | 0.88 | 0.86 | 0.88 |
| Average EUR:JPY forward rate | 148.12 | 152.10 | 136.83 | 138.23 |
| Average EUR:CHF forward rate | 0.96 | 0.94 | 1.00 | 0.97 |
| Average EUR:AUD forward rate | 1.64 | 1.67 | 1.53 | 1.54 |
| Average EUR:USD forward rate | 1.10 | 1.09 | 1.05 | 1.03 |
Foreign Currency Exchange Rate Exposure
Our risk exposure is based on the following assumptions:
| – | The SAP Group’s entities generally operate in their functional currencies. In exceptional cases and limited economic environments, operating transactions are denominated in currencies other than the functional currency, leading to a foreign currency exchange rate risk for the related monetary instruments. Where material, this foreign currency exchange rate risk is hedged. Therefore, fluctuations in foreign currency exchange rates only have an impact on profit with regard to our unhedged non-derivative monetary financial instruments and related income or expenses. |
| – | Our free-standing derivatives designed for hedging foreign currency exchange rate risks almost completely balance the changes in the fair values of the hedged item attributable to exchange rate movements in the Consolidated Income Statements in the same period. As a consequence, |
|
SAP Integrated Report 2023 | |||||
| To
Our Stakeholders |
Combined
Management Report |
Consolidated
Financial Statements IFRS |
Further
Information about Sustainability |
Additional Information |
||
| the hedged items and the hedging instruments are not exposed to foreign currency exchange rate risks, and thereby have no effect on profit. |
Consequently, we are only exposed to significant foreign currency exchange rate fluctuations with regard to the following:
| – | The spot component of derivatives held within a designated cash flow hedge relationship affecting other comprehensive income |
| – | Foreign currency embedded derivatives affecting other non-operating expense, net |
| – | Unhedged foreign-currency monetary assets and liabilities affecting other non-operating expense, net |
Thus, our foreign currency exposure (and our average/high/low exposure) as at December 31 was as follows:
| Foreign Currency Exposure | ||
| € billions | 2023 | 2022 |
| Year-end exposure toward all our major currencies | 4.2 | 1.7 |
| Average exposure | 3.3 | 1.6 |
| Highest exposure | 4.2 | 1.7 |
| Lowest exposure | 2.5 | 1.3 |
Foreign Currency Exchange Rate Sensitivity
If, on December 31, 2023, 2022, and 2021, the foreign currency exchange rates had been higher/lower as described below, this would have had the following effects on other non-operating expense, net and other comprehensive income:
| Foreign Currency Sensitivity | ||||||
| € millions | Effects
on Other Non-Operating Expense, Net |
Effects on Other Comprehensive Income | ||||
| 2023 | 2022 | 2021 | 2023 | 2022 | 2021 | |
| Derivatives held within a designated cash flow hedge relationship | ||||||
|
All major currencies –10% (2022: all major currencies –10%; 2021: all major currencies –10%) against the euro |
238 | 135 | 106 | |||
|
All major currencies +10% (2022: all major currencies +10%; 2021: all major currencies +10%) against the euro |
–238 | –135 | –106 | |||
| Thereof: USD –10% (2022: –10%; 2021: –10%) against the euro | 131 | 29 | 36 | |||
| Thereof: USD +10% (2022: +10%; 2021: +10%) against the euro | –131 | –29 | –36 | |||
| Embedded derivatives | ||||||
| All currencies –10% against the respective functional currency | –63 | –38 | –49 | |||
| All currencies +10% against the respective functional currency | 64 | 31 | 40 | |||
| Thereof: EUR –10% (2022: –10%; 2021: –10%) against the respective functional currency | –48 | –20 | –32 | |||
| Thereof: EUR +10% (2022: +10%; 2021: +10%) against the respective functional currency | 48 | 20 | 32 | |||
| Unhedged monetary assets and liabilities | ||||||
| All currencies –10% against the respective functional currency | –112 | –63 | –15 | |||
| All currencies +10% against the respective functional currency | 112 | 63 | 15 | |||
| Thereof: USD –10% (2022: –10%; 2021: –10%) against the respective functional currency | –46 | –44 | –2 | |||
| Thereof: USD +10% (2022: +10%; 2021: +10%) against the respective functional currency | 46 | 44 | 2 | |||
|
SAP Integrated Report 2023 | |||||
| To
Our Stakeholders |
Combined
Management Report |
Consolidated
Financial Statements IFRS |
Further
Information about Sustainability |
Additional Information |
||
Interest Rate Risk
Interest Rate Risk Factors
We are exposed to interest rate risk as a result of our investing and financing activities mainly in euros and U.S. dollars, since a large part of our investments are based on variable rates and/or short maturities (2023: 53%; 2022: 64%) and most of our financing transactions are based on fixed rates and long maturities (2023: 100%; 2022: 87%).
Interest Rate Risk Management
The aim of our interest rate risk management is to reduce profit or loss volatility and optimize our interest result by creating a balanced structure of fixed and variable cash flows. We therefore manage interest rate risks by adding interest-rate-related derivative instruments to a given portfolio of investments and debt financing. The desired fixed-floating mix of our net debt is set by the Treasury Committee.
Derivatives Designated as Hedging Instruments (Fair Value Hedges)
To match the interest rate risk from our financing transactions to our investments, we use receiver interest rate swaps to alter the interest cash flows of certain fixed-rate financial liabilities to floating, and by this means secure the fair value of the swapped financing transactions on a 1:1 ratio. Including interest rate swaps, 43% (2022: 52%) of our total interest-bearing financial liabilities outstanding as at December 31, 2023, had a fixed interest rate.
The amounts as at December 31, 2023, relating to items designated as hedged items were as follows:
Designated Hedged Items in Interest Rate Hedges
| 2023 | 2022 | |||
| € millions |
Fixed-Rate
in EUR |
Fixed-Rate Borrowing in USD |
Fixed-Rate
in EUR |
Fixed-Rate
in USD |
| Notional amount | 4,550 | 90 | 4,550 | 94 |
| Carrying amount | 3,964 | 89 | 3,732 | 95 |
| Accumulated fair value adjustments in Other financial liabilities | 556 | –6 | 782 | –9 |
| Change in fair value used for measuring ineffectiveness for the reporting period | 226 | 1 | –723 | –11 |
| Accumulated amount of fair value hedge adjustments for hedged items ceased to be adjusted for hedging gains/losses | 0 | –7 | 0 | -11 |
The amounts as at December 31, 2023, designated as hedging instruments were as follows:
Designated Hedging Instruments in Interest Rate Hedges
| 2023 | 2022 | |||
| € millions |
Interest
Rate EUR Borrowing |
Interest
Rate USD Borrowing |
Interest
Rate EUR Borrowing |
Interest
Rate USD Borrowing |
| Notional amount | 4,550 | 90 | 4,550 | 94 |
| Carrying amount | ||||
| Other financial assets | 0 | 0 | 0 | 0 |
| Other financial liabilities | –535 | –1 | –749 | –3 |
| Change in fair value used for measuring ineffectiveness for the reporting period | –214 | –2 | 700 | 10 |
|
SAP Integrated Report 2023 | |||||
| To
Our Stakeholders |
Combined
Management Report |
Consolidated
Financial Statements IFRS |
Further
Information about Sustainability |
Additional Information |
||
As at December 31, 2023, we held the following instruments to hedge exposures to changes in interest rates:
Details on Hedging Instruments in Interest Rate Hedges
| 2023 | |||||||||||
| Maturity | |||||||||||
| € millions | 2024 | 2027 | 2028 | 2029 | 2030 | 2031 | |||||
| EUR interest rate swaps | |||||||||||
| Nominal amounts | 1,000 | 1,000 | 800 | 500 | 1,250 | ||||||
| Average variable interest rate | 5.941% | 5.365% | 4.705% | 5.340% | 5.503% | ||||||
| USD interest rate swaps | |||||||||||
| Nominal amounts | 90 | ||||||||||
| Average variable interest rate | 6.150% | ||||||||||
| 2022 | |||||||||||
| Maturity | |||||||||||
| € millions | 2024 | 2027 | 2028 | 2029 | 2030 | 2031 | |||||
| EUR interest rate swaps | |||||||||||
| Nominal amounts | 1,000 | 1,000 | 800 | 500 | 1,250 | ||||||
| Average variable interest rate | 3.949% | 3.373% | 2.713% | 3.348% | 3.511% | ||||||
| USD interest rate swaps | |||||||||||
| Nominal amounts | 94 | ||||||||||
| Average variable interest rate | 5.150% | ||||||||||
Interest Rate Exposure
Our interest rate exposure (and our average/high/low exposure) as at December 31 was as follows:
Interest Rate Risk Exposure
| € billions | 2023 | 2022 | ||||||
| Year-End | Average | High | Low | Year-End | Average | High | Low | |
| Fair value interest rate risk | ||||||||
| From investments | 0.00 | 0.00 | 0.00 | 0.00 | 0.03 | 0.04 | 0.04 | 0.03 |
| Cash flow interest rate risk | ||||||||
| From investments (including interest-bearing cash) | 3.26 | 4.70 | 7.45 | 3.26 | 6.19 | 5.83 | 7.21 | 4.87 |
| From financing | 0 | 1.10 | 1.73 | 0 | 1.45 | 1.71 | 1.76 | 1.45 |
| From interest rate swaps | 4.64 | 4.64 | 4.64 | 4.64 | 4.64 | 4.84 | 4.88 | 4.64 |
Interest Rate Sensitivity
A sensitivity analysis is provided to show the impact of our interest rate risk exposure on profit or loss and equity in accordance with IFRS 7, considering the following:
| – | Changes in interest rates only affect the accounting for non-derivative fixed-rate financial instruments if they are recognized at fair value. Therefore, such interest rate changes do not change the carrying amounts of our non-derivative fixed-rate financial liabilities, as we account for them at amortized cost. Investments in fixed-rate financial assets classified as fair value |
|
SAP Integrated Report 2023 | |||||
| To
Our Stakeholders |
Combined
Management Report |
Consolidated
Financial Statements IFRS |
Further
Information about Sustainability |
Additional Information |
||
| through profit or loss were not material at each year end reported. Thus, we do not consider any fixed-rate instruments in the equity-related sensitivity calculation. |
| – | Income or expenses recorded in connection with non-derivative financial instruments with variable interest rates are subject to interest rate risk if they are not hedged items in an effective hedge relationship. Thus, we take into consideration interest rate changes relating to our variable-rate financing and our investments in money market instruments in the profit-related sensitivity calculation. |
| – | The designation of interest rate receiver swaps in a fair value hedge relationship leads to interest rate changes affecting Financial income, net. The fair value movements related to the interest rate swaps are not reflected in the sensitivity calculation, as they offset the fixed interest rate payments for the bonds and private placements as hedged items. However, changes in market interest rates affect the amount of interest payments from the interest rate swap. As a consequence, we include those effects of market interest rates on interest payments in the profit-related sensitivity calculation. |
If, on December 31, 2023, 2022, and 2021, interest rates had been higher/lower this would have had the following effects on Financial income, net.
Interest Rate Sensitivity
| € millions | Effects on Financial Income, Net | ||
| 2023 | 2022 | 2021 | |
| Derivatives held within a designated fair value hedge relationship | |||
|
Interest rates +100bps for U.S. dollar area/+100bps for euro area (2022: +75/+125bps for U.S. dollar/euro area; 2021: +75/+20bps for U.S. dollar/euro area) |
–46 | –58 | –11 |
|
Interest rates –100bps for U.S. dollar area/–100bps for euro area (2022: –25/–10bps for U.S. dollar/euro area; 2021: –25/–20bps for U.S. dollar/euro area) |
46 | 5 | 10 |
| Variable-rate financing | |||
|
Interest rates +100bps for U.S. dollar area/+100bps for euro area (2022: +75/+125bps for U.S. dollar/euro area; 2021: +75/+20bps for U.S. dollar/euro area) |
0 | –14 | –4 |
|
Interest rates –100bps for U.S. dollar area/–100bps for euro area (2022: –25/–10bps for U.S. dollar/euro area; 2021: –25/–20bps for U.S. dollar/euro area) |
0 | 1 | 3 |
| Variable-rate investments | |||
|
Interest rates +100bps for U.S. dollar area/+100bps for euro area (2022: +75/+125bps for U.S. dollar/euro area; 2021: +75/+20bps for U.S. dollar/euro area) |
32 | 26 | 24 |
|
Interest rates –100bps for U.S. dollar area/–100bps for euro area (2022: –25/–10bps for U.S. dollar/euro area; 2021: –25/–20bps for U.S. dollar/euro area) |
–32 | –5 | –9 |
Equity Price Risk
Equity Price Risk Factors
We are exposed to equity price risk with regard to our investments in equity securities.
Equity Price Risk Management
Our listed equity investments are monitored based on the current market value that is affected by the fluctuations in the volatile stock markets worldwide. Unlisted equity investments are monitored based on detailed financial information provided by the investees. The fair value of our listed equity investments depends on the equity prices, while the fair value of the unlisted equity investments is influenced by various unobservable input factors.
|
SAP Integrated Report 2023 | |||||
| To
Our Stakeholders |
Combined
Management Report |
Consolidated
Financial Statements IFRS |
Further
Information about Sustainability |
Additional Information |
||
Equity Price Exposure
On December 31, 2023, our exposure from our investments in equity securities was €4,967 million (2022: €5,137 million; 2021: €5,799 million).
Equity Price Sensitivity
Our sensitivity towards a fluctuation in equity prices is as follows:
Equity Price Sensitivity
| € millions | 2023 | 20221 | 20211 |
| Investments in equity securities | |||
| Increase in equity prices and respective unobservable inputs of 22% – increase of financial income, net | 1,093 | 503 | 515 |
| Decrease in equity prices and respective unobservable inputs of 22% – decrease of financial income, net | –1,093 | –503 | –515 |
1 For 2022 and 2021, a +/–10% increase and decrease was assumed.
Most of our equity securities are within the venture-capital-related investment activities. For purposes of our equity price sensitivity disclosure, we benchmarked the historical average of public market returns of the NASDAQ and S&P 500 to the average annual venture capital benchmark returns over a 12-year period, which is the assumed average holding period of venture capital funds. Overall, our analysis indicated a blended return range of +/– 22% in 2023.
Credit Risk
Credit Risk Factors
To reduce the credit risk in investments, we arrange to receive rights to collateral for certain investing activities in the full amount of the investment volume, which we would be allowed to make use of only in the case of default of the counterparty to the investment. In the absence of other significant agreements to reduce our credit risk exposure, the total amounts recognized as cash and cash equivalents, current investments, loans, and other financial receivables, trade receivables, and derivative financial assets represent our maximum exposure to credit risks, except for the agreements mentioned above.
Credit Risk Management
Cash at Banks, Time Deposits, and Debt Securities
To mitigate the credit risk from our investing activities and derivative financial assets, we conduct all our activities only with approved major financial institutions and issuers that carry high external ratings, as required by our internal treasury guideline. Among its stipulations, the guideline requires that we invest only in assets from issuers with a minimum rating of at least “BBB flat.” We only invest in issuers with a lower rating in exceptional cases. Such investments were not material in 2023 and 2022. The weighted average rating of our financial assets is A. We pursue a policy of cautious investments characterized by predominantly current investments, standard investment instruments, as well as a wide portfolio diversification by doing business with a variety of counterparties.
To further reduce our credit risk, we require collateral for certain investments in the full amount of the investment volume, which we would be allowed to make use of in the case of default of the counterparty to the investment. As such collateral, we only accept bonds with at least investment-grade rating level.
In addition, the concentration of credit risk that exists when counterparties are involved in similar activities by instrument, sector, or geographic area is further mitigated by diversification of counterparties throughout the world and adherence to an internal limit system for each counterparty.
|
SAP Integrated Report 2023 | |||||
| To
Our Stakeholders |
Combined
Management Report |
Consolidated
Financial Statements IFRS |
Further
Information about Sustainability |
Additional Information |
||
This internal limit system stipulates that the business volume with individual counterparties is restricted to a defined limit that depends on the lowest official long-term credit rating available by at least one of the major rating agencies, the Tier 1 capital of the respective financial institution, or participation in the German Depositors’ Guarantee Fund or similar protection schemes. We continuously monitor strict compliance with these counterparty limits. As the premium for credit default swaps mainly depends on market participants’ assessments of the creditworthiness of a debtor, we also closely observe the development of credit default swap spreads in the market to evaluate probable risk developments and react in a timely manner to changes should these manifest.
For cash at banks, time deposits, and debt securities such as acquired bonds or commercial papers, we apply the general impairment approach. As it is our policy to only invest in high-quality assets of issuers with a minimum rating of at least investment grade so as to minimize the risk of credit losses, we use the low credit risk exception. Thus, these assets are always allocated to stage 1 of the three-stage credit loss model and we record a loss allowance for an amount equal to 12-month expected credit losses. This loss allowance is calculated based on our exposure as at the respective reporting date, the loss given default for this exposure, and the credit default swap spread as a measure for the probability of default. To ensure that during their lifetime our investments always fulfill the requirement of being investment-grade, we monitor changes in credit risk by tracking published external credit ratings. Among other things, we consider cash at banks, time deposits, and debt securities to be in default when the counterparty is unlikely to pay its obligations in full, when there is information about a counterparty’s financial difficulties, or in case of a drastic increase in the credit default swap spread of a counterparty for a prolonged time period while the overall market environment remains rather stable. Such financial assets are written off either partially or in full if the likelihood of recovery is considered remote, which might be evidenced, for example, by the bankruptcy of a counterparty of such financial assets.
Trade Receivables
The default risk of our trade receivables is managed separately, mainly based on assessing the creditworthiness of customers through external ratings and on our past experience with the customers concerned. Based on this assessment, individual credit limits are established for each customer and deviations from such credit limits need to be approved by management.
We apply the simplified impairment approach using a provision matrix for all trade receivables and contract assets to take into account any lifetime expected credit losses already at initial recognition. For the purpose of the provision matrix, customers are clustered into different risk classes, mainly based on market information such as the country risk assessment of their country of origin. Loss rates used to reflect lifetime expected credit losses are determined using a roll-rate method based on the probability of a receivable progressing through different stages of being overdue and on our actual credit loss experience over the past years. These loss rates are enhanced by forward-looking information to reflect differences between economic conditions during the period over which the historical data has been collected, current conditions, and the expected changes in the economic conditions over the expected life of the receivables. Forward-looking information is based on changes in country risk ratings, or fluctuations in credit default swaps of countries of the customers we do business with. We continuously monitor outstanding receivables locally to assess whether there is objective evidence that our trade receivables and contract assets are credit-impaired. Evidence that trade receivables and contract assets are credit-impaired include, among the trade receivables being past due, information about significant financial difficulty of the customer or non-adherence to a payment plan. Under extreme situations such as the current war situation in Ukraine, related account receivables and contract assets are critically assessed to determine whether they are credit-impaired. We consider receivables to be in default when the counterparty is unlikely to pay its obligations in full, However, a delay of payments (for example, more than 90 days past due) in the normal course of business alone does not necessarily indicate a customer default. We write off account balances either partially or in full if we judge that the likelihood of recovery is remote, which might be evidenced, for example, when bankruptcy proceedings for a customer are finalized or when all enforcement efforts have been exhausted.
|
SAP Integrated Report 2023 | |||||
| To
Our Stakeholders |
Combined
Management Report |
Consolidated
Financial Statements IFRS |
Further
Information about Sustainability |
Additional Information |
||
The impact of default on our trade receivables from individual customers is mitigated by our large customer base and its distribution across many different industries, company sizes, and countries worldwide. For more information about our trade receivables, see Note (A.2).
Credit Risk Exposure
Cash, Time Deposits, and Debt Securities
As at December 31, 2023, our exposure to credit risk from cash, time deposits, and debt securities was as follows:
Credit Risk Exposure from Cash, Time Deposits, and Debt Securities
| € millions, unless otherwise stated | 2023 | ||||
| Equivalent
to External Rating |
Weighted
Average Loss Rate |
Gross
Carrying Amount Not Credit- Impaired |
Gross
Carrying Amount Credit- Impaired |
ECL Allowance | |
| Risk class 1 – low risk | AAA to BBB– | –0.1% | 8,664 | 0 | –7 |
| Risk class 2 – high risk | BB+ to D | 0.0% | 66 | 0 | 0 |
| Risk class 3 – unrated | NA | –3.9% | 77 | 0 | –3 |
| Total | –0.1% | 8,807 | 0 | –10 | |
| € millions, unless otherwise stated | 2022 | ||||
| Equivalent
to External Rating |
Weighted
Average Loss Rate |
Gross
Carrying Not Credit-Impaired |
Gross Carrying Amount Credit- Impaired |
ECL Allowance | |
| Risk class 1 – low risk | AAA to BBB– | –0.0% | 6,554 | 0 | –3 |
| Risk class 2 – high risk | BB+ to D | 0.0% | 33 | 0 | 0 |
| Risk class 3 – unrated | NA | –6.5% | 46 | 0 | –3 |
| Total | –0.1% | 6,633 | 0 | –6 | |
As at December 31, 2023, the majority of our other loans and other financial receivables was concentrated in Germany. There were no loans, or other financial receivables past due but not impaired and we had no indications of impairments of such assets that were not past due and not impaired as at that date.
Master Netting and Similar Arrangements
We enter into derivatives on the basis of the German Master Agreement on Financial Derivatives Transactions (“Deutscher Rahmenvertrag für Finanztermingeschäfte”) and similar agreements. The regulations of these agreements apply particularly in the case of insolvency and not during the normal course of business.
The following table shows the derivative instruments that are subject to such netting arrangements:
| Master Netting and Similar Arrangements | ||||||
| € millions | 2023 | 2022 | ||||
| Carrying Amounts | Nettable Amounts in Case of Insolvency | Net Amount | Carrying Amounts | Nettable Amounts in Case of Insolvency | Net Amount | |
| Financial assets | 90 | 55 | 35 | 68 | 33 | 35 |
| Financial liabilities | –623 | –55 | –568 | –849 | –33 | –816 |
|
SAP Integrated Report 2023 | |||||
| To
Our Stakeholders |
Combined
Management Report |
Consolidated
Financial Statements IFRS |
Further
Information about Sustainability |
Additional Information |
||
Trade Receivables and Contract Assets
As at December 31, 2023, our exposure to credit risk from trade receivables was as follows:
Credit Risk Exposure from Trade Receivables and Contract Assets
| € millions, unless otherwise stated | 2023 | |||
| Weighted Average Loss Rate |
Gross Carrying Amount Not Credit-Impaired |
Gross Carrying Amount Credit-Impaired |
ECL Allowance | |
| AR not due and due | –0.3% | 4,036 | 2 | –13 |
| AR overdue 1 to 30 days | –0.6% | 770 | 51 | –5 |
| AR overdue 30 to 90 days | –1.5% | 564 | 32 | –9 |
| AR overdue more than 90 days | –27.3% | 432 | 213 | –176 |
| Total | –3.3% | 5,802 | 298 | –203 |
| € millions, unless otherwise stated | 2022 | |||
| Weighted Average Loss Rate |
Gross Carrying Amount Not Credit-Impaired |
Gross Carrying Amount Credit-Impaired |
ECL Allowance | |
| AR not due and due | –1.0% | 3,146 | 10 | –31 |
| AR overdue 1 to 30 days | –1.0% | 1,420 | 80 | –15 |
| AR overdue 30 to 90 days | –2.3% | 582 | 64 | –15 |
| AR overdue more than 90 days | –27.2% | 499 | 236 | –200 |
| Total | –4.3% | 5,647 | 390 | –261 |
The movement in the ECL allowance for trade receivables and contract assets is as follows:
Movement in ECL Allowance for Trade Receivables and Contract Assets
| 2023 | 2022 | |
| € millions | ECL Allowance | ECL Allowance |
| Balance as at 1/1 | –261 | –175 |
| Net credit losses recognized | –32 | –187 |
| Amounts written off | 90 | 101 |
| Balance as at 12/31 | –203 | –261 |
Liquidity Risk
Liquidity Risk Factors
We are exposed to liquidity risk from our obligations towards suppliers, employees, and financial institutions.
Liquidity Risk Management
Our liquidity is managed by our global treasury department with the primary aim of maintaining liquidity at a level that is adequate to meet our financial obligations.
Generally, our primary source of liquidity is funds generated from our business operations. Our global treasury department manages liquidity centrally for all subsidiaries. Where possible, we pool their cash surplus so that we can use liquidity centrally for our business operations, for subsidiaries’ funding requirements, or to invest any net surplus in the market.
|
SAP Integrated Report 2023 | |||||
| To
Our Stakeholders |
Combined
Management Report |
Consolidated
Financial Statements IFRS |
Further
Information about Sustainability |
Additional Information |
||
With this strategy, we seek to optimize yields, while ensuring liquidity, by investing only with counterparties and issuers of high credit quality, as explained before. Hence, high levels of liquid assets and marketable securities provide a strategic reserve, helping keep SAP flexible, sound, and independent.
Apart from effective working capital and cash management, we have reduced the liquidity risk inherent in managing our day-to-day operations and meeting our financing responsibilities by arranging an adequate volume of available credit facilities with various financial institutions on which we can draw if necessary.
In order to retain high financial flexibility, in 2023, SAP SE entered into a sustainability-linked revolving credit facility with a volume of €3.0 billion with an initial term until 2028 plus two one-year extension options, replacing its previous credit facility of €2.5 billion from 2017. The use of the facility is not restricted by any financial covenants. Borrowings under the facility bear interest of EURIBOR or the agreed benchmark rate for the respective currency plus a base margin which might be adjusted depending on the fulfillment of agreed sustainability performance targets. We are also required to pay a commitment fee of 7bps per annum on the unused available credit. We have not drawn on the facility.
In September 2019, we initiated a commercial paper (Commercial Paper, or CP) program. As at December 31, 2023, we had €0 million of CP outstanding with maturities generally less than six months (2022: €930 million).
Additionally, as at December 31, 2023 and 2022, the Group had available lines of credit totaling €555 million and €555 million, respectively. There were immaterial borrowings outstanding under these lines of credit in all years presented.
Liquidity Risk Exposure
The table below is an analysis of the remaining contractual maturities of all our financial liabilities and guarantees held as at December 31, 2023.
Financial liabilities for which repayment can be requested by the contract partner at any time are assigned to the earliest possible period. Variable interest payments were calculated using the latest relevant interest rate fixed as at December 31, 2023. As we generally settle our derivative contracts gross, we show the pay and receive legs separately for all our currency and interest rate derivatives, whether or not the fair value of the derivative is negative. The cash outflows for the currency derivatives are translated using the applicable spot rate.
We continue to provide rental guarantees for certain offices used by Qualtrics. The amounts shown for the financial guarantees are the gross amounts we guarantee, however, we are entitled to indemnification payments by Qualtrics which will reduce the guarantee amounts disclosed.
Contractual Maturities of Non-Derivative Financial Liabilities
| € millions | Carrying
Amount |
Contractual Cash Flows | |||||
| 12/31/2023 | 2024 | 2025 | 2026 | 2027 | 2028 | Thereafter | |
| Non-derivative financial liabilities | |||||||
| Trade payables | –1,022 | –1,022 | 0 | 0 | 0 | 0 | 0 |
| Bonds | –6,780 | –941 | –952 | –1,161 | –1,045 | –1,033 | –2,604 |
| Private placements | –388 | –305 | –3 | –3 | –94 | 0 | 0 |
| Loans | 0 | 0 | 0 | 0 | 0 | 0 | 0 |
| Commercial paper | 0 | 0 | 0 | 0 | 0 | 0 | 0 |
| Lease liabilities | –1,621 | –350 | –260 | –204 | –159 | –127 | –804 |
| Other financial liabilities1 | –263 | –34 | –30 | 0 | 0 | 0 | 0 |
| Total of non-derivative financial liabilities | –10,075 | –2,652 | –1,245 | –1,368 | –1,298 | –1,160 | –3,408 |
| Financial guarantees | 0 | –19 | –19 | –19 | –19 | –19 | –309 |
|
SAP Integrated Report 2023 | |||||
| To
Our Stakeholders |
Combined
Management Report |
Consolidated
Financial Statements IFRS |
Further
Information about Sustainability |
Additional Information |
||
| € millions | Carrying
Amount |
Contractual Cash Flows | |||||
| 12/31/2022 | 2023 | 2024 | 2025 | 2026 | 2027 | Thereafter | |
| Non-derivative financial liabilities | |||||||
| Trade payables | –1,496 | –1,496 | 0 | 0 | 0 | 0 | 0 |
| Bonds | –8,155 | –1,690 | –941 | –962 | –1,162 | –1,045 | –3,636 |
| Private placements | –405 | –14 | –316 | –3 | –3 | –97 | 0 |
| Loans | –1,456 | –1,479 | 0 | 0 | 0 | 0 | 0 |
| Commercial paper | –928 | –932 | 0 | 0 | 0 | 0 | 0 |
| Lease liabilities | –2,140 | –398 | –317 | –257 | –228 | –188 | –1,071 |
| Other financial liabilities1 | –422 | –307 | –31 | 0 | 0 | 0 | 0 |
| Total of non-derivative financial liabilities | –15,002 | –6,316 | –1,605 | –1,222 | –1,393 | –1,330 | –4,707 |
| Financial guarantees | 0 | 0 | 0 | 0 | 0 | 0 | 0 |
| 1 The carrying amount of Other financial liabilities includes accrued interest for our non-derivative financial debt as well as for derivatives, while the cash outflow of this accrued interest is presented together with the underlying liability in the maturity analysis. | |||||||
Contractual Maturities of Derivative Financial Liabilities and Financial Assets
| € millions | Carrying
Amount |
Contractual Cash Flows | Carrying
Amount |
Contractual Cash Flows | ||
| 12/31/2023 | 2024 | Thereafter | 12/31/2022 | 2023 | Thereafter | |
| Derivative financial liabilities and assets | ||||||
| Derivative financial liabilities | ||||||
| Currency derivatives not designated as hedging instruments | –66 | –88 | ||||
| Cash outflows | –2,048 | 0 | –3,185 | –13 | ||
| Cash inflows | 2,017 | 0 | 3,113 | 0 | ||
| Currency derivatives designated as hedging instruments | –20 | –9 | ||||
| Cash outflows | –958 | –309 | ||||
| Cash inflows | 948 | 302 | ||||
| Interest rate derivatives designated as hedging instruments | –537 | –753 | ||||
| Cash outflows | –242 | –848 | –102 | –1,201 | ||
| Cash inflows | 63 | 301 | 63 | 364 | ||
| Total of derivative financial liabilities | –623 | –220 | –547 | –849 | –118 | –850 |
| Derivative financial assets | ||||||
| Currency derivatives not designated as hedging instruments | 52 | 30 | ||||
| Cash outflows | –2,992 | –1,713 | ||||
| Cash inflows | 3,042 | 1,740 | ||||
| Currency derivatives designated as hedging instruments | 33 | 33 | ||||
| Cash outflows | –1,418 | –1,039 | ||||
| Cash inflows | 1,441 | 1,069 | ||||
| Total of derivative financial assets | 85 | 73 | 0 | 63 | 57 | 0 |
| Total of derivative financial liabilities and assets | –538 | –147 | –547 | –787 | –61 | –850 |
|
SAP Integrated Report 2023 | |||||
| To
Our Stakeholders |
Combined
Management Report |
Consolidated
Financial Statements IFRS |
Further
Information about Sustainability |
Additional Information |
||
(F.2) Fair Value Disclosures on Financial Instruments
Level
Transfers
It is our policy that transfers between the different levels of the fair value hierarchy are deemed to have occurred at the beginning of the period of the event or change in circumstances that caused the transfer.
Fair Value of Financial Instruments
We use various types of financial instruments in the ordinary course of business, which are classified as either amortized cost (AC), fair value through other comprehensive income (FVOCI), or fair value through profit or loss (FVTPL). For those financial instruments measured at fair value or for which fair value must be disclosed, we have categorized the financial instruments into a three-level fair value hierarchy depending on the inputs used to determine fair value and their significance for the valuation techniques.
Fair Values of Financial Instruments and Classification Within the Fair Value Hierarchy
| € millions | Category | 12/31/2023 | ||||||
| Measurement Categories | Fair Value | |||||||
| Carrying
Amount |
At Amortized Cost |
At Fair Value |
Level 1 | Level 2 | Level 3 | Total | ||
| Assets | ||||||||
| Cash and cash equivalents | 8,124 | |||||||
| Cash at banks1 | AC | 3,369 | 3,369 | |||||
| Time deposits1 | AC | 2,277 | 2,277 | |||||
| Money market and similar funds | FVTPL | 2,478 | 2,478 | 2,478 | 2,478 | |||
| Trade and other receivables | 6,525 | |||||||
| Trade receivables1 | AC | 5,775 | 5,775 | |||||
| Trade receivables1 | FVOCI | 122 | 122 | 122 | ||||
| Other receivables2 | – | 628 | ||||||
| Other financial assets | 8,887 | |||||||
| Debt securities | AC | 129 | 129 | 129 | 129 | |||
| Equity securities | FVTPL | 4,967 | 4,967 | 156 | 0 | 4,811 | 4,967 | |
| Investments in associates2 | – | 135 | ||||||
| Time deposits | AC | 3,021 | 3,021 | 3,021 | 3,021 | |||
| Financial instruments related to employee benefit plans2 | – | 244 | ||||||
| Loans and other financial receivables | AC | 300 | 300 | 300 | 300 | |||
| Derivative assets | ||||||||
| Designated as hedging instrument | ||||||||
| FX forward contracts | – | 33 | 33 | 33 | 33 | |||
| Interest rate swaps | – | 0 | 0 | 0 | 0 | |||
| Not designated as hedging instrument | ||||||||
| FX forward contracts | FVTPL | 52 | 52 | 52 | 52 | |||
| Call options for share-based payments | FVTPL | 0 | 0 | 0 | 0 | |||
| Call option on equity shares | FVTPL | 5 | 5 | 5 | 5 | |||
| Liabilities | ||||||||
| Trade and other payables | –1,822 | |||||||
| Trade payables1 | AC | –1,022 | –1,022 | |||||
| Other payables2 | – | –800 | ||||||
| Financial liabilities | –9,676 | |||||||
| Non-derivative financial liabilities | ||||||||
| Loans | AC | 0 | 0 | 0 | 0 | |||
| Bonds | AC | –6,780 | –6,780 | –7,005 | 0 | –7,005 | ||
| Private placements | AC | –388 | –388 | –374 | –374 | |||
| Lease liabilities3 | –1,621 | –1,621 | ||||||
| Other non-derivative financial liabilities | AC | –263 | –263 | –263 | –263 | |||
| Derivative liabilities | ||||||||
| Designated as hedging instrument | ||||||||
| FX forward contracts | – | –20 | –20 | –20 | –20 | |||
| Interest rate swaps | – | –537 | –537 | –537 | –537 | |||
| Not designated as hedging instrument | ||||||||
| FX forward contracts | FVTPL | –66 | –66 | –66 | –66 | |||
| Total financial instruments, net | 12,038 | 4,798 | 7,034 | –4,242 | 2,268 | 4,816 | 2,720 | |
|
SAP Integrated Report 2023 | |||||
| To
Our Stakeholders |
Combined
Management Report |
Consolidated
Financial Statements IFRS |
Further
Information about Sustainability |
Additional Information |
||
Fair Values of Financial Instruments and Classification Within the Fair Value Hierarchy
| € millions | Category | 12/31/2022 | |||||||
| Measurement Categories | Fair Value | ||||||||
| Carrying
Amount |
At Amortized Cost |
At Fair Value |
Level 1 | Level 2 | Level 3 | Total | |||
| Assets | |||||||||
| Cash and cash equivalents | 9,008 | ||||||||
| Cash at banks1 | AC | 3,176 | 3,176 | ||||||
| Time deposits1 | AC | 2,976 | 2,976 | ||||||
| Money market and similar funds | FVTPL | 2,855 | 2,855 | 2,855 | 2,855 | ||||
| Trade and other receivables | 6,405 | ||||||||
| Trade receivables1 | AC | 5,776 | 5,776 | ||||||
| Trade receivables1 | FVOCI | ||||||||
| Other receivables2 | – | 629 | |||||||
| Other financial assets | 6,479 | ||||||||
| Debt securities | AC | 32 | 32 | 32 | 32 | ||||
| Equity securities | FVTPL | 5,138 | 5,138 | 258 | 0 | 4,880 | 5,138 | ||
| Investments in associates2 | – | 151 | |||||||
| Time deposits | AC | 654 | 654 | 654 | 654 | ||||
| Financial instruments related to employee benefit plans2 | – | 203 | |||||||
| Loans and other financial receivables | AC | 233 | 233 | 233 | 233 | ||||
| Derivative assets | |||||||||
| Designated as hedging instrument | |||||||||
| FX forward contracts | – | 33 | 33 | 33 | 33 | ||||
| Interest rate swaps | – | 0 | 0 | 0 | 0 | ||||
| Not designated as hedging instrument | |||||||||
| FX forward contracts | FVTPL | 30 | 30 | 30 | 30 | ||||
| Call options for share-based payments | FVTPL | 0 | 0 | 0 | 0 | ||||
| Call option on equity shares | FVTPL | 5 | 5 | 5 | 5 | ||||
| Liabilities | |||||||||
| Trade and other payables | –2,226 | ||||||||
| Trade payables1 | AC | –1,496 | –1,496 | ||||||
| Other payables2 | – | –730 | |||||||
| Financial liabilities | –14,355 | ||||||||
| Non-derivative financial liabilities | |||||||||
| Loans | AC | –1,456 | –1,456 | –1,456 | –1,456 | ||||
| Bonds | AC | –9,083 | –9,083 | –8,301 | –928 | –9,229 | |||
| Private placements | AC | –405 | –405 | –383 | –383 | ||||
| Lease liabilities3 | –2,140 | –2,140 | |||||||
| Other non-derivative financial liabilities | AC | –422 | –422 | –422 | –422 | ||||
| Derivatives | |||||||||
| Designated as hedging instrument | |||||||||
| FX forward contracts | – | –9 | –9 | –9 | –9 | ||||
| Interest rate swaps | – | –753 | –753 | –753 | –753 | ||||
| Not designated as hedging instrument | |||||||||
| FX forward contracts | FVTPL | –88 | –88 | –88 | –88 | ||||
| Total financial instruments, net | 5,311 | –2,154 | 7,212 | –5,156 | –3,087 | 4,886 | –3,357 | ||
|
1 We do not separately disclose the fair value for cash and cash equivalents, trade receivables, and accounts payable as their carrying amounts are a reasonable approximation of their fair values. 2 Since the line items Trade receivables, Trade payables, and Other financial assets contain both financial and non-financial assets or liabilities (such as other taxes or advance payments), the carrying amounts of non-financial assets or liabilities are shown to allow a reconciliation to the corresponding line items in the Consolidated Statements of Financial Position. 3 For lease liabilities, separate disclosure of fair value is not required. |
|||||||||
|
SAP Integrated Report 2023 | |||||
| To
Our Stakeholders |
Combined
Management Report |
Consolidated
Financial Statements IFRS |
Further
Information about Sustainability |
Additional Information |
||
Fair Values of Financial Instruments by Instrument Classification
| € millions | Category | 12/31/2023 | ||
| Carrying Amount |
At Amortized Cost |
At Fair Value |
||
| Financial assets | ||||
| At fair value through profit or loss | FVTPL | 7,502 | 7,502 | |
| At fair value through other comprehensive income | FVOCI | 122 | 122 | |
| At amortized cost | AC | 14,873 | 14,873 | |
| Financial liabilities | ||||
| At fair value through profit or loss | FVTPL | –66 | –66 | |
| At amortized cost | AC | –8,454 | –8,454 | |
Fair Values of Financial Instruments by Instrument Classification
| € millions | Category | 12/31/2022 | ||
| Carrying Amount |
At Amortized Cost |
At Fair Value |
||
| Financial assets | ||||
| At fair value through profit or loss | FVTPL | 8,028 | 8,028 | |
| At fair value through other comprehensive income | FVOCI | 0 | 0 | |
| At amortized cost | AC | 12,847 | 12,847 | |
| Financial liabilities | ||||
| At fair value through profit or loss | FVTPL | –88 | –88 | |
| At amortized cost | AC | –12,862 | –12,862 | |
|
SAP Integrated Report 2023 | |||||
| To
Our Stakeholders |
Combined
Management Report |
Consolidated
Financial Statements IFRS |
Further
Information about Sustainability |
Additional Information |
||
Determination of Fair Values
A description of the valuation techniques and the inputs used in the fair value measurement is given below:
Financial Instruments Measured at Fair Value on a Recurring Basis
| Type | Fair
Value Hierarchy |
Determination
of Fair Value/Valuation Technique |
Significant
Unobservable Inputs |
Interrelationship
Between Significant Unobservable Inputs and Fair Value Measurement |
|
| Other financial assets | |||||
| Money-market and similar funds | Level 1 | Quoted prices in an active market | NA | NA | |
| Debt securities | Level 1 | Quoted prices in an active market | NA | NA | |
| Listed equity securities | Level 1 | Quoted prices in an active market | NA | NA | |
| Level 2 | Quoted prices in an active market deducting a discount for the disposal restriction derived from the premium for a respective put option. | NA | NA | ||
| Unlisted equity securities | Level 3 | Market approach. Comparable company valuation using revenue multiples derived from companies comparable to the investee. |
Peer companies used (revenue multiples range from 1.0 to 17.5) Revenues of investees Discounts for lack of marketability (10% to 30%) |
The estimated fair value would increase (decrease) if: - The revenue multiples were higher (lower) - The investees’ revenues were higher (lower) - The liquidity discounts were lower (higher) |
|
| Market approach. Venture capital method evaluating a variety of quantitative and qualitative factors such as actual and forecasted results, cash position, recent or planned transactions, and market comparable companies. |
- Nature and selection of financing rounds - Weighting of financings rounds - Discounts for lack of marketability - Weighting of equity allocation method such as option pricing model and common stock equivalent model - Volatility assumptions - Estimated time to exit - Imminent exit value |
The estimated fair value would increase (decrease) if: - Different financing rounds are selected - Weighting of financing rounds changes - Weighting of the applied equity allocation methods changes - Volatility assumptions were higher(lower) - Estimated time to exit increases (decreases) - The imminent exit value increases (decreases) |
|||
| Last financing round valuations | Nature and pricing indication of latest financing round |
The estimated fair value would increase (decrease) if: - Price of latest financing round would increase (decrease) - the overall company value would be higher (lower) - the respective analyzed share class would be affected by this change due to its rights and preferences |
|||
| Net asset value/fair market value as reported by the respective funds | Net asset value calculations of the respective funds |
The estimated fair value would increase (decrease) if: Reported net asset value of respective fund would be higher (lower) |
|||
| Call option on equity shares | Level 3 | Market approach. Venture capital method evaluating a variety of quantitative and qualitative factors such as actual and forecasted results, cash position, recent or planned transactions, and market comparable companies. | NA | NA | |
| Other financial assets/ Financial liabilities | |||||
| FX forward contracts | Level 2 | Discounted cash flow using par method. Expected future cash flows based on forward exchange rates are discounted over the respective remaining term of the contracts using the respective deposit interest rates and spot rates. | NA | NA | |
| Deal contingent forward | Level 3 | Discounted cash flow. Expected future cash flows are estimated based on forward interest rates from observable yield curves and contract interest rates, discounted at a rate that reflects the credit risk of the counterparty. | Deal contingent premium as percentage of the equivalent at-the-money-forward option |
The estimated fair value would increase (decrease) if: - the uncertainty of the deal and thus the deal contingency premium would decrease (increase) |
|
| Interest rate swaps | Level 2 | Discounted cash flow. Expected future cash flows are estimated based on forward interest rates from observable yield curves and contract interest rates, discounted at a rate that reflects the credit risk of the counterparty. | NA | NA | |
|
SAP Integrated Report 2023 | |||||
| To
Our Stakeholders |
Combined
Management Report |
Consolidated
Financial Statements IFRS |
Further
Information about Sustainability |
Additional Information |
||
Financial Instruments Not Measured at Fair Value
| Type | Fair Value Hierarchy | Determination of Fair Value/Valuation Technique | |
| Financial liabilities | |||
| Fixed-rate bonds (financial liabilities) | Level 1 | Quoted prices in an active market | |
| Fixed-rate private placements/ loans (financial liabilities) | Level 2 |
Discounted cash flows Future cash outflows for fixed interest and principal are discounted over the term of the respective contracts using the market interest rates as at the reporting date. |
|
For other non-derivative financial assets/liabilities and variable rate financial debt, it is assumed that their carrying value reasonably approximates their fair values.
Transfers Between Levels 1 and 2
Transfers of equity securities from Level 2 to Level 1, which occurred because disposal restrictions lapsed and deducting a discount for such restriction was no longer necessary, did not take place in 2023 (2022: €93 million), while transfers from Level 1 to Level 2 did not occur at all.
Level 3 Fair Value Disclosures
The following table shows the reconciliation of fair values from the opening to the closing balances for our unlisted equity securities and call options on equity shares, as well as the deal contingent forward from our net investment hedge classified as Level 3 fair values:
|
SAP Integrated Report 2023 | |||||
| To
Our Stakeholders |
Combined
Management Report |
Consolidated
Financial Statements IFRS |
Further
Information about Sustainability |
Additional Information |
||
Reconciliation of Level 3 Fair Values
| € millions | 2023 | 2022 | ||
| Unlisted
Equity Securities and Call Options on Equity Shares |
Deal
Contingent Forward |
Unlisted
Equity Securities and Call Options on Equity Shares |
Deal
Contingent Forward |
|
| 1/1 | 4,883 | 0 | 4,881 | 0 |
| Transfers | ||||
| Into Level 3 | 9 | 0 | 0 | |
| Out of Level 3 | –8 | –25 | 0 | |
| Purchases | 417 | 522 | 0 | |
| Sales | –101 | –43 | 0 | |
| Settlements | 91 | 0 | ||
| Gains/losses | ||||
| Included in financial income, net | –219 | –106 | –789 | 0 |
| Included in exchange differences in other comprehensive income | –164 | 15 | 337 | 0 |
| 12/31 | 4,817 | 0 | 4,883 | 0 |
| Change in unrealized gains/losses in profit or loss for equity investments held at the end of the reporting period | 532 | 0 | –788 | 0 |
Transfers out of Level 3 are due to initial public offerings of the respective investees or distributions in kind in the form of listed investees. Changing the unobservable inputs to reflect reasonably possible alternative assumptions would not have a material impact on the fair values of our unlisted equity securities held as FVTPL as at the reporting date.
|
SAP Integrated Report 2023 | |||||
| To
Our Stakeholders |
Combined
Management Report |
Consolidated
Financial Statements IFRS |
Further
Information about Sustainability |
Additional Information |
||
Section G – Other Disclosures
This section provides additional disclosures on miscellaneous topics, including information pertaining to the Executive Board, the Supervisory Board, related party transactions, and other corporate governance topics.
(G.1) Prepaid Expenses and Other Tax Assets
| € millions | 2023 | 2022 | ||||
| Current | Non- Current |
Total | Current | Non- Current |
Total | |
| Prepaid expenses | 844 | 386 | 1,230 | 828 | 512 | 1,340 |
| Other tax assets | 241 | 33 | 274 | 244 | 49 | 293 |
| Total | 1,085 | 419 | 1,504 | 1,072 | 561 | 1,633 |
|
Other non-financial assets |
2,374 | 3,573 | 5,947 | 2,139 | 3,580 | 5,719 |
| Prepaid
expenses and other tax assets as % of Other non-financial assets |
46 | 12 | 25 | 50 | 16 | 29 |
Prepaid expenses primarily consist of prepayments for hyperscalers, support services, and software royalties. Other tax assets primarily consist of value-added tax (VAT).
(G.2) Other Tax Liabilities
| € millions | 2023 | 2022 | ||||
| Current | Non- Current |
Total | Current | Non- Current |
Total | |
| Other tax liabilities | 871 | 0 | 871 | 662 | 0 | 662 |
|
Other non-financial liabilities |
5,648 | 698 | 6,346 | 4,818 | 705 | 5,523 |
| Other
tax liabilities as % of Other non-financial liabilities |
15 | 0 | 14 | 14 | 0 | 12 |
Other tax liabilities primarily consist of VAT, payroll tax, sales tax, and withholding tax.
(G.3) Other Litigation, Claims, and Legal Contingencies
This Note discloses information about intellectual property-related litigation and claims, tax-related litigation other than income tax-related litigation (see Note (C.5)), and anti-bribery matters.
Uncertainty in Context of Legal Matters
The policies outlined in Note (A.4) for customer-related provisions, which include provisions for customer-related litigation cases and claims, equally apply to our other litigation, claims, and legal contingencies disclosed in this Note.
The outcome of litigation and claims is intrinsically subject to considerable uncertainty. Management’s view of these matters may also change in the future. Actual outcomes of litigation and claims may differ from the assessments made by management in prior periods, which could result in a material impact on our business, financial position, profit, cash flows, or reputation. Most of the lawsuits and claims are of a very individual nature and claims are either not quantified by the claimants or the claim amounts quantified are, based on historical evidence, not expected to be a good proxy for the expenditure that would be required to resolve the case concerned.
|
SAP Integrated Report 2023 | |||||
| To
Our Stakeholders |
Combined
Management Report |
Consolidated
Financial Statements IFRS |
Further
Information about Sustainability |
Additional Information |
||
The specifics of the jurisdictions where most of the claims are located further impair the predictability of the outcome of the cases. Therefore, it is typically not practicable to reliably estimate the financial effect that these lawsuits and claims would have if SAP were to incur expenditure for these cases.
Further, the expected timing of any resulting outflows of economic benefits from these lawsuits and claims is typically uncertain and not estimable, as it depends generally on the duration of the legal proceedings and settlement negotiations required to resolve them.
We are subject to a variety of claims and lawsuits that arise from time to time in the ordinary course of our business, including proceedings and claims that relate to companies we have acquired. We will continue to vigorously defend against all claims and lawsuits against us. The provisions recorded for these claims and lawsuits as at December 31, 2023, are neither individually nor in the aggregate material to SAP.
Among the claims and lawsuits disclosed in this Note are the following classes:
Intellectual Property-Related Litigation and Claims
Intellectual property-related litigation and claims are cases in which third parties have threatened or initiated litigation claiming that SAP violates one or more intellectual property rights that they possess. Such intellectual property rights may include patents, copyrights, and other similar rights.
Contingent liabilities exist from intellectual property-related litigation and claims for which no provision has been recognized. Generally, it is not practicable to estimate the financial impact of these contingent liabilities due to the uncertainties around the litigation and claims, as outlined above. Based on our past experience, most of the intellectual property-related litigation and claims tend to be either dismissed in court or settled out of court for amounts significantly below the originally claimed amounts. We currently believe that resolving the intellectual property-related claims and lawsuits pending as at December 31, 2023, will neither individually nor in the aggregate have a material adverse effect on our business, financial position, profit, or cash flows.
Individual cases of intellectual property-related litigation and claims include the following:
In June 2018, Teradata Corporation, Teradata US, Inc. and Teradata Operations, Inc. (collectively “Teradata”) filed a civil lawsuit against SAP SE, SAP America, Inc., and SAP Labs, LLC in U.S. federal court in California. Teradata alleged that SAP had misappropriated trade secrets of Teradata, had infringed Teradata’s copyrights (this claim was subsequently withdrawn by Teradata), and had violated U.S. antitrust laws. Teradata sought unspecified monetary damages and injunctive relief. In 2019, SAP asserted patent infringement counterclaims against Teradata seeking monetary damages and injunctive relief. In 2020, Teradata initiated a second civil lawsuit against SAP asserting patent infringement, seeking monetary damages and injunctive relief; in February 2021, SAP filed patent infringement counterclaims against Teradata in this second U.S. lawsuit as well as a civil lawsuit against Teradata in Germany asserting patent infringement, seeking monetary damages and injunctive relief. Currently, all claims between the parties have been dismissed. Teradata has appealed the dismissal of its trade secret and antitrust claims; this appeal is expected to be completed by late 2024.
Tax-Related Litigation
We are subject to ongoing audits by domestic and foreign tax authorities. In respect of non-income taxes, we are involved in various proceedings with only a few foreign tax authorities regarding assessments and litigation matters on intercompany royalty payments and intercompany services. The total potential amount in dispute related to these matters for all applicable years is approximately €416 million (2022: €344 million). We have not recorded a provision for these matters, as we believe that we will prevail.
For more information about our income tax-related litigation, see Note (C.5).
|
SAP Integrated Report 2023 | |||||
| To
Our Stakeholders |
Combined
Management Report |
Consolidated
Financial Statements IFRS |
Further
Information about Sustainability |
Additional Information |
||
Anti-Bribery Matters
SAP has received communications and whistleblower information alleging conduct that may violate anti-bribery laws in the United States (including the U.S. Foreign Corrupt Practices Act (FCPA)) and in other countries. SAP’s Office of Ethics & Compliance (OEC) conducted investigations with the assistance of an external law firm and voluntarily advised the U.S. Securities and Exchange Commission (U.S. SEC), the U.S. Department of Justice (U.S. DOJ), and local authorities where potential violations were investigated. In early January 2024, following comprehensive and exhaustive investigations, dialogue, and corresponding remediation activities, SAP entered into final settlement agreements with U.S. SEC and U.S. DOJ, as well as with local authorities and parties in South Africa, to resolve criminal and civil claims fully and finally against SAP. Under these agreements, SAP is required to make payments amounting to €207 million. As a consequence, as at December 31, 2023, provisions for fines in regulatory compliance matters totaling €155 million (December 31, 2022: €0 million, June 30, 2023: €170 million) were recognized in our Consolidated Financial Statements as well as repayments to customers, for which revenue recognized from contracts with customers have been reversed. A considerable portion of these repayments to customers was eligible to be credited against the fines incurred in the regulatory compliance matters. Immaterial amounts were already paid in 2022. The remaining payments will be made to a large extent within the first half of 2024.
(G.4) Board of Directors
Executive Board
Memberships on supervisory boards and other comparable governing bodies of enterprises, other than subsidiaries of SAP, on December 31, 2023
Christian Klein
Chief Executive Officer
Strategy & Operations, Corporate Development, Sustainability, Business AI, and Compliance
Supervisory Board, adidas AG, Herzogenaurach, Germany
Dominik Asam (from March 7, 2023)
Chief Financial Officer
Global Finance and Administration including Legal, Investor Relations, Internal Audit, Data Protection & Export Control
Supervisory Board, Bertelsmann Management SE and Bertelsmann SE & Co. KGaA, Guetersloh, Germany
Sabine Bendiek (until December 31, 2023)
Chief People & Operating Officer, Labor Relations Director
HR Strategy, Business Transformation, Leadership Development, Talent Development
Supervisory Board, Schaeffler AG, Herzogenaurach, Germany Technology and Innovation Strategy, SAP Business Technology Platform including Data Management, Analytics and Planning, Integration, Application Development Capabilities, Global Security
|
SAP Integrated Report 2023 | |||||
| To
Our Stakeholders |
Combined
Management Report |
Consolidated
Financial Statements IFRS |
Further
Information about Sustainability |
Additional Information |
||
Juergen Mueller
Chief Technology Officer
Technology & Innovation
Scott Russell
Customer Success
Global Field Organization including Sales, Services, Partner Ecosystem, Customer Engagement, Working Capital Management
Thomas Saueressig
SAP Product Engineering
Global Responsibility for all SAP Business Software Applications, Cloud Operations and Support, Cross-Development Functions, SAP Enterprise Adoption Organization, Emarsys
Board of Directors, Nokia Corporation, Espoo, Finland
Gina Vargiu-Breuer (from February 1, 2024)
People & Culture, Labor Relations Director
Julia White
Chief Marketing and Solutions Officer
Global Marketing, Corporate Communications, Government Affairs
Executive Board Members Who Left During 2023
Luka Mucic (until March 31, 2023)
Supervisory Board
Memberships on supervisory boards and other comparable governing bodies of enterprises, other than subsidiaries of SAP, on December 31, 2023
Prof. Dr. h. c. mult. Hasso Plattner 2, 4, 6, 8
Chairperson
Lars Lamadé1, 2, 4, 8
Deputy Chairperson
Head of Global Sponsorships
|
SAP Integrated Report 2023 | |||||
| To
Our Stakeholders |
Combined
Management Report |
Consolidated
Financial Statements IFRS |
Further
Information about Sustainability |
Additional Information |
||
Supervisory Board, Rhein-Neckar Loewen GmbH, Kronau, Germany
Manuela Asche-Holstein3, 7, 8
Industry Advisor Expert, SAP Germany SE & Co. KG, Walldorf, Germany
Aicha Evans2, 4, 6, 7
Chief Executive Officer and Member of the Board of Directors, Zoox, Inc., Foster City, CA, United States
Board of Directors, Joby Aviation LLC, Santa Cruz, CA, United States
Margret Klein-Magar1, 2, 3, 4
Vice President, Head of SAP Alumni Relations
Chairperson of the Spokespersons’ Committee of Senior Managers of SAP SE
Monika Kovachka-Dimitrova1, 2, 4, 7
Chief Operations Expert
Member of the SAP SE Works Council (Europe)
Peter Lengler1, 3, 7, 8
Value Advisor Expert
Member of the SAP Germany SE & Co. KG Works Council
Jennifer Xin-Zhe Li3, 5
General Partner of Changcheng Investment Partners, Beijing, China
Board of Directors, ABB Ltd., Zurich, Switzerland
Board of Directors, Kone Oy, Espoo, Finland (until February 28, 2023)
Board of Directors, Full Truck Alliance Co. Ltd., Nanjing, Jiangsu, China, and Cayman Islands
Dr. Qi Lu4, 7, 8
CEO, MiraclePlus Ltd., Beijing, China
Board of Directors, Pinduoduo Inc., Shanghai, China
Chairperson of the Board of Directors, Pine Field Holding Limited, Cayman Islands
Chairperson of the Board of Directors, Pine Field Holding Limited, Hong Kong, China
Chairperson of the Board of Directors, Pine Field Ltd., Beijing, China
Gerhard Oswald3, 4, 7
Managing Director of Oswald Consulting GmbH, Walldorf, Germany
Advisory Board, TSG 1899 Hoffenheim Fußball-Spielbetriebs GmbH, Sinsheim, Germany Advisory Board, appliedAI Initiative GmbH, Munich, Germany (from January 1, 2024)
|
SAP Integrated Report 2023 | |||||
| To
Our Stakeholders |
Combined
Management Report |
Consolidated
Financial Statements IFRS |
Further
Information about Sustainability |
Additional Information |
||
Christine Regitz1, 2, 4, 5
Vice President, Global Head of SAP Women in Tech
Supervisory Board, Schloss Dagstuhl – Leibniz Center for Informatics, Wadern, Germany
Supervisory Board, HV Capital Manager GmbH, Munich, Germany
Dr. h. c. Punit Renjen (from May 11, 2023)
Independent Management Consultant
Dr. Friederike Rotsch2, 3, 6, 7
General Counsel, Deutsche Bank AG, Frankfurt am Main, Germany
Heike Steck1, 2, 4, 5, 7
Senior Operations Manager
Member of the SAP SE Works Council and Member of the SAP SE Works Council (Europe)
Helmut Stengele
On Early Retirement, SAP Germany SE & Co. KG, Walldorf, Germany
Dr. Rouven Westphal2, 4, 5, 6 ,8
Member of the Executive Board of the Hasso Plattner Foundation, Potsdam, Germany, and Managing Director of the General Partner of HPC Germany GmbH & Co. KG, Potsdam, Germany
Advisory Board, Sharks Sports & Entertainment LLC, San José, CA, United States
Dr. Gunnar Wiedenfels2, 3, 5, 6
Chief Financial Officer, Warner Bros. Discovery, Inc., New York, NY, United States
Board of Directors, OWN LLC, West Hollywood, CA, United States
Board of Directors, Speechagain, Inc., New York, NY, United States
James Wright1, 3, 5, 8
Member of the SAP SE Works Council (Europe)
Supervisory Board Members Who Left During 2023
Prof. Dr. Gesche Joost (until May 11, 2023)
Professor for Design Research and Head of the Design Research Lab, Berlin University of the Arts
1 Appointed by the SAP SE Works Council (Europe)
|
SAP Integrated Report 2023 | |||||
| To
Our Stakeholders |
Combined
Management Report |
Consolidated
Financial Statements IFRS |
Further
Information about Sustainability |
Additional Information |
||
2 Member of the Company’s Personnel and Governance Committee
3 Member of the Company’s Audit and Compliance Committee
4 Member of the Company’s Technology and Strategy Committee
5 Member of the Company’s Finance and Investment Committee
6 Member of the Company’s Nomination Committee
7 Member of the Company’s People and Culture Committee
8 Member of the Company’s Go-To-Market and Operations Committee
(G.5) Executive and Supervisory Board Compensation
Accounting
Policy
The share-based payment amounts disclosed below in the table “Executive Board Compensation” are based on the grant date fair value of the share units in the respective year. In 2023, 2022, and 2021, share units were issued to the Executive Board members under the LTI 2020. For more information about the terms and details of this plan, see Note (B.3).
In the table “Share-Based Payment for Executive Board Members,” the share-based payment expense is the amount recorded in profit or loss under IFRS 2 (Share-Based Payment) in the respective period.
The total compensation of the Executive Board members for each of the years 2023, 2022, and 2021 was as follows:
Executive Board Compensation
| € thousands | 2023 | 2022 | 2021 |
| Short-term employee benefits | 19,632 | 12,556 | 25,015 |
| Share-based payment | 24,469 | 20,726 | 25,095 |
| Subtotal | 44,101 | 33,282 | 50,110 |
| Post-employment benefits | 1,033 | –1,429 | 464 |
| Thereof defined-benefit | 673 | –1,433 | 461 |
| Thereof defined-contribution | 360 | 4 | 3 |
| Termination Benefits | NA | 9,600 | NA |
| Total | 45,134 | 41,453 | 50,574 |
Share-Based Payment for Executive Board Members
| 2023 | 2022 | 2021 | |
| Number of share units granted | 214,530 | 205,965 | 238,428 |
| Total expense in € thousands | 36,127 | 9,986 | 6,356 |
The defined benefit obligation (DBO) for pensions to Executive Board members and the annual pension entitlement of the members of the Executive Board on reaching age 62 based on entitlements from performance-based and salary-linked plans were as follows:
Retirement Pension Plan for Executive Board Members
| € thousands | 2023 | 2022 | 2021 |
| DBO 12/31 | 2,192 | 1,462 | 3,435 |
| Annual pension entitlement | 137 | 114 | 108 |
|
SAP Integrated Report 2023 | |||||
| To
Our Stakeholders |
Combined
Management Report |
Consolidated
Financial Statements IFRS |
Further
Information about Sustainability |
Additional Information |
||
The total annual compensation of the Supervisory Board members is as follows:
Supervisory Board Compensation
| € thousands | 2023 | 2022 | 2021 |
| Total compensation | 5,427 | 5,206 | 3,856 |
| Thereof fixed compensation | 3,185 | 3,149 | 3,176 |
| Thereof committee remuneration | 2,242 | 2,058 | 680 |
The Supervisory Board compensation is a short-term benefit. The Supervisory Board members do not receive any share-based payment for their services. As far as members who are employee representatives on the Supervisory Board receive share-based payment, such compensation is for their services as employees only and is unrelated to their status as members of the Supervisory Board.
Payments to/DBO for Former Executive Board Members
| € thousands | 2023 | 2022 | 2021 |
| Payments | 2,329 | 2,217 | 2,159 |
| DBO 12/31 | 33,251 | 31,217 | 42,313 |
SAP did not grant any compensation advance or credit to, or enter into any commitment for the benefit of, any member of the Executive Board or Supervisory Board in 2023, 2022, or 2021.
(G.6) Related Party Transactions Other Than Board Compensation
Certain Supervisory Board members of SAP SE currently hold, or held within the last year, positions of significant responsibility with other entities. We have relationships with certain of these entities in the ordinary course of business, whereby we buy and sell products, assets, and services at prices believed to be consistent with those negotiated at arm’s length between unrelated parties.
Companies controlled by Hasso Plattner, Chairperson of the Supervisory Board of SAP SE and Chief Software Advisor of SAP, engaged in the following transactions with SAP: providing consulting services to SAP, receiving sport sponsoring from SAP, and making purchases of SAP products and services.
Occasionally, members of the Executive Board of SAP SE obtain services from SAP for which they pay a consideration consistent with those negotiated at arm’s length between unrelated parties.
All amounts related to the abovementioned transactions were immaterial to SAP in all periods presented.
Related Party Transactions
| Executive Board Members | Supervisory Board Members |
Companies Controlled by Supervisory Board Members |
Associated Entities | |||||||
| € millions | 2023 | 2022 | 2023 | 2022 | 2023 | 2022 | 2023 | 2022 | ||
| Products and services provided | NA | NA | 0 | 0 | 0 | 1 | 13 | 11 | ||
| Products and services received | NA | NA | 21 | 21 | 3 | 4 | 110 | 113 | ||
Sponsoring and other financial support provided |
NA | NA | NA | NA | 7 | 5 | NA | NA | ||
| Outstanding balances at year end (Vendors) | NA | NA | 0 | 0 | 0 | 0 | –6 | –18 | ||
| Outstanding balances at year end (Customers) | NA | NA | 0 | 0 | 0 | 0 | 0 | 4 | ||
| Commitments at year end | NA | NA | 0 | 0 | 422 | 51 | NA | NA | ||
| 1 Including services from employee representatives on the Supervisory Board in their capacity as employees of SAP | ||||||||||
| 2 The longest of these commitments is five years. | ||||||||||
|
SAP Integrated Report 2023 | |||||
| To
Our Stakeholders |
Combined
Management Report |
Consolidated
Financial Statements IFRS |
Further
Information about Sustainability |
Additional Information |
||
All of these balances are unsecured and interest-free and settlement is expected to occur in cash.
For information about the compensation of our Executive Board and Supervisory Board members, see Note (G.5).
(G.7) Principal Accountant Fees and Services
At the Annual General Meeting of Shareholders held on May 18, 2022, our shareholders elected BDO AG Wirtschaftsprüfungsgesellschaft (BDO) as SAP’s independent auditor for 2023. BDO has been the Company’s principal auditor since the fiscal year 2023. Dr. Jens Freiberg has signed as auditor responsible for the audit of the financial reporting and the group reporting of SAP SE since the fiscal year 2023.
For prior fiscal years since 2002, KPMG AG Wirtschaftsprüfungsgesellschaft was the Company’s principal auditor and Bodo Rackwitz signed as auditor responsible for the audit of the financial reporting and the group reporting of SAP SE for the years 2018 to 2022.
BDO and other firms in the global BDO network charged the following fees to SAP for audit and other professional services related to 2023 (KPMG for previous years):
| € millions | 2023 | 2022 | 2021 | ||||||
|
BDO AG (Germany) |
Foreign BDO Firms |
Total |
KPMG AG (Germany) |
Foreign KPMG Firms |
Total |
KPMG AG (Germany) |
Foreign KPMG Firms |
Total | |
| Audit fees | 8 | 5 | 13 | 4 | 10 | 14 | 3 | 8 | 12 |
| Audit-related fees | 0 | 1 | 1 | 3 | 7 | 10 | 2 | 5 | 7 |
| Tax fees | 0 | 0 | 0 | 0 | 0 | 0 | 0 | 0 | 0 |
| All other fees | 0 | 0 | 0 | 0 | 0 | 0 | 0 | 0 | 0 |
| Total | 8 | 6 | 14 | 7 | 17 | 24 | 6 | 13 | 19 |
Audit fees are the aggregate fees charged by BDO for auditing our consolidated financial statements and the statutory financial statements of SAP SE and its subsidiaries. The increase in audit fees for BDO AG is due to a centralized audit approach. Further, BDO Germany has engaged local BDO network firms to audit financial information of subsidiaries as part of the audit of our consolidated financial statements. Audit-related fees are fees charged by BDO for assurance and related services that are reasonably related to the performance of the audit and for service organization attestation procedures.
(G.8) Events After the Reporting Period
Organizational Changes
On January 9, 2024, SAP announced several organizational changes. Muhammad Alam was appointed a member of the Executive Board effective April 1, 2024, and a new Board area called Customer Services & Delivery will be formed under the leadership of Thomas Saueressig. The announced organizational changes might result in a change in SAP’s operating segments.
Settlement to Resolve Criminal and Civil Claims in United States and South Africa Fully and Finally Against SAP
In early January 2024, following exhaustive investigations, dialogue, and corresponding remediation activities, SAP entered into final settlement agreements with the U.S. SEC and U.S. DOJ, as well with as local authorities and parties in South Africa, to resolve criminal and civil claims fully and finally against SAP. For more information, see Note (G.3).
|
SAP Integrated Report 2023 | |||||
| To
Our Stakeholders |
Combined
Management Report |
Consolidated
Financial Statements IFRS |
Further
Information about Sustainability |
Additional Information |
||
Transformation Program 2024: Focus on Scalability of Operations and Key Strategic Growth Areas
In 2024, SAP will further increase its focus on key strategic growth areas, in particular business AI. It also intends to transform its operational setup to capture organizational synergies, and AI-driven efficiencies and prepare the Company for highly scalable future revenue growth.
To this end, and to ensure that SAP’s skill set and resources continue to meet future business needs, SAP will execute a Company-wide restructuring program in 2024. The majority of the approximately 8,000 affected positions is expected to be covered by voluntary leave programs and internal re-skilling measures. Reflecting re-investments into strategic growth areas, SAP expects to exit 2024 at a headcount similar to current levels.
Restructuring expenses are preliminarily projected at around €2 billion, the vast majority of which is expected to be recognized in the first half of 2024, impacting IFRS operating profit. Excluding restructuring expenses, the program is expected to provide only a minor cost benefit in 2024. Expected cost savings and re-investments are fully reflected in SAP’s 2024 outlook and the updated 2025 non-IFRS operating profit- and free cash flow ambition.
The Supervisory Board of SAP SE nominates Pekka Ala-Pietilä as new member of the Supervisory Board
On February 11, 2024, the Supervisory Board of SAP SE nominated Pekka Ala-Pietilä as a new member of the Supervisory Board and proposes Pekka Ala-Pietilä as the designated successor to Chairman Hasso Plattner. Pekka Ala-Pietilä will stand for election for a two-year term at the next Annual General Meeting and, if elected, will assume the role of chair. Punit Renjen has chosen to resign his mandate on the SAP Supervisory Board with effect from the end of SAP’s Annual General Meeting on May 15, 2024.
SAP Completes First Tranche of Share Repurchase Program
On February 14, 2024, the first tranche of the share repurchase program launched in 2023 was completed with a total volume of €1,011 million. For the volume processed until December 31, 2023, and for more information, see Note (E.2).
(G.9) Scope of Consolidation; Subsidiaries and Other Equity Investments
Entities Consolidated in the Financial Statements
| Total | |
| 12/31/2021 | 290 |
| Additions | 26 |
| Disposals | –28 |
| 12/31/2022 | 288 |
| Additions | 12 |
| Disposals | –65 |
| 12/31/2023 | 235 |
The additions relate to legal entities added in connection with acquisitions and foundations. The disposals are mainly due to mergers, liquidations, and divestitures of legal entities.
|
SAP Integrated Report 2023 | |||||
| To
Our Stakeholders |
Combined
Management Report |
Consolidated
Financial Statements IFRS |
Further
Information about Sustainability |
Additional Information |
||
Subsidiaries1
| Major Subsidiaries | ||||||
| Name and Location of Company | Ownership |
Total Revenue in 20232 |
Profit/Loss (–)
After Tax |
Total Equity as at 12/31/20232 |
Number of Employees as at 12/31/20233 |
Footnote |
| % | € thousands | € thousands | € thousands | |||
| Ariba Technologies India Private Limited, Bengaluru, India | 100 | 107,665 | 14,181 | 41,767 | 1,360 | |
| Ariba, Inc., Palo Alto, CA, United States | 100 | 1,426,356 | 689,432 | 6,618,961 | 1,589 | |
| Concur Technologies, Inc., Bellevue, WA, United States | 100 | 2,169,139 | 408,667 | 8,828,126 | 3,217 | |
| SAP (China) Co., Ltd., Shanghai, China | 100 | 1,313,574 | 21,903 | –75,918 | 6,528 | 17 |
| SAP (Schweiz) AG, Biel, Switzerland | 100 | 1,392,865 | 124,568 | 310,761 | 873 | |
| SAP (UK) Limited, Feltham, United Kingdom | 100 | 1,431,680 | 66,373 | 204,673 | 1,658 | 17 |
| SAP America, Inc., Newtown Square, PA, United States | 100 | 8,476,670 | –112,108 | 11,879,728 | 9,225 | |
| SAP Argentina S.A., Buenos Aires, Argentina | 100 | 237,309 | –19,467 | –7,742 | 1,134 | 17 |
| SAP Asia Pte. Ltd., Singapore, Singapore | 100 | 713,377 | 8,864 | 11,302 | 1,085 | 17 |
| SAP Australia Pty Ltd, Sydney, Australia | 100 | 808,936 | –17,934 | 96,836 | 1,302 | |
| SAP Brasil Ltda., São Paulo, Brazil | 100 | 810,113 | 37,881 | 112,716 | 2,839 | 17 |
| SAP Canada Inc., Toronto, Canada | 100 | 1,187,938 | 103,844 | 768,751 | 3,104 | |
| SAP Deutschland SE & Co. KG, Walldorf, Germany | 100 | 5,724,456 | 819,333 | 1,796,440 | 5,048 | 9 |
| SAP España – Sistemas, Aplicaciones y Productos en la Informática, S.A., Madrid, Spain | 100 | 640,969 | 29,122 | 120,151 | 959 | |
| SAP France S.A., Levallois-Perret, France | 100 | 1,217,078 | 146,869 | 1,924,300 | 1,575 | |
| SAP Hungary Rendszerek, Alkalmazások és Termékek az Adatfeldolgozásban Informatikai Kft., Budapest, Hungary | 100 | 169,259 | 6,545 | 35,395 | 1,452 | |
| SAP India Private Limited, Bengaluru, India | 100 | 792,589 | 94,539 | 310,957 | 2,379 | |
| SAP Industries, Inc., Newtown Square, PA, United States | 100 | 603,743 | 158,746 | 1,427,522 | 239 | |
| SAP Italia Sistemi Applicazioni Prodotti in Data Processing S.p.A., Vimercate, Italy | 100 | 743,718 | 20,902 | 92,681 | 826 | |
| SAP Japan Co., Ltd., Tokyo, Japan | 100 | 1,164,259 | 77,354 | 303,285 | 1,416 | |
| SAP Labs Bulgaria EOOD, Sofia, Bulgaria | 100 | 121,838 | 5,945 | 32,905 | 1,330 | |
| SAP Labs India Private Limited, Bengaluru, India | 100 | 890,380 | 99,539 | 281,808 | 10,672 | |
| SAP Labs, LLC, Palo Alto, CA, United States | 100 | 668,207 | 118,097 | 864,453 | 1,733 | |
| SAP México S.A. de C.V., Mexico City, Mexico | 100 | 531,654 | –6,246 | 131,233 | 1,118 | 17 |
| SAP National Security Services, Inc., Newtown Square, PA, United States | 100 | 1,152,270 | 215,069 | 567,360 | 638 | |
| SAP Nederland B.V., ’s-Hertogenbosch, the Netherlands | 100 | 828,363 | 281,244 | 967,086 | 687 | 14 |
| SAP Philippines, Inc., Taguig City, Philippines | 100 | 117,602 | 285 | 8,975 | 997 | 17 |
| SAP Service and Support Centre (Ireland) Limited, Dublin, Ireland | 100 | 336,355 | 85,456 | 125,741 | 1,757 | |
| SAP Services s.r.o., Prague, Czech Republic | 100 | 122,548 | 4,705 | 23,055 | 1,436 |
|
SAP Integrated Report 2023 | |||||
| To
Our Stakeholders |
Combined
Management Report |
Consolidated
Financial Statements IFRS |
Further
Information about Sustainability |
Additional Information |
||
Other Subsidiaries4
| Name and Location of Company |
Ownership (%) |
Footnote |
| “SAP Kazakhstan” LLP, Almaty, Kazakhstan | 100 | |
| 110405, Inc., Newtown Square, PA, United States | 100 | |
| Abakus Ukraine Limited Liability Company, Kyiv, Ukraine | 100 | |
| Ambin Properties Proprietary Limited, Johannesburg, South Africa | 100 | 17 |
| Apex Expert Solutions LLC, Chantilly, VA, United States | 100 | |
| AppGyver Inc., Indianapolis, IN, United States | 100 | |
| AppGyver Oy., Espoo, Finland | 100 | |
| Ariba Czech s.r.o., Prague, Czech Republic | 100 | |
| Ariba India Private Limited, Gurugram, India | 100 | |
| Ariba International Holdings, Inc., Wilmington, DE, United States | 100 | |
| Ariba International Singapore Pte. Ltd., Singapore, Singapore | 100 | |
| Ariba International, Inc., Wilmington, DE, United States | 100 | |
| Ariba Slovak Republic, s.r.o., Košice, Slovakia | 100 | |
| Ariba Software Technology Services (Shanghai) Co., Ltd., Shanghai, China | 100 | |
| Ariba Technologies Netherlands B.V., ’s-Hertogenbosch, the Netherlands | 100 | 14 |
| Baiza Capital Designated Activity Company, Dublin, Ireland | 0 | 5, 8 |
| Baiza Capital Italia s.r.l., Milan, Italy | 0 | 5, 8 |
| Baiza Capital LLC, Newark, NJ, United States | 0 | 8 |
| Baiza Capital S.A., Luxembourg, Luxembourg | 0 | 8 |
| Business Objects Holding B.V., ’s-Hertogenbosch, the Netherlands | 100 | 14 |
| Business Objects Option, LLC, Wilmington, DE, United States | 100 | |
| Business Objects Software Limited (Trading as SAP Solutions), Dublin, Ireland | 100 | |
| Callidus Software Inc., San Ramon, CA, United States | 100 | |
| CallidusCloud (India) Private Limited, Hyderabad, India | 100 | |
| Christie Partners Holding C.V., ’s-Hertogenbosch, the Netherlands | 100 | |
| Cleanshelf, Inc., San Francisco, CA, United States | 100 | 5 |
| CNQR Operations Mexico S. de. R.L. de. C.V., Mexico City, Mexico | 100 | |
| Concur (Canada), Inc., Toronto, Canada | 100 | |
| Concur (Czech) s.r.o., Prague, Czech Republic | 100 | |
| Concur (France) S.A.S., Levallois-Perret, France | 100 | |
| Concur (Germany) GmbH, Frankfurt am Main, Germany | 100 | 10, 11 |
| Concur (Japan) Ltd., Tokyo, Japan | 97 | |
| Concur (Philippines) Inc., Makati City, Philippines | 100 | |
| Concur (Switzerland) GmbH, Zurich, Switzerland | 100 | 15 |
| Concur Holdings (France) S.A.S., Levallois-Perret, France | 100 | |
| Concur Holdings (Netherlands) B.V., ’s-Hertogenbosch, the Netherlands | 100 | 14 |
| Concur Technologies (Australia) Pty. Limited, Sydney, Australia | 100 | |
| Concur Technologies (Hong Kong) Limited, Hong Kong, China | 100 | |
| Concur Technologies (India) Private Limited, Bengaluru, India | 100 | |
| Concur Technologies (Singapore) Pte. Ltd., Singapore, Singapore | 100 | 17 |
| Concur Technologies (UK) Limited, Feltham, United Kingdom | 100 | 17 |
| ConTgo Consulting Limited, Feltham, United Kingdom | 100 | 13, 17 |
| ConTgo Limited, Feltham, United Kingdom | 100 | 13 |
| Crystal Decisions (UK) Limited, Feltham, United Kingdom | 100 | 13 |
| Delos Cloud GmbH, Schönefeld, Germany | 100 |
|
SAP Integrated Report 2023 | |||||
| To
Our Stakeholders |
Combined
Management Report |
Consolidated
Financial Statements IFRS |
Further
Information about Sustainability |
Additional Information |
||
| Name and Location of Company |
Ownership (%) |
Footnote |
| Emarsys eMarketing Systems GmbH, Vienna, Austria | 100 | |
| Emarsys İletişim Sistemleri Tic. Ltd Şti., Istanbul, Turkey | 100 | |
| Emarsys Interactive Services GmbH, Berlin, Germany | 100 | |
| Emarsys Limited, Hong Kong, China | 100 | |
| Emarsys North America, Inc., Indianapolis, IN, United States | 100 | |
| Emarsys Pte. Ltd., Singapore, Singapore | 100 | |
| Emarsys Pty Ltd, Sydney, Australia | 100 | |
| Emarsys S.A.S., Levallois-Perret, France | 100 | |
| Emarsys Schweiz GmbH, Zurich, Switzerland | 100 | |
| Emarsys UK Ltd, London, United Kingdom | 100 | |
| EMARSYS-Technologies Informatikai Szolgáltató Kft., Budapest, Hungary | 100 | |
| ESS Cubed Procurement Proprietary Limited, Johannesburg, South Africa | 100 | |
| FreeMarkets Ltda., São Paulo, Brazil | 100 | |
| hybris GmbH, Munich, Germany | 100 | 10, 11 |
| INNAAS s.r.l., Rome, Italy | 100 | |
| LeadFormix, Inc., San Ramon, CA, United States | 100 | |
| LeanIX France S.A.R.L., Courbevoie, France | 100 | 5 |
| LeanIX GmbH, Bonn, Germany | 100 | 5 |
| LeanIX SI d.o.o., Ljubljana, Slovenia | 100 | 5 |
| LeanIX UK Limited, London, United Kingdom | 100 | 5 |
| LeanIX US Holdings, Inc., Watertown, MA, United States | 100 | 5 |
| LeanIX, B.V., Amsterdam, the Netherlands | 100 | 5 |
| LeanIX, Inc., Houston, TX, United States | 100 | 5 |
| LLC “Emarsys”, Moscow, Russia | 100 | |
| LLC “SAP Labs”, Moscow, Russia | 100 | |
| LLC “SAP Ukraine”, Kyiv, Ukraine | 100 | 17 |
| Loyalsys Technologies Israel Ltd., Tel Aviv, Israel | 100 | |
| LXTECH India Private Limited, Hyderabad, India | 100 | 5 |
| Nihon Ariba K.K., Tokyo, Japan | 100 | |
| Outerjoin, Inc., San Ramon, CA, United States | 100 | |
| OutlookSoft Deutschland GmbH, Walldorf, Germany | 100 | 10, 11 |
| PT SAP Indonesia, Jakarta, Indonesia | 99 | |
| Quadrem Africa Pty. Ltd., Johannesburg, South Africa | 100 | |
| Quadrem Brazil Ltda., Rio de Janeiro, Brazil | 100 | |
| Quadrem Chile Ltda., Santiago de Chile, Chile | 100 | |
| Quadrem International Ltd., Hamilton, Bermuda | 100 | |
| Quadrem Netherlands B.V., ’s-Hertogenbosch, the Netherlands | 100 | 14 |
| Quadrem Overseas Cooperatief U.A., ’s-Hertogenbosch, the Netherlands | 100 | |
| Quadrem Peru S.A.C., Lima, Peru | 100 | |
| SAP (Beijing) Software System Co., Ltd., Beijing, China | 100 | |
| SAP (China) Holding Co., Ltd., Beijing, China | 100 | |
| SAP Andina y del Caribe C.A., Caracas, Venezuela | 100 | 17 |
| SAP AZ LLC, Baku, Azerbaijan | 100 | |
| SAP Belgium – Systems, Applications and Products S.A., Brussels, Belgium | 100 | |
| SAP Beteiligungs GmbH, Walldorf, Germany | 100 | |
| SAP Bulgaria EOOD, Sofia, Bulgaria | 100 |
|
SAP Integrated Report 2023 | |||||
| To
Our Stakeholders |
Combined
Management Report |
Consolidated
Financial Statements IFRS |
Further
Information about Sustainability |
Additional Information |
||
| Name and Location of Company |
Ownership (%) |
Footnote |
| SAP Business Services Center Nederland B.V., ’s-Hertogenbosch, the Netherlands | 100 | 14 |
| SAP Chile Limitada, Santiago de Chile, Chile | 100 | 17 |
| SAP CIS, LLC, Moscow, Russia | 100 | |
| SAP Colombia S.A.S., Bogotá, D.C., Colombia | 100 | 17 |
| SAP Costa Rica, S.A., Escazú, Costa Rica | 100 | 17 |
| SAP ČR, spol. s r.o., Prague, Czech Republic | 100 | |
| SAP Cyprus Limited, Nicosia, Cyprus | 100 | |
| SAP Danmark A/S, Copenhagen, Denmark | 100 | |
| SAP Dritte Beteiligungs- und Vermögensverwaltungs GmbH, Walldorf, Germany | 100 | |
| SAP društvo s ograničenom odgovornošću za digitalnu ekonomiju novog tisućljeća, Zagreb, Croatia | 100 | |
| SAP East Africa Limited, Nairobi, Kenya | 100 | 17 |
| SAP Egypt LLC, Cairo, Egypt | 100 | 17 |
| SAP EMEA Inside Sales S.L., Madrid, Spain | 100 | |
| SAP Erste Beteiligungs- und Vermögensverwaltungs GmbH, Walldorf, Germany | 100 | 10, 11 |
| SAP Estonia OÜ, Tallinn, Estonia | 100 | |
| SAP Financial, Inc., Toronto, Canada | 100 | |
| SAP Finland Oy, Espoo, Finland | 100 | |
| SAP Foreign Holdings GmbH, Walldorf, Germany | 100 | |
| SAP France Holding S.A., Levallois-Perret, France | 100 | |
| SAP Global Marketing, Inc., New York, NY, United States | 100 | |
| SAP Hellas Single Member S.A., Athens, Greece | 100 | |
| SAP Hong Kong Co., Ltd., Hong Kong, China | 100 | 17 |
| SAP Hosting Beteiligungs GmbH, St. Leon-Rot, Germany | 100 | 10, 11 |
| SAP India (Holding) Pte. Ltd., Singapore, Singapore | 100 | |
| SAP International Panama, S.A., Panama City, Panama | 100 | |
| SAP International, Inc., Miami, FL, United States | 100 | |
| SAP Investments, Inc., Wilmington, DE, United States | 100 | |
| SAP Ireland Limited, Dublin, Ireland | 100 | 17 |
| SAP Ireland US - Financial Services Designated Activity Company, Dublin, Ireland | 100 | |
| SAP Israel Ltd., Ra’anana, Israel | 100 | 17 |
| SAP Korea Ltd., Seoul, South Korea | 100 | |
| SAP Labs France S.A.S., Mougins, France | 100 | |
| SAP Labs Israel Ltd., Ra’anana, Israel | 100 | |
| SAP Labs Korea, Inc., Seoul, South Korea | 100 | |
| SAP Latvia SIA, Riga, Latvia | 100 | |
| SAP Malaysia Sdn. Bhd., Kuala Lumpur, Malaysia | 100 | |
| SAP Middle East and North Africa L.L.C., Dubai, United Arab Emirates | 49 | 6, 17 |
| SAP Middle East FZ-LLC, Dubai, United Arab Emirates | 100 | 17 |
| SAP Nederland Holding B.V., ’s-Hertogenbosch, the Netherlands | 100 | 14 |
| SAP New Zealand Limited, Auckland, New Zealand | 100 | |
| SAP Norge AS, Oslo, Norway | 100 | |
| SAP North West Africa Ltd, Casablanca, Morocco | 100 | |
| SAP Österreich GmbH, Vienna, Austria | 100 | |
| SAP Perú S.A.C., Lima, Peru | 100 | 17 |
| SAP Polska Sp. z o.o., Warsaw, Poland | 100 | |
| SAP Portals Holding Beteiligungs GmbH, Walldorf, Germany | 100 |
|
SAP Integrated Report 2023 | |||||
| To
Our Stakeholders |
Combined
Management Report |
Consolidated
Financial Statements IFRS |
Further
Information about Sustainability |
Additional Information |
||
| Name and Location of Company |
Ownership (%) |
Footnote |
| SAP Portals Israel Ltd., Ra’anana, Israel | 100 | |
| SAP Portugal – Sistemas, Aplicações e Produtos Informáticos, Sociedade Unipessoal, Lda., Porto Salvo, Portugal | 100 | |
| SAP Projektverwaltungs- und Beteiligungs GmbH, Walldorf, Germany | 100 | |
| SAP Public Services, Inc., Washington, DC, United States | 100 | |
| SAP Puerto Rico GmbH, Walldorf, Germany | 100 | 10, 11, 17 |
| SAP Retail Solutions Beteiligungsgesellschaft GmbH, Walldorf, Germany | 100 | |
| SAP Saudi Arabia Software Services Ltd, Riyadh, Kingdom of Saudi Arabia | 100 | |
| SAP Saudi Arabia Software Trading Ltd, Riyadh, Kingdom of Saudi Arabia | 75 | 17 |
| SAP Sechste Beteiligungs- und Vermögensverwaltungs GmbH, Walldorf, Germany | 100 | 10, 11 |
| SAP Siebte Beteiligungs- und Vermögensverwaltungs GmbH, Walldorf, Germany | 100 | 10, 11 |
| SAP sistemi, aplikacije in produkti za obdelavo podatkov d.o.o., Ljubljana, Slovenia | 100 | |
| SAP Slovensko s.r.o., Bratislava, Slovakia | 100 | |
| SAP Software and Services WLL, Doha, Qatar | 49 | 6, 17 |
| SAP Svenska Aktiebolag, Stockholm, Sweden | 100 | |
| SAP System Application and Products Asia Myanmar Limited, Yangon, Myanmar | 100 | |
| SAP Systems, Applications and Products in Data Processing (Thailand) Ltd., Bangkok, Thailand | 100 | |
| SAP Taiwan Co., Ltd., Taipei, Taiwan | 100 | |
| SAP Technologies Inc., Palo Alto, CA, United States | 100 | |
| SAP Training and Development Institute FZCO, Dubai, United Arab Emirates | 100 | 17 |
| SAP Türkiye Yazilim Üretim ve Ticaret A.Ş., Istanbul, Turkey | 100 | |
| SAP UAB, Vilnius, Lithuania | 100 | |
| SAP Ventures Investment GmbH, Walldorf, Germany | 100 | 10, 11 |
| SAP Vierte Beteiligungs- und Vermögensverwaltungs GmbH, Walldorf, Germany | 100 | |
| SAP Vietnam Company Limited, Ho Chi Minh City, Vietnam | 100 | |
| SAP West Balkans d.o.o., Belgrade, Serbia | 100 | |
| SAP Zweite Beteiligungs- und Vermögensverwaltungs GmbH, Walldorf, Germany | 100 | 10, 11 |
| SAP.io Fund, L.P., Austin, TX, United States | 0 | 7 |
| Sapphire Fund Investments II Holdings, LLC, Austin, TX, United States | 100 | 7 |
| Sapphire Fund Investments II, L.P., Austin, TX, United States | 0 | 7 |
| Sapphire Fund Investments III Holdings, LLC, Austin, TX, United States | 100 | 7 |
| Sapphire Fund Investments III, L.P., Austin, TX, United States | 0 | 7 |
| Sapphire SAP HANA Fund of Funds, L.P., Austin, TX, United States | 0 | 7 |
| Sapphire Ventures Fund I, L.P., Austin, TX, United States | 0 | 7 |
| Sapphire Ventures Fund II, L.P., Austin, TX, United States | 0 | 7 |
| Sapphire Ventures Fund III, L.P., Austin, TX, United States | 0 | 7 |
| Sapphire Ventures Fund IV, L.P., Austin, TX, United States | 0 | 7 |
| Sapphire Ventures Fund V, L.P., Austin, TX, United States | 0 | 7 |
| Sapphire Ventures Fund VI, L.P., Austin, TX, United States | 0 | 7 |
| Sapphire Ventures Fund VII-A, L.P., Austin, TX, United States | 0 | 7 |
| SAPV (Mauritius), Ebene, Mauritius | 100 | 7 |
| SC SAP Romania SRL, Bucharest, Romania | 100 | |
| Shanghai SAP Cloud Technology Company, Ltd., Shanghai, China | 70 | |
| Signavio UK Ltd, Birmingham, United Kingdom | 100 | 13 |
| Signavio, Inc., Newtown Square, PA, United States | 100 | |
| SuccessFactors (Philippines), Inc., Pasig City, Philippines | 100 | 17 |
| SuccessFactors, Inc., Newtown Square, PA, United States | 100 |
|
SAP Integrated Report 2023 | |||||
| To
Our Stakeholders |
Combined
Management Report |
Consolidated
Financial Statements IFRS |
Further
Information about Sustainability |
Additional Information |
||
| Name and Location of Company |
Ownership (%) |
Footnote |
| Sybase Angola, LDA, Luanda, Angola | 100 | 16 |
| Sybase Iberia, S.L., Madrid, Spain | 100 | |
| Sybase International Holdings Corporation, LLC, San Ramon, CA, United States | 100 | |
| Sybase, Inc., San Ramon, CA, United States | 100 | |
| Systems Applications Products (Africa Region) Proprietary Limited, Johannesburg, South Africa | 100 | |
| Systems Applications Products (Africa) Proprietary Limited, Johannesburg, South Africa | 100 | |
| Systems Applications Products (South Africa) Proprietary Limited, Johannesburg, South Africa | 81 | 17 |
| Systems Applications Products Nigeria Limited, Victoria Island, Nigeria | 100 | 17 |
| Taulia (Shanghai) Smart Technology Co. Ltd., Shanghai, China | 100 | |
| Taulia Arabia LLC, Riyadh, Kingdom of Saudi Arabia | 100 | 5 |
| Taulia Australia Pty. Ltd., Sydney, Australia | 100 | |
| Taulia Bulgaria EOOD, Sofia, Bulgaria | 100 | |
| Taulia GmbH, Düsseldorf, Germany | 100 | 12 |
| Taulia LLC, San Francisco, CA, United States | 96 | |
| Taulia Singapore Pte. Ltd., Singapore, Singapore | 100 | |
| Taulia Trade Technology GmbH, Düsseldorf, Germany | 100 | 12 |
| Taulia UK Ltd., London, United Kingdom | 100 | |
| Technology Management Associates Inc., Chantilly, VA, United States | 100 | |
| TRX Europe Limited, Feltham, United Kingdom | 100 | 13, 17 |
| TRX Technologies India Private Limited, Bengaluru, India | 100 | |
| TRX UK Limited, Feltham, United Kingdom | 100 | 13 |
| TRX, Inc., Bellevue, WA, United States | 100 | |
| Volume Integration, Inc., Chantilly, VA, United States | 100 |
1 For the classification of the subsidiaries, the following figures are considered: revenues, profit/loss after tax, total equity, and number of employees.
2 These figures are based on our local IFRS financial statements prior to eliminations resulting from consolidation and therefore do not reflect the contribution of these companies included in the Consolidated Financial Statements. The translation of the equity into Group currency is based on period-end closing exchange rates, and on average exchange rates for revenue and net income/loss.
3 As at December 31, 2023, including managing directors, in FTE.
4 Figures for profit/loss after tax and total equity pursuant to HGB, section 285 and section 313 are not disclosed if they are of minor significance for a fair presentation of the profitability, liquidity, capital resources, and financial position of SAP SE, pursuant to HGB, section 313 (2) sentence 3 no. 4 and section 286 (3) sentence 1 no. 1.
5 Consolidated for the first time in 2023.
6 Agreements with the other shareholders provide that SAP SE fully controls the entity.
7 Structured entity belonging to SAP SE. The results of operations of these entities are included in SAP’s Consolidated Financial Statements in accordance with IFRS 10 (Consolidated Financial Statements).
8 In accordance with IFRS 10 the structured entity does not include the receivables and liabilities resulting from the supply chain financing (SCF) activities.
9 Entity whose personally liable partner is SAP SE.
10 Entity with (profit and) loss transfer agreement.
11 Pursuant to HGB, section 264 (3) or section 264b, the subsidiary is exempt from applying certain legal requirements to their statutory stand-alone financial statements including the requirement to prepare notes to the financial statements and a review of operations, the requirement of independent audit, and the requirement of public disclosure.
12 Pursuant to HGB, section 316 (1), the subsidiary is exempt from having its financial statements audited in respect of its financial year ended December 31, 2023.
13 Pursuant to section 480 of the UK Companies Act 2006, the entity is exempt from having its financial statements audited on the grounds that the entity is entitled to the benefits from a dormant entity exemption in respect of its financial year ended December 31, 2023.
14 Pursuant to article 2:403 of the Dutch Civil Code, the entity is exempt from applying certain legal requirements to their statutory stand-alone financial statements including the requirement to prepare the financial statements, the requirement of independent audit, and the requirement of public disclosure in respect of its financial year ended December 31, 2023, or in respect of its financial year ended September 30, 2023, respectively.
15 Pursuant to article 727a, paragraph 2 of the Swiss Code of Obligations, the entity is exempt from having its financial statements audited in respect of its financial year ended December 31, 2023, or in respect of its financial year ended September 30, 2023, respectively.
16 Pursuant to Angola Tax Law and Presidential Decree no. 147/13 of October 1, 2013, the entity does not qualify as being a Large Taxpayer and therefore is exempt from having its financial statements audited in respect of its financial year ended December 31, 2023.
17 Entity with support letter issued by SAP SE.
|
SAP Integrated Report 2023 | |||||
| To
Our Stakeholders |
Combined
Management Report |
Consolidated
Financial Statements IFRS |
Further
Information about Sustainability |
Additional Information |
||
Other Equity Investments
| Joint Arrangements and Investments in Associates | |
| Name and Location of Company | Ownership (%) |
| China DataCom Corporation Limited, Guangzhou, China | 28 |
| Procurement Negócios Eletrônicos S/A, Rio de Janeiro, Brazil | 17 |
| SAP Fioneer GmbH, Walldorf, Germany | 20 |
| Name and Location of Company |
| Equity Investments with Ownership of at Least 5% |
| 47th Street Partners I, L.P., Menlo Park, CA, United States |
| 83North IV, L.P., Hertzalia, Israel |
| Adverity GmbH, Vienna, Austria |
| Alation, Inc., Redwood City, CA, United States |
| Alchemist Accelerator Fund I LLC, San Francisco, CA, United States |
| Aleph-Bigg SPV, L.P., Grand Cayman, Cayman Islands |
| All Tax Platform - Solucoes Tributarias S.A., São Paulo, Brazil |
| Amplify Partners II L.P., Menlo Park, CA, United States |
| Amplify Partners III, L.P., Menlo Park, CA, United States |
| Amplify Partners IV, L.P., Menlo Park, CA, United States |
| Amplify Partners, L.P., Menlo Park, CA, United States |
| BGS Holdings, Inc., Austin, TX, United States |
| BioCatch Ltd., Tel Aviv, Israel |
| Bitonic Technology Labs, Inc., Karnataka, India |
| Blue Yard Capital 1 Alternative GmbH & Co. KG, Berlin, Germany |
| Blue Yard Capital I GmbH & Co. KG, Berlin, Germany |
| Blue Yard Crytpo 1, L.P., Hot Springs Village, AR, United States |
| Boldstart Ventures V, L.P., Miami, FL, United States |
| Boldstart Ventures VI, L.P., Miami, FL, United States |
| Brightfield Holdings, Inc., New York, NY, United States |
| Bryj Technologies, Inc. (fka Follow Analytics, Inc.), San Francisco, CA, United States |
| BY Capital 2 GmbH & Co. KG, Berlin, Germany |
| Catchpoint Systems, Inc., New York, NY, United States |
| CDQ AG, St. Gallen, Switzerland |
| Chalfen Ventures Fund I L.P., St Heiler, Jersey, Channel Islands |
| Chalfen Ventures Fund II L.P., St Helier, Jersey, Channel Islands |
| Chalfen Ventures Fund III L.P., St Helier, Jersey, Channel Islands |
| CircleCI, Inc., San Francisco, CA, United States |
| Clari, Inc., Sunnyvale, CA, United States |
| Cofinity-X GmbH, Cologne, Germany |
| Collectly, Inc., Pasadena, CA, United States |
| ComponentLab, Inc., Seattle, WA, United States |
| Contentful Global, Inc., Berlin, Germany |
| Costanoa Venture Capital II L.P., Palo Alto, CA, United States |
| Costanoa Venture Capital QZ, LLC, Palo Alto, CA, United States |
| Costanoa Venture Capital III L.P., Palo Alto, CA, United States |
|
SAP Integrated Report 2023 | |||||
| To
Our Stakeholders |
Combined
Management Report |
Consolidated
Financial Statements IFRS |
Further
Information about Sustainability |
Additional Information |
||
| Name and Location of Company |
| Creandum SPV TR (D) AB, Stockholm, Sweden |
| Cultivate Rollco LLc (fka Cultivate Technology, Inc.), San Francisco, CA, United States |
| Culture Amp, Inc., San Francisco, CA, United States |
| Cypress.io, Inc., Atlanta, GA, United States |
| Data Collective II L.P., Palo Alto, CA, United States |
| Data Collective III L.P., Palo Alto, CA, United States |
| Data Collective IV, L.P., Palo Alto, CA, United States |
| Digital Hub Rhein-Neckar GmbH, Ludwigshafen, Germany |
| Dremio Corporation, Santa Clara, CA, United States |
| Essence VC III, L.P., Seattle, WA, United States |
| FeedZai S.A., Lisbon, Portugal |
| Felix Capital Fund III, London, United Kingdom |
| Felix Ventures II, L.P., London, United Kingdom |
| Filament 2024, L.P., Brooklyn, NY, United States |
| Finco Services, Inc. (dba Current), New York, NY, United States |
| FloQast, Inc., Los Angeles, CA, United States |
| GitGuardian SAS, Paris, France |
| Gorgias Inc., San Francisco, CA, United States |
| Haystack Ventures V, L.P., Mill Valley, CA, United States |
| Haystack Ventures VI, L.P., Mill Valley, CA, United States |
| Haystack Ventures VII, L.P., San Francisco, CA, United States |
| Huntress Labs Incorporated, Ellicott City, MD, United States |
| IDG Ventures USA III, L.P., San Francisco, CA, United States |
| IEX Group, Inc., New York, NY, United States |
| InfluxData, Inc., San Francisco, CA, United States |
| Initialized CBH SPV LLC, Walnut, CA, United States |
| InnovationLab GmbH, Heidelberg, Germany |
| innoWerft Technologie- und Gründerzentrum Walldorf Stiftung GmbH, Walldorf, Germany |
| Involve.ai, Inc., Santa Monica, CA, United States |
| JetLenses Inc. (dba Verse Medical), New York, NY, United States |
| JupiterOne, Inc., Morrisville, NC, United States |
| Kaltura, Inc., New York, NY, United States |
| LeanData, Inc., Sunnyvale, CA, United States |
| LGVP F I LLC, Dover, DE, United States |
| Local Globe Opportunity Fund, L.P., St. Peter Port, Guernsey, Channel Islands |
| Local Globe VII, L.P., St. Peter Port, Guernsey, Channel Islands |
| Local Globe VIII, L.P., St. Peter Port, Guernsey, Channel Islands |
| Local Globe X, L.P., St. Peter Port, Guernsey, Channel Islands |
| LocalGlobe XI, L.P., St. Peter Port, Guernsey, Channel Islands |
| Mango Capital 2018, L.P., Los Altos, CA, United States |
| Mango Capital 2020, L.P., Los Altos, CA, United States |
| Mango Capital 2022, L.P., Los Altos, CA, United States |
| Matillion Ltd., Altrincham, United Kingdom |
| Medable Inc., Palo Alto, CA, United States |
| Mosaic Ventures Investors Fund I, L.P., London, United Kingdom |
| Notation Capital, L.P., Brooklyn, NY, United States |
| Notation Capital II CIRC, LLC, Brooklyn, NY, United States |
|
SAP Integrated Report 2023 | |||||
| To
Our Stakeholders |
Combined
Management Report |
Consolidated
Financial Statements IFRS |
Further
Information about Sustainability |
Additional Information |
||
| Name and Location of Company |
| Notation Capital II, L.P., Brooklyn, NY, United States |
| Notation Capital III, L.P., Brooklyn, NY, United States |
| OpenX Software Limited, Pasadena, CA, United States |
| Paper Education Company Inc., Quebec, Canada |
| Pendo.io, Inc., Raleigh, NC, United States |
| PivotNorth Early Fund I, L.P., Atherton, CA, United States |
| Point Nine Annex GmbH & Co. KG, Berlin, Germany |
| Point Nine Capital Fund II GmbH & Co. KG, Berlin, Germany |
| Point Nine Capital Fund III GmbH & Co. KG, Berlin, Germany |
| Point Nine Capital Fund IV GmbH & Co. KG, Berlin, Germany |
| Point Nine Capital Fund V GmbH & Co. KG, Berlin, Germany |
| Project 44, Inc., Chicago, IL, United States |
| PubNub, Inc., San Francisco, CA, United States |
| Qualified.com, Inc., San Francisco, CA, United States |
| Reltio, Inc., Redwood Shores, CA, United States |
| Restream, Inc., Austin, TX, United States |
| Ridge Ventures IV, L.P., San Francisco, CA, United States |
| Ridge Ventures V, L.P., San Francisco, CA, United States |
| SafeGraph, Inc., Denver, CO, United States |
| Sapphire Sport Parallel Fund, L.P., Austin, TX, United States |
| Sapphire Sport Parallel Fund II, L.P., Austin, TX, United States |
| Sapphire Sport, L.P., Austin, TX, United States |
| Side, Inc., San Francisco, CA, United States |
| Simpplr Inc., Redwood City, CA, United States |
| Smart City Planning, Inc., Tokyo, Japan |
| Splashtop, Inc., San Jose, CA, United States |
| Spring Mobile Solutions, Inc., Salt Lake City, UT, United States |
| StackHawk, Inc., Denver, CO, United States |
| Storm Ventures V, L.P., Menlo Park, CA, United States |
| SV Angel IV, L.P., San Francisco, CA, United States |
| Tetrate.io, Inc., Milpitas, CA, United States |
| The SaaStr Fund, L.P., Palo Alto, CA, United States |
| The SaaStr Fund II, L.P., Palo Alto, CA, United States |
| Third Kind Venture Capital II, L.P., New York, NY, United States |
| Third Kind Venture Capital III, L.P., New York, NY, United States |
| Tribe Capital LLC Series 3, Redwood City, CA, United States |
| Tribe Capital LLC Series 8, Redwood City, CA, United States |
| UJET, Inc., San Francisco, CA, United States |
| Unmind Ltd., London, United Kingdom |
| Upfront V, L.P., Santa Monica, CA, United States |
| Uptycs, Inc., Waltham, MA, United States |
| VerbIT, Inc., New York, NY, United States |
| Vistex, Inc., Hoffman Estates, IL, United States |
| Walkabout Ventures Fund II L.P., Los Angeles, CA, United States |
| Yapily Ltd., London, United Kingdom |
| Zesty Tech Ltd., Ramat Gan, Israel |
|
SAP Integrated Report 2023 | |||||
| To
Our Stakeholders |
Combined
Management Report |
Consolidated
Financial Statements IFRS |
Further
Information about Sustainability |
Additional Information |
||
(G.10) German Code of Corporate Governance
The German federal government published the German Corporate Governance Code (the “Code”) in February 2002 and introduced a commission that amends the Code from time to time. The Code contains statutory requirements and a number of recommendations and suggestions. Only the legal requirements are binding for German companies. With regard to the recommendations, the German Stock Corporation Act, section 161, requires that every year, listed companies publicly state the extent to which they have implemented them. Companies can deviate from the suggestions without having to make any public statements.
In 2023 and 2022, the Executive Board and Supervisory Board of SAP SE issued the required declarations of compliance. The declaration for 2023 was issued at the end of October 2023. These statements are available on our Web site: www.sap.com/investors/en/governance.
|
SAP Integrated Report 2023 | |||||
| To
Our Stakeholders |
Combined
Management Report |
Consolidated
Financial Statements IFRS |
Further
Information about Sustainability |
Additional Information |
||
Walldorf, February 21, 2024
SAP SE
Walldorf, Baden
The Executive Board
| Christian Klein | Dominik Asam |
| Dr. Juergen Mueller | Scott Russell |
| Thomas Saueressig | Gina Vargiu-Breuer |
| Julia White |
|
SAP Integrated Report 2023 | |||||
| To
Our Stakeholders |
Combined
Management Report |
Consolidated
Financial Statements IFRS |
Further
Information about Sustainability |
Additional Information |
||
Management’s Annual Report on Internal Control over Financial Reporting in the Consolidated Financial Statements
U.S. law requires that management submit a report on the effectiveness of internal control over financial reporting in the consolidated financial statements. For 2023, that report is as follows:
The management of SAP is responsible for establishing and maintaining adequate internal control over financial reporting as such term is defined in Rules 13a–15(f) and 15d–15(f) under the U.S. Securities Exchange Act of 1934. SAP’s internal control over financial reporting is a process designed under the supervision of SAP’s CEO and CFO to provide reasonable assurance regarding the reliability of financial reporting and the preparation of financial statements for external reporting purposes in accordance with International Financial Reporting Standards as issued by the International Accounting Standards Board.
SAP’s management assessed the effectiveness of the Company’s internal control over financial reporting as at December 31, 2023. In making this assessment, it used the criteria set forth by the Committee of Sponsoring Organizations of the Treadway Commission in Internal Control – Integrated Framework (2013).
Based on the assessment under these criteria, SAP management has concluded that, as at December 31, 2023, the Company’s internal control over financial reporting was effective.
|
SAP Integrated Report 2023 | |||||
| To
Our Stakeholders |
Combined
Management Report |
Consolidated
Financial Statements IFRS |
Further
Information about Sustainability |
Additional Information |
||
Further Information about Sustainability
| About This Further Information on Economic, Environmental, and Social Performance | 263 |
| Sustainability Management | 264 |
| Stakeholder Engagement | 266 |
| Materiality | 268 |
| Why Holistic Steering and Reporting Matters | 271 |
| Social Investments | 274 |
| Sustainable Procurement | 276 |
| Waste and Water | 279 |
| Public Policy | 282 |
| Memberships, Partnerships, and Commitments | 283 |
| Non-Financial Notes: Environmental Performance | 285 |
| Our Contribution to the UN Sustainable Development Goals | 296 |
| GRI Content Index | 300 |
| Stakeholder Capitalism Metrics | 315 |
| SASB Index | 317 |
| Task Force on Climate-Related Financial Disclosure (TCFD) | 318 |
|
SAP Integrated Report 2023 | |||||
| To
Our Stakeholders |
Combined
Management Report |
Consolidated
Financial Statements IFRS |
Further
Information about Sustainability |
Additional Information |
||
About This Further Information on Economic, Environmental, and Social Performance
The
social and environmental data and information included in the SAP Integrated Report has been prepared in accordance with
the GRI Standards and were subject to an independent assurance engagement of our external auditor with different levels of assurance.
At the end of each chapter, you will find a grey info box marked by the symbol  that contains further explanation about the audit scope.
Unless otherwise stated, all of the information in this Report relates to the situation as at December 31, 2023, or the fiscal year ended on that date. Furthermore, all financial numbers in this Report are based on continuing operations (unless otherwise noted). Non-financial information has not been adjusted (unless otherwise noted). For more information, see the Notes to the Consolidated Financial Statements, Note (D.1).
We also report on our contribution towards the United Nations Sustainable Development Goals (SDGs) and respond to the recommendations of the Task Force on Climate-Related Financial Disclosure (TCFD).
Furthermore, we map our reporting to two additional frameworks:
| – | The Software & IT Services Sustainability Accounting Standards prepared by the Sustainability Accounting Standards Board (SASB), now part of the Value Reporting Foundation. |
| – | The core “Stakeholder Capitalism Metrics” as proposed by the World Economic Forum’s International Business Council (WEF IBC). |
|
SAP Integrated Report 2023 | |||||
| To
Our Stakeholders |
Combined
Management Report |
Consolidated
Financial Statements IFRS |
Further
Information about Sustainability |
Additional Information |
||
Sustainability Management
At the heart of our strategy to bring SAP’s purpose of “helping the world run better and improving people’s lives” to life, sustainability is firmly anchored in our business strategy, governance, and executive compensation system. For more information about our corporate strategy, see the Strategy section.
We aim to create positive economic, environmental, and social impact within the planetary boundaries by using two key levers:
| 1) | SAP as enabler: We strive to provide products and services that support our customers in meeting their sustainability challenges and in capitalizing on the related opportunities. |
| 2) | SAP as exemplar: To live up to our corporate responsibility and to build resilience, we strive toward leading by example in SAP’s business operations and practices by running our own operations more sustainably. |
We leverage our dual approach in pursuit of a world with zero emissions, zero waste, and zero inequality.69
Sustainability Governance
To better seize the strategic opportunities of sustainability, in 2022 SAP brought together the key functional sustainability entities across SAP – corporate sustainability and the office of the chief sustainability officer, product development, marketing and solutions, and go-to-market teams – into a single end-to-end organizational unit and operating segment. This unit is led by two co-general managers reporting to the chief strategy officer who in turn reports to the CEO. Since January 2024, the co-general managers report directly to the CEO. The chief sustainability officer (CSO) leads SAP’s global corporate sustainability efforts. In addition to reporting to the co-general managers, the CSO reports to the Chief Financial Officer (CFO) with a dotted line. The CEO is the Executive Board sponsor for sustainability overall. Additionally, SAP’s CFO is co-sponsoring our environmental agenda (Environmental Management System (EMS) and Net Zero Program), while the Executive Board member responsible for Product Engineering is sponsoring SAP’s efforts on AI Ethics.
The Supervisory Board and its committees also deliberate on environmental, social, and governance (ESG) and related reporting matters. To this end, the Supervisory Board is regularly (at least once a year) briefed about the SAP Group’s sustainability approach and the state of its implementation. The entire Supervisory Board oversees the sustainability performance and advises the Executive Board in this regard.
Placing dedicated focus on SAP’s own operations, the ESG Steering Board (formerly Sustainability Council) serves as a governance body to steer SAP’s corporate sustainability performance. Convened by the CSO and consisting of senior executives from across the Company, it provides strategic guidance and cross-Company engagement for SAP’s holistic sustainability agenda.
SAP also regularly engages with external stakeholder groups such as non-governmental organizations (NGOs), non-profit organizations (NPOs), and academia. This notably includes an external sustainability advisory panel comprised of expert representatives from our customers, investors, partners, NGOs, and academia, who provide us with valuable outside-in feedback and advice.
For more information, see the Stakeholder Engagement section.
69 SAP’s sustainability performance has been recognized by sustainability ratings and ranking and independent analysts. Recognitions are listed on SAP’s Web site (link leads to information that was neither part of the statutory audit nor the independent limited assurance engagement performed by our external auditor).
|
SAP Integrated Report 2023 | |||||
| To
Our Stakeholders |
Combined
Management Report |
Consolidated
Financial Statements IFRS |
Further
Information about Sustainability |
Additional Information |
||
Changing Our Behavior and Culture
Employee engagement is essential for driving change throughout SAP. We have set up several programs to help employees understand how sustainability is engrained in our purpose and strategy, and how they can contribute. For example, SAP continues to include sustainability in its onboarding training for new hires, global and local employee engagement sessions, and various line-of-business-specific learning offerings. Furthermore, employees can take openSAP online courses on sustainability, which are also available to the general public for free.
To help drive progress in our sustainability initiatives, we need the support of employees throughout the organization. We currently have a global internal network of nearly 400 sustainability champions who represent different regions and areas of the business at SAP. Not only do they act as role models and multipliers, these champions tailor sustainability engagement activities to local and lines-of-business needs and interests and share best practices.
We measure the success of our initiatives through our employee engagement surveys. The latest results from 2023 showed that 81% of our employees stated, “I actively contribute to SAP’s sustainability goals.” This is down from 82% in 2022 and up from 47% in 2009 when we introduced the question.
Audit
Scope
The content of the Sustainability Management section was subject to an independent limited assurance engagement by our external auditor.
|
SAP Integrated Report 2023 | |||||
| To
Our Stakeholders |
Combined
Management Report |
Consolidated
Financial Statements IFRS |
Further
Information about Sustainability |
Additional Information |
||
Stakeholder Engagement
For SAP, stakeholder engagement and collaboration are deeply embedded into our process of innovation and the development of our products and services. Before we can design a new solution, we must first understand the issue we are addressing. This is why we regularly liaise with the stakeholder groups described below, including our sustainability and AI ethics advisory panels.
Customers
For more information about our customer engagement programs, see the Customers section.
Employees
We survey our employees regularly throughout the year. For the results of our latest employee survey, see the Employees section.
We strive for constructive labor relations across the world, working within each country’s requirements. We currently have social partners in 37 countries in Africa, the Americas, Asia, and Europe. These employee representative bodies consist of elected union members and/or non-union members and are consulted by SAP management mainly on topics that define the work environment and work processes. Collective bargaining agreements with unions are only made in countries where legally required. Overall, about 52% of our employees are represented by works councils or an independent trade union, or are covered by collective bargaining agreements. The working conditions and terms of employment of the remaining employees are not influenced or determined based on other collective bargaining agreements. To foster the goal that every SAP employee worldwide can be heard and speak out without fear of retaliation, we have established a Global Ombuds Office which operates as an informal, independent, and confidential channel on top of the formal complaint mechanisms in place, including our Speak Out whistleblower reporting tool. For more information, see the Business Conduct section.
In addition, the Executive Board answers employees’ questions in quarterly employee meetings. In regular coffee corner sessions, senior executives explain our strategy to employees and answer their questions directly.
Financial Analysts and Investors
For more information about our dialog with the financial community (that is, financial analysts, institutional investors, and retail shareholders), see the Investor Relations section.
Governments
For more information about our dialog with governments, see the Public Policy section.
Industry Analysts
Our Analyst Relations team, the Executive Board, and executives have strong relations with industry analysts and engage with them frequently on strategic SAP solutions and services.
Partners
With more than 25,500 partners around the world, the SAP ecosystem is vital to our success. We take a multifaceted approach to engagement that begins with the dedicated, interactive SAP Partner Portal. Partners receive regular communications including customized newsletters, training offers, and Web seminars, with the latest announcements and thought leadership relevant to their specific partnership type.
|
SAP Integrated Report 2023 | |||||
| To
Our Stakeholders |
Combined
Management Report |
Consolidated
Financial Statements IFRS |
Further
Information about Sustainability |
Additional Information |
||
Additionally, virtual events are held throughout the year, around the globe, to further gauge partners’ feedback on how SAP can continuously improve.
Non-Profit Organizations (NPOs) and Academia
Our ongoing dialog with non-profit organizations (NPOs) and academic institutions plays a crucial role in our understanding of the current challenges we face as a society and how our solutions can address them. Through the SAP University Alliances program, we actively engage with students and faculty members, introducing them to SAP software through various networking and educational activities. By partnering with over 2,800 educational institutions worldwide, we aim to integrate SAP's cutting-edge technology into curricula, enabling students to gain hands-on experience in using software that powers some of the world's largest organizations. This collaboration between SAP and our academic partners puts us in a unique position to equip the next generation with the skills they need to tackle the questions of the future. By providing students with practical experience and exposure to our software, we are nurturing a pool of talent for SAP and our ecosystem that can contribute to solving the challenges that lie ahead.
To learn more about our engagement with NPOs, see the Social Investments and Our Contribution to the UN SDGs sections of this report. Alternatively, you can visit the SAP University Alliances Web page for more information.
Sustainability Advisory Panel
In 2023, the panel discussed key initiatives related to our sustainability management solutions, environmental performance, and human rights. For more information about our Sustainability Advisory Panel, see the Sustainability Management section of this report.
AI Ethics Advisory Panel
Our AI ethics advisory panel consists of academic, policy, and industry experts who advise us on the development and operationalization of the guiding principles for artificial intelligence. In 2023, we held an in-person, 1.5-day workshop with the panel where topics such as ethical implications of generative AI, human rights and AI, and high-risk use cases, were discussed. For more information about AI ethics, see the Human Rights section.
Audit
Scope
The content of the Stakeholder Engagement section was subject to an independent limited assurance engagement by our external auditor.
|
SAP Integrated Report 2023 | |||||
| To
Our Stakeholders |
Combined
Management Report |
Consolidated
Financial Statements IFRS |
Further
Information about Sustainability |
Additional Information |
||
Materiality
Defining Key Priorities for Our Non-Financial Reporting
To select the topics to be included in our integrated reporting, we conducted a comprehensive materiality assessment in 2022, applying the requirements of the German Commercial Code as well as the materiality definition of the Universal Standards of the Global Reporting Initiative (GRI): “Material topics are topics that represent an organization’s most significant impacts on the economy, environment, and people, including impacts on their human rights.”
In 2023, we re-visited the results of the materiality analysis conducted in 2022 to evaluate if there had been changes in SAPs operations or operational environment that might trigger adjustments of the materiality analysis. As described below, no material changes occurred.
Below, we have detailed the key stages of the process we followed to assess the significance of each economic, social, and environmental impact.
Identification
We compiled a list of relevant topics that builds on the long list of 2020, using the artificial intelligence (AI) and Big Data solution from Datamaran Limited. To ensure timeliness and completeness, we enriched the list with an analysis of further external sources covering, among others, corporate peer reports as well as mandatory and voluntary regulations for the software sector. To identify key topics and their boundaries, we looked at areas related to our operations and supply chain and at topics related to our solutions. Additional topics identified were added and mapped to the long list.
Prioritization
To assess the significance of each topic on the updated long list, we considered the following two perspectives:
| 1) | Outside-in perspective (impact of the topic on SAP) |
| 2) | Inside-out perspective (SAP’s impact on the topic) |
To assess the outside-in perspective, we evaluated the financial, strategic, and regulatory relevance of each topic to SAP’s business success and resilience. To this end, we ranked the topics and applied thresholds.
Next, we assessed the inside-out perspective. In a first step, we qualitatively described positive and negative impact scenarios for each topic on the list based on the results of the impact assessment, using the Value Balancing Alliance (VBA) methodology, through which we aim to monetarily measure SAP’s impact on society and environment across the value chain, see the Why Holistic Steering and Reporting Matters section.
Following this, we assessed each negative impact scenario according to its likelihood and severity (scale, scope, remediability), and each positive impact scenario according to its likelihood, scale, and scope. We considered mitigation measures in place in the course of this process, and hence the net risks. During the assessment, we considered the input of several SAP sustainability experts from various units and regions, taking different stakeholders’ perspectives70 into account.
Next, we prioritized the assessed impacts by translating the result of each evaluation category into numeric values, ranking the topics, and applying thresholds to derive the material topics for SAP from the inside-out perspective.
70 Represented stakeholder groups are further explained in section Stakeholder Engagement.
|
SAP Integrated Report 2023 | |||||
| To
Our Stakeholders |
Combined
Management Report |
Consolidated
Financial Statements IFRS |
Further
Information about Sustainability |
Additional Information |
||
According to section 289c (3) of the German Commercial Code (Handelsgesetzbuch, HGB), the material topics are identified by considering both the inside-out and outside-in perspectives. In contrast, the material topics according to GRI 3 only take into account the inside-out perspective including the impact on human rights, in the context of their activities and business relationships.
Validation
The results of the 2022 materiality assessment were reviewed and confirmed by our executive owners for integrated reporting. Our CFO thereafter approved the materiality assessment.
Review
Feedback on and analysis of our integrated report will be taken into account during future materiality assessments.
Results
In our reporting, we seek to meet the materiality requirements of both the GRI Standards and section 289c (3) of the HGB despite diverging definitions.
The following topics are material according to the HGB and/or GRI:
| Topic | Definitions | Topic Material According to HGB | Topic
Material According to GRI |
Related Non-Financial Matters |
| Cybersecurity, privacy, and data protection | Protection of private, confidential, or sensitive information and data, as well as the vulnerability of critical information systems |  |
|
|
| Ethics and compliance | Responsible business conduct, including anti-corruption, anti-bribery, fair competition, respect for intellectual property, and responsible tax principles | |
|
Anti-corruption and bribery matters |
| Climate
change and air quality |
(Non-)greenhouse gas emissions from operations and products, as well as present or potential disruptive impacts of climate change | |
|
Environmental matters |
| Customer responsibility | Responsibility to help ensure customer satisfaction and customer rights, including responsible marketing and selling practices | |
|
|
| Employee engagement | Corporate culture, employee engagement and motivation, and strategic decisions involving workforce changes | |
|
Employee matters |
| Employee rights | Labor rights, including unionization, as well as compensation and benefits offered to employees by their employer | |
|
Employee matters |
| Well-being, health, and safety | Social, economic, psychological, and physical conditions of employees in their workplace, as well as employees’ occupational health and safety | |
|
Employee matters |
| Human rights | Fundamental rights of all individuals to live in dignity | |
|
Respect for human rights |
| Fair and inclusive workplace | Active integration, equal opportunity, and fair treatment and remuneration of all employees | |
||
| Talent and development | Talent attraction, retention, and development | |
||
| Energy | Energy consumption by operations and products, and the transition to renewable energy | |
|
SAP Integrated Report 2023 | |||||
| To
Our Stakeholders |
Combined
Management Report |
Consolidated
Financial Statements IFRS |
Further
Information about Sustainability |
Additional Information |
||
Re-Visiting the Results
To re-evaluate the results, we looked at all topics that had been considered in 2022, and pre-assessed whether (1) a positive or negative impact scenario and (2) financial, strategic, and regulatory relevance could have changed. To validate this pre-assessment, we additionally consulted internal experts and collected their views.
While the likelihood and severity of impact scenarios and the financial, strategic, and regulatory relevance of a topic to SAP’s business success and resilience had changed in a few instances, the overall list of material topics according to HGB and GRI had not.
Audit
Scope
The content of the Materiality section was subject to an independent limited assurance engagement by our external auditor.
|
SAP Integrated Report 2023 | |||||
| To
Our Stakeholders |
Combined
Management Report |
Consolidated
Financial Statements IFRS |
Further
Information about Sustainability |
Additional Information |
||
Why Holistic Steering and Reporting Matters
Global crises and challenges such as climate change, environmental degradation, rising societal inequalities, ongoing wars, and the COVID-19 pandemic have highlighted the urgent need for corporate accountability and value creation beyond financial performance.
Expectations of our stakeholders are still rising in this context: Customers ask us to help them in their sustainability transformation; employees expect SAP to be a truly purpose-driven company; investors demand disclosure of not only financial performance but also environmental, social, and governance (ESG) performance for their investment decisions; and governments around the globe increasingly implement ESG-related regulations, taxes, and policies.
Connecting financial and non-financial ESG metrics is key to comprehensively analyzing all dimensions of a company’s performance and working toward their integration and harmonization. On this journey, digital technologies play a fundamental role in delivering embedded, validated, and real-time data.
In addition to the perspective of connecting financial and non-financial ESG metrics, holistic steering and reporting integrates the dimensions of positive and negative impacts that businesses create along their complete value chain.
Our corporate sustainability approach is to create positive economic, social, and environmental impact within planetary boundaries.
Our Journey Toward Sustainable Impact
At SAP, we have been measuring our progress holistically and connecting financial and non-financial data since 2012, when we merged our sustainability and annual reports into an integrated report.
In 2019, SAP became a founding member of the Value Balancing Alliance (VBA) to contribute our experience to support the development of a standardized methodology along with 27 other like-minded, multinational companies. The VBA helps companies, investors, and other stakeholders integrate and compare non-financial performance based on the concept of impact.
We strive to embed impact measurement in our corporate and relevant business unit decision-making and target-setting. Holistic steering and reporting is being developed across the value chain. Our impact measurement experiences also form a foundation for our software innovations in the fields of climate action, circular economy, social responsibility, and holistic steering and reporting, helping customers on their ESG journeys.
Impact Measurement and Valuation
We derive the definition of impact from the Organisation for Economic Co-operation and Development (OECD), which states that the impact of an organization is the effect it has on the condition of the natural environment and the well-being of people. This impact can either be positive or negative and can be intended or unintended. Impact measurement and valuation is the process of first identifying and quantifying the positive and negative impacts that SAP has on people and the planet in monetary terms, and then intentionally reducing the negative impacts and increasing the positive impacts.
Monetary valuation of sustainability aspects is increasingly used by corporations and investors to integrate sustainability aspects in decision-making processes. It is the language that business understands, it enables comparability, it incorporates the local context and the complexity of how impacts arise, and in the future, it could be integrated in traditional accounting systems.
|
SAP Integrated Report 2023 | |||||
| To
Our Stakeholders |
Combined
Management Report |
Consolidated
Financial Statements IFRS |
Further
Information about Sustainability |
Additional Information |
||
Several institutions are working on developing and maturing impact measurement and valuation methodologies, most notably the International Foundation for Valuing Impacts (IFVI) and the VBA. These insights enable companies to create business value beyond revenue or profit growth while taking into consideration the long-term impacts of their business operations on the environment and society as a whole.
The methodologies in that context continue to mature year over year, and still have several challenges to solve. Fundamentals such as global standardization, non-netting of positive and negative impacts, regulatory uptake, and ensuring a reasonable range of valuation coefficients should be integrated in the ongoing global efforts. We overcome the maturity challenge through peer learning and exchange sessions at the VBA and by taking a sensitivity analysis approach where we determine the impacts across a broad range of valuation co-efficients.
Examples of Business Steering Based on VBA Methodologies
We disclosed a selection of the results of the VBA’s third methodology piloting exercise, which ended in November 2022, in our Integrated Report published in March 2023. In 2023, we leveraged these results and learnings to steer a number of our internal sustainability programs, which are mentioned below.
| – | Materiality analysis: In 2023, we revisited our materiality analysis to identify and prioritize key material topics. The VBA pilot analysis, which shows prioritized issues based on our procurement spend, was used as one of the sources to identify material issues for SAP. This data-driven, quantitative result complemented the qualitative approach generally used for materiality analyses, further improving quality and completeness. |
| – | Compensation cycle adjustment: In 2023, we integrated the concept of “living wages” into our annual compensation review process. |
| – | Human rights due diligence: The upstream hotspot analysis using monetized values for social indicators was an integral part of our annual risk assessment in the context of the German Supply Chain Due Diligence Act. The monetary valuation allowed us to set thresholds universally across different metrics to identify low, medium, or high risks. |
| – | Net zero 2030 and internal carbon pricing: We used the pilot results to update the emission baseline figures for our net zero 2030 target. In addition, the current social cost of carbon value set by the VBA, which is US$223 per ton of greenhouse gas (GHG), was used as the reference to update our internal carbon pricing. This brought the internal carbon price closer to the social cost of carbon than in previous years. |
2023 VBA Piloting and Results
Ending in December 2023, our fourth VBA pilot analyzed metrics including GHG emissions, water consumption, GDP contribution, and training. We used data from our Integrated Report 2022, internal controlling and HR systems, and our environmental management system. The analysis primarily focused on our own operations and our supply chain. In addition, we piloted a limited scope of our downstream impacts looking at GHG impacts from our on-premise software installations. Wherever possible, we used primary data for calculations. Where primary data was not available, we used proxies, modeling techniques, and assumptions that were well-defined and documented in the VBA method papers. Key stakeholders across all relevant lines of business were engaged in the pilot.
The most relevant findings from the GHG emissions, GDP contribution, living wages, and upstream hotspot analyses comprise:
| – | GHG emissions: Our analysis enabled us to identify the GHG impact of each subsidiary and location, and we now have insights into which SAP locations have the highest CO2 impacts and which locations have the lowest. Negative impacts of GHG on own operations and supply chain |
|
SAP Integrated Report 2023 | |||||
| To
Our Stakeholders |
Combined
Management Report |
Consolidated
Financial Statements IFRS |
Further
Information about Sustainability |
Additional Information |
||
| were monetized at more than US$163 million, and this has helped inform decision-making regarding our CO2 reduction strategy. While we are still developing a full downstream impact methodology, we calculated the negative impact of GHG emissions from our existing on-premise installations of our customer base at more than US$1.9 billion. While these impacts were calculated using the VBA’s recommended social cost of carbon valuation co-efficient of US$223 per ton of GHG, we realize that there is a wide range of values in the market, and the effort to standardize them further is ongoing. | |
| – | GDP contribution: Our overall GDP contribution from our operations and supply chain stands at more than US$8.4 billion (CapEx and OpEx). We have the breakdown of the GDP contribution by all our operating countries. This insight enables us to sharpen our messaging toward public sector companies and governments. |
| – | Upstream risk analysis: We conducted a complete upstream risk analysis using our procurement spend of 2022. The analysis showed that one of the highest negative monetized impacts was valued at more than US$584 million for the KPI Occupational Health & Safety, and the highest positive monetized impact was valued at US$8.4 billion for the KPI GDP Contribution. |
Our induced impact calculation showed that we created a total of 110,000 jobs in the supply chain due to our procurement spend and patterns.
The real value of monetization of impacts is observable when all our procurement categories and all the KPIs are represented on X and Y axes and the main risk areas are visualized.
Outlook
As the impact measurement and valuation ecosystem matures, we will continue to play an active role in its co-development and application and to enable our customers and partners. While we maintain existing partnerships with the VBA and WifOR Institute, we will actively seek other institutional and academic partnerships as well as explore AI capabilities in this topic. We plan to use materiality analyses and material topics as the foundation for developing and applying methodologies to understand, steer, and improve our overall impact. We will increase the frequency of impact valuations to quarterly for selected KPIs. Through our SAP Cloud for Sustainable Enterprises solution and other product lines, we support our customers in their own impact management journeys. As we look ahead, we see the potential for us to place impact management at the center of everything we do and strive to become an impact positive company.
Audit
Scope
The content of the Why Holistic Steering and Reporting Matters section was not subject to an independent limited assurance of our external auditor.
|
SAP Integrated Report 2023 | |||||
| To
Our Stakeholders |
Combined
Management Report |
Consolidated
Financial Statements IFRS |
Further
Information about Sustainability |
Additional Information |
||
Social Investments
Strategy
SAP recognizes the interdependencies between today's environmental and social issues, approaching them with a sustainable corporate strategy. Corporate social responsibility (CSR) is part of that strategy, embodying SAP’s purpose to help the world run better and improve people’s lives. CSR at SAP focuses on driving long-term social and environmental impact and business value with three focus areas that power equitable access to economic opportunity, education and employment, and the green economy. These focus areas are Accelerate Social Business, Build Future Skills, and Collaborate for Sustainability.
The vast majority of our social investments (2023: €25.2 million71) are aligned with the United Nations (UN) Sustainable Development Goals (SDGs), primarily focusing on quality education (SDG 4), gender equality (SDG 5), decent work and economic growth (SDG 8), reduced inequalities (SDG 10), climate action (SDG 13), and partnership for sustainable development (SDG 17).
Governance, Guidelines, and Policies
The head of CSR globally leads the SAP CSR team, reporting to our Global Government Affairs unit. C-level executives from different Board areas form the Global CSR Governance Committee, tasked with guiding, overseeing, and approving SAP’s CSR strategy. Additionally, regional CSR governance committees vet and approve significant CSR alliances and initiatives in collaboration with regional SAP CSR leaders. Our internal SAP CSR policy outlines our focus areas, ensuring our social investments uphold integrity and responsibility. It also delineates the operational standards, clarifying the distinct roles and accountabilities across global CSR, regional CSR, and line-of-business activities.
Impact Measurement and Management
We regularly assess the impact of our social investments, reporting specified output metrics for all initiatives across regions: employee engagement, volunteer hours, beneficiaries reached, youth trained, and social enterprises enabled. Moreover, each signature initiative adheres to a tailored impact measurement framework and logic model.72
We work with third-party evaluators to assess the impact of our initiatives. Specifically, in 2023, an extensive evaluation was conducted on SAP’s Africa Code Week (ACW). From 2015 to 2022, the ACW initiative engaged 14.6 million participants, introducing students to key digital skills essential for tomorrow’s tech workplace. In partnership with UNESCO, SAP’s gender-sensitive program reached primary and secondary school students, 46% of which were girls, across 48 African countries and promoted the integration of coding and computational thinking into seven national curricula, advancing the SDGs 4, 5, and 17.
By empowering a new generation of youth with the education, knowledge, and ICT skills needed to participate in the digital future, SAP’s program increases the likelihood that ACW beneficiaries will realize higher earnings during their working lives. Based on future increased income, Common Good Marketplace estimates that ACW catalyzed up to $1 billion73 in social value for program participants.
71 The topic of SDGs was neither part of the statutory audit nor the independent limited assurance engagement performed by our external auditor.
72 See SAP CSR in Review 2023 (link leads to information that was neither part of the statutory audit nor the independent limited assurance engagement performed by our external auditor).
73 Assuming 50% of program participants achieved moderate learning outcomes in ICT skill improvement (.125 net standard deviation learning gain in ICT skills).
|
SAP Integrated Report 2023 | |||||
| To
Our Stakeholders |
Combined
Management Report |
Consolidated
Financial Statements IFRS |
Further
Information about Sustainability |
Additional Information |
||
Equitable Access to Economic Opportunity – Accelerate Social Business
Social enterprises aim to generate profit while solving social or environmental problems. Unlike traditional businesses, they reinvest most of their earnings into their mission. SAP supports social enterprises through a three-pronged approach. Firstly, SAP enhances their organizational capacity while developing SAP employees by means of on-site and virtual pro bono consulting. Secondly, by promoting social procurement, SAP facilitates social enterprises to enter new B2B markets such as SAP Business Network. Thirdly, we advocate supportive policies and dedicate (non-)financial resources towards fostering a sustainable and inclusive economy, investing in essential network-building and stakeholder capacity enhancement.
In 2023, SAP significantly increased its virtual pro-bono consulting offering through the TRANSFORM Support Hub jointly powered by MovingWorlds, Unilever, and TRANSFORM. The global platform connects SAP employees with social enterprises worldwide. It serves as an international one-stop shop for non-financial support to social entrepreneurs, harmonizing resources and offerings from public, private, and social sectors. Pro-bono consulting offers our employees opportunities for personal and professional growth as it does for social entrepreneurs and their businesses.
As a result, in 2023, SAP made direct capacity for non-profit organizations and social enterprises through in-kind contributions of US$3.7 million (€3.3 million)74 through 140 consulting projects. The number of employees engaged as pro-bono consultants increased 45% year over year to 518.
Equitable Access to Education and Employment – Build Future Skills
SAP invests in innovative education models and fosters engagement with multistakeholder partnerships to enable pathways to employment and entrepreneurship in the sustainable and digital economy for youth in need (underrepresented, underserved, and underprivileged youth between the ages of 16 and 24).
In 2023, SAP continued collaborating with UNICEF’s Generation Unlimited and the digital marketplace Yoma to advance SAP Educate to Employ, a pilot program educating youth in need on soft skills, foundational knowledge, and SAP skills to enable a pathway to a successful career in the SAP ecosystem. The program started in Kenya, Nigeria, the Philippines, and South Africa with the goal of transitioning 25 youth per country to SAP-related roles. It has since engaged over 224,000 youth in digital skills training.
In 2023, in total, digital skill-building and coding programs trained 41,806 teachers and engaged 2.8 million youth, of which 46% were girls.
Equitable Access to a Green Economy – Collaborate for Sustainability
SAP fosters employee engagement, aligning employee contributions with its holistic sustainability framework. In 2023, SAP employees dedicated over 137,000 volunteer hours, of which 74% were skills-based. Our internal SAP Together volunteering and donation platform counts 47,300 registered employees and 459 volunteering opportunities.
Additionally, through a long-standing partnership with We Are Family Foundation, SAP champions youth inclusion in global dialogues through the Youth to the Table and Youth to the Front Fund programs. This collaboration increases youth representation in critical forums such as the World Economic Forum (WEF), UN General Assembly (UNGA), and Conference of the Parties (COP), showcasing SAP’s dedication to intertwining social responsibility with tangible sustainability efforts and inclusivity. In 2023, SAP’s sponsorship enabled over 35 youth social entrepreneurs and climate leaders to engage in a diverse array of forums, resulting in hundreds of meaningful exchanges.
This strategy also covers SAP’s humanitarian aid efforts extending to natural disasters and beyond. Where applicable, we mobilize a swift and effective response, providing immediate aid while focusing on long-term, sustainable rebuilding efforts.
Audit
Scope
The content of the Social Investments section was subject to an independent limited assurance engagement by our external auditor.
74 Exchange rate date: December 31, 2023.
|
SAP Integrated Report 2023 | |||||
| To
Our Stakeholders |
Combined
Management Report |
Consolidated
Financial Statements IFRS |
Further
Information about Sustainability |
Additional Information |
||
Sustainable Procurement
Making Our Supply Chain More Sustainable
A significant part of our social and environmental impact is delivered through our supply chain. Eliminating single-use plastics, decreasing carbon emissions, respecting human rights, and closely collaborating with a diverse supplier network are factors that contribute to a sustainable supply chain.
Our Global Procurement Organization (GPO), led by our chief procurement officer (CPO), aims to transform into a purpose-driven program. That is why we established the overarching Procurement with Purpose (PwP) initiative, which promotes purpose-driven initiatives such as diversity and social inclusion and environmental improvement from vendors.
Upholding High Standards Across Our Supply Chain
The SAP Supplier Code of Conduct75 (SCoC) is required in our standard supplier contracts and is an essential part of our supplier registration. This supplier registration ensures that potential suppliers of SAP are aware of SAP’s SCoC. We review and update our SCoC regularly to maintain high standards within our supplier network – the latest update being a new and improved version that was published at the end of 2023. This strengthens the SCoC’s enforceability and sends a clear message to our suppliers about its importance for SAP.
Our SCoC contains provisions on labor standards, human rights, environmental standards, and diversity and inclusion. Furthermore, we recommend to SAP suppliers that they deliver goods and services that are accessible to everyone, including people with disabilities.
What We Buy and Where We Buy It From
In 2023, we spent approximately €6.4 billion in purchases from around 13,000 suppliers worldwide (2022: approximately €7.2 billion from more than 13,000 suppliers worldwide). Within our seven procurement categories,76 we approach sustainable procurement from different angles: IT Solutions (example: reduce single-use plastics packaging and packaging material), Professional Services (example: CO2-reduced mobility concepts, electronic contracts), Marketing (example: sustainable merchandise and events), Cloud Infrastructure (example: sustainable cooling of data centers), Technical Services (example: managed services with remote delivery), Real Estate & Facilities (example: increase of self-produced solar energy and avoidance of single use tableware), and Car Fleet (example: sustainable mobility concepts with a commitment to emissions-free vehicle-only car fleet from the year 2025).
75 Link leads to information that was neither part of the statutory audit nor the independent limited assurance engagement performed by our external auditor.
76 (1) Car Fleet: Includes procurement relating to the global company car fleet and additional mobility options. (2) Cloud Infrastructure: Procures products and services for SAP’s cloud operations such as network services, data center, co-location, hyperscaler, middleware, and related goods and services. (3) Marketing: Supports topics related to SAP’s marketing, events, and merchandise. (4) Professional Services: Includes financial and legal services, temporary staff, and business travel areas. (5) Technical Services: Includes application and development services. (6) IT Solutions: Includes procurement for areas such as client services, equipment, communication, and software. (7) Real Estate and Facilities: Manages building related capital projects and operations, including catering and facility management.
|
SAP Integrated Report 2023 | |||||
| To
Our Stakeholders |
Combined
Management Report |
Consolidated
Financial Statements IFRS |
Further
Information about Sustainability |
Additional Information |
||
Percent of Suppliers per Region
Percent of total spend
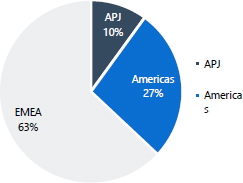
Suppliers by Category (Tier 1)
Percent of total spend
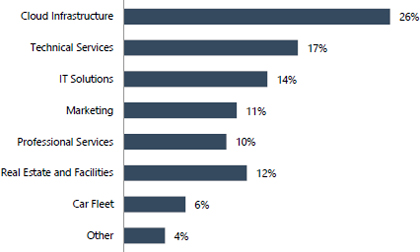
Environmental and Social Procurement
We believe that diverse and sustainable businesses bring significant added value to SAP. Establishing an inclusive supplier network – that is, minority enterprises defined by gender, ethnicity, disability, sexual orientation, and other characteristics, as well as certified social enterprises that focus their company’s mission on making social impact – remains a priority for SAP. We believe that our commitment to an inclusive, bias-free culture in our workplace must be mirrored in our approach to our supplier base.
Driven by our GPO, SAP’s supplier diversity and social enterprise initiatives aim to build the capacity of diverse and social businesses to provide a fair chance at competing for contracts and are treated equally to other SAP suppliers.
As part of its PwP program, SAP was a corporate member of supplier and social enterprise certification organizations such as WEConnect International, Disability:IN, and Social Enterprise UK.
These organizations enable the GPO to identify opportunities to engage with diverse suppliers and social enterprises, supporting our social procurement spend targets.
|
SAP Integrated Report 2023 | |||||
| To
Our Stakeholders |
Combined
Management Report |
Consolidated
Financial Statements IFRS |
Further
Information about Sustainability |
Additional Information |
||
In addition, our GPO has started to implement a supplier qualification process based on sustainability indicators.77 This will enable the organization to increase visibility over our vendors, improve our engagement, and make an informed supplier selection based on environmental and social performance. This process captures information pertaining to the performance of our suppliers in three focus areas: Social, diverse, and inclusive supply chain; environmental supply chain; and human rights in the value chain. As a next step, the GPO plans to set up a Supplier Enablement Team as a dedicated team responsible for the supplier qualification process.
Addressing Supply Chain Legislation Across the World
In light of the uptake in legislative action around the world, such as the UK and Australian Modern Slavery Act and the German Supply Chain Due Diligence Act (LkSG), SAP respects the human rights in its own operations but equally in its supply chain. This includes, for instance, introducing new concepts for identifying human rights risks across our supply chain (for more information, see the Human Rights section).
Audit
Scope
The content of the Sustainable Procurement section was subject to an independent limited assurance engagement by our external auditor.
77 Top 100 suppliers by emissions are part of the pilot for the improved qualification process.
|
SAP Integrated Report 2023 | |||||
| To
Our Stakeholders |
Combined
Management Report |
Consolidated
Financial Statements IFRS |
Further
Information about Sustainability |
Additional Information |
||
Waste and Water
Aspiring to a World of Zero Waste
We believe in SAP’s capabilities to help transform the economy into a low-carbon, circular system to reach a restorative and regenerative world of zero waste and significantly cleaner oceans. In alignment with SAP’s Global Environmental Policy78, our waste and water strategy and corresponding company-wide initiatives aim to continuously reduce SAP’s impact on the environment by generating less waste, reducing water consumption, and enabling our customer to do the same.
Being an Enabler: Leveraging Software Solutions
SAP advocates global systems change at scale to accelerate the transition to a circular economy. To make the circular economy the de facto approach to material use and waste management, we are working with our customers and partners on solutions that address full-circle transparency across a wide range of material flows. For more details about our circular economy solutions, see the Product Strategy section and our Circular Economy Solutions Web site79.
Being an Exemplar: Cutting Down Waste in Our Own Operations
Managing Our Discarded Electrical and Electronic Devices
Waste of electrical and electronic equipment (WEEE, or e-waste) is one of the world’s fastest-growing waste streams. As a global cloud company running data centers for our customers and office buildings across the world with a large amount of IT devices in place for our more than 107,000 employees, the ecological footprint of our electrical and electronic equipment (EEE) and their end-of-life treatment is a growing area of focus for SAP. In our Global Environmental Policy, we made the commitment to strive towards zero e-waste in our own operations by diverting close to 100% from incineration, landfill, and nature by 2030. As such, we cooperate with international and local IT asset lifecycle partners to reuse and recycle our e-waste. We also engaged with them to improve their sustainability roadmap – helping to reach our own sustainability target for 2030 – as well as with the Climate Neutral Data Centre Pact (CNDCP) Circularity working group to define sustainability measures and find new levers to drive positive change forward. By the end of 2023, we had reused 56% and recycled 37% (total: 93%) of our total WEEE. For more information about the accounting of our WEEE, see the Non-Financial Notes: Environmental Performance section.
78 The link leads to information that was neither part of the statutory audit nor included in the independent limited assurance engagement performed by our external auditor.
79 The link leads to information that was neither part of the statutory audit nor included in the independent limited assurance engagement performed by our external auditor.
|
SAP Integrated Report 2023 | |||||
| To
Our Stakeholders |
Combined
Management Report |
Consolidated
Financial Statements IFRS |
Further
Information about Sustainability |
Additional Information |
||
E-Waste Treatment
Tons
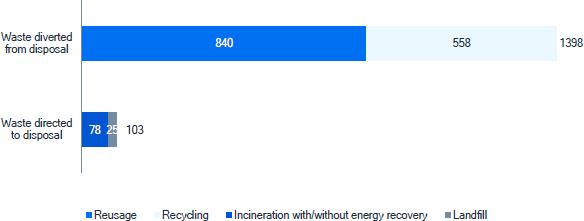
Cutting Down Residual Waste Within Own Operations
| Implemented Measures and Initiatives | |
| Elimination of single-use plastics |
Based on three principles ‘reduce waste, reuse items, and recycle materials’, we continued to collaborate with suppliers, service providers, partners, the internal global network of sustainability champions, and other stakeholders to eliminate single-use plastic products such as bottles, cups, stirrers, straws, cutlery, and food packaging. For example, in Barcelona we reduced plastic bottles in the employees’ daily lives by providing water filters for their own homes.
|
| Improve waste segregation and reduce residual waste |
● We continued our waste separation initiative by installing 55 further waste separation systems in the flexible workspaces in Walldorf and St. Leon-Rot.
● The office furniture and equipment from vacated seats and floors was reused in several sites.
● The global printing volume remained at a low level: 12.5 million pages (increase of 18% versus 2022; decrease of 74% versus 2019)
● ‘Too Good to Go’ app installed in selected German cafeterias enabled employees to pick up leftover lunches for a small fee to combat food waste. In 2023, more than 3,000 meals were saved.
● There is a Waste-to-Energy (WtE) process in our headquarters in which organic waste is used to generate biogas.
● An Indoor Smart Composting System was installed in Budapest (Hungary) and an Organic Waste Converter was installed in Bangalore (India) to process the organic waste generated in the office. |
| Assessment of our suppliers and partners |
In 2023, we conducted a WEEE treatment compliant assessment of a selected range of key upstream suppliers and downstream asset lifecycle partners:
● Upstream: 56% of servers and data storage products already comply with eco-design and hazardous waste requirements.
● Downstream: 94% of servers and data storage products undergo preparation for re-use, recovery, or recycling operations, or for proper treatment, including removal of all fluids and selective treatment.
With the results of our yearly assessments for our Taxonomy-related disclosures, we would also like to sensitize those suppliers who are not yet compliant to further develop their products and services in accordance with the requirements of the EU Taxonomy. |
Using Water Efficiently
Climate change affects – and is affected by – global water resources and management. This is why we continue to aim to use water as efficiently as possible in our data centers and offices even though our operations are not water-intensive.
In 2023, the water usage decreased compared to 2022 and remains at a lower level compared to the pre-pandemic situation due to the introduced flexible working mode and our implemented water-reduction measures.
|
SAP Integrated Report 2023 | |||||
| To
Our Stakeholders |
Combined
Management Report |
Consolidated
Financial Statements IFRS |
Further
Information about Sustainability |
Additional Information |
||
Global Water Usage
Thousand cubic meters
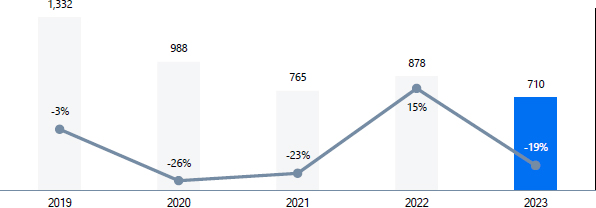
| Implemented Measures and Initiatives | |
| Water management efforts in SAP-owned data centers |
● We completed a robust and comprehensive climate risk and vulnerability assessment to identify physical climate risks that are material to SAP’s owned data centers. The results were discussed with relevant stakeholders from SAP and four climate hazards were selected for in-depth analysis, including “water stress.” The vulnerability of data centers to any of the priority hazards has been assessed.
● In our headquarters, we use adiabatic cooling (evaporative cooling) and closed water circuits to minimize water consumption for cooling our server racks. In 2023, we installed an adiabatic cooling system in Bangalore (India).
● In Colorado Springs (USA), we use free air cooling in the colder winter season and leverage a non-potable water system in the warmer months. By increasing the programmed outside temperature set point that determines when the sumps are filled with water, we were able to improve our water usage efficiency (WUE).
|
| Water management efforts in our offices |
● Based on our water risk-assessment for our ISO 14001-certified sites80: twenty percent of these sites are located in high to extremely high water-risk regions. In 2023, we enabled access to real consumption data in these sites by installing water (sub)meters and/or sensors to measure and improve our consumption.
● At our headquarters and other locations, we use rain and run-off water for irrigation and toilets.
● In Bangalore (India), a rainwater harvesting system was installed to improve water conservation and a system to capture atmospheric particles was implemented to produce water for the cafeteria.
● In Budapest (Hungary) and Bangalore (India), we installed water aerators that reduce the water usage by 40%. |
Audit Scope
The content of the Waste and Water section was subject to an independent limited assurance engagement by our external auditor.
80 Based on the Aqueduct Water Risk Atlas of the World Resource Institute.
|
SAP Integrated Report 2023 | |||||
| To
Our Stakeholders |
Combined
Management Report |
Consolidated
Financial Statements IFRS |
Further
Information about Sustainability |
Additional Information |
||
Public Policy
SAP has developed trusting and transparent relationships with governments worldwide by cooperatively exploring the potential for information and communications technologies to spur economic growth, create jobs, and address societal challenges. This includes consideration of the role governments play as users as well as policy makers, and by supporting the digital transformation of the public sector to become more efficient, effective, and citizen-oriented.
SAP engages with governments around the globe on various policy issues and on creating reasonable framework conditions for the adoption of new beneficial technologies or business models such as cloud computing, the Internet of Things, and Big Data.
SAP believes in transparency in the political process. Accordingly, we are registered in the Lobby Registry of the German Federal Parliament and selected state parliaments and in the European Transparency Register for interest representatives. In the United States, SAP is registered, and reports in compliance with, the federal Lobbying Disclosure Act. We are also registered in other countries, wherever required by local law.
Political Contributions
In accordance with the SAP Global Code of Ethics and Business Conduct, SAP does not make direct contributions for political purposes, to political parties, politicians, or political organizations other than through event sponsorships and related marketing as allowed by law and specifically approved by SAP Global Government Affairs and the Office of Ethics & Compliance (OEC). By the laws of the United States, SAP employees exercise their right to operate a political action committee (PAC). The SAP America PAC is an independent, registered, and strictly regulated organization that allows eligible SAP employees to voluntarily contribute to the SAP America PAC in the United States to financially support candidates seeking public office at the state and federal levels. Consistent with U.S. laws, SAP exercises no control over or influence on the SAP America PAC. SAP America PAC expenditure figures are transparent and accessible through the U.S. Federal Election Commission Web site.
Audit Scope
The content of the Public Policy section was subject to an independent limited assurance engagement by our external auditor.
|
SAP Integrated Report 2023 | |||||
| To
Our Stakeholders |
Combined
Management Report |
Consolidated
Financial Statements IFRS |
Further
Information about Sustainability |
Additional Information |
||
Memberships, Partnerships, and Commitments
To better understand and evolve sustainable performance, dialog, and exchange of knowledge and different perspectives on a national, regional, and global level, are vital for SAP, both for our company and customers. Hence, SAP subscribes to, commits to, and routinely engages in a range of third-party organizations, including:
| Organization | |
| Acumen | Advancing Women Executives |
| Africa Code Week | Alliance for Development and Climate |
| Alliance for Integrity | ASEAN Foundation |
| Ashoka Young Changemakers | Australian Indigenous Education Foundation |
| Australian Climate Leaders Coalition | ASSOCHAM |
| Beyond Sport | Bitkom e.V. |
| Breakthrough Energy Ventures | Business Avengers |
| Business Call to Action (UNDP) | Business for Nature’s Call to Action |
| Business for Social Responsibility | Business Coalition for a Global Plastics Treaty |
| Buy Social Canada | Buy Social USA |
| BSA - The Software Alliance | |
| Capital Equipment Coalition | CDP |
| CEO 2030 EU Climate Letters | CIPL |
| CII-ITC Center of Excellence for Sustainable Development | ChangemakerXchange |
| Climate Neutral Data Centers Pact | Climate Neutral Now |
| Code Unnati (India) | |
| Deloitte Digital | Deutsches Rechnungslegungs Standards Committee e.V. |
| Deutschland sicher im Netz e.V. | DIGITALEUROPE |
| Disability:IN | |
| econsense e.V. | EcoVadis |
| Ellen MacArthur Foundation (EMF) | EMF ERP Pledge |
| EMF London Design Festival Circular Design Project | ESMIG |
| Euclid Network | EU Code Week |
| European Climate Pact Pledge | European Green Digital Coalition (EGDC) |
| European Roundtable for Industry (ERT) | European Venture Philanthropy Association (EVPA) |
| Fundação Amazonas Sustentável | The Future of Privacy |
| Get Nature Positive | Global Business Alliance |
| Global Business Coalition for Education | GlobalGiving |
| Global Partnership for Sustainable Development Data | Goodwall |
| Gucci CEO Carbon Neutral Challenge | |
| Haus des Stiftens | |
| IMPACT2030 (founding member) | Information Technology Industry Council |
| INJAZ Al-Arab (former Junior Achievement MENA) | International Investors Association of Turkey (YASED) |
| Junior Achievement | |
| Klimabündnis Baden-Württemberg | |
| Latin Code Week | LEAF Coalition |
|
SAP Integrated Report 2023 | |||||
| To
Our Stakeholders |
Combined
Management Report |
Consolidated
Financial Statements IFRS |
Further
Information about Sustainability |
Additional Information |
||
| Organization | |
| Livelihood Funds | |
| make.sense | Mechanical Engineering Industry Association |
| Meet and Code | Metropolregion Rhein-Neckar |
| meQuilibrium | |
| National Chambers of Commerce | National Minority Supplier Development Council |
| Network for Teaching Entrepreneurship (NFTE) | |
| Ocean Plastics Leadership Network | |
| Pathway Japan | Platform for Accelerating the Circular Economy |
| Pratham Infotech Foundation | Pyxera Global |
| Race to Zero | RE100 |
| RebootKamp (RBK) | |
| Schmalenbach-Gesellschaft für Betriebswirtschaft e.V. | Science Based Targets initiative |
| SEND e.V. | Singapore Institute of International Affairs |
| Singapore International Foundation | Social Enterprise NL |
| Social Enterprise UK | Social Enterprise World Forum |
| Social Impact Award | Social Traders |
| SRIW | |
| Teach For All | techUK |
| Tech Saksham | The Public Affairs Council |
| The Benefits Council | TERI Innovative Solutions for Sustainable Development |
| The Climate Solutions Foundation | The Climate Pledge |
| The Conference Board, Inc. | The Green Web Foundation |
| Together with Nature Principles for Nature-Based Solutions | Topolytics |
| Transparency International Germany | Turkish Industry & Business Association (TÜSİAD) |
| The Women’s Industry Network | |
| UK Plastics Pact | United Nations Development Programme (UNDP) |
| UMUZI | UNICEF (Generation Unlimited) |
| United Nations Global Compact (since 2000) | UNGC Sustainable Ocean Principles & Sustainable Oceans Coalition |
| University of the People | US-EU Trade and Technology Council |
| UN Energy Compact called 24/7 Carbon Free Energy | |
| Value Balancing Alliance e.V. (founding member) | |
| We Are Family Foundation | WEConnect International |
| WEF Alliance of CEO Climate Leaders | WEF Global Alliance for Social Entrepreneurship |
| WEF Global Plastic Action Partnership | WEF 1t.org |
| WEF Stakeholder Capitalism Coalition | “We Mean Business” coalition |
| “We Mean Business” Letter to G20 Leaders | World Economic Forum (WEF) |
| WWF OneSource Coalition | World Business Council for Sustainable Development (WBCSD) |
| Young ICT Explorers | Yunus Social Business |
Audit
Scope
The content of the Memberships, Partnerships, and Commitments section was not subject to the independent limited assurance engagement of our external auditor.
|
SAP Integrated Report 2023 | |||||
| To
Our Stakeholders |
Combined
Management Report |
Consolidated
Financial Statements IFRS |
Further
Information about Sustainability |
Additional Information |
||
Non-Financial Notes: Environmental Performance
General Information
We understand environmental performance as the measurable outcome of SAP’s ability to meet environmental objectives and targets set forth in our Global Environmental Policy81. In this context, we determine SAP’s greenhouse gas footprint (in the following called carbon emissions) as well as total energy consumed and data center electricity as the three key environmental performance indicators. Furthermore, we realize external compensations through self-generated renewable electricity and by purchasing offsets and Energy Attribute Certificates (EACs). Plus, we identify water consumption and the end-of-life treatment of SAP’s electrical and electronic equipment as additional environmental topics relevant for our reporting.
Our gross carbon emissions for 2023 were 472 kilotons of CO2 equivalents (CO2e) (2022: 441 kilotons CO2e), including all carbon emission categories of Scope 1 and 2, as well as selected categories of Scope 3 relevant for our carbon neutrality target as described in Methodology and Further Details below. Our net carbon emissions (0 kilotons in 2023) are calculated by deducting purchased EACs, self-generated renewable electricity, and carbon offsets from our gross emissions in the reporting period. We disclose various environmental performance indicators, including carbon neutral-relevant Scope 1, 2, and 3 emissions in the Report Data Hub82.
Reporting Approach
Data for our environmental indicators is collected and reported on a quarterly basis and is subject to external assurance for annual reporting (limited or reasonable assurance). Reporting on total energy consumed and data center electricity is based on the data collected for the calculation of our carbon emissions. All numbers are based on the metric system. Whenever we state “tons,” we mean metric tons.
Carbon Emissions
Definition
We define the gross carbon emissions as the sum of all greenhouse gas emissions, measured and reported as CO2e, while net carbon emissions include the compensation with renewable electricity and carbon offsets (for more information, see External Reductions below).
Reporting Principles
SAP’s preparation of the carbon emissions is based on the Corporate Accounting and Reporting Standard, the GHG (Greenhouse Gas) Protocol Scope 2 Guidance, and the Corporate Value Chain (Scope 3) Accounting and Reporting Standard of the World Resources Institute/World Business Council for Sustainable Development. This approach conforms to the requirements of GRI Standard indicators 305-1, 305-2, and 305-3.
In alignment with the GHG Protocol Scope 2 Guidance, we report our net carbon emissions based on the two different calculation approaches: location-based and market-based.
81 Link leads to information that was neither part of the statutory audit nor the independent limited assurance engagement performed by our external auditor.
82 Selected data presented in the linked environmental section were part of the statutory audit or independent limited assurance engagement performed by our external auditor. For details, see the auditor’s assurance report.
|
SAP Integrated Report 2023 | |||||
| To
Our Stakeholders |
Combined
Management Report |
Consolidated
Financial Statements IFRS |
Further
Information about Sustainability |
Additional Information |
||
Organizational Boundaries
SAP defines its organizational boundaries by applying the operational control approach as set out in the GHG Protocol.
Operational control is established when SAP has the full authority to introduce and implement its operating policies. The emissions of all operations over which the company has operational control and all owned, leased facilities, co-location data centers, and vehicles that the company occupies or operates are accounted for in the carbon emissions. They are based either on measurements or, where no measured data is available, on estimations and extrapolations.
A portion of SAP’s leased facilities operates under full-service or multitenant leases, where SAP does not have access to actual energy consumption information. SAP includes these facilities in our definition of operational control and accounts for them by estimating related energy consumption.
To support the growing demand for SAP’s cloud offerings, we subcontract computation power in local third-party data centers. Carbon emissions are approximated and included based on the consumed or extrapolated computation power.
Data Consistency
Methodology Change
We aim to continuously refine SAP’s emissions calculation methodology and to increase the usage of measured instead of extrapolated input data. Methodology changes include changes in the source of activity data, additional new activity types, changes in emission factors, and changes in the methodology used to calculate carbon emissions. As we implemented our methodology approaches to the best of our current knowledge and ability, and consider such changes to be continuous desired progress, methodology changes will not lead to retrospective data adjustments. Hence, changes will be applied from the current year onward. The current year’s methodology changes are made transparent in this section, particularly under Methodology and Further Details.
Conversion Factors
The calculation of the carbon emissions is based on factors for conversion and extrapolation, provided by IEA, US EPA, UK DEFRA, Environment Canada, and GHG Protocol. SAP also uses extrapolation factors based on own reported data (of previous quarters) to determine an average consumption value per base unit (such as corporate cars: liters of fuel per car; facility: electricity consumption per m2).
Where relevant, our conversion factors consider CO2e for greenhouse gases. Global Warming Potential factors are based on the Sixth Assessment Report of the Intergovernmental Panel on Climate Change (IPCC). We report all our carbon emissions in CO2 equivalents including the impact from CH4 and N2O in our target-relevant Scope 1, Scope 2, and Scope 3. The emission impact of refrigerants includes hydrofluorocarbons (HFCs) only. We review all our emissions and extrapolation factors annually and update them if required.
Methodology and Further Details
Below you will find the different parameters contributing to our carbon emissions. Data coverage refers to the share of measured data (compared to extrapolated data) that is the basis for emissions calculation, such as kWh for electricity emissions or liters of fuel for corporate car emissions.
Carbon Neutrality 2023
SAP reached its target of carbon neutrality in its own operations in 2023. Carbon neutrality 2023 includes the following emission categories:
|
SAP Integrated Report 2023 | |||||
| To
Our Stakeholders |
Combined
Management Report |
Consolidated
Financial Statements IFRS |
Further
Information about Sustainability |
Additional Information |
||
Scope 1
Refers to direct carbon emissions and is defined as emissions from sources that are owned or controlled by the organization. At SAP, the following areas are covered by Scope 1:
| – | Stationary Combustion in Facilities: Emissions caused by oil or gas combustion of heating systems and generators in SAP office buildings and data centers. Emission calculation is based on gas and oil consumption in kWh. Where no measured data is available, stable values (kWh/m2) based on the previous year’s stationary combustion consumption data are used for extrapolation. In cases where no specific information is available, natural gas reported by local sites is assumed to be reported as a lower heating value. Besides gas and oil, we also use wood pellets to produce thermal heat for our buildings in our headquarters in Walldorf. The Scope 1 emissions of wood pellets can be set to net ‘0’, since the wood itself absorbs an equivalent amount of carbon emissions during the growth phase as the amount of emissions released through combustion. Still, to ensure complete accounting for all emissions caused, we document the direct carbon dioxide impact of burning wood pellets as ‘outside of scopes’ carbon emissions. In 2023, these emissions accounted for 0.461 kilotons of carbon emissions (2022: 0.686 kilotons). |
| – | Refrigerants in Facilities: HFC emissions caused by the loss of refrigerants used in cooling systems and air conditioning equipment. The emissions are extrapolated based on the number of server units in data centers83 and office space with an air conditioning (A/C) system (100% data coverage). All refrigerants are assumed to be HFC134a. |
| – | Mobile Combustion in Corporate Cars: Emissions from fuel combustion of company cars. In the context of carbon reporting, the term ‘company car’ refers to all cars for which SAP permanently covers the fuel costs. Emission calculation is based on fuel consumption. If detailed fuel data is not available in specific countries, stable values (liters/car) are used for extrapolation based on the number of company cars reported. The stable values for extrapolation are based on the previous year’s carbon emissions data. |
| – | Refrigerants in Corporate Cars: HFC emissions caused by air conditioning devices in company cars (fuel and electric cars). Refrigerant emissions are based on an estimate of HFC1234yf emissions per car (in Europe) and HFC134a emissions per car (for the rest of the world) and are extrapolated based on the number of corporate cars reported (100% data coverage). |
| – | Mobile Combustion in Corporate Jets: Emissions caused by business trips with SAP-owned or chartered jets. Emission calculation for SAP’s jets is based on actual fuel consumption (100% data coverage). |
Scope 2
Refers to indirect carbon emissions and is defined as emissions from the consumption of purchased electricity, purchased steam, or other sources of energy generated upstream from the organization. To determine SAP’s global net emissions, we use the location-based method to calculate the Scope 2 emissions. To calculate the market-based Scope 2 emissions, we have applied a regional EAC portfolio approach (see Renewable Electricity below). At SAP, the following emission categories are covered by Scope 2:
| – | Electricity in Office Buildings: Emissions caused by the consumption of purchased electricity in office buildings. Calculation of emissions is based on building electricity consumption. CO2e conversion factors are updated annually based on country-specific grid factors. Where no measured data is available, stable values (kWh/m2) based on the previous year’s energy consumption data are used for extrapolation. |
| – | Electricity in SAP-Owned Data Centers: Emissions caused by the consumption of purchased electricity in SAP-owned and -operated data centers. The calculation of emissions is based on data center electricity consumption (100% data coverage). CO2e conversion factors are updated annually based on country-specific grid factors. |
83 Since 2022, we also consider the server units located in our co-location data centers.
|
SAP Integrated Report 2023 | |||||
| To
Our Stakeholders |
Combined
Management Report |
Consolidated
Financial Statements IFRS |
Further
Information about Sustainability |
Additional Information |
||
| – | Electricity in Co-Location Data Centers: Emissions caused by the consumption of purchased electricity in co-location data centers. A co-location is a local computing center where the building infrastructure is controlled and managed by an external provider but where SAP has control over the operations of the network and server infrastructure on which SAP software is running. CO2e conversion factors are updated annually based on country-specific grid factors. Electricity consumption for co-location data centers is calculated based on the consumed server power and a power usage effectiveness (PUE) factor. Where no data is available, average factors are applied. |
| – | E-Mobility: Emissions from company cars with electric drive. Electricity consumption is calculated based on the number of e-cars per country, an average energy consumption value for e-cars, and an average mileage per year. Emissions calculation is based on country-specific emission factors (100% data coverage). |
| – | Home Office Electricity: Emissions caused by end-user IT equipment used by SAP employees working from home. Due to the high number of employees working from home (flexible hybrid working model, Pledge to Flex) we started to report the electricity emissions of IT equipment usage outside of the office in 2022. Per employee, an average equipment usage consisting of a notebook, monitor, and mobile phone is considered. For each of these hardware device types, the model that is primarily used by SAP employees is taken into account to determine the average electricity consumption per hour. Average daily usage, charging hours, and stand-by hours are additionally considered when calculating the electricity consumption of an employee in home office. The information about the share of home office per location is determined based on the latest commuting survey conducted in 2022 (see Employee Commuting). Emission calculation is based on country-specific emission factors. |
| – | Purchased Chilled and Hot Water and Steam: Emissions caused by the consumption of purchased heat or steam in office buildings (district heating). Calculation of emissions is based on consumption of district heating. Emission factors are updated annually. Where no measured data is available, stable values (kWh/m2) based on the previous year’s energy consumption data are used for extrapolation. |
Scope 3
Refers to other indirect carbon emissions, and is defined as emissions that are a consequence of operations of an organization but are not directly owned or controlled by the organization. Scope 3 emissions are divided into upstream and downstream emissions.
Upstream
Only selected upstream emissions are included in our target to be carbon neutral in our own operations in 2023. The following upstream Scope 3 carbon emissions are included in our carbon neutrality 2023 target:
| – | Business Flights: Emissions caused by business trips by airplane. Calculation of emissions is based on actual distance traveled and actual costs spent. This data is used to determine an average emission factor per euro spent based on short, medium, and long-haul flight emission factors. For CO2e calculation, this factor is applied to actual costs for business flights. Emission factors for business flights do not consider the radiative forcing factors. |
| – | Rental Cars: Emissions caused by business trips by rental car. An average emission factor from rental cars is calculated based on actual distance traveled and actual costs spent. This average emission factor is used for extrapolation based on the costs. |
| – | Train Travel: Emissions from business trips by train. An average emission factor from train travel is calculated based on actual distance traveled and actual costs spent. This average factor is used for extrapolation based on costs. In Germany, business trips by train are considered carbon neutral as they are compensated with 100% green electricity by Deutsche Bahn. |
|
SAP Integrated Report 2023 | |||||
| To
Our Stakeholders |
Combined
Management Report |
Consolidated
Financial Statements IFRS |
Further
Information about Sustainability |
Additional Information |
||
| – | Business Trips with Private Cars: Emissions from business trips with employee-owned cars and company cars without fuel card. Carbon calculation is based on distance traveled with the car. Company car trips with fuel cards are excluded from this activity type. |
| – | Employee Commuting: Emissions caused by commuting between home and work at an SAP office location. Considered are all modes of transport, excluding commuters with company cars. An SAP-global, Qualtrics-based commuting survey about the distance to work and the mode of transport is conducted to collect relevant data. The latest commuting survey was conducted in 2022 for which we received approximately 30,000 valid responses. These responses are the basis for our carbon calculation of employee commuting and home office electricity in 2023. Commuting data for non-responding employees and quarterly updates are extrapolated based on the number of FTEs, excluding those employees who have a company car. |
| – | Electricity Consumed by Hyperscale Services: Emissions caused by the consumption of purchased electricity resulting from the usage of hyperscale services in providers’ hyperscale data centers. Hyperscale data centers enable massive, efficient, and robust scalability of computing, system, and server architecture in order to respond to the increasing demand for cloud computing and Big Data solutions. Electricity consumption is calculated based on the total allocated server memory (RAM) and the operating processor hours (CPU) of all hyperscale services. Conversion factors are used to convert the allocated RAM and CPU values into a power value, and an average PUE factor is used to extrapolate the total hyperscale service electricity. For more information about the consideration of renewable energy sources in the calculation, see the External Reductions section. |
| – | Logistics: This category consists of the following three emission sources: 1) Emissions caused by mail and parcel delivery; 2) Emissions caused by the consumption of paper; and 3) Emissions caused by our customers downloading software data from our servers (prior to 2021, this was a downstream emissions category). Due to the insignificant emissions impact of these sources, calculation is done based on an average factor ‘carbon emissions per FTE.’ This factor has been determined based on historical emissions data of each category. |
Net Zero 2030
We aim to reach net zero across our value chain in line with a 1.5°C future by 2030. The net zero 2030 target is planned for submission to the SBTi in 2024. The baseline for the net zero target consists of SAP’s Scope 1 and 2 emissions as explained above except for the emissions from air conditioning devices in corporate cars as these emissions are very insignificant compared to SAP’s total footprint. The Scope 3 emissions taken into account for net zero are described below.
We measure the Scope 3 carbon emissions based on the GHG Protocol’s Corporate Value Chain (Scope 3) Accounting and Reporting Standard.
Upstream Scope 3
| – | Purchased Goods and Services: Includes all significant cradle-to-gate upstream emissions of goods and services that SAP purchased during the reporting period. We also include services from waste and water disposal in this category. Furthermore, the Purchased Goods and Services category includes the services from our hyperscaler providers, fuel- and energy-related activities, and upstream transportation and distribution. In contrast to the carbon neutrality 2023 target, we consider all significant cradle-to-gate emissions for the net zero 2030 target. Therefore, we apply a different calculation approach for all purchased goods and services. To derive the CO2e, SAP closely collaborates with a third-party provider that utilizes a spend-based method. We use coefficients that translate each US$ of spend into kilogram of CO2e. The coefficients are available for each country-sector combination and by supply chain tier (direct suppliers, suppliers of suppliers, and so on). |
| – | Capital Goods: Includes all cradle-to-gate upstream emissions of purchased capital goods, such as buildings, data center and IT equipment, cars, and so on. SAP applies the same calculation logic as described above in the section Purchased Goods and Services. |
|
SAP Integrated Report 2023 | |||||
| To
Our Stakeholders |
Combined
Management Report |
Consolidated
Financial Statements IFRS |
Further
Information about Sustainability |
Additional Information |
||
| – | Business Travel: Includes Scope 1 and 2 emissions of transportation of employees for business-related activities during the reporting year not owned or operated by SAP. The main components are emissions from business flights, rental cars, train travel, and business trips with private cars. The calculation approach is the same as outlined above in the Carbon Neutrality 2023 section. |
| – | Employee Commuting: Includes Scope 1 and 2 emissions of employees for transportation of employees between their homes and their worksites during the reporting year in vehicles not owned or operated by SAP. The calculation approach is the same as outlined above in the Carbon Neutrality 2023 section for the category employee commuting. |
Downstream Scope 3
Use of Sold Products: A big part of our overall emissions stems from the use of our software (customers running SAP solutions on their hardware and premises). Due to our lack of control over our customers’ IT landscapes, these emissions are not included in our carbon neutrality 2023 target. Nonetheless, we have been calculating the emissions for indicative purposes for many years. We are also taking them into account for our net zero 2030 target. Because of this, and to enhance the accuracy of the calculation, we refined the calculation methodology in 2023. The estimated energy consumption is extrapolated globally based on an average number of productive installations and average PUE, derived from SAP’s external data centers. Previously, we relied only on planning data to estimate the average system size. Now, we also use real data from our customers to calculate the weighted average system size. In addition, we revisited the underlying data base. The data base we used in the past for indicative purposes included systems with active and non-active maintenance contracts. Because of this, carbon emissions from products in use had been significantly overstated. For systems without maintenance contracts, SAP has no transparency on whether the solutions are still in use. Therefore, from 2023 onwards, we only consider on-premise solutions with active maintenance contracts. This way, we ensure that only active, still functional software products are used in the calculation.
Emissions are calculated using a global electricity emission factor. The calculation covers all of our major solutions, including on-premise software. Cloud solutions are not included, as they are part of internal, co-location, and hyperscale datacenter electricity emissions. Mobile solutions (for example, SAP apps running on customer IT equipment) are also not included.
SAP aims to constantly improve the calculation methodology. Calculation parameters will be adapted when significant technology changes occur or more accurate data sources are available.
Excluded Scope 3 Emissions
The following Scope 3 emissions sources are not applicable or insignificant to SAP’s business operations: Downstream transportation and distribution, processing of sold products, end-of-life treatment of sold products, downstream leased assets, franchises, and investments. Additionally, the category upstream leased assets are not relevant for SAP since we have classified emissions resulting from leased assets as Scope 1 and 2 emissions following the operational control approach of the GHG Protocol.
|
SAP Integrated Report 2023 | |||||
| To
Our Stakeholders |
Combined
Management Report |
Consolidated
Financial Statements IFRS |
Further
Information about Sustainability |
Additional Information |
||
Baseline for Net Zero
SAP’s 2023 Gross Carbon Emissions Along the Value Chain (Market-Based)
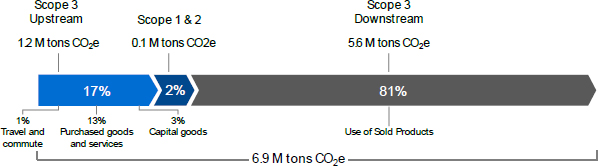
Renewable Electricity
As outlined in the Energy and Emissions section, SAP uses electricity from renewable energy sources to abate electricity-related emissions. This is a strategic lever to achieve our carbon neutrality target and net zero target.
Quality Criteria
We define renewable electricity as electricity coming from renewable electricity sources such as wind, solar, geothermal, sustainably sourced biomass (including biogas), and sustainable hydropower. As recommended by the Greenhouse Gas Protocol and CDP/RE100, we actively look for the best available quality and standards, which support renewable electricity projects that meet robust criteria in terms of environmental integrity, reporting and verification. We have defined quality criteria for the procurement of Energy Attribute Certificates (EACs) by SAP to drive change in the electricity market and to avoid the risk caused by low-quality products. The key characteristics of our renewable electricity purchasing guidelines are as follows:
| Quality Criteria for SAP’s Procurement of EACs | |
| Type of Renewable Electricity | Currently, SAP only considers solar photovoltaics (PV) and wind for its own renewable electricity sourcing. |
| Installation | The power plant producing the renewable electricity shall not be older than 10 years. In case of renovation of an old power plant, the 10-year rule applies only to the additional electricity output due to efficiency increase. SAP strives to not consider EACs from government-supported power plants. |
| Vintage | The renewable electricity must be produced in the same year or the year preceding the reporting period to which it will be applied. |
| EKOenergy | All of our purchased renewable electricity is EKOenergy-certified, a high-quality, internationally recognized not-for-profit ecolabel for renewable energy installations that fulfill additional sustainability criteria. Through the purchase of EKOenergy-certified electricity, we also contribute to EKOenergy’s Climate Fund, which finances solar projects tackling energy poverty. |
Calculation
For our carbon neutrality target we implement the following calculation approach for renewable electricity:
| Carbon Neutrality | |
| Scope 2 |
● The amount of renewable electricity used by SAP is calculated by adding the amounts of renewable electricity a) produced onsite, b) covered by EACs, and c) sourced through local green tariff agreements.
● The total of purchased EACs equals the total electricity consumption as well as the caused emissions of all electricity-related Scope 2 categories: electricity in office buildings, electricity in own data centers, electricity in co-location data centers, home office electricity, and e-mobility.
● The renewable electricity for EACs is only considered if confirmed by an official certificate or written confirmation of |
|
SAP Integrated Report 2023 | |||||
| To
Our Stakeholders |
Combined
Management Report |
Consolidated
Financial Statements IFRS |
Further
Information about Sustainability |
Additional Information |
||
|
our respective EAC suppliers (100% data coverage).
● For location-based reporting, we consider EACs regardless of the site where the electricity is generated (unbundled EACs). SAP uses the regional- or country-specific emissions factors to calculate the emission reductions achieved by the EACs.
● In the location-based net carbon emissions, the purchased as well as the self-produced renewable electricity is already deducted from our Scope 2 emissions.
● For market-based reporting, we apply a region-based market-boundary approach to account for our procured EACs for the market-based emissions. With ‘region-based market-boundary approach’, we refer to mapping the electricity consumption of our SAP sites to defined regions to ensure regional purchasing84. |
84 SAP aims to consider the latest guidelines on EAC market boundaries. In the 2023 RE100 disclosure report, we achieved an EAC market boundary alignment of 83% based on the criteria of RE100.
|
SAP Integrated Report 2023 | |||||
| To
Our Stakeholders |
Combined
Management Report |
Consolidated
Financial Statements IFRS |
Further
Information about Sustainability |
Additional Information |
||
| Carbon Neutrality | |
| Scope 3 |
• Covers electricity consumed by hyperscale services. • Market-based reporting: To a large proportion, most of SAP’s hyperscaler providers operate their data centers with renewable electricity sources. To ensure that SAP’s cloud infrastructure runs with 100% renewable electricity, we procure EACs for the remaining electricity consumption not already covered by renewable electricity from our providers. For this purpose, we use the latest available and assured renewable electricity information of our suppliers: For fiscal year 2023, we relied on supplier data from 2022, as externally assured data for 2023 was not yet available at the point of publication of this Integrated Report. • In the location-based net carbon emissions, the renewable electricity by our hyperscalers as well as the SAP-procured EACs for any remaining non-renewable electricity consumption is deducted from our Scope 3 hyperscaler emissions. • For SAP-procured EACs, we also ensure that it is confirmed by an official certificate or written confirmation of our respective EAC suppliers (100% data coverage). |
For our science-based target (net zero by 2030) baseline, we account Scope 2 market-based emissions in line with the GHG Protocol Scope 2 Guidance.
Carbon Offsets
As outlined in the Energy and Emissions section, SAP invests the equivalent of remaining emissions from our own operations (Scope 1, 2 and selected 3 emissions) in carbon projects to help reach its carbon neutrality target.
Quality Criteria
To support credible, genuine projects, SAP’s due diligence approach for its offset providers and nature-based projects are outlined in the Energy and Emissions section. Further details on SAP’s own, annually-reviewed quality expectations can be found below:
| Additionality / Carbon | Projects and benefits shall be additional. Assumptions regarding the baseline shall reflect reality as closely as possible and avoid overstatements. Deforestation shall not have occurred to implement planting projects. The risk of leakage site shall be identified, addressed, and reduced. |
| Biodiversity | Local biodiversity shall be protected or enhanced. Implementors shall ensure native ecosystems are not deteriorated. All planting projects shall grow a selection of genetically diverse, at best native and climate-resilient trees in mixed stands. |
| Community | Projects shall be designed to protect or promote human rights. Organizations must identify and consult impacted stakeholders and ensure that projects are implemented in collaboration or with support of local stakeholders. |
| Competence | Partners shall have a history of successfully implemented projects and expertise to implement the right projects in the right places. Scientific partnerships and project designs are strongly preferred. |
| Compliance | Partners must pass SAP’s standard compliance checks. Projects generating carbon offsets must be independently certified and validated. |
| Durability | Partners must implement measures to address causes of nature destruction, and protect the project site during the committed time, ideally permanently. The political environment shall not actively undermine project activities. If the (limited) extraction of timber is required to safeguard project durability, trees shall be responsibly harvested (for example, no large-scale clear-cuts), allowing for regrowth. |
| Transparency | Organizations must initially and regularly disclose selected data to provide transparency. Organizations leveraging technology, satellite imagery, or other tools to increase transparency, protection and/or understanding of the restored area are preferred. |
Calculation
In the net carbon emissions relevant for our carbon neutrality target, purchased offsets are already deducted from our gross emissions. When our net carbon emission became a short-term Incentive KPI of the Executive Board compensation, we defined and documented a multi-year carbon offsetting plan (which is part of the annual independent audit procedures) to prevent misusage.
In 2023, the voluntary investments in our carbon project portfolio (see the Energy and Emissions section) were used to compensate for the remaining emissions of the following emission categories which could not be avoided nor reduced:
| – | Scope 1: Stationary combustion in facilities, refrigerants in facilities, mobile combustion and refrigerants in corporate cars, mobile combustion in corporate jets |
| – | Scope 2: Purchased chilled and hot water and steam |
|
SAP Integrated Report 2023 | |||||
| To
Our Stakeholders |
Combined
Management Report |
Consolidated
Financial Statements IFRS |
Further
Information about Sustainability |
Additional Information |
||
| – | Scope 3: Business flights, rental cars, train travel, business trips with private cars, employee commuting, and logistics |
For our science-based target (net zero by 2030), we do not consider carbon offsets (beyond value chain mitigation) in line with the Science-Based Target initiative’s Corporate Net-Zero Standard.
Total Energy Consumed
We define total energy consumed as the sum of all energy consumed in SAP’s own operations (Scope 1 and 2), including energy from renewable sources. It is calculated based on the consumption data obtained through our measurements for the carbon emissions and is the sum of energy consumption from stationary combustion in facilities, mobile combustion in company cars, mobile combustion in corporate jets, electricity in offices, electricity in own data centers, purchased chilled water, purchased hot water, and purchased steam, and electricity in co-location data centers (see Data Center Electricity).
Data Center Electricity
We define data center electricity as the sum of electricity consumed to provide internal and external computation power in SAP-owned data centers and contracted third-party data centers (co-locations). A data center is any global, regional, or local computing center (location with any number of server units) that is part of our global IT infrastructure strategy. Hyperscale data centers are not part of our own operations and are therefore not reflected in this disclosure. Internally, we calculate the electricity consumption of hyperscale services as basis to determine the required procurement of EACs to ensure that SAP software solutions running on hyperscale data centers are powered with 100% renewable electricity.
Additional Environmental Aspects
Water Usage
By water usage, we mean the total amount of freshwater withdrawn for our office buildings and data centers. Data is based on measurements and estimations from sites. Data was provided for 84.7% of the total water consumption; the remaining data is extrapolated based on square meter footage.
E-Waste Management
Waste of Electrical and electronic equipment (WEEE / e-waste)85 means all the discarded electrical and electronic devices. These ranges from end-user IT equipment such as laptops, peripherals, and mobile devices to compute, to networking and storage devices of our data centers. Our international and local IT asset lifecycle partners test the collected WEEE to determine the correct treatment. We define the possible streams as follows:
Waste diverted from disposal:
| 1. | Reusage (top priority): Refurbishing and reselling functioning devices to give it a second life |
| 2. | Recycling (second priority – previously called “mechanical recycling”): Extracting raw materials to preserve and reuse them (such as plastics, metals, and rare earths) |
Waste directed to disposal:
| 1. | Incineration with and without energy recovery (previously called “thermal recycling”), whereby the former refers to the generation of energy through the incineration of waste |
85 The former categorization (Reusage vs. WEEE) has been replaced by a new structure aligned with the European Sustainability Reporting Standards (ESRS) E5 and still aligns with EU Directive 2008/98/EC & EU Directive 2012/19/EU. “Reusage” is included in WEEE and there are two sub-categories: “Waste diverted from disposal” and “Waste directed to disposal”. New terminology has also been implemented in alignment with ESRS E5 (specified in the text).
|
SAP Integrated Report 2023 | |||||
| To
Our Stakeholders |
Combined
Management Report |
Consolidated
Financial Statements IFRS |
Further
Information about Sustainability |
Additional Information |
||
| 2. | Landfill: Disposing of waste on a landfill site (we strive to avoid this treatment as much as possible) |
Calculation of E-Waste with Treatment Insights
The e-waste data we receive from our large IT asset lifecycle partners is based on weight or the number of devices which is converted into weight based on an average weight of the devices. To determine the share of end-of-life treatment practices (recycling versus incineration with/without energy recovery versus landfill), our partners aim to use the specific quotas of the recycling sites. If this data is not available, regional quotas or other available country quotas are used for approximation. We also collect reusage data from ISO 14001-certified SAP locations that are not (fully) covered by our large IT asset lifecycle partners. This amount is included in the reusage data visualized in the Waste and Water section.
In 2023, an analytical reporting sourcing system was developed and implemented to improve assessment and management, gain clear insights in sustainability performance in data centers (for example, waste diverted from disposal versus waste directed to disposal). We roll out monthly Sustainability & Commercial reports with complete insights in all process steps from handover to final processing for our data centers’ e-waste. This report includes information about raw and extracted hazardous materials.
Calculation of E-Waste Without Treatment Insights
To supplement our e-waste data from our large IT asset lifecycle partners, we also collect data from all locations that are a) in scope of our ISO 14001-certified environmental management system (EMS), and b) not (fully) covered by our large partners.
For SAP sites that are neither covered by our partners nor are part of SAP’s EMS, we extrapolate e-waste shares for end-user IT equipment based on full-time equivalents. The end-of-life treatment split into recycling and incineration with energy recovery and landfill is calculated based on the country-specific or region-specific factors of the Global E-waste Monitor 2020.
For co-location data centers not covered by our global IT asset lifecycle partners, we extrapolate the data based on the electricity consumption share. The e-waste treatment split into recycling and incineration with energy recovery and landfill is calculated based on the country-specific or region-specific factors of the Global E-waste Monitor 2020.
Overall, we achieved a data coverage for our WEEE reporting of 94%.
Audit
Scope
The content of the Non-Financial Notes: Environmental Performance section was subject to an independent limited assurance engagement by our external auditor. Under this engagement, the quantitative indicators carbon emissions (scope 1, scope 2, and scope 3 emissions relevant for SAP’s business model), total energy consumption and renewable energy certificates were audited at a reasonable assurance level.
|
SAP Integrated Report 2023 | |||||
| To
Our Stakeholders |
Combined
Management Report |
Consolidated
Financial Statements IFRS |
Further
Information about Sustainability |
Additional Information |
||
Our Contribution to the UN Sustainable Development Goals
The 17 United Nations Sustainable Development Goals (SDGs) provide a globally accepted framework anchored in human rights, which we use for communicating our purpose to “help the world run better and improve people’s lives.” We strive to execute on this purpose by being a role model for sustainable, purpose-led operations and by enabling our customers to operate in a sustainable way.
Following the adoption of the SDGs by world leaders in September 2015, we identified and aligned existing initiatives with all 17 SDGs. For example, we looked at the environmental and social impacts of customers using SAP technology and applications, linking these impacts to the SDGs. The resulting Web book “SAP and the UN Global Goals“ was published in early 2016 and has been updated regularly.
In discussions with our ESG Steering Board and external sustainability advisory panel, we defined the SDGs for which there is a tangible and material link between our own operational activities or the use of our software by customers.
The following table describes the potential positive (+) and negative (–) direct or indirect impacts of our company and of our products and services related to the selected SDGs. We use “direct” when we refer to impacts through our own operations; “indirect” describes impacts through the use of our solutions and technology or in our ecosystem.
SDG 3 Good Health and Well-Being
| Our Potential Direct and Indirect Impact |
Direct: + Provide access to a healthy lifestyle and a safe and healthy working environment for our employees |
Indirect: + Enhance safe and healthy working conditions, healthcare, and personalized medicine on a global scale - Increase transparency of physical, medical, and health conditions of individuals, which might be abused |
| Our KPIs and Targets | Business Health Culture Index | |
| Our Policies and Selected Activities and Programs to Enhance Positive Impacts and Mitigate Negative Impacts |
Direct: Global Health and Safety Policy; Employee Assistance Program; Healthy Leadership enablement, Employee Care Cycle for Mental Health, Global Mindfulness Practice, and programs for an active workplace and physical activity |
Indirect: SAP’s solutions for healthcare: SAP Environment, Health, and Safety Management; SAP S/4HANA for product compliance; SAP Concur duty of care functionality |
| Where You Can Find More Information in the SAP Integrated Report | Employees | |
SDG 4 Quality Education
| Our Potential Direct and Indirect Impact |
Direct: + Train and educate SAP employees |
Indirect: + Build capability in our ecosystem and among our customers |
| Our KPIs and Targets | Upskill two million people worldwide by 2025 | |
| Our Policies and Selected Activities and Programs to Enhance Positive Impacts and Mitigate Negative Impacts |
Direct: Cloud-based learning management system for employees |
Indirect: Free learning on SAP Learning site; SAP CSR education and digital skills program SAP Educate to Employ initiative in partnership with UNICEF and Generation Unlimited; SAP University Alliance SAP solutions: SAP SuccessFactors Learning |
| Where
You Can Find More Information in the SAP Integrated Report |
Employees Social Investments |
|
|
SAP Integrated Report 2023 | |||||
| To
Our Stakeholders |
Combined
Management Report |
Consolidated
Financial Statements IFRS |
Further
Information about Sustainability |
Additional Information |
||
SDG 8 Decent Work and Economic Growth
| Our Potential Direct and Indirect Impact |
Direct: + Create decent jobs at SAP through our growth plans, specifically in developing markets |
Indirect: + Enable an inclusive economy + Facilitate socially responsible employment + Respect human rights across value chains + Combat forced and child labor throughout supply chains - Fuel negative effects on employment through digitalization and automation; potentially increase precarious jobs |
| Our KPIs and Targets | Number of employees | |
| Our Policies and Selected Activities and Programs to Enhance Positive Impacts and Mitigate Negative Impacts |
Direct: Recruiting programs; Human Rights Commitment Statement; Human Rights Due Diligence Program |
Indirect: SAP’s solutions for social responsibility: SAP Environment, Health and Safety Management; SAP Rural Sourcing Management SAP Ariba Supplier Risk; SAP Fieldglass Contingent Workforce Management SAP CSR programs to foster social entrepreneurship |
| Where
You Can Find More Information in the SAP Integrated Report |
Employees |
|
SDG 9 Industry, Innovation, and Infrastructure
| Our Potential Direct and Indirect Impact |
Direct: + Increase inclusive and sustainable industrialization through SAP’s investments in research and development (including in developing countries) |
Indirect: + Support providers of infrastructure, financial services, and clean technologies + Provide “Best Practice” business processes through standard software solutions + Integrate small and medium-sized enterprises into global value chains and markets - Unconscious bias and discrimination in AI (Artificial Intelligence) technology |
| Our KPIs and Targets | NA | |
| Our Policies and Selected Activities and Programs to Enhance Positive Impacts and Mitigate Negative Impacts |
Direct: SAP Labs Network |
Indirect: SAP support for startups
through various programs, such as SAP.io Foundries, Sustainable Accelerator; SAP AI Ethics Guiding Principles, Policy and Governance |
| Where You Can Find More Information in the SAP Integrated Report | Strategy and Business Model | |
|
SAP Integrated Report 2023 | |||||
| To
Our Stakeholders |
Combined
Management Report |
Consolidated
Financial Statements IFRS |
Further
Information about Sustainability |
Additional Information |
||
SDG 10 Reduced Inequalities
| Our Potential Direct and Indirect Impact |
Direct
+ Ensure equal opportunity and inclusion of all employees, irrespective of age, sex, disability, race, ethnicity, origin, religion, or economic or other status
|
Indirect
+ Enable an inclusive economy by providing tools and systems to foster inclusion of all in workforce and supply chains
- Decouple societal groups from entire areas of employment through an accelerated digital divide and lack of digital skills
|
| Our KPIs and Targets |
■ 25% women on the three management levels below the Executive Board by 2027
■ Double the representation of African-American talent in the United States over the next three years (2022–2025)
■ Reach 5% of annual addressable procurement spend with social enterprises and with diverse businesses by 2025
|
|
| Our Policies and Selected Activities and Programs to Enhance Positive Impacts and Mitigate Negative Impacts |
Direct:
Human Rights Commitment Statement; Diversity & Inclusion programs including EDGE certification; Global Antidiscrimination Statement; social procurement initiative
|
Indirect:
SAP’s solutions for social responsibility: SAP SuccessFactors HXM Suite; SAP Ariba Supplier Risk; SAP’s internal standard for product accessibility
|
| Where You Can Find More Information in the SAP Integrated Report |
Employees Sustainable Procurement
|
|
SDG 12 Responsible Consumption and Production
| Our Potential Direct and Indirect Impact |
Direct:
+ Drive sustainable business practices and integrated reporting
- Use energy, water, and resources; produce waste
|
Indirect:
+ Decouple economic prosperity from resource consumption by enabling transparency and optimizing resource productivity in linear or circular economies
- Increase absolute resource and energy consumption because efficiency gains through automation may be counteracted (rebound effect)
|
| Our KPIs and Targets | We drive resource productivity with an aspiration to a world with zero waste. | |
| Our Policies and Selected Activities and Programs to Enhance Positive Impacts and Mitigate Negative Impacts |
Direct:
Supplier Code of Conduct; Sustainable Procurement; e-waste recycling
|
Indirect:
SAP’s solutions for the circular economy: SAP Responsible Design and Production; SAP Ariba Supplier Risk; product lifecycle management solutions; SAP S/4HANA for waste and recycling; SAP Returnable Packaging Management; SAP Rural Sourcing Management; SAP Green Token, and more
|
| Where You Can Find More Information in the SAP Integrated Report |
Energy and Emissions Waste and Water Sustainable Procurement
|
|
|
SAP Integrated Report 2023 | |||||
| To
Our Stakeholders |
Combined
Management Report |
Consolidated
Financial Statements IFRS |
Further
Information about Sustainability |
Additional Information |
||
SDG 13 Climate Action
| Our Potential Direct and Indirect Impact |
Direct:
+ Assume responsibility for products in use-related emissions by running customer applications in the SAP cloud powered with 100% renewable electricity
- Emit greenhouse gases
|
Indirect:
+ Contribute to climate change mitigation and strengthen resilience and adaptive capacity to climate-related hazards and natural disasters of our customers
+ Enable holistic operational steering by integrating climate-change relevant parameters and help understand and minimize the climate footprint of a company’s products, operations, and services
- Increase customers’ energy consumption through use of software
|
| Our KPIs and Targets | Become carbon neutral by 2023 in our own operations; net zero along our value chain by 2030 | |
| Our Policies and Selected Activities and Programs to Enhance Positive Impacts and Mitigate Negative Impacts |
Direct:
Global Environmental Policy; cross-company net-zero program; Cloud transformation; emissions reduction in installed base and on-premise solution portfolio; continuous avoidance and reduction of emissions in operations including transformation of company car-fleet; top supplier engagement program; procure 100% renewable electricity; carbon impact part of Executive Board compensation
|
Indirect:
Cloud powered by 100% renewable electricity; Business ambition for 1.5°C; SAP Cloud for Sustainable Enterprises; SAP’s solutions for climate action: SAP Sustainability Footprint Management; SAP Sustainability Data Exchange; SAP E-Mobility; SAP Landscape Management Cloud; SAP Transportation Management; SAP Environment, Health and Safety Management; SAP Cloud for Energy; SAP Concur; SAP Digital Vehicle Hub
|
|
Where You Can Find More Information in the SAP Integrated Report
|
Energy and Emissions Compensation Report 2023 |
|
SDG 17 Partnerships for the Goals
| Our Potential Direct and Indirect Impact |
Direct:
+ Build capacity throughout our broader ecosystem
|
|
| Our KPIs and Targets | NA | |
| Our Policies and Selected Activities and Programs to Enhance Positive Impacts and Mitigate Negative Impacts |
For more information, see the section
Memberships, Partnerships, and Commitments
|
|
| Where You Can Find More Information in the SAP Integrated Report |
Social Investments Memberships, Partnerships, and Commitments
|
|
Audit Scope
The content of the Our Contribution to the UN Sustainable Development Goals section was not subject to the independent limited assurance engagement of our external auditor.
|
SAP Integrated Report 2023 | |||||
| To
Our Stakeholders |
Combined
Management Report |
Consolidated
Financial Statements IFRS |
Further
Information about Sustainability |
Additional Information |
||
GRI Content Index
SAP SE has reported in accordance with the GRI Standards for the period from January 1, 2023, to December 31, 2023. The GRI 1 used was GRI 1: Foundation 2021.
The 11 material topics in this GRI Content Index were selected based on the comprehensive materiality assessment conducted in 2022 and reflect the requirements of GRI 3: Material Topics. We have clustered these topics according to the relevant non-financial matters set out in the German Commercial Code (Handelsgesetzbuch, HGB) (exception: the material topic “ethics and compliance” is not clustered under “Anti-corruption and bribery matters” as the corresponding GRI standards are defined more broadly).
We present the interconnection between the GRI topic-specific disclosures that are material to SAP and the 17 United Nations Sustainable Development Goals (UN SDGs).
General Disclosures
| GRI Standards | Disclosure Title | Links and Content | In
Scope of External Audit86 |
UN SDGs |
|
| GRI 2: General Disclosures 2021 | 2-1 | Organizational Details | Strategy and Business Model | ✔ | |
| 2-2 | Entities included in the organization’s sustainability reporting |
Strategy and Business Model About This Report Worldwide Office Locations |
✔ ✔ |
||
| 2-3 | Reporting period, frequency and contact point |
About This Report Independent assurance practitioner's report Financial Calendar and Addresses |
✔ | ||
| 2-4 | Restatements of information |
Non-Financial Notes: Environmental Performance In 2023, we did not have any material restatements of information of previous reporting periods. |
✔ | ||
| 2-5 | External assurance |
Independent assurance practitioner’s report Supervisory Board |
|||
| 2-6 | Activities, value chain, and other business relationships |
Strategy and Business Model Sustainable Procurement |
✔ ✔ |
||
| 2-7 | Employees |
Headcount and Personnel Expense Note (B.1) Employee Headcount Report Data Hub At SAP, we have a multitude of non-headcount-relevant employee categories defined. None of these categories match the GRI definition of “non-guaranteed hours employees.” However, at SAP we have employees who are paid hourly (for example, working students) but who have a reliable minimum number of hours guaranteed. This group represents about 1.3% of the total SAP workforce. |
✔ ✔
✔ |
8, 10 | |
86 Level of external audit: Limited assurance, reasonable assurance, and statutory audit. For more information about the External Audit scope, please refer to the Audit Scope checkboxes in each section.
|
SAP Integrated Report 2023 | |||||
| To
Our Stakeholders |
Combined
Management Report |
Consolidated
Financial Statements IFRS |
Further
Information about Sustainability |
Additional Information |
||
| GRI Standards | Disclosure Title | Links and Content | In
Scope of External Audit86 |
UN SDGs |
|
| 2-8 | Workers who are not employees |
In 2023, we had on average 999 workers87 who were not employees and whose work was controlled by SAP. GRI’s definition matches SAP’s external workforce category “temporary staff.” Temporary staff are all contracted through a recruitment agency, with a contract in line with country specific legislation. This external workforce is deployed to act as a replacement employee for a limited period of time, provide a specialist skill on a short-term basis, or cover temporary peaks in work. The performed work is equivalent to that done by employees and spans all types of roles in the business. Temporary staff has access to our Health, Safety & Well-Being offerings. However, we do not include temporary staff into our Health, Safety & Well-Being-related KPIs due to data collection boundaries. |
✔ | 8 | |
| 2-9 | Governance structure and composition |
SAP Executive Board Corporate Governance Statement Sustainability Management Executive Board Supervisory Board |
✔
|
5, 16 | |
| 2-10 | Nomination and selection of the highest governance body | Corporate Governance Statement | 5, 16 | ||
| 2-11 | Chair of the highest governance body | German stock corporations have a two-tier governance system due to the legislation (AktG §105), that is, an executive board and a supervisory board. Members of the supervisory board cannot also serve on the executive board. | ✔ | 16 | |
| 2-12 | Role of the highest governance body in overseeing the management of impacts |
Corporate Governance Statement Sustainability Management Risk Management and Risks |
✔ ✔ |
16 | |
| 2-13 | Delegation of responsibility for managing impacts |
Corporate Governance Statement Sustainability Management |
✔
|
||
| 2-14 | Role of the highest governance body in sustainability reporting |
Corporate Governance Statement Materiality |
✔
|
||
| 2-15 | Conflicts of interest | Corporate Governance Statement | 16 | ||
| 2-16 | Communication of critical concerns |
Corporate Governance Statement Report by the Supervisory Board The Supervisory Board is informed regularly and on an ad-hoc basis by the Executive Board about the Company’s strategy and the status of its implementation, business planning, profitability, and all aspects of business performance which are material for the SAP Group, including any deviations of actual business performance from plan, and about current risks, risk management, and corporate compliance. In addition, the Executive Board involves the Supervisory Board in decisions on matters of fundamental importance for the Company, including in case of transactions requiring the Supervisory Board’s prior consent. The Supervisory Board’s activities of the previous year, including its decisions on transactions requiring its prior consent, are described in detail in the Report by the Supervisory Board for the relevant fiscal year, which is included in SAP’s Integrated Report. Due to the overlapping and not always sharply delineated nature of matters discussed, disclosing a total number of critical concerns would not be accurate. We provide transparency qualitatively through the Report by the Supervisory Board. |
|||
87 Number represents the average headcount over the year 2023. The number of temporary staff declined by ~4% over the year 2023.
|
SAP Integrated Report 2023 | |||||
| To
Our Stakeholders |
Combined
Management Report |
Consolidated
Financial Statements IFRS |
Further
Information about Sustainability |
Additional Information |
||
| GRI Standards | Disclosure Title | Links and Content |
In Scope of External Audit86 |
UN SDGs |
|
| 2-17 | Collective knowledge of the highest governance body |
Compensation Report 2023 Corporate Governance Statement |
✔ | ||
| 2-18 | Evaluation of the performance of the highest governance body |
Report by the Supervisory Board Performance Management System |
✔ |
||
| 2-19 | Remuneration policies | Compensation Report 2023 | ✔ | ||
| 2-20 | Process to determine remuneration |
Corporate Governance Statement Compensation Report 2023 AGM Voting on Resolutions |
✔
|
||
| 2-21 | Annual total compensation ratio |
Compensation Report 2023 Corporate Governance Statement The average annual compensation of SAP employees and the information for the highest paid employee (CEO), from which the ratio can be calculated, has been provided in the Compensation Report 2023. |
✔ | ||
| 2-22 | Statement on sustainable development strategy | Letter from the CEO | |||
| 2-23 | Policy commitments |
Business Conduct Human Rights Code of Ethics and Business Conduct (CoEBC) |
✔ ✔ |
16 | |
| 2-24 | Embedding policy commitments | Business Conduct | ✔ | ||
| 2-25 | Processes to remediate negative impacts | Human Rights | ✔ | ||
| 2-26 | Mechanisms for seeking advice and raising concerns | Business Conduct | ✔ | 16 | |
| 2-27 | Compliance with laws and regulations | Note (G.3) Other Litigation, Claims, and Legal Contingencies | ✔ | ||
| 2-28 | Membership associations | Memberships, Partnerships, and Commitments | |||
| 2-29 | Approach to stakeholder engagement | Stakeholder Engagement | ✔ | ||
| 2-30 | Collective bargaining agreements | Stakeholder Engagement | ✔ | 8 | |
Disclosures on Material Topics
| GRI Standards | Disclosure Title | Links, Content, and Omissions | Boundaries | In
Scope of External Audit86 |
UN SDGs | |
| GRI 3: Material Topics 2021 | 3-1 | Process to determine material topics | Materiality | SAP | ✔ | |
| 3-2 | List of material topics | Materiality | SAP | ✔ | ||
|
SAP Integrated Report 2023 | |||||
| To
Our Stakeholders |
Combined
Management Report |
Consolidated
Financial Statements IFRS |
Further
Information about Sustainability |
Additional Information |
||
Topic-Specific Disclosures
Ethics and Compliance
| GRI Standards | Disclosure Title | Links, Content, and Omissions | Boundaries | In Scope of External Audit86 | UN SDGs | |
| GRI 3: Material Topics 2021 | 3-3 | Management of material topics |
Business Conduct Risks and Risk Management |
SAP |
✔ ✔ |
|
| GRI 205: Anti-corruption 2016 | 205-1 | Operations assessed for risks related to corruption |
Business Conduct Risk Management and Risks In alignment with the
different legal requirements in various countries, and as per the SAP Global Risk Management Policy and supporting processes,
SAP, together with legal advisory services as deemed appropriate, perform risk assessments globally. These include cross-business
topics and the evaluation of risks related to compliance, bribery, and corruption. Overall, our corporate risk assessments focus
on compliance topics. In addition, 38% of all audits concluded in 2023 under the risk-based audit plan are compliance-relevant
audits. As part of this process, a regular and dedicated focus is also placed on identifying high-risk countries so as to identify
deep dive reviews and necessary mitigations accompanied by regular monitoring. |
SAP |
✔ ✔ ✔ |
16 |
| 205-2 | Communication and training about anti-corruption policies and procedures |
SAP’s Code of Ethics and Business Conduct (CoEBC) provides the primary ethical and legal framework within which SAP conducts business. It also addresses SAP’s policies regarding anti-corruption. The CoEBC is available internally on the Company’s intranet and externally on the Internet. All members of the SAP Executive Board and Supervisory Board, all SAP employees, all SAP partners, suppliers, and shareholders, as well as the general public, have full access to the CoEBC. We do not collect the data of the geographical distribution and the type of our business partners who access the CoEBC. For a breakdown of the geographical distribution of all SAP employees, see the Report Data Hub. The completion rate for mandatory training applicable to all SAP employees88 on the subject of anti-corruption exceeded 99% in 2023. The numbers of employees per region are listed below: ● APJ: 21,465 ● Greater China: 6,595 ● EMEA: 13,221 (includes five Executive Board Members) ● MEE: 33,446 ● LAC: 5,805 ● North America: 21,325 (includes two Executive Board members) Furthermore, the Group Chief Compliance Officer (GCCO) reports on compliance matters on a quarterly basis to the Executive Board and to the Audit and Compliance Committee of the Supervisory Board. |
SAP + external parties |
✔
|
||
88 Excludes employees on long-term sick leave, parental leave, members of acquired companies, and those in early retirement.
|
SAP Integrated Report 2023 | |||||
| To
Our Stakeholders |
Combined
Management Report |
Consolidated
Financial Statements IFRS |
Further
Information about Sustainability |
Additional Information |
||
| GRI Standards | Disclosure Title | Links, Content, and Omissions | Boundaries |
In Scope of External Audit86 |
UN SDGs | |
| 205-3 | Confirmed incidents of corruption and actions taken | Of all cases, only material corruption cases are reported in Note G.3. | SAP | ✔ | 16 | |
| GRI 206: Anti-competitive Behavior 2016 | 206-1 | Legal actions for anti-competitive behavior, anti-trust, and monopoly practices |
Note (G.3) Other Litigation, Claims, and Legal Contingencies Of all cases, only material legal actions for anti-competitive behavior, anti-trust, and monopoly practices cases are reported in Note G.3. |
SAP | ✔ | 16, 17 |
| GRI 207: Tax 2019 | 207-1 | Approach to tax | SAP Global Tax Principles | SAP | 9, 11, 16 | |
| 207-2 | Tax governance, control, and risk management | SAP Global Tax Principles | SAP | 9, 11, 16 | ||
| 207-3 | Stakeholder engagement and management of concerns related to tax | SAP Global Tax Principles | SAP | 9, 11, 16 | ||
| 207-4 | Country-by-country reporting | As a German company, we report our tax expense separately for Germany and for the rest of the world. We are confident that this information meets our stakeholders’ demands. | ||||
|
SAP Integrated Report 2023 | |||||
| To
Our Stakeholders |
Combined
Management Report |
Consolidated
Financial Statements IFRS |
Further
Information about Sustainability |
Additional Information |
||
Environmental Matters
Energy
| GRI Standards | Disclosure Title | Links, Content, and Omissions | Boundaries | In
Scope of External Audit86 |
UN SDGs | |
| GRI 3: Material Topics 2021 | 3-3 | Management of material topics |
Energy and Emissions Non-Financial Notes: Environmental Performance |
SAP |
✔ ✔ |
|
| GRI 302: Energy 2016 | 302-1 | Energy consumption within the organization |
Energy and Emissions Non-Financial Notes: Environmental Performance Report Data Hub |
SAP |
✔ ✔ |
7, 8, 12, 13 |
| 302-2 | Energy consumption outside of the organization |
Energy and Emissions Non-Financial Notes: Environmental Performance Report Data Hub |
SAP + external parties |
✔ ✔ |
7, 8, 12, 13 | |
| 302-3 | Energy intensity |
Energy and Emissions Non-Financial Notes: Environmental Performance Report Data Hub Five-Year Summary The energy intensity ratio uses only energy consumption within the organization. |
SAP |
✔ ✔ ✔ ✔ |
7, 8, 12, 13 | |
| 302-4 | Reduction of energy consumption |
Energy and Emissions Non-Financial Notes: Environmental Performance Allocation of energy consumption reductions (which we experienced in 2023, for example for our own data center electricity) to conservation and efficiency initiatives cannot be presented precisely due to overlapping effects (such as reductions caused by the COVID-19 pandemic). |
SAP |
✔ ✔ ✔ |
7, 8, 13 | |
| 302-5 | Reductions in energy requirements of products and services | Most of our products are hosted in the cloud. For this reason, the energy consumption is included and reported in our CO2 emission calculation in the section Non-Financial Notes: Environmental Performance. | SAP | ✔ | 7, 8, 13 | |
Climate Change and Air Quality
| GRI Standards | Disclosure Title | Links, Content, and Omissions | Boundaries | In
Scope of External Audit86 |
UN SDGs | |
| GRI 3: Material Topics 2021 | 3-3 | Management of material topics |
Energy and Emissions Non-Financial Notes: Environmental Performance |
SAP |
✔ ✔ |
|
| GRI 305: Emissions 2016 | 305-1 | Direct (Scope 1) GHG emissions |
Energy and Emissions Non-Financial Notes: Environmental Performance Report Data Hub |
SAP |
✔ ✔ |
3, 12, 13, 14, 15 |
| 305-2 | Energy indirect (Scope 2) GHG emissions |
Energy and Emissions Non-Financial Notes: Environmental Performance Report Data Hub |
SAP |
✔ ✔ |
3, 12, 13, 14, 15 | |
| 305-3 | Other indirect (Scope 3) GHG emissions |
Energy and Emissions Non-Financial Notes: Environmental Performance Report Data Hub |
External parties |
✔ ✔ |
3, 12, 13, 14, 15 | |
|
SAP Integrated Report 2023 | |||||
| To
Our Stakeholders |
Combined
Management Report |
Consolidated
Financial Statements IFRS |
Further
Information about Sustainability |
Additional Information |
||
| GRI Standards | Disclosure Title | Links, Content, and Omissions | Boundaries | In
Scope of External Audit86 |
UN SDGs | |
| 305-4 | GHG emissions intensity |
Non-Financial Notes: Environmental Performance Five-Year-Summary Report Data Hub |
SAP + external parties |
✔ ✔ |
13, 14, 15 | |
| 305-5 | Reduction of GHG emissions |
Energy and Emissions Non-Financial Notes: Environmental Performance Report Data Hub Allocation of carbon emission reductions to avoidance and efficiency initiatives cannot be connected precisely due to overlapping effects (such as reductions caused by the COVID-19 pandemic). |
SAP + external parties |
✔ ✔
✔ |
13, 14, 15 | |
| 305-6 | Emissions of ozone-depleting substances (ODS) | As a software company with no production sites, emissions of ozone-depleting substances (ODS) are not material to SAP. | SAP | ✔ | 3, 12, 13, 14, 15 | |
| 305-7 | Nitrogen oxides (NOx), sulfur oxides (SOx), and other significant air emissions | We report all our carbon emissions in CO2 equivalents (CO2e) including the impact from CH4, N2O, and HFCs in our Scope 1 and 2 emissions. We do not provide a breakdown. As a software company with no production sites, sulfur oxides (SOx) and other significant air emissions are not material to SAP. | SAP | ✔ | 3, 12, 13, 15 | |
Employee Matters
The management approaches for the material topics ‘employee rights’, ‘employee engagement’, ‘talent and development‘ and ‘fair and inclusive workplace‘ strongly overlap. This is why we decided to combine them in one joint table, including their corresponding topic-specific disclosures:
| GRI Standards | Disclosure Title | Links, Content, and Omissions | Boundaries |
In Scope of External Audit86 |
UN SDGs | |
| GRI 3: Material Topics 2021 | 3-3 | Management of material topics |
Nothing has a greater impact on our long-term success than the creativity, talent, commitment, health, and well-being of our people. Their ability to innovate and understand the needs of our customers has the potential to deliver sustainable value to our Company and our society. The management approach is applicable not only to employee engagement and employee rights, but also to fair and inclusive workplace and talent and development. Employees |
SAP |
✔ ✔ |
|
| Women in Management |
Employees Report Data Hub |
SAP | ✔ | 5 | ||
| Employee Engagement | Employees | SAP | ✔ | |||
| GRI 401: Employment 2016 | 401-1 | New employee hires and employee turnover |
Employees Note (B.1) Employee Headcount Report Data Hub |
SAP |
✔ ✔ |
8 |
| 401-3 | Parental leave | Specific rates not disclosed since employees are subject to different parental leave rights that local regulations grant to them. | SAP | ✔ | 8 | |
|
SAP Integrated Report 2023 | |||||
| To
Our Stakeholders |
Combined
Management Report |
Consolidated
Financial Statements IFRS |
Further
Information about Sustainability |
Additional Information |
||
| GRI Standards | Disclosure Title | Links, Content, and Omissions | Boundaries |
In Scope of External Audit86 |
UN SDGs | |
| 402-1 | Minimum notice periods regarding operational changes | For the European Economic Area (EA) and European Union (EU), we consult with the SAP SE Works Council (Europe) on significant organizational changes. At the same time, the changes are discussed with the local social partners, including outside the EEA, EU, and United Kingdom (UK). There is no fixed lead time between informing employees and implementing the changes. However, in the event of significant changes, SAP provides extensive change management measures to bring employees closer to the justification for the implementation of the measure and to motivate them to contribute to the changes. | SAP | ✔ | 8 | |
| GRI 404: Training and Education 2016 | 404-1 | Average hours of training per year per employee |
Employees SAP offers a wide portfolio of learning and development offerings to help all of our employees to upskill and accelerate their career. We align training activities according to the needs of employees regardless of gender and employee categories, and they can freely choose from these offerings based on their role and development goals. |
SAP |
✔ ✔ |
4, 5, 8, 9, 10 |
| 404-2 | Programs for upgrading employee skills and transition assistance programs |
Employees SAP has both dedicated and volunteer staff that supports generational intelligence on matters of continued employability, managing career endings, and cross-generational integration and collaboration. These experts work to continuously improve processes and design programs that sustain employability for as long as possible. They provide training for cross-generation collaboration, facilitate flexible career endings for employees (such as part-time options), and keep employees connected with the Company after retirement. |
SAP
|
✔ ✔ |
4, 5, 8, 9, 10 | |
| 404-3 | Percentage of employees receiving regular performance and career development reviews |
Employees With our SAP Talk approach, employees and their managers regularly discuss performance and development goals, needs and progress, and share feedback. At SAP, it is expected that every employee, regardless of gender and employee category, has the opportunity to discuss the progress of their performance and development goals with their manager at least once a quarter. For this reason, we do not consider this a relevant disclosure. |
SAP |
✔ ✔ |
5, 8, 10 | |
| GRI 405: Diversity and Equal Opportunity 2016 | 405-1 | Diversity of governance bodies and employees |
Employees Corporate Governance Statement Supervisory Board Report Data Hub |
SAP |
✔
|
5, 8, 10 |
| 405-2 | Ratio of basic salary and remuneration of women to men | Specific rates are not reported, given that SAP’s bigger company goal is fair pay for all employees, following an approach of “aggregate, don’t segregate” so that everyone’s unique contribution is fairly and clearly reflected. Since data on gender pay is included but not exclusive to that philosophy, we only calculate and report this data on a local level where required by law. | SAP | ✔ | 5, 8, 10 | |
| GRI 406: Non-Discrimination 2016 | 406-1 | Incidents of discrimination and corrective actions taken | Confidentiality constraints. SAP does not publicly disclose this data. | SAP |
✔
|
8 |
|
SAP Integrated Report 2023 | |||||
| To
Our Stakeholders |
Combined
Management Report |
Consolidated
Financial Statements IFRS |
Further
Information about Sustainability |
Additional Information |
||
| GRI Standards | Disclosure Title | Links, Content, and Omissions | Boundaries |
In Scope of External Audit86 |
UN SDGs | |
| GRI 407: Freedom of Association and Collective Bargaining 2016 | 407-1 | Operations and suppliers in which the right to freedom of association and collective bargaining may be at risk |
Sustainable Procurement Stakeholder Engagement Human Rights without further specification of the topic has been considered material as a result of our materiality assessment. "Freedom of association and collective bargaining" has not been specifically contemplated as part of the analysis. |
SAP + external parties |
✔
✔
|
8 |
|
SAP Integrated Report 2023 | |||||
| To
Our Stakeholders |
Combined
Management Report |
Consolidated
Financial Statements IFRS |
Further
Information about Sustainability |
Additional Information |
||
Well-Being, Health, and Safety
| GRI Standards | Disclosure Title | Links, Content, and Omissions | Boundaries |
In
Scope Audit86 |
UN SDGs | |
| GRI 3: Material Topics 2021 | 3-3 | Management of material topics |
Nothing has a greater impact on our long-term success than the creativity, talent, commitment, health, safety, and well-being of our people. Their ability to collaborate, innovate, and understand the needs of our customers has the potential to deliver sustainable value to our company, customers, and society. As an enterprise software company, SAP’s occupational health and safety concerns relate to the knowledge industry and are different to those encountered in manufacturing industries. Most of our employees are of academic background and have sedentary, intellectually demanding jobs in a constantly changing business environment with specifically high demands on self-organization, international collaboration, flexibility, agility, and adaptability. Key health and safety management focus areas at SAP are stress management, self-management, work-life balance support, personal resilience, a psychologically safe work environment, an ergonomically safe office setup, travel medicine, pandemic management, vaccinations, road safety, and general medical prevention for all. Employees SAP provides manifold feedback opportunities and encourages its people to get involved and shape SAP’s caring culture and working conditions by “telling it like it is,” and in doing so, help us improve where needed. Our success is tracked through the Business Health Culture Index (BHCI) and the Stress-Satisfaction Score (measured by regular employee surveys), which revealed that job satisfaction was equal or higher than the perceived stress for about 74% of SAP participants in 2023. SAP Health & Safety Commitment Statement Conditions in which people live up to their full potential – now and in the future of work – are mainly defined by the organization’s leadership style and working culture. We believe that there can be no organizational health without individual health. SAP and its leaders take ownership for workplaces and a caring culture that foster physical health, safety, and mental well-being, while every employee is enabled and encouraged to take care of their individual health. The Global Health, Safety & Well-Being team (led by SAP’s Chief Medical Officer), together with their partners in Human Resources, Real Estate and Facilities, Occupational Safety and Physical Security, provide the information, education, and support to foster a healthy working culture and a supporting environment for all people. In doing so, we enable the organization to be a role model in safe, healthy, and sustainable people management. |
SAP + external parties |
✔
✔
✔
|
1, 3, 6 |
|
SAP Integrated Report 2023 | |||||
| To
Our Stakeholders |
Combined
Management Report |
Consolidated
Financial Statements IFRS |
Further
Information about Sustainability |
Additional Information |
||
| GRI Standards | Disclosure Title | Links, Content, and Omissions | Boundaries |
In
Scope Audit86 |
UN SDGs | |
| GRI 403: Occupational Health and Safety 2018 | 403-1 | Occupational health and safety management system |
SAP has developed an internal health and safety management system called “Run Healthy” which is built on International Labour Organization Occupational Health and Safety (ILO-OSH) standards and SAP's internal Health & Safety Policy. Run Healthy enables SAP organizations to assess their maturity state on health, safety, and well-being to develop and drive targeted initiatives across their organizations and to boost their local Business Health Culture Index, employee engagement, and employer attractivity. The implementation is voluntary and driven by the managing director according to country/line-of-business needs. We give all workers access to global offerings which are complemented according to local business needs. Local Run Healthy councils are key in the process to self-assess maturity levels in the light of covering local requirements and global standards. Run Healthy is expanded on a continuous basis. In addition, SAP engages with its suppliers, partners, and customers to promote the topics of people health and occupational safety beyond the boundaries of our company. SAP Supplier Code of Conduct Safety Instructions for Contractors Please also refer to GRI 2-8. |
SAP + external parties |
✔
|
3 |
| 403-2 | Hazard identification, risk assessment, and incident investigation |
Employees: How We Measure and Manage Our Performance Employees Sustainable Procurement: Improving Sustainability Through Practice SAP Health & Safety Commitment Statement Human Rights Commitment Statement SAP regularly conducts health risk assessments on global level with reporting on all manager levels. Mental health is key to SAP’s ability to provide innovative solutions for our customers. SAP has a long tradition in taking action against stigmatization and applying the Employee Care Cycle covering prevention, early detection, case management, and re-integration. With the Stress-Satisfaction Score, SAP is monitoring an early-watch KPI to measure resilience on people level and to detect fields of action on individual and organizational level. In 2023, we conducted a hybrid-work-related risk assessment to identify health risk factors while working hybrid. A “Country Health Dashboard” based on SAP Analytics Cloud supports the identification of health risks on country level. SAP relies on the enablement of internal multiplier networks such as the Health Ambassador Network, and external trainings and certifications to ensure health and safety competence across the organization. Our employees can use various tools to report concerns, as outlined in the Human Rights Commitment Statement, and are protected against retaliation. This document is core to our people-related policies, such as the Global Health and Safety Policy. For more information, see the Employees section. Please also refer to GRI 2-8. |
SAP + external parties |
✔
✔
|
3 | |
|
SAP Integrated Report 2023 | |||||
| To
Our Stakeholders |
Combined
Management Report |
Consolidated
Financial Statements IFRS |
Further
Information about Sustainability |
Additional Information |
||
| GRI Standards | Disclosure Title | Links, Content, and Omissions | Boundaries |
In
Scope Audit86 |
UN SDGs | |
| 403-3 | Occupational health services |
Employees: How We Measure and Manage Our Performance Employees By regularly conducting surveys, we continuously receive insights which enable SAP and particularly its Global Health, Safety & Well-Being organization, together with its strong partners in Human Resources, Real Estate and Facilities, Occupational Safety and Physical Security to enforce and adjust its initiatives and counteract adverse developments in time. Our Global Health, Safety & Well-Being team provides global frameworks and a comprehensive health, safety, and well-being portfolio to enable SAP’s business with its organizations at all levels to run healthy and safe. Please also refer to GRI 403-6 and GRI 2-8. |
SAP + external parties |
✔ ✔ ✔
|
3 | |
| 403-4 | Worker participation, consultation, and communication on occupational health and safety |
SAP’s Health & Safety program “Run Healthy” includes a self-assessment conducted by a cross-functional staffed council in order to drive tailor-made and effective local programs and initiatives. Digital solutions are leveraged to guide SAP’s people to their relevant health content by considering individual needs and location and to gather their feedback to drive highest standards of quality, as we do with the permanent Qualtrics-based Health Feedback Survey across all health and well-being offerings. A Run Healthy council is the execution entity for the Run Healthy program (see GRI 403-1 for its purpose and target). It meets regularly (usually quarterly) and contains the Run Healthy lead, different line-of-business representatives, such as from the Human Resources, Real Estate and Facilities, and Health departments, as well as an employee representative. The program is being expanded step by step; not all SAP employees are represented by the Run Healthy program. Please also refer to GRI 2-8. |
SAP + external parties | ✔ | 3 | |
| 403-5 | Worker training on occupational health and safety |
At SAP, we offer a flexible training and enablement portfolio (such as SAP’s learning platform Success Map) to enable our people to thrive in the future of work, foster healthy working habits, and become multipliers. In addition to flagship sessions on how to manage stress and foster a healthy work lifestyle, the “Are you OK?” mental well-being initiative continued and SAP launched its first Global Health Summit to enable stakeholders, people, and leaders on the renewed Health & Safety Policy. Please also refer to GRI 2-8. |
SAP + external parties | ✔ | 3 | |
|
SAP Integrated Report 2023 | |||||
| To
Our Stakeholders |
Combined
Management Report |
Consolidated
Financial Statements IFRS |
Further
Information about Sustainability |
Additional Information |
||
| GRI Standards | Disclosure Title | Links, Content, and Omissions | Boundaries | In
Scope of External Audit86 |
UN SDGs | |
| 403-6 | Promotion of worker health |
Employees SAP Health & Safety Commitment Statement At SAP, we offer a wide range of health and well-being services to our employees, ranging from general guidance on how to be more active and to deal with stress and challenging situations in- and outside SAP, conducting health and people days, consultation on ergonomic workplace set-up to prevent back pain, to local vaccination initiatives. Employees have access to these services and are informed about them in SAP’s internal employee portal, monthly newsletters, live sessions, and campaigns, or by contacting the SAP Health team directly. In addition, we have Web-based tools such as the SAP Health Navigator which guides SAP people toward health offerings and tips according to their individual needs. The Run Your Way program on our Fit@SAP activity challenge platform encourages people to integrate more physical activity into their daily life. Please also refer to GRI 2-8. |
SAP + external parties |
✔
✔
|
||
| 403-7 | Prevention and mitigation of occupational health and safety impacts directly linked by business relationships | As outlined in GRI 403-2, we have various approaches to identify negative occupational health and safety impacts such as the BHCI and Country Health Dashboard as well as various channels to report concerns and incidents. In addition, to ensure the health, safety, and well-being of our employees worldwide, SAP runs dedicated crises management and business continuity frameworks. To safeguard our people on business travels, SAP ensures medical and security assistance through a Travel Assistance Program. | SAP + external parties |
✔
|
3 | |
| 403-10 | Work-related ill health |
Fatalities and injuries are not a material issue for SAP, as most of our employees work in an office environment. Please refer to GRI 3-3 for the main types of work-related ill health. The identification of work-related hazards that pose a risk of ill health (such as via the BHCI or the Run Healthy program), as well the actions taken to eliminate/ minimize these hazards and risks, are outlined in GRI 403-1 to GRI 403-7. Internally, we track and monitor an SAP illness rate (in %) which is defined as the total number of days absent (including absences shorter than 3 days) / scheduled workdays per year (250 days) x 100. In 2023, SAP had a global illness rate of 2.1%.89 We do not break the illness rate down into different categories due to the low risk of specifically work-related illnesses. Therefore, we only track an overall illness rate. In 2023, our Stress Satisfaction Score evaluation (see GRI 403-2) confirmed lower stress levels on average compared to satisfaction. Furthermore, we leverage the company reports from our external Employee Assistance Program (EAP) providers to recognize health trends and to derivate appropriate actions. For non-employee workers, we require our suppliers and sub-suppliers to uphold health and safety standards via our Global Supplier Code of Conduct. In addition, in Germany we have safety Instructions for contractors in place. Please also refer to GRI 2-8. |
SAP + external parties | ✔ | 3 | |
89 Employees of recently acquired companies and SAP Israel as well as workers who are not SAP employees are excluded.
|
SAP Integrated Report 2023 | |||||
| To
Our Stakeholders |
Combined
Management Report |
Consolidated
Financial Statements IFRS |
Further
Information about Sustainability |
Additional Information |
||
Human Rights
| GRI Standards | Disclosure Title | Links, Content, and Omissions | Boundaries |
In Scope of External |
UN SDGs | |
| GRI 3: Material Topics 2021 | 3-3 | Management of material topics | Human Rights | SAP + external parties | ✔ | |
| GRI 407: Freedom of Association and Collective Bargaining 2016 | 407-1 | Operations and suppliers in which the right to freedom of association and collective bargaining may be at risk |
Sustainable Procurement Stakeholder Engagement Human Rights without further specification of the topic has been considered material as a result of our materiality assessment. "Freedom of association and collective bargaining" has not been specifically contemplated as part of the analysis. However, selected information has been included in the Human Rights section. |
SAP + external parties |
✔ ✔ |
8 |
| GRI 408: Child Labor 2016 | 408-1 | Operations and suppliers at significant risk for incidents of child labor |
Sustainable Procurement Human Rights without further specification of the topic has been considered material as a result of our materiality assessment. "Risks of child labor" has not been specifically contemplated as part of the analysis. However, selected information has been included in the Human Rights section. |
SAP + external parties | ✔ | 3, 8 |
| GRI 409: Forced or Compulsory Labor 2016 | 409-1 | Operations and suppliers at significant risk for incidents of forced or compulsory labor |
Sustainable Procurement Human Rights without further specification of the topic has been considered material as a result of our materiality assessment. "Risks of forced labor" has not been specifically contemplated as part of the analysis. However, selected information has been included in the Human Rights section. |
SAP + external parties | ✔ | 3, 8, 10 |
Security, Privacy, and Data Protection
| GRI Standards | Disclosure Title | Links, Content, and Omissions | Boundaries |
In Scope of External Audit86 |
UN SDGs | |
| GRI 3: Material Topics 2021 | 3-3 | Management of material topics |
Security, Cloud Compliance, Data Protection and Privacy SAP Trust Center: Data Protection and Privacy SAP Privacy Statement |
SAP + external parties |
✔
|
|
| GRI 418: Customer Privacy 2016 | 418-1 | Substantiated complaints concerning breaches of customer privacy and losses of customer data |
Security, Cloud Compliance, Data Protection and Privacy SAP has not received a written statement addressed from a competent authority or similar official body on customer privacy breaches or a complaint filed with SAP that has been acknowledged as legitimate by SAP. |
SAP + external parties |
✔ ✔ |
12, 16 |
|
SAP Integrated Report 2023 | |||||
| To
Our Stakeholders |
Combined
Management Report |
Consolidated
Financial Statements IFRS |
Further
Information about Sustainability |
Additional Information |
||
Customer Matters
Customer Responsibility
| GRI Standards | Disclosure Title | Links, Content, and Omissions | Boundaries | In
Scope of External Audit86 |
UN SDGs | |
| GRI 3: Material Topics 2021 | 3-3 | Management of material topics |
At SAP, we are committed to our purpose of helping the world run better and improving people’s lives. To this end, we aim to create innovations that help accelerate economic prosperity, drive positive social impact, and safeguard the planet. Strategy and Business Model Performance Management System Note (A.4) Customer-Related Provisions |
SAP + external parties |
✔
✔ ✔ ✔ |
|
| GRI 416: Customer Health and Safety 2016 | 416-1 | Assessment of the health and safety impacts of product and service categories |
Human Rights As a software company without any physical products or production sites, customer health and safety is mainly related to the responsible usage of technology, especially artificial intelligence. Guiding Principles for Artificial Intelligence |
SAP + external parties |
✔ ✔ |
3 |
| GRI 3: Material Topics 2021 | Customer Loyalty |
Customers Performance Management System |
SAP |
✔ ✔ |
4, 5, 8, 10 | |
Audit Scope
The content of the GRI Content Index section was subject to an independent limited assurance engagement by our external auditor The content of the column UN SDGs as well as quantitative and qualitative information in relation to GRI 207 Tax were not subject to the independent limited assurance engagement of our external auditor.
|
SAP Integrated Report 2023 | |||||
| To
Our Stakeholders |
Combined
Management Report |
Consolidated
Financial Statements IFRS |
Further
Information about Sustainability |
Additional Information |
||
Stakeholder Capitalism Metrics
To support long-term value creation, SAP has committed to applying the World Economic Forum (WEF) Stakeholder Capitalism Metrics and encourages further global standardization and convergence in the ESG reporting landscape. We include the standards in our own reporting and also offer the framework in our core sustainability software solutions.
The following table provides information about the core metrics proposed by the WEF White Paper titled “Measuring Stakeholder Capitalism: Towards Common Metrics and Consistent Reporting of Sustainable Value Creation.”
The table refers to the sections of our Combined Management Report, Notes, Form 20-F, and other sources that contain the respective disclosures. Core metrics that have not been identified as material for SAP during our latest materiality analysis have been omitted.
Principles of Governance
| Theme | Core Metrics and Disclosures | Links | Comments |
| Governing Purpose | Setting purpose | Strategy | |
| Quality of Governing Body | Governance body composition |
Corporate Governance Statement Supervisory Board Form 20-F Item 6 Note (G.4) |
|
| Stakeholder Engagement | Material issues impacting stakeholders |
Materiality Stakeholder Engagement |
|
| Ethical Behavior | Anti-corruption |
Business Conduct Note (G.3) Other Litigation, Claims, and Legal Contingencies SAP Partner Code of Conduct |
Provisions for material corruption cases would be reported together with further details in Note (G.3). Partners are also requested to complete any compliance training available based on their partner type. For more information, see SAP’s Partner Code of Conduct. |
| Protected ethics advice and reporting mechanisms |
Business Conduct Speak Out at SAP |
||
| Risk and Opportunity Oversight | Integrating risk and opportunity into business process |
Risk Management and Risks Expected Developments and Opportunities |
|
SAP Integrated Report 2023 | |||||
| To
Our Stakeholders |
Combined
Management Report |
Consolidated
Financial Statements IFRS |
Further
Information about Sustainability |
Additional Information |
||
Planet
| Theme | Core Metrics and Disclosures | Links | Comments |
| Climate Change | Greenhouse gas (GHG) emissions |
Energy and Emissions Report Data Hub |
|
| TCFD implementation |
Task Force on Climate-Related Financial Disclosure Energy and Emissions |
People
| Theme | Core Metrics and Disclosures | Links | Comments |
| Dignity and Equality | Diversity and inclusion (%) |
Employees Report Data Hub |
No disclosure of other indicators of diversity due to legal requirements in Germany. |
| Pay equality (%) |
SAP Named Among Best Companies to Work For in 2022 SAP Among Forbes’ America’s Best Employers For Women 2022 |
Creating an inclusive workplace that benefits employees, customers, and partners is a strategic commitment for SAP. We have received numerous recognitions for our advances in creating an inclusive and more equal workplace, such as, best place to work as part of “Fortune 100 Best Companies to Work For 2022”, Forbes’ America’s Best Employers For Women ranking, and many others. | |
| Wage level (%) | Compensation Report | In our Compensation Report, we disclose the vertical pay ratio. This ratio compares the total compensation granted to the CEO with that of all employees who were employed at year end. | |
| Skills for the Future | Training provided (#, $) | Employees | Training hours split by gender and employee category are not a material issue for SAP, as we align our training activities according to the needs of each employee and do not tolerate discrimination. |
Prosperity
| Theme | Core Metrics and Disclosures | Links | Comments |
| Community and Social Vitality | Total tax paid | Analysis of Consolidated Statements of Cash Flow |
Audit Scope
The content of the Stakeholder Capitalism Metrics section was not subject to the independent limited assurance engagement of our external auditor.
|
SAP Integrated Report 2023 | |||||
| To
Our Stakeholders |
Combined
Management Report |
Consolidated
Financial Statements IFRS |
Further
Information about Sustainability |
Additional Information |
||
SASB Index
SAP maps existing sustainability disclosures to the standards of the Sustainability Accounting Standards Board (SASB). The table below presents a set of sustainable indicators based on the SASB standards for Software and IT Services (Version 2023-06).
| Topic | Code | Links | Comments |
| Environmental Footprint of Hardware Infrastructure | TC-SI-130a.1 | Energy and Emissions | |
| TC-SI-130a.2 | Waste and Water | ||
| TC-SI-130a.3 |
Energy and Emissions Waste and Water |
||
| Data Privacy & Freedom of Expression | TC-SI-220a.1 | Security, Data Protection, and Privacy | For more information about data protection and privacy, see the SAP Trust Center. |
| Data Security | TC-SI-230a.2 |
Security, Data Protection, and Privacy Risk Management and Risks |
|
| Recruiting & Managing a Global, Diverse and Skilled Workforce | TC-SI-330a.1 |
Employees Note (B.1) Employee Headcount |
SAP is a multinational company with locations all over the world. At each location, we hire people based on their qualifications and our business needs. For an overview of our headcount per geographical area, see Note (B.1). |
| TC-SI-330a.2 |
Report Data Hub Employees |
||
| TC-SI-330a.3 |
Report Data Hub Employees |
As a global organization with employees from over 163 nationalities, our aspiration is that SAP’s workforce mirrors the diversity in society that includes gender parity and demographics of all of the regions where we have employees. | |
| Managing Systemic Risks from Technology Disruptions | TC-SI-550a.2 | Risk Management and Risks |
Audit Scope
The content of the SASB Index section was not subject to the independent limited assurance engagement of our external auditor.
|
SAP Integrated Report 2023 | |||||
| To
Our Stakeholders |
Combined
Management Report |
Consolidated
Financial Statements IFRS |
Further
Information about Sustainability |
Additional Information |
||
Task Force on Climate-Related Financial Disclosure (TCFD)
The TCFD recommends companies to disclose their climate-related financial risks to investors, lenders, insurers, and other stakeholders. For more information, see the table below.
| Area | Content | Section |
| Governance | SAP’s governance of climate-related risks and opportunities. |
Energy and Emissions Sustainability Management |
| Strategy | Actual and potential impacts of climate-related risks and opportunities on SAP’s businesses, strategy, and financial planning where such information is material. |
Energy and Emissions Sustainability Management Risk Management and Risks Strategy |
| Risk Management | How does SAP identify, assess, and manage climate-related risks? | Energy and Emissions |
| Metrics and Targets | Metrics and targets that SAP uses to assess and manage relevant climate-related risks and opportunities where such information is material. |
Energy and Emissions Risk Management and Risks Non-Financial Notes: Environmental Performance Report Data Hub90 |
Audit Scope
The content of the Task Force on Climate-Related Financial Disclosure (TCFD) section was not subject to the independent limited assurance engagement of our external auditor.
90 Link leads to information that was neither part of the statutory audit nor the independent limited assurance engagement performed by our external auditor.
|
SAP Integrated Report 2023 | |||||
| To
Our Stakeholders |
Combined
Management Report |
Consolidated
Financial Statements IFRS |
Further
Information about Sustainability |
Additional Information |
||
Additional Information
| Five-Year Summary | 320 |
| Financial Calendar and Addresses | 324 |
| Financial and Sustainability Publications | 325 |
| Publication Details | 327 |
|
SAP Integrated Report 2023 | |||||
| To
Our Stakeholders |
Combined
Management Report |
Consolidated
Financial Statements IFRS |
Further
Information about Sustainability |
Additional Information |
||
Five-Year Summary1,2
| € millions, unless otherwise stated | 2023 | 2022 | 2021 | 2020 | 2019 |
| Revenues | |||||
| Cloud (IFRS) | 13,664 | 11,426 | 8,701 | 8,080 | 6,933 |
| Cloud (non-IFRS) | 13,664 | 11,426 | 8,701 | 8,085 | 7,013 |
| Software licenses (IFRS) | 1,764 | 2,056 | 3,248 | 3,642 | 4,533 |
| Software licenses (non-IFRS) | 1,764 | 2,056 | 3,248 | 3,642 | 4,533 |
| Software support (IFRS) | 11,496 | 11,909 | 11,412 | 11,506 | 11,547 |
| Software support (non-IFRS) | 11,496 | 11,909 | 11,412 | 11,506 | 11,548 |
| Cloud and software (IFRS) | 26,924 | 25,391 | 23,361 | 23,228 | 23,012 |
| Cloud and software (non-IFRS) | 26,924 | 25,391 | 23,361 | 23,233 | 23,093 |
| Services (IFRS = non-IFRS) | 4,283 | 4,128 | 3,592 | 4,110 | 4,541 |
| Total revenue (IFRS) | 31,207 | 29,520 | 26,953 | 27,338 | 27,553 |
| Total revenue (non-IFRS) | 31,207 | 29,520 | 26,953 | 27,343 | 27,634 |
| Share of more predictable revenue (IFRS, in %) | 81 | 79 | 75 | 72 | 67 |
| Share of more predictable revenue (non-IFRS, in %) | 81 | 79 | 75 | 72 | 67 |
| Operating Expenses | |||||
| Cost of cloud (IFRS) | –3,884 | –3,499 | –2,881 | –2,699 | –2,534 |
| Cost of cloud (non-IFRS) | –3,749 | –3,391 | –2,754 | –2,451 | –2,228 |
| Cost of software licenses and support (IFRS) | –1,383 | –1,384 | –1,598 | –2,008 | –2,159 |
| Cost of software licenses and support (non-IFRS) | –1,318 | –1,302 | –1,516 | –1,911 | –2,018 |
| Cost of cloud and software (IFRS) | –5,267 | –4,883 | –4,479 | –4,707 | –4,692 |
| Cost of cloud and software (non-IFRS) | –5,067 | –4,694 | –4,269 | –4,362 | –4,247 |
| Cost of services (IFRS) | –3,407 | –3,155 | –2,740 | –3,178 | –3,662 |
| Cost of services (non-IFRS) | –3,029 | –2,904 | –2,506 | –3,000 | –3,408 |
| Total cost of revenue (IFRS) | –8,674 | –8,038 | –7,219 | –7,886 | –8,355 |
| Total cost of revenue (non-IFRS) | –8,096 | –7,598 | –6,775 | –7,362 | –7,655 |
| Research and development3 (IFRS) | –6,324 | –6,080 | –5,270 | –4,454 | –4,292 |
| Research and development3 (in % of total revenue, IFRS) | 20.3 | 20.6 | 19.6 | 16.3 | 15.6 |
| Sales and marketing (IFRS) | –8,828 | –7,946 | –6,856 | –7,106 | –7,693 |
| General and administration (IFRS) | –1,364 | –1,289 | –1,187 | –1,356 | –1,629 |
| Depreciation and amortization (IFRS) | –1,373 | –1,569 | –1,537 | –1,831 | –1,872 |
| Profits and Margins | |||||
| Cloud gross margin (in %, IFRS) | 71.6 | 69.4 | 66.9 | 66.6 | 63.5 |
| Cloud gross margin (in %, non-IFRS) | 72.6 | 70.3 | 68.4 | 69.7 | 68.2 |
| Cloud and software gross margin (in %, IFRS) | 80.4 | 80.8 | 80.8 | 79.7 | 79.6 |
| Cloud and software gross margin (in %, non-IFRS) | 81.2 | 81.5 | 81.7 | 81.2 | 81.6 |
| Services gross margin (in %, IFRS) | 20.5 | 23.6 | 23.7 | 22.7 | 19.4 |
| Services gross margin (in %, non-IFRS) | 29.3 | 29.7 | 30.3 | 27.0 | 25.0 |
| Software and support gross margin (IFRS, in %) | 89.6 | 90.1 | 89.1 | 86.7 | 86.6 |
| Software and support gross margin (non-IFRS, in %) | 90.1 | 90.7 | 89.7 | 87.4 | 87.4 |
| Gross margin (in %, IFRS) | 72.2 | 72.8 | 73.2 | 71.2 | 69.7 |
| Gross margin (in %, non-IFRS) | 74.1 | 74.3 | 74.9 | 73.1 | 72.3 |
| Operating profit (IFRS) | 5,787 | 6,090 | 6,308 | 6,623 | 4,473 |
|
SAP Integrated Report 2023 | |||||
| To
Our Stakeholders |
Combined
Management Report |
Consolidated
Financial Statements IFRS |
Further
Information about Sustainability |
Additional Information |
||
| € millions, unless otherwise stated | 2023 | 2022 | 2021 | 2020 | 2019 |
| Operating profit (non-IFRS) | 8,722 | 7,989 | 8,204 | 8,287 | 8,208 |
| Operating margin (in % of total revenue, IFRS) | 18.5 | 20.6 | 23.4 | 24.2 | 16.2 |
| Operating margin (in % of total revenue, non-IFRS) | 28.0 | 27.1 | 30.4 | 30.3 | 29.7 |
| Financial income, net | –456 | –1,389 | 2,178 | 776 | 198 |
| Profit before tax (PBT) | 5,341 | 4,513 | 8,505 | 7,220 | 4,596 |
| PBT margin (in % of revenues) | 17.1 | 15.3 | 31.6 | 26.4 | 16.7 |
| Income tax expense | –1,741 | –1,446 | –1,682 | –1,938 | –1,226 |
| Profit after tax4 | 5,964 | 1,708 | 5,376 | 5,283 | 3,370 |
| Effective tax rate (IFRS, in %) | 32.6 | 32.0 | 19.8 | 26.8 | 26.7 |
| Effective tax rate (non-IFRS, in %) | 29.3 | 29.6 | 20.7 | 26.5 | 26.2 |
| Return on equity4 (profit after tax in percentage of average equity) | 14 | 4 | 15 | 17 | 11 |
| Current cloud backlog | |||||
| Current cloud backlog | 13,745 | 11,024 | 8,674 | 7,155 | 6,681 |
| Non-IFRS Adjustments | |||||
| Revenue adjustments | 0 | 0 | 0 | 5 | 81 |
| Adjustment for acquisition-related charges | 345 | 330 | 405 | 577 | 689 |
| Adjustment for share-based payment expenses | 2,220 | 1,431 | 1,334 | 1,084 | 1,835 |
| Adjustment for restructuring | 215 | 138 | 157 | –3 | 1,130 |
| Adjustment for regulatory compliance matters | 155 | 0 | 0 | 0 | 0 |
| Segment Results | |||||
| Applications, Technology & Support | |||||
| Segment revenue | 30,057 | 28,496 | 26,170 | 25,786 | 26,167 |
| Segment gross margin (in % of corresponding revenue) | 73.5 | 73.5 | 74.9 | 73.7 | 72.7 |
| Segment profit | 9,811 | 8,824 | 9,308 | 9,479 | 9,387 |
| Segment margin (Segment profit in % of Segment revenue) | 32.6 | 31.0 | 35.6 | 36.8 | 35.9 |
| Liquidity and Cash Flow | |||||
| Net cash flows from operating activities from continuing operations | 6,210 | 5,675 | 6,182 | 7,194 | 3,496 |
| Net cash flows from investing activities from continuing operations | –4,603 | 699 | –2,856 | –2,986 | –7,021 |
| Net cash flows from financing activities from continuing operations | –7,758 | –6,074 | –2,885 | –3,997 | 102 |
| Capital expenditure | –785 | –877 | –800 | –816 | –817 |
| Free cash flow | 5,093 | 4,388 | 5,049 | 6,000 | 2,276 |
| Free cash flow in % of total revenue | 16 | 15 | 19 | 22 | 8 |
| Cash conversion rate (net cash flows from operating activities in % of profit after tax) | 104 | 332 | 115 | 136 | 104 |
| Cash and cash equivalents | 8,124 | 9,008 | 8,898 | 5,311 | 5,314 |
| Short-term investments | 3,151 | 686 | 2,632 | 1,470 | 67 |
|
Group liquidity (cash and cash equivalents/short-term investments/restricted cash) |
11,275 | 9,694 | 11,530 | 6,781 | 5,382 |
| Financial debts | –7,755 | –11,764 | –13,094 | –13,283 | –13,668 |
| Net liquidity (net debt) | 3,521 | –2,070 | –1,563 | –6,503 | –8,286 |
| Assets, Equity and Liabilities | |||||
| Trade and other receivables | 6,322 | 6,236 | 6,371 | 6,730 | 8,037 |
| Total current assets | 20,571 | 18,522 | 20,044 | 15,069 | 15,213 |
| Goodwill | 29,088 | 33,077 | 31,089 | 27,538 | 29,159 |
| Total non-current assets | 47,764 | 53,638 | 51,130 | 43,395 | 44,999 |
| Total current liabilities (including contract liabilities/deferred income) | 14,642 | 17,453 | 16,136 | 12,842 | 14,462 |
| Total non-current liabilities (including contract liabilities/deferred income) | 10,287 | 11,858 | 13,515 | 15,696 | 14,929 |
| Total equity (including contract liabilities/deferred income) | 43,406 | 42,848 | 41,523 | 29,927 | 30,822 |
|
SAP Integrated Report 2023 | |||||
| To
Our Stakeholders |
Combined
Management Report |
Consolidated
Financial Statements IFRS |
Further
Information about Sustainability |
Additional Information |
||
| € millions, unless otherwise stated | 2023 | 2022 | 2021 | 2020 | 2019 |
| Total assets | 68,335 | 72,159 | 71,174 | 58,464 | 60,215 |
| Contract liabilities/Deferred income – current (IFRS) | 4,975 | 5,309 | 4,431 | 3,996 | 4,266 |
| Equity ratio (total equity in % of total assets) | 64 | 59 | 58 | 51 | 51 |
| Debt ratio (total liabilities in % of total assets) | 36 | 41 | 42 | 49 | 49 |
| Investments in goodwill, intangible assets, or property, plant, and equipment (including capitalizations due to acquisitions) | 2,245 | 2,226 | 3,522 | 1,780 | 8,090 |
| Key SAP Stock Facts | |||||
| Issued shares5 (in millions) | 1,229 | 1,229 | 1,229 | 1,229 | 1,229 |
| Earnings per share, basic (in €) | 3.11 | 2.80 | 5.45 | 4.35 | 2.78 |
| Earnings per share, basic (non-IFRS, in €) | 5.04 | 4.03 | 6.65 | 5.41 | 5.11 |
| Earnings per share, diluted (in €) | 3.08 | 2.79 | 5.45 | 4.35 | 2.78 |
| Earnings per share, basic (in €)4 | 5.26 | 1.95 | 4.46 | 4.35 | 2.78 |
| Earnings per share, basic (non-IFRS, in €)4 | 7.05 | 4.08 | 6.73 | 5.41 | 5.11 |
| Earnings per share, diluted (in €)4 | 5.20 | 1.94 | 4.46 | 4.35 | 2.78 |
| Dividend per share6 (in €) | 2.20 | 2.05 | 2.45 | 1.85 | 1.58 |
| Total dividend distributed6 | 2,568 | 2,395 | 2,865 | 2,182 | 1,864 |
| Total dividend distributed6 (in % of profit after tax) | 43 | 140 | 53 | 41 | 55 |
| SAP share price5 (in €) | 139.48 | 96.39 | 129.40 | 107.22 | 120.32 |
| SAP share price – peak (in €) | 148.18 | 124.82 | 128.98 | 142.26 | 124.72 |
| SAP share price – low (in €) | 97.42 | 81.06 | 101.78 | 87.63 | 84.31 |
| Market capitalization5 (in € billions) | 171.4 | 118.5 | 153.4 | 131.7 | 147.8 |
| Return on SAP shares7, 1-year investment period (in %) | 44.7 | –22.8 | 16.5 | –10.9 | 38.4 |
| Return on SAP shares7, 5-year investment period (in %) | 9.9 | 0.6 | 8.6 | 7.9 | 15.6 |
| Return on SAP shares7, 10-year investment period (in %) | 8.4 | 4.7 | 11.8 | 11.0 | 13.9 |
| Employees and Personnel Expenses | |||||
| Number of employees5,8 | 107,602 | 106,312 | 102,658 | 102,430 | 100,330 |
| Number of employees, annual average8 | 106,043 | 105,582 | 100,453 | 101,476 | 99,157 |
| Number of employees in research and development5,8 | 36,444 | 35,280 | 33,377 | 29,580 | 27,634 |
| Personnel expenses | 17,006 | 15,157 | 13,487 | 13,420 | 14,870 |
| Personnel expenses – excluding share-based payments | 14,786 | 13,726 | 12,152 | 12,336 | 13,035 |
| Personnel expenses per employee – excluding share-based payments (in € thousands) | 139 | 130 | 121 | 122 | 131 |
| Operating profit per employee (in € thousands) | 55 | 58 | 63 | 65 | 45 |
| Women working at SAP (in %) | 35.2 | 34.9 | 34.3 | 33.6 | 33.5 |
| Women in management5,9 (total, in % of total number of employees) | 29.7 | 29.3 | 28.3 | 27.5 | 26.4 |
| Women managing managers5,9 (in %) | 24.5 | 25.0 | 24.1 | 23.5 | 22.5 |
| Women managing teams5,9 (in %) | 31.5 | 30.9 | 29.9 | 29.0 | 27.8 |
| Employee Engagement Index (in %) | 80 | 80 | 83 | 86 | 83 |
| Business Health Culture Index (BHCI, in %) | 81 | 81 | 81 | 80 | 80 |
| Leadership Trust Index (LTI, as NPS) | 71 | 72 | 67 | 62 | 59 |
| Employee retention (in %) | 96.4 | 92.8 | 93.2 | 95.3 | 93.3 |
| Total turnover rate (in %) | 6.0 | 9.0 | 9.0 | 7.0 | 10.7 |
| Customer | |||||
| Customer Net Promoter Score10 | 9 | 7 | 10 | 4 | –6 |
| Environment | |||||
| Net carbon emissions11,12 (in kilotons) | 0 | 85 | 110 | 135 | 300 |
| Net carbon emissions11 per employee5 (in tons) | 0 | 0.8 | 1.0 | 1.3 | 3.0 |
| Net carbon emissions11 per € revenue (in grams) | 0 | 2.8 | 3.9 | 4.9 | 10.9 |
|
SAP Integrated Report 2023 | |||||
| To
Our Stakeholders |
Combined
Management Report |
Consolidated
Financial Statements IFRS |
Further
Information about Sustainability |
Additional Information |
||
| € millions, unless otherwise stated | 2023 | 2022 | 2021 | 2020 | 2019 |
| Total energy consumption (Scope 1 and Scope 2)13 (in GWh) | 805 | 906 | 845 | 871 | 1,110 |
| Energy consumed (Scope 1 and Scope 2)13 per employee14 (in kWh) | 7,390 | 8,140 | 8,050 | 8,570 | 11,180 |
| Total data center electricity consumption (Scope 2)13 (in GWh) | 213 | 306 | 332 | 353 | 333 |
| Data center electricity consumption (Scope 2)13 per € revenue8 (in Wh) | 7 | 10 | 12 | 13 | 12 |
| Renewable electricity sourced (Scope 2 and Scope 3) (in %) | 100 | 100 | 100 | 100 | 100 |
| 1 Based on SAP Group results, according to IFRS, unless otherwise stated. | |||||
| 2 Unless otherwise stated, 2023, 2022, and 2021 numbers reflect continuing operations as a result of the divestiture of Qualtrics. | |||||
| 3 In 2023, SAP updated its cost allocation policy. R&D numbers for 2020 and 2019 have not been retrospectively adjusted. For more information, see the Notes to the Consolidated Financial Statements, Note (IN.1). | |||||
| 4 From continuing and discontinued operations | |||||
| 5 Numbers at year end. | |||||
| 6 2023 numbers are based on the proposed dividend and on level of treasury stock at year end. | |||||
| 7 Average annual return. | |||||
| 8 Full-time equivalents | |||||
| 9 Relates to different levels of management position. | |||||
| 10 From 2022, we are using our updated methodology for calculating customer Net promoter score. Prior years have not been adjusted. Please see Performance Management Systems in the management report of this integrated report for further information.. | |||||
| 11 In CO2 equivalents | |||||
| 12 Rounded to 5 kilotons | |||||
| 13 In 2022, we changed the composition of included KPIs. We excluded electricity consumed by hyperscale services (inidrect energy of our value chain, Scope 3) due to the (still) very limited control over the energy / electricity procurement of our value chain partners. In addition, we moved electricity consumption of co-location data centers from Scope 3 to Scope 2 due to the underlying leasing model and SAP’s operational control over the IT infrastructure. | |||||
|
SAP Integrated Report 2023 | |||||
| To
Our Stakeholders |
Combined
Management Report |
Consolidated
Financial Statements IFRS |
Further
Information about Sustainability |
Additional Information |
||
Financial Calendar and Addresses
Financial Calendar
| 2024 | |
| April 22 | Results for the first quarter 2024 |
| May 15 | Annual General Meeting of Shareholders, Mannheim, Germany |
| May 21 | Dividend payment |
| July 22 | Results for the second quarter and half-year 2024 |
| October 21 | Results for the third quarter 2024 |
Addresses
Group Headquarters
SAP SE
Dietmar-Hopp-Allee 16
69190 Walldorf
Germany
Tel. +49 6227 74 74 74
Fax +49 6227 75 75 75
E-mail info@sap.com
Web site www.sap.com
The addresses of all our international subsidiaries and sales partners are available on our public Web site at www.sap.com/directory/main.html.
For more information about the matters discussed in the report, contact:
Investor Relations
Tel. +49 6227 76 73 36
Fax +49 6227 74 08 05
E-mail investor@sap.com
Web site www.sap.com/investor
Press
Tel. +49 6227 74 63 15
E-mail press@sap.com
Web site www.sap.com/press
|
SAP Integrated Report 2023 | |||||
| To
Our Stakeholders |
Combined
Management Report |
Consolidated
Financial Statements IFRS |
Further
Information about Sustainability |
Additional Information |
||
Financial and Sustainability Publications
We present our financial, social, and environmental performance in the SAP Integrated Report 2023, which is available at www.sapintegratedreport.com. This SAP Integrated Report 2023 comprises all of the information required by accounting and disclosure standards applicable to us.
The following publications are available in English at www.sap.com/investor, or in German at www.sap.de/investor:
| – | Annual Report on Form 20-F (IFRS, available in English only) |
| – | SAP Integrated Report (PDF) |
| – | SAP SE Statutory Financial Statements and Review of Operations (HGB, available in German only) |
| – | Half-Year Reports |
| – | SAP Compensation Report |
| – | SAP Quarterly Statements |
| – | SAP INVESTOR, SAP’s shareholder magazine |
Complete information on the governance of SAP SE is available at www.sap.com/corpgovernance. Materials include:
| – | Information about the management of SAP SE, including the current members of the Executive Board and the Supervisory Board, their CVs and memberships in boards of other companies |
| – | Information about the Supervisory Boards’ committees, including their tasks and current composition |
| – | Details of managers’ (the Executive and Supervisory Board members’) transactions in SAP securities |
| – | Documents relating to SAP SE’s Annual General Meetings of Shareholder, including voting results |
| – | SAP SE’s Articles of Incorporation |
| – | Agreement on the Involvement of Employees in SAP SE |
| – | German Code of Corporate Governance |
| – | Declaration of Implementation pursuant to the German Stock Corporation Act, Section 161 |
| – | Global Code of Ethics and Business Conduct for Employees |
| – | Corporate Governance Statement pursuant to the German Commercial Code, Sections 315d and 289f |
| – | Rules of Procedure for the SAP SE Supervisory Board |
| – | Rules of Procedure for the SAP SE Executive Board |
| – | Profile of Skills and Expertise for the SAP SE Supervisory Board |
| – | Overview of the participation of Supervisory Board members in meetings of the Supervisory Board and its committees |
|
SAP Integrated Report 2023 | |||||
| To
Our Stakeholders |
Combined
Management Report |
Consolidated
Financial Statements IFRS |
Further
Information about Sustainability |
Additional Information |
||
Additional SAP policies are made public at http://www.sap.com/sustainability:
| – | SAP Human Rights Commitment Statement |
| – | SAP Global Health and Safety Management Policy |
| – | SAP Environmental Policy |
| – | SAP Global Anti-Discrimination Statement |
| – | SAP ‘s Guiding Principles for Artificial Intelligence and SAP Global Artificial Intelligence Ethics Policy |
| – | SAP Supplier Code of Conduct |
| – | SAP Partner Code of Conduct |
| – | SAP’s Global Tax Principles |
Further, the SAP Glossary is available at www.sap.com/glossary SAP Integrated Report project team with the support of SAP solutions
|
SAP Integrated Report 2023 | |||||
| To
Our Stakeholders |
Combined
Management Report |
Consolidated
Financial Statements IFRS |
Further
Information about Sustainability |
Additional Information |
||
Publication Details
Publisher
SAP
SE
Investor Relations
Concept and Realization
Printing
SAP has decided to publish the SAP Integrated Report solely as an electronic document. A hard copy of the audited consolidated financial statements can also be requested free of charge by sending an email to investor@sap.com or via phone +49 6227 7-67336.
Copyright
SAP
SE
Dietmar-Hopp-Allee 16
69190 Walldorf
Germany
© 2024 SAP SE or an SAP affiliate company. All rights reserved. No part of this publication may be reproduced or transmitted in any form or for any purpose without the express permission of SAP SE or an SAP affiliate company.
SAP and other SAP products and services mentioned herein as well as their respective logos are trademarks or registered trademarks of SAP SE (or an SAP affiliate company) in Germany and other countries. All other product and service names mentioned are the trademarks of their respective companies. Please see www.sap.com/about/legal/copyright.html for additional trademark information and notices.
Group Headquarters
SAP SE
Dietmar-Hopp-Allee 16
69190 Walldorf
Germany
www.sap.com
www.sap.com/investor