UNITED STATES
SECURITIES AND EXCHANGE COMMISSION
Washington, D.C. 20549
FORM 6-K
REPORT OF FOREIGN PRIVATE ISSUER PURSUANT TO RULE 13a-16 OR 15d-16
UNDER THE SECURITIES EXCHANGE ACT OF 1934
Date: March 1, 2024
Commission File Number: 001-33414
Denison Mines Corp.
(Name of registrant)
1100-40 University Avenue
Toronto ON
M5J 1T1 Canada
(Address of principal executive offices)
Indicate by check mark whether the registrant files or will file annual reports under cover Form 20-F or Form 40-F.
Form 20-F ☐ Form 40-F ☒
Indicate by check mark if the registrant is submitting the Form 6-K in paper as permitted by Regulation S-T Rule 101(b)(1): ☐
Indicate by check mark if the registrant is submitting the Form 6-K in paper as permitted by Regulation S-T Rule 101(b)(7): ☐
SIGNATURES
Pursuant to the requirements of the Securities Exchange Act of 1934, the registrant has duly caused this report to be signed on its behalf by the undersigned, thereunto duly authorized.
|
DENISON MINES CORP. |
|
|
|
/s/ Amanda Willett |
Date: March 1, 2024 |
Amanda Willett |
|
Vice President Legal and Corporate Secretary |
FORM 6-K EXHIBIT INDEX
Exhibit Number |
|
Description |
|
|
|
99.1 |
|
Consolidation Financial Statements for the year ended December 31, 2023 |
99.2 |
|
Management's Discussion and Analysis for the financial year ended December 31, 2023 |
99.3 |
|
|
99.4 |
|
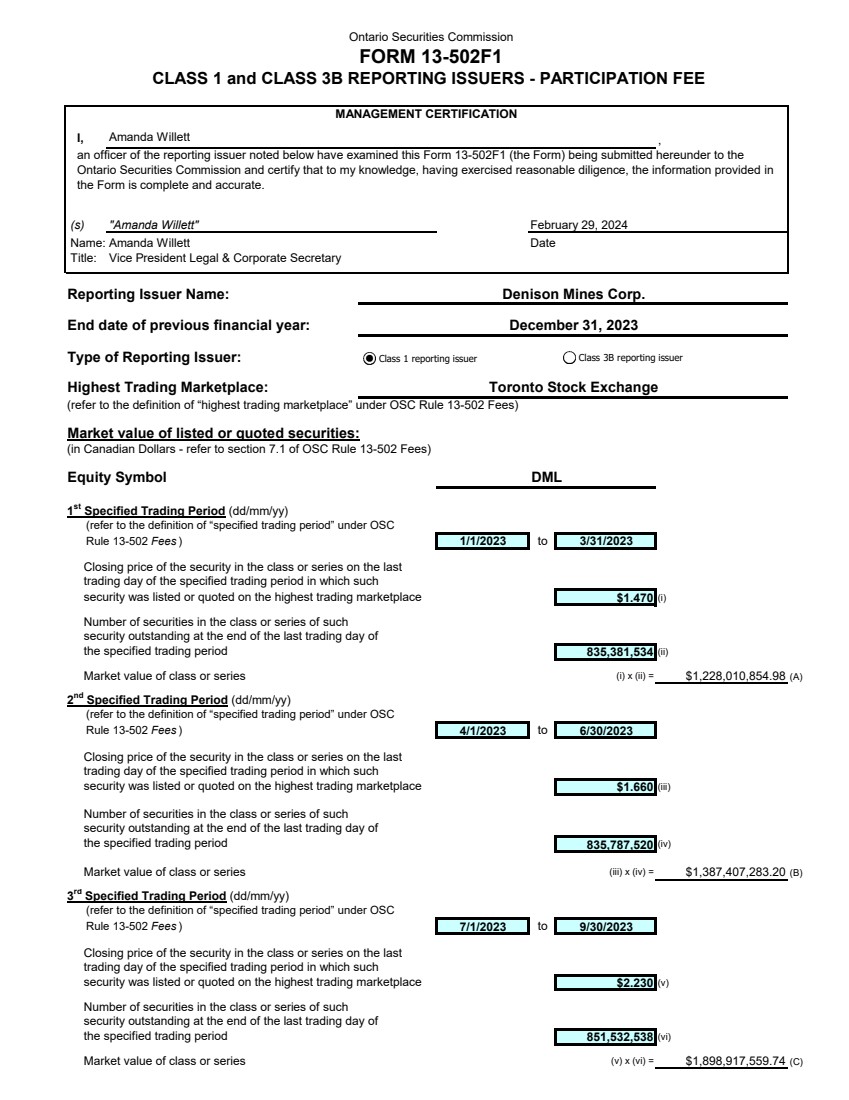
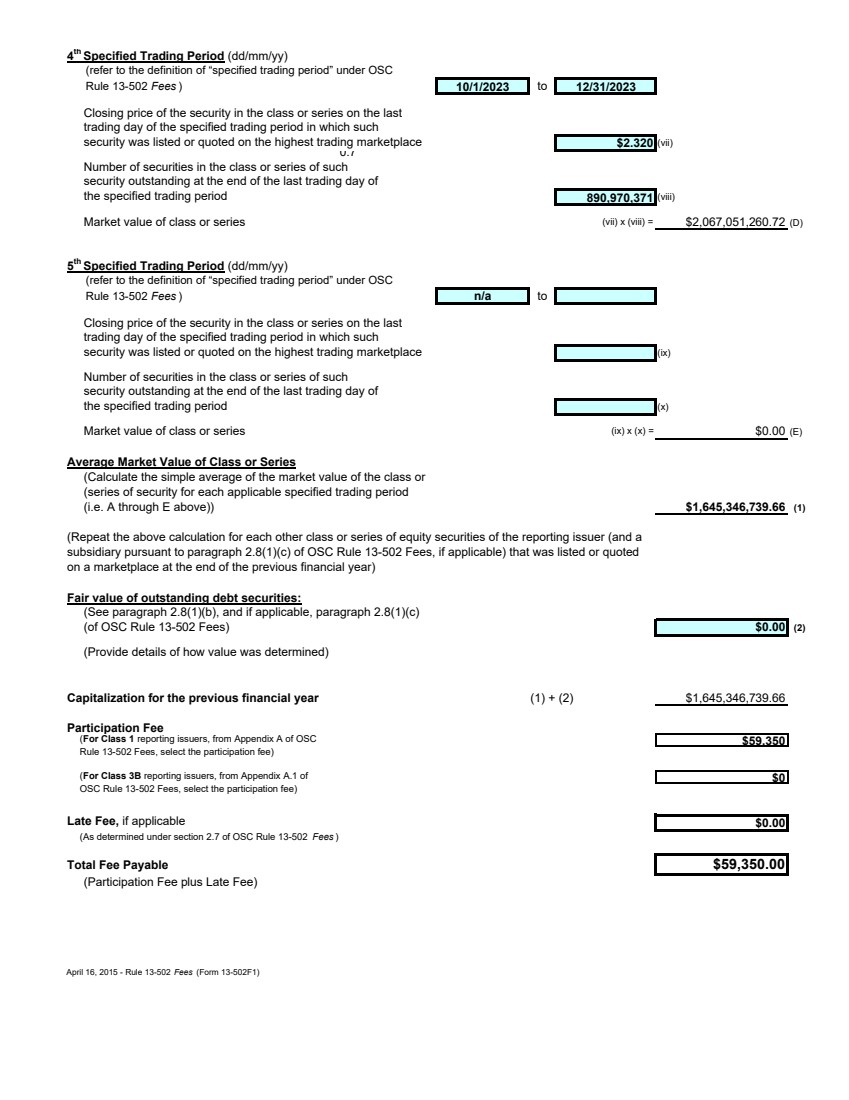
Ontario Form 13-502F1 - Reporting Issuer Participation Fee Form |
99.5 |
|
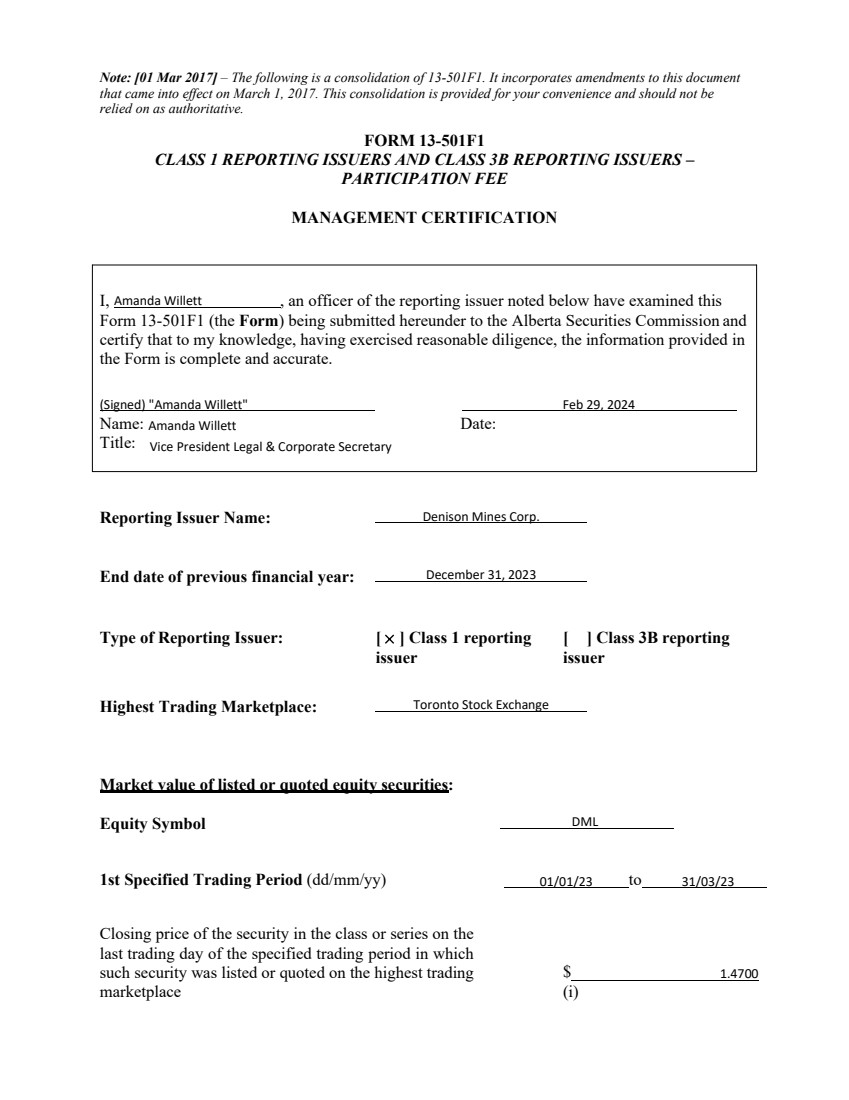
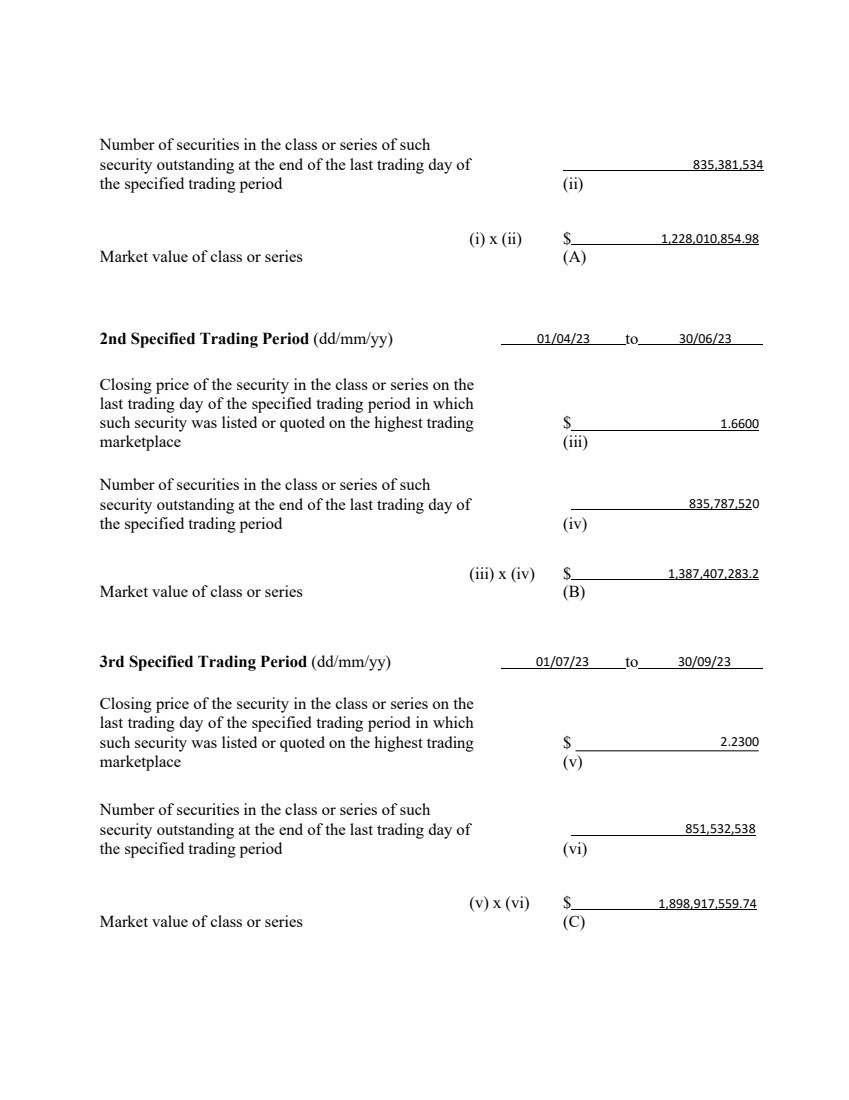
Alberta Form 13-501F1 - Reporting Issuer Participation Fee Form |
101.INS |
|
XBRL Instance Document |
101.SCH |
|
XBRL Taxonomy Extension Schema |
101.LAB |
|
XBRL Taxonomy Extension Label Linkbase |
101.CAL |
|
XBRL Taxonomy Extension Calculation Linkbase |
101.PRE |
|
XBRL Taxonomy Extension Presentation Linkbase |
101.DEF |
|
XBRL Taxonomy Extension Definition Linkbase |
Exhibit 99.1

ANNUAL CONSOLIDATED FINANCIAL STATEMENTS
FOR THE YEAR ENDED DECEMBER 31, 2023
|
ANNUAL CONSOLIDATED FINANCIAL STATEMENTS |
Responsibility for Financial Statements
The Company’s management is responsible for the integrity and fairness of presentation of these consolidated financial statements. The consolidated financial statements have been prepared by management, in accordance with International Financial Reporting Standards as issued by the International Accounting Standards Board, for review by the Audit Committee and approval by the Board of Directors.
The preparation of financial statements requires the selection of appropriate accounting policies in accordance with International Financial Reporting Standards and the use of estimates and judgements by management to present fairly and consistently the consolidated financial position of the Company. Estimates are necessary when transactions affecting the current period cannot be finalized with certainty until future information becomes available. In making certain material estimates, the Company’s management has relied on the judgement of independent specialists.
The Company’s management has developed and maintains a system of internal accounting controls to ensure, on a reasonable and cost-effective basis, that the financial information is timely reported and is accurate and reliable in all material respects and that the Company’s assets are appropriately accounted for and adequately safeguarded.
The consolidated financial statements have been audited by KPMG LLP, our independent auditor. Its report outlines the scope of its examination and expresses its opinions on the consolidated financial statements and internal control over financial reporting.
/s/ “David D. Cates” |
|
/s/ “Elizabeth Sidle” |
|
|
|
David D. Cates |
|
Elizabeth Sidle |
President and Chief Executive Officer |
|
Vice President Finance and Chief Financial Officer |
|
|
|
February 29, 2024 |
|
|
|
|
|
Management’s Report on Internal Control over Financial Reporting
The Company’s management is responsible for establishing and maintaining an adequate system of internal control over financial reporting. Management conducted an evaluation of the effectiveness of internal control over financial reporting based on the Internal Control – Integrated Framework, 2013 issued by the Committee of Sponsoring Organizations of the Treadway Commission. Based on this evaluation, management concluded that the Company’s internal control over financial reporting was effective as of December 31, 2023.
The effectiveness of the Company’s internal control over financial reporting as at December 31, 2023 has been audited by KPMG LLP, our independent auditor, as stated in its report which appears herein.
Changes to Internal Control over Financial Reporting
There has not been any change in the Company’s internal control over financial reporting during the twelve months ended December 31, 2023 that have materially affected, or are reasonably likely to materially affect, the Company’s internal control over financial reporting.
2

KPMG LLP
Bay Adelaide Centre
333 Bay Street, Suite 4600
Toronto, ON M5H 2S5
Canada
Tel 416-777-8500
Fax 416-777-8818
Report of Independent Registered Public Accounting Firm
To the Shareholders and Board of Directors of Denison Mines Corp.
Opinion on the Consolidated Financial Statements
We have audited the accompanying consolidated statements of financial position of Denison Mines Corp. (the Company), as of December 31, 2023 and 2022, the related consolidated statements of income and comprehensive income, changes in equity and cash flow for each of the years then ended, and the related notes (collectively, the consolidated financial statements). In our opinion, the consolidated financial statements present fairly, in all material respects, the financial position of the Company as of December 31, 2023 and 2022, and the financial performance and its cash flows for each of the years then ended, in conformity with International Financial Reporting Standards as issued by the International Accounting Standards Board.
We also have audited, in accordance with the standards of the Public Company Accounting Oversight Board (United States) (PCAOB), the Company’s internal control over financial reporting as of December 31, 2023, based on criteria established in Internal Control – Integrated Framework (2013) issued by the Committee of Sponsoring Organizations of the Treadway Commission, and our report dated February 29, 2024 expressed an unqualified opinion on the effectiveness of the Company’s internal control over financial reporting.
Basis for Opinion
These consolidated financial statements are the responsibility of the Company’s management. Our responsibility is to express an opinion on these consolidated financial statements based on our audits. We are a public accounting firm registered with the PCAOB and are required to be independent with respect to the Company in accordance with the U.S. federal securities laws and the applicable rules and regulations of the Securities and Exchange Commission and the PCAOB.
We conducted our audits in accordance with the standards of the PCAOB. Those standards require that we plan and perform the audit to obtain reasonable assurance about whether the consolidated financial statements are free of material misstatement, whether due to error or fraud. Our audits included performing procedures to assess the risks of material misstatement of the consolidated financial statements, whether due to error or fraud, and performing procedures that respond to those risks. Such procedures included examining, on a test basis, evidence regarding the amounts and disclosures in the consolidated financial statements. Our audits also included evaluating the accounting principles used and significant estimates made by management, as well as evaluating the overall presentation of the consolidated financial statements. We believe that our audits provide a reasonable basis for our opinion.
© 2024 KPMG LLP, an Ontario limited liability partnership and a member firm of the KPMG global organization of independent member firms affiliated with KPMG International Limited, a private English company limited by guarantee. All rights reserved.
3
|
Denison Mines Corp. February 29, 2024 |
Critical Audit Matter
The critical audit matter communicated below is a matter arising from the current period audit of the consolidated financial statements that was communicated or required to be communicated to the audit committee and that: (1) relates to accounts or disclosures that are material to the consolidated financial statements and (2) involved our especially challenging, subjective, or complex judgments. The communication of a critical audit matter does not alter in any way our opinion on the consolidated financial statements, taken as a whole, and we are not, by communicating the critical audit matter below, providing a separate opinion on the critical audit matter or on the accounts or disclosures to which it relates.
Indicators of impairment for mineral properties
As discussed in Note 10 to the consolidated financial statements, the Company’s mineral properties balance as of December 31, 2023 was $180,813 thousand. As discussed in note 2G. and 3A. to the consolidated financial statements, property, plant and equipment assets are assessed at the end of each reporting period to determine if there is any indication that the asset may be impaired. Mineral property assets are assessed for impairment using the impairment indicators under IFRS 6 - Exploration for and evaluation of mineral resources up until the commercial viability and technical feasibility for the property is established. Judgment is applied in identifying whether or not an indicator exists. Both internal and external sources of information are considered when determining the presence of an impairment indicator. Judgment is required when identifying indicators of impairment which include results from exploration programs during the reporting period, a decline in the reserves and resources by property, and events or changes to the operations.
We identified the evaluation of indicators of impairment for mineral properties as a critical audit matter. Assessing the Company’s evaluation of indicators of impairment involved the application of a higher degree of auditor judgment. Specifically, judgment was required to evaluate the facts and circumstances related to the Company’s mineral properties, including assessing the Company’s changes to the operations and results from exploration programs.
The following are the primary procedures we performed to address this critical audit matter. We evaluated the design and tested the operating effectiveness of certain internal controls related to the Company’s impairment indicator assessment process, including controls related to the Company’s impairment indicator review for mineral properties. We considered changes to the operations by assessing the Company’s future plans by comparing them to the budget approved by the Board of Directors and evaluating the time period remaining for the Company’s right to explore them by inspecting governmental filings. We evaluated the results from exploration programs by comparing them to recent exploration results.
/s/ KPMG LLP
Chartered Professional Accountants, Licensed Public Accountants
We have served as the Company’s auditor since 2020.
Toronto, Canada
February 29, 2024
4

KPMG LLP
Bay Adelaide Centre
333 Bay Street, Suite 4600
Toronto, ON M5H 2S5
Canada
Tel 416-777-8500
Fax 416-777-8818
Report of Independent Registered Public Accounting Firm
To the Shareholders and Board of Directors of Denison Mines Corp.
Opinion on Internal Control Over Financial Reporting
We have audited Denison Mines Corp.’s (the Company) internal control over financial reporting as of December 31, 2023, based on criteria established in Internal Control – Integrated Framework (2013) issued by the Committee of Sponsoring Organizations of the Treadway Commission. In our opinion, the Company maintained, in all material respects, effective internal control over financial reporting as of December 31, 2023, based on criteria established in Internal Control – Integrated Framework (2013) issued by the Committee of Sponsoring Organizations of the Treadway Commission.
We also have audited, in accordance with the standards of the Public Company Accounting Oversight Board (United States) (PCAOB), the consolidated statements of financial position of the Company as of December 31, 2023 and 2022, the related consolidated statements of income and comprehensive income, changes in equity, and cash flow for each of the years then ended, and the related notes (collectively, the consolidated financial statements), and our report dated February 29, 2024 expressed an unqualified opinion on those consolidated financial statements.
Basis for Opinion
The Company’s management is responsible for maintaining effective internal control over financial reporting and for its assessment of the effectiveness of internal control over financial reporting, included in the accompanying Management’s Report on Internal Control over Financial Reporting. Our responsibility is to express an opinion on the Company’s internal control over financial reporting based on our audit. We are a public accounting firm registered with the PCAOB and are required to be independent with respect to the Company in accordance with the U.S. federal securities laws and the applicable rules and regulations of the Securities and Exchange Commission and the PCAOB.
We conducted our audit in accordance with the standards of the PCAOB. Those standards require that we plan and perform the audit to obtain reasonable assurance about whether effective internal control over financial reporting was maintained in all material respects. Our audit of internal control over financial reporting included obtaining an understanding of internal control over financial reporting, assessing the risk that a material weakness exists, and testing and evaluating the design and operating effectiveness of internal control based on the assessed risk. Our audit also included performing such other procedures as we considered necessary in the circumstances. We believe that our audit provides a reasonable basis for our opinion.
© 2024 KPMG LLP, an Ontario limited liability partnership and a member firm of the KPMG global organization of independent member firms affiliated with KPMG International Limited, a private English company limited by guarantee. All rights reserved.
5
|
Denison Mines Corp. February 29, 2024 |
Definition and Limitations of Internal Control Over Financial Reporting
A company’s internal control over financial reporting is a process designed to provide reasonable assurance regarding the reliability of financial reporting and the preparation of financial statements for external purposes in accordance with generally accepted accounting principles. A company’s internal control over financial reporting includes those policies and procedures that (1) pertain to the maintenance of records that, in reasonable detail, accurately and fairly reflect the transactions and dispositions of the assets of the company; (2) provide reasonable assurance that transactions are recorded as necessary to permit preparation of financial statements in accordance with generally accepted accounting principles, and that receipts and expenditures of the company are being made only in accordance with authorizations of management and directors of the company; and (3) provide reasonable assurance regarding prevention or timely detection of unauthorized acquisition, use, or disposition of the company’s assets that could have a material effect on the financial statements.
Because of its inherent limitations, internal control over financial reporting may not prevent or detect misstatements. Also, projections of any evaluation of effectiveness to future periods are subject to the risk that controls may become inadequate because of changes in conditions, or that the degree of compliance with the policies or procedures may deteriorate.
/s/ KPMG LLP
Chartered Professional Accountants, Licensed Public Accountants
Toronto,Canada
February 29, 2024
6
|
ANNUAL CONSOLIDATED FINANCIAL STATEMENTS |
CONSOLIDATED STATEMENTS OF FINANCIAL POSITION
(Expressed in thousands of Canadian dollars (“CAD”) except for share amounts) |
|
|
|
|
|
|
|
|
At December 31 |
|
At December 31 |
||
|
|
2023 |
|
2022 |
||
ASSETS |
|
|
|
|
|
|
Current |
|
|
|
|
|
|
Cash and cash equivalents (note 4) |
|
$ |
131,054 |
|
$ |
50,915 |
Trade and other receivables (note 5) |
|
|
1,913 |
|
|
4,143 |
Inventories (note 6) |
|
|
3,580 |
|
|
2,713 |
Investments-equity instruments (note 7) |
|
|
10,400 |
|
|
8,022 |
Prepaid expenses and other |
|
|
1,594 |
|
|
1,367 |
|
|
|
148,541 |
|
|
67,160 |
Non-Current |
|
|
|
|
|
|
Inventories-ore in stockpiles (note 6) |
|
|
2,098 |
|
|
2,098 |
Investments-equity instruments (note 7) |
|
|
117 |
|
|
87 |
Investments-uranium (note 7) |
|
|
276,815 |
|
|
162,536 |
Investments-convertible debentures (note 7) |
|
|
15,565 |
|
|
- |
Investments-joint venture (note 8) |
|
|
17,290 |
|
|
19,305 |
Restricted cash and investments (note 9) |
|
|
11,231 |
|
|
11,105 |
Property, plant and equipment (note 10) |
|
|
254,946 |
|
|
253,505 |
Total assets |
|
$ |
726,603 |
|
$ |
515,796 |
|
|
|
|
|
|
|
LIABILITIES |
|
|
|
|
|
|
Current |
|
|
|
|
|
|
Accounts payable and accrued liabilities (note 11) |
|
$ |
10,822 |
|
$ |
10,299 |
Current portion of long-term liabilities: |
|
|
|
|
|
|
Deferred revenue (note 12) |
|
|
4,535 |
|
|
4,915 |
Reclamation obligations (note 13) |
|
|
2,256 |
|
|
2,865 |
Other liabilities (note 15) |
|
|
333 |
|
|
336 |
|
|
|
17,946 |
|
|
18,415 |
Non-Current |
|
|
|
|
|
|
Deferred revenue (note 12) |
|
|
30,423 |
|
|
28,380 |
Reclamation obligations (note 13) |
|
|
32,642 |
|
|
26,594 |
Other liabilities (note 15) |
|
|
1,201 |
|
|
1,441 |
Deferred income tax liability (note 16) |
|
|
2,607 |
|
|
4,950 |
Total liabilities |
|
|
84,819 |
|
|
79,780 |
|
|
|
|
|
|
|
EQUITY |
|
|
|
|
|
|
Share capital (note 17) |
|
|
1,655,024 |
|
|
1,539,209 |
Contributed surplus (note 18) |
|
|
69,823 |
|
|
70,281 |
Deficit |
|
|
(1,084,881) |
|
|
(1,175,256) |
Accumulated other comprehensive income (note 19) |
|
|
1,818 |
|
|
1,782 |
Total equity |
|
|
641,784 |
|
|
436,016 |
Total liabilities and equity |
|
$ |
726,603 |
|
$ |
515,796 |
Issued and outstanding common shares (note 17) |
|
|
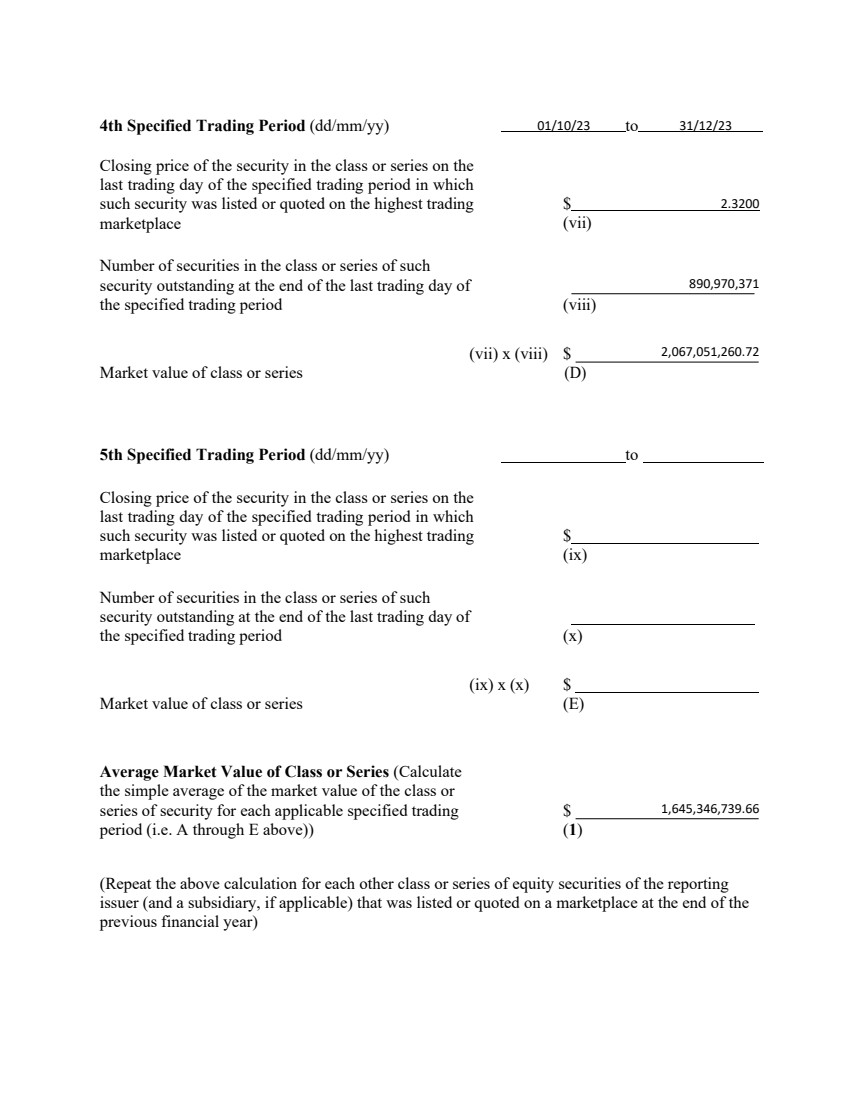
890,970,371 |
|
|
826,325,592 |
Commitments and contingencies (note 24)
Subsequent events (note 26)
The accompanying notes are an integral part of the consolidated financial statements
On behalf of the Board of Directors |
|
|
|
|
|
|
|
|
/s/ ‘Ron F. Hochstein’ |
|
/s/ ‘Patricia M. Volker’ |
|
|
|
Ron F. Hochstein |
|
Patricia M. Volker |
Chair of the Board |
|
Director |
7
|
ANNUAL CONSOLIDATED FINANCIAL STATEMENTS |
CONSOLIDATED STATEMENTS OF INCOME AND COMPREHENSIVE INCOME
(Expressed in thousands of CAD dollars except for share and per share amounts) |
|
|
|
|
|
|
|
|
Year Ended December 31 |
||||
|
|
2023 |
|
2022 |
||
|
|
|
|
|
|
|
REVENUES (note 21) |
|
$ |
1,855 |
|
$ |
8,973 |
|
|
|
|
|
|
|
EXPENSES |
|
|
|
|
|
|
Operating expenses (note 20 and 21) |
|
|
(3,898) |
|
|
(5,352) |
Exploration (note 21) |
|
|
(9,564) |
|
|
(8,097) |
Evaluation (note 21) |
|
|
(18,622) |
|
|
(22,181) |
General and administrative (note 21) |
|
|
(13,760) |
|
|
(12,538) |
Other income (note 20) |
|
|
136,472 |
|
|
55,244 |
|
|
|
90,628 |
|
|
7,076 |
Income before net finance expense, equity accounting |
|
|
92,483 |
|
|
16,049 |
|
|
|
|
|
|
|
Finance expense, net (note 20) |
|
|
(1,062) |
|
|
(2,859) |
Equity share of loss of joint venture (note 8) |
|
|
(4,400) |
|
|
(2,887) |
Income before taxes |
|
|
87,021 |
|
|
10,303 |
Income tax recovery (note 16): |
|
|
|
|
|
|
Deferred |
|
|
2,343 |
|
|
2,269 |
Net income from continuing operations |
|
|
89,364 |
|
|
12,572 |
Net income from discontinued operations , net of income taxes (note 21) |
|
|
1,011 |
|
|
1,782 |
Net income for the period |
|
$ |
90,375 |
|
$ |
14,354 |
|
|
|
|
|
|
|
Other comprehensive income (note 19): |
|
|
|
|
|
|
Items that are or may be subsequently reclassified to income : |
|
|
|
|
|
|
Foreign currency translation change |
|
|
36 |
|
|
6 |
Comprehensive income for the period |
|
$ |
90,411 |
|
$ |
14,360 |
|
|
|
|
|
|
|
|
|
|
|
|
|
|
Basic net income per share: |
|
|
|
|
|
|
Continuing operations |
|
$ |
0.11 |
|
$ |
0.02 |
Discontinued operations |
|
$ |
0.00 |
|
$ |
0.00 |
|
|
|
|
|
|
|
Diluted net income per share: |
|
|
|
|
|
|
Continuing operations |
|
$ |
0.10 |
|
$ |
0.02 |
Discontinued operations |
|
$ |
0.00 |
|
$ |
0.00 |
|
|
|
|
|
|
|
|
|
|
|
|
|
|
Weighted-average number of shares outstanding (in thousands): |
|
|
|
|
|
|
Basic |
|
|
848,023 |
|
|
818,891 |
Diluted |
|
|
853,969 |
|
|
828,735 |
The accompanying notes are an integral part of the consolidated financial statements
8
|
ANNUAL CONSOLIDATED FINANCIAL STATEMENTS |
CONSOLIDATED STATEMENTS OF CHANGES IN EQUITY
(Expressed in thousands of CAD dollars) |
|
|
|
|
|
|
|
|
Year Ended December 31 |
||||
|
|
2023 |
|
2022 |
||
Share capital (note 17) |
|
|
|
|
|
|
Balance-beginning of period |
|
$ |
1,539,209 |
|
$ |
1,517,029 |
Shares issued for cash, net of issue costs |
|
|
107,884 |
|
|
19,601 |
Other shares issued, net of issue costs |
|
|
193 |
|
|
169 |
Share options exercised-cash |
|
|
3,534 |
|
|
1,459 |
Share options exercised-transfer from contributed surplus |
|
|
1,474 |
|
|
550 |
Share units exercised-transfer from contributed surplus |
|
|
2,730 |
|
|
401 |
Balance-end of period |
|
|
1,655,024 |
|
|
1,539,209 |
|
|
|
|
|
|
|
Contributed surplus |
|
|
|
|
|
|
Balance-beginning of period |
|
|
70,281 |
|
|
67,496 |
Share-based compensation expense (note 18) |
|
|
3,746 |
|
|
3,736 |
Share options exercised-transfer to share capital |
|
|
(1,474) |
|
|
(550) |
Share units exercised-transfer to share capital |
|
|
(2,730) |
|
|
(401) |
Balance-end of period |
|
|
69,823 |
|
|
70,281 |
|
|
|
|
|
|
|
Deficit |
|
|
|
|
|
|
Balance-beginning of period |
|
|
(1,175,256) |
|
|
(1,189,610) |
Net income |
|
|
90,375 |
|
|
14,354 |
Balance-end of period |
|
|
(1,084,881) |
|
|
(1,175,256) |
|
|
|
|
|
|
|
Accumulated other comprehensive income (note 19) |
|
|
|
|
|
|
Balance-beginning of period |
|
|
1,782 |
|
|
1,776 |
Foreign currency translation |
|
|
36 |
|
|
6 |
Balance-end of period |
|
|
1,818 |
|
|
1,782 |
|
|
|
|
|
|
|
Total Equity |
|
|
|
|
|
|
Balance-beginning of period |
|
$ |
436,016 |
|
$ |
396,691 |
Balance-end of period |
|
$ |
641,784 |
|
$ |
436,016 |
The accompanying notes are an integral part of the consolidated financial statements
9
|
ANNUAL CONSOLIDATED FINANCIAL STATEMENTS |
CONSOLIDATED STATEMENTS OF CASH FLOW
(Expressed in thousands of CAD dollars) |
|
|
|
|
|
|
|
|
Year Ended December 31 |
||||
|
|
2023 |
|
2022 |
||
CASH PROVIDED BY (USED IN): |
|
|
|
|
|
|
OPERATING ACTIVITIES |
|
|
|
|
|
|
Net income for the period |
|
$ |
90,375 |
|
$ |
14,354 |
Adjustments and items not affecting cash and cash equivalents: |
|
|
|
|
|
|
Depletion, depreciation, amortization and accretion |
|
|
9,391 |
|
|
8,667 |
Fair value change losses (gains): |
|
|
|
|
|
|
Investments-equity instruments (notes 7 and 20) |
|
|
9 |
|
|
6,469 |
Investments-uranium (notes 7 and 20) |
|
|
(134,180) |
|
|
(29,422) |
Investments-convertible debentures (notes 7 and 20) |
|
|
(565) |
|
|
— |
Warrants on investment (notes 7 and 20) |
|
|
— |
|
|
(1,625) |
Share purchase warrants liabilities ( note 20) |
|
|
— |
|
|
(20,337) |
Joint venture-equity share of loss (note 8) |
|
|
4,400 |
|
|
2,887 |
Recognition of deferred revenue (note 12) |
|
|
(1,855) |
|
|
(5,987) |
Loss (gain) on property, plant and equipment disposals |
|
|
(1,299) |
|
|
25 |
Post-employment benefit payments (note 16) |
|
|
(105) |
|
|
(95) |
Reclamation obligation income statement adjustment (note 13) |
|
|
3,229 |
|
|
(4,126) |
Reclamation obligation expenditures (note 13) |
|
|
(3,118) |
|
|
(1,348) |
Reclamation liability deposit from joint venture partner (note 13) |
|
|
99 |
|
|
- |
Share-based compensation (note 18) |
|
|
3,746 |
|
|
3,736 |
Foreign exchange gain (note 20) |
|
|
(321) |
|
|
(816) |
Deferred income tax recovery (note 16) |
|
|
(2,343) |
|
|
(2,269) |
Change in non-cash operating working capital items (note 20) |
|
|
1,870 |
|
|
1,743 |
Net cash used in operating activities |
|
|
(30,667) |
|
|
(28,144) |
|
|
|
|
|
|
|
INVESTING ACTIVITIES |
|
|
|
|
|
|
(Decrease)/Increase in restricted cash and investments (note 9) |
|
|
(126) |
|
|
896 |
Purchase of investment in joint venture (note 8) |
|
|
(2,385) |
|
|
(800) |
Purchase of investment-convertible debentures (note 7) |
|
|
(15,000) |
|
|
— |
Additions of property, plant and equipment (note 10) |
|
|
(3,234) |
|
|
(6,869) |
Proceeds on disposal of investment – uranium (note 7) |
|
|
19,901 |
|
|
— |
Proceeds on disposal of property, plant and equipment |
|
|
125 |
|
|
12 |
Net cash used in investing activities |
|
|
(719) |
|
|
(6,761) |
|
|
|
|
|
|
|
FINANCING ACTIVITIES |
|
|
|
|
|
|
Issuance of debt obligations (note 15) |
|
|
— |
|
|
158 |
Repayment of debt obligations (note 15) |
|
|
(218) |
|
|
(209) |
Proceeds from share issues, net of issue costs (note 17) |
|
|
107,863 |
|
|
19,551 |
Proceeds from share options exercised (note 17) |
|
|
3,534 |
|
|
1,459 |
Net cash provided by financing activities |
|
|
111,179 |
|
|
20,959 |
|
|
|
|
|
|
|
Increase/(Decrease) in cash and cash equivalents |
|
|
79,793 |
|
|
(13,946) |
Foreign exchange effect on cash and cash equivalents |
|
|
346 |
|
|
863 |
Cash and cash equivalents, beginning of period |
|
|
50,915 |
|
|
63,998 |
Cash and cash equivalents, end of period |
|
$ |
131,054 |
|
$ |
50,915 |
Supplemental cash flow disclosure (note 20)
The accompanying notes are an integral part of the consolidated financial statements
10
|
ANNUAL CONSOLIDATED FINANCIAL STATEMENTS |
NOTES TO THE CONSOLIDATED FINANCIAL STATEMENTS FOR THE YEARS ENDED DECEMBER 31, 2023 and 2022
(Expressed in CAD dollars except for shares and per share amounts)
1.NATURE OF OPERATIONS
Denison Mines Corp. (“DMC”) and its subsidiary companies and joint arrangements (collectively, “Denison” or the “Company”) are engaged in uranium mining related activities, which can include acquisition, exploration, and development of uranium bearing properties, extraction, processing and selling of, and investing in uranium.
The Company has an effective 95.0% interest in the Wheeler River Joint Venture (“WRJV”), a 69.35% interest in the Waterbury Lake Uranium Limited Partnership (“WLULP”), a 22.5% interest in the McClean Lake Joint Venture (“MLJV”) (which includes the McClean Lake mill) and a 25.17% interest in the Midwest Joint Venture (“MWJV”), each of which are located in the eastern portion of the Athabasca Basin region in northern Saskatchewan, Canada. The McClean Lake mill is contracted to provide toll milling services to the Cigar Lake Joint Venture (“CLJV”) under the terms of a toll milling agreement between the parties (see note 12).
Through its 50% ownership of JCU (Canada) Exploration Company, Limited (“JCU”), Denison holds further indirect interests in various uranium project joint ventures in Canada, including the Millennium project (JCU 30.099%), the Kiggavik project (JCU 33.8118%) and the Christie Lake project (JCU 34.4508%). See note 8 for details.
In addition, Denison’s exploration portfolio includes further interests in properties in the Athabasca Basin region.
DMC is incorporated under the Business Corporations Act (Ontario) and domiciled in Canada. The address of its registered head office is 40 University Avenue, Suite 1100, Toronto, Ontario, Canada, M5J 1T1.
References to “2023” and “2022” refer to the year ended December 31, 2023, and the year ended December 31, 2022 respectively.
2.STATEMENT OF COMPLIANCE, ACCOUNTING POLICIES AND COMPARATIVE NUMBERS
Statement of Compliance
These consolidated financial statements have been prepared in accordance with International Financial Reporting Standard (“IFRS”) as issued by the International Accounting Standards Board (“IASB”).
These financial statements were approved by the board of directors for issue on February 29, 2024.
Material accounting policies
These consolidated financial statements are presented in Canadian dollars (“CAD”) and all financial information is presented in CAD, unless otherwise noted.
The preparation of the consolidated financial statements in conformity with IFRS requires management to make judgements, estimates and assumptions that affect the application of accounting policies and the reported amount of assets, liabilities, revenues and expenses. Actual results may vary from these estimates.
Estimates and underlying assumptions are reviewed on an ongoing basis. Revisions to accounting estimates are recognized in the period in which the estimates are revised and in any future periods affected. The areas involving a higher degree of judgement or complexity, or areas where assumptions and estimates are significant to the consolidated financial statements are disclosed in note 3.
11
|
ANNUAL CONSOLIDATED FINANCIAL STATEMENTS |
The Company has considered the amendments to IAS 1: Presentation of Financial Statements, IAS 8: Accounting Policies, Changes in Account Estimates and Errors, IAS 12: Income Taxes and IFRS 17: Reporting Standard for Insurance Contracts, which are effective for annual periods beginning on or after January 1, 2023 and has concluded that these amendments have no impact on the Company’s consolidated financial statements. The material accounting policies used in the preparation of these consolidated financial statements are described below:
A.Consolidation principles
The financial statements of the Company include the accounts of DMC, its subsidiaries and its joint arrangements (see note 25).
Subsidiaries
Subsidiaries are all entities over which the DMC group of entities has control. The group controls an entity where the group is exposed to, or has rights to, variable returns from its involvement with the entity and has the ability to affect those returns through its power to direct the activities of the entity. Subsidiaries are fully consolidated from the date on which control is transferred to the group and are deconsolidated from the date that control ceases. Intercompany transactions, balances and unrealized gains and losses from intercompany transactions are eliminated.
Joint arrangements
A joint arrangement is a contractual arrangement of which the DMC group of entities and another independent party have joint control. Joint arrangements are either joint operations or joint ventures. The classification of a joint arrangement as a joint operation or a joint venture depends upon the rights and obligations of the parties to the arrangement. The Company determines the type of joint arrangement in which it is involved by considering the structure and form of the arrangement, the terms agreed by the parties in the contractual arrangement and other facts and circumstances such as the parties’ rights and obligations arising from the arrangement.
Joint operations are contractual arrangements which involve joint control between the parties which have rights to the assets, and obligations for the liabilities, relating to the joint arrangement. The consolidated financial statements of the Company include its share of the assets in such joint operations, together with its share of the liabilities and the revenues and expenses arising jointly or otherwise from those operations. All such amounts are measured in accordance with the terms of each arrangement.
A joint venture is a joint arrangement over which the Company shares joint control and which provides the Company with the rights to the net assets of the joint arrangement. Joint ventures are accounted for using the equity method. Under the equity method, investments in joint ventures are initially recorded at cost and adjusted thereafter to record the Company’s share of post-acquisition earnings or loss of the joint venture as if the joint venture had been consolidated. The carrying value of investments in joint ventures is also increased or decreased to reflect the Company’s share of capital transactions, including amounts recognized in “Other comprehensive income or loss”, and for accounting changes that relate to periods subsequent to the date of acquisition.
B.Foreign currency translation
Functional and presentation currency
Items included in the financial statements of each entity in the DMC group are measured using the currency of the primary economic environment in which the entity operates (“the functional currency”). Primary and secondary indicators are used to determine the functional currency. Primary indicators include the currency that mainly influences sales prices, labour, material and other costs. Secondary indicators include the currency in which funds from financing activities are generated and in which receipts from operating activities are usually retained. Typically, the local currency has been determined to be the functional currency of Denison’s entities.
12
|
ANNUAL CONSOLIDATED FINANCIAL STATEMENTS |
The financial statements of entities that have a functional currency different from the presentation currency of DMC (“foreign operations”) are translated into Canadian dollars as follows: assets and liabilities at the closing rate at the date of the statement of financial position, and income and expenses at the average rate of the period (as this is considered a reasonable approximation to actual rates). All resulting changes are recognized in “Other comprehensive income or loss” as cumulative foreign currency translation adjustments.
When the Company disposes of its entire interest in a foreign operation, or loses control, joint control, or significant influence over a foreign operation, the foreign currency gains or losses accumulated in “Other comprehensive income or loss” related to the foreign operation are recognized in the statement of income or loss as translational foreign exchange gains or losses.
Transactions and balances
Foreign currency transactions are translated into an entity’s functional currency using the exchange rates prevailing at the dates of the transactions. Foreign exchange gains and losses resulting from the settlement of foreign currency transactions and from the translation at year-end exchange rates of monetary assets and liabilities denominated in currencies other than an operation’s functional currency are recognized in the statement of income or loss as transactional foreign exchange gains or losses.
C.Financial instruments
Financial assets and financial liabilities are recognized when the Company becomes a party to the contractual provisions of a financial instrument. Financial assets are derecognized when the rights to receive cash flows from the assets have expired or have been transferred and the Company has transferred substantially all risks and rewards of ownership. Financial liabilities are derecognized when the obligations specified in the contract are discharged, cancelled or expire.
At initial recognition, the Company classifies its financial instruments in the following categories:
Financial assets and liabilities at fair value through profit or loss (“FVTPL”)
A financial asset is classified in this category if it is a derivative instrument, an equity instrument for which the Company has not made the irrevocable election to classify as fair value through Other comprehensive income (“FVTOCI”), or a debt instrument that is not held within a business model whose objective includes holding the financial assets in order to collect contractual cash flows that are solely payments of principal and interest. Derivative financial liabilities and contingent consideration liabilities related to business combinations are also classified in this category. Financial instruments in this category are recognized initially and subsequently at fair value. Transaction costs are expensed in the statement of income or loss. Gains and losses arising from changes in fair value are presented in the statement of income or loss – within “Other income (expense)” in the period in which they arise.
Equity investments in shares and warrants, uranium investments, and convertible debentures are classified as financial assets at FVTPL.
Financial assets at amortized cost
A financial asset is classified in this category if it is a debt instrument and / or other similar asset that is held within a business model whose objective is to hold the asset in order to collect the contractual cash flows (i.e. principal and interest). Financial assets in this category are initially recognized at fair value plus transaction costs and subsequently measured at amortized cost using the effective interest method less a provision for impairment. Interest income is recorded in the statement of income or loss through “Finance income”.
Cash and cash equivalents, restricted cash, and trade and other receivables are classified as financial assets at amortized cost.
13
|
ANNUAL CONSOLIDATED FINANCIAL STATEMENTS |
Financial liabilities at amortized cost
All financial liabilities that are not recorded as FVTPL are classified in this category and are initially recognized less a discount (when material) to reduce the financial liabilities to fair value and less any directly attributable transaction costs. Subsequently, financial liabilities are measured at amortized cost using the effective interest method. Interest expense is recorded in the statement of income or loss through “Finance expense”.
Accounts payable and accrued liabilities, and debt obligations are classified as financial liabilities at amortized cost.
Refer to the “Fair Value of Financial Instruments” section of note 23 for the Company’s classification of its financial assets and liabilities within the fair value hierarchy.
D.Impairment of financial assets
At each reporting date, the Company assesses the expected credit losses ("ECLS") associated with its financial assets that are not carried at FVTPL. ECLS are calculated based on the difference between the contractual cash flows and the cash flows that the Company expects to receive, discounted, where applicable, based on the asset’s original effective interest rate.
For “Trade receivables”, the Company calculates ECLS based on historical credit loss experience, adjusted for forward-looking factors specific to debtors and the economic environment. In recording an impairment loss, the carrying amount of the asset is reduced by this expected credit loss (“ECL”) either directly or indirectly through the use of an allowance account.
E.Inventories
Expenditures, including depreciation, depletion and amortization of production assets, incurred in the mining and processing activities that will result in future uranium concentrate production, are deferred and accumulated as ore in stockpiles, in-process inventories and concentrate inventories. These amounts are carried at the lower of weighted average cost or net realizable value (“NRV”). NRV is calculated as the estimated future uranium concentrate selling price in the ordinary course of business (net of selling costs) less the estimated costs to complete production of the inventory into a saleable form.
Stockpiles are comprised of coarse ore that has been extracted from the mine and is available for further processing. Mining production costs are added to the stockpile as incurred and removed from the stockpile based upon the weighted average cost per ton of ore produced from mines considered to be in commercial production. The current portion of ore in stockpiles represents the amount expected to be processed in the next twelve months.
In-process and concentrate inventories include the cost of the ore removed from the stockpile, a pro-rata share of the amortization of the associated mineral property, as well as production costs incurred to process the ore into a saleable product. Processing costs typically include labor, chemical reagents and directly attributable mill overhead expenditures. Items are valued at weighted average cost.
Materials and other supplies held for use in the production of inventories are carried at weighted average cost and are not written down below that cost if the finished products in which they will be incorporated are expected to be sold at or above cost. However, when a decline in the price of concentrates indicates that the cost of the finished products exceeds NRV, the materials are written down to NRV. In such circumstances, the replacement cost of the materials may be the best available measure of their NRV.
F.Investments-uranium
The Company’s uranium investments are held for long-term capital appreciation. Investments in uranium are initially recorded at cost, on the date that control of the uranium passes to the Company.
14
|
ANNUAL CONSOLIDATED FINANCIAL STATEMENTS |
Cost includes the purchase price and any directly attributable transaction costs. Subsequent to initial recognition, investments in uranium are measured at fair value at each reporting period end. Fair value is determined based on the most recent month-end spot price for uranium published by UxC LLC (“UxC”) and converted to Canadian dollars using the foreign exchange rate at the date of the consolidated statement of financial position. Related fair value gains and losses recognized subsequent to initial recognition are recorded in the consolidated statement of income (loss) as a component of “Other income (expense)” in the period in which they arise.
G.Property, plant and equipment
Plant and equipment
Plant and equipment are recorded at acquisition or production cost and carried net of depreciation and impairments. Cost includes expenditures incurred by the Company that are directly attributable to the acquisition of the asset. Subsequent costs are included in the asset’s carrying amount or recognized as a separate asset, as appropriate, only when it is probable that future economic benefits associated with the item will flow to the Company and the cost can be measured reliably. The carrying amount of a replaced asset is derecognized when replaced. Repairs and maintenance costs are charged to the statement of income and loss during the period in which they are incurred.
Depreciation is calculated on a straight line or unit of production basis as appropriate. Where a straight-line methodology is used, the assets are depreciated to their estimated residual value over an estimated useful life which ranges from three to twenty years depending upon the asset type. Where a unit of production methodology is used, the assets are depreciated to their estimated residual value over the useful life defined by management’s best estimate of recoverable reserves and resources in the current estimated mine plan. When assets are retired or sold, the resulting gains or losses are reflected in the statement of income or loss as a component of “Other income (expense)”. The Company allocates the amount initially recognized in respect of an item of plant and equipment to its significant parts and depreciates separately each such part over its useful life. Residual values, methods of depreciation and useful lives of the assets are reviewed at least annually and adjusted if appropriate.
Where straight-line depreciation is utilized, the range of useful lives for various asset classes is generally as follows:
Buildings |
|
15 - 20 years; |
Production machinery and equipment |
|
5 - 7 years; |
Other assets |
|
3 - 5 years. |
Mineral property acquisition, exploration, evaluation and development costs
Costs relating to mineral and / or exploration rights acquired through a business combination or asset acquisition are capitalized and reported as part of “Property, plant and equipment”.
Exploration and Evaluation expenditures are expensed as incurred.
Once commercial viability and technical feasibility for a project has been established, the project is classified as a “Development Stage” mineral property, an impairment test is performed on the transition, and all further development costs are capitalized to the asset.
Once a development stage mineral property goes into commercial production, the project is classified as “Producing” and the accumulated costs are amortized over the estimated recoverable reserves and resources in the current mine plan using a unit of production basis.
Proceeds received from the sale of an interest in a property are credited against the carrying value of the property, with any difference recorded in the statement of income or loss as a gain or loss on sale within “Other income (expense)”.
15
|
ANNUAL CONSOLIDATED FINANCIAL STATEMENTS |
Lease assets (and lease obligations)
At the inception of a contract, the Company assesses whether a contract is, or contains, a lease. A contract is, or contains, a lease, if the contract conveys the right to control the use of an identified asset for a period of time in exchange for consideration. To assess whether a contract conveys the right to control the use of an identified asset, the Company assesses whether:
| ● | the contract involves the use of an identified asset – this may be specified explicitly or implicitly and should be physically distinct or represent substantially all of the capacity of a physically distinct asset. If the supplier has a substantive substitution right, then the asset is not identified; |
| ● | the Company has the right to obtain substantially all of the economic benefits from the use of the asset throughout the period of use; and |
| ● | the Company has the right to direct the use of the asset. The Company has this right when it has the decision-making rights that are most relevant to changing how and for what purpose the asset is used. In rare cases where the decision about how and for what purpose the asset is used is predetermined, the Company has the right to direct the use of the asset if either (a) the Company has the right to operate the asset; or (b) the Company designed the asset in a way that predetermines how and for what purpose it will be used. |
If the contract contains a lease, the Company accounts for the lease and non-lease components separately. For the lease component, a right-of-use asset and a corresponding lease liability are set-up at the date at which the leased asset is available for use by the Company. The right-of-use asset is depreciated over the shorter of the asset’s useful life and the lease term on a straight-line basis.
The lease payments associated with the lease liability are discounted using either the interest rate implicit in the lease, if available, or the Company’s incremental borrowing rate. Each lease payment is allocated between the liability and the finance cost (i.e. accretion) so as to produce a constant rate of interest on the remaining lease liability balance.
H.Impairment of non-financial assets
After application of the equity method to joint ventures, at each reporting date the Company determines whether there is objective evidence that the investment in the joint venture is impaired. If there is such evidence, the Company calculates the amount of impairment as the difference between the recoverable amount of the associate or joint venture and it’s carrying value, and then recognizes the loss within “Equity share of loss” in the statement of income or loss.
Property, plant and equipment assets are assessed at the end of each reporting period to determine if there is any indication that the asset may be impaired. If any such indication exists, an estimate of the recoverable amount of the asset is made. For the purpose of measuring recoverable amounts, assets are grouped at the lowest level, or cash generating unit (“CGU”), for which there are separately identifiable cash inflows. The recoverable amount is the higher of an asset’s fair value less costs of disposal and value in use (being the present value of the expected future cash flows of the relevant asset or CGU, as determined by management). An impairment loss is recognized for the amount by which the CGU’s carrying amount exceeds its recoverable amount.
Mineral property assets are assessed for impairment using the impairment indicators under IFRS 6 “Exploration for and Evaluation of Mineral Resources” up until the commercial viability and technical feasibility for the property is established. From that point onwards, mineral property assets are tested for impairment using the impairment indicators of IAS 36 “Impairment of Assets”.
16
|
ANNUAL CONSOLIDATED FINANCIAL STATEMENTS |
I.Employee benefits
Share-based compensation
The Company uses a fair value-based method of accounting for share options to employees and to non-employees. The fair value is determined using the Black-Scholes option pricing model on the date of the grant. The cost is recognized on a graded method basis, adjusted for expected forfeitures, over the applicable vesting period as an increase in share-based compensation expense and the contributed surplus account. When such share options are exercised, the proceeds received by the Company, together with the respective amount from contributed surplus, are credited to share capital.
The Company also has a share unit plan pursuant to which it may grant share units to employees – the share units are equity-settled awards. The Company determines the fair value of the awards on the date of grant. The cost is recognized on a graded method basis, adjusted for expected forfeitures, over the applicable vesting period, as an increase in share-based compensation expense and the contributed surplus account. When such share units are settled for common shares, the applicable amounts of contributed surplus are credited to share capital.
J.Reclamation provisions
Reclamation provisions, which are legal and constructive obligations related to the retirement of tangible long-lived assets, are recognized when such obligations are incurred, and a reasonable estimate of the value can be determined. These obligations are measured initially at the present value of expected cash flows using a pre-tax discount rate reflecting risks specific to the liability and the resulting costs are capitalized and added to the carrying value of the related assets. In subsequent periods, the liability is adjusted for the accretion of the discount and the expense is recorded in the statement of income or loss. Changes in the amount or timing of the underlying future cash flows or changes in the discount rate are immediately recognized as an increase or decrease in the carrying amounts of the related asset, if one exists, and liability. These costs are amortized to the results of operations over the life of the asset. Reductions in the amount of the liability are first applied against the amount of the net reclamation asset with any excess value being recorded in the statement of income or loss.
The Company’s activities are subject to numerous governmental laws and regulations. Estimates of future reclamation liabilities for asset decommissioning and site restoration are recognized in the period when such liabilities are incurred. These estimates are updated on a periodic basis and are subject to changing laws, regulatory requirements, changing technology and other factors which will be recognized when appropriate. Liabilities related to site restoration include long-term treatment and monitoring costs and incorporate total expected costs net of recoveries. Expenditures incurred to dismantle facilities, restore, and monitor closed resource properties are charged against the related reclamation liability.
K.Current and deferred income tax
Current income tax payable is based on taxable income for the period. Taxable income differs from income as reported in the statement of income or loss because it excludes items of income or expense that are taxable or deductible in other periods and it further excludes items that are never taxable or deductible. The Company’s liability for current tax is calculated using tax rates that have been enacted or substantively enacted by the balance sheet date.
17
|
ANNUAL CONSOLIDATED FINANCIAL STATEMENTS |
Deferred income taxes are accounted for using the balance sheet liability method. Deferred income tax assets and liabilities are computed based on temporary differences between the financial statement carrying values of the existing assets and liabilities and their respective income tax bases used in the computation of taxable income. Computed deferred tax liabilities are generally recognized for all taxable temporary differences and deferred tax assets are recognized to the extent that it is probable that taxable income will be available against which deductible temporary differences can be utilized. Such assets and liabilities are not recognized if the temporary difference arises from goodwill or from the initial recognition (other than in a business combination) of other assets and liabilities in a transaction that affects neither the taxable income nor the accounting income. Deferred tax liabilities are recognized for taxable temporary differences arising on investments in subsidiaries and investments, and interests in joint ventures, except where the Company is able to control the reversal of the temporary differences and it is probable that the temporary differences will not reverse in the foreseeable future. The carrying amount of deferred tax assets is reviewed at each balance sheet date and reduced to the extent that it is no longer probable that sufficient taxable earnings will be available to allow all or part of the asset to be recovered.
Deferred tax is calculated at the tax rates that are expected to apply in the period when the liability is settled or the asset realized, based on tax rates and tax laws that have been enacted or substantively enacted by the balance sheet date. Deferred tax is charged or credited to the statement of income or loss (or comprehensive income or loss in some specific cases), except when it relates to items charged or credited directly to equity, in which case the deferred tax is also recorded within equity.
Income tax assets and liabilities are offset when there is a legally enforceable right to offset the assets and liabilities and when they relate to income taxes levied by the same tax authority on either the same taxable entity or different taxable entities where there is an intention to settle the balance on a net basis.
L.Flow-through common shares
The Company’s Canadian exploration activities have been financed in part through the issuance of flow-through common shares, whereby the Canadian income tax deductions relating to these expenditures are claimable by the subscribers and not by the Company. The proceeds from issuing flow-through shares are allocated between the offering of shares and the sale of tax benefits. The allocation is based on the difference (“premium”) between the quoted price of the Company’s existing shares and the amount the investor pays for the actual flow-through shares. A liability is recognized for the premium when the shares are issued and is extinguished when the tax effect of the temporary differences, resulting from the renunciation of the tax deduction to the flow-through shareholders, is recorded - with the difference between the liability and the value of the tax assets renounced being recorded as a deferred tax expense. The tax effect of the renunciation is recorded at the time the Company makes the renunciation to its subscribers – which may differ from the effective date of renunciation. If the flow-through shares are not issued at a premium, a liability is not established, and on renunciation the full value of the tax assets renounced is recorded as a deferred tax expense.
18
|
ANNUAL CONSOLIDATED FINANCIAL STATEMENTS |
M.Revenue recognition
Revenue from pre-sold toll milling services
Revenue from the pre-sale of toll milling arrangement cash flows is recognized as the toll milling services are provided. At contract inception, the Company estimates the expected transaction price of the toll milling services being sold based on available information and calculates an average per unit transaction price that applies over the life of the contract. This unit price is used to draw-down the deferred revenue balance as the toll milling services occur. When changes occur to the expected timing, or volume of toll milling services, the per unit transaction price is adjusted to reflect the change (such review to be done annually, at a minimum), and a cumulative catch-up adjustment is made to reflect the updated rate. The amount of the upfront payment received from the toll milling pre-sale arrangements includes a significant financing component due to the longer-term nature of such agreements. As such, the Company also recognizes accretion expense on the deferred revenue balance which is recorded in the statement of income or loss through “Finance expense, net”.
Revenue from environmental services (i.e. Closed Mines group)
Environmental service contracts represent a series of distinct performance obligations that are substantially the same and have the same pattern of transfer of control to the customer. The transaction price is estimated at contract inception and is recognized over the life of the contract as control is transferred to the customer. Variable consideration, where applicable, is estimated at contract inception using either the expected value method or the most likely amount method. If it is highly probable that a subsequent reversal of revenue will not occur when the uncertainty has been resolved, the Company will recognize as revenue the estimated transaction price, including the estimate of the variable portion, upon transfer of control to the customer, otherwise the variable portion of the transaction price will be constrained, and will not be recognized as revenue until the uncertainty has been resolved.
N.Earnings (loss) per share
Basic earnings (loss) per share (“EPS”) is calculated by dividing the net income or loss for the period attributable to equity owners of DMC by the weighted average number of common shares outstanding during the period.
Diluted EPS is calculated by adjusting the weighted average number of common shares outstanding for dilutive instruments. The number of shares included with respect to options, warrants and similar instruments is computed using the treasury stock method.
O.Discontinued operations
A discontinued operation is a component of the Company that has either been disposed of, abandoned, or that is classified as held for sale and: (i) represents a separate major line of business or geographical area of operations; (ii) is part of a single coordinated plan to dispose of a separate major line of business or geographical area of operations; or (iii) is a subsidiary acquired exclusively with a view to resale. A component of the Company is comprised of operations and cash flows that can be clearly distinguished, operationally and for financial reporting purposes, from the rest of the Company. Further, a discontinued operation must be a component of the Company that was a cash generating unit ("CGU") while being held for use. Disposal groups to be abandoned include those that are to be used to the end of their economic life and those that are to be closed rather than sold.
Net income or loss of a discontinued operation and any gain or loss on disposal are combined and presented as net income or loss from discontinued operations, net of tax, in the statement of income or loss.
At the end of August, 2023, the Company’s long-term third party Closed Mine services contract came to an end and the Company ceased providing such third party care and maintenance services (see note 21). The Company is treating the Closed Mines segment as a discontinued operation as a result of the termination of this contract and the subsequent decision to no longer provide such services.
19
|
ANNUAL CONSOLIDATED FINANCIAL STATEMENTS |
3.CRITICAL ACCOUNTING ESTIMATES AND JUDGEMENTS
The preparation of consolidated financial statements in accordance with IFRS requires the use of certain critical accounting estimates and judgements that affect the amounts reported. It also requires management to exercise judgement in applying the Company’s accounting policies. These judgements and estimates are based on management’s best knowledge of the relevant facts and circumstances taking into account previous experience. Although the Company regularly reviews the estimates and judgements made that affect these financial statements, actual results may be materially different.
Significant estimates and judgements made by management relate to:
A.Mineral property impairment reviews and impairment adjustments
At each reporting date, the Company assesses whether there is an indicator that its mineral properties may be impaired. Judgement is applied in identifying whether or not an indicator exists. Impairment indicators exist when facts and circumstances suggest that the carrying amount of a mineral property may exceed its recoverable amount. Both internal and external sources of information are considered when determining the presence of an impairment indicator or an indicator of reversal of a previous impairment. Judgment is required when identifying indicators of impairment which include results from exploration programs during the reporting period, a decline in the reserves and resources by property, and events or changes to the operations such as: a) unfavourable changes in the property or project economics; b) environmental restrictions on development; c) the period for which the Company has the right to explore in the specific area has expired or will expire in the next 12 months and is not expected to be renewed; and d) substantive expenditure on further exploration for and evaluation of mineral resources in the specific area is neither budgeted nor planned. Judgment is also required when considering whether significant positive changes in any of these items indicate a previous impairment may have reversed.
When an indicator is identified, the Company determines the recoverable amount of the property, which is the higher of an asset’s fair value less costs of disposal or value in use. An impairment loss is recognized if the carrying value exceeds the recoverable amount. The recoverable amount of a mineral property may be determined by reference to estimated future operating results and discounted net cash flows, current market valuations of similar properties or a combination of the above. In undertaking this review, management of the Company is required to make significant estimates of, amongst other things: reserve and resource amounts, future production and sale volumes, forecast commodity prices, future operating, capital and reclamation costs to the end of the mine’s life and current market valuations from observable market data which may not be directly comparable. These estimates are subject to various risks and uncertainties, which may ultimately have an effect on the expected recoverable amount of a specific mineral property asset. Changes in these estimates could have a material impact on the carrying value of the mineral property amounts and the impairment losses recognized.
B.Reclamation obligations
Asset retirement obligations are recorded as a liability when the asset is initially constructed, or a constructive or legal obligation exists. The valuation of the liability typically involves identifying costs to be incurred in the future and discounting them to the present using an appropriate discount rate for the liability. The determination of future costs involves a number of estimates relating to timing, type of costs, mine closure plans, and review of potential methods and technical advancements. Furthermore, due to uncertainties concerning environmental remediation, the ultimate cost of the Company’s decommissioning liability could differ materially from amounts provided. The estimate of the Company’s obligation is subject to change due to amendments to applicable laws and regulations and as new information concerning the Company’s operations becomes available. The Company is not able to determine the impact on its financial position, if any, of environmental laws and regulations that may be enacted in the future.
20
|
ANNUAL CONSOLIDATED FINANCIAL STATEMENTS |
4.CASH AND CASH EQUIVALENTS
The cash and cash equivalent balance consists of:
|
|
|
|
|
|
|
|
|
At December 31 |
|
At December 31 |
||
(in thousands) |
|
2023 |
|
2022 |
||
|
|
|
|
|
|
|
Cash |
|
$ |
2,650 |
|
$ |
1,801 |
Cash in MLJV and MWJV |
|
|
1,036 |
|
|
1,263 |
Cash equivalents |
|
|
127,368 |
|
|
47,851 |
|
|
$ |
131,054 |
|
$ |
50,915 |
Cash equivalents consist of various investment savings account instruments and money market funds, all of which are short term in nature, highly liquid and readily convertible into cash.
5.TRADE AND OTHER RECEIVABLES
The trade and other receivables balance consists of:
|
|
|
|
|
||
|
|
At December 31 |
|
At December 31 |
||
(in thousands) |
|
2023 |
|
2022 |
||
|
|
|
|
|
|
|
Trade receivables |
|
$ |
899 |
|
$ |
3,184 |
Receivables in MLJV and MWJV |
|
|
623 |
|
|
508 |
Sales tax receivables |
|
|
364 |
|
|
428 |
Sundry receivables |
|
|
27 |
|
|
23 |
|
|
$ |
1,913 |
|
$ |
4,143 |
6.INVENTORIES
The inventories balance consists of:
|
|
|
|
|
|
|
|
|
At December 31 |
|
At December 31 |
||
(in thousands) |
|
2023 |
|
2022 |
||
|
|
|
|
|
|
|
Inventory of ore in stockpiles |
|
$ |
2,098 |
|
$ |
2,098 |
Mine and mill supplies in MLJV |
|
|
3,580 |
|
|
2,713 |
|
|
$ |
5,678 |
|
$ |
4,811 |
|
|
|
|
|
|
|
Inventories-by balance sheet presentation: |
|
|
|
|
|
|
Current |
|
$ |
3,580 |
|
$ |
2,713 |
Long term-ore in stockpiles |
|
|
2,098 |
|
|
2,098 |
|
|
$ |
5,678 |
|
$ |
4,811 |
Long-term ore in stockpile inventory represents an estimate of the amount of ore on the stockpile in excess of the next twelve months of planned mill production.
21
|
ANNUAL CONSOLIDATED FINANCIAL STATEMENTS |
7.INVESTMENTS
The investments balance consists of:
|
|
|
|
|
|
|
|
|
At December 31 |
|
At December 31 |
||
(in thousands) |
|
2023 |
|
2022 |
||
|
|
|
|
|
|
|
Investments: |
|
|
|
|
|
|
Equity instruments |
|
|
|
|
|
|
Shares |
|
$ |
10,390 |
|
$ |
8,022 |
Warrants |
|
|
127 |
|
|
87 |
Convertible Debentures |
|
|
15,565 |
|
|
— |
Physical Uranium |
|
|
276,815 |
|
|
162,536 |
|
|
$ |
302,897 |
|
$ |
170,645 |
|
|
|
|
|
|
|
Investments-by balance sheet presentation: |
|
|
|
|
|
|
Current |
|
$ |
10,400 |
|
$ |
8,022 |
Long-term |
|
|
292,497 |
|
|
162,623 |
|
|
$ |
302,897 |
|
$ |
170,645 |
The investments continuity summary is as follows:
|
|
|
|
|
|
|
|
|
|
|
||
|
|
Equity |
|
|
Convertible |
|
Physical |
|
Total |
|||
(in thousands) |
|
Instruments |
|
|
Debentures |
|
Uranium |
|
Investments |
|||
|
|
|
|
|
|
|
|
|
|
|
|
|
Balance-January 1, 2022 |
|
$ |
14,578 |
|
$ |
— |
|
$ |
133,114 |
|
$ |
147,692 |
Change in fair value gain to profit and (loss) (note 20) |
|
|
(6,469) |
|
|
— |
|
|
29,422 |
|
|
22,953 |
Balance-December 31, 2022 |
|
$ |
8,109 |
|
$ |
— |
|
$ |
162,536 |
|
$ |
170,645 |
Purchase of investments |
|
|
2,417 |
|
|
15,000 |
|
|
— |
|
|
17,417 |
Sale of investments |
|
|
— |
|
|
— |
|
|
(19,901) |
|
|
(19,901) |
Change in fair value gain to profit and (loss) (note 20) |
|
|
(9) |
|
|
565 |
|
|
134,180 |
|
|
134,736 |
Balance-December 31, 2023 |
|
$ |
10,517 |
|
$ |
15,565 |
|
$ |
276,815 |
|
$ |
302,897 |
At December 31, 2023, the Company holds equity instruments consisting of shares and warrants in publicly traded companies as well as convertible debt instruments. Non-current instruments consist of warrants in publicly traded companies exercisable for a period more than one year after the balance sheet date as well as convertible debt instruments convertible and redeemable for a period more than one year after the balance sheet date.
Investment in uranium
During the year ended December 31, 2023, the Company sold 200,000 pounds of physical uranium as uranium oxide concentrates (“U3O8”) at a weighted average price of $99.50 (US$73.38) per pound. As at December 31, 2023, the Company holds a total of 2,300,000 pounds of physical uranium as U3O8 at a cost of $84,377,000 (US$68,240,000 or US$29.67 per pound U3O8), including purchase commissions. Refer to note 26 for additional details.
22
|
ANNUAL CONSOLIDATED FINANCIAL STATEMENTS |
Investment in convertible debentures
During the year ended December 31, 2023, the Company completed a $15,000,000 strategic investment in F3 Uranium Corp. (“F3”) in the form of unsecured convertible debentures (the “Debentures”). The Debentures carry a 9% coupon (the “Interest”), payable quarterly over a 5-year term and will be convertible at Denison’s option into common shares of F3 at a conversion price of $0.56 per share. F3 has, at its sole discretion, the right to pay up to one-third of the Interest in common shares of F3 issued at a price per common share equal to the volume weighted average share price of F3’s common shares on the TSX Venture Exchange for the 20 trading days ending on the day prior to the date on which such payment of Interest is due. F3 will also have certain redemption rights on or after the third anniversary of the date of issuance of the Debentures and/or in the event of an F3 change of control. This investment is classified as financial assets measured at fair value through profit or loss. At December 31, 2023, the fair value of the Debentures was estimated to be $15,565,000, and a gain of $565,000 was recorded in the Consolidated Statements of Income and Comprehensive Income. Refer to note 20 and note 23 for additional details.
8.INVESTMENT IN JOINT VENTURE
The investment in joint venture balance consists of:
|
|
|
|
|
|
|
|
|
At December 31 |
|
At December 31 |
||
(in thousands) |
|
2023 |
|
2022 |
||
|
|
|
|
|
|
|
Investment in joint venture: |
|
|
|
|
|
|
JCU |
|
$ |
17,290 |
|
$ |
19,305 |
|
|
$ |
17,290 |
|
$ |
19,305 |
A summary of the investment in JCU is as follows:
|
|
|
|
(in thousands) |
|
|
|
|
|
|
|
Balance-December 31, 2022 |
|
$ |
19,305 |
Investment at cost: |
|
|
|
Equity share of loss |
|
|
(4,400) |
Additional investment in JCU |
|
|
2,385 |
Balance-December 31, 2023 |
|
$ |
17,290 |
JCU is a private company that holds a portfolio of twelve uranium project joint venture interests in Canada, including a 10% interest in the WRJV, a 30.099% interest in the Millennium project (Cameco Corporation 69.901%), a 33.8118% interest in the Kiggavik project (Orano Canada Inc. 66.1882%), and a 34.4508% interest in the Christie Lake project (UEC 65.5492%).
In 2023, each shareholder of JCU funded operations with an investment in JCU of $2,385,000. The investment was made by share subscription, where each shareholder acquired additional common shares in JCU in accordance with each shareholder's pro-rata ownership interest in JCU. As a result, the Company's ownership interest in JCU remained unchanged at 50%.
23
|
ANNUAL CONSOLIDATED FINANCIAL STATEMENTS |
The following tables summarize the consolidated financial information of JCU on a 100% basis, taking into account adjustments made by Denison for equity accounting purposes (including fair value adjustments and differences in accounting policies). Denison records its equity share of earnings (loss) in JCU one month in arrears (due to the information not yet being available), adjusted for any known material transactions that have occurred up to the period end date on which Denison is reporting.
|
|
|
|
|
|
|
|
|
|
At December 31 |
|
At December 31 |
|
||
(in thousands) |
|
2023 |
|
2022 |
|
||
|
|
|
|
|
|
|
|
Total current assets(1) |
|
$ |
525 |
|
$ |
2,273 |
|
Total non-current assets |
|
|
38,666 |
|
|
38,371 |
|
Total current liabilities |
|
|
(381) |
|
|
(1,949) |
|
Total non-current liabilities |
|
|
(4,230) |
|
|
(86) |
|
Total net assets |
|
$ |
34,580 |
|
$ |
38,609 |
|
|
|
|
|
|
|
|
|
|
|
|
Twelve Months Ended |
|
|
Twelve Months Ended |
|
|
|
|
November 30, 2023(2) |
|
|
November 30, 2022(2) |
|
|
|
|
|
|
|
|
|
Revenue |
|
$ |
— |
|
$ |
— |
|
Net loss |
|
|
(8,799) |
|
|
(5,775) |
|
Other comprehensive income |
|
$ |
— |
|
$ |
— |
|
|
|
|
|
|
|
|
|
|
|
|
|
|
|
|
|
Reconciliation of JCU net assets to Denison investment carrying value: |
|
|
|
|
|
|
|
Adjusted net assets of JCU–at December 31 |
|
$ |
38,609 |
|
$ |
42,784 |
|
Net loss |
|
|
(8,799) |
|
|
(5,775) |
|
Investment from owners |
|
|
4,770 |
|
|
1,600 |
|
Net assets of JCU–at November 30, 2023 |
|
$ |
34,580 |
|
$ |
38,609 |
|
Denison ownership interest |
|
|
50.00 |
% |
|
50.00 |
% |
Investment in JCU |
|
$ |
17,290 |
|
$ |
19,305 |
|
| (1) | Included in current assets are $525,000 in cash and cash equivalents (December 31, 2022 - $1,473,000). |
| (2) | Represents JCU net loss for the twelve months ended November 30 (recorded one month in arrears), adjusted for differences in fair value allocations and accounting policies. |
24
|
ANNUAL CONSOLIDATED FINANCIAL STATEMENTS |
9.RESTRICTED CASH AND INVESTMENTS
The Company has certain restricted cash and investments deposited to collateralize a portion of its reclamation obligations. The restricted cash and investments balance consists of:
|
|
|
|
|
|
|
|
|
At December 31 |
|
At December 31 |
||
(in thousands) |
|
2023 |
|
2022 |
||
|
|
|
|
|
|
|
Cash and cash equivalents |
|
$ |
3,259 |
|
$ |
3,133 |
Investments |
|
|
7,972 |
|
|
7,972 |
|
|
$ |
11,231 |
|
$ |
11,105 |
|
|
|
|
|
|
|
Restricted cash and investments-by item: |
|
|
|
|
|
|
Elliot Lake reclamation trust fund |
|
$ |
3,259 |
|
$ |
3,133 |
Letters of credit facility pledged assets |
|
|
7,972 |
|
|
7,972 |
|
|
$ |
11,231 |
|
$ |
11,105 |
At December 31, 2023 and December 31, 2022, investments consist of guaranteed investment certificates with maturities of less than 90 days.
Elliot Lake reclamation trust fund
The Company has the obligation to maintain its decommissioned Elliot Lake uranium mine pursuant to a Reclamation Funding Agreement effective December 21, 1995 (“Reclamation Agreement”) with the Governments of Canada and Ontario. The Reclamation Agreement, as further amended in February 1999, requires the Company to maintain funds in the reclamation trust fund equal to estimated reclamation spending for the succeeding six calendar years, less interest expected to accrue on the funds during the period. Withdrawals from this reclamation trust fund can only be made with the approval of the Governments of Canada and Ontario to fund Elliot Lake monitoring and site restoration costs.
In 2023, the Company deposited an additional $864,000 into the Elliot Lake reclamation trust fund and withdrew $886,000. In 2022, the Company deposited an additional $1,199,000 into the Elliot Lake reclamation trust fund and withdrew $974,000.
Letters of credit facility pledged assets
At December 31, 2023, the Company has $7,972,000 on deposit with Bank of Nova Scotia (“BNS”) as pledged restricted cash and investments pursuant to its obligations under the letters of credit facility (see notes 13 and 15).
25
|
ANNUAL CONSOLIDATED FINANCIAL STATEMENTS |
10.PROPERTY, PLANT AND EQUIPMENT
The property, plant and equipment (“PP&E”) continuity summary is as follows:
|
|
|
|
|
|
|
|
|
|
|
|
|
|
|
Plant and Equipment |
|
Mineral |
|
Total |
||||||
(in thousands) |
|
Owned |
|
Right-of-Use |
|
Properties |
|
PP&E |
||||
Cost: |
|
|
|
|
|
|
|
|
|
|
|
|
Balance-January 1, 2022 |
|
$ |
105,683 |
|
$ |
953 |
|
$ |
179,788 |
|
$ |
286,424 |
Additions (note 21) |
|
|
6,731 |
|
|
103 |
|
|
431 |
|
|
7,265 |
Disposals |
|
|
(187) |
|
|
(293) |
|
|
— |
|
|
(480) |
Reclamation adjustment (note 13) |
|
|
(4,159) |
|
|
— |
|
|
— |
|
|
(4,159) |
Balance-December 31, 2022 |
|
$ |
108,068 |
|
$ |
763 |
|
$ |
180,219 |
|
$ |
289,050 |
|
|
|
|
|
|
|
|
|
|
|
|
|
Additions (note 21) |
|
|
1,398 |
|
|
34 |
|
|
1,836 |
|
|
3,268 |
Disposals |
|
|
(259) |
|
|
(28) |
|
|
(1,242) |
|
|
(1,529) |
Reclamation adjustment (note 13) |
|
|
3,498 |
|
|
— |
|
|
— |
|
|
3,498 |
Balance-December 31, 2023 |
|
$ |
112,705 |
|
$ |
769 |
|
$ |
180,813 |
|
$ |
294,287 |
|
|
|
|
|
|
|
|
|
|
|
|
|
Accumulated amortization, depreciation: |
|
|
|
|
|
|
|
|
|
|
|
|
Balance-January 1, 2022 |
|
$ |
(31,420) |
|
$ |
(542) |
|
$ |
— |
|
$ |
(31,962) |
Amortization |
|
|
(199) |
|
|
— |
|
|
— |
|
|
(199) |
Depreciation (note 20) |
|
|
(3,797) |
|
|
(146) |
|
|
— |
|
|
(3,943) |
Disposals |
|
|
150 |
|
|
293 |
|
|
— |
|
|
443 |
Reclamation adjustment (note 13) |
|
|
116 |
|
|
— |
|
|
— |
|
|
116 |
Balance-December 31, 2022 |
|
$ |
(35,150) |
|
$ |
(395) |
|
$ |
— |
|
$ |
(35,545) |
|
|
|
|
|
|
|
|
|
|
|
|
|
Amortization |
|
|
(188) |
|
|
— |
|
|
— |
|
|
(188) |
Depreciation (note 20) |
|
|
(3,804) |
|
|
(140) |
|
|
— |
|
|
(3,944) |
Disposals |
|
|
259 |
|
|
27 |
|
|
— |
|
|
286 |
Reclamation adjustment (note 13) |
|
|
50 |
|
|
— |
|
|
— |
|
|
50 |
Balance-December 31, 2023 |
|
$ |
(38,833) |
|
$ |
(508) |
|
$ |
— |
|
$ |
(39,341) |
|
|
|
|
|
|
|
|
|
|
|
|
|
Carrying value: |
|
|
|
|
|
|
|
|
|
|
|
|
Balance-December 31, 2022 |
|
$ |
72,918 |
|
$ |
368 |
|
$ |
180,219 |
|
$ |
253,505 |
Balance-December 31, 2023 |
|
$ |
73,872 |
|
$ |
261 |
|
$ |
180,813 |
|
$ |
254,946 |
Plant and Equipment - Owned
The Company has a 22.5% interest in the McClean Lake mill through its ownership interest in the MLJV. The carrying value of the mill, comprised of various infrastructure, building and machinery assets, represents $55,036,000, or 74.5%, of the December 2023 total carrying value amount of owned Plant and Equipment assets.
The additions to PP&E in 2023 primarily relate to interests in mineral properties acquired in the period and renovations to the Company’s office building in Saskatoon.
26
|
ANNUAL CONSOLIDATED FINANCIAL STATEMENTS |
A toll milling agreement amongst the participants of the MLJV and the CLJV provides for the processing of certain output of the Cigar Lake mine at the McClean Lake mill, for which the owners of the McClean Lake mill receive a toll milling fee and other benefits. Denison has an agreement with Ecora Resources PLC (“Ecora”) (formerly named Anglo Pacific Group PLC “APG”) with respect to certain of the toll milling fees it receives from this toll milling agreement – see note 12. In determining the units of production amortization rate for the McClean Lake mill, the amount of production attributable to the mill assets includes Denison’s expected share of mill feed related to MLJV ores, MWJV ores and the CLJV toll milling contract. Milling activities in 2023 and 2022 at the McClean Lake mill were dedicated exclusively to processing and packaging ore from the Cigar Lake mine.
Plant and Equipment – Right-of-Use
The Company has included the cost of various right-of-use (“ROU”) assets within its plant and equipment ROU carrying value amount. These assets consist of building, vehicle and office equipment leases. The majority of the asset value is attributable to the building lease assets for the Company’s office in Toronto and warehousing space in Saskatoon.
Mineral Properties
The Company has various interests in development, evaluation and exploration projects located in Saskatchewan, Canada, which are either held directly or through option or various contractual agreements. The following projects, all located in Saskatchewan, represent $164,575,000, or 91.0%, of the carrying value amount of mineral property assets as at December 31, 2023:
| a) | Wheeler River – the Company has a 90.0% direct interest in the project, and an additional 5.0% indirect interest through its investment in JCU (includes the Phoenix and Gryphon deposits); |
| b) | Waterbury Lake – the Company has a 69.35% interest in the project (includes the THT and Huskie deposits) and also has a 2.0% net smelter return royalty on the portion of the project it does not own; |
| c) | Midwest – the Company has a 25.17% interest in the project (includes the Midwest Main and Midwest A deposits); |
| d) | Mann Lake – the Company has a 30.0% interest in the project; |
| e) | Wolly – the Company has a 20.77% interest in the project; |
| f) | Johnston Lake – the Company has a 100% interest in the project; and |
| g) | McClean Lake – the Company has a 22.5% interest in the project (includes the Sue D, Sue E, Caribou, McClean North and McClean South deposits). |
South Dufferin
In 2023, the Company entered into and completed an agreement to sell its 100% interest in the South Dufferin property to Skyharbour Resources Ltd (“Skyharbour”) in exchange for $125,000 in cash, 6,000,000 Skyharbour common shares, and 1,000,000 Skyharbour warrants with an exercise price of $0.60 and a 24 month term, for total consideration of $2,541,000 and a gain on sale of $1,299,000.
Waterbury Lake
In 2023, the Company increased its interest in the Waterbury Lake property from 67.41% to 69.35% pursuant to the dilution provisions in the agreements governing the project (see note 22).
27
|
ANNUAL CONSOLIDATED FINANCIAL STATEMENTS |
11.ACCOUNTS PAYABLE AND ACCRUED LIABILITIES
The accounts payable and accrued liabilities balance consists of:
|
|
|
|
|
|
|
|
|
At December 31 |
|
At December 31 |
||
(in thousands) |
|
2023 |
|
2022 |
||
Trade payables |
|
$ |
5,037 |
|
$ |
5,434 |
Payables in MLJV and MWJV |
|
|
4,843 |
|
|
4,036 |
Other payables |
|
|
942 |
|
|
829 |
|
|
$ |
10,822 |
|
$ |
10,299 |
12.DEFERRED REVENUE
The deferred revenue balance consists of:
|
|
|
|
|
|
|
|
|
At December 31 |
|
At December 31 |
||
(in thousands) |
|
2023 |
|
2022 |
||
Deferred revenue-pre-sold toll milling: |
|
|
|
|
|
|
CLJV Toll Milling-Ecora |
|
$ |
34,958 |
|
$ |
33,295 |
|
|
$ |
34,958 |
|
$ |
33,295 |
Deferred revenue-by balance sheet presentation: |
|
|
|
|
|
|
Current |
|
$ |
4,535 |
|
$ |
4,915 |
Non-current |
|
|
30,423 |
|
|
28,380 |
|
|
$ |
34,958 |
|
$ |
33,295 |
The deferred revenue liability continuity summary is as follows:
|
|
|
|
|
|
|
(in thousands) |
|
2023 |
|
2022 |
||
|
|
|
|
|
|
|
Balance-January 1 |
|
$ |
33,295 |
|
$ |
36,508 |
Revenue recognized during the period (note 21) |
|
|
(1,855) |
|
|
(5,987) |
Accretion (note 20) |
|
|
3,518 |
|
|
2,774 |
Balance-December 31 |
|
$ |
34,958 |
|
$ |
33,295 |
Arrangement with Ecora Resources PLC (“Ecora”)
In February 2017, Denison closed an arrangement with Ecora, formerly named Anglo Pacific Group PLC. Denison received an upfront payment of $43,500,000 in exchange for its right to receive specified future toll milling cash receipts from the MLJV earned by the Company related to the processing of specified Cigar Lake ore through the McClean Lake mill under the current toll milling agreement with the CLJV from July 1, 2016 onwards (the “Ecora Arrangement”). The up-front payment was based upon an estimate of the gross toll milling cash receipts to be received by Denison discounted at a rate of 8.50%.
At closing, the Company made payments to Ecora of $3,520,000, representing the Cigar Lake toll milling cash receipts received by Denison in respect of toll milling activity for the period from July 1, 2016 through January 31, 2017, and reflected those amounts as a reduction of the initial upfront amount received, thereby reducing the initial deferred revenue balance to $39,980,000 at the closing date.
28
|
ANNUAL CONSOLIDATED FINANCIAL STATEMENTS |
In 2023, the Company recognized $1,855,000 of toll milling revenue from the draw-down of deferred revenue, based on Cigar Lake toll milling production of 15,097,000 pounds U3O8 (100% basis). The drawdown in 2023 includes a cumulative decrease in revenue for prior periods of $1,948,000 resulting from changes in estimates to the toll milling drawdown rate during 2023.
In 2022, the Company recognized $5,987,000 of toll milling revenue from the draw-down of deferred revenue, based on Cigar Lake toll milling production of 18,010,000 pounds U3O8 (100% basis). The drawdown in 2022 includes a cumulative increase in revenue for prior periods of $1,070,000 resulting from changes in estimates to the toll milling drawdown rate during 2022.
The current portion of the deferred revenue liability reflects Denison’s estimate of Cigar Lake toll milling over the next 12 months. This assumption is based on current mill packaged production expectations and is reassessed on a quarterly basis.
13.RECLAMATION OBLIGATIONS
The reclamation obligations balance consists of:
|
|
|
|
|
|
|
|
|
At December 31 |
|
At December 31 |
||
(in thousands) |
|
2023 |
|
2022 |
||
|
|
|
|
|
|
|
Reclamation obligations-by item: |
|
|
|
|
|
|
Elliot Lake |
|
$ |
19,796 |
|
$ |
16,634 |
MLJV and MWJV |
|
|
12,215 |
|
|
10,069 |
Wheeler River and other |
|
|
2,887 |
|
|
2,756 |
|
|
$ |
34,898 |
|
$ |
29,459 |
|
|
|
|
|
|
|
Reclamation obligations-by balance sheet presentation: |
|
|
|
|
|
|
Current |
|
$ |
2,256 |
|
$ |
2,865 |
Non-current |
|
|
32,642 |
|
|
26,594 |
|
|
$ |
34,898 |
|
$ |
29,459 |
The reclamation obligations continuity summary is as follows:
|
|
|
|
|
|
|
(in thousands) |
|
2023 |
|
2022 |
||
|
|
|
|
|
|
|
Balance-January 1 |
|
$ |
29,459 |
|
$ |
37,532 |
Reclamation liability deposit from joint venture partner |
|
|
99 |
|
|
— |
Accretion (note 20) |
|
|
1,681 |
|
|
1,444 |
Expenditures incurred |
|
|
(3,118) |
|
|
(1,348) |
Liability adjustments-balance sheet (note 10) |
|
|
3,548 |
|
|
(4,043) |
Liability adjustment-income statement (note 21) |
|
|
3,229 |
|
|
(4,126) |
Balance-December 31 |
|
$ |
34,898 |
|
$ |
29,459 |
Site Restoration: Elliot Lake
The Elliot Lake uranium mine was closed in 1992 and capital works to decommission this site were completed in 1997. The remaining provision is for the estimated cost of monitoring the Tailings Management Areas at the Denison and Stanrock sites and for treatment of water discharged from these areas. The Company conducts its activities at both sites pursuant to licenses issued by the Canadian Nuclear Safety Commission (“CNSC”). The above accrual represents the Company’s best estimate of the present value of the total future reclamation cost, based on assumptions as to what levels of treatment will be required in the future, discounted at 5.45% per annum (December 31, 2022 – 5.71%). As at December 31, 2023, the undiscounted amount of estimated future reclamation costs, in current year dollars, is $45,283,000 (December 31, 2022 - $40,166,000).
29
|
ANNUAL CONSOLIDATED FINANCIAL STATEMENTS |
The reclamation costs are expected to be incurred between 2024 and 2083. Revisions to the reclamation liability for Elliot Lake are recognized in the income statement as the site is closed and there is no asset recognized for this site.
Spending on restoration activities at the Elliot Lake site is funded by the Elliot Lake Reclamation Trust fund (see note 9).
Site Restoration: McClean Lake Joint Venture and Midwest Joint Venture
The MLJV and MWJV operations are subject to environmental regulations as set out by the Saskatchewan government and the CNSC. Cost estimates of the expected future decommissioning and reclamation activities are prepared periodically and filed with the applicable regulatory authorities for approval. The above accrual represents the Company's best estimate of the present value of future reclamation costs discounted at 5.45% per annum (December 31, 2022 – 5.71%). As at December 31, 2023, the Company’s estimate of the undiscounted amount of future reclamation costs, in current year dollars, is $24,333,000 (December 31, 2022 - $23,601,000). The majority of the reclamation costs are expected to be incurred between 2038 and 2056. Revisions to the reclamation liabilities for the MLJV and MWJV are recognized on the balance sheet as adjustments to the assets associated with the sites.
Under the Saskatchewan Mineral Industry Environmental Protection Regulations (1996), the Company is required to provide its pro-rata share of financial assurances to the province of Saskatchewan relating to future decommissioning and reclamation plans that have been filed and approved by the applicable regulatory authorities. Accordingly, as at December 31, 2023, the Company has provided irrevocable standby letters of credit from a chartered bank in favour of the Saskatchewan Ministry of Environment, totalling $22,972,000, which relate to the most recently filed reclamation plan dated November 2021.
Refer to note 15 for details regarding further amendment to the letters of credit facility that occurred in December 2023.
Site Restoration: Wheeler River and other
The Company’s exploration and evaluation activities, including those related to Wheeler River, are subject to environmental regulations as set out by the government of Saskatchewan. Cost estimates of the estimated future decommissioning and reclamation activities are recognized when the liability is incurred. The accrual represents the Company’s best estimate of the present value of the future reclamation cost contemplated in these cost estimates discounted at 5.45% per annum (December 31, 2022 - 5.71%). As at December 31, 2023, the undiscounted amount of estimated future reclamation costs, in current year dollars, is estimated at $3,260,000 (December 31, 2022 - $3,601,000). Revisions to the reclamation liabilities for exploration and evaluation activities are recognized on the balance sheet as adjustments to the net reclamation assets associated with the respective properties.
As at December 31, 2023, the Company has provided irrevocable standby letters of credit from a chartered bank in favour of the Saskatchewan Ministry of Environment, totalling $992,000, which relate to the most recently filed reclamation plan for the Phoenix FFT site, dated December 2022. In 2023, the Company received a deposit of $99,000 from its joint venture partner to cover its share of the required letters of credit.
14.SHARE PURCHASE WARRANTS
In connection with the public offerings of units in February 2021 and March 2021, the Company issued 15,796,975 and 39,215,000 share purchase warrants to unit holders, respectively. The February 2021 warrants entitled the holder to acquire one common share of the Company at an exercise price of US$2.00 for 24 months after issuance (expired February 2023). The March 2021 warrants entitled the holder to acquire one common share of the Company at an exercise price of US$2.25 for 24 months after issuance (expired March 2023).
Since these warrants were exercisable in USD, which differs from the Company’s CAD functional currency, they were classified as derivative liabilities and were required to be carried as liabilities at Fair Value Though Profit or Loss. When the fair value of the warrants was revalued at each reporting period, the change in the liability was recorded through net profit or loss in “Other income (expense)”.
30
|
ANNUAL CONSOLIDATED FINANCIAL STATEMENTS |
At December 31, 2022, the fair value of the share purchase warrants were estimated to be $nil.
|
|
|
|
|
|
|
|
Number of |
|
Warrant |
|
(in thousands except warrant amounts) |
|
Warrants |
|
Liability |
|
|
|
|
|
|
|
Balance-December 31, 2022 |
|
55,006,475 |
|
$ |
— |
Expiry of share purchase warrants |
|
(55,006,475) |
|
|
— |
Balance-December 31, 2023 |
|
— |
|
$ |
— |
15.OTHER LIABILITIES
The other liabilities balance consists of:
|
|
|
|
|
||
|
|
At December 31 |
|
At December 31 |
||
(in thousands) |
|
2023 |
|
2022 |
||
|
|
|
|
|
|
|
Other liabilities: |
|
|
|
|
|
|
Post-employment benefits |
|
$ |
1,117 |
|
$ |
1,201 |
Lease obligations |
|
|
287 |
|
|
396 |
Loan obligations |
|
|
130 |
|
|
180 |
|
|
$ |
1,534 |
|
$ |
1,777 |
|
|
|
|
|
|
|
Other liabilities-by balance sheet presentation: |
|
|
|
|
|
|
Current |
|
$ |
333 |
|
$ |
336 |
Non-current |
|
|
1,201 |
|
|
1,441 |
|
|
$ |
1,534 |
|
$ |
1,777 |
Post-employment Benefits
The Company provides post-employment benefits for former Canadian employees who retired on immediate pension prior to 1997. The post-employment benefits provided include life insurance and medical and dental benefits as set out in the applicable group policies. No post-employment benefits are provided to employees outside the employee group referenced above. The post-employment benefit plan is not funded.
The effective date of the most recent actuarial valuation of the accrued benefit obligation is October 1, 2020. The amount accrued is based on estimates provided by the plan administrator which are based on past experience, limits on coverage as set out in the applicable group policies and assumptions about future cost trends. The significant assumptions used in the most recent valuation are listed below:
| ● | Discount rate of 1.75%; |
| ● | Medical cost increase trend rate of 4.09% in 2020, grading up to 5.30% per year by 2026, staying flat at 5.30% per year from 2026 to 2030 and then grading down to 4.05% per year from 2031 through to 2041; and |
| ● | Dental cost increase trend rate of 4.50% in 2020, grading up to 5.30% per year by 2026, staying flat at 5.30% per year from 2026 to 2030 and then grading down to 4.05% per year from 2031 through to 2041. |
31
|
ANNUAL CONSOLIDATED FINANCIAL STATEMENTS |
The post-employment benefits balance consists of:
|
|
|
|
|
|
|
|
|
At December 31 |
|
At December 31 |
||
(in thousands) |
|
2023 |
|
2022 |
||
Accrued benefit obligation |
|
$ |
1,117 |
|
$ |
1,201 |
|
|
$ |
1,117 |
|
$ |
1,201 |
|
|
|
|
|
|
|
Post-employment benefits-by balance sheet presentation: |
|
|
|
|
|
|
Current |
|
$ |
120 |
|
$ |
120 |
Non-current |
|
|
997 |
|
|
1,081 |
|
|
$ |
1,117 |
|
$ |
1,201 |
The post-employment benefits continuity summary is as follows:
|
|
|
|
|
|
|
(in thousands) |
|
2023 |
|
2022 |
||
|
|
|
|
|
|
|
Balance-January 1 |
|
$ |
1,201 |
|
$ |
1,274 |
Accretion (note 20) |
|
|
21 |
|
|
22 |
Benefits paid |
|
|
(105) |
|
|
(95) |
Balance-December 31 |
|
$ |
1,117 |
|
$ |
1,201 |
Debt Obligations
At December 31, 2023, the Company’s debt obligations are comprised of lease and loan liabilities. The debt obligations continuity summary is as follows:
|
|
|
|
|
|
|
|||
|
|
Lease |
|
Loan |
|
Total Debt |
|||
(in thousands) |
|
Liabilities |
|
Liabilities |
|
Obligations |
|||
|
|
|
|
|
|
|
|
|
|
Balance-January 1, 2022 |
|
$ |
452 |
|
$ |
56 |
|
$ |
508 |
Accretion (note 20) |
|
|
32 |
|
|
— |
|
|
32 |
Additions (note 10) |
|
|
87 |
|
|
158 |
|
|
245 |
Repayments |
|
|
(175) |
|
|
(34) |
|
|
(209) |
Balance-December 31, 2022 |
|
$ |
396 |
|
$ |
180 |
|
$ |
576 |
|
|
|
|
|
|
|
|
|
|
Accretion (note 20) |
|
|
27 |
|
|
— |
|
|
27 |
Additions |
|
|
33 |
|
|
— |
|
|
33 |
Repayments |
|
|
(168) |
|
|
(50) |
|
|
(218) |
Liability adjustment gain |
|
|
(1) |
|
|
— |
|
|
(1) |
Balance-December 31, 2023 |
|
$ |
287 |
|
$ |
130 |
|
$ |
417 |
32
|
ANNUAL CONSOLIDATED FINANCIAL STATEMENTS |
Debt Obligations – Scheduled Maturities
The following table outlines the Company’s scheduled maturities of its debt obligations at December 31, 2023:
|
|
|
|
|
|
|
||
|
|
Lease |
|
Loan |
|
Total Debt |
||
(in thousands) |
|
Liabilities |
|
Liabilities |
|
Obligations |
||
|
|
|
|
|
|
|
|
|
Maturity analysis-contractual undiscounted cash flows: |
|
|
|
|
|
|
|
|
Next 12 months |
|
$ |
161 |
|
52 |
|
$ |
213 |
One to five years |
|
|
150 |
|
83 |
|
|
233 |
More than five years |
|
|
— |
|
— |
|
|
— |
Total obligation-end of period-undiscounted |
|
|
311 |
|
135 |
|
|
446 |
Present value discount adjustment |
|
|
(24) |
|
(5) |
|
|
(29) |
Total obligation-end of period-discounted |
|
$ |
287 |
|
130 |
|
$ |
417 |
Letters of Credit Facility
In December 2023, the Company entered into an agreement with BNS to amend the terms of the Company’s Credit Facility to extend the maturity date to January 31, 2025 (the “Credit Facility”). All other terms of the Credit Facility (amount of credit facility, tangible net worth covenant, investment amounts, pledged assets and security for the facility) remain unchanged by the amendment and the Credit Facility remains subject to letter of credit and standby fees of 2.40% (0.40% on the $7,972,000 covered by pledged cash collateral) and 0.75% respectively. During the year ended December 31, 2023, the Company incurred letter of credit fees of $417,000 (December 31, 2022 - $383,000).
At December 31, 2023, the Company is in compliance with its facility covenants and has access to letters of credit of up to $23,964,000 (December 31, 2022 - $23,964,000). The facility is fully utilized as collateral for non-financial letters of credit issued in support of reclamation obligations for the MLJV, MWJV and Wheeler River (see note 13).
16.INCOME TAXES
The income tax recovery balance from continuing operations consists of:
|
|
|
|
|
||
(in thousands) |
|
2023 |
|
2022 |
||
|
|
|
|
|
|
|
Deferred income tax: |
|
|
|
|
|
|
Origination of temporary differences |
|
$ |
2,578 |
|
$ |
149 |
Tax benefit-previously unrecognized tax assets |
|
|
— |
|
|
2,128 |
Prior year under provision |
|
|
(235) |
|
|
(8) |
|
|
|
2,343 |
|
|
2,269 |
Income tax recovery |
|
$ |
2,343 |
|
$ |
2,269 |
33
|
ANNUAL CONSOLIDATED FINANCIAL STATEMENTS |
The Company operates in multiple industries and jurisdictions, and the related income is subject to varying rates of taxation. The combined Canadian tax rate reflects the federal and provincial tax rates in effect in Ontario, Canada for each applicable year. A reconciliation of the combined Canadian tax rate to the Company’s effective rate of income tax is as follows:
|
|
|
|
|
|
||
(in thousands) |
|
2023 |
|
2022 |
|
||
|
|
|
|
|
|
|
|
Income before taxes – continuing operations |
|
$ |
87,021 |
|
$ |
10,303 |
|
Combined Canadian tax rate |
|
|
26.50 |
% |
|
26.50 |
% |
Income tax expense at combined rate |
|
|
(23,061) |
|
|
(2,730) |
|
|
|
|
|
|
|
|
|
Difference in tax rates |
|
|
(6,536) |
|
|
(3,394) |
|
Non-deductible amounts |
|
|
(5,042) |
|
|
(3,018) |
|
Non-taxable amounts |
|
|
33,314 |
|
|
17,334 |
|
Change in deferred tax assets not recognized (1) |
|
|
3,925 |
|
|
(5,729) |
|
Change in tax rates, legislation |
|
|
(80) |
|
|
(151) |
|
Prior year under provision |
|
|
(235) |
|
|
(8) |
|
Other |
|
|
58 |
|
|
(35) |
|
Income tax recovery |
|
$ |
2,343 |
|
$ |
2,269 |
|
| (1) | The Company has recognized certain previously unrecognized Canadian tax assets in 2022 as a result of the renunciation of certain tax benefits to subscribers pursuant to the Company's flow-through share issuances of $8,000,000 in December 2022. |
The deferred income tax assets (liabilities) balance reported on the balance sheet is comprised of the temporary differences as presented below:
|
|
|
|
|
||
|
|
At December 31 |
|
At December 31 |
||
(in thousands) |
|
2023 |
|
2022 |
||
|
|
|
|
|
|
|
Deferred income tax assets: |
|
|
|
|
|
|
Property, plant and equipment, net |
|
$ |
387 |
|
$ |
387 |
Post-employment benefits |
|
|
295 |
|
|
314 |
Reclamation obligations |
|
|
11,699 |
|
|
8,990 |
Non-capital tax loss carry forwards |
|
|
18,489 |
|
|
20,070 |
Capital loss carry forward |
|
|
25,088 |
|
|
9,483 |
Other |
|
|
9,348 |
|
|
8,077 |
Deferred income tax assets-gross |
|
|
65,306 |
|
|
47,321 |
Set-off against deferred income tax liabilities |
|
|
(65,306) |
|
|
(47,321) |
Deferred income tax assets-per balance sheet |
|
$ |
— |
|
$ |
— |
|
|
|
|
|
|
|
Deferred income tax liabilities: |
|
|
|
|
|
|
Inventory |
|
$ |
(852) |
|
$ |
(759) |
Property, plant and equipment, net |
|
|
(40,707) |
|
|
(40,757) |
Investments-equity instruments and uranium |
|
|
(25,088) |
|
|
(9,483) |
Other |
|
|
(1,266) |
|
|
(1,272) |
Deferred income tax liabilities-gross |
|
|
(67,913) |
|
|
(52,271) |
Set-off of deferred income tax assets |
|
|
65,306 |
|
|
47,321 |
Deferred income tax liabilities-per balance sheet |
|
$ |
(2,607) |
|
$ |
(4,950) |
34
|
ANNUAL CONSOLIDATED FINANCIAL STATEMENTS |
The deferred income tax liability continuity summary is as follows:
|
|
|
|
|
||
(in thousands) |
|
2023 |
|
2022 |
||
|
|
|
|
|
|
|
Balance-January 1 |
|
$ |
(4,950) |
|
$ |
(7,219) |
Recognized in income |
|
|
2,343 |
|
|
2,269 |
Recognized in other liabilities (flow-through shares) |
|
|
— |
|
|
— |
Recognized in other comprehensive income |
|
|
— |
|
|
— |
Balance-December 31 |
|
$ |
(2,607) |
|
$ |
(4,950) |
Management believes that it is not probable that sufficient taxable profit will be available in future years to allow the benefit of the following deferred tax assets to be utilized:
|
|
|
|
|
||
|
|
At December 31 |
|
At December 31 |
||
(in thousands) |
|
2023 |
|
2022 |
||
|
|
|
|
|
|
|
Deferred income tax assets not recognized |
|
|
|
|
|
|
Property, plant and equipment |
|
$ |
6,985 |
|
$ |
5,372 |
Tax losses-capital |
|
|
38,445 |
|
|
55,704 |
Tax losses-operating |
|
|
69,919 |
|
|
57,580 |
Tax credits |
|
|
1,126 |
|
|
1,126 |
Other deductible temporary differences |
|
|
2,881 |
|
|
2,653 |
Deferred income tax assets not recognized |
|
$ |
119,356 |
|
$ |
122,435 |
The expiry dates of the Company’s Canadian operating tax losses and tax credits are as follows:
|
|
|
|
|
|
|
|||
|
|
Expiry |
|
At December 31 |
|
At December 31 |
|||
(in thousands) |
|
Date |
|
2023 |
|
2022 |
|||
|
|
|
|
|
|
|
|
|
|
Tax losses-gross |
|
|
2025-2043 |
|
$ |
324,965 |
|
$ |
287,754 |
|
|
|
|
|
|
|
|
|
|
Tax benefit at tax rate of 26% - 27% |
|
|
|
|
|
88,408 |
|
|
77,650 |
Set-off against deferred tax liabilities |
|
|
|
|
|
(18,489) |
|
|
(20,070) |
Total tax loss assets not recognized |
|
|
|
|
$ |
69,919 |
|
$ |
57,580 |
|
|
|
|
|
|
|
|
|
|
Tax credits |
|
|
2025-2035 |
|
|
1,126 |
|
|
1,126 |
Total tax credit assets not recognized |
|
|
|
|
$ |
1,126 |
|
$ |
1,126 |
35
|
ANNUAL CONSOLIDATED FINANCIAL STATEMENTS |
17.SHARE CAPITAL
Denison is authorized to issue an unlimited number of common shares without par value. A continuity summary of the issued and outstanding common shares and the associated dollar amounts is presented below:
|
|
|
|
|
|
|
|
Number of |
|
|
|
|
|
Common |
|
|
|
(in thousands except share amounts) |
|
Shares |
|
Share Capital |
|
|
|
|
|
|
|
Balance-January 1, 2022 |
|
812,429,995 |
|
$ |
1,517,029 |
Issued for cash: |
|
|
|
|
|
Shares issued proceeds-total |
|
11,042,862 |
|
|
20,200 |
Less: share issue costs |
|
— |
|
|
(599) |
Other share issue proceeds-total |
|
128,052 |
|
|
219 |
Less: other share issue costs |
|
— |
|
|
(50) |
Share option exercises |
|
2,169,681 |
|
|
1,459 |
Share option exercises-transfer from contributed surplus |
|
— |
|
|
550 |
Share unit exercises-transfer from contributed surplus |
|
555,002 |
|
|
401 |
|
|
13,895,597 |
|
|
22,180 |
Balance-December 31, 2022 |
|
826,325,592 |
|
$ |
1,539,209 |
|
|
|
|
|
|
Issued for cash: |
|
|
|
|
|
Shares issued proceeds-total |
|
56,786,160 |
|
|
112,969 |
Less: share issue costs |
|
— |
|
|
(5,085) |
Other share issue proceeds-total |
|
153,237 |
|
|
213 |
Less: other share issue costs |
|
— |
|
|
(20) |
Share option exercises |
|
4,559,047 |
|
|
3,534 |
Share option exercises-transfer from contributed surplus |
|
— |
|
|
1,474 |
Share unit exercises-transfer from contributed surplus |
|
3,146,335 |
|
|
2,730 |
|
|
64,644,779 |
|
|
115,815 |
Balance-December 31, 2023 |
|
890,970,371 |
|
$ |
1,655,024 |
Unit and Other Share Issues
On September 16, 2021, the Company filed a short form base shelf prospectus with the securities’ regulatory authorities in each of the provinces and territories in Canada and a registration statement on Form F-10 in the United States (“2021 Shelf Prospectus”) to qualify the issuance of securities up to an aggregate offering amount of $250,000,000 during the 25-month period ended October 16, 2023.
On September 28, 2021, Denison entered into an equity distribution agreement providing for an At-the-Market (“ATM”) equity offering program qualified by a prospectus supplement to the 2021 Shelf Prospectus (“2021 ATM Program"). The 2021 ATM Program allowed Denison, through its agents, to, from time to time, offer and sell, in Canada and the United States, such number of common shares as would have an aggregate offering price of up to US$50,000,000. The 2021 ATM Program was terminated on October 11, 2023.
During the year ended December 31, 2023, the Company issued 19,786,160 shares under the 2021 ATM Program. The common shares were issued at an average price of $1.91 per share for aggregate gross proceeds of $37,887,000. The Company also recognized issue costs of $845,000 related to these ATM share issuances, which include $757,000 of commissions and $88,000 associated with the maintenance of the 2021 Shelf Prospectus and 2021 ATM Program.
During the year ended December 31, 2022, the Company issued 11,042,862 shares under the 2021 ATM Program. The common shares were issued at an average price of $1.83 per share for aggregate gross proceeds of $20,200,000. The Company also recognized issue costs of $599,000 related to these ATM share issuances, which includes $404,000 of commissions and $195,000 associated with the maintenance of the 2021 Shelf Prospectus and 2021 ATM Program.
36
|
ANNUAL CONSOLIDATED FINANCIAL STATEMENTS |
In total, as at December 31, 2023, the Company issued 34,669,322 shares under the 2021 ATM Program for aggregate gross proceeds of $66,062,000. The common shares were issued at an average price of $1.91. The Company also recognized total issue costs of $2,192,000 related to its ATM share issuances which includes $1,321,000 of commissions and $871,000 associated with the set-up and maintenance of the 2021 Shelf Prospectus and 2021 ATM Program.
On October 16, 2023, the Company completed a bought deal public offering by way of a prospectus supplement to the 2021 Shelf Prospectus of 37,000,000 common shares of the Company at US$1.49 per share for gross proceeds of $75,082,000 (US$55,130,000). The Company also recognized issue costs of $4,240,000 related to this bought deal public offering share issuance.
Flow-Through Share Issues
During the year ended December 31, 2022, the Company financed a portion of its exploration programs through the use of flow-through share issuances. Canadian income tax deductions relating to these expenditures are claimable by the investors and not by the Company.
As at December 31, 2022, the Company had satisfied its obligation to spend $8,000,000 on eligible exploration expenditures by the end of fiscal 2022 due to the issuance of flow-through shares in March 2021. The Company renounced the income tax benefits of this issue in February 2022, with an effective date of renunciation to its subscribers of December 31, 2021.
18.SHARE-BASED COMPENSATION
The Company’s share-based compensation arrangements include share options, restricted share units (“RSUs”) and performance share units (“PSUs”).
Share-based compensation is recorded over the vesting period, and a summary of share-based compensation expense recognized in the statement of income (loss) is as follows:
|
|
|
|
|
||
(in thousands) |
|
2023 |
|
2022 |
||
|
|
|
|
|
|
|
Share based compensation expense for: |
|
|
|
|
|
|
Share options |
|
$ |
(1,324) |
|
$ |
(1,416) |
RSUs |
|
|
(2,336) |
|
|
(2,076) |
PSUs |
|
|
(86) |
|
|
(244) |
Share based compensation expense |
|
$ |
(3,746) |
|
$ |
(3,736) |
An additional $2,068,000 in share-based compensation expense remains to be recognized, up until December 2026, on outstanding share options and share units at December 31, 2023.
Share Options
The Company’s Share Option Plan provides for the granting of share options up to 10% of the issued and outstanding common shares at the time of grant, subject to a maximum of 39,670,000 common shares. As of December 31, 2023, an aggregate of 28,725,593 options (December 31, 2022 - 27,485,093) have been granted (less cancellations) since the Share Option Plan’s inception in 1997.
Under the Share Option Plan, all share options are granted at the discretion of the Company’s board of directors, including any vesting provisions if applicable. The term of any share option granted may not exceed ten years and the exercise price may not be lower than the closing price of the Company’s shares on the last trading day immediately preceding the date of grant. Typically, share options granted under the Share Option Plan have five-year terms and vesting period of two or three years. Share options issued during the twelve months ended December 31, 2023 and December 31, 2022 had vesting periods of three years.
37
|
ANNUAL CONSOLIDATED FINANCIAL STATEMENTS |
A continuity summary of the share options granted under the Company’s Share Option Plan is presented below:
|
|
|
|
|
||||||
|
|
2023 |
|
2022 |
||||||
|
|
|
|
Weighted |
|
|
|
Weighted |
||
|
|
|
|
Average |
|
|
|
Average |
||
|
|
|
|
Exercise |
|
|
|
Exercise |
||
|
|
Number of |
|
Price per |
|
Number of |
|
Price per |
||
|
|
Common |
|
Share |
|
Common |
|
Share |
||
|
|
Shares |
|
(CAD) |
|
Shares |
|
(CAD) |
||
Share options outstanding-January 1 |
|
8,539,214 |
|
$ |
1.09 |
|
9,449,895 |
|
$ |
0.86 |
Grants |
|
1,881,000 |
|
|
1.54 |
|
1,687,000 |
|
|
1.82 |
Exercises (1) |
|
(4,559,047) |
|
|
0.78 |
|
(2,169,681) |
|
|
0.67 |
Expiries |
|
(24,000) |
|
|
0.60 |
|
(26,000) |
|
|
0.85 |
Forfeitures |
|
(616,500) |
|
|
1.37 |
|
(402,000) |
|
|
1.14 |
Share options outstanding-December 31 |
|
5,220,667 |
|
$ |
1.49 |
|
8,539,214 |
|
$ |
1.09 |
Share options exercisable-December 31 |
|
2,757,669 |
|
$ |
1.35 |
|
5,178,714 |
|
$ |
0.78 |
| (1) | The weighted average share price at the date of exercise was $2.05 (December 31, 2022 - $1.75). |
A summary of the Company’s share options outstanding at December 31, 2023 is presented below:
|
|
|
|
|
|
|
|
|
|
Weighted |
|
|
|
Weighted- |
|
|
|
Average |
|
|
|
Average |
|
|
|
Remaining |
|
|
|
Exercise |
|
Range of Exercise |
|
Contractual |
|
Number of |
|
Price per |
|
Prices per Share |
|
Life |
|
Common |
|
Share |
|
(CAD) |
|
(Years) |
|
Shares |
|
(CAD) |
|
|
|
|
|
|
|
|
|
Share options outstanding |
|
|
|
|
|
|
|
$0.25 to $0.49 |
|
1.19 |
|
86,000 |
|
$ |
0.46 |
$0.50 to $0.74 |
|
1.13 |
|
75,500 |
|
|
0.65 |
$0.75 to $0.99 |
|
— |
|
— |
|
|
— |
$1.00 to $1.49 |
|
3.05 |
|
3,616,167 |
|
|
1.37 |
$1.50 to $1.99 |
|
3.22 |
|
1,270,000 |
|
|
1.83 |
$2.00 to $2.49 |
|
4.07 |
|
173,000 |
|
|
2.26 |
Share options outstanding-December 31, 2023 |
|
3.06 |
|
5,220,667 |
|
$ |
1.49 |
Share options outstanding at December 31, 2023 expire between March 2024 and December 2028.
38
|
ANNUAL CONSOLIDATED FINANCIAL STATEMENTS |
The fair value of each share option granted is estimated on the date of grant using the Black-Scholes option pricing model. The following table outlines the assumptions used in the model to determine the fair value of share options granted:
|
|
|
|
|
|
|
|
2023 |
|
2022 |
|
|
|
|
|
|
|
Risk-free interest rate |
|
3.68% - 4.70 |
% |
1.44% - 4.07 |
% |
Expected stock price volatility |
|
65.75% - 73.41 |
% |
73.8% - 76.78 |
% |
Expected life |
|
3.41 years to 3.43 |
years |
3.37 years to 3.42 |
years |
Expected dividend yield |
|
— |
|
— |
|
Fair value per options granted |
|
0.79 to 1.14 |
|
0.82 to 1.10 |
|
The fair values of share options with vesting provisions are amortized on a graded method basis as share-based compensation expense over the applicable vesting periods.
Share Units
The Company has a share unit plan which provides for the granting of share unit awards to directors, officers, employees and consultants of the Company, in the form of RSUs or PSUs. The maximum number of share units that are issuable under the share unit plan is 15,000,000. Each share unit represents the right to receive one common share from treasury, subject to the satisfaction of various time and / or performance conditions.
Under the plan, all share unit grants, vesting periods and performance conditions therein are approved by the Company’s board of directors. RSUs granted under the plan in 2023, to date, vest ratably over a period of three years. PSUs granted under the plan in 2023, vest over one year based upon the achievement of certain non-market performance vesting conditions. PSUs granted in 2018 vest ratably over a period of five years, PSUs granted in 2019 vest ratably over a period of four years and PSUs granted in 2020 vest ratably over a period of three years.
A continuity summary of the RSUs of the Company granted under the share unit plan for 2023 and 2022 is presented below:
|
|
|
|
|
||||||
|
|
2023 |
|
2022 |
||||||
|
|
|
|
Weighted |
|
|
|
Weighted |
||
|
|
|
|
Average |
|
|
|
Average |
||
|
|
Number of |
|
Fair Value |
|
Number of |
|
Fair Value |
||
|
|
Common |
|
Per RSU |
|
Common |
|
Per RSU |
||
|
|
Shares |
|
(CAD) |
|
Shares |
|
(CAD) |
||
|
|
|
|
|
|
|
|
|
|
|
RSUs outstanding-January 1 |
|
6,416,089 |
|
$ |
1.04 |
|
5,801,841 |
|
$ |
0.80 |
Grants |
|
1,507,000 |
|
|
1.52 |
|
1,251,000 |
|
|
2.08 |
Exercises (1) |
|
(2,157,835) |
|
|
0.93 |
|
(435,002) |
|
|
0.82 |
Forfeitures |
|
(184,335) |
|
|
1.65 |
|
(201,750) |
|
|
1.04 |
RSUs outstanding-December 31 |
|
5,580,919 |
|
$ |
1.20 |
|
6,416,089 |
|
$ |
1.04 |
RSUs vested-December 31 |
|
3,189,921 |
|
$ |
0.85 |
|
3,307,840 |
|
$ |
0.67 |
| (1) | The weighted average share price at the date of exercise was $1.94 (December 31, 2022 - $1.79). |
39
|
ANNUAL CONSOLIDATED FINANCIAL STATEMENTS |
A continuity summary of the PSUs of the Company granted under the share unit plan for 2023 and 2022 is presented below:
|
|
|
|
|
||||||
|
|
2023 |
|
2022 |
||||||
|
|
|
|
Weighted |
|
|
|
Weighted |
||
|
|
|
|
Average |
|
|
|
Average |
||
|
|
Number of |
|
Fair Value |
|
Number of |
|
Fair Value |
||
|
|
Common |
|
Per PSU |
|
Common |
|
Per PSU |
||
|
|
Shares |
|
(CAD) |
|
Shares |
|
(CAD) |
||
|
|
|
|
|
|
|
|
|
|
|
PSUs outstanding-January 1 |
|
1,470,000 |
|
$ |
0.77 |
|
1,530,000 |
|
$ |
0.62 |
Grants |
|
— |
|
|
— |
|
120,000 |
|
|
2.08 |
Exercises (1) |
|
(988,500) |
|
|
0.74 |
|
(120,000) |
|
|
0.38 |
Forfeitures |
|
— |
|
|
— |
|
(60,000) |
|
|
0.38 |
PSUs outstanding-December 31 |
|
481,500 |
|
$ |
0.83 |
|
1,470,000 |
|
$ |
0.77 |
PSUs vested-December 31 |
|
481,500 |
|
$ |
0.83 |
|
1,080,000 |
|
$ |
0.65 |
| (1) | The weighted average share price at the date of exercise was $2.07 (December 31, 2022 - $1.58). |
The fair value of each RSU and PSU granted is estimated on the date of grant using the Company’s closing share price on the day before the grant date.
19.ACCUMULATED OTHER COMPREHENSIVE INCOME
The accumulated other comprehensive income balance consists of:
|
|
|
|
|
|
|
|
|
At December 31 |
|
At December 31 |
||
(in thousands) |
|
2023 |
|
2022 |
||
|
|
|
|
|
|
|
Cumulative foreign currency translation |
|
$ |
456 |
|
$ |
420 |
Experience gains-post employment liability |
|
|
|
|
|
|
Gross |
|
|
1,847 |
|
|
1,847 |
Tax effect |
|
|
(485) |
|
|
(485) |
|
|
$ |
1,818 |
|
$ |
1,782 |
40
|
ANNUAL CONSOLIDATED FINANCIAL STATEMENTS |
20.SUPPLEMENTAL FINANCIAL INFORMATION
The components of Operating expenses for continuing operations are as follows:
|
|
|
|
|
||
(in thousands) |
|
2023 |
|
2022 |
||
|
|
|
|
|
|
|
Cost of goods and services sold: |
|
|
|
|
|
|
Cost of goods sold-mineral concentrates |
|
$ |
— |
|
$ |
(444) |
Operating overheads: |
|
|
|
|
|
|
Mining, other development expense |
|
|
(261) |
|
|
(660) |
Milling, conversion expense |
|
|
(2,463) |
|
|
(3,104) |
Less absorption: |
|
|
|
|
|
|
- Mineral properties |
|
|
— |
|
|
68 |
- Milling |
|
|
— |
|
|
— |
Other costs |
|
|
(986) |
|
|
(749) |
Cost of goods and services sold |
|
|
(3,710) |
|
|
(4,889) |
Reclamation asset amortization |
|
|
(188) |
|
|
(199) |
Selling expenses |
|
|
— |
|
|
(48) |
Sales royalties and non-income taxes |
|
|
— |
|
|
(216) |
Operating expenses – continuing operations |
|
$ |
(3,898) |
|
$ |
(5,352) |
The components of Other income for continuing operations are as follows:
|
|
|
|
|
||
(in thousands) |
|
2023 |
|
2022 |
||
|
|
|
|
|
|
|
Gains (losses) on: |
|
|
|
|
|
|
Foreign exchange |
|
$ |
321 |
|
$ |
816 |
Disposal of property, plant and equipment |
|
|
1,299 |
|
|
(25) |
Fair value changes: |
|
|
|
|
|
|
Investments-equity instruments (note 7) |
|
|
(9) |
|
|
(6,469) |
Investments-uranium (note 7) |
|
|
134,180 |
|
|
29,422 |
Investments-convertible debentures (note 7) |
|
|
565 |
|
|
— |
Warrants on investment (note 7) |
|
|
— |
|
|
1,625 |
Share purchase warrant liabilities (note 14) |
|
|
— |
|
|
20,337 |
Reclamation obligation adjustments (note 13) |
|
|
(3,229) |
|
|
4,126 |
Gain on recognition of proceeds–UI Repayment Agreement |
|
|
4,097 |
|
|
6,142 |
Uranium investment carrying charges |
|
|
(409) |
|
|
(374) |
Other |
|
|
(343) |
|
|
(356) |
Other income – continuing operations |
|
$ |
136,472 |
|
$ |
55,244 |
41
|
ANNUAL CONSOLIDATED FINANCIAL STATEMENTS |
The components of Finance expense for continuing operations are as follows:
|
|
|
|
|
||
(in thousands) |
|
2023 |
|
2022 |
||
|
|
|
|
|
|
|
Interest income |
|
$ |
4,189 |
|
$ |
1,419 |
Interest expense |
|
|
(4) |
|
|
(6) |
Accretion expense |
|
|
|
|
|
|
Deferred revenue (note 12) |
|
|
(3,518) |
|
|
(2,774) |
Post-employment benefits (note 15) |
|
|
(21) |
|
|
(22) |
Reclamation obligations (note 13) |
|
|
(1,681) |
|
|
(1,444) |
Debt obligations (note 15) |
|
|
(27) |
|
|
(32) |
Finance expense – continuing operations |
|
$ |
(1,062) |
|
$ |
(2,859) |
A summary of depreciation expense recognized in the statement of income (loss) is as follows:
|
|
|
|
|
||
(in thousands) |
|
2023 |
|
2022 |
||
|
|
|
|
|
|
|
Continuing operations: |
|
|
|
|
|
|
Operating expenses: |
|
|
|
|
|
|
Mining, other development expense |
|
$ |
(1) |
|
$ |
(2) |
Milling, conversion expense |
|
|
(2,455) |
|
|
(3,076) |
Evaluation |
|
|
(583) |
|
|
(270) |
Exploration |
|
|
(540) |
|
|
(266) |
General and administrative |
|
|
(154) |
|
|
(144) |
Decommissioning |
|
|
(211) |
|
|
(185) |
Depreciation expense-gross |
|
$ |
(3,944) |
|
$ |
(3,943) |
A summary of employee benefits expense recognized in the statement of income (loss) is as follows:
|
|
|
|
|
|
|
(in thousands) |
|
2023 |
|
2022 |
||
|
|
|
|
|
|
|
Salaries and short-term employee benefits |
|
$ |
(13,021) |
|
$ |
(12,416) |
Share-based compensation (note 18) |
|
|
(3,746) |
|
|
(3,736) |
Termination benefits |
|
|
(944) |
|
|
(2) |
Employee benefits expense |
|
$ |
(17,711) |
|
$ |
(16,154) |
A summary of lease related amounts recognized in the statement of income (loss) is as follows:
|
|
|
|
|
|
|
(in thousands) |
|
2023 |
|
2022 |
||
|
|
|
|
|
|
|
Accretion expense on lease liabilities |
|
$ |
(27) |
|
$ |
(32) |
Expenses relating to short-term leases |
|
|
(5,753) |
|
|
(6,095) |
Expenses relating to non-short term low-value leases |
|
|
— |
|
|
(1) |
Lease related expense-gross |
|
$ |
(5,780) |
|
$ |
(6,128) |
42
|
ANNUAL CONSOLIDATED FINANCIAL STATEMENTS |
The change in non-cash operating working capital items in the consolidated statements of cash flows is as follows:
|
|
|
|
|
|
|
(in thousands) |
|
2023 |
|
2022 |
||
|
|
|
|
|
|
|
Change in non-cash working capital items: |
|
|
|
|
|
|
Trade and other receivables |
|
$ |
2,230 |
|
$ |
(512) |
Inventories |
|
|
(866) |
|
|
741 |
Prepaid expenses and other assets |
|
|
(253) |
|
|
129 |
Accounts payable and accrued liabilities |
|
|
759 |
|
|
1,385 |
Change in non-cash working capital items |
|
$ |
1,870 |
|
$ |
1,743 |
The supplemental cash flow disclosure required for the consolidated statements of cash flows is as follows:
|
|
|
|
|
||
(in thousands) |
|
2023 |
|
2022 |
||
|
|
|
|
|
|
|
Supplemental cash flow disclosure: |
|
|
|
|
|
|
Interest paid |
|
$ |
(4) |
|
$ |
(6) |
Income taxes paid |
|
|
— |
|
|
— |
21.SEGMENTED INFORMATION
Business Segments
The Company operates in two primary segments – the Mining segment and the Corporate and Other segment. The Mining segment includes activities related to exploration, evaluation and development, mining, milling (including toll milling), sale of mineral concentrates and results of the Company’s mine decommissioning. The Corporate and Other segment includes general corporate expenses not allocated to the other segments.
43
|
ANNUAL CONSOLIDATED FINANCIAL STATEMENTS |
For the year ended December 31, 2023, reportable segment results were as follows:
|
|
|
|
|
|
|
|
|
|
|
|
|
|
|
Total |
|
|
|
|
|
Corporate |
|
Continuing |
(in thousands) |
|
Mining |
|
and Other |
|
Operations |
|
|
|
|
|
|
|
|
|
Statement of Operations: |
|
|
|
|
|
|
|
Revenues |
|
$ |
1,855 |
|
— |
|
1,855 |
|
|
|
|
|
|
|
|
Expenses: |
|
|
|
|
|
|
|
Operating expenses |
|
$ |
(3,898) |
|
— |
|
(3,898) |
Exploration |
|
|
(9,564) |
|
— |
|
(9,564) |
Evaluation |
|
|
(18,622) |
|
— |
|
(18,622) |
General and administrative |
|
|
(19) |
|
(13,741) |
|
(13,760) |
|
|
|
(32,103) |
|
(13,741) |
|
(45,844) |
Segment income (loss) |
|
$ |
(30,248) |
|
(13,741) |
|
(43,989) |
|
|
|
|
|
|
|
|
Revenues-supplemental: |
|
|
|
|
|
|
|
Toll milling services-deferred revenue (note 12) |
|
|
1,855 |
|
— |
|
1,855 |
|
|
$ |
1,855 |
|
— |
|
1,855 |
|
|
|
|
|
|
|
|
Capital additions: |
|
|
|
|
|
|
|
Property, plant and equipment (note 10) |
|
$ |
2,165 |
|
1,103 |
|
3,268 |
|
|
|
|
|
|
|
|
Long-lived assets: |
|
|
|
|
|
|
|
Plant and equipment |
|
|
|
|
|
|
|
Cost |
|
$ |
106,914 |
|
6,559 |
|
113,473 |
Accumulated depreciation |
|
|
(38,178) |
|
(1,162) |
|
(39,340) |
Mineral properties |
|
|
180,813 |
|
— |
|
180,813 |
|
|
$ |
249,549 |
|
5,397 |
|
254,946 |
44
|
ANNUAL CONSOLIDATED FINANCIAL STATEMENTS |
For the year ended December 31, 2022, reportable segment results were as follows:
|
|
|
|
|
|
|
|
|
|
|
|
|
|
|
Total |
|
|
|
|
|
Corporate |
|
Continuing |
(in thousands) |
|
Mining |
|
and Other |
|
Operations |
|
|
|
|
|
|
|
|
|
Statement of Operations: |
|
|
|
|
|
|
|
Revenues |
|
$ |
8,973 |
|
— |
|
8,973 |
|
|
|
|
|
|
|
|
Expenses: |
|
|
|
|
|
|
|
Operating expenses |
|
$ |
(5,352) |
|
— |
|
(5,352) |
Evaluation |
|
|
(8,097) |
|
— |
|
(8,097) |
Exploration |
|
|
(22,181) |
|
— |
|
(22,181) |
General and administrative |
|
|
(22) |
|
(12,516) |
|
(12,538) |
|
|
|
(35,652) |
|
(12,516) |
|
(48,168) |
Segment income (loss) |
|
$ |
(26,679) |
|
(12,516) |
|
(39,195) |
|
|
|
|
|
|
|
|
Revenues-supplemental: |
|
|
|
|
|
|
|
Toll milling services-deferred revenue (note 12) |
|
$ |
5,987 |
|
— |
|
5,987 |
Uranium concentrate sales |
|
|
2,986 |
|
— |
|
2,986 |
|
|
$ |
8,973 |
|
— |
|
8,973 |
|
|
|
|
|
|
|
|
Capital additions: |
|
|
|
|
|
|
|
Property, plant and equipment (note 10) |
|
$ |
2,634 |
|
4,631 |
|
7,265 |
|
|
|
|
|
|
|
|
Long-lived assets: |
|
|
|
|
|
|
|
Plant and equipment |
|
|
|
|
|
|
|
Cost |
|
$ |
103,338 |
|
5,493 |
|
108,831 |
Accumulated depreciation |
|
|
(34,803) |
|
(742) |
|
(35,545) |
Mineral properties |
|
|
180,219 |
|
— |
|
180,219 |
|
|
$ |
248,754 |
|
4,751 |
|
253,505 |
Discontinued Operations
At the end of August, 2023, the Company’s long-term third party closed mines services contract came to an end. Following the termination of this contract and during the fourth quarter, the Company determined that it would cease providing such third party care and maintenance services for closed mines and reorganized the business accordingly.
45
|
ANNUAL CONSOLIDATED FINANCIAL STATEMENTS |
The Company’s post-closure mine care and maintenance services were previously reported in a Closed Mines services segment which now constitutes a discontinued operation. The consolidated statement of income (loss) for the discontinued operation for 2023 and 2022 is as follows:
|
|
|
|
|
|
|
|
|
Year Ended |
||||
|
|
December 31 |
|
December 31 |
||
(in thousands) |
|
2023 |
|
2022 |
||
|
|
|
|
|
|
|
Revenue |
|
$ |
6,582 |
|
$ |
7,972 |
|
|
|
|
|
|
|
Expenses |
|
|
|
|
|
|
Operating expenses |
|
|
(5,715) |
|
|
(6,273) |
|
|
|
|
|
|
|
Other income |
|
|
|
|
|
|
Finance fees |
|
|
144 |
|
|
83 |
|
|
|
|
|
|
|
Income from discontinued operations, net of taxes |
|
$ |
1,011 |
|
$ |
1,782 |
Cash flows for the Closed Mines discontinued operation for 2023 and 2022 is as follows:
|
|
|
|
|
|
|
|
|
Year Ended |
||||
|
|
December 31 |
|
December 31 |
||
(in thousands) |
|
2023 |
|
2022 |
||
|
|
|
|
|
|
|
Cash inflow: |
|
|
|
|
|
|
Net cash from operating activities |
|
$ |
3,274 |
|
$ |
1,909 |
Net cash flows for the year |
|
$ |
3,274 |
|
$ |
1,909 |
Revenue Concentration
Until September 2023, the Company’s business was such that, at any given time, it sold its environmental and other services to a relatively small number of customers. During 2023, one customer from the discontinued operations (Closed Mines Services) segment and one customer from the Mining segment accounted for approximately 100% of total revenues consisting of 78%, and 22% respectively. During 2022, one customer from the discontinued operations segment and two customers from the Mining segment accounted for approximately 100% of total revenues consisting of 47%, and 53% respectively.
Revenue Commitments
The Company is contracted to pay onward to Ecora all toll milling cash proceeds received from the MLJV related to the processing of specified Cigar Lake ore through the McClean Lake mill (see note 12). The timing and amount of such future toll milling cash proceeds are outside the control of the Company.
46
|
ANNUAL CONSOLIDATED FINANCIAL STATEMENTS |
22.RELATED PARTY TRANSACTIONS
Korea Electric Power Corporation (“KEPCO”) and Korea Hydro & Nuclear Power (“KHNP”)
In connection with KEPCO’s indirect investment in Denison in June 2009, KEPCO and Denison became parties to a strategic relationship agreement. With KEPCO’s indirect ownership of Denison’s shares transferred from an affiliate of KEPCO to KHNP Canada Energy Ltd. (“KHNP Canada”), an affiliate of KEPCO’s wholly-owned subsidiary, KHNP, Denison and KHNP Canada entered into an amended and restated strategic relationship agreement (“KHNP SRA”) in September 2017. The KHNP SRA provides KHNP Canada, amongst other matters, the rights to: (a) subscribe for additional common shares in Denison’s future public equity offerings; (b) a right of first opportunity if Denison intends to sell any of its substantial assets; (c) a right to participate in certain purchases of substantial assets which Denison proposes to acquire; and (d) a right to nominate one director to Denison’s board so long as its share interest in Denison is above 5.0%.
KHNP Canada is also the majority member of the Korea Waterbury Uranium Limited Partnership (“KWULP”). KWULP is a consortium of investors that holds the non-Denison owned interests in Waterbury Lake Uranium Corporation (“WLUC”) and the WLULP, entities whose key asset is the Waterbury Lake property. At December 31, 2023, WLUC is owned by Denison Waterbury Corp (60%) and KWULP (40%) while the WLULP is owned by Denison Waterbury Corp (69.35% - limited partner), KWULP (30.63% - limited partner) and WLUC (0.02% - general partner). When a spending program is approved, each participant is required to fund these entities based upon its respective ownership interest or be diluted accordingly. Spending program approval requires 75% of the limited partners’ voting interest.
In January 2014, Denison agreed to allow KWULP to defer a decision regarding its funding obligation to WLUC and WLULP until September 30, 2015 and to not be immediately diluted as per the dilution provisions in the relevant agreements (“Dilution Agreement”). Instead, under the Dilution Agreement, dilution would be delayed until September 30, 2015 and then applied in each subsequent period, if applicable, in accordance with the original agreements. In exchange, Denison received authorization to approve spending programs on the property, up to an aggregate $10,000,000, until September 30, 2016 without obtaining approval from 75% of the voting interest. Under subsequent amendments, Denison and KWULP have agreed to extend Denison’s authorization under the Dilution Agreement to approve program spending up to an aggregate $20,000,000 until December 31, 2023.
In 2022, Denison funded 100% of the approved fiscal 2022 program for Waterbury Lake and KWULP continued to dilute its interest in the WLULP. As a result, Denison increased its interest in the WLULP from 66.90% to 67.41%, in two steps, which was accounted for using effective dates of May 31, 2023 and November 30, 2022. The increased ownership interest resulted in Denison recording its increased pro-rata share of the assets and liabilities of Waterbury Lake, the majority of which relates to an addition to mineral property assets of $363,000.
In 2023, Denison funded 100% of the approved fiscal 2023 program for Waterbury Lake and KWULP continued to dilute its interest in the WLULP. As a result, Denison increased its interest in the WLULP from 67.41% to 69.35%, which was accounted for using an effective date of October 31, 2023. The increased ownership interest resulted in Denison recording its increased pro-rata share of the assets and liabilities of Waterbury Lake, the majority of which relates to an addition to mineral property assets of $1,456,000.
Compensation of Key Management Personnel
Key management personnel are those persons having authority and responsibility for planning, directing and controlling the activities of the Company, directly or indirectly. Key management personnel includes the Company’s executive officers, vice-presidents and members of its Board of Directors.
47
|
ANNUAL CONSOLIDATED FINANCIAL STATEMENTS |
The following compensation was awarded to key management personnel:
|
|
|
|
|
||
(in thousands) |
|
2023 |
|
2022 |
||
|
|
|
|
|
|
|
Salaries and short-term employee benefits |
|
$ |
(3,302) |
|
$ |
(3,251) |
Share-based compensation |
|
|
(2,865) |
|
|
(3,083) |
Key management personnel compensation |
|
$ |
(6,167) |
|
$ |
(6,334) |
23.CAPITAL MANAGEMENT AND FINANCIAL RISK
Capital Management
The Company’s capital includes equity, cash, cash equivalents, investments in debt instruments, investments in equity instruments and the current portion of debt obligations. The Company’s primary objective with respect to its capital management is to ensure that it has sufficient capital to maintain its ongoing operations, to provide returns to shareholders and benefits for other stakeholders, and to pursue growth opportunities.
Long-term planning, annual budgeting and controls over major investment decisions are the primary tools used to manage the Company’s capital. The Company’s cash is managed centrally and disbursed to the various business units based on a system of internal controls that require review and approval of significant expenditures by the Company’s key decision makers. Under the Company’s delegation of authority guidelines, significant debt obligations require the approval of the Board of Directors.
The Company monitors and reviews the composition of its net cash and investment position on an ongoing basis and adjusts its holdings as necessary to achieve the desired level of risk and/or to accommodate operating plans for the current and future periods.
48
|
ANNUAL CONSOLIDATED FINANCIAL STATEMENTS |
The Company’s net cash and investment position is summarized below:
|
|
|
|
|
|
|
|
|
At December 31 |
|
At December 31 |
||
(in thousands) |
|
2023 |
|
2022 |
||
|
|
|
|
|
|
|
Net cash and investments: |
|
|
|
|
|
|
Cash and cash equivalents (note 4) |
|
$ |
131,054 |
|
$ |
50,915 |
Equity instrument investments (note 7) |
|
|
10,517 |
|
|
8,109 |
Investments-uranium (note 7) |
|
|
276,815 |
|
|
162,536 |
Investments-convertible debentures (note 7) |
|
|
15,565 |
|
|
— |
Debt obligations-current (note 15) |
|
|
(213) |
|
|
(216) |
Net cash and investments |
|
$ |
433,738 |
|
$ |
221,344 |
At December 31, 2023, total equity was $641,784,000 (December 31, 2022 - $436,016,000).
Financial Risk
The Company examines the various financial risks to which it is exposed and assesses the impact and likelihood of those risks. These risks may include credit risk, liquidity risk, currency risk, interest rate risk, commodity price risk, and equity price risk.
(a)Credit Risk
Credit risk is the risk of loss due to a counterparty’s inability to meet its obligations under a financial instrument that will result in a financial loss to the Company. The Company believes that the carrying amount of its cash and cash equivalents, trade and other receivables, restricted cash and investments, and convertible debentures represent its maximum credit exposure.
The maximum exposure to credit risk at the reporting dates is as follows:
|
|
|
|
|
|
|
|
|
At December 31 |
|
At December 31 |
||
(in thousands) |
|
2023 |
|
2022 |
||
|
|
|
|
|
|
|
Cash and cash equivalents |
|
$ |
131,054 |
|
$ |
50,915 |
Trade and other receivables |
|
|
1,913 |
|
|
4,143 |
Restricted cash and investments |
|
|
11,231 |
|
|
11,105 |
Investments-convertible debentures |
|
|
15,565 |
|
|
— |
|
|
$ |
159,763 |
|
$ |
66,163 |
The Company limits cash and cash equivalents, and restricted cash and investments risk by dealing with credit worthy financial institutions. The majority of the Company’s normal course trade receivables balance relates to its joint operations and joint venture partners who have established credit worthiness with the Company through past dealings. Based on its historical credit loss experience, the Company has recorded an allowance for credit loss of $nil on its normal course trade receivables as at December 31, 2023 and December 31, 2022.
The Company’s Mongolia Sale Receivable is accounted for at fair value and is assessed as having a fair value of $nil using Level 3 inputs.
(b)Liquidity Risk
Liquidity risk is the risk that the Company will encounter difficulties in meeting obligations associated with its financial liabilities as they become due. The Company has in place a planning and budgeting process to help determine the funds required to support the Company’s normal operating requirements on an ongoing basis.
49
|
ANNUAL CONSOLIDATED FINANCIAL STATEMENTS |
The Company ensures that there is sufficient committed capital to meet its short-term business requirements, taking into account its anticipated cash flows from operations, its holdings of cash and cash equivalents and equity investments, its financial covenants, and its access to credit and capital markets, if required.
The maturities of the Company’s financial liabilities at December 31, 2023 are as follows:
|
|
|
|
|
|
|
|
|
Within 1 |
|
1 to 5 |
||
(in thousands) |
|
Year |
|
Years |
||
|
|
|
|
|
|
|
Accounts payable and accrued liabilities (note 11) |
|
$ |
10,822 |
|
$ |
— |
Debt obligations (note 15) |
|
|
213 |
|
|
204 |
|
|
$ |
11,035 |
|
$ |
204 |
(c)Currency Risk
Foreign exchange risk is the risk that the fair value of future cash flows of a financial instrument will fluctuate because of changes in foreign exchange rates. The Company predominantly operates in Canada and incurs the majority of its operating and capital costs in Canadian dollars.
As the prices of uranium are quoted in U.S. currency, fluctuations in the Canadian dollar relative to the U.S. dollar can significantly impact the valuation of the Company’s holdings of physical uranium from a Canadian dollar perspective.
The Company is also exposed to some foreign exchange risk on its net U.S dollar financial asset position, including cash and cash equivalents held in U.S. dollars.
At December 31, 2023, the Company’s net U.S dollar financial assets and uranium investments were $24,228,000 and $276,815,000, respectively, in CAD dollars. The impact of the U.S dollar strengthening or weakening (by 10%) on the value of the Company’s net U.S dollar-denominated assets is as follows:
|
|
|
|
|
|
|
|
|
|
Dec. 31'2023 |
|
Sensitivity |
|
|
|
|
|
Foreign |
|
Foreign |
|
Change in |
|
|
|
Exchange |
|
Exchange |
|
net income |
|
(in thousands except foreign exchange rates) |
|
Rate |
|
Rate |
|
(loss) |
|
|
|
|
|
|
|
|
|
Currency risk |
|
|
|
|
|
|
|
CAD weakens |
|
1.3226 |
|
1.1903 |
|
$ |
30,081 |
CAD strengthens |
|
1.3226 |
|
1.4549 |
|
$ |
(30,081) |
|
|
|
|
|
|
|
|
Currently, the Company does not have any programs or instruments in place to hedge this possible currency risk.
(d)Interest Rate Risk
Interest rate risk is the risk that the fair value or future cash flows of a financial instrument will fluctuate because of changes in market interest rates. The Company is exposed to interest rate risk on its liabilities through its outstanding borrowings and on its assets through its investments in convertible debt instruments. The Company monitors its exposure to interest rates and has not entered into any derivative contracts to manage this risk. The sensitivity analysis below illustrates the impact of interest rate risk on the convertible debt instruments held by the Company at December 31, 2023:
50
|
ANNUAL CONSOLIDATED FINANCIAL STATEMENTS |
|
|
|
|
|
|
|
|
|
Absolute change |
|
Base |
|
1% increase |
|
1% decrease |
|
|
|
|
|
|
|
|
|
|
|
Credit spread |
|
|
20 |
% |
21 |
% |
19 |
% |
Convertible debentures fair value (in thousands) |
|
$ |
15,565 |
|
15,339 |
|
15,801 |
|
(e)Commodity Price Risk
The Company’s uranium holdings are directly tied to the spot price of uranium. At December 31, 2023, a 10% increase in the uranium spot price would have increased the value of the Company’s holdings of physical uranium by $27,681,500, while a 10% decrease would have decreased the value of the Company’s holdings of physical uranium by $27,681,500.
(f)Equity Price Risk
The Company is exposed to equity price risk on its investments in equity instruments of other publicly traded companies. At December 31, 2023, a 10% increase in the equity price should have increased the value of the Company’s holdings of equity instruments by $1,052,000, while a 10% decrease would have decreased the value of the Company’s holdings of equity instruments by $1,052,000. The Company is also exposed to equity price risk on its convertible debt instruments due to the underlying equity price of the invested company. The sensitivity analysis below illustrates the impact of equity price risk on the convertible debt instruments held by the Company at December 31, 2023:
|
|
|
|
|
|
|
|
Absolute change |
|
Base |
|
10% increase |
|
10% decrease |
|
|
|
|
|
|
|
|
|
Equity price |
|
$ |
0.40 |
|
0.44 |
|
0.36 |
Convertible debentures fair value (in thousands) |
|
$ |
15,565 |
|
16,307 |
|
14,562 |
Fair Value of Investments and Financial Instruments
IFRS requires disclosures about the inputs to fair value measurements, including their classification within a hierarchy that prioritizes the inputs to fair value measurement. The three levels of the fair value hierarchy are:
| ● | Level 1 - Unadjusted quoted prices in active markets for identical assets or liabilities; |
| ● | Level 2 - Inputs other than quoted prices that are observable for the asset or liability either directly or indirectly; and |
| ● | Level 3 - Inputs that are not based on observable market data. |
The fair value of financial instruments which trade in active markets, such as share and warrant equity instruments, is based on quoted market prices at the balance sheet date. The quoted market price used to value financial assets held by the Company is the current closing price. The fair value of financial instruments that do not trade in active markets have been valued using different valuation approaches. Warrants have been valued using the Black-Scholes pricing model. The convertible debentures have been valued using a valuation model based on the finite-difference method, which results in a pair of coupled partial differential equations that are solved simultaneously to calculate the value of the debt and embedded conversion option in a convertible bond. Inputs used for the valuation of the convertible debentures include: valuation dates, maturity date, risk-free rates, share prices of the bond issuer at valuation dates, equity volatility, stated interest rate, conversion price, redemption price, and the credit spreads. Significant unobservable inputs include a 20.05% credit spread that is based on the ICE BofA CCC & Lower US High Yield Index Option-Adjusted Spread and a volatility of 57% at December 31, 2023. The Company determines the valuation approaches for each type of financial instrument it holds in accordance with the most relevant measurement basis and re-assesses their relevancy during each reporting period.
51
|
ANNUAL CONSOLIDATED FINANCIAL STATEMENTS |
Except as otherwise disclosed, the fair values of cash and cash equivalents, trade and other receivables, accounts payable and accrued liabilities, restricted cash and cash equivalents and debt obligations approximate their carrying values as a result of the short-term nature of the instruments, the variable interest rate associated with the instruments or the fixed interest rate of the instruments being similar to market rates.
During 2023 and 2022, there were no transfers between levels 1, 2 and 3 and there were no changes in valuation techniques.
The following table illustrates the classification of the Company’s financial assets and liabilities within the fair value hierarchy as at December 31, 2023 and December 31, 2022:
|
|
|
|
|
|
|
|
|
|
|
|
|
Financial |
|
Fair |
|
December 31, |
|
December 31, |
||
|
|
Instrument |
|
Value |
|
2023 |
|
2022 |
||
(in thousands) |
|
Category(1) |
|
Hierarchy |
|
Fair Value |
|
Fair Value |
||
|
|
|
|
|
|
|
|
|
|
|
Financial Assets: |
|
|
|
|
|
|
|
|
|
|
Cash and equivalents |
|
Category B |
|
|
|
$ |
131,054 |
|
$ |
50,915 |
Trade and other receivables |
|
Category B |
|
|
|
|
1,913 |
|
|
4,143 |
Investments |
|
|
|
|
|
|
|
|
|
|
Equity instruments-shares |
|
Category A |
|
Level 1 |
|
|
10,390 |
|
|
8,022 |
Equity instruments-warrants |
|
Category A |
|
Level 2 |
|
|
127 |
|
|
87 |
Convertible Debentures |
|
Category A |
|
Level 3 |
|
|
15,565 |
|
|
— |
Restricted cash and equivalents |
|
|
|
|
|
|
|
|
|
|
Elliot Lake reclamation trust fund |
|
Category B |
|
|
|
|
3,259 |
|
|
3,133 |
Credit facility pledged assets |
|
Category B |
|
|
|
|
7,972 |
|
|
7,972 |
|
|
|
|
|
|
$ |
170,280 |
|
$ |
74,272 |
|
|
|
|
|
|
|
|
|
|
|
Financial Liabilities: |
|
|
|
|
|
|
|
|
|
|
Account payable and accrued liabilities |
|
Category C |
|
|
|
|
10,822 |
|
|
10,299 |
Debt obligations |
|
Category C |
|
|
|
|
417 |
|
|
576 |
|
|
|
|
|
|
$ |
11,239 |
|
$ |
10,875 |
| (1) | Financial instrument designations are as follows: Category A=Financial assets and liabilities at fair value through profit and loss; Category B=Financial assets at amortized cost; and Category C=Financial liabilities at amortized cost. |
Investments in uranium are categorized in Level 2. Investments in uranium are measured at fair value at each reporting period based on the month-end spot price for uranium published by UxC and converted to Canadian dollars using the period-end indicative foreign exchange rate.
24.COMMITMENTS AND CONTINGENCIES
General Legal Matters
The Company is involved, from time to time, in various legal actions and claims in the ordinary course of business. In the opinion of management, the aggregate amount of any potential liability is not expected to have a material adverse effect on the Company’s financial position or results.
Specific Legal Matters
Mongolia Mining Division Sale – Arbitration Proceedings with Uranium Industry a.s.
In November 2015, the Company sold all of its mining assets and operations located in Mongolia to Uranium Industry a.s (“UI”) pursuant to an amended and restated share purchase agreement (the “GSJV Agreement”). The primary assets at that time were the exploration licenses for the Hairhan, Haraat, Gurvan Saihan and Ulzit projects. As consideration for the sale per the GSJV Agreement, the Company received cash consideration of USD$1,250,000 prior to closing and the rights to receive additional contingent consideration of up to USD$12,000,000.
52
|
ANNUAL CONSOLIDATED FINANCIAL STATEMENTS |
On September 2016, the Mineral Resources Authority of Mongolia (“MRAM”) formally issued mining license certificates for all four projects, triggering Denison’s right to receive contingent consideration of USD$10,000,000 (collectively, the “Mongolia Sale Receivable”). The original due date for payment of the Mongolia Sale Receivable by UI was November 16, 2016. This contingent consideration is accounted for at fair value. Upon the issuance of the mining license receivable, the fair value of the contingent consideration was increased from $nil to US$10,000,000 and upon the non-payment by UI the fair value was reduced back to $nil.
Under an extension agreement between UI and the Company, the payment due date of the Mongolia Sale Receivable was extended from November 16, 2016 to July 16, 2017 (the “Extension Agreement”). As consideration for the extension, UI agreed to pay interest on the Mongolia Sale Receivable amount at a rate of 5% per year, payable monthly up to July 16, 2017 and they also agreed to pay a USD$100,000 instalment amount towards the balance of the Mongolia Sale Receivable amount. The required payments were not made.
In February 2017, the Company served notice to UI that it was in default of its obligations under the GSJV Agreement and the Extension Agreement and on December 12, 2017, the Company filed a Request for Arbitration between the Company and UI under the Arbitration Rules of the London Court of International Arbitration. The final award was rendered by an arbitration panel on July 27, 2020, with the panel finding in favour of Denison and ordering UI to pay the Company USD$10,000,000 plus interest at a rate of 5% per annum from November 16, 2016, plus certain legal and arbitration costs.
In January 2022, the Company executed a Repayment Agreement with UI (the “Repayment Agreement”). Under the terms of the Repayment Agreement, UI has agreed to make scheduled payments of the Arbitration Award, plus additional interest and fees, through a series of quarterly installments and annual milestone payments until December 31, 2025. The total amount due to Denison under the Repayment Agreement is approximately USD$16,000,000 inclusive of additional interest to be earned over the term of the agreement at a rate of 6.5% per annum. The Repayment Agreement includes customary covenants and conditions in favour of Denison, including certain restrictions on UI’s ability to take on additional debt, in consideration for Denison’s deferral of enforcement of the Arbitration Award while UI is in compliance with its obligations under the Repayment Agreement.
During the year ended December 31, 2023, the Company received US$3,100,000 from UI (December 31, 2022 - US$4,800,000), of which a portion relates to reimbursement of legal and other expenses incurred by Denison, resulting in the recognition of income of $4,097,000 (December 31, 2022 - $6,142,000) in the period. This contingent consideration continues to be recorded at fair value at each period end (December 31, 2023 and 2022- $nil).
53
|
ANNUAL CONSOLIDATED FINANCIAL STATEMENTS |
Performance Bonds and Letters of Credit
In conjunction with various contracts, reclamation and other performance obligations, the Company may be required to issue performance bonds and letters of credit as security to creditors to guarantee the Company’s performance. Any potential payments which might become due under these items would be related to the Company’s non-performance under the applicable contract. As at December 31, 2023, the Company had outstanding letters of credit of $23,964,000 for reclamation obligations which are collateralized by the Company’s 2024 Credit Facility (see note 15).
25.INTEREST IN OTHER ENTITIES
The significant subsidiaries, associates and joint arrangements of the Company at December 31, 2023 are listed below. The table also includes information related to key contractual arrangements associated with the Company’s mineral property interests that comprise 91.0% of the December 31, 2023 carrying value of its Mineral Property assets (see note 10).
|
|
|
|
|
|
|
|
|
|
|
|
|
|
|
December |
|
December |
|
Fiscal |
|
|
|
|
Place |
|
31, 2023 |
|
31, 2022 |
|
2023 |
|
|
|
|
Of |
|
Ownership |
|
Ownership |
|
Participating |
|
Accounting |
|
|
Business |
|
Interest (1) |
|
Interest (1) |
|
Interest (2) |
|
Method |
Subsidiaries |
|
|
|
|
|
|
|
|
|
|
Denison Mines Inc. |
|
Canada |
|
100.00 |
% |
100.00 |
% |
N/A |
|
Consolidation |
Denison AB Holdings Corp. |
|
Canada |
|
100.00 |
% |
100.00 |
% |
N/A |
|
Consolidation |
Denison Waterbury Corp |
|
Canada |
|
100.00 |
% |
100.00 |
% |
N/A |
|
Consolidation |
9373721 Canada Inc. |
|
Canada |
|
100.00 |
% |
100.00 |
% |
N/A |
|
Consolidation |
Denison Mines (Bermuda) I Ltd |
|
Bermuda |
|
100.00 |
% |
100.00 |
% |
N/A |
|
Consolidation |
|
|
|
|
|
|
|
|
|
|
|
Joint Operations |
|
|
|
|
|
|
|
|
|
|
Waterbury Lake Uranium Corp(3) |
|
Canada |
|
60.00 |
% |
60.00 |
% |
100 |
% |
Voting Share (4) |
Waterbury Lake Uranium LP(3) |
|
Canada |
|
69.35 |
% |
67.41 |
% |
100 |
% |
Voting Share (4) |
|
|
|
|
|
|
|
|
|
|
|
Joint Venture |
|
|
|
|
|
|
|
|
|
|
JCU |
|
Canada |
|
50.00 |
% |
50.00 |
% |
50.00 |
% |
Equity(5) |
|
|
|
|
|
|
|
|
|
|
|
Key Contractual Arrangements |
|
|
|
|
|
|
|
|
|
|
Wheeler River Joint Venture |
|
Canada |
|
90.00 |
% |
90.00 |
% |
90.00 |
%(5) |
Denison Share(4) |
Midwest Joint Venture |
|
Canada |
|
25.17 |
% |
25.17 |
% |
25.17 |
% |
Denison Share(4) |
Mann Lake Joint Venture |
|
Canada |
|
30.00 |
% |
30.00 |
% |
N/A |
(6) |
Denison Share(4) |
Wolly Joint Venture |
|
Canada |
|
20.77 |
% |
20.77 |
% |
20.77 |
% |
Denison Share(4) |
McClean Lake Joint Venture |
|
Canada |
|
22.50 |
% |
22.50 |
% |
22.50 |
% |
Denison Share(4) |
| (1) | Ownership Interest represents Denison’s percentage equity / voting interest in the entity or contractual arrangement. |
| (2) | Participating interest represents Denison’s percentage funding contribution to the particular joint operation or contractual arrangement. This percentage can differ from ownership interest in instances where other parties to the arrangement have carried interests, they are earning-in to the arrangement, or they are diluting their interest in the arrangement (provided the arrangement has dilution provisions therein). |
| (3) | WLUC and WLULP were acquired by Denison as part of the Fission Energy Corp. acquisition in April 2013. Denison uses its equity interest to account for its share of assets, liabilities, revenues and expenses for these joint operations. In 2023, Denison funded 100% of the activities in these joint operations pursuant to the terms of an agreement that allows it to approve spending for the WLULP without having the required 75% of the voting interest (see note 22). |
| (4) | Denison Share is where Denison accounts for its share of assets, liabilities, revenues and expenses in accordance with the specific terms within the contractual arrangement. This can be by using either its ownership interest (i.e. Voting Share) or its participating interest (i.e. Funding Share), depending on the arrangement terms. The Voting Share and Funding Share approaches produce the same accounting result when the Company’s ownership interest and participating interests are equal. |
| (5) | Denison indirectly owns an additional 5% ownership interest through its joint venture in JCU, which is accounted for using the equity method and is thus not reflected here as part of its participating share in the WRJV. |
| (6) | The participating interest for 2023 for this arrangement is shown as Not Applicable as there was no approved spending program carried out during fiscal 2023. |
54
|
ANNUAL CONSOLIDATED FINANCIAL STATEMENTS |
26.SUBSEQUENT EVENTS
Sale of Uranium
In January 2024, Denison finalized an agreement to sell 100,000 pounds of U3O8 at a price of US$100.00 per pound for delivery in April 2024.
Earn-In Agreement with Grounded Lithium Corp.
In January 2024, Denison entered into an agreement with Grounded Lithium Corp. (“Grounded Lithium”) with respect to the Kindersley Lithium Project (“KLP”) in Saskatchewan. The agreement includes a series of earn-in options, with each earn-in option being comprised of a cash payment to Grounded Lithium as well as dedicated expenditures to advance KLP. Should Denison complete all three earn-in options, it will have made cumulative cash payments to Grounded Lithium of $3.2 million and have funded $12.0 million in project expenditures and will have earned a 75% working interest in the KLP. Upon funding the total amounts of each earn-in option phase, Denison has the right to either exercise the earn-in option and acquire the working interest associated with that phase or move on to the ensuing option phase. The agreement terminates on the earliest of: (i) Denison electing to acquire its working interest and convert to a formal joint venture, (ii) June 30, 2028, or (iii) a date as otherwise agreed between the parties.
Acquisition of MaxPERF Tool Systems
In February 2024, the Company announced its acquisition of fixed and mobile MaxPERF Tool Systems from Penetrators Canada Inc. (“Penetrators”). The MaxPERF Tool Systems have been successfully deployed several times as a method of permeability enhancement in In-Situ Recovery (“ISR”) field studies conducted on the Company’s potential ISR mining projects, including at the Phoenix deposit. Penetrators has also agreed to work exclusively with Denison for a 10-year period with respect to the use of the MaxPERF Tool Systems for uranium mining applications, and related services, in Saskatchewan.
55
Exhibit 99.2

MANAGEMENT’S DISCUSSION & ANALYSIS
FOR THE YEAR ENDED
DECEMBER 31, 2023
TABLE OF CONTENTS |
|
|
|
2 |
|
|
5 |
|
|
10 |
|
|
11 |
|
|
20 |
|
|
21 |
|
|
29 |
|
|
36 |
|
|
38 |
|
|
51 |
This Management’s Discussion and Analysis (‘MD&A’) of Denison Mines Corp. and its subsidiary companies and joint arrangements (collectively, ‘Denison’ or the ‘Company’) provides a detailed analysis of the Company’s business and compares its financial results with those of the previous year. This MD&A is dated as of February 29, 2024 and should be read in conjunction with the Company’s audited consolidated financial statements and related notes for the year ended December 31, 2023. The audited consolidated financial statements are prepared in accordance with International Financial Reporting Standards (‘IFRS’) as issued by the International Accounting Standards Board (‘IASB’). All dollar amounts in this MD&A are expressed in Canadian dollars, unless otherwise noted.
Additional information about Denison, including the Company’s press releases, quarterly and annual reports, Annual Information Form and Form 40-F, is available through the Company’s filings with the securities regulatory authorities in Canada at www.sedarplus.ca (‘SEDAR+’) and the United States at www.sec.gov/edgar.shtml (‘EDGAR’).
|
MANAGEMENT’S DISCUSSION & ANALYSIS |
| ◾ | Exceptional annual earnings from continuing operations driven by $134.2 million gain on physical uranium investments |
During 2023, the Company’s earnings from continuing operations of $89.4 million ($0.11 per share) were driven by an impressive $134.2 million fair value gain on the Company’s investments in physical uranium. The Company acquired 2.5 million pounds U3O8 in 2021 at an average price of $36.67 per pound U3O8 (US$29.66 per pound U3O8). In the fourth quarter, the Company sold 200,000 pounds U3O8 at an average selling price of $99.50 per pound U3O8 (US$73.38 per pound U3O8), representing a realized gain on sale of $12.6 million (US$8.8 million). As at December 31, 2023, the Company’s remaining uranium portfolio has increased in value by 228% to $120.35 per pound U3O8 (US$91.00 per pound U3O8) for an aggregate value of approximately $276.8 million (US$209.3 million).
| ◾ | Feasibility Study for Wheeler River Phoenix deposit yields significant increase in project economics |
In June 2023, Denison released the results of the Feasibility Study (‘Phoenix FS’) completed for In-Situ Recovery (‘ISR’) mining of the high-grade Phoenix uranium deposit (‘Phoenix’), which is part of the Company’s flagship Wheeler River Project (‘Wheeler River’ or the ‘Project’).
The Phoenix FS demonstrates robust economics including:
| ● | Base case pre-tax Net Present Value (‘NPV’) (8%) of $2.34 billion (100% ownership-basis) representing a 150% increase in the base-case pre-tax NPV8% for Phoenix from the 2018 Pre-Feasibility Study (‘2018 PFS’). |
| ● | Very robust base-case pre-tax Internal Rate of Return (‘IRR’) of 105.9%. |
| ● | Adjusted base case after-tax NPV8% of $1.56 billion (100% basis) and IRR of 90.0% – with Denison’s effective 95% interest in the project equating to an adjusted base case after-tax NPV8% of $1.48 billion. |
| ● | Base case pre-tax and after-tax (adjusted) payback period of 10 months – equating to a reduction of 11 months for the pre-tax payback period from the 2018 PFS. |
| ● | Optimized production profile, based on ISR mine planning efforts evaluating production potential for individual well patterns – resulting in an increase to the planned rate of production by approximately 43% during the first five years of operations. |
| ● | Estimated pre-production capital costs of under $420 million (100% basis), yielding an impressive base-case after-tax (adjusted) NPV to initial capital cost ratio in excess of 3.7 to 1. |
| ● | Robust economics that easily absorb cost-inflation and design changes impacting both operating and capital costs, confirming Phoenix’s estimated cash operating and all-in costs to be amongst the lowest-cost uranium mining projects in the world. |
| ● | Phoenix FS plans aligned and costed to meet or exceed environmental criteria expected to be required by the ongoing regulatory approval process. |
| ● | Updated mineral resource estimate, reflecting the results of 70 drill holes completed in support of ISR de-risking and resource delineation activities, which has upgraded 30.9 million pounds U3O8 into measured mineral resources. The updated mineral resource also resulted in an increase to the average grade of the Zone A high-grade domain, which is now estimated to contain 56.3 million pounds U3O8 in Measured and Indicated mineral resources at an average grade of 46.0% U3O8. |
| ● | Upgraded 3.4 million pounds U3O8 into Proven mineral reserves, representing the equivalent of 85% of production planned during the first calendar year of operations. |
| ◾ | Phoenix ISR de-risking completed and focus transitions to engineering design |
The Phoenix FS reflects independent third-party validation of the selection of the ISR mining method for Phoenix and builds on the findings from a comprehensive and rigorous multi-year technical de-risking process highlighted by the highly successful completion of the leaching and neutralization phases of the Phoenix Feasibility Field Test (‘FFT’) in late 2022.
Through the technical de-risking process, Denison acquired extensive deposit-specific data and developed a robust ISR mine planning model that involved evaluation of the production potential for individual well patterns. With technical de-risking of the application of ISR at Phoenix substantially complete, Denison undertook front-end engineering design (‘FEED’) to support the advancement of the planned Phoenix operation and, with the results thereof substantially complete, is transitioning into detailed engineering design.
2
|
MANAGEMENT’S DISCUSSION & ANALYSIS |
| ◾ | Landmark Shared Prosperity Agreement signed with English River First Nation |
In September 2023, Denison announced the signing of a Shared Prosperity Agreement (‘SPA’) with English River First Nation ('ERFN') supporting the development and operation of Wheeler River. The SPA received support from a substantial majority of ERFN members who participated in a ratification vote on its key terms.
The signing of the SPA follows years of active engagement, including a four-month-long ERFN-led community consultation process ahead of the ratification vote, and represents a significant milestone in the history of both Denison's relationship with ERFN and the Project.
The SPA acknowledges that the Project is located within ERFN's Ancestral Lands and provides Denison with ERFN's consent to advance the Project. Additionally, the SPA outlines a shared recognition that ERFN is the Knowledge Keeper of the culture, ways, customs, and values of ERFN in relation to the environment and its Members and reflects ERFN's desire to prioritize sustainability. Amongst other key commitments, the SPA provides ERFN and its Members with (i) an important role in environmental monitoring and management, and (ii) benefits from community investment, business opportunities, employment and training opportunities, and financial compensation. Overall, the SPA describes a mutual commitment to maintain an open, respectful, and cooperative relationship between Denison and ERFN to ensure mutual prosperity as the development and operation of the Project progresses.
| ◾ | Phoenix Environmental Impact Statement (‘EIS’) advanced through regulatory review |
Denison’s draft EIS for Phoenix was submitted to the Saskatchewan Minister of Environment (‘SKMOE’) and the Canadian Nuclear Safety Commission (‘CNSC’) in late 2022. The EIS submission outlines the Company’s assessment of the potential effects, including applicable mitigation measures, of the proposed ISR uranium mine and processing plant planned for Phoenix, and reflects several years of baseline environmental data collection, technical assessments, plus extensive engagement and consultation with Indigenous and non-Indigenous interested parties.
In the first quarter of 2023, the Company received technical comments and information requests from both regulatory agencies and the Company has provided technical responses to both the Provincial and Federal regulators.
In August 2023, reflective of the extensive efforts undertaken by and for the Company, the CNSC deemed complete the Company’s responses to the approximately 250 Federal comments from the CNSC. In November 2023, a second round of information requests was received from the CNSC. Following the successful resolution of the outstanding comments from the Federal Indigenous Review Team, the Company expects to then be in position to submit a final version of EIS for consideration at a future hearing of the CNSC.
In October 2023 the Saskatchewan Ministry of Environment confirmed its satisfaction with Denison’s comment responses and proposed EIS updates. The confirmation would allow Denison to finalize the EIS for the purpose of obtaining a Provincial Environmental Assessment (‘EA’) approval, however this would delink the currently coordinated Provincial – Federal EA process, which is not expected to provide a meaningful schedule advantage for the Phoenix project. Denison plans to submit one version of the final EIS to both authorities once the Federal information requests have been resolved.
| ◾ | Phoenix ISR Feasibility Field Test Recovered Solution Management phase completed |
In November 2023, the Company announced the successful completion of the recovered solution management phase of the FFT. The FFT was designed to use the existing commercial-scale ISR test pattern to perform a combined assessment of the Phoenix deposit’s hydraulic flow properties along with the leaching characteristics that had been assessed through the metallurgical core-leach testing program. The prior phases of the FFT, completed in 2022, were highlighted by the recovery of 14,400 pounds of U3O8 dissolved in solutions generated during the leaching and neutralization phases of the test.
The solution recovered during the FFT was stored on site and this final phase of the FFT involved the treatment of the recovered solution via an on-site purpose-built treatment system. Following treatment, a uranium precipitate product and a treated effluent were produced. The mineralized precipitates have been recovered from the process with over 99.99% efficiency. The treated effluent was tested to ensure compliance with permit conditions before being injected into a designated subsurface area.
3
|
MANAGEMENT’S DISCUSSION & ANALYSIS |
| ◾ | Cost update to the 2018 PFS for Wheeler River Gryphon deposit (‘Gryphon’) confirms the project’s position amongst the lowest-cost uranium mining projects in the world |
During 2023, the Company also completed a cost update (‘Gryphon Update’) to the 2018 PFS for conventional underground mining of the basement-hosted Gryphon deposit. The scope of the Gryphon Update was targeted at the review and update of capital and operating costs. Mining and processing plans remain largely unchanged from the 2018 PFS aside from minor scheduling and construction sequencing optimizations. The key points include:
| ● | Base case pre-tax NPV (8%) of $1.43 billion (100% basis) is a 148% increase in the base-case pre-tax NPV8% for Gryphon from the 2018 PFS. |
| ● | Strong base-case pre-tax IRR of 41.4%. |
| ● | Base case after-tax NPV8% of $864.2 million (100% basis) and IRR of 37.6% – with Denison’s effective 95% interest in the project equating to a base case after-tax NPV8% of $821.0 million. |
| ● | Base case pre-tax payback period of 20 months, and base case after-tax payback period of 22 months – equating to a reduction of 17 months for the pre-tax payback period from the 2018 PFS. |
Importantly, Gryphon remains a highly valuable project that provides Denison with an additional source of low-cost potential production to deploy significant free cash flows expected from Phoenix.
| ◾ | $113.0 million raised through equity financings to fund operations and the advancement of Phoenix |
In October 2023, Denison completed a bought deal public offering resulting in the issuance of 37,000,000 shares at a price of $2.03 (US$1.49) per share for total gross proceeds of $75.1 million (US$55.1 million). Throughout 2023, Denison also issued 19,786,160 shares under its At-The-Market (‘ATM’) equity program at an average price of $1.91 per share for aggregate gross proceeds of $37.9 million.
| ◾ | Waterbury Lake inaugural ISR field test program completed |
In November 2023, the Company announced the completion of an inaugural ISR field test program at the Tthe Heldeth Túé uranium deposit (‘THT’) on the Waterbury Lake property. The program included (i) the installation of an eight well ISR test pattern designed to collect an initial database of hydrogeological data, (ii) testing of a permeability enhancement technique, (iii) the completion of hydrogeologic test work, highlighted by the achievement of hydraulic conductivity values consistent with those from the 2020 Preliminary Economic Assessment (‘PEA’), and (iv) the execution of an ion tracer test which established a 10 hour breakthrough time between the injection and extraction wells, while also demonstrating hydraulic control of the injected solution. Overall, the program successfully achieved each of its planned objectives.
| ◾ | Midwest internal concept study completed to examine potential application of ISR mining method |
The Company completed an internal conceptual mining study examining the potential application of ISR at the Company’s 25.17% owned Midwest Project (‘Midwest’). The concept study was prepared by Denison during 2022 and formally issued to the Midwest Joint Venture (‘MWJV’) in early 2023. Based on the positive results of the concept study, the MWJV provided Denison with approval to complete additional ISR-related work, to be undertaken for Midwest in 2023 and 2024.
| ◾ | Moon Lake South discovery of high-grade uranium mineralization |
In April 2023, Denison reported the discovery of high-grade sandstone hosted uranium mineralization approximately 30 metres above the unconformity in drill hole MS 23-10A, which was completed as part of the 2023 winter exploration program at the Moon Lake South property. The intersection in MS 23-10A returned 2.46% U3O8 over 8.0 metres, including a sub-interval grading 3.71% U3O8 over 4.5 metres. This result represents the best drill hole completed on the Moon Lake South property to date and is a high priority for follow-up exploration.
4
|
MANAGEMENT’S DISCUSSION & ANALYSIS |
| ◾ | $15 million strategic investment in F3 Uranium Corp. |
In October 2023, the Company completed a $15 million strategic investment in F3 Uranium Corp. (‘F3’) in the form of unsecured convertible debentures (the ‘Debentures’), which carry a 9% coupon and will be convertible at Denison’s option into common shares of F3 at a conversion price of $0.56 per share. F3 has the right to pay up to one third of the quarterly interest payable by issuing common shares. F3 will also have certain redemption rights on or after the third anniversary of the date of issuance of the Debentures and/or in the event of an F3 change of control.
| ◾ | Executive team changes undertaken in 2023 |
In December 2023, Denison announced the promotion of Ms. Elizabeth Sidle to the position of Chief Financial Officer, in addition to her position as the Company’s Vice President Finance. Ms. Sidle joined Denison in 2016, advancing to the position of Vice President Finance in 2021. Ms. Sidle had been serving as Denison's Interim Chief Financial Officer since September 1, 2023, during a temporary medical leave of absence of the Company's previous Chief Financial Officer and since his departure from Denison in late October 2023.
Denison also announced the addition of Mr. Geoff Smith to the position of Vice President Corporate Development & Commercial. Mr. Smith will be focused on supporting Denison's investor and customer engagement, the evaluation and execution of growth opportunities and financing arrangements, and the development and oversight of the Company's uranium sales and contracting strategies.
Denison Mines Corp. was formed under the laws of Ontario and is a reporting issuer in all Canadian provinces and territories. Denison’s common shares are listed on the Toronto Stock Exchange (the ‘TSX’) under the symbol ‘DML’ and on the NYSE American exchange under the symbol ‘DNN’.
Denison is a uranium exploration and development company with interests focused in the Athabasca Basin region of northern Saskatchewan, Canada. The Company has an effective 95% interest in its flagship Wheeler River Uranium Project, which is the largest undeveloped uranium project in the infrastructure rich eastern portion of the Athabasca Basin region of northern Saskatchewan. In mid-2023, the Phoenix FS was completed for the Phoenix deposit as an ISR mining operation, and an update to the previously prepared 2018 PFS was completed for Wheeler River’s Gryphon deposit as a conventional underground mining operation. Based on the respective studies, both deposits have the potential to be competitive with the lowest cost uranium mining operations in the world. Permitting efforts for the planned Phoenix ISR operation commenced in 2019 and have advanced significantly, with licensing in progress and a draft EIS submitted for regulatory and public review in October 2022.
Denison’s interests in Saskatchewan also include a 22.5% ownership interest in the McClean Lake Joint Venture (‘MLJV’), which includes unmined uranium deposits planned for extraction, via the MLJV’s Surface Access Borehole Resource Extract (‘SABRE’) mining method starting in 2025, and the McClean Lake uranium mill, which is contracted to process the ore from the Cigar Lake mine under a toll milling agreement, plus a 25.17% interest in the MWJV’s Midwest Main and Midwest A deposits and a 69.35% interest in the Tthe Heldeth Túé and Huskie deposits on the Waterbury Lake property. The Midwest Main, Midwest A, THT and Huskie deposits are located within 20 kilometres of the McClean Lake mill.
Through its 50% ownership of JCU (Canada) Exploration Company, Limited (‘JCU’), Denison holds additional interests in various uranium project joint ventures in Canada, including the Millennium project (JCU, 30.099%), the Kiggavik project (JCU, 33.8118%) and Christie Lake (JCU, 34.4508%).
Denison’s exploration portfolio includes further interests in properties covering approximately 385,000 hectares in the Athabasca Basin region.
5
|
MANAGEMENT’S DISCUSSION & ANALYSIS |
STRATEGY
Denison’s strategy is focused on leveraging its uniquely diversified asset base to position the Company to take advantage of the strong long-term fundamentals of the uranium market. The Company has built a portfolio of strategic uranium deposits, properties, and investments – highlighted by an effective 95% interest in Wheeler River and a minority interest in the MLJV, which owns an operating and licensed uranium mill, both of which are located in the infrastructure rich eastern portion of the Athabasca Basin region. While active in exploring for new uranium discoveries in the region, Denison’s present focus is on advancing Wheeler River to a development decision, with the potential to become the next large-scale uranium producer in Canada. With a shortage of low-cost uranium development projects in the global project pipeline, Denison offers shareholders exposure to value creation through the potential future development of Wheeler River and advancement of the Company’s other potential development projects. Denison’s exploration and development portfolio, and substantial physical holdings of uranium, provides investors with meaningful additional leverage to future increases in uranium prices.
URANIUM INDUSTRY OVERVIEW
During the year ended December 31, 2023, both the uranium spot price and long-term price continued their upward trend. In the spot market, the price of uranium started the year at US$48.00 per pound U3O8 and closed the year at the annual high of US$91.00 per pound U3O8 – a ~90% increase year over year. A material price increase was also observed in the long-term market, with the long-term price steadily increasing throughout the year from US$51.00 per pound U3O8 at December 31, 2022 to US$68.00 per pound U3O8 at December 31, 2023. This US$17.00 per pound U3O8 increase in the long-term price is the largest annual gain since 2007.
Positive momentum in uranium markets has continued in early 2024. In January 2024, the spot price for uranium surpassed US$100 per pound U3O8, a level viewed by market commentators as an important threshold. Prior to 2024, the spot uranium price had not been above US$100 per pound since 2008. The Company believes the current uranium market environment demonstrates notable similarities to the last time prices reached these levels. In the early 2000s, highly enriched uranium (‘HEU’) and other former Soviet Union supplies remained a market hangover from the Cold War with elevated inventory levels weighing on prices for years with limited new supply coming online. Ultimately, this period of low prices, then compounded with adverse supply shocks, created a favourable environment for uranium prices in future years when paired with significant expected demand growth driven by ambitious plans for nuclear power in China. Meaningful new sources of supply were scarce, due to years of under investment, at a time of rapid demand growth. The Japanese tsunami and associated Fukushima nuclear incident in 2011 disrupted the market and set in motion a similar period of low prices and excess inventories. Given the sudden shut-down of the Japanese nuclear fleet and other reductions in demand, excess uranium inventories and excess enrichment capacity, which provided the ability to create additional uranium supply, catalyzed a downward shock to price. During this extended period, prices were below the cost of production for many producers, leading to the shutdown of multiple mines and a sharp reduction in investment in new exploration and development activities across the sector. After years of supply discipline, and the accumulation of physical uranium positions amongst financial investors, the market reached an inflection point followed by four consecutive years of price increases between 2020 and 2023, reflective of a market transitioning to be driven by the cost of future production rather than by the availability of surplus inventories. Looking ahead, the Company believes the increasing demand for nuclear energy, coupled with a prolonged period of limited investment in new supply creates supply-demand dynamics that are supportive of strong uranium prices for the foreseeable future.
During 2023, investor interest in the uranium and nuclear energy sectors accelerated. This is believed to largely be driven by a continued focus on global goals to achieve net-zero carbon emissions, and the necessary role for nuclear energy in the “clean energy transition”. In assessing the potential paths to reduce carbon emissions many nations, policymakers, and interest groups have recognized the critical role that existing or planned future nuclear power plants could play in achieving decarbonization objectives. The Company believes these positive nuclear demand fundamentals support expectations for robust uranium markets.
There is global focus on the importance of nuclear power in enabling the achievement of carbon emission goals. At COP28 in Dubai in December 2023, this recognition was further enshrined as over 20 nations pledged to triple nuclear energy generation capacity by 2050 in an effort to avert the adverse consequences of climate change. The Company believes this wide-spread government support for nuclear energy represents a paradigm shift. In addition to the renewed commitment to nuclear from powerhouse nations like Japan, Korea, France, and the United States in recent years, multiple governments in 2023 adopted stances increasingly supportive of nuclear power generation including Belgium, Italy, and Sweden.
6
|
MANAGEMENT’S DISCUSSION & ANALYSIS |
Positive nuclear demand developments occurred in many nations in 2023. Three notable nuclear reactor projects that had been in construction for a decade reached commercial operations in 2023 including Vogle 3 in the United States, Olkiluoto in Finland, and Kakrapar in India. In China, additional reactors reached commercial operations and construction began on a further five reactors. China continues to be a major source of growth for nuclear energy, with UxC LLC (‘UxC’) expecting that over half of the 76 reactors builds it is currently projecting to be completed by 2030 will be in China. In Canada, Ontario Power Generation announced refurbishments plans for its Darlington nuclear plant and ongoing refurbishment continued at the Bruce Power nuclear facility in Ontario. Additionally, small modular reactors are being advanced in both Ontario and Saskatchewan. In Japan, two reactors were restarted in 2023, breaking a streak of two years without a restart. Taken together, forecasts from UxC for global reactor units and nuclear capacity in 2035 is 532 units and 504 gigawatts electrical (‘GWe’) installed capacity (estimated as of Q4’2023) – representing a 29% increase in global nuclear power generation from 433 units producing 392 GWe in 2023. With expected growth accelerating, UxC’s base case estimate of global uranium demand in 2035 increased 6%—from 240 million pounds U3O8 estimated as of Q4’2022 - to 254 million pounds U3O8 estimated as of Q4’2023.
While spot uranium prices increased significantly during 2023, the impact on price from physical uranium funds appears to be significantly less than in 2022. UxC estimates that physical uranium funds net additions to inventory levels were 5 million pounds of U3O8 in 2023 compared to secondary sources of demand, including physical uranium funds, acquiring at least 20 million pounds U3O8 in 2022, and an estimated 53 million pounds U3O8 in 2021. On the supply side, uranium production for 2023 is estimated at 141 million pounds U3O8, which represents a 9% increase over 2022 production levels, largely due to the ramp-up of the McArthur River mine and a modest production increase at Olympic Dam. UxC estimates total utility demand for 2023 at 198 million pounds U3O8 representing a 3% increase over 2022 demand levels. On balance, 2023 is expected to result in a significant primary supply shortfall of approximately 29% of total demand or 57 million pounds U3O8.
In Q4’2023 UxC estimated 2024 primary production to increase to 162 million pounds U3O8, with the production increase being supported by increasing production from Kazatomprom in Kazakhstan offset by lower production from Orano’s Arlit mine in Niger. However, in early 2024, Kazatomprom announced 2024 production is expected to be lower than previous guidance due to scare availability of sulphuric acid in the region as well as delays in completing construction for newly developed production areas. Additionally, UxC estimates secondary supplies for 2024 are projected at 34 million pounds of U3O8 equivalent (‘U3O8e’), which is a significant reduction from 56 million pounds U3O8e of secondary supplies estimated in 2023, 65 million pounds U3O8e in 2022, and 98 million pounds U3O8e in 2021. Strong secondary demand in past years has accelerated the process of drawing down these secondary sources of supply. With this rapid decline in secondary supplies, the market is expected to continue its shift from an inventory-driven market to a production-driven market in the coming years.
Nuclear sentiment also continues to be supported by an increased focus on energy security in the aftermath of Russia’s invasion of Ukraine. While the Russian invasion continues to be the most impactful geopolitical event, the importance of security of supply was further magnified in July of 2023, as a military coup was waged in Niger which led to the withdrawal of foreign embassy personnel, and a temporary shutdown of Orano’s uranium mining operations. In 2022, Niger ranked as the seventh largest uranium producing country. The Russian invasion of Ukraine in February 2022 continues to cause significant turmoil in the global nuclear fuel market. Russia is a significant supplier of enriched uranium to the rest of the world, operating 46% of the world’s uranium enrichment capacity. In 2021, Russian enrichment comprised 31% of European Union enrichment purchases and 28% of US utility enrichment purchases. While deliveries of material from Russia to Western utilities continue, increased demand for non-Russian supply has led to significantly increased prices for uranium processing services. From December 2021 to December 2023, the long-term price of conversion and enrichment services increased by 94% and 148%, respectively. In the short- to medium-term, in order to increase enriched uranium production in the supply-constrained Western enrichment market, Western enrichers are expected to input more UF6 (‘overfeed’) into their centrifuges in order maximize production capacity. As a consequence, Western utilities in aggregate will require more natural uranium feedstock to produce the same quantity of enriched uranium (i.e., new enrichment contracts require higher tails assay levels). In 2023, US and European utilities demonstrated a path towards reduced reliance on Russian nuclear fuel supply and increasingly favouring Western supply chains. In December 2023, a US bill to curb imports of Russian uranium was approved by US Congress. While the bill awaits approval by the US Senate, the bill is indicative of an ongoing shift of uranium supply chains away from Russia which increasingly favours North American uranium supply.
Russia is also a major player in uranium logistics, with significant quantities of uranium from Central Asia typically transported through Russia to Russian ports for delivery to Western uranium conversion facilities. UxC estimates Kazakhstan and Uzbekistan combined for 45% of global primary uranium production in 2023. As a result, logistics of uranium shipped through Russia remains an item of concern to uranium end users. Some uranium has been successfully shipped from Kazakhstan to Canada via the Trans-Caspian International Transport Route, which does not include transit through Russia; however, reports indicate that this route is subject to operational limitations.
7
|
MANAGEMENT’S DISCUSSION & ANALYSIS |
Overall, nuclear demand growth appears poised for acceleration led by a shifting energy mix towards decarbonized energy at a time when limited investment in bringing new uranium mine supply online has occurred over the past decade. While some idled or curtailed production from existing uranium mining operations is expected to return, production costs are expected to be higher than previous levels due to inflation and labour shortages, and lag times to bring on much of the potential new mine supply remains several years away.
The accelerated decline in secondary sources of uranium supply in recent years, the depletion of existing mines, the expectation of rising tails assay at Western enrichment plants, and growing future reactor demand, point to larger supply deficits during the second half of this decade that will be difficult to balance without considerable and rapid investment in new large-scale uranium mining projects. Given that uncovered utility uranium requirements for the period from 2024 to 2040, not including typical inventory building or restriction on existing supply agreements with Russia, are estimated at 2.2 billion pounds U3O8, it is evident that the necessary new future sources of supply required by the market have not yet been secured by utilities, and that the response from incumbent suppliers to sign significant long-term supply contracts in recent years have not satisfied the needs of utility customers, meaning that there is good reason to expect a further phase of utility procurement directed at incentivizing new projects to meet long-term demand needs.
SELECTED ANNUAL FINANCIAL INFORMATION
(in thousands, except for per share amounts) |
|
|
|
Year Ended December 31, 2023 |
|
Year Ended December 31, 2022 |
|
Year Ended December 31, 2021(3) |
||
|
|
|
|
|
|
|
|
|
||
Continuing Operations: |
|
|
|
|
|
|
|
|
||
Total revenues |
|
|
$ |
1,855 |
$ |
8,973 |
$ |
20,000 |
||
Exploration expenses |
|
|
$ |
(9,564) |
$ |
(8,097) |
$ |
(4,477) |
||
Evaluation expenses |
|
|
$ |
(18,622) |
$ |
(22,181) |
$ |
(15,521) |
||
Operating expenses |
|
|
$ |
(3,898) |
$ |
(5,352) |
$ |
(12,901) |
||
Other income |
|
|
$ |
136,472 |
$ |
55,244 |
$ |
44,163 |
||
Net income |
|
|
$ |
89,364 |
$ |
12,572 |
$ |
18,977 |
||
Basic earnings per share |
|
|
$ |
0.11 |
$ |
0.02 |
$ |
0.02 |
||
Diluted earnings per share |
|
|
$ |
0.10 |
$ |
0.02 |
$ |
0.02 |
||
|
|
|
|
|
|
|
|
|
||
Discontinued Operations: |
|
|
|
|
|
|
|
|
||
Net income |
|
|
$ |
1,011 |
$ |
1,782 |
$ |
N/A |
||
Basic and diluted earnings per share |
$ |
0.00 |
$ |
0.00 |
$ |
N/A |
||||
|
|
|
|
|
|
|
||||
(in thousands) |
|
|
|
As at December 31, 2023 |
|
As at December 31, 2022 |
|
As at December 31, 2021 |
||
|
|
|
|
|
|
|
|
|
|
|
Financial Position: |
|
|
|
|
|
|
|
|
||
Cash and cash equivalents |
|
|
$ |
131,054 |
$ |
50,915 |
$ |
63,998 |
||
Working capital(1) |
$ |
135,130 |
$ |
53,660 |
$ |
76,785 |
||||
Investments in uranium |
$ |
276,815 |
$ |
162,536 |
$ |
133,114 |
||||
Property, plant and equipment |
$ |
254,946 |
$ |
253,505 |
$ |
254,462 |
||||
Total assets |
$ |
726,603 |
$ |
515,796 |
$ |
510,284 |
||||
Total long-term liabilities(2) |
$ |
66,873 |
$ |
61,365 |
$ |
97,242 |
||||
| (1) | Working capital is a non-IFRS financial measure and is calculated as the value of current assets less the value of current liabilities, excluding non-cash current liabilities (i.e. working capital at December 31, 2023 excludes $4,535,000 from the current portion of deferred revenue, while working capital at December 31, 2022 excludes $4,915,000 from the current portion of deferred revenue). |
| (2) | Predominantly comprised of the non-current portion of deferred revenue, non-current reclamation obligations, share purchase warrant liabilities (where applicable) and deferred income tax liabilities. |
| (3) | In 2023, the Company discontinued its business of offering third-party closed mines care and maintenance services. The financial results for 2023 and 2022 have been represented in accordance with IFRS 5, Non-current Assets Held for Sale and Discontinued Operations. The financial results for 2021 fall outside of the restatement period, and have not been represented to reflect the discontinued operations of the Closed Mines group. See DISCONTINUED OPERATIONS below for further details. |
8
|
MANAGEMENT’S DISCUSSION & ANALYSIS |
SELECTED QUARTERLY FINANCIAL INFORMATION
|
|
|
|
2023 |
|
2023 |
|
2023 |
|
2023 |
(in thousands, except for per share amounts) |
|
Q4 |
|
Q3 |
|
Q2 |
|
Q1 |
||
|
|
|
|
|
|
|
|
|
|
|
Continuing Operations: |
|
|
|
|
|
|
|
|
||
Total revenues |
$ |
1,092 |
$ |
777 |
$ |
968 |
$ |
(982) |
||
Net earnings (loss) |
$ |
34,627 |
$ |
57,916 |
$ |
(345) |
$ |
(2,834) |
||
Basic and diluted earnings (loss) per share |
|
0.04 |
|
0.07 |
|
(0.00) |
|
(0.00) |
||
|
Discontinued Operations: |
|
|
|
|
|
|
|
|
||
Net income earnings (loss) |
$ |
(150) |
$ |
321 |
$ |
406 |
$ |
434 |
||
Basic and diluted earnings (loss) per share |
$ |
- |
$ |
- |
$ |
- |
$ |
- |
||
|
|
|
|
2022 |
|
2022 |
|
2022 |
|
2022 |
(in thousands, except for per share amounts) |
|
Q4 |
|
Q3 |
|
Q2 |
|
Q1 |
||
|
|
|
|
|
|
|
|
|
|
|
Continuing Operations: |
|
|
|
|
|
|
|
|
||
Total revenues |
$ |
1,015 |
$ |
996 |
$ |
4,491 |
$ |
2,471 |
||
Net earnings (loss) |
$ |
(6,247) |
$ |
(6,854) |
$ |
(16,688) |
$ |
42,361 |
||
Basic and diluted earnings (loss) per share |
$ |
(0.01) |
$ |
(0.01) |
$ |
(0.02) |
$ |
0.05 |
||
|
Discontinued Operations: |
|
|
|
|
|
|
|
|
||
Net earnings |
$ |
506 |
$ |
471 |
$ |
541 |
$ |
262 |
||
Basic and diluted earnings per share |
$ |
- |
$ |
- |
$ |
- |
$ |
- |
||
Significant items causing variations in quarterly results from continuing operations
| ● | The Company’s toll milling revenues fluctuate due to the timing of uranium processing at the McClean Lake mill, as well as changes to the estimated mineral resources of the Cigar Lake mine. Toll milling revenue rates were updated for changes to future toll milling production rates at McClean Lake in the first quarter of 2022 and the first, third and fourth quarters of 2023. During the first quarter of 2023, this update resulted in negative revenue. See RESULTS OF CONTINUING OPERATIONS below for further details. |
| ● | During the second quarter of 2022, the Company recognized $2,986,000 of non-recurring revenue from mineral sales. |
| ● | Exploration expenses are generally largest in the first and third quarters, due to the timing of the winter and summer exploration seasons in northern Saskatchewan; however, the 2022 exploration programs at Wheeler River took place during the third and fourth quarters due to the timing of ISR field programs and the FFT. |
| ● | Other income and expense fluctuate due to changes in the fair value of the Company’s portfolio investments, uranium investments and share purchase warrants (which expired unexercised in the first quarter of 2023). All of these instruments are (or were) recorded at fair value through profit or loss and are (or were) subject to fluctuations in the underlying share / commodity price. The Company’s uranium investments and certain of its share purchase warrants are (or were) also subject to fluctuations in the US dollar to Canadian dollar exchange rate. The impact of fair value changes on the Company’s net earnings / loss was particularly significant in the first and second quarters of 2022 and the second, third and fourth quarters of 2023. See OTHER INCOME below for more details. |
| ● | The Company’s results are also impacted, from time to time, by other non-recurring events arising from its ongoing activities, as discussed below, where applicable. |
9
|
MANAGEMENT’S DISCUSSION & ANALYSIS |
RESULTS OF CONTINUING OPERATIONS
REVENUES
McClean Lake Uranium Mill
McClean Lake is located on the eastern edge of the Athabasca Basin in northern Saskatchewan, approximately 750 kilometres north of Saskatoon. Denison holds a 22.5% ownership interest in the MLJV and the McClean Lake uranium mill, one of the world’s largest uranium processing facilities, which is contracted to process ore from the Cigar Lake mine under a toll milling agreement. The MLJV is a joint venture between Orano Canada Inc. (‘Orano Canada’) with a 77.5% interest and Denison with a 22.5% interest.
In February 2017, Denison closed an arrangement with Ecora Resources PLC (‘Ecora’, then known as Anglo Pacific Group PLC) and one of its wholly owned subsidiaries (the ‘Ecora Arrangement’) under which Denison received an upfront payment of $43,500,000 in exchange for its right to receive future toll milling cash receipts from the MLJV under the then current toll milling agreement with the Cigar Lake Joint Venture (‘CLJV’) from July 1, 2016 onwards. The Ecora Arrangement consists of certain contractual obligations of Denison to forward to Ecora the cash proceeds of future toll milling revenue earned by the Company related to the processing of specified Cigar Lake ore through the McClean Lake mill and, as such, the upfront payment was accounted for as deferred revenue.
During the year ended December 31, 2023, the McClean Lake mill processed 15.1 million pounds U3O8 for the CLJV (December 31, 2022 – 18.0 million pounds U3O8) and Denison recorded toll milling revenue of $1,855,000 (December 31, 2022 – $5,987,000). The decrease in toll milling revenue during the year ended December 31, 2023, as compared to the prior year, is predominantly due to the mill processing fewer pounds U3O8 for the CLJV. Additionally, a negative $1,946,000 non-cash cumulative accounting adjustment was recorded in the first quarter of 2023 which more than offset the revenue recognized from the first quarter’s toll milling activity of $964,000. By comparison, in the first quarter of 2022, the Company recognized toll milling revenue of $1,027,000 and a $1,444,000 positive non-cash cumulative accounting adjustment. The true ups recorded in the first quarter of both years were driven by changes in the estimated timing of the processing of the Cigar Lake ore. In the first quarter of 2022, the operators of the Cigar Lake mine announced a reduction in forecasted mine production from 18 million pounds U3O8 per year to 15 million pounds U3O8 per year in 2022 and 2023, and then to 13.5 million pounds U3O8 per year thereafter. In the first quarter of 2023, the operators of the Cigar Lake mine announced that forecasted future mine production was increased back to 18 million pounds U3O8 per year. Under IFRS 15, Revenue from Contracts with Customers, the change in the estimated timing of the toll milling of the CLJV ores in 2022 resulted in an increase to the implied financing component of the toll milling transaction, thus increasing the total deferred revenue to be recognized over the life of the toll milling contract as well as the deferred revenue drawdown rate. The updated drawdown rate was applied retrospectively to all pounds produced for the CLJV since the inception of the Ecora Arrangement in July 2016, resulting in the increase in revenue in the three months ended March 31, 2022. This was effectively reversed in the first quarter of 2023, resulting in the current period reduction in revenue.
During the year ended December 31, 2023, the Company also recorded accounting accretion expense of $3,518,000 on the toll milling deferred revenue balance (December 31, 2022 – $2,774,000). While the annual accretion expense will decrease over the life of the contract as the deferred revenue liability decreases over time, the increase in accretion expense in the year ended December 31, 2023, as compared to the prior year, was predominantly due to a $483,000 true-up to increase the life-to-date accretion expense recorded in the first quarter of 2023 due to the change in the timing in the estimated CLJV toll milling activities discussed above (December 31, 2022 – $297,000 true-up which reduced the life-to-date accretion expense).
The impact of the current and prior period true-ups to revenue and accretion are non-cash.
Mineral Sales
Mineral sales revenue for the year ended December 31, 2023 was $nil (December 31, 2022 – $2,986,000). Mineral sales revenue earned in the second quarter of 2022 was from the sale of 40,000 pounds U3O8 from inventory at an average price of $74.65 (US$59.25) per pound. The inventory sold in the second quarter of 2022 was from the Company’s share of production from the SABRE test mining program completed at McClean Lake in 2021.
10
|
MANAGEMENT’S DISCUSSION & ANALYSIS |
OPERATING EXPENSES
Mining
Operating expenses of the mining segment include depreciation and development costs, costs relating to the Elliot Lake closed mine sites, as well as cost of sales related to the sale of uranium, when applicable. Operating expenses in the year ended December 31, 2023 were $3,898,000 (December 31, 2022 – $5,352,000).
Included in operating expense is depreciation expense relating to the McClean Lake mill of $2,455,000 (December 31, 2022 – $3,076,000), as a result of processing approximately 15.1 million pounds U3O8 for the CLJV (December 31, 2022 – 18.0 million pounds), $986,000 in costs related to the Company’s Elliot Lake closed mines sites (December 31, 2022 – $749,000), and development and other operating costs of the MLJV of $273,000 (December 31, 2022 - $735,000).
Operating expenses for the year ended December 31, 2022 also includes $444,000 in cost of sales, selling expenses of $48,000, and sales royalties and resource surcharges of $216,000 related to the sale of 40,000 pounds of U3O8.
MINERAL PROPERTY EVALUATION
During the year ended December 31, 2023, Denison’s share of evaluation expenditures was $18,622,000 (December 31, 2022 –$22,181,000). The decrease in evaluation expenditures, compared to the prior period, was due to a decrease in Wheeler River ISR field activities as well as a decrease in costs associated with the FFT, slightly offset by an increase in ISR evaluation activities at the THT deposit on the Waterbury Lake property.
The following table summarizes the evaluation activities completed during the year ended December 31, 2023.
PROJECT EVALUATION ACTIVITIES | |||||
Notes:
| (1) | The Company’s effective ownership interest as at December 31, 2023, including the indirect 5% ownership interest held through JCU. |
| (2) | Represents Denison’s ownership position as at October 31, 2023. |
On June 26, 2023 Denison announced the results of (i) the Phoenix FS completed for ISR mining of the high-grade Phoenix deposit and (ii) an updated Gryphon PFS for conventional underground mining of the basement-hosted Gryphon deposit.
The Phoenix FS was completed by Wood Canada Limited (‘Wood’), WSP USA Environment and Infrastructure Inc. (‘WSP’), SRK Consulting (Canada) Inc. (‘SRK’), and Newmans Geotechnique Inc. (‘Newmans’). The study confirms robust economics and the technical viability of an ISR uranium mining operation with low initial capital costs and a high rate of return.
11
|
MANAGEMENT’S DISCUSSION & ANALYSIS |
The Phoenix FS reflects several design changes and the results of a rigorous technical de-risking program completed by Denison over the 4.5 years following the publication of the 2018 PFS, which was highlighted by the then-novel selection of the ISR mining method for Phoenix.
With the benefit of extensive lab and field testing of all key elements of the proposed ISR mining operation, and current cost estimates reflecting recent inflationary pressures, the Phoenix FS is expected to provide Denison with an excellent basis to advance engineering designs in support of a future final investment decision (‘FID’).
See the following tables for the highlights of the Phoenix FS.
Summary of Economic Results (100% Basis) – Base Case | |
Uranium selling price |
UxC Spot Price(1) (~US$66 to US$70/lb U3O8) |
Exchange Rate (US$:CAD$) |
1.35 |
Discount Rate |
8% |
Operating profit margin(2) |
90.9% |
|
|
Pre-tax NPV8%(3) (Change from 2018 PFS)(4) |
$2.34 billion (+150%) |
Pre-tax IRR(3) |
105.9% |
Pre-tax payback period(5) |
~10 months |
|
|
Post-tax NPV8%(3) |
$1.43 billion |
Post-tax IRR(3) |
82.3% |
Post-tax payback period(5) |
~11 months |
|
|
Adjusted Post-tax NPV8%(3)(6) |
$1.56 billion |
Adjusted Post-tax IRR(3)(6) |
90.0% |
Adjusted Post-tax payback period(3)(6) |
~10 months |
Notes
| (1) | Spot price forecast is based on “Composite Midpoint” scenario from UxC’s UMO (defined below) and is stated in constant (not-inflated) dollars. See Denison news releases dated June 26, 2023 and August 9, 2023 and the Wheeler Technical Report (defined below) for details. |
| (2) | Operating profit margin is calculated as aggregate uranium revenue less aggregate operating costs, divided by aggregate uranium revenue. Operating costs exclude all royalties, surcharges and income taxes. |
| (3) | NPV and IRR are calculated to the start of construction activities for the Phoenix operation and excludes $67.4 million in pre-FID expenditures. |
| (4) | Change from 2018 PFS is computed by reference to the same scenario from the 2018 PFS, adjusted to incorporate certain pre-FID costs for consistent comparability. |
| (5) | Payback period is stated as number of months to payback from the start of uranium production. |
| (6) | The Adjusted Post-tax NPV, IRR and payback period are based on the “adjusted post-tax” scenario, which includes the benefit of certain entity level tax attributes which are expected to be available and used to reduce taxable income from the Phoenix operation. See Denison news release dated June 26, 2023 and the Wheeler Technical Report (defined below) for details. |
Summary of Key Phoenix Operational Parameters (100% basis) | |
Mine life |
10 years |
Proven & Probable reserves(1) |
56.7 million lbs U3O8 (219,000 tonnes at 11.7% U3O8) |
First 5 years of reserves(2) |
41.9 million lbs U3O8 (Average 8.4 million lbs U3O8 / year) |
Remaining years of reserves |
14.8 million lbs U3O8 (Average 3.0 million lbs U3O8 / year) |
Initial capital costs(3) |
$419.4 million |
Average cash operating costs |
$8.51 (US$6.28) per lb U3O8 |
All-in cost(4) |
$21.73 (US$16.04) per lb U3O8 |
Notes:
| (1) | See Denison press release dated June 26, 2023 for additional details regarding Proven & Probable reserves. |
| (2) | The first five years is determined by reference to the 60-month period that commences at the start of operations. |
| (3) | Initial capital costs exclude $67.4 million in estimated pre-FID expenditures expected to be incurred before the projects FID has been made. |
| (4) | All-in cost is estimated on a pre-tax basis and includes all project operating costs, capital costs post-FID, and decommissioning costs divided by the estimated number of pounds U3O8 to be produced. |
12
|
MANAGEMENT’S DISCUSSION & ANALYSIS |
The Gryphon Update was prepared by Engcomp Engineering and Computing Professionals Inc. (‘Engcomp’), SLR International Corporation (‘SLR’), Stantec Consulting Ltd. (‘Stantec’), and Hatch Ltd. (‘Hatch’), and is largely based on the 2018 PFS, with efforts targeted at the review and update of capital and operating costs, as well as various minor scheduling and design optimizations. The study remains at the PFS level of confidence.
Overall, the Gryphon Update demonstrates that the underground development of Gryphon is a positive potential future use of cash flows generated from Phoenix, as it is able to leverage existing infrastructure to provide an additional source of low-cost production.
See the following tables for the highlights of the Gryphon Update.
Summary of Economic Results (100% Basis) – Base Case | |
Uranium selling price |
US$75/lb U3O8(1) (Fixed selling price) |
Exchange Rate (US$:CAD$) |
1.35 |
Discount Rate |
8% |
Operating profit margin(3) |
83.0% |
|
|
Pre-tax NPV8%(3) (Change from 2018 PFS)(4) |
$1.43 billion (+148%) |
Pre-tax IRR(3) |
41.4% |
Pre-tax payback period(5) |
~ 20 months |
|
|
Post-tax NPV8%(3)(6) |
$864.2 million |
Post-tax IRR(3)(6) |
37.6% |
Post-tax payback period(5)(6) |
~ 22 months |
Notes
| (1) | Fixed selling price is based on the forecasted annual “Composite Midpoint” long-term uranium price from UxC’s Q2’2023 UMO (defined below) and is stated in constant (not-inflated) dollars. See Denison news releases dated June 26, 2023 and August 9, 2023 and the Wheeler Technical Report (defined below) for details. |
| (2) | Operating profit margin is calculated as aggregate uranium revenue less aggregate operating costs, divided by aggregate uranium revenue. Operating costs exclude all royalties, surcharges and income taxes. |
| (3) | NPV and IRR are calculated to the start of construction activities for the Gryphon operation, and excludes $56.5 million in pre- FID expenditures. |
| (4) | Change from 2018 PFS is computed by reference to the same scenario from the 2018 PFS, adjusted to incorporate certain pre-FID costs for consistent comparability. |
| (5) | Payback period is stated as number of months to payback from the start of uranium production. |
| (6) | There is no “adjusted” post-tax case for Gryphon, given that the entity level tax attributes of the WRJV owners are assumed to have been fully depleted by the Phoenix operation. See Denison news release dated June 26, 2023 and the Wheeler Technical Report (defined below) for details. |
Summary of Key Gryphon Operational Parameters (100% basis) | |
Mine life |
6.5 years |
Probable reserves(1) |
49.7 million lbs U3O8 (1,257,000 tonnes at 1.8% U3O8) |
Average annual production |
7.6 million lbs U3O8 |
Initial capital costs(2) |
$737.4 million |
Average cash operating costs |
$17.27 (US$12.75) per lb U3O8 |
All-in cost(3) |
$34.50 (US$25.47) per lb U3O8 |
Notes:
| (1) | See Denison press released dated June 26, 2023 for additional details regarding Probable reserves. |
| (2) | Initial capital costs exclude $56.5 million in estimated pre-FID expenditures expected to be incurred before the project’s FID has been made. |
| (3) | All-in cost is estimated on a pre-tax basis and includes all project operating costs, capital costs post-FID, and decommissioning costs divided by the estimated number of pounds U3O8 to be produced. |
Further details regarding Wheeler River, including the estimated mineral reserves and resources for Phoenix and Gryphon, are provided in the Technical Report for the Wheeler River project titled ‘NI 43-101 Technical Report on the Wheeler River Project, Athabasca Basin, Saskatchewan, Canada’ with an effective date of June 23, 2023 (‘Wheeler Technical Report’). A copy of the Wheeler Technical Report is available on Denison’s website and under its profile on each of SEDAR+ and EDGAR.
13
|
MANAGEMENT’S DISCUSSION & ANALYSIS |
The location of the Wheeler River property, as well as the Phoenix and Gryphon deposits, and existing and proposed infrastructure, is shown on the map provided below.
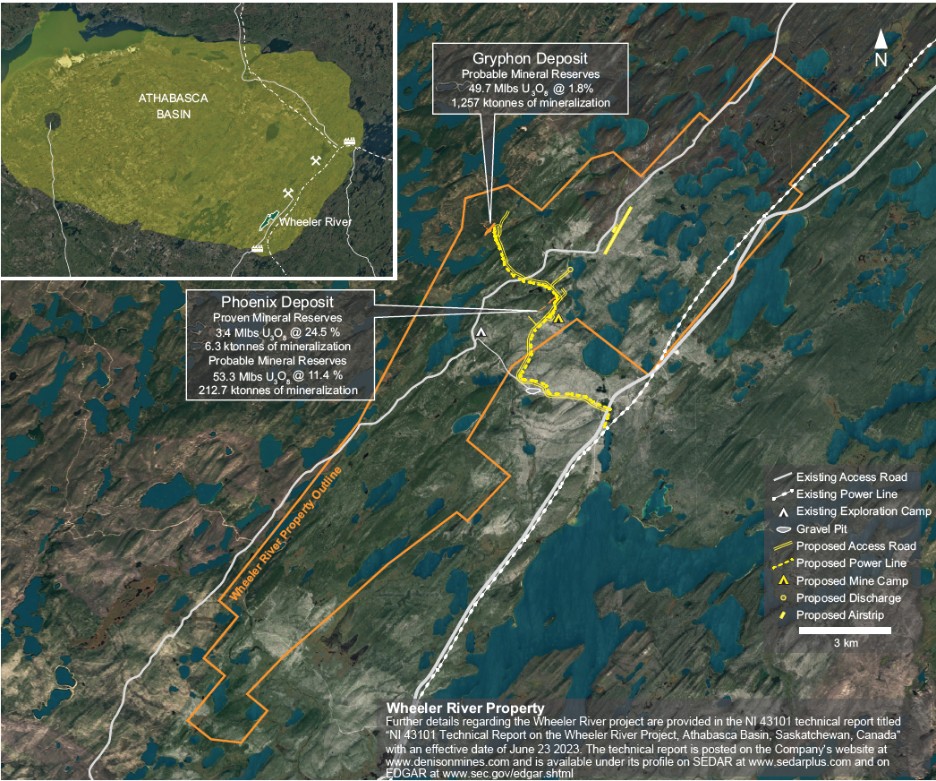
Evaluation Program
Denison’s 2023 evaluation activities for Wheeler River included (1) completing the third and final phase of the FFT, (2) completing the Phoenix FS and Gryphon Update, (3) advancing FEED optimization to support initiation of detailed design engineering, (4) advancing through the regulatory review of the draft EIS submitted in 2022, (5) initiating activities required to license and permit construction of the proposed Phoenix ISR operation, and (6) advancing the negotiation of impact benefit type agreements with interested parties.
During the year ended December 31, 2023, Denison’s share of evaluation costs at Wheeler River was $15,971,000 (December 31, 2022 – $23,044,000).
14
|
MANAGEMENT’S DISCUSSION & ANALYSIS |
Engineering Activities
Feasibility Field Test
The FFT was designed to use the commercial-scale ISR test pattern installed at Phoenix in 2021 to facilitate a combined evaluation of the Phoenix deposit's hydraulic flow properties, with the leaching characteristics that were previously assessed through the metallurgical core-leach testing program.
The successful completion of the leaching and neutralization phases of the FFT in the fourth quarter of 2022 provided further verification of the permeability, leachability, reclamation, and containment parameters needed for the successful application of the ISR mining method at the Phoenix deposit.
The final stage of the FFT, the recovered solution management phase, was completed in 2023 and involved treating the solutions recovered in 2022 during the leaching and neutralization phases to produce (i) a mineralized precipitate and (ii) a treated effluent solution that met permit criteria for re-injection back into the mineralized formation. The mineralized precipitate will be stored on surface at site and will be monitored in further care and maintenance activities. The recovered solution management phase was initiated in July 2023 and was completed in October 2023. A total of 560 cubic metres (‘m3‘) of recovered solution was successfully processed into treated effluent and a mineralized precipitate, containing an estimated 99.99% of the 14,400 pounds U3O8 previously estimated to be dissolved in the recovered solution. The treated effluent was tested to ensure compliance with permit conditions and was then injected into the mineralized zone. The results of this phase of the FFT validates the Company’s processing designs and assumptions for the future Phoenix processing plant.
With the completion of the recovered solution management phase, Denison has initiated the decommissioning the FFT facilities, in accordance with its permit conditions. Decommissioning involves the cleaning, deconstruction, and shipment off-site of equipment used during the leaching, neutralization, and solution management phases. As the decommissioning work was not completed prior to the onset of winter weather conditions, Denison expects to complete the majority of the decommissioning of the FFT site in 2024.
Metallurgical Testing
Metallurgical testing continued during 2023 at the Saskatchewan Research Council Laboratories (‘SRC’) in Saskatoon, including the completion of pilot plant operations, as part of FEED, to further inform key equipment sizing for the Phoenix plant, including thickeners/clarifiers, dewatering equipment selection including filtration vs pressure filter vs centrifuge, and to gather more information for yellowcake dryer vendors.
Phoenix FS
The results of the Phoenix FS were released in June 2023 and the Wheeler River Technical Report was filed in August 2023.
The Phoenix mineral resource estimate has been updated to reflect 70 additional drill holes completed since the previous mineral resource estimate from 2018. The additional drilling consisted primarily of test wells installed to support ISR de-risking activities and certain targeted resource definition drill holes. As a result of the additional drilling, 30.9 million pounds U3O8 (64,200 tonnes at 21.8% U3O8) have been upgraded from Indicated mineral resources to Measured mineral resources in recognition of the increased confidence in certain areas of Phoenix Zone A.
Phoenix is planned to be the first uranium ISR mining operation in the Athabasca Basin region. Comprehensive field and laboratory test work has been completed to de-risk the use of the ISR mining method at the Phoenix deposit –including the highly successful completion of the leaching and neutralization phases of the FFT at Phoenix in the fall of 2022. Over 3,300 data points have been collected within Phoenix to advance hydrogeological evaluations, and extensive groundwater flow modelling has been completed to develop an advanced three-dimensional estimation of the subsurface flows within and surrounding the Phoenix deposit. The data allowed for modelling of complex hydrogeological and geochemical datasets, which together with the uranium recovery curve, were used to estimate the rate of uranium dissolution within the orebody and facilitate the detailed wellfield design and production planning process.
Mining is planned to occur over a 10-year period, spanning 11 calendar years, with partial years of production occurring in both the first and final calendar year of the production plan. Progressive reclamation and decommissioning is planned to commence in each phase of the ore zone once production has ceased.
15
|
MANAGEMENT’S DISCUSSION & ANALYSIS |
The Proven and Probable mineral reserves at Phoenix are estimated to be 56.7 million pounds U3O8 (219,000 tonnes at 11.7% U3O8). This estimate is based on the aggregate mine feed to the plant and represents 80.6% recovery of the total available uranium (U3O8) in the Measured and Indicated mineral resources. Proven mineral reserves are those which were subject to a recovery test during the FFT in 2022.
Consistent with the 2018 PFS, the Phoenix FS calls for the construction of a processing plant on the Wheeler River site, which has been designed to receive uranium bearing solution (‘UBS’) from the wellfield for processing to a finished yellowcake product that meets industry standards.
An acidic lixiviant solution is prepared in the processing plant and transferred to an injection solution handling system for distribution in the wellfield. The solution is injected through a series of wells arranged in a pattern surrounding extraction / recovery wells, which are designed to pump the UBS up to surface once the lixiviant has travelled through the ore zone and dissolved the uranium from the host rock.
Once the UBS is received at the processing plant, removal of impurities such as iron (Fe) and radium (Ra) occur via Stage 1 (Fe/Ra) precipitation. Next the purified leach solution feeds the Stage 2 yellowcake precipitation circuit and the yellowcake product is dried and packaged for shipment. The processing plant has been designed based on an average uranium head grade of the UBS recovered from the wellfield of 22 grams per litre and is expected to recover 96.5% of the uranium feed contained in UBS after a 6-month ramp-up period of the plant (when recovery is expected to be initially 93.4%). Taken together with planned subsequent recoveries of uranium contained in the Stage 1 (Fe/Ra) precipitation product, total recovered uranium of 56.2 million pounds U3O8 is planned to be available for sale – representing a combined 99% recovery rate.
Overall, the processing plant flowsheet remains largely consistent with the 2018 PFS; however, additional provisions have been included for effluent treatment via a three-stage neutralization process. Whereas the 2018 PFS assumed a “closed loop” processing system, the Phoenix FS design is aligned with the engineering components and criteria included in the EA for the ISR project, which allow for the treatment of process solutions and controlled release of a treated effluent to the environment. This is an example of how the iterative nature of the EA process has informed project designs during the Phoenix FS process, to ensure that the plans are aligned and costed to meet or exceed environmental criteria expected to be required by the ongoing regulatory approval process. While this design for effluent treatment has been adopted for the Phoenix FS, the potential remains for ongoing FEED studies to optimize the processing plant design.
The Phoenix FS was prepared by Wood PLC, as the independent lead author, with a level of engineering design necessary to support a Class 3 capital cost estimate (AACE international standard with an accuracy of -15% /+25%).
Capital Costs
The estimated initial direct capital costs of $273.8 million represent a 32% increase compared to the initial direct capital costs from 2018 PFS, which have been adjusted to reflect the movement of offsite infrastructure costs from direct costs to Other (owner’s) costs. The increase in initial direct capital costs reflects recent inflationary trends in labour and materials costs and the impact of several design changes resulting from the substantive advancement of project designs from the 2018 PFS. Importantly, the design changes in the Phoenix FS reflect (i) modifications necessary to allow for production plan optimizations, leading to a 43% increase in the rate of production during the first five years of production, (ii) choices made as a result of the iterative EA evaluation process, and (iii) results of the multi-year technical de-risking program.
16
|
MANAGEMENT’S DISCUSSION & ANALYSIS |
Initial capital costs are expected to be incurred during a 24-month construction period that will include the establishment of site infrastructure, as well as the freeze wall perimeter around the Phase 1 mining zone and initial wellfield development within Phase 1.
Phoenix Capital Costs ($ millions) | |||
|
Initial |
Sustaining |
Total |
Wellfield |
$63.0 |
$177.1 |
$240.1 |
ISR processing plant |
$102.6 |
$- |
$102.6 |
Surface facilities |
$14.7 |
$2.1 |
$16.8 |
Utilities |
$34.8 |
$- |
$34.8 |
Electrical |
$19.1 |
$- |
$19.1 |
Civil and earthworks |
$39.6 |
$- |
$39.6 |
Decommissioning |
$- |
$88.8 |
$88.8 |
Subtotal – Direct Costs |
$273.8 |
$268.0 |
$541.8 |
Indirect costs |
$70.5 |
$31.6 |
$102.1 |
Other (owner’s) costs |
$32.7 |
$- |
$32.7 |
Contingency |
$42.6 |
$23.3 |
$65.9 |
Total Capital Costs |
$419.4 |
$322.9 |
742.3 |
Note: Figures may not sum due to rounding
Contingencies reflect approximately 11% of total capital costs, which is considered appropriate given the estimate was prepared to meet AACE Class 3 requirements, as well as Denison’s significant experience with key capital cost drivers through the completion of multiple field test programs at Phoenix since the 2018 PFS.
Taken together with estimated indirect costs, owner’s costs, sustaining and decommissioning capital costs, contingencies, and with the reallocation of certain costs to the pre-FID period, total life of mine capital costs are estimated at $742.3 million. This represents a 74% increase in life of mine capital costs compared to the 2018 PFS.
As is demonstrated by the project’s current NPV, the economic outcome of the project has not been adversely impacted by the increase in life of mine capital costs. Significant contributors to the overall increase in capital costs include the wellfield, ISR processing plant, and decommissioning costs, as further described below:
|
Wellfield +$141.0 million |
The increase includes the adoption of a phased “freeze wall” design to replace the novel “freeze dome” concept included in 2018 PFS. The freeze dome introduced significant technical risk to the ISR mining process and added complexity from an environmental protection standpoint. The cost of the freeze dome was included in initial capital costs, whereas the cost of the freeze wall is spread over the life of mine, thus significantly reducing the impact to the NPV from the overall increase in capital costs. Materials and installation costs for the ISR injection and extraction wells are now based on the Company’s actual experience in installing both large and small-diameter test wells during the de-risking process, providing a much more accurate estimate of costs compared to the 2018 PFS. |
|
Processing plant +$47.1 million |
The increase reflects a variety of design adjustments to the processing plant, including those which enable an increase in the planned production rate by 43% during the first 5 years, which has a positive impact on the NPV. |
|
Decommissioning +$60.2 million |
The increase reflects the incorporation of costs associated with ore zone groundwater remediation to achieve targets proposed in the EA; more detailed management and regulatory cost requirements, improved accuracy in well decommissioning activities, process plant decontamination and demolition including transport and disposal of waste materials, additional costs for decommissioning larger industrial water treatment facilities, and environmental monitoring labour and analytical costs. As these increased capital costs are primarily expected to occur at the end of the mine life, the impact to the NPV from the increased capital costs is minimized. |
17
|
MANAGEMENT’S DISCUSSION & ANALYSIS |
Operating Costs
Average estimated operating costs of $8.51 (US$6.28) per pound U3O8 produced remain highly competitive amongst the lowest-cost uranium mining operations globally. Operating costs during the first five years of production are expected to be $6.64 (US$4.90) per pound U3O8, benefitting from the increased scale of operations and higher concentrations of uranium contained in recovered UBS. During the remaining years of production, operating costs are expected to be $13.69 (US$10.10) per pound U3O8.
As a proportion of operating costs per pound, processing costs have increased from the 2018 PFS, now accounting for nearly 62%, as compared to 45% in the 2018 PFS. The biggest contributors to the increased processing costs include reagent usage, as well as estimated costs for reagents, fuel/propane, and labour.
Changes to reagent usage reflect the results of the Company's multi-year technical de-risking process, which has provided a robust data set of metallurgical tests on which the current estimate of reagent usage has been based, as compared to limited preliminary leach data used for the 2018 PFS.
The cost of reagents, fuel/propane, and labour reflect the impact of inflation and supply chain challenges experienced through 2022 and into 2023. Based on the timing of this study, reagent and fuel/propane prices used may be reflective of "peak inflation" pricing and present a possible opportunity for optimization in future years. These cost increases are expected to impact uranium mining operations globally; however, few have completed significant operating cycles and/or estimates of future costs in the current cost environment.
Uranium Selling Price Assumptions
The base case economic analysis assumes uranium sales from Phoenix mine production will be made from time to time throughout the production period at the forecasted annual “Composite Midpoint” uranium spot price from the Q2’2023 Uranium Market Outlook (‘UMO’) issued by UxC, LLC (‘UxC’), which is stated annually in constant (non-inflated) 2023 dollars and ranges from ~US$66 to US$70 per pound U3O8 during the indicative production period of the Phoenix operation. This is the same pricing methodology applied for Phoenix as the base case scenario in the 2018 PFS, where the “Composite Midpoint” uranium prices during the indicative years of production then ranged from only US$29 to US$45 per pound U3O8 in constant 2018 dollars. Consistent with the 2018 PFS, the overall cost profile and construction timeline of the planned Phoenix ISR mine is not expected to require substantial contract base loading to justify development. Accordingly, the spot price indicator from UxC has been used for the Phoenix base case economic analysis.
Gryphon Update
The mineral resource estimate for Gryphon remains unchanged from the 2018 PFS. Using a cut-off grade of 0.2% U3O8, Gryphon is estimated to contain Indicated mineral resources of 1,643,000 tonnes, at a grade of 1.7% U3O8 for a total of 61.9 million pounds U3O8, plus Inferred mineral resources of 73,000 tonnes at a grade of 1.2% U3O8 for a total of 1.9 million pounds U3O8. Mineral resources are stated inclusive of mineral reserves. Mineral resources that are not mineral reserves do not have demonstrated economic viability.
The mine development and production plan for Gryphon remains largely the same as the 2018 PFS. Access to the deposit is planned to be via a primary production shaft with a diameter of 6.1 metres, installed using a blind boring method to a depth of 550 metres below surface. A ventilation shaft with a diameter of 5.8 metres, is also planned to be excavated via blind boring to a depth of 550 metres.
Access from the shaft to the mine workings will be via a single ramp located on the hanging wall of the deposit. Mining is planned to consist of conventional underground longhole stoping mining methods and is expected to primarily utilize a longitudinal retreat approach. Mined stopes will be backfilled using a combination of rockfill, cemented rockfill, and hydraulic fill.
Overall, 49.7 million pounds U3O8 over 1,260,000 tonnes grading 1.8% U3O8 are planned to be extracted from Gryphon over an approximately 6.5-year mine life.
Consistent with the 2018 PFS, production from the Gryphon operation is assumed to be processed at the 22.5% Denison-owned McClean Lake processing plant, which is located in the northeastern portion of the Athabasca Basin region. The results from the 2018 PFS indicate that the Gryphon deposit is amenable to recovery utilizing the existing flowsheet for the McClean Lake mill with minimal required upgrades and an estimated recovery rate of 98.2%. Due to the volume of throughput expected from the Gryphon operation, the McClean Lake mill will require certain upgrades to process the mine production from Gryphon.
To facilitate access to the McClean Lake mill from the Wheeler River site, the Gryphon Update carries certain costs of building an extension to Highway 914 to connect the McArthur River and Cigar Lake operations and to allow for the transport of Gryphon mine production over an approximately 160 kilometre route.
18
|
MANAGEMENT’S DISCUSSION & ANALYSIS |
Due to its proximity to Phoenix, the Gryphon operation is expected to benefit from site infrastructure that is planned to be established in support of the Phoenix ISR mine (e.g., airstrip, camp, access road, power distribution). Additional site infrastructure for Gryphon is generally limited to items directly related to the underground mining operation, including incremental power distribution requirements, ore and waste rock handling, as well as mine water handling and treatment.
Capital Costs
Estimated direct initial capital costs of $487.6 million represent a 48% increase compared to the 2018 PFS. The increase in direct initial capital costs reflect recent inflationary trends in labour and materials costed using the Chemical Engineering Plant Cost Index. Initial capital costs are expected to be incurred during a 42-month construction period that will include approximately 24 months for the completion of the production shaft and vent raise. Surface facilities, underground excavation, haulage road, and McClean Lake mill upgrades are expected to take approximately 18 months. Initial ore recovery occurs prior to the completion of construction and ramps up for the mine to achieve full production by year 3.
Contingencies reflect approximately 25% of total capital costs, which is considered appropriate given the estimate was prepared to meet AACE Class 4 requirements in alignment with the stage of engineering and design efforts for the project.
Taken together with estimated indirect costs, sustaining and decommissioning capital costs, and the reallocation of certain costs to the pre-FID period, total life of mine capital costs are estimated at $841.1 million. This represents a 19% increase in life of mine capital costs compared to the 2018 PFS. Due to construction schedule optimization, the impact of increased capital costs to the NPV has been minimized.
Operating Costs
Estimated operating costs of $17.27 (US$12.75) per pound U3O8 produced have increased by approximately 14% from the 2018 PFS and remain highly competitive amongst the lowest-cost uranium mining operations globally. Operating costs have increased as a result of recent inflationary trends in labour and materials, partially offset by favourable updates to certain milling assumptions.
Uranium Selling Price Assumptions
The base case economic analysis assumes uranium sales from Gryphon mine production will be made throughout the mine life at a fixed price of US$75 per pound U3O8, which is based on the average of the forecasted annual “Composite Midpoint” long-term uranium price from UxC’s Q2’2023 UMO, which is stated in constant (non-inflated) 2023 dollars, during the indicative production period of Gryphon, rounded to the nearest US$5 per pound U3O8. This is the same pricing methodology applied for Gryphon as the base case scenario in the 2018 PFS, where the “Composite Midpoint” long-term uranium price during the indicative years of production averaged ~US$50 per pound U3O8 in then constant 2018 dollars. Consistent with the 2018 PFS, the overall cost profile and construction timeline of the planned Gryphon underground mine is considered to be more amenable to fixed (base escalated) price contracts with nuclear energy utilities to reduce risk and justify a development decision. Accordingly, the long-term price indicator from UxC has been used for the Gryphon base case economic analysis.
Front End Engineering Design
FEED activities were initiated for Phoenix in early 2023, prior to the completion of the Phoenix FS, in order to increase the level of engineering definition in key project areas. This parallel approach allowed for the results of several FEED scopes to be incorporated into the results of the Phoenix FS.
Following the completion of the Phoenix FS, additional FEED work continued, to assess opportunities to optimize the process plant and well field designs. FEED activities during 2023 included:
| ● | Studies on air emissions controls and water treatment improvements to optimize specific design requirements and support regulatory submissions and approvals. |
| ● | The development of a detailed procurement schedule and the initiation of ordering of long lead items for key electrical and control systems |
| ● | The advancement of electrical and instrumentation engineering with the completion of the electrical load studies, substation design, and updates to the single line diagram to allow for procurement of long-lead electrical requirements such as the main transformer. |
19
|
MANAGEMENT’S DISCUSSION & ANALYSIS |
| ● | Mechanical engineering activities with optimization studies for header house design; major process equipment selection; as well as plant HVAC design refinement to satisfy anticipated regulatory requirements. |
| ● | Wellfield optimization activities, including an updated tomography model, and advanced design of the Phase 1 freeze wall to support final refinements to the Phase 1 well field layout. |
| ● | The finalization of process flow diagrams and major equipment selection for the processing plant, using the results of the optimization test work. |
The FEED phase is expected to be completed in early 2024, and the Company plans to immediately transition to the detailed design engineering phase for the Phoenix mining and processing infrastructure. In January 2024, Denison announced that Wood has been selected to continue to work with Denison on the completion of several key scopes of the detailed design engineering activities for Phoenix
Environmental and Sustainability Activities and Licensing Activities
Environmental Assessment Activities
In October 2022, the draft EIS for the Phoenix ISR project was submitted to Provincial and Federal regulators for review and comment. Technical comments and information requests were received from both regulatory agencies in the first quarter of 2023 and the Company has provided technical responses to both the Provincial and Federal regulators.
In August 2023, the Company’s responses to the CNSC were deemed complete, allowing for the second phase of Federal review to begin and in November 2023, a second round of information requests was received from the CNSC. Following the successful resolution of the outstanding comments from the Federal Indigenous Review Team, the Company expects to then be in position to submit a final version of EIS for consideration at a future hearing of the CNSC.
In October 2023 the SKMOE confirmed its satisfaction with Denison’s comment responses and proposed EIS updates. The confirmation would allow Denison to finalize the EIS for the purpose of obtaining a Provincial EA approval, however this would delink the coordinated Provincial – Federal EA process, which is not expected to provide a meaningful schedule advantage for the Project. Denison plans to submit one version of the final EIS to both authorities once the Federal information requests have been resolved.
As part of the EA review process, Denison has also progressed the preparation of responses to the public comments received in relation to the Wheeler River draft EIS. During November 2023, Denison provided responses to Indigenous communities and other organizations that made comments during the public review of the Wheeler River EIS. These responses will be provided to the CNSC when the EIS is finalized.
Licensing Activities
The Company has advanced its application to obtain a site preparation and construction license from the CNSC for Phoenix with the submission of the majority of the required program and design documents, including the Company’s plans to safely design, manage, prepare, and construct the proposed ISR mine and processing facility. The CNSC is currently reviewing the application against technical requirements. Similar to the EA process, once the CNSC staff determine that the technical requirements of the application have been met, the staff will recommend a license be issued following a CNSC Commission hearing.
Evaluation Pipeline Properties
Waterbury Lake
In 2020, an independent PEA was completed for the Waterbury Lake Property (‘Waterbury’), which evaluated the potential use of the ISR mining method at the THT deposit. Further details regarding Waterbury, including the estimated mineral resources, are provided in the Technical Report for Waterbury titled ‘Preliminary Economic Assessment for the Tthe Heldeth Túé (J Zone) Deposit, Waterbury Lake Property, Northern Saskatchewan, Canada’ with an effective date of October 30, 2020, a copy of which is available on Denison’s website and under its profile on each of SEDAR+ and EDGAR.
Denison’s 2023 evaluation activities at Waterbury were designed to build upon the 2020 PEA and included an ISR field program consisting of the installation of eight new ISR test wells within the mineralized zone at THT, the collection of site-specific hydrogeological test data to verify permeability and containment assumptions, and the collection of fresh metallurgical drill core samples in order to support additional de-risking of the ISR mining approach for the THT deposit.
20
|
MANAGEMENT’S DISCUSSION & ANALYSIS |
The ISR field program commenced in the second quarter of 2023 with the installation of the first ISR test wells at THT. During the third quarter of 2023, the Company completed pump testing, injection testing, permeameter data collection, hydrogeological logging, metallurgical sampling, and geological logging. During the fourth quarter, an ion tracer test was completed.
The THT ISR field program successfully achieved each of its planned objectives including:
| ● | Confirmed Hydraulic Conductivity: Pump and injection tests were successfully completed within the test wells, validating hydraulic connectivity in 100% of the test wells within the ore zone, and achieving hydraulic conductivity values (a measure of permeability) consistent with the 2020 PEA for the project. Sufficient permeability within the ore zone is a key criterion for the successful deployment of the ISR mining method. |
| ● | Established 10-hour Breakthrough Time with Ion Tracer Test: The tracer test significantly increased the confidence in the initial hydrogeological evaluations (pump and injection tests) within the test wells. The tracer test demonstrated Denison’s ability to maintain hydraulic control of injected solutions and achieve breakthrough times consistent with expectations. |
| ● | Demonstrated the Effectiveness of Permeability Enhancement: One method of permeability enhancement was successfully deployed from multiple wells demonstrating the suitability of the method to the THT deposit. Efficiency of permeability enhancement was verified by comparison of pre- and post-permeability enhancement hydraulic testing. |
During the year ended December 31, 2023, evaluation costs at THT were $4,404,000 (Denison’s ownership share $2,978,000). The minority owner of the project, Korea Waturbury Uranium Limited Partnership (‘KWULP’), elected not to fund its share of the 2023 evaluation program and therefore Denison funded 100% of the program expenditures and as a result, Denison’s ownership interest increased from 67.41% to 69.35%.
Midwest
The MWJV is operated by Orano Canada and is host to the high-grade Midwest Main and Midwest A uranium deposits, which lie along strike and within six kilometres of the THT and Huskie deposits on Denison’s 69.35% owned Waterbury Lake project. The Midwest and Waterbury deposits are all located in close proximity to existing uranium mining and milling infrastructure including provincial highways, powerlines, and Denison’s 22.5% owned McClean Lake mill.
A concept study for ISR application at Midwest (the ‘Concept Study’) was prepared by Denison during 2022 and was formally issued to the MWJV in early 2023 (see Denison press release dated April 12, 2023). Based on the positive results of the Concept Study, the MWJV provided Denison with approval to complete additional ISR-related evaluation work for Midwest in 2023.
Denison’s 2023 evaluation plans for Midwest included (i) an inaugural ISR field program designed to assess site-specific technical elements of the Midwest deposit and (ii) a metallurgical test program. The field program was completed during the third quarter of 2023 and the results of the program, along with further technical studies, are expected to be used to further advance the evaluation of the ISR mining method for the property, including the potential future preparation of a PEA. Metallurgical sampling and test work on historic drill core samples was completed and consisted of bottle roll tests designed to provide initial site-specific, ISR focused, metallurgical results.
During the year ended December 31, 2023, Denison’s share of evaluation costs at Midwest was $127,000 (December 31, 2022 – $nil).
Community Engagement Activities
During the year ended December 31, 2023, Denison continued working with Indigenous communities of interest and collaborated on engagement activities in the Athabasca Basin region of northern Saskatchewan, including community visits to provide information about Phoenix and Denison’s other exploration and evaluation activities. Engagement activities in 2023 included site visits at the Phoenix FFT site, a series of community meetings and open houses in the Northern Village of Pinehouse Lake, the Northern Village of Beauval and the Northern Village of Île à la Crosse. Additionally, Denison carried out ongoing engagement activities with the Ya’thi Nene Lands and Resources Office related to the field activities at THT.
Significantly, on September 26, 2023, Denison and ERFN signed the SPA. The signing of the SPA follows years of active engagement, including a four-month-long ERFN-led community consultation process ahead of a ratification vote. The SPA acknowledges that the Project is located within ERFN’s Ancestral Lands and provides Denison with ERFN’s consent to advance the Project, which represents a significant milestone in the history of both Denison’s relationship with ERFN and the Project. Amongst other key commitments, the SPA provides ERFN and its Members with (i) an important role in environmental monitoring and management, and (ii) benefits from community investment, business opportunities, employment and training opportunities, and financial compensation.
21
|
MANAGEMENT’S DISCUSSION & ANALYSIS |
MINERAL PROPERTY EXPLORATION
During the year ended December 31, 2023, Denison’s share of exploration expenditures was $9,564,000 (December 31, 2022 –$8,097,000). The increase in exploration expenditures compared to the prior year was due to an increase in winter and summer exploration activities.
Exploration spending in the Athabasca Basin is generally seasonal in nature, with spending typically higher during the winter exploration season (January to mid-April) and summer exploration season (June to mid-October).
The following table summarizes the 2023 exploration activities. Exploration drilling programs were conducted at Wheeler River, Moon Lake South, Moon Lake, Johnston Lake, and at Waterfound, which is one of the Company’s non-operated properties. All exploration expenditure information in this MD&A covers the year ended December 31, 2023.
| (1) | The Company reports total exploration metres drilled and the number of holes that were successfully completed to their target depth. |
| (2) | Denison’s effective ownership interest as at December 31, 2023, including an indirect 12.90% ownership interest held through Denison’s 50% ownership of JCU. |
| (3) | Denison’s effective ownership interest as at December 31, 2023, including the indirect 5.0% ownership interest held through Denison’s 50% ownership of JCU. |
22
|
MANAGEMENT’S DISCUSSION & ANALYSIS |
The Company’s land position in the Athabasca Basin, as of December 31, 2023, is illustrated in the figure below. During the fourth quarter of 2023, the Company added three new projects to its exploration portfolio by staking 101,634 hectares in 21 new claims, expanding the Company’s Athabasca land package to 387,780 hectares (228 claims). The land position reported by the Company excludes the land positions held by JCU.
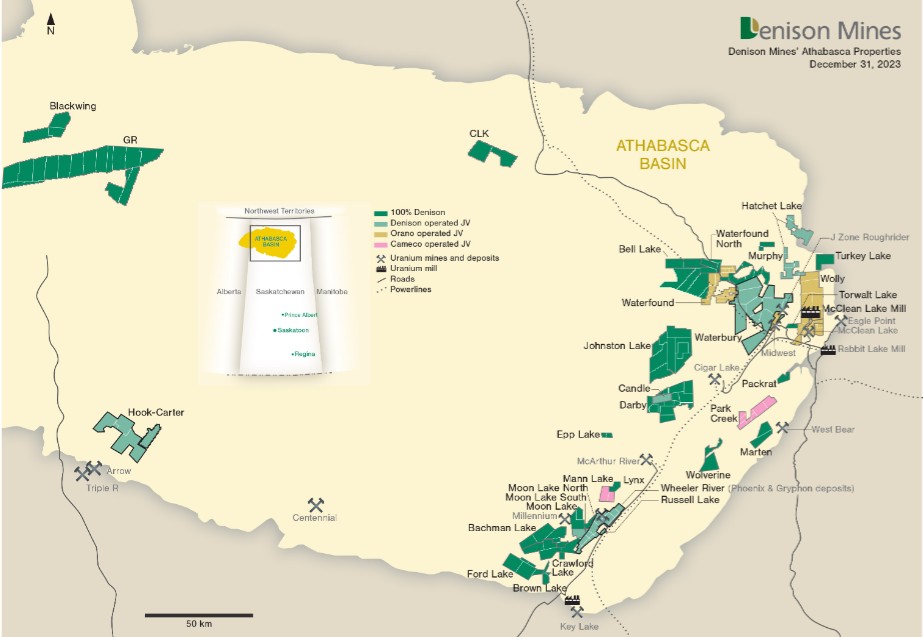
Wheeler River Exploration
Denison’s share of exploration costs at Wheeler River during the year ended December 31, 2023 was $1,785,000 (December 31, 2022 – $2,953,000).
Drilling
During the winter drilling program, three holes were drilled to test the potential to upgrade the unconformity-associated mineralization found in 2015 drill hole WR-597, located approximately 850 metres south of the Gryphon deposit (4.5% U3O8 over 4.5 metres), by testing the unconformity approximately 100 metres southwest along strike of WR-597. While the 2023 drill holes did not intersect unconformity-hosted uranium mineralization, multiple intervals of basement-hosted mineralization were identified: WR-810A intersected uranium mineralization grading 1.27% eU3O8 over 1.0 metres approximately 60 metres below the unconformity; and WR-811A identified basement-hosted mineralization grading 0.61% eU3O8 over 4.0 metres, approximately 4.0 metres below the unconformity.
The winter drilling program also included two additional holes at the Gryphon South target area, designed to test conductivity anomalies associated with the edges of a resistivity low anomaly, located an additional 2.8 kilometres along strike to the south of WR-810A and WR-811A. This basement resistivity low exhibits an S-shaped flexure, creating a structural setting where zones of both dilation and compression may be present, resulting in attractive targets for both basement-hosted and unconformity-hosted mineralization respectively.
23
|
MANAGEMENT’S DISCUSSION & ANALYSIS |
WR-808 targeted the southeast edge of the resistivity anomaly. A graphitic pelite was intersected in the upper basement, interpreted to explain the conductive response. Unfortunately, no significant structural disruption was associated with this graphitic pelite. Significant carbonate veining was observed approximately 150 metres below the unconformity, perhaps indicating that there may be a significant structure nearby. No significant elevated radioactivity was encountered in WR-808.
WR-809 targeted the northwest edge of the resistivity anomaly and intersected a graphitic fault zone approximately 40 metres below the unconformity consisting of sporadic breccias with structurally upgraded graphite with thicknesses of up to 20 centimetres. The up-dip projection of this structure at the unconformity presents a target for future exploration drilling.
The fall drilling program was completed in October 2023 and consisted of two holes (1,334 metres) at the Gryphon deposit.
WR-812 targeted the northern strike extension of the Gryphon E2 lens by targeting the E2 horizon approximately 40 metres along strike to the northeast of mineralization encountered in WR-507D2 (38.6% U3O8 over 0.5 metres), which represents the northeastern end of the current interpretation of the E2 lens. While the hole intersected several intervals of low-grade mineralization near the interpreted E2 horizon, including a peak interval grading 0.48% eU3O8 over 1.7 metres, the mineralization identified in WR-812 is not anticipated to have a significant impact on the resources estimated for the E2 lens.
WR-813 was designed to test the unconformity expression of the up-dip projection of mineralization encountered in WR-709 by targeting the unconformity approximately 40 metres northwest from the unconformity intersection of WR-709. While intense structural disruption, resulting in intense quartz dissolution and significant core loss in the basal sandstone column, was identified, no uranium mineralization above a 0.05% eU3O8 cutoff was encountered at the unconformity. Instead, a narrow interval of low-grade uranium mineralization grading 0.06% eU3O8 over 0.3 metres was intersected approximately 30 metres below the unconformity contact, from 585.0 metres to 585.3 metres, associated with the margins of interfingering pelitic intervals within a pegmatitic unit.
Ground Geophysics
In addition to the winter diamond drilling activities, a Stepwise Moving Loop Electromagnetic (‘SWML EM’) survey that was initiated at the N Zone target area in the fourth quarter of 2022 was completed in January 2023. The survey successfully identified conductivity anomalies that lie coincident to resistivity low features defined by previous DC resistivity surveys at N Zone. These anomalies will be used to generate targets for future exploration drilling programs.
Exploration Pipeline Properties
During the year ended December 31, 2023, five exploration field programs were carried out at Denison’s pipeline properties (four operated by Denison) and Denison’s share of exploration costs for these properties was $7,097,000 (December 31, 2022 – $4,713,000).
The Company continues to review, prioritize and rationalize its Athabasca Basin exploration portfolio with the objective of continuing to explore its highest priority projects, with the potential to deliver significant and meaningful new discoveries, with a strong focus on evaluating prospective corridors in close proximity to proposed Phoenix infrastructure that may have the potential to host high-grade, ISR-amendable unconformity associated deposits.
Bell Lake
During the first quarter of 2023, a Small Moving Loop Electromagnetic (‘SML EM’) survey was completed on the Company’s 100%-owned Bell Lake property to locate and refine the positions of discrete, steeply-dipping conductors within a broad resistivity low anomaly identified from the 2013 and 2015 DC resistivity surveys. The survey has successfully resolved discrete conductors associated with previously identified resistivity anomalies, presenting compelling exploration targets for future drilling programs.
Hook-Carter
Located in the southwest corner of the Athabasca basin, the Hook-Carter project is interpreted to host the northeast strike extension of the Patterson Lake corridor, which hosts NexGen Energy’s Arrow deposit, Fission Uranium’s Triple R deposit, and Purepoint Uranium Group’s Spitfire zone. The project also overlies the interpreted strike extension of the Carter and Derkson corridors, each of which represent highly prospective, under-explored corridors in which significant uranium mineralization may exist.
24
|
MANAGEMENT’S DISCUSSION & ANALYSIS |
A property-wide Z-Axis Tipper Electromagnetic (‘ZTEM’) survey was completed on the Company’s Hook-Carter property in June of 2023. The primary objective of the ZTEM survey is to develop a project-scale conductivity model that will provide valuable insight into the underlying basement geology. A total of 1,559 kilometres of ZTEM data was collected. The ZTEM survey data has provided a high-resolution property-scale conductivity model that will be used to drive future ground-based geophysics as Denison’s exploration team defines drill targets for future drilling programs on the property.
Johnston Lake
The Johnston Lake project is 100% owned and operated by Denison. The property, located approximately 20 kilometres northwest of Cameco’s Cigar Lake operation, consists of nine mineral dispositions totaling 28,647 hectares.
During the first quarter of 2023, an SML EM survey was completed on the property to better define basement conductivity associated with the MJ1 conductive trend and generate targets for future drill testing on the project. The results of the survey were used to generate drill targets for the 2023 exploration drilling program, and will also inform future potential programs on the property.
The 2023 exploration drilling program at Johnston Lake commenced in early June and was completed in the third quarter. A total of 6,202 metres was drilled in eight holes along the MJ-1 trend, where drilling completed by a previous operator identified significant uranium and base metal enrichment.
The 2023 exploration drilling program successfully explained the conductive response identified from the 2023 SML EM survey. Additionally, alteration and structure indicative of a potentially mineralizing system were intersected in all holes completed during the summer program. Low-grade mineralization was identified in several holes, highlighted by JL23-39, which intersected 0.89% U3O8 over 0.1 metres, intersected approximately 90 metres below the unconformity. The presence of this mineralization, along with the strike-slip nature of the MJ-1 corridor suggest that the MJ-1 corridor has the potential to host a Cigar Lake-style unconformity hosted uranium deposit.
Moon Lake
The Moon Lake property is located in the southeastern part of the Athabasca Basin, adjacent to the western boundary of the Wheeler River project. During the first quarter of 2023, the Company completed an exploration drilling program, consisting of one diamond drill hole drilled to 627 metres depth. No significant structure, alteration, or uranium mineralization was intersected.
Moon Lake South
The Moon Lake South property is also located adjacent to the western boundary of the Wheeler River project and is north of Denison’s 100% owned Crawford Lake project, approximately 30 kilometres northwest of Cameco’s Key Lake operation. The Moon Lake South project is a joint venture (‘Moon Lake South JV’) between Denison Mines Corp., which holds a 75% interest in the property, and CanAlaska Uranium Ltd., which holds the remaining 25% interest. Denison is the project operator.
The 2023 winter exploration program consisted of six completed diamond drill holes totaling 3,306 metres, designed to evaluate the potential to expand the footprint of known mineralization discovered in 2016 and 2021 by testing conductivity anomalies identified from the 2022 SWML EM survey.
In April 2023, the Company announced that uranium mineralization was encountered in four of the six drill holes completed during the 2023 winter exploration program, highlighted by MS-23-10A which intersected perched high-grade uranium mineralization lying approximately 30 metres above the sub-Athabasca unconformity. Assay results from the 2023 winter drilling program were received during the second quarter, which confirmed and upgraded the high-grade result reported from MS-23-10A, returning 2.46% U3O8 over 8.0 metres (0.05% U3O8 cut-off), including 3.71% U3O8 over 4.5 metres (2% U3O8 cut-off).
25
|
MANAGEMENT’S DISCUSSION & ANALYSIS |
Based on the results of the winter drilling program, the Moon Lake South JV approved a supplemental budget to expand the 2023 exploration program to include a summer/fall drilling program. The supplemental drilling program was initiated in early September and was completed in October 2023, consisting of eight completed diamond drill holes for a total of 4,822 metres. Each hole completed during the fall drilling program encountered anomalous uranium enrichment in the basal Athabasca sandstone or within the upper basement, highlighted by drill hole MS-23-19, which intersected two zones of mineralization which returned uranium mineralization above a 0.05% U3O8 cut-off. The mineralized intervals are depicted in the table below:
MINERALIZED DRILL RESULTS FOR 2023 FALL DRILLING PROGRAM | |||||
Hole Number |
Orientation (azi./dip) |
From (m) |
To (m) |
Length(1) (m) |
Grade (% eU3O8)(2) |
MS-23-19(3) |
306°/-56.7° |
559.2 |
560.2 |
1.0 |
0.11 |
MS-23-19(3) |
306°/-56.7° |
565.4 |
566.9 |
1.5 |
0.08 |
| 1) | Lengths indicated represent the down-hole length of mineralized intersections. |
| 2) | Grades reported using a cut-off grade of 0.05% U3O8. |
| 3) | MS-23-19 was collared at 6,366,637 mN, 466,719 mE, 520.0 mASL (UTM NAD83 Z13N). |
A SWML EM survey was initiated in December of 2023 and completed in early 2024 to infill widely spaced data from previous surveys to better resolve discrete conductors within the CR-3 corridor, along strike of high-grade mineralization discovered during the winter 2023 drilling program to develop targets for future drilling programs.
Waterfound River
Waterfound River (‘Waterfound’) is operated by Orano Canada. Denison has an effective 24.68% ownership interest in the project, including an 11.78% direct interest and a 12.90% indirect interest from its 50% ownership of JCU.
The 2023 diamond drill program was designed with three objectives: (i) to evaluate and define the extent of high-grade unconformity associated uranium mineralization around the recently discovered Crocodile zone (including the broad zone of uranium mineralization previously encountered in WF-74A, which returned 4.75% eU3O8 over 13.3 metres, including a peak interval of 25.23% eU3O8 over 0.5 metres); (ii) characterize and determine the extent of historical mineralization at the Alligator showing (includes 4.49% U3O8 over 10.53 metres); and (iii) test the potential for high-grade mineralization between the two mineralized zones.
The most significant mineralization returned from the 2023 winter drill program was encountered in WF-74A-1, which tested the unconformity approximately 17 metres south of WF-74A. Mineralization grading 0.53% eU3O8 over 4.6 metres was encountered straddling the unconformity contact.
The summer drill program was initiated in mid-June 2023 and was completed during the third quarter of 2023. Six holes were drilled during the summer program, for a total of 3,471 metres.
While significant structure and indicative alteration were intersected in each hole drilled during the summer program, only two holes (Holes WF-89 and WF-90, drilled on a fence approximately 1,250 metres west of the Crocodile showing) returned uranium mineralization with grades exceeding a 0.05% eU3O8 cutoff. WF-89 encountered disseminated blebs of uraninite within a sandstone matrix approximately 0.5 metres above the unconformity contact, grading 0.08% eU3O8 over 0.3 metres. The follow-up hole, WF-90, drilled approximately 25 metres grid south of the mineralization encountered in WF-89, intersected low-grade basement-hosted mineralization grading 0.09% eU3O8 over 0.2 metres, located approximately 55 metres below the unconformity contact.
GENERAL AND ADMINISTRATIVE EXPENSES
Total general and administrative expenses were $13,760,000 during the year ended December 31, 2023 (December 31, 2022 – $12,538,000). These costs are mainly comprised of head office salaries and benefits, stock based compensation expense, office costs in multiple regions, audit and regulatory costs, legal fees, investor relations expenses, project costs, and all other costs related to operating a public company with listings in Canada and the United States. The increase in general and administrative expenses in the current fiscal year is predominantly due to an increase in severance costs, travel costs associated with site visits to the Phoenix FFT site, and legal costs.
26
|
MANAGEMENT’S DISCUSSION & ANALYSIS |
OTHER INCOME AND EXPENSE
During the year ended December 31, 2023, the Company recognized net other income of $136,472,000 (December 31, 2022 – net other income of $55,244,000).
The main drivers of other income/expense are as follows:
Fair value gains or losses on uranium investments
During 2021, the Company acquired 2,500,000 pounds of U3O8 at a weighted average cost of $36.67 (US$29.66) per pound U3O8 (including purchase commissions of $0.05 (US$0.04) per pound U3O8) to be held as a long-term investment to strengthen the Company’s balance sheet and potentially enhance its ability to access future project financing in support of the advancement and/or construction of Wheeler River. Given that this material is held for long-term capital appreciation, the Company’s holdings are measured at fair value, with changes in fair value between reporting dates recorded through profit and loss. During the fourth quarter of 2023, the Company sold 200,000 pounds of U3O8 at a weighted average price of $99.50 (US$73.38) per pound U3O8. As at December 31, 2023 the Company holds 2,300,000 pounds of U3O8.
During the year ended December 31, 2023, the spot price of U3O8 increased from $65.01 (US$48.00) per pound U3O8 as at December 31, 2022, to $120.35 (US$91.00) per pound U3O8, at December 31, 2023, resulting in a fair value of the Company’s uranium investments of $276,815,000 and mark-to-market gains on the Company’s uranium holdings for the year ended December 31, 2023 of $134,180,000 (December 31, 2022 – mark to market gain of $29,422,000) including a realized gain on sale of $12,604,000 (US$8,775,000) from the fourth quarter uranium sales.
Fair value gains or losses on portfolio investments
During the year ended December 31, 2023, the Company recognized a loss of $9,000 on portfolio investments carried at fair value (December 31, 2022 – a loss of $6,469,000). Gains and losses on investments carried at fair value are determined by reference to the closing share price of the related investee at the end of the period, or, as applicable, immediately prior to disposal.
Fair value gains or losses on F3 Debentures
During the year ended December 31, 2023, the Company completed a $15 million strategic investment in F3 in the form of unsecured convertible debentures, which carry a 9% coupon and will be convertible at Denison’s option into common shares of F3 at a conversion price of $0.56 per share. F3 has the right to pay up to one third of the quarterly interest payable by issuing common shares. F3 will also have certain redemption rights on or after the third anniversary of the date of issuance of the Debentures and/or in the event of an F3 change of control. As a result of the Debentures’ conversion and redemption features, the contractual cash flow characteristics of these instruments do not solely consist of the payment of principal and interest and therefore the Debentures are accounted for as a financial asset at fair value through profit and loss. During the year ended December 31, 2023, the Company recognized a mark-to-market gain of $565,000 on its investments in the Debentures as a result of increases in the F3 share price as well as decreases in the risk-free rate and the credit spread.
Gain on receipt of proceeds from Uranium Industry a.s
In January 2022, the Company executed a Repayment Agreement (‘RA’) pursuant to which the parties negotiated the repayment of the debt owing from Uranium Industry a.s (‘UI’) to Denison in connection with the Company’s sale of its mining assets and operations located in Mongolia to UI in 2015 for upfront cash consideration as well as the rights to receive additional contingent consideration. Under the terms of the RA, UI has agreed to make scheduled payments of the amounts owing from the sale of the Mongolia operations through a series of quarterly installments and annual milestone payments, until December 31, 2025. The total amount due to Denison under the RA, including amounts received to date, is approximately US$16,000,000, inclusive of additional interest to be earned over the term of the agreement at a rate of 6.5% per annum. To date, the Company has collected US$7,900,000 of the amounts due under the RA. The RA includes customary covenants and conditions in favour of Denison, including certain restrictions on UI’s ability to take on additional debt, in consideration for Denison’s deferral of enforcement of the arbitration award while UI is in compliance with its obligations under the RA.
27
|
MANAGEMENT’S DISCUSSION & ANALYSIS |
During the year ended December 31, 2023, the Company received US$3,100,000, from UI (December 31, 2022 – US$4,800,000), of which a portion relates to reimbursement of legal and other expenses incurred by Denison. The decrease in payments received in 2023, as compared to the prior period, is a function of the repayment schedule, which included an initial payment of US$2,000,000 upon the execution of the RA in January 2022. During the year ended December 31, 2023, as a result of the payments received, the Company recorded gains related to the Mongolia sale receivable of $4,097,000 (December 31, 2022 – $6,142,000). This receivable is recorded at fair value at each period end (December 31, 2023 and December 31, 2022 – $nil).
Foreign exchange gains
During the year ended December 31, 2023, the Company recognized a foreign exchange gain of $321,000 (December 31, 2022 – gain of $816,000). The foreign exchange gain is predominantly due to the impact of the increase in the US dollar to Canadian dollar exchange rate during the year on US dollar cash and accounts receivable balances.
Fair value gains or losses on warrants on investments
In October 2021, the Company sold (1) 32,500,000 common shares of GoviEx Uranium Inc. (‘GoviEx’) and (2) 32,500,000 GoviEx warrants (‘GoviEx Warrants’) for combined gross proceeds of $15,600,000. The gross proceeds were allocated to the GoviEx shares and GoviEx Warrants based on their relative fair values at the time of sale.
The GoviEx Warrants entitled the holder to acquire from Denison one common share of GoviEx owned by Denison for $0.80 during the 18 month life of the warrant (until April 2023) and were accounted for as a derivative liability. At each applicable period end, the warrants were revalued, and the revaluation gains and losses are recorded in other income and expense.
During the year ended December 31, 2023, the Company recorded a fair value loss on the GoviEx Warrants of $nil (December 31, 2022 – gain of $1,625,000). The warrants expired unexercised in April 2023 and had already been reduced to a fair value of $nil at December 31, 2022.
Fair value gains or losses on share purchase warrants
In February and March 2021, Denison completed two equity offerings involving the issuance of units, which were comprised of one common share and one half of a common share purchase warrant. Each full warrant entitled the holder to acquire one common share of the Company at a pre-determined exercise price for 24 months after issuance. The exercise prices for the share purchase warrants were denominated in US dollars, which differs from the Company’s Canadian dollar functional currency, and therefore the warrants were classified as a non-cash derivative liability, rather than equity, on the Company’s statement of financial position.
At the date of issuance of the units, the gross proceeds of each offering were allocated between the common shares and the common share purchase warrants issued using the relative fair value basis approach, and the amount related to the warrants was recorded as a non-current derivative liability. At each applicable period end, the warrants were revalued, with the revaluation gains or losses recorded in other income and expense.
During the year ended December 31, 2023, the Company recorded a fair value loss of $nil on the revaluation of the Denison share purchase warrants (December 31, 2022 – gain of $20,337,000). The warrants expired in the first quarter of 2023 and had already been reduced to a fair value of $nil at December 31, 2022.
EQUITY SHARE OF INCOME FROM JOINT VENTURES
During the year ended December 31, 2023, the Company recorded its equity share of loss from JCU of $4,400,000 (December 31, 2022 – $2,887,000). The Company records its share of income or loss from JCU one month in arrears, based on the most available financial information, adjusted for any subsequent material transactions that have occurred. The increase in the equity share of loss of JCU in 2023 compared to 2022 was predominantly due to the revaluation of a financial liability owed by JCU that is accounted for at fair value.
28
|
MANAGEMENT’S DISCUSSION & ANALYSIS |
LIQUIDITY AND CAPITAL RESOURCES
Cash and cash equivalents were $131,054,000 at December 31, 2023 (December 31, 2022 – $50,915,000).
The increase in cash and cash equivalents of $80,139,000 was predominantly due to net cash provided by financing activities of $111,179,000, partially offset by net cash used in operations of $30,667,000 and net cash used in investing activities of $719,000.
Net cash used in operating activities of $30,667,000 was predominantly due to net income for the period, and adjustments for non-cash items, including fair value adjustments.
Net cash used in investing activities of $719,000 consists primarily of the Company’s cash proceeds of $19,901,000 from the sale of 200,000 pounds U3O8 at an average sales price of $99.50 per pound U3O8 (USD$73.38), which was more than offset by a $15,000,000 investment in the convertible debentures of F3, incremental investments in JCU, an increase in property plant & equipment, as well as an increase in restricted cash due to the Company’s funding the Elliot Lake reclamation trust fund.
Net cash provided by financing activities of $111,179,000 was mainly due to the net proceeds from the Company’s October equity financing, the ATM equity program, as well as stock option exercises. See below for further details regarding the October equity financing as well as the ATM program.
In September 2021, the Company filed a short form base shelf prospectus (‘2021 Base Shelf Prospectus’) with the securities regulatory authorities in each of the provinces and territories in Canada and in the United States, which subsequently expired on October 16, 2023. The 2021 Base Shelf Prospectus related to the public offering for sale of securities, in amounts, at prices, and on terms to be determined based on market conditions at the time of sale and as set forth in the 2021 Shelf Prospectus and pursuant to a prospectus supplement, for an aggregate offering amount of up to $250,000,000.
Also in September 2021, Denison entered into an equity distribution agreement providing for an ATM equity offering program (‘2021 ATM Program’), qualified by a prospectus supplement to the 2021 Base Shelf Prospectus. The 2021 ATM Program allowed Denison, through its agents, to, from time to time, offer and sell, in Canada and the United States, such number of common shares as would have an aggregate offering price of up to US$50,000,000.
During the year ended December 31, 2023, the Company issued 19,786,160 shares under the 2021 ATM Program. The common shares issued in the year ended December 31, 2023 were issued at an average price of $1.91 per share for aggregate gross proceeds of $37,887,000. During the year ended December 31, 2023, the Company also recognized issue costs of $845,000 related to its ATM share issuances, including $757,000 of commissions, for net proceeds of $37,042,000. In total, the Company issued 34,669,322 shares under the 2021 ATM Program at an average price of $1.91 per share for aggregate gross proceeds of $66,062,000 (US$49,800,000).
In October 2023, Denison issued 37,000,000 common shares pursuant to a public offering qualified by a prospectus supplement to the 2021 Base Shelf Prospectus. The common shares were priced at US$1.49 for gross proceeds of $75,082,000 (US$55,130,000).
Also during the year ended December 31, 2023, the Company received share issue proceeds of $3,534,000 related to the issuance of 4,559,047 shares upon the exercise of employee stock options.
Use of Proceeds
March 2021 Unit Financing
As disclosed in the Company’s prospectus supplement to its 2020 base shelf prospectus dated March 17, 2021 (‘March 2021 Prospectus Supplement’), the majority of the net proceeds of the equity financing from March 2021 were expected to be utilized to purchase physical uranium in the uranium spot market, with a target of acquiring approximately 2,500,000 pounds of U3O8, as well as general, corporate and administrative expenses, including storage costs for the purchased uranium. During 2021, the Company acquired 2,500,000 pounds of U3O8 with a total cost of $91,674,000. The remainder of the net proceeds of this financing were utilized for general, corporate, and administrative expenses, in line with the use of proceeds disclosed in the March 2021 Prospectus Supplement.
29
|
MANAGEMENT’S DISCUSSION & ANALYSIS |
2021 ATM Program Financing
As disclosed in the Company’s prospectus supplement to the 2021 Base Shelf Prospectus dated September 28, 2021 (‘September 2021 Prospectus Supplement’), the net proceeds raised under the 2021 ATM Program were expected to be utilized to potentially fund Wheeler River evaluation and detailed project engineering, long lead project construction items, as well as general, corporate and administrative expenses, subject to the actual amount raised. During the period from the closing of the financing in September 2021 to December 31, 2023, the Company’s use of proceeds from this offering was in line with that disclosed in the September 2021 Prospectus Supplement.
October 2023 Financing
As disclosed in the Company’s prospectus supplement to the 2021 Base Shelf Prospectus dated October 11, 2023 (‘October 2023 Prospectus Supplement’), the net proceeds of the October 2023 equity financing are expected to be utilized to fund the advancement of the Phoenix project through the procurement of long lead items (including associated engineering, testing, and design), exploration and evaluation expenses, as well as general, corporate and administrative expenses. During the period from the closing of the financing in October 2023 to December 31, 2023, the Company’s use of proceeds from this offering was in line with that disclosed in the October 2023 Prospectus Supplement.
Revolving Term Credit Facility
On December 21, 2023, the Company entered into an agreement with the Bank of Nova Scotia (‘BNS’) to extend the maturity date of the Company’s credit facility to January 31, 2025 (the ‘Credit Facility’). Under the Credit Facility, the Company has access to letters of credit of up to $23,964,000, which is fully utilized for non-financial letters of credit in support of reclamation obligations. All other terms of the Credit Facility (tangible net worth covenant, pledged cash, investments amount and security for the facility) remain unchanged by the amendment – including a requirement to provide $7,972,000 in cash collateral on deposit with BNS to maintain the current letters of credit issued under the Credit Facility.
Contractual Obligations and Contingencies
The Company has the following contractual obligations at December 31, 2023:
|
|
|
|
|
|
|
|
|
|
After |
(in thousands) |
|
Total |
|
1 Year |
|
2-3 Years |
|
4-5 Years |
|
5 Years |
Accounts payable and accrued liabilities |
$ |
10,822 |
$ |
10,822 |
$ |
- |
$ |
- |
$ |
- |
Lease liabilities |
|
311 |
|
161 |
|
146 |
|
4 |
|
- |
Debt obligations |
|
135 |
|
52 |
|
82 |
|
1 |
|
- |
|
$ |
11,268 |
$ |
11,035 |
$ |
228 |
$ |
5 |
$ |
- |
Exploration Spending Required to Maintain Exploration Portfolio in Good Standing
The Company has a portfolio of mineral properties, predominantly composed of 228 mineral claims in the Athabasca Basin region of Saskatchewan, Canada as at December 31, 2023. Under The Mineral Tenure Registry Regulations in Saskatchewan, once a claim has been ‘staked’, it may be held for an initial two-year period, and this period may be renewed year to year, subject to the holder expending a minimum required amount on exploration on the claim lands. Exploration expenditures that exceed the annual spending requirements may be carried forward and applied against future spending requirements. In addition, the Company, has mine surface lease payment obligations through its ownership interest in the MLJV and MWJV.
30
|
MANAGEMENT’S DISCUSSION & ANALYSIS |
In order to maintain the Company’s current exploration portfolio in good standing for a period of five years, the Company’s share of the required exploration expenditures is outlined in the table below.
|
|
|
|
|
|
|
|
|
|
|
(in thousands) |
|
Total |
|
1 Year |
|
2 Year |
|
3 Year |
|
4-5 Years |
Exploration expenditures required to maintain claim status |
$ |
9,487 |
$ |
105 |
$ |
1,995 |
$ |
2,262 |
$ |
5,125 |
Surface lease payments |
|
138 |
|
27 |
|
27 |
|
27 |
|
57 |
|
$ |
9,625 |
$ |
132 |
$ |
2,022 |
$ |
2,289 |
$ |
5,182 |
The Company routinely assesses its exploration portfolio in order to rank properties in accordance with their exploration potential. From time to time, strategic decisions are made to either acquire new claims, through staking or purchase, or to allow claims to lapse. Claims are allowed to lapse if the Company determines that no further exploration work is warranted by the Company. The amounts in the table above were calculated based on currently approved legislation and assumes that the land claims held at the date of the MD&A would be maintained for the duration of five years. In addition, where Denison holds a claim with a partner, the Company has assumed that each partner will fund its share of the required expenditures.
Reclamation Sites
The Company periodically reviews the anticipated costs of decommissioning and reclaiming its mill and mine sites as part of its environmental planning process. The Company’s reclamation liability, at December 31, 2023, is estimated to be $34,898,000, which is the present value amount that is expected to be sufficient to cover the projected future costs for reclamation of the Company’s mill and mine operations. There can be no assurance, however, that the ultimate cost of such reclamation obligations will not exceed the estimated liability contained in the Company’s financial statements.
Elliot Lake – The Elliot Lake uranium mine was closed in 1992 and capital works to decommission the site were completed in 1997. The remaining provision is for the estimated cost of monitoring the tailings management areas at the Denison and Stanrock sites and for treatment of water discharged from these areas. The Company conducts its activities at both sites pursuant to licenses issued by the CNSC. In the fourth quarter of 2023, an adjustment of $3,229,000 was made to increase the reclamation liability to reflect minor adjustments in future plans as well as changes in the long-term discount rate used to arrive at the Company’s best estimate of the present value of the total reclamation cost that will be required in the future. Spending on restoration activities at the Elliot Lake sites is funded from the Elliot Lake reclamation trust fund. At December 31, 2023, the amount of restricted cash and investments relating to the Elliot Lake reclamation trust fund was $3,259,000.
McClean Lake and Midwest – The McClean Lake and Midwest operations are subject to environmental regulations as set out by the Saskatchewan government and the CNSC. Cost estimates of future decommissioning and reclamation activities are prepared every 5 years and filed with the applicable regulatory authorities for approval. The most recent approved reclamation plan is dated November 2021 and was approved in January 2022. The Company’s best estimate of its share of the present value of the total reclamation liability is derived from this plan. In the fourth quarter of 2023, the Company increased the liability by $1,615,000 to reflect changes in the long-term discount rate used to estimate the present value of the reclamation liability. The majority of the reclamation costs are expected to be incurred between 2038 and 2056.
Under the Mineral Industry Environmental Protection Regulations, 1996, the Company is required to provide its pro-rata share of financial assurances to the Province of Saskatchewan. Under the November 2021 approved plan, the Company has put in place financial assurances of $22,972,000, providing irrevocable standby letters of credit from BNS in favour of SKMOE. As at December 31, 2023, to provide the required standby letters of credit, the Company is utilizing the Credit Facility.
Other – The Company’s exploration and evaluation activities are subject to environmental regulations as set out by the Saskatchewan government. Cost estimates of expected future decommissioning and reclamation activities are recognized when the liability is incurred. During the fourth quarter of 2023, an adjustment of $1,883,000 was made to increase the reclamation liability to reflect additional reclamation activities required as a result of the 2023 FFT activities, as well as changes in the long-term discount rate used to arrive at the Company’s best estimate of the present value of the total reclamation cost that will be required in the future. As at December 31, 2023, the Company has provided a standby letter of credit in the amount of $992,000 to the SKMOE related to this obligation utilizing the Credit Facility.
31
|
MANAGEMENT’S DISCUSSION & ANALYSIS |
FINANCIAL INSTRUMENTS AND INVESTMENTS
|
|
Financial |
|
Fair |
|
December 31, |
|
December 31, |
|
|
Instrument |
|
Value |
|
2023 |
|
2022 |
(in thousands) |
|
Category (1) |
|
Hierarchy |
|
Fair Value |
|
Fair Value |
|
|
|
|
|
|
|
|
|
Financial Assets: |
|
|
|
|
|
|
|
|
Cash and equivalents |
|
Category B |
|
|
$ |
131,054 |
$ |
50,915 |
Trade and other receivables |
|
Category B |
|
|
|
1,913 |
|
4,143 |
Investments |
|
|
|
|
|
|
|
|
Equity instruments (shares) |
|
Category A |
|
Level 1 |
|
10,390 |
|
8,022 |
Equity instruments (warrants) |
|
Category A |
|
Level 2 |
|
127 |
|
87 |
Convertible Debentures |
` |
Category A |
|
Level 3 |
|
15,565 |
|
- |
Restricted cash and equivalents |
|
|
|
|
|
|
|
|
|
Elliot Lake reclamation trust fund Credit facility pledged assets |
|
Category B Category B |
|
|
|
3,259 7,972 |
|
3,133 7,972 |
|
|
|
|
|
$ |
170,280 |
$ |
74,272 |
|
|
|
|
|
|
|
|
|
Financial Liabilities: |
|
|
|
|
|
|
|
|
Account payable and accrued liabilities |
|
Category C |
|
|
|
10,822 |
|
10,299 |
Debt obligations |
|
Category C |
|
|
|
417 |
|
576 |
|
|
|
|
|
$ |
11,239 |
$ |
10,875 |
Notes:
| 1. | Financial instrument designations are as follows: Category A=Financial assets and liabilities at fair value through profit and loss; Category B=Financial assets at amortized cost; Category C=Financial liabilities at amortized cost. |
The Company examines the various financial risks to which it is exposed and assesses the impact and likelihood of those risks. These risks may include currency risk, equity price risk, credit risk, interest rate risk, liquidity risk and commodity price risk.
Currency Risk
Changes in the value of the Canadian dollar compared to foreign currencies will affect the value, as reported, of the Company’s foreign denominated investments in uranium, cash and cash equivalents, trade and other receivables, and trade and other payables.
As the prices of uranium are quoted in U.S. currency, fluctuations in the Canadian dollar relative to the U.S. dollar can significantly impact the valuation of the Company’s holdings of physical uranium from a Canadian dollar perspective.
At December 31, 2023, the Company is exposed to some foreign exchange risk on its net U.S dollar financial asset position, including cash and cash equivalents held in U.S. dollars, predominantly as a result of U.S dollar financing activities.
At December 31, 2023, the Company’s net U.S dollar financial assets and uranium investments were $24,228,000, and $276,815,000, respectively. The impact of the U.S dollar strengthening or weakening (by 10%) on the value of the Company’s net U.S dollar-denominated assets is as follows:
|
|
December 31 2023 |
|
Sensitivity |
|
|
|
Foreign |
|
Foreign |
Change in |
|
|
Exchange |
|
Exchange |
net income |
(in thousands except foreign exchange rates) |
|
Rate |
|
Rate |
(loss) |
|
Currency risk |
|
|
|
|
|
CAD weakens |
|
1.3226 |
|
1.1903 |
30,081 |
CAD strengthens |
|
1.3226 |
|
1.4549 |
(30,081) |
|
|
|
|
|
|
32
|
MANAGEMENT’S DISCUSSION & ANALYSIS |
Equity Price Risk
The Company is exposed to equity price risk on its investments in equity instruments of other publicly traded companies. At December 31, 2023, a 10% increase in the equity price of all of the Company’s equity holdings would have increased the Company’s investments in equity instruments by $1,052,000 and a 10% decrease would have decreased the investments in equity instruments by $1,052,000. The Company is also exposed to equity price risk on the F3 Debentures due to the impact of changes in the underlying equity price of F2 on the value of the conversion option. The sensitivity analysis below illustrates the impact of equity price risk on the convertible debt instrument held by the Company at December 31, 2023:
Absolute change |
|
Base |
10% increase |
|
10% decrease |
|
|
|
|
|
|
|
|
Equity price |
$ |
0.40 |
0.44 |
|
0.36 |
|
Convertible debenture fair value (in thousands) |
$ |
15,565 |
16,307 |
|
14,562 |
|
Credit Risk
Credit risk is the risk of loss due to a counterparty’s inability to meet its obligations under a financial instrument that will result in a financial loss to the Company. The Company believes that the carrying amount of its cash and cash equivalents, trade and other receivables, restricted cash and investments, and Debentures represents its maximum credit exposure.
The maximum exposure to credit risk at the reporting dates is as follows:
|
|
|
|
At December 31 |
|
At December 31 |
(in thousands) |
|
|
|
2023 |
|
2022 |
|
|
|
|
|
|
|
Cash and cash equivalents |
|
|
$ |
131,054 |
$ |
50,915 |
Trade and other receivables |
|
|
|
1,913 |
|
4,143 |
Restricted cash and investments |
|
|
|
11,231 |
|
11,105 |
Investments-convertible debenture |
|
|
|
15,565 |
|
- |
|
|
|
$ |
159,763 |
$ |
66,163 |
The Company limits cash and cash equivalents and restricted cash and investment risk by dealing with credit worthy financial institutions. The majority of the Company’s normal course trade and other receivables balance relates to a small number of customers who have established credit worthiness with the Company through past dealings. Based on its historical credit loss experience, the Company has recorded an allowance for credit loss of $nil on its normal course trade and other receivables as at December 31, 2023 and December 31, 2022.
The Company’s Mongolia Sale Receivable is accounted for at fair value and is assessed as having a fair value of $nil using Level 3 inputs.
Interest Rate Risk
Interest rate risk is the risk that the fair value or future cash flows of a financial instrument will fluctuate because of changes in market interest rates. The Company is exposed to interest rate risk on its liabilities through its outstanding borrowings and on its assets through its investments in debt instruments. The Company monitors its exposure to interest rates and has not entered into any derivative contracts to manage this risk.
The sensitivity analysis below illustrates the impact of interest rate risk on the Debentures at December 31, 2023:
Absolute change |
|
Base |
1% increase |
|
1% decrease |
|
|
|
|
|
|
|
|
Credit spread |
|
20% |
21% |
|
19% |
|
Convertible debenture fair value (in thousands) |
$ |
15,565 |
15,339 |
|
15,801 |
|
33
|
MANAGEMENT’S DISCUSSION & ANALYSIS |
Liquidity Risk
Liquidity risk, in which the Company may encounter difficulties in meeting obligations associated with its financial liabilities as they become due, is managed through the Company’s planning and budgeting process, which determines the funds required to support the Company’s normal operating requirements on an ongoing basis. The Company ensures that there is sufficient committed capital to meet its short-term business requirements, taking into account its anticipated cash flows from operations, its holdings of cash and cash equivalents, debt instruments, equity investments, uranium holdings, and its access to credit facilities and capital markets, if required.
Commodity Price Risk
The Company’s investments in uranium are recorded at fair value, with changes in fair value being recorded in the profit or loss. At December 31, 2023, a 10% increase in the uranium spot price would increase the value of the Company’s investments by $27,681,000, while a 10% decrease would decrease the value of the investments by $27,681,000.
TRANSACTIONS WITH RELATED PARTIES
Korea Electric Power Corporation (‘KEPCO’)
Denison and KHNP Canada Energy Ltd. (‘KHNP Canada’) (which is an indirect subsidiary of KEPCO through Korea Hydro Nuclear Power Co., Ltd. (‘KHNP’)) are parties to the KHNP Strategic Relationship Agreement, which provides for a long-term collaborative business relationship between the parties and includes a right of KHNP Canada to nominate one representative to Denison’s Board of Directors provided that its shareholding percentage is at least 5%.
KHNP Canada is also the majority member of KWULP. KWULP is a consortium of investors that holds the non-Denison owned interests in Waterbury Lake Uranium Corporation and Waterbury Lake Uranium Limited Partnership (‘WLULP’), entities whose key asset is the Waterbury Lake property.
COMPENSATION OF KEY MANAGEMENT PERSONNEL
Key management personnel are those persons having authority and responsibility for planning, directing and controlling the activities of the Company, directly or indirectly. Key management personnel include the Company’s executive officers, vice-presidents and members of its Board of Directors.
The following compensation was awarded to key management personnel:
|
|
|
|
|
|
Year Ended December 31, |
Year Ended December 31, |
|
(in thousands) |
|
|
|
|
|
2023 |
|
2022 |
|
|
|
|
|
|
|
|
|
Salaries and short-term employee benefits |
|
|
|
|
$ |
3,302 |
$ |
3,251 |
Share-based compensation |
|
|
|
|
|
2,865 |
|
3,083 |
|
|
|
|
|
$ |
6,167 |
$ |
6,334 |
34
|
MANAGEMENT’S DISCUSSION & ANALYSIS |
OFF-BALANCE SHEET ARRANGEMENTS
The Company does not have any off-balance sheet arrangements.
SUBSEQUENT EVENTS
Sale of Uranium
In January 2024, Denison finalized an agreement to sell 100,000 pounds of U3O8 at a price of US$100.00 per pound for delivery in April 2024.
Earn-In Agreement with Grounded Lithium Corp.
In January 2024, Denison entered into an agreement with Grounded Lithium Corp. (“Grounded Lithium”) with respect to the Kindersley Lithium Project (“KLP”) in Saskatchewan. The agreement includes a series of earn-in options, with each earn-in option being comprised of a cash payment to Grounded Lithium as well as dedicated expenditures to advance KLP. Should Denison complete all three earn-in options, it will have made cumulative cash payments to Grounded Lithium of $3.2 million and have funded $12.0 million in project expenditures to earn a 75% working interest in the KLP. Upon funding the total amounts of each earn-in option phase, Denison has the right to either exercise the earn-in option and acquire the working interest associated with that phase or move on to the ensuing option phase. The agreement terminates on the earliest of: (i) Denison electing to acquire its working interest and convert to a formal joint venture or to terminate, (ii) June 30, 2028, or (iii) a date as otherwise agreed between the parties.
Acquisition of MaxPERF Tool Systems
In February 2024, the Company announced an acquisition of fixed and mobile MaxPERF Tool Systems from Penetrators Canada Inc. (“Penetrators”). The MaxPERF Tool Systems have been successfully deployed several times as a method of permeability enhancement in ISR field studies conducted on the Company’s potential ISR mining projects, including at the Phoenix deposit. Penetrators has also agreed to work exclusively with Denison for a 10-year period with respect to the use of the MaxPERF Tool Systems for uranium mining applications, and related services, in Saskatchewan.
OUTSTANDING SHARE DATA
Common Shares
At February 29, 2024, there were 890,996,371 common shares issued and outstanding and a total of 902,253,457 common shares on a fully-diluted basis.
Stock Options and Share Units
At February 29, 2024, there were 5,202,000 stock options, and 6,055,086 share units outstanding.
DISCONTINUED OPERATIONS
Closed Mine Services
At the end of August, 2023, the Company’s long-term third-party closed mines services contract came to an end. With the termination of this contract, the Company determined that it would cease providing such third-party care and maintenance services and will no longer earn revenue from Closed Mine services. The Company is now solely focused on care and maintenance of its owned legacy mines.
During the year ended December 31, 2023, the Company earned $1,011,000 in net income from discontinued operations (December 31, 2022 – $1,782,000). The decrease in net income from discontinued operations in the current year is due to the ending of the Company’s long-term third-party closed mines services contract at the end of August 2023.
35
|
MANAGEMENT’S DISCUSSION & ANALYSIS |
The 2024 Outlook, and discussion below, represents the Company’s best estimate of its cash flows for the year:
Notes:
1. Only material operations shown.
2. The outlook is prepared on a cash basis.
DEVELOPMENT & OPERATIONS
Development and operation expenditures are budgeted to be $5.0 million for 2024.
Denison’s share of operating and capital expenditures at the Orano Canada operated MLJV and MWJV are budgeted to be $2,579,000.
Denison’s share of the budget for the MLJV includes $1,575,000 to prepare the McClean North site for the commencement of SABRE mining in 2025, as well as the MLJV’s share of the cost of operations for the Sue water treatment plant.
Denison’s share of the MWJV budget includes $629,000 to fund a hybrid ISR/SABRE field test and resource delineation program at Midwest, including the planned completion of a multi-well ISR tracer test.
Operating expenditures in 2024 are also expected to include $1,097,000 for reclamation costs related to Denison’s legacy mine sites in Elliot Lake.
EXPLORATION
The exploration budget for 2024 is estimated at $10.2 million (Denison’s share).
Exploration efforts remain focused on discovering high-grade unconformity-hosted uranium deposits with ISR potential. The application of ISR in the Athabasca Basin has the potential to make smaller high-grade deposits economically viable, which has influenced new exploration strategies, particularly within highly prospective areas with widely spaced historical drilling.
Denison-operated exploration programs planned for 2024 have been designed to focus on the following objectives:
| 1) | Drill test high-priority exploration targets in proximity to planned Wheeler River infrastructure – including an estimated 6,500 metres in diamond drilling. |
| 2) | Continue to drill test the CR-3 trend on the Moon Lake South project to determine the potential source of the high-grade perched mineralization that was discovered during the winter 2023 drilling program. A total of 5,500 metres of diamond drilling is proposed for the project in 2024. |
36
|
MANAGEMENT’S DISCUSSION & ANALYSIS |
| 3) | Continue drill testing along strike of historical mineralization along the MJ-1 trend at Johnston Lake, focusing on high-priority geophysical targets identified from recent surveying. An estimated 6,000 metres of diamond drilling is planned for the project in 2024. |
| 4) | Continue efforts to refill and re-evaluate the target inventory on pipeline projects – including geophysical programs proposed along the CR-3 conductor trend on Moon Lake South and the adjacent Crawford Lake project. Additional geophysical surveying is planned for the Johnston Lake project to develop an inventory of drill targets for future drill programs. |
| 5) | Fund non-Denison operated exploration drill programs, including the Orano operated Waterfound project, where, there remains potential for additional discoveries along the LaRocque Lake conductive corridor, which hosts the Alligator and Crocodile zones. |
EVALUATION
In 2024 the Evaluation program at Wheeler River has been designed to advance the project towards a future final investment decision, including advancing detailed design engineering, undertaking field optimization programs, and advancing the procurement of long-lead items. Included in Denison’s direct share of planned evaluation expenditures for 2024 is $9.9 million for the procurement of capital items that are included in the estimated initial capital cost of the project in the Phoenix FS (100% project – $11.0 million). Additionally, efforts will continue to support the progression of regulatory processes, including the expected finalization of the EIS and the submission of additional operational plans required to obtain project licensing.
Building on the successful ISR field program at Waterbury Lake in 2023, the 2024 evaluation budget includes $4.5 million to update engineering designs and assessments and the resource model from the 2020 PEA for the THT ISR project, and potentially complete a PFS. The collection of baseline data is also expected to continue in 2024 to support a future EIS for the project.
The budget for Denison’s share of evaluation programs and technical services departmental net spending totals approximately $49.2 million (excluding Denison’s indirect 5% share attributable to its Wheeler River ownership interest held in JCU, discussed below). Additionally, this budget reflects that Denison will fund 100% of the expenditures for the evaluation work at Waterbury Lake in 2024.
The Company is currently evaluating its 2024 plans for KLP after entering into an earn-in agreement in January 2024 (see SUBSEQUENT EVENTS). Once 2024 plans for KLP have been finalized, the evaluation outlook will be updated.
JCU CASH CONTRIBUTIONS
The budget for 2024 includes cash contributions to JCU of $3.8 million. In 2024, JCU is anticipating funding its share of project expenditures at Wheeler River, Christie Lake, Waterfound, Close Lake, Kiggavik, and Millennium.
CORPORATE ADMINISTRATION AND OTHER INCOME
Cash corporate administration expenses are budgeted to be $9.5 million in 2024, and include head office salaries and benefits, office costs, audit and regulatory costs, legal fees, investor relations expenses and all other costs related to operating a public company with listings in Canada and the United States.
Other income in 2024 is expected to include (i) cash inflows of $5.3 million in connection with payments due under the RA with UI, and (ii) interest income of $6.3 million on the Company’s unrestricted and restricted cash and short-term investments.
EXPECTED URANIUM SALES
The Company currently plans to sell approximately 300,000 pounds of U3O8 from its physical uranium holdings during 2024. The proceeds from projected uranium sales have not been included in the OUTLOOK above and any realized proceeds will be dependent on market conditions at the time of the sales.
37
|
MANAGEMENT’S DISCUSSION & ANALYSIS |
CONTROLS AND PROCEDURES
The Company carried out an evaluation, under the supervision and with the participation of its management, including the President and Chief Executive Officer and the Vice-President Finance and Chief Financial Officer, of the effectiveness of the design and operation of the Company’s ‘disclosure controls and procedures’ (as defined in the Exchange Act Rule 13a-15(e)) as of the end of the period covered by this report. Based upon that evaluation, the President and Chief Executive Officer and the Vice President Finance and Chief Financial Officer concluded that the Company’s disclosure controls and procedures are effective as of December 31, 2023.
The Company’s management is responsible for establishing and maintaining an adequate system of internal control over financial reporting. Management conducted its evaluation of the effectiveness of internal control over financial reporting based on the Internal Control – Integrated Framework, 2013 issued by the Committee of Sponsoring Organizations of the Treadway Commission. Based on this evaluation, management concluded that the Company’s internal control over financial reporting was effective as of December 31, 2023.
There has not been any change in the Company’s internal control over financial reporting during 2023 that has materially affected, or is reasonably likely to materially affect, the Company’s internal control over financial reporting.
CRITICAL ACCOUNTING ESTIMATES AND JUDGEMENTS
The preparation of consolidated financial statements in accordance with IFRS requires the use of certain critical accounting estimates and judgements that affect the amounts reported. It also requires management to exercise judgement in applying the Company’s accounting policies. These judgements and estimates are based on management’s best knowledge of the relevant facts and circumstances taking into account previous experience. Although the Company regularly reviews the estimates and judgements made that affect these financial statements, actual results may be materially different.
Significant estimates and judgements made by management relate to:
Mineral property impairment reviews and impairment adjustments
At each reporting date, the Company assesses whether there is an indicator that its mineral properties may be impaired. Judgement is applied in identifying whether or not an indicator exists. Impairment indicators exists when facts and circumstances suggest that the carrying amount of a mineral property may exceed its recoverable amount. When an indicator is identified, the Company determines the recoverable amount of the property, which is the higher of an asset’s fair value less costs of disposal or value in use. An impairment loss is recognized if the carrying value exceeds the recoverable amount. The recoverable amount of a mineral property may be determined by reference to estimated future operating results and discounted net cash flows, current market valuations of similar properties or a combination of the above. In undertaking this review, management of the Company is required to make significant estimates of, amongst other things: reserve and resource amounts, future production and sale volumes, forecast commodity prices, future operating, capital and reclamation costs to the end of the mine’s life and current market valuations from observable market data which may not be directly comparable. These estimates are subject to various risks and uncertainties, which may ultimately have an effect on the expected recoverable amount of a specific mineral property asset. Changes in these estimates could have a material impact on the carrying value of the mineral property amounts and the impairment losses recognized.
Reclamation obligations
Asset retirement obligations are recorded as a liability when the asset is initially constructed or a constructive or legal obligation exists. The valuation of the liability typically involves identifying costs to be incurred in the future and discounting them to the present using an appropriate discount rate for the liability. The determination of future costs involves a number of estimates relating to timing, type of costs, mine closure plans, and review of potential methods and technical advancements. Furthermore, due to uncertainties concerning environmental remediation, the ultimate cost of the Company’s decommissioning liability could differ materially from amounts provided. The estimate of the Company’s obligation is subject to change due to amendments to applicable laws and regulations and as new information concerning the Company’s operations becomes available. The Company is not able to determine the impact on its financial position, if any, of environmental laws and regulations that may be enacted in the future.
38
|
MANAGEMENT’S DISCUSSION & ANALYSIS |
RISK FACTORS
Denison’s business, the value of its common shares (the ‘Shares’) and management’s expectations regarding the same are subject to known and unknown risks, uncertainties and other factors that may cause the actual results, level of activity, performance, or achievements of Denison to be materially different than anticipated. The following information pertains to the outlook and conditions currently known to Denison that have been identified with the potential to have a material impact on the financial condition of the Company. The risks set out below are not the only risks Denison faces. Risks and uncertainties not currently known to the Company or that have currently been assessed as immaterial may also materially and adversely affect Denison’s business, financial condition, results of operations and prospects. Other factors may arise in the future that are currently not foreseen by Denison, which may present additional risks in the future. Current and prospective security holders of Denison should carefully consider these risk factors.
Risks Relating to the Company and the Mining Industry
There is no assurance that Denison will be successful in generating and/or obtaining sufficient financing to fund its operations.
The exploration and development of mineral properties and operation of mines and associated facilities requires a substantial amount of capital and the ability of the Company to proceed with any of its plans with respect thereto depends on its ability to obtain financing through joint ventures, equity financing, debt financing or other means. There is no assurance that the Company will be successful in generating and/or obtaining required financing as and when needed on acceptable terms. For example, general market conditions, volatile uranium markets, a claim against the Company, a significant disruption to the Company’s business or operations, or other factors may make it difficult to secure the financing necessary to fund the substantial capital that is typically required in order to advance a mineral project, such as Wheeler River and Waterbury Lake, through the testing, feasibility, engineering and permitting processes necessary to support a production decision, or to place a property into commercial production.
Failure to obtain sufficient financing as and when needed on acceptable terms could result in the delay or indefinite postponement of any or all of the Company’s exploration, development or other growth initiatives.
Denison anticipates having negative operating cash flows in future periods, for which funds will have to be sourced or raised.
Denison had negative operating cash flow for recent past financial reporting periods. Denison anticipates that it will continue to have negative operating cash flow until such time, if at all, its Wheeler River project goes into production. To the extent that Denison has negative operating cash flow in future periods, Denison may need to allocate a portion of its cash reserves and/or physical uranium holdings to fund such negative cash flow. Denison may also be required to raise additional funds through the issuance of equity or debt securities, or asset sales. There can be no assurance that additional capital or other types of financing will be available when needed or that these financings will be on terms favourable to Denison.
Denison’s access to public financing and credit can be negatively impacted by global financial conditions.
Global financial conditions are subject to volatility arising from international geopolitical and global economic developments, general financial market turbulence, and market expectations of the same. Examples of such are the broad market impacts observed in connection with the COVID-19 pandemic, including market volatility and global inflation, and the Russia-Ukraine war. Access to public financing and credit in Canada can be negatively impacted by global financial conditions. Accordingly, the health of the global financing and credit markets may impact the ability of Denison to obtain equity or debt financing in the future and the terms at which financing or credit is available to Denison. Instances of volatility and market turmoil could adversely impact Denison's operations and the trading price of the Shares.
Mineral exploration and development are inherently speculative, and there is no assurance that the Company’s uranium interests are or will be commercially mineable.
Exploration for minerals and the development of mineral properties are speculative and involve significant uncertainties and financial risks that even a combination of careful evaluation, experience and technical knowledge may not eliminate. While the discovery of an ore body may result in substantial rewards, few properties which are explored result in the discovery of a commercially mineable deposit and/or are ultimately developed into producing mines. As at the date hereof, many of Denison’s projects are preliminary in nature and mineral resource estimates include inferred mineral resources, which are considered too speculative geologically to have the economic considerations applied that would enable them to be categorized as mineral reserves. Mineral resources that are not mineral reserves do not have demonstrated economic viability. Major expenses may be required to properly evaluate the prospectivity of an exploration property, to estimate mineral resources, establish mineral reserves and ultimately develop an orebody. There is no assurance that the Company’s uranium deposits are commercially mineable.
39
|
MANAGEMENT’S DISCUSSION & ANALYSIS |
The value of an investment in Denison could be materially impacted if the Company is unable to establish technical or economic feasibility for its projects, obtain required regulatory approvals and permitting, or maintain estimated project execution objectives and milestones.
Denison’s uranium production is dependent in part on the successful development of its known ore bodies, discovery of new ore bodies and/or revival of previously existing mining operations. The decision as to whether a property contains a commercial mineral deposit and should be brought into production will depend upon market conditions, as well as the results of exploration and evaluation programs and/or feasibility studies, and the recommendations of duly qualified engineers and/or geologists, all of which involves significant expense and risk. It is impossible to ensure that Denison’s current exploration and development programs will result in profitable commercial mining operations.
Projects being considered for development are subject to the completion of successful feasibility studies, engineering studies and environmental assessments, the issuance of necessary governmental permits and the availability of adequate financing, the completion or attainment of which are subject to their own risks and uncertainties. The inability to achieve necessary tasks or obtain required inputs, or any delays in the achievement of any key project tasks or inputs, could cause significant delays in timing, cost or results of the assessment of feasibility and/or the process to advance any project to a development decision. The economic feasibility of development projects is based upon many factors, including, among others: the accuracy of mineral reserve and resource estimates; metallurgical recoveries; capital and operating costs of such projects; government regulations relating to prices, taxes, royalties, infrastructure, land tenure, land use, importing and exporting, and environmental protection; political and economic climate; and uranium prices, which are historically volatile and cyclical.
For Wheeler River, the Company has been able to estimate the existence of mineral resources and mineral reserves and establish the potential for economic feasibility for commercial development, as set forth in, and subject to the estimates and assumptions described in, the Wheeler Technical Report. Substantial expenditures are still required prior to obtaining the required environmental approvals, permits and assets needed to commence commercial operations.
Where a feasibility study is completed by Denison, such as the Phoenix FS, any estimates of mineral reserves and mineral resources, development costs and schedule, operating costs and estimates of future cash flow contained therein, will be based on Denison’s interpretation of the information available to-date. Development projects have no operating history upon which to base developmental and operational estimates. Particularly for development projects, economic analyses and feasibility studies contain estimates based upon many factors, including estimates of mineral reserves, the interpretation of geologic and engineering data, anticipated tonnage and grades of ore to be mined and processed, the configuration of the ore body, expected recovery rates of uranium from the ore, estimated operating costs, anticipated climatic conditions and other factors. In addition, results from further studies completed on the project may alter the plans and/or schedule for a project, which in turn may cause potentially significant delays to previous estimates of schedule and/or increases in estimated costs. As a result, it is possible that actual capital and operating costs and economic returns will differ significantly from those estimated for a project prior to production. For example, the plan and schedule, the capital and operating cost projections, and the related economic indicators, in the Wheeler Technical Report may vary significantly from actual expenditures.
It is not unusual in the mining industry for new mining operations to take longer than originally anticipated to bring into a producing phase, and to require more capital than anticipated. Any of the following events, among others, could affect the profitability or economic feasibility of a project or delay or stop its advancement: unavailability of necessary capital, unexpected problems during the start-up phase delaying production, unanticipated changes in grade and tonnes of ore to be mined and processed, unanticipated adverse geological conditions, unanticipated metallurgical recovery problems, incorrect data on which engineering assumptions are made, unavailability of labour, increases in operating costs (including due to inflation), increased costs of mining or processing and refining facilities, unavailability of economic sources of power and water, unanticipated transportation costs, changes in government regulations (including regulations with respect to the environment, prices, royalties, duties, taxes, permitting, restrictions on production, quotas on exportation of minerals, etc.), changes or delays in permitting and regulatory approval processes or restrictions associated with permitting or regulatory approvals, fluctuations in uranium prices, accidents, labour actions and force majeure events.
The ability to sell and profit from the sale of any eventual mineral production from a property will be subject to contractual commitments as well as the prevailing conditions in the applicable marketplace at the time of sale and applicable government regulations. The demand for uranium and other minerals is subject to global economic influences and changing attitudes of consumers and demand from end-users.
Many of these factors are beyond the control of a mining company and therefore represent a market risk which could impact the long-term viability of Denison and its operations.
40
|
MANAGEMENT’S DISCUSSION & ANALYSIS |
Selection and use of novel mining methods present significant opportunities, as well as increased execution risk, for Denison.
As disclosed in the Wheeler Technical Report, Denison has selected the ISR mining method for production at the Phoenix deposit. While industry best practices have been utilized in the development of its estimates and technical studies, and field testing completed to date indicates that ground conditions and the mineral reserves estimated to be contained within the deposit are amenable to extraction by way of ISR to the level of certainty appropriate for a feasibility study, actual conditions could be materially different from those estimated.
The MLJV has developed the patented SABRE mining method, and has previously evaluated this innovative mining method via test mining at McClean Lake. While important milestones for the SABRE technology have been achieved to date, actual operations for a full-scale mining operation have not been proven and could be materially different than currently projected or otherwise anticipated. It is possible that actual costs and economic returns of any mining operations may differ materially from Denison’s or the MLJV’s best estimates, as applicable.
If these novel mining methods can be advanced, their commercial use beyond the projects for or on which they are being developed could present a significant opportunity for Denison and/or the MLJV to expand upon the benefits of such investments in innovation; however, the ability and process for a joint venture, or either partner thereof, to use the mining method on projects outside of their respective joint ventures has not yet been established.
Denison’s operations are dependent on permitting and licensing.
The development of mines and related facilities is contingent upon governmental approvals that are complex and time consuming to obtain and which may involve the coordination of multiple governmental agencies. The ability of the Company to obtain and maintain permits and approvals and to successfully explore and evaluate properties and/or develop and operate mines may be adversely affected by real or perceived impacts associated with its activities that impact the environment and human health and safety at its projects and in the surrounding communities.
The real or perceived effects of the activities of other mining companies, locally or globally, may also adversely impact the Company’s ability to obtain and maintain permits and approvals. Mining companies are often targets of actions by non-governmental organizations and environmental groups in the jurisdictions in which they operate. Such organizations and groups may take actions in the future to disrupt Denison's operations. They may also apply pressure to local, regional and national government officials to take actions which are adverse to Denison's operations. Such actions could have an adverse effect on Denison's ability to advance its projects and, as a result, on its financial position and results.
Environmental and regulatory review has become a long, complex and uncertain process that can cause potentially significant delays. Obtaining these government approvals includes among other things, completing environmental assessments and engaging with Indigenous and local communities. In addition, future changes in governments, regulations and policies, such as those impacting Denison’s mining operations and uranium transport, could materially and adversely affect Denison’s results of operations and financial condition in a particular period or its long-term business prospects. There can be no assurance that the Company will obtain or renew all necessary permits on acceptable terms or in a timely manner. Any significant delays in obtaining or renewing such permits or licences in the future could have a material adverse effect on Denison.
Denison’s operations are subject to extensive regulatory and policy risk.
Uranium mining and milling operations and exploration activities, as well as the transportation and handling of the products produced, are subject to extensive regulation by federal, provincial, and state governments. Such regulations relate to production, development, exploration, exports, imports, taxes and royalties, labour standards, occupational health, waste disposal, protection and remediation of the environment, mine decommissioning and reclamation, mine safety, toxic substances, transportation safety and emergency response, engagement with Indigenous peoples, and other matters. Compliance with such laws and regulations is currently, and has historically, increased the costs of exploring, drilling, developing, constructing, operating and closing Denison’s mines and processing facilities.
Denison expends significant financial and managerial resources to comply with such laws and regulations. Denison anticipates it will have to continue to do so as the trend toward stricter government regulation may continue. Because legal requirements are frequently changing and subject to interpretation, Denison is unable to predict the ultimate cost of compliance with these requirements or their effect on operations. While the Company has taken great care to ensure full compliance with its legal obligations, there can be no assurance that the Company has been or will be in full compliance with all of these laws and regulations, or with all permits and approvals that it is required to have.
It is possible that the costs, delays and other effects associated with such laws and regulations may impact Denison’s decisions with respect to exploration and development properties, including whether to proceed with exploration or development. It is also possible that such laws and regulations may result in Denison incurring significant costs due to a material change required to the methods of mining, milling, transportation and other project elements and/or to remediate or decommission properties in accordance with applicable environmental standards beyond those already established and estimated by the Company.
41
|
MANAGEMENT’S DISCUSSION & ANALYSIS |
Failure to comply with applicable laws, regulations and permitting requirements, even inadvertently, may result in enforcement actions. These actions may result in orders issued by regulatory or judicial authorities causing operations to cease or be curtailed, and may include corrective measures requiring capital expenditures, installation of additional equipment or remedial actions. Companies may be required to compensate others who suffer loss or damage by reason of their exploration or other activities and may have civil or criminal fines or penalties imposed for violations of applicable laws or regulations.
Denison is subject to risks and uncertainties related to engagement with Canada’s First Nations and Métis Peoples.
First Nations and Métis rights, entitlements and title claims may impact Denison’s ability and that of its joint venture partners to pursue exploration, development and mining at its Saskatchewan properties. Pursuant to historical treaties, First Nations in northern Saskatchewan are entitled to pursue hunting, fishing and other activities on their traditional lands and continue to assert title to the minerals within the lands. Métis people have not signed treaties; they assert Indigenous rights throughout Saskatchewan, including Indigenous title over the Company’s project lands.
Managing relations with the local First Nations and Métis communities is a matter of paramount importance to Denison. Engagement with, and consideration of other rights of, potentially affected Indigenous peoples may require accommodations, including undertakings regarding funding, contracting, environmental practices, employment and other matters. In the course of engagement, the Company also faces competing interests and demands. This may affect the timetable and costs of exploration, evaluation and development of the Company’s projects.
The Company’s relationships with communities of interest are critical to ensure the future success of its existing operations and the construction and development of its projects. There is an increasing level of public concern relating to the perceived effect of mining activities on the environment and communities. Adverse publicity relating to the mining industry generated by non-governmental organizations and others could have an adverse effect on the Company’s reputation or financial condition and may impact its relationship with the communities in proximity to which it operates. While the Company is committed to operating in a socially responsible manner, there is no guarantee that the Company’s efforts in this regard will mitigate this potential risk.
The inability of the Company to maintain positive relationships with local First Nations and Métis communities and other communities of interest may result in additional obstacles to permitting, increased legal challenges, or other disruptions to the Company’s exploration, development and production plans, and could have a significant adverse impact on the Company’s share price and financial condition.
Failure to maintain qualified and experienced employees on which Denison depends could result in business interruption.
Denison’s success depends on the efforts and abilities of certain senior officers and key employees. Certain of Denison’s employees have significant experience in the uranium industry, and the number of individuals with significant experience in this industry is small. While Denison does not foresee any reason why such officers and key employees will not remain with Denison, if for any reason they do not, Denison could be adversely affected. Denison has not purchased key man life insurance for any of these individuals.
Denison’s success also depends on the availability of and its competitiveness for qualified and experienced employees to work in Denison’s operations and Denison’s ability to attract and retain such employees. Effective staffing is about having the right numbers of the right people, in the right place at the right time, with the suitable knowledge, skill and experience to operate safety and effectively and to maintain compliance with internal controls, procedures and policies. To meet the Company’s objectives, Denison has been and will continue to need to increase its staffing levels to ensure it has suitable and sufficient organizational structures, staffing and competencies in place to effectively and reliably carry out its activities. Failure to adequately address such operational risks could result in breakdowns in internal procedures and systems, which could have a material adverse impact on the Company.
Disagreements or disputes with Denison’s joint venture counterparties could materially adversely impact the Company’s operations.
The Company is party to a number of joint venture arrangements which are material to the Company. The existence or occurrence of one or more of the following circumstances and events could have a material adverse impact on the Company’s business prospects, results of operations and financial condition: disagreements with joint venture partners on how to conduct exploration or development activities; inability of joint venture partners to meet their obligations to the joint venture or third parties; and disputes or litigation between joint venture partners regarding budgets, development activities, reporting requirements and other joint venture matters. The Company is, and has been, involved in disputes with its joint venture partners pursuant to the dispute resolution provisions of a joint venture agreement or civil claims. Any such disputes may not be resolved in the Company’s favour.
42
|
MANAGEMENT’S DISCUSSION & ANALYSIS |
Public health emergencies could materially impact business and operation plans.
As in the case of COVID-19, public health emergencies may cause disruptions to the Company’s business and operational plans. Such disruptions may result from (i) restrictions that governments and communities impose to address the emergency, (ii) restrictions that the Company and its contractors and subcontractors impose to ensure the safety of employees and others, (iii) shortages of employees and/or unavailability of contractors and subcontractors, and/or (iv) interruption of supplies from third parties upon which the Company relies. A disruption may have a material adverse effect on the Company’s business, financial condition and results of operations, which could be rapid and unexpected.
Compliance costs and risks of non-compliance with environmental, health, safety and other regulations could have a material adverse impact on Denison’s financial condition or results of operations.
Denison has expended significant financial and managerial resources to comply with environmental protection laws, regulations and permitting requirements in each jurisdiction where it operates, and anticipates that it will be required to continue to do so in the future as the historical trend toward stricter regulation may continue. The possibility of more stringent regulations exists in the areas of worker health and safety, the disposition of wastes, the decommissioning and reclamation of mining and processing sites, and other environmental matters each of which could have a material adverse impact on the costs or the viability of a particular project.
Denison’s facilities operate under various operating and environmental permits, licences and approvals that contain health, safety and/or environmental conditions that must be met, and Denison’s right to pursue its development plans is dependent upon receipt of, and compliance with, additional permits, licences and approvals. Failure to obtain such permits, licences and approvals and/or meet any conditions set forth therein could have a material adverse effect on Denison’s financial condition or results of operations.
Although the Company believes its operations comply, in all material respects, with all relevant permits, licences and regulations involving worker health and safety as well as the environment, there can be no assurance regarding continued compliance or ability of the Company to meet stricter environmental regulation, which may also require the expenditure of significant additional financial and managerial resources.
Health and safety hazards may pose a risk to Denison’s employees, contractors and operations.
Exploration and mining development and operating activities represent inherent safety hazards and maintaining the health and safety of the Company’s employees and contractors is of paramount importance to Denison. The Company has policies, procedures and controls in place intended to maintain the health and safety of its operations. Notwithstanding such efforts, safety incidents may still occur. Significant potential risks include, but are not limited to, vehicle accidents, unsafe road conditions or events and contact with energized sources.
Operations in the uranium industry are subject to risks uniquely associated with uranium mining and processing. For example, the risk of over-exposure to radiological materials by the Company’s employees, contractors, or others is inherent in Denison's operations, as they involve the treatment, monitoring, possession, handling, storage and/or transportation of radioactive materials (uranium, radon, etc.).
Employees involved in activities in remote areas may also be exposed to additional hazards as a result of equipment failure, such as risk of failure of heating equipment or damage to camp facilities; risk of being stranded due to breakdown or damage to mobile equipment, or risk of attacks on employees by wildlife. The impact of such hazards could be exacerbated by limited access to first aid or other medical care and/or delayed emergency response time.
Any incident resulting in serious injury or death could have profound impacts on the Company, its employees and others, as well as result in litigation and/or regulatory action (including, but not limited to suspension of development activities, fines or penalties), or otherwise adversely affect the Company’s reputation and ability to meet its objectives.
Mineral reserve and resource estimates may prove inaccurate.
Mineral reserve and resource figures are estimates, and no assurances can be given that the estimated quantities of uranium are in the ground and could be produced, or that Denison will receive the prices assumed in determining its mineral reserves. Such estimates are expressions of judgment based on knowledge, mining experience, analysis of drilling results and industry best practices. Valid estimates made at a given time may significantly change when new information becomes available. While Denison believes that the Company’s estimates of mineral reserves and mineral resources are well established and reflect management’s best estimates, by their nature, mineral reserve and resource estimates are imprecise and depend, to a certain extent, upon statistical inferences and geological interpretations, which may ultimately prove inaccurate. Furthermore, market price fluctuations, as well as increased capital or production costs or reduced recovery rates, may render mineral reserves and resources uneconomic and may ultimately result in a restatement of mineral reserves and resources. The evaluation of mineral reserves or resources is always influenced by economic and technological factors, which may change over time.
43
|
MANAGEMENT’S DISCUSSION & ANALYSIS |
Global demand fluctuations and international trade restrictions could adversely affect Denison’s outlook and financial condition.
The international nuclear fuel industry, including the supply of uranium concentrates, is relatively small compared to other minerals, and is generally highly competitive and heavily regulated. Worldwide demand for uranium is directly tied to the demand for electricity produced by the nuclear power industry, which is also subject to extensive government regulation and policies. In addition, the international marketing of uranium is subject to governmental policies and certain trade restrictions. For example, the supply and marketing of uranium from Russia is limited by international trade agreements.
In general, trade agreements, governmental policies and/or trade restrictions are beyond the control of Denison and may affect the supply of uranium available for use in markets like the United States and Europe, which are currently the largest markets for uranium in the world. Similarly, trade restrictions or foreign policy have the potential to impact the ability to supply uranium to developing markets, such as China and India. If substantial changes are made to regulations affecting the global marketing and supply of uranium, the Company’s business, financial condition and results of operations may be materially adversely affected.
The Company’s project viability and operational outlook could be negatively impacted by the volatility and sensitivity to fluctuations in uranium market prices.
The value of the Company’s current physical uranium holdings and its estimates of mineral resources, mineral reserves and the viability of future production for its projects are heavily influenced by long and short term market prices of U3O8. Historically, these prices have seen significant fluctuations, and have been and will continue to be affected by numerous factors beyond Denison’s control. Such factors include, among others: demand for nuclear power, political, economic and social conditions in uranium producing and consuming countries, public and political response to nuclear incidents, reprocessing of used reactor fuel and the re-enrichment of depleted uranium tails, sales of excess civilian and military inventories (including from the dismantling of nuclear weapons) by governments and industry participants, uranium supplies from other secondary sources, and production levels and costs of production from primary uranium suppliers.
Uranium prices failing to reach or sustain projected levels can impact operations by requiring a reassessment of the Company’s financial resources and/or the economic viability of the Company’s projects, and such reassessment alone may cause substantial delays and/or interruptions in project development, which could have a material adverse effect on the results of operations and financial condition of Denison.
Lack of public acceptance of nuclear energy and competition from other energy sources may result in lower demand for uranium.
Growth of the uranium and nuclear power industry will depend upon continued and increased acceptance of nuclear technology as a clean means of generating electricity. Because of unique political, technological and environmental factors that affect the nuclear industry, including the risk of a nuclear incident, the industry is subject to public opinion risks that could have an adverse impact on the demand for nuclear power and increase the regulation of the nuclear power industry.
Nuclear energy competes with other sources of energy, including oil, natural gas, coal and hydro-electricity. These other energy sources are, to some extent, interchangeable with nuclear energy, particularly over the longer term. Technical advancements in, and government subsidies for, renewable and other alternate forms of energy, such as wind and solar power, could make these forms of energy more commercially viable and put additional pressure on the demand for uranium concentrates. Sustained lower prices of alternate forms of energy may result in lower demand for uranium concentrates.
Market projections for future demand for uranium are based on various assumptions regarding the rate of construction and approval of new nuclear power plants, as well as continued public acceptance of nuclear energy around the world. The rationale for adopting nuclear energy can be varied, but often includes the clean and environmentally friendly operation of nuclear power plants, as well as the affordability and round-the-clock reliability of nuclear power. A change in public sentiment regarding nuclear energy could have a material impact on the number of nuclear power plants under construction, planned or proposed, which could have a material impact on the market’s and the Company’s expectations for the future demand for uranium and the future price of uranium.
The Russia-Ukraine war has highlighted to many global policymakers the significant geopolitical risk associated with an over reliance on sources of energy from politically unstable jurisdictions. In many cases, this has resulted in increased calls for a renewed focus on energy independence, to which many nations have identified nuclear power as a potentially critical energy alternative that can both improve energy sovereignty and support the achievement of carbon emission reduction climate goals.
Denison is reliant on other operators for the advancement and maintenance of certain of its joint venture interests.
For certain of Denison’s property interests, Denison is not the operator and therefore is not in control of the applicable activities and operations. As a result, Denison is and will be, to a certain extent, dependent on the operators for the nature and timing of activities related to these interests and may be unable to direct or control such activities.
44
|
MANAGEMENT’S DISCUSSION & ANALYSIS |
As an example, Orano Canada is the operator and majority participant in the MLJV and MWJV. The McClean Lake mill employs unionized workers who work under collective agreements. Orano Canada, as the operator, is responsible for most operational and production decisions and all dealings with unionized employees, and its decisions drive mill and mining operations. Similarly, Orano Canada is responsible for all licensing and dealings with various regulatory authorities. Orano Canada maintains the regulatory licences for operation of the McClean Lake mill, all of which are subject to renewal from time to time and are required in order for the mill to operate in compliance with applicable laws and regulations. Any lengthy work stoppages, or disruption to the operation of the mill or mining operations as a result of a licensing matter or regulatory compliance, may have a material adverse impact on the Company’s future cash flows, earnings, results of operations and financial condition.
Denison could be negatively impacted by its reliance on contractors and experts.
In various aspects of its operations, Denison relies on the services, expertise and recommendations of its service providers and their employees and contractors, whom often are engaged at significant expense to the Company. For example, the decision as to whether a property contains a commercial mineral deposit and should be brought into production will depend in large part upon the results of exploration programs and/or feasibility studies, and the recommendations of duly qualified third-party engineers and/or geologists. In addition, while Denison emphasizes the importance of conducting operations in a technically sound, safe and sustainable manner, it cannot exert absolute control over the actions of these third parties when providing services to Denison or otherwise operating on Denison’s properties. Any failure to act or material error, omission, act of negligence or act resulting in a technical failure, environmental pollution, accidents or spills, industrial and transportation accidents, work stoppages or other actions could adversely affect the Company’s operations and financial condition.
Denison is reliant on the licensed storage facilities with which it stores its physical uranium.
Any uranium purchased by the Company will be stored at one or more licensed uranium conversion facilities (“Facilities”), each owned by different third-party organizations. As the number of duly licensed Facilities is limited, there can be no assurance that storage arrangements that are commercially beneficial to the Company will remain readily available. Failure to negotiate commercially reasonable storage terms with the Facilities may have a material impact on the Company’s plans with respect to the physical uranium holdings.
By holding its investments in uranium with licensed Facilities, the Company is exposed to the credit risks of any such Facilities and their operators. There is no guarantee that the Company can fully recover all of its investments in uranium held with the Facilities. Failure to recover all uranium holdings could have a material adverse effect on the financial condition of the Company.
Any loss or damage of the uranium may not be fully covered or absolved by contractual arrangements with the Facilities or the Company’s insurance arrangements, and the Company may be financially and legally responsible for losses and/or damages not covered by indemnity provisions or insurance. Any failure to recover all of the uranium holdings could have a material adverse effect on the financial condition of the Company.
Fluctuations in foreign exchange rates could negatively affect the Company.
The Company maintains its accounting records and reports its financial position and results in Canadian dollars. Fluctuations in the U.S. currency exchange rate relative to the Canadian currency could significantly impact the Company, including its financial results, operations or the trading value of its securities, as the price of uranium is quoted in U.S. dollars, and a decrease in value of U.S. dollars would result in a relative decrease in the valuation of uranium and the associated market value from a Canadian currency perspective. Exchange rate fluctuations, and any potential negative consequences thereof, are beyond the Company’s control.
The Company may not realize the intended benefits of its transactions.
Denison has completed a number of transactions over the last several years, including the acquisition of physical uranium, and investments in JCU, F3 and KLP. Despite Denison’s belief that these transactions, and others which may be completed in the future, will be in Denison’s best interest and benefit the Company and Denison’s securityholders, Denison may not realize the anticipated benefits of such transactions or realize the full value of the consideration paid or received to complete the transactions. This could result in significant accounting impairments or write-downs of the carrying values of mineral properties or other assets and could adversely impact the Company and the price of its Shares.
Denison may be unable to exploit, expand and replace mineral reserves and mineral resources.
Denison’s mineral reserves and resources at its Wheeler River, Waterbury Lake, McClean Lake and Midwest projects are Denison’s material future sources of possible uranium production. Unless other mineral reserves or resources are discovered or acquired, Denison’s sources of future production for uranium concentrates will decrease over time if its current mineral reserves and mineral resources are exploited or otherwise depleted. There can be no assurance that future exploration, development and acquisition efforts will be successful in replenishing its mineral reserves and resources. In addition, while Denison believes that many of its properties demonstrate development potential, there can be no assurance that they can or will be successfully developed and put into production in future years.
45
|
MANAGEMENT’S DISCUSSION & ANALYSIS |
Competition for properties could limit the Company’s ability to add to or replace mineral reserves and mineral resources.
Significant competition exists for the limited supply of mineral lands available for acquisition. Participants in the mining business include large established companies with long operating histories. In certain circumstances, the Company may be at a disadvantage in acquiring new properties as competitors may have incumbency advantages, greater financial resources and more technical staff. Accordingly, there can be no assurance that the Company will be able to compete successfully to acquire new properties or that any such acquired assets would yield resources or reserves or result in commercial mining operations.
Challenges to Denison’s title to or interest in its properties could have a material adverse effect on Denison’s operations.
The Company has investigated its rights to explore and exploit all of its material properties and, to the best of its knowledge, those rights are in good standing. However, no assurance can be given that such rights will not be revoked, or significantly altered, to its detriment. There can also be no assurance that the Company’s rights will not be challenged or impugned by third parties, including the federal, provincial and local governments in Canada, as well as by First Nations and Métis.
There is also a risk that Denison's title to, or interest in, its properties may be subject to defects or challenges. If such defects or challenges cover a material portion of Denison's property, they could have a material adverse effect on Denison's results of operations, financial condition, reported mineral reserves and resources and/or long-term business prospects.
Failure to renew or a default in obligations under the Credit Facility or other debt arrangement, as applicable, could have a material adverse impact on Denison’s operations and financial condition.
The Credit Facility has a term of one year, which has been renewed annually, and will need to be renewed again on or before January 31, 2025. There is no certainty what terms of any renewal may be, or any assurance that such renewal will be made available to Denison.
Denison is required to satisfy certain financial covenants in order to maintain its good standing under the Credit Facility. Denison is also subject to a number of restrictive covenants under the Credit Facility and the Ecora Transaction, such as restrictions on Denison’s ability to incur additional indebtedness and sell, transfer or otherwise dispose of material assets. Denison may from time to time enter into other arrangements to borrow money in order to fund its operations and expansion plans, and such arrangements may include covenants that have similar obligations or that restrict its business in some way.
Events may occur in the future, including events out of Denison’s control, which could cause Denison to fail to satisfy its obligations under the Credit Facility, Ecora Transaction or other debt instruments. In such circumstances, the amounts drawn under Denison's debt agreements may become due and payable before the agreed maturity date, and Denison may not have the financial resources to repay such amounts when due. The Credit Facility and Ecora Transaction are secured by a pledge of the shares of Denison Mines Inc. If Denison were to default on its obligations under the Credit Facility, Ecora Transaction or other secured debt instruments in the future, the lender(s) under such debt instruments could enforce their security and seize significant portions of Denison’s assets.
Restrictions on change of control could delay or disrupt transactions otherwise beneficial to the Company or its securityholders.
The Ecora Transaction and certain other of Denison’s agreements contain provisions that could adversely impact Denison in the case of a transaction that would result in a change of control of Denison or certain of its subsidiaries. If consent is required from our counterparty and the counterparty chooses to withhold its consent, then such transaction opportunity could have to be abandoned or if such transaction were to proceed the counterparty could seek to terminate certain agreements with Denison, including certain agreements forming part of the Ecora Transaction, or require Denison to buy the counterparty’s rights back from them, which could adversely affect Denison’s financial resources and prospects. If applicable, these restrictive contractual provisions could delay or discourage a change in control of our company that could otherwise be beneficial to Denison or its securityholders.
Inaccuracy of decommissioning and reclamation estimates and insufficiency of financial assurance could impact the Company’s operations and financial condition.
As owner of the Elliot Lake decommissioned sites and part owner of the McClean Lake mill, McClean Lake mines, the Midwest uranium project and certain exploration properties, and for so long as the Company remains an owner thereof, the Company is obligated to eventually reclaim or participate in the reclamation of such properties. Most, but not all, of the Company’s reclamation obligations are secured, and cash and other assets of the Company have been reserved to secure this obligation. Although the Company’s financial statements record a liability for the asset retirement obligation, and the security requirements are periodically reviewed by applicable regulatory authorities, there can be no assurance or guarantee that the ultimate cost of such reclamation obligations will not exceed the estimated liability contained on the Company’s financial statements.
46
|
MANAGEMENT’S DISCUSSION & ANALYSIS |
As Denison’s properties approach or go into decommissioning, regulatory review of the Company’s decommissioning plans may result in additional decommissioning requirements, associated costs and the requirement to provide additional financial assurances. It is not possible to predict what level of decommissioning and reclamation (and financial assurances relating thereto) may be required from Denison in the future by regulatory authorities.
Technical innovation and obsolescence could reduce the demand for the Company’s uranium.
Requirements for Denison’s products and services may be affected by technological changes impacting the mining and/or nuclear industries. For example, technological changes in nuclear reactors, enrichment and used uranium fuel processing could reduce the demand for uranium. In addition, Denison’s competitors may adopt technological advancements that give them an advantage over Denison.
Denison’s insurance coverage may not be sufficient to cover losses from risks inherent in exploration and mining operations resulting in material economic harm to Denison.
Denison’s business is capital intensive and subject to a number of risks and hazards, including environmental pollution, accidents or spills, industrial and transportation accidents, labour disputes, changes in the regulatory environment, natural phenomena (such as inclement weather conditions) and encountering unusual or unexpected geological conditions. Many of the foregoing risks and hazards could result in damage to, or destruction of, Denison’s mineral properties or processing facilities in which it has an interest; personal injury or death; environmental damage; delays in or interruption of or cessation of exploration, development, production or processing activities; or costs, monetary losses and potential legal liability and adverse governmental action. In addition, due to the radioactive nature of the materials handled in uranium exploration, mining and processing, as applicable, additional costs and risks are incurred by Denison and its joint venture partners on a regular and ongoing basis.
Although Denison maintains insurance to cover some of these risks and hazards in amounts it believes to be reasonable, such insurance may not provide adequate coverage in the event of certain circumstances. No assurance can be given that such insurance will continue to be available, that it will be available at economically feasible premiums, or that it will provide sufficient coverage for losses related to these or other risks and hazards.
Denison may be subject to liability or sustain loss for certain risks and hazards against which it cannot insure or which it may reasonably elect not to insure because of the cost. This lack of insurance coverage could result in material economic harm to Denison.
Incidents with respect to Denison’s containment management obligations could have a material and adverse effect on its reputation, financial condition and results of operations.
Denison does not currently have any tailings production. However, the Company’s closed mines group is engaged in long-term monitoring for Denison’s closed mines in Elliot Lake, Ontario for which decommissioning and restoration has been completed. Such monitoring includes the operation of tailings storage facilities, the results of which are reviewed regularly by the Canadian Nuclear Safety Commission and the Elliot Lake Joint Regulatory Group, which consists of federal and provincial regulators. Denison’s other exploration and evaluation activities may also produce waste materials, for which containment procedures and practices are in place, in accordance with applicable regulatory and permit requirements. However, there is a risk of environmental contamination or other adverse effect due to a release of radioactive material or other materials produced by the Company’s activities if the infrastructure prepared therefor is not sufficient to achieve appropriate containment. Such an occurrence could have a material and adverse effect on the Company’s reputation, financial condition and results of operations.
The Company could be negatively impacted by any failure to comply with applicable anti-bribery and anti-corruption laws.
The Company is subject to anti-bribery and anti-corruption laws, including the Corruption of Foreign Public Officials Act (Canada) and the United States Foreign Corrupt Practices Act of 1977, as amended. Failure to comply with these laws could subject the Company to, among other things, reputational damage, civil or criminal penalties, other remedial measures and legal expenses which could adversely affect the Company’s business, results from operations, and financial condition. It may not be possible for the Company to ensure compliance with anti-bribery and anti-corruption laws in every jurisdiction in which its employees, agents, sub-contractors or joint venture partners are located or may be located in the future.
Climate change poses unique challenges that could materially impact Denison’s operations or financial condition.
Due to changes in local and global climatic conditions, many analysts and scientists predict an increase in the frequency of extreme weather events such as floods, droughts, forest and brush fires and extreme storms. Such events could materially disrupt the Company’s operations, particularly if they affect the Company’s sites, impact local infrastructure or threaten the health and safety of the Company’s employees, contractors and/or local communities. In addition, reported warming trends could result in later freeze-ups and warmer lake temperatures in the Athabasca Basin region, potentially affecting the Company’s winter exploration programs at certain of its material projects. Any such event could result in material economic harm to Denison.
47
|
MANAGEMENT’S DISCUSSION & ANALYSIS |
The Company is focused on operating in a manner designed to minimize the environmental impacts of its activities; however, certain environmental impacts from mineral exploration and mining activities may be inevitable. Increased environmental regulation and/or the use of fiscal policy by regulators in response to concerns over climate change and other environmental impacts, such as additional taxes levied on activities deemed harmful to the environment, could have a material adverse effect on Denison’s financial condition or results of operations.
Information systems upon which the Company may rely could be insufficient and/or vulnerable to cyberattack.
One of the Company’s material assets is its operational data and intellectual property and the ability to effectively retain and access that data is a priority for Denison. There is a risk that corporate data management systems are not implemented or utilized effectively to achieve ease of access and retrieval of timely, accurate and meaningful information about the business operations and risks to enable informed decision-making.
The accessibility of the Company’s corporate data may also be compromised through information security breaches. Although to date the Company has not experienced any information security breaches or any losses relating to cyber-attacks, there can be no assurance that the Company will not incur such losses in the future.
One of the most important things a company can do to prevent information security breaches is to ensure its people understand the importance of protecting its data and systems. In light of that, the Company has an Information Technology Acceptable Use Policy for its employees, for which it seeks annual review and affirmation of compliance, with procedures and practices in place designed to protect Denison’s information technology (“IT”) infrastructure. Denison also regularly deploys mandatory company-wide information technology and cyber-security training, to ensure familiarity with the risks and mitigation strategies, with the modules last launched in 2019 and 2022.
The Company's operations depend upon the availability, capacity, reliability and security of its IT infrastructure, and its ability to expand and update this infrastructure as required, to conduct daily operations. Denison relies on various IT systems in all areas of its operations, including financial reporting, contract management, exploration and development data analysis, human resource management, regulatory compliance and communications with employees and third parties.
These IT systems could be subject to network disruptions caused by a variety of sources, including computer viruses, security breaches and cyber-attacks, as well as network and/or hardware disruptions resulting from incidents such as unexpected interruptions or failures, natural disasters, fire, power loss, vandalism and theft. The Company's operations also depend on the timely maintenance, upgrade and replacement of networks, equipment, IT systems and software, as well as pre-emptive expenses to mitigate the risks of failures.
The ability of the IT function to support the Company’s business in the event of any such occurrence and the ability to recover key systems from unexpected interruptions cannot be fully tested. There is a risk that, if such an event occurs, the Company’s continuity plan may not be adequate to immediately address all repercussions of the disaster. In the event of a disaster affecting a data centre or key office location, key systems may be unavailable for a number of days, leading to inability to perform some business processes in a timely manner. As a result, the failure of Denison’s IT systems or a component thereof could, depending on the nature of any such failure, adversely impact the Company's reputation and results of operations.
Unauthorized access to Denison’s IT systems by employees or third parties could lead to corruption or exposure of confidential, fiduciary or proprietary information, interruption to communications or operations or disruption to the Company’s business activities or its competitive position. Further, disruption of critical IT services, or breaches of information security, could have a negative effect on the Company’s operational performance and its reputation. The Company's risk and exposure to these matters cannot be fully mitigated because of, among other things, the evolving nature of these threats. As a result, cyber security and the continued development and enhancement of controls, processes and practices designed to protect systems, computers, software, data and networks from attack, damage or unauthorized access remain a priority.
The Company applies technical and process controls in line with industry-accepted standards to protect information, assets and systems, and is always considering initiatives to enhance its cyber and data security; however, these controls may not adequately prevent cyber-security breaches. There is no assurance that the Company will not suffer losses associated with cyber-security breaches in the future, and may be required to expend significant additional resources to investigate, mitigate and remediate any potential vulnerabilities. As cyber threats continue to evolve, the Company may be required to expend additional resources to continue to modify or enhance protective measures or to investigate and remediate any security vulnerabilities.
48
|
MANAGEMENT’S DISCUSSION & ANALYSIS |
Events could cause the cost and impact of maintenance of key infrastructure and equipment to be significant or unexpected.
For continued operations and to ensure the health and safety of employees and others, the Company must maintain diverse physical assets and infrastructure. The cost of operation and maintenance and the operating performance of such facilities may be adversely affected by a variety of factors, including regular and unexpected maintenance and replacement expenditures; the aging of facilities which may reduce their operating performance and increase the cost of maintenance; potential breakdown or failure of equipment requiring emergency or temporary response; catastrophic events such as fires, explosions, earthquakes, volcanic eruptions, landslides, floods, releases of hazardous materials, severe storms or similar occurrences; and other factors discussed in these risk factors. Any of these events could significantly increase the expenses incurred by the Company and/or materially and adversely affect its business, financial condition and future results.
Conflicts of interest with the Company’s directors or officers could have a material adverse impact on the Company.
Some of the directors and officers of Denison are also directors of other companies that are similarly engaged in the business of acquiring, exploring and developing natural resource properties. Such associations may give rise to conflicts of interest from time to time. In particular, one of the consequences would be that corporate opportunities presented to a director or officer of Denison may be offered to another company or companies with which the director or officer is associated, and may not be presented or made available to Denison. The directors and officers of Denison are required by law to act honestly and in good faith with a view to the best interests of Denison, to disclose any interest which they may have in any project or opportunity of Denison, and, where applicable for directors, to abstain from voting on such matter. Conflicts of interest that arise will be subject to and governed by the procedures prescribed in the Company’s Code of Ethics and by the Ontario Business Corporations Act.
Disclosure and internal control systems provide reasonable assurance, but not absolute assurance, with respect to the reliability of the Company’s financial reporting.
Internal controls over financial reporting are procedures designed to provide reasonable assurance that transactions are properly authorized, assets are safeguarded against unauthorized or improper use, and transactions are properly recorded and reported. Disclosure controls and procedures are designed to ensure that information required to be disclosed by a company in reports filed with securities regulatory agencies is recorded, processed, summarized and reported on a timely basis and is accumulated and communicated to the company’s management, including its Chief Executive Officer and Chief Financial Officer, as appropriate, to allow timely decisions regarding required disclosure. A control system, no matter how well designed and operated, can provide only reasonable, not absolute, assurance with respect to the reliability of reporting, including financial reporting and financial statement preparation.
Interests of KEPCO and KHNP may not always be consistent with the interests of other securityholders.
Pursuant to the KHNP SRA, KHNP Canada is contractually entitled to representation on the Company’s board of directors (the “Board”). Provided KHNP Canada holds over 5% of the Shares, it is entitled to nominate one director for election to the Board at any shareholder meeting.
KHNP Canada’s right to nominate a director may give KHNP Canada influence on decisions made by Denison's Board. Although KHNP Canada’s director nominee will be subject to duties under the OBCA to act in the best interests of Denison as a whole, such director nominee is likely to be an employee of KHNP and he or she may give special attention to KHNP’s or KEPCO’s interests as indirect shareholders. The interests of KHNP and KEPCO, as indirect shareholders, may not always be consistent with the interests of other securityholders.
The KHNP SRA also includes provisions granting KHNP Canada a right of first offer for certain asset sales and the right to be approached to participate in certain potential acquisitions. The right of first offer and participation right of KHNP Canada may negatively affect Denison’s ability or willingness to entertain certain business opportunities, or the attractiveness of Denison as a potential party for certain business transactions. KEPCO’s large indirect shareholding block may also make Denison less attractive to third parties considering an acquisition of Denison if those third parties are not able to negotiate KEPCO or KHNP Canada’s support.
Risks Related to Our Securities
Fluctuations in the market price of the Shares are often outside the control of the Company and could materially impact securityholders’ investments in the Company and the Company’s access to capital.
The market price of the Shares may experience wide fluctuations which may not necessarily be related to the financial condition, operating performance, underlying asset values or prospects of the Company. These factors include macroeconomic developments in North America and globally, market perceptions of the attractiveness of particular industries – including mining and nuclear energy – and volatile trading due to unpredictable general market or trading sentiments.
49
|
MANAGEMENT’S DISCUSSION & ANALYSIS |
The market price of the Shares are likely to increase or decrease in response to a number of events and factors, including: Denison’s operating performance and the performance of competitors and other similar companies; the breadth of the public market for the Shares and the attractiveness of alternative investments; volatility in metal prices; the number of Shares to be publicly traded after an offering pursuant to any prospectus or prospectus supplement; the public’s reaction to the Company’s press releases, material change reports, other public announcements and its filings with the various securities regulatory authorities; the arrival or departure of key personnel; public perception of the nuclear industry and reaction to the developments therein; changes in recommendations by research analysts who track the Shares or the shares of other companies in the sector; developments that affect the market for all resource sector securities; changes in general economic and/or political conditions (including inflation); acquisitions, strategic alliances or joint ventures involving Denison or its competitors; and the other risk factors listed herein.
Many of these factors that could impact the market price of the Shares are not directly related to Denison’s results or operations and are, therefore, not within Denison’s control. Accordingly, the market price of the Shares at any given point in time may not accurately reflect the long-term value of Denison.
In recent years, the Company has been affected by the results of a seemingly significant change in investor sentiment towards nuclear energy and uranium in connection with a global trend towards the transition to “clean” energy sources, which is believed to have resulted in increased trading volumes and price volatility of the Shares. Investor sentiment can change quickly, and investors may make investment decisions based on third party media and/or social media discussions that may not accurately reflect the Company’s disclosure or actual results of operations. Such sentiments may cause volatility in the trading price of the Shares and may or may not be reflective of individual investor’s views as to the value of the underlying assets.
Market sentiment and trading in an entity’s shares can also be impacted by its inclusion in, or exclusion from, certain equity benchmarks and/or investable indices. For example, in 2021 the Shares were added to the S&P/TSX Composite Index, the headline index for the Canadian equity market. This inclusion could impact the Share price positively, with increased interest in purchasing the Common Shares. However, a decline in the index could result in investors selling the Shares of the Company for reasons that are unrelated to the Company’s operating results, underlying asset values or prospects. In addition, the removal of the Company from the S&P/TSX Composite Index could have a negative impact on the market price of the Shares, as certain shareholders who link investments to the index could be required to sell the Shares for reasons that are unrelated to the Company’s operating results, underlying asset values or prospects.
Accordingly, the market price of the Shares may decline even if the Company’s operating results, underlying asset values or prospects have not changed. Additionally, these factors, as well as other related factors, may cause decreases in asset values that are deemed to be other than temporary, which may result in impairment losses. There can be no assurance that continuing fluctuations in price and volume will not occur. If such increased levels of volatility and market turmoil continue, the Company’s operations could be adversely impacted, and the trading price of the Shares may be materially adversely affected.
Securities class-action litigation often has been brought against companies following periods of volatility in the market price of their securities. Denison may in the future be the target of similar litigation. Securities litigation could result in substantial costs and damages and divert management's attention and resources.
Dilution from further issuances could impact the value of a securityholder’s investment in the Company.
While active in exploring for new uranium discoveries in the Athabasca Basin region, Denison’s present focus is on advancing the Wheeler River project to a development decision, with the potential to become the next large scale uranium producer in Canada. Denison will require additional funds to further such activities.
Denison may sell additional debt or equity securities (including through the sale of securities convertible into Shares) to finance its exploration, evaluation, development, construction and other operations, acquisitions or other projects. Denison is authorized to issue an unlimited number of Shares. Denison cannot predict the size of future sales and issuances of debt or equity securities or the effect, if any, that future sales and issuances of debt or equity securities will have on the market price of the Shares. Sales or issuances of a substantial number of equity securities, or the perception that such sales could occur, may adversely affect prevailing market prices for the Shares. With any additional sale or issuance of equity securities, investors may suffer dilution of their voting power and it could reduce the value of their investment.
QUALIFIED PERSON
Chad Sorba, P.Geo., Denison’s Vice President Technical Services & Project Evaluation, who is a ‘Qualified Person’ within the meaning of this term in NI 43-101, has prepared and/or reviewed and confirmed the scientific and technical disclosure pertaining to the Company’s evaluation programs.
50
|
MANAGEMENT’S DISCUSSION & ANALYSIS |
Andy Yackulic, P.Geo., Denison’s Vice President Exploration, who is a ‘Qualified Person’ within the meaning of this term in NI 43-101, has prepared and/or reviewed and confirmed the scientific and technical disclosure pertaining to the Company’s exploration programs.
For more information regarding each of Denison’s material projects discussed herein, you are encouraged to refer to the applicable technical reports available on the Company’s website and under the Company’s profile on SEDAR+ (www.sedarplus.ca) and EDGAR (www.sec.gov/edgar.shtml):
| ● | For the Wheeler River project, the ‘Technical Report for the Wheeler River project titled ‘NI 43-101 Technical Report on the Wheeler River Project, Athabasca Basin, Saskatchewan, Canada’ with an effective date of June 23, 2023; |
| ● | For the Waterbury Lake project, ‘Preliminary Economic Assessment for the Tthe Heldeth Túé (J Zone) Deposit, Waterbury Lake Property, Northern Saskatchewan, Canada’ with an effective date of October 30, 2020; |
| ● | For the Midwest project, ‘Technical Report with an Updated Mineral Resource Estimate for the Midwest Property, Northern Saskatchewan, Canada’ dated March 26, 2018; and |
| ● | For the McClean Lake project, (A) the ‘Technical Report on the Denison Mines Inc. Uranium Properties, Saskatchewan, Canada’ dated November 21, 2005, as revised February 16, 2006, (B) the ‘Technical Report on the Sue D Uranium Deposit Mineral Resource Estimate, Saskatchewan, Canada’ dated March 31, 2006, and (C) the ‘Technical Report on the Mineral Resource Estimate for the McClean North Uranium Deposits, Saskatchewan’ dated January 31, 2007. |
ASSAY PROCEDURES AND DATA VERIFICATION
The Company reports preliminary radiometric equivalent grades (‘eU3O8’), derived from a calibrated down-hole total gamma probe, during or upon completion of its exploration programs and subsequently reports definitive U3O8 assay grades following sampling and chemical analysis of the mineralized drill core. Uranium assays are performed on split core samples by the Saskatchewan Research Council Geoanalytical Laboratories using an ISO/IEC 17025:2005 accredited method for the determination of U3O8 weight %. Sample preparation involves crushing and pulverizing core samples to 90% passing -106 microns. The resultant pulp is digested using aqua-regia and the solution analyzed for U3O8 weight % using ICP-OES. Geochemical results from composite core samples are reported as parts per million (‘ppm’) obtained from a partial HNO3:HCl digest with an ICP-MS finish. Boron values are obtained through NaO2/NaCO3 fusion followed by an ICP-OES finish. All data are subject to verification procedures by qualified persons employed by Denison prior to disclosure. For further details on Denison’s sampling, analysis, quality assurance program and quality control measures and data verification procedures please see Denison's Annual Information Form dated March 27, 2023 available on the Company’s website and filed under the Company's profile on SEDAR+ (www.sedarplus.ca) and in its Form 40-F available on EDGAR at www.sec.gov/edgar.shtml.
CAUTIONARY STATEMENT REGARDING FORWARD-LOOKING STATEMENTS
Certain information contained in this MD&A constitutes ‘forward-looking information’, within the meaning of the applicable United States and Canadian legislation concerning the business, operations and financial performance and condition of Denison.
Generally, these forward-looking statements can be identified by the use of forward-looking terminology such as ‘plans’, ‘expects’, ‘budget’, ‘scheduled’, ‘estimates’, ‘forecasts’, ‘intends’, ‘anticipates’, or ‘believes’, or the negatives and/or variations of such words and phrases, or state that certain actions, events or results ‘may’, ‘could’, ‘would’, ‘might’ or ‘will be taken’, ‘occur’, ‘be achieved’ or ‘has the potential to’.
In particular, this MD&A contains forward-looking information pertaining to the following: the results of, and estimates and assumptions within, the Phoenix FS and the Gryphon PFS Update, including the estimates of Denison's mineral reserves and mineral resources, and statements regarding anticipated budgets, fees, expenditures and timelines; Denison’s plans and objectives for 2023 and beyond; exploration, development and expansion plans and objectives, including Denison’s planned engineering, environmental assessment and other programs; statements regarding Denison’s EA plans and objectives; expectations regarding Denison’s community engagement activities and related agreements; expectations regarding Denison’s joint venture ownership interests and the continuity of its agreements with its partners; expectations regarding the toll milling of Cigar Lake ores, including projected annual production volumes; the RA with UI and payments thereunder; and the annual operating budget and capital expenditure programs, estimated exploration and development expenditures and reclamation costs and Denison's share of same. Statements relating to ‘mineral reserves’ or ‘mineral resources’ are deemed to be forward-looking information, as they involve the implied assessment, based on certain estimates and assumptions that the mineral reserves and mineral resources described can be profitably produced in the future.
51
|
MANAGEMENT’S DISCUSSION & ANALYSIS |
Forward looking statements are based on the opinions and estimates of management as of the date such statements are made, and they are subject to known and unknown risks, uncertainties and other factors that may cause the actual results, level of activity, performance or achievements of Denison to be materially different from those expressed or implied by such forward-looking statements. For example, the results of the Denison’s studies, including the Phoenix FS, and field work, may not be maintained after further testing or be representative of actual mining plans for the Phoenix deposit after further design and studies are completed. In addition, Denison may decide or otherwise be required to discontinue testing, evaluation and development work at Wheeler River or other projects or its exploration plans if it is unable to maintain or otherwise secure the necessary resources (such as testing facilities, capital funding, regulatory approvals, etc.) or operations are otherwise affected by regulatory or public health restrictions or requirements.
Denison believes that the expectations reflected in this forward-looking information are reasonable but no assurance can be given that these expectations will prove to be accurate and results may differ materially from those anticipated in this forward-looking information. For a discussion in respect of risks and other factors that could influence forward-looking events, please refer to the factors discussed under the heading ‘Risk Factors’ above. These factors are not, and should not be construed as being exhaustive.
Accordingly, readers should not place undue reliance on forward-looking statements. The forward-looking information contained in this MD&A is expressly qualified by this cautionary statement. Any forward-looking information and the assumptions made with respect thereto speaks only as of the date of this MD&A. Denison does not undertake any obligation to publicly update or revise any forward-looking information after the date of this MD&A to conform such information to actual results or to changes in Denison's expectations except as otherwise required by applicable legislation.
Cautionary Note to United States Investors Concerning Estimates of Measured, Indicated and Inferred Mineral Resources and Proven and Probable Mineral Reserves: This MD&A may use the terms ‘measured'’, ‘indicated’ and ‘inferred’ mineral resources. United States investors are advised that while such terms have been prepared in accordance with the definition standards on mineral reserves of the Canadian Institute of Mining, Metallurgy and Petroleum referred to in Canadian National Instrument 43-101 Mineral Disclosure Standards (‘NI 43-101’) and are recognized and required by Canadian regulations. Effective February 2019, the United States Securities and Exchange Commission (‘SEC’) adopted amendments to its disclosure rules to modernize the mineral property disclosure requirements for issuers whose securities are registered with the SEC under the Exchange Act and as a result, the SEC now recognizes estimates of “measured mineral resources”, “indicated mineral resources” and “inferred mineral resources”. In addition, the SEC has amended its definitions of “proven mineral reserves” and “probable mineral reserves” to be “substantially similar” to the corresponding definitions under the CIM Standards, as required under NI 43-101. However, information regarding mineral resources or mineral reserves in Denison’s disclosure may not be comparable to similar information made public by United States companies.
United States investors are also cautioned that while the SEC now recognizes ‘indicated mineral resources’ and ‘inferred mineral resources’, United States investors are cautioned not to assume that all or any part of measured or indicated mineral resources will ever be converted into mineral reserves. United States investors are also cautioned not to assume that all or any part of an inferred mineral resource exists, or is economically or legally mineable.
52
EXHIBIT 99.3
CONSENT OF INDEPENDENT REGISTERED PUBLIC ACCOUNTING FIRM
We consent to the incorporation by reference in the Registration Statements on Form S-8 (File No. 333-48174, No. 333-148915, No. 333-190121 and No. 333-224641), of our reports dated February 29, 2024 with respect to the consolidated financial statements of Denison Mines Corp. (the “Entity”), which comprise the consolidated statements of financial position as of December 31, 2023 and 2022, the related consolidated statements of income and comprehensive income, changes in equity and cash flow for each of the years then ended, and the related notes, and the effectiveness of internal control over financial reporting as of December 31, 2023, which reports appear in Exhibit 99.1 to this Form 6-K of the Entity dated March 1, 2024.
/s/ KPMG LLP
Chartered Professional Accountants, Licensed Public Accountants
Toronto, Canada
March 1, 2024
© 2024 KPMG LLP, an Ontario limited liability partnership and a member firm of the KPMG global organization of independent member firms affiliated with KPMG International Limited, a private English company limited by guarantee. All rights reserved.
|
I, , (s) Name: Date Title: Reporting Issuer Name: End date of previous financial year: Type of Reporting Issuer: Highest Trading Marketplace: (refer to the definition of “highest trading marketplace” under OSC Rule 13-502 Fees) Market value of listed or quoted securities: (in Canadian Dollars - refer to section 7.1 of OSC Rule 13-502 Fees) Equity Symbol 1st Specified Trading Period (dd/mm/yy) (refer to the definition of “specified trading period” under OSC Rule 13-502 Fees ) 1/1/2023 to 3/31/2023 Closing price of the security in the class or series on the last trading day of the specified trading period in which such security was listed or quoted on the highest trading marketplace $1.470 (i) Number of securities in the class or series of such security outstanding at the end of the last trading day of the specified trading period 835,381,534 (ii) Market value of class or series (i) x (ii) = $1,228,010,854.98 (A) 2nd Specified Trading Period (dd/mm/yy) (refer to the definition of “specified trading period” under OSC Rule 13-502 Fees ) 4/1/2023 to 6/30/2023 Closing price of the security in the class or series on the last trading day of the specified trading period in which such security was listed or quoted on the highest trading marketplace $1.660 (iii) Number of securities in the class or series of such security outstanding at the end of the last trading day of the specified trading period 835,787,520 (iv) Market value of class or series (iii) x (iv) = $1,387,407,283.20 (B) 3rd Specified Trading Period (dd/mm/yy) (refer to the definition of “specified trading period” under OSC Rule 13-502 Fees ) 7/1/2023 to 9/30/2023 Closing price of the security in the class or series on the last trading day of the specified trading period in which such security was listed or quoted on the highest trading marketplace $2.230 (v) Number of securities in the class or series of such security outstanding at the end of the last trading day of the specified trading period 851,532,538 (vi) Market value of class or series (v) x (vi) = $1,898,917,559.74 (C) Denison Mines Corp. DML Ontario Securities Commission FORM 13-502F1 CLASS 1 and CLASS 3B REPORTING ISSUERS - PARTICIPATION FEE Amanda Willett "Amanda Willett" an officer of the reporting issuer noted below have examined this Form 13-502F1 (the Form) being submitted hereunder to the Ontario Securities Commission and certify that to my knowledge, having exercised reasonable diligence, the information provided in the Form is complete and accurate. MANAGEMENT CERTIFICATION Vice President Legal & Corporate Secretary Amanda Willett February 29, 2024 December 31, 2023 Toronto Stock Exchange Class 1 reporting issuer Class 3B reporting issuer |
|
4th Specified Trading Period (dd/mm/yy) (refer to the definition of “specified trading period” under OSC Rule 13-502 Fees ) 10/1/2023 to 12/31/2023 Closing price of the security in the class or series on the last trading day of the specified trading period in which such security was listed or quoted on the highest trading marketplace $2.320 (vii) 0.7 Number of securities in the class or series of such security outstanding at the end of the last trading day of the specified trading period 890,970,371 (viii) Market value of class or series (vii) x (viii) = $2,067,051,260.72 (D) 5th Specified Trading Period (dd/mm/yy) (refer to the definition of “specified trading period” under OSC Rule 13-502 Fees ) n/a to Closing price of the security in the class or series on the last trading day of the specified trading period in which such security was listed or quoted on the highest trading marketplace (ix) Number of securities in the class or series of such security outstanding at the end of the last trading day of the specified trading period (x) Market value of class or series (ix) x (x) = $0.00 (E) Average Market Value of Class or Series (Calculate the simple average of the market value of the class or (series of security for each applicable specified trading period (i.e. A through E above)) $1,645,346,739.66 (1) Fair value of outstanding debt securities: (See paragraph 2.8(1)(b), and if applicable, paragraph 2.8(1)(c) (of OSC Rule 13-502 Fees) $0.00 (2) (Provide details of how value was determined) Capitalization for the previous financial year (1) + (2) $1,645,346,739.66 Participation Fee (For Class 1 reporting issuers, from Appendix A of OSC $59,350 Rule 13-502 Fees, select the participation fee) (For Class 3B reporting issuers, from Appendix A.1 of $0 OSC Rule 13-502 Fees, select the participation fee) Late Fee, if applicable $0.00 (As determined under section 2.7 of OSC Rule 13-502 Fees ) Total Fee Payable $59,350.00 (Participation Fee plus Late Fee) April 16, 2015 - Rule 13-502 Fees (Form 13-502F1) (Repeat the above calculation for each other class or series of equity securities of the reporting issuer (and a subsidiary pursuant to paragraph 2.8(1)(c) of OSC Rule 13-502 Fees, if applicable) that was listed or quoted on a marketplace at the end of the previous financial year) |
|
Title: Vice President Legal & Corporate Secretary Feb 29, 2024 Date: (Signed) "Amanda Willett" Name: Amanda Willett I, Amanda Willett , an officer of the reporting issuer noted below have examined this Form 13-501F1 (the Form) being submitted hereunder to the Alberta Securities Commission and certify that to my knowledge, having exercised reasonable diligence, the information provided in the Form is complete and accurate. Note: [01 Mar 2017] – The following is a consolidation of 13-501F1. It incorporates amendments to this document that came into effect on March 1, 2017. This consolidation is provided for your convenience and should not be relied on as authoritative. FORM 13-501F1 CLASS 1 REPORTING ISSUERS AND CLASS 3B REPORTING ISSUERS – PARTICIPATION FEE MANAGEMENT CERTIFICATION Reporting Issuer Name: Denison Mines Corp. End date of previous financial year: December 31, 2023 Type of Reporting Issuer: [ ] Class 1 reporting issuer [ ] Class 3B reporting issuer Highest Trading Marketplace: Toronto Stock Exchange Market value of listed or quoted equity securities: Equity Symbol DML 1st Specified Trading Period (dd/mm/yy) 01/01/23 to 31/03/23 Closing price of the security in the class or series on the last trading day of the specified trading period in which such security was listed or quoted on the highest trading marketplace $ 1.4700 (i) |
|
Number of securities in the class or series of such security outstanding at the end of the last trading day of the specified trading period 835,381,534 (ii) Market value of class or series (i) x (ii) $ 1,228,010,854.98 (A) 2nd Specified Trading Period (dd/mm/yy) 01/04/23 to 30/06/23 Closing price of the security in the class or series on the last trading day of the specified trading period in which such security was listed or quoted on the highest trading marketplace $ 1.6600 (iii) Number of securities in the class or series of such security outstanding at the end of the last trading day of the specified trading period 835,787,520 (iv) Market value of class or series (iii) x (iv) $ 1,387,407,283.2 (B) 3rd Specified Trading Period (dd/mm/yy) 01/07/23 to 30/09/23 Closing price of the security in the class or series on the last trading day of the specified trading period in which such security was listed or quoted on the highest trading marketplace $ (v) 2.2300 Number of securities in the class or series of such security outstanding at the end of the last trading day of the specified trading period 851,532,538 (vi) Market value of class or series (v) x (vi) $ 1,898,917,559.74 (C) |
|
4th Specified Trading Period (dd/mm/yy) 01/10/23 to 31/12/23 Closing price of the security in the class or series on the last trading day of the specified trading period in which such security was listed or quoted on the highest trading marketplace $ 2.3200 (vii) Number of securities in the class or series of such security outstanding at the end of the last trading day of the specified trading period (viii) 890,970,371 Market value of class or series (vii) x (viii) $ (D) 2,067,051,260.72 5th Specified Trading Period (dd/mm/yy) to Closing price of the security in the class or series on the last trading day of the specified trading period in which such security was listed or quoted on the highest trading marketplace $ (ix) Number of securities in the class or series of such security outstanding at the end of the last trading day of the specified trading period (x) Market value of class or series (ix) x (x) $ (E) Average Market Value of Class or Series (Calculate the simple average of the market value of the class or series of security for each applicable specified trading period (i.e. A through E above)) $ (1) 1,645,346,739.66 (Repeat the above calculation for each other class or series of equity securities of the reporting issuer (and a subsidiary, if applicable) that was listed or quoted on a marketplace at the end of the previous financial year) |
|
Fair value of outstanding debt securities: (Provide details of how value was determined) $ 0.0000 Capitalization for the previous financial year (1) + (2) (2) $ 1,645,346,739.66 Participation Fee $ 28,000.0000 Late Fee, if applicable $ 0.0000 Total Fee Payable $ 28,000.0000 (Participation Fee plus Late Fee) |