UNITED STATES SECURITIES AND EXCHANGE COMMISSION
Washington, D.C. 20549
FORM 20-F
☐ |
REGISTRATION STATEMENT PURSUANT TO SECTION 12(b) OR (g) |
OR | |
þ |
ANNUAL REPORT PURSUANT TO SECTION 13 OR 15(d) |
|
For the fiscal year ended December 31, 2023 |
OR | |
☐ |
TRANSITION REPORT PURSUANT TO SECTION 13 OR 15(d) |
OR | |
☐ |
SHELL COMPANY REPORT PURSUANT TO SECTION 13 OR 15(d) |
|
Date of event requiring this shell company report…………… |
|
For the transition period from to |
Commission file number: 1-14251
SAP SE
(Exact name of Registrant as specified in its charter)
SAP EUROPEAN COMPANY
(Translation of Registrant’s name into English)
Federal Republic of Germany
(Jurisdiction of incorporation or organization)
Dietmar-Hopp-Allee 16
69190 Walldorf
Federal Republic of Germany
(Address of principal executive offices)
Wendy Boufford
c/o SAP Labs
3410 Hillview Avenue, Palo Alto, CA, 94304, United States of America
650-849-4000 (Tel),
650-843-2041 (Fax)
(Name, Telephone, Email and/or Facsimile number and Address of Company Contact Person)
Securities registered or to be registered pursuant to Section 12(b) of the Act:
|
||
Title of each class (SAP) |
SAP |
Name of each exchange on which registered |
American Depositary Shares, each Representing one Ordinary Share, without nominal value |
|
New York Stock Exchange |
Ordinary Shares, without nominal value |
|
New York Stock Exchange* |
Securities registered or to be registered pursuant to Section 12(g) of the Act: None
Securities for which there is a reporting obligation pursuant to Section 15(d) of the Act: None
Indicate the number of outstanding shares of each of the issuer’s classes of capital or common stock as of the close of the period covered by the annual report:
Ordinary Shares, without nominal value: 1,228,504,232 (as of December 31, 2023)**
Indicate by check mark if the registrant is a well-known seasoned issuer, as defined in Rule 405 of the Securities Act.
Yes þ No ☐
If this report is an annual or transition report, indicate by check mark if the registrant is not required to file reports pursuant to Section 13 or 15(d) of the Securities Exchange Act of 1934.
Yes ☐ No þ
Note — Checking the box above will not relieve any registrant required to file reports pursuant to Section 13 or 15(d) of the Securities Exchange Act of 1934 from their obligations under those Sections.
Indicate by check mark whether the registrant (1) has filed all reports required to be filed by Section 13 or 15(d) of the Securities Exchange Act of 1934 during the preceding 12 months (or for such shorter period that the registrant was required to file such reports), and (2) has been subject to such filing requirements for the past 90 days.
Yes þ No ☐
Indicate by check mark whether the registrant has submitted electronically, if any, every Interactive Data File required to be submitted pursuant to Rule 405 of Regulation S-T (§232.405 of this chapter) during the preceding 12 months (or for such shorter period that the registrant was required to submit such files.)
Yes þ No ☐
Indicate by check mark whether the registrant is a large accelerated filer, an accelerated filer, a non-accelerated filer or an emerging growth company. See definition of “accelerated filer,” “large accelerated filer,” and “emerging growth company” in Rule 12b-2 of the Exchange Act. (Check one):
Large accelerated filer þ |
Accelerated filer ☐ |
Non-accelerated filer ☐ |
Emerging growth company ☐ |
If an emerging growth company that prepares its financial statements in accordance with U.S. GAAP, indicate by check mark if the registrant has elected not to use the extended transition period for complying with any new or revised financial accounting standards† provided pursuant to Section 13(a) of the Exchange Act.
†The term “new or revised financial accounting standard” refers to any update issued by the Financial Accounting Standards Board to its Accounting Standards Codification after April 5, 2012.
Indicate by check mark whether the registrant has filed a report on and attestation to its management’s assessment of the effectiveness of its internal control over financial reporting under Section 404(b) of the Sarbanes-Oxley Act (15 U.S.C. 7262 (b)) by the registered public accounting firm that prepared or issued its audit report ☑
If securities are registered pursuant to Section 12(b) of the Act, indicate by check mark whether the financial statements of the registrant included in the filing reflect the correction of an error to previously issued financial statements. ☐
Indicate by check mark whether any of those error corrections are restatements that required a recovery analysis of incentive-based compensation received by any of the registrant’s executive officers during the relevant recovery period pursuant to §240.10D-1(b). ☐
Indicate by check mark which basis of accounting the registrant has used to prepare the financial statements included in this filing:
U.S. GAAP ☐ International Financial Reporting Standards as issued by the International Accounting Standards Board ☑ Other ☐
If “Other” has been checked in response to the previous question, indicate by check mark which financial statement item the registrant has elected to follow.
Item 17 ☐ Item 18 ☐
If this is an annual report, indicate by check mark whether the registrant is a shell company (as defined in Rule 12b-2 of the Exchange Act).
Yes ☐ No þ
* |
Listed not for trading or quotation purposes, but only in connection with the registration of American Depositary Shares representing such ordinary shares pursuant to the requirements of the Securities and Exchange Commission. |
** |
Including 61,275,176 treasury shares. |
|
6 |
|
|
6 |
|
|
7 |
|
|
|
|
|
15 |
|
ITEM 1. IDENTITY OF DIRECTORS, SENIOR MANAGEMENT AND ADVISERS |
|
15 |
|
15 |
|
|
15 |
|
|
15 |
|
|
15 |
|
|
17 |
|
|
22 |
|
|
23 |
|
|
30 |
|
|
30 |
|
|
33 |
|
|
39 |
|
|
46 |
|
|
46 |
|
|
47 |
|
|
48 |
|
|
51 |
|
|
63 |
|
|
63 |
|
|
67 |
|
|
67 |
|
|
68 |
|
|
72 |
|
|
74 |
|
|
101 |
|
|
102 |
|
|
103 |
|
|
103 |
|
|
103 |
|
|
104 |
|
|
105 |
4
5
Introduction
SAP SE is a European Company (Societas Europaea, or “SE”) and is referred to in this report, together with its subsidiaries, as SAP, or as “Company,” “Group,” “we,” “our,” or “us.”
In this report: (i) references to “US$,” “$,” or “dollars” are to U.S. dollars; (ii) references to “€” or “euro” are to the euro. Our financial statements are denominated in euros, which is the currency of our home country, Germany. Certain amounts that appear in this report may not add up because of differences due to rounding. All numbers in SAP’s Consolidated Financial Statements IFRS are presented according to IFRS 5 (unless otherwise noted, figures are based on continuing operations). For more information, see Note D.1.
Unless otherwise specified herein, euro financial data have been converted into dollars at the noon buying rate in New York City for cable transfers in foreign currencies as certified for customs purposes by the Federal Reserve Bank of New York (the “Noon Buying Rate”) on December 31, 2023, which was 1.1062 EUR/USD. No representation is made that such euro amounts actually represent such dollar amounts or that such euro amounts could have been or can be converted into dollars at that or any other exchange rate on such date or on any other date. On February 9, 2024, the Noon Buying Rate for converting euro to dollars was US$1.0782 per €1.00.
Unless the context otherwise requires, references in this report to ordinary shares are to SAP SE’s ordinary shares, without nominal value. References in this report to “ADRs” are to SAP SE’s American Depositary Receipts, each representing one SAP ordinary share. References in this report to “ADSs” are to SAP SE’s American Depositary Shares, which are the deposited securities evidenced by the ADRs.
SAP, Adaptive Server, Advantage Database Server, BusinessObjects, ExpenseIt, LeanIX, PartnerEdge, PowerBuilder, PowerDesigner, Replication Server, SAP Ariba, SAP BusinessObjects Explorer, SAP BW/4HANA, SAP Concur, SAP EarlyWatch, SAP Fieldglass, SAP Fiori, SAP HANA, SAP Jam, SAP Lumira, SAP S/4HANA, SAP SuccessFactors, SAP Vora, Sapphire, SAP Signavio, SQL Anywhere, Taulia, The Best Run SAP, TripIt, TripLink, Web Intelligence and other SAP products and services mentioned herein as well as their respective logos are trademarks or registered trademarks of SAP SE (or an SAP affiliate company) in Germany and other countries.
Throughout this report, whenever a reference is made to our website, such reference does not incorporate by reference into this report the information contained on our website.
We intend to make this report and other periodic reports publicly available on our website (www.sap.com) without charge immediately following our filing with the U.S. Securities and Exchange Commission (SEC). Such reports are also available on the website maintained by the SEC (www.sec.gov). We assume no obligation to update or revise any part of this report, whether as a result of new information, future events or otherwise, unless we are required to do so by law.
Forward-Looking Statements
This report contains forward-looking statements and information based on the beliefs of, and assumptions made by, our management using information currently available to them. Any statements contained in this report that are not historical facts are forward-looking statements as defined in the U.S. Private Securities Litigation Reform Act of 1995. We have based these forward-looking statements on our current expectations, assumptions, and projections about future conditions and events. As a result, our forward-looking statements and information are subject to uncertainties and risks. A broad range of uncertainties and risks, many of which are beyond our control, could cause our actual results and performance to differ materially from any projections expressed in or implied by our forward-looking statements. The uncertainties and risks include, but are not limited to:
- |
Cybersecurity and Security: Cybersecurity attacks or breaches, and security vulnerabilities in our infrastructure or services or those of our third-party partners could materially impact our business operations, products and service delivery. |
- Technology and Products: Our technology and products may experience undetected defects, coding, or configuration errors, may not integrate as expected, or may not meet customer expectations.
- |
Ethical Behavior: Our global business exposes us to risks related to unethical behavior and non-compliance with policies by employees, other individuals, partners, third parties or entities associated with SAP. |
- International Laws and Regulations: Laws, regulatory requirements and standards in Germany, the United States, and elsewhere continue to be very stringent. Our international business activities and processes expose us to numerous and often conflicting laws and regulations, policies, standards, or other requirements and sometimes even conflicting regulatory requirements.
- |
Market Share and Profit: Our market share and profit could decline due to increased competition, market consolidation, technological innovation, and new business models in the software industry. |
- Global Economic and Political Environment: Uncertainty in the global economy and/or, financial markets, and social and political instability caused by state-based conflicts, terrorist attacks, civil unrest, war, or international hostilities could lead to disruptions in our business.
- Data Protection and Privacy: Non-compliance with increasingly complex and stringent, sometimes even conflicting, applicable data protection and privacy laws or failure to adequately meet the contractual requirements of SAP’s customers with respect to our products and services could lead to civil liabilities and fines, as well as loss of customers.
- |
Cloud Operations: We may not be able to properly protect and safeguard our critical information and assets, business operations, cloud offerings and portfolio presentation, and related infrastructure against cyberattacks, insufficient infrastructure, disruption or deficient performance |
- Innovation: We might not be able to compete effectively if we strategize our solution portfolio ineffectively or if we are unable to keep up with rapid technological and product innovations, enhancements, new business models, and changing market expectations.
6
- Sales and Services: Sales and implementation of SAP software and services, including cloud, are subject to several significant risks sometimes beyond our direct control.
- |
Mergers and Acquisitions: We might not acquire, integrate and divest companies effectively or successfully. |
- |
Legal and IP: Claims and lawsuits against us, such as for IP infringements, or our inability to obtain or maintain adequate licenses for third-party technology, or if we are unable to adequately protect or enforce our own intellectual property, may result in adverse outcomes. |
- Partner Ecosystem: If we are unable to scale, maintain, and enhance an effective partner ecosystem, revenue might not increase as expected.
We describe these and other risks and uncertainties in the Risk Factors section.
If one or more of these uncertainties or risks materializes, or if management’s underlying assumptions prove incorrect, our actual results could differ materially from those described in or inferred from our forward-looking statements and information.
The words “aim,” “anticipate,” “assume,” “believe,” “continue,” “could,” “counting on,” “is confident,” “development,” “estimate,” “expect,” “forecast,” “future trends,” “guidance,” “intend,” “may,” “might,” “outlook,” “plan,” “predict,” “project,” “seek,” “should,” “strategy,” “want,” “will,” “would,” and similar expressions as they relate to us are intended to identify such forward-looking statements. Such statements include, for example, those made in the Operating Results subsection; our quantitative and qualitative disclosures about market risk pursuant to the International Financial Reporting Standards (IFRS), namely IFRS 7 and related statements in our Notes to the Consolidated Financial Statements; Expected Developments and Risk Factors sections; and other forward-looking information appearing in other parts of this report.
To fully consider the factors that could affect our future financial results, both this report and our Integrated Report should be considered, as well as all of our other filings with the U.S. Securities and Exchange Commission (SEC). Readers are cautioned not to place undue reliance on these forward-looking statements, which speak only as of the date specified or the date of this report. We undertake no obligation to publicly update or revise any forward-looking statements as a result of new information that we receive about conditions that existed upon issuance of this report, future events, or otherwise, unless we are required to do so by law.
This report includes statistical data about the IT industry and global economic trends that comes from information published by sources including International Data Corporation (IDC), Gartner, the European Central Bank (ECB), and the International Monetary Fund (IMF). This type of data represents only the estimates of IDC, Gartner, the ECB, the IMF, and other sources of industry data. SAP does not adopt or endorse any of the statistical information provided by sources such as IDC, Gartner, the ECB, the IMF, or other similar sources that is contained in this report. The data from these sources is subject to risks and uncertainties, and subject to change based on various factors, including those described above, in the Risk Factors section, and elsewhere in this report. These and other factors could cause our results to differ materially from those expressed in the estimates made by third parties and SAP. We caution readers not to place undue reliance on this data.
Performance Management System1
In the reporting year, we used various performance measures to manage our performance with regard to our primary financial objectives, which are growth and profitability, and our primary non-financial objectives, which are customer loyalty, employee engagement, and carbon impact. We view growth and profitability as indicators of our current performance, while we see customer loyalty, employee engagement, and carbon impact as indicators of our future performance.
Measures to Manage Our Financial Performance
Measures to Manage Our Operating Financial Performance
In the reporting year, we used cloud revenue, cloud and software revenue, share of more predictable revenue, current cloud backlog, and operating profit (non-IFRS) as our key measures to manage our operating financial performance. In addition to these, we used several supporting measures to provide further insight into our financial performance:
Cloud revenue: This revenue driver comprises the main revenues of our cloud business. Revenue from cloud is derived from fees earned from providing customers with software as a service (SaaS), platform as a service (PaaS), and infrastructure as a service (IaaS). We measure cloud revenue at actual and constant currencies.
For more information about the composition of cloud revenue, and for a description of these services, see the Notes to the Consolidated Financial Statements, Note (A.1).
1 Unless otherwise stated, all performance measures are based on our continuing operations.
7
Cloud and software revenue: We use cloud and software revenue expressed in both actual currencies and constant currencies to measure our product growth. Our cloud and software revenue includes cloud revenue plus software license revenue and software support revenue. Cloud revenue and software support revenue are our two largest revenue streams. Customers that purchase software licenses also enter into related support contracts that generate recurring support revenue after the software sale.
SAP S/4HANA Cloud revenue: We used SAP S/4HANA Cloud revenue expressed in both actual currencies and constant currencies as an additional metric to measure our cloud core ERP growth. SAP offers a choice of SAP S/4HANA Cloud deployments – as a public cloud or private cloud SaaS offering.
Starting in 2024, SAP S/4HANA Cloud revenue will be replaced by the Cloud ERP Suite revenue metric.
Cloud ERP Suite revenue: We use Cloud ERP Suite revenue expressed in both actual currencies and constant currencies as a metric to measure the growth of our portfolio of strategic cloud solutions. Cloud ERP Suite references those offerings that are tightly integrated with our core ERP solutions and are included in key commercial packages, such as RISE with SAP. The following offerings currently contribute to Cloud ERP Suite revenue: SAP S/4HANA Cloud, SAP Business Technology Platform, and core solutions for HR and payroll, spend management, commerce, customer data solutions, business process transformation, and working capital management.
Total revenue: We use total revenue to measure our growth at both actual currencies and constant currencies.
Share of more predictable revenue: We use share of more predictable revenue as a measure to provide additional insight into our sustained business success. The total of cloud revenue and support revenue divided by total revenue is the share of more predictable revenue.
Cloud backlog: We use the following measures, in both actual and at constant currencies, to measure our forward-looking cloud performance:
– |
Total cloud backlog (TCB) |
– |
Current cloud backlog (CCB) |
– |
SAP S/4HANA CCB (to be discontinued in 2024) |
As of a specific key date, the TCB is the total contractually committed cloud revenue we expect to recognize and the CCB is the contractually committed cloud revenue we expect to recognize over the upcoming 12 months. Thus, they are subcomponents of our overall remaining performance obligations following IFRS 15.120. For our committed cloud business, we believe the TCB and the CCB are valuable indicators of our go-to-market success, as they reflect both new contracts won and existing contracts renewed. For more information on how we calculate these numbers, see the Notes to the Consolidated Financial Statements, Note (A.1).
As an additional metric, we used SAP S/4HANA CCB to measure the contractually committed cloud core ERP revenue we expect to recognize over the upcoming 12 months as of a specific key date. Starting in 2024, we will no longer disclose SAP S/4HANA CCB.
Cloud gross profit (non-IFRS): We use cloud gross profit (non-IFRS) expressed in both actual currencies and constant currencies to measure the process efficiency and performance of our cloud business.
Operating profit (non-IFRS): We use operating profit (non-IFRS) expressed in both actual currencies and constant currencies to measure our overall operational process efficiency and overall business performance.
Cloud gross margin (non-IFRS): We use our cloud gross margin (non-IFRS) to measure our process efficiency in our cloud business. Cloud gross margin (non-IFRS) is the ratio of our cloud gross profit (non-IFRS) to cloud revenue, expressed as a percentage.
Operating margin (non-IFRS): We use operating margin (non-IFRS) to measure our overall operational process efficiency. Operating margin (non-IFRS) is the ratio of our operating profit (non-IFRS) to total revenue, expressed as a percentage.
Measures to Manage Our Non-Operating Financial Performance
We used the following supporting measure to provide insight into our non-operating financial performance:
Financial income, net (IFRS and non-IFRS): This measure provides insight into the return on liquid assets and capital investments, and the cost of borrowed funds. To manage our financial income, net, we focus on cash flow, the composition of our liquid assets and capital investment portfolio, and the average rate of interest at which liquid assets and capital investments are invested. We also monitor average outstanding borrowings and associated finance costs.
Measures to Manage Overall Financial Performance
We used free cash flow as the key measure to manage our overall financial performance. In addition to that, we used several supporting measures to provide further insight into our overall financial performance:
Earnings per share (EPS) (IFRS and non-IFRS)2: EPS (basic and diluted) measures our overall performance because it captures all operating and non-operating elements of profit as well as income tax expense. It represents the portion of profit after tax attributable to equity holders of SAP SE allocable to each SAP share outstanding. EPS is influenced not only by our operating and non-operating business and income taxes but also by the number of shares outstanding.
2 We report earnings per share for our continuing operations, and total earnings per share for our continuing and discontinued operations.
8
Effective tax rate (IFRS and non-IFRS): We define our effective tax rate as the ratio of income tax expense to profit before tax, expressed as a percentage.
Operating, investing, and financing cash flows and free cash flow: Our consolidated statements of cash flows provide insight into how we generated and used cash and cash equivalents. When applied in conjunction with the other primary financial statements, it provides information that helps us evaluate the changes in our net assets, our financial structure (including our liquidity and solvency), and our ability to affect the amounts and timing of cash flows to adapt to changing circumstances and opportunities. We use our free cash flow measure to determine the cash flow remaining after all expenditures required to maintain or expand our organic business have been paid off. This measure provides management with supplemental information to assess our liquidity needs. We calculate free cash flow as net cash from operating activities minus purchases (other than purchases made in connection with business combinations) of intangible assets and property, plant, and equipment, as well as payments of lease liabilities.
Measures to Manage Our Non-Financial Performance
In the reporting year, we used the Customer Net Promoter Score (NPS), Employee Engagement Index, and net carbon emissions as our key measures to manage our non-financial performance. In addition to these, we used the Leadership Trust NPS as a supporting measure to provide further insight into our non-financial performance:
Customer NPS: The annual assessment of customer loyalty is based on a survey that includes the Customer NPS metric. The Customer NPS score is calculated based on the “Likelihood to Recommend” question with its proprietary scoring, identified on a scale of 0–10. We use this measure because we believe that we can only achieve our financial goals when our customers are loyal to, and satisfied with, SAP and our solutions. To derive the Customer NPS, we start with the percentage of “promoters” of SAP, that is, those giving us a score of 9 or 10 on a scale of 0–10. We then subtract the percentage of “detractors,” that is, those giving us a score of 0–6. The method ignores “passives,” that is, those giving us a score of 7 or 8. Consequently, the range of achievable scores is –100 to +100, with the latter being the best achievable score for customer loyalty as measured by the Customer NPS methodology. Starting in 2023, we made adjustments to the survey to further improve data quality and to align the sample more closely with SAP’s business priorities. We have excluded incomplete responses and responses from respondents who report that they have no influence over purchasing decisions, and we have restricted the number of eligible responses from Concur.
We determine the Employee Engagement Index and the Leadership Trust NPS as the average of the scores retrieved in each of the surveys we run within a fiscal year. Our engagement survey program “#Unfiltered” runs according to a “continuously listening” approach that includes multiple data collections throughout the year. The average scores provide an assessment, for the full year, of our employees’ engagement and trust level.
We measure both the Employee Engagement Index and the Leadership Trust NPS to get insights on the following:
– |
Employee Engagement Index: We use this index to measure the satisfaction and commitment of our employees, how proud they are of our company, and how strongly they identify with SAP. Applying this measure is recognition that our growth strategy depends on engaged employees. The index is measured as a percentage of favorable responses using five questions from our #Unfiltered engagement survey program. |
– |
Leadership Trust NPS: We use this score to further enhance accountability and to measure our collective effort to foster a work environment based on trust. It is derived from a question in our surveys that gauges employees’ trust in our leaders. Based on the Customer NPS methodology, the Leadership Trust NPS is calculated as a percentage of “promoters” (a score of 9 or 10 on a 10-point scale) minus the percentage of “detractors” (a score of 1 through 6). The method ignores “passives” (a score of 7 or 8). Consequently, the value range of the NPS is –100 to +100, with the latter being the best achievable score. |
Women in Executive Roles (WiER): Starting in 2024, we will use this KPI to measure the ratio of women to all genders in the three executive levels below the SAP Executive Board, namely the Global Executive Team, the Senior Executive Team, and the Executive Team.
SAP is dedicated to promoting gender equality in the workplace and is working toward achieving gender balance at all levels of the organization.
Our priority, with the help of this KPI, is to monitor how the Company is progressing on this commitment, especially at the most senior levels of the organization.
Greenhouse gas emissions: We use the following metrics to measure our progress toward our ambitious short-term and long-term climate targets (in kilotons of CO2 equivalents, rounded to the nearest kiloton). We define, measure, and report our greenhouse gas emissions according to the Greenhouse Gas (GHG) Protocol.
– |
Net carbon emissions: We used this metric to measure our progress toward our ambition to become carbon neutral in our own operations by 2023. The net carbon emissions (scope 1, scope 2, and selected scope 3 emissions) are calculated by deducting self-produced renewable energy, renewable energy certificates, and carbon offsets from our gross carbon emissions. The net carbon emissions metric will be discontinued from 2024 and replaced by the Gross greenhouse gas emissions metric. |
– |
Gross greenhouse gas emissions: Starting in 2024, we will use this metric to measure greenhouse gas emissions along the value chain (scope 1, scope 2, and scope 3 emissions relevant for SAP’s business model) as part of our Net Zero by 2030 commitment. We apply a market-based approach. Renewable energies, for example in the form of self-generated renewable electricity, investments in certified renewable energy certificates, long-term green electricity contracts (power purchase agreements), or renewable electricity purchased by our suppliers and customers can be counted toward the reduction of greenhouse gas emissions. |
9
Value-Based Management
Our holistic view of the performance measures described above, and the associated analyses, are together the foundation of our value-based management. We use planning and control processes to manage the compilation of these key measures and their availability to our decision-makers across various management levels.
SAP’s long-term strategic plans are the point of reference for our short- and medium-term planning and controlling processes. We initially identify future growth and profitability drivers at a highly aggregated level for the entire SAP Group. In a first step, the financial plan’s growth ambition is determined by its comprehensive product portfolio which is grouped into solution areas, with profitability drivers allocated to functions such as development, marketing, sales, delivery, and administration. In a second step, the planned total revenues and total expenses are generally allocated to the operating segments and the areas of functional responsibility of the individual members of the Executive Board (“Board area”). If a Board area represents not only a functional department but also has responsibility for operating segments within this Board area, the allocation is done at the lower segment level. Budget adjustments may be applied during the year to reflect changes in priorities, to achieve efficiency targets, and to reflect endogenous and exogenous factors. Such budget adjustments, and the assessment of performance, are handled at Board area level if the Board area is part of a segment, or at segment level if the Board area comprises several segments. It is then the individual Executive Board member’s responsibility to break down the allocated budget adjustments within the segment budget boundary. Based on an integrated portfolio process running in parallel to the budgeting process, we ensure aligned investment behavior across Board areas with regard to specific solution and/or subsolution areas. In a final step, customer-facing revenue targets and cost-of-sales and marketing targets are broken down into sales regions and market units.
Based on our detailed annual plans, we determine the budget for the respective fiscal year. We also have processes in place to forecast revenue and profit on a quarterly basis, to quantify whether we expect to realize our financial targets, and to identify any deviations from plan. We continuously monitor the affected operating segments and Board areas in the SAP Group to analyze their developments and define any appropriate actions. Our entire network of planning, control, and reporting processes is implemented in integrated planning and information systems, based on SAP software, across all organizational units so that we can conduct the evaluations and analyses needed to make informed decisions.
Non-IFRS Financial Measures Cited in This Report
Explanation of Non-IFRS Measures
We disclose certain financial measures that are not prepared in accordance with IFRS and are therefore considered non-IFRS financial measures. Our non-IFRS financial measures may not correspond to non-IFRS financial measures that other companies report. The non-IFRS financial measures that we report should only be considered in addition to, and not as substitutes for, nor as superior to, our IFRS financial measures.
We believe that the disclosed supplemental historical and prospective non-IFRS financial information provides useful information to investors, because management uses this information, in addition to financial data prepared in accordance with IFRS, to attain a more transparent understanding of our past performance and our anticipated future results.
We use these non-IFRS measures consistently in our internal planning and forecasting, reporting, and compensation, as well as in our external communications, as follows:
- Our management primarily uses these non-IFRS measures rather than IFRS measures as the basis for making financial, strategic, and operating decisions.
- |
The variable components of our Executive Board members’ and employees’ remuneration are based on non-IFRS numbers such as operating profit (non-IFRS) and operating margin (non-IFRS) rather than the respective IFRS measures. An additional variable component used is CCB. In September 2023, the SAP Supervisory Board decided that although expenses and corresponding releases for provisions for regulatory compliance matters are eliminated from operating profit (non-IFRS), they will affect the compensation paid to Executive Board members from fiscal year 2025 onward. This amendment does not apply to 2023 or 2024, to ensure that the Executive Board members’ current compensation is not affected by conduct that took place in performance periods prior to their appointment to the Executive Board. |
- The annual budgeting process for all management units is based on operating profit (non-IFRS) numbers rather than the respective IFRS financial measure.
- All forecast and performance reviews with all senior managers globally are based on these non-IFRS measures, rather than the respective IFRS financial measures.
- Both our internal performance targets and the guidance we provide to the capital markets are based on profit (non-IFRS) measures rather than the respective IFRS financial measures.
Our non-IFRS financial measures reflect adjustments based on the items below, as well as adjustments for the related income tax effects.
Operating Expense (Non-IFRS)
Numbers that are identified as operating expenses (non-IFRS) have been adjusted by excluding the following expenses:
- Acquisition-related charges
| ■ | Amortization expense/impairment charges for intangibles acquired in business combinations, including goodwill, and certain stand-alone acquisitions of intellectual property (including purchased in-process research and development) as well as sale/disposal gains and losses for these intangibles |
| ■ | Settlements of preexisting business relationships in connection with a business combination |
10
| ■ | Acquisition-related third-party expenses |
- Share-based payment expenses (applicable only until 2023)
- Restructuring expenses in accordance with IFRS
- Expenses for regulatory compliance matters associated with the provision for (potential) penalties arising from certain ongoing governmental investigations into our business operations, which are described in the Notes to the Consolidated Financial Statements 2023, Note (G.3), and are limited to the scope of IAS 37.
We exclude certain acquisition-related expenses for the purpose of calculating operating profit (non-IFRS) and operating margin (non-IFRS) when evaluating SAP’s continuing operational performance, because these expenses generally cannot be changed or influenced by management after the relevant acquisition other than by disposing of the acquired assets. Since management at levels below the Executive Board does not influence these expenses, we generally do not consider these expenses for the purpose of evaluating the performance of management units. For similar reasons, until 2023 we excluded share-based payment expenses, as these costs are impacted by share price developments and other factors beyond our control. We also exclude restructuring expenses because they are volatile and generally cannot be influenced by management at levels below the Executive Board. We exclude expenses related to regulatory compliance matters, as these expenses are non-recurring and relate to conduct that took place in prior performance periods, and so that users of our consolidated financial statements and the combined management report can see the information that our management uses to manage the business.
In recent years, SAP has replaced many of its cash-settled share-based compensation plans with equity-settled plans. Having most of these plans as equity-settled reduces the impact of share price fluctuations and of other factors outside of our control. For these reasons, SAP has decided that, from 2024, it will no longer exclude share-based payment expenses from its operating profit (non-IFRS).
Financial Income, Net (Non-IFRS)
Starting in 2024, numbers that are identified as financial income, net (non-IFRS) will be adjusted by excluding the following gains and losses:
–Gains and losses from equity securities, net
| ■ | Includes realized and unrealized effects from the disposal of equity securities, ongoing mark-to-market adjustments on marketable equity investments, changes in fair value of non-marketable equity securities, and others. |
We will exclude gains and losses from equity securities, net, for the purpose of increasing comparability period over period, by reducing volatility caused by share price fluctuation, market developments, and other factors beyond our control.
Constant Currencies Information
We believe it is important for investors to have information that provides insight into the development of our sales. Revenue measures determined under IFRS provide information that is useful in this regard. However, both sales volume and currency effects impact period-over-period changes in sales revenue. We do not sell standardized units of products and services so we cannot provide relevant information on sales volume by providing data on the changes in product and service units sold. To provide additional information that may be useful to investors in breaking down and evaluating changes in sales volume, we present information about our revenue and various values and components relating to operating profit that are adjusted for foreign currency effects. We calculate constant currency measures by translating foreign currencies using the average exchange rates from the comparative period instead of the current period. Constant currency measures on CCB use the closing exchange rate from the previous year’s corresponding key date instead of the average exchange rate.
Free Cash Flow
Among other measures, we use free cash flow to manage our overall financial performance. We define free cash flow as net cash from operating activities minus purchases of intangible assets and property, plant and equipment, and payments of lease liabilities.
Reconciliation of Operating Cash Flow from Continuing Operations to Free Cash Flow
€ millions |
|
2023 |
|
2022 |
|
∆ in% |
Net cash flows from operating activities – continuing operations |
|
6,210 |
|
5,675 |
|
9 |
Purchase of intangible assets and property, plant, and equipment |
|
-785 |
|
-877 |
|
-11 |
Payments of lease liabilities |
|
-332 |
|
-410 |
|
-19 |
Free cash flow |
|
5,093 |
|
4,388 |
|
16 |
Usefulness of Non-IFRS Measures
We believe that our non-IFRS measures are useful to investors for the following reasons:
- Our expense (non-IFRS), and profit (non-IFRS) measures, along with the CCB measure (see above), provide investors with insight into management’s decision-making because management uses these measures to run our business and make financial, strategic, and operating decisions.We exclude the expense adjustments outlined above when making decisions to allocate resources. In addition, we use these non-IFRS measures to facilitate comparisons of SAP’s operating performance from period to period.
11
- The non-IFRS measures provide investors with additional information that enables a comparison of year-over-year operating performance by eliminating certain direct effects of acquisitions, share-based compensation plans, restructuring plans, and regulatory compliance matters.
- Non-IFRS and non-GAAP (Generally Accepted Accounting Principles) measures are widely used in the software industry. In many cases, inclusion of our non-IFRS measures may facilitate comparison with our competitors’ corresponding non-IFRS and non-GAAP measures.
Limitations of Non-IFRS Measures
Without being analyzed in conjunction with the corresponding IFRS measures, the non-IFRS measures are not indicative of our present and future performance primarily for the following reasons:
| - | While our profit (non-IFRS) numbers reflect the elimination of certain acquisition-related expenses, no eliminations are made for the additional revenue or other income that results from the acquisitions. |
| - | The acquisition-related amortization expense that we eliminate in deriving our profit (non-IFRS) numbers is a recurring expense that will impact our financial performance in future years. |
| - | The remaining acquisition-related charges that we eliminate in deriving our profit (non-IFRS) numbers are likely to recur should SAP enter into business combinations in the future. Similarly, the restructuring expenses that we eliminate in deriving our profit (non-IFRS) numbers are likely to recur should SAP perform restructurings in the future. |
| - | The expense adjustment for acquisition-related charges does not arise from a common conceptual basis. This is because the expense adjustment aims to improve the comparability between post-acquisition periods and pre-acquisition periods. This should particularly be considered when evaluating our operating profit (non-IFRS) and operating margin (non-IFRS) numbers, as these combine our revenue and expenses (non-IFRS) despite the absence of a common conceptual basis. |
| - | Our restructuring charges resulted in significant cash outflows in the past and could do so in the future. |
| - | In the past, we have issued share-based payment awards to our employees every year and we intend to continue doing so in the future. Thus, our share-based payment expenses are recurring, although the amounts usually change from period to period. |
| - | Expenses ascribed to the regulatory compliance matters may include penalties and legal costs, all of which would impact the operating cash flows of the business. |
We believe that constant currency measures have limitations, particularly as the currency effects that are eliminated constitute a significant element of our revenue and expenses and could materially impact our performance. Therefore, we limit our use of constant currency measures to the analysis of changes in volume as one element of the full change in a financial measure. We do not evaluate our results and performance without considering operating profit (non-IFRS) at both nominal and constant currencies on the one hand, and changes in operating expenses, operating profit, or other measures of financial performance prepared in accordance with IFRS on the other. We caution the readers of our financial reports to follow a similar approach by considering actual and constant currency non-IFRS measures only in addition to, and not as a substitute for or superior to, changes in revenue, operating expenses, operating profit, or other measures of financial performance prepared in accordance with IFRS.
Despite these limitations, we believe that the presentation of our non-IFRS measures and the corresponding IFRS measures, together with the relevant reconciliations, provide useful information to management and investors regarding present and future business trends relating to our financial condition and results of operations.
Reconciliation of IFRS to Non-IFRS Financial Measures for 2023 and 2022
Reconciliation of Non-IFRS Revenue
€ millions, unless otherwise stated |
|
2023 |
|
2022 |
||||
|
|
IFRS |
|
Currency |
|
Non-IFRS |
|
IFRS |
|
|
|
|
Impact |
|
Constant |
|
|
|
|
|
|
|
|
Currency |
|
|
Revenue Numbers |
|
|
|
|
|
|
|
|
Cloud |
|
13,664 |
|
394 |
|
14,058 |
|
11,426 |
Software licenses |
|
1,764 |
|
37 |
|
1,801 |
|
2,056 |
Software support |
|
11,496 |
|
286 |
|
11,782 |
|
11,909 |
Software licenses and support |
|
13,261 |
|
323 |
|
13,584 |
|
13,965 |
Cloud and software |
|
26,924 |
|
717 |
|
27,641 |
|
25,391 |
Services |
|
4,283 |
|
109 |
|
4,392 |
|
4,128 |
Total revenue |
|
31,207 |
|
826 |
|
32,033 |
|
29,520 |
12
Reconciliation of Non-IFRS Operating Expenses
€ millions, unless otherwise stated |
|
2023 |
|
2022 |
||||||||||||
|
|
IFRS |
|
Adj. |
|
Non-IFRS |
|
Currency |
|
Non-IFRS |
|
IFRS |
|
Adj. |
|
Non-IFRS |
|
|
|
|
|
|
|
|
Impact |
|
Constant |
|
|
|
|
|
|
Operating Expense Numbers |
|
|
|
|
|
|
|
|
|
Currency |
|
|
|
|
|
|
Cost of cloud |
|
-3,884 |
|
135 |
|
-3,749 |
|
|
|
|
|
-3,499 |
|
108 |
|
-3,391 |
Cost of software licenses and support |
|
-1,383 |
|
64 |
|
-1,318 |
|
|
|
|
|
-1,384 |
|
82 |
|
-1,302 |
Cost of cloud and software |
|
-5,267 |
|
200 |
|
-5,067 |
|
|
|
|
|
-4,883 |
|
190 |
|
-4,694 |
Cost of services |
|
-3,407 |
|
378 |
|
-3,029 |
|
|
|
|
|
-3,155 |
|
250 |
|
-2,904 |
Total cost of revenue |
|
-8,674 |
|
577 |
|
-8,096 |
|
|
|
|
|
-8,038 |
|
440 |
|
-7,598 |
Gross profit |
|
22,534 |
|
577 |
|
23,111 |
|
|
|
|
|
21,482 |
|
440 |
|
21,922 |
Research and development |
|
-6,324 |
|
711 |
|
-5,613 |
|
|
|
|
|
-6,080 |
|
451 |
|
-5,629 |
Sales and marketing |
|
-8,828 |
|
1,246 |
|
-7,581 |
|
|
|
|
|
-7,946 |
|
789 |
|
-7,157 |
General and administration |
|
-1,364 |
|
186 |
|
-1,178 |
|
|
|
|
|
-1,289 |
|
146 |
|
-1,143 |
Restructuring |
|
-215 |
|
215 |
|
0 |
|
|
|
|
|
-138 |
|
138 |
|
0 |
Other operating income/expense, net |
|
-16 |
|
0 |
|
-16 |
|
|
|
|
|
60 |
|
-65 |
|
-5 |
Total operating expenses |
|
-25,420 |
|
2,935 |
|
-22,485 |
|
-504 |
|
-22,989 |
|
-23,429 |
|
1,898 |
|
-21,531 |
Reconciliation of Non-IFRS Profit Numbers, Income Tax, and Key Ratios
€ millions, unless otherwise stated |
|
2023 |
|
2022 |
||||||||||||
|
|
IFRS |
|
Adj. |
|
Non-IFRS |
|
Currency |
|
Non-IFRS |
|
IFRS |
|
Adj. |
|
Non-IFRS |
|
|
|
|
|
|
|
|
Impact |
|
Constant |
|
|
|
|
|
|
Profit Numbers |
|
|
|
|
|
|
|
|
|
Currency |
|
|
|
|
|
|
Operating profit (loss) |
|
5,787 |
|
2,935 |
|
8,722 |
|
322 |
|
9,044 |
|
6,090 |
|
1,898 |
|
7,989 |
Profit (loss) before tax from continuing operations |
|
5,341 |
|
2,935 |
|
8,276 |
|
|
|
|
|
4,513 |
|
1,898 |
|
6,412 |
Income tax expense |
|
-1,741 |
|
-685 |
|
-2,426 |
|
|
|
|
|
-1,446 |
|
-450 |
|
-1,895 |
Profit (loss) after tax from continuing operations |
|
3,600 |
|
2,250 |
|
5,850 |
|
|
|
|
|
3,068 |
|
1,449 |
|
4,517 |
Attributable to owners of parent |
|
3,634 |
|
2,246 |
|
5,880 |
|
|
|
|
|
3,277 |
|
1,442 |
|
4,719 |
Attributable to non-controlling interests |
|
-33 |
|
4 |
|
-29 |
|
|
|
|
|
-210 |
|
7 |
|
-202 |
Profit (loss) after tax1 |
|
5,964 |
|
2,032 |
|
7,995 |
|
|
|
|
|
1,708 |
|
2,837 |
|
4,545 |
Attributable to owners of parent1 |
|
6,139 |
|
2,093 |
|
8,232 |
|
|
|
|
|
2,284 |
|
2,489 |
|
4,773 |
Attributable to non-controlling interests1 |
|
-175 |
|
-62 |
|
-236 |
|
|
|
|
|
-576 |
|
348 |
|
-228 |
|
|
|
|
|
|
|
|
|
|
|
|
|
|
|
|
|
Key Ratios |
|
|
|
|
|
|
|
|
|
|
|
|
|
|
|
|
Operating margin (in %) |
|
18.5 |
|
|
|
28.0 |
|
|
|
28.2 |
|
20.6 |
|
|
|
27.1 |
Effective tax rate (in %) |
|
32.6 |
|
|
|
29.3 |
|
|
|
|
|
32.0 |
|
|
|
29.6 |
Earnings per share, basic (in €) from continuing operations |
|
3.11 |
|
|
|
5.04 |
|
|
|
|
|
2.80 |
|
|
|
4.03 |
Earnings per share, basic (in €)1 |
|
5.26 |
|
|
|
7.05 |
|
|
|
|
|
1.95 |
|
|
|
4.08 |
1 From continuing and discontinued operations
13
Non-IFRS Adjustments by Functional Areas
€ millions |
|
2023 |
|
2022 |
||||||||||||||||||||
|
|
IFRS |
|
Acquisition- |
|
SBP1 |
|
Restructuring |
|
RCM2 |
|
Non-IFRS |
|
IFRS |
|
Acquisition- |
|
SBP1 |
|
Restructuring |
|
RCM2 |
|
Non-IFRS |
|
|
|
|
Related |
|
|
|
|
|
|
|
|
|
|
|
Related |
|
|
|
|
|
|
|
|
Cost of cloud |
|
-3,884 |
|
42 |
|
94 |
|
0 |
|
0 |
|
-3,749 |
|
-3,499 |
|
54 |
|
53 |
|
0 |
|
0 |
|
-3,391 |
Cost of software licenses and support |
|
-1,383 |
|
26 |
|
38 |
|
0 |
|
0 |
|
-1,318 |
|
-1,384 |
|
34 |
|
48 |
|
0 |
|
0 |
|
-1,302 |
Cost of services |
|
-3,407 |
|
2 |
|
375 |
|
0 |
|
0 |
|
-3,029 |
|
-3,155 |
|
1 |
|
250 |
|
0 |
|
0 |
|
-2,904 |
Research and development |
|
-6,324 |
|
7 |
|
703 |
|
0 |
|
0 |
|
-5,613 |
|
-6,080 |
|
11 |
|
440 |
|
0 |
|
0 |
|
-5,629 |
Sales and marketing |
|
-8,828 |
|
257 |
|
834 |
|
0 |
|
155 |
|
-7,581 |
|
-7,946 |
|
286 |
|
503 |
|
0 |
|
0 |
|
-7,157 |
General and administration |
|
-1,364 |
|
11 |
|
175 |
|
0 |
|
0 |
|
-1,178 |
|
-1,289 |
|
9 |
|
137 |
|
0 |
|
0 |
|
-1,143 |
Restructuring |
|
-215 |
|
0 |
|
0 |
|
215 |
|
0 |
|
0 |
|
-138 |
|
0 |
|
0 |
|
138 |
|
0 |
|
0 |
Other operating income/expense, net |
|
-16 |
|
0 |
|
0 |
|
0 |
|
0 |
|
-16 |
|
60 |
|
-65 |
|
0 |
|
0 |
|
0 |
|
-5 |
Total operating expenses |
|
-25,420 |
|
345 |
|
2,220 |
|
215 |
|
155 |
|
-22,485 |
|
-23,429 |
|
330 |
|
1,431 |
|
138 |
|
0 |
|
-21,531 |
1 Share-based payments
2 Regulatory compliance matters
14
PART I
ITEM 1. IDENTITY OF DIRECTORS, SENIOR MANAGEMENT AND ADVISERS
Not applicable.
ITEM 2. OFFER STATISTICS AND EXPECTED TIMETABLE
Not applicable.
ITEM 3. KEY INFORMATION
Exchange Rates
The sales prices for our ordinary shares traded on German stock exchanges are denominated in euro. Fluctuations in the exchange rate between the euro and the U.S. dollar affect the dollar equivalent of the euro price of the ordinary shares traded on the German stock exchanges and, as a result, may affect the price of the ADRs traded on the New York Stock Exchange (NYSE) in the United States. See “Item 9. The Offer and Listing” for a description of the ADRs. In addition, SAP SE pays cash dividends, if any, in euro. As a result, any exchange rate fluctuations will also affect the dollar amounts received by the holders of ADRs on the conversion into dollars of cash dividends paid in euro on the ordinary shares represented by the ADRs. Deutsche Bank Trust Company Americas is the depositary (the Depositary) for SAP SE’s ADR program. The deposit agreement with respect to the ADRs requires the Depositary to convert any dividend payments from euro into dollars as promptly as practicable upon receipt. For additional information on the Depositary and the fees associated with SAP’s ADR program see “Item 12. Description of Securities Other Than Equity Securities — American Depositary Shares.”
For details on the impact of exchange rate fluctuations see “Item 5. Operating and Financial Review and Prospects — Foreign Currency Exchange Rate Exposure”.
Dividends
Dividend Distribution Policy
Dividends are jointly proposed by SAP SE’s Supervisory Board (Aufsichtsrat) and Executive Board (Vorstand) based on SAP SE’s year-end stand-alone statutory financial statements, subject to approval by the Annual General Meeting of Shareholders. Dividends are officially declared for the prior year at SAP SE’s Annual General Meeting of Shareholders. SAP SE’s Annual General Meeting of Shareholders usually convenes during the second quarter of each year. Following joint market standards in Europe for corporate actions processing, dividends are remitted to the custodian bank on behalf of the shareholders on the third business day following the Annual General Meeting of Shareholders. Record holders of the ADRs on the dividend record date will be entitled to receive payment of the dividend declared in respect of the year for which it is declared. Cash dividends payable to such holders will be paid to the Depositary in euro and, subject to certain exceptions, will be converted by the Depositary into U.S. dollars.
Dividends paid to holders of the ADRs may be subject to German withholding tax. See “Item 10. Additional Information — Taxation,” for further information.
15
Annual Dividends Paid and Proposed
The following table sets forth in euro the annual dividends paid or proposed to be paid per ordinary share in respect of each of the years indicated. One SAP ADR currently represents one SAP SE ordinary share. Accordingly, the final dividend per ADR is equal to the dividend for one SAP SE ordinary share and is dependent on the euro/U.S. dollar exchange rate. The table does not reflect tax credits that may be available to German taxpayers who receive dividend payments. If you own our ordinary shares or ADRs and if you are a U.S. resident, refer to “Item 10. Additional Information — Taxation,” for further information.
|
|
Dividend Paid per Ordinary Share |
|
||
Year Ended December 31, |
|
€ |
|
US$ |
|
2019 |
|
1.58 |
|
1.73 |
1 |
2020 |
|
1.85 |
|
2.26 |
1 |
2021 |
|
2.45 |
4 |
2.61 |
1 |
2022 |
|
2.05 |
|
2.23 |
1 |
2023 (proposed) |
|
2.20 |
2 |
2.37 |
2, 3 |
1 Translated for the convenience of the reader from euro into U.S. dollars at the Noon Buying Rate for converting euro into U.S. dollars on the dividend payment date. The Depositary is required to convert any dividend payments received from SAP as promptly as practicable upon receipt.
2 Subject to approval at the Annual General Meeting of Shareholders of SAP SE currently scheduled to be held on May 15, 2024.
3 Translated for the convenience of the reader from euro into U.S. dollars at the Noon Buying Rate for converting euro into U.S. dollars on February 9, 2024 of US$1.0782 per €1.00. The dividend paid may differ due to changes in the exchange rate.
4 Includes special increase of €0.50 to celebrate SAP's 50th anniversary.
The amount of dividends paid on the ordinary shares depends on the amount of profits to be distributed by SAP SE, which depends in part upon our financial performance. The Executive Board and the Supervisory Board of SAP SE will recommend to the Annual General Meeting of Shareholders in May 2024 that the total dividend be €2.20 per share. In addition, the amount of dividends received by holders of ADRs may be affected by fluctuations in exchange rates (see “Item 3. Key Information — Exchange Rates”). The timing, declaration, amount and payment of any future dividend will depend upon our future earnings, capital needs and other relevant factors, in each case as proposed by the Executive Board and the Supervisory Board of SAP SE and approved by the Annual General Meeting of Shareholders.
16
Risk Factors
Our operations and financial results are subject to various risks and uncertainties, including those described below, that could adversely affect our business, financial condition, results of operations, cash flows, and the trading price of our ADRs and ordinary shares.
Economic, Political, Social, and Regulatory Risks
Global Economic and Political Environment: Uncertainty in the global economy and/or financial markets, and social and political instability caused by state-based conflicts, terrorist attacks, civil unrest, war, or international hostilities could lead to disruptions in our business.
As a global company, we are influenced by multiple external factors that are difficult to predict, may develop quickly, and are beyond our influence and control. These include, among others: crises affecting credit or liquidity markets; regional or global recessions; sharp fluctuations in commodity prices, currency exchange rates or interest rates; inflation or deflation; sovereign debt and bank debt rating downgrades; restructurings or defaults; adverse geopolitical events (such as Russia’s invasion of Ukraine and the Israel - Hamas conflict); rising military tensions around the world (such as the China-Taiwan tensions) and in particular within Europe’s borders; global policy including in the United States, the European Union (EU), Russia, and China; and global pandemic diseases such as COVID-19.
Any of these events could have an adverse effect on our reputation, business, competitive or financial position, profit, and cash flows.
International Laws and Regulations: Laws, regulatory requirements and standards in Germany, the United States, and elsewhere continue to be very stringent. Our international business activities and processes expose us to numerous and often conflicting laws and regulations, policies, standards, or other requirements, and sometimes even conflicting regulatory requirements.
The SAP Group has a global presence and operates in most countries of the world. As a European company domiciled in Germany with securities listed in Germany and the United States, we are subject to European, German, U.S., and other governance-related regulatory requirements of the countries we operate in.
Our business is subject to numerous risks inherent to international business operations and associated consequences, such as changes in tax laws, changes in external reporting standards, and the interpretation of the complex tax rules in certain countries, including but not limited to conflict and overlap among tax regimes as well as the introduction of new tax concepts that harm digitalized business models; discriminatory, protectionist, or conflicting fiscal policies and tax laws; import and export regulations and trade sanctions; counter or even conflicting sanctions; embargoes, including but not limited to country-specific software certification requirements; and newly emerging cybersecurity and environmental, social, and governance (ESG) compliance and disclosure laws.
As we expand into new countries and markets or extend our business activities in these markets, including emerging and high-risk markets, these risks could intensify. The application of the respective local laws and regulations to our business is sometimes unclear, subject to change over time, and often conflicting among jurisdictions. Additionally, these laws and government approaches to enforcement continue to change and evolve, just as our products and services continually evolve. Compliance with these varying laws and regulations, including antitrust regulations, could involve significant costs or require changes in our products or business practices. Non-compliance could result in the imposition of penalties or cessation of orders due to alleged non-compliant activity. Governmental authorities could use considerable discretion in applying these statutes and any imposition of sanctions against us could be material.
Any of these events could have a material adverse effect on our operations globally or in one or more countries or regions, which could have a material adverse effect on our business, financial position, profit, and cash flows.
Legal and IP: Claims and lawsuits against us, such as for IP infringements, or our inability to obtain or maintain adequate licenses for third-party technology, or if we are unable to protect or enforce our own intellectual property, may result in adverse outcomes.
We have in the past, and believe that we will continue to be subject to, claims and lawsuits, including intellectual property infringement claims, as our solution portfolio grows; as we acquire companies with increased use of third-party code including open source code; as we expand into new industries with our offerings, resulting in greater overlap in the functional scope of offerings; and as non-practicing entities that do not design, manufacture, or distribute products assert intellectual property infringement claims.
Moreover, protecting and defending our intellectual property is crucial to our success. The outcome of litigation and other claims or lawsuits is intrinsically uncertain.
We are subject to risks and associated consequences in the following areas, among others: dependency in the aggregate on third-party technology, including cloud and Web services, that we embed in our products or that we resell to our customers; integration of open source software components from third parties into our software and the implications derived from it; inability to prevent third parties from obtaining, using, or selling without authorization what we regard as our proprietary technology and information; and the possibility that third parties might reverse-engineer or otherwise obtain and use technology and information that we regard as proprietary. Moreover, the laws and courts of certain countries might not offer effective means to enforce our legal or intellectual property rights. Finally, SAP may not be able to collect or otherwise enforce all judgments awarded to it in legal proceedings. The outcome of litigation and other claims or lawsuits is intrinsically uncertain. Management’s view of the litigation might also change in the future. Actual outcomes of litigation and other claims or lawsuits could differ from the assessments made by management in prior periods, which are the basis for our accounting for these litigations and claims under IFRS.
17
Data Protection and Privacy: Non-compliance with increasingly complex and stringent, sometimes even conflicting, applicable data protection and privacy laws, or failure to meet the contractual requirements of SAP’s customers with respect to our products and services, could lead to civil liabilities and fines, as well as loss of customers.
As a global software and service provider, SAP is required to comply with local laws wherever it does business. One of the relevant European data protection laws is the General Data Protection Regulation. International data transfers to third countries that do not provide for an adequate level of data protection require additional safeguards, including transfer risk assessments, to justify a transfer from the EU to a third country under the new EU standard contractual clauses.
Furthermore, evolving data protection and privacy laws, regulations, and other standards around the world (such as the California Consumer Privacy Act, the Chinese Personal Information Protection Law including data localization requirements, the EU Digital Services Act, and the EU’s proposed e-Privacy Regulation) are increasingly aimed at protecting individuals’ personal information when it comes to marketing and tracking their online activities. This may impose additional burdens for SAP due to increasing compliance standards that could restrict the use and adoption of SAP’s products and services (in particular cloud services) and make it more challenging and complex to meet customer expectations. These changing criteria also impact the compliant use of new technology, such as machine learning and Artificial Intelligence for product development and deployment of intelligent applications.
Non-compliance with applicable data protection and privacy laws by SAP or any of the subprocessors engaged by SAP within the processing of personal data could lead to risks. These include, among others: mandatory disclosure of breaches to affected individuals, customers, and data protection supervisory authorities; investigations and administrative measures by data protection supervisory authorities, such as the instruction to alter or stop non-compliant data processing activities, including the instruction to stop using non-compliant subprocessors; or the possibility of damage claims by customers and individuals, contract terminations, and potential fines.
In addition, the German Federal Office for the Protection of the Constitution and security industry experts continue to warn of risks related to a globally growing number of cybersecurity attacks aimed at obtaining or violating company data including personal data.
Any of these events could have a material adverse effect on our reputation, business, financial performance, competitive or financial position, profit, and cash flows.
Corporate Governance and Compliance Risks
Ethical Behavior: Our global business exposes us to risks related to unethical behavior and non-compliance with policies by employees, other individuals, partners, third parties, or entities associated with SAP.
SAP’s leadership position in the global market is founded on the long-term and sustainable trust of our stakeholders worldwide. Our overarching approach is one of corporate transparency, open communication with financial markets, regulators, and authorities, and adherence to recognized standards of business integrity. This commitment to recognized standards of business integrity is formalized in SAP’s CoEBC and supporting guidelines.
We are subject to risks and associated consequences in the following areas, among others: non-compliance with our policies and violation of compliance related rules, regulations, and legal requirements including, but not limited to, antitrust, anticorruption, and antibribery legislation in Germany, the U.S. Foreign Corrupt Practices Act, the UK Bribery Act, and other local laws prohibiting corrupt conduct; unethical and fraudulent behavior leading to criminal charges, fines, and claims by affected parties; collusion with external third parties; fraud and corruption; public sector transactions in territories exposed to a high risk of corruption; or increased exposure and impact on business activities in highly regulated industries.
Any of these events could have a material adverse effect on our reputation, business, competitive or financial position, profit, and cash flows. In recent years, the investigation team within SAP’s Office of Ethics & Compliance (OEC), together with the assistance of an external law firm, investigated whistleblower complaints alleging that the business conduct of some former SAP employees within subsidiary SAP companies did not comply with SAP’s policies and procedures or applicable laws. These investigations culminated in January 2024 in a settlement agreement with the U.S. Securities and Exchange Commission (U.S. SEC) and the U.S. Department of Justice (U.S. DOJ), as well as with local authorities in South Africa. SAP fully cooperated with law enforcement authorities, and took immediate steps to discipline the employees involved, including terminating all those implicated in potential law violations. Since these allegations were made, SAP has also significantly strengthened its compliance program and related internal controls in accordance with DOJ and regulatory expectations and requirements.
SAP has encountered situations in the past that required clear messaging and strong action on non-compliance in the context of corrupt behavior that has the potential to harm our business and reputation. SAP is continuing to investigate its dealings with the public sector.
Operational Business Risks
Sales and Services: Sales and implementation of SAP software and services, including cloud, are subject to several significant risks sometimes beyond our direct control.
A core element of our business is the successful implementation of software and service solutions. The implementation of SAP software and cloud-based service deliveries is led by SAP, by partners, by customers, or by a combination thereof.
18
We are subject to risks and associated consequences in the following areas, among others: implementation risks caused by insufficient or incorrect information provided by customers, insufficient customer expectation management, including scope, integration capabilities and aspects, and a lack of purposeful selection, implementation, or utilization of SAP solutions; a lack of customer commitments and respective engagements; challenges to achieve a seamlessly integrated, sufficiently automated and aligned service delivery; unrenderable services committed during the sales stage; inadequate contracting and consumption models based on subscription models for services, support, and application management; deviations from standard terms and conditions; or statements concerning solution developments that might be misperceived by customers as commitments on future software functionalities.
Any of these events could have an adverse effect on our reputation, business, competitive or financial position, profit, and cash flows.
Partner Ecosystem: If we are unable to scale, maintain, and enhance an effective partner ecosystem, revenue might not increase as expected.
An open and vibrant partner ecosystem is a fundamental pillar of our success and growth strategy. We have entered into partnership agreements that drive co-innovation on our platforms, profitably expand our routes to market to optimize market coverage, optimize cloud delivery, and provide high-quality services capacity in all market segments. Partners play a key role in driving market adoption of our entire solutions portfolio, by co-innovating on our platforms, embedding our technology, and reselling or implementing our software.
We are subject to risks and associated consequences in the following areas, among others: failure to establish and enable a network of qualified and fully committed partners; failure of partners to develop sufficient innovative solutions and content on our platforms or to provide high-quality products or services to meet customer expectations; failure of partners to embed our solutions sufficiently enough to profitably drive product adoption; failure of partners to adhere to applicable legal and compliance regulations; failure of partners to transform their business model in accordance with the transformation of SAP’s business model in a timely manner; and failure of partners to comply with contract terms in embargoed or high-risk countries.
If any of these risks materialize, this might have an adverse effect on the demand for our products and services as well as the partner’s loyalty and ability to deliver. As a result, we might not be able to scale our business to compete successfully with other vendors, which could have an adverse effect on our reputation, business, competitive or financial position, profit, and cash flows.
Cloud Operations: We may not be able to properly protect and safeguard our critical information and assets, business operations, cloud offerings and portfolio presentation, and related infrastructure against cyberattacks, insufficient infrastructure, disruption, or deficient performance.
SAP is highly dependent on the availability, integrity, and reliability of our infrastructure, including infrastructure provided by third-party business partners, and the software used in our cloud portfolio is inherently complex. Customers using our cloud services rely on the security of our infrastructure to protect the availability of our services and the data that they store on our infrastructure. Threat actors are focused on attacking third-party product and service providers, such as SAP, as a means of compromising our and our downstream customers’ systems and data.
We are subject to risks and associated consequences in the following areas, among others: the cloud portfolio or strategic direction of cloud operations may not fully meet customer demands; customers’ cloud service demands may not match our data center capacity or control investments; capacity shortages could affect SAP’s ability to deliver and operate cloud services as expected by or committed to our customers; scalability demands on infrastructure and operation could lead to cost increases and margin impacts; hyperscaler or infrastructure instabilities and the lack of availability or comprehensive contractual agreements could lead to challenges in meeting service level agreement (SLA) commitments; we might lack sufficient “future skills” for delivering and operating hybrid environments; we might lack the automation, standardization, and tools to manage and optimize operations and infrastructure; local legal requirements or changes to data sovereignty may lead to customers relocating their landscapes to a different data center; the loss of the right to use hardware purchased or leased from third parties could affect our ability to provide our cloud applications; disruptions to SAP’s cloud applications portfolio (such as system outages or downtimes, SAP network failure due to human or other errors, security breaches, or variability in user traffic for cloud applications) could affect customer SLAs; hardware failures or system errors might result in data loss or corruption; exploitation by threat actors of known and previously unknown (“zero day”) security vulnerabilities in our or our customers’ systems and software, including as a result of our or our customers’ failure to patch such vulnerabilities in a timely or effective manner; partner co-location of data centers might not adhere to our quality standards; or we might not comply with applicable certification requirements, such as the Payment Card Industry Data Security Standard (PCI DSS).
Any of these events could have a material adverse effect on our reputation, business, competitive or financial position, profit, and cash flows.
Cybersecurity and Security: Cybersecurity attacks or breaches, and security vulnerabilities in our infrastructure or services or those of our third-party partners could materially impact our business operations, products, and service delivery.
SAP delivers a full portfolio of solutions, hosts or manages elements of our customers’ businesses in the cloud, processes large amounts of data, and provides mobile solutions to users. While SAP executes each of these areas either directly or through partners and other third parties, our industry continues to experience a complex and threatening cybersecurity landscape. The severity of these cybersecurity threats is amplified due to the increasingly sophisticated and malicious global landscape in which we operate. This includes third-party data, products, and services that we incorporate into SAP products and services, and the increasingly advanced obfuscation, control-circumvention, and related techniques and tools – such as artificial intelligence – employed by threat actors targeting IT products, businesses, and the supply chain. When we become aware of unauthorized access to our systems or those of our third-party partners, we have action plans in place intended to identify and remediate the source and impact of such events. Like many companies, we and certain of our third-party partners have experienced and expect to continue to experience cyberattacks and other security incidents that affect our business. While we experience cybersecurity incidents of various kinds in the ordinary course of our business, we are not aware of any such incidents that have had a material impact on our business.
19
We are subject to risks and associated consequences in many areas including, but not limited to, an increasing number of global threat actor attacks using ransomware as their preferred method of attack as well as exploiting known and unknown bugs, errors and vulnerabilities in our software and systems or those of business partners, customers or other third parties. Given the nature of complex systems, software and services like ours, and the scanning tools that we deploy across our networks and products, we regularly identify and track security vulnerabilities. Security vulnerabilities are prioritized based on known and anticipated risks, and remediation activities aim to patch within the designated timeframes. Although we have standard routine patch management processes, we are unable to comprehensively apply patches or to confirm that mitigating measures are in place to mitigate all such vulnerabilities, or that any patches will be applied before exploitation by a threat actor. In other situations, vulnerabilities persist even after we have issued security patches, because our customers may fail to either apply the patches, update their systems, or authorize service downtime sufficient to allow for patching by SAP. If attackers are able to exploit vulnerabilities before patches are installed or mitigating measures are implemented, significant compromises could impact our and our customers’ systems and data.
We could also experience material exposure to our business operations and service delivery due to disruptions to backups, disaster recovery or business-continuity management processes, or as the result of malicious or inadvertent actions by threat actors, employees, contractors, or a host of other parties. Security threats may also exist due to delayed or insufficient responses to identified issues or other interdependencies such as cloud service providers and those beyond SAP’s cybersecurity infrastructure and protocols. SAP’s and/or its partners’ lack of sufficient security controls or compliance with existing controls could impact SAP’s and/or its partners’ ability to comply with applicable regulations and customer requirements. SAP and/or its partners could unknowingly introduce security threats and vulnerabilities without established security evaluation processes. Additionally, failure to integrate or maintain SAP’s cybersecurity infrastructure and protocols with network systems obtained through acquisitions could result in cyberbreaches, a loss of data confidentiality and integrity, and/or a loss of system availability.
Technology and Products: Our technology and products may experience undetected defects, coding or configuration errors, may not integrate as expected, or may not meet customer expectations.
We are subject to risks and associated consequences in the following areas, among others: failure of software products and services to fully meet market needs or customer expectations; failure of software products and services from acquired companies to fully comply with SAP quality standards; failure of new products, services, and cloud offerings, including third-party technologies, to comply with local standards and requirements; the possibility that new products, services, and cloud offerings or subsequent versions and updates to existing products, services, and cloud offerings might contain defects or security vulnerabilities, or might not be mature enough from the customer’s point of view for business-critical solutions, or might not be sufficiently secure after release or shipment despite all the due diligence SAP puts into quality; inability of algorithms to correctly adapt to evolving circumstances, which may lead to adverse decision-making processes in the context of AI-related technologies; and the inability to fulfil expectations of customers regarding time and quality in the defect resolution process.
Any of these events could have a material adverse effect on our reputation, business, competitive or financial position, profit, and cash flows.
Strategic Risks
Market Share and Profit: Our market share and profit could decline due to increased competition, market consolidation, technological innovation, and new business models in the software industry.
The market for cloud computing is increasingly competitive and is exhibiting strong growth relative to the market for on-premise solutions. To maintain or improve our operating results in the cloud business, it is important that we not only attract new customers but also that our existing customers renew their agreements with us when the initial contract term expires and purchase additional modules or additional capacity. Additionally, we need to bring innovations to the market in line with the demands of our ecosystem and ahead of our competitors, such as solutions to support new data-driven applications and the extension of our suite of intelligent technologies based on SAP Business Technology Platform (SAP BTP).
We are subject to risks and associated consequences in the following areas, among others: inability to deliver fully suitable solution and transformation services to our customers on the cloud transformation journey, both in cloud-only and hybrid scenarios; inability to successfully execute on our hyperscaler strategy; adverse, near-term revenue effects due to increasing cloud business and conversions from on-premise licenses to cloud subscriptions from existing SAP customers, which could have an adverse effect on related maintenance and services revenue; insufficient solution and service adoption together with increased complexity, as well as failures during the execution of our corporate strategy in the context of our portfolio for solutions and services, which could lead to a loss of SAP’s position as a leading cloud company and subsequently to reduced customer adoption; customers and partners being reluctant or unwilling to migrate and adapt to the cloud; customers considering cloud offerings from our competitors; strategic alliances among competitors; price pressure, cost increases, and loss of market share through traditional, new, and cooperating competitors and hyperscalers; and the inability to achieve the planned margin increase in time as planned.
Any of these events could have a material adverse effect on our reputation, business, competitive or financial position, profit, and cash flows.
Mergers and Acquisitions: We might not acquire, integrate, or divest companies or their components effectively or successfully.
To expand and consolidate our business, we acquire and divest businesses, products, and technologies, and we expect to continue doing so in the future. Over time, some of these acquisitions have increased in size and in strategic importance for SAP. Management negotiation of potential acquisitions and divestures and the integration and carve-out of acquired businesses, products, or technologies demands time, focus, and resources of both management and the workforce, and exposes us to unpredictable operational difficulties.
20
We are subject to risks and associated consequences in the following areas, among others: incorrect information or assumptions during the due diligence process for acquisitions, divestitures, and other transactions; failure to integrate acquired technologies or solutions successfully and profitably into SAP’s solution portfolio and strategy; failure to successfully integrate acquired entities and their operations; failure to fulfill the needs of the acquired company’s customers or partners; failure to implement, restore, or maintain internal controls, disclosure controls, and procedures and policies within acquired companies; debt incurrence or significant unexpected cash expenditures; impairment of goodwill and other intangible assets acquired in business combinations; and failure of acquired companies to comply with regulatory requirements..
We have in the past, and may in the future, choose to divest certain entities, businesses, or product lines. We may have difficulty obtaining terms acceptable to us. Additionally, we may experience difficulty carving out portions of or entire businesses, we may incur a loss of revenue or experience a negative impact on margins, or we may not achieve the desired strategic and financial benefits. Such potential transactions may also delay achievement of our strategic objectives, cause us to incur additional expenses, disrupt customer, partner, and employee relationships, and may expose us to unanticipated or ongoing obligations and liabilities, including as a result of indemnification obligations. Further, during the pendency of a divestiture, we may be subject to risks such as a decline in the business to be divested, a loss of employees, customers, or suppliers, and the risk that the transaction may not close, any of which could have a material adverse effect on the business to be divested as well as our retained business. If a divestiture is not completed for any reason, we may not be able to find another buyer on the same terms, and we may have incurred significant costs without the corresponding benefit.
Any of these events could have a material adverse effect on our reputation, business, competitive or financial position, profit, and cash flows.
Innovation: We might not be able to compete effectively if we strategize our solution portfolio ineffectively or if we are unable to keep up with rapid technological and product innovations, enhancements, new business models, and changing market expectations.
Our future success depends on our ability to keep pace with technological and process innovations and new business models, as well as on our ability to develop new products and services, enhance and expand our existing products and services portfolio, and integrate products and services we obtain through acquisitions. To be successful, we are required to adapt our products and our go-to-market approach to a cloud-based delivery and consumption model so as to satisfy increasing customer demand and to ensure an appropriate level of adoption, customer satisfaction, and retention.
We are subject to risks and associated consequences in the following areas, among others: inability to develop and sell new cloud products spanning various organizations on time and in line with market demands due to complexity in heterogeneous technical environments; inability to anticipate and develop technological improvements or succeed in adapting SAP products, services, processes, and business models to technological change, changing regulatory requirements, or emerging industry standards; a change in requirements of our customers and partners to strengthen the Intelligent Enterprise strategy; the possibility that our product and technology strategy might not be successful, or that our customers and partners might not adopt our technology platforms, applications, or cloud services quickly enough, or that they might consider other competing solutions in the market, or that our strategy might not match customers’ expectations and needs, specifically in the context of expanding the product portfolio into additional markets.
We are integrating AI into a number of our products, including our suite of enterprise applications and SAP BTP, and we expect our use of AI across our portfolio to continue to grow. As with many innovations, AI presents risks and challenges that could affect its adoption and therefore our business. AI algorithms or training methodologies may be flawed. Data sets may be overbroad, insufficient, or contain biased information. Content generated by AI systems may be offensive, illegal, or otherwise harmful. Ineffective or inadequate AI development or deployment practices by SAP or our partners could result in incidents that impair the acceptance of AI solutions or cause harm to individuals, customers, or society, or result in our products and services not working as intended. Human review of certain outputs may be required, which could introduce error or inefficiencies to the intended use of our AI-enabled offerings. As a result of these and other challenges associated with innovative technologies, our implementation of AI systems could subject us to competitive harm, regulatory action, legal liability, and brand or reputational harm.
In particular, there is significant uncertainty surrounding the applications of intellectual property and privacy laws to AI technology. Intellectual property ownership and license rights, including copyright, surrounding AI technology have not been fully addressed by courts or other laws or regulations of the jurisdictions in which we operate, and our use of AI technology or integration of AI technology into our products and services may result in disputes with respect to ownership or intellectual property, or exposure to claims of copyright or other intellectual property misappropriation. In addition, our AI technology may involve the processing of personal and other sensitive data and may be subject to laws, policies, legal obligations, and contractual requirements related to privacy, data protection, and information security. Various privacy laws extend rights to consumers (such as the right to obtain consent or delete certain personal data) and regulate automated decision making. An alleged or actual failure to meet these obligations may lead to regulatory investigations and fines or penalties; may require us to change our business practices or retrain our algorithms; or may prevent or limit our use of AI technology. It is also possible that we are held liable for intellectual property, privacy, or other legal violations of third-party AI technology that we use, and that we may not have full recourse for any damages that we suffer (for example, our use of third-party AI technology may be subject to limitations of liability or provide no liability coverage).
In addition, some AI scenarios present ethical issues or may have broad impacts on society, and there can be no assurance that our Global AI Ethics Policy or similar policies and procedures will be sufficient to address such issues. If we enable or offer AI solutions that have unintended consequences, unintended usage or customization by our customers and partners, or are controversial because of their impact on human rights, privacy, employment, or other social, economic, or political issues, we may experience reputational harm, adversely affecting our business and consolidated financial statements.
Any of these events could have a material adverse effect on our reputation, business, competitive or financial position, profit, and cash flows.
21
ITEM 4. INFORMATION ABOUT SAP
Our legal corporate name is SAP SE. SAP SE is translated in English to SAP European Company (Societas Europaea, or “SE”). SAP SE is organized in the Federal Republic of Germany under German and European law, see “Item 10. Additional Information.” Where the context requires in the discussion below, SAP SE also refers to our predecessor or previous legal forms and names, as the case may be, i.e. Systemanalyse und Programmentwicklung GbR (1972-1976), SAP Systeme, Anwendungen, Produkte in der Datenverarbeitung GmbH (1976-1988), “SAP Aktiengesellschaft Systeme, Anwendungen, Produkte in der Datenverarbeitung” (1988 – 2005) and “SAP AG” (2005 – 2014). Our principal executive offices, headquarters and registered office are located at Dietmar-Hopp-Allee 16, 69190 Walldorf, Germany. Our telephone number is +49-6227-7-47474.
For (i) a description of our principal capital expenditures and divestitures and the amount invested (including interests in other companies) since January 1, 2023 until the date of this report and (ii) information concerning our principal capital expenditures and divestitures currently in progress, including the distribution of these investments geographically and the method of financing, see “Item 4. Information About SAP – Description of Property.”
The following table sets forth our most significant subsidiaries based on total revenues of SAP group in 2023. All of these subsidiaries are wholly owned or controlled by SAP SE.
Name of Subsidiary |
|
Country of |
Germany |
|
|
SAP Deutschland SE & Co. KG, Walldorf |
|
Germany |
Rest of EMEA |
|
|
SAP (Schweiz) AG, Biel |
|
Switzerland |
SAP (UK) Limited, Feltham |
|
United Kingdom |
SAP España – Sistemas, Aplicaciones y Productos en la Informática, S.A., Madrid |
|
Spain |
SAP France, Levallois Perret |
|
France |
SAP Italia Sistemi Applicazioni Prodotti in Data Processing S.p.A., Vimercate |
|
Italy |
SAP Nederland B.V., 's-Hertogenbosch |
|
The Netherlands |
United States |
|
|
Ariba, Inc., Palo Alto |
|
USA |
Concur Technologies, Inc., Bellevue |
|
USA |
SAP America, Inc., Newtown Square |
|
USA |
SAP Industries, Inc., Newtown Square |
|
USA |
SAP National Security Services, Inc., Newtown Square |
|
USA |
Rest of Americas |
|
|
SAP Brasil Ltda., São Paulo |
|
Brazil |
SAP Canada, Inc., Toronto |
|
Canada |
SAP México S.A. de C.V., Mexico City |
|
Mexico |
Japan |
|
|
SAP Japan Co., Ltd., Tokyo |
|
Japan |
Rest of APJ |
|
|
SAP Australia Pty Ltd., Sydney |
|
Australia |
SAP China Co., Ltd., Shanghai |
|
China |
SAP India Private Limited, Bangalore |
|
India |
22
Strategy and Business Model
Overview of SAP
Founded in 1972, SAP is a global company headquartered in Walldorf, Germany. Our legal corporate name is SAP SE. SAP has been recognized as a market share leader in the following areas worldwide: enterprise applications software,3 enterprise resource management applications,4 supply chain management applications,5 procurement applications software,6 travel and expense management software,7 and enterprise resource planning software,8 among others. SAP Business Technology Platform comprises market-leading capabilities in key platform areas such as integration,9 planning10 and analytics,11 data quality,12 and process automation.13 The SAP Group has a global presence and employed more than 107,000 people as at December 31, 2023.
Our ordinary shares are listed on the Frankfurt Stock Exchange. American Depositary Receipts (ADRs) representing SAP SE ordinary shares are listed on the New York Stock Exchange (NYSE). SAP is a member of Germany’s DAX and TecDAX, the Dow Jones EURO STOXX 50, the Dow Jones Sustainability Index World, and the Dow Jones Sustainability Index Europe. As at December 31, 2023, SAP was the most valuable company in the DAX based on market capitalization and has been ranked under the top 5% of S&P Global ESG Scores in the S&P Global Corporate Sustainability Assessment.
Our Purpose
Our purpose at SAP remains steadfast: to “help the world run better and improve people’s lives.” We strive to achieve this by focusing on the challenges of current markets, the global environment, and by using the transformative power of artificial intelligence (AI) in business. SAP combines generative AI with business data. We are committed to providing AI solutions that are integral to our customers’ critical business processes, and ensuring that they are embedded in our portfolio, relevant, reliable, and responsible. Our products and services aim to help our customers meet the challenges as well as take advantage of the opportunities presented by today’s rapidly changing world.
In addition, we want our own business operations and practices to be sustainable and inclusive. SAP is committed to the goal set by the Paris Agreement of limiting global warming to 1.5 degrees Celsius in comparison to preindustrial levels. SAP has committed to achieve net-zero emissions along our entire value chain by 2030. We also support the United Nations Sustainable Development Goals (UN SDGs). Together with our customers and partners, we engage in several initiatives across the UN SDGs.
Our Vision
SAP’s vision is to bring out the best in every business. In our pursuit of this vision, we focus on three areas:
Agility at Scale
In a rapidly changing landscape, the need for business agility is paramount to maintaining competitiveness. We facilitate this through data insights that help organizations adapt to market conditions. Our cloud ERP solutions and SAP Business AI capabilities are integrated, providing agility and empowering organizations to pivot, whether to strategic shifts or unexpected market scenarios.
Achieve More Across the Value Chain
We help organizations leverage the collective intelligence that SAP provides to optimize performance across their value chain. By connecting core processes – from finance to supply chains and human resources to customer relations – we support efficient growth throughout businesses. Our solutions go beyond internal systems, linking businesses across enterprises and digitalizing transactions to foster transparent, resilient, and sustainable value chains.
3 IDC, Worldwide Enterprise Applications Software Market Shares, 2022: Cloud Is the Digital World Foundational Choice, Doc #US51040223, July 2023
4 IDC, Worldwide Semiannual Software Tracker, 2023H1, October 2023
5 IDC, Worldwide Semiannual Software Tracker, 2023H1, October 2023
6 IDC, Worldwide Semiannual Software Tracker, 2023H1, October 2023
7 IDC, Worldwide Travel and Expense Management Software Market Shares, 2022: Evolving Travel Models Pushing Digital Transformation, Doc #US49194223, September 2023
8 IDC, Worldwide Semiannual Software Tracker, 2023H1, October 2023
9 Gartner, Inc., Magic Quadrant for Data Integration Tools, Doc G00777860, December 2023
10 Gartner, Inc., Magic Quadrant for Financial Planning Software, Doc G00784792, December 2023
11 Gartner, Inc., Magic Quadrant for Analytics and Business Intelligence Platforms, Doc G00768632, April 2023
12 Gartner, Inc., Magic Quadrant for Data Quality Solutions, Doc G00759931, November 2022
13 Gartner, Inc., Magic Quadrant for Process Mining Tools, Doc G00774746, March 2023
23
Sustainability at Your Core
We have evolved beyond mere sustainability aspirations to actionable, sustainable outcomes. SAP’s green ledger initiative provides auditable sustainability practices as an extension of business operations. This approach enables organizations to record real impacts, report audit-ready ESG metrics, and act with ESG principles integrated into business processes, supporting data-driven sustainability management.
At SAP, our journey is one of continuous innovation and transformation, and we are committed to delivering solutions that are not only relevant and reliable but also responsible.
Our Business Model
Our business model, through which we implement our vision and strategy, can be summarized as follows:
We create value by first identifying the business needs of our customers and then developing and delivering cloud solutions, software, services, and support that address these needs. By proactively obtaining customer feedback on a regular basis, we strive to continuously improve our solutions, identify further business needs, and deliver enhanced value to our customers across the entire lifecycle – and thus continually improve the customer experience.
We derive revenue from fees charged to our customers for subscriptions to use our cloud solutions. Software licenses, on-premise support, consulting, development, training, and other services also contribute significant revenue.
For an overview of our product portfolio, see the Our Product Strategy section.
Subsidiaries, Acquisitions, and Joint Ventures
Subsidiaries
SAP SE is the parent company of the SAP Group. As at December 31, 2023, the SAP Group comprised 236 companies.
For a list of our subsidiaries, associates, and other equity investments, see the Notes to the Consolidated Financial Statements, Note (G.9).
Material Acquisitions
We continue to focus on organic investments in technology and innovations that should ensure sustainable growth of our product portfolio. Additionally, we may make targeted acquisitions to complement our solution offerings and improve coverage in key strategic markets.
The acquisition of LeanIX closed on November 7, 2023. LeanIX is a market leader in enterprise architecture management (EAM) software that drives the modernization of IT landscapes and continuous business transformation. The combined offering with SAP can provide a foundation for process optimization enabled by AI.
For more information about LeanIX, see the Notes to the Consolidated Financial Statements, Note (D.1).
Divestitures
Qualtrics
On March 13, resulting from a process that was initiated on January 26, 2023, SAP announced it had agreed to sell all of its 423 million shares in Qualtrics International Inc. as part of the acquisition of Qualtrics by funds affiliated with Silver Lake and Canada Pension Plan Investment Board at a purchase price of US$18.15 in cash per share. The sale closed on June 28, 2023. SAP remains a close go-to-market and technology partner with Qualtrics.
For more information about Qualtrics, see the Notes to the Consolidated Financial Statements, Note (D.1).
Sapphire Ventures
In addition to our investments in organic growth and acquisitions, SAP also supports entrepreneurs that aspire to build industry-leading businesses through venture capital funds managed by Sapphire Ventures. Sapphire Ventures manages more than US$10 billion (over €9 billion) and has invested in more than 200 companies. It pursues opportunities in which it can help fuel enterprise growth by adding expertise, relationships, geographic reach, and capital. It places a particular focus on companies in Europe, Israel, the United Kingdom, and the United States. Sapphire Ventures has committed to investing more than US$1 billion in the next generation of AI - powered enterprise technology startups.
Our Product Strategy
SAP’s product portfolio allows enterprises to manage their resources, spend, employees, and customer relationships. SAP Business Technology Platform (SAP BTP) is the platform for SAP, our customers, and our ecosystem to build, integrate, and extend solutions, and to manage enterprise data. It also serves as a central place for SAP Business AI technology.
24
SAP Business AI refers to artificial intelligence (AI) capabilities available across SAP’s suite of enterprise applications and SAP BTP. SAP offers a range of AI-powered use cases built into core business processes across finance, supply chain, procurement, sales, marketing, human resources, and IT. By using these AI capabilities, customers can benefit from automation, recommendations, forecasting, and natural human-machine interaction. In addition, SAP BTP provides business-specific AI services that empower our partners and customers to implement AI into their SAP applications and extensions while reducing data science effort, integration, and operational complexity.
In September 2023, we launched Joule, a copilot built directly into our solutions.
In November 2023, we introduced the new AI Foundation on SAP BTP group of technologies, new vector capabilities on SAP HANA to leverage AI, and SAP Build Code, an AI-powered solution set to make professional coders more productive.
In December 2023, we introduced Cloud ERP Suite as a clustering of our strategic cloud solutions. The following offerings are currently part of our Cloud ERP Suite: SAP S/4HANA Cloud as part of Cloud ERP, SAP BTP, core solutions for HR and payroll, spend management, commerce, customer data solutions, business process transformation, and working capital management. With SAP S/4HANA Cloud and SAP BTP as key elements and foundation of those offerings, we strive for an expansion of our commercial models, with increased focus on packaged suite deals and flexible consumption models, such as RISE Premium Plus. Further, we aim to drive the adoption of multi-cloud solutions across the mentioned offerings.
Further, SAP strives to help customers grow their businesses profitably, while at the same time minimizing the risks. To this end, SAP has two offerings, RISE with SAP and GROW with SAP, which cater to different customer objectives and requirements.
RISE with SAP is a business transformation solution aimed at helping customers migrate their ERP system to the cloud and accelerate their digital transformation. It is a tailored offering that targets SAP’s existing customer base running on other SAP solutions, or net-new customers with large or complex business requirements. RISE with SAP aims to provide enhanced productivity by means of automated processes, with the option of running technology operations as a service with SAP or in the customer’s own data center.
GROW with SAP is a commercial offering designed specifically to help grow midmarket companies that do not yet use an ERP system from SAP and aspire to go live within a short period of time without extensive customization. With GROW with SAP, customers can use predefined best-practice processes that are available for different industries, and can benefit from predictable costs, the continuous provision of technical innovations, and scalability. It is designed so that companies can grow according to their needs, without significantly increasing the complexity for business processes and management.
As the IT landscape continues to rapidly evolve, SAP is seeing a clear shift in customer preferences together with a growing demand for flexibility, agility, scalability, and cost-effectiveness. Understanding the importance of helping customers embrace digital technologies to thrive in today’s dynamic business environment, SAP has committed to a forward-thinking cloud strategy. SAP acknowledges that every organization’s experience with the cloud can be unique and can therefore be challenging, yet many customers who have made the shift to a cloud strategy can use the benefits that today’s business environments require, such as the ability to redistribute resources previously required for managing internal IT teams, and remote global accessibility from any location through an Internet connection regardless of where teams are located around the world. This strategy-shift to the cloud allows SAP to address these new market opportunities and requirements.
The strategic pillars of SAP’s product strategy and our development and innovations are presented below.
Cloud ERP
SAP S/4HANA Cloud provides software capabilities mainly for finance, risk management, project management, procurement, manufacturing, supply chain management, asset management, and research and development. It also includes platform capabilities such as a database (SAP HANA), data management, AI, and application lifecycle management, as well as cloud ERP solutions, which our customers consume as part of their transformation to SAP S/4HANA Cloud. These cloud ERP solutions help customers adopt new business models, such as subscription.
Human Capital Management
SAP SuccessFactors solutions for human experience management aim to empower organizations to create an agile and future-ready workforce in a rapidly changing workplace. Customers can use new offers such as skills ontology, personal growth framework for employees, and dynamic teams to work across traditional organizational structures. The portfolio includes core HR and payroll, talent management, employee experience management, and people and workforce analytics.
Spend Management
SAP’s spend management solutions aim to provide a more unified view of a customer’s spending to reduce costs, mitigate risks, improve collaboration, and make sure every spend decision is aligned with the business strategy. They cover direct and indirect spend, travel and expense, and external workforce management. Our SAP Ariba solutions combine industry-leading cloud-based applications to help companies discover and collaborate with a global network of partners. Our SAP Concur portfolio contains the world’s leading solutions for integrated travel, expense, and invoice management.
Customer Experience
SAP Customer Experience solutions aim to deliver a personalized view across customers and business partners, connecting the front- and back office with solutions spanning from point-of-sale to manufacturing, logistics, customer experience, and returns management.
25
SAP Business Technology Platform
SAP Business Technology Platform (SAP BTP) is our business-centric, and open platform consisting of market-leading technologies infused with AI that enables SAP development, customers, and the partner ecosystem to unlock innovation across the enterprise. SAP BTP enables customers and partners to build, integrate, and automate applications while leveraging insights from business data on a trusted enterprise-grade environment.
Key capabilities of SAP BTP include: SAP Build and SAP Build Code tools, and the ABAP Cloud development model, which provides an intuitive, modern development environment for IT and citizen developers; SAP HANA Cloud, SAP Datasphere, and SAP Analytics Cloud solutions which offer database, data management, analysis, and planning capabilities that utilize the value of data; SAP Integration Suite for enterprise iPaaS and API management to connect and automate business processes; and AI Foundation on SAP BTP, which has a rich toolset including access to a broad range of large language models (LLMs) from third-party providers and vector database capabilities to enable developers to create AI- and generative-AI-powered extensions and applications.
Industry Cloud
SAP’s industry cloud solutions offer SAP and our partners the opportunity to extend our core of business software with modular solutions addressing industry-specific functions built on SAP BTP.
Business Network
SAP Business Network is a business-to-business collaboration platform trusted by companies in 190 countries. The network helps digitalize key business processes across the supply chain and enables communication between trading partners beyond the four walls of an organization. This enables buyers and suppliers to find each other and execute end-to-end transactions, and helps businesses be transparent, resilient, and sustainable.
Business Process Transformation
Our SAP Signavio solutions help enable our customers to discover, analyze, and understand their business process operations. By benchmarking current process landscapes against best practices and allowing them to act on change recommendations, customers can define a target state and adapt as-is processes accordingly, while measuring whether realized outcomes match strategic goals.
In November 2023, SAP acquired LeanIX, a market leader in enterprise architecture management (EAM) which is designed to enable customers to visualize, assess, and manage the transition towards their target IT architectures. LeanIX solutions can help customers drive updates to their IT landscapes and, together with the SAP Signavio portfolio, enable continuous business transformation.
Working Capital Management
Taulia solutions for working capital management help enable customers to mitigate the effects of inflation by providing visibility into working capital and access to liquidity. The Taulia Cash Flow Acceleration Platform is designed to accelerate cash flow and create supply chain resilience. Taulia also embeds sustainability functions into core processes by offering financing to stimulate the supply base to impact its ESG (environmental, social, and governance) credentials.
Sustainability Management
SAP offers sustainability solutions and services that can help customers drive sustainable practices not only inside their organization but across the entire value chain. SAP Cloud for Sustainable Enterprises is a flexible solution portfolio that aims to enable businesses to manage sustainability holistically. The portfolio includes the following offerings: SAP Sustainability Control Tower for holistic steering and reporting across ESG metrics and SAP Sustainability Data Exchange for sharing standardized sustainability data across supply chains.
Partners and Ecosystem
Our worldwide ecosystem of more than 25,000 partners delivers not only services and support for our customers but also partner innovations that extend our solutions and ideally are built on SAP BTP.
Services and Support
We have reimagined our cloud services and support portfolio to focus on customer adoption and consumption.
The Services and Support portfolio includes SAP Enterprise Support, which provides foundational tools and services, curated content, and mission-critical support. It can be enhanced with incremental success plans such as SAP Preferred Success and SAP Cloud Application Services as well as success services and consulting services to address specific objectives, timelines, and plans. When customers pursue enterprise-wide transformational change, SAP offers SAP MaxAttention and SAP ActiveAttention plans for tailored, long-term strategic engagement.
26
Our Customers
Vision and Strategy
Focusing on Customer Success
We aim to maximize the value our customers derive from their investment in, and relationship with, SAP at every touchpoint in their experience with us over the engagement lifecycle. Our customer-facing teams – across solutions, sales, services, customer engagement, ecosystem, and others – work together along an operating model that aims to harmonize internal processes with the goal of delivering improved outcomes for our customers.
Company-Wide Global Experience Program
To further address and improve customer feedback, we have a Company-Wide Global Experience (XM) Program in place. This program aims to achieve a consistent end-to-end experience for our customers by standardizing experience initiatives and methodologies to help identify and close experience gaps across SAP.
Due Diligence
Governance
The head of Customer Success leads all customer-facing functions across sales, services, partner, and cloud engagements for SAP’s businesses globally. The Chief Marketing and Solutions Officer leads the development of our solution value propositions to provide clarity on SAP’s core differentiators. The People & Operations Board area is responsible for the Company-Wide XM Program, including conducting the Customer Net Promoter Score (NPS) survey.
Customer NPS is a KPI in the short-term incentive component of Executive Board remuneration. For more information about the Customer NPS, see the Performance Management System section.
Guidelines and Policies
Policies such as the Global Code of Ethics and Business Conduct for Employees and applicable General Terms and Conditions for our product govern our relationships with our customers.
How We Measure and Manage Our Performance
We use the Customer NPS as a feedback mechanism to measure customer loyalty. This and other results from the customer survey allow us to directly understand the customer experience and identify key pain points for action. Because of the importance of our customers to SAP, Customer NPS is one of our main non-financial KPIs.
In 2023, our Customer NPS increased 2 points year over year to 9 (2022: 714 ), which is within our target range of 8 to 12. The increase was driven by feedback regarding our comprehensive and robust SAP solutions, established value to customers’ business, and relationships with account teams. The Company-Wide XM Program ensures that the feedback received is heard by the responsible organizations within SAP so they can act to continually improve the customer experience.
For 2024, we expect a Customer NPS of 9 to 13. Further, we aim to see continuous improvements and to increase the score steadily in the medium term.
Related Risks for SAP
For related financial risks, see Sales and Services in the Risk Factors section.
14 Recalculated score according to 2023 methodology. Reported number for 2022 based on prior methodology was 3. Guidance for 2023 was based on the recalculated score of 7. For more information about Customer NPS calculation methodology, see Performance Management System.
27
Our Investments in Innovation
SAP’s strong commitment to research and development (R&D) is reflected in our expenditures:
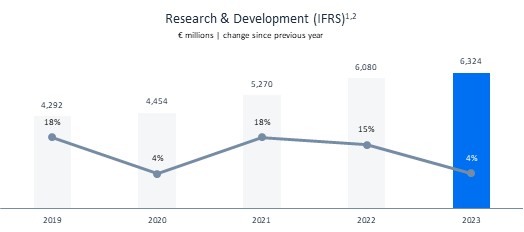
1 The numbers for 2023, 2022, and 2021 reflect continuing operations as a result of the divestiture of Qualtrics.
2 In 2023, SAP updated its cost allocation policy. R&D numbers for 2020 and 2019 have not been retrospectively adjusted. For more information, see the Notes to the Consolidated Financial Statements, Note (IN.1).
In 2023, our IFRS R&D ratio, reflecting R&D expenses as a portion of total revenue, decreased 0.3 percentage points (pp) to 20.3% (2022: 20.6%). Our non-IFRS R&D ratio decreased 1.1 pp to 18.0% year over year (2022: 19.1%). At the end of 2023, our total full-time equivalent (FTE) headcount in development was 36,444 (2022: 35,280). Measured in FTEs, our R&D headcount increased 1 pp to 34% of total headcount (2022: 33%).
Total R&D expense not only includes our own personnel costs but also the external costs of work and services from the providers and cooperation partners we work with to deliver and enhance our products. We also incur external costs for the following:
– |
Translating, localizing, and testing products |
– |
Obtaining certification for products in different markets |
– |
Patent attorney services and fees |
– |
Consulting related to our product strategy |
– |
Professional development of our R&D workforce |
Patents
Our investment in R&D has resulted in numerous patents. As at December 31, 2023, SAP held a total of close to 13,000 (2022: close to 13,000) validated patents worldwide. Of these, more than 650 (2022: more than 800) were granted and validated in 2023.
While our intellectual property is important to our success, we believe our business as a whole is not dependent on any particular patent or a combination of patents.
Competitive Intangibles
The majority of (intangible) resources that are the basis for our current as well as future success does not appear in the book value of equity in our Consolidated Financial Statements. This is apparent from a comparison of the market capitalization of SAP SE (based on all issued shares), which was €171.4 billion at the end of 2023 (2022: €118.4 billion), with the book value of our equity in the Consolidated Financial Statements, which was €43.4 billion (2022: €42.8 billion). This means that the market capitalization of our equity is more than three times higher than the book value.
Measuring Our Success
We use the following financial and non-financial objectives to steer our company:
- Growth
- Profitability
- Customer loyalty
- Employee engagement
- Carbon impact
28
Outlook and Results for 2023
Strategic Objective |
|
KPI |
|
2023 Outlook* |
|
2023 Results |
Growth |
|
Cloud revenue2 |
|
€14.0 billion to €14.2 billion |
|
€14.06 billion |
|
|
Cloud and software revenue2 |
|
€27.0 billion to €27.4 billion |
|
€27.64 billion |
Profitability |
|
Operating profit1,2 |
|
€8.65 billion to €8.95 billion |
|
€9.04 billion |
|
|
Free cash flow |
|
Approx. €4.9 billion |
|
€5.09 billion |
Customer Loyalty |
|
Customer Net Promoter Score |
|
8 to 12 |
|
9 |
Employee Engagement |
|
Employee Engagement Index |
|
76% to 80% |
|
80% |
Carbon Impact |
|
Net carbon emissions |
|
0 kt |
|
0 kt |
* The 2023 outlook was communicated in January 2023. It was updated twice during the year: in April to reflect the divestiture of Qualtrics, and again in July 2023. The 2023 outlook numbers above reflect the updated outlook from July 2023.
1 Non-IFRS.
2 At constant currencies.
Note: For a reconciliation of non-IFRS results to IFRS equivalents, see the Performance Management System section.
Outlook for 2024
Strategic Objective |
|
KPI |
|
2023 Results |
|
2024 Outlook |
Growth |
|
Cloud revenue |
|
€13.66 billion |
|
€17.0 billion to €17.3 billion2 |
|
|
Cloud and software revenue |
|
€26.92 billion |
|
€29.0 billion to €29.5 billion2 |
Profitability |
|
Operating profit (2024 methodology)1,3 |
|
€6.51 billion |
|
€7.6 billion to €7.9 billion1,2 |
|
|
Operating profit (2023 methodology) |
|
€8.72 billion |
|
— |
|
|
Free cash flow |
|
€5.09 billion |
|
Approx. €3.50 billion |
Customer Loyalty |
|
Customer Net Promoter Score |
|
9 |
|
9 to 13 |
Employee Engagement |
|
Employee Engagement Index |
|
80% |
|
76% to 80% |
Climate Performance: |
|
Gross greenhouse gas emissions |
|
6.9 million tons gross carbon emissions |
|
Steady decrease of our greenhouse gas emissions across the relevant value chain in line with our net-zero target |
Women in Executive Roles |
|
% of women in GET / SET / ET job levels out of the combined total of men, women, and other genders at the 3 job levels.4 |
|
22.2% |
|
25% in end of year 2027: |
1 Non-IFRS. The outlook for 2024 has been prepared in accordance with our updated non-IFRS definition applicable from 2024. For more information, see the Performance Management System section.
2 At constant currencies.
3 Based on the updated non-IFRS operating profit definition and excluding gains and losses from less material divestitures.
Note: For a reconciliation of non-IFRS results to IFRS equivalents, see the Performance Management System section.
4 GET: Global Executive Teams; SET: Senior Executive Teams; ET: Executive Teams.
29
Ambition for 2025
Strategic Objective |
|
KPI |
|
2025 Ambition |
Growth |
|
Cloud revenue |
|
More than €21.5 billion |
|
|
Total revenue |
|
More than €37.5 billion |
Profitability |
|
Cloud gross profit1 |
|
Approximately €16.2 billion |
|
|
Operating profit1 |
|
Approximately €10.0 billion |
|
|
Free cash flow |
|
Approximately €8.0 billion |
Customer Loyalty |
|
Customer Net Promoter Score |
|
Steady increase |
Employee Engagement |
|
Employee Engagement Index |
|
Steady increase |
Climate Performance: |
|
Gross greenhouse gas emissions |
|
Archiving net zero across the value chain by 2030 |
Women in Executive Roles |
|
% of women in GET / SET / ET job levels out of |
|
25% in end of year 2027 |
1 Non-IFRS. Our Ambition for 2025 has been adjusted in accordance with our updated non-IFRS definition applicable from 2024. For more information, see the Performance Management System section.
Note: For a reconciliation of non-IFRS results to IFRS equivalents, see the Performance Management System section.
Seasonality
Our business has historically experienced the highest revenue in the fourth quarter of each year, primarily due to year-end capital purchases by customers. Such factors have resulted in 2023, 2022, and 2021 first quarter revenue being lower than revenue in the prior year’s fourth quarter. We believe that this trend will continue in the near future but to a smaller extent as predictable revenues will further increase their share of total revenues. Unlike our on-premise software revenues, our on-premise support revenues and cloud revenues are less subject to seasonality and thus help to reduce this effect. For more information about the development of our share of more predictable revenue in 2023, see Item 5. Operating and Financial Review and Prospects – Operating Results (IFRS). For more information about the expected development of our share of more predictable revenue, see Item 5. Operating and Financial Review and Prospects – Expected Developments.
Security, Cloud Compliance, Data Protection and Privacy
Vision and Strategy
Every day, organizations around the world trust SAP with their data – either on premise at their physical locations, in the cloud, or when using mobile devices while on the move. Which is why security, cloud compliance, and data protection and privacy are of paramount importance to us. Therefore, the principles set out in the SAP Global Security Policy govern how we keep our data and our customers’ data safe, how we process it in compliance with local legislation, and how we protect it from malicious use. SAP uses the National Standards and Technology’s Cybersecurity Framework (NIST CSF) to assess how well we manage cybersecurity risk in the Company. The cybersecurity governance framework incorporates industry standards and best practices that help guide our understanding of cybersecurity threats, vulnerabilities, and impacts, and how to mitigate these risks using proactive measures.
SAP Global Security and Cloud Compliance
Cloud solutions and services are increasingly important to many companies’ daily operations. Organizations today are facing many risk factors and disruptions, such as war, political unrest, severe weather, pandemics, cyberattacks, and supply chain disruption, making digital solutions critical to organizational resilience. As a result, digital transformation is accelerating and cybersecurity is now even more crucial to IT security professionals, and to leaders in business and government, particularly in those organizations that have moved their core processes to the cloud.
The SAP strategy is focused on helping our customers in their digital transformation. Our SAP Global Security and Cloud Compliance (SGSC) unit supports this journey with the goals of reducing risk and promoting regulatory compliance, and by aligning people, procedures, and technology to protect business processes and data. The organization embraces a security-minded culture that embeds security and compliance in our development and deployment processes and helps secure digital transformation.
SGSC supports key stakeholders across SAP in our lines of business (LoBs), IT, and the presales organization in securing solutions, and drives operational excellence for security and cloud compliance across the enterprise. To protect our organization’s data and assets, and support high-quality risk management and reporting, SGSC regularly reviews and adapts our security policies, standards, and frameworks.
30
Data Protection
With our product and services portfolio, we aim to protect the rights of individuals involved and to meet relevant local requirements when processing personal data. In addition, we strive to strengthen SAP’s reputation in the long term as a sustainable and trustworthy partner in the market. We have implemented safeguards intended to help protect the fundamental rights of everyone whose data is processed by SAP, whether they are customers, suppliers, partners, prospects, employees, or applicants.
We develop and pursue our global data protection and privacy strategy in accordance with our business strategy. Our global data protection and privacy strategy is to constantly monitor the global regulatory data protection compliance landscape, identify relevant stakeholders, and enable them to take necessary measures. It is also designed to safeguard the processing of personal data. The strategy consists of four pillars to help ensure we comply with applicable data protection laws and regulations. These pillars are our global data protection and privacy policy, mandatory global data protection and privacy trainings for employees, our global data protection and privacy network and global data protection management system and its data protection control framework.
Due Diligence for Security and Cloud Compliance Topics
Governance
SGSC is led by a chief security compliance and risk officer and a chief security officer who report directly to the SAP chief technology officer (CTO). SGSC divisions are responsible for areas such as product and application security, cyberdefense, operational security risk management, security compliance, executive protection, physical security, and a Trust Office that supports customers and partners on matters relating to security and compliance.
The SAP Security and Cloud Compliance Governance Model is designed to ensure executive engagement and facilitates shared responsibility in quarterly SAP Security Advisory Board and Security Council meetings and in periodic updates to the Executive Board.
Our commitment to customers is to be open and transparent about security vulnerabilities. To ensure this, we work with several external stakeholder groups, including the SAP user groups for the Americas and for the German-speaking countries.
Guidelines and Policies
The purpose of the SAP Global Security Policy is to provide governance and structure for an appropriate and effective level of information security at SAP and our affiliated businesses. Aligned with the overall SAP corporate strategy and vision, it details management expectations and the strategic goals and objectives for SAP security.
This policy provides high-level requirements for numerous security domains. These include, but are not limited to, access control, physical security, network security management, incident response, and acceptable use. These requirements apply to all SAP employees, contractors, and consultants, and to external parties that are granted access to SAP information and information assets. SAP reviews the policy annually and enacts modifications as deemed appropriate and necessary to protect SAP and our own and our customers’ data and assets where new threats or vulnerabilities are identified. All SAP employees are required to read and adhere to this internal policy. The SAP Security Policy Framework consists of several levels of security documents that support the requirements described in the policy. In addition, the various LoBs at SAP may have supporting policies, standards, procedures, and practices.
Due Diligence for Data Protection Topics
Governance
Within the scope of their responsibilities, our global data protection officer (DPO) monitors the compliance of activities involving the processing of personal data. The DPO reports to our CFO. Within the Executive Board, the SAP CFO is responsible for compliance and enforcement of data protection and privacy. The DPO is responsible for the SAP Global Data Protection and Privacy Policy that addresses SAP’s data protection governance, and regularly informs the CFO about the status of data protection compliance in the SAP Group.
To meet and ensure consistent security and data protection compliance, SAP has implemented a formal governance model that assigns clear responsibilities across the SAP Group. Upon request, the DPO attends steering committee meetings and reports on matters relevant to data protection to the Audit and Compliance Committee of the SAP Supervisory Board.
SAP has established a global network of data protection and privacy coordinators (DPPCs) across all SAP Group entities that process personal data. This DPPC network consists of regional and local DPPCs to ensure data protection and privacy compliance on a local level. The DPPC network sensitizes our employees by conducting local training and monitoring the legal landscape. Where new data protection laws evolve, the DPPC network also helps the Data Protection and Privacy (DPP) team, which acts on behalf of the DPO, identify and analyze them. If this requires compliance activities, they align with the affected LoBs and help drive the relevant implementation. Supported by the DPPC network, the DPP team regularly engages with SAP Government Relations to represent SAP’s interests in the legislative process. In this regard, SAP participates in external working groups aiming at communicating industry-specific interests with respective governments.
31
SAP has implemented a data protection management system (DPMS) for our organization. The DPMS adheres to the generally recognized standard for data protection management systems as defined in the British Standard BS 10012, which comprises the data protection requirements of the European Union (EU) General Data Protection Regulation (GDPR) since version 10012:2017. Our DPMS covers almost all LoBs and is planned to be implemented in all acquired companies as well. It is designed as a framework covering all aspects of data protection compliance of SAP organizations and employees. The system is used as SAP’s standard methodology to ensure compliance with data protection legislation. The maintenance of the framework is subject to certification by the British Standards Institution (BSI) that confirms data protection compliance annually.
Guidelines and Policies
The SAP Global Data Protection and Privacy Policy sets a Group-wide governance standard and structure for the handling of personal data in accordance with data protection and privacy requirements. It also defines requirements for business processes that involve personal data and assigns clear responsibilities. The data protection principles set out in this policy are generally accepted and enshrined in most data protection laws around the world, including the EU GDPR. These principles provide the general framework in the SAP Group for the processing of personal data. We actively monitor changes to applicable laws and regulations so that we can update our standards on an ongoing basis as necessary to meet data protection compliance. The policy was last updated in 2023.
How We Measure and Manage Our Performance
Security and Cloud Compliance
Compliance processes at SAP adhere to trust-service criteria established by the American Institute of Certified Public Accountants (AICPA). Our security, privacy, confidentiality, and processing integrity controls are designed to achieve the appropriate control objectives. In addition, independent, external auditing partners regularly conduct security compliance audits.
SAP discloses vulnerabilities to customers and provides accompanying patches or instructions when the customer needs to take action. This procedure also applies to the rarer cases where SAP patches to cloud services require customer action. We disclose these instructions using SAP Security Notes published every second Tuesday of the month (Patch Day). By the time any vulnerabilities are disclosed to customers, the patches are already applied on cloud landscapes as a rule. This process is further supported by the publication of Common Vulnerabilities and Exposures (CVE documents) through MITRE that enable integration with the customer’s existing vulnerability and risk management tools. MITRE is a disclosure mechanism that provides customers with authoritative, public information from SAP about SAP software vulnerabilities that can be integrated with their existing risk management processes and tools.
We strive to reduce risk by continuously improving our processes for detecting and remediating attacks and vulnerabilities. To that end, we:
- Engage in internal and external audits across SAP globally
- Monitor and support our cloud and IT units with more than 2,800 controls that are audited and tested for design and operational effectiveness
- Offer service organization control (SOC) reports – such as SOC 1 Type II/ISAE 3402 and SOC 2 Type II/ISAE 3000 – to provide insights into the design and operational effectiveness of internal control systems implemented within cloud delivery units
- Have external internationally accredited auditors assess and certify our cloud services according to various reporting standards and ISO certifications, such as ISO 9001, ISO 27001, ISO 27017, ISO 27018, ISO 22301, and BS 10012
Data Protection
To help ensure necessary knowledge about data protection, global data protection and privacy training is mandatory for SAP employees. The training is conducted every two years, with the latest rolled out in 2023. This training helps our workforce handle personal data with due care and in accordance with the law and to maintain compliance with data protection requirements in their work.
We monitor compliance of data protection-relevant procedures across SAP. We maintain a record of processing activities (“procedure enrollment tool”), in which all procedures that process personal data must be documented. These records contain general information about the procedure according to clearly defined criteria that are necessary to meet proper documentation. The records are reportable and regularly reviewed.
We also track the quality of our data protection compliance level based on the annual recertification of our DPMS by the BSI. SAP has been audited by the BSI annually and awarded certifications according to BS 10012 since 2011. The most recent certification is valid until end of 2025.
SAP’s own quality standards and international regulations require careful selection and monitoring of subprocessors processing personal data on behalf of SAP and SAP customers. With the goal that all subprocessors meet data protection and security requirements for the processing of personal data, SAP has implemented a subprocessor verification process that is part of the overall SAP Third-Party Risk Management framework.
SAP respects the rights of the data subjects to obtain information as to whether personal data concerning them is being processed. All necessary information is made available to the data subjects within the framework of the privacy statements on the respective SAP Web sites.
In 2023, there were two notifiable data protection incidents in accordance with the GDPR for data that SAP processes for its own purposes and were reported to the supervisory authorities.
32
Related Risks for SAP
For related financial risks, see the Risk Factors section, specifically the Cybersecurity and Security and Data Protection and Privacy subsections.
Human Capital Resources
Vision and Strategy
People are at the heart of our organization. Aiming for a highly engaged, diverse, future-fit workforce equipped with the right skills helps SAP attract and retain the best talent.
As part of People & Operations, our People Strategy connects with our go-to-market and product strategies, bringing together the essential fabric of SAP’s transformation: our people, processes, and technology. Since 2020, we have been evolving our annual execution of our People Strategy, which contributes to our business strategy and value generation. It can be summarized across three strategic priorities powered by operational excellence, and showcasing SAP SuccessFactors solutions for human experience management (HXM):
– Build SAP’s Skills for the Future by attracting the best and most diverse talent and continuously up-/reskilling our people
– Drive SAP’s Winning and Inclusive Culture by fostering a culture that enables and rewards impact and business outcomes and nurtures inclusion and belonging
– Change the Way We Lead – Do What’s Right by driving accountability and empowerment in an agile, healthy, and inclusive environment
Due Diligence
Governance
Sabine Bendiek served as Chief People and Operating Officer and Labor Relations Director from January 1, 2021, until her departure from the Company on December 31, 2023. She is succeeded by Gina Vargiu-Breuer, who joined the SAP Executive Board in February 202415. The following functional areas help implement our People Strategy: Future of Work (including Global Health, Safety & Well-Being), Global Diversity & Inclusion, SAP Learning, Talent Attraction, Total Rewards, and our Global People Success Services team, which includes the HR Business Partner organization, People Experience, and Global HR Service Delivery.
Guidelines and Policies
SAP is committed to ensuring the fair and equal treatment of all employees in a sustainable manner. For that reason, we established comprehensive policies that guide us in our daily business. Examples include our SAP Global Antidiscrimination Statement and SAP Health & Safety Commitment Statement.16,17
How We Measure and Manage Our Performance
The impact of our People Strategy is measured by seven KPIs (see table “Our Key People-Related KPIs at a Glance”). Five out of the seven KPIs are based on the results of our engagement survey program #Unfiltered.18 With #Unfiltered, we strengthen our commitment to listen regularly to our employees and act together on their feedback. Our focus in 2023 was on continuing our efforts to further strengthen the excitement about the future of SAP. We gauged the sentiment on employee engagement (which includes excitement for the future of SAP), leadership trust, and health and well-being along with other topics twice in 2023. The average scores from both data collections were used as the full-year Employee Engagement Index and Leadership Trust Net Promoter Score.
Additional people-related KPIs can be found in Finance and ESG Data.19
15 As a result of the departure of Sabine Bendiek, as of January 1, 2024, SAP’s HR function has been re-established as an independent Board area named People & Culture.
16 The Commitment Statement, first published in February 2023, is the public version of our internal SAP Global Health & Safety Policy.
17 Both links lead to information that was not part of the statutory audit or the independent limited assurance engagement performed by our external auditor.
18 82,651 employees participated in the #Unfiltered survey in April (response rate: 76%), and 78,041 employees participated in the #Unfiltered survey in October (response rate: 71%). All headcount (HC)-relevant employees and, in addition, in Germany, the non-HC relevant employees on parental leave, on long-term sick leave, with a tenure of more than six months, PhD students, and vocational trainees were invited to take part in the 2023 #Unfiltered survey cycle.
19 Information was not part of the statutory audit or the independent limited assurance engagement performed by our external auditor.
33
Our Key People-Related KPIs at a Glance20
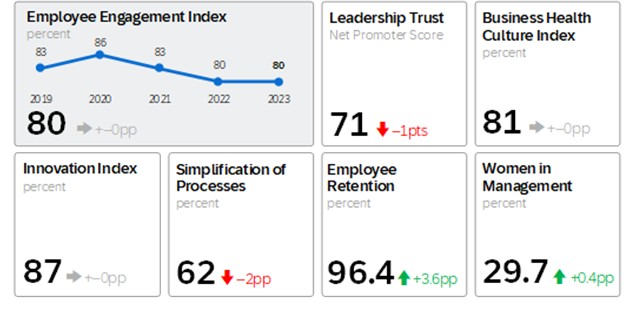
Below is an overview of how we put the three themes of our People Strategy and the KPIs into practice.
Build SAP’s Skills for the Future
SAP is committed to accelerating cloud growth. This requires workforce upskilling and expansion. Attracting, hiring, onboarding, developing, and retaining top talent is vital for our future success. In 2023, we focused on internal roles and strategic investment areas to support our transformation and long-term growth. The competitive talent market underscores the need to further communicate our Employer Value Proposition, encourage employee ambassadorship, and promote referrals. We remain committed to fostering inclusivity across generations, genders, nationalities, and more, to ensure a rich and diverse workforce.
For 2023, it remained our ambition to have 30% of management roles held by women. Our aspiration is to reach gender parity in our workforce at all levels and to retain women leaders.
As part of our strategic pillar “Build SAP’s Skills for the Future,” we focus on the skills transformation of our workforce. We have established one unified skills library, and are working to unify existing skills management tools to implement one single platform, SAP SuccessFactors, for all employees. This will enable greater skills transparency, data-driven workforce planning, and intentional upskilling, as well as enhance our processes from hire to retire.
Our learning strategy is closely aligned with our product and customer strategies to drive cohesive, skill-based development for both our ecosystem and our workforce.
20 Employee Engagement Index: For more information, see the Performance Management System section. The Employee Engagement Index target range for 2023 was 76% to 80%; this range will also be the target for 2024.
Leadership Trust Net Promoter Score: for more information, see the Performance Management System section.
Business Health Culture Index (BHCI): Indicates the extent to which SAP successfully offers employees a working environment that promotes health, and supports their long-term employability and their active engagement in reaching our corporate goals. The index covers questions concerning how employees rate their personal well-being, the working conditions at SAP, and our leadership culture. The BHCI is calculated based on the results of our #Unfiltered program (April 2023 survey). For 2024 through 2025, our ambition remains to keep the BHCI between 78% and 80%.
Innovation Index: Indicates to what extent we foster an innovation culture. The index is measured by three questions in our #Unfiltered program (April 2023 survey).
Simplification of Processes: Shows the impact of our continued efforts to simplify our processes. The index is measured by nine questions in our #Unfiltered program (October 2023 survey).
Employee Retention: Ratio of the average number of employees minus the employees who left voluntarily, to the average number of employees, taking into account the past 12 months (in full-time equivalents, or FTEs). This ratio puts emphasis on employee-initiated turnover. In other words, we seek to measure how many employees choose to stay with SAP. As opposed to keeping a low turnover rate, we aim to keep our retention rate high. The number of employees who left voluntarily excludes those who left voluntarily as part of restructuring-related departures, for more transparency and precise headcount management purposes.
Women in Management: We define “women in management” as the share of women in management positions as compared to the total number of managers, expressed by the number of individuals and not FTEs. It includes three categories: 1) Managers managing teams: Refers to managing teams of at least one employee or vacant position; 2) Managers managing managers: Refers to managing managers who manage teams; and 3) Executive Board members. For 2023, we kept our ambition to increase the rate of women in management to 30%. Our aspiration is to reach gender parity in our workforce at all levels and to retain women leaders.
34
Talent Attraction, Development, and Retention
External hires |
|
- 7,187 (FTE) (2022: 12,564) employees, of which 41.5% were women (2022: 38.1%) - Attracting diverse talent is supported by initiatives such as the SAP Returnship program for professionals who have taken a career break for caregiving, relocation, or military service. |
Early Talent21 hires and pipeline programs |
|
- Early Talent hires: out of 7,187 hired employees, 37.8% (FTE) (2022: 27.9%) are Early Talents. - Vocational Training / SAP Student Training and Rotation (VT/ STAR) program: average of 1,454 students and apprentices (from Australia, Brazil, China, Germany, Hungary, India, Ireland, Japan, New Zealand, South-East Asia, South Korea, Switzerland, and the United States); conversion rate22 of 82% (2022: 78%) - Cooperation with more than 2,700 academic institutions (events, executive lectures, office visits, competitions) - SAP Internship Experience Program: 1,568 (2022: 1,662) global participants in 22 countries |
Global onboarding |
|
- New employees must attend virtual corporate onboarding sessions (a total of 12 hours) that ensure they understand SAP’s strategy, culture, structure, operations, and success metrics. - Around 4,500 new hires completed these sessions in 2023, with a customer satisfaction rate of 4.5.23 - For new hires in customer-facing sales roles, corporate onboarding is complemented by role-based onboarding. In 2023, 1,212 new hires in customer-facing sales roles completed our role-based onboarding program. With each new hire completing at least 80 to 90 hours of learning, total trackable learning was more than 97,000 hours. |
Continuous learning, upskilling, and engagement |
|
- Self-paced online and live interactive training, and a peer-to-peer learning portfolio for all employees - Role-based solution upskilling program for customer-facing functions24 (completion rate: 53%)25 - Cloud upskilling program that reached 39,618 employees (2022: 34,233) - High employee-learning participation rate: in 2023, the participation rate was 99%, resulting in more than 2.3 million learning hours (2021: more than 3 million hours; 2022: more than 3.1 million hours with a 98% participation rate)., and 12,057 individuals spent more than 50 hours learning. - More than 1.8 million external learners upskilled on SAP solutions and technologies in 2023 as part of our ambition to upskill 2 million learners annually by 2025, including programs for underrepresented groups to build digital skills. |
Succession management process |
|
- Succession pipeline defined by supporting targeted development and facilitating Executive Board exposure in roundtables for incumbents and identified successors of executive roles |
SAP Alumni Network |
|
- 25,559 former employees (2022: 20,054 ); 5,903 current employees (2022: 5,444) |
Candidate and hiring manager experience |
|
- It is our goal to differentiate SAP by creating a great experience in every interaction. Qualtrics feedback surveys of candidates and hiring managers help provide the necessary insight to continuously improve our hiring practices. - Candidate Experience:26 4.22; Hiring Manager Experience:27 4.68; Quality of Hire: Score 1: 96%; Score 2: 67%28 |
Average tenure |
|
- 8.7 years (2022: 8.3 years) |
Earned employer, learning, and development recognitions |
|
- 170 (2022: 154); List of Workplace Culture Awards29 - Our approach to upskilling has been recognized by: – The Chief Learning Officer 2023 Learning Elite Awards – Gold Status – SAP being named a leader in three IDC MarketScape reports, the European and U.S. IT Training Services 2021 Vendor Assessment, and APeJ IT Training Services 2022 Vendor Assessment, and issued again in 2023. |
21 “Early Talents” are defined as having 0 to 3 years of experience in a professional setting when hired into a professional role.
22 Percentage who received permanent contracts after completing the VT/ STAR program
23 Score based on the question: “Overall, how satisfied are you with the Experience SAP session?” (scale: 1 being the lowest, 5 the highest rating).
24 The role-based skill program is mandatory for all SAP employees in Customer Success (CS) – excluding contract employees in CS roles in Germany, where the program is considered “highly recommended.”
25 The role-based skill program consists of the following levels: L100 completion rate: 50%, L200 completion rate: 45%, L300 completion rate: 121%, and Essential Learning completion rate: 53%.
26 The score is based on three questions (scale: 1 being the lowest, 5 the highest rating) about their experience with the recruiter, their ability to represent the Company, and the opportunities there, and their ability to serve as strategic advisor to find the best fit within the Company for the candidate.
27 This is a weighted average of the candidate touchpoint survey: Career Site, Post-Application, Post-Interview, and Post-Decision.
28 Score 1 is based on the question: “Would you hire this employee again?”; Score 2 is based on the question: “Has this employee ‘raised the bar’ for your team?”
29 Link leads to information that was not part of the statutory audit or the independent limited assurance engagement performed by our external auditor.
35
Drive SAP’s Winning and Inclusive Culture
With our performance management approach, we aim to establish a high-performance focus by linking business goals to the impact of individuals and teams. Development opportunities, meaningful reward packages, and a culture of inclusion foster an environment where the full potential of every individual is realized. It is critical that our employees see the link between their individual contribution and SAP’s future success.
Goal Setting and Reward Structure
Smart and transparent goal-setting approaches and continuous dialogue |
|
- SAP's top leadership sets goals for their organization based on SAP's and their respective Board area's strategy and focus areas and make them visible to all employees, kicking off a goal cascade through all required leadership levels, down to team and employee goal setting. In the time from January to April, up to 93% of our workforce documented their performance goals in 2023 (2022: 88%).30 - SAP Talk conversation and check-ins throughout the year are designed to ensure manager and employee dialogue, discuss goals defined according to the SMART31 methodology, agree upon and document these goals, and share feedback. |
Holistic Total Rewards value proposition |
|
Our rewards experiences bring value to our people and SAP. For example, we: - Ensure fair pay through annual, global reviews of our pay ranges and pay equity, and centrally-funded pay adjustments, so that all employees are within their pay range and acceptable spread of pay differences with peers. Our approach is agnostic of personal characteristics and recognized as market-leading by The Josh Bersin Company.32 - Follow a “pay-for-performance” approach with broad-based and targeted investments to reward individuals’ unique contribution and impact - Empower managers with a real-time analytics dashboard, powered by SAP, to make impactful rewards decisions - Motivate employees to drive our cloud transformation with short-term incentives using a unified KPI of growth in current cloud backlog (CCB) 33 - Drive ownership through our share-based compensation program, Move SAP, which vests quarterly and is share-settled in most countries (2023: 97% of employees eligible) - Ensure ownership is accessible for all employees through our global share purchase plan, Own SAP. Overall participation was 75% in 2023 (2022: 79%) with a collective investment of 6,710,033 shares (2022: 9,183,599). - Increase transparency for employees on their holistic rewards offerings – from pay to benefits and equity. Employees now have transparency into their own pay ranges (99.8% of all employees) and the value of top benefits offerings (66% of all employees). |
For more information, see the Notes to the Consolidated Financial Statements, Note (B.3).
At SAP, we strive to be the world’s most inclusive workplace, aiming to create a unique culture where everyone feels a sense of belonging, and human differences are celebrated and valued.
As a global organization with employees from 160 nationalities, we strive to consider the full spectrum of human differences and promote inclusion for each one of them (for example, inclusion of gender, race, LGBTQ+, generations, disability, and many other diversities). Our Diversity & Inclusion Strategy is built on three pillars:
– |
Workforce Diversity: We believe in leveraging the widest spectrum of human differences that represent a diversity of identities, thoughts, and perspectives to create business outcomes that help the world run better every day. |
– |
Workplace Inclusion: We foster a work environment where colleagues can thrive and engage to their fullest potential in driving SAP’s purpose. Inclusion involves active co-creation of the culture where all experiences lead to a feeling of acceptance and belonging. |
– |
Marketplace Leadership: We are aware of the potential impact we can have as one of the largest tech companies in the world, and therefore extend our diversity and inclusion focus to our entire ecosystem. |
30 M&A teams that are not yet using our Success Map tool are excluded.
31 SMART is an acronym that stands for Specific, Measurable, Achievable, Realistic, and Timely.
32 The Josh Bersin Company, SAP Transforms Total Rewards to Accomplish Pay Equity, 2023
33 Used in our sales leadership plans as a primary KPI, in non-quota carrying sales plans as a secondary KPI, and in our revenue-enabling plans as the core basis of evaluating our company success. For a definition of CCB, see the Performance Management System section.
36
Equality and Inclusion in the Workplace
Gender inclusion, advancement, and equality |
|
- Women in the overall workforce: 35.2% (2022: 34.9%); women in management roles: 29.7% (2022: 29.3%); women in executive roles:34 22.2% - SAP ranked #3 on Forbes’ list of the World’s Top Companies for Women in 2023, rising from #18 in 2022. - SAP Business Women’s Network impact: 3,300 participants at International Women’s Day and 150 chapter global events - We launched the Global Women’s Development Program for women below managerial levels, which has 263 participants across all Board areas. - The SAP Returnship program, a 20-week internship for mid-career professionals, converted 66% of the returnees into full-time employees and doubled in size. |
Autism inclusion |
|
- Celebrating 10 years of success in 2023, our Autism at Work program supported 244 (2022: 215) colleagues on the autism spectrum across 16 (2022: 15) countries. The program was also expanded to the Philippines. - SAP Autism Inclusion Pledge: we continued to support 126 companies with best-practice sharing. - We sponsored the first-ever Autism Inclusion Company of the Year Award in partnership with Disability:IN. - SAP received the HollyRod Foundation’s Corporate Compassion Award. - We created the Sensory Relaxation Room in Prague and the Tranquility Lounge at the SuccessConnect event in Las Vegas as neurodivergent-inclusive spaces. |
Race and ethnicity |
|
- SAP continued to be a member of the Equal@Work platform of ENAR, the European Network Against Racism. - We launched a global development program focused on levelling the playing field for underrepresented groups. The program was extended beyond North America to Africa and Brazil. |
LGBTQ+ inclusion |
|
- SAP joined the Partnership for Global LGBTIQA+ Equality’s “Pride on the Promenade” initiative at the World Economic Forum. - SAP received the following recognitions: Top rating in the Corporate Equality Index of the Human Rights Campaign in five countries; a gold seal in Uhlala Group’s PRIDE Champion Audit in Germany; gold certification in Japan in the PRIDE Index from Work With Pride for the fourth consecutive year. - SAP sponsored the Out & Equal 2023 Workplace Summit. |
Workplace accessibility |
|
- We received a 100% score on the Disability Equality Index for the fifth consecutive year. |
Global Employee Network Groups (ENGs) |
|
- SAP supports 13 global Employee Network Groups (ENGs), which foster a culture of inclusion and psychological safety in the workplace. - Executive Board members continue to be executive sponsors for ENGs. - Allyship for Inclusion initiative launched globally in 2023 in partnership with ENGs to build a culture of inclusion. |
Workplace inclusion |
|
- SAP launched the first global diversity survey to assess workforce representation. - We achieved a 92% workplace equality rating (compared to 91% in 2022) in the #Unfiltered survey. - We launched Intentional Inclusion workshops globally to raise awareness about overcoming unconscious bias. - In 2023, SAP was recognized as a Top Faith-Friendly Company by the Religious Freedom and Business Foundation. |
Marketplace leadership |
|
- SAP won 56 diversity and inclusion awards in 2023, more than in any previous year. - We activated the SAP EMEA South partner ecosystem on diversity and inclusion through active engagement with leadership. - We partnered with the World Economic Forum in best-practice sharing. - We enhanced our engagement with customers to advance diversity and inclusion (for example, Tech Day of Pink). - To foster the inclusion of transgender and non-binary people, SAP implemented the pronouns and preferred name functionalities available in the SAP SuccessFactors solutions it deploys internally. - The SAP Design team released accessibility design tools and the inaugural research handbook to enhance product accessibility. |
34 We define “women in executive roles” as the percentage of women on the three management levels below the Executive Board out of the combined total of men, women, and other genders at those three levels.
37
Change the Way We Lead – Do What’s Right
SAP’s leadership culture is built on our leadership credo: “Do what’s right, make SAP better for generations to come,” which focuses on empowerment of our leaders to make critical decisions and drive change, and on stewardship to bring along the next generation of leaders and employees.
Leadership Culture
Empowering and guiding our leaders |
|
- We strengthened SAP’s leadership culture, based on the credo, through the creation of a consistent approach to leadership engagement across all levels, including: – Executive strategy forums and clinics – Enabling executives to build high-performing organizations |
Reinforcing leadership culture |
|
- Traditional, peer, and experiential learning journeys focus on purpose-driven leadership and on driving high-performing teams and organizations. - We built accountability into critical processes and provided data transparency on leadership KPIs for organizational steering. |
Consistent enablement of leaders |
|
Targeted development offerings for each leadership tier, developing the skills to lead SAP into the future: - Enabling courageous conversations, providing feedback, intentional inclusion, and psychological safety - Scaling delivery of our modularized learning and flagship programs - Holding the SAP Leadership Summit - Percentage of leaders35 who have completed at least one relevant learning asset: 44.4% - Percentage of global senior executives who have completed relevant development offerings: 62.2% |
In addition to our leadership culture, one further strategic pillar is that of pursuing an agile, entrepreneurial, healthy, and innovative organization, which is essential in today’s rapidly changing environment.
A Future-Ready, Agile, Healthy, and Innovative Organization
Future of Work |
|
- SAP’s holistic approach to the future of work actively addresses trends and developments – including the AI revolution and skills shortage – to reimagine work at its core. We drive this transformation with state-of-the-art people practices and innovative workplace approaches to future-proof our organization in times of unprecedented change. - With our Pledge to Flex initiative, SAP established a new standard for flexible work as the foundation for successful hybrid work - also for the post-pandemic era. Our global “I’m In” campaign, launched in May, reaffirmed our commitment to flex work and recommended working in the office two to three days per week as a good practice for many employees in 2023. We see value in coming together in the office on a regular basis, as it supports camaraderie, team collaboration, productivity, and innovation. - Leveraging advanced technology and new office design concepts in frontrunner locations (London, Montréal, and Zurich) further supports SAP in attracting and retaining top talent in the tech industry. |
Health, safety, and well-being |
|
- The health, safety, and well-being of our people is a cornerstone of a sustainable Future of Work. To deliver on the promises outlined in SAP’s business strategy, our people need to run at their best and realize their full potential, while caring for their own health, their colleagues’ and team’s well-being, and their customers’ needs. - A caring culture and compliance with international and local health and safety regulations are integral parts of our business conduct, our duty of care, and our commitment to ethical leadership, as outlined in SAP’s Health & Safety Commitment Statement. - In 2023, for example, we: – Rolled out the revised internal SAP Global Health & Safety Policy with the SAP Global Health Summit and an employee enablement training – Updated SAP’s global health and safety management system in line with the SAP Global Health & Safety Policy – Continued the “Are you OK?” mental well-being initiative for leaders and employees as part of our commitment to a no-stigma working culture – Continued the SAP Global Mindfulness Practice program, supporting employees and customers in bringing mindfulness into daily personal and professional lives to increase their overall well-being and productivity |
Innovation |
|
- The SAP.iO programs curate a relevant and diverse startup ecosystem that extends the value of SAP solutions and meets the continuously evolving needs of our customers. The programs provide dedicated support to promising startups as they launch and scale relationships with SAP and our global network of customers, partners, and employees. In 2023, SAP.iO helped 120 startups scale their solutions and expand the SAP ecosystem. - Hasso Plattner Founders’ Award: the highest internal employee recognition at SAP |
35 The term “leaders” is inclusive of all SAP colleagues who are in a formal executive or people manager role – either managing a team or managing managers.
38
Deliver Operational Excellence and Showcase Human Experience Management
Delivering engaging experiences for SAP’s customers starts with our own workforce. A continued emphasis on operational excellence and experience management is key to delivering our human experience management (HXM) solutions and services efficiently, with both empathy and compliance. Examples include:
– |
SAP runs SAP SuccessFactors solutions to manage global SAP people data, and the SAP Analytics Cloud solution to provide analytics and insights. |
– |
SAP puts processes and tools in place that enable employees to work flexibly from different locations (including working from home or abroad for personal reasons), in line with local flexible work policies. |
– |
The SAP Signavio Process Intelligence solution provides our HR organization with insights on how HR support tickets flow between the various HR support teams. In addition, we are currently leveraging the SAP Build Process Automation solution to further automate processes such as bonus plans and variable pay. |
Related Risks for SAP
“Human rights and employee matters” is a risk factor that is assessed as part of SAP’s corporate financial risk management system. No material financial risks were identified through our risk framework as described in the Risk Factors section.
Energy and Emissions
Vision and Strategy
For over a decade now, climate action has been at the top of SAP’s corporate sustainability agenda in light of the increasing impacts of climate change and escalating global challenges such as ecosystem degradation and biodiversity loss. As outlined in the Sustainability Management36 section of the Integrated Report, we aim to take climate action through our dual approach as enabler and exemplar to help pave the way toward a low-carbon future for our customers, partners, and SAP, and create impact within planetary boundaries.
Due Diligence
Governance
As outlined in the Sustainability Management36 section of the Integrated Report, the Executive Board sponsorship for sustainability lies with the CEO, and for climate action with the CEO and CFO. The ESG Steering Board (formerly Sustainability Council) serves as a governance body to steer SAP’s corporate sustainability performance. The organizational unit and operating segment responsible for sustainability drives SAP’s holistic, cross-company sustainability agenda. The Office of the Chief Sustainability Officer (oCSO) is part of this unit and continues to shape SAP's response to climate change in close cooperation with other departments. Among other things, the oCSO is responsible for:
– |
Defining the Environmental Policy and determining a global environmental project portfolio to help steer SAP’s impact |
– |
Setting reduction and impact targets and embedding sustainability-related initiatives across SAP (for example, running the cross-board Environmental Management System and net-zero program) |
– |
Evaluating our carbon inventory and monitoring carbon emissions on a quarterly basis |
– |
Assessing and managing climate-related risks through a quarterly risk review |
– |
Managing nature-based investment decisions |
– |
Serving as advisor to our development units to develop solutions |
Sustainability is a company-wide effort, and initiatives are also driven outside this dedicated unit. For example, the global procurement organization aims to ensure that SAP purchases energy-efficient, sustainable products and services. The global real estate and facilities management team designs and operates many SAP facilities based on robust environmental standards such as ISO 14001:2015 and the Leadership in Energy and Environmental Design (LEED) certification program. Our global cloud services organization attends to the optimization of the energy consumption in our data centers, while our SAP IT department encourages employees to use IT equipment and business software responsibly. In addition, to be able to innovate and evolve sustainability further, we regularly engage externally with various stakeholder groups, such as non-governmental organizations (NGOs), investors, customers, and academia. For more information, see the Stakeholder Engagement37 section of the Integrated Report.
36 Link leads to information that was neither part of the statutory audit nor included in the independent limited assurance engagement performed by our external auditor.
37 Link leads to information that was neither part of the statutory audit nor included in the independent limited assurance engagement performed by our external auditor.
39
Guidelines and Policies
Our Global Environmental Policy38 provides the core framework for how we manage our environmental impact – in our own operations and with our customers. Updated in August 2023 and approved by the CEO, this policy guides our efforts to improve our ecological footprint, provide environmental performance transparency, and demonstrate sustainable leadership through transformational strategies. In addition, it helps us comply with internationally recognized sustainability standards as well as stakeholder expectations, primarily those of customers, investors, and employees.
How We Measure and Manage Our Performance
Our Carbon Reduction Targets
Target |
|
Base Year |
|
Target Year |
|
Target Description, Status, and Next Steps |
Carbon neutrality in our own operations by 2023 |
|
2017: 327 kilotons (kt) net carbon emissions39 |
|
2023: 0 kilotons (kt) net carbon emissions |
|
●
Net carbon emissions = gross carbon emissions (scope 1, 2, and selected scope 3)40 minus purchased renewable energy certificates (EACs), self-generated renewable energy, and carbon offsets.
●
To track progress on our target, we derived annual targets for our internal operational steering. Since the beginning of 2020, these annual targets have been integrated in the Executive Board’s short-term performance-based compensation41.
●
Status: Achieved42
|
1.5°C-aligned Science-Based Target (SBT) |
|
2023: 6.9 million tons gross carbon emissions (market-based) |
|
2030: reduction by 90% (near-term and long-term target) |
|
●
Acceleration of SAP’s science-based target43 (to reach net zero across our value chain in line with a 1.5°C future by 2030, 20 years earlier than originally planned) required a reassessment of the baseline, underlying scopes, calculation methodologies, and the target pathway.
●
Status and next steps:
o In 2023, our original SBT44 was replaced by our commitment to reach net zero by 2030 in line with the SBTi Corporate Net-Zero Standard. o In line with the Greenhouse Gas (GHG) Protocol, we revised the baseline, which includes scope 1, scope 2 market-based, and all business-relevant scope 3 value chain emissions. For more information, see the Non-Financial Notes45 section. o Next steps: submission to the SBTi in 2024 and publication of target pathway 2024–2030 in the SAP Integrated Report 2024. |
38 Link leads to information that was neither part of the statutory audit nor included in the independent limited assurance engagement performed by our external auditor.
39 We account and report all our carbon emissions in CO2 equivalents (CO2e).
40 To see which emission categories are considered in our carbon neutral target, see section Non-Financial Information: Environmental Performance (link leads to information that was neither part of the statutory audit nor included in the independent limited assurance engagement performed by our external auditor).
41 Link leads to information that was part of the compensation report audit of our external auditor (reasonable assurance level).
42 In Finance and ESG Data, we provide a carbon emissions breakdown and more details on progress (selected data presented in the linked environmental section were part of the statutory audit or independent limited assurance engagement performed by our external auditor. For more information, see the auditor's assurance report).
43 Acceleration decision made in 2022 to prevent and mitigate the intensifying adverse effects of climate change.
44 Confirmed by the SBTi in a 2019 reassessment, our original 1.5°C-aligned SBT (first defined in 2017) aimed for a reduction of 85% by 2050 compared to the base-year level 2016 (near-term target: reduction by 40% by 2025).
45 Link leads to information that was neither part of the statutory audit nor included in the independent limited assurance engagement performed by our external auditor.
40
Performance and Measures to Progress46
With our net carbon emissions dropping to 0 kilotons (kt) in 2023 (2022: 85 kt), we have achieved our carbon neutrality commitment within the targeted timeframe. To achieve our target, we continued and expanded existing initiatives and programs to drive efficiency and innovation, following our strategic approach to first avoid, secondly reduce, and thirdly – if no other option is feasible – compensate for residual emissions by investing in high-quality offset projects certified by international standards (for more information, see the section Investing in Carbon Offsets to Compensate for Our Remaining Emissions). Starting in 2024, we will shift toward reporting on our new leading environmental target of ‘net zero across our entire value chain by 2030.’
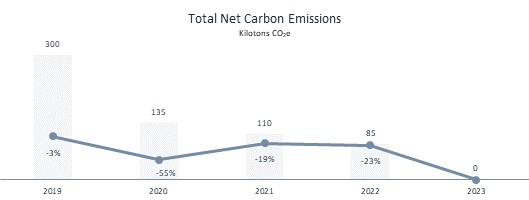
46 In Finance and ESG Data, we provide more details about our environmental data (selected data presented in the linked environmental section was part of the statutory audit or independent limited assurance engagement performed by our external auditor. For more information, see the auditor’s assurance report).
41
After post-COVID-19 catch-up effects and a corresponding increase in 2022, total energy consumption in our own operations decreased slightly in 2023. Looking at the data center electricity consumption, we continue to see a decrease attributable to a shift toward hyperscale services and the implemented energy efficiency measures taking effect.47 We have continued to reduce all electricity-related emission categories with electricity from renewable energy sources48 (for more information, see the Key Initiatives to Avoid and Reduce Emissions table below).
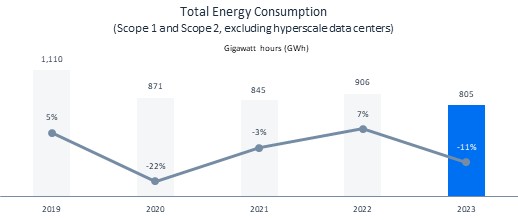
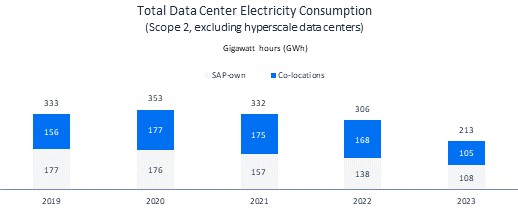
47 In 2023, hyperscaler electricity consumption was more than two times that of our co-locations. For more information about our energy consumption, see section Non-Financial Notes: Environmental Performance.
48 For more information, see section Non-Financial Notes: Environmental Performance.
42
Key Initiatives to Avoid and Reduce Emissions
Cloud Transformation | ||
SAP’s sustainability software portfolio |
|
● SAP delivers sustainability management solutions for sustainability reporting, climate action, circular economy, and social responsibility to enable our customers to run sustainable and resilient operations as described in the Product Strategy section.49 ● As co-innovation customers for the Sustainability Control Tower, Sustainability Footprint Management, Sustainability Data Exchange, and Green Ledger, various teams such as the Corporate Sustainability team and Sustainability Controlling team provide input and feedback to the development teams with the aim of leveraging a solution that enables companies to record, report, and act on their sustainability goals. |
Carbon-neutral cloud solutions and product-in-use emissions |
|
The vast majority of our overall carbon emissions result from the use of our software. To address this, we aim to help our customers, hardware providers, and others to run more energy-efficient operations. ●
By powering all data centers with 100% renewable electricity,50 we offer our customers carbon-neutral51 cloud software solutions and help them reduce their overall carbon emissions (upstream scope 3).
●
We started to develop a carbon footprint sizing approach with the aim of enabling our customers to gain transparency on the carbon impact of their SAP applications that run in SAP’s internal and external data centers, answering the question of how much our customers can reduce their environmental footprint while running SAP solutions on SAP’s self-operated or on SAP sourced infrastructure.
●
We collaborate with customers to optimize their on-premise landscapes so that they consume less energy (for example, we decommission legacy systems, archive unused data, consolidate business applications, and virtualize their system landscapes).
|
Supply Chain | ||
Environmentally conscious procurement |
|
● Multi-phased supply chain engagement program: We partner with (top) suppliers to procure low carbon and energy-efficient products and services to reduce their environmental footprint throughout the supply chain. ● We consider environmental requirements in procurement processes and decisions. For more information, see the Sustainable Procurement section. |
Fostering biodiversity and nature-based solutions to climate change |
|
● Intact forests help to slow climate change, safeguard biodiversity, and provide critical ecosystem services to people. Thus, reforestation projects are one part of SAP’s climate action plan. ● Since 2012, SAP has helped to plant over 16.3 million trees to support ecosystem restoration and sustainable development. SAP will continue to finance nature-based solutions and is committed to planting 21 million trees by the end of 2025. ● By applying strict quality criteria, SAP aims to support initiatives which restore and protect the right trees in the right places and have a positive impact on the local community, biodiversity, and climate. ●
Since 2021, SAP has been part of the 1t.org Corporate Alliance, which mobilizes business leaders to responsibly conserve, restore, and grow trees worldwide while pursuing the 1.5 degrees Celsius science-based target.
|
49 For more insight into our sustainability software portfolio, see SAP’s Web site (link leads to information that was neither part of the statutory audit nor the independent limited assurance engagement performed by our external auditor).
50 We achieve this by leveraging 1) investments in high-quality, EKOenergy-certified EACs, and 2) renewables produced on-site. The term “data center” refers to both SAP-owned and external data centers (co-location data centers and hyperscalers).
51 Relating to the electricity consumed by cloud solutions from SAP only.
43
Operations | ||
Running SAP facilities with 100% renewable electricity |
|
Since 2014, SAP has been running all its offices and data centers52 with 100% renewable electricity in alignment with our commitment toward the RE100 initiative. For this, we use two strategic levers: ● We invest in high-quality, EKOenergy-certified EACs53 to foster renewable energy generation. ● We produce renewable electricity in selected SAP locations worldwide through solar panels (such as in Palo Alto, CA, in the United States, Bangalore, India, and Mougins, France). At SAP’s headquarters, we are in the process of implementing an on-site Power Purchase Agreement (PPA) solar project with the aim of increasing the share of renewable electricity self-produced on-site and achieving price stability. ● As a potential third lever, we are running a green tariff pilot in Australia to power our local facilities with renewable electricity (bundled EACs). This approach allows us to reduce our entire electricity-consumption-related emissions (2023: 256 kt in total; 161 kt by SAP and 95 kt by suppliers; 2022: 257 kt). Going forward, we aim to expand the usage of Power Purchase Agreements for sourcing renewable electricity. |
ISO 14001 |
|
● SAP’s environmental management system (EMS) is implemented in over 45 sites in 26 countries worldwide and certified by the internationally recognized ISO 14001:2015 standard. In 2023, we successfully maintained this certification. ●
Target: Increase EMS scope to 100% of SAP’s major company-owned sites by 2025 (2023: 86%).
|
ISO 50001 |
|
● SAP’s headquarters in Germany and North America and 100% of SAP’s own major data centers (St. Leon-Rot and Walldorf in Germany, and Colorado Springs and Newtown Square in the United States) operate an ISO 50001:2018-certified energy management system. ●Efficient power usage effectiveness (PUE)54 at SAP headquarters in Germany and North America: 1.50 ● Core refurbishment of buildings: starting with building WDF01 at SAP’s headquarters in Germany, which aims to save 42% in final energy used annually compared to the previous construction method. ● Centralization of the cooling distribution system at SAP’s headquarters in Germany will allow the usage of environmentally friendly operating fluids and sector coupling (conversion of surplus energy into cooling energy by absorption chillers and use of heat pumps for room cooling). Electricity for the cooling system will be derived primarily from renewable sources (such as solar). |
Global car fleet: Transition to electric or zero-emission vehicles |
|
From 2025 onwards, all new company cars for employees are planned to be emission-free.55 At the end of 2023, about 14% of our global car fleet comprised emission-free vehicles. SAP also promotes various incentives to accelerate this change, for example: ●We power all SAP-owned charging stations at SAP locations with 100% renewable electricity. ● For larger vehicle fleets such as in Germany, the Netherlands, and others, we offer employees a subsidy to install a charging point at home, and reimburse them for the electricity consumed. As far as legally possible and factually reasonable, we will offer similar subsidies in all countries. ●In some countries, we offer our employees a discount or a higher budget if they choose an all-electric vehicle. ●
We continually expand SAP’s global charging infrastructure (2023: 1,650+ charging stations; 2022: 1,100+ charging stations).
|
Alternative commuting |
|
To generate a shift in commuting habits and foster inter-/multimodal mobility, we continue to offer various programs, such as: ● Company bicycle leasing programs: Employees can lease bicycles with the option of purchasing them after contract end. Such programs have already been established in Belgium, Germany, and Luxembourg. ●
Successful role out of a flexible mobility budget in spring 2023 as a regular mobility alternative in Germany (2023: about 1,950 participants). Participants receive a fixed monthly mobility budget to use any mode of transport to commute to work or in their leisure time (bicycle, e-scooter, rental car, train, bus, and so on).
|
Business flights |
|
●
We avoid business flights by investing in virtual collaboration and communication technologies.
●
In 2016, we began charging an internal carbon price for business flights, which we invest in high-quality carbon offset projects to counterbalance the carbon emissions these flights cause. By annually increasing the carbon price per flight ticket that is charged to the organizational cost center, we seek to incentivize the organizational units and employees to fly less or to choose an alternative, sustainable mode of travel.
|
52 The term “data center” refers to both SAP-owned and external data centers (co-location data centers and hyperscalers).
53 For more information, see section Non-Financial Notes: Environmental Performance.
54 The PUE is a ratio that describes the efficiency of a data center, with 1.0 being the ideal ratio.
55 “Emission-free” refers to vehicles that do not emit exhaust gas or other pollutants from the onboard source of power. These vehicles will gradually replace out of plug-in hybrid electric vehicles (PHEV) and vehicles with internal combustion engines (ICEV) as company cars.
44
Investing in Carbon Offsets to Compensate for Our Remaining Emissions
SAP financed a diverse portfolio of carbon projects56 with a strategic focus on natural carbon sinks to help avoid and remove from the atmosphere the equivalent of the remaining emissions from its own operations (2023: 215 kt, 2022: 97 kt; scope 1, 2, and selected scope 3 emissions).57 All offsets were generated by reforestation, forest protection, rural energy, and agroforestry projects implemented in collaboration with local communities. This voluntary investment in certified carbon offsets helped SAP reach its carbon-neutrality goal in 2023.
Carbon Project Portfolio and Long-Term Commitments
Offset Provider |
|
Description and Details |
Livelihoods Carbon Funds (LCF) |
|
●
SAP committed to invest approx. €10 million (accumulated) in the Livelihoods Carbon Funds 1–3 between the years 2013 and 2045. By year end 2023, SAP had invested approximately 42% of the total commitment.
●
The funds prefinance community-based ecosystem restoration, agroforestry, biodiversity preservation, and clean energy projects in developing countries.
●
Due diligence is ensured by applying strict, recognized (for example, Gold Standard), project management by trusted partners in collaboration with the local non-profit organizations, and joint overseeing of the strategy, project portfolio, and impact by the corporate co-investors and their individual company criteria.
●
Offset volume in 2023: 114 kt
|
Carbon Retailers |
|
●
SAP collaborates with an independent third-party carbon rating agency to systematically procure offsets from carbon retailers which are exclusively generated by the highest-rated carbon projects on the market based on the projects’ carbon score, additionality, durability, and co-benefits such as the impact on people and biodiversity. This diligent procurement approach helps SAP mitigate the risk of procuring non-genuine carbon emission reductions while reinforcing our own quality expectations (for more information, see the Non-Financial Notes: Environmental Performance section).
●
Offset volume in 2023: 101 kt
|
In 2023, we invested for the first time as a pilot in Sustainable Aviation Fuel (SAF), to reduce our business-flight-related emissions compared to emissions generated by using conventional (fossil) aviation fuel.58
Related Risks for SAP
In 2022, we performed a climate risk and vulnerability assessment to identify physical climate risks (acute and chronic) that are material to the SAP-relevant activity ‘data processing and hosting,’ as follows:
– |
Risk screening for all our own and co-location data centers based on a multitude of climate hazards (acute and chronic),59 using global climate models (representative concentration paths (RCPs) 2.6, 4.5, and 8.5). |
– |
Deep-dive exposure analysis for a selected range of climate hazards based on 2°C and 4°C scenarios: heatwaves and extreme precipitation (time horizon: 2021–2050)60 as well as river flooding and water stress (time horizon: 2030 and 2050).61 The hazards were selected based on the risk screening outcome and impact on data centers combined with expert discussions. |
– |
Vulnerability analysis of our own data centers with high exposures helped us identify the impact and risk of a hazard by considering current and past hazard experiences and implemented mitigation actions. |
– |
In 2023, we rolled out a vulnerability and adaptation questionnaire to our own data centers to ensure (on - site) measures are planned and/or in place to address the identified applicable main climate change risk (s). |
‘Climate change and air quality’ is a risk factor that is assessed as part of SAP’s Corporate Financial Risk Management System. No material financial risks were identified through our risk framework as described in the Risk Factors section.
56 Investments in projects and the corresponding carbon offsets represent a unit of reduced, avoided, or removed GHG emissions.
57 To finance our investments in high-quality carbon offset projects (for example, certified by the Gold Standard) and EACs, we leverage the collected internal air travel fees charged on business flights.
58 We have not (yet) counted the emission reductions received towards our carbon targets.
59 Examples of chronic hazards: changing temperature, heat stress, changing wind patterns, rise in sea level, and soil erosion. Examples of acute hazards: wildfires, water stress, droughts, floods, avalanches, and landslides.
60 Usage of Intergovernmental Panel on Climate Change (IPCC) RCP 2.6 and RCP 8.5.
61 Usage of IPCC RCP 4.5 and RCP 8.5.
45
Intellectual Property, Proprietary Rights and Licenses
We rely on a combination of the protections provided by applicable statutory and common law rights, including trade secret, copyright, patent, and trademark laws, license and non-disclosure agreements, and technical measures to establish and protect our proprietary rights in our products. For further details on risks related to SAP’s intellectual property rights, see “Item 3. Key Information — Risk Factors — Operational Risks.”
We may be dependent in the aggregate on technology that we license from third parties that is embedded into our products or that we resell to our customers. We have licensed and will continue to license numerous third-party software products that we incorporate into and/or distribute with our existing products. We endeavor to protect ourselves in the respective agreements by obtaining certain rights in case such agreements are terminated.
We are a party to patent cross-license agreements with several third parties.
We are named as a defendant or plaintiff in various legal proceedings for alleged intellectual property infringements. See Note (G.3) to our Consolidated Financial Statements for a more detailed discussion relating to certain of these legal proceedings.
Description of Property
Our principal office is located in Walldorf, Germany, where we own and occupy approximately 405,000 square meters of office and datacenter space including our facilities in neighboring St. Leon-Rot. We also own and lease office space in various other locations in Germany, totaling approximately 185,000 square meters. In approximately 80 countries worldwide, we occupy roughly 1,595,000 square meters. Except for our main office in Germany, most of our office spaces are leased. We also own certain real estate properties in Newtown Square, Palo Alto, and Colorado Springs (United States); Bangalore (India); Sao Leopoldo (Brazil); London (UK); Ra’anana (Israel); Sofia (Bulgaria) and a few other locations.
The office and datacenter space we occupy includes approximately 325,000 square meters in the EMEA region, excluding Germany, approximately 310,000 square meters in North and Latin America, and approximately 370,000 square meters in the APJ Region.
The space is being utilized for various corporate functions including research and development, our data centers, customer support, sales and marketing, consulting, training, and administration. Despite COVID-19 related aftereffects, substantially all our facilities are being fully used or sublet. We started in Q1/2023 with the renovation of our “headquarter building – WDF01” in Walldorf which won’t be usable until completion in early 2027. The footprint of this building is not included in the 2023 numbers above. We have closed our remaining offices in Russia and Belarus (except a small space for the “closure team”). For a disclosure on our non-current assets by geographic region see Note (D.7) to our Consolidated Financial Statements. Also see, “Item 6. Directors, Senior Management and Employees — Employees,” which discusses the numbers of our employees, in FTE’s, by business area and by geographic region, which may be used to approximate the productive capacity of our workspace in each region.
We believe that our facilities are in good operating condition and adequate for our present usage. We do not have any significant encumbrances on our properties. We do not believe we are subject to any environmental issues that may affect our utilization of any of our material assets. We are currently investing in the Flex Work readiness of our existing properties and where necessary we are undertaking construction activities to increase our capacity for future expansion of our business. We are also reviewing our portfolio to ensure that it covers our office space demands in line with the evolved Hybrid Work Guidance. Our significant construction activities are described below, under the heading “Principal Investments and Divestitures Currently in Progress.”
Investments
Principal Investments Currently in Progress
In 2023, we finalized various construction projects and continued construction activities in several locations. We plan to finance all of these projects from operating cash flow. Our most important projects are listed below.
Construction Projects
€ millions |
|
|
|
|
|
|
|
|
|
|
Country |
|
Location of Facility |
|
Short Description |
|
Estimated Total |
|
Costs Incurred as at |
|
Estimated Completion |
|
|
|
|
|
|
Cost |
|
12/31/2023 |
|
Date |
Germany |
|
Munich |
|
New office building for approx. 740 employees |
|
99 |
|
91 |
|
June 2024 |
Germany |
|
Walldorf |
|
General renovation of headquarters building for approx. 1,600 employees |
|
225 |
|
18 |
|
March 2027 |
India |
|
Bangalore |
|
New office building for approx. 3,500 employees |
|
86 |
|
8 |
|
December 2025 |
For more information about our planned investment expenditures, see the Investment Goals section. There were no material divestitures of facilities within the reporting period Our principal investments for property, plant, and equipment (other than from business combinations) amounted to €810 million in 2023 (2022: €1,129 million; 2021 €1,067 million).
46
Principal Investments and Divestitures for the Last Three Years
Principal investments in 2023 for property, plant, and equipment decreased compared to 2022. The investments relate primarily to replacement and purchase of information technology equipment and the construction and leasing of buildings and data centers. For further details related to property, plant, and equipment, see Note (D.4).
Our investments for intangible assets such as acquired technologies and customer relationships amounted to €560 million in 2023 compared to €472 million in 2022 (2021: €621 million). Our investments allocated to goodwill increased to €867 million in 2023 from €560 million in 2022 (2021: €1,736 million). The increase in 2023 was primarily due to the LeanIX acquisition (see Note (D.1) for additional information). For further details on investments related to acquisitions, see Notes (D.2) and (D.3) to our Consolidated Financial Statements.
For further information regarding the principal markets in which SAP conducts business, including a breakdown of total revenues by category of activity and geographic market for each of the last three years, see “Item 5. Operating and Financial Review and Prospects — Operating Results (IFRS)” of this report.
ITEM 4A. UNRESOLVED STAFF COMMENTS
None.
47
ITEM 5. OPERATING AND FINANCIAL REVIEW AND PROSPECTS
Overview
For information on our principal sources of revenue and how the different types of revenue are classified in our income statement refer to Note (A.1) to our Consolidated Financial Statements.
See “Item 4. Information about SAP — Products, Research & Development, and Services” for a more detailed description of the products and services we offer.
The following discussion is provided to enable a better understanding of our operating results for the periods covered, including:
- the factors that we believe impacted our performance in 2023;
- our outlook for 2023 compared to our 2023 actual performance (non-IFRS);
- a discussion of our operating results for 2023 compared to 2022 and for 2022 compared to 2021;
- the factors that we believe will impact our performance in 2024; and
- our financial targets and prospects.
The preceding overview should be read in conjunction with the more detailed discussion and analysis of our financial condition and results of operations in this Item 5, “Item 3. Key Information — Risk Factors” and “Item 18. Financial Statements.”
Furthermore, it should be read in conjunction with the additional financial information relating to Qualtrics which is presented in the table below and in Note (D.1) (revenues and expenses are presented after consolidation of transactions between Qualtrics and SAP’s continuing operations):
€ millions, unless otherwise stated |
|
2022 |
|
2021 |
Consolidated Income Statements |
|
|
|
|
Cloud revenue |
|
1,129 |
|
717 |
Total revenue |
|
1,351 |
|
889 |
Cost of cloud |
|
265 |
|
162 |
Total cost of revenue |
|
499 |
|
338 |
Total operating expenses (including total cost of revenue) |
|
-2,771 |
|
-2,541 |
Operating profit |
|
-1,420 |
|
-1,652 |
Profit (loss) before tax |
|
-1,423 |
|
-1,658 |
Income tax expense |
|
64 |
|
211 |
Profit (loss) after tax |
|
-1,359 |
|
-1,447 |
Attributable to owners of parent |
|
-993 |
|
-1,173 |
|
|
|
|
|
Earnings per share, basic (IFRS, in €)1 |
|
-0.85 |
|
-0.99 |
Earnings per share, diluted (IFRS, in €)1 |
|
-0.85 |
|
-0.99 |
|
|
|
|
|
Consolidated Statements of Cash Flow |
|
|
|
|
Net operating cash flow |
|
-29 |
|
41 |
Net investing cash flow |
|
-32 |
|
-208 |
Net financing cash flow |
|
-263 |
|
2,828 |
1 For 2022 and 2021, the weighted average number of shares was 1,167 million (diluted: 1.180 million) and 1,170 million (diluted: 1,175 million), respectively (treasury stock excluded).
Economy and the Market
The global economy expanded at a moderate but steady pace in 2023, describes the European Central Bank (ECB) in its most recent Economic Bulletin.1 It attributes this development to strong private consumption and the support of resilient labor markets.
1 European Central Bank, Economic Bulletin, Issue 8/2023, Publication Date: January 11, 2024.
48
Concerning the EMEA (Europe, Middle East, Africa) region, the euro area economy grew minimally over the first half of 2023, reports the ECB. In the second half of the year, real GDP contracted slightly, mostly due to a decline in inventories but also because of subdued confidence, low competitiveness, renewed geopolitical tensions, and tighter financing conditions. However, services activity grew modestly and contributed positively to growth in the second half of the year.
In the Americas region, U.S. economic growth showed more resilience than previously anticipated. Despite significant tightening of monetary policy, the United States showed a solid domestic demand and a strong labor market and, with significant government spending, reached a robust growth, states the ECB.
As for the APJ (Asia Pacific Japan) region, Chinese economic activity stabilized in 2023, driven by stronger consumer spending. The lifting of COVID-19 restrictions at the beginning of the year and a broader recovery in private consumption compensated for weakness in the Chinese residential sector. In Japan, however, real GDP growth contracted in 2023, as high inflation weighed on activity and consumption. However, growth returned to a slightly positive yet modest territory in the fourth quarter, states the ECB.
The IT Market
“The digital business era has arrived. Spending on digital technologies is growing while traditional, nondigital spending is stagnating or even slightly dropping. The demand for digital experiences from customers, employees, partners, and suppliers has shifted to an expectation. Companies looking to sustain and grow are seeking digital revenue streams while looking to digitize operations to reduce costs and increase efficiency.”2 This is how International Data Corporation (IDC), a U.S.-based market research firm, summarizes the current IT market situation. Therefore, reports IDC, “in the post-pandemic environment, digital-first strategies have moved from being a competitive advantage to being the basic standard needed for survival. Legacy systems are increasingly proving to be bottlenecks, hindering real-time data access and agile response mechanisms. In contrast, businesses that have embraced digital transformation are reaping the benefits of adaptability and more insightful data-driven decision-making.”3
In particular, IDC finds that “the technology within a digital business platform is essential for driving the innovation and new revenue streams that companies are looking for in the digital business era” and that “more digitally mature organizations with established digital business platforms are better able to compete in an increasingly digital world.”2 That is because these “autonomous business processes evolve the nature of information from intelligence to insights to immediate decisive actions. These advances, when utilized, give organizations a competitive advantage in speed, scale, and agility and will transform them into truly digital businesses.”3
“Today’s SaaS and cloud-enabled applications are packed with generative AI (GenAI), artificial intelligence, machine learning (ML), microservices, APIs, and automated workflows,”3 explains IDC, and elaborates: “The convergence of AI, automation, and analytics signals a transformative era in digital business. As these technologies have matured, they offer organizations unprecedented capabilities to drive innovation, optimize processes, and uncover actionable insights. This isn’t just about adopting new tools; it’s a major shift toward ‘deep intelligence’ and automation, bringing agility and an insight-driven approach to the center of digital enterprises.”4
A major topic, according to IDC, is sustainability: “ESG factors are swiftly emerging as critical determinants of a company’s long-term value. In today’s business climate, ESG considerations are no longer just a checklist. […] These are factoring in and becoming integral components to a company’s strategic plans.”4 In IDC’s view, therefore, “sustainability is increasingly linked to digital business […]. Digital technology spending can be both directly and indirectly dedicated to sustainability initiatives, either by specifically addressing corporate-sponsored endeavors or by establishing the platform necessary to eventually carry out sustainability goals.”2 IDC assesses that “organizations are increasingly turning to applications that can help them meticulously monitor and report their activities as well as achieve real-world sustainability milestones.”3
Impact on SAP
Despite macroeconomic uncertainties and geopolitical tensions, SAP again showed high resilience and all regions contributed positively to the results. The wind-down of business operations in Russia and Belarus was nearly completed in the first quarter of 2023 and remaining contract obligations were reduced to a non-material volume by the end of the year.
After two years of significant investments to accelerate SAP’s transition to the cloud (the so-called phase one), the second phase of our cloud transformation started in January 2023 with the publication of our results for the fourth quarter and full year 2022. At that time, SAP showed the passing of the tipping point towards positive profitability (non-IFRS), as planned and predicted in the strategy update that was communicated in October 2020.
Continuous execution along the midterm ambition and forthcoming positive results over the remaining quarters in 2023 underpinned SAP’s commitment to the corporate strategy. The focus on efficiencies and disciplined spending resulted in a significant expansion of its cloud gross margins (non-IFRS) throughout the year.
SAP has been an early adopter of AI technology. During the SAP Sapphire conference in May, the Company showcased the use of AI in various products. At the beginning of the second half of 2023, the Company announced strategic direct investments in three leading generative AI companies. The investments underscore SAP’s open ecosystem approach to AI, which is aimed at leveraging the best technology to embed AI across SAP’s portfolio. The Company anticipates significant possibilities for market expansion through these technologies and new premium offerings.
2 IDC FutureScape: Worldwide Digital Business Strategies 2024 Predictions, Doc #US50120323, October 2023.
3 IDC FutureScape: Worldwide Intelligent ERP 2024 Predictions, Doc #US51300923, October 2023.
4 IDC FutureScape: Worldwide CIO Agenda 2024 Predictions, Doc #US51294523, October 2023.
49
Performance Against Our Outlook for 2023 (Non-IFRS)
As in previous years, our 2023 operating profit-related goals and published outlook were based on our non-IFRS financial measures at constant currencies. For this reason, in the following section we discuss performance against our outlook in terms of non-IFRS numbers, unless otherwise stated, (at constant currencies) derived from IFRS measures. The subsequent section about International Financial Reporting Standards (IFRS) operating results discusses numbers only in terms of IFRS, so the numbers in that section are not expressly identified as IFRS numbers.
Outlook for 2023 (Non-IFRS)
The initial outlook for 2023, including Qualtrics (for more information, see the table “Comparison of Outlook and Results for 2023”), expected full-year cloud revenue to range between €15.3 billion and €15.7 billion, and cloud and software revenue to range between €28.2 billion and €28.7 billion, with more predictable revenue anticipated to make up 83% of this result. Furthermore, we expected operating profit (non-IFRS) to range between €8.8 billion and €9.1 billion and a free cash flow of approximately €5.0 billion. We expected a full-year 2023 effective tax rate (IFRS) of 28.0% to 32.0% (2022: 32.0%) and an effective tax rate (non-IFRS) of 26.0% to 28.0% (2022: 29.6%), strongly depending on the development of Sapphire Ventures’ investments. This initial outlook reflected SAP executing on its cloud strategy, which is driving the accelerated cloud growth through both new business and cloud adoption by existing customers, scaling SAP’s cloud momentum towards its midterm ambition.
In April 2023, we adjusted our outlook for continuing operations, reflecting the expected Qualtrics divestiture. We thereafter expected cloud revenue to range between €14.0 billion and €14.4 billion, cloud and software revenue to range between €26.9 billion and €27.4 billion, and operating profit (non-IFRS) to range between €8.6 billion and €8.9 billion. Furthermore, we adjusted the anticipated share of more predictable revenue to 82% and thereafter expected a free cash flow of approximately €4.9 billion.
In July 2023, to reflect then-current market development, we updated and tightened our ranges slightly. We lowered our expectations for cloud revenue to a range between €14.0 billion and €14.2 billion, and for cloud and software revenue to a range between €27.0 billion and €27.4 billion, but increased the range slightly for our expected operating profit (non-IFRS) to between €8.65 billion and €8.95 billion.
In October 2023, SAP reaffirmed its July 2023 outlook.
2023 Actual Revenue and Profit Performance Compared to Outlook (Non-IFRS)
Cloud revenue is within the range of our revised 2023 outlook, with the combined cloud and software and operating profit exceeding the upper end of our outlook range.
Comparison of Outlook and Results for 2023
|
|
|
|
Outlook for 2023 |
|
Revised Outlook |
|
Revised Outlook |
|
|
|
|
|
|
Results |
|
(Integrated Report |
|
for 2023 |
|
for 2023 |
|
Outlook for 2023 |
|
Results |
|
|
for 20221 |
|
2022) |
|
(Q1 Quarterly Statement) |
|
(Half-Year Report) |
|
(Q3 Quarterly Statement) |
|
for 2023 |
Cloud revenue |
|
€10.67 billion |
|
€15.3 billion |
|
€14.0 billion |
|
€14.0 billion |
|
€14.0 billion |
|
€14.06 billion |
(non-IFRS, at constant currencies) |
|
|
|
to €15.7 billion |
|
to €14.4 billion |
|
to €14.2 billion |
|
to €14.2 billion |
|
|
Cloud and software revenue |
|
€24.01 billion |
|
€28.2 billion |
|
€26.9 billion |
|
€27.0 billion |
|
€27.0 billion |
|
€27.64 billion |
(non-IFRS, at constant currencies) |
|
|
|
to €28.7. billion |
|
to €27.4 billion |
|
to €27.4 billion |
|
to €27.4 billion |
|
|
Operating profit |
|
€7.67 billion |
|
€8.8 billion |
|
€8.6 billion |
|
€8.65 billion |
|
€8.65 billion |
|
€9.04 billion |
(non-IFRS, at constant currencies) |
|
|
|
to €9.1 billion |
|
to €8.9 billion |
|
to €8.95 billion |
|
to €8.95 billion |
|
|
Share of predictable revenue |
|
79% |
|
83% |
|
82% |
|
82% |
|
82% |
|
81% |
Free cash flow |
|
€4.39 billion |
|
approx. €5.0 billion |
|
approx. €4.9 billion |
|
approx. €4.9 billion |
|
approx. €4.9 billion |
|
€5.08 billion |
Effective tax rate (IFRS) |
|
32.0% |
|
28.0% to 32.0% |
|
28.0% to 32.0% |
|
28.0% to 32.0% |
|
28.0% to 32.0% |
|
32.6% |
Effective tax rate (non-IFRS) |
|
29.6% |
|
26.0% to 28.0% |
|
26.0% to 28.0% |
|
26.0% to 28.0% |
|
26.0% to 28.0% |
|
29.3% |
1 Results for 2022 have been adjusted for continuing operations to reflect the divestiture of Qualtrics.
In the current global economic climate shaped by continuously high asset prices and disrupted by international conflicts, coupled with an increasing demand for artificial intelligence and data warehousing, the demand for our cloud solutions and services confirms our revised expectations, reflecting the strong business performance which is expected to continue to accelerate cloud revenue growth.
Our current cloud backlog (contractually committed cloud revenue that we expect to recognize over the upcoming 12 months) reached €13.75 billion at actual currencies (€14.04 billion at constant currencies; 2022: €11.73 billion at constant currencies). This was an increase of 25% (27% on a constant currency basis; 2022: 24%). The growth rate of our current cloud backlog is in line with our guidance from the year before to achieve a growth rate similar to 2022, while at a larger scale.
On December 31, 2023, total cloud backlog was up 37% to €44.25 billion (up 39% to €45.09 billion at constant currencies).
At constant currencies, the resulting cloud revenue grew from €10.67 billion in 2022 to €14.06 billion in 2023, in line with our guidance range of €14.0 billion to €14.2 billion. That represented an increase of 23% at constant currencies.
50
Cloud and software revenue grew 9% at constant currencies to €27.64 billion (2022: €24.01 billion), and thus ended higher than our revised outlook range forecasted for 2023 of €27.0 billion to €27.4 billion.
Thanks to the strong increase in cloud business, we were able to increase the share of more predictable revenue 2pp to 81% (2022: 79%), which is 1pp below our revised outlook.
Total revenue on a constant currency basis grew 9% in 2023 to €32.03 billion (2022: €27.90 billion).
Operating expenses (non-IFRS) on a constant currency basis increased 7% in 2023 to €22.99 billion (2022: €20.23 billion).
Our expense base in 2023 was impacted by our transformation to a fast-growing cloud business. The cloud gross margin (non-IFRS) for 2023 was 72.6%, increasing 2.2pp at constant currencies year over year. Our cloud margin benefitted from an increase in cloud revenue and significantly lower investments in the Next-Generation Cloud Delivery initiative (modernization of our cloud delivery to enable a more resilient and scalable cloud infrastructure).
Our overall headcount increased by 1,291 full-time equivalents, or FTEs (732 thereof organically), primarily in the functional areas Research and Development and Cloud.
Non-IFRS operating profit in 2023 was €9.04 billion on a constant currency basis (2022: €7.67 billion), reflecting an increase of 13%. Operating profit and margin benefitted from accelerated growth in revenue, completion of the Next Generation Cloud Delivery initiative, and strict cost management.
Thus, non-IFRS operating profit came in above the target range (€8.65 billion to €8.95 billion).
We achieved an effective tax rate (IFRS) of 32.6% and an effective tax rate (non-IFRS) of 29.3%, which is above the outlook of 28.0% to 32.0% (IFRS) and 26.0% to 28.0% (non-IFRS). This mainly resulted from changes in valuation allowances on deferred tax assets.
Operating Results (IFRS)
This section on operating results (IFRS) discusses results only in terms of IFRS measures.
Our 2023 Results Compared to Our 2022 Results (IFRS)
Revenue
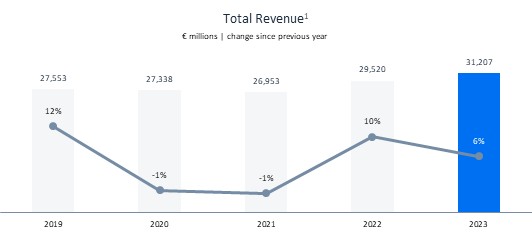
1 The numbers for 2023, 2022, and 2021 reflect continuing operations as a result of the divestiture of Qualtrics.
Total revenue increased from €29,520 million in 2022 to €31,207 million in 2023, representing an increase of €1,688 million, or 6%.
51
Cloud and software revenue represented 86% of total revenue in 2023 (2022: 86%). Service revenue increased 4% from €4,128 million in 2022 to €4,283 million in 2023, which was 14% of total revenue (2022: 14%).
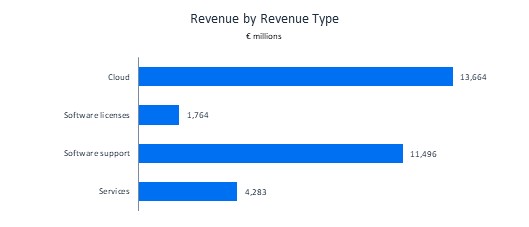
For more information about our regional performance, see the Revenue by Region section.
Cloud revenue refers to the income earned from contracts that permit the customer during the term of its contract with SAP to access specific software solutions hosted by SAP or third parties engaged by SAP. Software licenses revenue results from the fees earned from selling or licensing software to customers. Support revenue represents fees earned from providing customers with technical support services and unspecified software upgrades, updates, and enhancements. For more information about our revenue types, see the Notes to the Consolidated Financial Statements, Note (A.1).
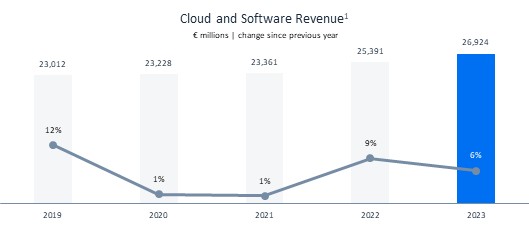
1 The numbers for 2023, 2022, and 2021 reflect continuing operations as a result of the divestiture of Qualtrics.
Cloud and software revenue grew from €25,391 million in 2022 to €26,924 million in 2023, an increase of 6%.
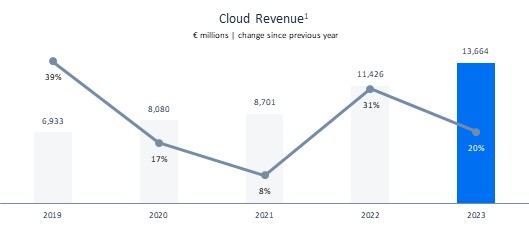
1 The numbers for 2023, 2022, and 2021 reflect continuing operations as a result of the divestiture of Qualtrics.
52
Cloud revenue increased €2,238 million, or 20%, from €11,426 million in 2022 to €13,664 million in 2023. Cloud revenue growth benefitted from the accelerated transition of our customers to the cloud. The transactional cloud revenue remained approximately at the level of the previous year. Cloud revenue for Cloud ERP Suite increased 29%, or €2,417 million, to €10,626 million in 2023 (2022: €8,209 million). For more information about Cloud ERP Suite, see the Performance Management System section.
The current cloud backlog increased €2,721 million, or 25%, to €13,745 million in 2023 (2022: €11,024 million).
Our software licenses revenue declined €292 million from €2,056 million in 2022 to €1,764 million in 2023.
The demand for SAP software helped us maintain a stable maintenance customer base for software support, resulting in software support revenue of €11,496 million in 2023 (2022: €11,909 million). The slight decline is attributable to the accelerated transition of our customers to the cloud and to unfavorable currency exchange rates. SAP Enterprise Support was the largest contributor to our software support revenue.
Software licenses and software support revenue decreased €705 million, or 5%, from €13,965 million in 2022 to €13,261 million in 2023.
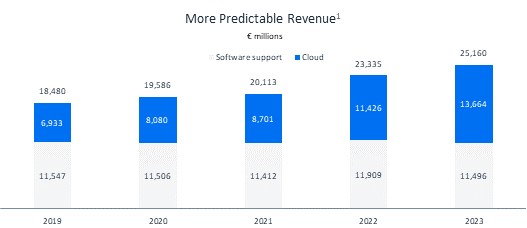
1 The numbers for 2023, 2022, and 2021 reflect continuing operations as a result of the divestiture of Qualtrics.
We define more predictable revenue as the sum of our cloud revenue and our software support revenue. Our more predictable revenue increased from €23,335 million in 2022 to €25,160 million in 2023. Cloud revenue surpassed support revenue in 2023 and drove the growth of 8%. More predictable revenue accounted for 81% of our total revenue in 2023 (2022: 79%), continuing the upward trend from prior years.
Services revenue combines revenue from consulting services, premium support services, and other services such as training services. Consulting services primarily relate to the implementation of our cloud and on-premise software products. Our premium support offering consists of high-end support services tailored to customer requirements. For more information, see the Notes to the Consolidated Financial Statements, Note (A.1).
Services revenue increased €155 million, or 4%, from €4,128 million in 2022 to €4,283 million in 2023. This increase was predominantly caused by very strong growth across the entire services portfolio of offerings with accelerated growth in our premium support revenues. At the same time, the revenue development was positively impacted by a year-over-year increase in order entry.
Consulting revenue and premium support revenue increased €165 million, or 4%, from €3,709 million in 2022 to €3,874 million in 2023. In 2023, consulting and premium support revenue contributed 90% of the total services revenue (2022: 90%) and 12% of total revenue (2022: 13%).
Revenue from other services decreased €10 million, or 2%, to €409 million in 2023 (2022: €419 million).
53
Revenue by Region
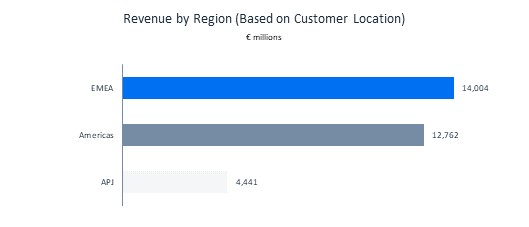
EMEA Region
In 2023, the EMEA region generated €14,004 million in revenue (2022: €12,909 million), which was 45% of total revenue (2022: 44%). Revenue in Germany increased 10% to €4,921 million (2022: €4,469 million). Germany contributed 35% (2022: 35%) of all EMEA region revenue. The remaining revenue in the EMEA region was primarily generated in France, Italy, the Netherlands, Switzerland, and the United Kingdom.
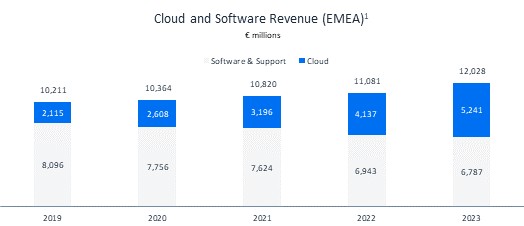
1 The numbers for 2023, 2022, and 2021 reflect continuing operations as a result of the divestiture of Qualtrics.
Cloud and software revenue generated in the EMEA region totaled €12,028 million (2022: €11,081 million). That was 86% of all revenue from the region (2022: 86%). Cloud revenue in the EMEA region rose 27% to €5,241 million in 2023 (2022: €4,137 million). Software licenses and software support revenue decreased 2% to €6,787 million in 2023 (2022: €6,943 million).
54
Americas Region
In 2023, 41% of our total revenue was generated in the Americas region (2022: 41%). Total revenue in the Americas region increased 4% to €12,762 million (2022: €12,227 million). Revenue in the United States increased to €10,204 million (2022: €9,799 million). The United States contributed 80% (2022: 80%) of all revenue generated in the Americas region. In the remaining countries of the Americas region, revenue increased 5% to €2,558 million. Revenue in the remaining countries of the Americas region was generated primarily in Brazil, Canada, and Mexico.
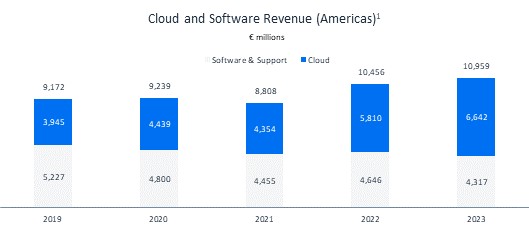
1 The numbers for 2023, 2022, and 2021 reflect continuing operations as a result of the divestiture of Qualtrics.
Cloud and software revenue generated in the Americas region totaled €10,959 million (2022: €10,456 million). That was 86% of all revenue from the region (2022: 86%). Cloud revenue in the Americas region rose 14% to €6,642 million in 2023 (2022: €5,810 million). The United States contributed 81% of cloud revenue generated in the Americas region. Software licenses and software support revenue in the Americas regions amounted to €4,317 million in 2023 (2022: €4,646 million).
APJ Region
In 2023, 14% of our total revenue was generated in the APJ region (2022: 15%). Total revenue in the APJ region increased 1% to €4,441 million (2022: €4,384 million) despite unfavorable changes in currency exchange rates for SAP. Total revenue in Japan increased to €1,243 million (2022: €1,218 million). Revenue from Japan accounted for 28% of all revenue generated in the APJ region (2022: 28%). In the remaining countries of the APJ region, revenue increased 1%. Revenue in the remaining countries of the APJ region was generated primarily in Australia, China, and India.
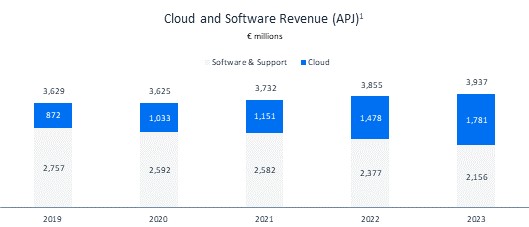
1 The numbers for 2023, 2022, and 2021 reflect continuing operations as a result of the divestiture of Qualtrics.
Cloud and software revenue in the APJ region totaled €3,937 million (2022: €3,855 million). That was 89% of all revenue from the region (2022: 88%). Cloud revenue in the APJ region rose 21% to €1,781 million in 2023 (2022: €1,478 million). Software licenses and software support revenue decreased from €2,377 million in 2022 to €2,156 million in 2023.
55
Operating Profit and Operating Margin
Operating profit decreased to €5,787 million and operating margin decreased 2.1pp to 18.5%. Operating profit was impacted by a reduced contribution from software licenses revenue and from increased total operating expenses. Share-based payment expenses increased to €2,220 million (2022: €1,431 million), mainly due to an increase in the SAP share price of more than €40 from January 1, 2023, to December 31, 2023 (January 1, 2022, to December 31, 2022: drop in the SAP share price of around €30). A shorter contract life for on-premise support contracts led to accelerated amortization of costs related to these contracts, resulting in higher amortization expenses amounting to €121 million for 2023 (2022: €0 million). Furthermore, higher personnel costs were driven by higher bonus expenses prompted by strong revenue growth and robust attainment of other bonus measures. In addition, the recognition of a provision for fines in regard to anti-bribery matters led to expenses of €155 million in 2023 (2022: €0 million). Operating profit was also impacted by investments in the Next-Generation Cloud Delivery campaign and in other research and development and sales and marketing initiatives to capture current and future growth opportunities. Next-Generation Cloud Delivery from SAP is the modernization of our cloud delivery to enable a more resilient and scalable cloud infrastructure, and ended mid-2023. Additionally, the prior-year operating profit included a disposal gain of €175 million from the sale of the SAP Litmos business.
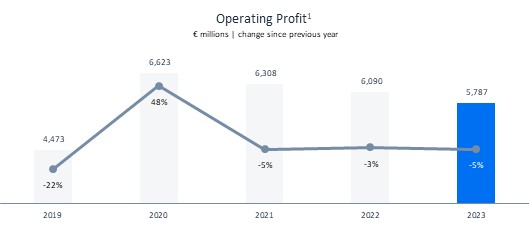
1 The numbers for 2023, 2022, and 2021 reflect continuing operations as a result of the divestiture of Qualtrics.
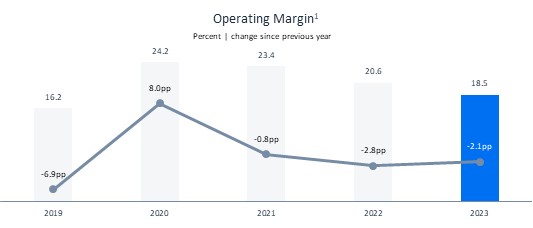
1 The numbers for 2023, 2022, and 2021 reflect continuing operations as a result of the divestiture of Qualtrics.
Changes to the individual elements in our cost of revenue were as follows:
Cost of Cloud and Software
Cost of cloud and software consists primarily of costs for deploying and operating cloud solutions, the cost of developing custom solutions that address customers’ specific business requirements, and customer support costs.
In 2023, the cost of cloud and software increased 8% to €5,267 million (2022: €4,883 million) and our cloud margin increased 2.2pp from 69.4% in 2022 to 71.6% in 2023, based on strong revenue growth paired with a slower growth in cost of cloud due to a scalable cloud infrastructure and operational efficiency. The software licenses and software support margin was 89.6%, 0.5pp below the prior-year level (2022: 90.1%). Software licenses and software support revenue decreased 5% to €13,261 million (2022: €13,965 million), primarily attributable to a 14% decline in software revenue. Software licenses and software support costs remained relatively constant year over year at €1,383 million (2022: €1,384 million).
56
Cost of Services
Cost of services consists primarily of the cost of consulting, premium services, and training courses, and the cost of bought-in consulting and training resources. The cost of services increased 8% to €3,407 million (2022: €3,155 million), in line with increased demand for project consulting and premium engagement services as well as higher business travel costs as COVID-related travel restrictions further eased around the world. Our gross margin on services, defined as services profit as a percentage of services revenue, decreased 3.1pp to 20.5% (2022: 23.6%). As our services business trends away from traditional software licensing and consulting revenue toward more subscription revenue from cloud solutions, we continue to adjust our service delivery resources to support our cloud offerings.
Research and Development
Our research and development (R&D) expense consists primarily of the personnel cost of our R&D employees, costs incurred for independent contractors whom we retain to assist in our R&D activities, and depreciation of the computer hardware and amortization of the software we use for our R&D activities.
The R&D expense rose 4% to €6,324 million in 2023 from €6,080 million in 2022. This increase was mainly due to higher personnel costs driven by a 3% year-over-year growth in our R&D headcount for additional capacity demands in relation to the increased revenue. The R&D expense was also impacted by several initiatives to capture current and future growth opportunities. R&D expense as a percentage of total revenue decreased to 20.3% in 2023 (2022: 20.6%). For more information, see the Our Investments in Innovation section.
Sales and Marketing Expense
Sales and marketing expense consists mainly of personnel costs, direct sales costs, and the cost of marketing our products and services.
Our sales and marketing expense grew 11% from €7,946 million in 2022 to €8,828 million in 2023. This increase is mainly attributable to higher personnel costs due to higher bonus payments prompted by strong revenue growth. In addition, travel costs for sales teams increased as COVID-related global travel restrictions accelerated to ease.
Accordingly, the ratio of sales and marketing expense to total revenue, expressed as a percentage, increased 1.4pp in 2023 to 28.3% (2022: 26.9%).
General and Administration Expense
Our general and administration expense consists mainly of personnel costs to support our finance and administration, human resource, and corporate functions.
General and administration expense increased 6% from €1,289 million in 2022 to €1,364 million in 2023. This increase is primarily due to higher personnel expenses in 2023, the majority thereof due to higher bonus payments. The ratio of general and administration expense to total revenue was flat year over year at 4.4% (2022: 4.4%).
Segment Information
At the end of 2023, SAP had one reportable segment: Applications, Technology & Services. The segment information for 2023 and the comparative prior periods were restated to conform with the new segment composition.
For more information about our segment reporting and the changes in the composition of our reportable segments in 2023, see the Notes to the Consolidated Financial Statements, Notes (C.1) and (C.2).
57
Applications, Technology & Services
€ millions, unless otherwise stated |
|
|
|
2023 |
|
2022 |
|
∆ in % |
|
∆ in % |
(non-IFRS) |
|
Actual |
|
Constant |
|
Actual |
|
Actual |
|
Constant |
|
|
Currency |
|
Currency |
|
Currency |
|
Currency |
|
Currency |
Cloud revenue - SaaS1 |
|
9,608 |
|
9,901 |
|
7,986 |
|
20 |
|
24 |
Cloud revenue - PaaS2 |
|
2,182 |
|
2,236 |
|
1,533 |
|
42 |
|
46 |
Cloud revenue - IaaS3 |
|
748 |
|
766 |
|
908 |
|
-18 |
|
-16 |
Cloud revenue |
|
12,538 |
|
12,903 |
|
10,428 |
|
20 |
|
24 |
Thereof SAP S/4HANA cloud revenue4 |
|
3,495 |
|
3,599 |
|
2,088 |
|
67 |
|
72 |
Cloud gross margin - SaaS1 (in %) |
|
70.1 |
|
70.5 |
|
69.0 |
|
1.1pp |
|
1.5pp |
Cloud gross margin - PaaS2 (in %) |
|
84.7 |
|
84.8 |
|
80.9 |
|
3.9pp |
|
3.9pp |
Cloud gross margin - IaaS3 (in %) |
|
34.3 |
|
32.5 |
|
35.2 |
|
-0.9pp |
|
-2.6pp |
Cloud gross margin (in %) |
|
70.5 |
|
70.7 |
|
67.8 |
|
2.7pp |
|
2.9pp |
Segment revenue |
|
30,057 |
|
30,853 |
|
28,496 |
|
5 |
|
8 |
Segment gross margin (in %) |
|
73.5 |
|
73.7 |
|
73.5 |
|
0.0pp |
|
0.1pp |
Segment profit |
|
9,811 |
|
10,129 |
|
8,824 |
|
11 |
|
15 |
Segment margin (in %) |
|
32.6 |
|
32.8 |
|
31.0 |
|
1.7pp |
|
1.9pp |
1 Software as a service: SaaS comprises all other offerings that are not shown as PaaS or IaaS.
2 Platform as a service: PaaS primarily includes SAP Business Technology Platform, the SAP LeanIX portfolio, and SAP Signavio solutions.
3 Infrastructure as a service: A major portion of IaaS comes from SAP HANA Enterprise Cloud.
4 Mainly derived from the Applications, Technology & Services segment.
The Applications, Technology & Services segment recorded a strong increase in cloud revenue of 20% in 2023 (24% at constant currencies), supported by SAP Business Technology Platform as well as SAP S/4HANA, whose cloud revenue increased 67% (72% at constant currencies) to €3,495 million. Cost of cloud for the Applications, Technology & Services segment increased 10% (13% at constant currencies), which overall caused the cloud gross margin to widen 2.7pp (2.9pp at constant currencies) to 70.5%. Thereof, PaaS and SaaS cloud gross margins grew 3.9pp and 1.5pp at constant currencies, which resulted in a cloud gross margin of 84.7% and 70.1% respectively. Software support revenue slightly decreased by 3% (1% at constant currencies) to €11,495 million in 2023. Software licenses revenue decreased 14% (12% at constant currencies) mainly due to the shift toward cloud revenue. As such, the segment achieved a total software licenses and support revenue of €13,259 million. Total segment revenue nevertheless rose 5% (8% at constant currencies) and ended 2023 at €30,057 million.
Overall, the share of more predictable revenue within the Applications, Technology & Services segment increased 1.6pp from 78.4% in 2022 to 80.0% in 2023.
Cost of revenue increased 5% (8% at constant currencies) compared to the prior year, ending 2023 at €7,951 million. This development was mainly driven by an increase in cost of cloud.
Consequently, segment profit increased 11% (15% at constant currencies) and reached €9,811 million in 2023, whereas segment margin improved 1.7pp (1.9pp at constant currencies).
Financial Income, Net
Financial income, net, increased to –€456 million (2022: –€1,389 million). Our finance income was €857 million (2022: €811 million) and our finance costs were €1,313 million (2022: €2,200 million).
Finance income primarily consists of interest income on investments in the amount of €486 million (2022: €193 million) and gains from IFRS 9-related fair value adjustments, mainly of Sapphire Ventures investments, and the disposal of equity securities totaling €380 million (2022: €608 million).
Finance costs mainly consist of interest expense on financial liabilities and from derivative instruments (including a forward contract to hedge the USD purchase price from the Qualtrics sale against EUR-USD fluctuations. This forward contract matured in the second quarter of 2023 with a total realized loss of €91 million, of which €106 million was recognized in finance costs) amounting to €639 million (2022: €272 million), and IFRS 9-related fair value adjustments or losses from disposal of Sapphire Ventures investments totaling €525 million (2022: €1,802 million). For more information about financing instruments, see the Notes to the Consolidated Financial Statements, Note (D.1) and Note (E.3).
Income Taxes
The effective tax rate in 2023 was 32.6% (2022: 32.0%). The year-over-year increase mainly resulted from changes in valuation allowances on deferred tax assets, in non-deductible expenses and withholding taxes, which were partly compensated by changes in tax-exempt income, mainly related to Sapphire Ventures. For more information about income taxes, see the Notes to the Consolidated Financial Statements, Note (C.5).
58
Our 2022 Results Compared to Our 2021 Results (IFRS)
All financial numbers are based on continuing operations (unless otherwise noted).
Total Revenue
Total revenue increased from €26,953 million in 2021 to €29,520 million in 2022, representing an increase of €2,566 million, or 10%.
Cloud and software revenue represented 86% of total revenue in 2022 (2021: 87%). Service revenue increased 15% from €3,592 million in 2021 to €4,128 million in 2022, which was 14% of total revenue (2021: 13%).
For more information about our regional performance, see the Revenue by Region section.
Cloud and Software Revenue
Cloud and software revenue grew from €23,361 million in 2021 to €25,391 million in 2022, an increase of 9%.
Cloud Revenue
Cloud revenue increased €2,725 million, or 31%, from €8,701 million in 2021 to €11,426 million in 2022. Cloud revenue reaccelerated its growth supported by a recovery of the transactional revenue. At the same time, the cloud revenue for SAP S/4HANA increased 92% from €1,090 million in 2021 to €2,088 million in 2022.
Software Licenses and Support
Our software licenses revenue declined €1,192 million from €3,248 million in 2021 to €2,056 million in 2022.
The demand for SAP software helped us maintain a stable maintenance customer base for software support, resulting in software support revenue of €11,909 million in 2022 (2021: €11,412 million). The increase in revenue was driven by the favorable currency exchange rates. SAP Enterprise Support was the largest contributor to our software support revenue.
Software licenses and software support revenue decreased €695 million, or 5%, from €14,660 million in 2021 to €13,965 million in 2022.
We define more predictable revenue as the sum of our cloud revenue and our software support revenue. Our more predictable revenue increased from €20,113 million in 2021 to €23,335 million in 2022. Cloud revenue drove the growth of 16%. More predictable revenue accounted for 79% of our total revenue in 2022 (2021: 75%), following the upward trend from prior years.
Services Revenue
Services revenue increased €536 million, or 15%, from €3,592 million in 2021 to €4,128 million in 2022. This increase was predominantly caused by very strong growth across the entire services portfolio of offerings with accelerated growth in our training revenue and premium support revenues. At the same time, the year over year revenue development was positively impacted by the recovery of order entry in 2021.
Consulting revenue and premium support revenue increased €474 million, or 15%, from €3,235 million in 2021 to €3,709 million in 2022. In 2022, consulting and premium support revenue contributed 90% of the total services revenue (2021: 90%) and 13% of total revenue (2021: 12%).
Revenue from other services increased €62 million, or 17%, to €419 million in 2022 (2021: €357 million).
Revenue by Region
EMEA Region
In 2022, the EMEA region was negatively impacted by the war in Ukraine and SAP’s decision to wind down its business operations in Russia and Belarus. The EMEA region generated €12,909 million in revenue (2021: €12,458 million), which was 44% of total revenue (2021: 46%). Revenue in Germany increased 3% to €4,469 million (2021: €4,324 million). Germany contributed 35% (2021: 35%) of all EMEA region revenue. The remaining revenue in the EMEA region was primarily generated in France, Italy, the Netherlands, Switzerland, and the United Kingdom.
Cloud and software revenue generated in the EMEA region totaled €11,081 million (2021: €10,820 million). That was 86% of all revenue from the region (2021: 87%). Cloud revenue in the EMEA region rose 29% to €4,137 million in 2022 (2021: €3,196 million). Software licenses and software support revenue decreased 9% to €6,943 million in 2022 (2021: €7,624 million).
Americas Region
In 2022, 41% of our total revenue was generated in the Americas region (2021: 38%). Total revenue in the Americas region increased 19% to €12,227 million (2021: €10,292 million). Revenue in the United States increased to €9,799 million (2021: €8,235 million). The United States contributed 80% (2021: 80%) of all revenue generated in the Americas region. In the remaining countries of the Americas region, revenue increased 18% to €2,427 million. Revenue in the remaining countries of the Americas region was generated primarily in Brazil, Canada, and Mexico.
59
Cloud and software revenue generated in the Americas region totaled €10,456 million (2021: €8,808 million). That was 86% of all revenue from the region (2021: 86%). Cloud revenue in the Americas region rose 33% to €5,810 million in 2022 (2021: €4,354 million). The United States, SAP’s largest market, contributed 81% of cloud revenue generated in the Americas region. Software licenses and software support revenue in the Americas regions amounted to €4,646 million in 2022 (2021: €4,455 million).
APJ Region
In 2022, 15% of our total revenue was generated in the APJ region (2021: 16%). Total revenue in the APJ region increased 4% to €4,384 million (2021: €4,204 million). Total revenue in Japan decreased to €1,218 million (2021: €1,286 million), primarily driven by unfavorable changes in currency exchange rates. Revenue from Japan accounted for 28% of all revenue generated in the APJ region (2021: 31%). In the remaining countries of the APJ region, revenue increased 9%. Revenue in the remaining countries of the APJ region was generated primarily in Australia, China, and India.
Cloud and software revenue in the APJ region totaled €3,855 million (2021: €3,732 million). That was 88% of all revenue from the region (2021: 89%). Cloud revenue in the APJ region rose 28% to €1,478 million in 2022 (2021: €1,151 million). Software licenses and software support revenue decreased from €2,582 million in 2021 to €2,377 million in 2022.
Operating Profit and Operating Margin
Operating profit decreased to €6,090 million and operating margin decreased 2.8pp to 20.6%. Operating profit was impacted by a reduced contribution from software licenses revenue and the decision to wind down our business operations in Russia and Belarus. The wind-down’s impact on full-year IFRS operating profit was approximately €410 million, including approximately €120 million from restructuring expenses. Operating profit was also impacted by accelerated investments in the Next-Generation Cloud Delivery campaign and in other research and development and sales and marketing initiatives to capture current and future growth opportunities. Next-Generation cloud delivery initiative is the modernization of our cloud delivery to enable a more resilient and scalable cloud infrastructure.
Additionally, operating profit included a disposal gain of €175 million from the sale of the SAP Litmos business.
Changes to the individual elements in our cost of revenue were as follows:
Cost of Cloud and Software
In 2022, the cost of cloud and software increased 8% to €4,883 million (2021: €4,479 million) and our cloud margin increased 2.5pp from 66.9% in 2021 to 69.4% in 2022. Cost of cloud benefitted from a reorganization within our Customer Success organization, under which cloud delivery resources were reallocated to sales roles focused on the implementation of our LACE (land adopt consume expand) strategy. This reorganization reduced the 2022 cost of cloud and, as a consequence, increased our sales and marketing expenses by approximately €40 million. Cost of cloud continued to be negatively impacted by investments in the Next-Generation Cloud Delivery initiative, which was completed mid-2023.
The software licenses and software support margin was 90.1%, 1.0pp above the prior year level (2021: 89.1%). Software licenses and software support revenue decreased 5% to €13,965 million (2021: €14,660 million), primarily arising from a 37% decline in software revenue. Software licenses and software support costs decreased correspondingly by 13% to €1,384 million (2021: €1,598 million).
Cost of Services
The cost of services increased 15% to €3,155 million (2021: €2,740 million), in line with increased demand for project consulting and premium engagement services as well as higher business travel costs as COVID related travelling restrictions eased around the world. Our gross margin on services, defined as services profit as a percentage of services revenue, decreased slightly by 0.1pp to 23.6% (2021: 23.7%). As our services business trends away from traditional software licensing and consulting revenue toward more subscription revenue from cloud solutions, we continue to adjust our service delivery resources to support our cloud offerings.
Research and Development
The R&D expense rose 15% to €6,080 million in 2022 from €5,270 million in 2021. This increase arises mainly from higher personnel costs driven by a 6% year over year growth in our R&D headcount for additional capacity demands in relation to the increased revenue. The R&D expense is also impacted by continued strategic investments in Next-Generation Cloud Delivery campaign and several other initiatives to capture current and future growth opportunities. R&D expense as a percentage of total revenue thus increased to 20.6% in 2022 (2021: 19.6%). For more information, see the Our Investments in Innovation section.
Sales and Marketing Expense
Our sales and marketing expense grew 16% from €6,856 million in 2021 to €7,946 million in 2022. This increase is for the most part attributable to the 6% growth in headcount from expansion of the global sales force as well as from higher bonus payments prompted by strong revenue growth. In addition, travel costs for sales teams increased as COVID related travel restrictions eased around the world. Similarly, marketing costs increased in 2022 as some of the marketing events resumed. Sales expenses were also impacted by the reorganization of our Customer Success organization to focus on the implementation of the LACE strategy.
60
Accordingly, the ratio of sales and marketing expense to total revenue, expressed as a percentage, increased 1.5pp in 2022 to 26.9% (2021: 25.4%).
General and Administration Expense
General and administration expense increased 9% from €1,187 million in 2021 to €1,289 million in 2022. This increase is primarily due to higher expenses from share-based payment expenses in 2022. The ratio of general and administration expense to total revenue remained flat year over year at 4.4% (2021: 4.4%).
Segment Information
The segment information below for 2022 and 2021 is presented for the reportable segment Applications, Technology & Services. For more information about our segment reporting and the changes in the composition of our reportable segments, see the Notes to the Consolidated Financial Statements, Notes (C.1) and (C.2), and the Performance Management System section.
Applications, Technology & Services1
€ millions, unless otherwise stated |
|
2022 |
|
2021 |
|
∆ in % |
|
∆ in % |
||
(non-IFRS) |
|
Actual |
|
Constant |
|
Actual |
|
Actual |
|
Constant |
|
|
Currency |
|
Currency |
|
Currency |
|
Currency |
|
Currency |
Cloud revenue – SaaS1 |
|
7,986 |
|
7,449 |
|
6,025 |
|
33 |
|
24 |
Cloud revenue – PaaS2 |
|
1,533 |
|
1,449 |
|
995 |
|
54 |
|
46 |
Cloud revenue – IaaS3 |
|
908 |
|
856 |
|
922 |
|
-2 |
|
-7 |
Cloud revenue |
|
10,428 |
|
9,754 |
|
7,941 |
|
31 |
|
23 |
Thereof SAP S/4HANA cloud revenue4 |
|
2,088 |
|
1,961 |
|
1,090 |
|
92 |
|
80 |
Cloud gross margin – SaaS1 (in %) |
|
69.0 |
|
69.2 |
|
68.4 |
|
0.6pp |
|
0.7pp |
Cloud gross margin – PaaS2 (in %) |
|
80.9 |
|
82.1 |
|
82.4 |
|
–1.6pp |
|
–0.3pp |
Cloud gross margin – IaaS3 (in %) |
|
35.2 |
|
39.6 |
|
32.8 |
|
2.4pp |
|
6.8pp |
Cloud gross margin (in %) |
|
67.8 |
|
68.5 |
|
66.1 |
|
1.8pp |
|
2.4pp |
Segment revenue |
|
28,496 |
|
26,961 |
|
26,170 |
|
9 |
|
3 |
Segment gross margin (in %) |
|
73.5 |
|
73.9 |
|
74.9 |
|
–1.3pp |
|
–0.9pp |
Segment profit |
|
8,824 |
|
8,472 |
|
9,308 |
|
-5 |
|
-9 |
Segment margin (in %) |
|
31.0 |
|
31.4 |
|
35.6 |
|
–4.6pp |
|
–4.1pp |
1 Software as a service: SaaS comprises all other offerings that are not shown as PaaS or IaaS.
2 Platform as a service: PaaS primarily includes SAP Business Technology Platform and SAP Signavio Solutions.
3 Infrastructure as a service: A major portion of IaaS comes from SAP HANA Enterprise Cloud.
4 Mainly derived from the Applications, Technology & Services segment.
61
The Applications, Technology & Services segment recorded a strong increase in cloud revenue of 31% in 2022 (23% at constant currencies), supported by SAP Business Technology Platform as well as SAP S/4HANA, whose cloud revenue increased 92% to €2,088 million. Cost of cloud for the Applications, Technology & Services segment increased 24% (14% at constant currencies), which overall caused the cloud gross margin to widen 1.8pp (2.4pp at constant currencies) to 67.8%. Thereof, SaaS grew 0.7pp and PaaS decreased by 0.3pp at constant currencies. Software support revenue increased 4% but remained flat at constant currencies level compared to the prior year, ending 2022 at €11,908 million. Software licenses revenue decreased 37% (39% at constant currencies) mainly due to the shift toward cloud revenue as more customers are choosing our RISE with SAP offering. As such, the segment achieved a total software licenses and support revenue of €13,964 million. Total segment revenue nevertheless rose by 9% (3% at constant currencies) and ended 2022 at €28,496 million.
Overall, the share of more predictable revenue within the Applications, Technology & Services segment increased from 73.9% in 2021 to 78.4% in 2022.
Cost of revenue increased 15% (7% at constant currencies) compared to the prior year, ending 2022 at €7,542 million. This development was mainly driven by a strong increase in cost of cloud.
Segment profit decreased 5% (9% at constant currencies) and ended 2022 at €8,824 million. This is mainly attributable to a 17% increase in total segment cost (10% at constant currencies) including accelerated investments in Next-Generation Cloud Delivery campaign and into other research and development and sales and marketing initiatives to capture current and future growth opportunities. Consequently, the segment margin narrowed 4.1pp at constant currencies.
Reconciliation of Cloud Revenues and Margins
€ millions, unless otherwise stated |
|
Q1–Q4 2022 |
|
Q1–Q4 2021 |
|
∆ in % |
||||||
|
|
Actual |
|
Currency |
|
Constant |
|
Actual |
|
Actual |
|
Constant |
|
|
Currency |
|
Impact |
|
Currency |
|
Currency |
|
Currency |
|
Currency |
Cloud revenue – SaaS1 |
|
8,985 |
|
620 |
|
8,365 |
|
6,784 |
|
32 |
|
23 |
Cloud revenue – PaaS2 |
|
1,533 |
|
84 |
|
1,449 |
|
995 |
|
54 |
|
46 |
Cloud revenue – IaaS3 |
|
908 |
|
52 |
|
856 |
|
922 |
|
-2 |
|
-7 |
Cloud revenue |
|
11,426 |
|
756 |
|
10,670 |
|
8,701 |
|
31 |
|
23 |
Thereof SAP S/4HANA Cloud revenue4 |
|
2,088 |
|
127 |
|
1,961 |
|
1,090 |
|
92 |
|
80 |
Cloud gross margin – SaaS1 (in %) |
|
72.1 |
|
|
|
72.1 |
|
71.1 |
|
1.0pp |
|
1.0pp |
Cloud gross margin – PaaS2 (in %) |
|
80.9 |
|
|
|
82.1 |
|
82.4 |
|
–1.6pp |
|
–0.3pp |
Cloud gross margin – IaaS3 (in %) |
|
35.2 |
|
|
|
39.6 |
|
32.9 |
|
2.3pp |
|
6.7pp |
Cloud gross margin (in %) |
|
70.3 |
|
|
|
70.8 |
|
68.4 |
|
2.0pp |
|
2.5pp |
1 Software as a service: SaaS comprises all other offerings that are not shown as PaaS or IaaS.
2 Platform as a service: PaaS primarily includes SAP Business Technology Platform and SAP Signavio Solutions.
3 Infrastructure as a service: A major portion of IaaS comes from SAP HANA Enterprise Cloud.
4 Mainly derived from the Applications, Technology & Services segment.
Financial Income, Net
Financial income, net, decreased to €-1,389 million (2021: €2,178 million). Our finance income was €811 million (2021: €3,123 million) and our finance costs were €2,200 million (2021: €945 million).
Finance income primarily consists of gains from IFRS 9-related fair value adjustments, mainly of Sapphire Ventures investments, and the disposal of equity securities totaling €608 million (2021: €3,067 million).
Finance costs mainly consist of IFRS 9-related fair value adjustments or losses from disposal of Sapphire Ventures investments totaling €1,802 million (2021: €654 million), and interest expense on financial liabilities amounting to €272 million (2021: €206 million). For more information about financing instruments, see the Notes to the Consolidated Financial Statements, Note (E.3).
Income Taxes
The effective tax rate in 2022 was 32.0% (2021: 19.8%). The year-over-year increase mainly resulted from changes in tax-exempt income due to the lower 2022 financial income contribution of Sapphire Ventures given prevailing market conditions. For more information about income taxes, see the Notes to the Consolidated Financial Statements, Note (C.5).
62
Foreign Currency Exchange Rate Exposure
Although our reporting currency is the euro, a significant portion of our business is conducted in currencies other than the euro. Since the Group’s entities usually conduct their business in their respective functional currencies, our risk of exchange rate fluctuations from ongoing ordinary operations is not considered significant. However, occasionally we generate foreign-currency-denominated receivables, payables, and other monetary items by transacting in a currency other than the functional currency; to mitigate the extent of the associated foreign currency exchange rate risk, a significant portion of these transactions is hedged. For more information about foreign currencies and our hedging activities, see Note (F.1) and Note (IN.1).
Approximately 74% of our total revenue in 2023 (2022: 73%) was attributable to operations in non-euro participating countries. We translated that revenue into euros for financial reporting purposes. Fluctuations in the exchange rate of the euro had an unfavorable impact of € 826 million on our total revenue for 2023, a favorable impact of €1,620 million on our total revenue for 2022 and an unfavorable impact of €375 million on our total revenue for 2021.
The impact of foreign currency exchange rate fluctuations discussed in the preceding paragraph is calculated by translating current period figures in local currency to euros at the monthly average exchange rate for the corresponding month in the prior year. Our revenue analysis, included within the “Operating Results” section of Item 5, discusses at times the effect of currency movements which are calculated in the same manner.
Liquidity and Capital Resources
Finances (IFRS)
Overview
Global Financial Management
We use global centralized financial management to control liquid assets and monitor exposure to interest rates and currencies. The primary aim of our financial management is to maintain liquidity in the Group at a level that is adequate to meet our financial obligations at all times. Most SAP entities have their liquidity managed centrally by the Group, so that liquid assets across the Group can be consolidated, monitored, and invested in accordance with Group policy. High levels of liquid assets help keep SAP flexible, sound, and independent. In addition, various credit facilities are currently available for additional liquidity, if required. For more information about these facilities, see the Credit Facilities section.
We manage credit, liquidity, interest rate, equity price, and foreign exchange rate risks on a Group-wide basis. We use selected derivatives exclusively for this purpose and not for speculation, which is defined as entering into a derivative instrument for which we do not have corresponding underlying transactions. The rules for the use of derivatives and other rules and processes concerning the management of financial risks are documented in our Treasury Guideline, which applies globally to all companies in the Group. For more information about the management of each financial risk and about our risk exposure, see the Notes to the Consolidated Financial Statements, Notes (F.1) and (F.2).
Capital Structure Management
The primary objective of our capital structure management is to maintain a strong financial profile for investor, creditor, and customer confidence, and to support the growth of our business. We seek to maintain a capital structure that will enable us to cover our funding requirements through the capital markets at reasonable conditions, and in so doing, ensure a high level of independence, and financial flexibility. For more information about the capital structure and its analysis, see the Analysis of Consolidated Statement of Financial Position section and the Notes to the Consolidated Financial Statements, Note (E.1).
The long-term credit rating for SAP SE is “A2” by Moody’s (positive outlook) and “A+” by Standard & Poor’s (stable outlook).
On May 16, 2023, SAP announced a new share repurchase program with an aggregate volume of up to €5 billion and a term until December 31, 2025. As at December 31, 2023, SAP had repurchased 7,563,796 shares at an average price of €125.49, with payouts of approximately €949 million under the program in 2023. Repurchased shares will primarily be used to service future awards granted under the ‘Move SAP’ share-based compensation plan.
Liquidity Management
Our primary source of cash, cash equivalents, and current investments is funds generated from our business operations. Over the past several years, our principal use of cash has been to support operations and our capital expenditure requirements resulting from our growth, to quickly repay financial debt, to acquire businesses, to pay dividends on our shares, and to buy back SAP shares on the open market. On December 31, 2023, our cash, cash equivalents, and current investments were primarily held in euros and U.S. dollars. We generally invest only in the financial assets of issuers or funds with a minimum credit rating of BBB, and pursue a policy of cautious investment characterized by wide portfolio diversification with a variety of counterparties, predominantly short-term investments, and standard investment instruments. Our investments in financial assets of issuers with a credit rating lower than BBB were not material in 2023.
63
We believe that our liquid assets combined with our undrawn credit facilities are sufficient to meet our operating financing needs in 2024 and, together with expected cash flows from operations, will support debt repayments, currently planned capital expenditure requirements, and capital returns to our shareholders over the near term and medium term. It may also be necessary to enter into financing transactions when additional funds are required that cannot be wholly sourced from free cash flow, to maintain flexibility, and/or limit repayment risk.
Therefore, we continuously monitor funding options available in the capital markets and trends in the availability of funds, as well as the cost of such funding. In recent years, we were able to repay additional debt within a short period of time due to our persistently strong free cash flow. For more information about the financial debt, see the Cash Flows and Liquidity section.
For further information about our planned capital expenditures see Investment Goals and Goals for Liquidity and Finance section. See Note (D.6) and Note (D.8) for our capital contribution commitments and purchase obligations respectively and Note (F.1) for lease and other financial liabilities.
As of December 31, 2023, €336 million of our other non-current non-financial liabilities have a maturity between 1 and 5 years and €362million have a maturity of more than 5 years. €220 million of our derivative financial liabilities have a maturity of less than 1 year and €420 million have a maturity between 1 and 5 years. €127 million of our derivative financial liabilities have a maturity of more than 5 years.
As of December 31, 2022, €417 million of our other non-current non-financial liabilities have a maturity between 1 and 5 years and €286 million have a maturity of more than 5 years. €118 million of our derivative financial liabilities have a maturity of less than 1 year and €592 million have a maturity between 1 and 5 years. €256 million of our derivative financial liabilities have a maturity of more than 5 years.
The timing of payments for the contractual obligations is based on payment schedules for those obligations where set payments exist. For other obligations with no set payment schedules, estimates for the most likely timing of cash payments have been made. The ultimate timing of these future cash flows may differ from these estimates. We do not believe we have forms of material off-balance sheet arrangements that would require disclosure other than those already disclosed.
Financial Debts
Financial debt is defined as the nominal volume of bank loans, commercial paper, private placements, and bonds.
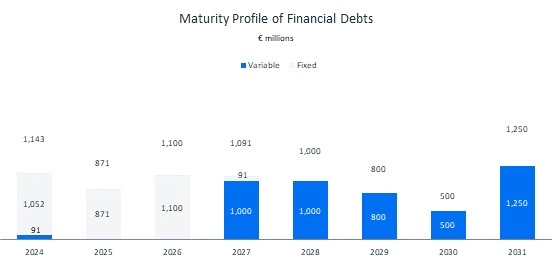
Nominal volume of financial debt on December 31, 2023, included amounts in euros (€7,755 million) and U.S. dollars (€655 million). On December 31, 2023, approximately 60% of the financial debt was held at variable interest rates, partially swapped from fixed into variable using interest rate swaps.
For information about the intended repayments, see the goals for liquidity and finance in the Financial Targets and Prospects section.
64
Financial Debt by Instrument
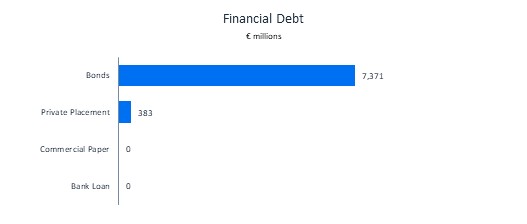
For more information about our financial debt, see the Notes to the Consolidated Financial Statements, Note (E.3).
Cash Flows and Liquidity
2023 Actual Cash Flow and Liquidity Performance Compared to Outlook
We met or exceeded the updated outlook for 2023.
€ billions |
|
2022 Results |
|
2023 Outlook1 |
|
2023 Results |
Capital expenditure |
|
-0.88 |
|
Approximately 0.95 |
|
-0.79 |
Free cash flow |
|
4.39 |
|
Approximately 4.9 |
|
5.09 |
1 The 2023 outlook was communicated in January 2023 and updated in April 2023 to reflect the expected Qualtrics divestiture. The 2023 outlook numbers reflect the updated outlook from April 2023.
Group Liquidity and Net Liquidity/Net Debt
€ millions |
|
2023 |
|
2022 |
|
∆ |
Cash and cash equivalents |
|
8,124 |
|
9,008 |
|
-883 |
Current time deposits and debt securities |
|
3,151 |
|
686 |
|
2,464 |
Group liquidity |
|
11,275 |
|
9,694 |
|
1,581 |
Current financial debt |
|
-1,143 |
|
-3,986 |
|
2,843 |
Non-current financial debt |
|
-6,612 |
|
-7,778 |
|
1,166 |
Financial debt |
|
-7,755 |
|
-11,764 |
|
4,009 |
Net liquidity (+)/net debt (–) |
|
3,521 |
|
-2,070 |
|
5,590 |
Lease liabilities |
|
-1,621 |
|
-2,140 |
|
519 |
Net debt including lease liabilities |
|
1,899 |
|
-4,210 |
|
6,109 |
Group liquidity consists of cash and cash equivalents (for example, cash at banks, money market funds, and time deposits with original maturity of three months or less) and current investments (for example, time deposits and debt securities with original maturities of greater than three months, and remaining maturities of less than one year included in current other financial assets). Group liquidity on December 31, 2023, primarily comprised amounts in euros and U.S. dollars.
The net increase in group liquidity compared to 2022 was mainly due to the Qualtrics divestiture, compensated by the acquisition of LeanIX, the share buyback program, and the repayment of Eurobonds, loans, and commercial paper.
Net liquidity/net debt is group liquidity less financial debt. For more information about our liquidity, see the Notes to the Consolidated Financial Statements, Note (E.3).
For more information about the impact of cash, cash equivalents, current investments, and our financial liabilities on our income statements, see the analysis of our financial income, net, in the Operating Results (IFRS) section.
65
Development of Net Debt
|
|
|
|
20231 |
|
2022 |
Net debt 12/31/2022 (PY: 12/31/2021) |
|
Free Cash Flow |
|
-2,070 |
|
-1,563 |
Net cash flows from operating activities – continuing operations |
|
|
|
6,210 |
|
5,675 |
Capital expenditure |
|
5,093 |
|
-785 |
|
-877 |
Lease payments |
|
|
|
-332 |
|
-410 |
Business combinations |
|
|
|
-1,168 |
|
-679 |
Dividends |
|
|
|
-2,395 |
|
-2,865 |
Treasury shares |
|
|
|
-949 |
|
-1,500 |
Net proceeds from Qualtrics sale |
|
|
|
5,510 |
|
0 |
Other |
|
|
|
-500 |
|
150 |
Net liquidity (+)/net debt (–) 12/31/2023 (PY: 12/31/2022) |
|
|
|
3,521 |
|
-2,070 |
1 Net debt as at 12/31/2022 includes continuing and discontinued operations, net liquidity/net debt as at 12/31/2023 only includes continuing operations.
Analysis of Consolidated Statements of Cash Flows
€ millions |
|
Years ended December 31, |
|
∆ in % |
|
∆ in % |
||||
|
|
2023 |
|
2022 |
|
2021 |
|
2023 vs. 2022 |
|
2022 vs. 2021 |
Net cash flows from operating activities |
|
6,210 |
|
5,675 |
|
6,182 |
|
9 |
|
-8 |
Net cash flows from investing activities |
|
-4,603 |
|
699 |
|
-2,856 |
|
<-100 |
|
<-100 |
Net cash flows from financing activities |
|
-7,758 |
|
-6,074 |
|
-2,885 |
|
28 |
|
>100 |
Analysis of Consolidated Statements of Cash Flows: 2023 compared to 2022
In 2023, cash inflows from operating activities increased €535 million to €6,210 million (2022: €5,675 million). This is particularly due to higher profitability, improvements in working capital, lower share-based payments (€1.1 billion in 2023 compared to €1.2 billion in 2022), and higher net interest received (€0.1 billion in 2023 compared to €0.1 billion net interest paid in 2022), which were compensated by higher income tax payments (€2.2 billion in 2023 compared to €1.6 billion in 2022) and higher restructuring payouts (€0.2 billion in 2023 compared to €0.1 billion in 2022). In addition, the decreased volume of trade receivables sold in 2023 amounting to €0.6 billion (€0.9 billion in 2022) affected operating cash flow. Cash collected from customer contracts increased compared to 2022.
Cash outflows from investing activities were €4,603 million in 2023, compared to €699 million cash inflows in 2022. We increased short-term time deposits and debt instruments by €2.5 billion. We paid, net of cash received, a total of €1.2 billion mainly for the LeanIX acquisition in 2023, compared to €0.7 billion mainly for the Taulia and Askdata acquisitions in 2022. We received, net of taxes paid, approximately €5.5 billion for the divestiture of Qualtrics in 2023. Capital expenditure on intangible assets and property, plant, and equipment decreased to €0.8 billion (€0.9 billion in 2022). For more information about current and planned capital expenditures, see the Investment Goals section.
In 2023, free cash flow (for the definition, see the Performance Management System section) increased to €5,093 million (2022: €4,388 million). The free cash flow conversion rate, defined as free cash flow as a percentage of profit after tax, decreased to 141% (2022: 143%).
Net cash outflows from financing activities were €7,758 million in 2023, compared to €6,074 million in 2022. The buyback of treasury shares with a volume of €0.95 billion in 2023 is included herein. Apart from the buyback of treasury shares, cash outflows in 2023 resulted from the repayment of €1.6 billion in Eurobonds, €1.45 billion in loans, and €0.93 billion in commercial paper when they matured. In 2022, we bought back treasury shares with a volume of €1.5 billion. Further cash outflows in 2022 resulted from the repayment of €0.9 billion in Eurobonds and US$0.445 billion in U.S. private placements when they matured.
The dividend payment made in 2023 was €2,395 million compared to €2,865 million paid the preceding year.
Analysis of Consolidated Statements of Cash Flows: 2022 Compared to 2021
In 2022, cash inflows from operating activities decreased €507 million to €5,675 million (2021: €6,182 million). This is particularly due to lower profitability, higher advance payments to hyperscalers (€0.5 billion in 2022 compared to €0.1 billion in 2021), and higher share-based payments (€1.2 billion in 2022 compared to €1.1 billion in 2021), which were compensated by lower income tax payments (€1.7 billion in 2022 compared to €2.0 billion in 2021). In addition, the increased volume of trade receivables sold in 2022 amounting to €0.9 billion (€0.5 billion in 2021) had a positive impact on operating cash flow. Cash collected from customer contracts increased compared to 2021.
66
Cash inflows from investing activities were €699 million in 2022 (2021: cash outflows of €2,856 million). We reduced short-term time deposits and debt instruments by €1.9 billion. We paid, net of cash received, a total of €0.7 billion mainly for the Taulia and Askdata acquisitions in 2022, compared to €1.0 billion mainly for the Signavio acquisition in 2021. We received approximately €0.3 billion for the divestiture of the SAP Litmos business in 2022. Capital expenditure on intangible assets and property, plant, and equipment increased (€0.9 billion in 2022 compared to €0.7 billion in 2021). For more information about current and planned capital expenditures,, see the Investment Goals section.
In 2022, free cash flow decreased to €4,388 million (2021: €5,106 million). The free cash flow conversion rate, defined as free cash flow as a percentage of profit after tax, increased to 143% compared to 75% in 2021.
Net cash outflows from financing activities were €6,074 million in 2022, compared to €2,885 million in 2021. The buyback of treasury shares with a volume of €1.5 billion in 2022 is included herein. Apart from the buyback of treasury shares, cash outflows in 2022 resulted from repayments of €0.9 billion in Eurobonds as scheduled, and US$0.445 billion in U.S. private placements when they matured. In 2021, we repaid €1.25 billion of the acquisition term loan for Qualtrics, €0.5 billion in Eurobonds when they matured, and €0.15 billion in commercial paper. In 2021, we further drew two short-term loans of €0.95 billion and €0.5 billion respectively, which can be repaid flexibly until September 2023.
The dividend payment of €2,865 million made in 2022 exceeded the amount paid the preceding year (€2,182 million), while the dividend paid per share increased from €1.85 to €2.45 (including a special dividend of €0.50 to celebrate SAP’s 50th anniversary).
Credit Facilities
Other sources of liquidity are available to us through various credit facilities, if required.
To retain high financial flexibility, we have available a €3.0 billion syndicated revolving credit facility with an end date in March 2028 plus two one-year extension options. A possible future utilization is not subject to any financial covenants. So far, we have not used, and do not currently foresee any need to use, this credit facility.
As at December 31, 2023, SAP SE had additional available credit facilities totaling €550 million. Several other SAP entities have credit facilities available that allow them to borrow funds at prevailing interest rates.
Obligations under Indemnifications and Guarantees
Our software license agreements and our cloud subscription agreements generally include certain provisions for indemnifying customers against liabilities if our software products infringe a third party’s intellectual property rights. In addition, we occasionally provide function or performance guarantees in routine consulting contracts and development arrangements. We also generally provide a six to twelve-month warranty on our software and a subscription-length warranty on cloud services with a 90 day claim cut off. Our warranty liability is included in other provisions. For more information on other provisions see Notes (A.4), (B.5), and (B.6) to our Consolidated Financial Statements. For more information on obligations and contingent liabilities refer to Notes (A.4), (D.6), (D.8) and (G.3) in our Consolidated Financial Statements.
Research and Development
For information on our R&D activities see “Item 4. Information about SAP — Our Investments in Innovation.” For information on our R&D costs see “Item 5. Operating and Financial Review and Prospects — Operating Results (IFRS)” and for information related to our R&D employees see “Item 6. Directors, Senior Management and Employees — Employees.”
New Accounting Standards Not Yet Adopted
See Note (IN.1) to our Consolidated Financial Statements for our discussion on new accounting standards not yet adopted.
67
Expected Developments
Future Trends in the Global Economy
Global economic growth will decrease slightly in 2024, mainly reflecting the impact of monetary policy tightening across advanced economies, projects the European Central Bank (ECB) in its most recent Economic Bulletin.1 This means that the global economy will expand but still at a rate below the historical average over the ECB’s projection horizon. With post-COVID-19 growth momentum waning, the services sector, which had previously proven resilient, might also show a greater deceleration in 2024.
Concerning the EMEA region, economic growth in the euro area might remain subdued in the near term, as interest rate increases could tighten financing conditions and dampen demand, but at the same time help push down inflation. However, these effects are likely to fade later on in the projection period because of rising real incomes and improving foreign demand, suggests the ECB. It also expects services activity in the EMEA region to soften in the coming months due to spillovers from weaker industrial activity, fading effects from the reopening of the economy, and the broadening impact of tighter financing conditions.
As for the Americas region, the ECB predicts that while economic growth in the United States could moderate in the near term as tighter monetary policy might restrain spending, the U.S. economy should recover again from the second half of 2024 onward.
For the APJ region, the ECB’s growth outlook remains broadly unrevised with respect to emerging Asia and China. In China, the ECB projects economic growth to gradually decrease over the coming years owing to structural factors such as population ageing. In Japan, economic growth might remain positive but modest in 2024, amid signs of a slight rebound in real consumption levels.
Economic Trends – GDP Growth Year Over Year
Percent |
|
2023 |
|
2024p |
|
2025p |
World |
|
3.1 |
|
3.1 |
|
3.2 |
Advanced Economies |
|
1.6 |
|
1.5 |
|
1.8 |
Emerging Markets and Developing Economies |
|
4.1 |
|
4.1 |
|
4.2 |
Regions (according to IMF taxonomy) |
|
|
|
|
|
|
Euro Area |
|
0.5 |
|
0.9 |
|
1.7 |
Germany |
|
-0.3 |
|
0.5 |
|
1.6 |
Emerging and Developing Europe |
|
2.7 |
|
2.8 |
|
2.5 |
Middle East and Central Asia |
|
2.0 |
|
2.9 |
|
4.2 |
Sub-Saharan Africa |
|
3.3 |
|
3.8 |
|
4.1 |
United States |
|
2.5 |
|
2.1 |
|
1.7 |
Canada |
|
1.1 |
|
1.4 |
|
2.3 |
Latin America and the Caribbean |
|
2.5 |
|
1.9 |
|
2.5 |
Japan |
|
1.9 |
|
0.9 |
|
0.8 |
Emerging and Developing Asia |
|
5.4 |
|
5.2 |
|
4.8 |
China |
|
5.2 |
|
4.6 |
|
4.1 |
p = projection
Source: International Monetary Fund (IMF), World Economic Outlook Update January 2024, Moderating Inflation and Steady Growth Open Path to Soft Landing (https://www.imf.org/-/media/Files/Publications/WEO/2024/Update/January/English/text.ashx), p. 6.
1 European Central Bank, Economic Bulletin, Issue 8/2023, Publication Date: January 11, 2024.
68
The IT Market:
Outlook for 2024 and Beyond
“Organizations that can make smarter investments and better execute on their strategies because of their digital business platforms will find themselves with a major competitive advantage over the next five years, leading them to capture significant portions of the digital market share.”2 That is the assessment of International Data Corporation (IDC), a U.S.-based market research firm. It projects that “spending on digital technology by organizations will grow at 7x the economy in 2024, as companies are compelled by market demands to grow digital business models and strengthen digital capabilities,”2 and finds that “in a scenario where agility is paramount, a continued reliance on legacy systems can be detrimental. As we move closer to 2025, organizations must prioritize this transition not just to be at the forefront of their market but simply to survive.”3
According to IDC, “by early 2025, organizations still on legacy systems will need to modernize their applications immediately to survive and adapt to the digital world already surpassing them.”3 In addition, by 2028, “organizations with established digital business platforms will have 50% higher digital market share with greater abilities to track ROI and execute digital revenue initiatives,”2 and “85% of CIOs will leverage organizational changes to harness AI, automation, and analytics, driving agile, insight-driven digital businesses.”4
Concerning sustainability, IDC expects that “by 2027, G2000 organizations’ business and IT leaders will dedicate at least 20% of their digital tech spending toward sustainability initiatives”, “meeting their digital goals while taking sustainability into account. These types of sustainability initiatives will increase in the next five years as significant parts of digital technology investment strategies.”2
In particular, IDC reports that “tools and technologies that facilitate real-time monitoring and reporting of ESG metrics will be essential” to “mitigate legal risks and enhance their brand and competitive advantage.”4 It predicts, for example, that “applications that enable real-time carbon footprint tracking and integrate seamlessly with green supply chain mechanisms will transition from a nice-to-have to a must-have”3 and that, therefore, “the automation of regulatory compliance will be essential for monitoring, analyzing, and reporting accurate ESG metrics to meet regulatory standards.”4
Impact on SAP
The global economy is currently impacted by multiple crises, such as political tensions, wars in Ukraine and the Middle East, disruptions of supply chains, and increasing natural disasters due to climate change. Nevertheless, SAP’s resilience is remarkable and with 83% of our revenue recurring, the Company is able to withstand economic pressure to a large degree. Even so, SAP must continue to evolve and remain agile while continuously adapting to a fast-changing landscape.
In 2024 and beyond, SAP plans to execute along the refined corporate strategy, with increasing focus on key strategic growth areas, such as cloud adoption, SAP Business AI, and value for customers. This makes us confident in our ability to expand our addressable market and deliver sustained topline growth. In addition, given our increased focus on operational efficiency, we are very confident we will be able to achieve our midterm ambition.
Financial Targets and Prospects
Revenue and Operating Profit Targets and Prospects (Non-IFRS)
Outlook 2024
The outlook for 2024 has been prepared in accordance with our updated non-IFRS definition from 2024. For more information, see the Performance Management System section.
For the full year 2024, SAP expects:
– |
€17.0 billion to €17.3 billion in cloud revenue at constant currencies (2023: €13.66 billion), up 24% to 27% at constant currencies |
– |
€29.0 billion to €29.5 billion in cloud and software revenue at constant currencies (2023: €26.92 billion), up 8% to 10% at constant currencies |
– |
€7.6 billion to €7.9 billion non-IFRS operating profit at constant currencies (2023: €6.51 billion, based on the updated non-IFRS operating profit definition and excluding gains and losses from less material divestitures), up 17% to 22% at constant currencies. |
– |
Free cash flow of approximately €3.5 billion (2023: €5.09 billion). This includes a preliminary €2 billion estimate for payouts associated with the program, a €0.2 billion impact from a settlement earlier this year of pre-existing regulatory compliance matters accrued in 2023, and a €0.2 billion adverse impact due to the discontinuation of the SAP-triggered financing program. |
– |
An effective tax rate (non-IFRS) of around 32.0% (2023: 30.3%, based on the updated non-IFRS definition) |
2 IDC FutureScape: Worldwide Digital Business Strategies 2024 Predictions, Doc #US50120323, October 2023.
3 IDC FutureScape: Worldwide Intelligent ERP 2024 Predictions, Doc #US51300923, October 2023.
4 IDC FutureScape: Worldwide CIO Agenda 2024 Predictions, Doc #US51294523, October 2023.
69
Furthermore, SAP provides the following additional forward-looking information for selected metrics:
– |
CCB: we expect a year-end growth rate similar that of 2023, while at a larger scale. |
– |
Cloud ERP Suite revenue: we expect to sustain the high growth rate in 2024. |
While SAP’s full-year 2024 business outlook is at constant currencies, numbers reported in actual currencies are likely to be impacted by exchange rate fluctuations as the year progresses. See the table below for the expected currency impacts for the full-year 2024. These expectations are based on the December 2023 level.
In percentage points (pp) |
|
FY/2024 |
Cloud revenue growth |
|
-2.0pp to 0.0pp |
Cloud and software revenue growth |
|
-1.5pp to 0.5pp |
Operating profit growth (non-IFRS) |
|
-2.0pp to 0.0pp |
The following table shows the estimates of the items that represent the differences between our non-IFRS financial measures and our IFRS financial measures for operating profit.
€ millions |
|
Estimated |
|
Actual |
|
|
Amounts for |
|
Amounts for |
|
|
2024 |
|
2023 |
Acquisition-related charges |
|
305–385 |
|
345 |
Restructuring |
|
about 2,000 |
|
214 |
Regulatory compliance matters |
|
0 |
|
155 |
Furthermore, the differences between free cash flow as our non-IFRS financial measure and operating cash flow as our IFRS financial measure include estimated cash flows in 2024 for leasing and capital expenditures of €1.2 billion (2023: €1.1 billion).
We do not provide an outlook for the effective tax rate (IFRS) due to the uncertainty and potential variability of gains and losses associated with equity investments, which are reconciling items between non-IFRS and IFRS.
Proposed Dividend
In 2024, we intend to pay a dividend of €2.20 per share (subject to shareholder approval at the Annual General Shareholders Meeting in May 2024). For more information, see the Financial Performance: Review and Analysis section.
Ambition 2025
In this section, all numbers (except cloud revenue and total revenue) are based exclusively on non-IFRS measures.
By 2025, SAP now expects:
– |
Non-IFRS cloud gross profit of approximately €16.2 billion, which now includes share-based compensation expenses of approximately €0.1 billion1 |
– |
Non-IFRS operating profit of approximately €10.0 billion, which now includes share-based compensation expenses of approximately €2 billion1 |
– |
Free cash flow of approximately €8.0 billion |
SAP continues to expect:
– |
Cloud revenue of more than €21.5 billion |
– |
Total revenue of more than €37.5 billion |
– |
The share of more predictable revenue to be approximately 86% |
Further, SAP strives for an acceleration of total revenue growth and an expansion of operating margin beyond 2025.
1 Non-IFRS. Our Ambition for 2025 has been adjusted in accordance with our updated non-IFRS definition applicable from 2024. For more information, see the Performance Management System section.
Note: For a reconciliation of non-IFRS results to IFRS equivalents, see the Performance Management System section.
70
Investment Goals
Our planned investment expenditures for 2024 and 2025, other than for business combinations, consist primarily of the purchase of IT infrastructure and the construction activities described in Item 4. Information about SAP – Description of Property. We expect investments in IT infrastructure to be approximately €400 million and in construction activities to be approximately €350 million in 2024. In 2024, we expect total capital expenditures of approximately €950 million. In 2025, capital expenditures are expected to decrease to approximately €700 million.
Goals for Liquidity and Finance
As of December 31, 2023, our net liquidity was €3.5 billion. We believe that our liquid assets combined with our undrawn credit facilities are sufficient to meet our operating financing needs in 2024 as well, and, together with expected cash flows from operations, will support debt repayments and our currently planned capital expenditure requirements over the near and medium term.
In 2024, we expect a free cash flow of approximately €3.5 billion (compared to €5.1 billion in 2023) and of around €8.0 billion in 2025. The decline in free cash flow in 2024 will be driven predominantly by our preliminary €2.0 billion estimated outflow for restructuring, a €200 million outflow for compliance matters, and a €200 million adverse impact due to the discontinuation of the SAP-triggered financing program.
In 2024, we intend to repay €850 million in Eurobonds and US$323 million in U.S. private placements. The ratio of net debt as of December 31, 2023, divided by the total of operating profit (IFRS) plus depreciation and amortization was –0.49x and therefore below our 2023 target of 0.5x.
Non-Financial Goals for 2024 and Ambition for 2025
In addition to our financial goals, we also focus on four non-financial targets: customer loyalty, employee engagement, carbon impact, and women in executive roles.
For 2024, SAP expects employee engagement, measured by the Employee Engagement Index, to be between 76% and 80% (2023: 80%). Through 2025, we aim to achieve a steady increase in our Employee Engagement Index score.
SAP measures customer loyalty using the Customer Net Promoter Score (Customer NPS). We expect the score to be between 9 and 13 for Customer NPS in 2024. SAP expects to steadily increase the Customer NPS through 2025.
In 2024, we expect to steadily decrease carbon emissions across the relevant value chain. Further, SAP has also committed to achieving net-zero along our value chain in line with a 1.5 degrees Celsius future in 2030.
From 2024, SAP will track a new KPI: Women in Executive Roles (WiER). For 2024 and beyond, we are expecting to steadily increase the percentage of women on Global Executive Team, Senior Executive Team, and Executive Team level as we strive to achieve our target of 25% by the end of 2027.
Premises on Which Our Outlook and Prospects Are Based
In preparing our outlook and prospects, we have taken into account all events known to us at the time we prepared this report that could influence SAP’s business going forward.
71
ITEM 6. DIRECTORS, SENIOR MANAGEMENT AND EMPLOYEES
Supervisory Board
The current members of the Supervisory Board of SAP SE, each member’s principal occupation, the year in which each was first elected and the year in which the term of each expires, respectively, are as follows:
Name |
|
Age |
|
Principal Occupation |
|
Year First |
|
Year Term |
Prof. Dr. h.c. mult. Hasso Plattner, Chairperson3, 6, 7,9 |
80 |
Chairman of the Supervisory Board |
2003 |
2024 |
||||
Lars Lamadé, Deputy Chairperson2, 3, 6, 9 |
|
52 |
|
Employee, Head of Global Sponsorships |
|
2002 |
|
2024 |
Manuela Asche-Holstein4, 8, 9 |
59 |
Employee, Industry Advisor Expert |
2021 |
2024 |
||||
Aicha Evans1, 3, 6, 7, 8 |
55 |
Chief Executive Officer and Member of the Board of Directors, Zoox, Inc. |
2017 |
2024 |
||||
Margret Klein-Magar2, 3, 4, 6 |
59 |
Employee, Vice President, Head of SAP Alumni Relations |
2012 |
2024 |
||||
Monika Kovachka-Dimitrova2, 3, 6, 8 |
48 |
Employee, Chief Operations Expert, Member of SAP SE Works Council (Europe) |
2019 |
2024 |
||||
Peter Lengler4, 8, 9 |
61 |
Employee, Value Advisor Expert, Member of SAP Germany SE & Co. KG Works Council |
2021 |
2024 |
||||
Jennifer Xin-Zhe Li4, 5, 10, 12 |
56 |
General Partner, Changcheng Investment Partners |
2022 |
2027 |
||||
Dr. Qi Lu6, 8, 9, 11 |
62 |
CEO, MiraclePlus |
2020 |
2027 |
||||
Gerhard Oswald1, 6, 8 |
|
70 |
|
Managing Director of Oswald Consulting GmbH |
|
2019 |
|
2024 |
Christine Regitz2, 3, 5, 6 |
57 |
Employee, Vice President, Global Head of SAP Women in Tech |
2015 |
2024 |
||||
Dr. h. c. Punit Renjen13 |
|
62 |
|
Independent Management Consultant |
|
2023 |
|
2024 |
Dr. Friederike Rotsch1, 3, 4, 7, 8 |
51 |
General Counsel, Deutsche Bank AG |
2018 |
2024 |
||||
Heike Steck2, 3, 5, 6, 8 |
62 |
Employee, Senior Operations Manager, Member of SAP SE Works Council and Member of SAP SE Works Council (Europe) |
2019 |
2024 |
||||
Helmut Stengele |
|
65 |
|
Employee, on early retirement |
|
2021 |
|
2024 |
Dr. Rouven Westphal3, 5, 6, 7, 9 |
51 |
Member of the Executive Board of the Hasso Plattner Foundation and Managing Director of the General Partner of HPC Germany GmbH & Co. KG |
2021 |
2026 |
||||
Dr. Gunnar Wiedenfels3, 4, 5, 7, 10 |
46 |
Chief Financial Officer, Warner Bros. Discovery Inc. |
2019 |
2026 |
||||
James Wright2, 4, 5, 9 |
61 |
Employee, Member of the SE Works Council (Europe) |
2019 |
2024 |
1 Elected by SAP SE’s shareholders on May 15, 2019.
2 Appointed by the SAP SE Works Council Europe on April 3, 2019.
3 Member of the Personnel and Governance Committee.
4 Member of the Audit and Compliance Committee.
5 Member of the Finance and Investment Committee.
6 Member of the Technology and Strategy Committee.
7 Member of the Nomination Committee.
8 Member of the People and Culture Committee.
9 Member of the Company's Go-To-Market and Operations Committee
10 Audit Committee financial experts.
11 Elected by SAP SE's shareholders on May 12, 2021.
12 Elected by SAP SE's shareholders on May 18, 2022.
13 Elected by SAP SE's shareholders on May 11, 2023.
For detailed information on the Supervisory Board committees and their tasks, including the Audit and Compliance Committee and the Personnel and Governance Committee, please refer to “Item 10 Additional Information — Corporate Governance.”
Pursuant to the Articles of Incorporation of SAP SE and the Agreement on the Involvement of Employees in SAP SE, members of the Supervisory Board of SAP SE consist of nine representatives of the shareholders and nine representatives of the European employees.
Certain current members of the Supervisory Board of SAP SE were members of supervisory boards and comparable governing bodies of enterprises other than SAP SE in Germany and other countries as of December 31, 2023. See Note (G.4) to our Consolidated Financial Statements for more detail. Apart from pension obligations for employees, SAP SE has not entered into contracts with any member of the Supervisory Board that provide for benefits upon a termination of the employment or service of the member.
72
Executive Board
The current members of the Executive Board, the year in which each member was first appointed and the year in which the term of each expires, respectively, are as follows:
Name |
|
Year First |
|
Year Current |
Christian Klein, CEO |
2018 |
2025 |
||
Dominik Asam |
2023 |
2026 |
||
Jürgen Müller |
2019 |
2024 |
||
Scott Russell |
2021 |
2027 |
||
Thomas Saueressig |
2019 |
2025 |
||
Gina Vargiu - Breuer |
|
2024 |
|
2027 |
Julia White |
|
2021 |
|
2027 |
A description of the management responsibilities and backgrounds of the current members of the Executive Board are as follows:
Christian Klein, CEO (Vorstandssprecher), 43 years old, holds a diploma in international business administration from the University of Cooperative Education in Mannheim, Germany. He joined SAP in 1999 and became a member of the Executive Board in 2018. On October 10, 2019 he became co-CEO alongside Jennifer Morgan and on April 20, 2020 he was appointed sole CEO. Christian oversees strategy & operations, corporate development, sustainability, business AI and compliance.
Dominik Asam, 54 years old, graduated in mechanical engineering at Technical University of Munich and École Centrale Paris. He also holds a master’s degree in business administration from INSEAD (European Institute of Business Administration). He joined SAP in March 2023 as Chief Financial Officer (CFO) and member of the Executive Board, succeeding Luka Mucic who left SAP on March 31, 2023. He is responsible for finance and administration including legal, investor relations, internal audit, data protection and export control. Prior to joining SAP, Dominik had served as CFO at Airbus SE from April 2019 to February 2023 and Infineon Technologies AG from 2011.
Jürgen Müller, 41 years old, holds a PhD in IT systems engineering from the Hasso Plattner Institute (HPI) for Software Engineering, University of Potsdam, Germany. He joined SAP in 2013 and became a member of the Executive Board in 2019. Jürgen is Chief Technology Officer (CTO) of SAP and leads the board area Technology and Innovation. He is responsible for the technology and innovation strategy and for the SAP Business Technology Platform which includes data management, analytics and planning, integration, and application development capabilities as well as global security. Before joining SAP, Jürgen was co-representative of Hasso Plattner’s research chair at the HPI.
Scott Russell, 51 years old, is a graduate of Australia’s Deakin University. He joined SAP in 2010 and became a member of the Executive Board in 2021. He leads Customer Success, SAP’s global commercial, partner ecosystem and customer engagement organization as well as working capital management. Prior to being named to the Executive Board, Scott most recently served as President of SAP Asia Pacific Japan (APJ). Before joining SAP, he was a Partner at PwC and a senior executive at IBM Corp.
Thomas Saueressig, 38 years old, holds a degree in Business Information Technology from the University of Cooperative Education in Mannheim, Germany, and a joint executive MBA from ESSEC, France, and Mannheim Business School, Germany. He joined SAP in 2004 and became a member of the Executive Board in 2019. Thomas leads the Board area SAP Product Engineering and has global responsibility for all SAP business software applications, cloud operations and support, cross-development functions as well as the SAP enterprise adoption organization and Emarsys.
Gina Vargiu - Breuer, 49 years old, holds a postgraduate diploma in advanced management from ESMT Berlin and a master degree in economic psychology from the Catholic University of Eichstätt - Ingolstadt. She first joined SAP in February 2024 as member of the Executive Board, succeeding Sabine Bendiek who left SAP on December 31, 2023. Gina is Chief People Officer with global responsibility for Human Resources including HR strategy, business transformation, leadership development, and talent development. She also serves as Labor Relations Director. Before joining SAP, Gina was Senior Vice President Global Human Resources at Siemens Energy.
Julia White, 50 years old, holds a master of business administration from Harvard Business School, Boston, USA. She first joined SAP in March 2021 as member of the Executive Board. Julia is Chief Marketing and Solutions Officer and is responsible for global and regional marketing, corporate communications, and government affairs. Before joining SAP, Julia was Corporate Vice President of Microsoft Corp., responsible for product marketing for Azure, Windows server and other cloud products.
The members of the Executive Board of SAP SE as of December 31, 2023 that are members on other supervisory boards and comparable governing bodies of enterprises, other than SAP, in Germany and other countries, are set forth in Note (G.4) to our Consolidated Financial Statements. SAP SE has not entered into contracts with any member of the Executive Board that provide for benefits upon a termination of the employment of service of the member, apart from pensions, benefits payable in the event of an early termination of service, and abstention compensation for the postcontractual noncompete period.
To our knowledge, there are no family relationships among any of the Supervisory Board and Executive Board members.
73
Compensation Report
Compensation for Executive and Supervisory Board Members
This compensation report describes the two compensation systems for Executive and Supervisory Board members, outlines the criteria that apply to the compensation for the year 2023, and discloses the amount of compensation. The compensation system for Executive Board members was approved by the Annual General Meeting on May 20, 2020, and the compensation system for Supervisory Board members was approved by the Annual General Meeting on May 11, 2023.
The current compensation report meets the requirements of section 162 of the German Stock Corporation Act (AktG). The compensation report for 2022 was approved by the Annual General Meeting on May 11, 2023.
The Supervisory Board engages regularly with SAP’s stakeholders, including investors, on the appropriateness of compensation transparency and structure. Based on this input, a new compensation system for the Executive Board members was approved at the Annual General Meeting on May 11, 2023. The new compensation system is effective from 2024 and will therefore form the basis of the 2024 compensation report. For more information, please see the 2024 compensation system for Executive Board members.
Compensation for Executive Board Members
Compensation System
The compensation for Executive Board members is intended to reflect the demanding role of Executive Board members leading a global company in a rapidly evolving sector. The compensation level is aimed to be competitive to support SAP in the global market for highly skilled executives, especially in the context of the international software industry. It is our goal that our Executive Board compensation provides sustainable incentive for committed, successful work in a dynamic business environment.
The Supervisory Board – supported by its Personnel and Governance Committee – determines the compensation for each Executive Board member based on their individual role and performance in its first regular meeting of each fiscal year, following the principles that the compensation:
| – | Promotes the business strategy |
| – | Ensures that extraordinary performance is appropriately rewarded and any failure to achieve specific targets triggers a tangible reduction in the compensation |
| – | Is in line with market standards in terms of its level and structure and reflects the Company's size, complexity, and economic situation |
| – | Takes account of the pay structure in the Company as a whole. In this context, the compensation is compared with the pay of SAP executives and non-executive SAP employees to ensure that the principle of proportionality is observed within SAP. |
The compensation system is, to a major extent, already aligned with the compensation agreements currently in place, with the exception of a few provisions relating to fringe benefits and/or pension commitments. When, in future, new members are appointed or members are reappointed, the Supervisory Board will ensure that the specific total compensation is aligned with the compensation system.
For more information about the work of the Supervisory Board and its committees, see Item 10. Additional Information.
The compensation contains performance-based elements and non-performance-based elements, as follows:
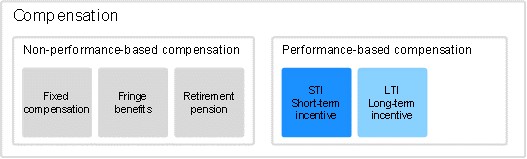
The amount of performance-based compensation depends primarily on SAP’s performance against predefined target values (Key Performance Indicators, KPIs) and on the SAP share price, and is subject to hurdles and caps. These KPIs and their target values as well as their weighting are set by the Supervisory Board each year and are aligned to the SAP budget for that year or to SAP’s externally communicated financial ambitions.
74
The Supervisory Board sets the individual total target compensation for each Executive Board member, comprised of the fixed compensation element and the two performance-based elements. This target compensation is benchmarked based on SAP’s global strategy, market position, business performance and future prospects of economy, and the compensation paid at comparable national and international companies. The benchmarking was conducted in January 2023 based on the compensation data from the DAX 40 companies as well as selected U.S.-based IT and other technology companies. 62 This benchmark was the basis for all compensation decisions made for 2023 and led to no changes. The Supervisory Board reviews, assesses, and sets the target compensation in its first meeting of each fiscal year (February 22, 2023, for 2023). The Supervisory Board is of the opinion that this approach ensures that the compensation is appropriate.
The compensation system is designed to support long - term growth in the Company’s value. The long-term incentive element therefore has significant weighting, making up about two-thirds of the CEO’s compensation target, and more than 50% of the ordinary Executive Board members’ compensation target.
In the case of any extraordinary, unforeseeable events, the Supervisory Board is entitled, at its reasonable discretion, to adjust the performance-based compensation before payout upwards or downwards in the interest of SAP. This discretion is limited to +/−20% for the STI and to +/−10% for the LTI.
The individual elements of SAP’s Executive Board compensation are described in more detail below.
Non-Performance-Based Compensation
Fixed Compensation
The fixed compensation is paid monthly in 12 equal installments in the Executive Board member’s home currency. Home currency is the currency of the Executive Board member’s primary place of residence.
Fringe Benefits
The contractually guaranteed fringe benefits mainly comprise insurance contributions, benefits in kind, expenses for maintenance of two households, use of aircraft, and tax gross-ups according to local conditions. The recurring fringe benefits are limited in terms of value to 10% of fixed compensation for ordinary Executive Board members and to 20% for the CEO. Executive Board members who have their permanent residence outside Germany are granted reimbursement of expenses for tax advice with a maximum value of 15% of fixed compensation for ordinary Executive Board members and 30% for the CEO. In case of a relocation to Germany from abroad, a relocation package of up to 15% of fixed compensation for ordinary Executive Board members and up to 30% for the CEO can be granted.
Additionally, to the extent that compensation benefit earned prior to moving to the SAP Executive Board is lost due to this move, a one-off payment (replacement award) could be granted in an amount of up to 200% of the fixed compensation.
According to the new compensation system approved on May 11, 2023, the cap on the amount of the individual member's fringe benefits determined for 2024, the provisions regarding the mobility package, the compensation in foreign currency and its limitation to a euro equivalent, and the replacement award could also apply retroactively for the period from January 1, 2023.
Retirement Pension
The retirement pension plan that applies at SAP is based on defined contributions. For Executive Board members whose permanent place of residence is outside Germany, SAP may specify a retirement pension plan that applies for employees at a company belonging to the SAP Group in the relevant country, limited to 30% of fixed compensation. According to the new compensation system approved on May 11, 2023, the pension-related commitments could also apply retroactively for the period from January 1, 2023.
62 The following U.S.-based companies were included: Adobe, Amazon.com, Apple, Automatic Data Processing, Cisco Systems, Cognizant Technology Solutions, Dell Technologies, DXC Technology, Meta, Hewlett Packard Enterprise, International Business Machines, Microsoft, Netflix, Oracle, salesforce.com, ServiceNow, VMware, Western Digital, and Workday.
75
Performance-Based Compensation
Short-Term Incentive
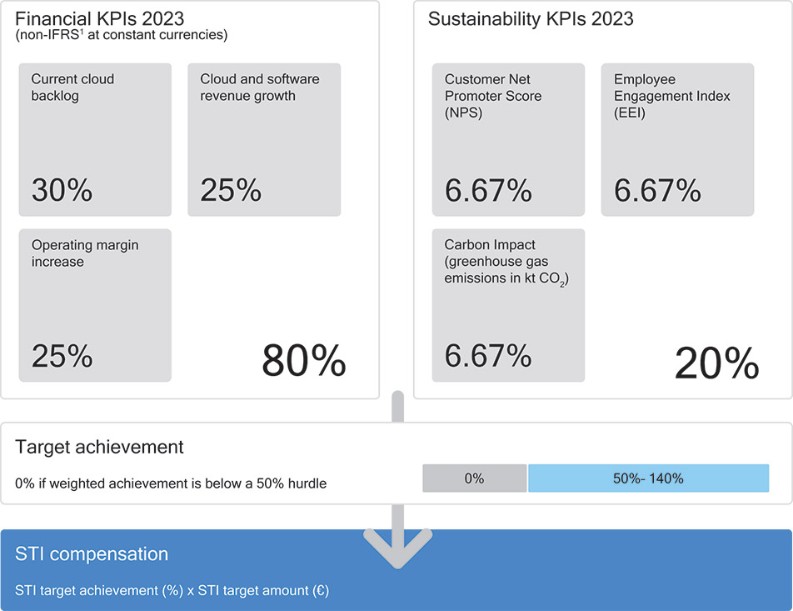
1 Based on non-IFRS metrics published in October 2023 reflecting the decision of the Supervisory Board in September 2023 (for more information, see the section Decisions for 2023).
The short-term, one-year performance-based compensation (Short-Term Incentive, STI) is determined based on a set of financial targets (financial KPIs) and sustainability targets (sustainability KPIs).
For the STI 2023, the financial KPIs have a total weighting of 80% and comprise non-IFRS constant currency current cloud backlog in 2023; year-over-year growth in non-IFRS constant currency cloud and software revenue in 2023; and non-IFRS constant currency operating margin development in 2023 year over year.
The sustainability KPIs have a total weighting of 20%, and comprise Customer Net Promoter Score, which measures SAP’s customer loyalty; Employee Engagement Index, which measures SAP’s employee commitment, pride, and loyalty; and Carbon Impact, which measures SAP’s greenhouse gas emissions.
The KPIs and their respective target values are derived from SAP’s budget for the respective year. For more information about KPIs, see the Performance Management System section in the SAP Integrated Report 2023.
Each underlying KPI includes a hurdle and a cap in addition to the overall hurdle of 50% and the overall cap of 140%. In the event that the hurdle for the individual KPIs is missed and results in the weighted target achievement also falling below the overall hurdle of 50%, the individual hurdle for the respective KPI will be ignored. If the weighted target achievement is below 50%, there is no STI payout. In this case, the target achievement for these KPIs is set to zero.
The STI compensation will be paid out after the Annual General Meeting of Shareholders in the following year. It is paid in the Executive Board member’s home currency. All Executive Board members are obliged to purchase SAP shares worth at least 5% of the actual payout amount in accordance with appropriate trading period regulations. These shares are subject to a three-year holding period.
Long-Term Incentive
The SAP Long-Term Incentive Program 2020 (LTI 2020) is granted in annual tranches and reflects SAP's long-term strategy and thus sets uniform incentives for the Executive Board members to achieve key targets from the long-term strategic plans. The LTI 2020 also serves to reward the Executive Board members for long-term SAP share price performance as compared to the market, thus ensuring that shareholders' interests are also honored. In addition, the LTI 2020 includes a component designed to ensure long-term retention of our Executive Board members.
76
The LTI 2020 is a virtual share program under which annual tranches with a term of approximately four years each are granted. When the individual tranches are granted, a certain grant amount specified in the Executive Board member's service contract is converted into virtual shares (Share Units) in each case. The grant amount cannot exceed 700% of the fixed compensation (based on the relevant euro amounts when determining the specific compensation). The grant amount is divided by the SAP share price, which corresponds to the arithmetic mean on the 20 trading days after scheduled publication of the preliminary results for the fourth quarter and the year as a whole (grant price). In 2023, the financial results were published on January 26, 2023. The Share Units allocated are composed of 1/3 financial performance share units (FSUs), 1/3 market performance share units (MSUs), and 1/3 retention share units (RSUs). All three types of Share Unit have a vesting period of approximately four years.
LTI Grant Process
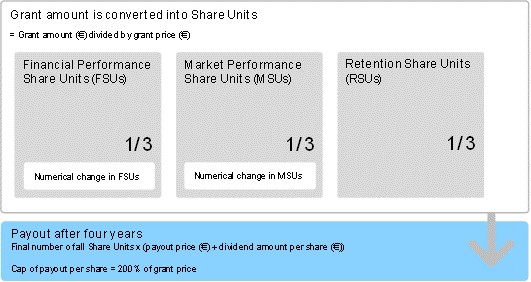
77
The number of RSUs does not change throughout the term, whereas the number of FSUs and MSUs may be subject to change as follows:
Numerical Change in FSUs
The final number of FSUs changes depending on SAP’s performance against the three equally weighted financial KPI targets over the entire three-year performance period. The targets for each tranche are based on the cumulative three-year sum of each KPI. Cloud revenue and total revenue have a cap of 110% and a hurdle of 90% target achievement, while operating income has a cap of 120% and a hurdle of 80% target achievement.
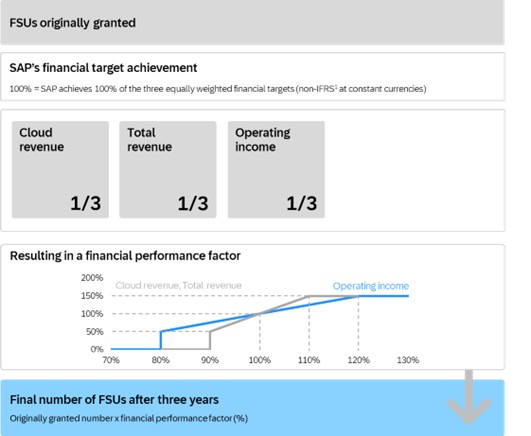
1 Based on non-IFRS metrics published in October 2023 reflecting the decision of the Supervisory Board in September 2023 (for more information, see the section Decisions for 2023).
The following examples of the FSU calculation illustrate possible outcomes assuming 1,000 FSUs granted:
SAP financial performance is better than targets |
|
|
|
|
Total revenue performance factor |
|
|
|
100% |
Cloud revenue performance factor |
|
|
|
125% |
Operating income performance factor capped at |
|
|
|
150% |
Financial performance factor |
|
(100% + 125% + 150%) / 3 |
|
125% |
Final number of FSUs |
|
125% x 1,000 |
|
1,250 |
|
|
|
|
|
SAP financial performance does not meet the targets |
|
|
|
|
Total revenue performance factor below 50% |
|
|
|
0% |
Cloud revenue performance factor |
|
|
|
65% |
Operating income performance factor |
|
|
|
100% |
Financial performance factor |
|
(0% + 65% + 100%) / 3 |
|
55% |
Final number of FSUs |
|
55% x 1,000 |
|
550 |
78
Numerical Change in MSUs
The number of MSUs initially awarded is multiplied by a performance factor. The performance factor depends on the amount of the total shareholder return (TSR) on the SAP share, measured for an entire performance period of approximately three years, and ranked in relation to the TSR performance of the companies of the NASDAQ-100 Index (Index). TSR reflects the performance of the share, combining share price development and granted and reinvested dividends. The market performance factor has a cap at 150% at the 75th percentile (P-75) and a hurdle of 50% at 25th percentile (P-25); below the hurdle, no MSUs are considered.
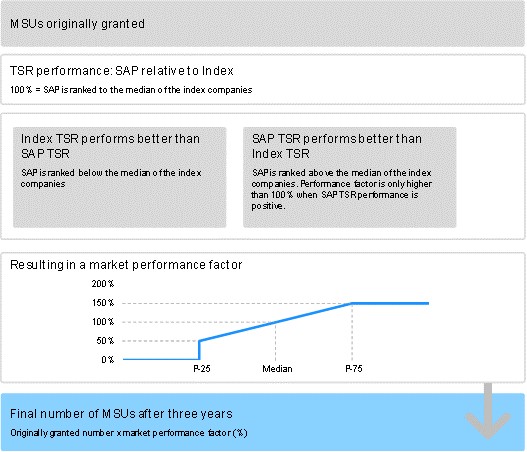
79
The following examples of the MSU calculation illustrate possible outcomes assuming 1,000 MSUs granted:
SAP TSR performs better than TSR of NASDAQ-100 companies |
|
|
|
|
SAP TSR performance |
|
|
|
+10% |
Performance factor |
|
55th percentile |
|
110% |
Final number of MSUs |
|
110% x 1,000 |
|
1,100 |
|
|
|
|
|
SAP TSR performs better than TSR of NASDAQ-100 companies; cap is triggered |
|
|
|
|
SAP TSR performance |
|
|
|
+18% |
Performance factor |
|
80th percentile |
|
160% |
|
|
Cap 75th percentile |
|
150% |
Final number of MSUs |
|
150% x 1,000 |
|
1,500 |
|
|
|
|
|
SAP TSR performs better than TSR of NASDAQ-100 companies; in a downwards market trend |
|
|
|
|
SAP TSR performance |
|
|
|
–5% |
Performance factor |
|
60th percentile |
|
120% |
|
|
Cap due to required positive performance |
|
100% |
Final number of MSUs |
|
100% x 1,000 |
|
1,000 |
|
|
|
|
|
TSR of NASDAQ-100 companies perform better than SAP TSR; low hurdle is triggered |
|
|
|
|
SAP TSR performance |
|
|
|
–5% |
Performance factor |
|
20th percentile |
|
40% |
|
|
Hurdle 25th percentile |
|
0% |
Final number of MSUs |
|
0% x 1,000 |
|
0 |
Payout of FSUs, MSUs, and RSUs
The value of the existing FSUs, MSUs, and RSUs will be paid out in euros following the Annual General Meeting of SAP, which accepts the financial statements for the third financial year following the financial year in which the Share Units were awarded. The performance of the Share Units is linked to the performance of the SAP share price, including dividend payments. Accordingly, an amount is paid out for each Share Unit (subject to the specifics described below) which equals the then-current SAP share price plus those dividends that were disbursed in respect of an SAP share in the period from the beginning of the year in which the Share Units were awarded until the end of the third year following the year in which the Share Units were awarded. The arithmetic mean of the SAP share price on the 20 trading days after scheduled publication of the preliminary results for the fourth quarter and the year as a whole will be used as the payout price.
The payout amount per Share Unit, including the dividend amounts due on the Share Units, is capped at 200% of the grant price. Due to the potential change in the number of FSUs and MSUs, the maximum possible payout amount under any of the annual tranches of the LTI 2020 is thus approximately 267% of the grant amount. Currency exchange rate risks are borne by the Executive Board members.
However, all types of Share Unit may expire during the entire term of a tranche under certain conditions.
LTI Forfeiture Rule
If an Executive Board member’s service contract is terminated before the end of the third year following the year in which the Share Units were granted, the PSUs (FSUs, MSUs) and RSUs are forfeited in whole or in part, depending on the circumstances of the relevant resignation from office or termination of the service contract. In case Share Units are forfeited in part, the percentage of the forfeiture is proportional to the four-year vesting period of each grant. This means that 25% of the grant is earned each year of the vesting period. Unearned grants are forfeited.
80
LTI Forfeiture Rules (including example calculation1)
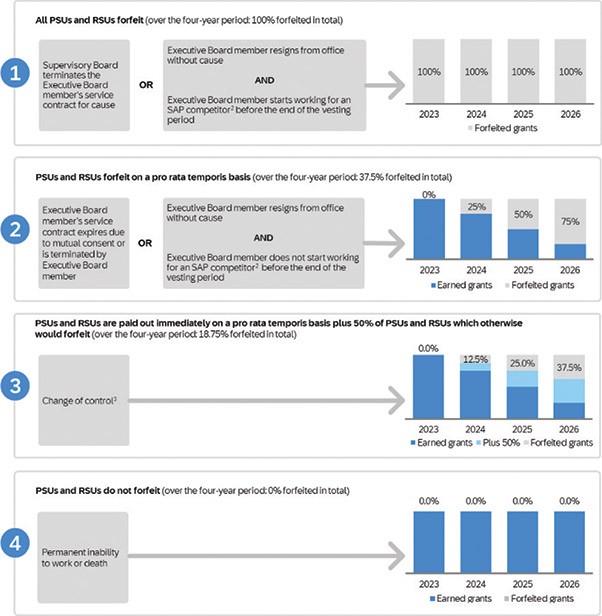
1 Example calculation with four tranches (grant allocation of 100%, stable share price from grant to vest, and no consideration of performance condition); Executive Board member’s contract terminates after year four (December 31, 2026).
2 As defined in the individual Executive Board members’ contracts.
3 For the definition, see the Early End-of-Service Undertakings section.
Foreign Currency Exchange Rate Cap
Where the fixed compensation and the STI are paid out in the Executive Board member's home currency, the total (gross) payout amount resulting from the fixed compensation and the STI for a financial year is limited to a maximum euro equivalent in case of exchange rate fluctuations. The euro cap for a full financial year equals 120% each for the sum of the fixed compensation and STI target amount converted into euro plus 20% of the grant amount for a tranche under the LTI 2020.
Target and Maximum Compensation
The compensation system allows for total target compensation (not considering any fringe benefits, replacement awards, retirement pension, and foreign currency exchange rate cap) of up to €6.0 million for ordinary Executive Board members and up to €13.6 million for the CEO.
The proportion of total target compensation consisting of fixed compensation, the STI, and the LTI (without fringe benefits and retirement pension) must be within the following ranges:
| – | Fixed compensation: 10% to 20% |
| – | STI: 20% to 30% |
| – | LTI: 50% to 70% |
81
Maximum compensation is the maximum amount which may be paid to an Executive Board member in total for a financial year. The maximum compensation (not considering any fringe benefits, replacement awards, retirement pension, and foreign currency exchange rate cap) is €13.2 million for ordinary Executive Board members and €29.8 million for the CEO. The maximum total compensation including all maximum possible benefits is €15.0 million for ordinary Executive Board members and €34.5 million for the CEO. When determining the compensation structure and the target compensation for the individual members of the Executive Board, the Supervisory Board must ensure that the potential payments, taking the STI and LTI caps into account, cannot exceed the maximum compensation and the maximum total compensation.
To illustrate the maximum total compensation including all maximum benefits, the LTI is allocated as high as the defined ranges allow, and the fixed compensation is allocated as low as the defined ranges allow. For this purpose, the recurring benefits include retirement pension, foreign currency exchange rate cap, and fringe benefits. In addition, based on the new compensation system, the limit of Julia White's and Scott Russell's fringe benefits determined for 2024 apply retroactively for 2023.
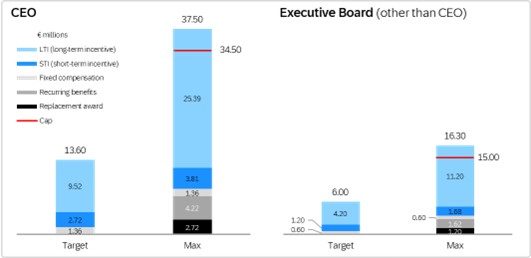
Clawback Provisions and Clawback Policy
SAP has the contractual right to request that the Executive Board member returns any payments made from the STI or LTI if it subsequently emerges that the payment was not justified in whole or in part because targets were not achieved at all or not achieved in the scope assumed when calculating the payment amount due on account of false information having been provided. In such case, the Executive Board member is obliged to repay to SAP the amount by which the payment actually made exceeds the payment amount due on the basis of the targets actually achieved.
In addition, in compliance with new requirements by the U.S. Securities and Exchange Commission and the New York Stock Exchange for companies listed in the United States, including foreign private issuers such as SAP, SAP adopted a clawback policy that is applicable as of October 2, 2023. This new policy requires the Supervisory Board to recoup incentive-based compensation from current and former Executive Board members in the case of a restatement of financial statements arising from material non-compliance with any financial reporting requirement under the U.S. federal securities laws that impacts the calculation of incentive-based compensation paid out in the last three years.
Offsetting Compensation in Case of Roles Assumed Inside and Outside the Group
At the request of the Supervisory Board, the Executive Board member will assume roles on the supervisory board or similar bodies at affiliates of SAP without receiving separate compensation. If, in exceptional cases, it is impossible to rule out compensation for a role assumed within the Group, it will be offset against the other compensation due to the Executive Board member. The Supervisory Board has to agree before an Executive Board member assumes any roles on supervisory boards or similar bodies at companies outside the Group and will decide in the individual case whether and to what extent any compensation is to be offset against compensation paid by SAP.
Decisions for 2023
No corrections were made to the payout amounts for the STI 2022 or LTI 2016 Plan tranche 2019 paid in May 2023. The Supervisory Board did not request that any Executive Board member return payments (clawback provision). On February 21, 2024, the Supervisory Board assessed SAP’s performance against the previously agreed targets and determined the amount of the STI 2023 for the entire Executive Board.
On July 27, 2023, the Supervisory Board decided to exclude the impact of the Qualtrics divestiture and resolved updated targets for the STI 2023 and the LTI tranches 2021, 2022, and 2023.
82
Furthermore, in September 2023, the Supervisory Board decided to exclude the expenses related to compliance matters from the variable Executive Board compensation for 2023 and 2024. This applies for the Executive Board members’ compensation components STI and LTI as far as the KPIs “Operating Margin Increase” (STI) and “Operating Income” (LTI) for the fiscal years 2023 and 2024 are concerned. This decision also affects the 2021 and 2022 tranches of the LTI 2020 (LTI 2021, LTI 2022, LTI 2023, LTI 2024) and the STI for the years 2023 and 2024 (STI 2023 and STI 2024). The Supervisory Board recognizes the fact that the compliance matters in question stem almost exclusively from events in the past when none of the current Executive Board members were in office. At the same time, it ensures that this temporary adjustment will safeguard the business performance focus of the compensation for the current Executive Board members. In addition, the current Executive Board has significantly improved, expanded, and made the Company’s compliance efforts much more effective to prevent comparable cases from occurring again in the future.
In accordance with the new compensation system effective 2024, the Supervisory Board resolved already on October 26, 2023, to set the cap on fringe benefits for Scott Russell at US$456,000 and for Julia White at US$363,000 for the year 2023.
On December 21, 2023, the Supervisory Board decided to exclude the impact of the LeanIX acquisition and resolved to neutralize the effects on the STI 2023 and the LTI tranches for 2021, 2022, and 2023.
STI Target Achievement 2023
KPI |
|
100% Target Value |
|
Results |
|
Target Achievement (in %) |
Current cloud backlog1 |
|
€13,689 million |
|
€13,967 million |
|
110.2 |
Cloud and software revenue growth1 |
|
+6.93 |
% |
+8.82 |
% |
119.2 |
Operating margin increase1 |
|
+51bps |
|
+120bps |
|
125.8 |
Customer Net Promoter Score |
|
+8 to +12 |
|
+9 |
|
100.0 |
Employee Engagement Index |
|
78 |
% |
80 |
% |
111.4 |
Net carbon emissions |
|
0 kt CO2 |
|
0 kt CO2 |
|
100.0 |
1 Non-IFRS, at constant currencies
The target achievement for the STI 2023 was 115.1%.
The following target achievement curves applied for the STI 2023:
Financial KPIs
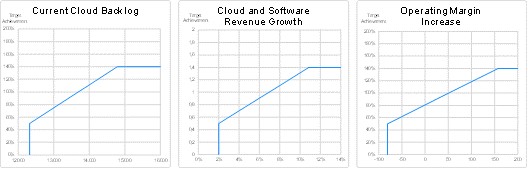
Non-Financial KPIs
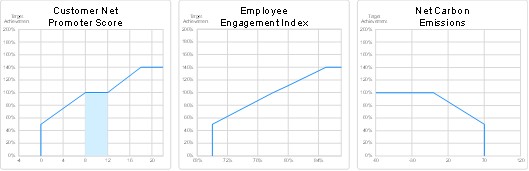
83
LTI 2020 − Tranche 2023 − FSU 100% Targets
In 2023, the Supervisory Board defined the 100% targets for the FSUs of the LTI 2020 tranche 2023. The targets are derived from the 2025 ambition communicated in October 2020 and were adjusted in July 2023 to reflect the impact of the Qualtrics divestiture.
|
|
100% Target Value |
KPI |
|
(cumulative 2023 to 2025) |
Cloud revenue1 |
|
€53.8 billion |
Total revenue1 |
|
€95.9 billion |
Operating profit1 |
|
€29.3 billion |
1 Non-IFRS, at constant currencies
LTI 2020 − Tranche 2020 – Target Achievement
In 2023, the Supervisory Board determined the target achievement of the FSUs and the MSUs of the LTI 2020 tranche 2020.
KPI |
|
100% Target Value |
|
|
|
|
|
|
(cumulative 2020 to |
|
Results |
|
Target Achievement |
|
|
2022) |
|
|
|
(in %) |
Financial performance factor |
|
|
|
|
|
|
Cloud revenue1 |
|
€33,000 million |
|
€30,202 million |
|
57.61 |
Total revenue1 |
|
€94,000 million |
|
€86,859 million |
|
62.02 |
Operating profit1 |
|
€30,200 million |
|
€23,814 million |
|
55.41 |
Market performance factor |
|
|
|
|
|
|
Ranking to NASDAQ-100 companies |
|
median |
|
85th |
|
0 |
1 Non - IFRS, at constant currencies
Overview of the Relations Between Target and Payout for Performance-Based Compensation
The total target achievements of the STI reflect the relation between the target amount and the payout amount. The STIs for the years 2019 to 2022 were already paid out.
STI Total Target Achievement
Percentage |
|
2023 |
|
2022 |
|
2021 |
|
2020 |
|
2019 |
|
|
115.1 |
|
61.2 |
|
133.3 |
|
0 |
|
82.4 |
The relation between the LTI target amounts for the 2020 to 2023 tranches and the theoretical payout amounts are based on SAP’s share price at year end. The 2019 tranche discloses the relation between the respective target amount and the actual payout amount in May 2023. The payout price for the tranche 2019 was calculated as the average share price between January 27, 2023, and February 24, 2023.
Relation Between Target Amount and Payout Amount of the LTI
Percentage |
|
LTI 2020 |
|
LTI 2016 Plan |
||||||
|
|
|
|
|
|
|
||||
|
|
2023 |
|
2022 |
|
2021 |
|
2020 |
|
2019 |
|
|
Tranche1 |
|
Tranche1 |
|
Tranche1 |
|
Tranche1 |
|
Tranche |
12/31/2023 |
|
149.1 |
|
158.5 |
|
165.9 |
|
63.0 |
|
95.6 |
12/31/2022 |
|
NA |
|
94.0 |
|
100.9 |
|
43.7 |
|
83.0 |
1 Consideration of theoretical payout amounts based on SAP’s share price and market data at year end
Amount of Compensation for 2023
We present the Executive Board compensation disclosures in accordance with section 162 of the AktG, for the current year as well as for the previous year 2022. For each member of the Executive Board, the following tables disclose the compensation awarded and due as well as the contractual compensation in the reporting year.
84
Contractual Compensation
The contractual compensation shows the target amounts agreed in the individual employment contracts, including fringe benefits, and corresponds to a target achievement of 100% for the respective periods. If the appointment term commences or ends during a financial year, the compensation is disclosed pro rata temporis.
As the fixed compensation and the STI are determined in the Executive Board member's home currency, a maximum euro equivalent (“euro cap”) is considered to limit the exchange rate fluctuations to 20% of the sum of contractual values for fixed compensation, STI, and LTI in euros. For conversion purposes from home currency into euro, for fixed compensation the average exchange rate and for the one-year variable compensation the year-end exchange rate of the respective period applies. The difference to the contractual exchange rate is disclosed.
It is ensured that the potential payments, taking the STI and LTI caps into account, cannot exceed the maximum compensation and the maximum total compensation.
Compensation Awarded and Due
Compensation that has been received and/or earned in the reporting year is defined as compensation awarded and due based on section 162 of the AktG. This means that the underlying services were fully rendered by the end of the reporting year, although payout only occurs after the end of the reporting year, in order to make reporting transparent and comprehensible and in order to ensure a connection between performance and compensation in the reporting period.
Therefore, the STI 2023 and the LTI 2020 tranche 2020 are both reported in 2023. The compensation awarded and due related to the LTI 2020 tranche 2020 is disclosed with the share price at year end and the performance factor of the PSUs at year end. The payout of this tranche in May 2024 will be calculated based on the performance period according to the plan terms. The difference in the payout amount according to share price and performance factor development between the year end and the end of the performance period pursuant to the plan terms will also be disclosed.
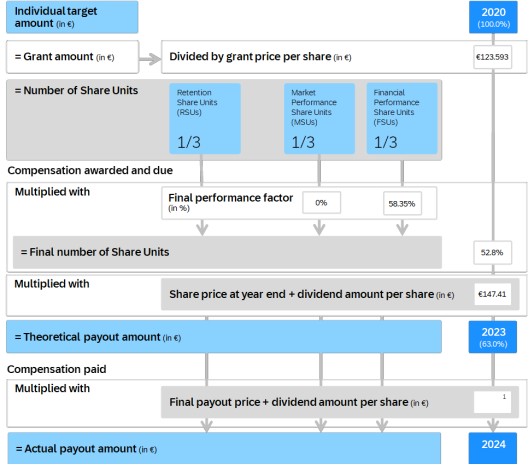
1 Value is determined at time of payout after the Compensation Report has been prepared.
85
In addition, the difference in the payout amount according to share price and performance factor development between the year end and the end of the performance period pursuant to the plan terms of the LTI 2016 Plan tranche 2019 is disclosed in 2023.
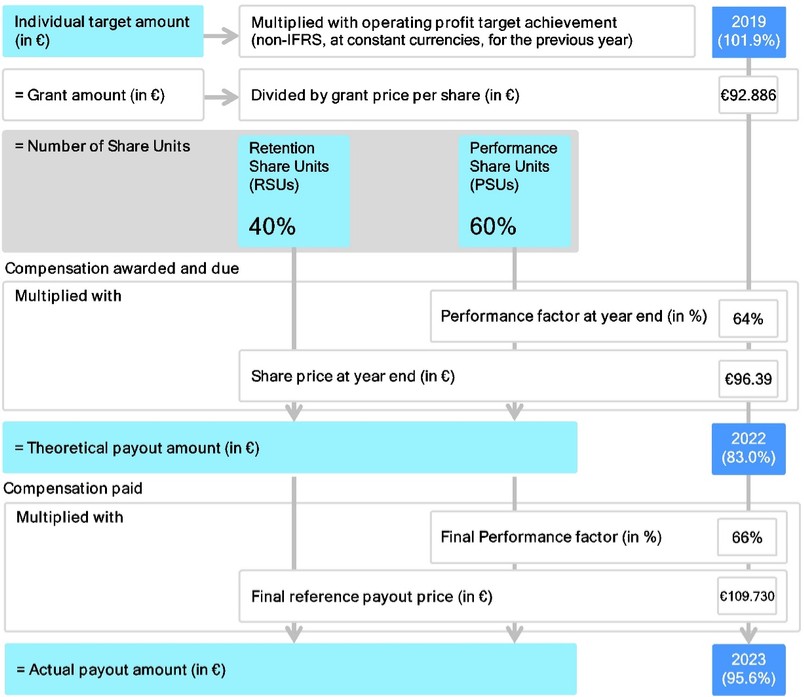
The individual amount resulting from the difference between the actual payout amount of 95.6% and the theoretical payout amount of 83.0% is disclosed in the following tables under "LTI 2016 Plan - Tranche 2019" in 2023.
For the fixed compensation and the STI paid out in the Executive Board member’s home currency, the amounts are converted to euro for reporting purposes. While for the fixed compensation and fringe benefits conversion into euro the annual average exchange rate applies, the STI is converted with the exchange rate at year end. For the actual payout of the STI, which is due after the annual shareholders meeting, the exchange rate at payout will apply. The individual amount resulting from the difference between the exchange rate at year end and at payout will be disclosed in the following tables under "Exchange rate fluctuations" in 2023.
86
Executive Board Members’ Compensation
|
|
|
|
Christian Klein |
|||||||||||||
|
|
|
|
CEO |
|||||||||||||
|
|
Contractual Compensation |
|
Compensation Awarded and Due |
|||||||||||||
|
|
|
|
2023 |
|
2023 |
|
|
|
2022 |
|
2022 |
|
|
|
|
|
€ thousands |
|
2023 |
|
(Min) |
|
(Max) |
|
2022 |
|
(Min) |
|
(Max) |
|
2023 |
in % |
2022 |
in % |
Fixed compensation |
|
1,100.0 |
|
1,100.0 |
|
1,100.0 |
|
1,100.0 |
|
1,100.0 |
|
1,100.0 |
|
1,100.0 |
15.4 |
1,100.0 |
23.5 |
Fringe benefits1 |
|
21.7 |
|
0 |
|
220.0 |
|
13.5 |
|
0 |
|
220.0 |
|
21.7 |
0.3 |
13.5 |
0.3 |
Total non-performance compensation |
|
1,121.7 |
|
1,100.0 |
|
1,320.0 |
|
1,113.5 |
|
1,100.0 |
|
1,320.0 |
|
1,121.7 |
15.7 |
1,113.5 |
23.8 |
One-year variable compensation |
|
|
|
|
|
|
|
|
|
|
|
|
|
|
|
|
|
STI 2022 |
|
|
|
|
|
|
|
1,900.0 |
|
0 |
|
2,660.0 |
|
|
0 |
1,162.8 |
24.9 |
STI 2023 |
|
1,900.0 |
|
0 |
|
2,660.0 |
|
|
|
|
|
|
|
2,186.9 |
30.6 |
|
0 |
Multiyear variable compensation |
|
|
|
|
|
|
|
|
|
|
|
|
|
|
|
|
|
LTI 2016 Plan – Tranche 2018 |
|
|
|
|
|
|
|
|
|
|
|
|
|
|
0 |
-163.9 |
-3.5 |
LTI 2016 Plan – Tranche 2019 |
|
|
|
|
|
|
|
|
|
|
|
|
|
386.9 |
5.4 |
2,561.8 |
54.8 |
LTI 2020 – Tranche 2020 |
|
|
|
|
|
|
|
|
|
|
|
|
|
3,462.6 |
48.4 |
|
0 |
LTI 2020 – Tranche 2022 |
|
|
|
|
|
|
|
5,500.0 |
|
0 |
|
14,666.7 |
|
|
0 |
|
0 |
LTI 2020 – Tranche 2023 |
|
5,500.0 |
|
0 |
|
14,666.7 |
|
|
|
|
|
|
|
|
0 |
|
0 |
Total performance compensation |
|
7,400.0 |
|
0 |
|
17,326.7 |
|
7,400.0 |
|
0 |
|
17,326.7 |
|
6,036.4 |
84.3 |
3,560.6 |
76.2 |
Total |
|
8,521.7 |
|
1,100.0 |
|
18,646.7 |
|
8,513.5 |
|
1,100.0 |
|
18,646.7 |
|
7,158.1 |
100.0 |
4,674.1 |
100.0 |
For the LTI 2016 Plan tranche 2019, the difference between the actual payout amount of €2,948.7 thousand and the theoretical payout amount of €2,561.8 thousand for Christian Klein is €386.9 thousand.
|
|
Dominik Asam |
|||||||||||||||
|
|
Member of the Executive Board (from 3/7/2023) |
|||||||||||||||
€ thousands |
|
Contractual Compensation |
|
Compensation Awarded and Due |
|||||||||||||
|
|
2023 |
|
2023 |
|
2023 |
|
2022 |
|
2022 |
|
2022 |
|
|
|
|
|
|
|
|
|
(Min) |
|
(Max) |
|
|
|
(Min) |
|
(Max) |
|
2023 |
in % |
2022 |
in % |
Fixed compensation |
|
655.1 |
|
655.1 |
|
655.1 |
|
|
|
|
|
|
|
655.1 |
16.6 |
|
0 |
Fringe benefits1 |
|
57.5 |
|
0 |
|
65.5 |
|
|
|
|
|
|
|
57.5 |
1.5 |
|
0 |
Replacement award |
|
1,600.0 |
|
1,600.0 |
|
1,600.0 |
|
|
|
|
|
|
|
1,600.0 |
40.6 |
|
0 |
Total non-performance compensation |
|
2,312.5 |
|
2,255.1 |
|
2,320.6 |
|
0 |
|
0 |
|
0 |
|
2,312.5 |
58.7 |
0 |
0 |
One-year variable compensation |
|
|
|
|
|
|
|
|
|
|
|
|
|
|
|
|
|
STI 2023 |
|
1,416.3 |
|
0 |
|
1,982.8 |
|
|
|
|
|
|
|
1,630.2 |
41.3 |
|
0 |
Multiyear variable compensation |
|
|
|
|
|
|
|
|
|
|
|
|
|
|
|
|
|
LTI 2020 – Tranche 2023 |
|
2,654.8 |
|
0 |
|
7,079.5 |
|
|
|
|
|
|
|
|
0 |
|
0 |
Total performance compensation |
|
4,071.1 |
|
0 |
|
9,062.3 |
|
0 |
|
0 |
|
0 |
|
1,630.2 |
41.3 |
0 |
0 |
Total |
|
6,383.6 |
|
2,255.1 |
|
11,382.9 |
|
0 |
|
0 |
|
0 |
|
3,942.7 |
100.0 |
0 |
0 |
87
With his appointment to the Executive Board, Dominik Asam received exceptional grants to compensate the loss of previously earned and forfeited compensation with his previous employer. The total loss of compensation was €3.85 million. The distribution of this amount reflects the nature and timing of the forfeited compensation as far as possible within the SAP compensation system. This results for 2023 in an STI of €0.43 million, an LTI grant of €0.6 million, and a replacement award of €1.6 million. These amounts are included in the table above in addition to the regular compensation. The outstanding difference will be granted as an STI and an LTI award in 2024. The replacement award is not considered in the maximum target compensation.
|
|
|
|
|
|
|
|
|
|
|
|
|
|
Sabine Bendiek |
|||
|
|
|
|
|
|
|
|
|
|
|
|
|
|
Member of the Executive Board (until 12/31/2023) |
|||
|
|
Contractual Compensation |
|
Compensation Awarded and Due |
|||||||||||||
|
|
|
|
2023 |
|
2023 |
|
|
|
2022 |
|
2022 |
|
|
|
|
|
€ thousands |
|
2023 |
|
(Min) |
|
(Max) |
|
2022 |
|
(Min) |
|
(Max) |
|
2023 |
in % |
2022 |
in % |
Fixed compensation |
|
700.0 |
|
700.0 |
|
700.0 |
|
700.0 |
|
700.0 |
|
700.0 |
|
700.0 |
34.7 |
700.0 |
49.6 |
Fringe benefits1 |
|
21.4 |
|
0 |
|
70.0 |
|
23.4 |
|
0 |
|
70.0 |
|
21.4 |
1.1 |
23.4 |
1.7 |
Total non-performance compensation |
|
721.4 |
|
700.0 |
|
770.0 |
|
723.4 |
|
700.0 |
|
770.0 |
|
721.4 |
35.8 |
723.4 |
51.2 |
One-year variable compensation |
|
|
|
|
|
|
|
|
|
|
|
|
|
|
|
|
|
STI 2022 |
|
|
|
|
|
|
|
1,125.8 |
|
0 |
|
1,576.1 |
|
|
0 |
689.0 |
48.8 |
STI 2023 |
|
1,125.8 |
|
0 |
|
1,576.1 |
|
|
|
|
|
|
|
1,295.7 |
64.2 |
|
0 |
Multiyear variable compensation |
|
|
|
|
|
|
|
|
|
|
|
|
|
|
|
|
|
LTI 2020 - Tranche 2022 |
|
|
|
|
|
|
|
2,754.3 |
|
0 |
|
7,344.8 |
|
|
0 |
|
0 |
LTI 2020 - Tranche 2023 |
|
2,174.3 |
|
0 |
|
5,798.0 |
|
|
|
|
|
|
|
|
0 |
|
0 |
Total performance compensation |
|
3,300.0 |
|
0 |
|
7,374.1 |
|
3,880.1 |
|
0 |
|
8,920.9 |
|
1,295.7 |
64.2 |
689.0 |
48.8 |
Total |
|
4,021.4 |
|
700.0 |
|
8,144.1 |
|
4,603.4 |
|
700.0 |
|
9,690.9 |
|
2,017.1 |
100.0 |
1,412.3 |
100.0 |
|
|
|
|
|
|
|
|
|
|
|
|
|
|
Luka Mucic |
|||
|
|
|
|
|
|
|
|
|
|
|
|
|
|
Member of the Executive Board (until 3/31/2023) |
|||
|
|
Contractual Compensation |
|
Compensation Awarded and Due |
|||||||||||||
|
|
|
|
2023 |
|
2023 |
|
|
|
2022 |
|
2022 |
|
|
|
|
|
€ thousands |
|
2023 |
|
(Min) |
|
(Max) |
|
2022 |
|
(Min) |
|
(Max) |
|
2023 |
in % |
2022 |
in % |
Fixed compensation |
|
187.5 |
|
187.5 |
|
187.5 |
|
750.0 |
|
750.0 |
|
750.0 |
|
187.5 |
9.2 |
750.0 |
23.1 |
Fringe benefits1 |
|
4.4 |
|
0 |
|
18.8 |
|
17.2 |
|
0 |
|
75.0 |
|
4.4 |
0.2 |
17.2 |
0.5 |
Total non-performance compensation |
|
191.9 |
|
187.5 |
|
206.3 |
|
767.2 |
|
750.0 |
|
825.0 |
|
191.9 |
9.4 |
767.2 |
23.6 |
One-year variable compensation |
|
|
|
|
|
|
|
|
|
|
|
|
|
|
|
|
|
STI 2022 |
|
|
|
|
|
|
|
1,150.0 |
|
0 |
|
1,610.0 |
|
|
0 |
703.8 |
21.7 |
STI 2023 |
|
287.5 |
|
0 |
|
402.5 |
|
|
|
|
|
|
|
330.9 |
16.3 |
|
0 |
Multiyear variable compensation |
|
|
|
|
|
|
|
|
|
|
|
|
|
|
|
|
|
LTI 2016 Plan - Tranche 2018 |
|
|
|
|
|
|
|
|
|
|
|
|
|
|
0 |
-194.7 |
-6.0 |
LTI 2016 Plan - Tranche 2019 |
|
|
|
|
|
|
|
|
|
|
|
|
|
297.8 |
14.6 |
1,971.6 |
60.7 |
LTI 2020 - Tranche 2020 |
|
|
|
|
|
|
|
|
|
|
|
|
|
1,213.3 |
59.7 |
|
0 |
LTI 2020 - Tranche 2022 |
|
|
|
|
|
|
|
2,900.0 |
|
0 |
|
7,733.3 |
|
|
0 |
|
0 |
LTI 2020 - Tranche 2023 |
|
715.1 |
|
0 |
|
1,906.9 |
|
|
|
|
|
|
|
|
0 |
|
0 |
Total performance compensation |
|
1,002.6 |
|
0 |
|
2,309.4 |
|
4,050.0 |
|
0 |
|
9,343.3 |
|
1,842.0 |
90.6 |
2,480.7 |
76.4 |
Total |
|
1,194.5 |
|
187.5 |
|
2,515.6 |
|
4,817.2 |
|
750.0 |
|
10,168.3 |
|
2,033.9 |
100.0 |
3,247.9 |
100.0 |
88
For the LTI 2016 Plan tranche 2019, the difference between the actual payout amount of €2,269.3 thousand and the theoretical payout amount of €1,971.6 thousand for Luka Mucic is €297.8 thousand.
|
|
|
|
|
|
|
|
|
|
|
|
|
|
Juergen Mueller |
|||
|
|
|
|
|
|
|
|
|
|
|
|
|
|
Member of the Executive Board |
|||
|
|
Contractual Compensation |
|
Compensation Awarded and Due |
|||||||||||||
|
|
|
|
2023 |
|
2023 |
|
|
|
2022 |
|
2022 |
|
|
|
|
|
€ thousands |
|
2023 |
|
(Min) |
|
(Max) |
|
2022 |
|
(Min) |
|
(Max) |
|
2023 |
in % |
2022 |
in % |
Fixed compensation |
|
700.0 |
|
700.0 |
|
700.0 |
|
700.0 |
|
700.0 |
|
700.0 |
|
700.0 |
19.2 |
700.0 |
21.8 |
Fringe benefits1 |
|
15.7 |
|
0 |
|
70.0 |
|
15.7 |
|
0 |
|
70.0 |
|
15.7 |
0.4 |
15.7 |
0.5 |
Total non-performance compensation |
|
715.7 |
|
700.0 |
|
770.0 |
|
715.7 |
|
700.0 |
|
770.0 |
|
715.7 |
19.6 |
715.7 |
22.3 |
One-year variable compensation |
|
|
|
|
|
|
|
|
|
|
|
|
|
|
|
|
|
STI 2022 |
|
|
|
|
|
|
|
1,125.8 |
|
0 |
|
1,576.1 |
|
|
0 |
689.0 |
21.5 |
STI 2023 |
|
1,125.8 |
|
0 |
|
1,576.1 |
|
|
|
|
|
|
|
1,295.7 |
35.5 |
|
0 |
Multiyear variable compensation |
|
|
|
|
|
|
|
|
|
|
|
|
|
|
|
|
|
LTI 2016 Plan - Tranche 2019 |
|
|
|
|
|
|
|
|
|
|
|
|
|
272.8 |
7.5 |
1,805.4 |
56.2 |
LTI 2020 - Tranche 2020 |
|
|
|
|
|
|
|
|
|
|
|
|
|
1,368.8 |
37.5 |
|
0 |
LTI 2020 - Tranche 2022 |
|
|
|
|
|
|
|
2,174.3 |
|
0 |
|
5,798.1 |
|
|
0 |
|
0 |
LTI 2020 - Tranche 2023 |
|
2,174.3 |
|
0 |
|
5,798.1 |
|
|
|
|
|
|
|
|
0 |
|
0 |
Total performance compensation |
|
3,300.1 |
|
0 |
|
7,374.2 |
|
3,300.1 |
|
0 |
|
7,374.2 |
|
2,937.3 |
80.4 |
2,494.3 |
77.7 |
Total |
|
4,015.7 |
|
700.0 |
|
8,144.2 |
|
4,015.7 |
|
700.0 |
|
8,144.2 |
|
3,653.0 |
100.0 |
3,210.0 |
100.0 |
For the LTI 2016 Plan tranche 2019, the difference between the actual payout amount of €2,078.2 thousand and the theoretical payout amount of €1,805.4 thousand for Juergen Mueller is €272.8 thousand.
|
|
Scott Russell |
|||||||||||||||
|
|
Member of the Executive Board |
|||||||||||||||
|
|
Contractual Compensation |
|
Compensation Awarded and Due |
|||||||||||||
|
|
|
|
2023 |
|
2023 |
|
|
|
2022 |
|
2022 |
|
|
|
|
|
€ thousands |
|
2023 |
|
(Min) |
|
(Max) |
|
2022 |
|
(Min) |
|
(Max) |
|
2023 |
in % |
2022 |
in % |
Fixed compensation |
|
1,000.0 |
|
1,000.0 |
|
1,000.0 |
|
1,000.0 |
|
1,000.0 |
|
1,000.0 |
|
1,000.0 |
32.5 |
1,000.0 |
43.8 |
Fringe benefits1 |
|
64.5 |
|
0 |
|
431.0 |
|
70.1 |
|
0 |
|
250.0 |
|
64.5 |
2.1 |
70.1 |
3.1 |
Exchange rate fluctuations (euro cap)2 |
|
112.7 |
|
0 |
|
1,100.0 |
|
202.8 |
|
0 |
|
1,100.0 |
|
112.7 |
3.7 |
202.8 |
8.9 |
Total non-performance compensation |
|
1,177.3 |
|
1,000.0 |
|
2,531.0 |
|
1,272.8 |
|
1,000.0 |
|
2,350.0 |
|
1,177.3 |
38.3 |
1,272.8 |
55.8 |
One-year variable compensation |
|
|
|
|
|
|
|
|
|
|
|
|
|
|
|
|
|
STI 2022 |
|
|
|
|
|
|
|
1,650.0 |
|
0 |
|
2,310.0 |
|
|
0 |
1,009.8 |
44.2 |
STI 2023 |
|
1,650.0 |
|
0 |
|
2,310.0 |
|
|
|
|
|
|
|
1,899.2 |
61.7 |
|
0 |
Multiyear variable compensation |
|
|
|
|
|
|
|
|
|
|
|
|
|
|
|
|
|
LTI 2020 – Tranche 2022 |
|
|
|
|
|
|
|
2,850.0 |
|
0 |
|
7,600.0 |
|
|
0 |
|
0 |
LTI 2020 – Tranche 2023 |
|
2,850.0 |
|
0 |
|
7,600.0 |
|
|
|
|
|
|
|
|
0 |
|
0 |
Total performance compensation |
|
4,500.0 |
|
0 |
|
9,910.0 |
|
4,500.0 |
|
0 |
|
9,910.0 |
|
1,899.2 |
61.7 |
1,009.8 |
44.2 |
Total |
|
5,677.3 |
|
1,000.0 |
|
12,441.0 |
|
5,772.8 |
|
1,000.0 |
|
12,260.0 |
|
3,076.4 |
100.0 |
2,282.6 |
100.0 |
89
|
|
Thomas Saueressig |
|||||||||||||||
|
|
Member of the Executive Board |
|||||||||||||||
|
|
Contractual Compensation |
|
Compensation Awarded and Due |
|||||||||||||
|
|
|
|
2023 |
|
2023 |
|
|
|
2022 |
|
2022 |
|
|
|
|
|
€ thousands |
|
2023 |
|
(Min) |
|
(Max) |
|
2022 |
|
(Min) |
|
(Max) |
|
2023 |
in % |
2022 |
in % |
Fixed compensation |
|
800.0 |
|
800.0 |
|
800.0 |
|
716.7 |
|
716.7 |
|
716.7 |
|
800.0 |
22.2 |
716.7 |
41.4 |
Fringe benefits1 |
|
15.9 |
|
0 |
|
80.0 |
|
15.7 |
|
0 |
|
72.0 |
|
15.9 |
0.4 |
15.7 |
0.9 |
Total non-performance compensation |
|
815.9 |
|
800.0 |
|
880.0 |
|
732.4 |
|
716.7 |
|
788.7 |
|
815.9 |
22.6 |
732.4 |
42.3 |
One-year variable compensation |
|
|
|
|
|
|
|
|
|
|
|
|
|
|
|
|
|
STI 2022 |
|
|
|
|
|
|
|
1,138.2 |
|
0 |
|
1,593.4 |
|
|
0 |
696.6 |
40.2 |
STI 2023 |
|
1,200.0 |
|
0 |
|
1,680.0 |
|
|
|
|
|
|
|
1,381.2 |
38.2 |
|
0 |
Multiyear variable compensation |
|
|
|
|
|
|
|
|
|
|
|
|
|
|
|
|
|
LTI 2016 Plan – Tranche 2019 |
|
|
|
|
|
|
|
|
|
|
|
|
|
45.6 |
1.3 |
301.7 |
17.4 |
LTI 2020 – Tranche 2020 |
|
|
|
|
|
|
|
|
|
|
|
|
|
1,368.8 |
37.9 |
|
0 |
LTI 2020 – Tranche 2022 |
|
|
|
|
|
|
|
2,278.8 |
|
0 |
|
6,076.8 |
|
|
0 |
|
0 |
LTI 2020 – Tranche 2023 |
|
2,800.0 |
|
0 |
|
7,466.7 |
|
|
|
|
|
|
|
|
0 |
|
0 |
Total performance compensation |
|
4,000.0 |
|
0 |
|
9,146.7 |
|
3,417.0 |
|
0 |
|
7,670.2 |
|
2,795.6 |
77.4 |
998.3 |
57.7 |
Total |
|
4,815.9 |
|
800.0 |
|
10,026.7 |
|
4,149.4 |
|
716.7 |
|
8,458.9 |
|
3,611.5 |
100.0 |
1,730.7 |
100.0 |
For the LTI 2016 Plan tranche 2019, the difference between the actual payout amount of €347.3 thousand and the theoretical payout amount of €301.7 thousand for Thomas Saueressig is €45.6 thousand.
|
|
Julia White |
|||||||||||||||
|
|
Member of the Executive Board |
|||||||||||||||
|
|
Contractual Compensation |
|
Compensation Awarded and Due |
|||||||||||||
|
|
|
|
2023 |
|
2023 |
|
|
|
2022 |
|
2022 |
|
|
|
|
|
€ thousands |
|
2023 |
|
(Min) |
|
(Max) |
|
2022 |
|
(Min) |
|
(Max) |
|
2023 |
in % |
2022 |
in % |
Fixed compensation |
|
750.0 |
|
750.0 |
|
750.0 |
|
750.0 |
|
750.0 |
|
750.0 |
|
750.0 |
29.3 |
750.0 |
32.9 |
Fringe benefits1 |
|
73.9 |
|
0 |
|
343.1 |
|
89.8 |
|
0 |
|
188.0 |
|
73.9 |
2.9 |
89.8 |
3.9 |
Exchange rate fluctuations (euro cap)2 |
|
230.1 |
|
0 |
|
800.0 |
|
369.6 |
|
0 |
|
800.0 |
|
230.1 |
9.0 |
369.6 |
16.2 |
Total non-performance compensation |
|
1,053.9 |
|
750.0 |
|
1,893.1 |
|
1,209.4 |
|
750.0 |
|
1,738.0 |
|
1,053.9 |
41.2 |
1,209.4 |
53.0 |
One-year variable compensation |
|
|
|
|
|
|
|
|
|
|
|
|
|
|
|
|
|
STI 2022 |
|
|
|
|
|
|
|
1,750.0 |
|
0 |
|
2,450.0 |
|
|
0 |
1,071.0 |
47.0 |
STI 2023 |
|
1,304.9 |
|
0 |
|
1,826.9 |
|
|
|
|
|
|
|
1,502.0 |
58.8 |
|
0 |
Multiyear variable compensation |
|
|
|
|
|
|
|
|
|
|
|
|
|
|
|
|
|
LTI 2020 – Tranche 2022 |
|
|
|
|
|
|
|
3,500.0 |
|
0 |
|
9,333.3 |
|
|
0 |
|
0 |
LTI 2020 – Tranche 2023 |
|
2,461.5 |
|
0 |
|
6,564.1 |
|
|
|
|
|
|
|
|
0 |
|
0 |
Total performance compensation |
|
3,766.5 |
|
0 |
|
8,391.0 |
|
5,250.0 |
|
0 |
|
11,783.3 |
|
1,502.0 |
58.8 |
1,071.0 |
47.0 |
Total |
|
4,820.4 |
|
750.0 |
|
10,284.1 |
|
6,459.4 |
|
750.0 |
|
13,521.3 |
|
2,555.9 |
100.0 |
2,280.4 |
100.0 |
90
With her appointment to the Executive Board, Julia White received exceptional grants to compensate the loss of previously earned and forfeited compensation with her previous employer. The total loss of compensation was €5.46 million. The distribution of this amount reflects the nature and timing of the forfeited compensation as far as possible within the SAP compensation system. This results for 2023 in an STI of €0.15 million and an LTI grant of €0.36 million (2022: STI of €0.6 million, LTI grant of €1.4 million, in 2021: STI of €0.4 million, LTI grant of €1.0 million, and replacement award of €1.5 million). The amounts for 2023 and 2022 are included in the table above in addition to the regular compensation.
|
|
Total Executive Board |
|||||||||||||||
|
|
Contractual Compensation |
|
Compensation Awarded and Due |
|||||||||||||
|
|
|
|
2023 |
|
2023 |
|
|
|
2022 |
|
2022 |
|
|
|
|
|
€ thousands |
|
2023 |
|
(Min) |
|
(Max) |
|
2022 |
|
(Min) |
|
(Max) |
|
2023 |
in % |
2022 |
in % |
Fixed compensation |
|
5,892.6 |
|
5,892.6 |
|
5,892.6 |
|
5,716.7 |
|
5,716.7 |
|
5,716.7 |
|
5,892.6 |
21.0 |
5,716.7 |
30.3 |
Fringe benefits1 |
|
274.9 |
|
0 |
|
1,298.4 |
|
245.4 |
|
0 |
|
945.0 |
|
274.9 |
1.0 |
245.4 |
1.3 |
Exchange rate fluctuations (euro cap) |
|
342.8 |
|
0 |
|
1,900.0 |
|
572.4 |
|
0 |
|
1,900.0 |
|
342.8 |
1.2 |
572.4 |
3.0 |
Replacement award |
|
1,600.0 |
|
1,600.0 |
|
1,600.0 |
|
0 |
|
0 |
|
0 |
|
1,600.0 |
5.7 |
0 |
0 |
Total non-performance compensation |
|
8,110.3 |
|
7,492.6 |
|
10,690.9 |
|
6,534.4 |
|
5,716.7 |
|
8,561.7 |
|
8,110.3 |
28.9 |
6,534.4 |
34.7 |
One-year variable compensation |
|
|
|
|
|
|
|
|
|
|
|
|
|
|
|
|
|
STI 2022 |
|
0 |
|
0 |
|
0 |
|
9,839.7 |
|
0 |
|
13,775.5 |
|
0 |
0 |
6,021.9 |
32.0 |
STI 2023 |
|
10,010.2 |
|
0 |
|
14,014.3 |
|
0 |
|
0 |
|
0 |
|
11,521.8 |
41.1 |
0 |
0 |
Multiyear variable compensation |
|
|
|
|
|
|
|
|
|
|
|
|
|
|
|
|
|
LTI 2016 Plan – Tranche 2018 |
|
0 |
|
0 |
|
0 |
|
0 |
|
0 |
|
0 |
|
0 |
0 |
-358.6 |
-1.9 |
LTI 2016 Plan – Tranche 2019 |
|
0 |
|
0 |
|
0 |
|
0 |
|
0 |
|
0 |
|
1,003.1 |
3.6 |
6,640.4 |
35.2 |
LTI 2020 – Tranche 2020 |
|
0 |
|
0 |
|
0 |
|
0 |
|
0 |
|
0 |
|
7,413.5 |
26.4 |
0 |
0 |
LTI 2020 – Tranche 2022 |
|
0 |
|
0 |
|
0 |
|
21,957.4 |
|
0 |
|
58,553.1 |
|
0 |
0 |
0 |
0 |
LTI 2020 – Tranche 2023 |
|
21,330.0 |
|
0 |
|
56,879.9 |
|
0 |
|
0 |
|
0 |
|
0 |
0 |
0 |
0 |
Total performance compensation |
|
31,340.2 |
|
0 |
|
70,894.3 |
|
31,797.1 |
|
0 |
|
72,328.7 |
|
19,938.4 |
71.1 |
12,303.7 |
65.3 |
Total |
|
39,450.5 |
|
7,492.6 |
|
81,585.2 |
|
38,331.5 |
|
5,716.7 |
|
80,890.4 |
|
28,048.7 |
100.0 |
18,838.1 |
100.0 |
1 Insurance contributions, the private use of company cars and aircraft, payments and related supplements for relocation, benefits in kind, reimbursement of costs for preparation of tax returns, and tax gross-ups according to local conditions
2 The value of the fixed and one-year variable compensation is granted in U.S. dollars.
Share-Based Payment Information Relating to Long-Term Incentives
Members of the Executive Board received, hold, or held Share Units issued to them under the LTI 2020 and hold or held Share Units issued to them under the LTI 2016 Plan. For more information about the terms and details of these programs, see the Notes to the Consolidated Financial Statements of the Integrated Report 2023, Note (B.3).
91
Executive Board Members’ Holdings
|
|
|
|
|
|
1/1/2023 |
|
During the Year |
|
12/31/2023 |
||||||
|
|
|
|
|
|
|
|
|
|
Exercised (E)/ |
|
|
|
|
|
Thereof |
|
|
|
|
|
|
|
|
|
|
Adjusted (A)/ |
|
|
|
Thereof |
|
Subject to |
Quantity of Share Units |
|
Specification |
|
Grant Date |
|
Outstanding |
|
Granted |
|
Forfeited (F) |
|
Outstanding |
|
Unvested |
|
Holding |
|
|
LTI 2020 - Tranche 2023 - FSU |
|
3/24/2023 |
|
0 |
|
16,726 |
|
0 |
|
16,726 |
|
16,726 |
|
16,726 |
|
|
LTI 2020 - Tranche 2023 - MSU |
|
3/24/2023 |
|
0 |
|
16,726 |
|
0 |
|
16,726 |
|
16,726 |
|
16,726 |
|
|
LTI 2020 - Tranche 2023 - RSU |
|
3/24/2023 |
|
0 |
|
16,726 |
|
0 |
|
16,726 |
|
16,726 |
|
16,726 |
|
|
LTI 2020 – Tranche 2022 – FSU |
|
3/28/2022 |
|
17,197 |
|
0 |
|
0 |
|
17,197 |
|
17,197 |
|
17,197 |
|
|
LTI 2020 – Tranche 2022 – MSU |
|
3/28/2022 |
|
17,197 |
|
0 |
|
0 |
|
17,197 |
|
17,197 |
|
17,197 |
|
|
LTI 2020 – Tranche 2022 – RSU |
|
3/28/2022 |
|
17,197 |
|
0 |
|
0 |
|
17,197 |
|
17,197 |
|
17,197 |
|
|
LTI 2020 – Tranche 2021 – FSU |
|
3/22/2021 |
|
17,230 |
|
0 |
|
0 |
|
17,230 |
|
17,230 |
|
17,230 |
|
|
LTI 2020 – Tranche 2021 – MSU |
|
3/22/2021 |
|
17,230 |
|
0 |
|
0 |
|
17,230 |
|
17,230 |
|
17,230 |
Christian Klein (CEO) |
|
LTI 2020 – Tranche 2021 – RSU |
|
3/22/2021 |
|
17,230 |
|
0 |
|
0 |
|
17,230 |
|
17,230 |
|
17,230 |
|
|
LTI 2020 – Tranche 2020 – FSU |
|
2/29/2020 |
|
14,834 |
|
0 |
|
-6,178 |
A |
8,656 |
|
0 |
|
8,656 |
|
|
LTI 2020 – Tranche 2020 – MSU |
|
2/29/2020 |
|
14,834 |
|
0 |
|
-14,834 |
A |
0 |
|
0 |
|
0 |
|
|
LTI 2020 – Tranche 2020 – RSU |
|
2/29/2020 |
|
14,834 |
|
0 |
|
0 |
|
14,834 |
|
0 |
|
14,834 |
|
|
LTI 2016 – Tranche 2019 – PSU |
|
11/20/2019 |
|
4,678 |
|
0 |
|
-4,678 |
A/E |
0 |
|
0 |
|
0 |
|
|
LTI 2016 – Tranche 2019 – PSU |
|
2/20/2019 |
|
15,628 |
|
0 |
|
-15,628 |
A/E |
0 |
|
0 |
|
0 |
|
|
LTI 2016 – Tranche 2019 – RSU |
|
11/20/2019 |
|
3,119 |
|
0 |
|
-3,119 |
E |
0 |
|
0 |
|
0 |
|
|
LTI 2016 – Tranche 2019 – RSU |
|
2/20/2019 |
|
10,419 |
|
0 |
|
-10,419 |
E |
0 |
|
0 |
|
0 |
|
|
LTI 2020 – Tranche 2023 – FSU |
|
3/24/2023 |
|
0 |
|
8,073 |
|
0 |
|
8,073 |
|
8,073 |
|
8,073 |
Dominik Asam (from 3/7/2023) |
|
LTI 2020 – Tranche 2023 – MSU |
|
3/24/2023 |
|
0 |
|
8,073 |
|
0 |
|
8,073 |
|
8,073 |
|
8,073 |
|
|
LTI 2020 – Tranche 2023 – RSU |
|
3/24/2023 |
|
0 |
|
8,073 |
|
0 |
|
8,073 |
|
8,073 |
|
8,073 |
|
|
LTI 2020 – Tranche 2023 – FSU |
|
3/24/2023 |
|
0 |
|
6,612 |
|
-4,960 |
F |
1,652 |
|
1,652 |
|
1,652 |
|
|
LTI 2020 – Tranche 2023 – MSU |
|
3/24/2023 |
|
0 |
|
6,612 |
|
-4,960 |
F |
1,652 |
|
1,652 |
|
1,652 |
|
|
LTI 2020 – Tranche 2023 – RSU |
|
3/24/2023 |
|
0 |
|
6,612 |
|
-4,960 |
F |
1,652 |
|
1,652 |
|
1,652 |
|
|
LTI 2020 – Tranche 2022 – FSU |
|
3/28/2022 |
|
8,612 |
|
0 |
|
-4,309 |
F |
4,303 |
|
4,303 |
|
4,303 |
Sabine Bendiek1 (until 12/31/2023) |
|
LTI 2020 – Tranche 2022 – MSU |
|
3/28/2022 |
|
8,612 |
|
0 |
|
-4,309 |
F |
4,303 |
|
4,303 |
|
4,303 |
|
|
LTI 2020 – Tranche 2022 – RSU |
|
3/28/2022 |
|
8,612 |
|
0 |
|
-4,309 |
F |
4,303 |
|
4,303 |
|
4,303 |
|
|
LTI 2020 – Tranche 2021 – FSU |
|
3/22/2021 |
|
10,570 |
|
0 |
|
-2,648 |
F |
7,922 |
|
7,922 |
|
7,922 |
|
|
LTI 2020 – Tranche 2021 – MSU |
|
3/22/2021 |
|
10,570 |
|
0 |
|
-2,648 |
F |
7,922 |
|
7,922 |
|
7,922 |
|
|
LTI 2020 – Tranche 2021 – RSU |
|
3/22/2021 |
|
10,570 |
|
0 |
|
-2,648 |
F |
7,922 |
|
7,922 |
|
7,922 |
|
|
LTI 2020 – Tranche 2023 – FSU |
|
3/24/2023 |
|
0 |
|
8,819 |
|
-8,276 |
F |
543 |
|
543 |
|
543 |
|
|
LTI 2020 – Tranche 2023 – MSU |
|
3/24/2023 |
|
0 |
|
8,819 |
|
-8,276 |
F |
543 |
|
543 |
|
543 |
|
|
LTI 2020 – Tranche 2023 – RSU |
|
3/24/2023 |
|
0 |
|
8,819 |
|
-8,276 |
F |
543 |
|
543 |
|
543 |
|
|
LTI 2020 – Tranche 2022 – FSU |
|
3/28/2022 |
|
9,068 |
|
0 |
|
-6,244 |
F |
2,824 |
|
2,824 |
|
2,824 |
|
|
LTI 2020 – Tranche 2022 – MSU |
|
3/28/2022 |
|
9,068 |
|
0 |
|
-6,244 |
F |
2,824 |
|
2,824 |
|
2,824 |
|
|
LTI 2020 – Tranche 2022 – RSU |
|
3/28/2022 |
|
9,068 |
|
0 |
|
-6,244 |
F |
2,824 |
|
2,824 |
|
2,824 |
Luka Mucic (until 3/31/2023) |
|
LTI 2020 – Tranche 2021 – FSU |
|
3/22/2021 |
|
8,679 |
|
0 |
|
-3,808 |
F |
4,871 |
|
4,871 |
|
4,871 |
|
|
LTI 2020 – Tranche 2021 – MSU |
|
3/22/2021 |
|
8,679 |
|
0 |
|
-3,808 |
F |
4,871 |
|
4,871 |
|
4,871 |
|
|
LTI 2020 – Tranche 2021 – RSU |
|
3/22/2021 |
|
8,679 |
|
0 |
|
-3,808 |
F |
4,871 |
|
4,871 |
|
4,871 |
|
|
LTI 2020 – Tranche 2020 – FSU |
|
2/29/2020 |
|
6,403 |
|
0 |
|
-3,370 |
F/A |
3,033 |
|
0 |
|
3,033 |
|
|
LTI 2020 – Tranche 2020 – MSU |
|
2/29/2020 |
|
6,403 |
|
0 |
|
-6,403 |
F/A |
0 |
|
0 |
|
0 |
|
|
LTI 2020 – Tranche 2020 – RSU |
|
2/29/2020 |
|
6,403 |
|
0 |
|
-1,205 |
F |
5,198 |
|
0 |
|
5,198 |
|
|
LTI 2016 – Tranche 2019 – PSU |
|
2/20/2019 |
|
15,628 |
|
0 |
|
-15,628 |
A/E |
0 |
|
0 |
|
0 |
|
|
LTI 2016 – Tranche 2019 – RSU |
|
2/20/2019 |
|
10,419 |
|
0 |
|
-10,419 |
E |
0 |
|
0 |
|
0 |
|
|
LTI 2020 - Tranche 2023 - FSU |
|
3/24/2023 |
|
0 |
|
8,667 |
|
0 |
|
8,667 |
|
8,667 |
|
8,667 |
92
|
|
LTI 2020 - Tranche 2023 - MSU |
|
3/24/2023 |
|
0 |
|
8,667 |
|
0 |
|
8,667 |
|
8,667 |
|
8,667 |
|
|
LTI 2020 - Tranche 2023 - RSU |
|
3/24/2023 |
|
0 |
|
8,667 |
|
0 |
|
8,667 |
|
8,667 |
|
8,667 |
|
|
LTI 2020 – Tranche 2022 – FSU |
|
3/28/2022 |
|
8,911 |
|
0 |
|
0 |
|
8,911 |
|
8,911 |
|
8,911 |
Scott Russell |
|
LTI 2020 – Tranche 2022 – MSU |
|
3/28/2022 |
|
8,911 |
|
0 |
|
0 |
|
8,911 |
|
8,911 |
|
8,911 |
|
|
LTI 2020 – Tranche 2022 – RSU |
|
3/28/2022 |
|
8,911 |
|
0 |
|
0 |
|
8,911 |
|
8,911 |
|
8,911 |
|
|
LTI 2020 – Tranche 2021 – FSU |
|
3/22/2021 |
|
8,170 |
|
0 |
|
0 |
|
8,170 |
|
8,170 |
|
8,170 |
|
|
LTI 2020 – Tranche 2021 – MSU |
|
3/22/2021 |
|
8,170 |
|
0 |
|
0 |
|
8,170 |
|
8,170 |
|
8,170 |
|
|
LTI 2020 – Tranche 2021 – RSU |
|
3/22/2021 |
|
8,170 |
|
0 |
|
0 |
|
8,170 |
|
8,170 |
|
8,170 |
|
|
LTI 2020 – Tranche 2023 – FSU |
|
3/24/2023 |
|
0 |
|
6,612 |
|
0 |
|
6,612 |
|
6,612 |
|
6,612 |
|
|
LTI 2020 – Tranche 2023 – MSU |
|
3/24/2023 |
|
0 |
|
6,612 |
|
0 |
|
6,612 |
|
6,612 |
|
6,612 |
|
|
LTI 2020 – Tranche 2023 – RSU |
|
3/24/2023 |
|
0 |
|
6,612 |
|
0 |
|
6,612 |
|
6,612 |
|
6,612 |
|
|
LTI 2020 – Tranche 2022 – FSU |
|
3/28/2022 |
|
6,798 |
|
0 |
|
0 |
|
6,798 |
|
6,798 |
|
6,798 |
|
|
LTI 2020 – Tranche 2022 – MSU |
|
3/28/2022 |
|
6,798 |
|
0 |
|
0 |
|
6,798 |
|
6,798 |
|
6,798 |
|
|
LTI 2020 – Tranche 2022 – RSU |
|
3/28/2022 |
|
6,798 |
|
0 |
|
0 |
|
6,798 |
|
6,798 |
|
6,798 |
Juergen Mueller |
|
LTI 2020 – Tranche 2021 – FSU |
|
3/22/2021 |
|
6,811 |
|
0 |
|
0 |
|
6,811 |
|
6,811 |
|
6,811 |
|
|
LTI 2020 – Tranche 2021 – MSU |
|
3/22/2021 |
|
6,811 |
|
0 |
|
0 |
|
6,811 |
|
6,811 |
|
6,811 |
|
|
LTI 2020 – Tranche 2021 – RSU |
|
3/22/2021 |
|
6,811 |
|
0 |
|
0 |
|
6,811 |
|
6,811 |
|
6,811 |
|
|
LTI 2020 – Tranche 2020 – FSU |
|
2/29/2020 |
|
5,864 |
|
0 |
|
-2,442 |
A |
3,422 |
|
0 |
|
3,422 |
|
|
LTI 2020 – Tranche 2020 – MSU |
|
2/29/2020 |
|
5,864 |
|
0 |
|
-5,864 |
A |
0 |
|
0 |
|
0 |
|
|
LTI 2020 – Tranche 2020 – RSU |
|
2/29/2020 |
|
5,864 |
|
0 |
|
0 |
|
5,864 |
|
0 |
|
5,864 |
|
|
LTI 2016 – Tranche 2019 – PSU |
|
2/20/2019 |
|
14,311 |
|
0 |
|
-14,311 |
A/E |
0 |
|
0 |
|
0 |
|
|
LTI 2016 – Tranche 2019 – RSU |
|
2/20/2019 |
|
9,541 |
|
0 |
|
-9,541 |
E |
0 |
|
0 |
|
0 |
|
|
LTI 2020 – Tranche 2023 – FSU |
|
3/24/2023 |
|
0 |
|
8,515 |
|
0 |
|
8,515 |
|
8,515 |
|
8,515 |
|
|
LTI 2020 – Tranche 2023 – MSU |
|
3/24/2023 |
|
0 |
|
8,515 |
|
0 |
|
8,515 |
|
8,515 |
|
8,515 |
|
|
LTI 2020 – Tranche 2023 – RSU |
|
3/24/2023 |
|
0 |
|
8,515 |
|
0 |
|
8,515 |
|
8,515 |
|
8,515 |
|
|
LTI 2020 – Tranche 2022 – FSU |
|
3/28/2022 |
|
7,125 |
|
0 |
|
0 |
|
7,125 |
|
7,125 |
|
7,125 |
|
|
LTI 2020 – Tranche 2022– MSU |
|
3/28/2022 |
|
7,125 |
|
0 |
|
0 |
|
7,125 |
|
7,125 |
|
7,125 |
|
|
LTI 2020 – Tranche 2022– RSU |
|
3/28/2022 |
|
7,125 |
|
0 |
|
0 |
|
7,125 |
|
7,125 |
|
7,125 |
Thomas Saueressig |
|
LTI 2020 - Tranche 2021 - FSU |
|
3/22/2021 |
|
6,811 |
|
0 |
|
0 |
|
6,811 |
|
6,811 |
|
6,811 |
|
|
LTI 2020 - Tranche 2021 - MSU |
|
3/22/2021 |
|
6,811 |
|
0 |
|
0 |
|
6,811 |
|
6,811 |
|
6,811 |
|
|
LTI 2020 - Tranche 2021 - RSU |
|
3/22/2021 |
|
6,811 |
|
0 |
|
0 |
|
6,811 |
|
6,811 |
|
6,811 |
|
|
LTI 2020 - Tranche 2020 - FSU |
|
2/29/2020 |
|
5,864 |
|
0 |
|
-2,442 |
A |
3,422 |
|
0 |
|
3,422 |
|
|
LTI 2020 - Tranche 2020 - MSU |
|
2/29/2020 |
|
5,864 |
|
0 |
|
-5,864 |
A |
0 |
|
0 |
|
0 |
|
|
LTI 2020 - Tranche 2020 - RSU |
|
2/29/2020 |
|
5,864 |
|
0 |
|
0 |
|
5,864 |
|
0 |
|
5,864 |
|
|
LTI 2016 – Tranche 2019 – PSU |
|
11/1/2019 |
|
2,392 |
|
0 |
|
-2,392 |
A/E |
0 |
|
0 |
|
0 |
|
|
LTI 2016 - Tranche 2019 - RSU |
|
11/1/2019 |
|
1,594 |
|
0 |
|
-1,594 |
E |
0 |
|
0 |
|
0 |
|
|
LTI 2020 - Tranche 2023 - FSU |
|
3/24/2023 |
|
0 |
|
7,486 |
|
0 |
|
7,486 |
|
7,486 |
|
7,486 |
|
|
LTI 2020 - Tranche 2023 - MSU |
|
3/24/2023 |
|
0 |
|
7,486 |
|
0 |
|
7,486 |
|
7,486 |
|
7,486 |
|
|
LTI 2020 - Tranche 2023 - RSU |
|
3/24/2023 |
|
0 |
|
7,486 |
|
0 |
|
7,486 |
|
7,486 |
|
7,486 |
|
|
LTI 2020 – Tranche 2022 – FSU |
|
3/28/2022 |
|
10,944 |
|
0 |
|
0 |
|
10,944 |
|
10,944 |
|
10,944 |
Julia White |
|
LTI 2020 – Tranche 2022 – MSU |
|
3/28/2022 |
|
10,944 |
|
0 |
|
0 |
|
10,944 |
|
10,944 |
|
10,944 |
|
|
LTI 2020 – Tranche 2022 – RSU |
|
3/28/2022 |
|
10,944 |
|
0 |
|
0 |
|
10,944 |
|
10,944 |
|
10,944 |
|
|
LTI 2020 – Tranche 2021 – FSU |
|
3/22/2021 |
|
8,674 |
|
0 |
|
0 |
|
8,674 |
|
8,674 |
|
8,674 |
|
|
LTI 2020 – Tranche 2021 – MSU |
|
3/22/2021 |
|
8,674 |
|
0 |
|
0 |
|
8,674 |
|
8,674 |
|
8,674 |
|
|
LTI 2020 – Tranche 2021 – RSU |
|
3/22/2021 |
|
8,674 |
|
0 |
|
0 |
|
8,674 |
|
8,674 |
|
8,674 |
Total |
|
|
|
|
|
593,424 |
|
214,530 |
|
-227,066 |
|
580,888 |
|
530,595 |
|
580,888 |
1 As Sabine Bendiek’s Executive Board service contract ends on December 31, 2023, her LTI holdings are reduced on a pro rata basis in accordance with the leaver rules.
93
Main Conditions
|
|
|
|
|
|
Grant Date Fair Value |
|
End of Performance |
|
End of |
|
|
Specification |
|
Grant Date |
|
Grant Price (in €) |
|
(in €) |
|
Period |
|
Vesting Period |
|
Payout |
LTI 2020 - Tranche 2023 - FSU |
|
3/24/2023 |
|
109.612 |
|
105.81 |
|
December 2025 |
|
12/31/2026 |
|
May 2027 |
LTI 2020 - Tranche 2023 - MSU |
|
3/24/2023 |
|
109.612 |
|
130.56 |
|
February 2026 |
|
12/31/2026 |
|
May 2027 |
LTI 2020 - Tranche 2023 - RSU |
|
3/24/2023 |
|
109.612 |
|
105.81 |
|
NA |
|
12/31/2026 |
|
May 2027 |
LTI 2020 - Tranche 2022 - FSU |
|
3/28/2022 |
|
106.605 |
|
96.84 |
|
December 2024 |
|
12/31/2025 |
|
May 2026 |
LTI 2020 - Tranche 2022 - MSU |
|
3/28/2022 |
|
106.605 |
|
108.20 |
|
February 2025 |
|
12/31/2025 |
|
May 2026 |
LTI 2020 - Tranche 2022 - RSU |
|
3/28/2022 |
|
106.605 |
|
96.84 |
|
NA |
|
12/31/2025 |
|
May 2026 |
LTI 2020 - Tranche 2021 - FSU |
|
3/22/2021 |
|
106.405 |
|
100.28 |
|
December 2023 |
|
12/31/2024 |
|
May 2025 |
LTI 2020 - Tranche 2021 - MSU |
|
3/22/2021 |
|
106.405 |
|
115.19 |
|
February 2024 |
|
12/31/2024 |
|
May 2025 |
LTI 2020 - Tranche 2021 - RSU |
|
3/22/2021 |
|
106.405 |
|
100.28 |
|
NA |
|
12/31/2024 |
|
May 2025 |
LTI 2020 - Tranche 2020 - FSU |
|
2/29/2020 |
|
123.593 |
|
110.65 |
|
December 2022 |
|
12/31/2023 |
|
May 2024 |
LTI 2020 - Tranche 2020 - MSU |
|
2/29/2020 |
|
123.593 |
|
122.22 |
|
February 2023 |
|
12/31/2023 |
|
May 2024 |
LTI 2020 - Tranche 2020 - RSU |
|
2/29/2020 |
|
123.593 |
|
110.65 |
|
NA |
|
12/31/2023 |
|
May 2024 |
LTI 2016 - Tranche 2019 - PSU |
|
2/20/2019 |
|
92.886 |
|
93.71 |
|
February 2023 |
|
12/31/2022 |
|
May 2023 |
LTI 2016 - Tranche 2019 - RSU |
|
2/20/2019 |
|
92.886 |
|
88.54 |
|
NA |
|
12/31/2022 |
|
May 2023 |
End-of-Service Benefits
Regular End-of-Service Undertakings
Retirement Pension Plan
The following retirement pension agreements apply to the individual members of the Executive Board:
| – | Dominik Asam, Sabine Bendiek, Christian Klein, Luka Mucic, Juergen Mueller, and Thomas Saueressig are entitled to receive a retirement pension when they reach the retirement age of 62 and retire from their Executive Board seat; or a disability pension depending on a health examination if, before reaching the regular retirement age, they become subject to occupational disability or permanent incapacity. A surviving dependent’s pension is paid on the death of a former member of the Executive Board, if covered. The disability pension is 100% of the vested retirement pension entitlement and is payable until the beneficiary’s 62nd birthday, after which it is replaced by a retirement pension. The surviving dependent’s pension is 60% of the retirement pension or vested disability pension entitlement at death. Entitlements are enforceable against SAP SE. Current pension payments are reviewed annually for adjustments and, if applicable, increased according to the surplus in the pension liability insurance or by 1% annually, depending on the agreement. If service is ended before the retirement age of 62, pension entitlement is reduced in proportion as the actual length of service stands in relation to the maximum possible length of service. Alternatively, the entitlement to benefits corresponds to the pension contributions paid up to that point. The applied retirement pension plan is contributory. The contribution is 4% of applicable compensation up to the applicable income threshold plus 14% of applicable compensation above the applicable income threshold. For this purpose, applicable compensation is 180% of annual base salary. The applicable income threshold is the statutory annual income threshold for the state pension plan in Germany (West), as amended from time to time. |
| – | SAP made contributions to a third-party pension plan for Scott Russell and Julia White. SAP’s matching contributions are based on payments by Scott Russell and Julia White into their pension plan. |
94
Pension Entitlements of Current Executive Board Members
|
|
|
|
|
|
Defined Benefit Obligations |
|
|
|
|
|
Net Defined Benefit Liability |
||||
|
|
Service Cost |
|
(DBO) |
|
Plan Assets |
|
(Asset) |
||||||||
€ thousands |
|
2023 |
|
2022 |
|
12/31/2023 |
|
12/31/2022 |
|
12/31/2023 |
|
12/31/2022 |
|
12/31/2023 |
|
12/31/2022 |
Christian Klein (CEO)1 |
|
85.5 |
|
217.4 |
|
621.8 |
|
420.0 |
|
1,244.8 |
|
990.2 |
|
-623.0 |
|
-570.2 |
Dominik Asam1 (from 3/7/2023) |
|
0 |
|
0 |
|
57.7 |
|
0 |
|
0 |
|
0 |
|
57.7 |
|
0 |
Sabine Bendiek1 (until 12/31/2023) |
|
73.1 |
|
125.6 |
|
237.1 |
|
145.6 |
|
487.4 |
|
324.8 |
|
-250.3 |
|
-179.2 |
Luka Mucic1 (until 3/31/2023) |
|
0 |
|
155.7 |
|
681.5 |
|
548.5 |
|
1,358.5 |
|
1,292.6 |
|
-677.0 |
|
-744.1 |
Juergen Mueller1 |
|
46.4 |
|
124.1 |
|
286.7 |
|
180.1 |
|
777.4 |
|
615.0 |
|
-490.7 |
|
-434.9 |
Thomas Saueressig1 |
|
52.9 |
|
146.4 |
|
307.2 |
|
167.4 |
|
625.3 |
|
454.4 |
|
-318.1 |
|
-287.0 |
Total |
|
257.9 |
|
769.2 |
|
2,192.0 |
|
1,461.6 |
|
4,493.4 |
|
3,677.0 |
|
-2,301.4 |
|
-2,215.4 |
1 The values shown here only reflect the pension entitlements that Christian Klein, Dominik Asam, Sabine Bendiek, Luka Mucic, Juergen Mueller, and Thomas Saueressig will receive from the retirement pension plan for Executive Board members.
Pension Entitlements of Former Executive Board Members
|
|
|
|
|
|
Defined Benefit Obligations |
|
|
|
|
|
Net Defined Benefit Liability |
||||
|
|
Pension Payments |
|
(DBO) |
|
Plan Assets |
|
(Asset) |
||||||||
€ thousands |
|
2023 |
|
2022 |
|
12/31/2023 |
|
12/31/2022 |
|
12/31/2023 |
|
12/31/2022 |
|
12/31/2023 |
|
12/31/2022 |
Werner Brandt |
|
110.3 |
|
102.1 |
|
2,145.4 |
|
1,766.0 |
|
2,022.8 |
|
1,655.4 |
|
122.6 |
|
110.6 |
Luisa Deplazes Delgado |
|
0 |
|
0 |
|
107.8 |
|
91.8 |
|
187.0 |
|
183.8 |
|
-79.2 |
|
-92.0 |
Adaire Fox-Martin |
|
0 |
|
0 |
|
386.3 |
|
331.1 |
|
750.2 |
|
734.2 |
|
-363.9 |
|
-403.1 |
Bernd Leukert |
|
0 |
|
0 |
|
589.8 |
|
501.5 |
|
1,135.7 |
|
1,117.6 |
|
-545.9 |
|
-616.1 |
Gerhard Oswald |
|
377.6 |
|
342.3 |
|
6,944.0 |
|
5,931.9 |
|
6,617.9 |
|
5,335.3 |
|
326.1 |
|
596.6 |
Stefan Ries |
|
0 |
|
0 |
|
345.5 |
|
295.3 |
|
680.1 |
|
665.8 |
|
-334.6 |
|
-370.5 |
Postcontractual Non-Compete Provisions
Each Executive Board member’s contract includes a 12-month postcontractual non-compete agreement. During this non-compete period, Executive Board members receive abstention payments corresponding to 50% of their average contractual compensation as members. This average is calculated on the basis of the preceding three years. Any other occupational income generated by the Executive Board member is deducted from their compensation. In accordance with the German Corporate Governance Code (GCGC), the Supervisory Board will offset any severance payments against such compensation for abstention.
The following table presents the theoretical amounts for the net present values of the postcontractual non-compete abstention payments. The calculation assumes the following:
- The Executive Board member leaves SAP at the end of their respective current contract term.
- Their final average contractual compensation prior to their departure equals their compensation in 2023.
Actual postcontractual non-compete payments will likely differ from these amounts depending on the time of departure and the compensation levels and target achievements at the time of departure.
Net Present Values of the Postcontractual Non-Compete Abstention Payments
€ thousands |
|
Contract Term Expires |
|
Discount Rate (in %) |
|
Net Present Value |
Christian Klein (CEO) |
|
4/30/2025 |
|
3.44 |
|
3,421.6 |
Dominik Asam (from 3/7/2023) |
|
3/6/2026 |
|
3.32 |
|
1,835.9 |
Juergen Mueller |
|
12/31/2024 |
|
3.57 |
|
1,763.5 |
Scott Russell |
|
1/31/2027 |
|
3.33 |
|
1,390.3 |
Thomas Saueressig |
|
10/31/2025 |
|
3.36 |
|
1,699.5 |
Julia White |
|
2/28/2027 |
|
3.33 |
|
1,152.2 |
Total |
|
|
|
|
|
11,263.1 |
95
Sabine Bendiek resigned from her position as Executive Board member upon the end of her current term on December 31, 2023. Starting in January 2024, she receives for a period of 12 months monthly abstention compensation for the postcontractual non - compete period totaling €2,452,967.
Early End-of-Service Undertakings
Severance Payments
The contracts for all Executive Board members provide that on termination before full term (for example, by the Company without cause where the member’s appointment is revoked, where the member becomes occupationally disabled, or in connection with a change of control), SAP SE will pay to the member the outstanding part of the compensation target for the entire remainder of the term, appropriately discounted for early payment. In accordance with section G.13 of the GCGC, payments made to an Executive Board member due to early termination must not exceed twice the annual total compensation. The annual total compensation is defined as the individual total target compensation comprised of the fixed compensation element and the two performance-based elements. In the case of change of control, the payment must not exceed 150% of the severance payment cap. Members are not entitled to that severance payment if they have not served SAP as a member of the Executive Board for at least one year or if they leave SAP SE for reasons for which they are responsible.
If an Executive Board member’s appointment to the Executive Board expires or ceases to exist because of, or as a consequence of, change or restructuring, or due to a change of control, SAP SE and each Executive Board member has the right to terminate the employment contract within eight weeks of the occurrence by giving six months’ notice. A change of control is deemed to occur when:
| – | A third party is required to make a mandatory takeover offer to the shareholders of SAP SE under the German Securities Acquisition and Takeover Act; |
| – | SAP SE merges with another company and becomes the subsumed entity; |
| – | A control or profit transfer agreement is concluded with SAP SE as the dependent company. |
An Executive Board member’s contract can also be terminated before full term if their appointment as an Executive Board member of SAP SE is revoked in connection with a change of control.
Postcontractual Non-Compete Provisions
Abstention compensation for the postcontractual non-compete period as described above is also payable on early contract termination.
Permanent Disability
In case of permanent disability, an Executive Board member’s contract will end at the end of the quarter in which the permanent inability to work was determined. The Executive Board member receives, in addition to a potential disability pension under the retirement plan described above, the monthly basic salary (fixed compensation) for a further 12 months starting from the date the permanent disability is determined.
Agreements with Executive Board Members for Early End-of-Service
Luka Mucic reached a mutual agreement with the Supervisory Board to end his employment at SAP with effect on March 31, 2023. Pursuant to the termination agreement, the following payments in connection with his early termination apply:
| – | A severance payment for the remainder of his original term of appointment until March 31, 2026, totaling €9,600,000 |
| – | Monthly instalments of the fixed compensation until March 31, 2023 |
| – | The STI 2022 and STI 2023 will be handled according to plan terms, and the STI 2023 reduced on a pro rata temporis basis. |
| – | Granted rights under the LTI 2016 Plan and the LTI 2020 will be handled according to plan terms with respect to the performance criteria and the payout schedule. The 2023 tranche will be reduced on a pro rata temporis basis. |
| – | The post-contractual non-compete obligation applies, with the abstention compensation being offset against the severance payment in accordance with section G. 13 of the GCGC. |
Compensation of Former Executive Board Members in 2023
|
|
|
|
|
|
LTI 2020 Plan – |
|
LTI 2016 Plan – |
|
Total Performance |
|
|
|
|
€ thousands |
|
Severance |
|
% of Total |
|
Tranche 2020 |
|
Tranche 20191 |
|
Compensation |
|
% of Total |
|
Total |
Michael Kleinemeier (until 4/30/2020) |
|
|
|
0 |
|
1,494.6 |
|
276.7 |
|
1,771.3 |
|
100.0 |
|
1,771.3 |
Jennifer Morgan (until 4/30/2020) |
|
|
|
0 |
|
1,144.7 |
|
423.8 |
|
1,568.5 |
|
100.0 |
|
1,568.5 |
Luka Mucic (until 3/31/2023) |
|
9,600.0 |
|
100.0 |
|
|
|
|
|
0 |
|
0 |
|
9,600.0 |
Stefan Ries (until 5/31/2020) |
|
|
|
0 |
|
522.9 |
|
250.9 |
|
773.8 |
|
100.0 |
|
773.8 |
1 Individual amount resulting from the difference between the actual payout amount in 2023 and the theoretical payout amount as at December 31, 2022
96
LTI Holdings of Former Executive Board Members in 2023
|
|
|
|
|
|
1/1/2023 |
|
During the Year |
|
12/31/2023 |
||||
|
|
|
|
|
|
|
|
Exercised (E)/ |
|
|
|
|
|
Thereof Subject |
|
|
|
|
|
|
|
|
Adjusted (A)/ |
|
|
|
Thereof |
|
to Holding |
Quantity of Share Units |
|
Specification |
|
Grant Date |
|
Outstanding |
|
Forfeited (F) |
|
Outstanding |
|
Unvested |
|
Period |
Robert Enslin |
|
LTI 2016 – Tranche 2019 – PSU |
|
2/20/2019 |
|
15,893 |
|
-15,893 |
A/E |
0 |
|
0 |
|
0 |
(until 4/5/2019) |
|
LTI 2016 – Tranche 2019 – RSU |
|
2/20/2019 |
|
722 |
|
-722 |
E |
0 |
|
0 |
|
0 |
|
|
LTI 2020 – Tranche 2020 – FSU |
|
2/29/2020 |
|
6,403 |
|
-2,667 |
A |
3,736 |
|
0 |
|
3,736 |
|
|
LTI 2020 – Tranche 2020 – MSU |
|
2/29/2020 |
|
6,403 |
|
-6,403 |
A |
0 |
|
0 |
|
0 |
Michael Kleinemeier |
|
LTI 2020 – Tranche 2020 – RSU |
|
2/29/2020 |
|
6,403 |
|
0 |
|
6,403 |
|
0 |
|
6,403 |
(until 4/30/2020) |
|
LTI 2016 – Tranche 2019 – PSU |
|
2/20/2019 |
|
20,375 |
|
-20,375 |
A/E |
0 |
|
0 |
|
0 |
|
|
LTI 2016 – Tranche 2019 – RSU |
|
2/20/2019 |
|
5,213 |
|
-5,213 |
E |
0 |
|
0 |
|
0 |
Bernd Leukert |
|
LTI 2016 – Tranche 2019 – PSU |
|
2/20/2019 |
|
20,335 |
|
-20,335 |
A/E |
0 |
|
0 |
|
0 |
(until 3/31/2019) |
|
LTI 2016 – Tranche 2019 – RSU |
|
2/20/2019 |
|
6,594 |
|
-6,594 |
E |
0 |
|
0 |
|
0 |
Bill McDermott |
|
LTI 2016 – Tranche 2019 – PSU |
|
2/20/2019 |
|
46,880 |
|
-46,880 |
A/E |
0 |
|
0 |
|
0 |
(until 11/15/2019) |
|
LTI 2016 – Tranche 2019 – RSU |
|
2/20/2019 |
|
7,348 |
|
-7,348 |
E |
0 |
|
0 |
|
0 |
|
|
LTI 2020 – Tranche 2020 – FSU |
|
2/29/2020 |
|
4,904 |
|
-2,043 |
A |
2,861 |
|
0 |
|
2,861 |
|
|
LTI 2020 – Tranche 2020 – MSU |
|
2/29/2020 |
|
4,904 |
|
-4,904 |
A |
0 |
|
0 |
|
0 |
|
|
LTI 2020 – Tranche 2020 – RSU |
|
2/29/2020 |
|
4,904 |
|
0 |
|
4,904 |
|
0 |
|
4,904 |
|
|
LTI 2016 – Tranche 2019 – PSU |
|
11/20/2019 |
|
3,826 |
|
-3,826 |
A/E |
0 |
|
0 |
|
0 |
Jennifer Morgan |
|
LTI 2016 – Tranche 2019 – PSU |
|
7/25/2019 |
|
2,781 |
|
-2,781 |
A/E |
0 |
|
0 |
|
0 |
(until 4/30/2020) |
|
LTI 2016 – Tranche 2019 – PSU |
|
2/20/2019 |
|
15,628 |
|
-15,628 |
A/E |
0 |
|
0 |
|
0 |
|
|
LTI 2016 – Tranche 2019 – RSU |
|
11/20/2019 |
|
2,552 |
|
-2,552 |
E |
0 |
|
0 |
|
0 |
|
|
LTI 2016 – Tranche 2019 – RSU |
|
7/25/2019 |
|
1,853 |
|
-1,853 |
E |
0 |
|
0 |
|
0 |
|
|
LTI 2016 – Tranche 2019 – RSU |
|
2/20/2019 |
|
10,419 |
|
-10,419 |
E |
0 |
|
0 |
|
0 |
|
|
LTI 2020 – Tranche 2020 – FSU |
|
2/29/2020 |
|
2,240 |
|
-933 |
A |
1,307 |
|
0 |
|
1,307 |
|
|
LTI 2020 – Tranche 2020 – MSU |
|
2/29/2020 |
|
2,240 |
|
-2,240 |
A |
0 |
|
0 |
|
0 |
Stefan Ries |
|
LTI 2020 – Tranche 2020 – RSU |
|
2/29/2020 |
|
2,240 |
|
0 |
|
2,240 |
|
0 |
|
2,240 |
(until 5/31/2020) |
|
LTI 2016 – Tranche 2019 – PSU |
|
2/20/2019 |
|
13,165 |
|
-13,165 |
A/E |
0 |
|
0 |
|
0 |
|
|
LTI 2016 – Tranche 2019 – RSU |
|
2/20/2019 |
|
8,776 |
|
-8,776 |
E |
0 |
|
0 |
|
0 |
Total |
|
|
|
|
|
223,001 |
|
-201,550 |
|
21,451 |
|
0 |
|
21,451 |
97
Executive Board: Other Information
We did not grant any compensation advance or credit to, or enter into any commitment for the benefit of, any member of our Executive Board in 2023 or the previous year.
As far as the law permits, SAP SE and its affiliated companies in Germany and elsewhere indemnify and hold harmless their respective directors and officers against and from the claims of third parties. To this end, we maintain directors’ and officers’ (D&O) group liability insurance. The policy is annual and is renewed from year to year. The insurance covers the personal liability of the insured group for financial loss caused by its managerial acts and omissions. The current D&O policy includes an individual deductible for Executive Board members of SAP SE as required by section 93 (2) of the AktG.
Comparative Information on the Change of Compensation and Company Performance
The following table discloses the relative change in compensation of active as well as former Executive Board members, the average compensation of the employees of the SAP Group (full-time equivalents), and year-over-year changes in selected earnings indicators. The compensation of Executive Board members is considered in accordance with section 162 of the AktG awarded and due.
The presentation of average employee compensation is based on the average full-time equivalent number of employees in the respective year. Average employee compensation comprises the personnel expenses for salaries, fringe benefits, employer contributions to social insurance, and any short-term and long-term variable compensation components attributable to the fiscal year. Therefore, employee compensation is also equivalent to granted and due compensation within the meaning of section 162 of the AktG and thus in line with Executive Board and Supervisory Board compensation.
|
|
2019 to 2018 |
|
2020 to 2019 |
|
2021 to 2020 |
|
20221) |
|
2022 to 2021 |
|
20231) |
|
2023 to 20221) |
|
|
|
Change in % |
|
Change in % |
|
Change in % |
|
€ thousands |
|
Change in % |
|
€ thousands |
|
Change in % |
|
Current Executive Board Members |
|
|
|
|
|
|
|
|
|
|
|
|
|
|
|
Christian Klein (CEO) (from 1/1/2018) |
|
7 |
|
-40 |
|
425 |
|
4,674 |
|
-20 |
|
7,158 |
|
53 |
|
Dominik Asam (from 3/7/2023) |
|
NA |
|
NA |
|
NA |
|
NA |
|
NA |
|
3,943 |
|
NA |
|
Sabine Bendiek (from 1/1/2021 until 12/31/2023) |
|
NA |
|
NA |
|
NA |
|
1,412 |
|
-65 |
|
2,017 |
|
43 |
|
Juergen Mueller (from 1/1/2019) |
|
NA |
|
-56 |
|
307 |
|
3,210 |
|
10 |
|
3,653 |
|
14 |
|
Scott Russell (from 2/1/2021) |
|
NA |
|
NA |
|
NA |
|
2,283 |
|
2 |
|
3,076 |
|
35 |
|
Thomas Saueressig (from 11/1/2019) |
|
NA |
|
162 |
|
307 |
|
1,731 |
|
-41 |
|
3,611 |
|
109 |
|
Julia White (from 3/1/2021) |
|
NA |
|
NA |
|
NA |
|
2,280 |
|
-45 |
|
2,556 |
|
12 |
|
Former Executive Board Members |
|
|
|
|
|
|
|
|
|
|
|
|
|
|
|
Werner Brandt (until 6/30/2014) |
|
0 |
|
2 |
|
2 |
|
102 |
|
0 |
|
110 |
|
8 |
|
Michael Kleinemeier (until 4/30/2020) |
|
57 |
|
38 |
|
-65 |
|
1,617 |
|
-4 |
|
1,495 |
|
-8 |
|
Jennifer Morgan (until 4/30/2020) |
|
10 |
|
747 |
|
-92 |
|
2,610 |
|
97 |
|
1,145 |
|
-56 |
|
Luka Mucic (until 3/31/2023) |
|
-36 |
|
-46 |
|
127 |
|
3,248 |
|
-25 |
|
11,634 |
|
258 |
|
Gerhard Oswald (until 12/31/2016) |
|
-82 |
|
-53 |
|
0 |
|
342 |
|
0 |
|
378 |
|
10 |
|
Stefan Ries (until 5/31/2020) |
|
61 |
|
230 |
|
-80 |
|
1,497 |
|
-20 |
|
523 |
|
-65 |
|
Earnings Indicators |
|
|
|
|
|
|
|
|
|
|
|
|
|
|
|
Total Revenue SAP Group (Non-IFRS) |
|
12 |
|
-1 |
|
2 |
|
29,520 |
|
11 |
|
31,207 |
|
6 |
|
Total Revenue SAP SE (German Commercial Code) |
|
7 |
|
-4 |
|
5 |
|
17,786 |
|
16 |
|
19,018 |
|
7 |
|
Operating Profit SAP Group (Non-IFRS) |
|
15 |
|
1 |
|
-1 |
|
7,989 |
|
-2 |
|
8,722 |
|
9 |
|
Net Income SAP SE (German Commercial Code) |
|
-31 |
|
87 |
|
8 |
|
1,912 |
|
-29 |
|
4,766 |
|
149 |
|
Average Annual Compensation of Employees SAP Group |
|
21 |
|
-12 |
|
13 |
|
139 |
|
4 |
|
156 |
|
12 |
|
1 SAP Group (non - IFRS) 2022 and 2023 from continuing operations Supervisory Board members’ compensation is governed by our Articles of Incorporation, section 16.
98
Compensation for Supervisory Board Members
Compensation System
By resolution of our Annual General Meeting of Shareholders on May 11, 2023, the section was changed. It now provides for additional compensation for the newly established role of a Lead Independent Director.
Each member of the Supervisory Board receives, in addition to the reimbursement of their expenses, an annual basic compensation of € 165,000. The chairperson receives € 275,000 and the deputy chairperson € 220,000 annually. In addition, we reimburse members of the Supervisory Board for the value-added tax payable on their compensation.
For membership of the Audit and Compliance Committee, Supervisory Board members receive an additional fixed annual compensation of €50,000, and for membership of any other Supervisory Board committee €35,000, provided that the committee concerned has met in the year. The chairperson of the Audit and Compliance Committee receives €95,000, and the chairpersons of the other committees receive €50,000. If a deputy chairperson is appointed for a committee, he or she receives €43,500 per year, and €72,500 per year for the Audit and Compliance Committee. The fixed remuneration is payable after the end of the year.
If the Supervisory Board appoints a Lead Independent Director, the Lead Independent Director shall receive compensation of €50,000 per year in addition to his or her basic compensation and in addition to his or her compensation for any memberships in committees.
Any members of the Supervisory Board who have served for less than the entire year receive one-twelfth of the annual compensation for each month of service commenced. This also applies to the increased compensation for the chairperson and the deputy chairperson(s) and to the compensation for the chairperson, any possible deputy chairperson, the members of a committee, and to the additional compensation for the Lead Independent Director.
Supervisory Board Members’ Compensation in 2023
€ thousands |
|
2023 |
|
2022 |
||||||||||||||||
|
|
Fixed |
|
|
|
Compensation for |
|
|
|
Total |
|
Fixed |
|
|
|
Compensation for |
|
|
|
Total |
|
|
Compensation |
|
% of Total |
|
Committee Work |
|
% of Total |
|
|
|
Compensation |
|
% of Total |
|
Committee Work |
|
% of Total |
|
|
Prof. Dr. h. c. mult. Hasso Plattner (Chairperson) |
|
275.0 |
|
64.0 |
|
155.0 |
|
36.0 |
|
430.0 |
|
275.0 |
|
62.6 |
|
164.2 |
|
37.4 |
|
439.2 |
Lars Lamadé (Deputy Chairperson) |
|
220.0 |
|
67.7 |
|
105.0 |
|
32.3 |
|
325.0 |
|
220.0 |
|
67.7 |
|
105.0 |
|
32.3 |
|
325.0 |
Manuela Asche-Holstein |
|
165.0 |
|
57.9 |
|
120.0 |
|
42.1 |
|
285.0 |
|
165.0 |
|
64.5 |
|
90.8 |
|
35.5 |
|
255.8 |
Aicha Evans |
|
165.0 |
|
51.6 |
|
155.0 |
|
48.4 |
|
320.0 |
|
165.0 |
|
51.6 |
|
155.0 |
|
48.4 |
|
320.0 |
Prof. Dr. Gesche Joost (until 5/11/2023) |
|
68.8 |
|
70.3 |
|
29.2 |
|
29.8 |
|
97.9 |
|
165.0 |
|
70.2 |
|
70.0 |
|
29.8 |
|
235.0 |
Margret Klein-Magar |
|
165.0 |
|
57.9 |
|
120.0 |
|
42.1 |
|
285.0 |
|
165.0 |
|
57.9 |
|
120.0 |
|
42.1 |
|
285.0 |
Monika Kovachka-Dimitrova |
|
165.0 |
|
61.1 |
|
105.0 |
|
38.9 |
|
270.0 |
|
165.0 |
|
61.1 |
|
105.0 |
|
38.9 |
|
270.0 |
Peter Lengler |
|
165.0 |
|
57.9 |
|
120.0 |
|
42.1 |
|
285.0 |
|
165.0 |
|
57.9 |
|
120.0 |
|
42.1 |
|
285.0 |
Jennifer Xin-Zhe Li (from 5/18/2022) |
|
165.0 |
|
55.9 |
|
130.0 |
|
44.1 |
|
295.0 |
|
110.0 |
|
60.8 |
|
70.8 |
|
39.2 |
|
180.8 |
Bernard Liautaud (until 5/18/2022) |
|
NA |
|
NA |
|
NA |
|
NA |
|
NA |
|
68.8 |
|
70.3 |
|
29.2 |
|
29.8 |
|
97.9 |
Dr. Qi Lu |
|
165.0 |
|
61.1 |
|
105.0 |
|
38.9 |
|
270.0 |
|
165.0 |
|
61.1 |
|
105.0 |
|
38.9 |
|
270.0 |
Gerhard Oswald |
|
165.0 |
|
51.4 |
|
156.3 |
|
48.6 |
|
321.3 |
|
165.0 |
|
59.7 |
|
111.2 |
|
40.3 |
|
276.2 |
Christine Regitz |
|
165.0 |
|
59.2 |
|
113.5 |
|
40.8 |
|
278.5 |
|
165.0 |
|
59.2 |
|
113.5 |
|
40.8 |
|
278.5 |
Dr. h. c. Punit Renjen (from 5/11/2023) |
|
146.7 |
|
64.5 |
|
80.9 |
|
35.6 |
|
227.5 |
|
NA |
|
NA |
|
NA |
|
NA |
|
NA |
Dr. Friederike Rotsch |
|
165.0 |
|
42.9 |
|
220.0 |
|
57.1 |
|
385.0 |
|
165.0 |
|
49.3 |
|
170.0 |
|
50.7 |
|
335.0 |
Heike Steck |
|
165.0 |
|
56.3 |
|
128.3 |
|
43.7 |
|
293.3 |
|
165.0 |
|
61.1 |
|
105.0 |
|
38.9 |
|
270.0 |
Helmut Stengele |
|
165.0 |
|
100.0 |
|
0 |
|
0 |
|
165.0 |
|
165.0 |
|
100.0 |
|
0 |
|
0 |
|
165.0 |
Dr. Rouven Westphal |
|
165.0 |
|
53.4 |
|
143.8 |
|
46.6 |
|
308.8 |
|
165.0 |
|
51.0 |
|
158.3 |
|
49.0 |
|
323.3 |
Dr. Gunnar Wiedenfels |
|
165.0 |
|
55.0 |
|
135.0 |
|
45.0 |
|
300.0 |
|
165.0 |
|
53.3 |
|
144.6 |
|
46.7 |
|
309.6 |
James Wright |
|
165.0 |
|
57.9 |
|
120.0 |
|
42.1 |
|
285.0 |
|
165.0 |
|
57.9 |
|
120.0 |
|
42.1 |
|
285.0 |
Total |
|
3,185.4 |
|
|
|
2,241.9 |
|
|
|
5,427.3 |
|
3,148.8 |
|
|
|
2,057.7 |
|
|
|
5,206.4 |
In 2023, we received services from members of the Supervisory Board (including services from employee representatives on the Supervisory Board in their capacity as employees of SAP) in the amount of €1,959,000 (2022: €1,855,000).
99
Long-Term Incentives for the Supervisory Board
We do not offer members of the Supervisory Board share-based payment for their Supervisory Board work. Any share-based payment awards received by employee-elected members relate to their position as SAP employees and not to their work on the Supervisory Board.
Supervisory Board: Other Information
We did not grant any compensation advance or credit to, or enter into any commitment for the benefit of, any member of our Supervisory Board in 2023 or the previous year.
Hasso Plattner, the chairperson of the Supervisory Board, entered into a consulting contract with SAP after joining the Supervisory Board in May 2003. The contract does not provide for any compensation. The only cost we incurred under the contract was the reimbursement of expenses.
As far as the law permits, we indemnify Supervisory Board members against, and hold them harmless from, claims brought by third parties. To this end, we maintain directors’ and officers’ (D&O) group liability insurance. In accordance with our Articles of Incorporation, the premiums for the insurance policy are paid by SAP.
Comparative Information on the Change of Compensation and Company Performance
The following table discloses the relative change in compensation of active as well as former Supervisory Board members, the average compensation of the SAP employees (full-time equivalents), and year-over-year changes in selected earnings indicators.
|
|
2019 to 2018 |
|
2020 to 2019 |
|
2021 to 2020 |
|
20221) |
|
2022 to 2021 |
|
20231) |
|
2023 to 20221) |
|
|
|
Change in % |
|
Change in % |
|
Change in % |
|
€ thousands |
|
Change in % |
|
€ thousands |
|
Change in % |
|
Current Supervisory Board Members |
|
|
|
|
|
|
|
|
|
|
|
|
|
|
|
Prof. Dr. h.c. mult. Hasso Plattner (Chairperson) |
|
-10 |
|
4 |
|
1 |
|
439 |
|
27 |
|
430 |
|
-2 |
|
Lars Lamadé (Deputy Chairperson (from 1/1/2022) |
|
0 |
|
0 |
|
6 |
|
325 |
|
64 |
|
325 |
|
0 |
|
Manuela Asche-Holstein (from 7/8/2021) |
|
NA |
|
NA |
|
NA |
|
256 |
|
200 |
|
285 |
|
11 |
|
Aicha Evans (from 7/1/2017) |
|
2 |
|
0 |
|
6 |
|
320 |
|
52 |
|
320 |
|
0 |
|
Margret Klein-Magar (Deputy Chairperson until 12/31/2021) |
|
2 |
|
0 |
|
4 |
|
285 |
|
10 |
|
285 |
|
0 |
|
Monika Kovachka-Dimitrova (from 5/15/2019) |
|
NA |
|
50 |
|
1 |
|
270 |
|
42 |
|
270 |
|
0 |
|
Peter Lengler (from 8/10/2021) |
|
NA |
|
NA |
|
NA |
|
285 |
|
255 |
|
285 |
|
0 |
|
Jennifer Xin-Zhe Li (from 5/18/2022) |
|
NA |
|
NA |
|
NA |
|
181 |
|
NA |
|
295 |
|
63 |
|
Dr. Qi Lu (from 12/21/2020) |
|
NA |
|
NA |
|
1,288 |
|
270 |
|
41 |
|
270 |
|
0 |
|
Gerhard Oswald (from 1/1/2019) |
|
NA |
|
6 |
|
-3 |
|
276 |
|
24 |
|
321 |
|
16 |
|
Christine Regitz |
|
4 |
|
1 |
|
5 |
|
279 |
|
34 |
|
279 |
|
0 |
|
Dr. h. c. Punit Renjen (from 5/11/2023) |
|
NA |
|
NA |
|
NA |
|
0 |
|
NA |
|
219 |
|
NA |
|
Dr. Friederike Rotsch (from 5/17/2018) |
|
62 |
|
3 |
|
8 |
|
335 |
|
44 |
|
385 |
|
15 |
|
Heike Steck (from 5/15/2019) |
|
NA |
|
50 |
|
9 |
|
270 |
|
32 |
|
270 |
|
0 |
|
Helmut Stengele (from 10/29/2021) |
|
NA |
|
NA |
|
NA |
|
165 |
|
300 |
|
165 |
|
0 |
|
Dr. Rouven Westphal (from 5/12/2021) |
|
NA |
|
NA |
|
NA |
|
323 |
|
133 |
|
309 |
|
-4 |
|
Dr. Gunnar Wiedenfels (from 5/15/2019) |
|
NA |
|
50 |
|
0 |
|
310 |
|
52 |
|
300 |
|
-3 |
|
James Wright (from 5/15/2019) |
|
NA |
|
50 |
|
0 |
|
285 |
|
40 |
|
285 |
|
0 |
|
Former Supervisory Board Members |
|
|
|
|
|
|
|
|
|
|
|
|
|
|
|
Prof. Dr. Gesche Joost (until 5/11/2023) |
|
0 |
|
0 |
|
0 |
|
235 |
|
26 |
|
98 |
|
-58 |
|
Earnings Indicators |
|
|
|
|
|
|
|
|
|
|
|
|
|
|
|
Total Revenue SAP Group (Non-IFRS) |
|
12 |
|
-1 |
|
2 |
|
29,520 |
|
11 |
|
31,207 |
|
6 |
|
Total Revenue SAP SE (German Commercial Code) |
|
7 |
|
-4 |
|
5 |
|
17,786 |
|
16 |
|
19,018 |
|
7 |
|
Operating Profit SAP Group (Non-IFRS) |
|
15 |
|
1 |
|
-1 |
|
7,989 |
|
-2 |
|
8,722 |
|
9 |
|
Net Income SAP SE (German Commercial Code) |
|
-31 |
|
87 |
|
8 |
|
1,912 |
|
-29 |
|
4,766 |
|
149 |
|
Average Annual Compensation of Employees SAP Group |
|
21 |
|
-12 |
|
13 |
|
139 |
|
4 |
|
156 |
|
12 |
|
1 SAP Group (non-IFRS) 2022 and 2023 from continuing operations Note: This is a convenience translation of the German original.
100
Independent Auditor's Report
Solely the original text in the German language is authoritative.
To SAP SE, Walldorf,
REPORT ON THE AUDIT OF THE COMPENSATION REPORT
We have audited the attached compensation report of SAP SE, Walldorf, for the financial year from January 1 to December 31, 2023, including the related disclosures, prepared to meet the requirements of Section 162 AktG [Aktiengesetz: German Stock Corporation Act].
Responsibilities of Executive Board members and the Supervisory Board
The Executive Board members and the Supervisory Board of SAP SE are responsible for the preparation of the compensation report, including the related disclosures, in accordance with the requirements of Section 162 AktG. The Executive Board members and the Supervisory Board are also responsible for such internal control as they have determined necessary to enable the preparation of the compensation report including the related disclosures, that is free from material misstatement, whether due to fraud or error.
Auditor's responsibilities
Our responsibility is to express an opinion on this compensation report, including the related disclosures, based on our audit. We conducted our audit in accordance with the German Generally Accepted Standards for Financial Statement Audits promulgated by the Institut der Wirtschaftsprüfer [Institute of Public Auditors in Germany] (IDW). Those standards require that we comply with ethical requirements and plan and perform the audit to obtain reasonable assurance about whether the remuneration report, including the related disclosures, is free from material misstatement.
An audit involves performing procedures to obtain audit evidence about the amounts, including the related disclosures, in the compensation report. The procedures selected depend on the auditor's professional judgement. This includes an assessment of the risks of material misstatement, whether due to fraud or error, in the compensation report, including the related disclosures. In assessing these risks, the auditor considers the internal control system relevant for the preparation of the compensation report, including the related disclosures. The objective is to plan and perform audit procedures that are appropriate in the circumstances, but not for the purpose of expressing an opinion on the effectiveness of the Company's internal control. An audit also includes evaluating the appropriateness of accounting policies used and the reasonableness of accounting estimates made by Executive Board members and the Supervisory Board, as well as evaluating the overall presentation of the compensation report, including the related disclosures.
We believe that the evidence we have obtained is sufficient and appropriate to provide a basis for our opinion.
Opinion
In our opinion, on the basis of the knowledge obtained in the audit, the compensation report for the financial year from January 1 to December 31, 2023, including the related disclosures, complies in all material respects with the financial reporting requirements of Section 162 AktG.
Other matter – formal examination of the remuneration report
The substantive audit of the compensation report described in this independent auditor's report includes the formal examination of the remuneration report required by Section 162 (3) AktG, including issuing an assurance report on this examination. As we have issued an unqualified opinion on the substantive audit of the compensation report, this opinion includes the conclusion that the disclosures pursuant to Section 162 (1) and (2) AktG have been made, in all material respects, in the compensation report.
Engagement Terms and Liability
This auditor’s report is intended exclusively for SAP SE, Walldorf for information on the result of the audit and liability is limited in accordance with the "BDO AG Wirtschaftsprüfungsgesellschaft - Special Terms and Conditions" dated March 1, 2021 agreed with the company and the "General Engagement Terms for Wirtschaftsprüfer and Wirtschaftsprüfungsgesellschaften [German Public Auditors and Public Audit Firms]" dated January 1, 2017 as issued by the IDW (www.bdo.de/auftragsbedingungen).
It was explicitly agreed in the audit contract with the client that the inclusion of third parties in the scope of protection is not intended. Therefore, we do not assume any responsibility towards third parties.
Frankfurt am Main, February 21, 2024
BDO AG
Wirtschaftsprüfungsgesellschaft
[Original German version signed by:]
Dr. Jens Freiberg |
Klaus Eckmann |
Wirtschaftsprüfer |
Wirtschaftsprüfer |
[German Public Auditor] |
[German Public Auditor] |
101
Employees
Headcount and Personnel Expense
Numbers disclosed in the Employees section63 are based on headcount (exceptions in FTE are indicated). We define headcount in FTE64 as the number of people on permanent employment contracts, taking into account their staffing percentage. Students, individuals employed by SAP but currently not working for reasons such as maternity/parental leave, and temporary employees on limited contracts of less than six months are excluded from our figures. The number of temporary employees is not material.
The personnel expense for each employee is defined as the overall personnel expense divided by the average number of employees.
For 2024, we plan a targeted restructuring program in close alignment with social partners, which is expected to affect about 8,000 employees from SAP's global workforce. For more information, see the Notes to the Consolidated Financial Statements, Note (G.8).
For more information about employee compensation and a breakdown of personnel expense, see the Notes to the Consolidated Financial Statements, Note (B.1) and Note (B.2).
Employee and Labor Relations
On a worldwide basis, we believe that our employee and labor relations are excellent.
On a corporate level, all employees of SAP in the member states of the European Union (including the United Kingdom for a transition period until May 2024) and in the contract states of the European Economic Area are represented by the SAP SE Works Council (WoC) (Europe). By law and agreement with SAP, the SAP SE WoC (Europe) is entitled to receive information on certain transnational matters and to consult with the Executive Board or a representative thereof. On the legal entity level, the SAP SE works council (Germany) represents the employees of SAP SE. The employees of SAP Deutschland SE & Co. KG (SAP Germany), hybris GmbH (Germany), Concur (Germany) GmbH, and Emarsys Interactive Services GmbH (Germany) are represented by separate works councils. Other employee representatives include the group works council (composed of members of the works councils of SAP SE, SAP Germany, hybris GmbH, Concur (Germany) GmbH and Emarsys Interactive Services GmbH (Germany)), the representatives of severely disabled persons in SAP SE and SAP Germany and the spokespersons committee as the representation of the executives of SAP SE (Germany).
Employees of each of SAP France, SAP France Holding, SAP Labs France and Concur (France) SAS are subject to the same collective agreement: “SYNTEC”. In France, effective December 31, 2019 the Workers Council, the Health and Safety Committee and the employee representative were replaced by a single instance named the “Economic and Social Committee”. Today, SAP France/SAP France Holding (in the same legal entity), SAP Labs France and Concur (France) SAS are represented by an Economic and Social Committee. The represented unions negotiate agreements with each of SAP France/SAP France Holding and SAP Labs France. For Concur (France) SAS the agreements are negotiated with the Economic and Social Committee. In addition, the employees of various other SAP entities, including SAP España – Sistemas, Aplicaciones y Productos en la Informática, S.A., SAP Belgium NV/SA., SAP Israel, SAP Nederland B.V., SAP Italia Sistemi Applicazioni Prodotti in Data Processing S.p.A., SAP China Beijing Branch, all entities in the Czech Republic (SAP ČR, spol. s r.o., SAP Services s.r.o., Ariba Czech s.r.o. and Concur Czech (s.r.o.)), SAP Brasil Ltda, SAP Korea Ltd. (Korea), SAP North West Africa Ltd. (Maroc), SAP Slovensko s.r.o. (Slovakia), SAP sistemi, aplikacije in produkti za obdelavo podatkov d.o.o. (Slovenia), SAP Romania SRL, SAP Svenska Aktiebolag (Sweden), SAP UK Ltd., and SAP Ireland Ltd. are represented by works councils, worker representatives, employee consultation forums and/or unions. In addition, some of these employees are subject to a collective bargaining agreement.
63All financial and non-financial numbers in this chapter are based on continuing operations excluding Qualtrics.
64Thereof acquisitions: 558.
102
Share Ownership
Beneficial Ownership of Shares
The ordinary shares beneficially owned by the persons listed in "Item 6. Directors, Senior Management and Employees — Compensation Report ” are disclosed in “Item 7. Major Shareholders and Related-Party Transactions — Major Shareholders.”
Share-Based Compensation Plans
Share- Based Compensation
We maintain certain share-based compensation plans. The share-based compensation from these plans result from cash-settled and equity-settled awards issued to employees. For more information on our share-based compensation plans refer to “Item 6. Directors, Senior Management and Employees — Compensation Report” and Note (B.3) to our Consolidated Financial Statements.
ITEM 7. MAJOR SHAREHOLDERS AND RELATED-PARTY TRANSACTIONS
Major Shareholders
The share capital of SAP SE consists of ordinary shares, which are issued only in bearer form. Accordingly, SAP SE generally cannot determine the identity of its shareholders or how many shares a particular shareholder owns. SAP’s ordinary shares are traded in the United States by means of ADRs. Each ADR currently represents one SAP SE ordinary share. On February 9, 2024, based on information provided by the Depositary there were 64,676,139 ADRs held of record by 654 registered holders. The ordinary shares underlying such ADRs represented 5.26% of the then-outstanding ordinary shares (including treasury stock). Because SAP’s ordinary shares are issued in bearer form only, we are unable to determine the number of ordinary shares directly held by persons with U.S. addresses.
The following table sets forth certain information regarding the beneficial ownership of the ordinary shares to the extent known to SAP as of February 9, 2024 of: (i) each person or group known by SAP SE to own beneficially 5% or more of the outstanding ordinary shares; and (ii) the beneficial ownership of all individuals who are currently members of the Supervisory Board and all members of the Executive Board, individually and as a group, in each case as reported to SAP SE by such persons. There was, as far as we are able to tell given the nature of our shares, no significant change in the percentage ownership held by any major shareholder during the past three years. None of the major shareholders have special voting rights.
Major Shareholders |
|
Ordinary Shares Beneficially Owned |
||
|
|
Number |
|
% of Outstanding |
Dietmar Hopp, collectively1 |
|
62,548,065 |
|
5.1 |
Hasso Plattner, Chairperson Supervisory Board, collectively2 |
|
37,007,518 |
|
3.012 |
Executive Board Members as a group (7 persons) |
|
26,949 |
|
0.002 |
Supervisory Board Members as a group (18 persons) |
|
37,035,265 |
|
3.015 |
Executive Board Members and Supervisory Board Members as a group (25 persons)3 |
|
37,062,214 |
|
3.017 |
BlackRock, Inc.4 |
|
76,782,227 |
|
6.3 |
1 The foregoisng information is based on a Schedule 13G filed by Dietmar Hopp and other affiliated persons and companies on February 11, 2022.
2 Includes Hasso Plattner Single Asset GmbH & Co. KG in which Hasso Plattner exercises voting and dispositive power. This number does not include the 39,807,809 shares owned (directly or indirectly) by Hasso Plattner Foundation.
3 We believe that, other than Hasso Plattner, each of the members of the Supervisory Board and the Executive Board beneficially owns less than 1% of SAP SE’s ordinary shares as of February 9, 2024.
4 As required under German law, BlackRock, Inc. informed SAP that they own more than 5% of SAP's outstanding ordinary shares. BlackRock, Inc. is not required to provide SAP with the number of shares owned as of February 9, 2024, and has not provided such information. The foregoing information is based on a Schedule 13G filed by BlackRock, Inc. on February 2, 2024.
Currently we are not aware of any arrangements, the operation of which may, at a subsequent date, result in a change in control of the company.
Related-Party Transactions
For information on related-party transactions see Note (G.6) to our Consolidated Financial Statements.
103
ITEM 8. FINANCIAL INFORMATION
Consolidated Financial Statements and Financial Statement Schedule
See “Item 18. Financial Statements” and pages F-1 through F-107.
Other Financial Information
Legal Proceedings
We are subject to a variety of legal proceedings and claims, either asserted or unasserted, which arise in the ordinary course of business, including claims and lawsuits involving businesses we have acquired.
Refer to Note (G.3) to our Consolidated Financial Statements for a detailed discussion of our material legal proceedings.
Dividend Policy
For more information on dividend policy see the disclosure in “Item 3. Key Information — Dividends”.
Significant Changes
Organizational Changes
Effective January 1, 2024, the Supervisory Board established the Government Security Committee, which is responsible for SAP's corporate activities in context of national security regulations.
Effective February 1, 2024, Gina Vargiu-Breuer was appointed to the Executive Board of SAP as Chief People Officer and labor director.
In January 2024, SAP appointed Muhammad Alam as a member of the Executive Board effective April 1, 2024.
Beginning April 1, 2024, Thomas Saueressig will lead a new Board area: Customer Services & Delivery.
On February 11, 2024, SAP announced that Punit Renjen chose to resign his mandate on the Supervisory Board effective as of the end of the Annual General Meeting scheduled for May 15, 2024. The Supervisory Board nominated Pekka-Ala-Pietilä to stand for election at the upcoming Annual General Meeting. In case of election, it is intended that Pekka-Ala-Pietilä will assume the role of Chairman of the Supervisory Board.
Settlement Agreement
In early January 2024, following exhaustive investigations, dialogue, and corresponding remediation activities, SAP entered into final settlement agreements with the U.S. SEC and U.S. DOJ as well as with local authorities and parties in South Africa, to resolve criminal and civil claims fully and finally against SAP. For more information, see Note G.3.
Transformation Program
In 2024, SAP will further increase its focus on key strategic growth areas, in particular Business AI. Also, it will transform its operational setup to capture organizational synergies, AI-driven efficiencies and to prepare the company for highly scalable future revenue growth. To this end, and to ensure that SAP’s skill set and resources continue to meet future business needs, SAP will execute a company-wide restructuring program in 2024. The majority of the approximately 8,000 affected positions is expected to be covered by voluntary leave programs and internal re-skilling measures. Restructuring expenses are projected at around €2 billion, the vast majority of which is expected to be recognized in the first half of 2024, impacting IFRS operating profit. For more information, see Note G.8.
Share Repurchase Program
On February 14, 2024, the first tranche of the share repurchase program launched in 2023 was completed with a total volume of €1,011 million. For the volume processed until December 31, 2023, please refer to Note E.2.
On February 26, 2024, SAP launched the second tranche of the share repurchase program. For further details about the program refer to the Treasury Shares section in Note E.2.
104
ITEM 9. THE OFFER AND LISTING
Our ordinary shares are officially listed on the Frankfurt Stock Exchange, the Berlin Stock Exchange and the Stuttgart Stock Exchange. The principal trading market for the ordinary shares is Xetra, the electronic dealing platform of Deutsche Boerse AG.
ADRs representing SAP SE ordinary shares are listed on the NYSE under the symbol “SAP,” and currently each ADR represents one ordinary share.
ITEM 10. ADDITIONAL INFORMATION
Articles of Incorporation
Organization and Register
SAP SE is a European Company (Societas Europaea, or “SE”) duly established under the laws of Germany and the European Union, registered in the Commercial Register (Handelsregister) at the Lower Court of Mannheim, Germany, under the entry number “HRB 719915.” SAP SE publishes its official notices in the Company Register (www.unternehmensregister.de) and Federal Gazette (www.bundesanzeiger.de).
Objects and Purposes
SAP’s Articles of Incorporation state that our objects involve, directly or indirectly, the development, production and marketing of products and the provision of services in the field of information technology and telecommunication, particularly in the following fields:
- |
developing and marketing integrated product and service solutions for e-commerce; |
- |
developing software and cloud solutions and the licensing of their use to others; |
- |
organization and deployment consulting, as well as user training, for software and cloud solutions; |
- |
selling, leasing, renting and arranging the procurement and provision of all other forms of use of information technology systems and relevant accessories; and |
- |
making capital investments in enterprises active within the scope of the corporate purpose to promote the opening and advancement of international markets in these fields. |
SAP is authorized to act in all the business areas listed above and to delegate such activities to affiliated entities within the meaning of the German Stock Corporation Act; in particular SAP is authorized to delegate its business in whole or in part to such entities. SAP SE is authorized to establish branch offices in Germany and other countries, as well as to form, acquire or invest in other companies of the same or related kind and to enter into collaboration and joint venture agreements. SAP is further authorized to invest in enterprises of all kinds principally for investment purposes. SAP is authorized to dispose of investments, to consolidate the management of enterprises in which it participates, to enter into affiliation agreements with such entities, or to limit its activities to manage its shareholdings.
Corporate Governance
Introduction
SAP SE, as a European Company with a two-tier board system, is governed by three separate bodies: the Supervisory Board, the Executive Board and the Annual General Meeting of Shareholders. Their rules are defined by European and German law, by the Agreement on the Involvement of Employees in SAP SE (“Employee Involvement Agreement", "EIA”), by the German Corporate Governance Code and by SAP’s Articles of Incorporation (Satzung) and are summarized below. See “Item 16G. Differences in Corporate Governance Practices” for additional information on our corporate governance practices.
The Supervisory Board
The Supervisory Board appoints and removes the members of the Executive Board and oversees and advises the management of the corporation. At regular intervals it meets to discuss current business as well as business development and planning. The SAP Executive Board must consult with the Supervisory Board concerning the corporate strategy, which is developed by the Executive Board. Types of transactions for which the Executive Board requires the Supervisory Board’s consent are listed in the Articles of Incorporation; in addition, the Supervisory Board has specified further types of transactions that require its consent. Accordingly, the Supervisory Board must also approve the annual budget of SAP upon submission by the Executive Board and certain subsequent deviations from the approved budget. The Supervisory Board is also responsible for representing SAP SE in transactions between SAP SE and Executive Board members.
105
The Supervisory Board, based on a recommendation by its Audit and Compliance Committee, provides its proposal for the election of the external independent auditor to the Annual General Meeting of Shareholders. Based on the preparatory work of the Audit and Compliance Committee, the Supervisory Board deliberates and resolves on the adoption of the SAP SE financial statements and is responsible for the approval of the SAP SE financial statements, the consolidated financial statements, and the combined management report (including the combined non-financial statement). The Supervisory Board is also responsible for monitoring the auditor’s independence and the audit quality, a task it has delegated to the Audit and Compliance Committee.
Pursuant to Article 40 (3) sentence 1 of the SE Regulation, the number of members of the supervisory board and the rules for determining this number are to be laid down in the Articles of Incorporation. Furthermore, pursuant to Section 17 (1) SE-AG, the size of supervisory boards of companies which, like SAP SE, have a capital stock exceeding €10,000,000, is limited to twenty - one members. In line with these provisions as well as the EIA, the Articles of Incorporation of SAP SE provide that the Supervisory Board shall be composed of eighteen members.
The current Supervisory Board of SAP SE consists of eighteen members, nine of whom are elected by the Annual General Meeting of Shareholders as shareholders’ representatives with the remaining nine being appointed as employees’ representatives by the SE Works Council in accordance with the EIA (see below for details). The SE Works Council represents the SAP employees in member states of the European Union and in the contract states of the European Economic Area. Pursuant to Section 17(2) SE-AG, the Supervisory Board of SAP SE must have a minimum of 30% men and 30% women. This quota for the Supervisory Board must be observed for any new appointment to the Supervisory Board. In 2023, there were four women on the shareholder representatives’ side of the Supervisory Board until May 2023 and three women on the shareholder representatives’ side of the Supervisory Board from May onwards. During all of 2023 there were five women on the employee representatives’ side. Thus, the percentage of women on the Supervisory Board exceeded the minimum quota of 30% throughout 2023.
The procedure for the appointment of the employee representatives on the Supervisory Board of SAP SE is governed by the EIA. In accordance with the EIA, for the current composition of the Supervisory Board, the nine seats reserved for employees’ representatives (“Employee Seats”) are allocated as follows: the first seven of the Employee Seats are allocated in proportion to the numbers of SAP employees employed in the individual countries (d`Hondt method), provided that if the first six seats are allocated to one country, the seventh seat is for the country with the second highest number of SAP employees. The eighth seat is allocated to the country represented in the SE Works Council with the highest number of SAP employees. The ninth seat is allocated to a country not already allocated a seat in the Supervisory Board but represented on the SE Works Council. In 2023 the first six seats were allocated to Germany, the seventh seat was allocated to the UK, the eighth seat was also allocated to Germany, and the ninth seat was allocated to a European country not represented by the first eight seats, as determined by the SE Works Council. The employees’ representatives for the first six seats allocated to Germany were determined by direct vote by all SAP employees with their principal place of employment in Germany. According to the EIA, the employees’ representative for the seventh seat allocated to the UK is generally determined according to the applicable provisions of the UK law on the election or appointment of employees’ representatives on a supervisory board. With regard to the eighth and ninth seats, members of the SE Works Council from Germany and Bulgaria were appointed by the SE Works Council as employees’ representatives.
Any Supervisory Board member elected by the shareholders at the Annual General Meeting of Shareholders may be removed by three-quarters of the votes cast at the Annual General Meeting of Shareholders. Any Supervisory Board member appointed in accordance with the EIA may be removed by the SE Works Council upon application by the body that nominated the respective employees’ representative for appointment by the SE Works Council or, in case the employees’ representative was directly elected, the majority of the employees entitled to vote.
The Supervisory Board elects a chairperson and one or two deputy chairperson(s) among its members by a majority of the votes cast. Only a shareholders’ representative may be elected as chairperson of the Supervisory Board. When electing the chairperson of the Supervisory Board, the oldest member in terms of age of the shareholders’ representatives on the Supervisory Board will chair the meeting and, in the event of a tied vote, will have the casting vote.
Unless otherwise mandatorily prescribed by law or the Articles of Incorporation, resolutions of the Supervisory Board are adopted by simple majority of the votes cast. In the event of a tie, the vote of the chairperson and, in the event that the chairperson does not participate in passing the resolution, the vote of the deputy chairperson, provided that he or she is a shareholders’ representative, will be decisive (casting vote).
Other than for the employees’ representatives on the first Supervisory Board of SAP SE, the Supervisory Board members may be elected or appointed for a period ending with the close of the Annual General Meeting of Shareholders at which the acts of the Supervisory Board are formally approved for the fourth fiscal year following the commencement of the term of office, not counting the year in which their term of office commences. In any event, the term of office shall end after six years at most. Re-election is possible. Our Supervisory Board holds four ordinary meetings per year and in addition convenes extraordinary meetings as needed or resolves by way of circular resolution. The compensation of the members of the Supervisory Board is set in the Articles of Incorporation.
All of the shareholder representatives are considered independent from SAP and the Supervisory Board. This is in compliance with the German Corporate Governance Code (GCGC), which stipulates that an adequate number of the shareholder representatives on our Supervisory Board be independent. To be considered for appointment to the Supervisory Board and for as long as they serve, members must comply with certain criteria concerning independence, conflicts of interest and multiple memberships of management, and supervisory and other governing bodies. They must be loyal to SAP in their conduct and must not accept any position in companies that are in competition with SAP. Members are subject to insider trading prohibitions and the respective directors’ dealing rules of the European Regulation (EU) No 596/2014 of the European Parliament and the Council of 16 April 2014 on market abuse and the German Securities Trading Act. A member of the Supervisory Board may not vote on matters relating to certain contractual agreements between such member and SAP SE. Further, as the compensation of the Supervisory Board members is set in the Articles of Incorporation, Supervisory Board members are unable to vote on their own compensation, with the exception that they are able to exercise voting rights in an Annual General Meeting of Shareholders in connection with a resolution amending the Articles of Incorporation.
106
The duties and procedures of the Supervisory Board and its committees are specified in their respective rules of procedure, if any, which reflect the requirements of European and German law, including the SE Regulation and the German Stock Corporation Act, the Articles of Incorporation and the recommendations of the GCGC.
According to the provisions of the Sarbanes-Oxley Act, SAP does not grant loans to the members of the Executive Board or the Supervisory Board.
The Supervisory Board may appoint committees from among its members and may, to the extent permitted by law, entrust such committees with the authority to make decisions on behalf of the Supervisory Board. Currently the Supervisory Board maintains the following committees:
The Audit and Compliance Committee
The Audit and Compliance Committee (Prüfungs- und Compliance-Ausschuss) handles matters concerning the financial statements and the auditing of the Group and SAP SE standalone accounting and reporting. Additionally, the Audit and Compliance Committee handles all investigative compliance related topics as well as the group-wide strategy of SAP and its implementation. Among the tasks of the Audit and Compliance Committee are the discussion of SAP’s quarterly statements, half year report and the year-end financial and non - financial reporting prepared under German and U.S. regulations, including this report. The Audit and Compliance Committee recommends to the Supervisory Board the appointment of the external independent auditor, determines focus audit areas, discusses critical accounting policies and estimates with the auditors, reviews the audit reports issued and audit issues identified by the auditor, and monitors the effectiveness of the internal audit function and receives regular reports about the function’s resources, audit plans (including the criteria used to create the plans), its audit methods and activities, and audit results. The Audit and Compliance Committee also negotiates the audit fees with the auditor and monitors the auditor’s independence and audit quality. SAP’s Office of Ethics and Compliance and SAP’s Global Risk and Assurance Services Office report regularly to the Audit and Compliance Committee, as well as upon request or the occurrence of certain findings. SAP’s Global Security & Cloud Compliance Office reports regularly to the Technology and Strategy Committee and to joint Audit and Compliance Committee and Technology and Strategy Committee meetings, as well as upon request or the occurrence of certain findings. The Audit and Compliance Committee reviews the effectiveness of SAP’s system for monitoring corporate security, which includes cybersecurity, with a focus on risk and incident management and mitigation. Finally, the Audit and Compliance Committee reviews the Compensation Report and prepares a recommendation for Supervisory Board to adapt and release the report for the respective fiscal year.
The Audit and Compliance Committee has established procedures regarding the prior approval of all audit and non-audit services provided by our external independent auditor. See “Item 16C. Principal Accountant Fees and Services” for details.
The Audit and Compliance Committee also does preparatory work for the full Supervisory Board’s deliberations and resolutions on the adoption of the annual financial statements, the approval of the consolidated annual financial statements and the Integrated Report, and on the dividend proposal. Additionally, the Audit and Compliance Committee assists in the preparation of the Compensation Report by reviewing it with regard to the fulfillment of all regulatory requirements. Furthermore, the Audit and Compliance Committee and the Finance and Investment Committee jointly prepare the full Supervisory Board’s resolution to approve the group annual plan.
The Supervisory Board has determined each of Jennifer Xin-Zhe Li, the Audit and Compliance Committee’s chairperson, and Dr. Gunnar Wiedenfels to be an audit committee financial expert as defined by the regulations of the SEC issued under Section 407 of the Sarbanes-Oxley Act as well as financial experts as defined by the German Stock Corporation Act, with both of them having expertise in the fields of accounting and auditing. Each of Ms. Li and Dr. Wiedenfels are “independent”, as such term is defined in Rule 10A-3 under the Exchange Act. See “Item 16A. Audit Committee Financial Expert” for details.
The Personnel and Governance Committee
The Personnel and Governance Committee (Personal- und Governance-Ausschuss) is responsible for personnel matters related to the Executive Board and matters concerning the coordination of the Supervisory Board. The Committee carries out the preparatory work necessary for key decisions made by the Supervisory Board concerning the members of the Executive Board, e.g. appointment and remuneration, as well as conclusion of, amendments to, and termination of Executive Board members’ service contracts and succession planning. The Committee also handles all matters related to corporate governance.
The German Stock Corporation Act prohibits the Personnel and Governance Committee from deciding on the compensation of the Executive Board members on behalf of the Supervisory Board and requires that such decision is made by the entire Supervisory Board. This Act also provides the Annual General Meeting of Shareholders with the right to vote on the system for the compensation of Executive Board members, such vote, however, not being legally binding for the Supervisory Board.
The Finance and Investment Committee
The Finance and Investment Committee (Finanz- und Investitionsausschuss) addresses general financing issues and is responsible for all matters related to financing, mergers & acquisitions, joint ventures, strategic investments and divestitures. Furthermore, it regularly discusses acquisitions of intellectual property and companies, venture capital investments and other investments with the Executive Board and reports to the Supervisory Board on such investments. It is also responsible for the approval of such investments if the individual investment amount exceeds certain specified limits, as well as – together with the Audit and Compliance Committee – for the preparation of the full Supervisory Board’s resolution to approve the group annual plan.
107
The Technology and Strategy Committee
The Technology and Strategy Committee (Technologie-und Strategieausschuss) advises the Executive Board on the overall business strategy of the company with regard to the development and use of technologies and the development of software and solutions, technological and strategic decisions including the product strategy. Additionally, the Technology and Strategy Committee reviews and monitors on a regular basis the technical systems and processes intended to defend against cybersecurity attacks and improve the security of SAP’s infrastructure. The Technology and Strategy Committee is focused on cybersecurity risk and incident product and operational-related impacts and mitigation.
The Nomination Committee
The Nomination Committee (Nominierungsausschuss) is exclusively composed of shareholder representatives. The purpose of this Committee is to propose suitable candidates for the Supervisory Board to recommend when the Annual General Meeting of Shareholders elects Supervisory Board members.
The People and Culture Committee
The People and Culture Committee (Ausschuss für Mitarbeiterangelegenheiten und Unternehmenskultur) is responsible for matters related to human resources (excluding senior management) with a focus on fostering a culture of innovation, performance, diversity, organizational design, and integrity. The Committee also maintains SAP’s network with universities and other stakeholders to support the company`s people strategy.
The Go-To-Market and Operations Committee
The main task of the Go-To-Market and Operations Committee is to support and advise the Executive Board on the Company's go-to-market strategy worldwide, including marketing, sales, service and support, ecosystem, government relations, communications as well as internal processes and operations.
The Executive Board
The Executive Board manages the Company’s business, is responsible for preparing its strategy and represents it in dealings with third parties. The Executive Board reports regularly to the Supervisory Board about SAP operations and business strategies and prepares special reports upon request. A person may not serve on the Executive Board and on the Supervisory Board at the same time.
The Executive Board and the Supervisory Board cooperate closely for the benefit of the Company. The Executive Board is required to provide the Supervisory Board regular, prompt and comprehensive information about all of the essential issues affecting the SAP Group’s business progress and its potential business risks. Furthermore, the Executive Board must maintain regular contact with the chairperson of the Supervisory Board and vice versa. The Executive Board must inform the chairperson of the Supervisory Board promptly about exceptional events that are of significance to SAP’s business. The Supervisory Board chairperson must inform the Supervisory Board accordingly and shall, if required, convene an extraordinary meeting of the Supervisory Board.
Pursuant to the Articles of Incorporation, the Executive Board must consist of at least two members. SAP SE’s Executive Board is currently comprised of seven members. Any two members of the Executive Board jointly or one member of the Executive Board and the holder of a special power of attorney (Prokurist) jointly may legally represent SAP SE. The Supervisory Board appoints each member of the Executive Board for a maximum term of five years, with the possibility of re-appointment. Under certain circumstances, a member of the Executive Board may be removed by the Supervisory Board prior to the expiration of that member’s term. A member of the Executive Board may not vote on matters relating to certain contractual agreements between such member and SAP SE, and may be liable to SAP SE if such member has a material interest in any contractual agreement between SAP and a third party which was not previously disclosed to and approved by the Supervisory Board. Further, as the compensation of the Executive Board members is set by the Supervisory Board, Executive Board members are unable to vote on their own compensation, with the exception that they are able to exercise voting rights in an Annual General Meeting of Shareholders resolving a non-binding vote on the system for the compensation of Executive Board members.
Under German law SAP SE’s Supervisory Board members and Executive Board members have a duty of loyalty and care towards SAP SE. They must exercise the standard of care of a prudent and diligent businessman and bear the burden of proving they did so if their actions are contested. Both bodies must consider the interest of SAP SE shareholders and our employees and, to some extent, the common good. Those who violate their duties may be held jointly and severally liable for any resulting damages, unless they acted pursuant to a lawful resolution of the Annual General Meeting of Shareholders.
SAP has a Global Code of Ethics and Business Conduct for Employees (CoEBC) that is applicable to all employees, managers, the members of SAP’s Executive Board, as well as employee representatives of the Supervisory Board (see “Item 16B. Code of Ethics” for details).
Under German law the Executive Board of SAP SE is required to assess and manage all major risks for the SAP Group. In addition, all measures taken by management to reduce and handle the risks have to be documented. Therefore, SAP’s Executive Board has adopted suitable measures such as implementing an enterprise-wide risk monitoring system to ensure that adverse developments endangering the corporate standing are recognized at a reasonably early point in time.
108
The Office of Ethics and Compliance was created by the SAP Executive Board in 2006 to oversee and coordinate legal and regulatory policy compliance at SAP. The Group Chief Compliance Officer heading the Office of Ethics and Compliance reports directly to CEO Christian Klein and also has direct communication channels and reporting obligations to the Audit and Compliance Committee of the Supervisory Board. The Office of Ethics and Compliance manages a network of field compliance officers based across the globe who act as the first point of contact for the business regarding compliance matters. The Office of Ethics and Compliance provides training and communication to SAP employees to raise awareness and understanding of legal and regulatory compliance policies. Speak Out at SAP is SAP’s independently managed whistleblower reporting tool, through which any matters or concerns can be reported easily, and, if desired, anonymously. The tool is available twenty four hours a day, seven days a week, both internally to SAP employees and externally to concerned parties, including customers, suppliers, and partners. Beyond Speak Out at SAP, we provide further reporting channels, including an internal ticketing system, a postal address for written submissions, as well as local contact persons worldwide. Employee help lines are also supported in each region where questions can be raised or questionable conduct can be reported without fear of retaliation.
The Annual General Meeting of Shareholders
Shareholders of the Company exercise their voting rights at shareholders’ meetings. The Executive Board calls the Annual General Meeting of Shareholders, which must take place within the first six months of each fiscal year. The Supervisory Board or the Executive Board may call an extraordinary meeting of the shareholders if the interests of the stock corporation so require. Additionally, shareholders of SAP SE holding in the aggregate a minimum of 5% of SAP SE’s issued share capital may call an extraordinary meeting of the shareholders. Shareholders as of the record date are entitled to attend and participate in shareholders’ meetings if they have provided timely notice of their intention to attend the meeting.
At the Annual General Meeting of Shareholders, the shareholders are asked, among other things, to formally approve the actions taken by the Executive Board and the Supervisory Board in the preceding fiscal year, to approve the appropriation of the corporation’s distributable profits and to appoint an external independent auditor. Shareholder representatives of the Supervisory Board are generally elected at the Annual General Meeting of Shareholders for a term not longer than six years. Shareholders may also be asked to grant authorization to repurchase treasury shares, to resolve on measures to raise or reduce the capital of the Company or to ratify amendments of our Articles of Incorporation. The Annual General Meeting of Shareholders can make management decisions only if requested to do so by the Executive Board.
Change in Control
There are no provisions in the Articles of Incorporation of SAP SE that would have the effect of delaying, deferring, or preventing a change in control of SAP SE and that would only operate with respect to a merger, acquisition or corporate restructuring involving it or any of its subsidiaries.
According to the German Securities Acquisition and Takeover Act (Wertpapiererwerbs- und Übernahmegesetz) a bidder seeking control of a company with its corporate seat in Germany or another state of the European Economic Area (EEA) and its shares being traded on an EEA stock exchange must publish an advance notice of its decision to make a tender offer, submit an offer statement to the Federal Financial Supervisory Authority (Bundesanstalt für Finanzdienstleistungsaufsicht) for review, and obtain certification from a qualified financial institution that adequate financing is in place to complete the offer. The offer statement must be published upon approval by the Federal Financial Supervisory Authority or expiry of a certain time period without such publication being prohibited by the Federal Financial Supervisory Authority. Once a shareholder has acquired shares representing at least 30% of the voting rights in an EEA-listed company, it must make an offer for all remaining shares. The Securities Acquisition and Takeover Act requires the executive board of the target company to refrain from taking any measures that may frustrate the success of the takeover offer. However, the target executive board is permitted to take any action that a prudent and diligent management of a company that is not the target of a takeover bid would also take. Moreover, the target executive board may search for other bidders and, with the prior approval of the supervisory board, may take other defensive measures, provided that both boards act within the parameters of their general authority under the German Stock Corporation Act. An executive board may also adopt specific defensive measures if such measures have been approved by the supervisory board and were specifically authorized by the Annual General Meeting of Shareholders no earlier than 18 months in advance of such measures by a resolution of at least 75% of the shares represented.
Under the European Takeover Directive of 2004 member states had to choose whether EU restrictions on defensive measures apply to companies that are registered in their territory. Germany decided to opt out and to retain its current restrictions on a board implementing defensive measures (as described above). As required by the European Takeover Directive if a country decides to opt out the German Securities Acquisition and Takeover Act grants companies the option of voluntarily applying the European standard by a change of the Articles of Incorporation (opt-in). SAP SE has not made use of this option.
Change in Share Capital
Under German law, the capital stock may be increased in consideration of contributions in cash or in kind, or by establishing authorized capital or contingent capital or by an increase of the company’s capital reserves. Authorized capital provides the Executive Board with the flexibility to issue new shares for a period of up to five years. The Executive Board must obtain the approval of the Supervisory Board before issuing new shares with regard to the authorized capital. Contingent capital allows the issuance of new shares for specified purposes, including stock option plans for Executive Board members or employees and the issuance of shares upon conversion of convertible bonds and exercise of stock options. By law, the Executive Board may only issue new shares with regard to the contingent capital for the specified purposes. Capital increases require an approval by at least 75% of the valid votes cast at the Annual General Meeting of Shareholders in which the increase is proposed and require an amendment to the Articles of Incorporation.
109
The share capital may be reduced by an amendment to the Articles of Incorporation approved by at least 75% of the valid votes cast at the Annual General Meeting of Shareholders. In addition, the Executive Board of SAP SE is allowed to authorize a reduction of the company’s capital stock by canceling a defined number of repurchased treasury shares if this repurchasing and the subsequent reduction have already been approved by the Annual General Meeting of Shareholders.
The Articles of Incorporation do not contain conditions regarding changes in the share capital that are more stringent than those provided by applicable European and German law.
Rights Accompanying our Shares
There are no limitations imposed by German law or the Articles of Incorporation of SAP SE on the rights to own securities, including the rights of non-residents or foreign holders to hold the ADRs or ordinary shares, to exercise voting rights or to receive dividends or other payments on such shares.
According to the German stock corporation law, the rights of shareholders cannot be amended without shareholders’ consent. The Articles of Incorporation do not provide more stringent conditions regarding changes of the rights of shareholders than those provided by applicable European and German law.
Voting Rights
Each ordinary SAP SE share represents one vote. Cumulative voting is not permitted under applicable European and German law. A corporation’s Articles of Incorporation may stipulate a majority necessary to pass a shareholders’ resolution differing from the majority provided by law, unless the law mandatorily requires a certain majority. Section 21 (1) of SAP SE’s Articles of Incorporation provides that resolutions may be passed at the Annual General Meeting of Shareholders with a majority of valid votes cast, unless a larger majority is prescribed by law or the Articles of Incorporation. SAP SE’s Articles of Incorporation as well as applicable European and German law require that the following matters, among others, be approved by at least 75% of the valid votes cast at the Annual General Meeting of Shareholders in which the matter is proposed:
- |
changing the corporate purpose of the company set out in the Articles of Incorporation; |
- |
capital increases and capital decreases; |
- |
excluding preemptive rights of shareholders to subscribe for new shares or for treasury shares; |
- |
dissolution; |
- |
a merger into, or a consolidation with, another company; |
- |
a transfer of all or virtually all of the assets; |
- |
a change of corporate form, including re-conversion into a German stock corporation; |
- |
a transfer of the registered seat to another EU member state; and |
- |
any other amendment to the Articles of Incorporation (pursuant to section 21 (2) sentence 1 of the Articles of Incorporation). For any amendments of the Articles of Incorporation which require a simple majority for stock corporations established under German law, however, section 21 (2) sentence 2 of SAP SE’s Articles of Incorporation provides that the simple majority of the valid votes cast is sufficient if at least half of the subscribed capital is represented or, in the absence of such quorum, the majority prescribed by law (i.e. two thirds of the votes cast, pursuant to sec. 59 of the SE Regulation) is sufficient. |
Dividend Rights
See “Item 3. Key Information — Dividends.”
Preemptive Rights
Shareholders have preemptive rights to subscribe (Bezugsrecht) for any issue of additional shares in proportion to their shareholdings in the issued capital. The preemptive rights may be excluded under certain circumstances by a shareholders’ resolution (approved by at least 75% of the valid votes cast at the Annual General Meeting of Shareholders) or by the Executive Board authorized by such shareholders’ resolutions and subject to the consent of the Supervisory Board.
Liquidation
If SAP SE were to be liquidated, any liquidation proceeds remaining after all of our liabilities were paid would be distributed to our shareholders in proportion to their shareholdings.
110
Disclosure of Shareholdings
SAP SE’s Articles of Incorporation do not require shareholders to disclose their shareholdings. The German Securities Trading Act (Wertpapierhandelsgesetz), however, requires holders of voting securities of SAP SE to notify SAP SE and the Federal Financial Supervisory Authority of the number of shares they hold if that number reaches, exceeds or falls below specified thresholds. These thresholds are 3%, 5%, 10%, 15%, 20%, 25%, 30%, 50% and 75% of the corporation’s outstanding voting rights. In respect of certificates representing shares, the notification requirement shall apply exclusively to the holder of the certificates. In addition, the German Securities Trading Act also obliges anyone who holds, directly or indirectly, financial instruments that convey an unconditional entitlement to acquire under a legally binding agreement, shares in SAP SE, to notify SAP SE and the Federal Financial Supervisory Authority if the thresholds mentioned above have been reached, exceeded or fallen below, with the exception of the 3% threshold. This notification obligation also exists for the holder of a financial instrument which merely de facto enables its holder or a third party to acquire shares in SAP SE, subject to the thresholds mentioned in the preceding sentence. In connection with this notification, obligation positions in voting rights and other financial instruments have to be aggregated.
Exchange Controls and Other Limitations Affecting Security Holders
The euro is a fully convertible currency. At the present time, Germany does not restrict the export or import of capital, except for investments in certain areas in accordance with applicable resolutions adopted by the United Nations and the European Union. However, for statistical purposes only, every individual or corporation residing in Germany (“Resident”) must report to the German Central Bank (Deutsche Bundesbank), subject only to certain immaterial exceptions, any payment received from or made to an individual or a corporation residing outside of Germany (“Non-Resident”) if such payment exceeds €12,500 (or the equivalent in a foreign currency). In addition, German Residents (except for individuals and certain financial institutions) must report any accounts payable to or receivable from Non-Residents if such payables or receivables, in the aggregate, exceed €5 million (or the equivalent in a foreign currency) at the end of any calendar month. Furthermore, companies resident in Germany with accounts payable to or receivable from Non-Residents in excess of €500 million have to report any payables or receivables to/from Non-Residents arising from derivative instruments at the end of each calendar quarter. Residents are also required to report annually to the German Central Bank any shares or voting rights of 10% or more which they hold directly or indirectly in non-resident corporations with total assets of more than €3 million. Corporations residing in Germany with assets in excess of €3 million must report annually to the German Central Bank any shares or voting rights of 10% or more held directly or indirectly by a Non-Resident.
Taxation
General
The following discussion is a summary of certain material German tax and U.S. federal income tax consequences of the acquisition, ownership and disposition of our ADRs or ordinary shares to a U.S. Holder. In general, a U.S. Holder (as hereinafter defined) is any beneficial owner of our ADRs or ordinary shares that (i) is a citizen or resident of the U.S. or a corporation organized under the laws of the U.S. or any political subdivision thereof, an estate whose income is subject to U.S. federal income tax regardless of its source or a trust, if a U.S. court can exercise primary supervision over its administration and one or more U.S. persons are authorized to control all substantial decisions of the trust; (ii) is not a resident of Germany for purposes of the income tax treaty between the U.S. and Germany (Convention between the Federal Republic of Germany and the United States of America for the Avoidance of Double Taxation and the Prevention of Fiscal Evasion with respect to Taxes on Income and Capital and to certain other Taxes, as amended by the Protocol of June 1, 2006 and as published in the German Federal Law Gazette 2008 vol. II pp. 611/851; the “Treaty”); (iii) owns the ADRs or ordinary shares as capital assets; (iv) does not hold the ADRs or ordinary shares as part of the business property of a permanent establishment or a fixed base in Germany; and (v) is fully entitled to the benefits under the Treaty with respect to income and gain derived in connection with the ADRs or ordinary shares. Special rules which are not discussed in the following summary apply to pension funds and certain other tax-exempt investors.
THE FOLLOWING IS NOT A COMPREHENSIVE DISCUSSION OF ALL GERMAN TAX AND U.S. FEDERAL INCOME TAX CONSEQUENCES THAT MAY BE RELEVANT FOR U.S. HOLDERS OF OUR ADRs OR ORDINARY SHARES. THEREFORE, U.S. HOLDERS ARE STRONGLY URGED TO CONSULT THEIR OWN TAX ADVISORS REGARDING THE OVERALL GERMAN TAX AND U.S. FEDERAL INCOME TAX CONSEQUENCES OF THE ACQUISITION, OWNERSHIP AND DISPOSITION OF OUR ADRs OR ORDINARY SHARES IN LIGHT OF THEIR PARTICULAR CIRCUMSTANCES, INCLUDING THE EFFECT OF ANY STATE, LOCAL OR OTHER FOREIGN OR DOMESTIC LAWS.
German Taxation
The summary set out below is based on German tax laws, interpretations thereof and applicable tax treaties to which Germany is a party and that are in force at the date of this report; it is subject to any changes in such authority occurring after that date, potentially with retroactive effect, that could result in German tax consequences different from those discussed below. This discussion is also based, in part, on representations of the Depositary and assumes that each obligation of the Deposit Agreement and any related agreements will be performed in accordance with its terms. For additional information on the Depository and the fees associated with SAP’s ADR program see “Item 12. Description of Securities Other Than Equity Securities — American Depository Shares.”
For purposes of applying German tax law and the applicable tax treaties to which Germany is a party, a holder of ADRs will generally be treated as owning the ordinary shares represented thereby.
111
German Taxation of Dividends
Under German income tax law, the full amount of dividends distributed by an incorporated company is generally subject to German withholding tax at a domestic rate of 25% plus a solidarity surtax of 5.5% thereon (effectively 1.375% of dividends before withholding tax), resulting in an aggregate withholding tax rate from dividends of 26.375%. Since January 1, 2017, taxes are incurred on the third bank working day after the Annual General Meeting of Shareholders, or at a later date as may be stipulated by SAP’s Articles of Incorporation or by the Annual General Meeting of Shareholders’ decision on dividends. Non-resident corporate shareholders will generally be entitled to a refund in the amount of two-fifths of the withholding tax (including solidarity surtax thereon). This does not preclude a further reduction or refund of withholding tax, if any, available under a relevant tax treaty.
Generally, for many non-resident shareholders the withholding tax rate is currently reduced under applicable income tax treaties. Rates and refund procedures may vary according to the applicable treaty. To reduce the withholding tax to the applicable treaty tax rate a non-resident shareholder must apply for a refund of withholding taxes paid. Any refund applications must be submitted electronically to the German Federal Tax Office (Bundeszentralamt für Steuern, BZSt). For details, such non-resident shareholders are urged to consult their own tax advisors. Special rules apply for the refund to U.S. Holders (we refer to the below section “Refund Procedures for U.S. Holders”).
Refund Procedures for U.S. Holders
Under the Treaty, a partial refund of the 25% withholding tax equal to 10% of the gross amount of the dividend and a full refund of the solidarity surtax can be obtained by a U.S. Holder. Thus, for each US$100 of gross dividends paid by SAP SE to a U.S. Holder, the dividends (which are dependent on the euro/U.S. dollar exchange rate at the time of payment) will be initially subject to a German withholding tax of US$26.375, of which US$11.375 may be refunded under the Treaty. As a result, a U.S. Holder effectively would receive a total dividend of US$85 (provided the euro/U.S. dollar exchange rate at the time of payment of the dividend is the same as at the time of refund, otherwise the effective dividend may be higher or lower). Further relief of German withholding tax under the Treaty may be available for corporate U.S. Holders owning at least 10% of the voting stock of SAP or U.S. Holders qualifying as pension fund within the meaning of the Treaty, subject to further requirements being met, in particular certain holding requirements.
To claim the refund of amounts withheld in excess of the Treaty rate, a U.S. Holder must submit a claim for refund including a certificate of residence and all relevant tax certificates to the German tax authorities. Since the beginning of 2023, applications for the exemption and reimbursement from withholding tax must be filed electronically using the officially prescribed data set. Hereby, it is necessary to use an official online portal to file the application: either the Federal Central Tax Office’s online portal (BZSt Online Portal, BOP) or the Elster online portal (EOP). To submit an application online, a software certificate (a BOP certificate or an EOP certificate) is required. The registration process for the certificate can take up to six weeks. Respective guidelines are available on the homepage of the German Federal Tax Office (http://www.bzst.de).
U.S. Holders must also submit to the German tax authorities a certification of their U.S. residency status (IRS Form 6166). This certification can be obtained from the Internal Revenue Service (IRS) by filing a request for certification on IRS Form 8802, which will not be processed unless a user fee is paid. IRS Form 8802 and its instructions can be obtained from the IRS website at www.irs.gov. U.S. Holders should consult their own tax advisors regarding how to obtain an IRS Form 6166.
The German tax authorities reserve the right to audit the entitlement to tax refunds for several years following their payment pursuant to the Treaty in individual cases.
The German tax authorities will issue refunds denominated in euros. In the case of shares held through banks or brokers participating in the Depository, the refunds will be issued to the Depository, which will convert the refunds to U.S. dollar. The resulting amounts will be paid to banks or brokers for the account of the U.S. Holders.
German Taxation of Capital Gains
Under German income tax law, a capital gain derived from the sale or other disposition of ADRs or ordinary shares by a non-resident shareholder is subject to income tax in Germany only if such non-resident shareholder has held, directly or indirectly, ADRs or ordinary shares representing 1% or more of the registered share capital of a company at any time during the five-year period immediately preceding the sale or other disposition.
However, a U.S. Holder of ADRs or ordinary shares that qualifies for benefits under the Treaty is not subject to German income or corporate income tax on the capital gain derived from the sale or other disposition of ADRs or ordinary shares.
German Gift and Inheritance Tax
Generally, a transfer of ADRs or ordinary shares by a shareholder at death or by way of gift will be subject to German gift or inheritance tax, respectively, if (i) the decedent or donor, or the heir, donee or other transferee is resident in Germany at the time of the transfer, or with respect to German citizens who are not resident in Germany, if the decedent or donor, or the heir, donee or other transferee has not been continuously outside of Germany for a period of more than five years; (ii) the ADRs or ordinary shares are part of the business property of a permanent establishment or a fixed base in Germany; or (iii) the ADRs or ordinary shares subject to such transfer form part of a portfolio that represents 10% or more of the registered share capital of the Company and has been held, directly or indirectly, by the decedent or donor, respectively, at the time of the transfer, actually or constructively together with related parties.
112
However, the right of the German government to impose gift or inheritance tax on a non-resident shareholder may be limited by an applicable estate tax treaty. In the case of a U.S. Holder, a transfer of ADRs or ordinary shares by a U.S. Holder at death or by way of gift generally will not be subject to German gift or inheritance tax by reason of the estate tax treaty between the U.S. and Germany (Convention between the Federal Republic of Germany and the United States of America for the Avoidance of Double Taxation with respect to Estate, Gift and Inheritance Taxes, German Federal Law Gazette 1982 vol. II page 846, as amended by the Protocol of December 14, 1998 and as published on December 21, 2000, German Federal Law Gazette 2001 vol. II, page 65; the “Estate Tax Treaty”) so long as (i) the decedent or donor, and (ii) the heir, donee or other transferee was not domiciled in Germany for purposes of the Estate Tax Treaty at the time the gift was made, or at the time of the decedent’s death, and the ADRs or ordinary shares were not held in connection with a permanent establishment or a fixed base in Germany. In general, the Estate Tax Treaty provides a credit against the U.S. federal gift or estate tax liability for the amount of gift or inheritance tax paid in Germany, subject to certain limitations, in a case where the ADRs or ordinary shares are subject to German gift or inheritance tax and U.S. federal gift or estate tax.
Other German Taxes
There are currently no German net worth, transfer, stamp or other similar taxes that would apply to a U.S. Holder on the acquisition, ownership, sale or other disposition of our ADRs or ordinary shares.
U.S. Taxation
The following discussion applies to U.S. Holders only if the ADRs and ordinary shares are held as capital assets for tax purposes. It does not address tax considerations applicable to U.S. Holders that may be subject to special tax rules, such as dealers or traders in securities, financial institutions, insurance companies, tax-exempt entities, regulated investment companies, U.S. Holders that hold ordinary shares or ADRs as a part of a straddle, conversion transaction or other arrangement involving more than one position, U.S. Holders that own (or are deemed for U.S. tax purposes to own) 10% or more (by vote or value) of the stock of SAP SE, U.S. Holders subject to special tax accounting rules as a result of any item of gross income with respect to the ADRs or shares being taken into account in the applicable financial statement, U.S. Holders that have a principal place of business or “tax home” outside the United States or U.S. Holders whose “functional currency” is not the U.S. dollar and U.S. Holders that hold ADRs or ordinary shares through partnerships or other pass-through entities.
The summary set out below is based upon the U.S. Internal Revenue Code of 1986, as amended (the “Code”), the Treaty and regulations, rulings and judicial decisions thereunder at the date of this report. Any such authority may be repealed, revoked or modified, potentially with retroactive effect, so as to result in U.S. federal income tax consequences different from those discussed below. No assurance can be given that the conclusions set out below would be sustained by a court if challenged by the IRS. The discussion below is based, in part, on representations of the Depositary, and assumes that each obligation in the Deposit Agreement and any related agreements will be performed in accordance with its terms.
For U.S. federal income tax purposes, a U.S. Holder of ADRs will be considered to own the ordinary shares represented thereby. Accordingly, unless the context otherwise requires, all references in this section to ordinary shares are deemed to refer likewise to ADRs representing an ownership interest in ordinary shares.
U.S. Taxation of Dividends
Subject to the discussion below under “Passive Foreign Investment Company Considerations”, distributions made by SAP SE with respect to ordinary shares (other than distributions in liquidation and certain distributions in redemption of stock), including the amount of German tax deemed to have been withheld in respect of such distributions, will generally be taxed to U.S. Holders as ordinary dividend income.
As discussed above, a U.S. Holder may obtain a refund of German withholding tax under the Treaty to the extent that the German withholding tax exceeds 15% of the dividend distributed. Thus, for each US$100 of gross dividends paid by SAP SE to a U.S. Holder, the dividends (which are dependent on the euro/ U.S. dollar exchange rate at the time of payment) will be initially subject to German withholding tax of US$25 plus US$1.375 solidarity surtax, and the U.S. Holder will receive US$73.625. A U.S. Holder who obtains the Treaty refund will receive from the German tax authorities an additional amount in euro that would be equal to US$11.375. For U.S. tax purposes, such U.S. Holder will be considered to have received a total distribution of US$100, which will be deemed to have been subject to German withholding tax of US$15 (15% of US$100) resulting in the net receipt of US$85 (provided the euro/ U.S. dollar exchange rate at the time of payment of the dividend is the same as at the time of refund, otherwise the effective dividend may be higher or lower).
In the case of a distribution in euro, the amount of the distribution generally will equal the U.S. dollar value of the euro distributed (determined by reference to the spot currency exchange rate on the date of receipt of the distribution, or receipt by the Depositary in the case of a distribution on ADRs), regardless of whether the holder in fact converts the euro into U.S. dollar, and the U.S. Holder will not realize any separate foreign currency gain or loss (except to the extent that such gain or loss arises on the actual disposition of foreign currency received). However, a U.S. Holder may be required to recognize foreign currency gain or loss on the receipt of a refund in respect of German withholding tax to the extent the U.S. dollar value of the refund differs from the U.S. dollar equivalent of that amount on the date of receipt of the underlying dividend.
113
Dividends paid by SAP SE generally will constitute “portfolio income” for purposes of the limitations on the use of passive activity losses (and, therefore, generally may not be offset by passive activity losses) and as “investment income” for purposes of the limitation on the deduction of investment interest expense. Dividends paid by SAP SE will not be eligible for the dividends received deduction generally allowed to U.S. corporations under Section 243 of the Code. Dividends paid by SAP SE to an individual are treated as “qualified dividends” (assuming the holding requirement is met) subject to capital gains rates, i.e., at a maximum rate of 20%, if SAP SE was not in the prior year and, is not in the year in which the dividend is paid, a passive foreign investment company (“PFIC”). Based on our audited financial statements and relevant market and shareholder data, we believe that we were not treated as a PFIC for U.S. federal income taxes with respect to our 2023 tax year. In addition, based on our audited financial statements and our current expectations regarding the value and nature of our assets, the sources and nature of our income, and relevant market and shareholder data, we do not anticipate becoming a PFIC for the 2024 tax year. Certain U.S. holders who are individuals, trusts, or estates, must pay a Medicare tax at a rate of 3.8% on the lesser of (i) net investment income such as dividends and (ii) the excess of modified adjusted gross income over the statutory thresholds.
U.S. Taxation of Capital Gains
In general, assuming that SAP SE at no time is a PFIC, upon a sale or exchange of ordinary shares to a person other than SAP SE, a U.S. Holder will recognize gain or loss in an amount equal to the difference between the amount realized on the sale or exchange and the U.S. Holder’s adjusted tax basis in the ordinary shares. Such gain or loss will be a capital gain or loss and will be considered a long-term capital gain (taxable at a reduced rate for individuals) if the ordinary shares were held for more than one year. Capital gains may also be subject to the Medicare tax at a rate of 3.8%. The deductibility of capital losses is subject to significant limitations. Upon a sale of ordinary shares to SAP SE, a U.S. Holder may recognize a capital gain or loss or, alternatively, may be considered to have received a distribution with respect to the ordinary shares, in each case depending upon the application to such sale of the rules of Section 302 of the Code.
Deposit and withdrawal of ordinary shares in exchange for ADRs by a U.S. Holder will not result in its realization of gain or loss for U.S. federal income tax purposes.
U.S. Information Reporting and Backup Withholding
Dividend payments made to holders and proceeds paid from the sale of shares or ADRs are subject to information reporting to the Internal Revenue Service (IRS) and will be subject to backup withholding (currently imposed at a 24% rate for 2023-2025) unless the holder (i) is a corporation or other exempt recipient or (ii) provides a taxpayer identification number on a properly completed IRS Form W-9 and certifies that no loss of exemption from backup withholding has occurred. Holders that are not U.S. persons are not subject to information reporting or backup withholding. However, such a holder may be required to provide a certification of its non-U.S. status in connection with payments received within the United States or through a U.S.-related financial intermediary.
Backup withholding is not an additional tax and any amounts withheld as backup withholding may be credited against a holder’s U.S. federal income tax liability. A holder may obtain a refund of any excess amounts withheld under the backup withholding rules by timely filing the appropriate claim for refund with the Internal Revenue Service and furnishing any required information.
Shareholders may be subject to other U.S. information reporting requirements and should consult their own tax advisors for application of these reporting requirements to their own facts and circumstances.
U.S. Foreign Tax Credit
In general, in computing its U.S. federal income tax liability, a U.S. Holder may elect for each taxable year to claim a deduction or, subject to the limitations on foreign tax credits generally, a credit for foreign income taxes paid or accrued by it. For U.S. foreign tax credit purposes, subject to the applicable limitations under the foreign tax credit rules, German tax withheld from dividends paid to a U.S. Holder, up to the 15% provided under the Treaty will be eligible for credit against the U.S. Holder’s federal income tax liability or, if the U.S. Holder has elected to deduct such taxes, may be deducted in computing taxable income. U.S. Holders should consult their tax advisors about potential U.S. tax consequences of German tax withheld and/or refunded, including with respect to fluctuation of the euro/U.S. dollar exchange rate.
For U.S. foreign tax credit purposes, dividends paid by SAP SE generally will be treated as foreign-source income and as “passive category income”. Gains or losses realized by a U.S. Holder on the sale or exchange of ordinary shares generally will be treated as U.S.-source gain or loss.
Passive Foreign Investment Company Considerations
Special and adverse U.S. tax rules apply to a U.S. Holder that holds an interest in a PFIC. Based on current projections concerning the composition of SAP SE’s income and assets, SAP SE does not believe that it will be treated as a PFIC for its current or future taxable years. However, because this conclusion is based on our current projections and expectations as to its future business activity, SAP SE can provide no assurance that it will not be treated as a PFIC in respect of its current or any future taxable years.
Material Contracts
See “Item 5. Operating and Financial Review and Prospects—Liquidity and Capital Disclosures”, for information on our credit facilities.
114
Documents on Display
We are subject to the informational requirements of the Securities Exchange Act of 1934 (“Exchange Act”), as amended. In accordance with these requirements, we file reports and furnish other information as a foreign private issuer with the SEC. These materials, including this report and the exhibits thereto, are available at www.sec.gov. In addition, information about us is available at our Web site: www.sap.com.
ITEM 11. QUANTITATIVE AND QUALITATIVE DISCLOSURES ABOUT MARKET RISK
We are exposed to various financial risks, such as market risks, including changes in foreign currency exchange rates, interest rates and equity prices, as well as credit risk and liquidity risk. We manage these risks on a Group-wide basis. Selected derivatives are exclusively used for this purpose and not for speculation, which is defined as entering into derivative instruments without a corresponding underlying transaction. Financial risk management is done centrally. See Note (F.1) to our Consolidated Financial Statements for our quantitative and qualitative disclosures about market risk.
115
ITEM 12. DESCRIPTION OF SECURITIES OTHER THAN EQUITY SECURITIES
American Depositary Shares
Fees and Charges Payable by ADR Holders
Deutsche Bank Trust Company Americas is the Depositary for SAP SE’s ADR program. ADR holders may be required to pay the following charges:
- |
taxes and other governmental charges; |
- |
registration fees as may be in effect from time to time for the registration of transfers of SAP ordinary shares on any applicable register to the Depositary or its nominee or the custodian or its nominee in connection with deposits or withdrawals under the Deposit Agreement; |
- |
applicable air courier, cable, telex and facsimile expenses of the Depositary; |
- |
expenses incurred by the Depositary in the conversion of foreign currency; |
- |
US $5.00 or less per 100 ADSs (or portion thereof) to the Depositary for the execution and delivery of ADRs (including in connection with the depositing of SAP ordinary shares or the exercising of rights) and the surrender of ADRs; |
- |
a maximum aggregate service fee of US $3.00 per 100 ADSs (or portion thereof) per calendar year to the Depositary for the services performed by the Depositary in administering the ADR program, including for processing any cash dividends and other cash distributions; and |
- |
US $5.00 or less per 100 ADSs (or portion thereof) to the Depositary for distribution of securities other than SAP ordinary shares or rights. |
These fees may at any time and from time to time be changed by agreement between SAP SE and the Depositary. These charges are described more fully in Section 5.9 of the Amended and Restated Deposit Agreement dated as of November 25, 2009, as amended by Amendment No. 1 dated as of March 18, 2016 and as may be further amended from time to time, incorporated by reference as Exhibits 4.1.1 and 4.1.2 to this report.
Applicable service fees are either deducted from any cash dividends or other cash distributions or charged separately to holders in a manner determined by the Depositary, depending on whether ADSs are registered in the name of investors (whether certificated or in book-entry form) or held in brokerage and custodian accounts (via the Depository Trust Company, or DTC). In the case of distributions of securities, the Depositary charges the applicable ADS record date holder concurrent with the distribution. In the case of ADSs registered in the name of the investor, whether certificated or in book entry form, the Depositary sends invoices to the applicable record date ADS holders. For ADSs held in brokerage and custodian accounts via DTC, the Depositary may, if permitted by the settlement systems provided by DTC, collect the fees through those settlement systems from the brokers and custodians holding ADSs in their DTC accounts. The brokers and custodians who hold their clients’ ADSs in DTC accounts in such case may in turn charge their clients’ accounts the amount of the service fees paid to the Depositary.
In the event of a refusal to pay applicable fees, the Depositary may refuse the requested services until payment is received or may set off the amount of the fees from any distribution to be made to the ADR holder, all in accordance with the Deposit Agreement.
If any taxes or other governmental charges are payable by the holders and/or beneficial owners of ADSs to the Depositary, the Depositary, the custodian or SAP may withhold or deduct from any distributions made in respect of the deposited SAP ordinary share and may sell for the account of the holder and/or beneficial owner any or all of the deposited ordinary shares and apply such distributions and sale proceeds in payment of such taxes (including applicable interest and penalties) or charges, with the holder and the beneficial owner thereof remaining fully liable for any deficiency.
Fees and Other Payments Payable by the Depositary to SAP
In connection with the ADR program, the Depositary has agreed to make certain payments to SAP and waive certain costs of providing ADR administrative and reporting services, including reporting of ADR program activity, distribution of information to investors and managing the ADR program. For the period beginning October 29, 2022 and ending October 28, 2023, the Depositary made direct and indirect payments to SAP in an aggregate amount of US$2,881,753 related to the ADR program.
116
PART II
ITEM 13. DEFAULTS, DIVIDEND ARREARAGES AND DELINQUENCIES
None.
ITEM 14. MATERIAL MODIFICATIONS TO THE RIGHTS OF SECURITY HOLDERS AND USE OF PROCEEDS
None.
ITEM 15. CONTROLS AND PROCEDURES
Evaluation of Disclosure Controls and Procedures
SAP designs disclosure controls and procedures to ensure that information required to be disclosed by SAP in reports that it files or submits under the Exchange Act is recorded, processed, summarized, and reported within the time periods specified in the Commission’s rules and forms. Disclosure controls and procedures include, without limitation, controls and procedures designed to ensure that information required to be disclosed by SAP in the reports that it files or submits under the Exchange Act is accumulated and communicated to SAP management, including SAP’s principal executive and financial officers (i.e. SAP’s chief executive officer (CEO) and chief financial officer (CFO)), or persons performing similar functions, as appropriate to allow timely decisions regarding required disclosure. SAP’s management evaluated, with the participation of SAP’s CEO and CFO the effectiveness of SAP’s disclosure controls and procedures as of December 31, 2023. The evaluation was led by SAP’s Global Risk & Assurance Services (GR&AS) function, including dedicated “GR&AS Internal Auditors” in all of SAP’s major entities and business units with the participation of process owners, SAP’s key corporate senior management, senior management of each business group, and as indicated above under the supervision of SAP’s CEO and CFO. Based on the foregoing management evaluation, SAP’s CEO and CFO, concluded that as of December 31, 2023, SAP’s disclosure controls and procedures were effective.
Management’s Annual Report on Internal Control Over Financial Reporting
The management of SAP is responsible for establishing and maintaining adequate internal control over financial reporting as such term is defined in Rules 13a-15(f) and 15d-15(f) under the Securities Exchange Act of 1934. SAP’s internal control over financial reporting is a process designed under the supervision of SAP’s CEO and CFO to provide reasonable assurance regarding the reliability of financial reporting and the preparation of financial statements for external reporting purposes in accordance with International Financial Reporting Standards as issued by the International Accounting Standards Board.
SAP’s management assessed the effectiveness of the Company’s internal control over financial reporting as of December 31, 2023. In making this assessment, it used the criteria set forth by the Committee of Sponsoring Organizations of the Treadway Commission in “Internal Control — Integrated Framework (2013)”.
Based on the assessment under these criteria, SAP management has concluded that, as of December 31, 2023, the Company’s internal control over financial reporting was effective.
BDO AG Wirtschaftsprüfungsgesellschaft defined as BDO, our independent registered public accounting firm, has issued its audit report on the effectiveness of SAP’s internal control over financial reporting, which is included in Item 18. Financial Statements, “Report of Independent Registered Public Accounting Firm.”
Changes in Internal Control Over Financial Reporting
Following the third quarter 2023 restatement due to an error correction related to the Qualtrics International Inc. divestiture, SAP has enhanced the internal control over the financial reporting framework related to the recording of material non-routine transactions. Enhancements were completed to ensure that internal controls related to the recording of material non-routine transactions during the period covered by this report were effective. In conjunction with these enhancements no other material changes have occurred in our internal control over financial reporting during the period covered by the report that has materially affected, or is reasonably likely to materially affect, our internal control over financial reporting.
117
ITEM 16. [RESERVED]
ITEM 16A. AUDIT COMMITTEE FINANCIAL EXPERT
Our Supervisory Board has determined that each of Jennifer Xin-Zhe Li and Dr. Gunnar Wiedenfels qualify as an “audit committee financial expert”, as defined by the regulations of the Commission issued pursuant to Section 407 of the Sarbanes-Oxley Act of 2002 and meet the requirements of Item 16A. Each of Ms. Li and Dr. Wiedenfels is “independent”, as such term is defined in Rule 10A-3 under the Exchange Act.
ITEM 16B. CODE OF ETHICS
In 2023, SAP’s Global Code of Ethics and Business Conduct for Employees (CoEBC) continued to apply to all employees, managers, the members of SAP’s Executive Board, as well as employee representatives on the Supervisory Board. It is the primary ethical framework guiding the way SAP conducts business and remains on course for success. It is available in 22 languages, and it is one of a number of global policies that provide clear guidance to employees. Newly acquired companies are required to meet the minimum standards set forth in the CoEBC. Our CoEBC constitutes a “code of ethics” as defined in Item 16.B of Form 20-F, and sets standards for all dealings with customers, partners, competitors, and suppliers, including regulations with regard to confidentiality, loyalty, preventing conflicts of interest, preventing bribery, data protection and privacy, and avoiding anti-competitive practices. The CoEBC is available on our website under http://www.sap.com/corporate-en/investors/governance/policies-statutes.epx.
118
ITEM 16C. PRINCIPAL ACCOUNTANT FEES AND SERVICES
Audit Fees, Audit Related Fees, Tax Fees and All Other Fees
Refer to Note (G.7) to our Consolidated Financial Statements for information on fees charged by our independent registered public accounting firm, BDO, for audit services and other professional services.
Audit Committee’s Pre-Approval Policies and Procedures
As required under German law, our shareholders appoint our external independent auditors to audit our financial statements, based on a proposal that is legally required to be submitted by the Supervisory Board. The Supervisory Board’s proposal is based on a recommendation by the Audit and Compliance Committee. See also the description in “Item 10. Additional Information — Corporate Governance.”
In 2002 our Audit and Compliance Committee adopted a policy with regard to the pre-approval of audit and non-audit services to be provided by our external independent auditors. This policy, which is designed to assure that such engagements do not impair the independence of our auditors, was amended several times since 2002 with the latest changes made to reflect the provisions on audit and non-audit services introduced by European Union in 2014. The policy requires prior approval of the Audit and Compliance Committee for all services to be provided by our external independent auditors for any entity of the SAP Group. With regard to non-audit services the policy distinguishes among three categories of services:
- |
“Prohibited services:” This category includes services that our external independent auditors must not be engaged to perform. These are services that are not permitted by applicable law or that would be inconsistent with maintaining the auditors’ independence. |
- |
“Services requiring universal approval:” Services of this category may be provided by our external independent auditors up to a certain aggregate amount in fees per year that is determined by the Audit and Compliance Committee. |
- |
“Services requiring individual approval:” Services of this category may only be provided by our external independent auditors if they have been individually (specifically) pre-approved by the Audit and Compliance Committee or an Audit and Compliance Committee member who is authorized by the Audit and Compliance Committee to make such approvals. |
Our Chief Accounting Officer or individuals empowered by him review all individual requests to engage our external independent auditors as a service provider in accordance with this policy and determines the category to which the requested service belongs. All requests for engagements with expected fees over a specified limit are additionally reviewed by our CFO. Based on the determination of the category the request is (i) declined if it is a “prohibited service,” (ii) approved if it is a “service requiring universal approval” and the maximum aggregate amount fixed by the Audit and Compliance Committee has not been reached or (iii) forwarded to the Audit and Compliance Committee for individual approval if the “service requires individual approval” or is a “service requiring universal approval” and the maximum aggregate amount fixed by the Audit and Compliance Committee has been exceeded.
Our Audit and Compliance Committee’s pre-approval policies also include information requirements to ensure the Audit and Compliance Committee is kept aware of the volume and nature of engagements involving our external independent auditors that were not individually pre-approved by the Audit and Compliance Committee itself.
Substantially all of the work performed to audit our Consolidated Financial Statements was performed by our principal independent public accounting firm’s full-time, permanent employees. See Note (G.7) to our Consolidated Financial Statements for additional information related to our principal accountant fees and services.
119
ITEM 16D. EXEMPTIONS FROM THE LISTING STANDARDS FOR AUDIT COMMITTEES
Rule 10A-3 of the Exchange Act requires that all members of our audit committee be independent, subject to certain exceptions. In accordance with German law, the Audit and Compliance Committee consists of both employee and shareholder elected members. Rule 10A-3 provides an exception for an employee of a foreign private issuer such as SAP who is not an executive officer of that issuer and who is elected to the supervisory board or audit committee of that issuer pursuant to the issuer’s governing law. In this case, the employee is exempt from the independence requirements of Rule 10A-3 and is permitted to sit on the audit committee.
We rely on this exemption. Our Audit and Compliance Committee includes four employee representatives, Manuela Asche-Holstein, Margret Klein-Magar, Peter Lengler, and James Wright, who were appointed to our Supervisory Board pursuant to the Agreement on the Involvement of Employees in SAP SE (see “Item 6. Directors, Senior Management and Employees.” for details). We believe that our reliance on this exemption does not materially adversely affect the ability of our Audit and Compliance Committee to act independently and to satisfy the other requirements of Rule 10A-3.
ITEM 16E. PURCHASES OF EQUITY SECURITIES BY THE ISSUER AND AFFILIATED PURCHASERS
At the Annual General Meeting of Shareholders on May 11, 2023, the Executive Board was authorized to acquire until the expiry of May 10, 2028, shares in the Company representing a pro rata amount of capital stock of up to € 120 million. The authorization from May 11, 2023 replaced the authorization from May 17, 2018.
The authorization is subject to the provision that the shares to be purchased, together with any other shares already acquired and held by SAP or which are attributable to SAP pursuant to Section 71d and Section 71e AktG (German Stock Corporation Act), do not account for more than 10% of SAP’s capital stock.
We did not purchase any ADRs in 2023. The following table sets out information concerning repurchases of SAP's ordinary shares. In May 2023 we announced a new share buy-back program, with an aggregate volume of up to € 5 billion and a term until December 31, 2025. The first tranche of this program began on August 14, 2023 and ran through the end of the fiscal year. The maximum number of SAP shares that SAP was able to additionally purchase under existing repurchase programs as of December 31, 2023 was 61,575,247.
|
|
|
|
|
|
(c) Total Number of |
|
(d) Maximum Number of |
|
|
|
|
|
|
Shares Purchased as |
|
Shares that May Yet Be |
|
|
(a) Total Number of |
|
(b) Average Price Paid |
|
Part of Publicly Announced |
|
Purchased Under these |
Period |
|
Shares Purchased |
|
per Share (in €) |
|
Plans and Programs |
|
Plans and Programs |
January 2023 |
|
0 |
|
0 |
|
0 |
|
61,463,738 |
February 2023 |
|
0 |
|
0 |
|
0 |
|
61,463,738 |
March 2023 |
|
0 |
|
0 |
|
0 |
|
62,811,811 |
April 2023 |
|
0 |
|
0 |
|
0 |
|
62,811,811 |
May 2023 |
|
0 |
|
0 |
|
0 |
|
62,811,811 |
June 2023 |
|
0 |
|
0 |
|
0 |
|
64,040,363 |
July 2023 |
|
0 |
|
0 |
|
0 |
|
64,040,363 |
August 2023 |
|
4,641,555 |
|
126.61 |
|
4,641,555 |
|
59,398,808 |
September 2023 |
|
2,548,697 |
|
123.45 |
|
2,548,697 |
|
59,858,253 |
October 2023 |
|
313,167 |
|
122.83 |
|
313,167 |
|
59,545,086 |
November 2023 |
|
36,420 |
|
136.07 |
|
36,420 |
|
59,508,666 |
December 2023 |
|
23,957 |
|
144.12 |
|
23,957 |
|
61,575,247 |
Total |
|
7,563,796 |
|
125.49 |
|
7,563,796 |
|
|
ITEM 16F. CHANGES IN REGISTRANT’S CERTIFYING ACCOUNTANT The following summarizes the principal ways in which our corporate governance practices differ from the NYSE corporate governance rules applicable to U.S. domestic issuers (the NYSE Rules).
Not applicable
120
ITEM 16G. DIFFERENCES IN CORPORATE GOVERNANCE PRACTICES
Introduction
SAP is incorporated under the laws of the European Union and Germany, with securities publicly traded on markets in Germany, including the Frankfurt Stock Exchange, and in the United States on the NYSE.
The NYSE Rules permit foreign private issuers to follow applicable home country corporate governance practices in lieu of the NYSE corporate governance standards, subject to certain exceptions. Foreign private issuers electing to follow home country corporate governance rules are required to disclose the principal differences in their corporate governance practices from those required under the NYSE Rules. This Item 16G summarizes the principal ways in which SAP’s corporate governance practices differ from the NYSE Rules applicable to domestic issuers.
Legal Framework
The primary sources of law relating to the corporate governance of a European Company are the Council Regulation (EC) No. 2157/2001 on the Statute for a European Company (the “SE Regulation”), the German Act on the Implementation of Council Regulation No. 2157/2001 of October 8, 2001 on the Statute for a European Company (Gesetz zur Ausführung der Verordnung (EG) Nr. 2157/2001 des Rates vom 8. Oktober 2001 über das Statut der Europäischen Gesellschaft (SE) – SE-Ausführungsgesetz; “SE-AG”) of December 22, 2004, and the German Stock Corporation Act (Aktiengesetz). Additionally, the European Regulation (EU) No 596/2014 of the European Parliament and the Council on market abuse (the “MAR”), the German Securities Trading Act (Wertpapierhandelsgesetz), the German Securities Purchase and Take Over Act (Wertpapiererwerbs- und Übernahmegesetz), the Stock Exchange Admission Regulations, the German Commercial Code (Handelsgesetzbuch) and certain other German statutes contain corporate governance rules applicable to SAP. In addition to these mandatory rules, the GCGC summarizes the mandatory statutory corporate governance principles found in the German Stock Corporation Act and other provisions of German law. Further, the GCGC contains supplemental recommendations and suggestions for standards on responsible corporate governance intended to reflect generally accepted best practices.
The German Stock Corporation Act requires the executive and the supervisory board of publicly listed companies like SAP to declare annually that the recommendations set forth in the GCGC have been and are being complied with or which of the recommendations have not been or are not being complied with and why not. SAP disclosed and reasoned deviations from a few of the GCGC recommendations in its Declaration of Compliance on a yearly basis from 2003 onwards. In its most recent Declaration of Compliance issued in October 2023, SAP declared that it has complied with all recommendations set out in the GCGC since the last declaration with the below exceptions. In the future, SAP will comply with the recommendations set out in the Code with the following exceptions:
Subsequent change to the target values for the Executive Board`s variable compensation (Deviation from recommendation G.8 GCGC).
As the Executive and the Supervisory Board of SAP SE already declared in September 2023 in the Update of the 2022 Declaration of Compliance, the Supervisory Board of SAP SE resolved to exclude the expenses related to regulatory compliance matters currently under investigation by the U.S. Department of Justice, the U.S. Securities and Exchange Commission, and other authorities in various countries, from the variable Executive Board compensation for the fiscal years 2023 and 2024. To this end, it decided to apply the non-IFRS definition used for SAP`s external reporting, pursuant to which expenses associated with regulatory compliance matters are eliminated, to Executive Board compensation for this period. Specifically, this concerns the calculation of target value achievement for the performance criteria “operating margin growth” and “operating profit” of the short-term and long-term variable compensation (STI and LTI). This temporary adjustment will safeguard the business performance focus of the compensation for the Executive Board members in office. At the same time, it will ensure that their current compensation is not affected by conduct that took place in prior performance periods. This recognizes the fact that the compliance matters in question stem almost exclusively from events in the past when none of the current Executive Board members were in office. In addition, the Supervisory Board believes that the current Executive Board has significantly improved, expanded, and made the Company`s compliance efforts much more effective to prevent comparable cases from occurring again in the future. Lastly, the adjustment will uphold the equal treatment of Executive Board members and employees regarding their compensation parameters.
Disbursement of remaining variable remuneration components if an Executive Board member`s service contract is terminated (precautionary declaration of non-conformity with recommendation G. 12 GCGC).
The service contracts for Executive Board members and the renumeration system in place for the Executive Board of SAP provide that in the event of a premature termination of the service contract for Executive Board members due to a change of control (as defined in the service contract for Executive Board members) the tranches already granted under the SAP Long-Term Incentive program 2020 (LTI 2020) will be disbursed without undue delay. The disbursement will be made pro rata temporis in the proportion which the actual term that was shortened due to the change of control bears to the four-year-term of a tranche plus 50% of the portion which should be forfeited if pro rata temporis aspects alone were considered. In view of the above, SAP declares, by way of precaution, non-conformity with the recommendation set out in section G.12 GCGC. The reason for the provision described above is that a change of control regularly entails changes within a company that let it appear unjustified to make the disbursement amount from long-term variable remuneration components dependent on the performance of the company and its share price after the change of control. In addition, SAP is convinced that the intended linkage of the remuneration to sustainable and long-term development is not lost due to this provision since the Executive Board members, during their term of service, cannot expect a change of control to later occur.
121
Declarations from 2018 to 2023 are available on the SAP website.
Significant Differences
We believe the following to be the significant differences between applicable European and German corporate governance practices, as SAP has implemented them, and those applicable to domestic companies under the NYSE Rules.
SAP SE is a European Company With a Two-Tier Board System
SAP is governed by three separate bodies: (i) the Supervisory Board, which counsels, supervises and controls the Executive Board; (ii) the Executive Board, which is responsible for the management of SAP; and (iii) the Annual General Meeting of Shareholders. The rules applicable to these governing bodies are defined by European and German law and by SAP’s Articles of Incorporation. This corporate structure differs from the unitary board of directors established by the relevant laws of all U.S. states and the NYSE Rules. Under the SE Regulation and the German Stock Corporation Act, the Supervisory Board and Executive Board are separate and no individual may be a member of both boards. See “Item 10. Additional Information — Corporate Governance” for additional information on the corporate structure.
Director Independence Rules
The NYSE Rules require that a majority of the members of the board of directors of a listed issuer and each member of its nominating, corporate governance, compensation and audit committee be “independent.” As a foreign private issuer, SAP is not subject to the NYSE board, compensation committee and corporate governance committee independence requirements but instead can elect to follow its home country rules. With respect to the audit committee, SAP is required to satisfy Rule 10A-3 of the Exchange Act, which provides certain exemptions from the audit committee independence requirements in the case of employee board representatives. The NYSE Rules stipulate that no director qualifies as “independent” unless the board of directors has made an affirmative determination that the director has no material direct or indirect relationship with the listed company. However, under the NYSE Rules a director may still be deemed independent even if the director or a member of a director’s immediate family has received during a 12-month period within the prior three years up to $120,000 in direct compensation. In addition, a director may also be deemed independent even if a member of the director’s immediate family works for the company’s auditor in a non-partner capacity and not on the company’s audit.
By contrast, the German Stock Corporation Act and the GCGC require that the Supervisory Board ensure that its members collectively have the knowledge, competencies and professional experience required to properly perform their duties. Additionally, the GCGC recommends that the Supervisory Board must have an appropriate number of independent shareholder representative members, as determined by those members, that also reflects the shareholder structure (C.6 GCGC), and determine annually whether such numbers have been met. More than half of the shareholder representatives must be independent from the company and from the Executive Board (C.7 GCGC). According to this definition, a Supervisory Board member is considered independent if he or she is independent from the company and the Executive Board, and independent from any controlling shareholder (C.6 GCGC). In the absence of a controlling shareholder at SAP, this last proviso does not apply. Supervisory Board members are considered independent from the company and the Executive Board if they have no personal or business relationship with the company or the Executive Board that may cause a substantial and not merely temporary conflict of interest (C.7 GCGC). Independence is assessed against a set of indicators (C.7 GCGC). The assessment should particularly take into consideration whether the Supervisory Board member (or a close family member) (i) was a member of the company`s Executive Board in the two years prior to the appointment to the Supervisory Board; (ii) has, or in the year prior to the appointment, had, directly or as a shareholder, or in a leading position at a non-group entity, a material business relationship with the company or one of the entities dependent on the company (for example, as a customer, supplier, lender, or advisor); (iii) is a close family member of a member of the Executive Board; (iv) has been a member of the Supervisory Board for more than 12 years. Under the Code, a Supervisory Board member can still be deemed independent even if one or more of the indicators applies; if one or more of the indicators applies and the Supervisory Board member concerned is still considered independent, the reasons for this must be given in the Corporate Governance Statement (C.8 GCGC). According to section C.10 GCGC, the chairpersons of the Supervisory Board, the Audit Committee, and the committee that addresses Executive Board compensation should be independent from the company and the Executive Board. The members of the Supervisory Board must ensure that they have enough time to perform their board duties and must carry out their duties carefully and in the company’s best interests. They must be loyal to SAP in their conduct, and the GCGC recommends that they should not accept appointment to governing bodies of, or exercise advisory functions at, companies that are in significant competition with SAP. The GCGC further recommends that each member of the Supervisory Board should inform the Supervisory Board of any conflicts of interest, and that material and sustained conflicts of interest involving a member of the Supervisory Board should result in the termination of that member’s Supervisory Board mandate. Supervisory Board members must disclose any planned conclusion of advisory or other service agreements or contracts for work with SAP, or loan agreements between them or persons closely related to them and SAP to the Supervisory Board promptly. Such agreements require the consent of the Supervisory Board. The Supervisory Board may grant its permission for any such transaction only if it is based on terms and conditions that are standard for the type of transaction in question and if the transaction is not contrary to SAP’s interest.
122
SAP complies with the director independence requirements and recommendations described above. In particular, the Supervisory Board of SAP SE determined in fiscal year 2023 that the shareholder representatives are all independent in the meaning of the recommendations at sections C.6 and C.7 of the Code, and, likewise, in accordance with the recommendation at section C.7 of the Code, more than half of the shareholder representatives are independent from the company and the Executive Board. In this context, the shareholder representatives determined that five (and thus more than half their total number) constitutes an appropriate number of independent shareholder representative members. Consequently, they determined that, when also considering the company`s shareholder structure, the Supervisory Board has an appropriate number of independent members in the meaning of section C.6 of the Code.
Principle 15 of the GCGC states that at least one member of the Audit Committee must have expertise in the field of accounting and at least one other member of the Audit Committee must have expertise in the field of auditing. According to Section D.3 of the GCGC the expertise in the field of accounting shall consist of special knowledge and experience in the application of accounting principles and internal control and risk management systems, and the expertise in the field of auditing shall consist of special knowledge and experience in the auditing of financial statements. Accounting and auditing also include sustainability reporting and its audit and assurance. Section D.3 of the GCGC recommends that the chairperson of the Audit Committee of the Supervisory Board should have appropriate expertise in at least one of the two areas. Section C.10 of the GCGC recommends that the chairperson of the Audit Committee should be independent from the company and the Executive Board as well as from the controlling shareholder. Furthermore, the chairperson of the Audit Committee should not simultaneously chair the Supervisory Board as a whole. Ms. Jennifer Xin-Zhe Li who is the current Chairperson of the Audit and Compliance Committee and Dr. Gunnar Wiedenfels as another member of the Audit and Compliance Committee meet these recommendations. However, applicable European and German corporate law does not require the Supervisory Board to make an affirmative determination for each individual member that it is independent or that a majority of Supervisory Board members or the members of a specific committee are independent. As described above, the GCGC only recommends that the shareholder representatives on the Supervisory Board determine whether they are independent in the meaning of and in compliance with the Code.
The NYSE independence requirements are closely linked with risks specific to unitary boards of directors that are customary for U.S. companies. In contrast, the two-tier board structure requires a strict separation of the executive board and supervisory board. In addition, the supervisory board of a European Company formed by conversion from a large German stock corporation which was subject to the principle of employee codetermination as outlined in the German Co-Determination Act of 1976 (Mitbestimmungsgesetz) is subject to at least the same level of employee participation which formerly existed in the German stock corporation that was converted to an SE. The terms of employee participation with regard to the Supervisory Board of SAP SE are, among others, set out in the Agreement on the Involvement of Employees in SAP SE. As a result, the Supervisory Board of SAP SE consists of 18 members, of which nine are representatives of SAP SE’s shareholders elected at the Annual General Meeting of Shareholders and nine members are representatives of the European employees. Only a shareholders’ representative may be elected as chairperson of the Supervisory Board. In case of a tied vote, the vote of the chairperson and, in the event that the chairperson does not participate in passing the resolution, the vote of the deputy chairperson, provided that he or she is a shareholders’ representative, will be decisive (casting vote). This board structure creates a different system of checks and balances, including employee participation, and cannot be directly compared with a unitary board system.
Audit Committee Independence
As a foreign private issuer, the NYSE Rules require SAP to establish an Audit Committee that satisfies the requirements of Rule 10A-3 of the Exchange Act with respect to audit committee independence. SAP is in compliance with these requirements. The Chairperson of SAP’s Audit and Compliance Committee (Jennifer Xin-Zhe Li), Dr. Gunnar Wiedenfels, Dr. Friederike Rotsch and Gerhard Oswald meet the independence requirements of Rule 10A-3 of the Exchange Act. The other four Audit and Compliance Committee members, Manuela Asche-Holstein, Peter Lengler, Margret Klein-Magar and James Wright, are employee representatives who are eligible for the exemption provided by Rule 10A-3 (b) (1) (iv) (C) (see “Item 16D Exemptions from the listing standards for audit committees” for details).
The Audit Committee independence requirements are similar to the Board independence recommendations of the GCGC. See the section above under “Director Independence Rules.” Nonetheless, SAP meets the NYSE Rules on audit committee independence applicable to foreign private issuers.
Rules on Non-Management Board Meetings are Different
Section 303 A.03 of the NYSE Rules stipulates that the non-management board of each listed issuer must meet at regularly scheduled executive sessions without the management. Under applicable European and German corporate law and the GCGC the Supervisory Board is entitled but not required to exclude Executive Board members from its meetings. The Supervisory Board exercises this right generally during its meetings. However, the Executive Board members should not attend Supervisory Board and its committees’ meetings at which the statutory auditor is called in as an expert. An exception can be made in the event that participation of the Executive Board is deemed necessary by the Supervisory Board or the relevant committee.
Rules on Establishing Committees Differ
Pursuant to Section 303 A.04 and 303 A.05 of the NYSE Rules listed companies are required to set up a Nominating/Corporate Governance Committee and a Compensation Committee, each composed entirely of independent directors and having a written charter specifying the committee’s purpose and responsibilities. In addition, each committee’s performance must be reviewed annually. Applicable European and German corporate law does not mandate the creation of specific supervisory board committees. The GCGC recommends that the Supervisory Board establishes a Nomination Committee; according to Principle 14 of the GCGC an Audit Committee is to be established. Currently, SAP has the following committees, which are in compliance with the GCGC: the Personnel and Governance Committee, the Audit and Compliance Committee, the Technology and Strategy Committee, the Finance and Investment Committee, the Nomination Committee, the People and Culture Committee and the Go-To-Market and Operations Committee (See “Item 10. Additional Information — Corporate Governance” for more information).
123
Rules on Shareholders’ Compulsory Approval are Different
Section 312 of the NYSE Rules requires U.S. companies to seek shareholder approval of all equity-compensation plans, including certain material revisions thereto (subject to certain exemptions as described in the rules), issuances of common stock, including convertible stock, if the common stock has, or will have upon issuance, voting power of or in excess of 20% of the then outstanding common stock, and issuances of common stock if they trigger a change of control.
According to applicable European law, the German Stock Corporation Act and other applicable German laws, shareholder approval is required for a broad range of matters, such as amendments to the articles of association, certain significant corporate transactions (including inter-company agreements and material restructurings), the offering of stock options and similar equity compensation to its Executive Board members or its employees by a way of a conditional capital increase or by using treasury shares (including significant aspects of such an equity compensation plan as well as the exercise thresholds), the issuance of new shares, the authorization to purchase the corporation’s own shares, and other essential issues, such as transfers of all, or substantially all, of the assets of the stock corporation, including shareholdings in subsidiaries.
Specific Principles of Corporate Governance
Under the NYSE Rules Section 303A.09 listed companies must adopt and disclose corporate guidelines. Since October 2007, SAP has applied, with few exceptions, and currently with only two exceptions, recommended corporate governance standards of the GCGC rather than company-specific principles of corporate governance. The GCGC recommendations differ from the NYSE Standards primarily as outlined in this Item 16G.
Specific Code of Business Conduct
The NYSE Rules Section 303 A.10 requires listed companies to adopt and disclose a code of business conduct and ethics for directors, officers and employees, and to disclose promptly any waivers of the code for directors or executive officers. Although not required under applicable European and German law, SAP has a Code of Business Conduct that applies to all employees, managers, the members of SAP’s Executive Board, as well as employee representatives on the Supervisory Board. In 2021, we amended the Code of Business Conduct and created a single global policy, the Global Code of Ethics and Business Conduct for Employees, or the CoEBC. The CoEBC, together with local language versions and appendices relevant for specific countries, was rolled out in early 2022. SAP complies with the requirement to disclose the Code of Business Conduct and any waivers of the code with respect to directors and executive officers. See “Item 16B. Code of Ethics” for details.
ITEM 16H. MINE SAFETY DISCLOSURE
Not applicable
ITEM 16I. DISCLOSURE REGARDING FOREIGN JURISDICTIONS THAT PREVENT INSPECTIONS
Not applicable
ITEM 16J. INSIDER TRADING POLICIES
Not applicable
ITEM 16K. CYBERSECURITY
Risk Management and Strategy
We have developed and implemented a cybersecurity risk management program intended to protect the confidentiality, integrity, and availability of our critical systems, information, and our customers’ data. Our cybersecurity risk management program and processes are part of our Executive Board-issued risk management policy that aligns our management of risk to our risk appetite, and is consistent with the methodologies, reporting channels and governance processes that apply across our enterprise risk management program to legal, compliance, strategic, operational, financial and other risk areas of the SAP Group. We have a central software solution to store, maintain, and report enterprise risk-relevant information, including cybersecurity risks.
Our cybersecurity risk management program includes a security software development program intended to reduce the introduction of risks into our software, a software vulnerability and patch management program, and cybersecurity incident detection, response, and recovery programs, among others. Our cybersecurity risk team is committed to integrating cybersecurity risks into our overall enterprise risk management system and processes.
124
We design and assess our cybersecurity risk management and strategy based on industry standard processes, regulatory requirements, certifications, and attestations, including the National Institute of Standards and Technology Cybersecurity Framework (NIST CSF). This does not imply that we meet specific technical standards, specifications, or requirements but that we use the NIST as a guide to advocate a risk-based approach to identify and assess cybersecurity risks relevant to our business.
Cybersecurity risks are reported to the Executive Board through cumulative risk and incident reporting and security updates. The Supervisory Board’s Technology and Strategy Committee (TSC) and its Audit & Compliance Committee (ACC) are apprised of key cybersecurity risks. By bringing these risks to the attention of the Executive Board, the TSC, and the ACC as appropriate, SAP’s disclosure decision makers have an early and recurring opportunity to assess the materiality of these cybersecurity risks.
Key elements of our cybersecurity risk management program include:
| ● | a security team responsible for managing (1) our cybersecurity risk assessment processes, (2) our security controls, and (3) our response to cybersecurity incidents; |
| ● | a Global Risk Management Policy that applies to employees and which is reviewed and updated as necessary; |
| ● | an Executive Board-established early warning risk management system designed to enable transparency and compliance with applicable regulations; |
| ● | risk assessments designed to help identify material cybersecurity risks to our critical systems, information, products, services, and our broader enterprise IT environment; |
| ● | a third-party risk management process for service providers, suppliers, and vendors; |
| ● | a Global Security Policy that applies to all employees and which is reviewed and updated as necessary; |
| ● | the use of external service providers, where appropriate, to assess, test or otherwise assist with aspects of our security controls; |
| ● | a cybersecurity incident response plan that includes procedures for responding to cybersecurity incidents and which is reviewed and updated as necessary; and |
| ● | cybersecurity awareness training of our employees, consultants, incident response personnel, and senior management. |
SAP internal and external experts are engaged to evaluate SAP’s risk identification, assessment, and monitoring systems and processes, including with respect to cybersecurity risks. For example, SAP engaged third party consultants to assist with its implementation of the NIST CSF, which included quarterly external risk assessments and the development of a NIST self-assessment process. The TSC and ACC periodically request an independent review of the quality of our cybersecurity risk monitoring systems.
Additionally, our risk monitoring systems are regularly audited by our external auditors and are subject to internal audits, including our cybersecurity monitoring systems. We consider the results of external and internal audits of our risk detection and monitoring systems and implement modifications as necessary. Finally, SAP engages third party legal consultants as necessary to assist with the implementation of legal requirements and industry standards, and to identify process weaknesses and track improvements.
In May 2020 we disclosed that some of our cloud products did not meet one or several of the contractually agreed or statutory IT security standards in place at the time. The affected products were limited to the acquired entity products SAP Success Factors, SAP Concur, SAP/Callidus Cloud Commissions, SAP/Callidus Cloud CPQ, as well as SAP C4C/Sales Cloud, SAP Cloud Platform and SAP Analytics Cloud (the Affected Cloud Products). These findings were not identified in response to a security incident. SAP completed the remediation of the identified areas in July 2020. In addition, SAP updated its security-related terms and conditions and informed and supported affected customers. Based on our assessment, the Affected Cloud Product deficiencies did not have a material impact on our operations, business strategy, results of operations, or financial condition, and we do not believe the Affected Cloud Product deficiencies will in the future materially affect us, including our operations, business strategy, results of operations, or financial condition.
We have not identified risks from existing and known cybersecurity threats that have materially affected or are reasonably likely to materially affect us, including our operations, business strategy, results of operations, or financial condition. However, we are subject to certain risks that if realized and sufficiently severe, are reasonably likely to materially affect our operations, business strategy or financial condition. See “Risk Factors – Cybersecurity and Security: Cybersecurity attacks or breaches, and security vulnerabilities in our infrastructure or services or those of our third-party partners could materially impact our business operations, products, and service delivery.”
Cybersecurity Governance
(1)Supervisory Board Oversight of Risks from Cybersecurity Threats
Starting in 2023, the Supervisory Board, through its Technology & Strategy Committee (TSC) and its Audit & Compliance Committee (ACC), oversees the Executive Board’s implementation of SAP’s cybersecurity risk management program. Before 2023, the ACC had full oversight responsibility for SAP’s cybersecurity risk management program.
The ACC reviews the effectiveness of SAP’s system for monitoring corporate security, which includes cybersecurity. The ACC discusses at least quarterly and in addition as needed with the members of the Executive Board, as well as the Chief Security Officer (CSO) and the Chief Security Compliance & Risk Officer (CSCRO), the cybersecurity controls and other measures established by the Executive Board. The ACC is focused on cybersecurity risk and incident management and mitigation.
125
The TSC reviews and monitors the technical systems and processes intended to defend against cybersecurity attacks and improve the security of SAP’s infrastructure. The TSC discusses at least quarterly and in addition as needed with the members of the Executive Board as well as the CSO and the CSCRO the potential and actual, if any, product and operational impacts of known cybersecurity risks and incidents. The TSC is focused on mitigating the product and operational-related impacts, if any, of cybersecurity risks and incidents.
The TSC and the ACC are informed about risks from cybersecurity threats by the Executive Board and security executives, with additional input from SAP’s Global Security & Cloud Compliance organization (SGSC), the Global Risk & Assurance Services group (GR&AS), SAP Legal, Business Information Security Officers (BISOs), and internal and external cybersecurity and legal consultants. In addition, the TSC and ACC often participate in meetings with the Executive Board or members thereof and security executives for the purpose of receiving information on and discussing SAP’s cybersecurity risks and risk management program. The TSC and ACC participate in key decisions on cybersecurity-related issues, including risk materiality assessments, incident response and the provision of any necessary related disclosures.
(2)Executive Board’s Role in Assessing and Managing SAP’s Material Risks from Cybersecurity Threats
(i) Executive Board Role in Assessing and Managing Material Risks from Cybersecurity Threats and Executive Board Expertise
The Executive Board is responsible for assessing and managing material risks, including cybersecurity risks. Specifically, the Executive Board supervises SAP’s efforts to prevent, detect, mitigate, and remediate cybersecurity risks through various means, including briefings from SAP security personnel and other SAP personnel involved in cybersecurity matters; threat detection and other intelligence information obtained from governmental, public, or private sources, including external consultants engaged by us; and alerts and reports produced by security tools deployed in the IT environment. In addition, the Executive Board supervises SAP’s internal cybersecurity personnel. Certain members of SAP’s Executive Board have engineering, computer science and data science backgrounds and degrees, and knowledge, skills, and hands on experience in cybersecurity risk and incident management.
(ii) Executive Board – Briefing on and Monitoring of Cybersecurity Risks and Incidents
The Executive Board is regularly apprised of and monitors SAP’s initiatives to prevent, detect, mitigate, and remediate cybersecurity risks and incidents, including processes supported by SGSC, SAP’s BISOs, GR&AS, SAP Legal, the Cybersecurity Control Team, and external legal and cybersecurity experts. The SAP Security and Cloud Compliance Governance Model is designed to ensure executive engagement and facilitates shared responsibility in quarterly SAP Security Advisory Board and Security Council meetings and in periodic updates to the Executive Board.
SAP Global Security & Cloud Compliance
SGSC is co-led by SAP’s CSO and its CSCRO, both of whom report to the Chief Technology Officer (CTO) and Executive Board member. SGSC is responsible for areas such as product and application security, cyber defense, operational security risk management, security compliance, executive protection, physical security, as well as the Trust Office that supports customers and partners with security-related issues. SGSC coordinates with SAP Legal and provides quarterly reports to the ACC and/or the TSC as well as the Executive Board regarding the prevention, detection, mitigation and remediation of cybersecurity risks and incidents, including assessments of the materiality of cybersecurity risks and incidents. In addition, the SGSC reports to the Executive Board, the TSC and/or ACC as necessary outside of the quarterly reporting cadence on any potentially material cybersecurity risks and incidents.
Business Information Security Officers (BISO)
Each of SAP’s product Lines of Business (LOB) has a BISO, who is a senior security leader assigned to manage the security strategy and operations of the LOB and coordinate with other BISOs through a BISO Council reporting to our CSO. These BISOs serve many important functions, including managing SAP’s risk within each LOB. It is the responsibility of each BISO to supervise and monitor the specific risks associated with their respective LOB. This facilitates the reporting of security threats to the Security & Risk Assurance (SRA) Team through the local unit risk coordinator. The SRA Team evaluates and measures the security risks using a cyber risk quantification tool. Once validated, these risks are recorded and included in the Global Enterprise risk register and subject to risk mitigation actions. In the event of an incident, the BISO helps manage the event and support the CSO, CSCRO and, ultimately, the Executive Board in their decision-making processes. BISOs are supported by local security resources to assist with implementing SAP’s security strategy and protections within the business and technology context best suited for the LOB in question. BISOs and SAP Legal coordinate on significant cybersecurity risks and incidents impacting their LOB.
Global Risk & Assurance Services Organization
SAP’s GR&AS organization, led by our Chief Risk Officer/Chief Audit Executive (CRO), provides quarterly updates to the ACC, the TSC, and the Executive Board on SAP’s risk management systems and risks meeting SAP’s internal risk threshold. The CRO reports to SAP’s Group CFO and is responsible for designing and implementing SAP’s risk management system, with oversight by the Executive Board.
Cybersecurity Control Team
SAP maintains a cross functional cybersecurity control team consisting of the CSO, the CSCRO, SVP Legal - Litigation and Cybersecurity, Chief Cybersecurity Counsel, Senior Corporate & Securities Counsel, Group Data Protection Officer & Head of SAP Data Protection, and members of SAP’s Corporate Financial Reporting department. This group meets on both a quarterly and an ad hoc basis to review cybersecurity issues, including but not limited to actual and potential cybersecurity incidents, thwarted attempts, cyber-related risks, and internal investigations (collectively, cybersecurity events). As part of its review and assessment, this group evaluates the implications, if any, of the cybersecurity events on SAP’s financial statements and related disclosures. Where appropriate, matters are escalated and discussed among SAP’s General Counsel, the Executive Board, the TSC and/or the ACC. Assessments ensue at this level with senior leaders from the Cybersecurity Control Team and cybersecurity consultants who provide the Executive Board, the TSC and/or the ACC with updates on an as-needed basis and in SAP Security briefings. SAP discusses any significant cybersecurity events, their impact on SAP's financial statements, and any related disclosures with its external auditors.
126
Employee Cybersecurity Education, Training and Compliance
SGSC provides annual, mandatory security training which includes education and training on key cybersecurity risks companies like SAP face, and SAP’s expectations of employees as part of its risk mitigation strategy. In addition to this regular education, the Executive Board, the TSC and the ACC receive training on cybersecurity topics from our CSO, CSCRO and internal security staff as part of the continuing education on cybersecurity topics that impact public companies.
(iii) Executive Board Reporting of Cybersecurity Risks to the ACC and the TSC of the Supervisory Board
The Executive Board regularly reports cybersecurity risks and incidents to the TSC and ACC, as outlined above, with a focus on significant risks and incidents. This reporting occurs through various processes with input from SGSC, GR&AS, SAP Legal, BISOs and internal and external cybersecurity and legal consultants. Additionally, the Executive Board often participates in meetings with the TSC and/or the ACC on cybersecurity-related issues, including risk materiality assessments, incident response, third party audit matters and the provision of any necessary related disclosures. In the case of a significant cybersecurity incident, the Executive Board, the TSC and/or the ACC coordinate as necessary with others both within SAP (including with respect to any significant cybersecurity incidents, the Disclosure Committee) and any outside experts involved in the matter on the determination of the materiality of cybersecurity risks and incidents to SAP and the provision of any related disclosures. Since SAP is a reporting entity under both German and U.S. laws, SAP adheres to both the Ad Hoc reporting requirements of the European Market Abuse Regulation and the U.S. federal securities laws requirements for periodic and annual disclosures.
127
PART III
ITEM 17. FINANCIAL STATEMENTS
Not applicable.
ITEM 18. FINANCIAL STATEMENTS
The Consolidated Financial Statements are included herein on pages F-1 through F-107.
The following are filed as part of this report:
- |
Report of Independent Registered Public Accounting Firm. |
- |
Consolidated Financial Statements |
| ● | Consolidated Income Statements for the years ended December 31, 2023, 2022, and 2021. |
| ● | Consolidated Statements of Comprehensive Income for the years ended December 31, 2023, 2022, and 2021. |
| ● | Consolidated Statements of Financial Position as of December 31, 2023 and 2022. |
| ● | Consolidated Statements of Changes in Equity for the years ended December 31, 2023, 2022, and 2021. |
| ● | Consolidated Statements of Cash Flows for the years ended December 31, 2023, 2022, and 2021. |
| ● | Notes to the Consolidated Financial Statements. |
128
ITEM 19. EXHIBITS
The following documents are filed as exhibits to this report:
1 |
Articles of Incorporation (Satzung) of SAP SE, effective as of May 11, 2023 (English translation). |
|
|
2.1 |
|
|
|
4.1.1 |
|
|
|
4.1.2 |
|
|
|
8 |
For a list of our subsidiaries see Note (G.9) to our Consolidated Financial Statements in “Item 18. Financial Statements”. |
|
|
12.1 |
|
|
|
12.2 |
|
|
|
13.1 |
|
|
|
13.2 |
|
|
|
15 |
Consent of BDO, Independent Registered Public Accounting Firm. |
|
|
15.1 |
Consent of KPMG, Independent Registered Public Accounting Firm. |
|
|
97 |
|
|
|
101.INS |
iXBRL Instance Document |
101.SCH |
iXBRL Taxonomy Schema Linkbase Document |
101.CAL |
iXBRL Taxonomy Calculation Linkbase Document |
101.DEF |
iXBRL Taxonomy Definition Linkbase Document |
101.LAB |
iXBRL Taxonomy Labels Linkbase Document |
101.PRE |
iXBRL Taxonomy Presentation Linkbase Document |
104.Cover Page |
Interactive Data File (formatted as Inline XBRL and included in Exhibit 101) |
1 |
Incorporated by reference to Exhibit 2.1 to SAP SE’s 2014 Annual Report on Form 20-F filed with the SEC on March 20, 2015. |
2 |
Incorporated by reference to Exhibit 99.(a)(2) of Post Effective Amendment #1 to SAP SE’s Registration Statement on Form F-6 filed on November 25, 2009. |
3Incorporated by reference to Exhibit 99.(a)(2) of Post Effective Amendment #2 to SAP SE’s Registration Statement on Form F-6 filed on March 18, 2016.
129
Signatures
The Registrant hereby certifies that it meets all of the requirements for filing on Form 20-F and that it has duly caused and authorized the undersigned to sign this report on its behalf.
|
SAP SE |
|
(Registrant) |
|
By: /s/ CHRISTIAN KLEIN |
|
|
|
Name: Christian Klein |
|
Title: Chief Executive Officer |
|
|
|
|
Dated: February 29, 2024 |
|
|
|
|
By: /s/ DOMINIK ASAM |
|
|
|
Name:Dominik Asam |
|
Title: Chief Financial Officer |
|
|
|
|
Dated: February 29, 2024 |
|
|
|
SAP SE AND SUBSIDIARIES |
|
130
Index to the Consolidated Financial Statements
|
Page |
Reports of Independent Registered Public Accounting Firm (BDO AG Wirtschaftsprüfungsgesellschaft, Frankfurt am Main, Germany, Auditor Firm ID: 1010) |
F-2 |
Report of Independent Registered Public Accounting Firm (KPMG AG Wirtschaftsprüfungsgesellschaft, Mannheim, Germany, Auditor Firm ID: 1021) |
F-5 |
Consolidated Financial Statements: |
|
Consolidated Income Statements for the years ended December 31, 2023, 2022 and 2021 |
F-6 |
Consolidated Statements of Comprehensive Income for the years ended December 31, 2023, 2022 and 2021 |
F-7 |
Consolidated Statements of Financial Position as of December 31, 2023 and 2022 |
F-8 |
Consolidated Statements of Changes in Equity for the years ended December 31, 2023, 2022 and 2021 |
F-9 |
Consolidated Statements of Cash Flows for the years ended December 31, 2023, 2022 and 2021 |
F-10 |
F-11 to F-107 |
F-1
Report of Independent Registered Public Accounting Firm
Shareholders and Supervisory Board
SAP SE
Walldorf, Germany
Opinion on the Consolidated Financial Statements
We have audited the accompanying consolidated statement of financial position of SAP SE (the “Company”) as of December 31, 2023, the related consolidated income statement, consolidated statements of comprehensive income, changes in equity and cash flows for the year then ended, and the related notes (collectively referred to as the “consolidated financial statements”). In our opinion, the consolidated financial statements present fairly, in all material respects, the financial position of the Company at December 31, 2023, and the results of its operations and its cash flows for the year then ended, in conformity with International Financial Reporting Standards as issued by the International Accounting Standards Board (IFRS).
We also have audited the adjustments to the 2022 and 2021 consolidated financial statements to retrospectively apply the change in accounting to present the Qualtrics disposal group as a discontinued operation, as discussed in Note D.1 as well as for the updated cost allocation policy, as described in Note IN.1 to the consolidated financial statements of the Company as of December 31, 2023. In our opinion, such adjustments are appropriate and have been properly applied. We were not engaged to audit, review, or apply any procedures to the 2022 and 2021 consolidated financial statements of the Company other than with respect to the adjustments and, accordingly, we do not express an opinion or any other form of assurance on the 2022 and 2021 consolidated financial statements taken as a whole.
We also have audited, in accordance with the standards of the Public Company Accounting Oversight Board (United States) (“PCAOB”), the Company's internal control over financial reporting as of December 31, 2023, based on criteria established in Internal Control – Integrated Framework (2013) issued by the Committee of Sponsoring Organizations of the Treadway Commission (“COSO”) and our report dated February 21, 2024, expressed an unqualified opinion thereon.
Basis for Opinion
These consolidated financial statements are the responsibility of the Company’s management. Our responsibility is to express an opinion on the Company’s consolidated financial statements based on our audit. We are a public accounting firm registered with the PCAOB and are required to be independent with respect to the Company in accordance with the U.S. federal securities laws and the applicable rules and regulations of the Securities and Exchange Commission and the PCAOB.
We conducted our audit in accordance with the standards of the PCAOB. Those standards require that we plan and perform the audit to obtain reasonable assurance about whether the consolidated financial statements are free of material misstatement, whether due to error or fraud.
Our audit included performing procedures to assess the risks of material misstatement of the consolidated financial statements, whether due to error or fraud, and performing procedures that respond to those risks. Such procedures included examining, on a test basis, evidence regarding the amounts and disclosures in the consolidated financial statements. Our audit also included evaluating the accounting principles used and significant estimates made by management, as well as evaluating the overall presentation of the consolidated financial statements. We believe that our audit provides a reasonable basis for our opinion.
Critical Audit Matters
The critical audit matters communicated below are matters arising from the current period audit of the consolidated financial statements that were communicated or required to be communicated to the audit committee and that: (1) relate to accounts or disclosures that are material to the consolidated financial statements and (2) involved our especially challenging, subjective, or complex judgments. The communication of critical audit matters does not alter in any way our opinion on the consolidated financial statements, taken as a whole, and we are not, by communicating the critical audit matters below, providing separate opinions on the critical audit matters or on the accounts or disclosures to which they relate.
Cloud revenue recognition
As discussed in note A.1 to the consolidated financial statements, the Company generated revenue in 2023 of EUR 31,207 million, of which EUR 13,664 million relates to cloud revenues from fees earned from providing customers a cloud offering with software as a service, platform as a service, infrastructure as a service and/or premium cloud support through subscriptions for use of the Company’s cloud solutions. For most of the Company’s cloud offerings, measured both in volume and number, the customer is entitled to continuously access and use one or more cloud solutions for a specified term, therefore cloud revenue is recognized based on time elapsed and thus ratably over the term of access. However, some cloud business models are provisioned on a consumption basis where a customer commits to a fixed value of spend on cloud services throughout the contract term, but with the discretion to call off cloud services on an as needed basis. For those arrangements cloud revenue is recognized based on consumption as it best reflects the measure towards satisfaction of the performance obligation(s).
F-2
We identified cloud revenue recognition of certain contracts as a critical audit matter. The principal considerations that led to the determination are the complex auditor judgments required to evaluate: (1) whether certain agreements with the same customer were economically linked and need to be combined; (2) whether the various services that are owed by the Company according to the contract qualified as separate performance obligations; (3) the allocation of the transaction price of a customer contract to the performance obligations in the contract based on standalone-selling prices; and (4) the point in time at which the provision of services by the Company for the specific performance obligation commences. Auditing these elements involved especially challenging and complex auditor judgment due to the complex nature of certain of the Company’s customer contracts and extent of audit effort required to address these matters.
The primary procedures we performed to address this critical audit matter included: (1) testing the design and the operating effectiveness of certain internal controls related to the revenue process, including controls related to the identification of certain economically linked agreements and separate performance obligations, the allocation of the transaction price to the performance obligations in certain contracts, and the point in time at which the provisioning of service commenced; (2) testing a sample of underlying contractual agreements and other related documents to evaluate the Company’s assessment of whether certain agreements were economically linked, the identified performance obligations, the allocation of the transaction price and the point in time at which the provision of service for the performance obligations identified commenced; and (3) testing key contractual terms and conditions from the respective contracts to evaluate the identified performance obligations and the point in time at which the provision of service for the identified performance obligations commenced.
Assessment of the Company’s uncertain tax treatments
As discussed in note C.5 to the consolidated financial statements, the Company disclosed contingent liabilities relating to tax uncertainties of EUR 1,815 million. The Company operates in multiple tax jurisdictions which continually revise, change, and implement tax laws with complexities and uncertainties due to different interpretations of these tax laws, especially relating to transfer pricing and intercompany transactions for the use of intellectual property. The nature of these activities can result in uncertainties in the estimation of the related tax exposures.
We identified the assessment of the Company’s tax provision related to uncertain tax positions, specifically from transfer pricing and intercompany transactions for the use of intellectual property, as a critical audit matter. The principal considerations that led to the determination included complex auditor judgement related to: (1) auditing key assumptions applied to the interpretation of tax laws, related regulations, case laws, and mutual agreement procedures across multiple jurisdictions; (2) determining whether a transfer pricing tax position is more-likely-than-not to be sustained; and (3) assessing whether intercompany transactions are based on the arm’s length principle. Auditing these elements involved especially challenging and complex auditor judgment due to the nature and extent of audit effort required to address these matters, including involvement of personnel with specialized skills and knowledge.
The primary procedures we performed to address this critical audit matter included utilizing personnel with specialized skill and knowledge in taxation to evaluate the appropriateness of management’s methods and key assumptions used to estimate certain uncertain tax positions by: (1) verifying understanding of the relevant facts by evaluating certain of the Company’s transfer pricing documentation; (2) assessing whether the Company’s processes and guidelines in connection with certain intercompany transactions support an arm’s length position; (3) evaluating for certain company business activities the reasonableness and consistency of management’s judgments (including application of tax regulations and interpretations), key assumptions and processes; and (4) assessing the overall reasonableness of conclusions reached regarding the identification, recognition, measurement, and disclosure of certain uncertain tax positions from transfer pricing and intercompany transactions for the use of intellectual property.
Measurement of unlisted equity securities
As discussed in note F.2 to the consolidated financial statements, the Company holds unlisted equity securities held at fair value of EUR 4,811 million as of December 31, 2023, primarily relating to Sapphire Ventures investments. These investments in unlisted equity securities are classified as financial instruments at fair value through profit and loss requiring a recurring fair value measurement using significant unobservable inputs.
We identified the measurement of certain unlisted equity securities at fair value as a critical audit matter due to the significant measurement uncertainty associated with the fair value of such investments relating to significant unobservable inputs used, such as the selection of appropriate comparable company data, in deriving revenue multiples as well as forecasted performance of the investees. Auditing these elements involved especially challenging and subjective auditor judgment due to the extent of specialized skills or knowledge needed.
The primary audit procedures we performed to address this critical audit matter included utilizing personnel with specialized knowledge and skill in valuation to assist in assessing and evaluating the appropriateness of the valuation technique used for a selection of certain investments in unlisted equity securities relating to Sapphire Ventures investments by: (1) assessing the appropriateness of the valuation technique selected by comparing it to our expectation based on industry experience and knowledge of the investment; (2) assessing the source, reliability and relevance of evidence used in determining significant unobservable inputs; (3) evaluating the significant unobservable inputs considered in the recurring measurement of fair value by comparing them to historical and market information; and (4) developing an independent range of acceptable fair value estimates utilizing available market information from third party sources to assess whether managements estimates are reasonable.
/s/ BDO AG Wirtschaftsprüfungsgesellschaft
We have served as the Company's auditor since 2023.
Frankfurt am Main, Germany
February 21, 2024
F-3
Report of Independent Registered Public Accounting Firm
Shareholders and Supervisory Board
SAP SE
Walldorf, Germany
Opinion on Internal Control over Financial Reporting
We have audited SAP SE’s (the “Company’s”) internal control over financial reporting as of December 31, 2023, based on criteria established in Internal Control – Integrated Framework (2013) issued by the Committee of Sponsoring Organizations of the Treadway Commission (the “COSO criteria”). In our opinion, the Company maintained, in all material respects, effective internal control over financial reporting as of December 31, 2023, based on the COSO criteria.
We also have audited, in accordance with the standards of the Public Company Accounting Oversight Board (United States) (“PCAOB”), the consolidated statement of financial position of the Company as of December 31, 2023, the related consolidated income statement and the consolidated statements of comprehensive income, changes in equity and cash flows for the year then ended, and the related notes and our report dated February 21, 2024, expressed an unqualified opinion thereon.
Basis for Opinion
The Company’s management is responsible for maintaining effective internal control over financial reporting and for its assessment of the effectiveness of internal control over financial reporting, included in the accompanying Item 15, Controls and Procedures. Our responsibility is to express an opinion on the Company’s internal control over financial reporting based on our audit. We are a public accounting firm registered with the PCAOB and are required to be independent with respect to the Company in accordance with U.S. federal securities laws and the applicable rules and regulations of the Securities and Exchange Commission and the PCAOB.
We conducted our audit of internal control over financial reporting in accordance with the standards of the PCAOB. Those standards require that we plan and perform the audit to obtain reasonable assurance about whether effective internal control over financial reporting was maintained in all material respects. Our audit included obtaining an understanding of internal control over financial reporting, assessing the risk that a material weakness exists, and testing and evaluating the design and operating effectiveness of internal control based on the assessed risk. Our audit also included performing such other procedures as we considered necessary in the circumstances. We believe that our audit provides a reasonable basis for our opinion.
Definition and Limitations of Internal Control over Financial Reporting
A company’s internal control over financial reporting is a process designed to provide reasonable assurance regarding the reliability of financial reporting and the preparation of financial statements for external purposes in accordance with generally accepted accounting principles. A company’s internal control over financial reporting includes those policies and procedures that (1) pertain to the maintenance of records that, in reasonable detail, accurately and fairly reflect the transactions and dispositions of the assets of the company; (2) provide reasonable assurance that transactions are recorded as necessary to permit preparation of financial statements in accordance with generally accepted accounting principles, and that receipts and expenditures of the company are being made only in accordance with authorizations of management and directors of the company; and (3) provide reasonable assurance regarding prevention or timely detection of unauthorized acquisition, use, or disposition of the company’s assets that could have a material effect on the financial statements.
Because of its inherent limitations, internal control over financial reporting may not prevent or detect misstatements. Also, projections of any evaluation of effectiveness to future periods are subject to the risk that controls may become inadequate because of changes in conditions, or that the degree of compliance with the policies or procedures may deteriorate.
/s/ BDO AG Wirtschaftsprüfungsgesellschaft
Frankfurt am Main, Germany
February 21, 2024
F-4
Report of Independent Registered Public Accounting Firm
To the Shareholders and Supervisory Board of SAP SE:
Opinion on the Consolidated Financial Statements
We have audited, before the effects of the retrospective adjustments to present the Qualtrics disposal group as discontinued operations as described in Note D.1 and the changes resulting from the Updated Cost Allocation Policy described in Note IN.1, the consolidated statements of financial position of SAP SE and subsidiaries (the Company) (SAP) as of December 31, 2022, the related consolidated income statements, and the consolidated statements of comprehensive income, changes in equity, and cash flows for each of the years in the two-year period ended December 31, 2022, and the related notes (collectively, the consolidated financial statements). The 2022 and 2021 consolidated financial statements before the effects of the retrospective adjustments to present the Qualtrics disposal group as discontinued operations as described in Note D.1 and the changes resulting from the Updated Cost Allocation Policy described in Note IN.1 are not presented herein. In our opinion, the consolidated financial statements, before the effects of the retrospective adjustments to present the Qualtrics disposal group as discontinued operations as described in Note D.1 and the changes resulting from the Updated Cost Allocation Policy described in Note IN.1, present fairly, in all material respects, the financial position of the Company as of December 31, 2022, and the results of its operations and its cash flows for each of the years in the two-year period ended December 31, 2022, in conformity with International Financial Reporting Standards as issued by the International Accounting Standards Board (IFRS).
We were not engaged to audit, review, or apply any procedures to the retrospective adjustments to present the Qualtrics disposal group as discontinued operations as described in Note D.1 and the changes resulting from the Updated Cost Allocation Policy described in Note IN.1 and, accordingly, we do not express an opinion or any other form of assurance about whether such adjustments are appropriate and have been properly applied. Those adjustments were audited by other auditors.
Basis for Opinion
These consolidated financial statements are the responsibility of the Company’s management. Our responsibility is to express an opinion on these consolidated financial statements based on our audits. We are a public accounting firm registered with the Public Company Accounting Oversight Board (United States) (PCAOB) and are required to be independent with respect to the Company in accordance with the U.S. federal securities laws and the applicable rules and regulations of the Securities and Exchange Commission and the PCAOB.
We conducted our audits in accordance with the standards of the PCAOB. Those standards require that we plan and perform the audit to obtain reasonable assurance about whether the consolidated financial statements are free of material misstatement, whether due to error or fraud.
Our audits included performing procedures to assess the risks of material misstatement of the consolidated financial statements, whether due to error or fraud, and performing procedures that respond to those risks. Such procedures included examining, on a test basis, evidence regarding the amounts and disclosures in the consolidated financial statements. Our audits also included evaluating the accounting principles used and significant estimates made by management, as well as evaluating the overall presentation of the consolidated financial statements. We believe that our audits provide a reasonable basis for our opinion.
/s/ KPMG AG Wirtschaftsprüfungsgesellschaft
We served as the Company’s auditor from 2002 to 2023.
Mannheim, Germany
February 22, 2023
F-5
Consolidated Financial Statements IFRS
Consolidated Income Statements of SAP Group for the Years Ended December 31
€ millions, unless otherwise stated |
|
Notes |
|
2023 |
|
2022 |
|
2021 |
Cloud |
|
|
|
13,664 |
|
11,426 |
|
8,701 |
Software licenses |
|
|
|
1,764 |
|
2,056 |
|
3,248 |
Software support |
|
|
|
11,496 |
|
11,909 |
|
11,412 |
Software licenses and support |
|
|
|
13,261 |
|
13,965 |
|
14,660 |
Cloud and software |
|
|
|
26,924 |
|
25,391 |
|
23,361 |
Services |
|
|
|
4,283 |
|
4,128 |
|
3,592 |
Total revenue |
|
(A.1), (C.2) |
|
31,207 |
|
29,520 |
|
26,953 |
|
|
|
|
|
|
|
|
|
Cost of cloud |
|
|
|
-3,884 |
|
-3,499 |
|
-2,881 |
Cost of software licenses and support |
|
|
|
-1,383 |
|
-1,384 |
|
-1,598 |
Cost of cloud and software |
|
|
|
-5,267 |
|
-4,883 |
|
-4,479 |
Cost of services |
|
|
|
-3,407 |
|
-3,155 |
|
-2,740 |
Total cost of revenue |
|
|
|
-8,674 |
|
-8,038 |
|
-7,219 |
Gross profit |
|
|
|
22,534 |
|
21,482 |
|
19,734 |
Research and development |
|
(D.9) |
|
-6,324 |
|
-6,080 |
|
-5,270 |
Sales and marketing |
|
|
|
-8,828 |
|
-7,946 |
|
-6,856 |
General and administration |
|
|
|
-1,364 |
|
-1,289 |
|
-1,187 |
Restructuring |
|
(B.6) |
|
-215 |
|
-138 |
|
-157 |
Other operating income/expense, net |
|
|
|
-16 |
|
60 |
|
44 |
Total operating expenses |
|
|
|
-25,420 |
|
-23,429 |
|
-20,645 |
Operating profit |
|
|
|
5,787 |
|
6,090 |
|
6,308 |
|
|
|
|
|
|
|
|
|
Other non-operating income/expense, net |
|
(C.3) |
|
9 |
|
-187 |
|
19 |
Finance income |
|
|
|
857 |
|
811 |
|
3,123 |
Finance costs |
|
|
|
-1,313 |
|
-2,200 |
|
-945 |
Financial income, net |
|
(C.4) |
|
-456 |
|
-1,389 |
|
2,178 |
Profit before tax from continuing operations |
|
(C.2) |
|
5,341 |
|
4,513 |
|
8,505 |
|
|
|
|
|
|
|
|
|
Income tax expense |
|
(C.5) |
|
-1,741 |
|
-1,446 |
|
-1,682 |
Profit after tax from continuing operations |
|
|
|
3,600 |
|
3,068 |
|
6,824 |
Attributable to owners of parent |
|
|
|
3,634 |
|
3,277 |
|
6,429 |
Attributable to non-controlling interests |
|
|
|
-33 |
|
-210 |
|
395 |
Profit (loss) after tax from discontinued operations |
|
(D.1) |
|
2,363 |
|
-1,359 |
|
-1,447 |
Profit after tax1 |
|
|
|
5,964 |
|
1,708 |
|
5,376 |
Attributable to owners of parent1 |
|
|
|
6,139 |
|
2,284 |
|
5,256 |
Attributable to non-controlling interests1 |
|
|
|
-175 |
|
-576 |
|
121 |
|
|
|
|
|
|
|
|
|
Earnings per share, basic (in €) from continuing operations |
|
(C.6) |
|
3.11 |
|
2.80 |
|
5.45 |
Earnings per share, basic (in €)1 |
|
(C.6) |
|
5.26 |
|
1.95 |
|
4.46 |
Earnings per share, diluted (in €) from continuing operations |
|
(C.6) |
|
3.08 |
|
2.79 |
|
5.45 |
Earnings per share, diluted (in €)1 |
|
(C.6) |
|
5.20 |
|
1.94 |
|
4.46 |
1 From continuing and discontinued operations
The accompanying Notes are an integral part of these Consolidated Financial Statements.
F-6
Consolidated Statements of Comprehensive Income of SAP Group for the Years Ended December 31
€ millions |
|
Notes |
|
2023 |
|
2022 |
|
2021 |
Profit after tax1 |
|
|
|
5,964 |
|
1,708 |
|
5,376 |
Items that will not be reclassified to profit or loss |
|
|
|
|
|
|
|
|
Remeasurements on defined benefit pension plans, before tax |
|
|
|
-45 |
|
71 |
|
43 |
Income taxes relating to remeasurements on defined benefit pension plans |
|
|
|
10 |
|
-15 |
|
-9 |
Remeasurements on defined benefit pension plans, net of tax |
|
|
|
-36 |
|
56 |
|
34 |
Other comprehensive income for items that will not be reclassified to profit or loss, net of tax |
|
|
|
-36 |
|
56 |
|
34 |
Items that will be reclassified subsequently to profit or loss |
|
|
|
|
|
|
|
|
Gains (losses) on exchange differences on translation, before tax |
|
|
|
-1,631 |
|
2,190 |
|
2,825 |
Reclassification adjustments on exchange differences on translation, before tax |
|
|
|
12 |
|
6 |
|
30 |
Exchange differences, before tax |
|
|
|
-1,618 |
|
2,195 |
|
2,855 |
Income taxes relating to exchange differences on translation |
|
|
|
21 |
|
-10 |
|
-9 |
Exchange differences, net of tax |
|
(E.2) |
|
-1,597 |
|
2,186 |
|
2,846 |
Gains (losses) on cash flow hedges/cost of hedging, before tax |
|
|
|
-11 |
|
53 |
|
-39 |
Reclassification adjustments on cash flow hedges/cost of hedging, before tax |
|
|
|
0 |
|
0 |
|
4 |
Cash flow hedges/cost of hedging, before tax |
|
(F.1) |
|
-11 |
|
53 |
|
-35 |
Income taxes relating to cash flow hedges/cost of hedging |
|
|
|
3 |
|
-14 |
|
9 |
Cash flow hedges/cost of hedging, net of tax |
|
(E.2) |
|
-8 |
|
39 |
|
-26 |
Other comprehensive income for items that will be reclassified to profit or loss, net of tax |
|
|
|
-1,605 |
|
2,224 |
|
2,819 |
Other comprehensive income, net of tax |
|
|
|
-1,641 |
|
2,280 |
|
2,853 |
Total comprehensive income |
|
|
|
4,323 |
|
3,988 |
|
8,230 |
Attributable to owners of parent |
|
|
|
4,670 |
|
4,385 |
|
8,058 |
Attributable to non-controlling interests |
|
|
|
-347 |
|
-396 |
|
172 |
1 From continuing and discontinued operations
The accompanying Notes are an integral part of these Consolidated Financial Statements.
F-7
/ Consolidated Statements of Financial Position of SAP Group as at December 31
€ millions |
|
Notes |
|
2023 |
|
2022 |
Cash and cash equivalents |
|
(E.3) |
|
8,124 |
|
9,008 |
Other financial assets |
|
(D.6), (E.3) |
|
3,344 |
|
853 |
Trade and other receivables |
|
(A.2) |
|
6,322 |
|
6,236 |
Other non-financial assets |
|
(A.3), (G.1) |
|
2,374 |
|
2,139 |
Tax assets |
|
|
|
407 |
|
287 |
Total current assets |
|
|
|
20,571 |
|
18,522 |
Goodwill |
|
(D.2) |
|
29,088 |
|
33,077 |
Intangible assets |
|
(D.3) |
|
2,505 |
|
3,835 |
Property, plant, and equipment |
|
(D.4), (D.5), (D.8) |
|
4,276 |
|
4,934 |
Other financial assets |
|
(D.6), (E.3) |
|
5,543 |
|
5,626 |
Trade and other receivables |
|
(A.2) |
|
203 |
|
169 |
Other non-financial assets |
|
(A.3), (G.1) |
|
3,573 |
|
3,580 |
Tax assets |
|
|
|
382 |
|
323 |
Deferred tax assets |
|
(C.5) |
|
2,193 |
|
2,095 |
Total non-current assets |
|
|
|
47,764 |
|
53,638 |
Total assets |
|
|
|
68,335 |
|
72,159 |
|
|
|
|
|
|
|
Trade and other payables |
|
|
|
1,783 |
|
2,146 |
Tax liabilities |
|
|
|
266 |
|
283 |
Financial liabilities |
|
(E.3), (D.5) |
|
1,735 |
|
4,808 |
Other non-financial liabilities |
|
(B.3), (B.5), (G.2) |
|
5,648 |
|
4,818 |
Provisions |
|
(A.4), (B.6), (G.3) |
|
235 |
|
90 |
Contract liabilities |
|
(A.1) |
|
4,975 |
|
5,309 |
Total current liabilities |
|
|
|
14,642 |
|
17,453 |
Trade and other payables |
|
|
|
39 |
|
79 |
Tax liabilities |
|
|
|
877 |
|
893 |
Financial liabilities |
|
(E.3), (D.5) |
|
7,941 |
|
9,547 |
Other non-financial liabilities |
|
(B.3), (B.5), (G.2) |
|
698 |
|
705 |
Provisions |
|
(A.4), (B.4), (B.6) |
|
433 |
|
359 |
Deferred tax liabilities |
|
(C.5) |
|
265 |
|
241 |
Contract liabilities |
|
(A.1) |
|
33 |
|
33 |
Total non-current liabilities |
|
|
|
10,287 |
|
11,858 |
Total liabilities |
|
|
|
24,928 |
|
29,311 |
Issued capital |
|
|
|
1,229 |
|
1,229 |
Share premium |
|
|
|
1,845 |
|
3,081 |
Retained earnings |
|
|
|
42,457 |
|
36,418 |
Other components of equity |
|
|
|
2,368 |
|
3,801 |
Treasury shares |
|
|
|
-4,741 |
|
-4,341 |
Equity attributable to owners of parent |
|
|
|
43,157 |
|
40,186 |
Non-controlling interests |
|
(E.2) |
|
249 |
|
2,662 |
Total equity |
|
(E.2) |
|
43,406 |
|
42,848 |
Total equity and liabilities |
|
|
|
68,335 |
|
72,159 |
The accompanying Notes are an integral part of these Consolidated Financial Statements.
F-8
Consolidated Statements of Changes in Equity of SAP Group for the Years Ended December 31
€ millions |
|
Equity Attributable to Owners of Parent |
|
Non- |
|
Total Equity |
||||||||||
|
|
Issued Capital |
|
Share |
|
Retained |
|
Other |
|
Treasury |
|
Total |
|
Controlling |
|
|
|
|
|
|
Premium |
|
Earnings |
|
Components |
|
Shares |
|
|
|
Interests |
|
|
|
|
|
|
|
|
|
|
of Equity |
|
|
|
|
|
|
|
|
Notes |
|
(E.2) |
|
(E.2) |
|
|
|
(E.2) |
|
(E.2) |
|
|
|
|
|
|
1/1/2021 |
|
1,229 |
|
545 |
|
32,026 |
|
-1,012 |
|
-3,072 |
|
29,716 |
|
211 |
|
29,927 |
Profit after tax1 |
|
|
|
|
|
5,256 |
|
|
|
|
|
5,256 |
|
121 |
|
5,376 |
Other comprehensive income |
|
|
|
|
|
34 |
|
2,768 |
|
|
|
2,802 |
|
51 |
|
2,853 |
Comprehensive income |
|
|
|
|
|
5,290 |
|
2,768 |
|
|
|
8,058 |
|
172 |
|
8,230 |
Share-based payments |
|
|
|
1,373 |
|
|
|
|
|
|
|
1,373 |
|
311 |
|
1,684 |
Dividends |
|
|
|
|
|
-2,182 |
|
|
|
|
|
-2,182 |
|
-88 |
|
-2,271 |
Transactions with non-controlling interests |
|
|
|
|
|
1,933 |
|
|
|
|
|
1,933 |
|
2,050 |
|
3,983 |
Other changes |
|
|
|
|
|
-44 |
|
|
|
|
|
-44 |
|
14 |
|
-30 |
12/31/2021 |
|
1,229 |
|
1,918 |
|
37,022 |
|
1,757 |
|
-3,072 |
|
38,853 |
|
2,670 |
|
41,523 |
Profit after tax1 |
|
|
|
|
|
2,284 |
|
|
|
|
|
2,284 |
|
-576 |
|
1,708 |
Other comprehensive income |
|
|
|
|
|
56 |
|
2,044 |
|
|
|
2,100 |
|
180 |
|
2,280 |
Comprehensive income |
|
|
|
|
|
2,340 |
|
2,044 |
|
|
|
4,385 |
|
-396 |
|
3,988 |
Share-based payments |
|
|
|
1,163 |
|
|
|
|
|
|
|
1,163 |
|
325 |
|
1,488 |
Dividends |
|
|
|
|
|
-2,865 |
|
|
|
|
|
-2,865 |
|
-29 |
|
-2,895 |
Purchase of treasury shares |
|
|
|
|
|
-1,500 |
|
|
|
|
|
-1,500 |
|
|
|
-1,500 |
Reissuance of treasury shares under share-based payments |
|
|
|
|
|
230 |
|
|
|
|
|
230 |
|
|
|
230 |
Changes in non-controlling interests |
|
|
|
|
|
-92 |
|
|
|
|
|
-92 |
|
90 |
|
-3 |
Other changes |
|
|
|
|
|
13 |
|
|
|
|
|
13 |
|
2 |
|
15 |
12/31/2022 |
|
1,229 |
|
3,081 |
|
36,418 |
|
3,801 |
|
-4,341 |
|
40,186 |
|
2,662 |
|
42,848 |
Profit after tax1 |
|
|
|
|
|
6,139 |
|
|
|
|
|
6,139 |
|
-175 |
|
5,964 |
Other comprehensive income |
|
|
|
|
|
-36 |
|
-1,433 |
|
|
|
-1,469 |
|
-172 |
|
-1,641 |
Comprehensive income |
|
|
|
|
|
6,103 |
|
-1,433 |
|
|
|
4,670 |
|
-347 |
|
4,323 |
Share-based payments |
|
|
|
1,032 |
|
|
|
|
|
|
|
1,032 |
|
121 |
|
1,153 |
Dividends |
|
|
|
|
|
-2,395 |
|
|
|
|
|
-2,395 |
|
-21 |
|
-2,417 |
Purchase of treasury shares |
|
|
|
|
|
|
|
|
|
-968 |
|
-968 |
|
|
|
-968 |
Reissuance of treasury shares under share-based payments |
|
|
|
|
|
|
|
|
|
568 |
|
568 |
|
|
|
568 |
Changes in non-controlling interests |
|
|
|
-2,268 |
|
2,197 |
|
|
|
|
|
-71 |
|
-2,164 |
|
-2,235 |
Other changes |
|
|
|
|
|
135 |
|
|
|
|
|
135 |
|
-1 |
|
134 |
12/31/2023 |
|
1,229 |
|
1,845 |
|
42,457 |
|
2,368 |
|
-4,741 |
|
43,157 |
|
249 |
|
43,406 |
1 From continuing and discontinued operations
The accompanying Notes are an integral part of these Consolidated Financial Statements.
F-9
Consolidated Statements of Cash Flows of SAP Group for the Years Ended December 31
€ millions |
|
Notes |
|
2023 |
|
2022 |
|
2021 |
Profit after tax1 |
|
|
|
5,964 |
|
1,708 |
|
5,376 |
Adjustments to reconcile profit after tax to net cash flow from operating activities: |
|
|
|
|
|
|
|
|
(Profit) loss after tax from discontinued operations |
|
|
|
-2,363 |
|
1,359 |
|
1,447 |
Depreciation and amortization |
|
(D.2)–(D.4) |
|
1,373 |
|
1,569 |
|
1,537 |
Share-based payment expenses |
|
(B.3) |
|
2,220 |
|
1,431 |
|
1,335 |
Income tax expense |
|
(C.5) |
|
1,741 |
|
1,446 |
|
1,682 |
Financial income, net |
|
(C.4) |
|
456 |
|
1,389 |
|
-2,178 |
Decrease/increase in allowances on trade receivables |
|
|
|
-10 |
|
77 |
|
-9 |
Other adjustments for non-cash items |
|
|
|
23 |
|
-175 |
|
15 |
Decrease/increase in trade and other receivables |
|
|
|
-393 |
|
196 |
|
497 |
Decrease/increase in other assets |
|
|
|
-700 |
|
-1,213 |
|
-645 |
Increase/decrease in trade payables, provisions, and other liabilities |
|
|
|
633 |
|
154 |
|
429 |
Increase/decrease in contract liabilities |
|
|
|
443 |
|
643 |
|
-59 |
Share-based payments |
|
(B.3) |
|
-1,091 |
|
-1,180 |
|
-1,056 |
Interest paid |
|
|
|
-393 |
|
-244 |
|
-198 |
Interest received |
|
|
|
469 |
|
156 |
|
56 |
Income taxes paid, net of refunds2 |
|
|
|
-2,161 |
|
-1,642 |
|
-2,047 |
Net cash flows from operating activities – continuing operations |
|
|
|
6,210 |
|
5,675 |
|
6,182 |
Net cash flows from operating activities – discontinued operations |
|
(D.1) |
|
122 |
|
-29 |
|
41 |
Net cash flows from operating activities1 |
|
|
|
6,332 |
|
5,647 |
|
6,223 |
Cash flows for business combinations, net of cash and cash equivalents acquired |
|
|
|
-1,168 |
|
-679 |
|
-1,032 |
Proceeds from sales of subsidiaries or other businesses |
|
|
|
0 |
|
289 |
|
-72 |
Cash flows from derivative financial instruments related to the sale of subsidiaries or businesses |
|
|
|
-91 |
|
0 |
|
0 |
Purchase of intangible assets and property, plant, and equipment |
|
|
|
-785 |
|
-877 |
|
-701 |
Proceeds from sales of intangible assets or property, plant, and equipment |
|
|
|
99 |
|
95 |
|
89 |
Purchase of equity or debt instruments of other entities |
|
|
|
-3,566 |
|
-2,320 |
|
-4,368 |
Proceeds from sales of equity or debt instruments of other entities |
|
|
|
907 |
|
4,190 |
|
3,229 |
Net cash flows from investing activities – continuing operations |
|
|
|
-4,603 |
|
699 |
|
-2,856 |
Net cash flows from investing activities – discontinued operations |
|
(D.1) |
|
5,510 |
|
-32 |
|
-208 |
Net cash flows from investing activities1 |
|
|
|
906 |
|
667 |
|
-3,063 |
Dividends paid |
|
(E.2) |
|
-2,395 |
|
-2,865 |
|
-2,182 |
Dividends paid on non-controlling interests |
|
|
|
-13 |
|
-12 |
|
-54 |
Purchase of treasury shares |
|
(E.2) |
|
-949 |
|
-1,500 |
|
0 |
Proceeds from borrowings |
|
(E.3) |
|
13 |
|
158 |
|
1,680 |
Repayments of borrowings |
|
(E.3) |
|
-4,081 |
|
-1,445 |
|
-1,952 |
Payments of lease liabilities |
|
|
|
-332 |
|
-410 |
|
-375 |
Transactions with non-controlling interests |
|
(E.2) |
|
0 |
|
0 |
|
-2 |
Net cash flows from financing activities – continuing operations |
|
|
|
-7,758 |
|
-6,074 |
|
-2,885 |
Net cash flows from financing activities – discontinued operations |
|
(D.1) |
|
24 |
|
-263 |
|
2,828 |
Net cash flows from financing activities1 |
|
|
|
-7,734 |
|
-6,337 |
|
-56 |
Effect of foreign currency rates on cash and cash equivalents |
|
|
|
-388 |
|
134 |
|
484 |
Net decrease/increase in cash and cash equivalents |
|
|
|
-883 |
|
109 |
|
3,587 |
/ Cash and cash equivalents at the beginning of the period |
|
(E.3) |
|
9,008 |
|
8,898 |
|
5,311 |
/ Cash and cash equivalents at the end of the period |
|
(E.3) |
|
8,124 |
|
9,008 |
|
8,898 |
1 From continuing and discontinued operations
2 Total income taxes paid, net of refunds 2023: —€2,973 million thereof contained in the line item "Net cash flows from investing activities - discontinued operations": —€815 million.
The accompanying Notes are an integral part of these Consolidated Financial Statements.
F-10
SAP SE AND SUBSIDIARIES
NOTES TO THE CONSOLIDATED FINANCIAL STATEMENTS IFRS
(IN.1) Basis for Preparation
General Information
The registered domicile of SAP SE is in Walldorf, Germany (Commercial Register of the Lower Court of Mannheim HRB 719915). The Consolidated Financial Statements for 2023 of SAP SE and its subsidiaries (collectively, “we,” “us,” “our,” “SAP,” “Group,” and “Company”) have been prepared in accordance with International Financial Reporting Standards (IFRS) and the additional requirements set forth in section 315e (1) of the German Commercial Code (HGB).
We have applied all IFRS standards and interpretations that were effective on and endorsed by the European Union (EU) as at December 31, 2023. There were no standards or interpretations as at December 31, 2023, impacting our Consolidated Financial Statements for the years ended December 31, 2023, 2022, and 2021, that were effective but not yet endorsed. Therefore, our Consolidated Financial Statements comply with both, IFRS as issued by the International Accounting Standards Board (IASB) and IFRS as endorsed by the EU.
Our Executive Board approved the Consolidated Financial Statements on February 21,2024, for submission to our Supervisory Board which approved the Consolidated Financial Statements on the same day.
All amounts included in the Consolidated Financial Statements are reported in millions of euros (€ millions) except where otherwise stated. As figures are rounded, numbers presented throughout this document may not add up precisely to the totals we provide and percentages may not precisely reflect the absolute figures.
Amounts disclosed in the Notes that are taken directly from our Consolidated Income Statements or our / Consolidated Statements of Financial Position are marked with the symbols and /, respectively.
Furthermore, all financial numbers in the Consolidated Financial Statements are based on continuing operations (unless otherwise noted).
Accounting Policies, Management Judgments, and Sources of Estimation Uncertainty
How We Present Our Accounting Policies, Judgments, and Estimates
To ease the understanding of our financial statements, we present the accounting policies, management judgments, and sources of estimation uncertainty (hereafter: accounting policies, judgments, and estimates) on a given subject together with other disclosures related to the same subject in the Note that deals with this subject. Accounting policies, judgments, and estimates that do not relate to a specific subject are presented in the following section.
For easier identification of our accounting policies, judgments, and estimates, the respective disclosures are marked with the symbol y and highlighted with a light gray box. They focus on the accounting choices made within the framework of the prevailing IFRS and refrain from repeating the underlying promulgated IFRS guidance, unless we consider it particularly important to the understanding of a Note’s content.
F-11
The following table provides an overview of where our accounting policies, management judgments, and estimates are disclosed:
Note |
|
y Accounting Policies, Judgments, and Estimates |
(IN.1) |
|
Basis for Preparation |
(A.1) |
|
Revenue |
(A.2) |
|
Trade and Other Receivables |
(A.3) |
|
Capitalized Cost from Contracts with Customers |
(A.4) |
|
Customer-Related Provisions |
(B.3) |
|
Share-Based Payments |
(B.4) |
|
Pension Plans and Similar Obligations |
(B.5) |
|
Other Employee-Related Obligations |
(B.6) |
|
Restructuring |
(C.1) |
|
Results of Segments |
(C.5) |
|
Income Taxes |
(D.1) |
|
Business Combinations and Divestitures |
(D.2) |
|
Goodwill |
(D.3) |
|
Intangible Assets |
(D.4) |
|
Property, Plant, and Equipment |
(D.5) |
|
Leases |
(D.6) |
|
Equity Investments |
(D.9) |
|
Income-Related Government Grants |
(E.2) |
|
Total Equity |
(E.3) |
|
Liquidity |
(F.1) |
|
Financial Risk Factors and Risk Management |
(F.2) |
|
Fair Value Disclosures on Financial Instruments |
(G.3) |
|
Other Litigation, Claims, and Legal Contingencies |
(G.5) |
|
Executive and Supervisory Board Compensation |
y General Accounting Policies |
Bases of Measurement |
The Consolidated Financial Statements have been prepared on the historical cost basis except for the following: |
- Derivative financial instruments, liabilities for cash-settled share-based payments, and financial assets with cash flows that are not solely payments of principal or interest are measured at fair value. |
- Post-employment benefits are measured at the present value of the defined benefit obligations less the fair value of the plan assets. |
- Monetary assets and liabilities denominated in foreign currencies are translated at period-end exchange rates. |
- Provisions are recognized at the best estimate of their fulfillment amount when they occur. |
Foreign Currencies
Income and expenses and operating cash flows of our foreign subsidiaries that use a functional currency other than the Euro are translated at average rates of foreign exchange (FX) computed on a monthly basis. Exchange differences resulting from foreign currency transactions are recognized in other non-operating income/expense, net.
F-12
The exchange rates of key currencies affecting the Company were as follows:
Exchange Rates
Equivalent to €1 |
|
|
|
Middle Rate |
|
Annual Average Exchange Rate |
||||||
|
|
|
|
as at 12/31 |
|
|
||||||
|
|
|
|
2023 |
|
2022 |
|
2023 |
|
2022 |
|
2021 |
Australian dollar |
|
AUD |
|
1.6263 |
|
1.5693 |
|
1.6285 |
|
1.5174 |
|
1.5747 |
Canadian dollar |
|
CAD |
|
1.4642 |
|
1.4440 |
|
1.4596 |
|
1.3703 |
|
1.4835 |
Swiss franc |
|
CHF |
|
0.9260 |
|
0.9847 |
|
0.9717 |
|
1.0052 |
|
1.0814 |
Pound sterling |
|
GBP |
|
0.8691 |
|
0.8869 |
|
0.8699 |
|
0.8526 |
|
0.8600 |
Japanese yen |
|
JPY |
|
156.33 |
|
140.66 |
|
151.94 |
|
138.01 |
|
129.86 |
U.S. dollar |
|
USD |
|
1.1050 |
|
1.0666 |
|
1.0816 |
|
1.0539 |
|
1.1835 |
Cost Classification
Cost of Cloud and Software
Cost of cloud and software includes the costs incurred in providing the services and producing the goods that generate cloud and software revenue. Consequently, this line item primarily includes employee expenses relating to these services, amortization of acquired intangibles, fees for third-party licenses, depreciation of our property, plant, and equipment (for example, of our data centers in which we host our cloud solutions), and costs for third-party hosting services. For more information about the capitalization of costs from contracts with customers, see Note (A.3).
Updated Cost Allocation Policy
Starting January 1, 2023, all activities related to changes in the code of SAP’s cloud and on-premise solutions are treated as development-related activities. Some of those activities, specifically code corrections, were previously considered as support-related activities. SAP believes that this update aligns SAP’s accounting policy with market standards and increases comparability to its peers.
For the full year 2023, the update of our cost allocation policy led to an increase in the cloud gross profit of approximately €95 million (2022: €88 million, 2021: €61 million), an increase in the software license and support gross profit of approximately €275 million (2022: €310 million, 2021: €326 million), and an increase in our research & development (R&D) expenses of approximately €370 million (2022: €398 million, 2021: €388 million).
Prior periods have been adjusted to reflect the updated cost allocation policy.
Cost of Services
Cost of services includes the costs incurred in providing the services that generate service revenue. Consequently, this line item primarily includes employee expenses and related training, system and system administration costs, and costs for third-party resources.
Research and Development
Research and development includes the costs incurred by activities related to the development of cloud and software solutions including resource and hardware costs for the development systems. The same applies for all activities related to changes in the code of SAP's cloud and software solutions. For more information about the recognition of internally generated intangible assets from development, see Note (D.3).
Please also note the Updated Cost Allocation Policy above.
Sales and Marketing
Sales and marketing includes the costs incurred for the selling activities (such as sales commissions and amortization of capitalized sales commissions) and marketing activities related to our software and cloud solutions and our service portfolio. For more information about the capitalization of costs from contracts with customers, see Note (A.3).
General and Administration
General and administration includes the costs related to finance and administrative functions, human resources, and general management as long as they are not directly attributable to one of the other operating expense line items.
F-13
y Management Judgments and Sources of Estimation Uncertainty
The preparation of the Consolidated Financial Statements requires our management to make judgments, estimates, and assumptions that affect the application of accounting policies and the reported amounts of assets, liabilities, revenues, and expenses, as well as disclosure of contingent liabilities.
We base our judgments, estimates, and assumptions on historical and forecast information, and on regional and industry economic conditions in which we or our customers operate. Changes to these conditions could adversely affect our estimates. Although we believe we have made reasonable estimates about the ultimate resolution of the underlying uncertainties, no assurance can be given that the final outcome of these matters will be consistent with what is reflected in our recognized assets, liabilities, revenues, and expenses and disclosed contingent liabilities. Actual results could differ significantly from original estimates.
The accounting policies that most frequently or significantly require us to make judgments, estimates, and assumptions, and therefore are critical to understanding our results of operations, include the following:
Note |
|
y Material Accounting Policies |
(A.1) |
|
Revenue recognition |
(A.2) |
|
Valuation of trade receivables |
(A.4), (G.3) |
|
Accounting for legal contingencies |
(B.3) |
|
Accounting for share-based payments |
(C.5) |
|
Accounting for income taxes |
(D.1) |
|
Accounting for business combinations |
(D.2) |
|
Accounting for goodwill |
(D.3) |
|
Accounting for intangible assets (including recognition of internally generated intangible assets from development) |
(D.6) |
|
Accounting for equity investments |
Our management periodically discusses these material accounting policies with the Audit and Compliance Committee of our Supervisory Board. |
y New Accounting Standards Not Yet Adopted |
|
The IASB has issued various amendments to the IFRS standards (such as IAS 1 (Presentation of Financial Statements), IAS 7 (Statement of Cash Flows), IFRS 7 (Financial Instruments Disclosure), and IFRS 16 (Lease Liability in a Sale and Leaseback Transaction)) that are relevant for SAP but not yet effective. We are currently assessing the impact on SAP, but do not expect material effects on our financial position or profit after tax. |
F-14
Section A — Customers
This section discusses disclosures related to contracts with our customers. These include but are not limited to explanations of how we recognize revenue, revenue disaggregation, and information about our trade receivables and customer-related obligations.
(A.1) Revenue
y Accounting for Revenue from Contracts with Customers |
|
Classes of Revenue |
|
We derive our revenue from fees charged to our customers for the use of our cloud offerings, for licenses to our on-premise software products, and for standardized and premium support services, consulting, customer-specific software developments, training, and other services. |
|
Cloud and software revenue, as presented in our Consolidated Income Statements, is the sum of our cloud revenue, our software license revenue, and our software support revenue. |
|
Cloud revenue represents fees earned from providing customers with any of the following: |
|
|
Software as a service (SaaS), that is, a right to use software functionality (including standard functionalities and custom cloud applications and extensions) in a cloud-based infrastructure hosted by SAP or third parties engaged by SAP, where the customer does not have the right to terminate the hosting contract and take possession of the software to either run it on its own IT infrastructure or to engage a third-party provider unrelated to SAP to host and manage the software; SaaS also includes transaction and agent fees for transactions that customers execute on our cloud-based transaction platforms. Platform as a service (PaaS), that is, access to a cloud-based platform to develop, deploy, integrate, and manage applications. Infrastructure as a service (IaaS), that is, hosting and related application management services for software hosted by SAP or third parties engaged by SAP. Premium cloud support, that is, support beyond the regular support embedded in the underlying cloud subscription services. |
Software license revenue represents fees earned from the sale or license of software to customers for use on the premises owned or fully controlled by the customer, in other words, where the customer has the right to take possession of the software for installation on the customer’s premises or on hardware of third-party hosting providers unrelated to SAP (on-premise software). Software license revenue includes revenue from both the sale of our standard software products and customer-specific on-premise-software development agreements. |
|
Software support revenue represents fees earned from providing customers with standardized support services that comprise unspecified future software updates, upgrades, and enhancements as well as technical product support services for on-premise software products. |
|
Services revenue primarily represents fees earned from professional consulting services, premium support services, and training services. |
|
Identification of Contract |
|
We frequently enter into multiple contracts with the same customer. For accounting purposes, we treat these contracts as a single contract if they are entered into at or near the same time and are economically interrelated. We do not combine contracts with closing days more than three months apart because we do not consider them being entered into near the same time. Judgment is required in evaluating whether various contracts are interrelated, which includes considerations as to whether they were negotiated as a package with a single commercial objective, whether the amount of consideration on one contract is dependent on the performance of the other contract, or if some or all goods in the contracts are a single performance obligation. |
|
New arrangements with existing customers can be either a new contract or the modification of prior contracts with the customer. Our judgment in making this determination considers whether there is a connection between the new arrangement and the pre-existing contracts, whether the goods and services under the new arrangement are highly interrelated with the goods and services sold under prior contracts, and how the goods and services under the new arrangement are priced. In determining whether a change in transaction price represents a contract modification or a change in variable consideration, we examine whether the change in price results from changing the contract or from applying unchanged existing contract provisions. |
F-15
Identification of Performance Obligations |
|
Our customer contracts often include various products and services. Typically, the products and services outlined in the Classes of Revenue section qualify as separate performance obligations and the portion of the contractual fee allocated to them is recognized separately. Judgment is required, however, in determining whether a good or service is considered a separate performance obligation. For our professional services and implementation activities, judgment is required to evaluate whether such services significantly integrate, customize, or modify the on-premise software or cloud service to which they relate. In this context, we consider the nature of the services and their volume relative to the volume of the on-premise software or cloud service to which they relate. In general, the implementation services for our cloud services go beyond pure setup activities and qualify as separate performance obligations. Similarly, our on-premise implementation services and our custom development services typically qualify as separate performance obligations. Non-distinct goods and services are combined into one distinct bundle of goods and services (combined performance obligation). |
|
When selling goods or services, we frequently grant customers options to acquire additional goods or services (for example, renewals of cloud or support arrangements, or additional volumes of purchased cloud solutions or software). We apply judgment in determining whether such options provide a material right to the customer that the customer would not receive without entering into that contract. In this judgment, we consider, for example, whether the options entitle the customer to a discount that exceeds the discount granted for the respective goods or services sold together with the option. |
|
Determination of Transaction Price |
|
We apply judgment in determining the amount to which we expect to be entitled in exchange for transferring promised goods or services to a customer. Generally, variable consideration is estimated based on the most likely amount and is included in the transaction price to the extent that the constraint does not apply. This includes estimates as to whether and to what extent subsequent concessions may be granted to customers and whether the customer is expected to pay the contractual fees. In this judgment, we consider our history with the respective customer or on a portfolio basis. |
|
The recognition constraint is applied to on-premise software transactions that include usage-based or sales-based contingent fees. In contrast, our typical cloud services do not provide the customer with a software license because the customer does not have the right to terminate the hosting contract and take possession of the software. Consequently, variable cloud fees are considered in the transaction price based on estimates, rather than being accounted for as usage-based or sales-based license royalties. If SAP pays consideration to a customer in exchange for a distinct good or service, and such purchase is linked to a customer contract, an estimate of fair value of such goods and services is required to conclude whether or not to account for a reduction in the transaction price of the linked customer contract. |
|
Only very rarely do our contracts include significant financing components. We do not account for financing components if the period between when SAP transfers the promised goods or services to the customer and when the customer pays for those goods or services is one year or less. |
|
Allocation of Transaction Price |
|
We have established a hierarchy to identify the standalone selling prices (SSPs) that we use to allocate the transaction price of a customer contract to the performance obligations in the contract. |
|
|
- Where standalone selling prices for an offering are observable and reasonably consistent across customers (that is, not highly variable), our SSP estimates are derived from our respective pricing history. Typically, our standardized support offerings and our professional service offerings follow this approach. - Where sales prices for an offering are not directly observable or highly variable across customers, we use estimation techniques. For renewable offerings with highly variable pricing across customers, these techniques consider the individual contract’s expected renewal price as far as this price is substantive. Typically, our cloud offerings follow this approach. For non-renewable offerings, these estimations follow a cost-plus-margin approach. - For offerings that lack renewals, have highly variable pricing, and lack substantial direct costs to estimate based on a cost-plus-margin approach, we allocate the transaction price by applying a residual approach. We use this technique in particular for our standard on-premise software offerings. |
|
Judgment is required when estimating SSPs. To judge whether the historical pricing of our goods and services is highly variable, we have established thresholds of pricing variability. For judging whether individually negotiated contractual renewal prices are substantive, we have established floor prices based on internal calculation which include a minimum margin that we use as SSPs whenever the contractual renewal prices are below these floor prices. In judging whether contracts are expected to renew at their contractual renewal prices, we rely on our respective renewal history. The SSPs of material right options depend on the probability of option exercise. In estimating these probabilities, we apply judgment considering historical exercise patterns. |
|
We review the SSPs periodically or whenever facts and circumstances change to ensure the most objective input parameters available are used. |
F-16
Recognition of Revenue |
|
Cloud revenue is recognized over time as the services are performed. For cloud business models where we grant rights to continuously access and use one or more cloud offerings for a certain term, revenue is recognized based on time elapsed and thus ratably over this term. For cloud business models provisioned on a consumption basis where a customer commits to a fixed value of spend on cloud services throughout the contract term, but with the discretion to call off cloud services during the contract term, we recognize revenue based on consumption as it best reflects our measure towards satisfaction of that performance obligation. In limited scenarios where the transaction price is entirely variable and determined by the customer’s consumption, we recognize revenue based on usage in the period in which it was earned. |
|
Software license revenue is recognized at a point in time or over time depending on whether we deliver standard software, customer-specific software, or software subscription contracts that combine the delivery of software and the obligation to deliver, in the future, unspecified software products: |
|
- Licenses for our standard on-premise software products are typically delivered by providing the customer with access to download the software. We recognize revenue for these on-premise licenses at the point in time when we grant the license rights to the customer and the customer has access to and thus control over the software. In judging whether our on-premise software offerings grant customers a right to use, rather than a right to access, our intellectual property, we have considered the usefulness of our software without subsequent updates to it. - Typically, our customer-specific on-premise software development agreements: ◾ Represent software developed for specific needs of individual customers and therefore do not have any use for us ◾ Provide us with an enforceable right to payment for performance completed to date |
|
For such development agreements, we recognize revenue over time as the software development progresses. Judgment is required in identifying an appropriate method to measure the progress toward complete satisfaction of such performance obligations. We typically measure progress of our development agreements based on the direct costs incurred to date in developing the software as a percentage of the total reasonably estimated direct costs to fully complete the development work (input-based percentage-of-completion method). This method of measuring progress faithfully depicts the transfer of the development services to the customer, as substantially all of these costs are cost of the staff or third parties performing the development work. In estimating the total cost to fully complete the development work, we consider our history with similar projects. |
|
- For agreements that combine the delivery of software and the obligation to deliver, in the future, unspecific software products, we recognize revenue at a point in time for licenses that are made immediately accessible to the customer. We recognize revenue ratably over the term of the software subscription contract for the unspecified software products, as our performance obligation is to stand ready to deliver such products on a when-and-if-available basis. |
|
Software support revenue is typically recognized based on time elapsed and thus ratably over the term of the support arrangement. Under our standardized support services, our performance obligation is to stand ready to provide technical product support and unspecified updates, upgrades, and enhancements on a when-and-if-available basis. Our customers simultaneously receive and consume the benefits of these support services as we perform. |
|
Service revenue is typically recognized over time. Where we stand ready to provide the service (such as access to learning content), we recognize revenue based on time elapsed and thus ratably over the service period. Consumption-based services (such as separately identifiable consulting services and premium support services and classroom training services) are recognized over time as the services are utilized, typically following the percentage-of-completion method or ratably. When using the percentage-of-completion method, we typically measure the progress toward complete satisfaction of the performance obligation in the same way and with the same reasoning and judgment as we do for customer-specific on-premise software development agreements. We apply judgment in determining whether a service qualifies as a stand-ready service or as a consumption-based service. |
|
Revenue for combined performance obligations is recognized over the longest period of all promises in the combined performance obligation. |
|
Judgment is also required in determining whether revenue is to be recognized at a point in time or over time. For performance obligations satisfied over time, we need to measure progress using the method that best reflects SAP’s performance. When using cost incurred as a measure of progress for recognizing revenue over time, we apply judgment in estimating the total cost to satisfy the performance obligation. |
|
All of the judgments and estimates mentioned above can significantly impact the timing and amount of revenue to be recognized. |
|
F-17
Contract Balances |
|
We recognize trade receivables for performance obligations satisfied over time gradually as the performance obligation is satisfied and in full once the invoice is due. Judgment is required in determining whether a right to consideration is unconditional and thus qualifies as a receivable. |
|
Contract liabilities primarily reflect invoices due or payments received in advance of revenue recognition. |
|
Typically, we invoice fees for on-premise standard software on contract closure and software delivery. Periodic fixed fees for cloud subscription services, software support services, and other multi-period agreements are typically invoiced yearly or quarterly in advance. Such fee prepayments account for the majority of our contract liability balance. Fees based on actual transaction volumes for cloud subscriptions and fees charged for non-periodical services are invoiced as the services are delivered. While payment terms and conditions vary by contract type and region, our terms typically require payment within 30 to 60 days. |
Geographic Information
The amounts for revenue by region in the following tables are based on the location of customers. The regions in the following table are EMEA (Europe, Middle East, and Africa), Americas (North America and Latin America), and APJ (Asia Pacific Japan).
Total Revenue by Region
€ millions |
|
2023 |
|
2022 |
|
2021 |
Germany |
|
4,921 |
|
4,469 |
|
4,324 |
Rest of EMEA |
|
9,083 |
|
8,440 |
|
8,135 |
EMEA |
|
14,004 |
|
12,909 |
|
12,458 |
United States |
|
10,204 |
|
9,799 |
|
8,235 |
Rest of Americas |
|
2,558 |
|
2,427 |
|
2,056 |
Americas |
|
12,762 |
|
12,227 |
|
10,292 |
Japan |
|
1,243 |
|
1,218 |
|
1,286 |
Rest of APJ |
|
3,199 |
|
3,166 |
|
2,917 |
APJ |
|
4,441 |
|
4,384 |
|
4,204 |
SAP Group |
|
31,207 |
|
29,520 |
|
26,953 |
Major Revenue Classes by Region
€ millions |
|
Cloud Revenue |
|
Cloud and Software Revenue |
||||||||
|
|
|
|
|
||||||||
|
|
2023 |
|
2022 |
|
2021 |
|
2023 |
|
2022 |
|
2021 |
EMEA |
|
5,241 |
|
4,137 |
|
3,196 |
|
12,028 |
|
11,081 |
|
10,820 |
Americas |
|
6,642 |
|
5,810 |
|
4,354 |
|
10,959 |
|
10,456 |
|
8,808 |
APJ |
|
1,781 |
|
1,478 |
|
1,151 |
|
3,937 |
|
3,855 |
|
3,732 |
SAP Group |
|
13,664 |
|
11,426 |
|
8,701 |
|
26,924 |
|
25,391 |
|
23,361 |
For information about the breakdown of revenue by segment and segment revenue by region, see Note (C.1).
F-18
Remaining Performance Obligations
Amounts of a customer contract’s transaction price that are allocated to the remaining performance obligations represent contracted revenue that has not yet been recognized. They include amounts recognized as contract liabilities and amounts that are contracted but not yet due.
The transaction price allocated to performance obligations that were unsatisfied or partially unsatisfied as at December 31, 2023, was €58.0 billion (December 31, 2022: €46.9 billion). The transaction price thereof allocated to cloud performance obligations that were unsatisfied or partially unsatisfied (total cloud backlog) as at December 31, 2023, was €44.3 billion (December 31, 2022: €32.4 billion). The remaining amount mostly comprises obligations to provide software support services. The vast majority of software support contracts are contracts in the renewal phase that typically have a one-year contract term, while cloud subscription contracts typically are multiple-year contracts. The portion of remaining performance obligations related to services consists of non-cancelable revenue from contracts for projects with a predefined output.
Overall, almost half of the total remaining performance obligations is expected to be recognized over the next 12 months following the respective balance sheet date. This estimate is based on several factors. For example, for certain cloud business models with a contractually agreed spend volume (consumption-based models), judgment is applied on customers’ deployment of the purchased solutions. The amount of the transaction price allocated to the remaining performance obligations, and changes in this amount over time, are impacted by, among others:
- Currency fluctuations
- The contract period of our cloud and software support contracts remaining at the balance sheet date, and thus the timing of contract renewals
Performance Obligations Satisfied in Previous Years
Revenue recognized in the reporting period for performance obligations satisfied in earlier periods was €78 million (December 31, 2022: €81 million), mainly resulting from changes in estimates of variable considerations and changes in estimates related to percentage-of-completion-based contracts.
Contract Balances
The following table presents the activities impacting contract liabilities balances during the year ended December 31, 2023:
Contract Liabilities
€ billions |
|
2023 |
/ 1/1/2023 |
|
5.3 |
Increases resulting from billing and invoices becoming due |
|
11.4 |
Decreases resulting from satisfaction of performance obligations |
|
-11.0 |
Other1 |
|
-0.7 |
/ 12/31/2023 |
|
5.0 |
1 Other includes, for example, the impact of foreign currency translation and business combinations and divestitures.
The amount of revenue recognized in the reporting period that was included in the contract liability balance at the beginning of the reporting period was €4.5 billion (December 31, 2022: €4.1 billion).
F-19
(A.2) Trade and Other Receivables
y Accounting for Trade and Other Receivables |
|
|
Depending on the business model, we measure trade receivables and contract assets from contracts with customers either at amortized cost, or at fair value through other comprehensive income (OCI) less expected credit losses. We account for expected credit losses by recording an allowance on a portfolio basis. We apply the simplified impairment approach. On initial measurement of the receivables, we consider all credit losses that are expected to occur during the lifetime of the receivables. We use a provision matrix to estimate these losses. Additionally, we recognize allowances for individual receivables if there is objective evidence of credit impairment. Account balances are written off either partially or in full if we judge that the likelihood of recovery is remote. For information about how the default risk for trade receivables is analyzed and managed, how the loss rates for the provision matrix are determined, how credit impairment is determined and what our criteria for write-offs are, see the section on credit risk in Note (F.1). In our Consolidated Income Statements, net gains/losses from expected credit loss allowances are included in Other operating income/expense, net. Gains/losses from foreign currency exchange rate fluctuations are included in Other non-operating income/expense, net. Determining our expected credit loss allowance involves significant judgment. In this judgment, we primarily consider our historical experience with credit losses in the respective provision matrix risk class and current data on overdue receivables. We expect that our historical default rates represent a reasonable approximation for future expected customer defaults. Besides historical data, our judgment used in developing the provision matrix considers reasonable and supportable forward-looking information (for example, changes in country risk ratings, and fluctuations in credit default swaps of the countries in which our customers are located). The assessment of whether a receivable is collectible involves the use of judgment and requires us to make assumptions about customer defaults that could change significantly. By applying this judgment, we record an allowance for a specific customer when it is probable that a credit loss has occurred and the amount of the loss is reasonably estimable. Basing the expected credit loss allowance for the remaining receivables primarily on our historical loss experience likewise requires judgment, as history may not be indicative of future development. Also, including reasonable and supportable forward-looking information in the loss rates of the expected credit loss allowance requires judgment, as they may not provide a reliable prediction for future development. |
Trade and Other Receivables
€ millions |
|
2023 |
|
2022 |
||||||||
|
|
Current |
|
Non-Current |
|
Total |
|
Current |
|
Non-Current |
|
Total |
Trade receivables, net |
|
5,892 |
|
5 |
|
5,897 |
|
5,782 |
|
0 |
|
5,782 |
Other receivables |
|
429 |
|
198 |
|
627 |
|
454 |
|
169 |
|
623 |
/ Total |
|
6,321 |
|
203 |
|
6,524 |
|
6,236 |
|
169 |
|
6,405 |
Contract assets are included in Other receivables in our Statement of Financial Position.Contract assets as at December 31, 2023, were €307 million (December 31, 2022: €343 million).
For more information about financial risk, how we manage credit risk, and details of our trade receivables and contract assets allowances, see Note (F.1).
F-20
(A.3) Capitalized Cost from Contracts with Customers
|
|
y Costs of Obtaining Customer Contracts Capitalized costs from customer contracts are classified as Other non-financial assets in our Statement of Financial Position. The capitalized assets for the incremental costs of obtaining a customer contract consist of sales commissions earned by our sales force and partners as well as amounts paid to employees with non-sales roles when the payments meet the definition of being an incremental cost to obtain a contract with a customer. Judgment is required in determining the amounts to be capitalized, particularly where the commissions are based on cumulative targets and where commissions relate to multiple performance obligations in one customer contract. We capitalize such cumulative target commissions for all customer contracts that count towards the cumulative target but only if nothing other than obtaining customer contracts can contribute to achieving the cumulative target. Commissions for contracts with multiple performance obligations or for probable renewals thereof are allocated to these performance obligations and probable renewals relative to the respective standalone selling price. Our sales commission payments for customer contract renewals are typically not commensurate with the commissions paid for new contracts. Thus, the commissions paid for renewable new contracts also relate to expected renewals of these contracts. Consequently, we amortize sales commissions paid for new customer contracts on a straight-line basis over the expected contract life including probable contract renewals. Judgment is required in estimating these contract lives. In exercising this judgment, we consider our expectation about future contract renewals which we evaluate periodically to confirm that the resulting amortization period properly reflects the expected contract life or if there are potential indicators of impairment. Commensurate payments are amortized over the contract term to which they relate. The amortization periods range from 18 months to seven years depending on the type of offering. Amortization of the capitalized costs of obtaining customer contracts is classified mainly as sales and marketing expense. We expense the incremental costs of obtaining a customer contract as incurred if we expect an amortization period of one year or less. The regular review of the amortization periods resulted in a shorter contract life for on-premise support contracts and consequently in an accelerated amortization of costs related to these contracts. This results, for capitalized cost of obtaining customer contracts as of December 31, 2023, in higher amortization expenses amounting to €121 million for 2023 and approximately €80 million for 2024. y Costs to Fulfill Customer Contracts Capitalized costs incurred to fulfill customer contracts mainly consist of direct costs for set-up and implementation of cloud products and custom cloud development contracts as far as these costs are not in scope of other accounting standards than IFRS 15. These costs are amortized after completion of the setup and implementation or the development, respectively, on a straight-line basis over the expected life of the cloud subscription contract including expected renewals. For the life of the contract, we consider our expectation about future contract renewals which we evaluate periodically to confirm that the resulting amortization period properly reflects the expected contract life. The amortization periods range from five to eight years depending on the type of offering. In addition, the capitalized costs include third-party license fees which are amortized over the term of the third-party license contract. Judgment is required in evaluating whether costs are directly related to customer contracts and in estimating contract lives. Amortization of capitalized costs to fulfill contracts for custom cloud applications and extensions is included in the cost of cloud. |
Capitalized Cost from Contracts with Customers
€ millions |
|
2023 |
|
2022 |
||||||||
|
|
Current |
|
Non-Current |
|
Total |
|
Current |
|
Non-Current |
|
Total |
Capitalized cost of obtaining customer contracts |
|
1,046 |
|
2,918 |
|
3,964 |
|
871 |
|
2,812 |
|
3,684 |
Capitalized cost to fulfill customer contracts |
|
199 |
|
236 |
|
436 |
|
164 |
|
206 |
|
370 |
Capitalized contract cost |
|
1,246 |
|
3,154 |
|
4,400 |
|
1,036 |
|
3,019 |
|
4,054 |
/ Other non-financial assets |
|
2,374 |
|
3,573 |
|
5,947 |
|
2,139 |
|
3,580 |
|
5,719 |
Capitalized contract cost as % of / Other non-financial assets |
|
52 |
|
88 |
|
74 |
|
48 |
|
84 |
|
71 |
Amortization Expense
€ millions |
|
2023 |
|
2022 |
Capitalized cost of obtaining customer contracts |
|
1,000 |
|
725 |
Capitalized cost to fulfill customer contracts |
|
327 |
|
243 |
F-21
(A.4) Customer-Related Provisions
y Expected Contract Losses |
|
|
Customer-related provisions mainly include expected contract losses. We adjust these provisions as further information becomes available and as circumstances change. Non-current provisions are measured at the present value of their expected settlement amounts as at the reporting date. The unit of account for the identification of potential onerous customer contracts is based on the contract definition of IFRS 15 including the contract combination guidance. The economic benefits considered in the assessment comprise the future benefits we are directly entitled to under the contract as well as the anticipated future benefits that are the economic consequence of the contract if these benefits can be reliably determined. y Customer-Related Litigation and Claims Customer-related provisions also include obligations resulting from customer-related litigation and claims. We are currently confronted with various claims and legal proceedings, including claims that relate to customers demanding indemnification for proceedings initiated against them based on their use of SAP software, and occasionally claims that relate to customers being dissatisfied with the products and services that we have delivered to them. The obligations arising from customer-related litigation and claims comprise cases in which we indemnify our customers against liabilities arising from a claim that our products infringe a third party’s patent, copyright, trade secret, or other proprietary rights. Due to uncertainties relating to these matters, provisions are based on the best information available. Significant judgment is required in the determination of whether and when a provision is to be recorded and what the appropriate amount for such provision should be. Notably, judgment is required in the following areas: - Determining whether an obligation exists - Determining the probability of outflow of economic benefits - Determining whether the amount of an obligation is reliably estimable - Estimating the amount of the expenditure required to settle the present obligation At the end of each reporting period, we reassess the potential obligations related to our pending claims and litigation and adjust our respective provisions to reflect the current best estimate. In addition, we monitor and evaluate new information that we receive after the end of the respective reporting period, but before the Consolidated Financial Statements are authorized for issue, to determine whether this provides additional information regarding conditions that existed at the end of the reporting period. Changes to the estimates and assumptions underlying our accounting for legal contingencies, and outcomes that differ from these estimates and assumptions, could require material adjustments to the carrying amounts of the respective provisions recorded and additional provisions. The expected timing or amounts of any outflows of economic benefits resulting from these lawsuits and claims are uncertain and not estimable, as they generally depend on the duration of the legal proceedings and settlement negotiations required to resolve the litigation and claims and the unpredictability of the outcomes of legal disputes in several jurisdictions. |
Contingent liabilities exist in respect of customer-related litigation and claims for which no provision has been recognized. It is not practicable to estimate the financial impact of these contingent liabilities due to the uncertainties around these lawsuits and claims as outlined above.
F-22
Section B — Employees
This section provides financial insights into our employee benefit arrangements. It should be read in conjunction with the compensation disclosures for key management personnel in Note (G.5).
(B.1) Employee Headcount
The following table provides an overview of employee headcount, broken down by function and by the regions EMEA (Europe, Middle East, and Africa), Americas (North America and Latin America), and APJ (Asia Pacific Japan).
Employee Headcount by Region and Function
Full-time equivalents |
|
12/31/2023 |
|
12/31/2022 |
|
12/31/2021 |
||||||||||||||||||
|
|
EMEA |
|
Americas |
|
APJ |
|
Total |
|
EMEA |
|
Americas |
|
APJ |
|
Total |
|
EMEA |
|
Americas |
|
APJ |
|
Total |
Cloud and software1 |
|
4,389 |
|
4,266 |
|
4,426 |
|
13,080 |
|
4,178 |
|
4,025 |
|
4,538 |
|
12,740 |
|
4,551 |
|
4,191 |
|
4,406 |
|
13,148 |
Services |
|
8,178 |
|
5,013 |
|
5,481 |
|
18,672 |
|
8,129 |
|
5,106 |
|
5,769 |
|
19,005 |
|
8,095 |
|
5,053 |
|
5,864 |
|
19,012 |
Research and development1 |
|
18,086 |
|
5,884 |
|
12,474 |
|
36,444 |
|
17,764 |
|
5,752 |
|
11,764 |
|
35,280 |
|
16,487 |
|
5,641 |
|
11,248 |
|
33,377 |
Sales and marketing |
|
12,086 |
|
10,300 |
|
5,342 |
|
27,728 |
|
11,671 |
|
10,633 |
|
5,463 |
|
27,766 |
|
10,721 |
|
10,186 |
|
5,183 |
|
26,090 |
General and administration |
|
3,619 |
|
1,777 |
|
1,307 |
|
6,704 |
|
3,387 |
|
1,804 |
|
1,240 |
|
6,431 |
|
3,278 |
|
1,866 |
|
1,164 |
|
6,308 |
Infrastructure |
|
2,834 |
|
1,274 |
|
867 |
|
4,975 |
|
2,795 |
|
1,382 |
|
912 |
|
5,089 |
|
2,602 |
|
1,299 |
|
821 |
|
4,722 |
SAP Group (December 31) |
|
49,191 |
|
28,515 |
|
29,897 |
|
107,602 |
|
47,924 |
|
28,702 |
|
29,686 |
|
106,312 |
|
45,734 |
|
28,236 |
|
28,687 |
|
102,658 |
Thereof acquisitions |
|
421 |
|
138 |
|
0 |
|
558 |
|
188 |
|
189 |
|
8 |
|
385 |
|
377 |
|
44 |
|
44 |
|
465 |
SAP Group (months' end average) |
|
48,222 |
|
28,239 |
|
29,582 |
|
106,043 |
|
47,359 |
|
28,785 |
|
29,438 |
|
105,582 |
|
44,622 |
|
27,822 |
|
28,009 |
|
100,453 |
1 Due to the updated cost allocation policy described in Note (IN.1), headcount numbers for the comparative period were adjusted accordingly.
(B.2) Employee Benefits Expenses
€ millions |
|
2023 |
|
2022 |
|
2021 |
Salaries |
|
12,128 |
|
11,369 |
|
10,120 |
Social security expenses |
|
1,919 |
|
1,779 |
|
1,516 |
Share-based payment expenses |
|
2,220 |
|
1,431 |
|
1,334 |
Pension expenses |
|
438 |
|
447 |
|
390 |
Employee-related restructuring expenses |
|
222 |
|
85 |
|
25 |
Termination benefits outside of restructuring plans |
|
64 |
|
44 |
|
101 |
Employee benefits expenses |
|
16,992 |
|
15,157 |
|
13,487 |
F-23
(B.3) Share-Based Payments
y Accounting for Share-Based Payments |
|
Classification in the Income Statement |
|
|
Share-based payments cover equity-settled and cash-settled awards issued to our employees. The respective expenses are recognized as employee benefits and classified in our Consolidated Income Statements according to the activities that the receiving employees perform. Valuation, Judgment, and Sources of Estimation Uncertainty We use certain assumptions in estimating the fair values for our share-based payments, including expected share price volatility and expected dividend yields. In addition, the final number of Performance Share Units (PSUs) vesting also depends on the achievement of performance indicators. Furthermore, the payout for cash-settled share units depends on our share price on the respective vesting dates. Changes to these assumptions and outcomes that differ from these assumptions could require material adjustments to the carrying amount of the liabilities we have recognized for these share-based payments. The fair value of the share units granted under the SAP Long-Term Incentive Program 2020 (LTI 2020) is dependent on our performance against the total shareholder return (TSR) for NASDAQ-100 companies, the volatility, and the expected correlation between the TSR of the NASDAQ-100 companies and our TSR. Regarding future payout under our cash-settled plans, the SAP share price is the most relevant factor. With respect to our LTI 2020, we believe that future payout will be significantly impacted not only by our share price but also by the relative TSR performance against the NASDAQ-100 companies. Future payouts under our LTI 2020 will also be dependent on meeting non-market-based performance conditions based on SAP's long-term strategy. The latter, however, is not incorporated into our fair value calculation but leads to adjustments of the quantity of awards granted. Changes in these factors could significantly affect the estimated fair values as calculated by the valuation model, and the future payout. Under the OWN SAP share purchase plan, we grant our employees discounts on share purchases. As those discounts are not dependent on future services to be provided by our employees, the discount is recognized as an expense when the discounts are granted. Presentation in the Statements of Cash Flows We present the payments of our cash-settled share-based payment plans separately in our Statements of Cash Flows under Cash flows from operating activities. As a result, the changes in other assets and in other liabilities presented in the reconciliation of operating cash flow do not consider share-based payment-related assets or liabilities. |
The operating expense line items in our income statement include the following share-based payment expenses:
Share-Based Payment Expenses by Functional Area
€ millions |
|
2023 |
|
2022 |
|
2021 |
Cost of cloud |
|
94 |
|
53 |
|
51 |
Cost of software licenses and support |
|
38 |
|
48 |
|
49 |
Cost of services |
|
375 |
|
250 |
|
233 |
Research and development |
|
703 |
|
440 |
|
402 |
Sales and marketing |
|
834 |
|
503 |
|
513 |
General and administration |
|
175 |
|
137 |
|
87 |
Share-based payment expenses |
|
2,220 |
|
1,431 |
|
1,334 |
Thereof cash-settled share-based payments |
|
806 |
|
356 |
|
1,136 |
Thereof equity-settled share-based payments |
|
1,414 |
|
1,075 |
|
199 |
Share-based payment expenses related to the Qualtrics plan are included in the results from discontinued operations (for more information, see Note (D.1)).
Our major share-based payment plans are described below.
Equity-Settled Move SAP Plan (Move)
Starting in 2022, we decided to grant share units under Move that we intend to predominantly settle in shares instead of cash. For more information about the terms and conditions of the cash-settled Move, see section b) Cash-Settled Share-Based Payments in this Note (B.3).
F-24
Different vesting schedules apply to specific share units. Granted share units will vest in different tranches mainly as follows:
| - | Restricted Stock Units (RSUs) with service condition only |
| - | Over a half-year period, |
| - | Over a three-year period on a quarterly basis after a waiting period of six months, or |
| - | Performance Share Units (PSUs) with service condition and upon achieving certain key performance indicators (KPIs) |
| - | Over a one-year period, |
| - | Over a three-year period on a quarterly basis after a waiting period of 12 months. |
The number of PSUs that will vest under the different tranches is mainly contingent upon achievement of two equally weighted KPIs in the year of grant: Operating profit (non-IFRS at constant currencies) and Cloud revenue (at constant currencies). Depending on the weighted average performance, the number of PSUs vesting ranges between 0% and 200% of the number initially granted. Performance against the KPI target was 112.4% in 2023 (2022: 84.3)%.
We intend to settle the share units classified as equity-settled by reissuing treasury shares upon vesting (for more information, see Note (E.2)).
The valuation was based on the following parameters and assumptions:
Fair Value and Parameters Used at Grant Date in 2023
|
|
Move |
€, unless otherwise stated |
|
(2022–2023 Tranches) |
Weighted average fair value as at grant date |
|
111.23 |
Information how fair value was measured at grant date |
|
|
Valuation model used |
|
Other1 |
Weighted average share price |
|
114.25 |
Weighted average expected dividend yield (in %) |
|
1.79 |
Weighted average initial life at grant date (in years) |
|
1.7 |
Weighted average remaining life of awards outstanding as at 12/31/2023 (in years) |
|
1.1 |
1 For these awards, the fair value is calculated by subtracting expected future dividends, if any, until maturity of the respective award from the prevailing share price as at the measurement date.
Fair Value and Parameters Used at Grant Date in 2022
€, unless otherwise stated |
|
Move |
|
|
(2022 Tranches) |
Weighted average fair value as at grant date |
|
93.80 |
Information how fair value was measured at grant date |
|
|
Valuation model used |
|
Other1 |
Weighted average share price |
|
97.61 |
Weighted average expected dividend yield (in %) |
|
2.43 |
Weighted average initial life at grant date (in years) |
|
1.6 |
Weighted average remaining life of awards outstanding as at 12/31/2022 (in years) |
|
1.2 |
1 For these awards, the fair value is calculated by subtracting expected future dividends, if any, until maturity of the respective award from the prevailing share price as at the measurement date.
F-25
Changes in Outstanding Awards
|
|
Move |
Thousands, unless otherwise stated |
|
(2022-2023 Tranches) |
12/31/2021 |
|
NA |
Granted2 |
|
15,371 |
Adjustment based upon KPI target achievement |
|
-139 |
Exercised |
|
-3,258 |
Forfeited |
|
-470 |
12/31/2022 |
|
11,504 |
Granted2 |
|
13,760 |
Adjustment based upon KPI target achievement |
|
115 |
Exercised |
|
-7,675 |
Forfeited |
|
-403 |
Change in settlement2 |
|
-471 |
12/31/2023 |
|
16,830 |
2 We have changed the classification of some share units granted under the Move plan with the initial intention to settle in shares from equity-settled to cash-settled because a cash outflow became probable. Share units with switched classification are considered in the number of granted share units.
The weighted average share price for awards exercised in 2023 was € 130.59 (2022: €92.00).
Own SAP Plan (Own)
Under the share purchase plan Own, employees have the opportunity to purchase, on a monthly basis, SAP shares without any required holding period. The investment per each eligible employee is limited to a percentage of the respective employee's monthly base salary. SAP matches the employee investment by 40% and adds a subsidy of €20 per month for non-executives. As part of SAP’s 50th anniversary celebration, SAP’s contribution was temporarily doubled from 40% to 80% from January to March 2022, contributing to the peak in 2022. This plan is not open to members of the Executive Board.
Numbers of Shares Purchased
Millions |
|
2023 |
|
2022 |
|
2021 |
Own |
|
6.5 |
|
9.2 |
|
5.7 |
As a result of Own, we have commitments to grant SAP shares to employees. We have fulfilled and intend to continue to meet these commitments through an agent who administers the equity-settled programs and purchases shares on the open market.
Recognized Expense
€ millions |
|
2023 |
|
2022 |
|
2021 |
Own |
|
239 |
|
307 |
|
200 |
Move (2022–2023 Tranches) |
|
1,175 |
|
768 |
|
NA |
Total |
|
1,414 |
|
1,075 |
|
200 |
Cash-Settled Move SAP Plan (Move) Including Grow SAP Plan
To retain and engage executives and certain employees, we grant share units under Move representing a contingent right to receive a cash payment determined by the SAP share price and the number of share units that ultimately vest. Since 2022, we intend to settle share units granted from then on predominantly in shares. For more information about the terms and conditions of the equity-settled Move, see section a) Equity-Settled Share-Based Payments in this Note (B.3). Obligations from outstanding share units granted before 2022 will continue to be settled in cash.
From 2020 to 2023, we granted share units under the Grow SAP Plan that we intend to settle in cash. This fixed term plan has broadly the same terms and conditions as Move and recognizes all employees’ commitment to SAP’s success, and deepens their participation in our future company performance.
F-26
Different vesting schedules apply to specific share units. Granted share units under the respective plans will vest in different tranches, mainly as follows:
–Restricted Stock Units (RSUs) with service condition only
| - | Over a half-year period, |
| - | Over a three-year period on annual basis, |
| - | Over a three-year period on a quarterly basis after a waiting period of six months, or |
–Performance Share Units (PSUs) with service condition and upon achieving certain key performance indicators (KPIs)
| - | Over a three-year period, or |
| - | Over a three-year period on a quarterly basis after a waiting period of 12 months. |
The number of PSUs that will vest under the different tranches is mainly contingent upon achievement of two equally weighted KPIs in the year of grant: operating profit (non-IFRS at constant currencies) and cloud revenue (at constant currencies). Depending on the weighted average performance, the number of PSUs vesting ranges between 0% and 200% of the number initially granted. Performance against the KPI target was 112.4% in 2023 (2022: 84.3%, 2021: 130.9%).
The share units classified as cash-settled are paid out in cash upon vesting.
SAP Long-Term Incentive Program 2020 (LTI 2020)
The LTI 2020 is a long-term, multiyear performance-based element of our Executive Board compensation that is granted in annual tranches. The LTI 2020 reflects SAP’s long-term strategy and thus sets uniform incentives to achieve key targets from the long-term strategic plans. The LTI 2020 also serves to reward the Executive Board members for long-term SAP share price performance as compared to the market, thus ensuring that shareholders’ interests are also honored. In addition, the LTI 2020 includes a component to ensure long-term retention of our Executive Board members.
The LTI 2020 is a virtual share program under which annual tranches with a term of approximately four years each are granted. When the individual tranches are granted, a certain grant amount specified in the Executive Board member’s service contract is converted into virtual shares (share units). For this purpose, the grant amount is divided by the price of the SAP share which corresponds to the arithmetic mean of the SAP share price on the 20 trading days after scheduled publication of the preliminary results for the fourth quarter and the year as a whole (grant price). The share units allocated are composed of 1/3 Financial Performance Share Units (FSUs), 1/3 Market Performance Share Units (MSUs), and 1/3 Retention Share Units. All three types of share units have a vesting period of approximately four years. In contrast to Retention Share Units, FSUs and MSUs are subject to changes in quantity. In this context, the following applies:
The number of FSUs initially awarded is multiplied by a performance factor. The performance factor consists of three equally weighted individual performance indicators relating to the three non-IFRS KPIs at constant currencies,derived from SAP’s long-term strategy: total revenue, cloud revenue, and operating income. The performance period throughout which the target achievement for these three KPIs is measured starts at the beginning of the financial year in which the FSUs are awarded and concludes upon the end of the second year following the year in which the share units were awarded. A numerical target value equaling 100% target achievement is set for each KPI. This constitutes, in each case, a cumulative value for the three years of the performance period.
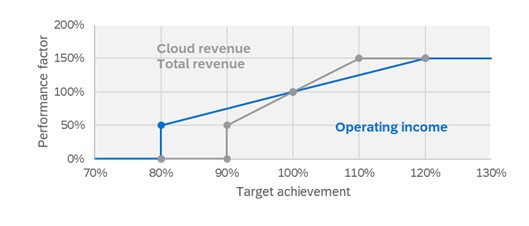
F-27
The number of MSUs initially awarded is likewise multiplied by a performance factor. The performance factor depends on the amount of the TSR on the SAP share, measured for an entire performance period of approximately three years, compared to the TSR for NASDAQ-100 companies. If the TSR on the SAP share equals the median, the performance factor will be 100%. If the TSR on the SAP share over the performance period is negative, the maximum performance factor will, however, in deviation from the summary above, be 100%.
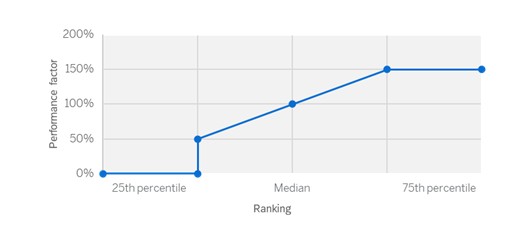
The performance of the share units is linked to the performance of the SAP share price, including dividend payments. Accordingly, an amount is paid out for each share unit which equals the SAP share price plus those dividends disbursed in respect of an SAP share in the period from the beginning of the year in which the share units were awarded until the end of the third year following the year in which the share units were awarded. The arithmetic mean of the SAP share price on the 20 trading days after scheduled publication of the preliminary results for the fourth quarter and the year as a whole will be used as the SAP share price. The payout amount per share unit, including the dividend amounts due on the share units, is capped at 200% of the grant price. The tranche is cash-settled and paid in euros after the Annual General Meeting of Shareholders of the corresponding year.
If an Executive Board member’s service contract is terminated before the end of the third year following the year in which the share units were granted, the Retention Share Units and PSUs are forfeited in whole or in part, depending on the circumstances of the relevant resignation from office or termination of the service contract.
Long-Term Incentive 2016 Plan (LTI 2016 Plan)
The purpose of the LTI 2016 Plan was to reward our Executive Board members for the annual achievement of SAP’s Operating profit (non-IFRS at constant currencies) targets, to ensure long-term retention of our Executive Board members, and to reward them for the long-term SAP share price performance as compared to its main peer group (Peer Group). An LTI tranche was granted annually and had a term of four years (2016–2019 tranches).
All share units granted in this way, comprising 60% PSUs and 40% Retention Share Units, had a vesting period of approximately four years. At the end of the vesting period, the corresponding share units were non-forfeitable. The payout price used for the settlement was the arithmetic mean of the XETRA closing prices of the SAP share on the 20 trading days following the publication of SAP’s fourth-quarter results subsequent to the end of the vesting period. The payout price was capped at 300% of the grant price. The number of PSUs ultimately paid out was dependent on the performance of the SAP share – absolute and relative to the Peer Group Index. The LTI tranche was cash-settled and paid in euros after the Annual General Shareholders’ Meeting of the corresponding year. The last LTI tranche 2019 was paid out in 2023.
F-28
The valuation was based on the following parameters and assumptions:
Fair Value and Parameters Used at Year End 2023
€, unless otherwise stated |
|
LTI 2020 |
|
Move |
|
|
(2020-2023 |
|
(2020–2023 |
|
|
Tranches) |
|
Tranches) |
Weighted average fair value as at 12/31/2023 |
|
154.24 |
|
137.98 |
Information how fair value was measured at measurement date |
|
|
|
|
Valuation model used |
|
Monte Carlo |
|
Other3 |
Share price |
|
139.48 |
|
139.48 |
Expected volatility (in %) |
|
15 to 23 |
|
NA |
Expected dividend yield (in %) |
|
NA |
|
1.52 |
Weighted average remaining life of awards outstanding as at 12/31/2023 (in years) |
|
1.9 |
|
0.7 |
3 For these awards, the fair value is calculated by subtracting expected future dividends, if any, until maturity of the respective award from the prevailing share price as at the measurement date.
Fair Value and Parameters Used at Year End 2022
€, unless otherwise stated |
|
LTI 2020 |
|
Move |
|
|
(2020 -2022 |
|
(2019-2022 |
|
|
Tranches) |
|
Tranches) |
Weighted average fair value as at 12/31/2022 |
|
94.83 |
|
94.78 |
Information how fair value was measured at measurement date |
|
|
|
|
Valuation model used |
|
Monte Carlo |
|
Other3 |
Share price |
|
96.39 |
|
96.39 |
Expected volatility (in %) |
|
24 to 31 |
|
NA |
Expected dividend yield (in %) |
|
NA |
|
2.03 |
Weighted average remaining life of awards outstanding as at 12/31/2022 (in years) |
|
2.3 |
|
0.8 |
3 For these awards, the fair value is calculated by subtracting expected future dividends, if any, until maturity of the respective award from the prevailing share price as at the measurement date.
For the LTI 2020 valuation, the NASDAQ-100 Total Return Index on December 31, 2023, was US$20,158.42 (2022: US$12,994.57). The expected volatility of the NASDAQ-100 companies of 34% to 36% (2022: 36% to 41%), and the expected correlation of SAP and the NASDAQ-100 companies of 24% to 27% (2022: 26% to 32%) are based on historical TSR data for SAP and the NASDAQ-100 companies.
The risk-free interest rate is derived from German government bonds with a similar duration. The SAP dividend yield is based on expected future dividends.
F-29
Changes in Outstanding Awards
Thousands, unless otherwise stated |
|
LTI 2020 |
|
Move |
|
|
(2020–2023 |
|
(2019–2023 |
|
|
Tranches) |
|
Tranches) |
12/31/2021 |
|
340 |
|
18,783 |
Granted4 |
|
206 |
|
2,997 |
Adjustment based upon KPI target achievement |
|
NA |
|
-36 |
Exercised |
|
0 |
|
-8,869 |
Forfeited |
|
0 |
|
-1,016 |
12/31/2022 |
|
546 |
|
11,859 |
Granted4 |
|
215 |
|
1,900 |
Adjustment based upon KPI target achievement |
|
-64 |
|
-57 |
Exercised |
|
0 |
|
-7,234 |
Forfeited |
|
-91 |
|
-266 |
Change in settlement4 |
|
NA |
|
470 |
12/31/2023 |
|
605 |
|
6,672 |
|
|
|
|
|
Total carrying amount (in € millions) of liabilities as at |
|
|
|
|
12/31/2022 |
|
23 |
|
752 |
12/31/2023 |
|
59 |
|
644 |
|
|
|
|
|
Total intrinsic value of vested awards (in € millions) as at |
|
|
|
|
12/31/2022 |
|
3 |
|
0 |
12/31/2023 |
|
15 |
|
0 |
|
|
|
|
|
Weighted average share price (in €) for awards exercised in |
|
|
|
|
2022 |
|
NA |
|
97.35 |
2023 |
|
NA |
|
117.86 |
|
|
|
|
|
Total expense (in € millions) recognized in |
|
|
|
|
2021 |
|
9 |
|
1,139 |
2022 |
|
8 |
|
346 |
2023 |
|
36 |
|
764 |
4 We have changed the classification of some share units granted under the Move plan with the initial intention to settle in shares from equity-settled to cash-settled because a cash outflow became probable. Share units with switched classification are considered in the number of granted share units.
Share-Based Payment Balances
€ millions |
|
2023 |
|
2022 |
||||||||
|
|
Current |
|
Non-Current |
|
Total |
|
Current |
|
Non-Current |
|
Total |
Share-based payment liabilities |
|
555 |
|
152 |
|
707 |
|
524 |
|
279 |
|
803 |
/ Other non-financial liabilities |
|
5,648 |
|
698 |
|
6,346 |
|
4,818 |
|
705 |
|
5,523 |
Share-based payment liabilities as % of / Other non-financial liabilities |
|
10 |
|
22 |
|
11 |
|
11 |
|
40 |
|
15 |
F-30
(B.4) Pension Plans and Similar Obligations
y Defined Contribution Plans |
|
|
Amounts for domestic and foreign defined contribution plans are based on a percentage of the employees’ salaries or on the amount of contributions made by employees. In Germany and some other countries, we make contributions to public pension schemes that are operated by national or local government or similar institutions. Expenses for such local state pension plans are recognized as short-term employee benefits, that is, social security expenses. y Defined Benefit Pension Plans The discount rates used in measuring our post-employment benefit assets and liabilities are derived from rates available on high-quality corporate bonds and government bonds for which the timing and amounts of payments match the timing and the amounts of our projected pension payments. Net interest expense and other expenses related to defined benefit plans are recognized as employee benefits expenses and classified in our Consolidated Income Statements according to the activities that the employees owning the awards perform. Since our domestic defined benefit pension plans primarily consist of an employee-financed post-retirement plan that is fully financed with qualifying insurance policies, current service cost may become a credit as a result of adjusting the defined benefit liability’s carrying amount to the fair value of the qualifying plan assets. Such adjustments are recorded in service cost. Total expenses on defined benefit pension plans comprise related current and past service costs as well as interest income and expense. |
Total Expense of Pension Plans
€ millions |
|
2023 |
|
2022 |
|
2021 |
Defined contribution plans |
|
381 |
|
425 |
|
328 |
Defined benefit pension plans |
|
57 |
|
22 |
|
62 |
Pension expenses |
|
438 |
|
447 |
|
390 |
Defined Benefit Plans
Present Value of the Defined Benefit Obligations (DBO) and the Fair Value of the Plan Assets
|
|
Domestic Plans |
|
Foreign Plans |
|
Other Foreign Post- |
|
Total |
||||||||
€ millions |
|
|
|
|
|
Employment Plans |
|
|
||||||||
|
|
2023 |
|
2022 |
|
2023 |
|
2022 |
|
2023 |
|
2022 |
|
2023 |
|
2022 |
Present value of the DBO |
|
1,060 |
|
949 |
|
686 |
|
577 |
|
256 |
|
211 |
|
2,002 |
|
1,737 |
Fair value of the plan assets |
|
1,063 |
|
953 |
|
672 |
|
579 |
|
98 |
|
91 |
|
1,833 |
|
1,623 |
Net defined benefit liability (asset)1 |
|
0 |
|
0 |
|
64 |
|
57 |
|
158 |
|
120 |
|
222 |
|
177 |
Thereof: Net defined benefit asset |
|
0 |
|
0 |
|
-17 |
|
-16 |
|
-63 |
|
0 |
|
-79 |
|
-16 |
Net defined benefit liability |
|
0 |
|
0 |
|
80 |
|
73 |
|
221 |
|
120 |
|
301 |
|
193 |
|
|
|
|
|
|
|
|
|
|
|
|
|
|
|
|
|
Net defined benefit asset as % of / Non-current other financial assets |
|
0 |
|
0 |
|
0 |
|
0 |
|
1 |
|
0 |
|
1 |
|
0 |
Net defined benefit liability as % of / Non-current provisions |
|
0 |
|
0 |
|
19 |
|
20 |
|
51 |
|
33 |
|
69 |
|
54 |
¹ After the effects of the asset ceiling
Of the present value of the DBO of our domestic plans, €1,006 million (2022: €899 million) relate to plans that provide for lump-sum payments not based on final salary; of the present value of the DBO of our foreign plans, €535 million (2022: €448 million) relate to plans that provide for annuity payments not based on final salary.
The following significant weighted average assumptions were used for the actuarial valuation of our domestic and foreign pension liabilities as well as other post-employment benefit obligations as at the respective measurement date:
Significant Actuarial Assumptions
Percent |
|
Domestic Plans |
|
Foreign Plans |
|
Other Foreign Post-Employment Plans |
||||||||||||
|
|
2023 |
|
2022 |
|
2021 |
|
2023 |
|
2022 |
|
2021 |
|
2023 |
|
2022 |
|
2021 |
Discount rate |
|
3.5 |
|
4.2 |
|
1.2 |
|
2.0 |
|
2.6 |
|
0.5 |
|
5.3 |
|
5.5 |
|
3.1 |
F-31
The sensitivity analysis table below shows how the present value of all defined benefit obligations would have been influenced by reasonably possible changes to significant actuarial assumptions. The sensitivity analysis considers change in discount rate assumptions, holding all other actuarial assumptions constant.
Sensitivity Analysis
€ millions |
|
Domestic Plans |
|
Foreign Plans |
|
Other Foreign Post-Employment Plans |
|
Total |
||||||||||||||||
|
|
2023 |
|
2022 |
|
2021 |
|
2023 |
|
2022 |
|
2021 |
|
2023 |
|
2022 |
|
2021 |
|
2023 |
|
2022 |
|
2021 |
Present value of all defined benefit obligations if: |
|
|
|
|
|
|
|
|
|
|
|
|
|
|
|
|
|
|
|
|
|
|
|
|
Discount rate was 50 basis points higher |
|
1,015 |
|
908 |
|
1,134 |
|
649 |
|
505 |
|
626 |
|
247 |
|
203 |
|
203 |
|
1,911 |
|
1,616 |
|
1,964 |
Discount rate was 50 basis points lower |
|
1,108 |
|
993 |
|
1,260 |
|
727 |
|
562 |
|
714 |
|
266 |
|
219 |
|
223 |
|
2,101 |
|
1,774 |
|
2,196 |
Investments in Plan Assets
Our investment strategy on domestic benefit plans is to invest all contributions in stable insurance policies.
Our investment strategies for foreign benefit plans vary according to the conditions in the country in which the respective benefit plans are situated. We have adopted a long-term investment horizon for all major foreign benefit plans. Although our policy is to invest in a risk-diversified portfolio consisting of a mix of assets, both the defined benefit obligation and plan assets can fluctuate over time, which exposes the Group to actuarial and market (investment) risks. Depending on the statutory requirements in each country, it might be necessary to reduce any underfunding by addition of liquid assets.
Plan Asset Allocation
€ millions |
|
2023 |
|
2022 |
||||
|
|
Quoted in an |
|
Not Quoted in an |
|
Quoted in an |
|
Not Quoted in an |
|
|
Active Market |
|
Active Market |
|
Active Market |
|
Active Market |
Total plan assets |
|
714 |
|
1,120 |
|
611 |
|
1,012 |
Thereof: Asset category |
|
|
|
|
|
|
|
|
Equity investments |
|
190 |
|
0 |
|
170 |
|
0 |
Corporate bonds |
|
233 |
|
0 |
|
190 |
|
0 |
Insurance policies |
|
59 |
|
1,120 |
|
41 |
|
1,012 |
Our expected contribution in 2024 to our domestic and foreign defined benefit pension plans is immaterial. The weighted duration of our defined benefit plans amounted to 10 years as at December 31, 2023 and 2022.
Total future benefit payments from our defined benefit plans as at December 31, 2023, are expected to be €2,707 million (2022: €2,404 million). Of this amount, 76% (2022: 76%) have maturities of over five years, and 55% (2022: 61%) relate to domestic plans.
(B.5) Other Employee-Related Obligations
y Accounting Policy |
As far as the obligation for long-term employee benefits is secured by pledged reinsurance coverage, it is offset with the relating plan asset. |
Other Employee-Related Liabilities
€ millions |
|
2023 |
|
2022 |
||||||||
|
|
Current |
|
Non-Current |
|
Total |
|
Current |
|
Non-Current |
|
Total |
Other employee-related liabilities |
|
4,205 |
|
546 |
|
4,751 |
|
3,632 |
|
426 |
|
4,058 |
/ Other non-financial liabilities |
|
5,648 |
|
698 |
|
6,346 |
|
4,818 |
|
705 |
|
5,523 |
Other employee-related liabilities as % of / Other non-financial liabilities |
|
74 |
|
78 |
|
75 |
|
75 |
|
60 |
|
73 |
Other employee-related liabilities mainly relate to obligations from bonuses and sales commissions, outstanding vacation, time credits accumulated in the working time account, employee-related social security expenses, severance payments outside restructuring programs, and jubilee expenses.
F-32
(B.6) Restructuring
y Recognition of Restructuring Provisions |
|
|
We only recognize provisions for restructuring if and when the following occurs: - SAP has designed a program that materially changes the scope of one of our businesses or the manner in which the business is conducted, and - A detailed and documented restructuring plan has been approved by our Executive Board, a member thereof, or a direct report of an Executive Board member, and - The program established is planned to start shortly after the program plan is approved and is expected to be completed in a timeframe that makes significant changes to the plan unlikely, and - The program has been announced to the parties affected or has commenced. We consider whether a change in business is material based on the business affected rather than for SAP as a whole. In judging whether a unit qualifies as a business for restructuring purposes, we consider if the unit has its own management team, has access to all inputs and processes necessary to provide outputs, and generates or could generate revenues. The materiality of a change to a business is assessed based on both the size and the nature of the change and therefore does not necessarily involve a material quantitative impact on our financial statements. |
Restructuring Expenses
€ millions |
|
2023 |
|
2022 |
|
2021 |
Employee-related restructuring expenses |
|
-222 |
|
-85 |
|
-25 |
Onerous contract-related restructuring expenses and restructuring-related impairment losses |
|
8 |
|
-52 |
|
-132 |
Restructuring expenses |
|
-215 |
|
-138 |
|
-157 |
Most of the restructuring expenses recognized in 2023 relate to the targeted restructuring program in selected areas of the company that SAP announced and launched in the first quarter of 2023 to further focus on its strategic growth areas and accelerated cloud transformation. Restructuring expenses primarily include employee-related benefits such as severance payments. The restructuring costs presented in 2022 mainly include expenses related to the wind-down of business in Russia and Belarus.
If not presented separately in our income statement, restructuring expenses would have been classified in the different expense items in our income statement as follows:
Restructuring Expenses by Functional Area
€ millions |
|
2023 |
|
2022 |
|
2021 |
Cost of cloud |
|
7 |
|
20 |
|
-127 |
Cost of software licenses and support |
|
-8 |
|
-9 |
|
-6 |
Cost of services |
|
-31 |
|
-70 |
|
-13 |
Research and development |
|
-42 |
|
-16 |
|
-12 |
Sales and marketing |
|
-121 |
|
-58 |
|
3 |
General and administration |
|
-19 |
|
-4 |
|
-2 |
Restructuring expenses |
|
-215 |
|
-138 |
|
-157 |
F-33
Section C — Financial Results
This section provides insight into the financial results of SAP's reportable segments and of SAP overall as far as not already covered by previous sections. This includes but is not limited to segment results, income taxes, and earnings per share.
(C.1) Results of Segments
General Information
At year end 2023, SAP had five operating segments that are regularly reviewed by the Executive Board, which is responsible for assessing the performance of the Company and for making resource allocation decisions as our chief operating decision-maker (CODM). The operating segments are largely organized and managed separately according to their product and service offerings. The Applications, Technology & Services (ATS) segment is SAP's only reportable segment.
In the first quarter of 2023, the non-reportable SAP Signavio segment was dissolved and integrated into the Applications, Technology & Services segment.
At the end of the second quarter of 2023, we sold our stake in Qualtrics, a formerly reportable segment. For more information about the sale of Qualtrics, see Note (D.1).
Due to their size, the following segments are non-reportable:
- The Emarsys segment derives its revenues mainly from the sale of cloud-based customer experience offerings and from the sale of related services.
- The Taulia segment derives its revenues mainly from the sale of working capital solutions.
- The Business Network segment combines SAP’s network offerings, covering procurement, logistics, asset management, and industry-specific solutions spanning end-to-end value chains. The segment generates revenues from cloud application subscriptions, transactional fees, and services.
- The Sustainability segment bundles a portfolio of sustainability-related solutions that enables SAP’s customers to record and report financial and non-financial metrics and act on improving their sustainability footprint across all ESG (Environmental, Social, and Governance) dimensions.
The segment information for 2023 and the comparative prior periods were restated to conform with the new segment composition.
F-34
y Segment Reporting Policies |
|
|
Our management reporting system, and hence our segment reporting system, reports our intersegment services as cost reductions and does not track them as internal revenue. Intersegment services mainly represent utilization of human resources of one segment by another segment on a project basis. Intersegment services are charged based on internal cost rates including certain indirect overhead costs but excluding a profit margin. Most of our depreciation and amortization expense affecting segment profits is allocated to the segments as part of broader infrastructure allocations and is thus not tracked separately on the operating segment level. Other depreciation and amortization expense is directly allocated to the operating segments. Our management reporting system produces a variety of reports that differ by the currency exchange rates used in the accounting for foreign-currency transactions and operations, where both actual and constant currency numbers are reported to and used by our CODM. Reports based on actual currencies use the same currency rates as are used in our financial statements. Reports based on constant currencies report revenues and expenses using the average exchange rates from the previous year’s corresponding period. We use an operating profit indicator to measure the performance of our operating segments. The accounting policies applied in the measurement of operating segment expenses and profit differ as follows from the IFRS accounting principles used to determine the operating profit measure in our income statement: The expense measures exclude: -
Acquisition-related charges such as amortization expense and impairment charges for intangibles acquired in business combinations, including goodwill impairment charges, and certain stand-alone acquisitions of intellectual property (including purchased in-process research and development) as well as sale/disposal gains and losses for these intangibles, settlements of pre-existing business relationships in connection with a business combination, and acquisition-related third-party expenses
-
Share-based payment expenses
-
Restructuring expenses
-
Regulatory compliance matter expenses
SAP headquarter functions which are exclusively managed on corporate level, such as finance, accounting, legal, human resources, global business operations, and corporate marketing, are not included in the results of our reportable segments. Revenues and expenses of our operating but non-reportable segments, and the certain activities managed on corporate level, as outlined above, are presented under the Other revenue and Other expenses items in the reconciliation in Note (C.2). Information about assets and liabilities and additions to non-current assets by segment is not regularly provided to our Executive Board. Goodwill by segment is disclosed in Note (D.2). |
F-35
Applications, Technology & Services
€ millions |
|
2023 |
|
2022 |
|
2021 |
||||
|
|
Actual |
|
Constant |
|
Actual |
|
Constant |
|
Actual |
|
|
Currency |
|
Currency1 |
|
Currency |
|
Currency1 |
|
Currency |
Cloud |
|
12,538 |
|
12,903 |
|
10,428 |
|
9,754 |
|
7,941 |
Software licenses |
|
1,764 |
|
1,801 |
|
2,056 |
|
1,972 |
|
3,248 |
Software support |
|
11,495 |
|
11,781 |
|
11,908 |
|
11,363 |
|
11,411 |
Software licenses and support |
|
13,259 |
|
13,582 |
|
13,964 |
|
13,335 |
|
14,659 |
Cloud and software |
|
25,797 |
|
26,485 |
|
24,392 |
|
23,089 |
|
22,600 |
Services |
|
4,260 |
|
4,369 |
|
4,104 |
|
3,872 |
|
3,570 |
Total segment revenue |
|
30,057 |
|
30,853 |
|
28,496 |
|
26,961 |
|
26,170 |
Cost of cloud |
|
-3,693 |
|
-3,779 |
|
-3,355 |
|
-3,073 |
|
-2,696 |
Cost of software licenses and support |
|
-1,277 |
|
-1,299 |
|
-1,331 |
|
-1,248 |
|
-1,431 |
Cost of cloud and software |
|
-4,971 |
|
-5,078 |
|
-4,686 |
|
-4,322 |
|
-4,127 |
Cost of services |
|
-2,981 |
|
-3,044 |
|
-2,856 |
|
-2,708 |
|
-2,453 |
Total cost of revenue |
|
-7,951 |
|
-8,122 |
|
-7,542 |
|
-7,030 |
|
-6,580 |
Segment gross profit |
|
22,105 |
|
22,731 |
|
20,954 |
|
19,931 |
|
19,590 |
Other segment expenses |
|
-12,294 |
|
-12,602 |
|
-12,130 |
|
-11,459 |
|
-10,282 |
Segment profit |
|
9,811 |
|
10,129 |
|
8,824 |
|
8,472 |
|
9,308 |
1 The 2023 constant currency amounts are only comparable to 2022 actual currency amounts; 2022 constant currency amounts are only comparable to 2021 actual currency amounts.
Directly allocated depreciation and amortization expense in the ATS segment decreased compared to 2022 by 23% (22% at constant currency) from €639 million to €491 million.
Segment Revenue by Region
€ millions |
|
EMEA |
|
Americas |
|
APJ |
|
Total Segment Revenue |
||||||||||||||||
|
|
2023 |
|
2022 |
|
2023 |
|
2022 |
|
2023 |
|
2022 |
|
2023 |
|
2022 |
||||||||
|
|
Actual |
|
Constant |
|
Actual |
|
Actual |
|
Constant |
|
Actual |
|
Actual |
|
Constant |
|
Actual |
|
Actual |
|
Constant |
|
Actual |
|
|
Currency |
|
Currency |
|
Currency |
|
Currency |
|
Currency |
|
Currency |
|
Currency |
|
Currency |
|
Currency |
|
Currency |
|
Currency |
|
Currency |
Applications, Technology & Services |
|
13,645 |
|
13,736 |
|
12,610 |
|
12,091 |
|
12,493 |
|
11,606 |
|
4,320 |
|
4,624 |
|
4,280 |
|
30,057 |
|
30,853 |
|
28,496 |
Total reportable segments |
|
13,645 |
|
13,736 |
|
12,610 |
|
12,091 |
|
12,493 |
|
11,606 |
|
4,320 |
|
4,624 |
|
4,280 |
|
30,057 |
|
30,853 |
|
28,496 |
€ millions |
|
EMEA |
|
Americas |
|
APJ |
|
Total Segment Revenue |
||||||||||||||||
|
|
|
|
2022 |
|
2021 |
|
|
|
2022 |
|
2021 |
|
|
|
2022 |
|
2021 |
|
|
|
2022 |
|
2021 |
|
|
Actual |
|
Constant |
|
Actual |
|
Actual |
|
Constant |
|
Actual |
|
Actual |
|
Constant |
|
Actual |
|
Actual |
|
Constant |
|
Actual |
Applications, Technology & Services |
|
12,610 |
|
12,382 |
|
12,267 |
|
11,606 |
|
10,386 |
|
9,826 |
|
4,280 |
|
4,193 |
|
4,077 |
|
28,496 |
|
26,961 |
|
26,170 |
Total reportable segments |
|
12,610 |
|
12,382 |
|
12,267 |
|
11,606 |
|
10,386 |
|
9,826 |
|
4,280 |
|
4,193 |
|
4,077 |
|
28,496 |
|
26,961 |
|
26,170 |
For a breakdown of revenue by region for the SAP Group, see Note (A.1).
F-36
(C.2) Reconciliation of Segment Measures to the Consolidated Income Statements
€ millions |
|
2023 |
|
2022 |
|
2021 |
||||
|
|
Actual |
|
Constant |
|
Actual |
|
Constant |
|
Actual |
|
|
Currency |
|
Currency1 |
|
Currency |
|
Currency1 |
|
Currency |
Total segment revenue for reportable segments |
|
30,057 |
|
30,853 |
|
28,496 |
|
26,961 |
|
26,170 |
Other revenue |
|
1,150 |
|
1,180 |
|
1,024 |
|
938 |
|
783 |
Adjustment for currency impact |
|
0 |
|
-826 |
|
0 |
|
1,620 |
|
0 |
Total revenue |
|
31,207 |
|
31,207 |
|
29,520 |
|
29,520 |
|
26,953 |
Total segment profit for reportable segments |
|
9,811 |
|
10,129 |
|
8,824 |
|
8,472 |
|
9,308 |
Other revenue |
|
1,150 |
|
1,180 |
|
1,024 |
|
938 |
|
783 |
Other expenses |
|
-2,239 |
|
-2,265 |
|
-1,858 |
|
-1,741 |
|
-1,887 |
Adjustment for currency impact |
|
0 |
|
-322 |
|
0 |
|
320 |
|
0 |
Adjustment for |
|
|
|
|
|
|
|
|
|
|
Acquisition-related charges |
|
-345 |
|
-345 |
|
-329 |
|
-329 |
|
-405 |
Share-based payment expenses |
|
-2,220 |
|
-2,220 |
|
-1,431 |
|
-1,431 |
|
-1,334 |
Restructuring |
|
-215 |
|
-215 |
|
-138 |
|
-138 |
|
-157 |
Adjustment for regulatory compliance matter expenses |
|
-155 |
|
-155 |
|
0 |
|
0 |
|
0 |
Operating profit |
|
5,787 |
|
5,787 |
|
6,090 |
|
6,090 |
|
6,308 |
Other non-operating income/expense, net |
|
9 |
|
9 |
|
-187 |
|
-187 |
|
19 |
Financial income, net |
|
-456 |
|
-456 |
|
-1,389 |
|
-1,389 |
|
2,178 |
Profit before tax from continuing operations |
|
5,341 |
|
5,341 |
|
4,513 |
|
4,513 |
|
8,505 |
1 The 2023 constant currency amounts are only comparable to 2022 actual currency amounts; 2022 constant currency amounts are only comparable to 2021 actual currency amounts.
(C.3) Other Non-Operating Income/Expense, Net
€ millions |
|
2023 |
|
2022 |
|
2021 |
Foreign currency exchange gain/loss, net |
|
46 |
|
-144 |
|
51 |
Thereof from financial assets at fair value through profit or loss |
|
571 |
|
515 |
|
316 |
Thereof from financial assets at amortized cost |
|
56 |
|
218 |
|
111 |
Thereof from financial liabilities at fair value through profit or loss |
|
-514 |
|
-766 |
|
-382 |
Thereof from financial liabilities at amortized cost |
|
-30 |
|
-88 |
|
-68 |
Miscellaneous income/expense, net |
|
-36 |
|
-44 |
|
-32 |
Other non-operating income/expense, net |
|
9 |
|
-187 |
|
19 |
F-37
(C.4) Financial Income, Net
€ millions |
|
2023 |
|
2022 |
|
2021 |
Finance income |
|
857 |
|
811 |
|
3,123 |
Thereof interest income from financial assets at amortized cost |
|
376 |
|
100 |
|
29 |
Thereof gains from financial assets at fair value through profit or loss |
|
380 |
|
608 |
|
3,067 |
Finance costs |
|
-1,313 |
|
-2,200 |
|
-945 |
Thereof losses from financial assets at fair value through profit or loss |
|
-525 |
|
-1,802 |
|
-654 |
Thereof interest expense from financial liabilities at amortized cost |
|
-400 |
|
-203 |
|
-156 |
Thereof interest expense from financial liabilities at fair value through profit or loss |
|
-239 |
|
-69 |
|
-50 |
Financial income, net |
|
-456 |
|
-1,389 |
|
2,178 |
Financial income, net, increased €934 million in 2023, in comparison to 2022, mainly due to:
| - | Lower net losses from the fair valuation of our equity investments (€1,049 million), |
| - | An increase in interest income due to a higher market interest rate level applied to a higher volume of interest-generating investments (€276 million) which is partially offset by an increase in interest expenses on our financial debt (€-197 million) (for more information, see Note (E.3)), and |
| - | An increase in interest expenses from derivatives (€-170 million), mainly from the deal contingent forward held in connection with the Qualtrics disposal (for more information, see Note (F.1)). |
(C.5) Income Taxes
y Judgments and Estimates |
|
|
We are subject to changing tax laws in multiple jurisdictions within the countries in which we operate. Our ordinary business activities also include transactions where the ultimate tax outcome is uncertain due to different interpretations of tax laws, such as those involving transfer pricing and intercompany transactions between SAP Group entities. In addition, the amount of income taxes we pay is generally subject to ongoing audits by domestic and foreign tax authorities. In determining our worldwide income tax provisions, judgment is involved in assessing whether to consider each uncertain tax treatment separately or together with one or more other uncertain tax treatments and whether to reflect the respective effect of uncertainty based on the most likely amount or the expected value. In applying these judgments, we consider the nature and the individual facts and circumstances of each uncertain tax treatment as well as the specifics of the respective jurisdiction, including applicable tax laws and our interpretation thereof. The assessment whether a deferred tax asset is impaired requires judgment, as we need to estimate future taxable profits to determine whether the utilization of the deferred tax asset is probable. In evaluating our ability to utilize our deferred tax assets, we consider all available positive and negative evidence, including the level of historical taxable income and projections for future taxable income over the periods in which the deferred tax assets are recoverable. Our judgment regarding future taxable income is based on assumptions about future market conditions and future profits of SAP. Judgment is also required in evaluating whether interest or penalties related to income taxes meet the definition of income taxes, and, if not, whether it is of financial nature. In this judgment, we particularly consider applicable local tax laws and interpretations on IFRS by national standard setters in the area of group financial reporting. |
Tax Expense by Geographic Location
€ millions |
|
2023 |
|
2022 |
|
2021 |
Current tax expense |
|
|
|
|
|
|
Germany |
|
596 |
|
539 |
|
603 |
Foreign |
|
1,356 |
|
1,165 |
|
1,366 |
Total current tax expense |
|
1,952 |
|
1,704 |
|
1,969 |
Deferred tax expense/income |
|
|
|
|
|
|
Germany |
|
74 |
|
86 |
|
108 |
Foreign |
|
-285 |
|
-344 |
|
-395 |
Total deferred tax income |
|
-211 |
|
-258 |
|
-287 |
Total income tax expense |
|
1,741 |
|
1,446 |
|
1,682 |
F-38
Major Components of Tax Expense
€ millions |
|
2023 |
|
2022 |
|
2021 |
Current tax expense/income |
|
|
|
|
|
|
Tax expense for current year |
|
1,935 |
|
1,717 |
|
1,702 |
Taxes for prior years |
|
17 |
|
-13 |
|
267 |
Total current tax expense |
|
1,952 |
|
1,704 |
|
1,969 |
Deferred tax expense/income |
|
|
|
|
|
|
Origination and reversal of temporary differences |
|
-222 |
|
-216 |
|
-311 |
Unused tax losses, research and development tax credits, and foreign tax credits |
|
11 |
|
-42 |
|
24 |
Total deferred tax income |
|
-211 |
|
-258 |
|
-287 |
Total income tax expense |
|
1,741 |
|
1,446 |
|
1,682 |
Profit Before Tax by Geographic Location
€ millions |
|
2023 |
|
2022 |
|
2021 |
Germany |
|
1,201 |
|
1,814 |
|
2,057 |
Foreign |
|
4,140 |
|
2,699 |
|
6,448 |
Total |
|
5,341 |
|
4,513 |
|
8,505 |
The following table reconciles the expected income tax expense, computed by applying our combined German tax rate of 26.5% (2022: 26.4%; 2021: 26.4%), to the actual income tax expense. Our 2023 combined German tax rate includes a corporate income tax rate of 15.0% (2022: 15.0%; 2021: 15.0%), plus a solidarity surcharge of 5.5% (2022: 5.5%; 2021: 5.5%) thereon, and trade taxes of 10.7% (2022: 10.6%; 2021: 10.6%).
Relationship Between Tax Expense and Profit Before Tax
€ millions, unless otherwise stated |
|
2023 |
|
2022 |
|
2021 |
Profit before tax from continuing operations |
|
5,341 |
|
4,513 |
|
8,505 |
Tax expense at applicable tax rate of 26.5% |
|
1,418 |
|
1,193 |
|
2,245 |
Tax effect of: |
|
|
|
|
|
|
Foreign tax rates |
|
-210 |
|
-134 |
|
-143 |
Non-deductible expenses |
|
241 |
|
138 |
|
141 |
Tax-exempt income |
|
-77 |
|
297 |
|
-630 |
Withholding taxes |
|
297 |
|
176 |
|
199 |
Research and development and foreign tax credits |
|
-89 |
|
-84 |
|
-73 |
Prior-year taxes |
|
-8 |
|
4 |
|
18 |
Assessment of deferred tax assets, research and development tax credits, and foreign tax credits |
|
138 |
|
-124 |
|
-36 |
Other |
|
31 |
|
-20 |
|
-39 |
Total income tax expense |
|
1,741 |
|
1,446 |
|
1,682 |
Effective tax rate (in %) |
|
32.6 |
|
32.0 |
|
19.8 |
F-39
Components of Recognized Deferred Tax Assets and Liabilities
€ millions |
|
2023 |
|
2022 |
Deferred tax assets |
|
|
|
|
Intangible assets |
|
1,074 |
|
1,069 |
Property, plant, and equipment |
|
37 |
|
27 |
Leases |
|
379 |
|
503 |
Other financial assets |
|
77 |
|
23 |
Trade and other receivables |
|
81 |
|
81 |
Pension provisions |
|
211 |
|
203 |
Share-based payments |
|
267 |
|
226 |
Other provisions and obligations |
|
692 |
|
753 |
Contract liabilities |
|
818 |
|
994 |
Carryforwards of unused tax losses |
|
147 |
|
180 |
Research and development and foreign tax credits |
|
44 |
|
110 |
Other |
|
370 |
|
134 |
Total deferred tax assets (gross) |
|
4,197 |
|
4,303 |
Netting |
|
-2,004 |
|
-2,208 |
/ Total deferred tax assets (net) |
|
2,193 |
|
2,095 |
Deferred tax liabilities |
|
|
|
|
Intangible assets |
|
581 |
|
835 |
Property, plant, and equipment |
|
89 |
|
108 |
Leases |
|
341 |
|
437 |
Other financial assets |
|
185 |
|
170 |
Trade and other receivables |
|
761 |
|
269 |
Pension provisions |
|
33 |
|
35 |
Other provisions and obligations |
|
245 |
|
269 |
Other |
|
34 |
|
326 |
Total deferred tax liabilities (gross) |
|
2,269 |
|
2,449 |
Netting |
|
-2,004 |
|
-2,208 |
/ Total deferred tax liabilities (net) |
|
265 |
|
241 |
The decrease in deferred tax assets for contract liabilities and the decrease in deferred tax liabilities for intangible assets mainly result from the divestiture of Qualtrics.
The increase in deferred tax assets for other in the amount of €236 million (2022: €169 million) and in deferred tax liabilities for trade and other receivables in the amount of €492 million (2022: €288 million), as well as the decrease in deferred tax liabilities for other in the amount of €292 million (2022: €140 million), mainly result from reclassifications, leading to a more consistent presentation of the components of recognized deferred tax assets and liabilities. The presentation for 2022 remains unchanged in this respect.
F-40
Items Not Resulting in a Deferred Tax Asset
€ millions |
|
2023 |
|
2022 |
|
2021 |
Unused tax losses |
|
|
|
|
|
|
Not expiring |
|
151 |
|
315 |
|
430 |
Expiring in the following year |
|
28 |
|
14 |
|
26 |
Expiring after the following year |
|
216 |
|
344 |
|
309 |
Total unused tax losses |
|
395 |
|
673 |
|
765 |
Deductible temporary differences |
|
325 |
|
378 |
|
602 |
Unused research and development and foreign tax credits |
|
|
|
|
|
|
Not expiring |
|
59 |
|
9 |
|
28 |
Expiring after the following year |
|
5 |
|
20 |
|
20 |
Total unused tax credits |
|
64 |
|
29 |
|
48 |
Of the unused tax losses, €181 million (2022: €276 million; 2021: €183 million) relate to U.S. state tax loss carryforwards.
We have not recognized a deferred tax liability on approximately €22.15 billion (2022: €28.91 billion) for undistributed profits of our subsidiaries, because we are in a position to control the timing of the reversal of the temporary difference and it is probable that such differences will not reverse in the foreseeable future.
Income Tax-Related Litigation
We are subject to ongoing tax audits by domestic and foreign tax authorities. Currently, we are in dispute mainly with the German and only a few foreign tax authorities. The German dispute is in respect of certain secured capital investments, while the few foreign disputes are mainly in respect of the deductibility of intercompany royalty payments and intercompany services. In all cases, we expect that a favorable outcome can only be achieved through litigation. For all of these matters, we have not recorded a provision as we believe that the tax authorities’ claims have no merit and that no adjustment is warranted. If, contrary to our view, the tax authorities were to prevail in their arguments before the court, we would expect to have an additional expense of approximately €1,815 million (2022: €1,607 million) in total (including related interest expenses and penalties of €1,003 million (2022: €881 million)).
Reform of International Taxation Rules
In October 2021, over 135 jurisdictions agreed on a new framework for the international tax system covering the re-allocation of taxing rights and the introduction of a global minimum corporate tax rate. In December 2021, the Organization for Economic Co-operation and Development (OECD) released model rules, which shall ensure that multinational enterprises with revenue above €750 million will be subject to a 15% minimum corporate tax rate. In December 2022, the Member States of the European Union (EU) adopted a directive on a global minimum level of taxation for multinational enterprise groups and large-scale domestic groups in the EU. By the end of 2023, Germany transposed the EU directive into national law, applicable for fiscal years beginning after December 30, 2023. SAP has performed an assessment of its potential exposure to the global minimum tax legislation. This assessment is based on our current understanding of the global minimum taxation rules and on the most recent information available regarding the financial performance of the constituent entities within SAP. Our simulation reveals that SAP should not be materially affected. SAP has applied the temporary mandatory exception to recognizing and disclosing information about deferred tax assets and liabilities related to the global minimum tax.
F-41
(C.6) Earnings per Share
€ millions, unless otherwise stated |
|
2023 |
|
2022 |
|
2021 |
Profit attributable to equity holders of SAP SE |
|
3,634 |
|
3,277 |
|
6,429 |
Profit attributable to equity holders of SAP SE1 |
|
6,139 |
|
2,284 |
|
5,256 |
Issued ordinary shares2 |
|
1,229 |
|
1,229 |
|
1,229 |
Effect of treasury shares2 |
|
-61 |
|
-58 |
|
-49 |
Weighted average shares outstanding, basic2 |
|
1,167 |
|
1,170 |
|
1,180 |
Dilutive effect of share-based payments2 |
|
12 |
|
5 |
|
0 |
Weighted average shares outstanding, diluted2 |
|
1,180 |
|
1,175 |
|
1,180 |
Earnings per share, basic, attributable to equity holders of SAP SE (in €) from continuing operations |
|
3.11 |
|
2.80 |
|
5.45 |
Earnings per share, basic, attributable to equity holders of SAP SE (in €)1 |
|
5.26 |
|
1.95 |
|
4.46 |
Earnings per share, diluted, attributable to equity holders of SAP SE (in €) from continuing operations |
|
3.08 |
|
2.79 |
|
5.45 |
Earnings per share, diluted, attributable to equity holders of SAP SE (in €)1 |
|
5.20 |
|
1.94 |
|
4.46 |
1 From continuing and discontinued operations
2 Number of shares in millions Section D — Invested Capital
F-42
This section highlights our non-current assets including investments that form the basis of our operating activities. Additions to invested capital include separate asset acquisitions or business combinations. Further, we disclose information about purchase obligations and capital contributions.
(D.1) Business Combinations and Divestitures
y Measuring Non-Controlling Interests and Allocation of Consideration Transferred |
|
|
We decide for each business combination whether to measure the non-controlling interest in the acquiree at fair value or at the proportionate share of the acquiree’s identifiable net assets. We classify costs related to executing business combinations as general and administration expense. In our accounting for business combinations, judgment is required in determining whether an intangible asset is identifiable and whether it should be recorded separately from goodwill. Additionally, estimating the acquisition-date fair values of the identifiable assets acquired and liabilities assumed involves considerable judgment. The necessary measurements are based on information available on the acquisition date and are based on expectations and assumptions that have been deemed reasonable by management. These judgments, estimates, and assumptions can materially affect our financial position and profit for several reasons, including the following: – Fair values assigned to assets subject to depreciation and amortization affect the amounts of depreciation and amortization to be recorded in operating profit in the periods following the acquisition. – Subsequent negative changes in the estimated fair values of assets may result in additional expense from impairment charges. – Subsequent changes in the estimated fair values of liabilities and provisions may result in additional expense (if increasing the estimated fair value) or additional income (if decreasing the estimated fair value). |
We acquire businesses in specific areas of strategic interest to us, particularly to broaden our product and service portfolio.
2023 Acquisitions
LeanIX Acquisition
On September 7, 2023, SAP announced its intent to acquire 100% of the shares of LeanIX GmbH (“LeanIX”), a leader in enterprise architecture management (EAM) software.
The acquisition closed on November 7, 2023, following satisfaction of customary closing conditions and regulatory approvals; the operating results and the assets and liabilities are reflected in our Consolidated Financial Statements starting on that date.
The acquisition is expected to further expand SAP’s business transformation portfolio, giving customers access to the full suite of tools required for continuous business transformation and facilitating AI-enabled process optimization.
Consideration transferred amounted to €1,231 million paid in cash.
The following table summarizes the values of identifiable assets acquired and liabilities assumed in connection with the acquisition of LeanIX, as at the acquisition date:
LeanIX Acquisition: Recognized Assets and Liabilities
€ millions |
|
|
Intangible assets |
|
476 |
Other identifiable assets |
|
102 |
Total identifiable assets |
|
578 |
Other identifiable liabilities |
|
214 |
Total identifiable liabilities |
|
214 |
Total identifiable net assets |
|
364 |
Goodwill |
|
867 |
Total consideration transferred |
|
1,231 |
As we are still obtaining the information necessary to identify and measure certain assets and liabilities, mainly tax-related items, the initial accounting for the LeanIX business combination is still incomplete.
In general, the goodwill arising from our acquisitions consists largely of the synergies and the know-how and skills of the acquired businesses’ workforces.
F-43
LeanIX goodwill was attributed to expected synergies from the acquisition, particularly in the following areas:
| - | Cross-selling to existing SAP customers across all regions, using SAP’s sales organization |
| - | Creating new offerings by combining LeanIX products and SAP products |
| - | LeanIX complements the transformation capabilities of SAP Signavio solutions and will give SAP customers unique clarity on the IT landscapes they need to reap the full benefit of business transformation |
The allocation of the goodwill resulting from the LeanIX acquisition to our operating segments depends on how our operating segments actually benefit from the synergies of the LeanIX business combination. For more information, see Note (D.2).
Impact of the Business Combination on Our Financial Statements
The amounts of revenue and profit or loss of the LeanIX business acquired in 2023 since the acquisition date were included in our Consolidated Income Statement for 2023 as follows:
|
|
2023 |
|
|
€ millions |
|
as Reported |
|
Contribution of LeanIX |
Revenue |
|
31,207 |
|
10 |
Profit after tax |
|
5,964 |
|
-8 |
Had LeanIX been consolidated as at January 1, 2023, our revenue and profit after tax for 2023 would not have been materially different.
2023 Divestitures
Qualtrics Disposal
On March 13, 2023, resulting from a process that was initiated on January 26, 2023, SAP announced it had agreed to sell all of its 423 million shares of Qualtrics International Inc. as part of the acquisition of Qualtrics by funds affiliated with Silver Lake as well as the Canada Pension Plan Investment Board. The sale closed on June 28, 2023, following satisfaction of customary closing conditions and regulatory approvals. At a purchase price of US$18.15 in cash per share, SAP’s stake was acquired for approximately US$7.7 billion. To secure the euro countervalue of the US$7.7 billion purchase price, we hedged an amount of US$7.1 billion by entering into a deal contingent forward applying net investment hedge accounting. For more information, see Note (F.1). At the time that Qualtrics was classified as a discontinued operation (following IFRS 5), there was no indication of an impairment (as the fair value less cost of disposal (calculated based on share prices) significantly exceeded the carrying amount).
SAP is a close go-to-market and technology partner for Qualtrics.
SAP’s financial results present Qualtrics as a discontinued operation as required under IFRS 5. The Qualtrics disposal group was previously included in the Qualtrics reportable segment.
The pre-tax disposal gain included in discontinued operations (€3,562 million) was calculated by adjusting the purchase price less the cost of disposal (€7,003 million) for net assets leaving the SAP Group (€5,800 million, consisting mostly of goodwill (€4,007 million) and other intangible assets (€1,294 million)), the corresponding non-controlling interests (€2,337 million), and amounts of other comprehensive income (€22 million). SAP incurred taxes amounting to €799 million in connection with the transaction.
The cash inflow resulting from the purchase price (€7,068 million) was offset by cash and cash equivalents of €713 million leaving the SAP Group.
SAP continues to provide rental guarantees for certain offices used by Qualtrics. Qualtrics is obligated to indemnify SAP with respect to the guarantees.
F-44
Additional financial information relating to Qualtrics is presented in the following tables (revenues and expenses are presented after consolidation of transactions between Qualtrics and SAP’s continuing operations):
€ millions, unless otherwise stated |
|
2023 |
|
2022 |
Consolidated Income Statements |
|
|
|
|
Cloud revenue |
|
621 |
|
1,129 |
Total revenue |
|
745 |
|
1,351 |
Cost of cloud |
|
-88 |
|
-265 |
Total cost of revenue |
|
-196 |
|
-499 |
Total operating expenses (including total cost of revenue) |
|
-1,155 |
|
-2,771 |
Disposal gain before tax |
|
3,562 |
|
0 |
Operating profit |
|
3,152 |
|
-1,420 |
Profit (loss) before tax |
|
3,162 |
|
-1,423 |
Income tax expense1 |
|
-799 |
|
64 |
Profit (loss) after tax |
|
2,363 |
|
-1,359 |
Attributable to owners of parent |
|
2,505 |
|
-993 |
|
|
|
|
|
Earnings per share, basic (IFRS, in €)2 |
|
2.15 |
|
-0.85 |
Earnings per share, diluted (IFRS, in €)2 |
|
2.12 |
|
-0.85 |
|
|
|
|
|
Consolidated Statements of Cash Flow |
|
|
|
|
Net operating cash flow |
|
122 |
|
-29 |
Net investing cash flow |
|
5,510 |
|
-32 |
Net financing cash flow |
|
24 |
|
-263 |
1 For 2023, €799 million relates to the gain on sale of discontinued operations.
2 For 2023 and 2022, the weighted average number of shares was 1,167 million (diluted: 1.180 million) and 1,170 million (diluted: 1,175 million), respectively (treasury stock excluded).
Total operating expenses includes share-based payment expenses related to Qualtrics' equity-settled plan of €403 million in 2023 (€1,182 million in 2022).
2022 Acquisitions
In 2022, we closed the acquisition of Taulia Inc., San Francisco, California (USA) (“Taulia”) and of INNAAS srl, Rome (Italy).
Taulia Acquisition
On January 27, 2022, SAP announced its intent to acquire a majority stake of Taulia (for information about SAP’s current shareholding percentage, see Note (G.9)), a leading provider of cloud-based working capital management solutions. The acquisition closed on March 9, 2022, following satisfaction of customary closing conditions and regulatory approvals; the operating results and the assets and liabilities are reflected in our consolidated financial statements starting on that date.
Consideration transferred amounted to €705 million.
F-45
The following table summarizes the values of identifiable assets acquired and liabilities assumed in connection with the acquisition of Taulia, as at the acquisition date:
Taulia Acquisition: Recognized Assets and Liabilities
€ millions |
|
|
Intangible assets |
|
157 |
Other identifiable assets |
|
87 |
Total identifiable assets |
|
244 |
Other identifiable liabilities |
|
88 |
Total identifiable liabilities |
|
88 |
Total identifiable net assets |
|
156 |
Goodwill |
|
549 |
Total consideration transferred |
|
705 |
Prior to December 31, 2022, we completed our accounting assessment relating to the supply chain financing (SCF) transactions offered by Taulia. Based on the setup of the compartments and series within which the SCF receivables and liabilities are siloed, and on the related contractual and founding agreements, we concluded that we do not control the receivables and liabilities resulting from the SCF activities under IFRS 10.Thus, we do not include the respective items in our balance sheet and do not show cash flows linked to the SCF transactions in investing/financing cash flow.
In Q1 2023, measurement of tax-related assets and liabilities for the Taulia business combination accounting was completed and resulted in €28 million adjusted to the Other identifiable assets' opening balance and Goodwill.
In general, the goodwill arising from our acquisitions consists largely of the synergies and the know-how and skills of the acquired businesses’ workforces.
Taulia goodwill was attributed to expected synergies from the acquisition, particularly in the following areas:
| - | Cross-selling to existing SAP customers across all regions, using SAP’s sales organization |
| - | Further expanding the SAP Business Network capabilities and strengthening SAP’s solutions for the CFO office |
| - | Creating new offerings by combining Taulia products and SAP products |
| - | Improving profitability in Taulia sales and operations |
The allocation of the goodwill resulting from the Taulia acquisition to our operating segments depends on how our operating segments actually benefit from the synergies of the Taulia business combination.
Impact of the Business Combination on Our Financial Statements
The amounts of revenue and profit or loss of the Taulia business acquired in 2022 since the acquisition date were included in our Consolidated Income Statement for 2022 as follows:
Taulia Acquisition: Impact on SAP’s Financials
€ millions |
|
20221 |
|
Contribution of |
|
|
as Reported |
|
Taulia |
Revenue |
|
30,871 |
|
59 |
Profit after tax |
|
1,708 |
|
-38 |
1 From continuing and discontinued operations
Had Taulia been consolidated as at January 1, 2022, our revenue and profit after tax for 2022 would not have been materially different.
2022 Divestitures
On August 17, 2022, SAP and Francisco Partners (FP) announced that FP had signed a definitive agreement with SAP America, Inc. under which FP would acquire SAP Litmos from SAP. The transaction closed on December 1, 2022, following satisfaction of applicable regulatory and other approvals.
The disposal gain of €175 million is included in Other operating income/expense, net.
F-46
2021 Acquisitions
In 2021, we closed the acquisition of Signavio GmbH, Berlin (Germany) (“Signavio”) and of Clarabridge, Inc., Reston, Virginia (USA) (“Clarabridge”).
Signavio Acquisition
In January 2021, SAP announced it had entered into an agreement to acquire the shares of Signavio, a leader in the enterprise business process intelligence and process management space that enables companies to understand, improve, transform, and manage all their business processes quickly and at scale.
The purchase price was €949 million. The transaction closed on March 5, 2021, following satisfaction of regulatory and other approvals. The Signavio operating results and assets and liabilities are reflected in our consolidated financial statements starting on that date.
The following table summarizes the values of identifiable assets acquired and liabilities assumed in connection with the acquisition of Signavio, as at the acquisition date:
Signavio Acquisition: Recognized Assets and Liabilities
€ millions |
|
|
Intangible assets |
|
255 |
Other identifiable assets |
|
73 |
Total identifiable assets |
|
328 |
Other identifiable liabilities |
|
108 |
Total identifiable liabilities |
|
108 |
Total identifiable net assets |
|
220 |
Goodwill |
|
729 |
Total consideration transferred |
|
949 |
In general, the goodwill arising from our acquisitions consists largely of the synergies and the know-how and skills of the acquired businesses’ workforces.
Signavio goodwill was attributed to expected synergies from the acquisition, particularly in the following areas:
| - | Cross-selling opportunities to existing SAP customers across all regions, using SAP’s sales organization |
| - | The acquisition of Signavio complements SAP's business process intelligence offerings and will help create new offerings by combining Signavio products and SAP products, but is also expected to result, for example, in increased SAP S/4HANA and RISE with SAP sales. |
| - | Improved profitability in Signavio sales and operations |
The allocation of the goodwill resulting from the Signavio acquisition to our operating segments depends on how our operating segments actually benefit from the synergies of the Signavio business combination.
Clarabridge Acquisition
On October 1, 2021 (after receipt of required regulatory approvals and satisfaction or waiver of other customary closing conditions), Qualtrics completed its previously announced acquisition of Clarabridge, a customer experience management software company headquartered in Reston, Virginia, USA, pursuant to an Agreement and Plan of Reorganization and Merger. The number of Qualtrics class A common stock issued to the sellers was fixed based on a valuation of US$1,125 million (subject to certain adjustments) – the assumed Qualtrics share price was US$37.33. The actual consideration transferred (mainly in shares valued at the acquisition date fair value of the common stock) amounted to US$1,298 million (€1,116 million). This includes €910 million of issued shares, €115 million of assumed awards, and €91 million of cash paid.
Qualtrics has (1) assumed, amended, and restated Clarabridge stock plans, and (2) converted the assumed options to purchase shares of Clarabridge stock outstanding into corresponding Qualtrics options. Qualtrics has granted equity incentive awards to certain continuing employees of Clarabridge and its subsidiaries under its own Qualtrics equity plan at Qualtrics’ sole discretion.
F-47
The following table summarizes the values of identifiable assets acquired and liabilities assumed in connection with the acquisition of Clarabridge, as at the acquisition date:
Clarabridge Acquisition: Recognized Assets and Liabilities
€ millions |
|
|
Intangible assets |
|
218 |
Other identifiable assets |
|
84 |
Total identifiable assets |
|
302 |
Other identifiable liabilities |
|
107 |
Total identifiable liabilities |
|
107 |
Total identifiable net assets |
|
195 |
Goodwill |
|
921 |
Total consideration transferred |
|
1,116 |
In general, the goodwill arising from our acquisitions consists largely of the synergies and the know-how and skills of the acquired businesses’ workforces.
The Clarabridge goodwill consists largely of the synergies that SAP expects to achieve from combining the acquired assets and operations with its existing operations, especially in its Qualtrics subsidiary.
Impact of Business Combinations on Our Consolidated Financial Statements
The amounts of revenue and profit or loss of the Signavio and Clarabridge businesses acquired in 2021 since the acquisition date are included in the 2021 consolidated income statements as follows:
2021 Acquisitions: Impact on SAP’s Financials (Signavio and Clarabridge)
€ millions |
|
20211 |
|
Contribution of 2021 Acquisitions |
|
|
as Reported |
|
|
Revenue |
|
27,842 |
|
70 |
Profit after tax |
|
5,376 |
|
-89 |
1 From continuing and discontinued operations
Had the acquired entities been consolidated as at January 1, 2021, our 2021 revenue and profit after tax would not have been materially different.
2021 Divestitures
On April 13, 2021, SAP and investment company Dediq GmbH, Munich (Germany) (“Dediq”) announced that they had agreed to enter into a partnership in the area of financial services. Following the close of the transaction in September 2021 (after satisfaction of all closing conditions including regulatory approvals), SAP and Dediq jointly own the new SAP Fioneer entity (with SAP owning a minority share).
SAP and SAP Fioneer have executed transition service and go-to-market agreements, among others.
The disposal gain relating to the transfer of the business (predominantly IP and employees) was included in Other operating income/expense, net (€77 million).
F-48
(D.2) Goodwill
y Goodwill and Intangible Asset Impairment Testing |
|
|
The annual goodwill impairment test is performed at the level of our operating segments, since there are no lower levels in SAP at which goodwill is monitored for internal management purposes. In general, the test is performed at the same time (at the beginning of the fourth quarter) for all operating segments. In making impairment assessments for our goodwill and intangible assets, the outcome of these tests is highly dependent on management’s assumptions regarding future cash flow projections and economic risks, which require significant judgment and assumptions about future developments. They can be affected by a variety of factors, including: - Changes in business strategy - Internal forecasts - Estimation of weighted-average cost of capital Changes to the assumptions underlying our goodwill and intangible assets impairment assessments could require material adjustments to the carrying amount of our recognized goodwill and intangible assets as well as the amounts of impairment charges recognized in profit or loss. The outcome of goodwill impairment tests may also depend on the allocation of goodwill to our operating segments. This allocation involves judgment as it is based on our estimates regarding which operating segments are expected to benefit from the synergies of business combinations. Changes in our segment structure result in the reallocation of goodwill with the reallocated goodwill being calculated based on relative values (if a direct allocation is not possible). |
Goodwill
€ millions |
|
|
Historical cost |
|
|
1/1/2022 |
|
31,190 |
Foreign currency exchange differences |
|
1,526 |
Additions from business combinations |
|
560 |
Retirements/disposals |
|
-95 |
12/31/2022 |
|
33,181 |
Foreign currency exchange differences |
|
-849 |
Additions from business combinations |
|
867 |
Retirements/disposals |
|
-4,008 |
12/31/2023 |
|
29,191 |
|
|
|
Accumulated amortization |
|
|
1/1/2022 |
|
102 |
Foreign currency exchange differences |
|
2 |
12/31/2022 |
|
104 |
Foreign currency exchange differences |
|
-1 |
12/31/2023 |
|
103 |
|
|
|
Carrying amount |
|
|
12/31/2022 |
|
33,077 |
12/31/2023 |
|
29,088 |
For more information about our segments and the changes in 2023, see Note (C.1).
Throughout 2023, we have - through a qualitative and quantitative analysis - been continuously monitoring whether triggering events exist.
We did not identify any triggering events that would indicate or cause the carrying amount of goodwill to exceed the recoverable amount.
F-49
For impairment testing purposes, the carrying amount of goodwill is allocated to the operating segments expected to benefit from goodwill as follows:
Goodwill by Operating Segment
€ millions |
|
Applications, |
|
Qualtrics1 |
|
Emarsys |
|
Taulia2 |
|
Business Network |
|
Sustainability |
|
Total |
|
|
Technology & Services |
|
|
|
|
|
|
|
|
|
|
|
|
12/31/2022 |
|
27,221 |
|
4,083 |
|
395 |
|
294 |
|
1,052 |
|
32 |
|
33,077 |
12/31/2023 |
|
27,392 |
|
0 |
|
395 |
|
296 |
|
976 |
|
29 |
|
29,088 |
1 The Qualtrics segment was dissolved after the divestiture of SAP's share in Qualtrics International Inc.
2 Taulia goodwill opening balance was adjusted by €28 million in 2023.
Due to the dissolution of the SAP Signavio segment at the beginning of 2023 (for more information, see Note (C.1)), the SAP Signavio goodwill (€410 million) was moved to the Applications, Technology & Services segment. Given the close proximity to the 2022 annual goodwill impairment test and the significant headroom, no formal impairment test was performed on the reallocation date of the SAP Signavio segment.
Based on the expected synergies, the goodwill added through the acquisition of LeanIX (€867 million) was provisionally allocated to the Applications, Technology & Services segment on December 31. As the initial accounting for the LeanIX business combination is incomplete (for more information, see Note (D.1)), the allocation is provisional. The goodwill impairment test for the Applications, Technology & Services segment on October 1 resulted in a headroom that is significantly higher than the portion of the goodwill that – at the end of December – was allocated to the segment. Thus, there is no impairment risk resulting from the allocation of the LeanIX goodwill.
Goodwill Impairment Test
The key assumptions on which management based its cash flow projections for the period covered by the underlying business plans are as follows:
Key Assumption |
|
Basis for Determining Values Assigned to Key Assumption |
Budgeted revenue growth |
|
Revenue growth rate achieved in the current year, adjusted for an expected increase in SAP’s addressable cloud and database markets; expected growth in the established software applications and analytics markets. Values assigned reflect our past experience and our expectations regarding an increase in the addressable markets. |
Budgeted operating margin |
|
Operating margin budgeted for a given budget period equals the operating margin achieved in the current year, increased by expected efficiency gains. Values assigned reflect past experience, except for efficiency gains. |
Discount rates |
|
Our estimated cash flow projections are discounted to present value using discount rates (after-tax rates). Discount rates are based on the weighted average cost of capital (WACC) approach. |
Terminal growth rate |
|
Our estimated cash flow projections for periods beyond the business plan were extrapolated using segment-specific terminal growth rates. These growth rates do not exceed the long-term average growth rates for the markets in which our segments operate. |
Key Assumptions and Detailed Planning Period
Percent, unless otherwise stated |
|
Applications, |
|
Emarsys |
|
Taulia |
|
Business Network |
|
Sustainability |
||||||||||
|
|
Technology & Services1 |
|
|
|
|
|
|
|
|
|
|
|
|
|
|
||||
|
|
2023 |
|
2022 |
|
2023 |
|
2022 |
|
2023 |
|
2022 |
|
2023 |
|
2022 |
|
2023 |
|
2022 |
Budgeted revenue growth (average of the budgeted period) |
|
12.8 |
|
11.4 |
|
13.3 |
|
13.9 |
|
22.3 |
|
24.8 |
|
12.7 |
|
14.0 |
|
31.5 |
|
34.6 |
After-tax discount rate |
|
11.9 |
|
11.1 |
|
12.3 |
|
11.7 |
|
11.0 |
|
11.3 |
|
12.5 |
|
11.9 |
|
11.7 |
|
10.9 |
Terminal growth rate |
|
3.0 |
|
3.0 |
|
3.0 |
|
3.0 |
|
3.0 |
|
3.0 |
|
3.0 |
|
3.0 |
|
3.0 |
|
3.0 |
Detailed planning period (in years) |
|
5 |
|
5 |
|
12 |
|
12 |
|
13 |
|
13 |
|
10 |
|
10 |
|
12 |
|
12 |
1 The 2022 figures relate to the Applications, Technology & Support segment without the reallocation of the SAP Signavio segment.
On October 1, 2023, we performed a goodwill impairment test for the operating segments.
F-50
Applications, Technology & Services Segment
For more information about our 2023 segment changes, see Note (C.1).
The recoverable amount was determined based on a fair value less costs of disposal calculation. The fair value measurement was categorized as a Level 3 fair value based on the inputs used in the valuation. The cash flow projections were based on actual operating results and specific estimates covering a detailed planning period and the terminal growth rate thereafter. The projected results were determined based on management’s estimates and are consistent with the assumptions a market participant would make (a target operating margin of 34.5% (2022: 27.8%) was used in the valuation).
We believe that no reasonably possible change in any of the above key assumptions would cause the carrying amount of our Applications, Technology & Services segment to exceed the recoverable amount.
Emarsys Segment
The recoverable amount was determined based on a fair value less costs of disposal calculation. The fair value measurement was categorized as a Level 3 fair value based on the inputs used in the valuation. The cash flow projections were based on actual operating results and specific estimates covering a detailed planning period and the terminal growth rate thereafter. The projected results were determined based on management’s estimates and are consistent with the assumptions a market participant would make (a target operating margin of 33.2% (2022: 29.4)% was used in the valuation).
Given the fact that the Emarsys segment is expected to show disproportionate growth in the coming years and has not yet reached a steady state, we have used a longer detailed planning period than one would apply in a more mature segment.
The recoverable amount exceeded the carrying amount by €618 million (2022: €513 million).
The following table shows the amounts by which the key assumptions would need to change individually (that is, without changing the other key assumptions) for the recoverable amount to be equal to the carrying amount. For budgeted revenue growth sensitivity, the cost structure was not adjusted, hence leading to a modified terminal operating margin:
Sensitivity to Change in Assumptions
|
|
|
|
Emarsys |
|
|
2023 |
|
2022 |
Budgeted revenue growth (change in pp) |
|
-2.5 |
|
-2.0 |
Target operating margin at the end of the budgeted period (change in pp) |
|
-21 |
|
-16 |
Taulia Segment
The recoverable amount was determined based on a fair value less costs of disposal calculation. The fair value measurement was categorized as a Level 3 fair value based on the inputs used in the valuation. The cash flow projections were based on actual operating results and specific estimates covering a detailed planning period and the terminal growth rate thereafter. The projected results were determined based on management’s estimates and are consistent with the assumptions a market participant would make (a target operating margin of 26.5% (2022: 24.9)% was used in the valuation).
Given the fact that the Taulia segment is expected to show disproportionate growth in the coming years and has not yet reached a steady state, we have used a longer detailed planning period than one would apply in a more mature segment.
The recoverable amount exceeded the carrying amount by €567 million (2022: €366 million).
F-51
The following table shows the amounts by which the key assumptions would need to change individually (that is, without changing the other key assumptions) for the recoverable amount to be equal to the carrying amount. For budgeted revenue growth sensitivity, the cost structure was not adjusted, hence leading to a modified terminal operating margin:
Sensitivity to Change in Assumptions
|
|
|
|
Taulia |
|
|
2023 |
|
2022 |
Budgeted revenue growth (change in pp) |
|
-1.6 |
|
-1.1 |
Target operating margin at the end of the budgeted period (change in pp) |
|
-15 |
|
-11 |
After-tax discount rate |
|
5.8 |
|
3.4 |
Business Network Segment
The recoverable amount was determined based on a fair value less costs of disposal calculation. The fair value measurement was categorized as a Level 3 fair value based on the inputs used in the valuation. The cash flow projections were based on actual operating results and specific estimates covering a detailed planning period and the terminal growth rate thereafter. The projected results were determined based on management’s estimates and are consistent with the assumptions a market participant would make (a target operating margin of 25.2% (2022: 24.2)% was used in the valuation).
Given the fact that the Business Network segment is expected to show disproportionate growth in the coming years and has not yet reached a steady state, we have used a longer detailed planning period than one would apply in a more mature segment.
The recoverable amount exceeded the carrying amount by €2,719 million (2022: €2,821 million).
The following table shows the amounts by which the key assumptions would need to change individually (that is, without changing the other key assumptions) for the recoverable amount to be equal to the carrying amount. For budgeted revenue growth sensitivity, the cost structure was not adjusted, hence leading to a modified terminal operating margin:
Sensitivity to Change in Assumptions
|
|
|
|
Business Network |
|
|
2023 |
|
2022 |
Budgeted revenue growth (change in pp) |
|
-3.0 |
|
-2.8 |
Target operating margin at the end of the budgeted period (change in pp) |
|
-19 |
|
-19 |
Sustainability Segment
The recoverable amount was determined based on a fair value less costs of disposal calculation. The fair value measurement was categorized as a Level 3 fair value based on the inputs used in the valuation. The cash flow projections were based on actual operating results and specific estimates covering a detailed planning period and the terminal growth rate thereafter. The projected results were determined based on management’s estimates and are consistent with the assumptions a market participant would make (a target operating margin of 26.9% (2022: 26.2)% was used in the valuation).
Given the fact that the Sustainability segment is expected to show disproportionate growth in the coming years and has not yet reached a steady state, we have used a longer detailed planning period than one would apply in a more mature segment.
The recoverable amount exceeded the carrying amount by €246 million (2022: €112 million).
The following table shows the amounts by which the key assumptions would need to change individually (that is, without changing the other key assumptions) for the recoverable amount to be equal to the carrying amount. For budgeted revenue growth sensitivity, the cost structure was not adjusted, hence leading to a modified terminal operating margin:
Sensitivity to Change in Assumptions
|
|
|
|
Sustainability |
|
|
2023 |
|
2022 |
Budgeted revenue growth (change in pp) |
|
-2.1 |
|
-1.4 |
Target operating margin at the end of the budgeted period (change in pp) |
|
-19 |
|
-13 |
After-tax discount rate |
|
8.3 |
|
3.9 |
F-52
(D.3) Intangible Assets
y Recognition of Intangibles |
|
|
Whereas in general, expenses for internally generated intangibles are expensed as incurred, development expenses incurred on standard-related customer development projects (for which the IAS 38 criteria are met cumulatively) are capitalized on a limited scale with those amounts being amortized over the estimated useful life for the majority of the projects of five to seven years. Determining whether internally generated intangible assets from development qualify for recognition requires significant judgment, particularly in the following areas: - Determining whether activities should be considered research activities or development activities - Determining whether the conditions for recognizing an intangible asset are met requires assumptions about future market conditions, customer demand, and other developments. - The term “technical feasibility” is not defined in IFRS, and therefore determining whether the completion of an asset is technically feasible requires judgment and a company-specific approach. - Determining the future ability to use or sell the intangible asset arising from the development and the determination of the probability of future benefits from sale or use - Determining whether a cost is directly or indirectly attributable to an intangible asset and whether a cost is necessary for completing a development These judgments impact the total amount of intangible assets that we present in our balance sheet as well as the timing of recognizing development expenses in profit or loss. y Measurement of Intangibles All our purchased intangible assets other than goodwill have finite useful lives. They are initially measured at acquisition cost and subsequently amortized based on the expected consumption of economic benefits over their estimated useful lives ranging from two to 20 years. Judgment is required in determining the following: - The useful life of an intangible asset, as this is based on our estimates regarding the period over which the intangible asset is expected to generate economic benefits to us - The amortization method, as IFRS requires the straight-line method to be used unless we can reliably determine the pattern in which the asset’s future economic benefits are expected to be consumed by us Both the amortization period and the amortization method have an impact on the amortization expense that is recorded in each period. y Classification of Intangibles We classify intangible assets according to their nature and use in our operations. Software and database licenses consist primarily of technology for internal use, whereas acquired technology consists primarily of purchased software to be incorporated into our product offerings. Customer relationships and other intangibles consist primarily of customer relationships and acquired trademark licenses. Amortization expenses of intangible assets are classified as Cost of cloud, Cost of services, Research and development, Sales and marketing, and General and administration, depending on the use of the respective intangible assets. |
F-53
Intangible Assets
€ millions |
|
Software and |
|
Acquired |
|
Customer |
|
Total |
|
|
Database Licenses |
|
Technology |
|
Relationships and |
|
|
|
|
|
|
|
|
Other Intangibles |
|
|
Historical cost |
|
|
|
|
|
|
|
|
1/1/2022 |
|
833 |
|
2,996 |
|
6,734 |
|
10,563 |
Foreign currency exchange differences |
|
8 |
|
170 |
|
337 |
|
515 |
Additions from business combinations |
|
0 |
|
65 |
|
98 |
|
163 |
Other additions |
|
244 |
|
0 |
|
65 |
|
309 |
Retirements/disposals |
|
-115 |
|
-703 |
|
-92 |
|
-910 |
Transfers |
|
87 |
|
-1 |
|
-85 |
|
1 |
12/31/2022 |
|
1,057 |
|
2,527 |
|
7,057 |
|
10,641 |
Foreign currency exchange differences |
|
-1 |
|
-65 |
|
-185 |
|
-251 |
Additions from business combinations |
|
0 |
|
121 |
|
355 |
|
476 |
Other additions |
|
22 |
|
3 |
|
59 |
|
84 |
Retirements/disposals |
|
-92 |
|
-767 |
|
-2,307 |
|
-3,166 |
Transfers |
|
87 |
|
0 |
|
-87 |
|
0 |
12/31/2023 |
|
1,073 |
|
1,819 |
|
4,892 |
|
7,784 |
|
|
|
|
|
|
|
|
|
Accumulated amortization |
|
|
|
|
|
|
|
|
1/1/2022 |
|
547 |
|
2,398 |
|
3,653 |
|
6,598 |
Foreign currency exchange differences |
|
7 |
|
137 |
|
171 |
|
315 |
Additions amortization |
|
99 |
|
209 |
|
458 |
|
766 |
Retirements/disposals |
|
-109 |
|
-703 |
|
-61 |
|
-873 |
12/31/2022 |
|
544 |
|
2,041 |
|
4,221 |
|
6,806 |
Foreign currency exchange differences |
|
-1 |
|
-57 |
|
-118 |
|
-176 |
Additions amortization |
|
146 |
|
77 |
|
305 |
|
528 |
Retirements/disposals |
|
-95 |
|
-477 |
|
-1,307 |
|
-1,879 |
12/31/2023 |
|
594 |
|
1,584 |
|
3,101 |
|
5,279 |
|
|
|
|
|
|
|
|
|
Carrying amount |
|
|
|
|
|
|
|
|
12/31/2022 |
|
513 |
|
486 |
|
2,836 |
|
3,835 |
12/31/2023 |
|
479 |
|
235 |
|
1,791 |
|
2,505 |
Significant Intangible Assets
€ millions, unless otherwise stated |
|
|
|
Remaining |
||||
|
|
Carrying Amount |
|
Useful Life |
||||
|
|
2023 |
|
2022 |
|
(in years) |
||
Concur – Customer relationships |
|
588 |
|
704 |
|
7 |
to |
11 |
LeanIX - Customer relationships |
|
345 |
|
0 |
|
|
|
13 |
Callidus – Customer relationships |
|
147 |
|
181 |
|
|
|
9 |
Signavio – Customer relationships |
|
178 |
|
183 |
|
|
|
13 |
Total significant intangible assets |
|
1,258 |
|
1,068 |
|
|
|
|
F-54
(D.4) Property, Plant, and Equipment
y Depreciation of Property, Plant and Equipment |
|
Property, plant, and equipment are typically depreciated using the straight-line method. Judgment is required in estimating the useful life of the assets. In this assessment we consider, among others, our history with similar assets and current and future changes in technology. |
Useful Lives of Property, Plant, and Equipment
Buildings |
|
Predominantly 25 to 50 years |
Leased assets and leasehold improvements |
|
Based on the term of the lease contract |
Information technology equipment |
|
2 to 6 years |
Office furniture |
|
4 to 20 years |
Automobiles |
|
4 to 5 years |
Property, Plant, and Equipment
€ millions |
|
Land and Buildings |
|
Land and |
|
Other Property, |
|
Other Property, |
|
Advance |
|
Total |
|
|
|
|
Buildings Leased |
|
Plant, and |
|
Plant, and |
|
Payments and |
|
|
|
|
|
|
|
|
Equipment |
|
Equipment |
|
Construction |
|
|
|
|
|
|
|
|
|
|
Leased |
|
in Progress |
|
|
12/31/2022 |
|
1,585 |
|
1,758 |
|
1,406 |
|
43 |
|
142 |
|
4,934 |
12/31/2023 |
|
1,430 |
|
1,320 |
|
1,309 |
|
55 |
|
162 |
|
4,276 |
|
|
|
|
|
|
|
|
|
|
|
|
|
Additions |
|
|
|
|
|
|
|
|
|
|
|
|
12/31/2022 |
|
46 |
|
399 |
|
567 |
|
30 |
|
87 |
|
1,129 |
12/31/2023 |
|
58 |
|
102 |
|
470 |
|
82 |
|
98 |
|
810 |
The additions (other than from business combinations) relate primarily to the replacement and purchase of information technology equipment and the construction and leasing of buildings and data centers. For more information about leases, see Note (D.5).
(D.5) Leases
y Accounting Policies, Judgments, and Estimates |
|
Under IFRS 16, a contract is or contains a lease if the contract conveys the right to control the use of an identified asset for a period of time in exchange for consideration. As a lessee, SAP recognizes a right-of-use asset representing its right to use the underlying asset and a lease liability representing its obligation to make lease payments. The right-of-use assets are depreciated on a straight-line basis and interest expense is recognized on the lease liabilities. The vast majority of our leases consist of facility and data center leases. Payments for short-term and low-value leases are expensed over the lease term. Extension options are included in the lease term if their exercise is reasonably certain. |
F-55
Leases in the Balance Sheet
€ millions |
|
12/31/2023 |
|
12/31/2022 |
Right-of-use assets |
|
|
|
|
Right-of-use assets – land and buildings |
|
1,320 |
|
1,758 |
Right-of-use assets – other property, plant, and equipment |
|
55 |
|
43 |
Total right-of-use assets |
|
1,375 |
|
1,801 |
/ Property, plant, and equipment |
|
4,276 |
|
4,934 |
Right-of-use assets as % of / Property, plant, and equipment |
|
32 |
|
37 |
|
|
|
|
|
Lease liabilities |
|
|
|
|
Current lease liabilities |
|
294 |
|
349 |
/ Current financial liabilities |
|
1,735 |
|
4,808 |
Current lease liabilities as % of / Current financial liabilities |
|
17 |
|
7 |
|
|
|
|
|
Non-current lease liabilities |
|
1,327 |
|
1,791 |
/ Non-current financial liabilities |
|
7,941 |
|
9,547 |
Non-current lease liabilities as % of / Non-current financial liabilities |
|
17 |
|
19 |
SAP is committed to future minimum lease payments in the amount of €37 million (2022: €49 million) for facility leases that had not yet commenced as at December 31, 2023.
Leases in the Income Statement
€ millions |
|
2023 |
|
2022 |
Lease expenses within operating profit |
|
|
|
|
Depreciation of right-of-use assets |
|
325 |
|
397 |
For more information about right-of-use asset additions, see Note (D.4), and for a maturity analysis of lease liabilities, see Note (F.1). For more information about the cash flow related to lease liabilities, see the “Reconciliation of Liabilities Arising from Financing Activities” table within Note (E.3).
F-56
(D.6) Equity Investments
y Accounting Policies, Judgments, and Estimates |
|
|
As we do not designate financial assets as “at fair value through profit or loss,” we generally classify financial assets into the following categories: at amortized cost (AC), at fair value through other comprehensive income (FVOCI), and at fair value through profit or loss (FVTPL), depending on the contractual cash flows of and our business model for holding the respective asset. For equity securities, as the cash flow characteristics are other than solely principal and interest, we take an investment-by-investment decision whether to classify as FVTPL or FVOCI. The valuation of equity securities of private companies requires judgment because it is typically based on significant unobservable inputs, as no market prices are available and there is inherent lack of liquidity. We take the most recent qualitative and quantitative information aspects into consideration to determine the fair value estimates of these equity securities. Considerable judgment and assumptions are involved with regard to the selection of appropriate comparable company data, the assessment of cash requirements of the business, the acceptance of the technology or products in the addressable markets, the actual and forecasted performance, the milestone achievements, the adequacy of price points from financing rounds, the transaction of similar securities of the same company, the rights and preferences of the underlying securities, the selection of adequate equity allocation parameters, the possible exit scenarios and associated weightings. Because all of these assumptions could change significantly, and because valuation is inherently uncertain, our estimated fair values may differ significantly from the values that would have been used had market prices for the investments existed and that will ultimately be realized, and those differences could be material. Gains/losses on equity securities at FVTPL include gains/losses from fair value fluctuations, from disposals as well as dividends, while gains/losses on equity securities at FVOCI only include dividends, all of which are shown in Financial income, net. Regular way purchases and sales are recorded as at the trade date. |
Equity Investments
€ millions |
|
2023 |
|
2022 |
||||||||
|
|
Current |
|
Non-Current |
|
Total |
|
Current |
|
Non-Current |
|
Total |
Equity securities |
|
0 |
|
4,967 |
|
4,967 |
|
0 |
|
5,138 |
|
5,138 |
Investments in associates |
|
0 |
|
135 |
|
135 |
|
0 |
|
151 |
|
151 |
Equity investments |
|
0 |
|
5,102 |
|
5,102 |
|
0 |
|
5,289 |
|
5,289 |
Other financial assets |
|
3,344 |
|
5,543 |
|
8,887 |
|
853 |
|
5,626 |
|
6,479 |
Equity investments as % of Other financial assets |
|
0 |
|
92 |
|
57 |
|
0 |
|
94 |
|
82 |
Investments in Associates
SAP has interests in a number of individually immaterial associates. We own more than 20% of the equity interests or have at least 20% of the voting rights in these entities. Based on these facts and the nature of the relationships, SAP has determined that it has significant influence.
The following table shows, in aggregate, the carrying amount and share of profit of these associates.
€ millions |
|
2023 |
|
2022 |
Carrying amount of interest in associates |
|
135 |
|
151 |
Share of profit and losses from continuing operations |
|
-16 |
|
-4 |
The vast majority of the carrying amount of interest in associates relates to SAP Fioneer GmbH.
For a list of the names of other equity investments, see Note (G.9).
Financial Commitments in Venture Capital Funds
€ millions |
|
2023 |
|
2022 |
Committed investments in venture capital funds |
|
269 |
|
303 |
F-57
SAP invests and holds interests in unrelated parties that manage investments in venture capital. On December 31, 2023, total commitments to make such investments amounted to €977 million (2022: €957 million), of which €708 million had been drawn (2022: €654 million). By investing in such venture capital funds, we are exposed to the risks inherent in the business areas in which the entities operate. Our maximum exposure to loss is the amount invested plus contractually committed future capital contributions.
Maturities
€ millions |
|
12/31/2023 |
|
|
Investments in Venture |
|
|
Capital Funds |
Due 2024 |
|
269 |
Total |
|
269 |
(D.7) Non-Current Assets by Region
The table below shows non-current assets excluding financial instruments, deferred tax assets, post-employment benefit assets, and rights arising under insurance contracts.
Non-Current Assets by Region
€ millions |
|
2023 |
|
2022 |
Germany |
|
7,125 |
|
5,897 |
Rest of EMEA |
|
5,902 |
|
5,897 |
EMEA |
|
13,027 |
|
11,794 |
United States |
|
25,236 |
|
32,385 |
Rest of Americas |
|
526 |
|
510 |
Americas |
|
25,762 |
|
32,894 |
India |
|
361 |
|
333 |
Rest of APJ |
|
809 |
|
877 |
APJ |
|
1,170 |
|
1,210 |
SAP Group |
|
39,959 |
|
45,899 |
The decrease in non-current assets in the United States is primarily due to the divestiture of Qualtrics. For more information, see Note (D.1).
For a breakdown of our employee headcount by region, see Note (B.1), and for a breakdown of revenue by region, see Note (A.1).
F-58
(D.8) Purchase Obligations
€ millions |
|
2023 |
|
2022 |
Contractual obligations for acquisition of property, plant, and equipment and intangible assets |
|
164 |
|
144 |
Other purchase obligations |
|
10,377 |
|
7,491 |
Purchase obligations |
|
10,541 |
|
7,635 |
The contractual obligations for acquisition of property, plant, and equipment and intangible assets relate primarily to the purchase of hardware, software, patents, office equipment, and vehicles. The remaining obligations relate mainly to cloud services, marketing, consulting, maintenance, license agreements, and other third-party agreements. The increase is mainly due to new purchase obligations related to cloud infrastructure services. Historically, the majority of such purchase obligations have been realized.
Maturities
€ millions |
|
12/31/2023 |
|
|
Purchase Obligations |
Due 2024 |
|
2,286 |
Due 2025 to 2028 |
|
7,752 |
Due thereafter |
|
503 |
Total |
|
10,541 |
(D.9)Income-Related Government Grants
y Recognition of Income-Related Government Grants |
|
We recognize Income-Related Government Grants as a reduction of the related expense in the period in which the expense is incurred. |
At the end of 2023, we received a grant from the German government to fund research and development expenditures related to cloud infrastructure. The grant will provide reimbursements of up to €329 million for qualifying expenditures through 2026. No material amounts were recognized or reimbursed in 2023.
F-59
Section E — Capital Structure, Financing, and Liquidity
This section describes how SAP manages its capital structure. Our capital management is based on a high equity ratio, modest financial leverage, a well-balanced maturity profile, and deep debt capacity.
(E.1) Capital Structure Management
The primary objective of our capital structure management is to maintain a strong financial profile for investor, creditor, and customer confidence, and to support the growth of our business. We seek to maintain a capital structure that will allow us to continuously cover our funding requirements through the capital markets on reasonable terms and, in so doing, ensure a high level of independence, confidence, and financial flexibility.
SAP’s prime principle of financial risk management is to safeguard liquidity at a level to be able to meet all our financial obligations. In order to support this goal, SAP’s principal use of cash is focused on:
| - | Capital expenditure |
| - | Quick repayment of financial debt |
| - | Acquisitions and venture activities |
| - | Payment of dividends |
| - | Share buy-backs to return excess cash to shareholders |
SAP SE’s long-term credit rating is “A2” by Moody’s (positive outlook) and “A+” by S&P Global Ratings (stable outlook).
|
|
12/31/2023 |
|
12/31/2022 |
|
|
||||
|
|
€ millions |
|
% of |
|
€ millions |
|
% of |
|
∆ in % |
|
|
|
|
Total Equity and |
|
|
|
Total Equity and |
|
|
|
|
|
|
Liabilities |
|
|
|
Liabilities |
|
|
/ Equity |
|
43,406 |
|
64 |
|
42,848 |
|
59 |
|
1 |
/ Current liabilities |
|
14,642 |
|
21 |
|
17,453 |
|
24 |
|
-16 |
/ Non-current liabilities |
|
10,287 |
|
15 |
|
11,858 |
|
16 |
|
-13 |
/ Liabilities |
|
24,928 |
|
36 |
|
29,311 |
|
41 |
|
-15 |
Thereof financial debt |
|
7,755 |
|
11 |
|
11,764 |
|
16 |
|
-34 |
Thereof lease liabilities |
|
1,621 |
|
2 |
|
2,140 |
|
3 |
|
-25 |
/ Total equity and liabilities |
|
68,335 |
|
100 |
|
72,159 |
|
100 |
|
-5 |
At maturity, we repaid €1,600 million in Eurobonds, €1,450 million in term loans, and €930 million in Commercial Paper in 2023. The ratio of total nominal volume of financial debt to total equity and liabilities decreased 5 pp. Applying IFRS 5, prior-year numbers include amounts attributable to Qualtrics.
(E.2) Total Equity
y Accounting for Interests in Subsidiaries
Changes in SAP's interest in a subsidiary that do not result in a loss of control are accounted for as equity transactions. When SAP loses control over the subsidiary, it derecognizes the assets and liabilities of the subsidiary, and any related non-controlling interests (NCI) and other components of equity. Any resulting gain or loss is recognized in profit or loss.
Issued Capital
SAP SE has issued no-par value bearer shares with a calculated nominal value of €1 per share. All of the shares issued are fully paid.
F-60
Number of Shares
|
|
Issued |
|
Treasury |
Millions |
|
Capital |
|
Shares |
1/1/2021 |
|
1,228.5 |
|
-48.9 |
12/31/2021 |
|
1,228.5 |
|
-48.9 |
Purchase of treasury shares |
|
0 |
|
-15.7 |
Reissuance of treasury shares under share-based payments |
|
0 |
|
3.3 |
12/31/2022 |
|
1,228.5 |
|
-61.4 |
Purchase of treasury shares |
|
0 |
|
-7.6 |
Reissuance of treasury shares under share-based payments |
|
0 |
|
7.7 |
12/31/2023 |
|
1,228.5 |
|
-61.3 |
On August 14, 2023, SAP launched a new share repurchase program designed primarily to service future share-based compensation awards. With a total volume of up to €1,250 million, the program will run until February 19, 2024. By December 31, 2023, we had repurchased shares with a total volume of €949 million. In addition, we reissued 7.7 million treasury shares to service share-based payment awards under our Move SAP Plan in 2023.
Authorized Shares
The Articles of Incorporation authorize the Executive Board to increase the issued capital as follows:
| - | By up to a total amount of €250 million by issuing new no-par value bearer shares against contributions in cash until May 19, 2025 (Authorized Capital I). The issuance is subject to the statutory subscription rights of existing shareholders. |
| - | By up to a total amount of €250 million by issuing new no-par value bearer shares against contributions in cash or in kind until May 19, 2025 (Authorized Capital II). Subject to the consent of the Supervisory Board, the Executive Board is authorized to exclude the shareholders’ statutory subscription rights in certain cases. |
Contingent Shares
SAP SE’s share capital is subject to a contingent capital increase, which will be implemented only insofar as the holders or creditors of convertible bonds or stock options issued or guaranteed by SAP SE or any of its directly or indirectly controlled subsidiaries under certain share-based payments exercise their conversion or subscription rights, and no other methods for servicing these rights are used. As at December 31, 2023, €100 million, representing 100 million shares, was still available for issuance (2022: €100 million).
Retained Earnings
Retained earnings mainly comprise profit after tax and dividend payments as well as transactions with non-controlling interests.
Other Components of Equity
€ millions |
|
Exchange |
|
Cash Flow |
|
Total |
|
|
Differences |
|
Hedges/Cost of |
|
|
|
|
|
|
Hedging |
|
|
1/1/2021 |
|
-1,016 |
|
4 |
|
-1,012 |
Other comprehensive income for items that will be reclassified to profit or loss, net of tax |
|
2,846 |
|
-26 |
|
2,819 |
12/31/2021 |
|
1,830 |
|
-22 |
|
1,808 |
Other comprehensive income for items that will be reclassified to profit or loss, net of tax |
|
2,186 |
|
39 |
|
2,224 |
12/31/2022 |
|
4,015 |
|
16 |
|
4,031 |
Other comprehensive income for items that will be reclassified to profit or loss, net of tax |
|
-1,597 |
|
-8 |
|
-1,605 |
12/31/2023 |
|
2,418 |
|
9 |
|
2,426 |
F-61
Treasury Shares
By resolution of SAP SE’s Annual General Meeting of Shareholders held on May 11, 2023, the authorization granted by the Annual General Meeting of Shareholders on May 17, 2018, regarding the acquisition of treasury shares was revoked to the extent it had not been exercised at that time, and replaced by a new authorization of the Executive Board of SAP SE to acquire, on or before May 10, 2028, shares of SAP SE representing a pro rata amount of capital stock of up to €120 million in aggregate, provided that the shares purchased under the authorization, together with any other shares in the Company previously acquired and held by, or attributable to, SAP SE do not account for more than 10% of SAP SE’s issued share capital. Although treasury shares are legally considered outstanding, there are no dividend or voting rights associated with them. We may redeem or resell shares held in treasury, or we may use treasury shares for the purpose of servicing option or conversion rights under the Company’s share-based payment plans. Also, we may use shares held in treasury as consideration in connection with mergers with, or acquisitions of, other companies.
Following the above authorization, in May 2023 we announced a new share buyback program with an aggregate volume of up to €5 billion and a term until December 31, 2025. As part of the first tranche of this program, we acquired shares with a volume of €949 million (without incidental acquisition costs) between August 14, 2023, and December 31, 2023.
Distribution Policy and Dividends
Our general intention is to remain in a position to return liquidity to our shareholders by distributing annual dividends totaling 40% or more of our profit after tax and by potentially repurchasing treasury shares in future.
In 2023, we distributed €2,395 million (€2.05 per share) in dividends for 2022, compared to €2,865 million (€2.45 per share, including a special dividend of €0.50 to celebrate SAP’s 50th anniversary) paid in 2022 for 2021 and €2,182 million (€1.85 per share) paid in 2021 for 2020.
The total dividend available for distribution to SAP SE shareholders is based on the profits of SAP SE as reported in its statutory financial statements prepared under the accounting rules in the German Commercial Code (Handelsgesetzbuch). For the year ended December 31, 2023, the Executive Board intends to propose that a dividend of €2.20 per share (that is, an estimated total dividend of €2,568 million), be paid from the profits of SAP SE.
Non-Controlling Interests
Until divestiture in June 2023, Qualtrics issued new shares to serve share-based payment awards under the Qualtrics Omnibus plan, which further reduced SAP’s ownership in Qualtrics to 69% (2022: 71%). In the first half of 2023, a loss of €141 million (2022: €366 million) was attributed to non-controlling interests of Qualtrics. For more information about the divestiture of Qualtrics, see Note (D.1). In 2023, a loss of €33 million (2022: €210 million) was attributed to non - controlling interests of other SAP entities.
F-62
(E.3) Liquidity
y Accounting for Non-Derivative Financial Instruments |
|
Classification and Measurement of Non-Derivative Financial Debt Investments |
|
|
Our non-derivative financial debt investments comprise cash at banks and cash equivalents (highly liquid investments with original maturities of three months or less, such as time deposits and money-market funds), loans and other financial receivables, and acquired debt securities. We generally classify financial assets as: at amortized cost (AC), at fair value through other comprehensive income (FVOCI), or at fair value through profit or loss (FVTPL), depending on the contractual cash flows of, and our business model for, holding the respective asset. Financial assets having cash flow characteristics other than solely principal and interest such as money market and similar funds are classified as FVTPL. Generally, other financial assets with cash flows consisting solely of principal and interest are held within a business model whose objective is "hold to collect" and are thus classified as AC. Occasionally, such other financial assets are held within a business model whose objective is "hold to collect and sell" in which case they are classified as FVOCI. Gains/losses on non-derivative financial debt investments at FVTPL are reported in Financial income, net and show interest income/expenses separately from other gains/losses which include gains/losses from fair value fluctuations and disposals. Gains/losses on non-derivative financial debt investments at AC are reported in Financial income, net and show interest income/expenses separately from other gains/losses which include gains/losses on disposals and changes in expected and incurred credit losses. Gains/losses from foreign currency exchange rate fluctuations are included in Other non-operating income/expense, net. Regular way purchases and sales are recorded as at the trade date. |
|
Impairment of Non-Derivative Financial Debt Investments For these financial assets, we apply considerable judgment by employing the general impairment approach as follows: -
For cash at banks, time deposits, and debt securities such as acquired bonds and acquired commercial papers, we apply the low credit risk exception, as it is our policy to invest only in high-quality assets of issuers with a minimum rating of at least investment grade to minimize the risk of credit losses. Thus, these assets are always allocated to stage 1 of the three-stage credit loss model, and we record a loss allowance at an amount equal to 12-month expected credit losses. This loss allowance is calculated based on our exposure at the respective reporting date, the loss given default for this exposure, and the credit default swap spread as a measure for the probability of default. Even though we invest only in assets of at least investment-grade, we also closely observe the development of credit default swap spreads as a measure of market participants’ assessments of the creditworthiness of a debtor to evaluate probable significant increases in credit risk to timely react to changes should these manifest. Among others, we consider cash at banks, time deposits, and debt securities to be in default when the counterparty is unlikely to pay its obligations in full, when there is information about a counterparty’s financial difficulties or if there is a drastic increase in a counterparty’s credit default swap spread for a prolonged time period while the overall market environment remains generally stable. Such financial assets are written off either partially or in full if the likelihood of recovery is considered remote, which might be evidenced, for example, by the bankruptcy of a counterparty of such financial assets.
-
Loans and other financial receivables are monitored based on borrower-specific internal and external information to determine whether there has been a significant increase in credit risk since initial recognition. We consider such assets to be in default if they are significantly beyond their due date or if the borrower is unlikely to pay its obligation. A write-off occurs when the likelihood of recovery is considered remote, for example when bankruptcy proceedings have been finalized or when all enforcement efforts have been exhausted.
|
Non-Derivative Financial Liabilities |
|
Non-derivative financial liabilities include bank loans, issued bonds, private placements, and other financial liabilities. Other financial liabilities also include customer funding liabilities which are funds we draw from and make payments on behalf of our customers for customers’ employee expense reimbursements, related credit card payments, and vendor payments. We present these funds in cash and cash equivalents and record our obligation to make these expense reimbursements and payments on behalf of our customers as customer funding liabilities. As we do not designate financial liabilities as FVTPL, we generally classify non-derivative financial liabilities as AC. Expenses and gains or losses on financial liabilities at AC mainly consist of interest expense which is shown in Financial income, net. Gains/losses from foreign currency exchange rate fluctuations are included in Other non-operating income/expense, net. Group Liquidity, Financial Debt, and Net Debt Group liquidity consists of cash at banks, money market and other funds, as well as time deposits and debt securities (both with remaining maturities of less than one year). Financial debt is defined as the nominal volume of bank loans, issued commercial papers, private placements, and bonds. Net debt is group liquidity less financial debt. |
F-63
Group Liquidity and Net Debt
€ millions |
|
2023 |
|
2022 |
|
∆ |
/ Cash and cash equivalents |
|
8,124 |
|
9,008 |
|
-883 |
Current time deposits and debt securities |
|
3,151 |
|
686 |
|
2,464 |
Group liquidity |
|
11,275 |
|
9,694 |
|
1,581 |
Current financial debt |
|
-1,143 |
|
-3,986 |
|
2,843 |
Non-current financial debt |
|
-6,612 |
|
-7,778 |
|
1,166 |
Financial debt |
|
-7,755 |
|
-11,764 |
|
4,009 |
Net debt (–) |
|
3,521 |
|
-2,070 |
|
5,590 |
While we continuously monitor the ratios presented in the capital structure table, we actively manage our liquidity and structure of our financial indebtedness based on the ratios group liquidity and net debt.
Cash and Cash Equivalents
€ millions |
|
2023 |
|
2022 |
||||||||
|
|
Current |
|
Non-Current |
|
Total |
|
Current |
|
Non-Current |
|
Total |
Cash at banks |
|
3,369 |
|
0 |
|
3,369 |
|
3,176 |
|
0 |
|
3,176 |
Time deposits |
|
2,130 |
|
0 |
|
2,130 |
|
2,932 |
|
0 |
|
2,932 |
Money market and other funds |
|
2,478 |
|
0 |
|
2,478 |
|
2,855 |
|
0 |
|
2,855 |
Debt securities |
|
150 |
|
0 |
|
150 |
|
47 |
|
0 |
|
47 |
Expected credit loss allowance |
|
-3 |
|
0 |
|
-3 |
|
-3 |
|
0 |
|
-3 |
/ Cash and cash equivalents |
|
8,124 |
|
0 |
|
8,124 |
|
9,008 |
|
0 |
|
9,008 |
Non-Derivative Financial Debt Investments
€ millions |
|
2023 |
|
2022 |
||||||||
|
|
Current |
|
Non-Current |
|
Total |
|
Current |
|
Non-Current |
|
Total |
Time deposits |
|
3,028 |
|
0 |
|
3,028 |
|
657 |
|
0 |
|
657 |
Debt securities |
|
129 |
|
0 |
|
129 |
|
32 |
|
0 |
|
32 |
Financial instruments related to employee benefit plans |
|
0 |
|
244 |
|
244 |
|
0 |
|
203 |
|
203 |
Loans and other financial receivables |
|
108 |
|
192 |
|
300 |
|
104 |
|
129 |
|
233 |
Expected credit loss allowance |
|
-7 |
|
0 |
|
-7 |
|
-3 |
|
0 |
|
-3 |
Non-derivative financial debt investments |
|
3,259 |
|
436 |
|
3,695 |
|
790 |
|
332 |
|
1,122 |
/ Other financial assets |
|
3,344 |
|
5,543 |
|
8,887 |
|
853 |
|
5,626 |
|
6,479 |
Non-derivative financial debt investments as % of / Other financial assets |
|
97 |
|
8 |
|
42 |
|
93 |
|
6 |
|
17 |
Time deposits with original maturity of three months or less are presented as cash and cash equivalents, and those with original maturities of greater than three months (investments considered in group liquidity) are presented as other financial assets. Debt securities consist of acquired commercial papers and acquired bonds of mainly financial and non-financial corporations and municipalities.
The increase in time deposits presented as cash equivalents and current investments and the increase in money market funds in 2023 are due to the proceeds from the Qualtrics divestiture.
For more information about financial risk and the nature of risk, see Note (F.1).
F-64
Financial Debt
€ millions |
|
2023 |
|
2022 |
||||||||||||||||
|
|
Nominal Volume |
|
Carrying Amount |
|
Nominal Volume |
|
Carrying Amount |
||||||||||||
|
|
Current |
|
Non-Current |
|
Current |
|
Non-Current |
|
Total |
|
Current |
|
Non-Current |
|
Current |
|
Non-Current |
|
Total |
Bonds |
|
850 |
|
6,521 |
|
849 |
|
5,932 |
|
6,780 |
|
1,600 |
|
7,381 |
|
1,600 |
|
6,556 |
|
8,155 |
Private placement transactions |
|
292 |
|
90 |
|
294 |
|
95 |
|
388 |
|
0 |
|
397 |
|
0 |
|
405 |
|
405 |
Commercial paper |
|
0 |
|
0 |
|
0 |
|
0 |
|
0 |
|
930 |
|
0 |
|
928 |
|
0 |
|
928 |
Bank loans |
|
0 |
|
0 |
|
0 |
|
0 |
|
0 |
|
1,456 |
|
0 |
|
1,456 |
|
0 |
|
1,456 |
Financial debt |
|
1,143 |
|
6,612 |
|
1,143 |
|
6,026 |
|
7,169 |
|
3,986 |
|
7,778 |
|
3,983 |
|
6,960 |
|
10,943 |
/ Financial liabilities1 |
|
|
|
|
|
1,735 |
|
7,941 |
|
9,676 |
|
|
|
|
|
4,808 |
|
9,547 |
|
14,354 |
Financial debt as % of / Financial liabilities |
|
|
|
|
|
66 |
|
76 |
|
74 |
|
|
|
|
|
83 |
|
73 |
|
76 |
1 In 2023, SAP changed the presentation of trade-debtors with a credit balance from Financial liabilities to Trade and other payables. Trade-debtors with credit balances for 2023 are €186 million (2022: €286 million). The presentation for 2022 remains unchanged.
Financial liabilities are unsecured, except for the retention of title and similar rights customary in our industry. Effective interest rates on our financial debt (including the effects from interest rate swaps) were 3.49% in 2023, 1.23% in 2022, and 0.83% in 2021.
For more information about the risk associated with our financial liabilities, see Note (F.1). For more information about fair values, see Note (F.2).
Bonds
|
|
2023 |
|
2022 |
|||||||||||
|
|
Maturity |
|
Issue Price |
|
Coupon Rate |
|
Effective Interest |
|
Nominal Volume |
|
Carrying |
|
Carrying |
|
|
|
|
|
|
|
|
|
Rate |
|
(in respective |
|
Amount |
|
Amount |
|
|
|
|
|
|
|
|
|
|
|
currency |
|
(in € millions) |
|
(in € millions) |
|
|
|
|
|
|
|
|
|
|
|
in millions) |
|
|
|
|
|
Eurobond 8 – 2014 |
|
2023 |
|
99.478 |
% |
1.125% (fix) |
|
1.24 |
% |
€ |
1,000 |
|
0 |
|
1,000 |
Eurobond 9 – 2014 |
|
2027 |
|
99.284 |
% |
1.750% (fix) |
|
1.87 |
% |
€ |
1,000 |
|
914 |
|
869 |
Eurobond 12 – 2015 |
|
2025 |
|
99.264 |
% |
1.000% (fix) |
|
1.13 |
% |
€ |
600 |
|
599 |
|
598 |
Eurobond 15 – 2018 |
|
2026 |
|
99.576 |
% |
1.000% (fix) |
|
1.06 |
% |
€ |
500 |
|
499 |
|
499 |
Eurobond 16 – 2018 |
|
2030 |
|
98.687 |
% |
1.375% (fix) |
|
1.50 |
% |
€ |
500 |
|
428 |
|
401 |
Eurobond 19 – 2018 |
|
2024 |
|
99.227 |
% |
0.750% (fix) |
|
0.89 |
% |
€ |
850 |
|
849 |
|
848 |
Eurobond 20 – 2018 |
|
2028 |
|
98.871 |
% |
1.250% (fix) |
|
1.38 |
% |
€ |
1,000 |
|
891 |
|
843 |
Eurobond 21 – 2018 |
|
2031 |
|
98.382 |
% |
1.625% (fix) |
|
1.78 |
% |
€ |
1,250 |
|
1,045 |
|
976 |
Eurobond 22 – 2020 |
|
2023 |
|
99.794 |
% |
0.000% (fix) |
|
0.07 |
% |
€ |
600 |
|
0 |
|
600 |
Eurobond 23 – 2020 |
|
2026 |
|
99.200 |
% |
0.125% (fix) |
|
0.26 |
% |
€ |
600 |
|
598 |
|
597 |
Eurobond 24 – 2020 |
|
2029 |
|
98.787 |
% |
0.375% (fix) |
|
0.51 |
% |
€ |
800 |
|
686 |
|
643 |
Eurobonds |
|
|
|
|
|
|
|
|
|
|
|
|
6,509 |
|
7,874 |
USD bond - 2018 |
|
2025 |
|
100.000 |
% |
4.69% (fix) |
|
4.74 |
% |
US$ |
300 |
|
271 |
|
281 |
Bonds |
|
|
|
|
|
|
|
|
|
|
|
|
6,780 |
|
8,155 |
All of our Eurobonds are listed for trading on the Luxembourg Stock Exchange.
F-65
Private Placements
|
|
2023 |
|
2022 |
|||||||||
|
|
Maturity |
|
Coupon Rate |
|
Effective Interest |
|
Nominal Volume |
|
Carrying Amount |
|
Carrying Amount |
|
|
|
|
|
|
|
Rate |
|
(in respective |
|
(in € millions) |
|
(in € millions) |
|
|
|
|
|
|
|
|
|
currency in |
|
|
|
|
|
|
|
|
|
|
|
|
|
millions) |
|
|
|
|
|
U.S. private placements |
|
|
|
|
|
|
|
|
|
|
|
|
|
Tranche 8 – 2012 |
|
2024 |
|
3.33% (fix) |
|
3.37 |
% |
US$ |
323 |
|
294 |
|
306 |
Tranche 9 – 2012 |
|
2027 |
|
3.53% (fix) |
|
3.57 |
% |
US$ |
100 |
|
95 |
|
99 |
Private placements |
|
|
|
|
|
|
|
|
|
|
388 |
|
405 |
The U.S. private placement notes were issued by one of our subsidiaries that has the U.S. dollar as its functional currency.
Commercial Paper Program
The net proceeds from our commercial paper (Commercial Paper, or CP) program are being used for general corporate purposes, including dividends and share repurchases. On December 31, 2023, we had no commercial papers outstanding. (December 31, 2022: €928 million carrying amount generally with a maturity of less than six months). The weighted average interest rate of the CP outstanding as of December 31, 2022, was 1.96%.
Loans
In March 2021, SAP drew two short-term bank loans of €950 million and €500 million with original tenors of one year that could be flexibly repaid until September 30, 2023. We repaid both loans in August 2023.
F-66
Reconciliation of Liabilities Arising from Financing Activities
The changes in our financial debts are reconciled to the cash flows from borrowings included in the cash flow from financing activities.
€ millions |
|
1/1/2023 |
|
Cash Flows |
|
Business |
|
Foreign |
|
Fair Value |
|
Other |
|
12/31/2023 |
|
|
|
|
|
|
Combinations |
|
Currency |
|
Changes |
|
|
|
|
Current financial debt |
|
3,986 |
|
-3,986 |
|
0 |
|
0 |
|
0 |
|
1,142 |
|
1,143 |
Non-current financial debt |
|
7,778 |
|
0 |
|
0 |
|
-24 |
|
0 |
|
-1,142 |
|
6,612 |
Financial debt (nominal volume) |
|
11,764 |
|
-3,986 |
|
0 |
|
-24 |
|
0 |
|
0 |
|
7,755 |
Basis adjustment |
|
-773 |
|
0 |
|
0 |
|
2 |
|
221 |
|
0 |
|
-550 |
Transaction costs |
|
-47 |
|
0 |
|
0 |
|
0 |
|
0 |
|
12 |
|
-35 |
Financial debt (carrying amount) |
|
10,943 |
|
-3,986 |
|
0 |
|
-22 |
|
221 |
|
12 |
|
7,169 |
Accrued interest and payment to banks |
|
203 |
|
-83 |
|
0 |
|
0 |
|
0 |
|
-27 |
|
94 |
Interest rate swaps |
|
753 |
|
0 |
|
0 |
|
-1 |
|
-215 |
|
0 |
|
537 |
Lease1 |
|
2,140 |
|
-332 |
|
0 |
|
55 |
|
0 |
|
-241 |
|
1,621 |
Total liabilities from financing activities |
|
14,039 |
|
-4,400 |
|
0 |
|
32 |
|
7 |
|
-256 |
|
9,421 |
1 Other includes new lease liabilities.
€ millions |
|
1/1/2022 |
|
Cash Flows |
|
Business |
|
Foreign |
|
Fair Value |
|
Other |
|
12/31/2022 |
|
|
|
|
|
|
Combinations |
|
Currency |
|
Changes |
|
|
|
|
Current financial debt |
|
3,755 |
|
-1,406 |
|
0 |
|
36 |
|
0 |
|
1,600 |
|
3,986 |
Non-current financial debt |
|
9,338 |
|
0 |
|
0 |
|
40 |
|
0 |
|
-1,600 |
|
7,778 |
Financial debt (nominal volume) |
|
13,094 |
|
-1,406 |
|
0 |
|
76 |
|
0 |
|
0 |
|
11,764 |
Basis adjustment |
|
-34 |
|
0 |
|
0 |
|
2 |
|
-741 |
|
0 |
|
-773 |
Transaction costs |
|
-55 |
|
0 |
|
0 |
|
0 |
|
0 |
|
8 |
|
-47 |
Financial debt (carrying amount) |
|
13,005 |
|
-1,406 |
|
0 |
|
77 |
|
-741 |
|
8 |
|
10,943 |
Accrued interest |
|
60 |
|
119 |
|
0 |
|
0 |
|
0 |
|
24 |
|
203 |
Interest rate swaps |
|
42 |
|
0 |
|
0 |
|
-1 |
|
711 |
|
0 |
|
753 |
Lease1 |
|
2,143 |
|
-424 |
|
0 |
|
55 |
|
0 |
|
366 |
|
2,140 |
Total liabilities from financing activities |
|
15,250 |
|
-1,711 |
|
0 |
|
131 |
|
-29 |
|
398 |
|
14,039 |
1 Other includes new lease liabilities.
F-67
Section F — Management of Financial Risk Factors
This section discusses financial risk factors and risk management regarding foreign currency exchange rate risk, interest rate risk, equity price risk, credit risk, and liquidity risk. Further, it contains information about financial instruments.
(F.1) Financial Risk Factors and Risk Management
y Accounting for Derivative Financial Instruments |
|
We use derivatives to hedge foreign currency risk or interest rate risk and designate them as cash flow or fair value hedges if they qualify for hedge accounting under IFRS 9, which involves judgment. Derivatives Not Designated as Hedging Instruments in Hedge Accounting Relationships Many transactions constitute economic hedges, and therefore contribute effectively to the securing of financial risks but do not qualify for hedge accounting under IFRS 9. To hedge currency risks inherent in foreign-currency denominated and recognized monetary assets and liabilities, we do not designate our held-for-trading derivative financial instruments in hedge accounting, because the profits and losses from the underlying transactions are recognized in profit or loss in the same periods as the profits or losses from the derivatives. In addition, we occasionally have contracts that contain foreign currency embedded derivatives that are required to be accounted for separately. Fair value fluctuations in the spot component of such derivatives at FVTPL are included in Other non-operating income/expense, net while the forward element is shown in Financial income, net. |
F-68
|
Derivatives Designated as Hedging Instruments a) Cash Flow Hedge In general, we apply cash flow hedge accounting to the foreign currency risk of highly probable forecasted transactions. With regard to foreign currency risk, hedge accounting relates to the spot price and to the intrinsic values of the derivatives designated and qualifying as cash flow hedges. Accordingly, the effective portion of these components determined on a present value basis is recorded in other comprehensive income. The forward element and time value as well as foreign currency basis spreads excluded from the hedging relationship are recorded as cost of hedging in a separate position in other comprehensive income. As the amounts are not material, they are presented together with the effective portion of the cash flow hedges in our consolidated statements of comprehensive income and consolidated statements of changes in equity. All other components including counterparty credit risk adjustments of the derivative and the ineffective portion are immediately recognized in Financial Income, net in profit or loss. Amounts accumulated in other comprehensive income are reclassified to profit or loss to Other non-operating income/expense, net and Financial income, net in the same period when the hedged item affects profit or loss. b)Net Investment Hedge In general, we do not hedge the foreign currency exposure from the net assets of subsidiaries with a functional currency different from the euro, and we do not apply net investment hedge accounting. However, in selected cases we might do so, and we applied net investment hedge accounting in 2023. For more information, see Note (D.1). The designated component in hedge accounting is the spot price of the derivatives designated and qualifying as net investment hedges. Accordingly, the effective portion of this component determined on a present value basis is recorded in Other comprehensive income. All other not-designated components or ineffective portions are immediately recognized in Financial Income, net in profit or loss. Amounts accumulated in Other comprehensive income are reclassified to profit or loss to Other non-operating income/expense, net in the same period when the foreign operation is partially disposed of or sold. c) Fair Value Hedge We apply fair value hedge accounting for certain of our fixed-rate financial liabilities and show the fair value fluctuations in Financial income, net. d) Valuation and Testing of Effectiveness At inception of a designated hedging relationship, we document our risk management strategy and the economic relationship between hedged item and hedging instrument. The existence of an economic relationship is demonstrated as well as the effectiveness of the hedging relationship tested prospectively by applying the critical terms match for our foreign currency hedges, since currencies, maturities, and the amounts are closely aligned for the forecasted transactions and for the spot element of the forward exchange rate contract or intrinsic value of the currency options, respectively. For interest rate swaps, effectiveness is tested prospectively using statistical methods in the form of a regression analysis, by which the validity and extent of the relationship between the change in value of the hedged items as the independent variable and the fair value change of the derivatives as the dependent variable is determined. The main sources of ineffectiveness are: -
The effect of the counterparty and our own credit risk on the fair value of the forward exchange contracts and interest rate swaps, which is not reflected in the respective hedged item, and
-
Differences in the timing of hedged item and hedged transaction in our cash flow hedges.
|
F-69
We are exposed to various financial risks, such as market risks (that is, foreign currency exchange rate risk, interest rate risk, and equity price risk), credit risk, and liquidity risk.
We manage market risks, credit risk, and liquidity risk on a Group-wide basis through our global treasury department, global risk management, and global credit management. Risk management policies are established to identify risks, to set appropriate risk limits, and to monitor risks. Risk management policies and hedging strategies are laid out in our internal guidelines (for example, treasury guideline and other internal guidelines), and are subject to continuous internal review, analysis, and update to reflect changes in market conditions and our business.
We only purchase derivative financial instruments to reduce risks and not for speculation, which is defined as entering into derivative instruments without a corresponding underlying transaction.
Foreign Currency Exchange Rate Risk
Foreign Currency Exchange Rate Risk Factors
As we are active worldwide, our ordinary operations are subject to risks associated with fluctuations in foreign currencies. Since the Group’s entities mainly conduct their operating business in their own functional currencies, our risk of exchange rate fluctuations from ongoing ordinary operations is not considered significant. However, the Group's entities occasionally generate foreign currency-denominated receivables, payables, and other monetary items by transacting in a currency other than the respective functional currency. To mitigate the extent of the associated foreign currency exchange rate risk, a significant portion of these transactions is hedged as described below.
In rare circumstances, transacting in a currency other than the functional currency also leads to embedded foreign currency derivatives being separated and measured at fair value through profit or loss.
In addition, the intellectual property (IP) holders in the SAP Group are exposed to risks associated with forecasted intercompany cash flows in foreign currencies. These cash flows arise out of royalty payments from subsidiaries to the respective IP holder. The royalties are linked to the subsidiaries’ external revenue. This arrangement leads to a concentration of the foreign currency exchange rate risk with the IP holders, as the royalties are mostly denominated in the subsidiaries’ local currencies, while the functional currency of the IP holders with the highest royalty volume is the euro. The highest foreign currency exchange rate exposure of this kind relates to the currencies of subsidiaries with significant operations, for example the U.S. dollar, the pound sterling, the Japanese yen, the Swiss franc, and the Australian dollar.
Generally, we are not exposed to any significant foreign currency exchange rate risk with regard to our investing and financing activities, as such activities are normally conducted in the functional currency of the investing or borrowing entity.
Foreign Currency Exchange Rate Risk Management
We continuously monitor our exposure to currency fluctuation risks based on monetary items and forecasted transactions and pursue a Group-wide strategy to manage foreign currency exchange rate risk, using derivative financial instruments, primarily foreign exchange forward contracts, as appropriate, with the primary aim of reducing profit or loss volatility. Most of the hedging instruments are not designated as being in a hedge accounting relationship.
Currency Hedges Designated as Hedging Instruments (Cash Flow Hedges)
We enter into derivative financial instruments, primarily foreign exchange forward contracts, to hedge significant forecasted cash flows (royalties) from foreign subsidiaries denominated in foreign currencies with a hedge ratio of 1:1 and a hedge horizon of up to 12 months, which is also the maximum maturity of the foreign exchange derivatives we use.
For all years presented, no previously highly probable transaction designated as a hedged item in a foreign currency cash flow hedge relationship ceased to be probable. Therefore, we did not discontinue any of our cash flow hedge relationships. Also, ineffectiveness was either not material or non-existent in all years reported. Generally, the cash flows of the hedged forecasted transactions are expected to occur and to be recognized in profit or loss monthly within a time frame of 12 months from the date of the Statement of Financial Position.
Currency Hedges Designated as Hedging Instruments (Net Investment Hedges)
We have hedged part of our net investment in our U.S. subsidiaries which have the U.S. dollar as their functional currency, by entering into a deal contingent forward. The hedged risk is the weakening of the U.S. dollar against the euro. The deal contingent forward is designated as a hedging instrument for the changes in the value of the net investment that is attributable to changes in the U.S. dollar/euro spot rate.
To assess hedge effectiveness, we have determined the economic relationship between the hedging instrument and the hedged item, by comparing changes in the carrying amount of the deal contingent forward that is attributable to a change in the spot rate with changes in the investment in the U.S. subsidiaries due to movements in the spot rate.
F-70
The amounts as at December 31, 2023, relating to items designated as hedged items were as follows:
Designated Hedged Items in Foreign Currency Exchange Rate Hedges
€ millions |
|
Forecasted |
|
Net Investment |
|
Forecasted |
|
Net Investment |
|
|
|
2023 |
|
2022 |
|||||
Change in value used for calculating hedge ineffectiveness |
|
|
19 |
|
-15 |
|
32 |
|
0 |
Cash flow hedge |
|
|
19 |
|
0 |
|
32 |
|
0 |
Cost of hedging |
|
|
-7 |
|
0 |
|
-9 |
|
0 |
Balances remaining in cash flow hedge reserve for which hedge accounting is no longer applied |
|
|
0 |
|
-15 |
|
0 |
|
0 |
The amounts as at December 31, 2023, designated as hedging instruments were as follows:
Designated Hedging Instruments in Foreign Currency Exchange Rate Hedges
€ millions |
|
Forecasted License |
|
Net Investment |
|
Forecasted License |
|
Net Investment |
|
|
2023 |
|
2022 |
||||
Nominal amount |
|
2,390 |
|
0 |
|
1,371 |
|
0 |
Carrying amount |
|
|
|
|
|
|
|
|
Other financial assets |
|
33 |
|
0 |
|
-9 |
|
0 |
Other financial liabilities |
|
-20 |
|
0 |
|
-9 |
|
0 |
Change in value recognized in OCI |
|
19 |
|
15 |
|
32 |
|
0 |
Hedge ineffectiveness recognized in Finance income, net |
|
0 |
|
-106 |
|
0 |
|
0 |
Cost of hedging recognized in OCI |
|
-7 |
|
0 |
|
-9 |
|
0 |
Amount reclassified from cash flow hedge in OCI to Other non-operating income, net |
|
62 |
|
0 |
|
-42 |
|
0 |
Amount reclassified from cost of hedging in OCI to Finance income, net |
|
-9 |
|
0 |
|
-7 |
|
0 |
On December 31, 2023, we held the following instruments to hedge exposures to changes in foreign currency:
Details on Hedging Instruments in Foreign Currency Exchange Rate Hedges
|
|
Maturity |
||||||
|
|
2023 |
|
2022 |
||||
|
|
1–6 Months |
|
7–12 Months |
|
1–6 Months |
|
7–12 Months |
Forward exchange contracts |
|
|
|
|
|
|
|
|
Net exposure in € millions |
|
1,364 |
|
1,025 |
|
822 |
|
550 |
Average EUR:GBP forward rate |
|
0.88 |
|
0.88 |
|
0.86 |
|
0.88 |
Average EUR:JPY forward rate |
|
148.12 |
|
152.10 |
|
136.83 |
|
138.23 |
Average EUR:CHF forward rate |
|
0.96 |
|
0.94 |
|
1.00 |
|
0.97 |
Average EUR:AUD forward rate |
|
1.64 |
|
1.67 |
|
1.53 |
|
1.54 |
Average EUR:USD forward rate |
|
1.10 |
|
1.09 |
|
1.05 |
|
1.03 |
F-71
Foreign Currency Exchange Rate Exposure
Our risk exposure is based on the following assumptions:
| - | The SAP Group’s entities generally operate in their functional currencies. In exceptional cases and limited economic environments, operating transactions are denominated in currencies other than the functional currency, leading to a foreign currency exchange rate risk for the related monetary instruments. Where material, this foreign currency exchange rate risk is hedged. Therefore, fluctuations in foreign currency exchange rates only have an impact on profit with regard to our unhedged non-derivative monetary financial instruments and related income or expenses. |
| - | Our free-standing derivatives designed for hedging foreign currency exchange rate risks almost completely balance the changes in the fair values of the hedged item attributable to exchange rate movements in the Consolidated Income Statements in the same period. As a consequence, the hedged items and the hedging instruments are not exposed to foreign currency exchange rate risks, and thereby have no effect on profit. |
Consequently, we are only exposed to significant foreign currency exchange rate fluctuations with regard to the following:
| - | The spot component of derivatives held within a designated cash flow hedge relationship affecting other comprehensive income |
| - | Foreign currency embedded derivatives affecting other non-operating expense, net |
| - | Unhedged foreign - currency monetary assets and liabilities affecting other non - operating expense, net |
Thus, our foreign currency exposure (and our average/high/low exposure) as at December 31 was as follows:
Foreign Currency Exposure
€ billions |
|
2023 |
|
2022 |
Year-end exposure toward all our major currencies |
|
4.2 |
|
1.7 |
Average exposure |
|
3.3 |
|
1.6 |
Highest exposure |
|
4.2 |
|
1.7 |
Lowest exposure |
|
2.5 |
|
1.3 |
Foreign Currency Exchange Rate Sensitivity
If, on December 31, 2023, 2022, and 2021, the foreign currency exchange rates had been higher/lower as described below, this would have had the following effects on other non-operating expense, net and other comprehensive income:
Foreign Currency Sensitivity
€ millions |
|
Effects on Other Non-Operating Expense, Net |
|
Effects on Other Comprehensive Income |
||||||||
|
|
2023 |
|
2022 |
|
2021 |
|
2023 |
|
2022 |
|
2021 |
Derivatives held within a designated cash flow hedge relationship |
|
|
|
|
|
|
|
|
|
|
|
|
All major currencies –10% (2022: all major currencies –10%; 2021: all major currencies –10%) against the euro |
|
|
|
|
|
|
|
238 |
|
135 |
|
106 |
All major currencies +10% (2022: all major currencies +10%; 2021: all major currencies +10%) against the euro |
|
|
|
|
|
|
|
-238 |
|
-135 |
|
-106 |
Thereof: USD –10% (2022: –10%; 2021: –10%) against the euro |
|
|
|
|
|
|
|
131 |
|
29 |
|
36 |
Thereof: USD +10% (2022: +10%; 2021: +10%) against the euro |
|
|
|
|
|
|
|
-131 |
|
-29 |
|
-36 |
Embedded derivatives |
|
|
|
|
|
|
|
|
|
|
|
|
All currencies –10% against the respective functional currency |
|
-63 |
|
-38 |
|
-49 |
|
|
|
|
|
|
All currencies +10% against the respective functional currency |
|
64 |
|
31 |
|
40 |
|
|
|
|
|
|
Thereof: EUR –10% (2022: –10%; 2021: –10%) against the respective functional currency |
|
-48 |
|
-20 |
|
-32 |
|
|
|
|
|
|
Thereof: EUR +10% (2022: +10%; 2021: +10%) against the respective functional currency |
|
48 |
|
20 |
|
32 |
|
|
|
|
|
|
Unhedged monetary assets and liabilities |
|
|
|
|
|
|
|
|
|
|
|
|
All currencies –10% against the respective functional currency |
|
-112 |
|
-63 |
|
-15 |
|
|
|
|
|
|
All currencies +10% against the respective functional currency |
|
112 |
|
63 |
|
15 |
|
|
|
|
|
|
Thereof: USD –10% (2022: –10%; 2021: –10%) against the respective functional currency |
|
-46 |
|
-44 |
|
-2 |
|
|
|
|
|
|
Thereof: USD +10% (2022: +10%; 2021: +10%) against the respective functional currency |
|
46 |
|
44 |
|
2 |
|
|
|
|
|
|
F-72
Interest Rate Risk
Interest Rate Risk Factors
We are exposed to interest rate risk as a result of our investing and financing activities mainly in euros and U.S. dollars, since a large part of our investments are based on variable rates and/or short maturities (2023: 53%; 2022: 64%) and most of our financing transactions are based on fixed rates and long maturities (2023: 100%; 2022: 87%).
Interest Rate Risk Management
The aim of our interest rate risk management is to reduce profit or loss volatility and optimize our interest result by creating a balanced structure of fixed and variable cash flows. We therefore manage interest rate risks by adding interest-rate-related derivative instruments to a given portfolio of investments and debt financing. The desired fixed-floating mix of our net debt is set by the Treasury Committee.
Derivatives Designated as Hedging Instruments (Fair Value Hedges)
To match the interest rate risk from our financing transactions to our investments, we use receiver interest rate swaps to alter the interest cash flows of certain fixed-rate financial liabilities to floating, and by this means secure the fair value of the swapped financing transactions on a 1:1 ratio. Including interest rate swaps, 43% (2022: 52%) of our total interest-bearing financial liabilities outstanding as at December 31, 2023, had a fixed interest rate.
The amounts as at December 31, 2023, relating to items designated as hedged items were as follows:
Designated Hedged Items in Interest Rate Hedges
€ millions |
|
2023 |
|
|
|
2022 |
||
|
|
Fixed-Rate |
|
Fixed-Rate |
|
Fixed-Rate |
|
Fixed-Rate |
|
|
Borrowing in EUR |
|
Borrowing in USD |
|
Borrowing in EUR |
|
Borrowing in USD |
Notional amount |
|
4,550 |
|
90 |
|
4,550 |
|
94 |
Carrying amount |
|
3,964 |
|
89 |
|
3,732 |
|
95 |
Accumulated fair value adjustments in Other financial liabilities |
|
556 |
|
-6 |
|
782 |
|
-9 |
Change in fair value used for measuring ineffectiveness for the reporting period |
|
226 |
|
1 |
|
-723 |
|
-11 |
Accumulated amount of fair value hedge adjustments for hedged items ceased to be adjusted for hedging gains/losses |
|
0 |
|
-7 |
|
0 |
|
-11 |
The amounts as at December 31, 2023, designated as hedging instruments were as follows:
Designated Hedging Instruments in Interest Rate Hedges
€ millions |
|
2023 |
|
|
|
2022 |
||
|
|
Interest Rate |
|
Interest Rate |
|
Interest Rate |
|
Interest Rate |
|
|
Swaps for |
|
Swaps for |
|
Swaps for |
|
Swaps for |
|
|
EUR Borrowing |
|
USD Borrowing |
|
EUR Borrowing |
|
USD Borrowing |
Notional amount |
|
4,550 |
|
90 |
|
4,550 |
|
94 |
Carrying amount |
|
|
|
|
|
|
|
|
Other financial assets |
|
0 |
|
0 |
|
0 |
|
0 |
Other financial liabilities |
|
-535 |
|
-1 |
|
-749 |
|
-3 |
Change in fair value used for measuring ineffectiveness for the reporting period |
|
-214 |
|
-2 |
|
700 |
|
10 |
F-73
As at December 31, 2023, we held the following instruments to hedge exposures to changes in interest rates:
Details on Hedging Instruments in Interest Rate Hedges
€ millions |
|
|
|
|
|
|
|
|
|
|
|
2023 |
|
|
|
|
|
|
|
|
|
|
|
|
|
Maturity |
|
|
|
2024 |
|
2027 |
|
2028 |
|
2029 |
|
2030 |
|
2031 |
|
EUR interest rate swaps |
|
|
|
|
|
|
|
|
|
|
|
|
|
Nominal amounts |
|
|
|
1,000 |
|
1,000 |
|
800 |
|
500 |
|
1,250 |
|
Average variable interest rate |
|
|
|
5.941 |
% |
5.365 |
% |
4.705 |
% |
5.340 |
% |
5.503 |
% |
USD interest rate swaps |
|
|
|
|
|
|
|
|
|
|
|
|
|
Nominal amounts |
|
90 |
|
|
|
|
|
|
|
|
|
|
|
Average variable interest rate |
|
6.150 |
% |
|
|
|
|
|
|
|
|
|
|
€ millions |
|
|
|
|
|
|
|
|
|
|
|
2022 |
|
|
|
|
|
|
|
|
|
|
|
|
|
Maturity |
|
|
|
2024 |
|
2027 |
|
2028 |
|
2029 |
|
2030 |
|
2031 |
|
EUR interest rate swaps |
|
|
|
|
|
|
|
|
|
|
|
|
|
Nominal amounts |
|
|
|
1,000 |
|
1,000 |
|
800 |
|
500 |
|
1,250 |
|
Average variable interest rate |
|
|
|
3.949 |
% |
3.373 |
% |
2.713 |
% |
3.348 |
% |
3.511 |
% |
USD interest rate swaps |
|
|
|
|
|
|
|
|
|
|
|
|
|
Nominal amounts |
|
94 |
|
|
|
|
|
|
|
|
|
|
|
Average variable interest rate |
|
5.150 |
% |
|
|
|
|
|
|
|
|
|
|
Interest Rate Exposure
Our interest rate exposure (and our average/high/low exposure) as at December 31 was as follows:
Interest Rate Risk Exposure
€ billions |
|
2023 |
|
2022 |
||||||||||||
|
|
Year-End |
|
Average |
|
High |
|
Low |
|
Year-End |
|
Average |
|
High |
|
Low |
Fair value interest rate risk |
|
|
|
|
|
|
|
|
|
|
|
|
|
|
|
|
From investments |
|
0.00 |
|
0.00 |
|
0.00 |
|
0.00 |
|
0.03 |
|
0.04 |
|
0.04 |
|
0.03 |
Cash flow interest rate risk |
|
|
|
|
|
|
|
|
|
|
|
|
|
|
|
|
From investments (including interest - bearing cash) |
|
3.26 |
|
4.70 |
|
7.45 |
|
3.26 |
|
6.19 |
|
5.83 |
|
7.21 |
|
4.87 |
From financing |
|
0 |
|
1.10 |
|
1.73 |
|
0 |
|
1.45 |
|
1.71 |
|
1.76 |
|
1.45 |
From interest rate swaps |
|
4.64 |
|
4.64 |
|
4.64 |
|
4.64 |
|
4.64 |
|
4.84 |
|
4.88 |
|
4.64 |
Interest Rate Sensitivity
A sensitivity analysis is provided to show the impact of our interest rate risk exposure on profit or loss and equity in accordance with IFRS 7, considering the following:
| - | Changes in interest rates only affect the accounting for non-derivative fixed-rate financial instruments if they are recognized at fair value. Therefore, such interest rate changes do not change the carrying amounts of our non-derivative fixed-rate financial liabilities, as we account for them at amortized cost. Investments in fixed-rate financial assets classified as fair value through profit or loss were not material at each year end reported. Thus, we do not consider any fixed-rate instruments in the equity-related sensitivity calculation. |
| - | Income or expenses recorded in connection with non-derivative financial instruments with variable interest rates are subject to interest rate risk if they are not hedged items in an effective hedge relationship. Thus, we take into consideration interest rate changes relating to our variable-rate financing and our investments in money market instruments in the profit-related sensitivity calculation. |
F-74
| - | The designation of interest rate receiver swaps in a fair value hedge relationship leads to interest rate changes affecting Financial income, net. The fair value movements related to the interest rate swaps are not reflected in the sensitivity calculation, as they offset the fixed interest rate payments for the bonds and private placements as hedged items. However, changes in market interest rates affect the amount of interest payments from the interest rate swap. As a consequence, we include those effects of market interest rates on interest payments in the profit-related sensitivity calculation. |
If, on December 31, 2023, 2022, and 2021, interest rates had been higher/lower this would have had the following effects on Financial income, net.
Interest Rate Sensitivity
€ millions |
|
Effects on Financial Income, Net |
||||
|
|
2023 |
|
2022 |
|
2021 |
Derivatives held within a designated fair value hedge relationship |
|
|
|
|
|
|
Interest rates +100bps for U.S. dollar area/+100bps for euro area (2022: +75/+125bps for U.S. dollar/euro area; 2021: +75/+20bps for U.S. dollar/euro area) |
|
-46 |
|
-58 |
|
-11 |
Interest rates –100bps for U.S. dollar area/–100bps for euro area (2022: –25/–10bps for U.S. dollar/euro area; 2021: –25/–20bps for U.S. dollar/euro area) |
|
46 |
|
5 |
|
10 |
Variable-rate financing |
|
|
|
|
|
|
Interest rates +100bps for U.S. dollar area/+100bps for euro area (2022: +75/+125bps for U.S. dollar/euro area; 2021: +75/+20bps for U.S. dollar/euro area) |
|
0 |
|
-14 |
|
-4 |
Interest rates –100bps for U.S. dollar area/–100bps for euro area (2022: –25/–10bps for U.S. dollar/euro area; 2021: –25/–20bps for U.S. dollar/euro area) |
|
0 |
|
1 |
|
3 |
Variable-rate investments |
|
|
|
|
|
|
Interest rates +100bps for U.S. dollar area/+100bps for euro area (2022: +75/+125bps for U.S. dollar/euro area; 2021: +75/+20bps for U.S. dollar/euro area) |
|
32 |
|
26 |
|
24 |
Interest rates –100bps for U.S. dollar area/–100bps for euro area (2022: –25/–10bps for U.S. dollar/euro area; 2021: –25/–20bps for U.S. dollar/euro area) |
|
-32 |
|
-5 |
|
-9 |
Equity Price Risk
Equity Price Risk Factors
We are exposed to equity price risk with regard to our investments in equity securities.
Equity Price Risk Management
Our listed equity investments are monitored based on the current market value that is affected by the fluctuations in the volatile stock markets worldwide. Unlisted equity investments are monitored based on detailed financial information provided by the investees. The fair value of our listed equity investments depends on the equity prices, while the fair value of the unlisted equity investments is influenced by various unobservable input factors.
Equity Price Exposure
On December 31, 2023, our exposure from our investments in equity securities was €4,967 million (2022: €5,137 million; 2021: €5,799 million).
Equity Price Sensitivity
Our sensitivity towards a fluctuation in equity prices is as follows:
Equity Price Sensitivity
€ millions |
|
2023 |
|
20221 |
|
20211 |
Investments in equity securities |
|
|
|
|
|
|
Increase in equity prices and respective unobservable inputs of 22% - increase of financial income, net |
|
1,093 |
|
503 |
|
515 |
Decrease in equity prices and respective unobservable inputs of 22% - decrease of financial income, net |
|
-1,093 |
|
-503 |
|
-515 |
1 For 2022 and 2021, a +/-10% increase and decrease was assumed.
Most of our equity securities are within the venture-capital-related investment activities. For purposes of our equity price sensitivity disclosure, we benchmarked the historical average of public market returns of the NASDAQ and S&P 500 to the average annual venture capital benchmark returns over a 12-year period, which is the assumed average holding period of venture capital funds. Overall, our analysis indicated a blended return range of +/- 22% in 2023.
F-75
Credit Risk
Credit Risk Factors
To reduce the credit risk in investments, we arrange to receive rights to collateral for certain investing activities in the full amount of the investment volume, which we would be allowed to make use of only in the case of default of the counterparty to the investment. In the absence of other significant agreements to reduce our credit risk exposure, the total amounts recognized as cash and cash equivalents, current investments, loans, and other financial receivables, trade receivables, and derivative financial assets represent our maximum exposure to credit risks, except for the agreements mentioned above.
Credit Risk Management
Cash at Banks, Time Deposits, and Debt Securities
To mitigate the credit risk from our investing activities and derivative financial assets, we conduct all our activities only with approved major financial institutions and issuers that carry high external ratings, as required by our internal treasury guideline. Among its stipulations, the guideline requires that we invest only in assets from issuers with a minimum rating of at least “BBB flat.” We only invest in issuers with a lower rating in exceptional cases. Such investments were not material in 2023 and 2022. The weighted average rating of our financial assets is A. We pursue a policy of cautious investments characterized by predominantly current investments, standard investment instruments, as well as a wide portfolio diversification by doing business with a variety of counterparties.
To further reduce our credit risk, we require collateral for certain investments in the full amount of the investment volume, which we would be allowed to make use of in the case of default of the counterparty to the investment. As such collateral, we only accept bonds with at least investment-grade rating level.
In addition, the concentration of credit risk that exists when counterparties are involved in similar activities by instrument, sector, or geographic area is further mitigated by diversification of counterparties throughout the world and adherence to an internal limit system for each counterparty. This internal limit system stipulates that the business volume with individual counterparties is restricted to a defined limit that depends on the lowest official long-term credit rating available by at least one of the major rating agencies, the Tier 1 capital of the respective financial institution, or participation in the German Depositors’ Guarantee Fund or similar protection schemes. We continuously monitor strict compliance with these counterparty limits. As the premium for credit default swaps mainly depends on market participants’ assessments of the creditworthiness of a debtor, we also closely observe the development of credit default swap spreads in the market to evaluate probable risk developments and react in a timely manner to changes should these manifest.
For cash at banks, time deposits, and debt securities such as acquired bonds or commercial papers, we apply the general impairment approach. As it is our policy to only invest in high-quality assets of issuers with a minimum rating of at least investment grade so as to minimize the risk of credit losses, we use the low credit risk exception. Thus, these assets are always allocated to stage 1 of the three-stage credit loss model and we record a loss allowance for an amount equal to 12-month expected credit losses. This loss allowance is calculated based on our exposure as at the respective reporting date, the loss given default for this exposure, and the credit default swap spread as a measure for the probability of default. To ensure that during their lifetime our investments always fulfill the requirement of being investment-grade, we monitor changes in credit risk by tracking published external credit ratings. Among other things, we consider cash at banks, time deposits, and debt securities to be in default when the counterparty is unlikely to pay its obligations in full, when there is information about a counterparty’s financial difficulties, or in case of a drastic increase in the credit default swap spread of a counterparty for a prolonged time period while the overall market environment remains rather stable. Such financial assets are written off either partially or in full if the likelihood of recovery is considered remote, which might be evidenced, for example, by the bankruptcy of a counterparty of such financial assets.
Trade Receivables
The default risk of our trade receivables is managed separately, mainly based on assessing the creditworthiness of customers through external ratings and on our past experience with the customers concerned. Based on this assessment, individual credit limits are established for each customer and deviations from such credit limits need to be approved by management.
F-76
We apply the simplified impairment approach using a provision matrix for all trade receivables and contract assets to take into account any lifetime expected credit losses already at initial recognition. For the purpose of the provision matrix, customers are clustered into different risk classes, mainly based on market information such as the country risk assessment of their country of origin. Loss rates used to reflect lifetime expected credit losses are determined using a roll-rate method based on the probability of a receivable progressing through different stages of being overdue and on our actual credit loss experience over the past years. These loss rates are enhanced by forward-looking information to reflect differences between economic conditions during the period over which the historical data has been collected, current conditions, and the expected changes in the economic conditions over the expected life of the receivables. Forward-looking information is based on changes in country risk ratings, or fluctuations in credit default swaps of countries of the customers we do business with. We continuously monitor outstanding receivables locally to assess whether there is objective evidence that our trade receivables and contract assets are credit-impaired. Evidence that trade receivables and contract assets are credit-impaired include, among the trade receivables being past due, information about significant financial difficulty of the customer or non-adherence to a payment plan. Under extreme situations such as the current war situation in Ukraine, related account receivables and contract assets are critically assessed to determine whether they are credit-impaired. We consider receivables to be in default when the counterparty is unlikely to pay its obligations in full, However, a delay of payments (for example, more than 90 days past due) in the normal course of business alone does not necessarily indicate a customer default. We write off account balances either partially or in full if we judge that the likelihood of recovery is remote, which might be evidenced, for example, when bankruptcy proceedings for a customer are finalized or when all enforcement efforts have been exhausted.
The impact of default on our trade receivables from individual customers is mitigated by our large customer base and its distribution across many different industries, company sizes, and countries worldwide. For more information about our trade receivables, see Note (A.2).
Credit Risk Exposure
Cash, Time Deposits, and Debt Securities
As at December 31, 2023, our exposure to credit risk from cash, time deposits, and debt securities was as follows:
Credit Risk Exposure from Cash, Time Deposits, and Debt Securities
€ millions, unless otherwise stated |
|
2023 |
||||||||
|
|
Equivalent to External |
|
Weighted Average Loss |
|
Gross Carrying Amount |
|
Gross Carrying Amount |
|
ECL Allowance |
|
|
Rating |
|
Rate |
|
Not Credit-Impaired |
|
Credit-Impaired |
|
|
Risk class 1 - low risk |
|
AAA to BBB- |
|
-0.1 |
% |
8,664 |
|
0 |
|
-7 |
Risk class 2 - high risk |
|
BB+ to D |
|
0.0 |
% |
66 |
|
0 |
|
0 |
Risk class 3 - unrated |
|
NA |
|
-3.9 |
% |
77 |
|
0 |
|
-3 |
Total |
|
|
|
-0.1 |
% |
8,807 |
|
0 |
|
-10 |
€ millions, unless otherwise stated |
|
2022 |
||||||||
|
|
Equivalent to External |
|
Weighted Average Loss |
|
Gross Carrying Amount |
|
Gross Carrying Amount |
|
ECL Allowance |
|
|
Rating |
|
Rate |
|
Not Credit-Impaired |
|
Credit-Impaired |
|
|
Risk class 1 - low risk |
|
AAA to BBB– |
|
-0.0 |
% |
6,554 |
|
0 |
|
-3 |
Risk class 2 - high risk |
|
BB+ to D |
|
0.0 |
% |
33 |
|
0 |
|
0 |
Risk class 3 - unrated |
|
NA |
|
-6.5 |
% |
46 |
|
0 |
|
-3 |
Total |
|
|
|
-0.1 |
% |
6,633 |
|
0 |
|
-6 |
As at December 31, 2023, the majority of our other loans and other financial receivables was concentrated in Germany. There were no loans, or other financial receivables past due but not impaired and we had no indications of impairments of such assets that were not past due and not impaired as at that date.
Master Netting and Similar Arrangements
We enter into derivatives on the basis of the German Master Agreement on Financial Derivatives Transactions (“Deutscher Rahmenvertrag für Finanztermingeschäfte”) and similar agreements. The regulations of these agreements apply particularly in the case of insolvency and not during the normal course of business.
F-77
The following table shows the derivative instruments that are subject to such netting arrangements:
Master Netting and Similar Arrangements
€ millions |
|
2023 |
|
2022 |
||||||||
|
|
|
|
Nettable Amounts |
|
|
|
|
|
|
|
|
|
|
|
|
in Case of |
|
|
|
|
|
Nettable Amounts in |
|
|
|
|
Carrying Amounts |
|
Insolvency |
|
Net Amount |
|
Carrying Amounts |
|
Case of Insolvency |
|
Net Amount |
Financial assets |
|
90 |
|
55 |
|
35 |
|
68 |
|
33 |
|
35 |
Financial liabilities |
|
-623 |
|
-55 |
|
-568 |
|
-849 |
|
-33 |
|
-816 |
Trade Receivables and Contract Assets
As at December 31, 2023, our exposure to credit risk from trade receivables was as follows:
Credit Risk Exposure from Trade Receivables and Contract Assets
€ millions, unless otherwise stated |
|
2023 |
||||||
|
|
Weighted Average Loss Rate |
|
Gross Carrying Amount |
|
Gross Carrying Amount |
|
ECL Allowance |
|
|
|
|
Not Credit-Impaired |
|
Credit-Impaired |
|
|
AR not due and due |
|
-0.3 |
% |
4,036 |
|
2 |
|
-13 |
AR overdue 1 to 30 days |
|
-0.6 |
% |
770 |
|
51 |
|
-5 |
AR overdue 30 to 90 days |
|
-1.5 |
% |
564 |
|
32 |
|
-9 |
AR overdue more than 90 days |
|
-27.3 |
% |
432 |
|
213 |
|
-176 |
Total |
|
-3.3 |
% |
5,802 |
|
298 |
|
-203 |
€ millions, unless otherwise stated |
|
2022 |
||||||
|
|
Weighted Average Loss Rate |
|
Gross Carrying Amount |
|
Gross Carrying Amount |
|
ECL Allowance |
|
|
|
|
Not Credit-Impaired |
|
Credit-Impaired |
|
|
AR not due and due |
|
-1.0 |
% |
3,146 |
|
10 |
|
-31 |
AR overdue 1 to 30 days |
|
-1.0 |
% |
1,420 |
|
80 |
|
-15 |
AR overdue 30 to 90 days |
|
-2.3 |
% |
582 |
|
64 |
|
-15 |
AR overdue more than 90 days |
|
-27.2 |
% |
499 |
|
236 |
|
-200 |
Total |
|
-4.3 |
% |
5,647 |
|
390 |
|
-261 |
The movement in the ECL allowance for trade receivables and contract assets is as follows:
Movement in ECL Allowance for Trade Receivables and Contract Assets
€ millions |
|
2023 |
|
2022 |
|
|
ECL Allowance |
|
ECL Allowance |
Balance as at 1/1 |
|
-261 |
|
-175 |
Net credit losses recognized |
|
-32 |
|
-187 |
Amounts written off |
|
90 |
|
101 |
Balance as at 12/31 |
|
-203 |
|
-261 |
Liquidity Risk
Liquidity Risk Factors
We are exposed to liquidity risk from our obligations towards suppliers, employees, and financial institutions.
F-78
Liquidity Risk Management
Our liquidity is managed by our global treasury department with the primary aim of maintaining liquidity at a level that is adequate to meet our financial obligations.
Generally, our primary source of liquidity is funds generated from our business operations. Our global treasury department manages liquidity centrally for all subsidiaries. Where possible, we pool their cash surplus so that we can use liquidity centrally for our business operations, for subsidiaries’ funding requirements, or to invest any net surplus in the market. With this strategy, we seek to optimize yields, while ensuring liquidity, by investing only with counterparties and issuers of high credit quality, as explained before. Hence, high levels of liquid assets and marketable securities provide a strategic reserve, helping keep SAP flexible, sound, and independent.
Apart from effective working capital and cash management, we have reduced the liquidity risk inherent in managing our day-to-day operations and meeting our financing responsibilities by arranging an adequate volume of available credit facilities with various financial institutions on which we can draw if necessary.
In order to retain high financial flexibility, in 2023, SAP SE entered into a sustainability-linked revolving credit facility with a volume of €3.0 billion with an initial term until 2028 plus two one-year extension options, replacing its previous credit facility of €2.5 billion from 2017. The use of the facility is not restricted by any financial covenants. Borrowings under the facility bear interest of EURIBOR or the agreed benchmark rate for the respective currency plus a base margin which might be adjusted depending on the fulfillment of agreed sustainability performance targets. We are also required to pay a commitment fee of 7bps per annum on the unused available credit. We have not drawn on the facility.
In September 2019, we initiated a commercial paper (Commercial Paper, or CP) program. As at December 31, 2023, we had €0 million of CP outstanding with maturities generally less than six months (2022: €930 million).
Additionally, as at December 31, 2023 and 2022, the Group had available lines of credit totaling €555 million and €555 million, respectively. There were immaterial borrowings outstanding under these lines of credit in all years presented.
Liquidity Risk Exposure
The table below is an analysis of the remaining contractual maturities of all our financial liabilities and guarantees held as at December 31, 2023.
Financial liabilities for which repayment can be requested by the contract partner at any time are assigned to the earliest possible period. Variable interest payments were calculated using the latest relevant interest rate fixed as at December 31, 2023. As we generally settle our derivative contracts gross, we show the pay and receive legs separately for all our currency and interest rate derivatives, whether or not the fair value of the derivative is negative. The cash outflows for the currency derivatives are translated using the applicable spot rate.
We continue to provide rental guarantees for certain offices used by Qualtrics. The amounts shown for the financial guarantees are the gross amounts we guarantee, however, we are entitled to indemnification payments by Qualtrics which will reduce the guarantee amounts disclosed.
Contractual Maturities of Non-Derivative Financial Liabilities
€ millions |
|
Carrying |
|
Contractual Cash Flows |
||||||||||
|
|
Amount |
|
|
||||||||||
|
|
12/31/2023 |
|
2024 |
|
2025 |
|
2026 |
|
2027 |
|
2028 |
|
Thereafter |
Non-derivative financial liabilities |
|
|
|
|
|
|
|
|
|
|
|
|
|
|
Trade payables |
|
-1,022 |
|
-1,022 |
|
0 |
|
0 |
|
0 |
|
0 |
|
0 |
Bonds |
|
-6,780 |
|
-941 |
|
-952 |
|
-1,161 |
|
-1,045 |
|
-1,033 |
|
-2,604 |
Private placements |
|
-388 |
|
-305 |
|
-3 |
|
-3 |
|
-94 |
|
0 |
|
0 |
Loans |
|
0 |
|
0 |
|
0 |
|
0 |
|
0 |
|
0 |
|
0 |
Commercial paper |
|
0 |
|
0 |
|
0 |
|
0 |
|
0 |
|
0 |
|
0 |
Lease liabilities |
|
-1,621 |
|
-350 |
|
-260 |
|
-204 |
|
-159 |
|
-127 |
|
-804 |
Other financial liabilities1 |
|
-263 |
|
-34 |
|
-30 |
|
0 |
|
0 |
|
0 |
|
0 |
Total of non-derivative financial liabilities |
|
-10,075 |
|
-2,652 |
|
-1,245 |
|
-1,368 |
|
-1,298 |
|
-1,160 |
|
-3,408 |
|
|
|
|
|
|
|
|
|
|
|
|
|
|
|
Financial guarantees |
|
0 |
|
-19 |
|
-19 |
|
-19 |
|
-19 |
|
-19 |
|
-309 |
F-79
€ millions |
|
Carrying |
|
Contractual Cash Flows |
||||||||||
|
|
Amount |
|
|
||||||||||
|
|
12/31/2022 |
|
2023 |
|
2024 |
|
2025 |
|
2026 |
|
2027 |
|
Thereafter |
Non-derivative financial liabilities |
|
|
|
|
|
|
|
|
|
|
|
|
|
|
Trade payables |
|
-1,496 |
|
-1,496 |
|
0 |
|
0 |
|
0 |
|
0 |
|
0 |
Bonds |
|
-8,155 |
|
-1,690 |
|
-941 |
|
-962 |
|
-1,162 |
|
-1,045 |
|
-3,636 |
Private placements |
|
-405 |
|
-14 |
|
-316 |
|
-3 |
|
-3 |
|
-97 |
|
0 |
Loans |
|
-1,456 |
|
-1,479 |
|
0 |
|
0 |
|
0 |
|
0 |
|
0 |
Commercial paper |
|
-928 |
|
-932 |
|
0 |
|
0 |
|
0 |
|
0 |
|
0 |
Lease liabilities |
|
-2,140 |
|
-398 |
|
-317 |
|
-257 |
|
-228 |
|
-188 |
|
-1,071 |
Other financial liabilities1 |
|
-422 |
|
-307 |
|
-31 |
|
0 |
|
0 |
|
0 |
|
0 |
Total of non-derivative financial liabilities |
|
-15,002 |
|
-6,316 |
|
-1,605 |
|
-1,222 |
|
-1,393 |
|
-1,330 |
|
-4,707 |
|
|
|
|
|
|
|
|
|
|
|
|
|
|
|
Financial guarantees |
|
0 |
|
0 |
|
0 |
|
0 |
|
0 |
|
0 |
|
0 |
1 The carrying amount of Other financial liabilities includes accrued interest for our non - derivative financial debt as well as for derivatives, while the cash outflow of this accrued interest is presented together with the underlying liability in the maturity analysis.
Contractual Maturities of Derivative Financial Liabilities and Financial Assets
€ millions |
|
Carrying |
|
Contractual Cash Flows |
|
Carrying |
|
Contractual Cash Flows |
||||
|
|
Amount |
|
|
|
Amount |
|
|
||||
|
|
12/31/2023 |
|
2024 |
|
Thereafter |
|
12/31/2022 |
|
2023 |
|
Thereafter |
Derivative financial liabilities and assets |
|
|
|
|
|
|
|
|
|
|
|
|
Derivative financial liabilities |
|
|
|
|
|
|
|
|
|
|
|
|
Currency derivatives not designated as hedging instruments |
|
-66 |
|
|
|
|
|
-88 |
|
|
|
|
Cash outflows |
|
|
|
-2,048 |
|
0 |
|
|
|
-3,185 |
|
-13 |
Cash inflows |
|
|
|
2,017 |
|
0 |
|
|
|
3,113 |
|
0 |
Currency derivatives designated as hedging instruments |
|
-20 |
|
|
|
|
|
-9 |
|
|
|
|
Cash outflows |
|
|
|
-958 |
|
|
|
|
|
-309 |
|
|
Cash inflows |
|
|
|
948 |
|
|
|
|
|
302 |
|
|
Interest rate derivatives designated as hedging instruments |
|
-537 |
|
|
|
|
|
-753 |
|
|
|
|
Cash outflows |
|
|
|
-242 |
|
-848 |
|
|
|
-102 |
|
-1,201 |
Cash inflows |
|
|
|
63 |
|
301 |
|
|
|
63 |
|
364 |
Total of derivative financial liabilities |
|
-623 |
|
-220 |
|
-547 |
|
-849 |
|
-118 |
|
-850 |
Derivative financial assets |
|
|
|
|
|
|
|
|
|
|
|
|
Currency derivatives not designated as hedging instruments |
|
52 |
|
|
|
|
|
30 |
|
|
|
|
Cash outflows |
|
|
|
-2,992 |
|
|
|
|
|
-1,713 |
|
|
Cash inflows |
|
|
|
3,042 |
|
|
|
|
|
1,740 |
|
|
Currency derivatives designated as hedging instruments |
|
33 |
|
|
|
|
|
33 |
|
|
|
|
Cash outflows |
|
|
|
-1,418 |
|
|
|
|
|
-1,039 |
|
|
Cash inflows |
|
|
|
1,441 |
|
|
|
|
|
1,069 |
|
|
Total of derivative financial assets |
|
85 |
|
73 |
|
0 |
|
63 |
|
57 |
|
0 |
Total of derivative financial liabilities and assets |
|
-538 |
|
-147 |
|
-547 |
|
-787 |
|
-61 |
|
-850 |
F-80
(F.2) Fair Value Disclosures on Financial Instruments
y Level Transfers |
It is our policy that transfers between the different levels of the fair value hierarchy are deemed to have occurred at the beginning of the period of the event or change in circumstances that caused the transfer. |
Fair Value of Financial Instruments
We use various types of financial instruments in the ordinary course of business, which are classified as either amortized cost (AC), fair value through other comprehensive income (FVOCI), or fair value through profit or loss (FVTPL). For those financial instruments measured at fair value or for which fair value must be disclosed, we have categorized the financial instruments into a three-level fair value hierarchy depending on the inputs used to determine fair value and their significance for the valuation techniques.
F-81
Fair Values of Financial Instruments and Classification Within the Fair Value Hierarchy
€ millions |
|
Category |
|
12/31/2023 |
||||||||||||
|
|
|
|
Carrying Amount |
|
Measurement Categories |
|
Fair Value |
||||||||
|
|
|
|
|
|
|
|
|
|
|
|
|
|
|
||
|
|
|
|
|
|
At Amortized |
|
At Fair Value |
|
Level 1 |
|
Level 2 |
|
Level 3 |
|
Total |
|
|
|
|
|
|
Cost |
|
|
|
|
|
|
|
|
|
|
|
|
|
|
|
|
|
|
|
|
|
|
|
|
|
|
|
Assets |
|
|
|
|
|
|
|
|
|
|
|
|
|
|
|
|
Cash and cash equivalents |
|
|
|
8,124 |
|
|
|
|
|
|
|
|
|
|
|
|
Cash at banks1 |
|
AC |
|
3,369 |
|
3,369 |
|
|
|
|
|
|
|
|
|
|
Time deposits1 |
|
AC |
|
2,277 |
|
2,277 |
|
|
|
|
|
|
|
|
|
|
Money market and similar funds |
|
FVTPL |
|
2,478 |
|
|
|
2,478 |
|
2,478 |
|
|
|
|
|
2,478 |
Trade and other receivables |
|
|
|
6,525 |
|
|
|
|
|
|
|
|
|
|
|
|
Trade receivables1 |
|
AC |
|
5,775 |
|
5,775 |
|
|
|
|
|
|
|
|
|
|
Trade receivables1 |
|
FVOCI |
|
122 |
|
|
|
122 |
|
|
|
122 |
|
|
|
|
Other receivables2 |
|
— |
|
628 |
|
|
|
|
|
|
|
|
|
|
|
|
Other financial assets |
|
|
|
8,887 |
|
|
|
|
|
|
|
|
|
|
|
|
Debt securities |
|
AC |
|
129 |
|
129 |
|
|
|
129 |
|
|
|
|
|
129 |
Equity securities |
|
FVTPL |
|
4,967 |
|
|
|
4,967 |
|
156 |
|
0 |
|
4,811 |
|
4,967 |
Investments in associates2 |
|
— |
|
135 |
|
|
|
|
|
|
|
|
|
|
|
|
Time deposits |
|
AC |
|
3,021 |
|
3,021 |
|
|
|
|
|
3,021 |
|
|
|
3,021 |
Financial instruments related to employee benefit plans2 |
|
— |
|
244 |
|
|
|
|
|
|
|
|
|
|
|
|
Loans and other financial receivables |
|
AC |
|
300 |
|
300 |
|
|
|
|
|
300 |
|
|
|
300 |
Derivative assets |
|
|
|
|
|
|
|
|
|
|
|
|
|
|
|
|
Designated as hedging instrument |
|
|
|
|
|
|
|
|
|
|
|
|
|
|
|
|
FX forward contracts |
|
— |
|
33 |
|
|
|
33 |
|
|
|
33 |
|
|
|
33 |
Interest rate swaps |
|
— |
|
0 |
|
|
|
0 |
|
|
|
0 |
|
|
|
0 |
Not designated as hedging instrument |
|
|
|
|
|
|
|
|
|
|
|
|
|
|
|
|
FX forward contracts |
|
FVTPL |
|
52 |
|
|
|
52 |
|
|
|
52 |
|
|
|
52 |
Call options for share-based payments |
|
FVTPL |
|
0 |
|
|
|
0 |
|
|
|
0 |
|
|
|
0 |
Call option on equity shares |
|
FVTPL |
|
5 |
|
|
|
5 |
|
|
|
|
|
5 |
|
5 |
Liabilities |
|
|
|
|
|
|
|
|
|
|
|
|
|
|
|
|
Trade and other payables |
|
|
|
-1,822 |
|
|
|
|
|
|
|
|
|
|
|
|
Trade payables1 |
|
AC |
|
-1,022 |
|
-1,022 |
|
|
|
|
|
|
|
|
|
|
Other payables2 |
|
— |
|
-800 |
|
|
|
|
|
|
|
|
|
|
|
|
Financial liabilities |
|
|
|
-9,676 |
|
|
|
|
|
|
|
|
|
|
|
|
Non-derivative financial liabilities |
|
|
|
|
|
|
|
|
|
|
|
|
|
|
|
|
Loans |
|
AC |
|
0 |
|
0 |
|
|
|
|
|
0 |
|
|
|
0 |
Bonds |
|
AC |
|
-6,780 |
|
-6,780 |
|
|
|
-7,005 |
|
0 |
|
|
|
-7,005 |
Private placements |
|
AC |
|
-388 |
|
-388 |
|
|
|
|
|
-374 |
|
|
|
-374 |
Lease liabilities3 |
|
|
|
-1,621 |
|
-1,621 |
|
|
|
|
|
|
|
|
|
|
Other non-derivative financial liabilities |
|
AC |
|
-263 |
|
-263 |
|
|
|
|
|
-263 |
|
|
|
-263 |
Derivative liabilities |
|
|
|
|
|
|
|
|
|
|
|
|
|
|
|
|
Designated as hedging instrument |
|
|
|
|
|
|
|
|
|
|
|
|
|
|
|
|
FX forward contracts |
|
— |
|
-20 |
|
|
|
-20 |
|
|
|
-20 |
|
|
|
-20 |
Interest rate swaps |
|
— |
|
-537 |
|
|
|
-537 |
|
|
|
-537 |
|
|
|
-537 |
Not designated as hedging instrument |
|
|
|
|
|
|
|
|
|
|
|
|
|
|
|
|
FX forward contracts |
|
FVTPL |
|
-66 |
|
|
|
-66 |
|
|
|
-66 |
|
|
|
-66 |
Total financial instruments, net |
|
|
|
12,038 |
|
4,798 |
|
7,034 |
|
-4,242 |
|
2,268 |
|
4,816 |
|
2,720 |
F-82
Fair Values of Financial Instruments and Classification Within the Fair Value Hierarchy
€ millions |
|
Category |
|
12/31/2022 |
||||||||||||
|
|
|
|
Carrying Amount |
|
Measurement Categories |
|
Fair Value |
||||||||
|
|
|
|
|
|
|
|
|
|
|
|
|
|
|
||
|
|
|
|
|
|
At Amortized |
|
At Fair Value |
|
Level 1 |
|
Level 2 |
|
Level 3 |
|
Total |
|
|
|
|
|
|
Cost |
|
|
|
|
|
|
|
|
|
|
|
|
|
|
|
|
|
|
|
|
|
|
|
|
|
|
|
Assets |
|
|
|
|
|
|
|
|
|
|
|
|
|
|
|
|
Cash and cash equivalents |
|
|
|
9,008 |
|
|
|
|
|
|
|
|
|
|
|
|
Cash at banks1 |
|
AC |
|
3,176 |
|
3,176 |
|
|
|
|
|
|
|
|
|
|
Time deposits1 |
|
AC |
|
2,976 |
|
2,976 |
|
|
|
|
|
|
|
|
|
|
Money market and similar funds |
|
FVTPL |
|
2,855 |
|
|
|
2,855 |
|
2,855 |
|
|
|
|
|
2,855 |
Trade and other receivables |
|
|
|
6,405 |
|
|
|
|
|
|
|
|
|
|
|
|
Trade receivables1 |
|
AC |
|
5,776 |
|
5,776 |
|
|
|
|
|
|
|
|
|
|
Trade receivables1 |
|
FVOCI |
|
|
|
|
|
|
|
|
|
|
|
|
|
|
Other receivables2 |
|
— |
|
629 |
|
|
|
|
|
|
|
|
|
|
|
|
Other financial assets |
|
|
|
6,479 |
|
|
|
|
|
|
|
|
|
|
|
|
Debt securities |
|
AC |
|
32 |
|
32 |
|
|
|
32 |
|
|
|
|
|
32 |
Equity securities |
|
FVTPL |
|
5,138 |
|
|
|
5,138 |
|
258 |
|
0 |
|
4,880 |
|
5,138 |
Investments in associates2 |
|
— |
|
151 |
|
|
|
|
|
|
|
|
|
|
|
|
Time deposits |
|
AC |
|
654 |
|
654 |
|
|
|
|
|
654 |
|
|
|
654 |
Financial instruments related to employee benefit plans2 |
|
— |
|
203 |
|
|
|
|
|
|
|
|
|
|
|
|
Loans and other financial receivables |
|
AC |
|
233 |
|
233 |
|
|
|
|
|
233 |
|
|
|
233 |
Derivative assets |
|
|
|
|
|
|
|
|
|
|
|
|
|
|
|
|
Designated as hedging instrument |
|
|
|
|
|
|
|
|
|
|
|
|
|
|
|
|
FX forward contracts |
|
— |
|
33 |
|
|
|
33 |
|
|
|
33 |
|
|
|
33 |
Interest rate swaps |
|
— |
|
0 |
|
|
|
0 |
|
|
|
0 |
|
|
|
0 |
Not designated as hedging instrument |
|
|
|
|
|
|
|
|
|
|
|
|
|
|
|
|
FX forward contracts |
|
FVTPL |
|
30 |
|
|
|
30 |
|
|
|
30 |
|
|
|
30 |
Call options for share-based payments |
|
FVTPL |
|
0 |
|
|
|
0 |
|
|
|
0 |
|
|
|
0 |
Call option on equity shares |
|
FVTPL |
|
5 |
|
|
|
5 |
|
|
|
|
|
5 |
|
5 |
Liabilities |
|
|
|
|
|
|
|
|
|
|
|
|
|
|
|
|
Trade and other payables |
|
— |
|
2,226 |
|
|
|
|
|
|
|
|
|
|
|
|
Trade payables1 |
|
AC |
|
-1,496 |
|
-1,496 |
|
|
|
|
|
|
|
|
|
|
Other payables2 |
|
— |
|
-730 |
|
|
|
|
|
|
|
|
|
|
|
|
Financial liabilities |
|
|
|
-14,355 |
|
|
|
|
|
|
|
|
|
|
|
|
Non-derivative financial liabilities |
|
|
|
|
|
|
|
|
|
|
|
|
|
|
|
|
Loans |
|
AC |
|
-1,456 |
|
-1,456 |
|
|
|
|
|
-1,456 |
|
|
|
-1,456 |
Bonds |
|
AC |
|
-9,083 |
|
-9,083 |
|
|
|
-8,301 |
|
-928 |
|
|
|
-9,229 |
Private placements |
|
AC |
|
-405 |
|
-405 |
|
|
|
|
|
-383 |
|
|
|
-383 |
Lease liabilities3 |
|
|
|
-2,140 |
|
-2,140 |
|
|
|
|
|
|
|
|
|
|
Other non-derivative financial liabilities |
|
AC |
|
-422 |
|
-422 |
|
|
|
|
|
-422 |
|
|
|
-422 |
Derivatives |
|
|
|
|
|
|
|
|
|
|
|
|
|
|
|
|
Designated as hedging instrument |
|
|
|
|
|
|
|
|
|
|
|
|
|
|
|
|
FX forward contracts |
|
— |
|
-9 |
|
|
|
-9 |
|
|
|
-9 |
|
|
|
-9 |
Interest rate swaps |
|
— |
|
-753 |
|
|
|
-753 |
|
|
|
-753 |
|
|
|
-753 |
Not designated as hedging instrument |
|
|
|
|
|
|
|
|
|
|
|
|
|
|
|
|
FX forward contracts |
|
FVTPL |
|
-88 |
|
|
|
-88 |
|
|
|
-88 |
|
|
|
-88 |
Total financial instruments, net |
|
|
|
5,311 |
|
-2,154 |
|
7,212 |
|
-5,156 |
|
-3,087 |
|
4,886 |
|
-3,357 |
1 We do not separately disclose the fair value for cash and cash equivalents, trade receivables, and accounts payable as their carrying amounts are a reasonable approximation of their fair values.
2 Since the line items Trade receivables, Trade payables, and Other financial assets contain both financial and non-financial assets or liabilities (such as other taxes or advance payments), the carrying amounts of non-financial assets or liabilities are shown to allow a reconciliation to the corresponding line items in the Consolidated Statements of Financial Position.
3 For lease liabilities, separate disclosure of fair value is not required.
F-83
Fair Values of Financial Instruments by Instrument Classification
€ millions |
|
Category |
|
12/31/2023 |
||||
|
|
|
|
Carrying Amount |
|
At Amortized Cost |
|
At Fair Value |
Financial assets |
|
|
|
|
|
|
|
|
At fair value through profit or loss |
|
FVTPL |
|
7,502 |
|
|
|
7,502 |
At fair value through other comprehensive income |
|
FVOCI |
|
122 |
|
|
|
122 |
At amortized cost |
|
AC |
|
14,873 |
|
14,873 |
|
|
Financial liabilities |
|
|
|
|
|
|
|
|
At fair value through profit or loss |
|
FVTPL |
|
-66 |
|
|
|
-66 |
At amortized cost |
|
AC |
|
-8,454 |
|
-8,454 |
|
|
Fair Values of Financial Instruments by Instrument Classification
€ millions |
|
Category |
|
12/31/2022 |
||||
|
|
|
|
Carrying Amount |
|
At Amortized Cost |
|
At Fair Value |
Financial assets |
|
|
|
|
|
|
|
|
At fair value through profit or loss |
|
FVTPL |
|
8,028 |
|
|
|
8,028 |
At fair value through other comprehensive income |
|
FVOCI |
|
0 |
|
|
|
0 |
At amortized cost |
|
AC |
|
12,847 |
|
12,847 |
|
|
Financial liabilities |
|
|
|
|
|
|
|
|
At fair value through profit or loss |
|
FVTPL |
|
-88 |
|
|
|
-88 |
At amortized cost |
|
AC |
|
-12,862 |
|
-12,862 |
|
|
F-84
Determination of Fair Values
A description of the valuation techniques and the inputs used in the fair value measurement is given below:
Financial Instruments Measured at Fair Value on a Recurring Basis
Type |
|
Fair Value |
|
Determination of Fair |
|
Significant |
|
Interrelationship |
|---|---|---|---|---|---|---|---|---|
Other financial assets |
|
|
|
|
|
|
|
|
Money-market and similar funds |
|
Level 1 |
|
Quoted prices in an active market |
|
NA |
|
NA |
Debt securities |
|
Level 1 |
|
Quoted prices in an active market |
|
NA |
|
NA |
Listed equity securities |
|
Level 1 |
|
Quoted prices in an active market |
|
NA |
|
NA |
|
|
Level 2 |
|
Quoted prices in an active market deducting a discount for the disposal restriction derived from the premium for a respective put option. |
|
NA |
|
NA |
Unlisted equity securities |
|
Level 3 |
|
Market approach. Comparable company valuation using revenue multiples derived from companies comparable to the investee. |
|
Peer companies used (revenue multiples range from 1.0 to 17.5) Revenues of investees Discounts for lack of marketability (10% to 30%) |
|
The estimated fair value would increase (decrease) if: -The revenue multiples were higher (lower) -The investees’ revenues were higher (lower) -The liquidity discounts were lower (higher) |
|
|
|
|
Market approach. Venture capital method evaluating a variety of quantitative and qualitative factors such as actual and forecasted results, cash position, recent or planned transactions, and market comparable companies. |
|
- Nature and selection of financing rounds - Weighting of financings rounds - Discounts for lack of marketability - Weighting of equity allocation method such as option pricing model and common stock equivalent model - Volatility assumptions - Estimated time to exit - Imminent exit value |
|
The estimated fair value would increase (decrease) if: - Different financing rounds are selected - Weighting of financing rounds changes -Weighting of the applied equity allocation methods changes - Volatility assumptions were higher (lower) - Estimated time to exit increases (decreases) - The imminent exit value increases (decreases) |
|
|
|
|
Last financing round valuations |
|
Nature and pricing indication of latest financing round |
|
The estimated fair value would increase (decrease) if: -Price of latest financing round would increase (decrease) - the overall company value would be higher (lower) - the respective analyzed share class would be affected by this change due to its rights and preferences |
|
|
|
|
Net asset value/fair market value as reported by the respective funds |
|
Net asset value calculations of the respective funds |
|
The estimated fair value would increase (decrease) if: Reported net asset value of respective fund would be higher (lower) |
Call option on equity shares |
|
Level 3 |
|
Market approach. Venture capital method evaluating a variety of quantitative and qualitative factors such as actual and forecasted results, cash position, recent or planned transactions, and market comparable companies. |
|
NA |
|
NA |
Other financial assets/ Financial liabilities |
|
|
|
|
||||
FX forward contracts |
|
Level 2 |
|
Discounted cash flow using par method. Expected future cash flows based on forward exchange rates are discounted over the respective remaining term of the contracts using the respective deposit interest rates and spot rates. |
|
NA |
|
NA |
Deal contingent forward |
|
Level 3 |
|
Discounted cash flow. Expected future cash flows are estimated based on forward interest rates from observable yield curves and contract interest rates, discounted at a rate that reflects the credit risk of the counterparty. |
|
Deal contingent premium as percentage of the equivalent at-the-money-forward option |
|
The estimated fair value would increase (decrease) if: - the uncertainty of the deal and thus the deal contingency premium would decrease (increase) |
Interest rate swaps |
|
Level 2 |
|
Discounted cash flow. Expected future cash flows are estimated based on forward interest rates from observable yield curves and contract interest rates, discounted at a rate that reflects the credit risk of the counterparty. |
|
NA |
|
NA |
F-85
Financial Instruments Not Measured at Fair Value
Type |
|
Fair Value Hierarchy |
|
Determination of Fair Value/Valuation Technique |
Financial liabilities |
|
|
|
|
Fixed-rate bonds (financial liabilities) |
|
Level 1 |
|
Quoted prices in an active market |
Fixed-rate private placements/ loans (financial liabilities) |
|
Level 2 |
|
Discounted cash flows Future cash outflows for fixed interest and principal are discounted over the term of the respective contracts using the market interest rates as at the reporting date. |
For other non-derivative financial assets/liabilities and variable rate financial debt, it is assumed that their carrying value reasonably approximates their fair values.
Transfers Between Levels 1 and 2
Transfers of equity securities from Level 2 to Level 1, which occurred because disposal restrictions lapsed and deducting a discount for such restriction was no longer necessary, did not take place in 2023 (2022: €93 million), while transfers from Level 1 to Level 2 did not occur at all.
Level 3 Fair Value Disclosures
The following table shows the reconciliation of fair values from the opening to the closing balances for our unlisted equity securities and call options on equity shares, as well as the deal contingent forward from our net investment hedge classified as Level 3 fair values:
Reconciliation of Level 3 Fair Values
€ millions |
|
|
|
2023 |
|
|
|
2022 |
|
|
Unlisted Equity Securities |
|
|
|
Unlisted Equity Securities |
|
|
|
|
and Call Options on |
|
Deal Contingent Forward |
|
and Call Options on Equity |
|
Deal Contingent Forward |
|
|
Equity Shares |
|
|
|
Shares |
|
|
1/1 |
|
4,883 |
|
0 |
|
4,881 |
|
0 |
Transfers |
|
|
|
|
|
|
|
|
Into Level 3 |
|
9 |
|
|
|
0 |
|
0 |
Out of Level 3 |
|
-8 |
|
|
|
-25 |
|
0 |
Purchases |
|
417 |
|
|
|
522 |
|
0 |
Sales |
|
-101 |
|
|
|
-43 |
|
0 |
Settlements |
|
|
|
91 |
|
|
|
0 |
Gains/losses |
|
|
|
|
|
|
|
|
Included in financial income, net |
|
-219 |
|
-106 |
|
-789 |
|
0 |
Included in exchange differences in other comprehensive income |
|
-164 |
|
15 |
|
337 |
|
0 |
12/31 |
|
4,817 |
|
0 |
|
4,883 |
|
0 |
Change in unrealized gains/losses in profit or loss for equity investments held at the end of the reporting period |
|
532 |
|
0 |
|
-788 |
|
0 |
Transfers out of Level 3 are due to initial public offerings of the respective investees or distributions in kind in the form of listed investees. Changing the unobservable inputs to reflect reasonably possible alternative assumptions would not have a material impact on the fair values of our unlisted equity securities held as FVTPL as at the reporting date.
F-86
Section G — Other Disclosures
This section provides additional disclosures on miscellaneous topics, including information pertaining to the Executive Board, the Supervisory Board, related party transactions, and other corporate governance topics.
(G.1) Prepaid Expenses and Other Tax Assets
€ millions |
|
2023 |
|
2022 |
||||||||
|
|
Current |
|
Non-Current |
|
Total |
|
Current |
|
Non-Current |
|
Total |
Prepaid expenses |
|
844 |
|
386 |
|
1,230 |
|
828 |
|
512 |
|
1,340 |
Other tax assets |
|
241 |
|
33 |
|
274 |
|
244 |
|
49 |
|
293 |
Total |
|
1,085 |
|
419 |
|
1,504 |
|
1,072 |
|
561 |
|
1,633 |
/ Other non-financial assets |
|
2,374 |
|
3,573 |
|
5,947 |
|
2,139 |
|
3,580 |
|
5,719 |
Prepaid expenses and other tax assets as % of / Other non-financial assets |
|
46 |
|
12 |
|
25 |
|
50 |
|
16 |
|
29 |
Prepaid expenses primarily consist of prepayments for hyperscalers, support services, and software royalties. Other tax assets primarily consist of value-added tax (VAT).
(G.2) Other Tax Liabilities
€ millions |
|
2023 |
|
2022 |
||||||||
|
|
Current |
|
Non-Current |
|
Total |
|
Current |
|
Non-Current |
|
Total |
Other tax liabilities |
|
871 |
|
0 |
|
871 |
|
662 |
|
0 |
|
662 |
/ Other non-financial liabilities |
|
5,648 |
|
698 |
|
6,346 |
|
4,818 |
|
705 |
|
5,523 |
Other tax liabilities as % of / Other non-financial liabilities |
|
15 |
|
0 |
|
14 |
|
14 |
|
0 |
|
12 |
Other tax liabilities primarily consist of VAT, payroll tax, sales tax, and withholding tax.
(G.3) Other Litigation, Claims, and Legal Contingencies
This Note discloses information about intellectual property-related litigation and claims, tax-related litigation other than income tax-related litigation (see Note (C.5)), and anti-bribery matters.
y Uncertainty in Context of Legal Matters |
|
The policies outlined in Note (A.4) for customer-related provisions, which include provisions for customer-related litigation cases and claims, equally apply to our other litigation, claims, and legal contingencies disclosed in this Note. The outcome of litigation and claims is intrinsically subject to considerable uncertainty. Management’s view of these matters may also change in the future. Actual outcomes of litigation and claims may differ from the assessments made by management in prior periods, which could result in a material impact on our business, financial position, profit, cash flows, or reputation. Most of the lawsuits and claims are of a very individual nature and claims are either not quantified by the claimants or the claim amounts quantified are, based on historical evidence, not expected to be a good proxy for the expenditure that would be required to resolve the case concerned. The specifics of the jurisdictions where most of the claims are located further impair the predictability of the outcome of the cases. Therefore, it is typically not practicable to reliably estimate the financial effect that these lawsuits and claims would have if SAP were to incur expenditure for these cases. Further, the expected timing of any resulting outflows of economic benefits from these lawsuits and claims is typically uncertain and not estimable, as it depends generally on the duration of the legal proceedings and settlement negotiations required to resolve them. |
We are subject to a variety of claims and lawsuits that arise from time to time in the ordinary course of our business, including proceedings and claims that relate to companies we have acquired. We will continue to vigorously defend against all claims and lawsuits against us.The provisions recorded for these claims and lawsuits as at December 31, 2023, are neither individually nor in the aggregate material to SAP.
F-87
Among the claims and lawsuits disclosed in this Note are the following classes:
Intellectual Property-Related Litigation and Claims
Intellectual property-related litigation and claims are cases in which third parties have threatened or initiated litigation claiming that SAP violates one or more intellectual property rights that they possess. Such intellectual property rights may include patents, copyrights, and other similar rights.
Contingent liabilities exist from intellectual property-related litigation and claims for which no provision has been recognized. Generally, it is not practicable to estimate the financial impact of these contingent liabilities due to the uncertainties around the litigation and claims, as outlined above. Based on our past experience, most of the intellectual property-related litigation and claims tend to be either dismissed in court or settled out of court for amounts significantly below the originally claimed amounts. We currently believe that resolving the intellectual property-related claims and lawsuits pending as at December 31, 2023, will neither individually nor in the aggregate have a material adverse effect on our business, financial position, profit, or cash flows.
Individual cases of intellectual property-related litigation and claims include the following:
In June 2018, Teradata Corporation, Teradata US, Inc. and Teradata Operations, Inc. (collectively “Teradata”) filed a civil lawsuit against SAP SE, SAP America, Inc., and SAP Labs, LLC in U.S. federal court in California. Teradata alleged that SAP had misappropriated trade secrets of Teradata, had infringed Teradata’s copyrights (this claim was subsequently withdrawn by Teradata), and had violated U.S. antitrust laws. Teradata sought unspecified monetary damages and injunctive relief. In 2019, SAP asserted patent infringement counterclaims against Teradata seeking monetary damages and injunctive relief. In 2020, Teradata initiated a second civil lawsuit against SAP asserting patent infringement, seeking monetary damages and injunctive relief; in February 2021, SAP filed patent infringement counterclaims against Teradata in this second U.S. lawsuit as well as a civil lawsuit against Teradata in Germany asserting patent infringement, seeking monetary damages and injunctive relief. Currently, all claims between the parties have been dismissed. Teradata has appealed the dismissal of its trade secret and antitrust claims; this appeal is expected to be completed by late 2024.
Tax-Related Litigation
We are subject to ongoing audits by domestic and foreign tax authorities. In respect of non-income taxes, we are involved in various proceedings with only a few foreign tax authorities regarding assessments and litigation matters on intercompany royalty payments and intercompany services. The total potential amount in dispute related to these matters for all applicable years is approximately €416 million (2022: €344 million). We have not recorded a provision for these matters, as we believe that we will prevail.
For more information about our income tax-related litigation, see Note (C.5).
Anti-Bribery Matters
SAP has received communications and whistleblower information alleging conduct that may violate anti-bribery laws in the United States (including the U.S. Foreign Corrupt Practices Act (FCPA)) and in other countries. SAP’s Office of Ethics & Compliance (OEC) conducted investigations with the assistance of an external law firm and voluntarily advised the U.S. Securities and Exchange Commission (U.S. SEC), the U.S. Department of Justice (U.S. DOJ), and local authorities where potential violations were investigated. In early January 2024, following comprehensive and exhaustive investigations, dialogue, and corresponding remediation activities, SAP entered into final settlement agreements with U.S. SEC and U.S. DOJ, as well as with local authorities and parties in South Africa, to resolve criminal and civil claims fully and finally against SAP. Under these agreements, SAP is required to make payments amounting to €207 million. As a consequence, as at December 31, 2023, provisions for fines in regulatory compliance matters totaling €155 million (December 31, 2022: €0 million, June 30, 2023: €170 million) were recognized in our Consolidated Financial Statements as well as repayments to customers, for which revenue recognized from contracts with customers have been reversed. A considerable portion of these repayments to customers was eligible to be credited against the fines incurred in the regulatory compliance matters. Immaterial amounts were already paid in 2022. The remaining payments will be made to a large extent within the first half of 2024.
(G.4) Board of Directors
Executive Board
Memberships on supervisory boards and other comparable governing bodies of enterprises, other than subsidiaries of SAP, on December 31, 2023
Christian Klein
Chief Executive Officer
Strategy & Operations, Corporate Development, Sustainability, Business AI, and Compliance
Supervisory Board, adidas AG, Herzogenaurach, Germany Global Finance and Administration including Legal, Investor Relations, Internal Audit, Data Protection & Export Control
F-88
Dominik Asam (from March 7, 2023)
Chief Financial Officer
Supervisory Board, Bertelsmann Management SE and Bertelsmann SE & Co. KGaA, Guetersloh, Germany
Sabine Bendiek (until December 31, 2023)
Chief People & Operating Officer, Labor Relations Director
HR Strategy, Business Transformation, Leadership Development, Talent Development
Supervisory Board, Schaeffler AG, Herzogenaurach, Germany
Juergen Mueller
Chief Technology Officer
Technology & Innovation
Technology and Innovation Strategy, SAP Business Technology Platform including Data Management, Analytics and Planning, Integration, Application Development Capabilities, Global Security
Scott Russell
Customer Success
Global Field Organization including Sales, Services, Partner Ecosystem, Customer Engagement, Working Capital Management
Thomas Saueressig
SAP Product Engineering
Global Responsibility for all SAP Business Software Applications, Cloud Operations and Support, Cross-Development Functions, SAP Enterprise Adoption Organization, Emarsys
Board of Directors, Nokia Corporation, Espoo, Finland
Gina Vargiu-Breuer (from February 1, 2024)
People & Culture, Labor Relations Director
Julia White
Chief Marketing and Solutions Officer
Global Marketing, Corporate Communications, Government Affairs
Executive Board Members Who Left During 2023
Luka Mucic (until March 31, 2023)
Supervisory Board
Memberships on supervisory boards and other comparable governing bodies of enterprises, other than subsidiaries of SAP, on December 31, 2023
Prof. Dr. h.c. mult. Hasso Plattner 2, 4, 6, 8
Chairperson
Lars Lamadé1, 2, 4, 8
Deputy Chairperson
Head of Global Sponsorships
Supervisory Board, Rhein-Neckar Loewen GmbH, Kronau, Germany
Manuela Asche- Holstein3, 7, 8
Industry Advisor Expert, SAP Germany SE & Co. KG, Walldorf, Germany Chief Executive Officer and Member of the Board of Directors, Zoox, Inc., Foster City, CA, United States
F-89
Aicha Evans2, 4, 6, 7
Board of Directors, Joby Aviation LLC, Santa Cruz, CA, United States
Margret Klein-Magar1, 2, 3, 4
Vice President, Head of SAP Alumni Relations
Chairperson of the Spokespersons’ Committee of Senior Managers of SAP SE
Monika Kovachka-Dimitrova1, 2, 4, 7
Chief Operations Expert
Member of the SAP SE Works Council (Europe)
Peter Lengler1, 3, 7, 8
Value Advisor Expert
Member of the SAP Germany SE & Co. KG Works Council
Jennifer Xin-Zhe Li3, 5
General Partner of Changcheng Investment Partners, Beijing, China
Board of Directors, ABB Ltd., Zurich, Switzerland
Board of Directors, Kone Oy, Espoo, Finland (until February 28, 2023)
Board of Directors, Full Truck Alliance Co. Ltd., Nanjing, Jiangsu, China, and Cayman Islands
Dr. Qi Lu4, 7, 8
CEO, MiraclePlus Ltd., Beijing, China
Board of Directors, Pinduoduo Inc., Shanghai, China
Chairperson of the Board of Directors, Pine Field Holding Limited, Cayman Islands
Chairperson of the Board of Directors, Pine Field Holding Limited, Hong Kong, China
Chairperson of the Board of Directors, Pine Field Ltd., Beijing, China
Gerhard Oswald3, 4, 7
Managing Director of Oswald Consulting GmbH, Walldorf, Germany
Advisory Board, TSG 1899 Hoffenheim Fußball-Spielbetriebs GmbH, Sinsheim, Germany
Advisory Board, appliedAI Initiative GmbH, Munich, Germany (from January 1, 2024)
Christine Regitz1, 2, 4, 5
Vice President, Global Head of SAP Women in Tech
Supervisory Board, Schloss Dagstuhl – Leibniz Center for Informatics, Wadern, Germany
Supervisory Board, HV Capital Manager GmbH, Munich, Germany
Dr. h. c. Punit Renjen (from May 11, 2023)
Independent Management Consultant
Dr. Friederike Rotsch2, 3, 6, 7
General Counsel, Deutsche Bank AG, Frankfurt am Main, Germany
Heike Steck1, 2, 4, 5, 7
Senior Operations Manager
Member of the SAP SE Works Council and Member of the SAP SE Works Council (Europe)
F-90
Helmut Stengele
On Early Retirement, SAP Germany SE & Co. KG, Walldorf, Germany
Dr. Rouven Westphal2, 4, 5, 6, 8
Member of the Executive Board of the Hasso Plattner Foundation, Potsdam, Germany, and Managing Director of the General Partner of HPC Germany GmbH & Co. KG, Potsdam, Germany
Advisory Board, Sharks Sports & Entertainment LLC, San José, CA, United States
Dr. Gunnar Wiedenfels2, 3, 5, 6
Chief Financial Officer, Warner Bros. Discovery, Inc., New York, NY, United States
Board of Directors, OWN LLC, West Hollywood, CA, United States
Board of Directors, Speechagain, Inc., New York, NY, United States
James Wright1, 3, 5, 8
Member of the SAP SE Works Council (Europe)
Supervisory Board Members Who Left During 2023
Prof. Dr. Gesche Joost (until May 11, 2023)
Professor for Design Research and Head of the Design Research Lab, Berlin University of the Arts
F-91
(G.5) Executive and Supervisory Board Compensation
y Accounting Policy |
|
The share-based payment amounts disclosed below in the table “Executive Board Compensation” are based on the grant date fair value of the share units in the respective year. In 2023, 2022, and 2021, share units were issued to the Executive Board members under the LTI 2020. For more information about the terms and details of this plan, see Note (B.3). In the table “Share-Based Payment for Executive Board Members,” the share-based payment expense is the amount recorded in profit or loss under IFRS 2 (Share-Based Payment) in the respective period. |
The total compensation of the Executive Board members for each of the years 2023, 2022, and 2021 was as follows:
Executive Board Compensation
€ thousands |
|
2023 |
|
2022 |
|
2021 |
Short-term employee benefits |
|
19,632 |
|
12,556 |
|
25,015 |
Share-based payment |
|
24,469 |
|
20,726 |
|
25,095 |
Subtotal |
|
44,101 |
|
33,282 |
|
50,110 |
Post-employment benefits |
|
1,033 |
|
-1,429 |
|
464 |
Thereof defined-benefit |
|
673 |
|
-1,433 |
|
461 |
Thereof defined-contribution |
|
360 |
|
4 |
|
3 |
Termination Benefits |
|
NA |
|
9,600 |
|
NA |
Total |
|
45,134 |
|
41,453 |
|
50,574 |
Share-Based Payment for Executive Board Members
|
|
2023 |
|
2022 |
|
2021 |
Number of share units granted |
|
214,530 |
|
205,965 |
|
238,428 |
Total expense in € thousands |
|
36,127 |
|
9,986 |
|
6,356 |
The defined benefit obligation (DBO) for pensions to Executive Board members and the annual pension entitlement of the members of the Executive Board on reaching age 62 based on entitlements from performance-based and salary-linked plans were as follows:
Retirement Pension Plan for Executive Board Members
€ thousands |
|
2023 |
|
2022 |
|
2021 |
DBO 12/31 |
|
2,192 |
|
1,462 |
|
3,435 |
Annual pension entitlement |
|
137 |
|
114 |
|
108 |
The total annual compensation of the Supervisory Board members is as follows:
Supervisory Board Compensation
€ thousands |
|
2023 |
|
2022 |
|
2021 |
Total compensation |
|
5,427 |
|
5,206 |
|
3,856 |
Thereof fixed compensation |
|
3,185 |
|
3,149 |
|
3,176 |
Thereof committee remuneration |
|
2,242 |
|
2,058 |
|
680 |
The Supervisory Board compensation is a short-term benefit. The Supervisory Board members do not receive any share-based payment for their services. As far as members who are employee representatives on the Supervisory Board receive share-based payment, such compensation is for their services as employees only and is unrelated to their status as members of the Supervisory Board.
F-92
Payments to/DBO for Former Executive Board Members
€ thousands |
|
2023 |
|
2022 |
|
2021 |
Payments |
|
2,329 |
|
2,217 |
|
2,159 |
DBO 12/31 |
|
33,251 |
|
31,217 |
|
42,313 |
SAP did not grant any compensation advance or credit to, or enter into any commitment for the benefit of, any member of the Executive Board or Supervisory Board in 2023, 2022, or 2021.
(G.6) Related Party Transactions Other Than Board Compensation
Certain Supervisory Board members of SAP SE currently hold, or held within the last year, positions of significant responsibility with other entities. We have relationships with certain of these entities in the ordinary course of business, whereby we buy and sell products, assets, and services at prices believed to be consistent with those negotiated at arm’s length between unrelated parties.
Companies controlled by Hasso Plattner, Chairperson of the Supervisory Board of SAP SE and Chief Software Advisor of SAP, engaged in the following transactions with SAP: providing consulting services to SAP, receiving sport sponsoring from SAP, and making purchases of SAP products and services.
Occasionally, members of the Executive Board of SAP SE obtain services from SAP for which they pay a consideration consistent with those negotiated at arm’s length between unrelated parties.
All amounts related to the abovementioned transactions were immaterial to SAP in all periods presented.
Related Party Transactions
|
|
|
|
|
|
|
|
|
|
Companies Controlled by |
|
|
|
|
||
|
|
Executive Board Members |
|
Supervisory Board Members |
|
Supervisory Board Members |
|
Associated Entities |
||||||||
€ millions |
|
2023 |
|
2022 |
|
2023 |
|
2022 |
|
2023 |
|
2022 |
|
2023 |
|
2022 |
Products and services provided |
|
NA |
|
NA |
|
0 |
|
0 |
|
0 |
|
1 |
|
13 |
|
11 |
Products and services received |
|
NA |
|
NA |
|
2 |
1 |
2 |
1 |
3 |
|
4 |
|
110 |
|
113 |
Sponsoring and other financial support provided |
|
NA |
|
NA |
|
NA |
|
NA |
|
7 |
|
5 |
|
NA |
|
NA |
Outstanding balances at year end (Vendors) |
|
NA |
|
NA |
|
0 |
|
0 |
|
0 |
|
0 |
|
-6 |
|
-18 |
Outstanding balances at year end (Customers) |
|
NA |
|
NA |
|
0 |
|
0 |
|
0 |
|
0 |
|
0 |
|
4 |
Commitments at year end |
|
NA |
|
NA |
|
0 |
|
0 |
|
42 |
2 |
51 |
|
NA |
|
NA |
1 Including services from employee representatives on the Supervisory Board in their capacity as employees of SAP
2 The longest of these commitments is five years.
All of these balances are unsecured and interest-free and settlement is expected to occur in cash.
For information about the compensation of our Executive Board and Supervisory Board members, see Note (G.5).
(G.7) Principal Accountant Fees and Services
At the Annual General Meeting of Shareholders held on May 18, 2022, our shareholders elected BDO AG Wirtschaftsprüfungsgesellschaft (BDO) as SAP’s independent auditor for 2023. BDO has been the Company’s principal auditor since the fiscal year 2023.
For prior fiscal years since 2002, KPMG AG Wirtschaftsprüfungsgesellschaft was the Company’s principal auditor.
F-93
BDO and other firms in the global BDO network charged the following fees to SAP for audit and other professional services related to 2023 (KPMG for previous years):
€ millions |
|
2023 |
|
2022 |
|
2021 |
||||||||||||
|
|
BDO AG |
|
Foreign BDO |
|
|
|
KPMG AG |
|
Foreign KPMG |
|
|
|
KPMG AG |
|
Foreign |
|
|
|
|
(Germany) |
|
Firms |
|
Total |
|
(Germany) |
|
Firms |
|
Total |
|
(Germany) |
|
KPMG Firms |
|
Total |
Audit fees |
|
8 |
|
5 |
|
13 |
|
4 |
|
10 |
|
14 |
|
3 |
|
8 |
|
12 |
Audit-related fees |
|
0 |
|
1 |
|
1 |
|
3 |
|
7 |
|
10 |
|
2 |
|
5 |
|
7 |
Tax fees |
|
0 |
|
0 |
|
0 |
|
0 |
|
0 |
|
0 |
|
0 |
|
0 |
|
0 |
All other fees |
|
0 |
|
0 |
|
0 |
|
0 |
|
0 |
|
0 |
|
0 |
|
0 |
|
0 |
Total |
|
8 |
|
6 |
|
14 |
|
7 |
|
17 |
|
24 |
|
6 |
|
13 |
|
19 |
Audit fees are the aggregate fees charged by BDO for auditing our consolidated financial statements and the statutory financial statements of SAP SE and its subsidiaries. The increase in audit fees for BDO AG is due to a centralized audit approach. Further, BDO Germany has engaged local BDO network firms to audit financial information of subsidiaries as part of the audit of our consolidated financial statements. Audit-related fees are fees charged by BDO for assurance and related services that are reasonably related to the performance of the audit and for service organization attestation procedures.
(G.8) Events After the Reporting Period
Organizational Changes
On January 9, 2024, SAP announced several organizational changes. Muhammad Alam was appointed a member of the Executive Board effective April 1, 2024, and a new Board area called Customer Services & Delivery will be formed under the leadership of Thomas Saueressig. The announced organizational changes might result in a change in SAP’s operating segments.
Settlement to Resolve Criminal and Civil Claims in United States and South Africa Fully and Finally Against SAP
In early January 2024, following exhaustive investigations, dialogue, and corresponding remediation activities, SAP entered into final settlement agreements with the U.S. SEC and U.S. DOJ, as well with as local authorities and parties in South Africa, to resolve criminal and civil claims fully and finally against SAP. For more information, see Note (G.3).
Transformation Program 2024: Focus on Scalability of Operations and Key Strategic Growth Areas
In 2024, SAP will further increase its focus on key strategic growth areas, in particular business AI. It also intends to transform its operational setup to capture organizational synergies, and AI-driven efficiencies and prepare the Company for highly scalable future revenue growth.
To this end, and to ensure that SAP’s skill set and resources continue to meet future business needs, SAP will execute a Company-wide restructuring program in 2024. The majority of the approximately 8,000 affected positions is expected to be covered by voluntary leave programs and internal re-skilling measures. Reflecting re-investments into strategic growth areas, SAP expects to exit 2024 at a headcount similar to current levels.
Restructuring expenses are preliminarily projected at around €2 billion, the vast majority of which is expected to be recognized in the first half of 2024, impacting IFRS operating profit. Excluding restructuring expenses, the program is expected to provide only a minor cost benefit in 2024. Expected cost savings and re-investments are fully reflected in SAP’s 2024 outlook and the updated 2025 non-IFRS operating profit- and free cash flow ambition.
The Supervisory Board of SAP SE nominates Pekka Ala-Pietilä as new member of the Supervisory Board
On February 11, 2024, the Supervisory Board of SAP SE nominated Pekka Ala-Pietilä as a new member of the Supervisory Board and proposes Pekka Ala-Pietilä as the designated successor to Chairman Hasso Plattner. Pekka Ala-Pietilä will stand for election for a two-year term at the next Annual General Meeting and, if elected, will assume the role of chair. Punit Renjen has chosen to resign his mandate on the SAP Supervisory Board with effect from the end of SAP’s Annual General Meeting on May 15, 2024.
SAP Completes First Tranche of Share Repurchase Program
On February 14, 2024, the first tranche of the share repurchase program launched in 2023 was completed with a total volume of €1,011 million. For the volume processed until December 31, 2023, and for more information, see Note (E.2).
F-94
(G.9) Scope of Consolidation; Subsidiaries and Other Equity Investments
Entities Consolidated in the Financial Statements
|
|
Total |
12/31/2021 |
|
290 |
Additions |
|
26 |
Disposals |
|
-28 |
12/31/2022 |
|
288 |
Additions |
|
12 |
Disposals |
|
-65 |
12/31/2023 |
|
235 |
The additions relate to legal entities added in connection with acquisitions and foundations. The disposals are mainly due to mergers, liquidations, and divestitures of legal entities.
F-95
Subsidiaries1
Major Subsidiaries
Name and Location of Company |
|
Ownership |
|
Total Revenue |
|
Profit/Loss |
|
Total Equity as |
|
Number of |
|
|
|
|
|
|
in 20232 |
|
(–) After Tax for |
|
at 12/31/20232 |
|
Employees as |
|
Footnote |
|
|
|
|
|
|
20232 |
|
|
|
at 12/31/20233 |
|
|
|
|
% |
|
€ thousands |
|
€ thousands |
|
€ thousands |
|
|
|
|
Ariba Technologies India Private Limited, Bengaluru, India |
|
100 |
|
107,665 |
|
14,181 |
|
41,767 |
|
1,360 |
|
|
Ariba, Inc., Palo Alto, CA, United States |
|
100 |
|
1,426,356 |
|
689,432 |
|
6,618,961 |
|
1,589 |
|
|
Concur Technologies, Inc., Bellevue, WA, United States |
|
100 |
|
2,169,139 |
|
408,667 |
|
8,828,126 |
|
3,217 |
|
|
SAP (China) Co., Ltd., Shanghai, China |
|
100 |
|
1,313,574 |
|
21,903 |
|
-75,918 |
|
6,528 |
|
17 |
SAP (Schweiz) AG, Biel, Switzerland |
|
100 |
|
1,392,865 |
|
124,568 |
|
310,761 |
|
873 |
|
|
SAP (UK) Limited, Feltham, United Kingdom |
|
100 |
|
1,431,680 |
|
66,373 |
|
204,673 |
|
1,658 |
|
17 |
SAP America, Inc., Newtown Square, PA, United States |
|
100 |
|
8,476,670 |
|
-112,108 |
|
11,879,728 |
|
9,225 |
|
|
SAP Argentina S.A., Buenos Aires, Argentina |
|
100 |
|
237,309 |
|
-19,467 |
|
-7,742 |
|
1,134 |
|
17 |
SAP Asia Pte. Ltd., Singapore, Singapore |
|
100 |
|
713,377 |
|
8,864 |
|
11,302 |
|
1,085 |
|
17 |
SAP Australia Pty Ltd, Sydney, Australia |
|
100 |
|
808,936 |
|
-17,934 |
|
96,836 |
|
1,302 |
|
|
SAP Brasil Ltda., São Paulo, Brazil |
|
100 |
|
810,113 |
|
37,881 |
|
112,716 |
|
2,839 |
|
17 |
SAP Canada Inc., Toronto, Canada |
|
100 |
|
1,187,938 |
|
103,844 |
|
768,751 |
|
3,104 |
|
|
SAP Deutschland SE & Co. KG, Walldorf, Germany |
|
100 |
|
5,724,456 |
|
819,333 |
|
1,796,440 |
|
5,048 |
|
9 |
SAP España - Sistemas, Aplicaciones y Productos en la Informática, S.A., Madrid, Spain |
|
100 |
|
640,969 |
|
29,122 |
|
120,151 |
|
959 |
|
|
SAP France S.A., Levallois-Perret, France |
|
100 |
|
1,217,078 |
|
146,869 |
|
1,924,300 |
|
1,575 |
|
|
SAP Hungary Rendszerek, Alkalmazások és Termékek az Adatfeldolgozásban Informatikai Kft., Budapest, Hungary |
|
100 |
|
169,259 |
|
6,545 |
|
35,395 |
|
1,452 |
|
|
SAP India Private Limited, Bengaluru, India |
|
100 |
|
792,589 |
|
94,539 |
|
310,957 |
|
2,379 |
|
|
SAP Industries, Inc., Newtown Square, PA, United States |
|
100 |
|
603,743 |
|
158,746 |
|
1,427,522 |
|
239 |
|
|
SAP Italia Sistemi Applicazioni Prodotti in Data Processing S.p.A., Vimercate, Italy |
|
100 |
|
743,718 |
|
20,902 |
|
92,681 |
|
826 |
|
|
SAP Japan Co., Ltd., Tokyo, Japan |
|
100 |
|
1,164,259 |
|
77,354 |
|
303,285 |
|
1,416 |
|
|
SAP Labs Bulgaria EOOD, Sofia, Bulgaria |
|
100 |
|
121,838 |
|
5,945 |
|
32,905 |
|
1,330 |
|
|
SAP Labs India Private Limited, Bengaluru, India |
|
100 |
|
890,380 |
|
99,539 |
|
281,808 |
|
10,672 |
|
|
SAP Labs, LLC, Palo Alto, CA, United States |
|
100 |
|
668,207 |
|
118,097 |
|
864,453 |
|
1,733 |
|
|
SAP México S.A. de C.V., Mexico City, Mexico |
|
100 |
|
531,654 |
|
-6,246 |
|
131,233 |
|
1,118 |
|
17 |
SAP National Security Services, Inc., Newtown Square, PA, United States |
|
100 |
|
1,152,270 |
|
215,069 |
|
567,360 |
|
638 |
|
|
SAP Nederland B.V., 's-Hertogenbosch, the Netherlands |
|
100 |
|
828,363 |
|
281,244 |
|
967,086 |
|
687 |
|
14 |
SAP Philippines, Inc., Taguig City, Philippines |
|
100 |
|
117,602 |
|
285 |
|
8,975 |
|
997 |
|
17 |
SAP Service and Support Centre (Ireland) Limited, Dublin, Ireland |
|
100 |
|
336,355 |
|
85,456 |
|
125,741 |
|
1,757 |
|
|
SAP Services s.r.o., Prague, Czech Republic |
|
100 |
|
122,548 |
|
4,705 |
|
23,055 |
|
1,436 |
|
|
F-96
Other Subsidiaries4
Name and Location of Company |
|
Ownership |
|
Footnote |
|
|
% |
|
|
"SAP Kazakhstan" LLP, Almaty, Kazakhstan |
|
100 |
|
|
110405, Inc., Newtown Square, PA, United States |
|
100 |
|
|
Abakus Ukraine Limited Liability Company, Kyiv, Ukraine |
|
100 |
|
|
Ambin Properties Proprietary Limited, Johannesburg, South Africa |
|
100 |
|
17 |
Apex Expert Solutions LLC, Chantilly, VA, United States |
|
100 |
|
|
AppGyver Inc., Indianapolis, IN, United States |
|
100 |
|
|
AppGyver Oy., Espoo, Finland |
|
100 |
|
|
Ariba Czech s.r.o., Prague, Czech Republic |
|
100 |
|
|
Ariba India Private Limited, Gurugram, India |
|
100 |
|
|
Ariba International Holdings, Inc., Wilmington, DE, United States |
|
100 |
|
|
Ariba International Singapore Pte. Ltd., Singapore, Singapore |
|
100 |
|
|
Ariba International, Inc., Wilmington, DE, United States |
|
100 |
|
|
Ariba Slovak Republic, s.r.o., Košice, Slovakia |
|
100 |
|
|
Ariba Software Technology Services (Shanghai) Co., Ltd., Shanghai, China |
|
100 |
|
|
Ariba Technologies Netherlands B.V., 's-Hertogenbosch, the Netherlands |
|
100 |
|
14 |
Baiza Capital Designated Activity Company, Dublin, Ireland |
|
0 |
|
5, 8 |
Baiza Capital Italia s.r.l., Milan, Italy |
|
0 |
|
5, 8 |
Baiza Capital LLC, Newark, NJ, United States |
|
0 |
|
8 |
Baiza Capital S.A., Luxembourg, Luxembourg |
|
0 |
|
8 |
Business Objects Holding B.V., 's-Hertogenbosch, the Netherlands |
|
100 |
|
14 |
Business Objects Option, LLC, Wilmington, DE, United States |
|
100 |
|
|
Business Objects Software Limited (Trading as SAP Solutions), Dublin, Ireland |
|
100 |
|
|
Callidus Software Inc., San Ramon, CA, United States |
|
100 |
|
|
CallidusCloud (India) Private Limited, Hyderabad, India |
|
100 |
|
|
Christie Partners Holding C.V., 's-Hertogenbosch, the Netherlands |
|
100 |
|
|
Cleanshelf, Inc., San Francisco, CA, United States |
|
100 |
|
5 |
F-97
Name and Location of Company |
|
Ownership |
|
Footnote |
|
|
% |
|
|
CNQR Operations Mexico S. de. R.L. de. C.V., Mexico City, Mexico |
|
100 |
|
|
Concur (Canada), Inc., Toronto, Canada |
|
100 |
|
|
Concur (Czech) s.r.o., Prague, Czech Republic |
|
100 |
|
|
Concur (France) S.A.S., Levallois-Perret, France |
|
100 |
|
|
Concur (Germany) GmbH, Frankfurt am Main, Germany |
|
100 |
|
10, 11 |
Concur (Japan) Ltd., Tokyo, Japan |
|
97 |
|
|
Concur (Philippines) Inc., Makati City, Philippines |
|
100 |
|
|
Concur (Switzerland) GmbH, Zurich, Switzerland |
|
100 |
|
15 |
Concur Holdings (France) S.A.S., Levallois-Perret, France |
|
100 |
|
|
Concur Holdings (Netherlands) B.V., 's-Hertogenbosch, the Netherlands |
|
100 |
|
14 |
Concur Technologies (Australia) Pty. Limited, Sydney, Australia |
|
100 |
|
|
Concur Technologies (Hong Kong) Limited, Hong Kong, China |
|
100 |
|
|
Concur Technologies (India) Private Limited, Bengaluru, India |
|
100 |
|
|
Concur Technologies (Singapore) Pte. Ltd., Singapore, Singapore |
|
100 |
|
17 |
Concur Technologies (UK) Limited, Feltham, United Kingdom |
|
100 |
|
17 |
ConTgo Consulting Limited, Feltham, United Kingdom |
|
100 |
|
13, 17 |
ConTgo Limited, Feltham, United Kingdom |
|
100 |
|
13 |
Crystal Decisions (UK) Limited, Feltham, United Kingdom |
|
100 |
|
13 |
Delos Cloud GmbH, Schönefeld, Germany |
|
100 |
|
|
Emarsys eMarketing Systems GmbH, Vienna, Austria |
|
100 |
|
|
Emarsys İletişim Sistemleri Tic. Ltd Şti., Istanbul, Turkey |
|
100 |
|
|
Emarsys Interactive Services GmbH, Berlin, Germany |
|
100 |
|
|
Emarsys Limited, Hong Kong, China |
|
100 |
|
|
Emarsys North America, Inc., Indianapolis, IN, United States |
|
100 |
|
|
Emarsys Pte. Ltd., Singapore, Singapore |
|
100 |
|
|
Emarsys Pty Ltd, Sydney, Australia |
|
100 |
|
|
Emarsys S.A.S., Levallois-Perret, France |
|
100 |
|
|
Emarsys Schweiz GmbH, Zurich, Switzerland |
|
100 |
|
|
Emarsys UK Ltd, London, United Kingdom |
|
100 |
|
|
EMARSYS-Technologies Informatikai Szolgáltató Kft., Budapest, Hungary |
|
100 |
|
|
ESS Cubed Procurement Proprietary Limited, Johannesburg, South Africa |
|
100 |
|
|
F-98
Name and Location of Company |
|
Ownership |
|
Footnote |
|
|
% |
|
|
FreeMarkets Ltda., São Paulo, Brazil |
|
100 |
|
|
hybris GmbH, Munich, Germany |
|
100 |
|
10, 11 |
INNAAS s.r.l., Rome, Italy |
|
100 |
|
|
LeadFormix, Inc., San Ramon, CA, United States |
|
100 |
|
|
LeanIX France S.A.R.L., Courbevoie, France |
|
100 |
|
5 |
LeanIX GmbH, Bonn, Germany |
|
100 |
|
5 |
LeanIX SI d.o.o., Ljubljana, Slovenia |
|
100 |
|
5 |
LeanIX UK Limited, London, United Kingdom |
|
100 |
|
5 |
LeanIX US Holdings, Inc., Watertown, MA, United States |
|
100 |
|
5 |
LeanIX, B.V., Amsterdam, the Netherlands |
|
100 |
|
5 |
LeanIX, Inc., Houston, TX, United States |
|
100 |
|
5 |
LLC "Emarsys", Moscow, Russia |
|
100 |
|
|
LLC “SAP Labs“, Moscow, Russia |
|
100 |
|
|
LLC “SAP Ukraine”, Kyiv, Ukraine |
|
100 |
|
17 |
Loyalsys Technologies Israel Ltd., Tel Aviv, Israel |
|
100 |
|
|
LXTECH India Private Limited, Hyderabad, India |
|
100 |
|
5 |
Nihon Ariba K.K., Tokyo, Japan |
|
100 |
|
|
Outerjoin, Inc., San Ramon, CA, United States |
|
100 |
|
|
OutlookSoft Deutschland GmbH, Walldorf, Germany |
|
100 |
|
10, 11 |
PT SAP Indonesia, Jakarta, Indonesia |
|
99 |
|
|
Quadrem Africa Pty. Ltd., Johannesburg, South Africa |
|
100 |
|
|
Quadrem Brazil Ltda., Rio de Janeiro, Brazil |
|
100 |
|
|
Quadrem Chile Ltda., Santiago de Chile, Chile |
|
100 |
|
|
Quadrem International Ltd., Hamilton, Bermuda |
|
100 |
|
|
F-99
Name and Location of Company |
|
Ownership |
|
Footnote |
|
|
% |
|
|
Quadrem Netherlands B.V., 's-Hertogenbosch, the Netherlands |
|
100 |
|
14 |
Quadrem Overseas Cooperatief U.A., 's-Hertogenbosch, the Netherlands |
|
100 |
|
|
Quadrem Peru S.A.C., Lima, Peru |
|
100 |
|
|
SAP (Beijing) Software System Co., Ltd., Beijing, China |
|
100 |
|
|
SAP (China) Holding Co., Ltd., Beijing, China |
|
100 |
|
|
SAP Andina y del Caribe C.A., Caracas, Venezuela |
|
100 |
|
17 |
SAP AZ LLC, Baku, Azerbaijan |
|
100 |
|
|
SAP Belgium – Systems, Applications and Products S.A., Brussels, Belgium |
|
100 |
|
|
SAP Beteiligungs GmbH, Walldorf, Germany |
|
100 |
|
|
SAP Bulgaria EOOD, Sofia, Bulgaria |
|
100 |
|
|
SAP Business Services Center Nederland B.V., ‘s-Hertogenbosch, the Netherlands |
|
100 |
|
14 |
SAP Chile Limitada, Santiago de Chile, Chile |
|
100 |
|
17 |
SAP CIS, LLC, Moscow, Russia |
|
100 |
|
|
SAP Colombia S.A.S., Bogotá, D.C., Colombia |
|
100 |
|
17 |
SAP Costa Rica, S.A., Escazú, Costa Rica |
|
100 |
|
17 |
SAP ČR, spol. s r.o., Prague, Czech Republic |
|
100 |
|
|
SAP Cyprus Limited, Nicosia, Cyprus |
|
100 |
|
|
SAP Danmark A/S, Copenhagen, Denmark |
|
100 |
|
|
SAP Dritte Beteiligungs- und Vermögensverwaltungs GmbH, Walldorf, Germany |
|
100 |
|
|
SAP društvo s ograničenom odgovornošću za digitalnu ekonomiju novog tisućljeća, Zagreb, Croatia |
|
100 |
|
|
SAP East Africa Limited, Nairobi, Kenya |
|
100 |
|
17 |
SAP Egypt LLC, Cairo, Egypt |
|
100 |
|
17 |
SAP EMEA Inside Sales S.L., Madrid, Spain |
|
100 |
|
|
F-100
Name and Location of Company |
|
Ownership |
|
Footnote |
|
|
% |
|
|
SAP Erste Beteiligungs- und Vermögensverwaltungs GmbH, Walldorf, Germany |
|
100 |
|
10, 11 |
SAP Estonia OÜ, Tallinn, Estonia |
|
100 |
|
|
SAP Financial, Inc., Toronto, Canada |
|
100 |
|
|
SAP Finland Oy, Espoo, Finland |
|
100 |
|
|
SAP Foreign Holdings GmbH, Walldorf, Germany |
|
100 |
|
|
SAP France Holding S.A., Levallois-Perret, France |
|
100 |
|
|
SAP Global Marketing, Inc., New York, NY, United States |
|
100 |
|
|
SAP Hellas Single Member S.A., Athens, Greece |
|
100 |
|
|
SAP Hong Kong Co., Ltd., Hong Kong, China |
|
100 |
|
17 |
SAP Hosting Beteiligungs GmbH, St. Leon-Rot, Germany |
|
100 |
|
10, 11 |
SAP India (Holding) Pte. Ltd., Singapore, Singapore |
|
100 |
|
|
SAP International Panama, S.A., Panama City, Panama |
|
100 |
|
|
SAP International, Inc., Miami, FL, United States |
|
100 |
|
|
SAP Investments, Inc., Wilmington, DE, United States |
|
100 |
|
|
SAP Ireland Limited, Dublin, Ireland |
|
100 |
|
17 |
SAP Ireland US - Financial Services Designated Activity Company, Dublin, Ireland |
|
100 |
|
|
SAP Israel Ltd., Ra’anana, Israel |
|
100 |
|
17 |
SAP Korea Ltd., Seoul, South Korea |
|
100 |
|
|
SAP Labs France S.A.S., Mougins, France |
|
100 |
|
|
SAP Labs Israel Ltd., Ra’anana, Israel |
|
100 |
|
|
SAP Labs Korea, Inc., Seoul, South Korea |
|
100 |
|
|
SAP Latvia SIA, Riga, Latvia |
|
100 |
|
|
SAP Malaysia Sdn. Bhd., Kuala Lumpur, Malaysia |
|
100 |
|
|
F-101
Name and Location of Company |
|
Ownership |
|
Footnote |
|
|
% |
|
|
SAP Middle East and North Africa L.L.C., Dubai, United Arab Emirates |
|
49 |
|
6, 17 |
SAP Middle East FZ-LLC, Dubai, United Arab Emirates |
|
100 |
|
17 |
SAP Nederland Holding B.V.,‘s-Hertogenbosch, the Netherlands |
|
100 |
|
14 |
SAP New Zealand Limited, Auckland, New Zealand |
|
100 |
|
|
SAP Norge AS, Oslo, Norway |
|
100 |
|
|
SAP North West Africa Ltd, Casablanca, Morocco |
|
100 |
|
|
SAP Österreich GmbH, Vienna, Austria |
|
100 |
|
|
SAP Perú S.A.C., Lima, Peru |
|
100 |
|
17 |
SAP Polska Sp. z o.o., Warsaw, Poland |
|
100 |
|
|
SAP Portals Holding Beteiligungs GmbH, Walldorf, Germany |
|
100 |
|
|
SAP Portals Israel Ltd., Ra’anana, Israel |
|
100 |
|
|
SAP Portugal – Sistemas, Aplicações e Produtos Informáticos, Sociedade Unipessoal, Lda., Porto Salvo, Portugal |
|
100 |
|
|
SAP Projektverwaltungs- und Beteiligungs GmbH, Walldorf, Germany |
|
100 |
|
|
SAP Public Services, Inc., Washington, DC, United States |
|
100 |
|
|
SAP Puerto Rico GmbH, Walldorf, Germany |
|
100 |
|
10, 11, 17 |
SAP Retail Solutions Beteiligungsgesellschaft GmbH, Walldorf, Germany |
|
100 |
|
|
SAP Saudi Arabia Software Services Ltd, Riyadh, Kingdom of Saudi Arabia |
|
100 |
|
|
SAP Saudi Arabia Software Trading Ltd, Riyadh, Kingdom of Saudi Arabia |
|
75 |
|
17 |
F-102
Name and Location of Company |
|
Ownership |
|
Footnote |
|
|
% |
|
|
SAP Sechste Beteiligungs- und Vermögensverwaltungs GmbH, Walldorf, Germany |
|
100 |
|
10, 11 |
SAP Siebte Beteiligungs- und Vermögensverwaltungs GmbH, Walldorf, Germany |
|
100 |
|
10, 11 |
SAP sistemi, aplikacije in produkti za obdelavo podatkov d.o.o., Ljubljana, Slovenia |
|
100 |
|
|
SAP Slovensko s.r.o., Bratislava, Slovakia |
|
100 |
|
|
SAP Software and Services WLL, Doha, Qatar |
|
49 |
|
6, 17 |
SAP Svenska Aktiebolag, Stockholm, Sweden |
|
100 |
|
|
SAP System Application and Products Asia Myanmar Limited, Yangon, Myanmar |
|
100 |
|
|
SAP Systems, Applications and Products in Data Processing (Thailand) Ltd., Bangkok, Thailand |
|
100 |
|
|
SAP Taiwan Co., Ltd., Taipei, Taiwan |
|
100 |
|
|
SAP Technologies Inc., Palo Alto, CA, United States |
|
100 |
|
|
SAP Training and Development Institute FZCO, Dubai, United Arab Emirates |
|
100 |
|
17 |
SAP Türkiye Yazilim Üretim ve Ticaret A.Ş., Istanbul, Turkey |
|
100 |
|
|
SAP UAB, Vilnius, Lithuania |
|
100 |
|
|
SAP Ventures Investment GmbH, Walldorf, Germany |
|
100 |
|
10, 11 |
SAP Vierte Beteiligungs- und Vermögensverwaltungs GmbH, Walldorf, Germany |
|
100 |
|
|
SAP Vietnam Company Limited, Ho Chi Minh City, Vietnam |
|
100 |
|
|
SAP West Balkans d.o.o., Belgrade, Serbia |
|
100 |
|
|
SAP Zweite Beteiligungs- und Vermögensverwaltungs GmbH, Walldorf, Germany |
|
100 |
|
10, 11 |
SAP.io Fund, L.P., Austin, TX, United States |
|
0 |
|
7 |
Sapphire Fund Investments II Holdings, LLC, Austin, TX, United States |
|
100 |
|
7 |
Sapphire Fund Investments II, L.P., Austin, TX, United States |
|
0 |
|
7 |
Sapphire Fund Investments III Holdings, LLC, Austin, TX, United States |
|
100 |
|
7 |
Sapphire Fund Investments III, L.P., Austin, TX, United States |
|
0 |
|
7 |
Sapphire SAP HANA Fund of Funds, L.P., Austin, TX, United States |
|
0 |
|
7 |
Sapphire Ventures Fund I, L.P., Austin, TX, United States |
|
0 |
|
7 |
Sapphire Ventures Fund II, L.P., Austin, TX, United States |
|
0 |
|
7 |
Sapphire Ventures Fund III, L.P., Austin, TX, United States |
|
0 |
|
7 |
Sapphire Ventures Fund IV, L.P., Austin, TX, United States |
|
0 |
|
7 |
Sapphire Ventures Fund V, L.P., Austin, TX, United States |
|
0 |
|
7 |
Sapphire Ventures Fund VI, L.P., Austin, TX, United States |
|
0 |
|
7 |
Sapphire Ventures Fund VII-A, L.P., Austin, TX, United States |
|
0 |
|
7 |
SAPV (Mauritius), Ebene, Mauritius |
|
100 |
|
7 |
SC SAP Romania SRL, Bucharest, Romania |
|
100 |
|
|
Shanghai SAP Cloud Technology Company, Ltd., Shanghai, China |
|
70 |
|
|
Signavio UK Ltd, Birmingham, United Kingdom |
|
100 |
|
13 |
Signavio, Inc., Newtown Square, PA, United States |
|
100 |
|
|
SuccessFactors (Philippines), Inc., Pasig City, Philippines |
|
100 |
|
17 |
F-103
Name and Location of Company |
|
Ownership |
|
Footnote |
|
|
% |
|
|
SuccessFactors, Inc., Newtown Square, PA, United States |
|
100 |
|
|
Sybase Angola, LDA, Luanda, Angola |
|
100 |
|
16 |
Sybase Iberia, S.L., Madrid, Spain |
|
100 |
|
|
Sybase International Holdings Corporation, LLC, San Ramon, CA, United States |
|
100 |
|
|
Sybase, Inc., San Ramon, CA, United States |
|
100 |
|
|
Systems Applications Products (Africa Region) Proprietary Limited, Johannesburg, South Africa |
|
100 |
|
|
Systems Applications Products (Africa) Proprietary Limited, Johannesburg, South Africa |
|
100 |
|
|
Systems Applications Products (South Africa) Proprietary Limited, Johannesburg, South Africa |
|
81 |
|
17 |
Systems Applications Products Nigeria Limited, Victoria Island, Nigeria |
|
100 |
|
17 |
Taulia (Shanghai) Smart Technology Co. Ltd., Shanghai, China |
|
100 |
|
|
Taulia Arabia LLC, Riyadh, Kingdom of Saudi Arabia |
|
100 |
|
5 |
Taulia Australia Pty. Ltd., Sydney, Australia |
|
100 |
|
|
Taulia Bulgaria EOOD, Sofia, Bulgaria |
|
100 |
|
|
Taulia GmbH, Düsseldorf, Germany |
|
100 |
|
12 |
Taulia LLC, San Francisco, CA, United States |
|
96 |
|
|
Taulia Singapore Pte. Ltd., Singapore, Singapore |
|
100 |
|
|
Taulia Trade Technology GmbH, Düsseldorf, Germany |
|
100 |
|
12 |
Taulia UK Ltd., London, United Kingdom |
|
100 |
|
|
Technology Management Associates Inc., Chantilly, VA, United States |
|
100 |
|
|
TRX Europe Limited, Feltham, United Kingdom |
|
100 |
|
13, 17 |
TRX Technologies India Private Limited, Bengaluru, India |
|
100 |
|
|
TRX UK Limited, Feltham, United Kingdom |
|
100 |
|
13 |
TRX, Inc., Bellevue, WA, United States |
|
100 |
|
|
Volume Integration, Inc., Chantilly, VA, United States |
|
100 |
|
|
1 For the classification of the subsidiaries, the following figures are considered: revenues, profit/loss after tax, total equity, and number of employees.
2 These figures are based on our local IFRS financial statements prior to eliminations resulting from consolidation and therefore do not reflect the contribution of these companies included in the Consolidated Financial Statements. The translation of the equity into Group currency is based on period-end closing exchange rates, and on average exchange rates for revenue and net income/loss.
3 As at December 31, 2023, including managing directors, in FTE.
4 Figures for profit/loss after tax and total equity pursuant to HGB, section 285 and section 313 are not disclosed if they are of minor significance for a fair presentation of the profitability, liquidity, capital resources, and financial position of SAP SE, pursuant to HGB, section 313 (2) sentence 3 no. 4 and section 286 (3) sentence 1 no. 1.
5 Consolidated for the first time in 2023.
6 Agreements with the other shareholders provide that SAP SE fully controls the entity.
7 Structured entity belonging to SAP SE. The results of operations of these entities are included in SAP’s Consolidated Financial Statements in accordance with IFRS 10 (Consolidated Financial Statements).
8 In accordance with IFRS 10 the structured entity does not include the receivables and liabilities resulting from the supply chain financing (SCF) activities.
9 Entity whose personally liable partner is SAP SE.
10 Entity with (profit and) loss transfer agreement.
11 Pursuant to HGB, section 264 (3) or section 264b, the subsidiary is exempt from applying certain legal requirements to their statutory stand-alone financial statements including the requirement to prepare notes to the financial statements and a review of operations, the requirement of independent audit, and the requirement of public disclosure.
12 Pursuant to HGB, section 316 (1), the subsidiary is exempt from having its financial statements audited in respect of its financial year ended December 31, 2023.
13 Pursuant to section 480 of the UK Companies Act 2006, the entity is exempt from having its financial statements audited on the grounds that the entity is entitled to the benefits from a dormant entity exemption in respect of its financial year ended December 31, 2023.
14 Pursuant to article 2:403 of the Dutch Civil Code, the entity is exempt from applying certain legal requirements to their statutory stand-alone financial statements including the requirement to prepare the financial statements, the requirement of independent audit, and the requirement of public disclosure in respect of its financial year ended December 31, 2023, or in respect of its financial year ended September 30, 2023, respectively.
15 Pursuant to article 727a, paragraph 2 of the Swiss Code of Obligations, the entity is exempt from having its financial statements audited in respect of its financial year ended December 31, 2023, or in respect of its financial year ended September 30, 2023, respectively.
16 Pursuant to Angola Tax Law and Presidential Decree no. 147/13 of October 1, 2013, the entity does not qualify as being a Large Taxpayer and therefore is exempt from having its financial statements audited in respect of its financial year ended December 31, 2023.
17 Entity with support letter issued by SAP SE.
F-104
Other Equity Investments
Name and Location of Company |
|
Ownership |
|
|
% |
Joint Arrangements and Investments in Associates |
|
|
China DataCom Corporation Limited, Guangzhou, China |
|
28 |
Procurement Negócios Eletrônicos S/A, Rio de Janeiro, Brazil |
|
17 |
SAP Fioneer GmbH, Walldorf, Germany |
|
20 |
Name and Location of Company |
|
Equity Investments with Ownership of at Least 5% |
|
47th Street Partners I, L.P., Menlo Park, CA, United States |
|
83North IV, L.P., Hertzalia, Israel |
|
Adverity GmbH, Vienna, Austria |
|
Alation, Inc., Redwood City, CA, United States |
|
Alchemist Accelerator Fund I LLC, San Francisco, CA, United States |
|
Aleph-Bigg SPV, L.P., Grand Cayman, Cayman Islands |
|
All Tax Platform - Solucoes Tributarias S.A., São Paulo, Brazil |
|
Amplify Partners II L.P., Menlo Park, CA, United States |
|
Amplify Partners III, L.P., Menlo Park, CA, United States |
|
Amplify Partners IV, L.P., Menlo Park, CA, United States |
|
Amplify Partners, L.P., Menlo Park, CA, United States |
|
BGS Holdings, Inc., Austin, TX, United States |
|
BioCatch Ltd., Tel Aviv, Israel |
|
Bitonic Technology Labs, Inc., Karnataka, India |
|
Blue Yard Capital 1 Alternative GmbH & Co. KG, Berlin, Germany |
|
Blue Yard Capital I GmbH & Co. KG, Berlin, Germany |
|
Blue Yard Crytpo 1, L.P., Hot Springs Village, AR, United States |
|
Boldstart Ventures V, L.P., Miami, FL, United States |
|
Boldstart Ventures VI, L.P., Miami, FL, United States |
|
Brightfield Holdings, Inc., New York, NY, United States |
|
Bryj Technologies, Inc. (fka Follow Analytics, Inc.), San Francisco, CA, United States |
|
BY Capital 2 GmbH & Co. KG, Berlin, Germany |
|
Catchpoint Systems, Inc., New York, NY, United States |
|
CDQ AG, St. Gallen, Switzerland |
|
Chalfen Ventures Fund I L.P., St Heiler, Jersey, Channel Islands |
|
Chalfen Ventures Fund II L.P., St Helier, Jersey, Channel Islands |
|
Chalfen Ventures Fund III L.P., St Helier, Jersey, Channel Islands |
|
CircleCI, Inc., San Francisco, CA, United States |
|
Clari, Inc., Sunnyvale, CA, United States |
|
Cofinity-X GmbH, Cologne, Germany |
|
Collectly, Inc., Pasadena, CA, United States |
|
ComponentLab, Inc., Seattle, WA, United States |
|
Contentful Global, Inc., Berlin, Germany |
|
Costanoa Venture Capital II L.P., Palo Alto, CA, United States |
|
Costanoa Venture Capital QZ, LLC, Palo Alto, CA, United States |
|
Costanoa Venture Capital III L.P., Palo Alto, CA, United States |
|
Creandum SPV TR (D) AB, Stockholm, Sweden |
|
Cultivate Rollco LLc (fka Cultivate Technology, Inc.), San Francisco, CA, United States |
|
F-105
Culture Amp, Inc., San Francisco, CA, United States |
|
Cypress.io, Inc., Atlanta, GA, United States |
|
Data Collective II L.P., Palo Alto, CA, United States |
|
Data Collective III L.P., Palo Alto, CA, United States |
|
Data Collective IV, L.P., Palo Alto, CA, United States |
|
Digital Hub Rhein-Neckar GmbH, Ludwigshafen, Germany |
|
Dremio Corporation, Santa Clara, CA, United States |
|
Essence VC III, L.P., Seattle, WA, United States |
|
FeedZai S.A., Lisbon, Portugal |
|
Felix Capital Fund III, London, United Kingdom |
|
Felix Ventures II, L.P., London, United Kingdom |
|
Filament 2024, L.P., Brooklyn, NY, United States |
|
Finco Services, Inc. (dba Current), New York, NY, United States |
|
FloQast, Inc., Los Angeles, CA, United States |
|
GitGuardian SAS, Paris, France |
|
Gorgias Inc., San Francisco, CA, United States |
|
Haystack Ventures V, L.P., Mill Valley, CA, United States |
|
Haystack Ventures VI, L.P., Mill Valley, CA, United States |
|
Haystack Ventures VII, L.P., San Francisco, CA, United States |
|
Huntress Labs Incorporated, Ellicott City, MD, United States |
|
IDG Ventures USA III, L.P., San Francisco, CA, United States |
|
IEX Group, Inc., New York, NY, United States |
|
InfluxData, Inc., San Francisco, CA, United States |
|
Initialized CBH SPV LLC, Walnut, CA, United States |
|
InnovationLab GmbH, Heidelberg, Germany |
|
innoWerft Technologie- und Gründerzentrum Walldorf Stiftung GmbH, Walldorf, Germany |
|
Involve.ai, Inc., Santa Monica, CA, United States |
|
JetLenses Inc. (dba Verse Medical), New York, NY, United States |
|
JupiterOne, Inc., Morrisville, NC, United States |
|
Kaltura, Inc., New York, NY, United States |
|
LeanData, Inc., Sunnyvale, CA, United States |
|
LGVP F I LLC, Dover, DE, United States |
|
Local Globe Opportunity Fund, L.P., St. Peter Port, Guernsey, Channel Islands |
|
Local Globe VII, L.P., St. Peter Port, Guernsey, Channel Islands |
|
Local Globe VIII, L.P., St. Peter Port, Guernsey, Channel Islands |
|
Local Globe X, L.P., St. Peter Port, Guernsey, Channel Islands |
|
Local Globe XI, L.P., St. Peter Port, Guernsey, Channel Islands |
|
Mango Capital 2018, L.P., Los Altos, CA, United States |
|
Mango Capital 2020, L.P., Los Altos, CA, United States |
|
Mango Capital 2022, L.P., Los Altos, CA, United States |
|
Matillion Ltd., Altrincham, United Kingdom |
|
Medable Inc., Palo Alto, CA, United States |
|
Mosaic Ventures Investors Fund I, L.P., London, United Kingdom |
|
Notation Capital, L.P., Brooklyn, NY, United States |
|
Notation Capital II CIRC, LLC, Brooklyn, NY, United States |
|
Notation Capital II, L.P., Brooklyn, NY, United States |
|
Notation Capital III, L.P., Brooklyn, NY, United States |
|
OpenX Software Limited, Pasadena, CA, United States |
|
Paper Education Company Inc., Quebec, Canada |
|
F-106
Pendo.io, Inc., Raleigh, NC, United States |
|
PivotNorth Early Fund I, L.P., Atherton, CA, United States |
|
Point Nine Annex GmbH & Co. KG, Berlin, Germany |
|
Point Nine Capital Fund II GmbH & Co. KG, Berlin, Germany |
|
Point Nine Capital Fund III GmbH & Co. KG, Berlin, Germany |
|
Point Nine Capital Fund IV GmbH & Co. KG, Berlin, Germany |
|
Point Nine Capital Fund V GmbH & Co. KG, Berlin, Germany |
|
Project 44, Inc., Chicago, IL, United States |
|
PubNub, Inc., San Francisco, CA, United States |
|
Qualified.com, Inc., San Francisco, CA, United States |
|
Reltio, Inc., Redwood Shores, CA, United States |
|
Restream, Inc., Austin, TX, United States |
|
Ridge Ventures IV, L.P., San Francisco, CA, United States |
|
Ridge Ventures V, L.P., San Francisco, CA, United States |
|
SafeGraph, Inc., Denver, CO, United States |
|
Sapphire Sport Parallel Fund, L.P., Austin, TX, United States |
|
Sapphire Sport Parallel Fund II, L.P., Austin, TX, United States |
|
Sapphire Sport, L.P., Austin, TX, United States |
|
Side, Inc., San Francisco, CA, United States |
|
Simpplr Inc., Redwood City, CA, United States |
|
Smart City Planning, Inc., Tokyo, Japan |
|
Splashtop, Inc., San Jose, CA, United States |
|
Spring Mobile Solutions, Inc., Salt Lake City, UT, United States |
|
StackHawk, Inc., Denver, CO, United States |
|
Storm Ventures V, L.P., Menlo Park, CA, United States |
|
SV Angel IV, L.P., San Francisco, CA, United States |
|
Tetrate.io, Inc., Milpitas, CA, United States |
|
The SaaStr Fund, L.P., Palo Alto, CA, United States |
|
The SaaStr Fund II, L.P., Palo Alto, CA, United States |
|
Third Kind Venture Capital II, L.P., New York, NY, United States |
|
Third Kind Venture Capital III, L.P., New York, NY, United States |
|
Tribe Capital LLC Series 3, Redwood City, CA, United States |
|
Tribe Capital LLC Series 8, Redwood City, CA, United States |
|
UJET, Inc., San Francisco, CA, United States |
|
Unmind Ltd., London, United Kingdom |
|
Upfront V, L.P., Santa Monica, CA, United States |
|
Uptycs, Inc., Waltham, MA, United States |
|
VerbIT, Inc., New York, NY, United States |
|
Vistex, Inc., Hoffman Estates, IL, United States |
|
Walkabout Ventures Fund II L.P., Los Angeles, CA, United States |
|
Yapily Ltd., London, United Kingdom |
|
Zesty Tech Ltd., Ramat Gan, Israel |
|
F-107
Exhibit 1
ARTICLES OF INCORPORATION

I. General Provisions
Section 1
Corporate Name, Registered Office and Domicile, and Period of Incorporation
1.The name of the Company is: SAP SE.
2.The Company‘s registered office and domicile is in Walldorf, Germany.
3.The Company is incorporated for an indefinite period of time.
Section 2
Corporate Purpose
1. |
The corporate purpose of the Company is direct or indirect activity in the area of development, production, and marketing of products and the provision of services in the fields of information technology and telecommunication, and particularly in the following fields: |
| - | developing and marketing integrated product and service solutions for e-commerce; |
| - | developing software and cloud solutions and the licensing of their use to others; |
| - | organization and deployment consulting, as well as user training, for software and cloud solutions; |
| - | selling, leasing, renting, and arranging the procurement and provision of all other forms of use of information technology systems and relevant accessories; |
| - | making capital investments in enterprises active within the scope of the corporate purpose to promote the opening and advancement of international markets in these fields. |
2. |
The Company is authorized to act in all the business areas listed in paragraph 1 and to delegate such activities to affiliated enterprises within the meaning of Sections 15 ff. of the German Stock Corporation Act (Aktiengesetz; "AktG"); in particular the Company is authorized to delegate its business in whole or in parts to such enterprises. The Company is authorized to establish branch offices in Germany and other countries, to found, acquire, and invest in other compa-nies of the same or a related kind and to enter into collaboration and joint ven-ture agreements. The Company is further authorized to invest in enterprises of all kinds principally for the purpose of placing financial resources. The Company is authorized to dispose of investments, to consolidate the management of enterprises in which it participates, to enter into affiliation agreements with such enterprises, or to do no more than manage its shareholding. |
2
3. |
The Company is authorized to take all actions and measures that are consistent with the corporate purpose or that directly or indirectly further the corporate purpose. |
Section 3
Official Notices and the Transfer of Information
1.Unless otherwise provided by law, the Company‘s official notices shall be made by publication in the German Federal Gazette (Bundesanzeiger) exclusively.To the extent that declarations or information are required by law to be made accessible to the shareholders without a specific form being determined for such purpose, publication on the Company‘s Internet site shall be sufficient.
2.Information may also be transmitted to the Company’s shareholders by means of telecommunication, insofar as this is legally permissible.
II. Capital Stock and Shares
Section 4
Capital Stock
1.The Company has capital stock of €1,228,504,232 and is divided into 1,228,504,232 no-par value ordinary shares. The capital stock was paid up by way of conversion of SAP AG to a European Company (SE).
2.The shares are no-par value shares. They are in bearer form.
3.Subject to the consent of the Supervisory Board, the Executive Board shall determine the form of the share certificates, dividend coupons, and renewal coupons, as well as bonds and interest coupons. The Company may combine single shares into share certificates representing a majority of shares (multiple-share certificates). Shareholders are not entitled to share certificates.
4.When new shares are issued, the commencement of dividend entitlement in respect of these new shares may be determined in derogation of Section 60 (2) AktG.
5.The Executive Board is authorized, subject to the consent of the Supervisory Board, to increase the capital stock, on one or more occasions on or before May 19, 2025, by an aggregate amount of up to €250 million against contri-butions in cash by issuing new no-par value bearer shares (Authorized Capital I). The new shares are to be offered to the shareholders for subscription, with an indirect subscription right within the meaning of Section 186 (5) sentence 1 AktG being sufficient in this context. The Executive Board is authorized, however, subject to the consent of the Supervisory Board, to exclude fractional shares from the shareholders' subscription rights.
The Executive Board may only exercise the authorization to exclude subscription rights to such an extent that the proportionate amount of the newly issued shares does not exceed a total of 10% of the share capital.
3
The decisive factor for the calculation of the 10% limit is the share capital that exists at the time the resolution on this authorization is passed. If the share capital is lower at the time the authorization is exercised, this value is decisive. As to the 10% limit, it shall be taken into account if, during the term of this authorization until it is exercised, other authorizations to issue shares in the Company, or to issue rights that enti-tle or oblige to subscribe to shares in the Company, are exercised and the sub-scription right is excluded.
The Executive Board is further authorized, subject to the consent of the Super-visory Board, to determine the further details of the implementation of capital increases from Authorized Capital I. The Supervisory Board is authorized to amend the wording of the Articles of Incorporation after the full or partial implementation of the capital stock increase from Authorized Capital I or after the expiration of the authorization period to reflect the volume of the capital increase from Authorized Capital I.
6. |
The Executive Board is authorized, subject to the consent of the Supervisory Board, to increase the capital stock, on one or more occasions on or before May 19, 2025, by an aggregate amount of up to €250 million against contri-butions in cash or in kind by issuing new no-par value bearer shares (Authorized Capital II). An indirect subscription right within the meaning of Section 186 (5) sentence 1 AktG may also ensure compliance with the statutory shareholders’ subscription right. The Executive Board is authorized, subject to the consent of the Supervisory Board, to exclude the shareholders' statutory subscription rights in the following circumstances: |
| - | in respect of fractional shares; |
| - | insofar as required to grant subscription rights to new shares to holders and/or beneficiaries of conversion and/or option rights or obligors under conversion and/or option obligations under bonds issued by the Company or a group company in the same volume as they would be entitled to if they exercised their conversion and/or option rights or fulfilled their conversion and/or option obligations; |
| - | in the case of capital increases against contributions in cash, if, in accor-dance with Section 186 (3) sentence 4 AktG, the issue price of the new shares does not fall significantly short of the stock exchange price of the same class and type of shares already traded on the stock exchange at the time of the final determination of the issue price and the proportionate amount of the newly issued shares does not exceed a total of 10% of the share capital. The decisive factor for the calculation of the 10% limit is the share capital that exists at the time the resolution on this authorization is passed. If the share capital is lower at the time the authorization is exercised, this value is decisive. As to the 10% limit, it shall be taken into account if, during the term of this authorization until it is exercised, other authorizations to issue or to sell shares in the Company, or to issue rights that entitle or |
4
oblige to subscribe to shares in the Company, are exercised and the sub-scription right is excluded pursuant to or in accordance with Section 186 (3) sentence 4 AktG;
- |
in the case of capital increases against contributions in kind for granting shares in connection with mergers with other enterprises or acquisitions of enterprises or parts thereof or interests therein or of other contributable assets; |
- |
to implement a scrip dividend by which shareholders are given the option of contributing their dividend entitlements to the Company (either in whole or in part) as a contribution in kind against the issue of new shares from Authorized Capital II. |
The Executive Board may only exercise the above-described authorization to exclude subscription rights to such an extent that the proportionate amount of the newly issued shares does not exceed a total of 10% of the share capital. The decisive factor for the calculation of the 10% limit is the share capital that exists at the time the resolution on this authorization is passed. If the share capital is lower at the time the authorization is exercised, this value is decisive. As to the 10% limit, it shall be taken into account if, during the term of this authorization until it is exercised, other authorizations to issue shares in the Company, or to issue rights that entitle or oblige to subscribe to shares in the Company, are exercised and the subscription right is excluded.
The Executive Board is further authorized, subject to the consent of the Super-visory Board, to determine the further details of the implementation of capital increases from Authorized Capital II. The Supervisory Board is authorized to amend the wording of the Articles of Incorporation after the full or partial im-plementation of the capital stock increase from Authorized Capital II or after the expiration of the authorization period to reflect the volume of the capital increase from Authorized Capital II.
7. |
The capital stock shall be subject to a further contingent increase by up to €100 million by issuing up to 100 million no-par value bearer shares (Contin-gent Capital I). The contingent capital increase shall be implemented only to the extent that the holders or creditors of convertible bonds or warrants under warrant-linked bonds issued or guaranteed by SAP SE or any of its direct or indirect majority holdings on or before May 11, 2026 by virtue of the authorization resolved by the annual General Meeting of Shareholders of May 12, 2021 exercise their conversion or option rights or fulfill their conversion or option obligations and no other methods for servicing these rights are used. The new shares shall in each case be issued at the conversion or option price to be determined in accordance with the above authorization resolution. The new shares shall participate in the profits as from the beginning of the fiscal year in which they are created as a result of the exercise of conversion or option rights or upon the fulfillment of the conversion or option obligation. The Executive Board shall be authorized to determine the further details of the implementation of the contingent capital increase. |
5
III. Constitution and Management of the Company
Section 5
Governing Bodies
The Company's governing bodies are:
a)the Executive Board (the management organ),
b)the Supervisory Board (the supervisory organ),
c)the General Meeting of Shareholders.
The Executive Board
Section 6
Composition of the Executive Board
1.The Executive Board shall consist of at least two persons. The Supervisory Board may determine a higher number of Executive Board members. The appointment of deputy members of the Executive Board is permissible. The latter have the same rights as the full members of the Executive Board regarding the external representation of the Company.
2.The appointment of the full members and the deputy members of the Executive Board, the conclusion of their employment contracts, and the revocation of their appointments are the responsibility of the Supervisory Board, as are the appoint-ment of a member of the Executive Board as chairperson of the Executive Board and the appointment of one or more member/s of the Executive Board as depu-ty chairperson/s of the Executive Board.
3.The full members and the deputy members of the Executive Board will be ap-pointed for a maximum period of five years. Reappointments are permissible.
Section 7
Rules of Procedure and Resolutions of the Executive Board
1.The Executive Board shall unanimously adopt its own rules of procedure, unless the Supervisory Board adopts rules of procedure for the Executive Board.
2.Resolutions of the Executive Board shall be adopted by a simple majority of votes cast, unless otherwise mandatorily prescribed by law or the Articles of Incorporation. Should a vote be tied, the chairperson of the Executive Board, if appointed, shall have the casting vote.
3.Unless otherwise mandatorily prescribed by law or the Articles of Incorporation, the Executive Board is quorate if at least half of its members participate in pass-ing the resolution.
6
Section 8
Legal Representation of the Company
The Company shall be legally represented
a)by two members of the Executive Board;
b)by one member of the Executive Board acting jointly with one holder of full com-mercial power of attorney (Prokurist) within the meaning of Sections 48-53 of the German Commercial Code (Handelsgesetzbuch; "HGB").
Section 9
Limitation of the Executive Board's Authority
The Executive Board owes a duty to the Company to adhere to the limitations imposed by the Articles of Incorporation or the Supervisory Board regarding the scope of its management authority or which result from a resolution adopted by the General Meeting of Shareholders pursuant to Section 119 AktG.
The Supervisory Board
Section 10
Composition, Term of Office
1.The Supervisory Board shall be composed of eighteen members. Nine members will be elected as shareholders‘ representatives by the General Meeting of Share-holders without being bound by nominations. Nine members will be appointed as employees‘ representatives by the SE Works Council in accordance with the agreement on the involvement of employees (Agreement on Employee Involve-ment) concluded in accordance with the German Act on the Involvement of Employees in European Companies (Gesetz über die Beteiligung der Arbeitneh-mer in einer Europäischen Gesellschaft (SE-Beteiligungsgesetz; "SEBG")). When the Supervisory Board members are elected or appointed (as the case may be), substitute members may be elected or appointed (as the case may be) at the same time. Reappointments are permissible.
2.Unless a shorter term of office is determined, the members of the Supervisory Board shall be elected or appointed for a period ending with the close of the annual General Meeting of Shareholders at which the acts of the Supervisory Board are formally approved for the fourth fiscal year following commencement of the term of office, not counting the year in which their term of office commences. In any event, the term of office shall end after six years at the latest.
3.In derogation of paragraphs 1 and 2, the following provisions shall apply for the first Supervisory Board with regard to the employees‘ representatives, as provided in the Agreement on Employee Involvement: The first employees‘ representatives on the first Supervisory Board have been appointed under the Agreement on Employee Involvement.
7
Their term of office shall end at the close of the 2015 annual General Meeting of Shareholders. The term of office of the succeeding employees‘ representatives on the first Supervisory Board of SAP SE appointed subsequent to this term of office shall end at the same time as the term of office of the shareholders‘ representatives on the first Supervisory Board. Paragraph 2 shall thereupon also apply to the term of office of the employees‘ representatives on the Supervisory Board.
4.The members and substitute members of the Supervisory Board may resign from office by submitting a written statement addressed to the chairperson of the Supervisory Board or to the Executive Board observing a period of notice of four weeks. Resignation from office for cause (aus wichtigem Grund) with immediate effect is permitted.
5.Unless a shorter term of office is determined within the limits of paragraph (2), successors for resigning shareholders’ representatives who are not replaced by substitute members will be elected for the remaining term of office of the resigning individual. This shall apply mutatis mutandis to the appointment of any successors for resigning employees' representatives who are not replaced by substitute members in accordance with the Agreement on Employee Involvement.
Section 11
Duties and Responsibilities of the Supervisory Board
1. |
The Supervisory Board shall have all of the duties and rights that are conferred upon it by law, the Articles of Incorporation, or otherwise. Both the Executive and Supervisory Boards shall be entitled to call a General Meeting of Share-holders. |
2. |
The Supervisory Board shall be authorized to amend the Articles of Incorporation where such amendments only concern the wording. |
3. |
The Supervisory Board shall be entitled at any time to supervise all manage-ment activities of the Executive Board and to this end to inspect and examine all books and records as well as the assets of the Company. |
4. |
The Executive Board shall report to the Supervisory Board continuously at least to the extent stipulated by law. |
5. |
The Supervisory Board may set up committees from among its members and, to the extent permitted by law, may delegate decision-making powers to them. |
6. |
The following transactions are subject to the prior approval of the Supervisory Board: |
- |
adoption of the group annual plan, which shall comprise at least the budget, the investment plan, and the liquidity planning; |
8
- |
investments in tangible fixed assets or intangible fixed assets which are either not included in the investment plan for the fiscal year and which, alone or when aggregated with other investments likewise not included, have an anticipated total volume of more than 10% of the last investment plan or which are included in the investment plan but whose volume determined in the investment plan is exceeded to such an extent that the excess amount, together with corresponding amounts of other investments exceeding the plan of the same fiscal year, if any, amounts to more than 10% of the total volume of the last investment plan; |
- |
acquisition and sale of enterprises and interests therein or parts thereof if the (anticipated) acquisition or sales price in an individual case exceeds 0.6% of the balance sheet total of the last group balance sheet approved by the Supervisory Board; this shall not apply to any acquisition or sale within the group; |
- |
incurring financial liabilities vis-à-vis companies which are not members of the group if either the volume of the individual financial liability exceeds 1.0% of the balance sheet total of the last group balance sheet approved by the Supervisory Board or if, as a result of incurring such liability, the group total of all financial liabilities incurred without the approval of the Supervisory Board and not yet repaid exceeds 3.0% of the balance sheet total of the last group balance sheet approved by the Supervisory Board; |
- |
concluding and amending any agreements which under applicable law or the Articles of Incorporation require the approval of the General Meeting of Shareholders. |
If permitted by law, the Supervisory Board may delegate the approval compe-tence for the above-mentioned transactions to a committee generally or in indi-vidual cases. The Supervisory Board may determine additional types of transac-tions which the Executive Board may only perform with the Supervisory Board‘s approval.
Section 12
Declarations of Intent of the Supervisory Board
1.Declarations of intent of the Supervisory Board and its committees shall be given on behalf of the Supervisory Board by the chairperson or – should he or she be unable to do so – by the deputy chairperson.
2.The chairperson of the Supervisory Board or his or her deputy shall be the permanent representative of the Supervisory Board vis-à-vis third parties, especially vis-à-vis courts and authorities as well as the Executive Board.
9
Section 13
Chairperson and Deputy Chairperson
1.Following a General Meeting of Shareholders at which all members of the Super-visory Board to be elected by the General Meeting of Shareholders have been newly appointed, a meeting of the Supervisory Board shall take place, which shall be held without special invitation. At this meeting the Supervisory Board shall elect a chairperson and one or two deputy chairperson(s) from among its members for the term of its office. When electing the chairperson of the Super-visory Board, the oldest member in terms of age of the shareholders‘ represen-tatives on the Supervisory Board will chair the meeting; Section 14 (6) sentence 3 shall apply mutatis mutandis.
2.Only a shareholders‘ representative may be elected as chairperson of the Super-visory Board.
3.If the chairperson is unable to discharge the duties of his or her office, the deputy chairperson shall do so in his or her place. This provision shall not affect Section 14 (6) sentence 4 and Section 20 (1).
4.If the chairperson or a deputy chairperson leaves the Supervisory Board before the end of his or her term of office, an election shall be held without delay to replace him or her.
Section 14
Calling of Meetings and Passing of Resolutions
1.The Supervisory Board shall adopt its own rules of procedure by a simple ma-jority vote. The following provisions apply to the calling of meetings, quorums, and resolutions. Supplementary provisions may be stipulated in the rules of procedure.
2.The chairperson shall call the Supervisory Board meetings in writing or text form, by letter, e-mail or facsimile message allowing a notice period of 14 days before the day of the meeting. The day on which the message calling the meeting is sent and the day of the meeting do not count toward the notice period. In urgent cases, the chairperson may shorten the notice period and also call the meeting orally or by telephone, or any other appropriate means of electronic transmission.
3.The meetings of the Supervisory Board and its committees shall as a rule be held with the members attending in person. The Supervisory Board may provide in its rules of procedure that the meetings of the Supervisory Board and its committees may also be held by video conference or that individual members of the Supervisory Board may attend the meeting by way of video transmission, subject to the proviso that in such cases, resolutions may also be adopted by video conference or by way of video transmission, respectively.
10
4.The Supervisory Board may provide in its rules of procedure for the permissibility of the adoption of resolutions of the Supervisory Board and its committees out-side of meetings by obtaining written or telephone votes or by voting by video conference or any other means of electronic communication (e.g. by e-mail or facsimile).
5.The members of the Executive Board may attend the meetings of the Supervi-sory Board, unless otherwise resolved in an individual case by the Supervisory Board or its chairperson.
6.Unless otherwise mandatorily prescribed by law or the Articles of Incorporation, the Supervisory Board is quorate if at least half of its members participate in passing the resolution. The resolutions of the Supervisory Board shall be adopted by a majority of the votes cast, unless otherwise mandatorily prescribed by law or the Articles of Incorporation. In the event of a tie, the vote of the chairperson and, in the event that the chairperson does not participate in passing the reso-lution, the vote of the deputy chairperson, provided that he or she is a share-holders‘ representative, shall be decisive (casting vote).
Section 15
Duty of Secrecy
1.The members of the Supervisory Board shall maintain secrecy in respect of any confidential information and secrets of the Company, notably business and trade secrets, that become known to them because of their membership of the Supervisory Board. Persons attending meetings of the Supervisory Board who are not members of the Supervisory Board shall be expressly enjoined to secrecy.
2.In the event that a member of the Supervisory Board intends to pass informa-tion on to a third party, he or she shall notify the Supervisory Board and the Executive Board of that intention in advance, naming the persons he or she wishes to inform. The Supervisory Board and the Executive Board must be given the opportunity to decide prior to the disclosure of information whether they consider such disclosure to violate paragraph 1 or not. The decision shall be delivered by the chairperson of the Supervisory Board and the chairperson or CEO of the Executive Board.
3.The members of the Supervisory Board shall continue to maintain secrecy as set forth in the foregoing paragraphs after they leave the Supervisory Board.
Section 16
Remuneration
1. |
Each member of the Supervisory Board shall receive an annual basic remune-ration of €165,000. The chairperson of the Supervisory Board shall receive an annual basic remuneration of €275,000 and each deputy chairperson shall receive €220,000. |
11
2.For membership of the audit committee, Supervisory Board members shall, in addition to their basic remuneration, receive an annual remuneration of €50,000, and for membership of another Supervisory Board committee €35,000, the chair-person of the audit committee shall receive an annual remuneration of €95,000, and the chairpersons of the other committees €50,000. If a deputy chairperson is appointed for a committee, his or her additional remuneration shall amount to €43,500 per year, and €72,500 per year for the audit committee. Any additional compensation for the chairmanship, any deputy chairmanship and membership of a committee pursuant to this paragraph 2 shall only accrue if the respective committee has met during the fiscal year.
3.If the Supervisory Board appoints a Lead Independent Director, the Lead Indepen-dent Director shall receive a compensation of €50,000 per year in addition to his or her basic compensation and in addition to his or her compensation for any memberships in committees.
4.Any members of the Supervisory Board having served for less than the entire fiscal year shall receive one twelfth of their respective compensation for each month of service commenced. The same shall apply with respect to the increased compen-sation for the chairperson and the deputy chairperson(s) pursuant to paragraph 1 sentence 2, to the compensation for the chairperson, any possible deputy chair-person, and the members of a committee pursuant to paragraph 2, and to the additional compensation for the Lead Independent Director pursuant to paragraph 3.
5.The remuneration shall be payable after the end of the fiscal year.
6.The remuneration shall be subject to the addition of any possible statutory value added tax.
7.The members of the Supervisory Board shall be included in a directors' and officers' (D&O) group liability insurance which provides for adequate cover and is maintained by the Company in its own interests, to the extent that such insurance is in place. The premiums for the insurance policy shall be paid by the Company.
The General Meeting of Shareholders
Section 17
Calling the General Meeting of Shareholders
1. |
The General Meeting of Shareholders shall be held at the registered office of the Company, at a location within a radius of 50 km from the registered office of the Company, or in a city in the Federal Republic of Germany where a German stock exchange is located. In the event that it is difficult to hold the General Meeting of Shareholders at these venues, the Executive Board or the Supervisory Board may call the meeting at a different venue. The invitation shall state the venue of the General Meeting of Shareholders. |
12
2.The Executive Board or the Supervisory Board shall call the General Meeting of Shareholders.
3.The General Meeting of Shareholders shall be called by publication of a single announcement in the German Federal Gazette (Bundesanzeiger), giving the information required by law, with a notice period of at least thirty days prior to the date of the General Meeting of Shareholders, which notice period is to be extended by the number of days of the application period pursuant to Section 18 (2); the day on which the General Meeting of Shareholders is held and the day on which it is called shall not be included in the calculation of the relevant period.
Section 18
Right to Attend the General Meeting of Shareholders
1.Shareholders are entitled to attend the General Meeting of Shareholders and to exercise their voting rights only if they have submitted an application prior to the General Meeting of Shareholders and furnished proof to the Company of their shareholding.
2.Application shall be made in text form in German or English and must be received by the Company at the address stated for such purpose in the calling notice no later than six days prior to the date of the General Meeting of Shareholders; the day on which the General Meeting of Shareholders is held and the day on which it is called shall not be included in the calculation of the relevant period. The calling notice may provide for a shorter period of time, which is to be specified as a number of days.
3.For proof of shareholding, proof in accordance with Section 67c (3) AktG shall be sufficient. The proof shall relate to the beginning of the 21st day prior to the General Meeting of Shareholders. Paragraph 2 shall apply mutatis mutandis to the proof.
4.The applicability of any other application or proof procedure available under mandatory law shall remain unaffected.
5.The Executive Board is authorized to provide that shareholders may participate in the General Meeting of Shareholders without being physically present at the venue of the General Meeting of Shareholders or being represented by a proxy and exercise all or certain of their rights in full or in part through electronic com-munication.
6.The Executive Board is authorized to provide that shareholders may vote in writing or through electronic communication (postal voting) without having to attend the General Meeting of Shareholders.
13
Section 19
Voting Rights
1.Each share carries one vote.
2.Voting rights may be exercised by proxy. The proxy authorization must be granted or revoked, and proof of the proxy authorization must be provided to the Com-pany, in the form prescribed by law. The calling notice may specify less strict requirements in this context. Such less strict requirements may be limited to the granting of proxy authorization to the proxies designated by the Company.
3.If no share certificates have been issued, the invitation to the General Meeting of Shareholders shall stipulate the provisions that have to be fulfilled by the share-holders in order to prove their voting rights.
Section 20
Chair of the General Meeting of Shareholders
Participation of Executive Board Members and Supervisory Board Members,
Video Transmission
1.The chairperson of the Supervisory Board shall preside over the General Meeting of Shareholders. If he or she is unable to do so, he or she shall deter-mine another member of the Supervisory Board to discharge this duty. If the chairperson is prevented from presiding over the meeting and has not determined another member to take his or her place, a member of the Super-visory Board elected by the shareholders‘ representatives on the Supervisory Board shall preside over the General Meeting of Shareholders.
2.The chairperson shall chair the proceedings and shall determine both the order of the agenda and the order and form of voting. The chairperson may also im-pose a reasonable time limit on the shareholders‘ right to ask questions and to speak; the chairperson may in particular reasonably determine a timeframe for the meeting, the discussions regarding the individual items on the agenda as well as for the individual questions and speaking contributions. The result of a vote may be determined by subtracting the affirmative votes or the negative votes and the abstentions from the total number of votes to which the voters are entitled.
3.The members of the Executive Board and Supervisory Board should take part in the General Meeting of Shareholders in person. If any member of the Super-visory Board is unable to attend the General Meeting of Shareholders in person because he or she has good reason to be abroad, it is possible for him or her to take part via video transmission.
4.The Executive Board is authorized to permit full or partial video or audio trans-mission of the General Meeting of Shareholders.
14
Section 20a
Virtual General Meeting of Shareholders
1.The Executive Board is authorized to determine that any or all General Meetings of Shareholders to be held on or before June 30, 2025, may be held as virtual General Meetings of Shareholders without the physical presence of the shareholders or their proxies at the place of the General Meeting.
2.The members of the Supervisory Board may also participate in a virtual General Meeting of Shareholders by means of video and audio transmission. This shall not apply to the chairperson of the General Meeting of Shareholders if he or she is a member of the Supervisory Board.
Section 21
Resolutions of the General Meeting of Shareholders
1.The resolutions of the General Meeting of Shareholders shall be adopted with a majority of valid votes cast, unless a larger majority is prescribed by law or the Articles of Incorporation.
2.A resolution of the General Meeting of Shareholders on an amendment of the Articles of Incorporation requires a majority of at least three quarters of valid votes cast. For any amendments of the Articles of Incorporation which require a simple majority for stock corporations established under German law, however, the simple majority of the valid votes cast shall suffice if at least half of the sub-scribed capital is represented or, in the absence of such quorum, the majority prescribed by law shall suffice.
Section 22
Record of the General Meeting of Shareholders
1.The proceedings at the General Meeting of Shareholders shall be recorded by notarial deed, and the record shall be signed by the notary public.
2.The record shall have full probative value for the shareholders, both with regard to their relationship inter se and in their relationship to their representatives.
3.The proxy documents need not be attached to the record.
15
IV. Annual Financial Statements and Appropriation of Retained Earnings
Section 23
Fiscal Year, Annual Report, Annual Financial Statements and Group Annual Financial Statements, Formal Approval of the Acts of the Executive and Supervisory Boards, Distribution of Retained Earnings
1.The fiscal year shall be the calendar year. The first fiscal year shall be the calen-dar year in which SAP SE is registered in the commercial register for the Com-pany.
2.In the first three months of each fiscal year, the Executive Board shall prepare the annual financial statements, the group annual financial statements, the management report, and the group management report for the previous fiscal year and submit them to the Supervisory Board and to the auditor. At that time the Executive Board shall submit to the Supervisory Board the proposal it wishes to make to the Annual General Meeting of Shareholders concerning the appro-priation of retained earnings. These provisions do not affect Sections 298 (3) and 315 (3) HGB.
3.The annual financial statements, the group annual financial statements, the management report, the group management report, the Supervisory Board’s report pursuant to Section 171 (2) AktG, and the Executive Board‘s proposal for the appropriation of the retained earnings shall be available for the sharehold-ers‘ inspection at the offices of the Company from the time when the Annual General Meeting of Shareholders is called. The obligations under the foregoing sentence shall not apply if the specified documents are made available on the Company’s website for the same period of time.
4.Each year, after receiving the Supervisory Board’s report pursuant to Section 171 (2) AktG, the Annual General Meeting of Shareholders shall resolve within the first six months of the fiscal year on the formal approval of the acts of the Executive and Supervisory Boards, the appropriation of the retained earnings, the appointment of the auditor, and in the cases provided for by law, the adop-tion of the annual financial statements, and approval of the group annual finan-cial statements.
5.When approving the annual financial statements, the Executive and Supervisory Boards shall be authorized to transfer to revenue reserves either all or part of the annual net income remaining after deduction of amounts to be transferred to the legal reserves and of any accumulated losses carried forward. The Execu-tive and Supervisory Boards may not transfer more than one half of the annual net income if, after such transfer, the other revenue reserves would exceed one half of the capital stock.
6.Instead of distributing a cash dividend, the General Meeting of Shareholders can resolve to appropriate retained earnings by way of distribution in kind.
16
V. Final Provisions
Section 24
Formation Costs
1.The Company shall bear all costs connected with its formation and conversion to a stock corporation, estimated to be DM 250,000.00.
2.The Company shall bear all costs connected with the formation of SAP SE by way of the conversion of SAP AG to a European Company (SE) in the amount of up to €4 million.
– End of Articles of Incorporation – I, Christian Klein, certify that:

SAP SE
Dietmar-Hopp-Allee 16
69190 Walldorf
Germany
17
Exhibit 12.1
CERTIFICATION
1.I have reviewed this annual report on Form 20-F of SAP SE;
2. |
Based on my knowledge, this report does not contain any untrue statement of a material fact or omit to state a material fact necessary to make the statements made, in light of the circumstances under which such statements were made, not misleading with respect to the period covered by this report; |
3. |
Based on my knowledge, the financial statements, and other financial information included in this report, fairly present in all material respects the financial condition, results of operations and cash flows of the company as of, and for, the periods presented in this report; |
4. |
The company’s other certifying officers and I are responsible for establishing and maintaining disclosure controls and procedures (as defined in Exchange Act Rules 13a-15(e) and 15d-15(e)) and internal control over financial reporting (as defined in Exchange Act Rules 13a-15(f) and 15d-15(f)) for the company and have: |
a) |
Designed such disclosure controls and procedures, or caused such disclosure controls and procedures to be designed under our supervision, to ensure that material information relating to the company, including its consolidated subsidiaries, is made known to us by others within those entities, particularly during the period in which this report is being prepared; |
b) |
Designed such internal control over financial reporting, or caused such internal control over financial reporting to be designed under our supervision, to provide reasonable assurance regarding the reliability of financial reporting and the preparation of financial statements for external purposes in accordance with generally accepted accounting principles; |
c) |
Evaluated the effectiveness of the company’s disclosure controls and procedures and presented in this report our conclusions about the effectiveness of the disclosure controls and procedures, as of the end of the period covered by this report based on such evaluation; and |
d) |
Disclosed in this report any change in the company’s internal control over financial reporting that occurred during the period covered by the annual report that has materially affected, or is reasonably likely to materially affect, the company’s internal control over financial reporting; and |
5. |
The company’s other certifying officers and I have disclosed, based on our most recent evaluation of internal control over financial reporting, to the company’s auditors and the audit committee of the company’s board of directors (or persons performing the equivalent functions): |
a) |
All significant deficiencies and material weaknesses in the design or operation of internal control over financial reporting which are reasonably likely to adversely affect the company’s ability to record, process, summarize and report financial information; and |
b) |
Any fraud, whether or not material, that involves management or other employees who have a significant role in the company’s internal control over financial reporting. |
Date: February 29, 2024 |
|
|
/s/ Christian Klein |
|
|
|
|
Name: |
Christian Klein |
|
|
|
Title: |
Chief Executive Officer |
Exhibit 12.2
CERTIFICATION
I, Dominik Asam, certify that:
1.I have reviewed this annual report on Form 20-F of SAP SE;
2. |
Based on my knowledge, this report does not contain any untrue statement of a material fact or omit to state a material fact necessary to make the statements made, in light of the circumstances under which such statements were made, not misleading with respect to the period covered by this report; |
3. |
Based on my knowledge, the financial statements, and other financial information included in this report, fairly present in all material respects the financial condition, results of operations and cash flows of the company as of, and for, the periods presented in this report; |
4. |
The company’s other certifying officers and I are responsible for establishing and maintaining disclosure controls and procedures (as defined in Exchange Act Rules 13a-15(e) and 15d-15(e)) and internal control over financial reporting (as defined in Exchange Act Rules 13a-15(f) and 15d-15(f)) for the company and have: |
a) |
Designed such disclosure controls and procedures, or caused such disclosure controls and procedures to be designed under our supervision, to ensure that material information relating to the company, including its consolidated subsidiaries, is made known to us by others within those entities, particularly during the period in which this report is being prepared; |
b) |
Designed such internal control over financial reporting, or caused such internal control over financial reporting to be designed under our supervision, to provide reasonable assurance regarding the reliability of financial reporting and the preparation of financial statements for external purposes in accordance with generally accepted accounting principles; |
c) |
Evaluated the effectiveness of the company’s disclosure controls and procedures and presented in this report our conclusions about the effectiveness of the disclosure controls and procedures, as of the end of the period covered by this report based on such evaluation; and |
d) |
Disclosed in this report any change in the company’s internal control over financial reporting that occurred during the period covered by the annual report that has materially affected, or is reasonably likely to materially affect, the company’s internal control over financial reporting; and |
5. |
The company’s other certifying officers and I have disclosed, based on our most recent evaluation of internal control over financial reporting, to the company’s auditors and the audit committee of the company’s board of directors (or persons performing the equivalent functions): |
a) |
All significant deficiencies and material weaknesses in the design or operation of internal control over financial reporting which are reasonably likely to adversely affect the company’s ability to record, process, summarize and report financial information; and |
b) |
Any fraud, whether or not material, that involves management or other employees who have a significant role in the company’s internal control over financial reporting. |
Date: February 29, 2024 |
|
|
/s/ Dominik Asam |
|
|
|
|
Name: |
Dominik Asam |
|
|
|
Title: |
Chief Financial Officer |
Exhibit 13.1
CERTIFICATION OF CHRISTIAN KLEIN, CHIEF EXECUTIVE OFFICER OF SAP SE
PURSUANT TO 18 U.S.C. SECTION 1350, AS ADOPTED PURSUANT TO SECTION 906
OF THE SARBANES-OXLEY ACT OF 2002
In connection with the Annual Report of SAP SE (the “Company”) on Form 20-F for the period ending December 31, 2023, as filed with the Securities and Exchange Commission on February 29, 2024 (the “Report”), the undersigned hereby certifies that, to his knowledge:
1. |
The Report fully complies with the requirements of Section 13(a) or 15(d) of the Securities Exchange Act of 1934; and |
2. |
The information contained in the Report fairly presents in all material respects the financial condition and results of operations of the Company. |
Date February 29, 2024 |
/s/ Christian Klein |
|
|
Name: |
Christian Klein |
|
Title: |
Chief Executive Officer |
The foregoing certification is being furnished solely pursuant to 18 U.S.C. § 1350 and is not being filed as part of the Report or as a separate disclosure document.
Exhibit 13.2
CERTIFICATION OF DOMINIK ASAM, CHIEF FINANCIAL OFFICER OF SAP SE PURSUANT TO 18
U.S.C. SECTION 1350, AS ADOPTED PURSUANT TO SECTION 906
OF THE SARBANES-OXLEY ACT OF 2002
In connection with the Annual Report of SAP SE (the “Company”) on Form 20-F for the period ending December 31, 2023, as filed with the Securities and Exchange Commission on February 29, 2024 (the “Report”), the undersigned hereby certifies that, to his knowledge:
1. |
The Report fully complies with the requirements of Section 13(a) or 15(d) of the Securities Exchange Act of 1934; and |
2. |
The information contained in the Report fairly presents in all material respects the financial condition and results of operations of the Company. |
Date February 29, 2024 |
|
/s/ Dominik Asam |
|
Name: |
Dominik Asam |
|
Title: |
Chief Financial Officer |
The foregoing certification is being furnished solely pursuant to 18 U.S.C. § 1350 and is not being filed as part of the Report or as a separate disclosure document.
Exhibit 15
Consent of Independent Registered Public Accounting Firm
We hereby consent to the incorporation by reference in the Registration Statements on Form S-8 (No. 333-263468, No. 333-213436, and No. 333-252295) of SAP SE (the Company) of our reports dated February 21, 2024, relating to the consolidated financial statements, and the effectiveness of the Company’s internal control over financial reporting, which appear in this Annual Report on Form 20-F.
/s/ BDO AG Wirtschaftsprüfungsgesellschaft
Frankfurt am Main, Germany
February 29, 2024
Exhibit 15.1
Consent of Independent Registered Public Accounting Firm
We consent to the incorporation by reference in the registration statements (Nos. 333-263468, 333-213436, and 333-252295) on Form S-8 of our report dated February 22, 2023, except for retrospective adjustments to present the Qualtrics disposal group as discontinued operations as described in Note D.1 and the changes resulting from the Updated Cost Allocation Policy described in Note IN.1, with respect to the consolidated financial statements of SAP SE.
/s/ KPMG AG Wirtschaftsprüfungsgesellschaft
Mannheim, Germany
February 29, 2024
Exhibit 97
SAP CLAWBACK POLICY
A. |
Introduction |
SAP SE is listed on the New York Stock Exchange (“NYSE") as a foreign private issuer and organized in the Federal Republic of Germany under German and European law. SAP SE is a European Company (Societas Europaea, or "SE") with a two-tier board system. It is governed by three separate bodies: the Supervisory Board, the Executive Board and the Annual General Meeting of Shareholders.
The Supervisory Board appoints and removes the members of the Executive Board and oversees and advises the management of the corporation. The Supervisory Board is also responsible for representing SAP SE in transactions between SAP SE and Executive Board members. This includes the conclusion of the service agreements between SAP SE and the Executive Board members and all aspects regarding the remuneration of the Executive Board members. The Executive Board manages SAP SE’s business, is responsible for preparing its strategy and represents it in dealings with third parties, including with SAP SE’s employees.
The Supervisory Board and the Executive Board have adopted this policy which provides for the recoupment of certain executive compensation in the event of an accounting restatement resulting from material noncompliance with financial reporting requirements under U.S. federal securities laws (the "Policy"). This Policy is designed to comply with Section 10D of the Securities Exchange Act of 1934 (the "Exchange Act") and applicable NYSE Listing Standards.
B. |
Policy Adoption |
In compliance with the two-tier board system described above, this Policy has been adopted by the Supervisory Board with regard to the recoupment of incentive-based compensation from current and former Executive Board members and by the Executive Board with regard to the recoupment of incentive-based compensation from certain current and former other executives, in each case, that are Covered Executives (as defined below).
C. |
Administration |
This Policy shall be administered by the Supervisory Board with regard current and former Executive Board members and the Executive Board with regard to other executives, in each case, that are Covered Executives (as defined below). Any determinations made by the Supervisory Board and/or the Executive Board, respectively, shall be final and binding on all affected individuals.
D. |
Covered Executives |
This Policy applies to:
| ● | SAP SE's current and former Executive Board members; |
| ● | SAP SE’s current and former executive officers other than the current and former Executive Board members, as determined by the Executive Board in accordance with Section 10D of the Exchange Act and the listing standards of the national securities exchange on which SAP SE's securities are listed; and |
| ● | such other current and former senior executives/employees who may from time to time be deemed subject to the Policy by the Executive Board |
(collectively the "Covered Executives").
2
E. |
Recoupment; Accounting Restatement |
In the event SAP SE is required to prepare an accounting restatement of its financial statements due to SAP SE's material noncompliance with any financial reporting requirement under the U.S. federal securities laws, the Supervisory Board or the Executive Board, respectively, will require reimbursement or forfeiture of any excess Incentive Compensation received by any Covered Executive during the three completed fiscal years immediately preceding the date on which SAP SE is required to prepare an accounting restatement.
F. |
Incentive Compensation |
For purposes of this Policy, Incentive Compensation means any of the following; provided that, such compensation is granted, earned, or vested based wholly or in part on the attainment of a financial reporting measure, including but not limited to:
| - | Annual bonuses and other short- and long-term cash incentives; |
| - | Stock options; |
| - | Stock appreciation rights; |
| - | Restricted stock; |
| - | Restricted stock units; |
| - | Performance shares; and |
| - | Performance units. |
For purposes of this Policy, financial reporting measures include but are not limited to:
| - | Operating margin increase; |
| - | Cloud and software revenue growth; |
| - | Cloud revenue; |
| - | Operating profit; |
| - | Software licenses & support and service revenue; and |
| - | TSR performance. |
G. |
Excess Incentive Compensation: Amount Subject to Recovery |
The amount to be recovered will be the excess of the Incentive Compensation paid to the Covered Executive based on the erroneous data over the Incentive Compensation that would have been paid to the Covered Executive had it been based on the restated results, as determined by the Supervisory Board or the Executive Board, respectively.
If the Supervisory Board or the Executive Board, respectively, cannot determine the amount of excess Incentive Compensation received by the Covered Executive directly from the information in the accounting restatement, then it will make its determination based on a reasonable estimate of the effect of the accounting restatement.
3
H. |
Method of Recoupment |
The Supervisory Board or the Executive Board, respectively, will determine, in its sole discretion, the method for recouping Incentive Compensation hereunder which may include, without limitation:
a) |
requiring reimbursement of cash Incentive Compensation previously paid; |
b) |
seeking recovery of any gain realized on the vesting, exercise, settlement, sale, transfer, or other disposition of any equity-based awards; |
c) |
offsetting the recouped amount from any compensation otherwise owed by SAP SE to the Covered Executive; |
d) |
cancelling outstanding vested or unvested equity awards; and/or |
e) |
taking any other remedial and recovery action permitted by law, as determined by the Supervisory Board or the Executive Board, respectively. |
I. |
No Indemnification |
SAP SE shall not indemnify any Covered Executives against the loss of any incorrectly awarded Incentive Compensation.
J. |
Interpretation |
The Supervisory Board or the Executive Board, respectively, is authorized to interpret and construe this Policy and to make all determinations necessary, appropriate, or advisable for the administration of this Policy. It is intended that this Policy be interpreted in a manner that is consistent with the requirements of Section 10D of the Exchange Act and any applicable rules or standards adopted by the Securities and Exchange Commission or any national securities exchange on which SAP SE's securities are listed.
K. |
Effective Date |
This Policy shall be effective as of October 2, 2023 (the "Effective Date") and shall apply to Incentive Compensation that is approved, awarded or granted to Covered Executives on or after that date.
L. |
Amendment; Termination |
The Supervisory Board and the Executive Board may amend this Policy from time to time in their discretion and shall amend this Policy as they deem necessary to reflect and comply with rules, guidance, regulations adopted by the Securities and Exchange Commission under Section 10D of the Exchange Act and to comply with any rules, guidance, or listing standards adopted by a national securities exchange on which SAP SE's securities are listed. The Supervisory Board and the Executive Board may terminate this Policy at any time.
M. |
Other Recoupment Rights |
The Supervisory Board and the Executive Board intend that this Policy will be applied to the fullest extent of the law. The Supervisory Board and the Executive Board may require that any employment agreement, service agreement, equity award agreement, or similar agreement entered into on or after the Effective Date shall, as a condition to the grant of any benefit thereunder, require a Covered Executive to agree to abide by the terms of this Policy.
4
Any right of recoupment under this Policy is in addition to, and not in lieu of, any other remedies or rights of recoupment that may be available to SAP SE pursuant to the terms of any similar policy in any employment agreement, service agreement, equity award agreement, or similar agreement and any other legal remedies available to SAP SE.
N. |
Impracticability |
The Supervisory Board or the Executive Board, respectively, shall recover any excess Incentive Compensation in accordance with this Policy, unless such recovery would be impracticable, as determined by the Supervisory Board or the Executive Board, respectively, in accordance with Rule 10D-1 of the Exchange Act and the listing standards of the national securities exchange on which SAP SE's securities are listed. Such determination shall be made after a reasonable and documented attempt to recover the Incentive-Based Compensation, which documentation shall be provided to any national securities exchange on which SAP SE's securities are listed.
O. |
Successors |
This Policy shall be binding and enforceable against all Covered Executives and their beneficiaries, heirs, executors, administrators or other legal representatives.