UNITED STATES
SECURITIES AND EXCHANGE COMMISSION
Washington, DC 20549
FORM 6-K
REPORT OF FOREIGN PRIVATE ISSUER
PURSUANT TO RULE 13a-16 OR 15d-16
UNDER THE SECURITIES EXCHANGE ACT OF 1934
For the month of February, 2024.
Commission File Number 001-38755
Suzano S.A.
(Exact name of registrant as specified in its charter)
SUZANO INC.
(Translation of Registrant’s Name into English)
Av. Professor Magalhaes Neto, 1,752
10th Floor, Rooms 1010 and 1011
Salvador, Brazil 41 810-012
(Address of principal executive office)
Indicate by check mark whether the registrant files or will file annual reports under cover of Form 20-F or Form 40-F.
Form 20-F x Form 40-F ¨
Indicate by check mark if the registrant is submitting the Form 6-K in paper as permitted by Regulation S-T Rule 101(b)(1): ¨
Indicate by check mark if the registrant is submitting the Form 6-K in paper as permitted by Regulation S-T Rule 101(b)(7): ¨
Enclosures:
Exhibit 99.1 – Earnings Release for Fourth Quarter 2023.
|
|
SIGNATURE
Pursuant to the requirements of the Securities Exchange Act of 1934, the registrant has duly caused this report to be signed on its behalf by the undersigned, thereunto duly authorized.
Date: February 28, 2024
| SUZANO S.A. | ||
| By: | /s/ Marcelo Feriozzi Bacci | |
| Name: | Marcelo Feriozzi Bacci | |
| Title: | Chief Financial and Investor Relations Officer |
Exhibit 99.1

Cash cost is the lowest since 4Q21
Year 2023 marked by progress “on time and on budget” in the Cerrado Project
São Paulo, February 28, 2024. Suzano S.A. (B3: SUZB3 | NYSE: SUZ), one of the world’s largest integrated pulp and paper producers, announces today its consolidated results for the fourth quarter of 2023 (4Q23).
HIGHLIGHTS
| · | Pulp sales of 2,761 thousand tons (stable vs. 4Q22). |
| · | Paper sales3 of 386 thousand tons (14% vs. 4Q22). |
| · | Adjusted EBITDA1 and Operating cash generation2: R$4.5 billion and R$2.8 billion, respectively. |
| · | Adjusted EBITDA1/ton of pulp of R$1,360/ton (-48% vs. 4Q22). |
| · | Adjusted EBITDA1/ton3 of paper of R$1,936/ton (-27% vs. 4Q22). |
| · | Net average pulp price in export market: US$572/ton (-31% vs. 4Q22). |
| · | Average net paper price3 of R$6,732/ton (-5% vs. 4Q22). |
| · | Pulp cash cost ex-downtime of R$816/ton (-13% vs. 4Q22). |
| · | Leverage of 3.1 times in USD and 3.0 times in BRL. |
| · | Cerrado Project completes 86% of physical progress and 78% of financial progress. |
| Financial Data (R$ million) | 4Q23 | 3Q23 | ΔQ-o-Q | 4Q22 | ΔY-o-Y | 2023 | 2022 | ΔY-o-Y | ||||||||||||||||||||||||
| Net Revenue | 10,372 | 8,948 | 16 | % | 14,370 | -28 | % | 39,756 | 49,831 | -20 | % | |||||||||||||||||||||
| Adjusted EBITDA2 | 4,505 | 3,695 | 22 | % | 8,175 | -45 | % | 18,273 | 28,195 | -35 | % | |||||||||||||||||||||
| Adjusted EBITDA Margin2 | 43 | % | 41 | % | 2 p.p. | 57 | % | -13 p.p. | 46 | % | 57 | % | -11 p.p. | |||||||||||||||||||
| Net Financial Result | 2,269 | (3,494 | ) | - | 2,000 | 13 | % | 5,781 | 6,433 | -10 | % | |||||||||||||||||||||
| Net Income | 4,515 | (729 | ) | - | 7,459 | -39 | % | 14,106 | 23,395 | -40 | % | |||||||||||||||||||||
| Operating Cash Generation3 | 2,779 | 1,896 | 47 | % | 6,463 | -57 | % | 11,566 | 22,563 | -49 | % | |||||||||||||||||||||
| Net Debt/ Adjusted EBITDA2 (x) (R$) | 3.0 x | 2.6 x | 0.4 x | 2.0 x | 1.0 x | 3.0 x | 2.0 x | 1.0 x | ||||||||||||||||||||||||
| Net Debt/ Adjusted EBITDA2 (x) (US$) | 3.1 x | 2.7 x | 0.4 x | 2.0 x | 1.1 x | 3.1 x | 2.0 x | 1.1 x |
| Operational Data ('000 tons) | 4Q23 | 3Q23 | ΔQ-o-Q | 4Q22 | ΔY-o-Y | 2023 | 2022 | ΔY-o-Y | ||||||||||||||||||||||||
| Sales | 3,148 | 2,817 | 12 | % | 3,097 | 2 | % | 11,507 | 11,906 | -3 | % | |||||||||||||||||||||
| Pulp | 2,761 | 2,486 | 11 | % | 2,759 | 0 | % | 10,215 | 10,600 | -4 | % | |||||||||||||||||||||
| Paper1 | 386 | 331 | 17 | % | 338 | 14 | % | 1,291 | 1,306 | -1 | % |
1Excludes non-recurring items. | 2Considers Adjusted EBITDA less sustaining capex (cash basis) | 3Considers the results of the Consumer Goods Unit (tissue).


The consolidated quarterly information has been prepared in accordance with the Securities and Exchange Commission (CVM) and Accounting Standards Committee (CPC) standards and is in compliance with International Accounting Standard (IFRS) issued by the International Accounting Standard Board (IASB). The data contained in this document was obtained from the financial information as made available to the CVM. The operating and financial information is presented based on consolidated numbers in Reais (R$). Summaries may diverge due to rounding.
| CONTENTS | |||
| EXECUTIVE SUMMARY | 3 | ||
| PULP BUSINESS PERFORMANCE | 3 | ||
| PULP SALES VOLUME AND REVENUE | 3 | ||
| PULP CASH COST | 5 | ||
| PULP SEGMENT EBITDA | 8 | ||
| OPERATING CASH FLOW FROM THE PULP SEGMENT | 9 | ||
| PAPER BUSINESS PERFORMANCE | 10 | ||
| PAPER SALES VOLUME AND REVENUE | 10 | ||
| PAPER SEGMENT EBITDA | 12 | ||
| OPERATING CASH FLOW FROM THE PAPER SEGMENT | 13 | ||
| FINANCIAL PERFORMANCE | 13 | ||
| NET REVENUE | 13 | ||
| CALENDAR OF SCHEDULED MAINTENANCE DOWNTIMES | 15 | ||
| COST OF GOODS SOLD (COGS) | 15 | ||
| SELLING EXPENSES | 16 | ||
| GENERAL AND ADMINISTRATIVE EXPENSES | 16 | ||
| ADJUSTED EBITDA | 17 | ||
| FINANCIAL RESULT | 17 | ||
| DERIVATIVE OPERATIONS | 18 | ||
| NET INCOME (LOSS) | 22 | ||
| DEBT | 23 | ||
| CAPEX | 25 | ||
| CERRADO PROJECT | 26 | ||
| OPERATING CASH GENERATION | 26 | ||
| FREE CASH FLOW | 27 | ||
| EVOLUTION OF NET DEBT | 27 | ||
| ESG | 28 | ||
| TOTAL OPERATIONAL EXPENDITURE - PULP | 28 | ||
| CAPITAL MARKETS | 28 | ||
| FIXED INCOME | 30 | ||
| RATINGS | 30 | ||
| UPCOMING EVENTS | 30 | ||
| APPENDICES | 32 | ||
| APPENDIX 1 – Operating Data | 32 | ||
| APPENDIX 2 – Consolidated Statement of Income and Goodwill Amortization | 34 | ||
| APPENDIX 3 – Consolidated Balance Sheet | 35 | ||
| APPENDIX 4 – Consolidated Statement of Cash Flow | 36 | ||
| APPENDIX 5 – EBITDA | 37 | ||
| APPENDIX 6 – Segmented Income Statement | 38 | ||
| Forward-Looking Statements | 40 | ||
Page
EXECUTIVE SUMMARY
2023 was one more year when the Company continued to move ahead its strategy and, despite a challenging first semester marked by declining pulp prices, market sentiment improved significantly, especially in the second half of the year. The improvement in fundamentals sustained a sequence of price increases, which led to higher adjusted EBITDA in this segment in 4Q23. Cash production cost excluding scheduled maintenance downtimes decreased significantly between 4Q23 and 4Q22 (-13%), reaching its lowest level since 4Q21. EBITDA from the paper business unit once again exceeded R$3 billion in a year, also benefited from the effect of the acquisition of Kimberly Clark's tissue business in the second half of the year and remaining practically in line with the record set in 2022. As such, consolidated adjusted EBITDA came to R$18.3 billion in 2023, with the same indicator contributing with R$4.5 billion in 4Q23.
As for financial management, net debt in USD remained stable, in comparison to the previous quarter, at US$11.5 billion. Leverage in USD ended the year at 3.1 times, remaining fully within the Company's debt policy. The increase compared to 3Q23 occurred basically due to the decrease in Adjusted EBITDA in the last 12 months. The foreign exchange hedging policy continued to play its part, bringing in a positive cash inflow of R$1.2 billion in the quarter and a positive cash adjustment of R$3.6 billion in the year.
Continuing the advances made in its strategy, within the context of the “Being an important player in pulp through solid projects” and “Being the best in class in the total pulp cost vision” avenues, the physical progress of the Cerrado Project remains as expected, reaching 86%, while financial progress was 78%. The company expects the project to go operational by June 2024, as announced earlier. Still within the scope of these same avenues, the Company announced at the end of the year, in addition to the investments disclosed in the previous quarter, the acquisition of 70 thousand hectares of land in the state of Mato Grosso do Sul, in a region covered by Suzano's operations, of which 50 thousand hectares are useful hectares, partially covered by eucalyptus trees of different ages. The acquisition price was R$1,826 million, to be paid in cash on the transaction date (expected in 2024). The transaction is aligned with Suzano's strategy of creating optionality in its business and expand self-sufficiency in wood supply in the long term.
PULP BUSINESS PERFORMANCE
PULP SALES VOLUME AND REVENUE
The last quarter of 2023 was marked by the increase in hardwood pulp prices, driven by two main factors: the continuous demand for pulp from China, despite lower paper production volumes in relation to the previous quarter, and the recovery in the paper and paperboard market across Europe during the period.
Page
In China, production of sanitary paper and printing & writing paper declined slightly between the quarters. In the sanitary paper segment, production declined after the online sales festival in November, which is responsible for heavily boosting sales of finished products. However, production and exports increased across all paper segments compared to 2023, notably in the sanitary paper segment. Paperboard production increased in relation to the previous quarter, despite the scenario of oversupply in the segment. Average prices of cardboard and printing and writing paper increased in the quarter, while average prices of sanitary paper remained stable.
The European market showed signs of improvement in the quarter, with the increase in operating utilization rate of sanitary paper, paperboard, special paper and printing & writing paper plants compared to the previous quarter. The recovery scenario also affected positively the price and demand of hardwood pulp and the reduction in pulp inventories at ports. The U.S. market continued to register solid demand for sanitary paper.
The supply of chemical pulp (BCP) in the quarter was affected by unscheduled downtimes, mostly for market reasons, as well as downtimes due to restricted wood supply, especially in the northern hemisphere. Compared to 4Q22, unscheduled downtimes increased, impacting the supply of hardwood pulp more significantly than of softwood pulp. This restricted supply, despite lower than in the previous quarter, softened the impact caused by the startup of new capacities.
Average PIX/FOEX prices of hardwood pulp in the quarter increased 17% in China and 9% in Europe compared to 3Q23. The average price difference between softwood and hardwood fibers in the quarter was USD134/t in China and USD283/t in Europe, which tends to drive the consumption of hardwood pulp.
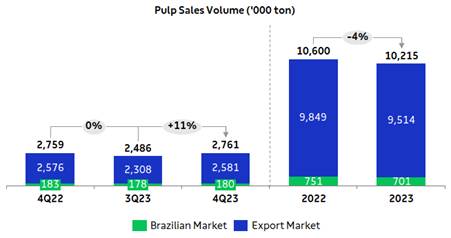
In this context, Suzano's pulp sales increased by 11% compared to the previous quarter, totaling 2,761 thousand tons and remained stable in relation to 4Q22. Sales performance in 2023 compared to 2022 was impacted by the company's decision to reduce its production volume for the year, as announced to the market in June 2023.
Page
Average net price in USD of pulp sold by Suzano in the period was US$568/t, increasing 4% from 3Q23 and declining 31% from 4Q22. In the export market, average net price charged by the Company was US$572/t, up 5% from 3Q23 and down 31% from 4Q22. Average net price in BRL was R$2,814/ton in 4Q23, up 6% from 3Q23, due to the better price scenario in China and Europe, and the increase in average USD versus average BRL (+2%). Compared to 4Q22, the 35% reduction was due to the lower average net price in USD during the period and the 6% decline in average USD versus average BRL.
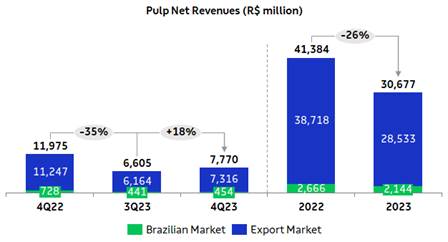
Net revenue from pulp increased 18% in the 4Q23 compared to 3Q23, due to: i) higher sales volume in the period (+11%); ii) higher average net price in USD (+4%); and iii) the increase in average USD versus average BRL (+2%). Compared to 4Q22, revenue decreased 35% due to lower average net price in USD (-31%) and the decline in average USD against average BRL (-6%).
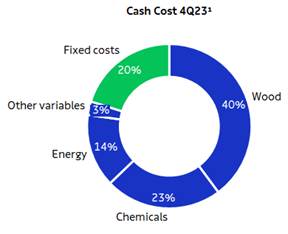
PULP CASH COST
Page
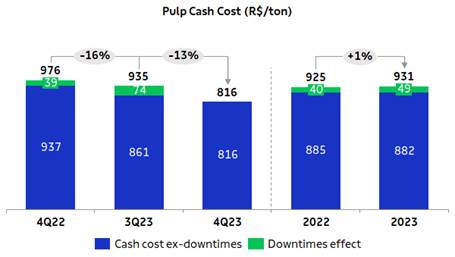
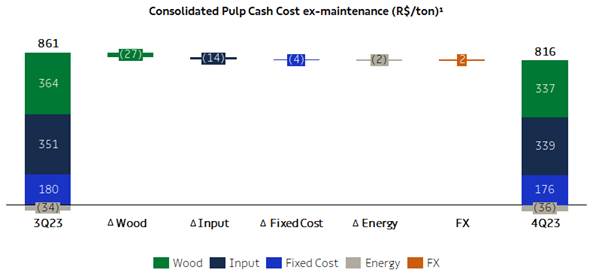
Cash cost excluding downtime in 4Q23 stood at R$816/t, decreasing 5% from 3Q23, due to: i) lower wood cost, mainly due to the reduction in average radius, lower specific consumption (better wood yield in mills) and the supply mix effect; ii) lower chemical prices (especially of caustic soda resulting from lower international prices – IHS); iii) lower consumption of inputs (mainly lime, clothing and natural gas), due to the greater operational efficiency of the mills and; iv) due to the higher dilution of fixed costs due to greater pulp production.
1 Excludes the impact of maintenance and administrative downtimes.
Page
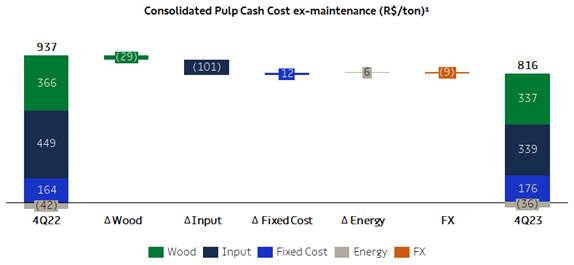
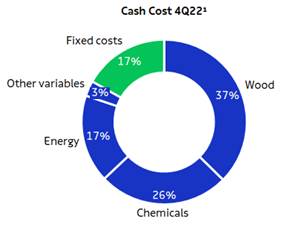
Cash cost excluding downtime in 4Q23 decreased 13% from 4Q22 due to: i) lower input prices, both in chemicals (mainly caustic soda) and energy (mainly natural gas), due to the drop in commodities; ii) the lower consumption of inputs (especially natural gas, chlorine dioxide and caustic soda), in turn due to the greater operational efficiency of the mills and the benefit provided by the greater energy efficiency project at the Jacareí mill; iii) the lower cost of wood, due to better price of diesel (a reflection of the fall in Brent), better performance of harvesting and logistics operations, smaller average radius in the period and lower specific consumption of wood. The positive factors in the cost of wood were partially offset by the greater price adjustments for services throughout 2023, mainly distributed in logistics and harvesting; and iv) the depreciation of the average USD against the BRL (-6%).
The positive effects on cash cost were partially offset by: i) higher fixed costs resulting from lower dilution on account of lower production volume and higher labor costs; ii) lower revenue from utilities due to lower export volume.
1 Excludes the impact of maintenance and administrative downtimes.
1 Excludes the impact of maintenance and administrative downtimes.
Page
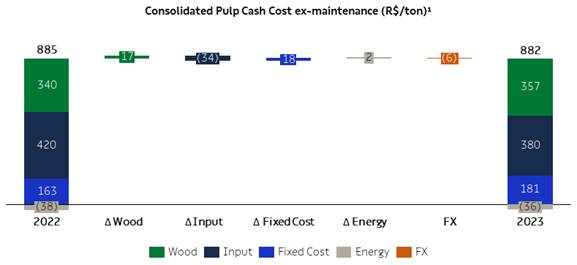
Cash cost excluding downtime in 2023 remained stable in relation to 2022, due to lower costs with inputs (especially Brent and caustic soda), and the devaluation of the average BRL against the USD (-3%), which was offset by higher wood and fixed costs.
 |
 |
1 Based on cash cost excluding downtimes. Excludes energy sales
PULP SEGMENT EBITDA
| Pulp Segment | 4Q23 | 3Q23 | ΔQ-o-Q | 4Q22 | ΔY-o-Y | 2023 | 2022 | ΔY-o-Y | ||||||||||||||||||||||||
| Adjusted EBITDA (R$ million)1 | 3,756 | 2,912 | 29 | % | 7,274 | -48 | % | 15,195 | 25,099 | -39 | % | |||||||||||||||||||||
| Sales volume (k ton) | 2,761 | 2,486 | 11 | % | 2,759 | 0 | % | 10,215 | 10,600 | -4 | % | |||||||||||||||||||||
| Pulp adjusted1 EBITDA (R$/ton) | 1,360 | 1,172 | 16 | % | 2,636 | -48 | % | 1,487 | 2,368 | -37 | % |
1 Excludes non-recurring items.
Adjusted EBITDA from pulp increased 29% from 3Q23 due to: i) higher sales volume (+11%); ii) the higher net pulp price in USD (+4%); iii) the lower cash COGS per ton, benefiting from the drop in the cash cost of production (inventory turnover effect) and the absence of scheduled maintenance stoppages; and iv) the appreciation of average USD against average BRL (+2%). The 16% increase in adjusted EBITDA per ton is explained by the same factors, except the volume effect.
Compared to 4Q22, the 48% decline in Adjusted EBITDA from pulp is due to the lower net average pulp price in USD (-31%) and the depreciation in average USD against average BRL (-6%), partially offset by the lower cost of production in the period. Adjusted EBITDA per ton fell 48% due to the same reasons.
1 Excludes non-recurring items.
Page
OPERATING CASH FLOW FROM THE PULP SEGMENT
| Pulp
Segment (R$ million) |
4Q23 | 3Q23 | ΔQ-o-Q | 4Q22 | ΔY-o-Y | 2023 | 2022 | ΔY-o-Y | ||||||||||||||||||||||||
| Adjusted EBITDA1 | 3,756 | 2,912 | 29 | % | 7,274 | -48 | % | 15,195 | 25,099 | -39 | % | |||||||||||||||||||||
| Maintenance Capex2 | (1,531 | ) | (1,612 | ) | -5 | % | (1,554 | ) | -2 | % | (6,028 | ) | (5,149 | ) | 17 | % | ||||||||||||||||
| Operating Cash Flow | 2,225 | 1,301 | 71 | % | 5,720 | -61 | % | 9,167 | 19,949 | -54 | % |
1 Excludes non-recurring items.
2 Cash basis.
Operating cash flow per ton in the pulp segment was 54% higher than in 3Q23, due to higher EBITDA per ton and lower sustaining capex per ton. Compared to 4Q22, the 61% reduction was due to lower EBITDA per ton.
Page
PAPER BUSINESS PERFORMANCE
The following data and analysis incorporate the joint results of the paper, packaging and consumer goods (tissue) businesses.
PAPER SALES VOLUME AND REVENUE
According to data published by Brazil's Forestry Industry Association (IBÁ), demand for printing & writing paper in 4Q23, including imports, fell 13% from the same period in 2022. In the year-to-date 2023 compared to the same period in 2022, the drop was 11%.
In the analysis of the year 2023 compared to 2022, the impact of lower domestic demand was concentrated in coated paper destined for the promotional segment, which was strongly affected by inventory adjustments across the chain and by continued changes in consumption patterns caused by digitalization, as well as the high comparison base in 2022.
As for uncoated paper lines, which account for the bulk of Suzano's sales volume, demand has been more resilient, and had a smaller reduction due to low exposure to changes in behavior due to digitalization, in addition to school and office paper (cutsize), whose seasonality is historically stronger in the second half of the year, as well as inventory adjustments throughout the year.
In the international markets, demand for printing & writing paper was affected mainly by inventory adjustments across the chain, and by macroeconomic uncertainties that restricted economic activity. Changes in consumption patterns, especially in mature markets in North America and Western Europe, where digitalization is in an advanced stage, also affected reduction. In Latin America (excluding Brazil), inventory adjustments also affected demand, though with lower impacts on uncoated paper segments.
Demand for paperboard in Brazil, Suzano’s flagship market for this product line, declined 8% in 4Q23 compared to 4Q22. Comparing the full year of 2023 with 2022, demand for paperboard in the domestic market remained stable, reflecting the inventory adjustments across the chain, especially in the second half of 2023, while demand for packaging remained stable during the year.
Consolidating the market segments mentioned above (paper market accessible to Suzano), total demand fell 11% in 4Q23 compared to 4Q22, while domestic demand decreased 8% in the full year of 2023 compared to 2022.
Despite the more challenging scenario, worth highlighting the expansion of markets served by our unique go-to-market model, and advancing in the strategy of winning new clients, ending 2023 with approximately 44 thousand active clients in the last twelve months. We also expanded the previously mentioned model with the opening of new operating DCs in Brazil and South America. Finally, we continue to move ahead with our digital transformation initiatives and invest in our portfolio of innovative products targeted at the packaging and single-use plastic replacement segments.
With the acquisition of Kimberly Clark's tissue business in Brazil, the consumer goods segment has accounted for a bigger share of the paper business results since 3Q23.
Suzano’s paper sales (printing & writing, paperboard and tissue) in the domestic market totaled 269 thousand tons in 4Q23, up 15% from the previous quarter, mainly due to the increase in printing & writing paper sales during a period of strong seasonality effects. Compared to 4Q22, paper sales increased 4%, reflecting above all the new volumes resulting from the acquisition of Kimberly Clark in Brazil and growth in printing & writing sales, following the performance of their respective markets.
International paper sales totaled 118 thousand tons, up 22% and 47%, respectively, from 3Q23 and 4Q22, corresponding to 30% of total sales volume in 4Q23. The higher volume of exports in comparison with both periods is due to the commercial strategy of allocating volumes between domestic and export markets.
Page


1 Includes the Consumer Goods Unit.
Average net price decreased 5% from the previous quarter and from 4Q22, mainly due to less favorable conditions in market for printing & writing paper and paperboard, despite the increase in tissue prices, addition to the effect of the acquisition of Kimberly Clark’s tissue business in Brazil.

Net revenue from paper sales amounted to R$2,602 million, up 11% and 9% from 3Q23 and 4T22, respectively, reflecting higher volume (+17% and +14%), partially offset by the 5% decrease in average net price.
Page

1 includes the consumer goods business.
PAPER SEGMENT EBITDA
| Paper Segment | 4Q23 | 3Q23 | ΔQ-o-Q | 4Q22 | ΔY-o-Y | 2023 | 2022 | ΔY-o-Y | ||||||||||||||||||
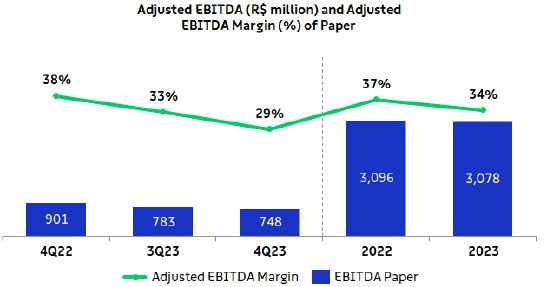
| Adjusted EBITDA (R$ million) 1 | 748 | 783 | -4 | % | 901 | -17 | % | 3,078 | 3,096 | -1 | % | |||||||||||||||
| Sales volume (k ton) | 386 | 331 | 17 | % | 338 | 14 | % | 1,291 | 1,306 | -1 | % | |||||||||||||||
| Paper adjusted1 EBITDA (R$/ton) | 1,936 | 2,366 | -18 | % | 2,664 | -27 | % | 2,384 | 2,371 | 1 | % |
1 Excludes non-recurring items.
Adjusted EBITDA from paper decreased 4% from 3Q23, mainly due to the lower average net price and the increase in administrative expenses, in turn caused by the increase in SG&A (regarding the adjustment of the variable remuneration provision) and the increase in other variable expenses resulting from higher sales. These effects were partially neutralized by higher sales volume. Adjusted EBITDA per ton decreased 18%, mainly due to the price effect and higher SG&A expenses.
Compared to 4Q22, despite volume growth, a 17% decrease was caused by lower average net price and higher SG&A expenses that was mainly affected by the booking of commercial and logistics expenses of acquisition of Kimberly Clark’s tissue business in Brazil). The decrease in adjusted EBITDA per ton is explained by the same factors.
Page

OPERATING CASH FLOW FROM THE PAPER SEGMENT
| Paper Segment (R$ million) |
4Q23 | 3Q23 | ΔQ-o-Q | 4Q22 | ΔY-o-Y | 2023 | 2022 | ΔY-o-Y | ||||||||||||||||||
| Adjusted EBITDA1 | 748 | 783 | -4 | % | 901 | -17 | % | 3,078 | 3,096 | -1 | % | |||||||||||||||
| Maintenance Capex2 | (195 | ) | (187 | ) | 4 | % | (158 | ) | 24 | % | (679 | ) | (483 | ) | 41 | % | ||||||||||
| Operating Cash Flow | 553 | 595 | -7 | % | 744 | -26 | % | 2,400 | 2,614 | -8 | % |
1 Excludes non-recurring items.
2 Cash basis.
Operating cash generation per ton in the paper segment was R$1,432/t in 4Q23, down 20% and 35%, respectively, from 3Q23 and 4Q22, due to lower EBITDA per ton and higher sustaining capex per ton.

FINANCIAL PERFORMANCE
NET REVENUE
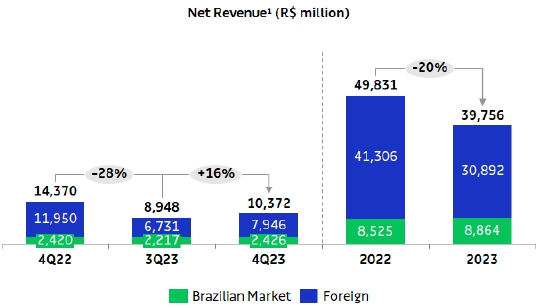
Suzano’s net revenue in 4Q23 was R$10,372 million, 77% of which came from exports (vs. 75% in 3Q23 and 83% in 4Q22). The 16% increase in relation to 3Q23 is due to: i) higher sales volume in the period (+12%); ii) the higher net average pulp price in USD (+4%); and iii) the increase in average USD versus average BRL (+2%). In relation to 4Q22, consolidated net revenue decreased 28%, mainly due to the lower net average pulp price in USD (-31%), lower net average paper price in USD in the export market (-35%) and the decline in average USD against average BRL (-6%).
Page
1 Does not include Portocel service revenue.
Page
CALENDAR OF SCHEDULED MAINTENANCE DOWNTIMES
| Mill – Pulp capacity | 2022 | 2023 | 2024 | |||||||||||||
| 1Q22 | 2Q22 | 3Q22 | 4Q22 | 1Q23 | 2Q23 | 3Q23 | 4Q23 | 1Q24 | 2Q24 | 3Q24 | 4Q24 | |||||
| Aracruz - Mill A (ES) – 590 kt | No downtime | |||||||||||||||
| Aracruz - Mill B (ES) – 830 kt | No downtime | |||||||||||||||
| Aracruz - Mill C (ES) – 920 kt | No downtime | |||||||||||||||
| Imperatriz (MA)1 – 1.650 kt | ||||||||||||||||
| Jacareí (SP) – 1.100 kt | ||||||||||||||||
| Limeira (SP)1 – 690 kt | ||||||||||||||||
| Mucuri - Mill 1 (BA)1 – 600 kt | No downtime | |||||||||||||||
| Mucuri - Mill 2 (BA) – 1.130 kt | No downtime | |||||||||||||||
| Suzano (SP)1 – 520 kt | No downtime | |||||||||||||||
| Três Lagoas - Mill 1 (MS) – 1.300 kt | No downtime | |||||||||||||||
| Três Lagoas - Mill 2 (MS) – 1.950 kt | No downtime | |||||||||||||||
| Veracel (BA)2 – 560 kt | No downtime | |||||||||||||||
1 Includes integrated capacities and fluff.
2 Veracel is a joint operation between Suzano (50%) and Stora Enso (50%) with total annual capacity of 1,120 thousand tons.
COST OF GOODS SOLD (COGS)
| COGS (R$ million) | 4Q23 | 3Q23 | ΔQ-o-Q | 4Q22 | ΔY-o-Y | 2023 | 2022 | ΔY-o-Y | |||||||||||||||
| COGS (Income statement) | 6,776 | 6,104 | 11 | % | 6,793 | 0 | % | 25,077 | 24,821 | 1 | % | ||||||||||||
| (-) Depreciation, depletion and amortization | 1,904 | 1,670 | 14 | % | 1,678 | 13 | % | 6,718 | 6,407 | 5 | % | ||||||||||||
| Cash COGS | 4,872 | 4,434 | 10 | % | 5,115 | -5 | % | 18,358 | 18,415 | 0 | % | ||||||||||||
| Sales volume | 3,148 | 2,817 | 12 | % | 3,097 | 2 | % | 11,507 | 11,906 | -3 | % | ||||||||||||
| Cash COGS/ton (R$/ton) | 1,548 | 1,574 | -2 | % | 1,651 | -6 | % | 1,595 | 1,547 | 3 | % |
Cash COGS in 4Q23 came to R$4,872 million, or R$1,548/ton. Compared to 3Q23, cash COGS increased 10%, chiefly due to higher sales volume of pulp and paper and higher logistics costs (higher costs with mill to port logistics and terminal), partially offset by the absence of scheduled maintenance downtimes and lower production costs ex-downtimes (as discussed previously). On a per-ton basis, the 2% reduction is explained by the lower cash cost of production and the absence of scheduled maintenance downtimes, partially offset by higher logistics costs.
Compared to 4Q22, cash COGS decreased 5%, chiefly due to lower production cost ex-downtimes, lower impact of scheduled maintenance downtimes (as discussed previously) and lower logistics costs (drop in Brent, lower expenses with international freight, in turn impacted by the cost factor and the effect of exchange rate appreciation, and lower costs with domestic terminals), but was partially offset by higher sales volume (especially paper, in turn due to new volumes resulting from the acquisition of Kimberly Clark in Brazil). On a per-ton basis, cash COGS decreased 6% year on year due to the same factors, except volume.
Page
SELLING EXPENSES
| Selling Expenses (R$ million) |
4Q23 | 3Q23 | ΔQ-o-Q | 4Q22 | ΔY-o-Y | 2023 | 2022 | ΔY-o-Y | |||||||||||||||||||
| Selling expenses (Income Statement) | 712 | 654 | 9 | % | 660 | 8 | % | 2,596 | 2,483 | 5 | % | ||||||||||||||||
| (-) Depreciation, depletion and amortization1 | 239 | 238 | 0 | % | 239 | 0 | % | 952 | 952 | 0 | % | ||||||||||||||||
| Cash selling expenses | 473 | 416 | 14 | % | 421 | 12 | % | 1,644 | 1,532 | 7 | % | ||||||||||||||||
| Sales volume | 3,148 | 2,817 | 12 | % | 3,097 | 2 | % | 11,507 | 11,906 | -3 | % | ||||||||||||||||
| Cash selling expenses/ton (R$/ton) | 150 | 148 | 2 | % | 136 | 10 | % | 143 | 129 | 11 | % | ||||||||||||||||
Cash selling expenses increased 14% from 3Q23, mainly due to higher sales volume and higher marketing and labor expenses due to higher effect of the incorporation of Kimberly Clark’s tissue assets in Brazil. Cash selling expenses per ton increased 2% due to the same factors, except volume.
In relation to 4Q22, the 12% increase in cash selling expenses is explained by higher sales volume and several expenses related to the acquisition of Kimberly Clark’s tissue assets in Brazil (marketing campaigns, personnel, auditing and consultancy, etc.). These effects were partially offset by lower logistics expenses, in turn due to lower inland offshore expenses and the positive effect of the appreciation of the average BRL vs. USD on expenses of similar nature. Cash selling expenses per ton increased 10%, due to the same factors mentioned above, except volume.
GENERAL AND ADMINISTRATIVE EXPENSES
| General
and Administrative Expenses (R$ million) |
4Q23 | 3Q23 | ΔQ-o-Q | 4Q22 | ΔY-o-Y | 2023 | 2022 | ΔY-o-Y | |||||||||||||||||||
| General and Administrative Expenses | 615 | 491 | 25 | % | 616 | 0 | % | 1,923 | 1,710 | 12 | % | ||||||||||||||||
| (-) Depreciation, depletion and amortization1 | 33 | 30 | 10 | % | 25 | 33 | % | 119 | 102 | 17 | % | ||||||||||||||||
| Cash general and administrative expenses | 582 | 461 | 26 | % | 591 | -2 | % | 1,804 | 1,608 | 12 | % | ||||||||||||||||
| Sales volume | 3,148 | 2,817 | 12 | % | 3,097 | 2 | % | 11,507 | 11,906 | -3 | % | ||||||||||||||||
| Cash general and administrative expenses/t (R$/ton) | 185 | 164 | 13 | % | 191 | -3 | % | 157 | 135 | 16 | % | ||||||||||||||||
Compared to 3Q23, the 26% increase in cash general and administrative expenses is mainly due to higher personnel expenses (mainly regarding the adjustment of variable compensation provision) and higher spending on third-party services. On a per-ton basis, these expenses increased 13% due to the same factors.
Compared to 4Q22, cash general and administrative expenses decreased 2% mainly due to lower expenses with variable compensation, partially offset by the booking of expenses with the acquisition of Kimberly Clark’s tissue business in Brazil and higher personnel expenses (salaries and benefits). On a per-ton basis, the 3% decrease is explained by the same factors.
Page
Other operating income (expenses) was an income of R$902 million in 4Q23, compared to an expense of R$10 million in 3Q23 and an income of R$981 million in 4Q22. The variation in relation to 3Q23 is mainly due to the updated fair value of biological assets (which happens in the second and fourth quarters of each year). Compared to 4Q22, the variation is mainly due to the lower impact of updated fair value of biological assets and lower results from sale and write-off of assets, partially offset by lower depreciation and amortization expenses.
ADJUSTED EBITDA
| Consolidated | 4Q23 | 3Q23 | ΔQ-o-Q | 4Q22 | ΔY-o-Y | 2023 | 2022 | ΔY-o-Y | |||||||||||||||||||||
| Adjusted EBITDA (R$ million)1 | 4,505 | 3,695 | 22 | % | 8,175 | -45 | % | 18,273 | 28,195 | -35 | % | ||||||||||||||||||
| Adjusted EBITDA1 Margin | 43 | % | 41 | % | 2 p.p. | 57 | % | -13 p.p. | 46 | % | 57 | % | -11 p.p. | ||||||||||||||||
| Sales Volume (k ton) | 3,148 | 2,817 | 12 | % | 3,097 | 2 | % | 11,507 | 11,906 | -3 | % | ||||||||||||||||||
| Adjusted EBITDA1/ton (R$/ton) | 1,431 | 1,312 | 9 | % | 2,639 | -46 | % | 1,588 | 2,368 | -33 | % |
1 Excludes non-recurring items.
The 22% increase in Adjusted EBITDA in 4Q23 versus 3Q23 is explained by: i) higher sales volume in the period (12%); ii) the higher net average pulp price in USD (+4%); iii) the lower cash COGS per ton, as already explained; and iv) the rise in average USD against average BRL (+2%). These factors were partially offset by higher SG&A expenses (+16%), especially higher administrative expenses resulting from the increase in personnel expenses (variable compensation), as explained earlier. Adjusted EBITDA per ton increased 9% due to the same factors explained above, excluding sales volume.
In relation to 4Q22, Adjusted EBITDA decreased 45% due to the lower average net pulp price in USD (-31%), the decline in average USD against average BRL (-6%) and higher SG&A expenses (+4%), mainly due to higher selling expenses, as explained earlier. These factors were partially offset by lower cash COGS per ton and higher sales volume (+2%). Adjusted EBITDA per ton decreased 46% due to the same factors, excluding sales volume.
FINANCIAL RESULT
| Financial Result (R$ million) |
4Q23 | 3Q23 | ΔQ-o-Q | 4Q22 | ΔY-o-Y | 2023 | 2022 | ΔY-o-Y | |||||||||||||||||||
| Financial Expenses | (1,175 | ) | (1,176 | ) | 0 | % | (1,190 | ) | -1 | % | (4,659 | ) | (4,590 | ) | 1 | % | |||||||||||
| Interest on loans and financing (local currency) | (376 | ) | (371 | ) | 1 | % | (338 | ) | 11 | % | (1,465 | ) | (1,352 | ) | 8 | % | |||||||||||
| Interest on loans and financing (foreign currency) | (884 | ) | (857 | ) | 3 | % | (768 | ) | 15 | % | (3,332 | ) | (2,656 | ) | 25 | % | |||||||||||
| Capitalized interest1 | 344 | 305 | 13 | % | 153 | 125 | % | 1,160 | 359 | 223 | % | ||||||||||||||||
| Other financial expenses | (259 | ) | (253 | ) | 3 | % | (238 | ) | 9 | % | (1,022 | ) | (942 | ) | 9 | % | |||||||||||
| Financial Income | 610 | 426 | 43 | % | 345 | 77 | % | 1,826 | 967 | 89 | % | ||||||||||||||||
| Interest on financial investments | 565 | 419 | 35 | % | 286 | 97 | % | 1,668 | 819 | 104 | % | ||||||||||||||||
| Other financial income | 45 | 6 | - | 59 | -24 | % | 157 | 148 | 6 | % | |||||||||||||||||
| Monetary and Exchange Variations | 1,343 | (1,880 | ) | - | 1,594 | -16 | % | 3,088 | 3,295 | -6 | % | ||||||||||||||||
| Foreign exchange variations (Debt) | 2,024 | (2,381 | ) | - | 2,162 | -6 | % | 4,186 | 3,949 | 6 | % | ||||||||||||||||
| Other foreign exchange variations | (681 | ) | 501 | - | (567 | ) | 20 | % | (1,098 | ) | (654 | ) | 68 | % | |||||||||||||
| Derivative income (loss), net2 | 1,492 | (864 | ) | - | 1,251 | 19 | % | 5,527 | 6,762 | -18 | % | ||||||||||||||||
| Operating Cash flow hedge | 1,006 | (440 | ) | - | 545 | 85 | % | 3,258 | 2,061 | 58 | % | ||||||||||||||||
| Cash flow - Cerrado project hedge | 125 | (249 | ) | - | 340 | -63 | % | 447 | 623 | -28 | % | ||||||||||||||||
| Debt hedge | 299 | (225 | ) | - | 399 | -25 | % | 1,532 | 4,066 | -62 | % | ||||||||||||||||
| Others 3 | 62 | 49 | 25 | % | (33 | ) | - | 290 | 12 | - | |||||||||||||||||
| Net Financial Result | 2,269 | (3,494 | ) | - | 2,000 | 13 | % | 5,781 | 6,433 | -10 | % |
1 Capitalized interest related to work in progress.
2 Variation in mark-to-market adjustment (4Q23: R$1,994 million | 3Q23: R$1,676 million), plus adjustments paid and received (4Q23 = R$1,174 million).
3 Includes commodity hedge and embedded derivatives.
Page
Financial expenses remained stable in relation to 3Q23. The increase in interest expenses in foreign currency, caused by the weaker FX rate average of monthly closings, was offset by the increase in capitalized interest (linked to the progress of the Cerrado Project). Compared to 4Q22, financial expenses decreased 1%, mainly due to the increase in capitalized interest, partially offset mainly by the increase in interest expenses in foreign currency resulting from the increase in the SOFR interest rate (4Q23: 5.32% p.a. | 4Q22: 3.62% p.a. - average reference).
Financial income grew 43% in relation to 3Q23, due to: i) the increase in interest on financial investments, mainly resulting from higher investments in BRL; ii) the increase in the SOFR interest rate (4Q23: 5.32% p.a. | 3Q23: 5.24% p.a. - average reference). Compared to 4Q22, the 77% increase was mainly due to the increase of the interest rate on financial application due to i) higher investment volume in BRL and USD, and ii) increase in the SOFR interest rate (4Q23: 5.32% p.a. | 4Q22: 3.62% p.a. - average reference).
Inflation adjustment and exchange variation had a positive impact of R$1,343 million on the Company’s financial results due to the 3% increase in BRL against USD at the close of 3Q23, which affected debt in foreign currency by US$2,024 million (US$12,663 million at the end of 4Q23). This effect was partially offset by the negative result of exchange variation on other balance sheet items in foreign currency (R$681 million), notably the impact on the Company’s cash position (65% in USD at the end of 4Q23). Note that the accounting impact of exchange variation on foreign currency debt has a cash impact only on the respective maturities.
Derivative operations resulted in a gain of R$1,492 million in 4Q23, due to the positive impact of stronger BRL in the end of quarter, and the positive impact of the fixed curve, despite the negative impact of foreign exchange coupon on debt and cash flow hedges. The mark-to-market adjustment of derivative instruments on December 31, 2023 was positive at R$1,994 million, compared to R$1,676 million on September 30, 2023, representing an increase of R$318 million. Note that the impact of BRL appreciation on the derivatives portfolio generates a cash impact only upon the respective maturities. The net effect on cash, which refers to the maturity of derivative operations in the fourth quarter, was a positive R$1,174 million (R$169 million gain on debt hedge, R$957 million gain on cash flow hedge and R$49 million gain from commodities).
As a result of the above factors, net financial result in 4Q23, considering all financial expense and income lines, was an income of R$2,269 million in 4Q23, compared to an expense of R$3,494 million in 3Q23 and an income of R$2,000 million in 4Q22.
DERIVATIVE OPERATIONS
Suzano carries out derivative operations exclusively for hedging purposes. The following table reflects the position of derivative hedging instruments on December 31, 2023:
| Notional (US$ million) | Fair Value (R$ million) | |||||||||||||||
| Hedge1 | 4Q23 | 3Q23 | 4Q23 | 3Q23 | ||||||||||||
| Debt | 4,939 | 5,155 | (487 | ) | (617 | ) | ||||||||||
| Cash Flow – Operating (ZCC + NDF) | 4,844 | 4,058 | 1,958 | 1,590 | ||||||||||||
| Cash Flow – Cerrado2 (ZCC + NDF) | 424 | 861 | 274 | 467 | ||||||||||||
| Others3 | 437 | 219 | 250 | 236 | ||||||||||||
| Total | 10,644 | 10,294 | 1,994 | 1,676 | ||||||||||||
1 See note 4.5 of the 2023 Financial Statements (DF) for further details and fair value sensitivity analysis.
2 Hedge program related to capex in BRL (ZCC) and EUR (NDF) of the Cerrado Project.
3 Includes commodity hedging and embedded derivatives.
Page
The Company’s foreign exchange exposure policy seeks to minimize the volatility of its cash generation and ensure greater flexibility in cash flow management. Currently, the policy stipulates that surplus dollars may be partially hedged (at least 40% and up to 75% of exchange variation exposure over the next 24 months) using plain vanilla instruments such as Zero Cost Collars (ZCC) and Non-Deliverable Forwards (NDF). At the end of 4Q23, 60% of the exchange variation exposure was covered.
Considering the foreign exchange exposure related to Capex in the Cerrado Project, since approximately 67% of Capex is pegged to local currency, the Board of Directors approved on October 28, 2021, a program for contracting additional specific hedge operations to protect from it such exposure. The program approved (established in the Derivatives Management Policy available on the Investor Relations website) initially involved a maximum amount (notional) of up to US$1 billion and a term of operations of up to 36 months. On July 27, 2022, the Board of Directors approved the expansion of the program, increasing the maximum amount (notional) to US$1.5 billion while maintaining the previously established term. To ensure transparency regarding the Cerrado Project's hedge program, since 4Q21 the Company has been prominently disclosing the operations contracted.
Since about 33% of the Capex of the Cerrado Project is denominated in EUR, in 3Q22, the Company contracted hedge operations through NDFs to protect the exposure in EUR of the Capex of the Cerrado Project, converting it into USD. This type of hedge is established in the Derivatives Management Policy available on the Investor Relations website.
ZCC transactions establish minimum and maximum limits for the exchange rate that minimize adverse effects in the event of significant appreciation of the BRL. As such, if the exchange rate is within such limits, the Company neither pays nor receives any financial adjustments. This characteristic allows for capturing greater benefits from export revenue in a potential scenario of BRL appreciation versus USD within the range contracted. In cases of extreme BRL appreciation, the Company is protected by the minimum limits, which are considered appropriate for the operation. However, this protection instrument also limits, temporarily and partially, potential gains in scenarios of extreme BRL depreciation when exchange rates exceed the maximum limits contracted.
On December 31, 2023, the outstanding notional value of operations involving forward USD sales through ZCCs related to Cash Flows (including those related to the Cerrado Project) was US$4,501 million, with an average forward rate ranging from R$5.43 to R$6.27 and maturities distributed between January 2024 and December 2025. On the same date, the outstanding notional value of operations involving forward USD sales through NDFs was US$505 million, whose maturities are distributed between March 2024 and April 2025 and with an average rate of R$5.26. Regarding hedge for foreign exchange exposure in EUR, the outstanding notional value of forward EUR purchases at the end of 4Q23 was €254 million (USD262 million), with an average contracted rate of 1.03 EUR/USD and maturities through July 2024. In 4Q23, operational, cash flow and Cerrado Project hedge operations resulted in a gain of R$1,132 million. The mark-to-market (“MtM” or “fair value”) value of these operations totaled R$2,231 million, with R$1,958 million related to cash flow operating hedge and R$274 million related to operating hedge of the Cerrado Project.
The following table presents a sensitivity analysis of the cash impact that the Company could have on its cash flow hedge portfolios (ZCC and NDF) if the exchange rate remains the same as at the end of 4Q23 (BRL/USD = 4.84) in the coming quarters, as well as the projected cash impact for R$0.10 variations below / above the strike of put/call options, respectively, defined in each quarter. Note that the figures presented in the table are the Company’s projections based on the end-of-period curves and could vary depending on market conditions.
Page
| Cash Adjustment (R$ million) | ||||||||||||||||||||
| Maturity (up to) |
Strike Range | Notional (US$ million) |
Actual | Exchange Rate 4Q23 (R$ 4.84) |
Sensitivity at R$ 0.10 / US$ variation (+/-) |
|||||||||||||||
| Zero Cost Collars | ||||||||||||||||||||
| 4Q23 | - | - | 621 | - | - | |||||||||||||||
| 1Q24 | 5.44 - 6.20 | 382 | - | 229 | 38 | |||||||||||||||
| 2Q24 | 5.56 - 6.40 | 560 | - | 401 | 56 | |||||||||||||||
| 3Q24 | 5.66 - 6.53 | 555 | - | 454 | 56 | |||||||||||||||
| 4Q24 | 5.71 - 6.63 | 505 | - | 437 | 51 | |||||||||||||||
| 1Q25 | 5.50 - 6.37 | 280 | - | 185 | 28 | |||||||||||||||
| 2Q25 | 5.22 - 6.03 | 642 | - | 243 | 64 | |||||||||||||||
| 3Q25 | 5.13 - 5.95 | 870 | - | 252 | 87 | |||||||||||||||
| 4Q25 | 5.08 - 5.86 | 545 | - | 130 | 55 | |||||||||||||||
| Total | 5.38 - 6.21 | 4,339 | 621 | 2,331 | 434 | |||||||||||||||
| NDF | ||||||||||||||||||||
| 4Q23 | - | - | 18 | - | - | |||||||||||||||
| 1Q24 | 5.22 | 85 | - | 32 | 9 | |||||||||||||||
| 2Q24 | 5.25 | 350 | - | 142 | 35 | |||||||||||||||
| 3Q24 | 5.35 | 20 | - | 10 | 2 | |||||||||||||||
| 4Q24 | 5.40 | 45 | - | 25 | 5 | |||||||||||||||
| 2Q25 | 5.54 | 5 | - | 3 | 1 | |||||||||||||||
| Total | 5.26 | 505 | 18 | 213 | 51 | |||||||||||||||
| Zero Cost Collars – Cerrado Project | ||||||||||||||||||||
| 4Q23 | - | - | 302 | - | - | |||||||||||||||
| 1Q24 | 5.87 - 6.98 | 95 | - | 98 | 9 | |||||||||||||||
| 2Q24 | 6.10 - 7.44 | 58 | - | 73 | 6 | |||||||||||||||
| 3Q24 | 6.35 - 8.34 | 9 | - | 14 | 1 | |||||||||||||||
| Total | 5.98 - 7.22 | 162 | 302 | 185 | 16 | |||||||||||||||
Page
| Cash Adjustment (R$ million) | ||||||||||||||||||||
| Maturity
(up to) |
Strike Range | Notional
(US$ million)1 |
Actual | Exchange
Rate 4Q23 (€ 1.11) |
Sensitivity
at € 0.10 / US$ variation (+/-) |
|||||||||||||||
| NDF – Cerrado Project (EUR/USD) | ||||||||||||||||||||
| 4Q23 | - | - | 17 | - | - | |||||||||||||||
| 1Q24 | 1.03 | 98 | - | 35 | 46 | |||||||||||||||
| 2Q24 | 1.03 | 96 | - | 33 | 45 | |||||||||||||||
| 3Q24 | 1.04 | 69 | - | 22 | 32 | |||||||||||||||
| Total | 1.03 | 262 | 17 | 90 | 123 | |||||||||||||||
1 Translated at the average contracted rate of 1.03 Euro/USD.
To mitigate the effects of exchange and interest rate variations on its debt and its cash flows, the Company also uses currency and interest rate swaps. Swap contracts are entered into considering different interest rates and inflation indices in order to mitigate the mismatch between financial assets and liabilities.
On December 31, 2023, the Company had an outstanding amount (notional value) of US$4,939 million in swap contracts as shown in the table below. In 4Q23, the result of debt hedge transactions was an income of R$299 million, mainly due to stronger BRL and the positive impact of the fixed curve, despite the negative impact of foreign exchange coupon. The mark-to-market adjustment (fair value) of these operations was a loss of R$487 million.
| Notional
(US$ million) |
Fair
Value (R$ million) |
||||||||||||||||||||
| Debt Hedge | Maturity (up to) |
Currency | 4Q23 | 3Q23 | 4Q23 | 3Q23 | |||||||||||||||
| Swap (PRÉ x USD) | 2024 | USD | 200 | 200 | (203 | ) | (244 | ) | |||||||||||||
| Swap (CDI x USD) | 2026 | USD | 1,025 | 1,015 | (1,082 | ) | (1,257 | ) | |||||||||||||
| Swap (SOFR x USD) | 2026 | USD | 2,556 | 2,929 | 741 | 921 | |||||||||||||||
| Swap (CDI x SOFR) | 2026 | USD | 125 | - | 26 | - | |||||||||||||||
| Swap SOFR | 2029 | USD | 151 | 151 | (17 | ) | 11 | ||||||||||||||
| Swap (IPCA x CDI) | 2036 | BRL | 883 | 1 | 860 | 1 | 48 | (48 | ) | ||||||||||||
| Total | 4,939 | 5,155 | (487 | ) | (617 | ) | |||||||||||||||
1 Translated at the quarterly closing exchange rate (R$4.84).
The following table presents a sensitivity analysis1 of the cash impact that the Company could have on its debt hedge portfolio (swaps) if the exchange rate remains the same as at the end of 4Q23 (BRL/USD = 4.84) in the coming quarters, as well as the projected variation in cash impact for each R$0.10 variation on the same reference exchange rate (4Q23). Note that the figures presented in the table are the Company’s projections based on the end-of-period curves and could vary depending on market conditions.
| Cash Adjustment (R$ million) | ||||||||||||||||
| Maturity (up to) |
Notional
(US$ million) |
Actual | R$
/ US$ = 4.84 (4Q23) |
Sensitivity
at R$ 0.10 / US$ variation (+/-)1 |
||||||||||||
| 4Q23 | - | 169 | - | - | ||||||||||||
| 2024 | 1,382 | - | 231 | (4 | ) | |||||||||||
| 2025 | 1,546 | - | (307 | ) | (62 | ) | ||||||||||
| 2026 | 1,012 | - | (433 | ) | (61 | ) | ||||||||||
| 2027 | 130 | - | 14 | - | ||||||||||||
| >=2028 | 869 | - | 169 | - | ||||||||||||
| Total | 4,939 | 169 | (326 | ) | (127 | ) | ||||||||||
1 Sensitivity analysis considers variation only in the exchange rate (R$/US$), while other variables are presumed constant.
Page
Other transactions involving the Company’s derivatives are related to the embedded derivative resulting from forestry partnerships and commodity hedges, as shown in the table.
| Notional
(US$ million) |
Fair
Value (R$ million) |
Cash
Adjustment (R$ million) |
|||||||||||||||||||||
| Other hedges | Maturity (up to) |
Index | 4Q23 | 3Q23 | 4Q23 | 3Q23 | 4Q23 | 3Q23 | |||||||||||||||
| Embedded derivative | 2038 | Fixed
USD | USD US-CPI |
132 | 129 | 230 | 143 | - | - | |||||||||||||||
| Commodities | 2024 | Brent/VLSF/
Others |
306 | 90 | 16 | 93 | 49 | 22 | |||||||||||||||
| Total | 437 | 219 | 250 | 236 | 49 | 22 | |||||||||||||||||
A portion of the forestry partnership agreements and standing timber supply agreements is denominated in USD per cubic meter of standing timber, adjusted by U.S. inflation measured by the Consumer Price Index (CPI), which is not related to inflation in the economic environment where the forests are located and, hence, constitutes an embedded derivative. This instrument, presented in the table above, consists of a sale swap contract of the variations in the US-CPI during the period of the contracts. See note 4 of the 4Q23 Financial Statements for more details and for a sensitivity analysis of the fair value in case of a sharp rise in the US-CPI and USD. On December 31, 2023, the outstanding (notional) value of the operation was US$132 million. The result from this swap in 4Q23 was a gain of R$88 million. The mark-to-market (fair value) adjustment of these operations generated a gain of R$230 million at the end of the quarter.
The Company is also exposed to the price of some commodities and, therefore, constantly assesses the contracting of derivative financial instruments to mitigate such risks. On December 31, 2023, the outstanding (notional) value of the operation was US$306 million. The result of this swap in 4Q23 was a loss of R$26 million. The mark-to-market (fair value) adjustment of these operations generated a gain of R$19 million at the end of the quarter.

NET INCOME (LOSS)
In 4Q23, the Company posted net income of R$4,515 million, as against a net loss of R$729 million in 3Q23 and net income of R$7,459 million in 4Q22. The variation in relation to 3Q23 is mainly explained by: i) the positive financial result, which was explained by the positive impact of stronger BRL on debt and derivative operations (compared to the negative result registered in the previous quarter); ii) the higher operating income caused by the increase in net revenue and other operating income (mainly due to the revaluation of biological asset). These effects were partially offset by deferred income taxes expenses (deferred levied mainly on gains from the exchange variation on debt and mark-to-market adjustments of derivatives and revaluation of biological asset), higher COGS and increase in SG&A expenses, as explained earlier.
Page
The variation in relation to 4Q22 is mainly due to the lower operating result (decline in net revenue), partially offset by the reduction in IR/CSLL expense and higher financial income.
DEBT
| Debt (R$ million) | 4Q23 | 3Q23 | ΔQ-o-Q | 4Q22 | ΔY-o-Y | |||||||||||||||
| Local Currency | 15,868 | 15,770 | 1 | % | 13,360 | 19 | % | |||||||||||||
| Short Term | 1,155 | 1,921 | -40 | % | 2,231 | -48 | % | |||||||||||||
| Long Term | 14,713 | 13,849 | 6 | % | 11,129 | 32 | % | |||||||||||||
| Foreign Currency | 61,305 | 62,781 | -2 | % | 61,215 | 0 | % | |||||||||||||
| Short Term | 3,603 | 2,698 | 34 | % | 1,104 | 226 | % | |||||||||||||
| Long Term | 57,702 | 60,083 | -4 | % | 60,111 | -4 | % | |||||||||||||
| Gross Debt | 77,173 | 78,551 | -2 | % | 74,575 | 3 | % | |||||||||||||
| (-) Cash | 21,613 | 20,927 | 3 | % | 17,472 | 24 | % | |||||||||||||
| Net debt | 55,560 | 57,624 | -4 | % | 57,103 | -3 | % | |||||||||||||
| Net debt/Adjusted EBITDA1 (x) - R$ | 3.0 | x | 2.6 | x | 0.4 | x | 2.0 | x | 1.0 | x | ||||||||||
| Net debt/Adjusted EBITDA1 (x) – US$ | 3.1 | x | 2.7 | x | 0.4 | x | 2.0 | x | 1.1 | x |
1Excluding non-recurring items.
On December 31, 2023, gross debt totaled R$77.2 billion and was composed of 94% long-term maturities and 6% short-term maturities. Foreign currency debt corresponded to 79% of the Company's total debt at the end of the quarter. The percentage of gross debt in foreign currency, considering the effect of debt hedge, was 87%. Compared to 3Q23, gross debt decreased 2%, mainly due to the positive effect of exchange variation of R$2,024 million. Suzano ended 4Q23 with 39% of total debt linked to ESG instruments.
Suzano contracts debt in foreign currency as a natural hedge, since net operating cash generation is mostly denominated in foreign currency (USD) due to its predominant status as an exporter. This structural exposure allows the Company to match loans and financing payments in USD with receivable flows from sales.

*Corresponding mainly to transaction costs (issue, funding, goodwill, discount and loss on business combinations, etc.).
On December 31, 2023, the total average cost of debt in USD was 5.0% p.a. (considering the debt in BRL adjusted by the market swap curve), compared to 5.1% p.a. on September 30, 2023. The average term of consolidated debt at the end of the quarter was 75 months, compared to 77 months at the end of 3Q23.
Page

1Considers the portion of debt with swap for fixed rate in foreign currency. The exposure of the original debt was: Fixed (US$) – 54%, SOFR – 26%, CDI – 11%, Other (Fixed R$, IPCA, TJLP, others) – 9%.
2Considers the portion of debt with currency swaps. The original debt was 80% in USD and 20% in BRL.
Cash and cash equivalents and financial investments on December 31, 2023 amounted to R$21.6 billion, 65% of which were in foreign currency, allocated in remunerated account or in short-term fixed-income investments abroad. The remaining 35% was invested in local currency fixed-income bonds (mainly CDBs, but also in government bonds and others), remunerated at the CDI rate.
On September 31, 2023, the company also had a stand-by credit facility totaling R$6.2 billion (US$1.3 billion) available through February 2027. This facility strengthens the company's liquidity position and can be withdrawn during times of uncertainty. As a result, the cash and equivalents of R$21.6 billion plus the credit facility described above amounted to a readily available cash position of R$27.8 billion on December 31, 2023. Moreover, the Company had at the end of 2023 a financing agreement with Finnvera (US$800 million) related to the Cerrado Project, as per the Notice to the Market of November 1, 2022, which has not yet been withdrawn, further strengthening its liquidity position.

On December 31, 2023, net debt stood at R$55.6 billion (US$11.5 billion), compared to R$57.6 billion (US$11.5 billion) on September 30, 2023. The decrease in net debt is mainly explained by the exchange rate variation (R$1.3 billion) and by the free cash generation in the period of R$ 876 million (for more details, refer to Free Cash Flow section).
Financial leverage, measured as the ratio of net debt to Adjusted EBITDA in BRL, was 3.0 times on December 31, 2023 (2.6 times in 3Q23). The same ratio in USD (the measure established in Suzano’s financial policy) rose to 3.1 times on December 31, 2023 (from 2.7 times in 3Q23).
Page

The breakdown of gross debt between trade and non-trade finance on December 31, 2023 is shown below:
| 2024 | 2025 | 2026 | 2027 | 2028 | 2029 onwards |
Total | ||||||||||||||||||||||
| Trade Finance1 | 73 | % | 54 | % | 47 | % | 49 | % | 0 | % | 2 | % | 23 | % | ||||||||||||||
| Non-Trade Finance2 | 27 | % | 46 | % | 53 | % | 51 | % | 100 | % | 98 | % | 77 | % |
1 EEC, ECN, EPP
2 Bonds, BNDES, CRA, Debentures, among others.
CAPEX
In 4Q23, capital expenditure (cash basis) totaled R$4,224 million. The 4% decrease in relation to 3Q23 was mainly due to: i) lower investments in Land and Forests; and ii) less spending on forest maintenance resulting from lower investments in forestry operations and wood purchases. Compared to 4Q22, the 18% decrease is mainly due to lower spending on the Cerrado Project.
The total amount of capital investments in 2023 was executed in line with the guidance released by the Company. The deviations between lines are due to greater expenditure on forest maintenance and land and forestry, as described: i) anticipation of disbursement for the acquisition of machinery for forestry operations; ii) higher expenses with roads and forestry resulting from the impacts of the greater volume of rain in the period and higher prices for services; and iii) greater expenditure on acquiring land and forests due to market opportunities. These effects were offset by the postponement of payments related to the Cerrado Project.
Page
For 2024, Management has approved a capital budget of R$16.5 billion, of which R$7.7 billion will be allocated to industrial and forestry maintenance and R$4.6 billion will be invested in the Cerrado Project, among others, mentioned in the table below.
| Investments1
(R$ million) |
4Q23 | 3Q23 | ΔQ-o-Q | 4Q22 | ΔY-o-Y | 2023 | 2022 | ΔY-o-Y |
Guidance 2024 |
||||||||||||||||||||||||||
| Maintenance | 1,726 | 1,799 | -4 | % | 1,712 | 1 | % | 6,707 | 5,632 | 19 | % | 7,677 | |||||||||||||||||||||||
| Industrial maintenance | 432 | 401 | 8 | % | 391 | 11 | % | 1,329 | 1,042 | 28 | % | 1,263 | |||||||||||||||||||||||
| Forestry maintenance | 1,221 | 1,339 | -9 | % | 1,241 | -2 | % | 5,199 | 4,449 | 17 | % | 6,177 | |||||||||||||||||||||||
| Others | 72 | 59 | 22 | % | 80 | -9 | % | 179 | 141 | 26 | % | 238 | |||||||||||||||||||||||
| Expansion and modernization | 145 | 190 | -24 | % | 137 | 6 | % | 694 | 462 | 50 | % | 331 | |||||||||||||||||||||||
| Land and forestry | 152 | 253 | -40 | % | 193 | -21 | % | 2,610 | 2,635 | -1 | % | 3,296 | |||||||||||||||||||||||
| Port terminals | 0 | 1 | -90 | % | 4 | -97 | % | 6 | 95 | -93 | % | 6 | |||||||||||||||||||||||
| Others | 11 | 20 | -45 | % | 100 | -89 | % | 49 | 119 | -59 | % | 538 | |||||||||||||||||||||||
| Cerrado Project | 2,190 | 2,140 | 2 | % | 2,999 | -27 | % | 8,511 | 7,367 | 16 | % | 4,605 | |||||||||||||||||||||||
| Total | 4,224 | 4,404 | -4 | % | 5,144 | -18 | % | 18,577 | 16,309 | 14 | % | 16,453 |
1 Does not include the acquisition of Kimberly Clark's tissue business in Brazil, in the amount of R$1,073 million, as explained in Note 15 of the 2Q23 financial statements.
CERRADO PROJECT
The Cerrado Project is progressing according to schedule on its physical and financial curves, closing the fourth quarter of 2023 with the “inside the fence” execution (which corresponds to industrial and infrastructure investments) reaching physical progress of 86% and financial progress of 78% (R$11,499 million). The Company expects the new pulp mill located in Ribas do Rio Pardo, Mato Grosso do Sul, with annual capacity of 2,550 thousand tons, to go operational by June 2024.
OPERATING CASH GENERATION
| Operating
Cash Flow (R$ million) |
4Q23 | 3Q23 | ΔQ-o-Q | 4Q22 | ΔY-o-Y | 2023 | 2022 | ΔY-o-Y | ||||||||||||||||||||||||
| Adjusted EBITDA1 | 4,505 | 3,695 | 22 | % | 8,175 | -45 | % | 18,273 | 28,195 | -35 | % | |||||||||||||||||||||
| Maintenance Capex2 | (1,726 | ) | (1,799 | ) | -4 | % | (1,712 | ) | 1 | % | (6,707 | ) | (5,632 | ) | 19 | % | ||||||||||||||||
| Operating Cash Flow | 2,779 | 1,896 | 47 | % | 6,463 | -57 | % | 11,566 | 22,563 | -49 | % | |||||||||||||||||||||
| Operating Cash Flow (R$/ton) | 883 | 673 | 31 | % | 2,087 | -58 | % | 1,005 | 1,895 | -47 | % |
1 Excludes non-recurring items.
2 Cash basis.
Operating cash generation, measured by adjusted EBITDA less sustaining capex (cash basis), amounted to R$2,779 million in 4Q23. The 31% increase in operating cash generation per ton is due to the higher adjusted EBITDA per ton and lower sustaining capex per ton. Compared to 4Q22, the 58% decrease is due to lower Adjusted EBITDA per ton.

Page
FREE CASH FLOW
| Free Cash Flow (R$ million) | 4Q23 | 3Q23 | ΔQ-o-Q | 4Q22 | ΔY-o-Y | 2023 | 2022 | ΔY-o-Y | ||||||||||||||||||||||||
| Adjusted EBITDA | 4,505 | 3,695 | 22 | % | 8,175 | -45 | % | 18,273 | 28,195 | -35 | % | |||||||||||||||||||||
| (-) Total Capex1 | (4,395 | ) | (4,492 | ) | -2 | % | (4,088 | ) | 7 | % | (20,233 | ) | (16,919 | ) | 20 | % | ||||||||||||||||
| (-) Leases contracts – IFRS 16 | (348 | ) | (293 | ) | 19 | % | (301 | ) | 16 | % | (1,218 | ) | (1,044 | ) | 17 | % | ||||||||||||||||
| (+/-) Δ Working capital2 | 810 | 340 | - | (1,578 | ) | - | 3,517 | (2,347 | ) | - | ||||||||||||||||||||||
| (-) Net interest3 | (627 | ) | (1,460 | ) | -57 | % | (404 | ) | 55 | % | (4,048 | ) | (3,474 | ) | 17 | % | ||||||||||||||||
| (-) Income taxes | (53 | ) | (166 | ) | -68 | % | (90 | ) | -42 | % | (308 | ) | (306 | ) | 1 | % | ||||||||||||||||
| (-) Dividend payment/Share Buyback Program | (190 | ) | (160 | ) | 19 | % | 2,349 | -92 | % | (1,073 | ) | (4,151 | ) | -74 | % | |||||||||||||||||
| (+/-) Derivative cash adjustment | 1,174 | 720 | 63 | % | 256 | - | 3,559 | 282 | - | |||||||||||||||||||||||
| Free cash flow | 876 | (1,815 | ) | - | (379 | ) | - | (1,531 | ) | 235 | - | |||||||||||||||||||||
| (+) Capex ex-maintenance | 2,763 | 2,839 | -3 | % | 1,731 | 62 | % | 13,818 | 9,456 | 46 | % | |||||||||||||||||||||
| (+) Dividend payment/Share Buyback Program | 190 | 160 | 19 | % | 2,349 | -92 | % | 1,073 | 4,151 | -74 | % | |||||||||||||||||||||
| Free cash flow – Adjusted4 | 3,829 | 1,183 | 224 | % | 3,701 | 3 | % | 13,360 | 13,842 | -3 | % |
1 Accrual basis, except for the Parkia deal (payment of R$1.6 billion in 2Q23) and investments related to the Cerrado Project since 2Q23, as per note 15 (Property, Plant and Equipment) to the Financial Statements. Also considering the acquisition of Kimberly Clark Brazil's tissue business in 2Q23 in the amount of R$1,073 million (operation is a business combination and not acquisition of assets).
2 Considers costs of capitalized loans paid in the amount of R$344 million in 4Q23 and R$1,160 million in 2023.
3 Considers interest paid on debt and interest received on financial investments.
4 Free cash flow prior to dividend payments and capex ex-maintenance (accrual basis).
Adjusted Free Cash Flow in 4Q23 was R$3,829 million, compared to R$1,183 million in 3Q23 and R$3,701 million in 4Q22. The increase of 224% from the previous quarter is mainly due to: i) lower concentration of interest payments in the period; ii) higher adjusted EBITDA; iii) higher disbursement of working capital resulting from the decrease in inventories and recoverable taxes and the increase in suppliers (Cerrado Project). These effects were partially offset by the increase in accounts receivable (higher pulp prices combined with higher sales volume); and iv) the increase in positive cash adjustment of derivatives.
Compared to 4Q22, Adjusted Free Cash Flow increased 3%, mainly due to the disbursement of working capital resulting from the increase in suppliers (Cerrado Project) and the reduction in accounts receivable (contrary to high consumption in this line in 4Q22), higher positive cash adjustment of derivatives and lower sustaining capex (accrual basis). These effects were partially offset by lower adjusted EBITDA.
EVOLUTION OF NET DEBT
Following were the changes in net debt in 2023:

1 Accrual basis, except for the capex related to Cerrado Project (cash basis), as per the Cash Flow Statement. Considers the business combination with Kimberly Clark’s tissue segment in Brazil (R$1,073 million).
2 Net of exchange variations on cash and financial investments.
3 Considers the total amounts related to lease contracts (given that the impact of land leasing on capex is offset in working capital for Cash Flow Statement purposes), advances to suppliers, derivatives cash adjustments, among others.
Page
ESG
In the fourth quarter of 2023, Suzano's annual results were released in some of the main ESG indices and ratings, with the company having the following assessments:
| · | Dow Jones Sustainability Index (DJSI): Suzano ranks 2nd spot in the list making up the index, in the forest and paper sector. |
| · | CDP: score “A-“ in Water and Climate and “B” in Forests. |
| · | Sustainalytics: the annual review of the Company maintained its "Low Risk" profile. |
| · | Corporate Sustainability Index (ISE): Suzano is once again in the portfolio, with its score improving from 81.8 to 85.3. |
| · | EcoVadis Sustainability: Platinum seal in 2023, and the Company's second straight year in the rating, with score of 78, placing it among the 1% best-rated companies globally by EcoVadis. |
TOTAL OPERATIONAL EXPENDITURE - PULP
Total operational disbursement in 2023 was R$2,116/ton, 5% higher than 2022, mainly due to higher maintenance capex (mainly forestry) and inflation, partially offset by lower commodity and input prices.
EVENTS SUBSEQUENT TO THE REPORTING PERIOD
On January 26, 2024, the Board of Directors approved the cancellation of 20 million common shares, with an average cost of R$42.69 (equivalent to R$854 million) which were held in treasury, without changing the share capital and against the balances of retained earnings reserves available. After the cancellation of the shares, the share capital of R$9,269 million is divided into 1,304,117,615 common shares, all nominative, book-entry and with no par value.
The Company deliberated in the same date a new share buyback program, in which it may acquire up to a maximum of 40 million common shares of its own issue with a maximum period of 18 months. For further details, on the cancellation of shares and the announced share buyback program, see Material Fact dated January 26, 2024 available on the investor relations website.
CAPITAL MARKETS
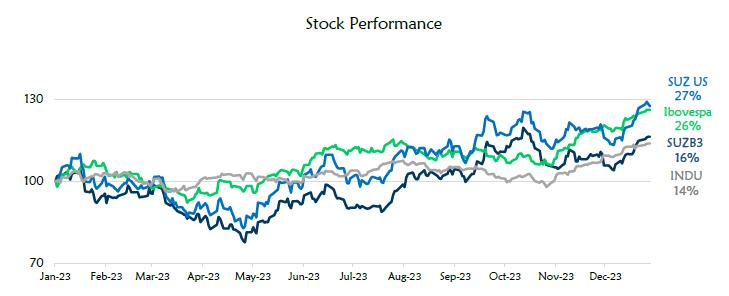
On December 31, 2023, Suzano’s stock was quoted at R$55.63/share (SUZB3) and US$11.36/share (SUZ). The Company’s stock is listed on the Novo Mercado, the listing segment of the São Paulo Stock Exchange (B3 – Brasil, Bolsa e Balcão) with the highest corporate governance standards, and on the New York Stock Exchange (NYSE) - Level II. The stock’s performance as of December 8, 2023 considers the adjustment due to the payment of dividends (“ex” date for earnings paid on January 10, 2024).
Page
Source: Bloomberg.

Source: Bloomberg.
On December 31, 2023, the Company's capital stock consisted of 1,324,117,615 common shares, of which 34,765,600 common shares were held in treasury. Suzano’s market capitalization on the same date (ex-treasury shares) stood at R$71.7 billion. Free float in 4Q23 corresponded to 50% of the total capital.

Page
FIXED INCOME
| Unit | Dec/23 | Sep/23 | Dec/22 | Δ Q-o-Q | Δ Y-o-Y | |||||||||||||||||||
| Fibria 2025 – Price | USD/k | 98.20 | 97.61 | 97.39 | 1 | % | 1 | % | ||||||||||||||||
| Fibria 2025 – Yield | % | 5.80 | 5.96 | 5.37 | -3 | % | 8 | % | ||||||||||||||||
| Suzano 2026 – Price | USD/k | 101.30 | 99.05 | 100.41 | 2 | % | 1 | % | ||||||||||||||||
| Suzano 2026 – Yield | % | 5.20 | 6.12 | 5.62 | -15 | % | -7 | % | ||||||||||||||||
| Fibria 2027 – Price | USD/k | 101.20 | 98.27 | 100.62 | 3 | % | 1 | % | ||||||||||||||||
| Fibria 2027 – Yield | % | 5.07 | 6.08 | 5.33 | -17 | % | -5 | % | ||||||||||||||||
| Suzano 2028 – Price | USD/k | 87.93 | 83.33 | 84.08 | 6 | % | 5 | % | ||||||||||||||||
| Suzano 2028 – Yield | % | 5.44 | 6.49 | 5.82 | -16 | % | -7 | % | ||||||||||||||||
| Suzano 2029 – Price | USD/k | 102.25 | 97.66 | 99.61 | 5 | % | 3 | % | ||||||||||||||||
| Suzano 2029 – Yield | % | 5.48 | 6.53 | 6.08 | -16 | % | -10 | % | ||||||||||||||||
| Suzano 2030 – Price | USD/k | 96.81 | 91.14 | 93.94 | 6 | % | 3 | % | ||||||||||||||||
| Suzano 2030 – Yield | % | 5.63 | 6.75 | 6.07 | -17 | % | -7 | % | ||||||||||||||||
| Suzano 2031 – Price | USD/k | 88.30 | 82.41 | 83.87 | 7 | % | 5 | % | ||||||||||||||||
| Suzano 2031 – Yield | % | 5.80 | 6.86 | 6.34 | -15 | % | -9 | % | ||||||||||||||||
| Suzano 2032 – Price | USD/k | 83.16 | 76.57 | 78.28 | 9 | % | 6 | % | ||||||||||||||||
| Suzano 2032 – Yield | % | 5.77 | 6.88 | 6.32 | -16 | % | -9 | % | ||||||||||||||||
| Suzano 2047 – Price | USD/k | 105.31 | 95.89 | 100.50 | 10 | % | 5 | % | ||||||||||||||||
| Suzano 2047 – Yield | % | 6.55 | 7.37 | 6.96 | -11 | % | -6 | % | ||||||||||||||||
| Treasury 10 years | % | 3.88 | 4.57 | 3.87 | -15 | % | 0 | % | ||||||||||||||||
Note: Senior Notes issued with face value of 100 USD/k.
RATINGS
| Agency | National Scale | Global Scale | Outlook | |||||
| Fitch Ratings | AAA | BBB- | Estável | |||||
| Standard & Poor’s | br.AAA | BBB- | Estável | |||||
| Moody’s | Aaa.br | Baa3 | Estável |
UPCOMING EVENTS
Earnings Conference Call (4Q23)
Date: February 29, 2024 (Thursday)
| Portuguese (simultaneous translation) | English |
| 10:00 a.m. (Brasília) | 10:00 a.m. (Brasília) |
| 8:00 a.m. (New York) | 8:00 a.m. (New York) |
| 1:00 p.m. (London) | 1:00 p.m. (London) |
Page

The conference call will be held in English and feature a presentation, with simultaneous webcast. The access links will be available on the Company’s Investor Relations website (www.suzano.com.br/ri).
If you are unable to participate, the webcast link will be available for future consultation on the Investor Relations website of Suzano S.A.
IR CONTACTS
Marcelo Bacci
Camila Nogueira
Roberto Costa
Mariana Dutra
Mariana Spinola
Luísa Puccini
Arthur Trovo
Tel.: +55 (11) 3503-9330
ri@suzano.com.br
www.suzano.com.br/ri
Page
APPENDICES
APPENDIX 1 – Operating Data
| Revenue Breakdown
(R$ '000) |
4Q23 | 3Q23 | Δ Q-o-Q | 4Q22 | Δ Q-o-Q | 2023 | 2022 | Δ Y-o-Y | |||||||||||||||||||
| Exports | 7,946,224 | 6,731,445 | 18 | % | 11,950,321 | -34 | % | 30,892,283 | 41,306,308 | -25 | % | ||||||||||||||||
| Pulp | 7,316,042 | 6,164,170 | 19 | % | 11,246,458 | -35 | % | 28,533,066 | 38,718,576 | -26 | % | ||||||||||||||||
| Paper | 630,182 | 567,275 | 11 | % | 703,863 | -10 | % | 2,359,217 | 2,587,732 | -9 | % | ||||||||||||||||
| Domestic Market | 2,425,321 | 2,216,568 | 9 | % | 2,419,386 | 0 | % | 8,863,292 | 8,524,638 | 4 | % | ||||||||||||||||
| Pulp | 453,846 | 440,860 | 3 | % | 728,455 | -38 | % | 2,144,199 | 2,665,746 | -20 | % | ||||||||||||||||
| Paper | 1,971,475 | 1,775,708 | 11 | % | 1,690,931 | 17 | % | 6,719,093 | 5,858,892 | 15 | % | ||||||||||||||||
| Total Net Revenue | 10,371,545 | 8,948,013 | 16 | % | 14,369,707 | -28 | % | 39,755,575 | 49,830,946 | -20 | % | ||||||||||||||||
| Pulp | 7,769,888 | 6,605,030 | 18 | % | 11,974,913 | -35 | % | 30,677,265 | 41,384,322 | -26 | % | ||||||||||||||||
| Paper | 2,601,657 | 2,342,983 | 11 | % | 2,394,794 | 9 | % | 9,078,310 | 8,446,624 | 7 | % |
| Sales volume (‘000) | 4Q23 | 3Q23 | Δ Q-o-Q | 4Q22 | Δ Q-o-Q | 2023 | 2022 | Δ Y-o-Y | |||||||||||||||||||
| Exports | 2,698,453 | 2,404,086 | 12 | % | 2,655,960 | 2 | % | 9,882,402 | 10,203,229 | -3 | % | ||||||||||||||||
| Pulp | 2,580,950 | 2,308,084 | 12 | % | 2,575,778 | 0 | % | 9,514,618 | 9,848,441 | -3 | % | ||||||||||||||||
| Paper | 117,503 | 96,002 | 22 | % | 80,182 | 47 | % | 367,784 | 354,788 | 4 | % | ||||||||||||||||
| Paperboard | 5,468 | 5,529 | -1 | % | 6,059 | -10 | % | 21,427 | 31,653 | -32 | % | ||||||||||||||||
| Printing & Writing | 111,994 | 90,422 | 24 | % | 73,599 | 52 | % | 346,194 | 321,148 | 8 | % | ||||||||||||||||
| Other paper1 | 41 | 51 | -20 | % | 524 | -92 | % | 163 | 1,987 | -92 | % | ||||||||||||||||
| Domestic Market | 449,089 | 412,575 | 9 | % | 441,372 | 2 | % | 1,624,336 | 1,702,488 | -5 | % | ||||||||||||||||
| Pulp | 180,111 | 177,878 | 1 | % | 183,251 | -2 | % | 700,823 | 751,212 | -7 | % | ||||||||||||||||
| Paper | 268,978 | 234,697 | 15 | % | 258,121 | 4 | % | 923,513 | 951,276 | -3 | % | ||||||||||||||||
| Paperboard | 37,343 | 37,029 | 1 | % | 39,443 | -5 | % | 145,047 | 159,993 | -9 | % | ||||||||||||||||
| Printing & Writing | 161,449 | 136,054 | 19 | % | 180,139 | -10 | % | 580,196 | 649,039 | -11 | % | ||||||||||||||||
| Other paper1 | 70,186 | 61,614 | 14 | % | 38,539 | 82 | % | 198,270 | 142,244 | 39 | % | ||||||||||||||||
| Total Sales Volume | 3,147,542 | 2,816,661 | 12 | % | 3,097,332 | 2 | % | 11,506,738 | 11,905,717 | -3 | % | ||||||||||||||||
| Pulp | 2,761,061 | 2,485,962 | 11 | % | 2,759,029 | 0 | % | 10,215,441 | 10,599,653 | -4 | % | ||||||||||||||||
| Paper | 386,481 | 330,699 | 17 | % | 338,303 | 14 | % | 1,291,297 | 1,306,064 | -1 | % | ||||||||||||||||
| Paperboard | 42,811 | 42,558 | 1 | % | 45,502 | -6 | % | 166,474 | 191,646 | -13 | % | ||||||||||||||||
| Printing & Writing | 273,443 | 226,476 | 21 | % | 253,738 | 8 | % | 926,390 | 970,187 | -5 | % | ||||||||||||||||
| Other paper1 | 70,227 | 61,665 | 14 | % | 39,063 | 80 | % | 198,433 | 144,231 | 38 | % |
1 Paper of other manufacturers sold by Suzano and tissue paper.
Page
| Average net price (R$/ton) |
4Q23 | 3Q23 | Δ Q-o-Q | 4Q22 | Δ Q-o-Q | 2023 | 2022 | Δ Y-o-Y | |||||||||||||||||||
| Exports | 2,945 | 2,800 | 5 | % | 4,499 | -35 | % | 3,126 | 4,048 | -23 | % | ||||||||||||||||
| Pulp | 2,835 | 2,671 | 6 | % | 4,366 | -35 | % | 2,999 | 3,931 | -24 | % | ||||||||||||||||
| Paper | 5,363 | 5,909 | -9 | % | 8,778 | -39 | % | 6,415 | 7,294 | -12 | % | ||||||||||||||||
| Domestic Market | 5,401 | 5,373 | 1 | % | 5,482 | -1 | % | 5,457 | 5,007 | 9 | % | ||||||||||||||||
| Pulp | 2,520 | 2,478 | 2 | % | 3,975 | -37 | % | 3,060 | 3,549 | -14 | % | ||||||||||||||||
| Paper | 7,330 | 7,566 | -3 | % | 6,551 | 12 | % | 7,276 | 6,159 | 18 | % | ||||||||||||||||
| Total | 3,295 | 3,177 | 4 | % | 4,639 | -29 | % | 3,455 | 4,185 | -17 | % | ||||||||||||||||
| Pulp | 2,814 | 2,657 | 6 | % | 4,340 | -35 | % | 3,003 | 3,904 | -23 | % | ||||||||||||||||
| Paper | 6,732 | 7,085 | -5 | % | 7,079 | -5 | % | 7,030 | 6,467 | 9 | % |
| Average net price (US$/ton) |
4Q23 | 3Q23 | Δ Q-o-Q | 4Q22 | Δ Q-o-Q | 2023 | 2022 | Δ Y-o-Y | |||||||||||||||||||
| Exports | 594 | 574 | 3 | % | 856 | -31 | % | 626 | 784 | -20 | % | ||||||||||||||||
| Pulp | 572 | 547 | 5 | % | 831 | -31 | % | 600 | 761 | -21 | % | ||||||||||||||||
| Paper | 1,082 | 1,211 | -11 | % | 1,670 | -35 | % | 1,284 | 1,412 | -9 | % | ||||||||||||||||
| Domestic Market | 1,090 | 1,101 | -1 | % | 1,043 | 5 | % | 1,092 | 969 | 13 | % | ||||||||||||||||
| Pulp | 509 | 508 | 0 | % | 756 | -33 | % | 613 | 687 | -11 | % | ||||||||||||||||
| Paper | 1,479 | 1,550 | -5 | % | 1,247 | 19 | % | 1,457 | 1,192 | 22 | % | ||||||||||||||||
| Total | 665 | 651 | 2 | % | 883 | -25 | % | 692 | 810 | -15 | % | ||||||||||||||||
| Pulp | 568 | 544 | 4 | % | 826 | -31 | % | 601 | 756 | -21 | % | ||||||||||||||||
| Paper | 1,359 | 1,452 | -6 | % | 1,347 | 1 | % | 1,407 | 1,252 | 12 | % |
| FX Rate R$/US$ | 4Q23 | 3Q23 | Δ Q-o-Q | 4Q22 | Δ Q-o-Q | 2023 | 2022 | Δ Y-o-Y | |||||||||||||||||||
| Closing | 4.84 | 5.01 | -3 | % | 5.22 | -7 | % | 4.84 | 5.22 | -7 | % | ||||||||||||||||
| Average | 4.96 | 4.88 | 2 | % | 5.26 | -6 | % | 5.00 | 5.17 | -3 | % |
Page
APPENDIX 2 – Consolidated Statement of Income and Goodwill Amortization
| Income Statement (R$ ‘000) |
4Q23 | 3Q23 | Δ Q-o-Q | 4Q22 | Δ Y-o-Y | 2023 | 2022 | Δ Y-o-Y | |||||||||||||||||||
| Net Revenue | 10,371,545 | 8,948,013 | 16 | % | 14,369,707 | -28 | % | 39,755,575 | 49,830,946 | -20 | % | ||||||||||||||||
| Cost of Goods Sold | (6,775,564 | ) | (6,104,256 | ) | 11 | % | (6,792,853 | ) | 0 | % | (25,076,675 | ) | (24,821,288 | ) | 1 | % | |||||||||||
| Gross Debt | 3,595,981 | 2,843,757 | 26 | % | 7,576,854 | -53 | % | 14,678,900 | 25,009,658 | -41 | % | ||||||||||||||||
| Gross Margin | 35 | % | 32 | % | 3 p.p. | 53 | % | -18 p.p. | 37 | % | 50 | % | -13 p.p. | ||||||||||||||
| Operating Expense/Income | (438,153 | ) | (1,160,262 | ) | -62 | % | (277,969 | ) | 58 | % | (2,462,612 | ) | (2,786,877 | ) | -12 | % | |||||||||||
| Selling Expenses | (711,641 | ) | (653,574 | ) | 9 | % | (660,372 | ) | 8 | % | (2,596,377 | ) | (2,483,194 | ) | 5 | % | |||||||||||
| General and Administrative Expenses | (614,892 | ) | (490,893 | ) | 25 | % | (615,872 | ) | 0 | % | (1,923,228 | ) | (1,709,767 | ) | 12 | % | |||||||||||
| Other Operating Income (Expenses) | 901,929 | (9,546 | ) | - | 980,852 | -8 | % | 2,076,372 | 1,121,716 | 85 | % | ||||||||||||||||
| Equity Equivalence | (13,549 | ) | (6,249 | ) | - | 17,423 | - | (19,379 | ) | 284,368 | - | ||||||||||||||||
| EBIT | 3,157,828 | 1,683,495 | 88 | % | 7,298,885 | -55 | % | 12,216,288 | 22,222,781 | -45 | % | ||||||||||||||||
| Depreciation, Amortization & Depletion | 1,787,944 | 1,939,646 | -8 | % | 1,910,259 | -6 | % | 7,321,110 | 7,407,890 | -1 | % | ||||||||||||||||
| EBITDA | 4,945,772 | 3,623,141 | 37 | % | 9,209,144 | -46 | % | 19,537,398 | 29,630,671 | -34 | % | ||||||||||||||||
| EBITDA Margin (%) | 48 | % | 40 | % | 7 p.p. | 64 | % | -16 p.p. | 49 | % | 59 | % | -10 p.p. | ||||||||||||||
| Adjusted EBITDA1 | 4,504,505 | 3,694,966 | 22 | % | 8,175,098 | -45 | % | 18,272,970 | 28,194,902 | -35 | % | ||||||||||||||||
| Adjusted EBITDA Margin1 | 43 | % | 41 | % | 2 p.p. | 57 | % | -13 p.p. | 46 | % | 57 | % | -11 p.p. | ||||||||||||||
| Net Financial Result | 2,269,458 | (3,494,316 | ) | - | 1,999,957 | 13 | % | 5,780,928 | 6,432,800 | -10 | % | ||||||||||||||||
| Financial Expenses | 610,005 | 425,746 | 43 | % | 344,938 | 77 | % | 1,825,649 | 967,010 | 89 | % | ||||||||||||||||
| Financial Revenues | (1,175,488 | ) | (1,175,608 | ) | 0 | % | (1,190,425 | ) | -1 | % | (4,659,162 | ) | (4,590,370 | ) | 1 | % | |||||||||||
| Exchange Rate Variation | 1,492,094 | (864,399 | ) | - | 1,251,053 | 19 | % | 5,526,714 | 6,761,567 | -18 | % | ||||||||||||||||
| Net Proceeds Generated by Derivatives | 1,342,847 | (1,880,055 | ) | - | 1,594,391 | -16 | % | 3,087,727 | 3,294,593 | -6 | % | ||||||||||||||||
| Earnings Before Taxes | 5,427,286 | (1,810,821 | ) | - | 9,298,842 | -42 | % | 17,997,216 | 28,655,581 | -37 | % | ||||||||||||||||
| Income and Social Contribution Taxes | (912,564 | ) | 1,082,064 | - | (1,839,952 | ) | -50 | % | (3,890,835 | ) | (5,260,694 | ) | -26 | % | |||||||||||||
| Net Income (Loss) | 4,514,722 | (728,757 | ) | - | 7,458,890 | -39 | % | 14,106,381 | 23,394,887 | -40 | % | ||||||||||||||||
| Net Margin | 44 | % | -8 | % | 52 p.p. | 52 | % | -8 p.p. | 35 | % | 47 | % | -11 p.p. |
1 Excluding non-recurring items and PPA effects.
| Goodwill amortization - PPA (R$ ‘000) | 4Q23 | 3Q23 | Δ Q-o-Q | 4Q22 | Δ Y-o-Y | |||||||||||||||
| COGS | (145,285 | ) | (142,885 | ) | 3 | % | (113,657 | ) | 1 | % | ||||||||||
| Selling Expenses | (207,467 | ) | (206,831 | ) | 0 | % | (207,740 | ) | 0 | % | ||||||||||
| General and administrative expenses | (2,377 | ) | (2,456 | ) | 0 | % | (2,625 | ) | -6 | % | ||||||||||
| Other operational revenues (expenses) | 20,782 | (3,106 | ) | - | (2,161 | ) | -82 | % | ||||||||||||
| Financial results | - | - | 0 | % | (4,722 | ) | -100 | % |
Page
APPENDIX 3 – Consolidated Balance Sheet
| Assets (R$ ’000) | 12/31/2023 | 09/30/2023 | 12/31/2022 | |||||||
| Current Assets | ||||||||||
| Cash and cash equivalents | 8,345,871 | 5,526,463 | 9,505,951 | |||||||
| Financial investments | 12,823,886 | 14,947,272 | 7,546,639 | |||||||
| Trade accounts receivable | 6,848,454 | 6,650,210 | 9,607,012 | |||||||
| Inventories | 5,946,948 | 6,478,233 | 5,728,261 | |||||||
| Recoverable taxes | 888,539 | 933,616 | 549,580 | |||||||
| Derivative financial instruments | 2,676,526 | 2,849,012 | 3,048,493 | |||||||
| Advance to suppliers | 113,743 | 111,547 | 108,146 | |||||||
| Dividend’s receivable | - | - | 7,334 | |||||||
| Other assets | 925,105 | 730,267 | 1,021,234 | |||||||
| Total Current Assets | 38,569,072 | 38,226,620 | 37,122,650 | |||||||
| Non-Current Assets | ||||||||||
| Financial investments | 443,400 | 453,301 | 419,103 | |||||||
| Recoverable taxes | 1,373,647 | 1,393,137 | 1,406,363 | |||||||
| Deferred taxes | 545,213 | 1,294,389 | 3,986,415 | |||||||
| Derivative financial instruments | 1,753,928 | 1,537,438 | 1,825,256 | |||||||
| Advance to suppliers | 2,242,229 | 2,113,874 | 1,592,132 | |||||||
| Judicial deposits | 361,693 | 354,142 | 362,561 | |||||||
| Other assets | 182,463 | 354,913 | 279,955 | |||||||
| Biological assets | 18,278,582 | 17,383,360 | 14,632,186 | |||||||
| Investments | 608,013 | 643,452 | 612,516 | |||||||
| Property, plant and equipment | 59,289,069 | 57,718,542 | 50,656,634 | |||||||
| Right of use on lease agreements | 5,196,631 | 5,267,493 | 5,109,226 | |||||||
| Intangible | 14,749,085 | 14,877,234 | 15,192,971 | |||||||
| Total Non-Current Assets | 105,023,953 | 103,391,275 | 96,075,318 | |||||||
| Total Assets | 143,593,025 | 141,617,895 | 133,197,968 | |||||||
| Liabilities and Equity (R$ ’000) | 12/31/2023 | 09/30/2023 | 12/31/2022 | |||||||
| Current Liabilities | ||||||||||
| Trade accounts payable | 5,572,219 | 5,905,156 | 6,206,570 | |||||||
| Loans, financing and debentures | 4,758,247 | 4,619,083 | 3,335,029 | |||||||
| Accounts payable for lease operations | 753,399 | 755,867 | 672,174 | |||||||
| Derivative financial instruments | 578,763 | 600,355 | 667,681 | |||||||
| Taxes payable | 443,454 | 399,623 | 449,122 | |||||||
| Payroll and charges | 766,905 | 767,434 | 674,525 | |||||||
| Liabilities for assets acquisitions and subsidiaries | 93,405 | 93,167 | 1,856,763 | |||||||
| Dividends payable | 1,316,528 | 2,682 | 5,094 | |||||||
| Advance from customers | 172,437 | 132,668 | 131,355 | |||||||
| Other liabilities | 339,683 | 294,974 | 494,230 | |||||||
| Total Current Liabilities | 14,795,040 | 13,571,009 | 14,492,543 | |||||||
| Non-Current Liabilities | ||||||||||
| Loans, financing and debentures | 72,414,445 | 73,931,955 | 71,239,562 | |||||||
| Accounts payable for lease operations | 5,490,383 | 5,633,226 | 5,510,356 | |||||||
| Derivative financial instruments | 1,857,309 | 2,109,636 | 4,179,114 | |||||||
| Liabilities for assets acquisitions and subsidiaries | 93,782 | 96,038 | 205,559 | |||||||
| Provision for judicial liabilities | 2,860,409 | 3,198,343 | 3,256,310 | |||||||
| Actuarial liabilities | 833,683 | 704,258 | 691,424 | |||||||
| Deferred taxes | 11,377 | 24,312 | 1,118 | |||||||
| Share-based compensation plans | 268,489 | 251,089 | 162,117 | |||||||
| Advance from customers | 74,715 | 91,423 | 136,161 | |||||||
| Other liabilities | 83,093 | 128,853 | 157,339 | |||||||
| Total Non-Current Liabilities | 83,987,685 | 86,169,133 | 85,539,060 | |||||||
| Total Liabilities | 98,782,725 | 99,740,142 | 100,031,603 | |||||||
| Shareholders’ Equity | ||||||||||
| Share capital | 9,235,546 | 9,235,546 | 9,235,546 | |||||||
| Capital reserves | 26,744 | 24,664 | 18,425 | |||||||
| Treasury shares | (1,484,014 | ) | (1,484,014 | ) | (2,120,324 | ) | ||||
| Retained earnings reserves | 35,376,198 | 22,690,645 | 24,207,869 | |||||||
| Other reserves | 1,538,296 | 1,637,970 | 1,719,516 | |||||||
| Retained earnings | - | 9,657,484 | - | |||||||
| Controlling shareholders’ | 44,692,770 | 41,762,295 | 33,061,032 | |||||||
| Non-controlling interest | 117,530 | 115,458 | 105,333 | |||||||
| Total Equity | 44,810,300 | 41,877,753 | 33,166,365 | |||||||
| Total Liabilities and Equity | 143,593,025 | 141,617,895 | 133,197,968 |
Page
APPENDIX 4 – Consolidated Statement of Cash Flow
| Cash Flow (R$ ’000) | 4Q23 | 4Q22 | 2023 | 2022 | ||||||||||||
| OPERATING ACTIVITIES | ||||||||||||||||
| Net income (loss) for the period | 4,514,723 | 7,458,890 | 14,106,382 | 23,394,887 | ||||||||||||
| Depreciation, depletion and amortization | 1,705,090 | 1,853,927 | 6,999,838 | 7,206,125 | ||||||||||||
| Depreciation of right of use | 82,855 | 61,056 | 321,271 | 231,966 | ||||||||||||
| Sublease of ships | - | - | - | (11,314 | ) | |||||||||||
| Interest expense on lease liabilities | 107,797 | 112,247 | 441,596 | 433,613 | ||||||||||||
| Result from sale and disposal of property, plant and equipment and biological assets, net | 157,277 | 27,136 | 331,285 | 509 | ||||||||||||
| Income (expense) from associates and joint ventures | 13,549 | (17,423 | ) | 19,379 | (284,368 | ) | ||||||||||
| Exchange rate and monetary variations, net | (1,342,847 | ) | (1,594,391 | ) | (3,087,727 | ) | (3,294,593 | ) | ||||||||
| Interest expenses on financing, loans and debentures, net | 1,259,595 | 1,105,200 | 4,797,094 | 4,007,737 | ||||||||||||
| Capitalized loan costs | (343,601 | ) | (152,963 | ) | (1,160,364 | ) | (359,407 | ) | ||||||||
| Accrual of interest on marketable securities | (510,591 | ) | (219,321 | ) | (1,352,522 | ) | (707,211 | ) | ||||||||
| Amortization of transaction costs | 17,358 | 16,474 | 67,353 | 69,881 | ||||||||||||
| Derivative gains, net | (1,492,094 | ) | (1,251,053 | ) | (5,526,714 | ) | (6,761,567 | ) | ||||||||
| Fair value adjustment of biological assets | (733,516 | ) | (1,028,141 | ) | (1,989,831 | ) | (1,199,759 | ) | ||||||||
| Deferred income tax and social contribution | 779,975 | 1,655,730 | 3,495,443 | 4,749,798 | ||||||||||||
| Interest on actuarial liabilities | 17,242 | 14,815 | 69,231 | 59,258 | ||||||||||||
| Provision for judicial liabilities, net | 58,923 | (13,519 | ) | 139,934 | 88,198 | |||||||||||
| Tax litigation reduction program | (14,031 | ) | - | - | - | |||||||||||
| Provision for doubtful accounts, net | 12,088 | (979 | ) | 35,202 | 1,652 | |||||||||||
| Provision for inventory losses, net | 17,115 | 41,915 | 31,419 | 56,060 | ||||||||||||
| Provision for loss of ICMS credits, net | 86,450 | (4,004 | ) | 348,628 | 58,003 | |||||||||||
| Tax credits | 15,108 | - | 15,108 | 1,324 | ||||||||||||
| Other | 22,502 | (5,074 | ) | 51,830 | 2,794 | |||||||||||
| Decrease (increase) in assets | (59,197 | ) | (1,300,874 | ) | 1,768,894 | (4,712,141 | ) | |||||||||
| Trade accounts receivable | (431,979 | ) | (1,192,715 | ) | 2,155,448 | (3,267,356 | ) | |||||||||
| Inventories | 314,714 | 124,806 | (48,673 | ) | (967,995 | ) | ||||||||||
| Recoverable taxes | (47,361 | ) | (39,397 | ) | (666,681 | ) | (381,408 | ) | ||||||||
| Other assets | 105,429 | (193,568 | ) | 328,800 | (95,382 | ) | ||||||||||
| Increase (decrease) in liabilities | 525,688 | (430,328 | ) | 588,117 | 2,030,444 | |||||||||||
| Trade accounts payable | 398,533 | (817,018 | ) | 463,003 | 1,533,118 | |||||||||||
| Taxes payable | 103,405 | 136,100 | 329,556 | 422,591 | ||||||||||||
| Payroll and charges | (529 | ) | 26,984 | 73,096 | 83,742 | |||||||||||
| Other liabilities | 24,279 | 223,606 | (277,538 | ) | (9,007 | ) | ||||||||||
| Cash provided by operating activities | 4,897,458 | 6,329,320 | 20,510,846 | 25,421,296 | ||||||||||||
| Payment of interest on financing, loans and debentures | (792,060 | ) | (600,035 | ) | (4,728,998 | ) | (4,019,072 | ) | ||||||||
| Capitalized loan costs paid | 343,601 | 152,963 | 1,160,364 | 359,407 | ||||||||||||
| Interest received on marketable securities | 165,267 | 196,313 | 681,268 | 544,849 | ||||||||||||
| Payment of income taxes | (52,559 | ) | (90,389 | ) | (308,002 | ) | (306,453 | ) | ||||||||
| Cash provided by operating activities | 4,561,707 | 5,988,172 | 17,315,478 | 21,640,620 | ||||||||||||
| INVESTING ACTIVITIES | ||||||||||||||||
| Additions to property, plant and equipment | (2,849,649 | ) | (2,644,002 | ) | (11,674,183 | ) | (9,791,238 | ) | ||||||||
| Additions to intangible | (99,205 | ) | (9,848 | ) | (104,931 | ) | (90,499 | ) | ||||||||
| Additions to biological assets | (1,445,859 | ) | (1,434,505 | ) | (5,777,952 | ) | (4,957,380 | ) | ||||||||
| Proceeds from sales of property, plant and equipment | 38,360 | 85,126 | 183,576 | 251,183 | ||||||||||||
| Capital increase in subsidiaries and affiliates | (13,387 | ) | (34,876 | ) | (48,462 | ) | (67,020 | ) | ||||||||
| Marketable securities, net | 1,995,227 | 3,163,941 | (5,296,370 | ) | 67,426 | |||||||||||
| Advances for acquisition (receipt) of wood from operations with development and partnerships | (137,050 | ) | (123,726 | ) | (690,908 | ) | (355,362 | ) | ||||||||
| Dividends received | 39,920 | - | 44,789 | 6,604 | ||||||||||||
| Asset acquisition | - | - | (1,615,140 | ) | - | |||||||||||
| Acquisition of subsidiaries | - | - | (1,060,718 | ) | (2,090,062 | ) | ||||||||||
| Net cash from acquisition of subsidiaries | - | - | 5,002 | 10,590 | ||||||||||||
| Cash used in investing activities | (2,471,643 | ) | (997,890 | ) | (26,035,297 | ) | (17,015,758 | ) | ||||||||
| FINANCING ACTIVITIES | ||||||||||||||||
| Proceeds from loans, financing and debentures | 973,054 | 994,234 | 10,944,794 | 1,335,715 | ||||||||||||
| Receipt of derivative transactions | 1,174,172 | 255,879 | 3,559,286 | 282,225 | ||||||||||||
| Payment of loans, financing and debentures | (812,456 | ) | (843,949 | ) | (4,296,447 | ) | (2,517,934 | ) | ||||||||
| Payment of leases | (348,426 | ) | (300,500 | ) | (1,218,399 | ) | (1,044,119 | ) | ||||||||
| Payment of dividends | (190,120 | ) | (2,349,203 | ) | (192,532 | ) | (4,150,782 | ) | ||||||||
| Liabilities for assets acquisitions and subsidiaries | - | (368 | ) | (116,924 | ) | (107,888 | ) | |||||||||
| Shares repurchased | - | - | (880,914 | ) | (1,904,424 | ) | ||||||||||
| Cash provided (used) by financing activities | 796,224 | (2,243,907 | ) | 7,798,864 | (8,107,207 | ) | ||||||||||
| EXCHANGE VARIATION ON CASH AND CASH EQUIVALENTS | (66,880 | ) | (198,585 | ) | (239,125 | ) | (602,480 | ) | ||||||||
| Increase (decrease) in cash and cash equivalents, net | 2,819,408 | 2,547,790 | (1,160,080 | ) | (4,084,825 | ) | ||||||||||
| At the beginning of the period | 5,526,463 | 6,958,161 | 9,505,951 | 13,590,776 | ||||||||||||
| At the end of the period | 8,345,871 | 9,505,951 | 8,345,871 | 9,505,951 | ||||||||||||
| Increase (decrease) in cash and cash equivalents, net | 2,819,408 | 2,547,790 | (1,160,080 | ) | (4,084,825 | ) |
Page
APPENDIX 5 – EBITDA
| (R$ '000, except where otherwise indicated) | 4Q23 | 4Q22 | 2023 | 2022 | ||||||||||||
| Net income | 4,514,722 | 7,458,890 | 14,106,381 | 23,394,887 | ||||||||||||
| Net Financial Result | (2,269,458 | ) | (1,999,957 | ) | (5,780,928 | ) | (6,432,800 | ) | ||||||||
| Income and Social Contribution Taxes | 912,564 | 1,839,952 | 3,890,835 | 5,260,694 | ||||||||||||
| EBIT | 3,157,828 | 7,298,885 | 12,216,288 | 22,222,781 | ||||||||||||
| Depreciation, Amortization and Depletion | 1,787,944 | 1,910,259 | 7,321,110 | 7,407,890 | ||||||||||||
| EBITDA1 | 4,945,772 | 9,209,144 | 19,537,398 | 29,630,671 | ||||||||||||
| EBITDA Margin | 48 | % | 64 | % | 49 | % | 59 | % | ||||||||
| COVID-19 - Expenses related to social actions to combat the virus | - | - | - | 178 | ||||||||||||
| Fair Value Update - Biological Asset | (733,516 | ) | (1,028,141 | ) | (1,989,831 | ) | (1,199,759 | ) | ||||||||
| Write-off of wood inventory | 22,998 | - | 22,998 | - | ||||||||||||
| Tax credits - Exclusion of ICMS in the PIS and COFINS calculation base | 15,108 | - | 15,108 | 1,324 | ||||||||||||
| Equity method | 13,549 | (17,423 | ) | 19,379 | (284,368 | ) | ||||||||||
| Extension of the PCHM grant | - | (7,711 | ) | - | (7,711 | ) | ||||||||||
| Extinction of packaging business line | 8,974 | - | 8,974 | - | ||||||||||||
| Provision of the Barge Contract with Norsul | - | 16,000 | 49,737 | 16,000 | ||||||||||||
| Tissue Operation Kimberly Clark Brazil | 829 | - | 25,171 | - | ||||||||||||
| Effective loss of the development contract advance program | 52 | - | 3,265 | - | ||||||||||||
| Accruals for losses on ICMS credits | 86,451 | (16,978 | ) | 348,628 | 58,003 | |||||||||||
| Income from disposal and write-off of property, plant and equipment and biological assets | 159,395 | 20,207 | 232,143 | (19,436 | ) | |||||||||||
| Adjusted EBITDA | 4,504,504 | 8,175,098 | 18,272,970 | 28,194,902 | ||||||||||||
| Adjusted EBITDA Margin | 43 | % | 57 | % | 46 | % | 57 | % |
1 The Company's EBITDA is calculated in accordance with CVM Instruction 527 of October 4, 2012.
Page
APPENDIX 6 – Segmented Income Statement
| 4Q23 | 4Q22 | |||||||||||||||||||||||||||||||
| Segmented Financial Statement (R$ '000) |
Pulp | Paper | Non Segmented |
Total Consolidated |
Pulp | Paper | Non Segmented |
Total Consolidated |
||||||||||||||||||||||||
| Net Revenue | 7,769,888 | 2,601,657 | - | 10,371,545 | 11,974,913 | 2,394,794 | - | 14,369,707 | ||||||||||||||||||||||||
| Cost of Goods Sold | (5,155,822 | ) | (1,619,742 | ) | - | (6,775,564 | ) | (5,497,058 | ) | (1,295,795 | ) | - | (6,792,853 | ) | ||||||||||||||||||
| Gross Profit | 2,614,066 | 981,915 | - | 3,595,981 | 6,477,855 | 1,098,999 | - | 7,576,854 | ||||||||||||||||||||||||
| Gross Margin | 34 | % | 38 | % | - | 35 | % | 54 | % | 46 | % | - | 53 | % | ||||||||||||||||||
| Operating Expense/Income | (128,762 | ) | (309,391 | ) | - | (438,153 | ) | (182,770 | ) | (95,199 | ) | - | (277,969 | ) | ||||||||||||||||||
| Selling Expenses | (453,103 | ) | (258,538 | ) | - | (711,641 | ) | (483,324 | ) | (177,048 | ) | - | (660,372 | ) | ||||||||||||||||||
| General and Administrative Expenses | (426,723 | ) | (188,169 | ) | - | (614,892 | ) | (431,950 | ) | (183,922 | ) | - | (615,872 | ) | ||||||||||||||||||
| Other Operating Income (Expenses) | 764,588 | 137,341 | - | 901,929 | 735,712 | 245,140 | - | 980,852 | ||||||||||||||||||||||||
| Equity Equivalence | (13,524 | ) | (25 | ) | - | (13,549 | ) | (3,208 | ) | 20,631 | - | 17,423 | ||||||||||||||||||||
| EBIT | 2,485,304 | 672,524 | - | 3,157,828 | 6,295,085 | 1,003,800 | - | 7,298,885 | ||||||||||||||||||||||||
| Depreciation, Amortization & Depletion | 1,570,420 | 217,524 | - | 1,787,944 | 1,744,893 | 165,366 | - | 1,910,259 | ||||||||||||||||||||||||
| EBITDA | 4,055,724 | 890,048 | - | 4,945,772 | 8,039,978 | 1,169,166 | - | 9,209,144 | ||||||||||||||||||||||||
| EBITDA Margin | 52 | % | 34 | % | - | 48 | % | 67 | % | 49 | % | - | 64 | % | ||||||||||||||||||
| Adjusted EBITDA1 | 3,756,297 | 748,208 | - | 4,504,505 | 7,273,957 | 901,141 | - | 8,175,098 | ||||||||||||||||||||||||
| Adjusted EBITDA Margin1 | 48 | % | 29 | % | - | 43 | % | 61 | % | 38 | % | - | 57 | % | ||||||||||||||||||
| Net Financial Result | - | - | 2,269,458 | 2,269,458 | - | - | 1,999,957 | 1,999,957 | ||||||||||||||||||||||||
| Earnings Before Taxes | 2,485,304 | 672,524 | 2,269,458 | 5,427,286 | 6,295,085 | 1,003,800 | 1,999,957 | 9,298,842 | ||||||||||||||||||||||||
| Income and Social Contribution Taxes | - | - | (912,564 | ) | (912,564 | ) | - | - | (1,839,952 | ) | (1,839,952 | ) | ||||||||||||||||||||
| Net Income (Loss) | 2,485,304 | 672,524 | 1,356,894 | 4,514,722 | 6,295,085 | 1,003,800 | 160,005 | 7,458,890 | ||||||||||||||||||||||||
| Net Margin | 32 | % | 26 | % | - | 44 | % | 53 | % | 42 | % | - | 52 | % | ||||||||||||||||||
1 Excluding non-recurring items and PPA effects.
Page
| 2023 | 2022 | |||||||||||||||||||||||||||||||
| Segmented Financial Statement (R$ '000) |
Pulp | Paper | Non Segmented |
Total Consolidated |
Pulp | Paper | Non Segmented |
Total Consolidated |
||||||||||||||||||||||||
| Net Revenue | 30,677,265 | 9,078,310 | - | 39,755,575 | 41,384,322 | 8,446,624 | - | 49,830,946 | ||||||||||||||||||||||||
| Cost of Goods Sold | (19,694,674 | ) | (5,382,001 | ) | - | (25,076,675 | ) | (19,958,000 | ) | (4,863,288 | ) | - | (24,821,288 | ) | ||||||||||||||||||
| Gross Profit | 10,982,591 | 3,696,309 | - | 14,678,900 | 21,426,322 | 3,583,336 | - | 25,009,658 | ||||||||||||||||||||||||
| Gross Margin | 36 | % | 41 | % | - | 37 | % | 52 | % | 42 | % | - | 50 | % | ||||||||||||||||||
| Operating Expense/Income | (1,537,433 | ) | (925,179 | ) | - | (2,462,612 | ) | (2,065,877 | ) | (721,000 | ) | - | (2,786,877 | ) | ||||||||||||||||||
| Selling Expenses | (1,842,818 | ) | (753,559 | ) | - | (2,596,377 | ) | (1,858,371 | ) | (624,823 | ) | - | (2,483,194 | ) | ||||||||||||||||||
| General and Administrative Expenses | (1,338,831 | ) | (584,397 | ) | - | (1,923,228 | ) | (1,211,539 | ) | (498,228 | ) | - | (1,709,767 | ) | ||||||||||||||||||
| Other Operating Income (Expenses) | 1,678,929 | 397,443 | - | 2,076,372 | 768,556 | 353,160 | - | 1,121,716 | ||||||||||||||||||||||||
| Equity Equivalence | (34,713 | ) | 15,334 | - | (19,379 | ) | 235,477 | 48,891 | - | 284,368 | ||||||||||||||||||||||
| EBIT | 9,445,158 | 2,771,130 | - | 12,216,288 | 19,360,445 | 2,862,336 | - | 22,222,781 | ||||||||||||||||||||||||
| Depreciation, Amortization & Depletion | 6,606,870 | 714,240 | - | 7,321,110 | 6,737,864 | 670,026 | - | 7,407,890 | ||||||||||||||||||||||||
| EBITDA | 16,052,028 | 3,485,370 | - | 19,537,398 | 26,098,309 | 3,532,362 | - | 29,630,671 | ||||||||||||||||||||||||
| EBITDA Margin | 52 | % | 38 | % | - | 49 | % | 63 | % | 42 | % | - | 59 | % | ||||||||||||||||||
| Adjusted EBITDA1 | 15,194,660 | 3,078,310 | - | 18,272,970 | 25,098,535 | 3,096,367 | - | 28,194,902 | ||||||||||||||||||||||||
| Adjusted EBITDA Margin1 | 50 | % | 34 | % | - | 46 | % | 61 | % | 37 | % | - | 57 | % | ||||||||||||||||||
| Net Financial Result | - | - | 5,780,928 | 5,780,928 | - | - | 6,432,800 | 6,432,800 | ||||||||||||||||||||||||
| Earnings Before Taxes | 9,445,158 | 2,771,130 | 5,780,928 | 17,997,216 | 19,360,445 | 2,862,336 | 6,432,800 | 28,655,581 | ||||||||||||||||||||||||
| Income and Social Contribution Taxes | - | - | (3,890,835 | ) | (3,890,835 | ) | - | - | (5,260,694 | ) | (5,260,694 | ) | ||||||||||||||||||||
| Net Income (Loss) | 9,445,158 | 2,771,130 | 1,890,093 | 14,106,381 | 19,360,445 | 2,862,336 | 1,172,106 | 23,394,887 | ||||||||||||||||||||||||
| Net Margin | 31 | % | 31 | % | - | 35 | % | 47 | % | 34 | % | - | 47 | % | ||||||||||||||||||
1 Excluding non-recurring items and PPA effects.
Page
Forward-Looking Statements
This release may contain forward-looking statements. Such statements are subject to known and unknown risks and uncertainties due to which such expectations may not happen at all or may substantially differ from what was expected. These risks include, among others, changes in future demand for the Company’s products, changes in factors affecting domestic and international product prices, changes in the cost structure, changes in the seasonal patterns of markets, changes in prices charged by competitors, foreign exchange variations, changes in the political or economic situation of Brazil, as well as emerging and international markets. The forward-looking statements were not reviewed by our independent auditors.
Page