UNITED STATES
SECURITIES AND EXCHANGE COMMISSION
WASHINGTON, DC 20549
FORM 8-K
CURRENT REPORT
Pursuant to Section 13 or 15(d)
of the Securities Exchange Act of 1934
Date of report (Date of earliest event reported): February 26, 2024 (February 26, 2024)
Arch Resources, Inc.
(Exact name of registrant as specified in its charter)
| Delaware | 1-13105 | 43-0921172 | ||
|
(State or other jurisdiction of incorporation) |
(Commission File Number) | (I.R.S. Employer Identification No.) |
CityPlace One
One CityPlace Drive, Suite 300
St. Louis, Missouri 63141
(Address, including zip code, of principal executive offices)
Registrant’s telephone number, including area code: (314) 994-2700
Securities registered pursuant to Section 12(b) of the Act:
| Title of each class: | Trading Symbol(s) | Name of each exchange on which registered: | ||
| Common Stock, $.01 par value | ARCH | New York Stock Exchange |
Check the appropriate box below if the Form 8-K filing is intended to simultaneously satisfy the filing obligation of the registrant under any of the following provisions:
| ¨ | Written communications pursuant to Rule 425 under the Securities Act (17 CFR 230.425) |
| ¨ | Soliciting material pursuant to Rule 14a-12 under the Exchange Act (17 CFR 240.14a-12) |
| ¨ | Pre-commencement communications pursuant to Rule 14d-2(b) under the Exchange Act (17 CFR 240.14d-2(b)) |
| ¨ | Pre-commencement communications pursuant to Rule 13e-4(c) under the Exchange Act (17 CFR 240.13e-4(c)) |
Indicate by check mark whether the registrant is an emerging growth company as defined in Rule 405 of the Securities Act of 1933 (Section 230.405 of this chapter) or Rule 12b-2 of the Securities Exchange Act of 1934 (Section 240.12b-2 of this chapter).
Emerging growth company ¨
If an emerging growth company, indicated by check mark if the registrant has elected not to use the extended transition period for complying with any new or revised financial accounting standards provided pursuant to Section 13(a) of the Exchange Act. ¨
| Item 7.01 | Regulation FD Disclosure. |
On February 27, 2024, Mr. Paul A. Lang, Chief Executive Officer of Arch Resources, Inc., will present at BMO Global Metals, Mining & Critical Minerals Conference. The slides associated with his presentation are attached as Exhibit 99.1 hereto and are hereby incorporated by reference.
The information contained in Item 7.01 and the exhibits attached hereto shall not be deemed “filed” for purposes of Section 18 of the Securities Exchange Act of 1934, as amended (the “Exchange Act”), or otherwise subject to the liabilities of that section, nor shall they be deemed incorporated by reference in any filing under the Securities Act of 1933, as amended (the “Securities Act”) or the Exchange Act, except as shall be expressly set forth by specific reference in such a filing.
| Item 9.01 | Financial Statements and Exhibits. |
| (d) | Exhibits |
The following exhibits are attached hereto and filed herewith.
| Exhibit No. |
|
||
| 99.1 | Arch Resources, Inc. Presentation Slides for BMO Global Metals, Mining & Critical Minerals Conference | ||
| 104 | Cover Page Interactive Data File (formatted as Inline XBRL and contained in Exhibit 101 |
Signatures
Pursuant to the requirements of the Securities Exchange Act of 1934, the registrant has duly caused this report to be signed on its behalf by the undersigned hereunto duly authorized.
| Dated: February 26, 2024 | Arch Resources, Inc. | |
| By: | /s/ Rosemary L. Klein | |
| Rosemary L. Klein | ||
| Senior Vice President – Law, General Counsel and Secretary | ||
|
BMO Global Metals, Mining & Critical Minerals Conference F E B R U A R Y 2 7 , 2 0 2 4 Paul A. Lang Chief Executive Officer |
|
2 Forward-Looking Information Forward-Looking Statements: This presentation contains “forward-looking statements” within the meaning of Section 27A of the Securities Act of 1933, as amended, and Section 21E of the Securities Exchange Act of 1934, as amended - that is, statements related to future, not past, events. In this context, forward-looking statements often address our expected future business and financial performance, and future plans, and often contain words such as “should,” “could,” “appears,” “estimates,” “projects,” “targets,” “expects,” “anticipates,” “intends,” “may,” “plans,” “predicts,” “believes,” “seeks,” “strives,” “will” or variations of such words or similar words. Actual results or outcomes may vary significantly, and adversely, from those anticipated due to many factors, including: loss of availability, reliability and cost-effectiveness of transportation facilities and fluctuations in transportation costs; operating risks beyond our control, including risks related to mining conditions, mining, processing and plant equipment failures or maintenance problems, weather and natural disasters, the unavailability of raw materials, equipment or other critical supplies, mining accidents, and other inherent risks of coal mining that are beyond our control; inflationary pressures and availability and price of mining and other industrial supplies; changes in coal prices, which may be caused by numerous factors beyond our control, including changes in the domestic and foreign supply of and demand for coal and the domestic and foreign demand for steel and electricity; volatile economic and market conditions; the effects of foreign and domestic trade policies, actions or disputes on the level of trade among the countries and regions in which we operate, the competitiveness of our exports, or our ability to export; the effects of significant foreign conflicts; the loss of, or significant reduction in, purchases by our largest customers; our relationships with, and other conditions affecting our customers and our ability to collect payments from our customers; risks related to our international growth; competition, both within our industry and with producers of competing energy sources, including the effects from any current or future legislation or regulations designed to support, promote or mandate renewable energy sources; alternative steel production technologies that may reduce demand for our coal; our ability to secure new coal supply arrangements or to renew existing coal supply arrangements; cyber-attacks or other security breaches that disrupt our operations, or that result in the unauthorized release of proprietary, confidential or personally identifiable information; our ability to acquire or develop coal reserves in an economically feasible manner; inaccuracies in our estimates of our coal reserves; defects in title or the loss of a leasehold interest; the availability and cost of surety bonds, including potential collateral requirements; we may not have adequate insurance coverage for some business risks; disruptions in the supply of coal from third parties; decreases in the coal consumption of electric power generators could result in less demand and lower prices for thermal coal; our ability to pay dividends or repurchase shares of our common stock according to our announced intent or at all; the loss of key personnel or the failure to attract additional qualified personnel and the availability of skilled employees and other workforce factors; public health emergencies, such as pandemics or epidemics, could have an adverse effect on our business; existing and future legislation and regulations affecting both our coal mining operations and our customers' coal usage, governmental policies and taxes, including those aimed at reducing emissions of elements such as mercury, sulfur dioxides, nitrogen oxides, particulate matter or greenhouse gases; increased pressure from political and regulatory authorities, along with environmental and climate change activist groups, and lending and investment policies adopted by financial institutions and insurance companies to address concerns about the environmental impacts of coal combustion; increased attention to environmental, social or governance matters (“ESG”); our ability to obtain or renew various permits necessary for our mining operations; risks related to regulatory agencies ordering certain of our mines to be temporarily or permanently closed under certain circumstances; risks related to extensive environmental regulations that impose significant costs on our mining operations and could result in litigation or material liabilities; the accuracy of our estimates of reclamation and other mine closure obligations; the existence of hazardous substances or other environmental contamination on property owned or used by us and risks related to tax legislation and our ability to use net operating losses and certain tax credits; All forward-looking statements in this presentation, as well as all other written and oral forward-looking statements attributable to us or persons acting on our behalf, are expressly qualified in their entirety by the cautionary statements contained in this section and elsewhere in this presentation . These factors are not necessarily all of the important factors that could cause actual results or outcomes to vary significantly, and adversely, from those anticipated at the time such statements were first made. These risks and uncertainties, as well as other risks of which we are not aware or which we currently do not believe to be material, may cause our actual future results and outcomes to be materially, and adversely, different than those expressed in our forward-looking statements. These forward-looking statements speak only as of the date on which such statements were made, and we do not undertake, and expressly disclaim, any duty to update our forward-looking statements, whether as a result of new information, future events or otherwise, except as may be required by the federal securities laws. For a description of some of the risks and uncertainties that may affect our future results, you should see the risk factors described from time to time in the reports we file with the Securities and Exchange Commission. Additionally, our discussions of certain ESG matters and issues herein are developed with various standards and frameworks (including standards for the measurement of underlying data), and the interests of various stakeholders. As such, such discussions may not necessarily be “material” under the federal securities laws for SEC reporting purposes. Furthermore, many of our disclosures regarding ESG matters are subject to methodological considerations or information, including from third parties, that is still evolving and subject to change. For example, our disclosures based on any standards may change due to revisions in framework requirements, availability of information, changes in our business or applicable government policies, or other factors, some of which may be beyond our control. This presentation includes certain non-GAAP financial measures, including Adjusted EBITDA, net cash, free cash flow, free cash flow yield, and modeled discretionary free cash flow. These non-GAAP financial measures are not measures of financial performance in accordance with generally accepted accounting principles and may exclude items that are significant in understanding and assessing our financial results. Therefore, these measures should not be considered in isolation or as an alternative to cash and cash equivalents, net income, earnings per fully-diluted share or other measures of profitability, liquidity or performance under generally accepted accounting principles. You should be aware that our presentation of these measures may not be comparable to similarly-titled measures used by other companies. A reconciliation of these financial measures to the most comparable measures presented in accordance with generally accepted accounting principles has been included at the end of this presentation. |
|
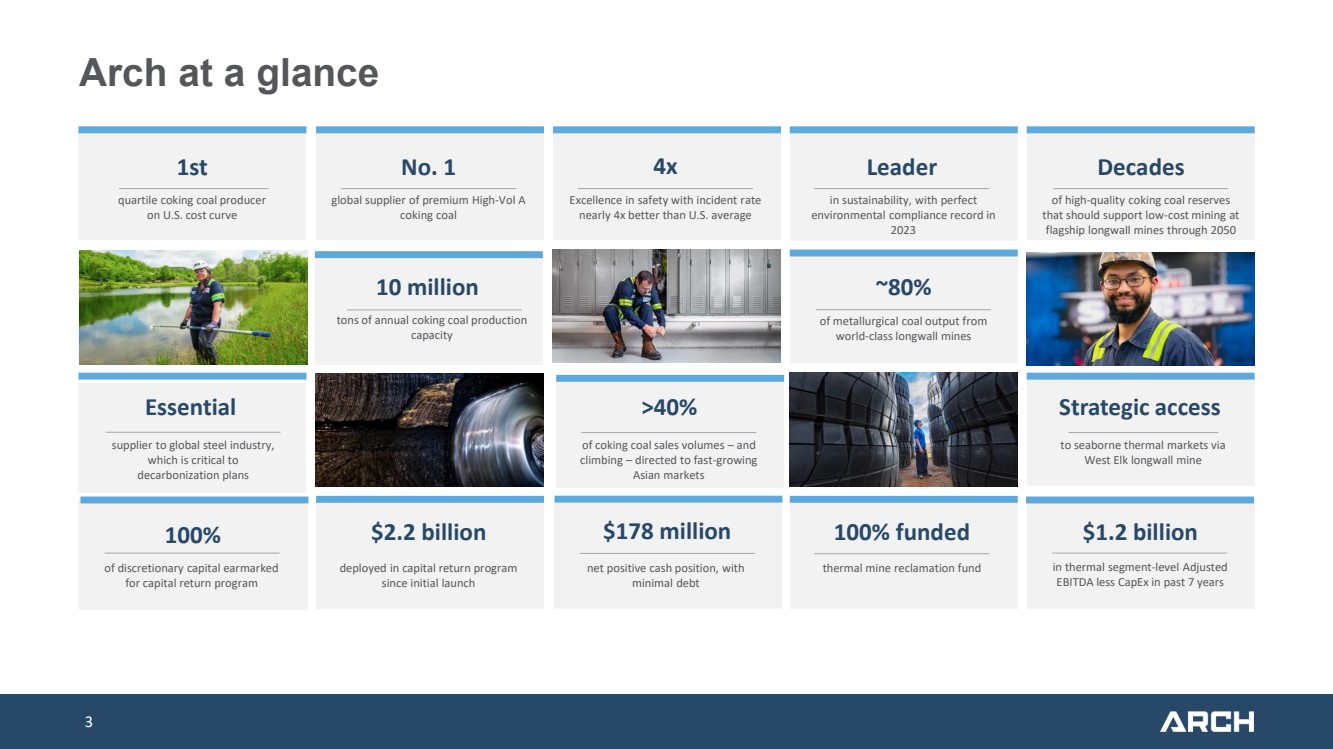
3 Arch at a glance 1st quartile coking coal producer on U.S. cost curve No. 1 global supplier of premium High-Vol A coking coal 4x Excellence in safety with incident rate nearly 4x better than U.S. average Leader Decades of high-quality coking coal reserves that should support low-cost mining at flagship longwall mines through 2050 100% of discretionary capital earmarked for capital return program Essential supplier to global steel industry, which is critical to decarbonization plans $178 million net positive cash position, with minimal debt Strategic access to seaborne thermal markets via West Elk longwall mine $2.2 billion deployed in capital return program since initial launch 10 million tons of annual coking coal production capacity 100% funded thermal mine reclamation fund in sustainability, with perfect environmental compliance record in 2023 ~80% of metallurgical coal output from world-class longwall mines $1.2 billion in thermal segment-level Adjusted EBITDA less CapEx in past 7 years >40% of coking coal sales volumes – and climbing – directed to fast-growing Asian markets |
|
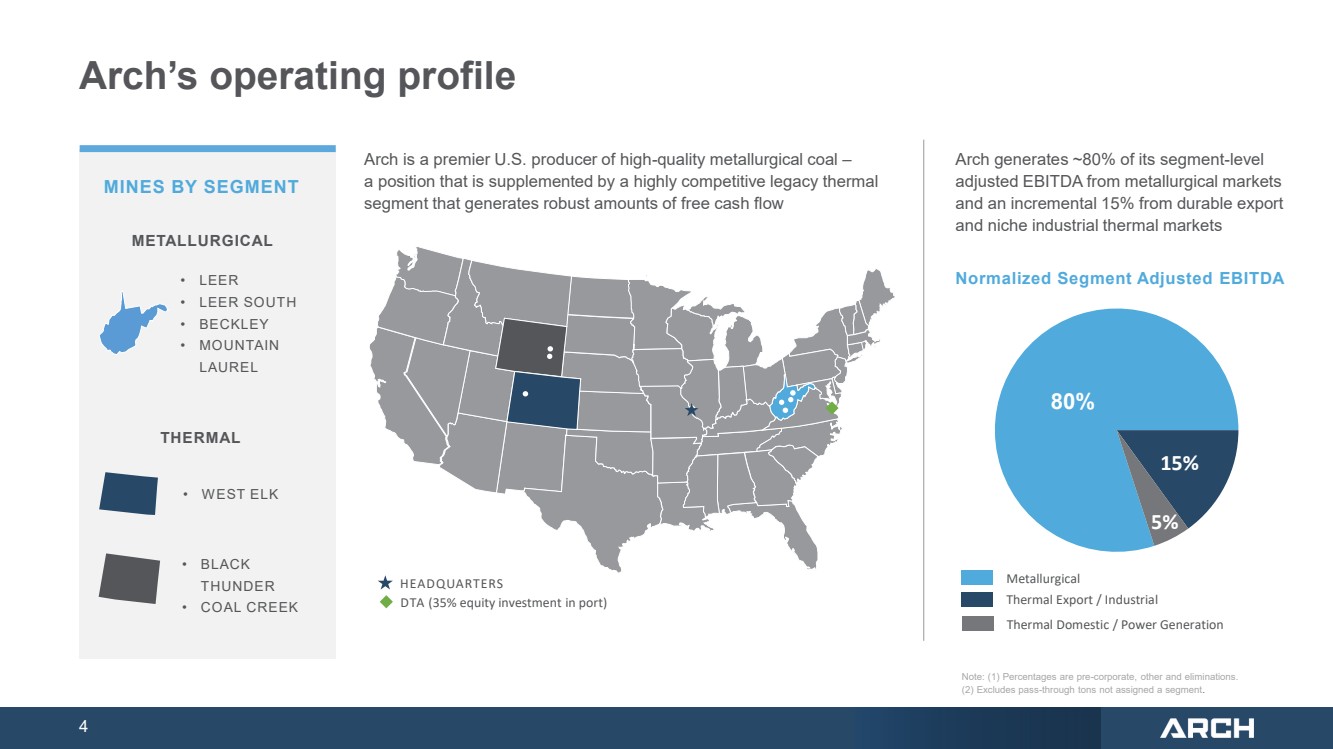
4 Arch’s operating profile • WEST ELK • LEER • LEER SOUTH • BECKLEY • MOUNTAIN LAUREL METALLURGICAL • BLACK THUNDER • COAL CREEK THERMAL MINES BY SEGMENT Normalized Segment Adjusted EBITDA Thermal Export / Industrial Metallurgical Arch is a premier U.S. producer of high-quality metallurgical coal – a position that is supplemented by a highly competitive legacy thermal segment that generates robust amounts of free cash flow Arch generates ~80% of its segment-level adjusted EBITDA from metallurgical markets and an incremental 15% from durable export and niche industrial thermal markets 15% 80% HEADQUARTERS DTA (35% equity investment in port) 5% Thermal Domestic / Power Generation Note: (1) Percentages are pre-corporate, other and eliminations. (2) Excludes pass-through tons not assigned a segment. |
|
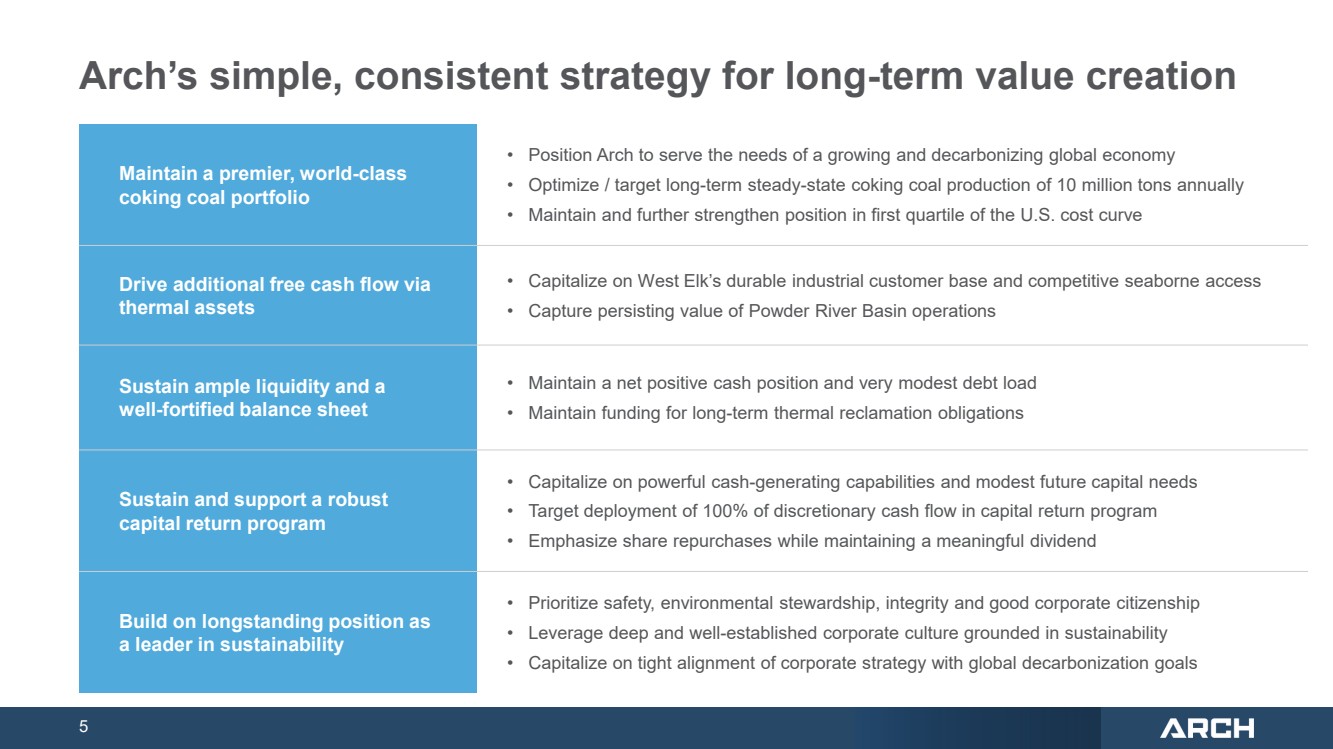
5 Arch’s simple, consistent strategy for long-term value creation Maintain a premier, world-class coking coal portfolio • Position Arch to serve the needs of a growing and decarbonizing global economy • Optimize / target long-term steady-state coking coal production of 10 million tons annually • Maintain and further strengthen position in first quartile of the U.S. cost curve Drive additional free cash flow via thermal assets • Capitalize on West Elk’s durable industrial customer base and competitive seaborne access • Capture persisting value of Powder River Basin operations Sustain ample liquidity and a well-fortified balance sheet • Maintain a net positive cash position and very modest debt load • Maintain funding for long-term thermal reclamation obligations Sustain and support a robust capital return program • Capitalize on powerful cash-generating capabilities and modest future capital needs • Target deployment of 100% of discretionary cash flow in capital return program • Emphasize share repurchases while maintaining a meaningful dividend Build on longstanding position as a leader in sustainability • Prioritize safety, environmental stewardship, integrity and good corporate citizenship • Leverage deep and well-established corporate culture grounded in sustainability • Capitalize on tight alignment of corporate strategy with global decarbonization goals |
|
6 ARCH RESOURCES INVESTMENT THESIS FOR COKING COAL |
|
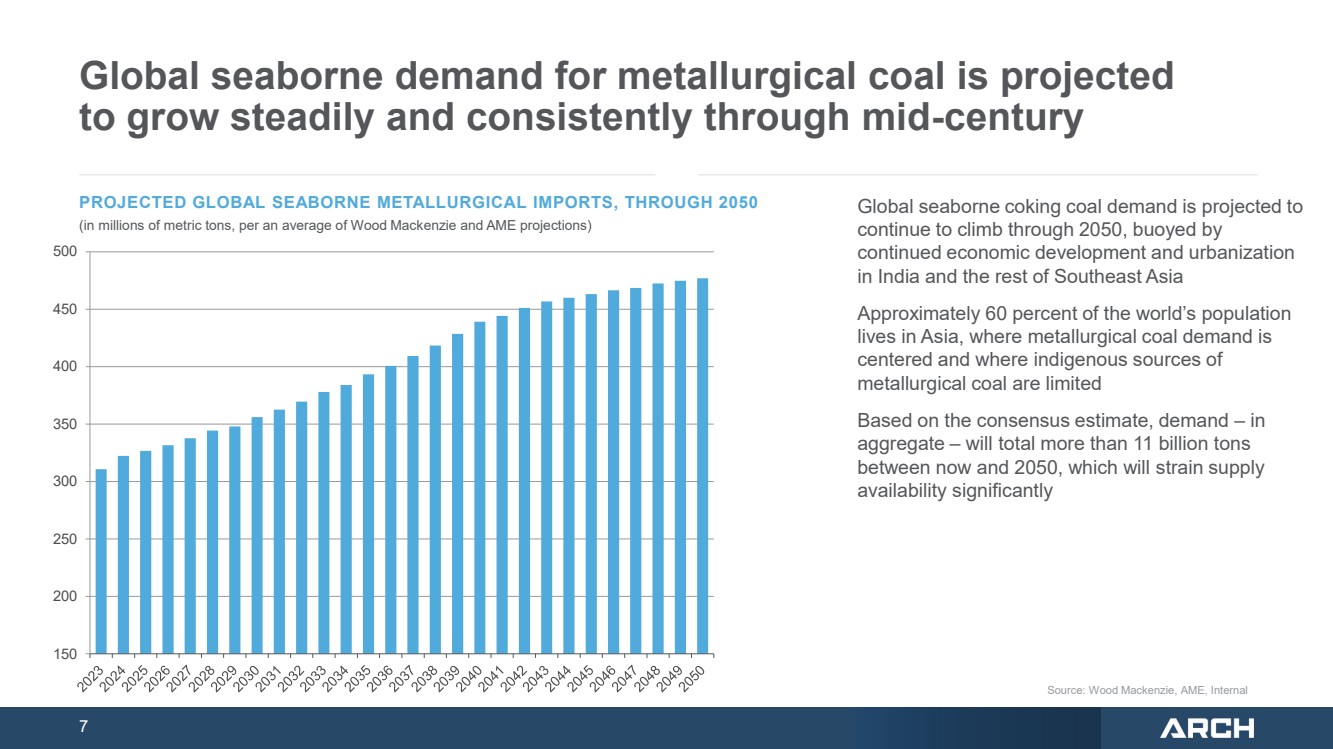
7 Source: Wood Mackenzie, AME, Internal 150 200 250 300 350 400 450 500 Global seaborne demand for metallurgical coal is projected to grow steadily and consistently through mid-century PROJECTED GLOBAL SEABORNE METALLURGICAL IMPORTS, THROUGH 2050 (in millions of metric tons, per an average of Wood Mackenzie and AME projections) Global seaborne coking coal demand is projected to continue to climb through 2050, buoyed by continued economic development and urbanization in India and the rest of Southeast Asia Approximately 60 percent of the world’s population lives in Asia, where metallurgical coal demand is centered and where indigenous sources of metallurgical coal are limited Based on the consensus estimate, demand – in aggregate – will total more than 11 billion tons between now and 2050, which will strain supply availability significantly |
|
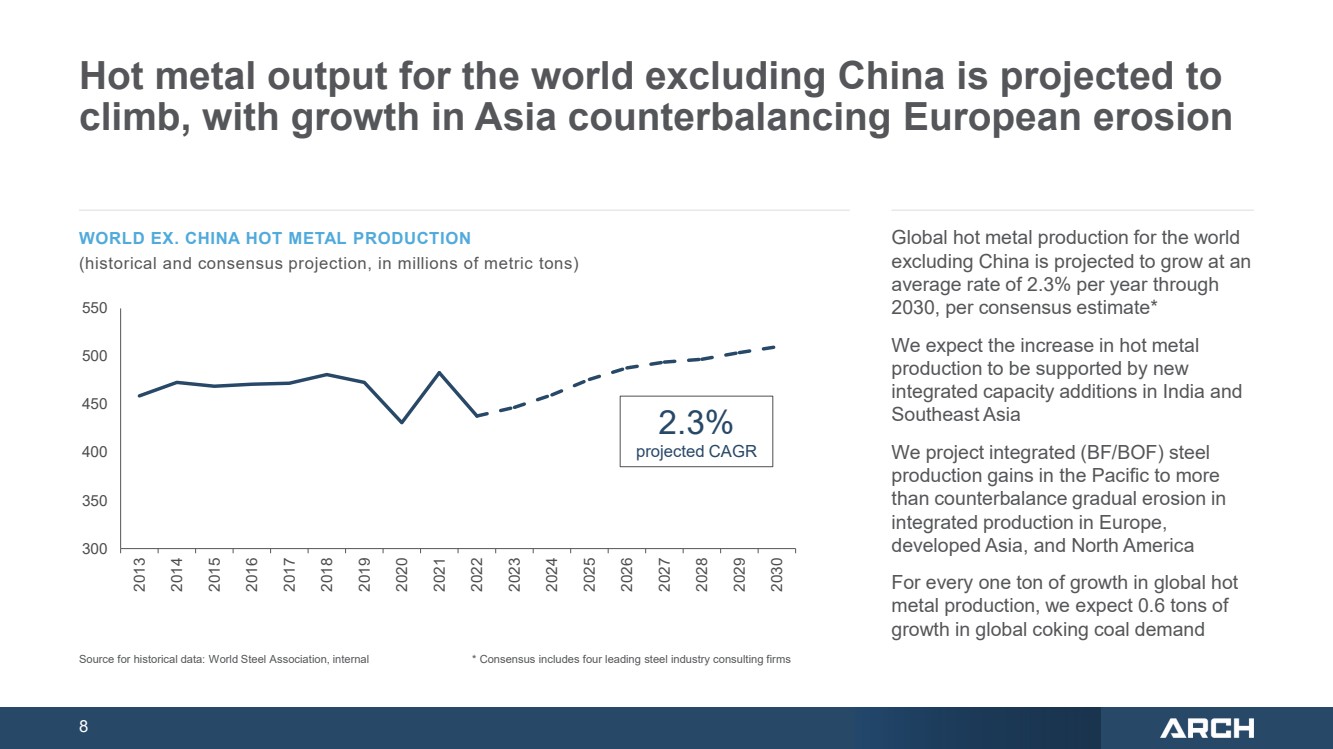
8 Hot metal output for the world excluding China is projected to climb, with growth in Asia counterbalancing European erosion Global hot metal production for the world excluding China is projected to grow at an average rate of 2.3% per year through 2030, per consensus estimate* We expect the increase in hot metal production to be supported by new integrated capacity additions in India and Southeast Asia We project integrated (BF/BOF) steel production gains in the Pacific to more than counterbalance gradual erosion in integrated production in Europe, developed Asia, and North America For every one ton of growth in global hot metal production, we expect 0.6 tons of growth in global coking coal demand WORLD EX. CHINA HOT METAL PRODUCTION (historical and consensus projection, in millions of metric tons) Source for historical data: World Steel Association, internal 300 350 400 450 500 550 2013 2014 2015 2016 2017 2018 2019 2020 2021 2022 2023 2024 2025 2026 2027 2028 2029 2030 * Consensus includes four leading steel industry consulting firms 2.3% projected CAGR |
|
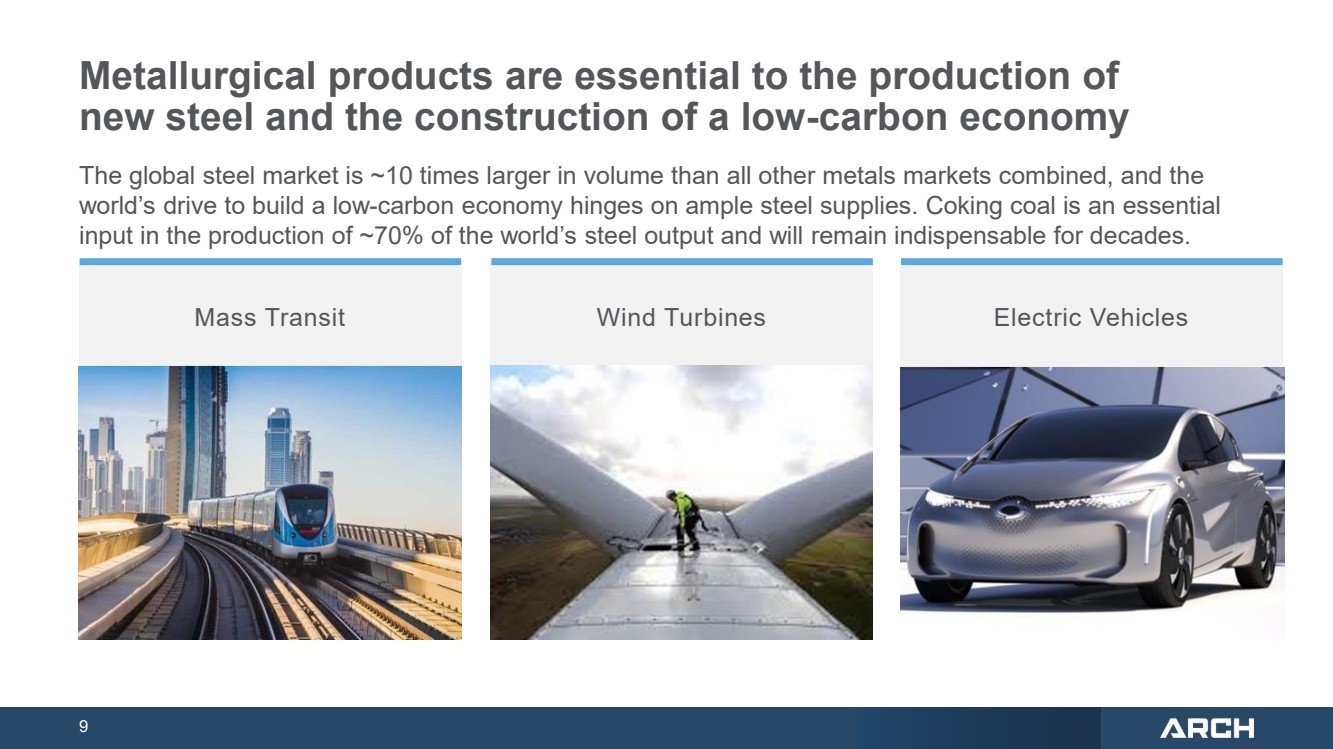
9 Metallurgical products are essential to the production of new steel and the construction of a low-carbon economy The global steel market is ~10 times larger in volume than all other metals markets combined, and the world’s drive to build a low-carbon economy hinges on ample steel supplies. Coking coal is an essential input in the production of ~70% of the world’s steel output and will remain indispensable for decades. Mass Transit Wind Turbines Electric Vehicles |
|
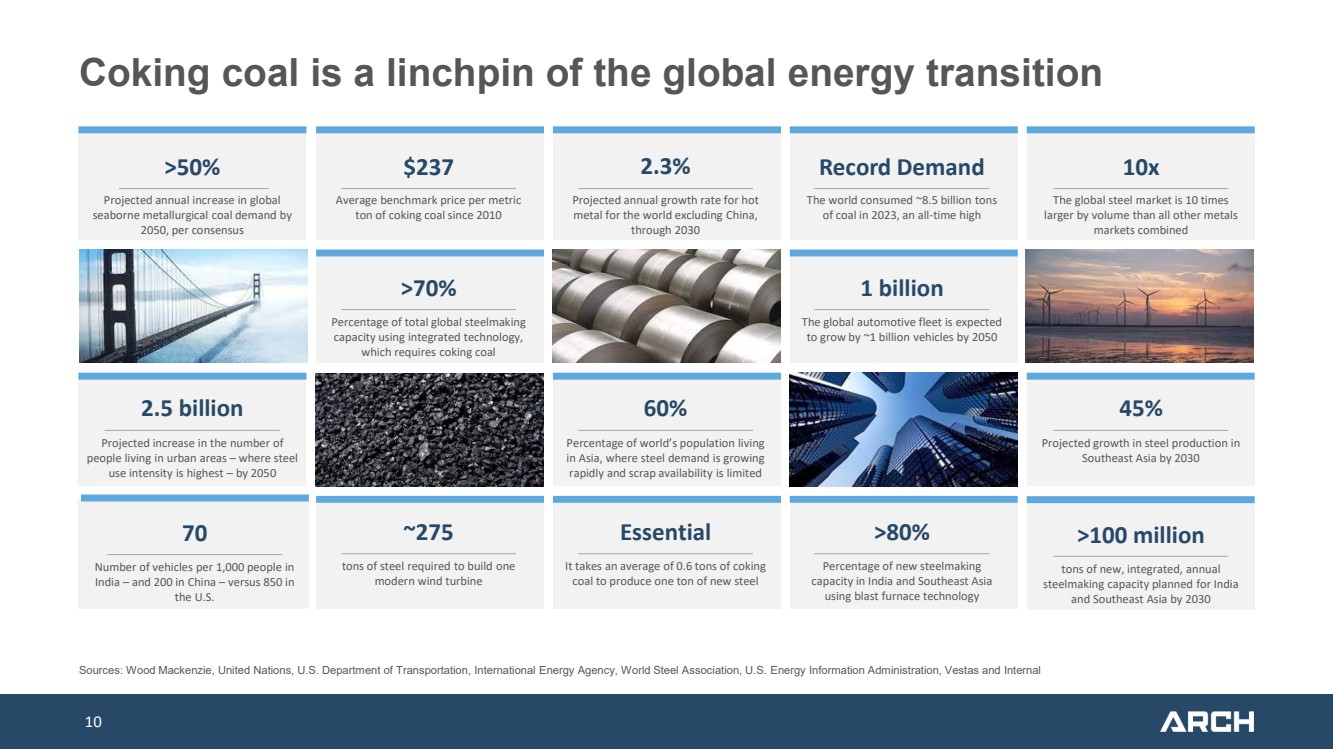
10 Coking coal is a linchpin of the global energy transition >50% Projected annual increase in global seaborne metallurgical coal demand by 2050, per consensus $237 Average benchmark price per metric ton of coking coal since 2010 2.3% Projected annual growth rate for hot metal for the world excluding China, through 2030 Record Demand The world consumed ~8.5 billion tons of coal in 2023, an all-time high 10x The global steel market is 10 times larger by volume than all other metals markets combined >70% Percentage of total global steelmaking capacity using integrated technology, which requires coking coal 1 billion The global automotive fleet is expected to grow by ~1 billion vehicles by 2050 2.5 billion Projected increase in the number of people living in urban areas – where steel use intensity is highest – by 2050 60% Percentage of world’s population living in Asia, where steel demand is growing rapidly and scrap availability is limited 45% Projected growth in steel production in Southeast Asia by 2030 ~275 tons of steel required to build one modern wind turbine Essential It takes an average of 0.6 tons of coking coal to produce one ton of new steel >80% Percentage of new steelmaking capacity in India and Southeast Asia using blast furnace technology Sources: Wood Mackenzie, United Nations, U.S. Department of Transportation, International Energy Agency, World Steel Association, U.S. Energy Information Administration, Vestas and Internal 70 Number of vehicles per 1,000 people in India – and 200 in China – versus 850 in the U.S. >100 million tons of new, integrated, annual steelmaking capacity planned for India and Southeast Asia by 2030 |
|
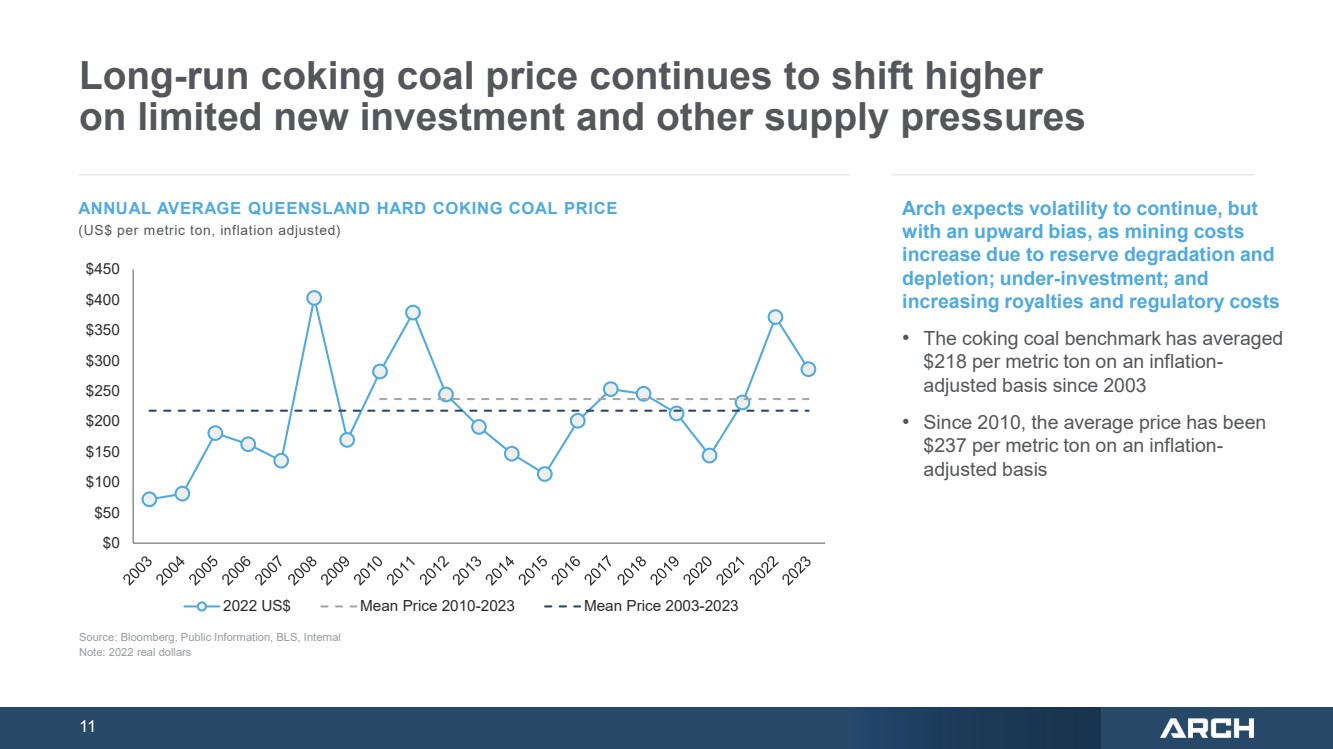
11 Long-run coking coal price continues to shift higher on limited new investment and other supply pressures Arch expects volatility to continue, but with an upward bias, as mining costs increase due to reserve degradation and depletion; under-investment; and increasing royalties and regulatory costs • The coking coal benchmark has averaged $218 per metric ton on an inflation-adjusted basis since 2003 • Since 2010, the average price has been $237 per metric ton on an inflation-adjusted basis ANNUAL AVERAGE QUEENSLAND HARD COKING COAL PRICE (US$ per metric ton, inflation adjusted) $0 $50 $100 $150 $200 $250 $300 $350 $400 $450 2022 US$ Mean Price 2010-2023 Mean Price 2003-2023 Source: Bloomberg, Public Information, BLS, Internal Note: 2022 real dollars |
|
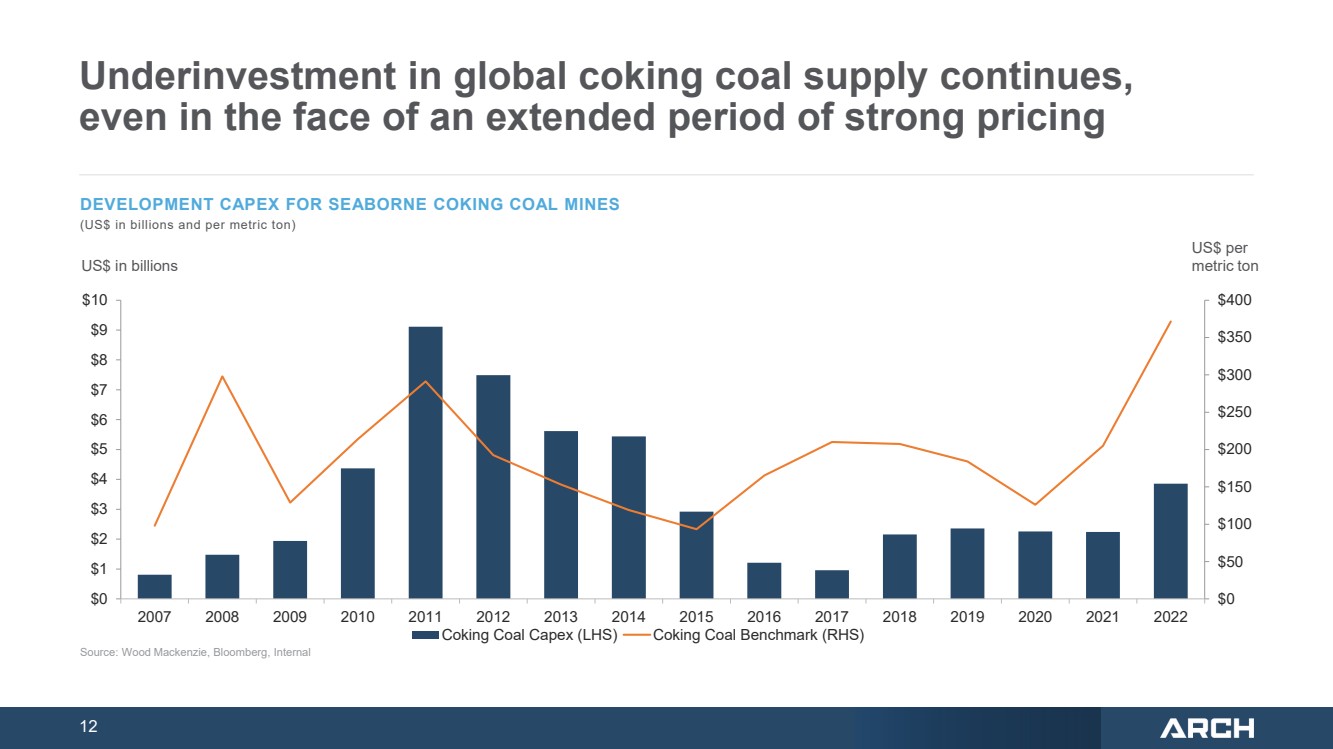
12 Underinvestment in global coking coal supply continues, even in the face of an extended period of strong pricing DEVELOPMENT CAPEX FOR SEABORNE COKING COAL MINES (US$ in billions and per metric ton) $0 $50 $100 $150 $200 $250 $300 $350 $400 $0 $1 $2 $3 $4 $5 $6 $7 $8 $9 $10 2007 2008 2009 2010 2011 2012 2013 2014 2015 2016 2017 2018 2019 2020 2021 2022 Coking Coal Capex (LHS) Coking Coal Benchmark (RHS) Source: Wood Mackenzie, Bloomberg, Internal US$ per US$ in billions metric ton |
|
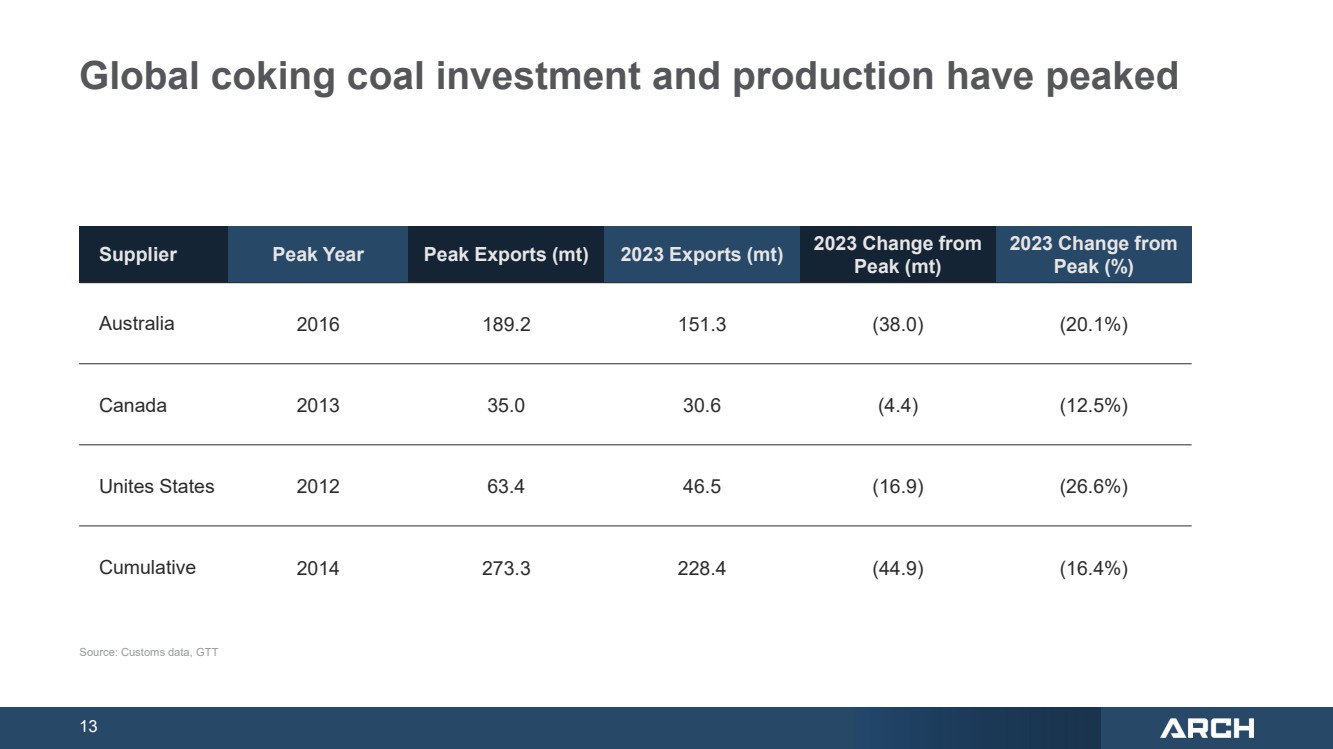
13 Global coking coal investment and production have peaked Source: Customs data, GTT Supplier Peak Year Peak Exports (mt) 2023 Exports (mt) 2023 Change from Peak (mt) 2023 Change from Peak (%) Australia 2016 189.2 151.3 (38.0) (20.1%) Canada 2013 35.0 30.6 (4.4) (12.5%) Unites States 2012 63.4 46.5 (16.9) (26.6%) Cumulative 2014 273.3 228.4 (44.9) (16.4%) |
|
14 ARCH RESOURCES ARCH’S PREMIER METALLURGICAL FRANCHISE |
|
15 Arch is a premier supplier of coking coal globally Arch has a world-class coking coal portfolio that ranks in the first quartile of the U.S. cost curve • Arch derives approximately 80% of its annual coking coal production from large, highly efficient longwall operations • We maintain a cost profile that is an estimated $50 per ton lower than the marginal cost of production for U.S. coking coal producers Arch is the No. 1 global supplier of premium, High-Vol A coking coal • Arch supplies approximately 30% of the world’s High-Vol A coking coal • High-Vol A coking coal typically trades at a premium to other U.S. coking coals in the marketplace • Arch’s High-Vol A coking coal is highly sought-after in marketplace due to its high Coke Strength after Reaction (CSR) and superior blending properties Arch is a widely recognized, longstanding leader in sustainability • Arch has maintained a safety record that is nearly four times better than the U.S. coal industry average • Arch had a perfect environmental compliance record in 2023 • Arch has reduced its Scope 1 and Scope 2 CO2e emissions by nearly 50% since its 2011 baseline year Arch has an extensive reserve base of high-quality coking coal that can support low-cost mining for decades • Each of Arch’s four coking coal mines have dedicated reserves that can support low-cost mining for 20 years or more • The yet-to-be-assigned reserves in the Leer reserve base provide future optionality for another low-cost longwall mine or – conversely – an additional 20-plus years of mining at Arch’s flagship Leer and Leer South longwall operations |
|
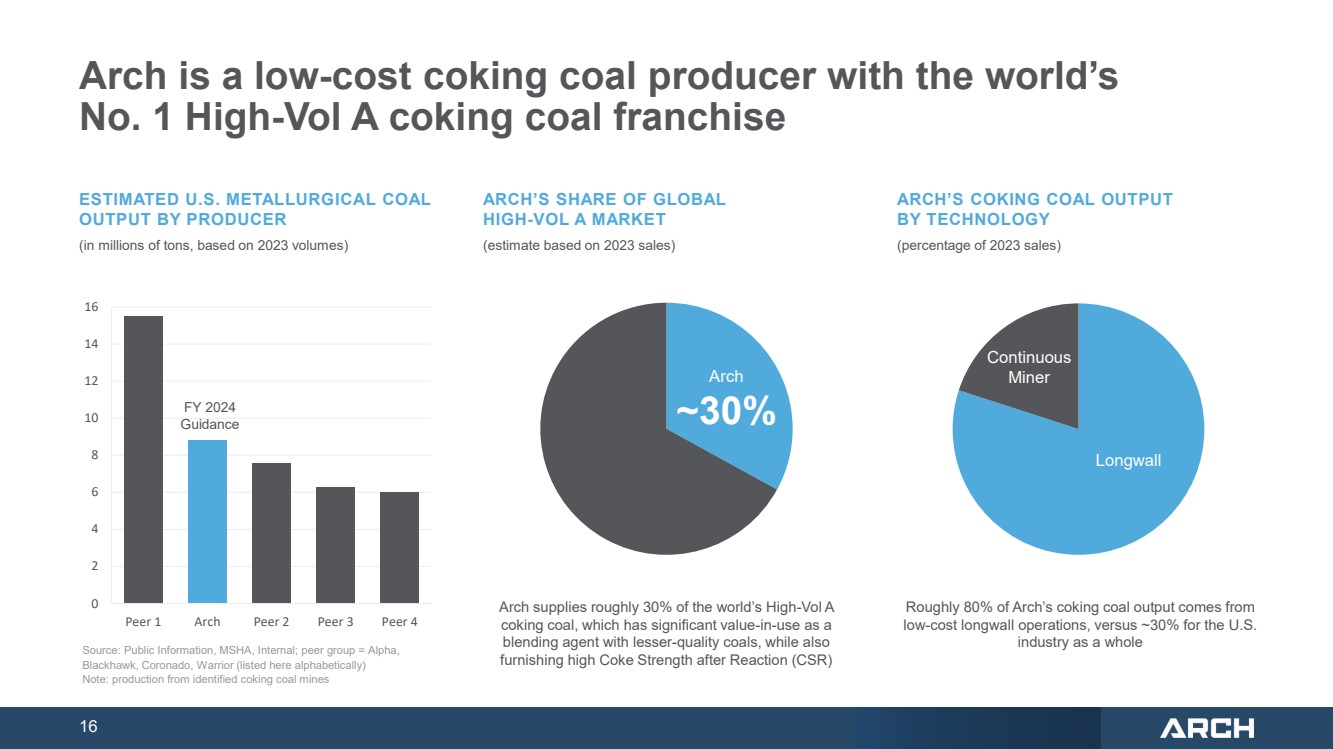
16 Arch is a low-cost coking coal producer with the world’s No. 1 High-Vol A coking coal franchise ARCH’S COKING COAL OUTPUT BY TECHNOLOGY (percentage of 2023 sales) Continuous Miner Longwall Roughly 80% of Arch’s coking coal output comes from low-cost longwall operations, versus ~30% for the U.S. industry as a whole 0 2 4 6 8 10 12 14 16 Peer 1 Arch Peer 2 Peer 3 Peer 4 ARCH’S SHARE OF GLOBAL HIGH-VOL A MARKET (estimate based on 2023 sales) Arch supplies roughly 30% of the world’s High-Vol A coking coal, which has significant value-in-use as a blending agent with lesser-quality coals, while also furnishing high Coke Strength after Reaction (CSR) Source: Public Information, MSHA, Internal; peer group = Alpha, Blackhawk, Coronado, Warrior (listed here alphabetically) Note: production from identified coking coal mines ESTIMATED U.S. METALLURGICAL COAL OUTPUT BY PRODUCER (in millions of tons, based on 2023 volumes) Arch Guidance FY 2024 ~30% |
|
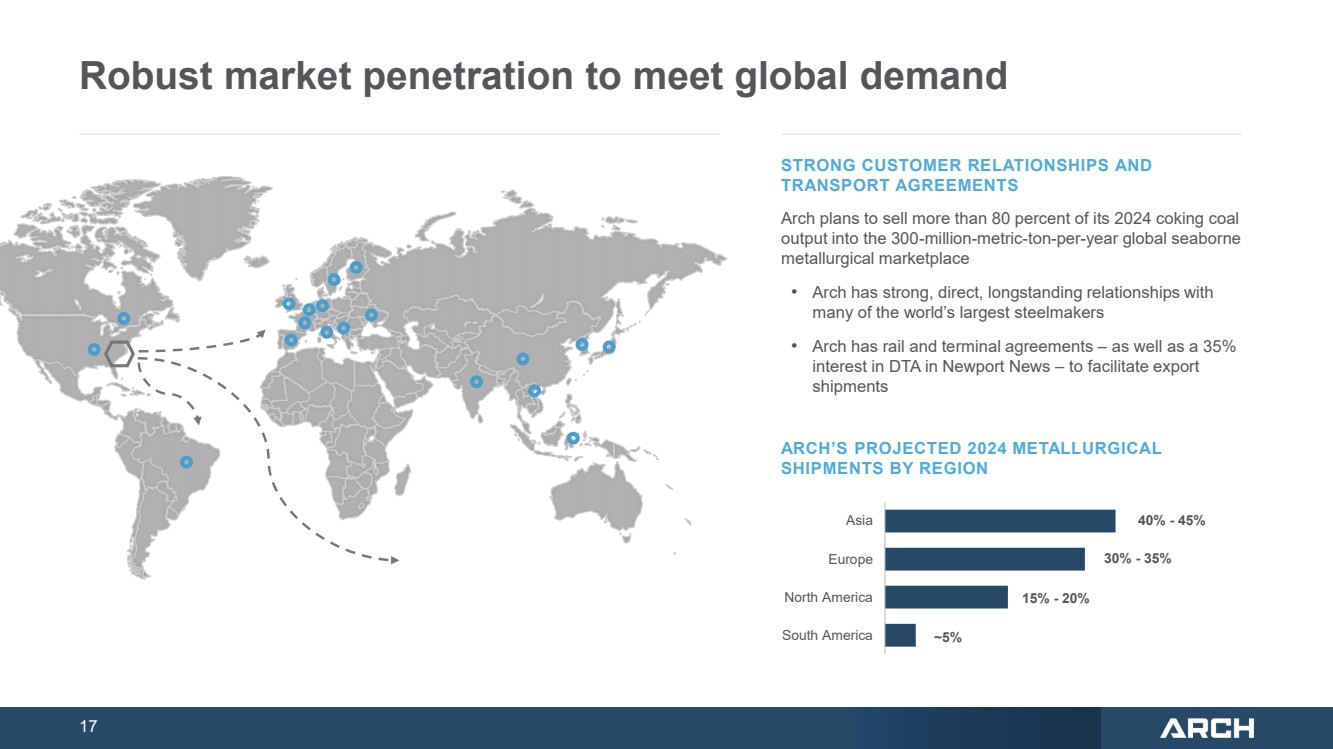
17 Robust market penetration to meet global demand South America North America Europe Asia 40% - 45% 30% - 35% 15% - 20% ~5% ARCH’S PROJECTED 2024 METALLURGICAL SHIPMENTS BY REGION STRONG CUSTOMER RELATIONSHIPS AND TRANSPORT AGREEMENTS Arch plans to sell more than 80 percent of its 2024 coking coal output into the 300-million-metric-ton-per-year global seaborne metallurgical marketplace • Arch has strong, direct, longstanding relationships with many of the world’s largest steelmakers • Arch has rail and terminal agreements – as well as a 35% interest in DTA in Newport News – to facilitate export shipments |
|
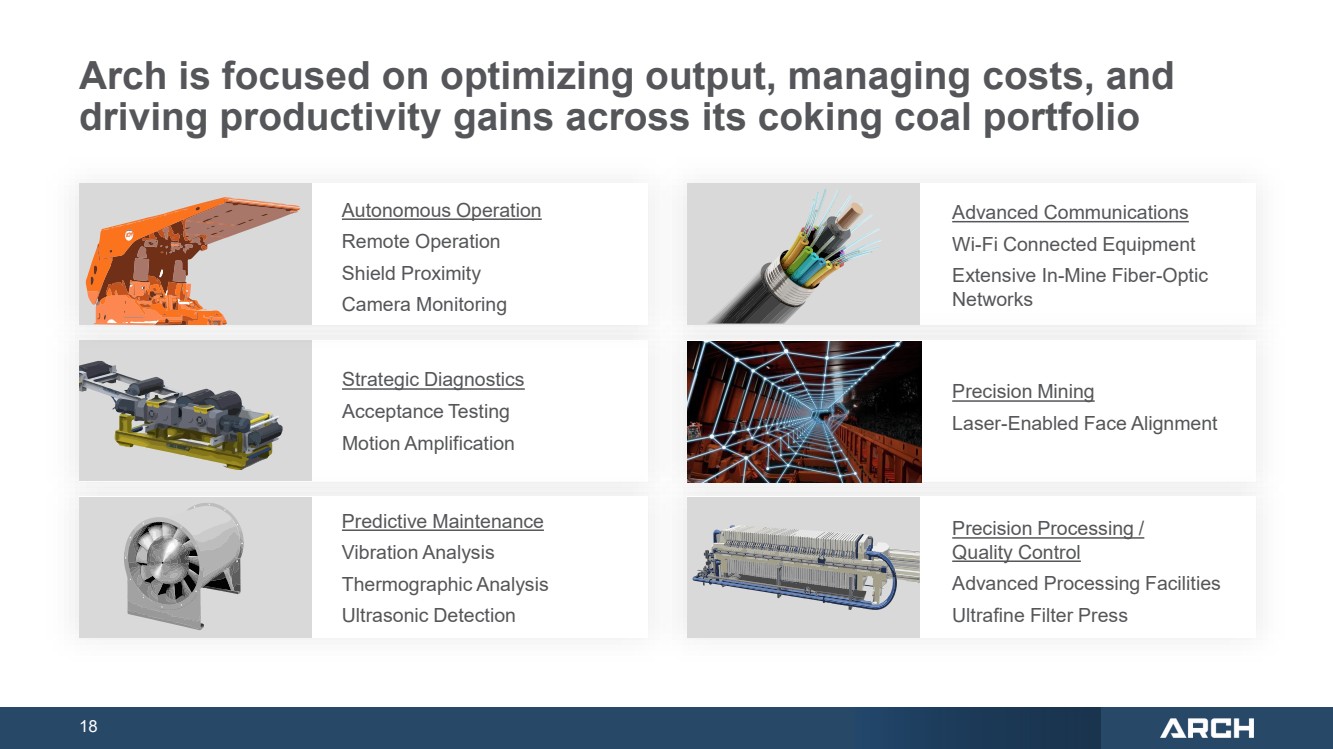
18 Arch is focused on optimizing output, managing costs, and driving productivity gains across its coking coal portfolio Autonomous Operation Remote Operation Shield Proximity Camera Monitoring Advanced Communications Wi-Fi Connected Equipment Extensive In-Mine Fiber-Optic Networks Strategic Diagnostics Acceptance Testing Motion Amplification Predictive Maintenance Vibration Analysis Thermographic Analysis Ultrasonic Detection Precision Mining Laser-Enabled Face Alignment Precision Processing / Quality Control Advanced Processing Facilities Ultrafine Filter Press |
|
19 ARCH’S COMPETITIVE THERMAL FRANCHISE ARCH THERMAL |
|
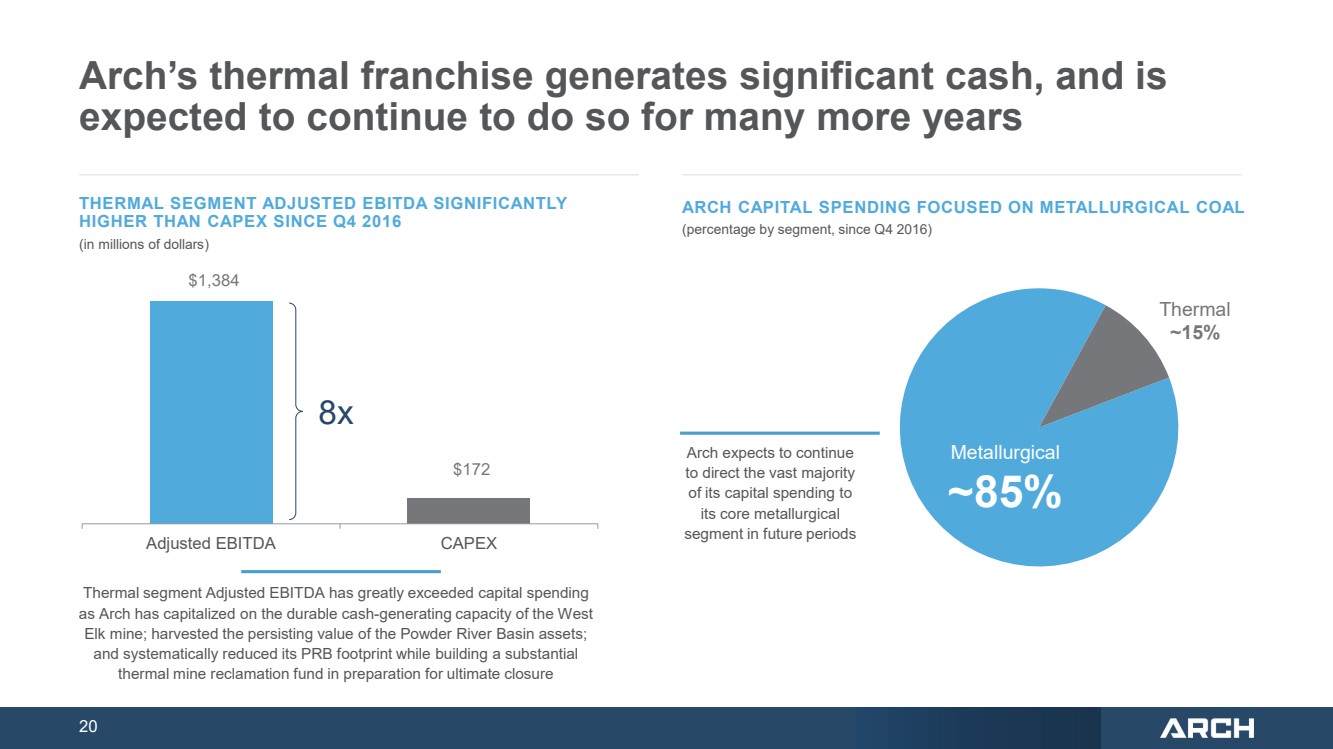
20 Arch’s thermal franchise generates significant cash, and is expected to continue to do so for many more years $1,384 $172 ARCH CAPITAL SPENDING FOCUSED ON METALLURGICAL COAL (percentage by segment, since Q4 2016) Thermal ~15% Arch expects to continue to direct the vast majority of its capital spending to its core metallurgical segment in future periods Metallurgical ~85% THERMAL SEGMENT ADJUSTED EBITDA SIGNIFICANTLY HIGHER THAN CAPEX SINCE Q4 2016 (in millions of dollars) Thermal segment Adjusted EBITDA has greatly exceeded capital spending as Arch has capitalized on the durable cash-generating capacity of the West Elk mine; harvested the persisting value of the Powder River Basin assets; and systematically reduced its PRB footprint while building a substantial thermal mine reclamation fund in preparation for ultimate closure 8x Adjusted EBITDA CAPEX |
|
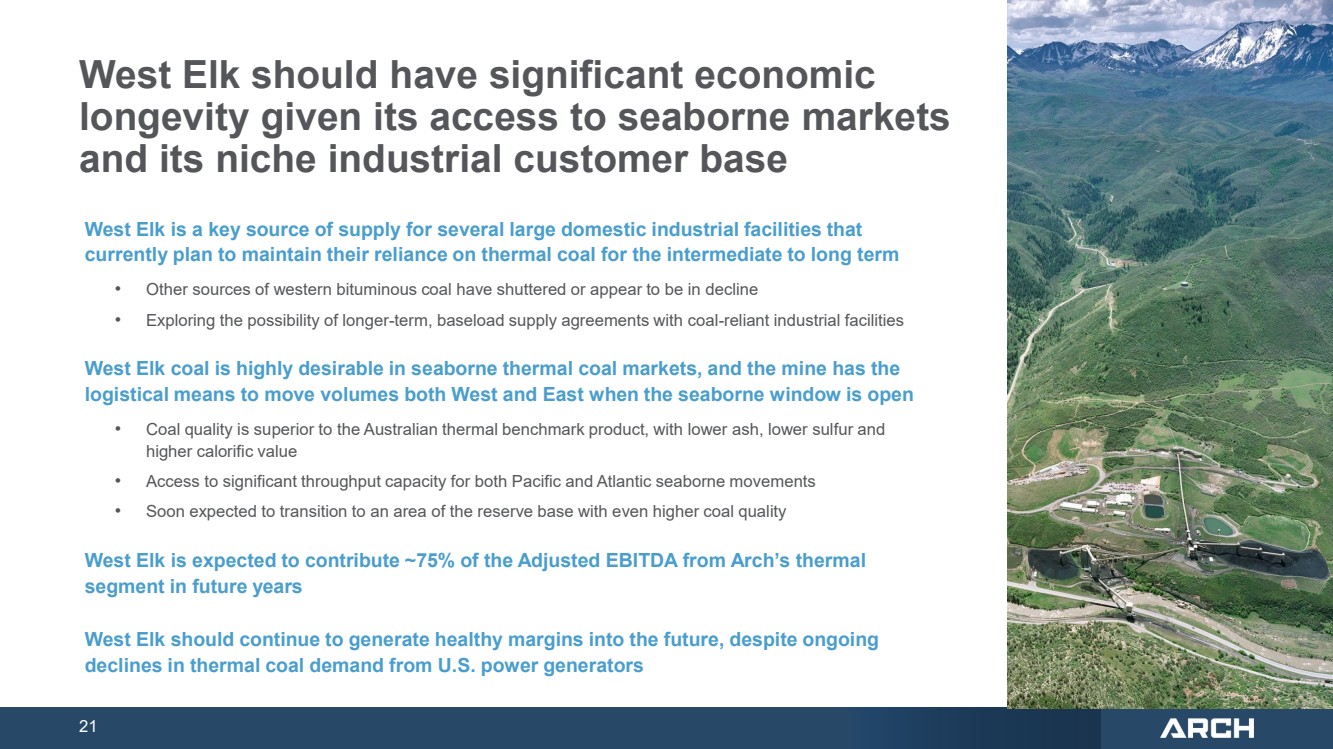
21 West Elk should have significant economic longevity given its access to seaborne markets and its niche industrial customer base West Elk is a key source of supply for several large domestic industrial facilities that currently plan to maintain their reliance on thermal coal for the intermediate to long term • Other sources of western bituminous coal have shuttered or appear to be in decline • Exploring the possibility of longer-term, baseload supply agreements with coal-reliant industrial facilities West Elk coal is highly desirable in seaborne thermal coal markets, and the mine has the logistical means to move volumes both West and East when the seaborne window is open • Coal quality is superior to the Australian thermal benchmark product, with lower ash, lower sulfur and higher calorific value • Access to significant throughput capacity for both Pacific and Atlantic seaborne movements • Soon expected to transition to an area of the reserve base with even higher coal quality West Elk is expected to contribute ~75% of the Adjusted EBITDA from Arch’s thermal segment in future years West Elk should continue to generate healthy margins into the future, despite ongoing declines in thermal coal demand from U.S. power generators |
|
22 ARCH’S SUSTAINABILITY LEADERSHIP ARCH SUSTAINABILITY |
|
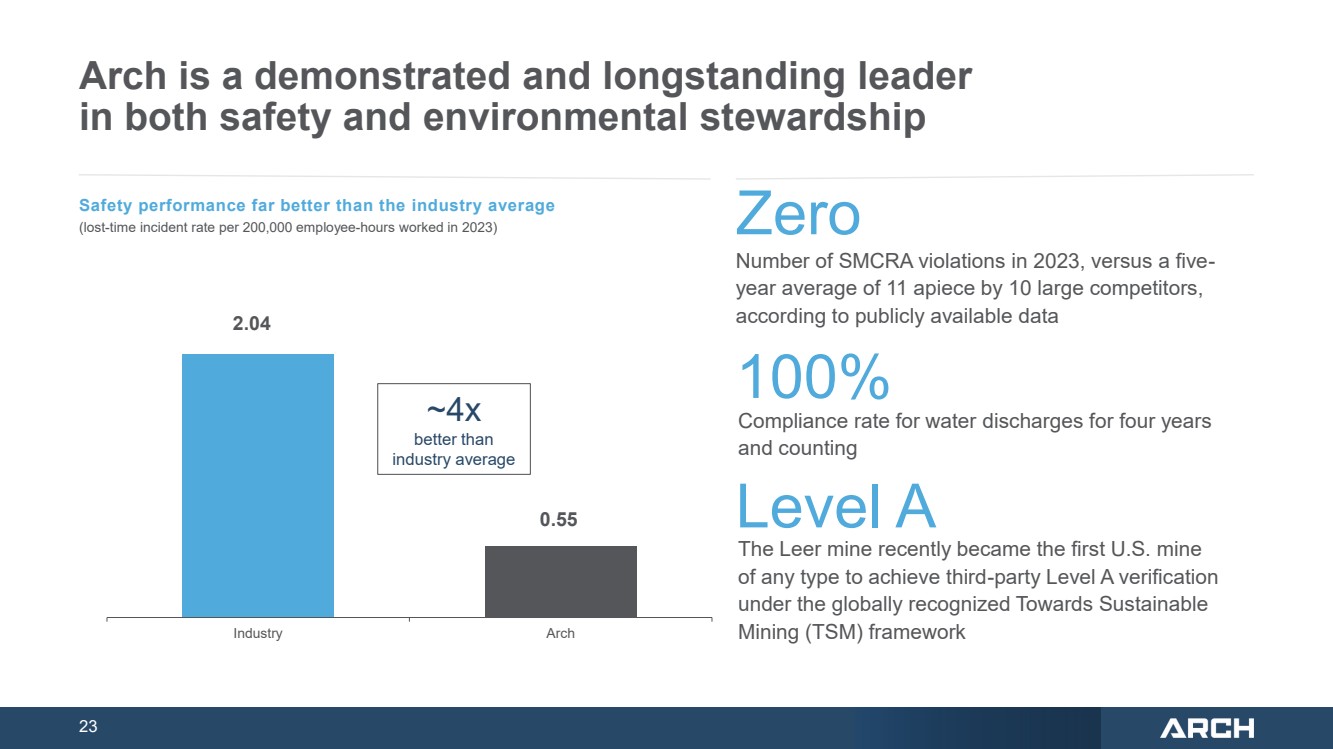
23 Arch is a demonstrated and longstanding leader in both safety and environmental stewardship Zero Number of SMCRA violations in 2023, versus a five-year average of 11 apiece by 10 large competitors, according to publicly available data Safety performance far better than the industry average (lost-time incident rate per 200,000 employee-hours worked in 2023) 2.04 0.55 Industry Arch 100% Compliance rate for water discharges for four years and counting ~4x better than industry average Level A The Leer mine recently became the first U.S. mine of any type to achieve third-party Level A verification under the globally recognized Towards Sustainable Mining (TSM) framework |
|
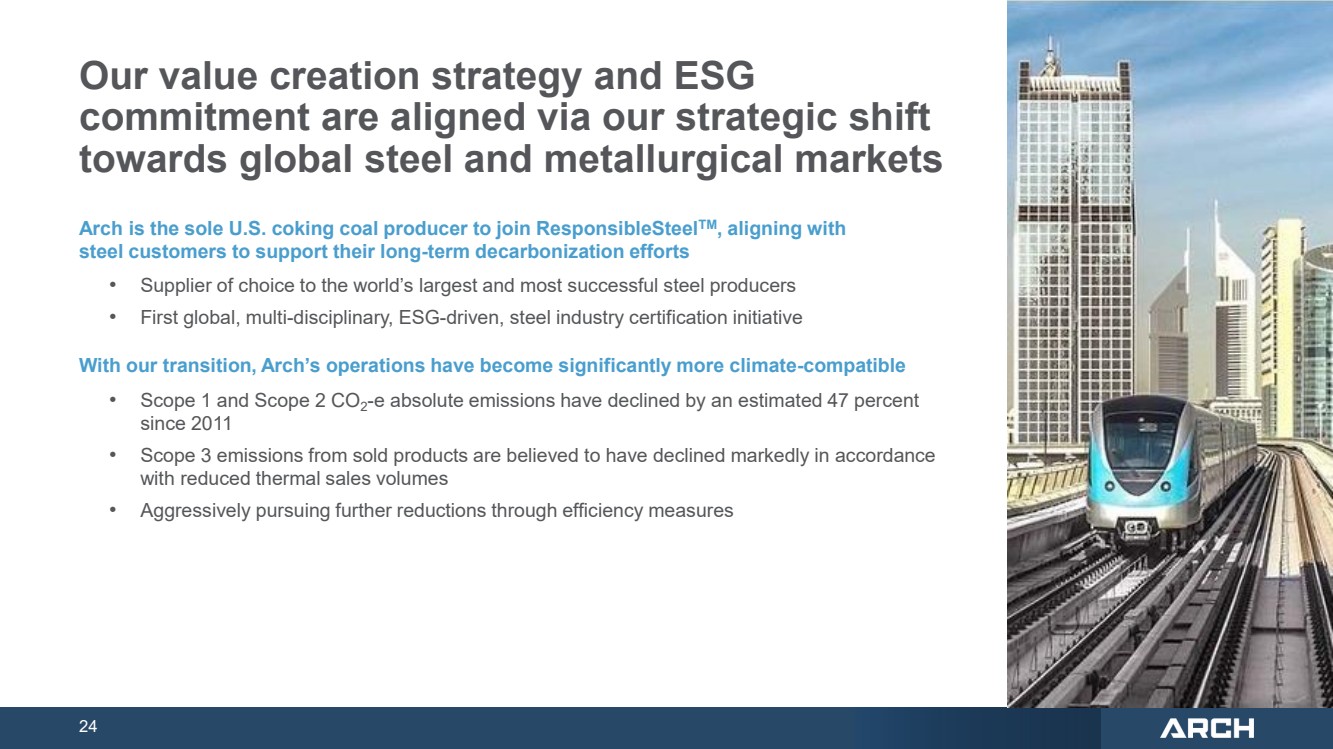
24 Our value creation strategy and ESG commitment are aligned via our strategic shift towards global steel and metallurgical markets Arch is the sole U.S. coking coal producer to join ResponsibleSteelTM, aligning with steel customers to support their long-term decarbonization efforts • Supplier of choice to the world’s largest and most successful steel producers • First global, multi-disciplinary, ESG-driven, steel industry certification initiative With our transition, Arch’s operations have become significantly more climate-compatible • Scope 1 and Scope 2 CO2 -e absolute emissions have declined by an estimated 47 percent since 2011 • Scope 3 emissions from sold products are believed to have declined markedly in accordance with reduced thermal sales volumes • Aggressively pursuing further reductions through efficiency measures |
|
25 STRONG FINANCIAL POSITION AND CAPITAL ALLOCATION PRIORITIES ARCH FINANCE |
|
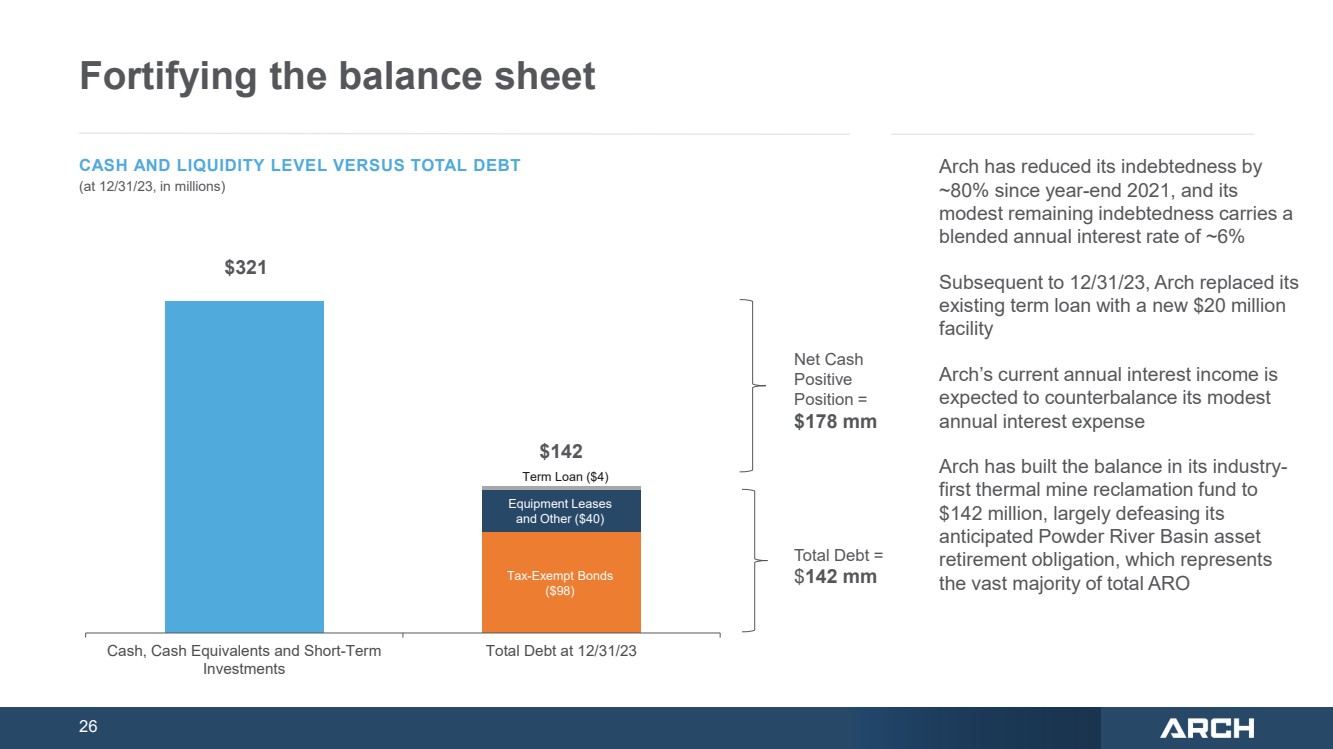
26 Cash, Cash Equivalents and Short-Term Investments Total Debt at 12/31/23 $$321 Equipment Leases and Other ($35) Tax-Exempt Bonds ($98) Term Loan ($4) CASH AND LIQUIDITY LEVEL VERSUS TOTAL DEBT (at 12/31/23, in millions) Net Cash Positive Position = $178 mm Fortifying the balance sheet Arch has reduced its indebtedness by ~80% since year-end 2021, and its modest remaining indebtedness carries a blended annual interest rate of ~6% Subsequent to 12/31/23, Arch replaced its existing term loan with a new $20 million facility Arch’s current annual interest income is expected to counterbalance its modest annual interest expense Arch has built the balance in its industry-first thermal mine reclamation fund to $142 million, largely defeasing its anticipated Powder River Basin asset retirement obligation, which represents the vast majority of total ARO Total Debt = $142 mm Equipment Leases and Other ($40) $$142 |
|
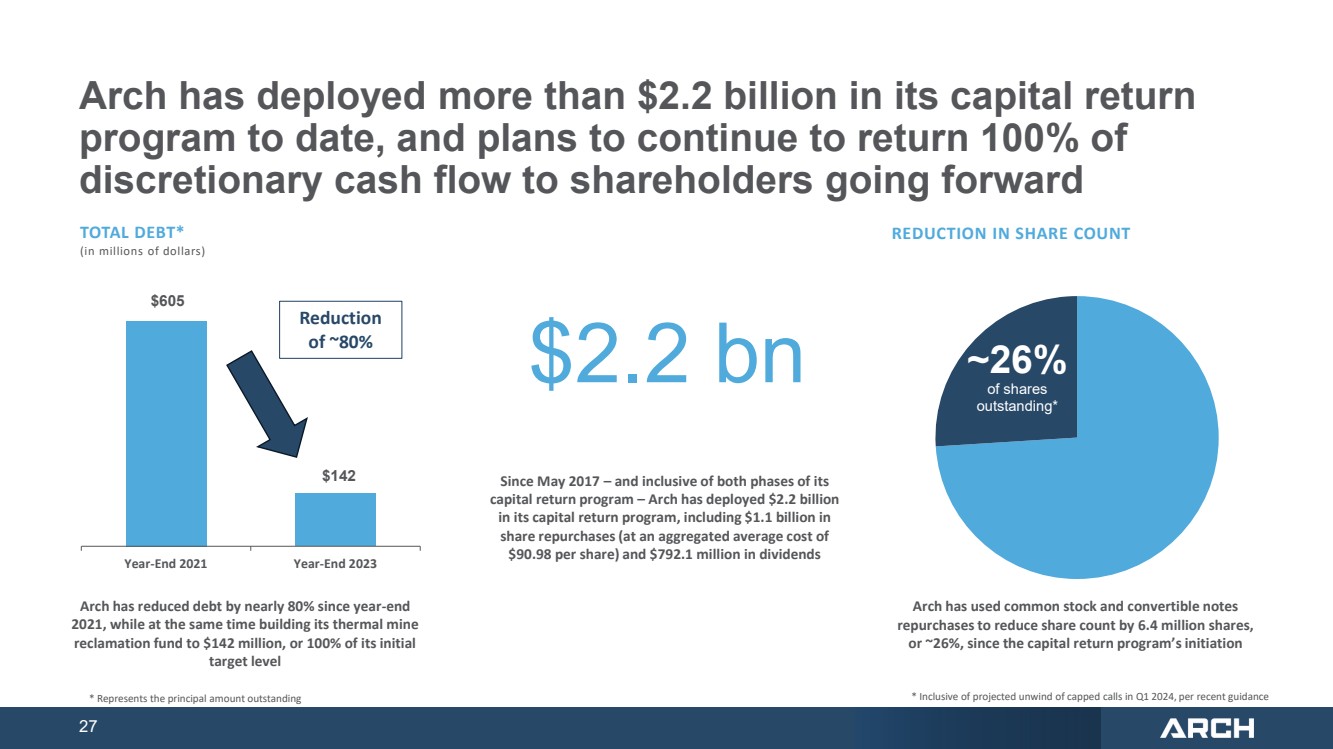
27 Arch has deployed more than $2.2 billion in its capital return program to date, and plans to continue to return 100% of discretionary cash flow to shareholders going forward 100% Arch has used common stock and convertible notes repurchases to reduce share count by 6.4 million shares, or ~26%, since the capital return program’s initiation TOTAL DEBT* (in millions of dollars) $605 $142 Year-End 2021 Year-End 2023 * Represents the principal amount outstanding Reduction of ~80% ~26% of shares outstanding* REDUCTION IN SHARE COUNT Arch has reduced debt by nearly 80% since year-end 2021, while at the same time building its thermal mine reclamation fund to $142 million, or 100% of its initial target level * Inclusive of projected unwind of capped calls in Q1 2024, per recent guidance $2.2 bn Since May 2017 – and inclusive of both phases of its capital return program – Arch has deployed $2.2 billion in its capital return program, including $1.1 billion in share repurchases (at an aggregated average cost of $90.98 per share) and $792.1 million in dividends |
|
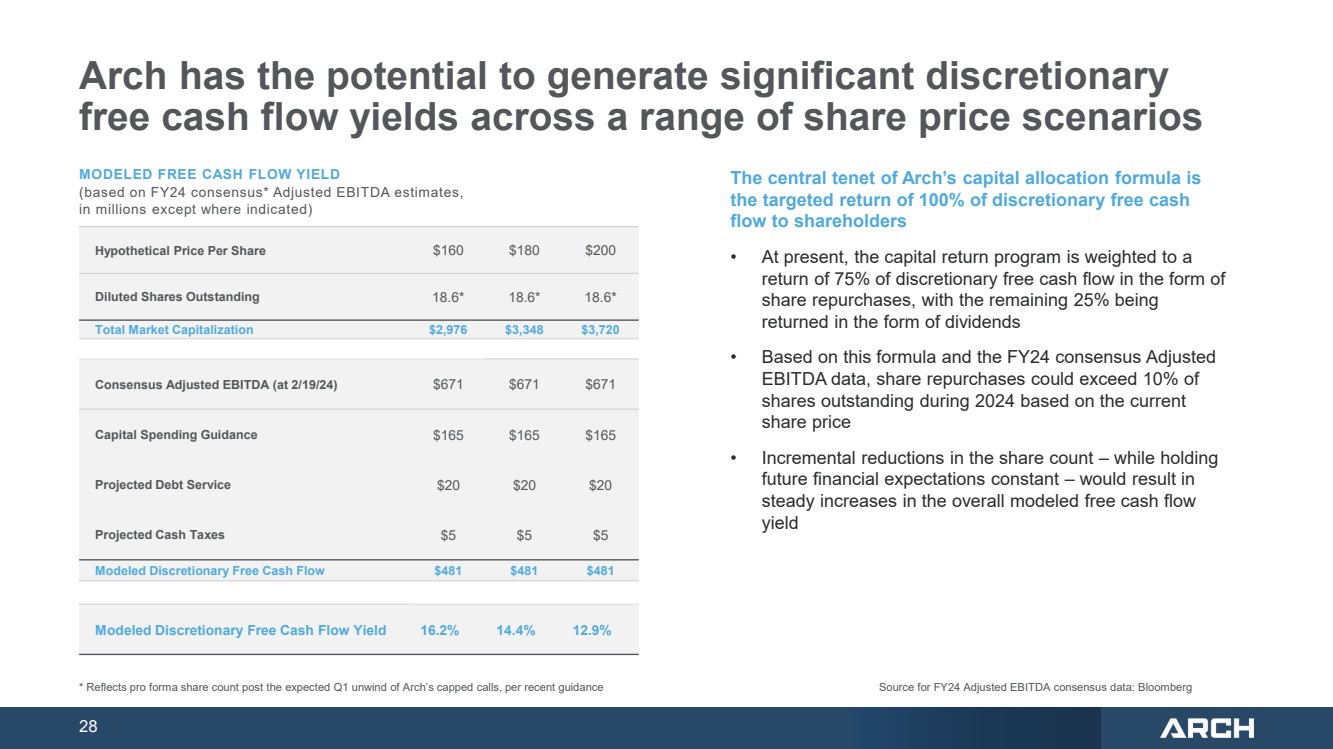
28 Arch has the potential to generate significant discretionary free cash flow yields across a range of share price scenarios Hypothetical Price Per Share $160 $180 $200 Diluted Shares Outstanding 18.6* 18.6* 18.6* Total Market Capitalization $2,976 $3,348 $3,720 Consensus Adjusted EBITDA (at 2/19/24) $671 $671 $671 Capital Spending Guidance $165 $165 $165 Projected Debt Service $20 $20 $20 Projected Cash Taxes $5 $5 $5 Modeled Discretionary Free Cash Flow $481 $481 $481 Modeled Discretionary Free Cash Flow Yield 16.2% 14.4% 12.9% MODELED FREE CASH FLOW YIELD (based on FY24 consensus* Adjusted EBITDA estimates, in millions except where indicated) * Reflects pro forma share count post the expected Q1 unwind of Arch’s capped calls, per recent guidance Source for FY24 Adjusted EBITDA consensus data: Bloomberg The central tenet of Arch’s capital allocation formula is the targeted return of 100% of discretionary free cash flow to shareholders • At present, the capital return program is weighted to a return of 75% of discretionary free cash flow in the form of share repurchases, with the remaining 25% being returned in the form of dividends • Based on this formula and the FY24 consensus Adjusted EBITDA data, share repurchases could exceed 10% of shares outstanding during 2024 based on the current share price • Incremental reductions in the share count – while holding future financial expectations constant – would result in steady increases in the overall modeled free cash flow yield |
|
29 ARCH RESOURCES IN SUMMARY |
|
30 Arch’s Value Proposition Premier Metallurgical Franchise Cash-Generative Thermal Franchise Sustainability Leadership that Supports Success Strong Financial Position and Capital Allocation Priorities Well-Positioned to Attractive Steel and Metallurgical Coal Markets |
|
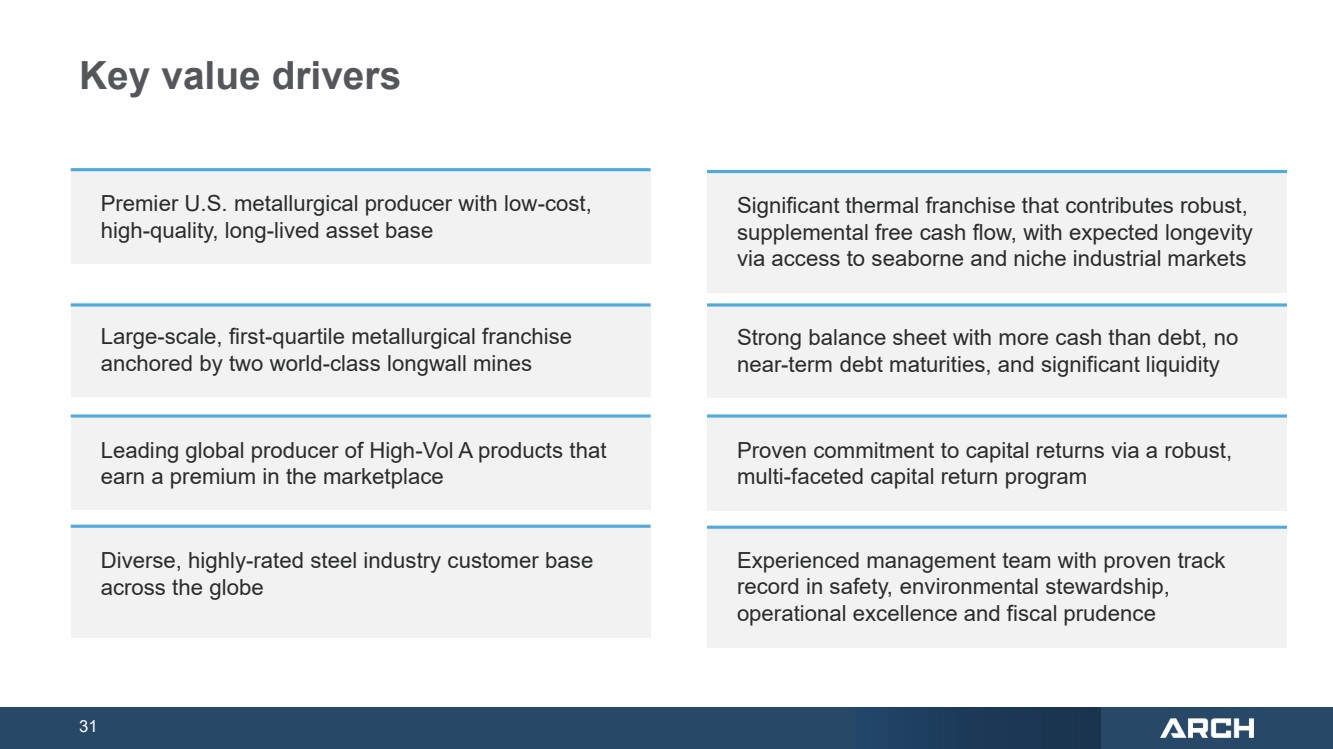
31 Key value drivers Premier U.S. metallurgical producer with low-cost, high-quality, long-lived asset base Large-scale, first-quartile metallurgical franchise anchored by two world-class longwall mines Leading global producer of High-Vol A products that earn a premium in the marketplace Diverse, highly-rated steel industry customer base across the globe Experienced management team with proven track record in safety, environmental stewardship, operational excellence and fiscal prudence Proven commitment to capital returns via a robust, multi-faceted capital return program Strong balance sheet with more cash than debt, no near-term debt maturities, and significant liquidity Significant thermal franchise that contributes robust, supplemental free cash flow, with expected longevity via access to seaborne and niche industrial markets |
|
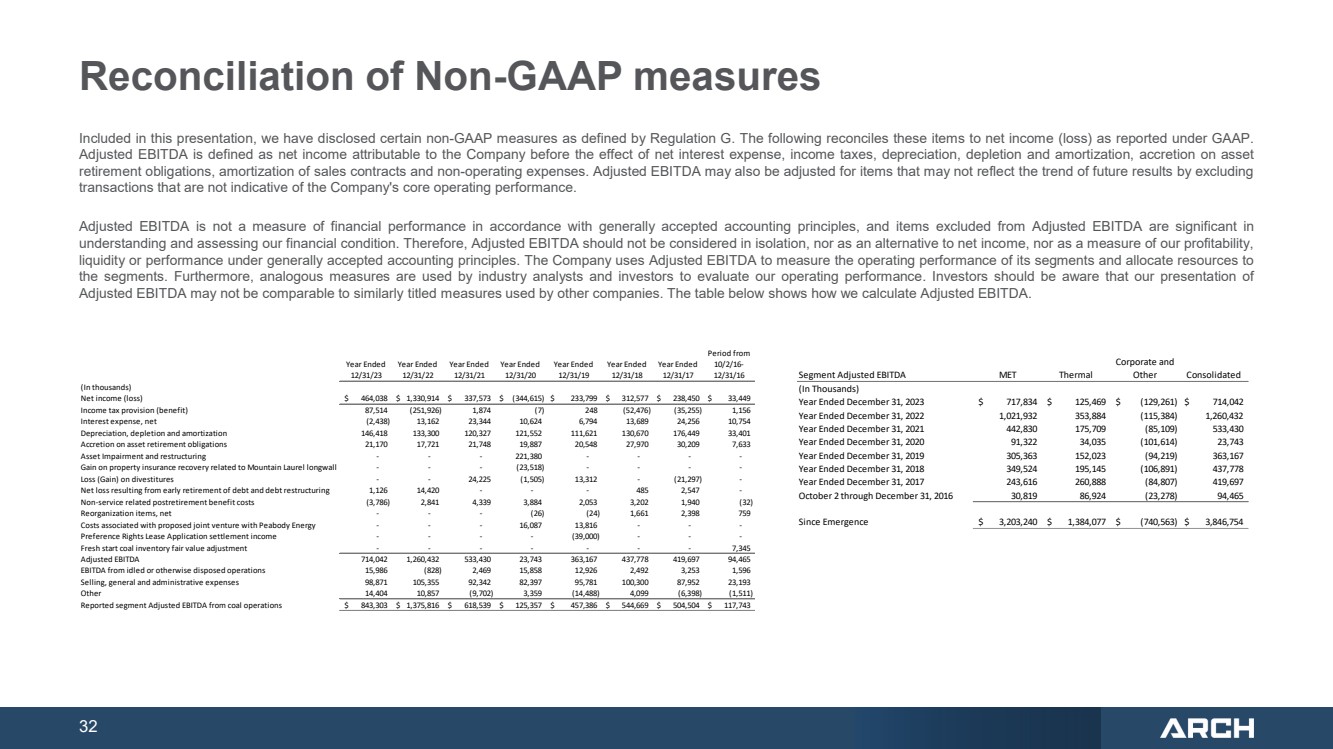
32 Reconciliation of Non-GAAP measures Included in this presentation, we have disclosed certain non-GAAP measures as defined by Regulation G. The following reconciles these items to net income (loss) as reported under GAAP. Adjusted EBITDA is defined as net income attributable to the Company before the effect of net interest expense, income taxes, depreciation, depletion and amortization, accretion on asset retirement obligations, amortization of sales contracts and non-operating expenses. Adjusted EBITDA may also be adjusted for items that may not reflect the trend of future results by excluding transactions that are not indicative of the Company's core operating performance. Adjusted EBITDA is not a measure of financial performance in accordance with generally accepted accounting principles, and items excluded from Adjusted EBITDA are significant in understanding and assessing our financial condition. Therefore, Adjusted EBITDA should not be considered in isolation, nor as an alternative to net income, nor as a measure of our profitability, liquidity or performance under generally accepted accounting principles. The Company uses Adjusted EBITDA to measure the operating performance of its segments and allocate resources to the segments. Furthermore, analogous measures are used by industry analysts and investors to evaluate our operating performance. Investors should be aware that our presentation of Adjusted EBITDA may not be comparable to similarly titled measures used by other companies. The table below shows how we calculate Adjusted EBITDA. Year Ended 12/31/23 Year Ended 12/31/22 Year Ended 12/31/21 Year Ended 12/31/20 Year Ended 12/31/19 Year Ended 12/31/18 Year Ended 12/31/17 Period from 10/2/16- 12/31/16 (In thousands) Net income (loss) $ 464,038 $ 1,330,914 $ 337,573 $ (344,615) $ 233,799 $ 312,577 $ 238,450 $ 33,449 Income tax provision (benefit) 87,514 (251,926) 1,874 (7) 248 (52,476) (35,255) 1,156 Interest expense, net (2,438) 13,162 23,344 10,624 6,794 13,689 24,256 10,754 Depreciation, depletion and amortization 146,418 133,300 120,327 121,552 111,621 130,670 176,449 33,401 Accretion on asset retirement obligations 21,170 17,721 21,748 19,887 20,548 27,970 30,209 7,633 Asset Impairment and restructuring - - - 221,380 - - - - Gain on property insurance recovery related to Mountain Laurel longwall - - - (23,518) - - - - Loss (Gain) on divestitures - - 24,225 (1,505) 13,312 - (21,297) - Net loss resulting from early retirement of debt and debt restructuring 1,126 14,420 - - - 485 2,547 - Non-service related postretirement benefit costs (3,786) 2,841 4,339 3,884 2,053 3,202 1,940 (32) Reorganization items, net - - - (26) (24) 1,661 2,398 759 Costs associated with proposed joint venture with Peabody Energy - - - 16,087 13,816 - - - Preference Rights Lease Application settlement income - - - - (39,000) - - - Fresh start coal inventory fair value adjustment - - - - - - - 7,345 Adjusted EBITDA 714,042 1,260,432 533,430 23,743 363,167 437,778 419,697 94,465 EBITDA from idled or otherwise disposed operations 15,986 (828) 2,469 15,858 12,926 2,492 3,253 1,596 Selling, general and administrative expenses 98,871 105,355 92,342 82,397 95,781 100,300 87,952 23,193 Other 14,404 10,857 (9,702) 3,359 (14,488) 4,099 (6,398) (1,511) Reported segment Adjusted EBITDA from coal operations $ 843,303 $ 1,375,816 $ 618,539 $ 125,357 $ 457,386 $ 544,669 $ 504,504 $ 117,743 Segment Adjusted EBITDA MET Thermal Corporate and Other Consolidated (In Thousands) Year Ended December 31, 2023 $ 717,834 $ 125,469 $ (129,261) $ 714,042 Year Ended December 31, 2022 1,021,932 353,884 (115,384) 1,260,432 Year Ended December 31, 2021 442,830 175,709 (85,109) 533,430 Year Ended December 31, 2020 91,322 34,035 (101,614) 23,743 Year Ended December 31, 2019 305,363 152,023 (94,219) 363,167 Year Ended December 31, 2018 349,524 195,145 (106,891) 437,778 Year Ended December 31, 2017 243,616 260,888 (84,807) 419,697 October 2 through December 31, 2016 30,819 86,924 (23,278) 94,465 Since Emergence $ 3,203,240 $ 1,384,077 $ (740,563) $ 3,846,754 |
|
33 APPENDIX: DEEPER DIVE INTO GLOBAL COKING COAL MARKET DYNAMICS ARCH RESOURCES |
|
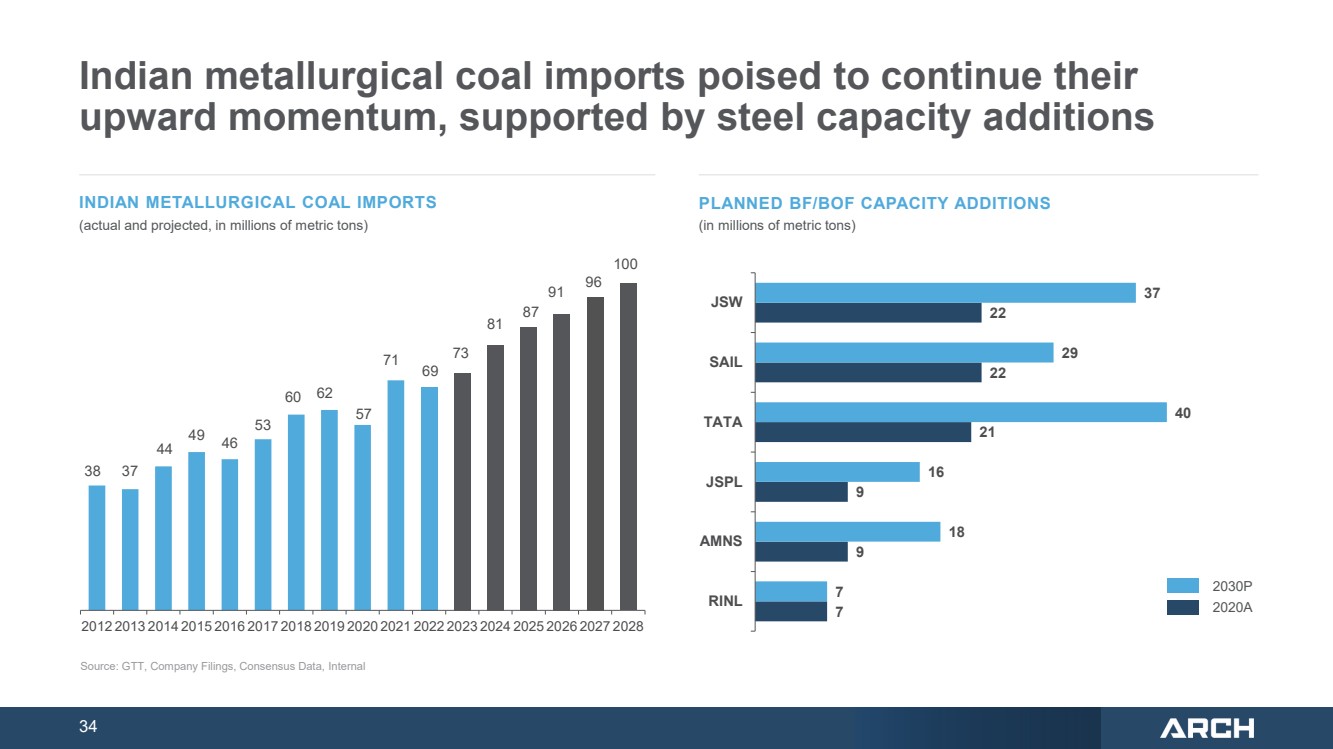
34 Source: GTT, Company Filings, Consensus Data, Internal 38 37 44 49 46 53 60 62 57 71 69 73 81 87 91 96 100 2012 2013 2014 2015 2016 2017 2018 2019 2020 2021 2022 2023 2024 2025 2026 2027 2028 7 9 9 21 22 22 7 18 16 40 29 37 RINL AMNS JSPL TATA SAIL JSW PLANNED BF/BOF CAPACITY ADDITIONS (in millions of metric tons) Indian metallurgical coal imports poised to continue their upward momentum, supported by steel capacity additions 2020A 2030P INDIAN METALLURGICAL COAL IMPORTS (actual and projected, in millions of metric tons) |
|
35 0 10 20 30 40 50 2013 2014 2015 2016 2017 2018 2019 2020 2021 2022 SOUTHEAST ASIA CRUDE STEEL PRODUCTION (in millions of metric tons) Source: World Steel Association, Wood Mackenzie, Internal Wood Mackenzie projects that Southeast Asia’s steel production will grow by more than 45% by 2030 – from 53 million tons to 78 million tons – mostly via the BOF route POTENTIAL INCREMENTAL STEEL CAPACITY ADDITIONS, BY TECHNOLOGY (in millions of metric tons) Capacity Additions in Mt Basic Oxygen Furnace (BOF) share Southeast Asia 69 90% Myanmar 4 100% Thailand 2 0% Vietnam 17 88% Cambodia 4 100% Philippines 10 78% Malaysia 13 88% Indonesia 19 100% Near- and intermediate-term steel capacity growth in Southeast Asia is projected to be significant and largely integrated |
|
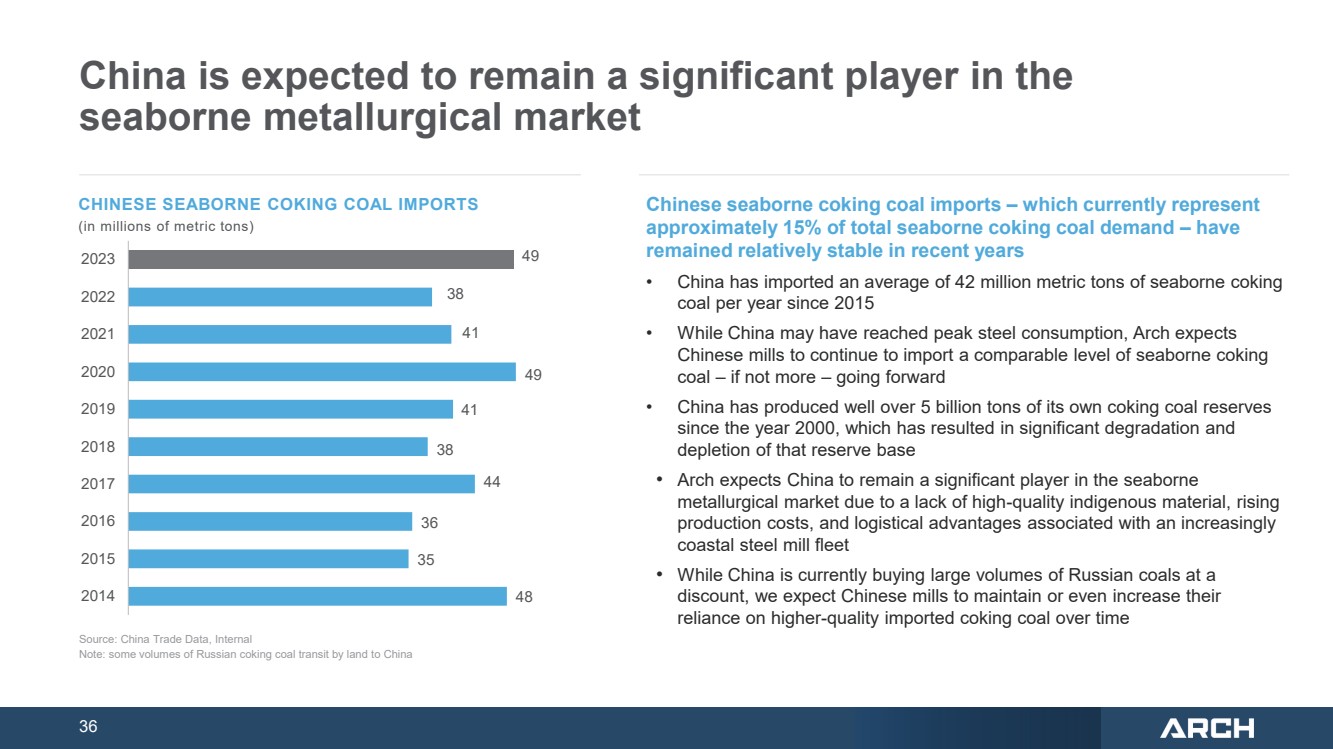
36 China is expected to remain a significant player in the seaborne metallurgical market CHINESE SEABORNE COKING COAL IMPORTS (in millions of metric tons) Source: China Trade Data, Internal Note: some volumes of Russian coking coal transit by land to China 48 35 36 44 38 41 49 41 38 49 2014 2015 2016 2017 2018 2019 2020 2021 2022 2023 Chinese seaborne coking coal imports – which currently represent approximately 15% of total seaborne coking coal demand – have remained relatively stable in recent years • China has imported an average of 42 million metric tons of seaborne coking coal per year since 2015 • While China may have reached peak steel consumption, Arch expects Chinese mills to continue to import a comparable level of seaborne coking coal – if not more – going forward • China has produced well over 5 billion tons of its own coking coal reserves since the year 2000, which has resulted in significant degradation and depletion of that reserve base • Arch expects China to remain a significant player in the seaborne metallurgical market due to a lack of high-quality indigenous material, rising production costs, and logistical advantages associated with an increasingly coastal steel mill fleet • While China is currently buying large volumes of Russian coals at a discount, we expect Chinese mills to maintain or even increase their reliance on higher-quality imported coking coal over time |
|
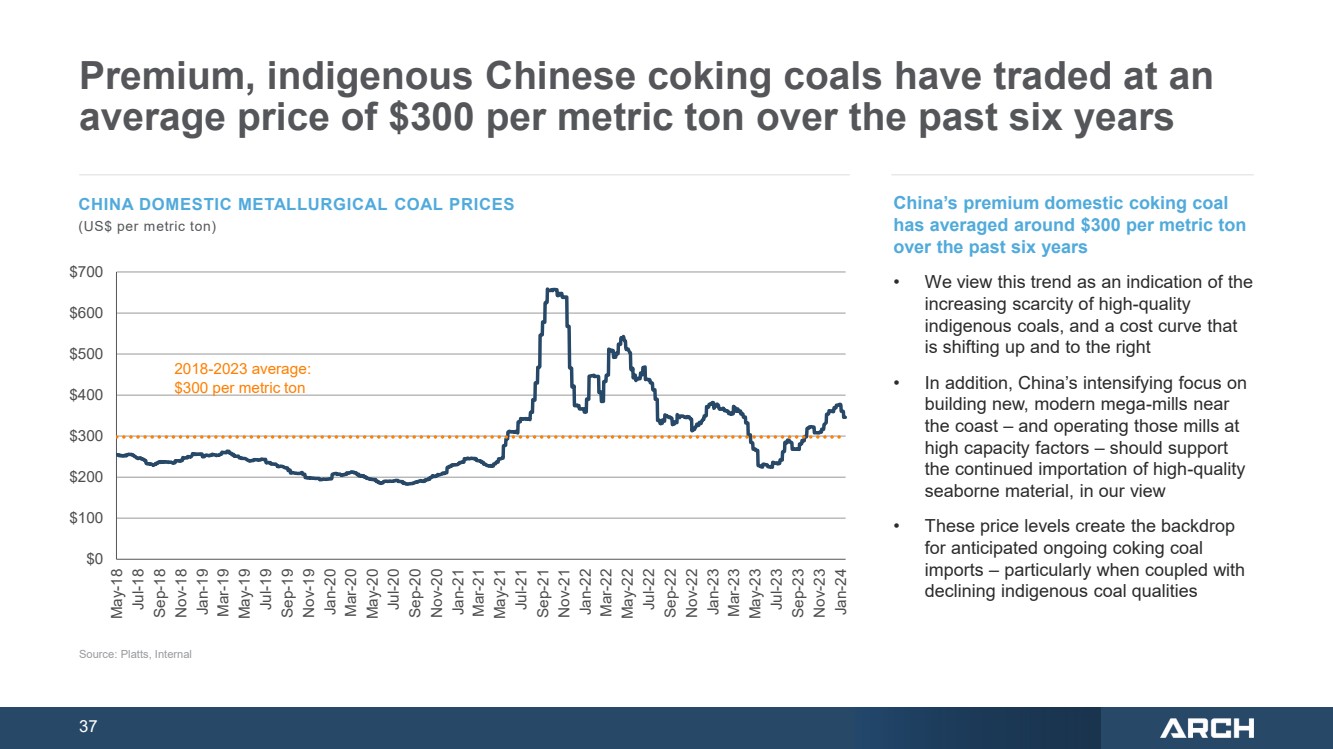
37 Premium, indigenous Chinese coking coals have traded at an average price of $300 per metric ton over the past six years China’s premium domestic coking coal has averaged around $300 per metric ton over the past six years • We view this trend as an indication of the increasing scarcity of high-quality indigenous coals, and a cost curve that is shifting up and to the right • In addition, China’s intensifying focus on building new, modern mega-mills near the coast – and operating those mills at high capacity factors – should support the continued importation of high-quality seaborne material, in our view • These price levels create the backdrop for anticipated ongoing coking coal imports – particularly when coupled with declining indigenous coal qualities CHINA DOMESTIC METALLURGICAL COAL PRICES (US$ per metric ton) Source: Platts, Internal $0 $100 $200 $300 $400 $500 $600 $700 May-18 Jul-18 Sep-18 Nov-18 Jan-19 Mar-19 May-19 Jul-19 Sep-19 Nov-19 Jan-20 Mar-20 May-20 Jul-20 Sep-20 Nov-20 Jan-21 Mar-21 May-21 Jul-21 Sep-21 Nov-21 Jan-22 Mar-22 May-22 Jul-22 Sep-22 Nov-22 Jan-23 Mar-23 May-23 Jul-23 Sep-23 Nov-23 Jan-24 2018-2023 average: $300 per metric ton |
|
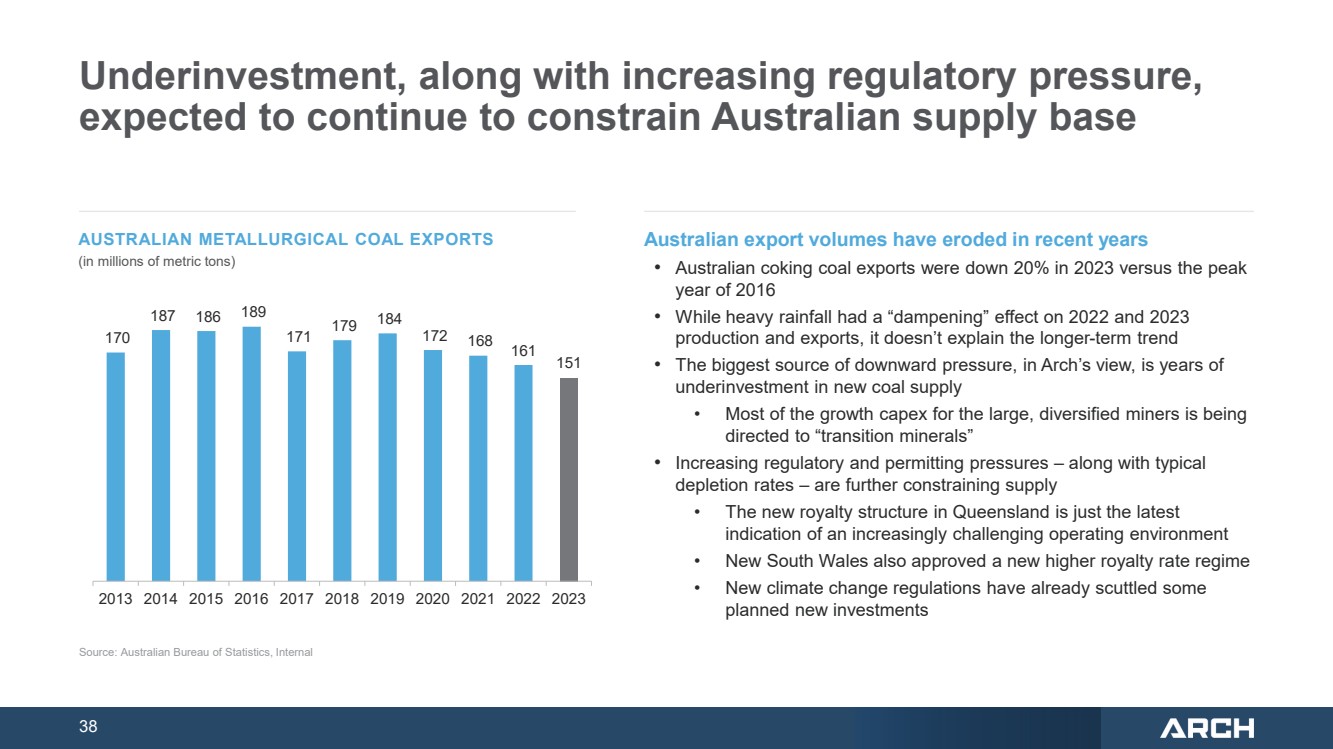
38 Underinvestment, along with increasing regulatory pressure, expected to continue to constrain Australian supply base Australian export volumes have eroded in recent years • Australian coking coal exports were down 20% in 2023 versus the peak year of 2016 • While heavy rainfall had a “dampening” effect on 2022 and 2023 production and exports, it doesn’t explain the longer-term trend • The biggest source of downward pressure, in Arch’s view, is years of underinvestment in new coal supply • Most of the growth capex for the large, diversified miners is being directed to “transition minerals” • Increasing regulatory and permitting pressures – along with typical depletion rates – are further constraining supply • The new royalty structure in Queensland is just the latest indication of an increasingly challenging operating environment • New South Wales also approved a new higher royalty rate regime • New climate change regulations have already scuttled some planned new investments AUSTRALIAN METALLURGICAL COAL EXPORTS (in millions of metric tons) 170 187 186 189 171 179 184 172 168 161 151 2013 2014 2015 2016 2017 2018 2019 2020 2021 2022 2023 Source: Australian Bureau of Statistics, Internal |
|
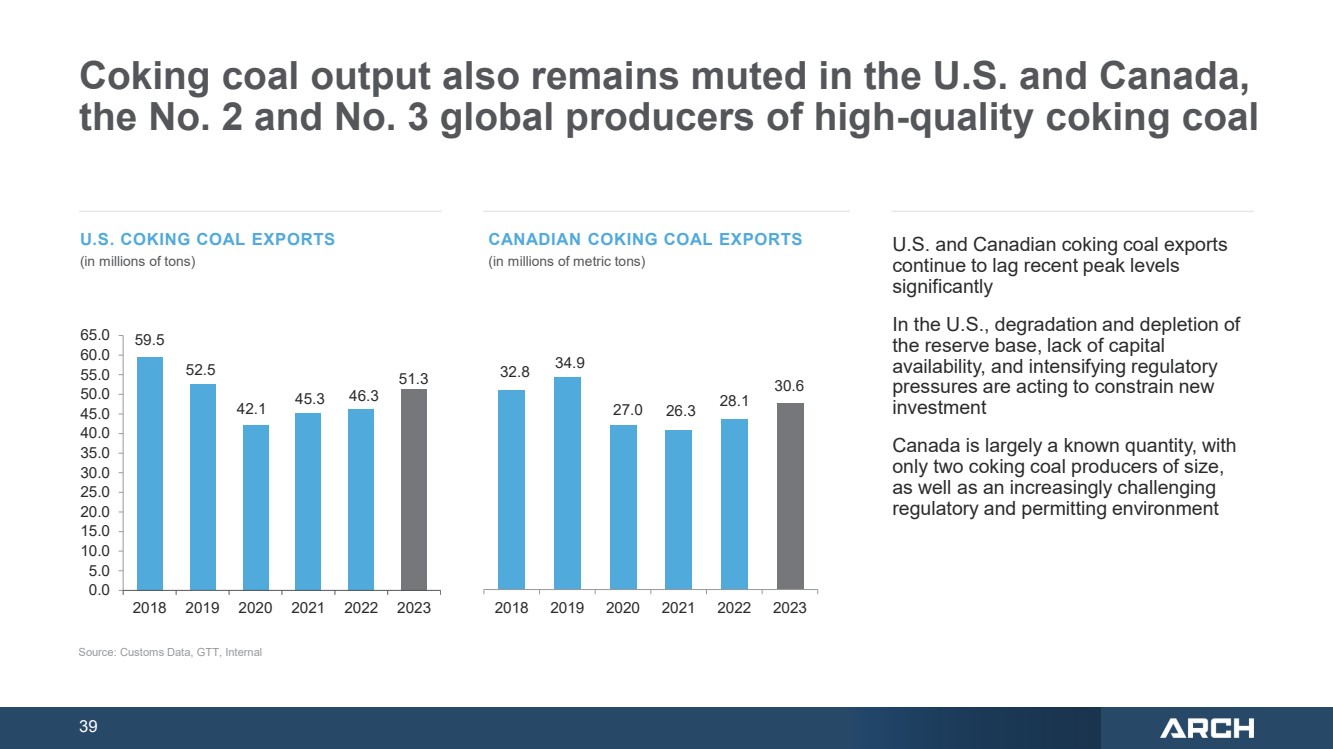
39 Coking coal output also remains muted in the U.S. and Canada, the No. 2 and No. 3 global producers of high-quality coking coal 59.5 52.5 42.1 45.3 46.3 51.3 0.0 5.0 10.0 15.0 20.0 25.0 30.0 35.0 40.0 45.0 50.0 55.0 60.0 65.0 2018 2019 2020 2021 2022 2023 U.S. and Canadian coking coal exports continue to lag recent peak levels significantly In the U.S., degradation and depletion of the reserve base, lack of capital availability, and intensifying regulatory pressures are acting to constrain new investment Canada is largely a known quantity, with only two coking coal producers of size, as well as an increasingly challenging regulatory and permitting environment 32.8 34.9 27.0 26.3 28.1 30.6 2018 2019 2020 2021 2022 2023 Source: Customs Data, GTT, Internal U.S. COKING COAL EXPORTS (in millions of tons) CANADIAN COKING COAL EXPORTS (in millions of metric tons) |
|
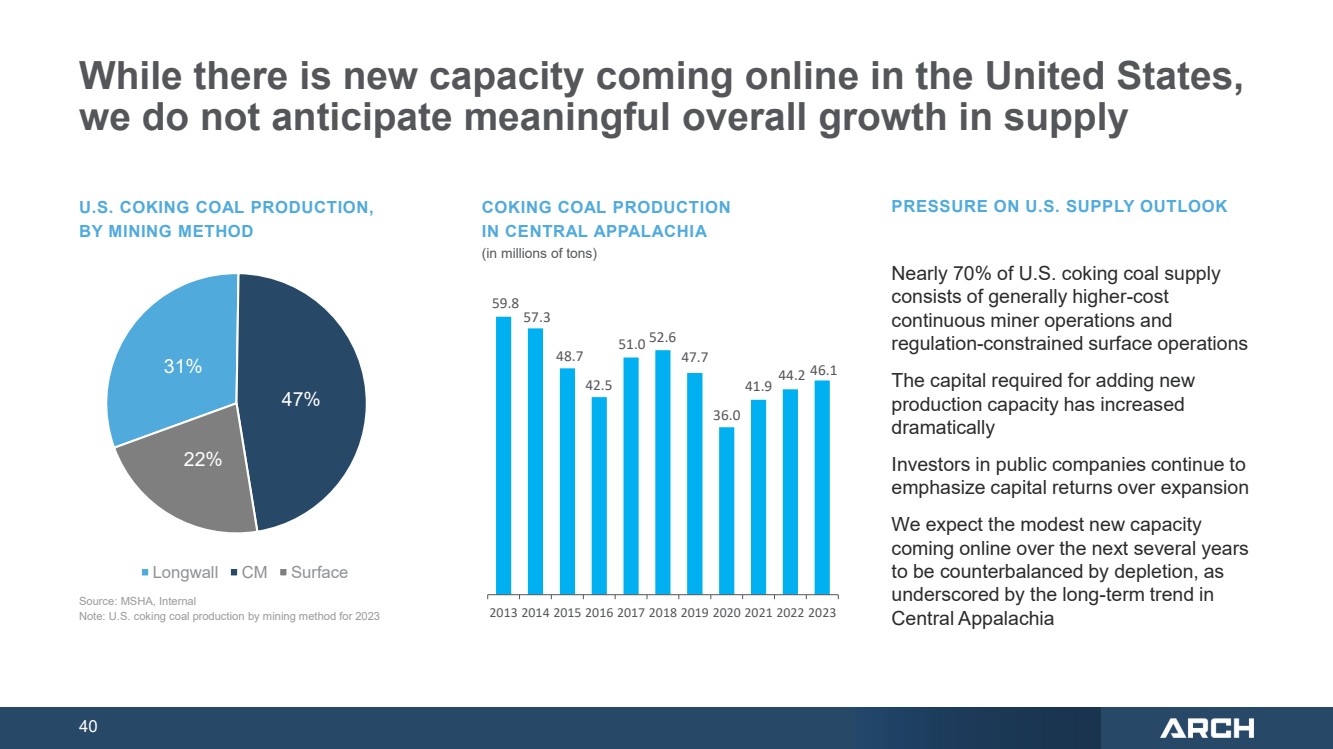
40 31% 47% 22% Longwall CM Surface While there is new capacity coming online in the United States, we do not anticipate meaningful overall growth in supply U.S. COKING COAL PRODUCTION, BY MINING METHOD COKING COAL PRODUCTION IN CENTRAL APPALACHIA (in millions of tons) Nearly 70% of U.S. coking coal supply consists of generally higher-cost continuous miner operations and regulation-constrained surface operations The capital required for adding new production capacity has increased dramatically Investors in public companies continue to emphasize capital returns over expansion We expect the modest new capacity coming online over the next several years to be counterbalanced by depletion, as underscored by the long-term trend in Central Appalachia PRESSURE ON U.S. SUPPLY OUTLOOK Source: MSHA, Internal Note: U.S. coking coal production by mining method for 2023 59.8 57.3 48.7 42.5 51.0 52.6 47.7 36.0 41.9 44.2 46.1 2013 2014 2015 2016 2017 2018 2019 2020 2021 2022 2023 |
|
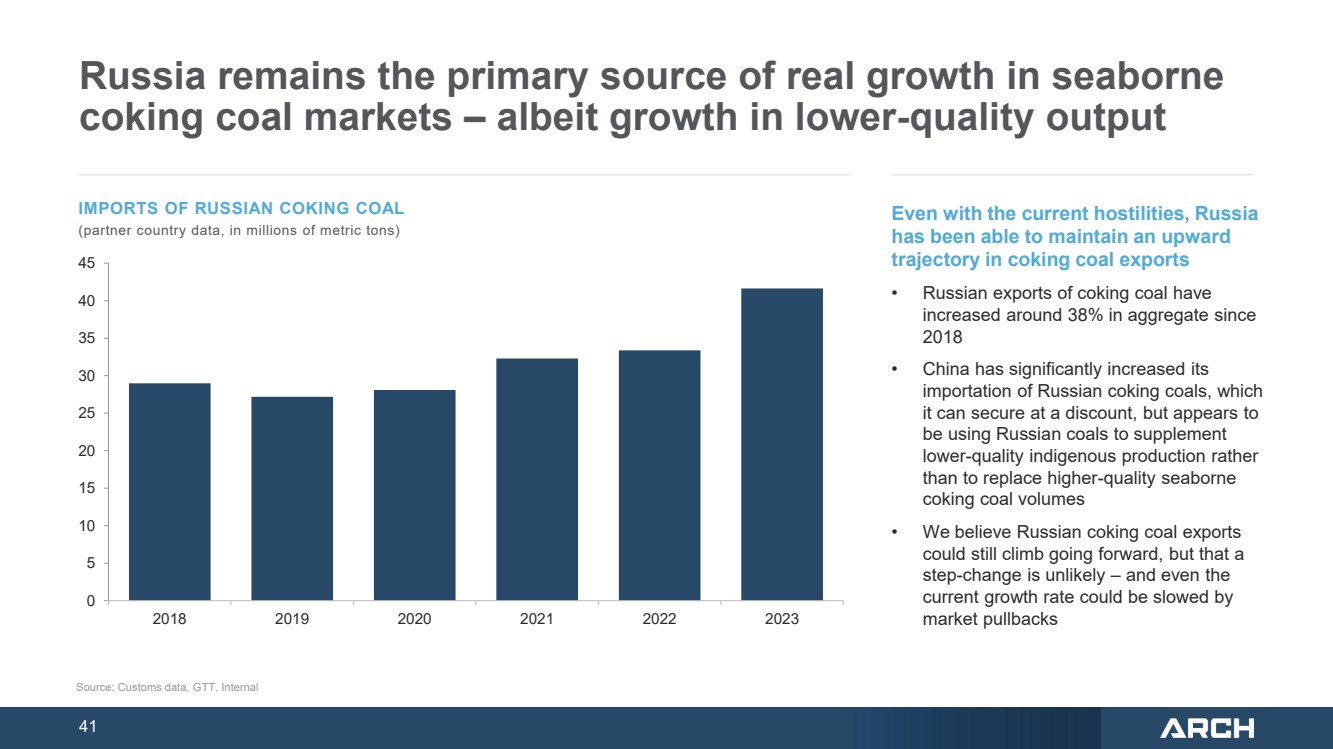
41 Russia remains the primary source of real growth in seaborne coking coal markets – albeit growth in lower-quality output Even with the current hostilities, Russia has been able to maintain an upward trajectory in coking coal exports • Russian exports of coking coal have increased around 38% in aggregate since 2018 • China has significantly increased its importation of Russian coking coals, which it can secure at a discount, but appears to be using Russian coals to supplement lower-quality indigenous production rather than to replace higher-quality seaborne coking coal volumes • We believe Russian coking coal exports could still climb going forward, but that a step-change is unlikely – and even the current growth rate could be slowed by market pullbacks IMPORTS OF RUSSIAN COKING COAL (partner country data, in millions of metric tons) Source: Customs data, GTT, Internal 0 5 10 15 20 25 30 35 40 45 2018 2019 2020 2021 2022 2023 |
|
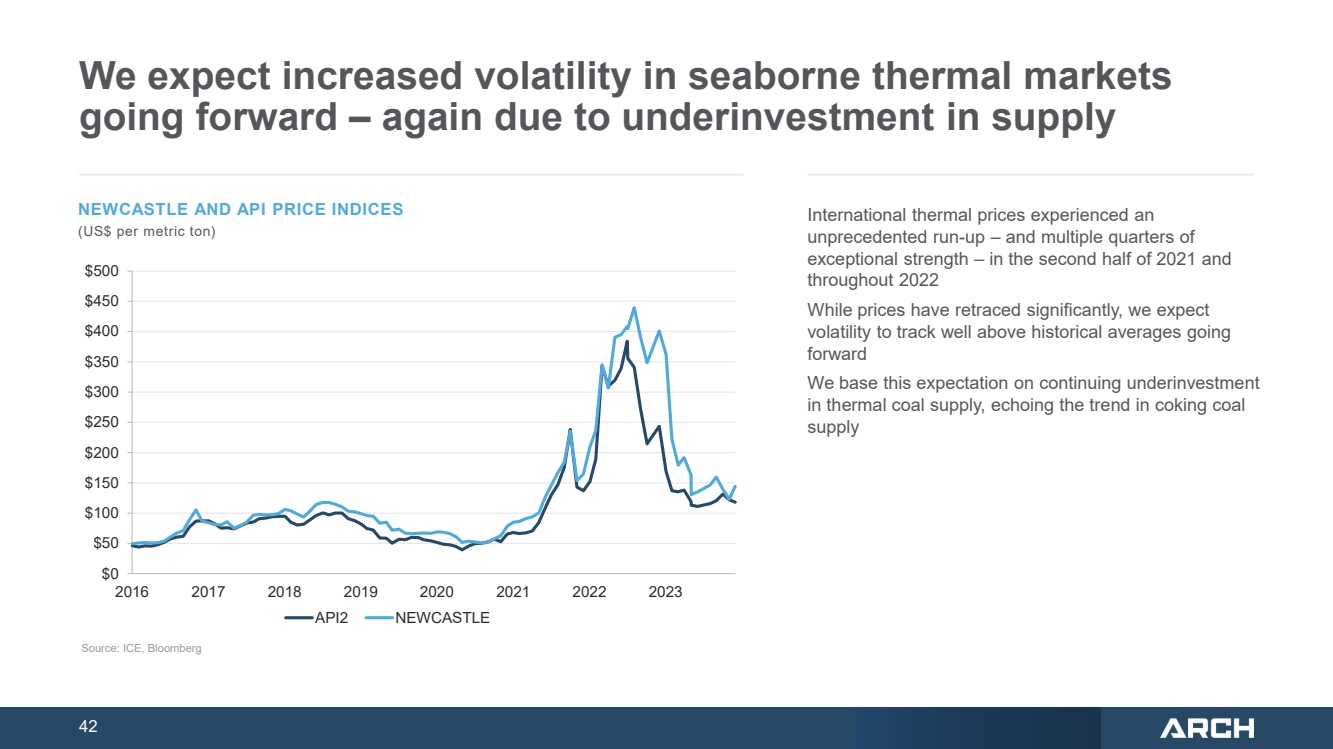
42 We expect increased volatility in seaborne thermal markets going forward – again due to underinvestment in supply International thermal prices experienced an unprecedented run-up – and multiple quarters of exceptional strength – in the second half of 2021 and throughout 2022 While prices have retraced significantly, we expect volatility to track well above historical averages going forward We base this expectation on continuing underinvestment in thermal coal supply, echoing the trend in coking coal supply Source: ICE, Bloomberg NEWCASTLE AND API PRICE INDICES (US$ per metric ton) $0 $50 $100 $150 $200 $250 $300 $350 $400 $450 $500 2016 2017 2018 2019 2020 2021 2022 2023 API2 NEWCASTLE |