UNITED
STATES
SECURITIES AND EXCHANGE COMMISSION
Washington, D.C. 20549
FORM 8-K
CURRENT REPORT
Pursuant to Section 13 OR 15(d) of The Securities Exchange Act of 1934
Date of Report (Date of earliest event reported): January 29, 2024
READY CAPITAL CORPORATION
(Exact name of registrant as specified in its charter)
| Maryland | 001-35808 | 90-0729143 | ||
| (State or other jurisdiction of incorporation) |
(Commission File Number) | (IRS Employer Identification No.) |
1251 Avenue of the Americas, 50th Floor
New York, NY 10020
(Address of principal
executive offices)
(Zip Code)
Registrant’s telephone number, including area code: (212) 257-4600
Check the appropriate box below if the Form 8-K filing is intended to simultaneously satisfy the filing obligation of the registrant under any of the following provisions:
| ¨ | Written communications pursuant to Rule 425 under the Securities Act (17 CFR 230.425) |
| ¨ | Soliciting material pursuant to Rule 14a-12 under the Exchange Act (17 CFR 240.14a-12) |
| ¨ | Pre-commencement communications pursuant to Rule 14d-2(b) under the Exchange Act (17 CFR 240.14d-2(b)) |
| ¨ | Pre-commencement communications pursuant to Rule 13e-4(c) under the Exchange Act (17 CFR 240.13e-4(c)) |
Securities registered pursuant to Section 12(b) of the Act:
| Title of each class | Trading Symbol(s) | Name of each exchange on which registered |
| Common Stock, $0.0001 par value | RC | New York Stock Exchange |
| Preferred Stock, 6.25% Series C Cumulative Convertible, $0.0001 par value per share | RC PRC | New York Stock Exchange |
| Preferred Stock, 6.50% Series E Cumulative Redeemable, par value $0.0001 per share | RC PRE | New York Stock Exchange |
| 6.20% Senior Notes due 2026 | RCB | New York Stock Exchange |
| 5.75% Senior Notes due 2026 | RCC | New York Stock Exchange |
Indicate by check mark whether the registrant is an emerging growth company as defined in Rule 405 of the Securities Act of 1933 (§230.405 of this chapter) or Rule 12b-2 of the Securities Exchange Act of 1934 (§240.12b-2 of this chapter).
Emerging growth company ¨
If an emerging growth company, indicate by check mark if the registrant has elected not to use the extended transition period for complying with any new or revised financial accounting standards provided pursuant to Section 13(a) of the Exchange Act. ¨
Item 7.01. Regulation FD Disclosure.
Beginning the week of January 29, 2024, members of management of Ready Capital Corporation (the “Company”) are scheduled to give a presentation at meetings with investors. A copy of the investor presentation is attached hereto as Exhibit 99.1 and is incorporated herein by reference.
The information in this Item 7.01 of this Current Report on Form 8-K (including Exhibit 99.1) shall not be deemed to be “filed” for the purposes of Section 18 of the Securities Exchange Act of 1934, as amended (the “Exchange Act”), or otherwise subject to the liability of such section, nor shall such information be deemed incorporated by reference in any filing under the Securities Act of 1933, as amended, or the Exchange Act, regardless of the general incorporation language of such filing, except as shall be expressly set forth by specific reference in such filing.
Item 9.01 Financial Statements and Exhibits.
(d) Exhibits.
| Exhibit No. |
Description | |
| 99.1 | Ready Capital Corporation investor presentation. | |
| 104 | Cover Page Interactive Data File (embedded within the Inline XBRL document). |
Signatures
Pursuant to the requirements of the Exchange Act, the registrant has duly caused this report to be signed by the undersigned hereunto duly authorized.
| READY CAPITAL CORPORATION | ||
| Date: January 29, 2024 | By: | /s/ Andrew Ahlborn |
| Name: | Andrew Ahlborn | |
| Title: | Chief Financial Officer | |
|
S T R I C T L Y P R I V A T E A N D C O N F I D E N T I A L January 2024 INVESTOR PRESENTATION |
|
C O N F I D E N T I A L 2 Disclaimer These materials and any presentation of which they form a part are not intended as an offer to sell, or the solicitation of an offer to purchase, any security, the offer and/or sale of which can only be made by definitive offering documentation. Any offer or solicitation with respect to any securities that may be issued by Ready Capital Corporation (“Ready Capital,” “RC,” or the “Company”) will be made only be means of definitive offering memoranda or prospectus, which will be provided to prospective investors and will contain material information that is not set forth herein, including risk factors relating to any such investment. Neither the Company nor any of its representatives or affiliates makes any representation or warranty, express or implied, as to the accuracy or completeness of the information contained herein and Company and its representatives disclaim all liability to the Recipient relating to, or resulting from, the use of this information. Nothing contained in this document is or shall be relied upon as a promise or representation as to the past, current or future performance of Company. There is no guarantee that any of the estimates, targets or projections illustrated in these materials and any presentation of which they form a part will be achieved. Any references herein to any of the Company’s past or present investments or its past or present performance, have been provided for illustrative purposes only. It should not be assumed that these investments were or will be profitable or that any future investments by the Company will be profitable or will equal the performance of these investments. Past performance is not indicative of future results and there can be no assurance that the Company will achieve comparable results in the future. This presentation contains statements that constitute "forward-looking statements," as such term is defined in Section 27A of the Securities Act of 1933, as amended, and Section 21E of the Securities Exchange Act of 1934, as amended, and such statements are intended to be covered by the safe harbor provided by the same. These statements are based on management's current expectations and beliefs and are subject to a number of trends and uncertainties that could cause actual results to differ materially from those described in the forward-looking statements; the Company can give no assurance that its expectations will be attained. Factors that could cause actual results to differ materially from the Company's expectations include, but are not limited to, applicable regulatory changes; general volatility of the capital markets; changes in the Company’s investment objectives and business strategy; the availability of financing on acceptable terms or at all; the availability, terms and deployment of capital; the availability of suitable investment opportunities; changes in the interest rates or the general economy; increased rates of default and/or decreased recovery rates on investments; changes in interest rates, interest rate spreads, the yield curve or prepayment rates; changes in prepayments of Company’s assets; the degree and nature of competition, including competition for the Company's target assets; and other factors, including those set forth in the Risk Factors section of the Company's most recent Annual Report on Form 10-K filed with the SEC, and other reports filed by the Company with the SEC, copies of which are available on the SEC's website, www.sec.gov. The Company undertakes no obligation to update these statements for revisions or changes after the date of this release, except as required by law. This presentation also contains market statistics and industry data which are subject to uncertainty and are not necessarily reflective of market conditions. These have been derived from third party sources and have not been independently verified by the Company or its affiliates. All material presented is compiled from sources believed to be reliable and current, but accuracy cannot be guaranteed. This presentation includes certain non-GAAP financial measures, including Distributable Earnings and core earnings. These non-GAAP financial measures should be considered only as supplemental to, and not as superior to, financial measures in accordance with GAAP. Please refer to the Appendix for the most recent GAAP information. |
|
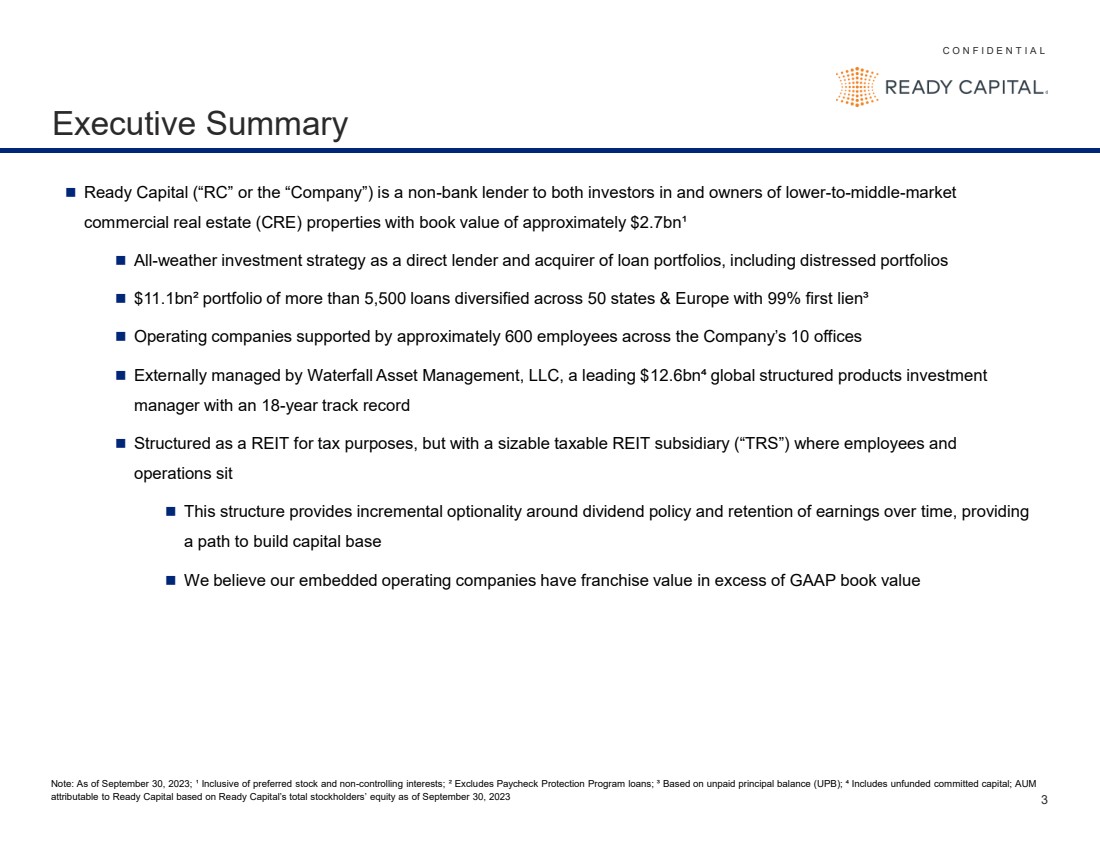
C O N F I D E N T I A L 3 Executive Summary ◼ Ready Capital (“RC” or the “Company”) is a non-bank lender to both investors in and owners of lower-to-middle-market commercial real estate (CRE) properties with book value of approximately $2.7bn¹ ◼ All-weather investment strategy as a direct lender and acquirer of loan portfolios, including distressed portfolios ◼ $11.1bn² portfolio of more than 5,500 loans diversified across 50 states & Europe with 99% first lien³ ◼ Operating companies supported by approximately 600 employees across the Company’s 10 offices ◼ Externally managed by Waterfall Asset Management, LLC, a leading $12.6bn⁴ global structured products investment manager with an 18-year track record ◼ Structured as a REIT for tax purposes, but with a sizable taxable REIT subsidiary (“TRS”) where employees and operations sit ◼ This structure provides incremental optionality around dividend policy and retention of earnings over time, providing a path to build capital base ◼ We believe our embedded operating companies have franchise value in excess of GAAP book value Note: As of September 30, 2023; ¹ Inclusive of preferred stock and non-controlling interests; ² Excludes Paycheck Protection Program loans; ³ Based on unpaid principal balance (UPB); ⁴ Includes unfunded committed capital; AUM attributable to Ready Capital based on Ready Capital’s total stockholders’ equity as of September 30, 2023 |
|
Business Overview |
|
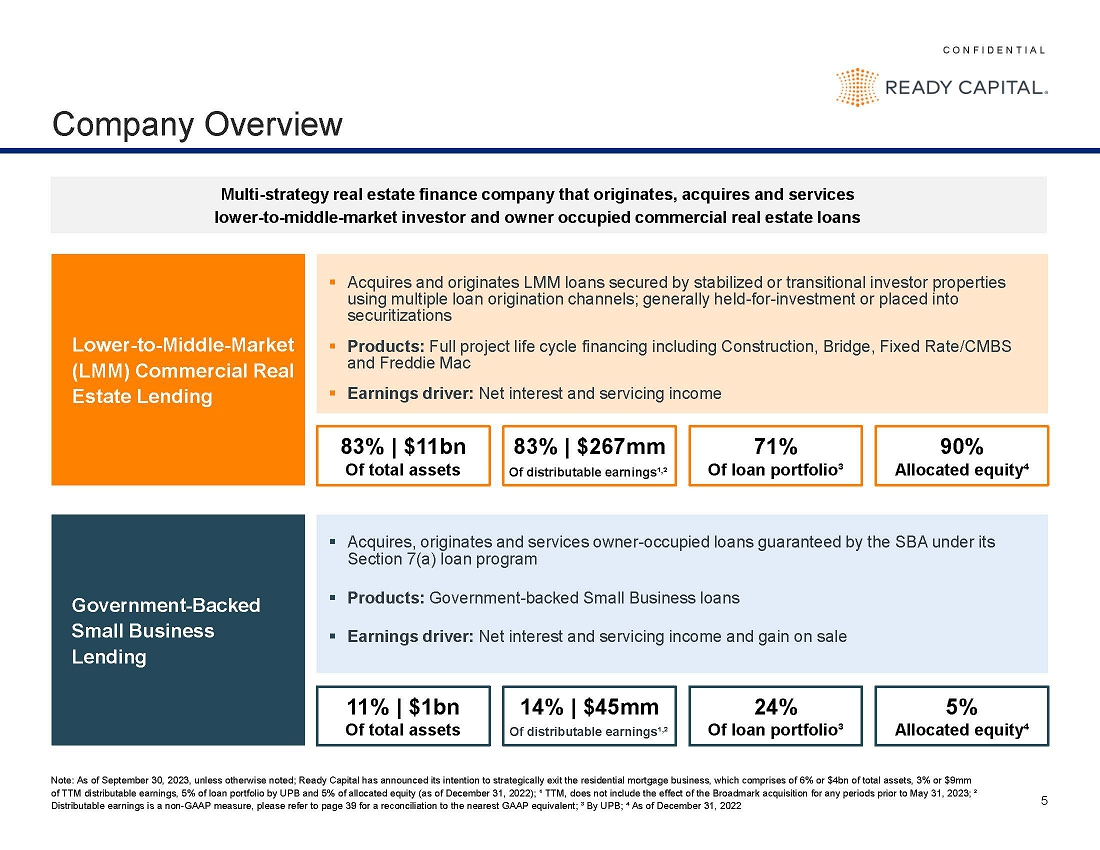
C O N F I D E N T I A L 5 ▪ Acquires and originates LMM loans secured by stabilized or transitional investor properties using multiple loan origination channels; generally held-for-investment or placed into securitizations ▪ Products: Full project life cycle financing including Construction, Bridge, Fixed Rate/CMBS and Freddie Mac ▪ Earnings driver: Net interest and servicing income Company Overview Multi-strategy real estate finance company that originates, acquires and services lower-to-middle-market investor and owner occupied commercial real estate loans Lower-to-Middle-Market (LMM) Commercial Real Estate Lending ▪ Acquires, originates and services owner-occupied loans guaranteed by the SBA under its Section 7(a) loan program ▪ Products: Government-backed Small Business loans ▪ Earnings driver: Net interest and servicing income and gain on sale Government-Backed Small Business Lending 14% | $45mm Of core earnings¹, ² 5% Allocated equity⁴ 11% | $1bn Of total assets 83% | $267mm Of core earnings¹, ² 90% Allocated equity⁴ 83% | $11bn Of total assets Note: As of September 30, 2023, unless otherwise noted; Ready Capital has announced its intention to strategically exit the residential mortgage business, which comprises of 6% or $4bn of total assets, 3% or $9mm of TTM core earnings, 5% of loan portfolio by UPB and 5% of allocated equity (as of December 31, 2022); ¹ TTM, does not include the effect of the Broadmark acquisition for any periods prior to May 31, 2023; ² Core earnings is a non-GAAP measure, please refer to page 39 for a reconciliation to the nearest GAAP equivalent; ³ By UPB; ⁴ As of December 31, 2022 71% Of loan portfolio³ 24% Of loan portfolio³ |
|
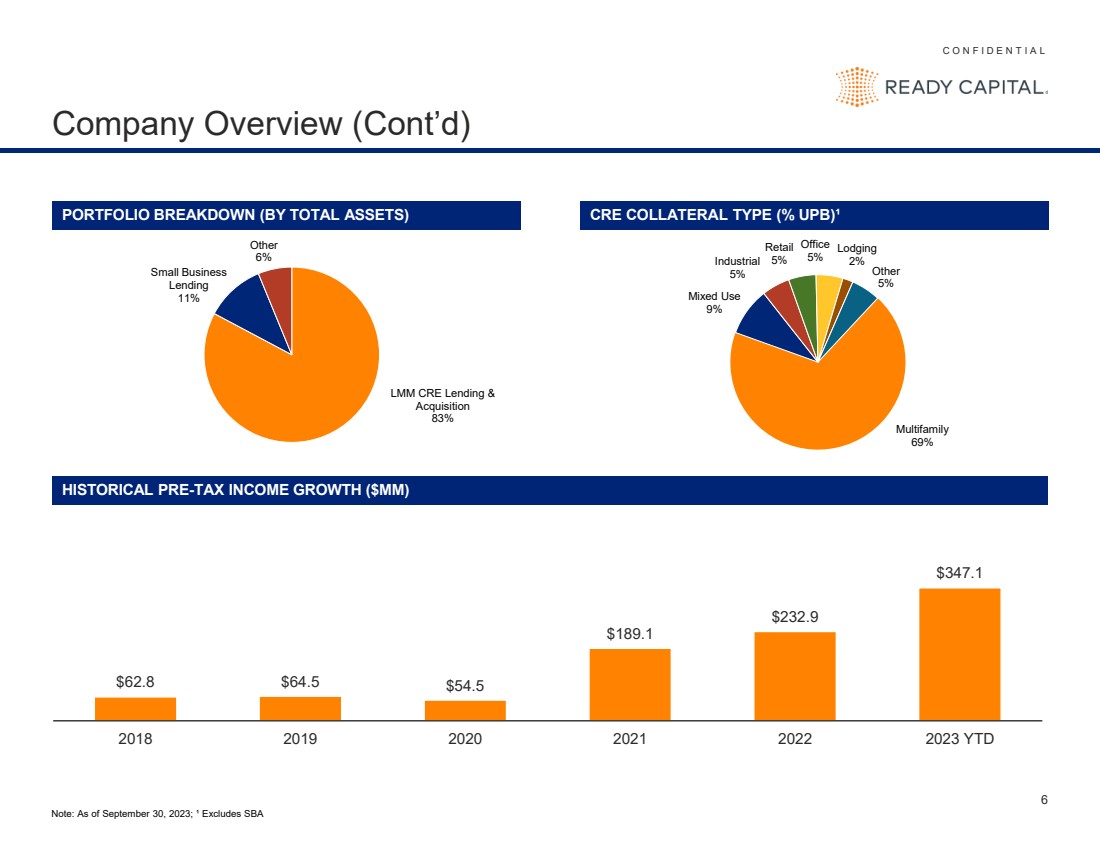
C O N F I D E N T I A L 6 Company Overview (Cont’d) PORTFOLIO BREAKDOWN (BY TOTAL ASSETS) CRE COLLATERAL TYPE (% UPB)¹ Multifamily 69% Mixed Use 9% Industrial 5% Retail 5% Office 5% Lodging 2% Other 5% $62.8 $64.5 $54.5 $189.1 $232.9 $347.1 2018 2019 2020 2021 2022 2023 YTD HISTORICAL PRE-TAX INCOME GROWTH ($MM) Note: As of September 30, 2023; ¹ Excludes SBA LMM CRE Lending & Acquisition 83% Small Business Lending 11% Other 6% |
|
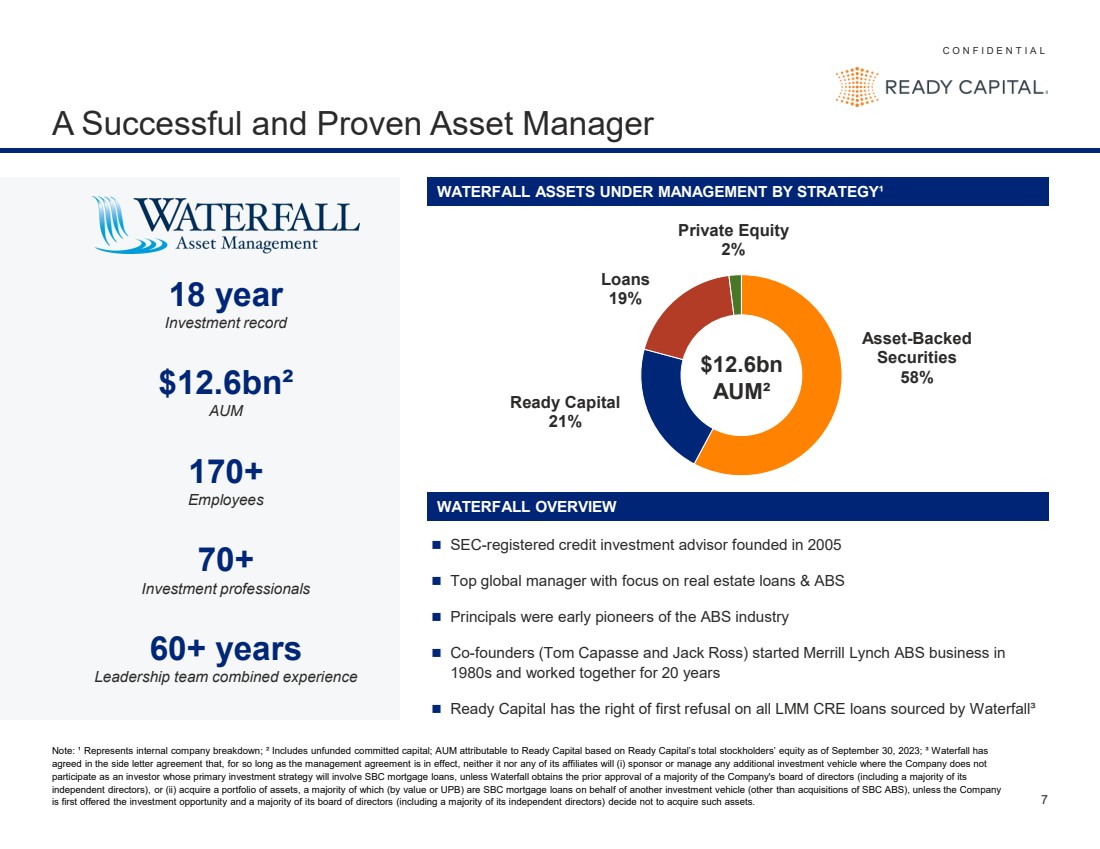
C O N F I D E N T I A L 7 A Successful and Proven Asset Manager Note: ¹ Represents internal company breakdown; ² Includes unfunded committed capital; AUM attributable to Ready Capital based on Ready Capital’s total stockholders’ equity as of September 30, 2023; ³ Waterfall has agreed in the side letter agreement that, for so long as the management agreement is in effect, neither it nor any of its affiliates will (i) sponsor or manage any additional investment vehicle where the Company does not participate as an investor whose primary investment strategy will involve SBC mortgage loans, unless Waterfall obtains the prior approval of a majority of the Company's board of directors (including a majority of its independent directors), or (ii) acquire a portfolio of assets, a majority of which (by value or UPB) are SBC mortgage loans on behalf of another investment vehicle (other than acquisitions of SBC ABS), unless the Company is first offered the investment opportunity and a majority of its board of directors (including a majority of its independent directors) decide not to acquire such assets. 18 year Investment record $12.6bn² AUM 170+ Employees 70+ Investment professionals 60+ years Leadership team combined experience Asset-Backed Securities 58% Ready Capital 21% Loans 19% Private Equity 2% $12.6bn AUM² ◼ SEC-registered credit investment advisor founded in 2005 ◼ Top global manager with focus on real estate loans & ABS ◼ Principals were early pioneers of the ABS industry ◼ Co-founders (Tom Capasse and Jack Ross) started Merrill Lynch ABS business in 1980s and worked together for 20 years ◼ Ready Capital has the right of first refusal on all LMM CRE loans sourced by Waterfall³ WATERFALL OVERVIEW WATERFALL ASSETS UNDER MANAGEMENT BY STRATEGY¹ |
|
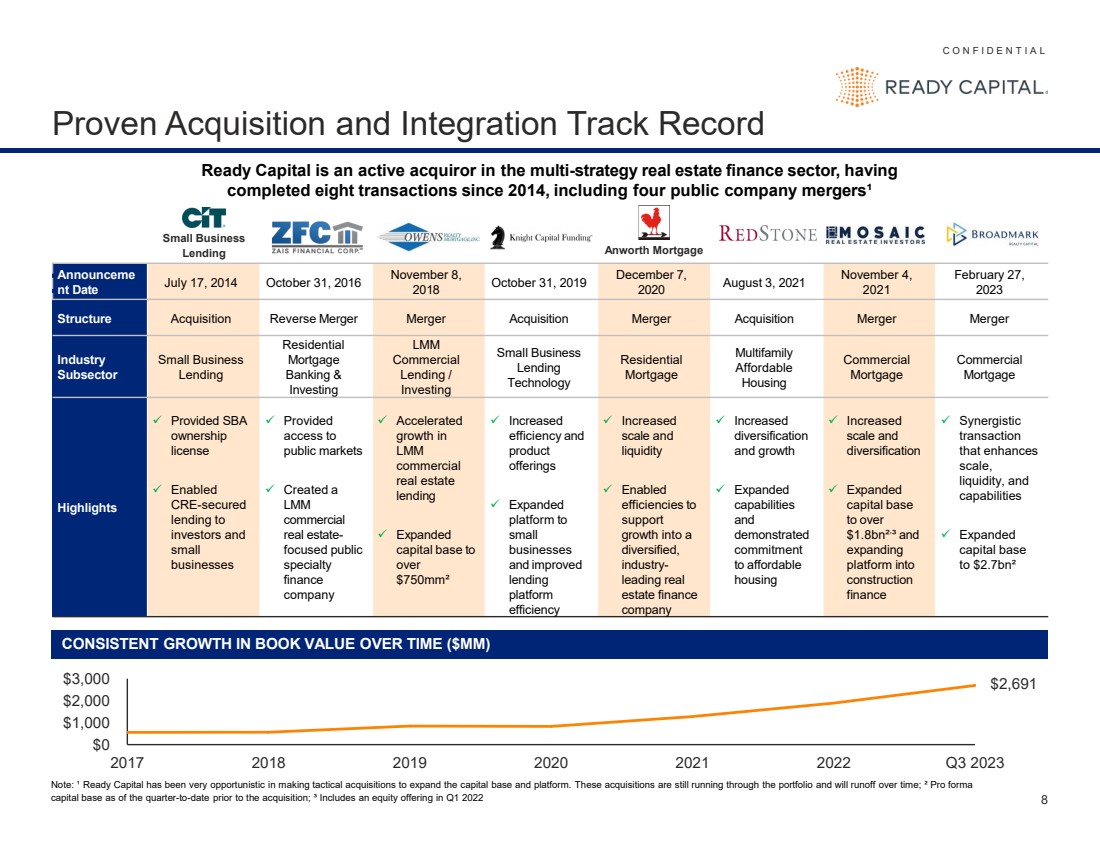
C O N F I D E N T I A L 8 Proven Acquisition and Integration Track Record Ready Capital is an active acquiror in the multi-strategy real estate finance sector, having completed eight transactions since 2014, including four public company mergers¹ Announceme nt Date July 17, 2014 October 31, 2016 November 8, 2018 October 31, 2019 December 7, 2020 August 3, 2021 November 4, 2021 February 27, 2023 Structure Acquisition Reverse Merger Merger Acquisition Merger Acquisition Merger Merger Industry Subsector Small Business Lending Residential Mortgage Banking & Investing LMM Commercial Lending / Investing Small Business Lending Technology Residential Mortgage Multifamily Affordable Housing Commercial Mortgage Commercial Mortgage Highlights ✓ Provided SBA ownership license ✓ Enabled CRE-secured lending to investors and small businesses ✓ Provided access to public markets ✓ Created a LMM commercial real estate-focused public specialty finance company ✓ Accelerated growth in LMM commercial real estate lending ✓ Expanded capital base to over $750mm² ✓ Increased efficiency and product offerings ✓ Expanded platform to small businesses and improved lending platform efficiency ✓ Increased scale and liquidity ✓ Enabled efficiencies to support growth into a diversified, industry-leading real estate finance company ✓ Increased diversification and growth ✓ Expanded capabilities and demonstrated commitment to affordable housing ✓ Increased scale and diversification ✓ Expanded capital base to over $1.8bn², ³ and expanding platform into construction finance ✓ Synergistic transaction that enhances scale, liquidity, and capabilities ✓ Expanded capital base to $2.7bn² Note: ¹ Ready Capital has been very opportunistic in making tactical acquisitions to expand the capital base and platform. These acquisitions are still running through the portfolio and will runoff over time; ² Pro forma capital base as of the quarter-to-date prior to the acquisition; ³ Includes an equity offering in Q1 2022 $0 $1,000 $2,000 $3,000 2017 2018 2019 2020 2021 2022 Q3 2023 CONSISTENT GROWTH IN BOOK VALUE OVER TIME ($MM) $2,691 Anworth Mortgage Small Business Lending |
|
Market Segment Overview |
|
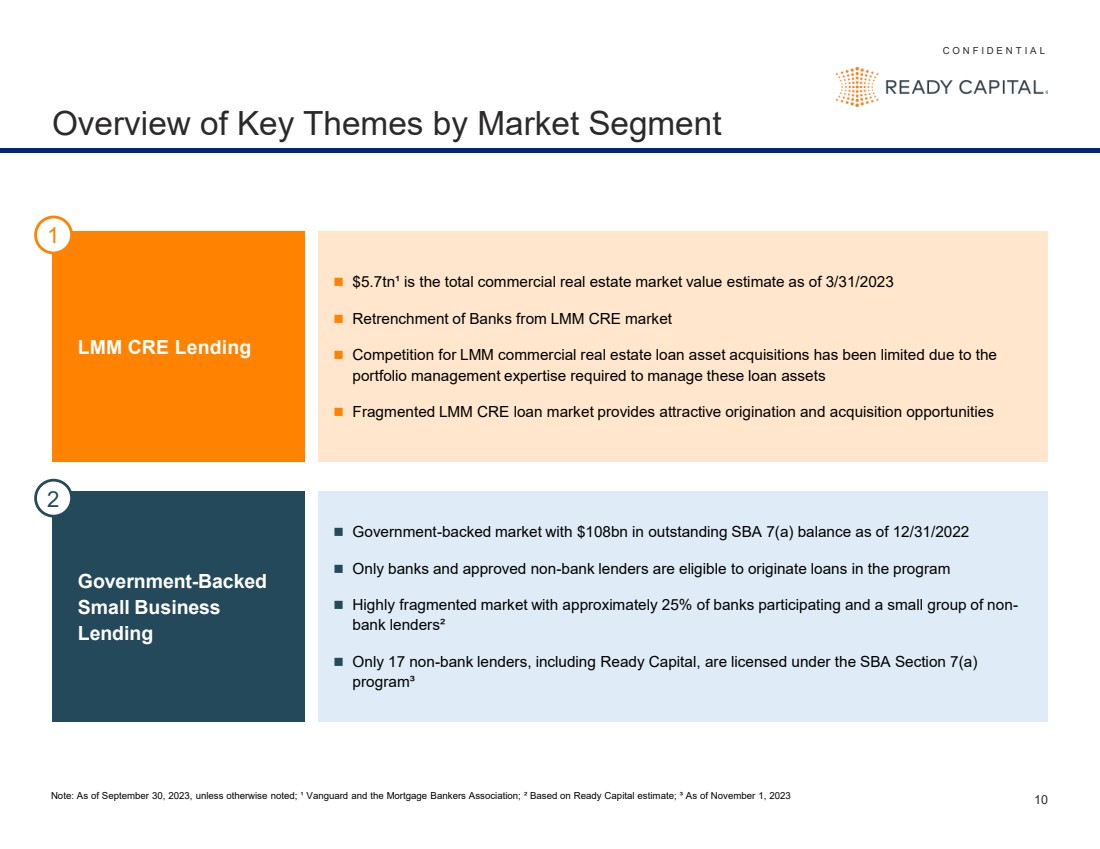
C O N F I D E N T I A L 10 Overview of Key Themes by Market Segment ◼ $5.7tn¹ is the total commercial real estate market value estimate as of 3/31/2023 ◼ Retrenchment of Banks from LMM CRE market ◼ Competition for LMM commercial real estate loan asset acquisitions has been limited due to the portfolio management expertise required to manage these loan assets ◼ Fragmented LMM CRE loan market provides attractive origination and acquisition opportunities ◼ Government-backed market with $108bn in outstanding SBA 7(a) balance as of 12/31/2022 ◼ Only banks and approved non-bank lenders are eligible to originate loans in the program ◼ Highly fragmented market with approximately 25% of banks participating and a small group of non-bank lenders² ◼ Only 17 non-bank lenders, including Ready Capital, are licensed under the SBA Section 7(a) program³ Government-Backed Small Business Lending LMM CRE Lending 1 2 Note: As of September 30, 2023, unless otherwise noted; ¹ Vanguard and the Mortgage Bankers Association; ² Based on Ready Capital estimate; ³ As of November 1, 2023 |
|
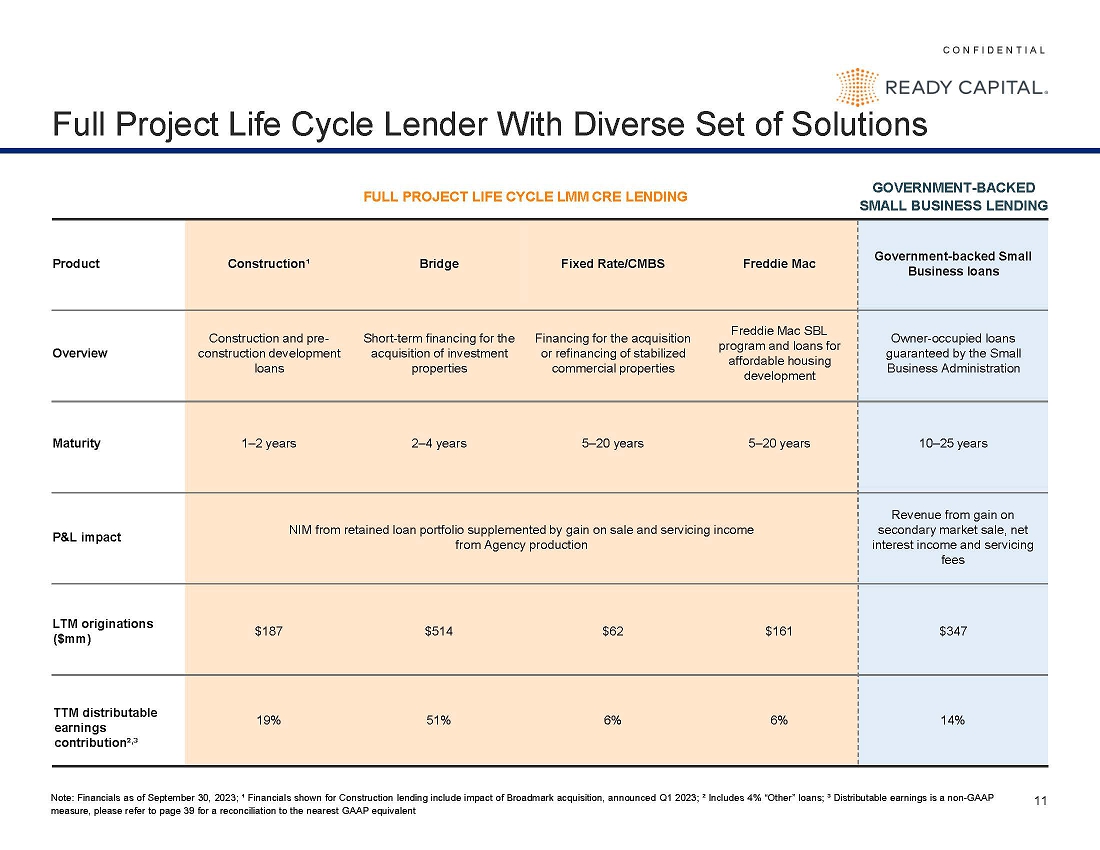
C O N F I D E N T I A L 11 Full Project Life Cycle Lender With Diverse Set of Solutions Product Construction¹ Bridge Fixed Rate/CMBS Freddie Mac Government-backed Small Business loans Overview Construction and pre-construction development loans Short-term financing for the acquisition of investment properties Financing for the acquisition or refinancing of stabilized commercial properties Freddie Mac SBL program and loans for affordable housing development Owner-occupied loans guaranteed by the Small Business Administration Maturity 1–2 years 2–4 years 5–20 years 5–20 years 10–25 years P&L impact NIM from retained loan portfolio supplemented by gain on sale and servicing income from Agency production Revenue from gain on secondary market sale, net interest income and servicing fees LTM originations ($mm) $187 $514 $62 $161 $347 TTM core earnings contribution², ³ 19% 51% 6% 6% 14% GOVERNMENT-BACKED SMALL BUSINESS LENDING FULL PROJECT LIFE CYCLE LMM CRE LENDING Note: Financials as of September 30, 2023; ¹ Financials shown for Construction lending include impact of Broadmark acquisition, announced Q1 2023; ² Includes 4% “Other” loans; ³ Core earnings is a non-GAAP measure, please refer to page 39 for a reconciliation to the nearest GAAP equivalent |
|
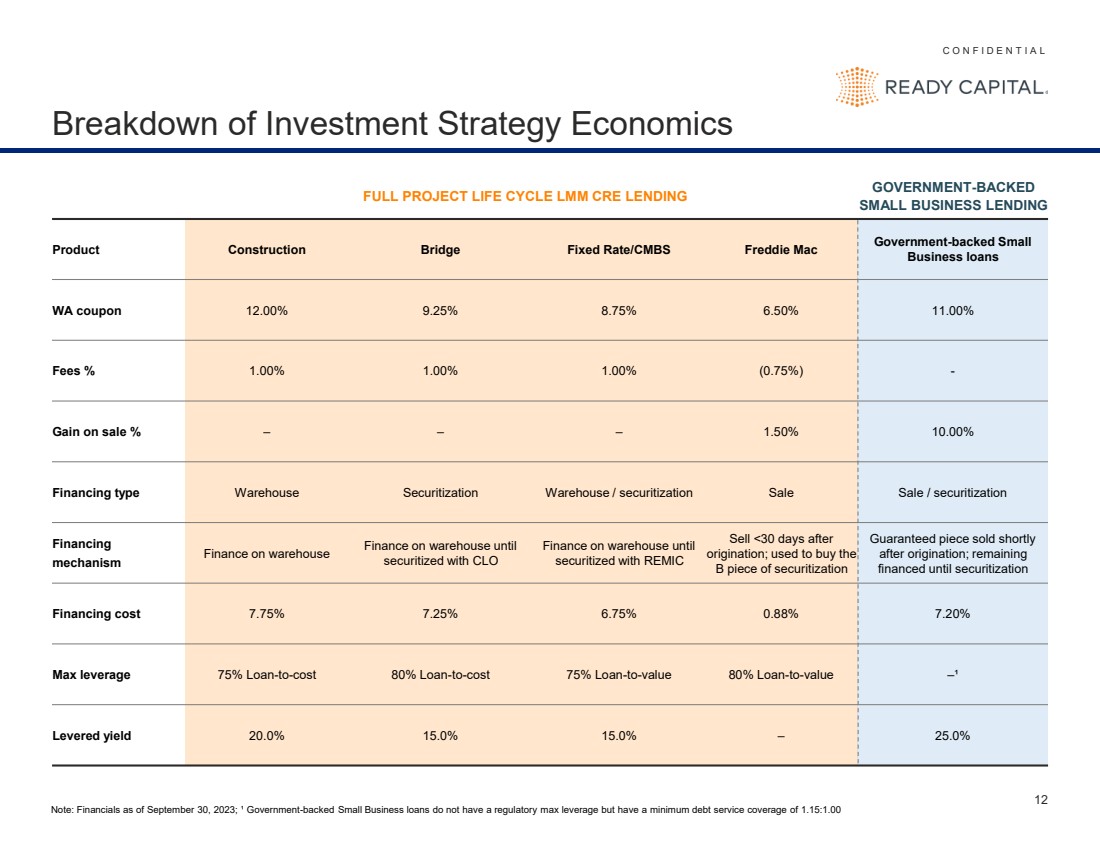
C O N F I D E N T I A L 12 Breakdown of Investment Strategy Economics Product Construction Bridge Fixed Rate/CMBS Freddie Mac Government-backed Small Business loans WA coupon 12.00% 9.25% 8.75% 6.50% 11.00% Fees % 1.00% 1.00% 1.00% (0.75%) - Gain on sale % – – – 1.50% 10.00% Financing type Warehouse Securitization Warehouse / securitization Sale Sale / securitization Financing mechanism Finance on warehouse Finance on warehouse until securitized with CLO Finance on warehouse until securitized with REMIC Sell <30 days after origination; used to buy the B piece of securitization Guaranteed piece sold shortly after origination; remaining financed until securitization Financing cost 7.75% 7.25% 6.75% 0.88% 7.20% Max leverage 75% Loan-to-cost 80% Loan-to-cost 75% Loan-to-value 80% Loan-to-value –¹ Levered yield 20.0% 15.0% 15.0% – 25.0% GOVERNMENT-BACKED SMALL BUSINESS LENDING FULL PROJECT LIFE CYCLE LMM CRE LENDING Note: Financials as of September 30, 2023; ¹ Government-backed Small Business loans do not have a regulatory max leverage but have a minimum debt service coverage of 1.15:1.00 |
|
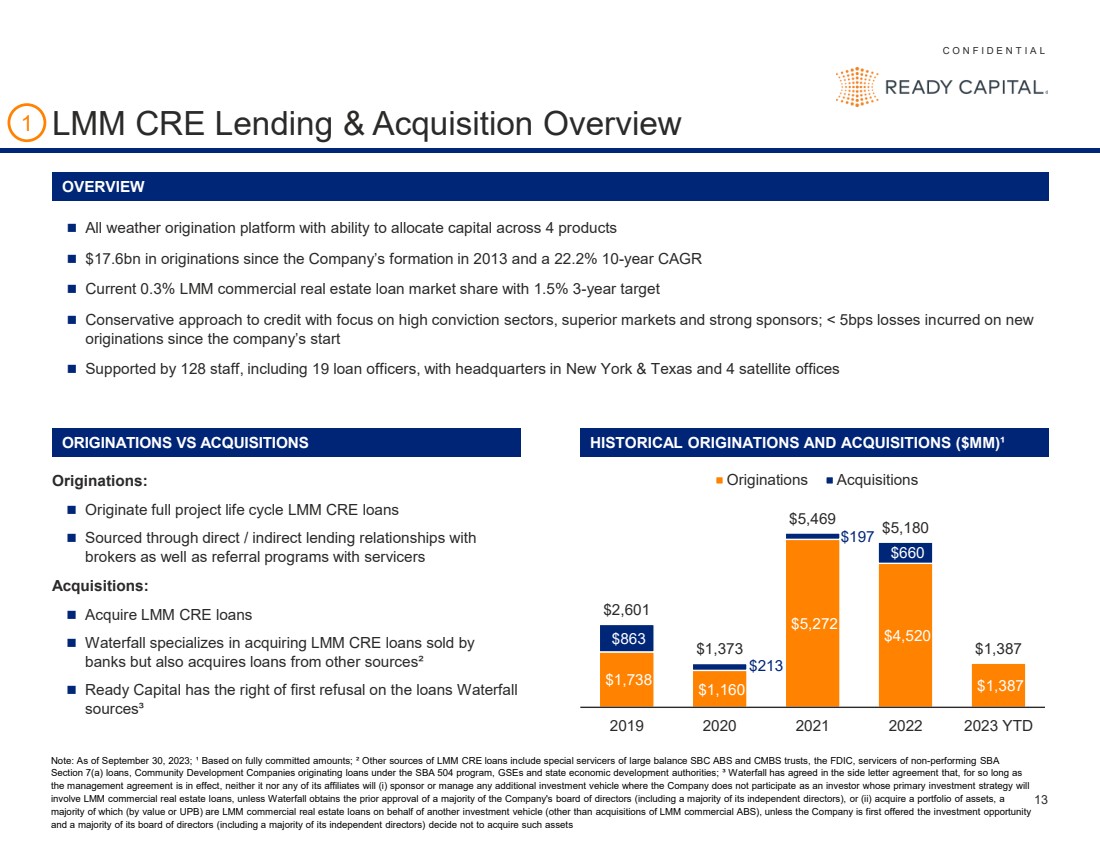
C O N F I D E N T I A L 13 LMM CRE Lending & Acquisition Overview Note: As of September 30, 2023; ¹ Based on fully committed amounts; ² Other sources of LMM CRE loans include special servicers of large balance SBC ABS and CMBS trusts, the FDIC, servicers of non-performing SBA Section 7(a) loans, Community Development Companies originating loans under the SBA 504 program, GSEs and state economic development authorities; ³ Waterfall has agreed in the side letter agreement that, for so long as the management agreement is in effect, neither it nor any of its affiliates will (i) sponsor or manage any additional investment vehicle where the Company does not participate as an investor whose primary investment strategy will involve LMM commercial real estate loans, unless Waterfall obtains the prior approval of a majority of the Company's board of directors (including a majority of its independent directors), or (ii) acquire a portfolio of assets, a majority of which (by value or UPB) are LMM commercial real estate loans on behalf of another investment vehicle (other than acquisitions of LMM commercial ABS), unless the Company is first offered the investment opportunity and a majority of its board of directors (including a majority of its independent directors) decide not to acquire such assets 1 ◼ All weather origination platform with ability to allocate capital across 4 products ◼ $17.6bn in originations since the Company’s formation in 2013 and a 22.2% 10-year CAGR ◼ Current 0.3% LMM commercial real estate loan market share with 1.5% 3-year target ◼ Conservative approach to credit with focus on high conviction sectors, superior markets and strong sponsors; < 5bps losses incurred on new originations since the company’s start ◼ Supported by 128 staff, including 19 loan officers, with headquarters in New York & Texas and 4 satellite offices $1,738 $1,160 $5,272 $4,520 $1,387 $863 $213 $197 $660 $2,601 $1,373 $5,469 $5,180 $1,387 2019 2020 2021 2022 2023 YTD Originations Acquisitions ORIGINATIONS VS ACQUISITIONS HISTORICAL ORIGINATIONS AND ACQUISITIONS ($MM)¹ Originations: ◼ Originate full project life cycle LMM CRE loans ◼ Sourced through direct / indirect lending relationships with brokers as well as referral programs with servicers Acquisitions: ◼ Acquire LMM CRE loans ◼ Waterfall specializes in acquiring LMM CRE loans sold by banks but also acquires loans from other sources² ◼ Ready Capital has the right of first refusal on the loans Waterfall sources³ OVERVIEW |
|
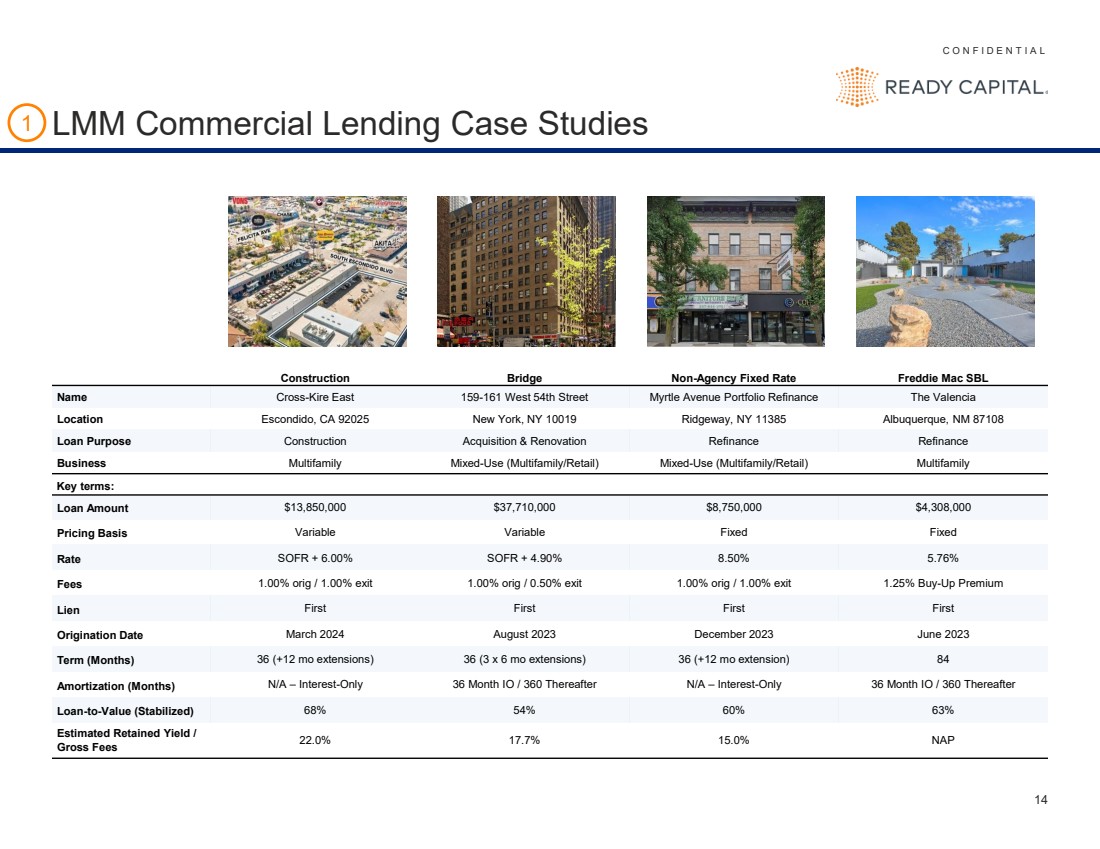
C O N F I D E N T I A L 14 LMM Commercial Lending Case Studies Construction Bridge Non-Agency Fixed Rate Freddie Mac SBL Name Cross-Kire East 159-161 West 54th Street Myrtle Avenue Portfolio Refinance The Valencia Location Escondido, CA 92025 New York, NY 10019 Ridgeway, NY 11385 Albuquerque, NM 87108 Loan Purpose Construction Acquisition & Renovation Refinance Refinance Business Multifamily Mixed-Use (Multifamily/Retail) Mixed-Use (Multifamily/Retail) Multifamily Key terms: Loan Amount $13,850,000 $37,710,000 $8,750,000 $4,308,000 Pricing Basis Variable Variable Fixed Fixed Rate SOFR + 6.00% SOFR + 4.90% 8.50% 5.76% Fees 1.00% orig / 1.00% exit 1.00% orig / 0.50% exit 1.00% orig / 1.00% exit 1.25% Buy-Up Premium Lien First First First First Origination Date March 2024 August 2023 December 2023 June 2023 Term (Months) 36 (+12 mo extensions) 36 (3 x 6 mo extensions) 36 (+12 mo extension) 84 Amortization (Months) N/A – Interest-Only 36 Month IO / 360 Thereafter N/A – Interest-Only 36 Month IO / 360 Thereafter Loan-to-Value (Stabilized) 68% 54% 60% 63% Estimated Retained Yield / Gross Fees 22.0% 17.7% 15.0% NAP 1 |
|
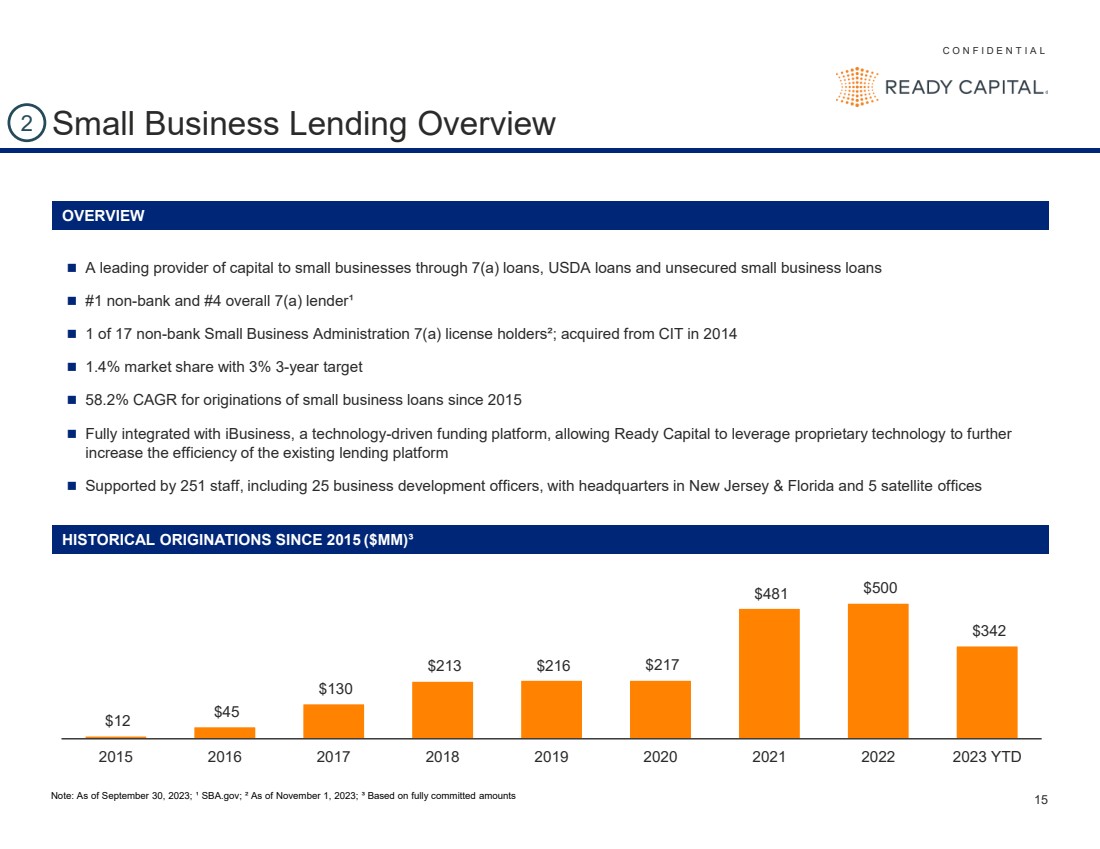
C O N F I D E N T I A L 15 Small Business Lending Overview OVERVIEW ◼ A leading provider of capital to small businesses through 7(a) loans, USDA loans and unsecured small business loans ◼ #1 non-bank and #4 overall 7(a) lender¹ ◼ 1 of 17 non-bank Small Business Administration 7(a) license holders²; acquired from CIT in 2014 ◼ 1.4% market share with 3% 3-year target ◼ 58.2% CAGR for originations of small business loans since 2015 ◼ Fully integrated with iBusiness, a technology-driven funding platform, allowing Ready Capital to leverage proprietary technology to further increase the efficiency of the existing lending platform ◼ Supported by 251 staff, including 25 business development officers, with headquarters in New Jersey & Florida and 5 satellite offices $12 $45 $130 $213 $216 $217 $481 $500 $342 2015 2016 2017 2018 2019 2020 2021 2022 2023 YTD 2 Note: As of September 30, 2023; ¹ SBA.gov; ² As of November 1, 2023; ³ Based on fully committed amounts HISTORICAL ORIGINATIONS SINCE 2015 ($MM)³ |
|
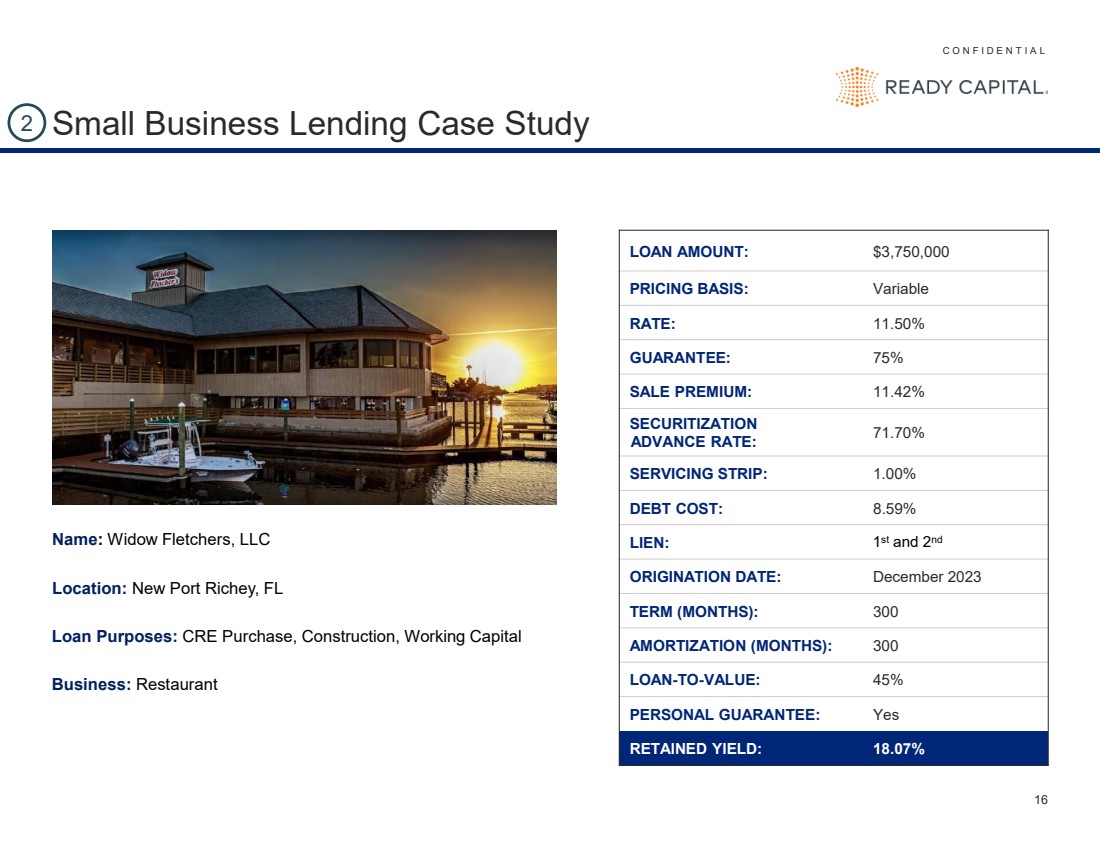
C O N F I D E N T I A L 16 LOAN AMOUNT: $3,750,000 PRICING BASIS: Variable RATE: 11.50% GUARANTEE: 75% SALE PREMIUM: 11.42% SECURITIZATION ADVANCE RATE: 71.70% SERVICING STRIP: 1.00% DEBT COST: 8.59% LIEN: 1st and 2nd ORIGINATION DATE: December 2023 TERM (MONTHS): 300 AMORTIZATION (MONTHS): 300 LOAN-TO-VALUE: 45% PERSONAL GUARANTEE: Yes RETAINED YIELD: 18.07% 2 Name: Widow Fletchers, LLC Location: New Port Richey, FL Loan Purposes: CRE Purchase, Construction, Working Capital Business: Restaurant Small Business Lending Case Study |
|
Key Credit Highlights |
|
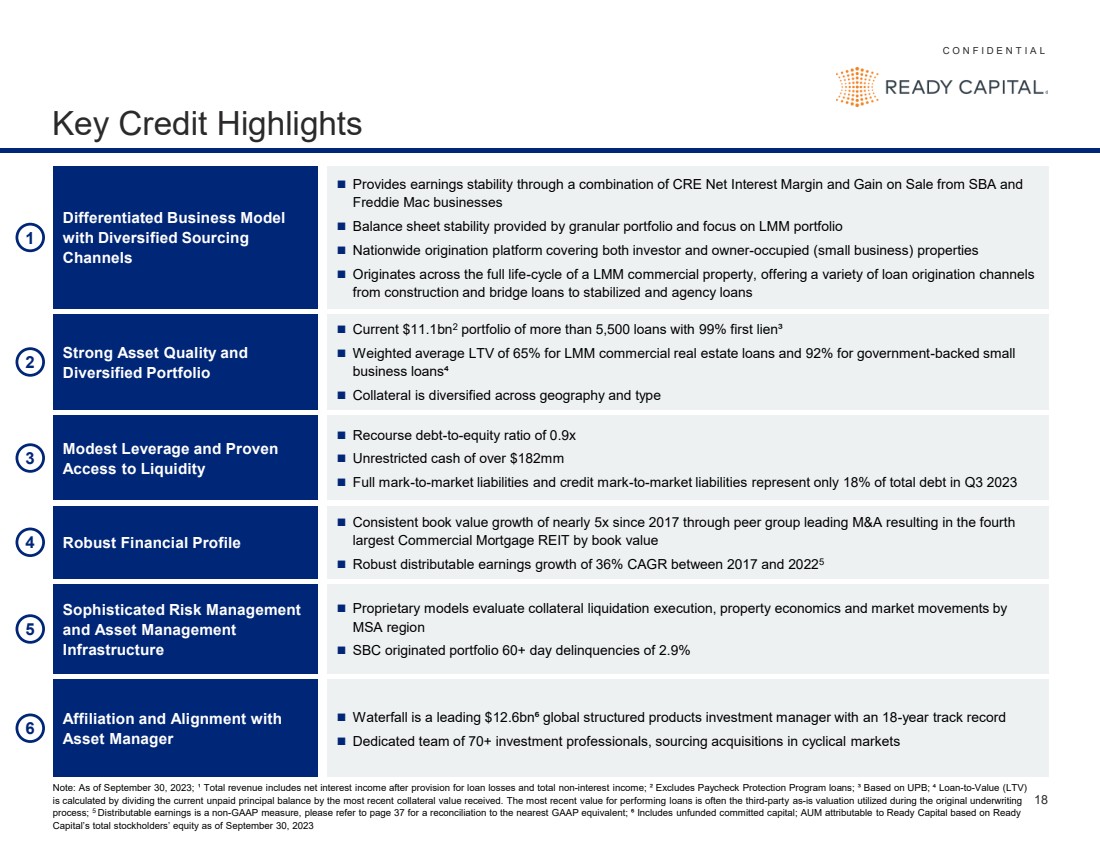
C O N F I D E N T I A L 18 Key Credit Highlights Note: As of September 30, 2023; ¹ Total revenue includes net interest income after provision for loan losses and total non-interest income; ² Excludes Paycheck Protection Program loans; ³ Based on UPB; ⁴ Loan-to-Value (LTV) is calculated by dividing the current unpaid principal balance by the most recent collateral value received. The most recent value for performing loans is often the third-party as-is valuation utilized during the original underwriting process; 5 Distributable earnings is a non-GAAP measure, please refer to page 37 for a reconciliation to the nearest GAAP equivalent; ⁶ Includes unfunded committed capital; AUM attributable to Ready Capital based on Ready Capital’s total stockholders’ equity as of September 30, 2023 Strong Asset Quality and Diversified Portfolio 2 ◼ Current $11.1bn2 portfolio of more than 5,500 loans with 99% first lien³ ◼ Weighted average LTV of 65% for LMM commercial real estate loans and 92% for government-backed small business loans⁴ ◼ Collateral is diversified across geography and type 4 Robust Financial Profile ◼ Consistent book value growth of nearly 5x since 2017 through peer group leading M&A resulting in the fourth largest Commercial Mortgage REIT by book value ◼ Robust distributable earnings growth of 36% CAGR between 2017 and 20225 Affiliation and Alignment with Asset Manager 6 ◼ Waterfall is a leading $12.6bn⁶ global structured products investment manager with an 18-year track record ◼ Dedicated team of 70+ investment professionals, sourcing acquisitions in cyclical markets Sophisticated Risk Management and Asset Management Infrastructure 5 ◼ Proprietary models evaluate collateral liquidation execution, property economics and market movements by MSA region ◼ SBC originated portfolio 60+ day delinquencies of 2.9% Differentiated Business Model with Diversified Sourcing Channels 1 ◼ Provides earnings stability through a combination of CRE Net Interest Margin and Gain on Sale from SBA and Freddie Mac businesses ◼ Balance sheet stability provided by granular portfolio and focus on LMM portfolio ◼ Nationwide origination platform covering both investor and owner-occupied (small business) properties ◼ Originates across the full life-cycle of a LMM commercial property, offering a variety of loan origination channels from construction and bridge loans to stabilized and agency loans Modest Leverage and Proven Access to Liquidity ◼ Recourse debt-to-equity ratio of 0.9x ◼ Unrestricted cash of over $182mm ◼ Full mark-to-market liabilities and credit mark-to-market liabilities represent only 18% of total debt in Q3 2023 3 |
|
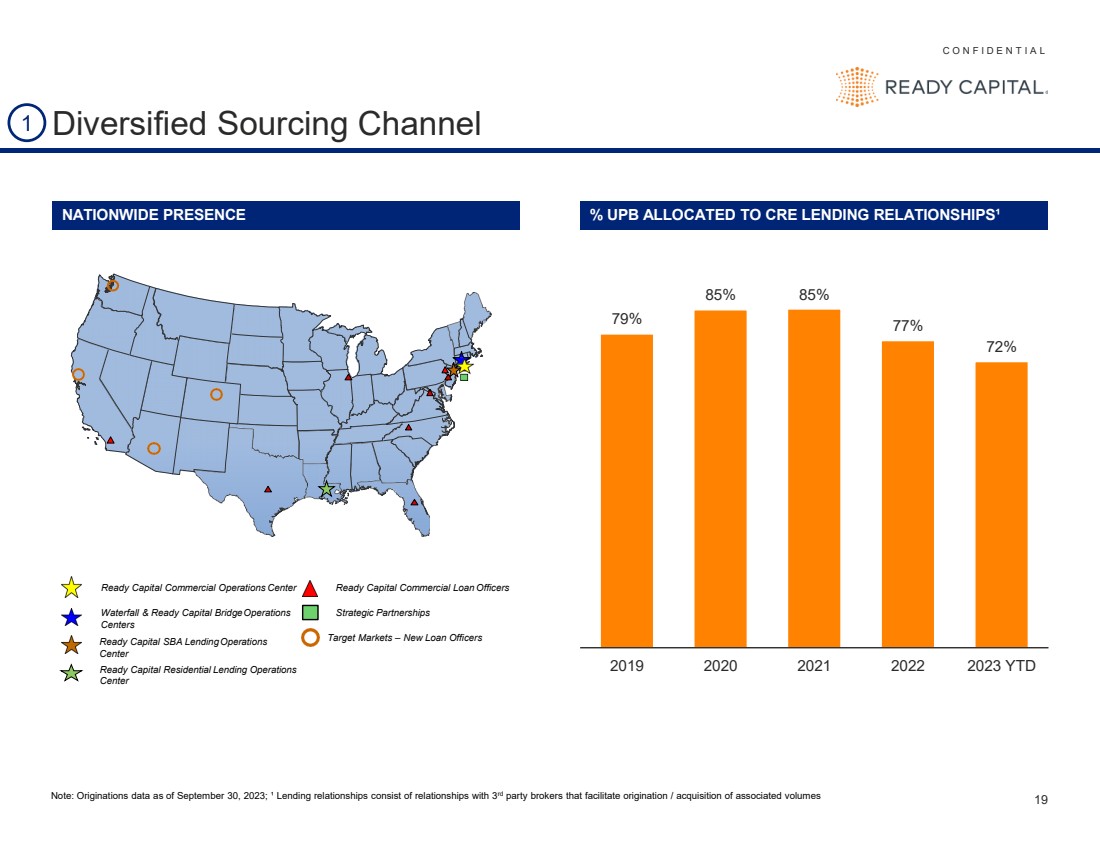
C O N F I D E N T I A L 19 79% 85% 85% 77% 72% 2019 2020 2021 2022 2023 YTD Diversified Sourcing Channel Ready Capital Commercial Operations Center Waterfall & Ready Capital BridgeOperations Centers Ready Capital SBA LendingOperations Center Ready Capital Commercial Loan Officers Strategic Partnerships Target Markets – New Loan Officers Ready Capital Residential Lending Operations Center NATIONWIDE PRESENCE % UPB ALLOCATED TO CRE LENDING RELATIONSHIPS¹ 1 Note: Originations data as of September 30, 2023; ¹ Lending relationships consist of relationships with 3rd party brokers that facilitate origination / acquisition of associated volumes |
|
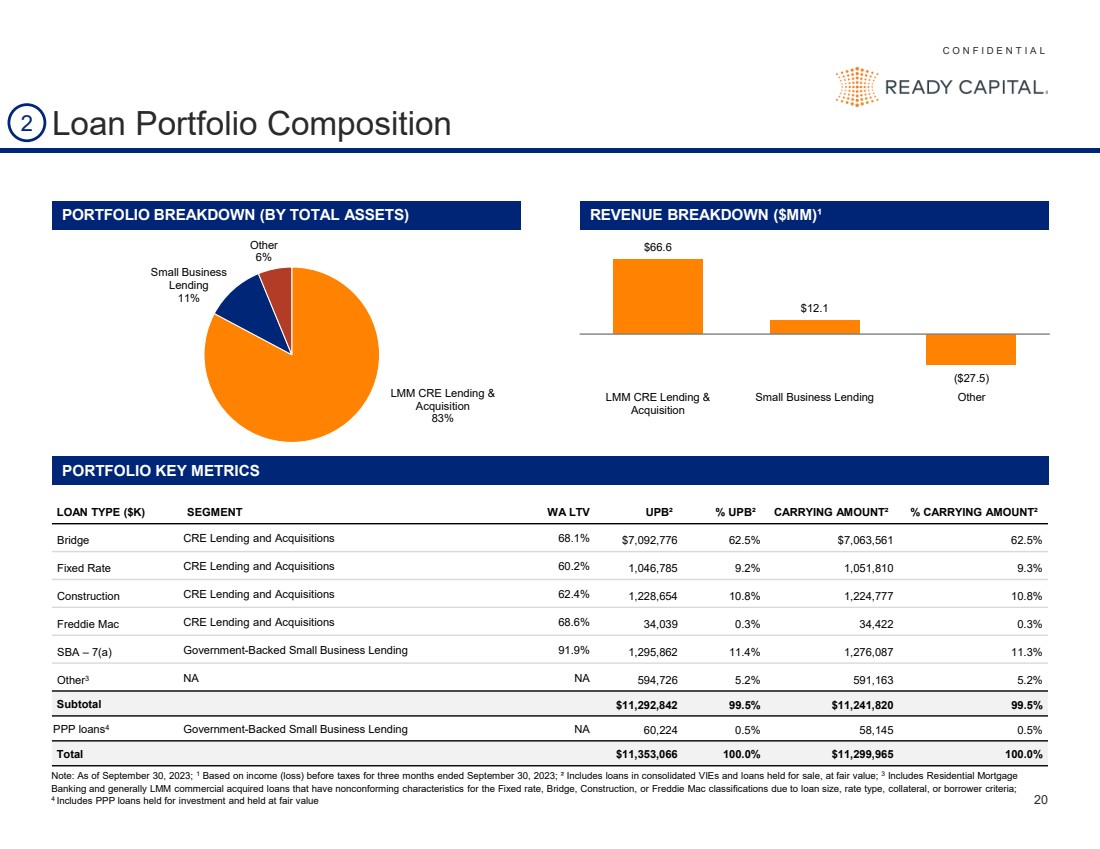
C O N F I D E N T I A L 20 Loan Portfolio Composition PORTFOLIO BREAKDOWN (BY TOTAL ASSETS) REVENUE BREAKDOWN ($MM)¹ Note: As of September 30, 2023; 1 Based on income (loss) before taxes for three months ended September 30, 2023; ² Includes loans in consolidated VIEs and loans held for sale, at fair value; 3 Includes Residential Mortgage Banking and generally LMM commercial acquired loans that have nonconforming characteristics for the Fixed rate, Bridge, Construction, or Freddie Mac classifications due to loan size, rate type, collateral, or borrower criteria; 4 Includes PPP loans held for investment and held at fair value LMM CRE Lending & Acquisition 83% Small Business Lending 11% Other 6% $66.6 $12.1 ($27.5) LMM CRE Lending & Acquisition Small Business Lending Other LOAN TYPE ($K) SEGMENT WA LTV UPB² % UPB² CARRYING AMOUNT² % CARRYING AMOUNT² Bridge CRE Lending and Acquisitions 68.1% $7,092,776 62.5% $7,063,561 62.5% Fixed Rate CRE Lending and Acquisitions 60.2% 1,046,785 9.2% 1,051,810 9.3% Construction CRE Lending and Acquisitions 62.4% 1,228,654 10.8% 1,224,777 10.8% Freddie Mac CRE Lending and Acquisitions 68.6% 34,039 0.3% 34,422 0.3% SBA – 7(a) Government-Backed Small Business Lending 91.9% 1,295,862 11.4% 1,276,087 11.3% Other3 NA NA 594,726 5.2% 591,163 5.2% Subtotal $11,292,842 99.5% $11,241,820 99.5% PPP loans4 Government-Backed Small Business Lending NA 60,224 0.5% 58,145 0.5% Total $11,353,066 100.0% $11,299,965 100.0% 2 PORTFOLIO KEY METRICS |
|
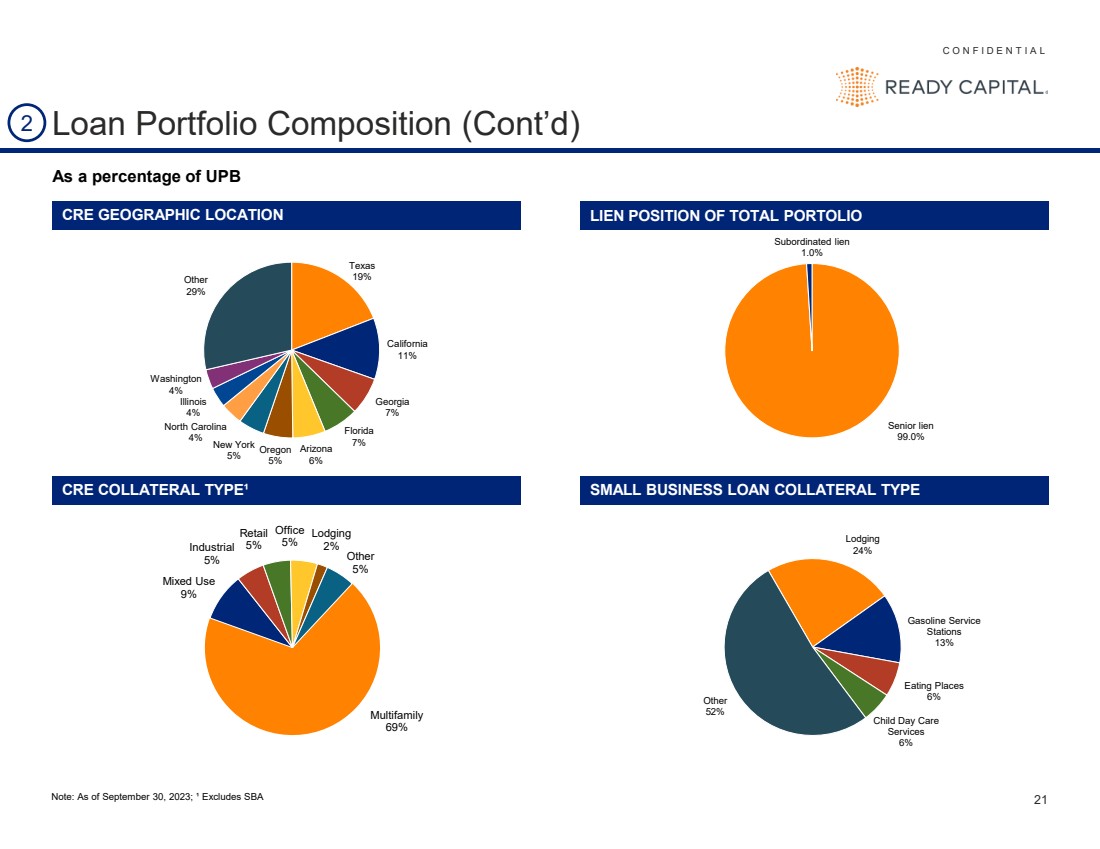
C O N F I D E N T I A L 21 Loan Portfolio Composition (Cont’d) CRE GEOGRAPHIC LOCATION LIEN POSITION OF TOTAL PORTOLIO Texas 19% California 11% Georgia 7% Florida 7% Arizona 6% Oregon 5% New York 5% North Carolina 4% Illinois 4% Washington 4% Other 29% Senior lien 99.0% Subordinated lien 1.0% CRE COLLATERAL TYPE¹ SMALL BUSINESS LOAN COLLATERAL TYPE Lodging 24% Gasoline Service Stations 13% Eating Places 6% Child Day Care Services 6% Other 52% Note: As of September 30, 2023; ¹ Excludes SBA 2 As a percentage of UPB Multifamily 69% Mixed Use 9% Industrial 5% Retail 5% Office 5% Lodging 2% Other 5% |
|
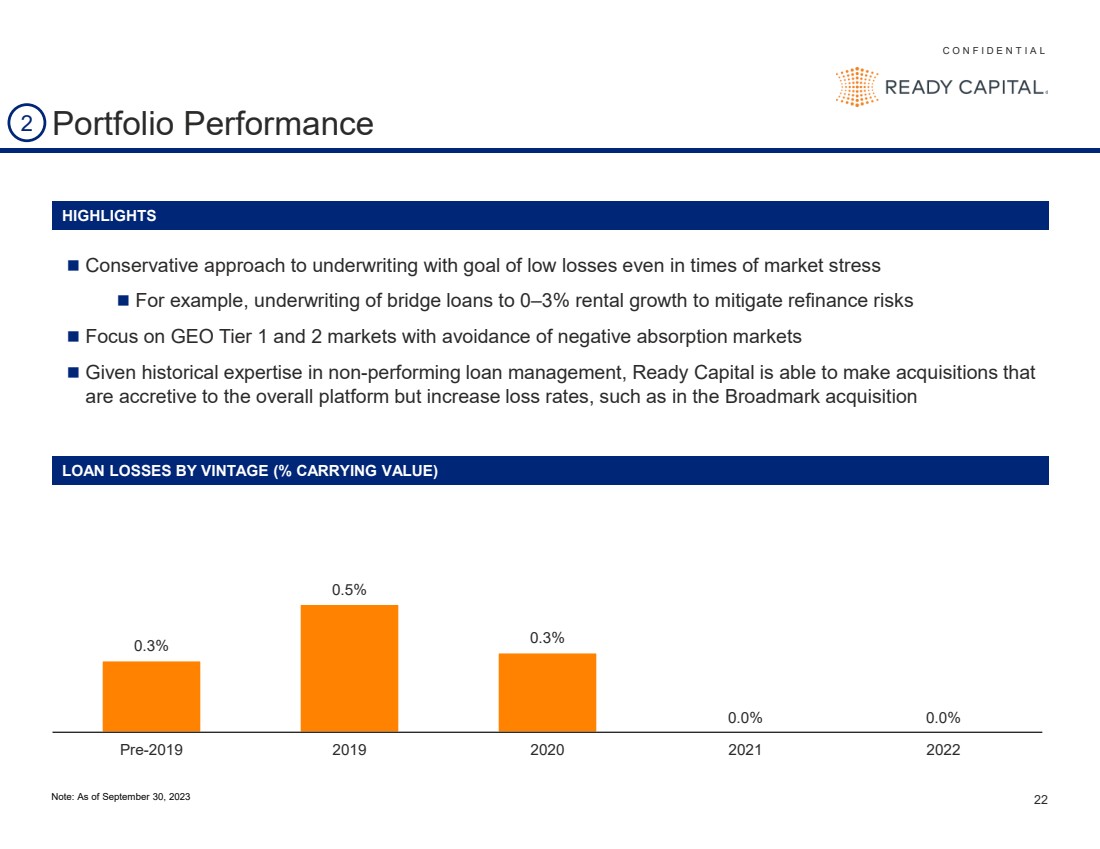
C O N F I D E N T I A L 22 Portfolio Performance HIGHLIGHTS LOAN LOSSES BY VINTAGE (% CARRYING VALUE) ◼ Conservative approach to underwriting with goal of low losses even in times of market stress ◼ For example, underwriting of bridge loans to 0–3% rental growth to mitigate refinance risks ◼ Focus on GEO Tier 1 and 2 markets with avoidance of negative absorption markets ◼ Given historical expertise in non-performing loan management, Ready Capital is able to make acquisitions that are accretive to the overall platform but increase loss rates, such as in the Broadmark acquisition 0.3% 0.5% 0.3% 0.0% 0.0% Pre-2019 2019 2020 2021 2022 2 Note: As of September 30, 2023 |
|
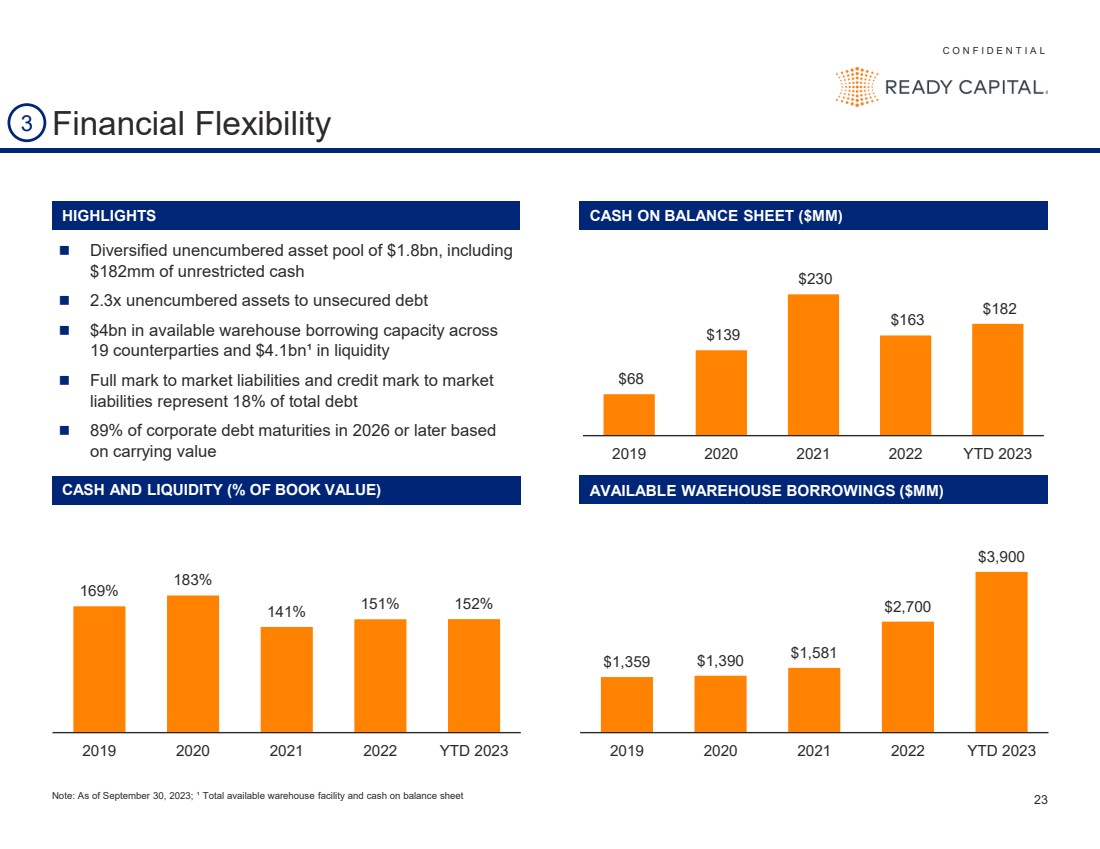
C O N F I D E N T I A L 23 Financial Flexibility HIGHLIGHTS CASH ON BALANCE SHEET ($MM) AVAILABLE WAREHOUSE BORROWINGS ($MM) ◼ Diversified unencumbered asset pool of $1.8bn, including $182mm of unrestricted cash ◼ 2.3x unencumbered assets to unsecured debt ◼ $4bn in available warehouse borrowing capacity across 19 counterparties and $4.1bn¹ in liquidity ◼ Full mark to market liabilities and credit mark to market liabilities represent 18% of total debt ◼ 89% of corporate debt maturities in 2026 or later based on carrying value 3 Note: As of September 30, 2023; ¹ Total available warehouse facility and cash on balance sheet 169% 183% 141% 151% 152% 2019 2020 2021 2022 YTD 2023 CASH AND LIQUIDITY (% OF BOOK VALUE) $68 $139 $230 $163 $182 2019 2020 2021 2022 YTD 2023 $1,359 $1,390 $1,581 $2,700 $3,900 2019 2020 2021 2022 YTD 2023 |
|
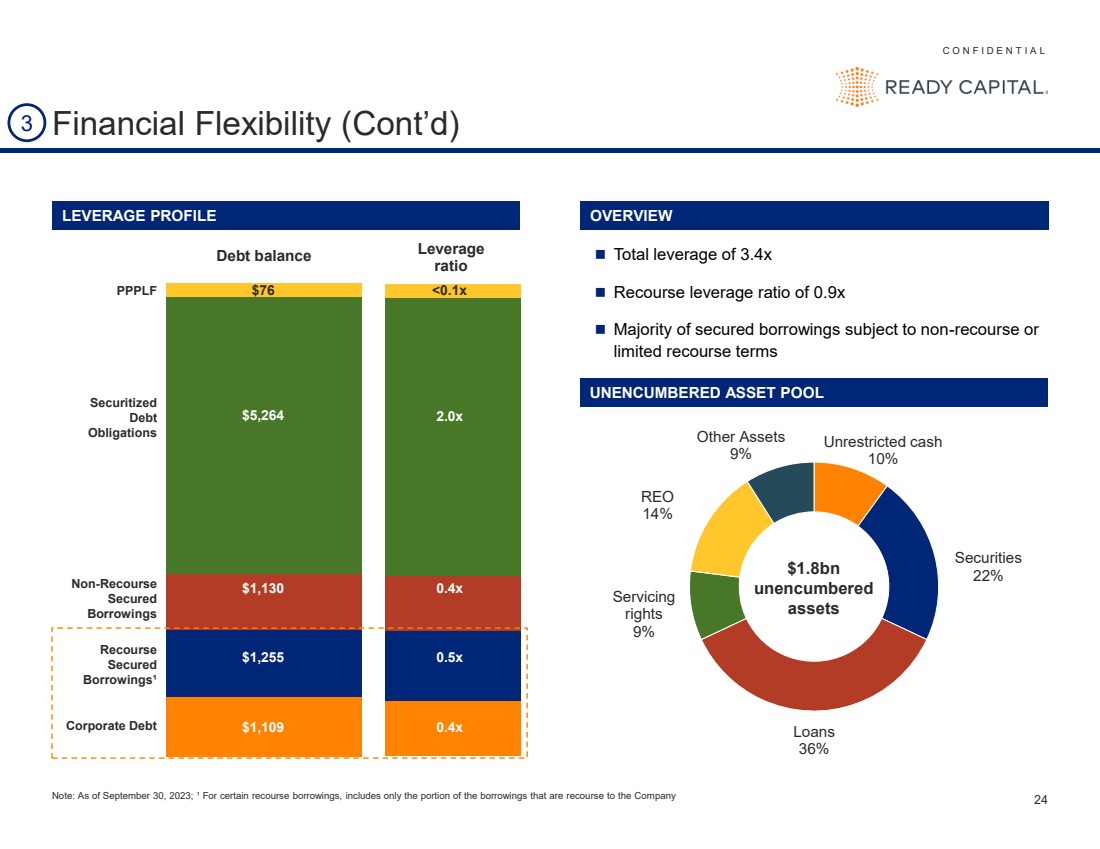
C O N F I D E N T I A L 24 3 Financial Flexibility (Cont’d) Debt balance Leverage ratio $1,109 $1,255 $1,130 $5,264 $76 0.4x 0.5x 0.4x 2.0x <0.1x Corporate Debt Recourse Secured Borrowings¹ Non-Recourse Secured Borrowings Securitized Debt Obligations PPPLF ◼ Total leverage of 3.4x ◼ Recourse leverage ratio of 0.9x ◼ Majority of secured borrowings subject to non-recourse or limited recourse terms UNENCUMBERED ASSET POOL Note: As of September 30, 2023; ¹ For certain recourse borrowings, includes only the portion of the borrowings that are recourse to the Company OVERVIEW Unrestricted cash 10% Securities 22% Loans 36% Servicing rights 9% REO 14% Other Assets 9% $1.8bn unencumbered assets LEVERAGE PROFILE |
|
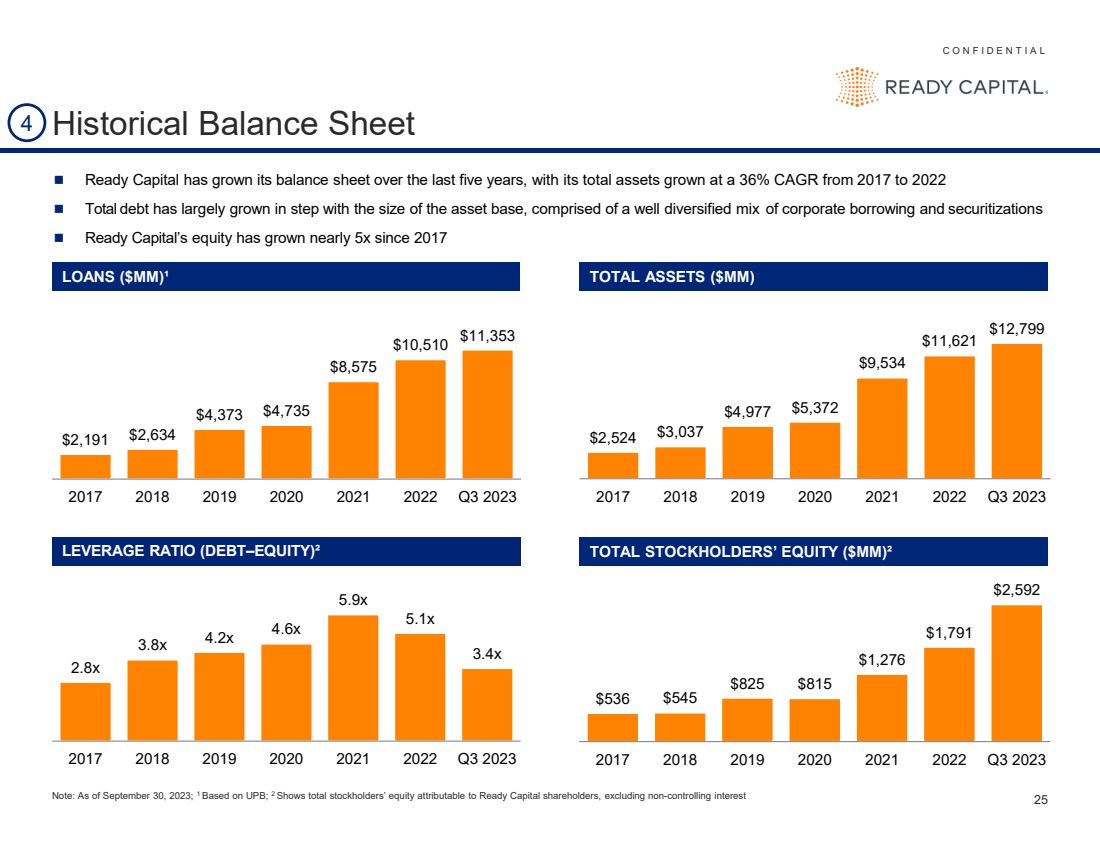
C O N F I D E N T I A L 25 Historical Balance Sheet $536 $545 $825 $815 $1,276 $1,791 $2,592 2017 2018 2019 2020 2021 2022 Q3 2023 ◼ Ready Capital has grown its balance sheet over the last five years, with its total assets grown at a 36% CAGR from 2017 to 2022 ◼ Total debt has largely grown in step with the size of the asset base, comprised of a well diversified mix of corporate borrowing and securitizations ◼ Ready Capital’s equity has grown nearly 5x since 2017 $2,191 $2,634 $4,373 $4,735 $8,575 $10,510 $11,353 2017 2018 2019 2020 2021 2022 Q3 2023 $2,524 $3,037 $4,977 $5,372 $9,534 $11,621 $12,799 2017 2018 2019 2020 2021 2022 Q3 2023 2.8x 3.8x 4.2x 4.6x 5.9x 5.1x 3.4x 2017 2018 2019 2020 2021 2022 Q3 2023 LOANS ($MM)¹ TOTAL ASSETS ($MM) LEVERAGE RATIO (DEBT–EQUITY)² TOTAL STOCKHOLDERS’ EQUITY ($MM)² Note: As of September 30, 2023; 1 Based on UPB; 2 Shows total stockholders’ equity attributable to Ready Capital shareholders, excluding non-controlling interest 4 |
|
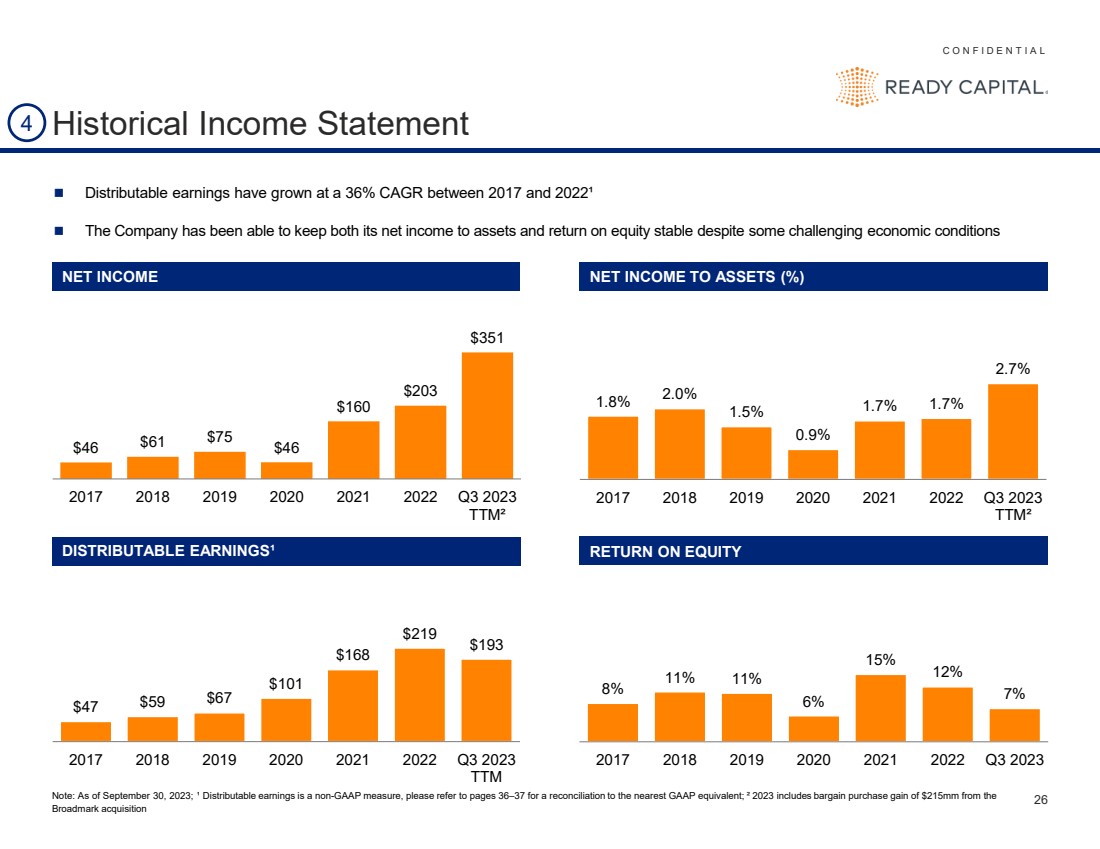
C O N F I D E N T I A L 26 $47 $59 $67 $101 $168 $219 $193 2017 2018 2019 2020 2021 2022 Q3 2023 TTM 1.8% 2.0% 1.5% 0.9% 1.7% 1.7% 2.7% 2017 2018 2019 2020 2021 2022 Q3 2023 TTM² $46 $61 $75 $46 $160 $203 $351 2017 2018 2019 2020 2021 2022 Q3 2023 TTM² Historical Income Statement NET INCOME NET INCOME TO ASSETS (%) DISTRIBUTABLE EARNINGS¹ RETURN ON EQUITY Note: As of September 30, 2023; ¹ Distributable earnings is a non-GAAP measure, please refer to pages 36–37 for a reconciliation to the nearest GAAP equivalent; ² 2023 includes bargain purchase gain of $215mm from the Broadmark acquisition 4 8% 11% 11% 6% 15% 12% 7% 2017 2018 2019 2020 2021 2022 Q3 2023 ◼ Distributable earnings have grown at a 36% CAGR between 2017 and 2022¹ ◼ The Company has been able to keep both its net income to assets and return on equity stable despite some challenging economic conditions |
|
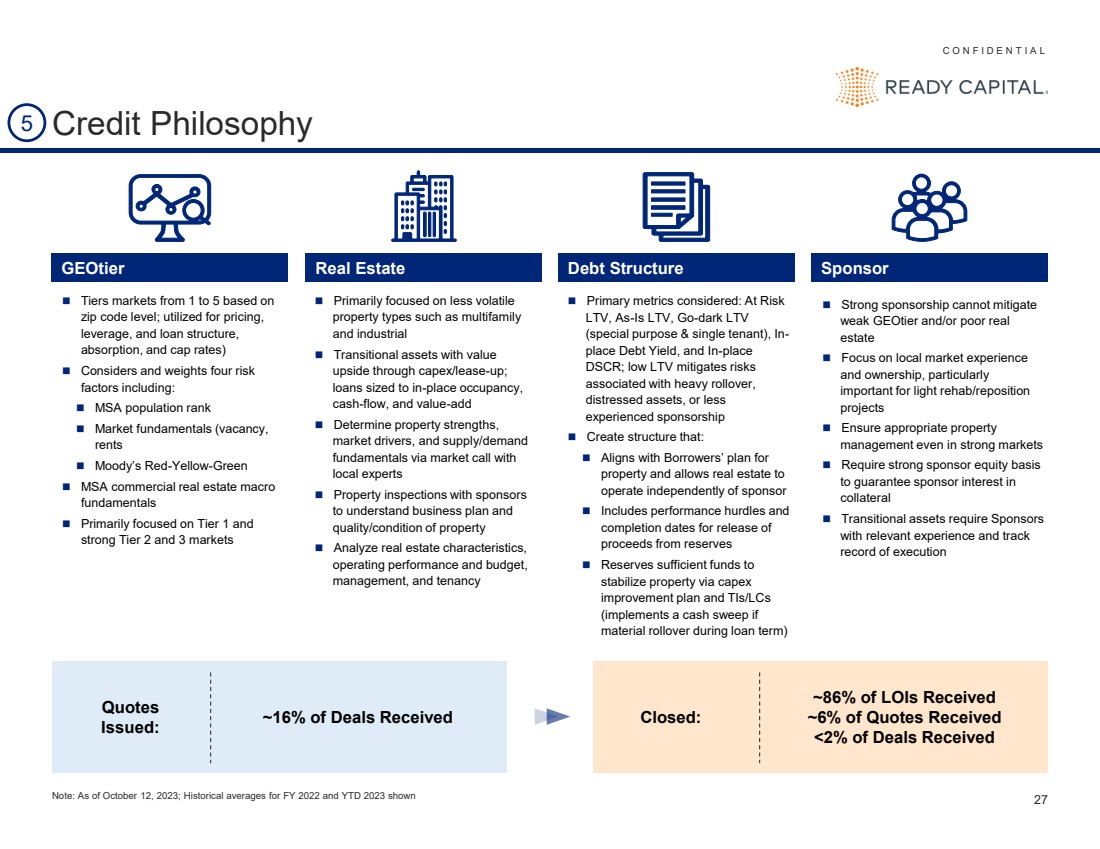
C O N F I D E N T I A L 27 GEOtier Real Estate Debt Structure ◼ Tiers markets from 1 to 5 based on zip code level; utilized for pricing, leverage, and loan structure, absorption, and cap rates) ◼ Considers and weights four risk factors including: ◼ MSA population rank ◼ Market fundamentals (vacancy, rents ◼ Moody’s Red-Yellow-Green ◼ MSA commercial real estate macro fundamentals ◼ Primarily focused on Tier 1 and strong Tier 2 and 3 markets ◼ Primarily focused on less volatile property types such as multifamily and industrial ◼ Transitional assets with value upside through capex/lease-up; loans sized to in-place occupancy, cash-flow, and value-add ◼ Determine property strengths, market drivers, and supply/demand fundamentals via market call with local experts ◼ Property inspections with sponsors to understand business plan and quality/condition of property ◼ Analyze real estate characteristics, operating performance and budget, management, and tenancy ◼ Primary metrics considered: At Risk LTV, As-Is LTV, Go-dark LTV (special purpose & single tenant), In-place Debt Yield, and In-place DSCR; low LTV mitigates risks associated with heavy rollover, distressed assets, or less experienced sponsorship ◼ Create structure that: ◼ Aligns with Borrowers’ plan for property and allows real estate to operate independently of sponsor ◼ Includes performance hurdles and completion dates for release of proceeds from reserves ◼ Reserves sufficient funds to stabilize property via capex improvement plan and TIs/LCs (implements a cash sweep if material rollover during loan term) ◼ Strong sponsorship cannot mitigate weak GEOtier and/or poor real estate ◼ Focus on local market experience and ownership, particularly important for light rehab/reposition projects ◼ Ensure appropriate property management even in strong markets ◼ Require strong sponsor equity basis to guarantee sponsor interest in collateral ◼ Transitional assets require Sponsors with relevant experience and track record of execution ~16% of Deals Received Sponsor 5 Credit Philosophy Quotes Issued: ~86% of LOIs Received ~6% of Quotes Received <2% of Deals Received Closed: Note: As of October 12, 2023; Historical averages for FY 2022 and YTD 2023 shown |
|
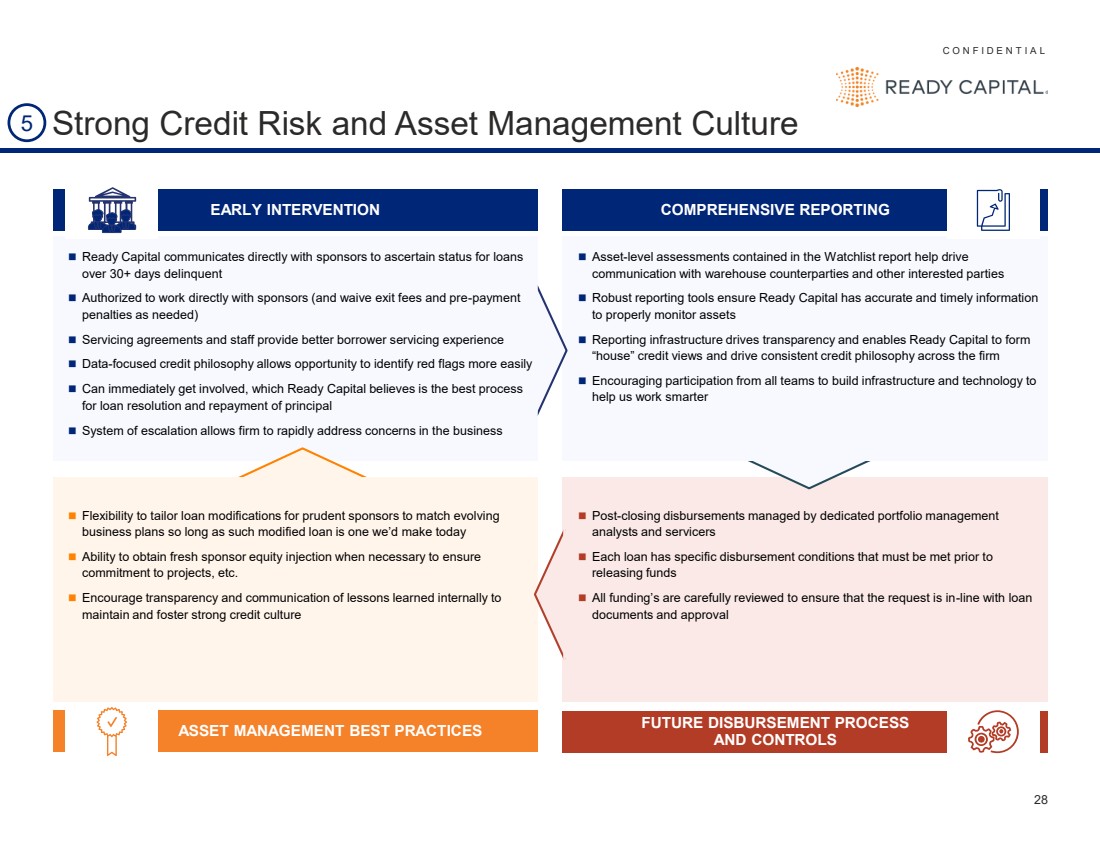
C O N F I D E N T I A L 28 ◼ Ready Capital communicates directly with sponsors to ascertain status for loans over 30+ days delinquent ◼ Authorized to work directly with sponsors (and waive exit fees and pre-payment penalties as needed) ◼ Servicing agreements and staff provide better borrower servicing experience ◼ Data-focused credit philosophy allows opportunity to identify red flags more easily ◼ Can immediately get involved, which Ready Capital believes is the best process for loan resolution and repayment of principal ◼ System of escalation allows firm to rapidly address concerns in the business ◼ Post-closing disbursements managed by dedicated portfolio management analysts and servicers ◼ Each loan has specific disbursement conditions that must be met prior to releasing funds ◼ All funding’s are carefully reviewed to ensure that the request is in-line with loan documents and approval ◼ Asset-level assessments contained in the Watchlist report help drive communication with warehouse counterparties and other interested parties ◼ Robust reporting tools ensure Ready Capital has accurate and timely information to properly monitor assets ◼ Reporting infrastructure drives transparency and enables Ready Capital to form “house” credit views and drive consistent credit philosophy across the firm ◼ Encouraging participation from all teams to build infrastructure and technology to help us work smarter 5 Strong Credit Risk and Asset Management Culture EARLY INTERVENTION FUTURE DISBURSEMENT PROCESS AND CONTROLS ASSET MANAGEMENT BEST PRACTICES COMPREHENSIVE REPORTING ◼ Flexibility to tailor loan modifications for prudent sponsors to match evolving business plans so long as such modified loan is one we’d make today ◼ Ability to obtain fresh sponsor equity injection when necessary to ensure commitment to projects, etc. ◼ Encourage transparency and communication of lessons learned internally to maintain and foster strong credit culture |
|
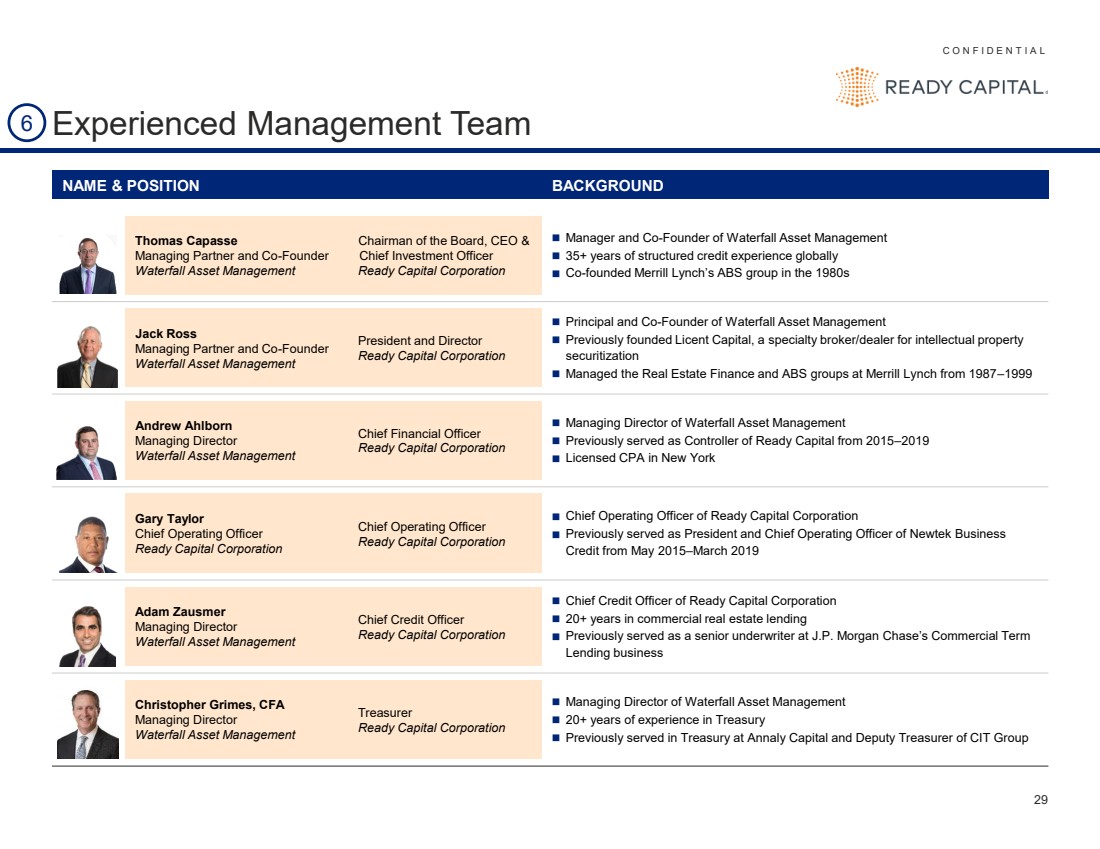
C O N F I D E N T I A L 29 Experienced Management Team NAME & POSITION BACKGROUND Thomas Capasse Managing Partner and Co-Founder Waterfall Asset Management Chairman of the Board, CEO & Chief Investment Officer Ready Capital Corporation ◼ Manager and Co-Founder of Waterfall Asset Management ◼ 35+ years of structured credit experience globally ◼ Co-founded Merrill Lynch’s ABS group in the 1980s Jack Ross Managing Partner and Co-Founder Waterfall Asset Management President and Director Ready Capital Corporation ◼ Principal and Co-Founder of Waterfall Asset Management ◼ Previously founded Licent Capital, a specialty broker/dealer for intellectual property securitization ◼ Managed the Real Estate Finance and ABS groups at Merrill Lynch from 1987–1999 Andrew Ahlborn Managing Director Waterfall Asset Management Chief Financial Officer Ready Capital Corporation ◼ Managing Director of Waterfall Asset Management ◼ Previously served as Controller of Ready Capital from 2015–2019 ◼ Licensed CPA in New York Gary Taylor Chief Operating Officer Ready Capital Corporation Chief Operating Officer Ready Capital Corporation ◼ Chief Operating Officer of Ready Capital Corporation ◼ Previously served as President and Chief Operating Officer of Newtek Business Credit from May 2015–March 2019 Adam Zausmer Managing Director Waterfall Asset Management Chief Credit Officer Ready Capital Corporation ◼ Chief Credit Officer of Ready Capital Corporation ◼ 20+ years in commercial real estate lending ◼ Previously served as a senior underwriter at J.P. Morgan Chase’s Commercial Term Lending business Christopher Grimes, CFA Managing Director Waterfall Asset Management Treasurer Ready Capital Corporation ◼ Managing Director of Waterfall Asset Management ◼ 20+ years of experience in Treasury ◼ Previously served in Treasury at Annaly Capital and Deputy Treasurer of CIT Group 6 |
|
Financial Summary |
|
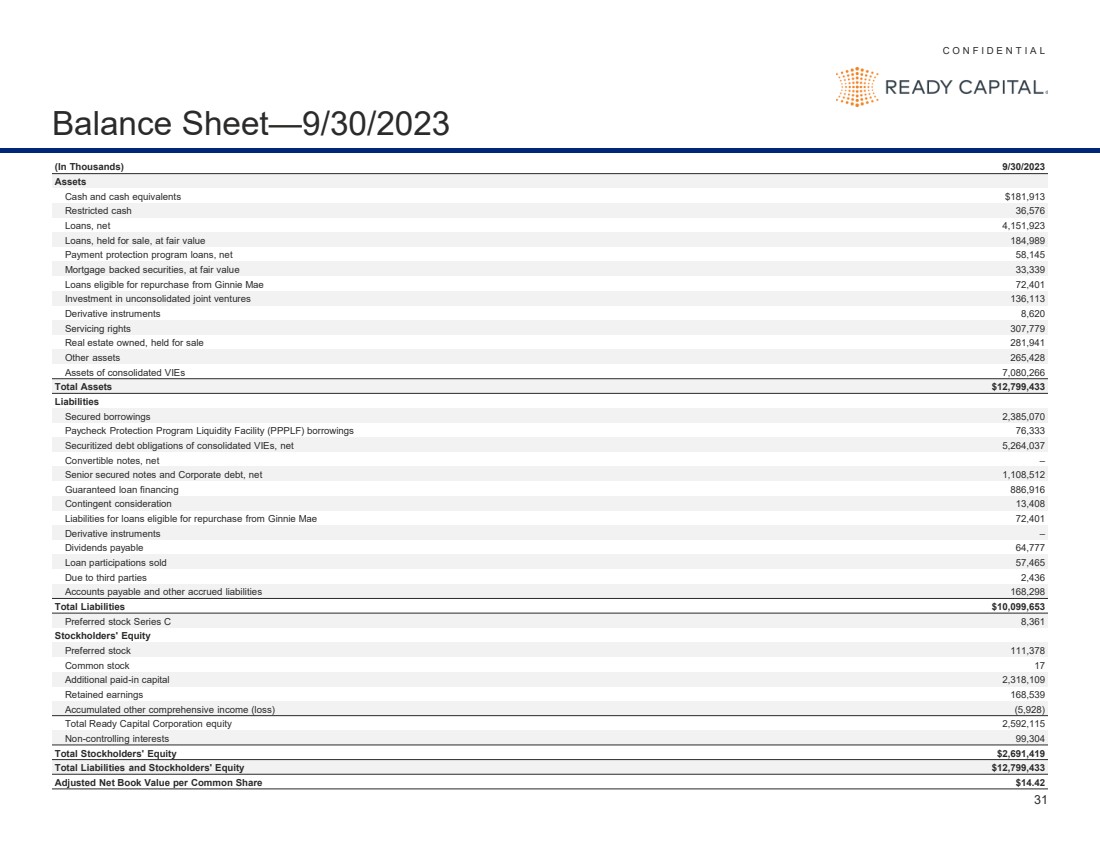
C O N F I D E N T I A L 31 Balance Sheet —9/30/2023 (In Thousands) 9/30/2023 Assets Cash and cash equivalents $181,913 Restricted cash 36,576 Loans, net 4,151,923 Loans, held for sale, at fair value 184,989 Payment protection program loans, net 58,145 Mortgage backed securities, at fair value 33,339 Loans eligible for repurchase from Ginnie Mae 72,401 Investment in unconsolidated joint ventures 136,113 Derivative instruments 8,620 Servicing rights 307,779 Real estate owned, held for sale 281,941 Other assets 265,428 Assets of consolidated VIEs 7,080,266 Total Assets $12,799,433 Liabilities Secured borrowings 2,385,070 Paycheck Protection Program Liquidity Facility (PPPLF) borrowings 76,333 Securitized debt obligations of consolidated VIEs, net 5,264,037 Convertible notes, net – Senior secured notes and Corporate debt, net 1,108,512 Guaranteed loan financing 886,916 Contingent consideration 13,408 Liabilities for loans eligible for repurchase from Ginnie Mae 72,401 Derivative instruments – Dividends payable 64,777 Loan participations sold 57,465 Due to third parties 2,436 Accounts payable and other accrued liabilities 168,298 Total Liabilities $10,099,653 Preferred stock Series C 8,361 Stockholders' Equity Preferred stock 111,378 Common stock 17 Additional paid -in capital 2,318,109 Retained earnings 168,539 Accumulated other comprehensive income (loss) (5,928) Total Ready Capital Corporation equity 2,592,115 Non -controlling interests 99,304 Total Stockholders' Equity $2,691,419 Total Liabilities and Stockholders' Equity $12,799,433 Adjusted Net Book Value per Common Share $14.42 |
|
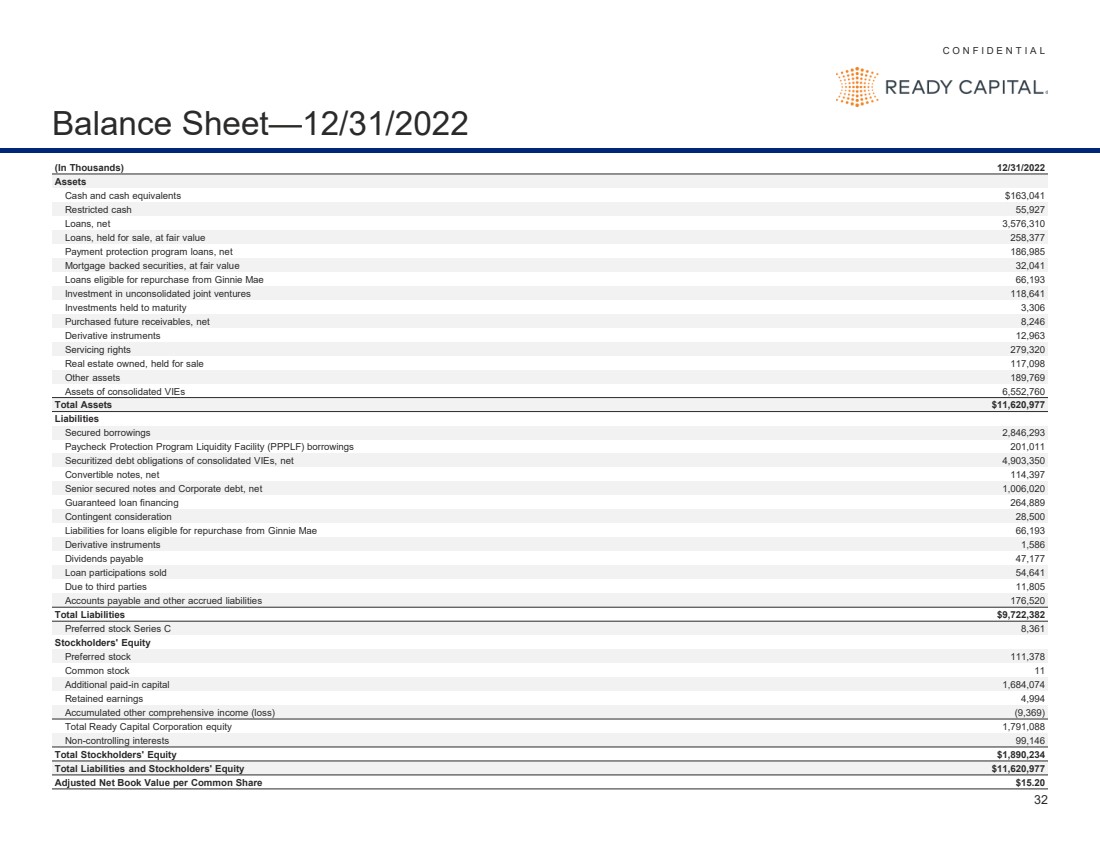
C O N F I D E N T I A L 32 Balance Sheet —12/31/2022 (In Thousands) 12/31/2022 Assets Cash and cash equivalents $163,041 Restricted cash 55,927 Loans, net 3,576,310 Loans, held for sale, at fair value 258,377 Payment protection program loans, net 186,985 Mortgage backed securities, at fair value 32,041 Loans eligible for repurchase from Ginnie Mae 66,193 Investment in unconsolidated joint ventures 118,641 Investments held to maturity 3,306 Purchased future receivables, net 8,246 Derivative instruments 12,963 Servicing rights 279,320 Real estate owned, held for sale 117,098 Other assets 189,769 Assets of consolidated VIEs 6,552,760 Total Assets $11,620,977 Liabilities Secured borrowings 2,846,293 Paycheck Protection Program Liquidity Facility (PPPLF) borrowings 201,011 Securitized debt obligations of consolidated VIEs, net 4,903,350 Convertible notes, net 114,397 Senior secured notes and Corporate debt, net 1,006,020 Guaranteed loan financing 264,889 Contingent consideration 28,500 Liabilities for loans eligible for repurchase from Ginnie Mae 66,193 Derivative instruments 1,586 Dividends payable 47,177 Loan participations sold 54,641 Due to third parties 11,805 Accounts payable and other accrued liabilities 176,520 Total Liabilities $9,722,382 Preferred stock Series C 8,361 Stockholders' Equity Preferred stock 111,378 Common stock 11 Additional paid -in capital 1,684,074 Retained earnings 4,994 Accumulated other comprehensive income (loss) (9,369) Total Ready Capital Corporation equity 1,791,088 Non -controlling interests 99,146 Total Stockholders' Equity $1,890,234 Total Liabilities and Stockholders' Equity $11,620,977 Adjusted Net Book Value per Common Share $15.20 |
|
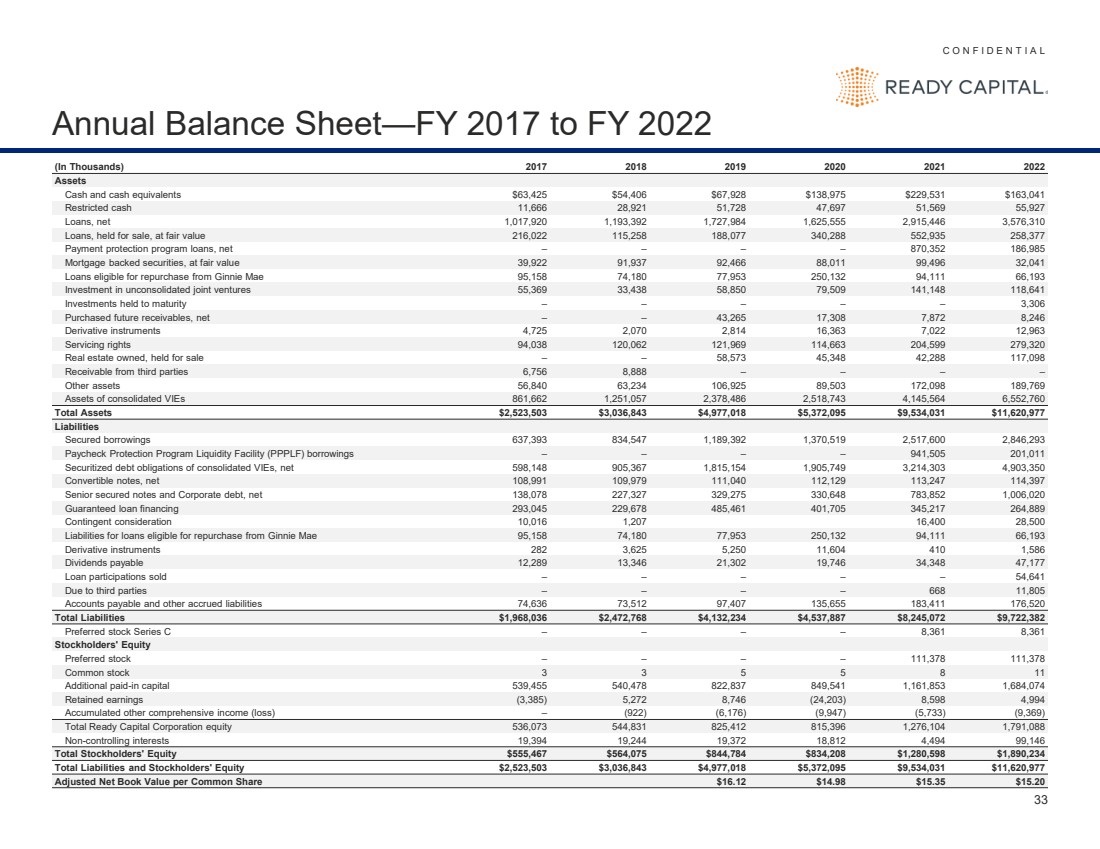
C O N F I D E N T I A L 33 Annual Balance Sheet—FY 2017 to FY 2022 (In Thousands) 2017 2018 2019 2020 2021 2022 Assets Cash and cash equivalents $63,425 $54,406 $67,928 $138,975 $229,531 $163,041 Restricted cash 11,666 28,921 51,728 47,697 51,569 55,927 Loans, net 1,017,920 1,193,392 1,727,984 1,625,555 2,915,446 3,576,310 Loans, held for sale, at fair value 216,022 115,258 188,077 340,288 552,935 258,377 Payment protection program loans, net – – – – 870,352 186,985 Mortgage backed securities, at fair value 39,922 91,937 92,466 88,011 99,496 32,041 Loans eligible for repurchase from Ginnie Mae 95,158 74,180 77,953 250,132 94,111 66,193 Investment in unconsolidated joint ventures 55,369 33,438 58,850 79,509 141,148 118,641 Investments held to maturity – – – – – 3,306 Purchased future receivables, net – – 43,265 17,308 7,872 8,246 Derivative instruments 4,725 2,070 2,814 16,363 7,022 12,963 Servicing rights 94,038 120,062 121,969 114,663 204,599 279,320 Real estate owned, held for sale – – 58,573 45,348 42,288 117,098 Receivable from third parties 6,756 8,888 – – – – Other assets 56,840 63,234 106,925 89,503 172,098 189,769 Assets of consolidated VIEs 861,662 1,251,057 2,378,486 2,518,743 4,145,564 6,552,760 Total Assets $2,523,503 $3,036,843 $4,977,018 $5,372,095 $9,534,031 $11,620,977 Liabilities Secured borrowings 637,393 834,547 1,189,392 1,370,519 2,517,600 2,846,293 Paycheck Protection Program Liquidity Facility (PPPLF) borrowings – – – – 941,505 201,011 Securitized debt obligations of consolidated VIEs, net 598,148 905,367 1,815,154 1,905,749 3,214,303 4,903,350 Convertible notes, net 108,991 109,979 111,040 112,129 113,247 114,397 Senior secured notes and Corporate debt, net 138,078 227,327 329,275 330,648 783,852 1,006,020 Guaranteed loan financing 293,045 229,678 485,461 401,705 345,217 264,889 Contingent consideration 10,016 1,207 16,400 28,500 Liabilities for loans eligible for repurchase from Ginnie Mae 95,158 74,180 77,953 250,132 94,111 66,193 Derivative instruments 282 3,625 5,250 11,604 410 1,586 Dividends payable 12,289 13,346 21,302 19,746 34,348 47,177 Loan participations sold – – – – – 54,641 Due to third parties – – – – 668 11,805 Accounts payable and other accrued liabilities 74,636 73,512 97,407 135,655 183,411 176,520 Total Liabilities $1,968,036 $2,472,768 $4,132,234 $4,537,887 $8,245,072 $9,722,382 Preferred stock Series C – – – – 8,361 8,361 Stockholders' Equity Preferred stock – – – – 111,378 111,378 Common stock 3 3 5 5 8 11 Additional paid-in capital 539,455 540,478 822,837 849,541 1,161,853 1,684,074 Retained earnings (3,385) 5,272 8,746 (24,203) 8,598 4,994 Accumulated other comprehensive income (loss) – (922) (6,176) (9,947) (5,733) (9,369) Total Ready Capital Corporation equity 536,073 544,831 825,412 815,396 1,276,104 1,791,088 Non-controlling interests 19,394 19,244 19,372 18,812 4,494 99,146 Total Stockholders' Equity $555,467 $564,075 $844,784 $834,208 $1,280,598 $1,890,234 Total Liabilities and Stockholders' Equity $2,523,503 $3,036,843 $4,977,018 $5,372,095 $9,534,031 $11,620,977 Adjusted Net Book Value per Common Share $16.12 $14.98 $15.35 $15.20 |
|
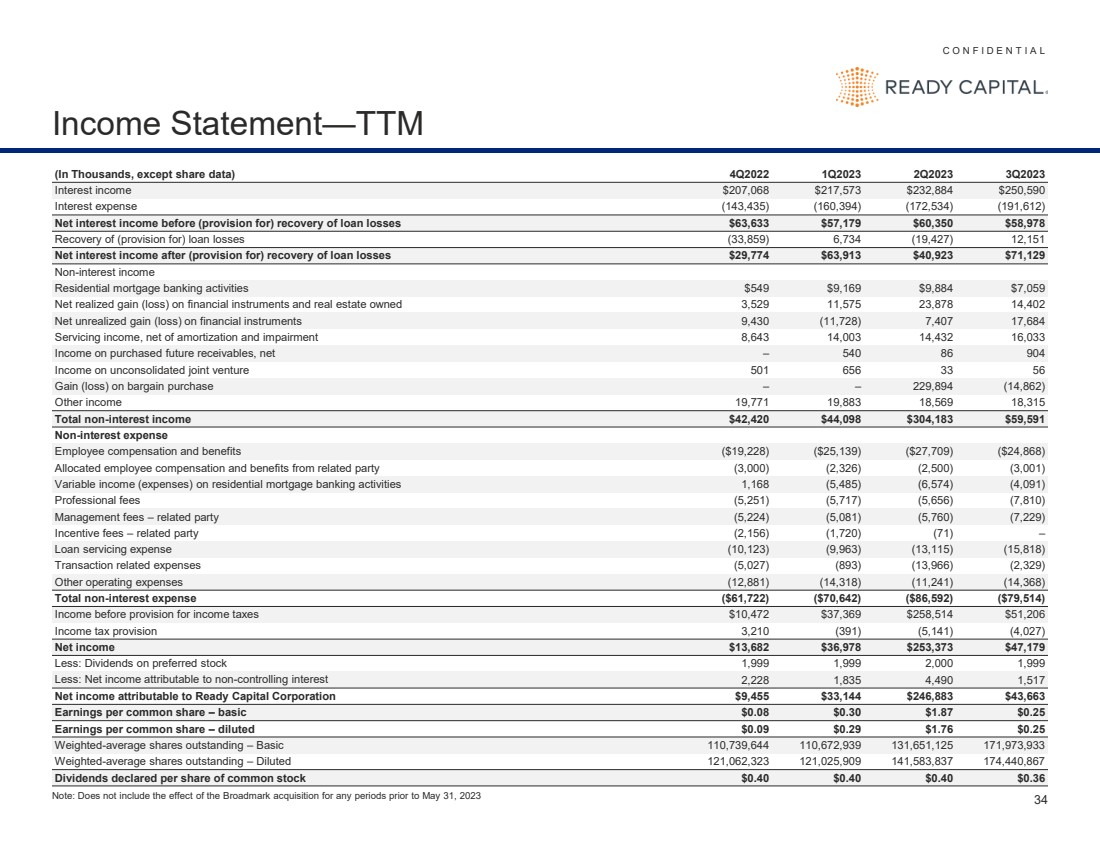
C O N F I D E N T I A L 34 Income Statement—TTM (In Thousands, except share data) 4Q2022 1Q2023 2Q2023 3Q2023 Interest income $207,068 $217,573 $232,884 $250,590 Interest expense (143,435) (160,394) (172,534) (191,612) Net interest income before (provision for) recovery of loan losses $63,633 $57,179 $60,350 $58,978 Recovery of (provision for) loan losses (33,859) 6,734 (19,427) 12,151 Net interest income after (provision for) recovery of loan losses $29,774 $63,913 $40,923 $71,129 Non-interest income Residential mortgage banking activities $549 $9,169 $9,884 $7,059 Net realized gain (loss) on financial instruments and real estate owned 3,529 11,575 23,878 14,402 Net unrealized gain (loss) on financial instruments 9,430 (11,728) 7,407 17,684 Servicing income, net of amortization and impairment 8,643 14,003 14,432 16,033 Income on purchased future receivables, net – 540 86 904 Income on unconsolidated joint venture 501 656 33 56 Gain (loss) on bargain purchase – – 229,894 (14,862) Other income 19,771 19,883 18,569 18,315 Total non-interest income $42,420 $44,098 $304,183 $59,591 Non-interest expense Employee compensation and benefits ($19,228) ($25,139) ($27,709) ($24,868) Allocated employee compensation and benefits from related party (3,000) (2,326) (2,500) (3,001) Variable income (expenses) on residential mortgage banking activities 1,168 (5,485) (6,574) (4,091) Professional fees (5,251) (5,717) (5,656) (7,810) Management fees – related party (5,224) (5,081) (5,760) (7,229) Incentive fees – related party (2,156) (1,720) (71) – Loan servicing expense (10,123) (9,963) (13,115) (15,818) Transaction related expenses (5,027) (893) (13,966) (2,329) Other operating expenses (12,881) (14,318) (11,241) (14,368) Total non-interest expense ($61,722) ($70,642) ($86,592) ($79,514) Income before provision for income taxes $10,472 $37,369 $258,514 $51,206 Income tax provision 3,210 (391) (5,141) (4,027) Net income $13,682 $36,978 $253,373 $47,179 Less: Dividends on preferred stock 1,999 1,999 2,000 1,999 Less: Net income attributable to non-controlling interest 2,228 1,835 4,490 1,517 Net income attributable to Ready Capital Corporation $9,455 $33,144 $246,883 $43,663 Earnings per common share – basic $0.08 $0.30 $1.87 $0.25 Earnings per common share – diluted $0.09 $0.29 $1.76 $0.25 Weighted-average shares outstanding – Basic 110,739,644 110,672,939 131,651,125 171,973,933 Weighted-average shares outstanding – Diluted 121,062,323 121,025,909 141,583,837 174,440,867 Dividends declared per share of common stock $0.40 $0.40 $0.40 $0.36 Note: Does not include the effect of the Broadmark acquisition for any periods prior to May 31, 2023 |
|
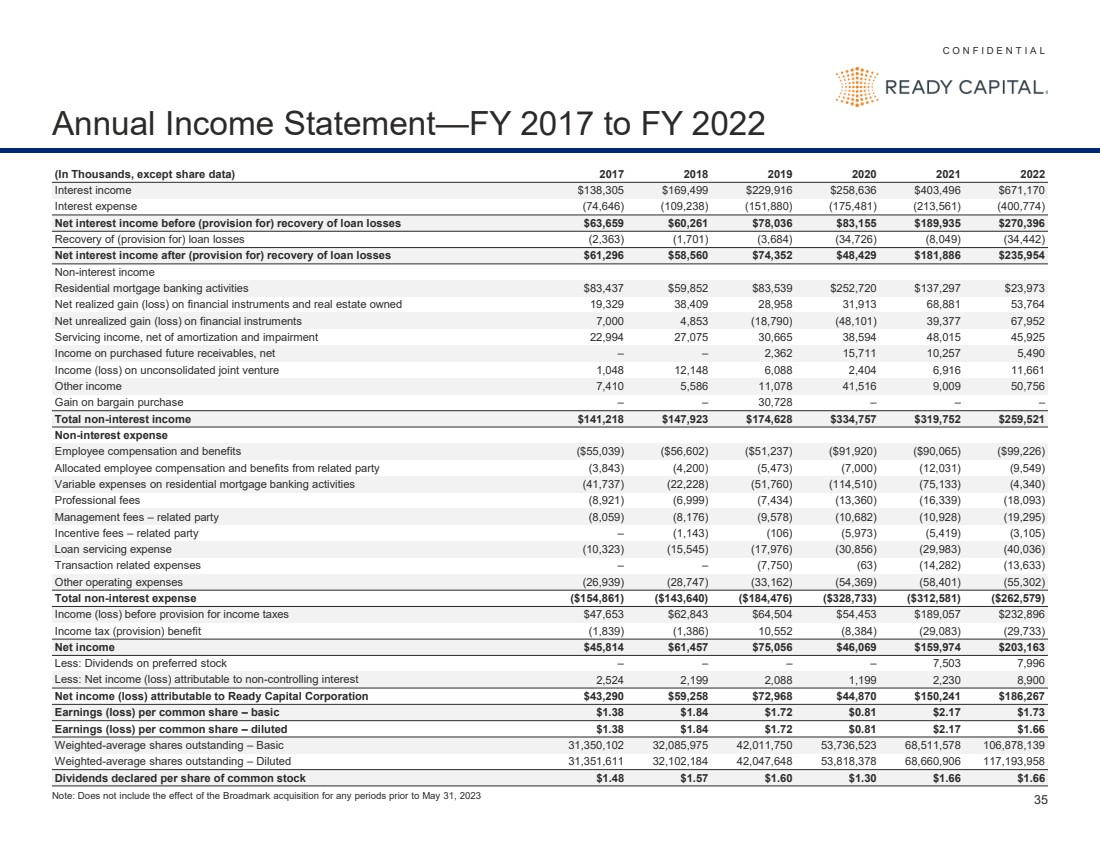
C O N F I D E N T I A L 35 Annual Income Statement—FY 2017 to FY 2022 (In Thousands, except share data) 2017 2018 2019 2020 2021 2022 Interest income $138,305 $169,499 $229,916 $258,636 $403,496 $671,170 Interest expense (74,646) (109,238) (151,880) (175,481) (213,561) (400,774) Net interest income before (provision for) recovery of loan losses $63,659 $60,261 $78,036 $83,155 $189,935 $270,396 Recovery of (provision for) loan losses (2,363) (1,701) (3,684) (34,726) (8,049) (34,442) Net interest income after (provision for) recovery of loan losses $61,296 $58,560 $74,352 $48,429 $181,886 $235,954 Non-interest income Residential mortgage banking activities $83,437 $59,852 $83,539 $252,720 $137,297 $23,973 Net realized gain (loss) on financial instruments and real estate owned 19,329 38,409 28,958 31,913 68,881 53,764 Net unrealized gain (loss) on financial instruments 7,000 4,853 (18,790) (48,101) 39,377 67,952 Servicing income, net of amortization and impairment 22,994 27,075 30,665 38,594 48,015 45,925 Income on purchased future receivables, net – – 2,362 15,711 10,257 5,490 Income (loss) on unconsolidated joint venture 1,048 12,148 6,088 2,404 6,916 11,661 Other income 7,410 5,586 11,078 41,516 9,009 50,756 Gain on bargain purchase – – 30,728 – – – Total non-interest income $141,218 $147,923 $174,628 $334,757 $319,752 $259,521 Non-interest expense Employee compensation and benefits ($55,039) ($56,602) ($51,237) ($91,920) ($90,065) ($99,226) Allocated employee compensation and benefits from related party (3,843) (4,200) (5,473) (7,000) (12,031) (9,549) Variable expenses on residential mortgage banking activities (41,737) (22,228) (51,760) (114,510) (75,133) (4,340) Professional fees (8,921) (6,999) (7,434) (13,360) (16,339) (18,093) Management fees – related party (8,059) (8,176) (9,578) (10,682) (10,928) (19,295) Incentive fees – related party – (1,143) (106) (5,973) (5,419) (3,105) Loan servicing expense (10,323) (15,545) (17,976) (30,856) (29,983) (40,036) Transaction related expenses – – (7,750) (63) (14,282) (13,633) Other operating expenses (26,939) (28,747) (33,162) (54,369) (58,401) (55,302) Total non-interest expense ($154,861) ($143,640) ($184,476) ($328,733) ($312,581) ($262,579) Income (loss) before provision for income taxes $47,653 $62,843 $64,504 $54,453 $189,057 $232,896 Income tax (provision) benefit (1,839) (1,386) 10,552 (8,384) (29,083) (29,733) Net income $45,814 $61,457 $75,056 $46,069 $159,974 $203,163 Less: Dividends on preferred stock – – – – 7,503 7,996 Less: Net income (loss) attributable to non-controlling interest 2,524 2,199 2,088 1,199 2,230 8,900 Net income (loss) attributable to Ready Capital Corporation $43,290 $59,258 $72,968 $44,870 $150,241 $186,267 Earnings (loss) per common share – basic $1.38 $1.84 $1.72 $0.81 $2.17 $1.73 Earnings (loss) per common share – diluted $1.38 $1.84 $1.72 $0.81 $2.17 $1.66 Weighted-average shares outstanding – Basic 31,350,102 32,085,975 42,011,750 53,736,523 68,511,578 106,878,139 Weighted-average shares outstanding – Diluted 31,351,611 32,102,184 42,047,648 53,818,378 68,660,906 117,193,958 Dividends declared per share of common stock $1.48 $1.57 $1.60 $1.30 $1.66 $1.66 Note: Does not include the effect of the Broadmark acquisition for any periods prior to May 31, 2023 |
|
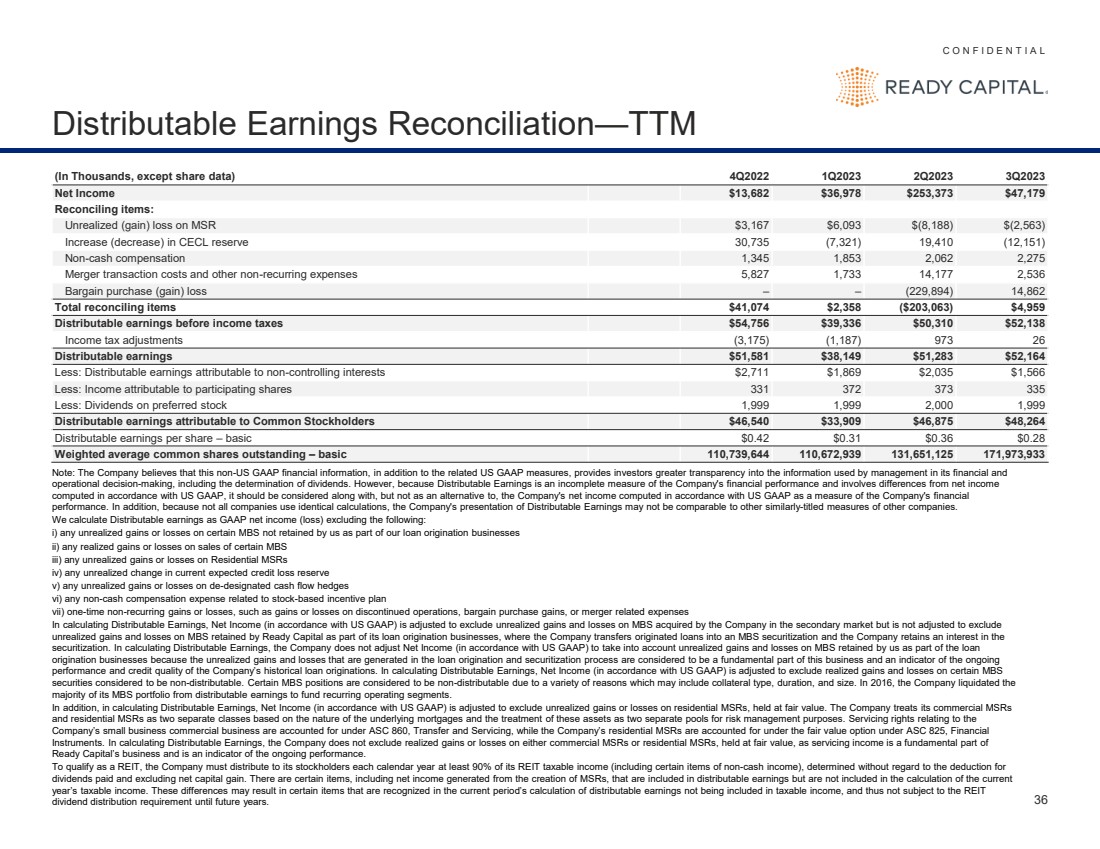
C O N F I D E N T I A L 36 Distributable Earnings Reconciliation—TTM Note: The Company believes that this non-US GAAP financial information, in addition to the related US GAAP measures, provides investors greater transparency into the information used by management in its financial and operational decision-making, including the determination of dividends. However, because Distributable Earnings is an incomplete measure of the Company's financial performance and involves differences from net income computed in accordance with US GAAP, it should be considered along with, but not as an alternative to, the Company's net income computed in accordance with US GAAP as a measure of the Company's financial performance. In addition, because not all companies use identical calculations, the Company's presentation of Distributable Earnings may not be comparable to other similarly-titled measures of other companies. We calculate Distributable earnings as GAAP net income (loss) excluding the following: i) any unrealized gains or losses on certain MBS not retained by us as part of our loan origination businesses ii) any realized gains or losses on sales of certain MBS iii) any unrealized gains or losses on Residential MSRs iv) any unrealized change in current expected credit loss reserve v) any unrealized gains or losses on de-designated cash flow hedges vi) any non-cash compensation expense related to stock-based incentive plan vii) one-time non-recurring gains or losses, such as gains or losses on discontinued operations, bargain purchase gains, or merger related expenses In calculating Distributable Earnings, Net Income (in accordance with US GAAP) is adjusted to exclude unrealized gains and losses on MBS acquired by the Company in the secondary market but is not adjusted to exclude unrealized gains and losses on MBS retained by Ready Capital as part of its loan origination businesses, where the Company transfers originated loans into an MBS securitization and the Company retains an interest in the securitization. In calculating Distributable Earnings, the Company does not adjust Net Income (in accordance with US GAAP) to take into account unrealized gains and losses on MBS retained by us as part of the loan origination businesses because the unrealized gains and losses that are generated in the loan origination and securitization process are considered to be a fundamental part of this business and an indicator of the ongoing performance and credit quality of the Company’s historical loan originations. In calculating Distributable Earnings, Net Income (in accordance with US GAAP) is adjusted to exclude realized gains and losses on certain MBS securities considered to be non-distributable. Certain MBS positions are considered to be non-distributable due to a variety of reasons which may include collateral type, duration, and size. In 2016, the Company liquidated the majority of its MBS portfolio from distributable earnings to fund recurring operating segments. In addition, in calculating Distributable Earnings, Net Income (in accordance with US GAAP) is adjusted to exclude unrealized gains or losses on residential MSRs, held at fair value. The Company treats its commercial MSRs and residential MSRs as two separate classes based on the nature of the underlying mortgages and the treatment of these assets as two separate pools for risk management purposes. Servicing rights relating to the Company’s small business commercial business are accounted for under ASC 860, Transfer and Servicing, while the Company’s residential MSRs are accounted for under the fair value option under ASC 825, Financial Instruments. In calculating Distributable Earnings, the Company does not exclude realized gains or losses on either commercial MSRs or residential MSRs, held at fair value, as servicing income is a fundamental part of Ready Capital’s business and is an indicator of the ongoing performance. To qualify as a REIT, the Company must distribute to its stockholders each calendar year at least 90% of its REIT taxable income (including certain items of non-cash income), determined without regard to the deduction for dividends paid and excluding net capital gain. There are certain items, including net income generated from the creation of MSRs, that are included in distributable earnings but are not included in the calculation of the current year’s taxable income. These differences may result in certain items that are recognized in the current period’s calculation of distributable earnings not being included in taxable income, and thus not subject to the REIT dividend distribution requirement until future years. (In Thousands, except share data) 4Q2022 1Q2023 2Q2023 3Q2023 Net Income $13,682 $36,978 $253,373 $47,179 Reconciling items: Unrealized (gain) loss on MSR $3,167 $6,093 $(8,188) $(2,563) Increase (decrease) in CECL reserve 30,735 (7,321) 19,410 (12,151) Non-cash compensation 1,345 1,853 2,062 2,275 Merger transaction costs and other non-recurring expenses 5,827 1,733 14,177 2,536 Bargain purchase (gain) loss – – (229,894) 14,862 Total reconciling items $41,074 $2,358 ($203,063) $4,959 Distributable earnings before income taxes $54,756 $39,336 $50,310 $52,138 Income tax adjustments (3,175) (1,187) 973 26 Distributable earnings $51,581 $38,149 $51,283 $52,164 Less: Distributable earnings attributable to non-controlling interests $2,711 $1,869 $2,035 $1,566 Less: Income attributable to participating shares 331 372 373 335 Less: Dividends on preferred stock 1,999 1,999 2,000 1,999 Distributable earnings attributable to Common Stockholders $46,540 $33,909 $46,875 $48,264 Distributable earnings per share – basic $0.42 $0.31 $0.36 $0.28 Weighted average common shares outstanding – basic 110,739,644 110,672,939 131,651,125 171,973,933 |
|
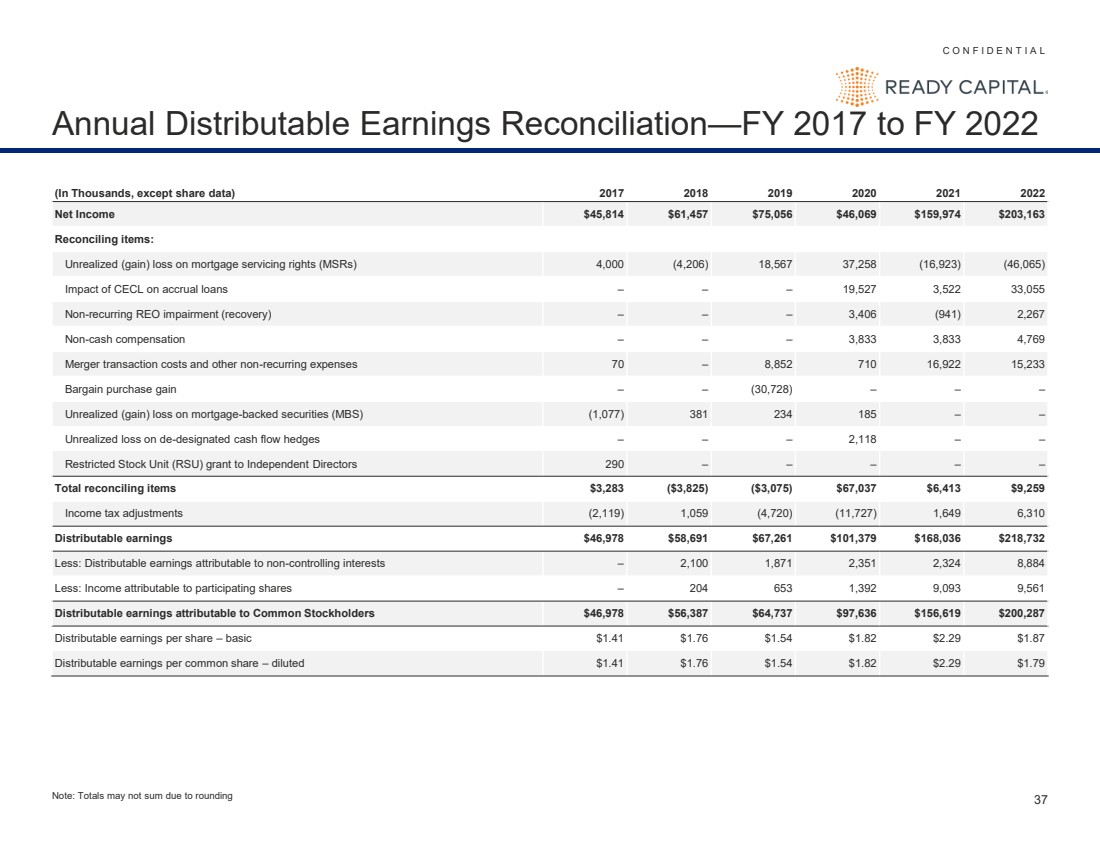
C O N F I D E N T I A L 37 Annual Distributable Earnings Reconciliation—FY 2017 to FY 2022 (In Thousands, except share data) 2017 2018 2019 2020 2021 2022 Net Income $45,814 $61,457 $75,056 $46,069 $159,974 $203,163 Reconciling items: Unrealized (gain) loss on mortgage servicing rights (MSRs) 4,000 (4,206) 18,567 37,258 (16,923) (46,065) Impact of CECL on accrual loans – – – 19,527 3,522 33,055 Non-recurring REO impairment (recovery) – – – 3,406 (941) 2,267 Non-cash compensation – – – 3,833 3,833 4,769 Merger transaction costs and other non-recurring expenses 70 – 8,852 710 16,922 15,233 Bargain purchase gain – – (30,728) – – – Unrealized (gain) loss on mortgage-backed securities (MBS) (1,077) 381 234 185 – – Unrealized loss on de-designated cash flow hedges – – – 2,118 – – Restricted Stock Unit (RSU) grant to Independent Directors 290 – – – – – Total reconciling items $3,283 ($3,825) ($3,075) $67,037 $6,413 $9,259 Income tax adjustments (2,119) 1,059 (4,720) (11,727) 1,649 6,310 Distributable earnings $46,978 $58,691 $67,261 $101,379 $168,036 $218,732 Less: Distributable earnings attributable to non-controlling interests – 2,100 1,871 2,351 2,324 8,884 Less: Income attributable to participating shares – 204 653 1,392 9,093 9,561 Distributable earnings attributable to Common Stockholders $46,978 $56,387 $64,737 $97,636 $156,619 $200,287 Distributable earnings per share – basic $1.41 $1.76 $1.54 $1.82 $2.29 $1.87 Distributable earnings per common share – diluted $1.41 $1.76 $1.54 $1.82 $2.29 $1.79 Note: Totals may not sum due to rounding |
|
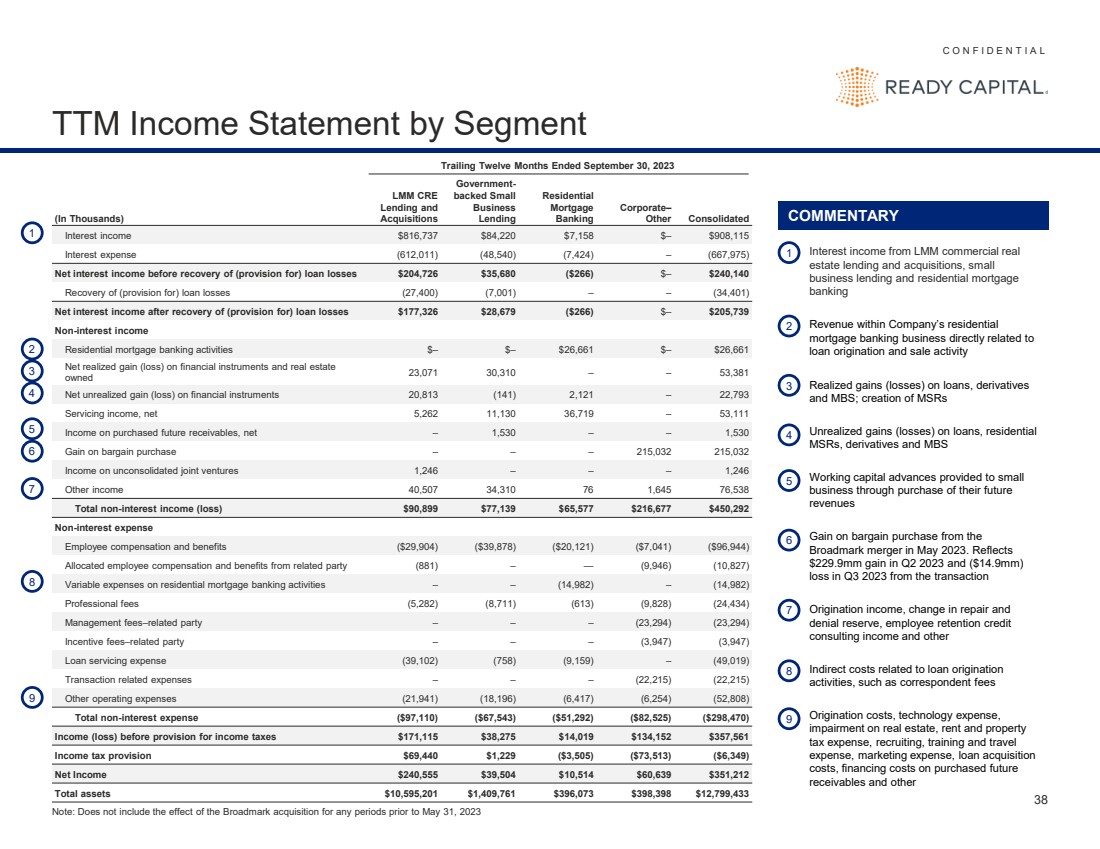
C O N F I D E N T I A L 38 TTM Income Statement by Segment Trailing Twelve Months Ended September 30, 2023 (In Thousands) LMM CRE Lending and Acquisitions Government-backed Small Business Lending Residential Mortgage Banking Corporate– Other Consolidated Interest income $816,737 $84,220 $7,158 $– $908,115 Interest expense (612,011) (48,540) (7,424) – (667,975) Net interest income before recovery of (provision for) loan losses $204,726 $35,680 ($266) $– $240,140 Recovery of (provision for) loan losses (27,400) (7,001) – – (34,401) Net interest income after recovery of (provision for) loan losses $177,326 $28,679 ($266) $– $205,739 Non-interest income Residential mortgage banking activities $– $– $26,661 $– $26,661 Net realized gain (loss) on financial instruments and real estate owned 23,071 30,310 – – 53,381 Net unrealized gain (loss) on financial instruments 20,813 (141) 2,121 – 22,793 Servicing income, net 5,262 11,130 36,719 – 53,111 Income on purchased future receivables, net – 1,530 – – 1,530 Gain on bargain purchase – – – 215,032 215,032 Income on unconsolidated joint ventures 1,246 – – – 1,246 Other income 40,507 34,310 76 1,645 76,538 Total non-interest income (loss) $90,899 $77,139 $65,577 $216,677 $450,292 Non-interest expense Employee compensation and benefits ($29,904) ($39,878) ($20,121) ($7,041) ($96,944) Allocated employee compensation and benefits from related party (881) – — (9,946) (10,827) Variable expenses on residential mortgage banking activities – – (14,982) – (14,982) Professional fees (5,282) (8,711) (613) (9,828) (24,434) Management fees–related party – – – (23,294) (23,294) Incentive fees–related party – – – (3,947) (3,947) Loan servicing expense (39,102) (758) (9,159) – (49,019) Transaction related expenses – – – (22,215) (22,215) Other operating expenses (21,941) (18,196) (6,417) (6,254) (52,808) Total non-interest expense ($97,110) ($67,543) ($51,292) ($82,525) ($298,470) Income (loss) before provision for income taxes $171,115 $38,275 $14,019 $134,152 $357,561 Income tax provision $69,440 $1,229 ($3,505) ($73,513) ($6,349) Net Income $240,555 $39,504 $10,514 $60,639 $351,212 Total assets $10,595,201 $1,409,761 $396,073 $398,398 $12,799,433 COMMENTARY 1 2 3 4 5 7 8 9 1 Interest income from LMM commercial real estate lending and acquisitions, small business lending and residential mortgage banking 2 Revenue within Company’s residential mortgage banking business directly related to loan origination and sale activity 3 Realized gains (losses) on loans, derivatives and MBS; creation of MSRs 4 Unrealized gains (losses) on loans, residential MSRs, derivatives and MBS 5 Working capital advances provided to small business through purchase of their future revenues 7 Origination income, change in repair and denial reserve, employee retention credit consulting income and other 8 Indirect costs related to loan origination activities, such as correspondent fees 9 Origination costs, technology expense, impairment on real estate, rent and property tax expense, recruiting, training and travel expense, marketing expense, loan acquisition costs, financing costs on purchased future receivables and other 6 6 Gain on bargain purchase from the Broadmark merger in May 2023. Reflects $229.9mm gain in Q2 2023 and ($14.9mm) loss in Q3 2023 from the transaction Note: Does not include the effect of the Broadmark acquisition for any periods prior to May 31, 2023 |
|
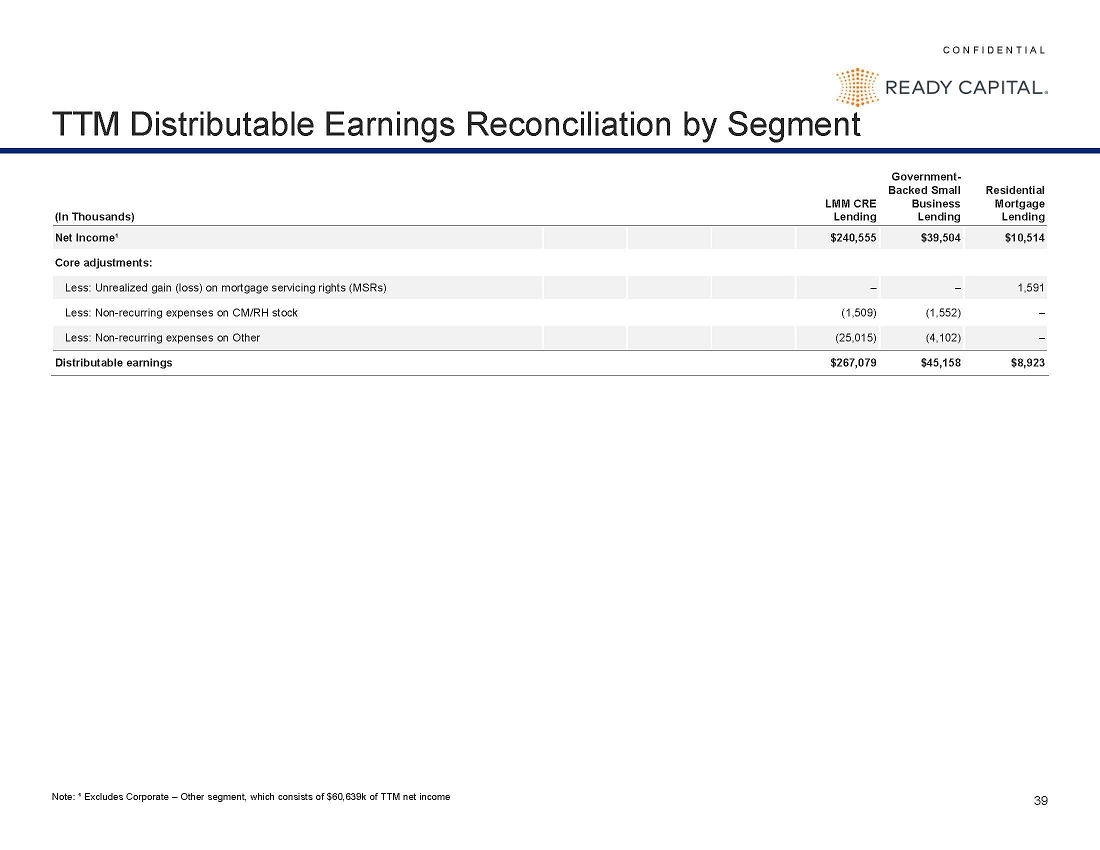
C O N F I D E N T I A L 39 TTM Core Earnings Reconciliation by Segment (In Thousands) LMM CRE Lending Government-Backed Small Business Lending Residential Mortgage Lending Net Income¹ $240,555 $39,504 $10,514 Core adjustments: Less: Unrealized gain (loss) on mortgage servicing rights (MSRs) – – 1,591 Less: Non-recurring expenses on CM/RH stock (1,509) (1,552) – Less: Non-recurring expenses on Other (25,015) (4,102) – Core earnings $267,079 $45,158 $8,923 Note: ¹ Excludes Corporate – Other segment, which consists of $60,639k of TTM net income |
|
Appendix |
|
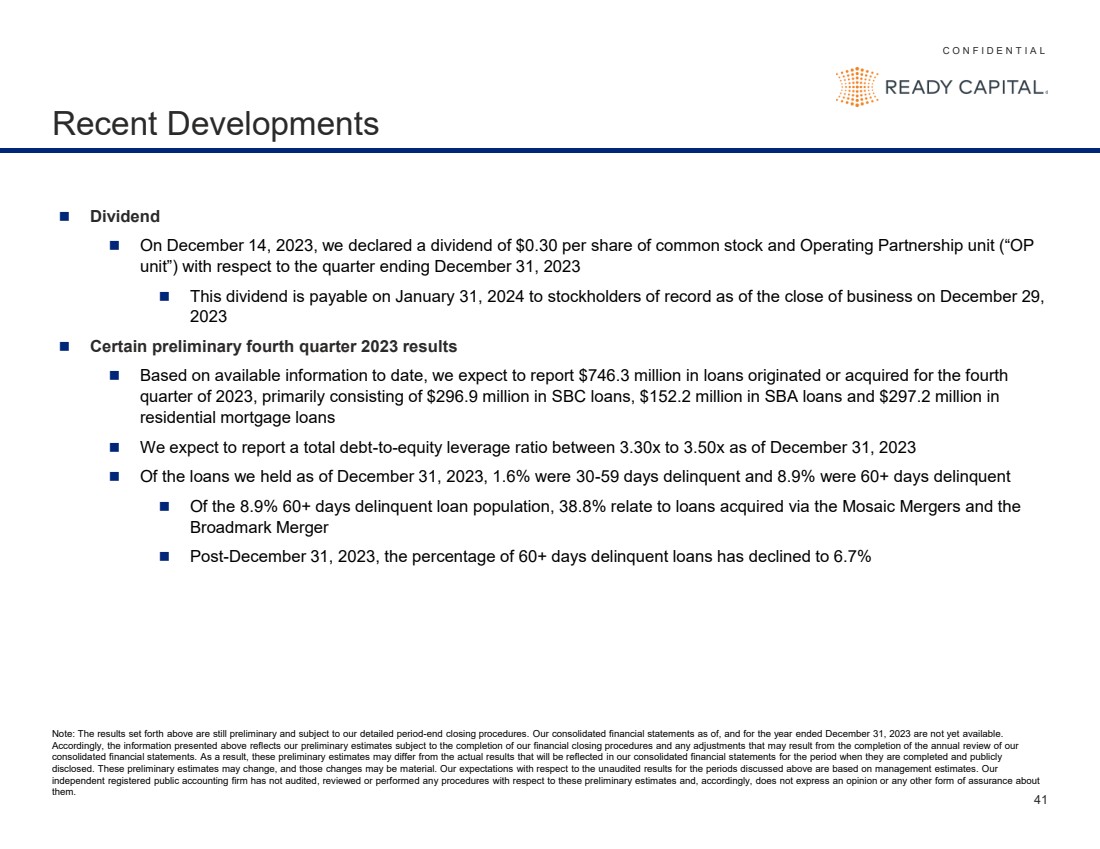
C O N F I D E N T I A L 41 Recent Developments ◼ Dividend ◼ On December 14, 2023, we declared a dividend of $0.30 per share of common stock and Operating Partnership unit (“OP unit”) with respect to the quarter ending December 31, 2023 ◼ This dividend is payable on January 31, 2024 to stockholders of record as of the close of business on December 29, 2023 ◼ Certain preliminary fourth quarter 2023 results ◼ Based on available information to date, we expect to report $746.3 million in loans originated or acquired for the fourth quarter of 2023, primarily consisting of $296.9 million in SBC loans, $152.2 million in SBA loans and $297.2 million in residential mortgage loans ◼ We expect to report a total debt-to-equity leverage ratio between 3.30x to 3.50x as of December 31, 2023 ◼ Of the loans we held as of December 31, 2023, 1.6% were 30-59 days delinquent and 8.9% were 60+ days delinquent ◼ Of the 8.9% 60+ days delinquent loan population, 38.8% relate to loans acquired via the Mosaic Mergers and the Broadmark Merger ◼ Post-December 31, 2023, the percentage of 60+ days delinquent loans has declined to 6.7% Note: The results set forth above are still preliminary and subject to our detailed period-end closing procedures. Our consolidated financial statements as of, and for the year ended December 31, 2023 are not yet available. Accordingly, the information presented above reflects our preliminary estimates subject to the completion of our financial closing procedures and any adjustments that may result from the completion of the annual review of our consolidated financial statements. As a result, these preliminary estimates may differ from the actual results that will be reflected in our consolidated financial statements for the period when they are completed and publicly disclosed. These preliminary estimates may change, and those changes may be material. Our expectations with respect to the unaudited results for the periods discussed above are based on management estimates. Our independent registered public accounting firm has not audited, reviewed or performed any procedures with respect to these preliminary estimates and, accordingly, does not express an opinion or any other form of assurance about them. |
|
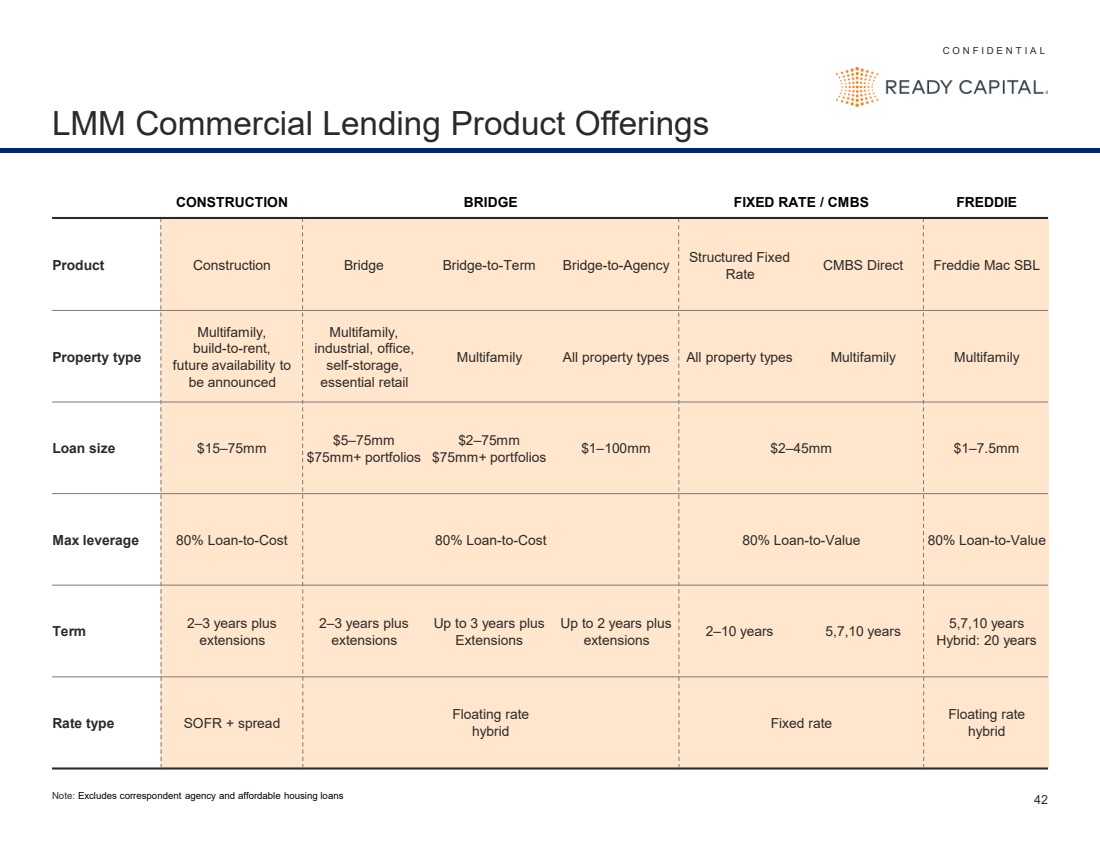
C O N F I D E N T I A L 42 LMM Commercial Lending Product Offerings CONSTRUCTION BRIDGE FIXED RATE / CMBS FREDDIE Product Construction Bridge Bridge-to-Term Bridge-to-Agency Structured Fixed Rate CMBS Direct Freddie Mac SBL Property type Multifamily, build-to-rent, future availability to be announced Multifamily, industrial, office, self-storage, essential retail Multifamily All property types All property types Multifamily Multifamily Loan size $15–75mm $5–75mm $75mm+ portfolios $2–75mm $75mm+ portfolios $1–100mm $2–45mm $1–7.5mm Max leverage 80% Loan-to-Cost 80% Loan-to-Cost 80% Loan-to-Value 80% Loan-to-Value Term 2–3 years plus extensions 2–3 years plus extensions Up to 3 years plus Extensions Up to 2 years plus extensions 2–10 years 5,7,10 years 5,7,10 years Hybrid: 20 years Rate type SOFR + spread Floating rate hybrid Fixed rate Floating rate hybrid Note: Excludes correspondent agency and affordable housing loans |
|
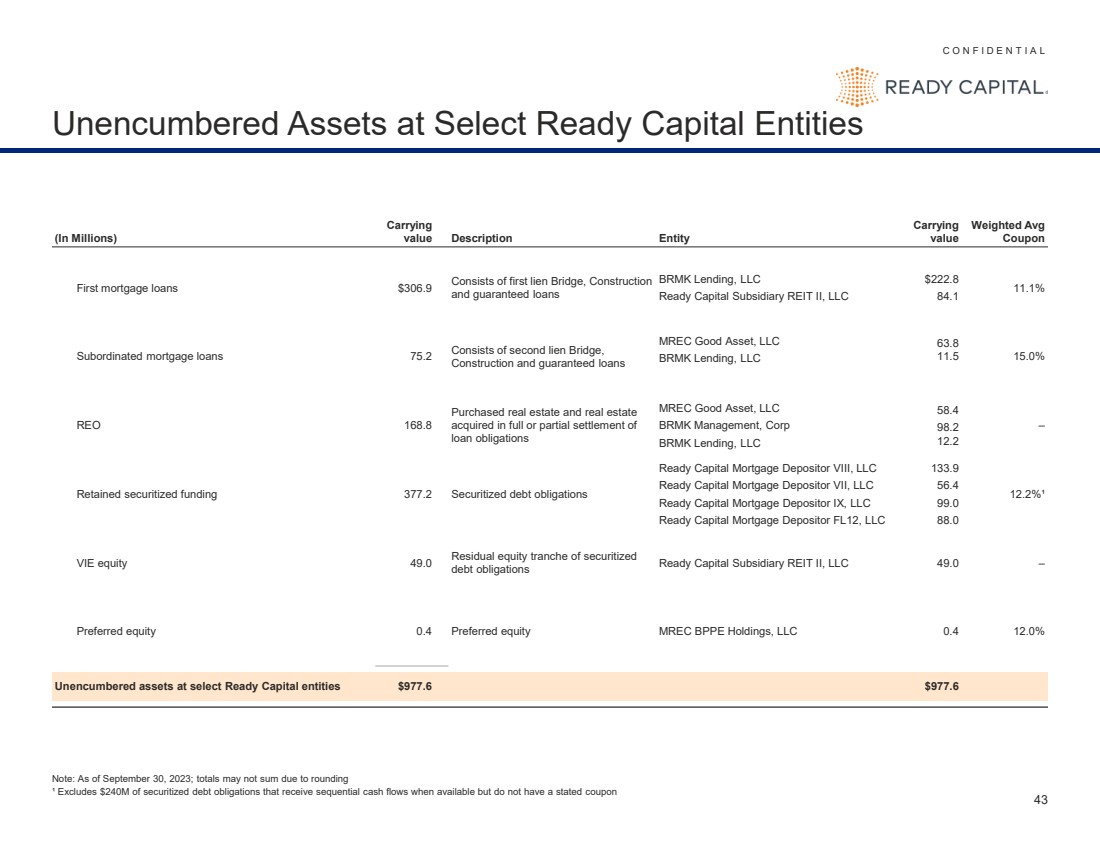
C O N F I D E N T I A L 43 Unencumbered Assets at Select Ready Capital Entities (In Millions) Carrying value Description Entity Carrying value Weighted Avg Coupon First mortgage loans $306.9 Consists of first lien Bridge, Construction and guaranteed loans BRMK Lending, LLC Ready Capital Subsidiary REIT II, LLC $222.8 84.1 11.1% Subordinated mortgage loans 75.2 Consists of second lien Bridge, Construction and guaranteed loans MREC Good Asset, LLC BRMK Lending, LLC 63.8 11.5 15.0% REO 168.8 Purchased real estate and real estate acquired in full or partial settlement of loan obligations MREC Good Asset, LLC BRMK Management, Corp BRMK Lending, LLC 58.4 98.2 12.2 – Retained securitized funding 377.2 Securitized debt obligations Ready Capital Mortgage Depositor VIII, LLC Ready Capital Mortgage Depositor VII, LLC Ready Capital Mortgage Depositor IX, LLC Ready Capital Mortgage Depositor FL12, LLC 133.9 56.4 99.0 88.0 12.2%¹ VIE equity 49.0 Residual equity tranche of securitized debt obligations Ready Capital Subsidiary REIT II, LLC 49.0 – Preferred equity 0.4 Preferred equity MREC BPPE Holdings, LLC 0.4 12.0% Unencumbered assets at select Ready Capital entities $977.6 $977.6 Note: As of September 30, 2023; totals may not sum due to rounding ¹ Excludes $240M of securitized debt obligations that receive sequential cash flows when available but do not have a stated coupon |
|
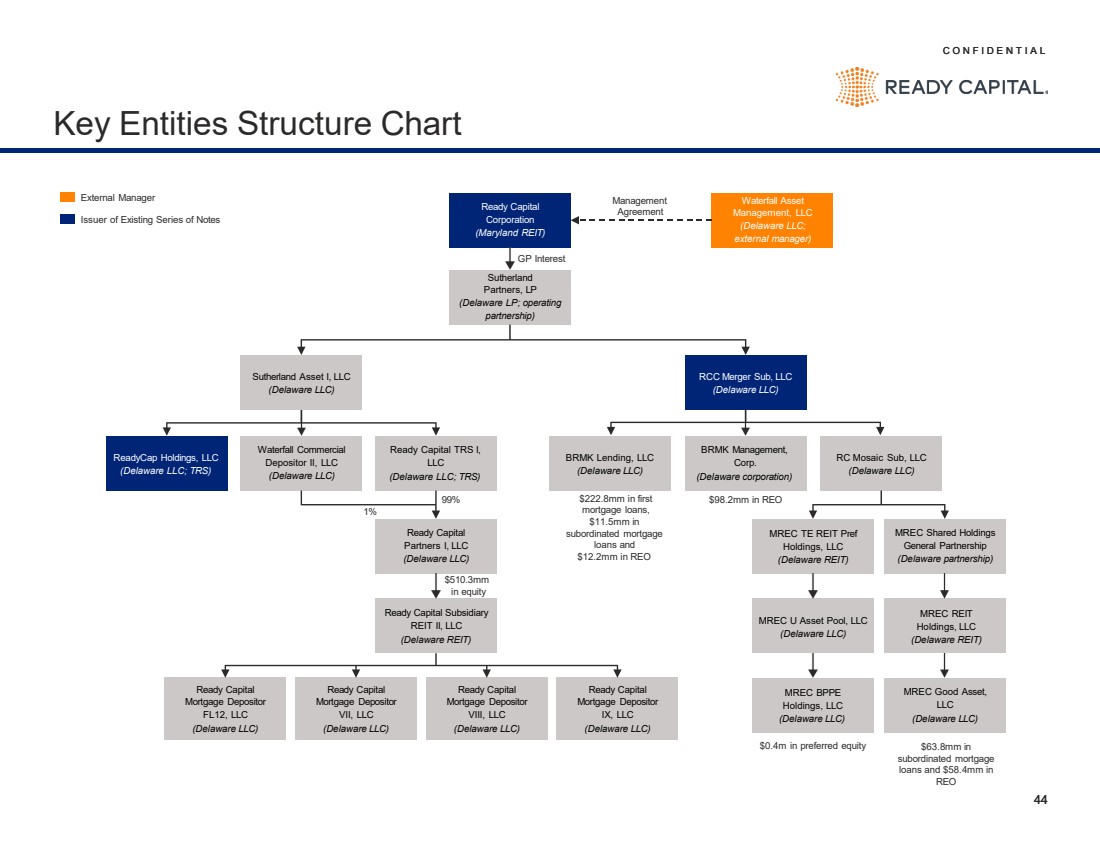
C O N F I D E N T I A L 44 C O N F I D E N T I A L 44 Key Entities Structure Chart GP Interest 99% 1% Management Agreement $63.8mm in subordinated mortgage loans and $58.4mm in REO $222.8mm in first $98.2mm in REO mortgage loans, $11.5mm in subordinated mortgage loans and $12.2mm in REO $0.4m in preferred equity $510.3mm in equity Ready Capital Corporation (Maryland REIT) Waterfall Asset Management, LLC (Delaware LLC; external manager) Sutherland Partners, LP (Delaware LP; operating partnership) Sutherland Asset I, LLC (Delaware LLC) ReadyCap Holdings, LLC (Delaware LLC; TRS) RCC Merger Sub, LLC (Delaware LLC) Waterfall Commercial Depositor II, LLC (Delaware LLC) RC Mosaic Sub, LLC (Delaware LLC) MREC TE REIT Pref Holdings, LLC (Delaware REIT) MREC Shared Holdings General Partnership (Delaware partnership) MREC U Asset Pool, LLC (Delaware LLC) MREC REIT Holdings, LLC (Delaware REIT) MREC BPPE Holdings, LLC (Delaware LLC) MREC Good Asset, LLC (Delaware LLC) Ready Capital TRS I, LLC (Delaware LLC; TRS) Ready Capital Partners I, LLC (Delaware LLC) Ready Capital Subsidiary REIT II, LLC (Delaware REIT) Ready Capital Mortgage Depositor VIII, LLC (Delaware LLC) Ready Capital Mortgage Depositor VII, LLC (Delaware LLC) Ready Capital Mortgage Depositor IX, LLC (Delaware LLC) Ready Capital Mortgage Depositor FL12, LLC (Delaware LLC) BRMK Lending, LLC (Delaware LLC) BRMK Management, Corp. (Delaware corporation) Issuer of Existing Series of Notes External Manager |