UNITED STATES
SECURITIES AND EXCHANGE COMMISSION
Washington, D.C. 20549
FORM 8-K
CURRENT REPORT
Pursuant to Section 13 or 15(d) of the Securities Exchange Act of 1934
| Date of Report (Date of earliest event reported): | January 23, 2024 |
McEWEN MINING INC.
(Exact name of registrant as specified in its charter)
| Colorado | 001-33190 | 84-0796160 | ||
| (State or other jurisdiction of incorporation) |
(Commission File Number) |
(IRS Employer Identification No.) |
|
150 King Street West, Suite 2800 Toronto, Ontario, Canada |
M5H 1J9 |
| (Address of principal executive offices) | (Zip Code) |
| Registrant’s telephone number including area code: | (866) 441-0690 |
(Former name or former address, if changed since last report)
Check the appropriate box below if the Form 8-K filing is intended to simultaneously satisfy the filing obligation of the registrant under any of the following provisions:
¨ Written communications pursuant to Rule 425 under the Securities Act (17 CFR 230.425)
¨ Soliciting material pursuant to Rule 14a-12 under the Exchange Act (17 CFR 240.14a-12)
¨ Pre-commencement communications pursuant to Rule 14d-2(b) under the Exchange Act (17 CFR 240.14d-2(b))
¨ Pre-commencement communications pursuant to Rule 13e-4(c) under the Exchange Act (17 CFR 240.13e-4(c))
Securities registered pursuant to Section 12(b) of the Act:
| Title of each class | Trading Symbol(s) | Name of each exchange on which registered | ||
| Common Stock | MUX | New York Stock Exchange |
Indicate by check mark whether the registrant is an emerging growth company as defined in Rule 405 of the Securities Act of 1933 (§230.405 of this chapter) or Rule 12b-2 of the Securities Exchange Act of 1934 (§240.12b-2 of this chapter).
Emerging growth company ¨
If an emerging growth company, indicate by check mark if the registrant has elected not to use the extended transition period for complying with any new or revised financial accounting standards provided pursuant to Section 13(a) of the Exchange Act. ¨
Item 7.01 Financial Statements and Exhibits.
On January 23, 2024, management of McEwen Mining Inc. (the “Company”) made a presentation regarding the Company and its operations, assets, plans and recent developments at the TD Securities Global Mining Conference. A copy of the Power Point slides used in conjunction with the presentation is furnished with this report as Exhibit 99.1.
The information furnished under this Item 7.01, including the referenced exhibit, shall not be deemed “filed” for purposes of Section 18 of the Securities Exchange Act of 1934, nor shall it be deemed incorporated by reference in any filing under the Securities Act of 1933, except as shall be expressly set forth by reference to such filing.
Item 9.01 Financial Statements and Exhibits.
(d) Exhibits. The following exhibits are furnished or filed with this report, as applicable:
| Exhibit No. | Description | |
| 99.1 |
Power Point Slides from TD Securities Global Mining Conference. |
|
| 104 | Cover Page Interactive Data File – the cover page XBRL tags are embedded within the Inline XBRL document |
SIGNATURES
Pursuant to the requirements of the Securities Exchange Act of 1934, the registrant has duly caused this report to be signed on its behalf by the undersigned hereunto duly authorized.
| McEWEN MINING INC. | ||
| Date: January 26, 2024 | By: | /s/ Carmen Diges |
| Carmen Diges, General Counsel | ||
Exhibit 99.1
The McEwen Mining January 2024 Difference TD Securities Global Mining Conference Cautionary Statement This presentation and the information included herein do not constitute an offer to buy or the solicitation of an offer to subscribe for or to buy any of the securities described herein, nor shall there be any sale of these securities in any jurisdiction in which such offer, solicitation or sale would be unlawful prior to registration or qualification under the securities laws of any such jurisdiction . This presentation contains certain forward - looking statements and information, including "forward - looking statements" within the meaning of the Private Securities Litigation Reform Act of 1995 ("Forward - looking Statements") . The Forward - looking Statements are intended to be subject to the safe harbor provided by Section 27 a of the Securities Act of 1933 , Section 21 e of the Securities Exchange Act of 1934 and Private Securities Litigation Reform Act of 1995 . The Forward - looking Statements express, as at the date of this presentation, McEwen Mining Inc . (the "Company") estimates, forecasts, projections, expectations or beliefs as to future events and results . Forward - looking Statements are necessarily based upon a number of estimates and assumptions that, while considered reasonable by management, are inherently subject to significant business, economic and competitive uncertainties, risks and contingencies . There can be no assurance that such statements and information will prove to be accurate . Therefore, actual results and future events could differ materially from those anticipated in such statements and information . Risks and uncertainties that could cause results or future events to differ materially from current expectations expressed or implied by the Forward - looking Statements include, but are not limited to, factors associated with fluctuations in the market price of precious metals, mining industry risks, political, economic, social and security risks associated with foreign operations, the ability of the corporation to receive or receive in a timely manner permits or other approvals required in connection with operations, risks associated with the construction of mining operations and commencement of production and the projected costs thereof, risks related to litigation, the state of the capital markets, environmental risks and hazards, uncertainty as to calculation of mineral resources and reserves, risk of delisting from a public exchange, and other risks . Readers should not place undue reliance on Forward - looking Statements, which speak only as of the date hereof . The Company undertakes no obligation to reissue or update Forward - looking Statements as a result of new information or events after the date hereof, except as required by law . See McEwen Mining's Annual Report on Form 10 - K/A for the fiscal year ended December 31 , 2022 , the Quarterly Report on Form 10 - Q for the quarters ended March 31 , 2023 , June 30 , 2023 , September 30 , 2023 and other filings with the Securities and Exchange Commission (the “SEC”), under the caption "Risk Factors", for additional information on risks, uncertainties and other factors relating to the Forward - looking Statements . All Forward - looking Statements made in this presentation are qualified by this cautionary statement . Unless otherwise stated, all currency information quoted in this presentation is in U . S . dollars . The technical contents of this presentation, including reserves, have been reviewed and approved by William Shaver, COO ; the exploration technical contents of this presentation including resources content have been reviewed and approved by Luke Willis, P . Geo . , Director of Resource Modelling ; all are Qualified Persons as defined by Canadian Securities Administrators National Instrument 43 - 101 "Standards of Disclosure for Mineral Projects" . Securities and Exchange Commission (“SEC”) . We are subject to the reporting requirements of the Securities and Exchange Act of 1934 , as amended (the “Exchange Act”) and applicable Canadian securities laws, and as a result, we have reported our mineral reserves and mineral resources according to two different standards . U . S . reporting requirements are governed by Item 1300 of Regulation S - K (“S - K 1300 ”), as issued by the U . S . Securities and Exchange Commission (“SEC”) . Canadian reporting requirements for disclosure of mineral properties are governed by National Instrument 43 - 101 Standards of Disclosure for Mineral Projects (“NI 43 - 101 ”), as adopted from the definitions provided by the Canadian Institute of Mining, Metallurgy and Petroleum . Both sets of reporting standards have similar goals in terms of conveying an appropriate level of confidence in the disclosures being reported, but the standards embody slightly different approaches and definitions . All disclosure of mineral resources and mineral reserves in this report are reported in accordance with S - K 1300 . Investors should be aware that the estimation of measured resources and indicated resources involve greater uncertainty as to their existence and economic feasibility than the estimation of proven and probable reserves, and therefore investors are cautioned not to assume that all or any part of measured or indicated resources will ever be converted into S - K 1300 compliant reserves . The estimation of inferred resources involves far greater uncertainty as to their existence and economic viability than the estimation of other categories of resources . It is generally assumed that the majority of Inferred resources will be later upgraded to the Indicated or Measured categories with further exploration . Investors are cautioned not to assume that all or any part of inferred resources exist, or that they can be mined legally or economically .
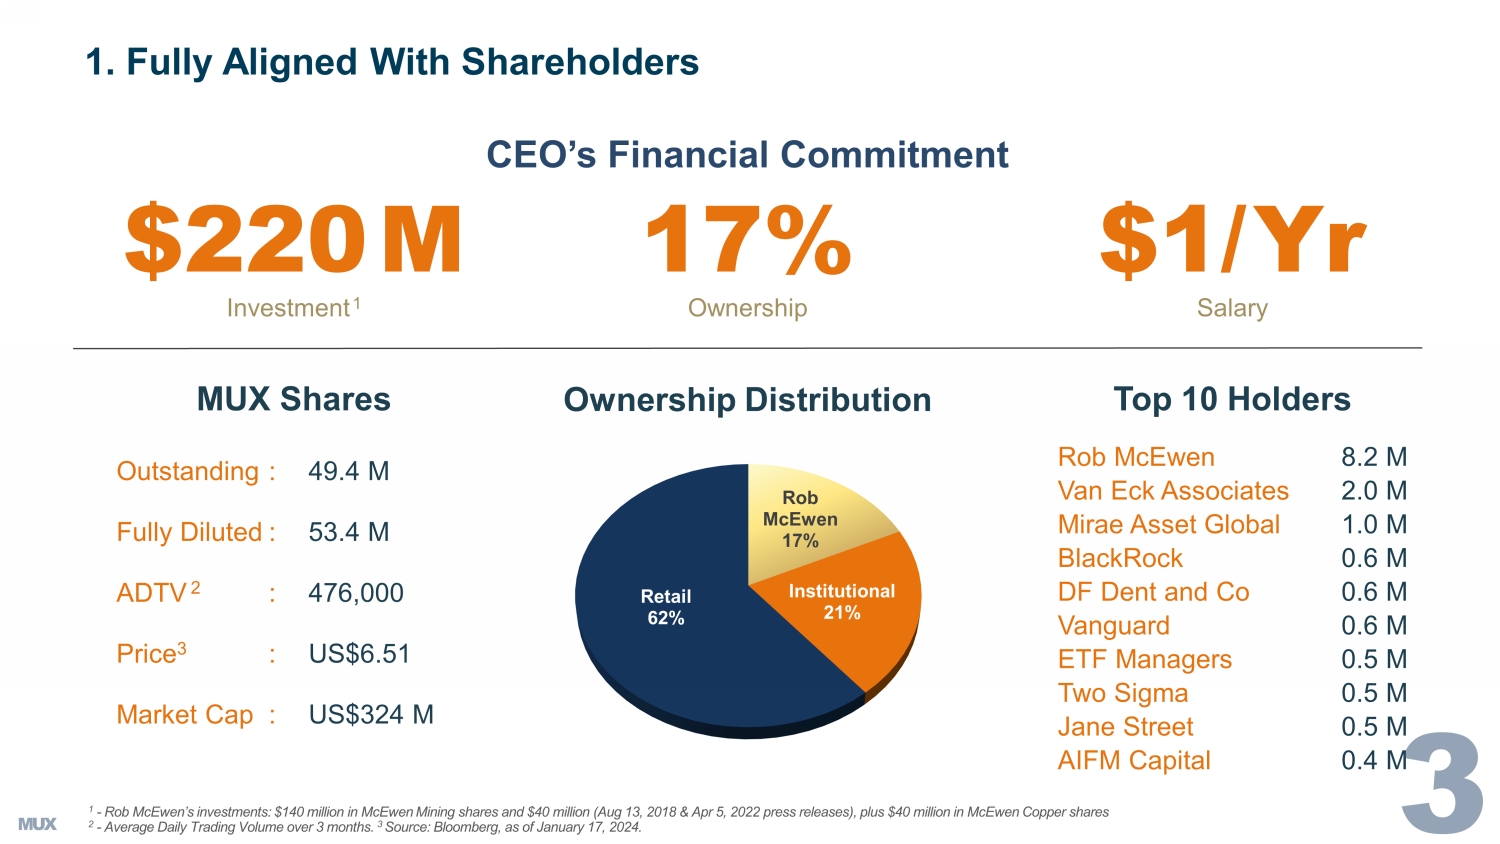
CEO’s Financial Commitment $ 220 M 17 % $1/ Y r Investment 1 Ownership Salary Rob McEwen 17% Institutional 21% Retail 62% 1 - Rob McEwen’s investments: $1 40 million in McEwen Mining shares and $ 40 million (Aug 13, 2018 & Apr 5, 2022 press releases) , plus $40 million in McEwen Copper shares 2 - Average Daily Trading Volume over 3 months. 3 Source: Bloomberg, as of January 17, 2024. Rob McEwen 8.2 M Van Eck Associates 2.0 M Mirae Asset Global 1.0 M BlackRock 0.6 M DF Dent and Co 0.6 M Vanguard 0.6 M ETF Managers 0.5 M Two Sigma 0.5 M Jane Street 0.5 M AIFM Capital 0.4 M MUX Shares Top 10 Holders Ownership Distribution Outstanding : 49.4 M Fully Diluted : 53.4 M ADTV 2 : 476,000 Price 3 : US$6.51 Market Cap : US$324 M 1. Fully Aligned With Shareholders McEwen Mining Gold Gold & Silver McEwen Copper Copper Los Azules Argentina Fox Mine Complex Timmins, Canada Gold Bar Mine Nevada Fenix Project Mexico Elder Creek Nevada 2.
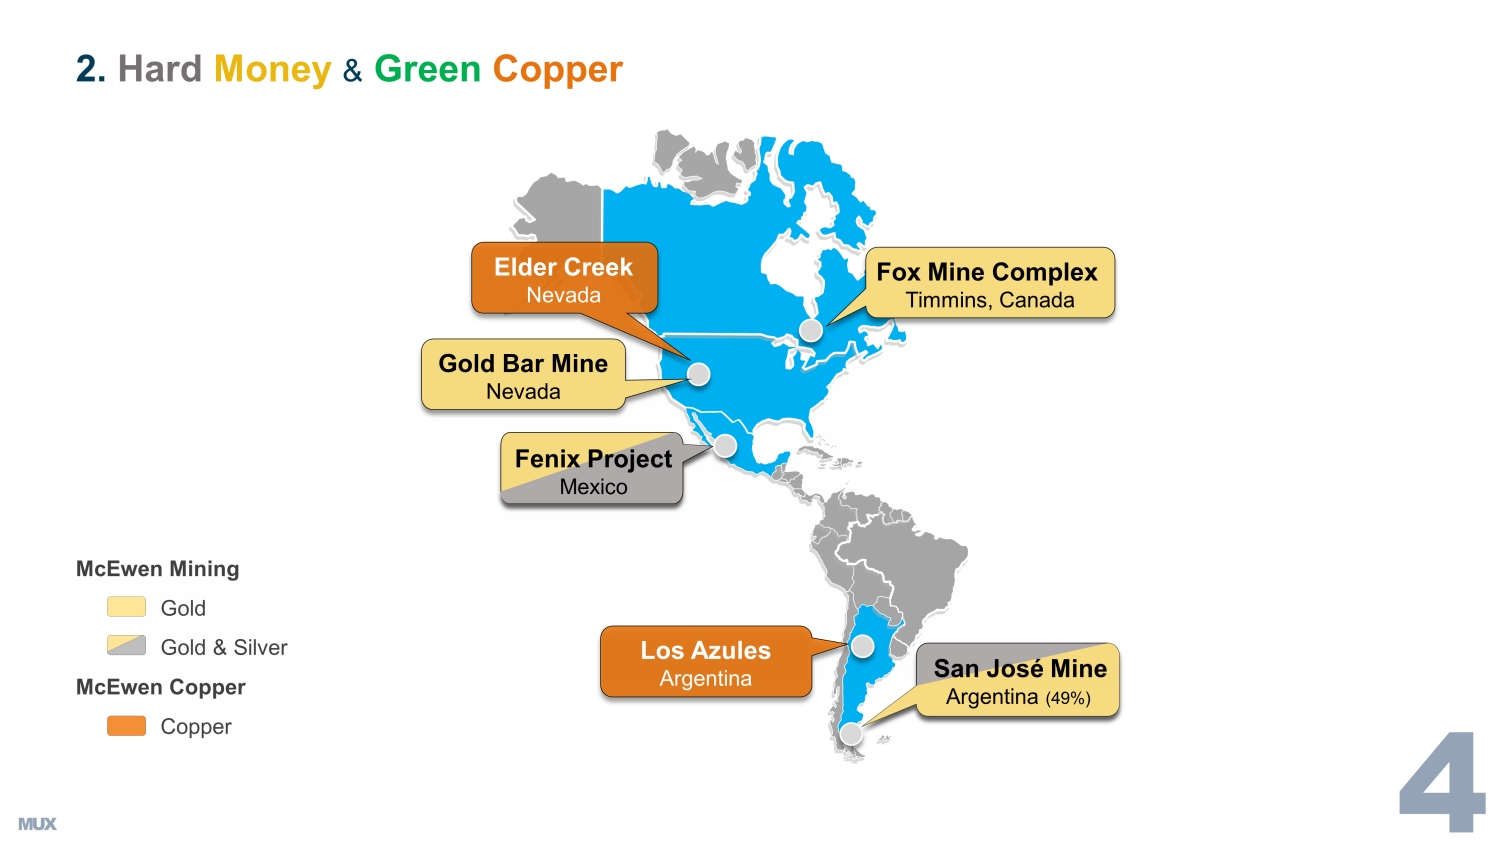
Hard Money & Green Copper San José Mine Argentina ( 49 %)
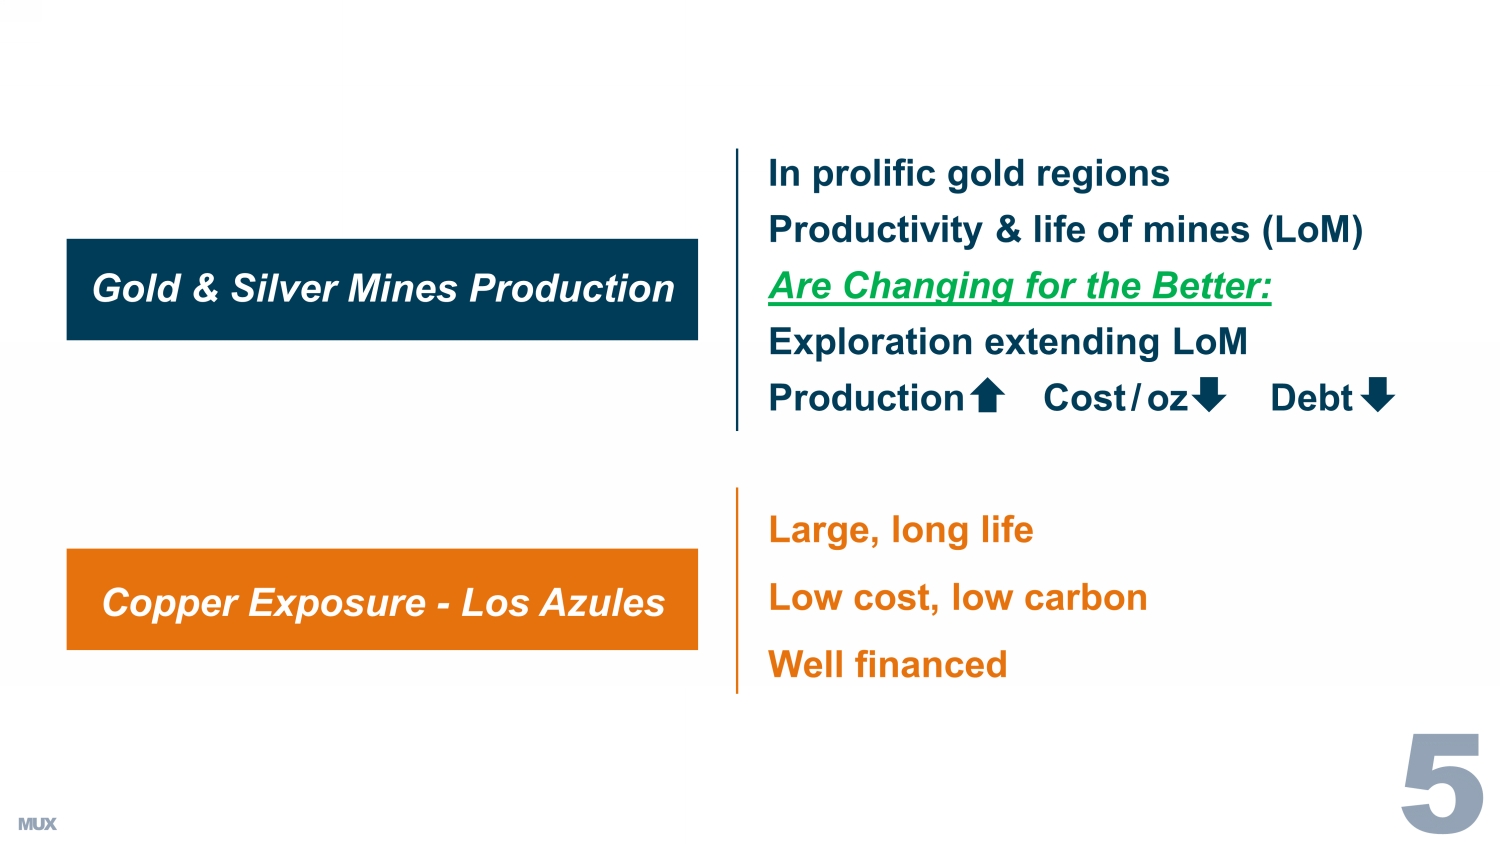
Gold & Silver Mines Production In prolific gold regions Productivity & life of mines (LoM) Are Changing for the Better: Exploration extending LoM Production Cost / oz Debt Large, long life Low cost, low carbon Well financed Copper Exposure - Los Azules MUX's AssetsRange of Estimated Value Per MUX Share1Low Mid HighMcEwenCopper2Los Azules$4.533 $7.484 $19.715Elder CreekRoyalty Portfolio $0.696 $0.696 $0.696Gold Silver $4.108 $8.217 $12.309 CurrentShare PriceTotal $9.32 $16.38 $32.70 $6.513.
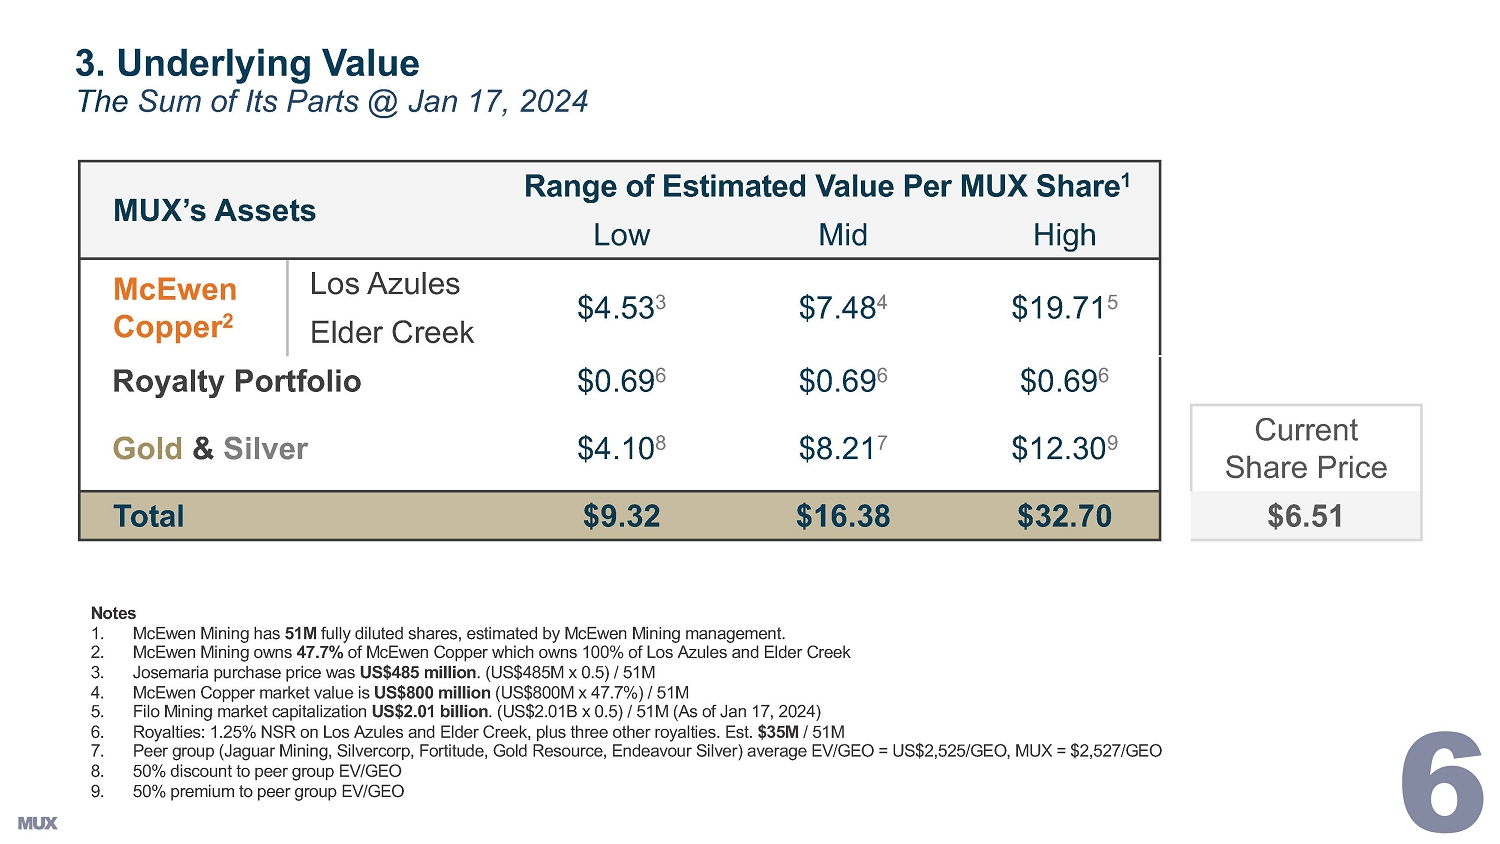
Underlying ValueThe Sum of Its Parts @ Jan 17, 2024Notes1. McEwen Mining has 51M fully diluted shares, estimated by McEwen Mining management.2. McEwen Mining owns 47.7% of McEwen Copper which owns 100% of Los Azules and Elder Creek3. Josemaria purchase price was US$485 million. (US$485M x 0.5) / 51M4. McEwen Copper market value is US$800 million (US$800M x 47.7%) / 51M5. Filo Mining market capitalization US$2.01 billion. (US$2.01B x 0.5) / 51M (As of Jan 17, 2024)6. Royalties: 1.25% NSR on Los Azules and Elder Creek, plus three other royalties. Est. $35M / 51M7. Peer group (Jaguar Mining, Silvercorp, Fortitude, Gold Resource, Endeavour Silver) average EV/GEO = US$2,525/GEO, MUX = $2,527/GEO8. 50% discount to peer group EV/GEO9. 50% premium to peer group EV/GEO Chile Peru Produce 40% of World's Annual Copper Production*Rank based on 2021 top 20 largest copper mines in the world by production capacity.
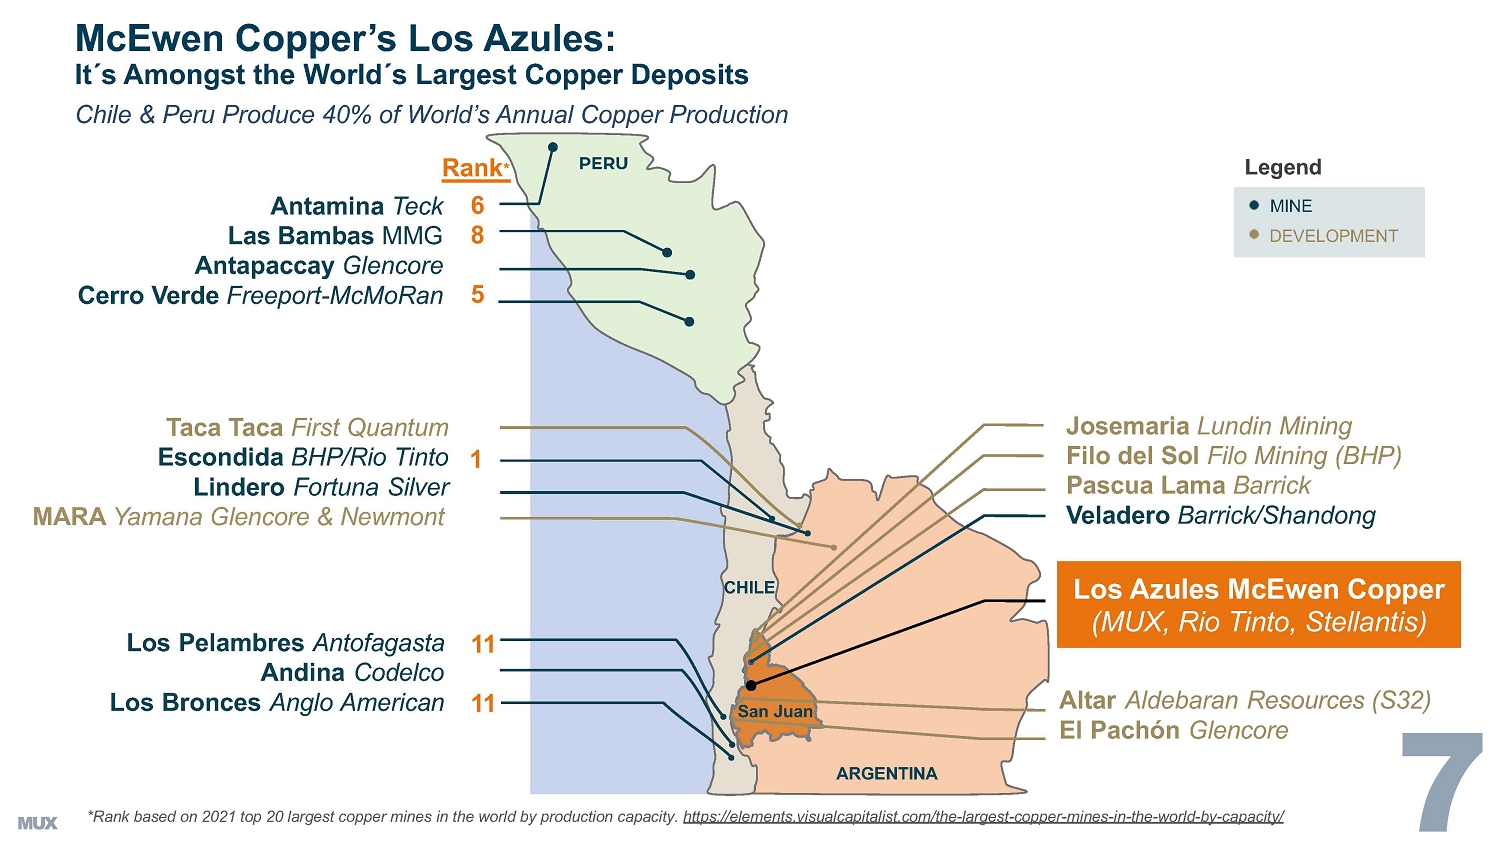
https://elements.visualcapitalist.com/the-largest-copper-mines-in-the-world-by-capacity/CHILEARGENTINALos Pelambres AntofagastaAndina CodelcoLos Bronces Anglo AmericanAntamina TeckLas Bambas MMGAntapaccay GlencoreCerro Verde Freeport-McMoRanPERUTaca Taca First QuantumEscondida BHP/Rio TintoLindero Fortuna SilverMARA Yamana Glencore NewmontJosemaria Lundin MiningFilo del Sol Filo Mining (BHP)Pascua Lama BarrickVeladero Barrick/ShandongLos Azules McEwen Copper(MUX, Rio Tinto, Stellantis)Altar Aldebaran Resources (S32)El Pachon GlencoreSan JuanRank*68511111MINEDEVELOPMENTLegendMcEwen Copper's Los Azules:Its Amongst the Worlds Largest Copper Deposits Amount Share Price Implied Market Cap MUX Ownership (%) Value ($) Value / MUX Share Aug 2022 $82 M $10 $256 M 68.1% $175 M $3.43 Feb 2023 $30 M $19 $550 M 51.9% $285 M $5.59 ARS $30 B 1 Oct 2023 $10 M $26 $800 M 47.7% $382 M $7.48 ARS $42 B 2 McEwen Copper’s Growing Impact on MUX Share Value Private Financing ($US) M – millions, B - billions Excludes 1.25% NSR on Los Azules & Elder Creek 1.
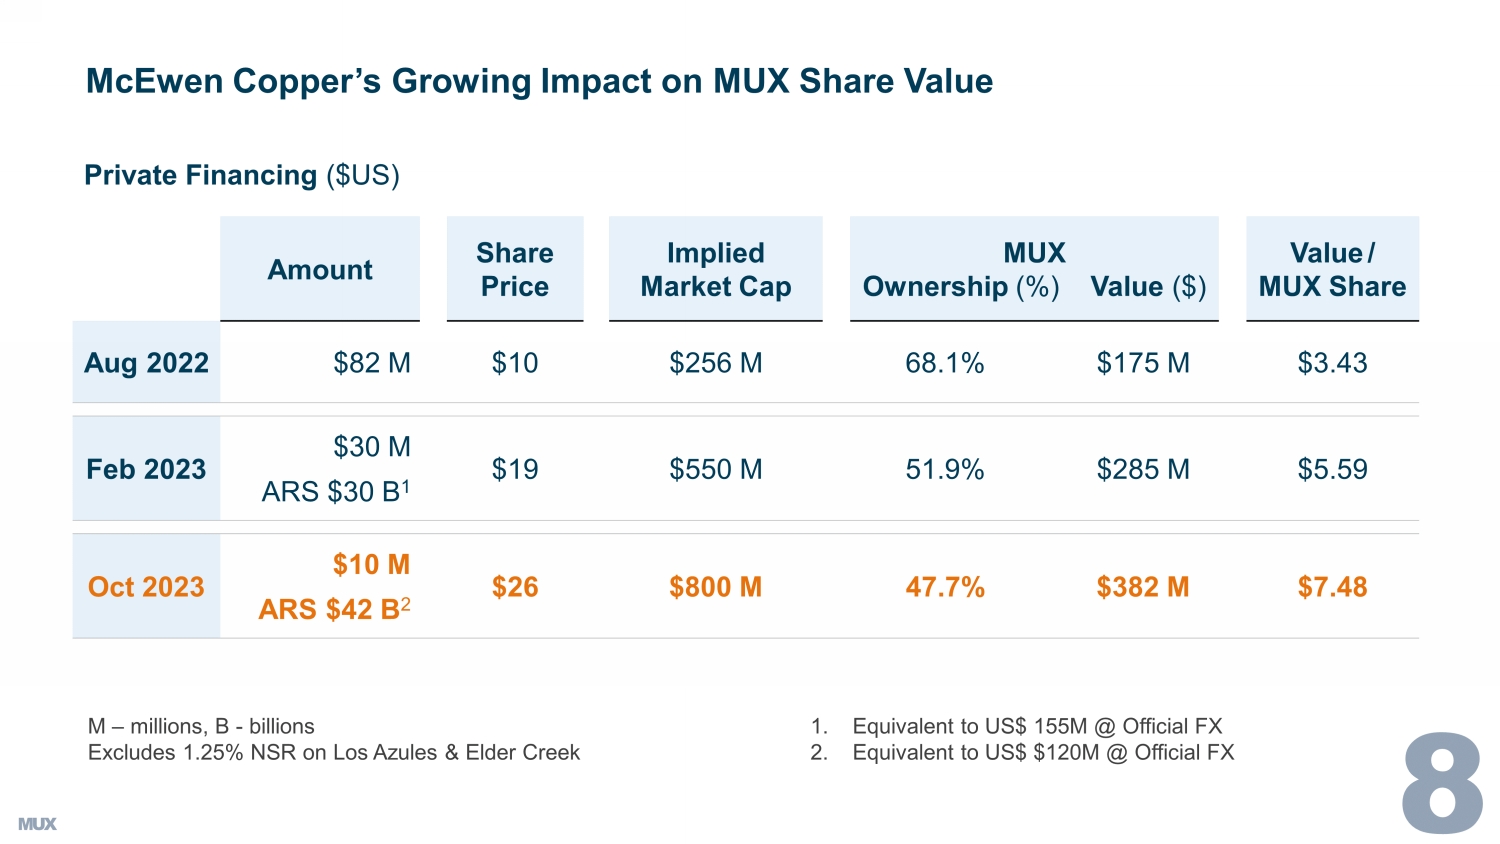
Equivalent to US$ 155M @ Official FX 2.
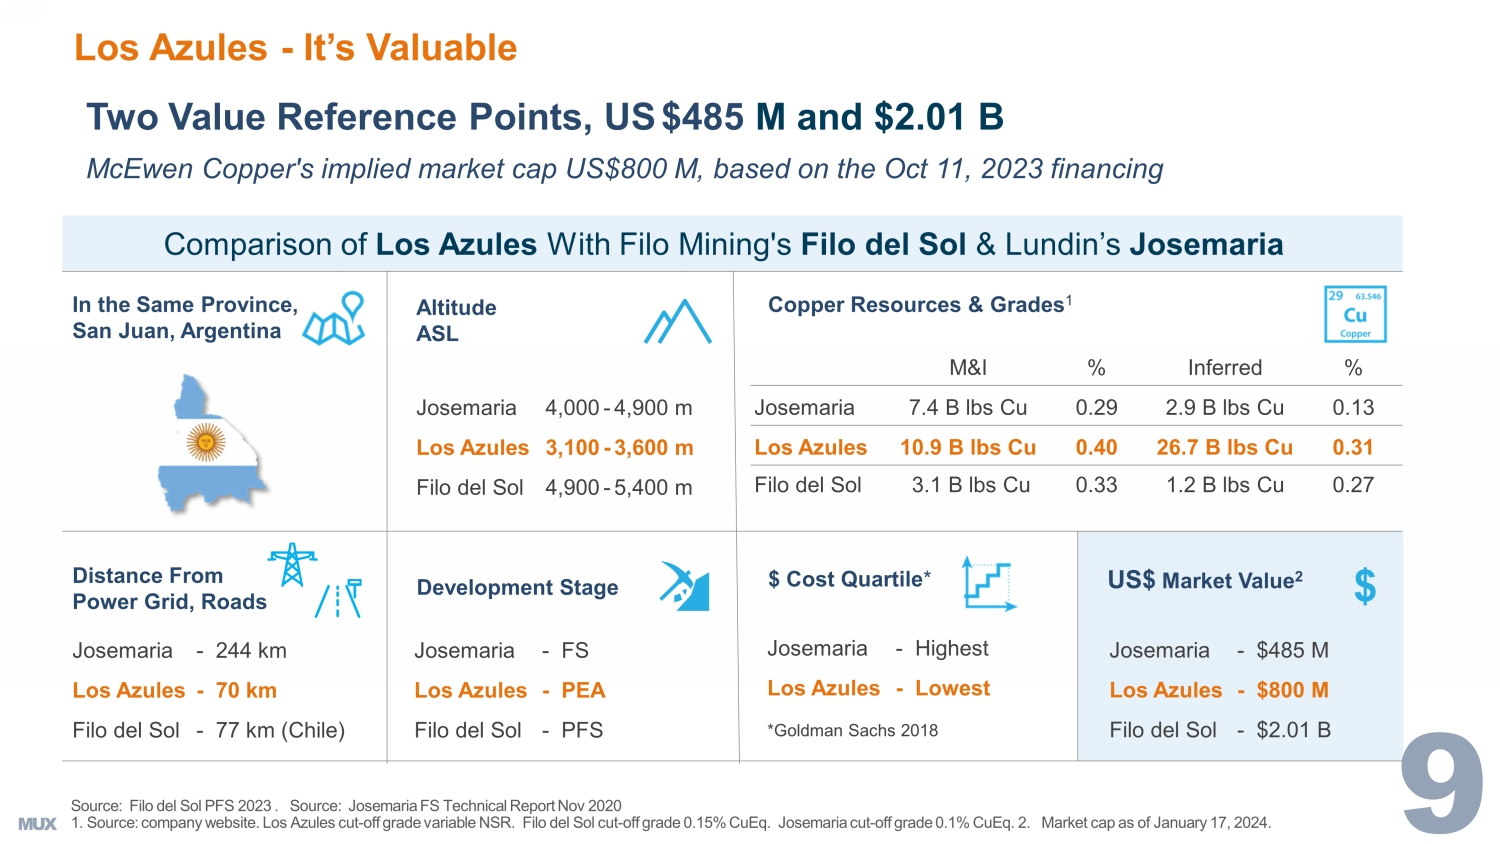
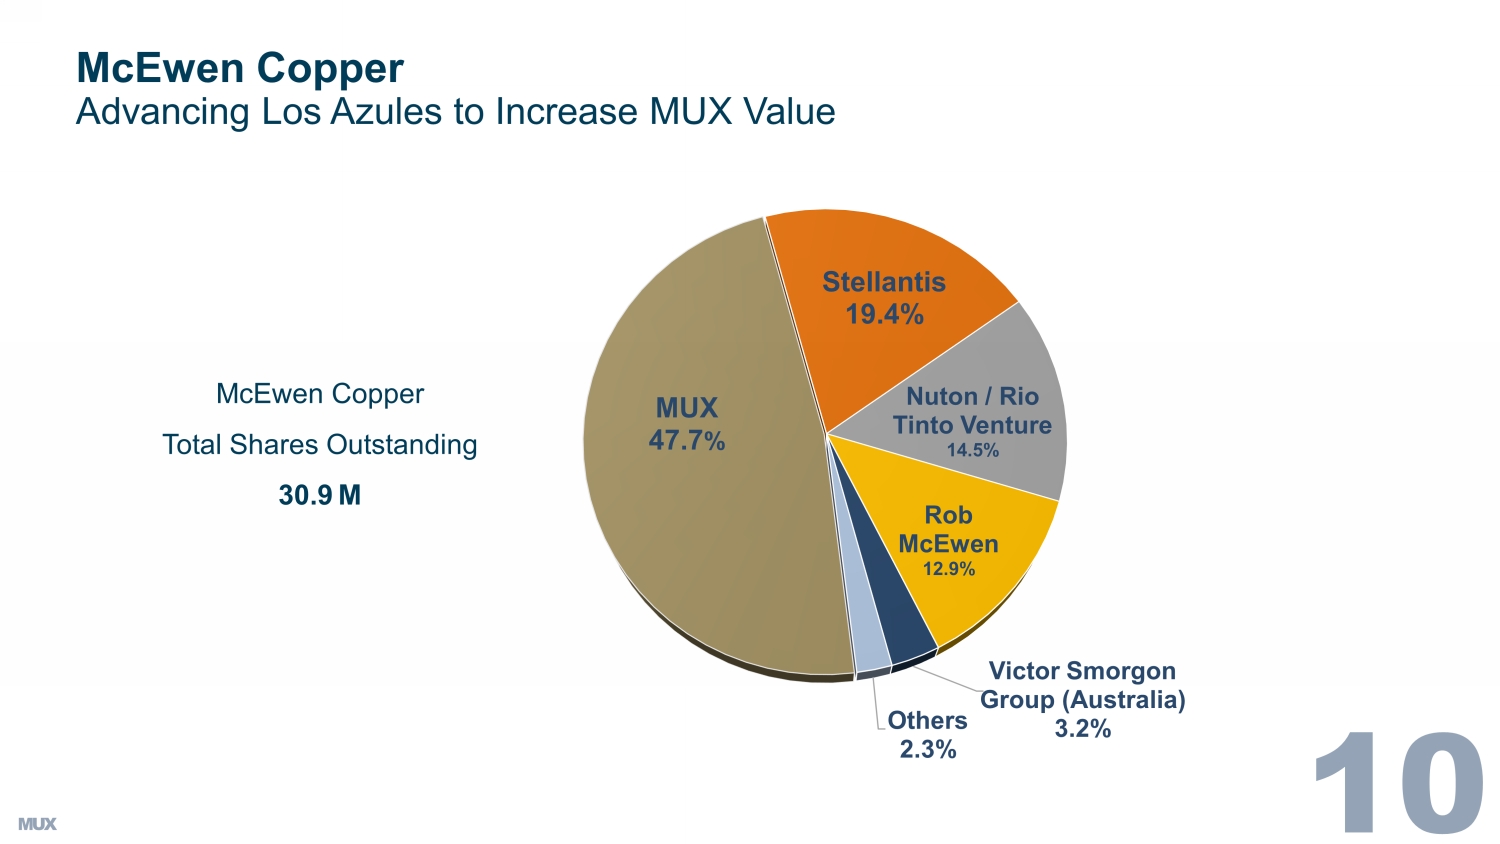
Equivalent to US$ $120M @ Official FX Two Value Reference Points, US $485 M and $2.01 B McEwen Copper's implied market cap US$800 M, based on the Oct 11, 2023 financing In the Same Province, San Juan, Argentina Comparison of Los Azules With Filo Mining's Filo del Sol & Lundin’s Josemaria Copper Resources & Grades 1 Distance From Power Grid, Roads Altitude ASL $ Cost Quartile * Development Stage M&I % Inferred % Josemaria 7.4 B lbs Cu 0.29 2.9 B lbs Cu 0.13 Los Azules 10.9 B lbs Cu 0.40 26.7 B lbs Cu 0.31 Filo del Sol 3.1 B lbs Cu 0.33 1.2 B lbs Cu 0.27 US$ Market Value 2 Source: Filo del Sol PFS 2023 . Source: Josemaria FS Technical Report Nov 2020 1. Source: company website. Los Azules cut - off grade variable NSR. Filo del Sol cut - off grade 0.15% CuEq . Josemaria cut - off grade 0.1% CuEq . 2. Market cap as of January 17, 2024. $ Josemaria 4,000 - 4,900 m Los Azules 3,100 - 3,600 m Filo del Sol 4,900 - 5,400 m Josemaria - 244 km Los Azules - 70 km Filo del Sol - 77 km (Chile) Josemaria - FS Los Azules - PEA Filo del Sol - PFS Josemaria - Highest Los Azules - Lowest *Goldman Sachs 2018 Josemaria - $485 M Los Azules - $800 M Filo del Sol - $2.01 B Los Azules - It’s Valuable MUX 47.7 % Stellantis 19.4% Nuton / Rio Tinto Venture 14.5% Rob McEwen 12.9% Victor Smorgon Group (Australia) 3.2% Others 2.3% MUX Stellantis McEwen Copper Advancing Los Azules to Increase MUX Value McEwen Copper Total Shares Outstanding 30.9 M
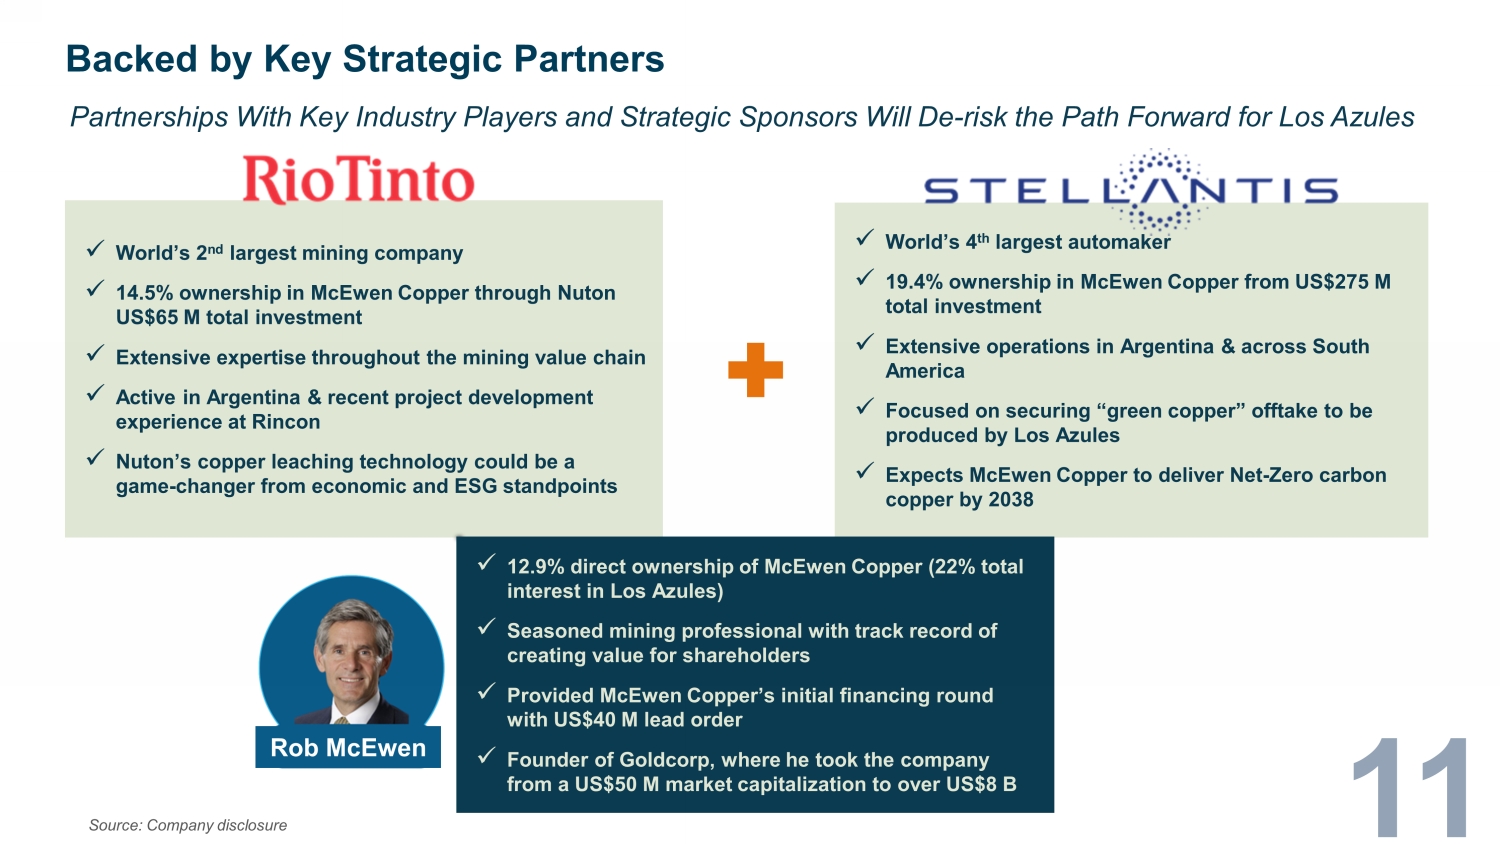
x World’s 2 nd largest mining company x 14.5% ownership in McEwen Copper through Nuton US$65 M total investment x Extensive expertise throughout the mining value chain x Active in Argentina & recent project development experience at Rincon x Nuton’s copper leaching technology could be a game - changer from economic and ESG standpoints Backed by Key Strategic Partners Source: Company disclosure Partnerships With Key Industry Players and Strategic Sponsors Will De - risk the Path Forward for Los Azules x World’s 4 th largest automaker x 19.4% ownership in McEwen Copper from US$275 M total investment x Extensive operations in Argentina & across South America x Focused on securing “green copper” offtake to be produced by Los Azules x Expects McEwen Copper to deliver Net - Zero carbon copper by 2038 x 12.9% direct ownership of McEwen Copper (22% total interest in Los Azules) x Seasoned mining professional with track record of creating value for shareholders x Provided McEwen Copper’s initial financing round with US$40 M lead order x Founder of Goldcorp, where he took the company from a US$50 M market capitalization to over US$8 B Rob McEwen -50 0 50 100 150 200 250 Sep-22 Oct-22 Nov-22 Dec-22 Jan-23 Feb-23 Mar-23 Apr-23 May-23 Jun-23 Jul-23 Aug-23 Sep-23 Oct-23 Nov-23 Dec-23 Jan-24 MUX GDX GDXJ Nasdaq Gold Silver Copper Dow 4.
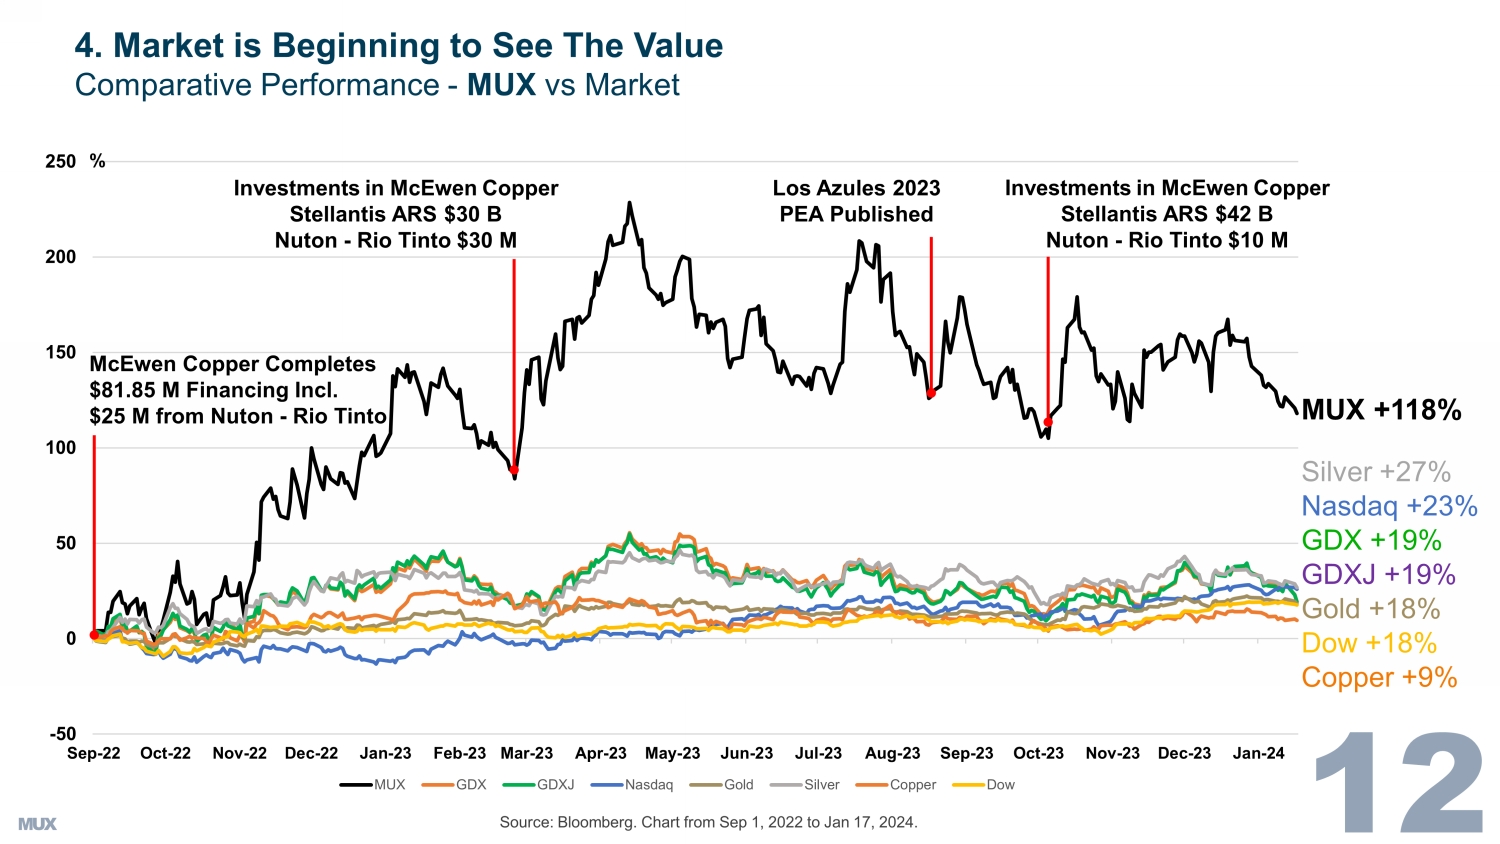
Market is Beginning to See The Value Comparative Performance - MUX vs Market GDXJ +19% % MUX +118% GDX +19% Gold +18% Copper +9% Source: Bloomberg. Chart from Sep 1, 2022 to Jan 17, 2024. Nasdaq +23% Dow +18% Investments in McEwen Copper Stellantis ARS $30 B Nuton - Rio Tinto $30 M Los Azules 2023 PEA Published McEwen Copper Completes $81.85 M Financing Incl.
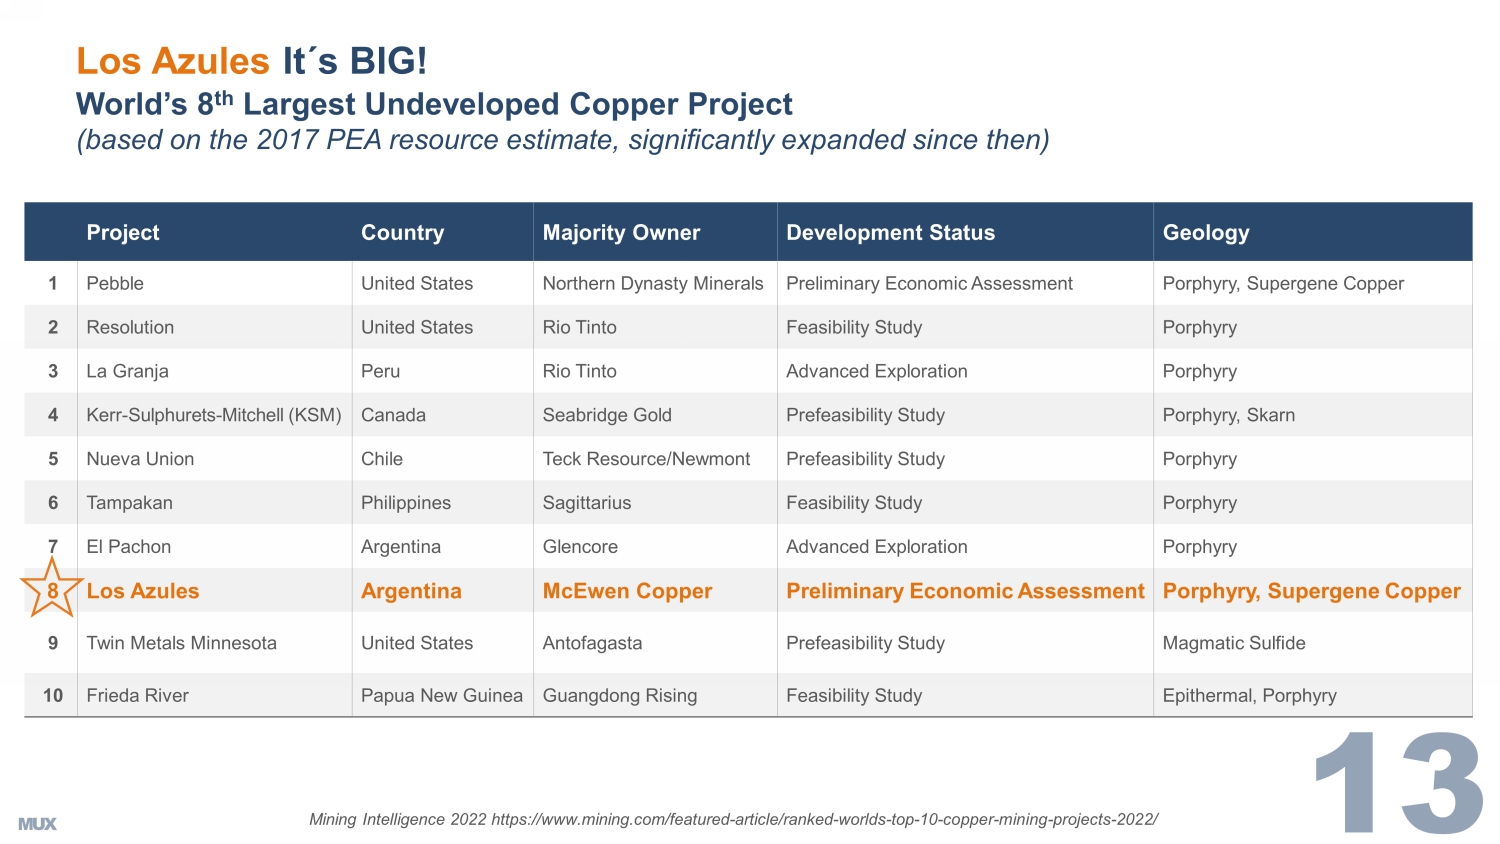
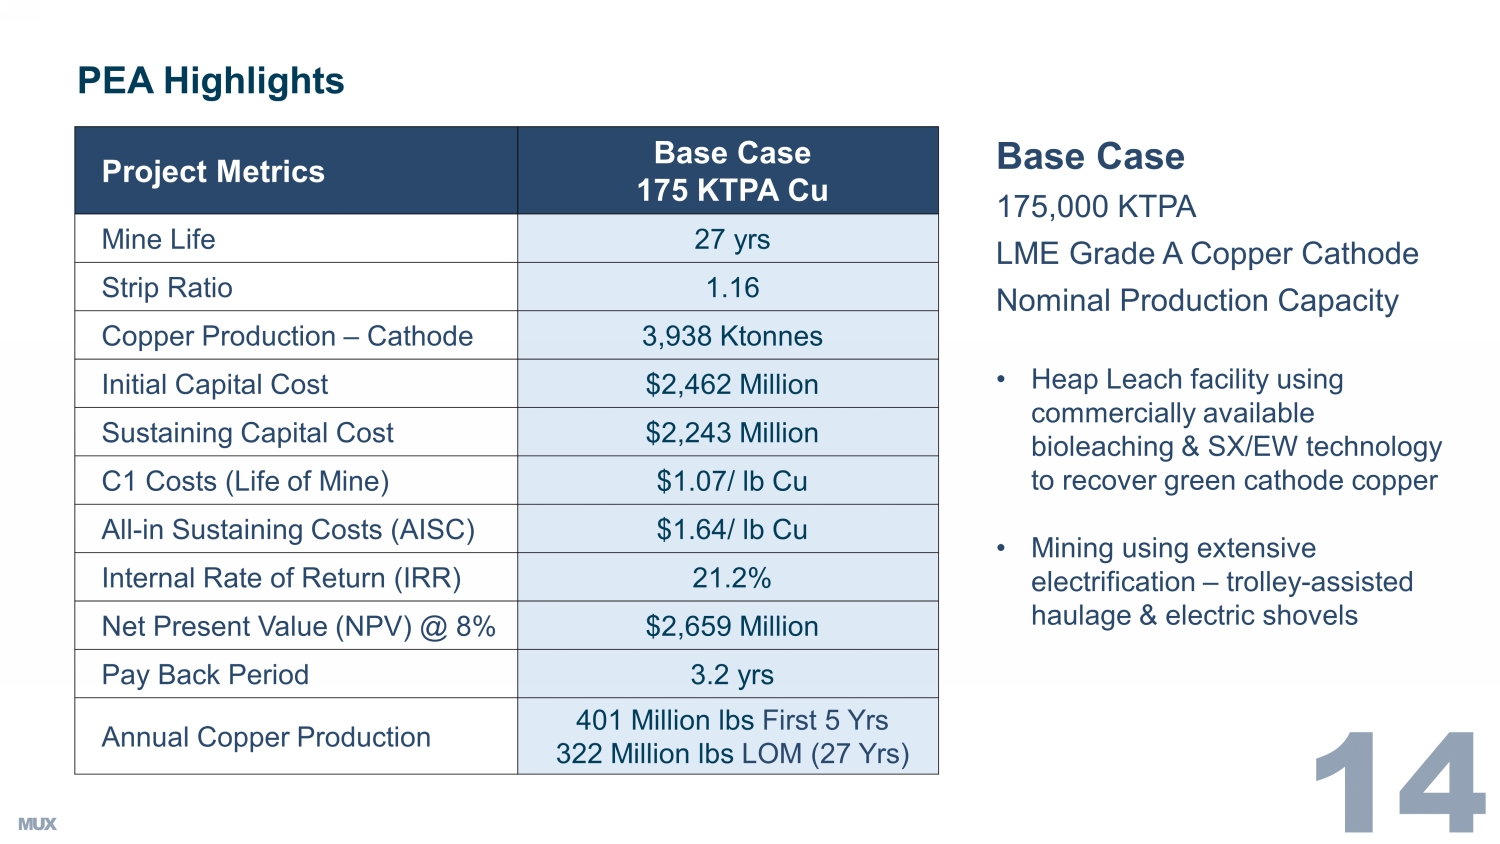
$25 M from Nuton - Rio Tinto Investments in McEwen Copper Stellantis ARS $42 B Nuton - Rio Tinto $10 M Silver +27% Project Country Majority Owner Development Status Geology 1 Pebble United States Northern Dynasty Minerals Preliminary Economic Assessment Porphyry, Supergene Copper 2 Resolution United States Rio Tinto Feasibility Study Porphyry 3 La Granja Peru Rio Tinto Advanced Exploration Porphyry 4 Kerr - Sulphurets - Mitchell (KSM) Canada Seabridge Gold Prefeasibility Study Porphyry , Skarn 5 Nueva Union Chile Teck Resource/Newmont Prefeasibility Study Porphyry 6 Tampakan Philippines Sagittarius Feasibility Study Porphyry 7 El Pachon Argentina Glencore Advanced Exploration Porphyry 8 Los Azules Argentina McEwen Copper Preliminary Economic Assessment Porphyry, Supergene Copper 9 Twin Metals Minnesota United States Antofagasta Prefeasibility Study Magmatic Sulfide 10 Frieda River Papua New Guinea Guangdong Rising Feasibility Study Epithermal, Porphyry World’s 8 th Largest Undeveloped Copper Project (based on the 2017 PEA resource estimate, significantly expanded since then) Los Azules It s BIG! Mining Intelligence 2022 https:// www.mining.com /featured - article/ranked - worlds - top - 10 - copper - mining - projects - 2022/ PEA Highlights Base Case 175,000 KTPA LME Grade A Copper Cathode Nominal Production Capacity • Heap Leach facility using commercially available bioleaching & SX/EW technology to recover green cathode copper • Mining using extensive electrification – trolley - assisted haulage & electric shovels Project Metrics Base Case 175 KTPA Cu Mine Life 27 yrs Strip Ratio 1.16 Copper Production – Cathode 3,938 Ktonnes Initial Capital Cost $2,462 Million Sustaining Capital Cost $2,243 Million C1 Costs (Life of Mine) $1.07/ lb Cu All - in Sustaining Costs (AISC) $1.64/ lb Cu Internal Rate of Return (IRR) 21.2% Net Present Value (NPV) @ 8% $2,659 Million Pay Back Period 3.2 yrs Annual Copper Production 401 Million lbs First 5 Yrs 322 Million lbs LOM (27 Yrs) MM0
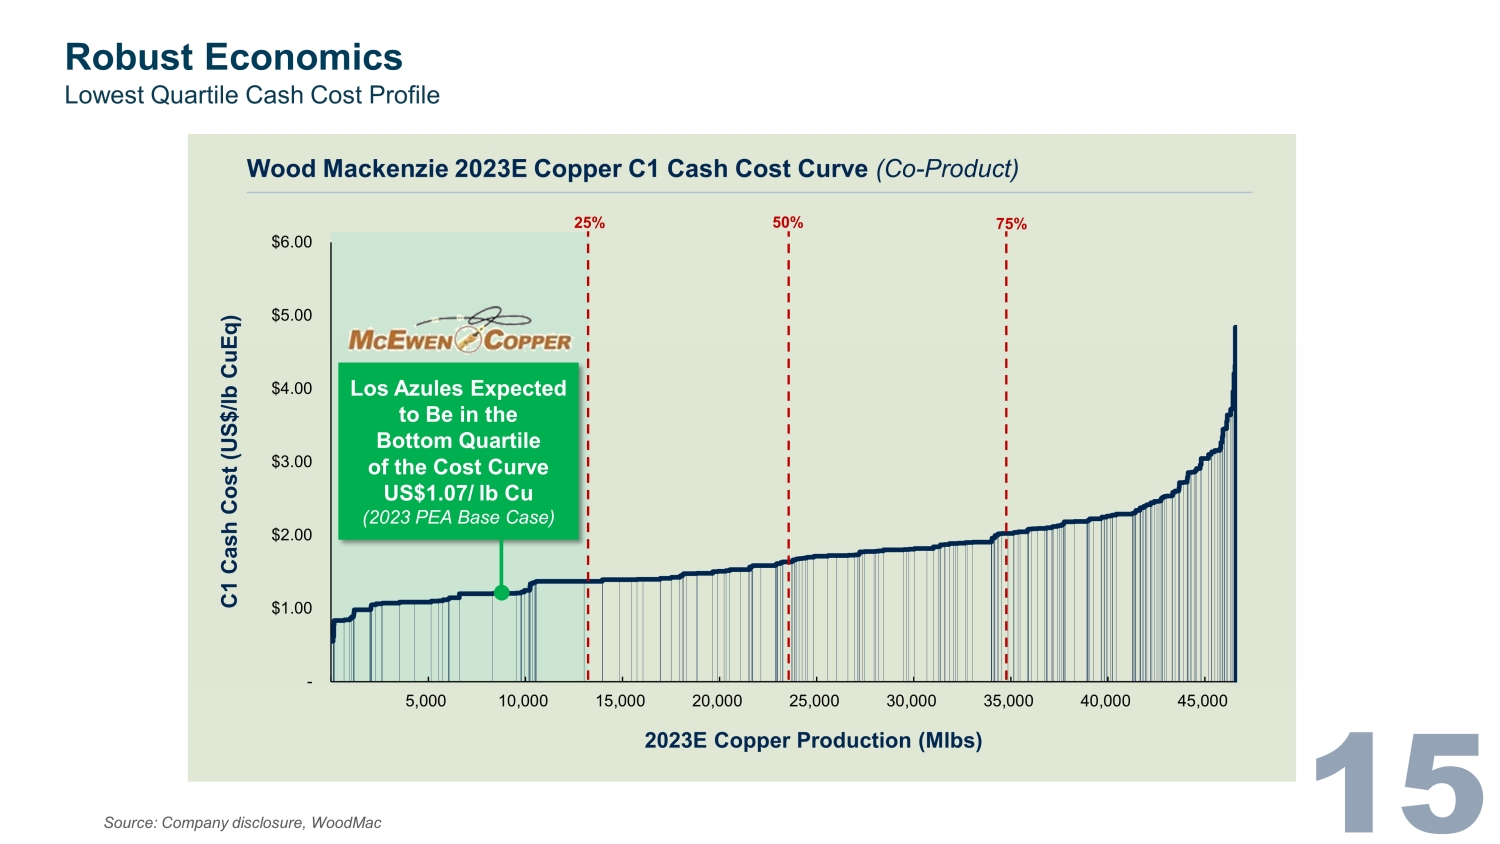
Robust Economics - $1.00 $2.00 $3.00 $4.00 $5.00 $6.00 5,000 10,000 15,000 20,000 25,000 30,000 35,000 40,000 45,000 C1 Cash Cost (US$/lb CuEq) 2023E Copper Production (Mlbs) Source: Company disclosure, WoodMac Lowest Quartile Cash Cost Profile 25% 50% 75% Wood Mackenzie 2023E Copper C1 Cash Cost Curve (Co - Product) Los Azules Expected to Be in the Bottom Quartile of the Cost Curve US$1.07/ lb Cu (2023 PEA Base Case)
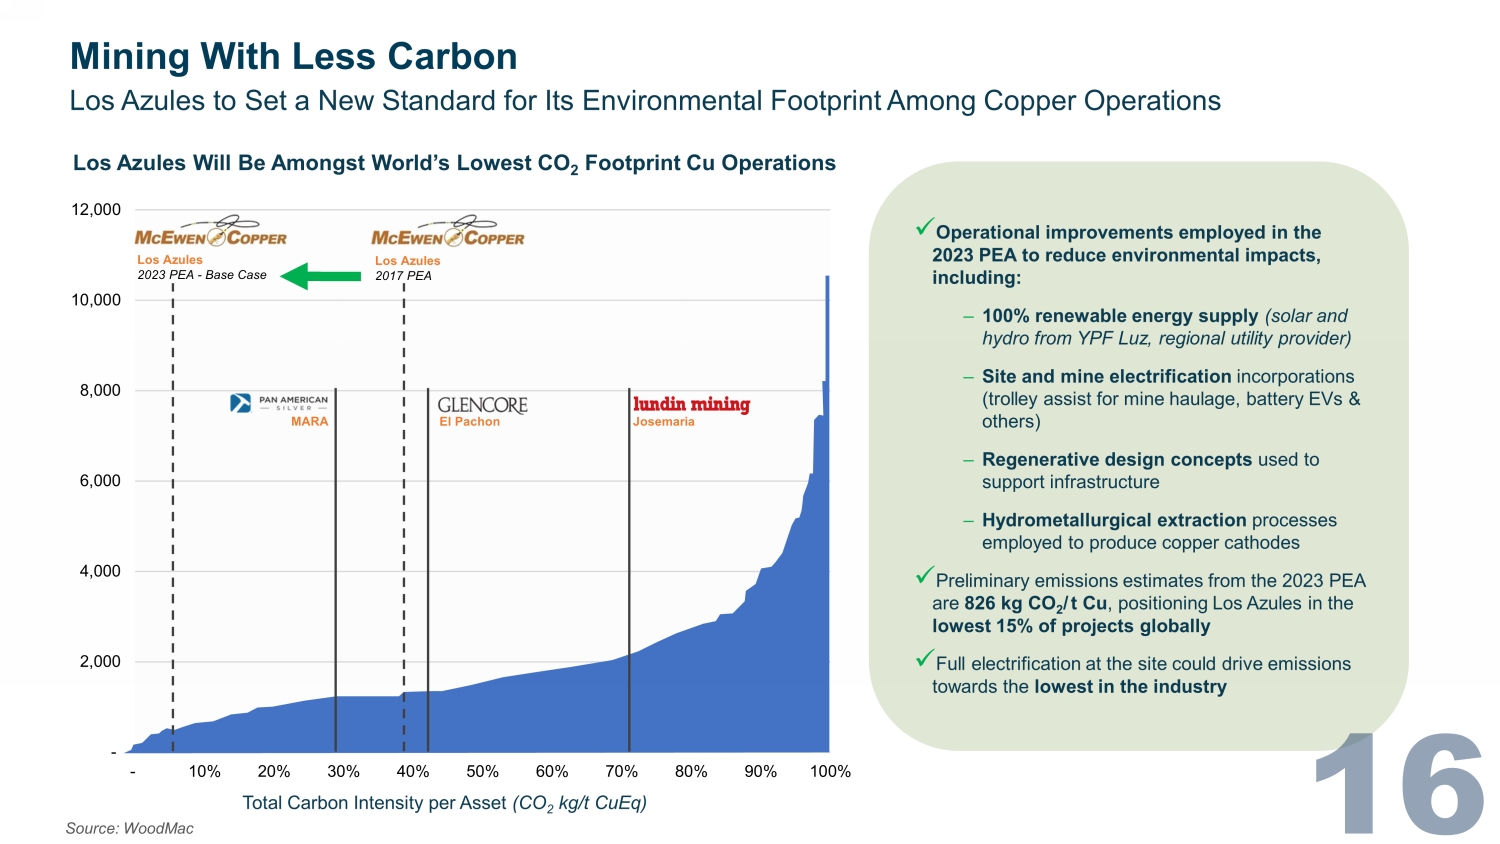
Los Azules Will Be Amongst World’s Lowest CO 2 Footprint Cu Operations Mining With Less Carbon - 2,000 4,000 6,000 8,000 10,000 12,000 - 10% 20% 30% 40% 50% 60% 70% 80% 90% 100% Source: WoodMac Los Azules to Set a New Standard for Its Environmental Footprint Among Copper Operations Total Carbon Intensity per Asset (CO 2 kg/t CuEq) Los Azules 2017 PEA Los Azules 2023 PEA - Base Case El Pachon Josemaria MARA x Operational improvements employed in the 2023 PEA to reduce environmental impacts, including: ‒ 100% renewable energy supply (solar and hydro from YPF Luz, regional utility provider) ‒ Site and mine electrification incorporations (trolley assist for mine haulage, battery EVs & others) ‒ Regenerative design concepts used to support infrastructure ‒ Hydrometallurgical extraction processes employed to produce copper cathodes x Preliminary emissions estimates from the 2023 PEA are 826 kg CO 2 / t Cu , positioning Los Azules in the lowest 15% of projects globally x Full electrification at the site could drive emissions towards the lowest in the industry 5. New Model for Mining

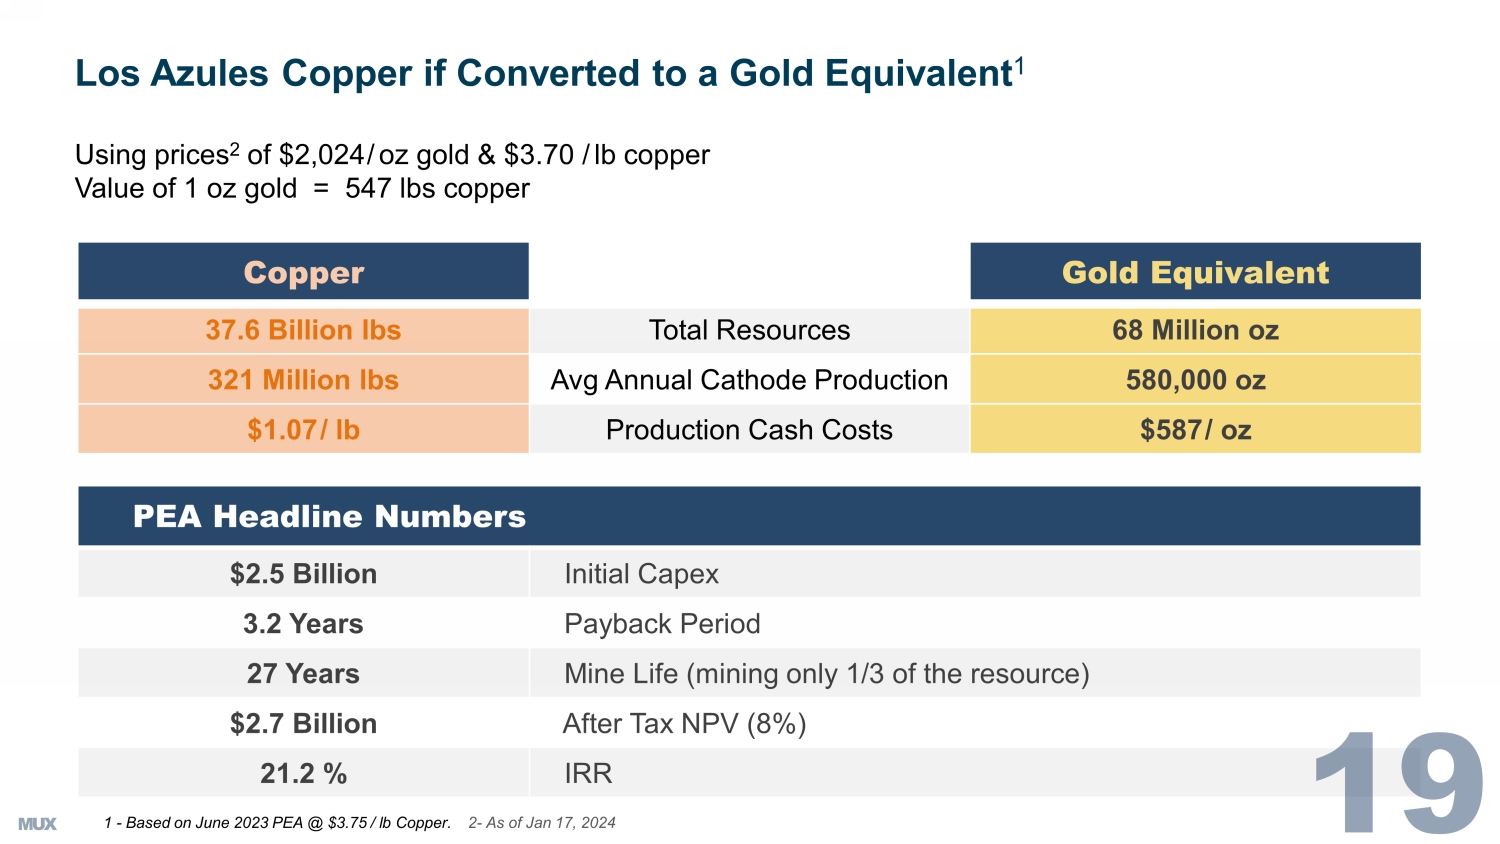
Copper Gold Equivalent 37.6 Billion lbs Total Resources 68 Million oz 321 Million lbs Avg Annual Cathode Production 580,000 oz $1.07 / lb Production Cash Costs $587 / oz Los Azules Copper if Converted to a Gold Equivalent 1 Using prices 2 of $2,024 / oz gold & $3.70 / lb copper Value of 1 oz gold = 547 lbs copper PEA Headline Numbers $2.5 Billion Initial Capex 3.2 Years Payback Period 27 Years Mine Life (mining only 1/3 of the resource) $2.7 Billion After Tax NPV (8%) 21.2 % IRR 1 - Based on June 2023 PEA @ $3.75 / lb Copper.
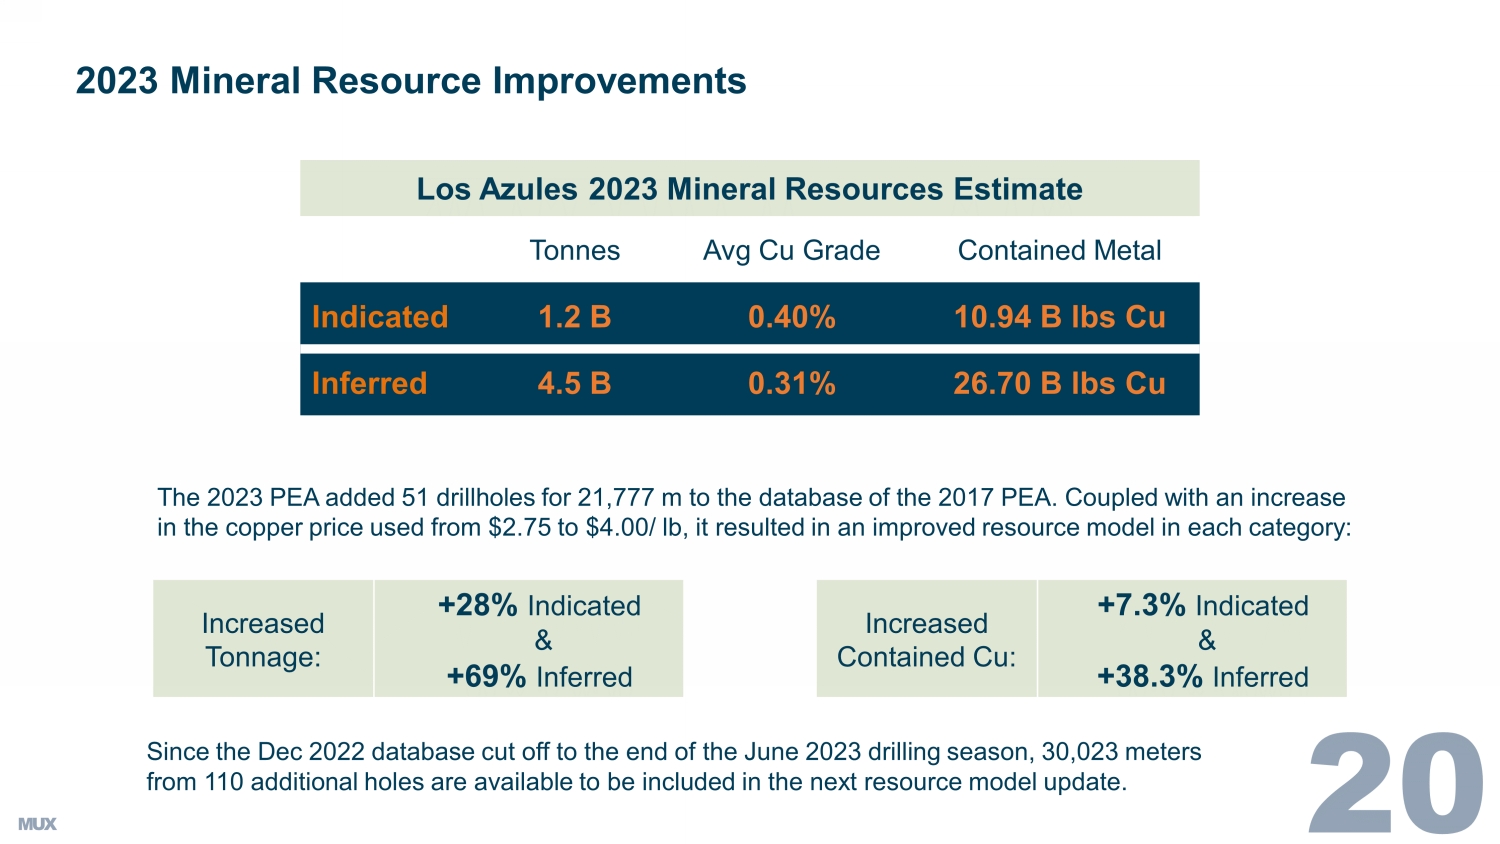
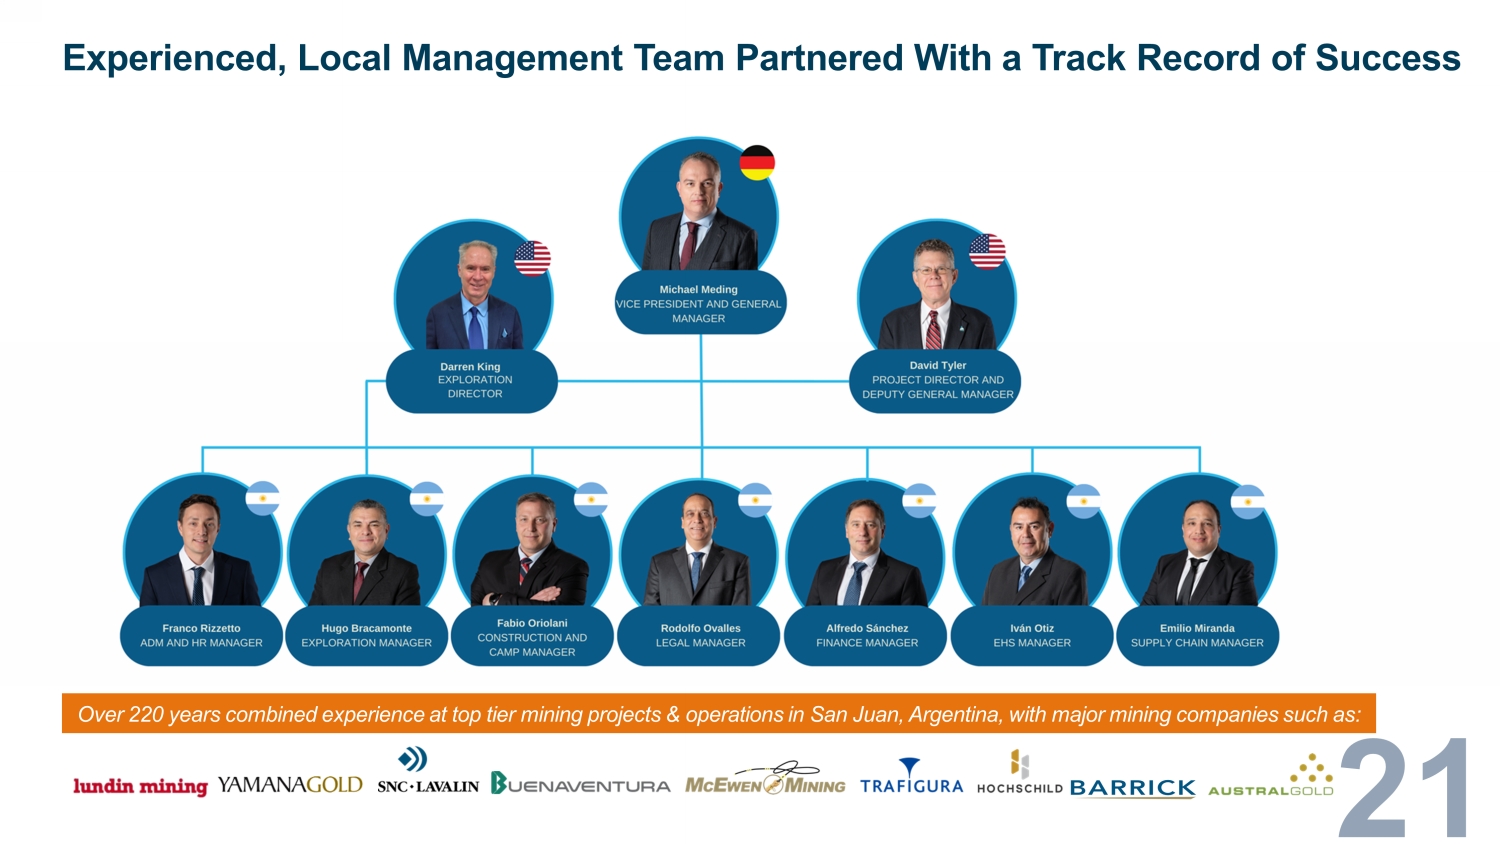
2 - As of Jan 17, 2024 LW0 LW1 SS2SS3 2023 Mineral Resource Improvements The 2023 PEA added 51 drillholes for 21,777 m to the database of the 2017 PEA. C oupled with an increase in the copper price used from $2.75 to $4.00/ lb, it resulted in an improved resource model in each category: Los Azules 2023 Mineral Resources Estimate Tonnes Avg Cu Grade Contained Metal Indicated 1.2 B 0.40% 10.94 B lbs Cu Inferred 4.5 B 0.31% 26.70 B lbs Cu . Since the Dec 2022 database cut off to the end of the June 2023 drilling season, 30,023 meters from 110 additional holes are available to be included in the next resource model update. Increased Tonnage: +28% Indicated & +69% Inferred Increased Contained Cu: +7.3% Indicated & +38.3% InferredLW0SS1SS2 Experienced, Local Management Team Partnered With a Track Record of Success Over 220 years combined experience at top tier mining projects & operations in San Juan, Argentina, with major mining compani es such as:
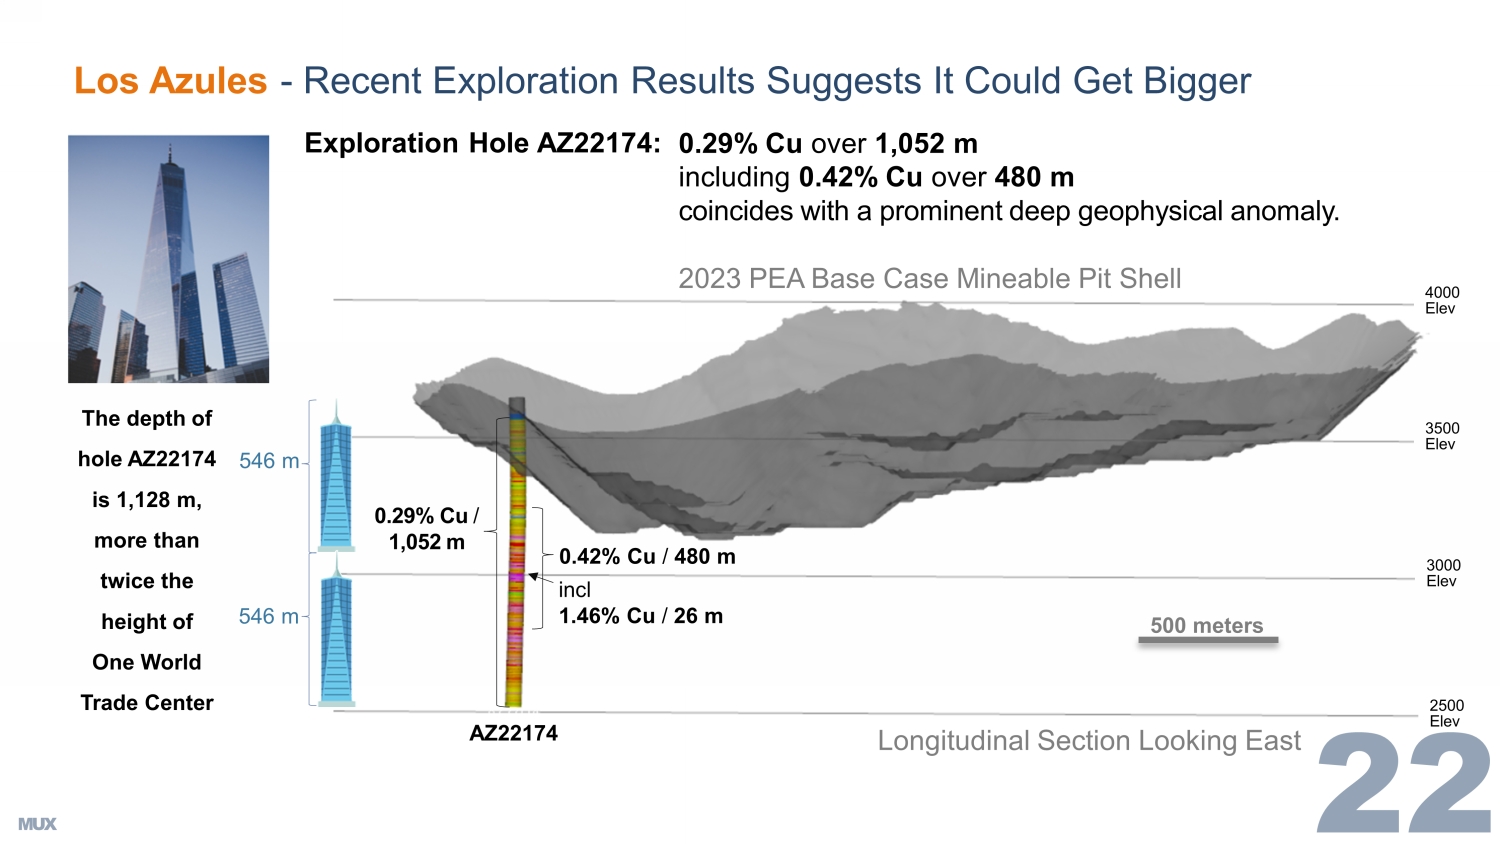
Los Azules - Recent Exploration Results Suggests It Could Get Bigger 3000 Elev 4000 Elev 500 meters The depth of hole AZ22174 is 1,128 m, more than twice the height of One World Trade Center incl 1.46% Cu / 26 m AZ22174 2500 Elev 3500 Elev 2023 PEA Base Case Mineable Pit Shell Exploration H ole AZ22174: 546 m 546 m 0.42% Cu / 480 m 0.29% Cu / 1,052 m 0.29% Cu over 1,052 m i ncluding 0.42% Cu over 480 m coincides with a prominent deep geophysical anomaly. Longitudinal Section Looking East 2022 & 2023 Highlights x Completed financings totaling $397 M , well - financed through 2024.
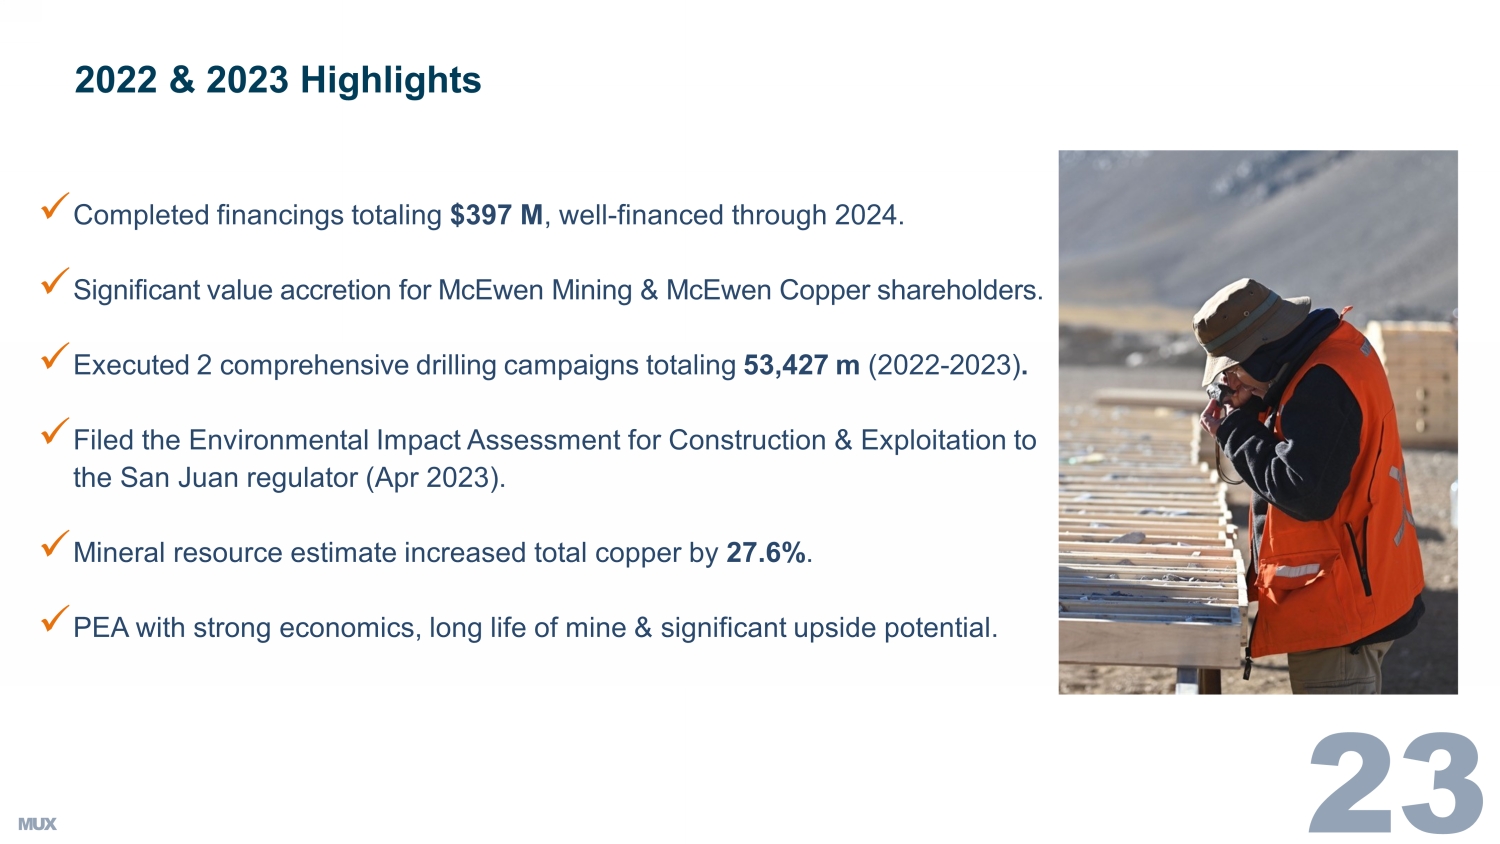
x Significant value accretion for McEwen Mining & McEwen Copper shareholders. x Executed 2 comprehensive drilling campaigns totaling 53,427 m (2022 - 2023) . x Filed the Environmental Impact Assessment for Construction & Exploitation to the San Juan regulator (Apr 2023). x Mineral resource estimate increased total copper by 27.6% . x PEA with strong economics, long life of mine & significant upside potential.
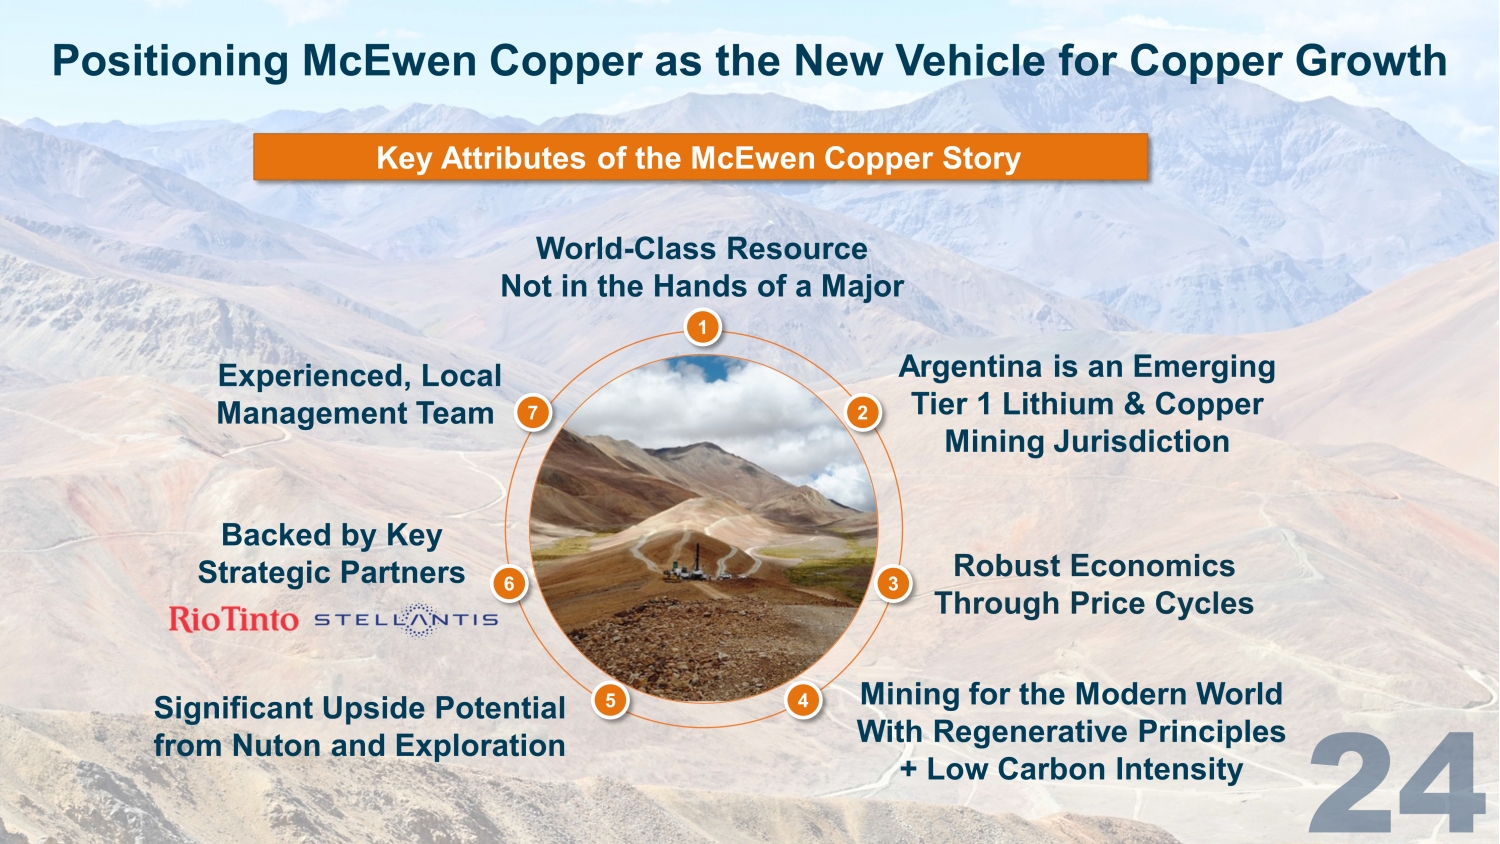
Positioning McEwen Copper as the New Vehicle for Copper Growth Backed by Key Strategic Partners 5 4 6 3 7 2 1 Mining for the Modern World With Regenerative Principles + Low Carbon Intensity Argentina is an Emerging Tier 1 Lithium & Copper Mining Jurisdiction Experienced, Local Management Team World - Class Resource Not in the Hands of a Major Robust Economics Through Price Cycles Significant Upside Potential from Nuton and Exploration Key Attributes of the McEwen Copper Story More Cash Less Debt Equity Financings Higher Cash Gross Profit Increasing Production Increasing working capital Strengthening balance sheet $16.1 M flow - through for Fox exploration & development in 2023 Targeting cost efficiencies Operational improvements Q3 2023 Q3 2023 2023 9M 2023 2023 $72 M $40 M $30 M USD + $30 B ARS $10 M USD + $42 B ARS $6 M USD to MUX McEwen Copper $28 M 155 GEOs Q3 2022 Q3 2022 2022 9M 2022 2022 $38 M $65 M $15 M flow - through MUX + $42 M McEwen Copper $11 M 133 K GEOs MUX Financial Picture Improving ARS = Argentine Pesos.
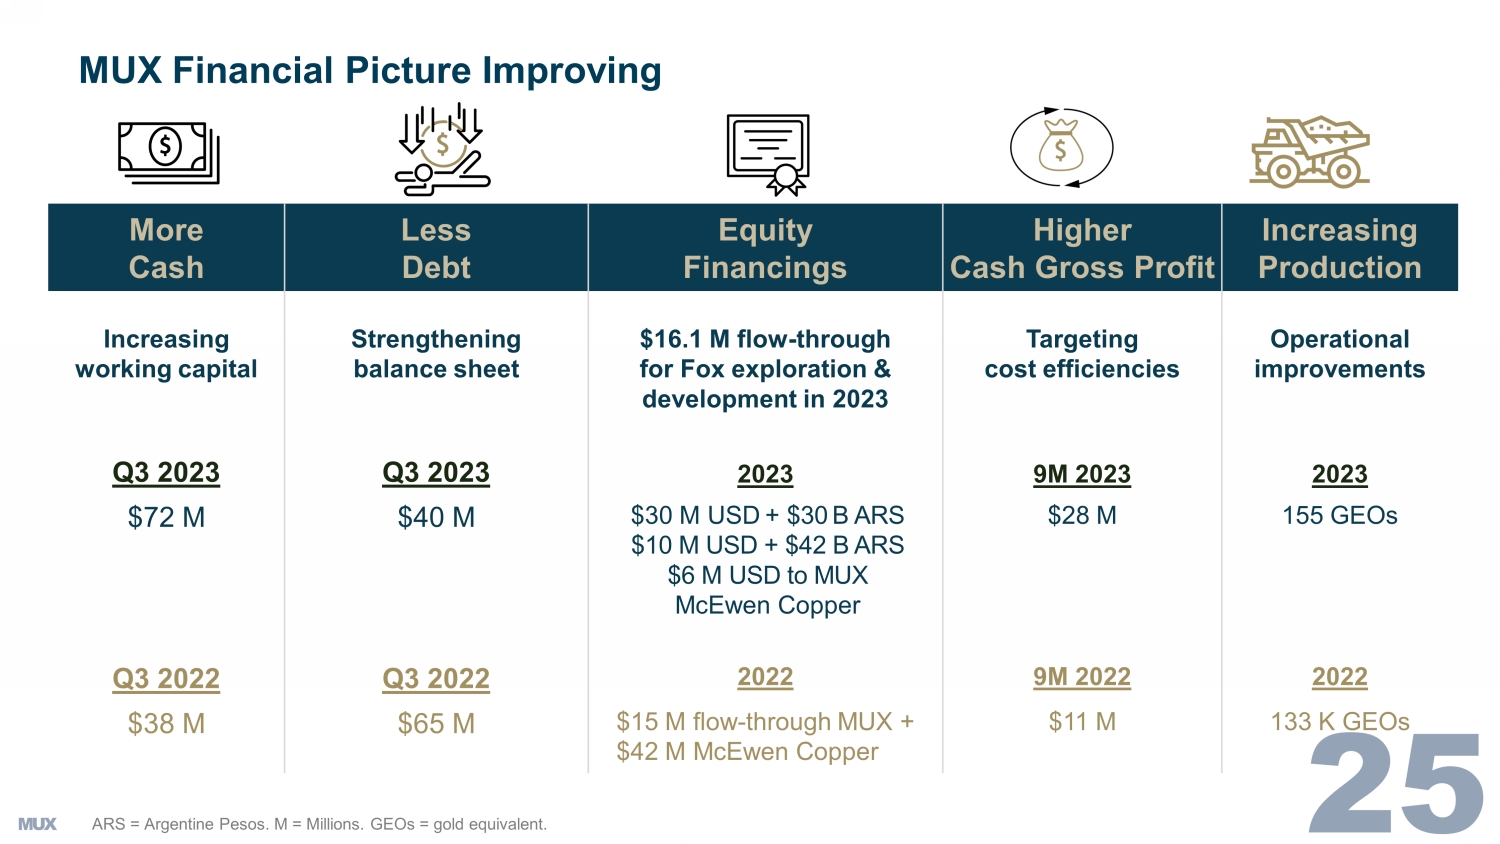
M = Millions. GEOs = gold equivalent.
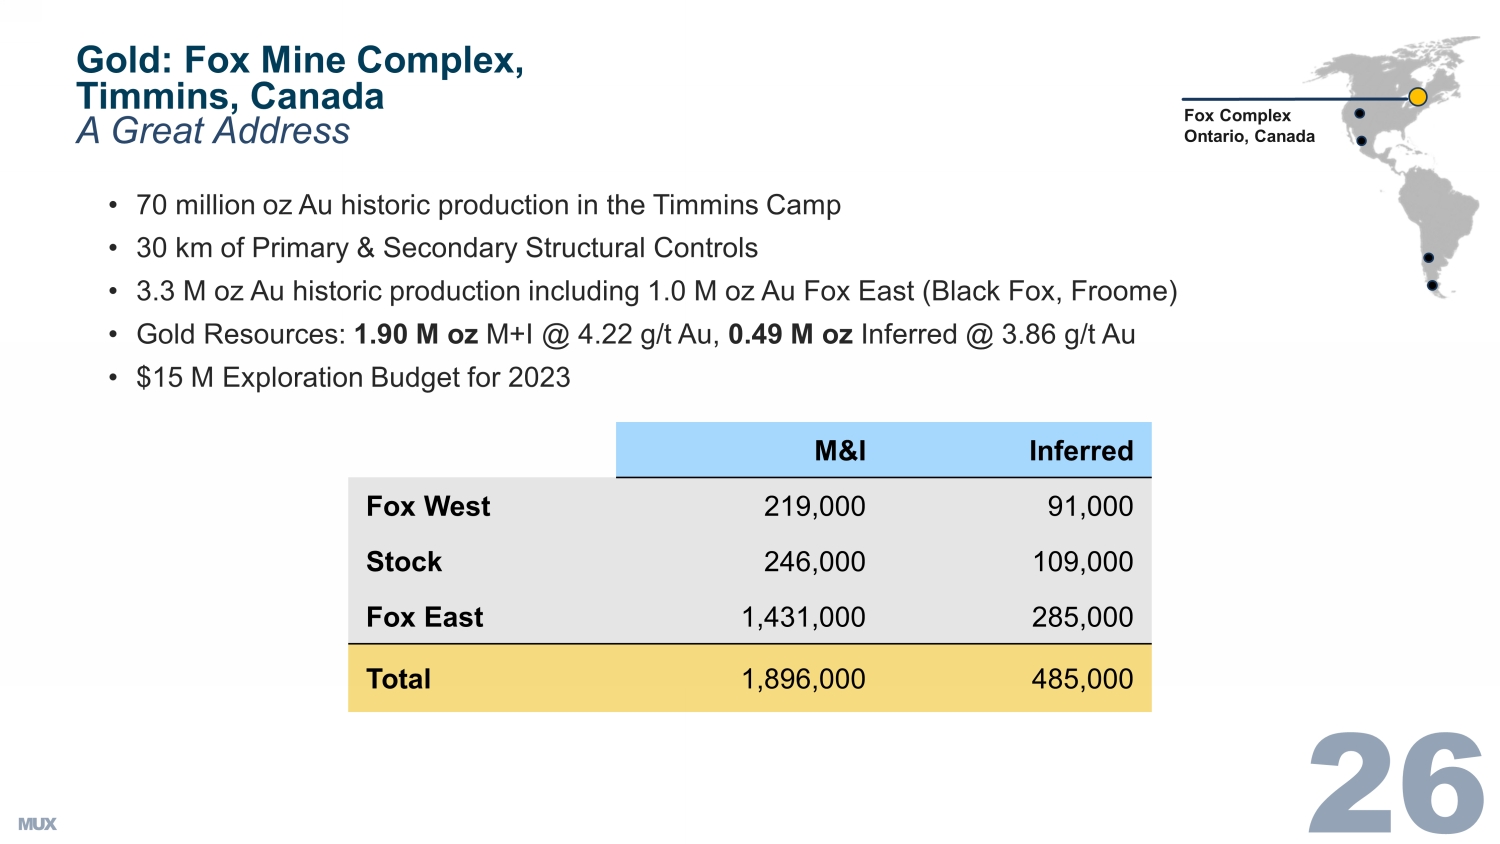
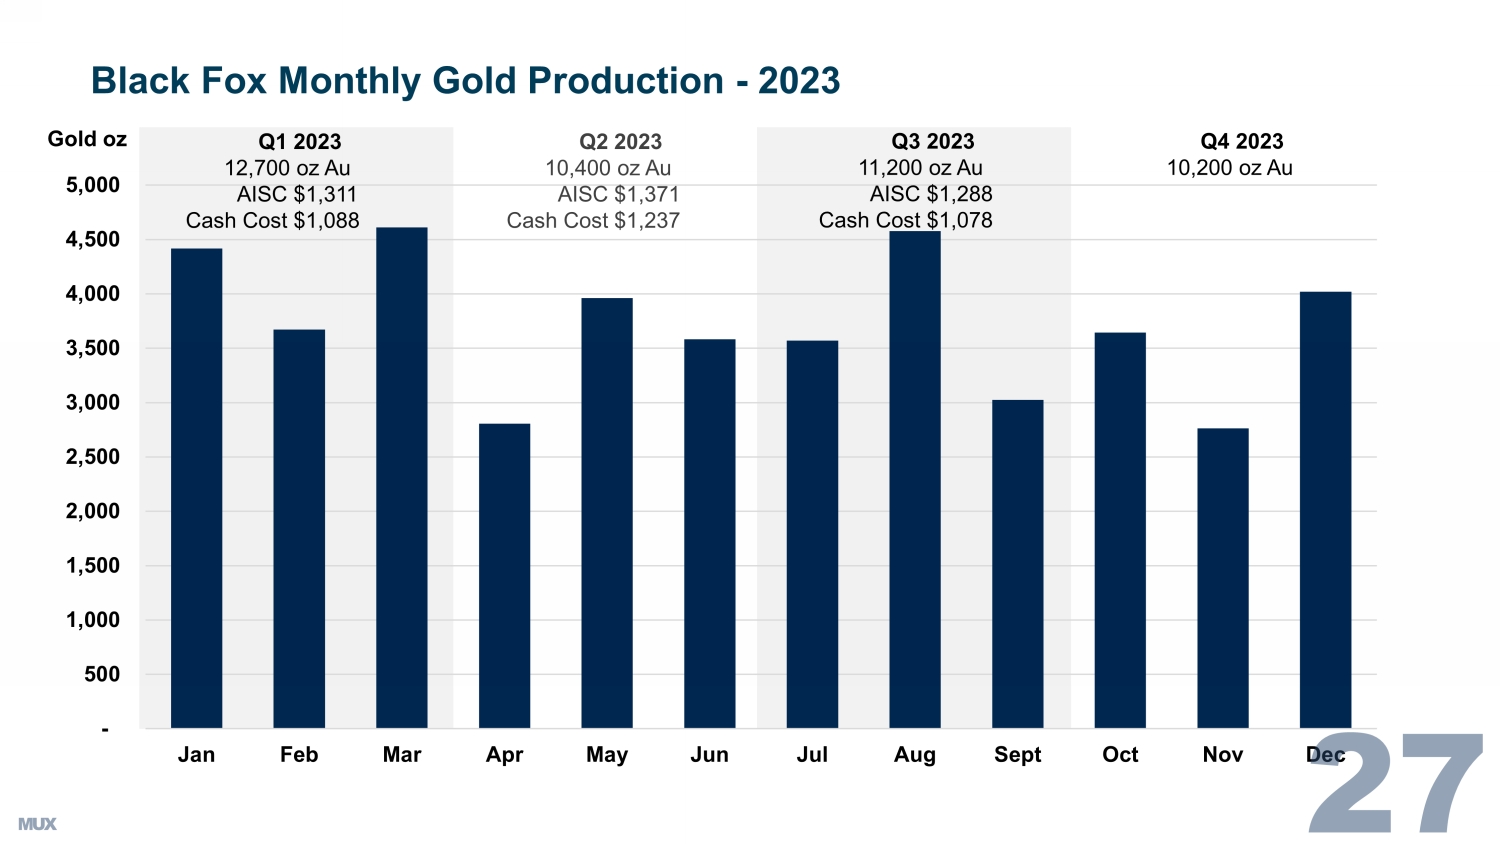
Fox Complex Ontario, Canada A Great Address • 70 million oz Au historic production in the Timmins Camp • 30 km of Primary & Secondary Structural Controls • 3.3 M oz Au historic production including 1.0 M oz Au Fox East (Black Fox, Froome) • Gold Resources: 1.90 M oz M+I @ 4.22 g/t Au, 0.49 M oz Inferred @ 3.86 g/t Au • $15 M Exploration Budget for 2023 Gold: Fox Mine Complex, Timmins, Canada M&I Inferred Fox West 219,000 91,000 Stock 246,000 109,000 Fox East 1,431,000 285,000 Total 1,896,000 485,000 - 500 1,000 1,500 2,000 2,500 3,000 3,500 4,000 4,500 5,000 Jan Feb Mar Apr May Jun Jul Aug Sept Oct Nov Dec Black Fox Monthly Gold Production - 2023 Gold oz Q1 2023 12,700 oz Au AISC $1,311 Cash Cost $1,088 Q2 2023 10,400 oz Au AISC $1,371 Cash Cost $1,237 Q3 2023 11,200 oz Au AISC $1,288 Cash Cost $1,078 Q4 2023 10,200 oz Au
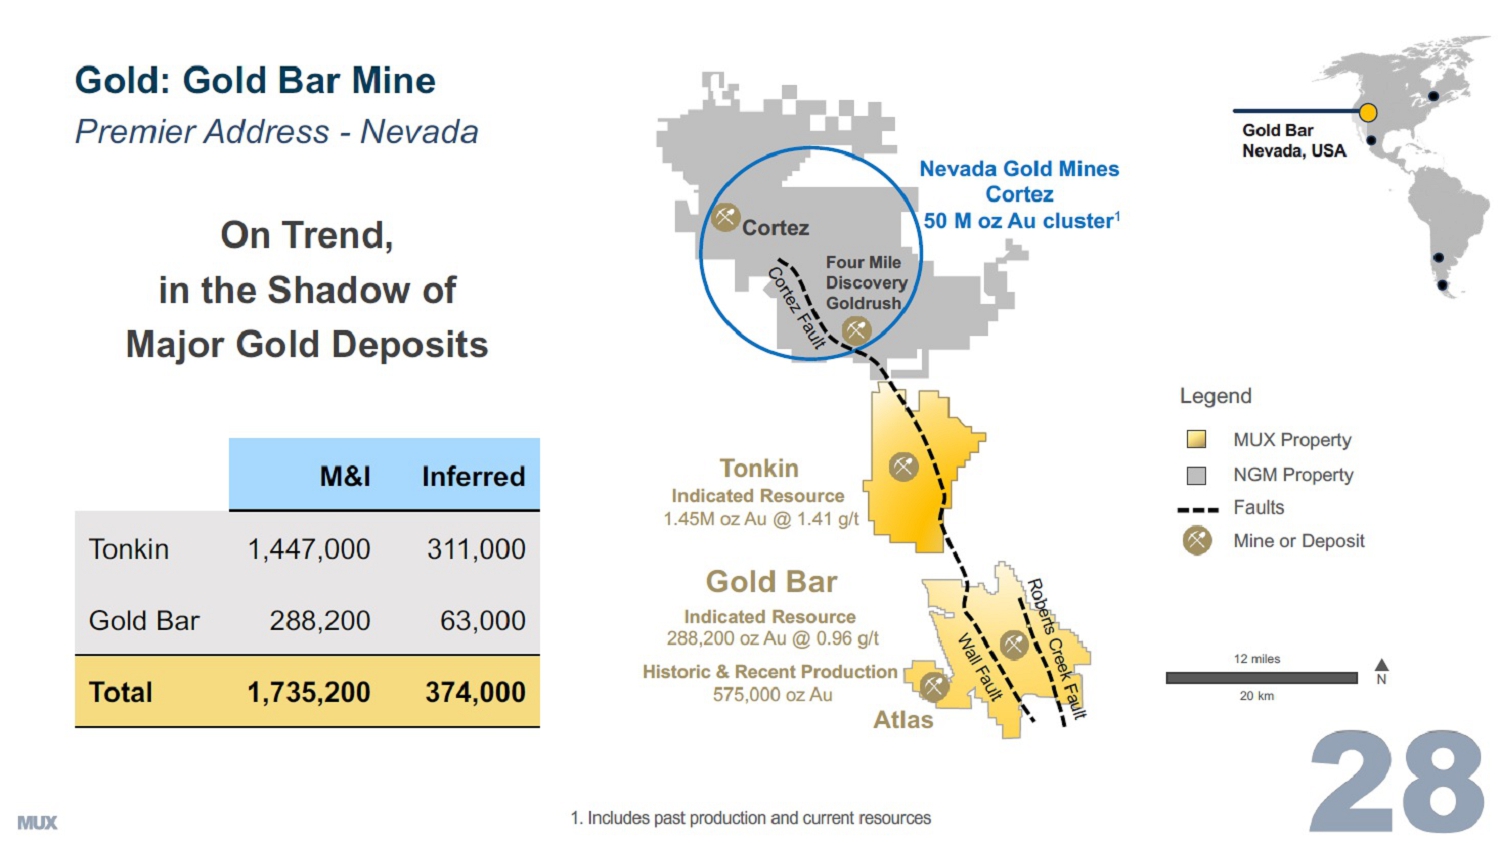
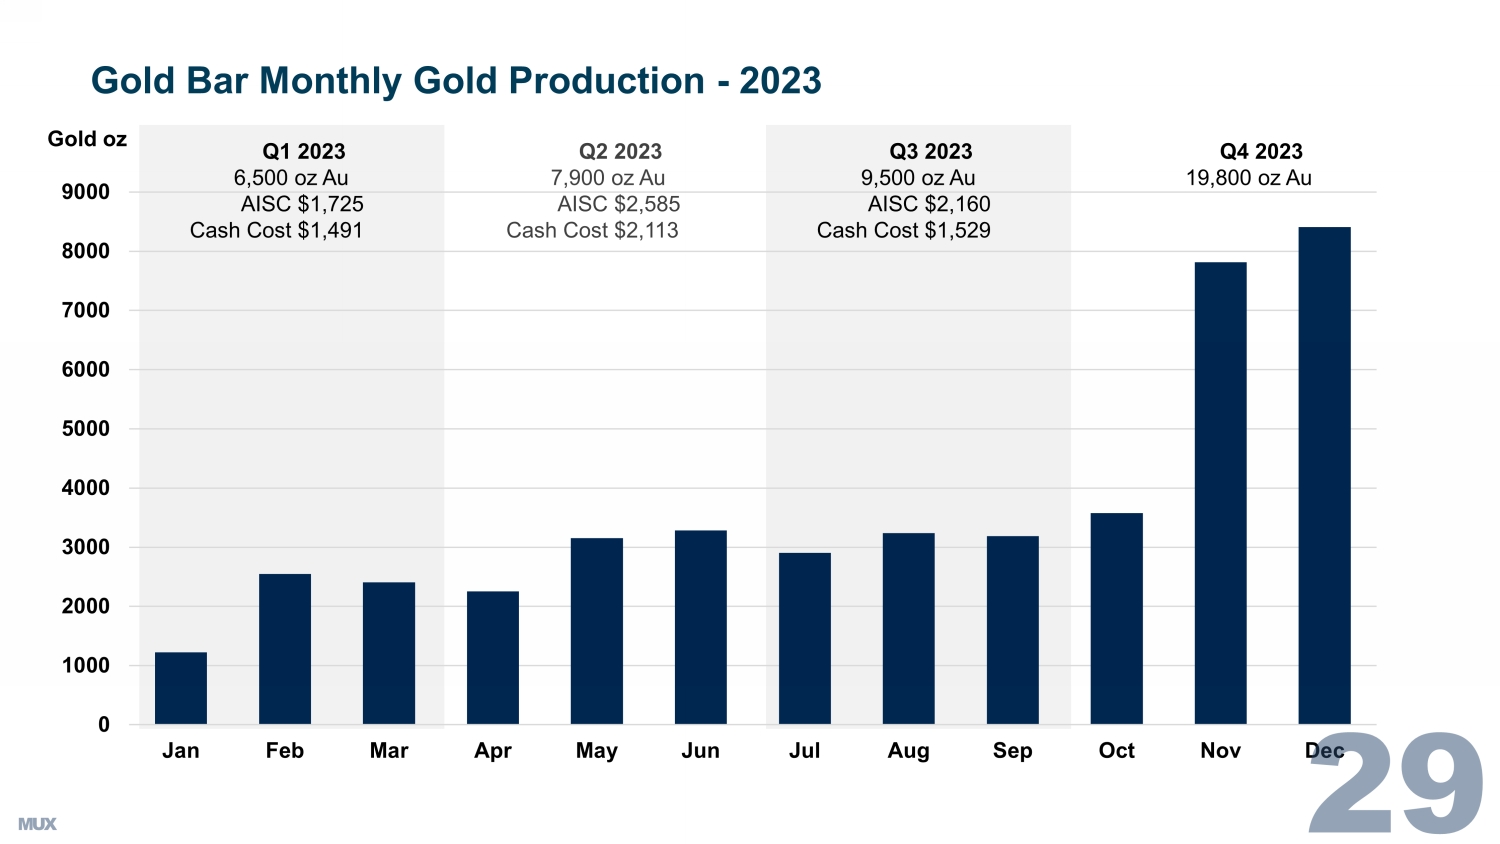
Premier Address - Nevada1. Includes past production and current resourcesGold BarNevada, USAOn Trend,in the Shadow ofMajor Gold DepositsMUX PropertyNGM PropertyFaultsMine or DepositLegend20 km12 milesNCortez FaultCortezNevada Gold MinesCortez50 M oz Au cluster1Four MileDiscoveryGoldrushWall FaultGold BarRoberts Creek FaultTonkinAtlasIndicated Resource1.45M oz Au @ 1.41 g/tIndicated Resource288,200 oz Au @ 0.96 g/tHistoric Recent Production575,000 oz AuGold: Gold Bar MineM InferredTonkin 1,447,000 311,000Gold Bar 288,200 63,000Total 1,735,200 374,000 0 1000 2000 3000 4000 5000 6000 7000 8000 9000 Jan Feb Mar Apr May Jun Jul Aug Sep Oct Nov Dec Gold Bar Monthly Gold Production - 2023 Gold oz Q1 2023 6,500 oz Au AISC $1,725 Cash Cost $1,491 Q2 2023 7,900 oz Au AISC $2,585 Cash Cost $2,113 Q3 2023 9,500 oz Au AISC $2,160 Cash Cost $1,529 Q4 2023 19,800 oz Au
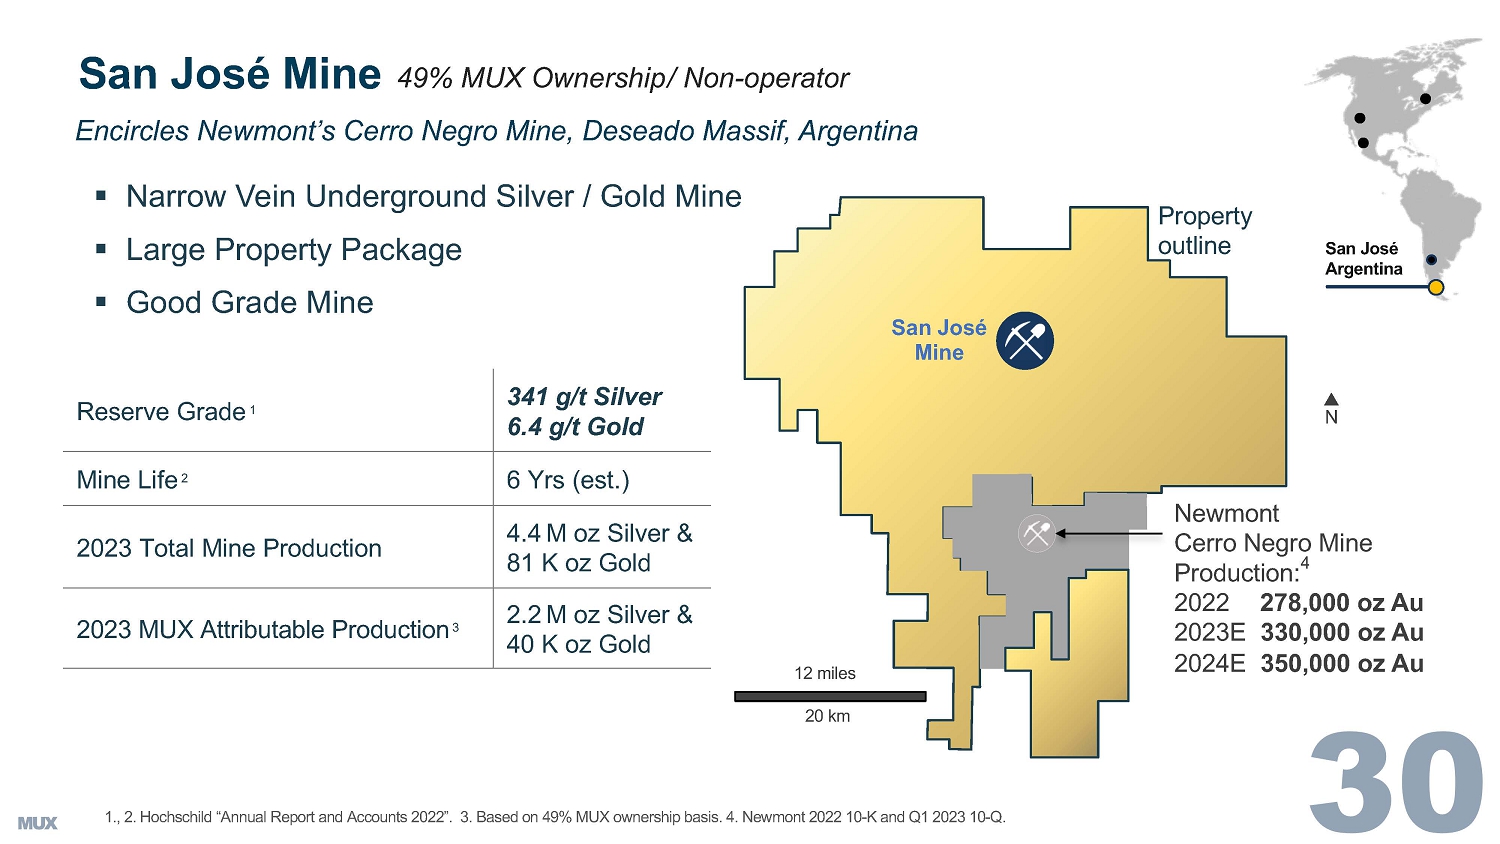
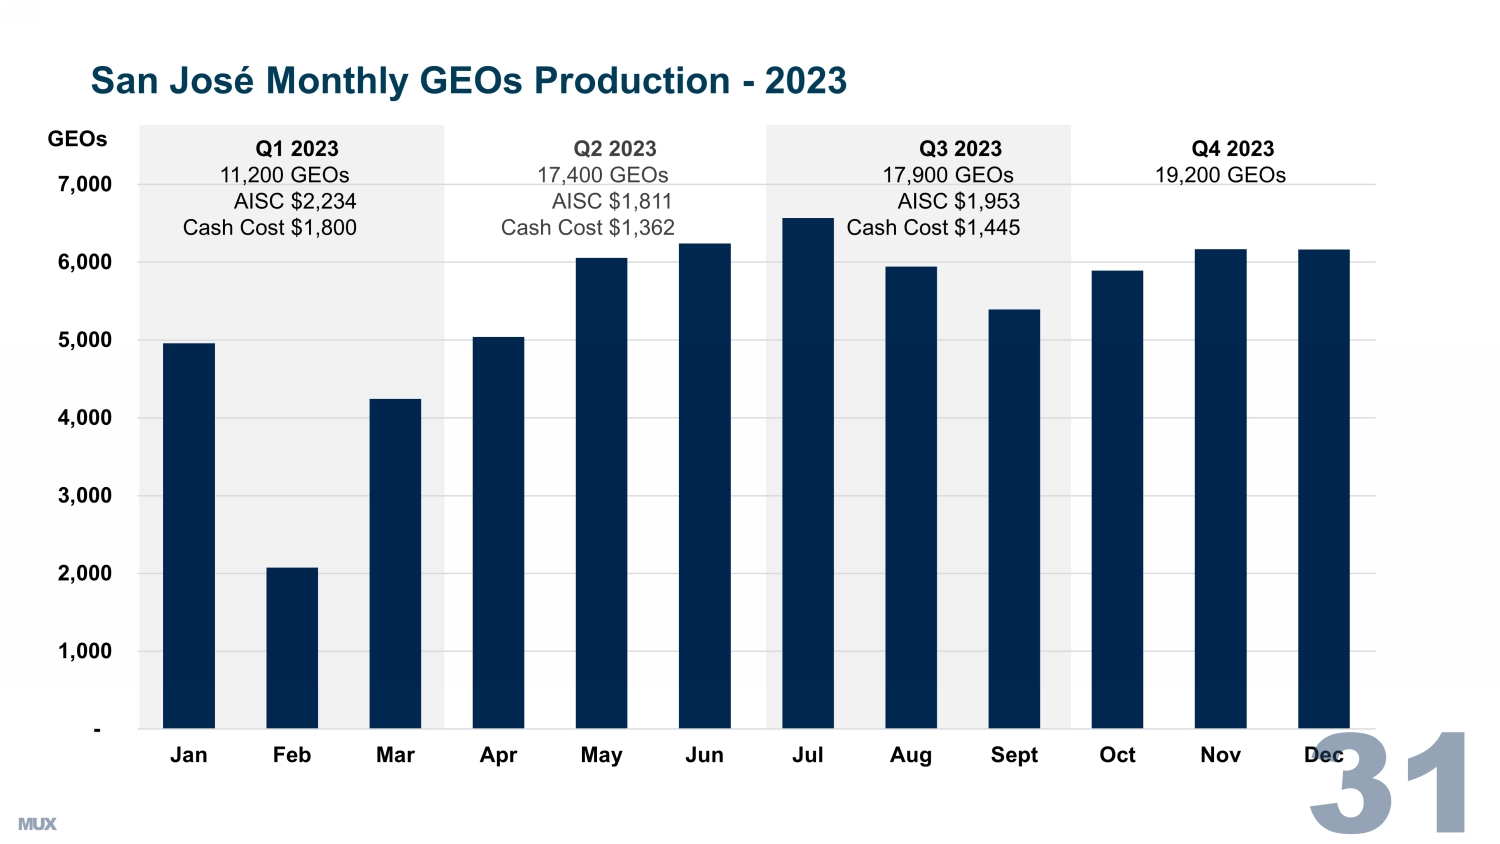
San JoseMineNNewmontCerro Negro MineProduction:42022 278,000 oz Au2023E 330,000 oz Au2024E 350,000 oz Au20 km12 milesSan JoseArgentina Narrow Vein Underground Silver / Gold Mine Large Property Package Good Grade MineReserve Grade1 341 g/t Silver6.4 g/t GoldMine Life 2 6 Yrs (est.)2023 Total Mine Production 4.4M oz Silver 81 K oz Gold2023 MUX Attributable Production3 2.2M oz Silver 40 K oz GoldPropertyoutline49% MUX Ownership / Non-operator1., 2. Hochschild "Annual Report and Accounts 2022". 3. Based on 49% MUX ownership basis. 4. Newmont 2022 10-K and Q1 2023 10-Q.San Jose MineEncircles Newmont's Cerro Negro Mine, Deseado Massif, Argentina San José Monthly GEOs Production - 2023 - 1,000 2,000 3,000 4,000 5,000 6,000 7,000 Jan Feb Mar Apr May Jun Jul Aug Sept Oct Nov Dec GEOs Q1 2023 11,200 GEOs AISC $2,234 Cash Cost $1,800 Q2 2023 17,400 GEOs AISC $1,811 Cash Cost $1,362 Q3 2023 17,900 GEOs AISC $1,953 Cash Cost $1,445 Q4 2023 19,200 GEOs
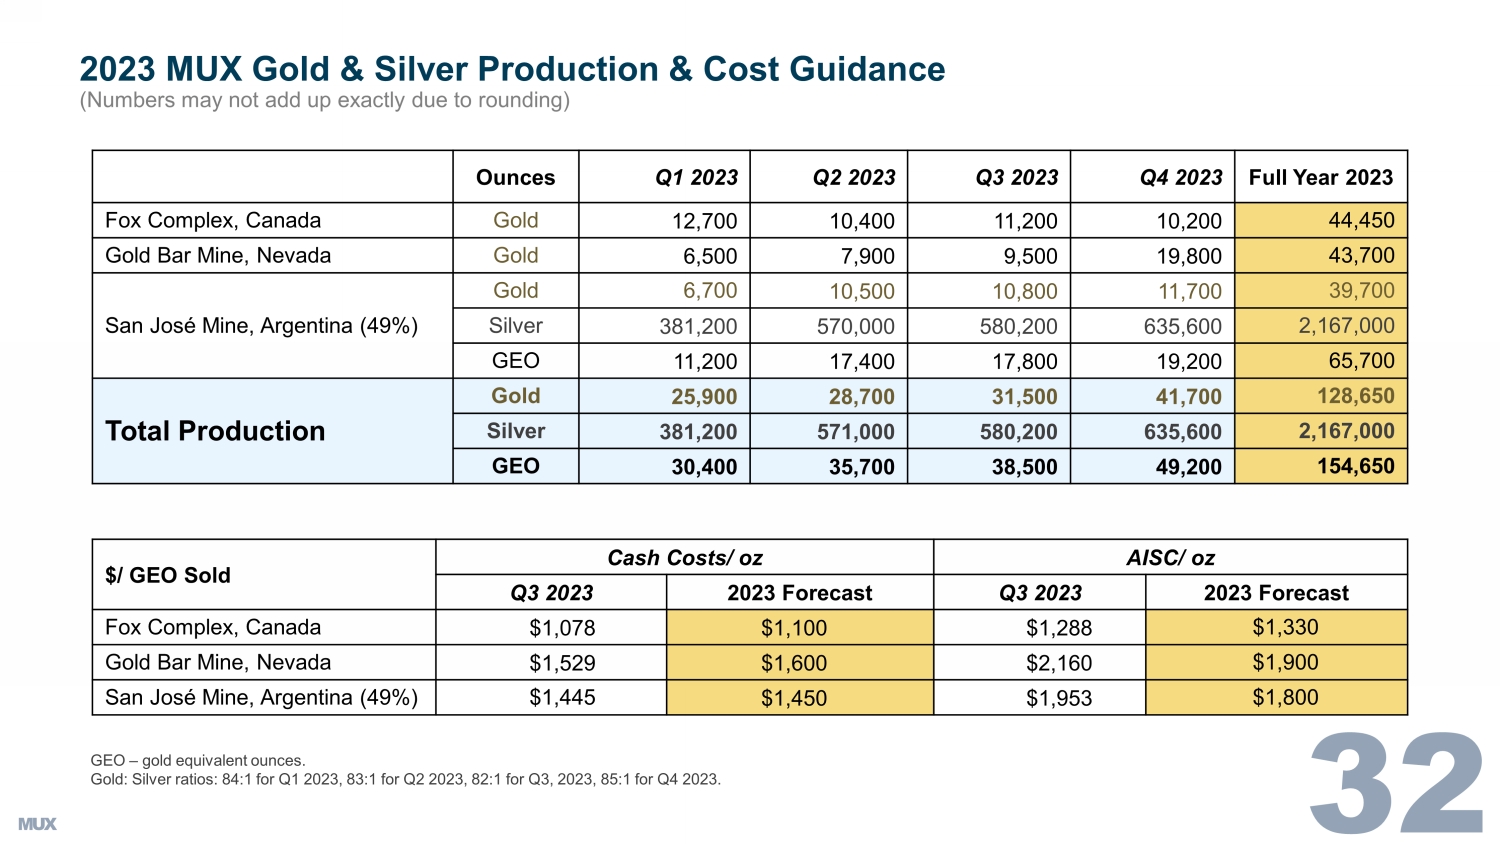
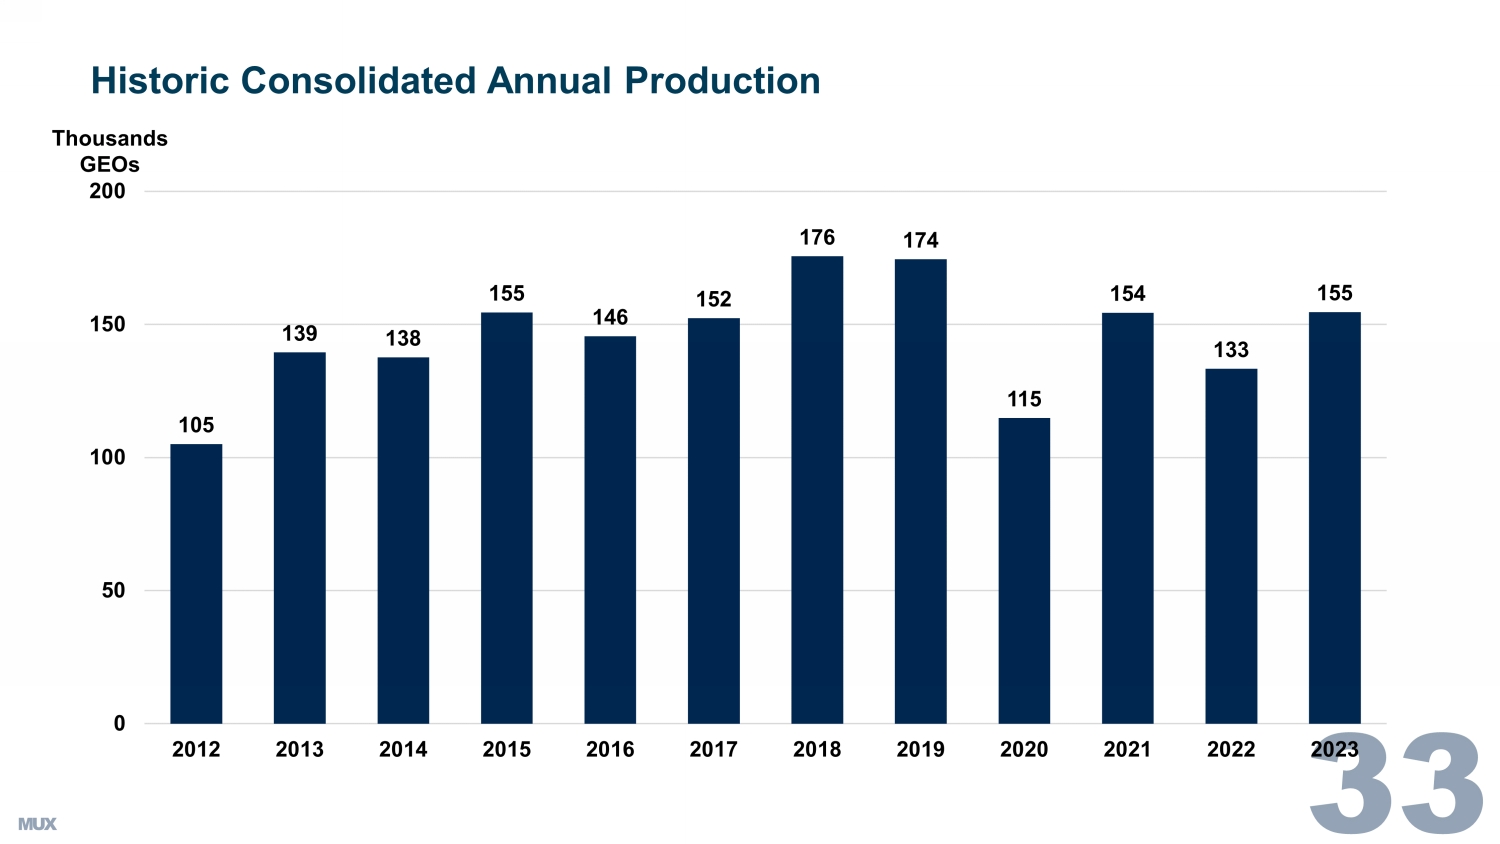
2023 MUX Gold & Silver Production & Cost Guidance ( Numbers may not add up exactly due to rounding) GEO – gold equivalent ounces. G old: Silver ratios: 84:1 for Q1 2023, 83:1 for Q2 2023, 82:1 for Q3, 2023, 85:1 for Q4 2023. Ounces Q1 2023 Q2 2023 Q3 2023 Q4 2023 Full Year 2023 Fox Complex, Canada Gold 12,700 10,400 11,200 10,200 44,450 Gold Bar Mine, Nevada Gold 6,500 7,900 9,500 19,800 43,700 San José Mine, Argentina (49%) Gold 6,700 10,500 10,800 11,700 39,700 Silver 381,200 570,000 580,200 635,600 2,167,000 GEO 11,200 17,400 17,800 19,200 65,700 Total Production Gold 25,900 28,700 31,500 41,700 128,650 Silver 381,200 571,000 580,200 635,600 2,167,000 GEO 30,400 35,700 38,500 49,200 154,650 $/ GEO Sold Cash Costs/ oz AISC/ oz Q3 2023 2023 Forecast Q3 2023 2023 Forecast Fox Complex, Canada $1,078 $1,100 $1,288 $1,330 Gold Bar Mine, Nevada $1,529 $1,600 $2,160 $1,900 San José Mine, Argentina (49%) $1,445 $1,450 $1,953 $1,800 Historic Consolidated Annual Production 105 139 138 155 146 152 176 174 115 154 133 155 0 50 100 150 200 2012 2013 2014 2015 2016 2017 2018 2019 2020 2021 2022 2023 Thousands GEOs
NON - GAAP Measures In this presentation, we have provided information prepared or calculated according to U . S . GAAP, as well as provided some non - U . S . GAAP ("non - GAAP") performance measures . Because the non - GAAP performance measures do not have any standardized meaning prescribed by U . S . GAAP, they may not be comparable to similar measures presented by other companies . Total Cash Costs per GEO, and All - in Sustaining Costs (“AISC”) per GEO . Total cash costs consist of mining, processing, on - site general and administrative costs, community and permitting costs related to current explorations, royalty costs, refining and treatment charges (for both doré and concentrate products), sales costs, export taxes and operational stripping costs . All - in sustaining cash costs consist of total cash costs (as described above), plus environmental rehabilitation costs, amortization of the asset retirement costs related to operating sites, sustaining exploration and development costs, and sustaining capital expenditures . In order to arrive at our consolidated all - in sustaining costs, we also include corporate general and administrative expenses . Depreciation is excluded from both total cash costs and all - in sustaining cash costs . For both total cash costs and all - in sustaining costs we include our attributable share of total cash costs from operations where we hold less than a 100 % economic share in the production, such as MSC, where we hold a 49 % interest . Total cash cost and all - in sustaining cash cost per GEO sold are calculated on a co - product basis by dividing the respective proportionate share of the total cash costs and all - in sustaining cash costs for the period attributable to each metal by the ounces of each respective metal sold . We use and report these measures to provide additional information regarding operational efficiencies both on a consolidated and an individual mine basis, and believe that these measures provide investors and analysts with useful information about our underlying costs of operations . A reconciliation to the nearest U . S . GAAP measure is provided in McEwen Mining's Annual Report on Form 10 - K/A for the year ended December 31 , 2022 . Earnings from Mining Operations The term Earnings from Mining Operations used in this presentation is a non - GAAP financial measure . We use and report this measure because we believe it provides investors and analysts with a useful measure of the underlying earnings from our mining operations . We define Earnings from Mining Operations as Gold and Silver Revenues from our El Gallo Mine, Black Fox Mine, and our 49 % attributable share of the San José Mine's Net Sales, less their respective Production Costs Applicable to Sales . To the extent that Production Costs Applicable to Sales may include depreciation and amortization expense related to the fair value increments on historical business acquisitions (fair value paid in excess of the carrying value of the underlying assets and liabilities assumed on the date of acquisition), we deduct this expense in order to arrive at Production Costs Applicable to Sales that only include depreciation and amortization expense incurred at the mine - site level . The San José Mine Net Sales and Production Costs Applicable to Sales are presented, on a 100 % basis, in Note 5 of McEwen Mining's Annual Report on Form 10 - K/A for the year ended December 31 , 2022 . Cash, Investments and Precious Metals The term cash, investments and precious metals used in this presentation is a non - GAAP financial measure . We report this measure to better understand our liquidity in each reporting period . Cash, investments and precious metals is calculated as the sum of cash, investments and ounces of doré held in inventory, valued at the London P . M . Fix spot price at the corresponding period . A reconciliation to the most directly comparable U . S . GAAP measure, Sales of Gold and Silver, is provided in McEwen Mining's Annual Report on Form 10 - K/A for the year ended December 31 , 2022 .
MUX: Cautionary Note RegardingSS0 Thank you! NYSE & TSX Stefan Spears Vice President Corporate Development McEwen Mining Direct: (647) 408 - 1849 Email: stefan@mcewenmining.com Michael Meding Vice President and General Manager McEwen Copper Direct: (775) 375 - 7125 Email: mmeding@mcewenmining.com