UNITED STATES
SECURITIES AND EXCHANGE COMMISSION
Washington, D.C. 20549
FORM 8-K
CURRENT REPORT
PURSUANT TO SECTION 13 OR 15(d) OF THE
SECURITIES EXCHANGE ACT OF 1934
| Date of report (Date of earliest event reported): | January 25, 2024 |
| Ameris Bancorp | ||
|
(Exact Name of Registrant as Specified in Charter)
|
||
| Georgia | 001-13901 | 58-1456434 |
|
(State or Other Jurisdiction of Incorporation) |
(Commission File Number) | (IRS Employer Identification No.) |
| 3490 Piedmont Road N.E., Suite 1550, Atlanta, Georgia | 30305 | |
| (Address of Principal Executive Offices) | (Zip Code) |
| Registrant’s telephone number, including area code: | (404) 639-6500 |
| (Former Name or Former Address, if Changed Since Last Report) |
Check the appropriate box below if the Form 8-K filing is intended to simultaneously satisfy the filing obligation of the registrant under any of the following provisions (see General Instruction A.2. below):
| ¨ | Written communications pursuant to Rule 425 under the Securities Act (17 CFR 230.425) |
| ¨ | Soliciting material pursuant to Rule 14a-12 under the Exchange Act (17 CFR 240.14a-12) |
| ¨ | Pre-commencement communications pursuant to Rule 14d-2(b) under the Exchange Act (17 CFR 240.14d-2(b)) |
| ¨ | Pre-commencement communications pursuant to Rule 13e-4(c) under the Exchange Act (17 CFR 240.13e-4(c)) |
Securities registered pursuant to Section 12(b) of the Act:
| Title of each class | Trading Symbol(s) | Name of each exchange on which registered |
| Common Stock, par value $1.00 per share | ABCB | Nasdaq Global Select Market |
Indicate by check mark whether the registrant is an emerging growth company as defined in Rule 405 of the Securities Act of 1933 (§230.405 of this chapter) or Rule 12b-2 of the Securities Exchange Act of 1934 (§240.12b-2 of this chapter).
Emerging growth company ¨
If an emerging growth company, indicate by check mark if the registrant has elected not to use the extended transition period for complying with any new or revised financial accounting standards provided pursuant to Section 13(a) of the Exchange Act. ¨
| Item 2.02 | Results of Operations and Financial Condition. |
On January 25, 2024, Ameris Bancorp (the “Company”) issued a press release announcing its unaudited financial results for the quarter and fiscal year ended December 31, 2023. A copy of that press release is attached to this Current Report on Form 8-K (this “Report”) as Exhibit 99.1.
The information contained in this Item 2.02 and in Exhibit 99.1 attached to this Report is being furnished and shall not be deemed filed for purposes of Section 18 of the Securities Exchange Act of 1934, as amended, or otherwise subject to the liabilities of such section. Furthermore, such information shall not be deemed to be incorporated by reference into any registration statement or other document filed pursuant to the Securities Act of 1933, as amended.
| Item 7.01 | Regulation FD Disclosure. |
A copy of the investor presentation material that the Company will present regarding its earnings during the teleconference beginning at 9:00 a.m. Eastern time on January 26, 2024 is attached to this Report as Exhibit 99.2. The investor presentation material is also available on the “Investor Relations” page of the Company’s website (http://www.amerisbank.com).
The information contained in this Item 7.01 and in Exhibit 99.2 attached to this Report is being furnished and shall not be deemed filed for purposes of Section 18 of the Securities Exchange Act of 1934, as amended, or otherwise subject to the liabilities of such section. Furthermore, such information shall not be deemed to be incorporated by reference into any registration statement or other document filed pursuant to the Securities Act of 1933, as amended.
| Item 9.01 | Financial Statements and Exhibits. |
| (d) | Exhibits. |
| 99.1 | Press release dated January 25, 2024 |
| 99.2 | Investor Presentation re: 4th Quarter 2023 Results |
| 104 | Cover Page Interactive Data File (embedded within the Inline XBRL document) |
SIGNATURE
Pursuant to the requirements of the Securities Exchange Act of 1934, as amended, the registrant has duly caused this report to be signed on its behalf by the undersigned, hereunto duly authorized.
| AMERIS BANCORP | ||
| By: | /s/ Nicole S. Stokes | |
| Nicole S. Stokes | ||
| Chief Financial Officer | ||
| Date: January 25, 2024 | ||
Exhibit 99.1

News Release
AMERIS BANCORP ANNOUNCES FOURTH QUARTER AND
FULL YEAR 2023 FINANCIAL RESULTS
Highlights of the Company’s results for the full year 2023 include the following:
| · | Net income of $269.1 million, or $3.89 per diluted share |
| · | Adjusted net income(1) of $276.3 million, or $4.00 per diluted share |
| · | Growth in tangible book value(1) of $3.72 per share, or 12.4%, to $33.64 at December 31, 2023 |
| · | Increase in the allowance for credit losses to 1.52% of loans, from 1.04% at December 31, 2022, due to forecasted economic conditions, particularly related to commercial real estate price levels |
| · | Nonperforming portfolio assets, excluding government-guaranteed loans, as a percentage of total assets improved to 0.33% at December 31, 2023, compared with 0.34% at December 31, 2022 |
| · | Adjusted efficiency ratio(1) of 52.58% |
| · | Organic growth in loans of $414.1 million, or 2.1% |
| · | Growth in total deposits of $1.25 billion, or 6.4% |
| · | Growth in TCE ratio(1) of 97bps, or 11.2%, to 9.64% at December 31, 2023 |
Significant items from the Company’s results for the fourth quarter of 2023 include the following:
| · | Net income of $65.9 million, or $0.96 per diluted share |
| · | Adjusted net income(1) of $73.6 million, or $1.07 per diluted share |
| · | Stable net interest margin of 3.54% |
| · | Adjusted efficiency ratio(1) of 52.87% |
| · | Growth in TCE ratio(1) of 53bps to 9.64% at December 31, 2023, compared with 9.11% last quarter |
ATLANTA, GA, January 25, 2024 - Ameris Bancorp (Nasdaq: ABCB) (the “Company”) today reported net income of $65.9 million, or $0.96 per diluted share, for the quarter ended December 31, 2023, compared with $82.2 million, or $1.18 per diluted share, for the quarter ended December 31, 2022. The Company reported adjusted net income(1) of $73.6 million, or $1.07 per diluted share, for the quarter ended December 31, 2023, compared with $81.1 million, or $1.17 per diluted share, for the same period in 2022. Adjusted net income excludes after-tax merger and conversion charges, FDIC special assessment, natural disaster expenses, servicing right valuation adjustments, gain on bank owned life insurance (“BOLI”) proceeds, gain on sale of mortgage servicing rights (“MSR”) and gain/loss on sale of bank premises.
For the year ended December 31, 2023, the Company reported net income of $269.1 million, or $3.89 per diluted share, compared with $346.5 million, or $4.99 per diluted share, for 2022. The Company reported adjusted net income(1) of $276.3 million, or $4.00 per diluted share, for the year ended December 31, 2023, compared with $329.4 million, or $4.75 per diluted share, for 2022. Adjusted net income for the year excludes the same items listed above for the fourth quarter.
Commenting on the Company’s results, Palmer Proctor, the Company’s Chief Executive Officer, said, “The solid fourth quarter financial results were a successful way to end 2023 and have us well positioned for 2024. For the quarter and the full year, we continued to grow tangible book value and strengthened our balance sheet through strong deposit growth, controlled loan growth, sound asset quality, increased reserves for credit losses and robust capital growth. We continue to operate with discipline to execute our strategies and to produce strong financial results. Looking forward, we are focused on maintaining disciplined growth and top of peer group financial results in our strong Southeastern markets.”
(1) Considered non-GAAP financial measure - See reconciliation of GAAP to non-GAAP financial measures in tables 9A - 9D
Net Interest Income and Net Interest Margin
Net interest income on a tax-equivalent basis for 2023 increased to $838.8 million, compared with $804.9 million for 2022. The Company's net interest margin was 3.61% for 2023, compared with 3.76% for 2022. The Company recorded accretion income of $910,000 for 2023, compared with accretion expense of $285,000 for 2022. The increase in net interest income is primarily attributable to deployment of excess liquidity in the loan and securities portfolios during the year.
Net interest income on a tax-equivalent basis (TE) was $207.0 million in the fourth quarter of 2023, a decrease of $1.7 million, or 0.8%, from last quarter and $18.0 million, or 8.0%, compared with the fourth quarter of 2022. The Company's net interest margin was stable at 3.54% for both the third and fourth quarters of 2023, while down from 4.03% reported for the fourth quarter of 2022.
Yields on earning assets increased seven basis points during the quarter to 5.69%, compared with 5.62% in the third quarter of 2023, and increased 78 basis points from 4.91% in the fourth quarter of 2022. Yields on loans increased to 5.83% during the fourth quarter of 2023, compared with 5.81% for the third quarter of 2023 and 5.07% for the fourth quarter of 2022.
Loan production in the banking division during the fourth quarter of 2023 was $417.4 million, with weighted average yields of 10.35%, compared with $621.0 million and 9.49%, respectively, in the third quarter of 2023 and $612.9 million and 7.92%, respectively, in the fourth quarter of 2022. Loan production in the lines of business (including retail mortgage, warehouse lending, SBA and premium finance) amounted to an additional $3.3 billion during the fourth quarter of 2023, with weighted average yields of 7.38%, compared with $4.2 billion and 7.28%, respectively, during the third quarter of 2023 and $3.6 billion and 6.06%, respectively, during the fourth quarter of 2022.
The Company’s total cost of funds was 2.32% in the fourth quarter of 2023, an increase of eight basis points compared with the third quarter of 2023. Deposit costs increased 16 basis points during the fourth quarter of 2023 to 2.16%, compared with 2.00% in the third quarter of 2023. Costs of interest-bearing deposits increased during the quarter from 2.97% in the third quarter of 2023 to 3.17% in the fourth quarter of 2023, reflecting deposit beta catch-up in the current hold phase of the interest rate cycle.
Noninterest Income
Noninterest income decreased $6.9 million, or 11.0%, in the fourth quarter of 2023 to $56.2 million, compared with $63.2 million for the third quarter of 2023, primarily as a result of decreased mortgage banking activity, which declined by $4.8 million, or 13.3%, to $31.5 million in the fourth quarter of 2023, compared with $36.3 million for the third quarter of 2023. Gain on sale spreads decreased to 1.93% in the fourth quarter of 2023 from 2.15% for the third quarter of 2023. Total production in the retail mortgage division decreased to $891.1 million in the fourth quarter of 2023, compared with $1.18 billion for the third quarter of 2023. The retail mortgage open pipeline was $400.1 million at the end of the fourth quarter of 2023, compared with $623.9 million at September 30, 2023.
For the full year 2023, noninterest income decreased $41.6 million, or 14.6%, to $242.8 million, compared with $284.4 million for 2022, primarily as a result of decreased mortgage banking activity, which declined by $45.0 million, or 24.3%, to $139.9 million in 2023, compared with $184.9 million in 2022. Production in the retail mortgage division decreased to $4.3 billion in 2023, compared with $5.5 billion in 2022, while gain on sale spreads narrowed to 2.07% in 2023 from 2.27% in 2022.
Noninterest Expense
Noninterest expense increased $7.6 million, or 5.3%, to $149.0 million during the fourth quarter of 2023, compared with $141.4 million for the third quarter of 2023. During the fourth quarter of 2023, the Company recorded $11.6 million related to the FDIC special assessment and a $1.9 million gain on sale of bank premises. Excluding those charges, adjusted expenses(1) decreased approximately $2.1 million, or 1.5%, to $139.3 million in the fourth quarter of 2023, from $141.4 million in the third quarter of 2023. The decrease in adjusted expenses(1) resulted from a $4.5 million decline in mortgage expenses related to reduced production, offset by a $3.3 million increase in the banking division, the majority of which was related to increased legal and professional fees, data processing expenses and a decrease in the gain on sale of OREO properties. Management continues to deliver high performing operating efficiency, with an adjusted efficiency ratio(1) of 52.87% in the fourth quarter of 2023, compared with 52.02% in the third quarter of 2023.
(1) Considered non-GAAP financial measure - See reconciliation of GAAP to non-GAAP financial measures in tables 9A - 9D
For the full year 2023, noninterest expense increased $17.6 million, or 3.1%, to $578.3 million, compared with $560.7 million in 2022. Excluding adjustment items of $9.7 million in 2023 and $1.3 million in 2022, adjusted expenses increased $9.3 million, or 1.7% to $586.6 million in 2023, from $559.3 million in 2022. This increase is primarily attributable to a reduction in deferred loan origination costs, partially offset by a reduction in variable expenses related to mortgage production.
Income Tax Expense
The Company's effective tax rate for 2023 was 24.6%, compared with 23.5% in 2022. The Company's effective tax rate for the fourth quarter of 2023 was 27.1%, compared with 23.7% in the third quarter of 2023. The increased rate for the fourth quarter of 2023 was primarily a result of a return to provision adjustment when the Company filed its 2022 income tax returns in the fourth quarter of 2023.
Balance Sheet Trends
Total assets at December 31, 2023 were $25.20 billion, compared with $25.05 billion at December 31, 2022. Debt securities available-for-sale decreased to $1.40 billion, compared with $1.50 billion at December 31, 2022. Loans, net of unearned income, increased $414.1 million, or 2.1%, to $20.27 billion at December 31, 2023, compared with $19.86 billion at December 31, 2022. Loans held for sale decreased $110.7 million from $392.1 million at December 31, 2022 to $281.3 million at December 31, 2023 due to a decline in mortgage activity resulting from the rising rate environment.
At December 31, 2023, total deposits amounted to $20.71 billion, or 97.0% of total funding, compared with $19.46 billion and 90.7%, respectively, at December 31, 2022. During the fourth quarter of 2023, deposits grew $118.2 million with NOW and money market accounts increasing $513.9 million and retail CD accounts increasing $48.5 million, with such increases being offset in part by a $98.0 million decrease in noninterest-bearing accounts and a $324.2 million decrease in brokered CDs. Due to the increased interest rate environment, the Company continued to see the shift of customer deposits from noninterest bearing accounts into interest bearing accounts, such that at December 31, 2023, noninterest-bearing deposit accounts were $6.49 billion, or 31.3% of total deposits, compared with $7.93 billion, or 40.7% of total deposits, at December 31, 2022.
During the fourth quarter of 2023, utilizing existing liquidity the Company reduced borrowings with the FHLB by $700.0 million.
Shareholders’ equity at December 31, 2023 totaled $3.43 billion, an increase of $229.3 million, or 7.2%, from December 31, 2022. The increase in shareholders’ equity was primarily the result of earnings of $269.1 million during 2023, partially offset by dividends declared and share repurchases. Tangible book value per share(1) increased $1.26 per share, or 15.4% annualized, during the fourth quarter to $33.64 at December 31, 2023. The Company recorded an improvement of $0.36 per share of tangible book value(1) this quarter from other comprehensive income related to the decrease in net unrealized losses on the securities portfolio. For the year-to-date period, tangible book value per share(1) increased $3.72, or 12.4%, to $33.64 at December 31, 2023, compared with $29.92 at December 31, 2022. Tangible common equity as a percentage of tangible assets was 9.64% at December 31, 2023, compared with 8.67% at the end of 2022.
Credit Quality
Credit quality remains strong in the Company. During the fourth quarter of 2023, the Company recorded a provision for credit losses of $23.0 million, compared with a provision of $24.5 million in the third quarter of 2023. Nonperforming assets as a percentage of total assets increased 11 basis points to 0.69% during the quarter. Approximately $90.2 million, or 51.7%, of the nonperforming assets at December 31, 2023 were GNMA-guaranteed mortgage loans, which have minimal loss exposure. Excluding these government-guaranteed loans, nonperforming assets as a percentage of total assets were only 0.33% at December 31, 2023, compared with 0.27% at September 30, 2023. The net charge-off ratio was 26 basis points for the fourth quarter of 2023, compared with 23 basis points in the third quarter of 2023.
Conference Call
The Company will host a teleconference at 9:00 a.m. Eastern time on Friday, January 26, 2024, to discuss the Company's results and answer appropriate questions. The conference call can be accessed by dialing 1-877-317-6789. The conference call access code is Ameris Bancorp. A replay of the call will be available one hour after the end of the conference call until February 2, 2024. To listen to the replay, dial 1-877-344-7529. The conference replay access code is 3003910. The financial information discussed will also be available on the Investor Relations page of the Ameris Bank website at ir.amerisbank.com.
(1) Considered non-GAAP financial measure - See reconciliation of GAAP to non-GAAP financial measures in tables 9A - 9D
About Ameris Bancorp
Ameris Bancorp is the parent of Ameris Bank, a state-chartered bank headquartered in Atlanta, Georgia. Ameris operates 164 financial centers across the Southeast and also serves consumer and business customers nationwide through select lending channels. Ameris manages $25.20 billion in assets as of December 31, 2023, and provides a full range of traditional banking and lending products, treasury and cash management, insurance premium financing, and mortgage and refinancing services. Learn more about Ameris at www.amerisbank.com.
(1) Considered non-GAAP financial measure - See reconciliation of GAAP to non-GAAP financial measures in tables 9A - 9D
This news release contains certain performance measures determined by methods other than in accordance with accounting principles generally accepted in the United States of America (“GAAP”). The Company’s management uses these non-GAAP financial measures in its analysis of the Company’s performance. These measures are useful when evaluating the underlying performance and efficiency of the Company’s operations and balance sheet. The Company’s management believes that these non-GAAP financial measures provide a greater understanding of ongoing operations, enhance comparability of results with prior periods and demonstrate the effects of significant gains and charges in the current period. The Company’s management believes that investors may use these non-GAAP financial measures to evaluate the Company’s financial performance without the impact of unusual items that may obscure trends in the Company’s underlying performance. These disclosures should not be viewed as a substitute for financial measures determined in accordance with GAAP, nor are they necessarily comparable to non-GAAP financial measures that may be presented by other companies.
This news release contains forward-looking statements, as defined by federal securities laws, including, among other forward-looking statements, certain plans, expectations and goals. Words such as “may,” “believe,” “expect,” “anticipate,” “intend,” “will,” “should,” “plan,” “estimate,” “predict,” “continue” and “potential” or the negative of these terms or other comparable terminology, as well as similar expressions, are meant to identify forward-looking statements. The forward-looking statements in this news release are based on current expectations and are provided to assist in the understanding of potential future performance. Such forward-looking statements involve numerous assumptions, risks and uncertainties that may cause actual results to differ materially from those expressed or implied in any such statements, including, without limitation, the following: general competitive, economic, unemployment, political and market conditions and fluctuations, including real estate market conditions, and the effects of such conditions and fluctuations on the creditworthiness of borrowers, collateral values, asset recovery values and the value of investment securities; movements in interest rates and their impacts on net interest margin; expectations on credit quality and performance; legislative and regulatory changes; changes in U.S. government monetary and fiscal policy; competitive pressures on product pricing and services; the cost savings and any revenue synergies expected to result from acquisition transactions, which may not be fully realized within the expected timeframes if at all; the success and timing of other business strategies; our outlook and long-term goals for future growth; and natural disasters, geopolitical events, acts of war or terrorism or other hostilities, public health crises and other catastrophic events beyond our control. For a discussion of some of the other risks and other factors that may cause such forward-looking statements to differ materially from actual results, please refer to the Company’s filings with the Securities and Exchange Commission, including the Company’s Annual Report on Form 10-K for the year ended December 31, 2022 and the Company's subsequently filed periodic reports and other filings. Forward-looking statements speak only as of the date they are made, and the Company undertakes no obligation to update or revise forward-looking statements.
For more information, contact:
Nicole S. Stokes
Chief Financial Officer
(404) 240-1514
AMERIS BANCORP AND SUBSIDIARIES
FINANCIAL TABLES
| Financial Highlights | Table 1 |
| Three Months Ended | Twelve Months Ended | |||||||||||||||||||||||||||
| Dec | Sep | Jun | Mar | Dec | Dec | Dec | ||||||||||||||||||||||
| (dollars in thousands except per share data) | 2023 | 2023 | 2023 | 2023 | 2022 | 2023 | 2022 | |||||||||||||||||||||
| EARNINGS | ||||||||||||||||||||||||||||
| Net income | $ | 65,934 | $ | 80,115 | $ | 62,635 | $ | 60,421 | $ | 82,221 | $ | 269,105 | $ | 346,540 | ||||||||||||||
| Adjusted net income | $ | 73,568 | $ | 80,115 | $ | 62,635 | $ | 59,935 | $ | 81,086 | $ | 276,253 | $ | 329,415 | ||||||||||||||
| COMMON SHARE DATA | ||||||||||||||||||||||||||||
| Earnings per share available to common shareholders | ||||||||||||||||||||||||||||
| Basic | $ | 0.96 | $ | 1.16 | $ | 0.91 | $ | 0.87 | $ | 1.19 | $ | 3.90 | $ | 5.01 | ||||||||||||||
| Diluted | $ | 0.96 | $ | 1.16 | $ | 0.91 | $ | 0.87 | $ | 1.18 | $ | 3.89 | $ | 4.99 | ||||||||||||||
| Adjusted diluted EPS(1) | $ | 1.07 | $ | 1.16 | $ | 0.91 | $ | 0.86 | $ | 1.17 | $ | 4.00 | $ | 4.75 | ||||||||||||||
| Cash dividends per share | $ | 0.15 | $ | 0.15 | $ | 0.15 | $ | 0.15 | $ | 0.15 | $ | 0.60 | $ | 0.60 | ||||||||||||||
| Book value per share (period end) | $ | 49.62 | $ | 48.41 | $ | 47.51 | $ | 46.89 | $ | 46.09 | $ | 49.62 | $ | 46.09 | ||||||||||||||
| Tangible book value per share (period end)(1) | $ | 33.64 | $ | 32.38 | $ | 31.42 | $ | 30.79 | $ | 29.92 | $ | 33.64 | $ | 29.92 | ||||||||||||||
| Weighted average number of shares | ||||||||||||||||||||||||||||
| Basic | 68,824,004 | 68,879,352 | 68,989,549 | 69,171,562 | 69,138,431 | 68,977,453 | 69,193,591 | |||||||||||||||||||||
| Diluted | 69,014,793 | 68,994,247 | 69,034,763 | 69,322,664 | 69,395,224 | 69,104,158 | 69,419,721 | |||||||||||||||||||||
| Period end number of shares | 69,053,341 | 69,138,461 | 69,139,783 | 69,373,863 | 69,369,050 | 69,053,341 | 69,369,050 | |||||||||||||||||||||
| Market data | ||||||||||||||||||||||||||||
| High intraday price | $ | 53.84 | $ | 45.34 | $ | 37.18 | $ | 50.54 | $ | 54.24 | $ | 53.84 | $ | 55.62 | ||||||||||||||
| Low intraday price | $ | 34.26 | $ | 33.21 | $ | 28.33 | $ | 34.28 | $ | 44.61 | $ | 28.33 | $ | 38.22 | ||||||||||||||
| Period end closing price | $ | 53.05 | $ | 38.39 | $ | 34.21 | $ | 36.58 | $ | 47.14 | $ | 53.05 | $ | 47.14 | ||||||||||||||
| Average daily volume | 390,190 | 361,167 | 475,198 | 452,242 | 340,890 | 419,347 | 400,670 | |||||||||||||||||||||
| PERFORMANCE RATIOS | ||||||||||||||||||||||||||||
| Return on average assets | 1.03 | % | 1.25 | % | 0.98 | % | 0.98 | % | 1.34 | % | 1.06 | % | 1.47 | % | ||||||||||||||
| Adjusted return on average assets(1) | 1.15 | % | 1.25 | % | 0.98 | % | 0.97 | % | 1.32 | % | 1.09 | % | 1.39 | % | ||||||||||||||
| Return on average common equity | 7.73 | % | 9.56 | % | 7.63 | % | 7.54 | % | 10.30 | % | 8.12 | % | 11.24 | % | ||||||||||||||
| Adjusted return on average tangible common equity(1) | 12.81 | % | 14.35 | % | 11.53 | % | 11.41 | % | 15.78 | % | 12.55 | % | 16.92 | % | ||||||||||||||
| Earning asset yield (TE) | 5.69 | % | 5.62 | % | 5.52 | % | 5.25 | % | 4.91 | % | 5.52 | % | 4.19 | % | ||||||||||||||
| Total cost of funds | 2.32 | % | 2.24 | % | 2.05 | % | 1.59 | % | 0.94 | % | 2.05 | % | 0.46 | % | ||||||||||||||
| Net interest margin (TE) | 3.54 | % | 3.54 | % | 3.60 | % | 3.76 | % | 4.03 | % | 3.61 | % | 3.76 | % | ||||||||||||||
| Efficiency ratio | 56.80 | % | 52.21 | % | 53.60 | % | 52.08 | % | 49.57 | % | 53.65 | % | 51.65 | % | ||||||||||||||
| Adjusted efficiency ratio (TE)(1) | 52.87 | % | 52.02 | % | 53.41 | % | 51.99 | % | 49.61 | % | 52.58 | % | 52.48 | % | ||||||||||||||
| CAPITAL ADEQUACY (period end) | ||||||||||||||||||||||||||||
| Shareholders' equity to assets | 13.60 | % | 13.02 | % | 12.73 | % | 12.47 | % | 12.76 | % | 13.60 | % | 12.76 | % | ||||||||||||||
| Tangible common equity to tangible assets(1) | 9.64 | % | 9.11 | % | 8.80 | % | 8.55 | % | 8.67 | % | 9.64 | % | 8.67 | % | ||||||||||||||
| OTHER DATA (period end) | ||||||||||||||||||||||||||||
| Full time equivalent employees | ||||||||||||||||||||||||||||
| Banking Division | 2,060 | 2,049 | 2,069 | 2,093 | 2,079 | 2,060 | 2,079 | |||||||||||||||||||||
| Retail Mortgage Division | 595 | 601 | 613 | 630 | 633 | 595 | 633 | |||||||||||||||||||||
| Warehouse Lending Division | 7 | 8 | 8 | 8 | 8 | 7 | 8 | |||||||||||||||||||||
| SBA Division | 28 | 33 | 35 | 39 | 39 | 28 | 39 | |||||||||||||||||||||
| Premium Finance Division | 75 | 78 | 76 | 78 | 76 | 75 | 76 | |||||||||||||||||||||
| Total Ameris Bancorp FTE headcount | 2,765 | 2,769 | 2,801 | 2,848 | 2,835 | 2,765 | 2,835 | |||||||||||||||||||||
| Branch locations | 164 | 164 | 164 | 164 | 164 | 164 | 164 | |||||||||||||||||||||
| Deposits per branch location | $ | 126,271 | $ | 125,551 | $ | 124,653 | $ | 121,326 | $ | 118,675 | $ | 126,271 | $ | 118,675 | ||||||||||||||
(1) Considered non-GAAP financial measure - See reconciliation of GAAP to non-GAAP financial measures in tables 9A - 9D
AMERIS BANCORP AND SUBSIDIARIES
FINANCIAL TABLES
| Income Statement | Table 2 |
| Three Months Ended | Twelve Months Ended | |||||||||||||||||||||||||||
| Dec | Sep | Jun | Mar | Dec | Dec | Dec | ||||||||||||||||||||||
| (dollars in thousands except per share data) | 2023 | 2023 | 2023 | 2023 | 2022 | 2023 | 2022 | |||||||||||||||||||||
| Interest income | ||||||||||||||||||||||||||||
| Interest and fees on loans | $ | 303,487 | $ | 304,699 | $ | 292,012 | $ | 271,964 | $ | 250,263 | $ | 1,172,162 | $ | 834,969 | ||||||||||||||
| Interest on taxable securities | 14,033 | 14,754 | 15,915 | 14,300 | 13,029 | 59,002 | 34,656 | |||||||||||||||||||||
| Interest on nontaxable securities | 326 | 331 | 339 | 339 | 358 | 1,335 | 1,176 | |||||||||||||||||||||
| Interest on deposits in other banks | 14,368 | 10,769 | 13,686 | 9,113 | 9,984 | 47,936 | 23,008 | |||||||||||||||||||||
| Interest on federal funds sold | — | — | — | — | 8 | — | 77 | |||||||||||||||||||||
| Total interest income | 332,214 | 330,553 | 321,952 | 295,716 | 273,642 | 1,280,435 | 893,886 | |||||||||||||||||||||
| Interest expense | ||||||||||||||||||||||||||||
| Interest on deposits | 111,749 | 102,999 | 88,087 | 53,182 | 33,071 | 356,017 | 56,105 | |||||||||||||||||||||
| Interest on other borrowings | 14,364 | 19,803 | 24,325 | 30,882 | 16,434 | 89,374 | 36,755 | |||||||||||||||||||||
| Total interest expense | 126,113 | 122,802 | 112,412 | 84,064 | 49,505 | 445,391 | 92,860 | |||||||||||||||||||||
| Net interest income | 206,101 | 207,751 | 209,540 | 211,652 | 224,137 | 835,044 | 801,026 | |||||||||||||||||||||
| Provision for loan losses | 30,401 | 30,095 | 43,643 | 49,376 | 24,648 | 153,515 | 52,610 | |||||||||||||||||||||
| Provision for unfunded commitments | (7,438 | ) | (5,634 | ) | 1,873 | 346 | 8,246 | (10,853 | ) | 19,226 | ||||||||||||||||||
| Provision for other credit losses | (11 | ) | (2 | ) | — | 7 | (4 | ) | (6 | ) | (139 | ) | ||||||||||||||||
| Provision for credit losses | 22,952 | 24,459 | 45,516 | 49,729 | 32,890 | 142,656 | 71,697 | |||||||||||||||||||||
| Net interest income after provision for credit losses | 183,149 | 183,292 | 164,024 | 161,923 | 191,247 | 692,388 | 729,329 | |||||||||||||||||||||
| Noninterest income | ||||||||||||||||||||||||||||
| Service charges on deposit accounts | 12,252 | 12,092 | 11,295 | 10,936 | 11,125 | 46,575 | 44,499 | |||||||||||||||||||||
| Mortgage banking activity | 31,461 | 36,290 | 40,742 | 31,392 | 22,855 | 139,885 | 184,904 | |||||||||||||||||||||
| Other service charges, commissions and fees | 1,234 | 1,221 | 975 | 971 | 968 | 4,401 | 3,875 | |||||||||||||||||||||
| Gain (loss) on securities | (288 | ) | (16 | ) | (6 | ) | 6 | 3 | (304 | ) | 203 | |||||||||||||||||
| Other noninterest income | 11,589 | 13,594 | 14,343 | 12,745 | 13,397 | 52,271 | 50,943 | |||||||||||||||||||||
| Total noninterest income | 56,248 | 63,181 | 67,349 | 56,050 | 48,348 | 242,828 | 284,424 | |||||||||||||||||||||
| Noninterest expense | ||||||||||||||||||||||||||||
| Salaries and employee benefits | 75,966 | 81,898 | 81,336 | 80,910 | 75,196 | 320,110 | 319,719 | |||||||||||||||||||||
| Occupancy and equipment | 13,197 | 12,745 | 12,522 | 12,986 | 12,905 | 51,450 | 51,361 | |||||||||||||||||||||
| Data processing and communications expenses | 14,028 | 12,973 | 13,451 | 13,034 | 12,486 | 53,486 | 49,228 | |||||||||||||||||||||
| Credit resolution-related expenses(1) | 157 | (1,360 | ) | 848 | 435 | 372 | 80 | 29 | ||||||||||||||||||||
| Advertising and marketing | 2,974 | 2,723 | 2,627 | 3,532 | 3,818 | 11,856 | 12,481 | |||||||||||||||||||||
| Amortization of intangible assets | 4,425 | 4,425 | 4,688 | 4,706 | 4,709 | 18,244 | 19,744 | |||||||||||||||||||||
| Merger and conversion charges | — | — | — | — | 235 | — | 1,212 | |||||||||||||||||||||
| Other noninterest expenses | 38,264 | 28,042 | 32,931 | 23,818 | 25,340 | 123,055 | 106,881 | |||||||||||||||||||||
| Total noninterest expense | 149,011 | 141,446 | 148,403 | 139,421 | 135,061 | 578,281 | 560,655 | |||||||||||||||||||||
| Income before income tax expense | 90,386 | 105,027 | 82,970 | 78,552 | 104,534 | 356,935 | 453,098 | |||||||||||||||||||||
| Income tax expense | 24,452 | 24,912 | 20,335 | 18,131 | 22,313 | 87,830 | 106,558 | |||||||||||||||||||||
| Net income | $ | 65,934 | $ | 80,115 | $ | 62,635 | $ | 60,421 | $ | 82,221 | $ | 269,105 | $ | 346,540 | ||||||||||||||
| Diluted earnings per common share | $ | 0.96 | $ | 1.16 | $ | 0.91 | $ | 0.87 | $ | 1.18 | $ | 3.89 | $ | 4.99 | ||||||||||||||
(1) Includes expenses associated with problem loans and OREO, as well as OREO losses and writedowns.
AMERIS BANCORP AND SUBSIDIARIES
FINANCIAL TABLES
| Period End Balance Sheet | Table 3 |
| Dec | Sep | Jun | Mar | Dec | ||||||||||||||||
| (dollars in thousands) | 2023 | 2023 | 2023 | 2023 | 2022 | |||||||||||||||
| Assets | ||||||||||||||||||||
| Cash and due from banks | $ | 230,470 | $ | 241,137 | $ | 284,552 | $ | 266,400 | $ | 284,567 | ||||||||||
| Federal funds sold and interest-bearing deposits in banks | 936,834 | 1,304,636 | 1,034,578 | 1,754,453 | 833,565 | |||||||||||||||
| Debt securities available-for-sale, at fair value | 1,402,944 | 1,424,081 | 1,460,356 | 1,496,836 | 1,500,060 | |||||||||||||||
| Debt securities held-to-maturity, at amortized cost | 141,512 | 141,859 | 142,513 | 134,175 | 134,864 | |||||||||||||||
| Other investments | 71,794 | 104,957 | 109,656 | 146,715 | 110,992 | |||||||||||||||
| Loans held for sale | 281,332 | 381,466 | 391,472 | 395,096 | 392,078 | |||||||||||||||
| Loans, net of unearned income | 20,269,303 | 20,201,079 | 20,471,759 | 19,997,871 | 19,855,253 | |||||||||||||||
| Allowance for credit losses | (307,100 | ) | (290,104 | ) | (272,071 | ) | (242,658 | ) | (205,677 | ) | ||||||||||
| Loans, net | 19,962,203 | 19,910,975 | 20,199,688 | 19,755,213 | 19,649,576 | |||||||||||||||
| Other real estate owned | 6,199 | 3,397 | 6,170 | 1,502 | 843 | |||||||||||||||
| Premises and equipment, net | 216,435 | 217,564 | 218,662 | 218,878 | 220,283 | |||||||||||||||
| Goodwill | 1,015,646 | 1,015,646 | 1,015,646 | 1,015,646 | 1,015,646 | |||||||||||||||
| Other intangible assets, net | 87,949 | 92,375 | 96,800 | 101,488 | 106,194 | |||||||||||||||
| Cash value of bank owned life insurance | 395,778 | 393,769 | 391,483 | 389,201 | 388,405 | |||||||||||||||
| Other assets | 454,603 | 465,968 | 449,042 | 412,781 | 416,213 | |||||||||||||||
| Total assets | $ | 25,203,699 | $ | 25,697,830 | $ | 25,800,618 | $ | 26,088,384 | $ | 25,053,286 | ||||||||||
| Liabilities | ||||||||||||||||||||
| Deposits | ||||||||||||||||||||
| Noninterest-bearing | $ | 6,491,639 | $ | 6,589,610 | $ | 6,706,897 | $ | 7,297,893 | $ | 7,929,579 | ||||||||||
| Interest-bearing | 14,216,870 | 14,000,735 | 13,736,228 | 12,599,562 | 11,533,159 | |||||||||||||||
| Total deposits | 20,708,509 | 20,590,345 | 20,443,125 | 19,897,455 | 19,462,738 | |||||||||||||||
| Other borrowings | 509,586 | 1,209,553 | 1,536,989 | 2,401,327 | 1,875,736 | |||||||||||||||
| Subordinated deferrable interest debentures | 130,315 | 129,817 | 129,319 | 128,820 | 128,322 | |||||||||||||||
| Other liabilities | 428,542 | 421,046 | 406,555 | 407,587 | 389,090 | |||||||||||||||
| Total liabilities | 21,776,952 | 22,350,761 | 22,515,988 | 22,835,189 | 21,855,886 | |||||||||||||||
| Shareholders' Equity | ||||||||||||||||||||
| Preferred stock | — | — | — | — | — | |||||||||||||||
| Common stock | 72,516 | 72,514 | 72,515 | 72,484 | 72,264 | |||||||||||||||
| Capital stock | 1,945,385 | 1,942,852 | 1,939,865 | 1,937,664 | 1,935,211 | |||||||||||||||
| Retained earnings | 1,539,957 | 1,484,424 | 1,414,742 | 1,362,512 | 1,311,258 | |||||||||||||||
| Accumulated other comprehensive income (loss), net of tax | (35,939 | ) | (60,818 | ) | (50,618 | ) | (35,581 | ) | (46,507 | ) | ||||||||||
| Treasury stock | (95,172 | ) | (91,903 | ) | (91,874 | ) | (83,884 | ) | (74,826 | ) | ||||||||||
| Total shareholders' equity | 3,426,747 | 3,347,069 | 3,284,630 | 3,253,195 | 3,197,400 | |||||||||||||||
| Total liabilities and shareholders' equity | $ | 25,203,699 | $ | 25,697,830 | $ | 25,800,618 | $ | 26,088,384 | $ | 25,053,286 | ||||||||||
| Other Data | ||||||||||||||||||||
| Earning assets | $ | 23,103,719 | $ | 23,558,078 | $ | 23,610,334 | $ | 23,925,146 | $ | 22,826,812 | ||||||||||
| Intangible assets | 1,103,595 | 1,108,021 | 1,112,446 | 1,117,134 | 1,121,840 | |||||||||||||||
| Interest-bearing liabilities | 14,856,771 | 15,340,105 | 15,402,536 | 15,129,709 | 13,537,217 | |||||||||||||||
| Average assets | 25,341,990 | 25,525,913 | 25,631,846 | 25,115,927 | 24,354,979 | |||||||||||||||
| Average common shareholders' equity | 3,383,554 | 3,324,960 | 3,293,049 | 3,250,289 | 3,168,320 | |||||||||||||||
AMERIS BANCORP AND SUBSIDIARIES
FINANCIAL TABLES
| Asset Quality Information | Table 4 |
| Three Months Ended | Twelve Months Ended | |||||||||||||||||||||||||||
| Dec | Sep | Jun | Mar | Dec | Dec | Dec | ||||||||||||||||||||||
| (dollars in thousands) | 2023 | 2023 | 2023 | 2023 | 2022 | 2023 | 2022 | |||||||||||||||||||||
| Allowance for Credit Losses | ||||||||||||||||||||||||||||
| Balance at beginning of period | $ | 339,180 | $ | 326,783 | $ | 295,497 | $ | 258,163 | $ | 229,135 | $ | 258,163 | $ | 200,981 | ||||||||||||||
| Adoption of ASU 2022-02 | — | — | — | (1,711 | ) | — | (1,711 | ) | — | |||||||||||||||||||
| Provision for loan losses | 30,401 | 30,095 | 43,643 | 49,376 | 24,648 | 153,515 | 52,610 | |||||||||||||||||||||
| Provision for unfunded commitments | (7,438 | ) | (5,634 | ) | 1,873 | 346 | 8,246 | (10,853 | ) | 19,226 | ||||||||||||||||||
| Provision for other credit losses | (11 | ) | (2 | ) | — | 7 | (4 | ) | (6 | ) | (139 | ) | ||||||||||||||||
| Provision for credit losses | 22,952 | 24,459 | 45,516 | 49,729 | 32,890 | 142,656 | 71,697 | |||||||||||||||||||||
| Charge-offs | 20,104 | 19,488 | 20,670 | 14,956 | 8,371 | 75,218 | 33,075 | |||||||||||||||||||||
| Recoveries | 6,699 | 7,426 | 6,440 | 4,272 | 4,509 | 24,837 | 18,560 | |||||||||||||||||||||
| Net charge-offs (recoveries) | 13,405 | 12,062 | 14,230 | 10,684 | 3,862 | 50,381 | 14,515 | |||||||||||||||||||||
| Ending balance | $ | 348,727 | $ | 339,180 | $ | 326,783 | $ | 295,497 | $ | 258,163 | $ | 348,727 | $ | 258,163 | ||||||||||||||
| Allowance for loan losses | $ | 307,100 | $ | 290,104 | $ | 272,071 | $ | 242,658 | $ | 205,677 | $ | 307,100 | $ | 205,677 | ||||||||||||||
| Allowance for unfunded commitments | 41,558 | 48,996 | 54,630 | 52,757 | 52,411 | 41,558 | 52,411 | |||||||||||||||||||||
| Allowance for other credit losses | 69 | 80 | 82 | 82 | 75 | 69 | 75 | |||||||||||||||||||||
| Total allowance for credit losses | $ | 348,727 | $ | 339,180 | $ | 326,783 | $ | 295,497 | $ | 258,163 | $ | 348,727 | $ | 258,163 | ||||||||||||||
| Net Charge-off Information | ||||||||||||||||||||||||||||
| Charge-offs | ||||||||||||||||||||||||||||
| Commercial, financial and agricultural | $ | 15,840 | $ | 16,519 | $ | 13,316 | $ | 12,233 | $ | 5,108 | $ | 57,908 | $ | 18,635 | ||||||||||||||
| Consumer | 2,785 | 948 | 2,052 | 1,140 | 1,136 | 6,925 | 4,926 | |||||||||||||||||||||
| Indirect automobile | 20 | 36 | 65 | 34 | 86 | 155 | 265 | |||||||||||||||||||||
| Premium Finance | 1,347 | 1,951 | 1,848 | 1,421 | 1,812 | 6,567 | 5,452 | |||||||||||||||||||||
| Real estate - construction and development | — | — | — | — | 27 | — | 27 | |||||||||||||||||||||
| Real estate - commercial and farmland | 84 | — | 3,320 | — | 196 | 3,404 | 3,574 | |||||||||||||||||||||
| Real estate - residential | 28 | 34 | 69 | 128 | 6 | 259 | 196 | |||||||||||||||||||||
| Total charge-offs | 20,104 | 19,488 | 20,670 | 14,956 | 8,371 | 75,218 | 33,075 | |||||||||||||||||||||
| Recoveries | ||||||||||||||||||||||||||||
| Commercial, financial and agricultural | 4,701 | 4,745 | 3,545 | 2,043 | 2,072 | 15,034 | 9,954 | |||||||||||||||||||||
| Consumer | 130 | 203 | 194 | 297 | 217 | 824 | 882 | |||||||||||||||||||||
| Indirect automobile | 177 | 158 | 225 | 216 | 229 | 776 | 1,045 | |||||||||||||||||||||
| Premium Finance | 1,100 | 1,639 | 1,680 | 1,382 | 1,682 | 5,801 | 5,065 | |||||||||||||||||||||
| Real estate - construction and development | 303 | 74 | 472 | 100 | 223 | 949 | 892 | |||||||||||||||||||||
| Real estate - commercial and farmland | 90 | 371 | 61 | 44 | 48 | 566 | 225 | |||||||||||||||||||||
| Real estate - residential | 198 | 236 | 263 | 190 | 38 | 887 | 497 | |||||||||||||||||||||
| Total recoveries | 6,699 | 7,426 | 6,440 | 4,272 | 4,509 | 24,837 | 18,560 | |||||||||||||||||||||
| Net charge-offs (recoveries) | $ | 13,405 | $ | 12,062 | $ | 14,230 | $ | 10,684 | $ | 3,862 | $ | 50,381 | $ | 14,515 | ||||||||||||||
| Non-Performing Assets | ||||||||||||||||||||||||||||
| Nonaccrual portfolio loans | $ | 60,961 | $ | 53,806 | $ | 57,025 | $ | 68,028 | $ | 65,221 | $ | 60,961 | $ | 65,221 | ||||||||||||||
| Other real estate owned | 6,199 | 3,397 | 6,170 | 1,502 | 843 | 6,199 | 843 | |||||||||||||||||||||
| Repossessed assets | 17 | 22 | 9 | 25 | 28 | 17 | 28 | |||||||||||||||||||||
| Accruing loans delinquent 90 days or more | 16,988 | 11,891 | 13,424 | 15,792 | 17,865 | 16,988 | 17,865 | |||||||||||||||||||||
| Non-performing portfolio assets | $ | 84,165 | $ | 69,116 | $ | 76,628 | $ | 85,347 | $ | 83,957 | $ | 84,165 | $ | 83,957 | ||||||||||||||
| Serviced GNMA-guaranteed mortgage nonaccrual loans | 90,156 | 80,752 | 69,655 | 74,999 | 69,587 | 90,156 | 69,587 | |||||||||||||||||||||
| Total non-performing assets | $ | 174,321 | $ | 149,868 | $ | 146,283 | $ | 160,346 | $ | 153,544 | $ | 174,321 | $ | 153,544 | ||||||||||||||
| Asset Quality Ratios | ||||||||||||||||||||||||||||
| Non-performing portfolio assets as a percent of total assets | 0.33 | % | 0.27 | % | 0.30 | % | 0.33 | % | 0.34 | % | 0.33 | % | 0.34 | % | ||||||||||||||
| Total non-performing assets as a percent of total assets | 0.69 | % | 0.58 | % | 0.57 | % | 0.61 | % | 0.61 | % | 0.69 | % | 0.61 | % | ||||||||||||||
| Net charge-offs as a percent of average loans (annualized) | 0.26 | % | 0.23 | % | 0.28 | % | 0.22 | % | 0.08 | % | 0.25 | % | 0.08 | % | ||||||||||||||
AMERIS BANCORP AND SUBSIDIARIES
FINANCIAL TABLES
| Loan Information | Table 5 |
| Dec | Sep | Jun | Mar | Dec | ||||||||||||||||
| (dollars in thousands) | 2023 | 2023 | 2023 | 2023 | 2022 | |||||||||||||||
| Loans by Type | ||||||||||||||||||||
| Commercial, financial and agricultural | $ | 2,688,929 | $ | 2,632,836 | $ | 2,718,831 | $ | 2,722,180 | $ | 2,679,403 | ||||||||||
| Consumer | 241,552 | 259,797 | 307,486 | 349,775 | 384,037 | |||||||||||||||
| Indirect automobile | 34,257 | 47,108 | 63,231 | 83,466 | 108,648 | |||||||||||||||
| Mortgage warehouse | 818,728 | 852,823 | 1,147,413 | 958,418 | 1,038,924 | |||||||||||||||
| Municipal | 492,668 | 497,093 | 510,410 | 505,515 | 509,151 | |||||||||||||||
| Premium Finance | 946,562 | 1,007,334 | 988,731 | 947,257 | 1,023,479 | |||||||||||||||
| Real estate - construction and development | 2,129,187 | 2,236,686 | 2,217,744 | 2,144,605 | 2,086,438 | |||||||||||||||
| Real estate - commercial and farmland | 8,059,754 | 7,865,389 | 7,815,779 | 7,721,732 | 7,604,868 | |||||||||||||||
| Real estate - residential | 4,857,666 | 4,802,013 | 4,702,134 | 4,564,923 | 4,420,305 | |||||||||||||||
| Total loans | $ | 20,269,303 | $ | 20,201,079 | $ | 20,471,759 | $ | 19,997,871 | $ | 19,855,253 | ||||||||||
| Loans by Risk Grade | ||||||||||||||||||||
| Grades 1 through 5 - Pass | $ | 19,846,731 | $ | 19,812,895 | $ | 20,114,816 | $ | 19,654,232 | $ | 19,513,726 | ||||||||||
| Grade 6 - Other assets especially mentioned | 203,725 | 187,449 | 171,035 | 116,345 | 104,614 | |||||||||||||||
| Grade 7 - Substandard | 218,847 | 200,735 | 185,908 | 227,294 | 236,913 | |||||||||||||||
| Grade 8 - Doubtful | — | — | — | — | — | |||||||||||||||
| Grade 9 - Loss | — | — | — | — | — | |||||||||||||||
| Total loans | $ | 20,269,303 | $ | 20,201,079 | $ | 20,471,759 | $ | 19,997,871 | $ | 19,855,253 | ||||||||||
AMERIS BANCORP AND SUBSIDIARIES
FINANCIAL TABLES
| Average Balances | Table 6 |
| Three Months Ended | Twelve Months Ended | |||||||||||||||||||||||||||
| Dec | Sep | Jun | Mar | Dec | Dec | Dec | ||||||||||||||||||||||
| (dollars in thousands) | 2023 | 2023 | 2023 | 2023 | 2022 | 2023 | 2022 | |||||||||||||||||||||
| Earning Assets | ||||||||||||||||||||||||||||
| Federal funds sold | $ | — | $ | — | $ | — | $ | — | $ | 924 | $ | — | $ | 10,836 | ||||||||||||||
| Interest-bearing deposits in banks | 936,733 | 864,028 | 998,609 | 859,614 | 1,009,935 | 914,818 | 1,993,672 | |||||||||||||||||||||
| Debt securities - taxable | 1,503,889 | 1,548,647 | 1,582,076 | 1,586,404 | 1,451,861 | 1,555,009 | 1,065,511 | |||||||||||||||||||||
| Debt securities - nontaxable | 40,227 | 40,896 | 42,580 | 43,052 | 44,320 | 41,679 | 39,779 | |||||||||||||||||||||
| Other investments | 87,678 | 101,517 | 117,020 | 131,044 | 83,730 | 109,175 | 58,170 | |||||||||||||||||||||
| Loans held for sale | 405,080 | 464,452 | 577,606 | 490,295 | 371,952 | 484,070 | 718,599 | |||||||||||||||||||||
| Loans | 20,252,773 | 20,371,689 | 20,164,938 | 19,820,749 | 19,212,560 | 20,154,321 | 17,521,461 | |||||||||||||||||||||
| Total Earning Assets | $ | 23,226,380 | $ | 23,391,229 | $ | 23,482,829 | $ | 22,931,158 | $ | 22,175,282 | $ | 23,259,072 | $ | 21,408,028 | ||||||||||||||
| Deposits | ||||||||||||||||||||||||||||
| Noninterest-bearing deposits | $ | 6,572,190 | $ | 6,655,191 | $ | 6,729,789 | $ | 7,136,373 | $ | 8,138,887 | $ | 6,771,464 | $ | 8,005,201 | ||||||||||||||
| NOW accounts | 3,760,992 | 3,661,701 | 3,949,850 | 4,145,991 | 3,621,454 | 3,878,034 | 3,675,586 | |||||||||||||||||||||
| MMDA | 5,994,361 | 5,527,731 | 5,002,590 | 4,994,195 | 5,161,047 | 5,382,865 | 5,128,497 | |||||||||||||||||||||
| Savings accounts | 817,075 | 915,678 | 1,009,749 | 1,005,614 | 1,010,966 | 936,454 | 1,005,752 | |||||||||||||||||||||
| Retail CDs | 2,281,357 | 2,200,413 | 2,024,014 | 1,612,325 | 1,450,037 | 2,031,828 | 1,604,978 | |||||||||||||||||||||
| Brokered CDs | 1,122,684 | 1,441,854 | 1,393,206 | 125,133 | — | 1,024,606 | — | |||||||||||||||||||||
| Total Deposits | 20,548,659 | 20,402,568 | 20,109,198 | 19,019,631 | 19,382,391 | 20,025,251 | 19,420,014 | |||||||||||||||||||||
| Non-Deposit Funding | ||||||||||||||||||||||||||||
| Federal funds purchased and securities sold under agreements to repurchase | — | — | — | — | 1 | — | 1,477 | |||||||||||||||||||||
| FHLB advances | 538,096 | 943,855 | 1,408,855 | 1,968,811 | 918,228 | 1,210,242 | 279,409 | |||||||||||||||||||||
| Other borrowings | 311,091 | 312,572 | 316,626 | 361,445 | 377,056 | 325,260 | 393,393 | |||||||||||||||||||||
| Subordinated deferrable interest debentures | 130,054 | 129,554 | 129,056 | 128,557 | 128,060 | 129,310 | 127,316 | |||||||||||||||||||||
| Total Non-Deposit Funding | 979,241 | 1,385,981 | 1,854,537 | 2,458,813 | 1,423,345 | 1,664,812 | 801,595 | |||||||||||||||||||||
| Total Funding | $ | 21,527,900 | $ | 21,788,549 | $ | 21,963,735 | $ | 21,478,444 | $ | 20,805,736 | $ | 21,690,063 | $ | 20,221,609 | ||||||||||||||
AMERIS BANCORP AND SUBSIDIARIES
FINANCIAL TABLES
| Interest Income and Interest Expense (TE) | Table 7 |
| Three Months Ended | Twelve Months Ended | |||||||||||||||||||||||||||
| Dec | Sep | Jun | Mar | Dec | Dec | Dec | ||||||||||||||||||||||
| (dollars in thousands) | 2023 | 2023 | 2023 | 2023 | 2022 | 2023 | 2022 | |||||||||||||||||||||
| Interest Income | ||||||||||||||||||||||||||||
| Federal funds sold | $ | — | $ | — | $ | — | $ | — | $ | 8 | $ | — | $ | 77 | ||||||||||||||
| Interest-bearing deposits in banks | 14,368 | 10,769 | 13,686 | 9,113 | 9,984 | 47,936 | 23,008 | |||||||||||||||||||||
| Debt securities - taxable | 14,033 | 14,754 | 15,915 | 14,300 | 13,029 | 59,002 | 34,656 | |||||||||||||||||||||
| Debt securities - nontaxable (TE) | 413 | 418 | 430 | 429 | 454 | 1,690 | 1,489 | |||||||||||||||||||||
| Loans held for sale | 6,846 | 7,460 | 8,398 | 7,007 | 5,519 | 29,711 | 29,699 | |||||||||||||||||||||
| Loans (TE) | 297,501 | 298,102 | 284,471 | 265,802 | 245,603 | 1,145,876 | 808,826 | |||||||||||||||||||||
| Total Earning Assets | $ | 333,161 | $ | 331,503 | $ | 322,900 | $ | 296,651 | $ | 274,597 | $ | 1,284,215 | $ | 897,755 | ||||||||||||||
| Interest Expense | ||||||||||||||||||||||||||||
| Interest-Bearing Deposits | ||||||||||||||||||||||||||||
| NOW accounts | $ | 19,293 | $ | 17,255 | $ | 18,003 | $ | 15,033 | $ | 8,564 | $ | 69,584 | $ | 14,367 | ||||||||||||||
| MMDA | 54,002 | 45,683 | 35,224 | 27,809 | 20,683 | 162,718 | 33,143 | |||||||||||||||||||||
| Savings accounts | 974 | 1,791 | 2,296 | 1,288 | 654 | 6,349 | 1,287 | |||||||||||||||||||||
| Retail CDs | 22,257 | 19,013 | 14,751 | 7,629 | 3,170 | 63,650 | 7,308 | |||||||||||||||||||||
| Brokered CDs | 15,223 | 19,257 | 17,813 | 1,423 | — | 53,716 | — | |||||||||||||||||||||
| Total Interest-Bearing Deposits | 111,749 | 102,999 | 88,087 | 53,182 | 33,071 | 356,017 | 56,105 | |||||||||||||||||||||
| Non-Deposit Funding | ||||||||||||||||||||||||||||
| Federal funds purchased and securities sold under agreements to repurchase | — | — | — | — | — | — | 4 | |||||||||||||||||||||
| FHLB advances | 7,089 | 12,543 | 17,222 | 22,448 | 8,801 | 59,302 | 9,710 | |||||||||||||||||||||
| Other borrowings | 3,798 | 3,821 | 3,902 | 5,349 | 4,953 | 16,870 | 19,209 | |||||||||||||||||||||
| Subordinated deferrable interest debentures | 3,477 | 3,439 | 3,201 | 3,085 | 2,680 | 13,202 | 7,832 | |||||||||||||||||||||
| Total Non-Deposit Funding | 14,364 | 19,803 | 24,325 | 30,882 | 16,434 | 89,374 | 36,755 | |||||||||||||||||||||
| Total Interest-Bearing Funding | $ | 126,113 | $ | 122,802 | $ | 112,412 | $ | 84,064 | $ | 49,505 | $ | 445,391 | $ | 92,860 | ||||||||||||||
| Net Interest Income (TE) | $ | 207,048 | $ | 208,701 | $ | 210,488 | $ | 212,587 | $ | 225,092 | $ | 838,824 | $ | 804,895 | ||||||||||||||
AMERIS BANCORP AND SUBSIDIARIES
FINANCIAL TABLES
| Yields(1) | Table 8 |
| Three Months Ended | Twelve Months Ended | |||||||||||||||||||||||||||
| Dec | Sep | Jun | Mar | Dec | Dec | Dec | ||||||||||||||||||||||
| 2023 | 2023 | 2023 | 2023 | 2022 | 2023 | 2022 | ||||||||||||||||||||||
| Earning Assets | ||||||||||||||||||||||||||||
| Federal funds sold | — | % | — | % | — | % | — | % | 3.43 | % | — | % | 0.71 | % | ||||||||||||||
| Interest-bearing deposits in banks | 6.09 | % | 4.94 | % | 5.50 | % | 4.30 | % | 3.92 | % | 5.24 | % | 1.15 | % | ||||||||||||||
| Debt securities - taxable | 3.70 | % | 3.78 | % | 4.03 | % | 3.66 | % | 3.56 | % | 3.79 | % | 3.25 | % | ||||||||||||||
| Debt securities - nontaxable (TE) | 4.07 | % | 4.06 | % | 4.05 | % | 4.04 | % | 4.06 | % | 4.05 | % | 3.74 | % | ||||||||||||||
| Loans held for sale | 6.71 | % | 6.37 | % | 5.83 | % | 5.80 | % | 5.89 | % | 6.14 | % | 4.13 | % | ||||||||||||||
| Loans (TE) | 5.83 | % | 5.81 | % | 5.66 | % | 5.44 | % | 5.07 | % | 5.69 | % | 4.62 | % | ||||||||||||||
| Total Earning Assets | 5.69 | % | 5.62 | % | 5.52 | % | 5.25 | % | 4.91 | % | 5.52 | % | 4.19 | % | ||||||||||||||
| Interest-Bearing Deposits | ||||||||||||||||||||||||||||
| NOW accounts | 2.04 | % | 1.87 | % | 1.83 | % | 1.47 | % | 0.94 | % | 1.79 | % | 0.39 | % | ||||||||||||||
| MMDA | 3.57 | % | 3.28 | % | 2.82 | % | 2.26 | % | 1.59 | % | 3.02 | % | 0.65 | % | ||||||||||||||
| Savings accounts | 0.47 | % | 0.78 | % | 0.91 | % | 0.52 | % | 0.26 | % | 0.68 | % | 0.13 | % | ||||||||||||||
| Retail CDs | 3.87 | % | 3.43 | % | 2.92 | % | 1.92 | % | 0.87 | % | 3.13 | % | 0.46 | % | ||||||||||||||
| Brokered CDs | 5.38 | % | 5.30 | % | 5.13 | % | 4.61 | % | — | % | 5.24 | % | — | % | ||||||||||||||
| Total Interest-Bearing Deposits | 3.17 | % | 2.97 | % | 2.64 | % | 1.82 | % | 1.17 | % | 2.69 | % | 0.49 | % | ||||||||||||||
| Non-Deposit Funding | ||||||||||||||||||||||||||||
| Federal funds purchased and securities sold under agreements to repurchase | — | % | — | % | — | % | — | % | — | % | — | % | 0.27 | % | ||||||||||||||
| FHLB advances | 5.23 | % | 5.27 | % | 4.90 | % | 4.62 | % | 3.80 | % | 4.90 | % | 3.48 | % | ||||||||||||||
| Other borrowings | 4.84 | % | 4.85 | % | 4.94 | % | 6.00 | % | 5.21 | % | 5.19 | % | 4.88 | % | ||||||||||||||
| Subordinated deferrable interest debentures | 10.61 | % | 10.53 | % | 9.95 | % | 9.73 | % | 8.30 | % | 10.21 | % | 6.15 | % | ||||||||||||||
| Total Non-Deposit Funding | 5.82 | % | 5.67 | % | 5.26 | % | 5.09 | % | 4.58 | % | 5.37 | % | 4.59 | % | ||||||||||||||
| Total Interest-Bearing Liabilities | 3.35 | % | 3.22 | % | 2.96 | % | 2.38 | % | 1.55 | % | 2.99 | % | 0.76 | % | ||||||||||||||
| Net Interest Spread | 2.34 | % | 2.40 | % | 2.56 | % | 2.87 | % | 3.36 | % | 2.53 | % | 3.43 | % | ||||||||||||||
| Net Interest Margin(2) | 3.54 | % | 3.54 | % | 3.60 | % | 3.76 | % | 4.03 | % | 3.61 | % | 3.76 | % | ||||||||||||||
| Total Cost of Funds(3) | 2.32 | % | 2.24 | % | 2.05 | % | 1.59 | % | 0.94 | % | 2.05 | % | 0.46 | % | ||||||||||||||
(1) Interest and average rates are calculated on a tax-equivalent basis using an effective tax rate of 21%.
(2) Rate calculated based on average earning assets.
(3) Rate calculated based on total average funding including noninterest-bearing deposits.
AMERIS BANCORP AND SUBSIDIARIES
FINANCIAL TABLES
Non-GAAP Reconciliations
| Adjusted Net Income | Table 9A |
| Three Months Ended | Twelve Months Ended | |||||||||||||||||||||||||||
| Dec | Sep | Jun | Mar | Dec | Dec | Dec | ||||||||||||||||||||||
| (dollars in thousands except per share data) | 2023 | 2023 | 2023 | 2023 | 2022 | 2023 | 2022 | |||||||||||||||||||||
| Net income available to common shareholders | $ | 65,934 | $ | 80,115 | $ | 62,635 | $ | 60,421 | $ | 82,221 | $ | 269,105 | $ | 346,540 | ||||||||||||||
| Adjustment items: | ||||||||||||||||||||||||||||
| Merger and conversion charges | — | — | — | — | 235 | — | 1,212 | |||||||||||||||||||||
| Gain on sale of MSR | — | — | — | — | (1,672 | ) | — | (1,356 | ) | |||||||||||||||||||
| Servicing right impairment (recovery) | — | — | — | — | — | — | (21,824 | ) | ||||||||||||||||||||
| Gain on BOLI proceeds | — | — | — | (486 | ) | — | (486 | ) | (55 | ) | ||||||||||||||||||
| FDIC special assessment | 11,566 | — | — | — | — | 11,566 | — | |||||||||||||||||||||
| Natural disaster expenses | — | — | — | — | — | — | 151 | |||||||||||||||||||||
| (Gain) loss on bank premises | (1,903 | ) | — | — | — | — | (1,903 | ) | (45 | ) | ||||||||||||||||||
| Tax effect of adjustment items (Note 1) | (2,029 | ) | — | — | — | 302 | (2,029 | ) | 4,792 | |||||||||||||||||||
| After tax adjustment items | 7,634 | — | — | (486 | ) | (1,135 | ) | 7,148 | (17,125 | ) | ||||||||||||||||||
| Adjusted net income | $ | 73,568 | $ | 80,115 | $ | 62,635 | $ | 59,935 | $ | 81,086 | $ | 276,253 | $ | 329,415 | ||||||||||||||
| Weighted average number of shares - diluted | 69,014,793 | 68,994,247 | 69,034,763 | 69,322,664 | 69,395,224 | 69,104,158 | 69,419,721 | |||||||||||||||||||||
| Net income per diluted share | $ | 0.96 | $ | 1.16 | $ | 0.91 | $ | 0.87 | $ | 1.18 | $ | 3.89 | $ | 4.99 | ||||||||||||||
| Adjusted net income per diluted share | $ | 1.07 | $ | 1.16 | $ | 0.91 | $ | 0.86 | $ | 1.17 | $ | 4.00 | $ | 4.75 | ||||||||||||||
| Average assets | $ | 25,341,990 | $ | 25,525,913 | $ | 25,631,846 | $ | 25,115,927 | $ | 24,354,979 | $ | 25,404,873 | $ | 23,644,754 | ||||||||||||||
| Return on average assets | 1.03 | % | 1.25 | % | 0.98 | % | 0.98 | % | 1.34 | % | 1.06 | % | 1.47 | % | ||||||||||||||
| Adjusted return on average assets | 1.15 | % | 1.25 | % | 0.98 | % | 0.97 | % | 1.32 | % | 1.09 | % | 1.39 | % | ||||||||||||||
| Average common equity | $ | 3,383,554 | $ | 3,324,960 | $ | 3,293,049 | $ | 3,250,289 | $ | 3,168,320 | $ | 3,313,361 | $ | 3,083,081 | ||||||||||||||
| Average tangible common equity | $ | 2,277,810 | $ | 2,214,775 | $ | 2,178,323 | $ | 2,130,856 | $ | 2,039,094 | $ | 2,200,883 | $ | 1,947,222 | ||||||||||||||
| Return on average common equity | 7.73 | % | 9.56 | % | 7.63 | % | 7.54 | % | 10.30 | % | 8.12 | % | 11.24 | % | ||||||||||||||
| Adjusted return on average tangible common equity | 12.81 | % | 14.35 | % | 11.53 | % | 11.41 | % | 15.78 | % | 12.55 | % | 16.92 | % | ||||||||||||||
Note 1: Tax effect is calculated utilizing a 21% rate for taxable adjustments. Gain on BOLI proceeds is non-taxable and no tax effect is included. A portion of the merger and conversion charges for the twelve months ended December 2022 are nondeductible for tax purposes.
AMERIS BANCORP AND SUBSIDIARIES
FINANCIAL TABLES
Non-GAAP Reconciliations (continued)
| Adjusted Efficiency Ratio (TE) | Table 9B |
| Three Months Ended | Twelve Months Ended | |||||||||||||||||||||||||||
| Dec | Sep | Jun | Mar | Dec | Dec | Dec | ||||||||||||||||||||||
| (dollars in thousands) | 2023 | 2023 | 2023 | 2023 | 2022 | 2023 | 2022 | |||||||||||||||||||||
| Adjusted Noninterest Expense | ||||||||||||||||||||||||||||
| Total noninterest expense | $ | 149,011 | $ | 141,446 | $ | 148.403 | $ | 139,421 | $ | 135,061 | $ | 578,281 | $ | 560,655 | ||||||||||||||
| Adjustment items: | ||||||||||||||||||||||||||||
| Merger and conversion charges | — | — | — | — | (235 | ) | — | (1,212 | ) | |||||||||||||||||||
| FDIC special assessment | (11,566 | ) | — | — | — | — | (11,566 | ) | — | |||||||||||||||||||
| Natural disaster expenses | — | — | — | — | — | — | (151 | ) | ||||||||||||||||||||
| Gain (loss) on bank premises | 1,903 | — | — | — | — | 1,903 | 45 | |||||||||||||||||||||
| Adjusted noninterest expense | $ | 139,348 | $ | 141,446 | $ | 148.403 | $ | 139,421 | $ | 134,826 | $ | 568,618 | $ | 559,337 | ||||||||||||||
| Total Revenue | ||||||||||||||||||||||||||||
| Net interest income | $ | 206,101 | $ | 207,751 | $ | 209,540 | $ | 211,652 | $ | 224,137 | $ | 835,044 | $ | 801,026 | ||||||||||||||
| Noninterest income | 56,248 | 63,181 | 67,349 | 56,050 | 48,348 | 242,828 | 284,424 | |||||||||||||||||||||
| Total revenue | $ | 262,349 | $ | 270,932 | $ | 276,889 | $ | 267,702 | $ | 272,485 | $ | 1,077,872 | $ | 1,085,450 | ||||||||||||||
| Adjusted Total Revenue | ||||||||||||||||||||||||||||
| Net interest income (TE) | $ | 207,048 | $ | 208,701 | $ | 210,488 | $ | 212,587 | $ | 225,092 | $ | 838,824 | $ | 804,895 | ||||||||||||||
| Noninterest income | 56,248 | 63,181 | 67,349 | 56,050 | 48,348 | 242,828 | 284,424 | |||||||||||||||||||||
| Total revenue (TE) | 263,296 | 271,882 | 277,837 | 268,637 | 273,440 | 1,081,652 | 1,089,319 | |||||||||||||||||||||
| Adjustment items: | ||||||||||||||||||||||||||||
| (Gain) loss on securities | 288 | 16 | 6 | (6 | ) | (3 | ) | 304 | (203 | ) | ||||||||||||||||||
| Gain on sale of MSR | — | — | — | — | (1,672 | ) | — | (1,356 | ) | |||||||||||||||||||
| Gain on BOLI proceeds | — | — | — | (486 | ) | — | (486 | ) | (55 | ) | ||||||||||||||||||
| Servicing right impairment (recovery) | — | — | — | — | — | — | (21,824 | ) | ||||||||||||||||||||
| Adjusted total revenue (TE) | $ | 263,584 | $ | 271,898 | $ | 277,843 | $ | 268,145 | $ | 271,765 | $ | 1,081,470 | $ | 1,065,881 | ||||||||||||||
| Efficiency ratio | 56.80 | % | 52.21 | % | 53.60 | % | 52.08 | % | 49.57 | % | 53.65 | % | 51.65 | % | ||||||||||||||
| Adjusted efficiency ratio (TE) | 52.87 | % | 52.02 | % | 53.41 | % | 51.99 | % | 49.61 | % | 52.58 | % | 52.48 | % | ||||||||||||||
| Tangible Book Value Per Share | Table 9C |
| Three Months Ended | Twelve Months Ended | |||||||||||||||||||||||||||
| Dec | Sep | Jun | Mar | Dec | Dec | Dec | ||||||||||||||||||||||
| (dollars in thousands except per share data) | 2023 | 2023 | 2023 | 2023 | 2022 | 2023 | 2022 | |||||||||||||||||||||
| Total shareholders' equity | $ | 3,426,747 | $ | 3,347,069 | $ | 3,284,630 | $ | 3,253,195 | $ | 3,197,400 | $ | 3,426,747 | $ | 3,197,400 | ||||||||||||||
| Less: | ||||||||||||||||||||||||||||
| Goodwill | 1,015,646 | 1,015,646 | 1,015,646 | 1,015,646 | 1,015,646 | 1,015,646 | 1,015,646 | |||||||||||||||||||||
| Other intangibles, net | 87,949 | 92,375 | 96,800 | 101,488 | 106,194 | 87,949 | 106,194 | |||||||||||||||||||||
| Total tangible shareholders' equity | $ | 2,323,152 | $ | 2,239,048 | $ | 2,172,184 | $ | 2,136,061 | $ | 2,075,560 | $ | 2,323,152 | $ | 2,075,560 | ||||||||||||||
| Period end number of shares | 69,053,341 | 69,138,461 | 69,139,783 | 69,373,863 | 69,369,050 | 69,053,341 | 69,369,050 | |||||||||||||||||||||
| Book value per share (period end) | $ | 49.62 | $ | 48.41 | $ | 47.51 | $ | 46.89 | $ | 46.09 | $ | 49.62 | $ | 46.09 | ||||||||||||||
| Tangible book value per share (period end) | $ | 33.64 | $ | 32.38 | $ | 31.42 | $ | 30.79 | $ | 29.92 | $ | 33.64 | $ | 29.92 | ||||||||||||||
AMERIS BANCORP AND SUBSIDIARIES
FINANCIAL TABLES
Non-GAAP Reconciliations (continued)
| Tangible Common Equity to Tangible Assets | Table 9D |
| Three Months Ended | Twelve Months Ended | |||||||||||||||||||||||||||
| Dec | Sep | Jun | Mar | Dec | Dec | Dec | ||||||||||||||||||||||
| (dollars in thousands except per share data) | 2023 | 2023 | 2023 | 2023 | 2022 | 2023 | 2022 | |||||||||||||||||||||
| Total shareholders' equity | $ | 3,426,747 | $ | 3,347,069 | $ | 3,284,630 | $ | 3,253,195 | $ | 3,197,400 | $ | 3,426,747 | $ | 3,197,400 | ||||||||||||||
| Less: | ||||||||||||||||||||||||||||
| Goodwill | 1,015,646 | 1,015,646 | 1,015,646 | 1,015,646 | 1,015,646 | 1,015,646 | 1,015,646 | |||||||||||||||||||||
| Other intangibles, net | 87,949 | 92,375 | 96,800 | 101,488 | 106,194 | 87,949 | 106,194 | |||||||||||||||||||||
| Total tangible shareholders' equity | $ | 2,323,152 | $ | 2,239,048 | $ | 2,172,184 | $ | 2,136,061 | $ | 2,075,560 | $ | 2,323,152 | $ | 2,075,560 | ||||||||||||||
| Total assets | $ | 25,203,699 | $ | 25,697,830 | $ | 25,800,618 | $ | 26,088,384 | $ | 25,053,286 | $ | 25,203,699 | $ | 25,053,286 | ||||||||||||||
| Less: | ||||||||||||||||||||||||||||
| Goodwill | 1,015,646 | 1,015,646 | 1,015,646 | 1,015,646 | 1,015,646 | 1,015,646 | 1,015,646 | |||||||||||||||||||||
| Other intangibles, net | 87,949 | 92,375 | 96,800 | 101,488 | 106,194 | 87,949 | 106,194 | |||||||||||||||||||||
| Total tangible assets | $ | 24,100,104 | $ | 24,589,809 | $ | 24,688,172 | $ | 24,971,250 | $ | 23,931,446 | $ | 24,100,104 | $ | 23,931,446 | ||||||||||||||
| Equity to Assets | 13.60 | % | 13.02 | % | 12.73 | % | 12.47 | % | 12.76 | % | 13.60 | % | 12.76 | % | ||||||||||||||
| Tangible Common Equity to Tangible Assets | 9.64 | % | 9.11 | % | 8.80 | % | 8.55 | % | 8.67 | % | 9.64 | % | 8.67 | % | ||||||||||||||
AMERIS BANCORP AND SUBSIDIARIES
FINANCIAL TABLES
| Segment Reporting | Table 10 |
| Three Months Ended | Twelve Months Ended | |||||||||||||||||||||||||||
| Dec | Sep | Jun | Mar | Dec | Dec | Dec | ||||||||||||||||||||||
| (dollars in thousands) | 2023 | 2023 | 2023 | 2023 | 2022 | 2023 | 2022 | |||||||||||||||||||||
| Banking Division | ||||||||||||||||||||||||||||
| Net interest income | $ | 166,114 | $ | 167,595 | $ | 171,441 | $ | 175,328 | $ | 185,909 | $ | 680,478 | $ | 646,283 | ||||||||||||||
| Provision for credit losses | 21,194 | 20,833 | 40,831 | 47,140 | 35,946 | 129,998 | 61,898 | |||||||||||||||||||||
| Noninterest income | 24,069 | 26,245 | 24,652 | 23,898 | 23,448 | 98,864 | 91,550 | |||||||||||||||||||||
| Noninterest expense | ||||||||||||||||||||||||||||
| Salaries and employee benefits | 55,687 | 56,226 | 55,196 | 56,442 | 52,296 | 223,551 | 196,823 | |||||||||||||||||||||
| Occupancy and equipment expenses | 11,865 | 11,437 | 11,175 | 11,606 | 11,482 | 46,083 | 45,081 | |||||||||||||||||||||
| Data processing and telecommunications expenses | 12,540 | 11,786 | 11,898 | 11,797 | 11,085 | 48,021 | 43,957 | |||||||||||||||||||||
| Other noninterest expenses | 33,089 | 20,274 | 27,643 | 19,023 | 21,811 | 100,029 | 85,953 | |||||||||||||||||||||
| Total noninterest expense | 113,181 | 99,723 | 105,912 | 98,868 | 96,674 | 417,684 | 371,814 | |||||||||||||||||||||
| Income before income tax expense | 55,808 | 73,284 | 49,350 | 53,218 | 76,737 | 231,660 | 304,121 | |||||||||||||||||||||
| Income tax expense | 17,206 | 18,283 | 13,312 | 12,848 | 16,545 | 61,649 | 75,367 | |||||||||||||||||||||
| Net income | $ | 38,602 | $ | 55,001 | $ | 36,038 | $ | 40,370 | $ | 60,192 | $ | 170,011 | $ | 228,754 | ||||||||||||||
| Retail Mortgage Division | ||||||||||||||||||||||||||||
| Net interest income | $ | 24,053 | $ | 22,805 | $ | 21,417 | $ | 20,027 | $ | 19,837 | $ | 88,302 | $ | 79,194 | ||||||||||||||
| Provision for credit losses | 1,005 | 2,399 | 3,278 | 2,853 | (2,778 | ) | 9,535 | 12,351 | ||||||||||||||||||||
| Noninterest income | 30,588 | 35,691 | 39,808 | 31,058 | 24,011 | 137,145 | 182,039 | |||||||||||||||||||||
| Noninterest expense | ||||||||||||||||||||||||||||
| Salaries and employee benefits | 16,996 | 21,231 | 21,930 | 20,160 | 19,164 | 80,317 | 107,810 | |||||||||||||||||||||
| Occupancy and equipment expenses | 1,210 | 1,182 | 1,224 | 1,283 | 1,242 | 4,899 | 5,579 | |||||||||||||||||||||
| Data processing and telecommunications expenses | 1,318 | 1,052 | 1,397 | 1,069 | 1,203 | 4,836 | 4,580 | |||||||||||||||||||||
| Other noninterest expenses | 11,634 | 12,153 | 11,859 | 11,747 | 11,126 | 47,393 | 48,224 | |||||||||||||||||||||
| Total noninterest expense | 31,158 | 35,618 | 36,410 | 34,259 | 32,735 | 137,445 | 166,193 | |||||||||||||||||||||
| Income before income tax expense | 22,478 | 20,479 | 21,537 | 13,973 | 13,891 | 78,467 | 82,689 | |||||||||||||||||||||
| Income tax expense | 4,720 | 4,301 | 4,523 | 2,934 | 2,916 | 16,478 | 17,364 | |||||||||||||||||||||
| Net income | $ | 17,758 | $ | 16,178 | $ | 17,014 | $ | 11,039 | $ | 10,975 | $ | 61,989 | $ | 65,325 | ||||||||||||||
| Warehouse Lending Division | ||||||||||||||||||||||||||||
| Net interest income | $ | 5,965 | $ | 6,008 | $ | 6,166 | $ | 5,700 | $ | 6,601 | $ | 23,839 | $ | 26,727 | ||||||||||||||
| Provision for credit losses | (68 | ) | (589 | ) | 411 | (194 | ) | 117 | (440 | ) | (1,074 | ) | ||||||||||||||||
| Noninterest income | 929 | 662 | 1,404 | 480 | 579 | 3,475 | 4,537 | |||||||||||||||||||||
| Noninterest expense | ||||||||||||||||||||||||||||
| Salaries and employee benefits | 296 | 924 | 772 | 802 | 427 | 2,794 | 1,973 | |||||||||||||||||||||
| Occupancy and equipment expenses | 3 | 1 | — | 1 | 1 | 5 | 4 | |||||||||||||||||||||
| Data processing and telecommunications expenses | 51 | 30 | 44 | 46 | 49 | 171 | 187 | |||||||||||||||||||||
| Other noninterest expenses | 229 | 219 | 223 | 202 | 191 | 873 | 830 | |||||||||||||||||||||
| Total noninterest expense | 579 | 1,174 | 1,039 | 1,051 | 668 | 3,843 | 2,994 | |||||||||||||||||||||
| Income before income tax expense | 6,383 | 6,085 | 6,120 | 5,323 | 6,395 | 23,911 | 29,344 | |||||||||||||||||||||
| Income tax expense | 1,340 | 1,278 | 1,285 | 1,118 | 1,342 | 5,021 | 6,162 | |||||||||||||||||||||
| Net income | $ | 5,043 | $ | 4,807 | $ | 4,835 | $ | 4,205 | $ | 5,053 | $ | 18,890 | $ | 23,182 | ||||||||||||||
AMERIS BANCORP AND SUBSIDIARIES
FINANCIAL TABLES
| Segment Reporting (continued) | Table 10 |
| Three Months Ended | Twelve Months Ended | |||||||||||||||||||||||||||
| Dec | Sep | Jun | Mar | Dec | Dec | Dec | ||||||||||||||||||||||
| (dollars in thousands) | 2023 | 2023 | 2023 | 2023 | 2022 | 2023 | 2022 | |||||||||||||||||||||
| SBA Division | ||||||||||||||||||||||||||||
| Net interest income | $ | 2,168 | $ | 1,962 | $ | 2,331 | $ | 1,957 | $ | 2,491 | $ | 8,418 | $ | 14,724 | ||||||||||||||
| Provision for credit losses | 794 | 1,677 | 424 | (104 | ) | 265 | 2,791 | (349 | ) | |||||||||||||||||||
| Noninterest income | 653 | 579 | 1,476 | 605 | 302 | 3,313 | 6,265 | |||||||||||||||||||||
| Noninterest expense | ||||||||||||||||||||||||||||
| Salaries and employee benefits | 1,014 | 1,209 | 1,316 | 1,309 | 1,306 | 4,848 | 5,305 | |||||||||||||||||||||
| Occupancy and equipment expenses | 36 | 36 | 40 | 37 | 98 | 149 | 360 | |||||||||||||||||||||
| Data processing and telecommunications expenses | 19 | 32 | 46 | 37 | 30 | 134 | 116 | |||||||||||||||||||||
| Other noninterest expenses | (189 | ) | 157 | 333 | 422 | 368 | 723 | 1,387 | ||||||||||||||||||||
| Total noninterest expense | 880 | 1,434 | 1,735 | 1,805 | 1,802 | 5,854 | 7,168 | |||||||||||||||||||||
| Income before income tax expense | 1,147 | (570 | ) | 1,648 | 861 | 726 | 3,086 | 14,170 | ||||||||||||||||||||
| Income tax expense | 241 | (120 | ) | 346 | 181 | 153 | 648 | 2,976 | ||||||||||||||||||||
| Net income | $ | 906 | $ | (450 | ) | $ | 1,302 | $ | 680 | $ | 573 | $ | 2,438 | $ | 11,194 | |||||||||||||
| Premium Finance Division | ||||||||||||||||||||||||||||
| Net interest income | $ | 7,801 | $ | 9,381 | $ | 8,185 | $ | 8,640 | $ | 9,299 | $ | 34,007 | $ | 34,098 | ||||||||||||||
| Provision for credit losses | 27 | 139 | 572 | 34 | (660 | ) | 772 | (1,129 | ) | |||||||||||||||||||
| Noninterest income | 9 | 4 | 9 | 9 | 8 | 31 | 33 | |||||||||||||||||||||
| Noninterest expense | ||||||||||||||||||||||||||||
| Salaries and employee benefits | 1,973 | 2,308 | 2,122 | 2,197 | 2,003 | 8,600 | 7,808 | |||||||||||||||||||||
| Occupancy and equipment expenses | 83 | 89 | 83 | 59 | 82 | 314 | 337 | |||||||||||||||||||||
| Data processing and telecommunications expenses | 100 | 73 | 66 | 85 | 119 | 324 | 388 | |||||||||||||||||||||
| Other noninterest expenses | 1,057 | 1,027 | 1,036 | 1,097 | 978 | 4,217 | 3,953 | |||||||||||||||||||||
| Total noninterest expense | 3,213 | 3,497 | 3,307 | 3,438 | 3,182 | 13,455 | 12,486 | |||||||||||||||||||||
| Income before income tax expense | 4,570 | 5,749 | 4,315 | 5,177 | 6,785 | 19,811 | 22,774 | |||||||||||||||||||||
| Income tax expense | 945 | 1,170 | 869 | 1,050 | 1,357 | 4,034 | 4,689 | |||||||||||||||||||||
| Net income | $ | 3,625 | $ | 4,579 | $ | 3,446 | $ | 4,127 | $ | 5,428 | $ | 15,777 | $ | 18,085 | ||||||||||||||
| Total Consolidated | ||||||||||||||||||||||||||||
| Net interest income | $ | 206,101 | $ | 207,751 | $ | 209,540 | $ | 211,652 | $ | 224,137 | $ | 835,044 | $ | 801,026 | ||||||||||||||
| Provision for credit losses | 22,952 | 24,459 | 45,516 | 49,729 | 32,890 | 142,656 | 71,697 | |||||||||||||||||||||
| Noninterest income | 56,248 | 63,181 | 67,349 | 56,050 | 48,348 | 242,828 | 284,424 | |||||||||||||||||||||
| Noninterest expense | ||||||||||||||||||||||||||||
| Salaries and employee benefits | 75,966 | 81,898 | 81,336 | 80,910 | 75,196 | 320,110 | 319,719 | |||||||||||||||||||||
| Occupancy and equipment expenses | 13,197 | 12,745 | 12,522 | 12,986 | 12,905 | 51,450 | 51,361 | |||||||||||||||||||||
| Data processing and telecommunications expenses | 14,028 | 12,973 | 13,451 | 13,034 | 12,486 | 53,486 | 49,228 | |||||||||||||||||||||
| Other noninterest expenses | 45,820 | 33,830 | 41,094 | 32,491 | 34,474 | 153,235 | 140,347 | |||||||||||||||||||||
| Total noninterest expense | 149,011 | 141,446 | 148,403 | 139,421 | 135,061 | 578,281 | 560,655 | |||||||||||||||||||||
| Income before income tax expense | 90,386 | 105,027 | 82,970 | 78,552 | 104,534 | 356,935 | 453,098 | |||||||||||||||||||||
| Income tax expense | 24,452 | 24,912 | 20,335 | 18,131 | 22,313 | 87,830 | 106,558 | |||||||||||||||||||||
| Net income | $ | 65,934 | $ | 80,115 | $ | 62,635 | $ | 60,421 | $ | 82,221 | $ | 269,105 | $ | 346,540 | ||||||||||||||
Exhibit 99.2


4 th Quarter 2023 Results Investor Presentation Cautionary Statements 1 This presentation contains forward - looking statements, as defined by federal securities laws, including, among other forward - looking statements, certain plans, expectations and goals . Words such as “may,” “believe,” “expect,” “anticipate,” “intend,” “will,” “should,” “plan,” “estimate,” “predict,” “continue” and “potential” or the negative of these terms or other comparable terminology, as well as similar expressions, are meant to identify forward - looking statements . The forward - looking statements in this presentation are based on current expectations and are provided to assist in the understanding of potential future performance . Such forward - looking statements involve numerous assumptions, risks and uncertainties that may cause actual results to differ materially from those expressed or implied in any such statements, including, without limitation, the following : general competitive, economic, unemployment, political and market conditions and fluctuations, including real estate market conditions, and the effects of such conditions and fluctuations on the creditworthiness of borrowers, collateral values, asset recovery values and the value of investment securities ; movements in interest rates and their impacts on net interest margin, investment security valuations and other performance measures ; expectations on credit quality and performance ; legislative and regulatory changes ; changes in U . S . government monetary and fiscal policy ; competitive pressures on product pricing and services ; the success and timing of other business strategies ; our outlook and long - term goals for future growth ; and natural disasters, geopolitical events, acts of war or terrorism or other hostilities, public health crises and other catastrophic events beyond our control . For a discussion of some of the other risks and other factors that may cause such forward - looking statements to differ materially from actual results, please refer to the Company’s filings with the Securities and Exchange Commission, including the Company’s Annual Report on Form 10 - K for the year ended December 31 , 2022 and the Company’s subsequently filed periodic reports and other filings . Forward - looking statements speak only as of the date they are made, and the Company undertakes no obligation to update or revise forward - looking statements .

Ameris Profile Investment Rationale • Top of peer financial results with culture of discipline – credit, liquidity, expense control, capital • Proven liquidity management supported by strong, stable deposit base • Proven stewards of shareholder value – TBV has grown 12 % annualized over past five years • Experienced executive team with skills and leadership to continue to grow organically • Diversified loan portfolio among geographies and product lines • Diversified revenue streams with strong core bank and lines of business Strong Southeastern Markets • Atlanta’s premier independent banking franchise • Scarcity value in many of the fastest growing regions in nation • Stable core deposit base • Over 65% of our franchise is in MSAs which grew at least 2x the national average over the last 15 years 2 Charlotte MSA Tampa MSA Orlando MSA Ameris Profile 4Q23 includes the impact of $11.6 million FDIC special assessment Focus on Shareholder Value 1 – Considered Non - GAAP measures – See reconciliation of GAAP to Non - GAAP measures in Appendix $29.92 $30.79 $31.42 $32.38 $33.64 $28.00 $29.00 $30.00 $31.00 $32.00 $33.00 $34.00 4Q22 1Q23 2Q23 3Q23 4Q23 Consistent Tangible Book Value (1) Growth 137,424 128,281 128,486 129,486 113,338 1.50% 2.00% 2.50% 3.00% 3.50% 4.00% 100,000 105,000 110,000 115,000 120,000 125,000 130,000 135,000 140,000 145,000 4Q22 1Q23 2Q23 3Q23 4Q23 Stable pre - tax pre - provision net revenue ROA (1) (in 000's) PPNR PPNR ROA $1.18 $0.87 $0.91 $1.16 $0.96 $0.00 $0.20 $0.40 $0.60 $0.80 $1.00 $1.20 $1.40 4Q22 1Q23 2Q23 3Q23 4Q23 Diluted EPS $19.5 $19.9 $20.4 $20.6 $20.7 $18.8 $19.0 $19.2 $19.4 $19.6 $19.8 $20.0 $20.2 $20.4 $20.6 $20.8 $21.0 4Q22 1Q23 2Q23 3Q23 4Q23 Total Deposits (in billions) 3


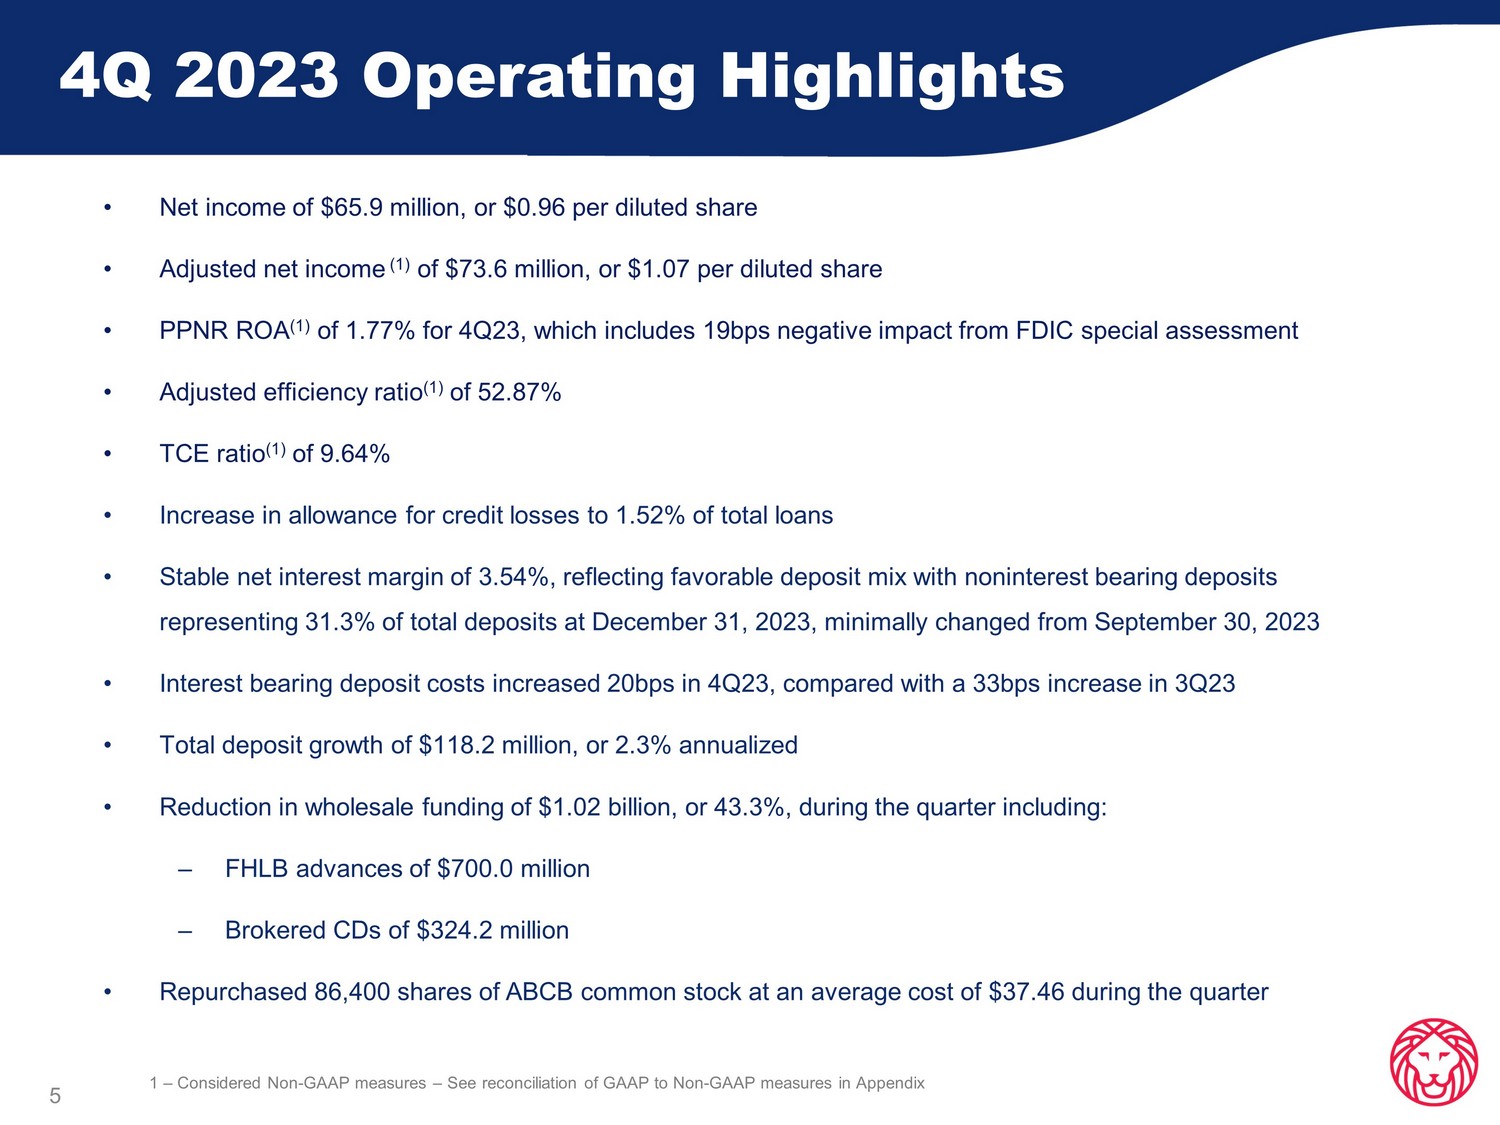
4 th Quarter 2023 Financial Results 4Q 2023 Operating Highlights 5 • Net income of $65.9 million, or $0.96 per diluted share • Adjusted net income (1) of $73.6 million, or $1.07 per diluted share • PPNR ROA (1) of 1.77% for 4Q23, which includes 19bps negative impact from FDIC special assessment • Adjusted efficiency ratio (1) of 52.87% • TCE ratio (1) of 9.64% • Increase in allowance for credit losses to 1.52% of total loans • Stable net interest margin of 3.54%, reflecting favorable deposit mix with noninterest bearing deposits representing 31.3% of total deposits at December 31, 2023, minimally changed from September 30, 2023 • Interest bearing deposit costs increased 20bps in 4Q23, compared with a 33bps increase in 3Q23 • Total deposit growth of $118.2 million, or 2.3% annualized • Reduction in wholesale funding of $1.02 billion, or 43.3%, during the quarter including: – FHLB advances of $700.0 million – Brokered CDs of $324.2 million • Repurchased 86,400 shares of ABCB common stock at an average cost of $37.46 during the quarter 1 – Considered Non - GAAP measures – See reconciliation of GAAP to Non - GAAP measures in Appendix 2023 Operating Highlights 6 • Net income of $269.1 million, or $3.89 per diluted share • Adjusted net income (1) of $276.3 million, or $4.00 per diluted share • PPNR ROA (1) of 1.97%, which includes 4bps negative impact from FDIC special assessment • Growth in tangible book value (1) of $3.72 per share, or 12.4%, to $33.64 • Adjusted efficiency ratio (1) of 52.58% • Net interest margin of 3.61% • Organic loan growth of $414.1 million, or 2.1% • Total deposit growth of $1.25 billion, or 6.4% • Reduction in FHLB Advances of $1.30 billion • Increase in allowance for credit losses to 1.52% of total loans at December 31, 2023, compared with 1.04% at December 31, 2022, due to economic forecast • Redemption of $75 million in floating rate (was 8.39%) subordinated notes due 2027 and repurchase (at a discount) and redemption of $12.0 million aggregate principal of 4.25% fixed - to - floating subordinated notes due 2029 1 – Considered Non - GAAP measures – See reconciliation of GAAP to Non - GAAP measures in Appendix


Financial Highlights 7 1 – Considered Non - GAAP measures – See reconciliation of GAAP to Non - GAAP measures in Appendix 2 – Growth rates are annualized for the applicable periods 3 – Excludes serviced GNMA - guaranteed mortgage loans (dollars in thousands, except per share data) Quarter to Date Results Year to Date Results 4Q23 3Q23 Change 4Q22 Change 2023 2022 Change Net Interest Income $ 206,101 $ 207,751 - 1% $ 224,137 - 8% $ 835,044 $ 801,026 4% Noninterest Income $ 56,248 $ 63,181 - 11% $ 48,348 16% $ 242,828 $ 284,424 - 15% Provision for Credit Losses $ 22,952 $ 24,459 - 6% $ 32,890 - 30% $ 142,656 $ 71,697 99% Noninterest Expense $ 149,011 $ 141,446 5% $ 135,061 10% $ 578,281 $ 560,655 3% Net Income $ 65,934 $ 80,115 - 18% $ 82,221 - 20% $ 269,105 $ 346,540 - 22% Net Income Per Diluted Share $ 0.96 $ 1.16 - 17% $ 1.18 - 19% $ 3.89 $ 4.99 - 22% Return on Average Assets 1.03% 1.25% - 17% 1.34% - 23% 1.06% 1.47% - 28% Return on Average Equity 7.73% 9.56% - 19% 10.30% - 25% 8.12% 11.24% - 28% Efficiency Ratio 56.80% 52.21% 9% 49.57% 15% 53.65% 51.65% 4% Net Interest Margin 3.54% 3.54% 0% 4.03% - 12% 3.61% 3.76% - 4% Adjusted Net Income (1) $ 73,568 $ 80,115 - 8% $ 81,086 - 9% $ 276,253 $ 329,415 - 16% Adjusted Net Income Per Diluted Share (1) $ 1.07 $ 1.16 - 8% $ 1.17 - 9% $ 4.00 $ 4.75 - 16% Adjusted Return on Assets (1) 1.15% 1.25% - 8% 1.32% - 13% 1.09% 1.39% - 22% Adjusted Return on TCE (1) 12.81% 14.35% - 11% 15.78% - 19% 12.55% 16.92% - 26% Adjusted Efficiency Ratio (1) 52.87% 52.02% 2% 49.61% 7% 52.58% 52.48% 0% Organic Loan Growth $ 68,224 $ (270,680) - 125% $ 576,131 - 88% $ 414,050 $ 3,508,729 - 88% Organic Loan Growth Rate (2) 1.35% - 5.29% - 126% 12.25% - 89% 2.09% 22.10% - 91% Portfolio NPAs/Assets (3) 0.33% 0.27% 24% 0.34% 0% 0.33% 0.34% 0% Total NPAs/Assets 0.69% 0.58% 19% 0.61% 13% 0.69% 0.61% 13% Strong Net Interest Margin 8 • Above peer group margin at 3.54% • Net interest income (TE) of $207.0 million in 4Q23, compared with $208.7 million in 3Q23 – Interest income (TE) increased $1.7 million – Interest expense increased $3.3 million • Average earning assets decreased $164.8 million • Total deposit costs up 16bp in 4Q23, compared with a 24bp increase in 3Q23 • Noninterest bearing deposits remain above historic levels and were 31.3% of total deposits at quarter end • Average brokered CDs down $319.2 million during the quarter • Average FHLB advances down $405.8 million during the quarter Spread Income and Margin $225.1 $212.6 $210.5 $208.7 $207.0 4.03% 3.76% 3.60% 3.54% 3.54% 3.25% 3.50% 3.75% 4.00% 4.25% 4.50% 4.75% 5.00% 5.25% $195.0 $200.0 $205.0 $210.0 $215.0 $220.0 $225.0 $230.0 4Q22 1Q23 2Q23 3Q23 4Q23 Net Interest Income (TE) (in millions) NIM


Diversified Revenue Stream 9 • Strong revenue base of net interest income from core banking division • Additional revenue provided by our diversified lines of business Mortgage Banking Activity • Retail mortgage activity has continued to stabilize back to pre - pandemic levels • Mortgage banking activity was 12% of total revenue in 4Q23 • Purchase business remained at 85% in 4Q23 due to strong core relationships with builders and realtors • Approximately 88% of the net interest income included in mortgage revenue is related to portfolio loans generated from the mortgage division • Gain on sale margin remains compressed at 1.93% in 4Q23 Other Noninterest Income • Other Noninterest Income has been stable contributor to total revenue • Other Noninterest Income includes: • Fee income from equipment finance group • BOLI income • Gains on sales of SBA loans 82% 79% 76% 77% 79% 9% 12% 15% 13% 12% 9% 9% 9% 10% 9% $273.4 $268.6 $277.8 $271.9 $263.3 0% 20% 40% 60% 80% 100% 120% 4Q22 1Q23 2Q23 3Q23 4Q23 FTE Revenue Sources (in millions) FTE Net Interest Income Mortgage Banking Activity Other Noninterest Income 1.93% 0.00% 0.50% 1.00% 1.50% 2.00% 2.50% 4Q22 1Q23 2Q23 3Q23 4Q23 Mortgage Gain on Sale Margin Disciplined Expense Control Adjusted Operating Expenses (1) and Efficiency Ratio (1) OPEX Highlights 10 • Management continues to deliver high performing operating efficiency • Adjusted efficiency ratio of 52.87% in 4Q23, compared with 52.02% in 3Q23 • Total adjusted operating expenses decreased $2.1 million in 4Q23 compared with 3Q23 ‒ Increase of $3.3 million in 4Q23 banking division operating expenses primarily due to: ‒ $1.1 million increase in credit resolution - related expenses primarily resulting from lower OREO gains ‒ $1.1 million increase in legal and professional fees ‒ $754,000 increase in data processing and communications expenses – Net decrease of $5.4 million in 4Q23 lines of business operating expenses due to variable compensation related to production decreases • Disciplined expense control throughout the Company with identified reallocation of resources utilized to fund future technology and innovation costs 1 – Considered Non - GAAP measures – See reconciliation of GAAP to Non - GAAP measures in Appendix $96.4 $98.9 $105.9 $99.7 $103.0 $38.4 $40.6 $42.5 $41.7 $36.3 20.0 40.0 60.0 80.0 100.0 120.0 140.0 160.0 180.0 4Q22 1Q23 2Q23 3Q23 4Q23 Adjusted Operating Expenses (in millions) Banking LOBs 49.61% 51.99% 53.41% 52.02% 52.87% 40.00% 45.00% 50.00% 55.00% 60.00% 65.00% 4Q22 1Q23 2Q23 3Q23 4Q23 Adjusted Efficiency Ratio
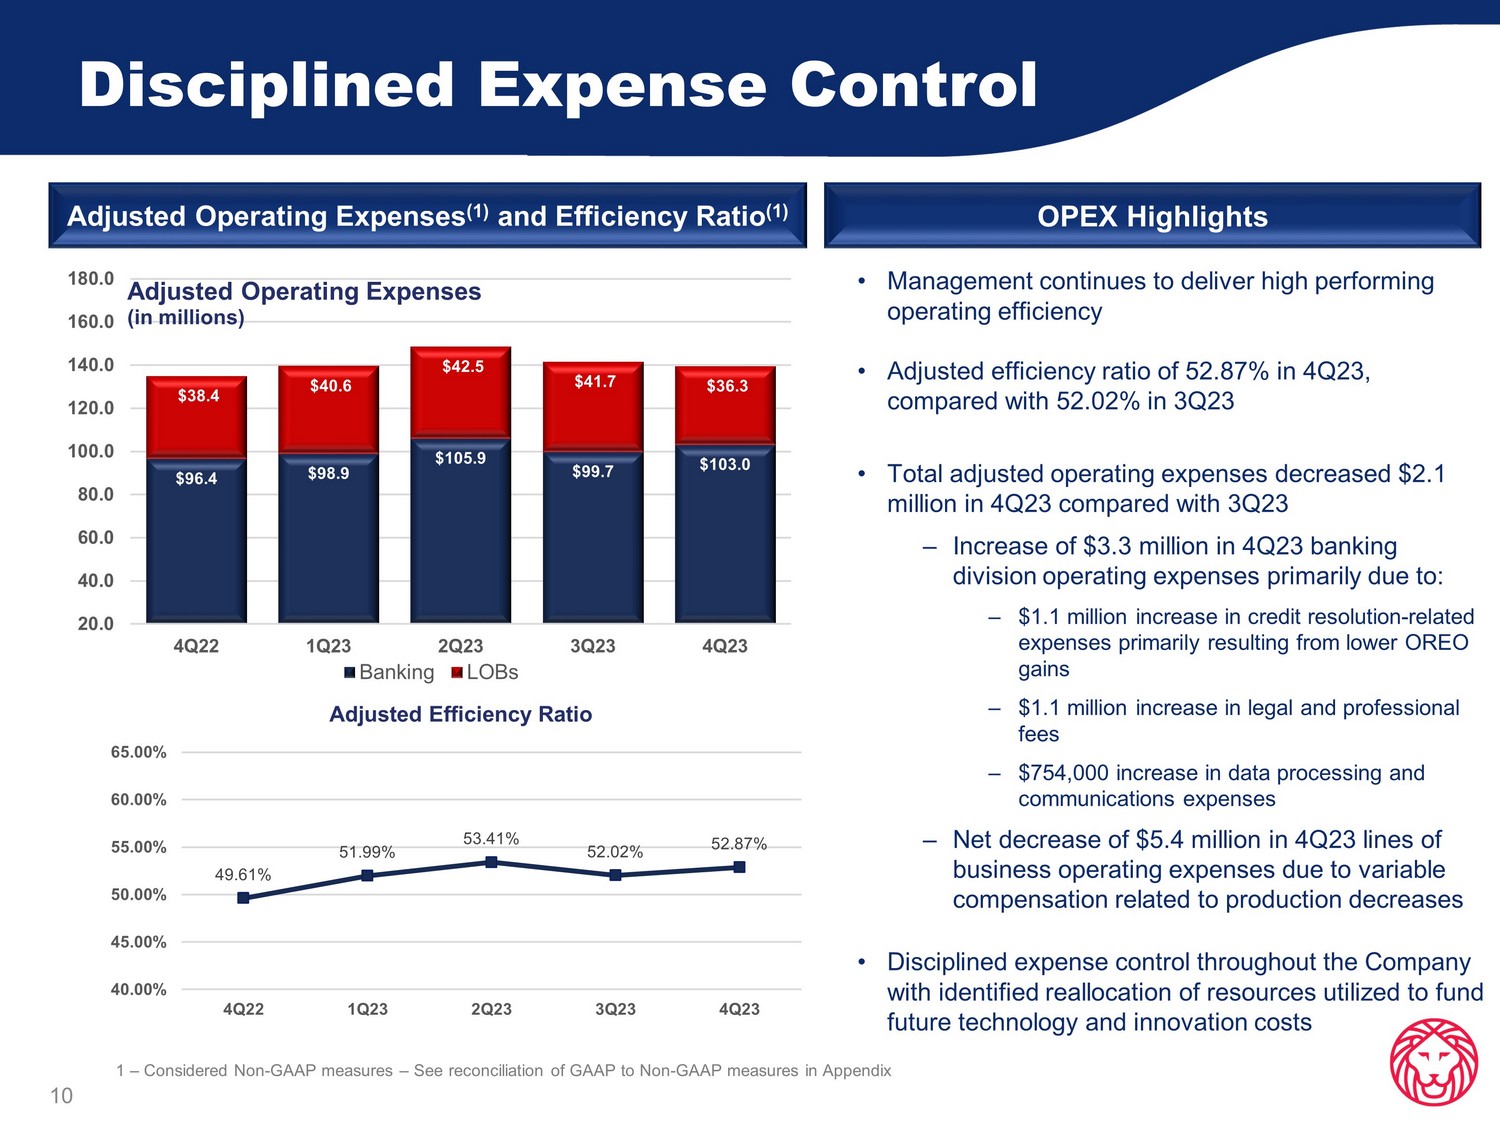
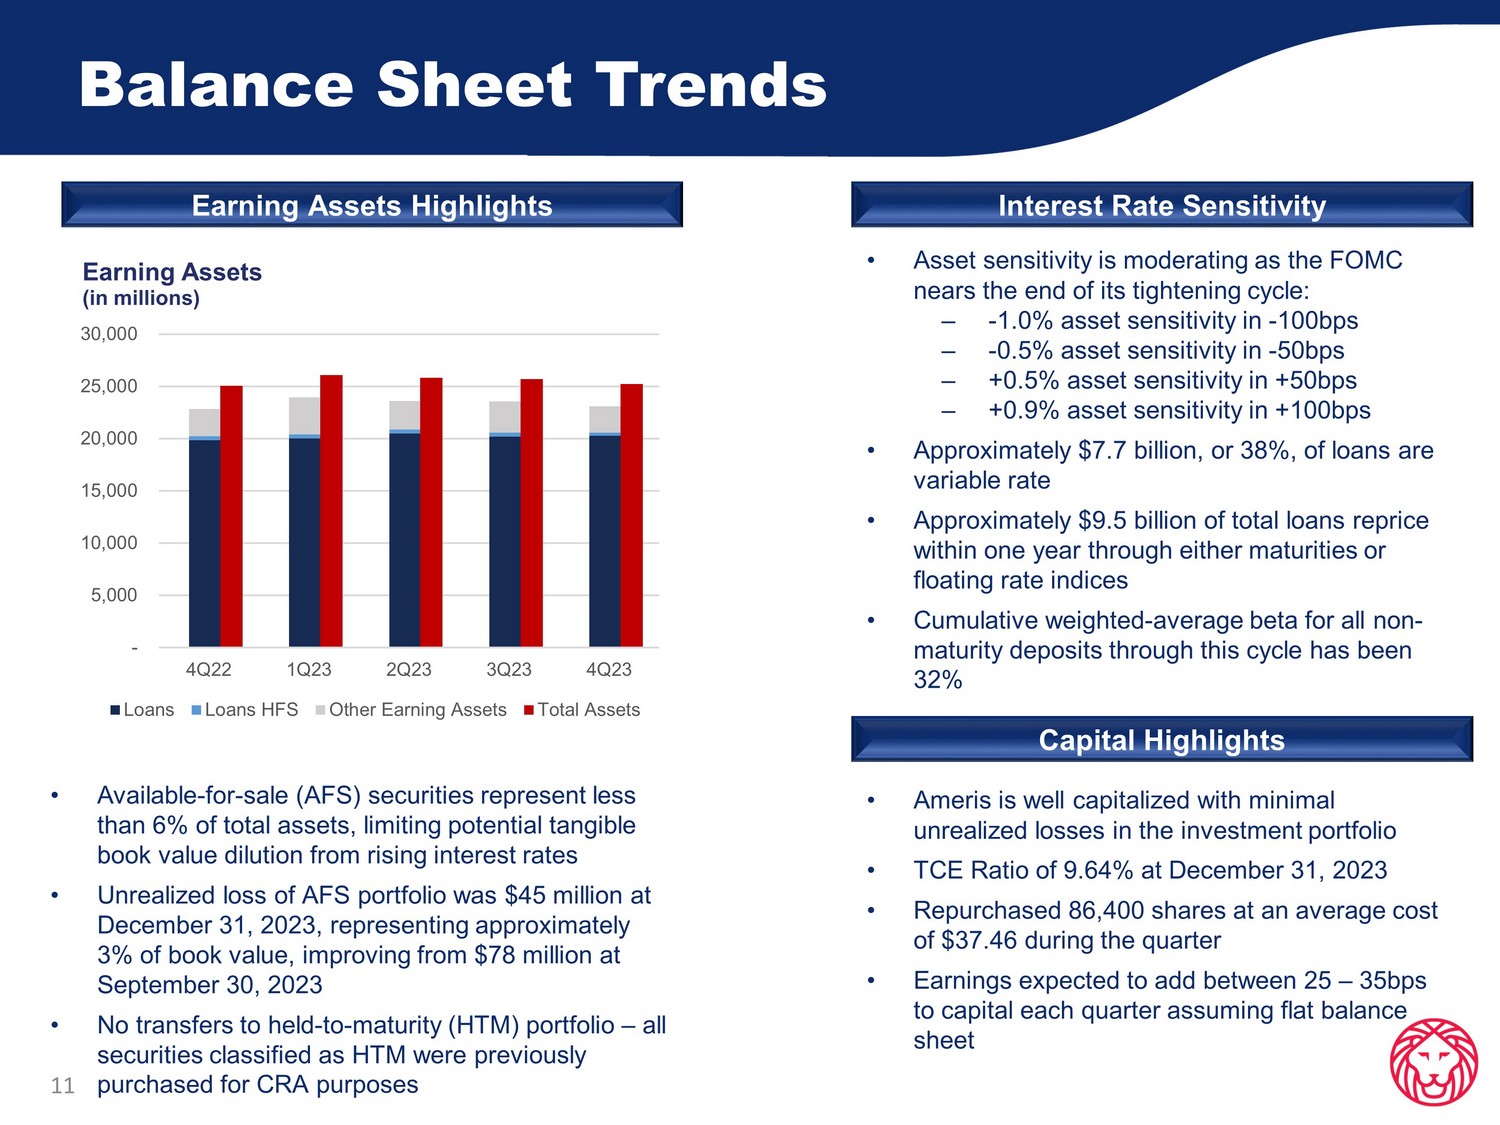
Balance Sheet Trends 11 • Asset sensitivity is moderating as the FOMC nears the end of its tightening cycle: – - 1.0% asset sensitivity in - 100bps – - 0.5% asset sensitivity in - 50bps – +0.5% asset sensitivity in +50bps – +0.9% asset sensitivity in +100bps • Approximately $7.7 billion, or 38%, of loans are variable rate • Approximately $9.5 billion of total loans reprice within one year through either maturities or floating rate indices • Cumulative weighted - average beta for all non - maturity deposits through this cycle has been 32% Interest Rate Sensitivity Earning Assets Highlights • Available - for - sale (AFS) securities represent less than 6% of total assets, limiting potential tangible book value dilution from rising interest rates • Unrealized loss of AFS portfolio was $45 million at December 31, 2023, representing approximately 3% of book value, improving from $78 million at September 30, 2023 • No transfers to held - to - maturity (HTM) portfolio – all securities classified as HTM were previously purchased for CRA purposes Capital Highlights • Ameris is well capitalized with minimal unrealized losses in the investment portfolio • TCE Ratio of 9.64% at December 31, 2023 • Repurchased 86,400 shares at an average cost of $37.46 during the quarter • Earnings expected to add between 25 – 35bps to capital each quarter assuming flat balance sheet - 5,000 10,000 15,000 20,000 25,000 30,000 4Q22 1Q23 2Q23 3Q23 4Q23 Earning Assets (in millions) Loans Loans HFS Other Earning Assets Total Assets Proven Liquidity Plan 12 At December 31, 2023 $ in millions Total Available Amount Used Net Availability Internal Sources Cash $ 1,167 $ - $ 1,167 Unpledged Securities 936 - 936 External Sources FHLB 5,424 1,148 4,276 FRB Discount Window 2,670 - 2,670 Brokered Deposits 2,935 1,145 1,790 Other 127 - 127 Total Liquidity $ 13,259 $ 2,293 $ 10,966 • Diverse sources of liquidity available to the Company • Minimal unrealized losses on unpledged securities due to disciplined investment strategy • Majority of funding used is short term to manage interest rate profile and provide flexibility as liquidity needs fluctuate • Have not accessed Bank Term Funding Program • Available liquidity sources provide approximately 120.1% coverage for uninsured deposits and approximately 169.1% coverage for non - collateralized uninsured deposits • No single depositor represents more than 1.3% of total deposits • Uninsured and uncollateralized deposits represent 31.1% of total deposits Sources of Liquidity Solid Liquidity Plan $9.13 (43.7%) $6.48 (31.1%) $0.0 $1.0 $2.0 $3.0 $4.0 $5.0 $6.0 $7.0 $8.0 $9.0 $10.0 4Q22 1Q23 2Q23 3Q23 4Q23 Uninsured Deposits (in billions) Uninsured Deposits Uninsured Deposits Excl.
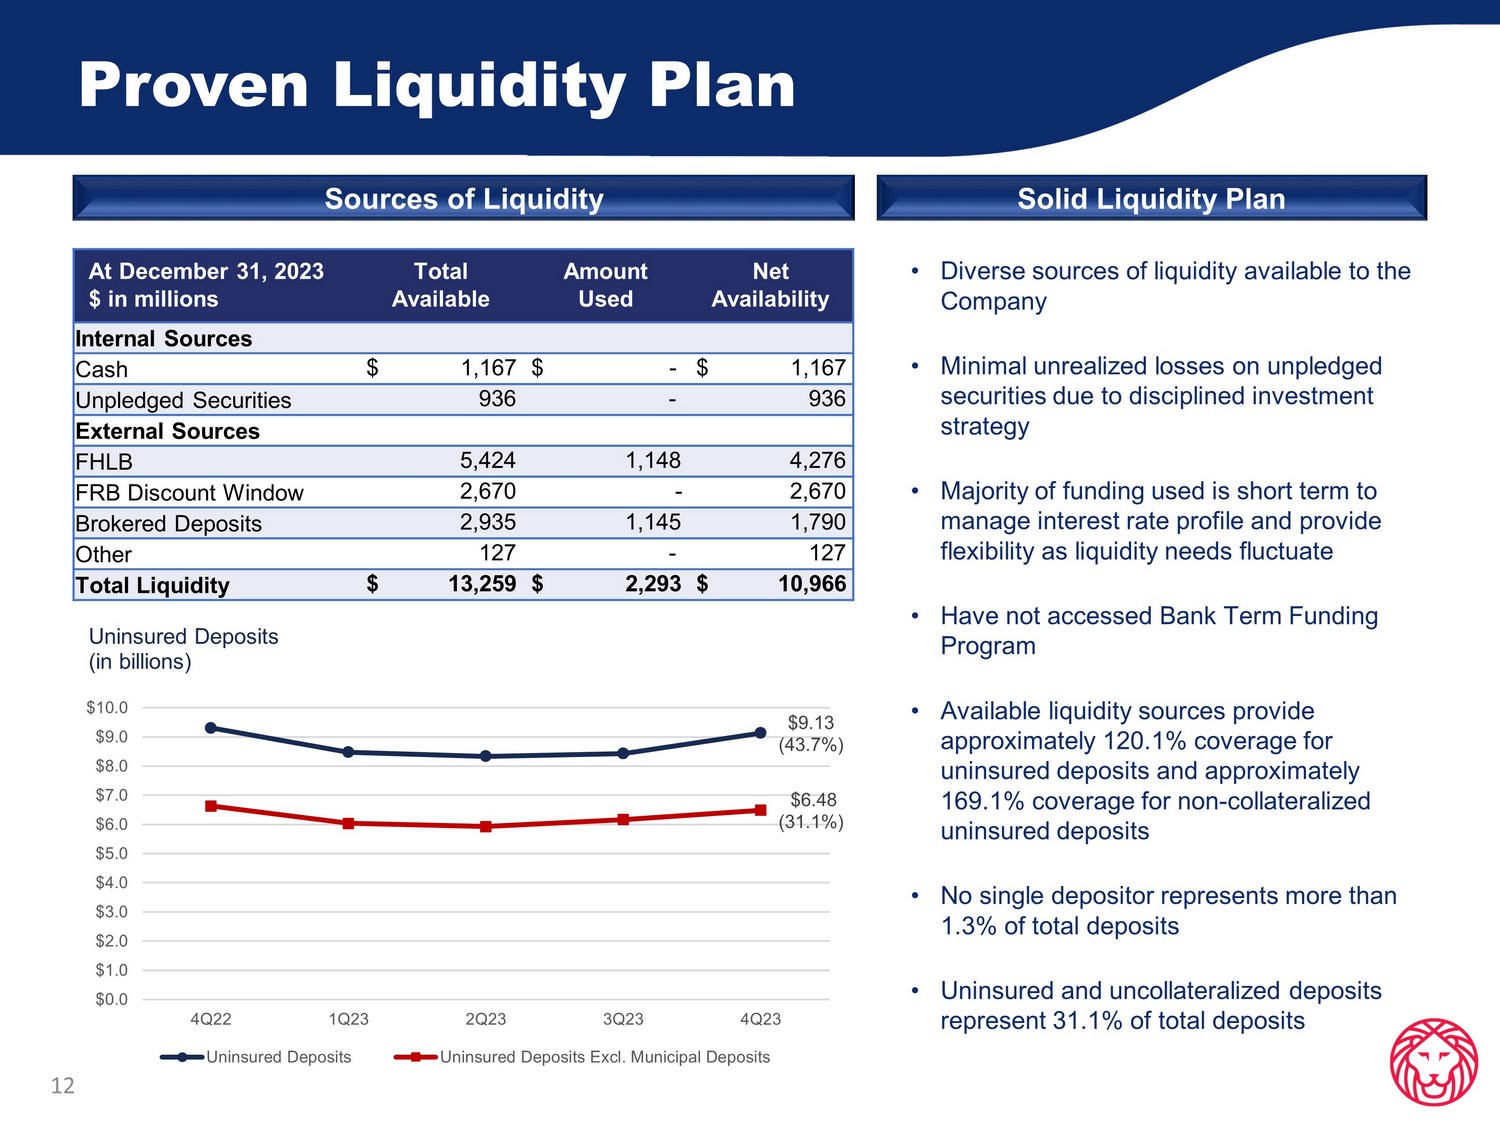
Municipal Deposits

Strong Core Deposit Base 13 Deposit Highlights • Noninterest bearing deposits remained strong at 31.3% of total deposits • Total deposits increased $118.2 million in 4Q23 compared with 3Q23 • MMDA and savings increased $127.2 million, or 1.9% • NOW accounts increased $364.6 million, or 10.1% • Noninterest - bearing deposits decreased $98.0 million, or 1.5% • Brokered CDs decreased $324.2 million, or 22.1% Deposit Type Balance (in 000s) Count Average per account (in 000’s) NIB 6,491,639 299,049 21.7 NOW 3,972,479 44,618 89.0 MMDA 5,968,135 31,697 188.3 Savings 808,350 64,560 12.5 CD 3,467,906 40,782 85.0 Total 20,708,509 480,706 43.1 Deposits by Product Type NIB 31% NOW 19% MMDA 29% Savings 4% CD 17% Deposits by Type 4Q23 Consumer 37% Commercial 43% Public 14% Brokered 6% Deposits by Customer 4Q23 18.83 19.73 20.81 20.29 20.81 20.44 20.90 22.46 23.69 25.27 26.45 27.46 26.26 26.84 27.89 28.62 29.92 30.79 31.42 32.38 33.64 $5.00 $10.00 $15.00 $20.00 $25.00 $30.00 $35.00 $40.00 4Q18 1Q19 2Q19 3Q19 4Q19 1Q20 2Q20 3Q20 4Q20 1Q21 2Q21 3Q21 4Q21 1Q22 2Q22 3Q22 4Q22 1Q23 2Q23 3Q23 4Q23 Tangible Book Value Capital and TBV Proven Stewards of Shareholder Value 14 • Management focused on long term growth in TBV (1) , such that over the past five years TBV has grown by 12% annualized • TBV increased $1.26 per share in 4Q23: – $0.81 from retained earnings – $0.36 from impact of OCI – $0.09 from all other items including stock compensation and share repurchases 1 – Considered Non - GAAP measures – See reconciliation of GAAP to Non - GAAP measures in Appendix Equipment Finance Acquisition LION Acquisition CECL Adoption


Loan Diversification and Credit Quality Diversified Loan Portfolio 4Q23 Loan Portfolio 16 • Loan portfolio is well diversified across loan types and geographies • CRE and C&D concentrations were 282% and 74%, respectively, at 4Q23 • Non - owner occupied office loans totaled $1.43 billion at 4Q23, or 7.0% of total loans • Continued strong asset quality metrics at 4Q23 as compared with 4Q22, as evidenced by a lower volume of Classified Loans and NPAs, net of GNMA - backed mortgage loans • ACL increased to 1.52% of total loans during 4Q23, which allows the Bank to be well - positioned to address forecasted negative economic conditions • Limited exposure in SNCs and syndications • Continued diligence by credit staff on portfolio reviews given the current economic environment, focused on maturing and floating - rate loans, particularly in C&D and investor CRE loans Portfolio Highlights Agriculture 1% C&I 22% Municipal 2% Consumer 1% Investor CRE 25% OO CRE 9% Construction 11% Multi - Family 5% SFR Mortgage & HELOC 24% Total Loans $20.3 Billion Loan Production vs Growth 17 • 4Q23 loan production was spread across various product lines and maintained good diversification in the portfolio • The largest categories contributing to 4Q23 production were Premium Finance, Homebuilder and Equipment Finance • Overall, 4Q23 production exhibited an 11% decrease from 3Q23 (1) Loan P roduction reflects committed balance total, excluding Mortgage Warehouse production.
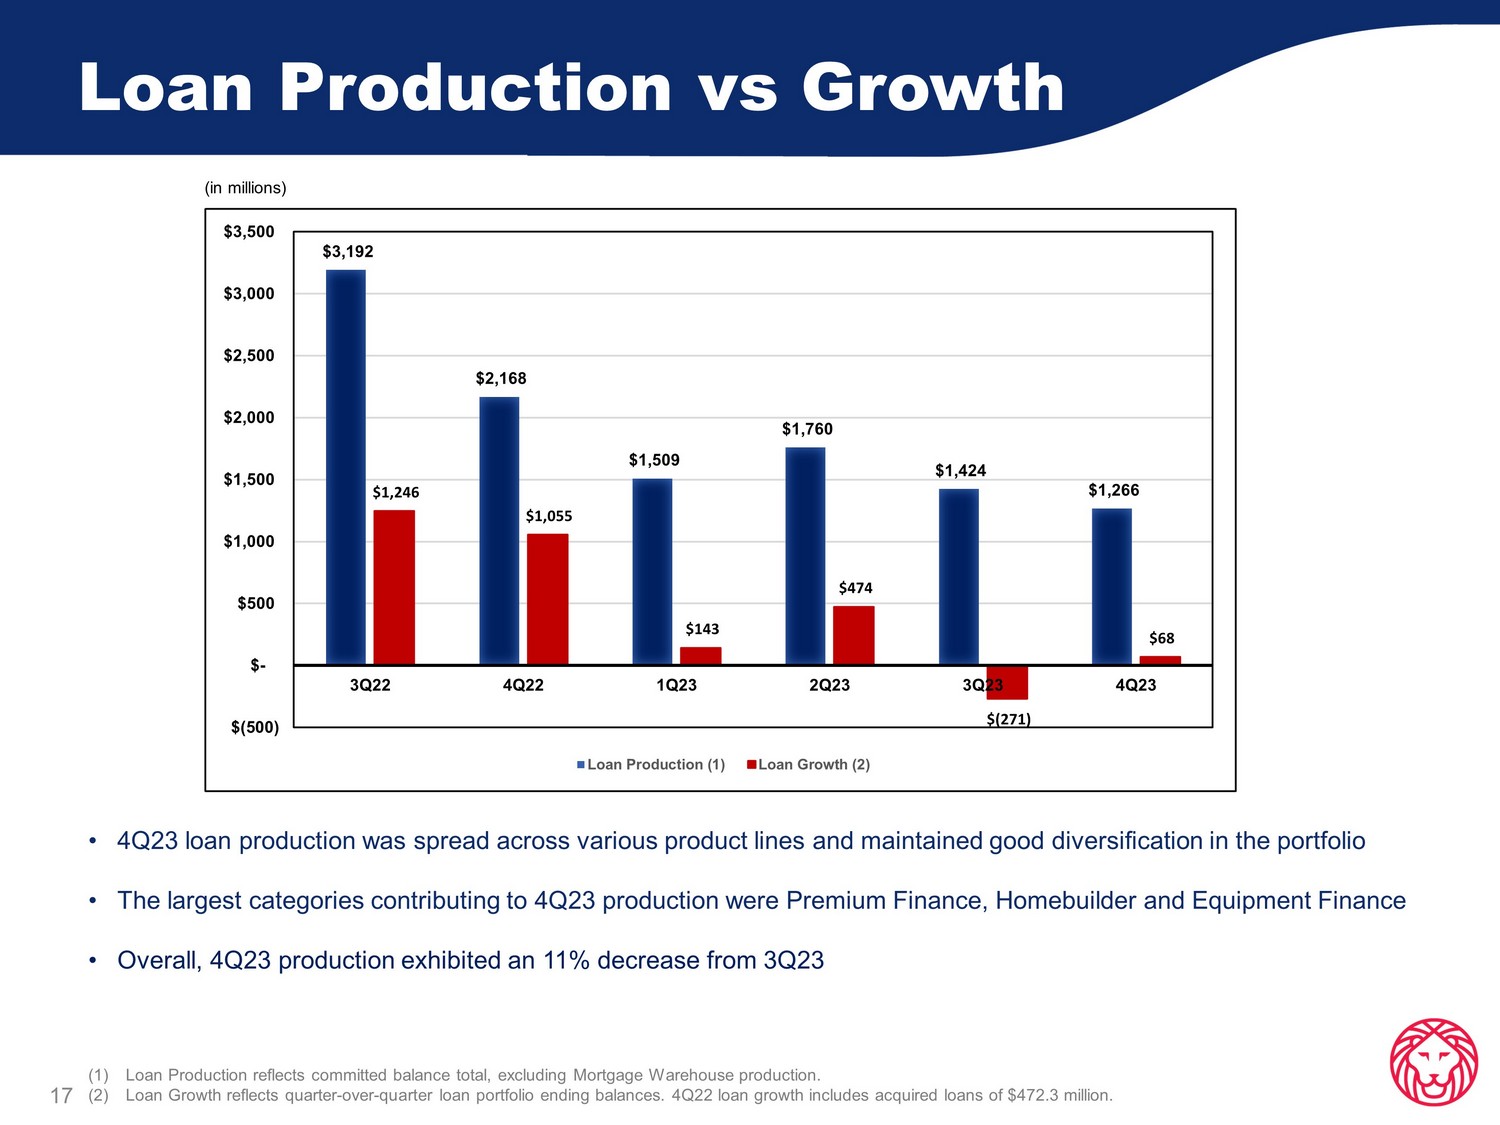
(2) L oan G rowth reflects quarter - over - quarter loan portfolio ending balances. 4Q22 loan growth includes acquired loans of $472.3 million. (in millions) $3,192 $2,168 $1,509 $1,760 $1,424 $1,266 $1,246 $1,055 $143 $474 $(271) $68 $(500) $- $500 $1,000 $1,500 $2,000 $2,500 $3,000 $3,500 3Q22 4Q22 1Q23 2Q23 3Q23 4Q23 Loan Production (1) Loan Growth (2)

Loan Balance Changes 4Q23 Loan Balance Changes 18 • Loan balances increased $68.3 million during 4Q23, primarily the result of increases in portfolio mortgages, commercial real estate and C&I loans; total loan growth was $414.1 million, or 2.1% annualized through 4Q23 • The decrease in C&D loans was primarily the result of projects completed, totaling $123.5 million, which transferred balances into other CRE categories; the difference represents primarily advances on existing loans (in millions) $194 $56 $56 $(4) $(13) $(18) $(34) $(61) $(108) $(125) $(75) $(25) $25 $75 $125 $175 $225 CRE SFR Mtgs C&I Municipal Indirect Consumer Mtg WHSE Premium Finance C&D Allowance for Credit Losses 19 • Increase in reserve during 4Q23 due to forecasted economic conditions • The ACL on loans totaled $307.1 million at 4Q23, a net increase of $ 17.0 mil lion, or 5.9%, from 3Q23 • The reserve for unfunded commitments totaled $41.6 million, a decrease of $7.4 million, or 15.2%, primarily due to lower unfunded balances • During 4Q23, a provision expense of $23.0 million was recorded • The ACL on loans equated to 1.52% of total loans at 4Q23, compared with 1.44% at 3 Q23 • The total ACL on loans + unfunded commitments was $348.7 million, or 1.39% 4Q23 CECL Reserve Reserve Summary (in millions) 4Q23 Allowance Coverage Balance (MM's) ALLL (MM's) % ALLL Gross Loans 20,269.3$ 307.1$ 1.52% Unfunded Commitments 4,799.4$ 41.6$ 0.87% ACL / Total Loans + Unfunded 25,068.7$ 348.7$ 1.39%


Allowance for Credit Losses 20 • Results were primarily driven by negative forecasts for CRE and home prices over the next four quarters • The ALLL for the two CRE categories (RE – C&D, RE – CRE) exhibited the highest net increase from 3 Q23 of $5.9 million • The blended ALLL% fo r those two categories was 1.68% at 4Q23 • The increase in the CFIA category was primarily driven by a higher ALLL for the Equipment Finance division 4 Q23 CECL Reserve by Loan Type Reserve Summary Reserve Methodology • Moody’s December 2023 forecast model provided material inputs into ACL • Primary model drivers included: • US and regional unemployment rates • US GDP • US and regional home price indices • US and state - level CRE price index for our five - state footprint • Estimate derived utilizing Baseline scenario ; a pproximately 98% of the ACL was driven by model factors with less than 1% based on Q - Factors Loan Type Net Outstanding (MM's) ALLL (MM's) % ALLL 9/30/23 ALLL (MM's) Change from 3Q23 CFIA 2,688.9$ 64.1$ 2.38% 53.7$ 10.4$ Consumer 241.5$ 3.9$ 1.61% 4.1$ (0.2)$ Indirect 34.3$ 0.1$ 0.29% 0.1$ -$ Municipal 492.7$ 0.3$ 0.06% 0.3$ -$ Premium Finance 946.6$ 0.6$ 0.06% 0.6$ -$ RE - C&D 2,129.2$ 61.0$ 2.86% 63.2$ (2.2)$ RE - CRE 8,059.7$ 110.1$ 1.37% 102.0$ 8.1$ RE - RES 4,857.7$ 65.3$ 1.34% 64.4$ 0.9$ Warehouse Lending 818.7$ 1.7$ 0.20% 1.7$ -$ Grand Total 20,269.3$ 307.1$ 1.52% 290.1$ 17.0$ NPA / Charge - Off Trend 21 • Net of GNMA - guaranteed mortgage loans, NPAs increased as a percentage of total assets to 0.33% at 4Q23 vs 0.27% at 3Q23 • Total NPAs in creased $24.5 million, to $174.3 million, primarily as a result of: • $ 9.4 million increase in 90+ past due GNMA - guaranteed mortgage loans • $4.5 million increase in Premium Finance 90+ past due loans • $3.9 million increase in 90+ past due portfolio mortgage loans • Net charge - offs totaled $13.4 million, which equated to an annualized NCO ratio of 0.26% • Net charge - offs for 2023 totaled $50.4 million, or 0.25% of average loans • Included in 2023 charge - offs was a total of $5.5 million of pre - acquisition, non - performing loans in the Equipment Finance division that were 100% reserved at the acquisition date • Excluding those items, 2023 net charge - offs totaled $44.9 million, or 0.22% of average loans Non - Performing Assets (NPAs) Net Charge - Offs ($ in millions) 0.61% 0.61% 0.57% 0.58% 0.69% 0.34% 0.33% 0.30% 0.27% 0.33% 0.00% 0.10% 0.20% 0.30% 0.40% 0.50% 0.60% 0.70% 0.80% 4Q22 1Q23 2Q23 3Q23 4Q23 Non - Performing Assets NPA / Total Assets NPA x GNMA / Total Assets 0.08% 0.22% 0.28% 0.23% 0.26% -0.03% 0.02% 0.07% 0.12% 0.17% 0.22% 0.27% 0.32% $- $2.0 $4.0 $6.0 $8.0 $10.0 $12.0 $14.0 $16.0 4Q22 1Q23 2Q23 3Q23 4Q23 Net Charge - Offs Net Charge-offs NCO Ratio (Annualized)


Problem Loan Trends 22 • Compared to 4Q22, classified loans decreased $38.7 million, or 23.1% • For 4Q23, t otal classified loans, excluding GNMA - guaranteed mortgage loans, in creased $8.6 million • Total criticized loans (including special mention ), excluding GNMA - guaranteed mortgage loans, increased $25.0 million in 4Q23 • Nonperforming l oans, excluding GNMA - guaranteed mortgage loans, increased $12.2 million in 4Q23 • The watch list is primarily comprised of the following loan types: Highlights (in millions) Note: Criticized, Classified and Nonperforming loan totals exclude GNMA - guaranteed loans Total Loans Criticized Loans Classified Loans Nonperforming Loans GNMA-guaranteed Loans $65.7 4Q23 $332.4 $77.9 $120.0 $128.6 $307.4 4Q22 1Q23 2Q23 3Q23 $20,269.3$20,201.1$19,855.3 $19,997.9 $271.9 $83.1 $268.6 $83.8 $20,471.8 $287.2 $167.3 $152.3 $116.2 $70.4 $69.6 $75.0 $69.7 $80.8 $90.2 1.37% 1.34% 1.40% 1.52% 1.64% 0.84% 0.76% 0.57% 0.59% 0.63% 0.42% 0.42% 0.34% 0.33% 0.38% $0 $50 $100 $150 $200 $250 $300 $350 $400 4Q22 1Q23 2Q23 3Q23 4Q23 Criticized Loans Classified Loans Nonperforming Loans Expressed as a percent of Total Loans Net of GNMA - backed Mortgage Loans 33% Owner - Occupied RRE 14% Assisted Living 12% Multi - Family 11% Mortgage WHSE 6% Warehouse Retail 6% Investor CRE Loans 23 Investor CRE 25% C&D 11% Multi - Family 5% Stratification of Investor CRE Portfolio • Non - Owner Occupied CRE portfolio is well diversified • Over 80% of CRE loans are located in MSAs in the Bank’s five - state footprint, which exhibit population growth forecasts exceeding the national average • Overall, past dues for investor CRE loans were 0.04% and NPAs 0.06% CRE Positioned in Growing Markets Outstanding Loans (MMs) 5-Yr Proj Population Growth Rate Atlanta-Sandy Springs-Alpharetta GA 2,257.2$ 4.7% Jacksonville FL 781.2$ 6.9% Orlando-Kissimmee-Sanford FL 646.9$ 6.4% Tampa-St Petersburg-Clearwater FL 310.6$ 5.2% Charlotte-Concord-Gatonia NC 288.2$ 5.8% Greenville-Anderson SC 284.9$ 4.7% Charleston-North Charleston SC 279.8$ 6.3% Columbia, SC 255.3$ 3.6% Miami-Ft Lauderdale-Pompano Beach FL 207.4$ 2.0% Tallahassee FL 135.2$ 2.8% U.S.

National Average 2.2% Loan Type Outstanding (MM's) % NPL % PD Avg Size Commitment (000's) Construction Loans: RRE - Presold 288.5$ 0.10% 0.22% 461.3$ RRE - Spec & Models 241.6$ 0.00% 0.00% 426.0$ RRE - Lots & Land 106.0$ 0.00% 0.09% 434.2$ RRE - Subdivisions 20.8$ 0.00% 0.00% 2,126.2$ Sub-Total RRE Construction 656.9$ 0.04% 0.11% 459.9$ CML - Improved 1,414.0$ 0.00% 0.09% 14,867.5$ CML - Raw Land & Other 58.2$ 0.00% 0.05% 425.9$ Sub-Total CRE Construction 1,472.2$ 0.00% 0.09% 7,572.6$ Total Construction Loans 2,129.1$ 0.01% 0.10% 1,434.3$ Term Loans: Office 1,236.5$ 0.16% 0.00% 2,971.2$ General Retail 955.0$ 0.00% 0.08% 1,707.8$ Multi-Family 928.0$ 0.00% 0.00% 6,341.8$ Strip Center, Anchored 733.9$ 0.00% 0.00% 7,230.7$ Warehouse / Industrial 679.9$ 0.00% 0.00% 3,057.3$ Hotels / Motels 461.5$ 0.61% 0.00% 4,634.5$ Strip Center, Non-Anchored 410.8$ 0.00% 0.00% 3,667.7$ Mini-Storage Warehouse 337.7$ 0.00% 0.00% 3,587.8$ Assisted Living Facilities 133.1$ 0.00% 0.00% 6,050.5$ Misc CRE (Church, etc) 108.6$ 0.00% 0.09% 1,156.4$ Sub-Total CRE Term Loans 5,985.0$ 0.08% 0.01% 3,173.8$ Grand Total Investor CRE Loans 8,114.1$ 0.06% 0.04% 2,150.4$ Office Portfolio • 87% of non - owner occupied office loans are located in MSAs in the Bank’s primary footprint; overall, the average vacancy was ~7% • Central Business District (CBD) locations represented 8 % of non - owner occupied properties ; Charleston, SC, Orlando, FL and Tampa, FL represent the largest CBD MSAs ( 88 % of total CBD properties) • The portion of the ACL apportioned to non - owner occupied office loans was 1 .

87 % * Results based on loans > $ 1 million, or 95 % of total loans • Non - owner occupied office loans totaled $1.43 billion of outstanding balances and $1.64 billion of total committed exposure at 4Q23 • As a percentage of total loans outstanding and committed exposure, non - owner occupied office loans were 7.0% and 6.5%, respectively • 69% are comprised of Class A, Essential - Use Facility or Medical Office Building (MOB) Highlights 24 Construction , $325.6 Investor CRE , $1,311.2 Owner - Occupied , $547.8 Total Office Portfolio by Loan Type (Total Committed Exposure) Class A 34% Class B 28% Essential Use 17% MOB 18% Class C 3% Investor Office Portfolio by Property Class * 11% 17% 31% 14% 27% $- $100 $200 $300 $400 $500 2024 2025 2026 2027 2028 and beyond Scheduled Investor Office Maturities 7.5% 13.0% 6.5% 0.8% 4.3% 0.0% 2.0% 4.0% 6.0% 8.0% 10.0% 12.0% 14.0% Class A Class B Class C Essential Use MOB Average Vacancy by Investor Office Property Class * Commercial Real Estate Production 4Q23 Investor Commercial Real Estate Production Summary: 25 4Q23 Residential Construction Production Summary: • 4 Q23 production of C&D and CRE loans - $344.4 million in total committed exposure • Residential real estate construction: • Spec/model to pre - sold ratio of 0.65:1 • Investor CRE 4Q23 production: • Production totaled $64.6 million • Weighted average 1.60:1 debt service coverage • Weighted average 55.5% loan/value • Summary of CRE production by collateral state: Highlights Loan Type Outstanding (MM's) Committed Exposure (MM's) Avg Size Commitment (000's) RRE Construction - Pre-Sold 35.7$ 128.8$ 377.7$ RRE Construction - Spec 32.3$ 84.3$ 333.3$ A&D, RRE Lots, Other Land Loans 2.4$ 6.7$ 479.1$ RRE Construction - Model 0.1$ 0.9$ 457.5$ Total Construction Loans 70.5$ 220.7$ 361.9$ Loan Type Outstanding (MM's) Committed Exposure (MM's) Debt Service Coverage (DSC)* Loan / Value* Mini-Storage Warehouses 26.3$ 43.7$ 1.36 58.7% Other CRE Types 10.0$ 29.7$ 1.95 43.8% Retail (inc Single-Tenant) 11.8$ 18.3$ 1.32 67.0% Warehouse / Industrial 10.7$ 18.3$ 2.04 55.2% Office 3.0$ 8.7$ 1.43 66.8% Misc CRE (Church, etc.) 0.5$ 2.7$ 1.39 39.0% Multi-Family 2.3$ 2.3$ 1.40 32.5% Hotels -$ -$ 0.00 0.0% Strip Center, Non-Anchored -$ -$ 0.00 0.0% Strip Center, Anchored -$ -$ 0.00 0.0% Total Investor CRE Loans 64.6$ 123.7$ 1.60 55.5% FL 7% GA 35% SC 4% NC 19% Others 35% Equipment Finance Portfolio 26 • Total loans were $1.29 billion, or 6.3% of the Bank’s total portfolio • The overall average loan size was $50.8 thousand • Loan production totaled $199.6 million in 4Q23.
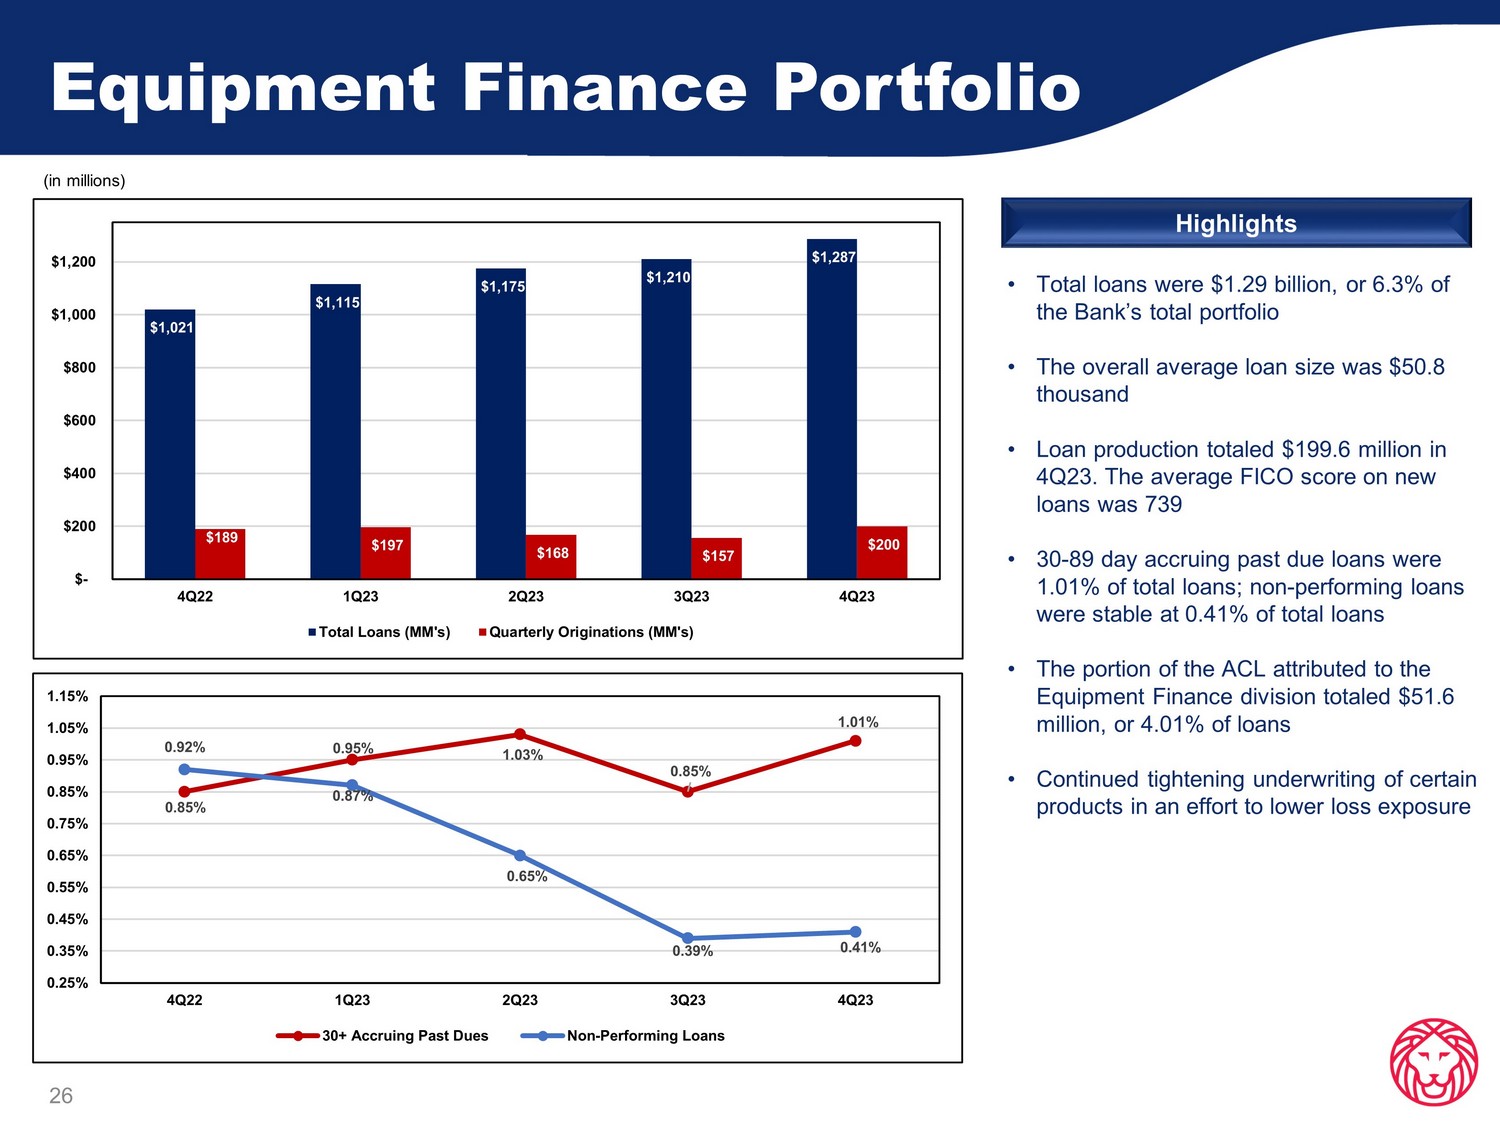

Appendix
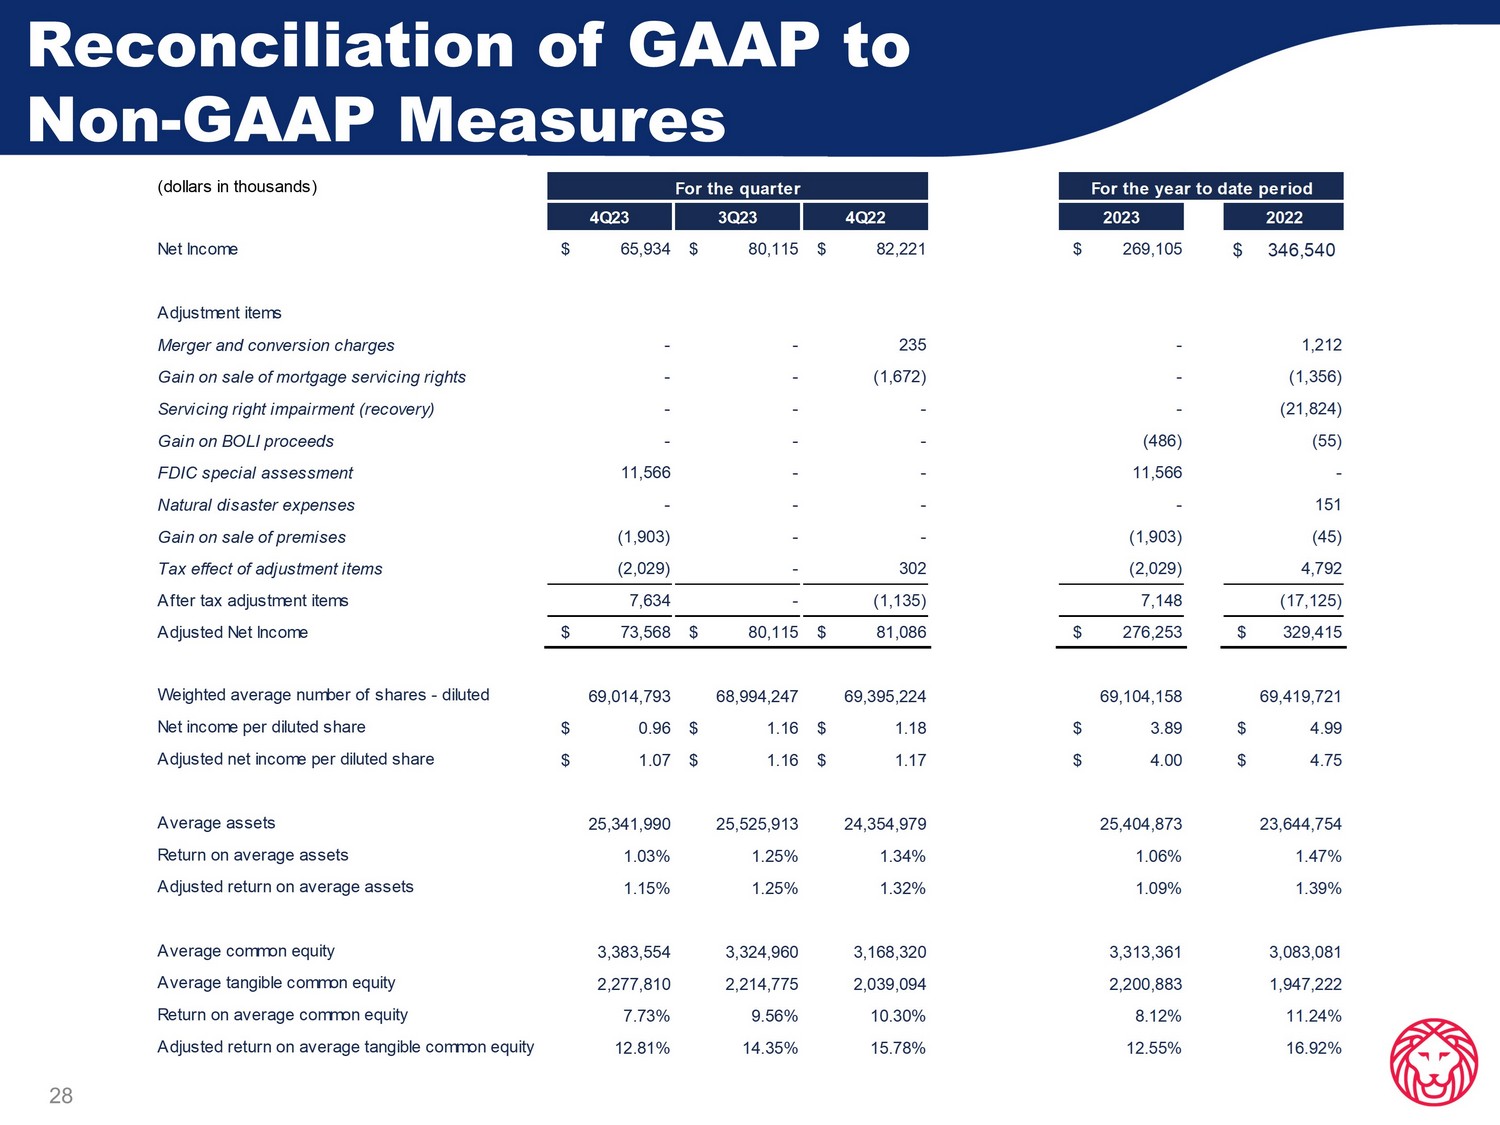
The average FICO score on new loans was 739 • 30 - 89 day accruing past due loans were 1.01% of total loans; non - performing loans were stable at 0.41% of total loans • The portion of the ACL attributed to the Equipment Finance division totaled $51.6 million, or 4.01% of loans • Continued tightening underwriting of certain products in an effort to lower loss exposure Highlights (in millions) $1,021 $1,115 $1,175 $1,210 $1,287 $189 $197 $168 $157 $200 $- $200 $400 $600 $800 $1,000 $1,200 4Q22 1Q23 2Q23 3Q23 4Q23 Total Loans (MM's) Quarterly Originations (MM's) 0.85% 0.95% 1.03% 0.85% 1.01% 0.92% 0.87% 0.65% 0.39% 0.41% 0.25% 0.35% 0.45% 0.55% 0.65% 0.75% 0.85% 0.95% 1.05% 1.15% 4Q22 1Q23 2Q23 3Q23 4Q23 30+ Accruing Past Dues Non-Performing Loans 28 Reconciliation of GAAP to Non - GAAP Measures (dollars in thousands) 4Q23 3Q23 4Q22 2023 2022 Net Income $ 65,934 $ 80,115 $ 82,221 $ 269,105 346,540$ Adjustment items Merger and conversion charges - - 235 - 1,212 Gain on sale of mortgage servicing rights - - (1,672) - (1,356) Servicing right impairment (recovery) - - - - (21,824) Gain on BOLI proceeds - - - (486) (55) FDIC special assessment 11,566 - - 11,566 - Natural disaster expenses - - - - 151 Gain on sale of premises (1,903) - - (1,903) (45) Tax effect of adjustment items (2,029) - 302 (2,029) 4,792 After tax adjustment items 7,634 - (1,135) 7,148 (17,125) Adjusted Net Income $ 73,568 $ 80,115 $ 81,086 $ 276,253 $ 329,415 Weighted average number of shares - diluted 69,014,793 68,994,247 69,395,224 69,104,158 69,419,721 Net income per diluted share $ 0.96 $ 1.16 $ 1.18 $ 3.89 $ 4.99 Adjusted net income per diluted share $ 1.07 $ 1.16 $ 1.17 $ 4.00 $ 4.75 Average assets 25,341,990 25,525,913 24,354,979 25,404,873 23,644,754 Return on average assets 1.03% 1.25% 1.34% 1.06% 1.47% Adjusted return on average assets 1.15% 1.25% 1.32% 1.09% 1.39% Average common equity 3,383,554 3,324,960 3,168,320 3,313,361 3,083,081 Average tangible common equity 2,277,810 2,214,775 2,039,094 2,200,883 1,947,222 Return on average common equity 7.73% 9.56% 10.30% 8.12% 11.24% Adjusted return on average tangible common equity 12.81% 14.35% 15.78% 12.55% 16.92% For the quarter For the year to date period 29 Reconciliation of GAAP to Non - GAAP Measures (dollars in thousands) 4Q23 3Q23 2Q23 1Q23 4Q22 2023 2022 Adjusted Noninterest Expense Total noninterest expense 149,011$ 141,446$ 148,403$ 139,421$ 135,061$ 578,281$ 560,655$ Adjustment items: Merger and conversion charges - - - - (235) - (1,212) FDIC special assessment (11,566) - - - - (11,566) - Natural disaster expenses - - - - - - (151) Gain on sale of premises 1,903 - - - - 1,903 45 Adjusted noninterest expense 139,348$ 141,446$ 148,403$ 139,421$ 134,826$ 568,618$ 559,337$ Total Revenue Net interest income 206,101$ 207,751$ 209,540$ 211,652$ 224,137$ 835,044$ 801,026$ Noninterest income 56,248 63,181 67,349 56,050 48,348 242,828 284,424 Total revenue 262,349$ 270,932$ 276,889$ 267,702$ 272,485$ 1,077,872$ 1,085,450$ Adjusted Total Revenue Net interest income (TE) 207,048$ 208,701$ 210,488$ 212,587$ 225,092$ 838,824$ 804,895$ Noninterest income 56,248 63,181 67,349 56,050 48,348 242,828 284,424 Total revenue (TE) 263,296$ 271,882$ 277,837$ 268,637$ 273,440$ 1,081,652$ 1,089,319$ Adjustment items: (Gain) loss on securities 288 16 6 (6) (3) 304 (203) Gain on BOLI proceeds - - - (486) - (486) (55) Gain on sale of mortgage servicing rights - - - - (1,672) - (1,356) Servicing right impairment (recovery) - - - - - - (21,824) Adjusted total revenue (TE) 263,584$ 271,898$ 277,843$ 268,145$ 271,765$ 1,081,470$ 1,065,881$ Efficiency ratio 56.80% 52.21% 53.60% 52.08% 49.57% 53.65% 51.65% Adjusted efficiency ratio (TE) 52.87% 52.02% 53.41% 51.99% 49.61% 52.58% 52.48% Year to DateQuarter to Date

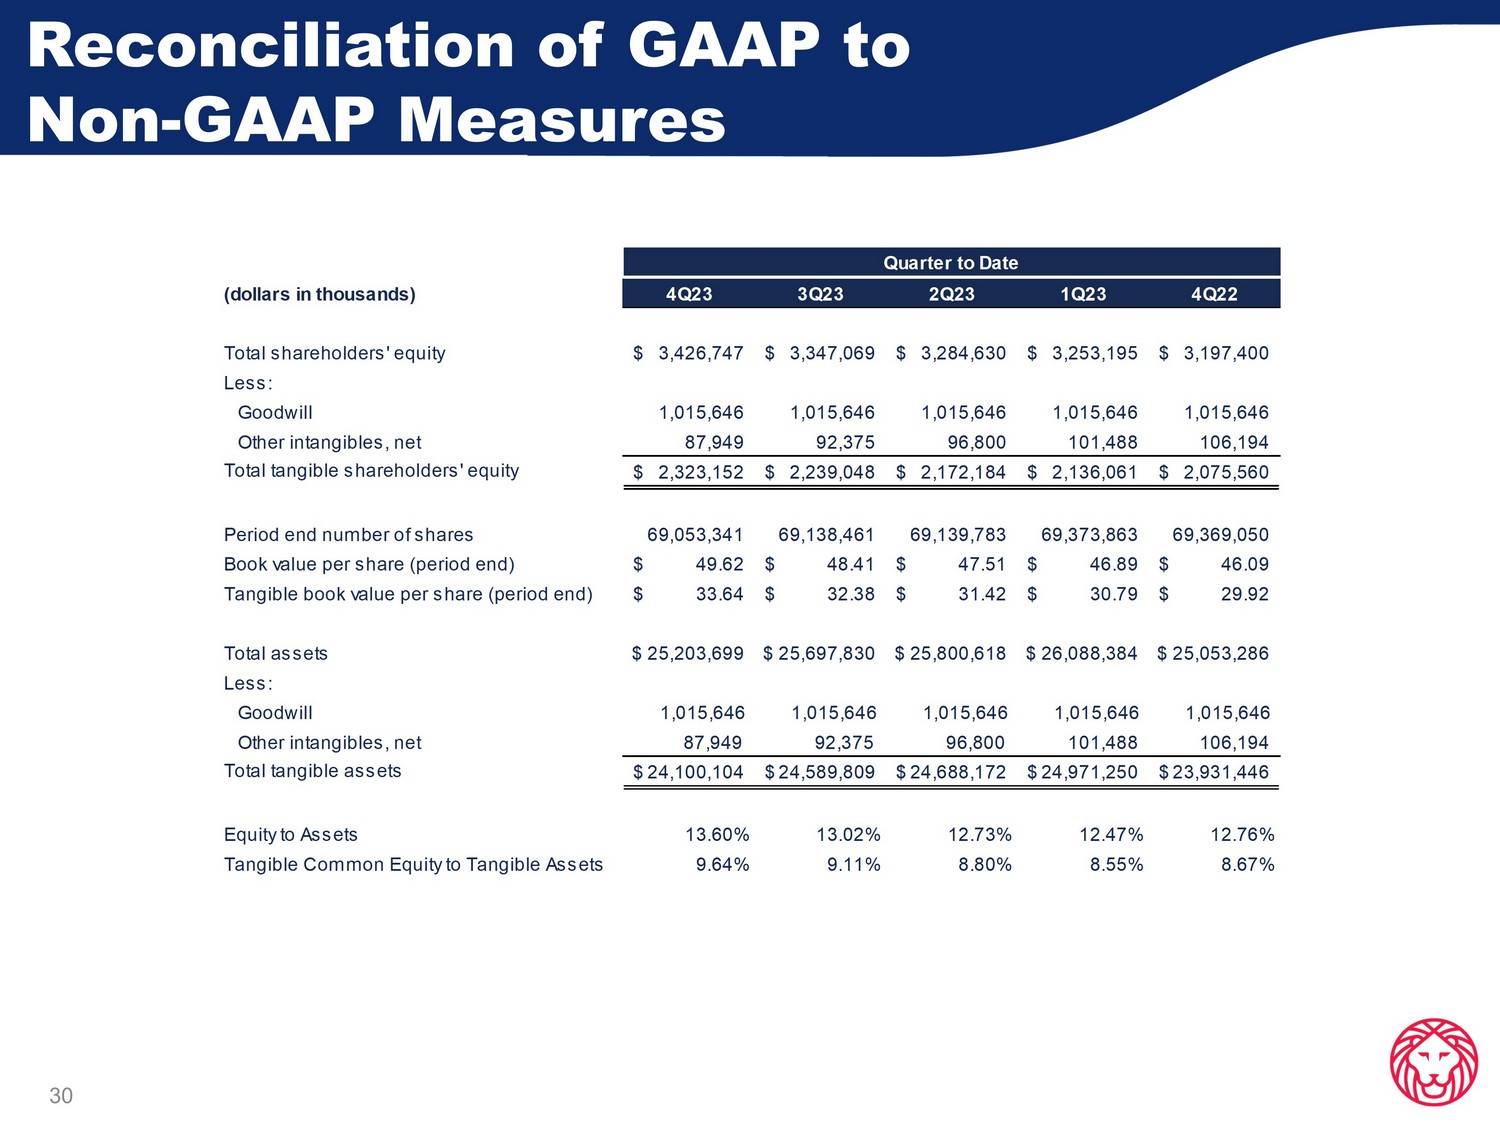
30 Reconciliation of GAAP to Non - GAAP Measures (dollars in thousands) 4Q23 3Q23 2Q23 1Q23 4Q22 Total shareholders' equity 3,426,747$ 3,347,069$ 3,284,630$ 3,253,195$ 3,197,400$ Less: Goodwill 1,015,646 1,015,646 1,015,646 1,015,646 1,015,646 Other intangibles, net 87,949 92,375 96,800 101,488 106,194 Total tangible shareholders' equity 2,323,152$ 2,239,048$ 2,172,184$ 2,136,061$ 2,075,560$ Period end number of shares 69,053,341 69,138,461 69,139,783 69,373,863 69,369,050 Book value per share (period end) 49.62$ 48.41$ 47.51$ 46.89$ 46.09$ Tangible book value per share (period end) 33.64$ 32.38$ 31.42$ 30.79$ 29.92$ Total assets $ 25,203,699 $ 25,697,830 $ 25,800,618 $ 26,088,384 $ 25,053,286 Less: Goodwill 1,015,646 1,015,646 1,015,646 1,015,646 1,015,646 Other intangibles, net 87,949 92,375 96,800 101,488 106,194 Total tangible assets 24,100,104$ 24,589,809$ 24,688,172$ 24,971,250$ 23,931,446$ Equity to Assets 13.60% 13.02% 12.73% 12.47% 12.76% Tangible Common Equity to Tangible Assets 9.64% 9.11% 8.80% 8.55% 8.67% Quarter to Date 31 Reconciliation of GAAP to Non - GAAP Measures (dollars in thousands) 4Q23 3Q23 2Q23 1Q23 4Q22 4Q23 4Q22 Net income 65,934$ 80,115$ 62,635$ 60,421$ 82,221$ 269,105$ 346,540$ Plus: Income taxes 24,452 24,912 20,335 18,131 22,313 87,830 106,558 Provision for credit losses 22,952 24,459 45,516 49,729 32,890 142,656 71,697 Pre-tax pre-provision net revenue (PPNR) 113,338$ 129,486$ 128,486$ 128,281$ 137,424$ 499,591$ 524,795$ Average Assets $ 25,341,990 $ 25,525,913 $ 25,631,846 $ 25,115,927 $ 24,354,979 $25,404,873 $23,644,754 Return on Average Assets (ROA) 1.03% 1.25% 0.98% 0.98% 1.34% 1.06% 1.47% PPNR ROA 1.77% 2.01% 2.01% 2.07% 2.24% 1.97% 2.22% Quarter to Date Year to Date


32 Reconciliation of GAAP to Non - GAAP Measures (dollars in thousands) 4Q23 3Q23 2Q23 1Q23 4Q22 3Q22 2Q22 1Q22 4Q21 3Q21 2Q21 Total shareholders' equity 3,426,747$ 3,347,069$ 3,284,630$ 3,253,195$ 3,197,400$ 3,119,070$ 3,073,376$ 3,007,159$ 2,966,451$ 2,900,770$ 2,837,004$ Less: Goodwill 1,015,646 1,015,646 1,015,646 1,015,646 1,015,646 1,023,071 1,023,056 1,022,345 1,012,620 928,005 928,005 Other intangibles, net 87,949 92,375 96,800 101,488 106,194 110,903 115,613 120,757 125,938 60,396 63,783 Total tangible shareholders' equity 2,323,152$ 2,239,048$ 2,172,184$ 2,136,061$ 2,075,560$ 1,985,096$ 1,934,707$ 1,864,057$ 1,827,893$ 1,912,369$ 1,845,216$ Period end number of shares 69,053,341 69,138,461 69,139,783 69,373,863 69,369,050 69,352,709 69,360,461 69,439,084 69,609,228 69,635,435 69,767,209 Book value per share (period end) 49.62$ 48.41$ 47.51$ 46.89$ 46.09$ 44.97$ 44.31$ 43.31$ 42.62$ 41.66$ 40.66$ Tangible book value per share (period end) 33.64$ 32.38$ 31.42$ 30.79$ 29.92$ 28.62$ 27.89$ 26.84$ 26.26$ 27.46$ 26.45$ 1Q21 4Q20 3Q20 2Q20 1Q20 4Q19 3Q19 2Q19 1Q19 4Q18 Total shareholders' equity 2,757,596$ 2,647,088$ 2,564,683$ 2,460,130$ 2,437,150$ 2,469,582$ 2,420,723$ 1,537,121$ 1,495,584$ 1,456,347$ Less: Goodwill 928,005 928,005 928,005 928,005 931,947 931,637 911,488 501,140 501,308 503,434 Other intangibles, net 67,848 71,974 76,164 80,354 85,955 91,586 97,328 52,437 55,557 58,689 Total tangible shareholders' equity 1,761,743$ 1,647,109$ 1,560,514$ 1,451,771$ 1,419,248$ 1,446,359$ 1,411,907$ 983,544$ 938,719$ 894,224$ Period end number of shares 69,713,426 69,541,481 69,490,546 69,461,968 69,441,274 69,503,833 69,593,833 47,261,584 47,585,309 47,499,941 Book value per share (period end) 39.56$ 38.06$ 36.91$ 35.42$ 35.10$ 35.53$ 34.78$ 32.52$ 31.43$ 30.66$ Tangible book value per share (period end) 25.27$ 23.69$ 22.46$ 20.90$ 20.44$ 20.81$ 20.29$ 20.81$ 19.73$ 18.83$ As of As of Ameris Bancorp Press Release & Financial Highlights December 31, 2023