UNITED STATES
SECURITIES AND EXCHANGE COMMISSION
Washington, D.C. 20549
FORM 6-K
REPORT OF FOREIGN PRIVATE ISSUER
PURSUANT TO SECTION 13a-16 OR 15d-16 UNDER
THE SECURITIES EXCHANGE ACT OF 1934
January 25, 2024
Commission file number:
001-14251
SAP EUROPEAN COMPANY
(Translation of registrant's name into English)
Dietmar-Hopp-Allee 16
69190 Walldorf
Federal Republic of Germany
(Address of principal executive offices)
Indicate by check mark whether the registrant files or will file annual reports under cover of Form 20-F or Form 40-F.
Form 20-F [X] Form 40-F [ ]
SAP SE
FORM 6-K
On January 23, 2024, SAP SE, ("SAP"), issued a quarterly statement (the “Quarterly Statement”) announcing SAP’s financial results for the fourth quarter and fiscal year ended December 31, 2023. The Quarterly Statement is attached as Exhibit 99.1 hereto and incorporated by reference herein. Further, SAP issued a pre-announcement, announcing plans to implement a company-wide transformation program in 2024. Additionally, SAP is updating its ambition for 2025. The Pre-Announcement is attached as Exhibit 99.2 hereto and incorporated by reference herein
The Quarterly Statement discloses certain non-IFRS measures. These measures are not prepared in accordance with IFRS and are therefore considered non-IFRS financial measures. The non-IFRS financial measures that we report should be considered in addition to, and not as substitutes for or superior to, revenue, operating income, cash flows, or other measures of financial performance prepared in accordance with IFRS.
Please refer to Explanations of Non-IFRS Measures online (www.sap.com/investor) for further information regarding the non-IFRS measures.
Any statements contained in this document that are not historical facts are forward-looking statements as defined in the U.S. Private Securities Litigation Reform Act of 1995. Words such as "anticipate," "believe," "estimate," "expect," "forecast," "intend," "may," "plan," "project," "predict," "should" and "will" and similar expressions as they relate to SAP are intended to identify such forward-looking statements. SAP undertakes no obligation to publicly update or revise any forward-looking statements. All forward-looking statements are subject to various risks and uncertainties that could cause actual results to differ materially from expectations. The factors that could affect SAP's future financial results are discussed more fully in SAP's filings with the U.S. Securities and Exchange Commission (the "SEC"), including SAP's most recent Annual Report on Form 20-F filed with the SEC. Readers are cautioned not to place undue reliance on these forward-looking statements, which speak only as of their dates.
EXHIBITS
| Exhibit No. | Exhibit |
| 99.1 | Quarterly Statement dated January 23, 2024 |
| 99.2 | Pre-Announcement dated January 23, 2024 |
SIGNATURES
Pursuant to the requirements of the Securities Exchange Act of 1934, the registrant has duly caused this report to be signed on its behalf by the undersigned, thereunto duly authorized.
| SAP SE | |||
| (Registrant) | |||
| By: | /s/ Christopher Sessar | ||
| Name: Dr. Christopher Sessar | |||
| Title: Chief Accounting Officer | |||
| By: | /s/ Julia Zicke | ||
| Name: Dr. Julia Zicke | |||
| Title: Head of External Reporting and Accounting Technology | |||
Date: January 25, 2024
EXHIBIT INDEX
| Exhibit No. | Exhibit |
| 99.1 | Quarterly Statement dated January 23, 2024 |
| 99.2 | Pre-Announcement dated January 23, 2024 |
Exhibit 99.1

SAP Announces Q4 and FY 2023 Results
| ● | SAP exceeds non-IFRS operating profit and cash flow outlook for FY 2023 | |
| ● | Cloud revenue up 20% and up 23% at constant currencies for FY 2023, underpinned by 25% cloud revenue growth at constant currencies in the fourth quarter | |
| ● | Current cloud backlog of €13.7 billion, up 25% and up 27% at constant currencies | |
| ● | IFRS cloud gross profit up 23%, non-IFRS cloud gross profit up 23% and up 27% at constant currencies in FY 2023 | |
| ● | IFRS operating profit down 5%, non-IFRS operating profit up 9% and up 13% at constant currencies in FY 2023 | |
| ● | 2024 outlook anticipates accelerating cloud revenue growth | |
| ● | Planned transformation program including restructuring in 2024 reflects focus on scalability of operations and Business AI | |
| ● | 2025 non-IFRS operating profit and free cash flow ambition updated to reflect updated non-IFRS definition as well as approximately half a billion Euro of incremental efficiency gains from the program |
FY 2023 | in € millions, unless otherwise stated; based on SAP group results from continuing operations SAP SE (NYSE: SAP) announced today its financial results for the fourth quarter and fiscal year ended December 31, 2023.
Walldorf,
Germany – January 23, 2024.
All figures in this statement are based on SAP group results from continuing operations unless otherwise noted. See section (N) Discontinued Operations.
 |
Financial Performance |
Group results at a glance – Fourth quarter 2023
| IFRS | Non-IFRS1 | |||||||
| € million, unless otherwise stated | Q4 2023 | Q4 2022 | ∆ in % | Q4 2023 | Q4 2022 | ∆ in % | ∆
in % const. curr. |
|
| Cloud revenue | 3,699 | 3,078 | 20 | 3,699 | 3,078 | 20 | 25 | |
| Thereof SAP S/4HANA Cloud revenue | 1,028 | 662 | 55 | 1,028 | 662 | 55 | 61 | |
| Software licenses | 841 | 907 | –7 | 841 | 907 | –7 | –6 | |
| Software support | 2,846 | 2,993 | –5 | 2,846 | 2,993 | –5 | –1 | |
| Software licenses and support revenue | 3,687 | 3,900 | –5 | 3,687 | 3,900 | –5 | –2 | |
| Cloud and software revenue | 7,386 | 6,978 | 6 | 7,386 | 6,978 | 6 | 10 | |
| Total revenue | 8,468 | 8,064 | 5 | 8,468 | 8,064 | 5 | 9 | |
| Share of more predictable revenue (in %) | 77 | 75 | 2pp | 77 | 75 | 2pp | ||
| Operating profit (loss) | 1,900 | 2,002 | –5 | 2,510 | 2,560 | –2 | 2 | |
| Profit (loss) after tax from continuing operations | 1,165 | 600 | 94 | 1,626 | 1,008 | 61 | ||
| Profit (loss) after tax2 | 1,165 | 326 | >100 | 1,626 | 1,023 | 59 | ||
| Earnings per share - Basic (in €) from continuing operations | 1.02 | 0.63 | 60 | 1.41 | 0.98 | 44 | ||
| Earnings per share - Diluted (in €) from continuing operations | 1.01 | 0.63 | 59 | |||||
| Earnings per share - Basic (in €)2 | 1.02 | 0.46 | >100 | 1.41 | 1.00 | 41 | ||
| Earnings per share - Diluted (in €)2 | 1.01 | 0.46 | >100 | |||||
| Net cash flows from operating activities from continuing operations | 1,909 | 2,022 | –6 | |||||
| Free cash flow | 1,660 | 1,726 | –4 | |||||
| Number of employees (FTE, December 31) | 107,602 | 106,312 | 1 | |||||
1 For a breakdown of the individual adjustments see table “Non-IFRS Adjustments by Functional Areas” in this Quarterly Statement.
2 From continuing and discontinued operations
Group results at a glance – Full year 2023
| IFRS | Non-IFRS1 | |||||||
| € million, unless otherwise stated |
Q1–Q4 2023 |
Q1–Q4 2022 |
∆ in % |
Q1–Q4 2023 |
Q1–Q4 2022 |
∆ in % | ∆
in % const. curr. |
|
| Cloud revenue | 13,664 | 11,426 | 20 | 13,664 | 11,426 | 20 | 23 | |
| Thereof SAP S/4HANA Cloud revenue | 3,495 | 2,088 | 67 | 3,495 | 2,088 | 67 | 72 | |
| Software licenses | 1,767 | 2,056 | –14 | 1,767 | 2,056 | –14 | –12 | |
| Software support | 11,497 | 11,909 | –3 | 11,497 | 11,909 | –3 | –1 | |
| Software licenses and support revenue | 13,264 | 13,965 | –5 | 13,264 | 13,965 | –5 | –3 | |
| Cloud and software revenue | 26,928 | 25,391 | 6 | 26,928 | 25,391 | 6 | 9 | |
| Total revenue | 31,207 | 29,520 | 6 | 31,207 | 29,520 | 6 | 9 | |
| Share of more predictable revenue (in %) | 81 | 79 | 2pp | 81 | 79 | 2pp | ||
| Operating profit (loss) | 5,785 | 6,090 | –5 | 8,721 | 7,989 | 9 | 13 | |
| Profit (loss) after tax from continuing operations | 3,564 | 3,068 | 16 | 5,815 | 4,517 | 29 | ||
| IFRS | Non-IFRS1 | |||||||
| € million, unless otherwise stated |
Q1–Q4 2023 |
Q1–Q4 2022 |
∆ in % |
Q1–Q4 2023 |
Q1–Q4 2022 |
∆ in % | ∆
in % const. curr. |
|
| Profit (loss) after tax2 | 5,928 | 1,708 | >100 | 7,960 | 4,545 | 75 | ||
| Earnings per share - Basic (in €) from continuing operations | 3.08 | 2.80 | 10 | 5.01 | 4.03 | 24 | ||
| Earnings per share - Diluted (in €) from continuing operations | 3.05 | 2.79 | 9 | |||||
| Earnings per share - Basic (in €)2 | 5.23 | 1.95 | >100 | 7.02 | 4.08 | 72 | ||
| Earnings per share - Diluted (in €)2 | 5.17 | 1.94 | >100 | |||||
| Net cash flows from operating activities from continuing operations | 6,193 | 5,675 | 9 | |||||
| Free cash flow | 5,083 | 4,388 | 16 | |||||
| Number of employees (FTE, December 31) | 107,602 | 106,312 | 1 | |||||
1 For a breakdown of the individual adjustments see table “Non-IFRS Adjustments by Functional Areas” in this Quarterly Statement.
2 From continuing and discontinued operations
 |
Financial Highlights1 |
Fourth Quarter 2023
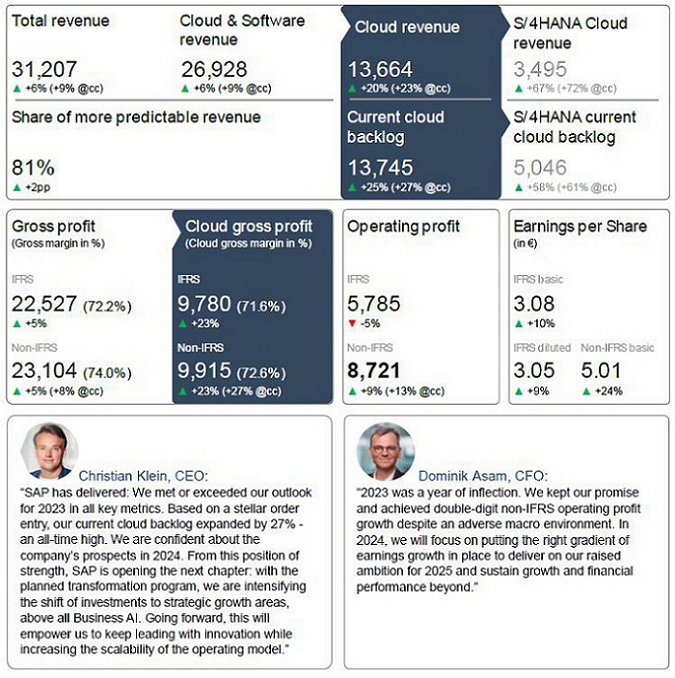
In the fourth quarter, SAP’s cloud momentum further accelerated with sequential growth rate increases in both current cloud backlog and cloud revenue. Current cloud backlog was up 25% to €13.75 billion and up 27% at constant currencies, its fastest pace on record. SAP S/4HANA current cloud backlog was up 58% to €5.05 billion and up 61% at constant currencies. Cloud revenue was up 20% to €3.70 billion and up 25% at constant currencies, mainly driven by the growth of SAP’s combined SaaS and PaaS portfolio, which was up 22% and up 28% at constant currencies. SAP S/4HANA Cloud revenue was up 55% to €1.03 billion and up 61% at constant currencies.
Supported by a particularly solid performance in Europe, software licenses revenue decreased by only 7% to €841 million and was down 6% at constant currencies. Cloud and software revenue was up 6% to €7.39 billion and up 10% at constant currencies. Services revenue was flat at €1.08 billion and up 4% at constant currencies. Total revenue was up 5% to €8.47 billion and up 9% at constant currencies.
The share of more predictable revenue increased by 2 percentage points to 77% in the fourth quarter.
Cloud gross profit was up 25% (IFRS) to €2.66 billion, up 24% to €2.69 billion (non-IFRS), and up 30% (non-IFRS at constant currencies). Cloud gross profit growth was supported by a strong increase in cloud gross margins.
IFRS operating profit decreased 5% to €1.90 billion. Non-IFRS operating profit was down 2% to €2.51 billion and was up 2% at constant currencies. Fourth quarter operating profit was negatively affected by the accelerated amortization of capitalized sales commissions related to the on-premise business (see section (O) Capitalized Cost from Contracts with Customers – Costs of Obtaining Customer Contracts) as well as higher bonus accruals related to the strong financial performance. In addition, prior year fourth quarter IFRS operating profit included a disposal gain of €175 million which resulted in a non-IFRS operating profit of €109 million related to the sale of the SAP Litmos business.
IFRS earnings per share (basic) increased 60% to €1.02. Non-IFRS earnings per share (basic) increased 44% to €1.41. The effective tax rate was 33.8% (IFRS) and 31.4% (non-IFRS). The year-over-year decrease in effective tax rate mainly resulted from changes in tax-exempt income, predominantly related to Sapphire Ventures, which were partly offset by changes in valuation allowances on deferred taxes and withholding taxes.
1 The Q4 and full year 2023 results were also impacted by other effects. For details, please refer to the disclosures on page 31 of this document.
Full Year 2023
SAP performed against its financial outlook as follows (continuing operations2):
| Actual 2022 | 2023
Outlook (as of April 21) |
Revised
2023 Outlook (as of October 18) |
Actual 2023 | |
| Cloud revenue (at constant currencies) | €11.43 billion | €14.00 – 14.40 billion | €14.00 – 14.20 billion | €14.06 billion |
| Cloud and software revenue (at constant currencies) | €25.39 billion | €26.90 – 27.40 billion | €27.00 – 27.40 billion | €27.65 billion |
| Operating profit (non-IFRS, at constant currencies) | €7.99 billion | €8.60 – 8.90 billion | €8.65 – 8.95 billion | €9.05 billion |
| Share of more predictable revenue | 79% | approx. 82% | approx. 82% | 81% |
| Free cash flow | €4.4 billion | approx. 4.9 billion | approx. €4.9 billion | €5.08 billion |
| Effective tax rate (IFRS) | 32.0% | 28.0% – 32.0% | 28.0% – 32.0% | 32.6% |
| Effective tax rate (non-IFRS) | 29.6% | 26.0% - 28.0% | 26.0% - 28.0% | 29.3% |
As of December 31, total cloud backlog – which is defined as the contractually committed cloud revenue we expect to recognize in future periods – was up 37% to €44 billion and up 39% at constant currencies.
For the full year, cloud revenue was up 20% to €13.66 billion and up 23% at constant currencies, mainly driven by strong double-digit growth across the SaaS and PaaS portfolio, which was up 23% and up 26% at constant currencies. SAP S/4HANA Cloud revenue was up 67% to €3.49 billion and up 72% at constant currencies.
Software licenses revenue was down 14% to €1.77 billion and down 12% at constant currencies. Cloud and software revenue was up 6% to €26.93 billion and up 9% at constant currencies. Services revenue was up 4% to €4.28 billion and up 6% at constant currencies. Total revenue was up 6% to €31.21 billion and up 9% at constant currencies.
The share of more predictable revenue increased by 2 percentage points year over year to 81% for the full year 2023.
Cloud gross profit was up 23% (IFRS) to €9.78 billion, up 23% to €9.91 billion (non-IFRS), and up 27% (non-IFRS at constant currencies). IFRS Cloud gross margin was up 2.2 percentage points to 71.6%, non-IFRS cloud gross margin up 2.2 percentage points to 72.6% and up 2.4 percentage points at constant currencies.
IFRS operating profit was down 5% to €5.79 billion and IFRS operating margin decreased by 2.1 percentage points to 18.5%. Non-IFRS operating profit increased 9% to €8.72 billion and increased 13% at constant currencies, non-IFRS operating margin increased by 0.9 percentage points to 27.9% and was up 1.2 percentage points to 28.2% at constant currencies.
IFRS earnings per share (basic) increased 10% to €3.08 and non-IFRS earnings per share (basic) increased 24% to €5.01. The effective tax rate was 32.6% (IFRS) and 29.3% (non-IFRS), which is above the outlook of 28.0% to 32.0% (IFRS) and 26.0% to 28.0% (non-IFRS). The increase mainly resulted from changes in valuation allowances on deferred taxes.
Free cash flow for the full year was up 16% to €5.08 billion, exceeding the revised outlook of approximately €4.9 billion. While higher payouts for taxes and restructuring weighed on free cash flow, the positive development was driven by SAP’s profitability and improvements in working capital and interest payments. In addition, lower payouts for share-based compensation, capex, and leasing supported the positive development. At year end, net liquidity was €3.52 billion.
Share Repurchase Program
On May 16, SAP announced a new share repurchase program with an aggregate volume of up to €5 billion and a term until December 31, 2025. As of December 31, 2023, SAP had repurchased 7,563,796 shares at an average price of €125.49 resulting in payouts of approximately €949 million under the program.
2 Full-year 2023 outlook updated for continuing operations as of April 21, 2023, to reflect the Qualtrics divestiture as reported in Q1 2023 quarterly statement.
Non-Financial Performance 2023
Customer net promoter score (NPS) increased 2 points year over year to 9 in 2023 within the outlook range.
SAP’s employee engagement index remains stable at 80% meeting the upper end of the target range and demonstrating continued high level of engagement. SAP’s retention rate was 96.4%, in 2023. The proportion of women in management increased to 29.7%. In the fourth quarter, the Company also reached 35.2% of women in the workforce.
Net carbon emissions were 0kt in 2023, meaning the Company is carbon neutral in its own operations.
 |
Business Highlights |
In the fourth quarter, customers around the globe continued to choose “RISE with SAP” to drive their end-to-end business transformations. These customers included: Amer Sports, AusNet, Boots, Christchurch City Council, Coles Group, Covestro, Daikin Industries, Daimler Truck, Deutsche Telekom, EMS, Harrods, Hilti, IBM, KONE, Kyndryl, Landis+Gyr, Marathon Petroleum, Marks and Spencer, Messe Frankfurt, Munich Airport, NEC Corporation, NVIDIA, Nestlé, OXG Glasfaser, SLB, Smyths Toys Superstores, Vodafone Group, and Wärtsilä Corporation.
AES Indiana, Allianz, ARAG, DAK-Gesundheit, Tropicana Brands Group, and Zurich Insurance Company went live on SAP S/4HANA Cloud in the fourth quarter.
Lowe Enterprises, Mangopay, Merida & Centurion Germany, Okuma Europe, Serrala Group, and Solidia Technologies chose “GROW with SAP”, an offering helping midsize customers adopt cloud ERP with speed, predictability, and continuous innovation.
Key customer wins across SAP’s solution portfolio included: Ahold Delhaize, Airservices Australia, Beiersdorf, Bosideng, Delivery Hero, Douglas, DZ BANK, Ericsson, MATSUMOTO PRECISION, Mercedes-Benz Group, NEOM, Robert Bosch, TechnipFMC, TE Connectivity, Volkswagen, and Wipro.
Axpo Holding, Campari Group, and Roca Sanitario, went live on SAP solutions.
In
the fourth quarter, SAP’s cloud revenue performance was particularly strong in APJ and EMEA and solid in the Americas region. Brazil,
Germany, France, India, and South Korea had outstanding cloud revenue growth while Japan and Saudi Arabia showed exceptional strength.
For the full year, Germany, Brazil and India all had outstanding performances in cloud revenue while France, Japan, South Korea, the
Netherlands, Mexico, Chile and Switzerland were particularly strong.
On October 25, SAP announced, that Siemens Healthineers AG, a leading global medical technology company, had selected the RISE with SAP solution to support the company’s digital transformation journey.
On November 2, SAP announced at the SAP TechEd event, a comprehensive series of generative AI capabilities and advancements aimed at empowering developers of all skill levels to supercharge their businesses in the age of AI.
On November 8, SAP announced, that it had completed the acquisition of LeanIX.
On November 21, SAP and the Mercedes-AMG PETRONAS F1 Team announced a multiyear partnership to join forces to drive efficiency on and off the racetrack.
On November 22, SAP announced that the Hilti Group, a global leader providing innovative hardware, software and services to the construction industry, is using the Circelligence solution to increase the circularity of its resources.
On December 13, SAP announced that it deepened its partnership with IBM on AI and Quantum. IBM also selected RISE with SAP across the enterprise, broadening its global reach, and continued to embrace the cloud through the use of SAP Fieldglass and SAP Learning Hub.
On January 9, 2024, SAP announced changes to its Executive Board to build on the company’s success to enable customers to benefit from the cloud in the era of AI. Starting April 1, 2024, a new Board area will be created to accelerate cloud growth and adoption. This Board area, led by Thomas Saueressig, will be focused on ensuring customers’ ability to embrace continuous innovation in the cloud. At the same time, Muhammad Alam will join the Executive Board, succeeding Thomas Saueressig and assuming responsibility for SAP’s product engineering.
On January 17, SAP was named one of the 100 most sustainable companies in the world, joining the Corporate Knights Global 100 once again.
Segment Results at a Glance
SAP’s reportable segment showed the following performance:
| Applications, Technology & Services1 | Q4 2023 | ||
|
€ million, unless otherwise stated (Non-IFRS) |
Actual Currency |
∆ in % |
∆ in % Constant Currency |
| Cloud revenue – SaaS2 | 2,601 | 20 | 25 |
| Cloud revenue – PaaS3 | 620 | 42 | 46 |
| Cloud revenue – IaaS4 | 184 | –10 | –7 |
| Cloud revenue | 3,405 | 21 | 26 |
| Cloud gross profit – SaaS2 | 1,836 | 24 | 31 |
| Cloud gross profit – PaaS3 | 533 | 49 | 53 |
| Cloud gross profit – IaaS4 | 51 | –33 | –43 |
| Cloud gross profit | 2,420 | 27 | 32 |
| Segment revenue | 8,168 | 5 | 9 |
| Segment profit (loss) | 2,686 | –2 | 2 |
| Segment margin (in %) | 32.9 | –2.2pp | –2.2pp |
1 Segment information for comparative prior periods were restated to conform with the new segment composition.
2 Software as a service: SaaS comprises all other offerings which are not shown as PaaS and IaaS.
3 Platform as a service: PaaS primarily includes SAP Business Technology Platform and SAP Signavio.
4 Infrastructure as a service: A major portion of IaaS comes from SAP HANA Enterprise Cloud
In the fourth quarter, segment revenue in AT&S was up 5% to €8.17 billion and up 9% at constant currencies, primarily due to strong cloud revenue growth, which was supported by SAP S/4HANA as well as Business Technology Platform. Operating Expenses of the segment increased by 8% and by 13% at constant currencies, resulting in a segment margin of 32.9% at actual and constant currencies. This implies a decrease of 2.2 percentage points and 2.2 percentage points at constant currencies compared to the fourth quarter of the prior year.
Cloud Performance
| Q4 2023 | Q1–Q4 2023 | ||||||
|
€ millions, unless otherwise stated (non-IFRS) |
Actual Currency |
∆ in % | ∆
in % Constant Currency |
Actual Currency |
∆ in % | ∆ in % Constant Currency |
|
| Current Cloud Backlog | |||||||
| Total | 13,745 | 25 | 27 | 13,745 | 25 | 27 | |
| Thereof SAP S/4HANA | 5,046 | 58 | 61 | 5,046 | 58 | 61 | |
| Cloud Revenue | |||||||
| SaaS1 | 2,894 | 19 | 24 | 10,734 | 19 | 23 | |
| PaaS2 | 620 | 42 | 46 | 2,182 | 42 | 46 | |
| IaaS3 | 184 | –10 | –7 | 748 | –18 | –16 | |
| Total | 3,699 | 20 | 25 | 13,664 | 20 | 23 | |
| Thereof SAP S/4HANA | 1,028 | 55 | 61 | 3,495 | 67 | 72 | |
| Cloud Gross Profit | |||||||
| SaaS1 | 2,109 | 22 | 29 | 7,809 | 21 | 25 | |
| PaaS2 | 533 | 49 | 53 | 1,849 | 49 | 53 | |
| IaaS3 | 51 | –33 | –43 | 257 | –20 | –22 | |
| Total | 2,693 | 24 | 30 | 9,915 | 23 | 27 | |
| Cloud Gross Margin (in %) | |||||||
| SaaS1 (in %) | 72.9 | 1.9pp | 2.4pp | 72.7 | 0.7pp | 1.0pp | |
| PaaS2 (in %) | 85.8 | 4.1pp | 3.8pp | 84.8 | 3.9pp | 3.9pp | |
| Q4 2023 | Q1–Q4 2023 | ||||||
|
€ millions, unless otherwise stated (non-IFRS) |
Actual Currency |
∆ in % | ∆
in % Constant Currency |
Actual Currency |
∆ in % | ∆
in % Constant Currency |
|
| IaaS3 (in %) | 27.9 | –9.7pp | –14.4pp | 34.3 | –0.9pp | –2.6pp | |
| Total | 72.8 | 2.5pp | 2.7pp | 72.6 | 2.2pp | 2.4pp | |
1 Software as a service: SaaS comprises all other offerings which are not shown as PaaS and IaaS.
2 Platform as a service: PaaS primarily includes SAP Business Technology Platform, SAP LeanIX and SAP Signavio.
3 Infrastructure as a service: A major portion of IaaS comes from SAP HANA Enterprise Cloud.
 |
Business Outlook |
SAP’s business outlook, which includes the financial outlook 2024 as well as the financial ambition 2025, is based on SAP’s updated non-IFRS definition of profit measures which, beginning in 2024, include share-based compensation expenses and exclude gains and losses from equity securities, net. For more details, please see section (P) Non-IFRS Definition Update.
Furthermore, the 2024 outlook and 2025 ambition for free cash flow assume all payouts associated with the planned restructuring program will be completed in 2024.
Financial Outlook 2024
For 2024, SAP expects:
| · | €17.0 – 17.3 billion cloud revenue at constant currencies (2023: €13.66 billion), up 24% to 27% at constant currencies. |
| · | €29.0 – 29.5 billion cloud and software revenue at constant currencies (2023: €26.93 billion), up 8% to 10% at constant currencies. |
| · | €7.6 – 7.9 billion non-IFRS operating profit at constant currencies (2023: €6.51 billion based on updated non-IFRS operating profit definition), up 17% to 21% at constant currencies. |
| · | Free cash flow of approximately €3.5 billion (2023: €5.08 billion). This includes a preliminary €2 billion estimate for payouts associated with the program, a €0.2 billion impact from a settlement earlier this year of pre-existing regulatory compliance matters accrued in 2023, as well as a €0.2 billion adverse impact due to the discontinuation of the SAP-triggered financing program. |
| · | An effective tax rate (non-IFRS) of approximately 32% (2023: 30.3% based on updated tax rate definition (non-IFRS))3. |
While SAP’s 2024 financial outlook is at constant currencies, actual currency reported figures are expected to be impacted by currency exchange rate fluctuations as the Company progresses through the year. See the table below.
Currency Impact Assuming December 2023 Rates Apply for 2024
| In percentage points | Q1 2024 | FY 2024 |
| Cloud revenue growth | –2.5pp to –0.5pp | –2.0pp to 0.0pp |
| Cloud and software revenue growth | –2.0pp to 0.0pp | –1.5pp to +0.5pp |
| Operating profit growth (non-IFRS) | –3.0pp to –1.0pp | –2.0pp to 0.0pp |
3 The effective tax rate (non-IFRS) is a non-IFRS financial measure and is presented for supplemental informational purposes only. We do not provide an outlook for the effective tax rate (IFRS) due to the uncertainty and potential variability of gains and losses associated with equity investments, which are reconciling items between the two effective tax rates (non-IFRS and IFRS). These items cannot be provided without unreasonable efforts but could have a significant impact on our future effective tax rate (IFRS).
Non-Financial Outlook 2024
In 2024, SAP now expects:
| · | A customer net promoter score of 9 to 13. |
| · | The employee engagement index in the range of 76% to 80%. |
| · | To steadily decrease carbon emissions across the relevant value chain, in line with our target of achieving Net Zero carbon emissions by 2030. |
| · | To steadily increase the number of women in executive roles in line with our end of year 2027 target to achieve 25%. At the end of 2023 SAP reached 22.2%. |
Ambition 2025
SAP is updating its financial ambition 2025. The update reflects the strong performance in the fourth quarter 2023, the updated non-IFRS definition of profit measures, as well as the anticipated benefits from the 2024 transformation program.
The update of the non-IFRS operating profit ambition includes a reduction by approximately €2 billion due to the inclusion of share-based compensation expenses under the updated non-IFRS definition, as well as an increase of approximately €0.5 billion due to anticipated incremental efficiency gains from the transformation program.
By 2025, SAP now expects:
| · | Non-IFRS cloud gross profit of approximately €16.2 billion, now including share-based compensation expenses of approximately €0.1 billion (previously: approximately €16.3 billion, excluding share-based compensation expenses). |
| · | Non-IFRS operating profit of approximately €10.0 billion, now including share-based compensation expenses of approximately €2 billion (previously: approximately €11.5 billion, excluding share-based compensation expenses). |
| · | Free cash flow of approximately €8.0 billion (previously: approximately €7.5 billion). |
SAP continues to expect:
| · | Cloud revenue of more than €21.5 billion. |
| · | Total revenue of more than €37.5 billion. |
| · | A share of more predictable revenue of approximately 86%. |
The 2025 ambition is based on an exchange rate of 1.10 USD per EUR.
In addition to our targets of achieving Net Zero carbon emissions across the value chain by 2030 and reaching 25% women in executive roles by the end of 2027, SAP continues to aim for:
| · | Steadily increasing the employee engagement index. |
| · | Steadily increasing the customer net promoter score. |
2024 Transformation Program: Focus on scalability of operations and key strategic growth areas
In 2024, SAP will further increase its focus on key strategic growth areas, in particular Business AI. It also intends to transform its operational setup to capture organizational synergies, AI-driven efficiencies and to prepare the company for highly scalable future revenue growth.
To this end, and to ensure that SAP’s skill set and resources continue to meet future business needs, SAP plans to execute a company-wide restructuring program in 2024. The majority of the approximately 8,000 affected positions is expected to be covered by voluntary leave programs and internal re-skilling measures. Reflecting re-investments into strategic growth areas, SAP expects to exit 2024 at a headcount similar to current levels.
Restructuring expenses are preliminarily projected at around €2 billion, the vast majority of which is expected to be recognized in the first half of 2024, impacting IFRS operating profit. Excluding restructuring expenses, the program is expected to provide only a minor cost benefit in 2024. Expected cost savings and re-investments are fully reflected in SAP’s 2024 outlook and the updated 2025 non-IFRS operating profit- and free cash flow ambition.
 |
Additional Information |
This press release and all information therein is preliminary and unaudited. Due to rounding, numbers may not add up precisely.
SAP Annual General Meeting of Shareholders
The Annual General Meeting of Shareholders will take place on May 15, 2024, as a physical event in the SAP Arena in Mannheim, Germany. The whole event will be webcast on the Company’s website and online voting options will be available. Further details will be published at https://www.sap.com/agm in early April.
SAP Performance Measures
For more information about our key growth metrics and performance measures, their calculation, their usefulness, and their limitations, please refer to the following document on our Investor Relations website: https://www.sap.com/investors/performance-measures
Webcast
SAP senior management will host a financial analyst conference call on Wednesday, January 24th at 07:00 AM (CET) / 06:00 AM (GMT) / 1:00 AM (EST) / Tuesday, January 23rd 10:00 PM (PST), followed by a press conference at 10:00 AM (CET) / 9:00 AM (GMT) / 4:00 AM (Eastern) / 1:00 AM (PST). Both conferences will be webcast on the Company’s website at https://www.sap.com/investor and will be available for replay. Supplementary financial information pertaining to the fourth quarter results can be found at https://www.sap.com/investor.
About SAP
SAP’s strategy is to help every business run as an intelligent, sustainable enterprise. As a market leader in enterprise application software, we help companies of all sizes and in all industries run at their best: SAP customers generate 87% of total global commerce. Our machine learning, Internet of Things (IoT), and advanced analytics technologies help turn customers’ businesses into intelligent enterprises. SAP helps give people and organizations deep business insight and fosters collaboration that helps them stay ahead of their competition. We simplify technology for companies so they can consume our software the way they want – without disruption. Our end-to-end suite of applications and services enables business and public customers across 26 industries globally to operate profitably, adapt continuously, and make a difference. With a global network of customers, partners, employees, and thought leaders, SAP helps the world run better and improve people’s lives. For more information, visit www.sap.com.
For more information, financial community only:
| Anthony Coletta | +49 (6227) 7-60437 | investor@sap.com, CET |
Follow SAP Investor Relations on LinkedIn at SAP Investor Relations.
For more information, press only:
| Joellen Perry | +1 (650) 445-6780 | joellen.perry@sap.com, PT |
| Daniel Reinhardt | +49 (6227) 7-40201 | daniel.reinhardt@sap.com, CET |
For customers interested in learning more about SAP products:
| Global Customer Center: | +49 180 534-34-24 |
| United States Only: | +1 (800) 872-1SAP (+1-800-872-1727) |
Note to editors:
To preview and download broadcast-standard stock footage and press photos digitally, please visit www.sap.com/photos. On this platform, you can find high resolution material for your media channels.
This document contains forward-looking statements, which are predictions, projections, or other statements about future events. These statements are based on current expectations, forecasts, and assumptions that are subject to risks and uncertainties that could cause actual results and outcomes to materially differ. Additional information regarding these risks and uncertainties may be found in our filings with the Securities and Exchange Commission, including but not limited to the risk factors section of SAP’s 2022 Annual Report on Form 20-F.
© 2024 SAP SE. All rights reserved.
SAP and other SAP products and services mentioned herein as well as their respective logos are trademarks or registered trademarks of SAP SE in Germany and other countries. Please see https://www.sap.com/copyright for additional trademark information and notices.

Contents
Financial and Non-Financial Key Facts
(IFRS and Non-IFRS)
| € millions, unless otherwise stated |
Q1 2022 |
Q2 2022 |
Q3 2022 |
Q4 2022 |
TY 2022 |
Q1 2023 |
Q2 2023 |
Q3 2023 |
Q4 2023 |
TY 2023 |
| Revenues | ||||||||||
| Cloud | 2,565 | 2,796 | 2,986 | 3,078 | 11,426 | 3,178 | 3,316 | 3,472 | 3,699 | 13,664 |
| % change – yoy | 29 | 32 | 36 | 29 | 31 | 24 | 19 | 16 | 20 | 20 |
| % change constant currency – yoy | 23 | 23 | 23 | 21 | 23 | 22 | 22 | 23 | 25 | 23 |
| SAP S/4HANA Cloud | 404 | 473 | 548 | 662 | 2,088 | 719 | 828 | 920 | 1,028 | 3,495 |
| % change – yoy | 78 | 84 | 98 | 101 | 91 | 78 | 75 | 68 | 55 | 67 |
| % change constant currency – yoy | 71 | 72 | 81 | 90 | 79 | 76 | 79 | 77 | 61 | 72 |
| Software licenses | 317 | 426 | 406 | 907 | 2,056 | 276 | 316 | 335 | 841 | 1,767 |
| % change – yoy | –34 | –34 | –38 | –38 | –37 | –13 | –26 | –17 | –7 | –14 |
| % change constant currency – yoy | –36 | –38 | –42 | –39 | –39 | –13 | –24 | –14 | –6 | –12 |
| Software support | 2,923 | 2,977 | 3,016 | 2,993 | 11,909 | 2,905 | 2,873 | 2,872 | 2,846 | 11,497 |
| % change – yoy | 4 | 5 | 5 | 3 | 4 | –1 | –3 | –5 | –5 | –3 |
| % change constant currency – yoy | 1 | 0 | –2 | –1 | 0 | –1 | –1 | –1 | –1 | –1 |
| Software licenses and support | 3,240 | 3,403 | 3,422 | 3,900 | 13,965 | 3,180 | 3,189 | 3,208 | 3,687 | 13,264 |
| % change – yoy | –1 | –2 | –3 | –11 | –5 | –2 | –6 | –6 | –5 | –5 |
| % change constant currency – yoy | –4 | –7 | –9 | –14 | –9 | –2 | –4 | –2 | –2 | –3 |
| Cloud and software | 5,806 | 6,199 | 6,408 | 6,978 | 25,391 | 6,358 | 6,505 | 6,679 | 7,386 | 26,928 |
| % change – yoy | 10 | 11 | 12 | 3 | 9 | 10 | 5 | 4 | 6 | 6 |
| % change constant currency – yoy | 6 | 4 | 3 | –1 | 3 | 8 | 8 | 9 | 10 | 9 |
| Total revenue | 6,773 | 7,207 | 7,476 | 8,064 | 29,520 | 7,441 | 7,554 | 7,744 | 8,468 | 31,207 |
| % change – yoy | 10 | 11 | 13 | 5 | 10 | 10 | 5 | 4 | 5 | 6 |
| % change constant currency – yoy | 6 | 5 | 4 | 0 | 4 | 9 | 8 | 9 | 9 | 9 |
| Share of more predictable revenue (in %) | 81 | 80 | 80 | 75 | 79 | 82 | 82 | 82 | 77 | 81 |
| Profits | ||||||||||
| Operating profit (loss) (IFRS) | 1,471 | 1,060 | 1,557 | 2,002 | 6,090 | 803 | 1,358 | 1,724 | 1,900 | 5,785 |
| Operating profit (loss) (non-IFRS) | 1,676 | 1,678 | 2,075 | 2,560 | 7,989 | 1,875 | 2,058 | 2,278 | 2,510 | 8,721 |
| % change | –3 | –12 | –1 | 3 | –3 | 12 | 23 | 10 | –2 | 9 |
| % change constant currency | –6 | –15 | –8 | 1 | –7 | 12 | 28 | 16 | 2 | 13 |
| Profit (loss) after tax (IFRS) | 1,016 | 613 | 839 | 600 | 3,068 | 403 | 724 | 1,272 | 1,165 | 3,564 |
| Profit (loss) after tax (non-IFRS) | 1,171 | 1,098 | 1,240 | 1,008 | 4,517 | 1,254 | 1,249 | 1,687 | 1,626 | 5,815 |
| % change | –29 | –50 | –42 | –56 | –45 | 7 | 14 | 36 | 61 | 29 |
| Margins | ||||||||||
| Cloud gross margin (IFRS, in %) | 68.2 | 70.2 | 69.8 | 69.2 | 69.4 | 70.5 | 71.1 | 72.7 | 71.9 | 71.6 |
| Cloud gross margin (non-IFRS, in %) | 68.9 | 71.2 | 70.8 | 70.3 | 70.3 | 71.4 | 72.2 | 73.7 | 72.8 | 72.6 |
| Software license and support gross margin (IFRS, in %) | 89.3 | 90.1 | 90.0 | 90.8 | 90.1 | 88.6 | 90.1 | 90.0 | 90.8 | 89.5 |
| Software license and support gross margin (non-IFRS, in %) | 89.7 | 90.7 | 90.7 | 91.4 | 90.7 | 89.2 | 90.5 | 90.4 | 89.9 | 90.0 |
| Cloud and software gross margin (IFRS, in %) | 80.0 | 81.1 | 80.6 | 81.3 | 80.8 | 79.5 | 80.3 | 81.0 | 80.7 | 80.4 |
| Cloud and software gross margin (non-IFRS, in %) | 80.5 | 81.9 | 81.4 | 82.1 | 81.5 | 80.3 | 81.2 | 81.7 | 81.3 | 81.2 |
| Gross margin (IFRS, in %) | 72.2 | 72.7 | 72.8 | 73.4 | 72.8 | 71.0 | 71.6 | 72.8 | 73.2 | 72.2 |
| € millions, unless otherwise stated |
Q1 2022 |
Q2 2022 |
Q3 2022 |
Q4 2022 |
TY 2022 |
Q1 2023 |
Q2 2023 |
Q3 2023 |
Q4 2023 |
TY 2023 |
| Gross margin (non-IFRS, in %) | 73.1 | 74.3 | 74.4 | 75.1 | 74.3 | 72.9 | 73.8 | 74.5 | 74.8 | 74.0 |
| Operating margin (IFRS, in %) | 21.7 | 14.7 | 20.8 | 24.8 | 20.6 | 10.8 | 18.0 | 22.3 | 22.4 | 18.5 |
| Operating margin (non-IFRS, in %) | 24.8 | 23.3 | 27.8 | 31.7 | 27.1 | 25.2 | 27.2 | 29.4 | 29.6 | 27.9 |
| ATS segment – Segment gross margin (in %) | 72.5 | 73.7 | 73.3 | 74.5 | 73.5 | 72.3 | 73.3 | 74.3 | 74.2 | 73.6 |
| ATS segment – Segment margin in % | 28.9 | 27.7 | 31.5 | 35.1 | 31.0 | 29.7 | 32.3 | 35.8 | 32.9 | 32.7 |
| Key Profit Ratios | ||||||||||
| Effective tax rate (IFRS, in %) | 25.5 | 34.2 | 28.3 | 42.8 | 32.0 | 40.5 | 33.8 | 27.8 | 33.8 | 32.6 |
| Effective tax rate (non-IFRS, in %) | 25.4 | 29.1 | 26.6 | 37.2 | 29.6 | 28.3 | 30.4 | 27.1 | 31.4 | 29.3 |
| Earnings per share, basic (IFRS, in €) from continuing operations | 0.87 | 0.54 | 0.75 | 0.63 | 2.80 | 0.35 | 0.62 | 1.09 | 1.02 | 3.08 |
| Earnings per share, basic (non-IFRS, in €) from continuing operations | 1.00 | 0.95 | 1.10 | 0.98 | 4.03 | 1.08 | 1.07 | 1.45 | 1.41 | 5.01 |
| Earnings per share, basic (IFRS, in €)1,2 | 0.63 | 0.29 | 0.57 | 0.46 | 1.95 | 0.41 | 2.70 | 1.09 | 1.02 | 3.08 |
| Earnings per share, basic (non-IFRS, in €)1,2 | 1.00 | 0.96 | 1.12 | 1.00 | 4.08 | 1.27 | 2.88 | 1.45 | 1.41 | 5.01 |
| Order Entry and current cloud backlog | ||||||||||
| Current cloud backlog | 8,937 | 9,543 | 10,334 | 11,024 | 11,024 | 11,148 | 11,537 | 12,269 | 13,745 | 13,745 |
| % change – yoy | 25 | 32 | 36 | 27 | 27 | 25 | 21 | 19 | 25 | 25 |
| % change constant currency – yoy | 21 | 23 | 24 | 24 | 24 | 25 | 25 | 25 | 27 | 27 |
| SAP S/4HANA Current cloud backlog | 1,925 | 2,258 | 2,662 | 3,194 | 3,194 | 3,418 | 3,717 | 4,199 | 5,046 | 5,046 |
| % change – yoy | 86 | 100 | 108 | 86 | 86 | 78 | 65 | 58 | 58 | 58 |
| % change constant currency – yoy | 79 | 87 | 90 | 82 | 82 | 79 | 70 | 66 | 61 | 61 |
| Share of cloud orders greater than €5 million based on total cloud order entry volume (in %)3 | 43 | 49 | 42 | 55 | 50 | 45 | 46 | 49 | 62 | 55 |
| Share of cloud orders smaller than €1 million based on total cloud order entry volume (in %)3 | 29 | 25 | 26 | 18 | 23 | 26 | 25 | 21 | 14 | 19 |
| Share of on-premise orders greater than €5 million based on total software order entry volume (in %) | 40 | 33 | 28 | 29 | 31 | 26 | 22 | 21 | 22 | 22 |
| Share of on-premise orders smaller than €1 million based on total software order entry volume (in %) | 33 | 40 | 49 | 37 | 40 | 50 | 50 | 44 | 44 | 46 |
| Liquidity and Cash Flow | ||||||||||
| Net cash flows from operating activities | 2,465 | 301 | 887 | 2,022 | 5,675 | 2,311 | 848 | 1,124 | 1,909 | 6,193 |
| Capital expenditure | –212 | –196 | –277 | –193 | –877 | –257 | –156 | –182 | –190 | –785 |
| Payments of lease liabilities | –93 | –116 | –97 | –103 | –410 | –99 | –89 | –78 | –59 | –325 |
| Free cash flow | 2,159 | –10 | 513 | 1,726 | 4,388 | 1,955 | 604 | 865 | 1,660 | 5,083 |
| % of total revenue | 32 | 0 | 7 | 21 | 15 | 26 | 8 | 11 | 20 | 16 |
| % of profit after tax (IFRS) | 213 | –2 | 61 | 288 | 143 | 485 | 83 | 68 | 142 | 143 |
| Group liquidity | 11,267 | 8,236 | 8,554 | 9,694 | 9,694 | 9,700 | 14,326 | 12,122 | 11,275 | 11,275 |
| Financial debt (–) | –12,171 | –12,282 | –12,282 | –11,764 | –11,764 | –10,751 | –10,146 | –8,445 | –7,755 | –7,755 |
| Net liquidity (+) / Net debt(–) | –904 | –4,046 | –3,728 | –2,070 | –2,070 | –1,050 | 4,180 | 3,677 | 3,521 | 3,521 |
| Financial Position | ||||||||||
| Cash and cash equivalents | 8,927 | 7,472 | 7,316 | 9,008 | 9,008 | 8,766 | 14,142 | 9,378 | 8,124 | 8,124 |
| Goodwill | 32,140 | 33,879 | 35,664 | 33,077 | 33,077 | 28,563 | 28,581 | 29,144 | 29,088 | 29,088 |
| Total assets | 73,754 | 72,605 | 74,840 | 72,159 | 72,159 | 73,533 | 69,719 | 68,011 | 68,291 | 68,291 |
| Contract liabilities (current) | 7,630 | 6,883 | 5,487 | 5,309 | 5,309 | 7,547 | 6,743 | 5,256 | 5,026 | 5,026 |
| Equity ratio (total equity in % of total assets) | 58 | 59 | 62 | 59 | 59 | 58 | 60 | 64 | 63 | 63 |
| Non-Financials |
| € millions, unless otherwise stated |
Q1 2022 |
Q2 2022 |
Q3 2022 |
Q4 2022 |
TY 2022 |
Q1 2023 |
Q2 2023 |
Q3 2023 |
Q4 2023 |
TY 2023 |
| Number of employees (quarter end)3 | 104,670 | 104,988 | 106,912 | 106,312 | 106,312 | 105,132 | 105,328 | 106,495 | 107,602 | 107,602 |
| Employee retention (in %, rolling 12 months) | 92.5 | 92.0 | 92.2 | 92.8 | 92.8 | 93.8 | 95.1 | 96.0 | 96.4 | 96.4 |
| Women in management (in %, quarter end) | 28.6 | 28.9 | 29.2 | 29.3 | 29.3 | 29.4 | 29.5 | 29.5 | 29.7 | 29.7 |
| Net carbon emissions4 (in kilotons) | 20 | 20 | 20 | 20 | 85 | 0 | 0 | 0 | 0 | 0 |
1 From continuing and discontinued operations.
2 To conform to refined calculation logic, prior quarters have been adjusted.
3 In full-time equivalents.
5 In CO2 equivalents. SAP’s carbon emission numbers are rounded to the nearest 5 kt. Therefore, the rounded full-year totals may not precisely equal the sum of the rounded quarterly numbers.
Primary Financial Statements of SAP Group (IFRS)
(A) Consolidated Income Statements
(A.1) Consolidated Income Statements – Quarter
| € millions, unless otherwise stated | Q4 2023 | Q4 2022 | ∆ in % | |
| Cloud | 3,699 | 3,078 | 20 | |
| Software licenses | 841 | 907 | –7 | |
| Software support | 2,846 | 2,993 | –5 | |
| Software licenses and support | 3,687 | 3,900 | –5 | |
| Cloud and software | 7,386 | 6,978 | 6 | |
| Services | 1,081 | 1,085 | 0 | |
| Total revenue | 8,468 | 8,064 | 5 | |
| Cost of cloud | –1,041 | –947 | 10 | |
| Cost of software licenses and support | –382 | –358 | 7 | |
| Cost of cloud and software | –1,423 | –1,305 | 9 | |
| Cost of services | –848 | –844 | 1 | |
| Total cost of revenue | –2,271 | –2,149 | 6 | |
| Gross profit | 6,197 | 5,915 | 5 | |
| Research and development | –1,669 | –1,598 | 4 | |
| Sales and marketing | –2,267 | –2,107 | 8 | |
| General and administration | –362 | –345 | 5 | |
| Restructuring | 7 | –27 | N/A | |
| Other operating income/expense, net | –4 | 166 | N/A | |
| Total operating expenses | –6,567 | –6,061 | 8 | |
| Operating profit (loss) | 1,900 | 2,002 | –5 | |
| Other non-operating income/expense, net | –33 | –71 | –54 | |
| Finance income | 284 | 128 | >100 | |
| Finance costs | –391 | –1,012 | –61 | |
| Financial income, net | –107 | –884 | –88 | |
| Profit (loss) before tax from continuing operations | 1,761 | 1,048 | 68 | |
| Income tax expense | –595 | –448 | 33 | |
| Profit (loss) after tax from continuing operations | 1,165 | 600 | 94 | |
| Attributable to owners of parent | 1,185 | 740 | 60 | |
| Attributable to non-controlling interests | –20 | –140 | –86 | |
| Profit (loss) after tax from discontinued operations | 0 | –273 | N/A | |
| Profit (loss) after tax2 | 1,165 | 326 | >100 | |
| Attributable to owners of parent2 | 1,185 | 541 | >100 | |
| Attributable to non-controlling interests2 | –20 | –214 | –91 | |
| Earnings per share, basic (in €)1 from continuing operations | 1.02 | 0.63 | 60 | |
| Earnings per share, basic (in €)1, 2 | 1.02 | 0.46 | >100 | |
| Earnings per share, diluted (in €)1 from continuing operations | 1.01 | 0.63 | 59 | |
| Earnings per share, diluted (in €)1, 2 | 1.01 | 0.46 | >100 |
1 For the three months ended December 31, 2023 and 2022, the weighted average number of shares was 1,166 million (diluted 1,178 million) and 1,166 million (diluted: 1,172 million), respectively (treasury stock excluded).
2 From continuing and discontinued operations
(A.2) Consolidated Income Statements – Year-to-Date
| € millions, unless otherwise stated | Q1–Q4 2023 | Q1–Q4 2022 | ∆ in % | |
| Cloud | 13,664 | 11,426 | 20 | |
| Software licenses | 1,767 | 2,056 | –14 | |
| Software support | 11,497 | 11,909 | –3 | |
| Software licenses and support | 13,264 | 13,965 | –5 | |
| Cloud and software | 26,928 | 25,391 | 6 | |
| Services | 4,279 | 4,128 | 4 | |
| Total revenue | 31,207 | 29,520 | 6 | |
| Cost of cloud | –3,884 | –3,499 | 11 | |
| Cost of software licenses and support | –1,390 | –1,384 | 0 | |
| Cost of cloud and software | –5,274 | –4,883 | 8 | |
| Cost of services | –3,405 | –3,155 | 8 | |
| Total cost of revenue | –8,680 | –8,038 | 8 | |
| Gross profit | 22,527 | 21,482 | 5 | |
| Research and development | –6,322 | –6,080 | 4 | |
| Sales and marketing | –8,830 | –7,946 | 11 | |
| General and administration | –1,360 | –1,289 | 6 | |
| Restructuring | –215 | –138 | 56 | |
| Other operating income/expense, net | –16 | 60 | N/A | |
| Total operating expenses | –25,421 | –23,429 | 9 | |
| Operating profit (loss) | 5,785 | 6,090 | –5 | |
| Other non-operating income/expense, net | –24 | –187 | –87 | |
| Finance income | 857 | 811 | 6 | |
| Finance costs | –1,327 | –2,200 | –40 | |
| Financial income, net | –469 | –1,389 | –66 | |
| Profit (loss) before tax from continuing operations | 5,292 | 4,513 | 17 | |
| Income tax expense | –1,728 | –1,446 | 19 | |
| Profit (loss) after tax from continuing operations | 3,564 | 3,068 | 16 | |
| Attributable to owners of parent | 3,598 | 3,277 | 10 | |
| Attributable to non-controlling interests | –34 | –210 | –84 | |
| Profit (loss) after tax from discontinued operations | 2,363 | –1,359 | N/A | |
| Profit (loss) after tax2 | 5,928 | 1,708 | >100 | |
| Attributable to owners of parent2 | 6,103 | 2,284 | >100 | |
| Attributable to non-controlling interests2 | –175 | –576 | –70 | |
| Earnings per share, basic (in €)1 from continuing operations | 3.08 | 2.80 | 10 | |
| Earnings per share, basic (in €)1, 2 | 5.23 | 1.95 | >100 | |
| Earnings per share, diluted (in €)1 from continuing operations | 3.05 | 2.79 | 9 | |
| Earnings per share, diluted (in €)1, 2 | 5.17 | 1.94 | >100 |
1 For the full year 2023 and 2022, the weighted average number of shares was 1,167 million (diluted: 1,180 million) and 1,170 million (diluted: 1,175 million), respectively (treasury stock excluded).
2 From continuing and discontinued operations (B) Consolidated Statements of Financial Position
| as at 12/31/2023 and 12/31/2022 | ||
| € millions | 2023 | 2022 |
| Cash and cash equivalents | 8,124 | 9,008 |
| Other financial assets | 3,344 | 853 |
| Trade and other receivables | 6,361 | 6,236 |
| Other non-financial assets | 2,358 | 2,139 |
| Tax assets | 344 | 287 |
| Total current assets | 20,531 | 18,522 |
| Goodwill | 29,088 | 33,077 |
| Intangible assets | 2,505 | 3,835 |
| Property, plant, and equipment | 4,276 | 4,934 |
| Other financial assets | 5,543 | 5,626 |
| Trade and other receivables | 203 | 169 |
| Other non-financial assets | 3,552 | 3,580 |
| Tax assets | 400 | 323 |
| Deferred tax assets | 2,193 | 2,095 |
| Total non-current assets | 47,760 | 53,638 |
| Total assets | 68,291 | 72,159 |
| € millions | 2023 | 2022 |
| Trade and other payables1 | 1,775 | 2,147 |
| Tax liabilities | 205 | 283 |
| Financial liabilities1 | 1,731 | 4,808 |
| Other non-financial liabilities | 5,607 | 4,818 |
| Provisions | 232 | 90 |
| Contract liabilities | 5,026 | 5,309 |
| Total current liabilities | 14,576 | 17,453 |
| Trade and other payables | 39 | 79 |
| Tax liabilities | 877 | 893 |
| Financial liabilities | 7,945 | 9,547 |
| Other non-financial liabilities | 698 | 705 |
| Provisions | 486 | 359 |
| Deferred tax liabilities | 272 | 241 |
| Contract liabilities | 33 | 33 |
| Total non-current liabilities | 10,350 | 11,858 |
| Total liabilities | 24,926 | 29,311 |
| Issued capital | 1,229 | 1,229 |
| Share premium | 1,846 | 3,081 |
| Retained earnings | 42,417 | 36,418 |
| Other components of equity | 2,366 | 3,801 |
| Treasury shares | –4,741 | –4,341 |
| Equity attributable to owners of parent | 43,116 | 40,186 |
| Non-controlling interests | 249 | 2,662 |
| Total equity | 43,365 | 42,848 |
| Total equity and liabilities | 68,291 | 72,159 |
1 In 2023 SAP changed the presentation of trade debtors with a credit balance from Financial liabilities to Trade and other payables.
The impact for 2023 is €186 million (2022: €286 million). The presentation for 2022 remains unchanged.
(C) Consolidated Statements of Cash Flows
| € millions | Q1–Q4 2023 | Q1–Q4 2022 |
| Profit (loss) after tax | 5,928 | 1,708 |
| Adjustments to reconcile profit (loss) after tax to net cash flows from operating activities: | ||
| (Profit) loss after tax from discontinued operations | –2,363 | 1,359 |
| Depreciation and amortization | 1,373 | 1,569 |
| Share-based payment expense | 2,221 | 1,431 |
| Income tax expense | 1,728 | 1,446 |
| Financial income, net | 469 | 1,389 |
| Decrease/increase in allowances on trade receivables | –10 | 77 |
| Other adjustments for non-cash items | 10 | –175 |
| Decrease/increase in trade and other receivables | –433 | 196 |
| Decrease/increase in other assets | –666 | –1,213 |
| Increase/decrease in trade payables, provisions, and other liabilities | 661 | 154 |
| Increase/decrease in contract liabilities | 495 | 643 |
| Share-based payments | –1,091 | –1,180 |
| Interest paid | –356 | –244 |
| Interest received | 469 | 156 |
| Income taxes paid, net of refunds | –2,242 | –1,642 |
| Net cash flows from operating activities – continuing operations | 6,193 | 5,675 |
| Net cash flows from operating activities – discontinued operations | 122 | –29 |
| Net cash flows from operating activities | 6,315 | 5,647 |
| Business combinations, net of cash and cash equivalents acquired | –1,168 | –679 |
| Proceeds from sales of subsidiaries or other businesses | 0 | 289 |
| Cash flows from derivative financial instruments related to the sale of subsidiaries or businesses | –91 | 0 |
| Purchase of intangible assets or property, plant, and equipment | –785 | –877 |
| Proceeds from sales of intangible assets or property, plant, and equipment | 99 | 95 |
| Purchase of equity or debt instruments of other entities | –3,566 | –2,320 |
| Proceeds from sales of equity or debt instruments of other entities | 907 | 4,190 |
| Net cash flows from investing activities – continuing operations | –4,603 | 699 |
| Net cash flows from investing activities – discontinued operations | 5,510 | –32 |
| Net cash flows from investing activities | 906 | 667 |
| Dividends paid | –2,395 | –2,865 |
| Dividends paid on non-controlling interests | –13 | –12 |
| Purchase of treasury shares | –949 | –1,500 |
| Proceeds from borrowings | 13 | 158 |
| Repayments of borrowings | –4,081 | –1,445 |
| Payments of lease liabilities | –325 | –410 |
| Net cash flows from financing activities – continuing operations | –7,751 | –6,074 |
| Net cash flows from financing activities – discontinued operations | 24 | –263 |
| Net cash flows from financing activities | –7,727 | –6,337 |
| Effect of foreign currency rates on cash and cash equivalents | –378 | 134 |
| Net decrease/increase in cash and cash equivalents | –883 | 109 |
| Cash and cash equivalents at the beginning of the period | 9,008 | 8,898 |
| Cash and cash equivalents at the end of the period | 8,124 | 9,008 |
| Due to rounding, numbers may not add up precisely. | ||
(D) Basis of Non-IFRS Presentation
SAP disclose certain financial measures such as expense (non-IFRS) and profit measures (non-IFRS) that are not prepared in accordance with IFRS and are therefore considered non-IFRS financial measures.
For a more detailed description of all of SAP’s non-IFRS measures and their limitations as well as SAP’s constant currency and free cash flow figures, see Explanation of Non-IFRS Measures online.
(E) Reconciliation from Non-IFRS Numbers to IFRS Numbers
(E.1) Reconciliation of Non-IFRS Revenue – Quarter
| € millions, unless otherwise stated | Q4 2023 | Q4 2022 | ∆ in % | |||
| IFRS |
Currency Impact |
Non-IFRS Constant Currency |
IFRS | IFRS |
Non-IFRS Constant Currency |
|
| Revenue Numbers | ||||||
| Cloud | 3,699 | 160 | 3,859 | 3,078 | 20 | 25 |
| Software licenses | 841 | 14 | 854 | 907 | –7 | –6 |
| Software support | 2,846 | 106 | 2,952 | 2,993 | –5 | –1 |
| Software licenses and support | 3,687 | 119 | 3,807 | 3,900 | –5 | –2 |
| Cloud and software | 7,386 | 280 | 7,666 | 6,978 | 6 | 10 |
| Services | 1,081 | 44 | 1,125 | 1,085 | 0 | 4 |
| Total revenue | 8,468 | 323 | 8,791 | 8,064 | 5 | 9 |
(E.2) Reconciliation of Non-IFRS Operating Expenses – Quarter
| € millions, unless otherwise stated | Q4 2023 | Q4 2022 | ∆ in % | ||||||||
| IFRS | Adj. | Non-IFRS |
Currency Impact |
Non-IFRS Constant Currency |
IFRS | Adj. | Non- IFRS |
IFRS | Non- IFRS |
Non-IFRS Constant Currency |
|
| Operating Expense Numbers | |||||||||||
| Cost of cloud | –1,041 | 34 | –1,006 | –947 | 33 | –915 | 10 | 10 | |||
| Cost of software licenses and support | –382 | 10 | –372 | –358 | 24 | –334 | 7 | 12 | |||
| Cost of cloud and software | –1,423 | 44 | –1,378 | –1,305 | 57 | –1,248 | 9 | 10 | |||
| Cost of services | –848 | 90 | –758 | –844 | 81 | –762 | 1 | –1 | |||
| Total cost of revenue | –2,271 | 135 | –2,136 | –2,149 | 138 | –2,011 | 6 | 6 | |||
| Gross profit | 6,197 | 135 | 6,331 | 5,915 | 138 | 6,053 | 5 | 5 | |||
| Research and development | –1,669 | 172 | –1,497 | –1,598 | 150 | –1,449 | 4 | 3 | |||
| Sales and marketing | –2,267 | 258 | –2,010 | –2,107 | 257 | –1,850 | 8 | 9 | |||
| General and administration | –362 | 52 | –310 | –345 | 51 | –295 | 5 | 5 | |||
| Restructuring | 7 | –7 | 0 | –27 | 27 | 0 | N/A | N/A | |||
| Other operating income/expense, net | –4 | 0 | –4 | 166 | –65 | 100 | N/A | N/A | |||
| Total operating expenses | –6,567 | 610 | –5,957 | –225 | –6,183 | –6,061 | 557 | –5,504 | 8 | 8 | 12 |
(E.3) Reconciliation of Non-IFRS Profit Figures, Income Tax, and Key Ratios – Quarter
| € millions, unless otherwise stated | Q4 2023 | Q4 2022 | ∆ in % | ||||||||
| IFRS | Adj. | Non-IFRS |
Currency Impact |
Non-IFRS Constant Currency |
IFRS | Adj. | Non- IFRS |
IFRS | Non- IFRS |
Non-IFRS Constant Currency |
|
| Profit Numbers | |||||||||||
| Operating profit (loss) | 1,900 | 610 | 2,510 | 98 | 2,608 | 2,002 | 557 | 2,560 | –5 | –2 | 2 |
| Profit (loss) before tax from continuing operations | 1,761 | 610 | 2,371 | 1,048 | 557 | 1,605 | 68 | 48 | |||
| Income tax expense | –595 | –149 | –745 | –448 | –149 | –597 | 33 | 25 | |||
| Profit (loss) after tax from continuing operations | 1,165 | 461 | 1,626 | 600 | 408 | 1,008 | 94 | 61 | |||
| Attributable to owners of parent | 1,185 | 460 | 1,645 | 740 | 405 | 1,145 | 60 | 44 | |||
| Attributable to non-controlling interests | –20 | 1 | –19 | –140 | 3 | –137 | –86 | –86 | |||
| Profit (loss) after tax1 | 1,165 | 461 | 1,626 | 326 | 697 | 1,023 | >100 | 59 | |||
| Attributable to owners of parent1 | 1,185 | 460 | 1,645 | 541 | 623 | 1,164 | >100 | 41 | |||
| Attributable to non-controlling interests1 | –20 | 1 | –19 | –214 | 74 | –140 | –91 | –86 | |||
| Key Ratios | |||||||||||
| Operating margin (in %) | 22.4 | 29.6 | 29.7 | 24.8 | 31.7 | –2.4pp | –2.1pp | –2.1pp | |||
| Effective tax rate (in %)2 | 33.8 | 31.4 | 42.8 | 37.2 | –8.9pp | –5.8pp | |||||
| Earnings per share, basic (in €) from continuing operations | 1.02 | 1.41 | 0.63 | 0.98 | 60 | 44 | |||||
| Earnings per share, basic (in €)1 | 1.02 | 1.41 | 0.46 | 1.00 | >100 | 41 | |||||
1 From continuing and discontinued operations
2 The difference between our effective tax rate (IFRS) and effective tax rate (non-IFRS) in Q4 2023 and Q4 2022 mainly resulted from tax effects of share-based payment expenses and acquisition-related charges.
(E.4) Reconciliation of Non-IFRS Revenue – Year-to-Date
| € millions, unless otherwise stated | Q1–Q4 2023 | Q1–Q4 2022 | ∆ in % | |||
| IFRS |
Currency Impact |
Non-IFRS Constant Currency |
IFRS | IFRS |
Non-IFRS Constant Currency |
|
| Revenue Numbers | ||||||
| Cloud | 13,664 | 394 | 14,058 | 11,426 | 20 | 23 |
| Software licenses | 1,767 | 37 | 1,805 | 2,056 | –14 | –12 |
| Software support | 11,497 | 286 | 11,783 | 11,909 | –3 | –1 |
| Software licenses and support | 13,264 | 323 | 13,588 | 13,965 | –5 | –3 |
| Cloud and software | 26,928 | 717 | 27,645 | 25,391 | 6 | 9 |
| Services | 4,279 | 109 | 4,387 | 4,128 | 4 | 6 |
| Total revenue | 31,207 | 826 | 32,033 | 29,520 | 6 | 9 |
(E.5) Reconciliation of Non-IFRS Operating Expenses – Year-to-Date
| € millions, unless otherwise stated | Q1–Q4 2023 | Q1–Q4 2022 | ∆ in % | ||||||||
| IFRS | Adj. | Non-IFRS |
Currency Impact |
Non-IFRS Constant Currency |
IFRS | Adj. | Non- IFRS |
IFRS | Non- IFRS |
Non-IFRS Constant Currency |
|
| Operating Expense Numbers | |||||||||||
| Cost of cloud | –3,884 | 135 | –3,749 | –3,499 | 108 | –3,391 | 11 | 11 | |||
| Cost of software licenses and support | –1,390 | 64 | –1,326 | –1,384 | 82 | –1,302 | 0 | 2 | |||
| Cost of cloud and software | –5,274 | 200 | –5,075 | –4,883 | 190 | –4,694 | 8 | 8 | |||
| Cost of services | –3,405 | 378 | –3,028 | –3,155 | 250 | –2,904 | 8 | 4 | |||
| Total cost of revenue | –8,680 | 577 | –8,102 | –8,038 | 440 | –7,598 | 8 | 7 | |||
| Gross profit | 22,527 | 577 | 23,104 | 21,482 | 440 | 21,922 | 5 | 5 | |||
| Research and development | –6,322 | 711 | –5,611 | –6,080 | 451 | –5,629 | 4 | 0 | |||
| Sales and marketing | –8,830 | 1,247 | –7,583 | –7,946 | 789 | –7,157 | 11 | 6 | |||
| General and administration | –1,360 | 186 | –1,174 | –1,289 | 146 | –1,143 | 6 | 3 | |||
| Restructuring | –215 | 215 | 0 | –138 | 138 | 0 | 56 | N/A | |||
| Other operating income/expense, net | –16 | 0 | –16 | 60 | –65 | –5 | N/A | >100 | |||
| Total operating expenses | –25,421 | 2,936 | –22,486 | –500 | –22,985 | –23,429 | 1,898 | –21,531 | 9 | 4 | 7 |
(E.6) Reconciliation of Non-IFRS Profit Figures, Income Tax, and Key Ratios – Year-to-Date
| € millions, unless otherwise stated | Q1–Q4 2023 | Q1–Q4 2022 | ∆ in % | ||||||||
| IFRS | Adj. | Non-IFRS |
Currency Impact |
Non-IFRS Constant Currency |
IFRS | Adj. | Non- IFRS |
IFRS | Non- IFRS |
Non-IFRS Constant Currency |
|
| Profit Numbers | |||||||||||
| Operating profit (loss) | 5,785 | 2,936 | 8,721 | 326 | 9,047 | 6,090 | 1,898 | 7,989 | –5 | 9 | 13 |
| Profit (loss) before tax from continuing operations | 5,292 | 2,936 | 8,228 | 4,513 | 1,898 | 6,412 | 17 | 28 | |||
| Income tax expense | –1,728 | –685 | –2,413 | –1,446 | –450 | –1,895 | 19 | 27 | |||
| Profit (loss) after tax from continuing operations | 3,564 | 2,251 | 5,815 | 3,068 | 1,449 | 4,517 | 16 | 29 | |||
| Attributable to owners of parent | 3,598 | 2,247 | 5,844 | 3,277 | 1,442 | 4,719 | 10 | 24 | |||
| Attributable to non-controlling interests | –34 | 4 | –29 | –210 | 7 | –202 | –84 | –85 | |||
| Profit (loss) after tax1 | 5,928 | 2,032 | 7,960 | 1,708 | 2,837 | 4,545 | >100 | 75 | |||
| Attributable to owners of parent1 | 6,103 | 2,094 | 8,196 | 2,284 | 2,489 | 4,773 | >100 | 72 | |||
| Attributable to non-controlling interests1 | –175 | –62 | –236 | –576 | 348 | –228 | –70 | 4 | |||
| Key Ratios | |||||||||||
| Operating margin (in %) | 18.5 | 27.9 | 28.2 | 20.6 | 27.1 | –2.1pp | 0.9pp | 1.2pp | |||
| Effective tax rate (in %)2 | 32.6 | 29.3 | 32.0 | 29.6 | 0.6pp | –0.2pp | |||||
| Earnings per share, basic (in €) from continuing operations | 3.08 | 5.01 | 2.80 | 4.03 | 10 | 24 | |||||
| Earnings per share, basic (in €)1 | 5.23 | 7.02 | 1.95 | 4.08 | >100 | 72 | |||||
1 From continuing and discontinued operations
2 The difference between our effective tax rate (IFRS) and effective tax rate (non-IFRS) in 2023 and 2022 mainly resulted from tax effects of share-based payment expenses, acquisition-related charges and restructuring expenses.
(F) Non-IFRS Adjustments – Actuals and Estimates
| € millions |
Estimated Amounts Full Year 2024 |
Q1–Q4 2023 | Q4 2023 |
Q1–Q4 2022 |
Q4 2022 |
| Operating profit (loss) (IFRS) | 5,785 | 1,900 | 6,090 | 2,002 | |
| Adjustment for acquisition-related charges | 305–385 | 345 | 88 | 330 | 37 |
| Adjustment for share-based payment expenses | N/A | 2,221 | 544 | 1,431 | 494 |
| Adjustment for restructuring | at around €2 billion | 215 | –7 | 138 | 27 |
| Adjustment for regulatory compliance matter expenses | 0 | 155 | –15 | - | - |
| Operating expense adjustments | 2,936 | 610 | 1,898 | 557 | |
| Operating profit (loss) (non-IFRS) | 8,721 | 2,510 | 7,989 | 2,560 |
(G) Non-IFRS Adjustments by Functional Areas
| € millions | Q4 2023 | Q4 2022 | ||||||||||
| IFRS | Acquisition- Related |
SBP1 | Restruc- turing |
RCM2 | Non-IFRS | IFRS |
Acquisition- Related |
SBP1 | Restruc- turing |
RCM2 | Non-IFRS | |
| Cost of cloud | –1,041 | 10 | 24 | 0 | 0 | –1,006 | –947 | 14 | 19 | 0 | - | –915 |
| Cost of software licenses and support | –382 | 0 | 10 | 0 | 0 | –372 | –358 | 10 | 14 | 0 | - | –334 |
| Cost of services | –848 | 1 | 89 | 0 | 0 | –758 | –844 | 0 | 81 | 0 | - | –762 |
| Research and development | –1,669 | 2 | 170 | 0 | 0 | –1,497 | –1,598 | 3 | 147 | 0 | - | –1,449 |
| Sales and marketing | –2,267 | 64 | 208 | 0 | –15 | –2,010 | –2,107 | 73 | 184 | 0 | - | –1,850 |
| General and administration | –362 | 9 | 43 | 0 | 0 | –310 | –345 | 1 | 49 | 0 | - | –295 |
| Restructuring | 7 | 0 | 0 | –7 | 0 | 0 | –27 | 0 | 0 | 27 | - | 0 |
| Other operating income/expense, net | –4 | 0 | 0 | 0 | 0 | –4 | 166 | –65 | 0 | 0 | - | 100 |
| Total operating expenses | –6,567 | 88 | 544 | –7 | –15 | –5,957 | –6,061 | 37 | 494 | 27 | - | –5,504 |
1 Share-based Payments
2 Regulatory Compliance Matters
| € millions | Q1–Q4 2023 | Q1–Q4 2022 | ||||||||||
| IFRS | Acquisition- Related |
SBP1 | Restruc- turing |
RCM2 | Non-IFRS | IFRS |
Acquisition- Related |
SBP1 | Restruc- turing |
RCM2 | Non-IFRS | |
| Cost of cloud | –3,884 | 42 | 94 | 0 | 0 | –3,749 | –3,499 | 54 | 53 | 0 | - | –3,391 |
| Cost of software licenses and support | –1,390 | 26 | 38 | 0 | 0 | –1,326 | –1,384 | 34 | 48 | 0 | - | –1,302 |
| Cost of services | –3,405 | 2 | 375 | 0 | 0 | –3,028 | –3,155 | 1 | 250 | 0 | - | –2,904 |
| Research and development | –6,322 | 7 | 704 | 0 | 0 | –5,611 | –6,080 | 11 | 440 | 0 | - | –5,629 |
| Sales and marketing | –8,830 | 257 | 834 | 0 | 155 | –7,583 | –7,946 | 286 | 503 | 0 | - | –7,157 |
| General and administration | –1,360 | 11 | 175 | 0 | 0 | –1,174 | –1,289 | 9 | 137 | 0 | - | –1,143 |
| Restructuring | –215 | 0 | 0 | 215 | 0 | 0 | –138 | 0 | 0 | 138 | - | 0 |
| Other operating income/expense, net | –16 | 0 | 0 | 0 | 0 | –16 | 60 | –65 | 0 | 0 | - | –5 |
| Total operating expenses | –25,421 | 345 | 2,221 | 215 | 155 | –22,486 | –23,429 | 330 | 1,431 | 138 | - | –21,531 |
1 Share-based Payments
2 Regulatory Compliance Matters
If not presented in a separate line item in our income statement, the restructuring expenses would break down as follows:
| € millions | Q4 2023 | Q1–Q4 2023 | Q4 2022 | Q1–Q4 2022 |
| Cost of cloud | 4 | 7 | 0 | 20 |
| Cost of software licenses and support | 1 | –8 | –5 | –9 |
| Cost of services | –4 | –31 | –9 | –70 |
| Research and development | 2 | –42 | –10 | –16 |
| Sales and marketing | 7 | –121 | –2 | –58 |
| General and administration | –3 | –19 | –2 | –4 |
| Restructuring expenses | 7 | –215 | –27 | –138 |
(H.1) Segment Policies and Segment Changes
SAP has one reportable segment: the Applications, Technology & Services segment.
At the end of the second quarter 2023, we sold Qualtrics, formerly a reportable segment which derived its revenues mainly from the sale of experience management cloud solutions. For more information related to the sale of Qualtrics, see Note (M) in this quarterly statement.
For a more detailed description of SAP’s segment reporting, see Note (C.1) “Results of Segments” of our Consolidated Financial Statements 2023.
(H.2) Segment Reporting – Quarter
Applications, Technology & Services1
|
€ millions, unless otherwise stated (non-IFRS) |
Q4 2023 | Q4 2022 | ∆ in % | ∆ in % | |
|
Actual Currency |
Constant Currency |
Actual Currency |
Actual Currency |
Constant Currency |
|
| Cloud – SaaS2 | 2,601 | 2,724 | 2,172 | 20 | 25 |
| Cloud – PaaS3 | 620 | 641 | 438 | 42 | 46 |
| Cloud – IaaS4 | 184 | 190 | 204 | –10 | –7 |
| Cloud | 3,405 | 3,555 | 2,814 | 21 | 26 |
| Software licenses | 841 | 854 | 907 | –7 | –6 |
| Software support | 2,846 | 2,952 | 2,993 | –5 | –1 |
| Software licenses and support | 3,687 | 3,806 | 3,899 | –5 | –2 |
| Cloud and software | 7,092 | 7,361 | 6,713 | 6 | 10 |
| Services | 1,076 | 1,119 | 1,079 | 0 | 4 |
| Total segment revenue | 8,168 | 8,480 | 7,792 | 5 | 9 |
| Cost of cloud | –985 | –1,026 | –903 | 9 | 14 |
| Cost of software licenses and support | –354 | –362 | –335 | 6 | 8 |
| Cost of cloud and software | –1,339 | –1,388 | –1,239 | 8 | 12 |
| Cost of services | –769 | –792 | –752 | 2 | 5 |
| Total cost of revenue | –2,108 | –2,180 | –1,991 | 6 | 10 |
| Cloud gross profit – SaaS2 | 1,836 | 1,937 | 1,476 | 24 | 31 |
| Cloud gross profit – PaaS3 | 533 | 548 | 357 | 49 | 53 |
| Cloud gross profit – IaaS4 | 51 | 44 | 77 | –33 | –43 |
| Cloud gross profit | 2,420 | 2,529 | 1,910 | 27 | 32 |
| Segment gross profit | 6,059 | 6,300 | 5,802 | 4 | 9 |
| Other segment expenses | –3,374 | –3,512 | –3,069 | 10 | 14 |
| Segment profit (loss) | 2,686 | 2,788 | 2,732 | –2 | 2 |
| SAP S/4 HANA | |||||
| SAP S/4HANA Cloud revenue5 | 1,028 | 1,067 | 662 | 55 | 61 |
| SAP S/4HANA Current cloud backlog | 5,046 | 5,153 | 3,194 | 58 | 61 |
| Margins | |||||
| Segment gross margin (in %) | 74.2 | 74.3 | 74.5 | –0.3pp | –0.2pp |
| Segment margin (in %) | 32.9 | 32.9 | 35.1 | –2.2pp | –2.2pp |
1 Segment information for comparative prior periods were restated to conform with the new segment composition.
2 Software as a service: SaaS comprises all other offerings which are not shown as PaaS or IaaS.
3 Platform as a service: PaaS primarily includes SAP Business Technology Platform, the SAP LeanIX portfolio, and SAP Signavio solutions.
4 Infrastructure as a service: A major portion of IaaS comes from SAP HANA Enterprise Cloud.
5 Mainly derived from the Applications, Technology & Services segment.
Reconciliation of Cloud Revenues – Quarter
|
€ millions, unless otherwise stated (Non-IFRS) |
Q4 2023 | Q4 2022 | ∆ in % | |||
| Actual Currency |
Currency Impact |
Constant Currency |
Actual Currency |
Actual Currency |
Constant Currency |
|
| Cloud revenue – SaaS1 | 2,894 | 134 | 3,029 | 2,436 | 19 | 24 |
| Cloud revenue – PaaS2 | 620 | 20 | 641 | 438 | 42 | 46 |
| Cloud revenue – IaaS3 | 184 | 5 | 190 | 204 | –10 | –7 |
| Cloud revenue | 3,699 | 160 | 3,859 | 3,078 | 20 | 25 |
| Cloud gross profit – SaaS1 | 2,109 | 115 | 2,223 | 1,729 | 22 | 29 |
| Cloud gross profit – PaaS2 | 533 | 15 | 548 | 357 | 49 | 53 |
| Cloud gross profit – IaaS³ | 51 | –7 | 44 | 77 | –33 | –43 |
| Cloud gross profit | 2,693 | 123 | 2,816 | 2,164 | 24 | 30 |
1 Software as a service: SaaS comprises all other offerings which are not shown as PaaS or IaaS.
2 Platform as a service: PaaS primarily includes SAP Business Technology Platform, the SAP LeanIX portfolio, and SAP Signavio solutions.
3 Infrastructure as a service: A major portion of IaaS comes from SAP HANA Enterprise Cloud.
(H.3) Segment Reporting – Year-to-Date
Applications, Technology & Services1
|
€ millions, unless otherwise stated (non-IFRS) |
Q1–Q4 2023 | Q1–Q4 2022 | ∆ in % | ∆ in % | |
|
Actual Currency |
Constant Currency |
Actual Currency |
Actual Currency |
Constant Currency |
|
| Cloud – SaaS2 | 9,608 | 9,901 | 7,986 | 20 | 24 |
| Cloud – PaaS3 | 2,182 | 2,236 | 1,533 | 42 | 46 |
| Cloud – IaaS4 | 748 | 766 | 908 | –18 | –16 |
| Cloud | 12,538 | 12,903 | 10,428 | 20 | 24 |
| Software licenses | 1,767 | 1,805 | 2,056 | –14 | –12 |
| Software support | 11,496 | 11,781 | 11,908 | –3 | –1 |
| Software licenses and support | 13,263 | 13,586 | 13,964 | –5 | –3 |
| Cloud and software | 25,801 | 26,489 | 24,392 | 6 | 9 |
| Services | 4,256 | 4,364 | 4,104 | 4 | 6 |
| Total segment revenue | 30,056 | 30,853 | 28,496 | 5 | 8 |
| Cost of cloud | –3,692 | –3,777 | –3,355 | 10 | 13 |
| Cost of software licenses and support | –1,276 | –1,298 | –1,331 | –4 | –2 |
| Cost of cloud and software | –4,968 | –5,075 | –4,686 | 6 | 8 |
| Cost of services | –2,976 | –3,039 | –2,856 | 4 | 6 |
| Total cost of revenue | –7,944 | –8,114 | –7,542 | 5 | 8 |
| Cloud gross profit – SaaS2 | 6,740 | 6,980 | 5,514 | 22 | 27 |
| Cloud gross profit – PaaS3 | 1,849 | 1,896 | 1,240 | 49 | 53 |
| Cloud gross profit – IaaS4 | 257 | 250 | 319 | –20 | –22 |
| Cloud gross profit | 8,846 | 9,125 | 7,073 | 25 | 29 |
| Segment gross profit | 22,112 | 22,739 | 20,954 | 6 | 9 |
| Other segment expenses | –12,281 | –12,589 | –12,130 | 1 | 4 |
| Segment profit (loss) | 9,831 | 10,149 | 8,824 | 11 | 15 |
| SAP S/4 HANA | |||||
| SAP S/4HANA Cloud revenue5 | 3,495 | 3,599 | 2,088 | 67 | 72 |
| SAP S/4HANA Current cloud backlog | 5,046 | 5,153 | 3,194 | 58 | 61 |
| Margins | |||||
| Segment gross margin (in %) | 73.6 | 73.7 | 73.5 | 0.0pp | 0.2pp |
| Segment margin (in %) | 32.7 | 32.9 | 31.0 | 1.7pp | 1.9pp |
1 Segment information for comparative prior periods were restated to conform with the new segment composition.
2 Software as a service: SaaS comprises all other offerings which are not shown as PaaS or IaaS.
3 Platform as a service: PaaS primarily includes SAP Business Technology Platform, the SAP LeanIX portfolio, and SAP Signavio solutions.
4 Infrastructure as a service: A major portion of IaaS comes from SAP HANA Enterprise Cloud.
5 Mainly derived from the Applications, Technology & Services segment.
Reconciliation of Cloud Revenues and Gross Profit – Year-to-Date
|
€ millions, unless otherwise stated (non-IFRS) |
Q1–Q4 2023 | Q1-Q4 2022 | ∆ in % | |||
| Actual Currency |
Currency Impact |
Constant Currency |
Actual Currency | Actual Currency |
Constant Currency |
|
| Cloud revenue – SaaS1 | 10,734 | 322 | 11,056 | 8,985 | 19 | 23 |
| Cloud revenue – PaaS2 | 2,182 | 54 | 2,236 | 1,533 | 42 | 46 |
| Cloud revenue – IaaS3 | 748 | 18 | 766 | 908 | –18 | –16 |
| Cloud revenue | 13,664 | 394 | 14,058 | 11,426 | 20 | 23 |
| Cloud gross profit – SaaS1 | 7,809 | 270 | 8,079 | 6,475 | 21 | 25 |
| Cloud gross profit – PaaS2 | 1,849 | 47 | 1,896 | 1,240 | 49 | 53 |
| Cloud gross profit – IaaS³ | 257 | –7 | 250 | 319 | –20 | –22 |
| Cloud gross profit | 9,915 | 309 | 10,224 | 8,035 | 23 | 27 |
1 Software as a service: SaaS comprises all other offerings which are not shown as PaaS or IaaS.
2 Platform as a service: PaaS primarily includes SAP Business Technology Platform, the SAP LeanIX portfolio, and SAP Signavio solutions.
3 Infrastructure as a service: A major portion of IaaS comes from SAP HANA Enterprise Cloud.
| (I) | Revenue by Region (IFRS and Non-IFRS) |
| (I.1) | Revenue by Region (IFRS and Non-IFRS) – Quarter |
| € millions | Q4 2023 | Q4 2022 | ∆ in % | |||
| Actual currency |
Currency Impact |
Constant Currency |
Actual currency | Actual currency |
Constant Currency |
|
| Cloud Revenue by Region | ||||||
| EMEA | 1,431 | 15 | 1,447 | 1,128 | 27 | 28 |
| Americas | 1,769 | 111 | 1,880 | 1,560 | 13 | 21 |
| APJ | 499 | 34 | 533 | 391 | 28 | 36 |
| Cloud revenue | 3,699 | 160 | 3,859 | 3,078 | 20 | 25 |
| Cloud and Software Revenue by Region | ||||||
| EMEA | 3,358 | 20 | 3,378 | 3,105 | 8 | 9 |
| Americas | 2,979 | 191 | 3,170 | 2,862 | 4 | 11 |
| APJ | 1,049 | 69 | 1,118 | 1,011 | 4 | 11 |
| Cloud and software revenue | 7,386 | 280 | 7,666 | 6,978 | 6 | 10 |
| Total Revenue by Region | ||||||
| Germany | 1,421 | 1 | 1,422 | 1,279 | 11 | 11 |
| Rest of EMEA | 2,464 | 23 | 2,488 | 2,336 | 5 | 6 |
| Total EMEA | 3,886 | 24 | 3,910 | 3,615 | 7 | 8 |
| United States | 2,724 | 141 | 2,865 | 2,645 | 3 | 8 |
| Rest of Americas | 674 | 79 | 753 | 663 | 2 | 14 |
| Total Americas | 3,398 | 220 | 3,618 | 3,308 | 3 | 9 |
| Japan | 329 | 32 | 361 | 308 | 7 | 17 |
| Rest of APJ | 855 | 47 | 902 | 833 | 3 | 8 |
| Total APJ | 1,184 | 79 | 1,263 | 1,141 | 4 | 11 |
| Total revenue | 8,468 | 323 | 8,791 | 8,064 | 5 | 9 |
| (I.2) | Revenue by Region (IFRS and Non-IFRS) – Year-to-Date |
| € millions | Q1–Q4 2023 | Q1–Q4 2022 | ∆ in % | |||
| Actual Currency |
Currency Impact |
Constant Currency |
Actual Currency | Actual Currency |
Constant Currency |
|
| Cloud Revenue by Region | ||||||
| EMEA | 5,241 | 52 | 5,293 | 4,137 | 27 | 28 |
| Americas | 6,642 | 218 | 6,859 | 5,810 | 14 | 18 |
| APJ | 1,781 | 124 | 1,905 | 1,478 | 21 | 29 |
| Cloud revenue | 13,664 | 394 | 14,058 | 11,426 | 20 | 23 |
| Cloud and Software Revenue by Region | ||||||
| EMEA | 12,028 | 80 | 12,109 | 11,081 | 9 | 9 |
| Americas | 10,959 | 362 | 11,321 | 10,456 | 5 | 8 |
| APJ | 3,941 | 274 | 4,215 | 3,855 | 2 | 9 |
| Cloud and software revenue | 26,928 | 717 | 27,645 | 25,391 | 6 | 9 |
| Total Revenue by Region | ||||||
| Germany | 4,916 | 2 | 4,918 | 4,469 | 10 | 10 |
| Rest of EMEA | 9,083 | 91 | 9,175 | 8,440 | 8 | 9 |
| Total EMEA | 13,999 | 93 | 14,092 | 12,909 | 8 | 9 |
| United States | 10,204 | 289 | 10,494 | 9,799 | 4 | 7 |
| Rest of Americas | 2,558 | 133 | 2,691 | 2,427 | 5 | 11 |
| Total Americas | 12,762 | 422 | 13,184 | 12,227 | 4 | 8 |
| Japan | 1,243 | 121 | 1,364 | 1,218 | 2 | 12 |
| Rest of APJ | 3,203 | 190 | 3,392 | 3,166 | 1 | 7 |
| Total APJ | 4,445 | 311 | 4,756 | 4,384 | 1 | 8 |
| Total revenue | 31,207 | 826 | 32,033 | 29,520 | 6 | 9 |
| (J) | Employees by Region and Functional Areas |
| Full-time equivalents | 12/31/2023 | 12/31/2022 | ||||||
| EMEA | Americas | APJ | Total | EMEA | Americas | APJ | Total | |
| Cloud and software1 | 4,389 | 4,266 | 4,426 | 13,080 | 4,178 | 4,025 | 4,538 | 12,740 |
| Services | 8,178 | 5,013 | 5,481 | 18,672 | 8,129 | 5,106 | 5,769 | 19,005 |
| Research and development1 | 18,086 | 5,884 | 12,474 | 36,444 | 17,764 | 5,752 | 11,764 | 35,280 |
| Sales and marketing | 12,086 | 10,300 | 5,342 | 27,728 | 11,671 | 10,633 | 5,463 | 27,766 |
| General and administration | 3,619 | 1,777 | 1,307 | 6,704 | 3,387 | 1,804 | 1,240 | 6,431 |
| Infrastructure | 2,834 | 1,274 | 867 | 4,975 | 2,795 | 1,382 | 912 | 5,089 |
| SAP Group (12/31) | 49,191 | 28,515 | 29,897 | 107,602 | 47,924 | 28,702 | 29,686 | 106,312 |
| Thereof acquisitions2 | 421 | 138 | 0 | 558 | 188 | 189 | 8 | 385 |
| SAP Group (twelve months' end average) | 48,222 | 28,239 | 29,582 | 106,043 | 47,359 | 28,785 | 29,438 | 105,582 |
1 Due to the updated cost allocation policy described in Note (L), headcount numbers for the comparative period were adjusted accordingly.
2 Acquisitions closed between January 1 and December 31 of the respective year.
| (K) | Financial Income, Net |
In the fourth quarter of 2023, finance income mainly consisted of gains from disposals and fair value adjustments of equity securities totaling €141 million (Q4/2022: €54 million) and €380 million in the full year 2023 (Q1-Q4/2022: €608 million), and interest income from loans and receivables, other financial assets (cash, cash equivalents, and current investments) as well as from derivatives amounting to €143 million in the fourth quarter of 2023 (Q4/2022: €70 million) and €486 million in the full year 2023 (Q1-Q4/2022: €193 million).
In the fourth quarter of 2023, finance costs were primarily impacted by losses from disposals and fair value adjustments of equity securities amounting to €196 million (Q4/2022: €862 million) and €525 million in the full year 2023 (Q1-Q4/2022: €1,802 million) and interest expense on financial liabilities including lease liabilities and negative effects from derivatives amounting to €135 million in the full year 2023 (Q4/2022: €110 million) and €639 million in the full year 2023 (Q1-Q4/2022: €272 million).
| (L) | Updated Cost Allocation Policy |
Starting January 1, 2023, all activities related to changes in the code of SAP’s cloud and on-premise solutions are treated as development-related activities. Some of those activities, specifically code corrections, were previously considered as support-related activities. SAP believes this update aligns SAP’s accounting policy with market standards and increases comparability to its peers.
In the fourth quarter 2023, this update of our cost allocation policy resulted in an increase of the cloud gross profit (IFRS) by approximately €25 million (Q4/2022: €22 million), an increase of the software license and support gross profit (IFRS) by approximately €80 million (Q4/2022: €78 million), and an increase of our research and development (R&D) expenses (IFRS) by approximately €105 million (Q4/2022: €99 million).
In the full year 2023, the update of our cost allocation policy led to an increase of the cloud gross profit (IFRS) by approximately €95 million (Q1-Q4/2022: €88 million), an increase of the software license and support gross profit (IFRS) by approximately €275 million (Q1-Q4/2022: €310 million), and an increase of our R&D expenses (IFRS) by approximately €370 million (Q1-Q4/2022: €398 million).
Prior periods have been adjusted to reflect the updated cost allocation policy.
| (M) | Business combinations |
LeanIX Acquisition
On September 7, 2023, SAP announced its intent to acquire 100% of LeanIX GmbH (“LeanIX”), a leader in enterprise architecture management (EAM) software. The acquisition closed on November 7, 2023, following satisfaction of customary closing conditions and regulatory approvals; the operating results and the assets and liabilities are reflected in our consolidated financial statements starting on that date. The acquisition is expected to further expand SAP’s business transformation portfolio, giving customers access to the full suite of tools required for continuous business transformation and facilitating AI-enabled process optimization. Consideration transferred amounted to €1,231 million paid in cash.
In the fourth quarter of 2023, the contribution of LeanIX to revenue was approximately €10 million, to operating profit approximately -€11 million (IFRS) and approximately -€6 million (Non-IFRS).
| (N) | Discontinued Operations |
On March 13, resulting from a process that was initiated on January 26, SAP announced it had agreed to sell all of its 423 million shares of Qualtrics International Inc. as part of the acquisition of Qualtrics by funds affiliated with Silver Lake as well as the Canada Pension Plan Investment Board. The sale closed on June 28, 2023, following satisfaction of customary closing conditions and regulatory approvals. At a purchase price of US$18.15 in cash per share, SAP’s stake was acquired for approximately US$7.7 billion.
The pre-tax disposal gain included into discontinued operations (€3.6 billion) was calculated by adjusting the purchase price less cost of disposal (€7.0 billion) for net assets leaving the SAP Group (-€5.8 billion, mostly goodwill (-€4.0 billion) and other intangible assets (-€1.3 billion)) and the corresponding non-controlling interests (€2.3 billion) and amounts of other comprehensive income (<€0.1 billion). SAP incurred taxes amounting to €0.8 billion in connection with the transaction.
The cash inflow resulting from the purchase price (€7.1 billion) was offset by cash and cash equivalents of €0.7 billion leaving the SAP group.
The P&L line item “Profit (loss) from discontinued operation” still reflects the Qualtrics activities up to the date of the sale (the comparative figures have been adjusted accordingly). In the fourth quarter 2023, tax payment of €0.1 billion relating to the gain on the sale of Qualtrics were made. These payments were recognized in SAP’s discontinued operations, reducing the investing cash flow.
Financial information relating to Qualtrics is presented in the following tables (revenues and expenses are presented after consolidation of transactions between Qualtrics and SAP’s continuing operations):
| € billion, unless otherwise stated | Q1–Q4 2023 | Q1–Q4 2022 |
| Consolidated Income Statements | ||
| Cloud revenue | 0.6 | 1.1 |
| Total revenue | 0.7 | 1.4 |
| Cost of cloud | –0.1 | –0.3 |
| Total cost of revenue | –0.2 | –0.5 |
| Total operating expenses (including total cost of revenue) | –1.2 | –2.8 |
| Disposal gain before tax | 3.6 | 0.0 |
| Operating profit | 3.2 | –1.4 |
| Profit (loss) before tax | 3.2 | –1.4 |
| Income tax expense1 | –0.8 | 0.1 |
| Profit (loss) after tax | 2.4 | –1.4 |
| Attributable to owners of parent | 2.5 | –1.0 |
| Earnings per share, basic (IFRS, in €)2 | 2.15 | –0.85 |
| Earnings per share, diluted (IFRS, in €)2 | 2.12 | –0.85 |
| Earnings per share, basic (non-IFRS, in €)2 | 2.01 | 0.05 |
| Consolidated Statements of Cash Flow | ||
| Net operating cash flow | 0.1 | –0.0 |
| Net investing cash flow | 5.5 | –0.0 |
| Net financing cash flow | 0.0 | –0.3 |
1 For 2023, € 0.8 billion is relating to the gain on sale of discontinued operations.
2 For the full year 2023 and 2022, the weighted average number of shares was 1,167 million (diluted 1,180 million) and 1,170 million (diluted: 1,175 million), respectively (treasury stock excluded).
| € billion, unless otherwise stated | Q1–Q4 2023 | Q1–Q4 2022 |
| Profit (loss) after tax (IFRS) | 2.4 | –1.4 |
| Adjustment for acquisition related charges | –0.8 | 0.3 |
| Adjustment for share-based payment expenses | 0.4 | 1.2 |
| Adjustment for restructuring expenses | 0.0 | 0.0 |
| Adjustment for tax impact of non-IFRS adjustments | 0.2 | –0.1 |
| Profit (loss) after tax (non-IFRS) | 2.1 | 0.0 |
| Attributable to owners of parent | 2.4 | 0.1 |
| (O) | Capitalized Cost from Contracts with Customers – Costs of Obtaining Customer Contracts |
As disclosed in Consolidated Financial Statements for 2022, Note (A.3), the determination of the amortization period for capitalized sales commissions requires judgement. In exercising this judgment, we consider our expectation about future contract renewals which we evaluate periodically to confirm that the resulting amortization period properly reflects the expected contract life or if there are potential indicators of impairment. The latest review of the amortization periods resulted in a shorter contract life for on-premise support contracts. As a result of this assessment, we have accelerated amortization of the related capitalized sales commissions in the amount of €63 million as of September 30, 2023.
For Q4 2023, this change in contract life resulted in higher amortization costs of €59 million. SAP expects an estimated impact for the full year 2024 of €80 million. The amortization periods now range from 18 months to seven years depending on the type of offering.
| (P) | Non-IFRS Definition Update |
In recent years, SAP has substituted many of its share-based compensation plans from cash-settled to equity-settled. With the majority of the share-based compensation (SBC) plans being equity-settled, the impact of share price fluctuation and factors outside of our control is reduced. For these reasons, SAP has decided that, from 2024, it will no longer exclude share-based payment expenses from its operation profit (non-IFRS).
Also starting in 2024, numbers that are identified as financial income, net (non-IFRS) will be adjusted by excluding gains and losses from equity securities, net. This adjustment will include realized and unrealized effects from the disposal of equity securities, ongoing mark-to-market adjustments on marketable equity investments, changes in fair value of non-marketable equity securities and others. SAP will exclude gains and losses from equity securities, net for the purpose of increasing comparability period over period by reducing volatility caused by share price and market developments, as well as other factors outside our control.
The adjustments to SAP’s non-IFRS definitions will also impact our profit before tax (non-IFRS), profit after tax (non-IFRS), and our non-IFRS key ratios such as operating margin, effective tax rate, and earnings per share, basic.
| (Q) | Anti-Bribery Matters |
SAP has received communications and whistleblower information alleging conduct that may violate anti-bribery laws in the United States (including the U.S. Foreign Corrupt Practices Act (FCPA)) and in other countries. The Office of Ethics and Compliance (OEC) of SAP conducted investigations with the assistance of an external law firm and voluntarily advised the U.S. Securities and Exchange Commission (U.S. SEC) and the U.S. Department of Justice (U.S. DOJ), as well as local authorities where potential violations were investigated. Early January 2024, following comprehensive and exhaustive investigations, dialogue, and corresponding remediation activities, SAP entered into final settlement agreements with U.S. SEC and U.S. DOJ as well as local authorities and parties in South Africa, to resolve criminal and civil claims fully and finally against SAP. SAP is required to execute payments amounting to €207 million. As a consequence, as of December 31, 2023, provisions for fines regarding regulatory compliance matters totaling €155 million (December 31, 2022: €0 million, June 30, 2023: €170 million) have been recognized in our consolidated financial statements as well as repayments to customers, for which revenue recognized from contracts with customers have been reversed. A considerable portion of these customer repayments were eligible to be credited against fines incurred due to regulatory compliance matters. Immaterial amounts have already been paid in 2022. The remaining payments will be executed to a large extent within the first half of 2024.
Exhibit 99.2
SAP Updates its Ambition 2025 and Announces Transformation Program for 2024
Walldorf, Germany – January 23, 2024.
SAP SE (NYSE: SAP) SAP announces plans to implement a company-wide transformation program including restructuring for 2024. In addition, SAP is updating its ambition for 2025. The update reflects the strong performance in the fourth quarter 2023, the updated non-IFRS definition of profit measures, as well as the anticipated benefits from the new program.
The updated 2025 non-IFRS operating profit ambition of approximately €10.0 billion now reflects share-based compensation expenses of approximately €2 billion. Based on SAP’s analysis, this profit ambition is materially ahead of corresponding analyst consensus estimates. In addition, the updated 2025 free cash flow ambition of approximately €8.0 billion is ahead of the latest analyst consensus.
Ambition 2025
The update of the non-IFRS operating profit ambition includes a reduction by approximately €2 billion due to the inclusion of share-based compensation expenses under the updated non-IFRS definition, as well as an increase of approximately €0.5 billion due to anticipated incremental efficiency gains from the transformation program.
By 2025, SAP now expects:
| · | Non-IFRS cloud gross profit of approximately €16.2 billion, now including share-based compensation expenses of approximately €0.1 billion (previously: approximately €16.3 billion, excluding share-based compensation expenses) |
| · | Non-IFRS operating profit of approximately €10.0 billion, now including share-based compensation expenses of approximately €2 billion (previously: approximately €11.5 billion, excluding share-based compensation expenses) |
| · | Free cash flow of approximately €8.0 billion (previously: approximately €7.5 billion) |
SAP continues to expect:
| · | Cloud revenue of more than €21.5 billion |
| · | Total revenue of more than €37.5 billion |
| · | A share of more predictable revenue of approximately 86% |
The 2025 ambition is based on an exchange rate of 1.10 USD per EUR.
2024 Transformation Program: Focus on scalability of operations and key strategic growth areas
In 2024, SAP will further increase its focus on key strategic growth areas, in particular Business AI. It also intends to transform its operational setup to capture organizational synergies, AI-driven efficiencies and to prepare the company for highly scalable future revenue growth.
To this end and to ensure that SAP’s skill-set and resources continue to meet future business needs, SAP plans to execute a company-wide restructuring program in 2024. The majority of the approximately 8,000 affected positions is expected to be covered by voluntary leave programs and internal re-skilling measures. Reflecting re-investments into strategic growth areas, SAP expects to exit 2024 at a headcount similar to current levels.
Restructuring expenses are preliminarily projected at around €2 billion, the vast majority of which is expected to be recognized in the first half of 2024, impacting IFRS operating profit. Excluding restructuring expenses, the program is expected to provide only a minor cost benefit in 2024. Expected cost savings and re-investments are fully reflected in SAP’s 2024 outlook and the updated 2025 non-IFRS operating profit- and free cash flow ambition.
Financial Outlook 2024
SAP’s business outlook, which includes the financial outlook 2024 as well as the financial ambition 2025, is based on SAP’s updated non-IFRS definition of profit measures which, beginning in 2024, include share-based compensation expenses and exclude gains and losses from equity securities, net.
Furthermore, the 2024 outlook and 2025 ambition for free cash flow assume all payouts associated with the planned restructuring program will be completed in 2024.
For 2024, SAP expects:
| · | €17.0 – 17.3 billion cloud revenue at constant currencies (2023: €13.66 billion), up 24% to 27% at constant currencies. |
| · | €29.0 – 29.5 billion cloud and software revenue at constant currencies (2023: €26.93 billion), up 8% to 10% at constant currencies. |
| · | €7.6 – 7.9 billion non-IFRS operating profit at constant currencies (2023: €6.51 billion based on updated non-IFRS operating profit definition), up 17% to 21% at constant currencies. |
| · | Free cash flow of approximately €3.5 billion (2023: €5.08 billion). This includes a preliminary €2 billion estimate for payouts associated with the program, a €0.2 billion impact from a settlement earlier this year of pre-existing regulatory compliance matters accrued in 2023, as well as a €0.2 billion adverse impact due to the discontinuation of the SAP-triggered financing program. |
| · | A non-IFRS effective tax rate of approximately 32% (2023: 30.3% based on updated non-IFRS tax rate definition). |
While SAP’s 2024 financial outlook is at constant currencies, actual currency reported figures are expected to be impacted by currency exchange rate fluctuations as the Company progresses through the year.
SAP will publish its fourth quarter and full year 2023 results shortly after this release.
SAP senior management will discuss these items in more detail during its financial analyst conference call on Wednesday, January 24th at 07:00 AM (CET) / 06:00 AM (GMT) / 1:00 AM (EST) / Tuesday, January 23rd 10:00 PM (PST), which will be webcast on the Company’s website at https://www.sap.com/investor and will be available for replay.
Contact:
Anthony Coletta,
Chief Investor Relations Officer
+49 (6227) 7-60437
investor@sap.com