UNITED STATES
SECURITIES AND EXCHANGE COMMISSION
Washington, D.C. 20549
FORM 8-K
CURRENT REPORT
PURSUANT TO SECTION 13 OR 15(d) OF THE SECURITIES EXCHANGE ACT OF 1934
Date of Report (Date of earliest event reported): January 24, 2024
UNITED COMMUNITY BANKS, INC.
(Exact name of registrant as specified in its charter)
| Georgia | 001-35095 | 58-1807304 |
| (State or other jurisdiction of incorporation) | (Commission file number) | (IRS Employer Identification No.) |
125 Highway 515 East
Blairsville, Georgia 30512
(Address of principal executive offices)
Registrant's telephone number,
including area code:
(706) 781-2265
Not applicable
(Former name or former address, if changed since last report)
Check the appropriate box below if the Form 8-K filing is intended to simultaneously satisfy the filing obligation of the registrant under any of the following provisions:
| ¨ | Written communications pursuant to Rule 425 under the Securities Act (17 CFR 230.425) | |
| ¨ | Soliciting material pursuant to Rule 14a-12 under the Exchange Act (17 CFR 240.14a-12) | |
| ¨ | Pre-commencement communications pursuant to Rule 14d-2(b) under the Exchange Act (17 CFR 240.14d-2(b)) | |
| ¨ | Pre-commencement communications pursuant to Rule 13e-4(c) under the Exchange Act (17 CFR 240.13e-4(c)) |
Securities registered pursuant to Section 12(b) of the Act:
| Title of Each Class | Trading Symbol(s) | Name of Each Exchange on Which Registered | ||
| Common stock, par value $1 per share | UCBI | Nasdaq Global Select Market | ||
| Depositary shares, each representing 1/1000th interest in a share of Series I Non-Cumulative Preferred Stock | UCBIO | Nasdaq Global Select Market |
Indicate by check mark whether the registrant is an emerging growth company as defined in as defined in Rule 405 of the Securities Act of 1933 (§230.405 of this chapter) or Rule 12b-2 of the Securities Exchange Act of 1934 (§240.12b-2 of this chapter).
Emerging growth company ¨
If an emerging growth company, indicate by check mark if the registrant has elected not to use the extended transition period for complying with any new or revised financial accounting standards provided pursuant to Section 13(a) of the Exchange Act. ¨
| Item 2.02 | Results of Operations and Financial Condition. |
| On January 24, 2024, United Community Banks, Inc. (“United”) issued a press release announcing financial results for its fourth fiscal quarter of 2023. The press release is furnished as Exhibit 99.1 to this Current Report on Form 8-K. | |
| The information furnished pursuant to this Item 2.02, including Exhibit 99.1, shall not be deemed “filed” for purposes of Section 18 of the Securities Exchange Act of 1934 (the “Exchange Act”) or otherwise subject to the liabilities under Section 18 of the Exchange Act and shall not be deemed to be incorporated by reference into any filing of the Company under the Securities Act of 1933 or the Exchange Act. | |
| Item 7.01 | Regulation FD Disclosure. |
| On January 24, 2024, United will hold an earnings conference call and webcast at 11:00 a.m. (Eastern Time) to discuss financial results for its fourth fiscal quarter of 2023. The press release referenced above in Item 2.02 contains information about how to access the conference call and webcast. A copy of the slide presentation to be used during the earnings call and webcast is furnished as Exhibit 99.2 to this Current Report on Form 8-K. The slide presentation also will be available on our website, www.ucbi.com, under the “Investor Relations – Events and Presentations” section. | |
| The information furnished pursuant to this Item 7.01, including Exhibit 99.2, shall not be deemed “filed” for purposes of Section 18 of the Exchange Act or otherwise subject to the liabilities under Section 18 of the Exchange Act and shall not be deemed to be incorporated by reference into any filing of the Company under the Securities Act of 1933 or the Exchange Act. | |
| Item 9.01 | Financial Statements and Exhibits. |
| (d) Exhibits |
EXHIBIT INDEX
| Exhibit No. | Description | |
| 99.1 | United Community Banks, Inc. Press Release, dated January 24, 2024. | |
| 99.2 | Slide presentation to be used during January 24, 2024 earnings call. | |
| 104 | The cover page from this Current Report on Form 8-K, formatted in Inline XBRL. |
SIGNATURES
Pursuant to the requirements of the Securities Exchange Act of 1934, the registrant has duly caused this report to be signed on its behalf by the undersigned hereunto duly authorized.
| UNITED COMMUNITY BANKS, INC. | ||
| By: | /s/ Jefferson L. Harralson | |
| Jefferson L. Harralson | ||
| Executive Vice President and Chief Financial Officer | ||
| Date: January 24, 2024 | ||
Exhibit 99.1

For Immediate Release
For more information:
Jefferson Harralson
Chief Financial Officer
(864) 240-6208
Jefferson_Harralson@ucbi.com
United Community Banks, Inc. Reports Fourth Quarter Results
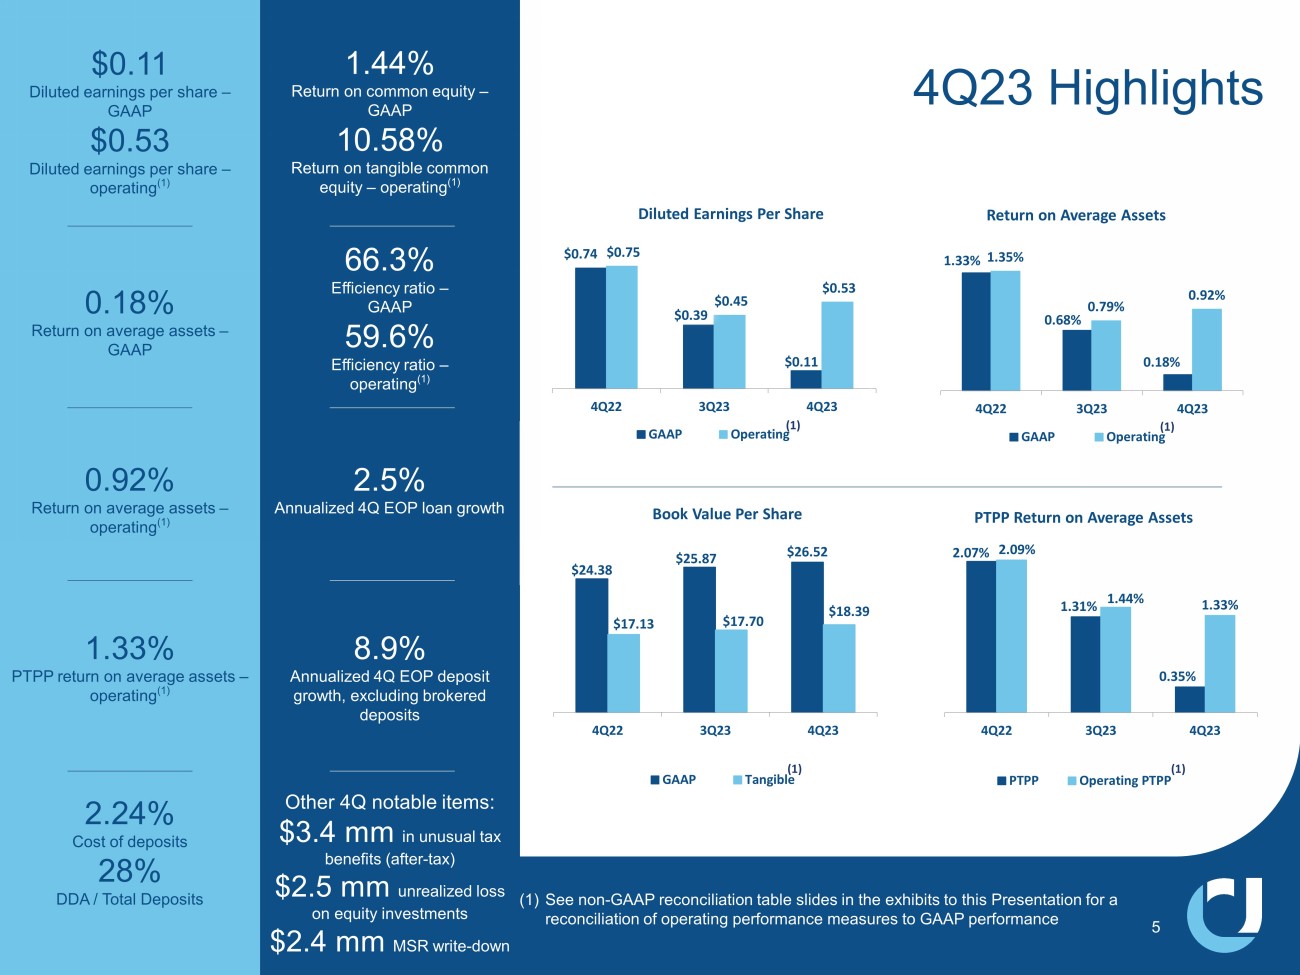
GREENVILLE, SC – January 24, 2024 - United Community Banks, Inc. (NASDAQ: UCBI) (“United”) today announced net income for the fourth quarter of $14.1 million and pre-tax, pre-provision income of $25.8 million. Diluted earnings per share of $0.11 for the quarter represented a decrease of $0.28 or 72% from the third quarter of 2023 and a decrease of $0.63 or 85%, from the fourth quarter of 2022.
On an operating basis, diluted earnings per share of $0.53 increased $0.08 or 18% compared to last quarter. Non-operating items included merger charges, losses for the previously reported bond portfolio restructuring transaction and an FDIC special assessment. Deposits grew by 8% annualized and loans grew at a 2.5% annualized rate during the quarter. Net interest revenue increased modestly during the quarter due to growth in interest bearing assets which offset the effect of a lower margin.
For the quarter, United’s return on assets was 0.18% and 0.92% on an operating basis. Return on common equity was 1.44% and return on tangible common equity was 10.58% on an operating basis. On a pre-tax, pre-provision basis, operating return on assets was 1.33% for the quarter. At quarter-end, tangible common equity to tangible assets was 8.36%, up eighteen basis points from the third quarter of 2023.
Chairman and CEO Lynn Harton stated, “Our focus continues to be on both maintaining a strong balance sheet and investing in growth as we continue to build the company. This quarter, we entered into a bond portfolio restructuring transaction to reduce our exposure to interest rate volatility in this uncertain environment. This will have the additional advantage of increasing our earnings in 2024. In our core banking operations, we continue to be pleased with the ability of our teams to grow our book of business. In the fourth quarter, strong deposit growth allowed us to reduce high cost brokered deposits and more than fund loan growth. While the cost of deposits continued to drift upward, the pace of margin compression has slowed. Asset quality remained solid with net charge-offs for the bank, excluding Navitas, at low levels. Looking into 2024, we expect broader credit performance to remain strong, but are closely monitoring for potential changes in both the economic environment overall and specifically in our markets.”
United’s net interest margin decreased by 5 basis points to 3.19% compared to the third quarter. The average yield on United’s interest-earning assets was up 14 basis points to 5.31%, but funding costs increased by 22 basis points, leading to the modest reduction in the net interest margin. Net charge-offs were $10.1 million, or 0.22%, of average loans during the quarter, down 37 basis points compared to the third quarter of 2023. Excluding Navitas, net charge-offs were 0.05% of average loans. Nonperforming assets were 34 basis points relative to total assets, which is in line with the prior quarter.
Mr. Harton concluded, “We are excited and optimistic about 2024. Economic conditions remain strong in our markets, though we continue to be cautious in our underwriting and portfolio management given the inherent uncertainty in the environment. Our teams continue to be focused on leading our markets in customer service, knowing that it is our connections with our customers and communities that drive our success. In 2023, including recently in the fourth quarter, we added a new member to our Board of Directors, and added new market leaders, new commercial bankers and new line-of-business leaders. We also expanded our market reach and service capabilities with new locations across our footprint. In November, United was named one of the “Best Banks to Work For” by American Banker for the seventh consecutive year, an accolade that underscores our belief that we are a great place to work for great people. We are in the final phases of refreshing our corporate logo and brand across our franchise. Our commitment to investing in our people, technology and customers’ needs with a culture of caring will remain the same as we continue to grow.”
2023 Financial Highlights:
| · | Completed a successful year with strong, high-quality loan and deposit growth and completed acquisitions in high-growth markets in Alabama, the Florida panhandle and Miami, which were all strategic priorities |
| · | The fourth quarter bond portfolio restructuring transaction resulted in a pre-tax loss of $52 million and the FDIC special assessment was $10 million, which reduced GAAP and operating EPS by approximately $0.39 |
| · | Full-year EPS of $1.54, a decrease of 39% compared to 2022; full year operating EPS of $2.11, a decrease of 21% from 2022 |
| · | Return on assets of 0.68%, or 0.94%, on an operating basis |
| · | Pre-tax, pre-provision return on assets of 1.53% on an operating basis |
| · | Return on common equity of 5.34%, or 7.33%, on an operating basis |
| · | Return on tangible common equity of 10.6% on an operating basis |
| · | A provision for credit losses of $89.4 million compared to a provision for credit losses of $63.9 million in 2022, with both periods including a provision establishing an initial allowance for acquired banks |
| · | Strong loan growth of $3.0 billion or $972 million, excluding loans acquired from acquired banks |
| · | Core transaction deposits were up $796 million compared to 2022; excluding acquired banks, 2023 core transaction deposits were down $984 million, or 6% |
| · | Net interest margin of 3.35%, which was down 3 basis points from last year primarily due to increased deposit costs |
| · | Noninterest income was down $62.2 million primarily due to the bond portfolio restructuring transaction |
| · | Excluding the bond portfolio restructuring transaction, noninterest income was down $4.8 million primarily due to a decline in mortgage fees, as higher rates led to lower demand and business volume |
| · | The efficiency ratio of 60.1%, or 56.2% on an operating basis, increased, primarily driven by higher deposit rates and a compressing NIM |
| · | Net charge-offs of $52.2 million, or 0.30% of average total loans, were up from the $9.65 million of net charge-offs in 2022 |
Fourth Quarter 2023 Financial Highlights:
| · | Net income of $14.1 million and pre-tax, pre-provision income of $25.8 million; operating net income of $64.8 million |
| · | EPS decreased by 85% compared to last year on a GAAP basis and 29% on an operating basis; compared to third quarter 2023, EPS decreased 72% on a GAAP basis and increased 18% on an operating basis |
| · | The bond portfolio restructuring transaction and the FDIC special assessment reduced GAAP and operating EPS by $0.38 |
| · | Return on assets of 0.18%, and 0.92% on an operating basis |
| · | Pre-tax, pre-provision return on assets of 1.33% excluding non-operating items |
| · | Return on common equity of 1.4%, or 7.3% when excluding non-operating items |
| · | Return on tangible common equity of 10.6% on an operating basis |
| · | Loan production of $1.4 billion, resulting in loan growth of 2.5% annualized for the quarter |
| · | Total deposits, excluding brokered deposits, were up $504 million, or 8.9% annualized, from last quarter, driven by seasonal increases in public funds |
| · | Net interest margin of 3.19% was down 5 basis points from the third quarter due to increased deposit costs |
| · | Mortgage closings of $204 million compared to $253 million a year ago; mortgage rate locks of $223 million compared to $364 million a year ago |
| · | Noninterest income was down $55.1 million, primarily due to the pre-tax loss of $51.7 million resulting from the bond portfolio restructuring transaction |
| · | Excluding the bond portfolio restructuring transaction, noninterest income was down $3.4 million from third quarter primarily due to a seasonal decline in mortgage fees |
| · | Noninterest expenses increased $10.1 million compared to the third quarter mostly due to the FDIC special assessment of $10.0 million |
| · | Efficiency ratio of 66.3%, or 59.6% on an operating basis, up from third quarter largely driven by increased group medical insurance costs |
| · | Net charge-offs of $10.1 million, or 0.22% of average loans, down 37 basis points from the net charge-offs level experienced in the third quarter, which included a $19 million charge-off from an 8.7% participation in a large, nationally syndicated credit |
| · | Nonperforming assets of 0.34% of total assets, are in line with September 30, 2023 |
| · | Quarterly common shareholder dividend of $0.23 per share declared during the quarter, an increase of 5% year-over-year |
Conference Call
United will hold a conference call on Wednesday, January 24, 2024, at 11 a.m. ET to discuss the contents of this press release and to share business highlights for the quarter. Participants can pre-register for the conference call by navigating to https://dpregister.com/sreg/10185556/fb5d089df4. Those without internet access or who are unable to pre-register may dial in by calling 1-866-777-2509. Participants are encouraged to dial in 15 minutes prior to the call start time. The conference call also will be webcast and available for replay by selecting “Events and Presentations” under “News and Events” within the Investor Relations section of United’s website at ucbi.com.
UNITED COMMUNITY BANKS, INC.
Selected Financial Information
(in thousands, except per share data)
| 2023 | 2022 | Fourth Quarter 2023- | For the Twelve Months Ended December 31, | YTD 2023- | ||||||||||||||||||||||||||||||||
| Fourth Quarter | Third Quarter | Second Quarter | First Quarter | Fourth Quarter | 2022 Change | 2023 | 2022 | 2022 Change | ||||||||||||||||||||||||||||
| INCOME SUMMARY | ||||||||||||||||||||||||||||||||||||
| Interest revenue | $ | 338,698 | $ | 323,147 | $ | 295,775 | $ | 279,487 | $ | 240,831 | $ | 1,237,107 | $ | 813,155 | ||||||||||||||||||||||
| Interest expense | 135,245 | 120,591 | 95,489 | 68,017 | 30,943 | 419,342 | 60,798 | |||||||||||||||||||||||||||||
| Net interest revenue | 203,453 | 202,556 | 200,286 | 211,470 | 209,888 | (3 | )% | 817,765 | 752,357 | 9 | % | |||||||||||||||||||||||||
| Provision for credit losses | 14,626 | 30,268 | 22,753 | 21,783 | 19,831 | (26 | ) | 89,430 | 63,913 | 40 | ||||||||||||||||||||||||||
| Noninterest income | (23,090 | ) | 31,977 | 36,387 | 30,209 | 33,354 | 75,483 | 137,707 | (45 | ) | ||||||||||||||||||||||||||
| Total revenue | 165,737 | 204,265 | 213,920 | 219,896 | 223,411 | (26 | ) | 803,818 | 826,151 | (3 | ) | |||||||||||||||||||||||||
| Noninterest expenses | 154,587 | 144,474 | 132,407 | 139,805 | 117,329 | 32 | 571,273 | 470,149 | 22 | |||||||||||||||||||||||||||
| Income before income tax expense | 11,150 | 59,791 | 81,513 | 80,091 | 106,082 | 232,545 | 356,002 | |||||||||||||||||||||||||||||
| Income tax (benefit) expense | (2,940 | ) | 11,925 | 18,225 | 17,791 | 24,632 | 45,001 | 78,530 | ||||||||||||||||||||||||||||
| Net income | 14,090 | 47,866 | 63,288 | 62,300 | 81,450 | 187,544 | 277,472 | |||||||||||||||||||||||||||||
| Non-operating items | 67,450 | 9,168 | 3,645 | 8,631 | 1,470 | 88,894 | 19,375 | |||||||||||||||||||||||||||||
| Income tax benefit of non-operating items | (16,714 | ) | (2,000 | ) | (820 | ) | (1,955 | ) | (323 | ) | (21,489 | ) | (4,246 | ) | ||||||||||||||||||||||
| Net income - operating (1) | $ | 64,826 | $ | 55,034 | $ | 66,113 | $ | 68,976 | $ | 82,597 | (22 | ) | $ | 254,949 | $ | 292,601 | (13 | ) | ||||||||||||||||||
| Pre-tax pre-provision income (5) | $ | 25,776 | $ | 90,059 | $ | 104,266 | $ | 101,874 | $ | 125,913 | (80 | ) | $ | 321,975 | $ | 419,915 | (23 | ) | ||||||||||||||||||
| PERFORMANCE MEASURES | ||||||||||||||||||||||||||||||||||||
| Per common share: | ||||||||||||||||||||||||||||||||||||
| Diluted net income - GAAP | $ | 0.11 | $ | 0.39 | $ | 0.53 | $ | 0.52 | $ | 0.74 | (85 | ) | $ | 1.54 | $ | 2.52 | (39 | ) | ||||||||||||||||||
| Diluted net income - operating (1) | 0.53 | 0.45 | 0.55 | 0.58 | 0.75 | (29 | ) | 2.11 | 2.66 | (21 | ) | |||||||||||||||||||||||||
| Common stock cash dividends declared | 0.23 | 0.23 | 0.23 | 0.23 | 0.22 | 5 | 0.92 | 0.86 | 7 | |||||||||||||||||||||||||||
| Book value | 26.52 | 25.87 | 25.98 | 25.76 | 24.38 | 9 | 26.52 | 24.38 | 9 | |||||||||||||||||||||||||||
| Tangible book value (3) | 18.39 | 17.70 | 17.83 | 17.59 | 17.13 | 7 | 18.39 | 17.13 | 7 | |||||||||||||||||||||||||||
| Key performance ratios: | ||||||||||||||||||||||||||||||||||||
| Return on common equity - GAAP (2)(4) | 1.44 | % | 5.32 | % | 7.47 | % | 7.34 | % | 10.86 | % | 5.34 | % | 9.54 | % | ||||||||||||||||||||||
| Return on common equity - operating (1)(2)(4) | 7.27 | 6.14 | 7.82 | 8.15 | 11.01 | 7.33 | 10.07 | |||||||||||||||||||||||||||||
| Return on tangible common equity - operating (1)(2)(3)(4) | 10.58 | 9.03 | 11.35 | 11.63 | 15.20 | 10.63 | 14.04 | |||||||||||||||||||||||||||||
| Return on assets - GAAP (4) | 0.18 | 0.68 | 0.95 | 0.95 | 1.33 | 0.68 | 1.13 | |||||||||||||||||||||||||||||
| Return on assets - operating (1)(4) | 0.92 | 0.79 | 1.00 | 1.06 | 1.35 | 0.94 | 1.19 | |||||||||||||||||||||||||||||
| Return on assets -pre-tax pre-provision, excluding non-operating items (1)(4)(5) | 1.33 | 1.44 | 1.65 | 1.71 | 2.09 | 1.53 | 1.80 | |||||||||||||||||||||||||||||
| Net interest margin (fully taxable equivalent) (4) | 3.19 | 3.24 | 3.37 | 3.61 | 3.76 | 3.35 | 3.38 | |||||||||||||||||||||||||||||
| Efficiency ratio - GAAP | 66.33 | 61.32 | 55.71 | 57.20 | 47.95 | 60.09 | 52.31 | |||||||||||||||||||||||||||||
| Efficiency ratio - operating (1) | 59.57 | 57.43 | 54.17 | 53.67 | 47.35 | 56.17 | 50.16 | |||||||||||||||||||||||||||||
| Equity to total assets | 11.95 | 11.85 | 11.89 | 11.90 | 11.25 | 11.95 | 11.25 | |||||||||||||||||||||||||||||
| Tangible common equity to tangible assets (3) | 8.36 | 8.18 | 8.21 | 8.17 | 7.88 | 8.36 | 7.88 | |||||||||||||||||||||||||||||
| ASSET QUALITY | ||||||||||||||||||||||||||||||||||||
| Nonperforming assets (“NPAs”) | $ | 92,877 | $ | 90,883 | $ | 103,737 | $ | 73,403 | $ | 44,281 | 110 | $ | 92,877 | $ | 44,281 | 110 | ||||||||||||||||||||
| Allowance for credit losses - loans | 208,071 | 201,557 | 190,705 | 176,534 | 159,357 | 31 | 208,071 | 159,357 | 31 | |||||||||||||||||||||||||||
| Allowance for credit losses - total | 224,128 | 219,624 | 212,277 | 197,923 | 180,520 | 24 | 224,128 | 180,520 | 24 | |||||||||||||||||||||||||||
| Net charge-offs (recoveries) | 10,122 | 26,638 | 8,399 | 7,084 | 6,611 | 52,243 | 9,654 | |||||||||||||||||||||||||||||
| Allowance for credit losses - loans to loans | 1.14 | % | 1.11 | % | 1.10 | % | 1.03 | % | 1.04 | % | 1.14 | % | 1.04 | % | ||||||||||||||||||||||
| Allowance for credit losses - total to loans | 1.22 | 1.21 | 1.22 | 1.16 | 1.18 | 1.22 | 1.18 | |||||||||||||||||||||||||||||
| Net charge-offs to average loans (4) | 0.22 | 0.59 | 0.20 | 0.17 | 0.17 | 0.30 | 0.07 | |||||||||||||||||||||||||||||
| NPAs to total assets | 0.34 | 0.34 | 0.40 | 0.28 | 0.18 | 0.34 | 0.18 | |||||||||||||||||||||||||||||
| AT PERIOD END ($ in millions) | ||||||||||||||||||||||||||||||||||||
| Loans | $ | 18,319 | $ | 18,203 | $ | 17,395 | $ | 17,125 | $ | 15,335 | 19 | $ | 18,319 | $ | 15,335 | 19 | ||||||||||||||||||||
| Investment securities | 5,822 | 5,701 | 5,914 | 5,915 | 6,228 | (7 | ) | 5,822 | 6,228 | (7 | ) | |||||||||||||||||||||||||
| Total assets | 27,297 | 26,869 | 26,120 | 25,872 | 24,009 | 14 | 27,297 | 24,009 | 14 | |||||||||||||||||||||||||||
| Deposits | 23,311 | 22,858 | 22,252 | 22,005 | 19,877 | 17 | 23,311 | 19,877 | 17 | |||||||||||||||||||||||||||
| Shareholders’ equity | 3,262 | 3,184 | 3,106 | 3,078 | 2,701 | 21 | 3,262 | 2,701 | 21 | |||||||||||||||||||||||||||
| Common shares outstanding (thousands) | 119,010 | 118,976 | 115,266 | 115,152 | 106,223 | 12 | 119,010 | 106,223 | 12 | |||||||||||||||||||||||||||
(1) Excludes non-operating items as detailed on Non-GAAP Performance Measures Reconciliation on next page.
(2) Net income less preferred stock dividends, dividend by average realized common equity, which excludes accumulated other comprehensive income (loss).
(3) Excludes effect of acquisition related intangibles and associated amortization.
(4) Annualized.
(5) Excludes income tax expense and provision for credit losses.
UNITED COMMUNITY BANKS, INC.
Non-GAAP Performance Measures Reconciliation
Selected Financial Information
(in thousands, except per share data)
| 2023 | 2022 | Twelve
Months Ended December 31, |
||||||||||||||||||||||||||
| Fourth
Quarter |
Third
Quarter |
Second
Quarter |
First
Quarter |
Fourth
Quarter |
2023 | 2022 | ||||||||||||||||||||||
| Net income to operating income reconciliation | ||||||||||||||||||||||||||||
| Net income (GAAP) | $ | 14,090 | $ | 47,866 | $ | 63,288 | $ | 62,300 | $ | 81,450 | $ | 187,544 | $ | 277,472 | ||||||||||||||
| Bond portfolio restructuring loss | 51,689 | — | — | — | — | 51,689 | — | |||||||||||||||||||||
| FDIC special assessment | 9,995 | — | — | — | — | 9,995 | — | |||||||||||||||||||||
| Merger-related and other charges | 5,766 | 9,168 | 3,645 | 8,631 | 1,470 | 27,210 | 19,375 | |||||||||||||||||||||
| Income tax benefit of non-operating items | (16,714 | ) | (2,000 | ) | (820 | ) | (1,955 | ) | (323 | ) | (21,489 | ) | (4,246 | ) | ||||||||||||||
| Net income - operating | $ | 64,826 | $ | 55,034 | $ | 66,113 | $ | 68,976 | $ | 82,597 | $ | 254,949 | $ | 292,601 | ||||||||||||||
| Net income to pre-tax pre-provision income reconciliation | ||||||||||||||||||||||||||||
| Net income (GAAP) | $ | 14,090 | $ | 47,866 | $ | 63,288 | $ | 62,300 | $ | 81,450 | $ | 187,544 | $ | 277,472 | ||||||||||||||
| Income tax (benefit) expense | (2,940 | ) | 11,925 | 18,225 | 17,791 | 24,632 | 45,001 | 78,530 | ||||||||||||||||||||
| Provision for credit losses | 14,626 | 30,268 | 22,753 | 21,783 | 19,831 | 89,430 | 63,913 | |||||||||||||||||||||
| Pre-tax pre-provision income | $ | 25,776 | $ | 90,059 | $ | 104,266 | $ | 101,874 | $ | 125,913 | $ | 321,975 | $ | 419,915 | ||||||||||||||
| Diluted income per common share reconciliation | ||||||||||||||||||||||||||||
| Diluted income per common share (GAAP) | $ | 0.11 | $ | 0.39 | $ | 0.53 | $ | 0.52 | $ | 0.74 | $ | 1.54 | $ | 2.52 | ||||||||||||||
| Bond portfolio restructuring loss | 0.32 | — | — | — | — | 0.33 | — | |||||||||||||||||||||
| FDIC special assessment | 0.06 | — | — | — | — | 0.06 | — | |||||||||||||||||||||
| Merger-related and other charges | 0.04 | 0.06 | 0.02 | 0.06 | 0.01 | 0.18 | 0.14 | |||||||||||||||||||||
| Diluted income per common share - operating | $ | 0.53 | $ | 0.45 | $ | 0.55 | $ | 0.58 | $ | 0.75 | $ | 2.11 | $ | 2.66 | ||||||||||||||
| Book value per common share reconciliation | ||||||||||||||||||||||||||||
| Book value per common share (GAAP) | $ | 26.52 | $ | 25.87 | $ | 25.98 | $ | 25.76 | $ | 24.38 | $ | 26.52 | $ | 24.38 | ||||||||||||||
| Effect of goodwill and other intangibles | (8.13 | ) | (8.17 | ) | (8.15 | ) | (8.17 | ) | (7.25 | ) | (8.13 | ) | (7.25 | ) | ||||||||||||||
| Tangible book value per common share | $ | 18.39 | $ | 17.70 | $ | 17.83 | $ | 17.59 | $ | 17.13 | $ | 18.39 | $ | 17.13 | ||||||||||||||
| Return on tangible common equity reconciliation | ||||||||||||||||||||||||||||
| Return on common equity (GAAP) | 1.44 | % | 5.32 | % | 7.47 | % | 7.34 | % | 10.86 | % | 5.34 | % | 9.54 | % | ||||||||||||||
| Bond portfolio restructuring loss | 4.47 | — | — | — | — | 1.15 | — | |||||||||||||||||||||
| FDIC special assessment | 0.86 | — | — | — | — | 0.22 | — | |||||||||||||||||||||
| Merger-related and other charges | 0.50 | 0.82 | 0.35 | 0.81 | 0.15 | 0.62 | 0.53 | |||||||||||||||||||||
| Return on common equity - operating | 7.27 | 6.14 | 7.82 | 8.15 | 11.01 | 7.33 | 10.07 | |||||||||||||||||||||
| Effect of goodwill and other intangibles | 3.31 | 2.89 | 3.53 | 3.48 | 4.19 | 3.30 | 3.97 | |||||||||||||||||||||
| Return on tangible common equity - operating | 10.58 | % | 9.03 | % | 11.35 | % | 11.63 | % | 15.20 | % | 10.63 | % | 14.04 | % | ||||||||||||||
| Return on assets reconciliation | ||||||||||||||||||||||||||||
| Return on assets (GAAP) | 0.18 | % | 0.68 | % | 0.95 | % | 0.95 | % | 1.33 | % | 0.68 | % | 1.13 | % | ||||||||||||||
| Bond portfolio restructuring loss | 0.57 | — | — | — | — | 0.15 | — | |||||||||||||||||||||
| FDIC special assessment | 0.11 | — | — | — | — | 0.03 | — | |||||||||||||||||||||
| Merger-related and other charges | 0.06 | 0.11 | 0.05 | 0.11 | 0.02 | 0.08 | 0.06 | |||||||||||||||||||||
| Return on assets - operating | 0.92 | % | 0.79 | % | 1.00 | % | 1.06 | % | 1.35 | % | 0.94 | % | 1.19 | % | ||||||||||||||
| Return on assets to return on assets- pre-tax pre-provision reconciliation | ||||||||||||||||||||||||||||
| Return on assets (GAAP) | 0.18 | % | 0.68 | % | 0.95 | % | 0.95 | % | 1.33 | % | 0.68 | % | 1.13 | % | ||||||||||||||
| Income tax (benefit) expense | (0.04 | ) | 0.18 | 0.29 | 0.29 | 0.41 | 0.17 | 0.32 | ||||||||||||||||||||
| Provision for credit losses | 0.21 | 0.45 | 0.35 | 0.34 | 0.33 | 0.34 | 0.27 | |||||||||||||||||||||
| Bond portfolio restructuring loss | 0.75 | — | — | — | — | 0.20 | — | |||||||||||||||||||||
| FDIC special assessment | 0.15 | — | — | — | — | 0.04 | — | |||||||||||||||||||||
| Merger-related and other charges | 0.08 | 0.13 | 0.06 | 0.13 | 0.02 | 0.10 | 0.08 | |||||||||||||||||||||
| Return on assets - pre-tax pre-provision, excluding non-operating items | 1.33 | % | 1.44 | % | 1.65 | % | 1.71 | % | 2.09 | % | 1.53 | % | 1.80 | % | ||||||||||||||
| Efficiency ratio reconciliation | ||||||||||||||||||||||||||||
| Efficiency ratio (GAAP) | 66.33 | % | 61.32 | % | 55.71 | % | 57.20 | % | 47.95 | % | 60.09 | % | 52.31 | % | ||||||||||||||
| FDIC special assessment | (4.29 | ) | — | — | — | — | (1.05 | ) | — | |||||||||||||||||||
| Merger-related and other charges | (2.47 | ) | (3.89 | ) | (1.54 | ) | (3.53 | ) | (0.60 | ) | (2.87 | ) | (2.15 | ) | ||||||||||||||
| Efficiency ratio - operating | 59.57 | % | 57.43 | % | 54.17 | % | 53.67 | % | 47.35 | % | 56.17 | % | 50.16 | % | ||||||||||||||
| Tangible common equity to tangible assets reconciliation | ||||||||||||||||||||||||||||
| Equity to total assets (GAAP) | 11.95 | % | 11.85 | % | 11.89 | % | 11.90 | % | 11.25 | % | 11.95 | % | 11.25 | % | ||||||||||||||
| Effect of goodwill and other intangibles | (3.27 | ) | (3.33 | ) | (3.31 | ) | (3.36 | ) | (2.97 | ) | (3.27 | ) | (2.97 | ) | ||||||||||||||
| Effect of preferred equity | (0.32 | ) | (0.34 | ) | (0.37 | ) | (0.37 | ) | (0.40 | ) | (0.32 | ) | (0.40 | ) | ||||||||||||||
| Tangible common equity to tangible assets | 8.36 | % | 8.18 | % | 8.21 | % | 8.17 | % | 7.88 | % | 8.36 | % | 7.88 | % | ||||||||||||||
UNITED COMMUNITY BANKS, INC.
Financial Highlights
Loan Portfolio Composition at Period-End
(in millions)
| 2023 | 2022 | Linked | Year over | |||||||||||||||||||||||||
| Fourth Quarter | Third Quarter | Second Quarter | First Quarter | Fourth Quarter | Quarter Change | Year Change | ||||||||||||||||||||||
| LOANS BY CATEGORY | ||||||||||||||||||||||||||||
| Owner occupied commercial RE | $ | 3,264 | $ | 3,279 | $ | 3,111 | $ | 3,141 | $ | 2,735 | $ | (15 | ) | $ | 529 | |||||||||||||
| Income producing commercial RE | 4,264 | 4,130 | 3,670 | 3,611 | 3,262 | 134 | 1002 | |||||||||||||||||||||
| Commercial & industrial | 2,411 | 2,504 | 2,550 | 2,442 | 2,252 | (93 | ) | 159 | ||||||||||||||||||||
| Commercial construction | 1,860 | 1,850 | 1,739 | 1,806 | 1,598 | 10 | 262 | |||||||||||||||||||||
| Equipment financing | 1,543 | 1,534 | 1,510 | 1,447 | 1,374 | 9 | 169 | |||||||||||||||||||||
| Total commercial | 13,342 | 13,297 | 12,580 | 12,447 | 11,221 | 45 | 2,121 | |||||||||||||||||||||
| Residential mortgage | 3,199 | 3,043 | 2,905 | 2,756 | 2,355 | 156 | 844 | |||||||||||||||||||||
| Home equity lines of credit | 959 | 941 | 927 | 930 | 850 | 18 | 109 | |||||||||||||||||||||
| Residential construction | 302 | 399 | 463 | 492 | 443 | (97 | ) | (141 | ) | |||||||||||||||||||
| Manufactured housing | 336 | 343 | 340 | 326 | 317 | (7 | ) | 19 | ||||||||||||||||||||
| Consumer | 181 | 180 | 180 | 174 | 149 | 1 | 32 | |||||||||||||||||||||
| Total loans | $ | 18,319 | $ | 18,203 | $ | 17,395 | $ | 17,125 | $ | 15,335 | $ | 116 | $ | 2,984 | ||||||||||||||
| LOANS BY STATE | ||||||||||||||||||||||||||||
| Georgia | $ | 4,357 | $ | 4,321 | $ | 4,281 | $ | 4,177 | $ | 4,051 | $ | 36 | $ | 306 | ||||||||||||||
| South Carolina | 2,780 | 2,801 | 2,750 | 2,672 | 2,587 | (21 | ) | 193 | ||||||||||||||||||||
| North Carolina | 2,492 | 2,445 | 2,355 | 2,257 | 2,186 | 47 | 306 | |||||||||||||||||||||
| Tennessee | 2,244 | 2,314 | 2,387 | 2,458 | 2,507 | (70 | ) | (263 | ) | |||||||||||||||||||
| Florida | 2,442 | 2,318 | 1,708 | 1,745 | 1,308 | 124 | 1,134 | |||||||||||||||||||||
| Alabama | 1,082 | 1,070 | 1,062 | 1,029 | — | 12 | 1,082 | |||||||||||||||||||||
| Commercial Banking Solutions | 2,922 | 2,934 | 2,852 | 2,787 | 2,696 | (12 | ) | 226 | ||||||||||||||||||||
| Total loans | $ | 18,319 | $ | 18,203 | $ | 17,395 | $ | 17,125 | $ | 15,335 | $ | 116 | $ | 2,984 | ||||||||||||||
UNITED COMMUNITY BANKS, INC.
Financial Highlights
Loan Portfolio Composition at Year-End
(in millions)
| 2023 | 2022 | 2021 | 2020 | 2019 | ||||||||||||||||
| LOANS BY CATEGORY | ||||||||||||||||||||
| Owner occupied commercial RE | $ | 3,264 | $ | 2,735 | $ | 2,322 | $ | 2,090 | $ | 1,720 | ||||||||||
| Income producing commercial RE | 4,264 | 3,262 | 2,601 | 2,541 | 2,008 | |||||||||||||||
| Commercial & industrial | 2,411 | 2,252 | 1,910 | 2,499 | 1,221 | |||||||||||||||
| Commercial construction | 1,860 | 1,598 | 1,015 | 967 | 976 | |||||||||||||||
| Equipment financing | 1,543 | 1,374 | 1,083 | 864 | 745 | |||||||||||||||
| Total commercial | 13,342 | 11,221 | 8,931 | 8,961 | 6,670 | |||||||||||||||
| Residential mortgage | 3,199 | 2,355 | 1,638 | 1,285 | 1,118 | |||||||||||||||
| Home equity | 959 | 850 | 694 | 697 | 661 | |||||||||||||||
| Residential construction | 302 | 443 | 359 | 281 | 236 | |||||||||||||||
| Manufactured housing | 336 | 317 | — | — | — | |||||||||||||||
| Consumer | 181 | 149 | 138 | 147 | 128 | |||||||||||||||
| Total loans | $ | 18,319 | $ | 15,335 | $ | 11,760 | $ | 11,371 | $ | 8,813 | ||||||||||
| LOANS BY STATE | ||||||||||||||||||||
| Georgia | $ | 4,357 | $ | 4,051 | $ | 3,778 | $ | 3,685 | $ | 3,606 | ||||||||||
| South Carolina | 2,780 | 2,587 | 2,235 | 1,947 | 1,708 | |||||||||||||||
| North Carolina | 2,492 | 2,186 | 1,895 | 1,281 | 1,156 | |||||||||||||||
| Tennessee | 2,244 | 2,507 | 373 | 415 | 421 | |||||||||||||||
| Florida | 2,442 | 1,308 | 1,148 | 1,435 | — | |||||||||||||||
| Alabama | 1,082 | — | — | — | — | |||||||||||||||
| Commercial Banking Solutions | 2,922 | 2,696 | 2,331 | 2,608 | 1,922 | |||||||||||||||
| Total loans | $ | 18,319 | $ | 15,335 | $ | 11,760 | $ | 11,371 | $ | 8,813 | ||||||||||
UNITED COMMUNITY BANKS, INC.
Financial Highlights
Credit Quality
(in thousands)
| 2023 | ||||||||||||
| Fourth Quarter |
Third Quarter |
Second Quarter |
||||||||||
| NONACCRUAL LOANS | ||||||||||||
| Owner occupied RE | $ | 3,094 | $ | 5,134 | $ | 3,471 | ||||||
| Income producing RE | 30,128 | 30,255 | 32,542 | |||||||||
| Commercial & industrial | 13,467 | 13,382 | 30,823 | |||||||||
| Commercial construction | 1,878 | 1,065 | 115 | |||||||||
| Equipment financing | 8,505 | 9,206 | 8,989 | |||||||||
| Total commercial | 57,072 | 59,042 | 75,940 | |||||||||
| Residential mortgage | 13,944 | 11,893 | 11,419 | |||||||||
| Home equity | 3,772 | 4,009 | 2,777 | |||||||||
| Residential construction | 944 | 2,074 | 1,682 | |||||||||
| Manufactured housing | 15,861 | 12,711 | 10,782 | |||||||||
| Consumer | 94 | 89 | 19 | |||||||||
| Total nonaccrual loans held for investment | 91,687 | 89,818 | 102,619 | |||||||||
| OREO and repossessed assets | 1,190 | 1,065 | 1,118 | |||||||||
| Total NPAs | $ | 92,877 | $ | 90,883 | $ | 103,737 | ||||||
| 2023 | ||||||||||||||||||||||||
| Fourth Quarter | Third Quarter | Second Quarter | ||||||||||||||||||||||
| (in thousands) | Net Charge-Offs |
Net Charge-Offs to Average Loans (1) |
Net Charge-Offs |
Net Charge-Offs to Average Loans (1) |
Net Charge-Offs |
Net Charge-Offs to Average Loans (1) |
||||||||||||||||||
| NET CHARGE-OFFS BY CATEGORY | ||||||||||||||||||||||||
| Owner occupied RE | $ | 35 | — | % | $ | 582 | 0.07 | % | $ | (205 | ) | (0.03 | )% | |||||||||||
| Income producing RE | (562 | ) | (0.05 | ) | 3,011 | 0.30 | 1,184 | 0.13 | ||||||||||||||||
| Commercial & industrial | 547 | 0.09 | 17,542 | 2.71 | 2,746 | 0.44 | ||||||||||||||||||
| Commercial construction | 33 | 0.01 | (49 | ) | (0.01 | ) | (105 | ) | (0.02 | ) | ||||||||||||||
| Equipment financing | 7,926 | 2.05 | 6,325 | 1.62 | 2,537 | 0.69 | ||||||||||||||||||
| Total commercial | 7,979 | 0.24 | 27,411 | 0.83 | 6,157 | 0.20 | ||||||||||||||||||
| Residential mortgage | 12 | — | (129 | ) | (0.02 | ) | (43 | ) | (0.01 | ) | ||||||||||||||
| Home equity | (68 | ) | (0.03 | ) | (2,784 | ) | (1.17 | ) | (59 | ) | (0.03 | ) | ||||||||||||
| Residential construction | (13 | ) | (0.01 | ) | 341 | 0.31 | 623 | 0.53 | ||||||||||||||||
| Manufactured housing | 1,444 | 1.69 | 1,168 | 1.34 | 620 | 0.75 | ||||||||||||||||||
| Consumer | 768 | 1.70 | 631 | 1.37 | 1,101 | 2.51 | ||||||||||||||||||
| Total | $ | 10,122 | 0.22 | $ | 26,638 | 0.59 | $ | 8,399 | 0.20 | |||||||||||||||
(1) Annualized.
UNITED COMMUNITY BANKS, INC.
Consolidated Balance Sheets (Unaudited)
(in thousands, except share and per share data)
| December 31, 2023 |
December 31, 2022 |
|||||||
| ASSETS | ||||||||
| Cash and due from banks | $ | 200,781 | $ | 195,771 | ||||
| Interest-bearing deposits in banks | 803,094 | 316,082 | ||||||
| Federal funds and other short-term investments | — | 135,000 | ||||||
| Cash and cash equivalents | 1,003,875 | 646,853 | ||||||
| Debt securities available-for-sale | 3,331,084 | 3,614,333 | ||||||
| Debt securities held-to-maturity (fair value $2,095,620 and $2,191,073, respectively) | 2,490,848 | 2,613,648 | ||||||
| Loans held for sale at fair value | 33,008 | 13,600 | ||||||
| Loans and leases held for investment | 18,318,755 | 15,334,627 | ||||||
| Less allowance for credit losses - loans and leases | (208,071 | ) | (159,357 | ) | ||||
| Loans and leases, net | 18,110,684 | 15,175,270 | ||||||
| Premises and equipment, net | 378,421 | 298,456 | ||||||
| Bank owned life insurance | 345,371 | 299,297 | ||||||
| Accrued interest receivable | 87,782 | 72,807 | ||||||
| Net deferred tax asset | 113,214 | 129,313 | ||||||
| Derivative financial instruments | 50,352 | 50,636 | ||||||
| Goodwill and other intangible assets, net | 990,087 | 779,248 | ||||||
| Other assets | 362,525 | 315,423 | ||||||
| Total assets | $ | 27,297,251 | $ | 24,008,884 | ||||
| LIABILITIES AND SHAREHOLDERS’ EQUITY | ||||||||
| Liabilities: | ||||||||
| Deposits: | ||||||||
| Noninterest-bearing demand | $ | 6,534,307 | $ | 7,643,081 | ||||
| NOW and interest-bearing demand | 6,155,193 | 4,350,878 | ||||||
| Money market | 5,600,587 | 4,510,680 | ||||||
| Savings | 1,207,807 | 1,456,337 | ||||||
| Time | 3,649,498 | 1,781,482 | ||||||
| Brokered | 163,219 | 134,049 | ||||||
| Total deposits | 23,310,611 | 19,876,507 | ||||||
| Short-term borrowings | — | 158,933 | ||||||
| Federal Home Loan Bank advances | — | 550,000 | ||||||
| Long-term debt | 324,823 | 324,663 | ||||||
| Derivative financial instruments | 84,811 | 99,543 | ||||||
| Accrued expenses and other liabilities | 315,481 | 298,564 | ||||||
| Total liabilities | 24,035,726 | 21,308,210 | ||||||
| Shareholders' equity: | ||||||||
| Preferred stock, $1 par value: 10,000,000 shares authorized; 3,662 and 4,000 shares Series I issued and outstanding, respectively; $25,000 per share liquidation preference | 88,266 | 96,422 | ||||||
| Common stock, $1 par value; 200,000,000 shares authorized; 119,010,319 and 106,222,758 shares issued and outstanding, respectively | 119,010 | 106,223 | ||||||
| Common stock issuable; 620,108 and 607,128 shares, respectively | 13,110 | 12,307 | ||||||
| Capital surplus | 2,699,112 | 2,306,366 | ||||||
| Retained earnings | 581,219 | 508,844 | ||||||
| Accumulated other comprehensive loss | (239,192 | ) | (329,488 | ) | ||||
| Total shareholders’ equity | 3,261,525 | 2,700,674 | ||||||
| Total liabilities and shareholders’ equity | $ | 27,297,251 | $ | 24,008,884 | ||||
UNITED COMMUNITY BANKS, INC.
Consolidated Statements of Income (Unaudited)
(in thousands, except per share data)
| Three Months Ended December 31, |
Twelve Months Ended December 31, |
|||||||||||||||
| 2023 | 2022 | 2023 | 2022 | |||||||||||||
| Interest revenue: | ||||||||||||||||
| Loans, including fees | $ | 281,909 | $ | 197,330 | $ | 1,042,605 | $ | 673,402 | ||||||||
| Investment securities, including tax exempt of $1,732, 2,561, $7,295 and $10,323 | 44,025 | 40,781 | 169,800 | 131,824 | ||||||||||||
| Deposits in banks and short-term investments | 12,764 | 2,720 | 24,702 | 7,929 | ||||||||||||
| Total interest revenue | 338,698 | 240,831 | 1,237,107 | 813,155 | ||||||||||||
| Interest expense: | ||||||||||||||||
| Deposits: | ||||||||||||||||
| NOW and interest-bearing demand | 44,527 | 9,688 | 125,336 | 17,312 | ||||||||||||
| Money market | 50,967 | 11,244 | 156,397 | 18,274 | ||||||||||||
| Savings | 758 | 356 | 2,866 | 693 | ||||||||||||
| Time | 35,511 | 3,498 | 110,975 | 5,820 | ||||||||||||
| Deposits | 131,763 | 24,786 | 395,574 | 42,099 | ||||||||||||
| Short-term borrowings | 9 | 480 | 3,195 | 507 | ||||||||||||
| Federal Home Loan Bank advances | — | 1,424 | 5,761 | 1,424 | ||||||||||||
| Long-term debt | 3,473 | 4,253 | 14,812 | 16,768 | ||||||||||||
| Total interest expense | 135,245 | 30,943 | 419,342 | 60,798 | ||||||||||||
| Net interest revenue | 203,453 | 209,888 | 817,765 | 752,357 | ||||||||||||
| Provision for credit losses | 14,626 | 19,831 | 89,430 | 63,913 | ||||||||||||
| Net interest revenue after provision for credit losses | 188,827 | 190,057 | 728,335 | 688,444 | ||||||||||||
| Noninterest income: | ||||||||||||||||
| Service charges and fees | 9,621 | 9,519 | 38,412 | 38,163 | ||||||||||||
| Mortgage loan gains and related fees | 1,956 | 3,104 | 19,220 | 32,524 | ||||||||||||
| Wealth management fees | 5,965 | 5,835 | 23,740 | 23,594 | ||||||||||||
| Gains from other loan sales | 2,237 | 1,504 | 9,146 | 10,730 | ||||||||||||
| Other lending and loan servicing fees | 3,994 | 2,487 | 13,973 | 10,005 | ||||||||||||
| Securities losses, net | (51,689 | ) | (184 | ) | (53,333 | ) | (3,872 | ) | ||||||||
| Other | 4,826 | 11,089 | 24,325 | 26,563 | ||||||||||||
| Total noninterest income | (23,090 | ) | 33,354 | 75,483 | 137,707 | |||||||||||
| Total revenue | 165,737 | 223,411 | 803,818 | 826,151 | ||||||||||||
| Noninterest expenses: | ||||||||||||||||
| Salaries and employee benefits | 82,343 | 68,143 | 318,464 | 276,205 | ||||||||||||
| Occupancy | 11,616 | 8,866 | 42,640 | 36,247 | ||||||||||||
| Communications and equipment | 11,610 | 10,516 | 43,264 | 38,234 | ||||||||||||
| FDIC assessments and other regulatory charges | 14,992 | 3,098 | 27,449 | 9,894 | ||||||||||||
| Professional fees | 7,062 | 5,496 | 26,732 | 20,166 | ||||||||||||
| Lending and loan servicing expense | 2,176 | 1,604 | 9,722 | 9,350 | ||||||||||||
| Outside services - electronic banking | 2,931 | 3,954 | 11,577 | 12,583 | ||||||||||||
| Postage, printing and supplies | 2,162 | 2,441 | 9,467 | 8,749 | ||||||||||||
| Advertising and public relations | 2,559 | 2,052 | 9,473 | 8,384 | ||||||||||||
| Amortization of intangibles | 4,055 | 1,619 | 15,175 | 6,826 | ||||||||||||
| Merger-related and other charges | 5,766 | 1,470 | 27,210 | 19,375 | ||||||||||||
| Other | 7,315 | 8,070 | 30,100 | 24,136 | ||||||||||||
| Total noninterest expenses | 154,587 | 117,329 | 571,273 | 470,149 | ||||||||||||
| Net income before income taxes | 11,150 | 106,082 | 232,545 | 356,002 | ||||||||||||
| Income tax (benefit) expense | (2,940 | ) | 24,632 | 45,001 | 78,530 | |||||||||||
| Net income | $ | 14,090 | $ | 81,450 | $ | 187,544 | $ | 277,472 | ||||||||
| Preferred stock dividends, net of discount on repurchases | 1,395 | 1,718 | 5,665 | 6,875 | ||||||||||||
| Earnings allocated to participating securities | 77 | 461 | 1,032 | 1,462 | ||||||||||||
| Net income available to common shareholders | $ | 12,618 | $ | 79,271 | $ | 180,847 | $ | 269,135 | ||||||||
| Net income per common share: | ||||||||||||||||
| Basic | $ | 0.11 | $ | 0.74 | $ | 1.54 | $ | 2.52 | ||||||||
| Diluted | 0.11 | 0.74 | 1.54 | 2.52 | ||||||||||||
| Weighted average common shares outstanding: | ||||||||||||||||
| Basic | 119,612 | 106,795 | 117,603 | 106,661 | ||||||||||||
| Diluted | 119,713 | 106,916 | 117,745 | 106,778 | ||||||||||||
Average Consolidated Balance Sheets and Net Interest Analysis
For the Three Months Ended December 31,
(dollars in thousands, fully taxable equivalent (FTE))
| 2023 | 2022 | |||||||||||||||||||||||
| Average Balance |
Interest | Average Rate |
Average Balance |
Interest | Average Rate |
|||||||||||||||||||
| Assets: | ||||||||||||||||||||||||
| Interest-earning assets: | ||||||||||||||||||||||||
| Loans, net of unearned income (FTE) (1)(2) | $ | 18,167,572 | $ | 281,776 | 6.15 | % | $ | 15,002,836 | $ | 197,502 | 5.22 | % | ||||||||||||
| Taxable securities (3) | 5,772,630 | 42,293 | 2.93 | 6,325,165 | 38,220 | 2.42 | ||||||||||||||||||
| Tax-exempt securities (FTE) (1)(3) | 367,585 | 2,326 | 2.53 | 490,838 | 3,440 | 2.80 | ||||||||||||||||||
| Federal funds sold and other interest-earning assets | 1,092,939 | 13,294 | 4.83 | 453,090 | 2,912 | 2.55 | ||||||||||||||||||
| Total interest-earning assets (FTE) | 25,400,726 | 339,689 | 5.31 | 22,271,929 | 242,074 | 4.32 | ||||||||||||||||||
| Noninterest-earning assets: | ||||||||||||||||||||||||
| Allowance for loan losses | (204,631 | ) | (152,551 | ) | ||||||||||||||||||||
| Cash and due from banks | 210,383 | 217,873 | ||||||||||||||||||||||
| Premises and equipment | 377,765 | 297,523 | ||||||||||||||||||||||
| Other assets (3) | 1,516,268 | 1,166,424 | ||||||||||||||||||||||
| Total assets | $ | 27,300,511 | $ | 23,801,198 | ||||||||||||||||||||
| Liabilities and Shareholders’ Equity: | ||||||||||||||||||||||||
| Interest-bearing liabilities: | ||||||||||||||||||||||||
| Interest-bearing deposits: | ||||||||||||||||||||||||
| NOW and interest-bearing demand | $ | 5,961,835 | 44,527 | 2.96 | $ | 4,385,916 | 9,688 | 0.88 | ||||||||||||||||
| Money market | 5,799,213 | 50,967 | 3.49 | 4,628,585 | 11,244 | 0.96 | ||||||||||||||||||
| Savings | 1,227,708 | 758 | 0.24 | 1,480,908 | 356 | 0.10 | ||||||||||||||||||
| Time | 3,611,790 | 35,117 | 3.86 | 1,708,311 | 3,143 | 0.73 | ||||||||||||||||||
| Brokered time deposits | 60,583 | 394 | 2.58 | 51,258 | 355 | 2.75 | ||||||||||||||||||
| Total interest-bearing deposits | 16,661,129 | 131,763 | 3.14 | 12,254,978 | 24,786 | 0.80 | ||||||||||||||||||
| Federal funds purchased and other borrowings | 7,958 | 9 | 0.45 | 47,487 | 480 | 4.01 | ||||||||||||||||||
| Federal Home Loan Bank advances | — | — | — | 135,000 | 1,424 | 4.18 | ||||||||||||||||||
| Long-term debt | 324,801 | 3,473 | 4.24 | 324,590 | 4,253 | 5.20 | ||||||||||||||||||
| Total borrowed funds | 332,759 | 3,482 | 4.15 | 507,077 | 6,157 | 4.82 | ||||||||||||||||||
| Total interest-bearing liabilities | 16,993,888 | 135,245 | 3.16 | 12,762,055 | 30,943 | 0.96 | ||||||||||||||||||
| Noninterest-bearing liabilities: | ||||||||||||||||||||||||
| Noninterest-bearing deposits | 6,690,251 | 7,993,816 | ||||||||||||||||||||||
| Other liabilities | 410,067 | 383,270 | ||||||||||||||||||||||
| Total liabilities | 24,094,206 | 21,139,141 | ||||||||||||||||||||||
| Shareholders’ equity | 3,206,305 | 2,662,057 | ||||||||||||||||||||||
| Total liabilities and shareholders’ equity | $ | 27,300,511 | $ | 23,801,198 | ||||||||||||||||||||
| Net interest revenue (FTE) | $ | 204,444 | $ | 211,131 | ||||||||||||||||||||
| Net interest-rate spread (FTE) | 2.15 | % | 3.36 | % | ||||||||||||||||||||
| Net interest margin (FTE) (4) | 3.19 | % | 3.76 | % | ||||||||||||||||||||
| (1) | Interest revenue on tax-exempt securities and loans has been increased to reflect comparable interest on taxable securities and loans. The rate used was 26%, reflecting the statutory federal income tax rate and the federal tax adjusted state income tax rate. |
| (2) | Included in the average balance of loans outstanding are loans on which the accrual of interest has been discontinued and loans that are held for sale. |
| (3) | Unrealized gains and losses on AFS securities, including those related to the transfer from AFS to HTM, have been reclassified to other assets. Pretax unrealized losses of $458 million in 2023 and $454 million in 2022 are included in other assets for purposes of this presentation. |
| (4) | Net interest margin is taxable equivalent net interest revenue divided by average interest-earning assets. |
Average Consolidated Balance Sheets and Net Interest Analysis
For the Twelve Months Ended December 31,
(dollars in thousands, fully taxable equivalent (FTE))
| 2023 | 2022 | |||||||||||||||||||||||
| Average Balance |
Interest | Average Rate |
Average Balance |
Interest | Average Rate |
|||||||||||||||||||
| Assets: | ||||||||||||||||||||||||
| Interest-earning assets: | ||||||||||||||||||||||||
| Loans, net of unearned income (FTE) (1)(2) | $ | 17,576,424 | $ | 1,042,578 | 5.93 | % | $ | 14,571,746 | $ | 673,491 | 4.62 | % | ||||||||||||
| Taxable securities (3) | 5,929,687 | 162,505 | 2.74 | 6,284,603 | 121,501 | 1.93 | ||||||||||||||||||
| Tax-exempt securities (FTE) (1)(3) | 381,731 | 9,796 | 2.57 | 496,327 | 13,865 | 2.79 | ||||||||||||||||||
| Federal funds sold and other interest-earning assets | 642,499 | 26,397 | 4.11 | 1,065,057 | 9,104 | 0.85 | ||||||||||||||||||
| Total interest-earning assets (FTE) | 24,530,341 | 1,241,276 | 5.06 | 22,417,733 | 817,961 | 3.65 | ||||||||||||||||||
| Non-interest-earning assets: | ||||||||||||||||||||||||
| Allowance for loan losses | (191,016 | ) | (135,144 | ) | ||||||||||||||||||||
| Cash and due from banks | 239,574 | 204,852 | ||||||||||||||||||||||
| Premises and equipment | 355,139 | 288,044 | ||||||||||||||||||||||
| Other assets (3) | 1,517,940 | 1,275,263 | ||||||||||||||||||||||
| Total assets | $ | 26,451,978 | $ | 24,050,748 | ||||||||||||||||||||
| Liabilities and Shareholders’ Equity: | ||||||||||||||||||||||||
| Interest-bearing liabilities: | ||||||||||||||||||||||||
| Interest-bearing deposits: | ||||||||||||||||||||||||
| NOW and interest-bearing demand | $ | 5,161,071 | 125,336 | 2.43 | $ | 4,486,263 | 17,312 | 0.39 | ||||||||||||||||
| Money market | 5,462,677 | 156,397 | 2.86 | 4,900,667 | 18,274 | 0.37 | ||||||||||||||||||
| Savings | 1,312,469 | 2,866 | 0.22 | 1,482,599 | 693 | 0.05 | ||||||||||||||||||
| Time | 3,106,989 | 100,973 | 3.25 | 1,693,307 | 5,152 | 0.30 | ||||||||||||||||||
| Brokered time deposits | 224,914 | 10,002 | 4.45 | 61,636 | 668 | 1.08 | ||||||||||||||||||
| Total interest-bearing deposits | 15,268,120 | 395,574 | 2.59 | 12,624,472 | 42,099 | 0.33 | ||||||||||||||||||
| Federal funds purchased and other borrowings | 75,965 | 3,195 | 4.21 | 13,004 | 507 | 3.90 | ||||||||||||||||||
| Federal Home Loan Bank advances | 124,425 | 5,761 | 4.63 | 34,027 | 1,424 | 4.18 | ||||||||||||||||||
| Long-term debt | 324,753 | 14,812 | 4.56 | 323,102 | 16,768 | 5.19 | ||||||||||||||||||
| Total borrowed funds | 525,143 | 23,768 | 4.53 | 370,133 | 18,699 | 5.05 | ||||||||||||||||||
| Total interest-bearing liabilities | 15,793,263 | 419,342 | 2.66 | 12,994,605 | 60,798 | 0.47 | ||||||||||||||||||
| Noninterest-bearing liabilities: | ||||||||||||||||||||||||
| Noninterest-bearing deposits | 7,091,034 | 7,967,321 | ||||||||||||||||||||||
| Other liabilities | 397,337 | 377,221 | ||||||||||||||||||||||
| Total liabilities | 23,281,634 | 21,339,147 | ||||||||||||||||||||||
| Shareholders’ equity | 3,170,344 | 2,711,601 | ||||||||||||||||||||||
| Total liabilities and shareholders’ equity | $ | 26,451,978 | $ | 24,050,748 | ||||||||||||||||||||
| Net interest revenue (FTE) | $ | 821,934 | $ | 757,163 | ||||||||||||||||||||
| Net interest-rate spread (FTE) | 2.40 | % | 3.18 | % | ||||||||||||||||||||
| Net interest margin (FTE) (4) | 3.35 | % | 3.38 | % | ||||||||||||||||||||
| (1) | Interest revenue on tax-exempt securities and loans has been increased to reflect comparable interest on taxable securities and loans. The rate used was 26%, reflecting the statutory federal income tax rate and the federal tax adjusted state income tax rate. |
| (2) | Included in the average balance of loans outstanding are loans on which the accrual of interest has been discontinued and loans that are held for sale. |
| (3) | Unrealized gains and losses on AFS securities, including those related to the transfer from AFS to HTM, have been reclassified to other assets. Pretax unrealized losses of $424 million in 2023 and $277 million in 2022 are included in other assets for purposes of this presentation. |
| (4) | Net interest margin is taxable equivalent net-interest revenue divided by average interest-earning assets. |
About United Community Banks, Inc.
United Community Banks, Inc. (NASDAQ: UCBI) is the financial holding company for United Community, a top 100 US financial institution that is committed to improving the financial health and well-being of its customers and ultimately the communities it serves. United Community provides a full range of banking, wealth management, and mortgage services. As of December 31, 2023, United Community has $27.2 billion in assets and 207 offices across Alabama, Florida, Georgia, North Carolina, South Carolina, and Tennessee, as well as a national SBA lending franchise and a national equipment financing subsidiary. United Community has been recognized nationally as a leader in customer service, financial performance, and workplace environment. Among the accolades, United Community is a nine-time winner of the J.D. Power award that ranked the bank #1 in customer satisfaction with consumer banking in the Southeast and was recognized in 2023 by Forbes as one of the World's Best Banks and one of America's Best Banks. United Community was also recognized by Newsweek in 2023 as one of the Most Trusted Companies in America, is a multi-award recipient of the Greenwich Excellence Awards and was named by American Banker as one of the "Best Banks to Work For" in 2023 for the seventh consecutive year. Additional information about United Community can be found at ucbi.com.
Non-GAAP Financial Measures
This press release, including the accompanying financial statement tables, contains financial information determined by methods other than in accordance with generally accepted accounting principles, or GAAP. This financial information includes certain operating performance measures, which exclude merger-related and other charges that are not considered part of recurring operations, such as “operating net income,” “pre-tax, pre-provision income,” “operating net income per diluted common share,” “operating earnings per share,” “tangible book value per common share,” “operating return on common equity,” “operating return on tangible common equity,” “operating return on assets,” “return on assets - pre-tax, pre-provision, excluding non-operating items,” “return on assets - pre-tax, pre-provision,” “operating efficiency ratio,” and “tangible common equity to tangible assets.” These non-GAAP measures are included because United believes they may provide useful supplemental information for evaluating United’s underlying performance trends. Further, United’s management uses these measures in managing and evaluating United’s business and intends to refer to them in discussions about United’s operations and performance. These measures should be viewed in addition to, and not as an alternative to or substitute for, measures determined in accordance with GAAP, and are not necessarily comparable to non-GAAP measures that may be presented by other companies. To the extent applicable, reconciliations of these non-GAAP measures to the most directly comparable measures as reported in accordance with GAAP are included with the accompanying financial statement tables.
Caution About Forward-Looking Statements
This press release contains “forward-looking statements” within the meaning of Section 27A of the Securities Act of 1933, as amended, and Section 21E of the Securities Exchange Act of 1934, as amended. In general, forward-looking statements usually may be identified through use of words such as “may,” “believe,” “expect,” “anticipate,” “intend,” “will,” “should,” “plan,” “estimate,” “predict,” “continue” and “potential” or the negative of these terms or other comparable terminology, and include statements related to the strength of our pipelines and their ability to support business growth across our markets and our belief that our high-quality balance sheet and business mix will support strong performance regardless of future economic conditions. Forward-looking statements are not historical facts and represent management’s beliefs, based upon information available at the time the statements are made, with regard to the matters addressed; they are not guarantees of future performance. Actual results may prove to be materially different from the results expressed or implied by the forward-looking statements. Forward-looking statements are subject to numerous assumptions, risks and uncertainties that change over time and could cause actual results or financial condition to differ materially from those expressed in or implied by such statements.
Factors that could cause or contribute to such differences include, but are not limited to (1) the risk that the cost savings and any revenue synergies from acquisitions may not be realized or take longer than anticipated to be realized, (2) disruption of customer, supplier, employee or other business partner relationships as a result of these acquisitions, (3) reputational risk and the reaction of each of the companies’ customers, suppliers, employees or other business partners to these acquisitions, (4) the risks relating to the integration of acquired banks’ operations into the operations of United, including the risk that such integration will be materially delayed or will be more costly or difficult than expected, (5) the risks associated with United’s pursuit of future acquisitions, (6) the risk associated with expansion into new geographic or product markets, and (7) general competitive, economic, political, regulatory and market conditions. Further information regarding additional factors which could affect the forward-looking statements contained in this press release can be found in the cautionary language included under the headings “Cautionary Note Regarding Forward-Looking Statements” and “Risk Factors” in United’s Annual Report on Form 10-K for the year ended December 31, 2022, and other documents subsequently filed by United with the United States Securities and Exchange Commission (“SEC”).
Many of these factors are beyond United’s ability to control or predict. If one or more events related to these or other risks or uncertainties materialize, or if the underlying assumptions prove to be incorrect, actual results may differ materially from the forward-looking statements. Accordingly, shareholders and investors should not place undue reliance on any such forward-looking statements. Any forward-looking statement speaks only as of the date of this communication, and United undertakes no obligation to update or revise any forward-looking statements, whether as a result of new information, future events or otherwise, except as required by law. New risks and uncertainties may emerge from time to time, and it is not possible for United to predict their occurrence or how they will affect United.
United qualifies all forward-looking statements by these cautionary statements.
# # #
Exhibit 99.2
Member FDIC. © 2024 United Community Bank | ucbi.com 4Q23 Investor Presentation January 24, 2024
Disclosures 2 CAUTIONARY STATEMENT This Investor Presentation contains “forward - looking statements” within the meaning of Section 27 A of the Securities Act of 1933 , as amended, and Section 21 E of the Securities Exchange Act of 1934 , as amended . In general, forward - looking statements usually may be identified through use of words such as “may,” “believe,” “expect,” “anticipate,” “intend,” “will,” “should,” “plan,” “estimate,” “predict,” “continue” and “potential” or the negative of these terms or other comparable terminology, and include statements related to potential benefits of the First National Bank of South Miami merger, and the strength of our pipelines and their ability to support business growth across our markets and our belief that our high - quality balance sheet and business mix will support strong performance regardless of future economic conditions . Forward - looking statements are not historical facts and represent management’s beliefs, based upon information available at the time the statements are made, with regard to the matters addressed; they are not guarantees of future performance . Actual results may prove to be materially different from the results expressed or implied by the forward - looking statements . Forward - looking statements are subject to numerous assumptions, risks and uncertainties that change over time and could cause actual results or financial condition to differ materially from those expressed in or implied by such statements . Factors that could cause or contribute to such differences include, but are not limited to ( 1 ) the risk that the cost savings and any revenue synergies from acquisitions may not be realized or take longer than anticipated to be realized, ( 2 ) disruption of customer, supplier, employee or other business partner relationships as a result of these acquisitions, ( 3 ) reputational risk and the reaction of each of the companies’ customers, suppliers, employees or other business partners to these acquisitions, ( 4 ) the risks relating to the integration of acquired banks’ operations into the operations of United, including the risk that such integration will be materially delayed or will be more costly or difficult than expected, ( 5 ) the risks associated with United’s pursuit of future acquisitions, ( 6 ) the risk associated with expansion into new geographic or product markets, and ( 7 ) general competitive, economic, political, regulatory and market conditions . Further information regarding additional factors which could affect the forward - looking statements contained in this press release can be found in the cautionary language included under the headings “Cautionary Note Regarding Forward - Looking Statements” and “Risk Factors” in United’s Annual Report on Form 10 - K for the year ended December 31 , 2022 , and other documents subsequently filed by United with the United States Securities and Exchange Commission (“SEC”) . Many of these factors are beyond United’s ability to control or predict . If one or more events related to these or other risks or uncertainties materialize, or if the underlying assumptions prove to be incorrect, actual results may differ materially from the forward - looking statements . Accordingly, shareholders and investors should not place undue reliance on any such forward - looking statements . Any forward - looking statement speaks only as of the date of this communication, and United undertakes no obligation to update or revise any forward - looking statements, whether as a result of new information, future events or otherwise, except as required by law . New risks and uncertainties may emerge from time to time, and it is not possible for United to predict their occurrence or how they will affect United . United qualifies all forward - looking statements by these cautionary statements .
Disclosures 3 NON - GAAP MEASURES This Investor Presentation includes financial information determined by methods other than in accordance with generally accepted accounting principles (“GAAP”) . This financial information includes certain operating performance measures, which exclude merger - related and other charges that are not considered part of recurring operations . Such measures include : “Earnings per share – operating,” “Diluted earnings per share – operating,” “Tangible book value per share,” “Return on common equity – operating,” “Return on tangible common equity – operating,” “Return on assets – operating,” “Return on assets – pre - tax pre - provision, excluding merger - related and other charges,” “Efficiency ratio – operating,” “Noninterest income – operating,” “Expenses – operating,” and “Tangible common equity to tangible assets . ” Management has included these non - GAAP measures because it believes these measures may provide useful supplemental information for evaluating United’s underlying performance trends . Further, management uses these measures in managing and evaluating United’s business and intends to refer to them in discussions about United’s operations and performance . Operating performance measures should be viewed in addition to, and not as an alternative to or substitute for, measures determined in accordance with GAAP, and are not necessarily comparable to non - GAAP measures that may be presented by other companies . To the extent applicable, reconciliations of these non - GAAP measures to the most directly comparable GAAP measures can be found in the ‘Non - GAAP Reconciliation Tables’ included in the exhibits to this Presentation .
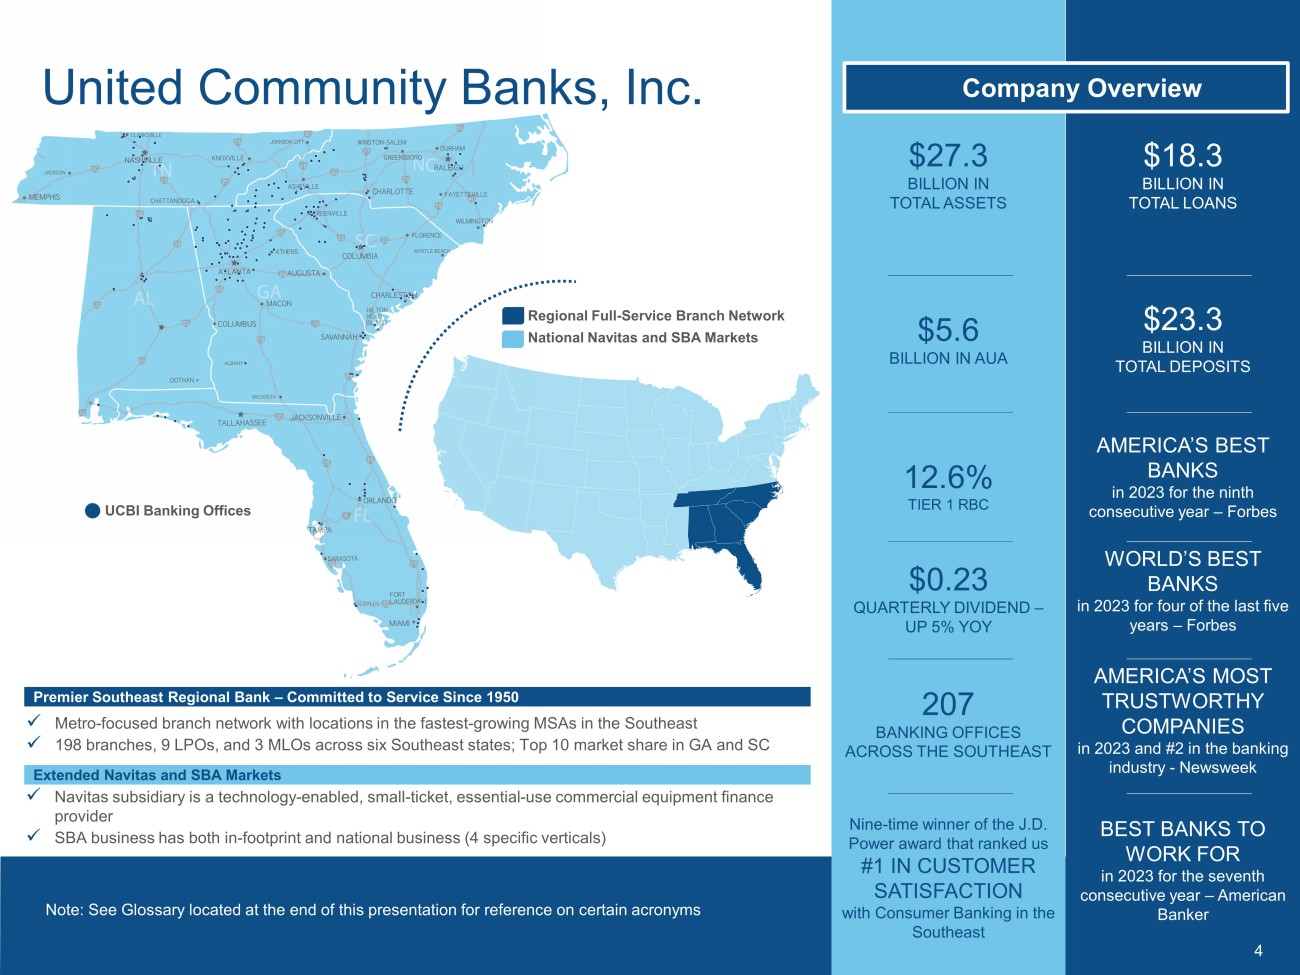
$27.3 BILLION IN TOTAL ASSETS United Community Banks, Inc. $23.3 BILLION IN TOTAL DEPOSITS Note: See Glossary located at the end of this presentation for reference on certain acronyms 207 BANKING OFFICES ACROSS THE SOUTHEAST Nine - time winner of the J.D. Power award that ranked us #1 IN CUSTOMER SATISFACTION with Consumer Banking in the Southeast AMERICA’S MOST TRUSTWORTHY COMPANIES in 2023 and #2 in the banking industry - Newsweek $0.23 QUARTERLY DIVIDEND – UP 5% YOY WORLD’S BEST BANKS in 2023 for four of the last five years – Forbes $5.6 BILLION IN AUA 12.6% TIER 1 RBC BEST BANKS TO WORK FOR in 2023 for the seventh consecutive year – American Banker 4 Premier Southeast Regional Bank – Committed to Service Since 1950 x Metro - focused branch network with locations in the fastest - growing MSAs in the Southeast x 198 branches, 9 LPOs, and 3 MLOs across six Southeast states; Top 10 market share in GA and SC Extended Navitas and SBA Markets $18.3 BILLION IN TOTAL LOANS AMERICA’S BEST BANKS in 2023 for the ninth consecutive year – Forbes x Navitas subsidiary is a technology - enabled, small - ticket, essential - use commercial equipment finance provider x SBA business has both in - footprint and national business (4 specific verticals) UCBI Banking Offices Regional Full - Service Branch Network National Navitas and SBA Markets Company Overview 2.5% Annualized 4Q EOP loan growth $0.74 $0.39 $0.11 $0.75 $0.45 $0.53 4Q22 3Q23 4Q23 Diluted Earnings Per Share GAAP Operating (1) 8.9% Annualized 4Q EOP deposit growth, excluding brokered deposits $24.38 $25.87 $26.52 $17.13 $17.70 $18.39 4Q22 3Q23 4Q23 Book Value Per Share GAAP Tangible 1.44% Return on common equity – GAAP 10.58% Return on tangible common equity – operating (1) Other 4Q notable items: $3.4 mm in unusual tax benefits (after - tax) $2.5 mm unrealized loss on equity investments $2.4 mm MSR write - down 0.92% Return on average assets – operating (1) 1.33% PTPP return on average assets – operating (1) 2.24% Cost of deposits 28% DDA / Total Deposits $0.11 Diluted earnings per share – GAAP $0.53 Diluted earnings per share – operating (1) 0.18% Return on average assets – GAAP 4Q23 Highlights (1) See non - GAAP reconciliation table slides in the exhibits to this Presentation for a reconciliation of operating performance measures to GAAP performance 1.33% 0.68% 0.18% 1.35% 0.79% 0.92% 4Q22 3Q23 4Q23 Return on Average Assets GAAP Operating 2.07% 1.31% 0.35% 2.09% 1.44% 1.33% 4Q22 3Q23 4Q23 PTPP Return on Average Assets PTPP Operating PTPP (1) (1) 5 (1) 66.3% Efficiency ratio – GAAP 59.6% Efficiency ratio – operating (1)
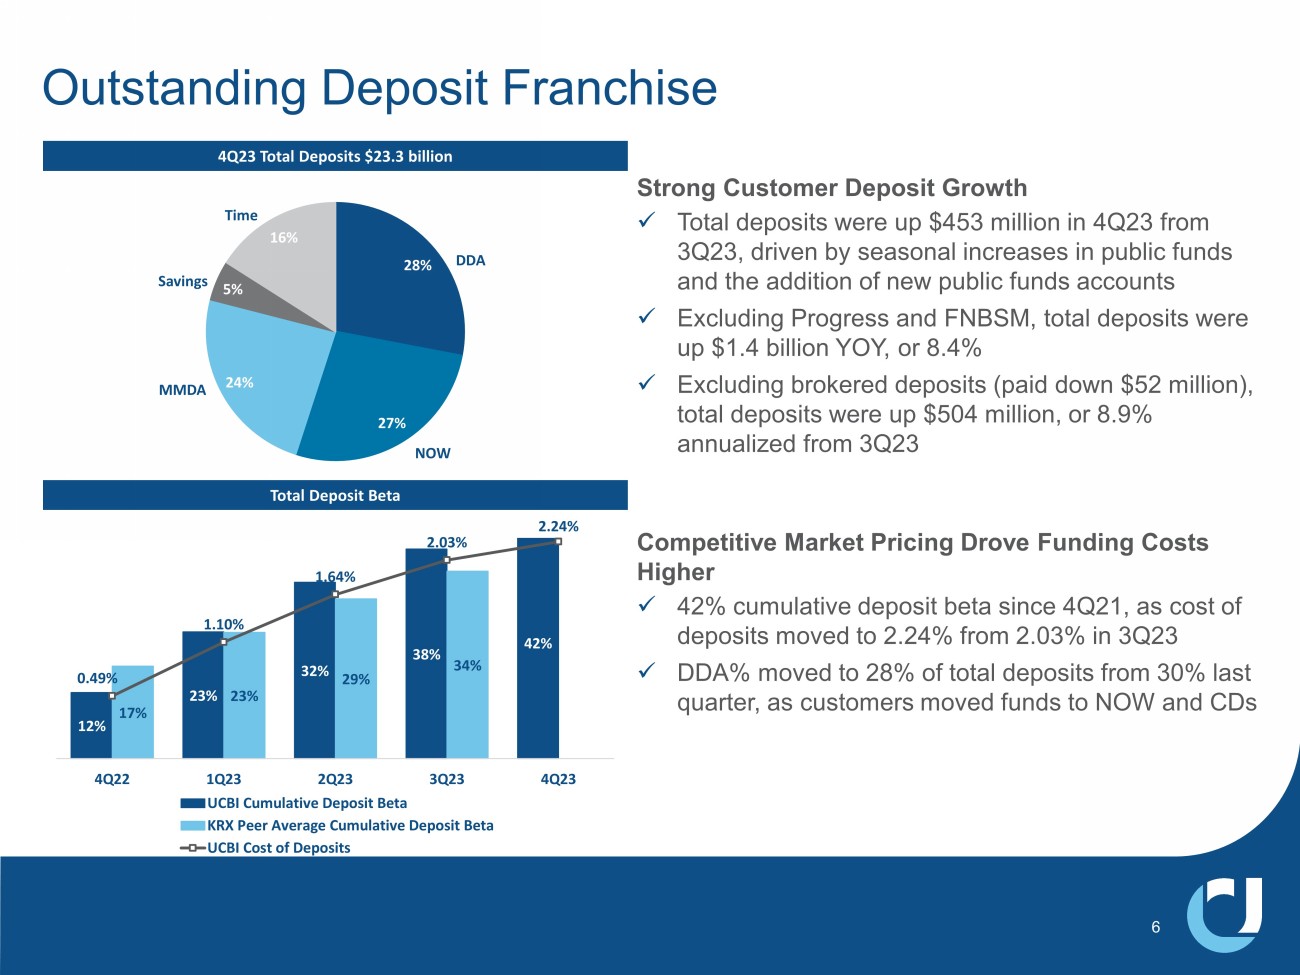
Strong Customer Deposit Growth x Total deposits were up $453 million in 4Q23 from 3Q23, driven by seasonal increases in public funds and the addition of new public funds accounts x Excluding Progress and FNBSM, total deposits were up $1.4 billion YOY, or 8.4% x Excluding brokered deposits (paid down $52 million), total deposits were up $504 million, or 8.9% annualized from 3Q23 Competitive Market Pricing Drove Funding Costs Higher x 42% cumulative deposit beta since 4Q21, as cost of deposits moved to 2.24% from 2.03% in 3Q23 x DDA% moved to 28% of total deposits from 30% last quarter, as customers moved funds to NOW and CDs 28% 27% 24% 5% 16% DDA MMDA Savings Time NOW Outstanding Deposit Franchise 4Q23 Total Deposits $23.3 billion Total Deposit Beta 12% 23% 32% 38% 42% 17% 23% 29% 34% 0.49% 1.10% 1.64% 2.03% 2.24% -0.22% 0.28% 0.78% 1.28% 1.78% 2.28% 0% 5% 10% 15% 20% 25% 30% 35% 40% 4Q22 1Q23 2Q23 3Q23 4Q23 UCBI Cumulative Deposit Beta KRX Peer Average Cumulative Deposit Beta UCBI Cost of Deposits 6 $19.9 $20.7 $22.3 $22.1 $23.3 $1.3 $0.8 4Q22 1Q23 2Q23 3Q23 4Q23 UCBI Acquisitions $ in billions Deposit Trends x Deposits are granular with a $35 thousand average account size and are diverse by industry and geography x Business deposits of $8.5 billion and personal deposits of $11.4 billion in 4Q23 • The remaining $3.4 billion of deposits are predominantly comprised of public funds 4Q23 Total Deposits $23.3 billion Deposit Mix Shift Customer Deposit Granularity $19,677 $19,417 $19,613 $19,956 $20,594 $69,749 $72,650 $75,033 $75,865 $76,419 4Q22 1Q23 2Q23 3Q23 4Q23 Personal Deposits Avg.
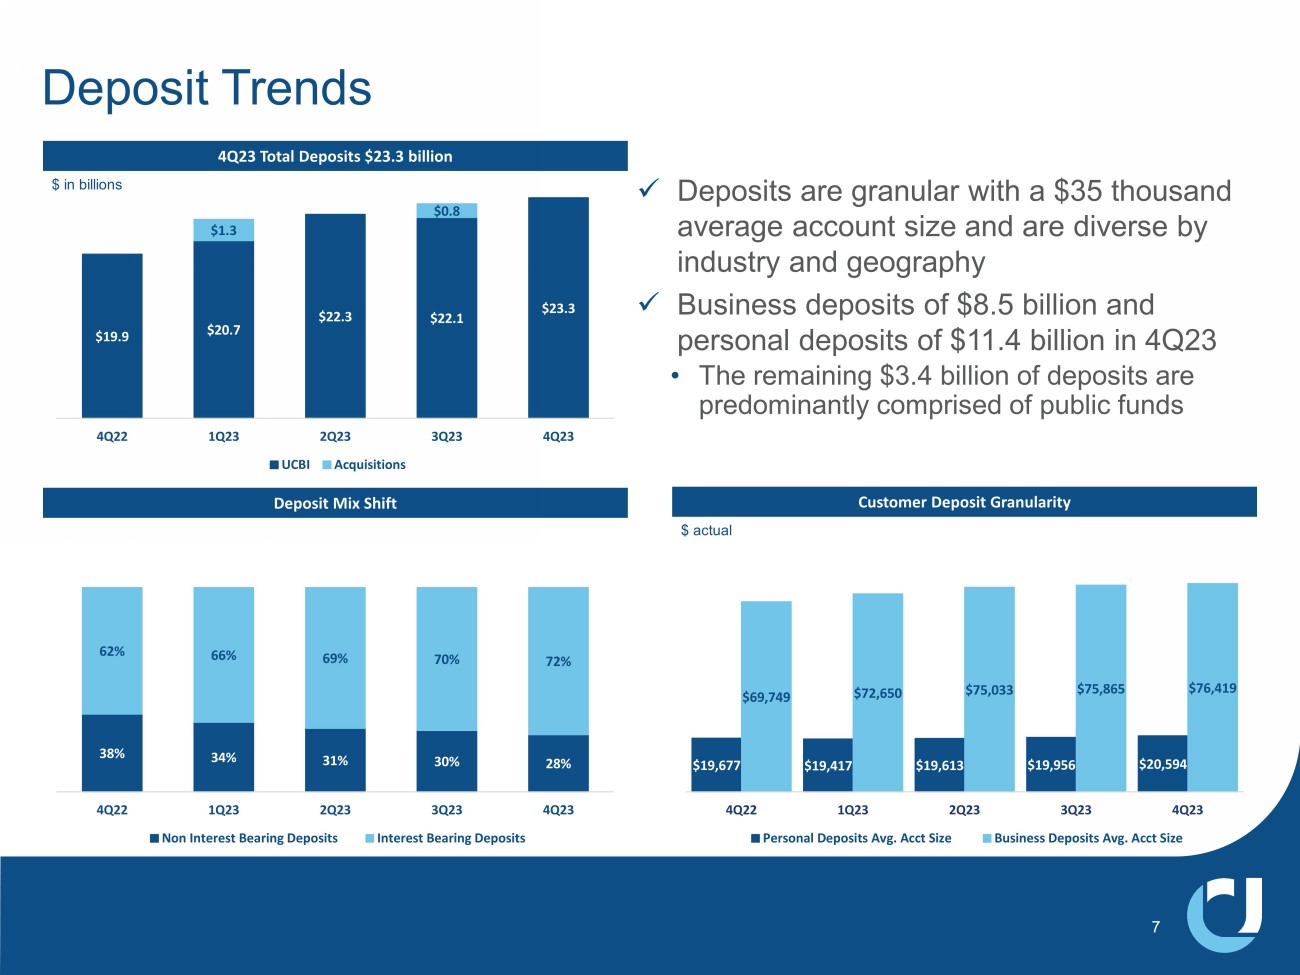
Acct Size Business Deposits Avg.
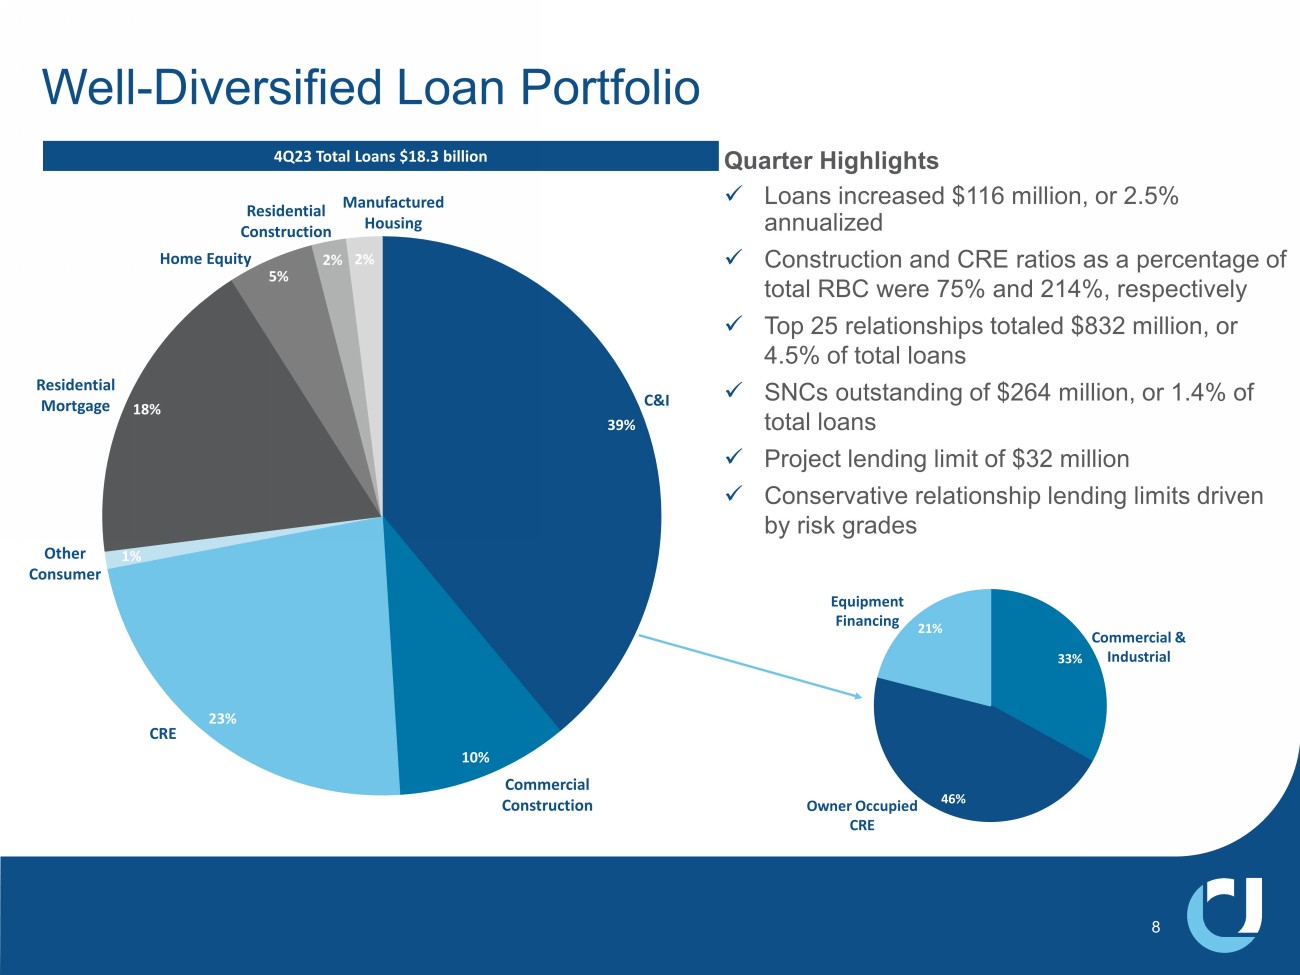
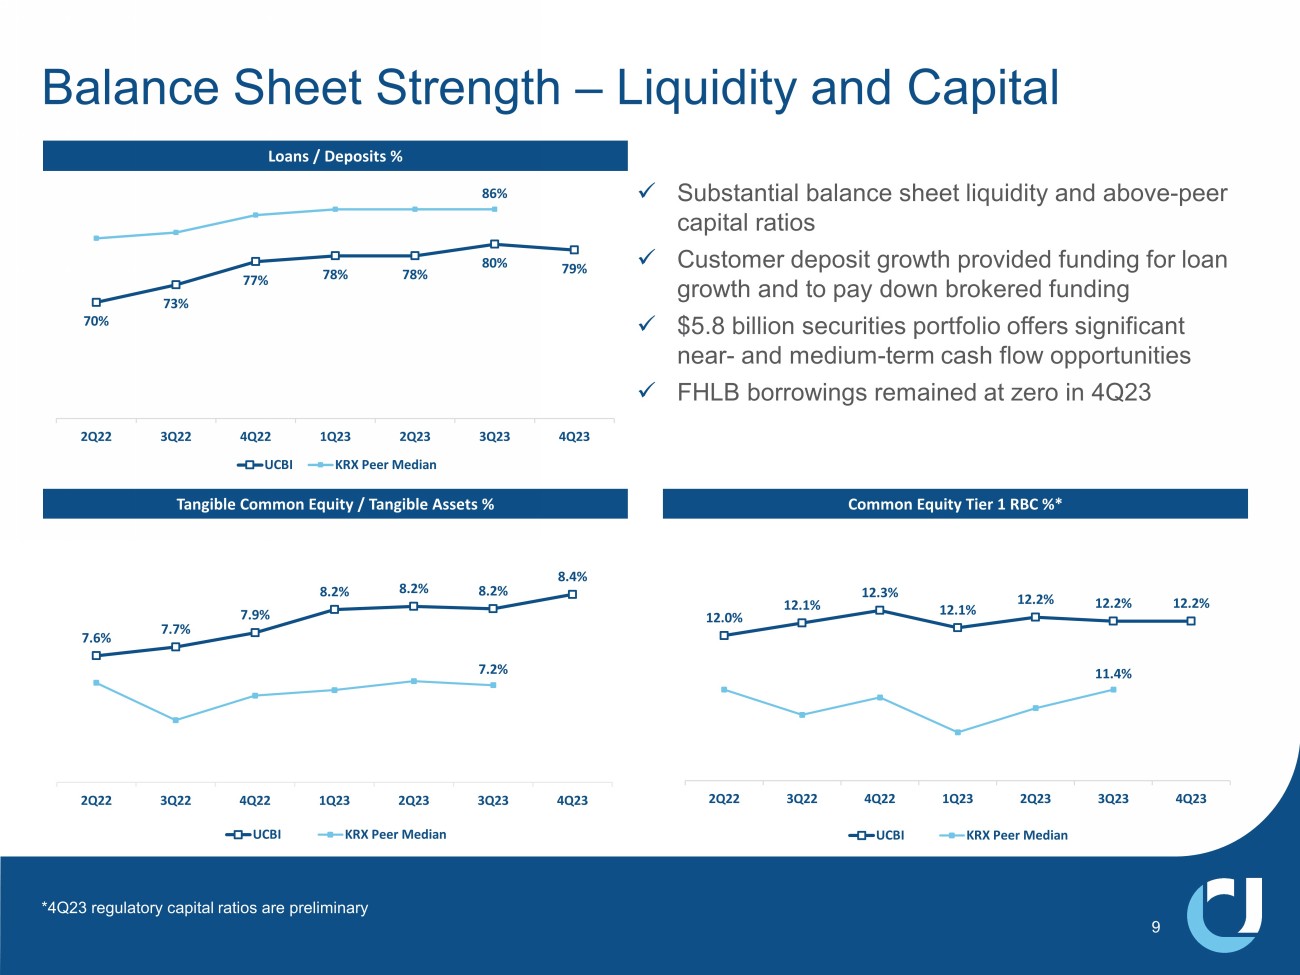
Acct Size 38% 34% 31% 30% 28% 62% 66% 69% 70% 72% 4Q22 1Q23 2Q23 3Q23 4Q23 Non Interest Bearing Deposits Interest Bearing Deposits 7 $ actual 39% 10% 23% 1% 18% 5% 2% 2% Residential Mortgage Manufactured Housing 4Q23 Total Loans $18.3 billion Well - Diversified Loan Portfolio Quarter Highlights x Loans increased $116 million, or 2.5% annualized x Construction and CRE ratios as a percentage of total RBC were 75% and 214%, respectively x Top 25 relationships totaled $832 million, or 4.5% of total loans x SNCs outstanding of $264 million, or 1.4% of total loans x Project lending limit of $32 million x Conservative relationship lending limits driven by risk grades C&I Commercial Construction CRE Other Consumer Home Equity Residential Construction 33% 46% 21% Commercial & Industrial Owner Occupied CRE Equipment Financing 8 x Substantial balance sheet liquidity and above - peer capital ratios x Customer deposit growth provided funding for loan growth and to pay down brokered funding x $5.8 billion securities portfolio offers significant near - and medium - term cash flow opportunities x FHLB borrowings remained at zero in 4Q23 7.6% 7.7% 7.9% 8.2% 8.2% 8.2% 8.4% 7.2% 2Q22 3Q22 4Q22 1Q23 2Q23 3Q23 4Q23 UCBI KRX Peer Median Loans / Deposits % Tangible Common Equity / Tangible Assets % Common Equity Tier 1 RBC %* 70% 73% 77% 78% 78% 80% 79% 86% 2Q22 3Q22 4Q22 1Q23 2Q23 3Q23 4Q23 UCBI KRX Peer Median 12.0% 12.1% 12.3% 12.1% 12.2% 12.2% 12.2% 11.4% 2Q22 3Q22 4Q22 1Q23 2Q23 3Q23 4Q23 UCBI KRX Peer Median Balance Sheet Strength – Liquidity and Capital 9 *4Q23 regulatory capital ratios are preliminary
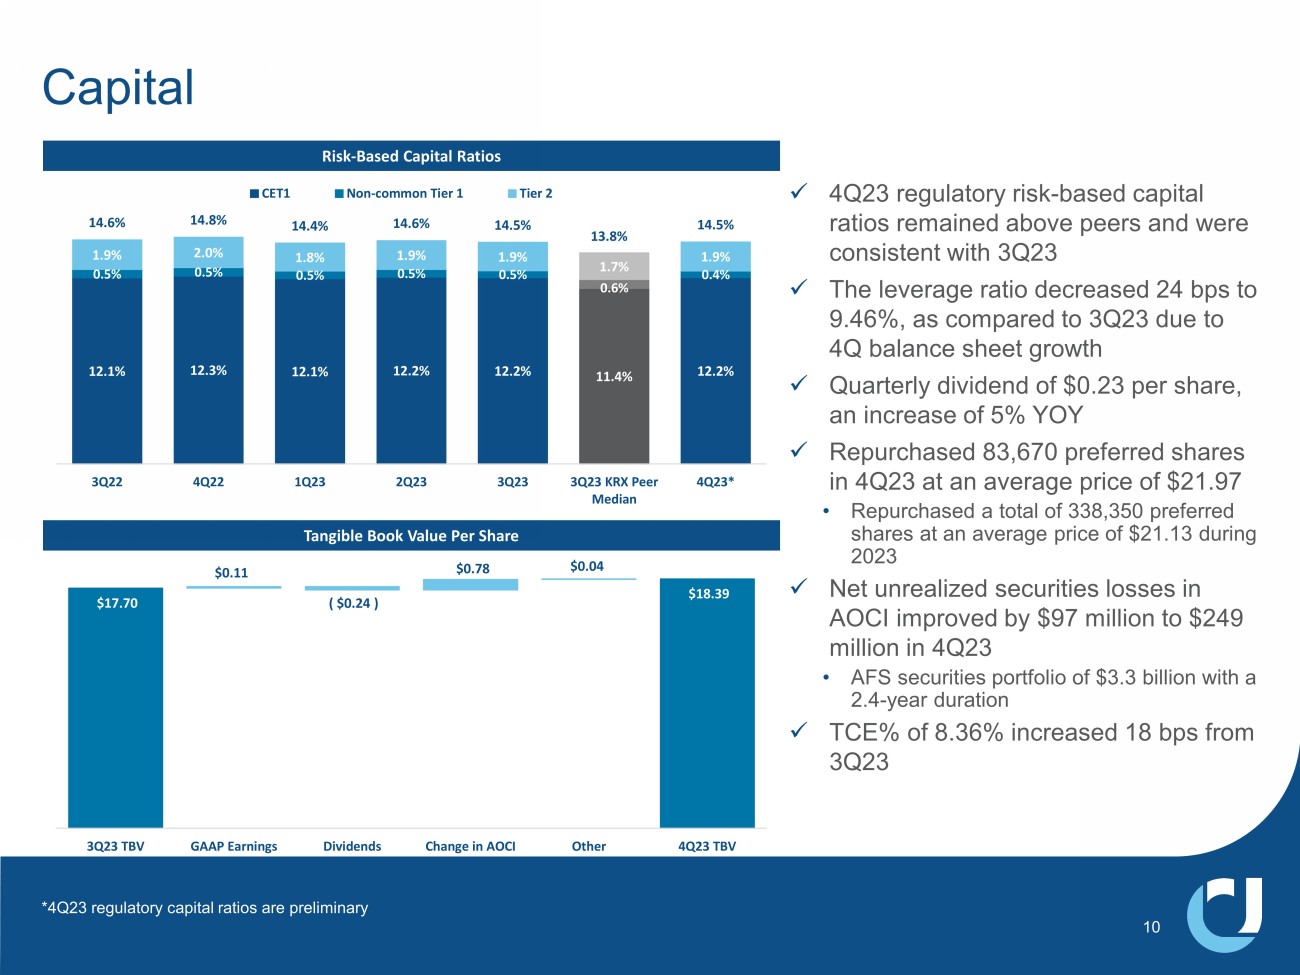
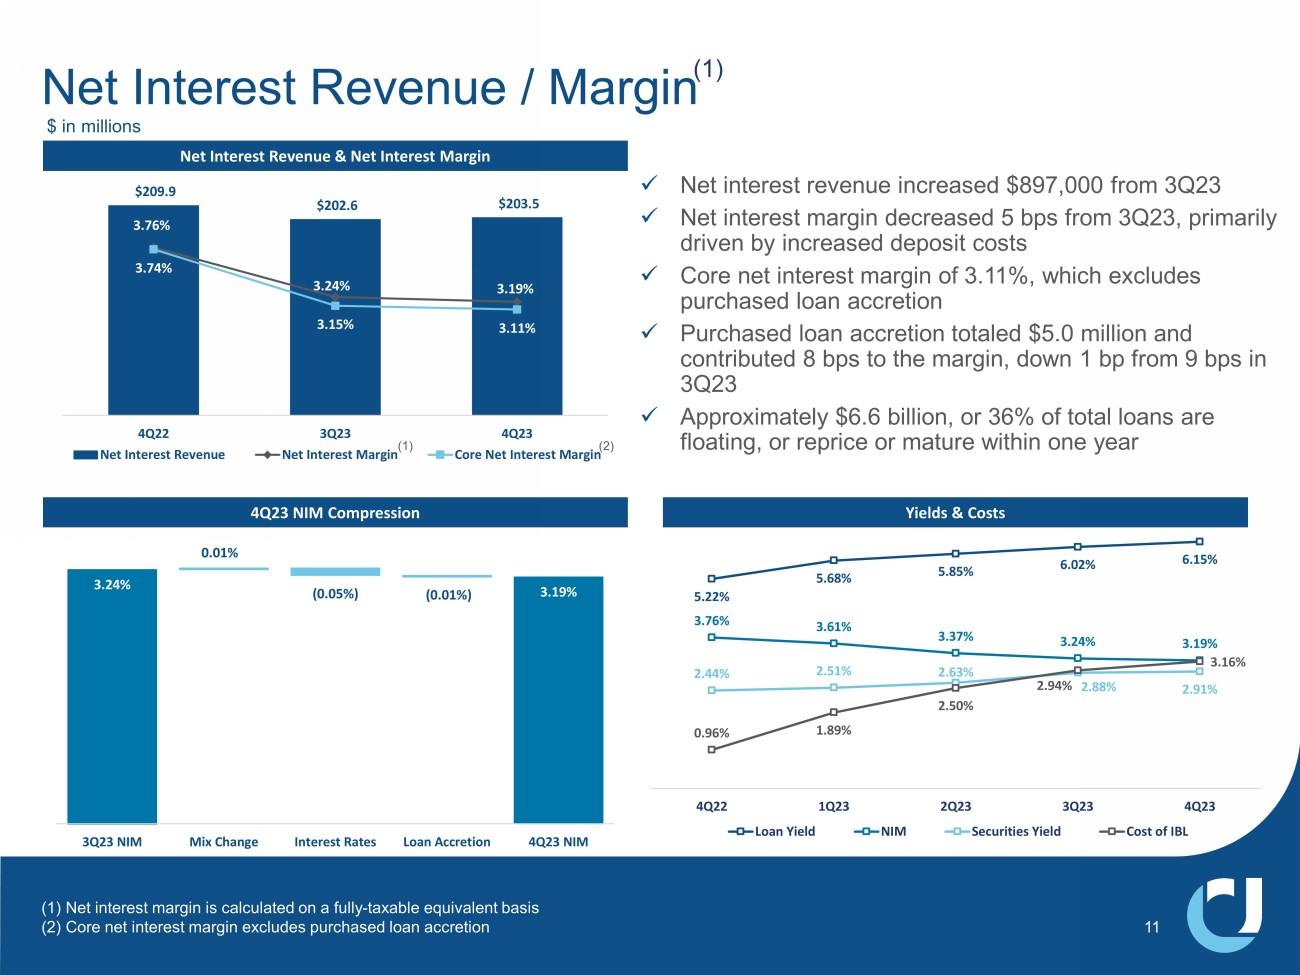
Risk - Based Capital Ratios Tangible Book Value Per Share x 4Q23 regulatory risk - based capital ratios remained above peers and were consistent with 3Q23 x The leverage ratio decreased 24 bps to 9.46%, as compared to 3Q23 due to 4Q balance sheet growth x Quarterly dividend of $0.23 per share, an increase of 5% YOY x Repurchased 83,670 preferred shares in 4Q23 at an average price of $21.97 • Repurchased a total of 338,350 preferred shares at an average price of $21.13 during 2023 x Net unrealized securities losses in AOCI improved by $97 million to $249 million in 4Q23 • AFS securities portfolio of $3.3 billion with a 2.4 - year duration x TCE% of 8.36% increased 18 bps from 3Q23 12.1% 12.3% 12.1% 12.2% 12.2% 11.4% 12.2% 0.5% 0.5% 0.5% 0.5% 0.5% 0.6% 0.4% 1.9% 2.0% 1.8% 1.9% 1.9% 1.7% 1.9% 14.6% 14.8% 14.4% 14.6% 14.5% 13.8% 14.5% 3Q22 4Q22 1Q23 2Q23 3Q23 3Q23 KRX Peer Median 4Q23* CET1 Non-common Tier 1 Tier 2 Total Capital $18.39 $17.70 $0.11 ( $0.24 ) $0.78 $0.04 3Q23 TBV GAAP Earnings Dividends Change in AOCI Other 4Q23 TBV 10 *4Q23 regulatory capital ratios are preliminary $209.9 $202.6 $203.5 3.76% 3.24% 3.19% 3.74% 3.15% 3.11% $100.0 $120.0 $140.0 $160.0 $180.0 $200.0 2.00% 2.50% 3.00% 3.50% 4.00% 4Q22 3Q23 4Q23 Net Interest Revenue Net Interest Margin Core Net Interest Margin 3.19% 3.24% 0.01% ( 0.05% ) ( 0.01% ) 3Q23 NIM Mix Change Interest Rates Loan Accretion 4Q23 NIM Net Interest Revenue & Net Interest Margin 4Q23 NIM Compression x Net interest revenue increased $897,000 from 3Q23 x Net interest margin decreased 5 bps from 3Q23, primarily driven by increased deposit costs x Core net interest margin of 3.11%, which excludes purchased loan accretion x Purchased loan accretion totaled $5.0 million and contributed 8 bps to the margin, down 1 bp from 9 bps in 3Q23 x Approximately $6.6 billion, or 36% of total loans are floating, or reprice or mature within one year Net Interest Revenue / Margin (1) Yields & Costs $ in millions 5.22% 5.68% 5.85% 6.02% 6.15% 3.76% 3.61% 3.37% 3.24% 3.19% 2.44% 2.51% 2.63% 2.88% 2.91% 0.96% 1.89% 2.50% 2.94% 3.16% 4Q22 1Q23 2Q23 3Q23 4Q23 Loan Yield NIM Securities Yield Cost of IBL (1) Net interest margin is calculated on a fully - taxable equivalent basis (2) Core net interest margin excludes purchased loan accretion (2) (1) 11
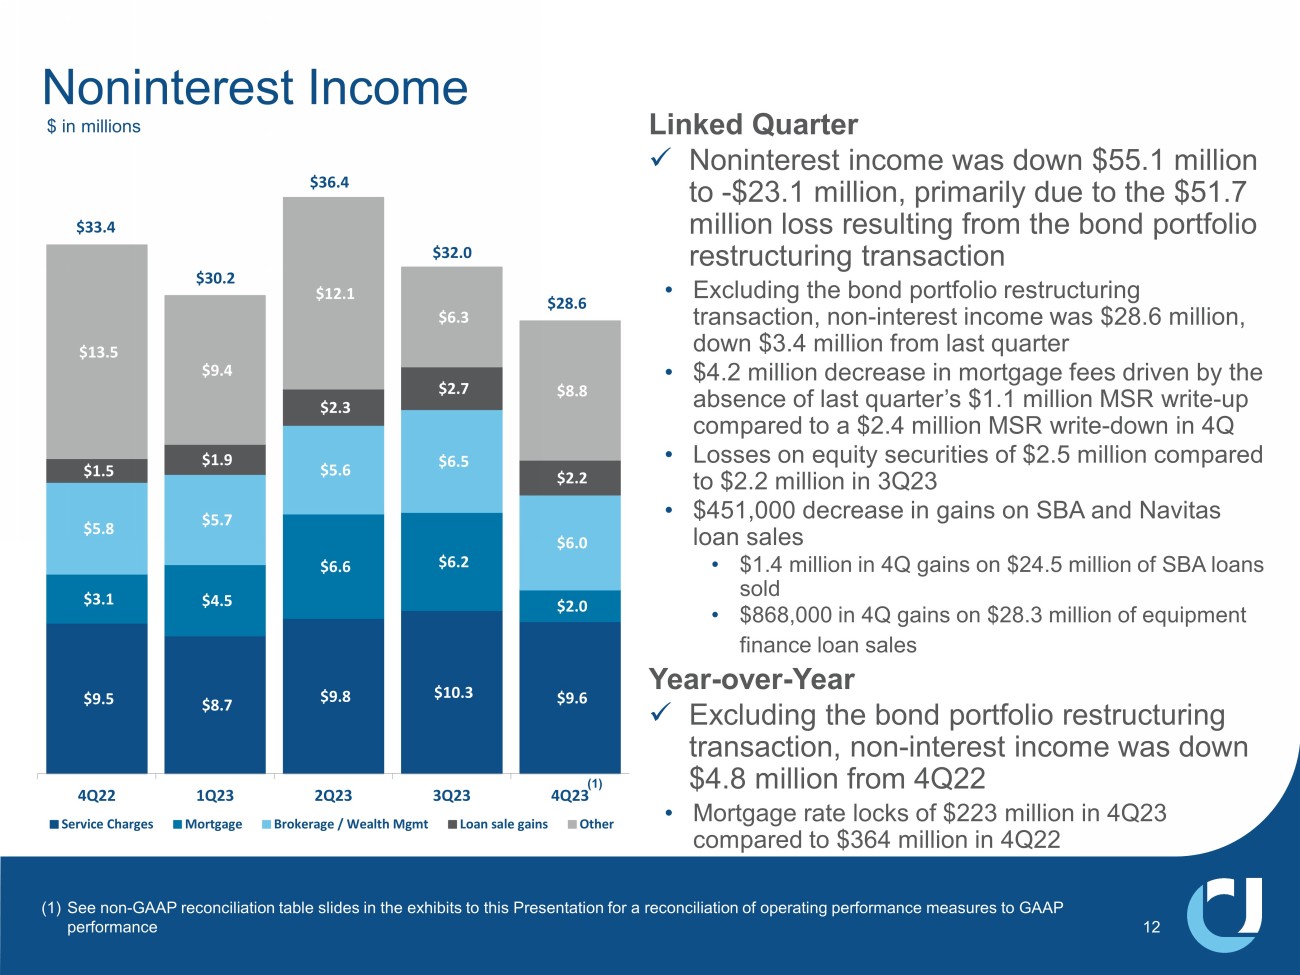
$9.5 $8.7 $9.8 $10.3 $9.6 $3.1 $4.5 $6.6 $6.2 $2.0 $5.8 $5.7 $5.6 $6.5 $6.0 $1.5 $1.9 $2.3 $2.7 $2.2 $13.5 $9.4 $12.1 $6.3 $8.8 4Q22 1Q23 2Q23 3Q23 4Q23 Service Charges Mortgage Brokerage / Wealth Mgmt Loan sale gains Other $36.4 $32.0 Linked Quarter x Noninterest income was down $55.1 million to - $23.1 million, primarily due to the $51.7 million loss resulting from the bond portfolio restructuring transaction • Excluding the bond portfolio restructuring transaction, non - interest income was $28.6 million, down $3.4 million from last quarter • $4.2 million decrease in mortgage fees driven by the absence of last quarter’s $1.1 million MSR write - up compared to a $2.4 million MSR write - down in 4Q • Losses on equity securities of $2.5 million compared to $2.2 million in 3Q23 • $451,000 decrease in gains on SBA and Navitas loan sales • $1.4 million in 4Q gains on $24.5 million of SBA loans sold • $868,000 in 4Q gains on $28.3 million of equipment finance loan sales Year - over - Year x Excluding the bond portfolio restructuring transaction, non - interest income was down $4.8 million from 4Q22 • Mortgage rate locks of $223 million in 4Q23 compared to $364 million in 4Q22 $30.2 $33.4 12 Noninterest Income $ in millions $28.6 (1) See non - GAAP reconciliation table slides in the exhibits to this Presentation for a reconciliation of operating performance meas ures to GAAP performance (1)
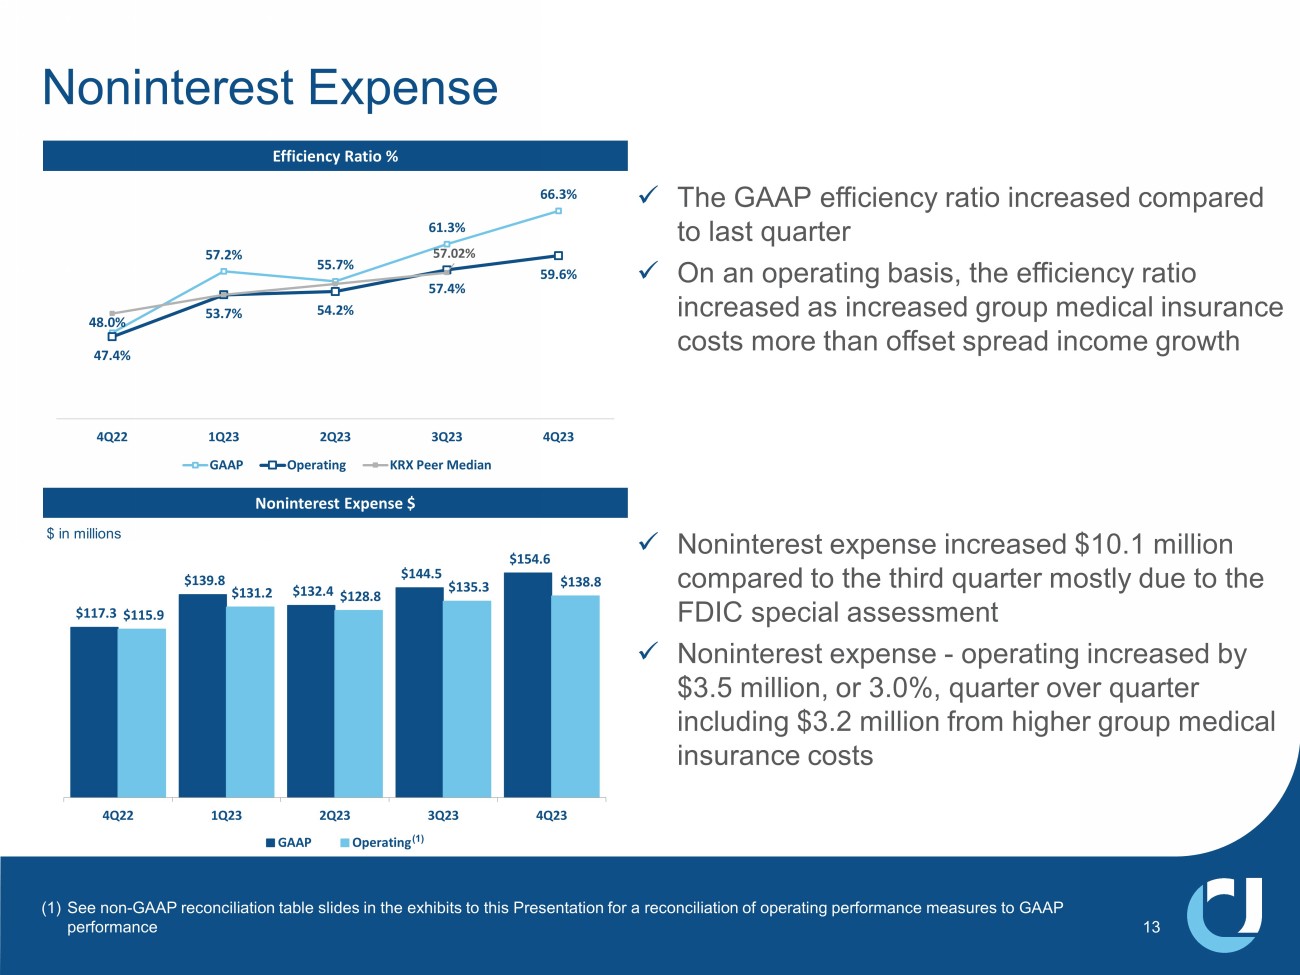
$117.3 $139.8 $132.4 $144.5 $154.6 $115.9 $131.2 $128.8 $135.3 $138.8 4Q22 1Q23 2Q23 3Q23 4Q23 GAAP Operating Noninterest Expense $ in millions x The GAAP efficiency ratio increased compared to last quarter x On an operating basis, the efficiency ratio increased as increased group medical insurance costs more than offset spread income growth Efficiency Ratio % Noninterest Expense $ 48.0% 57.2% 55.7% 61.3% 66.3% 47.4% 53.7% 54.2% 57.4% 59.6% 57.02% 4Q22 1Q23 2Q23 3Q23 4Q23 GAAP Operating KRX Peer Median x Noninterest expense increased $10.1 million compared to the third quarter mostly due to the FDIC special assessment x Noninterest expense - operating increased by $3.5 million, or 3.0%, quarter over quarter including $3.2 million from higher group medical insurance costs 13 (1) See non - GAAP reconciliation table slides in the exhibits to this Presentation for a reconciliation of operating performance meas ures to GAAP performance (1)
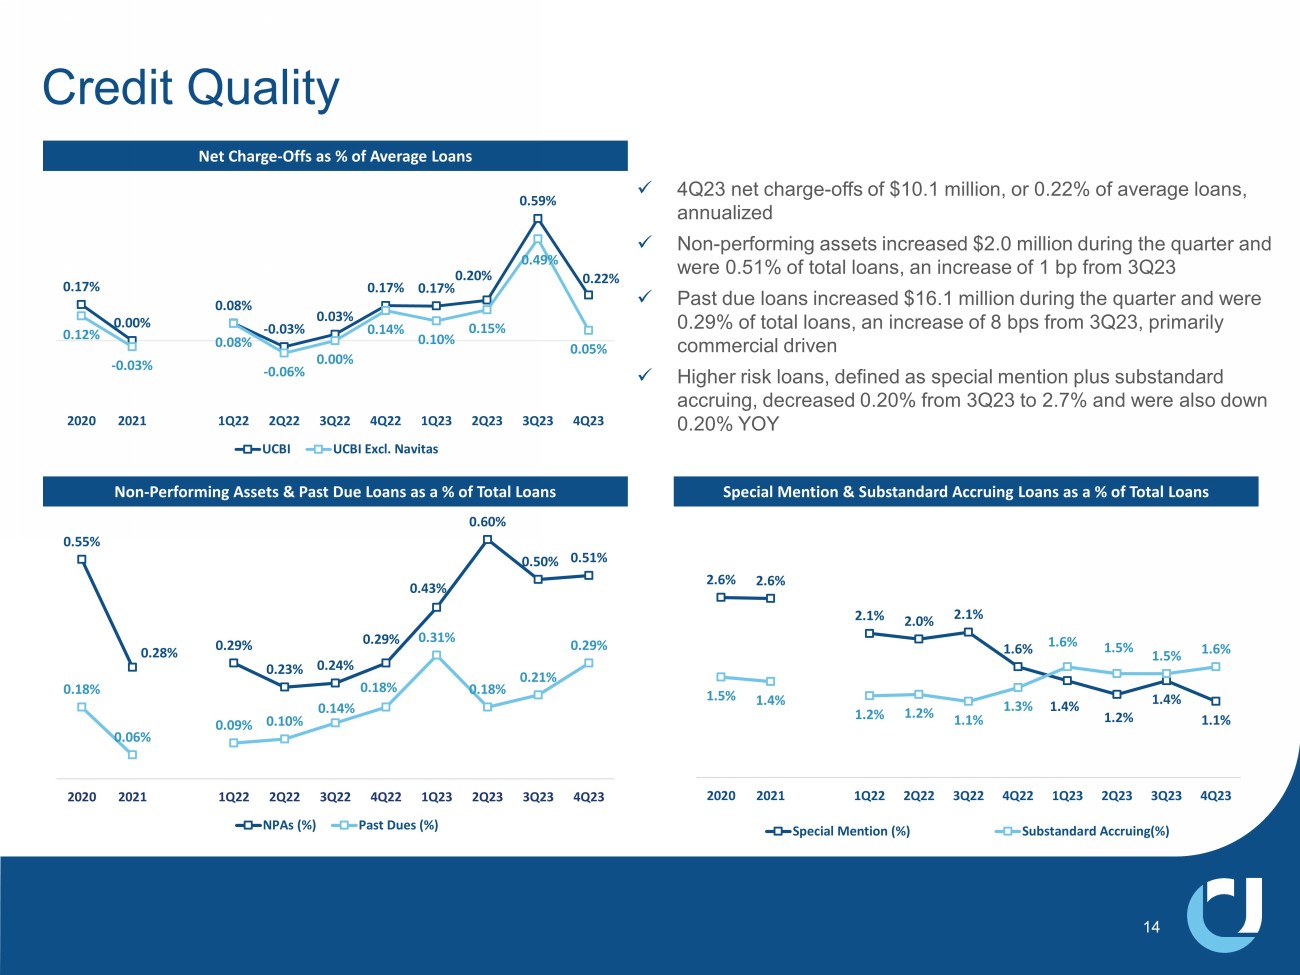
x 4Q23 net charge - offs of $10.1 million, or 0.22% of average loans, annualized x Non - performing assets increased $2.0 million during the quarter and were 0.51% of total loans, an increase of 1 bp from 3Q23 x Past due loans increased $16.1 million during the quarter and were 0.29% of total loans, an increase of 8 bps from 3Q23, primarily commercial driven x Higher risk loans, defined as special mention plus substandard accruing, decreased 0.20% from 3Q23 to 2.7% and were also down 0.20% YOY Credit Quality Net Charge - Offs as % of Average Loans Non - Performing Assets & Past Due Loans as a % of Total Loans 0.55% 0.28% 0.29% 0.23% 0.24% 0.29% 0.43% 0.60% 0.50% 0.51% 0.18% 0.06% 0.09% 0.10% 0.14% 0.18% 0.31% 0.18% 0.21% 0.29% 2020 2021 1Q22 2Q22 3Q22 4Q22 1Q23 2Q23 3Q23 4Q23 NPAs (%) Past Dues (%) 2.6% 2.6% 2.1% 2.0% 2.1% 1.6% 1.4% 1.2% 1.4% 1.1% 1.5% 1.4% 1.2% 1.2% 1.1% 1.3% 1.6% 1.5% 1.5% 1.6% 2020 2021 1Q22 2Q22 3Q22 4Q22 1Q23 2Q23 3Q23 4Q23 Special Mention (%) Substandard Accruing(%) Special Mention & Substandard Accruing Loans as a % of Total Loans 14 0.17% 0.00% 0.08% - 0.03% 0.03% 0.17% 0.17% 0.20% 0.59% 0.22% 0.12% - 0.03% 0.08% - 0.06% 0.00% 0.14% 0.10% 0.15% 0.49% 0.05% 2020 2021 1Q22 2Q22 3Q22 4Q22 1Q23 2Q23 3Q23 4Q23 UCBI UCBI Excl.
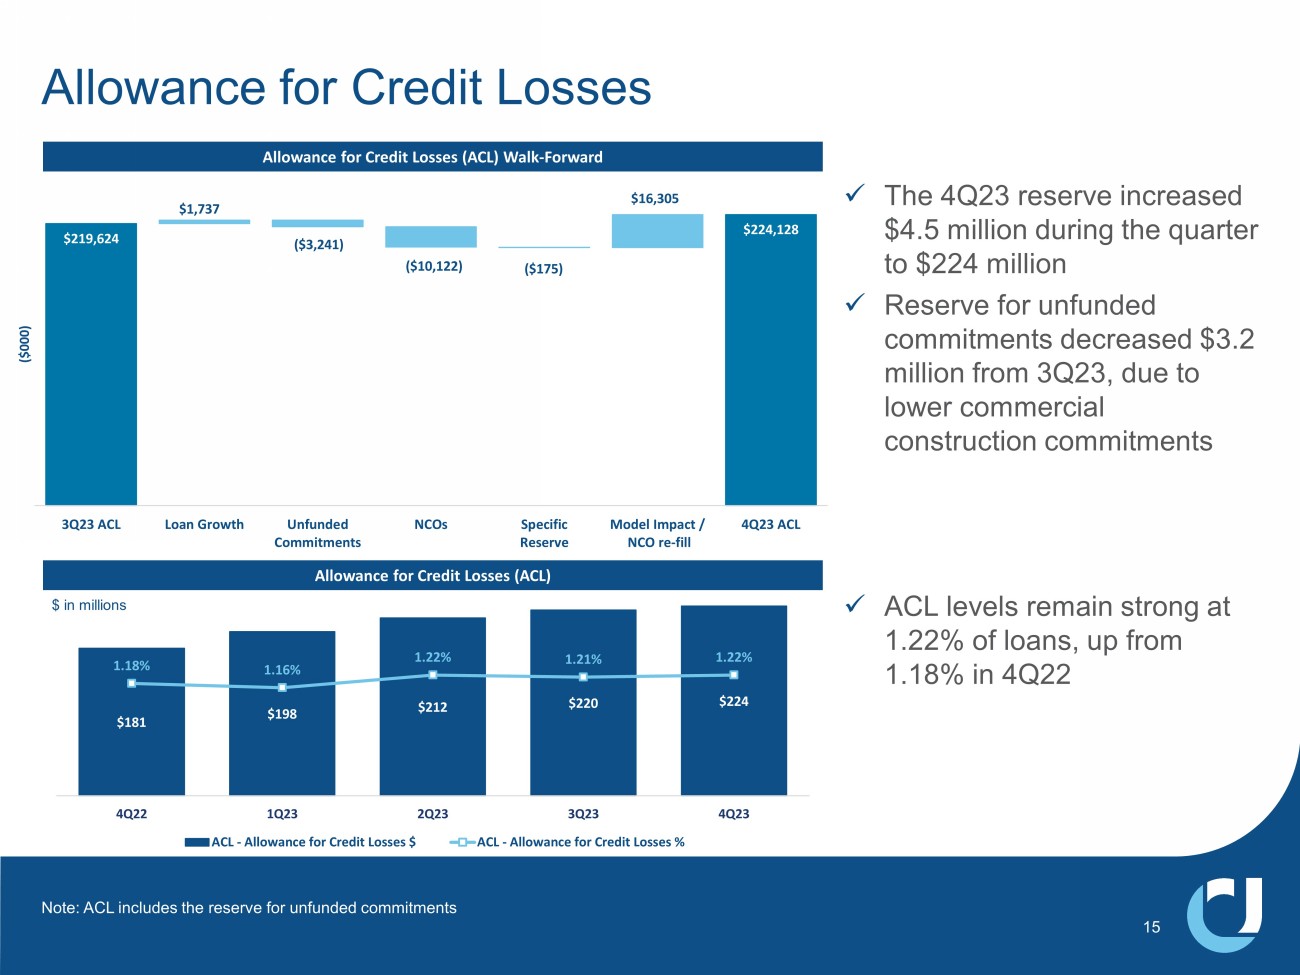
Navitas Allowance for Credit Losses Allowance for Credit Losses (ACL) Walk - Forward Allowance for Credit Losses (ACL) Note: ACL includes the reserve for unfunded commitments x The 4Q23 reserve increased $4.5 million during the quarter to $224 million x Reserve for unfunded commitments decreased $3.2 million from 3Q23, due to lower commercial construction commitments x ACL levels remain strong at 1.22% of loans, up from 1.18% in 4Q22 $181 $198 $212 $220 $224 1.18% 1.16% 1.22% 1.21% 1.22% 0.65% 0.75% 0.85% 0.95% 1.05% 1.15% 1.25% 1.35% 1.45% 1.55% $30 $50 $70 $90 $110 $130 $150 $170 $190 $210 4Q22 1Q23 2Q23 3Q23 4Q23 ACL - Allowance for Credit Losses $ ACL - Allowance for Credit Losses % $219,624 $224,128 $1,737 ( $3,241 ) ( $10,122 ) ( $175 ) $16,305 3Q23 ACL Loan Growth Unfunded Commitments NCOs Specific Reserve Model Impact / NCO re-fill 4Q23 ACL ($000) 15 $ in millions Member FDIC.

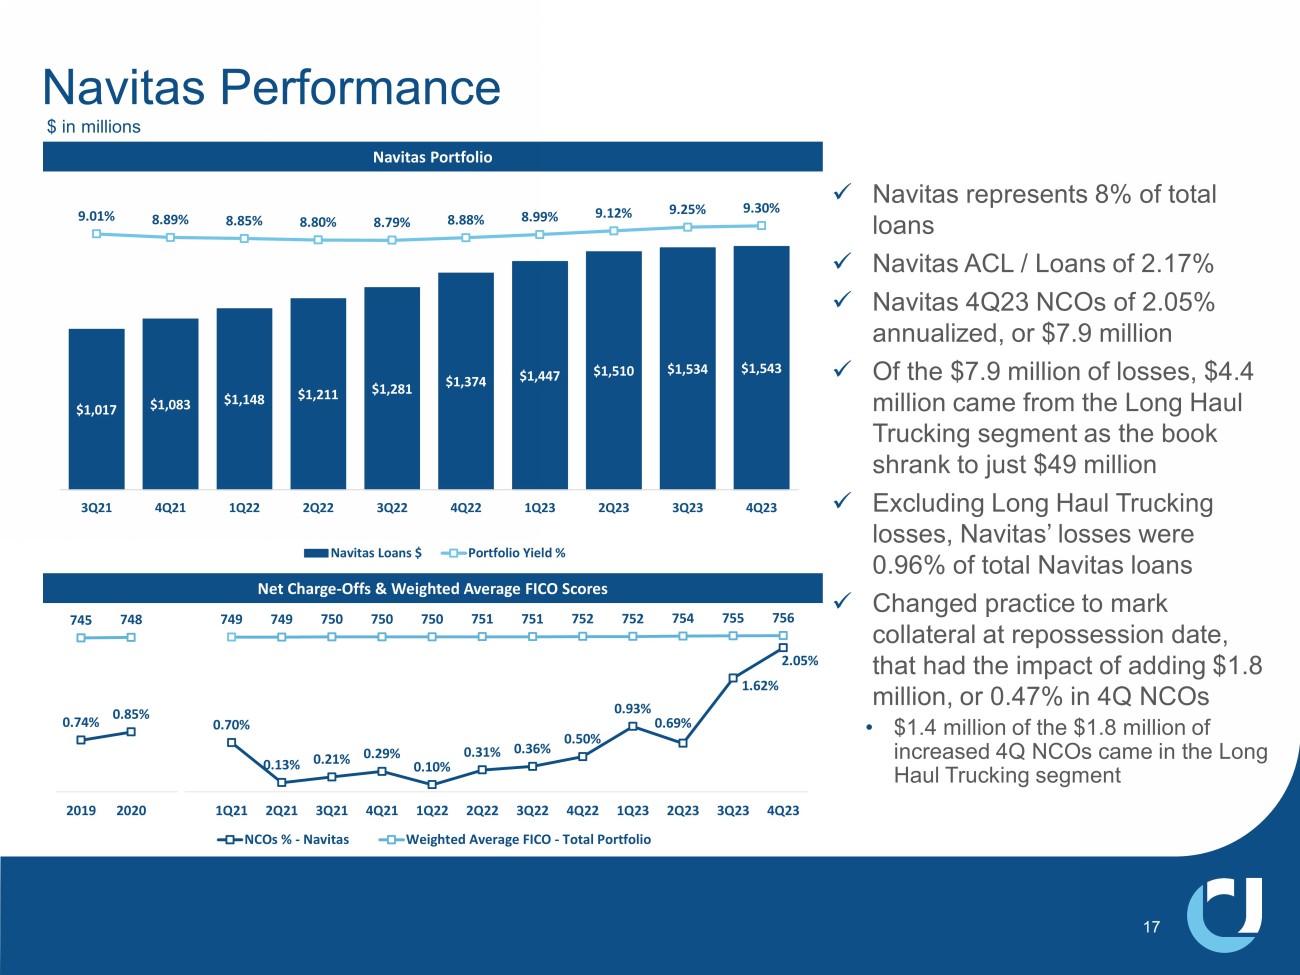
© 2024 United Community Bank | ucbi.com 4Q23 INVESTOR PRESENTATION Exhibits Navitas Portfolio Net Charge - Offs & Weighted Average FICO Scores x Navitas represents 8% of total loans x Navitas ACL / Loans of 2.17% x Navitas 4Q23 NCOs of 2.05% annualized, or $7.9 million x Of the $7.9 million of losses, $4.4 million came from the Long Haul Trucking segment as the book shrank to just $49 million x Excluding Long Haul Trucking losses, Navitas’ losses were 0.96% of total Navitas loans x Changed practice to mark collateral at repossession date, that had the impact of adding $1.8 million, or 0.47% in 4Q NCOs • $1.4 million of the $1.8 million of increased 4Q NCOs came in the Long Haul Trucking segment Navitas Performance $ in millions $1,017 $1,083 $1,148 $1,211 $1,281 $1,374 $1,447 $1,510 $1,534 $1,543 9.01% 8.89% 8.85% 8.80% 8.79% 8.88% 8.99% 9.12% 9.25% 9.30% 0.00% 1.00% 2.00% 3.00% 4.00% 5.00% 6.00% 7.00% 8.00% 9.00% 10.00% $0 $200 $400 $600 $800 $1,000 $1,200 $1,400 $1,600 $1,800 3Q21 4Q21 1Q22 2Q22 3Q22 4Q22 1Q23 2Q23 3Q23 4Q23 Navitas Loans $ Portfolio Yield % 17 0.74% 0.85% 0.70% 0.13% 0.21% 0.29% 0.10% 0.31% 0.36% 0.50% 0.93% 0.69% 1.62% 2.05% 745 748 749 749 750 750 750 751 751 752 752 754 755 756 1 101 201 301 401 501 601 701 801 0.00% 0.50% 1.00% 1.50% 2.00% 2.50% 2019 2020 1Q21 2Q21 3Q21 4Q21 1Q22 2Q22 3Q22 4Q22 1Q23 2Q23 3Q23 4Q23 NCOs % - Navitas Weighted Average FICO - Total Portfolio 1% 20% 25% 49% 6% Selected Portfolios – Office $ in millions Note: Progress acquisition contributed $74 million of the increase in office loans outstanding from 4Q22 to 1Q23; Reclass of FNB SM office loans contributed $70 million of the increase in office loans outstanding from 3Q23 to 4Q23 18 Outstanding $785 million % of Total Loans 4.3% Average Loan Size $1.3 million Median Loan Size $553 thousand Largest Loan Size $12.4 million 30 + Days Past Due $2.4 million Special Mention $11.5 million Substandard Accruing $3.2 million Non Accruals $1.4 million 4Q23 Portfolio Characteristics Investment CRE – Office $666 $683 $664 $661 $710 $722 $711 $785 1Q22 2Q22 3Q22 4Q22 1Q23 2Q23 3Q23 4Q23 Substandard Special Mention Pass
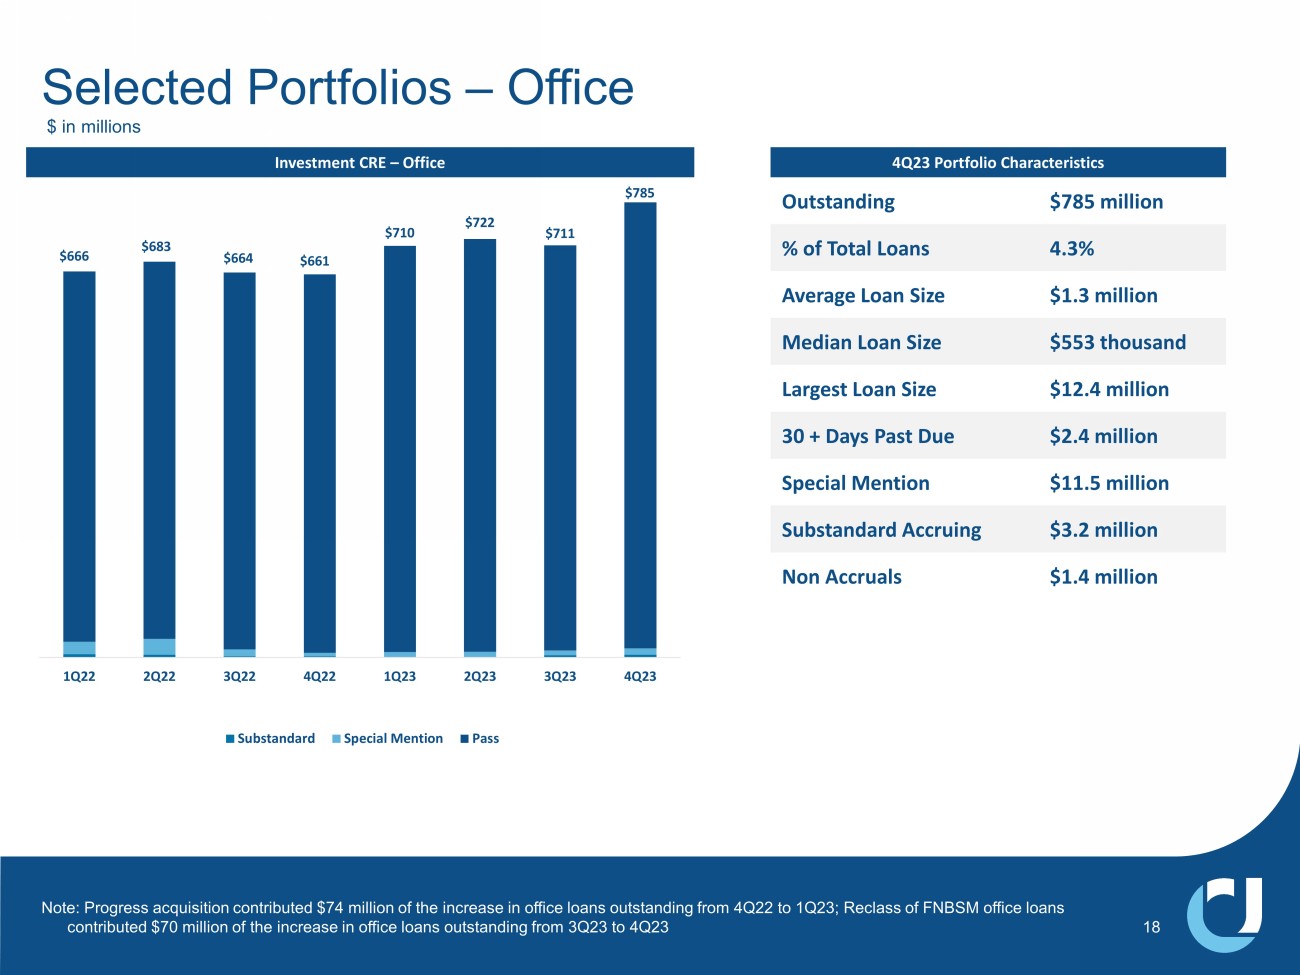
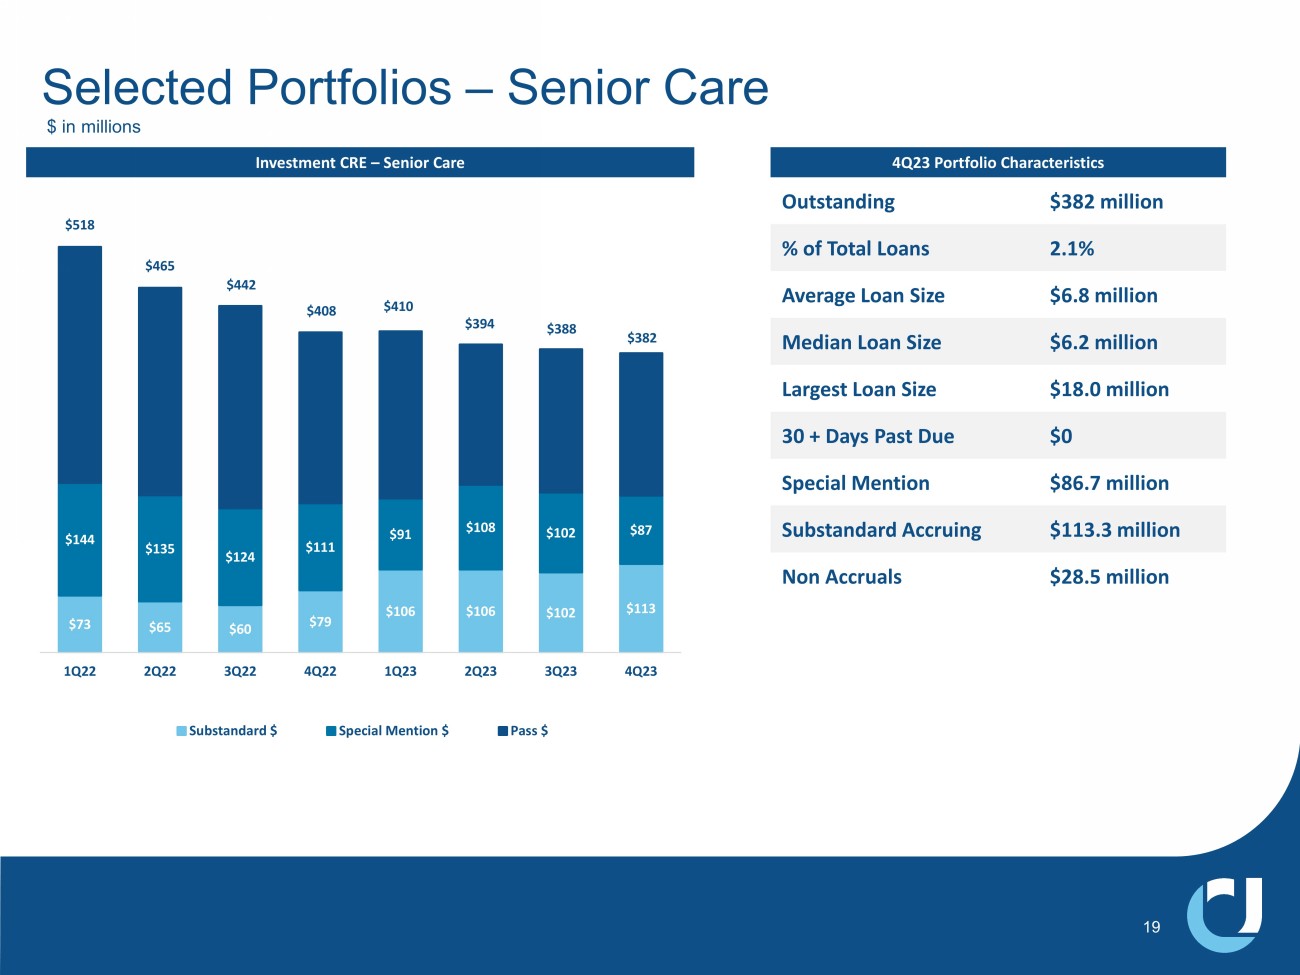
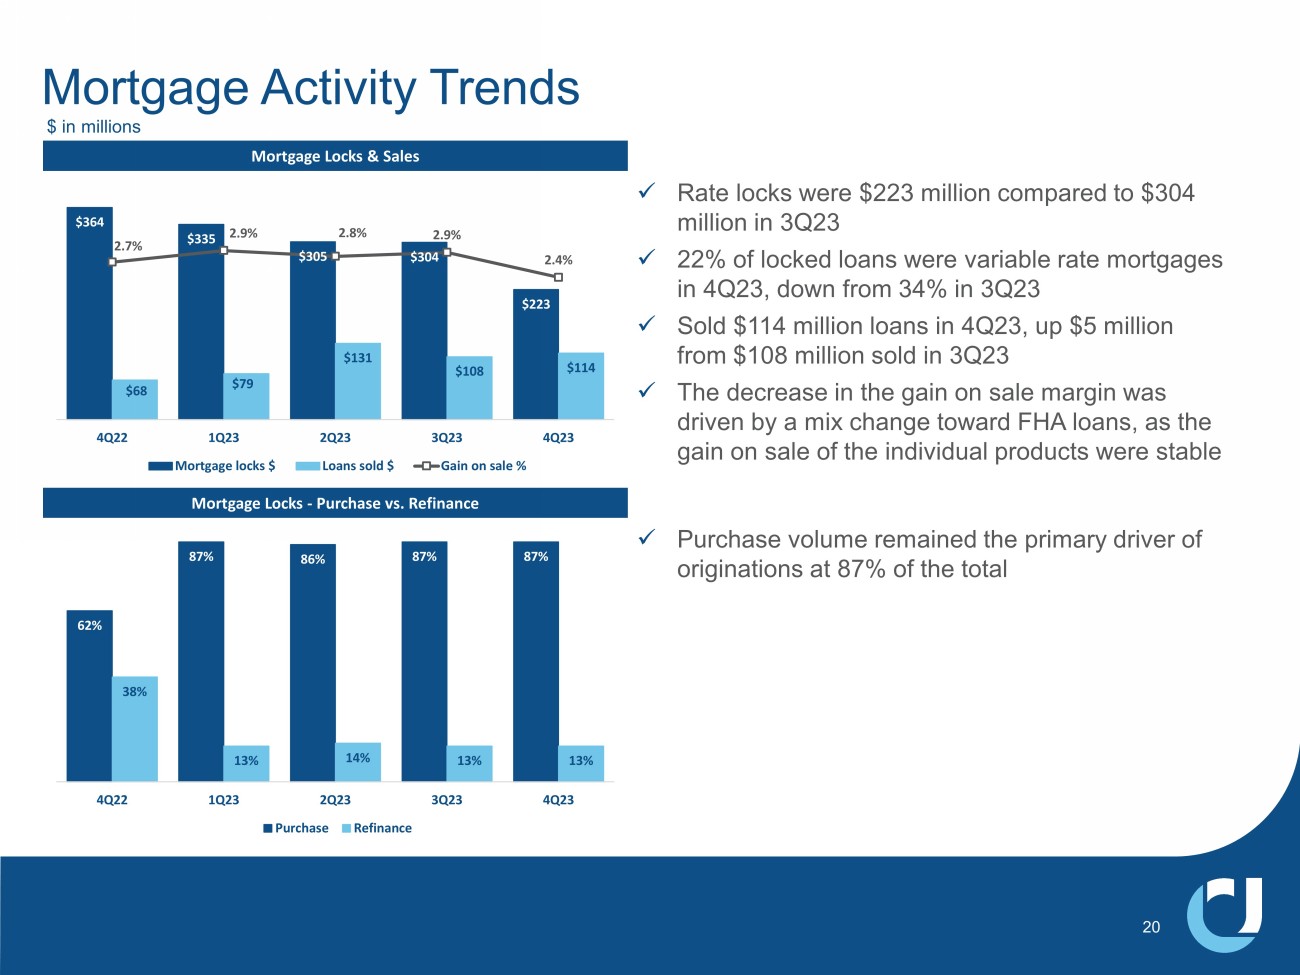
1% 20% 25% 49% 6% Selected Portfolios – Senior Care $ in millions $73 $65 $60 $79 $106 $106 $102 $113 $144 $135 $124 $111 $91 $108 $102 $87 $518 $465 $442 $408 $410 $394 $388 $382 1Q22 2Q22 3Q22 4Q22 1Q23 2Q23 3Q23 4Q23 Substandard $ Special Mention $ Pass $ 19 4Q23 Portfolio Characteristics Investment CRE – Senior Care Outstanding $382 million % of Total Loans 2.1% Average Loan Size $6.8 million Median Loan Size $6.2 million Largest Loan Size $18.0 million 30 + Days Past Due $0 Special Mention $86.7 million Substandard Accruing $113.3 million Non Accruals $28.5 million x Rate locks were $223 million compared to $304 million in 3Q23 x 22% of locked loans were variable rate mortgages in 4Q23, down from 34% in 3Q23 x Sold $114 million loans in 4Q23, up $5 million from $108 million sold in 3Q23 x The decrease in the gain on sale margin was driven by a mix change toward FHA loans, as the gain on sale of the individual products were stable Mortgage Locks & Sales Mortgage Locks - Purchase vs. Refinance Mortgage Activity Trends $364 $335 $305 $304 $223 $68 $79 $131 $108 $114 2.7% 2.9% 2.8% 2.9% 2.4% 0.00% 0.50% 1.00% 1.50% 2.00% 2.50% 3.00% 3.50% 4.00% $0 $50 $100 $150 $200 $250 $300 $350 $400 4Q22 1Q23 2Q23 3Q23 4Q23 Mortgage locks $ Loans sold $ Gain on sale % 62% 87% 86% 87% 87% 38% 13% 14% 13% 13% 4Q22 1Q23 2Q23 3Q23 4Q23 Purchase Refinance $ in millions 20 x Purchase volume remained the primary driver of originations at 87% of the total (1) Includes MSAs with a population greater than 1,000,000 (2) Includes MSAs with a population between 500,000 and 1,000,000 Footprint Focused on High - Growth MSAs in Southeast 21 21.9% 8.8% 5.4% 5.3% 3.7% 3.2% 2.8% 2.3% 2.1% 2.0% Atlanta, GA Greenville, SC Nashville, TN Miami, FL Raleigh, NC Gainesville, GA Knoxville, TN Orlando, FL Charlotte, NC Myrtle Beach, SC Top 10 MSAs - % of Total Deposits UCBI's % of Total Deposits ’23 – ’28 Proj.
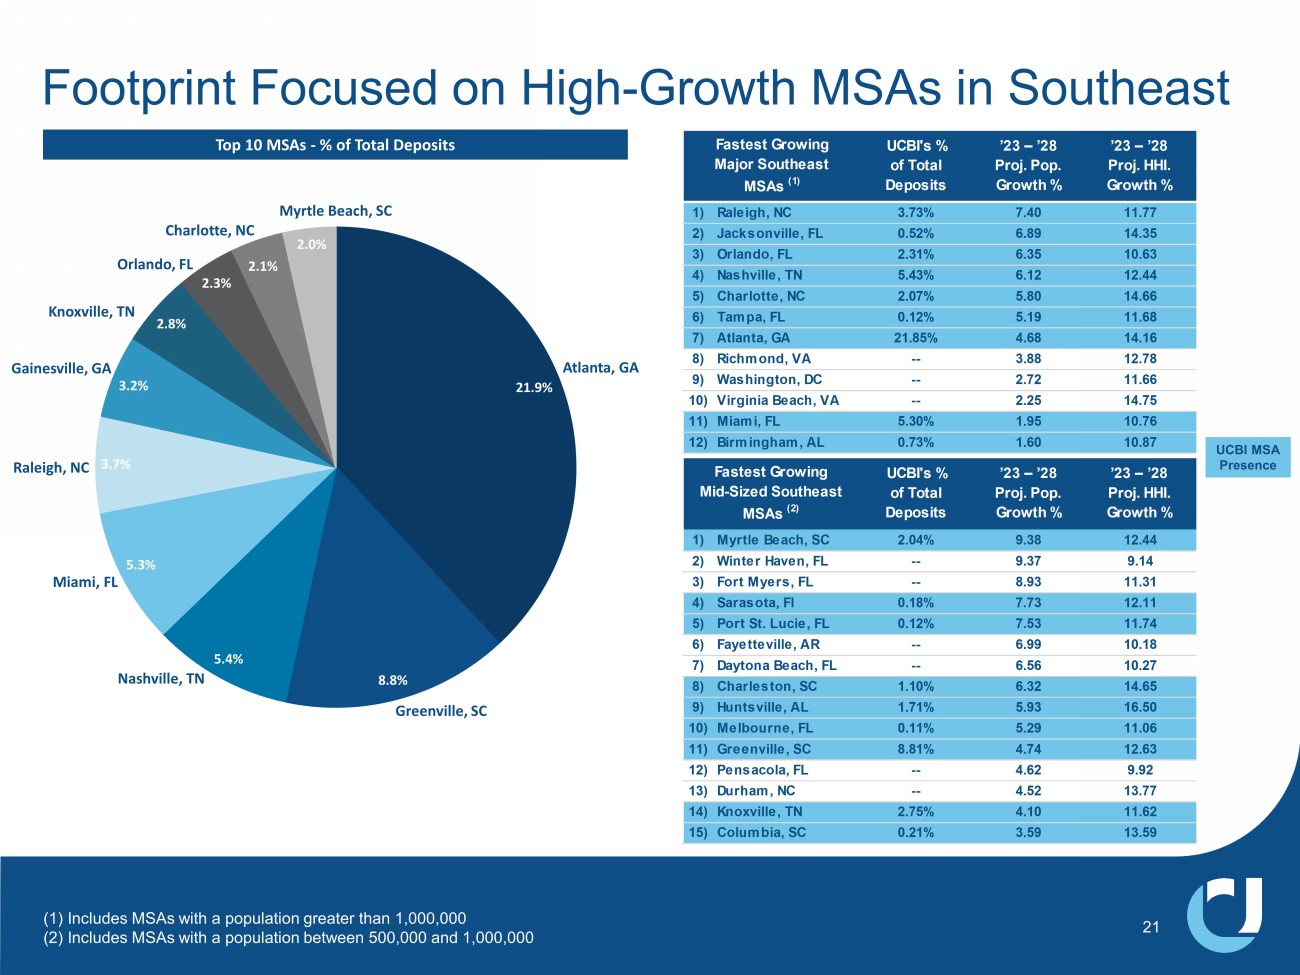
Pop. Growth % ’23 – ’28 Proj. HHI. Growth % 1) Raleigh, NC 3.73% 7.40 11.77 2) Jacksonville, FL 0.52% 6.89 14.35 3) Orlando, FL 2.31% 6.35 10.63 4) Nashville, TN 5.43% 6.12 12.44 5) Charlotte, NC 2.07% 5.80 14.66 6) Tampa, FL 0.12% 5.19 11.68 7) Atlanta, GA 21.85% 4.68 14.16 8) Richmond, VA -- 3.88 12.78 9) Washington, DC -- 2.72 11.66 10) Virginia Beach, VA -- 2.25 14.75 11) Miami, FL 5.30% 1.95 10.76 12) Birmingham, AL 0.73% 1.60 10.87 Fastest Growing Major Southeast MSAs (1) UCBI's % of Total Deposits ’23 – ’28 Proj. Pop. Growth % ’23 – ’28 Proj. HHI. Growth % 1) Myrtle Beach, SC 2.04% 9.38 12.44 2) Winter Haven, FL -- 9.37 9.14 3) Fort Myers, FL -- 8.93 11.31 4) Sarasota, Fl 0.18% 7.73 12.11 5) Port St.
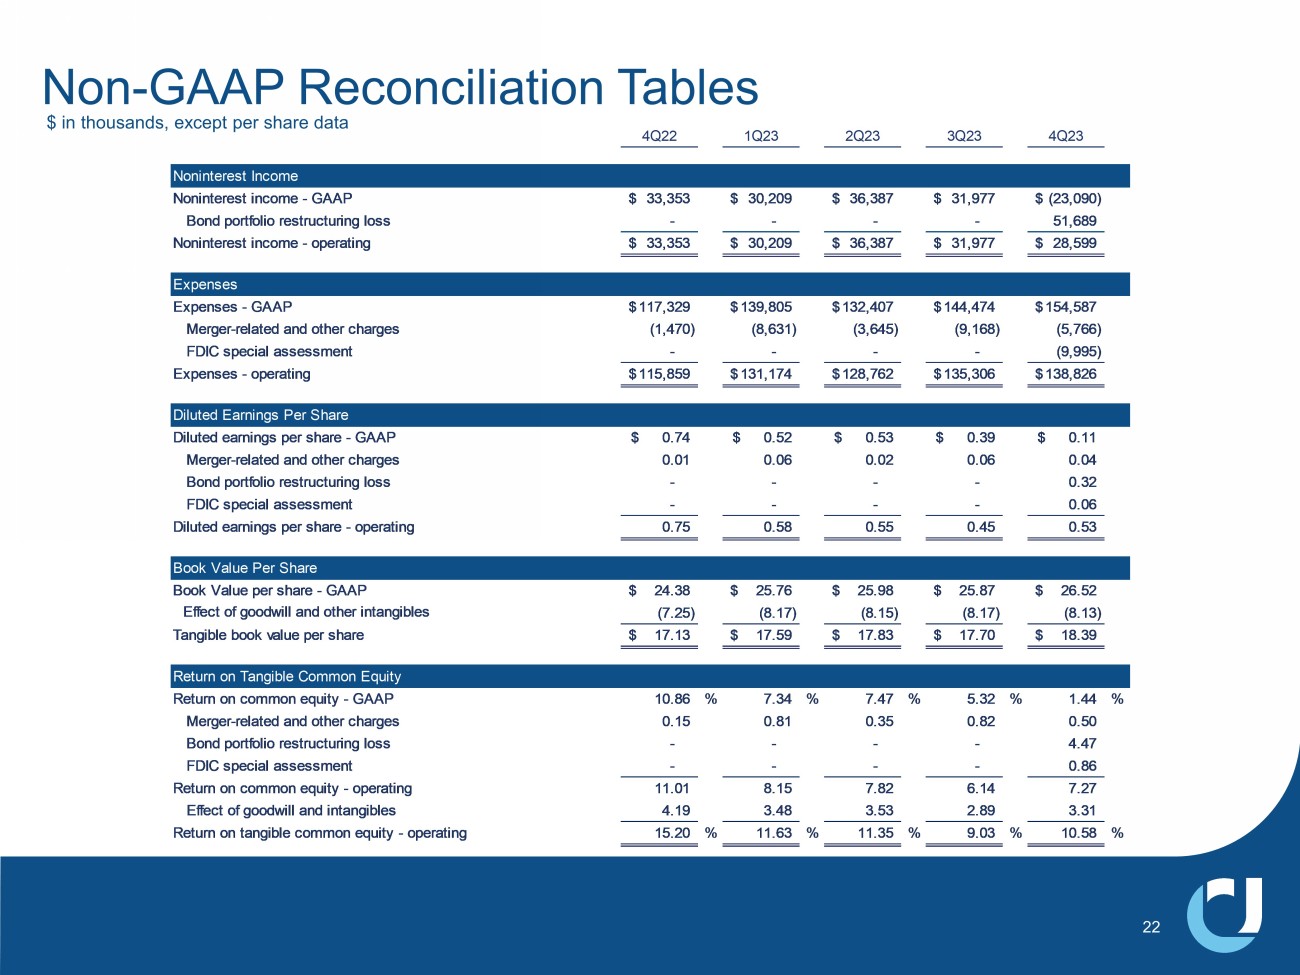
Lucie, FL 0.12% 7.53 11.74 6) Fayetteville, AR -- 6.99 10.18 7) Daytona Beach, FL -- 6.56 10.27 8) Charleston, SC 1.10% 6.32 14.65 9) Huntsville, AL 1.71% 5.93 16.50 10) Melbourne, FL 0.11% 5.29 11.06 11) Greenville, SC 8.81% 4.74 12.63 12) Pensacola, FL -- 4.62 9.92 13) Durham, NC -- 4.52 13.77 14) Knoxville, TN 2.75% 4.10 11.62 15) Columbia, SC 0.21% 3.59 13.59 Fastest Growing Mid-Sized Southeast MSAs (2) UCBI MSA Presence Non - GAAP Reconciliation Tables 22 4Q22 1Q23 2Q23 3Q23 4Q23 Noninterest Income Noninterest income - GAAP 33,353$ 30,209$ 36,387$ 31,977$ (23,090)$ Bond portfolio restructuring loss - - - - 51,689 Noninterest income - operating 33,353$ 30,209$ 36,387$ 31,977$ 28,599$ Expenses Expenses - GAAP 117,329$ 139,805$ 132,407$ 144,474$ 154,587$ Merger-related and other charges (1,470) (8,631) (3,645) (9,168) (5,766) FDIC special assessment - - - - (9,995) Expenses - operating 115,859$ 131,174$ 128,762$ 135,306$ 138,826$ Diluted Earnings Per Share Diluted earnings per share - GAAP 0.74$ 0.52$ 0.53$ 0.39$ 0.11$ Merger-related and other charges 0.01 0.06 0.02 0.06 0.04 Bond portfolio restructuring loss - - - - 0.32 FDIC special assessment - - - - 0.06 Diluted earnings per share - operating 0.75 0.58 0.55 0.45 0.53 Book Value Per Share Book Value per share - GAAP 24.38$ 25.76$ 25.98$ 25.87$ 26.52$ Effect of goodwill and other intangibles (7.25) (8.17) (8.15) (8.17) (8.13) Tangible book value per share 17.13$ 17.59$ 17.83$ 17.70$ 18.39$ Return on Tangible Common Equity Return on common equity - GAAP 10.86 % 7.34 % 7.47 % 5.32 % 1.44 % Merger-related and other charges 0.15 0.81 0.35 0.82 0.50 Bond portfolio restructuring loss - - - - 4.47 FDIC special assessment - - - - 0.86 Return on common equity - operating 11.01 8.15 7.82 6.14 7.27 Effect of goodwill and intangibles 4.19 3.48 3.53 2.89 3.31 Return on tangible common equity - operating 15.20 % 11.63 % 11.35 % 9.03 % 10.58 % $ in thousands, except per share data Non - GAAP Reconciliation Tables 23 4Q22 1Q23 2Q23 3Q23 4Q23 Return on Assets Return on assets - GAAP 1.33 % 0.95 % 0.95 % 0.68 % 0.18 % Merger-related and other charges - - - - 0.06 Bond portfolio restructuring loss - - - - 0.57 FDIC special assessment 0.02 0.11 0.05 0.11 0.11 Return on assets - operating 1.35 % 1.06 % 1.00 % 0.79 % 0.92 % Return on Assets to Return on Assets - Pre-tax Pre-provision Return on assets - GAAP 1.33 % 0.95 % 0.95 % 0.68 % 0.18 % Income tax expense (benefit) 0.41 0.29 0.29 0.18 (0.04) (Release of) provision for credit losses 0.33 0.34 0.35 0.45 0.21 Return on assets - pre-tax, pre-provision 2.07 1.58 1.59 1.31 0.35 Merger-related and other charges 0.02 0.13 0.06 0.13 0.08 Bond portfolio restructuring loss - - - - 0.75 FDIC special assessment - - - - 0.15 Return on assets - operating 2.09 % 1.71 % 1.65 % 1.44 % 1.33 % Efficiency Ratio Efficiency ratio - GAAP 47.95 % 57.20 % 55.71 % 61.32 % 66.33 % Merger-related and other charges (0.60) (3.53) (1.54) (3.89) (2.47) FDIC special assessment - - - - (4.29) Return on assets - operating 47.35 % 53.67 % 54.17 % 57.43 % 59.57 % Tangible Common Equity to Tangible Assets Equity to assets ratio - GAAP 11.25 % 11.90 % 11.89 % 11.85 % 11.95 % Effect of goodwill and intangibles (2.97) (3.36) (3.31) (3.33) (3.27) Effect of preferred equity (0.40) (0.37) (0.37) (0.34) (0.32) Tangible common equity to tangible assets ratio 7.88 % 8.17 % 8.21 % 8.18 % 8.36 % $ in thousands, except per share data
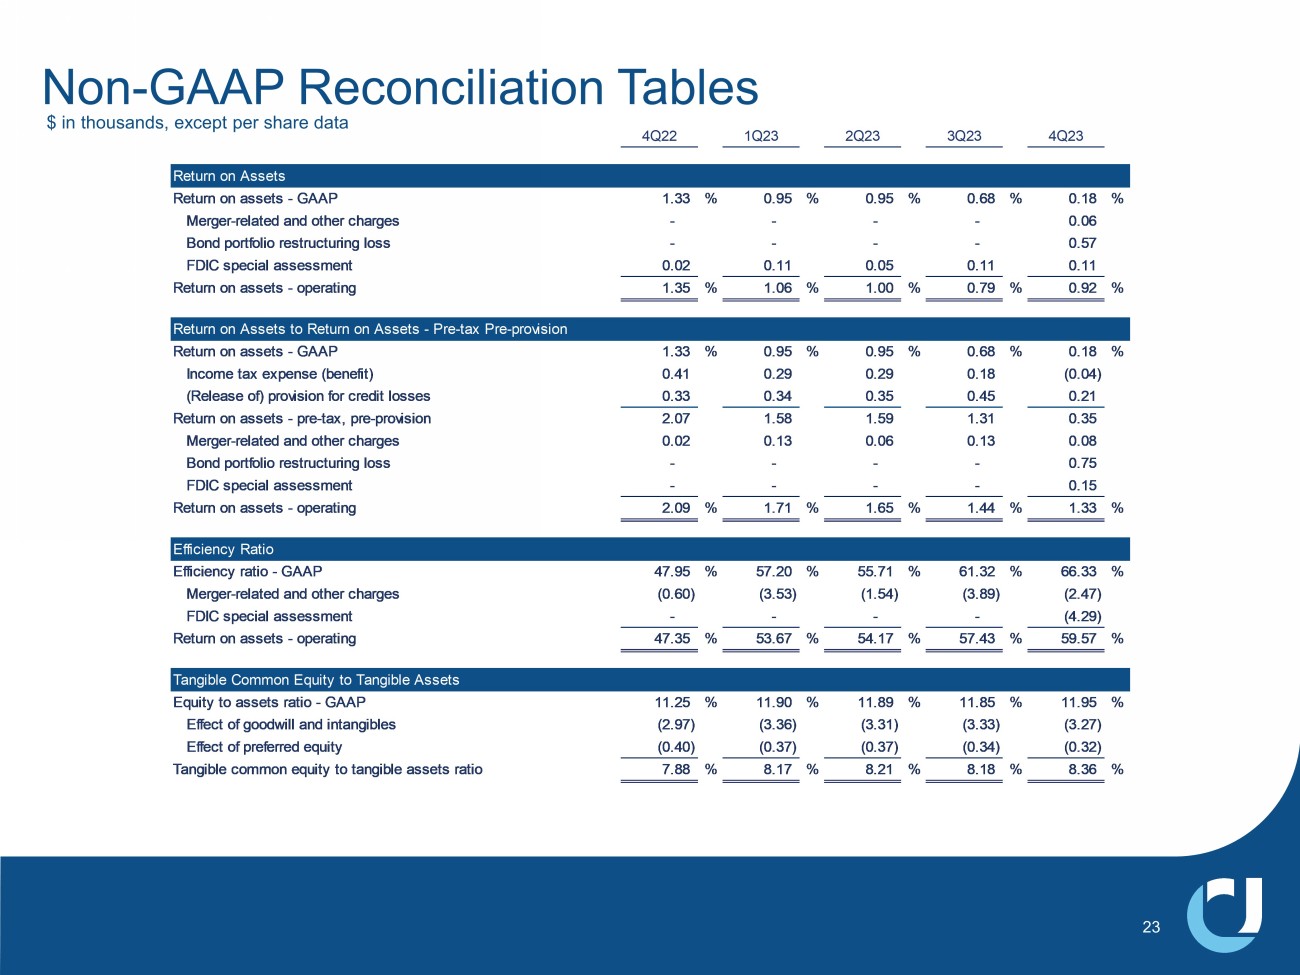
Glossary ACL – Allowance for Credit Losses MLO – Mortgage Loan Office ALLL – Allowance for Loan Losses MMDA – Money Market Deposit Account AOCI – Accumulated Other Comprehensive Income (Loss) MTM – Marked-to-market AUA – Assets Under Administration MSA – Metropolitan Statistical Area BPS – Basis Points MSR – Mortgage Servicing Rights Asset C&I – Commercial and Industrial NCO – Net Charge-Offs C&D – Construction and Development NIM – Net Interest Margin CECL – Current Expected Credit Losses NOW – Negotiable Order of Withdrawal CET1 – Common Equity Tier 1 Capital NPA – Non-Performing Asset CRE – Commercial Real Estate NSF – Non-sufficient Funds CSP – Customer Service Profiles OO RE – Owner Occupied Commercial Real Estate DDA – Demand Deposit Account PCD – Loans Purchased with Credit Deterioration EOP – End of Period PPP – Paycheck Protection Program EPS – Earnings Per Share PTPP – Pre-Tax, Pre-Provision Earnings FHA – Federal Housing Administration RBC – Risk Based Capital FTE – Fully-taxable equivalent ROA – Return on Assets GAAP – Accounting Principles Generally Accepted in the USA SBA – United States Small Business Administration IBL – Interest-bearing liabilities TCE – Tangible Common Equity ICS – Insured Cash Sweep USDA – United States Department of Agriculture KRX – KBW Nasdaq Regional Banking Index VA – Veterans Affairs LPO – Loan Production Office YOY – Year over Year 24