UNITED STATES
SECURITIES AND EXCHANGE COMMISSION
WASHINGTON, D.C. 20549
FORM 8-K
CURRENT REPORT
Pursuant to Section 13 or 15(d) of the Securities Exchange Act of 1934
Date of Report (Date of earliest event reported) January 12, 2024
Citigroup Inc.
(Exact name of registrant as specified in its charter)
Delaware |
1-9924 |
52-1568099 |
(State or other jurisdiction |
(Commission |
(IRS Employer |
|
|
|
|
388 Greenwich Street, New York, (Address of principal executive offices) |
|
10013 |
(212) 559-1000
(Registrant's telephone number,
including area code)
Check the appropriate box below if the Form 8-K filing is intended to simultaneously satisfy the filing obligation of the registrant under any of the following provisions:
☐ Written communications pursuant to Rule 425 under the Securities Act (17 CFR 230.425)
☐ Soliciting material pursuant to Rule 14a-12 under the Exchange Act (17 CFR 240.14a-12)
☐ Pre-commencement communications pursuant to Rule 14d-2(b) under the Exchange Act (17 CFR 240.14d-2(b))
☐ Pre-commencement communications pursuant to Rule 13e-4(c) under the Exchange Act (17 CFR 240.13e-4(c))
Securities registered pursuant to Section 12(b) of the Securities Exchange Act of 1934 formatted in Inline XBRL: See Exhibit 99.3
Indicate by check mark whether the registrant is an emerging growth company as defined in Rule 405 of the Securities Act of 1933 (§230.405 of this chapter) or Rule 12b-2 of the Securities Exchange Act of 1934 (§240.12b-2 of this chapter).
Emerging growth company ☐
If an emerging growth company, indicate by check mark if the registrant has elected not to use the extended transition period for complying with any new or revised financial accounting standards provided pursuant to Section 13(a) of the Exchange Act. ☐
CITIGROUP INC.
Current Report on Form 8-K
Item 2.02 Results of Operations and Financial Condition.
On January 12, 2024, Citigroup Inc. announced its results for the quarter and year ended December 31, 2023. A copy of the related press release, filed as Exhibit 99.1 to this Form 8-K, is incorporated herein by reference in its entirety and shall be deemed to be “filed” for purposes of the Securities Exchange Act of 1934, as amended (the Act).
In addition, a copy of the Citigroup Inc. Quarterly Financial Data Supplement for the quarter and year ended December 31, 2023 is being furnished as Exhibit 99.2 to this Form 8-K and shall not be deemed to be “filed” for purposes of Section 18 of the Act or otherwise subject to the liabilities of that section.
Item 9.01 Financial Statements and Exhibits.
(d) Exhibits.
Exhibit Number |
|
|
|
|
|
99.1 |
|
|
|
|
|
99.2 |
|
Citigroup Inc. Quarterly Financial Data Supplement for the quarter and year ended December 31, 2023. |
|
|
|
99.3 |
|
|
|
|
|
104.1 |
|
See the cover page of this Current Report on Form 8-K, formatted in Inline XBRL. |
SIGNATURE
Pursuant to the requirements of the Securities Exchange Act of 1934, the registrant has duly caused this report to be signed on its behalf by the undersigned hereunto duly authorized.
|
|
CITIGROUP INC. |
|
|
|
Dated: January 12, 2024 |
|
|
|
By: |
/s/ Johnbull E. Okpara |
|
|
Johnbull E. Okpara |
|
|
Controller and Chief Accounting Officer |
|
|
(Principal Accounting Officer) |
Exhibit 99.1
|
For Immediate Release Citigroup Inc. (NYSE: C) January 12, 2024 |
|
|
|
FOURTH QUARTER AND FULL YEAR 2023 RESULTS AND KEY METRICS
|
|
|
|
Citi CEO Jane Fraser said, “While the fourth quarter was very disappointing due to the impact of notable items, we made substantial progress simplifying Citi and executing our strategy in 2023. We restructured around five core, interconnected businesses to align our organization with our strategy and to provide greater transparency into their performance. Revenues ex-divestitures grew by 4%(7) and we met our full-year expense guidance. We increased our CET1 ratio to 13.3%, grew our Tangible Book Value per share by 6% to $86.19, and returned $6 billion in capital to our shareholders in the form of common dividends and share buybacks. “Services revenues were up 16% for the year driven by share gains and client wins. In Markets, our fourth quarter Fixed Income results were disappointing as we saw a significant slowdown in December. We had a decent quarter in Equities, particularly in Derivatives, and saw growth in Prime balances. Investment Banking revenue continued to be impacted by a weak wallet globally while activity picked up in the fourth quarter with revenues up 27%. While investment activity in Asia rebounded during the quarter, up 21%, Wealth revenues were down in 2023 and we fully recognize that this business isn’t where it needs to be. USPB was a bright spot with every product up double-digits in the quarter and up 14% overall for the year. “Given how far we are down the path of our simplification and divestures, 2024 will be a turning point as we’ll be able to completely focus on the performance of our five businesses and our Transformation. We remain confident in our ability to adapt to evolving capital and macro environments to reach our medium-term targets and return capital to our shareholders, whilst continuing the investments needed for our Transformation,” Ms. Fraser concluded. |
||
|
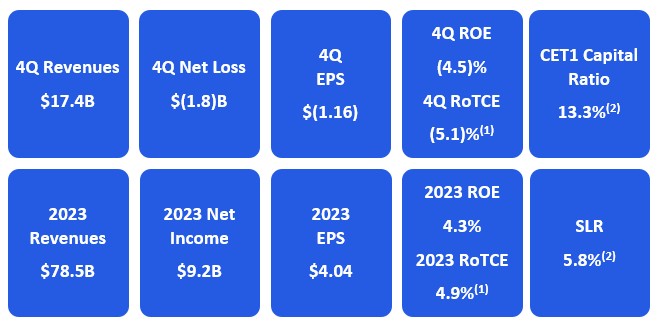
RETURNED ~$6 BILLION IN THE FORM OF DIVIDENDS AND REPURCHASES IN 2023 (~$1.5 BILLION IN THE QUARTER) 2023 PAYOUT RATIO OF 76%(3) BOOK VALUE PER SHARE OF $98.71 TANGIBLE BOOK VALUE PER SHARE OF $86.19(4) New York, January 12, 2024 – Citigroup Inc. today reported a net loss for the fourth quarter 2023 of $(1.8) billion, or $(1.16) per diluted share, on revenues of $17.4 billion. This compares to net income of $2.5 billion, or $1.16 per diluted share, on revenues of $18.0 billion for the fourth quarter 2022. As previously disclosed(5), fourth quarter results included several notable items consisting of: expenses associated with the Federal Deposit Insurance Corporation (FDIC) special assessment of approximately $1.7 billion pre-tax; a reserve build of $1.3 billion associated with transfer risk in Russia and Argentina; the pre-tax revenue impact from the fourth quarter of 2023 devaluation of the Argentine peso of approximately $880 million(6); and a restructuring charge of approximately $780 million related to actions taken as part of Citi’s organizational simplification. The combination of these items negatively impacted diluted earnings per share by approximately $2.00. Excluding these items(5), diluted earnings per share would have been $0.84 for the quarter. Revenues decreased 3% from the prior-year period on a reported basis. Excluding divestiture-related impacts(7) and the pre-tax impact of the Argentina devaluation, revenues increased 2%, driven by strength across Services, US Personal Banking (USPB) and Investment Banking, partially offset by lower revenues in Markets and Wealth and the revenue reduction from the closed exits and wind-downs. |
|
Net loss of $(1.8) billion decreased from net income of $2.5 billion in the prior-year period, primarily driven by higher expenses, higher cost of credit and the lower revenues.
Earnings per share of $(1.16) decreased from $1.16 per diluted share in the prior-year period, reflecting the net loss.
For the full year 2023, Citigroup reported net income of $9.2 billion, on revenues of $78.5 billion, compared to net income of $14.8 billion on revenues of $75.3 billion for the full year 2022.
Percentage comparisons throughout this press release are calculated for the fourth quarter 2023 versus the fourth quarter 2022, unless otherwise specified.
Fourth Quarter Financial Results
Citigroup |
|
4Q'23 |
|
3Q'23 |
|
4Q'22 |
|
QoQ% |
|
YoY% |
|
|
2023 |
|
2022 |
|
%r |
||||||||
Total revenues, net of interest expense |
|
17,440 |
|
20,139 |
|
18,006 |
|
(13)% |
|
(3)% |
|
|
78,462 |
|
|
75,338 |
|
4% |
|||||||
|
|
|
|
|
|
|
|
|
|
|
|
|
|
|
|
|
|
|
|
||||||
Total operating expenses |
|
15,996 |
|
13,511 |
|
12,985 |
|
18% |
|
23% |
|
|
56,366 |
|
|
51,292 |
|
10% |
|||||||
|
|
|
|
|
|
|
|
|
|
|
|
|
|
|
|
|
|
|
|
||||||
Net credit losses |
|
1,994 |
|
1,637 |
|
1,180 |
|
22% |
|
69% |
|
|
|
6,437 |
|
|
3,789 |
|
70% |
||||||
Net ACL build / (release)(a) |
|
397 |
|
125 |
|
640 |
|
NM |
|
(38)% |
|
|
|
924 |
|
|
1,247 |
|
(26)% |
||||||
Other provisions(b) |
|
1,156 |
|
78 |
|
25 |
|
NM |
|
NM |
|
|
|
1,825 |
|
|
203 |
|
NM |
||||||
Total cost of credit |
|
3,547 |
|
1,840 |
|
1,845 |
|
93% |
|
92% |
|
|
9,186 |
|
|
5,239 |
|
75% |
|||||||
|
|
|
|
|
|
|
|
|
|
|
|
|
|
|
|
|
|
|
|
||||||
Income (loss) from continuing operations before taxes |
|
(2,103) |
|
4,788 |
|
3,176 |
|
NM |
|
NM |
|
|
12,910 |
|
|
18,807 |
|
(31)% |
|||||||
Provision for income taxes |
|
(296) |
|
1,203 |
|
640 |
|
NM |
|
NM |
|
|
|
3,528 |
|
|
3,642 |
|
(3)% |
||||||
Income (loss) from continuing operations |
|
(1,807) |
|
3,585 |
|
2,536 |
|
NM |
|
NM |
|
|
9,382 |
|
|
15,165 |
|
(38)% |
|||||||
Income (loss) from discontinued operations, net of taxes |
|
(1) |
|
2 |
|
(2) |
|
NM |
|
50% |
|
|
|
(1) |
|
|
(231) |
|
100% |
||||||
Net income attributable to non-controlling interest |
|
31 |
|
41 |
|
21 |
|
(24)% |
|
48% |
|
|
|
153 |
|
|
89 |
|
72% |
||||||
Citigroup's net income (loss) |
|
$ |
(1,839) |
|
$ |
3,546 |
|
$ |
2,513 |
|
NM |
|
NM |
|
|
$ |
9,228 |
|
$ |
14,845 |
|
(38)% |
|||
|
|
|
|
|
|
|
|
|
|
|
|
|
|
|
|
|
|
|
|
||||||
|
|
|
|
|
|
|
|
|
|
|
|
|
|
|
|
|
|
|
|
||||||
EOP loans ($B) |
|
689 |
|
666 |
|
657 |
|
3% |
|
5% |
|
|
|
|
|
|
|||||||||
EOP assets ($B) |
|
2,405 |
|
2,369 |
|
2,417 |
|
2% |
|
- |
|
|
|
|
|
|
|||||||||
EOP deposits ($B) |
|
1,309 |
|
1,274 |
|
1,366 |
|
3% |
|
(4)% |
|
|
|
|
|
|
|||||||||
|
|
|
|
|
|
|
|
|
|
|
|
|
|
|
|
|
|
|
|
||||||
|
|
|
|
|
|
|
|
|
|
|
|
|
|
|
|
|
|
|
|
||||||
Book value per share |
|
$ |
98.71 |
|
$ |
99.28 |
|
$ |
94.06 |
|
(1)% |
|
5% |
|
|
$ |
98.71 |
|
$ |
94.06 |
|
5% |
|||
Tangible book value per share(4) |
|
$ |
86.19 |
|
$ |
86.90 |
|
$ |
81.65 |
|
(1)% |
|
6% |
|
|
$ |
86.19 |
|
$ |
81.65 |
|
6% |
|||
Common Equity Tier 1 (CET1) Capital ratio(2) |
|
13.3% |
|
13.6% |
|
13.0% |
|
|
|
|
|
|
|
13.3% |
|
|
13.0% |
|
|
||||||
Supplementary Leverage ratio (SLR)(2) |
|
5.8% |
|
6.0% |
|
5.8% |
|
|
|
|
|
|
|
5.8% |
|
|
5.8% |
|
|
||||||
Return on average common equity (ROE) |
|
(4.5)% |
|
6.7% |
|
5.0% |
|
|
|
|
|
|
|
4.3% |
|
|
7.7% |
|
|
||||||
Return on average tangible common equity (RoTCE)(1) |
|
(5.1)% |
|
7.7% |
|
5.8% |
|
(1,280)bps |
|
(1,090)bps |
|
|
|
4.9% |
|
|
8.9% |
|
(400)bps |
||||||
Note: Please refer to the Appendices and Footnotes at the end of this press release for additional information.
(a)Includes credit reserve build / (release)for loans and provision for credit losses on unfunded lending commitments.
(b)Includes provisions on Other Assets,policyholder benefits and claims and HTM debt securities.
2
Citigroup
Citigroup revenues of $17.4 billion in the fourth quarter 2023 decreased 3% on a reported basis. Excluding divestiture-related impacts and the pre-tax impact of the Argentina devaluation, revenues increased 2%, driven by strength across Services, USPB and Investment Banking, partially offset by lower revenues in Markets and Wealth and the revenue reduction from the closed exits and wind-downs.
Citigroup operating expenses of $16.0 billion on a reported basis increased 23% in the fourth quarter 2023, which included the FDIC special assessment of $1.7 billion pre-tax and modest divestiture-related costs. Excluding the impact of the FDIC special assessment and the modest divestiture-related costs, expenses increased 10% to $14.2 billion, largely driven by the restructuring charge.
Citigroup cost of credit was approximately $3.5 billion in the fourth quarter 2023, compared to $1.8 billion in the prior-year period. In addition to the reserve build for transfer risk, quarterly cost of credit was driven by cards net credit losses, which are now at pre-Covid levels, as well as allowance for credit losses (ACL) builds for new card volumes.
Citigroup net loss of $(1.8) billion in the fourth quarter 2023, compared to net income of $2.5 billion in the prior-year period, driven by the higher expenses, the higher cost of credit and the lower revenues. Citigroup’s effective tax rate was 14% in the current quarter versus 20% in the fourth quarter 2022, primarily driven by a different geographic mix of pre-tax earnings in the current quarter.
Citigroup’s total allowance for credit losses was approximately $21.8 billion at quarter end, compared to $19.4 billion at the end of the prior-year period. Total allowance for credit losses on loans was approximately $18.1 billion at quarter end, compared to $17.0 billion at the end of the prior-year period, with a reserve-to-funded loans ratio of 2.66%, compared to 2.60% at the end of the prior-year period. Total non-accrual loans increased 31% from the prior-year period to $3.2 billion. Corporate non-accrual loans increased 68% to $1.9 billion. Consumer non-accrual loans were largely unchanged at $1.3 billion.
Citigroup’s end-of-period loans were $689 billion at quarter end, up 5% versus the prior-year period, largely reflecting growth in cards in USPB.
Citigroup’s end-of-period deposits were approximately $1.3 trillion at quarter end, down (4)% versus the prior-year period. The decline in deposits was largely due to a reduction in Services reflecting quantitative tightening, and a reduction in USPB and Wealth reflecting a shift of deposits to higher-yielding products.
3
Citigroup’s book value per share of $98.71 and tangible book value per share of $86.19 at quarter end increased 5% and 6%, respectively, versus the prior-year period. The increases were largely driven by net income, common share repurchases, and beneficial movements in the accumulated other comprehensive income (AOCI) component of equity, partially offset by payment of common and preferred dividends. At quarter end, Citigroup’s CET1 Capital ratio was 13.3% versus 13.6% in the prior quarter, driven by the net loss for the period, higher deferred tax assets, payment of common and preferred dividends, share repurchases, and higher risk-weighted assets, partially offset by a benefit from the accumulated other comprehensive income (AOCI). Citigroup’s Supplementary Leverage ratio for the fourth quarter 2023 was 5.8% versus 6.0% in the prior quarter. During the quarter, Citigroup returned a total of $1.5 billion to common shareholders in the form of dividends and repurchases.
Services |
|
4Q'23 |
|
3Q'23 |
|
4Q'22 |
|
QoQ% |
|
YoY% |
|
|
2023 |
|
2022 |
|
%r |
||||
Net interest income |
|
2,869 |
|
2,853 |
|
2,534 |
|
1% |
|
13% |
|
|
11,027 |
|
|
8,832 |
|
25% |
|||
Non-interest revenue |
|
|
555 |
|
|
643 |
|
|
690 |
|
(14)% |
|
(20)% |
|
|
2,625 |
|
|
2,947 |
|
(11)% |
Treasury and Trade Solutions |
|
|
3,424 |
|
|
3,496 |
|
|
3,224 |
|
(2)% |
|
6% |
|
|
13,652 |
|
|
11,779 |
|
16% |
Net interest income |
|
|
556 |
|
|
573 |
|
|
501 |
|
(3)% |
|
11% |
|
|
2,171 |
|
|
1,486 |
|
46% |
Non-interest revenue |
|
|
520 |
|
|
553 |
|
|
539 |
|
(6)% |
|
(4)% |
|
|
2,227 |
|
|
2,354 |
|
(5)% |
Securities Services |
|
|
1,076 |
|
|
1,126 |
|
|
1,040 |
|
(4)% |
|
3% |
|
|
4,398 |
|
|
3,840 |
|
15% |
Total Services revenues |
|
4,500 |
|
4,622 |
|
4,264 |
|
(3)% |
|
6% |
|
18,050 |
|
15,619 |
|
16% |
|||||
|
|
|
|
|
|
|
|
|
|
|
|
|
|
|
|
|
|
|
|
|
|
Total operating expenses |
|
|
2,594 |
|
|
2,518 |
|
|
2,389 |
|
3% |
|
9% |
|
10,024 |
|
8,728 |
|
15% |
||
|
|
|
|
|
|
|
|
|
|
|
|
|
|
|
|
|
|
|
|
|
|
Net credit losses |
|
|
(6) |
|
|
27 |
|
|
7 |
|
NM |
|
NM |
|
|
40 |
|
|
51 |
|
(22)% |
Net ACL build / (release)(a) |
|
|
105 |
|
|
29 |
|
|
(18) |
|
NM |
|
NM |
|
|
29 |
|
|
152 |
|
(81)% |
Other provisions(b) |
|
|
547 |
|
|
39 |
|
|
1 |
|
NM |
|
NM |
|
|
881 |
|
|
4 |
|
NM |
Total cost of credit |
|
646 |
|
95 |
|
(10) |
|
NM |
|
NM |
|
950 |
|
207 |
|
NM |
|||||
|
|
|
|
|
|
|
|
|
|
|
|
|
|
|
|
|
|
|
|
|
|
Net income (loss) |
|
$ |
776 |
|
$ |
1,332 |
|
$ |
1,368 |
|
(42)% |
|
(43)% |
|
4,605 |
|
4,888 |
|
(6)% |
||
|
|
|
|
|
|
|
|
|
|
|
|
|
|
|
|
|
|
|
|
|
|
|
|
|
|
|
|
|
|
|
|
|
|
|
|
|
|
|
|
|
|
|
|
Services Key Statistics and Metrics ($B) |
|
|
|
|
|
|
|
|
|
|
|
|
|
|
|
|
|
|
|
|
|
Allocated Average TCE(c) |
|
|
23 |
|
|
23 |
|
|
23 |
|
- |
|
2% |
|
|
23 |
|
|
23 |
|
2% |
RoTCE(c) |
|
|
13.4% |
|
|
23.0% |
|
|
24.1% |
|
(960)bps |
|
(1,070)bps |
|
|
20.0% |
|
|
21.7% |
|
(170)bps |
Average loans |
|
|
83 |
|
|
83 |
|
|
78 |
|
- |
|
6% |
|
|
81 |
|
|
82 |
|
(1)% |
Average deposits |
|
|
802 |
|
|
796 |
|
|
825 |
|
1% |
|
(3)% |
|
|
810 |
|
|
808 |
|
- |
Cross border transaction value |
|
|
99 |
|
|
88 |
|
|
81 |
|
13% |
|
23% |
|
|
358 |
|
|
312 |
|
15% |
US dollar clearing volume (#MM) |
|
|
40 |
|
|
40 |
|
|
38 |
|
1% |
|
5% |
|
|
157 |
|
|
149 |
|
6% |
Commercial card spend volume |
|
|
17 |
|
|
17 |
|
|
15 |
|
(2)% |
|
8% |
|
|
67 |
|
|
57 |
|
16% |
Assets under custody and/or administration (AUC/AUA) ($T) |
|
|
25 |
|
|
23 |
|
|
22 |
|
9% |
|
13% |
|
|
|
|
|
|||
Note: Please refer to the Appendices and Footnotes at the end of this press release for additional information.
(a) Includes credit reserve build / (release)for loans and provision for credit losses on unfunded lending commitments.
(b) Includes provisions on Other Assets and for HTM debt securities.
(c) TCE and RoTCE are non-GAAP financial measures.See Appendix I for a reconciliation of the summation of the segments' and component's average allocated TCE.
4
Services
Services revenues of $4.5 billion were up 6%, largely driven by higher net interest income across Treasury and Trade Solutions (TTS) and Securities Services, partially offset by lower non-interest revenues driven by the Argentina devaluation. Services non-interest revenues were up 20%, excluding the impact of the Argentina devaluation.
Treasury and Trade Solutions revenues of $3.4 billion increased 6%, driven by 13% growth in net interest income, partially offset by a 20% decrease in non-interest revenues, driven by the impact of the Argentina devaluation. The increase in net interest income was primarily driven by higher interest rates. The decline in non-interest revenues was partially offset by an increase in cross-border flows of 23%, outpacing global GDP growth, and an increase in U.S. Dollar clearing volumes of 5%.
Securities Services revenues increased 3%, driven by net interest income growth of 11%, partially offset by a 4% decline in non-interest revenue, largely reflecting the Argentina devaluation. Citi also continued to onboard assets under custody and administration, which increased 13%, or approximately $2.9 trillion.
Services operating expenses of $2.6 billion increased 9%, primarily driven by continued investments in technology, product innovation and client experience.
Services cost of credit was $646 million, compared to $(10) million in the prior-year period, driven by a reserve build of approximately $652 million, primarily associated with the transfer risk in Russia and Argentina.
Services net income of approximately $776 million decreased 43%, driven by the higher expenses and the higher cost of credit, partially offset by the higher revenues.
Markets |
|
4Q'23 |
|
3Q'23 |
|
4Q'22 |
|
QoQ% |
|
YoY% |
|
|
2023 |
|
2022 |
|
%Δ |
|||
Rates and currencies |
|
|
1,758 |
|
|
2,769 |
|
|
2,728 |
|
(37)% |
|
(36)% |
|
|
10,885 |
|
11,556 |
|
(6)% |
Spread products / other fixed income |
|
|
833 |
|
|
1,081 |
|
|
711 |
|
(23)% |
|
17% |
|
|
3,935 |
|
4,154 |
|
(5)% |
Fixed Income markets |
|
|
2,591 |
|
|
3,850 |
|
|
3,439 |
|
(33)% |
|
(25)% |
|
|
14,820 |
|
15,710 |
|
(6)% |
Equity markets |
|
|
819 |
|
|
942 |
|
|
748 |
|
(13)% |
|
9% |
|
|
4,037 |
|
4,451 |
|
(9)% |
Total Markets revenues |
|
|
3,410 |
|
|
4,792 |
|
|
4,187 |
|
(29)% |
|
(19)% |
|
|
18,857 |
|
20,161 |
|
(6)% |
|
|
|
|
|
|
|
|
|
|
|
|
|
|
|
|
|
|
|
|
|
Total operating expenses |
|
|
3,434 |
|
|
3,303 |
|
|
3,174 |
|
4% |
|
8% |
|
|
13,238 |
|
12,413 |
|
7% |
|
|
|
|
|
|
|
|
|
|
|
|
|
|
|
|
|
|
|
|
|
Net credit losses |
|
|
30 |
|
|
(4) |
|
|
1 |
|
NM |
|
NM |
|
|
32 |
|
(5) |
|
NM |
Net ACL build / (release)(a) |
|
|
53 |
|
|
127 |
|
|
45 |
|
(58)% |
|
18% |
|
|
205 |
|
90 |
|
NM |
Other provisions(b) |
|
|
126 |
|
|
40 |
|
|
(7) |
|
NM |
|
NM |
|
|
200 |
|
70 |
|
NM |
Total cost of credit |
|
|
209 |
|
|
163 |
|
|
39 |
|
28% |
|
NM |
|
|
437 |
|
155 |
|
NM |
|
|
|
|
|
|
|
|
|
|
|
|
|
|
|
|
|
|
|
|
|
Net income (loss) |
|
$ |
(134) |
|
$ |
1,066 |
|
$ |
787 |
|
NM |
|
NM |
|
|
3,953 |
|
5,872 |
|
(33)% |
|
|
|
|
|
|
|
|
|
|
|
|
|
|
|
|
|
|
|
|
|
|
|
|
|
|
|
|
|
|
|
|
|
|
|
|
|
|
|
|
|
|
Markets Key Statistics and Metrics ($B) |
|
|
|
|
|
|
|
|
|
|
|
|
|
|
|
|
|
|
|
|
Allocated Average TCE(c) |
|
|
53 |
|
|
53 |
|
|
52 |
|
- |
|
3% |
|
|
53 |
|
52 |
|
3% |
RoTCE(c) |
|
|
(1.0)% |
|
|
8.0% |
|
|
6.1% |
|
(900)bps |
|
(710)bps |
|
|
7.4% |
|
11.4% |
|
(400)bps |
Average trading assets |
|
|
391 |
|
|
393 |
|
|
332 |
|
(1)% |
|
18% |
|
|
379 |
|
334 |
|
13% |
Average VaR |
|
|
138 |
|
|
116 |
|
|
142 |
|
19% |
|
(2)% |
|
|
132 |
|
122 |
|
8% |
|
|
|
|
|
|
|
|
|
|
|
|
|
|
|
|
|
|
|
|
|
Note: Please refer to the Appendices and Footnotes at the end of this press release for additional information.
(a) Includes credit reserve build / (release) for loans and provision for credit losses on unfunded lending commitments.
(b) Includes provisions on Other Assets and HTM debt securities.
(c) TCE and RoTCE are non-GAAP financial measures. See Appendix I for a reconciliation of the summation of the segments' and component's average allocated TCE.
5
Markets
Markets revenues of $3.4 billion decreased 19%, driven by a decline in Fixed Income, including the impact of the devaluation, partially offset by an increase in Equity.
Fixed Income revenues of $2.6 billion decreased 25%, largely driven by rates and currencies on lower volatility and a significant slowdown in December as well as the impact of the Argentina devaluation.
Equity revenues of $819 million increased 9%, driven by gains across all products, including derivatives, and the business also benefited from growth in prime balances.
Markets operating expenses of $3.4 billion increased 8%, driven by investments in transformation and risk and controls and volume related costs, partially offset by productivity savings.
Markets cost of credit was $209 million, compared to $39 million in the prior-year period, driven by a reserve build of approximately $179 million, primarily associated with the transfer risk in Russia and Argentina.
Markets net loss of $(134) million was driven by the higher expenses, the lower revenues and the higher cost of credit in the quarter.
Banking |
|
4Q'23 |
|
3Q'23 |
|
4Q'22 |
|
QoQ% |
|
YoY% |
|
|
2023 |
|
2022 |
|
%Δ |
|||||
Total Investment Banking |
|
|
669 |
|
|
693 |
|
|
525 |
|
(3)% |
|
27% |
|
|
|
2,538 |
|
|
2,510 |
|
1% |
Total Corporate Lending(a) |
|
|
411 |
|
|
698 |
|
|
553 |
|
(41)% |
|
(26)% |
|
|
|
2,473 |
|
|
2,579 |
|
(4)% |
Total Banking revenues(a) |
|
|
1,080 |
|
|
1,391 |
|
|
1,078 |
|
(22)% |
|
- |
|
|
|
5,011 |
|
|
5,089 |
|
(2)% |
Gain / (loss) on loan hedges |
|
|
(131) |
|
|
(47) |
|
|
(300) |
|
NM |
|
56% |
|
|
|
(443) |
|
|
307 |
|
NM |
Total Banking revenues including gain/(loss) on loan hedges |
|
|
949 |
|
|
1,344 |
|
|
778 |
|
(29)% |
|
22% |
|
|
|
4,568 |
|
|
5,396 |
|
(15)% |
|
|
|
|
|
|
|
|
|
|
|
|
|
|
|
|
|
|
|
|
|
|
|
Total operating expenses |
|
|
1,155 |
|
|
1,220 |
|
|
845 |
|
(5)% |
|
37% |
|
|
|
4,869 |
|
|
4,471 |
|
9% |
Net credit losses |
|
|
71 |
|
|
28 |
|
|
96 |
|
NM |
|
(26)% |
|
|
|
169 |
|
|
106 |
|
59% |
Net ACL build / (release)(b) |
|
|
(225) |
|
|
(95) |
|
|
(81) |
|
NM |
|
NM |
|
|
|
(723) |
|
|
423 |
|
NM |
Other provisions(c) |
|
|
339 |
|
|
5 |
|
|
12 |
|
NM |
|
NM |
|
|
|
389 |
|
|
20 |
|
NM |
Total cost of credit |
|
|
185 |
|
|
(62) |
|
|
27 |
|
NM |
|
NM |
|
|
|
(165) |
|
|
549 |
|
NM |
|
|
|
|
|
|
|
|
|
|
|
|
|
|
|
|
|
|
|
|
|
|
|
Net income (loss) |
|
$ |
(322) |
|
$ |
169 |
|
$ |
(55) |
|
NM |
|
NM |
|
|
$ |
(48) |
|
$ |
386 |
|
NM |
|
|
|
|
|
|
|
|
|
|
|
|
|
|
|
|
|
|
|
|
|
|
|
|
|
|
|
|
|
|
|
|
|
|
|
|
|
|
|
|
|
|
|
|
|
|
Banking Key Statistics and Metrics |
|
|
|
|
|
|
|
|
|
|
|
|
|
|
|
|
|
|
|
|
|
|
Allocated Average TCE(d) ($B) |
|
|
21 |
|
|
21 |
|
|
22 |
|
- |
|
(1)% |
|
|
|
21 |
|
|
22 |
|
(1)% |
RoTCE(d) |
|
|
(6.0)% |
|
|
3.1% |
|
|
(1.0)% |
|
(910)bps |
|
(500)bps |
|
|
|
(0.2)% |
|
|
1.8% |
|
(200)bps |
Average loans ($B) |
|
|
87 |
|
|
87 |
|
|
96 |
|
- |
|
(9)% |
|
|
|
90 |
|
|
98 |
|
(8)% |
|
|
|
|
|
|
|
|
|
|
|
|
|
|
|
|
|
|
|
|
|
|
|
Advisory |
|
|
286 |
|
|
299 |
|
|
258 |
|
(4)% |
|
11% |
|
|
|
1,017 |
|
|
1,332 |
|
(24)% |
Equity underwriting |
|
|
110 |
|
|
123 |
|
|
132 |
|
(11)% |
|
(17)% |
|
|
|
500 |
|
|
621 |
|
(19)% |
Debt underwriting |
|
|
310 |
|
|
272 |
|
|
217 |
|
14% |
|
43% |
|
|
|
1,196 |
|
|
1,100 |
|
9% |
Investment Banking fees |
|
|
706 |
|
|
694 |
|
|
607 |
|
2% |
|
16% |
|
|
|
2,713 |
|
|
3,053 |
|
(11)% |
|
|
|
|
|
|
|
|
|
|
|
|
|
|
|
|
|
|
|
|
|
|
|
Note: Please refer to the Appendices and Footnotes at the end of this press release for additional information.
(a) Excludes gain / (loss) on credit derivatives as well as the mark-to-market on loans at fair value. For additional information, please refer to Footnote 8.
(b) Includes credit reserve build / (release) for loans and provision for credit losses on unfunded lending commitments.
(c) Includes provisions on Other Assets and HTM debt securities.
(d) TCE and RoTCE are non-GAAP financial measures. See Appendix I for a reconciliation of the summation of the segments' and component's average allocated TCE.
6
Banking
Banking revenues of $949 million increased 22%, driven by growth in Investment Banking fees and lower losses on loan hedges, partially offset by lower Corporate Lending revenue.
Investment Banking revenues of $669 million increased 27%, driven by Debt Capital Markets (DCM) and Advisory, partially offset by Equity Capital Markets (ECM). Investment Banking fees in Advisory increased 11% versus the prior-year period, reflecting higher client activity. Investment Banking fees in DCM increased 43%, driven by both non-investment and investment grade activity. Investment Banking fees in ECM decreased 17% versus the prior-year period, driven by geopolitical concerns and general IPO market conditions.
Corporate Lending revenues of $411 million, excluding mark-to-market on loan hedges,(8) decreased 26% versus the prior-year, largely driven by lower revenue share from Investment Banking, Services and Markets(9).
Banking operating expenses of $1.2 billion increased 37%, primarily driven by the absence of an operational loss reserve release in the prior year, as continued investments in talent and infrastructure were offset by productivity savings.
Banking cost of credit was $185 million, compared to $27 million in the prior-year period, driven by a net reserve build of approximately $114 million, primarily associated with the transfer risk in Russia and Argentina.
Banking net loss of $(322) million, was driven by the higher expenses and the higher cost of credit, partially offset by the higher revenues.
|
USPB ($ in millions, except as otherwise noted) |
|
4Q'23 |
|
3Q'23 |
|
4Q'22 |
|
QoQ% |
|
YoY% |
|
|
2023 |
|
2022 |
|
%r |
|||||
Branded Cards |
|
$ |
2,620 |
|
$ |
2,539 |
|
$ |
2,389 |
|
3% |
|
10% |
|
|
|
9,988 |
|
|
8,962 |
|
11% |
Retail Services |
|
|
1,636 |
|
|
1,728 |
|
|
1,421 |
|
(5)% |
|
15% |
|
|
|
6,617 |
|
|
5,469 |
|
21% |
Retail Banking |
|
|
684 |
|
|
650 |
|
|
597 |
|
5% |
|
15% |
|
|
|
2,582 |
|
|
2,441 |
|
6% |
Total revenues, net of interest expense |
|
|
4,940 |
|
|
4,917 |
|
|
4,407 |
|
- |
|
12% |
|
|
19,187 |
|
16,872 |
|
14% |
||
|
|
|
|
|
|
|
|
|
|
|
|
|
|
|
|
|
|
|
|
|
|
|
Total operating expenses |
|
2,594 |
|
2,481 |
|
2,609 |
|
5% |
|
(1)% |
|
|
10,102 |
|
9,782 |
|
3% |
|||||
|
|
|
|
|
|
|
|
|
|
|
|
|
|
|
|
|
|
|
|
|
|
|
Net credit losses |
|
|
1,599 |
|
|
1,343 |
|
|
852 |
|
19% |
|
88% |
|
|
|
5,234 |
|
|
2,918 |
|
79% |
Net ACL build / (release)(a) |
|
|
472 |
|
|
113 |
|
|
867 |
|
NM |
|
(46)% |
|
|
|
1,465 |
|
|
516 |
|
NM |
Other provisions(b) |
|
|
3 |
|
|
3 |
|
|
4 |
|
- |
|
(25)% |
|
|
|
8 |
|
|
14 |
|
(43)% |
Total cost of credit |
|
2,074 |
|
1,459 |
|
1,723 |
|
42% |
|
20% |
|
|
6,707 |
|
3,448 |
|
95% |
|||||
|
|
|
|
|
|
|
|
|
|
|
|
|
|
|
|
|
|
|
|
|
|
|
Net income (loss) |
|
$ |
201 |
|
$ |
756 |
|
$ |
54 |
|
(73)% |
|
NM |
|
|
1,820 |
|
2,770 |
|
(34)% |
||
|
|
|
|
|
|
|
|
|
|
|
|
|
|
|
|
|
|
|
|
|
|
|
|
|
|
|
|
|
|
|
|
|
|
|
|
|
|
|
|
|
|
|
|
|
|
USPB Key Statistics and Metrics ($B) |
|
|
|
|
|
|
|
|
|
|
|
|
|
|
|
|
|
|
|
|
|
|
Allocated average TCE(c) |
|
|
22 |
|
|
22 |
|
|
21 |
|
- |
|
6% |
|
|
|
22 |
|
|
21 |
|
6% |
RoTCE(c) |
|
|
3.6% |
|
|
13.7% |
|
|
1.0% |
|
(1,010 )bps |
|
260 bps |
|
|
|
8.3% |
|
|
13.4% |
|
(510) bps |
Average loans |
|
|
202 |
|
|
196 |
|
|
180 |
|
3% |
|
12% |
|
|
|
193 |
|
|
171 |
|
13% |
Average deposits |
|
|
105 |
|
|
110 |
|
|
111 |
|
(5)% |
|
(5)% |
|
|
|
110 |
|
|
115 |
|
(4)% |
US cards average loans |
|
|
158 |
|
|
153 |
|
|
143 |
|
3% |
|
10% |
|
|
|
|
|
|
|
|
|
US credit card spend volume(d) |
|
|
156 |
|
|
149 |
|
|
152 |
|
5% |
|
2% |
|
|
|
|
|
|
|
|
|
New account acquisitions (in 000s) |
|
|
3,722 |
|
|
3,298 |
|
|
3,829 |
|
13% |
|
(3)% |
|
|
|
|
|
|
|
|
|
Note: Please refer to the Appendices and Footnotes at the end of this press release for additional information.
(a) Includes credit reserve build / (release) for loans and provision for credit losses on unfunded lending commitments.
(b) Includes provisions on policholder benefits and claims and Other Assets.
(c) TCE and RoTCE are non-GAAP financial measures. See Appendix I for a reconciliation of the summation of the segments' and component's average allocated TCE.
(d) Credit card spend volume was previously referred to as card purchase sales.
7
US Personal Banking (USPB)
USPB revenues of $4.9 billion increased 12%, driven by higher net interest income due to loan growth in cards and higher deposit spreads.
Branded Cards revenues of $2.6 billion increased 10%, driven by higher net interest margin and interest-earning balance growth of 13%. Revenue also benefited from growth in new account acquisitions, up 8%, and spend volumes, up 3%.
Retail Services revenues of $1.6 billion increased 15%, driven by higher net interest margin and interest-earning balance growth of 11%, as well as lower partner payments due to higher net credit losses.
Retail Banking revenues of $684 million increased 15%, driven by higher deposit spreads, loan growth and improved mortgage margins.
USPB operating expenses of $2.6 billion decreased 1%, primarily driven by lower non-volume related expenses, partially offset by risk and control and business-led investments.
USPB cost of credit was $2.1 billion, compared to $1.7 billion in the prior-year period. The increase was largely driven by higher net credit losses, which are now at pre-Covid levels, partially offset by a lower ACL build.
USPB net income of $201 million, was driven by the higher revenues and the lower expenses, partially offset by the higher cost of credit.
Wealth |
|
4Q'23 |
|
3Q'23 |
|
4Q'22 |
|
QoQ% |
|
YoY% |
|
|
2023 |
|
2022 |
|
%r |
|||||
Private Bank |
|
542 |
|
617 |
|
599 |
|
(12)% |
|
(10)% |
|
|
|
2,332 |
|
|
2,812 |
|
(17)% |
|||
Wealth at Work |
|
|
211 |
|
|
234 |
|
|
195 |
|
(10)% |
|
8% |
|
|
|
862 |
|
|
730 |
|
18% |
Citigold |
|
|
918 |
|
|
1,004 |
|
|
929 |
|
(9)% |
|
(1)% |
|
|
|
3,897 |
|
|
3,906 |
|
- |
Total revenues, net of interest expense |
|
|
1,671 |
|
|
1,855 |
|
|
1,723 |
|
(10)% |
|
(3)% |
|
|
7,091 |
|
7,448 |
|
(5)% |
||
|
|
|
|
|
|
|
|
|
|
|
|
|
|
|
|
|
|
|
|
|
|
|
Total operating expenses |
|
1,647 |
|
1,711 |
|
1,585 |
|
(4)% |
|
4% |
|
|
6,644 |
|
6,058 |
|
10% |
|||||
|
|
|
|
|
|
|
|
|
|
|
|
|
|
|
|
|
|
|
|
|
|
|
Net credit losses |
|
|
31 |
|
|
24 |
|
|
56 |
|
29% |
|
(45)% |
|
|
|
98 |
|
|
103 |
|
(5)% |
Net ACL build / (release)(a) |
|
|
(26) |
|
|
(27) |
|
|
(115) |
|
4% |
|
77% |
|
|
|
(97) |
|
|
202 |
|
NM |
Other provisions(b) |
|
|
(1) |
|
|
1 |
|
|
2 |
|
NM |
|
NM |
|
|
|
(3) |
|
|
1 |
|
NM |
Total cost of credit |
|
4 |
|
(2) |
|
(57) |
|
NM |
|
NM |
|
|
(2) |
|
306 |
|
(101)% |
|||||
|
|
|
|
|
|
|
|
|
|
|
|
|
|
|
|
|
|
|
|
|
|
|
Net income (loss) |
|
$ |
5 |
|
$ |
118 |
|
$ |
175 |
|
(96)% |
|
(97)% |
|
|
346 |
|
950 |
|
(64)% |
||
|
|
|
|
|
|
|
|
|
|
|
|
|
|
|
|
|
|
|
|
|
|
|
|
|
|
|
|
|
|
|
|
|
|
|
|
|
|
|
|
|
|
|
|
|
|
Wealth Key Statistics and Metrics ($B) |
|
|
|
|
|
|
|
|
|
|
|
|
|
|
|
|
|
|
|
|
|
|
Allocated Average TCE(c) |
|
|
13 |
|
|
13 |
|
|
14 |
|
- |
|
(4)% |
|
|
|
13 |
|
|
14 |
|
(4)% |
RoTCE(c) |
|
|
0.1% |
|
|
3.5% |
|
|
5.0% |
|
(340) bps |
|
(490) bps |
|
|
|
2.6% |
|
|
6.8% |
|
(420) bps |
Loans |
|
|
152 |
|
|
151 |
|
|
149 |
|
1% |
|
2% |
|
|
|
|
|
|
|
|
|
Deposits |
|
|
323 |
|
|
307 |
|
|
325 |
|
5% |
|
(1)% |
|
|
|
|
|
|
|
|
|
Client investment assets(d) |
|
|
498 |
|
|
471 |
|
|
443 |
|
6% |
|
12% |
|
|
|
|
|
|
|
|
|
EoP client balances |
|
|
973 |
|
|
929 |
|
|
917 |
|
5% |
|
6% |
|
|
|
|
|
|
|
|
|
Note: Please refer to the Appendices and Footnotes at the end of this press release for additional information.
(a) Includes credit reserve build / (release) for loans and provision for credit losses on unfunded lending commitments.
(b) Includes provisions on Other Assets and policyholder benefits and claims.
(c) TCE and RoTCE are non-GAAP financial measures. See Appendix I for a reconciliation of the summation of the segments' and component's average allocated TCE.
(d) Includes Assets under management, and trust and custody assets.
8
Wealth
Wealth revenues of $1.7 billion decreased 3%, driven by lower deposit spreads, partially offset by lower mortgage funding cost and higher investment fee revenues.
Private Bank revenues of $542 million decreased 10%, driven by lower deposit spreads and lower deposit and loan volumes, partially offset by higher investment revenue.
Wealth at Work revenues of $211 million increased 8%, driven by higher mortgage and investment revenue, partially offset by lower deposit revenue.
Citigold revenues of $918 million decreased 1%, as lower deposit spreads were partially offset by growth in investment revenue globally and higher deposit revenue in Asia.
Wealth operating expenses of $1.6 billion increased 4%, largely driven by investments in risk and controls and technology, partially offset by productivity savings.
Wealth cost of credit was $4 million, as net credit losses of $31 million were largely offset by an ACL release for loans and unfunded commitments of $26 million.
Wealth net income was $5 million, as the lower revenues were largely offset by the higher expenses.
All Other (Managed Basis) (a) (b) |
|
4Q'23 |
|
3Q'23 |
|
4Q'22 |
|
QoQ% |
|
YoY% |
|
|
2023 |
|
2022 |
|
%Δ |
|||||
Legacy Franchises (Managed Basis) |
|
1,710 |
|
1,802 |
|
1,829 |
|
(5)% |
|
(7)% |
|
|
7,198 |
|
7,467 |
|
(4)% |
|||||
|
|
|
|
|
|
|
|
|
|
|
|
|
|
|
|
|
|
|
|
|
|
|
Corporate / Other |
|
|
322 |
|
|
411 |
|
|
609 |
|
(22)% |
|
(47)% |
|
|
2,165 |
|
1,521 |
|
42% |
||
|
|
|
|
|
|
|
|
|
|
|
|
|
|
|
|
|
|
|
|
|
|
|
Total revenues |
|
|
2,032 |
|
|
2,213 |
|
|
2,438 |
|
(8)% |
|
(17)% |
|
|
9,363 |
|
8,988 |
|
4% |
||
|
|
|
|
|
|
|
|
|
|
|
|
|
|
|
|
|
|
|
|
|
|
|
|
|
|
|
|
|
|
|
|
|
|
|
|
|
|
|
|
|
|
|
|
|
|
Total operating expenses |
|
|
4,466 |
|
|
2,164 |
|
|
2,325 |
|
NM |
|
92% |
|
|
11,117 |
|
9,144 |
|
22% |
||
|
|
|
|
|
|
|
|
|
|
|
|
|
|
|
|
|
|
|
|
|
|
|
|
|
|
|
|
|
|
|
|
|
|
|
|
|
|
|
|
|
|
|
|
|
|
Net credit losses |
|
|
236 |
|
|
238 |
|
|
186 |
|
(1)% |
|
27% |
|
|
|
870 |
|
|
772 |
|
13% |
|
|
|
|
|
|
|
|
|
|
|
|
|
|
|
|
|
|
|
|
|
|
|
Net ACL build / (release)(c) |
|
81 |
|
(24) |
|
(35) |
|
NM |
|
NM |
|
|
106 |
|
(368) |
|
NM |
|||||
|
|
|
|
|
|
|
|
|
|
|
|
|
|
|
|
|
|
|
|
|
|
|
Other provisions(d) |
|
142 |
|
(10) |
|
13 |
|
NM |
|
NM |
|
|
350 |
|
94 |
|
NM |
|||||
|
|
|
|
|
|
|
|
|
|
|
|
|
|
|
|
|
|
|
|
|
|
|
Total cost of credit |
|
|
459 |
|
|
204 |
|
|
164 |
|
NM |
|
NM |
|
|
|
1,326 |
|
|
498 |
|
NM |
|
|
|
|
|
|
|
|
|
|
|
|
|
|
|
|
|
|
|
|
|
|
|
|
|
|
|
|
|
|
|
|
|
|
|
|
|
|
|
|
|
|
|
|
|
|
Net income (loss) |
|
$ |
(2,254) |
|
$ |
(109) |
|
$ |
71 |
|
NM |
|
NM |
|
|
|
(2,107) |
|
|
163 |
|
NM |
|
|
|
|
|
|
|
|
|
|
|
|
|
|
|
|
|
|
|
|
|
|
|
|
|
|
|
|
|
|
|
|
|
|
|
|
|
|
|
|
|
|
|
|
|
|
All Other Key Statistics and Metrics ($B) |
|
|
|
|
|
|
|
|
|
|
|
|
|
|
|
|
|
|
|
|
|
|
|
|
|
|
|
|
|
|
|
|
|
|
|
|
|
|
|
|
|
|
|
|
|
Allocated Average TCE(e) |
|
|
32 |
|
|
33 |
|
|
27 |
|
- |
|
22% |
|
|
|
31 |
|
|
26 |
|
20% |
|
|
|
|
|
|
|
|
|
|
|
|
|
|
|
|
|
|
|
|
|
|
|
Note: Please refer to the Appendices and Footnotes at the end of this press release for additional information.
(a) Includes Legacy Franchises and certain unallocated costs of global staff functions (including finance, risk, human resources, legal and compliance-related costs), other corporate expenses, and unallocated global operations and technology expenses and income taxes, as well as Corporate Treasury investment activities and discontinued operations.
(b) Reflects results on a managed basis, which excludes divestiture-related impacts related to Citi's divestiture of its Asia consumer banking businesses and the planned divestiture of Mexico consumer banking and small business and middle markets within Legacy Franchises. For additional information, please refer to Footnote 10.
(c) Includes credit reserve build / (release) for loans and provision for credit losses on unfunded lending commitments.
(d) Includes provisions on Other Assets and policyholder benefits and claims.
(e) TCE is a non-GAAP financial measures. See Appendix I for a reconciliation of the summation of the segments' and component's average allocated TCE.
9
All Other (Managed Basis)(10)
All Other (Managed Basis) revenues of $2.0 billion decreased 17%, driven by a decrease in net interest income of 29%, largely driven by higher funding costs in Corporate/Other and the closed exits and wind-downs, partially offset by higher non-interest revenue.
Legacy Franchises (Managed Basis)(10) revenues of $1.7 billion decreased 7%, primarily driven by the closed exits and wind-downs, partially offset by higher rates and volumes in Mexico and Mexican Peso appreciation.
Corporate / Other revenues decreased to $322 million from $609 million in the prior-year period, in part driven by higher funding costs.
All Other (Managed Basis) expenses of $4.5 billion increased 92%, driven by the FDIC special assessment and the restructuring charge, partially offset by lower expenses driven by the closed exits and wind-downs.
All Other (Managed Basis) cost of credit of $459 million, reflecting net credit losses of $236 million, an ACL build for loans and unfunded commitments of $81 million and other provisions of $142 million.
All Other (Managed Basis) net loss of $(2.3) billion, was driven by the higher expenses, the lower revenues and the higher cost of credit.
10
Citigroup will host a conference call today at 12:00 PM (ET). A live webcast of the presentation, as well as financial results and presentation materials, will be available at https://www.citigroup.com/global/investors. The live webcast of the presentation can also be accessed at https://www.veracast.com/webcasts/citigroup/webinars/Citi4Q23.cfm.
Additional financial, statistical and business-related information, as well as business and segment trends, is included in a Quarterly Financial Data Supplement. Both this earnings release and Citigroup’s Fourth Quarter 2023 Quarterly Financial Data Supplement are available on Citigroup’s website at www.citigroup.com.
Citi is a preeminent banking partner for institutions with cross-border needs, a global leader in wealth management and a valued personal bank in its home market of the United States. Citi does business in nearly 160 countries and jurisdictions, providing corporations, governments, investors, institutions and individuals with a broad range of financial products and services.
Additional information may be found at www.citigroup.com | Twitter: @Citi | YouTube: www.youtube.com/citi | Blog: http://blog.citigroup.com | Facebook: www.facebook.com/citi | LinkedIn: www.linkedin.com/company/citi
Certain statements in this release are “forward-looking statements” within the meaning of the Private Securities Litigation Reform Act of 1995. These statements are based on management’s current expectations and are subject to uncertainty and changes in circumstances. These statements are not guarantees of future results or occurrences. Actual results and capital and other financial condition may differ materially from those included in these statements due to a variety of factors. These factors include, among others: Citi’s ability to achieve its objectives, including expense savings, from its transformation, strategic and other initiatives, which include management and operating model changes and other actions, as well as the divestiture of Citi’s consumer, small business and middle-market operations in Mexico, which involves significant execution uncertainty and complexity and may result in higher than expected expenses, certain losses or other negative financial or strategic impacts; a potential U.S. federal government shutdown and the resulting impacts; continued elevated interest rates and the impacts on macroeconomic conditions, customer and client behavior, as well as Citi’s funding costs; potential reductions in benchmark interest rates and the resulting impacts on net interest income; potential recessions in the U.S., Europe and other regions or countries; revisions to the U.S. Basel III rules, including the recently issued notice of proposed rulemaking, known as the Basel III Endgame, related to the U.S. regulatory capital framework, and other proposed changes in regulatory capital rules; continued elevated levels of inflation and its impacts; potential increased regulatory requirements and costs; the various uncertainties and impacts related to or resulting from Russia’s war in Ukraine and escalating conflict in the Middle East; impacts from any potential additional currency devaluations in Argentina; and the precautionary statements included in this release. These factors also consist of those contained in Citigroup’s filings with the U.S. Securities and Exchange Commission, including without limitation the “Risk Factors” section of Citigroup’s 2022 Form 10-K. Any forward-looking statements made by or on behalf of Citigroup speak only as to the date they are made, and Citi does not undertake to update forward-looking statements to reflect the impact of circumstances or events that arise after the date the forward-looking statements were made.
Contacts: |
|
|
|
|
|
Investors: |
Jennifer Landis |
(212) 559-2718 |
|
|
|
Press: |
Danielle Romero-Apsilos |
(212) 816-2264 |
|
|
|
11
Appendix A
|
Citigroup ($ in millions) |
|
4Q23 |
|
3Q23 |
|
4Q22 |
|||
|
|
|
|
|
|
|
|||
Net Income (Loss) |
|
$ |
(1,839) |
|
$ |
3,546 |
|
$ |
2,513 |
Less: Preferred Dividends |
|
|
300 |
|
|
333 |
|
|
238 |
Net Income (Loss) to Common Shareholders |
|
$ |
(2,139) |
|
$ |
3,213 |
|
$ |
2,275 |
|
|
|
|
|
|
|
|
|
|
Average Common Equity |
|
$ |
189,440 |
|
$ |
189,158 |
|
$ |
180,523 |
Less: Average Goodwill and Intangibles |
|
|
(24,268) |
|
|
(23,831) |
|
|
(23,644) |
Average Tangible Common Equity (TCE) |
|
$ |
165,172 |
|
$ |
165,327 |
|
$ |
156,879 |
|
|
|
|
|
|
|
|
|
|
ROE |
|
|
(4.5)% |
|
|
6.7% |
|
|
5.0% |
|
|
|
|
|
|
|
|
|
|
RoTCE |
|
|
(5.1)% |
|
|
7.7% |
|
|
5.8% |
|
Citigroup ($ in millions) |
|
2023 |
|
2022 |
||
Net Income (Loss) |
|
$ |
9,228 |
|
$ |
14,845 |
Less: Preferred Dividends |
|
|
1,198 |
|
|
1,032 |
Net Income (Loss) to Common Shareholders |
|
$ |
8,030 |
|
$ |
13,813 |
|
|
|
|
|
|
|
Average Common Equity |
|
$ |
187,730 |
|
$ |
180,093 |
Less: Average Goodwill and Intangibles |
|
|
(24,374) |
|
|
(24,150) |
Average Tangible Common Equity (TCE) |
|
$ |
163,356 |
|
$ |
155,943 |
|
|
|
|
|
|
|
ROE |
|
|
4.3% |
|
|
7.7% |
|
|
|
|
|
|
|
RoTCE |
|
|
4.9% |
|
|
8.9% |
Appendix B(5)(6)(7)
|
Citigroup ($ in millions) |
|
4Q'23 |
|
4Q'22 |
|
% Δ YoY |
||
Total Citigroup Revenue - As Reported |
|
$ |
17,440 |
|
$ |
18,006 |
|
(3)% |
Less: |
|
|
|
|
|
|
|
|
Total Divestiture-related Impact on Revenue |
|
|
(62) |
|
|
209 |
|
|
Devaluation of Argentine Peso Impact on Revenue |
|
(880) |
|
(289) |
|
|
||
Total Citigroup Revenue, Excluding Impact of Total Divestiture-related and Devaluation of Argentine Peso |
|
$ |
18,382 |
|
$ |
18,086 |
|
2% |
|
|
|
|
|
|
|
|
|
Total Citigroup Operating Expenses - As Reported |
|
$ |
15,996 |
|
$ |
12,985 |
|
23% |
Less: |
|
|
|
|
|
|
|
|
Total Divestiture-related Impact on Operating Expenses |
|
|
106 |
|
|
58 |
|
|
FDIC Special Assessment Impact on Operating Expenses |
|
1,706 |
|
- |
|
|
||
Total Citigroup Operating Expenses, Excluding Impact of Total Divestiture-related and FDIC Special Assessment |
|
$ |
14,184 |
|
$ |
12,927 |
|
10% |
|
Citigroup ($ in millions) |
|
|
2023 |
|
|
2022 |
|
% Δ YoY |
Total Citigroup Revenue - As Reported |
|
$ |
78,462 |
|
$ |
75,338 |
|
4% |
Less: |
|
|
|
|
|
|
|
|
Total Divestiture-related Impact on Revenue |
|
1,346 |
|
854 |
|
|||
Total Citigroup Revenue, Excluding Total Impact of Divestiture-related |
|
$ |
77,116 |
|
$ |
74,484 |
|
4% |
12
Appendix C(5)(6)
|
Services ($ in millions) |
|
4Q '23 |
|
4Q '22 |
|
% Δ YoY |
||
Services Non-interest Revenue - As Reported |
|
$ |
1,075 |
|
$ |
1,229 |
|
(13)% |
Less: |
|
|
|
|
|
|
|
|
Devaluation of Argentine Peso Impact on Revenue |
|
|
(579) |
|
|
(153) |
|
|
Services Non-interest Revenue, Excluding Impact of Devaluation of Argentine Peso |
|
$ |
1,654 |
|
$ |
1,382 |
|
20% |
Appendix D(a)
|
All Other ($in millions) |
|
4Q'23 |
|
3Q'23 |
|
4Q'22 |
|
% Δ QoQ |
|
% Δ YoY |
|
2023 |
|
2022 |
|
% Δ YoY |
|||||||
|
|
|
|
|
|
|
|
|
|
|
|
|
|
|
|
|
|||||||
All Other Revenues, Managed Basis |
|
$ |
2,032 |
|
$ |
2,213 |
|
$ |
2,438 |
|
|
(8)% |
|
|
(17)% |
|
$ |
9,363 |
|
$ |
8,988 |
|
4% |
Add: |
|
|
|
|
|
|
|
|
|
|
|
|
|
|
|
|
|
|
|
|
|
|
|
All Other Divestiture-related Impact on Revenue(c)(d)(e)(g) |
|
$ |
(62) |
|
$ |
396 |
|
$ |
209 |
|
|
|
|
|
|
|
$ |
1,346 |
|
$ |
854 |
|
|
All Other Revenues, Including All Other Divestiture-related Impact |
|
$ |
1,970 |
|
$ |
2,609 |
|
$ |
2,647 |
|
|
(24)% |
|
|
(26)% |
|
$ |
10,709 |
|
$ |
9,842 |
|
9% |
|
|
|
|
|
|
|
|
|
|
|
|
|
|
|
|
|
|
|
|
|
|
|
|
All Other Operating Expenses, Managed Basis |
|
$ |
4,466 |
|
$ |
2,164 |
|
$ |
2,325 |
|
|
NM |
|
|
92% |
|
$ |
11,117 |
|
$ |
9,144 |
|
22% |
Add: |
|
|
|
|
|
|
|
|
|
|
|
|
|
|
|
|
|
|
|
|
|
|
|
All Other Divestiture-related Impact on Operating Expenses(b)(f)(h) |
|
$ |
106 |
|
$ |
114 |
|
$ |
58 |
|
|
|
|
|
|
|
$ |
372 |
|
$ |
696 |
|
|
All Other Operating Expenses, Including All Other Divestiture-related Impact |
|
$ |
4,572 |
|
$ |
2,278 |
|
$ |
2,383 |
|
|
101% |
|
|
92% |
|
$ |
11,489 |
|
$ |
9,840 |
|
17% |
|
|
|
|
|
|
|
|
|
|
|
|
|
|
|
|
|
|
|
|
|
|
|
|
All Other Cost of Credit, Managed Basis |
|
$ |
459 |
|
$ |
204 |
|
$ |
164 |
|
|
NM |
|
|
NM |
|
$ |
1,326 |
|
$ |
498 |
|
NM |
Add: |
|
|
|
|
|
|
|
|
|
|
|
|
|
|
|
|
|
|
|
|
|
|
|
All Other Net credit losses |
|
|
33 |
|
|
(19) |
|
|
(18) |
|
|
|
|
|
|
|
|
(6) |
|
|
(156) |
|
|
All Other Net ACL build / (release)(i) |
|
|
(63) |
|
|
2 |
|
|
(23) |
|
|
|
|
|
|
|
|
(61) |
|
|
232 |
|
|
All Other Other provisions(j) |
|
|
- |
|
|
- |
|
|
- |
|
|
|
|
|
|
|
|
- |
|
|
- |
|
|
All Other Citigroup Cost of Credit, Including All Other Divestiture-related Impact |
|
$ |
429 |
|
$ |
187 |
|
$ |
123 |
|
|
NM |
|
|
NM |
|
$ |
1,259 |
|
$ |
574 |
|
NM |
|
|
|
|
|
|
|
|
|
|
|
|
|
|
|
|
|
|
|
|
|
|
|
|
All Other Citigroup Net Income (Loss), Managed Basis |
|
$ |
(2,254) |
|
$ |
(109) |
|
$ |
71 |
|
|
NM |
|
|
NM |
|
$ |
(2,107) |
|
$ |
163 |
|
NM |
Add: |
|
|
|
|
|
|
|
|
|
|
|
|
|
|
|
|
|
|
|
|
|
|
|
All Other Divestiture-related Impact on Revenue(c)(d)(e)(g) |
|
|
(62) |
|
|
396 |
|
|
209 |
|
|
|
|
|
|
|
|
1,346 |
|
|
854 |
|
|
All Other Divestiture-related Impact on Operating Expenses(b)(f)(h) |
|
|
(106) |
|
|
(114) |
|
|
(58) |
|
|
|
|
|
|
|
|
(372) |
|
|
(696) |
|
|
All Other Divestiture-related Impact on Cost of Credit |
|
|
30 |
|
|
17 |
|
|
41 |
|
|
|
|
|
|
|
|
67 |
|
|
(76) |
|
|
All Other Divestiture-related Impact on Taxes |
|
|
27 |
|
|
(85) |
|
|
(79) |
|
|
|
|
|
|
|
|
(382) |
|
|
(266) |
|
|
All Other Net Income (Loss), Including All Other Divestiture-related Impact |
|
$ |
(2,365) |
|
$ |
105 |
|
$ |
184 |
|
|
NM |
|
|
NM |
|
$ |
(1,448) |
|
$ |
(21) |
|
NM |
(a) Reconciling Items consist of the divestiture-related impacts excluded from the results of All Other, as well as All Other—Legacy Franchises on a managed basis
(b) 1Q22 includes an approximate $535 million ($489 million after-tax) goodwill write-down due to re-segmentation and timing of Asia consumer banking business divestitures. For additional information, see Citi's Quarterly Report on Form 10-Q for the quarterly period ended March 31, 2022.
(c) 3Q22 includes an approximate $616 million gain on sale recorded in revenue (approximately $290 million after various taxes) related to Citi's sale of the Philippines consumer banking business. For additional information, see Citi's Quarterly Report on Form 10-Q for the quarterly period ended September 30, 2022
(d) 4Q22 includes an approximate $209 million (approximately $115 million after various taxes) gain on sale recorded in revenue related to Citi's sale of the Thailand consumer banking business. For additional information, see Citi's Annual Report on Form 10-K for the annual period ended December 31, 2022.
(e) 1Q23 includes an approximate $1.059 billion gain on sale recorded in revenue (approximately $727 million after various taxes) related to Citi's sale of the India consumer banking business. For additional information, see Citi's Quarterly Report on Form 10-Q for the quarterly period ended March 31, 2023.
(f) 2Q23 includes approximately $79 million in expenses (approximately $57 million after-tax), primarily related to separation costs in Mexico and severance costs in Asia exit markets. For additional information, see Citi's Quarterly Report on Form 10-Q for the quarterly period ended June 30, 2023.
(g) 3Q23 includes an approximate $403 million gain on sale recorded in revenue (approximately $284 million after various taxes) related to Citi's sale of the Taiwan consumer banking business. For additional information, see Citi's Quarterly Report on Form 10-Q for the quarterly period ended September 30, 2023.
(h) 4Q23 includes approximately $106 million in expenses (approximately $75 million after-tax), primarily related to separation costs in Mexico and severance costs in Asia exit markets.
(i) Includes credit reserve build / (release) for loans and provision for credit losses on unfunded lending commitments
(j) Includes provisions for policyholder benefits and claims and other assets.
13
Appendix E
($ in millions) |
|
4Q'23(1) |
|
3Q'23 |
|
4Q'22 |
|||
|
|
|
|
|
|
|
|||
Citigroup Common Stockholders' Equity(2) |
|
$ |
187,937 |
|
$ |
190,134 |
|
$ |
182,325 |
Add: Qualifying noncontrolling interests |
|
|
208 |
|
|
193 |
|
|
128 |
Regulatory Capital Adjustments and Deductions: |
|
|
|
|
|
|
|
|
|
Add: CECL transition provision(3) |
|
|
1,514 |
|
|
1,514 |
|
|
2,271 |
Less: |
|
|
|
|
|
|
|
|
|
Accumulated net unrealized gains (losses) on cash flow hedges, net of tax |
|
|
(1,406) |
|
|
(1,259) |
|
|
(2,522) |
Cumulative unrealized net gain (loss) related to changes in fair value of financial liabilities attributable to own creditworthiness, net of tax |
|
|
(383) |
|
|
625 |
|
|
1,441 |
Intangible Assets: |
|
|
|
|
|
|
|
|
|
Goodwill, net of related deferred tax liabilities (DTLs)(4) |
|
|
18,778 |
|
|
18,552 |
|
|
19,007 |
Identifiable intangible assets other than mortgage servicing rights (MSRs), net of related DTLs |
|
|
3,349 |
|
|
3,444 |
|
|
3,411 |
Defined benefit pension plan net assets; other |
|
|
1,317 |
|
|
1,340 |
|
|
1,935 |
Deferred tax assets (DTAs) arising from net operating loss, foreign tax credit and general business credit carry-forwards(5) |
|
|
11,580 |
|
|
11,219 |
|
|
12,197 |
Excess over 10% / 15% limitations for other DTAs, certain common stock investments, and MSRs(5)(6) |
|
|
2,936 |
|
|
1,786 |
|
|
325 |
Common Equity Tier 1 Capital (CET1) |
|
$ |
153,488 |
|
$ |
156,134 |
|
$ |
148,930 |
|
|
|
|
|
|
|
|
|
|
Risk-Weighted Assets (RWA)(3) |
|
$ |
1,152,800 |
|
$ |
1,148,550 |
|
$ |
1,142,985 |
|
|
|
|
|
|
|
|
|
|
Common Equity Tier 1 Capital Ratio (CET1 / RWA)(3) |
|
|
13.3% |
|
|
13.6% |
|
|
13.0% |
Note: Citi’s binding CET1 Capital ratios were derived under the Basel III Standardized Approach for all periods reflected.
| (1) | Preliminary. |
| (2) | Excludes issuance costs related to outstanding preferred stock in accordance with Federal Reserve Board regulatory reporting requirements. |
| (3) | Please refer to Footnote 2 at the end of this press release for additional information. |
| (4) | Includes goodwill “embedded” in the valuation of significant common stock investments in unconsolidated financial institutions. |
| (5) | Represents deferred tax excludable from Basel III CET1 Capital, which includes net DTAs arising from net operating loss, foreign tax credit and general business credit tax carry-forwards and DTAs arising from timing differences (future deductions) that are deducted from CET1 capital exceeding the 10% limitation. |
| (6) | Assets subject to 10%/15% limitations include MSRs, DTAs arising from temporary differences and significant common stock investments in unconsolidated financial institutions. For all periods presented, the deduction related only to DTAs arising from temporary differences that exceeded the 10% limitation. |
Appendix F
($ in millions) |
|
4Q'23(1) |
|
3Q'23 |
|
4Q'22 |
|||
|
|
|
|
|
|
|
|||
Common Equity Tier 1 Capital (CET1)(2) |
|
$ |
153,488 |
|
$ |
156,134 |
|
$ |
148,930 |
|
|
|
|
|
|
|
|
|
|
Additional Tier 1 Capital (AT1)(3) |
|
|
18,909 |
|
|
20,744 |
|
|
20,215 |
|
|
|
|
|
|
|
|
|
|
Total Tier 1 Capital (T1C) (CET1 + AT1) |
|
$ |
172,397 |
|
$ |
176,878 |
|
$ |
169,145 |
|
|
|
|
|
|
|
|
|
|
Total Leverage Exposure (TLE)(2) |
|
$ |
2,960,105 |
|
$ |
2,927,392 |
|
$ |
2,906,773 |
|
|
|
|
|
|
|
|
|
|
Supplementary Leverage Ratio (T1C / TLE) |
|
|
5.8% |
|
|
6.0% |
|
|
5.8% |
| (1) | Preliminary. |
| (2) | Please refer to Footnote 2 at the end of this press release for additional information |
| (3) | Additional Tier 1 Capital primarily includes qualifying noncumulative perpetual preferred stock and qualifying trust preferred securities. |
14
Appendix G
($ and shares in millions) |
|
4Q'23(1) |
|
3Q'23 |
|
4Q'22 |
|||
|
|
|
|
|
|
||||
Common Stockholders' Equity |
|
$ |
187,853 |
|
$ |
190,008 |
|
$ |
182,194 |
Less: |
|
|
|
|
|
|
|||
Goodwill |
|
|
20,098 |
|
|
19,829 |
|
|
19,691 |
Intangible Assets (other than MSRs) |
|
|
3,730 |
|
|
3,811 |
|
|
3,763 |
Goodwill and Identifiable Intangible Assets (other than MSRs) Related to Assets Held-for-Sale |
|
|
- |
|
|
49 |
|
|
589 |
Tangible Common Equity (TCE) |
|
$ |
164,025 |
|
$ |
166,319 |
|
$ |
158,151 |
|
|
|
|
|
|
|
|||
Common Shares Outstanding (CSO) |
|
|
1,903.1 |
|
|
1,913.9 |
|
|
1,937.0 |
|
|
|
|
|
|
|
|||
Tangible Book Value Per Share |
|
$ |
86.19 |
|
$ |
86.90 |
|
$ |
81.65 |
(1) Preliminary.
Appendix H
All Other |
|
4Q'23 |
|
3Q'23 |
|
4Q'22 |
|
% Δ QoQ |
|
% Δ YoY |
|||
Corporate Lending Revenues - As Reported |
|
$ |
280 |
|
$ |
651 |
|
$ |
253 |
|
(57)% |
|
11% |
|
|
|
|
|
|
|
|
|
|
|
|
|
|
Less: |
|
|
|
|
|
|
|
|
|
|
|
|
|
|
|
|
|
|
|
|
|
|
|
|
|
|
|
Gain/(loss) on loan hedges(8) |
|
$ |
(131) |
|
$ |
(47) |
|
$ |
(300) |
|
NM |
|
56% |
|
|
|
|
|
|
|
|
|
|
|
|
|
|
Corporate Lending Revenues - Excluding Gain/(loss) on loan hedges |
|
$ |
411 |
|
$ |
698 |
|
$ |
553 |
|
(41)% |
|
(26)% |
Appendix I(1)
($in billions) |
|
4Q'23 |
|
3Q'23 |
|
4Q'22 |
|
|||
|
|
|
|
|
|
|
|
|||
Average Tangible Common Equity (TCE) |
|
|
|
|
|
|
|
|
|
|
Services |
|
$ |
23.0 |
|
$ |
23.0 |
|
$ |
22.5 |
|
Markets |
|
|
53.1 |
|
|
53.1 |
|
|
51.6 |
|
Banking |
|
|
21.4 |
|
|
21.4 |
|
|
21.7 |
|
USPB |
|
|
21.9 |
|
|
21.9 |
|
|
20.7 |
|
Wealth |
|
|
13.4 |
|
|
13.4 |
|
|
13.9 |
|
All Other |
|
|
32.4 |
|
|
32.5 |
|
|
26.5 |
|
Total Citigroup Average TCE |
|
$ |
165.2 |
|
$ |
165.3 |
|
$ |
156.9 |
|
Plus: |
|
|
|
|
|
|
|
|
|
|
Average Goodwill |
|
|
20.4 |
|
|
19.9 |
|
|
19.1 |
|
Average Intangible Assets (other than MSRs) |
|
|
3.8 |
|
|
3.9 |
|
|
3.8 |
|
Average Goodwill and Identifiable Intangible Assets (other than MSRs) Related to Assets Held-for-Sale |
|
|
- |
|
|
0.1 |
|
|
0.7 |
|
Total Citigroup Average Common Stockholders' Equity |
|
$ |
189.4 |
|
$ |
189.2 |
|
$ |
180.5 |
|
(1) TCE and TBVPS are non-GAAP financial measures.
Appendix J(5)(6)
Citigroup |
|
|
|
($in millions, except per share amounts) |
|
4Q'23 |
|
Citigroup Diluted EPS - As Reported |
|
$(1.16) |
|
Add: |
|
|
|
Total Notable Items Impact on Diluted EPS(a) |
|
2.00 |
|
Citigroup Diluted EPS, Excluding Notable Items |
|
$0.84 |
|
15
(a) On a pre-tax basis the notable items total approximately $(4.7) billion and include the following items: FDIC special assessment of $(1.7) billion, restructuring charge of $(0.8) billion, devaluation of Argentine peso of $(0.9) billion and transfer risk related to Russia and Argentina of $(1.3) billion. In total, on an after - tax basis the notable items are $(3.8) billion.
16
(1) Preliminary. Citigroup’s allocated average tangible common equity (TCE) and return on average tangible common equity (RoTCE) are non-GAAP financial measures. RoTCE represents annualized net income available to common shareholders as a percentage of average TCE. For the components of these calculations, see Appendix A. See Appendix G for a reconciliation of common equity to TCE. For a reconciliation of the summation of the segments’ and components’ average allocated TCE to Citigroup’s total average stockholder’s equity, see Appendix I.
(2) Ratios as of December 31, 2023 are preliminary. Citigroup’s Common Equity Tier 1 (CET1) Capital ratio and Supplementary Leverage ratio (SLR) reflect certain deferrals based on the modified regulatory capital transition provision related to the Current Expected Credit Losses (CECL) standard. Excluding these deferrals, Citigroup’s CET1 Capital ratio and SLR as of December 31, 2023 would be 13.2% and 5.8%, respectively, on a fully reflected basis. For additional information, see “Capital Resources—Regulatory Capital Treatment—Modified Transition of the Current Expected Credit Losses Methodology” in Citigroup’s 2022 Annual Report on Form 10-K. Certain prior period amounts have been revised to conform with enhancements made in the current period.
For the composition of Citigroup’s CET1 Capital and ratio, see Appendix E. For the composition of Citigroup’s SLR, see Appendix F.
(3) Citigroup’s payout ratio is the sum of common dividends and common share repurchases divided by net income available to common shareholders.
(4) Citigroup’s tangible book value per share is a non-GAAP financial measure. See Appendix G for a reconciliation of common equity to tangible common equity and resulting calculation of tangible book value per share.
(5) For additional information on the notable items, see Citi’s Current Report on Form 8-K filed on January 10, 2024 with the U.S. Securities and Exchange Commission. Results of operations excluding the impact of these notable items are non-GAAP financial measures. Citi believes the presentation of its results of operations and financial condition excluding the impacts of these notable items provides a meaningful depiction of the underlying fundamentals of its broader results for investors, industry analysts and others. For a reconciliation to reported results, please refer to Appendix B and C. For a reconciliation to reported EPS, refer to appendix J.
(6) Citi recorded an approximate $880 million translation loss in revenues in Argentina in the fourth quarter of 2023 due to the recent devaluation of the Argentine peso. This decrease in revenues impacted Services, Markets, and Banking. The translation loss does not include net interest income of approximately $250 million on Citi’s net investment in Argentina in the quarter.
(7) Fourth quarter 2023 results included divestiture-related impacts of $(138) million in earnings before taxes (approximately $(111) million after-tax). This amount included $(62) million revenues from certain divestitures, recorded in Other revenue, $106 million of aggregate divestiture-related costs, recorded in Operating expenses, a $(30) million of divestiture-related credit costs, and related taxes of $(27) million.
Fourth quarter 2022 results included divestiture-related impacts of $192 million in earnings before taxes (approximately $113 million after-tax). This amount included $209 million primarily related to the gain on sale from certain divestitures, recorded in Other revenue, $58 million of aggregate divestiture-related costs, recorded in Operating expenses, a $41 million benefit of divestiture-related credit costs, and related taxes of $79 million.
Results of operations excluding these divestiture-related impacts are non-GAAP financial measures. For additional information and a reconciliation to reported results, please refer to Appendix B and D.
(8) Credit derivatives are used to economically hedge a portion of the Corporate Lending portfolio that includes both accrual loans and loans at fair value. Gain / (loss) on loan hedges includes the mark-to-market on the credit derivatives and the mark-to-market on the loans in the portfolio that are at fair value. In the fourth quarter 2023, gain / (loss) on loan hedges included $(131) million related to Corporate Lending, compared to $(300) million in the prior-year period. The fixed premium costs of these hedges are netted against the Corporate Lending revenues to reflect the cost of credit protection. Citigroup’s results of operations excluding the impact of gain / (loss) on loan hedges are non-GAAP financial measures. For a reconciliation to reported results, please refer to Appendix H.
(9) Certain revenues earned by Citi are subject to a revenue sharing agreement to Banking – Corporate Lending from Investment Banking and certain Markets and Services products sold to clients.
(10) All Other (Managed Basis) reflects results on a managed basis, which excludes divestiture-related impacts, for all periods, related to Citi’s divestitures of its Asia consumer banking businesses and the planned divestiture of Mexico consumer banking and small business and middle market banking within Legacy Franchises. Certain of the results of operations of All Other (Managed Basis) and Legacy Franchises (Managed Basis) that exclude divestiture-related impacts are non-GAAP financial measures. Citi believes the presentation of its results of operations excluding these divestiture-related impacts provide a meaningful depiction of the underlying fundamentals of its All Other (Managed Basis) and Legacy Franchises (Managed Basis) results for investors, industry analysts and others, including increased transparency and clarity into operating results, improved visibility into management decisions and their impacts on operational performance; enables better comparison to peer companies; and allows Citi to provide a long-term strategic view of the category going forward. In addition, Citi’s Chief Operating Decision Maker, or its Chief Executive Officer, regularly reviews financial information on a managed basis that excludes these divestiture-related impacts. For additional information and a reconciliation of these results, please refer to Appendix D.
17
Exhibit 99.2

CITIGROUP—QUARTERLY FINANCIAL DATA SUPPLEMENT |
|
4Q23 |
|
|
|
||
|
|
|
|
|
Page |
|
|
Citigroup |
|
|
|
Financial Summary |
|
1 |
|
Consolidated Statement of Income |
|
2 |
|
Consolidated Balance Sheet |
|
3 |
|
Operating Segment, Reporting Unit, and Component—Net Revenues and Income |
|
4 |
|
|
|
||
Services |
|
5 |
|
Markets |
|
6 |
|
Banking |
|
7 |
|
U.S. Personal Banking (USPB) |
|
8 |
|
Metrics |
|
9 |
|
Wealth |
|
10 |
|
All Other |
|
11 |
|
Legacy Franchises |
|
12 |
|
Corporate/Other |
|
13 |
|
Reconciling Items—Divestiture-related impacts |
|
14 |
|
|
|
||
Citigroup Supplemental Detail |
|
|
|
Average Balances and Interest Rates |
|
15 |
|
Loans |
|
16 |
|
Deposits |
|
17 |
|
Allowance for Credit Losses (ACL) Rollforward |
|
18 |
|
Allowance for Credit Losses on Loans (ACLL) and Unfunded Lending Commitments (ACLUC) |
|
19 - 20 |
|
Non-Accrual Assets |
|
21 |
|
CET1 Capital and Supplementary Leverage Ratios, Tangible Common Equity, Book Value Per Share and Tangible Book Value Per Share |
|
22 |
|
|
|
|
|
|
|
|
|
CITIGROUP FINANCIAL SUMMARY
(In millions of dollars, except per share amounts and as otherwise noted)
|
|
|
|
|
|
|
|
|
|
|
|
|
|
|
|
|
4Q23 Increase/ |
|
|
Full |
|
Full |
|
FY 2023 vs. |
||||
|
|
4Q |
|
1Q |
|
2Q |
|
3Q |
|
4Q |
|
(Decrease) from |
|
|
Year |
|
Year |
|
FY 2022 Increase/ |
|||||||||
|
|
2022 |
|
2023 |
|
2023 |
|
2023 |
|
2023 |
|
3Q23 |
|
4Q22 |
|
|
2022 |
|
2023 |
|
(Decrease) |
|||||||
|
|
|
|
|
|
|
|
|
|
|
|
|
|
|
|
|
|
|
|
|
|
|
|
|
|
|
|
|
Total revenues, net of interest expense(1)(2)(3)(4) |
|
$ |
18,006 |
|
$ |
21,447 |
|
$ |
19,436 |
|
$ |
20,139 |
|
$ |
17,440 |
|
(13%) |
|
(3%) |
|
|
$ |
75,338 |
|
$ |
78,462 |
|
4% |
Total operating expenses(5)(6)(7) |
|
|
12,985 |
|
|
13,289 |
|
|
13,570 |
|
|
13,511 |
|
|
15,996 |
|
18% |
|
23% |
|
|
|
51,292 |
|
|
56,366 |
|
10% |
Net credit losses (NCLs) |
|
|
1,180 |
|
|
1,302 |
|
|
1,504 |
|
|
1,637 |
|
|
1,994 |
|
22% |
|
69% |
|
|
|
3,789 |
|
|
6,437 |
|
70% |
Credit reserve build / (release) for loans |
|
|
593 |
|
|
435 |
|
|
257 |
|
|
179 |
|
|
478 |
|
NM |
|
(19%) |
|
|
|
956 |
|
|
1,349 |
|
41% |
Provision / (release) for unfunded lending commitments |
|
|
47 |
|
|
(194) |
|
|
(96) |
|
|
(54) |
|
|
(81) |
|
(50%) |
|
NM |
|
|
|
291 |
|
|
(425) |
|
NM |
Provisions for benefits and claims, HTM debt securities and other assets |
|
|
25 |
|
|
432 |
|
|
159 |
|
|
78 |
|
|
1,156 |
|
NM |
|
NM |
|
|
|
203 |
|
|
1,825 |
|
NM |
Provisions for credit losses and for benefits and claims |
|
|
1,845 |
|
|
1,975 |
|
|
1,824 |
|
|
1,840 |
|
|
3,547 |
|
93% |
|
92% |
|
|
|
5,239 |
|
|
9,186 |
|
75% |
Income (loss) from continuing operations before income taxes |
|
|
3,176 |
|
|
6,183 |
|
|
4,042 |
|
|
4,788 |
|
|
(2,103) |
|
NM |
|
NM |
|
|
|
18,807 |
|
|
12,910 |
|
(31%) |
Income taxes (benefits) |
|
|
640 |
|
|
1,531 |
|
|
1,090 |
|
|
1,203 |
|
|
(296) |
|
NM |
|
NM |
|
|
|
3,642 |
|
|
3,528 |
|
(3%) |
Income (loss) from continuing operations |
|
|
2,536 |
|
|
4,652 |
|
|
2,952 |
|
|
3,585 |
|
|
(1,807) |
|
NM |
|
NM |
|
|
|
15,165 |
|
|
9,382 |
|
(38%) |
Income (loss) from discontinued operations, net of taxes(8) |
|
|
(2) |
|
|
(1) |
|
|
(1) |
|
|
2 |
|
|
(1) |
|
NM |
|
50% |
|
|
|
(231) |
|
|
(1) |
|
100% |
Net income (loss) before noncontrolling interests |
|
|
2,534 |
|
|
4,651 |
|
|
2,951 |
|
|
3,587 |
|
|
(1,808) |
|
NM |
|
NM |
|
|
|
14,934 |
|
|
9,381 |
|
(37%) |
Net income (loss) attributable to noncontrolling interests |
|
|
21 |
|
|
45 |
|
|
36 |
|
|
41 |
|
|
31 |
|
(24%) |
|
48% |
|
|
|
89 |
|
|
153 |
|
72% |
Citigroup's net income (loss) |
|
$ |
2,513 |
|
$ |
4,606 |
|
$ |
2,915 |
|
$ |
3,546 |
|
$ |
(1,839) |
|
NM |
|
NM |
|
|
$ |
14,845 |
|
$ |
9,228 |
|
(38%) |
|
|
|
|
|
|
|
|
|
|
|
|
|
|
|
|
|
|
|
|
|
|
|
|
|
|
|
|
|
Diluted earnings per share: |
|
|
|
|
|
|
|
|
|
|
|
|
|
|
|
|
|
|
|
|
|
|
|
|
|
|
|
|
Income (loss) from continuing operations |
|
$ |
1.16 |
|
$ |
2.19 |
|
$ |
1.33 |
|
$ |
1.63 |
|
$ |
(1.16) |
|
NM |
|
NM |
|
|
$ |
7.11 |
|
$ |
4.04 |
|
(43%) |
Citigroup's net income (loss) |
|
$ |
1.16 |
|
$ |
2.19 |
|
$ |
1.33 |
|
$ |
1.63 |
|
$ |
(1.16) |
|
NM |
|
NM |
|
|
$ |
7.00 |
|
$ |
4.04 |
|
(42%) |
|
|
|
|
|
|
|
|
|
|
|
|
|
|
|
|
|
|
|
|
|
|
|
|
|
|
|
|
|
Preferred dividends |
|
$ |
238 |
|
$ |
277 |
|
$ |
288 |
|
$ |
333 |
|
$ |
300 |
|
(10%) |
|
26% |
|
|
$ |
1,032 |
|
$ |
1,198 |
|
16% |
|
|
|
|
|
|
|
|
|
|
|
|
|
|
|
|
|
|
|
|
|
|
|
|
|
|
|
|
|
Income allocated to unrestricted common shareholders - basic |
|
|
|
|
|
|
|
|
|
|
|
|
|
|
|
|
|
|
|
|
|
|
|
|
|
|
|
|
Income (loss) from continuing operations |
|
$ |
2,253 |
|
$ |
4,296 |
|
$ |
2,595 |
|
$ |
3,158 |
|
$ |
(2,217) |
|
NM |
|
NM |
|
|
$ |
13,930 |
|
$ |
7,851 |
|
(44%) |
Citigroup's net income (loss) |
|
$ |
2,251 |
|
$ |
4,295 |
|
$ |
2,594 |
|
$ |
3,160 |
|
$ |
(2,218) |
|
NM |
|
NM |
|
|
$ |
13,700 |
|
$ |
7,850 |
|
(43%) |
|
|
|
|
|
|
|
|
|
|
|
|
|
|
|
|
|
|
|
|
|
|
|
|
|
|
|
|
|
Income allocated to unrestricted common shareholders - diluted |
|
|
|
|
|
|
|
|
|
|
|
|
|
|
|
|
|
|
|
|
|
|
|
|
|
|
|
|
Income (loss) from continuing operations |
|
$ |
2,264 |
|
$ |
4,307 |
|
$ |
2,610 |
|
$ |
3,174 |
|
$ |
(2,217) |
|
NM |
|
NM |
|
|
$ |
13,971 |
|
$ |
7,908 |
|
(43%) |
Citigroup's net income (loss) |
|
$ |
2,262 |
|
$ |
4,306 |
|
$ |
2,609 |
|
$ |
3,176 |
|
$ |
(2,218) |
|
NM |
|
NM |
|
|
$ |
13,741 |
|
$ |
7,907 |
|
(42%) |
|
|
|
|
|
|
|
|
|
|
|
|
|
|
|
|
|
|
|
|
|
|
|
|
|
|
|
|
|
Shares (in millions): |
|
|
|
|
|
|
|
|
|
|
|
|
|
|
|
|
|
|
|
|
|
|
|
|
|
|
|
|
Average basic |
|
|
1,936.9 |
|
|
1,943.5 |
|
|
1,942.8 |
|
|
1,924.4 |
|
|
1,909.7 |
|
(1%) |
|
(1%) |
|
|
|
1,946.7 |
|
|
1,930.1 |
|
(1%) |
Average diluted |
|
|
1,955.9 |
|
|
1,964.1 |
|
|
1,968.6 |
|
|
1,951.7 |
|
|
1,909.7 |
|
(2%) |
|
(2%) |
|
|
|
1,964.3 |
|
|
1,955.8 |
|
- |
Common shares outstanding, at period end |
|
|
1,937.0 |
|
|
1,946.8 |
|
|
1,925.7 |
|
|
1,913.9 |
|
|
1,903.1 |
|
(1%) |
|
(2%) |
|
|
|
|
|
|
|
|
|
|
|
|
|
|
|
|
|
|
|
|
|
|
|
|
|
|
|
|
|
|
|
|
|
|
|
|
|
|
Regulatory capital ratios and performance metrics: |
|
|
|
|
|
|
|
|
|
|
|
|
|
|
|
|
|
|
|
|
|
|
|
|
|
|
|
|
Common Equity Tier 1 (CET1) Capital ratio(9)(10)(11) |
|
|
13.03% |
|
|
13.44% |
|
|
13.37% |
|
|
13.59% |
|
|
13.3% |
|
|
|
|
|
|
|
|
|
|
|
|
|
Tier 1 Capital ratio(9)(10)(11) |
|
|
14.80% |
|
|
15.31% |
|
|
15.24% |
|
|
15.40% |
|
|
15.0% |
|
|
|
|
|
|
|
|
|
|
|
|
|
Total Capital ratio(9)(10)(11) |
|
|
15.46% |
|
|
15.40% |
|
|
15.84% |
|
|
15.78% |
|
|
15.1% |
|
|
|
|
|
|
|
|
|
|
|
|
|
Supplementary Leverage ratio (SLR)(9)(11)(12) |
|
|
5.82% |
|
|
5.96% |
|
|
5.97% |
|
|
6.04% |
|
|
5.8% |
|
|
|
|
|
|
|
|
|
|
|
|
|
Return on average assets |
|
|
0.41% |
|
|
0.76% |
|
|
0.47% |
|
|
0.58% |
|
|
(0.30%) |
|
|
|
|
|
|
|
0.62% |
|
|
0.38% |
|
|
Return on average common equity |
|
|
5.0% |
|
|
9.5% |
|
|
5.6% |
|
|
6.7% |
|
|
(4.5%) |
|
|
|
|
|
|
|
7.7% |
|
|
4.3% |
|
|
Average tangible common equity (TCE) (in billions of dollars) |
|
$ |
156.9 |
|
$ |
161.1 |
|
$ |
164.1 |
|
$ |
165.3 |
|
$ |
165.2 |
|
- |
|
5% |
|
|
$ |
155.9 |
|
$ |
163.4 |
|
5% |
Return on average tangible common equity (RoTCE)(13) |
|
|
5.8% |
|
|
10.9% |
|
|
6.4% |
|
|
7.7% |
|
|
(5.1%) |
|
(1,280) bps |
|
(1,090) bps |
|
|
|
8.9% |
|
|
4.9% |
|
(400) bps |
Efficiency ratio (total operating expenses/total revenues, net) |
|
|
72.1% |
|
|
62.0% |
|
|
69.8% |
|
|
67.1% |
|
|
91.7% |
|
2,460 bps |
|
1,960 bps |
|
|
|
68.1% |
|
|
71.8% |
|
370 bps |
|
|
|
|
|
|
|
|
|
|
|
|
|
|
|
|
|
|
|
|
|
|
|
|
|
|
|
|
|
Balance sheet data (in billions of dollars, except per share amounts): |
|
|
|
|
|
|
|
|
|
|
|
|
|
|
|
|
|
|
|
|
|
|
|
|
|
|
|
|
Total assets |
|
$ |
2,416.7 |
|
$ |
2,455.1 |
|
$ |
2,423.7 |
|
$ |
2,368.5 |
|
$ |
2,405.3 |
|
2% |
|
- |
|
|
|
|
|
|
|
|
|
Total average assets |
|
|
2,430.6 |
|
|
2,462.2 |
|
|
2,465.6 |
|
|
2,413.8 |
|
|
2,427.3 |
|
1% |
|
- |
|
|
|
2,396.0 |
|
|
2,442.2 |
|
2% |
Total loans |
|
|
657.2 |
|
|
652.0 |
|
|
660.6 |
|
|
666.3 |
|
|
689.4 |
|
3% |
|
5% |
|
|
|
|
|
|
|
|
|
Total deposits |
|
|
1,366.0 |
|
|
1,330.5 |
|
|
1,319.9 |
|
|
1,273.5 |
|
|
1,308.7 |
|
3% |
|
(4%) |
|
|
|
|
|
|
|
|
|
Citigroup's stockholders' equity |
|
|
201.2 |
|
|
208.3 |
|
|
208.7 |
|
|
209.5 |
|
|
205.5 |
|
(2%) |
|
2% |
|
|
|
|
|
|
|
|
|
Book value per share |
|
|
94.06 |
|
|
96.59 |
|
|
97.87 |
|
|
99.28 |
|
|
98.71 |
|
(1%) |
|
5% |
|
|
|
|
|
|
|
|
|
Tangible book value per share |
|
|
81.65 |
|
|
84.21 |
|
|
85.34 |
|
|
86.90 |
|
|
86.19 |
|
(1%) |
|
6% |
|
|
|
|
|
|
|
|
|
|
|
|
|
|
|
|
|
|
|
|
|
|
|
|
|
|
|
|
|
|
|
|
|
|
|
|
|
|
Direct staff (in thousands) |
|
|
240 |
|
|
240 |
|
|
240 |
|
|
240 |
|
|
239 |
|
- |
|
- |
|
|
|
|
|
|
|
|
|
|
|
|
|
|
|
|
|
|
|
|
|
|
|
|
|
|
|
|
|
|
|
|
|
|
|
|
|
|
(1) |
See footnote 7 on page 14. |
(2) |
See footnote 5 on page 14. |
(3) |
See footnote 4 on page 14. |
(4) |
See footnote 3 on page 14. |
(5) |
See footnote 2 on page 14. |
(6) |
See footnote 6 on page 14. |
(7) |
See footnote 8 on page 14. |
(8) |
2Q22 discontinued operations reflects the release of a currency translation adjustment (CTA) loss (net of hedges) recorded in Accumulated Other Comprehensive Income (AOCI) related to the substantial liquidation of a legal entity (with a non-U.S. dollar functional currency) that had previously divested a legacy business. |
(9) |
4Q23 is preliminary. |
(10) |
Citi's binding CET1 Capital and Tier 1 Capital ratios were derived under the Basel III Standardized Approach, whereas Citi's binding Total Capital ratios were derived under the Basel III Advanced Approaches framework for all periods presented. For the composition of Citi's CET1 Capital and ratio, see page 22. |
(11) |
Citi's regulatory capital ratios and components reflect certain deferrals based on the modified regulatory capital transition provision related to the Current Expected Credit Losses (CECL) standard. For additional information, see "Capital Resources-Regulatory Capital Treatment-Modified Transition of the Current Expected Credit Losses Methodology" in Citigroup's 2022 Annual Report on Form 10-K. |
(12) |
For the composition of Citi's SLR, see page 22. |
(13) |
TCE and RoTCE are non-GAAP financial measures. See page 22 for a reconciliation of Citi's average TCE to Citi's total average stockholders' equity. |
Note: Ratios and variance percentages are calculated based on the displayed amounts.
NM Not meaningful.
Reclassified to conform to the current period's presentation.
Page 1
CITIGROUP CONSOLIDATED STATEMENT OF INCOME
(In millions of dollars)
|
|
|
|
|
|
|
|
|
|
|
|
|
|
|
|
|
4Q23 Increase/ |
|
|
Full |
|
Full |
|
FY 2023 vs. |
||||
|
|
4Q |
|
1Q |
|
2Q |
|
3Q |
|
4Q |
|
(Decrease) from |
|
|
Year |
|
Year |
|
FY 2022 Increase/ |
|||||||||
|
|
2022 |
|
2023 |
|
2023 |
|
2023 |
|
2023 |
|
3Q23 |
|
4Q22 |
|
|
2022 |
|
2023 |
|
(Decrease) |
|||||||
|
|
|
|
|
|
|
|
|
|
|
|
|
|
|
|
|
|
|
|
|
|
|
|
|
|
|
|
|
Revenues |
|
|
|
|
|
|
|
|
|
|
|
|
|
|
|
|
|
|
|
|
|
|
|
|
|
|
|
|
Interest revenue |
|
$ |
25,708 |
|
$ |
29,395 |
|
$ |
32,647 |
|
$ |
34,837 |
|
$ |
36,379 |
|
4% |
|
42% |
|
|
$ |
74,408 |
|
$ |
133,258 |
|
79% |
Interest expense |
|
|
12,438 |
|
|
16,047 |
|
|
18,747 |
|
|
21,009 |
|
|
22,555 |
|
7% |
|
81% |
|
|
|
25,740 |
|
|
78,358 |
|
NM |
Net interest income (NII) |
|
|
13,270 |
|
|
13,348 |
|
|
13,900 |
|
|
13,828 |
|
|
13,824 |
|
- |
|
4% |
|
|
|
48,668 |
|
|
54,900 |
|
13% |
|
|
|
|
|
|
|
|
|
|
|
|
|
|
|
|
|
|
|
|
|
|
|
|
|
|
|
|
|
Commissions and fees |
|
|
2,016 |
|
|
2,366 |
|
|
2,132 |
|
|
2,195 |
|
|
2,212 |
|
1% |
|
10% |
|
|
|
9,175 |
|
|
8,905 |
|
(3%) |
Principal transactions |
|
|
2,419 |
|
|
3,939 |
|
|
2,528 |
|
|
3,008 |
|
|
1,473 |
|
(51%) |
|
(39%) |
|
|
|
14,159 |
|
|
10,948 |
|
(23%) |
Administrative and other fiduciary fees |
|
|
880 |
|
|
896 |
|
|
989 |
|
|
971 |
|
|
925 |
|
(5%) |
|
5% |
|
|
|
3,784 |
|
|
3,781 |
|
- |
Realized gains (losses) on investments |
|
|
(7) |
|
|
72 |
|
|
49 |
|
|
30 |
|
|
37 |
|
23% |
|
NM |
|
|
|
67 |
|
|
188 |
|
NM |
Impairment losses on investments and other assets |
|
|
(222) |
|
|
(86) |
|
|
(71) |
|
|
(70) |
|
|
(96) |
|
(37%) |
|
57% |
|
|
|
(499) |
|
|
(323) |
|
35% |
Provision for credit losses on AFS debt securities(1) |
|
|
(2) |
|
|
(1) |
|
|
1 |
|
|
(1) |
|
|
(3) |
|
NM |
|
(50%) |
|
|
|
5 |
|
|
(4) |
|
NM |
Other revenue (loss) |
|
|
(348) |
|
|
913 |
|
|
(92) |
|
|
178 |
|
|
(932) |
|
NM |
|
NM |
|
|
|
(21) |
|
|
67 |
|
NM |
Total non-interest revenues (NIR) |
|
|
4,736 |
|
|
8,099 |
|
|
5,536 |
|
|
6,311 |
|
|
3,616 |
|
(43%) |
|
(24%) |
|
|
|
26,670 |
|
|
23,562 |
|
(12%) |
Total revenues, net of interest expense |
|
$ |
18,006 |
|
$ |
21,447 |
|
$ |
19,436 |
|
$ |
20,139 |
|
$ |
17,440 |
|
(13%) |
|
(3%) |
|
|
|
75,338 |
|
|
78,462 |
|
4% |
|
|
|
|
|
|
|
|
|
|
|
|
|
|
|
|
|
|
|
|
|
|
|
|
|
|
|
|
|
|
|
|
|
|
|
|
|
|
|
|
|
|
|
|
|
|
|
|
|
|
|
|
|
|
|
|
|
|
Provisions for credit losses and for benefits and claims |
|
|
|
|
|
|
|
|
|
|
|
|
|
|
|
|
|
|
|
|
|
|
|
|
|
|
|
|
Net credit losses |
|
|
1,180 |
|
|
1,302 |
|
|
1,504 |
|
|
1,637 |
|
|
1,994 |
|
22% |
|
69% |
|
|
|
3,789 |
|
|
6,437 |
|
70% |
Credit reserve build / (release) for loans |
|
|
593 |
|
|
435 |
|
|
257 |
|
|
179 |
|
|
478 |
|
NM |
|
(19%) |
|
|
|
956 |
|
|
1,349 |
|
41% |
Provision for credit losses on loans |
|
|
1,773 |
|
|
1,737 |
|
|
1,761 |
|
|
1,816 |
|
|
2,472 |
|
36% |
|
39% |
|
|
|
4,745 |
|
|
7,786 |
|
64% |
Provision for credit losses on held-to-maturity (HTM) debt securities |
|
|
5 |
|
|
(17) |
|
|
(4) |
|
|
(3) |
|
|
- |
|
100% |
|
(100%) |
|
|
|
33 |
|
|
(24) |
|
NM |
Provision for credit losses on other assets |
|
|
- |
|
|
425 |
|
|
149 |
|
|
56 |
|
|
1,132 |
|
NM |
|
NM |
|
|
|
76 |
|
|
1,762 |
|
NM |
Policyholder benefits and claims |
|
|
20 |
|
|
24 |
|
|
14 |
|
|
25 |
|
|
24 |
|
(4%) |
|
20% |
|
|
|
94 |
|
|
87 |
|
(7%) |
Provision for credit losses on unfunded lending commitments |
|
|
47 |
|
|
(194) |
|
|
(96) |
|
|
(54) |
|
|
(81) |
|
(50%) |
|
NM |
|
|
|
291 |
|
|
(425) |
|
NM |
Total provisions for credit losses and for benefits and claims(2) |
|
|
1,845 |
|
|
1,975 |
|
|
1,824 |
|
|
1,840 |
|
|
3,547 |
|
93% |
|
92% |
|
|
|
5,239 |
|
|
9,186 |
|
75% |
|
|
|
|
|
|
|
|
|
|
|
|
|
|
|
|
|
|
|
|
|
|
|
|
|
|
|
|
|
Operating expenses |
|
|
|
|
|
|
|
|
|
|
|
|
|
|
|
|
|
|
|
|
|
|
|
|
|
|
|
|
Compensation and benefits |
|
|
6,618 |
|
|
7,538 |
|
|
7,388 |
|
|
7,424 |
|
|
6,882 |
|
(7%) |
|
4% |
|
|
|
26,655 |
|
|
29,232 |
|
10% |
Premises and equipment |
|
|
601 |
|
|
598 |
|
|
595 |
|
|
620 |
|
|
695 |
|
12% |
|
16% |
|
|
|
2,320 |
|
|
2,508 |
|
8% |
Technology / communication |
|
|
2,358 |
|
|
2,127 |
|
|
2,309 |
|
|
2,256 |
|
|
2,414 |
|
7% |
|
2% |
|
|
|
8,587 |
|
|
9,106 |
|
6% |
Advertising and marketing |
|
|
424 |
|
|
331 |
|
|
361 |
|
|
324 |
|
|
377 |
|
16% |
|
(11%) |
|
|
|
1,556 |
|
|
1,393 |
|
(10%) |
Restructuring |
|
|
N/A |
|
|
N/A |
|
|
N/A |
|
|
N/A |
|
|
781 |
|
NM |
|
NM |
|
|
|
N/A |
|
|
781 |
|
NM |
Other operating |
|
|
2,984 |
|
|
2,695 |
|
|
2,917 |
|
|
2,887 |
|
|
4,847 |
|
68% |
|
62% |
|
|
|
12,174 |
|
|
13,346 |
|
10% |
Total operating expenses |
|
|
12,985 |
|
|
13,289 |
|
|
13,570 |
|
|
13,511 |
|
|
15,996 |
|
18% |
|
23% |
|
|
|
51,292 |
|
|
56,366 |
|
10% |
|
|
|
|
|
|
|
|
|
|
|
|
|
|
|
|
|
|
|
|
|
|
|
|
|
|
|
|
|
Income (loss) from continuing operations before income taxes |
|
|
3,176 |
|
|
6,183 |
|
|
4,042 |
|
|
4,788 |
|
|
(2,103) |
|
NM |
|
NM |
|
|
|
18,807 |
|
|
12,910 |
|
(31%) |
Provision for income taxes |
|
|
640 |
|
|
1,531 |
|
|
1,090 |
|
|
1,203 |
|
|
(296) |
|
NM |
|
NM |
|
|
|
3,642 |
|
|
3,528 |
|
(3%) |
|
|
|
|
|
|
|
|
|
|
|
|
|
|
|
|
|
|
|
|
|
|
|
|
|
|
|
|
|
Income (loss) from continuing operations |
|
|
2,536 |
|
|
4,652 |
|
|
2,952 |
|
|
3,585 |
|
|
(1,807) |
|
NM |
|
NM |
|
|
|
15,165 |
|
|
9,382 |
|
(38%) |
Discontinued operations(3) |
|
|
|
|
|
|
|
|
|
|
|
|
|
|
|
|
|
|
|
|
|
|
|
|
|
|
|
|
Income (loss) from discontinued operations |
|
|
(2) |
|
|
(1) |
|
|
(1) |
|
|
2 |
|
|
(1) |
|
NM |
|
50% |
|
|
|
(272) |
|
|
(1) |
|
100% |
Provision (benefit) for income taxes |
|
|
- |
|
|
- |
|
|
- |
|
|
- |
|
|
- |
|
- |
|
- |
|
|
|
(41) |
|
|
- |
|
100% |
Income (loss) from discontinued operations, net of taxes |
|
|
(2) |
|
|
(1) |
|
|
(1) |
|
|
2 |
|
|
(1) |
|
NM |
|
50% |
|
|
|
(231) |
|
|
(1) |
|
100% |
|
|
|
|
|
|
|
|
|
|
|
|
|
|
|
|
|
|
|
|
|
|
|
|
|
|
|
|
|
Net income (loss) before noncontrolling interests |
|
|
2,534 |
|
|
4,651 |
|
|
2,951 |
|
|
3,587 |
|
|
(1,808) |
|
NM |
|
NM |
|
|
|
14,934 |
|
|
9,381 |
|
(37%) |
Net income (loss) attributable to noncontrolling interests |
|
|
21 |
|
|
45 |
|
|
36 |
|
|
41 |
|
|
31 |
|
(24%) |
|
48% |
|
|
|
89 |
|
|
153 |
|
72% |
|
|
|
|
|
|
|
|
|
|
|
|
|
|
|
|
|
|
|
|
|
|
|
|
|
|
|
|
|
Citigroup's net income (loss) |
|
$ |
2,513 |
|
$ |
4,606 |
|
$ |
2,915 |
|
$ |
3,546 |
|
$ |
(1,839) |
|
NM |
|
NM |
|
|
$ |
14,845 |
|
$ |
9,228 |
|
(38%) |
|
|
|
|
|
|
|
|
|
|
|
|
|
|
|
|
|
|
|
|
|
|
|
|
|
|
|
|
|
(1) |
This presentation is in accordance with ASC 326, which requires the provision for credit losses on AFS securities to be included in revenue. |
(2) |
This total excludes the provision for credit losses on AFS securities, which is disclosed separately above. |
(3) |
See footnote 8 on page 1. |
N/A Not applicable.
NM Not meaningful.
Reclassified to conform to the current period's presentation.
Page 2
CITIGROUP CONSOLIDATED BALANCE SHEET
(In millions of dollars)
|
|
|
|
|
|
|
|
|
|
|
|
|
|
|
|
|
4Q23 Increase/ |
||
|
|
December 31, |
|
March 31, |
|
June 30, |
|
September 30, |
|
December 31, |
|
(Decrease) from |
|||||||
|
|
2022 |
|
2023 |
|
2023 |
|
2023 |
|
2023(1) |
|
3Q23 |
|
4Q22 |
|||||
Assets |
|
|
|
|
|
|
|
|
|
|
|
|
|
|
|
|
|
|
|
Cash and due from banks (including segregated cash and other deposits) |
|
$ |
30,577 |
|
$ |
26,224 |
|
$ |
25,763 |
|
$ |
26,548 |
|
$ |
27,342 |
|
3% |
|
(11%) |
Deposits with banks, net of allowance |
|
|
311,448 |
|
|
302,735 |
|
|
271,145 |
|
|
227,439 |
|
|
233,590 |
|
3% |
|
(25%) |
Securities borrowed and purchased under agreements to resell, net of allowance |
|
|
365,401 |
|
|
384,198 |
|
|
337,103 |
|
|
335,059 |
|
|
336,750 |
|
1% |
|
(8%) |
Brokerage receivables, net of allowance |
|
|
54,192 |
|
|
55,491 |
|
|
60,850 |
|
|
66,194 |
|
|
56,337 |
|
(15%) |
|
4% |
Trading account assets |
|
|
334,114 |
|
|
383,906 |
|
|
423,189 |
|
|
406,368 |
|
|
411,756 |
|
1% |
|
23% |
Investments |
|
|
|
|
|
|
|
|
|
|
|
|
|
|
|
|
|
|
|
Available-for-sale debt securities |
|
|
249,679 |
|
|
240,487 |
|
|
237,334 |
|
|
241,783 |
|
|
256,936 |
|
6% |
|
3% |
Held-to-maturity debt securities, net of allowance |
|
|
268,863 |
|
|
264,342 |
|
|
262,066 |
|
|
259,456 |
|
|
254,247 |
|
(2%) |
|
(5%) |
Equity securities |
|
|
8,040 |
|
|
7,749 |
|
|
7,745 |
|
|
7,759 |
|
|
7,902 |
|
2% |
|
(2%) |
Total investments |
|
|
526,582 |
|
|
512,578 |
|
|
507,145 |
|
|
508,998 |
|
|
519,085 |
|
2% |
|
(1%) |
Loans, net of unearned income |
|
|
|
|
|
|
|
|
|
|
|
|
|
|
|
|
|
|
|
Consumer(2) |
|
|
368,067 |
|
|
363,696 |
|
|
374,591 |
|
|
377,714 |
|
|
389,197 |
|
3% |
|
6% |
Corporate(3) |
|
|
289,154 |
|
|
288,299 |
|
|
286,021 |
|
|
288,634 |
|
|
300,165 |
|
4% |
|
4% |
Loans, net of unearned income |
|
|
657,221 |
|
|
651,995 |
|
|
660,612 |
|
|
666,348 |
|
|
689,362 |
|
3% |
|
5% |
Allowance for credit losses on loans (ACLL) |
|
|
(16,974) |
|
|
(17,169) |
|
|
(17,496) |
|
|
(17,629) |
|
|
(18,145) |
|
(3%) |
|
(7%) |
Total loans, net |
|
|
640,247 |
|
|
634,826 |
|
|
643,116 |
|
|
648,719 |
|
|
671,217 |
|
3% |
|
5% |
Goodwill |
|
|
19,691 |
|
|
19,882 |
|
|
19,998 |
|
|
19,829 |
|
|
20,098 |
|
1% |
|
2% |
Intangible assets (including MSRs) |
|
|
4,428 |
|
|
4,632 |
|
|
4,576 |
|
|
4,540 |
|
|
4,421 |
|
(3%) |
|
- |
Property, plant and equipment, net |
|
|
26,253 |
|
|
27,119 |
|
|
27,818 |
|
|
27,959 |
|
|
28,747 |
|
3% |
|
9% |
Other assets, net of allowance |
|
|
103,743 |
|
|
103,522 |
|
|
102,972 |
|
|
96,824 |
|
|
95,963 |
|
(1%) |
|
(7%) |
Total assets |
|
$ |
2,416,676 |
|
$ |
2,455,113 |
|
$ |
2,423,675 |
|
$ |
2,368,477 |
|
$ |
2,405,306 |
|
2% |
|
- |
|
|
|
|
|
|
|
|
|
|
|
|
|
|
|
|
|
|
|
|
Liabilities |
|
|
|
|
|
|
|
|
|
|
|
|
|
|
|
|
|
|
|
Non-interest-bearing deposits in U.S. offices |
|
$ |
122,655 |
|
$ |
123,969 |
|
$ |
109,844 |
|
$ |
104,061 |
|
$ |
112,089 |
|
8% |
|
(9%) |
Interest-bearing deposits in U.S. offices |
|
|
607,470 |
|
|
587,477 |
|
|
590,700 |
|
|
569,428 |
|
|
576,784 |
|
1% |
|
(5%) |
Total U.S. deposits |
|
|
730,125 |
|
|
711,446 |
|
|
700,544 |
|
|
673,489 |
|
|
688,873 |
|
2% |
|
(6%) |
Non-interest-bearing deposits in offices outside the U.S. |
|
|
95,182 |
|
|
90,404 |
|
|
91,899 |
|
|
84,663 |
|
|
88,988 |
|
5% |
|
(7%) |
Interest-bearing deposits in offices outside the U.S. |
|
|
540,647 |
|
|
528,609 |
|
|
527,424 |
|
|
515,354 |
|
|
530,820 |
|
3% |
|
(2%) |
Total international deposits |
|
|
635,829 |
|
|
619,013 |
|
|
619,323 |
|
|
600,017 |
|
|
619,808 |
|
3% |
|
(3%) |
|
|
|
|
|
|
|
|
|
|
|
|
|
|
|
|
|
|
|
|
Total deposits |
|
|
1,365,954 |
|
|
1,330,459 |
|
|
1,319,867 |
|
|
1,273,506 |
|
|
1,308,681 |
|
3% |
|
(4%) |
Securities loaned and sold under agreements to resell |
|
|
202,444 |
|
|
257,681 |
|
|
260,035 |
|
|
256,770 |
|
|
269,157 |
|
5% |
|
33% |
Brokerage payables |
|
|
69,218 |
|
|
76,708 |
|
|
69,433 |
|
|
75,076 |
|
|
65,961 |
|
(12%) |
|
(5%) |
Trading account liabilities |
|
|
170,647 |
|
|
185,010 |
|
|
170,664 |
|
|
164,624 |
|
|
155,345 |
|
(6%) |
|
(9%) |
Short-term borrowings |
|
|
47,096 |
|
|
40,187 |
|
|
40,430 |
|
|
43,166 |
|
|
37,457 |
|
(13%) |
|
(20%) |
Long-term debt |
|
|
271,606 |
|
|
279,684 |
|
|
274,510 |
|
|
275,760 |
|
|
286,619 |
|
4% |
|
6% |
Other liabilities(4) |
|
|
87,873 |
|
|
76,365 |
|
|
79,314 |
|
|
69,380 |
|
|
75,835 |
|
9% |
|
(14%) |
Total liabilities |
|
$ |
2,214,838 |
|
$ |
2,246,094 |
|
$ |
2,214,253 |
|
$ |
2,158,282 |
|
$ |
2,199,055 |
|
2% |
|
(1%) |
|
|
|
|
|
|
|
|
|
|
|
|
|
|
|
|
|
|
|
|
Equity |
|
|
|
|
|
|
|
|
|
|
|
|
|
|
|
|
|
|
|
Stockholders' equity |
|
|
|
|
|
|
|
|
|
|
|
|
|
|
|
|
|
|
|
Preferred stock |
|
$ |
18,995 |
|
$ |
20,245 |
|
$ |
20,245 |
|
$ |
19,495 |
|
$ |
17,600 |
|
(10%) |
|
(7%) |
Common stock |
|
|
31 |
|
|
31 |
|
|
31 |
|
|
31 |
|
|
31 |
|
- |
|
- |
Additional paid-in capital |
|
|
108,458 |
|
|
108,369 |
|
|
108,579 |
|
|
108,757 |
|
|
108,955 |
|
- |
|
- |
Retained earnings |
|
|
194,734 |
|
|
198,353 |
|
|
199,976 |
|
|
202,135 |
|
|
198,905 |
|
(2%) |
|
2% |
Treasury stock, at cost |
|
|
(73,967) |
|
|
(73,262) |
|
|
(74,247) |
|
|
(74,738) |
|
|
(75,238) |
|
(1%) |
|
(2%) |
Accumulated other comprehensive income (loss) (AOCI) |
|
|
(47,062) |
|
|
(45,441) |
|
|
(45,865) |
|
|
(46,177) |
|
|
(44,800) |
|
3% |
|
5% |
Total common equity |
|
$ |
182,194 |
|
$ |
188,050 |
|
$ |
188,474 |
|
$ |
190,008 |
|
$ |
187,853 |
|
(1%) |
|
3% |
|
|
|
|
|
|
|
|
|
|
|
|
|
|
|
|
|
|
|
|
Total Citigroup stockholders' equity |
|
$ |
201,189 |
|
$ |
208,295 |
|
$ |
208,719 |
|
$ |
209,503 |
|
$ |
205,453 |
|
(2%) |
|
2% |
Noncontrolling interests |
|
|
649 |
|
|
724 |
|
|
703 |
|
|
692 |
|
|
798 |
|
15% |
|
23% |
Total equity |
|
|
201,838 |
|
|
209,019 |
|
|
209,422 |
|
|
210,195 |
|
|
206,251 |
|
(2%) |
|
2% |
Total liabilities and equity |
|
$ |
2,416,676 |
|
$ |
2,455,113 |
|
$ |
2,423,675 |
|
$ |
2,368,477 |
|
$ |
2,405,306 |
|
2% |
|
- |
|
|
|
|
|
|
|
|
|
|
|
|
|
|
|
|
|
|
|
|
(1) |
December 31, 2023 is preliminary. |
(2) |
Consumer loans include loans managed by USPB, Wealth and All Other-Legacy Franchises (other than Mexico Small Business and Middle-Market Banking (Mexico SBMM) loans) that are included in Consumer loans. |
(3) |
Corporate loans include loans managed by Services, Markets, Banking, and All Other—Legacy Franchises-Mexico SBMM that are included in Corporate loans. |
(4) |
Includes allowance for credit losses for unfunded lending commitments. See page 19. |
NM Not meaningful.
Reclassified to conform to the current period's presentation.
Page 3
OPERATING SEGMENT, REPORTING UNIT AND COMPONENT DETAILS
(In millions of dollars)
|
|
|
|
|
|
|
|
|
|
|
|
|
|
|
|
|
4Q23 Increase/ |
|
|
Full |
|
Full |
|
FY 2023 vs. |
||||
|
|
4Q |
|
1Q |
|
2Q |
|
3Q |
|
4Q |
|
(Decrease) from |
|
|
Year |
|
Year |
|
FY 2022 Increase/ |
|||||||||
|
|
2022 |
|
2023 |
|
2023 |
|
2023 |
|
2023 |
|
3Q23 |
|
4Q22 |
|
|
2022 |
|
2023 |
|
(Decrease) |
|||||||
Revenues, net of interest expense |
|
|
|
|
|
|
|
|
|
|
|
|
|
|
|
|
|
|
|
|
|
|
|
|
|
|
|
|
Services |
|
$ |
4,264 |
|
$ |
4,383 |
|
$ |
4,545 |
|
$ |
4,622 |
|
$ |
4,500 |
|
(3%) |
|
6% |
|
|
$ |
15,619 |
|
$ |
18,050 |
|
16% |
Markets |
|
|
4,187 |
|
|
5,817 |
|
|
4,838 |
|
|
4,792 |
|
|
3,410 |
|
(29%) |
|
(19%) |
|
|
|
20,161 |
|
|
18,857 |
|
(6%) |
Banking |
|
|
778 |
|
|
1,141 |
|
|
1,134 |
|
|
1,344 |
|
|
949 |
|
(29%) |
|
22% |
|
|
|
5,396 |
|
|
4,568 |
|
(15%) |
U.S. Personal Banking |
|
|
4,407 |
|
|
4,711 |
|
|
4,619 |
|
|
4,917 |
|
|
4,940 |
|
- |
|
12% |
|
|
|
16,872 |
|
|
19,187 |
|
14% |
Wealth |
|
|
1,723 |
|
|
1,766 |
|
|
1,799 |
|
|
1,855 |
|
|
1,671 |
|
(10%) |
|
(3%) |
|
|
|
7,448 |
|
|
7,091 |
|
(5%) |
All Other—managed basis(1)(2) |
|
|
2,438 |
|
|
2,611 |
|
|
2,507 |
|
|
2,213 |
|
|
2,032 |
|
(8%) |
|
(17%) |
|
|
|
8,988 |
|
|
9,363 |
|
4% |
Reconciling Items—Divestiture-related impacts(3) |
|
|
209 |
|
|
1,018 |
|
|
(6) |
|
|
396 |
|
|
(62) |
|
NM |
|
NM |
|
|
|
854 |
|
|
1,346 |
|
58% |
Total net revenues—reported |
|
$ |
18,006 |
|
$ |
21,447 |
|
$ |
19,436 |
|
$ |
20,139 |
|
$ |
17,440 |
|
(13%) |
|
(3%) |
|
|
$ |
75,338 |
|
$ |
78,462 |
|
4% |
|
|
|
|
|
|
|
|
|
|
|
|
|
|
|
|
|
|
|
|
|
|
|
|
|
|
|
|
|
Income (loss) from continuing operations |
|
|
|
|
|
|
|
|
|
|
|
|
|
|
|
|
|
|
|
|
|
|
|
|
|
|
|
|
Services |
|
$ |
1,379 |
|
$ |
1,302 |
|
$ |
1,224 |
|
$ |
1,348 |
|
$ |
797 |
|
(41%) |
|
(42%) |
|
|
$ |
4,924 |
|
$ |
4,671 |
|
(5%) |
Markets |
|
|
803 |
|
|
1,894 |
|
|
1,167 |
|
|
1,081 |
|
|
(122) |
|
NM |
|
NM |
|
|
|
5,924 |
|
|
4,020 |
|
(32%) |
Banking |
|
|
(58) |
|
|
66 |
|
|
42 |
|
|
170 |
|
|
(322) |
|
NM |
|
NM |
|
|
|
383 |
|
|
(44) |
|
NM |
U.S. Personal Banking |
|
|
54 |
|
|
402 |
|
|
461 |
|
|
756 |
|
|
201 |
|
(73%) |
|
NM |
|
|
|
2,770 |
|
|
1,820 |
|
(34%) |
Wealth |
|
|
175 |
|
|
159 |
|
|
64 |
|
|
118 |
|
|
5 |
|
(96%) |
|
(97%) |
|
|
|
950 |
|
|
346 |
|
(64%) |
All Other—managed basis(1)(2) |
|
|
70 |
|
|
181 |
|
|
86 |
|
|
(102) |
|
|
(2,255) |
|
NM |
|
NM |
|
|
|
398 |
|
|
(2,090) |
|
NM |
Reconciling Items—Divestiture-related impacts(3) |
|
|
113 |
|
|
648 |
|
|
(92) |
|
|
214 |
|
|
(111) |
|
NM |
|
NM |
|
|
|
(184) |
|
|
659 |
|
NM |
Income (loss) from continuing operations—reported |
|
|
2,536 |
|
|
4,652 |
|
|
2,952 |
|
|
3,585 |
|
|
(1,807) |
|
NM |
|
NM |
|
|
|
15,165 |
|
|
9,382 |
|
(38%) |
|
|
|
|
|
|
|
|
|
|
|
|
|
|
|
|
|
|
|
|
|
|
|
|
|
|
|
|
|
Discontinued operations |
|
|
(2) |
|
|
(1) |
|
|
(1) |
|
|
2 |
|
|
(1) |
|
NM |
|
50% |
|
|
|
(231) |
|
|
(1) |
|
100% |
|
|
|
|
|
|
|
|
|
|
|
|
|
|
|
|
|
|
|
|
|
|
|
|
|
|
|
|
|
Net income (loss) attributable to noncontrolling interests |
|
|
21 |
|
|
45 |
|
|
36 |
|
|
41 |
|
|
31 |
|
(24%) |
|
48% |
|
|
|
89 |
|
|
153 |
|
72% |
|
|
|
|
|
|
|
|
|
|
|
|
|
|
|
|
|
|
|
|
|
|
|
|
|
|
|
|
|
Net income (loss) |
|
$ |
2,513 |
|
$ |
4,606 |
|
$ |
2,915 |
|
$ |
3,546 |
|
$ |
(1,839) |
|
NM |
|
NM |
|
|
$ |
14,845 |
|
$ |
9,228 |
|
(38%) |
|
|
|
|
|
|
|
|
|
|
|
|
|
|
|
|
|
|
|
|
|
|
|
|
|
|
|
|
|
(1) |
Includes Legacy Franchises and certain unallocated costs of global staff functions (including finance, risk, human resources, legal, and compliance-related costs), other corporate expenses, and unallocated global operations and technology expenses, and income taxes, as well as Corporate Treasury investment activities and discontinued operations. |
(2) |
Reflects results on a managed basis, which excludes divestiture-related impacts related to Citi's divestitures of its Asia consumer banking businesses and the planned divestiture of Mexico consumer banking, small business and middle markets within Legacy Franchises. See page 14 for additional information. |
(3) |
Reconciling Items consist of the divestiture-related impacts excluded from All Other on a managed basis. See page 14 for additional information. The Reconciling Items are fully reflected in the various line items on Citi's Consolidated Statement of Income (page 2). |
NM Not meaningful.
Reclassified to conform to the current period's presentation.
Page 4
SERVICES
(In millions of dollars, except as otherwise noted)
|
|
|
|
|
|
|
|
|
|
|
|
|
|
|
|
|
4Q23 Increase/ |
|
|
Full |
|
Full |
|
FY 2023 vs. |
||||
|
|
4Q |
|
1Q |
|
2Q |
|
3Q |
|
4Q |
|
(Decrease) from |
|
|
Year |
|
Year |
|
FY 2022 Increase/ |
|||||||||
|
|
2022 |
|
2023 |
|
2023 |
|
2023 |
|
2023 |
|
3Q23 |
|
4Q22 |
|
|
2022 |
|
2023 |
|
(Decrease) |
|||||||
Net interest income (including dividends) |
|
$ |
3,035 |
|
$ |
3,115 |
|
$ |
3,232 |
|
$ |
3,426 |
|
$ |
3,425 |
|
- |
|
13% |
|
|
$ |
10,318 |
|
$ |
13,198 |
|
28% |
Fee revenue |
|
|
|
|
|
|
|
|
|
|
|
|
|
|
|
|
|
|
|
|
|
|
|
|
|
|
|
|
Commissions and fees |
|
|
717 |
|
|
740 |
|
|
785 |
|
|
780 |
|
|
813 |
|
4% |
|
13% |
|
|
|
2,882 |
|
|
3,118 |
|
8% |
Other |
|
|
581 |
|
|
605 |
|
|
663 |
|
|
632 |
|
|
608 |
|
(4%) |
|
5% |
|
|
|
2,490 |
|
|
2,508 |
|
1% |
Total fee revenue |
|
|
1,298 |
|
|
1,345 |
|
|
1,448 |
|
|
1,412 |
|
|
1,421 |
|
1% |
|
9% |
|
|
|
5,372 |
|
|
5,626 |
|
5% |
Principal transactions |
|
|
212 |
|
|
226 |
|
|
242 |
|
|
267 |
|
|
271 |
|
1% |
|
28% |
|
|
|
854 |
|
|
1,006 |
|
18% |
All other(1) |
|
|
(281) |
|
|
(303) |
|
|
(377) |
|
|
(483) |
|
|
(617) |
|
(28%) |
|
NM |
|
|
|
(925) |
|
|
(1,780) |
|
(92%) |
Total Non-interest revenue |
|
|
1,229 |
|
|
1,268 |
|
|
1,313 |
|
|
1,196 |
|
|
1,075 |
|
(10%) |
|
(13%) |
|
|
|
5,301 |
|
|
4,852 |
|
(8%) |
Total revenues, net of interest expense |
|
|
4,264 |
|
|
4,383 |
|
|
4,545 |
|
|
4,622 |
|
|
4,500 |
|
(3%) |
|
6% |
|
|
|
15,619 |
|
|
18,050 |
|
16% |
Total operating expenses |
|
|
2,389 |
|
|
2,408 |
|
|
2,504 |
|
|
2,518 |
|
|
2,594 |
|
3% |
|
9% |
|
|
|
8,728 |
|
|
10,024 |
|
15% |
Net credit losses on loans |
|
|
7 |
|
|
6 |
|
|
13 |
|
|
27 |
|
|
(6) |
|
NM |
|
NM |
|
|
|
51 |
|
|
40 |
|
(22%) |
Credit reserve build / (release) for loans |
|
|
1 |
|
|
(72) |
|
|
(14) |
|
|
6 |
|
|
127 |
|
NM |
|
NM |
|
|
|
128 |
|
|
47 |
|
(63%) |
Provision for credit losses on unfunded lending commitments |
|
|
(19) |
|
|
7 |
|
|
(26) |
|
|
23 |
|
|
(22) |
|
NM |
|
(16%) |
|
|
|
24 |
|
|
(18) |
|
NM |
Provisions for credit losses for HTM debt securities and other assets |
|
|
1 |
|
|
45 |
|
|
250 |
|
|
39 |
|
|
547 |
|
NM |
|
NM |
|
|
|
4 |
|
|
881 |
|
NM |
Provision for credit losses |
|
|
(10) |
|
|
(14) |
|
|
223 |
|
|
95 |
|
|
646 |
|
NM |
|
NM |
|
|
|
207 |
|
|
950 |
|
NM |
Income from continuing operations before taxes |
|
|
1,885 |
|
|
1,989 |
|
|
1,818 |
|
|
2,009 |
|
|
1,260 |
|
(37%) |
|
(33%) |
|
|
|
6,684 |
|
|
7,076 |
|
6% |
Income taxes |
|
|
506 |
|
|
687 |
|
|
594 |
|
|
661 |
|
|
463 |
|
(30%) |
|
(8%) |
|
|
|
1,760 |
|
|
2,405 |
|
37% |
Income from continuing operations |
|
|
1,379 |
|
|
1,302 |
|
|
1,224 |
|
|
1,348 |
|
|
797 |
|
(41%) |
|
(42%) |
|
|
|
4,924 |
|
|
4,671 |
|
(5%) |
Noncontrolling interests |
|
|
11 |
|
|
13 |
|
|
16 |
|
|
16 |
|
|
21 |
|
31% |
|
91% |
|
|
|
36 |
|
|
66 |
|
83% |
Net income |
|
$ |
1,368 |
|
$ |
1,289 |
|
$ |
1,208 |
|
$ |
1,332 |
|
$ |
776 |
|
(42%) |
|
(43%) |
|
|
$ |
4,888 |
|
$ |
4,605 |
|
(6%) |
EOP assets (in billions) |
|
$ |
599 |
|
$ |
585 |
|
$ |
584 |
|
$ |
551 |
|
$ |
585 |
|
6% |
|
(2%) |
|
|
|
|
|
|
|
|
|
Average assets (in billions) |
|
|
577 |
|
|
598 |
|
|
583 |
|
|
565 |
|
|
581 |
|
3% |
|
1% |
|
|
$ |
545 |
|
$ |
582 |
|
7% |
Efficiency ratio |
|
|
56% |
|
|
55% |
|
|
55% |
|
|
54% |
|
|
58% |
|
400 bps |
|
200 bps |
|
|
|
56% |
|
|
56% |
|
0 bps |
Average allocated TCE (in billions)(2) |
|
$ |
22.5 |
|
$ |
23.0 |
|
$ |
23.0 |
|
$ |
23.0 |
|
$ |
23.0 |
|
- |
|
2% |
|
|
|
22.5 |
|
|
23.0 |
|
2% |
RoTCE(2) |
|
|
24.1% |
|
|
22.7% |
|
|
21.1% |
|
|
23.0% |
|
|
13.4% |
|
(960) bps |
|
(1,070) bps |
|
|
|
21.7% |
|
|
20.0% |
|
(170) bps |
|
|
|
|
|
|
|
|
|
|
|
|
|
|
|
|
|
|
|
|
|
|
|
|
|
|
|
|
|
Revenue by component |
|
|
|
|
|
|
|
|
|
|
|
|
|
|
|
|
|
|
|
|
|
|
|
|
|
|
|
|
Net interest income |
|
$ |
2,534 |
|
$ |
2,600 |
|
$ |
2,705 |
|
$ |
2,853 |
|
$ |
2,869 |
|
1% |
|
13% |
|
|
$ |
8,832 |
|
$ |
11,027 |
|
25% |
Non-interest revenue |
|
|
690 |
|
|
726 |
|
|
701 |
|
|
643 |
|
|
555 |
|
(14%) |
|
(20%) |
|
|
|
2,947 |
|
|
2,625 |
|
(11%) |
Treasury and Trade Solutions |
|
|
3,224 |
|
|
3,326 |
|
|
3,406 |
|
|
3,496 |
|
|
3,424 |
|
(2%) |
|
6% |
|
|
|
11,779 |
|
|
13,652 |
|
16% |
Net interest income |
|
|
501 |
|
|
515 |
|
|
527 |
|
|
573 |
|
|
556 |
|
(3%) |
|
11% |
|
|
|
1,486 |
|
|
2,171 |
|
46% |
Non-interest revenue |
|
|
539 |
|
|
542 |
|
|
612 |
|
|
553 |
|
|
520 |
|
(6%) |
|
(4%) |
|
|
|
2,354 |
|
|
2,227 |
|
(5%) |
Securities Services |
|
|
1,040 |
|
|
1,057 |
|
|
1,139 |
|
|
1,126 |
|
|
1,076 |
|
(4%) |
|
3% |
|
|
|
3,840 |
|
|
4,398 |
|
15% |
Total Services |
|
$ |
4,264 |
|
$ |
4,383 |
|
$ |
4,545 |
|
$ |
4,622 |
|
$ |
4,500 |
|
(3%) |
|
6% |
|
|
$ |
15,619 |
|
$ |
18,050 |
|
16% |
|
|
|
|
|
|
|
|
|
|
|
|
|
|
|
|
|
|
|
|
|
|
|
|
|
|
|
|
|
Revenue by geography |
|
|
|
|
|
|
|
|
|
|
|
|
|
|
|
|
|
|
|
|
|
|
|
|
|
|
|
|
North America |
|
$ |
1,223 |
|
$ |
1,204 |
|
$ |
1,295 |
|
$ |
1,333 |
|
$ |
1,300 |
|
(2%) |
|
6% |
|
|
$ |
4,782 |
|
$ |
5,132 |
|
7% |
International |
|
|
3,041 |
|
|
3,179 |
|
|
3,250 |
|
|
3,289 |
|
|
3,200 |
|
(3%) |
|
5% |
|
|
|
10,837 |
|
|
12,918 |
|
19% |
Total |
|
$ |
4,264 |
|
$ |
4,383 |
|
$ |
4,545 |
|
$ |
4,622 |
|
$ |
4,500 |
|
(3%) |
|
6% |
|
|
$ |
15,619 |
|
$ |
18,050 |
|
16% |
|
|
|
|
|
|
|
|
|
|
|
|
|
|
|
|
|
|
|
|
|
|
|
|
|
|
|
|
|
Key drivers (in billions of dollars, except as otherwise noted) |
|
|
|
|
|
|
|
|
|
|
|
|
|
|
|
|
|
|
|
|
|
|
|
|
|
|
|
|
Average loans by reporting unit (in billions) |
|
|
|
|
|
|
|
|
|
|
|
|
|
|
|
|
|
|
|
|
|
|
|
|
|
|
|
|
Treasury and Trade Solutions (TTS) |
|
$ |
76 |
|
$ |
78 |
|
$ |
79 |
|
$ |
82 |
|
$ |
82 |
|
- |
|
8% |
|
|
$ |
80 |
|
$ |
80 |
|
- |
Securities Services |
|
|
2 |
|
|
1 |
|
|
1 |
|
|
1 |
|
|
1 |
|
- |
|
(50%) |
|
|
|
2 |
|
|
1 |
|
(50%) |
Total |
|
$ |
78 |
|
$ |
79 |
|
$ |
80 |
|
$ |
83 |
|
$ |
83 |
|
- |
|
6% |
|
|
$ |
82 |
|
$ |
81 |
|
(1%) |
|
|
|
|
|
|
|
|
|
|
|
|
|
|
|
|
|
|
|
|
|
|
|
|
|
|
|
|
|
ACLL as a % of EOP loans(3) |
|
|
0.46% |
|
|
0.36% |
|
|
0.32% |
|
|
0.33% |
|
|
0.47% |
|
14 bps |
|
1 bps |
|
|
|
|
|
|
|
|
|
|
|
|
|
|
|
|
|
|
|
|
|
|
|
|
|
|
|
|
|
|
|
|
|
|
|
|
|
|
Average deposits by reporting unit and selected component (in billions) |
|
|
|
|
|
|
|
|
|
|
|
|
|
|
|
|
|
|
|
|
|
|
|
|
|
|
|
|
Treasury and Trade Solutions (TTS) |
|
$ |
694 |
|
$ |
704 |
|
$ |
688 |
|
$ |
676 |
|
$ |
680 |
|
1% |
|
(2%) |
|
|
$ |
675 |
|
$ |
687 |
|
2% |
Securities Services |
|
|
131 |
|
|
125 |
|
|
125 |
|
|
120 |
|
|
122 |
|
2% |
|
(7%) |
|
|
|
133 |
|
|
123 |
|
(8%) |
Total |
|
$ |
825 |
|
$ |
829 |
|
$ |
813 |
|
$ |
796 |
|
$ |
802 |
|
1% |
|
(3%) |
|
|
$ |
808 |
|
$ |
810 |
|
- |
|
|
|
|
|
|
|
|
|
|
|
|
|
|
|
|
|
|
|
|
|
|
|
|
|
|
|
|
|
AUC/AUA (in trillions of dollars) |
|
$ |
22.2 |
|
$ |
23.0 |
|
$ |
23.6 |
|
$ |
23.0 |
|
$ |
25.1 |
|
9% |
|
13% |
|
|
|
|
|
|
|
|
|
Cross-border transaction value |
|
$ |
81.1 |
|
$ |
83.0 |
|
$ |
87.8 |
|
$ |
87.8 |
|
$ |
99.4 |
|
13% |
|
23% |
|
|
$ |
311.6 |
|
$ |
358.0 |
|
15% |
U.S. dollar clearing volume (in millions) |
|
|
38.2 |
|
|
38.3 |
|
|
38.8 |
|
|
40.0 |
|
|
40.2 |
|
1% |
|
5% |
|
|
|
148.6 |
|
|
157.3 |
|
6% |
Commercial card spend volume |
|
$ |
15.4 |
|
$ |
16.0 |
|
$ |
17.3 |
|
$ |
16.9 |
|
$ |
16.6 |
|
(2%) |
|
8% |
|
|
$ |
57.4 |
|
$ |
66.8 |
|
16% |
|
|
|
|
|
|
|
|
|
|
|
|
|
|
|
|
|
|
|
|
|
|
|
|
|
|
|
|
|
| (1) | Services includes revenues earned by Citi that are subject to a revenue sharing arrangement with Banking—Corporate Lending for Investment Banking, Markets, and Services products sold to clients. |
| (2) | TCE and RoTCE are non-GAAP financial measures. See page 22 for a reconciliation of the summation of the segments' and component's average allocated TCE to Citi's total average TCE and Citi's total average stockholders' equity. |
| (3) | Excludes loans that are carried at fair value for all periods. |
NM Not meaningful.
Reclassified to conform to the current period's presentation.
Page 5
MARKETS
(In millions of dollars, except as otherwise noted)
|
|
|
|
|
|
|
|
|
|
|
|
|
|
|
|
|
4Q23 Increase/ |
|
|
Full |
|
Full |
|
FY 2023 vs. |
||||
|
|
4Q |
|
1Q |
|
2Q |
|
3Q |
|
4Q |
|
(Decrease) from |
|
|
Year |
|
Year |
|
FY 2022 Increase/ |
|||||||||
|
|
2022 |
|
2023 |
|
2023 |
|
2023 |
|
2023 |
|
3Q23 |
|
4Q22 |
|
|
2022 |
|
2023 |
|
(Decrease) |
|||||||
|
|
|
|
|
|
|
|
|
|
|
|
|
|
|
|
|
|
|
|
|
|
|
|
|
|
|
|
|
Net interest income (including dividends) |
|
$ |
1,582 |
|
$ |
1,562 |
|
$ |
2,009 |
|
$ |
1,700 |
|
$ |
1,994 |
|
17% |
|
26% |
|
|
$ |
5,819 |
|
$ |
7,265 |
|
25% |
Fee revenue |
|
|
|
|
|
|
|
|
|
|
|
|
|
|
|
|
|
|
|
|
|
|
|
|
|
|
|
|
Brokerage and fees |
|
|
328 |
|
|
385 |
|
|
331 |
|
|
337 |
|
|
328 |
|
(3%) |
|
- |
|
|
|
1,452 |
|
|
1,381 |
|
(5%) |
Investment banking fees(1) |
|
|
106 |
|
|
89 |
|
|
97 |
|
|
103 |
|
|
103 |
|
- |
|
(3%) |
|
|
|
481 |
|
|
392 |
|
(19%) |
Other |
|
|
40 |
|
|
40 |
|
|
32 |
|
|
32 |
|
|
46 |
|
44% |
|
15% |
|
|
|
139 |
|
|
150 |
|
8% |
Total fee revenue |
|
|
474 |
|
|
514 |
|
|
460 |
|
|
472 |
|
|
477 |
|
1% |
|
1% |
|
|
|
2,072 |
|
|
1,923 |
|
(7%) |
|
|
|
|
|
|
|
|
|
|
|
|
|
|
|
|
|
|
|
|
|
|
|
|
|
|
|
|
|
Principal transactions |
|
|
2,346 |
|
|
3,915 |
|
|
2,540 |
|
|
2,874 |
|
|
1,233 |
|
(57%) |
|
(47%) |
|
|
|
13,087 |
|
|
10,562 |
|
(19%) |
All other(2) |
|
|
(215) |
|
|
(174) |
|
|
(171) |
|
|
(254) |
|
|
(294) |
|
(16%) |
|
(37%) |
|
|
|
(817) |
|
|
(893) |
|
(9%) |
Total Non-interest revenue |
|
|
2,605 |
|
|
4,255 |
|
|
2,829 |
|
|
3,092 |
|
|
1,416 |
|
(54%) |
|
(46%) |
|
|
|
14,342 |
|
|
11,592 |
|
(19%) |
Total revenues, net of interest expense |
|
|
4,187 |
|
|
5,817 |
|
|
4,838 |
|
|
4,792 |
|
|
3,410 |
|
(29%) |
|
(19%) |
|
|
|
20,161 |
|
|
18,857 |
|
(6%) |
Total operating expenses |
|
|
3,174 |
|
|
3,163 |
|
|
3,338 |
|
|
3,303 |
|
|
3,434 |
|
4% |
|
8% |
|
|
|
12,413 |
|
|
13,238 |
|
7% |
Net credit losses on loans |
|
|
1 |
|
|
4 |
|
|
2 |
|
|
(4) |
|
|
30 |
|
NM |
|
NM |
|
|
|
(5) |
|
|
32 |
|
NM |
Credit reserve build / (release) for loans |
|
|
35 |
|
|
63 |
|
|
(24) |
|
|
124 |
|
|
41 |
|
(67%) |
|
17% |
|
|
|
80 |
|
|
204 |
|
NM |
Provision for credit losses on unfunded lending commitments |
|
|
10 |
|
|
(3) |
|
|
(11) |
|
|
3 |
|
|
12 |
|
NM |
|
20% |
|
|
|
10 |
|
|
1 |
|
(90%) |
Provisions for credit losses for HTM debt securities and other assets |
|
|
(7) |
|
|
19 |
|
|
15 |
|
|
40 |
|
|
126 |
|
NM |
|
NM |
|
|
|
70 |
|
|
200 |
|
NM |
Provision for credit losses |
|
|
39 |
|
|
83 |
|
|
(18) |
|
|
163 |
|
|
209 |
|
28% |
|
NM |
|
|
|
155 |
|
|
437 |
|
NM |
Income (loss) from continuing operations before taxes |
|
|
974 |
|
|
2,571 |
|
|
1,518 |
|
|
1,326 |
|
|
(233) |
|
NM |
|
NM |
|
|
|
7,593 |
|
|
5,182 |
|
(32%) |
Income taxes (benefits) |
|
|
171 |
|
|
677 |
|
|
351 |
|
|
245 |
|
|
(111) |
|
NM |
|
NM |
|
|
|
1,669 |
|
|
1,162 |
|
(30%) |
Income (loss) from continuing operations |
|
|
803 |
|
|
1,894 |
|
|
1,167 |
|
|
1,081 |
|
|
(122) |
|
NM |
|
NM |
|
|
|
5,924 |
|
|
4,020 |
|
(32%) |
Noncontrolling interests |
|
|
16 |
|
|
21 |
|
|
19 |
|
|
15 |
|
|
12 |
|
(20%) |
|
(25%) |
|
|
|
52 |
|
|
67 |
|
29% |
Net income (loss) |
|
$ |
787 |
|
$ |
1,873 |
|
$ |
1,148 |
|
$ |
1,066 |
|
$ |
(134) |
|
NM |
|
NM |
|
|
$ |
5,872 |
|
$ |
3,953 |
|
(33%) |
EOP assets (in billions) |
|
$ |
950 |
|
$ |
1,009 |
|
$ |
1,006 |
|
$ |
996 |
|
$ |
988 |
|
(1%) |
|
4% |
|
|
|
|
|
|
|
|
|
Average assets (in billions) |
|
|
979 |
|
|
994 |
|
|
1,032 |
|
|
1,018 |
|
|
1,028 |
|
1% |
|
5% |
|
|
$ |
984 |
|
$ |
1,018 |
|
3% |
Efficiency ratio |
|
|
76% |
|
|
54% |
|
|
69% |
|
|
69% |
|
|
101% |
|
3,200 bps |
|
2,500 bps |
|
|
|
62% |
|
|
70% |
|
800 bps |
Average allocated TCE (in billions)(3) |
|
$ |
51.6 |
|
$ |
53.1 |
|
$ |
53.1 |
|
$ |
53.1 |
|
$ |
53.1 |
|
- |
|
3% |
|
|
|
51.6 |
|
|
53.1 |
|
3% |
RoTCE(3) |
|
|
6.1% |
|
|
14.3% |
|
|
8.7% |
|
|
8.0% |
|
|
(1.0%) |
|
(900) bps |
|
(710) bps |
|
|
|
11.4% |
|
|
7.4% |
|
(400) bps |
|
|
|
|
|
|
|
|
|
|
|
|
|
|
|
|
|
|
|
|
|
|
|
|
|
|
|
|
|
Revenue by component |
|
|
|
|
|
|
|
|
|
|
|
|
|
|
|
|
|
|
|
|
|
|
|
|
|
|
|
|
Fixed Income markets |
|
$ |
3,439 |
|
$ |
4,650 |
|
$ |
3,729 |
|
$ |
3,850 |
|
$ |
2,591 |
|
(33%) |
|
(25%) |
|
|
$ |
15,710 |
|
$ |
14,820 |
|
(6%) |
Equity markets |
|
|
748 |
|
|
1,167 |
|
|
1,109 |
|
|
942 |
|
|
819 |
|
(13%) |
|
9% |
|
|
|
4,451 |
|
|
4,037 |
|
(9%) |
Total |
|
$ |
4,187 |
|
$ |
5,817 |
|
$ |
4,838 |
|
$ |
4,792 |
|
$ |
3,410 |
|
(29%) |
|
(19%) |
|
|
$ |
20,161 |
|
$ |
18,857 |
|
(6%) |
|
|
|
|
|
|
|
|
|
|
|
|
|
|
|
|
|
|
|
|
|
|
|
|
|
|
|
|
|
Rates and currencies |
|
$ |
2,728 |
|
$ |
3,578 |
|
$ |
2,780 |
|
$ |
2,769 |
|
$ |
1,758 |
|
(37%) |
|
(36%) |
|
|
$ |
11,556 |
|
$ |
10,885 |
|
(6%) |
Spread products / other fixed income |
|
|
711 |
|
|
1,072 |
|
|
949 |
|
|
1,081 |
|
|
833 |
|
(23%) |
|
17% |
|
|
|
4,154 |
|
|
3,935 |
|
(5%) |
Total Fixed Income markets revenues |
|
$ |
3,439 |
|
$ |
4,650 |
|
$ |
3,729 |
|
$ |
3,850 |
|
$ |
2,591 |
|
(33%) |
|
(25%) |
|
|
$ |
15,710 |
|
$ |
14,820 |
|
(6%) |
|
|
|
|
|
|
|
|
|
|
|
|
|
|
|
|
|
|
|
|
|
|
|
|
|
|
|
|
|
Revenue by geography |
|
|
|
|
|
|
|
|
|
|
|
|
|
|
|
|
|
|
|
|
|
|
|
|
|
|
|
|
North America |
|
$ |
1,191 |
|
$ |
2,063 |
|
$ |
1,720 |
|
$ |
1,923 |
|
$ |
1,250 |
|
(35%) |
|
5% |
|
|
$ |
6,846 |
|
$ |
6,956 |
|
2% |
International |
|
|
2,996 |
|
|
3,754 |
|
|
3,118 |
|
|
2,869 |
|
|
2,160 |
|
(25%) |
|
(28%) |
|
|
|
13,315 |
|
|
11,901 |
|
(11%) |
Total |
|
$ |
4,187 |
|
$ |
5,817 |
|
$ |
4,838 |
|
$ |
4,792 |
|
$ |
3,410 |
|
(29%) |
|
(19%) |
|
|
$ |
20,161 |
|
$ |
18,857 |
|
(6%) |
|
|
|
|
|
|
|
|
|
|
|
|
|
|
|
|
|
|
|
|
|
|
|
|
|
|
|
|
|
Key drivers (in billions of dollars) |
|
|
|
|
|
|
|
|
|
|
|
|
|
|
|
|
|
|
|
|
|
|
|
|
|
|
|
|
Average loans |
|
$ |
111 |
|
$ |
111 |
|
$ |
107 |
|
$ |
108 |
|
$ |
115 |
|
6% |
|
4% |
|
|
$ |
111 |
|
$ |
110 |
|
(1%) |
NCLs as a % of average loans |
|
|
0.00% |
|
|
0.01% |
|
|
0.01% |
|
|
(0.01%) |
|
|
0.10% |
|
11 bps |
|
10 bps |
|
|
|
0.00% |
|
|
0.03% |
|
3 bps |
ACLL as a % of EOP loans(4) |
|
|
0.58% |
|
|
0.66% |
|
|
0.67% |
|
|
0.76% |
|
|
0.71% |
|
(5) bps |
|
13 bps |
|
|
|
|
|
|
|
|
|
Average Trading account assets |
|
$ |
332 |
|
$ |
349 |
|
$ |
382 |
|
$ |
393 |
|
$ |
391 |
|
(1%) |
|
18% |
|
|
$ |
334 |
|
$ |
379 |
|
13% |
Average deposits |
|
|
21 |
|
|
23 |
|
|
23 |
|
|
24 |
|
|
23 |
|
(4%) |
|
10% |
|
|
|
21 |
|
|
23 |
|
10% |
|
|
|
|
|
|
|
|
|
|
|
|
|
|
|
|
|
|
|
|
|
|
|
|
|
|
|
|
|
| (1) | Investment banking fees are primarily composed of underwriting, advisory, loan syndication structuring, and other related financing activity. |
| (2) | Markets includes revenues earned by Citi that are subject to a revenue sharing arrangement with Banking - Corporate Lending for Investment Banking, Markets, and Services products sold to clients. |
| (3) | TCE and RoTCE are non - GAAP financial measures. See page 22 for a reconciliation of the summation of the segments' and component's average allocated TCE to Citi's total average TCE and Citi's total average stockholders’ equity. |
| (4) | Excludes loans that are carried at fair value for all periods. |
NM Not meaningful.
Reclassified to conform to the current period's presentation.
Page 6
BANKING
(In millions of dollars, except as otherwise noted)
|
|
|
|
|
|
|
|
|
|
|
|
|
|
|
|
|
4Q23 Increase/ |
|
|
Full |
|
Full |
|
FY 2023 vs. |
||||
|
|
4Q |
|
1Q |
|
2Q |
|
3Q |
|
4Q |
|
(Decrease) from |
|
|
Year |
|
Year |
|
FY 2022 Increase/ |
|||||||||
|
|
2022 |
|
2023 |
|
2023 |
|
2023 |
|
2023 |
|
3Q23 |
|
4Q22 |
|
|
2022 |
|
2023 |
|
(Decrease) |
|||||||
|
|
|
|
|
|
|
|
|
|
|
|
|
|
|
|
|
|
|
|
|
|
|
|
|
|
|
|
|
Net interest income (including dividends) |
|
$ |
529 |
|
$ |
491 |
|
$ |
522 |
|
$ |
544 |
|
$ |
537 |
|
(1%) |
|
2% |
|
|
$ |
2,057 |
|
$ |
2,094 |
|
2% |
Fee revenue |
|
|
|
|
|
|
|
|
|
|
|
|
|
|
|
|
|
|
|
|
|
|
|
|
|
|
|
|
Investment banking fees(1) |
|
|
607 |
|
|
740 |
|
|
573 |
|
|
694 |
|
|
706 |
|
2% |
|
16% |
|
|
|
3,053 |
|
|
2,713 |
|
(11%) |
Other |
|
|
46 |
|
|
42 |
|
|
39 |
|
|
39 |
|
|
38 |
|
(3%) |
|
(17%) |
|
|
|
174 |
|
|
158 |
|
(9%) |
Total Fee revenue |
|
|
653 |
|
|
782 |
|
|
612 |
|
|
733 |
|
|
744 |
|
2% |
|
14% |
|
|
|
3,227 |
|
|
2,871 |
|
(11%) |
Principal transactions |
|
|
(452) |
|
|
(334) |
|
|
(216) |
|
|
(163) |
|
|
(223) |
|
(37%) |
|
51% |
|
|
|
(133) |
|
|
(936) |
|
NM |
All other(2) |
|
|
48 |
|
|
202 |
|
|
216 |
|
|
230 |
|
|
(109) |
|
NM |
|
NM |
|
|
|
245 |
|
|
539 |
|
NM |
Total Non-interest revenue |
|
|
249 |
|
|
650 |
|
|
612 |
|
|
800 |
|
|
412 |
|
(49%) |
|
65% |
|
|
|
3,339 |
|
|
2,474 |
|
(26%) |
Total revenues, net of interest expense |
|
|
778 |
|
|
1,141 |
|
|
1,134 |
|
|
1,344 |
|
|
949 |
|
(29%) |
|
22% |
|
|
|
5,396 |
|
|
4,568 |
|
(15%) |
Total operating expenses |
|
|
845 |
|
|
1,232 |
|
|
1,262 |
|
|
1,220 |
|
|
1,155 |
|
(5%) |
|
37% |
|
|
|
4,471 |
|
|
4,869 |
|
9% |
Net credit losses on loans |
|
|
96 |
|
|
12 |
|
|
58 |
|
|
28 |
|
|
71 |
|
NM |
|
(26%) |
|
|
|
106 |
|
|
169 |
|
59% |
Credit reserve build / (release) for loans |
|
|
(153) |
|
|
(66) |
|
|
(112) |
|
|
(29) |
|
|
(163) |
|
NM |
|
(7%) |
|
|
|
270 |
|
|
(370) |
|
NM |
Provision for credit losses on unfunded lending commitments |
|
|
72 |
|
|
(174) |
|
|
(51) |
|
|
(66) |
|
|
(62) |
|
6% |
|
NM |
|
|
|
153 |
|
|
(353) |
|
NM |
Provisions for credit losses for HTM debt securities and other assets |
|
|
12 |
|
|
87 |
|
|
(42) |
|
|
5 |
|
|
339 |
|
NM |
|
NM |
|
|
|
20 |
|
|
389 |
|
NM |
Provision for credit losses |
|
|
27 |
|
|
(141) |
|
|
(147) |
|
|
(62) |
|
|
185 |
|
NM |
|
NM |
|
|
|
549 |
|
|
(165) |
|
NM |
Income (loss) from continuing operations before taxes |
|
|
(94) |
|
|
50 |
|
|
19 |
|
|
186 |
|
|
(391) |
|
NM |
|
NM |
|
|
|
376 |
|
|
(136) |
|
NM |
Income taxes (benefits) |
|
|
(36) |
|
|
(16) |
|
|
(23) |
|
|
16 |
|
|
(69) |
|
NM |
|
(92%) |
|
|
|
(7) |
|
|
(92) |
|
NM |
Income (loss) from continuing operations |
|
|
(58) |
|
|
66 |
|
|
42 |
|
|
170 |
|
|
(322) |
|
NM |
|
NM |
|
|
|
383 |
|
|
(44) |
|
NM |
Noncontrolling interests |
|
|
(3) |
|
|
2 |
|
|
1 |
|
|
1 |
|
|
- |
|
(100%) |
|
100% |
|
|
|
(3) |
|
|
4 |
|
NM |
Net income (loss) |
|
$ |
(55) |
|
$ |
64 |
|
$ |
41 |
|
$ |
169 |
|
$ |
(322) |
|
NM |
|
NM |
|
|
$ |
386 |
|
$ |
(48) |
|
NM |
EOP assets (in billions) |
|
$ |
152 |
|
$ |
146 |
|
$ |
147 |
|
$ |
145 |
|
$ |
147 |
|
1% |
|
(3%) |
|
|
|
|
|
|
|
|
|
Average assets (in billions) |
|
|
160 |
|
|
155 |
|
|
154 |
|
|
150 |
|
|
149 |
|
(1%) |
|
(7%) |
|
|
$ |
159 |
|
$ |
152 |
|
(4%) |
Efficiency ratio |
|
|
109% |
|
|
108% |
|
|
111% |
|
|
91% |
|
|
122% |
|
3,100 bps |
|
1,300 bps |
|
|
|
83% |
|
|
107% |
|
2,400 bps |
Average allocated TCE (in billions)(3) |
|
$ |
21.7 |
|
$ |
21.4 |
|
$ |
21.4 |
|
$ |
21.4 |
|
$ |
21.4 |
|
- |
|
(1%) |
|
|
|
21.7 |
|
|
21.4 |
|
(1%) |
RoTCE(3) |
|
|
(1.0)% |
|
|
1.2% |
|
|
0.8% |
|
|
3.1% |
|
|
(6.0)% |
|
(910) bps |
|
(500) bps |
|
|
|
1.8% |
|
|
(0.2)% |
|
(200) bps |
|
|
|
|
|
|
|
|
|
|
|
|
|
|
|
|
|
|
|
|
|
|
|
|
|
|
|
|
|
Revenue by component |
|
|
|
|
|
|
|
|
|
|
|
|
|
|
|
|
|
|
|
|
|
|
|
|
|
|
|
|
Total Investment Banking |
|
$ |
525 |
|
$ |
675 |
|
$ |
501 |
|
$ |
693 |
|
$ |
669 |
|
(3%) |
|
27% |
|
|
$ |
2,510 |
|
$ |
2,538 |
|
1% |
Corporate Lending—excluding gain/(loss) on loan hedges(2)(4) |
|
|
553 |
|
|
665 |
|
|
699 |
|
|
698 |
|
|
411 |
|
(41%) |
|
(26%) |
|
|
|
2,579 |
|
|
2,473 |
|
(4%) |
Total Banking revenues (ex-gain/(loss) on loan hedges)(2)(4) |
|
|
1,078 |
|
|
1,340 |
|
|
1,200 |
|
|
1,391 |
|
|
1,080 |
|
(22%) |
|
- |
|
|
|
5,089 |
|
|
5,011 |
|
(2%) |
Gain/(loss) on loan hedges(2)(4) |
|
|
(300) |
|
|
(199) |
|
|
(66) |
|
|
(47) |
|
|
(131) |
|
NM |
|
56% |
|
|
|
307 |
|
|
(443) |
|
NM |
Total Banking revenues including gain/(loss) on loan hedges(2)(4) |
|
$ |
778 |
|
$ |
1,141 |
|
$ |
1,134 |
|
$ |
1,344 |
|
$ |
949 |
|
(29%) |
|
22% |
|
|
$ |
5,396 |
|
$ |
4,568 |
|
(15%) |
|
|
|
|
|
|
|
|
|
|
|
|
|
|
|
|
|
|
|
|
|
|
|
|
|
|
|
|
|
Business Metrics—Investment Banking Fees |
|
|
|
|
|
|
|
|
|
|
|
|
|
|
|
|
|
|
|
|
|
|
|
|
|
|
|
|
Advisory |
|
$ |
258 |
|
$ |
276 |
|
$ |
156 |
|
$ |
299 |
|
$ |
286 |
|
(4%) |
|
11% |
|
|
$ |
1,332 |
|
$ |
1,017 |
|
(24%) |
Equity underwriting (Equity Capital Markets (ECM)) |
|
|
132 |
|
|
109 |
|
|
158 |
|
|
123 |
|
|
110 |
|
(11%) |
|
(17%) |
|
|
|
621 |
|
|
500 |
|
(19%) |
Debt underwriting (Debt Capital Markets (DCM)) |
|
|
217 |
|
|
355 |
|
|
259 |
|
|
272 |
|
|
310 |
|
14% |
|
43% |
|
|
|
1,100 |
|
|
1,196 |
|
9% |
Total |
|
$ |
607 |
|
$ |
740 |
|
$ |
573 |
|
$ |
694 |
|
$ |
706 |
|
2% |
|
16% |
|
|
$ |
3,053 |
|
$ |
2,713 |
|
(11%) |
|
|
|
|
|
|
|
|
|
|
|
|
|
|
|
|
|
|
|
|
|
|
|
|
|
|
|
|
|
Revenue by geography |
|
|
|
|
|
|
|
|
|
|
|
|
|
|
|
|
|
|
|
|
|
|
|
|
|
|
|
|
North America |
|
$ |
157 |
|
$ |
370 |
|
$ |
430 |
|
$ |
597 |
|
$ |
378 |
|
(37%) |
|
NM |
|
|
$ |
2,453 |
|
$ |
1,775 |
|
(28%) |
International |
|
|
621 |
|
|
771 |
|
|
704 |
|
|
747 |
|
|
571 |
|
(24%) |
|
(8%) |
|
|
|
2,943 |
|
|
2,793 |
|
(5%) |
Total |
|
$ |
778 |
|
$ |
1,141 |
|
$ |
1,134 |
|
$ |
1,344 |
|
$ |
949 |
|
(29%) |
|
22% |
|
|
$ |
5,396 |
|
$ |
4,568 |
|
(15%) |
|
|
|
|
|
|
|
|
|
|
|
|
|
|
|
|
|
|
|
|
|
|
|
|
|
|
|
|
|
Key drivers (in billions of dollars) |
|
|
|
|
|
|
|
|
|
|
|
|
|
|
|
|
|
|
|
|
|
|
|
|
|
|
|
|
Average loans |
|
$ |
96 |
|
$ |
93 |
|
$ |
91 |
|
$ |
87 |
|
$ |
87 |
|
- |
|
(9%) |
|
|
$ |
98 |
|
$ |
90 |
|
(8%) |
NCLs as a % of average loans |
|
|
0.40% |
|
|
0.05% |
|
|
0.26% |
|
|
0.13% |
|
|
0.32% |
|
19 bps |
|
(8) bps |
|
|
|
0.11% |
|
|
0.19% |
|
8 bps |
ACLL as a % of EOP loans(5) |
|
|
1.89% |
|
|
1.86% |
|
|
1.77% |
|
|
1.78% |
|
|
1.60% |
|
(18) bps |
|
(29) bps |
|
|
|
|
|
|
|
|
|
Average deposits |
|
|
2 |
|
|
1 |
|
|
1 |
|
|
1 |
|
|
1 |
|
- |
|
(50%) |
|
|
|
1 |
|
|
1 |
|
- |
|
|
|
|
|
|
|
|
|
|
|
|
|
|
|
|
|
|
|
|
|
|
|
|
|
|
|
|
|
(1) |
Investment banking fees are primarily composed of underwriting, advisory, loan syndication structuring, and other related financing activity. |
(2) |
Banking includes revenues earned by Citi that are subject to a revenue sharing arrangement with Banking—Corporate Lending for Investment Banking, Markets, and Services products sold to clients. |
(3) |
TCE and RoTCE are non-GAAP financial measures. See page 22 for a reconciliation of the summation of the segments' and component's average allocated TCE to Citi's total average TCE and Citi's total average stockholders' equity. |
(4) |
Credit derivatives are used to economically hedge a portion of the corporate loan portfolio that includes both accrual loans and loans at fair value. Gain/(loss) on loan hedges includes the mark-to-market on the credit derivatives partially offset by the mark-to-market on the loans in the portfolio that are at fair value. Hedges on accrual loans reflect the mark-to-market on credit derivatives used to economically hedge the corporate loan accrual portfolio. The fixed premium costs of these hedges are netted against the corporate lending revenues to reflect the cost of credit protection. Citigroup’s results of operations excluding the impact of gain/(loss) on loan hedges are non-GAAP financial measures. |
(5) |
Excludes loans that are carried at fair value for all periods. |
NM Not meaningful.
Reclassified to conform to the current period's presentation.
Page 7
U.S. PERSONAL BANKING
(In millions of dollars, except as otherwise noted)
|
|
|
|
|
|
|
|
|
|
|
|
|
|
|
|
|
4Q23 Increase/ |
|
|
Full |
|
Full |
|
FY 2023 vs. |
||||
|
|
4Q |
|
1Q |
|
2Q |
|
3Q |
|
4Q |
|
(Decrease) from |
|
|
Year |
|
Year |
|
FY 2022 Increase/ |
|||||||||
|
|
2022 |
|
2023 |
|
2023 |
|
2023 |
|
2023 |
|
3Q23 |
|
4Q22 |
|
|
2022 |
|
2023 |
|
(Decrease) |
|||||||
|
|
|
|
|
|
|
|
|
|
|
|
|
|
|
|
|
|
|
|
|
|
|
|
|
|
|
|
|
Net interest income |
|
$ |
4,736 |
|
$ |
4,854 |
|
$ |
4,883 |
|
$ |
5,175 |
|
$ |
5,238 |
|
1% |
|
11% |
|
|
$ |
18,062 |
|
$ |
20,150 |
|
12% |
Fee revenue |
|
|
|
|
|
|
|
|
|
|
|
|
|
|
|
|
|
|
|
|
|
|
|
|
|
|
|
|
Interchange fees |
|
|
2,422 |
|
|
2,277 |
|
|
2,482 |
|
|
2,434 |
|
|
2,481 |
|
2% |
|
2% |
|
|
|
9,190 |
|
|
9,674 |
|
5% |
Card rewards and partner payments |
|
|
(2,832) |
|
|
(2,590) |
|
|
(2,827) |
|
|
(2,777) |
|
|
(2,889) |
|
(4%) |
|
(2%) |
|
|
|
(10,862) |
|
|
(11,083) |
|
(2%) |
Other |
|
|
99 |
|
|
104 |
|
|
72 |
|
|
75 |
|
|
98 |
|
31% |
|
(1%) |
|
|
|
462 |
|
|
349 |
|
(24%) |
Total fee revenue |
|
|
(311) |
|
|
(209) |
|
|
(273) |
|
|
(268) |
|
|
(310) |
|
(16%) |
|
- |
|
|
|
(1,210) |
|
|
(1,060) |
|
12% |
All other |
|
|
(18) |
|
|
66 |
|
|
9 |
|
|
10 |
|
|
12 |
|
20% |
|
NM |
|
|
|
20 |
|
|
97 |
|
NM |
Total Non-interest revenue |
|
|
(329) |
|
|
(143) |
|
|
(264) |
|
|
(258) |
|
|
(298) |
|
(16%) |
|
9% |
|
|
|
(1,190) |
|
|
(963) |
|
19% |
Total revenues, net of interest expense |
|
|
4,407 |
|
|
4,711 |
|
|
4,619 |
|
|
4,917 |
|
|
4,940 |
|
- |
|
12% |
|
|
|
16,872 |
|
|
19,187 |
|
14% |
|
|
|
|
|
|
|
|
|
|
|
|
|
|
|
|
|
|
|
|
|
|
|
|
|
|
|
|
|
Total operating expenses |
|
|
2,609 |
|
|
2,529 |
|
|
2,498 |
|
|
2,481 |
|
|
2,594 |
|
5% |
|
(1%) |
|
|
|
9,782 |
|
|
10,102 |
|
3% |
Net credit losses on loans |
|
|
852 |
|
|
1,074 |
|
|
1,218 |
|
|
1,343 |
|
|
1,599 |
|
19% |
|
88% |
|
|
|
2,918 |
|
|
5,234 |
|
79% |
Credit reserve build / (release) for loans |
|
|
867 |
|
|
576 |
|
|
303 |
|
|
114 |
|
|
471 |
|
NM |
|
(46%) |
|
|
|
517 |
|
|
1,464 |
|
NM |
Provision for credit losses on unfunded lending commitments |
|
|
- |
|
|
- |
|
|
1 |
|
|
(1) |
|
|
1 |
|
NM |
|
100% |
|
|
|
(1) |
|
|
1 |
|
NM |
Provisions for benefits and claims, and other assets |
|
|
4 |
|
|
(1) |
|
|
3 |
|
|
3 |
|
|
3 |
|
- |
|
(25%) |
|
|
|
14 |
|
|
8 |
|
(43%) |
Provisions for credit losses and for benefits and claims (PBC) |
|
|
1,723 |
|
|
1,649 |
|
|
1,525 |
|
|
1,459 |
|
|
2,074 |
|
42% |
|
20% |
|
|
|
3,448 |
|
|
6,707 |
|
95% |
Income (loss) from continuing operations before taxes |
|
|
75 |
|
|
533 |
|
|
596 |
|
|
977 |
|
|
272 |
|
(72%) |
|
NM |
|
|
|
3,642 |
|
|
2,378 |
|
(35%) |
Income taxes (benefits) |
|
|
21 |
|
|
131 |
|
|
135 |
|
|
221 |
|
|
71 |
|
(68%) |
|
NM |
|
|
|
872 |
|
|
558 |
|
(36%) |
Income (loss) from continuing operations |
|
|
54 |
|
|
402 |
|
|
461 |
|
|
756 |
|
|
201 |
|
(73%) |
|
NM |
|
|
|
2,770 |
|
|
1,820 |
|
(34%) |
Noncontrolling interests |
|
|
- |
|
|
- |
|
|
- |
|
|
- |
|
|
- |
|
- |
|
- |
|
|
|
- |
|
|
- |
|
- |
Net income (loss) |
|
$ |
54 |
|
$ |
402 |
|
$ |
461 |
|
$ |
756 |
|
$ |
201 |
|
(73%) |
|
NM |
|
|
$ |
2,770 |
|
$ |
1,820 |
|
(34%) |
EOP assets (in billions) |
|
$ |
231 |
|
$ |
228 |
|
$ |
228 |
|
$ |
231 |
|
$ |
242 |
|
5% |
|
5% |
|
|
|
|
|
|
|
|
|
Average assets (in billions) |
|
|
223 |
|
|
231 |
|
|
229 |
|
|
230 |
|
|
232 |
|
1% |
|
4% |
|
|
$ |
213 |
|
$ |
231 |
|
8% |
Efficiency ratio |
|
|
59% |
|
|
54% |
|
|
54% |
|
|
50% |
|
|
53% |
|
300 bps |
|
(600) bps |
|
|
|
58% |
|
|
53% |
|
(500) bps |
Average allocated TCE (in billions)(1) |
|
$ |
20.7 |
|
$ |
21.9 |
|
$ |
21.9 |
|
$ |
21.9 |
|
$ |
21.9 |
|
- |
|
6% |
|
|
|
20.7 |
|
|
21.9 |
|
6% |
RoTCE(1) |
|
|
1.0% |
|
|
7.4% |
|
|
8.4% |
|
|
13.7% |
|
|
3.6% |
|
(1,010) bps |
|
260 bps |
|
|
|
13.4% |
|
|
8.3% |
|
(510) bps |
|
|
|
|
|
|
|
|
|
|
|
|
|
|
|
|
|
|
|
|
|
|
|
|
|
|
|
|
|
Revenue by component |
|
|
|
|
|
|
|
|
|
|
|
|
|
|
|
|
|
|
|
|
|
|
|
|
|
|
|
|
Branded Cards |
|
$ |
2,389 |
|
$ |
2,472 |
|
$ |
2,357 |
|
$ |
2,539 |
|
$ |
2,620 |
|
3% |
|
10% |
|
|
$ |
8,962 |
|
$ |
9,988 |
|
11% |
Retail Services |
|
|
1,421 |
|
|
1,610 |
|
|
1,643 |
|
|
1,728 |
|
|
1,636 |
|
(5%) |
|
15% |
|
|
|
5,469 |
|
|
6,617 |
|
21% |
Retail Banking |
|
|
597 |
|
|
629 |
|
|
619 |
|
|
650 |
|
|
684 |
|
5% |
|
15% |
|
|
|
2,441 |
|
|
2,582 |
|
6% |
Total |
|
$ |
4,407 |
|
$ |
4,711 |
|
$ |
4,619 |
|
$ |
4,917 |
|
$ |
4,940 |
|
- |
|
12% |
|
|
$ |
16,872 |
|
$ |
19,187 |
|
14% |
|
|
|
|
|
|
|
|
|
|
|
|
|
|
|
|
|
|
|
|
|
|
|
|
|
|
|
|
|
Average loans and deposits (in billions) |
|
|
|
|
|
|
|
|
|
|
|
|
|
|
|
|
|
|
|
|
|
|
|
|
|
|
|
|
Average loans |
|
$ |
180 |
|
$ |
184 |
|
$ |
189 |
|
$ |
196 |
|
$ |
202 |
|
3% |
|
12% |
|
|
$ |
171 |
|
$ |
193 |
|
13% |
ACLL as a % of EOP loans(2) |
|
|
6.31% |
|
|
6.62% |
|
|
6.44% |
|
|
6.36% |
|
|
6.28% |
|
(8) bps |
|
(3) bps |
|
|
|
|
|
|
|
|
|
Average deposits |
|
|
111 |
|
|
111 |
|
|
113 |
|
|
110 |
|
|
105 |
|
(5%) |
|
(5%) |
|
|
|
115 |
|
|
110 |
|
(4%) |
|
|
|
|
|
|
|
|
|
|
|
|
|
|
|
|
|
|
|
|
|
|
|
|
|
|
|
|
|
(1) |
TCE and RoTCE are non-GAAP financial measures. See page 22 for a reconciliation of the summation of the segments' and component's average allocated TCE to Citi's total average TCE and Citi's total average stockholders' equity. |
(2) |
Excludes loans that are carried at fair value for all periods. |
NM Not meaningful.
Reclassified to conform to the current period's presentation.
Page 8
U.S. PERSONAL BANKING
Metrics
|
|
|
|
|
|
|
|
|
|
|
|
|
|
|
|
|
4Q23 Increase/ |
||
|
|
4Q |
|
1Q |
|
2Q |
|
3Q |
|
4Q |
|
(Decrease) from |
|||||||
|
|
2022 |
|
2023 |
|
2023 |
|
2023 |
|
2023 |
|
3Q23 |
|
4Q22 |
|||||
|
|
|
|
|
|
|
|
|
|
|
|
|
|
|
|
|
|
|
|
U.S. Personal Banking Key Indicators (in billions of dollars, except as otherwise noted) |
|
|
|
|
|
|
|
|
|
|
|
|
|
|
|
|
|
|
|
|
|
|
|
|
|
|
|
|
|
|
|
|
|
|
|
|
|
|
|
New account acquisitions (in thousands) |
|
|
|
|
|
|
|
|
|
|
|
|
|
|
|
|
|
|
|
Branded Cards |
|
|
1,023 |
|
|
1,164 |
|
|
1,131 |
|
|
1,146 |
|
|
1,105 |
|
(4%) |
|
8% |
Retail Services |
|
|
2,806 |
|
|
1,976 |
|
|
2,393 |
|
|
2,152 |
|
|
2,617 |
|
22% |
|
(7%) |
Credit card spend volume |
|
|
|
|
|
|
|
|
|
|
|
|
|
|
|
|
|
|
|
Branded Cards |
|
$ |
125.3 |
|
$ |
115.9 |
|
$ |
126.8 |
|
$ |
125.2 |
|
$ |
129.5 |
|
3% |
|
3% |
Retail Services |
|
|
27.1 |
|
|
20.8 |
|
|
24.8 |
|
|
23.3 |
|
|
26.0 |
|
12% |
|
(4%) |
Average loans(1) |
|
|
|
|
|
|
|
|
|
|
|
|
|
|
|
|
|
|
|
Branded Cards |
|
$ |
95.4 |
|
$ |
96.8 |
|
$ |
99.8 |
|
$ |
103.2 |
|
$ |
106.6 |
|
3% |
|
12% |
Retail Services |
|
|
48.0 |
|
|
48.8 |
|
|
49.0 |
|
|
50.2 |
|
|
51.6 |
|
3% |
|
8% |
Retail Banking |
|
|
36.6 |
|
|
38.0 |
|
|
40.3 |
|
|
42.2 |
|
|
43.9 |
|
4% |
|
20% |
EOP loans(1) |
|
|
|
|
|
|
|
|
|
|
|
|
|
|
|
|
|
|
|
Branded Cards |
|
$ |
100.2 |
|
$ |
97.1 |
|
$ |
103.0 |
|
$ |
105.2 |
|
$ |
111.1 |
|
6% |
|
11% |
Retail Services |
|
|
50.5 |
|
|
48.4 |
|
|
50.0 |
|
|
50.5 |
|
|
53.6 |
|
6% |
|
6% |
Retail Banking |
|
|
37.1 |
|
|
39.2 |
|
|
41.5 |
|
|
43.1 |
|
|
44.4 |
|
3% |
|
20% |
Total revenues, net of interest expenses as a % of average loans |
|
|
|
|
|
|
|
|
|
|
|
|
|
|
|
|
|
|
|
Branded Cards |
|
|
9.94% |
|
|
10.36% |
|
|
9.47% |
|
|
9.76% |
|
|
9.75% |
|
|
|
|
Retail Services |
|
|
11.75% |
|
|
13.38% |
|
|
13.45% |
|
|
13.66% |
|
|
12.58% |
|
|
|
|
NII as a % of average loans(2) |
|
|
|
|
|
|
|
|
|
|
|
|
|
|
|
|
|
|
|
Branded Cards |
|
|
9.03% |
|
|
9.36% |
|
|
9.01% |
|
|
9.12% |
|
|
9.17% |
|
|
|
|
Retail Services |
|
|
16.93% |
|
|
17.54% |
|
|
17.44% |
|
|
17.77% |
|
|
16.99% |
|
|
|
|
NCLs as a % of average loans |
|
|
|
|
|
|
|
|
|
|
|
|
|
|
|
|
|
|
|
Branded Cards |
|
|
1.68% |
|
|
2.18% |
|
|
2.47% |
|
|
2.72% |
|
|
3.06% |
|
|
|
|
Retail Services |
|
|
3.30% |
|
|
4.08% |
|
|
4.46% |
|
|
4.53% |
|
|
5.44% |
|
|
|
|
Retail Banking |
|
|
0.53% |
|
|
0.66% |
|
|
0.59% |
|
|
0.59% |
|
|
0.62% |
|
|
|
|
Loans 90+ days past due as a % of EOP loans |
|
|
|
|
|
|
|
|
|
|
|
|
|
|
|
|
|
|
|
Branded Cards |
|
|
0.63% |
|
|
0.78% |
|
|
0.81% |
|
|
0.92% |
|
|
1.07% |
|
|
|
|
Retail Services |
|
|
1.56% |
|
|
1.76% |
|
|
1.77% |
|
|
2.12% |
|
|
2.36% |
|
|
|
|
Retail Banking(3) |
|
|
0.45% |
|
|
0.42% |
|
|
0.39% |
|
|
0.38% |
|
|
0.40% |
|
|
|
|
Loans 30-89 days past due as a % of EOP loans |
|
|
|
|
|
|
|
|
|
|
|
|
|
|
|
|
|
|
|
Branded Cards |
|
|
0.69% |
|
|
0.76% |
|
|
0.81% |
|
|
0.97% |
|
|
1.03% |
|
|
|
|
Retail Services |
|
|
1.62% |
|
|
1.66% |
|
|
1.81% |
|
|
2.13% |
|
|
2.15% |
|
|
|
|
Retail Banking(3) |
|
|
0.57% |
|
|
0.47% |
|
|
0.57% |
|
|
0.55% |
|
|
0.62% |
|
|
|
|
Branches (actual) |
|
|
654 |
|
|
653 |
|
|
653 |
|
|
652 |
|
|
647 |
|
(1%) |
|
(1%) |
Mortgage originations |
|
$ |
2.7 |
|
$ |
3.3 |
|
$ |
4.5 |
|
$ |
3.9 |
|
$ |
2.8 |
|
(28%) |
|
4% |
|
|
|
|
|
|
|
|
|
|
|
|
|
|
|
|
|
|
|
|
(1) |
Average loans, EOP loans and the related consumer delinquency amounts and ratios include interest and fees receivables balances. |
(2) |
Net interest income includes certain fees that are recorded as interest revenue. |
(3) |
Excludes U.S. government-sponsored agency guaranteed loans. |
Reclassified to conform to the current period’s presentation.
Page 9
WEALTH
(In millions of dollars, except as otherwise noted)
|
|
|
|
|
|
|
|
|
|
|
|
|
|
|
|
|
4Q23 Increase/ |
|
|
Full |
|
Full |
|
FY 2023 vs. |
||||
|
|
4Q |
|
1Q |
|
2Q |
|
3Q |
|
4Q |
|
(Decrease) from |
|
|
Year |
|
Year |
|
FY 2022 Increase/ |
|||||||||
|
|
2022 |
|
2023 |
|
2023 |
|
2023 |
|
2023 |
|
3Q23 |
|
4Q22 |
|
|
2022 |
|
2023 |
|
(Decrease) |
|||||||
|
|
|
|
|
|
|
|
|
|
|
|
|
|
|
|
|
|
|
|
|
|
|
|
|
|
|
|
|
Net interest income |
|
$ |
1,166 |
|
$ |
1,121 |
|
$ |
1,113 |
|
$ |
1,182 |
|
$ |
1,044 |
|
(12%) |
|
(10%) |
|
|
$ |
4,744 |
|
$ |
4,460 |
|
(6%) |
Fee revenue |
|
|
|
|
|
|
|
|
|
|
|
|
|
|
|
|
|
|
|
|
|
|
|
|
|
|
|
|
Commissions and fees |
|
|
247 |
|
|
305 |
|
|
307 |
|
|
302 |
|
|
297 |
|
(2%) |
|
20% |
|
|
|
1,218 |
|
|
1,211 |
|
(1%) |
Other |
|
|
198 |
|
|
174 |
|
|
207 |
|
|
217 |
|
|
210 |
|
(3%) |
|
6% |
|
|
|
866 |
|
|
808 |
|
(7%) |
Total fee revenue |
|
|
445 |
|
|
479 |
|
|
514 |
|
|
519 |
|
|
507 |
|
(2%) |
|
14% |
|
|
|
2,084 |
|
|
2,019 |
|
(3%) |
All other |
|
|
112 |
|
|
166 |
|
|
172 |
|
|
154 |
|
|
120 |
|
(22%) |
|
7% |
|
|
|
620 |
|
|
612 |
|
(1%) |
Total Non-interest revenue |
|
|
557 |
|
|
645 |
|
|
686 |
|
|
673 |
|
|
627 |
|
(7%) |
|
13% |
|
|
|
2,704 |
|
|
2,631 |
|
(3%) |
Total revenues, net of interest expense |
|
|
1,723 |
|
|
1,766 |
|
|
1,799 |
|
|
1,855 |
|
|
1,671 |
|
(10%) |
|
(3%) |
|
|
|
7,448 |
|
|
7,091 |
|
(5%) |
Total operating expenses |
|
|
1,585 |
|
|
1,626 |
|
|
1,660 |
|
|
1,711 |
|
|
1,647 |
|
(4%) |
|
4% |
|
|
|
6,058 |
|
|
6,644 |
|
10% |
Net credit losses on loans |
|
|
56 |
|
|
20 |
|
|
23 |
|
|
24 |
|
|
31 |
|
29% |
|
(45%) |
|
|
|
103 |
|
|
98 |
|
(5%) |
Credit reserve build / (release) for loans |
|
|
(96) |
|
|
(69) |
|
|
30 |
|
|
(19) |
|
|
(27) |
|
(42%) |
|
72% |
|
|
|
190 |
|
|
(85) |
|
NM |
Provision for credit losses on unfunded lending commitments |
|
|
(19) |
|
|
(6) |
|
|
1 |
|
|
(8) |
|
|
1 |
|
NM |
|
NM |
|
|
|
12 |
|
|
(12) |
|
NM |
Provisions for benefits and claims, and other assets |
|
|
2 |
|
|
(3) |
|
|
- |
|
|
1 |
|
|
(1) |
|
NM |
|
NM |
|
|
|
1 |
|
|
(3) |
|
NM |
Provisions for credit losses and for benefits and claims (PBC) |
|
|
(57) |
|
|
(58) |
|
|
54 |
|
|
(2) |
|
|
4 |
|
NM |
|
NM |
|
|
|
306 |
|
|
(2) |
|
(101%) |
Income from continuing operations before taxes |
|
|
195 |
|
|
198 |
|
|
85 |
|
|
146 |
|
|
20 |
|
(86%) |
|
(90%) |
|
|
|
1,084 |
|
|
449 |
|
(59%) |
Income taxes |
|
|
20 |
|
|
39 |
|
|
21 |
|
|
28 |
|
|
15 |
|
(46%) |
|
(25%) |
|
|
|
134 |
|
|
103 |
|
(23%) |
Income from continuing operations |
|
|
175 |
|
|
159 |
|
|
64 |
|
|
118 |
|
|
5 |
|
(96%) |
|
(97%) |
|
|
|
950 |
|
|
346 |
|
(64%) |
Noncontrolling interests |
|
|
- |
|
|
- |
|
|
- |
|
|
- |
|
|
- |
|
- |
|
- |
|
|
|
- |
|
|
- |
|
- |
Net income |
|
$ |
175 |
|
$ |
159 |
|
$ |
64 |
|
$ |
118 |
|
$ |
5 |
|
(96%) |
|
(97%) |
|
|
$ |
950 |
|
$ |
346 |
|
(64%) |
EOP assets (in billions) |
|
$ |
259 |
|
$ |
258 |
|
$ |
241 |
|
$ |
236 |
|
$ |
232 |
|
(2%) |
|
(10%) |
|
|
|
|
|
|
|
|
|
Average assets (in billions) |
|
|
258 |
|
|
261 |
|
|
251 |
|
|
240 |
|
|
234 |
|
(3%) |
|
(9%) |
|
|
$ |
259 |
|
$ |
247 |
|
(5%) |
Efficiency ratio |
|
|
92% |
|
|
92% |
|
|
92% |
|
|
92% |
|
|
99% |
|
700 bps |
|
700 bps |
|
|
|
81% |
|
|
94% |
|
1,300 bps |
Average allocated TCE (in billions)(1) |
|
$ |
13.9 |
|
$ |
13.4 |
|
$ |
13.4 |
|
$ |
13.4 |
|
$ |
13.4 |
|
- |
|
(4%) |
|
|
|
13.9 |
|
|
13.4 |
|
(4%) |
RoTCE(1) |
|
|
5.0% |
|
|
4.8% |
|
|
1.9% |
|
|
3.5% |
|
|
0.1% |
|
(340) bps |
|
(490) bps |
|
|
|
6.8% |
|
|
2.6% |
|
(420) bps |
|
|
|
|
|
|
|
|
|
|
|
|
|
|
|
|
|
|
|
|
|
|
|
|
|
|
|
|
|
Revenue by component |
|
|
|
|
|
|
|
|
|
|
|
|
|
|
|
|
|
|
|
|
|
|
|
|
|
|
|
|
Private Bank |
|
$ |
599 |
|
$ |
568 |
|
$ |
605 |
|
$ |
617 |
|
$ |
542 |
|
(12%) |
|
(10%) |
|
|
$ |
2,812 |
|
$ |
2,332 |
|
(17%) |
Wealth at Work |
|
|
195 |
|
|
193 |
|
|
224 |
|
|
234 |
|
|
211 |
|
(10%) |
|
8% |
|
|
|
730 |
|
|
862 |
|
18% |
Citigold |
|
|
929 |
|
|
1,005 |
|
|
970 |
|
|
1,004 |
|
|
918 |
|
(9%) |
|
(1%) |
|
|
|
3,906 |
|
|
3,897 |
|
- |
Total |
|
$ |
1,723 |
|
$ |
1,766 |
|
$ |
1,799 |
|
$ |
1,855 |
|
$ |
1,671 |
|
(10%) |
|
(3%) |
|
|
$ |
7,448 |
|
$ |
7,091 |
|
(5%) |
|
|
|
|
|
|
|
|
|
|
|
|
|
|
|
|
|
|
|
|
|
|
|
|
|
|
|
|
|
Revenue by geography |
|
|
|
|
|
|
|
|
|
|
|
|
|
|
|
|
|
|
|
|
|
|
|
|
|
|
|
|
North America |
|
$ |
966 |
|
$ |
900 |
|
$ |
904 |
|
$ |
953 |
|
$ |
858 |
|
(10%) |
|
(11%) |
|
|
$ |
3,927 |
|
$ |
3,615 |
|
(8%) |
International |
|
|
757 |
|
|
866 |
|
|
895 |
|
|
902 |
|
|
813 |
|
(10%) |
|
7% |
|
|
|
3,521 |
|
|
3,476 |
|
(1%) |
Total |
|
$ |
1,723 |
|
$ |
1,766 |
|
$ |
1,799 |
|
$ |
1,855 |
|
$ |
1,671 |
|
(10%) |
|
(3%) |
|
|
$ |
7,448 |
|
$ |
7,091 |
|
(5%) |
|
|
|
|
|
|
|
|
|
|
|
|
|
|
|
|
|
|
|
|
|
|
|
|
|
|
|
|
|
Key drivers (in billions of dollars) |
|
|
|
|
|
|
|
|
|
|
|
|
|
|
|
|
|
|
|
|
|
|
|
|
|
|
|
|
|
|
|
|
|
|
|
|
|
|
|
|
|
|
|
|
|
|
|
|
|
|
|
|
|
|
|
|
|
EOP Client balances |
|
|
|
|
|
|
|
|
|
|
|
|
|
|
|
|
|
|
|
|
|
|
|
|
|
|
|
|
Client investment assets(2) |
|
$ |
443 |
|
$ |
459 |
|
$ |
470 |
|
$ |
471 |
|
$ |
498 |
|
6% |
|
12% |
|
|
|
|
|
|
|
|
|
Deposits |
|
|
325 |
|
|
322 |
|
|
315 |
|
|
307 |
|
|
323 |
|
5% |
|
(1%) |
|
|
|
|
|
|
|
|
|
Loans |
|
|
149 |
|
|
150 |
|
|
151 |
|
|
151 |
|
|
152 |
|
1% |
|
2% |
|
|
|
|
|
|
|
|
|
Total |
|
$ |
917 |
|
$ |
931 |
|
$ |
936 |
|
$ |
929 |
|
$ |
973 |
|
5% |
|
6% |
|
|
|
|
|
|
|
|
|
|
|
|
|
|
|
|
|
|
|
|
|
|
|
|
|
|
|
|
|
|
|
|
|
|
|
|
|
|
ACLL as a % of EOP loans |
|
|
0.59% |
|
|
0.52% |
|
|
0.54% |
|
|
0.53% |
|
|
0.51% |
|
(2) bps |
|
(8) bps |
|
|
|
|
|
|
|
|
|
|
|
|
|
|
|
|
|
|
|
|
|
|
|
|
|
|
|
|
|
|
|
|
|
|
|
|
|
|
(1) |
TCE and RoTCE are non-GAAP financial measures. See page 22 for a reconciliation of the summation of the segments' and component's average allocated TCE to Citi's total average TCE and Citi's total average stockholders' equity. |
(2) |
Includes Assets under management, and trust and custody assets. |
NM Not meaningful.
Reclassified to conform to the current period's presentation.
Page 10
ALL OTHER—MANAGED BASIS(1)(2)(3)
(In millions of dollars, except as otherwise noted)
|
|
|
|
|
|
|
|
|
|
|
|
|
|
|
|
|
4Q23 Increase/ |
|
|
Full |
|
Full |
|
FY 2023 vs. |
||||
|
|
4Q |
|
1Q |
|
2Q |
|
3Q |
|
4Q |
|
(Decrease) from |
|
|
Year |
|
Year |
|
FY 2022 Increase/ |
|||||||||
|
|
2022 |
|
2023 |
|
2023 |
|
2023 |
|
2023 |
|
3Q23 |
|
4Q22 |
|
|
2022 |
|
2023 |
|
(Decrease) |
|||||||
|
|
|
|
|
|
|
|
|
|
|
|
|
|
|
|
|
|
|
|
|
|
|
|
|
|
|
|
|
Net interest income |
|
$ |
2,222 |
|
$ |
2,205 |
|
$ |
2,141 |
|
$ |
1,801 |
|
$ |
1,586 |
|
(12%) |
|
(29%) |
|
|
$ |
7,668 |
|
$ |
7,733 |
|
1% |
Non-interest revenue(4)(5)(6)(7) |
|
|
216 |
|
|
406 |
|
|
366 |
|
|
412 |
|
|
446 |
|
8% |
|
NM |
|
|
|
1,320 |
|
|
1,630 |
|
23% |
Total revenues, net of interest expense |
|
|
2,438 |
|
|
2,611 |
|
|
2,507 |
|
|
2,213 |
|
|
2,032 |
|
(8%) |
|
(17%) |
|
|
|
8,988 |
|
|
9,363 |
|
4% |
Total operating expenses(8)(9)(10) |
|
|
2,325 |
|
|
2,258 |
|
|
2,229 |
|
|
2,164 |
|
|
4,466 |
|
NM |
|
92% |
|
|
|
9,144 |
|
|
11,117 |
|
22% |
Net credit losses on loans |
|
|
186 |
|
|
198 |
|
|
198 |
|
|
238 |
|
|
236 |
|
(1%) |
|
27% |
|
|
|
772 |
|
|
870 |
|
13% |
Credit reserve build / (release) for loans |
|
|
(39) |
|
|
- |
|
|
77 |
|
|
(19) |
|
|
92 |
|
NM |
|
NM |
|
|
|
(488) |
|
|
150 |
|
NM |
Provision for credit losses on unfunded lending commitments |
|
|
4 |
|
|
(19) |
|
|
(9) |
|
|
(5) |
|
|
(11) |
|
NM |
|
NM |
|
|
|
120 |
|
|
(44) |
|
NM |
Provisions for benefits and claims, HTM debt securities and other assets |
|
|
13 |
|
|
285 |
|
|
(67) |
|
|
(10) |
|
|
142 |
|
NM |
|
NM |
|
|
|
94 |
|
|
350 |
|
NM |
Provisions for credit losses and for benefits and claims (PBC) |
|
|
164 |
|
|
464 |
|
|
199 |
|
|
204 |
|
|
459 |
|
NM |
|
NM |
|
|
|
498 |
|
|
1,326 |
|
NM |
Income (loss) from continuing operations before taxes |
|
|
(51) |
|
|
(111) |
|
|
79 |
|
|
(155) |
|
|
(2,893) |
|
NM |
|
NM |
|
|
|
(654) |
|
|
(3,080) |
|
NM |
Income taxes (benefits) |
|
|
(121) |
|
|
(292) |
|
|
(7) |
|
|
(53) |
|
|
(638) |
|
NM |
|
NM |
|
|
|
(1,052) |
|
|
(990) |
|
6% |
Income (loss) from continuing operations |
|
|
70 |
|
|
181 |
|
|
86 |
|
|
(102) |
|
|
(2,255) |
|
NM |
|
NM |
|
|
|
398 |
|
|
(2,090) |
|
NM |
Income (loss) from discontinued operations, net of taxes(11) |
|
|
(2) |
|
|
(1) |
|
|
(1) |
|
|
2 |
|
|
(1) |
|
NM |
|
50% |
|
|
|
(231) |
|
|
(1) |
|
100% |
Noncontrolling interests |
|
|
(3) |
|
|
9 |
|
|
- |
|
|
9 |
|
|
(2) |
|
NM |
|
33% |
|
|
|
4 |
|
|
16 |
|
NM |
Net income (loss) |
|
$ |
71 |
|
$ |
171 |
|
$ |
85 |
|
$ |
(109) |
|
$ |
(2,254) |
|
NM |
|
NM |
|
|
$ |
163 |
|
$ |
(2,107) |
|
NM |
EOP assets (in billions) |
|
$ |
226 |
|
$ |
229 |
|
$ |
218 |
|
$ |
209 |
|
$ |
211 |
|
1% |
|
(7%) |
|
|
|
|
|
|
|
|
|
Average assets (in billions) |
|
|
234 |
|
|
223 |
|
|
217 |
|
|
211 |
|
|
203 |
|
(4%) |
|
(13%) |
|
|
$ |
236 |
|
$ |
212 |
|
(10%) |
Efficiency ratio |
|
|
95% |
|
|
86% |
|
|
89% |
|
|
98% |
|
|
220% |
|
12,200 bps |
|
12,500 bps |
|
|
|
102% |
|
|
119% |
|
1,700 bps |
Average allocated TCE (in billions)(12) |
|
|
26.5 |
|
|
28.3 |
|
|
31.3 |
|
|
32.5 |
|
|
32.4 |
|
- |
|
22% |
|
|
|
25.5 |
|
|
30.6 |
|
20% |
|
|
|
|
|
|
|
|
|
|
|
|
|
|
|
|
|
|
|
|
|
|
|
|
|
|
|
|
|
Revenue by reporting unit and component |
|
|
|
|
|
|
|
|
|
|
|
|
|
|
|
|
|
|
|
|
|
|
|
|
|
|
|
|
Asia Consumer |
|
$ |
576 |
|
$ |
503 |
|
$ |
475 |
|
$ |
289 |
|
$ |
257 |
|
(11%) |
|
(55%) |
|
|
$ |
2,926 |
|
$ |
1,524 |
|
(48%) |
Mexico Consumer/SBMM |
|
|
1,221 |
|
|
1,288 |
|
|
1,407 |
|
|
1,522 |
|
|
1,461 |
|
(4%) |
|
20% |
|
|
|
4,622 |
|
|
5,678 |
|
23% |
Legacy Holdings Assets |
|
|
32 |
|
|
8 |
|
|
5 |
|
|
(9) |
|
|
(8) |
|
11% |
|
NM |
|
|
|
(81) |
|
|
(4) |
|
95% |
Corporate/Other |
|
|
609 |
|
|
812 |
|
|
620 |
|
|
411 |
|
|
322 |
|
(22%) |
|
(47%) |
|
|
|
1,521 |
|
|
2,165 |
|
42% |
Total |
|
$ |
2,438 |
|
$ |
2,611 |
|
$ |
2,507 |
|
$ |
2,213 |
|
$ |
2,032 |
|
(8%) |
|
(17%) |
|
|
$ |
8,988 |
|
$ |
9,363 |
|
4% |
|
|
|
|
|
|
|
|
|
|
|
|
|
|
|
|
|
|
|
|
|
|
|
|
|
|
|
|
|
Asia Consumer - Key Indicators (in billions of dollars) |
|
|
|
|
|
|
|
|
|
|
|
|
|
|
|
|
|
|
|
|
|
|
|
|
|
|
|
|
EOP loans |
|
$ |
13.3 |
|
$ |
10.0 |
|
$ |
9.1 |
|
$ |
8.0 |
|
$ |
7.4 |
|
(8%) |
|
(44%) |
|
|
|
|
|
|
|
|
|
EOP deposits |
|
|
14.5 |
|
|
14.4 |
|
|
12.2 |
|
|
10.8 |
|
|
9.5 |
|
(12%) |
|
(34%) |
|
|
|
|
|
|
|
|
|
Average loans |
|
|
13.2 |
|
|
12.1 |
|
|
9.5 |
|
|
8.6 |
|
|
7.8 |
|
(9%) |
|
(41%) |
|
|
|
|
|
|
|
|
|
NCLs as a % of average loans |
|
|
1.23% |
|
|
1.47% |
|
|
1.73% |
|
|
1.43% |
|
|
3.87% |
|
|
|
|
|
|
|
|
|
|
|
|
|
Loans 90+ days past due as a % of EOP loans |
|
|
0.37% |
|
|
0.55% |
|
|
0.55% |
|
|
0.61% |
|
|
0.69% |
|
|
|
|
|
|
|
|
|
|
|
|
|
Loans 30-89 days past due as a % of EOP loans |
|
|
0.53% |
|
|
0.65% |
|
|
0.66% |
|
|
0.73% |
|
|
0.80% |
|
|
|
|
|
|
|
|
|
|
|
|
|
|
|
|
|
|
|
|
|
|
|
|
|
|
|
|
|
|
|
|
|
|
|
|
|
|
|
|
|
|
Mexico Consumer/SBMM - Key Indicators (in billions of dollars) |
|
|
|
|
|
|
|
|
|
|
|
|
|
|
|
|
|
|
|
|
|
|
|
|
|
|
|
|
EOP loans |
|
$ |
21.9 |
|
$ |
24.0 |
|
$ |
26.0 |
|
$ |
26.0 |
|
$ |
27.1 |
|
4% |
|
24% |
|
|
|
|
|
|
|
|
|
EOP deposits |
|
|
36.5 |
|
|
38.3 |
|
|
40.8 |
|
|
40.0 |
|
|
42.2 |
|
6% |
|
16% |
|
|
|
|
|
|
|
|
|
Average loans |
|
|
21.3 |
|
|
22.8 |
|
|
24.7 |
|
|
26.0 |
|
|
25.8 |
|
(1%) |
|
21% |
|
|
|
|
|
|
|
|
|
NCLs as a % of average loans |
|
|
2.48% |
|
|
2.63% |
|
|
2.52% |
|
|
2.95% |
|
|
3.00% |
|
|
|
|
|
|
|
|
|
|
|
|
|
Loans 90+ days past due as a % of EOP loans (Mexico Consumer only) |
|
|
1.28% |
|
|
1.24% |
|
|
1.37% |
|
|
1.32% |
|
|
1.35% |
|
|
|
|
|
|
|
|
|
|
|
|
|
Loans 30-89 days past due as a % of EOP loans (Mexico Consumer only) |
|
|
1.26% |
|
|
1.26% |
|
|
1.28% |
|
|
1.33% |
|
|
1.35% |
|
|
|
|
|
|
|
|
|
|
|
|
|
|
|
|
|
|
|
|
|
|
|
|
|
|
|
|
|
|
|
|
|
|
|
|
|
|
|
|
|
|
Legacy Holdings Assets - Key Indicators (in billions of dollars) |
|
|
|
|
|
|
|
|
|
|
|
|
|
|
|
|
|
|
|
|
|
|
|
|
|
|
|
|
EOP loans |
|
$ |
3.0 |
|
$ |
2.8 |
|
$ |
2.7 |
|
$ |
2.5 |
|
$ |
2.5 |
|
- |
|
(17%) |
|
|
|
|
|
|
|
|
|
|
|
|
|
|
|
|
|
|
|
|
|
|
|
|
|
|
|
|
|
|
|
|
|
|
|
|
|
|
| (1) | Includes Legacy Franchises and certain unallocated costs of global staff functions (including finance, risk, human resources, legal and compliance-related costs), other corporate expenses, and unallocated global operations and technology expenses and income taxes, as well as Corporate Treasury investment activities and discontinued operations. |
| (2) | Reflects results on a managed basis, which excludes divestiture-related impacts related to Citi's sales of its Asia consumer banking businesses and the divestiture of Mexico consumer banking, small business and middle markets within Legacy Franchises. See page 14 for additional information. |
(3)Certain of the results of operations of All Other—Managed basis are non-GAAP financial measures. See page 14 for additional information.
(4) |
See footnote 7 on page 14. |
(5) |
See footnote 5 on page 14. |
(6) |
See footnote 3 on page 14. |
(7) |
See footnote 4 on page 14. |
(8) |
See footnote 2 on page 14. |
(9) |
See footnote 6 on page 14. |
(10) |
See footnote 8 on page 14. |
(11)See footnote 8 on page 1.
(12)TCE is a non-GAAP financial measure. See page 22 for a reconciliation of the summation of the segments' and component's average allocated TCE
NM Not meaningful.
Reclassified to conform to the current period's presentation.
Page 11
ALL OTHER—MANAGED BASIS(1)(2)
Legacy Franchises(3)
(In millions of dollars, except as otherwise noted)
|
|
|
|
|
|
|
|
|
|
|
|
|
|
|
|
|
4Q23 Increase/ |
|
|
Full |
|
Full |
|
FY 2023 vs. |
||||
|
|
4Q |
|
1Q |
|
2Q |
|
3Q |
|
4Q |
|
(Decrease) from |
|
|
Year |
|
Year |
|
FY 2022 Increase/ |
|||||||||
|
|
2022 |
|
2023 |
|
2023 |
|
2023 |
|
2023 |
|
3Q23 |
|
4Q22 |
|
|
2022 |
|
2023 |
|
(Decrease) |
|||||||
|
|
|
|
|
|
|
|
|
|
|
|
|
|
|
|
|
|
|
|
|
|
|
|
|
|
|
|
|
Net interest income |
|
$ |
1,302 |
|
$ |
1,256 |
|
$ |
1,305 |
|
$ |
1,262 |
|
$ |
1,187 |
|
(6%) |
|
(9%) |
|
|
$ |
5,536 |
|
$ |
5,010 |
|
(10%) |
Non-interest revenue(4)(5)(6)(7) |
|
|
527 |
|
|
543 |
|
|
582 |
|
|
540 |
|
|
523 |
|
(3%) |
|
(1%) |
|
|
|
1,931 |
|
|
2,188 |
|
13% |
Total revenues, net of interest expense |
|
|
1,829 |
|
|
1,799 |
|
|
1,887 |
|
|
1,802 |
|
|
1,710 |
|
(5%) |
|
(7%) |
|
|
|
7,467 |
|
|
7,198 |
|
(4%) |
Total operating expenses(8)(9)(10) |
|
|
1,748 |
|
|
1,664 |
|
|
1,685 |
|
|
1,663 |
|
|
1,624 |
|
(2%) |
|
(7%) |
|
|
|
6,994 |
|
|
6,636 |
|
(5%) |
Net credit losses on loans |
|
|
186 |
|
|
198 |
|
|
198 |
|
|
238 |
|
|
236 |
|
(1%) |
|
27% |
|
|
|
772 |
|
|
870 |
|
13% |
Credit reserve build / (release) for loans |
|
|
(39) |
|
|
- |
|
|
77 |
|
|
(19) |
|
|
92 |
|
NM |
|
NM |
|
|
|
(488) |
|
|
150 |
|
NM |
Provision for credit losses on unfunded lending commitments |
|
|
4 |
|
|
(19) |
|
|
(9) |
|
|
(5) |
|
|
(11) |
|
NM |
|
NM |
|
|
|
120 |
|
|
(44) |
|
NM |
Provisions for benefits and claims, HTM debt securities and other assets |
|
|
13 |
|
|
174 |
|
|
46 |
|
|
(9) |
|
|
153 |
|
NM |
|
NM |
|
|
|
91 |
|
|
364 |
|
NM |
Provisions for credit losses and for benefits and claims (PBC) |
|
|
164 |
|
|
353 |
|
|
312 |
|
|
205 |
|
|
470 |
|
NM |
|
NM |
|
|
|
495 |
|
|
1,340 |
|
NM |
Income (loss) from continuing operations before taxes |
|
|
(83) |
|
|
(218) |
|
|
(110) |
|
|
(66) |
|
|
(384) |
|
NM |
|
NM |
|
|
|
(22) |
|
|
(778) |
|
NM |
Income taxes (benefits) |
|
|
(52) |
|
|
(159) |
|
|
(58) |
|
|
24 |
|
|
(108) |
|
NM |
|
NM |
|
|
|
(145) |
|
|
(301) |
|
NM |
Income (loss) from continuing operations |
|
|
(31) |
|
|
(59) |
|
|
(52) |
|
|
(90) |
|
|
(276) |
|
NM |
|
NM |
|
|
|
123 |
|
|
(477) |
|
NM |
Noncontrolling interests |
|
|
3 |
|
|
2 |
|
|
3 |
|
|
2 |
|
|
1 |
|
(50%) |
|
(67%) |
|
|
|
3 |
|
|
8 |
|
NM |
Net income (loss) |
|
$ |
(34) |
|
$ |
(61) |
|
$ |
(55) |
|
$ |
(92) |
|
$ |
(277) |
|
NM |
|
NM |
|
|
$ |
120 |
|
$ |
(485) |
|
NM |
EOP assets (in billions) |
|
$ |
95 |
|
$ |
92 |
|
$ |
91 |
|
$ |
78 |
|
$ |
78 |
|
- |
|
(18%) |
|
|
|
|
|
|
|
|
|
Average assets (in billions) |
|
|
97 |
|
|
95 |
|
|
90 |
|
|
85 |
|
|
79 |
|
(7%) |
|
(19%) |
|
|
$ |
109 |
|
$ |
87 |
|
(20%) |
Efficiency ratio |
|
|
96% |
|
|
92% |
|
|
89% |
|
|
92% |
|
|
95% |
|
300 bps |
|
(100) bps |
|
|
|
94% |
|
|
92% |
|
-200 bps |
Allocated TCE (in billions)(11) |
|
|
11.1 |
|
|
10.0 |
|
|
10.0 |
|
|
10.0 |
|
$ |
10.0 |
|
- |
|
(10%) |
|
|
|
11.1 |
|
|
10.0 |
|
(10%) |
|
|
|
|
|
|
|
|
|
|
|
|
|
|
|
|
|
|
|
|
|
|
|
|
|
|
|
|
|
Revenue by reporting unit and component |
|
|
|
|
|
|
|
|
|
|
|
|
|
|
|
|
|
|
|
|
|
|
|
|
|
|
|
|
Asia Consumer |
|
$ |
576 |
|
$ |
503 |
|
$ |
475 |
|
$ |
289 |
|
$ |
257 |
|
(11%) |
|
(55%) |
|
|
$ |
2,926 |
|
$ |
1,524 |
|
(48%) |
Mexico Consumer/SBMM |
|
|
1,221 |
|
|
1,288 |
|
|
1,407 |
|
|
1,522 |
|
|
1,461 |
|
(4%) |
|
20% |
|
|
|
4,622 |
|
|
5,678 |
|
23% |
Legacy Holdings Assets |
|
|
32 |
|
|
8 |
|
|
5 |
|
|
(9) |
|
|
(8) |
|
11% |
|
NM |
|
|
|
(81) |
|
|
(4) |
|
95% |
Total |
|
$ |
1,829 |
|
$ |
1,799 |
|
$ |
1,887 |
|
$ |
1,802 |
|
$ |
1,710 |
|
(5%) |
|
(7%) |
|
|
$ |
7,467 |
|
$ |
7,198 |
|
(4%) |
|
|
|
|
|
|
|
|
|
|
|
|
|
|
|
|
|
|
|
|
|
|
|
|
|
|
|
|
|
Asia Consumer - Key Indicators (in billions of dollars) |
|
|
|
|
|
|
|
|
|
|
|
|
|
|
|
|
|
|
|
|
|
|
|
|
|
|
|
|
EOP loans |
|
$ |
13.3 |
|
$ |
10.0 |
|
$ |
9.1 |
|
$ |
8.0 |
|
$ |
7.4 |
|
(8%) |
|
(44%) |
|
|
|
|
|
|
|
|
|
EOP deposits |
|
|
14.5 |
|
|
14.4 |
|
|
12.2 |
|
|
10.8 |
|
|
9.5 |
|
(12%) |
|
(34%) |
|
|
|
|
|
|
|
|
|
Average loans |
|
|
13.2 |
|
|
12.1 |
|
|
9.5 |
|
|
8.6 |
|
|
7.8 |
|
(9%) |
|
(41%) |
|
|
|
|
|
|
|
|
|
NCLs as a % of average loans |
|
|
1.23% |
|
|
1.47% |
|
|
1.73% |
|
|
1.43% |
|
|
3.87% |
|
|
|
|
|
|
|
|
|
|
|
|
|
Loans 90+ days past due as a % of EOP loans |
|
|
0.37% |
|
|
0.55% |
|
|
0.55% |
|
|
0.61% |
|
|
0.69% |
|
|
|
|
|
|
|
|
|
|
|
|
|
Loans 30-89 days past due as a % of EOP loans |
|
|
0.53% |
|
|
0.65% |
|
|
0.66% |
|
|
0.73% |
|
|
0.80% |
|
|
|
|
|
|
|
|
|
|
|
|
|
|
|
|
|
|
|
|
|
|
|
|
|
|
|
|
|
|
|
|
|
|
|
|
|
|
|
|
|
|
Mexico Consumer/SBMM - Key Indicators (in billions of dollars) |
|
|
|
|
|
|
|
|
|
|
|
|
|
|
|
|
|
|
|
|
|
|
|
|
|
|
|
|
EOP loans |
|
$ |
21.9 |
|
$ |
24.0 |
|
$ |
26.0 |
|
$ |
26.0 |
|
$ |
27.1 |
|
4% |
|
24% |
|
|
|
|
|
|
|
|
|
EOP deposits |
|
|
36.5 |
|
|
38.3 |
|
|
40.8 |
|
|
40.0 |
|
|
42.2 |
|
6% |
|
16% |
|
|
|
|
|
|
|
|
|
Average loans |
|
|
21.3 |
|
|
22.8 |
|
|
24.7 |
|
|
26.0 |
|
|
25.8 |
|
(1%) |
|
21% |
|
|
|
|
|
|
|
|
|
NCLs as a % of average loans |
|
|
2.48% |
|
|
2.63% |
|
|
2.52% |
|
|
2.95% |
|
|
3.00% |
|
|
|
|
|
|
|
|
|
|
|
|
|
Loans 90+ days past due as a % of EOP loans (Mexico Consumer only) |
|
|
1.28% |
|
|
1.24% |
|
|
1.37% |
|
|
1.32% |
|
|
1.35% |
|
|
|
|
|
|
|
|
|
|
|
|
|
Loans 30-89 days past due as a % of EOP loans (Mexico Consumer only) |
|
|
1.26% |
|
|
1.26% |
|
|
1.28% |
|
|
1.33% |
|
|
1.35% |
|
|
|
|
|
|
|
|
|
|
|
|
|
|
|
|
|
|
|
|
|
|
|
|
|
|
|
|
|
|
|
|
|
|
|
|
|
|
|
|
|
|
Legacy Holdings Assets - Key Indicators (in billions of dollars) |
|
|
|
|
|
|
|
|
|
|
|
|
|
|
|
|
|
|
|
|
|
|
|
|
|
|
|
|
EOP loans |
|
$ |
3.0 |
|
$ |
2.8 |
|
$ |
2.7 |
|
$ |
2.5 |
|
$ |
2.5 |
|
- |
|
(17%) |
|
|
|
|
|
|
|
|
|
|
|
|
|
|
|
|
|
|
|
|
|
|
|
|
|
|
|
|
|
|
|
|
|
|
|
|
|
|
(1) |
Reflects results on a managed basis, which excludes divestiture-related impacts related to Citi's sales of its Asia consumer banking businesses and the divestiture of Mexico consumer banking, small business and middle markets within Legacy Franchises. See page 14 for additional information. |
(2) |
Certain of the results of operations of All Other—Managed basis are non-GAAP financial measures. See page 14 for additional information. |
(3) |
Legacy Franchises consists of the consumer franchises in 13 markets across Asia and EMEA that Citi intends to exit or has exited (Asia Consumer); the consumer, small business and middle-market banking (Mexico SBMM) operations in Mexico (collectively Mexico Consumer/SBMM); and Legacy Holdings Assets (primarily North America consumer mortgage loans and other legacy assets). |
(4) |
See footnote 7 on page 14. |
(5) |
See footnote 5 on page 14. |
(6) |
See footnote 3 on page 14. |
(7) |
See footnote 4 on page 14. |
(8) |
See footnote 2 on page 14. |
(9) |
See footnote 6 on page 14. |
(10) |
See footnote 8 on page 14. |
(11) |
TCE is a non-GAAP financial measure. See page 22 for a reconciliation of the summation of the segments' and component's average allocated TCE |
NM Not meaningful.
Reclassified to conform to the current period's presentation.
Page 12
ALL OTHER
Corporate/Other(1)
(In millions of dollars, except as otherwise noted)
|
|
|
|
|
|
|
|
|
|
|
|
4Q23 Increase/ |
|
|
Full |
|
Full |
|
FY 2023 vs. |
|||||||||
|
|
4Q |
|
1Q |
|
2Q |
|
3Q |
|
4Q |
|
(Decrease) from |
|
|
Year |
|
Year |
|
FY 2022 Increase/ |
|||||||||
|
|
2022 |
|
2023 |
|
2023 |
|
2023 |
|
2023 |
|
3Q23 |
|
4Q22 |
|
|
2022 |
|
2023 |
|
(Decrease) |
|||||||
|
|
|
|
|
|
|
|
|
|
|
|
|
|
|
|
|
|
|
|
|
|
|
|
|
|
|
|
|
Net interest income |
|
$ |
920 |
|
$ |
949 |
|
$ |
836 |
|
$ |
539 |
|
$ |
399 |
|
(26%) |
|
(41%) |
|
|
$ |
2,132 |
|
$ |
2,723 |
|
28% |
Non-interest revenue |
|
|
(311) |
|
|
(137) |
|
|
(216) |
|
|
(128) |
|
|
(77) |
|
40% |
|
59% |
|
|
|
(611) |
|
|
(558) |
|
9% |
Total revenues, net of interest expense |
|
|
609 |
|
|
812 |
|
|
620 |
|
|
411 |
|
|
322 |
|
(22%) |
|
(33%) |
|
|
|
1,521 |
|
|
2,165 |
|
42% |
Total operating expenses |
|
|
577 |
|
|
594 |
|
|
544 |
|
|
501 |
|
|
2,842 |
|
NM |
|
(13%) |
|
|
|
2,150 |
|
|
4,481 |
|
NM |
Provisions for HTM debt securities and other assets |
|
|
- |
|
|
111 |
|
|
(113) |
|
|
(1) |
|
|
(11) |
|
NM |
|
(100%) |
|
|
|
3 |
|
|
(14) |
|
NM |
Income (loss) from continuing operations before taxes |
|
|
32 |
|
|
107 |
|
|
189 |
|
|
(89) |
|
|
(2,509) |
|
NM |
|
NM |
|
|
|
(632) |
|
|
(2,302) |
|
NM |
Income taxes (benefits) |
|
|
(69) |
|
|
(133) |
|
|
51 |
|
|
(77) |
|
|
(530) |
|
NM |
|
(12%) |
|
|
|
(907) |
|
|
(689) |
|
24% |
Income (loss) from continuing operations |
|
|
101 |
|
|
240 |
|
|
138 |
|
|
(12) |
|
|
(1,979) |
|
NM |
|
NM |
|
|
|
275 |
|
|
(1,613) |
|
NM |
Income (loss) from discontinued operations, net of taxes(2) |
|
|
(2) |
|
|
(1) |
|
|
(1) |
|
|
2 |
|
|
(1) |
|
NM |
|
NM |
|
|
|
(231) |
|
|
(1) |
|
100% |
Noncontrolling interests |
|
|
(6) |
|
|
7 |
|
|
(3) |
|
|
7 |
|
|
(3) |
|
NM |
|
NM |
|
|
|
1 |
|
|
8 |
|
NM |
Net income (loss) |
|
$ |
105 |
|
$ |
232 |
|
$ |
140 |
|
$ |
(17) |
|
$ |
(1,977) |
|
NM |
|
NM |
|
|
$ |
43 |
|
$ |
(1,622) |
|
NM |
EOP assets (in billions) |
|
$ |
131 |
|
$ |
137 |
|
$ |
127 |
|
$ |
131 |
|
$ |
133 |
|
2% |
|
- |
|
|
|
|
|
|
|
|
|
Average allocated TCE (in billions)(3) |
|
|
15.4 |
|
|
18.3 |
|
|
21.3 |
|
|
22.5 |
|
|
22.4 |
|
- |
|
45% |
|
|
$ |
14.4 |
|
$ |
21.1 |
|
47% |
|
|
|
|
|
|
|
|
|
|
|
|
|
|
|
|
|
|
|
|
|
|
|
|
|
|
|
|
|
| (1) | Includes certain unallocated costs of global staff functions (including finance, risk, human resources, legal and compliance-related costs), other corporate expenses and unallocated global operations and technology expenses and income taxes, as well as Corporate Treasury investment activities and discontinued operations. |
| (2) | See footnote 8 on page 1. |
| (3) | TCE is a non-GAAP financial measure. See page 22 for a reconciliation of the summation of the segments' and component's average allocated TCE |
NM Not meaningful.
Reclassified to conform to the current period's presentation.
Page 13
RECONCILING ITEMS(1)
(Divestiture-related Impacts)
(In millions of dollars, except as otherwise noted)
|
|
|
|
|
|
|
|
|
|
|
|
|
|
|
|
|
4Q23 Increase/ |
|
|
Full |
|
Full |
|
FY 2023 vs. |
||||
|
|
4Q |
|
1Q |
|
2Q |
|
3Q |
|
4Q |
|
(Decrease) from |
|
|
Year |
|
Year |
|
FY 2022 Increase/ |
|||||||||
|
|
2022 |
|
2023 |
|
2023 |
|
2023 |
|
2023 |
|
3Q23 |
|
4Q22 |
|
|
2022 |
|
2023 |
|
(Decrease) |
|||||||
|
|
|
|
|
|
|
|
|
|
|
|
|
|
|
|
|
|
|
|
|
|
|
|
|
|
|
|
|
Net interest income |
|
$ |
- |
|
$ |
- |
|
$ |
- |
|
$ |
- |
|
$ |
- |
|
- |
|
- |
|
|
$ |
- |
|
$ |
- |
|
- |
Non-interest revenue(3)(4)(5)(7) |
|
|
209 |
|
|
1,018 |
|
|
(6) |
|
|
396 |
|
|
(62) |
|
NM |
|
NM |
|
|
|
854 |
|
|
1,346 |
|
58% |
Total revenues, net of interest expense |
|
|
209 |
|
|
1,018 |
|
|
(6) |
|
|
396 |
|
|
(62) |
|
NM |
|
NM |
|
|
|
854 |
|
|
1,346 |
|
58% |
Total operating expenses(2)(6)(8) |
|
|
58 |
|
|
73 |
|
|
79 |
|
|
114 |
|
|
106 |
|
(7%) |
|
83% |
|
|
|
696 |
|
|
372 |
|
(47%) |
Net credit losses on loans |
|
|
(18) |
|
|
(12) |
|
|
(8) |
|
|
(19) |
|
|
33 |
|
NM |
|
NM |
|
|
|
(156) |
|
|
(6) |
|
96% |
Credit reserve build / (release) for loans |
|
|
(22) |
|
|
3 |
|
|
(3) |
|
|
2 |
|
|
(63) |
|
NM |
|
NM |
|
|
|
259 |
|
|
(61) |
|
NM |
Provision for credit losses on unfunded lending commitments |
|
|
(1) |
|
|
1 |
|
|
(1) |
|
|
- |
|
|
- |
|
- |
|
100% |
|
|
|
(27) |
|
|
- |
|
100% |
Provisions for benefits and claims, HTM debt securities and other assets |
|
|
- |
|
|
- |
|
|
- |
|
|
- |
|
|
- |
|
- |
|
- |
|
|
|
- |
|
|
- |
|
- |
Provisions for credit losses and for benefits and claims (PBC) |
|
|
(41) |
|
|
(8) |
|
|
(12) |
|
|
(17) |
|
|
(30) |
|
(76%) |
|
27% |
|
|
|
76 |
|
|
(67) |
|
NM |
Income (loss) from continuing operations before taxes |
|
|
192 |
|
|
953 |
|
|
(73) |
|
|
299 |
|
|
(138) |
|
NM |
|
NM |
|
|
|
82 |
|
|
1,041 |
|
NM |
Income taxes (benefits) |
|
|
79 |
|
|
305 |
|
|
19 |
|
|
85 |
|
|
(27) |
|
NM |
|
NM |
|
|
|
266 |
|
|
382 |
|
44% |
Income (loss) from continuing operations |
|
|
113 |
|
|
648 |
|
|
(92) |
|
|
214 |
|
|
(111) |
|
NM |
|
NM |
|
|
|
(184) |
|
|
659 |
|
NM |
Income (loss) from discontinued operations, net of taxes |
|
|
- |
|
|
- |
|
|
- |
|
|
- |
|
|
- |
|
- |
|
- |
|
|
|
- |
|
|
- |
|
- |
Noncontrolling interests |
|
|
- |
|
|
- |
|
|
- |
|
|
- |
|
|
- |
|
- |
|
- |
|
|
|
- |
|
|
- |
|
- |
Net income (loss) |
|
$ |
113 |
|
$ |
648 |
|
$ |
(92) |
|
$ |
214 |
|
$ |
(111) |
|
NM |
|
NM |
|
|
$ |
(184) |
|
$ |
659 |
|
NM |
|
|
|
|
|
|
|
|
|
|
|
|
|
|
|
|
|
|
|
|
|
|
|
|
|
|
|
|
|
| (1) | Reconciling Items consist of the divestiture-related impacts excluded from the results of All Other, as well as All Other—Legacy Franchises on a managed basis. The Reconciling Items are fully reflected on Citi's Consolidated Statement of Income on page 2 for each respective line item. |
| (2) | 1Q22 includes an approximate $535 million ($489 million after-tax) goodwill write-down due to re-segmentation and timing of Asia consumer banking business divestitures. For additional information, see Citi's Quarterly Report on Form 10-Q for the quarterly period ended March 31, 2022. |
| (3) | 3Q22 includes an approximate $616 million gain on sale recorded in revenue (approximately $290 million after various taxes) related to Citi's sale of the Philippines consumer banking business. For additional information, see Citi's Quarterly Report on Form 10-Q for the quarterly period ended September 30, 2022 |
| (4) | 4Q22 includes an approximate $209 million (approximately $115 million after various taxes) gain on sale recorded in revenue related to Citi's sale of the Thailand consumer banking business. For additional information, see Citi's Annual Report on Form 10-K for the annual period ended December 31, 2022. |
| (5) | 1Q23 includes an approximate $1.059 billion gain on sale recorded in revenue (approximately $727 million after various taxes) related to Citi's sale of the India consumer banking business. For additional information, see Citi's Quarterly Report on Form 10-Q for the quarterly period ended March 31, 2023. |
| (6) | 2Q23 includes approximately $79 million in expenses (approximately $57 million after-tax), primarily related to separation costs in Mexico and severance costs in Asia exit markets. For additional information, see Citi's Quarterly Report on Form 10-Q for the quarterly period ended June 30, 2023. |
| (7) | 3Q23 includes an approximate $403 million gain on sale recorded in revenue (approximately $284 million after various taxes) related to Citi's sale of the Taiwan consumer banking business. For additional information, see Citi's Quarterly Report on Form 10-Q for the quarterly period ended September 30, 2023. |
| (8) | 4Q23 includes approximately $106 million in operating expenses (approximately $75 million after-tax), primarily related to separation costs in Mexico and, severance costs in the Asia exit markets. |
NM Not meaningful.
Reclassified to conform to the current period's presentation.
Page 14
AVERAGE BALANCES AND INTEREST RATES(1)(2)(3)(4)(5)
Taxable Equivalent Basis
|
|
Average Volumes |
|
Interest |
|
% Average Rate (4) |
|
||||||||||||||||||
In millions of dollars, except as otherwise noted |
|
4Q22 |
|
3Q23 |
|
4Q23(5) |
|
4Q22 |
|
3Q23 |
|
4Q23(5) |
|
4Q22 |
|
3Q23 |
|
4Q23(5) |
|
||||||
Assets |
|
|
|
|
|
|
|
|
|
|
|
|
|
|
|
|
|
|
|
|
|
|
|
|
|
Deposits with banks |
|
$ |
305,658 |
|
$ |
260,159 |
|
$ |
251,723 |
|
$ |
2,343 |
|
$ |
2,645 |
|
$ |
2,513 |
|
3.04% |
|
4.03% |
|
3.96% |
|
Securities borrowed and purchased under resale agreements(6) |
|
|
358,513 |
|
|
352,608 |
|
|
357,058 |
|
|
3,779 |
|
|
7,363 |
|
|
8,096 |
|
4.18% |
|
8.28% |
|
9.00% |
|
Trading account assets(7) |
|
|
277,374 |
|
|
345,864 |
|
|
354,090 |
|
|
2,626 |
|
|
3,893 |
|
|
4,067 |
|
3.76% |
|
4.47% |
|
4.56% |
|
Investments |
|
|
519,072 |
|
|
508,854 |
|
|
516,272 |
|
|
3,812 |
|
|
4,727 |
|
|
4,993 |
|
2.91% |
|
3.69% |
|
3.84% |
|
|
|
|
|
|
|
|
|
|
|
|
|
|
|
|
|
|
|
|
|
|
|
|
|
|
|
Consumer loans |
|
|
360,518 |
|
|
375,632 |
|
|
380,430 |
|
|
8,148 |
|
|
9,609 |
|
|
9,669 |
|
8.97% |
|
10.15% |
|
10.08% |
|
Corporate loans |
|
|
291,984 |
|
|
286,654 |
|
|
294,242 |
|
|
4,121 |
|
|
5,447 |
|
|
5,832 |
|
5.60% |
|
7.54% |
|
7.86% |
|
Total loans (net of unearned income)(8) |
|
|
652,502 |
|
|
662,286 |
|
|
674,672 |
|
|
12,269 |
|
|
15,056 |
|
|
15,501 |
|
7.46% |
|
9.02% |
|
9.12% |
|
Other interest-earning assets |
|
|
98,131 |
|
|
76,400 |
|
|
76,483 |
|
|
912 |
|
|
1,176 |
|
|
1,230 |
|
3.69% |
|
6.11% |
|
6.38% |
|
Total average interest-earning assets |
|
$ |
2,211,250 |
|
$ |
2,206,171 |
|
$ |
2,230,298 |
|
$ |
25,741 |
|
$ |
34,860 |
|
$ |
36,400 |
|
4.62% |
|
6.27% |
|
6.48% |
|
|
|
|
|
|
|
|
|
|
|
|
|
|
|
|
|
|
|
|
|
|
|
|
|
|
|
Liabilities |
|
|
|
|
|
|
|
|
|
|
|
|
|
|
|
|
|
|
|
|
|
|
|
|
|
Deposits |
|
$ |
1,131,425 |
|
$ |
1,121,163 |
|
$ |
1,124,798 |
|
$ |
5,998 |
|
$ |
9,630 |
|
$ |
10,235 |
|
2.10% |
|
3.41% |
|
3.61% |
|
Securities loaned and sold under repurchase agreements(6) |
|
|
205,138 |
|
|
275,123 |
|
|
288,144 |
|
|
2,267 |
|
|
6,090 |
|
|
6,830 |
|
4.38% |
|
8.78% |
|
9.40% |
|
Trading account liabilities(7) |
|
|
121,423 |
|
|
111,367 |
|
|
106,399 |
|
|
681 |
|
|
892 |
|
|
878 |
|
2.23% |
|
3.18% |
|
3.27% |
|
Short-term borrowings and other interest-bearing liabilities |
|
|
153,326 |
|
|
117,435 |
|
|
116,054 |
|
|
1,420 |
|
|
1,956 |
|
|
2,056 |
|
3.67% |
|
6.61% |
|
7.03% |
|
Long-term debt(9) |
|
|
169,642 |
|
|
158,485 |
|
|
165,349 |
|
|
2,072 |
|
|
2,441 |
|
|
2,556 |
|
4.85% |
|
6.11% |
|
6.13% |
|
Total average interest-bearing liabilities |
|
$ |
1,780,954 |
|
$ |
1,783,573 |
|
$ |
1,800,744 |
|
$ |
12,438 |
|
$ |
21,009 |
|
$ |
22,555 |
|
2.77% |
|
4.67% |
|
4.97% |
|
|
|
|
|
|
|
|
|
|
|
|
|
|
|
|
|
|
|
|
|
|
|
|
|
|
|
Net interest income as a % of average interest-earning assets (NIM)(9) |
|
|
|
|
|
|
|
|
|
|
$ |
13,303 |
|
$ |
13,851 |
|
$ |
13,845 |
|
2.39% |
|
2.49% |
|
2.46% |
|
|
|
|
|
|
|
|
|
|
|
|
|
|
|
|
|
|
|
|
|
|
|
|
|
|
|
4Q23 increase (decrease) from: |
|
|
|
|
|
|
|
|
|
|
|
|
|
|
|
|
|
|
|
7 |
bps |
(3) |
bps |
|
|
|
|
|
|
|
|
|
|
|
|
|
|
|
|
|
|
|
|
|
|
|
|
|
|
|
|
|
|
|
|
|
|
|
|
|
|
|
|
|
|
|
|
|
|
|
|
|
|
|
|
|
|
| (1) | Interest revenue and Net interest income include the taxable equivalent adjustments (based on the U.S. federal statutory tax rate of 21%) of $33 million for 4Q22, $23 million for 3Q23 and $21 million for 4Q23. |
| (2) | Citigroup average balances and interest rates include both domestic and international operations. |
| (3) | Monthly averages have been used by certain subsidiaries where daily averages are unavailable. |
| (4) | Average rate percentage is calculated as annualized interest over average volumes. |
| (5) | 4Q23 is preliminary. |
| (6) | Average volumes of securities borrowed or purchased under agreements to resell and securities loaned or sold under agreements to repurchase are reported net pursuant to FIN 41; the related interest excludes the impact of ASU 2013-01 (Topic 210). |
| (7) | Interest expense on Trading account liabilities of Services, Markets, and Banking is reported as a reduction of Interest revenue. Interest revenue and Interest expense on cash collateral positions are reported in Trading account assets and Trading account liabilities, respectively. |
| (8) | Nonperforming loans are included in the average loan balances. |
| (9) | Excludes hybrid financial instruments with changes in fair value recorded in Principal transactions revenue. |
Reclassified to conform to the current period's presentation.
Page 15
EOP LOANS(1)(2)
(In billions of dollars)
|
|
|
|
|
|
|
|
|
|
|
|
|
|
|
|
|
4Q23 Increase/ |
||
|
|
4Q |
|
1Q |
|
2Q |
|
3Q |
|
4Q |
|
(Decrease) from |
|||||||
|
|
2022 |
|
2023 |
|
2023 |
|
2023 |
|
2023 |
|
3Q23 |
|
4Q22 |
|||||
|
|
|
|
|
|
|
|
|
|
|
|
|
|
|
|
|
|
|
|
Corporate loans by region |
|
|
|
|
|
|
|
|
|
|
|
|
|
|
|
|
|
|
|
North America |
|
$ |
127.8 |
|
$ |
125.1 |
|
$ |
121.7 |
|
$ |
123.0 |
|
$ |
128.9 |
|
5% |
|
1% |
International |
|
|
161.4 |
|
|
163.2 |
|
|
164.3 |
|
|
165.6 |
|
|
171.3 |
|
3% |
|
6% |
Total corporate loans |
|
$ |
289.2 |
|
$ |
288.3 |
|
$ |
286.0 |
|
$ |
288.6 |
|
$ |
300.2 |
|
4% |
|
4% |
|
|
|
|
|
|
|
|
|
|
|
|
|
|
|
|
|
|
|
|
Corporate loans by segment and reporting unit |
|
|
|
|
|
|
|
|
|
|
|
|
|
|
|
|
|
|
|
Services |
|
$ |
76.6 |
|
$ |
80.1 |
|
$ |
83.6 |
|
$ |
83.4 |
|
$ |
84.7 |
|
2% |
|
11% |
Markets |
|
|
114.2 |
|
|
111.5 |
|
|
107.2 |
|
|
112.8 |
|
|
122.2 |
|
8% |
|
7% |
Banking |
|
|
91.3 |
|
|
89.0 |
|
|
87.0 |
|
|
84.2 |
|
|
84.9 |
|
1% |
|
(7%) |
All Other - Legacy Franchises - Mexico SBMM |
|
|
7.1 |
|
|
7.7 |
|
|
8.2 |
|
|
8.2 |
|
|
8.4 |
|
2% |
|
18% |
Total corporate loans |
|
$ |
289.2 |
|
$ |
288.3 |
|
$ |
286.0 |
|
$ |
288.6 |
|
$ |
300.2 |
|
4% |
|
4% |
|
|
|
|
|
|
|
|
|
|
|
|
|
|
|
|
|
|
|
|
U.S. Personal Banking |
|
|
|
|
|
|
|
|
|
|
|
|
|
|
|
|
|
|
|
Branded Cards |
|
$ |
100.2 |
|
$ |
97.1 |
|
$ |
103.0 |
|
$ |
105.2 |
|
$ |
111.1 |
|
6% |
|
11% |
Retail Services |
|
|
50.5 |
|
|
48.4 |
|
|
50.0 |
|
|
50.5 |
|
|
53.6 |
|
6% |
|
6% |
Retail Banking |
|
|
37.1 |
|
|
39.2 |
|
|
41.5 |
|
|
43.1 |
|
|
44.4 |
|
3% |
|
20% |
Total USPB |
|
$ |
187.8 |
|
$ |
184.7 |
|
$ |
194.5 |
|
$ |
198.8 |
|
$ |
209.1 |
|
5% |
|
11% |
|
|
|
|
|
|
|
|
|
|
|
|
|
|
|
|
|
|
|
|
Wealth by region |
|
|
|
|
|
|
|
|
|
|
|
|
|
|
|
|
|
|
|
North America |
|
$ |
98.2 |
|
$ |
98.9 |
|
$ |
99.5 |
|
$ |
101.1 |
|
$ |
101.6 |
|
- |
|
3% |
International |
|
|
51.0 |
|
|
51.0 |
|
|
51.0 |
|
|
49.5 |
|
|
49.9 |
|
1% |
|
(2%) |
Total Wealth |
|
$ |
149.2 |
|
$ |
149.9 |
|
$ |
150.5 |
|
$ |
150.6 |
|
$ |
151.5 |
|
1% |
|
2% |
|
|
|
|
|
|
|
|
|
|
|
|
|
|
|
|
|
|
|
|
All Other - Consumer |
|
|
|
|
|
|
|
|
|
|
|
|
|
|
|
|
|
|
|
Asia Consumer(3) |
|
$ |
13.3 |
|
$ |
10.0 |
|
$ |
9.1 |
|
$ |
8.0 |
|
$ |
7.4 |
|
(8%) |
|
(44%) |
Mexico Consumer |
|
|
14.8 |
|
|
16.3 |
|
|
17.8 |
|
|
17.8 |
|
|
18.7 |
|
5% |
|
26% |
Legacy Holdings Assets |
|
|
3.0 |
|
|
2.8 |
|
|
2.7 |
|
|
2.5 |
|
|
2.5 |
|
- |
|
(17%) |
Total |
|
$ |
31.1 |
|
$ |
29.1 |
|
$ |
29.6 |
|
$ |
28.3 |
|
$ |
28.6 |
|
1% |
|
(8%) |
|
|
|
|
|
|
|
|
|
|
|
|
|
|
|
|
|
|
|
|
Total consumer loans |
|
$ |
368.1 |
|
$ |
363.7 |
|
$ |
374.6 |
|
$ |
377.7 |
|
$ |
389.2 |
|
3% |
|
6% |
|
|
|
|
|
|
|
|
|
|
|
|
|
|
|
|
|
|
|
|
Total loans - EOP |
|
$ |
657.2 |
|
$ |
652.0 |
|
$ |
660.6 |
|
$ |
666.3 |
|
$ |
689.4 |
|
3% |
|
5% |
|
|
|
|
|
|
|
|
|
|
|
|
|
|
|
|
|
|
|
|
Total loans - average |
|
$ |
652.5 |
|
$ |
653.7 |
|
$ |
653.6 |
|
$ |
662.3 |
|
$ |
674.7 |
|
2% |
|
3% |
|
|
|
|
|
|
|
|
|
|
|
|
|
|
|
|
|
|
|
|
NCLs as a % of total average loans |
|
|
0.72% |
|
|
0.81% |
|
|
0.92% |
|
|
0.98% |
|
|
1.17% |
|
19 bps |
|
45 bps |
|
|
|
|
|
|
|
|
|
|
|
|
|
|
|
|
|
|
|
|
(1) |
Corporate loans include loans managed by Services, Markets, Banking, and All Other—Legacy Franchises-Mexico SBMM that are included in Corporate loans. |
(2) |
Consumer loans include loans managed by USPB, Wealth and All Other-Legacy Franchises (other than Mexico Small Business and Middle-Market Banking (Mexico SBMM) loans) that are included in Consumer loans. |
(3) |
Asia Consumer also includes loans in Poland and Russia. |
NM Not meaningful.
Reclassified to conform to the current period's presentation.
Page 16
EOP DEPOSITS
(In billions of dollars)
|
|
|
|
|
|
|
|
|
|
|
|
|
|
|
|
|
4Q23 Increase/ |
||
|
|
4Q |
|
1Q |
|
2Q |
|
3Q |
|
4Q |
|
(Decrease) from |
|||||||
|
|
2022 |
|
2023 |
|
2023 |
|
2023 |
|
2023 |
|
3Q23 |
|
4Q22 |
|||||
Services, Markets, and Banking by region |
|
|
|
|
|
|
|
|
|
|
|
|
|
|
|
|
|
|
|
North America |
|
$ |
405.5 |
|
$ |
394.7 |
|
$ |
393.2 |
|
$ |
371.5 |
|
$ |
371.1 |
|
- |
|
(8%) |
International |
|
|
439.9 |
|
|
424.7 |
|
|
425.0 |
|
|
410.8 |
|
|
429.8 |
|
5% |
|
(2%) |
Total |
|
$ |
845.4 |
|
$ |
819.4 |
|
$ |
818.2 |
|
$ |
782.3 |
|
$ |
800.9 |
|
2% |
|
(5%) |
|
|
|
|
|
|
|
|
|
|
|
|
|
|
|
|
|
|
|
|
Treasury and Trade Solutions |
|
$ |
701.3 |
|
$ |
670.9 |
|
$ |
671.4 |
|
$ |
643.0 |
|
$ |
659.5 |
|
3% |
|
(6%) |
Securities Services |
|
|
119.8 |
|
|
124.2 |
|
|
124.4 |
|
|
113.7 |
|
|
119.9 |
|
5% |
|
- |
Services |
|
$ |
821.1 |
|
$ |
795.1 |
|
$ |
795.8 |
|
$ |
756.7 |
|
$ |
779.4 |
|
3% |
|
(5%) |
Markets |
|
|
22.6 |
|
|
23.0 |
|
|
21.5 |
|
|
24.7 |
|
|
20.8 |
|
(16%) |
|
(8%) |
Banking |
|
|
1.7 |
|
|
1.3 |
|
|
0.9 |
|
|
0.9 |
|
|
0.7 |
|
(22%) |
|
(59%) |
Total |
|
$ |
845.4 |
|
$ |
819.4 |
|
$ |
818.2 |
|
$ |
782.3 |
|
$ |
800.9 |
|
2% |
|
(5%) |
|
|
|
|
|
|
|
|
|
|
|
|
|
|
|
|
|
|
|
|
U.S Personal Banking |
|
$ |
112.5 |
|
$ |
114.7 |
|
$ |
112.3 |
|
$ |
108.9 |
|
$ |
103.2 |
|
(5%) |
|
(8%) |
|
|
|
|
|
|
|
|
|
|
|
|
|
|
|
|
|
|
|
|
Wealth |
|
|
|
|
|
|
|
|
|
|
|
|
|
|
|
|
|
|
|
North America |
|
$ |
193.9 |
|
$ |
192.6 |
|
$ |
184.7 |
|
$ |
183.8 |
|
$ |
196.2 |
|
7% |
|
1% |
International |
|
|
131.4 |
|
|
129.6 |
|
|
129.8 |
|
|
123.6 |
|
|
126.5 |
|
2% |
|
(4%) |
Total |
|
$ |
325.3 |
|
$ |
322.2 |
|
$ |
314.5 |
|
$ |
307.4 |
|
$ |
322.7 |
|
5% |
|
(1%) |
|
|
|
|
|
|
|
|
|
|
|
|
|
|
|
|
|
|
|
|
All Other |
|
|
|
|
|
|
|
|
|
|
|
|
|
|
|
|
|
|
|
Legacy Franchises |
|
|
|
|
|
|
|
|
|
|
|
|
|
|
|
|
|
|
|
Asia Consumer(1) |
|
$ |
14.5 |
|
$ |
14.4 |
|
$ |
12.2 |
|
$ |
10.8 |
|
$ |
9.5 |
|
(12%) |
|
(34%) |
Mexico Consumer/SBMM |
|
|
36.5 |
|
|
38.3 |
|
|
40.8 |
|
|
40.0 |
|
|
42.2 |
|
6% |
|
16% |
Legacy Holdings Assets |
|
|
- |
|
|
- |
|
|
- |
|
|
- |
|
|
- |
|
- |
|
- |
Corporate/Other |
|
|
31.8 |
|
|
21.5 |
|
|
21.9 |
|
|
24.1 |
|
|
30.2 |
|
25% |
|
(5%) |
Total |
|
$ |
82.8 |
|
$ |
74.2 |
|
$ |
74.9 |
|
$ |
74.9 |
|
$ |
81.9 |
|
9% |
|
(1%) |
|
|
|
|
|
|
|
|
|
|
|
|
|
|
|
|
|
|
|
|
Total deposits - EOP |
|
$ |
1,366.0 |
|
$ |
1,330.5 |
|
$ |
1,319.9 |
|
$ |
1,273.5 |
|
$ |
1,308.7 |
|
3% |
|
(4%) |
|
|
|
|
|
|
|
|
|
|
|
|
|
|
|
|
|
|
|
|
Total deposits - average |
|
$ |
1,361.1 |
|
$ |
1,363.2 |
|
$ |
1,338.2 |
|
$ |
1,315.1 |
|
$ |
1,319.7 |
|
- |
|
(3%) |
|
|
|
|
|
|
|
|
|
|
|
|
|
|
|
|
|
|
|
|
|
|
|
|
|
|
|
|
|
|
|
|
|
|
|
|
|
|
|
|
(1) |
Asia Consumer also includes deposits of Poland and Russia. |
NMNot meaningful.
Reclassified to conform to the current period's presentation.
Page 17
ALLOWANCE FOR CREDIT LOSSES (ACL) ROLLFORWARD
(In millions of dollars, except ratios)
|
|
|
|
|
|
|
|
|
|
|
|
|
|
|
|
|
|
|
|
|
|
|
|
|
|
|
|
|
|
|
|
|
|
|
|
|
|
|
|
|
|
|
|
|
|
|
|
|
|
|
|
|
ACLL/EOP |
||
|
|
Balance |
|
|
|
Builds (releases) |
|
FY 2022 |
|
|
Balance |
|
|
|
|
|
|
Builds (Releases) |
|
YTD 2023 |
|
|
Balance |
|
Loans |
||||||||||||||||||||||||||||||
|
|
12/31/21 |
|
|
1Q22 |
|
2Q22 |
|
3Q22 |
|
4Q22 |
|
|
FY 2022 |
|
FX/Other |
|
|
12/31/22 |
|
|
1Q23 |
|
2Q23 |
|
3Q23 |
|
4Q23 |
|
|
YTD 2023 |
|
FX/Other(1) |
|
|
12/31/23 |
|
12/31/23 |
|||||||||||||||||
Allowance for credit losses on loans (ACLL) |
|
|
|
|
|
|
|
|
|
|
|
|
|
|
|
|
|
|
|
|
|
|
|
|
|
|
|
|
|
|
|
|
|
|
|
|
|
|
|
|
|
|
|
|
|
|
|
|
|
|
|
|
|
||
Services |
|
$ |
183 |
|
|
$ |
241 |
|
$ |
(7) |
|
$ |
(107) |
|
$ |
1 |
|
|
$ |
128 |
|
$ |
45 |
|
|
$ |
356 |
|
|
$ |
(72) |
|
$ |
(14) |
|
$ |
6 |
|
$ |
127 |
|
|
$ |
47 |
|
$ |
(6) |
|
|
$ |
397 |
|
|
||
Markets |
|
|
588 |
|
|
|
(80) |
|
|
8 |
|
|
117 |
|
|
35 |
|
|
|
80 |
|
|
(35) |
|
|
|
633 |
|
|
|
63 |
|
|
(24) |
|
|
124 |
|
|
41 |
|
|
|
204 |
|
|
(18) |
|
|
|
819 |
|
|
||
Banking |
|
|
1,470 |
|
|
|
435 |
|
|
(77) |
|
|
65 |
|
|
(153) |
|
|
|
270 |
|
|
(14) |
|
|
|
1,726 |
|
|
|
(66) |
|
|
(112) |
|
|
(29) |
|
|
(163) |
|
|
|
(370) |
|
|
(2) |
|
|
|
1,354 |
|
|
||
Legacy Franchises corporate (Mexico SBMM) |
|
|
174 |
|
|
|
5 |
|
|
(3) |
|
|
(34) |
|
|
(7) |
|
|
|
(39) |
|
|
5 |
|
|
|
140 |
|
|
|
(10) |
|
|
(2) |
|
|
1 |
|
|
1 |
|
|
|
(10) |
|
|
14 |
|
|
|
144 |
|
|
||
Total corporate ACLL |
|
$ |
2,415 |
|
|
$ |
601 |
|
$ |
(79) |
|
$ |
41 |
|
$ |
(124) |
|
|
$ |
439 |
|
$ |
1 |
|
|
$ |
2,855 |
|
|
$ |
(85) |
|
$ |
(152) |
|
$ |
102 |
|
$ |
6 |
|
|
$ |
(129) |
|
$ |
(12) |
|
|
$ |
2,714 |
|
0.93% |
||
U.S. Cards |
|
$ |
10,840 |
|
|
$ |
(1,009) |
|
$ |
447 |
|
$ |
303 |
|
$ |
814 |
|
|
$ |
555 |
|
$ |
(2) |
|
|
$ |
11,393 |
|
|
$ |
536 |
|
$ |
276 |
|
$ |
128 |
|
$ |
466 |
|
|
$ |
1,406 |
|
$ |
(173) |
|
|
$ |
12,626 |
|
7.67% |
||
Retail Banking |
|
|
514 |
|
|
|
(87) |
|
|
(6) |
|
|
2 |
|
|
53 |
|
|
|
(38) |
|
|
(29) |
|
|
|
447 |
|
|
|
40 |
|
|
27 |
|
|
(14) |
|
|
5 |
|
|
|
58 |
|
|
(29) |
|
|
|
476 |
|
|
||
Total USPB |
|
$ |
11,354 |
|
|
$ |
(1,096) |
|
$ |
441 |
|
$ |
305 |
|
$ |
867 |
|
|
$ |
517 |
|
$ |
(31) |
|
|
$ |
11,840 |
|
|
$ |
576 |
|
$ |
303 |
|
$ |
114 |
|
$ |
471 |
|
|
$ |
1,464 |
|
$ |
(202) |
|
|
$ |
13,102 |
|
|
||
Wealth |
|
|
667 |
|
|
|
34 |
|
|
197 |
|
|
55 |
|
|
(96) |
|
|
|
190 |
|
|
26 |
|
|
|
883 |
|
|
|
(69) |
|
|
30 |
|
|
(19) |
|
|
(27) |
|
|
|
(85) |
|
|
(30) |
|
|
|
768 |
|
|
||
All Other - consumer |
|
|
2,019 |
|
|
|
(151) |
|
|
(25) |
|
|
40 |
|
|
(54) |
|
|
|
(190) |
|
|
(433) |
|
|
|
1,396 |
|
|
|
13 |
|
|
76 |
|
|
(18) |
|
|
28 |
|
|
|
99 |
|
|
66 |
|
|
|
1,561 |
|
|
||
Total consumer ACLL |
|
$ |
14,040 |
|
|
$ |
(1,213) |
|
$ |
613 |
|
$ |
400 |
|
$ |
717 |
|
|
$ |
517 |
|
$ |
(438) |
|
|
$ |
14,119 |
|
|
$ |
520 |
|
$ |
409 |
|
$ |
77 |
|
$ |
472 |
|
|
$ |
1,478 |
|
$ |
(166) |
|
|
$ |
15,431 |
|
3.97% |
||
Total ACLL |
|
$ |
16,455 |
|
|
$ |
(612) |
|
$ |
534 |
|
$ |
441 |
|
$ |
593 |
|
|
$ |
956 |
|
$ |
(437) |
|
|
$ |
16,974 |
|
|
$ |
435 |
|
$ |
257 |
|
$ |
179 |
|
$ |
478 |
|
|
$ |
1,349 |
|
$ |
(178) |
|
|
$ |
18,145 |
|
2.66% |
||
Allowance for credit losses on unfunded lending commitments (ACLUC) |
|
$ |
1,871 |
|
|
$ |
474 |
|
$ |
(159) |
|
$ |
(71) |
|
$ |
47 |
|
|
$ |
291 |
|
$ |
(11) |
|
|
$ |
2,151 |
|
|
$ |
(194) |
|
$ |
(96) |
|
$ |
(54) |
|
$ |
(81) |
|
|
$ |
(425) |
|
$ |
2 |
|
|
$ |
1,728 |
|
|
||
Total ACLL and ACLUC (EOP) |
|
|
18,326 |
|
|
|
|
|
|
|
|
|
|
|
|
|
|
|
|
|
|
|
|
|
|
|
19,125 |
|
|
|
|
|
|
|
|
|
|
|
|
|
|
|
|
|
|
|
|
|
|
|
19,873 |
|
|
||
Other(2) |
|
|
148 |
|
|
|
(6) |
|
|
27 |
|
|
83 |
|
|
5 |
|
|
|
109 |
|
|
(14) |
|
|
|
243 |
|
|
|
408 |
|
|
145 |
|
|
53 |
|
|
1,132 |
|
|
|
1,738 |
|
|
(98) |
|
|
|
1,883 |
|
|
||
Total allowance for credit losses (ACL) |
|
$ |
18,474 |
|
|
$ |
(144) |
|
$ |
402 |
|
$ |
453 |
|
$ |
645 |
|
|
$ |
1,356 |
|
$ |
(462) |
|
|
$ |
19,368 |
|
|
$ |
649 |
|
$ |
306 |
|
$ |
178 |
|
$ |
1,529 |
|
|
$ |
2,662 |
|
$ |
(274) |
|
|
$ |
21,756 |
|
|
||
|
|
|
|
|
|
|
|
|
|
|
|
|
|
|
|
|
|
|
|
|
|
|
|
|
|
|
|
|
|
|
|
|
|
|
|
|
|
|
|
|
|
|
|
|
|
|
|
|
|
|
|
|
|
||
|
|
|
|
|
|
|
|
|
|
|
|
|
|
|
|
|
|
|
|
|
|
|
|
|
|
|
|
|
|
|
|
|
|
|
|
|
|
|
|
|
|
|
|
|
|
|
|
|
|
|
|
|
|
||
(1)Includes the January 1, 2023 opening adjustment related to the adoption of ASU No. 2022-02 Financial Instruments - Credit Losses (Topic 326) TDRs and Vintage Disclosures. See page 19.
(2)Includes ACL activity on HTM securities and Other assets.
Reclassified to conform to the current period's presentation.
Page 18
ALLOWANCE FOR CREDIT LOSSES ON LOANS AND UNFUNDED LENDING COMMITMENTS
Page 1
(In millions of dollars)
|
|
|
|
|
|
|
|
|
|
|
|
|
|
|
|
|
4Q23 Increase/ |
|
|
Full |
|
Full |
|
FY 2023 vs. |
||||
|
|
4Q |
|
1Q |
|
2Q |
|
3Q |
|
4Q |
|
(Decrease) from |
|
|
Year |
|
Year |
|
FY 2022 Increase/ |
|||||||||
|
|
2022 |
|
2023 |
|
2023 |
|
2023 |
|
2023 |
|
3Q23 |
|
4Q22 |
|
|
2022 |
|
2023 |
|
(Decrease) |
|||||||
Total Citigroup |
|
|
|
|
|
|
|
|
|
|
|
|
|
|
|
|
|
|
|
|
|
|
|
|
|
|
|
|
Allowance for credit losses on loans (ACLL) at beginning of period |
|
$ |
16,309 |
|
$ |
16,974 |
|
$ |
17,169 |
|
$ |
17,496 |
|
$ |
17,629 |
|
1% |
|
8% |
|
|
$ |
16,455 |
|
$ |
16,974 |
|
|
Adjustment to opening balance |
|
|
|
|
|
|
|
|
|
|
|
|
|
|
|
|
|
|
|
|
|
|
|
|
|
|
|
|
Financial instruments—TDRs and Vintage Disclosures(1) |
|
|
- |
|
|
(352) |
|
|
- |
|
|
- |
|
|
- |
|
|
|
|
|
|
|
- |
|
|
(352) |
|
|
Adjusted ACLL at beginning of period |
|
|
16,309 |
|
|
16,622 |
|
|
17,169 |
|
|
17,496 |
|
|
17,629 |
|
1% |
|
8% |
|
|
|
16,455 |
|
|
16,622 |
|
1% |
Gross credit (losses) on loans |
|
|
(1,467) |
|
|
(1,634) |
|
|
(1,879) |
|
|
(2,000) |
|
|
(2,368) |
|
(18%) |
|
(61%) |
|
|
|
(5,156) |
|
|
(7,881) |
|
(53%) |
Gross recoveries on loans |
|
|
287 |
|
|
332 |
|
|
375 |
|
|
363 |
|
|
374 |
|
3% |
|
30% |
|
|
|
1,367 |
|
|
1,444 |
|
6% |
Net credit (losses) / recoveries on loans (NCLs) |
|
|
(1,180) |
|
|
(1,302) |
|
|
(1,504) |
|
|
(1,637) |
|
|
(1,994) |
|
22% |
|
69% |
|
|
|
(3,789) |
|
|
(6,437) |
|
70% |
Replenishment of NCLs |
|
|
1,180 |
|
|
1,302 |
|
|
1,504 |
|
|
1,637 |
|
|
1,994 |
|
22% |
|
69% |
|
|
|
3,789 |
|
|
6,437 |
|
70% |
Net reserve builds / (releases) for loans |
|
|
593 |
|
|
435 |
|
|
257 |
|
|
179 |
|
|
478 |
|
NM |
|
(19%) |
|
|
|
956 |
|
|
1,349 |
|
41% |
Provision for credit losses on loans (PCLL) |
|
|
1,773 |
|
|
1,737 |
|
|
1,761 |
|
|
1,816 |
|
|
2,472 |
|
36% |
|
39% |
|
|
|
4,745 |
|
|
7,786 |
|
64% |
Other, net(2)(3)(4)(5)(6)(7) |
|
|
72 |
|
|
112 |
|
|
70 |
|
|
(46) |
|
|
38 |
|
NM |
|
(47%) |
|
|
|
(437) |
|
|
174 |
|
|
ACLL at end of period (a) |
|
$ |
16,974 |
|
$ |
17,169 |
|
$ |
17,496 |
|
$ |
17,629 |
|
$ |
18,145 |
|
3% |
|
7% |
|
|
$ |
16,974 |
|
$ |
18,145 |
|
|
|
|
|
|
|
|
|
|
|
|
|
|
|
|
|
|
|
|
|
|
|
|
|
|
|
|
|
|
|
Allowance for credit losses on unfunded lending commitments (ACLUC)(8) (a) |
|
$ |
2,151 |
|
$ |
1,959 |
|
$ |
1,862 |
|
$ |
1,806 |
|
$ |
1,728 |
|
(4%) |
|
(20%) |
|
|
$ |
2,151 |
|
$ |
1,728 |
|
|
|
|
|
|
|
|
|
|
|
|
|
|
|
|
|
|
|
|
|
|
|
|
|
|
|
|
|
|
|
Provision (release) for credit losses on unfunded lending commitments |
|
$ |
47 |
|
$ |
(194) |
|
$ |
(96) |
|
$ |
(54) |
|
$ |
(81) |
|
(50%) |
|
NM |
|
|
$ |
291 |
|
$ |
(425) |
|
|
|
|
|
|
|
|
|
|
|
|
|
|
|
|
|
|
|
|
|
|
|
|
|
|
|
|
|
|
|
Total allowance for credit losses on loans, leases and unfunded lending commitments [sum of (a)] |
|
$ |
19,125 |
|
$ |
19,128 |
|
$ |
19,358 |
|
$ |
19,435 |
|
$ |
19,873 |
|
2% |
|
4% |
|
|
$ |
19,125 |
|
$ |
19,873 |
|
|
|
|
|
|
|
|
|
|
|
|
|
|
|
|
|
|
|
|
|
|
|
|
|
|
|
|
|
|
|
Total ACLL as a percentage of total loans(9) |
|
|
2.60% |
|
|
2.65% |
|
|
2.67% |
|
|
2.68% |
|
|
2.66% |
|
(2) bps |
|
6 bps |
|
|
|
|
|
|
|
|
|
|
|
|
|
|
|
|
|
|
|
|
|
|
|
|
|
|
|
|
|
|
|
|
|
|
|
|
|
|
Consumer |
|
|
|
|
|
|
|
|
|
|
|
|
|
|
|
|
|
|
|
|
|
|
|
|
|
|
|
|
ACLL at beginning of period |
|
$ |
13,361 |
|
$ |
14,119 |
|
$ |
14,389 |
|
$ |
14,866 |
|
$ |
14,912 |
|
- |
|
12% |
|
|
$ |
14,040 |
|
$ |
14,119 |
|
|
Adjustments to opening balance |
|
|
|
|
|
|
|
|
|
|
|
|
|
|
|
|
|
|
|
|
|
|
|
|
|
|
|
|
Financial instruments—TDRs and Vintage Disclosures(1) |
|
|
- |
|
|
(352) |
|
|
- |
|
|
- |
|
|
- |
|
|
|
|
|
|
|
- |
|
|
(352) |
|
|
Adjusted ACLL at beginning of period |
|
|
13,361 |
|
|
13,767 |
|
|
14,389 |
|
|
14,866 |
|
|
14,912 |
|
- |
|
12% |
|
|
|
14,040 |
|
|
13,767 |
|
(2%) |
|
|
|
|
|
|
|
|
|
|
|
|
|
|
|
|
|
|
|
|
|
|
|
|
|
|
|
|
|
NCLs |
|
|
(1,062) |
|
|
(1,280) |
|
|
(1,429) |
|
|
(1,579) |
|
|
(1,899) |
|
20% |
|
79% |
|
|
|
(3,611) |
|
|
(6,187) |
|
71% |
Replenishment of NCLs |
|
|
1,062 |
|
|
1,280 |
|
|
1,429 |
|
|
1,579 |
|
|
1,899 |
|
20% |
|
79% |
|
|
|
3,611 |
|
|
6,187 |
|
71% |
Net reserve builds/ (releases) for loans |
|
|
717 |
|
|
520 |
|
|
409 |
|
|
77 |
|
|
472 |
|
NM |
|
(34%) |
|
|
|
517 |
|
|
1,478 |
|
NM |
Provision for credit losses on loans (PCLL) |
|
|
1,779 |
|
|
1,800 |
|
|
1,838 |
|
|
1,656 |
|
|
2,371 |
|
43% |
|
33% |
|
|
|
4,128 |
|
|
7,665 |
|
86% |
Other, net(2)(3)(4)(5)(6)(7) |
|
|
41 |
|
|
102 |
|
|
68 |
|
|
(31) |
|
|
47 |
|
NM |
|
15% |
|
|
|
(438) |
|
|
186 |
|
NM |
ACLL at end of period (b) |
|
$ |
14,119 |
|
$ |
14,389 |
|
$ |
14,866 |
|
$ |
14,912 |
|
$ |
15,431 |
|
3% |
|
9% |
|
|
$ |
14,119 |
|
$ |
15,431 |
|
|
|
|
|
|
|
|
|
|
|
|
|
|
|
|
|
|
|
|
|
|
|
|
|
|
|
|
|
|
|
Consumer ACLUC(8) (b) |
|
$ |
120 |
|
$ |
101 |
|
$ |
88 |
|
$ |
65 |
|
$ |
62 |
|
(5%) |
|
(48%) |
|
|
$ |
120 |
|
$ |
62 |
|
|
|
|
|
|
|
|
|
|
|
|
|
|
|
|
|
|
|
|
|
|
|
|
|
|
|
|
|
|
|
Provision (release) for credit losses on unfunded lending commitments |
|
$ |
(20) |
|
$ |
(17) |
|
$ |
(4) |
|
$ |
(20) |
|
$ |
(5) |
|
75% |
|
75% |
|
|
$ |
100 |
|
$ |
(46) |
|
|
|
|
|
|
|
|
|
|
|
|
|
|
|
|
|
|
|
|
|
|
|
|
|
|
|
|
|
|
|
Total allowance for credit losses on loans, leases and unfunded lending commitments [sum of (b)] |
|
$ |
14,239 |
|
$ |
14,490 |
|
$ |
14,954 |
|
$ |
14,977 |
|
$ |
15,493 |
|
3% |
|
9% |
|
|
$ |
14,239 |
|
$ |
15,493 |
|
|
|
|
|
|
|
|
|
|
|
|
|
|
|
|
|
|
|
|
|
|
|
|
|
|
|
|
|
|
|
Consumer ACLL as a percentage of total consumer loans |
|
|
3.84% |
|
|
3.96% |
|
|
3.97% |
|
|
3.95% |
|
|
3.97% |
|
2 bps |
|
13 bps |
|
|
|
|
|
|
|
|
|
|
|
|
|
|
|
|
|
|
|
|
|
|
|
|
|
|
|
|
|
|
|
|
|
|
|
|
|
|
Corporate |
|
|
|
|
|
|
|
|
|
|
|
|
|
|
|
|
|
|
|
|
|
|
|
|
|
|
|
|
ACLL at beginning of period |
|
$ |
2,948 |
|
$ |
2,855 |
|
$ |
2,780 |
|
$ |
2,630 |
|
$ |
2,717 |
|
3% |
|
(8%) |
|
|
$ |
2,415 |
|
$ |
2,855 |
|
|
|
|
|
|
|
|
|
|
|
|
|
|
|
|
|
|
|
|
|
|
|
|
|
|
|
|
|
|
|
NCLs |
|
|
(118) |
|
|
(22) |
|
|
(75) |
|
|
(58) |
|
|
(95) |
|
64% |
|
(19%) |
|
|
|
(178) |
|
|
(250) |
|
40% |
Replenishment of NCLs |
|
|
118 |
|
|
22 |
|
|
75 |
|
|
58 |
|
|
95 |
|
64% |
|
(19%) |
|
|
|
178 |
|
|
250 |
|
40% |
Net reserve builds / (releases) for loans |
|
|
(124) |
|
|
(85) |
|
|
(152) |
|
|
102 |
|
|
6 |
|
(94%) |
|
NM |
|
|
|
439 |
|
|
(129) |
|
NM |
Provision for credit losses on loans (PCLL) |
|
|
(6) |
|
|
(63) |
|
|
(77) |
|
|
160 |
|
|
101 |
|
(37%) |
|
NM |
|
|
|
617 |
|
|
121 |
|
(80%) |
Other, net(2) |
|
|
31 |
|
|
10 |
|
|
2 |
|
|
(15) |
|
|
(9) |
|
40% |
|
NM |
|
|
|
1 |
|
|
(12) |
|
|
ACLL at end of period (c) |
|
$ |
2,855 |
|
$ |
2,780 |
|
$ |
2,630 |
|
$ |
2,717 |
|
$ |
2,714 |
|
- |
|
(5%) |
|
|
$ |
2,855 |
|
$ |
2,714 |
|
|
|
|
|
|
|
|
|
|
|
|
|
|
|
|
|
|
|
|
|
|
|
|
|
|
|
|
|
|
|
Corporate ACLUC(8) (c) |
|
$ |
2,031 |
|
$ |
1,858 |
|
$ |
1,774 |
|
$ |
1,741 |
|
$ |
1,666 |
|
(4%) |
|
(18%) |
|
|
$ |
2,031 |
|
$ |
1,666 |
|
|
|
|
|
|
|
|
|
|
|
|
|
|
|
|
|
|
|
|
|
|
|
|
|
|
|
|
|
|
|
Provision (release) for credit losses on unfunded lending commitments |
|
$ |
67 |
|
$ |
(177) |
|
$ |
(92) |
|
$ |
(34) |
|
$ |
(76) |
|
NM |
|
NM |
|
|
$ |
191 |
|
$ |
(379) |
|
|
|
|
|
|
|
|
|
|
|
|
|
|
|
|
|
|
|
|
|
|
|
|
|
|
|
|
|
|
|
Total allowance for credit losses on loans, leases and unfunded lending commitments [sum of (c)] |
|
$ |
4,886 |
|
$ |
4,638 |
|
$ |
4,404 |
|
$ |
4,458 |
|
$ |
4,380 |
|
(2%) |
|
(10%) |
|
|
$ |
4,886 |
|
$ |
4,380 |
|
|
|
|
|
|
|
|
|
|
|
|
|
|
|
|
|
|
|
|
|
|
|
|
|
|
|
|
|
|
|
Corporate ACLL as a percentage of total corporate loans(9) |
|
|
1.01% |
|
|
0.98% |
|
|
0.94% |
|
|
0.97% |
|
|
0.93% |
|
(4) bps |
|
(8) bps |
|
|
|
|
|
|
|
|
|
|
|
|
|
|
|
|
|
|
|
|
|
|
|
|
|
|
|
|
|
|
|
|
|
|
|
|
|
|
Footnotes to this table are on the following page (page 20).
Page 19
ALLOWANCE FOR CREDIT LOSSES ON LOANS AND UNFUNDED LENDING COMMITMENTS
Page 2
The following footnotes relate to the table on the preceding page (page 19):
| (1) | Includes the January 1, 2023 opening adjustment related to the adoption of ASU No. 2022-02 Financial Instruments - Credit Losses (Topic 326) TDRs and Vintage Disclosures. |
| (2) | Includes all adjustments to the allowance for credit losses, such as changes in the allowance from acquisitions, dispositions, securitizations, foreign currency translation (FX translation), purchase accounting adjustments, etc. |
| (3) | 4Q22 primarily relates to FX translation. |
| (4) | 1Q23 primarily relates to FX translation. |
| (5) | 2Q23 primarily relates to FX translation. |
| (6) | 3Q23 primarily relates to FX translation. |
| (7) | 4Q23 primarily relates to FX translation. |
| (8) | Represents additional credit reserves recorded as other liabilities on the Consolidated Balance Sheet. |
| (9) | Excludes loans that are carried at fair value of $5.4 billion, $5.1 billion, $5.8 billion, $7.4 billion, and $7.6 billion, December 31, 2022, March 31, 2023, June 30, 2023, September 30, 2023, and December 31, 2023, respectively. |
NM Not meaningful.
Reclassified to conform to the current period's presentation.
Page 20
NON-ACCRUAL ASSETS
(In millions of dollars)
|
|
|
|
|
|
|
|
|
|
|
|
|
|
|
|
|
4Q23 Increase/ |
||
|
|
4Q |
|
1Q |
|
2Q |
|
3Q |
|
4Q |
|
(Decrease) from |
|||||||
|
|
2022 |
|
2023 |
|
2023 |
|
2023 |
|
2023 |
|
3Q23 |
|
4Q22 |
|||||
|
|
|
|
|
|
|
|
|
|
|
|
|
|
|
|
|
|
|
|
Corporate non-accrual loans by region(1) |
|
|
|
|
|
|
|
|
|
|
|
|
|
|
|
|
|
|
|
North America |
|
$ |
138 |
|
$ |
285 |
|
$ |
358 |
|
$ |
934 |
|
$ |
978 |
|
5% |
|
NM |
International |
|
|
984 |
|
|
928 |
|
|
903 |
|
|
1,041 |
|
|
904 |
|
(13%) |
|
(8%) |
Total |
|
$ |
1,122 |
|
$ |
1,213 |
|
$ |
1,261 |
|
$ |
1,975 |
|
$ |
1,882 |
|
(5%) |
|
68% |
|
|
|
|
|
|
|
|
|
|
|
|
|
|
|
|
|
|
|
|
Corporate non-accrual loans by segment and component(1) |
|
|
|
|
|
|
|
|
|
|
|
|
|
|
|
|
|
|
|
Banking |
|
$ |
757 |
|
$ |
833 |
|
$ |
799 |
|
$ |
946 |
|
$ |
799 |
|
(16%) |
|
6% |
Services |
|
|
153 |
|
|
133 |
|
|
123 |
|
|
94 |
|
|
103 |
|
10% |
|
(33%) |
Markets |
|
|
13 |
|
|
38 |
|
|
133 |
|
|
743 |
|
|
791 |
|
6% |
|
NM |
Mexico SBMM |
|
|
199 |
|
|
209 |
|
|
206 |
|
|
192 |
|
|
189 |
|
(2%) |
|
(5%) |
Total |
|
$ |
1,122 |
|
$ |
1,213 |
|
$ |
1,261 |
|
$ |
1,975 |
|
$ |
1,882 |
|
(5%) |
|
68% |
|
|
|
|
|
|
|
|
|
|
|
|
|
|
|
|
|
|
|
|
Consumer non-accrual loans(1) |
|
|
|
|
|
|
|
|
|
|
|
|
|
|
|
|
|
|
|
U.S. Personal Banking |
|
$ |
282 |
|
$ |
287 |
|
$ |
276 |
|
$ |
280 |
|
$ |
291 |
|
4% |
|
3% |
Wealth |
|
|
259 |
|
|
321 |
|
|
260 |
|
|
287 |
|
|
288 |
|
- |
|
11% |
Asia Consumer(2) |
|
|
30 |
|
|
29 |
|
|
24 |
|
|
25 |
|
|
22 |
|
(12%) |
|
(27%) |
Mexico Consumer |
|
|
457 |
|
|
480 |
|
|
498 |
|
|
463 |
|
|
479 |
|
3% |
|
5% |
Legacy Holdings Assets - Consumer |
|
|
289 |
|
|
278 |
|
|
263 |
|
|
247 |
|
|
235 |
|
(5%) |
|
(19%) |
Total |
|
$ |
1,317 |
|
$ |
1,395 |
|
$ |
1,321 |
|
$ |
1,302 |
|
$ |
1,315 |
|
1% |
|
- |
|
|
|
|
|
|
|
|
|
|
|
|
|
|
|
|
|
|
|
|
Total non-accrual loans (NAL) |
|
$ |
2,439 |
|
$ |
2,608 |
|
$ |
2,582 |
|
$ |
3,277 |
|
$ |
3,197 |
|
(2%) |
|
31% |
|
|
|
|
|
|
|
|
|
|
|
|
|
|
|
|
|
|
|
|
Other real estate owned (OREO)(3) |
|
$ |
15 |
|
$ |
21 |
|
$ |
31 |
|
$ |
37 |
|
$ |
36 |
|
(3%) |
|
NM |
|
|
|
|
|
|
|
|
|
|
|
|
|
|
|
|
|
|
|
|
NAL as a percentage of total loans |
|
|
0.37% |
|
|
0.40% |
|
|
0.39% |
|
|
0.49% |
|
|
0.46% |
|
(3) bps |
|
9 bps |
|
|
|
|
|
|
|
|
|
|
|
|
|
|
|
|
|
|
|
|
ACLL as a percentage of NAL |
|
|
696% |
|
|
658% |
|
|
678% |
|
|
538% |
|
|
568% |
|
|
|
|
|
|
|
|
|
|
|
|
|
|
|
|
|
|
|
|
|
|
|
|
(1) |
Corporate loans are placed on non-accrual status based upon a review by Citigroup’s risk officers. Corporate non-accrual loans may still be current on interest payments. With limited exceptions, the following practices are applied for consumer loans: consumer loans, excluding credit cards and mortgages, are placed on non-accrual status at 90 days past due, and are charged off at 120 days past due; residential mortgage loans are placed on non-accrual status at 90 days past due and written down to net realizable value at 180 days past due. Consistent with industry conventions, Citigroup generally accrues interest on credit card loans until such loans are charged off, which typically occurs at 180 days contractual delinquency. As such, the non-accrual loan disclosures do not include credit card loans. The balances above represent non-accrual loans within Consumer loans and Corporate loans on the Consolidated Balance Sheet. |
(2) |
Asia Consumer also includes Non-accrual assets of Poland and Russia. |
(3) |
Represents the carrying value of all property acquired by foreclosure or other legal proceedings when Citigroup has taken possession of the collateral. Also includes former premises and property for use that is no longer contemplated. |
NM Not meaningful.
Reclassified to conform to the current period’s presentation.
Page 21
CITIGROUP
CET1 CAPITAL AND SUPPLEMENTARY LEVERAGE RATIOS, TANGIBLE COMMON EQUITY, BOOK VALUE
PER SHARE AND TANGIBLE BOOK VALUE PER SHARE
(In millions of dollars or shares, except per share amounts and ratios)
|
|
|
|
|
|
|
|
|
|
|
|
Full |
|
Full |
|||||||
|
|
December 31, |
|
March 31, |
|
June 30, |
|
September 30, |
|
December 31, |
|
Year |
|
Year |
|||||||
Common Equity Tier 1 Capital Ratio and Components (1) |
|
2022 |
|
2023 |
|
2023 |
|
2023 |
|
2023(2) |
|
2022 |
|
2023 |
|||||||
Citigroup common stockholders' equity (3) |
|
$ |
182,325 |
|
$ |
188,186 |
|
$ |
188,610 |
|
$ |
190,134 |
|
$ |
187,937 |
|
|
|
|
|
|
Add: qualifying noncontrolling interests |
|
|
128 |
|
|
207 |
|
|
209 |
|
|
193 |
|
|
208 |
|
|
|
|
|
|
Regulatory capital adjustments and deductions: |
|
|
|
|
|
|
|
|
|
|
|
|
|
|
|
|
|
|
|
|
|
Add: |
|
|
|
|
|
|
|
|
|
|
|
|
|
|
|
|
|
|
|
|
|
CECL transition provision (4) |
|
|
2,271 |
|
|
1,514 |
|
|
1,514 |
|
|
1,514 |
|
|
1,514 |
|
|
|
|
|
|
Less: |
|
|
|
|
|
|
|
|
|
|
|
|
|
|
|
|
|
|
|
|
|
Accumulated net unrealized gains (losses) on cash flow hedges, net of tax |
|
|
(2,522) |
|
|
(2,161) |
|
|
(1,990) |
|
|
(1,259) |
|
|
(1,406) |
|
|
|
|
|
|
Cumulative unrealized net gain (loss) related to changes in fair value of financial liabilities attributable to own creditworthiness, net of tax |
|
|
1,441 |
|
|
1,037 |
|
|
307 |
|
|
625 |
|
|
(383) |
|
|
|
|
|
|
Intangible assets: |
|
|
|
|
|
|
|
|
|
|
|
|
|
|
|
|
|
|
|
|
|
Goodwill, net of related deferred tax liabilities (DTLs)(5) |
|
|
19,007 |
|
|
18,844 |
|
|
18,933 |
|
|
18,552 |
|
|
18,778 |
|
|
|
|
|
|
Identifiable intangible assets other than mortgage servicing rights (MSRs), net of related DTLs |
|
|
3,411 |
|
|
3,607 |
|
|
3,531 |
|
|
3,444 |
|
|
3,349 |
|
|
|
|
|
|
Defined benefit pension plan net assets; other |
|
|
1,935 |
|
|
1,999 |
|
|
2,020 |
|
|
1,340 |
|
|
1,317 |
|
|
|
|
|
|
Deferred tax assets (DTAs) arising from net operating loss, foreign tax credit and general business credit carry-forwards(7) |
|
|
12,197 |
|
|
11,783 |
|
|
11,461 |
|
|
11,219 |
|
|
11,580 |
|
|
|
|
|
|
Excess over 10% / 15% limitations for other DTAs, certain common stock investments and MSRs(7)(8) |
|
|
325 |
|
|
1,045 |
|
|
1,828 |
|
|
1,786 |
|
|
2,936 |
|
|
|
|
|
|
Common Equity Tier 1 Capital (CET1) |
|
$ |
148,930 |
|
$ |
153,753 |
|
$ |
154,243 |
|
$ |
156,134 |
|
$ |
153,488 |
|
|
|
|
|
|
Risk-Weighted Assets (RWA)(4) |
|
$ |
1,142,985 |
|
$ |
1,144,359 |
|
$ |
1,153,450 |
|
$ |
1,148,550 |
|
$ |
1,152,800 |
|
|
|
|
|
|
Common Equity Tier 1 Capital ratio (CET1/RWA) |
|
|
13.03% |
|
|
13.44% |
|
|
13.37% |
|
|
13.59% |
|
|
13.3% |
|
|
|
|
|
|
|
|
|
|
|
|
|
|
|
|
|
|
|
|
|
|
|
|
|
|
|
|
Supplementary Leverage Ratio and Components |
|
|
|
|
|
|
|
|
|
|
|
|
|
|
|
|
|
|
|
|
|
Common Equity Tier 1 Capital (CET1)(4) |
|
$ |
148,930 |
|
$ |
153,753 |
|
$ |
154,243 |
|
$ |
156,134 |
|
$ |
153,488 |
|
|
|
|
|
|
Additional Tier 1 Capital (AT1)(6) |
|
|
20,215 |
|
|
21,496 |
|
|
21,500 |
|
|
20,744 |
|
|
18,909 |
|
|
|
|
|
|
Total Tier 1 Capital (T1C) (CET1 + AT1) |
|
$ |
169,145 |
|
$ |
175,249 |
|
$ |
175,743 |
|
$ |
176,878 |
|
$ |
172,397 |
|
|
|
|
|
|
Total Leverage Exposure (TLE)(4) |
|
$ |
2,906,773 |
|
$ |
2,939,744 |
|
$ |
2,943,546 |
|
$ |
2,927,392 |
|
$ |
2,960,105 |
|
|
|
|
|
|
Supplementary Leverage ratio (T1C/TLE) |
|
|
5.82% |
|
|
5.96% |
|
|
5.97% |
|
|
6.04% |
|
|
5.8% |
|
|
|
|
|
|
|
|
|
|
|
|
|
|
|
|
|
|
|
|
|
|
|
|
|
|
|
|
|
|
|
|
|
|
|
|
|
|
|
|
|
|
|
|
|
|
|
|
|
|
Tangible Common Equity, Book Value and Tangible Book Value Per Share |
|
|
|
|
|
|
|
|
|
|
|
|
|
|
|
|
|
|
|
|
|
Common stockholders' equity |
|
$ |
182,194 |
|
$ |
188,050 |
|
$ |
188,474 |
|
$ |
190,008 |
|
$ |
187,853 |
|
|
|
|
|
|
Less: |
|
|
|
|
|
|
|
|
|
|
|
|
|
|
|
|
|
|
|
|
|
Goodwill |
|
|
19,691 |
|
|
19,882 |
|
|
19,998 |
|
|
19,829 |
|
|
20,098 |
|
|
|
|
|
|
Intangible assets (other than MSRs) |
|
|
3,763 |
|
|
3,974 |
|
|
3,895 |
|
|
3,811 |
|
|
3,730 |
|
|
|
|
|
|
Goodwill and identifiable intangible assets (other than MSRs) related to assets HFS |
|
|
589 |
|
|
246 |
|
|
246 |
|
|
49 |
|
|
- |
|
|
|
|
|
|
Tangible common equity (TCE)(9) |
|
$ |
158,151 |
|
$ |
163,948 |
|
$ |
164,335 |
|
$ |
166,319 |
|
$ |
164,025 |
|
|
|
|
|
|
Common shares outstanding (CSO) |
|
|
1,937.0 |
|
|
1,946.8 |
|
|
1,925.7 |
|
|
1,913.9 |
|
|
1,903.1 |
|
|
|
|
|
|
Book value per share (common equity/CSO) |
|
$ |
94.06 |
|
$ |
96.59 |
|
$ |
97.87 |
|
$ |
99.28 |
|
$ |
98.71 |
|
|
|
|
|
|
Tangible book value per share (TCE/CSO)(9) |
|
$ |
81.65 |
|
$ |
84.21 |
|
$ |
85.34 |
|
$ |
86.90 |
|
$ |
86.19 |
|
|
|
|
|
|
|
|
|
|
|
|
|
|
|
|
|
|
|
|
|
|
|
|
|
|
|
|
Average TCE (in billions of dollars)(9) |
|
|
|
|
|
|
|
|
|
|
|
|
|
|
|
|
|
|
|
|
|
Services |
|
$ |
22.5 |
|
$ |
23.0 |
|
$ |
23.0 |
|
$ |
23.0 |
|
$ |
23.0 |
|
$ |
22.5 |
|
$ |
23.0 |
Markets |
|
|
51.6 |
|
|
53.1 |
|
|
53.1 |
|
|
53.1 |
|
|
53.1 |
|
|
51.6 |
|
|
53.1 |
Banking |
|
|
21.7 |
|
|
21.4 |
|
|
21.4 |
|
|
21.4 |
|
|
21.4 |
|
|
21.7 |
|
|
21.4 |
U.S. Personal Banking |
|
|
20.7 |
|
|
21.9 |
|
|
21.9 |
|
|
21.9 |
|
|
21.9 |
|
|
20.7 |
|
|
21.9 |
Wealth |
|
|
13.9 |
|
|
13.4 |
|
|
13.4 |
|
|
13.4 |
|
|
13.4 |
|
|
13.9 |
|
|
13.4 |
All Other |
|
|
26.5 |
|
|
28.3 |
|
|
31.3 |
|
|
32.5 |
|
|
32.4 |
|
|
25.5 |
|
|
30.6 |
Total Citi average TCE |
|
$ |
156.9 |
|
$ |
161.1 |
|
$ |
164.1 |
|
$ |
165.3 |
|
$ |
165.2 |
|
$ |
155.9 |
|
$ |
163.4 |
|
|
|
|
|
|
|
|
|
|
|
|
|
|
|
|
|
|
|
|
|
|
Plus: |
|
|
|
|
|
|
|
|
|
|
|
|
|
|
|
|
|
|
|
|
|
Average Goodwill |
|
$ |
19.1 |
|
$ |
18.7 |
|
$ |
20.0 |
|
$ |
19.9 |
|
$ |
20.4 |
|
$ |
19.4 |
|
$ |
20.1 |
Average Intangible assets (other than MSRs) |
|
|
3.8 |
|
|
3.9 |
|
|
3.9 |
|
|
3.9 |
|
|
3.8 |
|
|
4.0 |
|
|
3.9 |
Average Goodwill and identifiable intangible assets (other than MSRs) related to assets HFS |
|
|
0.7 |
|
|
0.4 |
|
|
0.2 |
|
|
0.1 |
|
|
- |
|
|
0.8 |
|
|
0.3 |
Total Citi average common stockholders' equity (in billions of dollars) |
|
$ |
180.5 |
|
$ |
184.1 |
|
$ |
188.2 |
|
$ |
189.2 |
|
$ |
189.4 |
|
$ |
180.1 |
|
$ |
187.7 |
|
|
|
|
|
|
|
|
|
|
|
|
|
|
|
|
|
|
|
|
|
|
(1) |
See footnote 10 on page 1. |
(2) |
December 31, 2023 is preliminary. |
(3) |
Excludes issuance costs related to outstanding preferred stock in accordance with Federal Reserve Board regulatory reporting requirements. |
(4) |
See footnote 11 on page 1. |
(5) |
Includes goodwill “embedded” in the valuation of significant common stock investments in unconsolidated financial institutions. |
(6) |
Additional Tier 1 Capital primarily includes qualifying noncumulative perpetual preferred stock and qualifying trust preferred securities. |
(7) |
Represents deferred tax excludable from Basel III CET1 Capital, which includes net DTAs arising from net operating loss, foreign tax credit and general business credit tax carry-forwards and DTAs arising from timing differences (future deductions) that are deducted from CET1 capital exceeding the 10% limitation. |
(8) |
Assets subject to 10% / 15% limitations include MSRs, DTAs arising from temporary differences and significant common stock investments in unconsolidated financial institutions. For all periods presented, the deduction related only to DTAs arising from temporary differences that exceeded the 10% limitation. |
(9) |
TCE and TBVPS are non-GAAP financial measures. |
Reclassified to conform to the current period's presentation.
Page 22
|
|
|
Exhibit 99.3 |
|
|
|
|
Citigroup Inc. securities registered pursuant to Section 12(b) of the Securities Exchange Act of 1934: | |||
|
|
|
|
Title of each class |
Ticker |
Title for iXBRL |
Name of each |
|
|
||
Common Stock, par value $.01 per share |
C |
Common Stock, par value $.01 per share |
New York Stock Exchange |
Depositary Shares, each representing 1/1,000th interest in a share of 7.125% Fixed/Floating Rate Noncumulative Preferred Stock, Series J |
C Pr J |
Dep Shs, represent 1/1,000th interest in a share of 7.125% Fix/Float Rate Noncum Pref Stk, Ser J |
New York Stock Exchange |
|
|
|
|
7.625% Trust Preferred Securities of Citigroup Capital III (and registrant’s guaranty with respect thereto) |
C/36Y |
7.625% TRUPs of Cap III (and registrant’s guaranty) |
New York Stock Exchange |
7.875% Fixed Rate / Floating Rate Trust Preferred Securities (TruPS®) of Citigroup Capital XIII (and registrant’s guaranty with respect thereto) |
C N |
7.875% FXD / FRN TruPS of Cap XIII (and registrant’s guaranty) |
New York Stock Exchange |
Medium-Term Senior Notes, Series N, Callable Step-Up Coupon Notes Due March 31, 2036 of CGMHI (and registrant’s guaranty with respect thereto) |
C/36A |
MTN, Series N, Callable Step-Up Coupon Notes Due Mar 2036 of CGMHI (and registrant’s guaranty) |
New York Stock Exchange |
Medium-Term Senior Notes, Series N, Callable Step-Up Coupon Notes Due February 26, 2036 of CGMHI (and registrant's guaranty with respect thereto) |
C/36 |
MTN, Series N, Callable Step-Up Coupon Notes Due Feb 2036 of CGMHI (and registrant's guaranty) |
New York Stock Exchange |
Medium-Term Senior Notes, Series N, Callable Fixed Rate Notes Due December 18, 2035 of CGMHI (and registrant's guaranty with respect thereto) |
C/35 |
MTN, Series N, Callable Fixed Rate Notes Due Dec 2035 of CGMHI (and registrant's guaranty) |
New York Stock Exchange |
Medium-Term Senior Notes, Series N, Callable Fixed Rate Notes Due April 26, 2028 of CGMHI (and registrant’s guaranty with respect thereto) |
C/28 |
MTN, Series N, Callable Fixed Rate Notes Due Apr 2028 of CGMHI (and registrant’s guaranty) |
New York Stock Exchange |
Medium-Term Senior Notes, Series N, Floating Rate Notes Due September 17, 2026 of CGMHI (and registrant’s guaranty with respect thereto) |
C/26 |
MTN, Series N, Floating Rate Notes Due Sept 2026 of CGMHI (and registrant’s guaranty) |
New York Stock Exchange |
Medium-Term Senior Notes, Series N, Floating Rate Notes Due September 15, 2028 of CGMHI (and registrant’s guaranty with respect thereto) |
C/28A |
MTN, Series N, Floating Rate Notes Due Sept 2028 of CGMHI (and registrant’s guaranty) |
New York Stock Exchange |
Medium-Term Senior Notes, Series N, Floating Rate Notes Due October 6, 2028 of CGMHI (and registrant’s guaranty with respect thereto) |
C/28B |
MTN, Series N, Floating Rate Notes Due Oct 2028 of CGMHI (and registrant’s guaranty) |
New York Stock Exchange |
Medium-Term Senior Notes, Series N, Floating Rate Notes Due March 21, 2029 of CGMHI (and registrant’s guaranty with respect thereto) |
C/29A |
MTN, Series N, Floating Rate Notes Due Mar 2029 of CGMHI (and registrant’s guaranty) |
New York Stock Exchange |