UNITED STATES
SECURITIES AND EXCHANGE COMMISSION
WASHINGTON, D.C. 20549
FORM 8-K
CURRENT REPORT
PURSUANT TO SECTION 13 OR 15(d) OF THE
SECURITIES EXCHANGE ACT OF 1934
Date of report (Date of earliest event reported): January 3, 2024
AGREE REALTY CORPORATION
(Exact name of registrant as specified in its charter)
Maryland
(State or other jurisdiction of incorporation)
|
1-12928 (Commission file number) |
38-3148187 (I.R.S. Employer Identification No.) |
|
32301 Woodward Avenue Royal Oak, MI (Address of principal executive offices) |
48073 (Zip code) |
(Registrant’s telephone number, including area code) (248) 737-4190
Not applicable
(Former name or former address, if changed since last report)
Check the appropriate box below if the Form 8-K filing is intended to simultaneously satisfy the filing obligation of the registrant under any of the following provisions:
| ¨ | Written communications pursuant to Rule 425 under the Securities Act (17 CFR 230.425) |
| ¨ | Soliciting material pursuant to Rule 14a-12 under the Exchange Act (17 CFR 240.14a-12) |
| ¨ | Pre-commencement communications pursuant to Rule 14d-2(b) under the Exchange Act (17 CFR 240.14d-2(b)) |
| ¨ | Pre-commencement communications pursuant to Rule 13e-4(c) under the Exchange Act (17 CFR 240.13e-4(c)) |
Securities registered pursuant to Section 12(b) of the Act:
| Title of each class | Trading
Symbol(s) |
Name
of each exchange on which registered |
| Common Stock, $0.0001 par value | ADC | New York Stock Exchange |
| Depositary Shares, each representing one-thousandth of a share of 4.25% Series A Cumulative Redeemable Preferred Stock, $0.0001 par value | ADCPrA | New York Stock Exchange |
Indicate by check mark whether the registrant is an emerging growth company as defined in Rule 405 of the Securities Act of 1933 (§230.405 of this chapter) or Rule 12b-2 of the Securities Exchange Act of 1934 (§240.12b-2 of this chapter).
Emerging growth company ¨
If an emerging growth company, indicate by check mark if the registrant has elected not to use the extended transition period for complying with any new or revised financial accounting standards provided pursuant to Section 13(a) of the Exchange Act. ¨
Item 7.01. Regulation FD Disclosure.
On January 3, 2024, Agree Realty Corporation (the “Company”) issued a press release announcing the Company’s investment activity for 2023 and updates on its portfolio and its fourth quarter 2023 capital markets activities.
A copy of the press release is furnished as Exhibit 99.1 to this report. The Company also posted an updated investor presentation to its website, which is furnished as Exhibit 99.2 to this report. The press release and investor presentation can be found on the Investors section of the Company’s website at www.agreerealty.com.
The information in this Item 7.01, including Exhibits 99.1 and 99.2 attached hereto, is being furnished and shall not be deemed to be “filed” for purposes of Section 18 of the Securities Exchange Act of 1934 (the “Exchange Act”) or otherwise subject to the liabilities of such section, nor shall such information be deemed to be incorporated by reference in any filing under the Securities Act of 1933 or the Exchange Act, except as shall be expressly set forth by specific reference in such a filing.
Item 8.01. Other Events.
On January 3, 2024, the Company announced its weighted-average number of common shares outstanding for the three and twelve months ended December 31, 2023. The following table computes the Company’s weighted-average number of common shares outstanding for the periods:
| Three Months | Twelve Months | |||||||
| Ended | Ended | |||||||
| December 31, 2023 |
December 31, 2023 |
|||||||
| Weighted-average number of common shares outstanding | 100,519,338 | 95,431,468 | ||||||
| Less: Unvested restricted stock | (240,059 | ) | (240,059 | ) | ||||
| Weighted-average number of common shares outstanding used in basic earnings per share | 100,279,279 | 95,191,409 | ||||||
| Weighted-average number of common shares outstanding used in basic earnings per share | 100,279,279 | 95,191,409 | ||||||
| Effect of dilutive securities: | ||||||||
| Share-based compensation | 107,445 | 131,261 | ||||||
| ATM forward equity offerings | 10,372 | 39,519 | ||||||
| September 2022 Forward Offering | - | 75,223 | ||||||
| Weighted-average number of common shares outstanding used in diluted earnings per share | 100,397,096 | 95,437,412 | ||||||
| Operating Partnership Units ("OP Units") | 347,619 | 347,619 | ||||||
| Weighted-average number of common shares and OP Units outstanding used in diluted earnings per share | 100,744,715 | 95,785,031 | ||||||
To account for the potential dilution resulting from the forward equity offerings on earnings per share calculations, the Company used the treasury stock method to determine the dilution during the period of time prior to settlement. The impact of the offerings on the Company’s weighted-average diluted shares for the three months ended December 31, 2023 was 10,372 weighted-average incremental shares. The impact of the offerings on the Company’s weighted-average diluted shares for the twelve months ended December 31, 2023 was 114,742 weighted-average incremental shares.
| Item 9.01. | Financial Statements and Exhibits. |
(d) Exhibits
| Exhibit | Description | |
| 99.1 | Press release, dated January 3, 2024, entitled “Agree Realty Announces 2023 Investment Activity & Provides Capital Markets Update”. | |
| 99.2 | January 2024 Investor Presentation. | |
| 104 | Cover Page Interactive Data File (embedded within the Inline XBRL document). |
SIGNATURES
Pursuant to the requirements of the Securities Exchange Act of 1934, the registrant has duly caused this report to be signed on its behalf by the undersigned hereunto duly authorized.
| AGREE REALTY CORPORATION | |||
| Date: January 3, 2024 | By: | /s/ Peter Coughenour | |
| Name: | Peter Coughenour | ||
| Title: | Chief Financial Officer and Secretary | ||
Exhibit 99.1
 |
32301 Woodward Avenue Royal Oak, MI 48073 www.agreerealty.com
FORIMMEDIATE RELEASE |
Agree Realty Announces 2023 Investment Activity & Provides Capital Markets Update
Fourth Quarter Capital Markets Activity Further Fortifies Balance Sheet
Royal Oak, MI, January 3, 2024 -- Agree Realty Corporation (NYSE: ADC) (the “Company”) today announced a summary of its investment activity in 2023 and provided an update on its portfolio as well as its fourth quarter capital markets activity.
2023 Investment Activity
Total real estate investment activity for 2023, inclusive of acquisition, development, and Developer Funding Platform (“DFP”) projects completed or currently under construction, amounted to a total of $1.34 billion. The 319 properties are net leased to industry-leading tenants, span 27 retail sectors and are located in 41 states across the country.
During the twelve months ended December 31, 2023, the Company acquired 282 retail net lease properties for total acquisition volume of approximately $1.19 billion. The acquisitions were completed at a weighted-average capitalization rate of 6.9% and had a weighted-average remaining lease term of 11.3 years. Approximately 73.7% of the annualized base rents acquired during the year were derived from investment grade retail tenants. Approximately 8.9% of annualized base rents acquired during the year were derived from ground leased assets.
Acquisition volume for the fourth quarter totaled $187.2 million at a weighted-average capitalization rate of 7.2%, which is 80 basis points higher than the fourth quarter of 2022. The acquisitions had a weighted-average remaining lease term of 10.1 years, and approximately 70.5% of annualized base rents were generated from investment grade retail tenants. Approximately 14.8% of annualized base rents acquired derived from ground leased assets.
As of December 31, 2023, the Company’s portfolio generated approximately 69.1% of annualized base rents from investment grade retail tenants. Properties ground leased to tenants increased to approximately $65.2 million of annualized base rents and represented approximately 11.7% of total annualized base rents.
CEO Comments
“I am once again very pleased with our performance throughout the past twelve months. The pre-equitization of our balance sheet in 2022 and the execution of the only 5.5-year term loan in the REIT space this past year enabled us to invest capital at superior risk-adjusted returns despite a turbulent rate environment. We maintained our discipline, refused to go up the risk curve and positioned our Company for continued earnings growth in 2024,” said Joey Agree, President and Chief Executive Officer. “During the fourth quarter, we raised forward equity to further bolster our fortress balance sheet. We will remain disciplined capital allocators as the interest rate and cap rate environments hopefully stabilize.”
Capital Markets Update
During the fourth quarter of 2023, the Company entered into forward sale agreements in connection with its at-the-market equity (“ATM”) program to sell an aggregate of 3,833,871 shares of common stock for anticipated net proceeds of approximately $235.6 million.
As of December 31, 2023, the Company had total liquidity of over $1.0 billion, which includes $773.0 million of availability under its revolving credit facility, $235.6 million of outstanding forward equity, and cash on hand.
The following table presents the Company’s outstanding forward equity offerings as of December 31, 2023:
| Forward Equity Offerings |
Shares Sold |
Shares Settled |
Shares Remaining |
Net Proceeds Received |
Anticipated Net Proceeds Remaining |
||||||||||
| Q4 2023 ATM Forward Offerings | 3,833,871 | - | 3,833,871 | - | $235,618,977 | ||||||||||
| Total Forward Equity Offerings | 3,833,871 | - | 3,833,871 | - | $235,618,977 |
About Agree Realty Corporation
Agree Realty Corporation is a publicly traded real estate investment trust that is RETHINKING RETAIL through the acquisition and development of properties net leased to industry-leading, omni-channel retail tenants. As of December 31, 2023, the Company owned and operated a portfolio of 2,135 properties, located in 49 states and containing approximately 44.2 million square feet of gross leasable area. The Company’s common stock is listed on the New York Stock Exchange under the symbol “ADC”. For additional information on the Company and RETHINKING RETAIL, please visit www.agreerealty.com.
Forward-Looking Statements
This press release contains forward-looking statements, including statements about projected financial and operating results, within the meaning of Section 27A of the Securities Act of 1933, as amended (the “Securities Act”) and Section 21E of the Securities Exchange Act of 1934, as amended (the “Exchange Act”). The Company intends such forward-looking statements to be covered by the safe harbor provisions for forward-looking statements contained in the Private Securities Litigation Reform Act of 1995 and includes this statement for purposes of complying with these safe harbor provisions. Forward-looking statements are generally identifiable by use of forward-looking terminology such as “may,” “will,” “should,” “potential,” “intend,” “expect,” “seek,” “anticipate,” “estimate,” “approximately,” “believe,” “could,” “project,” “predict,” “forecast,” “continue,” “assume,” “plan,” “outlook” or other similar words or expressions. Forward-looking statements are based on certain assumptions and can include future expectations, future plans and strategies, financial and operating projections or other forward-looking information. Although these forward-looking statements are based on good faith beliefs, reasonable assumptions and the Company’s best judgment reflecting current information, you should not rely on forward-looking statements since they involve known and unknown risks, uncertainties and other factors which are, in some cases, beyond the Company’s control and which could materially affect the Company’s results of operations, financial condition, cash flows, performance or future achievements or events. Currently, some of the most significant factors, include the potential adverse effect of ongoing worldwide economic uncertainties and increased inflation and interest rates on the financial condition, results of operations, cash flows and performance of the Company and its tenants, the real estate market and the global economy and financial markets. The extent to which these conditions will impact the Company and its tenants will depend on future developments, which are highly uncertain and cannot be predicted with confidence. Moreover, investors are cautioned to interpret many of the risks identified in the risk factors discussed in the Company’s Annual Report on Form 10-K and subsequent quarterly reports filed with the Securities and Exchange Commission (the “SEC”), as well as the risks set forth below, as being heightened as a result of the ongoing and numerous adverse impacts of the macroeconomic environment. Additional important factors, among others, that may cause the Company’s actual results to vary include the general deterioration in national economic conditions, weakening of real estate markets, decreases in the availability of credit, increases in interest rates, adverse changes in the retail industry, the Company’s continuing ability to qualify as a REIT and other factors discussed in the Company’s reports filed with the SEC. The forward-looking statements included in this press release are made as of the date hereof. Unless legally required, the Company disclaims any obligation to update any forward-looking statements, whether as a result of new information, future events, changes in the Company’s expectations or assumptions or otherwise.
For further information about the Company’s business and financial results, please refer to the “Management’s Discussion and Analysis of Financial Condition and Results of Operations” and “Risk Factors” sections of the Company’s SEC filings, including, but not limited to, its Annual Report on Form 10-K and Quarterly Reports on Form 10-Q, copies of which may be obtained at the Investor Relations section of the Company’s website at www.agreerealty.com.
The Company defines the “weighted-average capitalization rate” for acquisitions and dispositions as the sum of contractual fixed annual rents computed on a straight-line basis over the primary lease terms and anticipated annual net tenant recoveries, divided by the purchase and sale prices for occupied properties.
The Company defines “annualized base rent” as the annualized amount of contractual minimum rent required by tenant lease agreements as of December 31, 2023, computed on a straight-line basis. Annualized base rent is not, and is not intended to be, a presentation in accordance with generally accepted accounting principles (“GAAP”). The Company believes annualized contractual minimum rent is useful to management, investors, and other interested parties in analyzing concentrations and leasing activity.
###
Contact:
Peter Coughenour
Chief Financial Officer
Agree Realty Corporation
(248) 737-4190
Exhibit 99.2
JANUARY 2024
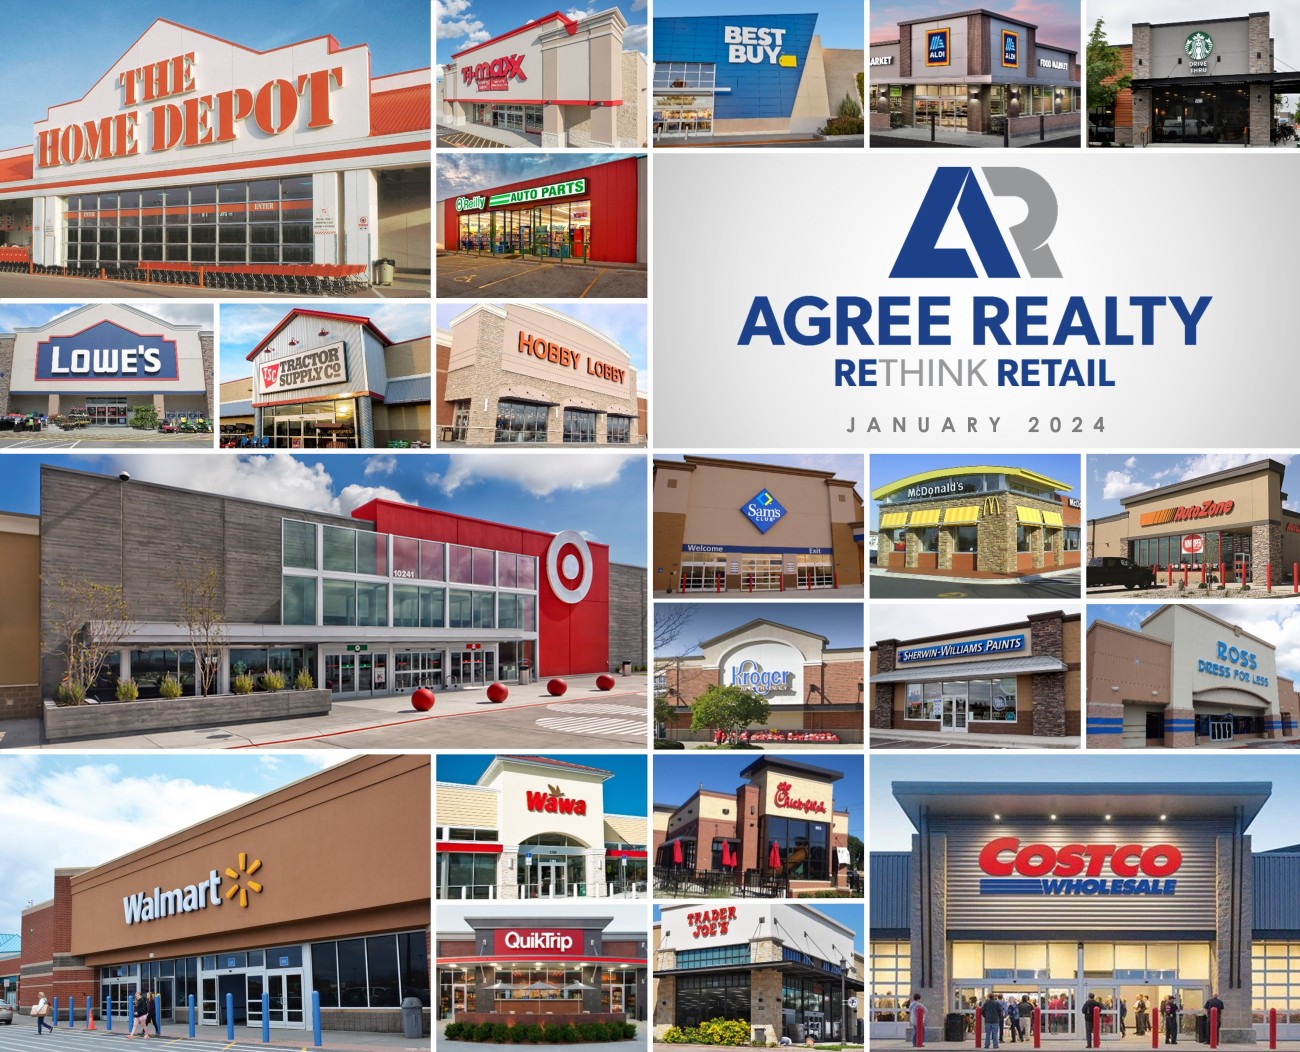
1 © 20 24 AGREE REALTY CORPORATION . ALL RIGHTS RESERVED. CONFIDENTIAL. Agree Realty Overview (NYSE: ADC) OUR COMPANY NET LEASE REIT FOCUSED ON THE ACQUISITION & DEVELOPMENT OF HIGH - QUALITY RETAIL PROPERTIES Founded in 1971 by Executive Chairman, Richard Agree Public on the NYSE since 1994 $ 8.9 billion retail net lease REIT headquartered in Royal Oak, Michigan 2,135 retail properties totaling over 44 million square feet in 49 states Investment grade issuer ratings of Baa1 from Moody’s and BBB from S&P RE THINK RETAIL Capitalize on distinct market positioning in the retail net lease space Focus on industry - leading retailers through our three unique external growth platforms Leverage our real estate acumen and relationships to identify superior risk - adjusted opportunities Maintain a conservative and flexible capital structure that enables our growth trajectory Provide consistent, high - quality earnings growth and a well - covered, growing dividend As of December 31, 2023 , unless otherwise noted.
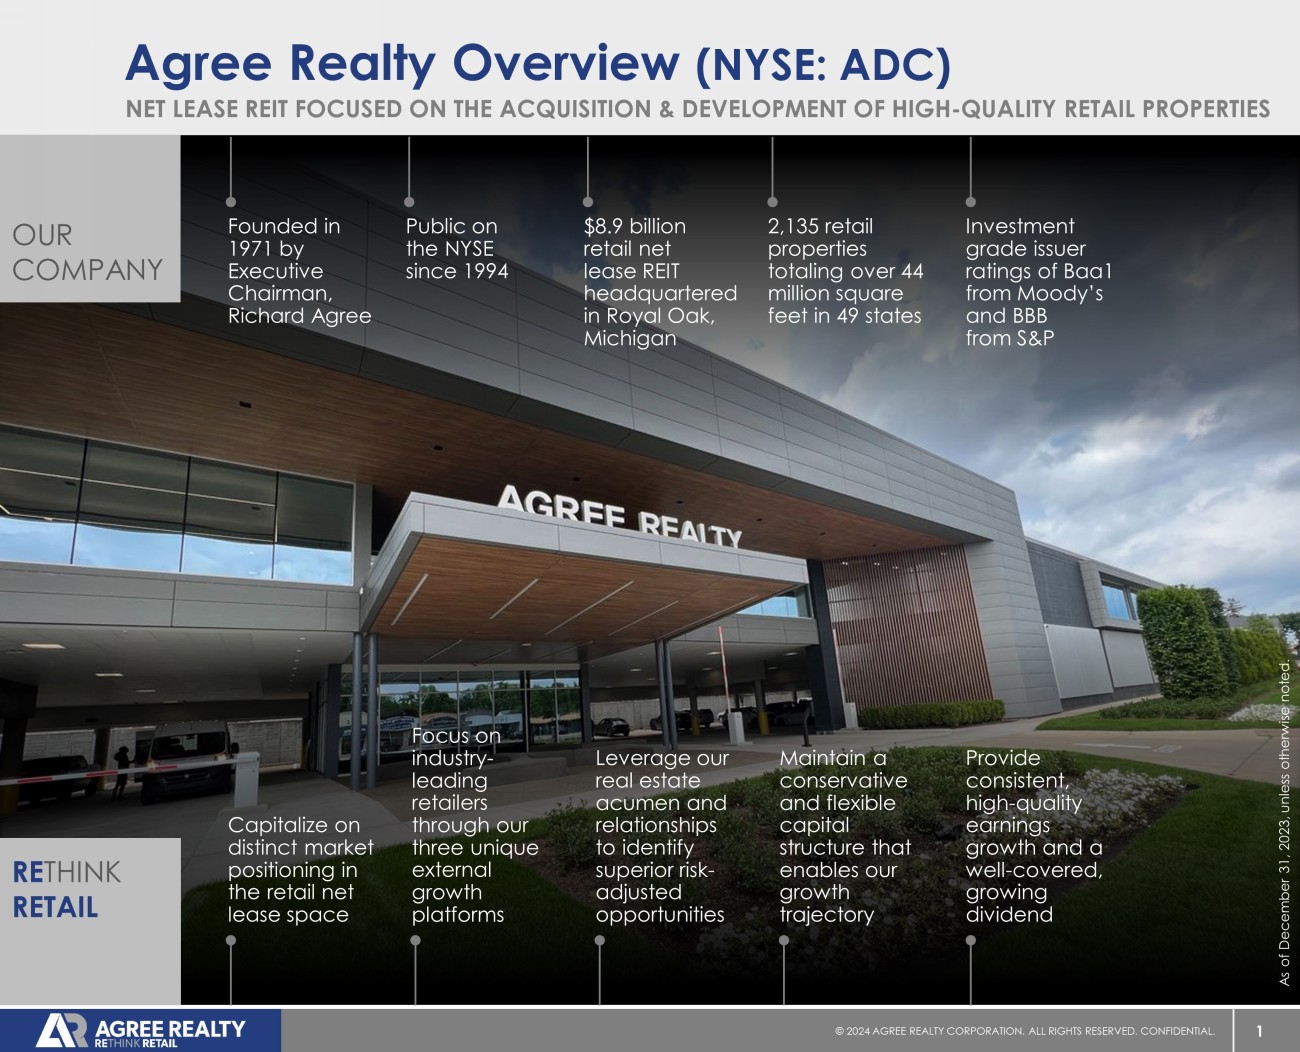
2 © 20 24 AGREE REALTY CORPORATION . ALL RIGHTS RESERVED. CONFIDENTIAL. RE THINKING RETAIL 3 © 20 24 AGREE REALTY CORPORATION . ALL RIGHTS RESERVED. CONFIDENTIAL. consistency noun steadfast adherence to the same principles, course, or form [ kuh n - sis - tuh n - see ]
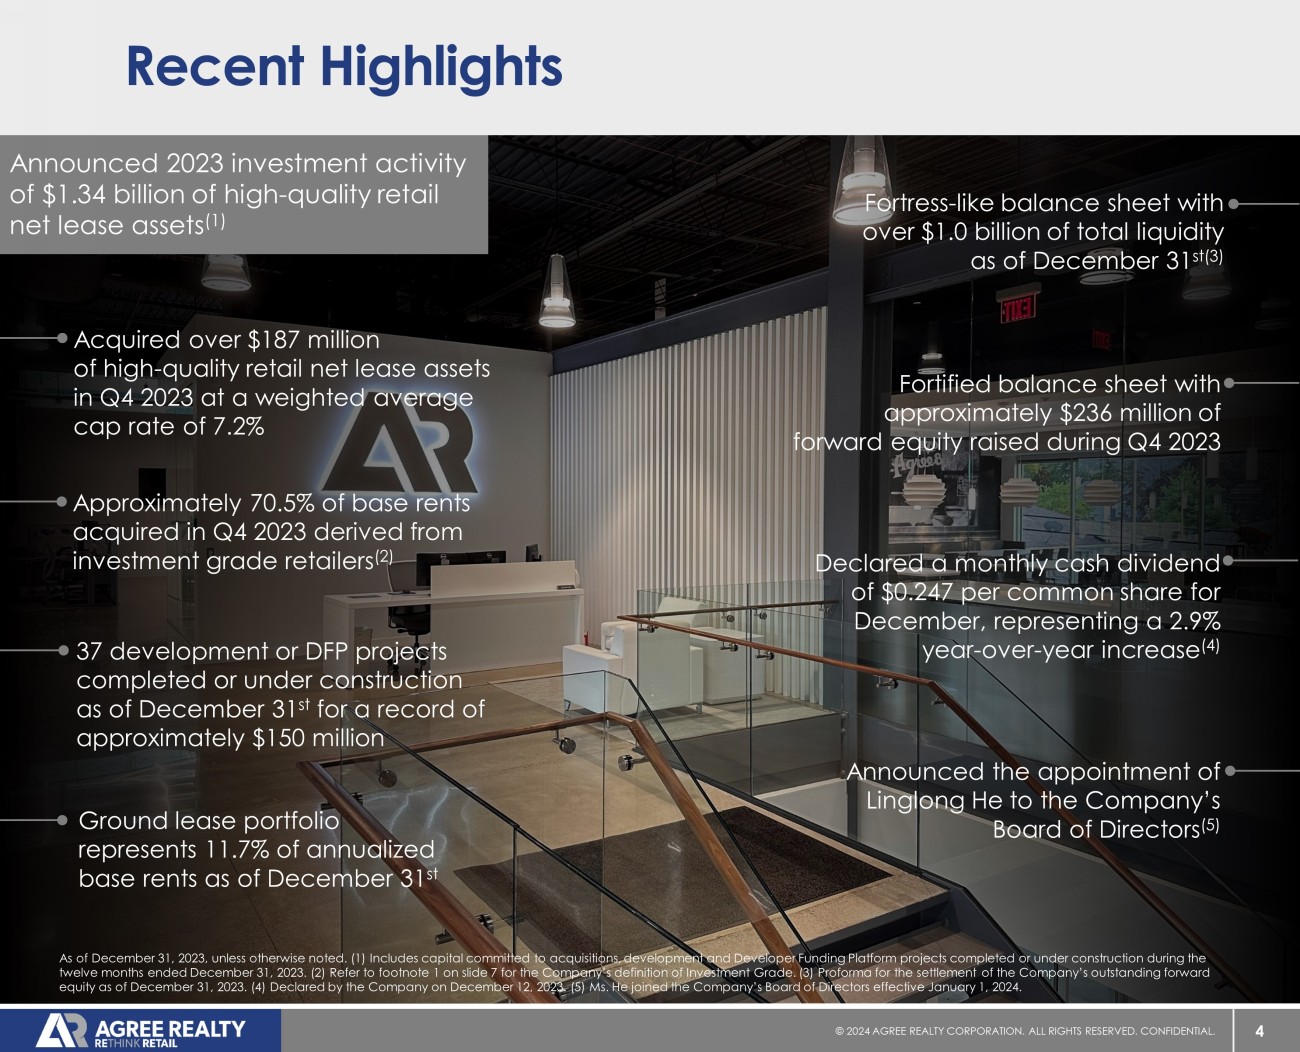
4 © 20 24 AGREE REALTY CORPORATION . ALL RIGHTS RESERVED. CONFIDENTIAL. As of December 31, 2023, unless otherwise noted. (1) Includes capital committed to acquisitions, development and Developer Fu ndi ng Platform projects completed or under construction during the twelve months ended December 31, 2023. (2) Refer to footnote 1 on slide 7 for the Company’s definition of Investment Grade. ( 3) Proforma for the settlement of the Company’s outstanding forward equity as of December 31, 2023. (4) Declared by the Company on December 12, 2023. (5) Ms. He joined the Company’s Board of Di rec tors effective January 1, 2024. Recent Highlights Ground lease portfolio represents 11.7% of annualized base rents as of December 31 st Declared a monthly cash dividend of $ 0.247 per common share for December , representing a 2.9 % year - over - year increase (4) 37 development or DFP projects completed or under construction as of December 31 st for a record of approximately $150 million Acquired over $187 million of high - quality retail net lease assets in Q4 2023 at a weighted average cap rate of 7.2% Approximately 70.5% of base rents acquired in Q4 2023 derived from investment grade retailers (2) Announced 2023 investment activity of $1.34 billion of high - quality retail net lease assets (1) Fortified balance sheet with approximately $236 million of forward equity raised during Q4 2023 Fortress - like balance sheet with over $1.0 billion of total liquidity as of December 31 st(3) Announced the appointment of Linglong He to the Company’s Board of Directors (5)

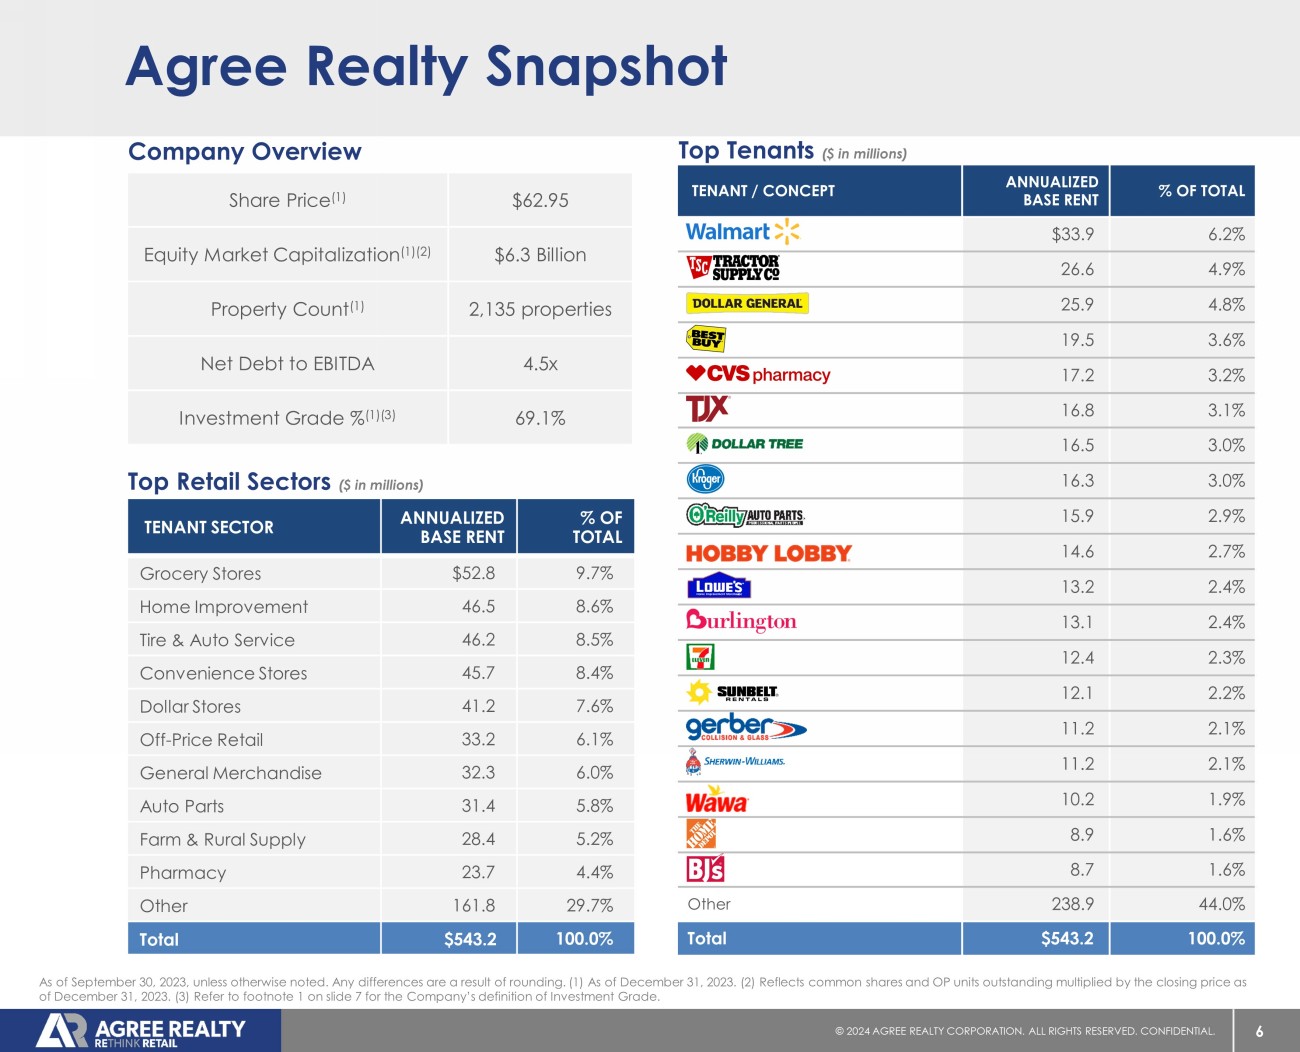
The Country’s Leading Retail Portfolio 6 © 20 24 AGREE REALTY CORPORATION . ALL RIGHTS RESERVED. CONFIDENTIAL. TENANT / CONCEPT ANNUALIZED BASE RENT % OF TOTAL $33.9 6.2% 26.6 4.9% 25.9 4.8% 19.5 3.6% 17.2 3.2% 16.8 3.1% 16.5 3.0% 16.3 3.0% 15.9 2.9% 14.6 2.7% 13.2 2.4% 13.1 2.4% 12.4 2.3% 12.1 2.2% 11.2 2.1% 11.2 2.1% 10.2 1.9% 8.9 1.6% 8.7 1.6% Other 238.9 44.0% Total $543.2 100.0% Agree Realty Snapshot TENANT SECTOR ANNUALIZED BASE RENT % OF TOTAL Grocery Stores $52.8 9.7% Home Improvement 46.5 8.6% Tire & Auto Service 46.2 8.5% Convenience Stores 45.7 8.4% Dollar Stores 41.2 7.6% Off - Price Retail 33.2 6.1% General Merchandise 32.3 6.0% Auto Parts 31.4 5.8% Farm & Rural Supply 28.4 5.2% Pharmacy 23.7 4.4% Other 161.8 29.7% Total $543.2 100.0% Share Price (1) $62.95 Equity Market Capitalization (1)(2) $6.3 Billion Property Count (1) 2,135 properties Net Debt to EBITDA 4.5x Investment Grade % (1)(3) 69.1% Company Overview Top Tenants ($ in millions) Top Retail Sectors ($ in millions) As of September 30, 2023, unless otherwise noted. Any differences are a result of rounding. (1) As of December 31, 2023. (2) Ref lects common shares and OP units outstanding multiplied by the closing price as of December 31, 2023. (3) Refer to footnote 1 on slide 7 for the Company’s definition of Investment Grade.
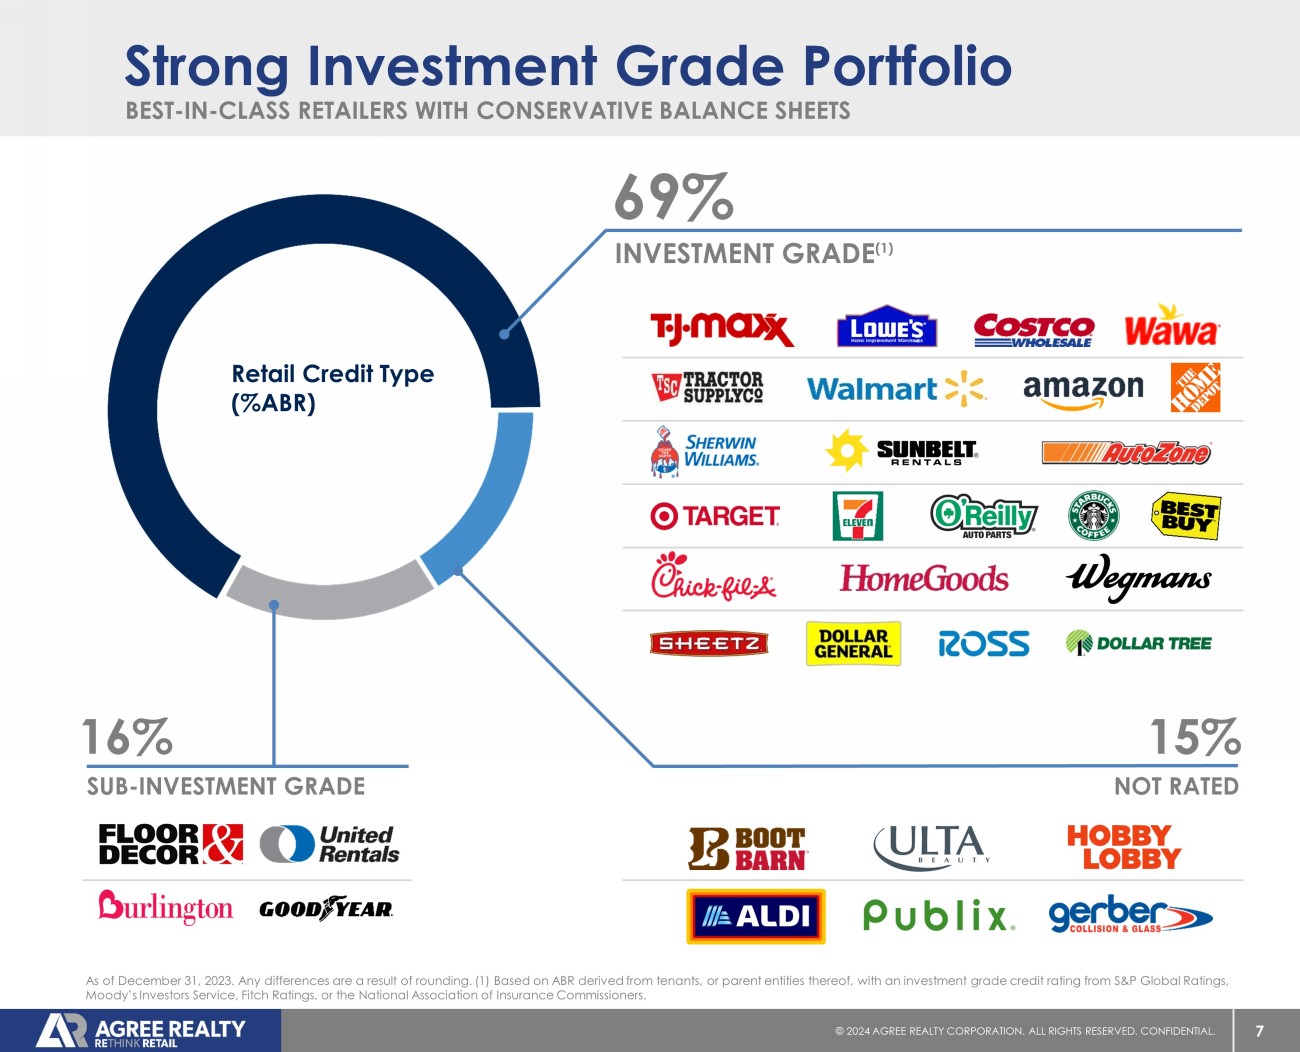
7 © 20 24 AGREE REALTY CORPORATION . ALL RIGHTS RESERVED. CONFIDENTIAL. BEST - IN - CLASS RETAILERS WITH CONSERVATIVE BALANCE SHEETS Strong Investment Grade Portfolio 16% SUB - INVESTMENT GRADE 15% NOT RATED 69% INVESTMENT GRADE (1) As of December 31, 2023. Any differences are a result of rounding. (1) Based on ABR derived from tenants, or parent entities the reof, with an investment grade credit rating from S&P Global Ratings, Moody’s Investors Service, Fitch Ratings, or the National Association of Insurance Commissioners. Retail Credit Type (%ABR)
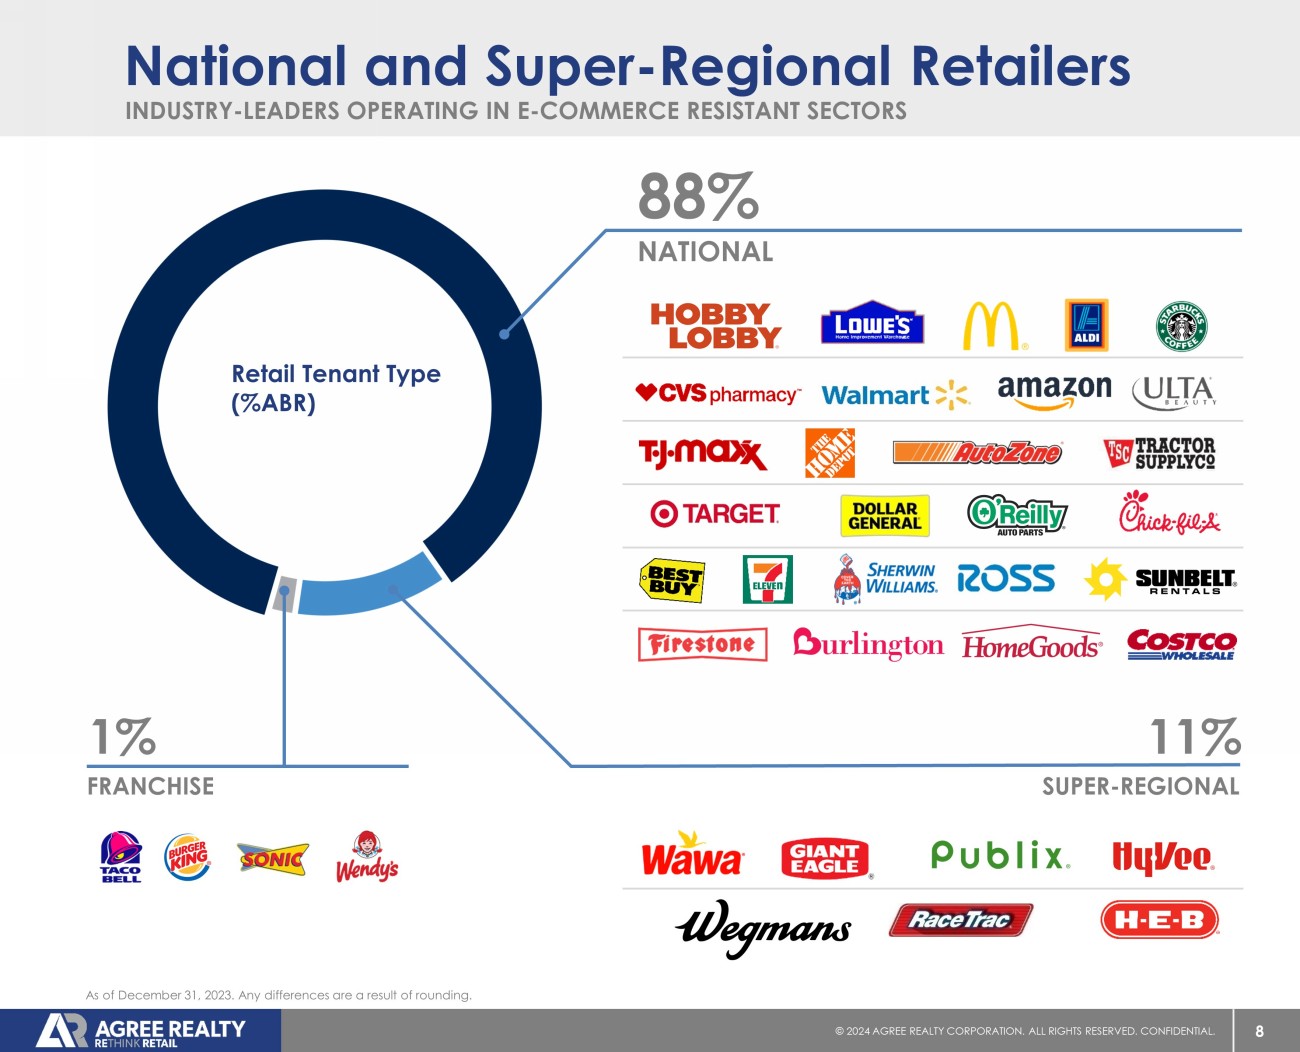
8 © 20 24 AGREE REALTY CORPORATION . ALL RIGHTS RESERVED. CONFIDENTIAL. INDUSTRY - LEADERS OPERATING IN E - COMMERCE RESISTANT SECTORS National and Super - Regional Retailers 1% FRANCHISE 11% SUPER - REGIONAL 88% NATIONAL As of December 31, 2023. Any differences are a result of rounding. Retail Tenant Type (%ABR)
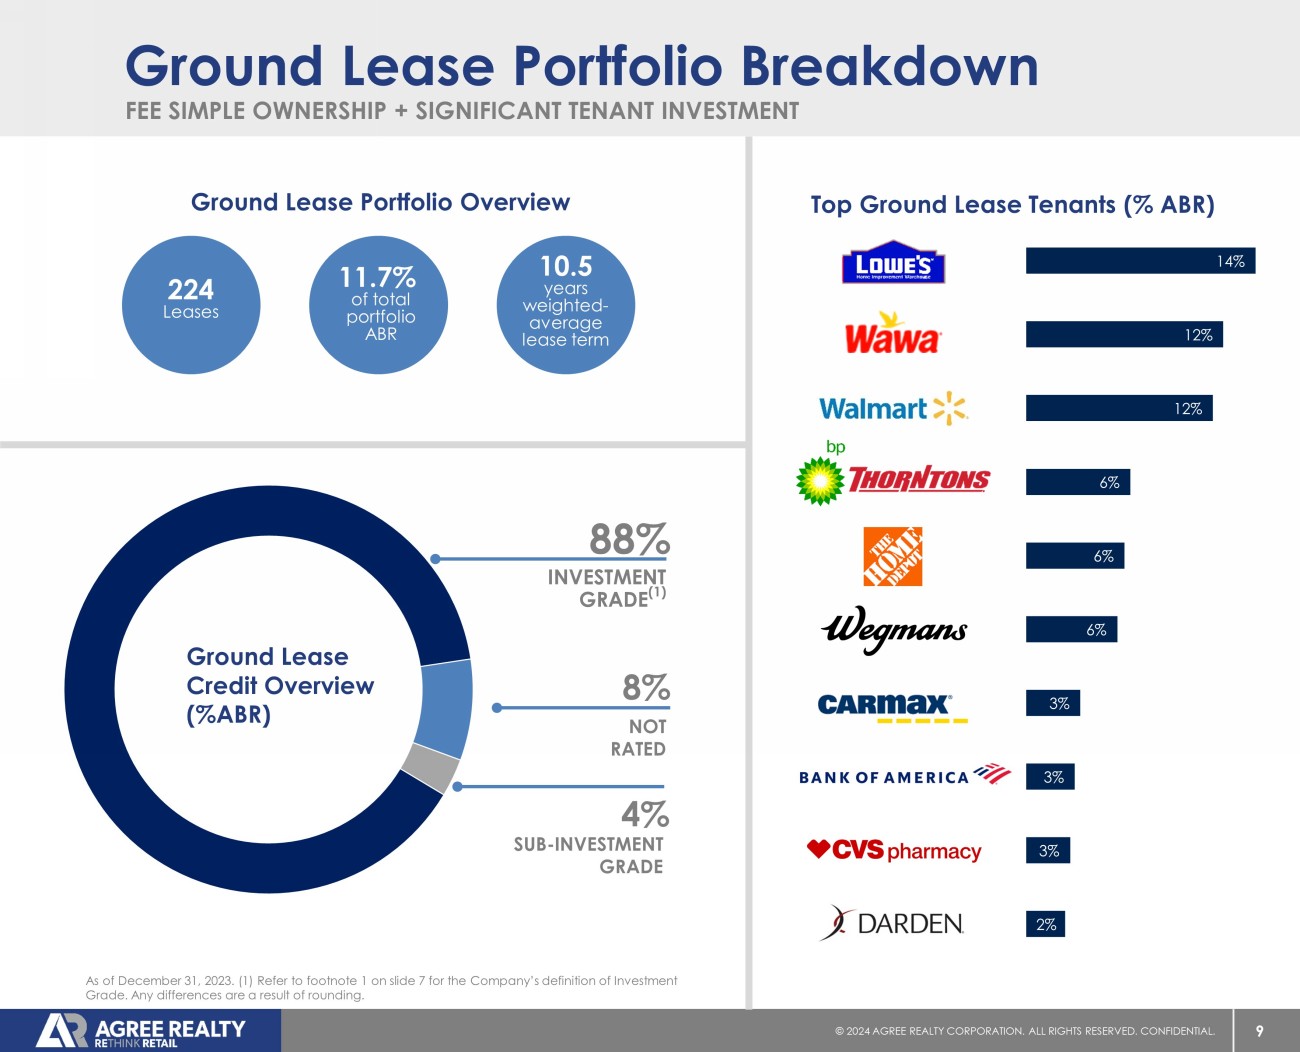
9 © 20 24 AGREE REALTY CORPORATION . ALL RIGHTS RESERVED. CONFIDENTIAL. 14% 12% 12% 6% 6% 6% 3% 3% 3% 2% As of December 31, 2023. (1) Refer to footnote 1 on slide 7 for the Company’s definition of Investment Grade. Any differences are a result of rounding. FEE SIMPLE OWNERSHIP + SIGNIFICANT TENANT INVESTMENT Ground Lease Portfolio Breakdown Ground Lease Credit Overview (%ABR) 88% INVESTMENT GRADE (1) 8% NOT RATED 4% SUB - INVESTMENT GRADE Ground Lease Portfolio Overview 224 Leases 11.7% of total portfolio ABR 10.5 years weighted - average lease term Top Ground Lease Tenants (% ABR)
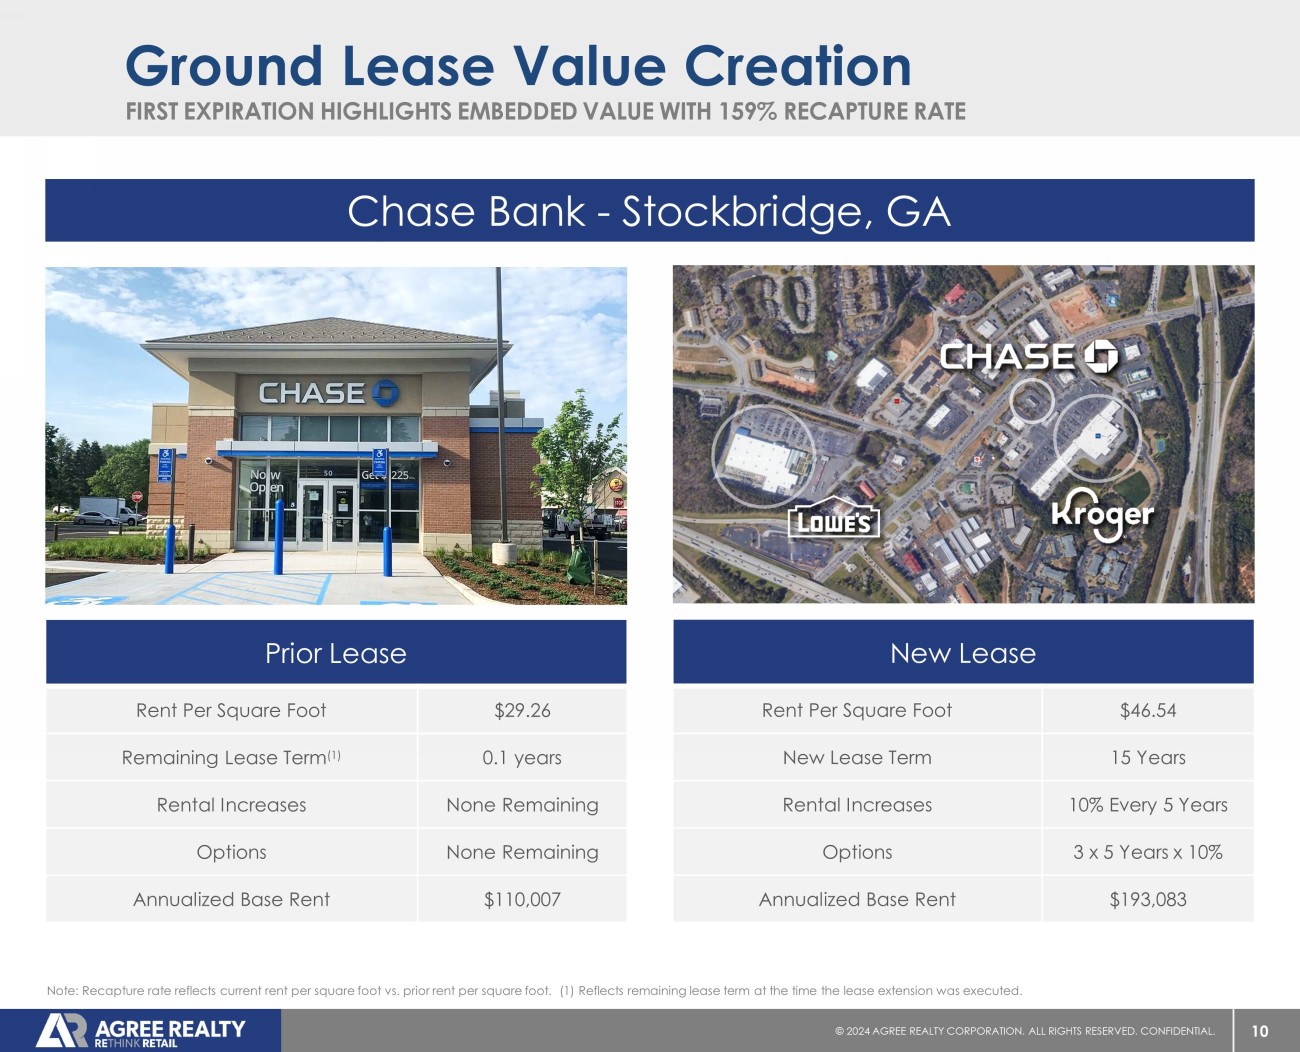
10 © 20 24 AGREE REALTY CORPORATION . ALL RIGHTS RESERVED. CONFIDENTIAL. FIRST EXPIRATION HIGHLIGHTS EMBEDDED VALUE WITH 159% RECAPTURE RATE Ground Lease Value Creation Chase Bank - Stockbridge, GA New Lease Rent Per Square Foot $46.54 New Lease Term 15 Years Rental Increases 10% Every 5 Years Options 3 x 5 Years x 10% Annualized Base Rent $193,083 Prior Lease Rent Per Square Foot $29.26 Remaining Lease Term (1) 0.1 years Rental Increases None Remaining Options None Remaining Annualized Base Rent $110,007 Note: Recapture rate reflects current rent per square foot vs. prior rent per square foot. (1) Reflects remaining lease term at the time the lease extension was executed.

Disciplined Investment Strategy & Active Portfolio Management 12 © 20 24 AGREE REALTY CORPORATION . ALL RIGHTS RESERVED. CONFIDENTIAL.
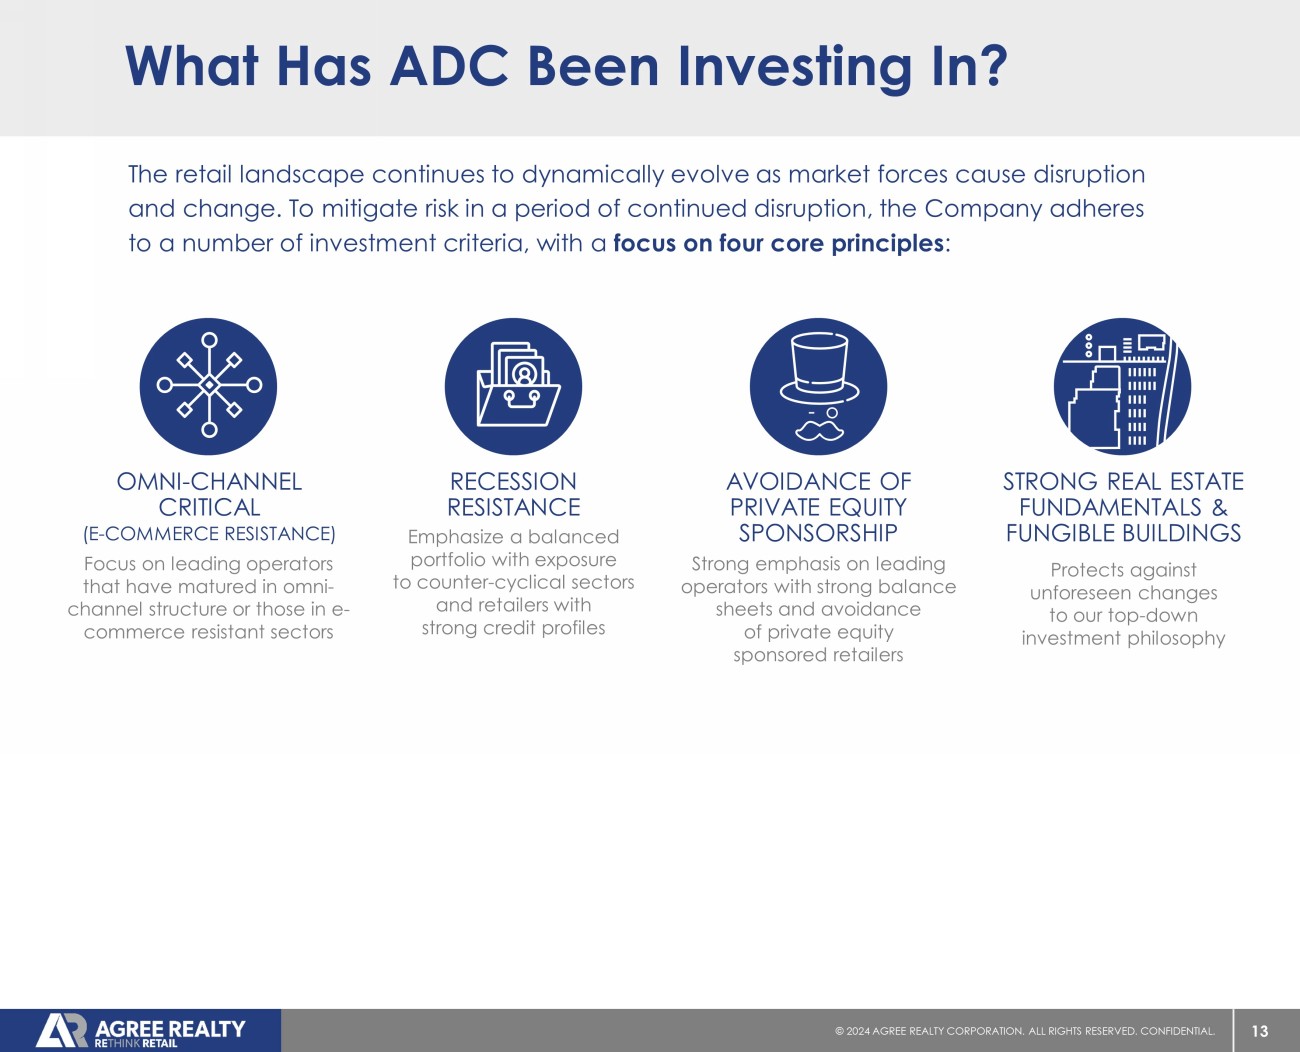
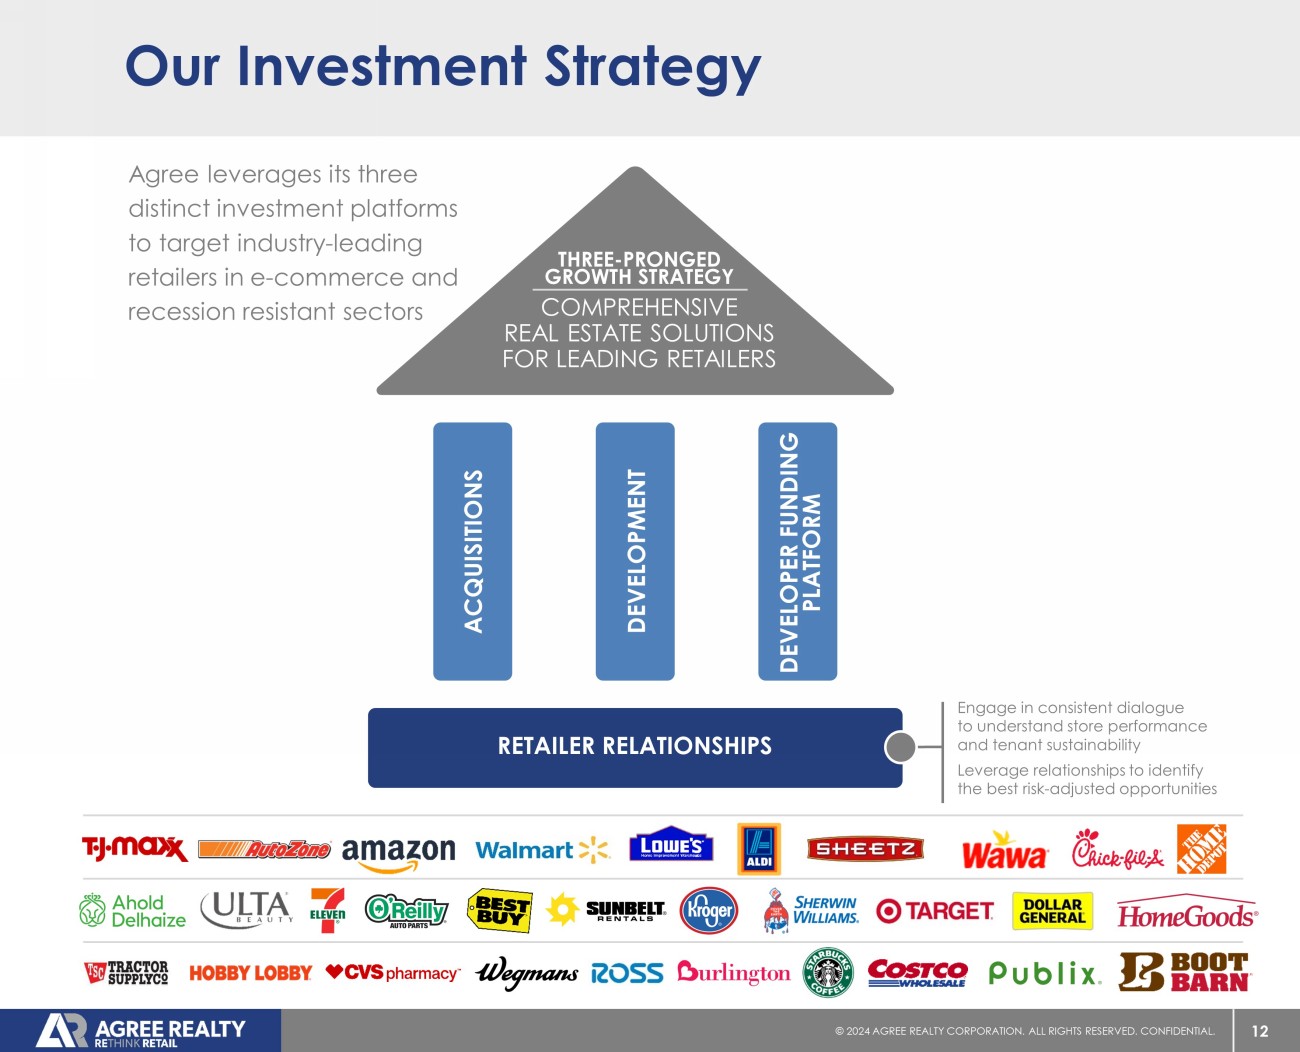
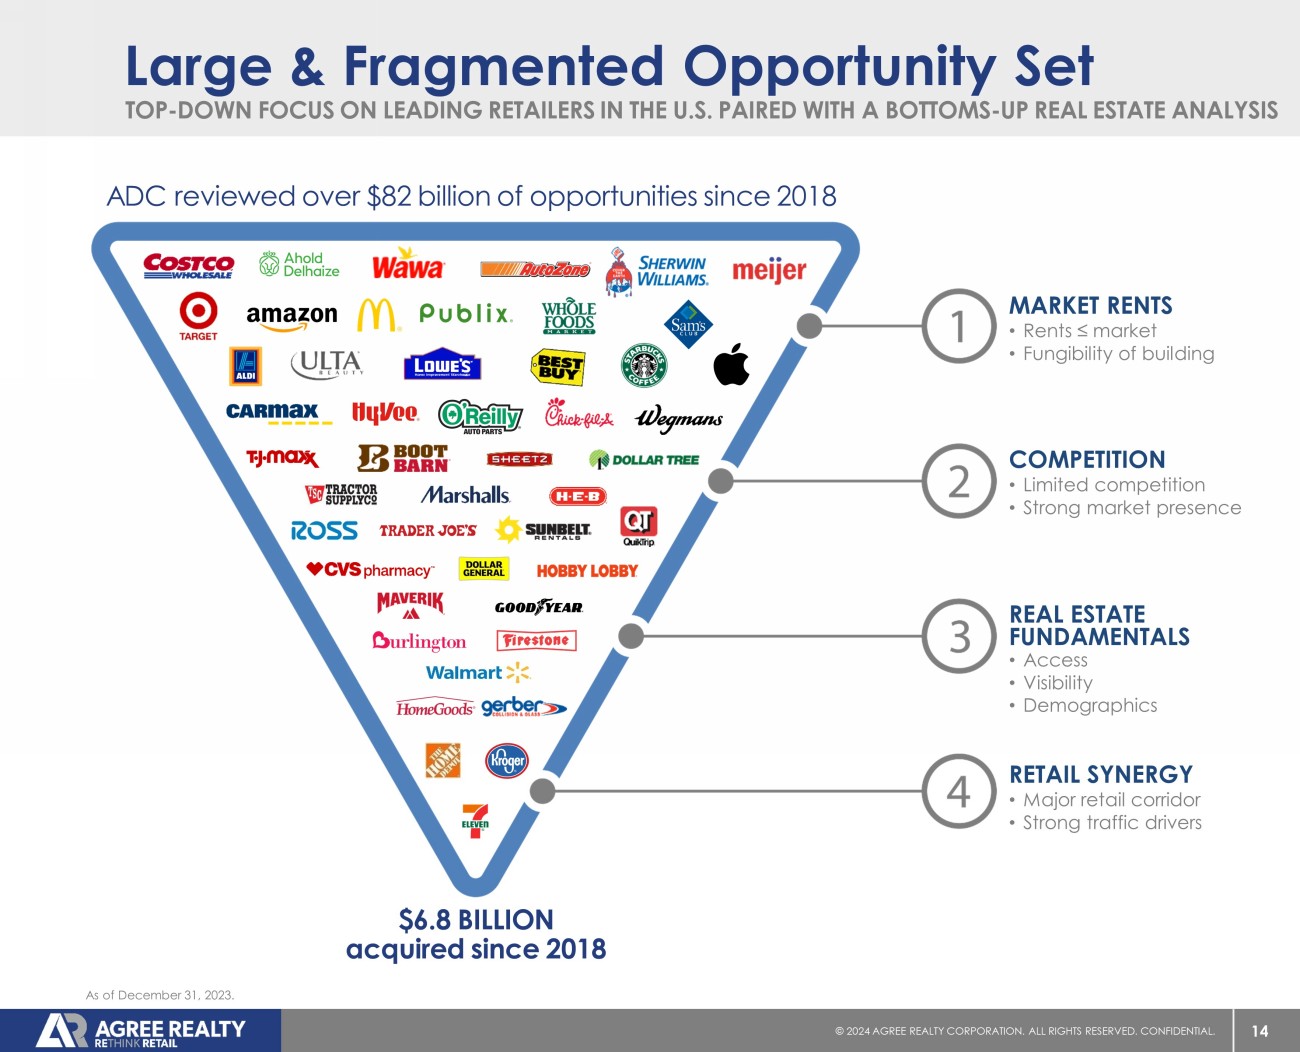
Engage in consistent dialogue to understand store performance and tenant sustainability Leverage relationships to identify the best risk - adjusted opportunities Our Investment Strategy Agree leverages its three distinct investment platforms to target industry - leading retailers in e - commerce and recession resistant sectors THREE - PRONGED GROWTH STRATEGY COMPREHENSIVE REAL ESTATE SOLUTIONS FOR LEADING RETAILERS ACQUISITIONS DEVELOPMENT DEVELOPER FUNDING PLATFORM RETAILER RELATIONSHIPS 13 © 20 24 AGREE REALTY CORPORATION . ALL RIGHTS RESERVED. CONFIDENTIAL. What Has ADC Been Investing In? The retail landscape continues to dynamically evolve as market forces cause disruption and change. To mitigate risk in a period of continued disruption, the Company adheres to a number of investment criteria, with a focus on four core principles : Focus on leading operators that have matured in omni - channel structure or those in e - commerce resistant sectors OMNI - CHANNEL CRITICAL (E - COMMERCE RESISTANCE) Emphasize a balanced portfolio with exposure to counter - cyclical sectors and retailers with strong credit profiles RECESSION RESISTANCE Strong emphasis on leading operators with strong balance sheets and avoidance of private equity sponsored retailers AVOIDANCE OF PRIVATE EQUITY SPONSORSHIP Protects against unforeseen changes to our top - down investment philosophy STRONG REAL ESTATE FUNDAMENTALS & FUNGIBLE BUILDINGS 14 © 20 24 AGREE REALTY CORPORATION . ALL RIGHTS RESERVED. CONFIDENTIAL. TOP - DOWN FOCUS ON LEADING RETAILERS IN THE U.S. PAIRED WITH A BOTTOMS - UP REAL ESTATE ANALYSIS Large & Fragmented Opportunity Set REAL ESTATE FUNDAMENTALS • Rents ≤ market • Fungibility of building MARKET RENTS • Limited competition • Strong market presence COMPETITION • Access • Visibility • Demographics • Major retail corridor • Strong traffic drivers RETAIL SYNERGY ADC reviewed over $82 billion of opportunities since 2018 $6.8 BILLION acquired since 2018 As of December 31, 2023.
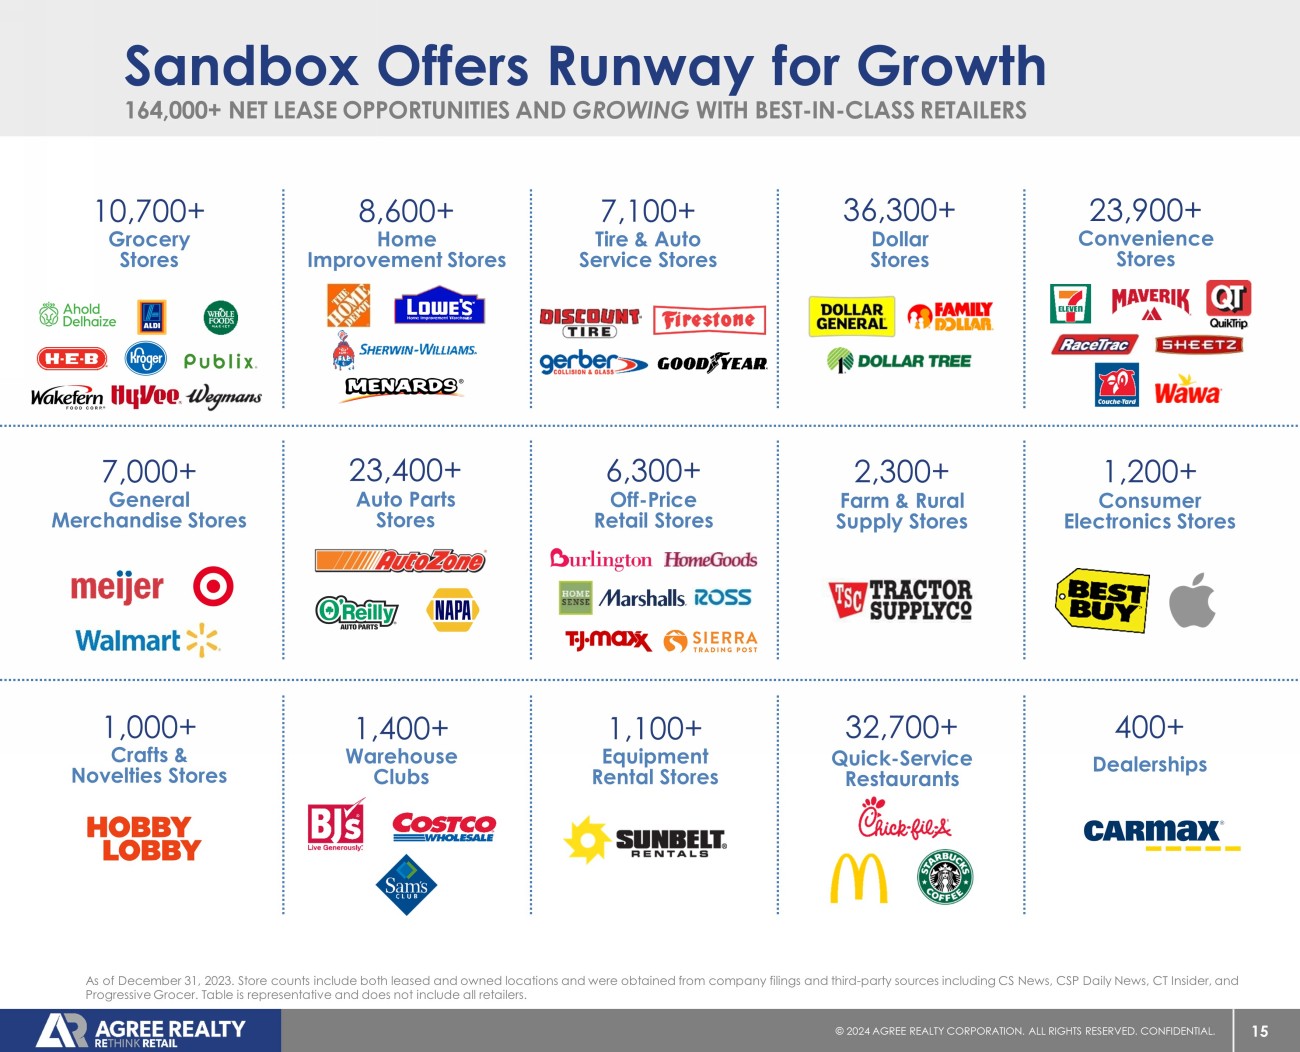
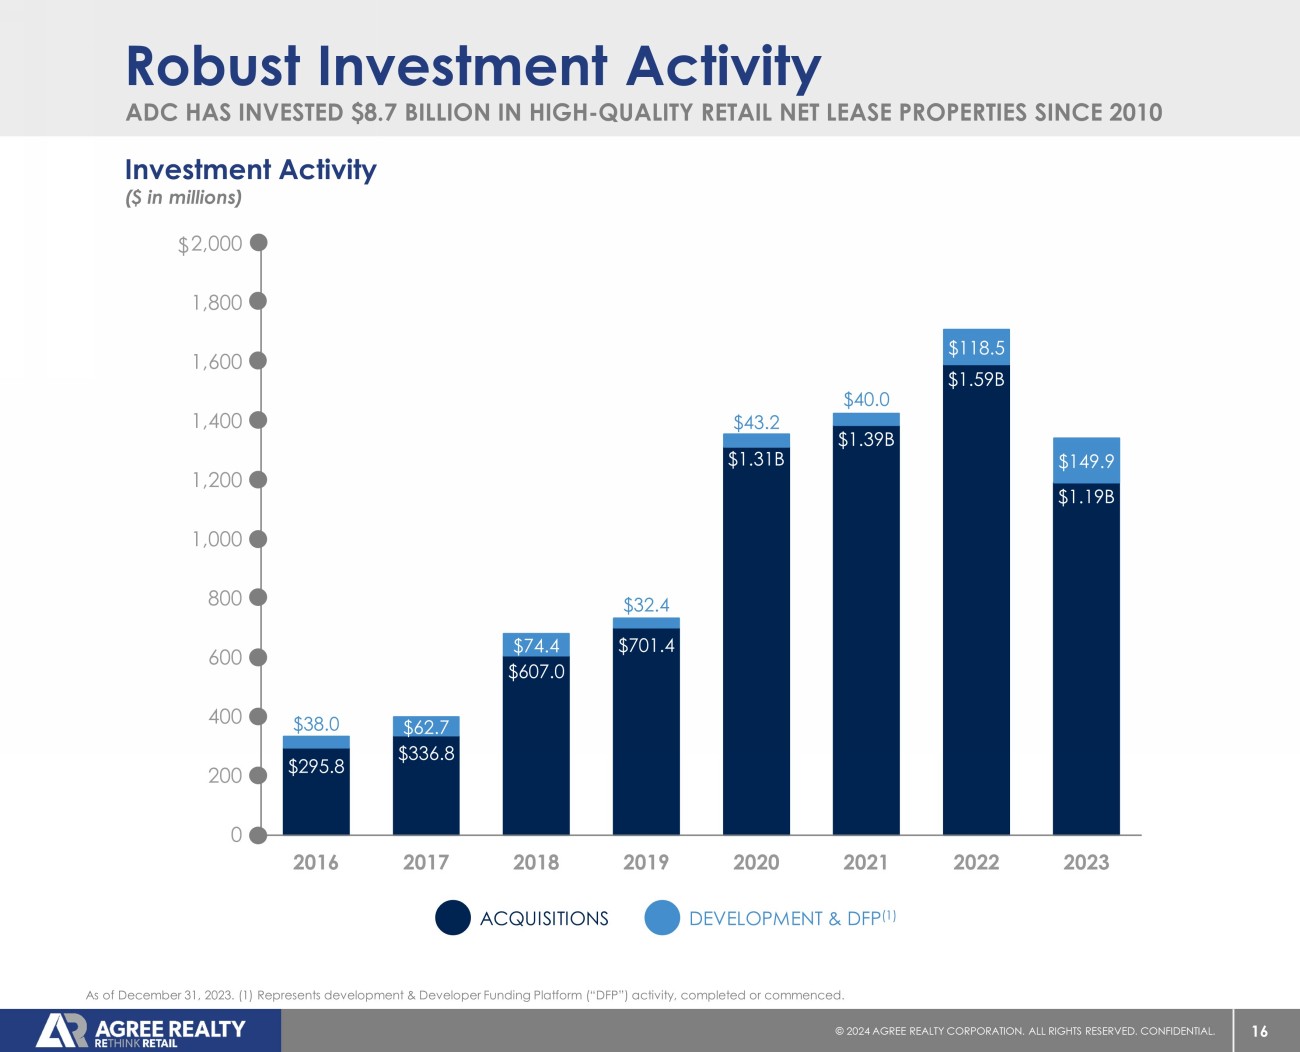
15 © 20 24 AGREE REALTY CORPORATION . ALL RIGHTS RESERVED. CONFIDENTIAL. As of December 31, 2023. Store counts include both leased and owned locations and were obtained from company filings and thir d - p arty sources including CS News, CSP Daily News, CT Insider, and Progressive Grocer. Table is representative and does not include all retailers. 164,000+ NET LEASE OPPORTUNITIES AND GROWING WITH BEST - IN - CLASS RETAILERS Sandbox Offers Runway for Growth Auto Parts Stores 23,400+ Farm & Rural Supply Stores 2,300+ Crafts & Novelties Stores 1,000+ Quick - Service Restaurants 32,700+ Equipment Rental Stores 1,100+ Warehouse Clubs 1,400+ Home Improvement Stores 8,600+ Consumer Electronics Stores 1,200+ Grocery Stores 10,700+ Dealerships 400+ Convenience Stores 23,900+ Off - Price Retail Stores 6,300+ Tire & Auto Service Stores 7,100+ Dollar Stores 36,300+ General Merchandise Stores 7,000+ 16 © 20 24 AGREE REALTY CORPORATION . ALL RIGHTS RESERVED. CONFIDENTIAL. ADC HAS INVESTED $ 8.7 BILLION IN HIGH - QUALITY RETAIL NET LEASE PROPERTIES SINCE 2010 Robust Investment Activity DEVELOPMENT & DFP (1) ACQUISITIONS Investment Activity ($ in millions) As of December 31, 2023. (1) Represents development & Developer Funding Platform (“DFP”) activity, completed or commenced. $ $295.8 $336.8 $607.0 $701.4 $1.31B $1.39B $1.59B $1.19B $38.0 $62.7 $74.4 $32.4 $43.2 $40.0 $118.5 $149.9 0 200 400 600 800 1,000 1,200 1,400 1,600 1,800 2,000 2016 2017 2018 2019 2020 2021 2022 2023
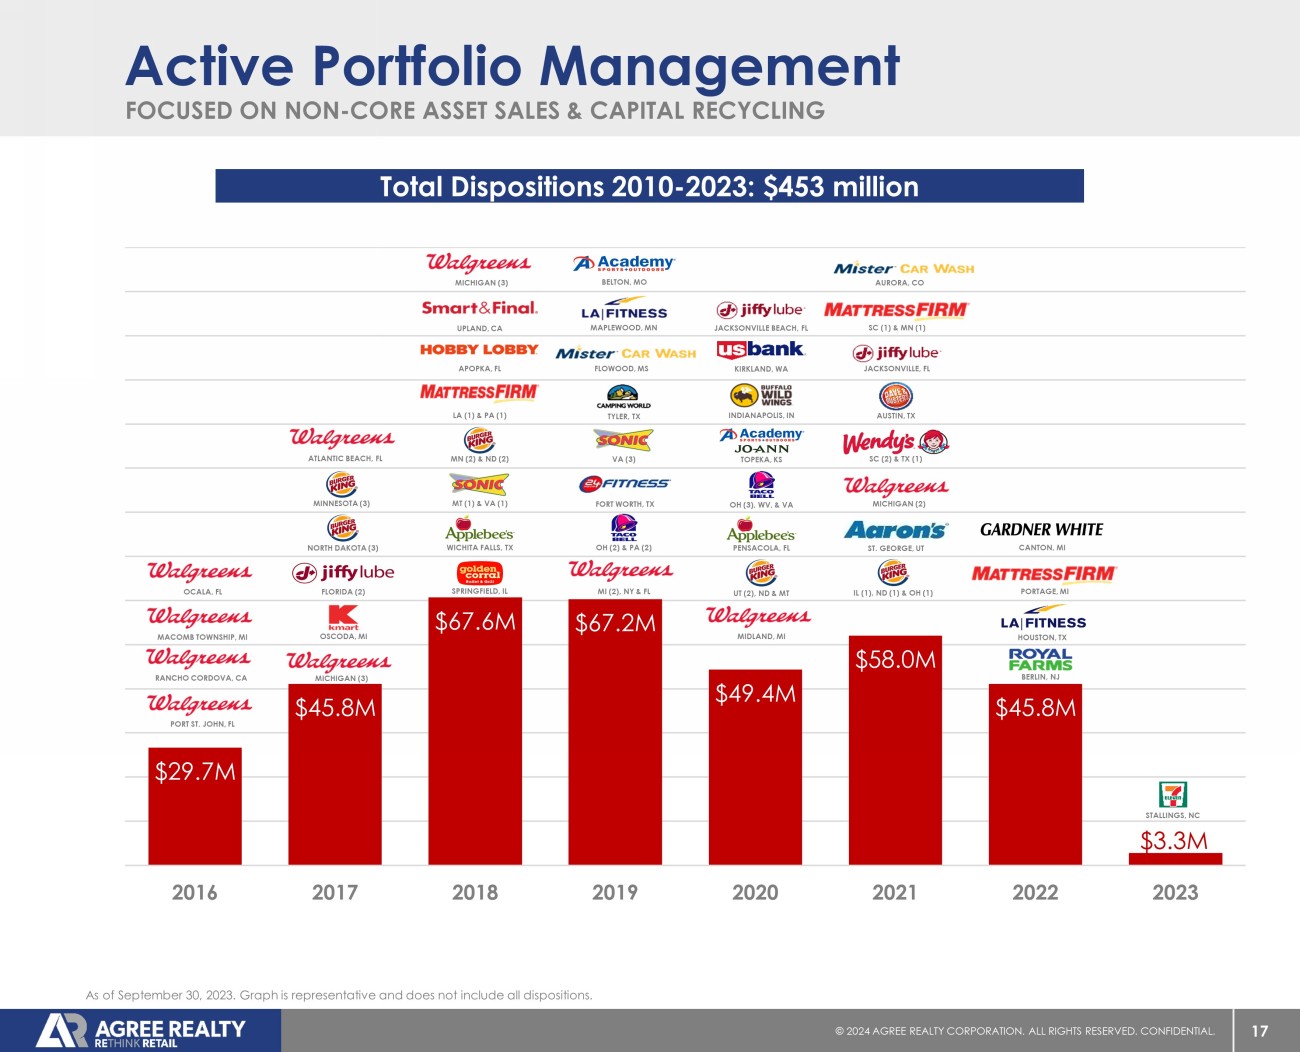
17 © 20 24 AGREE REALTY CORPORATION . ALL RIGHTS RESERVED. CONFIDENTIAL. $29.7M $45.8M $67.6M $67.2M $49.4M $58.0M $45.8M $3.3M 2016 2017 2018 2019 2020 2021 2022 2023 BERLIN, NJ HOUSTON, TX PORTAGE, MI CANTON, MI FOCUSED ON NON - CORE ASSET SALES & CAPITAL RECYCLING Active Portfolio Management As of September 30, 2023. Graph is representative and does not include all dispositions. Total Dispositions 2010 - 2023: $453 million STALLINGS, NC MICHIGAN (3) OSCODA, MI FLORIDA (2) NORTH DAKOTA (3) MINNESOTA (3) ATLANTIC BEACH, FL MT (1) & VA (1) WICHITA FALLS, TX SPRINGFIELD, IL UPLAND, CA APOPKA, FL LA (1) & PA (1) MN (2) & ND (2) MICHIGAN (3) FORT WORTH, TX OH (2) & PA (2) FLOWOOD, MS MAPLEWOOD, MN TYLER, TX BELTON, MO MI (2), NY & FL VA (3) MIDLAND, MI UT (2), ND & MT PENSACOLA, FL OH (3), WV, & VA TOPEKA, KS INDIANAPOLIS, IN KIRKLAND, WA JACKSONVILLE BEACH, FL IL (1), ND (1) & OH (1) MICHIGAN (2) ST. GEORGE, UT SC (2) & TX (1) AUSTIN, TX JACKSONVILLE, FL SC (1) & MN (1) AURORA, CO PORT ST.
Fortified Balance Sheet
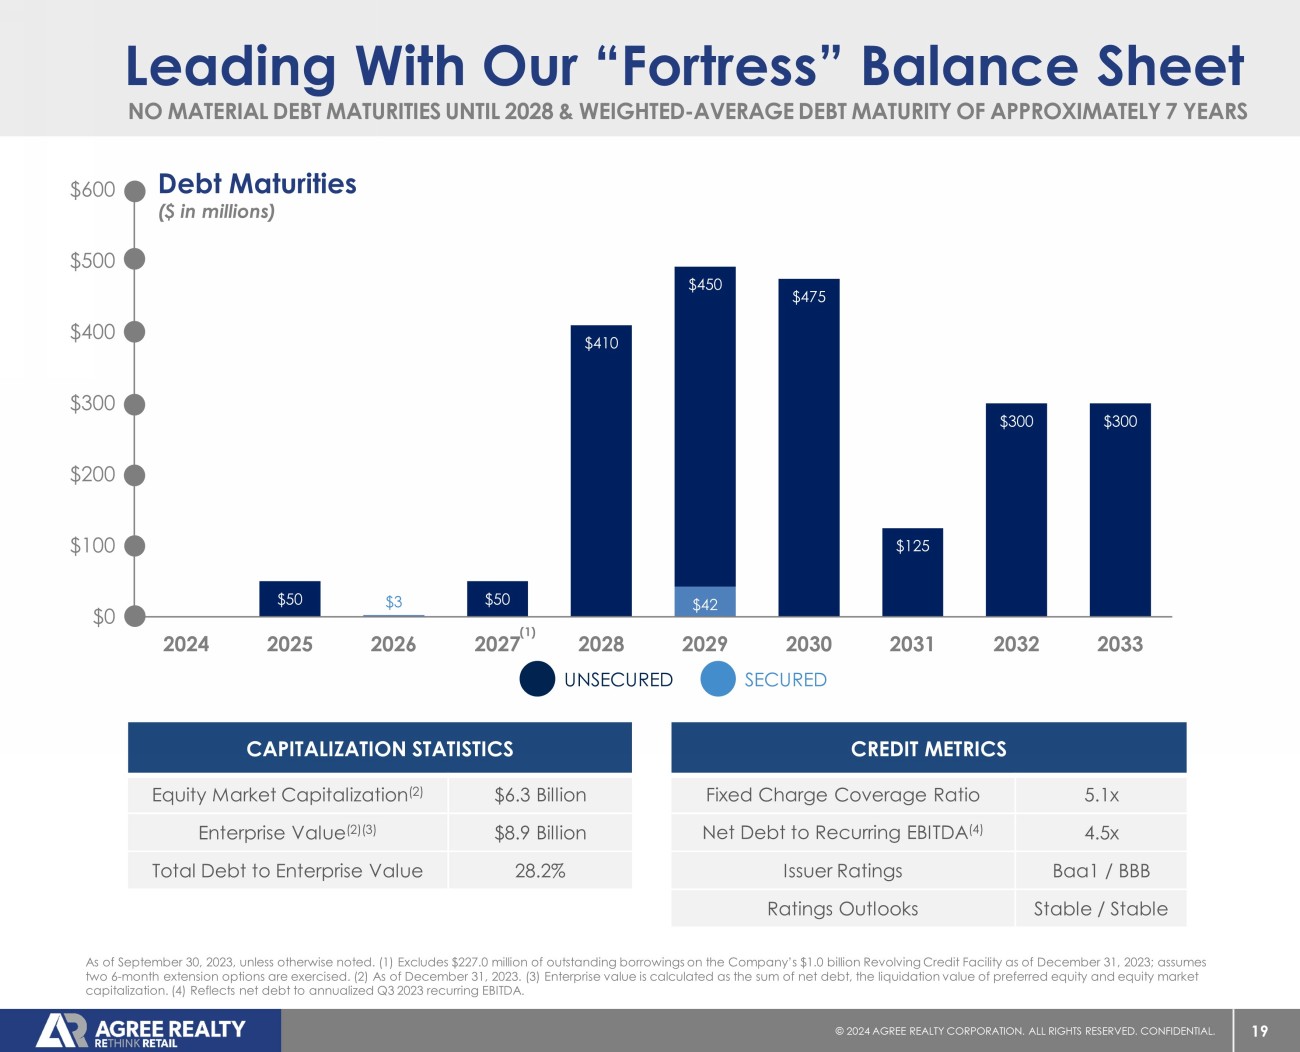
JOHN, FL RANCHO CORDOVA, CA MACOMB TOWNSHIP, MI OCALA, FL 19 © 20 24 AGREE REALTY CORPORATION . ALL RIGHTS RESERVED. CONFIDENTIAL. Leading With Our “Fortress” Balance Sheet CAPITALIZATION STATISTICS Equity Market Capitalization (2) $6.3 Billion Enterprise Value (2)(3) $8.9 Billion Total Debt to Enterprise Value 28.2% CREDIT METRICS Fixed Charge Coverage Ratio 5.1x Net Debt to Recurring EBITDA (4) 4.5x Issuer Ratings Baa1 / BBB Ratings Outlooks Stable / Stable As of September 30, 2023, unless otherwise noted. (1) Excludes $227.0 million of outstanding borrowings on the Company’s $1.0 bi llion Revolving Credit Facility as of December 31, 2023; assumes two 6 - month extension options are exercised. (2) As of December 31, 2023. (3) Enterprise value is calculated as the sum of net d ebt, the liquidation value of preferred equity and equity market capitalization. (4) Reflects net debt to annualized Q3 2023 recurring EBITDA.
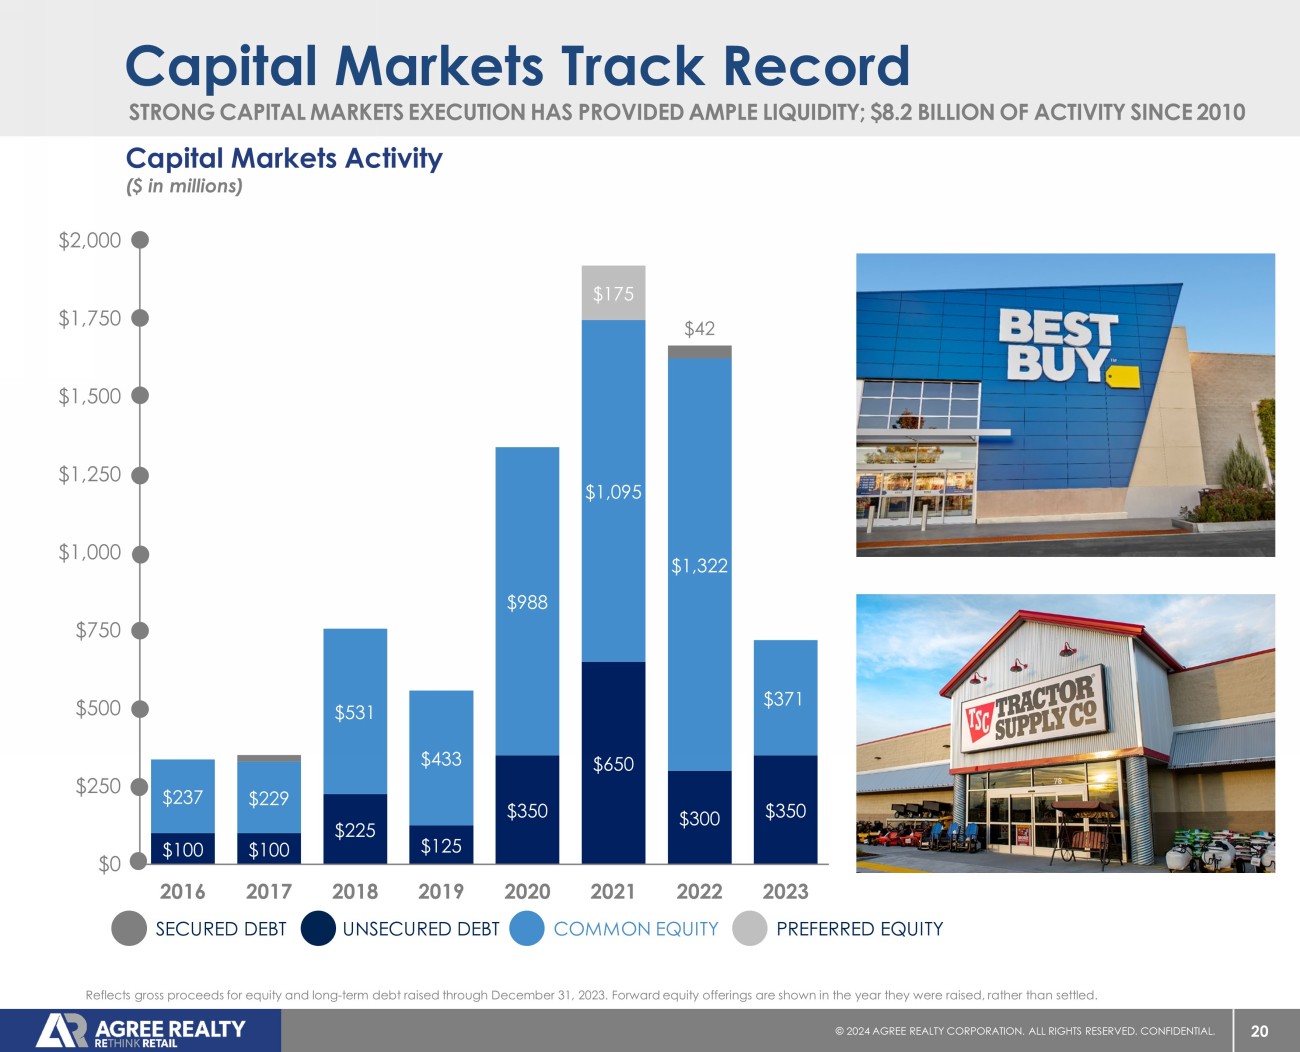
Debt Maturities ($ in millions) SECURED UNSECURED 1 c NO MATERIAL DEBT MATURITIES UNTIL 2028 & WEIGHTED - AVERAGE DEBT MATURITY OF APPROXIMATELY 7 YEARS (1) $3 $42 $50 $0 $50 $410 $450 $475 $125 $300 $300 $0 $100 $200 $300 $400 $500 $600 2024 2025 2026 2027 2028 2029 2030 2031 2032 2033 20 © 20 24 AGREE REALTY CORPORATION . ALL RIGHTS RESERVED. CONFIDENTIAL. $100 $100 $225 $125 $350 $650 $300 $350 $237 $229 $531 $433 $988 $1,095 $1,322 $371 $42 $175 $0 $250 $500 $750 $1,000 $1,250 $1,500 $1,750 $2,000 2016 2017 2018 2019 2020 2021 2022 2023 STRONG CAPITAL MARKETS EXECUTION HAS PROVIDED AMPLE LIQUIDITY; $8.2 BILLION OF ACTIVITY SINCE 2010 Capital Markets Track Record Reflects gross proceeds for equity and long - term debt raised through December 31, 2023. Forward equity offerings are shown in th e year they were raised, rather than settled.
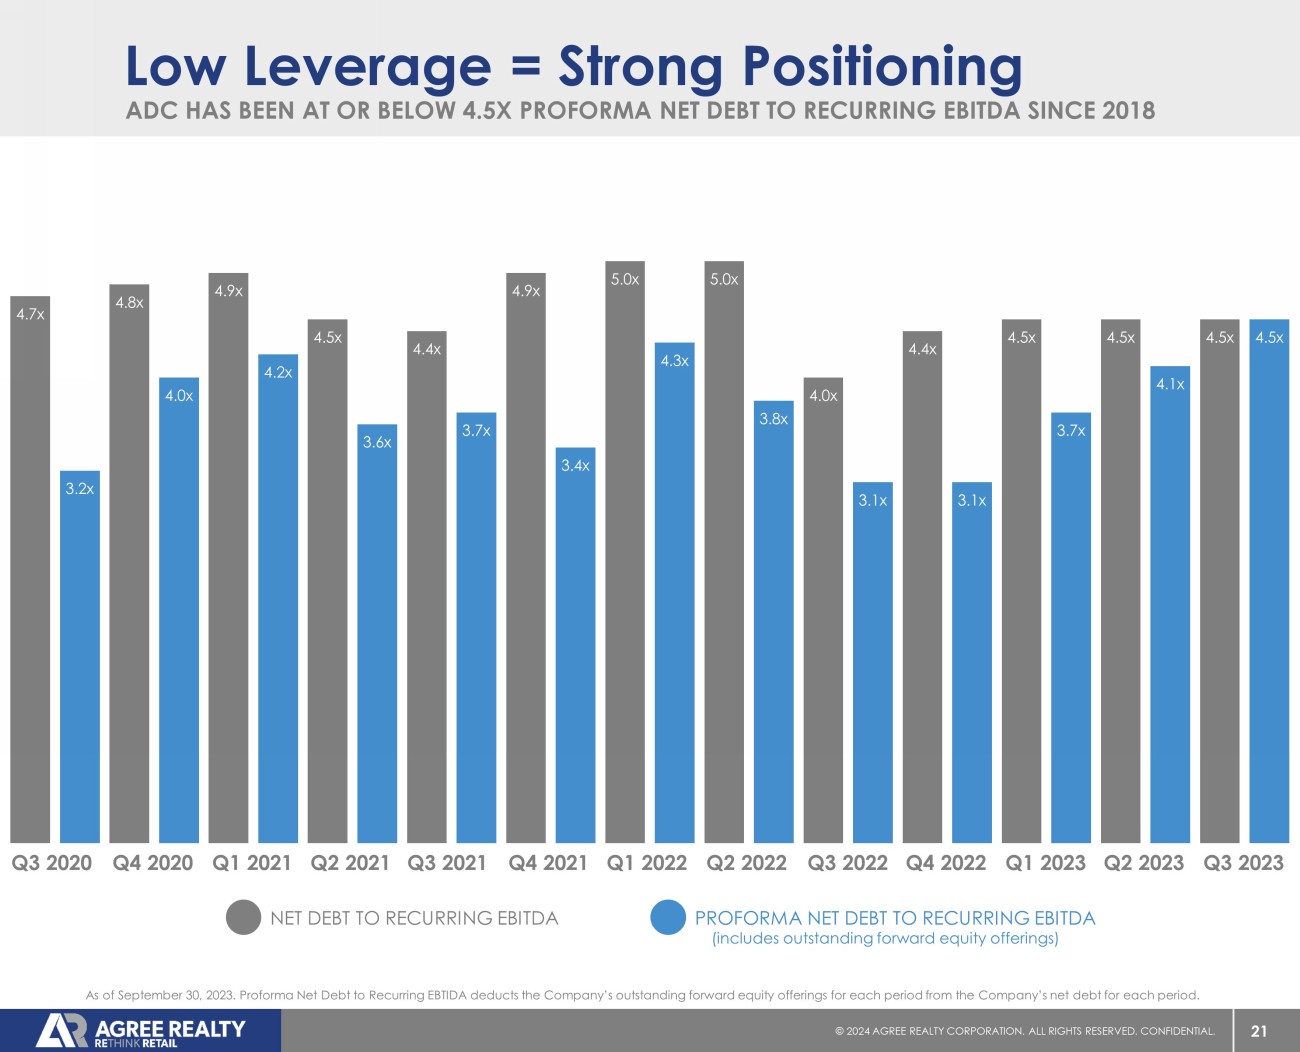
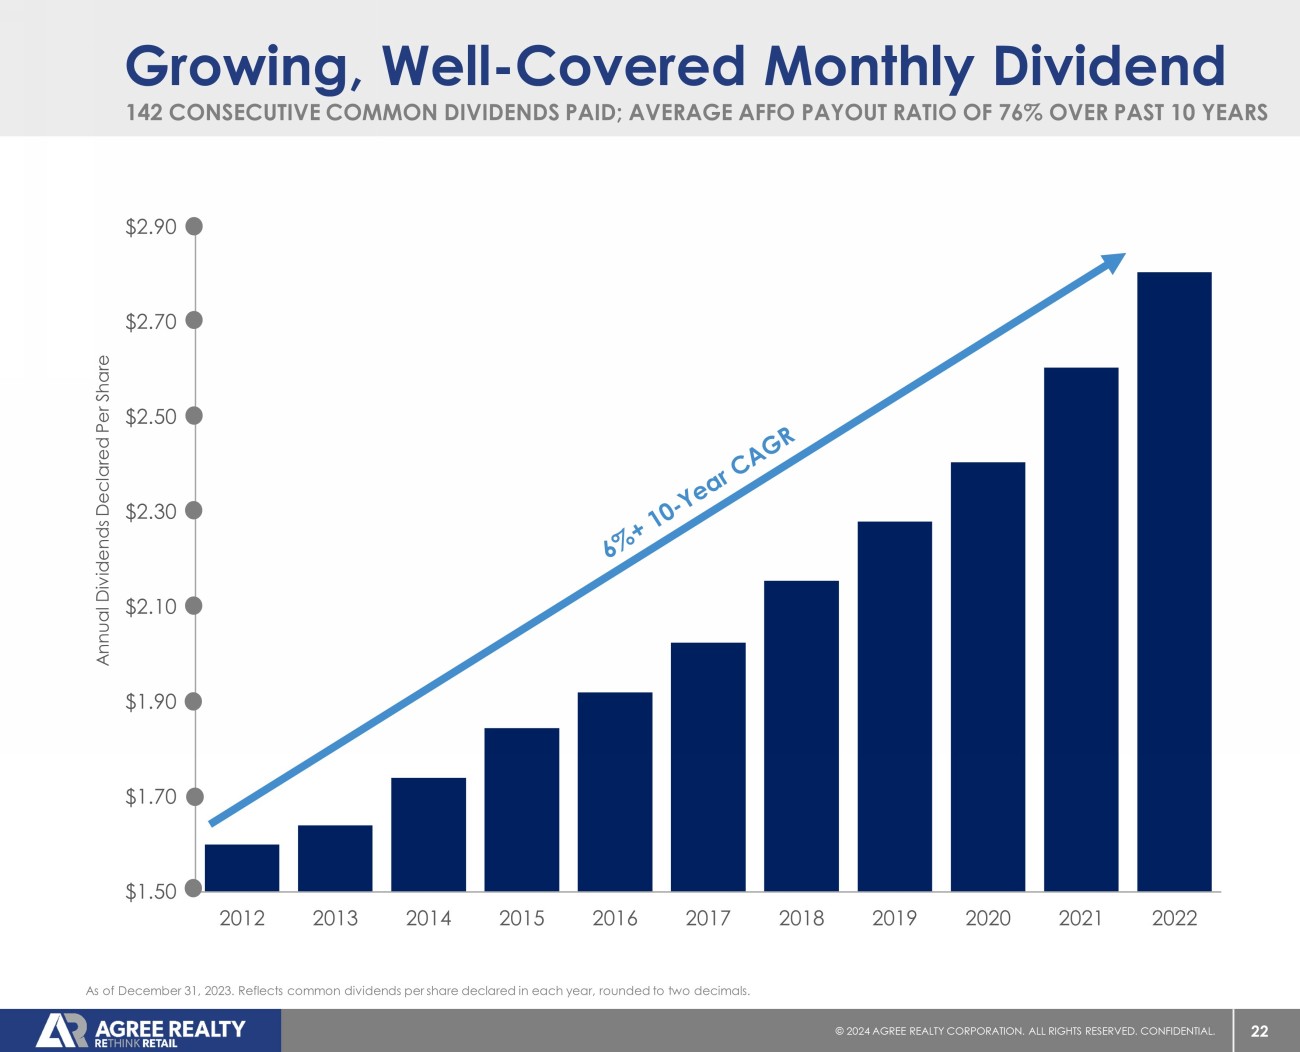
Capital Markets Activity ($ in millions) COMMON EQUITY UNSECURED DEBT SECURED DEBT PREFERRED EQUITY 21 © 20 24 AGREE REALTY CORPORATION . ALL RIGHTS RESERVED. CONFIDENTIAL. (includes outstanding forward equity offerings) ADC HAS BEEN AT OR BELOW 4.5X PROFORMA NET DEBT TO RECURRING EBITDA SINCE 2018 Low Leverage = Strong Positioning As of September 30, 2023. Proforma Net Debt to Recurring EBTIDA deducts the Company’s outstanding forward equity offerings fo r e ach period from the Company’s net debt for each period. PROFORMA NET DEBT TO RECURRING EBITDA NET DEBT TO RECURRING EBITDA Q1 2023 Q2 2023 Q3 2023 Q4 2020 Q1 2021 Q2 2021 Q3 2021 Q4 2021 Q1 2022 Q2 2022 Q3 2022 Q4 2022 Q3 2020 4.7x 3.2x 4.8x 4.0x 4.9x 4.2x 4.5x 3.6x 4.4x 3.7x 4.9x 3.4x 5.0x 4.3x 5.0x 3.8x 4.0x 3.1x 4.4x 3.1x 4.5x 3.7x 4.5x 4.1x 4.5x 4.5x 22 © 20 24 AGREE REALTY CORPORATION . ALL RIGHTS RESERVED. CONFIDENTIAL. $1.50 $1.70 $1.90 $2.10 $2.30 $2.50 $2.70 $2.90 2012 2013 2014 2015 2016 2017 2018 2019 2020 2021 2022 Annual Dividends Declared Per Share 142 CONSECUTIVE COMMON DIVIDENDS PAID; AVERAGE AFFO PAYOUT RATIO OF 76% OVER PAST 10 YEARS Growing, Well - Covered Monthly Dividend As of December 31, 2023. Reflects common dividends per share declared in each year, rounded to two decimals.
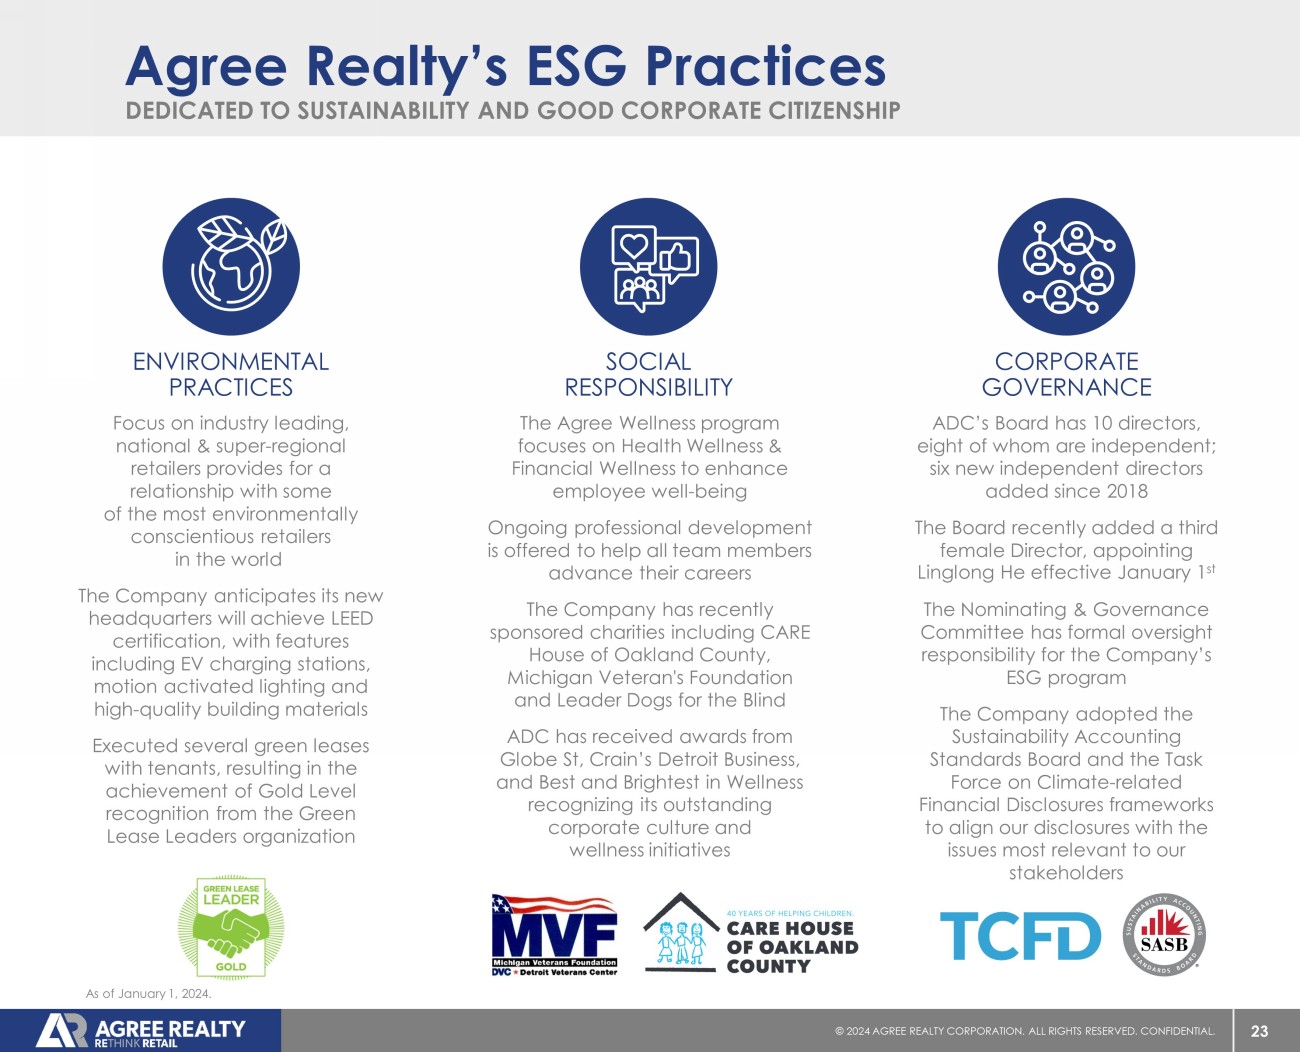
23 © 20 24 AGREE REALTY CORPORATION . ALL RIGHTS RESERVED. CONFIDENTIAL. The Agree Wellness program focuses on Health Wellness & Financial Wellness to enhance employee well - being Ongoing professional development is offered to help all team members advance their careers The Company has recently sponsored charities including CARE House of Oakland County, Michigan Veteran's Foundation and Leader Dogs for the Blind ADC has received awards from Globe St, Crain’s Detroit Business, and Best and Brightest in Wellness recognizing its outstanding corporate culture and wellness initiatives SOCIAL RESPONSIBILITY DEDICATED TO SUSTAINABILITY AND GOOD CORPORATE CITIZENSHIP Agree Realty’s ESG Practices Focus on industry leading, national & super - regional retailers provides for a relationship with some of the most environmentally conscientious retailers in the world The Company anticipates its new headquarters will achieve LEED certification, with features including EV charging stations, motion activated lighting and high - quality building materials Executed several green leases with tenants, resulting in the achievement of Gold Level recognition from the Green Lease Leaders organization ENVIRONMENTAL PRACTICES ADC’s Board has 10 directors, eight of whom are independent; six new independent directors added since 2018 The Board recently added a third female Director, appointing Linglong He effective January 1 st The Nominating & Governance Committee has formal oversight responsibility for the Company’s ESG program The Company adopted the Sustainability Accounting Standards Board and the Task Force on Climate - related Financial Disclosures frameworks to align our disclosures with the issues most relevant to our stakeholders CORPORATE GOVERNANCE As of January 1, 2024.
24 © 20 24 AGREE REALTY CORPORATION . ALL RIGHTS RESERVED. CONFIDENTIAL. Investment Summary Highlights FORTIFIED BALANCE SHEET HIGHEST - QUALITY RETAIL REAL ESTATE INVESTMENT GRADE ISSUER RATINGS Robust growth trajectory MULTI - YEAR TRACK RECORD OF EXECUTION Well - covered & consistent dividend 25 © 20 24 AGREE REALTY CORPORATION . ALL RIGHTS RESERVED. CONFIDENTIAL. APPENDIX
26 © 20 24 AGREE REALTY CORPORATION . ALL RIGHTS RESERVED. CONFIDENTIAL. Forward - Looking Statements This presentation contains forward - looking statements within the meaning of Section 27A of the Securities Act of 1933, as amended (the “Securities Act”) and Section 21E of the Securities Exchange Act of 1934, as amended (the “Exchange Act”). The Company intends such forward - looking statements to be covered by the safe harbor provisions for forward - looking statements contained in the Private Securities Litigation Reform Act of 1995 and includes this statement for purposes of complying with these safe harbor provisions. Forward - looking statements are generally identifiable by use of forward - looking terminology such as “may,” “will,” “should,” “potential,” “intend,” “expect,” “seek,” “anticipate,” “estimate,” “approximately,” “believe,” “could,” “project,” “predict,” “forecast,” “continue,” “assume,” “plan,” references to “outlook” or other similar words or expressions. Forward - looking statements are based on certain assumptions and can include future expectations, future plans and strategies, financial and operating projections and forecasts and other forward - looking information and estimates. These forward - looking statements are subject to various risks and uncertainties, many of which are beyond the Company’s control, which could cause actual results to differ materially from such statements. Certain factors could occur that might cause actual results to vary, including the potential adverse effect of ongoing worldwide economic uncertainties, disruptions in the banking system and financial markets, and increased inflation on the financial condition, results of operations, cash flows and performance of the Company and its tenants, the real estate market and the global economy and financial markets, the general deterioration in national economic conditions, weakening of real estate markets, decreases in the availability of credit, increases in interest rates, adverse changes in the retail industry, the Company’s continuing ability to qualify as a REIT and other risks and uncertainties as described in greater detail in the Company’s filings with the Securities and Exchange Commission (the “SEC”), including, without limitation, the Company’s Annual Report on Form 10 - K and subsequent quarterly reports. Except as required by law, the Company disclaims any obligation to update any forward - looking statements, whether as a result of new information, future events or otherwise. For further information about the Company’s business and financial results, please refer to the “Management’s Discussion and Analysis of Financial Condition and Results of Operations” and “Risk Factors” sections of the Company’s SEC filings, including, but not limited to, its Annual Report on Form 10 - K and Quarterly Reports on Form 10 - Q, copies of which may be obtained at the Investors section of the Company’s website at www.agreerealty.com . All information in this presentation is as of December 31 , 2023 , unless otherwise noted . The Company undertakes no duty to update the statements in this presentation to conform the statements to actual results or changes in the Company’s expectations .
27 © 20 24 AGREE REALTY CORPORATION . ALL RIGHTS RESERVED. CONFIDENTIAL. Non - GAAP Financial Measures This presentation includes a non - GAAP financial measure, Net Debt to Recurring EBITDA, which is presented on an actual and profo rma basis. A reconciliation of this non - GAAP financial measure to the most directly comparable GAAP measure is included in the follo wing pages. The components of this ratio and their use and utility to management are described further in the section below. Components of Net Debt to Recurring EBITDA EBITDAre is defined by Nareit to mean net income computed in accordance with GAAP, plus interest expense, income tax expense, depreciation and amortization, any gains (or losses) from sales of real estate assets and/or changes in control, any impairme nt charges on depreciable real estate assets, and after adjustments for unconsolidated partnerships and joint ventures. The Company conside rs the non - GAAP measure of EBITDAre to be a key supplemental measure of the Company's performance and should be considered along with, but not as an alternative to, net income or loss as a measure of the Company's operating performance. The Company considers EBITDAre a key supplemental measure of the Company's operating performance because it provides an additional supplemental measure of the Company's performance and operating cash flow that is widely known by industry analysts, lenders and investors. The Company’s calculation of EBITDAre may not be comparable to EBITDAre reported by other REITs that interpret the Nareit definition differently than the Company. Recurring EBITDA The Company defines Recurring EBITDA as EBITDAre with the addback of noncash amortization of above - and below - market lease intangibles, and after adjustments for the run - rate impact of the Company's investment and disposition activity for the period presented, as well as adjustments for non - recurring benefits or expenses. The Company considers the non - GAAP measure of Recurrin g EBITDA to be a key supplemental measure of the Company's performance and should be considered along with, but not as an alter nat ive to, net income or loss as a measure of the Company's operating performance. The Company considers Recurring EBITDA a key supplemental measure of the Company's operating performance because it represents the Company's earnings run rate for the per iod presented and because it is widely followed by industry analysts, lenders and investors. Our Recurring EBITDA may not be com par able to Recurring EBITDA reported by other companies that have a different interpretation of the definition of Recurring EBITDA. Our rat io of net debt to Recurring EBITDA is used by management as a measure of leverage and may be useful to investors in understanding the Company’s ability to service its debt, as well as assess the borrowing capacity of the Company. Our ratio of net debt to Rec urr ing EBITDA is calculated by taking annualized Recurring EBITDA and dividing it by our net debt per the consolidated balance sheet. Net Debt The Company defines Net Debt as total debt less cash, cash equivalents and cash held in escrows. The Company considers the non - GAAP measure of Net Debt to be a key supplemental measure of the Company's overall liquidity, capital structure and leverage . The Company considers Net Debt a key supplemental measure because it provides industry analysts, lenders and investors useful inf orm ation in understanding our financial condition. The Company’s calculation of Net Debt may not be comparable to Net Debt reported by ot her REITs that interpret the definition differently than the Company. The Company presents Net Debt on both an actual and proforma basis, assuming the Anticipated Net Proceeds from Outstanding Forwards are used to pay down debt. The Company believes the proforma measure may be useful to investors in understanding the potential effect of the Anticipated Net Proceeds from Outstanding For war ds on the Company’s capital structure, its future borrowing capacity, and its ability to service its debt. Anticipated Net Proceeds from Outstanding Forwards Since the first quarter of 2018, the Company has utilized forward sale agreements to sell shares of common stock. Selling common stock through forward sale agreements enables the Company to set the price of suc h s hares upon pricing the offering (subject to certain adjustments) while delaying the issuance of such shares and the receipt of the net proceeds by the Company. Given the Company’s frequent use of forward sale agreements, the Company considers the non - GAAP measure of Anticipated Net Proceeds from Outstanding Forwards to be a key supplemental measure of the Company's overall liquidity, capit al structure and leverage. The Company defines Anticipated Net Proceeds from Outstanding Forwards as the number of shares outsta ndi ng under forward sale agreements at the end of each quarter, multiplied by the applicable forward sale price for each agreement, respectively.
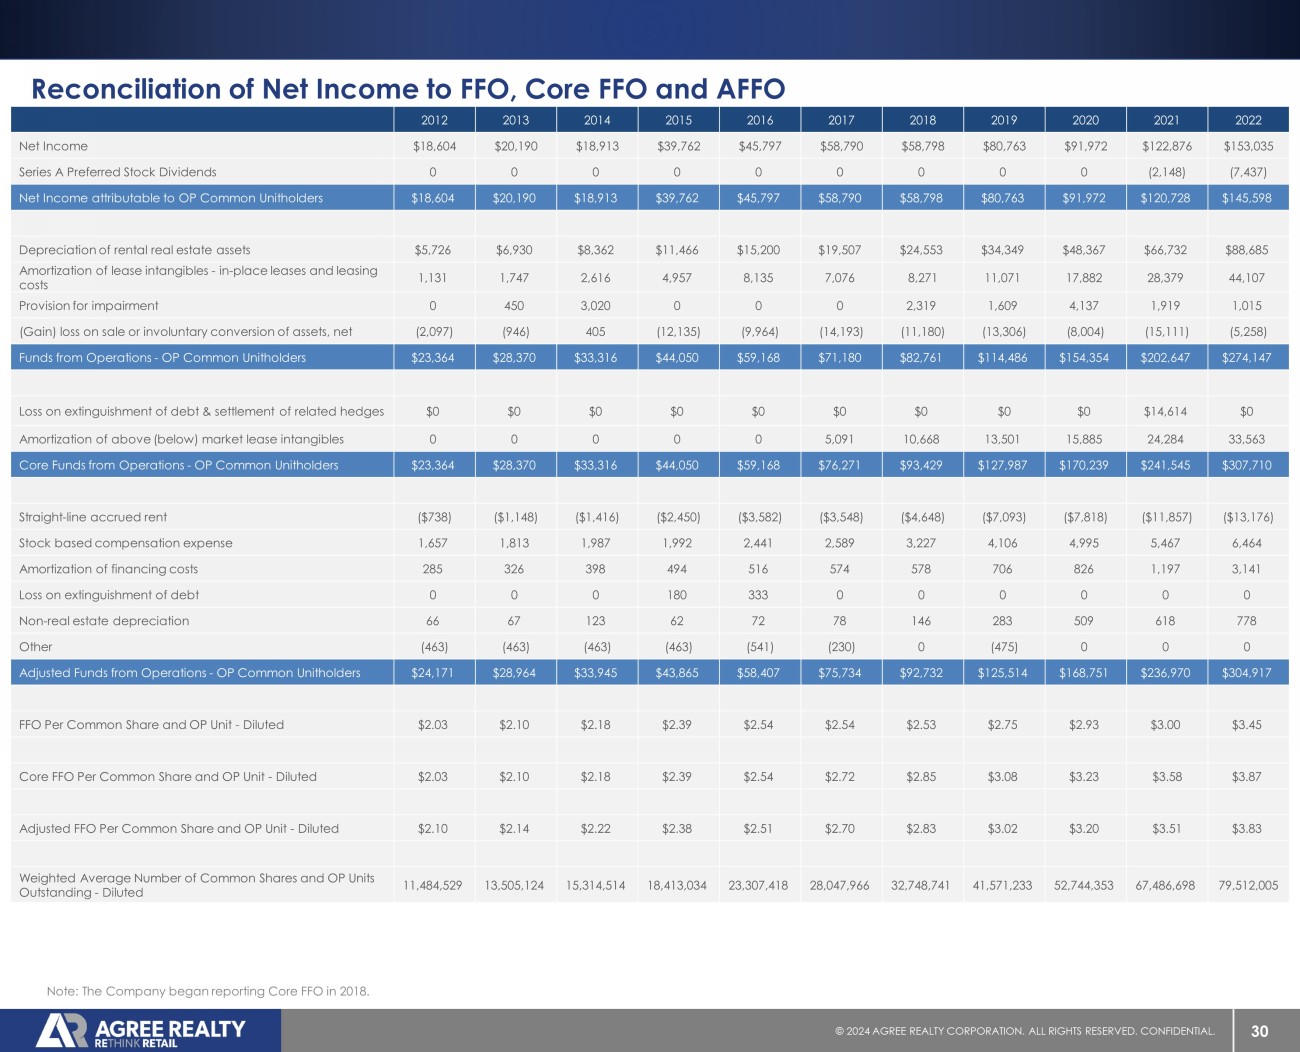
28 © 20 24 AGREE REALTY CORPORATION . ALL RIGHTS RESERVED. CONFIDENTIAL. Non - GAAP Financial Measures This presentation also includes the non - GAAP measures of Annualized Base Rent (“ABR”), Funds From Operations (“FFO” or “ Nareit FFO”), Core Funds From Operations (“Core FFO”) and Adjusted Funds From Operations (“AFFO”). ABR represents the annualized amount of contractual minimum rent required by tenant lease agreements, computed on a straight - line basis. ABR is not, and is not intended to be, a presentation in accordance with GAAP. The Company believes annualized contractual minimum rent is useful to management, inves tor s, and other interested parties in analyzing concentrations and leasing activity. FFO, Core FFO and AFFO are reconciled to the m ost directly comparable GAAP measure in the following pages and are described in further detail below. Components of Funds from Operations, Core Funds from Operations, and Adjusted Funds from Operations Funds from Operations (“FFO” or “ Nareit FFO”) is defined by the National Association of Real Estate Investment Trusts, Inc. (“ Nareit ”) to mean net income computed in accordance with GAAP, excluding gains (or losses) from sales of real estate assets and/or changes in control, plus real estate related depreciation and amortization and any impairment charges on depreciable real estate assets, an d after adjustments for unconsolidated partnerships and joint ventures. Historical cost accounting for real estate assets in accordan ce with GAAP implicitly assumes that the value of real estate assets diminishes predictably over time. Since real estate values instead ha ve historically risen or fallen with market conditions, most real estate industry investors consider FFO to be helpful in evaluating a real e sta te company’s operations. FFO should not be considered an alternative to net income as the primary indicator of the Company’s operating per for mance, or as an alternative to cash flow as a measure of liquidity. Further, while the Company adheres to the Nareit definition of FFO, its presentation of FFO is not necessarily comparable to similarly titled measures of other REITs due to the fact that all REITs may not use the same definition. Core Funds from Operations (“Core FFO”) The Company defines Core FFO as Nareit FFO with the addback of ( i ) noncash amortization of acquisition purchase price related to above - and below - market lease intangibles and discount on assumed debt and (ii) certain infrequently occurring items that reduce or increase net income in accordance with GAAP. Management believes that its measure of Core FFO facilitates useful comparison of performance to its peers who predominantly transact in sale - leaseback transactions and are thereby not required by GAAP to allocate purchase price to lease intangibles. Unlike many of its peers, the Company has acqu ire d the substantial majority of its net - leased properties through acquisitions of properties from third parties or in connection with th e acquisitions of ground leases from third parties. Core FFO should not be considered an alternative to net income as the primary indicator of the Company’s operating performance, or as an alternative to cash flow as a measure of liquidity. Further, the Company’s presenta tio n of Core FFO is not necessarily comparable to similarly titled measures of other REITs due to the fact that all REITs may not use th e same definition. Adjusted Funds from Operations (“AFFO”) is a non - GAAP financial measure of operating performance used by many companies in the REIT industry. AFFO further adjusts FFO and Core FFO for certain non - cash items that reduce or increase net income computed in accord ance with GAAP. Management considers AFFO a useful supplemental measure of the Company’s performance, however, AFFO should not be considered an alternative to net income as an indication of its performance, or to cash flow as a measure of liquidity or abi lit y to make distributions. The Company’s computation of AFFO may differ from the methodology for calculating AFFO used by other equity RE ITs , and therefore may not be comparable to such other REITs.
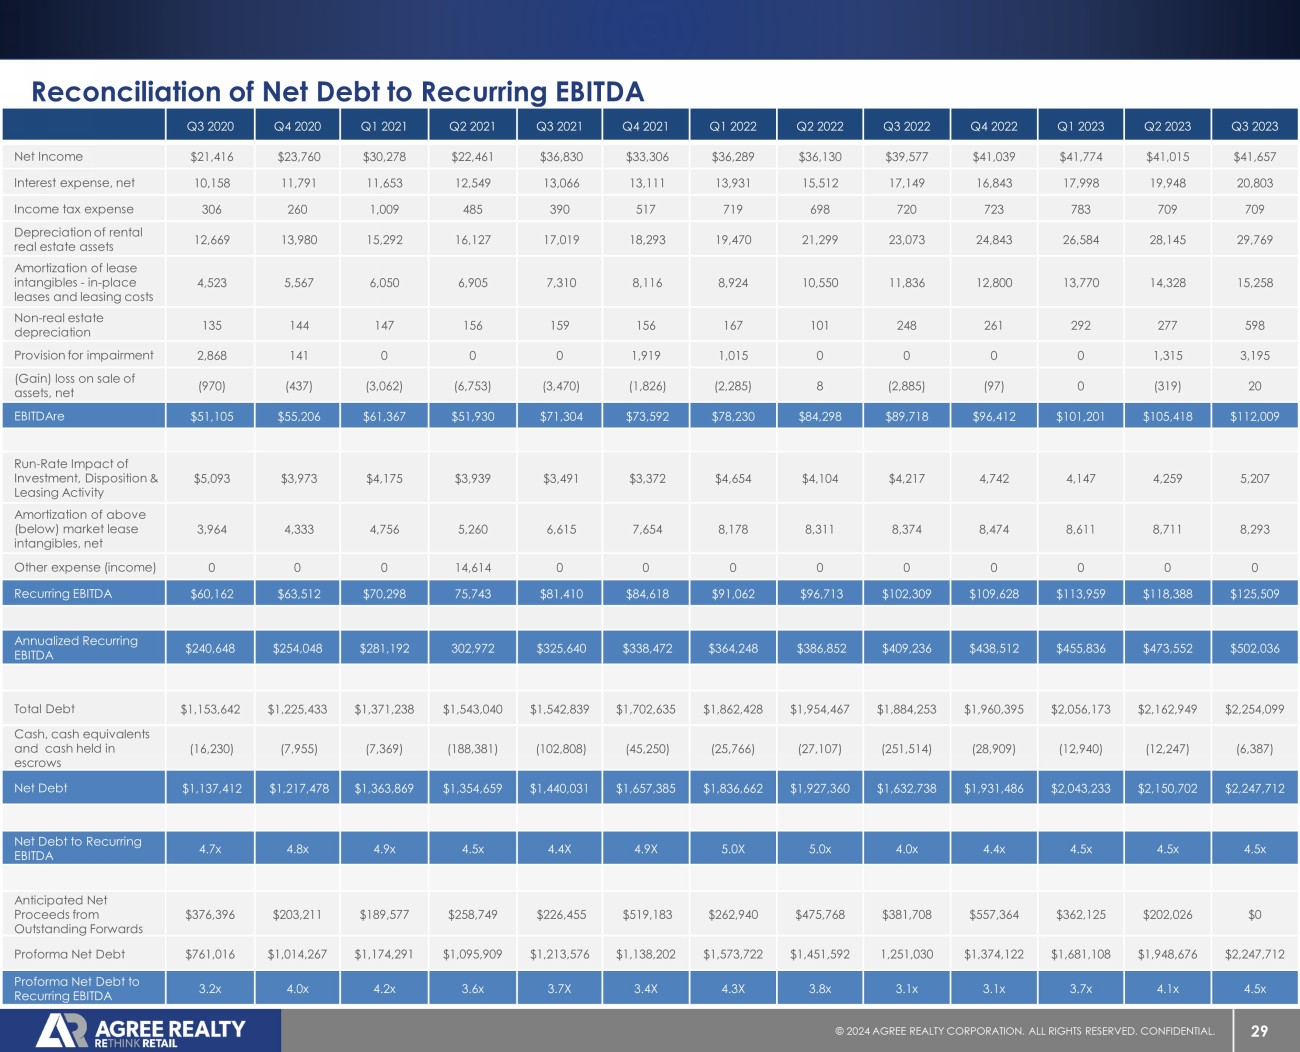
29 © 20 24 AGREE REALTY CORPORATION . ALL RIGHTS RESERVED. CONFIDENTIAL. Reconciliation of Net Debt to Recurring EBITDA Q3 2020 Q4 2020 Q1 2021 Q2 2021 Q3 2021 Q4 2021 Q1 2022 Q2 2022 Q3 2022 Q4 2022 Q1 2023 Q2 2023 Q3 2023 Net Income $21,416 $23,760 $30,278 $22,461 $36,830 $33,306 $36,289 $36,130 $39,577 $41,039 $41,774 $41,015 $41,657 Interest expense, net 10,158 11,791 11,653 12,549 13,066 13,111 13,931 15,512 17,149 16,843 17,998 19,948 20,803 Income tax expense 306 260 1,009 485 390 517 719 698 720 723 783 709 709 Depreciation of rental real estate assets 12,669 13,980 15,292 16,127 17,019 18,293 19,470 21,299 23,073 24,843 26,584 28,145 29,769 Amortization of lease intangibles - in - place leases and leasing costs 4,523 5,567 6,050 6,905 7,310 8,116 8,924 10,550 11,836 12,800 13,770 14,328 15,258 Non - real estate depreciation 135 144 147 156 159 156 167 101 248 261 292 277 598 Provision for impairment 2,868 141 0 0 0 1,919 1,015 0 0 0 0 1,315 3,195 (Gain) loss on sale of assets, net (970) (437) (3,062) (6,753) (3,470) (1,826) (2,285) 8 (2,885) (97) 0 (319) 20 EBITDAre $51,105 $55,206 $61,367 $51,930 $71,304 $73,592 $78,230 $84,298 $89,718 $96,412 $101,201 $105,418 $112,009 Run - Rate Impact of Investment, Disposition & Leasing Activity $5,093 $3,973 $4,175 $3,939 $3,491 $3,372 $4,654 $4,104 $4,217 4,742 4,147 4,259 5,207 Amortization of above (below) market lease intangibles, net 3,964 4,333 4,756 5,260 6,615 7,654 8,178 8,311 8,374 8,474 8,611 8,711 8,293 Other expense (income) 0 0 0 14,614 0 0 0 0 0 0 0 0 0 Recurring EBITDA $60,162 $63,512 $70,298 75,743 $81,410 $84,618 $91,062 $96,713 $102,309 $109,628 $113,959 $118,388 $125,509 Annualized Recurring EBITDA $240,648 $254,048 $281,192 302,972 $325,640 $338,472 $364,248 $386,852 $409,236 $438,512 $455,836 $473,552 $502,036 Total Debt $1,153,642 $1,225,433 $1,371,238 $1,543,040 $1,542,839 $1,702,635 $1,862,428 $1,954,467 $1,884,253 $1,960,395 $2,056,173 $2,162,949 $2,254,099 Cash, cash equivalents and cash held in escrows (16,230) (7,955) (7,369) (188,381) (102,808) (45,250) (25,766) (27,107) (251,514) (28,909) (12,940) (12,247) (6,387) Net Debt $1,137,412 $1,217,478 $1,363,869 $1,354,659 $1,440,031 $1,657,385 $1,836,662 $1,927,360 $1,632,738 $1,931,486 $2,043,233 $2,150,702 $2,247,712 Net Debt to Recurring EBITDA 4.7x 4.8x 4.9x 4.5x 4.4X 4.9X 5.0X 5.0x 4.0x 4.4x 4.5x 4.5x 4.5x Anticipated Net Proceeds from Outstanding Forwards $376,396 $203,211 $189,577 $258,749 $226,455 $519,183 $262,940 $475,768 $381,708 $557,364 $362,125 $202,026 $0 Proforma Net Debt $761,016 $1,014,267 $1,174,291 $1,095,909 $1,213,576 $1,138,202 $1,573,722 $1,451,592 1,251,030 $1,374,122 $1,681,108 $1,948,676 $2,247,712 Proforma Net Debt to Recurring EBITDA 3.2x 4.0x 4.2x 3.6x 3.7X 3.4X 4.3X 3.8x 3.1x 3.1x 3.7x 4.1x 4.5x 30 © 20 24 AGREE REALTY CORPORATION . ALL RIGHTS RESERVED. CONFIDENTIAL. 2012 2013 2014 2015 2016 2017 2018 2019 2020 2021 2022 Net Income $18,604 $20,190 $18,913 $39,762 $45,797 $58,790 $58,798 $80,763 $91,972 $122,876 $153,035 Series A Preferred Stock Dividends 0 0 0 0 0 0 0 0 0 (2,148) (7,437) Net Income attributable to OP Common Unitholders $18,604 $20,190 $18,913 $39,762 $45,797 $58,790 $58,798 $80,763 $91,972 $120,728 $145,598 Depreciation of rental real estate assets $5,726 $6,930 $8,362 $11,466 $15,200 $19,507 $24,553 $34,349 $48,367 $66,732 $88,685 Amortization of lease intangibles - in - place leases and leasing costs 1,131 1,747 2,616 4,957 8,135 7,076 8,271 11,071 17,882 28,379 44,107 Provision for impairment 0 450 3,020 0 0 0 2,319 1,609 4,137 1,919 1,015 (Gain) loss on sale or involuntary conversion of assets, net (2,097) (946) 405 (12,135) (9,964) (14,193) (11,180) (13,306) (8,004) (15,111) (5,258) Funds from Operations - OP Common Unitholders $23,364 $28,370 $33,316 $44,050 $59,168 $71,180 $82,761 $114,486 $154,354 $202,647 $274,147 Loss on extinguishment of debt & settlement of related hedges $0 $0 $0 $0 $0 $0 $0 $0 $0 $14,614 $0 Amortization of above (below) market lease intangibles 0 0 0 0 0 5,091 10,668 13,501 15,885 24,284 33,563 Core Funds from Operations - OP Common Unitholders $23,364 $28,370 $33,316 $44,050 $59,168 $76,271 $93,429 $127,987 $170,239 $241,545 $307,710 Straight - line accrued rent ($738) ($1,148) ($1,416) ($2,450) ($3,582) ($3,548) ($4,648) ($7,093) ($7,818) ($11,857) ($13,176) Stock based compensation expense 1,657 1,813 1,987 1,992 2,441 2,589 3,227 4,106 4,995 5,467 6,464 Amortization of financing costs 285 326 398 494 516 574 578 706 826 1,197 3,141 Loss on extinguishment of debt 0 0 0 180 333 0 0 0 0 0 0 Non - real estate depreciation 66 67 123 62 72 78 146 283 509 618 778 Other (463) (463) (463) (463) (541) (230) 0 (475) 0 0 0 Adjusted Funds from Operations - OP Common Unitholders $24,171 $28,964 $33,945 $43,865 $58,407 $75,734 $92,732 $125,514 $168,751 $236,970 $304,917 FFO Per Common Share and OP Unit - Diluted $2.03 $2.10 $2.18 $2.39 $2.54 $2.54 $2.53 $2.75 $2.93 $3.00 $3.45 Core FFO Per Common Share and OP Unit - Diluted $2.03 $2.10 $2.18 $2.39 $2.54 $2.72 $2.85 $3.08 $3.23 $3.58 $3.87 Adjusted FFO Per Common Share and OP Unit - Diluted $2.10 $2.14 $2.22 $2.38 $2.51 $2.70 $2.83 $3.02 $3.20 $3.51 $3.83 Weighted Average Number of Common Shares and OP Units Outstanding - Diluted 11,484,529 13,505,124 15,314,514 18,413,034 23,307,418 28,047,966 32,748,741 41,571,233 52,744,353 67,486,698 79,512,005 Reconciliation of Net Income to FFO, Core FFO and AFFO Note: The Company began reporting Core FFO in 2018.
31 © 20 24 AGREE REALTY CORPORATION . ALL RIGHTS RESERVED. CONFIDENTIAL. CONTACT PETER COUGHENOUR Chief Financial Officer (248) 737 - 4190 investors@agreerealty.com