UNITED STATES
SECURITIES AND EXCHANGE COMMISSION
Washington, DC 20549
FORM 6-K
REPORT OF FOREIGN PRIVATE ISSUER
PURSUANT TO RULE 13a-16 OR 15d-16 UNDER
THE SECURITIES EXCHANGE ACT OF 1934
December 7, 2023
Commission File Number 1-14712
ORANGE
(Translation of registrant’s name into English)
111 quai du Président Roosevelt
92130 Issy-les-Moulineaux, France
(Address of principal executive offices)
Indicate by check mark whether the Registrant files or will file
annual reports under cover Form 20-F or Form 40-F
Form 20-F ☒ |
|
Form 40-F ☐ |
THIS REPORT ON FORM 6-K SHALL BE DEEMED TO BE INCORPORATED BY REFERENCE IN THE REGISTRATION STATEMENT ON FORM F-3 OF ORANGE FILED WITH THE SECURITIES AND EXCHANGE COMMISSION ON THE DATE HEREOF AND TO BE PART THEREOF FROM THE DATE ON WHICH THIS REPORT IS FURNISHED, TO THE EXTENT NOT SUPERSEDED BY DOCUMENTS OR REPORTS SUBSEQUENTLY FILED OR FURNISHED BY ORANGE.
Exhibit List
Exhibit No. |
|
Description |
Exhibit 99.1 |
|
|
Exhibit 99.2 |
|
|
Exhibit 99.3 |
|
PRESENTATION OF INFORMATION
The financial information presented in this Report on Form 6-K, including the Exhibits attached hereto, is unaudited, unless otherwise noted. In particular, the financial information (i) drawn from the unaudited interim condensed consolidated financial statements for the six months ended June 30, 2022 and 2023, (ii) with respect to the three month and nine month periods ended September 30, 2022 and 2023, and (iii) for any dates subsequent to September 30, 2023 is unaudited.
CAUTIONARY STATEMENT ABOUT FORWARD-LOOKING STATEMENTS
As used herein, the terms “Orange,” “Orange Group,” the “Group,” “we,” “our,” “ours” and “us,” unless the context otherwise requires, refer to Orange together with its consolidated subsidiaries, and the “Company” and “Orange S.A.” refer to the parent company, a French société anonyme (corporation), without its subsidiaries.
This Report on Form 6-K, including the Exhibits attached hereto, contains forward-looking statements (within the meaning of Section 27A of the U.S. Securities Act of 1933 (the “Securities Act”) or Section 21E of the U.S. Securities Exchange Act of 1934 (the “Exchange Act”)), including, without limitation, certain statements made in Exhibit 99.1 and Exhibit 99.3 attached hereto. Forward-looking statements can be identified by the use of forward-looking terminology such as “should”, “could”, “can”, “contemplate”, “would”, “will”, “expect”, “consider”, “believe”, “anticipate”, “pursue”, “foresee”, “plan”, “project”, forecast”, “guideline”, “predict”, “intend”, “is designed to”, “be aimed at”, “strategy”, “objective”, “prospects”, “outlook”, “trends”, “may”, “might”, “target”, “aim”, “change”, “intention”, “ambition”, “risk”, “potential”, “commitment” or similar expressions or the negative thereof or other variations thereof or comparable terminology, or by the forward-looking nature of discussions of strategy, plans or intentions. Although Orange believes these statements are based on reasonable assumptions, these forward-looking statements are subject to numerous risks and uncertainties, including matters not yet known to Orange or not currently considered material by Orange, and there can be no assurance that anticipated events will occur or that the objectives set out will actually be achieved.
Important factors that could cause actual results to differ materially from the results anticipated in the forward-looking statements include the following:
| ● | Orange’s broad geographic footprint and the scope of its activities expose it to geopolitical, macroeconomic, security and operational risks; |
| ● | The shift of Orange’s ecosystem toward a more open and fragmented model enables global non-telco players to take an increasing share of the service and network value chain; |
| ● | The high concentration of Orange’s critical suppliers, the growing use of outsourcing, as well as global supply tensions represent a risk for the Group’s activities; |
| ● | Orange is exposed to risks of disclosure or inappropriate modification of stakeholder data, particularly in the event of cyberattacks; |
| ● | A large part of Orange’s revenues is generated in both highly competitive and regulated markets, where pressure on prices remains strong in an inflationary context; |
| ● | Orange is exposed to the risk of interruption to its services, particularly in the event of cyberattacks, conflicts or a shortage of strategic resources; |
| ● | Orange’s technical infrastructure is vulnerable to intentional or accidental damage, but also to natural disasters, the occurrence of which has increased due to climate change; |
| ● | Faced with the high connectivity needs linked to changing uses, Orange must accelerate the roll-out of its networks while improving the quality of service, but such investments are constrained by the availability of its resources; |
| ● | The development of mobile financial services activities in an increasing number of countries poses risks to Orange that are specific to this sector in each of its host countries; |
| ● | The execution of Orange’s new strategy may not yield the expected results; |
| ● | The Group’s brand policy represents a risk for the Orange brand image; |
| ● | The scope of Orange’s business activities and the interconnection of its networks expose it to various acts of technical fraud, specific to the telecommunications sector; |
| ● | Orange operates in highly regulated markets, and its business activities and earnings could be materially affected by changes in laws or regulations, including those that are extraterritorial in nature, or by changes in government policy; |
| ● | Orange is exposed, particularly as a result of cyberattacks, to risks of disclosure or inappropriate modification of personal data, especially those of its customers; |
| ● | Orange faces a variety of internal and external risks relating to human health and safety. |
Forward-looking statements speak only as of the date they are made. Other than as required by law, Orange does not undertake any obligation to update these statements in light of new information or future developments. Orange urges you to carefully review and consider the various disclosures it makes in this Report on Form 6-K and its Annual Report on Form 20-F for the year ended December 31, 2022, filed on March 30, 2023 (the “Annual Report on Form 20-F”), including the documents incorporated by reference, concerning the factors that may affect its business, including the disclosures made in “Item 3. Key information—3.D. Risk factors,” “Item 5. Operating and financial review and prospects,” and “Item 11. Quantitative and qualitative disclosures about market risk” in the Annual Report on Form 20-F. These statements should be read completely and with the documents that are referenced herein and filed as exhibits and with the understanding that Orange’s actual future results may be materially different from what is expected. Orange qualifies all forward-looking statements by these cautionary statements.
SIGNATURES
Pursuant to the requirements of the Securities Exchange Act of 1934, the registrant has duly caused this report to be signed on its behalf by the undersigned, thereunto duly authorized.
|
|
ORANGE |
|
|
|
|
|
|
Date: December 7, 2023 |
By: |
/s/ Patrice Lambert - de Diesbach |
|
Name: |
Patrice Lambert - de Diesbach |
|
Title: |
Senior VP, Head of Investor Relations |
Exhibit 99.1

Operating and Financial Review and Prospects
and
First Half Unaudited Interim Condensed Consolidated Financial Statements
for the six months ended June 30, 2022 and 2023
|
|
Table of contents
OPERATING AND FINANCIAL REVIEW AND PROSPECTS FOR THE SIX MONTHS ENDED JUNE 30, 2022 AND 2023 |
3 |
|
|
|
|
|
4 |
|
|
|
|
|
8 |
|
|
|
|
|
13 |
|
|
|
|
|
27 |
|
|
|
|
|
28 |
|
|
|
|
|
31 |
|
|
|
|
F-1 |
|
|
1. Operating and Financial Review and Prospects for the Six Months Ended June 30, 2022 and 2023
OPERATING AND FINANCIAL REVIEW AND PROSPECTS FOR THE SIX MONTHS ENDED JUNE 30, 2022 AND 2023 |
3 |
|
4 |
||
|
4 |
|
|
5 |
|
|
5 |
|
8 |
||
|
8 |
|
|
8 |
|
|
10 |
|
|
10 |
|
|
10 |
|
|
11 |
|
|
11 |
|
|
12 |
|
|
12 |
|
|
12 |
|
13 |
||
|
14 |
|
|
14 |
|
|
14 |
|
|
15 |
|
|
15 |
|
|
16 |
|
|
16 |
|
|
16 |
|
|
17 |
|
|
17 |
|
|
18 |
|
|
18 |
|
|
19 |
|
|
20 |
|
|
20 |
|
|
21 |
|
|
21 |
|
|
21 |
|
|
22 |
|
|
22 |
|
|
22 |
|
|
23 |
|
|
23 |
|
|
23 |
|
|
24 |
|
|
24 |
|
|
24 |
|
|
24 |
|
|
24 |
|
|
25 |
|
|
25 |
|
|
25 |
|
|
25 |
|
|
1.3.6.3 OPERATING INCOME – INTERNATIONAL CARRIERS & SHARED SERVICES |
26 |
|
1.3.6.4 ECONOMIC CAPEX – INTERNATIONAL CARRIERS & SHARED SERVICES |
26 |
|
26 |
|
|
26 |
|
|
27 |
|
27 |
||
|
27 |
|
|
27 |
|
|
1.4.2 FINANCIAL DEBT AND LIQUIDITY POSITION OF TELECOM ACTIVITIES |
28 |
28 |
||
|
28 |
|
|
30 |
|
|
31 |
|
31 |
||
|
31 |
|
|
31 |
|
|
31 |
|
|
31 |
|
3 |
This document contains forward-looking statements about Orange. By nature, achievement of these forward-looking statements is subject to numerous risks and uncertainties that could cause the actual results to differ materially from those described in such forward-looking statements. The most significant risks are detailed in Item 3.D Risk factors of the Annual Report of Orange on Form 20-F for the year ended December 31, 2022 (the “2022 Form 20-F”).
The following discussion is based on the unaudited interim condensed consolidated financial statements for the six months ended June 30, 2022 and 2023 (the “Interim Consolidated Financial Statements”) prepared in accordance with IAS 34 “Interim Financial Reporting,” as endorsed by the European Union (EU) and published by the International Accounting Standards Board (“IASB”) (see Note 2 to the Interim Consolidated Financial Statements) included elsewhere in this document.
Data on a comparable basis, economic CAPEX (referred to as “eCAPEX” or “economic CAPEX”) and net financial debt are financial indicators not defined by International Financial Reporting Standards (“IFRS”). For further information on the calculation of these indicators and the reasons why the Orange group uses them and considers them useful, see Section 1.5 Financial indicators not defined by IFRS and Section 1.6.4 Financial glossary. The non-IFRS financial information is not intended to be a substitute for, and should be read in conjunction with, the unaudited Interim Consolidated Financial Statements, including the Notes thereto, included elsewhere in this document.
Data on a historical basis (see Section 1.6.4 Financial glossary) relates to data for prior periods as reported in the Interim Consolidated Financial Statements for the current period. The transition from data on a historical basis to data on a comparable basis for the first half of 2022 is set out in Section 1.5.1 Data on a comparable basis.
Unless stated otherwise, the segment information (see Note 1 to the Interim Consolidated Financial Statements) presented in the following sections is before eliminations for transactions with other segments. The references to websites contained in this report are provided for reference only; the information contained on the referenced websites is not incorporated by reference in this document.
As used in this document, the terms “Orange”, “Orange group” and the “Group”, unless the context otherwise requires, refer to Orange together with its consolidated subsidiaries, and “Orange SA” and the “Company” refer only to the parent company, a French société anonyme (corporation), without its subsidiaries.
Unless stated otherwise, data in the tables is presented in millions of euros, without a decimal point. This presentation may, in some cases, lead to negligible differences in the totals and sub-totals in the tables. Furthermore, the changes presented are calculated on the basis of data in thousands of euros.
1.1 Overview
1.1.1 Financial data and workforce information
Operating data
|
|
2023 |
|
2022 |
|
2022 |
|
% change |
|
% change |
|
|
|
|
|
data on a |
|
data on a |
|
data on a |
|
data on a |
|
|
|
|
|
comparable |
|
historical basis |
|
comparable |
|
historical basis |
|
(at June 30, in millions of euros) |
|
|
|
basis (1) |
|
|
|
basis (1) |
|
|
|
Revenue (1) |
|
21,545 |
|
21,133 |
|
21,297 |
|
2.0 |
% |
1.2 |
% |
Operating income |
|
2,142 |
|
2,412 |
|
2,420 |
|
(11.2) |
% |
(11.5) |
% |
Telecom activities |
|
2,215 |
|
2,491 |
|
2,499 |
|
(11.1) |
% |
(11.4) |
% |
Mobile Financial Services |
|
(73) |
|
(80) |
|
(80) |
|
8.3 |
% |
8.3 |
% |
Investments in property, plant and equipment and intangible assets |
|
3,834 |
|
3,699 |
|
3,850 |
|
3.6 |
% |
(0.4) |
% |
Telecom activities |
|
3,814 |
|
3,686 |
|
3,836 |
|
3.5 |
% |
(0.6) |
% |
Mobile Financial Services |
|
20 |
|
14 |
|
14 |
|
47.9 |
% |
47.9 |
% |
eCAPEX (2) (Non-IFRS Indicator) |
|
3,154 |
|
3,344 |
|
3,413 |
|
(5.7) |
% |
(7.6) |
% |
Telecom activities |
|
3,133 |
|
3,330 |
|
3,399 |
|
(5.9) |
% |
7.8 |
% |
Mobile Financial Services |
|
20 |
|
14 |
|
14 |
|
47.9 |
% |
47.9 |
% |
Average number of employees (full-time equivalents) (3) |
|
127,070 |
|
131,136 |
|
131,115 |
|
(3.1) |
% |
(3.1) |
% |
Number of employees (active employees at end of period) (3) |
|
135,740 |
|
136,600 |
|
136,566 |
|
(0.6) |
% |
(0.6) |
% |
(1) Revenues from telecom activities. The net banking income (NBI) of Mobile Financial Services is recognized in other operating income.
(2) eCAPEX is a non-IFRS financial indicator provided as additional information only and should not be considered a substitute for Purchases of property, plant and equipment and intangible assets or Investments in, property, plant and equipment and intangible assets. See Section 1.5 Financial indicators not defined by IFRS and Section 1.6.4 Financial glossary.
(3) See Section 1.6.4 Financial glossary. As of June 30, 2023, excluding VOO employees acquired in June 2023 by Orange Belgium and currently being integrated (see Section 1.1.3 Significant events).
Consolidated net income
|
|
2023 |
|
2022 |
|
|
|
|
data on a |
(at June 30, in millions of euros) |
|
|
|
historical basis |
Operating Income |
|
2,142 |
|
2,420 |
Finance costs, net |
|
(592) |
|
(373) |
Income taxes |
|
(461) |
|
(580) |
Consolidated net income |
|
1,088 |
|
1,467 |
Net income attributable to owners of the parent company |
|
877 |
|
1,218 |
Net income attributable to non-controlling interests |
|
211 |
|
249 |
|
4 |
Net financial debt
|
|
June 30, |
|
Dec. 31, |
|
|
2023 |
|
2022 |
|
|
|
|
data on a |
(in millions of euros) |
|
|
|
historical basis |
Net financial debt (1) |
|
27,274 |
|
25,298 |
(1) Net financial debt is a non-IFRS financial indicator provided as additional information only and should not be considered a substitute for financial liabilities. See Section 1.5 Financial indicators not defined by IFRS, Section 1.6.4 Financial glossary, and Note 10.3 to the Interim Consolidated Financial Statements. Net financial debt as defined and used by Orange does not take into account Mobile Financial Services activities, for which this concept is not relevant.
For further information on the risks relating to the Orange group’s financial debt, see “Item 3. Key information—3.D. Risk factors” in the 2022 Form 20-F.
1.1.2 Summary of results for the first half of 2023
In an environment still affected by inflation (see Section 1.1.3 Significant events) and geopolitical uncertainty, the Group achieved solid results for the first half of 2023, in terms of both business and financial performance.
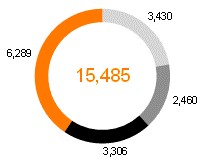
Revenues totaled 21,545 million euros in the first half of 2023, an increase of 1.2% on a historical basis (see Section 1.2.1 Group revenues for a more complete discussion of the historical basis) and 2.0% on a comparable basis versus the first half of 2022. On a comparable basis, revenue growth of 412 million euros is driven mainly (i) by 3.6% growth in retail services (B2C+B2B, see Section 1.6.4 Financial glossary), boosted in particular by price increases introduced gradually in the Group’s European countries in 2022 and during the first half of 2023, and (ii) to a lesser degree, by an 8.8% increase in equipment sales, (iii) while wholesale services, impacted by the decline in unbundling revenues on the copper network in France and by regulatory cuts in call termination rates in Europe, fell 5.9% year on year. On a comparable basis:
| − | Africa & Middle East countries continued to be the main contributor to growth, with revenues rising by 10.5% year on year (i.e. an increase of 330 million euros), due to all growth engines in the area (mobile data, fixed broadband, Orange Money and B2B); |
| − | European countries grew 3.3% year on year (i.e. an increase of 176 million euros), primarily driven by a strong performance in Poland (up 6.3%) and by recovery in Spain (returning to growth of 2.5%); |
| − | France declined 1.5% (i.e. a decrease of 135 million euros), mainly due to lower revenues from wholesale services and, to a lesser degree, conventional telephony services (narrowband). Excluding fixed-only narrowband services, other retail services (B2C+B2B) grew by 2.7% in the first half of 2023. |
Commercial activity performed very well in the first half of 2023, in an environment that remains highly competitive. The Group’s convergent customer base thus reached 11.6 million customers at June 30, 2023, up 0.8% year on year. Mobile services had 246.2 million accesses at the end of June 2023 (up 4.4% year on year), of which 97.4 million were contracts (up 8.1% year on year). At June 30, 2023, fixed services totaled 44.6 million accesses (down 2.8% compared to June 30, 2022), including 15.1 million very high-speed broadband accesses, an area that continued to grow strongly (up 14.0% year on year). Impacted by the downward trend in conventional fixed telephony, fixed narrowband access fell 14.4% between June 30, 2022 and June 30, 2023.
Operating income totaled 2,142 million euros in the first half of 2023, down 11.5% on a historical basis and 11.2% on a comparable basis versus the first half of 2022. This change was largely due to an additional provision of 257 million euros recognized for the French “part-time for seniors” plans (relating to agreements for the employment of older workers in France) in order to take into account pension reforms enacted in France in April 2023.
Consolidated net income stood at 1,088 million euros in the first half of 2023, compared with 1,467 million euros in the first half of 2022, i.e. a decline of 378 million euros. This decrease reflects the decrease in operating income and the deterioration in net finance costs, partially offset by the decrease in income taxes.
Investments in property, plant and equipment and intangible assets, was 3,834 million euros in the first half of 2023, a decrease of (0.4)% on a historical basis and an increase of 3.6% on a comparable basis versus the first half of 2022. Economic CAPEX, or eCAPEX, was 3,154 million euros in the first half of 2023, a reduction of 7.6% on a historical basis and 5.7% on a comparable basis versus the first half of 2022, mainly due to the decline in gross investments in very high-speed fixed broadband networks (FTTH) following the major roll-outs of recent years. Orange had 68.3 million households connectable to FTTH worldwide at June 30, 2023 (up 12.6% year on year on a comparable basis). eCAPEX is a non-IFRS financial indicator provided as additional information only and should not be considered a substitute for Purchases of property, plant and equipment and intangible assets or Investments in, property, plant and equipment and intangible assets. See Section 1.5 Financial indicators not defined by IFRS and Section 1.6.4 Financial glossary.
Current and non-current financial liabilities (excluding derivatives) totaled 37,446 million euros at June 30, 2023, an increase of 808 million euros compared with December 31, 2022. Net financial debt totaled 27,274 million euros at June 30, 2023, an increase of 1,976 million euros compared with December 31, 2022. This increase is mainly due to the acquisition by Orange Belgium of a stake of around 75% in VOO (see Section 1.1.3 Significant events). Net financial debt (see Note 10.3 to the Interim Consolidated Financial Statements) is a financial indicator that is not defined by IFRS that is provided as additional information only and should not be considered a substitute for Financial liabilities. For further information on the calculation of this indicator and the reasons why the Orange group uses it, see Section 1.5 Financial indicators not defined by IFRS and Section 1.6.4 Financial glossary.
1.1.3 Significant events
Governance
On March 24, 2023, Céline Fornaro was appointed by ministerial decree as a member of the Orange Board of Directors to represent the French government, replacing Stéphanie Besnier.
|
5 |
On May 23, 2023, the Shareholders’ Meeting approved all the resolutions submitted to shareholders by the Board of Directors, including the appointment of two new directors: Momar Nguer, replacing Jean-Michel Severino, and Gilles Grapinet, replacing Bernard Ramanantsoa.
To support the guidelines related to the new strategic plan, the Executive Committee has evolved. As of April 3, 2023:
| − | Jean-François Fallacher has been appointed Chief Executive Officer of Orange France, |
| − | Michaël Trabbia has been appointed Chief Executive Officer of Orange Wholesale, |
| − | Jean-Michel Thibaud has been appointed interim Executive Director, Finance, Performance and Development, following the departure of Ramon Fernandez, |
| − | Fabienne Dulac has been appointed Executive Vice President, Transformation. |
Finally, Bruno Zerbib has been appointed Group Chief Technology & Innovation Officer with effect from June 1, 2023.
In April 2023, the Group also announced the appointment of Laurent Martinez as Executive Director in charge of Finance, Performance and Development from September 1, 2023.
Lead the Future, Orange’s new strategic plan
In February 2023, Orange launched Lead the Future, its new strategic plan that aims to capitalize on recognized excellence in its core business and to grow sustainably in countries in Europe and Africa & Middle East. Orange has also confirmed the repositioning of its Enterprise activities in next-generation connectivity solutions and the acceleration in cybersecurity. The plan is accompanied by the implementation of an ambitious new business model with social and environmental responsibility and operational excellence at its core.
Lead the Future is based on four pillars: (i) capitalizing on our core business, to reinforce our excellence and our quality of service; (ii) capitalizing on infrastructure in all the countries where the Group is present; (iii) transforming Orange Business in order to accelerate growth in the Enterprise services segment and strengthen Orange’s position in cybersecurity; and (iv) pursuing growth in the Africa & Middle East countries. Lead the Future also aims to put in place a new business model guided by an ambitious policy of social and environmental responsibility.
Inflationary environment
In the first half of 2023, widespread inflation continued to weigh on the Group’s operating margins, particularly through higher energy costs, higher labor expenses and higher costs of other products and services (in particular through indexation effects: rent, operating taxes and levies payable, services, etc.). In this macroeconomic environment (see Note 2.3 to the Interim Consolidated Financial Statements), Orange continued its efforts to achieve its financial objectives. In this regard, the Group has several key advantages in this inflationary environment:
• |
the Group has some capacity to increase prices due to a high level of customer satisfaction and the quality of its network. In France, price increases took place during the first half of 2023, representing an additional 1 or 2 euros on B2C fixed and mobile contracts under the Orange and Sosh brands. In addition to France, all European countries began introducing price increases in 2022, which will continue in 2023. In terms of revenue, the effect of these price increases is gradual. Over the first half of 2023, the price increases partially offset the impact of inflation on the Group’s costs. |
In terms of energy, Orange has significant coverage of its electricity needs (the Group’s main energy component) at prices set through Power Purchase Agreements (PPAs) and purchases already made on the markets. In addition to the measures already taken, Orange is also continuing the work undertaken across its scope to optimize its energy consumption. Purchases of energy, whose main component is electricity, totaled 520 million euros in the first half of 2023, rising by around 37% compared with the first half of 2022 on a comparable basis. The Group expects its energy expenses (mainly electricity) to total around 1.1 billion euros in 2023.
With regard to labor expenses, only some Group entities are required to increase their overall salary budgets in line with inflation, as is the case in Belgium and Luxembourg. In France, Orange SA implemented an overall salary budget increase of 4.8% in 2023, maintaining a particular focus on the lowest compensation levels. Orange is thus stepping up its efforts to improve employees’ purchasing power, while maintaining the Group’s financial balance.
In addition, BuyIn, the procurement joint venture between Orange and Deutsche Telekom, provides the Group with some bargaining power to secure supplies and limit price increases. Orange also relies on its operational efficiency plan to offset the inflationary effects that the Group is experiencing (see Progress of the operational efficiency plan below).
The Group’s lead in rolling out its network, especially for fiber optic, also enables Orange to reduce its exposure to the higher costs associated with this activity; In addition, Orange’s decision to retain control of its infrastructure, particularly through Totem, its European TowerCo, enables it to partially limit the Group’s exposure to the effects of rent indexation to inflation for this asset class.
Finally, from a financial point of view, the strength of the Group’s balance sheet, its diversified financing and interest rate risk management policy, as well as Orange’s creditworthiness, limit the Group’s exposure to the effect of rising interest rates.
Capitalizing on the core business
In March 2023, Orange announced that it had signed a distribution agreement with OneWeb (a Low Earth Orbit satellite communications company) aimed at improving and extending the Group’s global connectivity, particularly in rural and remote areas of Europe, Latin America and Africa. Thanks to this partnership, Orange will be able to offer telecommunication operators and businesses an enhanced connectivity offering incorporating OneWeb’s LEO (Low Earth Orbit) solution, making it possible to connect, with improved latency, hard-to-reach areas that could not be served until now. Other benefits of this partnership include increased resilience and geographic coverage of B2B and backhaul solutions in these remote areas.
In March 2023, Orange Wholesale France (OWF), the Orange entity dedicated to the telecommunication operator market in France, in partnership with Networth, launched a complete VoIP telephony and fiber Internet connectivity offering called All Fibre. This offer is a turnkey solution for operators
|
6 |
without a network or service platform operating in the professionals and very small businesses markets. It offers extensive national coverage and is simple, convenient, time-saving and cost-effective for telecommunication operators.
Capitalizing on infrastructure
In January 2023, Orange Belgium and Telenet announced that they had signed two wholesale commercial agreements for the sale of fixed services giving access to their respective hybrid fiber-coaxial and fiber-to-the-home networks. The agreements will provide access to the other party’s fixed networks for a period of 15 years and cover both current hybrid fiber-coaxial technologies and future fiber-to-the-home technologies in both network areas. Orange Belgium believes that these agreements will promote investment and competition in the Belgian telecommunication market.
In February 2023, Orange and Vodafone announced that they would cooperate to build and share an Open Radio Access Network (Open RAN) in rural areas of Europe where both operators have mobile networks. The first commercial sites will be rolled out in a rural area of Romania, near Bucharest. This Open RAN network sharing agreement, which is a first in Europe, demonstrates the two operators’ commitment to rolling out this technology for future mobile networks in Europe and also to supporting the European Commission’s goal of rolling out 5G to all populated areas by 2030. Thanks to this new operating model based on the integration of multi-provider equipment and software, Orange and Vodafone will each benefit from greater agility when adding new radio sites or upgrading existing ones, while minimizing costs and energy consumption.
In April 2023, Totem, Orange’s European TowerCo, announced the roll-out of a next-generation 5G network within the Orange Vélodrome stadium in Marseille to meet the expectations of the public, organizers and media for various sporting events. The four French telecommunication operators have been able to connect their equipment to the antenna infrastructure rolled out by Totem, with next-generation antennae developed for these locations with high mobile usage densities, offering homogeneous high-quality network coverage and high energy efficiency.
The Group also continues to make substantial investments in international connectivity projects. In April 2023, Orange announced the roll-out of a new submarine cable linking Tunisia and France, co-financed by the European Commission as part of the “Mechanism for Interconnection in Europe” (MIE) program. The 1,050-kilometer cable is due to be commissioned at the end of 2025. Named Via Tunisia, this cable is part of the Medusa submarine cable system in the Mediterranean Sea, the entry into force of the construction contract for Via Tunisia was announced in July 2023.
In addition, Orange borrowed 500 million euros from the European Investment Bank (EIB) in March 2023 to help finance the roll-out in France of its 5G mobile network and the reinforcement of its 4G mobile network capacity in rural areas. This financing is part of the roadmap of Orange’s new strategic plan, which aims, among other things, to capitalize on the Group’s infrastructure in order to consolidate Orange’s leading position in terms of quality of service and networks.
Transforming Orange Business and strengthening cybersecurity
Orange Business transformation plan
As part of the Lead the Future strategic plan, Orange announced in February 2023 that it wanted to radically transform its B2B telecommunication operator model in order to adapt to the changing B2B market. Orange Business aims to position itself as a leader in next-generation connectivity solutions. This ambition is based in particular on its recognized expertise in secure and trusted connectivity solutions, which are the foundation of the digital transformation of businesses. It is also based on a refocusing of its portfolio of offerings, a change in its business model and a major cost optimization program.
In March 2023, Orange Business presented to the employee representative bodies the operational implementation of its strategic priorities within the framework of the Lead the Future strategic plan. This plan carries a strong ambition to transform and simplify Orange Business, whose market is undergoing profound changes, towards a Digital Services Company (DSC) model.
As part of this transformation, Orange Business opened discussions with trade unions during the first half of 2023. After several negotiation meetings, Orange Business finally opted for a voluntary departure plan (VDP), which could lead to the loss of around 650 jobs in France in Orange Business’s main legacy activities. The first meetings with the representative bodies took place in early June 2023 (see Note 5.3 to the Interim Consolidated Financial Statements).
At the same time, to accelerate its digital transformation towards a DSC model, Orange Business has launched a training and retraining program for 5,000 employees in key digital professions (virtualization, cloud, data, artificial intelligence and cybersecurity), as well as an ambitious recruitment program for 800 experts in cybersecurity and the same number in digital services, including Cloud and Digital & Data.
Digital transformation of B2B customers
To meet the expectations of businesses, particularly those related to the refocusing of their needs, Orange Business combines the expertise of a network operator with that of a DSC. With this in mind, and drawing on its secure, digitized infrastructure, Orange Business is focusing its expertise on five value propositions offering end-to-end solutions and combining networks, cloud, security, data and AI.
To this end, in June 2023 Orange Business, Orange Cyberdefense and Palo Alto Networks, a global leader in cybersecurity services, announced a new collaboration to deliver a managed Secure Access Service Edge (SASE) solution that meets business requirements for network and security, high performance, simplicity and Zero Trust 2.0 network access. Fully managed, this offer meets the needs of businesses looking for agility and whose infrastructure is oriented toward the cloud, while guaranteeing a high level of security.
Pursuing growth in the Africa & Middle East countries
In June 2023, Orange Middle East and Africa and Digital Africa signed a strategic partnership to strengthen the support and growth of African start-ups in the “Orange Digital Centers” network. Selected start-ups will be able to access a range of resources, including mentoring programs, technical assistance, funding, and networking opportunities through the Orange Digital Center (ODC) and the Digital Africa community.
Changes in the asset portfolio
Acquisition of approximately 75% of VOO by Orange Belgium
Following the agreements signed in December 2021, in June 2023 Orange announced Orange Belgium’s acquisition of 75% of the capital minus one share of telecommunication operator VOO. This acquisition represents an investment of 1.349 billion euros net of cash acquired. At the end of the transaction, Nethys retains a minority interest in VOO and now has protective rights to ensure the completion of the industrial and social project. The Group has granted Nethys a commitment to purchase its residual stake in VOO, exercisable for three years. As of the acquisition date, a current financial liability of 279 million euros was recognized in this respect (see Note 3.2 to the Interim Consolidated Financial Statements).
|
7 |
The acquisition of VOO marks an important step in Orange’s convergence ambitions in Belgium, and is expected to generate significant synergies, mainly related to the transfer of VOO’s Mobile Virtual Network Operator (MVNO) business to the Orange Belgium network.
Conclusions from the Orange Bank strategic review and exclusive negotiations entered into with BNP Paribas
As part of a strategic review launched several months ago, Orange began looking for a partner to support the development of its banking subsidiary. At the end of June 2023, the Board of Directors agreed to enter into exclusive negotiations with BNP Paribas to define a referral partnership for Orange Bank’s customer portfolio in France and to develop financing solutions for mobile handsets. The two groups will also discuss the terms of a takeover of Orange Bank’s business in Spain. The activities of Orange Bank Africa are not affected.
This partnership will provide a continuity solution for Orange Bank customers and is in line with the intention to progressively withdraw Orange Bank from the retail banking market in France and Spain. Orange Bank currently has a solid balance sheet and will continue to meet all its regulatory obligations until its future withdrawal from the market.
This operation will have no impact on the Group’s financial trajectory for the 2023–2025 period as set out in February 2023 during Orange’s new strategic plan presentation (see Lead the Future, Orange’s new strategic plan, above).
This project will be subject to various information and consultation procedures with employee representative bodies. The Group will also work with the relevant authorities and regulators (see Note 3.2 to the Interim Consolidated Financial Statements).
Agreement for the disposal of all OCS and Orange Studio securities to the Canal+ Group
In January 2023, Orange and the Canal+ Group announced the signature of an agreement anticipating the acquisition by the Canal+ Group of all securities held by Orange in the OCS pay TV package and in Orange Studio, the film and series co-production subsidiary. Following the deal, the Canal+ Group will be the sole shareholder of both companies.
Since their creation in 2007 and 2008 respectively, competition in the audiovisual sector, particularly for OCS, has continued to intensify with the emergence of powerful international platforms. Through this agreement with the Canal+ Group, Orange’s historic partner and a recognized European player in the creation and distribution of content, the Group aims to sustain the long-term development of these two subsidiaries, while preserving jobs and the pre-financing of content. Canal+ has been a 33.34% shareholder of OCS since 2012 and is its leading distributor.
Completion of the operation remains subject to the approval of the relevant administrative, regulatory and competition authorities and to the related and/or contractual conditions precedent (see Note 3.2 to the Interim Consolidated Financial Statements).
Planned creation of a joint venture with Deutsche Telekom, Telefónica and Vodafone for the implementation of a digital advertising technology platform in Europe
In February 2023, Orange, Deutsche Telekom, Telefónica and Vodafone announced plans to form a joint venture to develop a technology platform for digital advertising (ad tech) in Europe. The platform is specifically designed to offer consumers a step change in the control, transparency and protection of their data, which is currently collected, distributed and stored at scale by major, non-European players. It is expected to benefit consumers, advertisers and publishers. Its creation has been authorized by the European Commission. The four companies will take equal 25% stakes in this newly formed joint venture, to be based in Belgium and run by independent management.
1.2 Analysis of the Group’s results and capital expenditure
1.2.1 Group revenues
1.2.1.1 Revenues
Group revenue by segment (1) |
|
2023 |
|
2022 |
|
2022 |
|
% change |
|
% change |
|
(at June 30, in millions of euros) |
|
|
|
data on a |
|
|
|
data on a |
|
|
|
|
|
|
|
comparable |
|
data on a |
|
comparable |
|
data on a |
|
|
|
|
|
basis |
|
historical basis |
|
basis |
|
historical basis |
|
France |
|
8,691 |
|
8,826 |
|
8,827 |
|
(1.5) |
% |
(1.5) |
% |
Europe |
|
5,546 |
|
5,371 |
|
5,325 |
|
3.3 |
% |
4.1 |
% |
Spain |
|
2,321 |
|
2,265 |
|
2,265 |
|
2.5 |
% |
2.5 |
% |
Other European countries |
|
3,230 |
|
3,111 |
|
3,065 |
|
3.8 |
% |
5.4 |
% |
Eliminations |
|
(5) |
|
(5) |
|
(5) |
|
(13.2) |
% |
(13.2) |
% |
Africa & Middle-East |
|
3,472 |
|
3,141 |
|
3,381 |
|
10.5 |
% |
2.7 |
% |
Enterprise |
|
3,944 |
|
3,911 |
|
3,888 |
|
0.8 |
% |
1.4 |
% |
Totem |
|
342 |
|
328 |
|
328 |
|
4.3 |
% |
4.3 |
% |
International Carriers & Shared Services |
|
763 |
|
771 |
|
772 |
|
(1.0) |
% |
(1.1) |
% |
Eliminations |
|
(1,214) |
|
(1,215) |
|
(1,224) |
|
|
|
|
|
Group revenue |
|
21,545 |
|
21,133 |
|
21,297 |
|
2.0 |
% |
1.2 |
% |
(1) Revenues from telecom activities (see Note 1.1 to the Interim Consolidated Financial Statements). The net banking income (NBI) of Mobile Financial Services is recognized in other operating income (see Notes 1.2 and 1.3 to the Interim Consolidated Financial Statements).
|
8 |
Group revenue by offer (1) |
|
2023 |
|
2022 |
|
2022 |
|
% change |
|
% change |
|
(at June 30, in millions of euros) |
|
|
|
data on a |
|
|
|
data on a |
|
|
|
|
|
|
|
comparable |
|
data on a |
|
comparable |
|
data on a |
|
|
|
|
|
basis |
|
historical basis |
|
basis |
|
historical basis |
|
Retail services (B2C+B2B) (2) |
|
16,021 |
|
15,467 |
|
15,626 |
|
3.6 |
% |
2.5 |
% |
Convergent services |
|
3,958 |
|
3,806 |
|
3,806 |
|
4.0 |
% |
4.0 |
% |
Mobile only services |
|
5,611 |
|
5,288 |
|
5,454 |
|
6.1 |
% |
2.9 |
% |
Fixed only services |
|
4,467 |
|
4,556 |
|
4,567 |
|
(2.0) |
% |
(2.2) |
% |
IT & integration services |
|
1,985 |
|
1,816 |
|
1,799 |
|
9.3 |
% |
10.3 |
% |
Wholesale services |
|
3,389 |
|
3,602 |
|
3,638 |
|
(5.9) |
% |
(6.9) |
% |
Equipment sales |
|
1,586 |
|
1,458 |
|
1,465 |
|
8.8 |
% |
8.2 |
% |
Other revenues |
|
549 |
|
606 |
|
567 |
|
(9.4) |
% |
(3.2) |
% |
Group revenue |
|
21,545 |
|
21,133 |
|
21,297 |
|
2.0 |
% |
1.2 |
% |
(1)Revenues from telecom activities (see Note 1.1 to the Interim Consolidated Financial Statements). The net banking income (NBI) of Mobile Financial Services is recognized in other operating income (see Notes 1.2 and 1.3 to the Interim Consolidated Financial Statements).
(2) |
See Section 1.6.4 Financial glossary. |
The revenues of the Orange group totaled 21,545 million euros in the first half of 2023, i.e. an increase of 1.2% on a historical basis and 2.0% on a comparable basis, compared with the first half of 2022.
Change on a historical basis
On a historical basis, the increase of 1.2%, i.e. 248 million euros, in Group revenues between the first half of 2022 and the first half of 2023 included:
| − | the negative effect of foreign exchange fluctuations, which amounted to 226 million euros, mainly due to changes in the Egyptian pound against the euro of 210 million euros; |
| − | the favorable effect of changes in the scope of consolidation and other changes of 62 million euros. This mainly included (i) the effect of the acquisition of VOO by Orange Belgium on June 2, 2023 for 42 million euros (see Section 1.1.3 Significant events), and (ii) the effect of the acquisition of SCRT and Telsys by Orange Cyberdefense on November 8, 2022 for 20 million euros; |
| − | the organic change on a comparable basis, i.e. a 412 million euro increase in revenues. |
Change on a comparable basis
On a comparable basis, the increase of 412 million euros, i.e. 2.0%, in Group revenues between the first half of 2022 and the first half of 2023 was primarily due to:
| − | the increase of 323 million euros (i.e. 6.1%), in Mobile-only services in connection with (i) the strong growth in mobile services (prepaid and contract) in almost all the Africa & Middle East countries, driven largely by the growth in data services and (ii) to a lesser extent, by the increase in mobile-only contracts in Other European countries and in France (linked in particular to price increases, see Section 1.1.3 Significant events) and for Enterprise services; |
| − | the increase of 169 million euros (i.e. 9.3%), in IT & Integration Services, mainly for Enterprise services (driven by cybersecurity services and unified communications and collaboration services), and to a lesser extent in Poland; |
| − | the increase of 152 million euros (i.e. 4.0%), in Convergent services, which grew in all European countries except Romania, reflecting the growth in the number of convergent service customers, the penetration of fiber offers in customer bases, and price increases (see Section 1.1.3 Significant events); and |
| − | the increase of 128 million euros (i.e. 8.8%), in Equipment sales, in virtually all European countries, with marked growth in Spain (strong demand for renewed mobile handsets) and Poland (upgrading to higher-value products, growth in equipment sales to businesses). |
These favorable changes were partially offset by:
| − | the decrease of 213 million euros (i.e. 5.9%), in Wholesale services, mainly in France, and to a lesser extent in Europe: |
| - | in France, the decline in wholesale services was mainly due to (i) the decline in unbundling revenues on the copper network, (ii) the reduction in the construction of fiber optic networks (Public Initiative Networks or PINs), (iii) the decline in mobile and fixed interconnection (mainly due to the decrease in voice and message traffic and to regulatory cuts in call termination rates), and to a lesser extent (iv) the decrease in FTTH line co-financing received from other operators, (v) partially offset by the increase in FTTH lines leased to third-party carriers, |
| - | in Europe and for international wholesale services, the decrease in wholesale services was essentially due to (i) regulatory cuts in mobile and fixed-line call termination rates, and (ii) a decrease in international transit activity (particularly in Spain), (iii) partially offset, in Europe, by the increase in national roaming in Spain, |
| - | at the Group level, these changes were partially offset by the sale of rights of use for the Arimao submarine cable linking Cuba to Martinique, the increase in wholesale services in the Africa & Middle East countries (mainly due to the implementation of a national roaming agreement in Egypt), and to a lesser extent by the growth in Totem’s activities; |
− |
the decrease of 89 million euros (i.e. 2.0%), in Fixed-only services, mainly due to: |
| - | the decrease in fixed-only services for Enterprise services, linked to (i) the decrease in data services, mainly due to the general trend toward the transformation of data service technologies, particularly internationally, and (ii) the decline in voice services with the downward trend in traditional fixed telephony, |
| - | the downward trend in fixed-only narrowband services (traditional telephony), mainly in France, |
| - | partially offset by the growth of fixed-only broadband services in the Africa & Middle East countries (broadband and very high-speed broadband) and in France (due to the increase in fiber optic offers); and |
|
9 |
| − | to a lesser extent, the decrease of 57 million euros (i.e. 9.4%), in Other revenues, mainly in France, due to the decline in the construction of build-to-suit mobile sites. |
The review of the change in revenues by business segment is detailed in Section 1.3 Review by business segment.
1.2.1.2 Number of accesses to telecom activities
Number of accesses from telecom activities (1) |
|
2023 |
|
2022 |
|
2022 |
|
% change |
|
% change |
|
(at June 30, in thousands, at the end of the period) |
|
|
|
data on a |
|
|
|
data on a |
|
|
|
|
|
|
|
comparable |
|
data on a |
|
comparable |
|
data on a |
|
|
|
|
|
basis |
|
historical basis |
|
basis |
|
historical basis |
|
Convergent services |
|
|
|
|
|
|
|
|
|
|
|
Number of convergent customers |
|
11,642 |
|
11,552 |
|
11,552 |
|
0.8 |
% |
0.8 |
% |
Mobile services |
|
|
|
|
|
|
|
|
|
|
|
Number of mobile accesses (2) |
|
246,175 |
|
235,746 |
|
235,746 |
|
4.4 |
% |
4.4 |
% |
o/w: Convergent customers mobile accesses |
|
21,428 |
|
21,056 |
|
21,056 |
|
1.8 |
% |
1.8 |
% |
Mobile-only accesses |
|
224,748 |
|
214,690 |
|
214,690 |
|
4.7 |
% |
4.7 |
% |
o/w: Contract customers mobile accesses |
|
97,434 |
|
90,138 |
|
90,138 |
|
8.1 |
% |
8.1 |
% |
Prepaid customers mobile accesses |
|
148,741 |
|
145,607 |
|
145,607 |
|
2.2 |
% |
2.2 |
% |
Fixed services |
|
|
|
|
|
|
|
|
|
|
|
Number of fixed accesses |
|
44,613 |
|
45,916 |
|
45,916 |
|
(2.8) |
% |
(2.8) |
% |
Fixed Retail accesses |
|
30,527 |
|
31,072 |
|
31,072 |
|
(1.8) |
% |
(1.8) |
% |
o/w: Fixed Broadband accesses |
|
24,475 |
|
24,002 |
|
24,002 |
|
2.0 |
% |
2.0 |
% |
o/w: Very high‑speed broadband fixed accesses |
|
15,076 |
|
13,224 |
|
13,224 |
|
14.0 |
% |
14.0 |
% |
o/w: Convergent customers fixed accesses |
|
11,642 |
|
11,552 |
|
11,552 |
|
0.8 |
% |
0.8 |
% |
Fixed‑only accesses |
|
12,833 |
|
12,450 |
|
12,450 |
|
3.1 |
% |
3.1 |
% |
Fixed Narrowband accesses |
|
6,051 |
|
7,070 |
|
7,070 |
|
(14.4) |
% |
(14.4) |
% |
Fixed Wholesale accesses |
|
14,087 |
|
14,845 |
|
14,845 |
|
(5.1) |
% |
(5.1) |
% |
Number of mobile and fixed accesses from telecom activities (1) |
|
290,789 |
|
281,662 |
|
281,662 |
|
3.2 |
% |
3.2 |
% |
(1) As of June 30, 2023, excluding accesses of the telecommunication operator, VOO, acquired in June 2023 by Orange Belgium and currently being integrated (see Section 1.1.3 Significant events).
(2) Excluding customers of Mobile Virtual Network Operators (MVNOs).
1.2.2 Group operating results
1.2.2.1 Group operating income
In the first half of 2023, the Orange group’s operating income stood at 2,142 million euros (including 2,215 million euros from telecom activities and a loss of 73 million euros from Mobile Financial Services activities), down 11.5% on a historical basis and 11.2% on a comparable basis versus the first half of 2022.
Change on a historical basis
On a historical basis, the decrease of 11.5%, i.e. 278 million euros, in Group operating income between the first half of 2022 and the first half of 2023 was due to:
| − | on the one hand, (i) the negative effect of foreign exchange fluctuations of 32 million euros (mainly as a result of changes in the Egyptian pound against the euro of 37 million euros), (ii) partially offset by the favorable effect of changes in the scope of consolidation and other changes of 24 million euros; |
| − | and, on the other hand, the organic change on a comparable basis, i.e. a 270 million euro decrease in operating income. |
Change on a comparable basis
On a comparable basis, the decrease of 270 million euros, i.e. 11.2%, in Group operating income between the first half of 2022 and the first half of 2023 was mainly due to:
| − | the increase of 301 million euros in specific labor expenses. This increase mainly related to the French part-time for seniors plans (a program relating to agreements for the employment of older workers in France) and was mainly due to (i) the recognition, in the first half of 2023, of an expense of 257 million euros corresponding to the additional provision for the pension reform enacted in April 2023 in France, and (ii) the recognition, in the first half of 2022, of an actuarial gain of 84 million euros linked to the sharp rise in the discount rate curve in the 2022 macroeconomic context (see Note 6 to the Interim Consolidated Financial Statements); |
| − | the increase of 5.0%, i.e. 183 million euros, in adjusted commercial expenses, equipment and content costs (see Section 1.6.4 Financial glossary), mainly due to the rising cost of handsets and other equipment sold, in Europe (in line with the growth in equipment sales), for Enterprise services (in particular unified communication and collaboration services) and for international wholesale services (in connection with the sale of rights of use for the Arimao submarine cable linking Cuba to Martinique); |
| − | the increase of 9.3%, i.e. 165 million euros, in other network expenses and IT expenses (see Section 1.6.4 Financial glossary), due to (i) higher energy access costs for fixed and mobile networks, mainly in France and, to a lesser extent, in Other European countries and the Africa & Middle East countries (see Section 1.1.3 Significant events), and (ii) increased IT expenses for Enterprise services (related in particular to the growth in cybersecurity services); |
| − | the 106 million euro increase in depreciation and amortization of fixed assets (mainly in France and, to a lesser extent, in the Africa & Middle East countries), linked in particular to the material investments made in recent years, especially in connection with the roll-out of fixed (FTTH) and mobile networks; |
|
10 |
| − | the increase of 6.9%, i.e. 103 million euros, in adjusted other external purchases (see Section 1.6.4 Financial glossary), mainly due to (i) the increase in overheads (the resumption of travel, more consulting and support missions, use of temporary staff, higher vehicle energy costs), and (ii) the increase in lease property restructuring expenses (in particular due to rent indexation and the impact of higher energy costs on lease expenses); |
| − | and, to a lesser extent, the increase of 29 million euros in restructuring programs costs. |
These unfavorable changes were partially offset by:
| − | the increase of 2.0%, i.e. 412 million euros, in revenues; |
| − | the decrease of 5.9%, i.e. 123 million euros, in service fees and inter-operator costs (see Section 1.6.4 Financial glossary) resulting from (i) the decrease in interconnection costs (mainly in Europe, for international wholesale services and in France), in line with the decline in wholesale services revenues, and largely linked to regulatory cuts in call termination rates and the decline in international transit in several European countries, (ii) partially offset by the increase in network charges in France and, to a lesser extent, in Europe (Poland, Belgium), due in particular to the migration of customers to third-party very high-speed broadband networks; |
| − | the recognition in the first half of 2023 of 57 million euros in net income from significant litigations, mainly due to a provision reversal of 97 million euros in connection with the litigation between Digicel and Orange (see Notes 5.2 and 14 to the Interim Consolidated Financial Statements); and |
| − | the increase of 23.9% i.e. 36 million euros, in adjusted other operating income (net of adjusted other operating expenses, see Section 1.6.4 Financial glossary), essentially due to (i) developments in various litigations between the two periods, and (ii) the increase in net banking income (NBI, see Notes 1.2 and 1.3 to the Consolidated Financial Statements) in Mobile Financial Services, (iii) partially offset by the increase in impairment and losses on trade receivables in telecom activities (see Notes 4 and 5.2 to the Consolidated Financial Statements) and by the increase in the cost of bank credit risk (see Notes 1.2, 1.3, 5.2 and 12.2 to the Consolidated Financial Statements). |
1.2.3 Group net income
|
|
2023 |
|
2022 |
|
|
|
|
data on a |
(at June 30, in millions of euros) |
|
|
|
historical basis |
Operating Income |
|
2,142 |
|
2,420 |
Cost of gross financial debt (except financed assets) |
|
(528) |
|
(297) |
Interest on debts related to financed assets |
|
(6) |
|
(1) |
Gains (losses) on assets contributing to net financial debt |
|
130 |
|
(9) |
Foreign exchange gain (loss) |
|
(32) |
|
(40) |
Interests on lease liabilities |
|
(116) |
|
(61) |
Other net financial expenses |
|
(40) |
|
36 |
Finance costs, net |
|
(592) |
|
(373) |
Income taxes |
|
(461) |
|
(580) |
Consolidated net income |
|
1,088 |
|
1,467 |
Net income attributable to owners of the parent company |
|
877 |
|
1,218 |
Net income attributable to non-controlling interests |
|
211 |
|
249 |
The consolidated net income of the Orange group amounted to 1,088 million euros in the first half of 2023, compared with 1,467 million euros in the first half of 2022, i.e. a decrease of 378 million euros. This decrease reflects (i) the 278 million euro decrease in operating income and the 220 million euro deterioration in net finance costs (ii) partially offset by the 119 million euro decrease in income taxes.
The 220 million euro deterioration in net finance costs (see Note 10 to the Interim Consolidated Financial Statements) between the two periods was mainly due to:
| − | the increase in the cost of gross financial debt (except financed assets) mainly due to (i) the change in the interest rate effect of derivatives hedging debt denominated in Polish zloty, (ii) the change in the fair value of derivatives entered into to take advantage of the current favorable market conditions for future issues, and (iii) the increase in interest on the variable-rate portion of debt and on short-term financing in a context of rising interest rates; |
| − | and, to a lesser extent, (i) the increase in other net financial expenses, and (ii) the rise in interests on lease liabilities, largely as a result of the increase in interest rates impacting the discount rates applied to new contracts since January 1, 2023 and the effects of rent indexation in this inflationary environment; |
| − | partially offset by the increase in gains (losses) on assets constituting net financial debt, due to the increase in the return on investments as a result of the rise in interest rates. |
The 119 million euro decrease in income taxes (see Note 9 to the Interim Consolidated Financial Statements) between the two periods is due in particular to changes in the accounting result of the French tax consolidation group entities.
After taking into account non-controlling interests (see Note 13.6 to the Interim Consolidated Financial Statements), the net income attributable to owners of the parent company amounted to 877 million euros in the first half of 2023, compared with 1,218 million euros in the first half of 2022, i.e. a decrease of 341 million euros.
1.2.4 Group comprehensive income
The transition from Group consolidated net income to Group consolidated comprehensive income is detailed in the Consolidated statement of comprehensive income.
|
11 |
1.2.5 Group capital expenditure
Group investments in property, plant and equipment and intangible assets (1) |
|
2023 |
|
2022 |
|
2022 |
|
% change |
|
% change |
|
(at June 30, in millions of euros) |
|
|
|
data on a |
|
|
|
data on a |
|
|
|
|
|
|
|
comparable |
|
data on a |
|
comparable |
|
data on a |
|
|
|
|
|
basis |
|
historical basis |
|
basis |
|
historical basis |
|
eCAPEX(2) |
|
3,154 |
|
3,344 |
|
3,413 |
|
(5.7) |
% |
(7.6) |
% |
Elimination of the price of disposal of fixed assets (3) |
|
153 |
|
124 |
|
124 |
|
23.2 |
% |
23.3 |
% |
Telecommunication licenses |
|
383 |
|
162 |
|
244 |
|
136.1 |
% |
56.9 |
% |
Financed assets (4) |
|
145 |
|
69 |
|
69 |
|
110.2 |
% |
110.2 |
% |
Investments in property, plant and equipment and intangible assets |
|
3,834 |
|
3,699 |
|
3,850 |
|
3.6 |
% |
(0.4) |
% |
(1) See Note 1.4 to the Interim Consolidated Financial Statements.
(2) eCAPEX is a non-IFRS financial indicator provided as additional information only and should not be considered a substitute for Purchases of property, plant and equipment and intangible assets or Investments in, property, plant and equipment and intangible assets. See Section 1.5 Financial indicators not defined by IFRS and Section 1.6.4 Financial glossary. For more information on the transition from economic CAPEX (eCAPEX) to Investments in property, plant and equipment and intangible assets, see Section 1.5.3 Financial indicators not defined by IFRS - eCAPEX.
(3) Elimination of proceeds from sales of property, plant and equipment and intangible assets included in economic CAPEX (eCAPEX).
(4) Financed assets include set-top boxes (STBs) in France, which are financed by an intermediary bank and meet the standard criterion for the definition of fixed assets according to IAS 16.
On a historical basis, the Group’s investments in property, plant and equipment and intangible assets decreased slightly between the first half of 2022 and the first half of 2023. This change was due (i) mainly to the negative effect of foreign exchange fluctuations (mainly the Egyptian pound against the euro), and (ii) to a lesser extent, to the unfavorable effect of changes in the scope of consolidation and other changes, (iii) offset overall by organic growth on a comparable basis, i.e. an increase in investments in property, plant and equipment and intangible assets.
On a comparable basis, the Group’s investments in property, plant and equipment and intangible assets increased between the first half of 2022 and the first half of 2023, mainly due to (i) the increase in expenditure on telecommunication licenses, and (ii) to a lesser extent, the increase in expenses related to financed assets, (iii) partially offset by the decline in other investments in property, plant and equipment and intangible assets.
Group financial investments (see Section 1.6.4 Financial glossary) are detailed in the Consolidated statement of cash flows and in Section 1.4.1 Liquidity and cash flows from telecom activities.
1.2.5.1 Economic CAPEX
In the first half of 2023, the Orange group’s economic CAPEX stood at 3,154 million euros (including 3,133 million euros from telecom activities and 20 million euros from Mobile Financial Services), down 7.6% on a historical basis and 5.7% on a comparable basis versus the first half of 2022. The ratio of economic CAPEX to revenues from telecom activities was 14.5% in the first half of 2022, down 1.4 points on a historical basis and 1.2 points on a comparable basis versus the first half of 2022.
Change on a historical basis
On a historical basis, the decrease of 7.6%, i.e. 259 million euros, in Group economic CAPEX between the first half of 2022 and the first half of 2023 was due to:
| − | the negative effect of foreign exchange fluctuations of 57 million euros, mainly due to changes in the Egyptian pound against the euro of 48 million euros; |
| − | the negative effect of changes in the scope of consolidation and other changes of 12 million euros; |
| − | the organic change on a comparable basis, i.e. a 190 million euro decrease in economic CAPEX. |
Change on a comparable basis
On a comparable basis, the decrease of 190 million euros, i.e. 5.7%, in Group economic CAPEX between the first half of 2022 and the first half of 2023 was mainly due to:
| − | the decline in gross investment in very high-speed fixed broadband networks (FTTH), mainly in France, and to a lesser extent in Europe (Spain, Poland), following the major roll-outs of recent years. At June 30, 2023, the Group had 68.3 million households connectable to FTTH worldwide (up 12.6% year on year), including 35.6 million in France, 16.7 million in Spain, 12.5 million in Other European countries and 3.5 million in the Africa & Middle East countries. At June 30, 2023, the total number of households connectable to all very high-speed broadband networks combined (i.e. FTTH and cabled networks) was 70.0 million; |
| − | the decrease in economic CAPEX relating to leased handsets, Liveboxes and equipment installed at customers’ premises in France, in connection with the increase in financed assets (also recognized in investments in property, plant and equipment and intangible assets); |
| − | the decline in investment in very high-speed mobile broadband networks (4G/5G) in Spain, following the major roll-outs in the country in previous years; |
| − | and, to a lesser extent, the increase in disposals of fixed assets, mainly in France (particularly related to asset rotation, due to the marketing of fiber optics) and in Poland (real estate disposals carried out as part of the optimization of real estate assets); |
| − | partially offset by (i) increased investment in networks in the Africa & Middle East countries, in line with business growth (capacity investments) and changes in usage, (ii) increased investment in IT and customer service platforms, mainly in Europe (Belgium, Poland and Romania) and in France, and (iii) lower co-financing received from third-party operators in France. |
1.2.5.2 Telecommunication licenses
In the first half of 2023, telecommunication licenses amounted to 383 million euros and mainly concerned (i) Belgium for 303 million euros, mainly in the general context of the acquisition of 5G licenses and the renewal of existing 2G/3G spectrum in the 700 MHz, 900 MHz, 1,400 MHz, 1,800 MHz, 2,100 MHz and 3,600 MHz frequency bands, and, to a lesser extent, (ii) Botswana for 38 million euros, and (iii) Spain for 31 million euros.
|
12 |
In the first half of 2022, telecommunication licenses amounted to 244 million euros on a historical basis and mainly related to (i) Egypt for 203 million euros, with the acquisition of 4G licenses in the 2,600 MHz frequency band, and, to a lesser extent, (ii) Slovakia for 16 million euros (acquisition of a 5G license), and (iii) Belgium for 11 million euros.
In addition, telecommunication licenses may, in some cases, give rise to annual fees recognized as operating taxes and levies payables in the Consolidated income statement.
1.3 Review by business segment
The following table presents, for the Orange group, the main operating data (financial data and workforce information) by segment for the first half-years of 2023 and 2022 on a comparable basis and 2022 on a historical basis.
For more details on segment information, see Note 1 to the Interim Consolidated Financial Statements.
|
|
France |
|
|
|
|
|
|
|
Europe |
|
|
|
|
|
|
|
|
|
|
|
Period ended June 30 |
|
|
|
Spain |
|
Other |
|
Europe |
|
Total Europe |
(in millions of euros) |
|
|
|
|
|
European |
|
Eliminations |
|
|
|
|
|
|
|
|
countries |
|
|
|
|
|
|
|
|
|
|
|
|
|
|
|
2023 |
|
|
|
|
|
|
|
|
|
|
Revenue |
|
8,691 |
|
2,321 |
|
3,230 |
|
(5) |
|
5,546 |
EBITDAaL |
|
2,859 |
|
582 |
|
848 |
|
— |
|
1,430 |
Operating Income |
|
1,186 |
|
81 |
|
290 |
|
— |
|
371 |
eCAPEX |
|
1,429 |
|
347 |
|
407 |
|
— |
|
754 |
Telecommunication licenses |
|
— |
|
31 |
|
313 |
|
— |
|
344 |
Average number of employees (1) |
|
43,248 |
|
6,079 |
|
20,884 |
|
— |
|
26,963 |
|
|
|
|
|
|
|
|
|
|
|
2022 – Data on a comparable basis |
|
|
|
|
|
|
|
|
|
|
Revenue |
|
8,826 |
|
2,265 |
|
3,111 |
|
(5) |
|
5,371 |
EBITDAaL |
|
3,014 |
|
524 |
|
810 |
|
— |
|
1,335 |
Operating Income |
|
1,470 |
|
(19) |
|
260 |
|
— |
|
242 |
eCAPEX |
|
1,652 |
|
465 |
|
378 |
|
— |
|
843 |
Telecommunication licenses |
|
8 |
|
6 |
|
27 |
|
— |
|
33 |
Average number of employees |
|
47,019 |
|
6,169 |
|
21,653 |
|
— |
|
27,822 |
|
|
|
|
|
|
|
|
|
|
|
2022 – Data on a historical basis |
|
|
|
|
|
|
|
|
|
|
Revenue |
|
8,827 |
|
2,265 |
|
3,065 |
|
(5) |
|
5,325 |
EBITDAaL |
|
3,035 |
|
524 |
|
799 |
|
— |
|
1,323 |
Operating Income |
|
1,436 |
|
(19) |
|
278 |
|
— |
|
260 |
eCAPEX |
|
1,673 |
|
465 |
|
369 |
|
— |
|
835 |
Telecommunication licenses |
|
8 |
|
6 |
|
27 |
|
— |
|
33 |
Average number of employees |
|
47,009 |
|
6,169 |
|
21,653 |
|
— |
|
27,822 |
(1)As of June 30, 2023, excluding the employees of VOO, acquired in June 2023 by Orange Belgium and currently being integrated (see Section 1.1.3 Significant events).
Period ended June 30 |
|
Africa & |
|
Entreprise |
|
Totem |
|
International |
|
Telecom |
|
Total telecom |
|
Mobile Financial |
|
Group |
|
Group total |
(in millions of euros) |
|
Middle East |
|
|
|
|
|
Carriers & |
|
activities |
|
activities |
|
Services |
|
eliminations |
|
|
|
|
|
|
|
|
|
|
Shared Services |
|
eliminations |
|
|
|
|
|
|
|
|
|
|
|
|
|
|
|
|
|
|
|
|
|
|
|
|
|
|
|
2023 |
|
|
|
|
|
|
|
|
|
|
|
|
|
|
|
|
|
|
Revenue |
|
3,472 |
|
3,944 |
|
342 |
|
763 |
|
(1,210) |
|
21,549 |
|
— |
|
(4) |
|
21,545 |
EBITDAaL |
|
1,260 |
|
311 |
|
183 |
|
(86) |
|
— |
|
5,957 |
|
(62) |
|
— |
|
5,895 |
Operating Income |
|
742 |
|
118 |
|
127 |
|
(329) |
|
— |
|
2,215 |
|
(73) |
|
— |
|
2,142 |
eCAPEX |
|
648 |
|
140 |
|
65 |
|
97 |
|
— |
|
3,133 |
|
20 |
|
— |
|
3,154 |
Telecommunication licenses |
|
38 |
|
— |
|
— |
|
— |
|
— |
|
383 |
|
— |
|
— |
|
383 |
Average number of employees (1) |
|
14,598 |
|
29,313 |
|
189 |
|
11,879 |
|
— |
|
126,191 |
|
879 |
|
— |
|
127,070 |
|
|
|
|
|
|
|
|
|
|
|
|
|
|
|
|
|
|
|
2022 – Data on a comparable basis |
|
|
|
|
|
|
|
|
|
|
|
|
|
|
|
|
|
|
Revenue |
|
3,141 |
|
3,911 |
|
328 |
|
771 |
|
(1,211) |
|
21,137 |
|
— |
|
(4) |
|
21,133 |
EBITDAaL |
|
1,125 |
|
373 |
|
180 |
|
(122) |
|
— |
|
5,904 |
|
(56) |
|
— |
|
5,849 |
Operating Income |
|
694 |
|
162 |
|
120 |
|
(197) |
|
— |
|
2,491 |
|
(80) |
|
— |
|
2,412 |
eCAPEX |
|
554 |
|
143 |
|
44 |
|
94 |
|
— |
|
3,330 |
|
14 |
|
— |
|
3,344 |
Telecommunication licenses |
|
121 |
|
— |
|
— |
|
— |
|
— |
|
162 |
|
— |
|
— |
|
162 |
Average number of employees |
|
14,380 |
|
28,525 |
|
152 |
|
12,322 |
|
— |
|
130,220 |
|
916 |
|
— |
|
131,136 |
|
|
|
|
|
|
|
|
|
|
|
|
|
|
|
|
|
|
|
2022 – Data on a historical basis |
|
|
|
|
|
|
|
|
|
|
|
|
|
|
|
|
|
|
Revenue |
|
3,381 |
|
3,888 |
|
328 |
|
772 |
|
(1,220) |
|
21,301 |
|
— |
|
(4) |
|
21,297 |
EBITDAaL |
|
1,214 |
|
364 |
|
180 |
|
(128) |
|
— |
|
5,989 |
|
(56) |
|
— |
|
5,934 |
Operating Income |
|
739 |
|
152 |
|
120 |
|
(207) |
|
— |
|
2,499 |
|
(80) |
|
— |
|
2,420 |
eCAPEX |
|
609 |
|
144 |
|
44 |
|
94 |
|
— |
|
3,399 |
|
14 |
|
— |
|
3,413 |
Telecommunication licenses |
|
203 |
|
— |
|
— |
|
— |
|
— |
|
244 |
|
— |
|
— |
|
244 |
Average number of employees |
|
14,380 |
|
28,681 |
|
152 |
|
12,155 |
|
— |
|
130,199 |
|
916 |
|
— |
|
131,115 |
|
13 |
1.3.1 France
France |
|
2023 |
|
2022 |
|
2022 |
|
% change |
|
% change |
|
(at June 30, in millions of euros) |
|
|
|
data on a |
|
data on a |
|
data on a |
|
data on a |
|
|
|
|
|
comparable |
|
historical basis |
|
comparable |
|
historical basis |
|
|
|
|
|
basis |
|
|
|
basis |
|
|
|
Revenue |
|
8,691 |
|
8,826 |
|
8,827 |
|
(1.5) |
% |
(1.5) |
% |
EBITDAaL |
|
2,859 |
|
3,014 |
|
3,035 |
|
(5.1) |
% |
(5.8) |
% |
EBITDAaL/Revenue |
|
32.9 |
% |
34.1 |
% |
34.4 |
% |
(1.2) |
pt |
(1.5) |
pt |
Operating income |
|
1,186 |
|
1,470 |
|
1,436 |
|
(19.3) |
% |
(17.4) |
% |
eCAPEX |
|
1,429 |
|
1,652 |
|
1,673 |
|
(13.5) |
% |
(14.6) |
% |
eCAPEX/Revenue |
|
16.4 |
% |
18.7 |
% |
19.0 |
% |
(2.3) |
pt |
(2.5) |
pt |
Telecommunication licenses (1) |
|
— |
|
8 |
|
8 |
|
(99.4) |
% |
(99.4) |
% |
Average number of employees |
|
43,248 |
|
47,019 |
|
47,009 |
|
(8.0) |
% |
(8.0) |
% |
(1) See Section 1.2.5.2 Telecommunication licenses.
1.3.1.1 Revenues – France
France |
|
2023 |
|
2022 |
|
2022 |
|
% change |
|
% change |
|
(at June 30, in millions of euros) |
|
|
|
data on a |
|
data on a |
|
data on a |
|
data on a |
|
|
|
|
|
comparable |
|
historical basis |
|
comparable |
|
historical basis |
|
|
|
|
|
basis |
|
|
|
basis |
|
|
|
Revenue |
|
8,691 |
|
8,826 |
|
8,827 |
|
(1.5) |
% |
(1.5) |
% |
Retail services (B2C+B2B) |
|
5,539 |
|
5,466 |
|
5,466 |
|
1.3 |
% |
1.3 |
% |
Convergent services |
|
2,493 |
|
2,406 |
|
2,406 |
|
3.6 |
% |
3.6 |
% |
Mobile-only services |
|
1,182 |
|
1,154 |
|
1,154 |
|
2.4 |
% |
2.4 |
% |
Fixed-only services |
|
1,865 |
|
1,907 |
|
1,907 |
|
(2.2) |
% |
(2.2) |
% |
Fixed-only broadband services |
|
1,496 |
|
1,473 |
|
1,473 |
|
1.6 |
% |
1.6 |
% |
Fixed-only narrowband services |
|
369 |
|
434 |
|
434 |
|
(14.9) |
% |
(14.9) |
% |
Wholesale services |
|
2,257 |
|
2,452 |
|
2,455 |
|
(7.9) |
% |
(8.1) |
% |
Equipment sales |
|
584 |
|
552 |
|
552 |
|
5.7 |
% |
5.7 |
% |
Other revenues |
|
310 |
|
355 |
|
353 |
|
(12.7) |
% |
(12.1) |
% |
Change on a historical basis
On a historical basis, the 136 million euro decrease in revenues from France between the first half of 2022 and the first half of 2023 was mainly due to the organic change on a comparable basis, i.e. a 135 million euro decrease in revenues.
Change on a comparable basis
On a comparable basis, the decrease of 135 million euros, i.e. 1.5%, in revenues from France between the first half of 2022 and the first half of 2023 was mainly due to:
| − | the decline in Wholesale services, due to (i) the decline in unbundling revenues on the copper network, (ii) the reduction in the construction of fiber optic networks (PINs), (iii) the decline in mobile and fixed interconnection (mainly due to the decrease in voice and message traffic and to regulatory cuts in call termination rates), and (iv) to a lesser extent, the decrease in FTTH line co-financing received from other operators, (v) partially offset by the increase in FTTH lines leased to third-party operators and the growth in visitor roaming; |
| − | the decrease in Fixed-only narrowband services due to the downward trend in traditional telephony (down 14.9%) and the migration of customers toward fixed broadband (FTTH) and convergent offers; |
| − | and the decline in Other revenues, mainly due to the decline in the construction of build-to-suit mobile sites. |
This decrease was partially offset by:
| − | the increase in Convergent services revenue, which continued to grow, with year-on-year growth of 0.9% in the convergent customer base. This growth in volume is also accompanied by growth in value. Half-year convergent ARPO (see Section 1.6.4 Financial glossary) increased by 2.9% between June 30, 2022 and June 30, 2023, driven by (i) rate increases and (ii) by a favorable mix effect, with higher-value convergent offers, thanks in particular to fiber; |
| − | the increase in Equipment sales, mainly related to sales of higher-value mobile handsets; |
| − | the growth of Mobile-only services, driven by the 3.7% increase in half-year mobile-only ARPO (see Section 1.6.4 Financial glossary) between the two periods. The mobile-only access base decreased by 3.2% year on year, mainly due to the decline in the prepaid mobile access base; |
| − | and the growth of Fixed-only broadband services, due to the 0.6% increase in half-year fixed-only broadband ARPO (see Section 1.6.4 Financial glossary) between the two periods. The fixed-only broadband access base was down slightly by 0.2% year on year. |
1.3.1.2 EBITDAaL – France
Change on a historical basis
On a historical basis, the 176 million euro decrease in EBITDAaL in France between the first half of 2022 and the first half of 2023 was due to:
| − | on the one hand, (i) the negative effect of changes in the scope of consolidation and other changes of 23 million euros, (ii) partially offset by the favorable effect of foreign exchange fluctuations of 1 million euros; and |
| − | on the other hand, the organic change on a comparable basis, i.e. a decrease of 155 million euros in EBITDAaL. |
|
14 |
Change on a comparable basis
On a comparable basis, the 155 million euro decrease in EBITDAaL in France between the first half of 2022 and the first half of 2023 was mainly due to:
| − | (i) the 135 million euro decrease in revenue, (ii) the increase in other network expenses (network operating and maintenance expenses), mainly due to the increase in energy access costs for fixed and mobile networks (see Section 1.1.3 Significant events), (iii) the increase in network expenses, mainly due to the migration of customers to third-party very high-speed broadband (FTTH) networks, and (iv) the decrease in other operating income and expenses, due in particular to the counter-effect of the recognition, in the first half of 2022, of an insurance reimbursement relating to damage caused by storm Alex; |
− |
partially offset by (i) lower labor expenses, mainly due to the decline in the average number of employees (full-time equivalent) between the two periods, and (ii) lower interconnection costs, in line with the decline in wholesale services revenues, and largely related to the decrease in voice and message traffic and regulatory cuts in call termination rates. |
1.3.1.3 Operating income – France
Change on a historical basis
On a historical basis, the 250 million euro decrease in operating income from France between the first half of 2022 and the first half of 2023 included (i) the positive effect of changes in the scope of consolidation and other changes of 33 million euros, (ii) the positive effect of foreign exchange fluctuations of 1 million euros, and (iii) the organic change on a comparable basis, i.e. a 284 million euro decrease in operating income.
Change on a comparable basis
On a comparable basis, the 284 million euro decrease in operating income in France between the first half of 2022 and the first half of 2023 was mainly due to:
| − | the decrease of 155 million euros in EBITDAaL; |
| − | the increase of 149 million euros in specific labor expenses. This increase mainly related to the French part-time for seniors plans and was mainly due to the recognition, in the first half of 2023, of an additional provision for the pension reform enacted in April 2023 in France (see Note 6 to the Interim Consolidated Financial Statements); and |
| − | the increase in depreciation and amortization of fixed assets due to the material investments made in recent years, especially in connection with the roll-out of fixed (FTTH) and mobile networks; |
− |
partially offset (i) by the recognition in the first half of 2023 of a provision reversal of 97 million euros in connection with the litigation between Digicel and Orange (see Notes 5.2 and 14 to the Interim Consolidated Financial Statements), and (ii) to a lesser extent, by lower restructuring programs costs. |
1.3.1.4 Economic CAPEX – France
Change on a historical basis
On a historical basis, the 243 million euro decrease in economic CAPEX in France between the first half of 2022 and the first half of 2023 was due to (i) the negative effect of changes in the scope of consolidation and other changes of 21 million euros, and (ii) the organic change on a comparable basis, i.e. a 223 million euro decrease in economic CAPEX.
Change on a comparable basis
On a comparable basis, the 223 million euro decrease in economic CAPEX in France between the first half of 2022 and the first half of 2023 was mainly due to:
| − | the steep drop in investment in very high-speed fixed broadband networks (FTTH), after the material investments made in recent years; |
| − | the decrease in economic CAPEX relating to leased handsets, Liveboxes and equipment installed at customers’ premises, notably in connection with the increase in financed assets (also recognized in investments in property, plant and equipment and intangible assets); and |
| − | to a lesser extent, the increase in disposals of fixed assets (linked in particular to asset rotation due to the marketing of fiber optic networks); |
− |
partially offset by the decrease in co-financing received from third-party operators. |
|
15 |
1.3.1.5 Additional information – France
France |
|
2023 |
|
2022 |
|
2022 |
|
% change |
|
% change |
|
(at June 30, in thousands, at the end of the period) |
|
|
|
data on a |
|
data on a |
|
data on a |
|
data on a |
|
|
|
|
|
comparable |
|
historical basis |
|
comparable |
|
historical basis |
|
|
|
|
|
basis |
|
|
|
basis |
|
|
|
Convergent services |
|
|
|
|
|
|
|
|
|
|
|
Number of convergent customers |
|
5,962 |
|
5,909 |
|
5,909 |
|
0.9 |
% |
0.9 |
% |
6-month convergent ARPO (in euros) (2) |
|
72.6 |
|
70.6 |
|
70.6 |
|
2.9 |
% |
2.9 |
% |
Mobile services |
|
|
|
|
|
|
|
|
|
|
|
Number of mobile accesses (1) |
|
21,693 |
|
21,873 |
|
21,873 |
|
(0.8) |
% |
(0.8) |
% |
o/w: Convergent customers mobile accesses |
|
10,191 |
|
9,990 |
|
9,990 |
|
2.0 |
% |
2.0 |
% |
Mobile-only accesses |
|
11,502 |
|
11,883 |
|
11,883 |
|
(3.2) |
% |
(3.2) |
% |
o/w: Contract customers mobile accesses |
|
20,667 |
|
20,279 |
|
20,279 |
|
1.9 |
% |
1.9 |
% |
Prepaid customers mobile accesses |
|
1,026 |
|
1,593 |
|
1,593 |
|
(35.6) |
% |
(35.6) |
% |
6-month mobile-only ARPO (in euros) (2) |
|
17.7 |
|
17.0 |
|
17.0 |
|
3.7 |
% |
3.7 |
% |
Fixed services |
|
|
|
|
|
|
|
|
|
|
|
Number of fixed accesses |
|
27,586 |
|
28,871 |
|
28,871 |
|
(4.4) |
% |
(4.4) |
% |
Fixed Retail accesses |
|
14,859 |
|
15,333 |
|
15,333 |
|
(3.1) |
% |
(3.1) |
% |
o/w: Fixed Broadband accesses |
|
12,370 |
|
12,332 |
|
12,332 |
|
0.3 |
% |
0.3 |
% |
o/w: Very high‑speed broadband fixed accesses |
|
7,706 |
|
6,537 |
|
6,537 |
|
17.9 |
% |
17.9 |
% |
o/w: Convergent customers fixed accesses |
|
5,962 |
|
5,909 |
|
5,909 |
|
0.9 |
% |
0.9 |
% |
Fixed-only accesses |
|
6,409 |
|
6,424 |
|
6,424 |
|
(0.2) |
% |
(0.2) |
% |
6-month fixed-only broadband ARPO (in euro) (2) |
|
36.3 |
|
36.1 |
|
36.1 |
|
0.6 |
% |
0.6 |
% |
o/w: Fixed Narrowband accesses |
|
2,488 |
|
3,001 |
|
3,001 |
|
(17.1) |
% |
(17.1) |
% |
o/w: PSTN accesses |
|
2,457 |
|
2,967 |
|
2,967 |
|
(17.2) |
% |
(17.2) |
% |
Other fixed accesses |
|
31 |
|
33 |
|
33 |
|
(7.4) |
% |
(7.4) |
% |
Fixed Wholesale accesses |
|
12,728 |
|
13,538 |
|
13,538 |
|
(6.0) |
% |
(6.0) |
% |
o/w: FTTH accesses |
|
6,656 |
|
5,788 |
|
5,788 |
|
15.0 |
% |
15.0 |
% |
Copper accesses |
|
6,072 |
|
7,750 |
|
7,750 |
|
(21.6) |
% |
(21.6) |
% |
(1) Excluding customers of Mobile Virtual Network Operators (MVNOs).
(2) See Section 1.6.4 Financial glossary.
1.3.2 Europe
Europe |
|
2023 |
|
2022 |
|
2022 |
|
% change |
|
% change |
|
(at June 30, in millions of euros) |
|
|
|
data on a |
|
|
|
data on a |
|
|
|
|
|
|
|
comparable |
|
data on a |
|
comparable |
|
data on a |
|
|
|
|
|
basis |
|
historical basis |
|
basis |
|
historical basis |
|
Revenue |
|
5,546 |
|
5,371 |
|
5,325 |
|
3.3 |
% |
4.1 |
% |
EBITDAaL |
|
1,430 |
|
1,335 |
|
1,323 |
|
7.1 |
% |
8.1 |
% |
EBITDAaL/Revenue |
|
25.8 |
% |
24.9 |
% |
24.8 |
% |
0.9 |
pt |
0.9 |
pt |
Operating income |
|
371 |
|
242 |
|
260 |
|
53.7 |
% |
43.0 |
% |
eCAPEX |
|
754 |
|
843 |
|
835 |
|
(10.7) |
% |
(9.7) |
% |
eCAPEX/Revenue |
|
13.6 |
% |
15.7 |
% |
15.7 |
% |
(2.1) |
pt |
(2.1) |
pt |
Telecommunication licenses (1) |
|
344 |
|
33 |
|
33 |
|
n/a |
|
n/a |
|
Average number of employees (2) |
|
26,963 |
|
27,822 |
|
27,822 |
|
(3.1) |
% |
(3.1) |
% |
(1) See Section 1.2.5.2 Telecommunication licenses.
(2) As of June 30, 2023, excluding the employees of VOO, acquired in June 2023 by Orange Belgium and currently being integrated (see Section 1.1.3 Significant events).
1.3.2.1 Revenues – Europe
Europe |
|
2023 |
|
2022 |
|
2022 |
|
% change |
|
% change |
|
(at June 30, in millions of euros) |
|
|
|
data on a |
|
|
|
data on a |
|
|
|
|
|
|
|
comparable |
|
data on a |
|
comparable |
|
data on a |
|
|
|
|
|
basis |
|
historical basis |
|
basis |
|
historical basis |
|
Revenue |
|
5,546 |
|
5,371 |
|
5,325 |
|
3.3 |
% |
4.1 |
% |
Retail services (B2C+B2B) |
|
3,791 |
|
3,648 |
|
3,642 |
|
3.9 |
% |
4.1 |
% |
Convergent services |
|
1,466 |
|
1,400 |
|
1,400 |
|
4.7 |
% |
4.7 |
% |
Mobile-only services |
|
1,449 |
|
1,414 |
|
1,414 |
|
2.5 |
% |
2.5 |
% |
Fixed-only services |
|
614 |
|
615 |
|
614 |
|
(0.0) |
% |
0.1 |
% |
IT & integration services |
|
262 |
|
219 |
|
214 |
|
19.2 |
% |
22.1 |
% |
Wholesale services |
|
814 |
|
875 |
|
877 |
|
(7.1) |
% |
(7.2) |
% |
Equipment sales |
|
822 |
|
720 |
|
719 |
|
14.3 |
% |
14.3 |
% |
Other revenues |
|
120 |
|
128 |
|
87 |
|
(6.2) |
% |
37.4 |
% |
|
16 |
Europe |
|
2023 |
|
2022 |
|
2022 |
|
% change |
|
% change |
|
(at June 30, in millions of euros) |
|
|
|
data on a |
|
|
|
data on a |
|
|
|
|
|
|
|
comparable |
|
data on a |
|
comparable |
|
data on a |
|
|
|
|
|
basis |
|
historical basis |
|
basis |
|
historical basis |
|
Revenue |
|
5,546 |
|
5,371 |
|
5,325 |
|
3.3 |
% |
4.1 |
% |
Spain |
|
2,321 |
|
2,265 |
|
2,265 |
|
2.5 |
% |
2.5 |
% |
Poland |
|
1,375 |
|
1,294 |
|
1,292 |
|
6.3 |
% |
6.4 |
% |
Belgium & Luxembourg |
|
740 |
|
719 |
|
677 |
|
2.9 |
% |
9.3 |
% |
Central Europe (1) |
|
1,117 |
|
1,101 |
|
1,099 |
|
1.4 |
% |
1.6 |
% |
Eliminations |
|
(8) |
|
(9) |
|
(9) |
|
— |
|
— |
|
(1) Central Europe: entities in Moldova, Romania and Slovakia.
Change on a historical basis
On a historical basis, the 221 million euro increase in revenues from European countries between the first half of 2022 and the first half of 2023 was due to:
| − | the favorable effect of changes in the scope of consolidation and other changes of 42 million euros, due to the acquisition of VOO by Orange Belgium on June 2, 2023 (see Section 1.1.3 Significant events); |
| − | the positive effect of foreign exchange fluctuations of 3 million euros; and |
| − | the organic change on a comparable basis, i.e. a 176 million euro increase in revenues. |
Change on a comparable basis
On a comparable basis, the increase of 176 million euros, i.e. 3.3%, in revenues from European countries between the first half of 2022 and the first half of 2023 was mainly due to:
| − | the increase in Equipment sales, mainly in Spain (see Section 1.3.2.6 Additional information – Spain) and Poland (linked to demand for higher-value handsets and growth in B2B equipment sales); |
| − | the increase in Convergent services, mainly in Belgium (up 14.9% year on year), Poland (up 8.1% year on year), Spain (up 1.6% year on year) and Slovakia (up 30.9% year on year), driven in particular by the rise in half-year convergent ARPO and mainly linked to the rate increases introduced in 2022 and the first half of 2023 (see Section 1.1.3 Significant events). In addition, the Group’s convergent customer base in Europe reached 5.7 million customers at June 30, 2023, up 0.7% year on year; |
| − | the growth of IT & Integration Services, mainly in Poland; and |
| − | the growth in Mobile-only services in all countries except Spain, mainly driven by growth in half-year mobile-only ARPO (linked in particular to rate increases, see Section 1.1.3 Significant events). The mobile-only access base decreased by 0.6% year on year, mainly due to the downward trend in prepaid offers and the ongoing migration of mobile-only customers to convergent offers; |
| − | partially offset by a decrease in Wholesale services in all countries, mainly due to regulatory cuts in call termination rates (mobile and fixed) and a decline in international transit (particularly in Spain). |
1.3.2.2 EBITDAaL – Europe
Change on a historical basis
On a historical basis, the 107 million euro increase in EBITDAaL in Europe between the first half of 2022 and the first half of 2023 was due to (i) the favorable effect of changes in scope of consolidation and other changes of 10 million euros due to the acquisition of VOO by Orange Belgium on June 2, 2023 (see Section 1.1.3 Significant events), (ii) the positive effect of foreign exchange fluctuations of 1 million euros, and (iii) the organic change on a comparable basis, i.e. a 95 million euro increase in EBITDAaL.
Change on a comparable basis
On a comparable basis, the 95 million euro increase in EBITDAaL from countries in Europe between the first half of 2022 and the first half of 2023 was mainly due to:
| − | (i) the 176 million euro increase in revenue, (ii) the decrease in service fees and inter-operator costs, due to lower interconnection costs (in relation to regulatory cuts in call termination rates and the decrease in international transit activity), (iii) the decrease in other operating expenses, particularly due to developments in various litigations between the two periods, and (iv) the decrease in operating taxes and levies payables; |
| − | partially offset by (i) the increase in commercial expenses, equipment and content costs, mainly due to the growth in equipment sales in Poland and Spain, (ii) the increase in other network expenses (network operating and maintenance expenses) and IT expenses, due to higher energy access costs for fixed and mobile networks in Other European countries (see Section 1.1.3 Significant events) and the increase in traffic, (iii) the increase in labor expenses, mainly due to the rise in salaries and wages between the two periods in a context of widespread inflation (see Section 1.1.3 Significant events), and (iv) the increase in interests on lease liabilities. |
1.3.2.3 Operating income – Europe
Change on a historical basis
On a historical basis, the 112 million euro increase in operating income from countries in Europe between the first half of 2022 and the first half of 2023 included (i) the negative effect of changes in the scope of consolidation and other changes of 18 million euros, and (ii) the organic change on a comparable basis, i.e. a 130 million euro increase in operating income.
|
17 |
Change on a comparable basis
On a comparable basis, the 130 million euro increase in operating income from countries in Europe between the first half of 2022 and the first half of 2023 was primarily due to (i) the 95 million euro increase in EBITDAaL and (ii) to a lesser extent, the decrease in depreciation and amortization of fixed assets, mainly in Spain (see Section 1.3.2.6 Additional information – Spain).
1.3.2.4 Economic CAPEX – Europe
Change on a historical basis
On a historical basis, the 81 million euro decrease in economic CAPEX from countries in Europe between the first half of 2022 and the first half of 2023 included (i) the positive effect of changes in the scope of consolidation and other changes of 9 million euros, and (ii) the organic change on a comparable basis, i.e. a 90 million euro decrease in economic CAPEX.
Change on a comparable basis
On a comparable basis, the decrease of 90 million euro in economic CAPEX from countries in Europe between the first half of 2022 and the first half of 2023 was mainly due to (i) lower investment in networks in Spain (see Section 1.3.2.6 Additional information – Spain), (ii) partially offset by higher investment in Other European countries, mainly in Belgium and Romania (IT investment on the one hand, and leased handsets, Liveboxes and equipment installed at customers’ premises on the other).
1.3.2.5 Additional information – Europe
Europe (1) |
|
2023 |
|
2022 |
|
2022 |
|
% change |
|
% change |
|
(at June 30, in thousands, at the end of the period) |
|
|
|
data on a |
|
|
|
data on a |
|
|
|
|
|
|
|
comparable |
|
data on a |
|
comparable |
|
data on a |
|
|
|
|
|
basis |
|
historical basis |
|
basis |
|
historical basis |
|
Convergent services |
|
|
|
|
|
|
|
|
|
|
|
Number of convergent customers |
|
5,681 |
|
5,643 |
|
5,643 |
|
0.7 |
% |
0.7 |
% |
Mobile services |
|
|
|
|
|
|
|
|
|
|
|
Number of mobile accesses (2) |
|
54,727 |
|
54,820 |
|
54,820 |
|
(0.2) |
% |
(0.2) |
% |
o/w: Convergent customers mobile accesses |
|
11,237 |
|
11,066 |
|
11,066 |
|
1.5 |
% |
1.5 |
% |
Mobile-only accesses |
|
43,490 |
|
43,753 |
|
43,753 |
|
(0.6) |
% |
(0.6) |
% |
o/w: Contract customers mobile accesses |
|
43,362 |
|
41,861 |
|
41,861 |
|
3.6 |
% |
3.6 |
% |
Prepaid customers mobile accesses |
|
11,365 |
|
12,959 |
|
12,959 |
|
(12.3) |
% |
(12.3) |
% |
Fixed services |
|
|
|
|
|
|
|
|
|
|
|
Number of fixed accesses |
|
12,070 |
|
12,527 |
|
12,527 |
|
(3.7) |
% |
(3.7) |
% |
Fixed Retail accesses |
|
10,711 |
|
11,220 |
|
11,220 |
|
(4.5) |
% |
(4.5) |
% |
o/w: Fixed Broadband accesses |
|
8,807 |
|
8,913 |
|
8,913 |
|
(1.2) |
% |
(1.2) |
% |
o/w: Very high-speed broadband fixed accesses |
|
6,297 |
|
5,924 |
|
5,924 |
|
6.3 |
% |
6.3 |
% |
o/w: Convergent customers fixed accesses |
|
5,681 |
|
5,643 |
|
5,643 |
|
0.7 |
% |
0.7 |
% |
Fixed-only accesses |
|
3,127 |
|
3,270 |
|
3,270 |
|
(4.4) |
% |
(4.4) |
% |
o/w: Fixed Narrowband accesses |
|
1,904 |
|
2,308 |
|
2,308 |
|
(17.5) |
% |
(17.5) |
% |
Fixed Wholesale accesses |
|
1,359 |
|
1,307 |
|
1,307 |
|
4.0 |
% |
4.0 |
% |
(1) As of June 30, 2023, excluding accesses of the telecommunication operator, VOO, acquired in June 2023 by Orange Belgium and currently being integrated (see Section 1.1.3 Significant events).
(2) Excluding customers of Mobile Virtual Network Operators (MVNOs).
|
18 |
1.3.2.6 Additional information – Spain
Spain |
|
2023 |
|
2022 |
|
2022 |
|
% change |
|
% change |
|
(at June 30, in millions of euros) |
|
|
|
data on a |
|
|
|
data on a |
|
|
|
|
|
|
|
comparable |
|
data on a |
|
comparable |
|
data on a |
|
|
|
|
|
basis |
|
historical basis |
|
basis |
|
historical basis |
|
Revenue |
|
2,321 |
|
2,265 |
|
2,265 |
|
2.5 |
% |
2.5 |
% |
EBITDAaL |
|
582 |
|
524 |
|
524 |
|
11.0 |
% |
11.0 |
% |
EBITDAaL/Revenue |
|
25.1 |
% |
23.1 |
% |
23.1 |
% |
1.9 |
pt |
1.9 |
pt |
Operating income |
|
81 |
|
(19) |
|
(19) |
|
n/a |
|
n/a |
|
eCAPEX |
|
347 |
|
465 |
|
465 |
|
(25.5) |
% |
(25.5) |
% |
eCAPEX/Revenue |
|
14.9 |
% |
20.5 |
% |
20.5 |
% |
(5.6) |
pt |
(5.6) |
pt |
Telecommunication licenses (1) |
|
31 |
|
6 |
|
6 |
|
385.5 |
% |
385.5 |
% |
Average number of employees |
|
6,079 |
|
6,169 |
|
6,169 |
|
(1.5) |
% |
(1.5) |
% |
(1) See Section 1.2.5.2 Telecommunication licenses.
Revenues – Spain
Spain |
|
2023 |
|
2022 |
|
2022 |
|
% change |
|
% change |
|
(at June 30, in millions of euros) |
|
|
|
data on a |
|
data on a |
|
data on a |
|
data on a |
|
|
|
|
|
comparable |
|
historical basis |
|
comparable |
|
historical basis |
|
|
|
|
|
basis |
|
|
|
basis |
|
|
|
Revenue |
|
2,321 |
|
2,265 |
|
2,265 |
|
2.5 |
% |
2.5 |
% |
Retail services (B2C+B2B) |
|
1,589 |
|
1,565 |
|
1,565 |
|
1.5 |
% |
1.5 |
% |
Convergent services |
|
946 |
|
931 |
|
931 |
|
1.6 |
% |
1.6 |
% |
Mobile-only services |
|
389 |
|
399 |
|
399 |
|
(2.4) |
% |
(2.4) |
% |
Fixed-only services |
|
231 |
|
217 |
|
217 |
|
6.3 |
% |
6.3 |
% |
IT & integration services |
|
23 |
|
18 |
|
18 |
|
29.5 |
% |
29.5 |
% |
Wholesale services |
|
384 |
|
406 |
|
406 |
|
(5.4) |
% |
(5.4) |
% |
Equipment sales |
|
347 |
|
293 |
|
293 |
|
18.2 |
% |
18.2 |
% |
Other revenues |
|
1 |
|
— |
|
— |
|
141.8 |
% |
141.8 |
% |
Change on a historical basis and on a comparable basis
On a historical basis and a comparable basis, the increase of 56 million euros, i.e. 2.5%, in revenues in Spain between the two periods was mainly due to:
| − | growth in Equipment sales, due in particular to strong demand for renewals and higher-value mobile handsets; |
| − | growth in Convergent services revenue, mainly driven by growth in half-year convergent ARPO (up 4.2% year on year), due in particular to the overhaul of convergent offers in August 2022 and a moderate marketing policy, offsetting the erosion of the customer base (down 2.5% year on year); and |
| − | the increase in Fixed-only services, driven by both (i) the increase in fixed-only broadband services, due to the 3.4% year-on-year growth in the fixed-only broadband access base and the 3.2% increase in half-year fixed-only broadband ARPO, and (ii) the growth in IT & Integration Services; |
| − | partially offset by (i) the decline in Wholesale services, mainly due to the cut in call termination rates and the decline in international transit, and (ii) the decline in Mobile-only services, mainly due to the market’s continued migration towards low-cost services and convergent offers, resulting in half-year mobile-only ARPO remaining stable year on year. |
EBITDAaL – Spain
Change on a historical basis and on a comparable basis
On a historical basis and a comparable basis, the 58 million euro growth in EBITDAaL in Spain between the first half of 2022 and the first half of 2023 was due to:
| − | (i) the 56 million euro increase in revenue, (ii) the decrease in service fees and inter-operator costs, mainly due to the cut in call termination rates and the decrease in international transit, and (iii) the decrease in operating taxes and levies payables; |
| − | partially offset by an increase in commercial expenses and equipment costs, in line with the growth in equipment sales. |
Operating income – Spain
Change on a historical basis and on a comparable basis
On a historical basis and a comparable basis, the 100 million euro increase in operating income in Spain between the first half of 2022 and the first half of 2023 was mainly due to (i) the 58 million euro increase in EBITDAaL, and (ii) the decrease in the depreciation and amortization of fixed assets, mainly due to the counter-effect of the end of the amortization of Jazztel’s subscriber base assets in the first half of 2022.
|
19 |
Economic CAPEX – Spain
Change on a historical basis and on a comparable basis
On a historical basis and a comparable basis, the 119 million euro decrease in economic CAPEX in Spain between the first half of 2022 and the first half of 2023 was mainly due to the decrease in investments in networks, resulting mainly from (i) lower capital expenditure on very high-speed broadband mobile networks (4G/5G) and capacity investments, following the material investments made in recent years, and (ii) to a lesser extent, the decrease in investments in very high-speed fixed broadband networks (FTTH).
1.3.3 Africa & Middle East
Africa & Middle East |
|
2023 |
|
2022 |
|
2022 |
|
% change |
|
% change |
|
(at June 30, in millions of euros) |
|
|
|
data on a |
|
|
|
data on a |
|
|
|
|
|
|
|
comparable |
|
data on a |
|
comparable |
|
data on a |
|
|
|
|
|
basis |
|
historical basis |
|
basis |
|
historical basis |
|
Revenue |
|
3,472 |
|
3,141 |
|
3,381 |
|
10.5 |
% |
2.7 |
% |
EBITDAaL |
|
1,260 |
|
1,125 |
|
1,214 |
|
12.0 |
% |
3.8 |
% |
EBITDAaL / Revenue |
|
36.3 |
% |
35.8 |
% |
35.9 |
% |
0.5 |
pt |
0.4 |
pt |
Operating income |
|
742 |
|
694 |
|
739 |
|
6.9 |
% |
0.3 |
% |
eCAPEX |
|
648 |
|
554 |
|
609 |
|
17.1 |
% |
6.4 |
% |
eCAPEX / Revenue |
|
18.7 |
% |
17.6 |
% |
18.0 |
% |
1.0 |
pt |
0.6 |
pt |
Telecommunication licenses (1) |
|
38 |
|
121 |
|
203 |
|
(68.2) |
% |
(81.1) |
% |
Average number of employees |
|
14,598 |
|
14,380 |
|
14,380 |
|
1.5 |
% |
1.5 |
% |
(1) See Section 1.2.5.2 Telecommunication licenses.
The Africa & Middle East countries continue to suffer political or economic instability and sometimes tax or regulatory pressures that could affect the business and results of Group subsidiaries and shareholdings, and may continue to affect them in the future. In some cases, these situations may result in the Group recognizing asset impairment (see Note 7 to the Interim Consolidated Financial Statements). For further information on the risk factors, see ”Item 3.D Risk factors of the 2022 Form 20-F.
1.3.3.1 Revenues – Africa & Middle East
Africa & Middle East |
|
2023 |
|
2022 |
|
2022 |
|
% change |
|
% change |
|
(at June 30, in millions of euros) |
|
|
|
data on a |
|
|
|
data on a |
|
|
|
|
|
|
|
comparable |
|
data on a |
|
comparable |
|
data on a |
|
|
|
|
|
basis |
|
historical basis |
|
basis |
|
historical basis |
|
Revenue |
|
3,472 |
|
3,141 |
|
3,381 |
|
10.5 |
% |
2.7 |
% |
Retail services (B2C+B2B) |
|
3,083 |
|
2,795 |
|
2,984 |
|
10.3 |
% |
3.3 |
% |
Mobile-only services |
|
2,652 |
|
2,413 |
|
2,578 |
|
9.9 |
% |
2.8 |
% |
Fixed-only services |
|
411 |
|
362 |
|
384 |
|
13.4 |
% |
6.9 |
% |
IT & integration services |
|
21 |
|
19 |
|
21 |
|
5.9 |
% |
(1.6) |
% |
Wholesale services |
|
324 |
|
284 |
|
324 |
|
14.3 |
% |
0.1 |
% |
Equipment sales |
|
43 |
|
48 |
|
55 |
|
(9.0) |
% |
(21.2) |
% |
Other revenues |
|
21 |
|
15 |
|
18 |
|
38.5 |
% |
15.8 |
% |
Africa & Middle East |
|
2023 |
|
2022 |
|
2022 |
|
% change |
|
% change |
|
(at June 30, in millions of euros) |
|
|
|
data on a |
|
data on a |
|
data on a |
|
data on a |
|
|
|
|
|
comparable |
|
historical basis |
|
comparable |
|
historical basis |
|
|
|
|
|
basis |
|
|
|
basis |
|
|
|
Revenue |
|
3,472 |
|
3,141 |
|
3,381 |
|
10.5 |
% |
2.7 |
% |
Sonatel sub-group (1) |
|
1,210 |
|
1,079 |
|
1,087 |
|
12.2 |
% |
11.3 |
% |
Côte d’Ivoire sub-group (2) |
|
760 |
|
732 |
|
732 |
|
3.8 |
% |
3.9 |
% |
Egypt |
|
368 |
|
288 |
|
503 |
|
27.7 |
% |
(26.8) |
% |
Morocco |
|
352 |
|
326 |
|
338 |
|
8.0 |
% |
4.0 |
% |
Jordan |
|
227 |
|
223 |
|
221 |
|
1.8 |
% |
2.9 |
% |
Cameroon |
|
227 |
|
205 |
|
205 |
|
10.9 |
% |
10.9 |
% |
Congo (DRC) |
|
215 |
|
193 |
|
191 |
|
11.3 |
% |
12.7 |
% |
Other countries (3) |
|
146 |
|
129 |
|
138 |
|
13.2 |
% |
5.7 |
% |
Eliminations |
|
(35) |
|
(35) |
|
(35) |
|
— |
|
— |
|
(1) Sonatel sub-group: entities in Senegal, Mali, Guinea, Guinea-Bissau and Sierra Leone.
(2) Côte d’Ivoire sub-group: entities in Côte d’Ivoire, Burkina Faso and Liberia.
(3) Other countries: mainly entities in Botswana, Central African Republic (CAR) and Madagascar.
Change on a historical basis
On a historical basis, the 91 million euro increase in revenues in the Africa & Middle East countries between the first half of 2022 and the first half of 2023 included (i) the negative effect of foreign exchange fluctuations of 239 million euros, mainly as a result of changes in the Egyptian pound against the euro of 210 million euros, and (ii) the organic change on a comparable basis, i.e. a 330 million euro increase in revenues.
Change on a comparable basis
On a comparable basis, the increase of 330 million euros, i.e. 10.5%, in revenues from the Africa & Middle East countries between the first half of 2022 and the first half of 2023 was primarily due to:
|
20 |
| − | the increase in Mobile-only services, driven by (i) the increase in data services, which rose 17.9% year on year, driven in particular by the momentum in the 4G customer base, which grew 15.9% year on year to 56.7 million customers at June 30, 2023, and (ii) the year-on-year growth of 23.1% in the revenues of Orange Money, mainly due to 26.0% growth in the active customer base. Furthermore, the mobile access base continues to grow and posted an increase of 5.0% year on year; |
| − | the growth of Fixed-only services, driven by the development of fixed-only broadband services, which increased 17.4% year on year. The fixed-only broadband access base totaled 3.1 million customers at June 30, 2023, up 21.9% year on year; and |
| − | the increase in Wholesale services, largely due to the introduction of a national roaming agreement in Egypt. |
1.3.3.2 EBITDAaL – Africa & Middle East
Change on a historical basis
On a historical basis, the 46 million euro increase in EBITDAaL in the Africa & Middle East countries between the first half of 2022 and the first half of 2023 included (i) the negative effect of foreign exchange fluctuations of 89 million euros, mainly as a result of changes in the Egyptian pound against the euro, and (ii) the organic change on a comparable basis, i.e. a 135 million euro increase in EBITDAaL.
Change on a comparable basis
On a comparable basis, the 135 million euro increase in EBITDAaL in the Africa & Middle East countries between the first half of 2022 and the first half of 2023 was mainly due to revenue growth of 330 million euros, partially offset by:
| − | higher operating taxes and levies payables as a result of business growth; |
| − | the rise in other network expenses (network operating and maintenance expenses) and IT expenses as a result of traffic growth, ongoing network roll-outs in all countries and higher energy access costs for fixed and mobile networks (see Section 1.1.3 Significant events); |
| − | higher commercial expenses, equipment and content costs, primarily related to (i) higher SIM card costs in several countries, (ii) the signature of a distribution agreement in Egypt, and (iii) higher commissions as part of the expansion of Orange Money; |
| − | higher labor expenses, mainly wages and employee benefit expenses, in almost all countries in the region; |
| − | the increase in other external purchases, primarily overheads and lease property restructuring expenses; and |
− |
higher service fees and inter-operator costs, in line with revenue growth in wholesale services and mostly related to the introduction of a national roaming agreement in Egypt. |
1.3.3.3 Operating income – Africa & Middle East
Change on a historical basis
On a historical basis, the 2 million euro increase in operating income in the Africa & Middle East countries between the first half of 2022 and the first half of 2023 included (i) the negative effect of foreign exchange fluctuations of 45 million euros, mainly as a result of changes in the Egyptian pound against the euro, and (ii) the organic change on a comparable basis, i.e. a 48 million euro increase in operating income.
Change on a comparable basis
On a comparable basis, the 48 million euro increase in operating income in the Africa & Middle East countries between the first half of 2022 and the first half of 2023 was primarily due to the 135 million euro increase in EBITDAaL, partially offset by (i) the increase in depreciation and amortization of fixed assets, essentially in Côte d’Ivoire and Congo (DRC), in line with the material investments made in recent years, and (ii) the recognition in the first half of 2023 of a net expense on significant litigations of 38 million euros.
1.3.3.4 Economic CAPEX – Africa & Middle East
Change on a historical basis
On a historical basis, the 39 million euro increase in economic CAPEX in the Africa & Middle East countries between the first half of 2022 and the first half of 2023 included (i) the negative effect of foreign exchange fluctuations of 56 million euros, mainly as a result of changes in the Egyptian pound against the euro, and (ii) the organic change on a comparable basis, i.e. a 95 million euro increase in economic CAPEX.
Change on a comparable basis
On a comparable basis, the 95 million euro increase in economic CAPEX in the Africa & Middle East countries between the first half of 2022 and the first half of 2023 was mainly due to increased investments in networks in the region in order to support business growth (capacity investments) and usage trends.
|
21 |
1.3.3.5 Additional information – Africa & Middle East
Africa & Middle East |
|
2023 |
|
2022 |
|
2022 |
|
% change |
|
% change |
|
(at June 30, in thousands, at the end of the period) |
|
|
|
data on a |
|
|
|
data on a |
|
|
|
|
|
|
|
comparable |
|
data on a |
|
comparable |
|
data on a |
|
|
|
|
|
basis |
|
historical basis |
|
basis |
|
historical basis |
|
Mobile services |
|
|
|
|
|
|
|
|
|
|
|
Number of mobile accesses (1) |
|
146,172 |
|
139,212 |
|
139,212 |
|
5.0 |
% |
5.0 |
% |
o/w: Contract customers mobile accesses |
|
9,822 |
|
8,156 |
|
8,156 |
|
20.4 |
% |
20.4 |
% |
Prepaid customers mobile accesses |
|
136,350 |
|
131,055 |
|
131,055 |
|
4.0 |
% |
4.0 |
% |
Fixed services |
|
|
|
|
|
|
|
|
|
|
|
Number of fixed accesses |
|
3,889 |
|
3,319 |
|
3,319 |
|
17.2 |
% |
17.2 |
% |
Fixed Retail accesses |
|
3,889 |
|
3,319 |
|
3,319 |
|
17.2 |
% |
17.2 |
% |
o/w: Fixed Broadband accesses |
|
3,060 |
|
2,509 |
|
2,509 |
|
21.9 |
% |
21.9 |
% |
Fixed Narrowband accesses |
|
830 |
|
810 |
|
810 |
|
2.4 |
% |
2.4 |
% |
(1) Excluding customers of Mobile Virtual Network Operators (MVNOs).
1.3.4 Enterprise
Enterprise |
|
2023 |
|
2022 |
|
2022 |
|
% change |
|
% change |
|
(at June 30, in millions of euros) |
|
|
|
data on a |
|
|
|
data on a |
|
|
|
|
|
|
|
comparable |
|
data on a |
|
comparable |
|
data on a |
|
|
|
|
|
basis |
|
historical basis |
|
basis |
|
historical basis |
|
Revenue |
|
3,944 |
|
3,911 |
|
3,888 |
|
0.8 |
% |
1.4 |
% |
EBITDAaL |
|
311 |
|
373 |
|
364 |
|
(16.7) |
% |
(14.7) |
% |
EBITDAaL / Revenue |
|
7.9 |
% |
9.5 |
% |
9.4 |
% |
(1.7) |
pt |
(1.5) |
pt |
Operating income |
|
118 |
|
162 |
|
152 |
|
(27.3) |
% |
(22.4) |
% |
eCAPEX |
|
140 |
|
143 |
|
144 |
|
(1.7) |
% |
(2.4) |
% |
eCAPEX / Revenue |
|
3.6 |
% |
3.6 |
% |
3.7 |
% |
(0.1) |
pt |
(0.1) |
pt |
Average number of employees |
|
29,313 |
|
28,525 |
|
28,681 |
|
2.8 |
% |
2.2 |
% |
Lead the Future is an ambitious strategic plan to transform and simplify Orange Business, whose market is undergoing profound changes, towards a Digital Services Company model (DSC, see Section 1.1.3 Significant events).
1.3.4.1 Revenues – Enterprise
Enterprise |
|
2023 |
|
2022 |
|
2022 |
|
% change |
|
% change |
|
(at June 30, in millions of euros) |
|
|
|
data on a |
|
|
|
data on a |
|
|
|
|
|
|
|
comparable |
|
data on a |
|
comparable |
|
data on a |
|
|
|
|
|
basis |
|
historical basis |
|
basis |
|
historical basis |
|
Revenue |
|
3,944 |
|
3,911 |
|
3,888 |
|
0.8 |
% |
1.4 |
% |
Fixed-only services |
|
1,641 |
|
1,748 |
|
1,738 |
|
(6.2) |
% |
(5.6) |
% |
Voice services (1) |
|
464 |
|
516 |
|
514 |
|
(10.2) |
% |
(9.7) |
% |
Data services (2) |
|
1,177 |
|
1,232 |
|
1,224 |
|
(4.5) |
% |
(3.9) |
% |
IT & integration services |
|
1,794 |
|
1,676 |
|
1,663 |
|
7.1 |
% |
7.9 |
% |
Services and mobile equipment (3) |
|
509 |
|
487 |
|
487 |
|
4.4 |
% |
4.5 |
% |
Mobile-only services |
|
348 |
|
326 |
|
325 |
|
7.0 |
% |
7.0 |
% |
Wholesale services |
|
20 |
|
20 |
|
20 |
|
0.4 |
% |
0.4 |
% |
Equipment sales |
|
140 |
|
141 |
|
141 |
|
(0.9) |
% |
(0.9) |
% |
(1) Voice services include (i) legacy voice offers (PSTN access), (ii) Voice over Internet Protocol (VoIP) products, (iii) audio-conference services, (iv) incoming traffic for call centers, and (v) network equipment sales related to the operation of voice services.
(2) Data services include (i) legacy data solutions still offered by Orange Business Services (Frame Relay, Transrel, leased lines, narrowband), (ii) services having reached a certain maturity, such as IP-VPN, and broadband infrastructure products such as satellite and fiber optic access, (iii) satellite TV broadcast services, (iv) Business Everywhere roaming offers, and (v) network equipment sales related to the operation of data services.
(3) Mobile services and equipment include (i) mobile-only services, (ii) wholesale services corresponding to incoming mobile B2B traffic invoiced to other carriers, and (iii) mobile equipment sales.
Change on a historical basis
On a historical basis, the 56 million euro increase in Enterprise revenues between the first half of 2022 and the first half of 2023 was due to:
| − | the positive effect of changes in the scope of consolidation and other changes of 20 million euros related to the acquisition of SCRT and Telsys by Orange Cyberdefense on November 8, 2022; |
| − | the favorable effect of foreign exchange fluctuations, i.e. 3 million euros; and |
| − | the organic change on a comparable basis, i.e. a 33 million euro increase in revenues. |
Change on a comparable basis
On a comparable basis, the increase of 33 million euros, i.e. 0.8%, in Enterprise revenues between the first half of 2022 and the first half of 2023 was primarily due to:
| − | growth in IT & Integration Services, driven by the growing requirements of businesses in the field of cybersecurity services, reflected in revenues of 533 million euros for Orange Cyberdefense in the first half of 2023 (up 11.4% year on year), and integration services (up 9.5% year on year), including unified communication and collaboration services; and |
| − | growth in Mobile services and equipment, largely as a result of the increase in the customer base and the development of new mobile services such as private mobile networks (PMRs, Professional Mobile Radio); |
|
22 |
| − | partially offset by the decline in Fixed-only services, impacted by both (i) the decrease in Data services revenues, due to the general trend toward the transformation of data service technologies, and (ii) the decline in Voice services, which continued to be affected by the downward trend in traditional fixed telephony, primarily in France. |
1.3.4.2 EBITDAaL – Enterprise
Change on a historical basis
On a historical basis, the 54 million euro decrease in Enterprise EBITDAaL between the first half of 2022 and the first half of 2023 included (i) the favorable effect of foreign exchange fluctuations of 5 million euros, (ii) the positive effect of changes in the scope of consolidation and other changes of 4 million euros, and (iii) the organic change on a comparable basis, i.e. a 62 million euro decrease in EBITDAaL.
Change on a comparable basis
On a comparable basis, the 62 million euro decrease in Enterprise EBITDAaL between the first half of 2022 and the first half of 2023 was mainly due to:
| − | the increase in commercial expenses and equipment costs in connection with the growth in sales of equipment for unified communication and collaboration services; |
| − | higher IT costs related for the most part to increased cybersecurity services; |
| − | the rise in labor expenses, mainly due to the growth in the average number of employees (full-time equivalent) related to the development of IT & Integration Services and information technologies as part of the transformation of Orange Business into a Digital Services Company model (DSC, see Section 1.1.3 Significant events); and |
| − | the increase in other external purchases, primarily because of higher network construction costs for resale to third parties, in line with the development of integration services and information technologies; |
− |
partially offset by (i) the reduction in other operating expenses, (ii) the 33 million euro increase in revenues, and (iii) the reduction in service fees and inter-operator costs, mainly due to the decline in voice traffic. |
1.3.4.3 Operating income – Enterprise
Change on a historical basis
On a historical basis,the decrease of 34 million euros in Enterprise operating income between the first half of 2022 and the first half of 2023 included (i) the positive effect of foreign exchange fluctuations of 6 million euros, (ii) the positive effect of changes in the scope of consolidation and other changes of 4 million euros, and (iii) the organic change on a comparable basis, i.e. a 44 million euro decrease in operating income.
Change on a comparable basis
On a comparable basis, the 44 million euro decrease in Enterprise operating income between the first half of 2022 and the first half of 2023 was mainly due to:
| − | the 62 million euro decrease in EBITDAaL; and |
| − | the 25 million euro increase in specific labor expenses. This increase mainly related to the French part-time for seniors plans and was mainly due to the recognition, in the first half of 2023, of an additional provision for the pension reform enacted in April 2023 in France (see Note 6 to the Interim Consolidated Financial Statements); |
| − | partially offset by the decline in depreciation and amortization of fixed assets and higher gains on disposals of fixed assets. |
1.3.4.4 Economic CAPEX – Enterprise
Change on a historical basis
On a historical basis, the 4 million euro decrease in Enterprise economic CAPEX between the first half of 2022 and the first half of 2023 included (i) the negative effect of foreign exchange fluctuations of 1 million euros, and (ii) the organic change on a comparable basis, i.e. a 2 million euro decrease in economic CAPEX.
Change on a comparable basis
On a comparable basis, the 2 million euro decrease in Enterprise economic CAPEX between the first half of 2022 and the first half of 2023 was mainly due to an increase in disposals of fixed assets following the sale of a building in the United States by Globecast.
|
23 |
1.3.4.5 Additional information – Enterprise
Entreprise |
|
2023 |
|
2022 |
|
2022 |
|
% change |
|
% change |
|
(at June 30, in thousands, at the end of the period) |
|
|
|
data on a |
|
|
|
data on a |
|
|
|
|
|
|
|
comparable |
|
data on a |
|
comparable |
|
data on a |
|
|
|
|
|
basis |
|
historical basis |
|
basis |
|
historical basis |
|
Mobile services |
|
|
|
|
|
|
|
|
|
|
|
Number of mobile accesses in France (1) |
|
23,583 |
|
19,842 |
|
19,842 |
|
18.9 |
% |
18.9 |
% |
Fixed services |
|
|
|
|
|
|
|
|
|
|
|
Number of fixed accesses in France |
|
1,068 |
|
1,199 |
|
1,199 |
|
(11.0) |
% |
(11.0) |
% |
Fixed Retail accesses |
|
1,068 |
|
1,199 |
|
1,199 |
|
(11.0) |
% |
(11.0) |
% |
o/w: Fixed Broadband accesses |
|
238 |
|
248 |
|
248 |
|
(4.0) |
% |
(4.0) |
% |
Fixed Narrowband accesses |
|
830 |
|
951 |
|
951 |
|
(12.8) |
% |
(12.8) |
% |
IP‑VPN accesses worldwide (2) |
|
337 |
|
348 |
|
348 |
|
(3.1) |
% |
(3.1) |
% |
o/w: IP‑VPN accesses in France (2) |
|
294 |
|
300 |
|
300 |
|
(2.1) |
% |
(2.1) |
% |
(1) Contract customers. Excluding customers of Mobile Virtual Network Operators (MVNOs).
(2) Accesses of customers outside the Orange group, excluding the carrier market.
1.3.5 Totem
Totem |
|
2023 |
|
2022 |
|
2022 |
|
% change |
|
% change |
|
(at June 30, in millions of euros) |
|
|
|
data on a |
|
|
|
data on a |
|
|
|
|
|
|
|
comparable |
|
data on a |
|
comparable |
|
data on a |
|
|
|
|
|
basis |
|
historical basis |
|
basis |
|
historical basis |
|
Revenue |
|
342 |
|
328 |
|
328 |
|
4.3 |
% |
4.3 |
% |
EBITDAaL |
|
183 |
|
180 |
|
180 |
|
1.6 |
% |
1.6 |
% |
EBITDAaL/Revenue |
|
53.4 |
% |
54.8 |
% |
54.8 |
% |
(1.4) |
pt |
(1.4) |
pt |
Operating income |
|
127 |
|
120 |
|
120 |
|
6.0 |
% |
6.0 |
% |
eCAPEX |
|
65 |
|
44 |
|
44 |
|
47.8 |
% |
47.8 |
% |
eCAPEX/Revenue |
|
19.0 |
% |
13.4 |
% |
13.4 |
% |
5.6 |
pt |
5.6 |
pt |
Average number of employees |
|
189 |
|
152 |
|
152 |
|
24.4 |
% |
24.4 |
% |
1.3.5.1 Revenues –Totem
Totem |
|
2023 |
|
2022 |
|
2022 |
|
% change |
|
% change |
|
(at June 30, in millions of euros) |
|
|
|
data on a |
|
|
|
data on a |
|
|
|
|
|
|
|
comparable |
|
data on a |
|
comparable |
|
data on a |
|
|
|
|
|
basis |
|
historical basis |
|
basis |
|
historical basis |
|
Revenue |
|
342 |
|
328 |
|
328 |
|
4.3 |
% |
4.3 |
% |
Wholesale services |
|
342 |
|
328 |
|
328 |
|
4.3 |
% |
4.3 |
% |
Other revenues |
|
— |
|
— |
|
— |
|
— |
|
— |
|
Change on a historical basis and on a comparable basis
On a historical and comparable basis, the increase of 14 million euros, i.e. 4.3%, in Totem revenues between the first half of 2022 and the first half of 2023 was primarily due to:
| − | the increase in studies and site redevelopment work in France; and |
| − | the 4.1% year-on-year rise in hosting revenues. In the first half of 2023, 16.4% of hosting revenues were generated from external customers, up 0.3 percentage points compared with the first half of 2022. |
At June 30, 2023, Totem had almost 27,200 sites with approximately 37,500 active occupants, i.e. an occupancy rate of 1.38 occupants per site.
1.3.5.2 EBITDAaL –Totem
Change on a historical basis and on a comparable basis
On a historical and comparable basis, the 3 million euro increase in Totem EBITDAaL between the first half of 2022 and the first half of 2023 was mainly due to the 14 million euro increase in revenues, partially offset by:
| − | the increase in the depreciation and amortization of right-of-use assets, interests on lease liabilities and lease property restructuring expenses (in other external purchases) resulting from higher lease rental costs in this inflationary environment (see Section 1.1.3 Significant events) and the higher number of leased sites to support growth in the hosting business; and |
| − | to a lesser extent, higher labor expenses, mainly as a result of business growth and the gradual ramp-up of the company established at the end of 2021. |
1.3.5.3 Operating income –Totem
Change on a historical basis and on a comparable basis
On a historical and comparable basis, the 7 million euro increase in Totem’s operating income between the first half of 2022 and the first half of 2023 was due to the 3 million euro increase in EBITDAaL.
|
24 |
1.3.5.4 Economic CAPEX –Totem
Change on a historical basis and on a comparable basis
On a historical and comparable basis, the 21 million euro increase in Totem’s economic CAPEX between the first half of 2022 and the second half of 2023 was primarily due to the significant increase in studies and works, the development of the construction of new mobile sites and the increase in roll-outs (especially 5G).
1.3.6 International Carriers & Shared Services
International Carriers & Shared Services |
|
2023 |
|
2022 |
|
2022 |
|
% change |
|
% change |
|
(at June 30, in millions of euros) |
|
|
|
data on a |
|
|
|
data on a |
|
|
|
|
|
|
|
comparable |
|
data on a |
|
comparable |
|
data on a |
|
|
|
|
|
basis |
|
historical basis |
|
basis |
|
historical basis |
|
Revenue |
|
763 |
|
771 |
|
772 |
|
(1.0) |
% |
(1.1) |
% |
EBITDAaL |
|
(86) |
|
(122) |
|
(128) |
|
29.8 |
% |
32.9 |
% |
EBITDAaL / Revenue |
|
(11.2) |
% |
(15.8) |
% |
(16.5) |
% |
4.6 |
pt |
5.3 |
pt |
Operating income |
|
(329) |
|
(197) |
|
(207) |
|
(67.4) |
% |
(58.8) |
% |
eCAPEX |
|
97 |
|
94 |
|
94 |
|
3.0 |
% |
2.9 |
% |
eCAPEX / Revenue |
|
12.7 |
% |
12.2 |
% |
12.2 |
% |
0.5 |
pt |
0.5 |
pt |
Average number of employees |
|
11,879 |
|
12,322 |
|
12,155 |
|
(3.6) |
% |
(2.3) |
% |
1.3.6.1 Revenues – International Carriers & Shared Services
International Carriers & Shared Services |
|
2023 |
|
2022 |
|
2022 |
|
% change |
|
% change |
|
(at June 30, in millions of euros) |
|
|
|
data on a |
|
|
|
data on a |
|
|
|
|
|
|
|
comparable |
|
data on a |
|
comparable |
|
data on a |
|
|
|
|
|
basis |
|
historical basis |
|
basis |
|
historical basis |
|
Revenue |
|
763 |
|
771 |
|
772 |
|
(1.0) |
% |
(1.1) |
% |
Wholesale services |
|
516 |
|
538 |
|
539 |
|
(4.0) |
% |
(4.1) |
% |
Other revenues |
|
247 |
|
233 |
|
234 |
|
6.1 |
% |
5.7 |
% |
Change on a historical basis
On a historical basis, the 9 million euro decrease in International Carriers & Shared Services revenues between the first half of 2022 and the first half of 2023 was due to (i) the adverse effect of changes in the scope of consolidation and other changes of 1 million euros, (ii) the negative effect of foreign exchange fluctuations of 1 million euros, and (iii) the organic change on a comparable basis, i.e. a 7 million euro decrease in revenues.
Change on a comparable basis
On a comparable basis, the decrease of 7 million euros, i.e. 1.0%, in International Carriers & Shared Services revenues between the first half of 2022 and the first half of 2023 was due to:
| − | the 22 million euro decrease in Wholesale services related to (i) the downward trend in voice traffic and the refocusing of services toward higher-value activities, (ii) partially offset by the sale of rights of use for the Arimao submarine cable linking Cuba to Martinique and by the increase in mobile data services (resulting from market growth and increased travel); |
− |
partially offset by the 14 million euro increase in Other revenues. That increase was due to (i) higher Sofrecom revenues, and (ii) higher Orange Marine revenues, firstly due to the increase in studies and cable-laying, and secondly due to the sale of a submarine robot, (iii) partially offset by the decline in revenues from content business (OCS and Orange Studio, currently being disposed of, see Section 1.1.3 Significant events). |
1.3.6.2 EBITDAaL – International Carriers & Shared Services
Change on a historical basis
On a historical basis,the 42 million euro improvement in International Carriers & Shared Services EBITDAaL between the first half of 2022 and the first half of 2023 was due to (i) the favorable effect of foreign exchange fluctuations of 6 million euros and (ii) the organic change on a comparable basis, i.e. a 36 million euro increase in EBITDAaL.
Change on a comparable basis
On a comparable basis, the 36 million euro improvement in International Carriers & Shared Services EBITDAaL between the first half of 2022 and the first half of 2023 was primarily due to:
| − | the sharp decline in interconnection fees in line with lower wholesale services revenues and relating for the most part to the drop in voice traffic; |
| − | the decrease in the depreciation and amortization of right-of-use assets, chiefly related to the termination of leases on tertiary buildings (offices and stores) and technical sites; and |
| − | lower labor expenses, in line with the reduction in the number of employees (full-time equivalent) between the two periods, particularly for shared services; |
− |
partially offset by (i) higher selling expenses and equipment costs due to production transferred from inventory following the sale of rights of use for the Arimao submarine cable linking Cuba to Martinique, (ii) higher IT expenses, primarily as a result of increased outsourcing, and (iii) the increase in other external purchases, mainly due to higher lease property restructuring expenses in this inflationary environment (see Section 1.1.3 Significant events). |
|
25 |
1.3.6.3 Operating income – International Carriers & Shared Services
Change on a historical basis
On a historical basis, the 122 million euro decline in International Carriers & Shared Services operating income between the first half of 2022 and the first half of 2023 included (i) the favorable effect of foreign exchange fluctuations of 6 million euros, (ii) the positive effect of changes in the scope of consolidation and other changes of 5 million euros, and (iii) the organic change on a comparable basis, i.e. a 132 million euro decrease in operating income.
Change on a comparable basis
On a comparable basis, the 132 million euro decline in International Carriers & Shared Services operating income between the first half of 2022 and the first half of 2023 was primarily due to:
| − | the 127 million euro increase in specific labor expenses. This increase was mainly related to the French part-time for seniors plans and the recognition of (i) an additional provision in the first half of 2023 to take into account pension reforms enacted in France in April 2023, and (ii) an actuarial gain of 84 million euros in the first half of 2022 related to the sharp rise in the discount rate curve in the 2022 macroeconomic context (see Note 6 to the Interim Consolidated Financial Statements); and |
| − | the recognition of a 52 million euro expense for restructuring programs costs, primarily for the optimization of real estate assets in France; |
| − | partially offset by the 36 million euro increase in EBITDAaL. |
1.3.6.4 Economic CAPEX – International Carriers & Shared Services
Change on a historical basis
On a historical basis, the 3 million euro increase in International Carriers & Shared Services economic CAPEX between the first half of 2022 and the first half of 2023 was largely due to the organic change on a comparable basis, i.e. a 3 million euro increase in economic CAPEX.
Change on a comparable basis
On a comparable basis, the 3 million euro increase in International Carriers & Shared Services economic CAPEX between the first half of 2022 and the first half of 2023 was primarily due to the reduction in disposals of fixed assets.
1.3.7 Mobile Financial Services
Mobile Financial Services |
|
2023 |
|
2022 |
|
2022 |
|
% change |
|
% change |
|
(at June 30, in millions of euros) |
|
|
|
data on a |
|
|
|
data on a |
|
|
|
|
|
|
|
comparable |
|
data on a |
|
comparable |
|
data on a |
|
|
|
|
|
basis |
|
historical basis |
|
basis |
|
historical basis |
|
Net banking income (NBI) (1) |
|
75 |
|
56 |
|
56 |
|
33.5 |
% |
33.5 |
% |
Cost of bank credit risk (2) |
|
(32) |
|
(22) |
|
(22) |
|
48.6 |
% |
48.6 |
% |
Operating Income |
|
(73) |
|
(80) |
|
(80) |
|
8.3 |
% |
8.3 |
% |
eCAPEX |
|
20 |
|
14 |
|
14 |
|
47.9 |
% |
47.9 |
% |
Average number of employees |
|
879 |
|
916 |
|
916 |
|
(4.1) |
% |
(4.1) |
% |
(1) Net banking income (NBI) recognized as other operating income (see Notes 1.2 and 1.3 to the Interim Consolidated Financial Statements).
(2) Cost of bank credit risk recognized in other operating expenses (see Notes 1.2 and 1.3 to the Interim Consolidated Financial Statements).
In the first half of 2023, the Mobile Financial Services activities continued to grow, particularly:
| − | in Europe, with the continued development of value-added services and the continuous improvement of quality of service. At June 30, 2023, Orange Bank had nearly 2.0 million customers in France and Spain (this number includes customers of all products and services sold by Orange Bank for individuals, professionals and businesses: accounts, loans and mobile insurance); and |
− |
in Africa, with the launch of new offers (Prestige loans and real estate loans) and steady growth in business loans and microcredit. At June 30, 2023, Orange Bank Africa had 1.2 million customers. |
As part of the strategic review of Orange Bank, the Group announced in late June that it had entered into exclusive negotiations with BNP Paribas to support the development of its banking subsidiary (see Section 1.1.3 Significant events).
1.3.7.1 Operating activities
The segment information for Mobile Financial Services (operating income, investments in property, plant and equipment and intangible assets) is presented in Notes 1.2, 1.3 and 1.4 to the Interim Consolidated Financial Statements.
Operating income - Mobile Financial Services
Change on a historical basis and on a comparable basis
On a historical and comparable basis, the 7 million euro improvement in operating income between the first half of 2022 and the first half of 2023 was mainly due to:
| − | (i) the increase in net banking income (NBI, see Notes 1.2 and 1.3 to the Interim Consolidated Financial Statements), driven by the increase in bank account and credit products in France and Spain and the development of banking activities in Côte d’Ivoire, and (ii) the reduction in the depreciation and amortization of fixed assets; |
|
26 |
| − | partially offset by (i) the increase in the cost of bank credit risk (see Notes 1.2, 1.3 and 5.2 to the Interim Consolidated Financial Statements), related primarily to the development of the credit business, and (ii) the increase in other operating expenses. |
Economic CAPEX - Mobile Financial Services
Change on a historical basis and on a comparable basis
On a historical and comparable basis, the 7 million euro increase in Mobile Financial Services economic CAPEX between the first half of 2022 and the first half of 2023 was due to the increase in IT investment.
1.3.7.2 Assets, liabilities and cash flows
The segment information for Mobile Financial Services (assets, liabilities and cash flows) is presented in Notes 1.5, 1.6 and 1.7 to the Interim Consolidated Financial Statements, and Mobile Financial Services activities (financial assets and liabilities) are described in Note 12 to the Interim Consolidated Financial Statements.
1.4 Cash flow and financial debt of telecom activities
To ensure the transparency of the financial statements and separate out the performance of telecom activities and Mobile Financial Services activities, the analysis and financial commentary are split to reflect these two business areas. Thus, Section 1.4 Cash flow and financial debt of telecom activities covers telecom activities, and Section 1.3.7 Mobile Financial Services is dedicated to the Group's banking activities.
1.4.1Liquidity and cash flows from telecom activities
1.4.1.1Cash flows from telecom activities
Cash flows from telecom activities are presented in Note 1.7 to the Interim Consolidated Financial Statements.
Simplified statement of cash flows from telecom activities (1) |
|
2023 |
|
2022 |
(at June 30, in millions of euros) |
|
|
|
data on a |
|
|
|
|
historical basis |
Net cash provided by operating activities |
|
5,885 |
|
5,789 |
Net cash used in investing activities |
|
(4,050) |
|
(4,622) |
Net cash used in financing activities |
|
(1,830) |
|
(1,517) |
Cash change in cash and cash equivalents from telecom activities |
|
4 |
|
(349) |
Cash and cash equivalents in the opening balance |
|
5,846 |
|
8,188 |
Cash change in cash and cash equivalents |
|
4 |
|
(349) |
Non‑cash change in cash and cash equivalents |
|
40 |
|
32 |
Cash and cash equivalents in the closing balance from telecom activities |
|
5,890 |
|
7,871 |
(1) See Note 1.7 to the Interim Consolidated Financial Statements.
Net cash provided by operating activities (telecom activities)
Between the first half of 2022 and the first half of 2023, the 96 million euro increase in net cash provided by operating activities of telecom activities was mainly due to:
| − | (i) the 215 million euro change in working capital requirement between the two periods, (ii) the 155 million euro decrease in operating taxes and levies paid, and (iii) the change in non-monetary items included in operating income from telecom activities; |
| − | partially offset by (i) the 285 million euro decrease in operating income from telecom activities on a historical basis (see Section 1.2.2.1 Group operating income), (ii) the 67 million euro increase in income tax paid, and (iii) the 59 million euro increase in interest paid and interest rates effects on derivatives, net (net of dividends received, and including interests paid on lease liabilities and on debts related to financed assets), mostly resulting from the increase in interests paid on lease liabilities and on debts related to financed assets. |
Net cash flows used in investing activities (telecom activities)
Between the first half of 2022 and the first half of 2023, the 571 million euro decrease in net cash used in investing activities of telecom activities was primarily due to:
| − | the change in investments and other financial assets between the two periods (mainly investments at fair value), with a decrease of 1,122 million euros in the first half of 2023, compared with an increase of 707 million euros in the first half of 2022, due to the Group’s active cash management policy; |
| − | largely offset by: |
| - | the acquisition in the first half of 2023 of approximately 75% of VOO by Orange Belgium for 1,349 million euros net of cash acquired (see Section 1.1.3 Significant events); and |
| - | to a lesser extent, the 92 million euro decrease in purchases (sales) of property, plant and equipment and intangible assets paid (and received), mostly stemming from the decline in telecommunication licenses paid, together with (i) the counter-effect of the recognition in the first half of 2022 of the acquisition of 4G licenses in Egypt, (ii) partially offset by the acquisition of licenses in Belgium in the first half of 2023 in the general context of the acquisition of 5G licenses and the renewal of the existing 2G/3G spectrum (see Section 1.2.5.2 Telecommunication licenses). |
|
27 |
Net cash flows used in financing activities (telecom activities)
Between the first half of 2022 and the first half of 2023, the 314 million euro increase in net cash flows related to the financing of telecom activities was primarily due to:
| − | the change of cash collateral deposits, with a 252 million euro decrease in the first half of 2023, compared with a 922 million euro increase in the first half of 2022, resulting from the change in the fair value of the derivatives used to hedge the Group’s bond issues; |
| − | the 503 million euro increase in medium and long-term debt redemptions and repayments, essentially resulting from the redemption by Orange SA of a bond issue for a nominal amount of 500 million euros in the first half of 2023 (see Note 10.4 to the Interim Consolidated Financial Statements); |
| − | the 149 million euro decrease in medium and long-term debt issuances (see Note 10.4 to the Interim Consolidated Financial Statements); |
− |
partially offset by: |
| - | the change in bank overdrafts and short-term borrowings, with a 537 million euro increase in the first half of 2023, compared with an 892 million euro decrease in the first half of 2022, primarily resulting from the increased use of negotiable debt securities (NEU Commercial Paper); and |
| - | to a lesser extent, (i) the recognition in the first half of 2023 of subordinated notes issuances (net of redemptions and other expenses) of 177 million euros (see Note 13.4 to the Interim Consolidated Financial Statements), and (ii) the effect of Orange Bank capital increases subscribed by the Group between the two periods. |
1.4.2 Financial debt and liquidity position of telecom activities
Net financial debt (see Note 10.3 to the Interim Consolidated Financial Statements) is a financial indicator that is not defined by IFRS. For further information on the calculation of this indicator and the reasons why the Orange group uses it, see Section 1.5 Financial indicators not defined by IFRS and Section 1.6.4 Financial glossary. Net financial debt as defined and used by Orange does not include Mobile Financial Services activities, for which this concept is not relevant.
|
|
June 30, |
|
Dec. 31, |
(in millions of euros) |
|
2023 |
|
2022 |
|
|
|
|
data on a |
|
|
|
|
historical basis |
Net financial debt (1) |
|
27,274 |
|
25,298 |
| (1) | Net financial debt is a non-IFRS financial indicator provided as additional information only and should not be considered a substitute for Financial liabilities. See Section 1.5 Financial indicators not defined by IFRS, Section 1.6.4 Financial glossary, and Note 10.3 to the Interim Consolidated Financial Statements. Net financial debt as defined and used by Orange does not take into account Mobile Financial Services activities, for which this concept is not relevant. |
As of June 30, 2023, the liquidity position of telecom activities amounted to 15,485 million euros (see Note 11.1 to the Interim Consolidated Financial Statements). The changes in the financial assets and liabilities and financial results of telecom activities are detailed in Note 10 to the Interim Consolidated Financial Statements.
1.5 Financial indicators not defined by IFRS
In this document, in addition to the financial indicators reported in accordance with IFRS (International Financial Reporting Standards), Orange publishes financial indicators not defined by IFRS. As described below, these figures are presented as additional information and are not meant to be substitutes for, or to be confused with, the financial indicators as defined by IFRS.
1.5.1 Data on a comparable basis
In order to allow investors to track the annual changes in the Group’s operations, data on a comparable basis is presented for the previous period. The transition from data on a historical basis to data on a comparable basis involves retaining the results for the fiscal year ended and restating the previous fiscal year in order to present financial data with comparable methods, scope of consolidation and exchange rates over comparable periods. Orange provides the details of the effect of changes in method, scope of consolidation and exchange rates on its key operating indicators in order to isolate the intrinsic business effect. The method used is to apply to the data of the corresponding period of the preceding fiscal year the methods and the scope of consolidation for the period ended, as well as the average exchange rates used in the Consolidated income statement for the period ended.
Orange’s management believes that the presentation of these indicators on a comparable basis is relevant because these are indicators used internally by the Group for monitoring its operating activities. Changes on a comparable basis better reflect organic business changes.
Data on a comparable basis is not a financial indicator defined by IFRS and may not be comparable to similarly titled indicators used by other groups. It is provided as additional information only and should not be considered a substitute for an analysis of the Group’s historical data for the past fiscal year or previous periods.
|
28 |
Group
The table below presents, for the Orange group, the transition from data on a historical basis to data on a comparable basis for the first half of 2022, for the main operating data.
First half year 2022 / Group |
|
Revenue |
|
Operating |
|
Average |
(at June 30, 2022, in millions of euros) |
|
|
|
income |
|
number of |
|
|
|
|
|
|
employees |
Data on a historical basis |
|
21,297 |
|
2,420 |
|
131,115 |
Foreign exchange fluctuations (1) |
|
(226) |
|
(32) |
|
— |
Egyptian pound (EGP) |
|
(210) |
|
(37) |
|
— |
Leone (SLE) |
|
(20) |
|
(5) |
|
— |
Moroccan dirham (MAD) |
|
(12) |
|
(1) |
|
— |
US dollar (USD) |
|
18 |
|
6 |
|
— |
Guinean franc (GNF) |
|
11 |
|
5 |
|
— |
Other |
|
(13) |
|
— |
|
— |
Changes in the scope of consolidation and other changes |
|
62 |
|
24 |
|
20 |
Acquisition/Takeover of VOO (2) |
|
42 |
|
(3) |
|
n/a |
Acquisition of SCRT and Telsys by Orange Cyberdefense |
|
20 |
|
1 |
|
81 |
Other |
|
— |
|
26 |
|
(61) |
Data on a comparable basis |
|
21,133 |
|
2,412 |
|
131,136 |
(1) Foreign exchange fluctuations between the average exchange rates for the first half of 2022 and the average exchange rates for the first half of 2023.
(2) Data excluding the employees of VOO, acquired in June 2023 by Orange Belgium and currently being integrated (see Section 1.1.3 Significant events).
The changes included in the transition from data on a historical basis to data on a comparable basis for the first half of 2022 include:
| − | foreign exchange fluctuations between the average exchange rates for the first half of 2022 and the average exchange rates for the first half of 2023; and |
| − | changes in the scope of consolidation (see Section 1.1.3 Significant events and Note 3.2 to the Interim Consolidated Financial Statements) and other changes, primarily including: |
| - | the takeover of VOO by Orange Belgium (Europe segment) on June 2, 2023 (see Section 1.1.3 Significant events and Note 3.2 to the Interim Consolidated Financial Statements), effective as of June 1, 2022 on a comparable basis; and |
| - | the acquisitions of SCRT and Telsys by Orange Cyberdefense (Enterprise segment) on November 8, 2022, effective as of January 1, 2022 on a comparable basis. |
|
29 |
Segments
The table below presents, for each Orange group segment, the transition from data on a historical basis to data on a comparable basis for the first half of 2022, for the main operating data.
First half year 2022 / Segments |
|
Revenue |
|
EBITDAaL |
|
Operating |
|
eCAPEX |
|
Average |
(at June 30, 2022, in millions of euros) |
|
|
|
|
|
income |
|
|
|
number of |
|
|
|
|
|
|
|
|
|
|
employees |
France |
|
|
|
|
|
|
|
|
|
|
Data on a historical basis |
|
8,827 |
|
3,035 |
|
1,436 |
|
1,673 |
|
47,009 |
Foreign exchange fluctuations (1) |
|
— |
|
1 |
|
1 |
|
— |
|
— |
Changes in the scope of consolidation and other changes (2) |
|
— |
|
(23) |
|
33 |
|
(21) |
|
10 |
Data on a comparable basis |
|
8,826 |
|
3,014 |
|
1,470 |
|
1,652 |
|
47,019 |
Europe |
|
|
|
|
|
|
|
|
|
|
Data on a historical basis |
|
5,325 |
|
1,323 |
|
260 |
|
835 |
|
27,822 |
Foreign exchange fluctuations (1) |
|
3 |
|
1 |
|
— |
|
— |
|
— |
Changes in the scope of consolidation and other changes (2) |
|
42 |
|
10 |
|
(18) |
|
9 |
|
— |
Acquisition/Takeover of VOO (3) |
|
42 |
|
10 |
|
(3) |
|
9 |
|
n/a |
Other changes (2) |
|
— |
|
— |
|
(15) |
|
— |
|
— |
Data on a comparable basis |
|
5,371 |
|
1,335 |
|
242 |
|
843 |
|
27,822 |
Africa & Middle East |
|
|
|
|
|
|
|
|
|
|
Data on a historical basis |
|
3,381 |
|
1,214 |
|
739 |
|
609 |
|
14,380 |
Foreign exchange fluctuations (1) |
|
(239) |
|
(89) |
|
(45) |
|
(56) |
|
— |
Changes in the scope of consolidation and other changes (2) |
|
— |
|
— |
|
— |
|
— |
|
— |
Data on a comparable basis |
|
3,141 |
|
1,125 |
|
694 |
|
554 |
|
14,380 |
Entreprise |
|
|
|
|
|
|
|
|
|
|
Data on a historical basis |
|
3,888 |
|
364 |
|
152 |
|
144 |
|
28,681 |
Foreign exchange fluctuations (1) |
|
3 |
|
5 |
|
6 |
|
(1) |
|
— |
Changes in the scope of consolidation and other changes (2) |
|
20 |
|
4 |
|
4 |
|
— |
|
(156) |
Acquisition of SCRT and Telsys by Orange Cyberdefense |
|
20 |
|
1 |
|
1 |
|
— |
|
81 |
Other changes (2) |
|
— |
|
3 |
|
3 |
|
— |
|
(237) |
Data on a comparable basis |
|
3,911 |
|
373 |
|
162 |
|
143 |
|
28,525 |
Totem |
|
|
|
|
|
|
|
|
|
|
Data on a historical basis |
|
328 |
|
180 |
|
120 |
|
44 |
|
152 |
Foreign exchange fluctuations (1) |
|
— |
|
— |
|
— |
|
— |
|
— |
Changes in the scope of consolidation and other changes (2) |
|
— |
|
— |
|
— |
|
— |
|
— |
Data on a comparable basis |
|
328 |
|
180 |
|
120 |
|
44 |
|
152 |
International Carriers & Shared Services |
|
|
|
|
|
|
|
|
|
|
Data on a historical basis |
|
772 |
|
(128) |
|
(207) |
|
94 |
|
12,155 |
Foreign exchange fluctuations (1) |
|
(1) |
|
6 |
|
6 |
|
— |
|
— |
Changes in the scope of consolidation and other changes (2) |
|
(1) |
|
— |
|
5 |
|
— |
|
166 |
Data on a comparable basis |
|
771 |
|
(122) |
|
(197) |
|
94 |
|
12,322 |
Mobile Financial Services |
|
|
|
|
|
|
|
|
|
|
Data on a historical basis |
|
— |
|
(56) |
|
(80) |
|
14 |
|
916 |
Foreign exchange fluctuations (1) |
|
— |
|
— |
|
— |
|
— |
|
— |
Changes in the scope of consolidation and other changes (2) |
|
— |
|
— |
|
— |
|
— |
|
— |
Data on a comparable basis |
|
— |
|
(56) |
|
(80) |
|
14 |
|
916 |
(1) Foreign exchange fluctuations between the average exchange rates for the first half of 2022 and the average exchange rates for the first half of 2023.
(2) Including the effect of internal reorganizations between segments, which have no effect at Group level.
(3) Data excluding the employees of VOO, acquired in June 2023 by Orange Belgium and currently being integrated (see Section 1.1.3 Significant events).
1.5.2 eCAPEX
eCAPEX (or “economic CAPEX”) relates to both (i) Investments in property, plant and equipment and intangible assets, excluding telecommunication licenses and financed assets, less the price of disposal of fixed assets, and (ii) Purchases of property, plant and equipment and intangible assets excluding telecommunication licenses and changes in fixed asset trade payables, less the price of disposal of fixed assets.
The table below shows the transition from (i) Investments in property, plant and equipment and intangible assets as presented in Note 1.4 to the Interim Consolidated Financial Statements, and (ii) Purchases of property, plant and equipment and intangible assets, excluding changes in fixed asset trade payables, as presented in the Consolidated statement of cash flows in the Interim Consolidated Financial Statements, to (iii) eCAPEX.
|
|
2023 |
|
2022 |
|
|
|
|
data on a |
(at June 30, in millions of euros) |
|
|
|
historical basis |
Investments in property, plant and equipment and intangible assets |
|
3,834 |
|
3,850 |
Financed assets |
|
(145) |
|
(69) |
Purchases of property, plant and equipment and intangible assets (1) |
|
3,690 |
|
3,781 |
Price of disposal of fixed assets |
|
(153) |
|
(124) |
Telecommunication licenses |
|
(383) |
|
(244) |
eCAPEX (Non-IFRS Indicator) |
|
3,154 |
|
3,413 |
(1) See Consolidated statement of cash flows. Excluding changes in fixed asset trade payables. Financed assets have no effect on cash flows when they are purchased.
Orange’s management believes that the presentation of eCAPEX is relevant because this indicator (i) does not include investments in telecommunication licenses (the acquisition of these licenses is not part of the daily monitoring of operating investments) and financed assets (no effect on net cash flows when they are purchased), and (ii) allows, in a context of asset rotation primarily linked to the fiber optic economic model, more accurate measurement of the actual amount of investments by excluding the price of disposal of fixed assets. It is the indicator used internally by the Group in allocating resources, in order to measure the operating efficiency of the use of investments for each of its business segments.
eCAPEX is not a financial indicator defined by IFRS and may not be comparable to similarly titled indicators used by other groups. It is provided as additional information only and should not be considered a substitute for Purchases of property, plant and equipment and intangible assets, or Investments in property, plant and equipment and intangible assets.
|
30 |
1.5.3Net financial debt
Net financial debt as defined and used by Orange does not include Mobile Financial Services activities, for which this concept is not relevant. It consists of (i) financial liabilities excluding operating payables (translated into euros at the year-end closing rate) including derivative instruments (assets and liabilities), (ii) less cash collateral paid, cash, cash equivalents and investments at fair value. Furthermore, financial instruments designated as cash flow hedges, included in net financial debt, are set up to hedge in particular items that are not included therein, such as future cash flows. As a consequence, the portion of these unmatured hedging instruments recorded in other comprehensive income is added to gross financial debt to offset this temporary difference.
The breakdown of net financial debt is shown in Note 10.3 to the Interim Consolidated Financial Statements.
Net financial debt is an indicator of financial position used by the Group. Net financial debt is a frequently disclosed indicator. It is widely used by analysts, investors, rating agencies and most groups in all business sectors in Europe.
Net financial debt is not a financial indicator defined by IFRS and may not be comparable to similarly titled indicators used by other groups. It is provided as additional information only and should not be considered a substitute for an analysis of all the Group’s assets and liabilities.
1.6 Additional information
1.6.1 Litigation and unrecognized contractual commitments
The main events that took place in the first half of 2023 affecting litigation and unrecognized contractual commitments are described in Note 14 to the Interim Consolidated Financial Statements.
1.6.2 Related party transactions
In the first half of 2023, the amounts of related party transactions did not present significant changes compared with December 31, 2022 (see Note 8.3 to the Interim Consolidated Financial Statements).
1.6.3 Subsequent events
The main events occurring after June 30, 2023 are described in Note 15 to the Interim Consolidated Financial Statements and in Exhibit 99.3 to the Report on Form 6-K dated December 7, 2023.
1.6.4 Financial glossary
Average number of employees (full-time equivalents): average number of active employees over the reporting period, prorated for their work time, including both permanent contracts and fixed-term contracts.
Change in working capital requirement: the change in working capital requirement consists of:
| − | the Change in working capital requirement for operations, which is made up of (i) the changes in gross inventories, (ii) the change in gross trade receivables, (iii) the change in trade payables for other goods and services, and (iv) changes in other customer contract assets and liabilities; and |
| − | the Change in working capital requirement excluding operations, which includes the change in other assets and liabilities (excluding operating taxes and levies receivables and payables). |
Commercial expenses, equipment and content costs: see External purchases.
Convergent ARPO: average revenues per customer from convergent services (Average Revenues Per Offer - ARPO) for the period are calculated by dividing (i) the revenues from consumer convergent offers billed to customers (excluding the effect of spreading the equipment subsidy pursuant to IFRS 15) over the period in question, by (ii) the weighted average number of customers of consumer convergent offers over the same period. The weighted average number of customers is the average of monthly averages over the period in question. The monthly average is the arithmetic average of the number of customers at the beginning and end of the month. Convergent ARPO is expressed in monthly revenues per convergent offers customer.
Convergent services: see Revenues.
Data on a comparable basis: data with comparable methods, scope of consolidation and exchange rates are presented for the preceding period (see Section 1.5.1 Data on a comparable basis). The transition from data on a historical basis to data on a comparable basis involves retaining the results for the period just ended and restating the corresponding period from the previous fiscal year in order to present financial data with comparable methods, scope of consolidation and exchange rates over comparable periods. The method used is to apply to the data of the corresponding period of the preceding fiscal year the methods and the scope of consolidation for the period ended, as well as the average exchange rates used in the Consolidated income statement for the period ended. Changes on a comparable basis reflect organic business changes. Data on a comparable basis is not a financial indicator defined by IFRS and may not be comparable to similarly titled indicators used by other groups (see Section 1.5 Financial indicators not defined by IFRS).
Data on a historical basis: data for past periods as reported in the Interim Consolidated Financial Statements of the current financial period.
EBITDAaL or “EBITDA after Leases”: operating income (i) before depreciation and amortization of fixed assets, effects resulting from business combinations, reclassification of the cumulative translation adjustment from liquidated entities, impairment of goodwill and fixed assets and the share of profits (losses) of associates and joint ventures, (ii) after interests on lease liabilities and interests on debts related to financed assets, and (iii) adjusted for significant litigations, specific labor expenses, the review of fixed assets, investments and business portfolio, restructuring programs costs, acquisition and integration costs and, where appropriate, other specific items that are systematically specified in relation to income or expenses
|
31 |
(see Note 1 to the Interim Consolidated Financial Statements). Orange’s management believes that presenting the EBITDAaL indicator is relevant because it is the key operational performance indicator used internally by the Group to manage and assess its segment results. EBITDAaL is not a financial indicator defined by IFRS and may not be comparable to similarly titled indicators used by other groups. It is provided as additional information only and should not be considered a substitute for operating income or net cash flow provided by operating activities.
eCAPEX or “economic CAPEX”: investments in property, plant and equipment and intangible assets excluding telecommunication licenses and financed assets, less the price of disposal of fixed assets (see Note 1.4 to the Interim Consolidated Financial Statements). eCAPEX is not a financial indicator defined by IFRS and may not be comparable to similarly titled indicators used by other groups (see Section 1.5 Financial indicators not defined by IFRS).
Economic CAPEX: see eCAPEX.
Equipment sales: see Revenues.
External purchases: external purchases include the following operating expenses, excluding leases falling within the scope of application of IFRS 16 (see Note 5.1 to the Interim Consolidated Financial Statements):
| − | Commercial expenses, equipment and content costs: cost of handsets and other equipment sold, retail fees and commissions, advertising, promotional, sponsoring and rebranding expenses, and content costs; |
| − | Service fees and inter-operator costs: network expenses and interconnection costs; |
| − | Other network expenses and IT expenses: subcontracting expenses for operations and technical maintenance and IT expenses; and |
| − | Other external purchases: overheads, lease property restructuring expenses, purchases of other services and service fees, purchases of equipment and other supplies held in inventory, call center subcontracting expenses and other external services, net of capitalized costs of goods and services. |
Financial investments: financial investments include (i) cash paid for investment securities, net of cash acquired and investments in associates and joint ventures, as well as purchases of equity securities measured at fair value, and (ii) changes in ownership interest with no gain of control of subsidiaries.
Fixed- only broadband ARPO: average revenues per fixed-only services customer (Average Revenues Per Offer – ARPO) for the period is calculated by dividing (i) the revenues from retail fixed-only broadband services (excluding the effect of the spreading of the equipment subsidy pursuant to IFRS 15) over the relevant period, by (ii) the weighted average number of fixed-only broadband customers in the same period. The weighted average number of customers is the average of monthly averages over the period in question. The monthly average is the arithmetic average of the number of customers at the beginning and end of the month. Fixed-only broadband ARPO is expressed in monthly revenues per fixed-only customer.
Fixed-only services : see Revenues.
Investments in property, plant and equipment and intangible assets: see eCAPEX.
IT & Integration Services: see Revenues.
Labor expenses: wages and employee benefit expenses (net of capitalized costs), employee profit-sharing expenses, and expenses relating to share-based compensation (see Note 6 to the Interim Consolidated Financial Statements).
Mobile-only ARPO: average revenues per customer of mobile-only services (Average Revenues Per Offer – ARPO) for the period is calculated by dividing (i) the revenues from retail mobile-only services (excluding machine-to-machine and the effect of spreading the equipment subsidy pursuant to IFRS 15) over the relevant period, by (ii) the weighted average number of customers of mobile-only services (excluding machine-to-machine) in the same period. The weighted average number of customers is the average of monthly averages over the period in question. The monthly average is the arithmetic average of the number of customers at the beginning and end of the month. Mobile-only ARPO is expressed in monthly revenues per mobile-only customer.
Mobile-only services: see Revenues.
Net financial debt: net financial debt as defined and used by Orange does not incorporate Mobile Financial Services activities, for which this concept is not relevant. It consists of (i) financial liabilities excluding operating payables (translated into euros at the year-end closing rate) including derivative instruments (assets and liabilities), (ii) less cash collateral paid, cash, cash equivalents and investments at fair value. Furthermore, financial instruments designated as cash flow hedges, included in net financial debt, are set up to hedge in particular items that are not included therein, such as future cash flows. As a consequence, the portion of these unmatured hedging instruments recorded in other comprehensive income is added to gross financial debt to offset this temporary difference (see Note 10.3 to the Interim Consolidated Financial Statements). Net financial debt is not a financial indicator defined by IFRS and may not be comparable to similarly titled indicators used by other group (see Section 1.5 Financial indicators not defined by IFRS).
Number of employees (active employees at end of period): number of employees working on the last day of the reporting period, including both permanent contracts and fixed-term contracts.
Operating taxes and levies payables: taxes and levies including the CET (contribution économique territoriale – territorial economic contribution) and the IFER (imposition forfaitaire sur les entreprises de réseaux – flat-rate tax on network enterprises) in France, spectrum fees and levies on telecommunication services.
Other external purchases: see External purchases.
Other network expenses and IT expenses: see External purchases.
Other operating expenses: see Other operating income and expenses.
Other operating income and expenses: other operating income net of other operating expenses. Other operating income and expenses includes:
| − | Other operating income: primarily net banking income (NBI), income from customer collection, site rentals and franchises income, tax credits and subsidies, income from universal service, brand royalties and management fees invoiced to certain unconsolidated entities, rebilling of network sharing costs, income from litigation, and income relating to line damage; and |
|
32 |
| − | Other operating expenses: primarily for litigation, allowances and losses on trade receivables of telecom activities, the cost of bank credit risk, universal service charges, operating foreign exchange gains/losses, and acquisition and integration costs (see Note 5.2 to the Interim Consolidated Financial Statements). |
Other revenues: see Revenues.
Retail services (B2C+B2B) revenues: aggregation of revenues from convergent services, mobile-only services, fixed-only services and IT & Integration Services (see definitions). Retail Services (B2C+B2B) revenues include all revenues of a given scope excluding revenues from wholesale services, equipment sales and other revenues (see definitions).
Retail services (B2C+B2B): see Retail services (B2C+B2B) revenues.
Revenues: revenues (see Note 1.1 to the Interim Consolidated Financial Statements) include:
| − | Convergent services: revenues from retail convergent offers to B2C customers, excluding equipment sales (see definition). A convergent offer is defined as the combination of, at least, fixed broadband access (xDSL, FTTx, cable, fixed 4G) and a mobile voice contract; |
| − | Mobile-only services: revenues from retail mobile plans (mainly outgoing calls: voice, SMS and data), excluding convergent services and equipment sales (see definitions); |
| − | Fixed-only services : revenues from retail fixed services, excluding convergent services and equipment sales (see definitions). It includes (i) fixed narrowband services (traditional fixed telephony), (ii) fixed broadband services, and (iii) business solutions and networks (with the exception of France, for which essential business solutions and networks are supported by the Enterprise segment). For the Enterprise segment, revenue from fixed-only services includes network equipment sales linked to the operation of voice and data services; |
| − | IT & Integration Services: revenues including unified communication and collaboration services (Local Area Network and telephony, consulting, integration and project management services), hosting and infrastructure services (including cloud computing), app services (customer relations management and other app services), security services, video-conference services, services related to machine-to-machine activities (excluding connectivity), as well as equipment sales related to the above products and services; |
| − | Wholesale services: revenues including (i) mobile services to carriers, which include, in particular, incoming mobile traffic, visitor roaming, network sharing, national roaming and Mobile Virtual Network Operators (MVNOs), (ii) fixed services to carriers, which include, in particular, national interconnection, services to international carriers, high-speed and very high-speed broadband access services (fiber access, unbundling of telephone lines, xDSL access sales), and telephone lines sold wholesale, and (iii) equipment sales to other carriers; |
| − | Equipment sales: sales of fixed and mobile equipment, with the exception of (i) equipment sales related to the provision of IT & Integration Services, (ii) sales of network equipment related to operation of voice and data services in the Enterprise segment, (iii) equipment sales to other carriers, and (iv) equipment sales to external distributors and brokers; and |
| − | Other revenues: revenues including equipment sales to dealers and brokers, revenues from portals, revenues from online advertising and the Group’s transversal activities, and miscellaneous other revenues. |
Service fees and inter-operator costs: see External purchases.
Wages and employee benefit expenses: see Labor expenses.
Wholesale services: see Revenues.
|
33 |
2. Unaudited Interim Condensed Consolidated Financial Statements for the Six Months Ended June 30, 2022 and 2023
The accompanying notes are an integral part of the consolidated financial statements.
|
F-1 |
Consolidated income statement
|
|
|
|
|
|
|
|
(in millions of euros, except for per share data) |
|
Note |
|
June 30, 2023 |
|
June 30, 2022 |
|
Revenue |
|
1.1 |
|
21,545 |
|
21,297 |
|
External purchases |
|
5.1 |
|
(9,347) |
|
(9,050) |
|
Other operating income |
|
|
|
376 |
|
366 |
|
Other operating expenses |
|
5.2 |
|
(150) |
|
(231) |
|
Labor expenses |
|
6 |
|
(4,624) |
|
(4,329) |
|
Operating taxes and levies |
|
|
|
(1,223) |
|
(1,235) |
|
Gains (losses) on disposal of fixed assets, investments and activities |
|
3.1 |
|
50 |
|
36 |
|
Restructuring costs |
|
5.3 |
|
(35) |
|
(47) |
|
Depreciation and amortization of fixed assets |
|
|
|
(3,604) |
|
(3,585) |
|
Depreciation and amortization of financed assets |
|
|
|
(59) |
|
(47) |
|
Depreciation and amortization of right-of-use assets |
|
|
|
(745) |
|
(762) |
|
Reclassification of translation adjustment from liquidated entities |
|
|
|
— |
|
3 |
|
Impairment of goodwill |
|
7 |
|
— |
|
— |
|
Impairment of fixed assets |
|
|
|
(4) |
|
(2) |
|
Impairment of right-of-use assets |
|
|
|
(28) |
|
5 |
|
Share of profits (losses) of associates and joint ventures |
|
8 |
|
(8) |
|
1 |
|
Operating income |
|
|
|
2,142 |
|
2,420 |
|
Cost of gross financial debt excluding financed assets |
|
|
|
(528) |
|
(297) |
|
Interests on debts related to financed assets |
|
|
|
(6) |
|
(1) |
|
Gains (losses) on assets contributing to net financial debt |
|
|
|
130 |
|
(9) |
|
Foreign exchange gain (loss) |
|
|
|
(32) |
|
(40) |
|
Interests on lease liabilities |
|
|
|
(116) |
|
(61) |
|
Other net financial expenses |
|
|
|
(40) |
|
36 |
|
Finance costs, net |
|
10.2 |
|
(592) |
|
(373) |
|
Income taxes |
|
9 |
|
(461) |
|
(580) |
|
Consolidated net income |
|
|
|
1,088 |
|
1,467 |
|
Net income attributable to owners of the parent company |
|
|
|
877 |
|
1,218 |
|
Non-controlling interests |
|
|
|
211 |
|
249 |
|
|
|
|
|
|
|
|
|
Earnings per share (in euros) attributable to parent company |
|
|
|
|
|
|
|
Net income |
|
|
|
|
|
|
|
– basic |
|
|
|
0.30 |
|
0.42 |
|
– diluted |
|
|
|
0.30 |
|
0.42 |
|
| (1) |
|
F-2 |
Consolidated statement of comprehensive income
(in millions of euros) |
|
Note |
|
June 30, 2023 |
|
June 30, 2022 |
|
Consolidated net income |
|
|
|
1,088 |
|
1,467 |
|
Remeasurements of the net defined benefit liability |
|
|
|
(13) |
|
170 |
|
Assets at fair value |
|
|
|
— |
|
(33) |
|
Income tax relating to items that will not be reclassified |
|
|
|
3 |
|
(44) |
|
Share of other comprehensive income in associates and joint ventures that will not be reclassified |
|
|
|
1 |
|
— |
|
Items that will not be reclassified to profit or loss (a) |
|
|
|
(9) |
|
93 |
|
Assets at fair value |
|
|
|
3 |
|
1 |
|
Cash flow hedges |
|
10.2 |
|
(277) |
|
438 |
|
Translation adjustment gains and losses |
|
13.5 |
|
(65) |
|
(37) |
|
Income tax relating to items that are or may be reclassified |
|
|
|
69 |
|
(107) |
|
Share of other comprehensive income in associates and joint ventures that are or may be reclassified |
|
|
|
(9) |
|
39 |
|
Items that are or may be reclassified subsequently to profit or loss (b) |
|
|
|
(278) |
|
333 |
|
Other consolidated comprehensive income (a) + (b) |
|
|
|
(288) |
|
426 |
|
Consolidated comprehensive income |
|
|
|
801 |
|
1,893 |
|
Comprehensive income attributable to the owners of the parent company |
|
|
|
579 |
|
1,591 |
|
Comprehensive income attributable to non-controlling interests |
|
|
|
222 |
|
302 |
|
| (2) |
|
F-3 |
Consolidated statement of financial position
(in millions of euros) |
|
Note |
|
June 30, 2023 |
|
December 31, 2022 |
Assets |
|
|
|
|
|
|
Goodwill |
|
3.2 |
|
23,963 |
|
23,113 |
Other intangible assets |
|
|
|
15,108 |
|
14,946 |
Property, plant and equipment |
|
|
|
32,527 |
|
31,640 |
Right-of-use assets |
|
|
|
8,149 |
|
7,936 |
Interests in associates and joint ventures |
|
8 |
|
1,501 |
|
1,486 |
Non-current financial assets related to Mobile Financial Services activities |
|
12.1 |
|
539 |
|
656 |
Non-current financial assets |
|
10.1 |
|
1,002 |
|
977 |
Non-current derivatives assets |
|
10.1 |
|
1,155 |
|
1,458 |
Other non-current assets |
|
|
|
183 |
|
216 |
Deferred tax assets |
|
|
|
509 |
|
421 |
Total non-current assets |
|
|
|
84,636 |
|
82,847 |
Inventories |
|
|
|
1,090 |
|
1,048 |
Trade receivables |
|
4 |
|
6,184 |
|
6,305 |
Other customer contract assets |
|
|
|
1,634 |
|
1,570 |
Current financial assets related to Mobile Financial Services activities |
|
12.1 |
|
3,262 |
|
2,742 |
Current financial assets |
|
10.1 |
|
3,342 |
|
4,541 |
Current derivatives assets |
|
10.1 |
|
113 |
|
112 |
Other current assets |
|
|
|
2,174 |
|
2,217 |
Operating taxes and levies receivables |
|
|
|
1,226 |
|
1,265 |
Current taxes assets |
|
|
|
220 |
|
149 |
Prepaid expenses |
|
|
|
1,097 |
|
851 |
Cash and cash equivalents |
|
10.1 |
|
6,022 |
|
6,004 |
Total current assets |
|
|
|
26,364 |
|
26,803 |
Total assets |
|
|
|
111,000 |
|
109,650 |
Equity and liabilities |
|
|
|
|
|
|
Share capital |
|
13.1 |
|
10,640 |
|
10,640 |
Share premiums and statutory reserve |
|
|
|
16,859 |
|
16,859 |
Subordinated notes |
|
13.4 |
|
5,148 |
|
4,950 |
Retained earnings |
|
|
|
(1,261) |
|
(666) |
Equity attributable to the owners of the parent company |
|
|
|
31,386 |
|
31,784 |
Non-controlling interests |
|
13.6 |
|
3,019 |
|
3,172 |
Total equity |
|
13 |
|
34,406 |
|
34,956 |
Non-current financial liabilities |
|
10.1 |
|
31,786 |
|
31,930 |
Non-current derivatives liabilities |
|
10.1 |
|
341 |
|
397 |
Non-current lease liabilities |
|
|
|
7,097 |
|
6,901 |
Non-current fixed assets payables |
|
|
|
1,575 |
|
1,480 |
Non-current financial liabilities related to Mobile Financial Services activities |
|
12.1 |
|
69 |
|
82 |
Non-current employee benefits |
|
|
|
2,600 |
|
2,567 |
Non-current dismantling provisions |
|
|
|
713 |
|
670 |
Non-current restructuring provisions |
|
|
|
53 |
|
43 |
Other non-current liabilities |
|
|
|
281 |
|
276 |
Deferred tax liabilities |
|
|
|
1,157 |
|
1,124 |
Total non-current liabilities |
|
|
|
45,671 |
|
45,471 |
Current financial liabilities |
|
10.1 |
|
5,651 |
|
4,702 |
Current derivatives liabilities |
|
10.1 |
|
51 |
|
51 |
Current lease liabilities |
|
|
|
1,503 |
|
1,509 |
Current fixed assets payables |
|
|
|
2,707 |
|
3,101 |
Trade payables |
|
|
|
7,341 |
|
7,067 |
Customer contract liabilities |
|
|
|
2,683 |
|
2,579 |
Current financial liabilities related to Mobile Financial Services activities |
|
12.1 |
|
3,447 |
|
3,034 |
Current employee benefits |
|
|
|
2,416 |
|
2,418 |
Current dismantling provisions |
|
|
|
16 |
|
26 |
Current restructuring provisions |
|
|
|
87 |
|
119 |
Other current liabilities |
|
|
|
2,629 |
|
2,526 |
Operating taxes and levies payables |
|
|
|
1,852 |
|
1,405 |
Current taxes payables |
|
|
|
379 |
|
538 |
Deferred income |
|
|
|
162 |
|
149 |
Total current liabilities |
|
|
|
30,924 |
|
29,223 |
Total equity and liabilities |
|
|
|
111,000 |
|
109,650 |
|
F-4 |
Consolidated statements of changes in shareholders’ equity
(in millions of euros) |
|
Note |
|
Attributable to owners of the parent company |
|
Attributable to non-controlling interests |
|
Total |
|
||||||||||||||||
|
|
|
|
Number of |
|
Share |
|
Share |
|
Subor- |
|
Reserves |
|
Other |
|
Total |
|
Reserves |
|
Other |
|
Total |
|
equity |
|
|
|
|
|
issued shares |
|
capital |
|
premiums |
|
dinated |
|
|
|
compre- |
|
|
|
|
|
compre- |
|
|
|
|
|
|
|
|
|
|
|
|
|
and |
|
notes |
|
|
|
hensive |
|
|
|
|
|
hensive |
|
|
|
|
|
|
|
|
|
|
|
|
|
statutory |
|
|
|
|
|
income |
|
|
|
|
|
income |
|
|
|
|
|
|
|
|
|
|
|
|
|
reserve |
|
|
|
|
|
|
|
|
|
|
|
|
|
|
|
|
|
Balance as of December 31, 2021 |
|
|
|
2,660,056,599 |
|
10,640 |
|
16,859 |
|
5,497 |
|
(399) |
|
(257) |
|
32,341 |
|
2,825 |
|
195 |
|
3,020 |
|
35,361 |
|
Consolidated comprehensive income |
|
|
|
— |
|
— |
|
— |
|
— |
|
1,218 |
|
373 |
|
1,591 |
|
249 |
|
54 |
|
302 |
|
1,893 |
|
Share-based compensation |
|
|
|
— |
|
— |
|
— |
|
— |
|
5 |
|
— |
|
5 |
|
1 |
|
— |
|
1 |
|
6 |
|
Purchase of treasury shares |
|
|
|
— |
|
— |
|
— |
|
— |
|
— |
|
— |
|
— |
|
— |
|
— |
|
— |
|
— |
|
Dividends |
|
|
|
— |
|
— |
|
— |
|
— |
|
(1,063) |
|
— |
|
(1,063) |
|
(277) |
|
— |
|
(277) |
|
(1,340) |
|
Subordinated notes remuneration |
|
|
|
— |
|
— |
|
— |
|
— |
|
(121) |
|
— |
|
(121) |
|
— |
|
— |
|
— |
|
(121) |
|
Changes in ownership interests with no gain/loss of control |
|
|
|
— |
|
— |
|
— |
|
— |
|
(2) |
|
— |
|
(2) |
|
3 |
|
— |
|
3 |
|
1 |
|
Changes in ownership interests with gain/loss of control |
|
|
|
— |
|
— |
|
— |
|
— |
|
— |
|
— |
|
— |
|
(1) |
|
— |
|
(1) |
|
(1) |
|
Other movements |
|
|
|
— |
|
— |
|
— |
|
— |
|
3 |
|
— |
|
3 |
|
5 |
|
— |
|
5 |
|
8 |
|
Balance as of June 30, 2022 |
|
|
|
2,660,056,599 |
|
10,640 |
|
16,859 |
|
5,497 |
|
(358) |
|
116 |
|
32,753 |
|
2,805 |
|
249 |
|
3,054 |
|
35,807 |
|
Consolidated comprehensive income |
|
|
|
— |
|
— |
|
— |
|
— |
|
928 |
|
(469) |
|
459 |
|
222 |
|
(38) |
|
184 |
|
643 |
|
Share-based compensation |
|
|
|
— |
|
— |
|
— |
|
— |
|
6 |
|
— |
|
6 |
|
2 |
|
— |
|
2 |
|
8 |
|
Purchase of treasury shares |
|
|
|
— |
|
— |
|
— |
|
— |
|
(7) |
|
— |
|
(7) |
|
— |
|
— |
|
— |
|
(7) |
|
Dividends |
|
|
|
— |
|
— |
|
— |
|
— |
|
(798) |
|
— |
|
(798) |
|
(51) |
|
— |
|
(51) |
|
(849) |
|
Issues and purchases of subordinated notes |
|
|
|
— |
|
— |
|
— |
|
(547) |
|
51 |
|
— |
|
(496) |
|
— |
|
— |
|
— |
|
(496) |
|
Subordinated notes remuneration |
|
|
|
— |
|
— |
|
— |
|
— |
|
(94) |
|
— |
|
(94) |
|
— |
|
— |
|
— |
|
(94) |
|
Changes in ownership interests with no gain/loss of control |
|
|
|
— |
|
— |
|
— |
|
— |
|
(8) |
|
— |
|
(8) |
|
(3) |
|
— |
|
(3) |
|
(11) |
|
Changes in ownership interests with gain/loss of control |
|
|
|
— |
|
— |
|
— |
|
— |
|
— |
|
— |
|
— |
|
1 |
|
— |
|
1 |
|
1 |
|
Other movements |
|
|
|
— |
|
— |
|
— |
|
— |
|
(32) |
|
— |
|
(32) |
|
(16) |
|
— |
|
(16) |
|
(48) |
|
Balance as of December 31, 2022 |
|
|
|
2,660,056,599 |
|
10,640 |
|
16,859 |
|
4,950 |
|
(313) |
|
(353) |
|
31,784 |
|
2,960 |
|
211 |
|
3,172 |
|
34,956 |
|
Consolidated comprehensive income |
|
|
|
— |
|
— |
|
— |
|
— |
|
877 |
|
(299) |
|
579 |
|
211 |
|
11 |
|
222 |
|
801 |
|
Share-based compensation |
|
|
|
— |
|
— |
|
— |
|
— |
|
5 |
|
— |
|
5 |
|
1 |
|
— |
|
1 |
|
6 |
|
Purchase of treasury shares |
|
13.2 |
|
— |
|
— |
|
— |
|
— |
|
2 |
|
— |
|
2 |
|
— |
|
— |
|
— |
|
2 |
|
Dividends |
|
13.3 |
|
— |
|
— |
|
— |
|
— |
|
(1,064) |
|
— |
|
(1,064) |
|
(374) |
|
— |
|
(374) |
|
(1,438) |
|
Issues and purchases of subordinated notes |
|
13.4 |
|
— |
|
— |
|
— |
|
198 |
|
(22) |
|
— |
|
177 |
|
— |
|
— |
|
— |
|
177 |
|
Subordinated notes remuneration |
|
13.4 |
|
— |
|
— |
|
— |
|
— |
|
(100) |
|
— |
|
(100) |
|
— |
|
— |
|
— |
|
(100) |
|
Changes in ownership interests with no gain/loss of control |
|
|
|
— |
|
— |
|
— |
|
— |
|
(6) |
|
— |
|
(6) |
|
(2) |
|
— |
|
(2) |
|
(7) |
|
Changes in ownership interests with gain/loss of control (1) |
|
3.2 |
|
— |
|
— |
|
— |
|
— |
|
— |
|
— |
|
— |
|
— |
|
— |
|
— |
|
— |
|
Other movements |
|
|
|
— |
|
— |
|
— |
|
— |
|
11 |
|
— |
|
11 |
|
— |
|
— |
|
— |
|
11 |
|
Balance as of June 30, 2023 |
|
|
|
2,660,056,599 |
|
10,640 |
|
16,859 |
|
5,148 |
|
(610) |
|
(652) |
|
31,386 |
|
2,797 |
|
222 |
|
3,019 |
|
34,406 |
|
| (1) | Included the fair value of the minority shareholders' equity of VOO at the acquisition date for 279 million euros, offset by the effect of the recognition of the financial liability related to the put option granted to Nethys by Orange. |
|
F-5 |
Analysis of changes in shareholders’ equity related to components of the other comprehensive income
|
|
|
|
|
|
|
|
|
|
|
|
|
|
|
|
|
|
|
|
|
|
|
|
|
|
|
|
|
|
|
|
(in millions of euros) |
|
Attributable to owners of the parent company |
|
Attributable to non-controlling interests |
|
Total other |
|
||||||||||||||||||||||||
|
|
Assets at |
|
Hedging |
|
Translation |
|
Actuarial |
|
Deferred |
|
Other |
|
Total |
|
Assets at |
|
Hedging |
|
Translation |
|
Actuarial |
|
Deferred |
|
Other |
|
Total |
|
compre- |
|
|
|
fair value |
|
instruments |
|
adjustment |
|
gains and |
|
tax |
|
compre- |
|
|
|
fair value |
|
instruments |
|
adjustment |
|
gains and |
|
tax |
|
compre- |
|
|
|
hensive |
|
|
|
|
|
|
|
|
|
losses |
|
|
|
hensive |
|
|
|
|
|
|
|
|
|
losses |
|
|
|
hensive |
|
|
|
income |
|
|
|
|
|
|
|
|
|
|
|
|
|
income of |
|
|
|
|
|
|
|
|
|
|
|
|
|
income of |
|
|
|
|
|
|
|
|
|
|
|
|
|
|
|
|
|
associates |
|
|
|
|
|
|
|
|
|
|
|
|
|
associates |
|
|
|
|
|
|
|
|
|
|
|
|
|
|
|
|
|
and joint |
|
|
|
|
|
|
|
|
|
|
|
|
|
and joint |
|
|
|
|
|
|
|
|
|
|
|
|
|
|
|
|
|
ventures |
|
|
|
|
|
|
|
|
|
|
|
|
|
ventures |
|
|
|
|
|
|
|
|
|
|
|
|
|
|
|
|
|
|
|
|
|
|
|
|
|
|
|
|
|
|
|
|
|
|
|
|
|
Balance as of December 31, 2021 |
|
78 |
|
220 |
|
(96) |
|
(516) |
|
97 |
|
(39) |
|
(257) |
|
(3) |
|
(3) |
|
212 |
|
(11) |
|
1 |
|
— |
|
195 |
|
(62) |
|
Variation |
|
(32) |
|
406 |
|
(56) |
|
171 |
|
(145) |
|
28 |
|
373 |
|
— |
|
32 |
|
20 |
|
(2) |
|
(6) |
|
10 |
|
54 |
|
426 |
|
Balance as of June 30, 2022 |
|
46 |
|
626 |
|
(152) |
|
(344) |
|
(48) |
|
(11) |
|
116 |
|
(3) |
|
29 |
|
232 |
|
(13) |
|
(5) |
|
10 |
|
249 |
|
365 |
|
Variation |
|
(79) |
|
(139) |
|
(303) |
|
7 |
|
32 |
|
14 |
|
(470) |
|
(1) |
|
(3) |
|
(33) |
|
(1) |
|
1 |
|
(2) |
|
(38) |
|
(507) |
|
Balance as of December 31, 2022 |
|
(33) |
|
487 |
|
(455) |
|
(337) |
|
(16) |
|
3 |
|
(353) |
|
(4) |
|
25 |
|
198 |
|
(14) |
|
(4) |
|
9 |
|
211 |
|
(142) |
|
Variation (1) |
|
3 |
|
(260) |
|
(94) |
|
(11) |
|
68 |
|
(4) |
|
(299) |
|
1 |
|
(17) |
|
30 |
|
(2) |
|
3 |
|
(4) |
|
11 |
|
(288) |
|
Balance as of June 30, 2023 |
|
(30) |
|
226 |
|
(550) |
|
(348) |
|
52 |
|
(1) |
|
(652) |
|
(3) |
|
9 |
|
228 |
|
(16) |
|
— |
|
5 |
|
222 |
|
(430) |
|
| (3) | (1) At June 30, 2023, the variation of (288) million euros in other comprehensive income includes changes in cash flow hedging in pound sterling for (159) million euros and in US dollars for (88) million euros of Orange SA |
|
F-6 |
Consolidated statement of cash flows
|
|
|
|
|
|
|
(in millions of euros) |
|
Note |
|
June 30, 2023 |
|
June 30, 2022 |
Operating activities |
|
|
|
|
|
|
Consolidated net income |
|
|
|
1,088 |
|
1,467 |
Non-monetary items and reclassified items for presentation |
|
|
|
6,517 |
|
6,215 |
Operating taxes and levies |
|
|
|
1,223 |
|
1,235 |
Gains (losses) on disposal of fixed assets, investments and activities |
|
3.1 |
|
(50) |
|
(36) |
Other gains and losses |
|
|
|
(22) |
|
(13) |
Depreciation and amortization of fixed assets |
|
|
|
3,604 |
|
3,585 |
Depreciation and amortization of financed assets |
|
|
|
59 |
|
47 |
Depreciation and amortization of right-of-use assets |
|
|
|
745 |
|
762 |
Changes in provisions |
|
|
|
(151) |
|
(335) |
Reclassification of cumulative translation adjustment from liquidated entities |
|
|
|
— |
|
(3) |
Impairment of fixed assets |
|
|
|
4 |
|
2 |
Impairment of right-of-use assets |
|
|
|
28 |
|
(5) |
Share of profits (losses) of associates and joint ventures |
|
|
|
8 |
|
(1) |
Operational net foreign exchange and derivatives |
|
|
|
8 |
|
17 |
Finance costs, net |
|
|
|
592 |
|
373 |
Income taxes |
|
9 |
|
461 |
|
580 |
Share-based compensation |
|
|
|
6 |
|
6 |
Changes in working capital and operating banking activities (1) |
|
|
|
140 |
|
(5) |
Decrease (increase) in inventories, gross |
|
|
|
(14) |
|
(40) |
Decrease (increase) in trade receivables, gross |
|
|
|
220 |
|
99 |
Increase (decrease) in trade payables |
|
|
|
126 |
|
90 |
Changes in other customer contract assets and liabilities |
|
|
|
33 |
|
75 |
Changes in other assets and liabilities (2) |
|
|
|
(225) |
|
(229) |
Other net cash out |
|
|
|
(2,010) |
|
(2,040) |
Operating taxes and levies paid |
|
|
|
(804) |
|
(958) |
Dividends received |
|
|
|
1 |
|
2 |
Interest paid and interest rates effects on derivatives, net (3) |
|
|
|
(561) |
|
(504) |
Income taxes paid |
|
|
|
(647) |
|
(581) |
Net cash provided by operating activities (a) |
|
|
|
5,736 |
|
5,636 |
Investing activities |
|
|
|
|
|
|
Purchases and sales of property, plant and equipment and intangible assets (4) |
|
|
|
(3,809) |
|
(3,892) |
Purchases of property, plant and equipment and intangible assets (5) |
|
|
|
(3,690) |
|
(3,781) |
Increase (decrease) in fixed assets payables |
|
|
|
(285) |
|
(237) |
Sales of property, plant and equipment and intangible assets |
|
|
|
166 |
|
126 |
Cash paid for investment securities, net of cash acquired |
|
|
|
(1,350) |
|
(12) |
Takeover of VOO in Belgium |
|
3.2 |
|
(1,349) |
|
— |
Other |
|
|
|
— |
|
(12) |
Investments in associates and joint ventures |
|
|
|
(25) |
|
(8) |
Purchases of investment securities measured at fair value |
|
|
|
(40) |
|
(17) |
Proceeds from sales of investment securities, net of cash transferred |
|
|
|
29 |
|
0 |
Other proceeds from sales of investment securities at fair value |
|
|
|
3 |
|
2 |
Decrease (increase) in securities and other financial assets |
|
|
|
1,215 |
|
(593) |
Investments at fair value, excluding cash equivalents |
|
|
|
1,205 |
|
(694) |
Other |
|
|
|
10 |
|
101 |
Net cash used in investing activities (b) |
|
|
|
(3,978) |
|
(4,519) |
|
F-7 |
(in millions of euros) |
|
Note |
|
June 30, 2023 |
|
June 30, 2022 |
|
Financing activities |
|
|
|
|
|
|
|
Medium and long-term debt issuances |
|
10.4 |
|
836 |
|
985 |
|
Medium and long-term debt redemptions and repayments (6) |
|
10.4 |
|
(834) |
|
(331) |
|
Repayments of lease liabilities |
|
|
|
(789) |
|
(737) |
|
Increase (decrease) of bank overdrafts and short-term borrowings |
|
|
|
498 |
|
(884) |
|
Decrease (increase) of cash collateral deposits |
|
|
|
(260) |
|
899 |
|
Exchange rates effects on derivatives, net |
|
|
|
(14) |
|
(103) |
|
Subordinated notes issuances (purchases) and other related fees |
|
13.4 |
|
177 |
|
— |
|
Coupon on subordinated notes |
|
13.4 |
|
(102) |
|
(121) |
|
Proceeds (purchases) treasury shares |
|
|
|
2 |
|
20 |
|
Capital increase (decrease) - non-controlling interests |
|
|
|
2 |
|
— |
|
Changes in ownership interests with no gain / loss of control |
|
|
|
(10) |
|
1 |
|
Dividends paid to owners of the parent company |
|
13.3 |
|
(1,064) |
|
(1,063) |
|
Dividends paid to non-controlling interests |
|
13.6 |
|
(222) |
|
(177) |
|
Net cash used in financing activities (c) |
|
|
|
(1,779) |
|
(1,510) |
|
Cash change in cash and cash equivalents (a) + (b) + (c) |
|
|
|
(22) |
|
(394) |
|
Net change in cash and cash equivalents |
|
|
|
|
|
|
|
Cash and cash equivalents in the opening balance |
|
|
|
6,004 |
|
8,621 |
|
Cash change in cash and cash equivalents |
|
|
|
(22) |
|
(394) |
|
Non-cash change in cash and cash equivalents |
|
|
|
40 |
|
32 |
|
o/w effect of exchange rates changes and other non-monetary effects |
|
|
|
40 |
|
32 |
|
Cash and cash equivalents in the closing balance |
|
|
|
6,022 |
|
8,259 |
|
| (1) | Operating banking activities mainly include transactions with customers and credit institutions. They are presented in changes in other assets and liabilities. |
| (2) | Excluding operating tax receivables and payables. |
| (3) | Including interests paid on lease liabilities in the amount of (113) million euros at June 30, 2023 and (60) million euros at June 30, 2022. |
| (4) | Including telecommunication licenses paid for (202) million euros at June 30, 2023 and (302) million euros at June 30, 2022. |
| (5) | Investments in financed assets amounting to 145 million euros at June 30, 2023 and 69 million euros at June 30, 2022 have no effect on the statement of cash flows at the time of acquisition. |
| (6) | Including payments related to liabilities on financed assets for (56) million euros at June 30, 2023 and (44) million euros at June 30, 2022. |
|
F-8 |
Note 1 Segment information
1.1 Segment revenue
|
|
|
|
|
|
|
|
|
|
|
(in millions of euros) |
|
France |
|
Europe |
||||||
|
|
|
|
Spain |
|
Other |
|
Eliminations |
|
Total |
|
|
|
|
|
|
European |
|
Europe |
|
|
|
|
|
|
|
|
countries (1) |
|
|
|
|
June 30, 2023 |
|
|
|
|
|
|
|
|
|
|
Revenue |
|
8,691 |
|
2,321 |
|
3,230 |
|
(5) |
|
5,546 |
Convergence services |
|
2,493 |
|
946 |
|
520 |
|
— |
|
1,466 |
Mobile-only services |
|
1,182 |
|
389 |
|
1,060 |
|
— |
|
1,449 |
Fixed-only services |
|
1,865 |
(5) |
231 |
|
384 |
|
— |
|
614 |
IT & integration services |
|
— |
|
23 |
|
238 |
|
— |
|
262 |
Wholesale |
|
2,257 |
|
384 |
|
434 |
|
(5) |
|
814 |
Equipment sales |
|
584 |
|
347 |
|
475 |
|
— |
|
822 |
Other revenue |
|
310 |
|
1 |
|
119 |
|
— |
|
120 |
External |
|
8,332 |
|
2,299 |
|
3,183 |
|
— |
|
5,482 |
Inter-operating segments |
|
359 |
|
22 |
|
47 |
|
(5) |
|
64 |
|
|
|
|
|
|
|
|
|
|
|
June 30, 2022 |
|
|
|
|
|
|
|
|
|
|
Revenue |
|
8,827 |
|
2,265 |
|
3,065 |
|
(5) |
|
5,325 |
Convergence services |
|
2,406 |
|
931 |
|
469 |
|
— |
|
1,400 |
Mobile-only services |
|
1,154 |
|
399 |
|
1,015 |
|
— |
|
1,414 |
Fixed-only services |
|
1,907 |
(5) |
217 |
|
397 |
|
— |
|
614 |
IT & integration services |
|
— |
|
18 |
|
196 |
|
— |
|
214 |
Wholesale |
|
2,455 |
|
406 |
|
476 |
|
(5) |
|
877 |
Equipment sales |
|
552 |
|
293 |
|
426 |
|
— |
|
719 |
Other revenue |
|
353 |
|
— |
|
87 |
|
— |
|
87 |
External |
|
8,485 |
|
2,240 |
|
3,015 |
|
— |
|
5,255 |
Inter-operating segments |
|
342 |
|
25 |
|
51 |
|
(5) |
|
70 |
| (1) | Including the contribution of VOO from June 2, 2023. The contribution of VOO to Group revenue amounts to 38 million euros at June 30, 2023. |
| (2) | Including, at the end of June 2023, revenue of 2,546 million euros in France,9 million euros in Spain, 861 million euros in other European countries and 528 million euros in other countries. |
Including, at the end of June 2022, revenue of 2,552 million euros in France, 8 million euros in Spain, 838 million euros in other European countries and 491 million euros in other countries.
| (3) | Including, at the end of June 2023, revenue of 239 million euros in France and 104 million euros in Spain. Including, at the end of June 2022, revenue of 224 million euros in France and 105 million euros in Spain. |
| (4) | Including revenue of 674 million euros at the end of June 2023 and 690 million euros at the end of June 2022 in France. |
| (5) | Including, at the end of June 2023, fixed only broadband revenue of 1,496 million euros and fixed only narrowband revenue of 369 million euros. |
Including, at the end of June 2022, fixed only broadband revenue of 1,473 million euros and fixed only narrowband revenue of 434 million euros.
| (6) | Including, at the end of June 2023, revenue of 1,177 million euros from data services and revenue of 464 million euros from voice services. |
Including, at the end of June 2022, revenue of 1,224 million euros from data services and revenue of 514 million euros from voice services.
(in millions of euros) |
|
Africa & |
|
Enterprise (2) |
|
Totem (3) |
|
International |
|
Eliminations |
|
Total |
|
Mobile |
|
Eliminations |
|
Orange |
|
|
Middle-East |
|
|
|
|
|
Carriers & |
|
telecom |
|
telecom |
|
Financial |
|
telecom |
|
consolidated |
|
|
|
|
|
|
|
|
Shared |
|
activities |
|
activities |
|
Services |
|
activities / |
|
financial |
|
|
|
|
|
|
|
|
Services (4) |
|
|
|
|
|
|
|
mobile |
|
statements |
|
|
|
|
|
|
|
|
|
|
|
|
|
|
|
|
financial |
|
|
|
|
|
|
|
|
|
|
|
|
|
|
|
|
|
|
services |
|
|
June 30, 2023 |
|
|
|
|
|
|
|
|
|
|
|
|
|
|
|
|
|
|
Revenue |
|
3,472 |
|
3,944 |
|
342 |
|
763 |
|
(1,210) |
|
21,549 |
|
— |
|
(4) |
|
21,545 |
Convergence services |
|
— |
|
— |
|
— |
|
— |
|
— |
|
3,958 |
|
— |
|
— |
|
3,958 |
Mobile-only services |
|
2,652 |
|
348 |
|
— |
|
— |
|
(19) |
|
5,611 |
|
— |
|
(0) |
|
5,611 |
Fixed-only services |
|
411 |
|
1,641 |
(6) |
— |
|
— |
|
(64) |
|
4,467 |
|
— |
|
(0) |
|
4,467 |
IT & integration services |
|
21 |
|
1,794 |
|
— |
|
— |
|
(89) |
|
1,987 |
|
— |
|
(3) |
|
1,985 |
Wholesale |
|
324 |
|
20 |
|
342 |
|
516 |
|
(885) |
|
3,389 |
|
— |
|
— |
|
3,389 |
Equipment sales |
|
43 |
|
140 |
|
— |
|
— |
|
(4) |
|
1,586 |
|
— |
|
(0) |
|
1,586 |
Other revenue |
|
21 |
|
— |
|
— |
|
247 |
|
(148) |
|
550 |
|
— |
|
(1) |
|
549 |
External |
|
3,386 |
|
3,767 |
|
64 |
|
514 |
|
— |
|
21,545 |
|
— |
|
— |
|
21,545 |
Inter-operating segments |
|
86 |
|
177 |
|
278 |
|
249 |
|
(1,210) |
|
4 |
|
— |
|
(4) |
|
— |
|
|
|
|
|
|
|
|
|
|
|
|
|
|
|
|
|
|
|
June 30, 2022 |
|
|
|
|
|
|
|
|
|
|
|
|
|
|
|
|
|
|
Revenue |
|
3,381 |
|
3,888 |
|
328 |
|
772 |
|
(1,220) |
|
21,301 |
|
— |
|
(4) |
|
21,297 |
Convergence services |
|
— |
|
— |
|
— |
|
— |
|
— |
|
3,806 |
|
— |
|
— |
|
3,806 |
Mobile-only services |
|
2,578 |
|
325 |
|
— |
|
— |
|
(18) |
|
5,454 |
|
— |
|
(0) |
|
5,454 |
Fixed-only services |
|
384 |
|
1,738 |
(6) |
— |
|
— |
|
(75) |
|
4,568 |
|
— |
|
(1) |
|
4,567 |
IT & integration services |
|
21 |
|
1,663 |
|
— |
|
— |
|
(96) |
|
1,802 |
|
— |
|
(2) |
|
1,799 |
Wholesale |
|
324 |
|
20 |
|
328 |
|
539 |
|
(904) |
|
3,638 |
|
— |
|
— |
|
3,638 |
Equipment sales |
|
55 |
|
141 |
|
— |
|
— |
|
(3) |
|
1,465 |
|
— |
|
(0) |
|
1,465 |
Other revenue |
|
18 |
|
— |
|
— |
|
234 |
|
(124) |
|
568 |
|
— |
|
(1) |
|
567 |
External |
|
3,298 |
|
3,692 |
|
56 |
|
511 |
|
— |
|
21,297 |
|
— |
|
— |
|
21,297 |
Inter-operating segments |
|
83 |
|
196 |
|
272 |
|
261 |
|
(1,220) |
|
4 |
|
— |
|
(4) |
|
— |
|
F-9 |
1.2 Segment revenue to consolidated net income at June 30, 2023
|
|
|
|
|
|
|
|
|
|
|
|
|
(in millions of euros) |
|
France |
|
Europe |
|
Africa & |
||||||
|
|
|
|
Spain |
|
Other |
|
Elimina- |
|
Total |
|
Middle- |
|
|
|
|
|
|
European |
|
tions |
|
|
|
East |
|
|
|
|
|
|
countries(1) |
|
Europe |
|
|
|
|
|
|
|
|
|
|
|
|
|
|
|
|
|
Revenue |
|
8,691 |
|
2,321 |
|
3,230 |
|
(5) |
|
5,546 |
|
3,472 |
External purchases |
|
(3,572) |
|
(1,414) |
|
(1,880) |
|
5 |
|
(3,290) |
|
(1,352) |
Other operating income |
|
594 |
|
46 |
|
142 |
|
(2) |
|
187 |
|
23 |
Other operating expenses |
|
(260) |
|
(74) |
|
(72) |
|
2 |
|
(145) |
|
(117) |
Labor expenses |
|
(1,711) |
|
(135) |
|
(392) |
|
— |
|
(528) |
|
(296) |
Operating taxes and levies |
|
(662) |
|
(64) |
|
(56) |
|
— |
|
(120) |
|
(348) |
Gains (losses) on disposal of fixed assets, investments and activities |
|
— |
|
— |
|
— |
|
— |
|
— |
|
— |
Restructuring costs |
|
— |
|
— |
|
— |
|
— |
|
— |
|
— |
Depreciation and amortization of financed assets |
|
(59) |
|
— |
|
— |
|
— |
|
— |
|
— |
Depreciation and amortization of right-of-use assets |
|
(126) |
|
(82) |
|
(101) |
|
— |
|
(184) |
|
(94) |
Impairment of right-of-use assets |
|
— |
|
— |
|
— |
|
— |
|
— |
|
— |
Interests on debts related to financed assets(3) |
|
(6) |
|
— |
|
— |
|
— |
|
— |
|
— |
Interests on lease liabilities(3) |
|
(29) |
|
(15) |
|
(22) |
|
— |
|
(37) |
|
(28) |
EBITDAaL |
|
2,859 |
|
582 |
|
848 |
|
— |
|
1,430 |
|
1,260 |
Significant litigations |
|
95 |
|
— |
|
— |
|
— |
|
— |
|
(38) |
Specific labour expenses |
|
(188) |
|
— |
|
— |
|
— |
|
— |
|
— |
Fixed assets, investments and businesses portfolio review |
|
— |
|
— |
|
25 |
|
— |
|
25 |
|
3 |
Restructuring programs costs |
|
(2) |
|
— |
|
(10) |
|
— |
|
(10) |
|
(2) |
Acquisition and integration costs |
|
— |
|
(3) |
|
(23) |
|
— |
|
(26) |
|
— |
Depreciation and amortization of fixed assets |
|
(1,602) |
|
(513) |
|
(565) |
|
— |
|
(1,078) |
|
(516) |
Reclassification of translation adjustment from liquidated entities |
|
— |
|
— |
|
— |
|
— |
|
— |
|
— |
Impairment of goodwill |
|
— |
|
— |
|
— |
|
— |
|
— |
|
— |
Impairment of fixed assets |
|
— |
|
— |
|
(3) |
|
— |
|
(3) |
|
(2) |
Share of profits (losses) of associates and joint ventures |
|
(12) |
|
— |
|
(4) |
|
— |
|
(4) |
|
9 |
Elimination of interests on debts related to financed assets(3) |
|
6 |
|
— |
|
— |
|
— |
|
— |
|
— |
Elimination of interests on lease liabilities(3) |
|
29 |
|
15 |
|
22 |
|
— |
|
37 |
|
28 |
Operating Income |
|
1,186 |
|
81 |
|
290 |
|
— |
|
371 |
|
742 |
Cost of gross financial debt except financed assets |
|
— |
|
— |
|
— |
|
— |
|
— |
|
— |
Interests on debts related to financed assets(3) |
|
— |
|
— |
|
— |
|
— |
|
— |
|
— |
Gains (losses) on assets contributing to net financial debt |
|
— |
|
— |
|
— |
|
— |
|
— |
|
— |
Foreign exchange gain (loss) |
|
— |
|
— |
|
— |
|
— |
|
— |
|
— |
Interests on lease liabilities(3) |
|
— |
|
— |
|
— |
|
— |
|
— |
|
— |
Other net financial expenses |
|
— |
|
— |
|
— |
|
— |
|
— |
|
— |
Finance costs, net |
|
— |
|
— |
|
— |
|
— |
|
— |
|
— |
Income Tax |
|
— |
|
— |
|
— |
|
— |
|
— |
|
— |
Consolidated net income |
|
— |
|
— |
|
— |
|
— |
|
— |
|
— |
| (1) | Including the contribution of VOO from June 2, 2023. |
| (2) | Mobile Financial Services' net banking income is recognized in other operating income and amounts to 75 million euros at the end of June 2023. The cost of risk is included in other operating expenses and amounts to (32) million euros at the end of June 2023. |
| (3) | Presentation adjustments allow the reallocation of the lines of specific items identified in the segment information to the operating revenue and expense lines presented in the consolidated income statement. Interests on debts related to financed assets and interests on lease liabilities are included in segment EBITDAaL. They are excluded from segment operating income and included in net finance costs presented in the consolidated income statement. |
(in millions of euros) |
|
Enterprise |
|
Totem |
|
Interna- |
|
Elimination |
|
Total |
|
Mobile |
|
Elimina- |
|
Total |
|
Presenta- |
|
Orange |
|
|
|
|
|
|
tional |
|
telecom |
|
telecom |
|
Financial |
|
tions |
|
|
|
tion adjust- |
|
consoli- |
|
|
|
|
|
|
Carriers & |
|
activities |
|
activities |
|
Services (2) |
|
telecom |
|
|
|
ments(3) |
|
dated |
|
|
|
|
|
|
Shared |
|
|
|
|
|
|
|
activites / |
|
|
|
|
|
financial |
|
|
|
|
|
|
Services |
|
|
|
|
|
|
|
mobile |
|
|
|
|
|
statements |
|
|
|
|
|
|
|
|
|
|
|
|
|
|
financial |
|
|
|
|
|
|
|
|
|
|
|
|
|
|
|
|
|
|
|
|
services |
|
|
|
|
|
|
Revenue |
|
3,944 |
|
342 |
|
763 |
|
(1,210) |
|
21,549 |
|
— |
|
(4) |
|
21,545 |
|
— |
|
21,545 |
External purchases |
|
(2,173) |
|
(59) |
|
(999) |
|
2,171 |
|
(9,274) |
|
(62) |
|
5 |
|
(9,331) |
|
(16) |
|
(9,347) |
Other operating income |
|
98 |
|
— |
|
1,027 |
|
(1,629) |
|
300 |
|
77 |
|
(2) |
|
376 |
|
— |
|
376 |
Other operating expenses |
|
(297) |
|
— |
|
(7) |
|
668 |
|
(158) |
|
(35) |
|
1 |
|
(191) |
|
41 |
|
(150) |
Labor expenses |
|
(1,135) |
|
(8) |
|
(640) |
|
— |
|
(4,318) |
|
(41) |
|
— |
|
(4,359) |
|
(265) |
|
(4,624) |
Operating taxes and levies |
|
(40) |
|
(3) |
|
(47) |
|
— |
|
(1,220) |
|
(1) |
|
— |
|
(1,221) |
|
(2) |
|
(1,223) |
Gains (losses) on disposal of fixed assets, investments and activities |
|
— |
|
— |
|
— |
|
— |
|
— |
|
— |
|
— |
|
— |
|
50 |
|
50 |
Restructuring costs |
|
— |
|
— |
|
— |
|
— |
|
— |
|
— |
|
— |
|
— |
|
(35) |
|
(35) |
Depreciation and amortization of financed assets |
|
— |
|
— |
|
— |
|
— |
|
(59) |
|
— |
|
— |
|
(59) |
|
— |
|
(59) |
Depreciation and amortization of right-of-use assets |
|
(83) |
|
(83) |
|
(171) |
|
— |
|
(740) |
|
(2) |
|
— |
|
(742) |
|
(3) |
|
(745) |
Impairment of right-of-use assets |
|
(1) |
|
— |
|
— |
|
— |
|
— |
|
— |
|
— |
|
— |
|
(28) |
|
(28) |
Interests on debts related to financed assets(3) |
|
— |
|
— |
|
— |
|
— |
|
(6) |
|
— |
|
— |
|
(6) |
|
6 |
|
n/a |
Interests on lease liabilities(3) |
|
(5) |
|
(5) |
|
(12) |
|
— |
|
(116) |
|
— |
|
— |
|
(116) |
|
116 |
|
n/a |
EBITDAaL |
|
311 |
|
183 |
|
(86) |
|
— |
|
5,957 |
|
(62) |
|
— |
|
5,895 |
|
(137) |
|
n/a |
Significant litigations |
|
— |
|
— |
|
— |
|
— |
|
57 |
|
— |
|
— |
|
57 |
|
(57) |
|
n/a |
Specific labour expenses |
|
(29) |
|
— |
|
(48) |
|
— |
|
(265) |
|
— |
|
— |
|
(265) |
|
265 |
|
n/a |
Fixed assets, investments and businesses portfolio review |
|
12 |
|
— |
|
8 |
|
— |
|
50 |
|
— |
|
— |
|
50 |
|
(50) |
|
n/a |
Restructuring programs costs |
|
(4) |
|
— |
|
(52) |
|
— |
|
(70) |
|
— |
|
— |
|
(70) |
|
70 |
|
n/a |
Acquisition and integration costs |
|
— |
|
— |
|
(4) |
|
— |
|
(31) |
|
— |
|
— |
|
(31) |
|
31 |
|
n/a |
Depreciation and amortization of fixed assets |
|
(176) |
|
(61) |
|
(160) |
|
— |
|
(3,593) |
|
(11) |
|
— |
|
(3,604) |
|
— |
|
(3,604) |
Reclassification of translation adjustment from liquidated entities |
|
— |
|
— |
|
— |
|
— |
|
— |
|
— |
|
— |
|
— |
|
— |
|
— |
Impairment of goodwill |
|
— |
|
— |
|
— |
|
— |
|
— |
|
— |
|
— |
|
— |
|
— |
|
— |
Impairment of fixed assets |
|
— |
|
— |
|
1 |
|
— |
|
(4) |
|
— |
|
— |
|
(4) |
|
— |
|
(4) |
Share of profits (losses) of associates and joint ventures |
|
— |
|
— |
|
(1) |
|
— |
|
(8) |
|
— |
|
— |
|
(8) |
|
— |
|
(8) |
Elimination of interests on debts related to financed assets(3) |
|
— |
|
— |
|
— |
|
— |
|
6 |
|
— |
|
— |
|
6 |
|
(6) |
|
n/a |
Elimination of interests on lease liabilities(3) |
|
5 |
|
5 |
|
12 |
|
— |
|
116 |
|
— |
|
— |
|
116 |
|
(116) |
|
n/a |
Operating Income |
|
118 |
|
127 |
|
(329) |
|
— |
|
2,215 |
|
(73) |
|
— |
|
2,142 |
|
— |
|
2,142 |
Cost of gross financial debt except financed assets |
|
— |
|
— |
|
— |
|
— |
|
— |
|
— |
|
— |
|
— |
|
— |
|
(528) |
Interests on debts related to financed assets(3) |
|
— |
|
— |
|
— |
|
— |
|
— |
|
— |
|
— |
|
— |
|
— |
|
(6) |
Gains (losses) on assets contributing to net financial debt |
|
— |
|
— |
|
— |
|
— |
|
— |
|
— |
|
— |
|
— |
|
— |
|
130 |
Foreign exchange gain (loss) |
|
— |
|
— |
|
— |
|
— |
|
— |
|
— |
|
— |
|
— |
|
— |
|
(32) |
Interests on lease liabilities(3) |
|
— |
|
— |
|
— |
|
— |
|
— |
|
— |
|
— |
|
— |
|
— |
|
(116) |
Other net financial expenses |
|
— |
|
— |
|
— |
|
— |
|
— |
|
— |
|
— |
|
— |
|
— |
|
(40) |
Finance costs, net |
|
— |
|
— |
|
— |
|
— |
|
— |
|
— |
|
— |
|
— |
|
— |
|
(592) |
Income tax |
|
— |
|
— |
|
— |
|
— |
|
— |
|
— |
|
— |
|
— |
|
— |
|
(461) |
Consolidated net income |
|
— |
|
— |
|
— |
|
— |
|
— |
|
— |
|
— |
|
— |
|
— |
|
1,088 |
|
F-10 |
1.3 Segment revenue to consolidated net income at June 30, 2022
(in millions of euros) |
|
France |
|
Europe |
|
Africa & |
||||||
|
|
|
|
Spain |
|
Other |
|
Elimina- |
|
Total |
|
Middle- |
|
|
|
|
|
|
European |
|
tions |
|
|
|
East |
|
|
|
|
|
|
countries |
|
Europe |
|
|
|
|
|
|
|
|
|
|
|
|
|
|
|
|
|
Revenue |
|
8,827 |
|
2,265 |
|
3,065 |
|
(5) |
|
5,325 |
|
3,381 |
External purchases |
|
(3,537) |
|
(1,407) |
|
(1,762) |
|
5 |
|
(3,164) |
|
(1,335) |
Other operating income |
|
618 |
|
47 |
|
141 |
|
— |
|
188 |
|
21 |
Other operating expenses |
|
(250) |
|
(77) |
|
(106) |
|
— |
|
(183) |
|
(113) |
Labor expenses |
|
(1,775) |
|
(128) |
|
(369) |
|
— |
|
(497) |
|
(290) |
Operating taxes and levies |
|
(664) |
|
(82) |
|
(59) |
|
— |
|
(141) |
|
(324) |
Gains (losses) on disposal of fixed assets, investments and activities |
|
— |
|
— |
|
— |
|
— |
|
— |
|
— |
Restructuring costs |
|
— |
|
— |
|
— |
|
— |
|
— |
|
— |
Depreciation and amortization of financed assets |
|
(47) |
|
— |
|
— |
|
— |
|
— |
|
— |
Depreciation and amortization of right-of-use assets |
|
(130) |
|
(86) |
|
(101) |
|
— |
|
(187) |
|
(95) |
Impairment of right-of-use assets |
|
— |
|
— |
|
— |
|
— |
|
— |
|
— |
Interests on debts related to financed assets(2) |
|
(1) |
|
— |
|
— |
|
— |
|
— |
|
— |
Interests on lease liabilities(2) |
|
(5) |
|
(8) |
|
(10) |
|
— |
|
(18) |
|
(31) |
EBITDAaL |
|
3,035 |
|
524 |
|
799 |
|
— |
|
1,323 |
|
1,214 |
Significant litigations |
|
— |
|
— |
|
— |
|
— |
|
— |
|
— |
Specific labour expenses |
|
(39) |
|
— |
|
— |
|
— |
|
— |
|
— |
Fixed assets, investments and businesses portfolio review |
|
— |
|
— |
|
20 |
|
— |
|
20 |
|
2 |
Restructuring programs costs |
|
(13) |
|
(8) |
|
(3) |
|
— |
|
(11) |
|
(4) |
Acquisition and integration costs |
|
— |
|
— |
|
(13) |
|
— |
|
(13) |
|
— |
Depreciation and amortization of fixed assets |
|
(1,551) |
|
(543) |
|
(533) |
|
— |
|
(1,076) |
|
(509) |
Reclassification of translation adjustment from liquidated entities |
|
— |
|
— |
|
— |
|
— |
|
— |
|
— |
Impairment of goodwill |
|
— |
|
— |
|
— |
|
— |
|
— |
|
— |
Impairment of fixed assets |
|
— |
|
— |
|
— |
|
— |
|
— |
|
(2) |
Share of profits (losses) of associates and joint ventures |
|
(3) |
|
— |
|
(1) |
|
— |
|
(1) |
|
7 |
Elimination of interests on debts related to financed assets(2) |
|
1 |
|
— |
|
— |
|
— |
|
— |
|
— |
Elimination of interests on lease liabilities(2) |
|
5 |
|
8 |
|
10 |
|
— |
|
18 |
|
31 |
Operating Income |
|
1,436 |
|
(19) |
|
278 |
|
— |
|
260 |
|
739 |
Cost of gross financial debt except financed assets |
|
— |
|
— |
|
— |
|
— |
|
— |
|
— |
Interests on debts related to financed assets(2) |
|
— |
|
— |
|
— |
|
— |
|
— |
|
— |
Gains (losses) on assets contributing to net financial debt |
|
— |
|
— |
|
— |
|
— |
|
— |
|
— |
Foreign exchange gain (loss) |
|
— |
|
— |
|
— |
|
— |
|
— |
|
— |
Interests on lease liabilities(2) |
|
— |
|
— |
|
— |
|
— |
|
— |
|
— |
Other net financial expenses |
|
— |
|
— |
|
— |
|
— |
|
— |
|
— |
Finance costs, net |
|
— |
|
— |
|
— |
|
— |
|
— |
|
— |
Income taxes |
|
— |
|
— |
|
— |
|
— |
|
— |
|
— |
Consolidated net income |
|
— |
|
— |
|
— |
|
— |
|
— |
|
— |
| (1) | Mobile Financial Services' net banking income is recognized in other operating income and amounts to 56 million euros at the end of June 2022. The cost of risk is included in other operating expenses and amounts to (22) million euros at the end of June 2022. |
| (2) | Presentation adjustments allow the reallocation of the lines of specific items identified in the segment information to the operating revenue and expense lines presented in the consolidated income statement. Interests on debts related to financed assets and interests on lease liabilities are included in segment EBITDAaL. They are excluded from segment operating income and included in net finance costs presented in the consolidated income statement. |
(in millions of euros) |
|
Enterprise |
|
Totem |
|
Interna- |
|
Elimina- |
|
Total |
|
Mobile |
|
Elimina- |
|
Total |
|
Presenta- |
|
Orange |
|
|
|
|
|
|
tional |
|
tion |
|
telecom |
|
Financial |
|
tions |
|
|
|
tion |
|
consoli- |
|
|
|
|
|
|
Carriers & |
|
telecom |
|
activities |
|
Services(1) |
|
telecom |
|
|
|
adjust- |
|
dated |
|
|
|
|
|
|
Shared |
|
activities |
|
|
|
|
|
activities/ |
|
|
|
ments (2) |
|
financial |
|
|
|
|
|
|
Services |
|
|
|
|
|
|
|
mobile |
|
|
|
|
|
statements |
|
|
|
|
|
|
|
|
|
|
|
|
|
|
financial |
|
|
|
|
|
|
|
|
|
|
|
|
|
|
|
|
|
|
|
|
services |
|
|
|
|
|
|
Revenue |
|
3,888 |
|
328 |
|
772 |
|
(1,220) |
|
21,301 |
|
— |
|
(4) |
|
21,297 |
|
— |
|
21,297 |
External purchases |
|
(2,041) |
|
(59) |
|
(1,019) |
|
2,172 |
|
(8,984) |
|
(64) |
|
9 |
|
(9,039) |
|
(11) |
|
(9,050) |
Other operating income |
|
90 |
|
— |
|
1,020 |
|
(1,629) |
|
309 |
|
65 |
|
(8) |
|
366 |
|
— |
|
366 |
Other operating expenses |
|
(337) |
|
— |
|
(5) |
|
677 |
|
(211) |
|
(14) |
|
4 |
|
(222) |
|
(9) |
|
(231) |
Labor expenses |
|
(1,109) |
|
(6) |
|
(644) |
|
— |
|
(4,321) |
|
(40) |
|
— |
|
(4,361) |
|
33 |
|
(4,329) |
Operating taxes and levies |
|
(48) |
|
(4) |
|
(53) |
|
— |
|
(1,234) |
|
(1) |
|
— |
|
(1,235) |
|
— |
|
(1,235) |
Gains (losses) on disposal of fixed assets, investments and activities |
|
— |
|
— |
|
— |
|
— |
|
— |
|
— |
|
— |
|
— |
|
36 |
|
36 |
Restructuring costs |
|
— |
|
— |
|
— |
|
— |
|
— |
|
— |
|
— |
|
— |
|
(47) |
|
(47) |
Depreciation and amortization of financed assets |
|
— |
|
— |
|
— |
|
— |
|
(47) |
|
— |
|
— |
|
(47) |
|
— |
|
(47) |
Depreciation and amortization of right-of-use assets |
|
(75) |
|
(78) |
|
(195) |
|
— |
|
(761) |
|
(2) |
|
— |
|
(762) |
|
— |
|
(762) |
Impairment of right-of-use assets |
|
(1) |
|
— |
|
— |
|
— |
|
(1) |
|
— |
|
— |
|
(1) |
|
6 |
|
5 |
Interests on debts related to financed assets(2) |
|
— |
|
— |
|
— |
|
— |
|
(1) |
|
— |
|
— |
|
(1) |
|
1 |
|
n/a |
Interests on lease liabilities(2) |
|
(2) |
|
(2) |
|
(3) |
|
— |
|
(61) |
|
— |
|
— |
|
(61) |
|
61 |
|
n/a |
EBITDAaL |
|
364 |
|
180 |
|
(128) |
|
— |
|
5,989 |
|
(56) |
|
— |
|
5,934 |
|
70 |
|
n/a |
Significant litigations |
|
— |
|
— |
|
(2) |
|
— |
|
(2) |
|
— |
|
— |
|
(2) |
|
2 |
|
n/a |
Specific labour expenses |
|
(4) |
|
— |
|
79 |
|
— |
|
36 |
|
— |
|
— |
|
35 |
|
(35) |
|
n/a |
Fixed assets, investments and businesses portfolio review |
|
3 |
|
— |
|
12 |
|
— |
|
36 |
|
— |
|
— |
|
36 |
|
(36) |
|
n/a |
Restructuring programs costs |
|
(11) |
|
— |
|
(2) |
|
— |
|
(41) |
|
— |
|
— |
|
(41) |
|
41 |
|
n/a |
Acquisition and integration costs |
|
— |
|
— |
|
(7) |
|
— |
|
(21) |
|
(1) |
|
— |
|
(21) |
|
21 |
|
n/a |
Depreciation and amortization of fixed assets |
|
(205) |
|
(61) |
|
(161) |
|
— |
|
(3,563) |
|
(23) |
|
— |
|
(3,585) |
|
— |
|
(3,585) |
Reclassification of translation adjustment from liquidated entities |
|
3 |
|
— |
|
— |
|
— |
|
3 |
|
— |
|
— |
|
3 |
|
— |
|
3 |
Impairment of goodwill |
|
— |
|
— |
|
— |
|
— |
|
— |
|
— |
|
— |
|
— |
|
— |
|
— |
Impairment of fixed assets |
|
— |
|
— |
|
— |
|
— |
|
(2) |
|
— |
|
— |
|
(2) |
|
— |
|
(2) |
Share of profits (losses) of associates and joint ventures |
|
— |
|
— |
|
(2) |
|
— |
|
1 |
|
— |
|
— |
|
1 |
|
— |
|
1 |
Elimination of interests on debts related to financed assets(2) |
|
— |
|
— |
|
— |
|
— |
|
1 |
|
— |
|
— |
|
1 |
|
(1) |
|
n/a |
Elimination of interests on lease liabilities(2) |
|
2 |
|
2 |
|
3 |
|
— |
|
61 |
|
— |
|
— |
|
61 |
|
(61) |
|
n/a |
Operating Income |
|
152 |
|
120 |
|
(207) |
|
— |
|
2,499 |
|
(80) |
|
— |
|
2,420 |
|
— |
|
2,420 |
Cost of gross financial debt except financed assets |
|
— |
|
— |
|
— |
|
— |
|
— |
|
— |
|
— |
|
— |
|
— |
|
(297) |
Interests on debts related to financed assets(2) |
|
— |
|
— |
|
— |
|
— |
|
— |
|
— |
|
— |
|
— |
|
— |
|
(1) |
Gains (losses) on assets contributing to net financial debt |
|
— |
|
— |
|
— |
|
— |
|
— |
|
— |
|
— |
|
— |
|
— |
|
(9) |
Foreign exchange gain (loss) |
|
— |
|
— |
|
— |
|
— |
|
— |
|
— |
|
— |
|
— |
|
— |
|
(40) |
Interests on lease liabilities(2) |
|
— |
|
— |
|
— |
|
— |
|
— |
|
— |
|
— |
|
— |
|
— |
|
(61) |
Other net financial expenses |
|
— |
|
— |
|
— |
|
— |
|
— |
|
— |
|
— |
|
— |
|
— |
|
36 |
Finance costs, net |
|
— |
|
— |
|
— |
|
— |
|
— |
|
— |
|
— |
|
— |
|
— |
|
(373) |
Income taxes |
|
— |
|
— |
|
— |
|
— |
|
— |
|
— |
|
— |
|
— |
|
— |
|
(580) |
Consolidated net income |
|
— |
|
— |
|
— |
|
— |
|
— |
|
— |
|
— |
|
— |
|
— |
|
1,467 |
|
F-11 |
1.4 Segment investments
|
|
|
|
|
|
|
|
|
|
|
(in millions of euros) |
|
France |
|
Europe |
||||||
|
|
|
|
Spain |
|
Other |
|
Elimina- |
|
Total |
|
|
|
|
|
|
European |
|
tions |
|
|
|
|
|
|
|
|
countries(1) |
|
Europe |
|
|
|
|
|
|
|
|
|
|
|
|
|
|
|
|
|
|
|
|
|
|
|
|
June 30, 2023 |
|
|
|
|
|
|
|
|
|
|
eCapex |
|
1,429 |
|
347 |
|
407 |
|
— |
|
754 |
Elimination of proceeds from sales of property, plant and equipment and intangible assets |
|
78 |
|
— |
|
46 |
|
— |
|
46 |
Telecommunications licenses |
|
— |
|
31 |
|
313 |
|
— |
|
344 |
Financed assets |
|
145 |
|
— |
|
— |
|
— |
|
— |
Total investments(4) |
|
1,652 |
|
378 |
|
766 |
|
— |
|
1,143 |
|
|
|
|
|
|
|
|
|
|
|
June 30, 2022 |
|
|
|
|
|
|
|
|
|
|
eCapex |
|
1,673 |
|
465 |
|
369 |
|
— |
|
835 |
Elimination of proceeds from sales of property, plant and equipment and intangible assets |
|
59 |
|
— |
|
36 |
|
— |
|
36 |
Telecommunications licenses |
|
8 |
|
6 |
|
27 |
|
— |
|
33 |
Financed assets |
|
69 |
|
— |
|
— |
|
— |
|
— |
Total investments (5) |
|
1,809 |
|
472 |
|
432 |
|
— |
|
904 |
| (1) | Including the contribution of VOO from June 2, 2023. |
| (2) | Including investments in intangible assets and property, plant and equipment in France for 106 million euros at the end of June 2023 and 100 million euros at the end of June 2022. |
| (3) | Including investments in intangible assets and property, plant and equipment in France for 106 million euros at the end of June 2023 and 110 million euros at the end of June 2022. |
| (4) | Including 1,163 million euros for other intangible assets and 2,671 million euros for tangible assets. |
| (5) | Including 991 million euros for other intangible assets and 2,858 million euros for tangible assets. |
(in millions of euros) |
|
Africa & |
|
Enterpri- |
|
Totem |
|
International |
|
Eliminations |
|
Total |
|
Mobile |
|
Eliminations |
|
Orange |
|
|
Middle East |
|
se(2) |
|
|
|
Carriers & |
|
telecom |
|
telecom |
|
Financial |
|
telecom |
|
consolidated |
|
|
|
|
|
|
|
|
Shared |
|
activities |
|
activities |
|
Services |
|
activities/ |
|
financial |
|
|
|
|
|
|
|
|
Services (3) |
|
and |
|
|
|
|
|
mobile |
|
statements |
|
|
|
|
|
|
|
|
|
|
unallocated |
|
|
|
|
|
financial |
|
|
|
|
|
|
|
|
|
|
|
|
items |
|
|
|
|
|
services |
|
|
|
|
|
|
|
|
|
|
|
|
|
|
|
|
|
|
|
|
|
June 30, 2023 |
|
|
|
|
|
|
|
|
|
|
|
|
|
|
|
|
|
|
eCapex |
|
648 |
|
140 |
|
65 |
|
97 |
|
— |
|
3,133 |
|
20 |
|
— |
|
3,154 |
Elimination of proceeds from sales of property, plant and equipment and intangible assets |
|
4 |
|
14 |
|
— |
|
11 |
|
— |
|
153 |
|
— |
|
— |
|
153 |
Telecommunications licenses |
|
38 |
|
— |
|
— |
|
— |
|
— |
|
383 |
|
— |
|
— |
|
383 |
Financed assets |
|
— |
|
— |
|
— |
|
— |
|
— |
|
145 |
|
— |
|
— |
|
145 |
Total investments(4) |
|
690 |
|
155 |
|
65 |
|
108 |
|
— |
|
3,814 |
|
20 |
|
— |
|
3,834 |
|
|
|
|
|
|
|
|
|
|
|
|
|
|
|
|
|
|
|
June 30, 2022 |
|
|
|
|
|
|
|
|
|
|
|
|
|
|
|
|
|
|
eCapex |
|
609 |
|
144 |
|
44 |
|
94 |
|
— |
|
3,399 |
|
14 |
|
— |
|
3,413 |
Elimination of proceeds from sales of property, plant and equipment and intangible assets |
|
3 |
|
8 |
|
— |
|
19 |
|
— |
|
124 |
|
— |
|
— |
|
124 |
Telecommunications licenses |
|
203 |
|
— |
|
— |
|
— |
|
— |
|
244 |
|
— |
|
— |
|
244 |
Financed assets |
|
— |
|
— |
|
— |
|
— |
|
— |
|
69 |
|
— |
|
— |
|
69 |
Total investments (5) |
|
815 |
|
151 |
|
44 |
|
113 |
|
— |
|
3,836 |
|
14 |
|
— |
|
3,850 |
|
F-12 |
1.5 Segment assets
|
|
|
|
|
|
|
|
|
|
|
(in millions of euros) |
|
France |
|
Europe |
||||||
|
|
|
|
Spain |
|
Other |
|
Elimina- |
|
Total |
|
|
|
|
|
|
European |
|
tions |
|
|
|
|
|
|
|
|
countries (1) |
|
Europe |
|
|
|
|
|
|
|
|
|
|
|
|
|
June 30, 2023 |
|
|
|
|
|
|
|
|
|
|
Goodwill |
|
13,176 |
|
2,734 |
|
2,746 |
|
— |
|
5,480 |
Other intangible assets |
|
4,227 |
|
1,938 |
|
2,725 |
|
— |
|
4,663 |
Property, plant and equipment |
|
16,923 |
|
3,561 |
|
5,191 |
|
— |
|
8,752 |
Right-of-use assets |
|
2,152 |
|
1,165 |
|
1,035 |
|
— |
|
2,200 |
Interests in associates and joint ventures |
|
1,060 |
|
— |
|
340 |
|
— |
|
340 |
Non-current assets included in the calculation of net financial debt |
|
— |
|
— |
|
— |
|
— |
|
— |
Other |
|
8 |
|
13 |
|
29 |
|
— |
|
42 |
Total non-current assets |
|
37,546 |
|
9,411 |
|
12,066 |
|
— |
|
21,477 |
Inventories |
|
402 |
|
73 |
|
253 |
|
— |
|
325 |
Trade receivables |
|
1,831 |
|
588 |
|
1,298 |
|
— |
|
1,886 |
Other customer contract assets |
|
343 |
|
188 |
|
429 |
|
— |
|
617 |
Prepaid expenses |
|
75 |
|
396 |
|
92 |
|
— |
|
489 |
Current assets included in the calculation of net financial debt |
|
— |
|
— |
|
— |
|
— |
|
— |
Other |
|
854 |
|
52 |
|
177 |
|
— |
|
229 |
Total current assets |
|
3,507 |
|
1,297 |
|
2,249 |
|
— |
|
3,547 |
Total assets |
|
41,053 |
|
10,708 |
|
14,316 |
|
— |
|
25,024 |
|
|
|
|
|
|
|
|
|
|
|
December 31, 2022 |
|
|
|
|
|
|
|
|
|
|
Goodwill |
|
13,176 |
|
2,734 |
|
1,852 |
|
— |
|
4,586 |
Other intangible assets |
|
4,331 |
|
1,994 |
|
2,287 |
|
— |
|
4,280 |
Property, plant and equipment |
|
16,906 |
|
3,640 |
|
4,239 |
|
— |
|
7,879 |
Right-of-use assets |
|
1,946 |
|
1,035 |
|
1,023 |
|
— |
|
2,058 |
Interests in associates and joint ventures |
|
1,070 |
|
— |
|
313 |
|
— |
|
313 |
Non-current assets included in the calculation of net financial debt |
|
— |
|
— |
|
— |
|
— |
|
— |
Other |
|
9 |
|
12 |
|
43 |
|
— |
|
55 |
Total non-current assets |
|
37,438 |
|
9,415 |
|
9,755 |
|
— |
|
19,171 |
Inventories |
|
429 |
|
73 |
|
187 |
|
— |
|
260 |
Trade receivables |
|
2,055 |
|
601 |
|
1,176 |
|
(1) |
|
1,776 |
Other customer contract assets |
|
371 |
|
174 |
|
425 |
|
— |
|
600 |
Prepaid expenses |
|
41 |
|
373 |
|
61 |
|
— |
|
434 |
Current assets included in the calculation of net financial debt |
|
— |
|
— |
|
— |
|
— |
|
— |
Other |
|
789 |
|
77 |
|
215 |
|
— |
|
292 |
Total current assets |
|
3,685 |
|
1,298 |
|
2,064 |
|
(1) |
|
3,361 |
Total assets |
|
41,123 |
|
10,714 |
|
11,819 |
|
(1) |
|
22,532 |
| (1) | Including the contribution of VOO from June 2, 2023. |
| (2) | Including 1,318 million euros of current assets related to isolation of electronic money at the end of June 2023 and 1,242 million euros in 2022. |
| (3) | Including intangible and tangible assets for 532 million euros in France at the end of June 2023 and 526 million euros in 2022. |
| (4) | Including intangible and tangible assets for 757 million euros in France at the end of June 2023 and 748 million euros in 2022. |
|
F-13 |
(in millions of euros) |
|
Africa & |
|
Enterprise |
|
Totem |
|
International |
|
Eliminations |
|
Total |
|
Mobile |
|
Eliminations |
|
Orange |
|
|
Middle East |
|
|
|
|
|
Carriers & |
|
telecom |
|
telecom |
|
Financial |
|
telecom |
|
consolidated |
|
|
|
|
|
|
|
|
Shared |
|
activities |
|
activities |
|
Services |
|
activities / |
|
financial |
|
|
|
|
|
|
|
|
Services |
|
and |
|
|
|
|
|
mobile |
|
statements |
|
|
|
|
|
|
|
|
|
|
unallocated |
|
|
|
|
|
financial |
|
|
|
|
|
|
|
|
|
|
|
|
items |
|
|
|
|
|
services |
|
|
|
|
|
|
|
|
|
|
|
|
|
|
|
|
|
|
|
|
|
June 30, 2023 |
|
|
|
|
|
|
|
|
|
|
|
|
|
|
|
|
|
|
Goodwill |
|
1,411 |
|
2,255 |
|
1,624 |
|
18 |
|
— |
|
23,963 |
|
— |
|
— |
|
23,963 |
Other intangible assets |
|
1,820 |
|
581 |
(3) |
7 |
(4) |
3,746 |
(5) |
— |
|
15,044 |
|
64 |
|
— |
|
15,108 |
Property, plant and equipment |
|
4,392 |
|
395 |
(3) |
946 |
(4) |
1,109 |
(5) |
— |
|
32,517 |
|
9 |
|
— |
|
32,527 |
Right-of-use assets |
|
767 |
|
420 |
|
675 |
|
1,913 |
|
— |
|
8,128 |
|
22 |
|
— |
|
8,149 |
Interests in associates and joint ventures |
|
87 |
|
3 |
|
— |
|
11 |
|
— |
|
1,501 |
|
— |
|
— |
|
1,501 |
Non-current assets included in the calculation of net financial debt |
|
— |
|
— |
|
— |
|
— |
|
1,087 |
|
1,087 |
|
— |
|
— |
|
1,087 |
Other |
|
28 |
|
36 |
|
4 |
|
20 |
|
1,535 |
|
1,674 |
|
654 |
(6) |
(27) |
|
2,300 |
Total non-current assets |
|
8,505 |
|
3,690 |
|
3,257 |
|
6,818 |
|
2,623 |
|
83,915 |
|
749 |
|
(27) |
|
84,636 |
Inventories |
|
155 |
|
117 |
|
— |
|
90 |
|
- |
|
1,090 |
|
0 |
|
— |
|
1,090 |
Trade receivables |
|
1,036 |
|
1,323 |
|
238 |
|
1,175 |
|
(1,320) |
|
6,170 |
|
55 |
|
(41) |
|
6,184 |
Other customer contract assets |
|
10 |
|
664 |
|
— |
|
— |
|
- |
|
1,634 |
|
— |
|
— |
|
1,634 |
Prepaid expenses |
|
294 |
|
105 |
|
22 |
|
116 |
|
(33) |
|
1,069 |
|
29 |
|
— |
|
1,097 |
Current assets included in the calculation of net financial debt |
|
— |
|
— |
|
— |
|
— |
|
9,299 |
|
9,299 |
|
— |
|
— |
|
9,299 |
Other |
|
1,851 |
(2) |
256 |
|
13 |
|
580 |
|
(128) |
|
3,657 |
|
3,434 |
(7) |
(31) |
|
7,060 |
Total current assets |
|
3,347 |
|
2,465 |
|
273 |
|
1,963 |
|
7,818 |
|
22,919 |
|
3,518 |
|
(73) |
|
26,364 |
Total assets |
|
11,852 |
|
6,155 |
|
3,530 |
|
8,780 |
|
10,441 |
|
106,834 |
|
4,267 |
|
(100) |
|
111,000 |
|
|
|
|
|
|
|
|
|
|
|
|
|
|
|
|
|
|
|
December 31, 2022 |
|
|
|
|
|
|
|
|
|
|
|
|
|
|
|
|
|
|
Goodwill |
|
1,420 |
|
2,289 |
|
1,624 |
|
18 |
|
— |
|
23,113 |
|
— |
|
— |
|
23,113 |
Other intangible assets |
|
1,956 |
|
577 |
(3) |
6 |
(4) |
3,741 |
(5) |
— |
|
14,892 |
|
54 |
|
— |
|
14,946 |
Property, plant and equipment |
|
4,315 |
|
417 |
(3) |
943 |
(4) |
1,169 |
(5) |
— |
|
31,630 |
|
10 |
|
— |
|
31,640 |
Right-of-use assets |
|
819 |
|
438 |
|
649 |
|
2,002 |
|
— |
|
7,912 |
|
23 |
|
— |
|
7,936 |
Interests in associates and joint ventures |
|
89 |
|
3 |
|
— |
|
12 |
|
— |
|
1,486 |
|
— |
|
— |
|
1,486 |
Non-current assets included in the calculation of net financial debt |
|
— |
|
— |
|
— |
|
— |
|
1,390 |
|
1,390 |
|
— |
|
— |
|
1,390 |
Other |
|
27 |
|
36 |
|
4 |
|
21 |
|
1,430 |
|
1,583 |
|
781 |
(6) |
(27) |
|
2,337 |
Total non-current assets |
|
8,626 |
|
3,761 |
|
3,226 |
|
6,964 |
|
2,820 |
|
82,005 |
|
869 |
|
(27) |
|
82,847 |
Inventories |
|
127 |
|
91 |
|
— |
|
141 |
|
— |
|
1,048 |
|
0 |
|
— |
|
1,048 |
Trade receivables |
|
954 |
|
1,339 |
|
272 |
|
1,042 |
|
(1,200) |
|
6,237 |
|
130 |
|
(62) |
|
6,305 |
Other customer contract assets |
|
11 |
|
588 |
|
— |
|
— |
|
— |
|
1,570 |
|
— |
|
— |
|
1,570 |
Prepaid expenses |
|
178 |
|
125 |
|
19 |
|
61 |
|
(28) |
|
830 |
|
22 |
|
— |
|
851 |
Current assets included in the calculation of net financial debt |
|
— |
|
— |
|
— |
|
— |
|
10,451 |
|
10,451 |
|
— |
|
— |
|
10,451 |
Other |
|
1,720 |
(2) |
278 |
|
13 |
|
424 |
|
150 |
|
3,666 |
|
2,931 |
(7) |
(18) |
|
6,579 |
Total current assets |
|
2,991 |
|
2,421 |
|
304 |
|
1,668 |
|
9,373 |
|
23,801 |
|
3,083 |
|
(81) |
|
26,803 |
Total assets |
|
11,616 |
|
6,182 |
|
3,530 |
|
8,631 |
|
12,192 |
|
105,807 |
|
3,951 |
|
(108) |
|
109,650 |
| (5) | Including intangible and tangible assets for 1,692 million euros in France at the end of June 2023 and 1,746 million euros in 2022. Intangible assets also include the Orange brand for 3,133 million euros. |
| (6) | Including 644 million euros of non-current financial assets related to Mobile Financial Services at the end of June 2023 and 772 million euros in 2022 (see Note 12.1). |
| (7) | Including 3,271 million euros of current financial assets related to Mobile Financial Services at the end of June 2023 (of which 569 million euros related to trade receivables sold by Orange Spain) and including 2,747 million euros of current financial assets related to Mobile Financial Services in 2022 (of which 519 million euros related to trade receivables sold by Orange Spain) (see Note 12.1). |
|
F-14 |
1.6 Segment liabilities
|
|
|
|
|
|
|
|
|
|
|
(in millions of euros) |
|
France |
|
Europe |
||||||
|
|
|
|
Spain |
|
Other |
|
Elimina- |
|
Total |
|
|
|
|
|
|
European |
|
tions |
|
|
|
|
|
|
|
|
countries(1) |
|
Europe |
|
|
|
|
|
|
|
|
|
|
|
|
|
June 30, 2023 |
|
|
|
|
|
|
|
|
|
|
Equity |
|
— |
|
— |
|
— |
|
— |
|
— |
Non-current lease liabilities |
|
1,932 |
|
1,072 |
|
869 |
|
— |
|
1,941 |
Non-current fixed assets payables |
|
466 |
|
405 |
|
484 |
|
— |
|
889 |
Non-current employee benefits |
|
1,492 |
|
3 |
|
59 |
|
— |
|
62 |
Non-current liabilities included in the calculation of net financial debt |
|
— |
|
— |
|
- |
|
— |
|
— |
Other |
|
346 |
|
13 |
|
269 |
|
— |
|
282 |
Total non-current liabilities |
|
4,236 |
|
1,493 |
|
1,681 |
|
— |
|
3,174 |
Current lease liabilities |
|
237 |
|
194 |
|
206 |
|
— |
|
399 |
Current fixed assets payables |
|
1,192 |
|
398 |
|
329 |
|
— |
|
727 |
Trade payables |
|
2,934 |
|
870 |
|
1,136 |
|
— |
|
2,006 |
Customer contracts liabilities |
|
843 |
|
225 |
|
554 |
|
— |
|
779 |
Current employee benefits |
|
1,197 |
|
45 |
|
144 |
|
— |
|
189 |
Deferred income |
|
- |
|
83 |
|
21 |
|
— |
|
104 |
Current liabilities included in the calculation of net financial debt |
|
- |
|
- |
|
- |
|
— |
|
— |
Other |
|
1,047 |
|
138 |
|
622 |
|
— |
|
760 |
Total current liabilities |
|
7,450 |
|
1,952 |
|
3,012 |
|
— |
|
4,964 |
Total equity and liabilities |
|
11,686 |
|
3,445 |
|
4,692 |
|
— |
|
8,137 |
|
|
|
|
|
|
|
|
|
|
|
December 31, 2022 |
|
|
|
|
|
|
|
|
|
|
Equity |
|
- |
|
- |
|
- |
|
— |
|
— |
Non-current lease liabilities |
|
1,740 |
|
961 |
|
870 |
|
— |
|
1,831 |
Non-current fixed assets payables |
|
468 |
|
429 |
|
396 |
|
— |
|
825 |
Non-current employee benefits |
|
1,522 |
|
5 |
|
18 |
|
— |
|
23 |
Non-current liabilities included in the calculation of net financial debt |
|
- |
|
- |
|
— |
|
— |
|
— |
Other |
|
347 |
|
13 |
|
247 |
|
— |
|
259 |
Total non-current liabilities |
|
4,076 |
|
1,408 |
|
1,531 |
|
— |
|
2,939 |
Current lease liabilities |
|
214 |
|
178 |
|
194 |
|
— |
|
373 |
Current fixed assets payables |
|
1,383 |
|
451 |
|
460 |
|
— |
|
911 |
Trade payables |
|
2,924 |
|
868 |
|
971 |
|
(1) |
|
1,839 |
Customer contracts liabilities |
|
830 |
|
228 |
|
513 |
|
— |
|
740 |
Current employee benefits |
|
1,243 |
|
56 |
|
125 |
|
— |
|
181 |
Deferred income |
|
— |
|
67 |
|
20 |
|
— |
|
86 |
Current liabilities included in the calculation of net financial debt |
|
— |
|
- |
|
- |
|
— |
|
— |
Other |
|
763 |
|
143 |
|
269 |
|
— |
|
412 |
Total current liabilities |
|
7,357 |
|
1,992 |
|
2,552 |
|
(1) |
|
4,542 |
Total equity and liabilities |
|
11,433 |
|
3,399 |
|
4,083 |
|
(1) |
|
7,481 |
| (1) | Including the contribution of VOO from June 2, 2023. |
| (2) | Including 1,318 million euros of current financial liabilities related to the isolation of electronic money at the end of June 2023 and 1,242 million euros in 2022. |
|
|
|
|
|
|
|
|
|
|
|
|
|
|
|
|
|
|
|
(in millions of euros) |
|
Africa & |
|
Enterprise |
|
Totem |
|
International |
|
Eliminations |
|
Total |
|
Mobile |
|
Eliminations |
|
Orange |
|
|
Middle- |
|
|
|
|
|
Carriers & |
|
telecom |
|
telecom |
|
Financial |
|
telecom |
|
consolidated |
|
|
East |
|
|
|
|
|
Shared |
|
activities |
|
activities |
|
Services |
|
activities / |
|
financial |
|
|
|
|
|
|
|
|
Services |
|
and |
|
|
|
|
|
mobile |
|
statements |
|
|
|
|
|
|
|
|
|
|
unallocated |
|
|
|
|
|
financial |
|
|
|
|
|
|
|
|
|
|
|
|
items |
|
|
|
|
|
services |
|
|
June 30, 2023 |
|
|
|
|
|
|
|
|
|
|
|
|
|
|
|
|
|
|
Equity |
|
— |
|
— |
|
— |
|
— |
|
35,111 |
|
35,111 |
|
(705) |
|
— |
|
34,406 |
Non-current lease liabilities |
|
678 |
|
309 |
|
494 |
|
1,722 |
|
— |
|
7,076 |
|
21 |
|
— |
|
7,097 |
Non-current fixed assets payables |
|
220 |
|
— |
|
— |
|
— |
|
— |
|
1,575 |
|
— |
|
— |
|
1,575 |
Non-current employee benefits |
|
92 |
|
237 |
|
2 |
|
703 |
|
— |
|
2,588 |
|
12 |
|
— |
|
2,600 |
Non-current liabilities included in the calculation of net financial debt |
|
— |
|
— |
|
— |
|
— |
|
32,091 |
|
32,091 |
|
— |
|
— |
|
32,091 |
Other |
|
102 |
|
26 |
|
121 |
|
48 |
|
1,265 |
|
2,191 |
|
144 |
(3) |
(27) |
|
2,308 |
Total non-current liabilities |
|
1,092 |
|
572 |
|
617 |
|
2,474 |
|
33,357 |
|
45,522 |
|
177 |
|
(27) |
|
45,671 |
Current lease liabilities |
|
170 |
|
129 |
|
143 |
|
420 |
|
— |
|
1,498 |
|
4 |
|
— |
|
1,503 |
Current fixed assets payables |
|
627 |
|
55 |
|
12 |
|
87 |
|
— |
|
2,701 |
|
6 |
|
— |
|
2,707 |
Trade payables |
|
1,508 |
|
903 |
|
284 |
|
1,009 |
|
(1,320) |
|
7,325 |
|
58 |
|
(41) |
|
7,341 |
Customer contracts liabilities |
|
92 |
|
837 |
|
9 |
|
157 |
|
(33) |
|
2,683 |
|
— |
|
— |
|
2,683 |
Current employee benefits |
|
111 |
|
472 |
|
5 |
|
424 |
|
— |
|
2,398 |
|
17 |
|
— |
|
2,416 |
Deferred income |
|
36 |
|
9 |
|
— |
|
9 |
|
— |
|
158 |
|
4 |
|
— |
|
162 |
Current liabilities included in the calculation of net financial debt |
|
— |
|
— |
|
— |
|
— |
|
5,711 |
|
5,711 |
|
— |
|
(9) |
|
5,702 |
Other |
|
2,241 |
(2) |
306 |
|
32 |
|
578 |
|
(1,236) |
|
3,727 |
|
4,705 |
(4) |
(22) |
|
8,410 |
Total current liabilities |
|
4,785 |
|
2,711 |
|
485 |
|
2,684 |
|
3,122 |
|
26,202 |
|
4,795 |
|
(73) |
|
30,924 |
Total equity and liabilities |
|
5,877 |
|
3,284 |
|
1,102 |
|
5,158 |
|
71,590 |
|
106,834 |
|
4,267 |
|
(100) |
|
111,000 |
|
|
|
|
|
|
|
|
|
|
|
|
|
|
|
|
|
|
|
December 31, 2022 |
|
|
|
|
|
|
|
|
|
|
|
|
|
|
|
|
|
|
Equity |
|
— |
|
— |
|
— |
|
— |
|
35,589 |
|
35,589 |
|
(633) |
|
— |
|
34,956 |
Non-current lease liabilities |
|
691 |
|
320 |
|
476 |
|
1,820 |
|
— |
|
6,879 |
|
23 |
|
— |
|
6,901 |
Non-current fixed assets payables |
|
188 |
|
— |
|
— |
|
— |
|
— |
|
1,480 |
|
— |
|
— |
|
1,480 |
Non-current employee benefits |
|
89 |
|
242 |
|
2 |
|
682 |
|
— |
|
2,560 |
|
7 |
|
— |
|
2,567 |
Non-current liabilities included in the calculation of net financial debt |
|
— |
|
— |
|
— |
|
— |
|
32,265 |
|
32,265 |
|
— |
|
— |
|
32,265 |
Other |
|
96 |
|
16 |
|
115 |
|
43 |
|
1,235 |
|
2,112 |
|
172 |
(3) |
(27) |
|
2,257 |
Total non-current liabilities |
|
1,064 |
|
579 |
|
593 |
|
2,545 |
|
33,500 |
|
45,296 |
|
202 |
|
(27) |
|
45,471 |
Current lease liabilities |
|
209 |
|
134 |
|
142 |
|
433 |
|
— |
|
1,504 |
|
4 |
|
— |
|
1,509 |
Current fixed assets payables |
|
589 |
|
68 |
|
9 |
|
134 |
|
(0) |
|
3,094 |
|
6 |
|
— |
|
3,101 |
Trade payables |
|
1,307 |
|
909 |
|
256 |
|
942 |
|
(1,200) |
|
6,976 |
|
153 |
|
(62) |
|
7,067 |
Customer contracts liabilities |
|
93 |
|
750 |
|
9 |
|
184 |
|
(27) |
|
2,580 |
|
— |
|
— |
|
2,579 |
Current employee benefits |
|
88 |
|
455 |
|
6 |
|
421 |
|
— |
|
2,394 |
|
24 |
|
— |
|
2,418 |
Deferred income |
|
40 |
|
8 |
|
— |
|
10 |
|
— |
|
145 |
|
5 |
|
— |
|
149 |
Current liabilities included in the calculation of net financial debt |
|
— |
|
— |
|
— |
|
— |
|
4,759 |
|
4,759 |
|
— |
|
(6) |
|
4,753 |
Other |
|
2,031 |
(2) |
311 |
|
11 |
|
572 |
|
(630) |
|
3,470 |
|
4,190 |
(4) |
(12) |
|
7,647 |
Total current liabilities |
|
4,358 |
|
2,636 |
|
432 |
|
2,696 |
|
2,901 |
|
24,922 |
|
4,382 |
|
(81) |
|
29,223 |
Total equity and liabilities |
|
5,422 |
|
3,215 |
|
1,026 |
|
5,240 |
|
71,989 |
|
105,807 |
|
3,951 |
|
(108) |
|
109,650 |
| (3) | Including 131 million euros of non-current financial liabilities related to Mobile Financial Services activities at the end of June 2023 and 171 million euros in 2022 (see Note 12.1). |
| (4) | Including 3,447 million euros of current financial liabilities related to Mobile Financial Services activities at the end of June 2023 and 3,034 million euros in 2022 (see Note 12.1). |
|
F-15 |
1.7 Simplified statement of cash flows on telecommunication and mobile financial services activities
(in millions of euros) |
|
June 30, 2023 |
|
||||||
|
|
Telecom |
|
Mobile |
|
Eliminations |
|
Orange |
|
|
|
activities |
|
Financial |
|
telecom |
|
consoli- |
|
|
|
|
|
Services |
|
activities / |
|
dated |
|
|
|
|
|
|
|
mobile |
|
financial |
|
|
|
|
|
|
|
financial |
|
statement |
|
|
|
|
|
|
|
services |
|
|
|
Operating activities |
|
|
|
|
|
|
|
|
|
Consolidated net income |
|
1,161 |
|
(73) |
|
— |
|
1,088 |
|
Non-monetary items and reclassified items for presentation |
|
6,486 |
|
30 |
|
— |
|
6,517 |
|
Changes in working capital and operating banking activities |
|
252 |
|
(112) |
|
— |
|
140 |
|
Decrease (increase) in inventories, gross |
|
(14) |
|
— |
|
— |
|
(14) |
|
Decrease (increase) in trade receivables, gross |
|
166 |
|
75 |
|
(21) |
|
220 |
|
Increase (decrease) in trade payables |
|
203 |
|
(98) |
|
21 |
|
126 |
|
Changes in other customer contract assets and liabilities |
|
33 |
|
— |
|
— |
|
33 |
|
Changes in other assets and liabilities |
|
(136) |
|
(89) |
|
— |
|
(225) |
|
Other net cash out |
|
(2,015) |
|
6 |
|
— |
|
(2,010) |
|
Operating taxes and levies paid |
|
(807) |
|
3 |
|
— |
|
(804) |
|
Dividends received |
|
1 |
|
— |
|
— |
|
1 |
|
Interest paid and interest rates effects on derivatives, net |
|
(563) |
(1) |
2 |
|
— |
|
(561) |
|
Income taxes paid |
|
(647) |
|
— |
|
— |
|
(647) |
|
Net cash provided by operating activities (a) |
|
5,885 |
(2) |
(149) |
|
— |
|
5,736 |
|
Investing activities |
|
|
|
|
|
|
|
|
|
Purchases (sales) of property, plant and equipment and intangible assets(3) |
|
(3,789) |
|
(20) |
|
— |
|
(3,809) |
|
Purchases of property, plant and equipment and intangible assets (4) |
|
(3,669) |
|
(20) |
|
— |
|
(3,690) |
|
Increase (decrease) in fixed assets payables |
|
(285) |
|
— |
|
— |
|
(285) |
|
Sales of property, plant and equipment and intangible assets |
|
166 |
|
— |
|
— |
|
166 |
|
Cash paid for investment securities, net of cash acquired |
|
(1,350) |
|
— |
|
— |
|
(1,350) |
|
Investments in associates and joint ventures |
|
(25) |
|
— |
|
— |
|
(25) |
|
Purchases of investment securities measured at fair value |
|
(40) |
|
— |
|
— |
|
(40) |
|
Sales of investment securities, net of cash transferred |
|
29 |
|
— |
|
— |
|
29 |
|
Sales of investment securities at fair value |
|
3 |
|
— |
|
— |
|
3 |
|
Decrease (increase) in securities and other financial assets |
|
1,122 |
|
90 |
|
3 |
|
1,215 |
|
Net cash used in investing activities (b) |
|
(4,050) |
|
69 |
|
3 |
|
(3,978) |
|
Financing activities |
|
|
|
|
|
|
|
|
|
Cash flows from financing activities |
|
|
|
|
|
|
|
|
|
Medium and long-term debt issuances |
|
836 |
|
— |
|
— |
|
836 |
|
Medium and long-term debt redemptions and repayments(5) |
|
(834) |
|
— |
|
— |
|
(834) |
|
Increase (decrease) of bank overdrafts and short-term borrowings |
|
537 |
|
(36) |
|
(3) |
|
498 |
|
Decrease (increase) of cash collateral deposits |
|
(252) |
|
(8) |
|
— |
|
(260) |
|
Exchange rates effects on derivatives, net |
|
(14) |
|
— |
|
— |
|
(14) |
|
Other cash flows |
|
|
|
|
|
|
|
|
|
Lease liabilities repayments |
|
(787) |
|
(2) |
|
— |
|
(789) |
|
Subordinated notes issuances (purchases) and other related fees |
|
177 |
|
— |
|
— |
|
177 |
|
Coupon on subordinated notes |
|
(102) |
|
— |
|
— |
|
(102) |
|
Sales (purchases) of treasury shares |
|
2 |
|
— |
|
— |
|
2 |
|
Changes in ownership interests owners of the parent company |
|
— |
|
— |
|
— |
|
— |
|
Capital increase (decrease) - non-controlling interests |
|
2 |
|
— |
|
— |
|
2 |
|
Capital increase (decrease) - Telecom activities / Mobile Financial Services (6) |
|
(100) |
|
100 |
|
— |
|
— |
|
Changes in ownership interests with no gain / loss of control |
|
(10) |
|
— |
|
— |
|
(10) |
|
Dividends paid to owners of the parent company |
|
(1,064) |
|
— |
|
— |
|
(1,064) |
|
Dividends paid to non-controlling interests |
|
(222) |
|
— |
|
— |
|
(222) |
|
Net cash used in financing activities (c) |
|
(1,830) |
|
54 |
|
(3) |
|
(1,779) |
|
Net change in cash and cash equivalents |
|
|
|
|
|
|
|
|
|
Cash and cash equivalents in the opening balance |
|
5,846 |
|
158 |
|
— |
|
6,004 |
|
Cash change in cash and cash equivalents (a) + (b) + (c) |
|
4 |
|
(26) |
|
— |
|
(22) |
|
Non-cash change in cash and cash equivalents |
|
40 |
|
— |
|
— |
|
40 |
|
o/w effect of exchange rates changes and other non-monetary effects |
|
40 |
|
— |
|
— |
|
40 |
|
Cash and cash equivalents in the closing balance |
|
5,890 |
|
133 |
|
— |
|
6,022 |
|
|
F-16 |
|
|
|
|
|
|
|
|
|
|
(in millions of euros) |
|
June 30, 2022 |
|
||||||
|
|
Telecom |
|
Mobile |
|
Eliminations |
|
Orange |
|
|
|
activities |
|
Financial |
|
telecom |
|
consoli- |
|
|
|
|
|
Services |
|
activities / |
|
dated |
|
|
|
|
|
|
|
mobile |
|
financial |
|
|
|
|
|
|
|
financial |
|
statement |
|
|
|
|
|
|
|
services |
|
|
|
Operating activities |
|
|
|
|
|
|
|
|
|
Consolidated net income |
|
1,546 |
|
(80) |
|
— |
|
1,467 |
|
Non-monetary items and reclassified items for presentation |
|
6,249 |
|
(35) |
|
— |
|
6,215 |
|
Changes in working capital and operating banking activities |
|
37 |
|
(42) |
|
1 |
|
(6) |
|
Decrease (increase) in inventories, gross |
|
(41) |
|
— |
|
— |
|
(40) |
|
Decrease (increase) in trade receivables, gross |
|
98 |
|
4 |
|
(3) |
|
99 |
|
Increase (decrease) in trade payables |
|
50 |
|
37 |
|
3 |
|
90 |
|
Changes in other customer contract assets and liabilities |
|
75 |
|
— |
|
1 |
|
75 |
|
Changes in other assets and liabilities |
|
(146) |
|
(83) |
|
— |
|
(229) |
|
Other net cash out |
|
(2,044) |
|
4 |
|
— |
|
(2,040) |
|
Operating taxes and levies paid |
|
(962) |
|
4 |
|
— |
|
(958) |
|
Dividends received |
|
2 |
|
— |
|
— |
|
2 |
|
Interest paid and interest rates effects on derivatives, net |
|
(504) |
(1) |
— |
|
— |
|
(504) |
|
Income taxes paid |
|
(580) |
|
(1) |
|
— |
|
(581) |
|
Net cash provided by operating activities (a) |
|
5,789 |
(2) |
(153) |
|
— |
|
5,636 |
|
Investing activities |
|
|
|
|
|
|
|
|
|
Purchases (sales) of property, plant and equipment and intangible assets (3) |
|
(3,880) |
|
(11) |
|
— |
|
(3,892) |
|
Purchases of property, plant and equipment and intangible assets (4) |
|
(3,767) |
|
(14) |
|
— |
|
(3,781) |
|
Increase (decrease) in fixed assets payables |
|
(239) |
|
3 |
|
— |
|
(237) |
|
Sales of property, plant and equipment and intangible assets |
|
126 |
|
— |
|
— |
|
126 |
|
Cash paid for investment securities, net of cash acquired |
|
(12) |
|
— |
|
— |
|
(12) |
|
Investments in associates and joint ventures |
|
(8) |
|
— |
|
— |
|
(8) |
|
Purchases of investment securities measured at fair value |
|
(17) |
|
— |
|
— |
|
(17) |
|
Sales of investment securities, net of cash transferred |
|
— |
|
— |
|
— |
|
— |
|
Sales of investment securities at fair value |
|
2 |
|
— |
|
— |
|
2 |
|
Decrease (increase) in securities and other financial assets |
|
(707) |
|
114 |
|
— |
|
(593) |
|
Net cash used in investing activities (b) |
|
(4,622) |
|
103 |
|
— |
|
(4,519) |
|
Financing activities |
|
|
|
|
|
|
|
|
|
Cash flows from financing activities |
|
|
|
|
|
|
|
|
|
Medium and long-term debt issuances |
|
985 |
|
— |
|
— |
|
985 |
|
Medium and long-term debt redemptions and repayments(5) |
|
(331) |
|
— |
|
— |
|
(331) |
|
Increase (decrease) of bank overdrafts and short-term borrowings |
|
(892) |
|
8 |
|
— |
|
(884) |
|
Decrease (increase) of cash collateral deposits |
|
922 |
|
(23) |
|
— |
|
899 |
|
Exchange rates effects on derivatives, net |
|
(103) |
|
— |
|
— |
|
(103) |
|
Other cash flows |
|
|
|
|
|
|
|
|
|
Lease liabilities repayments |
|
(734) |
|
(2) |
|
— |
|
(737) |
|
Subordinated notes issuances (purchases) and other related fees |
|
— |
|
— |
|
— |
|
— |
|
Coupon on subordinated notes |
|
(121) |
|
— |
|
— |
|
(121) |
|
Sales (purchases) of treasury shares |
|
20 |
|
— |
|
— |
|
20 |
|
Capital increase (decrease) - non-controlling interests |
|
— |
|
— |
|
— |
|
— |
|
Capital increase (decrease) - Telecom activities / Mobile Financial Services |
|
(23) |
|
23 |
|
— |
|
— |
|
Changes in ownership interests with no gain / loss of control |
|
1 |
|
— |
|
— |
|
1 |
|
Dividends paid to owners of the parent company |
|
(1,063) |
|
— |
|
— |
|
(1,063) |
|
Dividends paid to non-controlling interests |
|
(177) |
|
— |
|
— |
|
(177) |
|
Net cash used in financing activities (c) |
|
(1,517) |
|
6 |
|
— |
|
(1,510) |
|
Net change in cash and cash equivalents |
|
|
|
|
|
|
|
|
|
Cash and cash equivalents in the opening balance |
|
8,188 |
|
433 |
|
— |
|
8,621 |
|
Cash change in cash and cash equivalents (a) + (b) + (c) |
|
(349) |
|
(45) |
|
— |
|
(394) |
|
Non-cash change in cash and cash equivalents |
|
32 |
|
— |
|
— |
|
32 |
|
o/w effect of exchange rates changes and other non-monetary effects |
|
32 |
|
— |
|
— |
|
32 |
|
Cash and cash equivalents in the closing balance |
|
7,871 |
|
388 |
|
— |
|
8,259 |
|
| (1) | Including (112) million euros at June 30, 2023 and (60) million euros at June 30, 2022 of interests paid on lease liabilities. |
| (2) | Including significant litigations (paid) and received for (22) million euros at June 30, 2023 and (13) million euros at June 30, 2022. |
| (3) | Including telecommunication licenses paid for (202) million euros at June 30, 2023 and (302) million euros at June 30, 2022. |
| (4) | Investments in financed assets amounting to 145 million euros at June 30, 2023 and 69 million euros at June 30, 2022 have no effect on the statement of cash flows at the time of acquisition. |
| (5) | Including repayments of debts relating to financed assets for (56) million euros at June 30, 2023 and (44) million euros at June 30, 2022. |
| (6) | Corresponds to the 100 million euros capital increase of Orange Bank subscribed by Orange at June 30, 2023. |
The table below shows the reconciliation between net cash provided by operating activities (telecom activities), as shown in the simplified statement of cash flows, and organic cash flow from telecom activities.
|
|
|
|
|
(in millions of euros) |
|
June 30, 2023 |
|
June 30, 2022 |
Net cash provided by operating activities (telecom activities) |
|
5,885 |
|
5,789 |
Purchases (sales) of property, plant and equipment and intangible assets |
|
(3,789) |
|
(3,880) |
Repayments of lease liabilities |
|
(787) |
|
(734) |
Repayments of debts relating to financed assets |
|
(56) |
|
(44) |
Elimination of telecommunication licenses paid |
|
202 |
|
302 |
Elimination of significant litigation paid / (received) |
|
22 |
|
13 |
Organic cash flow from telecom activities |
|
1,477 |
|
1,445 |
|
F-17 |
Note 2 Basis of preparation of the consolidated financial statements
This note describes the changes in accounting policies since the publication of the 2022 consolidated financial statements and applied by Orange ("the Group") in the preparation of its interim financial statements for the half-year ended June 30, 2023.
2.1 Basis of preparation of the financial statements
The condensed consolidated financial statements and notes for the first half of 2023 were prepared under the responsibility of the Board of Directors on July 25, 2023.
In accordance with European Regulation no. 1606/2002 dated July 19, 2002, the interim financial statements were prepared in accordance with IAS 34 "Interim Financial Reporting", as endorsed by the European Union (EU) and published by the IASB (International Accounting Standards Board).
The interim financial statements were prepared using the same accounting policies as the financial statements for the year ended December 31, 2022, apart from the specific requirements of IAS 34 and effects of new standards as described in Note 2.4.
The Group’s consolidated financial statements are presented in millions of euros, rounded to the nearest million. This may in certain circumstances lead to non-significant discrepancies in the totals and subtotals shown in the tables.
For the reported periods, the accounting standards and interpretations endorsed by the EU are similar to the compulsory standards and interpretations published by the IASB, with the exception of standards and interpretations currently being endorsed, that have no effect on the Group's accounts. Consequently, the Group financial statements are prepared in accordance with IFRS standards and interpretations, as published by the IASB.
In the absence of any accounting standard or interpretation, applicable to a specific transaction or event, the Group's management uses its judgment to define and apply an accounting policy that will result in relevant and reliable information, such that the financial statements:
| − | fairly present the Group’s financial position, financial performance and cash flows; |
| − | reflect the economic substance of transactions; |
| − | are neutral; |
| − | are prepared on a prudent basis; and |
| − | are complete in all material respects. |
2.2 Use of estimates and judgement
Orange’s management uses its judgment to define the appropriate accounting treatment of certain transactions and makes estimates insofar as many items included in the financial statements cannot be measured with precision or current accounting standards and interpretations do not specifically deal with the related accounting issues. Management revises these estimates if the underlying circumstances evolve or if there is new information or additional experience.
2.3 Changes in the macroeconomic environment
The judgment and estimates made by the Group also take into account the volatility of certain data linked to the complexity of the current macroeconomic context, and the Group has paid particular attention to:
| − | any impacts on impairment tests, whether on changes in market data (discount rate, changes in inflation) or on flows used; |
| − | consequences of changes in market data on the valuation of certain Group assets and liabilities; |
| − | price volatility or the risk of supply difficulties, particularly of electricity, in certain countries. |
2.4 New standards and interpretations applied from January 1, 2023
New standards and amendments to standards whose effective date is January 1, 2023 are described below.
2.4.1 |
Amendment to IAS 1: Disclosure of accounting policies |
The amendment to the standard indicates that an entity must now disclose its material accounting policies rather than its significant accounting policies. This amendment should only marginally change the information provided by the Group in its notes to the consolidated financial statements.
2.4.2 |
Amendment to IAS 8: Definition of accounting estimates |
The amendment to the standard revised the definition of accounting estimates without changing the concept. The implementation of this amendment has no impact on the Group’s consolidated financial statements and could only marginally change the information provided by the Group in its notes to the annual consolidated financial statements.
2.4.3 |
Amendment to IAS 12: Taxes – Deferred tax related to assets and liabilities acquired through a single transaction |
The amendment introduces a new exception to the exemption from the initial recognition of deferred taxes. As a result of this amendment, an entity does not apply the initial recognition exemption for transactions that give rise to deductible temporary differences.
|
F-18 |
Under applicable tax law, equal taxable and deductible temporary differences may arise on initial recognition of an asset and a liability in a transaction that is not a business combination and that affects neither accounting profit nor taxable profit. For example, this may occur when the lease liability and the corresponding right-of-use asset are recognized under IFRS 16 at the inception of a lease. The Group’s accounting policies were already aligned with the proposals of the amendment.
2.4.4 |
IFRS 17 and amendments to IFRS 9: Insurance Contracts |
The Group is not subject to the provisions of the new IFRS 17 standard on the recognition and measurement of insurance contracts. The amendments to IFRS 9 propose provisions enabling the disclosure of comparative information to companies adopting IFRS 17 for the first time.
Note 3 Gains and losses on disposal and main changes in scope of consolidation
3.1 Gains (losses) on disposal of fixed assets, investments and activities
|
|
|
|
|
(in millions of euros) |
|
June 30, 2023 |
|
June 30, 2022 |
Gains (losses) on disposal of fixed assets |
|
50 |
|
41 |
o/w proceeds from disposal of fixed assets(1) |
|
153 |
|
124 |
o/w net book value of fixed assets sold |
|
(103) |
|
(83) |
Gains (losses) on disposal of investments and activities |
|
— |
|
(5) |
Gain (losses) on disposal of fixed assets, investments and activities |
|
50 |
|
36 |
| (1) | The proceeds from disposal of fixed assets is used to calculate eCAPEX. This operating performance indicator relates to acquisition of property, plant and equipment and intangible assets excluding telecommunication licenses and financed assets, net of the price of disposal of fixed assets. |
3.2 Main changes in scope of consolidation and ongoing transactions
Main changes in the scope of consolidation
Takeover of VOO in Belgium
On June 2nd, 2023, Orange Belgium finalized the acquisition from Nethys of 75% of the capital minus one share of VOO for 1,369 million euros. VOO's contribution is consolidated in the Group's financial statements from this date.
This transaction is intended to support Orange Belgium’s national convergent strategy and is expected to generate significant synergies, mainly related to the transfer of VOO’s MVNO business to the Orange Belgium network.
At the end of the transaction, Nethys will retain a minority interest in VOO and governance rights to ensure the completion of the industrial and social project.
A put option granted by Orange to Nethys on its stake in VOO, exercisable until June 2026, led to the recognition of a current financial liability of 279 million euros at the acquisition date, corresponding to the fair value of equity attributable to minority interests.
The transaction also gives Nethys the option of converting its stake in VOO into Orange Belgium's shares until June 2025. If necessary, Nethys has a put option granted by Orange on these shares, exercisable until June 2026.
(in millions of euros) |
|
At acquisition date |
Acquisition cost |
|
1,369 |
Cash acquired |
|
(19) |
Cash paid for investment securities, net of cash acquired |
|
1,349 |
In accordance with IFRS 3 - Business Combinations, the Group has one year from the acquisition date to assess the fair value of acquired identifiable assets and assumed liabilities. This work is currently being finalized at June 30, 2023.
The amounts given below are therefore provisional and will be reviewed during the second half of 2023.
(in millions of euros) |
|
At acquisition date |
Purchase price related to the acquisition of the 75% share |
|
1,369 |
Fair value of the non-controlling interests |
|
279 |
Acquisition cost (a) |
|
1,648 |
Net book value acquired before purchase price allocation (b) |
|
763 |
Preliminary goodwill (a)-(b) |
|
885 |
Liability guarantees, which are customary in this type of transaction, were also granted to Orange.
Ongoing transactions at June 30, 2023
Signing of an agreement between Orange and MásMóvil to combine their activities in Spain
On July 23, 2022, Orange and MásMóvil have signed a binding agreement relating to the combination of their activities in Spain (excluding Totem Spain and MásMóvil Portugal). This business combination will take the form of a 50-50 joint venture, co-controlled by Orange and the shareholder of
|
F-19 |
MásMóvil. The Orange group would then lose exclusive control over its activities in Spain, and the joint venture would be consolidated using the equity method in the Orange group’s financial statements.
Completion of the transaction remains subject to the approval of the European Commission and other competent administrative, regulatory and antitrust authorities and to the relevant and/or contractual conditions precedent.
European Commission has carried out a preliminary investigation (phase I) and has decided to open an in-depth investigation (phase II) to assess the creation of a joint venture project by Orange and MásMóvil in terms of the European Union Merger Regulation.
In view of the progress of the transaction and the need to obtain the green light from the relevant antitrust and administrative authorities, the Group considers that IFRS 5 criteria relating to measurement and presentation of operations held for sale are not met at June 30, 2023.
This transaction could be completed in the second half of 2023.
Agreement signed for the sale of Orange's OCS and Orange Studio shares to the Canal+ Group
On January 9, 2023, Orange and the Canal+ Group announced the signature of a memorandum of understanding anticipating the sale to the Canal+ Group of all capital held by Orange in the OCS pay TV package and in Orange Studio, the film and series co-production subsidiary. The Canal+ Group will become the sole shareholder of the two companies following this transaction.
Completion of the transaction remains subject to the approval of the European Commission and other competent administrative, regulatory and antitrust authorities and to the relevant and/or contractual conditions precedent.
The Group considers that the IFRS 5 criteria relating to measurement and presentation of operations held for sale are not met at June 30, 2023.
Other projects
Completion of the strategic review of Orange Bank and opening of exclusive negotiations with BNP Paribas
On June 28, 2023, the Orange group has announced entering into exclusive negotiations with BNP Paribas to define a referral partnership for the Orange Bank customer portfolio in France, and to develop financing solutions for mobile devices. The two groups will also discuss the terms of a takeover of Orange Bank's business in Spain.
This partnership with BNP Paribas, which will provide a continuity solution for Orange Bank customers, is part of Orange’s wider intention to progressively withdraw Orange Bank from the retail banking market in France and Spain by the end of 2025.
This is only a statement of intent, and any binding decisions or actions on the project will only be taken once the consultation period with employee representative bodies has ended and any recommendations from the "Autorité de Contrôle Prudentiel et de Résolution" (ACPR) have been taken into account. Consequently, the Group considers that the IFRS 5 criteria "Non-current assets held for sale and discontinued operations" are not met at June 30, 2023.
Note 4 Trade receivables
(in millions of euros) |
|
June 30, 2023 |
|
December 31, 2022 |
Net book value of trade receivables - in the opening balance |
|
6,305 |
|
6,029 |
Business related variations |
|
(202) |
|
299 |
Changes in the scope of consolidation (1) |
|
90 |
|
(3) |
Translation adjustment |
|
(10) |
|
(76) |
Reclassifications and other items |
|
— |
|
56 |
Net book value of trade receivables - in the closing balance |
|
6,184 |
|
6,305 |
(in millions of euros) |
|
June 30, 2023 |
|
December 31, 2022 |
Net trade receivables, depreciated according to their age |
|
1,332 |
|
1,191 |
Net trade receivables, depreciated according to other criteria |
|
453 |
|
324 |
Net trade receivables past due |
|
1,785 |
|
1,515 |
Net trade receivables not past due (1) |
|
4,399 |
|
4,790 |
Net trade receivables |
|
6,184 |
|
6,305 |
o/w short-term trade receivables |
|
5,883 |
|
6,022 |
o/w long-term trade receivables (2) |
|
301 |
|
283 |
(1) |
Not past due receivables are presented net of the balance of expected losses on trade receivables. |
(2) |
Includes receivables from sales of handsets with payment on installments that are payable in more than 12 months and receivables from equipment financial lease offers for business. |
The Group assessed the risk of non-recovery of trade receivables at June 30, 2023 and recognized impairment and losses on trade receivables in the income statement for an amount of (102) million euros over the period in the income statement ((74) million euros at June 30, 2022).
For Mobile Financial Services, the assessment of bank credit risk is described in Note 12.2.
Unchanged from December 31, 2022, Orange still considers that the concentration of counterparty risk related to customer accounts is limited due to the large number of customers, their diversity (residential, professional and large companies), their belonging to various sectors of the economy and their geographical dispersion in France and abroad.
|
F-20 |
The table below provides an analysis of the change in impairment of telecom activities trade receivables in the statement of financial position:
(in millions of euros) |
|
June 30, 2023 |
|
December 31, 2022 |
Allowances on trade receivables - in the opening balance |
|
(996) |
|
(1,012) |
Net addition with impact on income statement |
|
(102) |
|
(208) |
Losses on trade receivables |
|
121 |
|
218 |
Changes in the scope of consolidation(1) |
|
(117) |
|
(6) |
Translation adjustment |
|
2 |
|
16 |
Reclassifications and other items |
|
(1) |
|
(4) |
Allowances on trade receivables - in the closing balance |
|
(1,093) |
|
(996) |
Sales of non-recourse operating receivables programs
Orange has set up non-recourse programs to sell its receivables due in installments in several countries. These are no longer recorded on the balance sheet. The receivables sold mainly concern Spain (of which a part has been sold to Orange Bank – see Note 12.1), Romania, Poland and France and amounted to approximately 385 million euros during the first semester 2023 and approximately 640 million euros at December 31, 2022.
Note 5 Purchases and other expenses
5.1 External purchases
|
|
|
|
|
(in millions of euros) |
|
June 30, 2023 |
|
June 30, 2022 |
Commercial, equipment expenses and content rights |
|
(3,838) |
|
(3,681) |
o/w costs of terminals and other equipment sold |
|
(2,205) |
|
(2,039) |
o/w advertising, promotional, sponsoring and rebranding costs |
|
(386) |
|
(398) |
Service fees and inter-operator costs |
|
(1,949) |
|
(2,104) |
o/w interconnexion costs |
|
(1,138) |
|
(1,346) |
Other network expenses, IT expenses |
|
(1,944) |
|
(1,784) |
Other external purchases |
|
(1,616) |
|
(1,481) |
o/w building cost for resale |
|
(559) |
|
(572) |
o/w overhead |
|
(631) |
|
(566) |
Total external purchases |
|
(9,347) |
|
(9,050) |
5.2 Other operating expenses
|
|
|
|
|
(in millions of euros) |
|
June 30, 2023 |
|
June 30, 2022 |
Allowances and losses on trade receivables - telecom activities |
|
(102) |
|
(74) |
Litigation |
|
71 |
(1) |
(41) |
Cost of bank credit risk |
|
(33) |
|
(23) |
Operating foreign exchange gains (losses) |
|
(19) |
|
(12) |
Acquisition and integration costs |
|
(16) |
|
(7) |
Expenses from universal service |
|
(14) |
|
(14) |
Other expenses |
|
(37) |
|
(60) |
Total other operating expenses |
|
(150) |
|
(231) |
Impairment and losses on trade receivables from telecom activities are detailed in Note 4.
The cost of credit risk applies only to Mobile Financial Services and includes impairment charges and reversals on fixed-income securities, loans and receivables to customers as well as impairment charges and reversals relating to guarantee commitments given, losses on receivables and recovery of amortized debts (see Note 12.2).
Certain expenses related to litigation are directly recorded in other operating expenses. The Group's significant litigations are described in Note 14.1.
5.3 Restructuring costs
(in millions of euros) |
|
June 30, 2023 |
|
June 30, 2022 |
|
Departure plans |
|
(11) |
|
(11) |
|
Lease property restructuring |
|
(8) |
|
— |
|
Distribution channels |
|
(1) |
|
(11) |
|
Other |
|
(14) |
|
(25) |
|
Total restructuring costs |
|
(35) |
|
(47) |
|
Orange Business presented the operational implementation of its strategic priorities within the framework of the strategic plan Lead the future. This plan carries a strong ambition to transform and simplify Orange Business, whose market is undergoing profound changes, and could lead to the loss of approximately 650 positions in France which includes the main historical activities of Orange Business, on a voluntary basis. Consultation with employee representative bodies has begun, and should be completed in the second half of 2023. As a result, no provision for restructuring has been booked for the first half of 2023.
5.4 Working capital management – payables
Extension of supplier payment deadlines
Supplier payment terms are mutually agreed between the suppliers and Orange in accordance with the regulations in force. Certain key suppliers and Orange have agreed to a flexible payment schedule which, for certain invoices, can be extended up to six months.
|
F-21 |
Trade payables for goods and services and fixed assets payables that were subject to a payment extension, and which had an impact on the change in working capital requirement at the end of the period, amounted to approximately 416 million euros at June 30, 2023.
Note 6 Labor expenses
(in millions of euros) |
|
June 30, 2023 |
|
June 30, 2022 |
Wages and employee benefit expenses |
|
(4,548) |
|
(4,241) |
o/w French part-time for seniors plans (1) |
|
(225) |
|
62 |
Others |
|
(75) |
|
(87) |
Total labor expenses |
|
(4,624) |
|
(4,329) |
| (1) | At June 30, 2023 costs relating to the French part-time for seniors plans (Temps Partiel Senior (TPS)) mainly include the effect of the pension reform in France for (257) million euros. |
At June 30, 2022 TPS plans included an actuarial gain of 84 million euros arising from the increase of the discount rates' curve in the macroeconomic context.
In France, the pension reform law, gradually raising the legal retirement age to 64, was enacted on April 14, 2023. The French part-time for seniors plans (Temps Partiel Senior (TPS)) signed in 2018 and 2021 provided in this case for the extension of these plans for the employees concerned. Accordingly, an additional provision of 257 million euros has been recognized, and the discounted cost of the benefits amounts to 1,782 million euros at June 30, 2023 (1,753 million euros at December 31, 2022). This additional provision is partially offset by the reversal of the provision for benefits paid during the period.
The effects of the reform on post-employment benefits and other long-term benefits (excluding TPS plans) are not material at June 30, 2023.
Note 7 Impairment losses
Impairment tests are carried out annually and when there is an indication that assets may be impaired.
Changes in the economic and financial climate, appreciation of the telecommunications operators’ resilience to deteriorating local economic conditions, change in the market capitalization of telecommunications companies and changes in business performance serve as indicators of potential impairment.
The elements taken into account by the Group at June 30, 2023 remain unchanged from those described at December 31, 2022.
As the preparation of multi-year plans will be performed during the second half of 2023, the half-year reassessments resulting from the identification of impairment indicators are based on a preliminary review of projected cash flows and changes in financial parameters used at the end of the previous year.
At June 30, 2023
At June 30, 2023, the review of impairment indicators has not led the Group to recognize any impairment loss.
At June 30, 2022
At June 30, 2022, the review of impairment indicators has not led the Group to recognize any impairment loss.
Note 8 Interests in associates and joint ventures
8.1 Change in associates and joint ventures
The table below shows the value of the main interests in associates and joint ventures:
Company |
|
Main activity |
|
Main co- |
|
% |
|
|
|
|
(in millions of euros) |
|
|
|
shareholder |
|
interest |
|
June 30, 2023 |
|
December 31, 2022 |
Entities jointly controlled |
|
|
|
|
|
|
|
|
|
|
Orange Concessions and its subsidiaries |
|
Operation / maintenance related to Public Initiative Networks |
|
Consortium HIN (50%) |
|
50 |
% |
1,047 |
|
1,057 |
Światłowód Inwestycje Sp. z o.o. (FiberCo in Poland) |
|
Construction / operation in Poland |
|
APG Group (50%) |
|
50 |
% (1) |
334 |
|
306 |
Mauritius Telecom |
|
Telecommunications operator in Mauritius |
|
Mauritius government (34%) |
|
40 |
% |
74 |
|
72 |
Other |
|
|
|
|
|
|
|
17 |
|
17 |
Entities under significant influence |
|
|
|
|
|
|
|
|
|
|
Orange Tunisie |
|
Telecommunications operator in Tunisia |
|
Investec (51%) |
|
49 |
% |
13 |
|
17 |
Savoie connectée |
|
Fiber infrastructure operator |
|
Covage (70%) |
|
30 |
% |
7 |
|
7 |
IRISnet |
|
Telecommunications operator in Belgium |
|
Ministry of the Brussels-Capital Region (MBCR) (53%) |
|
22 |
% |
6 |
|
6 |
Other |
|
|
|
|
|
|
|
3 |
|
3 |
Total associates and joint ventures |
|
|
|
|
|
|
|
1,501 |
|
1,486 |
(1)Corresponds to Orange Polska's percentage interest in Światłowód Inwestycje Sp. z o.o. (FiberCo in Poland).
The change in interests in associates and joint ventures is as follows:
(in millions of euros) |
|
June 30, 2023 |
|
December 31, 2022 |
Interests in associates and joint ventures - in the opening balance |
|
1,486 |
|
1,440 |
|
F-22 |
Dividends |
|
(9) |
|
(5) |
Share of profits (losses) |
|
(8) |
|
(2) |
Change in components of other comprehensive income(1) |
|
(8) |
|
51 |
Changes in the scope of consolidation |
|
— |
|
(3) |
Change in capital |
|
22 |
|
11 |
Translation adjustment |
|
14 |
|
(2) |
Reclassifications and other items |
|
4 |
|
(3) |
Interests in associates and joint ventures - in the closing balance |
|
1,501 |
|
1,486 |
| (1) | In 2022, included the effect of the change in fair value of cash flow hedge derivatives, net of tax, recognized in other comprehensive income for 33 million euros of Orange Concessions, and 18 million euros of the FiberCo in Poland. |
8.2 Main figures of associates and joint ventures
The key figures relating to Orange Concessions and Światłowód Inwestycje Sp. z o.o. (FiberCo in Poland) are as follows (figures from financial statements of entities taken as a whole):
(in millions of euros) |
|
June 30, 2023 |
|
December 31, 2022 |
||||
|
|
Orange |
|
Światłowód |
|
Orange |
|
Światłowód |
|
|
Concessions |
|
Inwestycje Sp. z o.o. |
|
Concessions |
|
Inwestycje Sp. z o.o. |
Assets |
|
|
|
|
|
|
|
|
Non-current assets |
|
3,660 |
|
465 |
|
3,699 |
|
372 |
Current assets |
|
395 |
|
199 |
|
417 |
|
197 |
Total assets |
|
4,055 |
|
664 |
|
4,115 |
|
569 |
|
|
|
|
|
|
|
|
|
Liabilities |
|
|
|
|
|
|
|
|
Shareholder's equity |
|
2,097 |
|
317 |
|
2,117 |
|
281 |
Non-current liabilities |
|
1,492 |
|
272 |
|
1,494 |
|
198 |
Current liabilities |
|
466 |
|
75 |
|
505 |
|
90 |
Total equity and liabilities |
|
4,055 |
|
664 |
|
4,115 |
|
569 |
|
|
|
|
|
|
|
|
|
Income statement |
|
|
|
|
|
|
|
|
Revenue |
|
285 |
|
20 |
|
768 |
|
29 |
Operating income |
|
(20) |
|
(4) |
|
(7) |
|
(4) |
Finance costs, net |
|
(5) |
|
(6) |
|
(35) |
|
(5) |
Income tax |
|
— |
|
2 |
|
8 |
|
1 |
Net income |
|
(25) |
|
(8) |
|
(35) |
|
(8) |
8.3 Related party transactions
The main transactions between the Group and related parties essentially consist of transactions with consolidated companies using the equity method, of which Orange Concessions and Światłowód Inwestycje Sp. z o.o., (FiberCo in Poland). In addition, the amounts of the transactions with related parties have not changed significantly since December 31, 2022.
Note 9 Income taxes
(in millions of euros) |
|
June 30, 2023 |
|
June 30, 2022 |
Total Income tax |
|
(461) |
|
(580) |
Current tax |
|
(436) |
|
(555) |
Deferred tax |
|
(25) |
|
(25) |
The decrease of the tax expense at June 30, 2023 is notably explained by the evolution of the accounting results of entities in the French tax group.
Deferred tax assets recoverability
At each period end, the Group reviews the recoverable amount of the deferred tax assets. The recoverability of the deferred tax assets is assessed in the light of the latest business plans used for impairment testing that may be restated to take into account specific tax issues.
Over the presented periods, the analysis conducted on the basis of the business plans did not lead to the recognition of any material effect in the accounts.
Developments in tax disputes and audits
Tax disputes and audits within the Group have not been subject to any significant developments over the period.
International tax reform
The Group is closely monitoring developments related to the implementation of the international tax reform introducing an additional worldwide minimum tax and is continuing its work on estimating this additional tax.
|
F-23 |
Note 10 Financial assets, liabilities and financial results (telecom activities)
10.1 Financial assets and liabilities of telecom activities
In order to improve the readability of financial statements and distinguish the performance of telecom activities from the performance of Mobile Financial Services, the notes related to financial assets and liabilities and results are split to reflect these two business scopes.
Note 10 presents the financial assets, liabilities and related gains and losses specific to telecom activities and Note 12 focuses on the financial assets and liabilities of Mobile Financial Services as its financial results were not material.
The following table reconciles the contributive balances of assets and liabilities for each of these two scopes (intra-group transactions between telecom activities and Mobile Financial Services activities are not eliminated) with the consolidated statement of financial position at June 30, 2023.
(in millions of euros) |
|
Orange |
|
o/w telecom |
|
Note |
|
o/w Mobile |
|
Note |
|
o/w eliminations |
|
|
|
consolidated |
|
activities |
|
|
|
Financial |
|
|
|
telecom |
|
|
|
financial |
|
|
|
|
|
Services |
|
|
|
activities / |
|
|
|
statements |
|
|
|
|
|
|
|
|
|
mobile financial |
|
|
|
|
|
|
|
|
|
|
|
|
|
services |
|
|
|
|
|
|
|
|
|
|
|
|
|
|
|
Non-current financial assets related to Mobile Financial Services activities |
|
539 |
|
— |
|
|
|
539 |
|
12.1.1 |
|
— |
|
Non-current financial assets |
|
1,002 |
|
1,030 |
|
10.5 |
|
— |
|
|
|
(27) |
(1) |
Non-current derivatives assets |
|
1,155 |
|
1,050 |
|
10.3 |
|
105 |
|
|
|
— |
|
Current financial assets related to Mobile Financial Services activities |
|
3,262 |
|
— |
|
|
|
3,271 |
|
12.1.1 |
|
(9) |
|
Current financial assets |
|
3,342 |
|
3,343 |
|
10.5 |
|
— |
|
|
|
(1) |
|
Current derivatives assets |
|
113 |
|
113 |
|
10.3 |
|
— |
|
|
|
— |
|
Cash and cash equivalents |
|
6,022 |
|
5,890 |
|
10.3 |
|
133 |
|
|
|
— |
|
|
|
|
|
|
|
|
|
|
|
|
|
|
|
Non-current financial liabilities related to Mobile Financial Services activities |
|
69 |
|
— |
|
|
|
96 |
|
12.1.2 |
|
(27) |
(1) |
Non-current financial liabilities |
|
31,786 |
|
31,786 |
|
10.3 |
|
— |
|
|
|
— |
|
Non-current derivatives liabilities |
|
341 |
|
305 |
|
10.3 |
|
35 |
|
|
|
— |
|
Current financial liabilities related to Mobile Financial Services activities |
|
3,447 |
|
— |
|
|
|
3,447 |
|
12.1.2 |
|
(1) |
|
Current financial liabilities |
|
5,651 |
|
5,660 |
|
10.3 |
|
— |
|
|
|
(9) |
|
Current derivatives liabilities |
|
51 |
|
51 |
|
10.3 |
|
— |
|
|
|
— |
|
| (1) | Loan granted by Orange SA to Orange Bank. |
Orange SA granted a current account advance to Orange Bank in June 2023, for an amount of 150 million euros, maturing in December 31, 2023, with an option to increase to 400 million euros at a later date. At June 30, 2023, this current account advance has not been drawn down by Orange Bank.
10.2 Income and expenses related to financial assets and liabilities
The cost of net financial debt consists of income and expenses related to the components of net financial debt for the period.
Foreign exchange gains & losses mainly includes the revaluation in euros of bonds and bank loans denominated in foreign currencies as well as the symmetrical revaluation of the associated hedges as defined by IFRS 9.
|
|
|
|
|
|
|
|
|
|
|
|
|
|
|
|
|
|
Finance costs, net |
|
|
Other |
||||||||||
|
|
|
|
|
|
|
|
|
|
|
|
|
|
|
compre- |
|
|
|
|
|
|
|
|
|
|
|
|
|
|
|
hensive |
|
|
|
|
|
|
|
|
|
|
|
|
|
|
|
income |
(in millions of euros) |
|
Cost of gross |
|
Gains |
|
Cost of net |
|
Foreign |
|
Other net |
|
Finance |
|
|
Reserves |
|
|
financial debt (1) |
|
(losses) on |
|
financial |
|
exchange |
|
financial |
|
costs, net |
|
|
|
|
|
|
|
assets |
|
debt |
|
gains |
|
expenses |
|
|
|
|
|
|
|
|
|
contributing |
|
|
|
(losses) |
|
|
|
|
|
|
|
|
|
|
|
to net |
|
|
|
|
|
|
|
|
|
|
|
|
|
|
|
financial debt |
|
|
|
|
|
|
|
|
|
|
|
June 30, 2023 |
|
|
|
|
|
|
|
|
|
|
|
|
|
|
|
Financial assets |
|
— |
|
130 |
|
130 |
|
21 |
|
21 |
|
|
|
|
3 |
Financial liabilities |
|
(563) |
|
— |
|
(563) |
|
(17) |
|
— |
|
|
|
|
— |
Lease liabilities |
|
— |
|
— |
|
— |
|
— |
|
(116) |
|
|
|
|
— |
Derivatives |
|
29 |
|
— |
|
29 |
|
(37) |
|
— |
|
|
|
|
(286) |
Discounting expense |
|
— |
|
— |
|
— |
|
— |
|
(60) |
|
|
|
|
— |
Total |
|
(534) |
|
130 |
|
(404) |
|
(32) |
|
(156) |
|
(592) |
|
|
(283) |
June 30, 2022 |
|
|
|
|
|
|
|
|
|
|
|
|
|
|
|
Financial assets |
|
— |
|
(9) |
|
(9) |
|
17 |
|
59 |
|
|
|
|
(32) |
Financial liabilities |
|
(497) |
|
— |
|
(497) |
|
(378) |
|
— |
|
|
|
|
— |
Lease liabilities |
|
— |
|
— |
|
— |
|
— |
|
(61) |
|
|
|
|
— |
Derivatives |
|
199 |
|
— |
|
199 |
|
321 |
|
— |
|
|
|
|
488 |
Discounting expense |
|
— |
|
— |
|
— |
|
— |
|
(24) |
|
|
|
|
— |
Total |
|
(298) |
|
(9) |
|
(307) |
|
(40) |
|
(26) |
|
(373) |
|
|
456 |
|
F-24 |
At June 30, 2023, the consolidated statement of comprehensive income includes a loss in cash flow hedges amounting to (286) million euros (of which (277) million euros related to fully consolidated entities), against a gain of 488 million euros (of which 438 million euros related to fully consolidated entities) in the first semester of 2022. These effects mainly reflect the hedges, via cross currency swaps, of future coupons on Group debts denominated in foreign currencies:
| − | The loss for the first half of 2023 is mainly due to the depreciation of the US dollar against the euro and by the increase of the long-term interest rate spread. |
| − | The gain for the first half of 2022 was mainly due to the appreciation of the US dollar against the euro and by the reduction of the long-term interest rate spread. |
10.3 Net financial debt
Net financial debt as defined and used by Orange does not includes Mobile Financial Services activities for which this concept is not relevant and is described in the following table:
(in millions of euros) |
|
June 30, 2023 |
|
December 31, 2022 |
TDIRA (1) |
|
641 |
|
638 |
Bonds |
|
29,388 |
|
29,943 |
Bank loans and from development organizations and multilateral lending institutions |
|
3,963 |
|
3,309 |
Debt relating to financed assets |
|
390 |
|
316 |
Cash collateral received |
|
811 |
|
1,072 |
NEU Commercial Paper (2) |
|
1,615 |
|
1,004 |
Bank overdrafts |
|
255 |
|
250 |
Other financial liabilities (3) |
|
383 |
|
105 |
Current and non-current financial liabilities (excluding derivatives) included in the calculation of net financial debt |
|
37,446 |
|
36,638 |
Current and non-current derivatives (liabilities) (4) |
|
357 |
|
386 |
Current and non-current derivatives (assets) (4) |
|
(1,163) |
|
(1,455) |
Other comprehensive income components related to unmatured hedging instruments |
|
(142) |
|
114 |
Gross financial debt after derivatives (a) |
|
36,498 |
|
35,684 |
Cash collateral paid (5) |
|
(28) |
|
(38) |
Investments at fair value (6) |
|
(3,306) |
|
(4,500) |
Cash equivalents |
|
(3,430) |
|
(3,178) |
Cash |
|
(2,460) |
|
(2,668) |
Other financial assets |
|
— |
|
(2) |
Assets included in the calculation of net financial debt (b) |
|
(9,224) |
|
(10,386) |
Net financial debt (a) + (b) |
|
27,274 |
|
25,298 |
| (1) | Perpetual securities redeemable in shares. |
| (2) | Negotiable European Commercial Papers (formerly called “commercial papers”). |
| (3) | Includes the financial liability of 279 million euros relating to the purchase option granted by Orange to Nethys (see Note 3.2.). |
| (4) | At June 30, 2023, the foreign exchange effect of the cross currency swaps hedging foreign exchange risk on gross debt notional is an unrealized gain of 742 million euros. |
| (5) | Only cash collateral paid, included in non-current financial assets of the consolidated statement of financial position, are deducted from gross financial debt. |
| (6) | Only investments at fair value, included in current financial assets of the consolidated statement of financial position, are deducted from gross financial debt. |
10.4 Main bonds and bank loans repayments and issuances
During the first semester of 2023, Orange SA redeemed a bond at maturity, on March 1, 2023 for 500 million euros with a coupon of 2,5%.
On March 1, 2023, Orange SA issued a bank loan from the European Investment Bank (EIB) for 500 million euros, maturing on March 1, 2030, with 6-month euribor variable rate + 39 bps.
10.5 Financial assets
The financial assets break down as follows:
|
|
|
|
|
|
|
|
|
|
|
|
June 30, 2023 |
|
December 31, 2022 |
|
||||
(in millions of euros) |
|
Non-current |
|
Current |
|
Total |
|
Total |
|
Financial assets at fair value through other comprehensive income that will not be reclassified to profit or loss |
|
448 |
|
— |
|
448 |
|
419 |
|
Investments securities |
|
448 |
|
— |
|
448 |
|
419 |
|
Financial assets at fair value through profit or loss |
|
221 |
|
3,306 |
|
3,528 |
|
4,745 |
|
Investments at fair value (1) |
|
— |
|
3,306 |
|
3,306 |
|
4,500 |
|
Investments securities |
|
193 |
|
— |
|
193 |
|
206 |
|
Cash collateral paid |
|
28 |
|
— |
|
28 |
|
38 |
|
Other |
|
— |
|
— |
|
— |
|
2 |
|
Financial assets at amortized cost |
|
360 |
|
37 |
|
397 |
|
381 |
|
Receivables related to investments (2) |
|
80 |
|
26 |
|
106 |
|
106 |
|
Other |
|
280 |
|
11 |
|
291 |
|
275 |
|
Total financial assets |
|
1,030 |
|
3,343 |
|
4,372 |
|
5,545 |
|
| (1) | NEU Commercial papers and bond securities only. |
| (2) | Including loan granted by Orange SA to Orange Bank for 27 million euros. |
|
F-25 |
Note 11 Information on market risk and fair value of financial assets and liabilities (telecom activities)
11.1 Risk management policy
During the first semester of 2023, the macroeconomic context is marked by the raise of interest rates by central banks to limit inflationary pressures. These evolutions on financial market also did not challenge the risk management Group policy related to the financial instruments.
Thus, the Group has continued its hedging policy to minimize its exposure to interest rate and operating and financial foreign exchange risks. Furthermore, Orange has continued to diversify its sources of funding that allow the Group to present the following liquidity position at June 30, 2023:
Liquidity position
(in millions of euros)
|
|
Available undrawn amount of credit facilities |
|
Investments at fair value |
|
|
Cash |
|
|
Cash equivalents |
For specific management of counterparty risk related to customer accounts, see Note 4.
11.2 Orange's credit ratings
Orange's credit ratings have changed since December 31, 2022, Moody's Investors Service (Moody's) has changed the outlook from stable to positive.
At June 30, 2023, Orange's debt ratings are set forth below:
|
Standard & Poor's |
Moody's |
Fitch Ratings |
Long-term debt |
BBB+ |
Baa1 |
BBB+ |
Outlook |
Stable |
Positive |
Stable |
Short-term debt |
A2 |
P2 |
F2 |
11.3 Financial ratios
The financial ratios described at December 31, 2022 remain respected at June 30, 2023.
11.4 Fair value levels of financial assets and liabilities
No event with a significant impact on the determination of the fair value of financial assets and liabilities has occurred during the first half of 2023.
Note 12 Mobile Financial Services activities
12.1 Financial assets and liabilities of Mobile Financial Services
The financial statements of Mobile Financial Services activities were put into the format of Orange group's consolidated financial statements and therefore differ from a presentation that complies with the banking format.
In order to improve the readability of financial statements and distinguish the performance of telecom activities from the performance of Mobile Financial Services, the notes related to financial assets and liabilities are split to reflect these two business scopes.
Note 10 presents the financial assets, liabilities and related gains and losses specific to telecom activities and Note 12 focuses on the financial assets and liabilities of Mobile Financial Services, as its financial results were not material.
|
F-26 |
The following table reconciles the balances of assets and liabilities for each of these two scopes (intra-group transactions between telecom activities and Mobile Financial Services activities are not eliminated) with the consolidated statement of financial position at June 30, 2023.
|
|
|
|
|
|
|
|
|
|
|
|
|
|
(in millions of euros) |
|
Orange |
|
o/w telecom |
|
Note |
|
o/w Mobile |
|
Note |
|
o/w eliminations |
|
|
|
consolidated |
|
activities |
|
|
|
Financial |
|
|
|
telecom |
|
|
|
financial |
|
|
|
|
|
Services |
|
|
|
activities / mobile |
|
|
|
statements |
|
|
|
|
|
|
|
|
|
financial services |
|
Non-current financial assets related to Mobile Financial Services activities |
|
539 |
|
— |
|
|
|
539 |
|
12.1.1 |
|
— |
|
Non-current financial assets |
|
1,002 |
|
1,030 |
|
10.5 |
|
— |
|
|
|
(27) |
(1) |
Non-current derivatives assets |
|
1,155 |
|
1,050 |
|
10.3 |
|
105 |
|
|
|
— |
|
Current financial assets related to Mobile Financial Services activities |
|
3,262 |
|
— |
|
|
|
3,271 |
|
12.1.1 |
|
(9) |
|
Current financial assets |
|
3,342 |
|
3,343 |
|
10.5 |
|
— |
|
|
|
(1) |
|
Current derivatives assets |
|
113 |
|
113 |
|
10.3 |
|
— |
|
|
|
— |
|
Cash and cash equivalents |
|
6,022 |
|
5,890 |
|
10.3 |
|
133 |
|
|
|
— |
|
|
|
|
|
|
|
|
|
|
|
|
|
|
|
Non-current financial liabilities related to Mobile Financial Services activities |
|
69 |
|
— |
|
|
|
96 |
|
12.1.2 |
|
(27) |
(1) |
Non-current financial liabilities |
|
31,786 |
|
31,786 |
|
10.3 |
|
— |
|
|
|
— |
|
Non-current derivatives liabilities |
|
341 |
|
305 |
|
10.3 |
|
35 |
|
|
|
— |
|
Current financial liabilities related to Mobile Financial Services activities |
|
3,447 |
|
— |
|
|
|
3,447 |
|
12.1.2 |
|
(1) |
|
Current financial liabilities |
|
5,651 |
|
5,660 |
|
10.3 |
|
— |
|
|
|
(9) |
|
Current derivatives liabilities |
|
51 |
|
51 |
|
10.3 |
|
— |
|
|
|
— |
|
| (1) | Loan granted by Orange SA to Orange Bank. |
The Mobile Financial Services segment includes Orange Bank and other entities. As the contribution of other entities to the statement of financial position of the Mobile Financial Services segment and therefore of the Group is not material, only Orange Bank data is presented in detail below.
12.1.1 Financial assets related to Orange Bank transactions (excluding derivatives)
The financial assets related to Orange Bank transactions break down as follows:
(in millions of euros) |
|
June 30, 2023 |
|
December 31, 2022 |
||||
|
|
Non-current |
|
Current |
|
Total |
|
Total |
Financial assets at fair value through other comprehensive income that will not be reclassified to profit or loss |
|
3 |
|
— |
|
3 |
|
3 |
Investments securities |
|
3 |
|
— |
|
3 |
|
3 |
Financial assets at fair value through other comprehensive income that may be reclassified to profit or loss |
|
266 |
|
5 |
|
271 |
|
296 |
Debt securities |
|
266 |
|
5 |
|
271 |
|
296 |
Financial assets at fair value through profit or loss |
|
45 |
|
— |
|
45 |
|
50 |
Investments at fair value |
|
— |
|
— |
|
— |
|
— |
Cash collateral paid |
|
37 |
|
— |
|
37 |
|
42 |
Other |
|
8 |
|
— |
|
8 |
|
8 |
Financial assets at amortized cost |
|
225 |
|
3,248 |
|
3,474 |
|
3,021 |
Fixed-income securities |
|
225 |
|
1 |
|
226 |
|
310 |
Loans and receivables to customers |
|
— |
|
2,486 |
|
2,486 |
|
2,517 |
Loans and receivables to credit institutions |
|
— |
|
762 |
|
762 |
|
191 |
Other |
|
— |
|
— |
|
— |
|
2 |
Total financial assets related to Orange Bank activities |
|
539 |
|
3,254 |
|
3,793 |
|
3,370 |
Loans and receivables of Orange Bank.
Loans and receivables of Orange Bank are composed of loans and receivables to customers and credit institutions.
In the context of adapting Orange Bank's accounts into the Group's financial statements, the following have been considered as loans and advances to customers: clearing accounts and other amounts due, as well as amounts related to securities transactions on behalf of customers.
At June 30, 2023, loans and receivables of Orange Bank to customers are mainly composed of overdrafts (872 million euros), housing loans (932 million euros) and the purchase of receivables between Orange Bank Spain and Orange Spain (569 million euros).
Loans and receivables of Orange Bank from credit institutions are mainly composed of current assets corresponding to overnight deposits and loans.
12.1.2 Financial liabilities related to Orange Bank transactions (excluding derivatives)
Debts related to Orange Bank operations are composed of payables to customers for 2,188 million euros, with credit institutions for 891 million euros as well as by certificates of deposits for 283 million euros.
At June 30, 2023, debts related to Orange Bank operations with customers are mainly composed of special savings accounts for 890 million euros and current accounts for 1,297 million euros.
Debts related to Orange Bank operations with financial institutions are mainly composed of term borrowings and advances.
Targeted Longer-Term Refinancing Operations (TLTRO) bonds are repaid in accordance with the ECB's timetable: 481 million euros on June 28, 2023 and 60 million euros in December 2023.
|
F-27 |
12.2 Information on credit risk management related to Orange Bank activities
Against an inflationary environment, Orange Bank is maintaining its cautious provisioning policy in the face of economic uncertainties, notably through forward-looking provisions. At June 30, 2023, these provisions have been revised to include the new OECD Gross Domestic Product (GDP) projections for 2023 and 2024, as well as the inflationary context and unemployment rate in France and Spain. Given the improvement in GDP forecasts, partially included in the scenarios used by the bank, the provisions calculated for the forward-looking effect have been reduced from 7 million euros at December 31, 2022 to 6 million euros at June 30, 2023.
At June 30, 2023, the cost of risk of Orange Bank is 31 million euros (2.3% of average outstanding), including 13 million euros in France (1.3% of average outstanding) and 18 million euros in Spain (5.6% of average outstanding).
Since the end of 2022, Orange Bank has noted an increase in the cost of credit risk in France and Spain, due on the one hand to the increase in consumer credit production since the second half of 2022, and on the other hand to a deterioration in portfolio quality, as a direct consequence of the effects of inflation on the most vulnerable consumers.
In this context, Orange Bank has decided to tighten its conditions for granting consumer loans and overdraft facilities in France, reduce its marketing investment in prospective customers and raise the interest rates. Finally, the bank has taken steps to reduce the stock of non-performing exposures (NPE), in order to maintain its non-performing loan (NPL) ratio at around 5% and keep its cost of risk under control.
12.3 Information on interest rate and liquidity risk management related to Orange Bank activities
Interest-rate risk management is based on 2 indicators:
| − | The interest-rate gap, which corresponds to the difference between customer loans and deposits. This indicator determines the Bank's interest-rate risk (upward or downward). Since 2022, the bank has been exposed to rising interest rates; |
| − | The sensitivity of the Economic Value of Equity (EVE), which, in accordance with regulatory methodology, allow to calculates the Bank's sensitivity to an interest-rate impact. This indicator is managed within the limits of the Bank's risk appetite; |
The Bank manages this interest-rate risk through the use of swap hedges. Items are hedged on a macro basis for loan portfolios and on a micro basis for issues and securities held.
Liquidity risk is actively managed.
In addition to the regular calculation of regulatory ratios, liquidity is managed on a daily basis on the following two pillars:
| − | Deposit levels; |
| − | Loan production; |
The commercial gap, i.e. the difference between deposits and loans, has sharply and steadily narrowed since the beginning of 2023, thanks in particular to the raising of term accounts with customers on Raisin, the German deposit-taking platform. Customer deposits thus rose by around 400 million euros over the half-year.
This liquidity made it possible to repay the 481 million euros of TLTRO at the end of June.
At June 30, 2023, the liquidity Coverage Ratio (LCR) was maintained at a high level of 745%.
In June 2023, a current account advance agreement has been set up between Orange SA and Orange Bank for an amount of 150 million euros, maturing on December 31, 2023. At June 30, 2023, this current account advance has not been drawn down by Orange Bank.
Note 13 Equity
At June 30, 2023, Orange SA's share capital amounted to 10,640,226,396 euros, divided into 2,660,056,599 ordinary shares with a par value of 4 euros each.
The shares held in registered form for at least two years by the same shareholder are granted with a double voting right. At June 30, 2023, the public sector owns 22.95% of Orange SA's share capital and 29.16% of the voting rights, and the employees of the Group own either within the employee shareholding plan or in registered form 7.99% of Orange SA's share capital and 12.05% of the voting rights.
13.1 Changes in share capital
No new shares were issued during the first half of 2023.
13.2 Treasury shares
As authorized by the Shareholders' Meeting of May 23, 2023, the Board of Directors implemented a new share Buyback Program (the 2023 Buyback Program) and canceled the 2022 Buyback Program, with immediate effect. This authorization is valid for a period of 18 months from the aforementioned Shareholders' Meeting. The 2023 Buyback Program is described in the Orange Universal Registration Document filed with the French Financial Markets Authority (Autorité des marchés financiers – AMF) on March 29, 2023.
At June 30, 2023, the Company held 874,145 of its own shares (of which 510,000 shares in connection with the liquidity contract and 364,145 shares in connection with the LTIP free share award plans (Long Term Incentive Plan) 2021-2023 and 2022-2024).
During the first semester 2023, Orange delivered 917,026 treasury shares to the beneficiaries of the LTIP 2020-2022 free share award plans.
|
F-28 |
At December 31, 2022, the Company held 1,965,171 treasury shares (of which 1,285,171 under the 2020-2022, 2021-2023 and 2022-2024 free share award plans and 680,000 shares in connection with the liquidity contract).
13.3 Dividends
The Shareholders' Meeting held on May 23, 2023 approved the payment of a dividend of 0.70 euro per share in respect of the 2022 fiscal year. Given the payment of the interim dividend of 0.30 euro per share on December 7, 2022 for a total amount of 797 million euros, the balance of the dividend amounting to 0.40 euro per share was paid on June 7, 2023 for an amount of 1,064 million euros.
13.4 Subordinated notes
Nominal value of subordinated notes
On April 5, 2023, Orange has launched a repurchase offer for its 1 billion euros deeply subordinated notes with an initial early redemption date of February 7, 2024. On April 18, 2023, following this offer, the Group was able to repurchase 802 million euros of these subordinated notes. The nominal amount remaining in circulation after this repurchase amount to 198 million euros.
On April 18, 2023, as part of its EMTN (Euro Medium Term Notes) Program, Orange issued 1 billion euros of subordinated notes with a fixed annual coupon of 5.375%. Orange has a call option on this tranche from January 18, 2023 and upon the occurence of certain contractually defined events. The interest rate is revised from 2030 and step-up clauses provided for a coupon adjustment of 0.25% from 2035 and an additional 0.75% from 2050.
The amount presented in the "subordinated notes" column of the consolidated statements of changes in shareholders' equity of 5,148 million euros corresponds to the nominal amount recorded at historical value (the bonds denominated in pounds sterling have been fully repaid in early 2023).
Subordinated notes remuneration
During the six months ended June 30, 2023, the remuneration of subordinated notes is as follows:
|
|
|
|
|
|
|
|
|
|
June 30, 2023 |
|
June 30, 2022 |
||||
Initial issue |
|
Initial |
|
Initial |
|
Initial |
|
Rate |
|
(in millions of |
|
(in millions of |
|
(in millions of |
|
(in millions of |
date |
|
nominal |
|
nominal |
|
currency |
|
|
|
currency) |
|
euros) |
|
currency) |
|
euros) |
|
|
value |
|
value |
|
|
|
|
|
|
|
|
|
|
|
|
|
|
(in millions |
|
(in millions |
|
|
|
|
|
|
|
|
|
|
|
|
|
|
of currency) |
|
of euros) |
|
|
|
|
|
|
|
|
|
|
|
|
2/7/2014 |
|
1,000 |
|
1,000 |
|
EUR |
|
5.25 |
% |
(60) |
|
(60) |
|
(53) |
|
(53) |
10/1/2014 |
|
1,250 |
|
1,250 |
|
EUR |
|
5.00 |
% |
— |
|
— |
|
— |
|
— |
10/1/2014 |
|
600 |
|
771 |
|
GBP |
|
5.75 |
% |
— |
|
— |
|
(24) |
|
(29) |
4/15/2019 |
|
1,000 |
|
1,000 |
|
EUR |
|
2.38 |
% |
(24) |
|
(24) |
|
(24) |
|
(24) |
9/19/2019 |
|
500 |
|
500 |
|
EUR |
|
1.75 |
% |
(9) |
|
(9) |
|
(9) |
|
(9) |
10/15/2020 |
|
700 |
|
700 |
|
EUR |
|
1.75 |
% |
— |
|
— |
|
— |
|
— |
5/11/2021 |
|
500 |
|
500 |
|
EUR |
|
1.38 |
% |
(7) |
|
(7) |
|
(7) |
|
(7) |
4/18/2023 |
|
1,000 |
|
1,000 |
|
EUR |
|
5.38 |
% |
— |
|
— |
|
— |
|
— |
Subordinated notes remuneration classified in equity |
|
|
|
(100) |
|
|
|
(121) |
||||||||
Coupons on subordinated notes reclassified as short-term borrowings at the end of 2022 and paid in 2023 |
|
|
|
(2) |
|
|
|
— |
||||||||
Subordinated notes remuneration paid |
|
|
|
(102) |
|
|
|
(121) |
||||||||
The remuneration of holders is recorded in equity five working days before the annual payment date, unless Orange exercises its right to defer the payment.
The tax impact relating to the remuneration of subordinated notes for 31 million euros is recorded in profit or loss in the period.
13.5 Cumulative translation adjustments
|
|
|
|
|
(in millions of euros) |
|
June 30, 2023 |
|
June 30, 2022 |
Gain (loss) recognized in other comprehensive income during the period |
|
(65) |
|
(33) |
Reclassification to net income for the period |
|
1 |
|
(4) |
Total translation adjustments |
|
(65) |
|
(37) |
The change in translation adjustments recognized in other comprehensive income mainly includes:
| − | in the first half of 2023, the (65) million euros decrease is due to the depreciation of several currencies, including the Egyptian pound, partially offset by the appreciation of the Polish zloty; |
| − | in the first half of 2022, the (37) million euros decrease is due to the depreciation of several currencies, including the Egyptian pound and the Polish zloty; |
|
F-29 |
13.6 Non-controlling interests
|
|
|
|
|
(in millions of euros) |
|
June 30, 2023 |
|
June 30, 2022 |
Dividends paid to non-controlling interests (1) |
|
374 |
|
277 |
o/w Sonatel group |
|
202 |
|
185 |
o/w Orange Côte d'Ivoire group |
|
53 |
|
— |
o/w Orange Polska group |
|
51 |
|
35 |
o/w Médi Telecom and its subsidiaries |
|
34 |
|
33 |
o/w Jordan Telecom group |
|
25 |
|
17 |
(1) Of which 222 million euros in dividends paid out at June 30, 2023 and 177 million euro at June 30, 2022.
|
|
|
|
|
(in millions of euros) |
|
June 30, 2023 |
|
December 31, 2022 |
Credit part of equity attributable to non-controlling interests (a) |
|
3,031 |
|
3,183 |
o/w Orange Polska group |
|
1,269 |
|
1,250 |
o/w Sonatel group |
|
836 |
|
907 |
o/w Orange Côte d'Ivoire group |
|
215 |
|
253 |
o/w Orange Romania and its subsidiaries |
|
192 |
|
217 |
o/w Jordan Telecom group |
|
176 |
|
193 |
o/w Orange Belgium group |
|
154 |
|
155 |
o/w Médi Telecom and its subsidiaries |
|
124 |
|
140 |
Debit part of equity attributable to non-controlling interests (b) |
|
(11) |
|
(11) |
Total equity attributable to non-controlling interests (a) + (b) |
|
3,019 |
|
3,172 |
Note 14 Litigation and unrecognized contractual commitments
14.1 Litigation
At June 30, 2023, the provisions for risks recorded by the Group for all disputes in which the Group is involved (with the exception of liabilities relating to disputes between Orange and the tax or social administrations in relation to operational or income taxes or social contributions, which are recognized in the corresponding items of the balance sheet) amounted to 254 million euros compared with 387 million euros at December 31, 2022. Orange believes that any disclosure of the amount of provisions on a case-by-case basis for ongoing disputes could seriously harm the Group's position.
This note describes the new proceedings and developments in existing litigation having occurred since the publication of the consolidated financial statements for the year ended December 31, 2022.
– In the course of the ongoing proceedings in the "Enterprise" market segment, only the proceedings with Adista are still ongoing.
– In the course of ongoing proceeding with Digicel (anti-competitive practices on the mobile and fixed-to-mobile markets in the French Caribbean and in French Guiana), the French Supreme Court in March 2023 has partially reversed the judgment rendered by the Paris Court of Appeal on June 17, 2020 on the specific point of the progressive nature of the base on which interest applies to compensate for the cash flow loss. Orange has filed another appeal to the Court of Appeal in March 2023. The proceedings are ongoing.
– In the course of ongoing proceedings against Bouygues Telecom regarding the quality of services of its wholesale offers, Bouygues Telecom has once again reassessed his damage to 85 million euros. Orange considers this claim to be unfounded.
– On February 24, 2023, Bouygues Telecom and the SDAIF ("société de développement pour l’accès à l’infrastructure fibre") brought an action against Orange before the Paris Commercial Court concerning the FTTH socket restitution mechanism, which allows commercial telecom operators who have access to the Orange fiber network to realize themselves the connection of their final customers and to be returned a part of the cost of this connection when the line is taken over by a new commercial operator. Bouygues Telecom and SDAIF argue that the mechanism established by Orange is not compatible with the regulatory framework and claim 125 million euros corresponding in their opinion to the amounts of refunds due for the cancellations of the FTTH lines since the beginning of the contract. Orange considers these claims to be unfounded.
– In the course of the ongoing second proceedings opposing three operators (including Orange Polska and Polkomtel) to the Polish operator P4 for 314 million zlotys (71 million euros), the Court of Appeal decided to take over the proceedings which were initially suspended awaiting decision on the first claim for compensation amounting to 316 million zlotys (71 million euros). The proceedings are ongoing.
– In the dispute between Orange Romania and the Romanian Competition Council, the Supreme Court rejected in June 2023 the appeal of the Romanian Competition Council and upheld the annulment of the decision of the Romanian Competition Council. This dispute is now closed.
– In the dispute between Orange Mali and the Remacotem association on the grounds of unlawful billing of calls diverted to voicemail, the Bamako Court of Appeal rejected in March 2023 the appeal filed by Orange Mali and Malitel against the Bamako Court of Appeal decision rendered on November 3, 2021. The grace period having ended in May 2023, following the decision rendered by the Bamako Supreme Court in March 2023, Orange Mali and the Remacotem association have entered into a settlement agreement that ends this dispute. The Remacotem association withdrew its claim. This dispute is now closed.
– In the dispute between Zain and Jordan Telecommunications Company (Orange Jordan) for failure to open geographical numbers allocated by the Jordanian regulator in application of the interconnexion agreement entered into by Zain and Orange Jordan, pursuant to which Zain considers that it suffered an estimated loss of 250 million Jordanian dinars (323 million euros), the Jordanian Supreme Court confirmed the incompetence of the judiciary jurisdiction and considered that the arbitration clause applied to the lawsuit. This dispute is now closed as Zain has not initiated an arbitration proceedings.
– As part of the proceedings concerning Korek Telecom, on March 20, 2023, an arbitral tribunal set up under the aegis of the International Chamber of Commerce rendered a final award in the dispute between the Kuwaiti logistics group Agility and Orange, indirectly (through their joint venture), and their former Iraqi co-shareholder in the capital of the Iraqi operator Korek Telecom. The arbitral tribunal awarded 1.7 billion of US dollars in
|
F-30 |
damages to the joint venture and Korek Telecom's former holding company for various breaches of the shareholders' agreement and tortious acts committed by the former Iraqi co-shareholder, including collusion with the Iraqi telecommunications regulator. At this stage of the proceedings, this decision has no impact on the Group's consolidated financial statements. Other proceedings, in particular the ICSID arbitration initiated by Orange against the Iraqi government, are still in progress.
Apart from the proceedings mentioned above, there are no other administrative, legal or arbitration proceedings (whether pending, suspended, or threatened) of which Orange is aware, either new or having evolved since the publication of the consolidated financial statements for the year ended December 31, 2022, which have had over the period, or which may have, a material impact on the Group’s financial position or profitability.
14.2 Unrecognized contractual commitments
During the first half of 2023, the Group had not entered into any new commitments that may have a material effect on its current or future financial position compared to those described in the consolidated financial statements at December 31, 2022.
Note 15 Subsequent events
Orange SA: distribution of an interim dividend
As its meeting held on July 25, 2023, the Board of Directors resolved to distribute an interim dividend of 0.30 euro per share in respect of 2023. This interim dividend will be paid in cash on December 6, 2023. The estimated payment amounts to 798 million euros based on the number of ordinary share outstanding at June 30, 2023.
Amendment to current account advance agreement with Orange Bank
Orange SA has amended the current account advance agreement granted to Orange Bank in June 2023, increasing the amount immediately available to 400 million euros, with a maturity extension to December 31, 2025.
|
F-31 |
Exhibit 99.2
CAPITALIZATION
The following table sets forth our current and long-term liabilities and total capitalization as of June 30, 2023 prepared on the basis of International Financial Reporting Standards (“IFRS”) as adopted by the European Union, which, for the period presented, are in conformity with IFRS as published by the International Accounting Standards Board (“IASB”). See Note 2.2 to the consolidated financial statements for the three years ended December 31, 2022 included in Orange’s Annual Report on Form 20-F and Note 2.1 to the unaudited interim condensed consolidated financial statements for the six months ended June 30, 2022 and 2023.
|
|
At June 30, |
(in millions of euros) |
|
2023 |
|
|
|
(A) Current Financial Liabilities (1) (including short term portion of long term financial liabilities) that are: |
|
|
Guaranteed (1) |
|
2 |
Secured (2) (3), of which € 1,503 million pursuant to IFRS 16 |
|
2,395 |
Unguaranteed/Unsecured |
|
5,990 |
Total current financial and lease liabilities |
|
8,388 |
|
|
|
Current Financial Liabilities |
|
6,885 |
Of which total current financial liabilities related to telecommunications activities |
|
5,711 |
Of which total current financial liabilities related to Orange Bank activities, excluding € 2,188 million client deposits |
|
1,183 |
Elimination of current financial liabilities between Telcos and Orange Bank activities |
|
(10) |
Current lease liabilities as accounted for pursuant to IFRS 16 |
|
1,503 |
|
|
|
(B) Non-current Financial Liabilities (1) (excluding short term portion) that are: |
|
|
Guaranteed (1) |
|
21 |
Secured (2) (4), of which € 7,097 million pursuant to IFRS 16 |
|
7,978 |
Unguaranteed/Unsecured (5) |
|
31,294 |
Total non-current financial and lease liabilities |
|
39,292 |
|
|
|
Total Non-current Financial Liabilities |
|
32,195 |
Of which total non-current financial liabilities related to telecommunications activities |
|
32,091 |
Of which total non-current financial liabilities related to Orange Bank activities |
|
131 |
Elimination of non-current financial liabilities between Telcos and Orange Bank activities |
|
(27) |
Non-current lease liabilities as accounted for pursuant to IFRS 16 |
|
7,097 |
|
|
|
(C) Minority Interests (excluded from net income): |
|
2,808 |
|
|
|
(D) Equity attributable to shareholders of Orange S.A. (excluding net income): |
|
|
Share capital (6) |
|
10,640 |
Other Reserves (7) |
|
19,869 |
|
|
|
Equity attributable to equity holders of Orange S.A. (excluding net income) (5) |
|
30,509 |
|
|
|
Capitalization (A + B + C + D) |
|
80,997 |
(1) |
Neither Orange nor its subsidiaries have financial indebtedness guaranteed by third parties outside of Orange. |
(2) |
Does not include certain financial debt, comprised of asset or mortgage-backed securities with respect to which either Orange SA or any of its subsidiaries has given pledges, guarantees, privileges or other security interests. |
(3) |
Includes Orange Bank's current liabilities for a total of € 967 million, comprised of targeted longer-term refinancing operations with the European Central Bank and repurchase agreement (repo) operations with banks. |
(4) |
A significant portion thereof corresponds to cash collateral for derivatives. |
Orange SA has received €811 million in deposit as cash collateral. Orange has concluded agreements with various financial counterparts that may impose a daily settlement corresponding, subject to threshold conditions, to the variation in the market value of these instruments (mark to market). Orange has issued debt securities in foreign currencies (USD, CHF, GBP, HKD, NOK) that it has generally swapped for euro.
(5) |
On September 4, 2023, Orange issued its inaugural Sustainability-Linked Bond for a total amount of €500 million. |
(6) |
No additional new shares have been issued since June 30, 2023. |
(7) |
Other reserves include reserves with respect to issue premiums, conversions, gains (losses) registered directly in shareholders' equity and accumulated reserves (losses). |
Exhibit 99.3
Recent Developments Since June 30, 2023
The financial information presented in the Report on Form 6-K, including this Exhibit 99.3, is unaudited, unless otherwise noted.
This document, which is an Exhibit to Orange’s Report on Form 6-K dated December 7, 2023 (the “Form 6-K”), contains forward-looking statements (within the meaning of Section 27A of the U.S. Securities Act of 1933 or Section 21E of the U.S. Securities Exchange Act of 1934). Forward-looking statements can be identified by the use of forward-looking terminology such as “should”, “could”, “can”, “would”, “will”, “expect”, “consider”, “confirm”, “believe”, “anticipate”, “suggest”, “pursue”, “foresee”, “plan”, “predict”, “benefit”, “carry out”, “meet”, “increase”, “exceed”, “preserve”, “optimize”, “control”, “intend”, “continue”, “maintain”, “invest,” “be aimed at”, “strategy”, “objective”, “prospects”, “outlook”, “trends”, “may”, “target”, “aim”, “change”, “intention”, “ambition”, “risk”, “potential”, “implementation”, “roll-out”, “commitment” or “progression” or similar expressions or the negative thereof or other variations thereof or comparable terminology, or by the forward-looking nature of discussions of strategy, plans or intentions. Although Orange believes these statements are based on reasonable assumptions, these forward-looking statements are subject to numerous risks and uncertainties, including matters not yet known to Orange or not currently considered material by Orange, and there can be no assurance that anticipated events will occur or that the objectives set out will actually be achieved. Therefore, actual results may differ materially from those described in the forward-looking statements. Forward-looking statements speak only as of the date they are made. Other than as required by law, Orange does not undertake any obligation to update these statements in light of new information or future developments. Orange urges you to carefully review and consider the various disclosures it makes concerning the factors that may affect its business, including the disclosures made in “Item 3. Key information—3.D. Risk factors,” “Item 5. Operating and financial review and prospects,” and “Item 11. Quantitative and qualitative disclosures about market risk” in its 2022 Annual Report on Form 20-F, and “Cautionary Statement Regarding Forward-Looking Statements” in the Form 6-K.
I. Financial information for the three-month and nine-month periods ended September 30, 2023
|
|
Q3 2023 |
|
change |
|
change |
|
|
9M 2023 |
|
change |
|
change |
|
|
|
|
|
comparable |
|
historical |
|
|
|
|
comparable |
|
historical |
|
In millions of euros (1) |
|
|
|
basis (2) |
|
basis |
|
|
|
|
basis (2) |
|
basis |
|
Revenues |
|
10,999 |
|
1.8 |
% |
1.6 |
% |
|
32,544 |
|
1.9 |
% |
1.3 |
% |
Investments in property, plant and equipment and intangible assets |
|
1,709 |
|
(17.8) |
% |
(18.3) |
% |
|
5,543 |
|
(4.1) |
% |
(6.7) |
% |
eCAPEX (3) (excluding licenses) (Non-IFRS Indicator) |
|
1,597 |
|
(7.0) |
% |
(7.7) |
% |
|
4,751 |
|
(6.1) |
% |
(7.6) |
% |
| (1) | See Appendix 1: Key financial indicators. |
| (2) | See Appendix 4: Glossary – Key figures not defined by IFRS. |
| (3) | eCAPEX is not a financial indicator defined by IFRS and may not be comparable to similarly-titled indicators used by other companies. It is provided as additional information only and should not be considered as a substitute for purchases of or investments in property, plant and equipment and intangible assets. See Appendix 2: Capital expenditures and eCapex information and Appendix 4: Glossary – Key figures not defined by IFRS for relevant information and important information and a reconciliation of this amount to the pertinent IFRS amount. |
Revenues
Orange Group Revenues for the third quarter of 2023 were 10,999 million euros, an increase of 1.8%, or 194 million euros, year on year1 (compared with +2.6% in 2Q and +2.0% in H1). Revenue growth in the quarter was driven by retail services2, which grew by 3.8%, or 304 million euros (+4.3% in 2Q and +3.6% in H1). This increase, in absolute terms, was more than double the decline in revenues from wholesale services, which continued to decrease, falling 6.7% or -123 million euros (-4.1% in 2Q and -5.9% in H1).
In France, continued growth in retail services excluding the public switched telephone network (“PSTN”) (+3.4%) and in mobile equipment sales (+3.0%) offset the anticipated decline in wholesale services revenues. Revenues thus continued their improvement, falling -0.5% (-1.3% in 2Q and -1.8% in 1Q).
In Europe, revenues from retail services continued to grow, up 2.3%, thanks to the value strategy and in spite of an unfavorable baseline effect related to progressive price increases during 2022.
Africa & Middle East continued to demonstrate very strong growth of 12.2%, driven by double-digit increases in its four growth engines (+17.8% for mobile data, +17.0% for fixed broadband, +28.2% for Orange Money and +20.3% for B2B across the board).
Growth in IT & Integration services revenues in the Enterprise sector accelerated to 9.3% (+8.8% in 2Q and +7.1% in H1) and more than offset the structural decline in the Voice and Data legacy businesses. Enterprise revenues increased 0.6%, reflecting stable mobile revenues, with the growth in services being offset by the decrease in equipment sales.
1 |
Unless otherwise stated, percentage changes are on a year-on-year basis, calculated against the third quarter of 2022 and on a comparable basis. |
2Services invoiced to customers (B2C and B2B). See definition in Appendix 4: Glossary.
Customer base growth
In terms of commercial performance3, the Group maintained its leadership position in convergence, with 11.9 million convergent customers Group-wide (+1.0%), as well as its commercial momentum in mobile contracts and very high-speed fixed broadband accesses. Mobile services had 250.9 million accesses (+4.2%), including 100.8 million contracts (+9.0%). Fixed services totaled 44.8 million accesses (-2.9%), including 16.0 million very high-speed broadband accesses which continued to grow strongly (+12.8%). Fixed narrowband accesses continued their structural decline (-14.3%).
Capital expenditures and eCAPEX
Investments in property, plant and equipment and intangible assets totaled €1,709 million in the third quarter 2023, decreasing 18.3% on an historical basis and 17.8% on a comparable basis in the third quarter compared with the related period in 2022.
Group eCAPEX was 1,597 million euros in the third quarter of 2023, a year-on-year reduction of 7.0%, in line with the objective of a substantial reduction for the year as a whole. Group eCAPEX is not a financial indicator defined by IFRS and may not be comparable to similarly-titled indicators used by other companies. It is provided as additional information only and should not be considered as a substitute for purchases of or investments in property, plant and equipment and intangible assets. See Appendix 4: Glossary – Key figures not defined by IFRS.
Changes in asset portfolio
Acquisition of NEHS Digital and Xperis
On September 26, 2023, Enovacom, the healthcare subsidiary of Orange Business and the French leader in healthcare data interoperability, announced that it had finalized the acquisition of two subsidiaries of the Mutuelle Nationale des Hospitaliers (MNH) group:
| - | NEHS Digital, an editor, a service provider and distributor of healthcare solutions, particularly in medical imaging, and |
| - | Xperis, a healthcare data interoperability specialist. |
These two entities NEHS Digital and Xperis cover five key areas of expertise: medical imaging, telemedicine, the organization of medical interpretation services, the production and coordination of care services, and the security and interoperability of information systems. Following the integration of NEHS Digital and Xperis, Enovacom’s teams will benefit from the expertise of more than 600 e-healthcare professionals.
This acquisition, confirming Enovacom's position as one of the leaders in the e-healthcare sector in France, is part of the strategic plan Lead the future and reinforces Orange Business’ strategy to develop solutions for healthcare professionals.
3Changes are presented on a comparable basis.
Review by operating segment
France
|
|
Q3 2023 |
|
change |
|
change |
|
|
9M 2023 |
|
change |
|
change |
|
|
|
|
|
comparable |
|
historical |
|
|
|
|
comparable |
|
historical |
|
In millions of euros |
|
|
|
basis |
|
basis |
|
|
|
|
basis |
|
basis |
|
Revenues |
|
4,439 |
|
(0.5) |
% |
(0.6) |
% |
|
13,130 |
|
(1.2) |
% |
(1.2) |
% |
Retail services (B2C+B2B) |
|
2,804 |
|
2.1 |
% |
2.1 |
% |
|
8,343 |
|
1.6 |
% |
1.6 |
% |
Convergence |
|
1,277 |
|
4.9 |
% |
4.9 |
% |
|
3,770 |
|
4.0 |
% |
4.0 |
% |
Mobile-only |
|
592 |
|
0.0 |
% |
0.0 |
% |
|
1,774 |
|
1.6 |
% |
1.6 |
% |
Fixed-only |
|
934 |
|
(0.4) |
% |
(0.4) |
% |
|
2,799 |
|
(1.6) |
% |
(1.6) |
% |
Wholesale |
|
1,131 |
|
(7.4) |
% |
(7.5) |
% |
|
3,389 |
|
(7.8) |
% |
(7.9) |
% |
Equipment sales |
|
350 |
|
3.0 |
% |
3.0 |
% |
|
934 |
|
4.7 |
% |
4.7 |
% |
Other revenues |
|
154 |
|
1.0 |
% |
(0.5) |
% |
|
464 |
|
(8.6) |
% |
(8.6) |
% |
Growth in retail services continued to drive revenues in the third quarter
France, with revenues of 4,439 million euros, reduced the decline to 0.5% year on year (-22 million euros, after -1.3% in 2Q and -1.8% in 1Q). This was due to the expected decline in wholesale services of 7.4% (-91 million euros) that was partially offset by the growth of retail services (+56 million euros).
Excluding PSTN, revenues from retail services continued their growth rising 3.4%, thanks to the value strategy, mainly implemented through base price increases the full impact of which is only being seen in the second half of the year. All ARPOs increased and convergent ARPO reached 74 euros, +2.7 euros year on year.
In this context, commercial activity remained good in the third quarter, with net additions of +83,0004 in mobile (compared with +29,000 in 2Q) and -31,000 in fixed-line broadband (compared with -33,000 in 2Q), including +259,000 in fiber (compared with +250,000 in 2Q), while maintaining a disciplined marketing policy and “more and more” actions that will continue to fuel growth in the coming quarters. The churn rate remained under control at 11.9%.
Lastly, revenues from equipment sales were up 3% in the third quarter, largely as a result of sales of higher-value mobile handsets.
Europe
|
|
Q3 2023 |
|
change |
|
change |
|
|
9M 2023 |
|
change |
|
change |
|
|
|
|
|
comparable |
|
historical |
|
|
|
|
comparable |
|
historical |
|
In millions of euros |
|
|
|
basis |
|
basis |
|
|
|
|
basis |
|
basis |
|
Revenues |
|
2,923 |
|
0.0 |
% |
5.8 |
% |
|
8,469 |
|
2.1 |
% |
4.7 |
% |
Retail services (B2C+B2B) |
|
2,069 |
|
2.3 |
% |
12.2 |
% |
|
5,859 |
|
3.3 |
% |
6.8 |
% |
Convergence |
|
818 |
|
3.7 |
% |
15.2 |
% |
|
2,284 |
|
4.3 |
% |
8.2 |
% |
Mobile-only |
|
747 |
|
0.9 |
% |
2.5 |
% |
|
2,196 |
|
2.0 |
% |
2.5 |
% |
Fixed-only |
|
381 |
|
(0.8) |
% |
27.3 |
% |
|
995 |
|
(0.3) |
% |
9.0 |
% |
IT & Integration services |
|
123 |
|
11.9 |
% |
15.2 |
% |
|
384 |
|
16.7 |
% |
19.8 |
% |
Wholesale |
|
444 |
|
(10.8) |
% |
(8.5) |
% |
|
1,258 |
|
(8.4) |
% |
(7.7) |
% |
Equipment sales |
|
412 |
|
3.9 |
% |
6.8 |
% |
|
1,234 |
|
10.6 |
% |
11.7 |
% |
Other revenues |
|
(1) |
|
- |
|
- |
|
|
118 |
|
(10.5) |
% |
(12.8) |
% |
4Excluding prepaid.
Continued growth in retail services
Revenues in Europe were stable in the third quarter (+1 million euros, after +2.7% in 2Q).
The growth of 2.3% in retail services (+46 million euros, after rising 4.2% in 2Q) was driven by the value strategy, even though the impact of the price increases in 2022 in all geographical areas was only moderate. The positive performances of Convergence (+3.7%) and B2B (+3.1%) offset slowing year-on-year growth of 3.9% in equipment sales (+11.1% in 2Q), as well as the decrease of 10.8% in wholesale services (-6.7% in 2Q), due to the regulatory decline in call termination rates (with little impact on margins) and international traffic, particularly in Spain.
Commercial activity improved in the third quarter compared with the second quarter, with net additions of +76,000 in fiber (Fiber to the Home - FTTH) (compared with +71,000 in 2Q), while net additions in Mobile contracts excluding machine to machine (“M2M”) decreased by 59,000, affected by the termination of a temporary contract in Romania. Adjusted for this change in the commercial base, mobile net additions would be 100,000.
Revenues in Spain were stable at +0.1% (+2.1% in 2Q), due to growth of 2.4% in retail services (+1.9% in 2Q), tied to the increase in ARPOs and the improvement in the churn rate. This performance was partially offset by the decline in wholesale services revenues (-10.6%) which were impacted, as in previous quarters, by the regulatory reduction in call termination rates, with little effect on margins. Equipment sales continued to grow rising 4.1% year on year.
In a highly competitive market, Spain continued to sustain its growth focusing on customer value management combined with a rigorous marketing policy. This was reflected again in the quarter with a 3.9% improvement in convergent ARPO, while churn continued to decrease resulting in a 2.6-point decline in the annualized churn rate.
The FTTH customer base grew 9,000 (+6,000 in 2Q), while that of Mobile contracts (excluding M2M) rose 3,000 (+51,000 in 2Q).
Africa & Middle East
|
|
Q3 2023 |
|
change |
|
change |
|
|
9M 2023 |
|
change |
|
change |
|
|
|
|
|
comparable |
|
historical |
|
|
|
|
comparable |
|
historical |
|
In millions of euros |
|
|
|
basis |
|
basis |
|
|
|
|
basis |
|
basis |
|
Revenues |
|
1,816 |
|
12.2 |
% |
1.9 |
% |
|
5,287 |
|
11.1 |
% |
2.4 |
% |
Retail services (B2C+B2B) |
|
1,615 |
|
11.8 |
% |
2.3 |
% |
|
4,698 |
|
10.8 |
% |
3.0 |
% |
Mobile-only |
|
1,380 |
|
11.2 |
% |
1.6 |
% |
|
4,031 |
|
10.3 |
% |
2.4 |
% |
Fixed-only |
|
217 |
|
12.2 |
% |
3.4 |
% |
|
628 |
|
13.0 |
% |
5.6 |
% |
IT & Integration services |
|
18 |
|
86.2 |
% |
79.5 |
% |
|
38 |
|
32.2 |
% |
24.4 |
% |
Wholesale |
|
173 |
|
16.4 |
% |
0.1 |
% |
|
497 |
|
15.0 |
% |
0.1 |
% |
Equipment sales |
|
21 |
|
(1.5) |
% |
(14.2) |
% |
|
64 |
|
(6.7) |
% |
(19.1) |
% |
Other revenues |
|
7 |
|
47.7 |
% |
3.7 |
% |
|
29 |
|
40.7 |
% |
12.4 |
% |
Africa & Middle East continued to deliver double-digit growth in the third quarter of 2023 driven by its four growth engines
Africa & Middle East revenues increased strongly in the third quarter rising 12.2% (+197 million euros, after +12.0% in 2Q). Ten of the 16 consolidated countries achieved double-digit growth. The region continued to demonstrate its agility and resilience amid security tensions and currency devaluations in some countries.
This performance was underpinned by the rapid development of retail services (+11.8%, vs. +11.2% in 2Q) due to double-digit growth in the four growth engines, namely mobile data (+17.8%, vs. +16.7% in 2Q), fixed broadband (+17.0%, vs. +16.8% in 2Q), Orange Money (+28.2%, vs. +25.5% in 2Q) and B2B across the board (+20.3%, vs. +13.2% in 2Q), with a positive effect on volume and value.
The mobile customer base reached 148.0 million, a year-on-year increase of 4.0% (+5.0% in 2Q), with a +5.2% increase in average mobile ARPO (+4.3% in 2Q).
Enterprise
|
|
Q3 2023 |
|
change |
|
change |
|
|
9M 2023 |
|
change |
|
change |
|
|
|
|
|
comparable |
|
historical |
|
|
|
|
comparable |
|
historical |
|
In millions of euros |
|
|
|
basis |
|
basis |
|
|
|
|
basis |
|
basis |
|
Revenues |
|
1,901 |
|
0.6 |
% |
(0.3) |
% |
|
5,846 |
|
0.8 |
% |
0.9 |
% |
Fixed-only |
|
788 |
|
(7.5) |
% |
(8.6) |
% |
|
2,429 |
|
(6.6) |
% |
(6.6) |
% |
Voice |
|
214 |
|
(14.2) |
% |
(14.7) |
% |
|
678 |
|
(11.5) |
% |
(11.4) |
% |
Data |
|
574 |
|
(4.7) |
% |
(6.1) |
% |
|
1,752 |
|
(4.6) |
% |
(4.6) |
% |
IT & Integration services |
|
886 |
|
9.3 |
% |
8.6 |
% |
|
2,681 |
|
7.8 |
% |
8.1 |
% |
Mobile |
|
227 |
|
(0.4) |
% |
(0.4) |
% |
|
736 |
|
2.9 |
% |
2.9 |
% |
Mobile-only |
|
173 |
|
6.4 |
% |
6.4 |
% |
|
521 |
|
6.8 |
% |
6.8 |
% |
Wholesale |
|
10 |
|
4.1 |
% |
4.1 |
% |
|
31 |
|
1.6 |
% |
1.6 |
% |
Equipment sales |
|
44 |
|
(20.9) |
% |
(20.9) |
% |
|
184 |
|
(6.5) |
% |
(6.5) |
% |
Acceleration of IT & Integration services and implementation of the recovery plan
Enterprise revenues reached 1,901 million euros in the third quarter of 2023, with slight growth of 0.6% (+11 million euros, following + 2.4% in 2Q).
The growth of IT & Integration services of 9.3% (+76 million euros, after +8.8% in 2Q) offset the structural decline of 7.5% in fixed Voice and Data legacy activities (-64 million euros, -5.8% in 2Q). Mobile revenues stagnated, down 0.4% (-1 million euros, after + 9.4% in 2Q) due to the decrease in equipment sales, which offset the increase in mobile services revenues.
In the third quarter, IT & Integration services accounted for 46.6% of revenues (45.5% in the first half). The Digital & Data and Orange Cyberdefense activities produced third-quarter growth of 7.1% (+4.7% in 2Q) and 13.0% (+12.2% in 2Q) respectively.
The acquisition of NEHS Digital and Xperis reinforces Orange Business’ strategy of developing solutions for healthcare professionals.
The simplification of the Orange Business product portfolio is on track to halve the number of products and services in 1Q 2024.
The training and retraining plan for key digital professions (virtualization, Cloud, data, artificial intelligence and cybersecurity) resulted in 7,874 certifications out of the 20,000 targeted by 2025.
Totem
|
|
Q3 2023 |
|
change |
|
change |
|
|
9M 2023 |
|
change |
|
change |
|
|
|
|
|
comparable |
|
historical |
|
|
|
|
comparable |
|
historical |
|
In millions of euros |
|
|
|
basis |
|
basis |
|
|
|
|
basis |
|
basis |
|
Revenues |
|
170 |
|
1.1 |
% |
1.1 |
% |
|
513 |
|
3.2 |
% |
3.2 |
% |
Wholesale |
|
170 |
|
1.1 |
% |
1.1 |
% |
|
513 |
|
3.2 |
% |
3.2 |
% |
Other revenues |
|
- |
|
- |
|
- |
|
|
- |
|
- |
|
- |
|
Revenues for the Totem TowerCo5 reached 170 million euros in the third quarter, an increase of 1.1% (+2 million euros, following +0.7% in 2Q), driven by a 3.1% rise in hosting revenues. In the third quarter of 2023, 16.7% of hosting revenues came from external customers.
This change reflects the increase in the number of sites, which reached 27,203 at September 30, 2023 (compared with 26,990 at September 30, 2022, +213 sites), with a tenancy ratio at 1.38 co-tenants per site, which is well on the way to achieving the target of 1.5 co-tenants by 2026.
International Carriers & Shared Services
|
|
Q3 2023 |
|
change |
|
change |
|
|
9M 2023 |
|
change |
|
change |
|
|
|
|
|
comparable |
|
historical |
|
|
|
|
comparable |
|
historical |
|
In millions of euros |
|
|
|
basis |
|
basis |
|
|
|
|
basis |
|
basis |
|
Revenues |
|
351 |
|
(6.7) |
% |
(7.1) |
% |
|
1,114 |
|
(2.8) |
% |
(3.1) |
% |
Wholesale |
|
231 |
|
(11.8) |
% |
(12.2) |
% |
|
747 |
|
(6.6) |
% |
(6.7) |
% |
Other revenues |
|
120 |
|
4.9 |
% |
4.3 |
% |
|
367 |
|
5.7 |
% |
5.2 |
% |
International wholesale services revenues declined 11.8% in the third quarter (-31 million euros, following + 4.7% in 2Q due to the sale of Arimao cable for 47 million euros). The downward trend in voice traffic was partially offset by roaming services and Data activities.
The 4.9% increase in other revenues (+6 million euros, +6.3% in 2Q) was primarily due to the resale of Orange Marine’s submarine cables and sustained growth in its installation and maintenance activities.
Mobile Financial Services
Mobile Financial Services had 3.26 million customers at September 30, 2023, including 2.0 million in Europe (Orange Bank) and 1.26 million in Africa (Orange Bank Africa), a year-on-year increase of 0.36 million customers.
The announcement that exclusive negotiations had been entered into with BNP Paribas with a view to withdrawing from the European retail banking market had little effect on the activities of Orange Bank, which maintained the high quality of its offering. In France, it is still ranked number one among online banks for customer satisfaction by the Trustpilot review platform and Google Customer Reviews.
In Africa, loan production continued to increase, due to the rise in the value of loans granted.
The Banking Commission of the West African Monetary Union (WAMU) has approved the opening of an Orange Bank Africa branch in Senegal. It is scheduled to launch in 2024.
5 |
European company within the Orange group that owns and manages the passive mobile infrastructure portfolio of telecommunication towers, initially in France and Spain. It has been presented as a separate business segment since January 1, 2022. |
Appendix 1: Financial key indicators6
Q3 data
|
|
Q3 2023 |
|
Q3 2022 |
|
Q3 2022 |
|
|
variation |
|
change |
|
|
|
|
|
comparable |
|
historical |
|
|
comparable |
|
historical |
|
In millions of euros |
|
|
|
basis |
|
basis |
|
|
basis |
|
basis |
|
Revenues |
|
10,999 |
|
10,805 |
|
10,823 |
|
|
1.8 |
% |
1.6 |
% |
France |
|
4,439 |
|
4,461 |
|
4,465 |
|
|
(0.5) |
% |
(0.6) |
% |
Europe |
|
2,923 |
|
2,922 |
|
2,764 |
|
|
0.0 |
% |
5.8 |
% |
Africa & Middle East |
|
1,816 |
|
1,619 |
|
1,782 |
|
|
12.2 |
% |
1.9 |
% |
Enterprise |
|
1,901 |
|
1,891 |
|
1,906 |
|
|
0.6 |
% |
(0.3) |
% |
Totem |
|
170 |
|
168 |
|
168 |
|
|
1.1 |
% |
1.1 |
% |
International Carriers & Shared Services |
|
351 |
|
376 |
|
378 |
|
|
(6.7) |
% |
(7.1) |
% |
Intra-Group eliminations |
|
(601) |
|
(632) |
|
(640) |
|
|
|
|
|
|
Investments in property, plant and equipment and intangible assets |
|
1,709 |
|
2,079 |
|
2,092 |
|
|
(17.8) |
% |
(18.3) |
% |
eCAPEX (1) (Non-IFRS Indicator) |
|
1,597 |
|
1,717 |
|
1,731 |
|
|
(7.0) |
% |
(7.7) |
% |
o/w Telecom activities |
|
1,588 |
|
1,711 |
|
1,725 |
|
|
(7.2) |
% |
(7.9) |
% |
as % of revenues |
|
14.4 |
% |
15.8 |
% |
15.9 |
% |
|
(1.4) |
pt |
(1.5) |
pt |
o/w Mobile Financial Services |
|
8 |
|
6 |
|
6 |
|
|
36.5 |
% |
36.5 |
% |
| (1) | See Section Appendix 4: Glossary – Key figures not defined by IFRS |
9M data
|
|
9M 2023 |
|
9M 2022 |
|
9M 2022 |
|
|
variation |
|
change |
|
|
|
|
|
comparable |
|
historical |
|
|
comparable |
|
historical |
|
In millions of euros |
|
|
|
basis |
|
basis |
|
|
basis |
|
basis |
|
Revenues |
|
32,544 |
|
31,938 |
|
32,120 |
|
|
1.9 |
% |
1.3 |
% |
France |
|
13,130 |
|
13,287 |
|
13,291 |
|
|
(1.2) |
% |
(1.2) |
% |
Europe |
|
8,469 |
|
8,293 |
|
8,089 |
|
|
2.1 |
% |
4.7 |
% |
Africa & Middle East |
|
5,287 |
|
4,760 |
|
5,162 |
|
|
11.1 |
% |
2.4 |
% |
Enterprise |
|
5,846 |
|
5,802 |
|
5,795 |
|
|
0.8 |
% |
0.9 |
% |
Totem |
|
513 |
|
497 |
|
497 |
|
|
3.2 |
% |
3.2 |
% |
International Carriers & Shared Services |
|
1,114 |
|
1,147 |
|
1,150 |
|
|
(2.8) |
% |
(3.1) |
% |
Intra-Group eliminations |
|
(1,814) |
|
(1,848) |
|
(1,864) |
|
|
|
|
|
|
Investments in property, plant and equipment and intangible assets |
|
5,543 |
|
5,778 |
|
5,942 |
|
|
(4.1) |
% |
(6.7) |
% |
eCAPEX (1) (Non-IFRS Indicator) |
|
4,751 |
|
5,061 |
|
5,143 |
|
|
(6.1) |
% |
(7.6) |
% |
o/w Telecom activities |
|
4,722 |
|
5,042 |
|
5,123 |
|
|
(6.3) |
% |
(7.8) |
% |
as % of revenues |
|
14.5 |
% |
15.8 |
% |
15.9 |
% |
|
(1.3) |
pt |
(1.4) |
pt |
o/w Mobile Financial Services |
|
29 |
|
20 |
|
20 |
|
|
44.4 |
% |
44.4 |
% |
| (1) | See Section Appendix 4: Glossary – Key figures not defined by IFRS |
6 |
eCAPEX or “economic CAPEX” is not a financial performance indicator as defined by IFRS and may not be directly comparable to indicators referenced by similarly-named indicators used by other companies. It is provided as additional information only and should not be considered as a substitute for purchases of or investments in property, plant and equipment and intangible assets. See Appendix 2 for a reconciliation under IFRS. |
Appendix 2: Capital expenditures and eCAPEX information
eCAPEX or “economic CAPEX” relates to both (i) Investments in property, plant and equipment and intangible assets, excluding telecommunication licenses and financed assets, less the price of disposal of fixed assets, and (ii) Purchases of property, plant and equipment and intangible assets excluding telecommunication licenses and changes in fixed asset trade payables, less the price of disposal of fixed assets. eCAPEX is not a financial performance indicator as defined by IFRS and may not be directly comparable to indicators referenced by similarly-named indicators used by other companies. It is provided as additional information only and should not be considered as a substitute for purchases of or investments in property, plant and equipment and intangible assets.
The tables below shows the transition from (i) Investments in property, plant and equipment and intangible assets, and (ii) Purchases of property, plant and equipment and intangible assets, excluding trade payables, to (iii) eCAPEX.
|
|
Q3 2023 |
|
Q3 2022 |
In millions of euros |
|
|
|
Historical basis |
|
|
|
|
|
Investments in property, plant and equipment and intangible assets |
|
1,709 |
|
2,092 |
Financed assets |
|
(45) |
|
(67) |
Purchases of property, plant and equipment and intangible assets (1) |
|
1,665 |
|
2,026 |
Price of disposal of fixed assets |
|
(47) |
|
(68) |
Telecommunications licenses |
|
(21) |
|
(227) |
eCAPEX (Non-IFRS Indicator) |
|
1,597 |
|
1,731 |
| (1) | Excluded changes in fixed assets trade payables. Financed assets have no effect on cash flow upon acquisition. |
|
|
9M 2023 |
|
9M 2022 |
In millions of euros |
|
|
|
Historical basis |
|
|
|
|
|
Investments in property, plant and equipment and intangible assets |
|
5,543 |
|
5,942 |
Financed assets |
|
(189) |
|
(136) |
Purchases of property, plant and equipment and intangible assets (1) |
|
5,354 |
|
5,806 |
Price of disposal of fixed assets |
|
(200) |
|
(192) |
Telecommunications licenses |
|
(403) |
|
(471) |
eCAPEX (Non-IFRS Indicator) |
|
4,751 |
|
5,143 |
| (1) | Excluded changes in fixed assets trade payables. Financed assets have no effect on cash flow upon acquisition. |
Appendix 3: Key performance indicators
|
|
September 30, |
|
September 30, |
In thousand, at the end of the period |
|
2023 |
|
2022 |
Number of convergent customers |
|
11,896 |
|
11,577 |
Number of mobile accesses (excluding MVNOs) (1) |
|
250,854 |
|
240,424 |
o/w Convergent customers mobile accesses |
|
21,889 |
|
21,196 |
Mobile only accesses |
|
228,965 |
|
219,228 |
o/w Contract customers mobile accesses |
|
100,826 |
|
92,123 |
Prepaid customers mobile accesses |
|
150,028 |
|
148,301 |
Number of fixed accesses (2) |
|
44,808 |
|
45,654 |
Fixed Retail accesses |
|
30,914 |
|
31,006 |
Fixed Broadband accesses |
|
25,064 |
|
24,180 |
o/w Very high‑speed broadband fixed accesses |
|
16,006 |
|
13,697 |
Convergent customers fixed accesses |
|
11,896 |
|
11,577 |
Fixed accesses only |
|
13,168 |
|
12,603 |
Fixed Narrowband accesses |
|
5,850 |
|
6,826 |
Fixed Wholesale accesses |
|
13,894 |
|
14,648 |
Group total accesses (1+2) |
|
295,662 |
|
286,078 |
2022 data is on a comparable basis and includes access to the telecom operator VOO acquired in June 2023 by Orange Belgium.
Appendix 4: Glossary
Key figures not defined by IFRS
Data on a comparable basis: data based on comparable accounting principles, scope of consolidation and exchange rates are presented for previous periods. The transition from data on an historical basis to data on a comparable basis consists of keeping the results for the period ended and then restating the results for the corresponding period of the preceding year for the purpose of presenting, over comparable periods, financial data with comparable accounting principles, scope of consolidation and exchange rate. The method used is to apply to the data of the corresponding period of the preceding year, the accounting principles and scope of consolidation for the period just ended as well as the average exchange rate used for the income statement for the period ended. Changes in data on a comparable basis reflect organic business changes. Data on a comparable basis is not a financial aggregate as defined by IFRS and may not be comparable to similarly named indicators used by other companies.
eCAPEX or “economic CAPEX”: (i) acquisitions of property, plant and equipment and intangible assets, excluding telecommunications licenses and financed assets, (ii) less the price of disposal of property, plant and equipment and intangible assets. eCAPEX is not a financial performance indicator as defined by IFRS standards and may not be directly comparable to indicators referenced by similarly named indicators in other companies. It is provided as additional information only and should not be considered as a substitute for purchases of or investments in property, plant and equipment and intangible assets.
Performance indicators
Fixed retail accesses: number of fixed broadband accesses (xDSL (ADSL and VDSL), FTTx, cable, Fixed-4G (fLTE) and other broadband accesses (satellite, Wimax and others)) and fixed narrowband accesses (mainly PSTN) and payphones.
Fixed wholesale accesses: number of fixed broadband and narrowband wholesale accesses operated by Orange.
Convergence
Convergent services: customer base and revenues from B2C Convergent retail offers, excluding equipment sales (see definition) defined as an offer combining at least a broadband access (xDSL, FTTx, cable or Fixed-4G (fLTE) with cell-lock) and a mobile voice contract (excluding MVNOs).
Convergent ARPO: average quarterly revenues per convergent offer (ARPO) calculated by dividing revenues from retail Convergent services offers invoiced to B2C customers generated over the past three months (excluding IFRS 15 adjustments) by the weighted average number of retail Convergent offers over the same period. ARPO is expressed by monthly revenues per convergent offer.
Mobile-only services
Mobile-only services: revenues from mobile offers (mainly outgoing calls: voice, SMS and data) invoiced to retail customers, excluding convergent services and equipment sales (see definitions). The customer base includes customers with a contract excluding retail convergence, machine-to-machine contracts and prepaid cards.
Mobile-only ARPO: average quarterly revenues from Mobile-only (ARPO) calculated by dividing revenues from Mobile-only retail services (excluding machine-to-machine and IFRS 15 adjustments) generated over the past three months by the weighted average of Mobile-only customers (excluding machine-to-machine) over the same period. The ARPO is expressed as monthly revenues per Mobile-only customer.
Fixed-only services
Fixed-only services: revenues from fixed retail offers, excluding B2C convergent offers and equipment sales (see definitions). It includes (i) fixed narrowband services (conventional fixed telephony), (ii) fixed broadband services, and (iii) business solutions and networks (with the exception of France, for which essential business solutions and networks are supported by Enterprise). For the Enterprise segment, Fixed-only service revenues include sales of network equipment related to the operation of voice and data services. The customer base consists of fixed narrowband and fixed broadband customers, excluding retail convergence customers.
IT & integration services
IT & Integration services: revenues from unified communication and collaboration services (Local Area Network and telephony, advising, integration and project management), hosting and infrastructure services (including Cloud Computing), applications services (customer relations management and other applications services), security services, video conferencing offers, machine-to-machine services (excluded connectivity) as well as sales of equipment related to the above products and services.
Wholesale
Wholesale: revenues from other carriers consists of (i) mobile services to other carriers including incoming traffic, visitor roaming, network sharing, national roaming and Mobile Virtual Network Operators (MVNOs), (ii) fixed services to other carriers including national networking, services to international carriers, high-speed and very high-speed broadband access (fibre access, unbundling of telephone lines and xDSL access sales) and the sale of telephone lines on the wholesale market, and (iii) equipment sales to other carriers.
Equipment sales
Equipment sales: revenues from all mobile and fixed equipment sales, excluding (i) equipment sales associated with the supply of IT & Integration services, (ii) sales of network equipment related to the operation of voice and data services in the Enterprise operating segment, (iii) equipment sales to other carriers, and (iv) equipment sales to dealers and brokers.
Other revenues
Other revenues: revenues including (i) equipment sales to brokers and dealers, (ii) portal, (iii) on-line advertising revenues, (iv) corporate transversal business line activities, and (v) other miscellaneous revenues.
II. Other Recent Developments
Joint venture with Masmovil in Spain
On July 28, 2023, the European Commission suspended its analysis of the joint venture with Masmovil in Spain (Phase II, which began in April), in order for the parties to provide feedback on the competition concerns it had identified and the commitments that the two groups could make to resolve them. Since the end of July, the parties are in a “Stop the clock” phase and negotiations with remedy takers are ongoing, in coordination with the European Commission. Clearance is expected towards the end of 2023 and closing is expected in the first quarter of 2024.
A sustainability-linked bond issuance
On September 4, 2023, Orange successfully completed its inaugural sustainability-linked bond issuance, for a nominal amount of 500 million euros. This enables Orange to extend the maturity of its debt and diversify its sources of financing on favorable terms.
Financial penalty regarding widespread fiber deployment by 2020 from French telecom regulatory authority (L'autorité de régulation des communications électroniques, des postes et de la distribution de la presse, or ARCEP)
In 2018, Orange proposed commitments regarding widespread deployment of fiber by 2020 (fiber to the home or FTTH) in accordance with Article L33-13 of the French Postal and Electronic Communications Code (the “CPCE”), which were accepted by the French government by a decree (arrêté) dated July 26, 2018. These commitments, which Orange acknowledged were enforceable against it, were to provide FTTH coverage in approximately 3,000 municipalities in France (the so-called AMII7 zone) for 100% of homes and professional premises, to which offers of telecommunications services can be marketed given their FTTH coverage by the end of 2020. This deadline was postponed due to Covid.
On November 7, 2023, the ARCEP imposed a financial penalty of 26 million euros on Orange for failing to meet that first deadline in the AMII zone. Orange will appeal the ARCEP decision; however, this appeal does not suspend the required payment of the financial penalty, which is due within two months of the notification of the penalty.
Widespread fiber deployment by 2025
On November 7, 2023, Orange and the French government announced that they had reached a tentative new agreement on the widespread deployment of fiber by 2025. This agreement includes a proposal for new commitments by Orange in the AMII zone, to be achieved by 2025. Under this agreement, Orange is seeking to increase the pace of deployment within the AMII zone and has modified its previous commitments for 2022 to bring fiber to an additional 1,120,000 homes by the end of 2025. Although this agreement is based on new commitments, it extends the deadline for Orange to meet its commitments, thereby avoiding the risk of a penalty in 2024 given that the commitments which will replace the previous ones will be verified in 2025. The agreement has been submitted to ARCEP for an advisory opinion before being definitively approved by the French government, which is expected before the end of 2023.
Where deployment disparities between different urban areas exist, additional efforts will be made in areas with the lowest fiber coverage within this perimeter to make more than 140,000 homes connectable to a fiber network by 2024. Orange will also provide an “on demand” offer, seeking to provide connectivity to all customers who are not eligible for fiber within six months of their request.8 This offer will be available until the copper network is shut down. This proposal targets delivery of widespread fiber availability in the AMII zone by the end of 2025. In the most densely populated areas, Orange is continuing the deployments, with the aim of making more than 300,000 homes and businesses connectable to a fiber network by 2025. In 2024, the Group will conduct a trial of on-demand deployment for its customers in two major cities within this perimeter. Orange will continue to offer fiber access at a subsidized rate for eligible households until at least 2027.
Dividend
On December 6, 2023, Orange made an interim dividend cash payment for 2023 of 0.30 euros per share. A dividend of 0.72 euros per share for 2023 will be proposed to the Annual Shareholder’s Meeting in 2024.
7AMII zones are the least densely populated private initiative zones in France.
8 |
In accordance with current regulations dated November 1, 2023 and the offer for access to the terminal part of Orange FTTH lines outside the most densely populated zones. |