UNITED STATES
SECURITIES AND EXCHANGE COMMISSION
Washington, D.C. 20549
Form 6-K
REPORT OF FOREIGN PRIVATE ISSUER PURSUANT TO
RULE
13a-16 OR 15d-16 UNDER
THE SECURITIES EXCHANGE ACT OF 1934
For the month of November 2023
Commission File Number 001-38752
Qifu Technology, Inc.
(Translation of registrant’s name into English)
7/F Lujiazui Finance Plaza
No. 1217 Dongfang Road
Pudong New Area, Shanghai 200122
People’s Republic of China
(Address of principal executive office)
Indicate by check mark whether the registrant files or will file annual reports under cover of Form 20-F or Form 40-F. Form 20-F x Form 40-F ¨
Exhibit Index
SIGNATURES
Pursuant to the requirements of the Securities Exchange Act of 1934, the registrant has duly caused this report to be signed on its behalf by the undersigned, thereunto duly authorized.
| Qifu Technology, Inc. | ||
| By: | /s/Alex Xu | |
| Name: | Alex Xu | |
| Title: | Director and Chief Financial Officer | |
| Date: November 16, 2023 | ||
Exhibit 99.1
Qifu Technology Announces Third Quarter 2023 Unaudited Financial Results
Shanghai, China, November 16, 2023, Qifu Technology, Inc. (NASDAQ: QFIN; HKEx: 3660) (“Qifu Technology” or the “Company”), a leading Credit-Tech platform in China, today announced its unaudited financial results for the third quarter ended September 30, 2023.
Third Quarter 2023 Business Highlights
| · | As of September 30, 2023, our platform has connected 155 financial institutional partners and 227.9 million consumers*1 with potential credit needs, cumulatively, an increase of 12.0% from 203.5 million a year ago. |
| · | Cumulative users with approved credit lines*2 were 49.2 million as of September 30, 2023, an increase of 14.4% from 43.0 million as of September 30, 2022. |
| · | Cumulative borrowers with successful drawdown, including repeat borrowers was 29.4 million as of September 30, 2023, an increase of 11.9% from 26.3 million as of September 30, 2022. |
| · | In the third quarter of 2023, financial institutional partners originated 18,504,320 loans*3 through our platform. Total facilitation and origination loan volume reached RMB123,148 million*4, an increase of 11.3% from RMB110,675 million in the same period of 2022. |
| · | Out of those loans originated by financial institutions, RMB69,579 million was under capital-light model, Intelligence Credit Engine (“ICE”) and other technology solutions*5, representing 56.5% of the total, an increase of 7.7% from RMB64,583 million in the same period of 2022. |
| · | Total outstanding loan balance*6 was RMB189,100 million as of September 30, 2023, an increase of 18.2% from RMB160,020 million as of September 30, 2022. |
| · | RMB116,283 million of such loan balance was under capital-light model, “ICE” and other technology solutions*7, an increase of 27.5% from RMB91,196 million as of September 30, 2022. |
| · | The weighted average contractual tenor of loans originated by financial institutions across our platform in the third quarter of 2023 was approximately 11.23 months, compared with approximately 12.27 months in the same period of 2022. |
| · | 90 day+ delinquency rate*8 of loans originated by financial institutions across our platform was 1.82% as of September 30, 2023. |
| · | Repeat borrower contribution*9 of loans originated by financial institutions across our platform for the third quarter of 2023 was 91.5%. |
1 Refers to cumulative registered users across our platform.
2 “Users with approved credit lines” refers to the total number of users who had submitted their credit applications and were approved with a credit line at the end of each period.
3 Including 5,935,834 loans across “V-pocket”, and 12,568,486 loans across other products.
4 Refers to the total principal amount of loans facilitated and originated during the given period, including loan volume facilitated through Intelligence Credit Engine (“ICE”) and other technology solutions.
5 “ICE” is an open platform on our “360 Jietiao” APP, we match borrowers and financial institutions through big data and cloud computing technology on “ICE”, and provide pre-loan investigation report of borrowers. For loans facilitated through “ICE”, the Company does not bear principal risk. Loan facilitation volume through “ICE” was RMB9,629 million in the third quarter of 2023.
Under other technology solutions, we offer financial institutions on-premise deployed, modular risk management SaaS, which helps financial institution partners improve credit assessment results. Loan facilitation volume through other technology solutions was RMB 26,563 million in the third quarter of 2023.
6 “Total outstanding loan balance” refers to the total amount of principal outstanding for loans facilitated and originated at the end of each period, including loan balance for “ICE” and other technology solutions, excluding loans delinquent for more than 180 days.
7 Outstanding loan balance for “ICE” and other technology solutions were RMB12,720 million and RMB42,134 million, respectively, as of September 30, 2023.
8 “90 day+ delinquency rate” refers to the outstanding principal balance of on- and off-balance sheet loans that were 91 to 180 calendar days past due as a percentage of the total outstanding principal balance of on- and off-balance sheet loans across our platform as of a specific date. Loans that are charged-off and loans under “ICE” and other technology solutions are not included in the delinquency rate calculation.
9 “Repeat borrower contribution” for a given period refers to (i) the principal amount of loans borrowed during that period by borrowers who had historically made at least one successful drawdown, divided by (ii) the total loan facilitation and origination volume through our platform during that period.
|
|
Third Quarter 2023 Financial Highlights
| · | Total net revenue was RMB4,281.0 million (US$586.8 million), compared to RMB4,144.1 million in the same period of 2022. |
| · | Income from operations was RMB1,388.9 million (US$190.4 million), compared to RMB1,158.3 million in the same period of 2022. |
| · | Non-GAAP*10 income from operations was RMB1,432.2 million (US$196.3 million), compared to RMB1,207.8 million in the same period of 2022. |
| · | Operating margin was 32.4%. Non-GAAP operating margin was 33.5%. |
| · | Net income was RMB1,137.7 million (US$155.9 million), compared to RMB988.4 million in the same period of 2022. |
| · | Non-GAAP net income was RMB1,181.0 million (US$161.9 million), compared to RMB1,037.9 million in the same period of 2022. |
| · | Net income attributed to the Company was RMB1,142.0 million (US$156.5 million), compared to RMB992.8 million in the same period of 2022. |
| · | Net income margin was 26.6%. Non-GAAP net income margin was 27.6%. |
10 Non-GAAP income from operations (Adjusted Income from operations), Non-GAAP net income (Adjusted net income), Non-GAAP operating margin and Non-GAAP net income margin are non-GAAP financial measures. For more information on these non-GAAP financial measures, please see the section of “Use of Non-GAAP Financial Measures Statement” and the table captioned “Unaudited Reconciliations of GAAP and Non-GAAP Results” set forth at the end of this press release.
Mr. Haisheng Wu, Chief Executive Officer and Director of Qifu Technology, commented, “As macro-economic recovery stalled and consumer sentiment softened, we made timely adjustment to our strategies and focused our effort on refined operations to drive better profitability and quality growth. For the third quarter, total loan facilitation and origination volume was RMB123.1 billion, up 11.3% year-on-year. Approximately 56% of the loan volume was facilitated under the capital-light model, ICE and other technology solutions.
Through optimizing customer acquisition channels and enriching product and service offerings, we added over 1.7 million new users with approved credit lines. In addition, we continued to strengthen our partnership with financial institutions and achieve overall better funding terms. During the quarter with the help of new ABS issuance, we further reduce our overall funding costs to record low levels.
As economic headwind persists, we experienced some fluctuation in asset quality during the quarter. However, many of the operational initiatives we launched in the quarter should continue to make positive contributions through the remainder of this year and the next year. In the long run, we will continue to drive for consistent executions and optimal balance between quality growth and manageable risks.”
“We are pleased to report another quarter of solid financial results in a rather challenging macro environment. Total revenue was RMB4.28 billion and non-GAAP net income was RMB1.18 billion for the third quarter,” Mr. Alex Xu, Chief Financial Officer, commented. “During the quarter, despite the macro uncertainty, we continued to improve our operational efficiency and drive for better economic returns. At the end of the third quarter, our total cash and cash equivalent*11 was approximately RMB8.2 billion, and we generated approximately RMB1.2 billion cash from operations. Our strong financial positions not only enable us to drive quality growth, but also allow us to deliver attractive shareholder returns through dividend payout and share repurchase.”
Mr. Yan Zheng, Chief Risk Officer, added, “We started to see fluctuation on key risk metrics in the third quarter as macro uncertainties impacted consumers’ sentiment and financial wellness. We took quick actions to tighten our credit assessment criteria to cope with the uncertainties. Among key leading indicators, Day-1 delinquency rate*12 was 4.6%, and 30-day collection rates*13 was approximately 87% for the third quarter. As the economic conditions change, we will continue to take a prudent approach in managing risks and navigating through this challenging macro headwinds.”
11 Including “Cash and cash equivalents”, “Restricted cash”, and “Security deposit prepaid to third-party guarantee companies”.
12 “Day-1 delinquency rate” is defined as (i) the total amount of principal that became overdue as of a specified date, divided by (ii) the total amount of principal that was due for repayment as of such specified date.
13 “30 day collection rate” is defined as (i) the amount of principal that was repaid in one month among the total amount of principal that became overdue as of a specified date, divided by (ii) the total amount of principal that became overdue as of such specified date.
|
|
Third Quarter 2023 Financial Results
Total net revenue was RMB4,281.0 million (US$586.8 million), compared to RMB4,144.1 million in the same period of 2022, and RMB3,914.3 million in the prior quarter.
Net revenue from Credit Driven Services was RMB3,071.0 million (US$420.9 million), compared to RMB2,941.1 million in the same period of 2022, and RMB2,788.7 million in the prior quarter.
Loan facilitation and servicing fees-capital heavy were RMB479.2 million (US$65.7 million), compared to RMB582.9 million in the same period of 2022 and RMB395.5 million in the prior quarter. The year-over-year decrease was primarily due to shorter tenor of the loans compared to that in the same period of 2022. The sequential increase was primarily due to higher capital-heavy loan volume and longer effective tenor of the loans compared to that in the prior quarter.
Financing income*14 was RMB1,369.9 million (US$187.8 million), compared to RMB877.1 million in the same period of 2022 and RMB1,188.7 million in the prior quarter. The year-over-year and sequential increases were primarily due to the growth in average outstanding balance of the on-balance-sheet loans.
Revenue from releasing of guarantee liabilities was RMB1,165.7 million (US$159.8 million), compared to RMB1,447.6 million in the same period of 2022, and RMB1,158.6 million in the prior quarter. The year-over-year and sequential changes reflected the changes in average outstanding balance of off-balance-sheet capital-heavy loans.
Other services fees were RMB56.1 million (US$7.7 million), compared to RMB33.6 million in the same period of 2022, and RMB45.9 million in the prior quarter. The year-over-year and sequential increases were mainly due to the increases in late payment fees under the capital-heavy model.
Net revenue from Platform Services was RMB1,210.1 million (US$165.9 million), compared to RMB1,203.0 million in the same period of 2022 and RMB1,125.6 million in the prior quarter.
Loan facilitation and servicing fees-capital light were RMB863.9 million (US$118.4 million), compared to RMB1,040.2 million in the same period of 2022 and RMB887.8 million in the prior quarter. The year-over-year decrease was mainly due to lower capital-light loan volume and shorter effective tenor of the loans. The sequential decrease was primarily due to lower capital-light loan volume.
Referral services fees were RMB234.2 million (US$32.1 million), compared to RMB85.4 million in the same period of 2022 and RMB160.9 million in the prior quarter. The year-over-year and sequential increases were mainly due to the increase in the loan facilitation volume through ICE.
Other services fees were RMB112.0 million (US$15.4 million), compared to RMB77.4 million in the same period of 2022 and RMB76.9 million in the prior quarter. The year-over-year and sequential increases were mainly due to increase in late payment fees and other service fees.
Total operating costs and expenses were RMB2,892.2 million (US$396.4 million), compared to RMB2,985.9 million in the same period of 2022 and RMB2,732.8 million in the prior quarter.
Facilitation, origination and servicing expenses were RMB639.8 million (US$87.7 million), compared to RMB617.3 million in the same period of 2022 and RMB648.0 million in the prior quarter. The year-over-year increase was primarily due to higher credit search fees and collection fees.
Funding costs were RMB160.2 million (US$22.0 million), compared to RMB138.5 million in the same period of 2022 and RMB165.2 million in the prior quarter. The year-over-year increase was primarily due to increases in funding from ABS, as a result of continued growth in on-balance-sheet loan balance, partially offset by the lower average cost of ABS.
Sales and marketing expenses were RMB529.6 million (US$72.6 million), compared to RMB624.1 million in the same period of 2022 and RMB436.5 million in the prior quarter. The year-over-year decrease was mainly due to decline in unit customer acquisition cost. The sequential increase was mainly due to larger number of new users and slightly higher unit cost in the third quarter.
|
|
General and administrative expenses were RMB95.4 million (US$13.1 million), compared to RMB102.7 million in the same period of 2022 and RMB112.8 million in the prior quarter. The year-over-year and sequential decreases were mainly due to decreases in professional service fees and our continued effort to improve operational efficiency.
Provision for loans receivable was RMB509.0 million (US$69.8 million), compared to RMB191.5 million in the same period of 2022 and RMB483.3 million in the prior quarter. The year-over-year and sequential increases were mainly due to the growth in loan origination volume of on-balance-sheet loans.
Provision for financial assets receivable was RMB86.9 million (US$11.9 million), compared to RMB115.1 million in the same period of 2022 and RMB82.3 million in the prior quarter. The year-over-year and sequential changes mainly reflected the Company’s consistent approach in assessing provisions commensurate with its underlying loan profile.
Provision for accounts receivable and contract assets was RMB39.7 million (US$5.4 million), compared to RMB53.8 million in the same period of 2022 and RMB47.2 million in the prior quarter. The year-over-year and sequential changes reflected the Company’s consistent approach in assessing provisions commensurate with its underlying loan profile.
Provision for contingent liability was RMB831.6 million (US$114.0 million), compared to RMB1,142.8 million in the same period of 2022 and RMB757.6 million in the prior quarter. The year-over-year and sequential changes reflected the Company’s consistent approach in assessing provisions commensurate with its underlying loan profile. In addition, the sequential increase was also partially due to the increase in loan facilitation volume of off-balance-sheet loans.
Income from operations was RMB1,388.9 million (US$190.4 million), compared to RMB1,158.3 million in the same period of 2022 and RMB1,181.5 million in the prior quarter.
Non-GAAP income from operations was RMB1,432.2 million (US$196.3 million), compared to RMB1,207.8 million in the same period of 2022 and RMB1,234.7 million in the prior quarter.
Operating margin was 32.4%. Non-GAAP operating margin was 33.5%.
Income before income tax expense was RMB1,478.1 million (US$202.6 million), compared to RMB1,171.5 million in the same period of 2022 and RMB1,366.3 million in the prior quarter.
Net income was RMB1,137.7 million (US$155.9 million), compared to RMB988.4 million in the same period of 2022 and RMB1,093.4 million in the prior quarter.
Non-GAAP net income was RMB1,181.0 million (US$161.9 million), compared to RMB1,037.9 million in the same period of 2022 and RMB1,146.6 million in the prior quarter.
Net income margin was 26.6%. Non-GAAP net income margin was 27.6%.
Net income attributed to the Company was RMB1,142.0 million (US$156.5 million), compared to RMB992.8 million in the same period of 2022 and RMB1,097.4 million in the prior quarter.
Non-GAAP net income attributed to the Company was RMB1,185.3 million (US$162.5 million), compared to RMB1,042.4 million in the same period of 2022 and RMB1,150.7 million in the prior quarter.
Net income per fully diluted ADS was RMB6.94 (US$0.96).
Non-GAAP net income per fully diluted ADS was RMB7.20 (US$0.99).
Weighted average basic ADS used in calculating GAAP and non-GAAP net income per ADS was 160.39 million.
Weighted average diluted ADS used in calculating GAAP and non-GAAP net income per ADS was 164.61 million.
14 “Financing income” is generated from loans facilitated through the Company’s platform funded by the consolidated trusts and Fuzhou Microcredit, which charge fees and interests from borrowers.
|
|
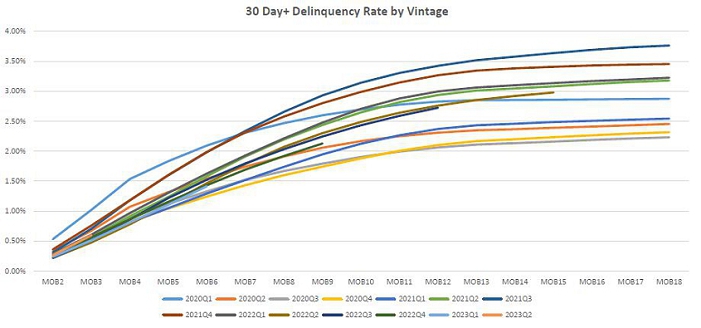
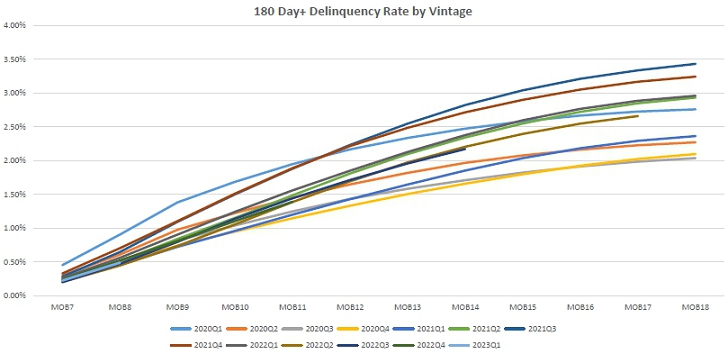
30 Day+ Delinquency Rate by Vintage and 180 Day+ Delinquency Rate by Vintage
The following charts and tables display the historical cumulative 30 day+ delinquency rates by loan facilitation and origination vintage and 180 day+ delinquency rates by loan facilitation and origination vintage for all loans facilitated and originated through the Company’s platform. Loans under “ICE” and other technology solutions are not included in the 30 day+ charts and the 180 day+ charts:
|
|
Update on Share Repurchase
On June 20, 2023, the Company announced a share repurchase plan whereby the Company is authorized to repurchase its American depositary shares (“ADSs”) or Class A ordinary shares with an aggregate value of up to US$150 million during the 12-month period from June 20, 2023. From the launch of the share repurchase plan to November 16, 2023, the Company in aggregate purchased approximately 4.9 million ADSs in the open market for a total cost of approximately US$80 million (inclusive of commissions) at an average price around US$16.2 per ADS pursuant to the share repurchase plan.
Business Outlook
Given the slower than expected macro-economic recovery and persistent uncertainties, the Company will continue to take a prudent approach in business planning and risk management. As such, the Company now expects total loan volume for the fourth quarter to be between RMB116 billion and RMB126 billion, and for the full year total loan volume to be between RMB473 billion and RMB483 billion, representing a year-on-year growth of 15%-17%. This outlook reflects the Company’s current and preliminary views, which is subject to material changes.
Conference Call Preregistration
Qifu Technology’s management team will host an earnings conference call at 7:30 PM U.S. Eastern Time on Thursday, November 16, 2023 (8:30 AM Beijing Time on Friday, November 17, 2023).
All participants wishing to join the conference call must pre-register online using the link provided below.
Registration Link: https://register.vevent.com/register/BI21f98dce365242beac459791a07d81ab
Upon registration, each participant will receive details for the conference call, including dial-in numbers and a unique access PIN. Please dial in 10 minutes before the call is scheduled to begin.
Additionally, a live and archived webcast of the conference call will be available on the Investor Relations section of the Company's website at http://ir.qifu.tech.
About Qifu Technology
Qifu Technology is a Credit-Tech platform in China that provides a comprehensive suite of technology services to assist financial institutions and consumers and SMEs in the loan lifecycle, ranging from borrower acquisition, preliminary credit assessment, fund matching and post-facilitation services. The Company is dedicated to making credit services more accessible and personalized to consumers and SMEs through Credit-Tech services to financial institutions.
For more information, please visit: https://ir.qifu.tech.
Use of Non-GAAP Financial Measures Statement
To supplement our financial results presented in accordance with U.S. GAAP, we use Non-GAAP financial measure, which is adjusted from results based on U.S. GAAP to exclude share-based compensation expenses. Reconciliations of our Non-GAAP financial measures to our U.S. GAAP financial measures are set forth in tables at the end of this earnings release, which provide more details on the Non-GAAP financial measures.
|
|
We use Non-GAAP income from operation, Non-GAAP operating margin, Non-GAAP net income, Non-GAAP net income margin, Non-GAAP net income attributed to the Company and Non-GAAP net income per fully diluted ADS in evaluating our operating results and for financial and operational decision-making purposes. Non-GAAP income from operation represents income from operation excluding share-based compensation expenses. Non-GAAP operating margin is equal to Non-GAAP income from operation divided by total net revenue. Non-GAAP net income represents net income excluding share-based compensation expenses. Non-GAAP net income margin is equal to Non-GAAP net income divided by total net revenue. Non-GAAP net income attributed to the Company represents net income attributed to the Company excluding share-based compensation expenses. Non-GAAP net income per fully diluted ADS represents net income per fully diluted ADS excluding share-based compensation expenses. Such adjustments have no impact on income tax. We believe that Non-GAAP income from operation and Non-GAAP net income help identify underlying trends in our business that could otherwise be distorted by the effect of certain expenses that we include in results based on U.S. GAAP. We believe that Non-GAAP income from operation and Non-GAAP net income provide useful information about our operating results, enhance the overall understanding of our past performance and future prospects and allow for greater visibility with respect to key metrics used by our management in its financial and operational decision-making. Our Non-GAAP financial information should be considered in addition to results prepared in accordance with U.S. GAAP, but should not be considered a substitute for or superior to U.S. GAAP results. In addition, our calculation of Non-GAAP financial information may be different from the calculation used by other companies, and therefore comparability may be limited.
Exchange Rate Information
This announcement contains translations of certain RMB amounts into U.S. dollars at specified rates solely for the convenience of the reader. Unless otherwise noted, all translations from RMB to U.S. dollars are made at a rate of RMB7.2960 to US$1.00, the exchange rate set forth in the H.10 statistical release of the Board of Governors of the Federal Reserve System as of September 29, 2023.
Safe Harbor Statement
Any forward-looking statements contained in this announcement are made under the “safe harbor” provisions of the U.S. Private Securities Litigation Reform Act of 1995. Forward-looking statements can be identified by terminology such as “will,” “expects,” “anticipates,” “future,” “intends,” “plans,” “believes,” “estimates” and similar statements. Among other things, the business outlook and quotations from management in this announcement, as well as the Company’s strategic and operational plans, contain forward-looking statements. Qifu Technology may also make written or oral forward-looking statements in its periodic reports to the U.S. Securities and Exchange Commission (“SEC”), in announcements made on the website of The Stock Exchange of Hong Kong Limited (the “Hong Kong Stock Exchange”), in its annual report to shareholders, in press releases and other written materials and in oral statements made by its officers, directors or employees to third parties. Statements that are not historical facts, including the Company’s business outlook, beliefs and expectations, are forward-looking statements. Forward-looking statements involve inherent risks and uncertainties. A number of factors could cause actual results to differ materially from those contained in any forward-looking statement, which factors include but not limited to the following: the Company’s growth strategies, the Company’s cooperation with 360 Group, changes in laws, rules and regulatory environments, the recognition of the Company’s brand, market acceptance of the Company’s products and services, trends and developments in the credit-tech industry, governmental policies relating to the credit-tech industry, general economic conditions in China and around the globe, and assumptions underlying or related to any of the foregoing. Further information regarding these and other risks and uncertainties is included in Qifu Technology’s filings with the SEC and announcements on the website of the Hong Kong Stock Exchange. All information provided in this press release is as of the date of this press release, and Qifu Technology does not undertake any obligation to update any forward-looking statement, except as required under applicable law.
For more information, please contact:
Qifu Technology
E-mail: ir@360shuke.com
|
|
Unaudited Condensed Consolidated Balance Sheets
(Amounts in thousands of Renminbi (“RMB”) and U.S. dollars (“USD”)
except for number of shares and per share data, or otherwise noted)
| December 31, | September 30, | September 30, | ||||||||||
| 2022 | 2023 | 2023 | ||||||||||
| RMB | RMB | USD | ||||||||||
| ASSETS | ||||||||||||
| Current assets: | ||||||||||||
| Cash and cash equivalents | 7,165,584 | 4,938,298 | 676,850 | |||||||||
| Restricted cash | 3,346,779 | 3,067,100 | 420,381 | |||||||||
| Short term investments | 57,000 | - | - | |||||||||
| Security deposit prepaid to third-party guarantee companies | 396,699 | 192,037 | 26,321 | |||||||||
| Funds receivable from third party payment service providers | 1,158,781 | 1,664,417 | 228,127 | |||||||||
| Accounts receivable and contract assets, net | 2,868,625 | 2,842,438 | 389,589 | |||||||||
| Financial assets receivable, net | 2,982,076 | 2,716,113 | 372,274 | |||||||||
| Amounts due from related parties | 394,872 | 67,312 | 9,226 | |||||||||
| Loans receivable, net | 15,347,662 | 23,469,654 | 3,216,784 | |||||||||
| Prepaid expenses and other assets | 379,388 | 1,052,436 | 144,248 | |||||||||
| Total current assets | 34,097,466 | 40,009,805 | 5,483,800 | |||||||||
| Non-current assets: | ||||||||||||
| Accounts receivable and contract assets, net-non current | 261,319 | 159,923 | 21,919 | |||||||||
| Financial assets receivable, net-non current | 688,843 | 570,009 | 78,126 | |||||||||
| Amounts due from related parties | 33,236 | 8,177 | 1,121 | |||||||||
| Loans receivable, net-non current | 3,136,994 | 2,870,943 | 393,495 | |||||||||
| Property and equipment, net | 47,602 | 148,285 | 20,324 | |||||||||
| Land use rights,net | 998,185 | 982,642 | 134,682 | |||||||||
| Intangible assets | 4,696 | 13,567 | 1,860 | |||||||||
| Goodwill | - | 41,210 | 5,648 | |||||||||
| Deferred tax assets | 1,019,171 | 1,181,488 | 161,936 | |||||||||
| Other non-current assets | 55,658 | 53,021 | 7,267 | |||||||||
| Total non-current assets | 6,245,704 | 6,029,265 | 826,378 | |||||||||
| TOTAL ASSETS | 40,343,170 | 46,039,070 | 6,310,178 | |||||||||
| LIABILITIES AND EQUITY | ||||||||||||
| Current liabilities: | ||||||||||||
| Payable to investors of the consolidated trusts-current | 6,099,520 | 6,938,377 | 950,984 | |||||||||
| Accrued expenses and other current liabilities | 2,004,551 | 2,674,368 | 366,553 | |||||||||
| Amounts due to related parties | 113,697 | 152,740 | 20,935 | |||||||||
| Short term loans | 150,000 | 756,278 | 103,657 | |||||||||
| Guarantee liabilities-stand ready | 4,120,346 | 3,981,851 | 545,758 | |||||||||
| Guarantee liabilities-contingent | 3,418,391 | 3,352,336 | 459,476 | |||||||||
| Income tax payable | 661,015 | 1,010,478 | 138,498 | |||||||||
| Other tax payable | 182,398 | 129,555 | 17,757 | |||||||||
| Total current liabilities | 16,749,918 | 18,995,983 | 2,603,618 | |||||||||
| Non-current liabilities: | ||||||||||||
| Deferred tax liabilities | 100,835 | 117,173 | 16,060 | |||||||||
| Payable to investors of the consolidated trusts-noncurrent | 4,521,600 | 5,697,700 | 780,935 | |||||||||
| Other long-term liabilities | 39,520 | 98,574 | 13,511 | |||||||||
| Total non-current liabilities | 4,661,955 | 5,913,447 | 810,506 | |||||||||
| TOTAL LIABILITIES | 21,411,873 | 24,909,430 | 3,414,124 | |||||||||
| TOTAL QIFU TECHNOLOGY INC EQUITY | 18,847,156 | 21,053,214 | 2,885,579 | |||||||||
| Noncontrolling interests | 84,141 | 76,426 | 10,475 | |||||||||
| TOTAL EQUITY | 18,931,297 | 21,129,640 | 2,896,054 | |||||||||
| TOTAL LIABILITIES AND EQUITY | 40,343,170 | 46,039,070 | 6,310,178 | |||||||||
|
|
Unaudited Condensed Consolidated Statements of Operations
(Amounts in thousands of Renminbi (“RMB”) and U.S. dollars (“USD”)
except for number of shares and per share data, or otherwise noted)
| Three months ended September 30, | Nine months ended September 30, | |||||||||||||||||||||||
| 2022 | 2023 | 2023 | 2022 | 2023 | 2023 | |||||||||||||||||||
| RMB | RMB | USD | RMB | RMB | USD | |||||||||||||||||||
| Credit driven services | 2,941,106 | 3,070,969 | 420,911 | 8,809,503 | 8,490,297 | 1,163,692 | ||||||||||||||||||
| Loan facilitation and servicing fees-capital heavy | 582,857 | 479,248 | 65,686 | 1,724,628 | 1,185,924 | 162,544 | ||||||||||||||||||
| Financing income | 877,051 | 1,369,855 | 187,754 | 2,485,871 | 3,624,475 | 496,776 | ||||||||||||||||||
| Revenue from releasing of guarantee liabilities | 1,447,592 | 1,165,737 | 159,778 | 4,522,107 | 3,534,111 | 484,390 | ||||||||||||||||||
| Other services fees | 33,606 | 56,129 | 7,693 | 76,897 | 145,787 | 19,982 | ||||||||||||||||||
| Platform services | 1,203,023 | 1,210,057 | 165,852 | 3,837,872 | 3,304,227 | 452,881 | ||||||||||||||||||
| Loan facilitation and servicing fees-capital light | 1,040,210 | 863,860 | 118,402 | 3,169,165 | 2,516,970 | 344,979 | ||||||||||||||||||
| Referral services fees | 85,381 | 234,190 | 32,098 | 468,031 | 503,530 | 69,014 | ||||||||||||||||||
| Other services fees | 77,432 | 112,007 | 15,352 | 200,676 | 283,727 | 38,888 | ||||||||||||||||||
| Total net revenue | 4,144,129 | 4,281,026 | 586,763 | 12,647,375 | 11,794,524 | 1,616,573 | ||||||||||||||||||
| Facilitation, origination and servicing | 617,311 | 639,795 | 87,691 | 1,787,872 | 1,928,125 | 264,272 | ||||||||||||||||||
| Funding costs | 138,475 | 160,181 | 21,955 | 366,105 | 484,429 | 66,397 | ||||||||||||||||||
| Sales and marketing | 624,104 | 529,632 | 72,592 | 1,791,761 | 1,388,295 | 190,282 | ||||||||||||||||||
| General and administrative | 102,721 | 95,393 | 13,075 | 318,869 | 313,039 | 42,906 | ||||||||||||||||||
| Provision for loans receivable | 191,542 | 508,990 | 69,763 | 1,098,859 | 1,511,160 | 207,122 | ||||||||||||||||||
| Provision for financial assets receivable | 115,144 | 86,875 | 11,907 | 279,361 | 237,892 | 32,606 | ||||||||||||||||||
| Provision for accounts receivable and contract assets | 53,762 | 39,724 | 5,445 | 170,787 | 84,694 | 11,608 | ||||||||||||||||||
| Provision for contingent liabilities | 1,142,820 | 831,563 | 113,975 | 3,305,458 | 2,269,487 | 311,059 | ||||||||||||||||||
| Total operating costs and expenses | 2,985,879 | 2,892,153 | 396,403 | 9,119,072 | 8,217,121 | 1,126,252 | ||||||||||||||||||
| Income from operations | 1,158,250 | 1,388,873 | 190,360 | 3,528,303 | 3,577,403 | 490,321 | ||||||||||||||||||
| Interest income, net | 57,819 | 49,713 | 6,814 | 126,007 | 170,337 | 23,347 | ||||||||||||||||||
| Foreign exchange (loss) gain | (68,583 | ) | (659 | ) | (90 | ) | (155,241 | ) | 3,171 | 435 | ||||||||||||||
| Other income, net | 24,027 | 40,175 | 5,506 | 227,485 | 225,727 | 30,938 | ||||||||||||||||||
| Investment loss | - | - | - | (8,996 | ) | (30,112 | ) | (4,127 | ) | |||||||||||||||
| Income before income tax expense | 1,171,513 | 1,478,102 | 202,590 | 3,717,558 | 3,946,526 | 540,914 | ||||||||||||||||||
| Income taxes expense | (183,159 | ) | (340,412 | ) | (46,657 | ) | (579,891 | ) | (785,637 | ) | (107,681 | ) | ||||||||||||
| Net income | 988,354 | 1,137,690 | 155,933 | 3,137,667 | 3,160,889 | 433,233 | ||||||||||||||||||
| Net loss attributable to noncontrolling interests | 4,481 | 4,357 | 597 | 14,505 | 12,707 | 1,742 | ||||||||||||||||||
| Net income attributable to ordinary shareholders of the Company | 992,835 | 1,142,047 | 156,530 | 3,152,172 | 3,173,596 | 434,975 | ||||||||||||||||||
| Net income per ordinary share attributable to ordinary shareholders of Qifu Technology, Inc. | ||||||||||||||||||||||||
| Basic | 3.18 | 3.56 | 0.49 | 10.12 | 9.85 | 1.35 | ||||||||||||||||||
| Diluted | 3.09 | 3.47 | 0.48 | 9.81 | 9.61 | 1.32 | ||||||||||||||||||
| Net income per ADS attributable to ordinary shareholders of Qifu Technology, Inc. | ||||||||||||||||||||||||
| Basic | 6.36 | 7.12 | 0.98 | 20.24 | 19.70 | 2.70 | ||||||||||||||||||
| Diluted | 6.18 | 6.94 | 0.96 | 19.62 | 19.22 | 2.64 | ||||||||||||||||||
| Weighted average shares used in calculating net income per ordinary share | ||||||||||||||||||||||||
| Basic | 312,481,135 | 320,789,494 | 320,789,494 | 311,571,575 | 322,240,695 | 322,240,695 | ||||||||||||||||||
| Diluted | 321,521,765 | 329,220,827 | 329,220,827 | 321,224,803 | 330,391,888 | 330,391,888 | ||||||||||||||||||
|
|
Unaudited Condensed Consolidated Statements of Cash Flows
(Amounts in thousands of Renminbi (“RMB”) and U.S. dollars (“USD”)
except for number of shares and per share data, or otherwise noted)
| Three months ended September 30, | Nine months ended September 30, | |||||||||||||||||||||||
| 2022 | 2023 | 2023 | 2022 | 2023 | 2023 | |||||||||||||||||||
| RMB | RMB | USD | RMB | RMB | USD | |||||||||||||||||||
| Net cash provided by operating activities | 1,592,127 | 1,243,893 | 170,490 | 4,130,038 | 4,766,559 | 653,311 | ||||||||||||||||||
| Net cash used in investing activities | (2,981,196 | ) | (2,260,922 | ) | (309,885 | ) | (5,675,628 | ) | (9,262,095 | ) | (1,269,476 | ) | ||||||||||||
| Net cash provided by financing activities | 881,092 | 702,952 | 96,348 | 3,010,269 | 1,978,079 | 271,118 | ||||||||||||||||||
| Effect of foreign exchange rate changes | 7,081 | 4,934 | 675 | 4,704 | 10,492 | 1,439 | ||||||||||||||||||
| Net (decrease) increase in cash and cash equivalents | (500,896 | ) | (309,143 | ) | (42,372 | ) | 1,469,383 | (2,506,965 | ) | (343,608 | ) | |||||||||||||
| Cash, cash equivalents, and restricted cash, beginning of period | 10,730,226 | 8,314,541 | 1,139,603 | 8,759,947 | 10,512,363 | 1,440,839 | ||||||||||||||||||
| Cash, cash equivalents, and restricted cash, end of period | 10,229,330 | 8,005,398 | 1,097,231 | 10,229,330 | 8,005,398 | 1,097,231 | ||||||||||||||||||
|
|
Unaudited Condensed Consolidated Statements of Comprehensive Income
(Amounts in thousands of Renminbi (“RMB”) and U.S. dollars (“USD”)
except for number of shares and per share data, or otherwise noted)
| Three months ended September 30, | ||||||||||||
| 2022 | 2023 | 2023 | ||||||||||
| RMB | RMB | USD | ||||||||||
| Net income | 988,354 | 1,137,690 | 155,933 | |||||||||
| Other comprehensive income, net of tax of nil: | ||||||||||||
| Foreign currency translation adjustment | 36,950 | 4,051 | 555 | |||||||||
| Other comprehensive income | 36,950 | 4,051 | 555 | |||||||||
| Total comprehensive income | 1,025,304 | 1,141,741 | 156,488 | |||||||||
| Comprehensive loss attributable to noncontrolling interests | 4,481 | 4,357 | 597 | |||||||||
| Comprehensive income attributable to ordinary shareholders | 1,029,785 | 1,146,098 | 157,085 | |||||||||
| Nine months ended September 30, | ||||||||||||
| 2022 | 2023 | 2023 | ||||||||||
| RMB | RMB | USD | ||||||||||
| Net income | 3,137,667 | 3,160,889 | 433,233 | |||||||||
| Other comprehensive income, net of tax of nil: | ||||||||||||
| Foreign currency translation adjustment | 80,270 | 20,724 | 2,840 | |||||||||
| Other comprehensive income | 80,270 | 20,724 | 2,840 | |||||||||
| Total comprehensive income | 3,217,937 | 3,181,613 | 436,073 | |||||||||
| Comprehensive loss attributable to noncontrolling interests | 14,505 | 12,707 | 1,742 | |||||||||
| Comprehensive income attributable to ordinary shareholders | 3,232,442 | 3,194,320 | 437,815 | |||||||||
|
|
Unaudited Reconciliations of GAAP and Non-GAAP Results
(Amounts in thousands of Renminbi (“RMB”) and U.S. dollars (“USD”)
except for number of shares and per share data, or otherwise noted)
| Three months ended September 30, | ||||||||||||
| 2022 | 2023 | 2023 | ||||||||||
| RMB | RMB | USD | ||||||||||
| Reconciliation of Non-GAAP Net Income to Net Income | ||||||||||||
| Net income | 988,354 | 1,137,690 | 155,933 | |||||||||
| Add: Share-based compensation expenses | 49,550 | 43,289 | 5,933 | |||||||||
| Non-GAAP net income | 1,037,904 | 1,180,979 | 161,866 | |||||||||
| GAAP net income margin | 23.8 | % | 26.6 | % | ||||||||
| Non-GAAP net income margin | 25.0 | % | 27.6 | % | ||||||||
| Net income attributable to shareholders of Qifu Technology, Inc. | 992,835 | 1,142,047 | 156,530 | |||||||||
| Add: Share-based compensation expenses | 49,550 | 43,289 | 5,933 | |||||||||
| Non-GAAP net income attributable to shareholders of Qifu Technology, Inc. | 1,042,385 | 1,185,336 | 162,463 | |||||||||
| Weighted average ADS used in calculating net income per ordinary share for both GAAP and non-GAAP EPS -diluted | 160,760,883 | 164,610,414 | 164,610,414 | |||||||||
| Net income per ADS attributable to ordinary shareholders of Qifu Technology, Inc. -diluted | 6.18 | 6.94 | 0.96 | |||||||||
| Non-GAAP net income per ADS attributable to ordinary shareholders of Qifu Technology, Inc. -diluted | 6.48 | 7.20 | 0.99 | |||||||||
| Reconciliation of Non-GAAP Income from operations to Income from operations | ||||||||||||
| Income from operations | 1,158,250 | 1,388,873 | 190,360 | |||||||||
| Add: Share-based compensation expenses | 49,550 | 43,289 | 5,933 | |||||||||
| Non-GAAP Income from operations | 1,207,800 | 1,432,162 | 196,293 | |||||||||
| GAAP operating margin | 27.9 | % | 32.4 | % | ||||||||
| Non-GAAP operating margin | 29.1 | % | 33.5 | % | ||||||||
| Nine months ended September 30, | ||||||||||||
| 2022 | 2023 | 2023 | ||||||||||
| RMB | RMB | USD | ||||||||||
| Reconciliation of Non-GAAP Net Income to Net Income | ||||||||||||
| Net income | 3,137,667 | 3,160,889 | 433,233 | |||||||||
| Add: Share-based compensation expenses | 148,383 | 143,032 | 19,604 | |||||||||
| Non-GAAP net income | 3,286,050 | 3,303,921 | 452,837 | |||||||||
| GAAP net income margin | 24.8 | % | 26.8 | % | ||||||||
| Non-GAAP net income margin | 26.0 | % | 28.0 | % | ||||||||
| Net income attributable to shareholders of Qifu Technology, Inc. | 3,152,172 | 3,173,596 | 434,975 | |||||||||
| Add: Share-based compensation expenses | 148,383 | 143,032 | 19,604 | |||||||||
| Non-GAAP net income attributable to shareholders of Qifu Technology, Inc. | 3,300,555 | 3,316,628 | 454,579 | |||||||||
| Weighted average ADS used in calculating net income per ordinary share for both GAAP and non-GAAP EPS -diluted | 160,612,402 | 165,195,944 | 165,195,944 | |||||||||
| Net income per ADS attributable to ordinary shareholders of Qifu Technology, Inc. -diluted | 19.62 | 19.22 | 2.64 | |||||||||
| Non-GAAP net income per ADS attributable to ordinary shareholders of Qifu Technology, Inc. -diluted | 20.55 | 20.08 | 2.75 | |||||||||
| Reconciliation of Non-GAAP Income from operations to Income from operations | ||||||||||||
| Income from operations | 3,528,303 | 3,577,403 | 490,321 | |||||||||
| Add: Share-based compensation expenses | 148,383 | 143,032 | 19,604 | |||||||||
| Non-GAAP Income from operations | 3,676,686 | 3,720,435 | 509,925 | |||||||||
| GAAP operating margin | 27.9 | % | 30.3 | % | ||||||||
| Non-GAAP operating margin | 29.1 | % | 31.5 | % | ||||||||
|
|