UNITED STATES
SECURITIES AND EXCHANGE COMMISSION
Washington, D.C. 20549
Form 6-K
Report of Foreign Private Issuer
Pursuant to Rules 13a-16 or 15d-16 under
the Securities Exchange Act of 1934
For the month of November 2023
Commission File Number: 001-38836
BIOCERES CROP SOLUTIONS CORP.
(Translation of registrant’s name into English)
Ocampo 210 bis, Predio CCT, Rosario
Province of Santa Fe, Argentina
(Address of principal executive offices)
Indicate by check mark whether the registrant files or will file annual reports under cover Form 20-F or Form 40-F.
Form 20-F x Form 40-F ¨
Indicate by check mark if the registrant is submitting the Form 6-K in paper as permitted by Regulation S-T Rule 101(b)(1): ¨
Indicate by check mark if the registrant is submitting the Form 6-K in paper as permitted by Regulation S-T Rule 101(b)(7): ¨
Exhibit List
| Exhibit No. | Description | |
| 99.1 | Press release, Bioceres Crop Solutions Corp. reports first fiscal quarter 2024 financial and operational results. |
SIGNATURES
Pursuant to the requirements of the Securities Exchange Act of 1934, the registrant has duly caused this report to be signed on its behalf by the undersigned, thereunto duly authorized.
| BIOCERES CROP SOLUTIONS CORP. | ||
| (Registrant) | ||
| Dated: November 13, 2023 | By: | /s/ Federico Trucco |
| Name: | Federico Trucco | |
| Title: | Chief Executive Officer | |
|
FISCAL FIRST QUARTER 2024 Financial and Operating Results |
|
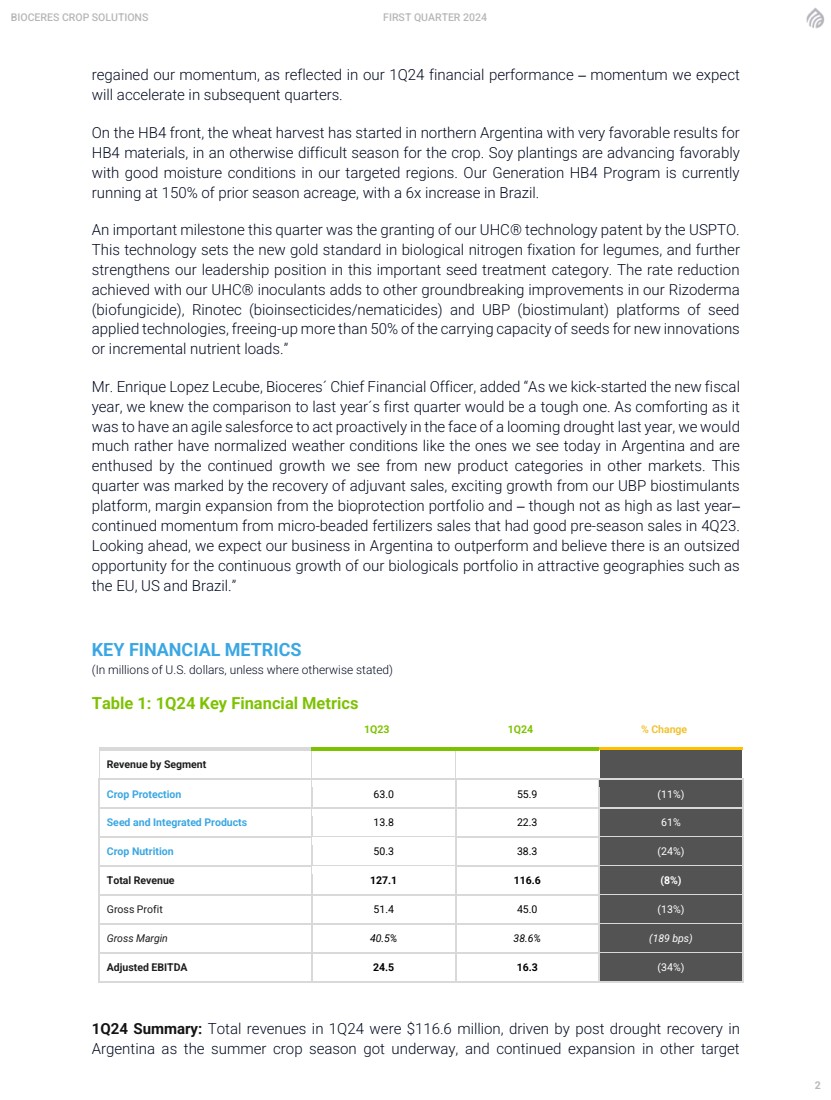
BIOCERES CROP SOLUTIONS FIRST QUARTER 2024 1 Bioceres Crop Solutions Reports Fiscal First Quarter 2024 Financial and Operational Results 1Q24 revenues at $116.6 million, and adjusted EBITDA at $16.3 million Groundbreaking patent obtained in key product category ROSARIO, Argentina – November 13, 2023 – Bioceres Crop Solutions Corp. (Bioceres) (NASDAQ: BIOX), a leader in the development and commercialization of productivity solutions designed to regenerate agricultural ecosystems while making crops more resilient to climate change, announced financial results for the first quarter ended September 30, 2023. Financial results are expressed in U.S. dollars and are presented in accordance with International Financial Reporting Standards. All comparisons in this announcement are year-over-year (YoY), unless otherwise noted. FINANCIAL & BUSINESS HIGHLIGHTS • Total revenues in 1Q24 were $116.6 million, driven by post-drought recovery at the start of the Argentine summer crop season, and continued global expansion. Adjusted EBITDA for the quarter was $16.3 million. • HB4 wheat harvest and soybean planting beginning in Latin America. HB4 wheat harvest underway in Argentina, with favorable preliminary results compared to non-HB4 varieties, in a season that was still affected by drought. By contrast, soybean planting is beginning under more favorable soil moisture conditions. • US Patent awarded for UHC® technology, a new gold standard in biological nitrogen fixation. Rate reduction with extended pre-inoculation period enables chemical substitution and new seed applied innovations. • Completed construction of a new state-of-the-art adjuvant production plant in Londrina, Brazil, which is strategically positioned to expand Bioceres’ footprint in the high-growth Brazilian market. MANAGEMENT REVIEW Mr. Federico Trucco, Bioceres’ Chief Executive Officer, commented: “The first quarter of fiscal 2023 was a record-setting quarter in which we nearly doubled revenues as compared to the prior year period. Part of our growth during 1Q23 resulted from anticipated 2Q23 sales, as weather conditions were quickly deteriorating in our main LATAM market, which ultimately positioned us to mitigate part of the effects of what became a historical drought, extending through the next three quarters. With rain patterns now normalized and plantings in our main markets progressing at full force, we have |
|
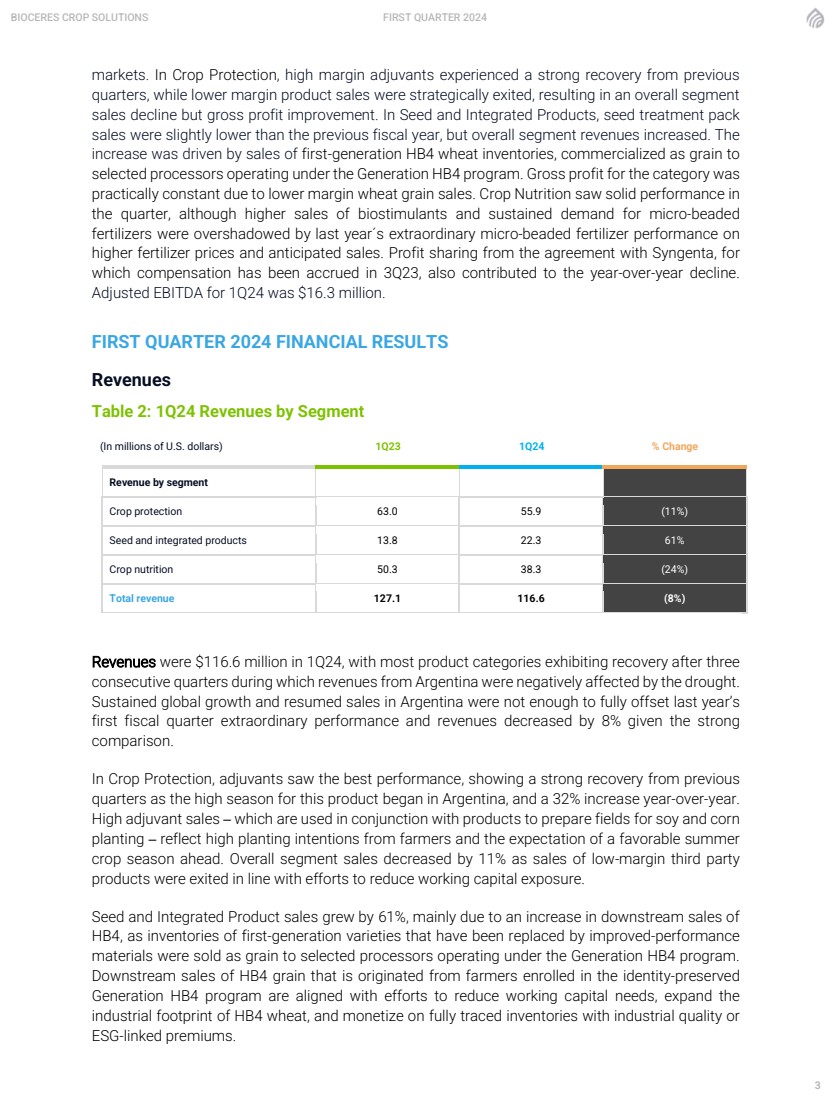
BIOCERES CROP SOLUTIONS FIRST QUARTER 2024 2 regained our momentum, as reflected in our 1Q24 financial performance ─ momentum we expect will accelerate in subsequent quarters. On the HB4 front, the wheat harvest has started in northern Argentina with very favorable results for HB4 materials, in an otherwise difficult season for the crop. Soy plantings are advancing favorably with good moisture conditions in our targeted regions. Our Generation HB4 Program is currently running at 150% of prior season acreage, with a 6x increase in Brazil. An important milestone this quarter was the granting of our UHC® technology patent by the USPTO. This technology sets the new gold standard in biological nitrogen fixation for legumes, and further strengthens our leadership position in this important seed treatment category. The rate reduction achieved with our UHC® inoculants adds to other groundbreaking improvements in our Rizoderma (biofungicide), Rinotec (bioinsecticides/nematicides) and UBP (biostimulant) platforms of seed applied technologies, freeing-up more than 50% of the carrying capacity of seeds for new innovations or incremental nutrient loads.” Mr. Enrique Lopez Lecube, Bioceres´ Chief Financial Officer, added “As we kick-started the new fiscal year, we knew the comparison to last year´s first quarter would be a tough one. As comforting as it was to have an agile salesforce to act proactively in the face of a looming drought last year, we would much rather have normalized weather conditions like the ones we see today in Argentina and are enthused by the continued growth we see from new product categories in other markets. This quarter was marked by the recovery of adjuvant sales, exciting growth from our UBP biostimulants platform, margin expansion from the bioprotection portfolio and ─ though not as high as last year─ continued momentum from micro-beaded fertilizers sales that had good pre-season sales in 4Q23. Looking ahead, we expect our business in Argentina to outperform and believe there is an outsized opportunity for the continuous growth of our biologicals portfolio in attractive geographies such as the EU, US and Brazil.” KEY FINANCIAL METRICS (In millions of U.S. dollars, unless where otherwise stated) Table 1: 1Q24 Key Financial Metrics 1Q23 1Q24 % Change Revenue by Segment Crop Protection 63.0 55.9 (11%) Seed and Integrated Products 13.8 22.3 61% Crop Nutrition 50.3 38.3 (24%) Total Revenue 127.1 116.6 (8%) Gross Profit 51.4 45.0 (13%) Gross Margin 40.5% 38.6% (189 bps) Adjusted EBITDA 24.5 16.3 (34%) 1Q24 Summary: Total revenues in 1Q24 were $116.6 million, driven by post drought recovery in Argentina as the summer crop season got underway, and continued expansion in other target |
|
BIOCERES CROP SOLUTIONS FIRST QUARTER 2024 3 markets. In Crop Protection, high margin adjuvants experienced a strong recovery from previous quarters, while lower margin product sales were strategically exited, resulting in an overall segment sales decline but gross profit improvement. In Seed and Integrated Products, seed treatment pack sales were slightly lower than the previous fiscal year, but overall segment revenues increased. The increase was driven by sales of first-generation HB4 wheat inventories, commercialized as grain to selected processors operating under the Generation HB4 program. Gross profit for the category was practically constant due to lower margin wheat grain sales. Crop Nutrition saw solid performance in the quarter, although higher sales of biostimulants and sustained demand for micro-beaded fertilizers were overshadowed by last year´s extraordinary micro-beaded fertilizer performance on higher fertilizer prices and anticipated sales. Profit sharing from the agreement with Syngenta, for which compensation has been accrued in 3Q23, also contributed to the year-over-year decline. Adjusted EBITDA for 1Q24 was $16.3 million. FIRST QUARTER 2024 FINANCIAL RESULTS Revenues Table 2: 1Q24 Revenues by Segment (In millions of U.S. dollars) 1Q23 1Q24 % Change Revenue by segment Crop protection 63.0 55.9 (11%) Seed and integrated products 13.8 22.3 61% Crop nutrition 50.3 38.3 (24%) Total revenue 127.1 116.6 (8%) Revenues were $116.6 million in 1Q24, with most product categories exhibiting recovery after three consecutive quarters during which revenues from Argentina were negatively affected by the drought. Sustained global growth and resumed sales in Argentina were not enough to fully offset last year’s first fiscal quarter extraordinary performance and revenues decreased by 8% given the strong comparison. In Crop Protection, adjuvants saw the best performance, showing a strong recovery from previous quarters as the high season for this product began in Argentina, and a 32% increase year-over-year. High adjuvant sales ─ which are used in conjunction with products to prepare fields for soy and corn planting ─ reflect high planting intentions from farmers and the expectation of a favorable summer crop season ahead. Overall segment sales decreased by 11% as sales of low-margin third party products were exited in line with efforts to reduce working capital exposure. Seed and Integrated Product sales grew by 61%, mainly due to an increase in downstream sales of HB4, as inventories of first-generation varieties that have been replaced by improved-performance materials were sold as grain to selected processors operating under the Generation HB4 program. Downstream sales of HB4 grain that is originated from farmers enrolled in the identity-preserved Generation HB4 program are aligned with efforts to reduce working capital needs, expand the industrial footprint of HB4 wheat, and monetize on fully traced inventories with industrial quality or ESG-linked premiums. |
|
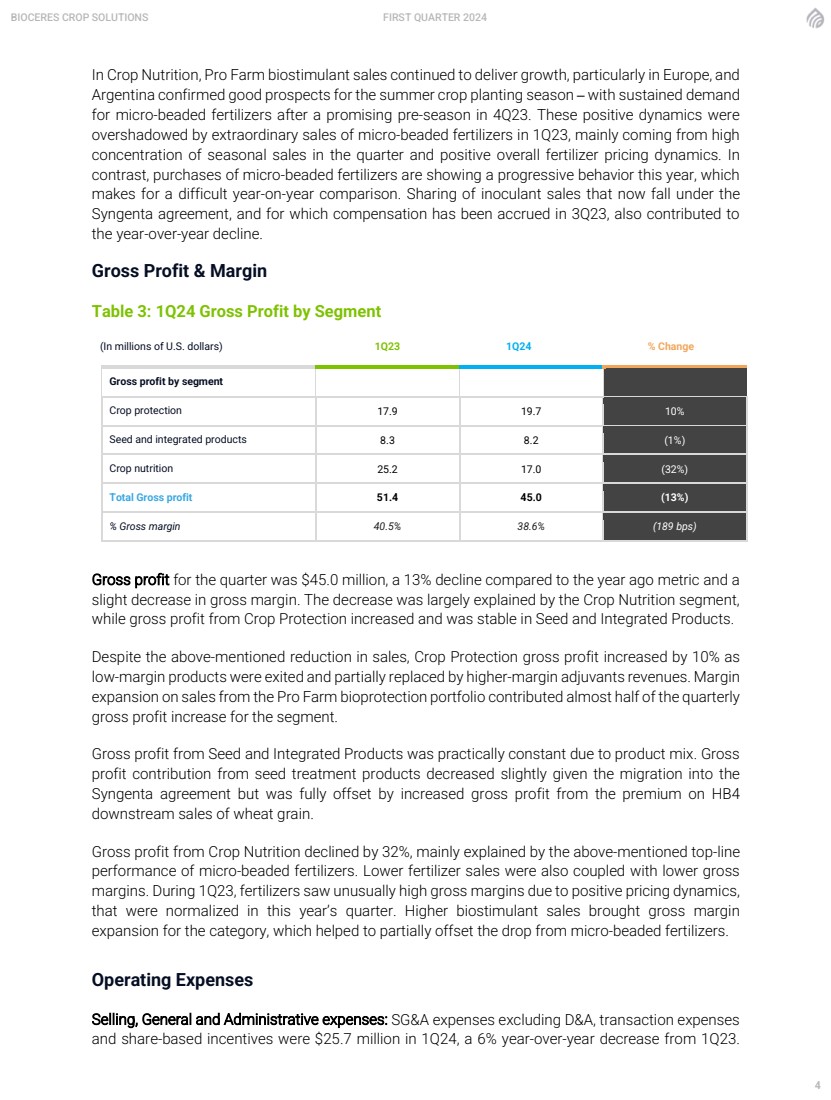
BIOCERES CROP SOLUTIONS FIRST QUARTER 2024 4 In Crop Nutrition, Pro Farm biostimulant sales continued to deliver growth, particularly in Europe, and Argentina confirmed good prospects for the summer crop planting season ─ with sustained demand for micro-beaded fertilizers after a promising pre-season in 4Q23. These positive dynamics were overshadowed by extraordinary sales of micro-beaded fertilizers in 1Q23, mainly coming from high concentration of seasonal sales in the quarter and positive overall fertilizer pricing dynamics. In contrast, purchases of micro-beaded fertilizers are showing a progressive behavior this year, which makes for a difficult year-on-year comparison. Sharing of inoculant sales that now fall under the Syngenta agreement, and for which compensation has been accrued in 3Q23, also contributed to the year-over-year decline. Gross Profit & Margin Table 3: 1Q24 Gross Profit by Segment (In millions of U.S. dollars) 1Q23 1Q24 % Change Gross profit by segment Crop protection 17.9 19.7 10% Seed and integrated products 8.3 8.2 (1%) Crop nutrition 25.2 17.0 (32%) Total Gross profit 51.4 45.0 (13%) % Gross margin 40.5% 38.6% (189 bps) Gross profit for the quarter was $45.0 million, a 13% decline compared to the year ago metric and a slight decrease in gross margin. The decrease was largely explained by the Crop Nutrition segment, while gross profit from Crop Protection increased and was stable in Seed and Integrated Products. Despite the above-mentioned reduction in sales, Crop Protection gross profit increased by 10% as low-margin products were exited and partially replaced by higher-margin adjuvants revenues. Margin expansion on sales from the Pro Farm bioprotection portfolio contributed almost half of the quarterly gross profit increase for the segment. Gross profit from Seed and Integrated Products was practically constant due to product mix. Gross profit contribution from seed treatment products decreased slightly given the migration into the Syngenta agreement but was fully offset by increased gross profit from the premium on HB4 downstream sales of wheat grain. Gross profit from Crop Nutrition declined by 32%, mainly explained by the above-mentioned top-line performance of micro-beaded fertilizers. Lower fertilizer sales were also coupled with lower gross margins. During 1Q23, fertilizers saw unusually high gross margins due to positive pricing dynamics, that were normalized in this year’s quarter. Higher biostimulant sales brought gross margin expansion for the category, which helped to partially offset the drop from micro-beaded fertilizers. Operating Expenses Selling, General and Administrative expenses: SG&A expenses excluding D&A, transaction expenses and share-based incentives were $25.7 million in 1Q24, a 6% year-over-year decrease from 1Q23. |
|
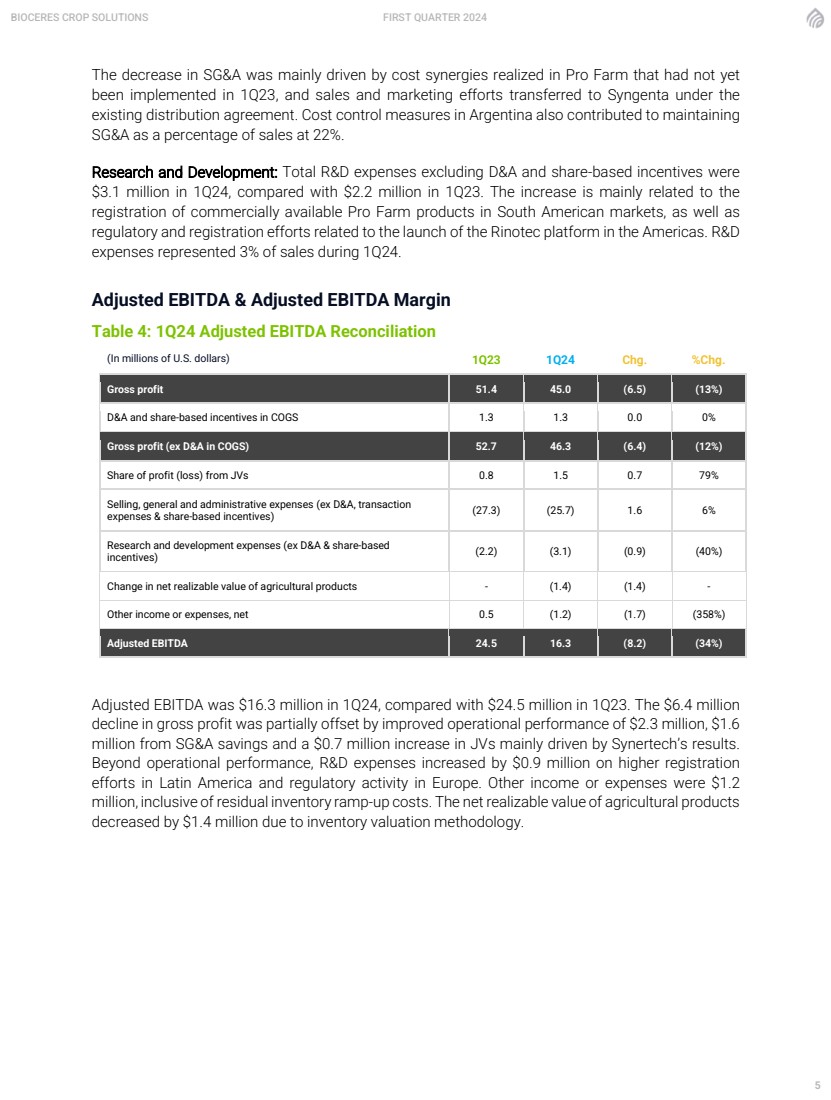
BIOCERES CROP SOLUTIONS FIRST QUARTER 2024 5 The decrease in SG&A was mainly driven by cost synergies realized in Pro Farm that had not yet been implemented in 1Q23, and sales and marketing efforts transferred to Syngenta under the existing distribution agreement. Cost control measures in Argentina also contributed to maintaining SG&A as a percentage of sales at 22%. Research and Development: Total R&D expenses excluding D&A and share-based incentives were $3.1 million in 1Q24, compared with $2.2 million in 1Q23. The increase is mainly related to the registration of commercially available Pro Farm products in South American markets, as well as regulatory and registration efforts related to the launch of the Rinotec platform in the Americas. R&D expenses represented 3% of sales during 1Q24. Adjusted EBITDA & Adjusted EBITDA Margin Table 4: 1Q24 Adjusted EBITDA Reconciliation (In millions of U.S. dollars) 1Q23 1Q24 Chg. %Chg. Gross profit 51.4 45.0 (6.5) (13%) D&A and share-based incentives in COGS 1.3 1.3 0.0 0% Gross profit (ex D&A in COGS) 52.7 46.3 (6.4) (12%) Share of profit (loss) from JVs 0.8 1.5 0.7 79% Selling, general and administrative expenses (ex D&A, transaction expenses & share-based incentives) (27.3) (25.7) 1.6 6% Research and development expenses (ex D&A & share-based incentives) (2.2) (3.1) (0.9) (40%) Change in net realizable value of agricultural products - (1.4) (1.4) - Other income or expenses, net 0.5 (1.2) (1.7) (358%) Adjusted EBITDA 24.5 16.3 (8.2) (34%) Adjusted EBITDA was $16.3 million in 1Q24, compared with $24.5 million in 1Q23. The $6.4 million decline in gross profit was partially offset by improved operational performance of $2.3 million, $1.6 million from SG&A savings and a $0.7 million increase in JVs mainly driven by Synertech’s results. Beyond operational performance, R&D expenses increased by $0.9 million on higher registration efforts in Latin America and regulatory activity in Europe. Other income or expenses were $1.2 million, inclusive of residual inventory ramp-up costs. The net realizable value of agricultural products decreased by $1.4 million due to inventory valuation methodology. |
|
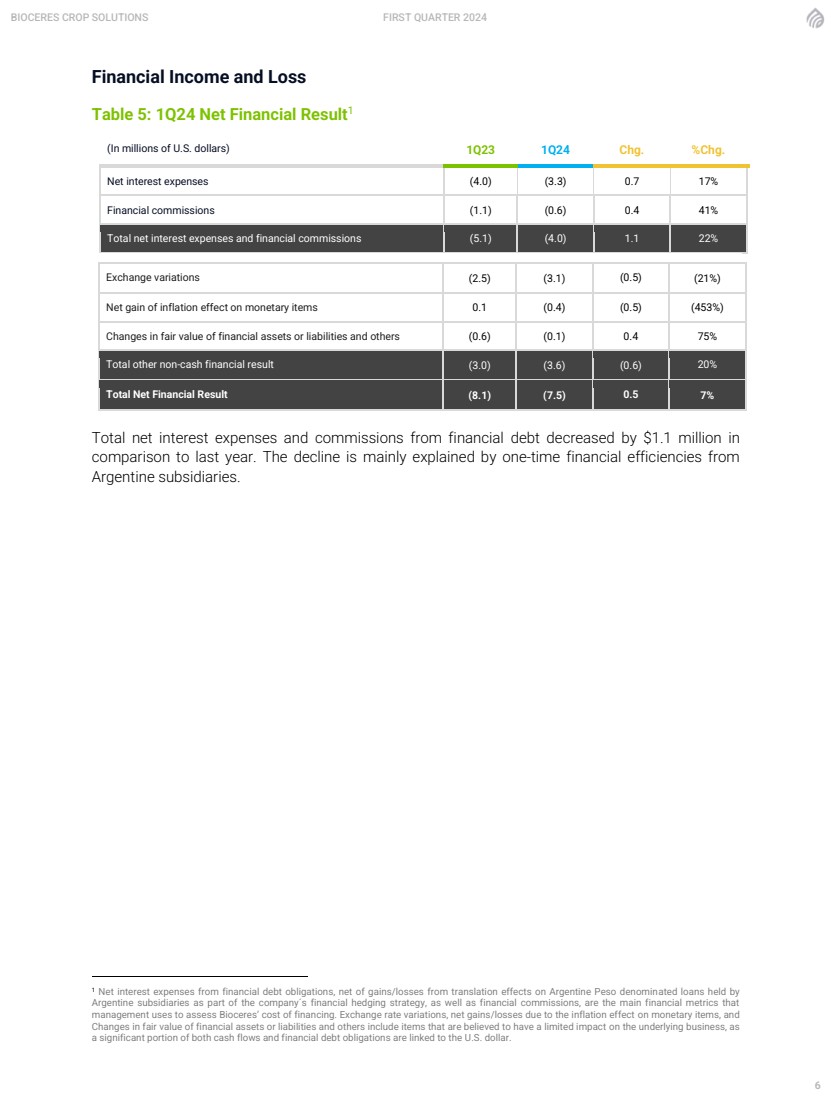
BIOCERES CROP SOLUTIONS FIRST QUARTER 2024 6 Financial Income and Loss Table 5: 1Q24 Net Financial Result1 (In millions of U.S. dollars) 1Q23 1Q24 Chg. %Chg. Net interest expenses (4.0) (3.3) 0.7 17% Financial commissions (1.1) (0.6) 0.4 41% Total net interest expenses and financial commissions (5.1) (4.0) 1.1 22% Exchange variations (2.5) (3.1) (0.5) (21%) Net gain of inflation effect on monetary items 0.1 (0.4) (0.5) (453%) Changes in fair value of financial assets or liabilities and others (0.6) (0.1) 0.4 75% Total other non-cash financial result (3.0) (3.6) (0.6) 20% Total Net Financial Result (8.1) (7.5) 0.5 7% Total net interest expenses and commissions from financial debt decreased by $1.1 million in comparison to last year. The decline is mainly explained by one-time financial efficiencies from Argentine subsidiaries. 1 Net interest expenses from financial debt obligations, net of gains/losses from translation effects on Argentine Peso denominated loans held by Argentine subsidiaries as part of the company´s financial hedging strategy, as well as financial commissions, are the main financial metrics that management uses to assess Bioceres’ cost of financing. Exchange rate variations, net gains/losses due to the inflation effect on monetary items, and Changes in fair value of financial assets or liabilities and others include items that are believed to have a limited impact on the underlying business, as a significant portion of both cash flows and financial debt obligations are linked to the U.S. dollar. |
|
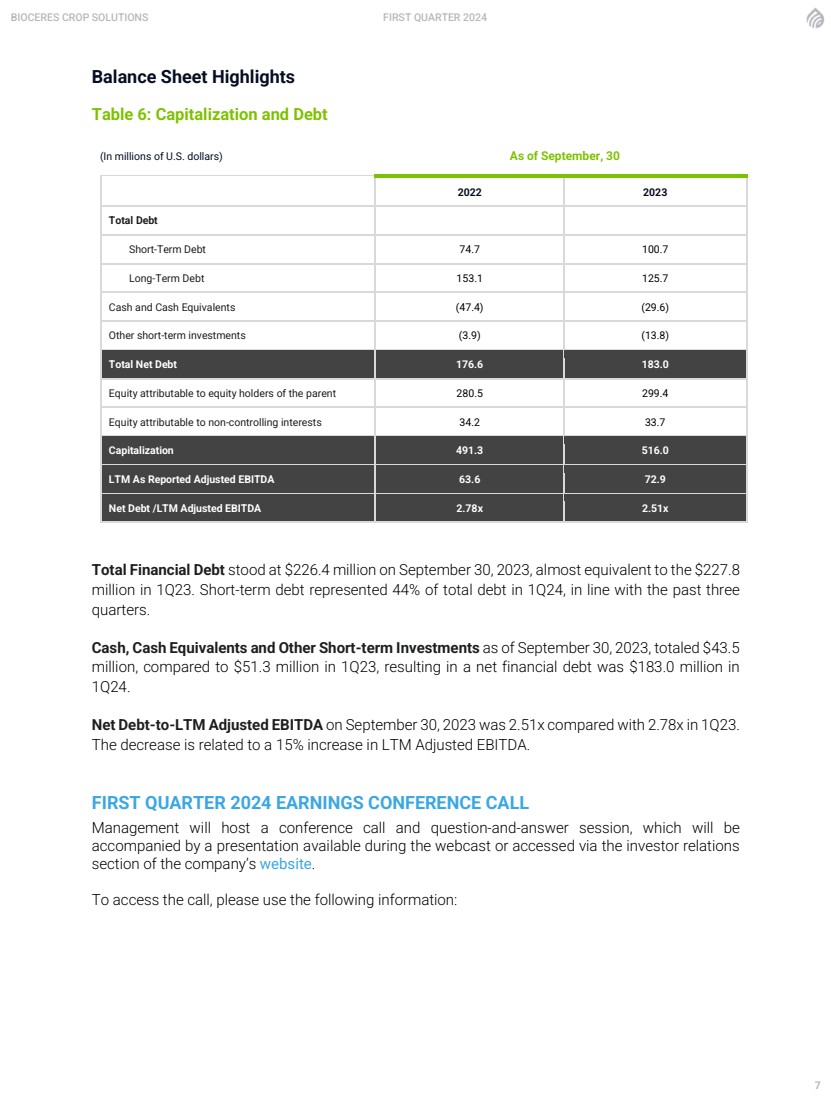
BIOCERES CROP SOLUTIONS FIRST QUARTER 2024 7 Balance Sheet Highlights Table 6: Capitalization and Debt (In millions of U.S. dollars) As of September, 30 2022 2023 Total Debt Short-Term Debt 74.7 100.7 Long-Term Debt 153.1 125.7 Cash and Cash Equivalents (47.4) (29.6) Other short-term investments (3.9) (13.8) Total Net Debt 176.6 183.0 Equity attributable to equity holders of the parent 280.5 299.4 Equity attributable to non-controlling interests 34.2 33.7 Capitalization 491.3 516.0 LTM As Reported Adjusted EBITDA 63.6 72.9 Net Debt /LTM Adjusted EBITDA 2.78x 2.51x Total Financial Debt stood at $226.4 million on September 30, 2023, almost equivalent to the $227.8 million in 1Q23. Short-term debt represented 44% of total debt in 1Q24, in line with the past three quarters. Cash, Cash Equivalents and Other Short-term Investments as of September 30, 2023, totaled $43.5 million, compared to $51.3 million in 1Q23, resulting in a net financial debt was $183.0 million in 1Q24. Net Debt-to-LTM Adjusted EBITDA on September 30, 2023 was 2.51x compared with 2.78x in 1Q23. The decrease is related to a 15% increase in LTM Adjusted EBITDA. FIRST QUARTER 2024 EARNINGS CONFERENCE CALL Management will host a conference call and question-and-answer session, which will be accompanied by a presentation available during the webcast or accessed via the investor relations section of the company’s website. To access the call, please use the following information: |
|
BIOCERES CROP SOLUTIONS FIRST QUARTER 2024 8 Date: Tuesday, November 14, 2023 Time: 8:30 a.m. EST, 5:30 a.m. PST US Toll Free dial-in number: 1-833-470-1428 International dial-in numbers: Click here Conference ID: 194157 Webcast: Click here Please dial in 5-10 minutes prior to the start time to register and join. The conference call will be broadcast live and available for replay here and via the investor relations section of the company’s website here. A replay of the call will be available through November 19, 2023, following the conference. Toll Free Replay Number: 1-866-813-9403 International Replay Number: +44 204 525 0658 Replay ID: 873470 About Bioceres Crop Solutions Corp. Bioceres Crop Solutions Corp. (NASDAQ: BIOX) is a leader in the development and commercialization of productivity solutions designed to regenerate agricultural ecosystems while making crops more resilient to climate change. To do this, Bioceres’ solutions create economic incentives for farmers and other stakeholders to adopt environmentally friendlier production practices. The company has a unique biotech platform with high-impact, patented technologies for seeds and microbial ag-inputs, as well as next generation Crop Nutrition and Protection solutions. Through its HB4® program, the company is bringing digital solutions to support growers’ decisions and provide end-to-end traceability for production outputs. For more information, visit here. Contact Bioceres Crop Solutions Paula Savanti Head of Investor Relations investorrelations@biocerescrops.com Forward-Looking Statements This communication includes “forward-looking statements” within the meaning of the “safe harbor” provisions of the United States Private Securities Litigation Reform Act of 1995. Forward-looking statements may be identified by the use of words such as “forecast,” “intend,” “seek,” “target,” “anticipate,” “believe,” “expect,” “estimate,” “plan,” “outlook,” and “project” and other similar expressions that predict or indicate future events or trends or that are not statements of historical matters. Such forward-looking statements include estimated financial data and, among others, statements related to the expected or potential impact of the novel coronavirus (COVID-19) pandemic, and the related responses by governments, clients and the company, on our business, financial condition, liquidity position and results of operations, and any such forward-looking |
|
BIOCERES CROP SOLUTIONS FIRST QUARTER 2024 9 statements, whether concerning the COVID-19 pandemic or otherwise, involve risks, assumptions and uncertainties. These forward-looking statements include, but are not limited to, whether (i) the health and safety measures implemented to safeguard employees and assure business continuity will be successful, (ii) the uncertainty related to COVID-19 in the farming community will be short lived, and (iii) we will be able to coordinate efforts to ramp up inventories. Such forward-looking statements are based on management’s reasonable current assumptions, expectations, plans and forecasts regarding the company’s current or future results and future business and economic conditions more generally. Such forward-looking statements involve risks, uncertainties and other factors, which may cause the actual results, levels of activity, performance or achievement of the company to be materially different from any future results expressed or implied by such forward-looking statements, and there can be no assurance that actual results will not differ materially from management’s expectations or could affect the company’s ability to achieve its strategic goals, including the uncertainties relating to the impact of COVID-19 on the company’s business, operations, liquidity and financial results and the other factors that are described in the sections entitled “Risk Factors” in the company's Securities and Exchange Commission filings updated from time to time. The preceding list is not intended to be an exhaustive list of all of our forward-looking statements. Therefore, you should not rely on any of these forward-looking statements as predictions of future events. All forward-looking statements contained in this release are qualified in their entirety by this cautionary statement. Forward-looking statements speak only as of the date they are or were made, and the company does not intend to update or otherwise revise the forward-looking statements to reflect events or circumstances after the date of this release or to reflect the occurrence of unanticipated events, except as required by law. Use of non-IFRS financial information The company supplements the use of IFRS financial measures with non-IFRS financial measures, including Adjusted EBITDA, Adjusted EBITDA Margin, Net debt, Net interest expenses, Comparable figures which exclude the impact of IAS29 as explained below and pro forma numbers which are inclusive of historical Pro Farm financials. The non-IFRS measures should not be considered in isolation or as a substitute for measures of performance prepared in accordance with IFRS and may be different from non-IFRS measures used by other companies. In addition, the non-IFRS measures are not based on any comprehensive set of accounting rules or principles. Non-IFRS measures have limitations in that they do not reflect all of the amounts associated with our results of operations as determined in accordance with IFRS. This non-IFRS financial measures should only be used to evaluate the company’s results of operations in conjunction with the most comparable IFRS financial measures. In addition, other companies may report similarly titled measures, but calculate them differently, which reduces their usefulness as a comparative measure. Management utilizes these non-IFRS metrics as performance measures in evaluating and making operational decisions regarding our business. Adjusted EBITDA and adjusted EBITDA margin The company defines adjusted EBITDA as profit/(loss) exclusive of financial income/(costs), income tax benefit/(expense), depreciation, amortization, share-based compensation, inventory purchase allocation and one-time transactional expenses. Management believes that adjusted EBITDA provides useful supplemental information to investors about the company and its results. Adjusted EBITDA is among the measures used by the management team to evaluate the company’s financial and operating performance and make day-to-day financial and operating decisions. In addition, adjusted EBITDA and similarly titled measures |
|
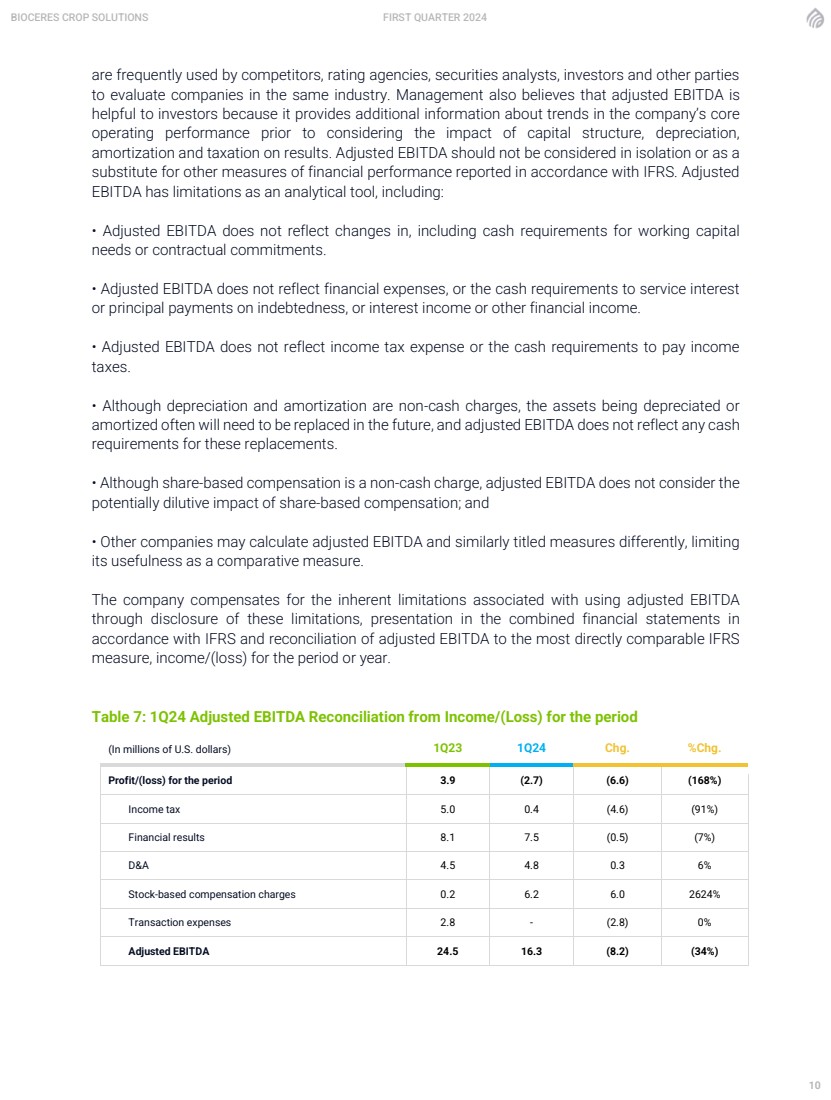
BIOCERES CROP SOLUTIONS FIRST QUARTER 2024 10 are frequently used by competitors, rating agencies, securities analysts, investors and other parties to evaluate companies in the same industry. Management also believes that adjusted EBITDA is helpful to investors because it provides additional information about trends in the company’s core operating performance prior to considering the impact of capital structure, depreciation, amortization and taxation on results. Adjusted EBITDA should not be considered in isolation or as a substitute for other measures of financial performance reported in accordance with IFRS. Adjusted EBITDA has limitations as an analytical tool, including: • Adjusted EBITDA does not reflect changes in, including cash requirements for working capital needs or contractual commitments. • Adjusted EBITDA does not reflect financial expenses, or the cash requirements to service interest or principal payments on indebtedness, or interest income or other financial income. • Adjusted EBITDA does not reflect income tax expense or the cash requirements to pay income taxes. • Although depreciation and amortization are non-cash charges, the assets being depreciated or amortized often will need to be replaced in the future, and adjusted EBITDA does not reflect any cash requirements for these replacements. • Although share-based compensation is a non-cash charge, adjusted EBITDA does not consider the potentially dilutive impact of share-based compensation; and • Other companies may calculate adjusted EBITDA and similarly titled measures differently, limiting its usefulness as a comparative measure. The company compensates for the inherent limitations associated with using adjusted EBITDA through disclosure of these limitations, presentation in the combined financial statements in accordance with IFRS and reconciliation of adjusted EBITDA to the most directly comparable IFRS measure, income/(loss) for the period or year. Table 7: 1Q24 Adjusted EBITDA Reconciliation from Income/(Loss) for the period (In millions of U.S. dollars) 1Q23 1Q24 Chg. %Chg. Profit/(loss) for the period 3.9 (2.7) (6.6) (168%) Income tax 5.0 0.4 (4.6) (91%) Financial results 8.1 7.5 (0.5) (7%) D&A 4.5 4.8 0.3 6% Stock-based compensation charges 0.2 6.2 6.0 2624% Transaction expenses 2.8 - (2.8) 0% Adjusted EBITDA 24.5 16.3 (8.2) (34%) |
|
BIOCERES CROP SOLUTIONS FIRST QUARTER 2024 11 Net debt and net debt to adjusted EBITDA Net debt is defined as the sum of long and short-term borrowings less cash and cash equivalents and other short-term investments. This measure is used by management and investment analysts to show the financial strength of the company. Management is consistently tracking the company’s leverage position and its ability to repay and service the debt obligations over time. Therefore, management has set a leverage ratio target that is measured by net debt divided by adjusted EBITDA. Net interest expenses Net interest expenses are defined as the sum of interest, other financial results, and gains/losses from translation effects on Argentine Peso denominated loans held by Rizobacter Argentina. Gains/losses from translation effects on Argentine Peso denominated loans are part of the hedging activities conducted by the company to manage cost of financing. Net interest expenses and financial commissions represent the main financial metrics that management uses to assess Bioceres’ cost of financing. Application of IAS 29 Argentina has been classified as a hyperinflationary economy under the terms of IAS 29 beginning July 1, 2018. IAS 29 requires adjusting all non-monetary items in the statement of financial position by applying a general price index from the month they were booked to the end of the reporting period. At the same time, it also requires that all items in the statement of income are expressed in terms of the measuring unit current at the end of the reporting period. Consequently, on a monthly basis, results of operations for each reporting period are measured in Argentine Pesos and adjusted for inflation by the applicable monthly inflation rate each month. All amounts need to be restated by applying the change in the general price index from the dates when the items of income and expenses were initially recorded in the financial statements. As a result, each monthly results of operations are readjusted each successive month to reflect changes in the monthly inflation rate. After the restatement explained above, IAS 21 “The Effects of Changes in Foreign Exchange Rates”, addresses the way results must be translated under inflation accounting, stating that all amounts shall be translated at the closing rate of the date of the most recent statement of financial position. Accordingly, monthly results of operations in Argentine Pesos, after adjustment for inflation pursuant to IAS 29, as described above, must then be converted into U.S dollars at the closing exchange rate for such monthly reported period. This conversion changes every prior reported monthly statement of income in U.S dollars as each monthly amount is readjusted under IAS 29 for inflation per above and reconverted at different exchange rates for each monthly reported period under IAS 21. As a result, the impact of monthly inflationary adjustments and monthly conversion adjustments vary the results of operation month to month until year end. |
|
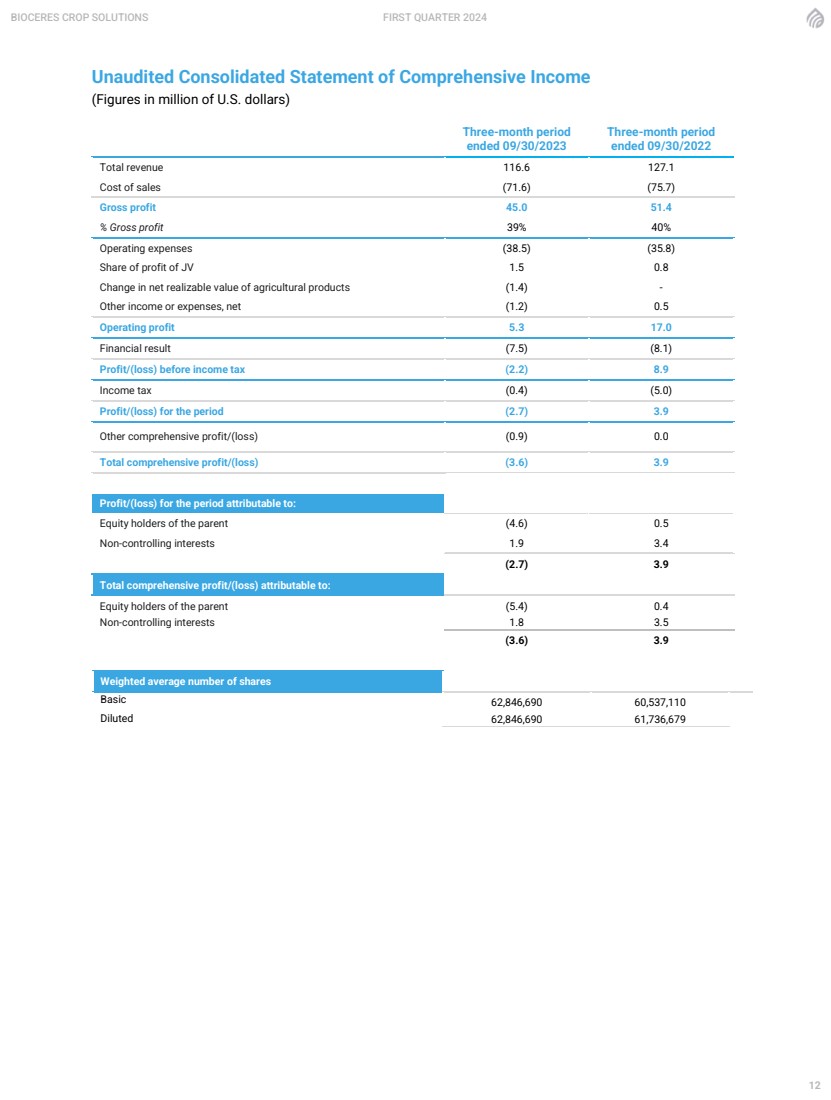
BIOCERES CROP SOLUTIONS FIRST QUARTER 2024 12 Unaudited Consolidated Statement of Comprehensive Income (Figures in million of U.S. dollars) Three-month period ended 09/30/2023 Three-month period ended 09/30/2022 Total revenue 116.6 127.1 Cost of sales (71.6) (75.7) Gross profit 45.0 51.4 % Gross profit 39% 40% Operating expenses (38.5) (35.8) Share of profit of JV 1.5 0.8 Change in net realizable value of agricultural products (1.4) - Other income or expenses, net (1.2) 0.5 Operating profit 5.3 17.0 Financial result (7.5) (8.1) Profit/(loss) before income tax (2.2) 8.9 Income tax (0.4) (5.0) Profit/(loss) for the period (2.7) 3.9 Other comprehensive profit/(loss) (0.9) 0.0 Total comprehensive profit/(loss) (3.6) 3.9 Profit/(loss) for the period attributable to: Equity holders of the parent (4.6) 0.5 Non-controlling interests 1.9 3.4 (2.7) 3.9 Total comprehensive profit/(loss) attributable to: Equity holders of the parent (5.4) 0.4 Non-controlling interests 1.8 3.5 (3.6) 3.9 Weighted average number of shares Basic 62,846,690 60,537,110 Diluted 62,846,690 61,736,679 |
|
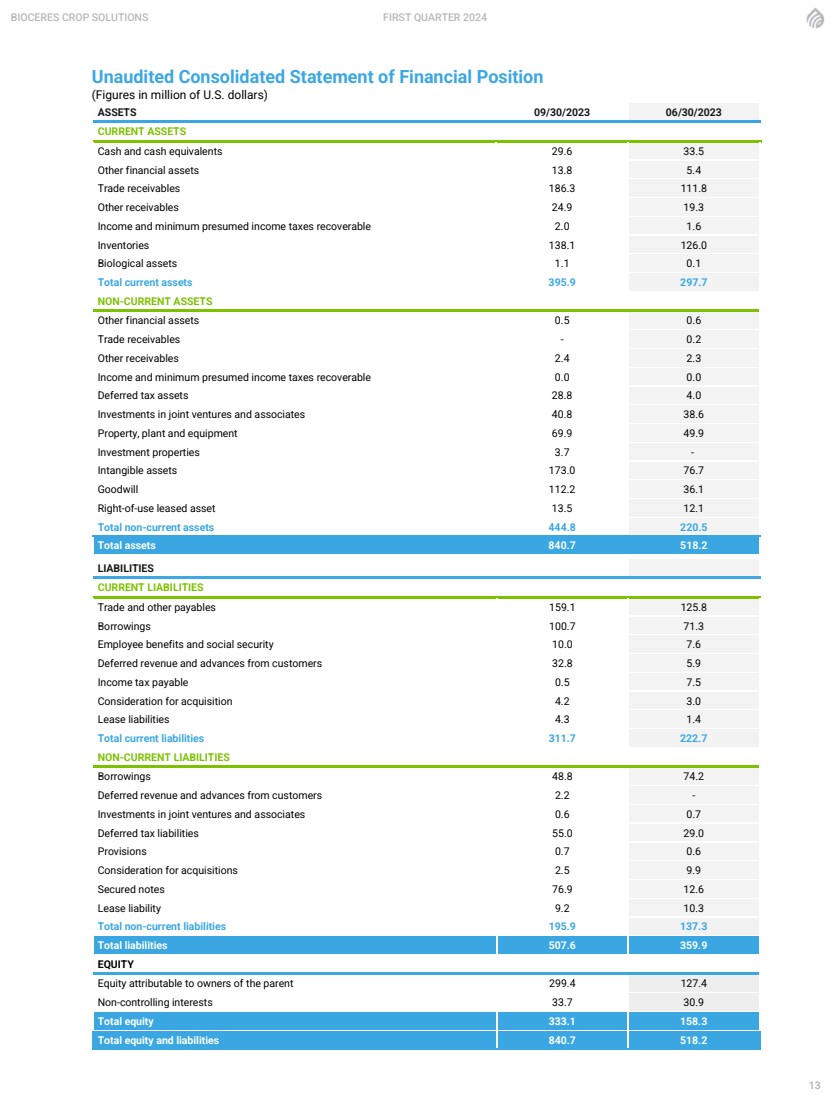
BIOCERES CROP SOLUTIONS FIRST QUARTER 2024 13 Unaudited Consolidated Statement of Financial Position (Figures in million of U.S. dollars) ASSETS 09/30/2023 06/30/2023 CURRENT ASSETS Cash and cash equivalents 29.6 33.5 Other financial assets 13.8 5.4 Trade receivables 186.3 111.8 Other receivables 24.9 19.3 Income and minimum presumed income taxes recoverable 2.0 1.6 Inventories 138.1 126.0 Biological assets 1.1 0.1 Total current assets 395.9 297.7 NON-CURRENT ASSETS Other financial assets 0.5 0.6 Trade receivables - 0.2 Other receivables 2.4 2.3 Income and minimum presumed income taxes recoverable 0.0 0.0 Deferred tax assets 28.8 4.0 Investments in joint ventures and associates 40.8 38.6 Property, plant and equipment 69.9 49.9 Investment properties 3.7 - Intangible assets 173.0 76.7 Goodwill 112.2 36.1 Right-of-use leased asset 13.5 12.1 Total non-current assets 444.8 220.5 Total assets 840.7 518.2 LIABILITIES CURRENT LIABILITIES Trade and other payables 159.1 125.8 Borrowings 100.7 71.3 Employee benefits and social security 10.0 7.6 Deferred revenue and advances from customers 32.8 5.9 Income tax payable 0.5 7.5 Consideration for acquisition 4.2 3.0 Lease liabilities 4.3 1.4 Total current liabilities 311.7 222.7 NON-CURRENT LIABILITIES Borrowings 48.8 74.2 Deferred revenue and advances from customers 2.2 - Investments in joint ventures and associates 0.6 0.7 Deferred tax liabilities 55.0 29.0 Provisions 0.7 0.6 Consideration for acquisitions 2.5 9.9 Secured notes 76.9 12.6 Lease liability 9.2 10.3 Total non-current liabilities 195.9 137.3 Total liabilities 507.6 359.9 EQUITY Equity attributable to owners of the parent 299.4 127.4 Non-controlling interests 33.7 30.9 Total equity 333.1 158.3 Total equity and liabilities 840.7 518.2 |