SECURITIES AND EXCHANGE COMMISSION
Washington, D.C. 20549
FORM 6-K
REPORT OF FOREIGN PRIVATE ISSUER
Pursuant to Rule 13a-16 or 15d-16 of the
Securities Exchange Act of 1934
For the month of November 2023
Commission file number: 001-32749
FRESENIUS MEDICAL CARE AG & Co. KGaA
(Translation of registrant's name into English)
Else-Kröner Strasse 1
61346 Bad Homburg
Germany
(Address of principal executive offices)
Indicate by check mark whether the registrant files or will file annual reports under cover of Form 20-F or Form 40-F.
Form 20-F x Form 40-F ¨
On November 1, 2023, Fresenius Medical Care AG & Co. KGaA (the “Company”) issued a Press Release announcing its third quarter results for the period ending September 30, 2023. A copy of the Press Release is furnished as Exhibit 99.1 and the corresponding financial figures as Exhibit 99.2.
The attached Press Release contains non-GAAP financial measures. For purposes of Regulation G, a non-GAAP financial measure is a numerical measure of a company’s performance, financial position, or cash flows that either excludes or includes amounts that are not normally excluded or included in the most directly comparable measure calculated and presented in accordance with generally accepted accounting principles. To supplement the Company’s third quarter 2023 consolidated financial results presented in accordance with International Financial Reporting Standards, or IFRS® Accounting Standards, we have used non-GAAP financial measures, including (a) EBITDA, or operating income excluding interest, taxes, depreciation and amortization, (b) free cash flow, (c) net leverage ratio (ratio of net debt to adjusted EBITDA) and (d) results presented in constant currency and as adjusted for special items identified in the Press Release and associated tables. These non-GAAP measures are provided to enhance the user’s overall understanding of our current financial performance and our prospects for the future. In addition, because we have historically reported certain non-GAAP financial measures in our financial results, we believe the inclusion of these non-IFRS® financial measures provides consistency and comparability in our financial reporting to prior periods for which these non-GAAP financial measures were previously reported. These non-GAAP financial measures should not be used as a substitute for or be considered superior to GAAP financial measures. Reconciliation of the non-GAAP financial measures to the most comparable IFRS® financial measures are included in the attached Financial Statements. As the reconciliation of amounts stated in Constant Currency is inherent in the disclosure included in the Press Release, we believe that a separate reconciliation would not provide any additional benefit.
The Exhibits attached hereto, shall not be deemed “filed” for purposes of Section 18 of the Securities and Exchange Act of 1934 (the “Exchange Act”) or otherwise subject to the liabilities of that section, nor shall they be deemed incorporated by reference in any filing under the Securities Act of 1933 or the Exchange Act, regardless of any general incorporation language in such filing.
EXHIBITS
The following exhibits are being furnished with this Report:
| Exhibit 99.1 | Press release issued on November 1, 2023. |
| Exhibit 99.2 | Complete overview of the third quarter 2023 and first nine months 2023. |
SIGNATURES
Pursuant to the requirements of the Securities Exchange Act of 1934, the Registrant has duly caused this report to be signed on its behalf by the undersigned thereunto duly authorized.
DATE: November 1, 2023
| Fresenius Medical Care AG & Co. KGaA, | |
| a partnership limited by shares, represented by: | |
| fresenius medical care management AG, its | |
| General Partner |
| By: | /s/ Helen Giza | |||
| Name: | Helen Giza | |||
| Title: | Chief Executive Officer and Chair of the Management Board of the General Partner |
| By: | /s/ Martin Fischer | |||
| Name: | Martin Fischer | |||
| Title: | Chief Financial Officer and member of the Management Board of the General Partner |
Exhibit 99.1

| Press Release | Media contact |
| Leif Heussen | |
| T +49 6172 608-4030 | |
| leif.heussen@fresenius.com | |
| Contact for analysts and investors |
|
| Dr. Dominik Heger | |
| T +49 6172 609-2601 | |
| dominik.heger@fmc-ag.com | |
| www.freseniusmedicalcare.com |
November 1, 2023
Fresenius Medical Care continues to execute on turnaround plan and raises 2023 earnings outlook due to strong operational performance in first nine months and solid business outlook for the fourth quarter
| - | Continued solid organic growth in Care Enablement and Care Delivery including sequentially stable same market treatment growth in the U.S. |
| - | Successful execution on turnaround plan driving productivity improvements in Care Delivery and pricing in Care Enablement |
| - | FME25 transformation savings fully on track |
| - | Continued execution on portfolio optimization strategy |
| - | FY 2023 earnings outlook raised |
Helen Giza, Chief Executive Officer of Fresenius Medical Care, said: “Our unwavering focus on executing against our strategic plan and the successful implementation of turnaround measures to date, continue to translate into improved operating performance. Notably in the third quarter, we continued to unlock sustainable savings with our FME25 program, further improved our labor productivity and continued to execute on our portfolio optimization plan. Given our improving performance for the first nine months of the year and solid expectations for the remainder of the year, we confidently upgrade our full year earnings outlook.”
Page
| Key figures (IFRS, unaudited) | ||||||||||||||||||||||||||||||||
| Q3 2023 | Q3 2022 | Growth | Growth | 9M 2023 | 9M 2022 | Growth | Growth | |||||||||||||||||||||||||
| EUR m | EUR m | yoy | yoy, cc | EUR m | EUR m | yoy | yoy, cc | |||||||||||||||||||||||||
| Revenue | 4,936 | 5,096 | -3 | % | +7 | % | 14,466 | 14,401 | 0 | % | +5 | % | ||||||||||||||||||||
| Operating income | 324 | 472 | -31 | % | -28 | % | 942 | 1,160 | -19 | % | -18 | % | ||||||||||||||||||||
| excl. special items and PRF1 | 431 | 377 | +14 | % | +20 | % | 1,186 | 1,052 | +13 | % | +14 | % | ||||||||||||||||||||
| Net income2 | 84 | 230 | -63 | % | -61 | % | 311 | 535 | -42 | % | -41 | % | ||||||||||||||||||||
| excl. special items and PRF1 | 168 | 168 | 0 | % | +5 | % | 497 | 481 | +3 | % | +5 | % | ||||||||||||||||||||
| Basic EPS (EUR) | 0.29 | 0.78 | -63 | % | -61 | % | 1.06 | 1.82 | -42 | % | -41 | % | ||||||||||||||||||||
| excl. special items and PRF1 | 0.57 | 0.57 | 0 | % | +5 | % | 1.69 | 1.64 | +3 | % | +5 | % | ||||||||||||||||||||
yoy = year-on-year, cc = at constant currency, EPS = earnings per share
Successful execution against the strategic plan
Fresenius Medical Care has continuously advanced its structural change. After implementing the new operating model along with the corresponding new financial reporting, the simplification of the governance structure through a legal form conversion remains on track to be completed by 1 December 2023.
Fresenius Medical Care continues to successfully execute on its operational efficiency and turnaround plans. In the third quarter, the FME25 transformation program delivered EUR 97 million of savings, resulting in EUR 232 million for the first nine months of the year. The Company is fully on track to achieve sustainable savings of EUR 250 to 300 million by year end 2023 and EUR 650 million by year end 2025.
Moreover, Fresenius Medical Care is executing its portfolio optimization plan to exit non-core and dilutive assets. In the third quarter, the Company entered into an agreement to sell National Cardiovascular Partners (NCP) with 21 facilities providing outpatient cardiac catheterization and vascular laboratory services, which are included in the U.S. Care Delivery business, in connection with its Legacy Portfolio Optimization program.
1 For FY 2022, special items included costs related to the FME25 program, the impact of the war in Ukraine, the impact of hyperinflation in Turkiye, the Humacyte investment remeasurement and the net gain related to InterWell Health. Additionally, the FY 2022 basis for the 2023 outlook was adjusted for U.S. Provider Relief Funding. For FY 2023, special items include costs related to the FME25 program, the Humacyte investment remeasurement, the costs associated with the legal form conversion and effects from legacy portfolio optimization. For further details please see the reconciliation attached to the Press Release.
2 Net income attributable to shareholders of Fresenius Medical Care AG & Co. KGaA In line with the Company’s disciplined financial policy, Fresenius Medical Care has already refinanced a bond of EUR 650 million, maturing in November 2023.
Page
The Company is using a mix of long-term bank financing at very attractive financing conditions as well as cash and short-term debt. Upcoming extraordinary cash inflows will enable the Company to further delever.
Revenue development supported by solid organic growth
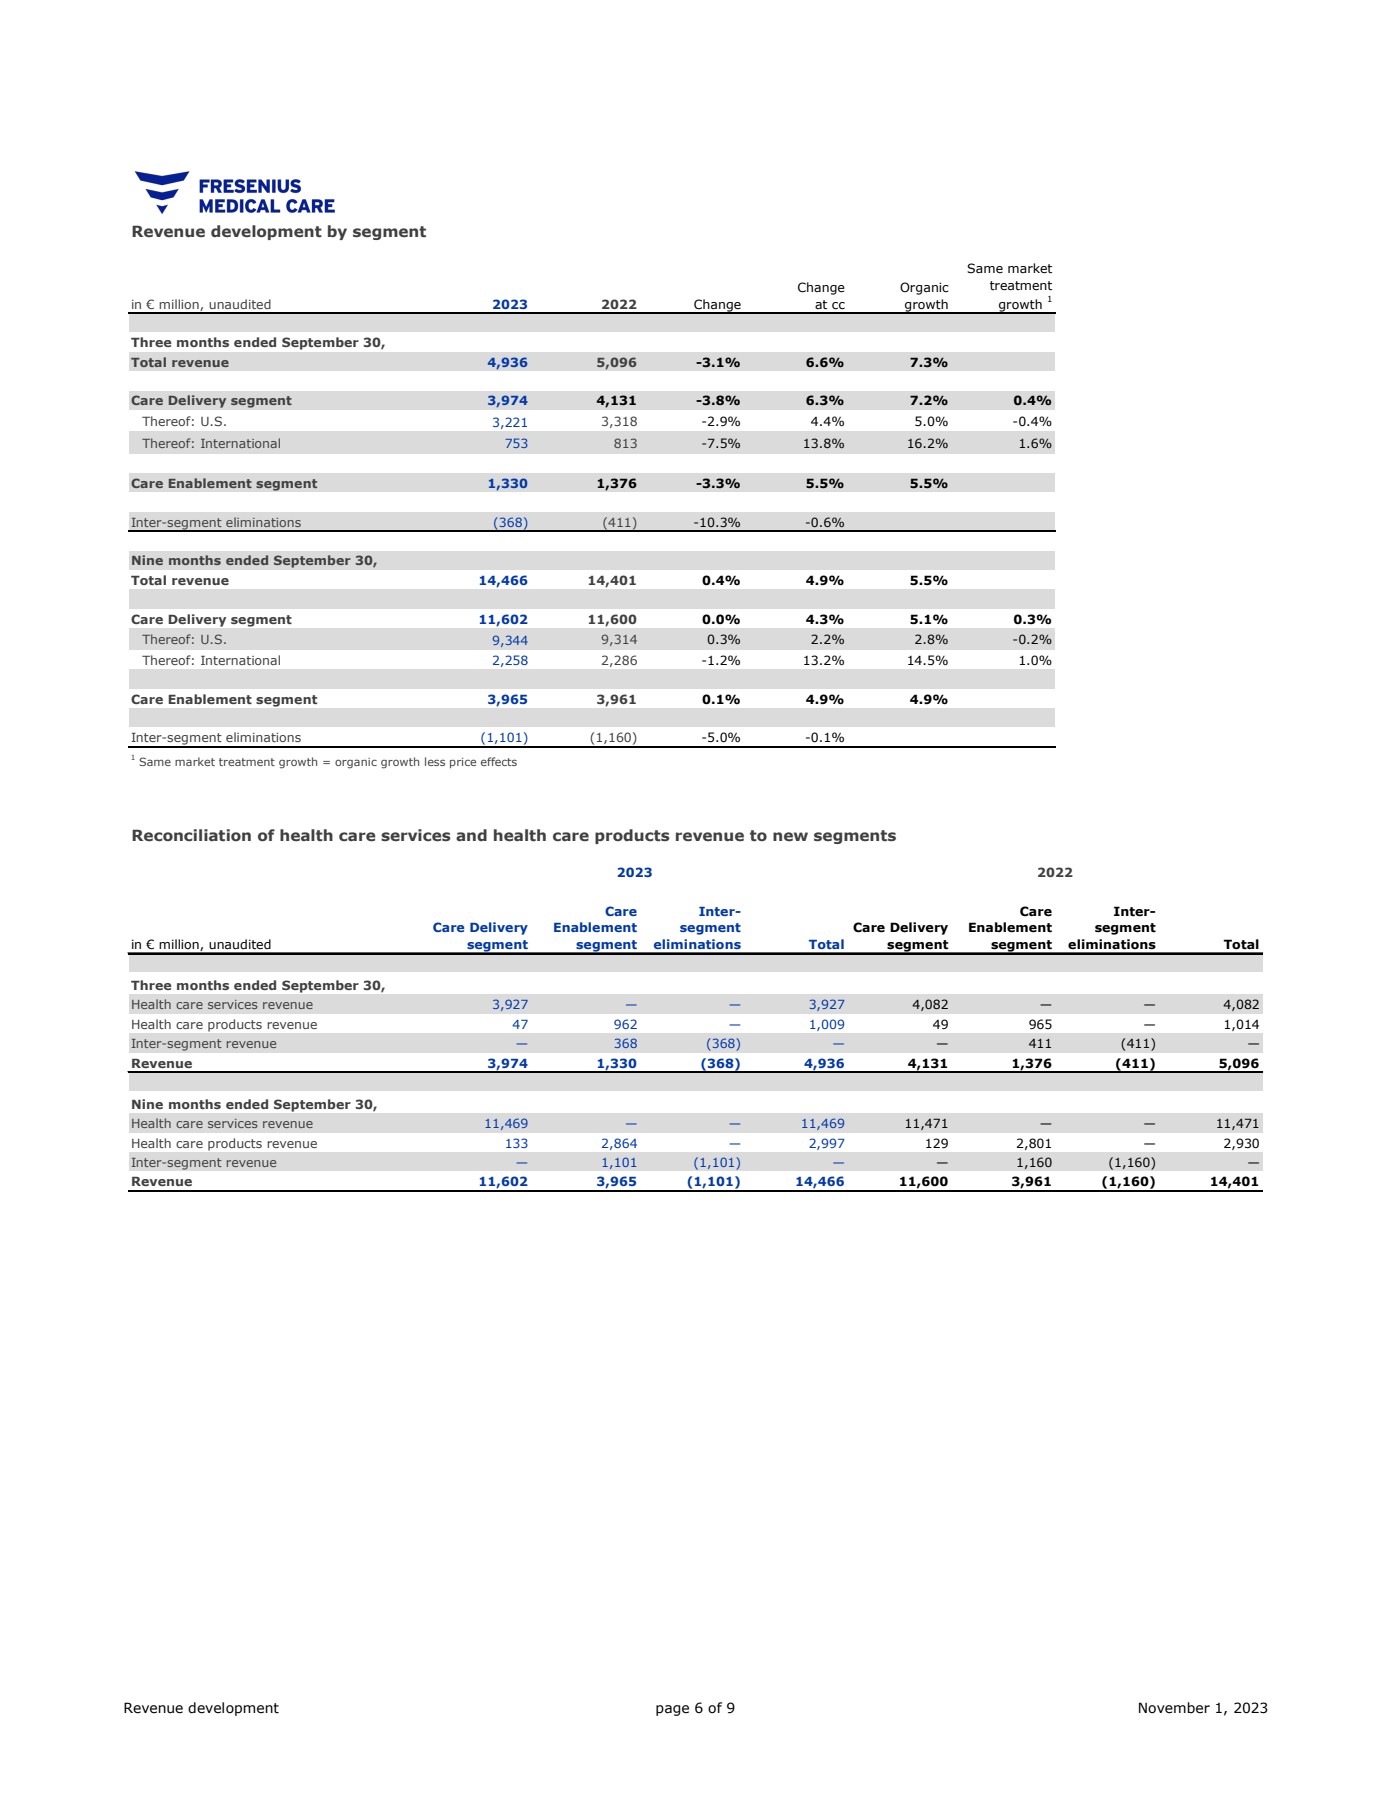
Revenue decreased by 3% to EUR 4,936 million in the third quarter (+7% at constant currency, +7% organic).
Care Delivery revenue decreased by 4% to EUR 3,974 million (+6% at constant currency, +7% organic).
In Care Delivery U.S., revenue declined by 3% (+4% at constant currency, +5% organic). A negative exchange rate effect and a decrease in dialysis days was partially offset by organic growth, which was supported by a favorable impact from the value-based care business, reimbursement rate increases and a favorable payor mix. The annualization effect of COVID-19-related excess mortality in the late-stage CKD (Chronic Kidney Disease) and ESRD (End-Stage Renal Disease) population continues to weigh on same market treatment growth (-0.4%). Adjusted for the exit from less profitable acute care contracts same market treatment growth was at +0.2%.
In Care Delivery International, revenue declined by 7% (+14% at constant currency, +16% organic). A negative exchange rate effect and the impact of closed or sold clinics was partially offset by organic growth, which was driven by a significant effect of hyperinflation in various markets. Despite the annualization effect of COVID-19-related excess mortality, same market treatment growth was positive at 1.6%.
Care Enablement revenue declined by 3% to EUR 1,330 million (+5% at constant currency, +5% organic). The negative exchange rate effects have been partly offset by higher sales of in-center disposables, machines for chronic treatment and home hemodialysis products as well as higher average sales prices.
Within Inter-segment eliminations, revenue for products transferred between the operating segments at fair market value declined by 10% to EUR 368 million (-1% at constant currency).3
3 The Company transfers products between segments at fair market value. The associated internal revenues and expenses and any remaining internally generated profit or loss for the product transfers are recorded within the operating segments initially, are eliminated upon consolidation and are included within “Inter-segment eliminations”.
Page
In the first nine months, revenue was stable at EUR 14,466 million (+5% at constant currency, +5% organic). Care Delivery revenue was stable at EUR 11,602 million (+4% at constant currency, +5% organic), with stable revenue for Care Delivery U.S. (+2% at constant currency, +3% organic), and a revenue decline of 1% for Care Delivery International (+13% at constant currency, +14% organic). Care Enablement revenue was stable at EUR 3,965 million (+5% at constant currency, +5% organic). Inter-segment eliminations declined by 5% and amounted to EUR 1,101 million (stable at constant currency).
Earnings development driven by productivity improvements and FME25 savings
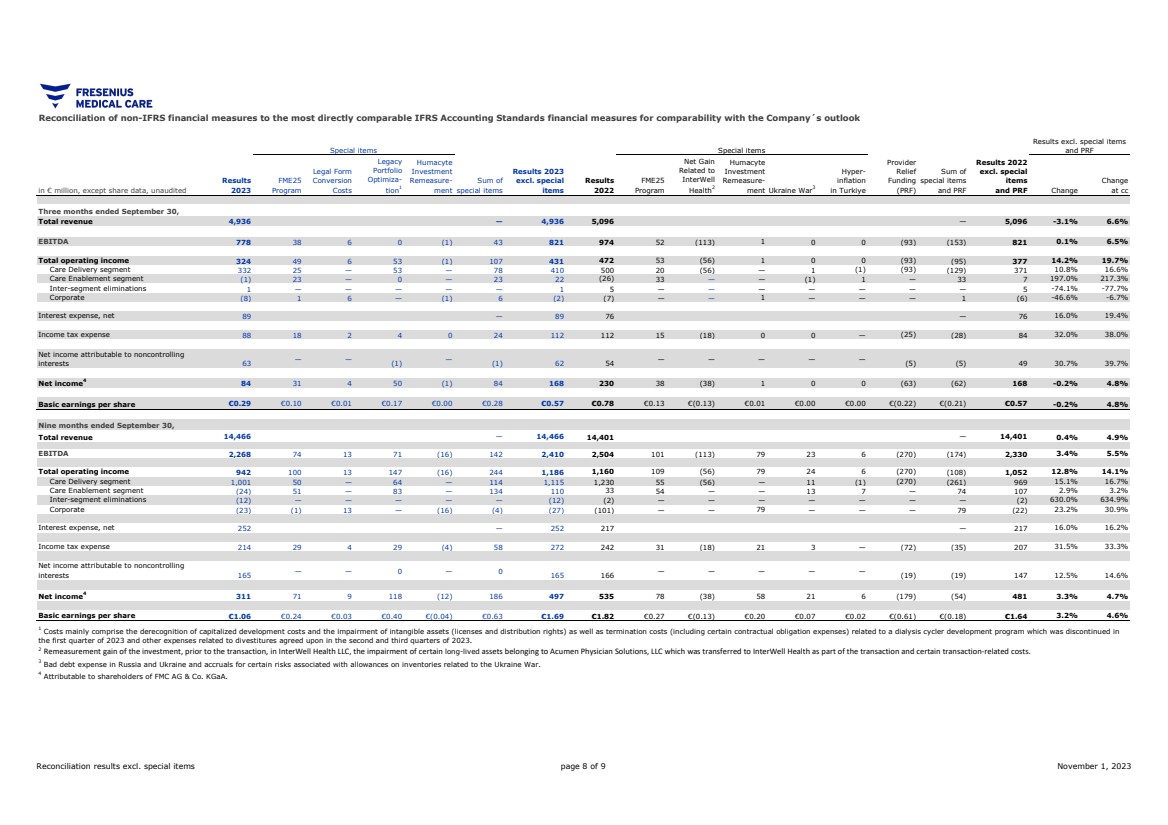
Operating income decreased by 31% to EUR 324 million (-28% at constant currency), resulting in a margin of 6.6% (Q3 2022: 9.3%). Operating income excluding special items and U.S. Provider Relief Funding (PRF)1 increased by 14% to EUR 431 million (+20% at constant currency), resulting in a margin of 8.7% (Q3 2022: 7.4%).
Operating income in Care Delivery decreased by 34% to EUR 332 million (-29% at constant currency), resulting in a margin of 8.4% (Q3 2022: 12.1%). Operating income excluding special items and PRF1 increased by 11% to EUR 410 million (+17% at constant currency), resulting in a margin of 10.3% (Q3 2022: 9.0%). This was mainly driven by business growth, savings from the FME25 program and lower personnel expenses resulting from improved productivity. The operating income development was negatively impacted by lower income attributable to a non-recurring consent payment for certain pharmaceuticals, inflationary cost increases as well as by foreign currency translation.
Operating income in Care Enablement amounted
to EUR -1 million (Q3 2022:
EUR -26 million), resulting in a margin of -0.1% (Q3 2022: -1.9%). Operating income excluding special items increased by 197% to EUR
22 million (+217% at constant currency), resulting in a margin of 1.7% (Q3 2022: 0.5%). The improvement compared to the previous year’s
quarter was mainly driven by increased volumes, improved pricing and savings from the FME25 program. These effects were partially offset
by inflationary cost increases and negative foreign currency transaction effects.
Operating income for Corporate amounted to EUR -8 million (Q3 2022: EUR -7 million). Excluding special items, operating income amounted to EUR -2 million (Q3 2022: EUR -6 million).
In the first nine months, operating income decreased by 19% to EUR 942 million (-18% at constant currency), resulting in a margin of 6.5% (9M 2022: 8.1%). Excluding special items and PRF1, operating income increased by 13% to EUR 1,186 million (+14% at constant currency), resulting in a margin of 8.2% (9M 2022: 7.3%). In Care Delivery, operating income declined by 19% to EUR 1,001 million (-18% at constant currency), resulting in a margin of 8.6% (9M 2022: 10.6%). In Care Enablement, operating income decreased to EUR -24 million (9M 2022: EUR 33 million), resulting in a margin of -0.6% (9M 2022: 0.8%). Operating income for Corporate amounted to EUR -23 million (9M 2022: EUR -101 million).
Page
Net income2 decreased by 63% to EUR 84 million (-61% at constant currency). Excluding special items and PRF1, net income2 remained stable at EUR 168 million (+5% at constant currency).
In the first nine months, net income2 declined by 42% to EUR 311 million (-41% at constant currency). Excluding special items and PRF1, net income2 increased by 3% to EUR 497 million (+5% at constant currency).
Basic earnings per share (EPS) decreased by 63% to EUR 0.29 (-61% at constant currency). EPS excluding special items and PRF1 remained stable at EUR 0.57 (+5% at constant currency).
In the first nine months, EPS declined by 42% to EUR 1.06 (-41% at constant currency). Excluding special items and PRF1, EPS increased by 3% to EUR 1.69 (+5% at constant currency).
Page
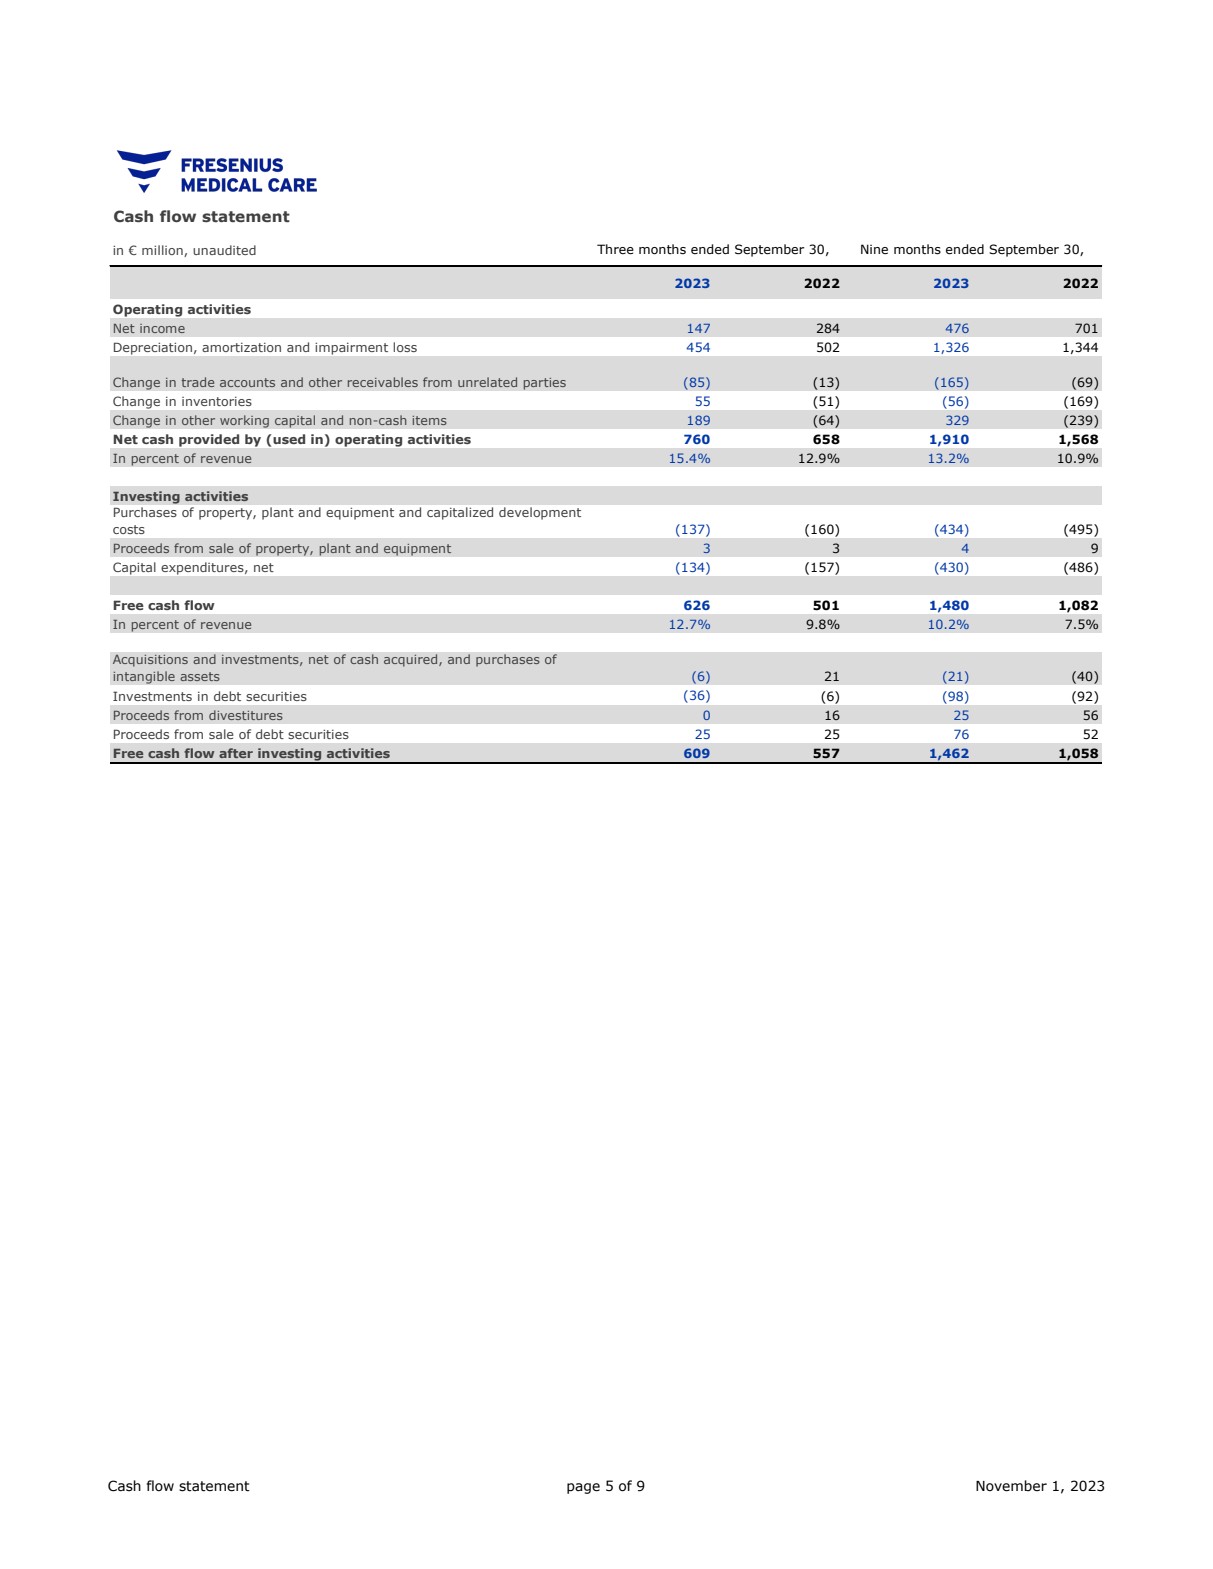
Strong cash flow development
In the third quarter, Fresenius Medical Care generated EUR 760 million of operating cash flow (Q3 2022: EUR 658 million), resulting in a margin of 15.4% (Q3 2022: 12.9%). The increase in net cash provided by operating activities is the result of the change in certain working capital items, in particular due to the recoupment of advanced payments during 2022, which had been received under the U. S. Medicare Accelerated and Advance Payment Program in 2020.
In the first nine months, operating cashflow amounted to EUR 1,910 million (9M 2022: EUR 1,568 million), resulting in a margin of 13.2% (9M 2022: 10.9%).
Free cash flow4
amounted to EUR 626 million in the third quarter (Q3 2022:
EUR 501 million), resulting in a margin of 12.7% (Q3 2022: 9.8%). In the first nine months, Fresenius Medical Care generated free cash
flow of EUR 1,480 million (9M 2022: EUR 1,082 million), resulting in a margin of 10.2% (9M 2022: 7.5%).
Outlook
The Company continues to expect for 2023 revenue to grow at a low to mid-single digit percentage rate (2022 basis: EUR 19,398 million).
Based on the earnings development for the first nine months of the year and solid business expectations for the remainder of the year, Fresenius Medical Care raises its earnings outlook for 2023. The Company now expects operating income to grow at a low-single digit percentage rate (2022 basis: EUR 1,540 million; previous target: remain flat or decline by up to a low-single digit percentage rate)5.
The Company’s target to achieve an operating income margin of 10 to 14% by 2025 remains unchanged.
4 Net cash provided by / used in operating activities, after capital expenditures, before acquisitions, investments, and dividends
5
Revenue and operating income, as referred to in the outlook, are both on a constant currency basis and excluding special
items. Special items will be provided as separate KPI (“Revenue excluding special items”, “Operating income excluding
special items”) to capture effects that are unusual in nature and have not been foreseeable or not foreseeable in size or impact
at the time of giving guidance. These items are excluded to ensure comparability of the figures presented with the Company’s financial
targets which have been defined excluding special items.
For FY 2022, special items included costs related to the FME25 program, the impact of the war in Ukraine, the impact of hyperinflation
in Turkiye, the Humacyte investment remeasurement, and the net gain related to InterWell Health. Additionally, the basis (FY 2022) for
the 2023 outlook was adjusted for Provider Relief Funding. For FY 2023, special items include costs related to the FME25 program, the
Humacyte investment remeasurement, the costs associated with the legal form conversion and effects from legacy portfolio optimization.
For further details please see the reconciliation attached to the Press Release.
Page
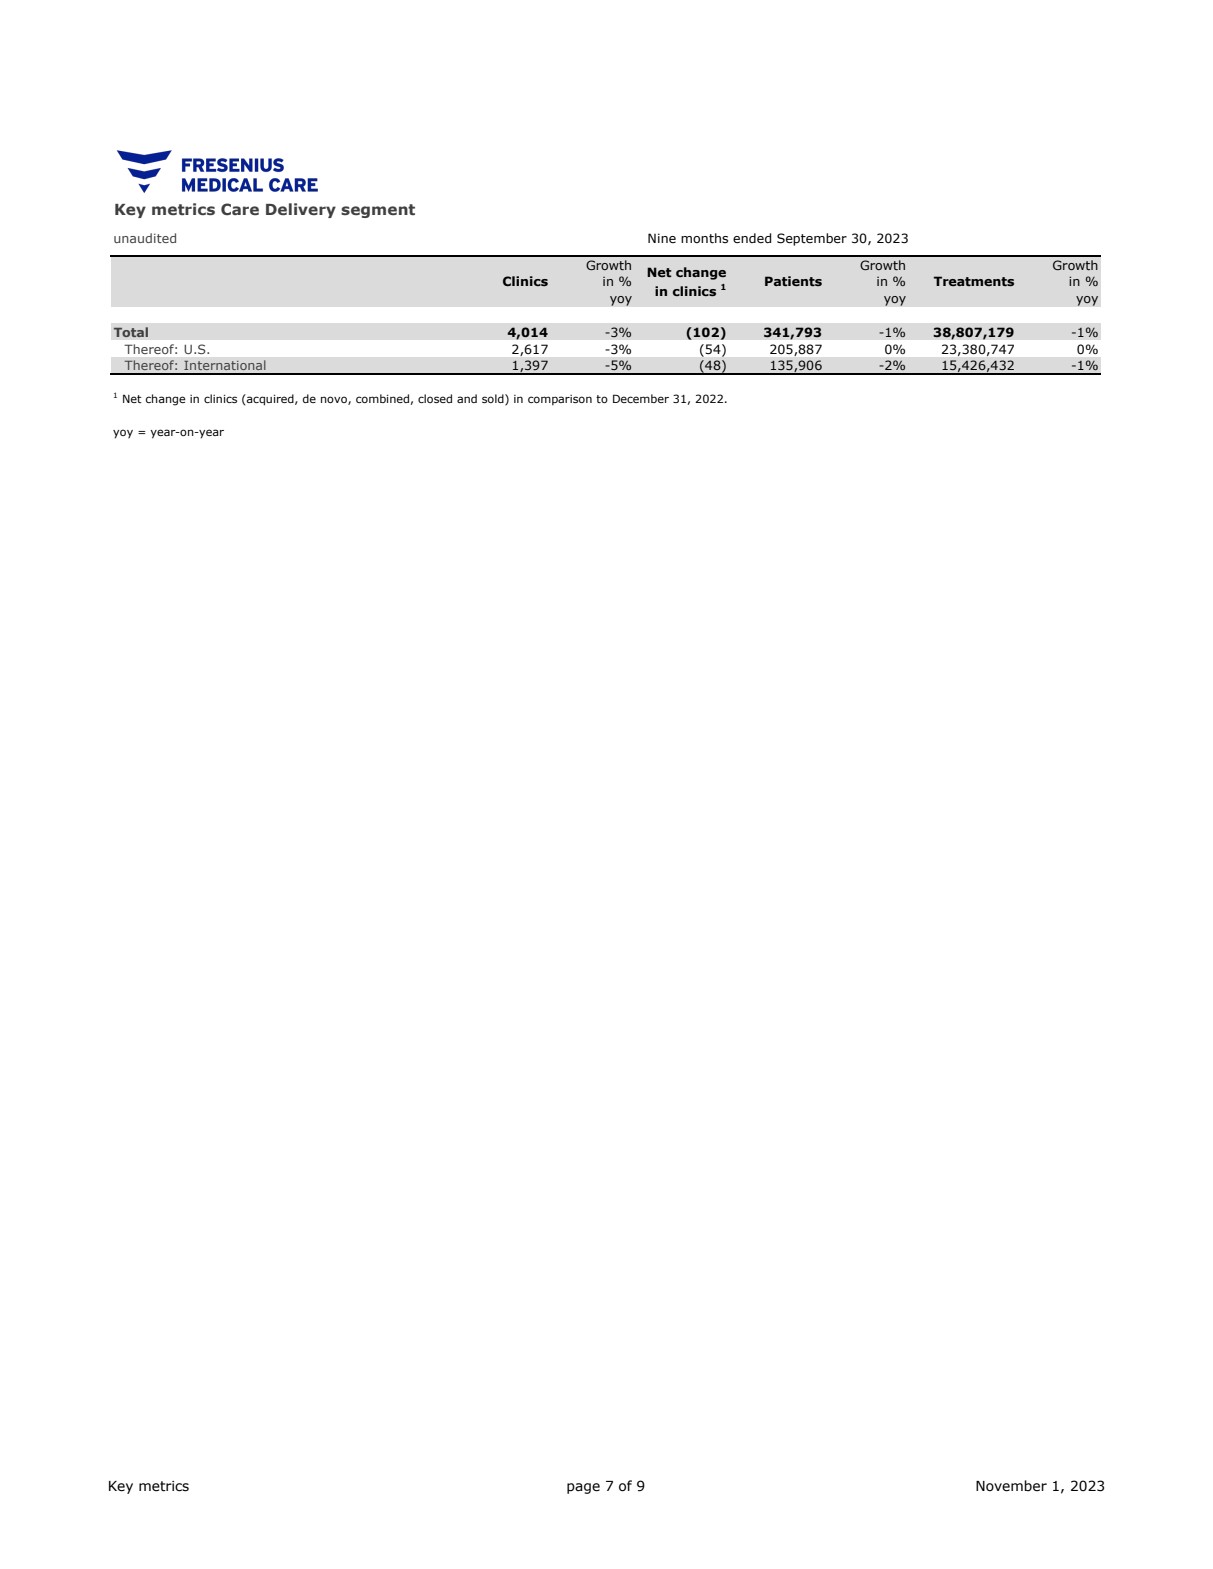
Patients, clinics and employees
As of September 30, 2023, Fresenius Medical Care treated 341,793 patients in 4,014 dialysis clinics worldwide and had 123,106 employees (headcount) globally, compared to 130,295 employees as of September 30, 2022.
Conference call
Fresenius Medical Care will host a conference call to discuss the results of the third quarter on November 2, 2023 at 3:30 p.m. CET / 10:30 a.m. EDT. Details will be available on the Fresenius Medical Care website in the “Investors” section. A replay will be available shortly after the call.
Please refer to our statement of earnings included at the end of this news and to the attachments as separate PDF files for a complete overview of the results of the third quarter and first nine months of 2023. Our 6-K disclosure provides more details.
Fresenius Medical Care is the world's leading provider of products and services for individuals with renal diseases of which around 3.9 million patients worldwide regularly undergo dialysis treatment. Through its network of 4,014 dialysis clinics, Fresenius Medical Care provides dialysis treatments for approximately 342,000 patients around the globe. Fresenius Medical Care is also the leading provider of dialysis products such as dialysis machines or dialyzers. Fresenius Medical Care is listed on the Frankfurt Stock Exchange (FME) and on the New York Stock Exchange (FMS).
For more information visit the Company’s website at www.freseniusmedicalcare.com.
Disclaimer:
This release contains forward-looking statements that are subject to various risks and uncertainties. Actual results could differ materially from those described in these forward-looking statements due to various factors, including, but not limited to, changes in business, economic and competitive conditions, legal changes, regulatory approvals, impacts related to COVID-19, results of clinical studies, foreign exchange rate fluctuations, uncertainties in litigation or investigative proceedings, and the availability of financing. These and other risks and uncertainties are detailed in Fresenius Medical Care AG & Co. KGaA's reports filed with the U.S. Securities and Exchange Commission. Fresenius Medical Care AG & Co. KGaA does not undertake any responsibility to update the forward-looking statements in this release.
Implementation of measures as presented herein may be subject to information and consultation procedures with works councils and other employee representative bodies, as per local laws and practice. Consultation procedures may lead to changes on proposed measures.
Page

Statement of earnings in € million, except share data, unaudited Three months ended September 30, Revenue Costs of revenue Selling, general and administrative expenses Research and development expenses Income from equity method investees Other operating income other operating expense Remeasurement Gain from InterWell Health Operating income Operat ing income excl. special items and PRF I nterest expense, net Income before taxe5 Income tax expense Net income Net income attributable to noncontrolling interests Net income' Net income' excl. special items and PRF Weighted average number of shares Ba5ic earning5 per 5hare Basic earnings per share excl. special items and PRF In percent of revenue Operating income margin Operat ing income margin excl. special items and PRF 1 Attributable t o shareholders of FMC AG & Co. KGaA. 2023 4,936 3,707 794 53 (23) (6 5) 146 324 431 89 235 88 147 63 84 168 293,413,449 C0.29 €0,57 6.6 O/o 8 .7% For a reconciliation of special items, please refer to the table at the end of the press release. 2022 Change 5,096 - 3 ,10/o 3,853 - 3 ,8% 8 17 - 2 ,9% 61 - 13 ,7% (17) 29.7% (158) -78,8% 215 -32.60/o (147) 472 - 3 1.30/o 377 14 .2% 76 16 .0% 396 -40.40/o 112 - 2 1.2% 284 -48 .00/o 54 18 .7% 230 -63.30/o 168 - 0 ,2% 293,413,449 C0.78 -63.30/o €0,57 - 0 ,2% 9,30/o 7.4% Change at cc 6,60/o 6.4% 4 .6% - 10 ,8% 30.5% -74,5% - 14.40/o -27.80/o 19 .7% 19.4% - 3 6.90/o - 17 .8% -44.50/o 26.8% -60.90/o 4 .8% -60.90/o 4 .8% Statement of earnings in € million, except share data, unaudited Revenue Costs of re-venue Selling, general and administrative expenses Research and development expenses Income from equity method investees Other operating income Other operating expense Remeasurement Gain from InterWell Health Operating income Operating income excl.
Page

special items and PRF Interest expense, net Income before taxes Income tax expense Net income Net income attributable to noncontrolling interests Net income' Net income' excl. special items and PRF Weighted a verage number of shares Basic earnings per share Basic earnings per share excl. special items and PRF In perce.nt of reve.nue Operating income margin Operating income margin excl. special items and PRF 1 Attributable to shareholders of FMC AG & Co. KGaA. Nine months ended September 30, 2023 2022 Change 14,466 14,401 0.40/o 10,890 10,738 1.4% 2,351 2,365 -0.6% 166 167 -0.4% (98) {47) 108. 1% (258) (397) -52.6% 473 562 -16.0% ( 147) 942 1, 160 - 18.80/o 1, 186 1,052 12.8% 252 217 16.0% 690 943 -26.80/o 214 242 -11.5% 476 701 -32.10/o 165 166 -0.8% 3 11 535 -4 1.80/o 497 481 3.3% 293,4 13,449 293, 190, 145 € 1.06 Cl.82 -4 1.90/o € 1.69 €1.64 3.2% 6.50/o 8.10/o 8.2% 7.3% For a reconciliation of special items, please refer to the table at the end of the press release. Change at cc 4.90/o 6. 1% 2.4% 0.5% 108.2% -44.4% 1.2% - 18.00/o 14.1% 16.2% -25.90/o -10.5% -3 1. 20/o 1.0% -4 1. 20/o 4.7% -4 1.30/o 4.6% Reconciliation of non-IFRS financial measures to the most directly comparable IFRS Accounting Standards financial measures for comparability with the Company's outlook in € million, unaudited Operating performance excl.
Page

special items These items are excluded to ensure comparability of the figures presented with the Company's financial t argets which have been defined excluding special items. Revenue Operating income Special items: FME25 Progran Legal Form Conversion Costs Legacy Portfolio Optimization' Humacyte Investment Remeasurement Net Gain Related to InterWell Health' Ukraine War3 Hyperinflation n Turkiye Provider Relief Funding (PRF) Sum of special items and PRF Operating income excl. special items and PRF Net income• Special items: FME25 Progran Legal Form Conversion Costs Legacy Portfolio Optimization' Humacyte Investment Remeasurement Net Gain Related to InterWell Health' Ukraine War3 Hyperinflation n Turkiye Provider Relief Funding Sum of special items and PRF Net income4 excl. special items and PRF Three months ended September 30, Nine months ended September 30, 2023 4, 9 3 6 324 49 6 53 (1) 107 431 8 4 31 4 so (1) 84 168 2022 5,096 472 53 1 (56) 0 0 (93) (Q'i) 377 230 38 1 (38) 0 0 (63) (62) 168 2023 14,4 66 942 100 13 147 (16) ? 44 1,186 3 11 71 9 118 (12) 186 497 2022 1 4,401 1, 160 109 79 (56) 24 6 (270) (108 ) 1,052 535 78 58 (38) 21 6 (179) (54) 481 1 Costs mainly comprise the derecognition of capitalized development costs and the impairment of intangible assets (licenses and distribution rights) as well as termination costs (including certain contractual obligation expenses) related to a dialy sis cycler development program which was discontinued in the first quarter of 2023 and other expenses related to divestitures agreed upon in the second and third quarters of 2023. 2 Remeasurement gain of the investment , prior to the transaction, in InterWell Health LLC, the impairment of certain long-lived assets belonging to Acumen Physician Solutions, LLC which was t ransferred to Int erWell Health as part of the transaction and certain transactionrelated costs. 3 Bad debt expense in Russia and Ukraine and accruals for certain risks associated with allowances on inventories related to the Ukraine War. 4 Attributable to shareholders of FMC AG & Co. KGaA
Page
|
Content: Statement of earnings page 2 Segment information page 3 Balance sheet page 4 Cash flow page 5 page 6 Key metrics page 7 page 8 Outlook 2023 page 9 Disclaimer Fresenius Medical Care AG & Co. KGaA November 1, 2023 COMPLETE OVERVIEW OF THE THIRD QUARTER AND FIRST NINE MONTHS 2023 Investor Relations Copyright by Fresenius Medical Care AG & Co. KGaA email: ir@fmc-ag.com phone: +49 6172 609 2525 Revenue development by segment Reconciliation results excl. special items This release contains forward-looking statements that are subject to various risks and uncertainties. Actual results could differ materially from those described in these forward-looking statements due to certain factors, including changes in business, economic and competitive conditions, regulatory reforms, foreign exchange rate fluctuations, uncertainties in litigation or investigative proceedings, and the availability of financing. These and other risks and uncertainties are detailed in Fresenius Medical Care AG & Co. KGaA's reports filed with the U.S. Securities and Exchange Commission. Fresenius Medical Care AG & Co. KGaA does not undertake any responsibility to update the forward-looking statements in this release. Rounding adjustments applied to individual numbers and percentages may result in these figures differing immaterially from their absolute values. Furthermore, totals and subtotals in tables may differ slightly from unrounded figures due to rounding in accordance with commercial rounding conventions. |
|
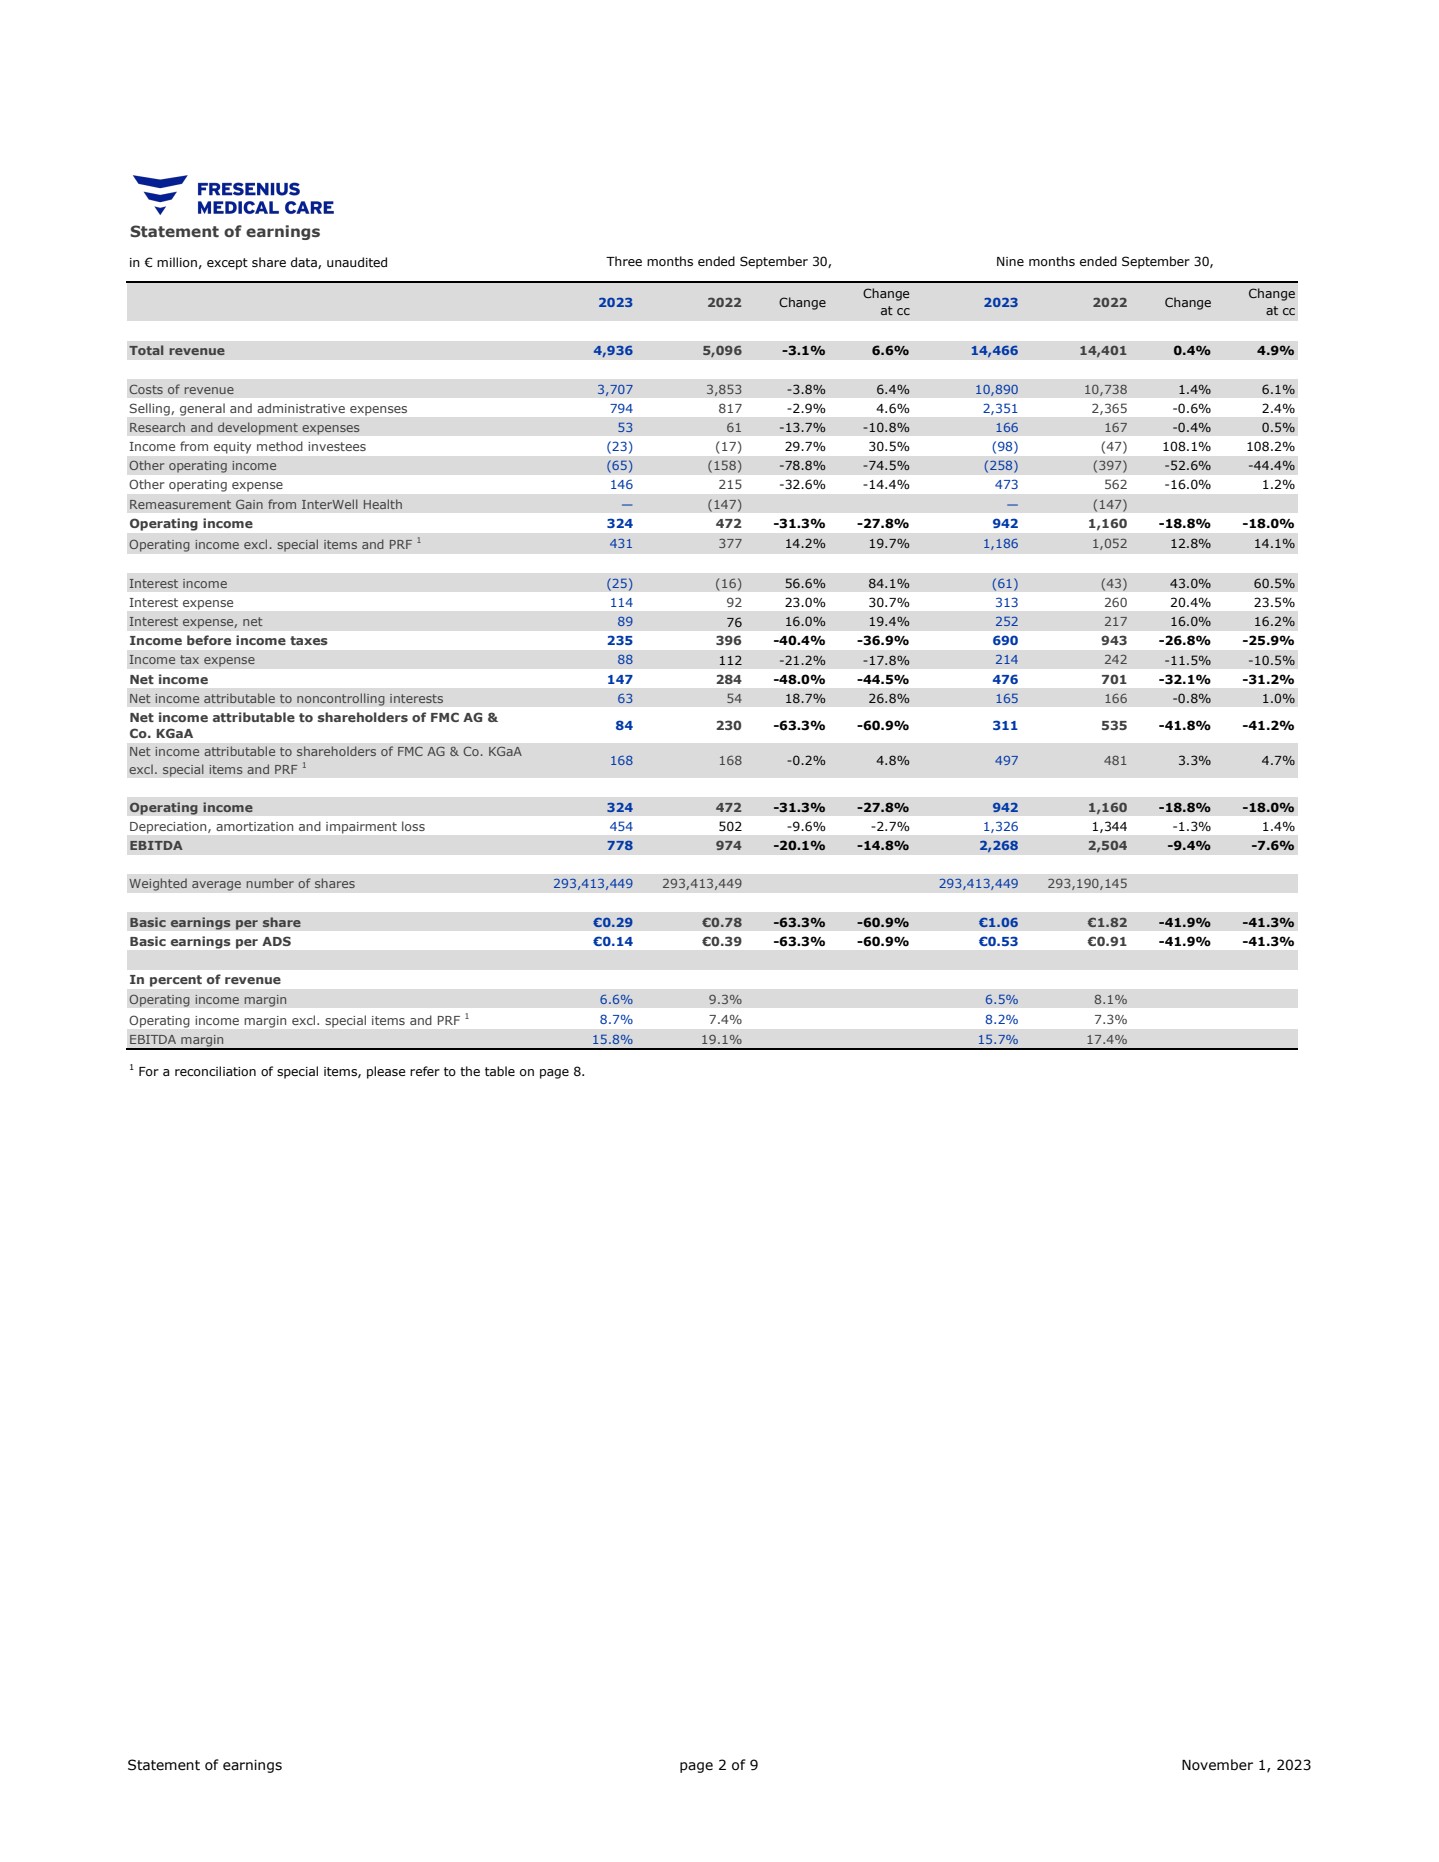
Statement of earnings in € million, except share data, unaudited 2023 2022 Change Change at cc 2023 2022 Change Change at cc Total revenue 4,936 5,096 -3.1% 6.6% 14,466 14,401 0.4% 4.9% Costs of revenue 3,707 3,853 -3.8% 6.4% 10,890 10,738 1.4% 6.1% Selling, general and administrative expenses 794 817 -2.9% 4.6% 2,351 2,365 -0.6% 2.4% Research and development expenses 53 61 -13.7% -10.8% 166 167 -0.4% 0.5% Income from equity method investees (23) (17) 29.7% 30.5% (98) (47) 108.1% 108.2% Other operating income (65) (158) -78.8% -74.5% (258) (397) -52.6% -44.4% Other operating expense 146 215 -32.6% -14.4% 473 562 -16.0% 1.2% Remeasurement Gain from InterWell Health — (147) — (147) Operating income 324 472 -31.3% -27.8% 942 1,160 -18.8% -18.0% Operating income excl. special items and PRF 1 431 377 14.2% 19.7% 1,186 1,052 12.8% 14.1% Interest income (25) (16) 56.6% 84.1% (61) (43) 43.0% 60.5% Interest expense 114 92 23.0% 30.7% 313 260 20.4% 23.5% Interest expense, net 89 76 16.0% 19.4% 252 217 16.0% 16.2% Income before income taxes 235 396 -40.4% -36.9% 690 943 -26.8% -25.9% Income tax expense 88 112 -21.2% -17.8% 214 242 -11.5% -10.5% Net income 147 284 -48.0% -44.5% 476 701 -32.1% -31.2% Net income attributable to noncontrolling interests 63 54 18.7% 26.8% 165 166 -0.8% 1.0% Net income attributable to shareholders of FMC AG & Co. KGaA 84 230 -63.3% -60.9% 311 535 -41.8% -41.2% Net income attributable to shareholders of FMC AG & Co. KGaA excl. special items and PRF 1 168 168 -0.2% 4.8% 497 481 3.3% 4.7% Operating income 324 472 -31.3% -27.8% 942 1,160 -18.8% -18.0% Depreciation, amortization and impairment loss 454 502 -9.6% -2.7% 1,326 1,344 -1.3% 1.4% EBITDA 778 974 -20.1% -14.8% 2,268 2,504 -9.4% -7.6% Weighted average number of shares 293,413,449 293,413,449 293,413,449 293,190,145 Basic earnings per share €0.29 €0.78 -63.3% -60.9% €1.06 €1.82 -41.9% -41.3% Basic earnings per ADS €0.14 €0.39 -63.3% -60.9% €0.53 €0.91 -41.9% -41.3% In percent of revenue Operating income margin 6.6% 9.3% 6.5% 8.1% Operating income margin excl. special items and PRF 1 8.7% 7.4% 8.2% 7.3% EBITDA margin 15.8% 19.1% 15.7% 17.4% 1 For a reconciliation of special items, please refer to the table on page 8. Three months ended September 30, Nine months ended September 30, Statement of earnings page 2 of 9 November 1, 2023 |
|
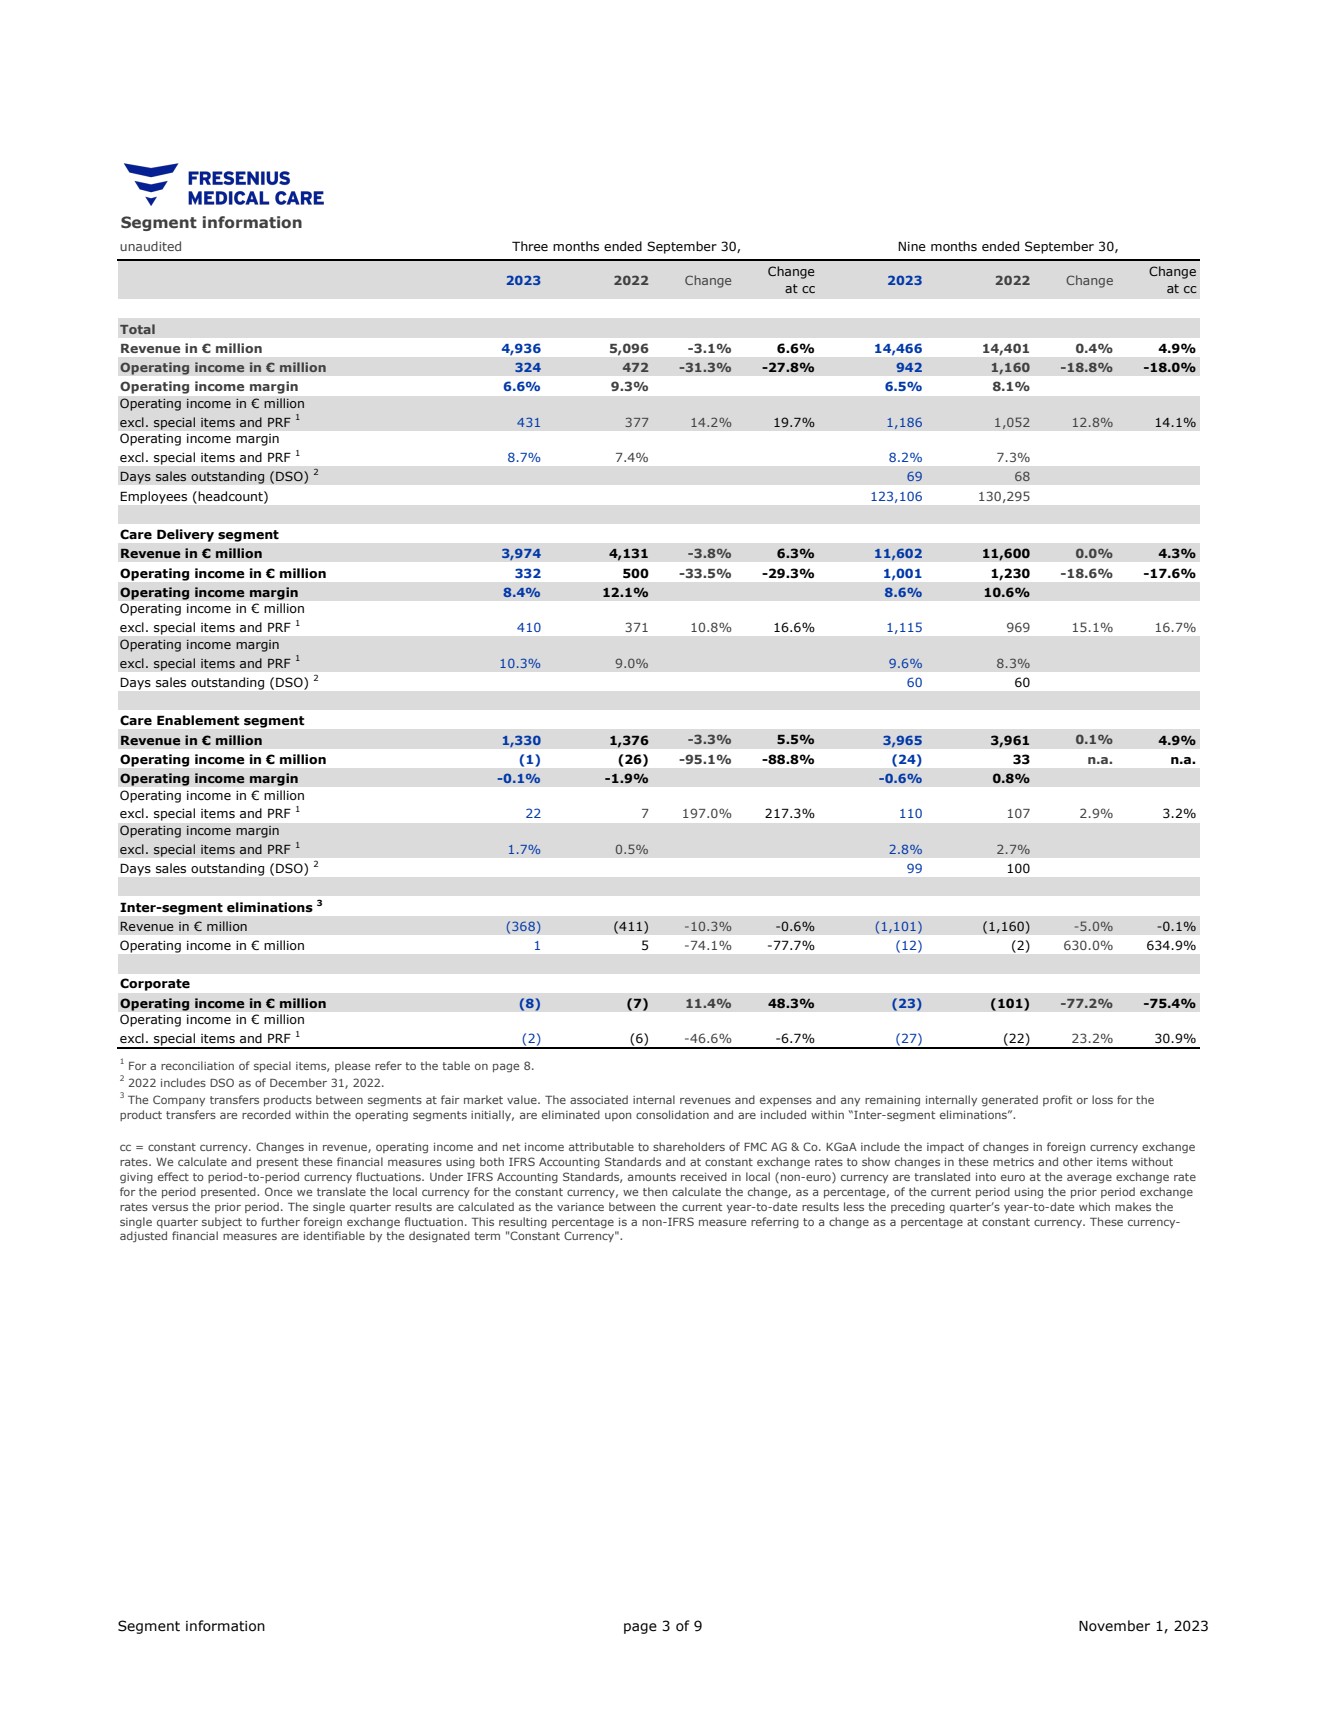
Segment information unaudited 2023 2022 Change Change at cc 2023 2022 Change Change at cc Total Revenue in € million 4,936 5,096 -3.1% 6.6% 14,466 14,401 0.4% 4.9% Operating income in € million 324 472 -31.3% -27.8% 942 1,160 -18.8% -18.0% Operating income margin 6.6% 9.3% 6.5% 8.1% Operating income in € million excl. special items and PRF 1 431 377 14.2% 19.7% 1,186 1,052 12.8% 14.1% Operating income margin excl. special items and PRF 1 8.7% 7.4% 8.2% 7.3% Days sales outstanding (DSO) 2 69 68 Employees (headcount) 123,106 130,295 Care Delivery segment Revenue in € million 3,974 4,131 -3.8% 6.3% 11,602 11,600 0.0% 4.3% Operating income in € million 332 500 -33.5% -29.3% 1,001 1,230 -18.6% -17.6% Operating income margin 8.4% 12.1% 8.6% 10.6% Operating income in € million excl. special items and PRF 1 410 371 10.8% 16.6% 1,115 969 15.1% 16.7% Operating income margin excl. special items and PRF 1 10.3% 9.0% 9.6% 8.3% Days sales outstanding (DSO) 2 60 60 Care Enablement segment Revenue in € million 1,330 1,376 -3.3% 5.5% 3,965 3,961 0.1% 4.9% Operating income in € million (1) (26) -95.1% -88.8% (24) 33 n.a. n.a. Operating income margin -0.1% -1.9% -0.6% 0.8% Operating income in € million excl. special items and PRF 1 22 7 197.0% 217.3% 110 107 2.9% 3.2% Operating income margin excl. special items and PRF 1 1.7% 0.5% 2.8% 2.7% Days sales outstanding (DSO) 2 99 100 Inter-segment eliminations 3 Revenue in € million (368) (411) -10.3% -0.6% (1,101) (1,160) -5.0% -0.1% Operating income in € million 1 5 -74.1% -77.7% (12) (2) 630.0% 634.9% Corporate Operating income in € million (8) (7) 11.4% 48.3% (23) (101) -77.2% -75.4% Operating income in € million excl. special items and PRF 1 (2) (6) -46.6% -6.7% (27) (22) 23.2% 30.9% 2 2022 includes DSO as of December 31, 2022. 1 For a reconciliation of special items, please refer to the table on page 8. 3 The Company transfers products between segments at fair market value. The associated internal revenues and expenses and any remaining internally generated profit or loss for the product transfers are recorded within the operating segments initially, are eliminated upon consolidation and are included within “Inter-segment eliminations”. cc = constant currency. Changes in revenue, operating income and net income attributable to shareholders of FMC AG & Co. KGaA include the impact of changes in foreign currency exchange rates. We calculate and present these financial measures using both IFRS Accounting Standards and at constant exchange rates to show changes in these metrics and other items without giving effect to period-to-period currency fluctuations. Under IFRS Accounting Standards, amounts received in local (non-euro) currency are translated into euro at the average exchange rate for the period presented. Once we translate the local currency for the constant currency, we then calculate the change, as a percentage, of the current period using the prior period exchange rates versus the prior period. The single quarter results are calculated as the variance between the current year-to-date results less the preceding quarter’s year-to-date which makes the single quarter subject to further foreign exchange fluctuation. This resulting percentage is a non-IFRS measure referring to a change as a percentage at constant currency. These currency-adjusted financial measures are identifiable by the designated term "Constant Currency". Three months ended September 30, Nine months ended September 30, Segment information page 3 of 9 November 1, 2023 |
|
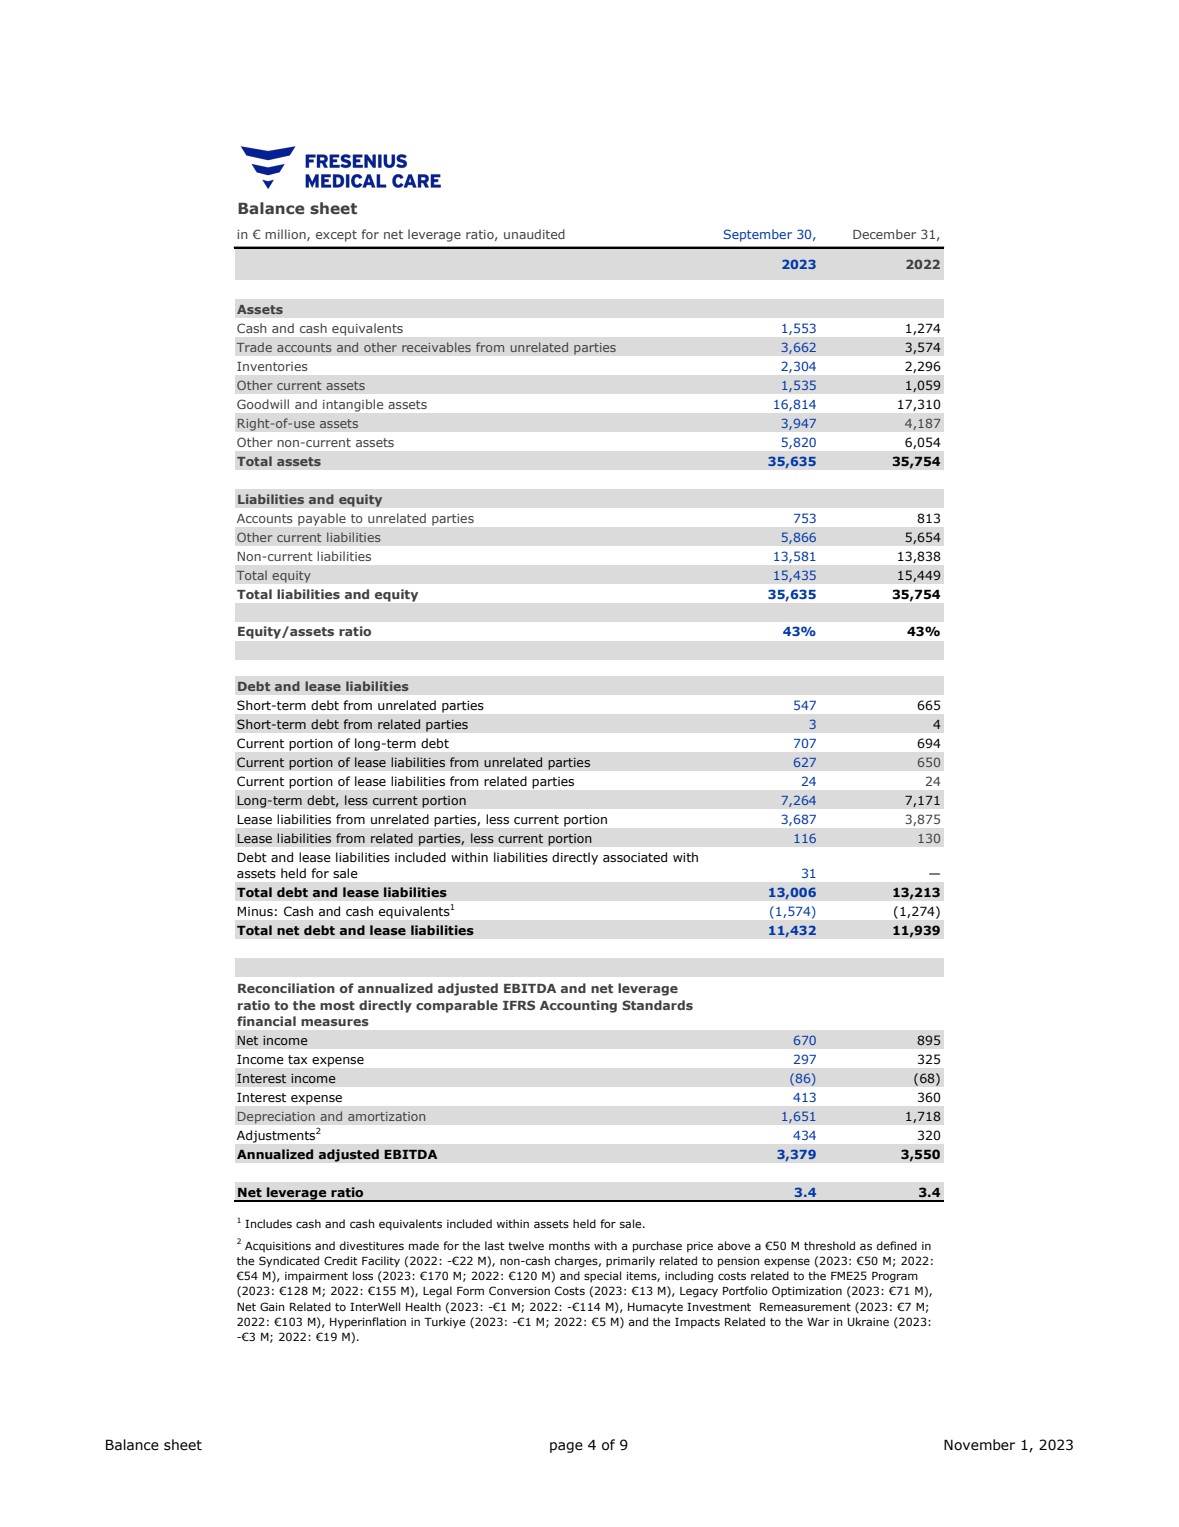
Balance sheet in € million, except for net leverage ratio, unaudited September 30, December 31, 2023 2022 Assets Cash and cash equivalents 1,553 1,274 Trade accounts and other receivables from unrelated parties 3,662 3,574 Inventories 2,304 2,296 Other current assets 1,535 1,059 Goodwill and intangible assets 16,814 17,310 Right-of-use assets 3,947 4,187 Other non-current assets 5,820 6,054 Total assets 35,635 35,754 Liabilities and equity Accounts payable to unrelated parties 753 813 Other current liabilities 5,866 5,654 Non-current liabilities 13,581 13,838 Total equity 15,435 15,449 Total liabilities and equity 35,635 35,754 Equity/assets ratio 43% 43% Debt and lease liabilities Short-term debt from unrelated parties 547 665 Short-term debt from related parties 3 4 Current portion of long-term debt 707 694 Current portion of lease liabilities from unrelated parties 627 650 Current portion of lease liabilities from related parties 24 24 Long-term debt, less current portion 7,264 7,171 Lease liabilities from unrelated parties, less current portion 3,687 3,875 Lease liabilities from related parties, less current portion 116 130 Debt and lease liabilities included within liabilities directly associated with assets held for sale 31 — Total debt and lease liabilities 13,006 13,213 Minus: Cash and cash equivalents1 (1,574) (1,274) Total net debt and lease liabilities 11,432 11,939 Reconciliation of annualized adjusted EBITDA and net leverage ratio to the most directly comparable IFRS Accounting Standards financial measures Net income 670 895 Income tax expense 297 325 Interest income (86) (68) Interest expense 413 360 Depreciation and amortization 1,651 1,718 Adjustments2 434 320 Annualized adjusted EBITDA 3,379 3,550 Net leverage ratio 3.4 3.4 1 Includes cash and cash equivalents included within assets held for sale. 2 Acquisitions and divestitures made for the last twelve months with a purchase price above a €50 M threshold as defined in the Syndicated Credit Facility (2022: -€22 M), non-cash charges, primarily related to pension expense (2023: €50 M; 2022: €54 M), impairment loss (2023: €170 M; 2022: €120 M) and special items, including costs related to the FME25 Program (2023: €128 M; 2022: €155 M), Legal Form Conversion Costs (2023: €13 M), Legacy Portfolio Optimization (2023: €71 M), Net Gain Related to InterWell Health (2023: -€1 M; 2022: -€114 M), Humacyte Investment Remeasurement (2023: €7 M; 2022: €103 M), Hyperinflation in Turkiye (2023: -€1 M; 2022: €5 M) and the Impacts Related to the War in Ukraine (2023: -€3 M; 2022: €19 M). Balance sheet page 4 of 9 November 1, 2023 |
|
Cash flow statement in € million, unaudited 2023 2022 2023 2022 Operating activities Net income 147 284 476 701 Depreciation, amortization and impairment loss 454 502 1,326 1,344 Change in trade accounts and other receivables from unrelated parties (85) (13) (165) (69) Change in inventories 55 (51) (56) (169) Change in other working capital and non-cash items 189 (64) 329 (239) Net cash provided by (used in) operating activities 760 658 1,910 1,568 In percent of revenue 15.4% 12.9% 13.2% 10.9% Investing activities Purchases of property, plant and equipment and capitalized development costs (137) (160) (434) (495) Proceeds from sale of property, plant and equipment 3 3 4 9 Capital expenditures, net (134) (157) (430) (486) Free cash flow 626 501 1,480 1,082 In percent of revenue 12.7% 9.8% 10.2% 7.5% Acquisitions and investments, net of cash acquired, and purchases of intangible assets (6) 21 (21) (40) Investments in debt securities (36) (6) (98) (92) Proceeds from divestitures 0 16 25 56 Proceeds from sale of debt securities 25 25 76 52 Free cash flow after investing activities 609 557 1,462 1,058 Three months ended September 30, Nine months ended September 30, Cash flow statement page 5 of 9 November 1, 2023 |
|
in € million, unaudited 2023 2022 Change Change at cc Organic growth Same market treatment growth 1 Three months ended September 30, Total revenue 4,936 5,096 -3.1% 6.6% 7.3% Care Delivery segment 3,974 4,131 -3.8% 6.3% 7.2% 0.4% Thereof: U.S. 3,221 3,318 -2.9% 4.4% 5.0% -0.4% Thereof: International 753 813 -7.5% 13.8% 16.2% 1.6% Care Enablement segment 1,330 1,376 -3.3% 5.5% 5.5% Inter-segment eliminations (368) (411) -10.3% -0.6% Nine months ended September 30, Total revenue 14,466 14,401 0.4% 4.9% 5.5% Care Delivery segment 11,602 11,600 0.0% 4.3% 5.1% 0.3% Thereof: U.S. 9,344 9,314 0.3% 2.2% 2.8% -0.2% Thereof: International 2,258 2,286 -1.2% 13.2% 14.5% 1.0% Care Enablement segment 3,965 3,961 0.1% 4.9% 4.9% Inter-segment eliminations (1,101) (1,160) -5.0% -0.1% in € million, unaudited Care Delivery segment Care Enablement segment Inter-segment eliminations Total Care Delivery segment Care Enablement segment Inter-segment eliminations Total Three months ended September 30, Health care services revenue 3,927 — — 3,927 4,082 — — 4,082 Health care products revenue 47 962 — 1,009 49 965 — 1,014 Inter-segment revenue — 368 (368) — — 411 (411) — Revenue 3,974 1,330 (368) 4,936 4,131 1,376 (411) 5,096 Nine months ended September 30, Health care services revenue 11,469 — — 11,469 11,471 — — 11,471 Health care products revenue 133 2,864 — 2,997 129 2,801 — 2,930 Inter-segment revenue — 1,101 (1,101) — — 1,160 (1,160) — Revenue 11,602 3,965 (1,101) 14,466 11,600 3,961 (1,160) 14,401 Revenue development by segment 1 Same market treatment growth = organic growth less price effects 2023 Reconciliation of health care services and health care products revenue to new segments 2022 Revenue development page 6 of 9 November 1, 2023 |
|
unaudited Clinics Growth in % yoy Net change in clinics 1 Patients Growth in % yoy Treatments Growth in % yoy Total 4,014 -3% (102) 341,793 -1% 38,807,179 -1% Thereof: U.S. 2,617 -3% (54) 205,887 0% 23,380,747 0% Thereof: International 1,397 -5% (48) 135,906 -2% 15,426,432 -1% yoy = year-on-year Key metrics Care Delivery segment Nine months ended September 30, 2023 1 Net change in clinics (acquired, de novo, combined, closed and sold) in comparison to December 31, 2022. Key metrics page 7 of 9 November 1, 2023 |
|
in € million, except share data, unaudited Results 2023 FME25 Program Legal Form Conversion Costs Legacy Portfolio Optimiza-tion1 Humacyte Investment Remeasure-ment Sum of special items Results 2023 excl. special items Results 2022 FME25 Program Net Gain Related to InterWell Health2 Humacyte Investment Remeasure-ment Ukraine War3 Hyper-inflation in Turkiye Provider Relief Funding (PRF) Sum of special items and PRF Results 2022 excl. special items and PRF Change Change at cc Three months ended September 30, Total revenue 4,936 — 4,936 5,096 — 5,096 -3.1% 6.6% EBITDA 778 38 6 0 (1) 43 821 974 52 (113) 1 0 0 (93) (153) 821 0.1% 6.5% Total operating income 324 49 6 53 (1) 107 431 472 53 (56) 1 0 0 (93) (95) 377 14.2% 19.7% Care Delivery segment 332 25 — 53 — 78 410 500 20 (56) — 1 (1) (93) (129) 371 10.8% 16.6% Care Enablement segment (1) 23 — 0 — 23 22 (26) 33 — — (1) 1 — 33 7 197.0% 217.3% Inter-segment eliminations 1 — — — — — 1 5 — — — — — — — 5 -74.1% -77.7% Corporate (8) 1 6 — (1) 6 (2) (7) — — 1 — — — 1 (6) -46.6% -6.7% Interest expense, net 89 — 89 76 — 76 16.0% 19.4% Income tax expense 88 18 2 4 0 24 112 112 15 (18) 0 0 — (25) (28) 84 32.0% 38.0% Net income attributable to noncontrolling interests 63 — — (1) — (1) 62 54 — — — — — (5) (5) 49 30.7% 39.7% Net income4 84 31 4 50 (1) 84 168 230 38 (38) 1 0 0 (63) (62) 168 -0.2% 4.8% Basic earnings per share €0.29 €0.10 €0.01 €0.17 €0.00 €0.28 €0.57 €0.78 €0.13 €(0.13) €0.01 €0.00 €0.00 €(0.22) €(0.21) €0.57 -0.2% 4.8% Nine months ended September 30, Total revenue 14,466 — 14,466 14,401 — 14,401 0.4% 4.9% EBITDA 2,268 74 13 71 (16) 142 2,410 2,504 101 (113) 79 23 6 (270) (174) 2,330 3.4% 5.5% Total operating income 942 100 13 147 (16) 244 1,186 1,160 109 (56) 79 24 6 (270) (108) 1,052 12.8% 14.1% Care Delivery segment 1,001 50 — 64 — 114 1,115 1,230 55 (56) — 11 (1) (270) (261) 969 15.1% 16.7% Care Enablement segment (24) 51 — 83 — 134 110 33 54 — — 13 7 — 74 107 2.9% 3.2% Inter-segment eliminations (12) — — — — — (12) (2) — — — — — — — (2) 630.0% 634.9% Corporate (23) (1) 13 — (16) (4) (27) (101) — — 79 — — — 79 (22) 23.2% 30.9% Interest expense, net 252 — 252 217 — 217 16.0% 16.2% Income tax expense 214 29 4 29 (4) 58 272 242 31 (18) 21 3 — (72) (35) 207 31.5% 33.3% Net income attributable to noncontrolling interests 165 — — 0 — 0 165 166 — — — — — (19) (19) 147 12.5% 14.6% Net income4 311 71 9 118 (12) 186 497 535 78 (38) 58 21 6 (179) (54) 481 3.3% 4.7% Basic earnings per share €1.06 €0.24 €0.03 €0.40 €(0.04) €0.63 €1.69 €1.82 €0.27 €(0.13) €0.20 €0.07 €0.02 €(0.61) €(0.18) €1.64 3.2% 4.6% 4 Attributable to shareholders of FMC AG & Co. KGaA. 3 Bad debt expense in Russia and Ukraine and accruals for certain risks associated with allowances on inventories related to the Ukraine War. 2 Remeasurement gain of the investment, prior to the transaction, in InterWell Health LLC, the impairment of certain long-lived assets belonging to Acumen Physician Solutions, LLC which was transferred to InterWell Health as part of the transaction and certain transaction-related costs. 1 Costs mainly comprise the derecognition of capitalized development costs and the impairment of intangible assets (licenses and distribution rights) as well as termination costs (including certain contractual obligation expenses) related to a dialysis cycler development program which was discontinued in the first quarter of 2023 and other expenses related to divestitures agreed upon in the second and third quarters of 2023. Special items Reconciliation of non-IFRS financial measures to the most directly comparable IFRS Accounting Standards financial measures for comparability with the Company´s outlook Special items Results excl. special items and PRF Reconciliation results excl. special items page 8 of 9 November 1, 2023 |
|
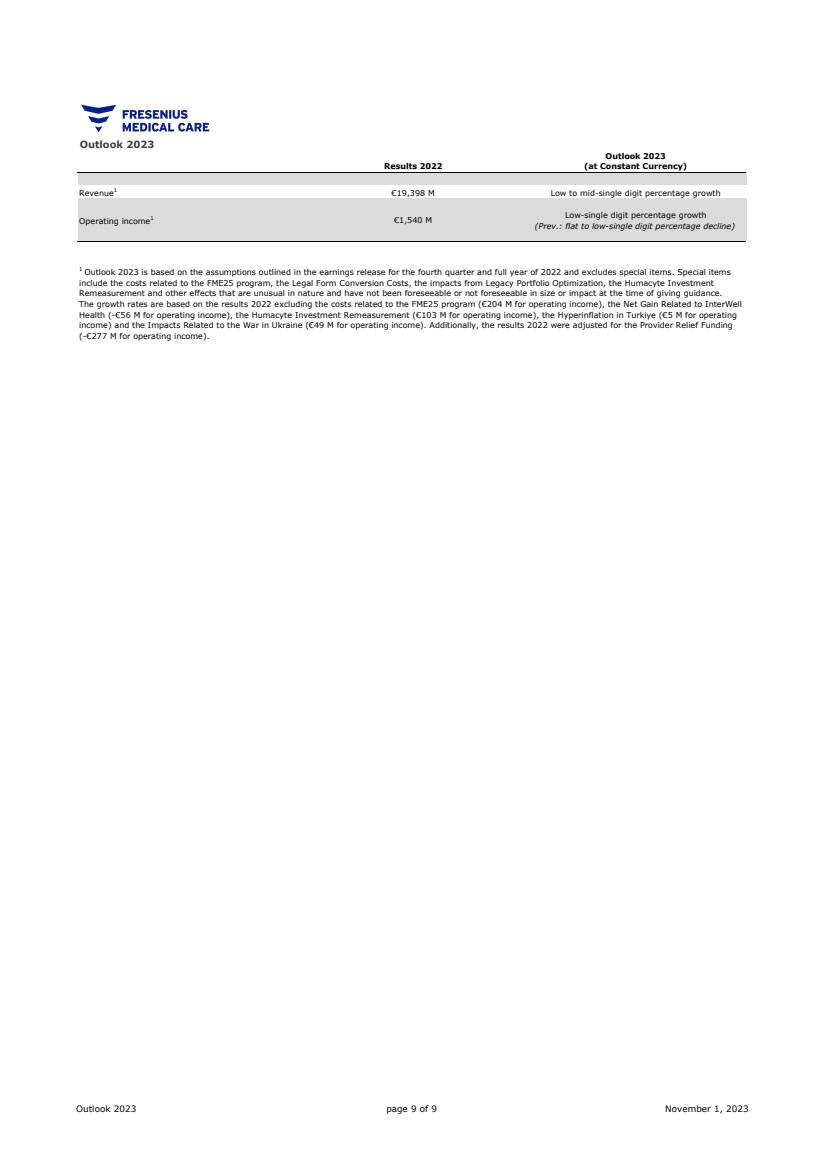
Outlook 2023 Spalte1 Results 2022 Outlook 2023 (at Constant Currency) Revenue1 €19,398 M Low to mid-single digit percentage growth Operating income1 €1,540 M Low-single digit percentage growth (Prev.: flat to low-single digit percentage decline) 1 Outlook 2023 is based on the assumptions outlined in the earnings release for the fourth quarter and full year of 2022 and excludes special items. Special items include the costs related to the FME25 program, the Legal Form Conversion Costs, the impacts from Legacy Portfolio Optimization, the Humacyte Investment Remeasurement and other effects that are unusual in nature and have not been foreseeable or not foreseeable in size or impact at the time of giving guidance. The growth rates are based on the results 2022 excluding the costs related to the FME25 program (€204 M for operating income), the Net Gain Related to InterWell Health (-€56 M for operating income), the Humacyte Investment Remeasurement (€103 M for operating income), the Hyperinflation in Turkiye (€5 M for operating income) and the Impacts Related to the War in Ukraine (€49 M for operating income). Additionally, the results 2022 were adjusted for the Provider Relief Funding (-€277 M for operating income). Outlook 2023 page 9 of 9 November 1, 2023 |