UNITED STATES
SECURITIES AND EXCHANGE COMMISSION
Washington, D.C. 20549
FORM 8-K
CURRENT REPORT
Pursuant to Section 13 or Section 15(d) of the Securities Exchange Act of 1934
Date of Report (Date of Earliest Event Reported): October 17, 2023
DARIOHEALTH CORP.
(Exact name of registrant as specified in its charter)
| Delaware | 001-37704 | 45-2973162 | ||
| (State or other jurisdiction of incorporation) |
(Commission File Number) |
(IRS Employer Identification No.) |
18 W. 18th St, 5th Floor
New York, New York 10011
(Address of Principal Executive Offices)
972- 4-770-4055
(Issuer’s telephone number)
(Former name or former address, if changed since last report)
Check the appropriate box below if the Form 8-K filing is intended to simultaneously satisfy the filing obligation to the registrant under any of the following provisions:
| ¨ | Written communications pursuant to Rule 425 under the Securities Act (17 CFR 230.425) |
| ¨ | Soliciting material pursuant to Rule 14a-12 under the Exchange Act (17 CFR 240.14a-12) |
| ¨ | Pre-commencement communications pursuant to Rule 14d-2(b) under the Exchange Act (17 CFR 240.14d-2(b)) |
| ¨ | Pre-commencement communications pursuant to Rule 13e-4(c) under the Exchange Act (17 CFR 240.13e-4(c)) |
Securities registered pursuant to Section 12(b) of the Act:
| Title of each class | Trading Symbol(s) |
Name of exchange on which registered |
||
| Common Stock, par value $0.0001 per share | DRIO | The Nasdaq Capital Market LLC |
Indicate by check mark whether the registrant is an emerging growth company as defined in as defined in Rule 405 of the Securities Act of 1933 (§230.405 of this chapter) or Rule 12b-2 of the Securities Exchange Act of 1934 (§240.12b-2 of this chapter).
Emerging growth company ¨
If an emerging growth company, indicate by check mark if the registrant has elected not to use the extended transition period for complying with any new or revised financial accounting standards provided pursuant to Section 13(a) of the Exchange Act. ¨
Item 7.01 Regulation FD Disclosure.
On October 17, 2023, DarioHealth Corp. presented the attached investor presentation at its Investor Day, a copy of which is attached hereto as Exhibit 99.1.
Item 9.01 Financial Statements and Exhibits.
(d) Exhibits
| 99.1 | Investor presentation dated October 17, 2023 |
| 104 | Cover Page Interactive Data File (embedded within the Inline XBRL document). |
SIGNATURES
Pursuant to the requirements of the Securities Exchange Act of 1934, the Registrant has duly caused this report to be signed on its behalf by the undersigned hereunto duly authorized.
| Dated: October 17, 2023 | DARIOHEALTH CORP. | ||
| By: | /s/ Zvi Ben David | ||
| Name: | Zvi Ben David | ||
| Title: | Chief Financial Officer, Treasurer and Secretary | ||
|
Investors Day DarioHealth Corp. Nasdaq | DRIO | October 17th, 2023 |
|
01 This presentation of DarioHealth Corp. (“Dario”, the “Company”, “we” and “our”) and statements of our management or agents related thereto contain or may contain forward-looking statements within the meaning of the Private Securities Litigation Reform Act of 1995 (the “Act”). Statements which are not historical reflect our current expectations and projections about our future results, performance, liquidity, financial condition, prospects and opportunities and are based upon information currently available to us and our management and their interpretation of what is believed to be significant factors affecting our business, including many assumptions regarding future events. For example, when we discuss our growth potential and return on investment, the potential market opportunity, potential increase in revenue based on multi-condition accounts, the potential benefits to be realized by the strategic agreement with Sanofi U.S. Services Inc. (“Sanofi”) and the expected contract value and potential revenues and product offering, we are using forward-looking statements. Words such as “seek,” “intend,” “believe,” “plan,” “estimate,” “expect,” “anticipate,” “will,” “would,” and other similar expressions all denote forward-looking statements within the meaning of the Act. Readers are cautioned that actual results, performance, liquidity, financial condition and results of operations, prospects and opportunities could differ materially and perhaps substantially from those expressed in, or implied by, these forward-looking statements as a result of various risks, uncertainties and other factors. Factors that could cause or contribute to such differences include, but are not limited to our compliance with regulatory requirements, the impact of current and any future competition, our current and future capital requirements and our ability to satisfy our capital needs through financing transactions or otherwise, our ability to manufacture, market and generate sales of our Dario® diabetes management solution, as well as other factors and risks discussed in the Company’s filings (including the results of the Company’s commercial and regulatory plans for Dario®) with the U.S. Securities and Exchange Commission (the “SEC”). Forward-looking statement We undertake no obligation to publicly update any forward-looking statements, whether as a result of new information, future events or otherwise, except as required by applicable law. In addition, readers are cautioned that any estimates, forecasts or projections contained in this presentation or as may be discussed by our management or agents have been prepared by our management in good faith on a basis believed to be reasonable. However, such estimates, forecasts and projections involve significant elements of subjective judgment and analysis, and no representation can be made as to their attainability. No representation or warranty (express or implied) is made or is to be relied upon as a promise or representation as to our future performance. Readers are cautioned that such estimates, forecasts or projections have not been audited and have not been prepared in conformance with generally accepted accounting principles. This presentation contains market data related to our business and industry, including projections that are based on a number of assumptions. If these assumptions turn out to be incorrect, our actual results may differ materially from the projections based on these assumptions. As a result, the market for our products may not grow at the rates projected by these data, or at all. If the assumptions upon which the projections are based prove to be incorrect, or if the market for our products fails to grow at the rates projected, our results will differ materially from the projections included in this presentation. This presentation shall not constitute an offer to sell or the solicitation of an offer to buy any securities, nor shall there be any sale of any securities in any state or jurisdiction in which such offer, solicitation or sale would be unlawful prior to registration or qualification under the securities laws of any such state or jurisdiction. |
|
About Dario Digital Health Solutions |
|
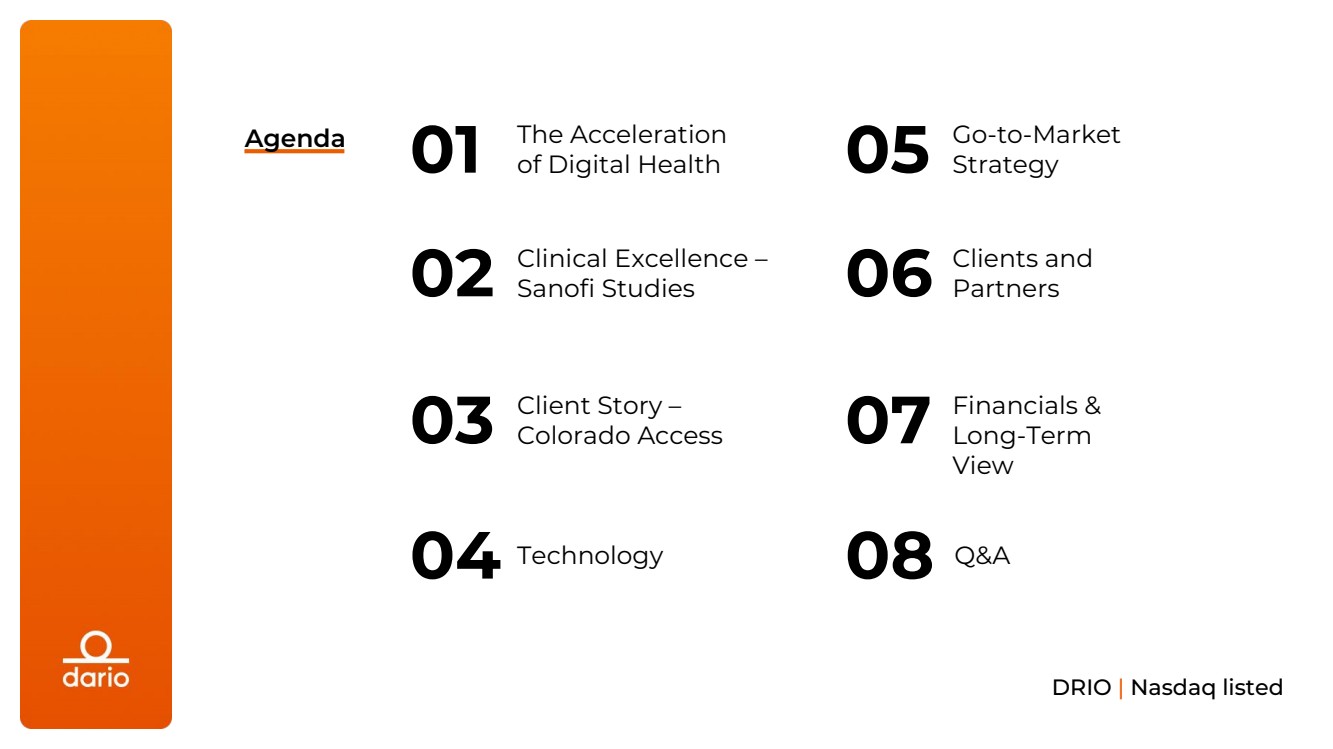
DRIO | Nasdaq listed Agenda 01 The Acceleration of Digital Health 02 Clinical Excellence – Sanofi Studies 03 Client Story – Colorado Access 04 Technology 05 Go-to-Market Strategy 06 Clients and Partners 07 Financials & Long-Term View 08 Q&A |
|
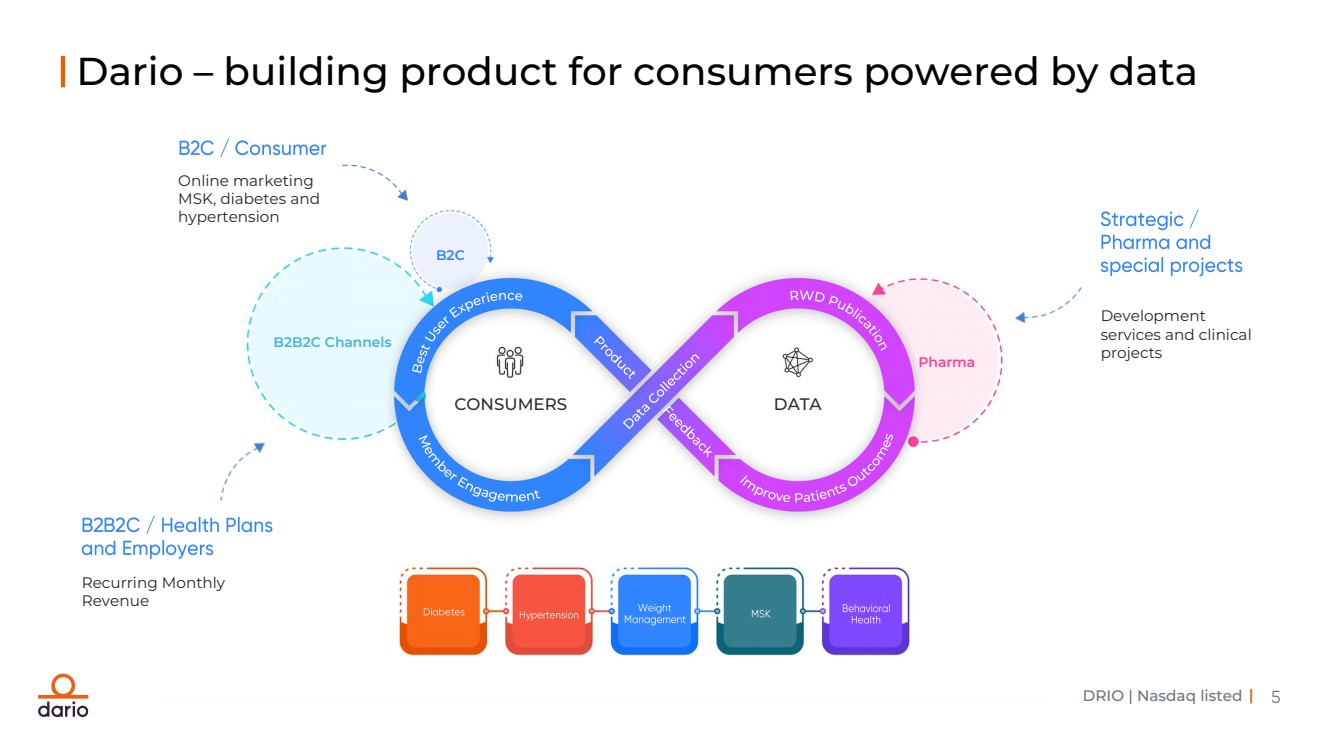
DRIO | Nasdaq listed | Best User Experience Member Engagement RWD Publication Improve Patients Outcomes CONSUMERS DATA Pharma B2C B2B2C Channels Dario – building product for consumers powered by data Online marketing MSK, diabetes and hypertension Recurring Monthly Revenue Development services and clinical projects |
|
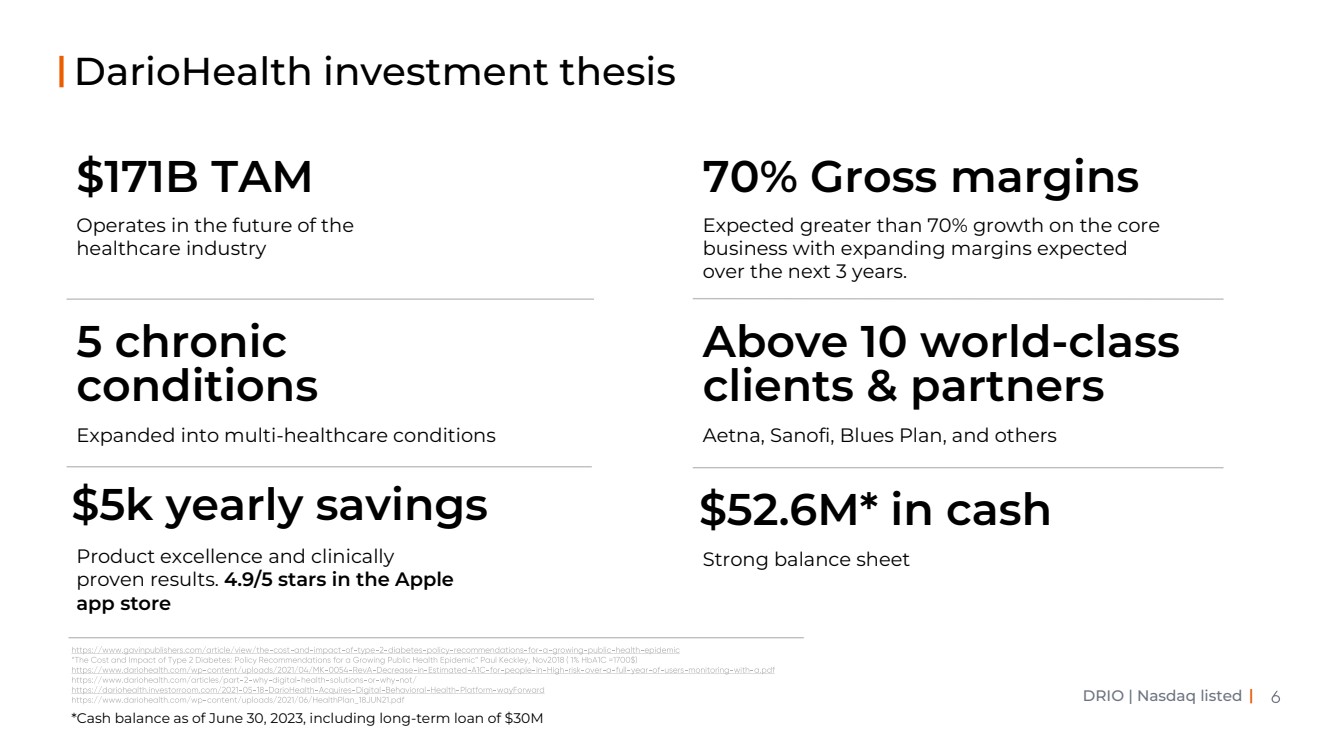
DRIO | Nasdaq listed | DarioHealth investment thesis Above 10 world-class clients & partners Aetna, Sanofi, Blues Plan, and others Expected greater than 70% growth on the core business with expanding margins expected over the next 3 years. 70% Gross margins Strong balance sheet $52.6M* in cash Operates in the future of the healthcare industry Expanded into multi-healthcare conditions 5 chronic conditions Product excellence and clinically proven results. 4.9/5 stars in the Apple app store $5k yearly savings $171B TAM *Cash balance as of June 30, 2023, including long-term loan of $30M |
|
The Acceleration of Digital Health Arnaud Robert, Strategic Advisor |
|
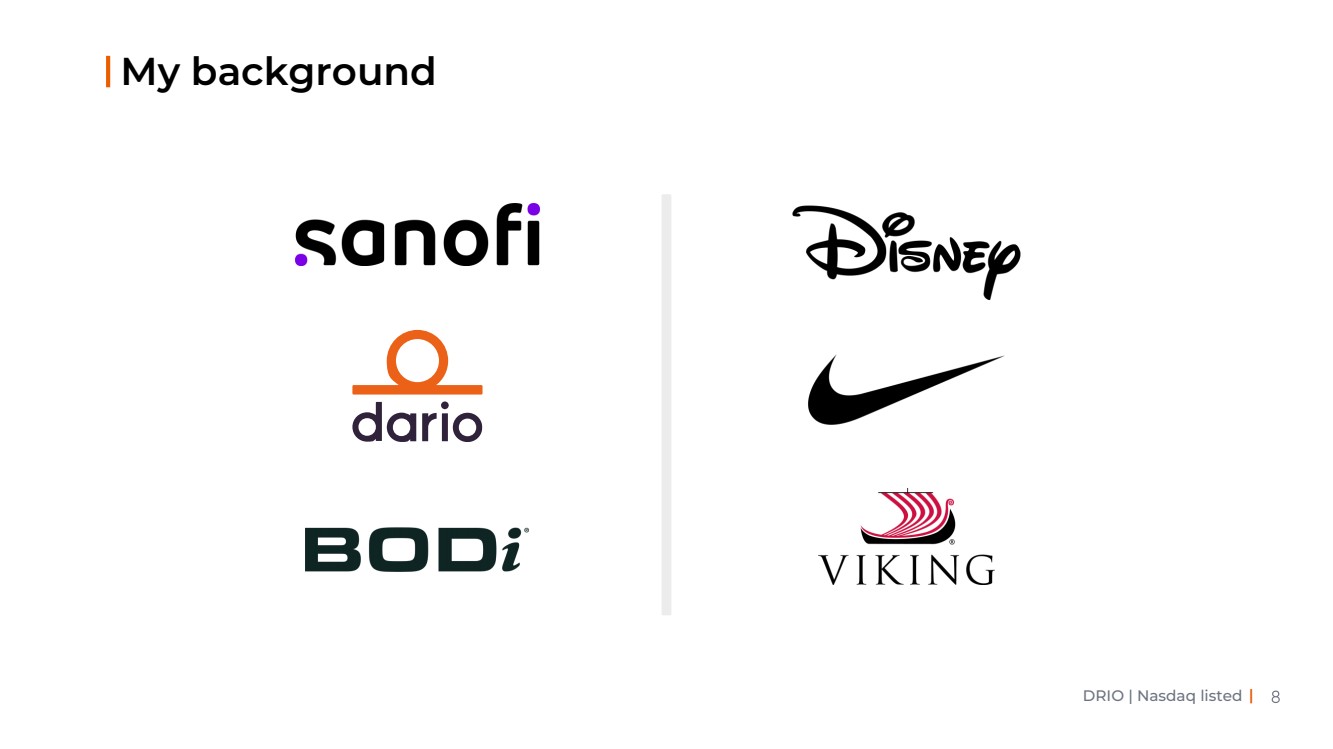
DRIO | Nasdaq listed | My background |
|
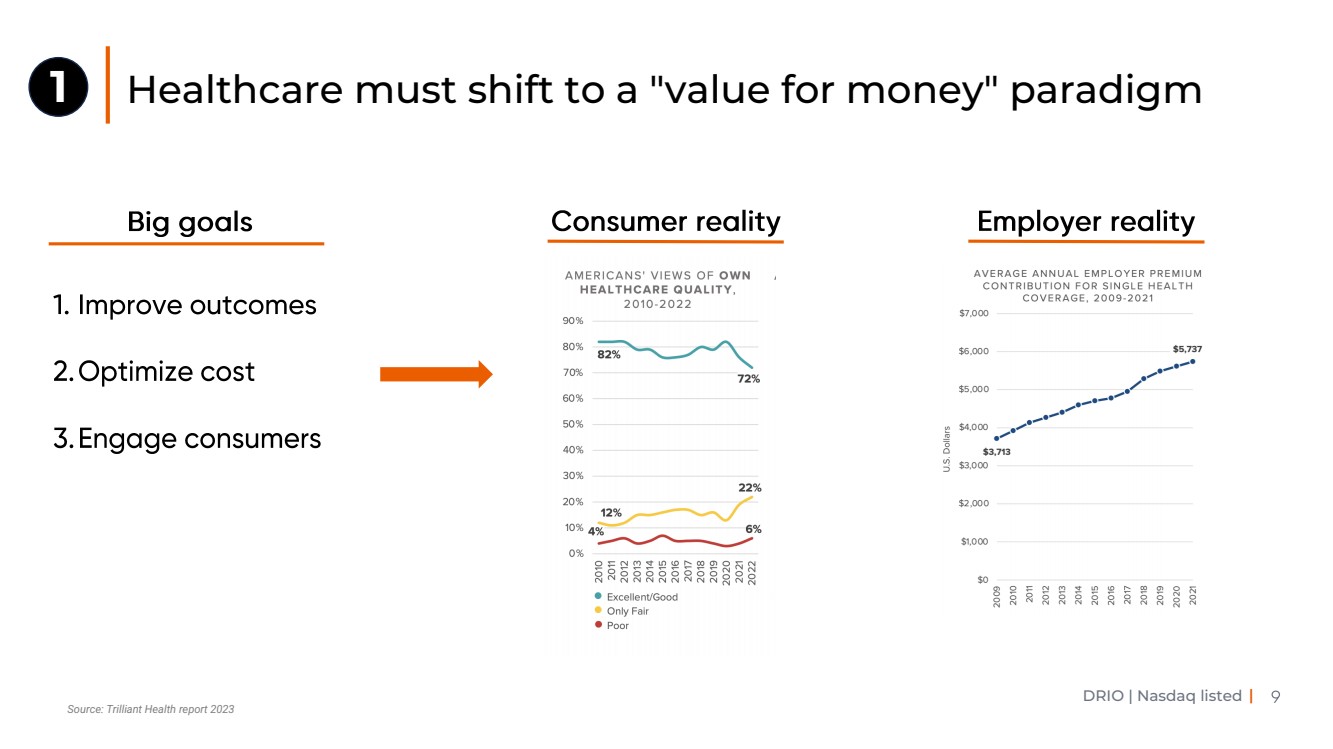
DRIO | Nasdaq listed | 1 Healthcare must shift to a "value for money" paradigm Source: Trilliant Health report 2023 |
|
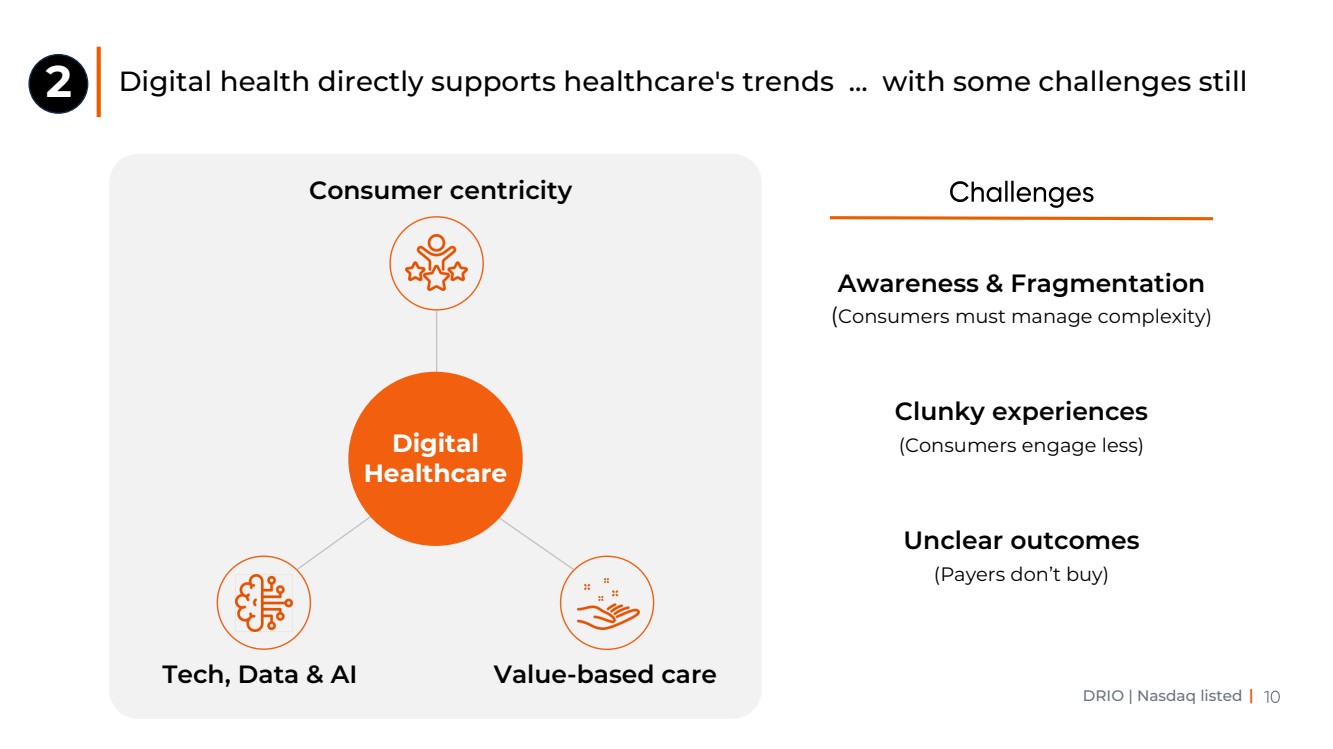
DRIO | Nasdaq listed | Consumer centricity Tech, Data & AI Value-based care 2 Digital health directly supports healthcare's trends ... with some challenges still Awareness & Fragmentation (Consumers must manage complexity) (Consumers engage less) Clunky experiences (Payers don’t buy) Unclear outcomes Digital Healthcare |
|
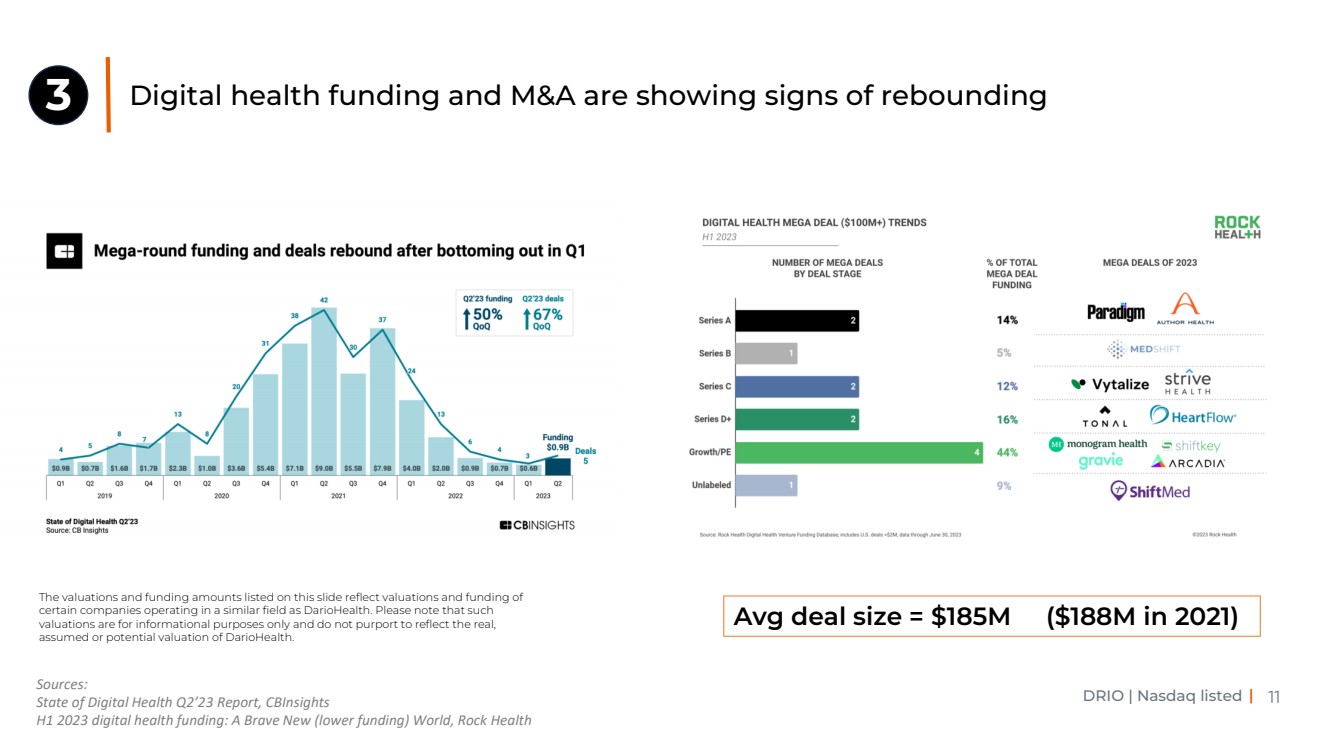
DRIO | Nasdaq listed | Sources: State of Digital Health Q2’23 Report, CBInsights H1 2023 digital health funding: A Brave New (lower funding) World, Rock Health Avg deal size = $185M ($188M in 2021) 3 Digital health funding and M&A are showing signs of rebounding The valuations and funding amounts listed on this slide reflect valuations and funding of certain companies operating in a similar field as DarioHealth. Please note that such valuations are for informational purposes only and do not purport to reflect the real, assumed or potential valuation of DarioHealth. |
|
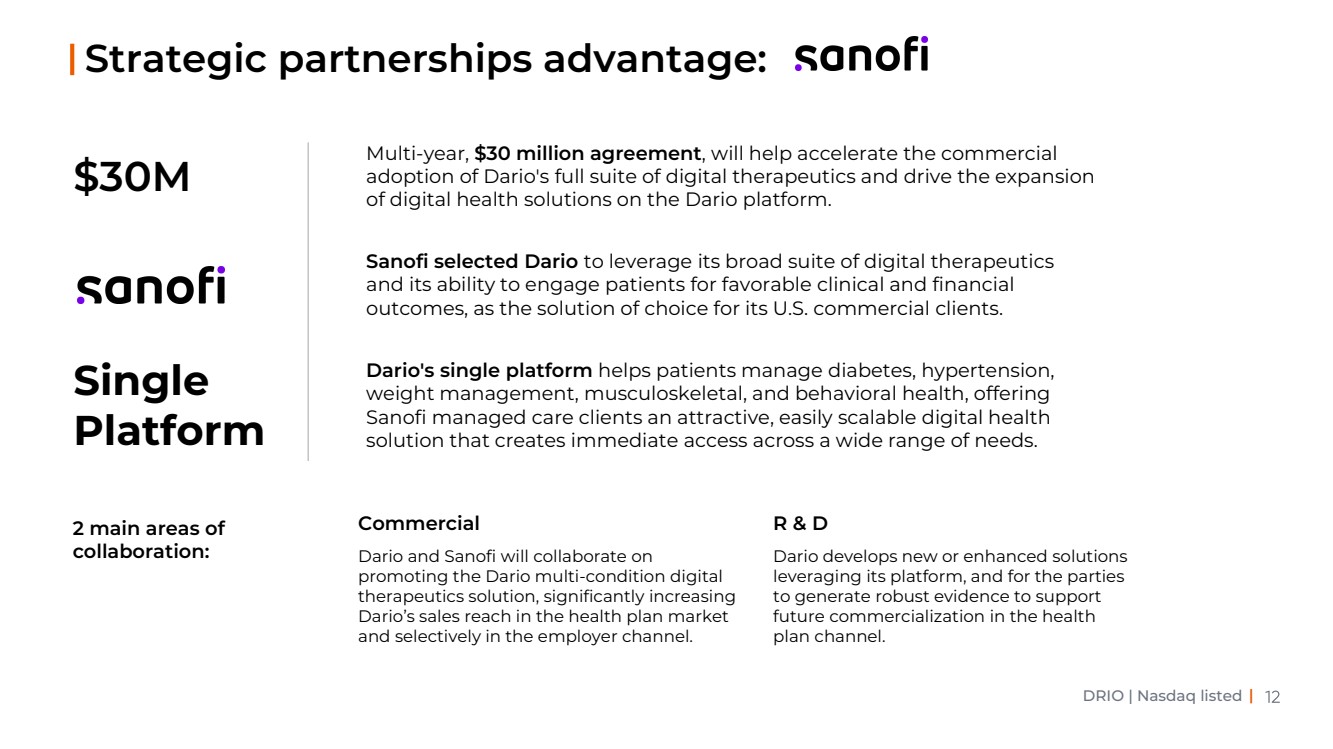
DRIO | Nasdaq listed | Strategic partnerships advantage: $30M Multi-year, $30 million agreement, will help accelerate the commercial adoption of Dario's full suite of digital therapeutics and drive the expansion of digital health solutions on the Dario platform. Sanofi selected Dario to leverage its broad suite of digital therapeutics and its ability to engage patients for favorable clinical and financial outcomes, as the solution of choice for its U.S. commercial clients. Dario's single platform helps patients manage diabetes, hypertension, weight management, musculoskeletal, and behavioral health, offering Sanofi managed care clients an attractive, easily scalable digital health solution that creates immediate access across a wide range of needs. Single Platform 2 main areas of collaboration: Dario and Sanofi will collaborate on promoting the Dario multi-condition digital therapeutics solution, significantly increasing Dario’s sales reach in the health plan market and selectively in the employer channel. Commercial Dario develops new or enhanced solutions leveraging its platform, and for the parties to generate robust evidence to support future commercialization in the health plan channel. R & D |
|
Clinical Excellence – Sanofi Studies Felix Lee, U.S. Digital Healthcare Medical Head, Sanofi U.S |
|
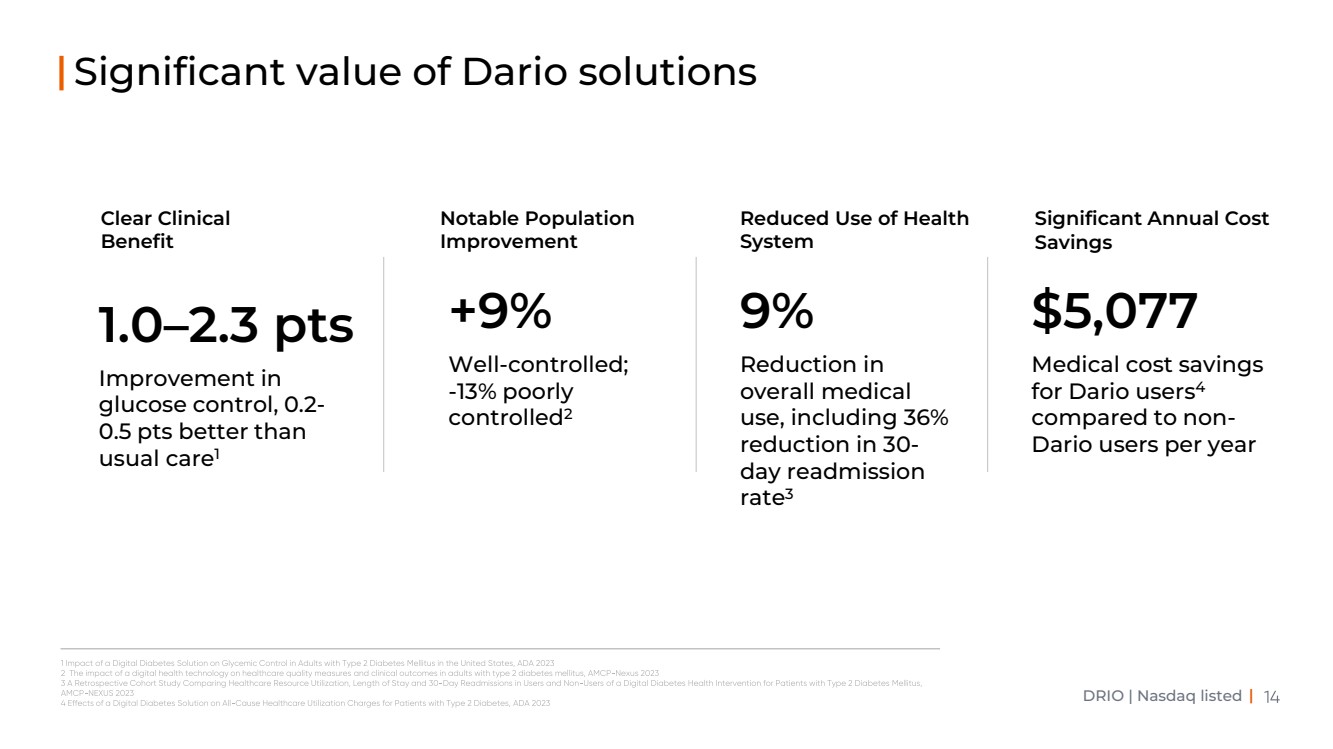
DRIO | Nasdaq listed | Well-controlled; -13% poorly controlled2 +9% Reduction in overall medical use, including 36% reduction in 30- day readmission rate3 9% Medical cost savings for Dario users4 compared to non-Dario users per year $5,077 Significant value of Dario solutions Improvement in glucose control, 0.2- 0.5 pts better than usual care1 1.0–2.3 pts Clear Clinical Benefit Notable Population Improvement Reduced Use of Health System Significant Annual Cost Savings |
|
Client Success Story Colorado Access |
|
DRIO | Nasdaq listed | Client Testimonial: Colorado Access |
|
Product Innovation Eitan Shay, Chief Product Officer |
|
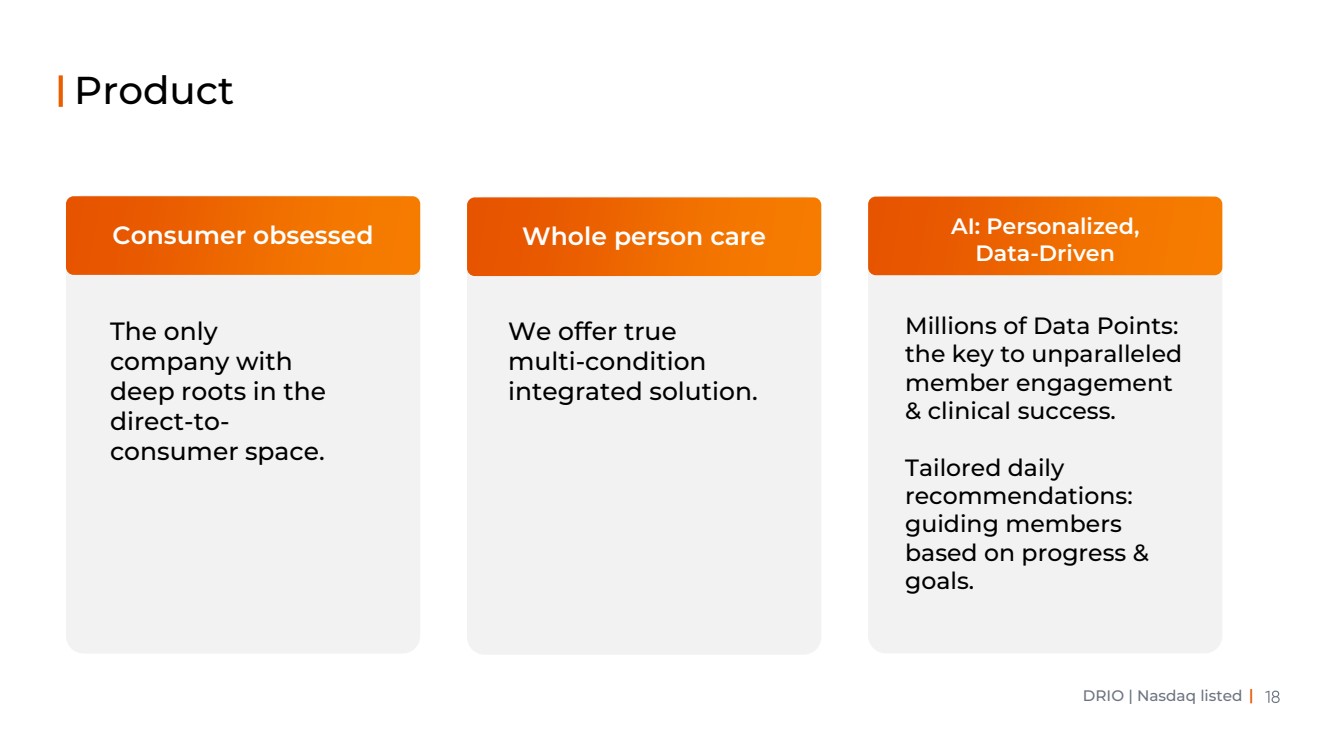
DRIO | Nasdaq listed | Product Whole person care We offer true multi-condition integrated solution. Consumer obsessed The only company with deep roots in the direct-to-consumer space. AI: Personalized, Data-Driven Millions of Data Points: the key to unparalleled member engagement & clinical success. Tailored daily recommendations: guiding members based on progress & goals. |
|
DRIO | Nasdaq listed | Dario’s Digital Health Solutions |
|
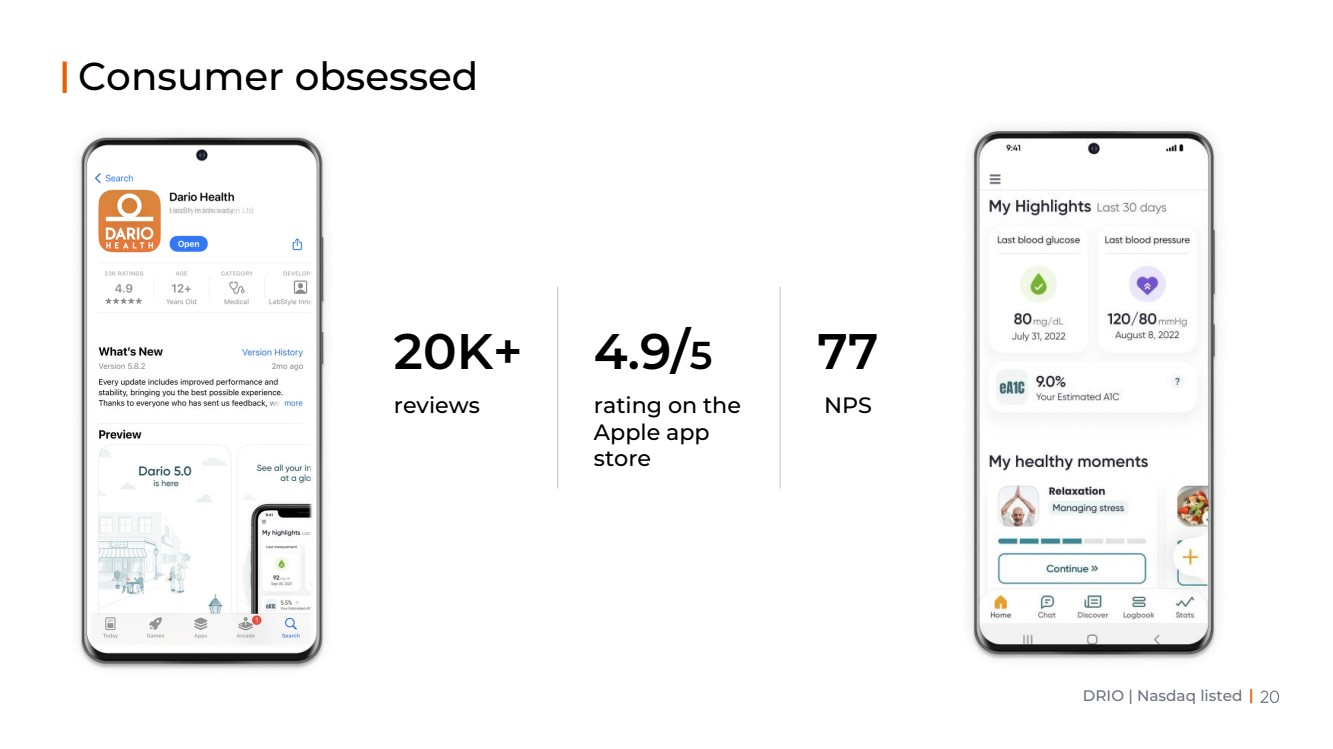
DRIO | Nasdaq listed | Consumer obsessed rating on the Apple app store 4.9/5 reviews 20K+ NPS 77 |
|
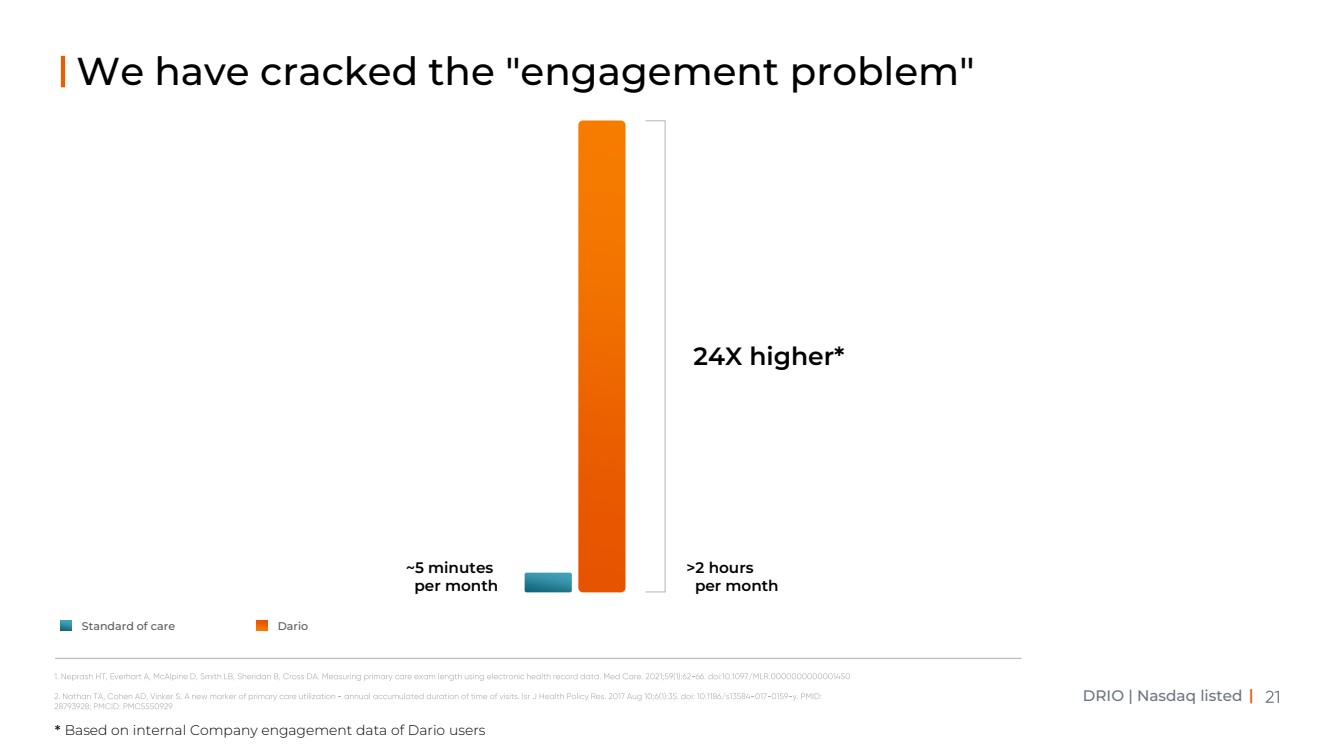
DRIO | Nasdaq listed | We have cracked the "engagement problem" ~5 minutes per month >2 hours per month 24X higher* Standard of care Dario * Based on internal Company engagement data of Dario users |
|
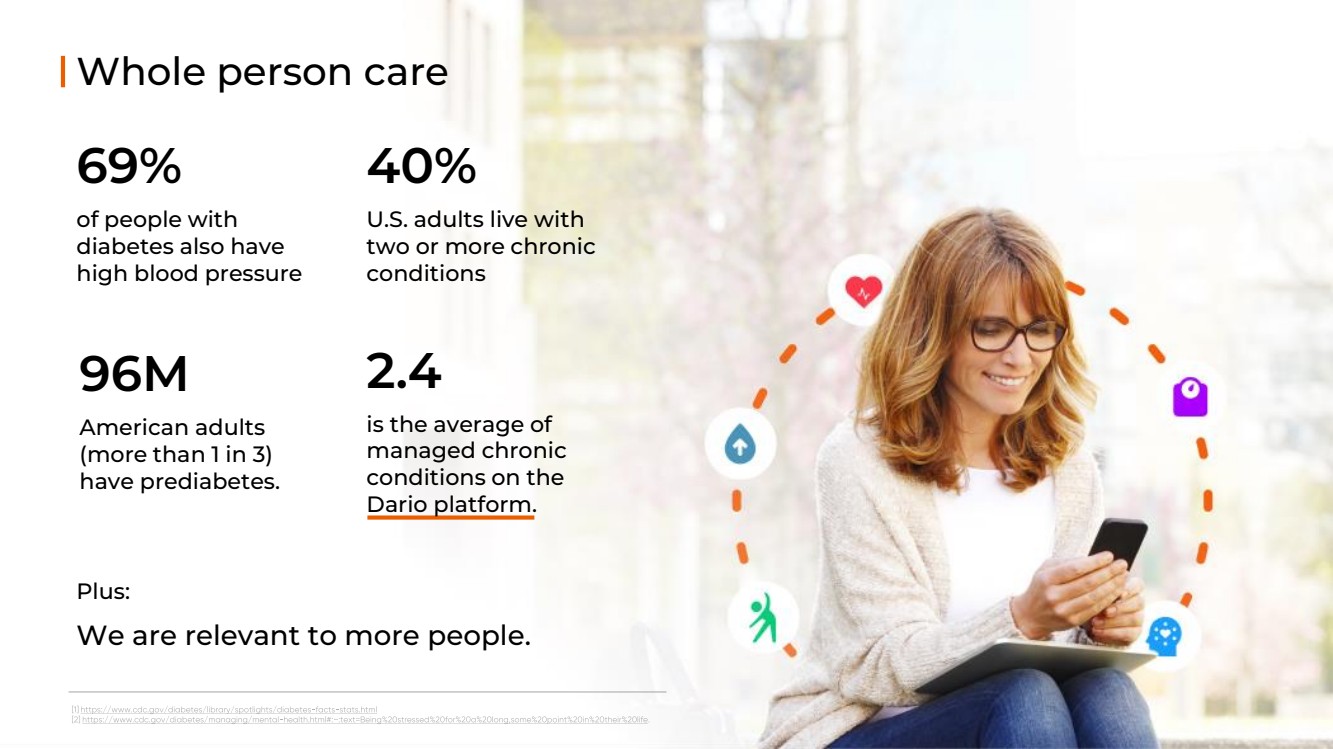
DRIO | Nasdaq listed | Whole person care of people with diabetes also have high blood pressure 69% U.S. adults live with two or more chronic conditions 40% is the average of managed chronic conditions on the Dario platform. 2.4 Plus: We are relevant to more people. American adults (more than 1 in 3) have prediabetes. 96M |
|
DRIO | Nasdaq listed | Whole person care Interdisciplinary team Consistent coaching experience One consolidated experience |
|
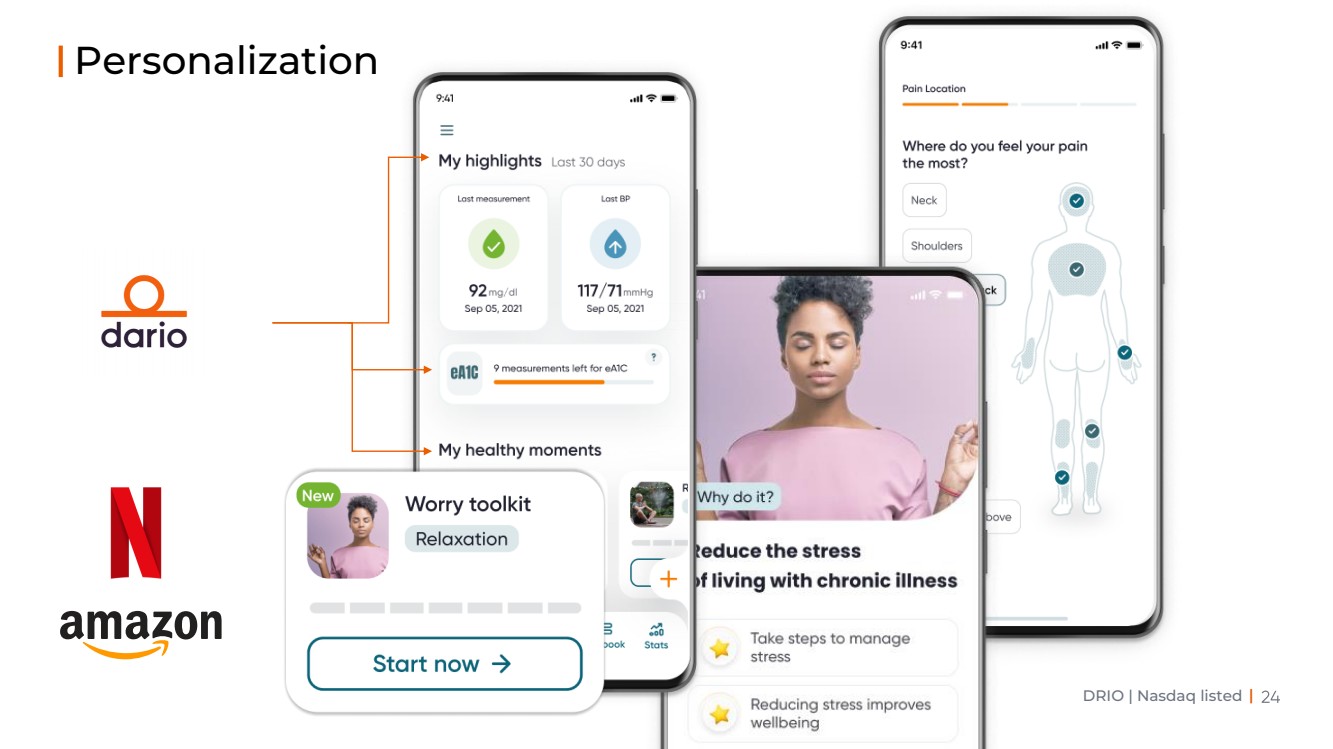
DRIO | Nasdaq listed | Personalization |
|
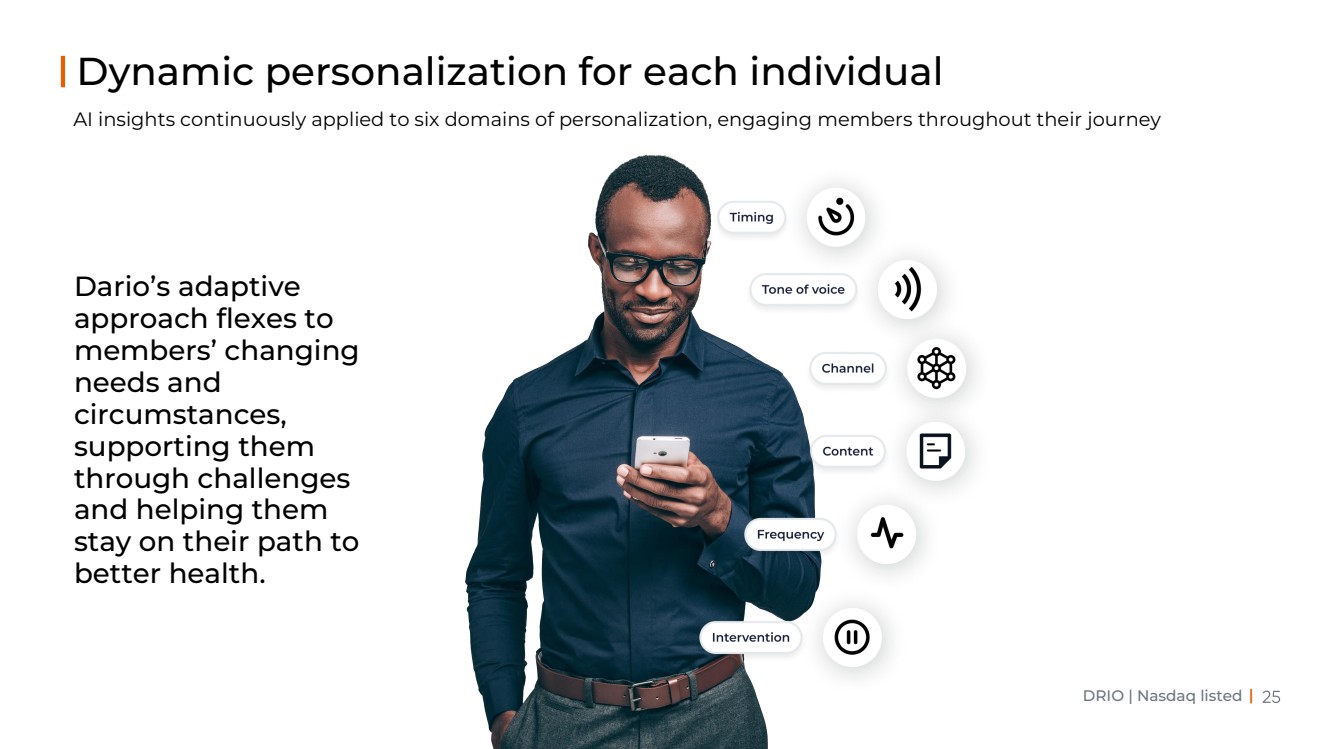
DRIO | Nasdaq listed | Dynamic personalization for each individual AI insights continuously applied to six domains of personalization, engaging members throughout their journey Dario’s adaptive approach flexes to members’ changing needs and circumstances, supporting them through challenges and helping them stay on their path to better health. |
|
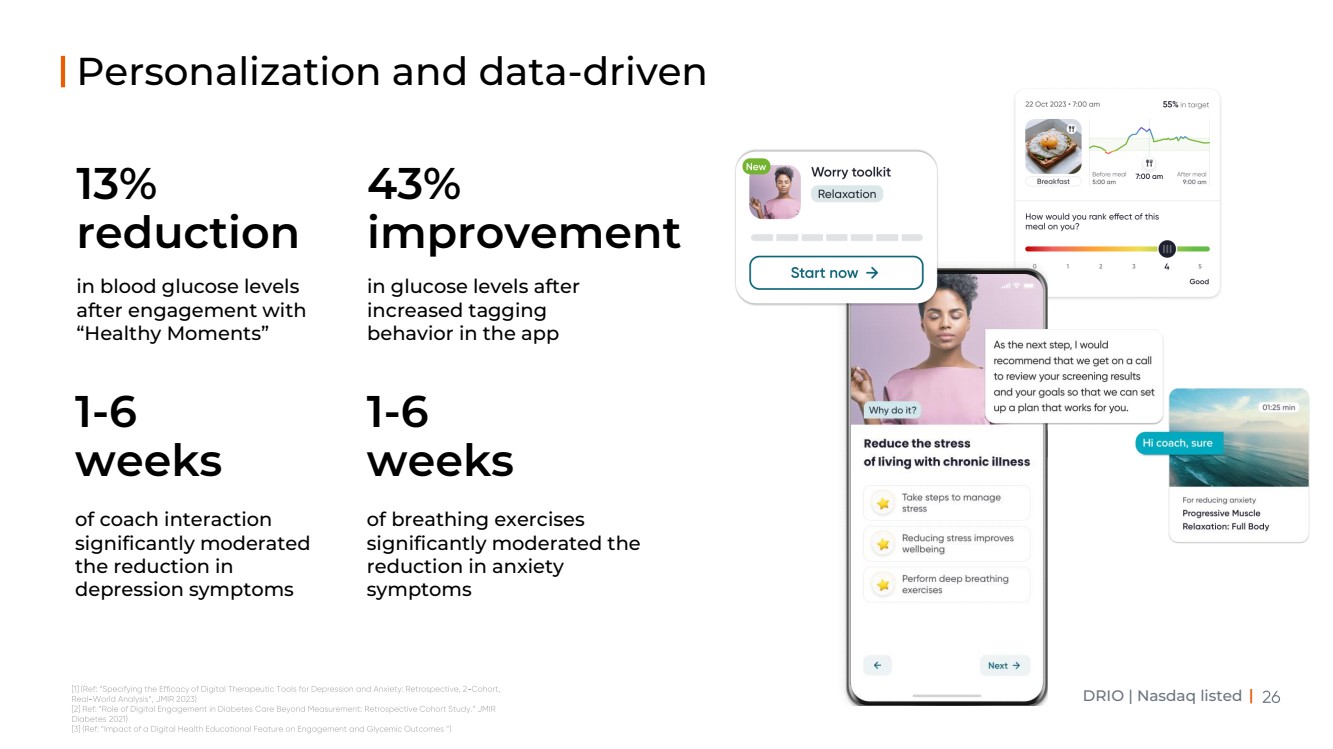
DRIO | Nasdaq listed | Personalization and data-driven in blood glucose levels after engagement with “Healthy Moments” 13% reduction of coach interaction significantly moderated the reduction in depression symptoms 1-6 weeks of breathing exercises significantly moderated the reduction in anxiety symptoms 1-6 weeks in glucose levels after increased tagging behavior in the app 43% improvement |
|
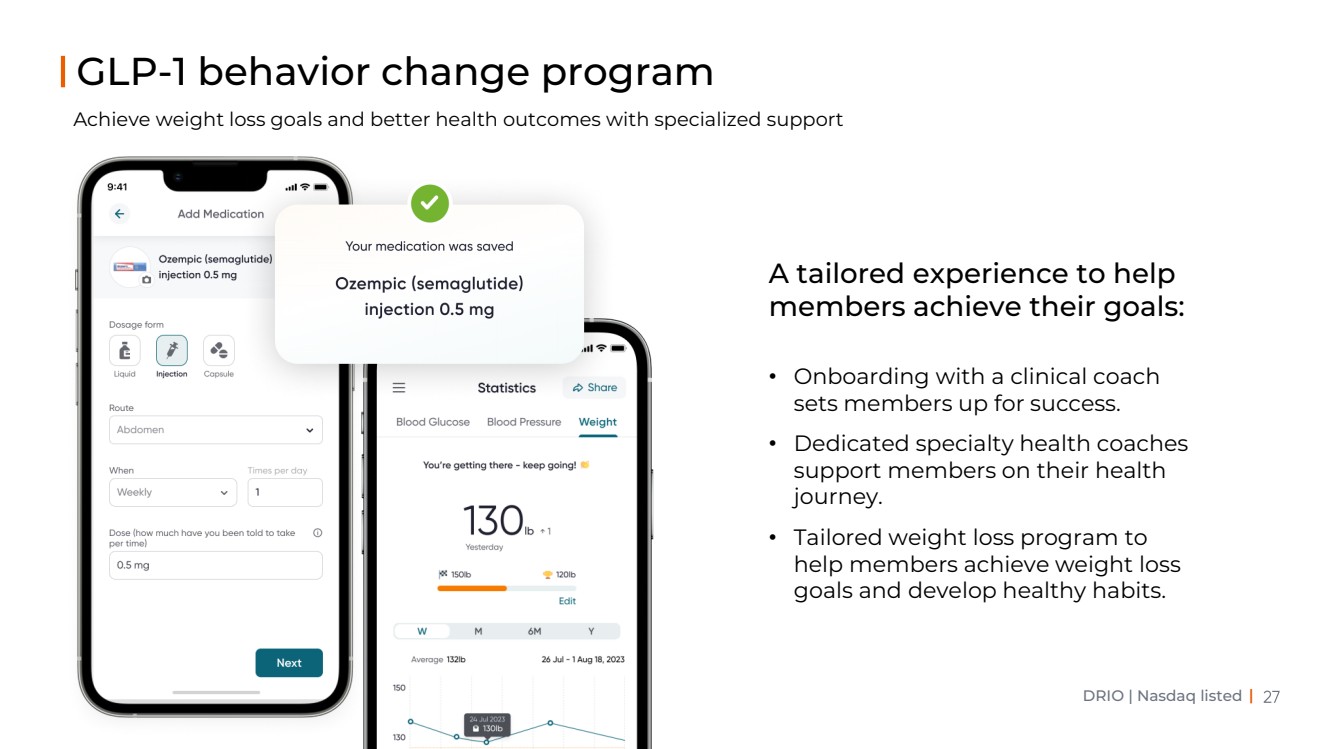
DRIO | Nasdaq listed | • Onboarding with a clinical coach sets members up for success. • Dedicated specialty health coaches support members on their health journey. • Tailored weight loss program to help members achieve weight loss goals and develop healthy habits. GLP-1 behavior change program Achieve weight loss goals and better health outcomes with specialized support A tailored experience to help members achieve their goals: |
|
DRIO | Nasdaq listed | Dario Member Testimonials |
|
Go-to-Market Strategy Rick Anderson, President |
|
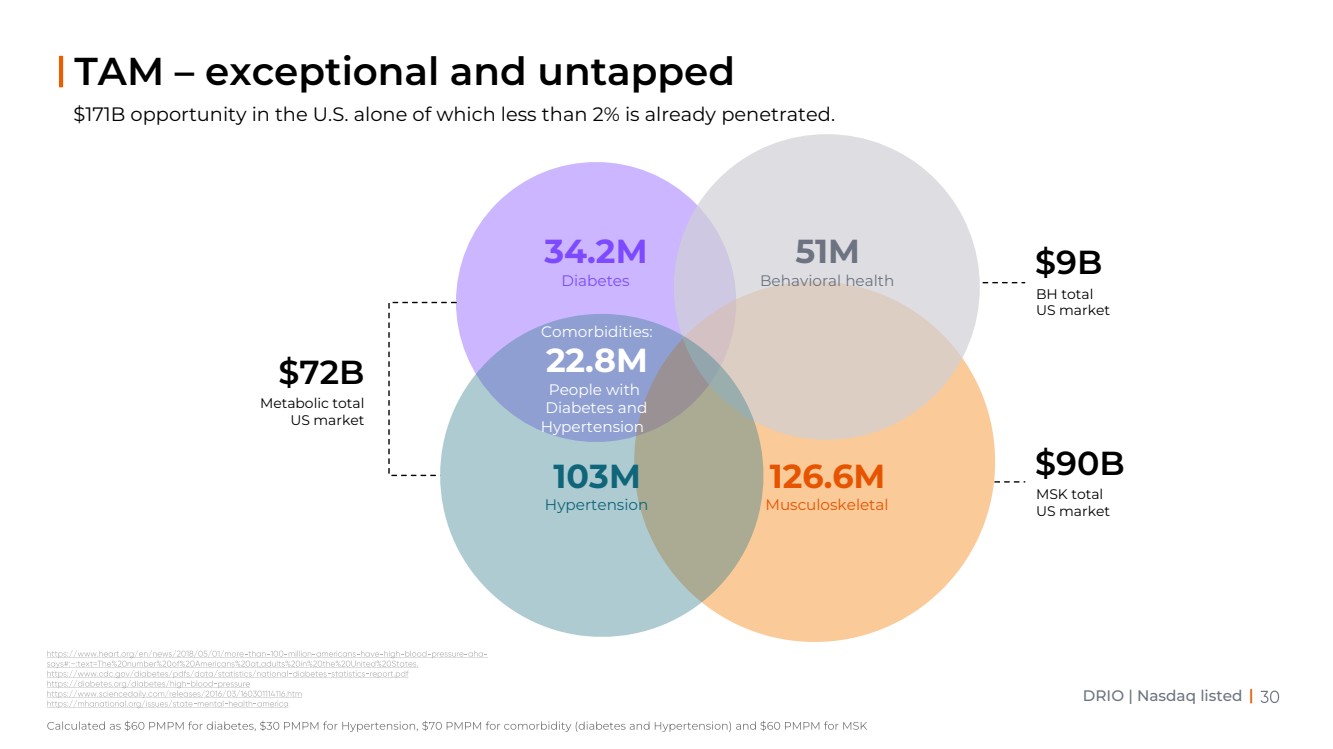
DRIO | Nasdaq listed | $171B opportunity in the U.S. alone of which less than 2% is already penetrated. TAM – exceptional and untapped 22.8M Comorbidities - People with Diabetes and Hypertension 34.2M Diabetes 51M Behavioral health Comorbidities: 22.8M People with Diabetes and Hypertension 126.6M Musculoskeletal 103M Hypertension Metabolic total US market $72B BH total US market $9B MSK total US market $90B |
|
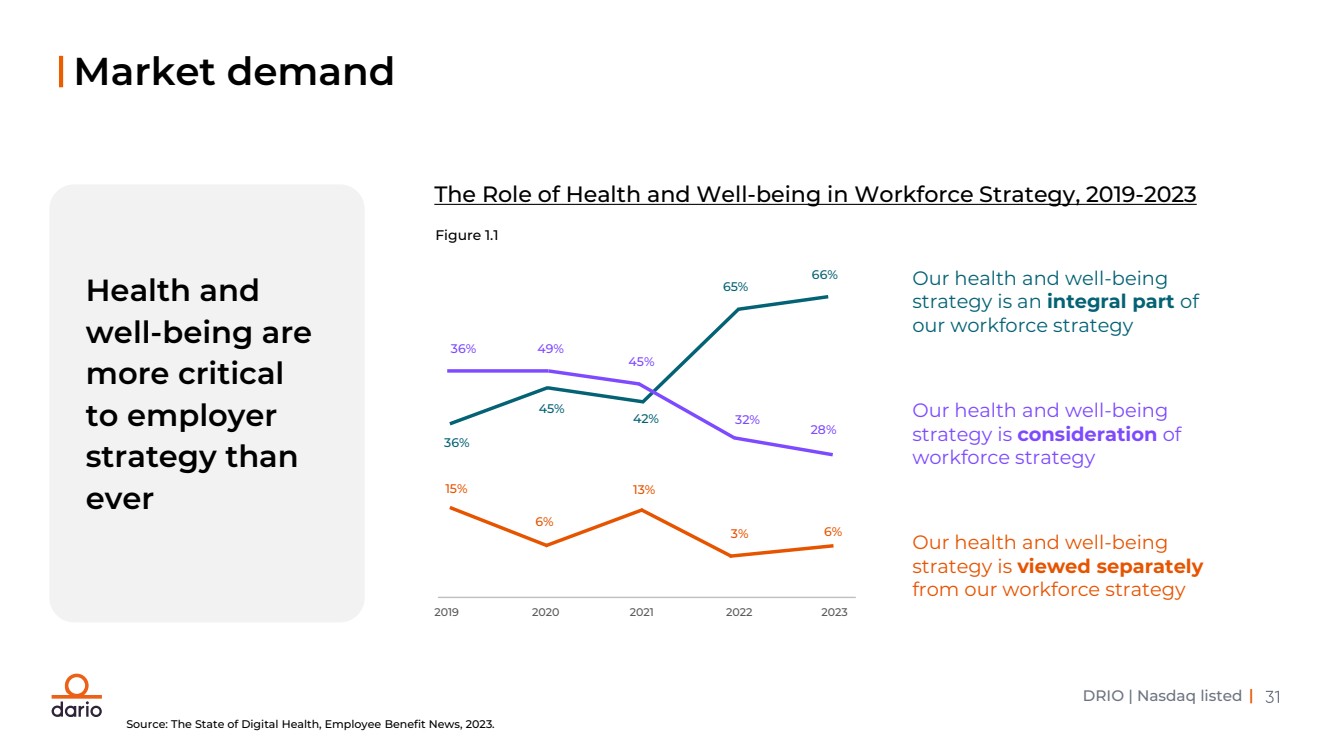
DRIO | Nasdaq listed | Market demand Health and well-being are more critical to employer strategy than ever The Role of Health and Well-being in Workforce Strategy, 2019-2023 2019 2020 2021 2022 2023 3% 6% 13% 6% 15% 36% 45% 42% 65% 66% 36% 49% 45% 32% 28% Our health and well-being strategy is an integral part of our workforce strategy Our health and well-being strategy is consideration of workforce strategy Our health and well-being strategy is viewed separately from our workforce strategy Figure 1.1 Source: The State of Digital Health, Employee Benefit News, 2023. |
|
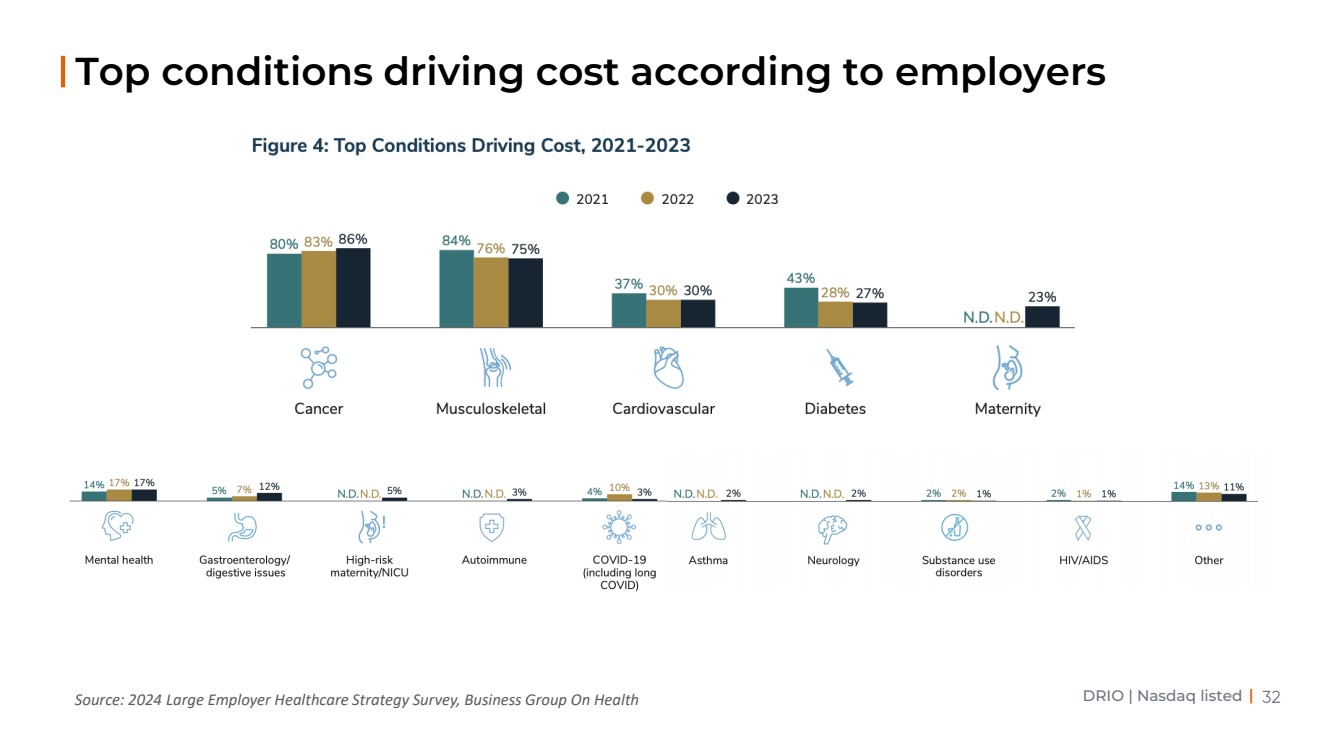
DRIO | Nasdaq listed | Source: 2024 Large Employer Healthcare Strategy Survey, Business Group On Health Top conditions driving cost according to employers |
|
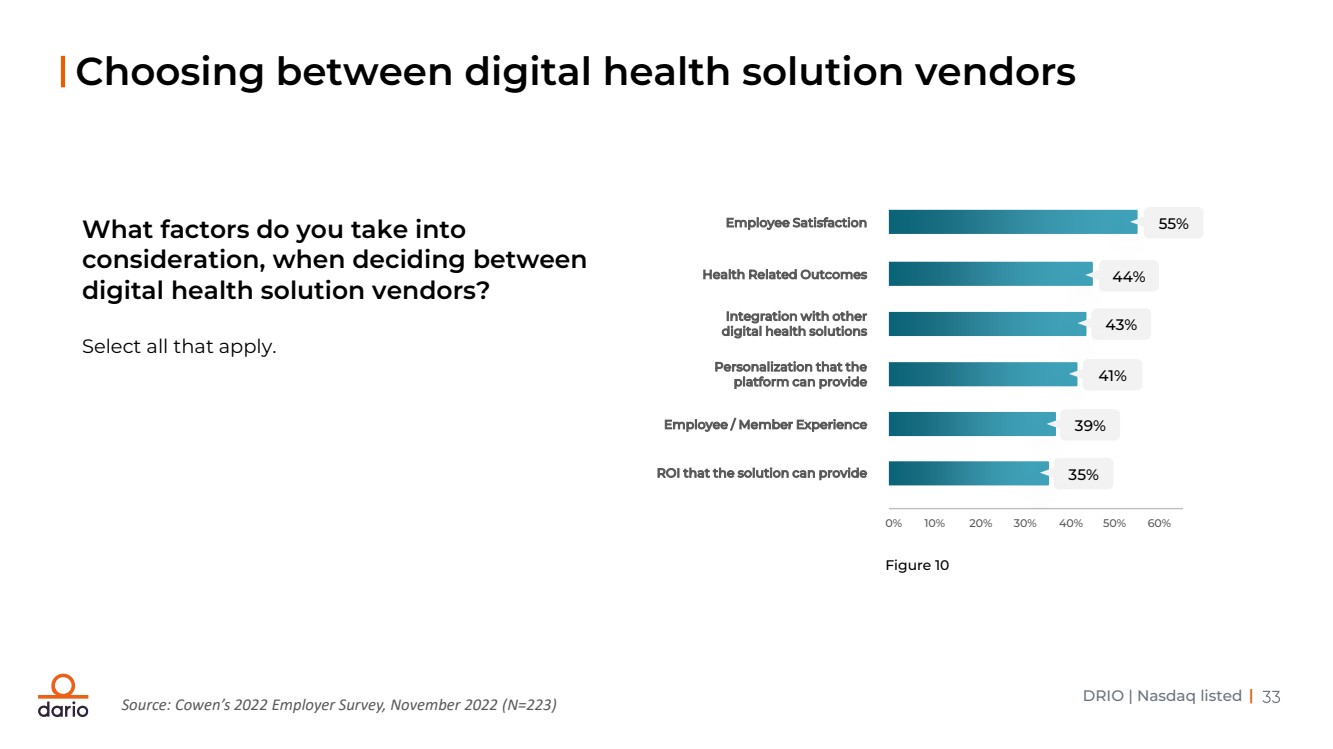
DRIO | Nasdaq listed | Choosing between digital health solution vendors What factors do you take into consideration, when deciding between digital health solution vendors? Select all that apply. 0% 10% 20% 30% 40% 50% 60% Employee Satisfaction Health Related Outcomes Integration with other digital health solutions Personalization that the platform can provide Employee / Member Experience ROI that the solution can provide 55% 44% 43% 41% 39% 35% Source: Cowen’s 2022 Employer Survey, November 2022 (N=223) Figure 10 |
|
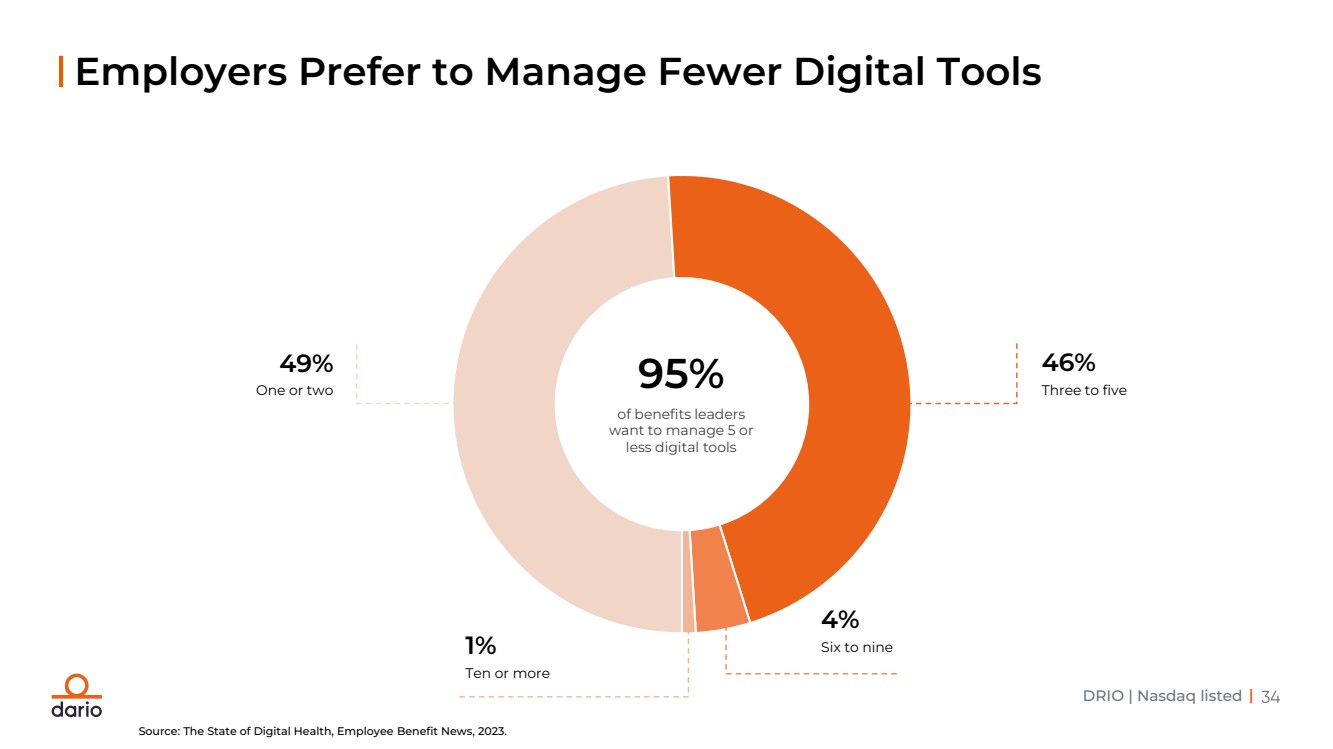
DRIO | Nasdaq listed | Employers Prefer to Manage Fewer Digital Tools of benefits leaders want to manage 5 or less digital tools 95% 46% Three to five 4% 1% Six to nine Ten or more 49% One or two Source: The State of Digital Health, Employee Benefit News, 2023. |
|
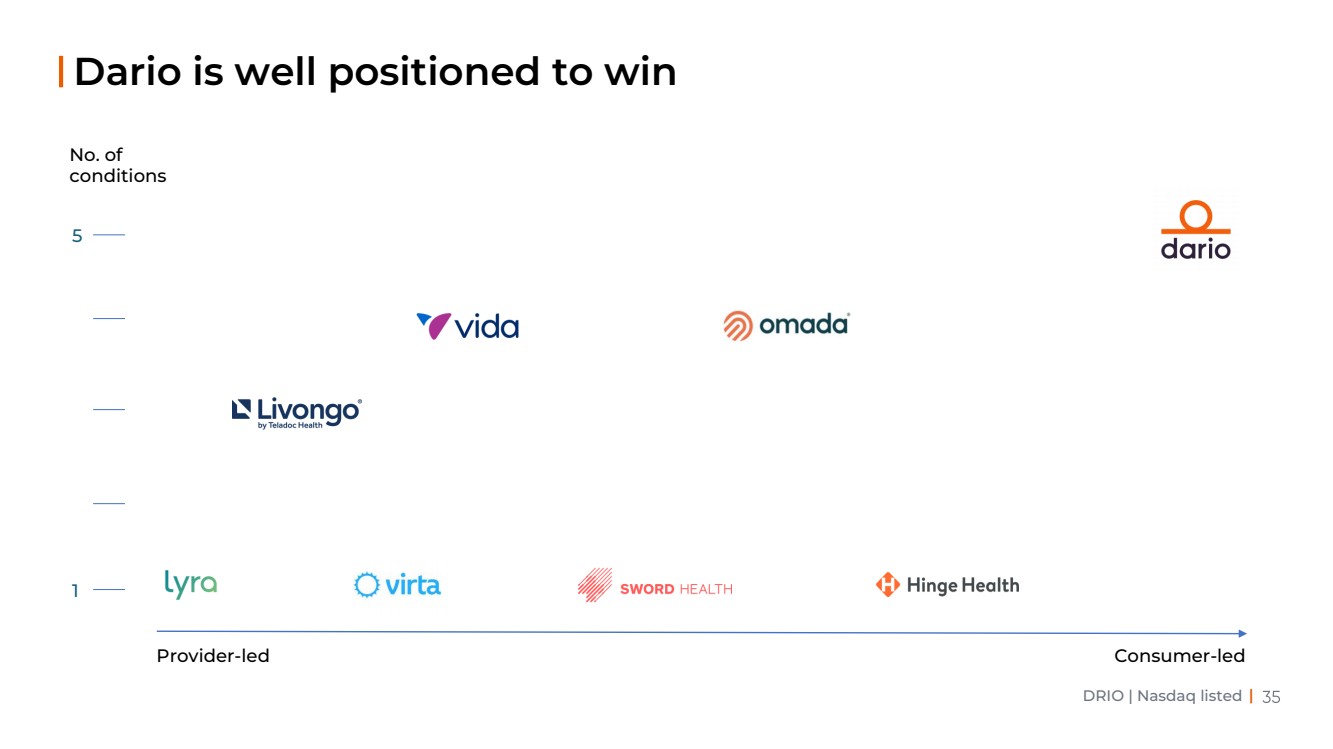
DRIO | Nasdaq listed | Dario is well positioned to win Provider-led Consumer-led No. of conditions 1 5 |
|
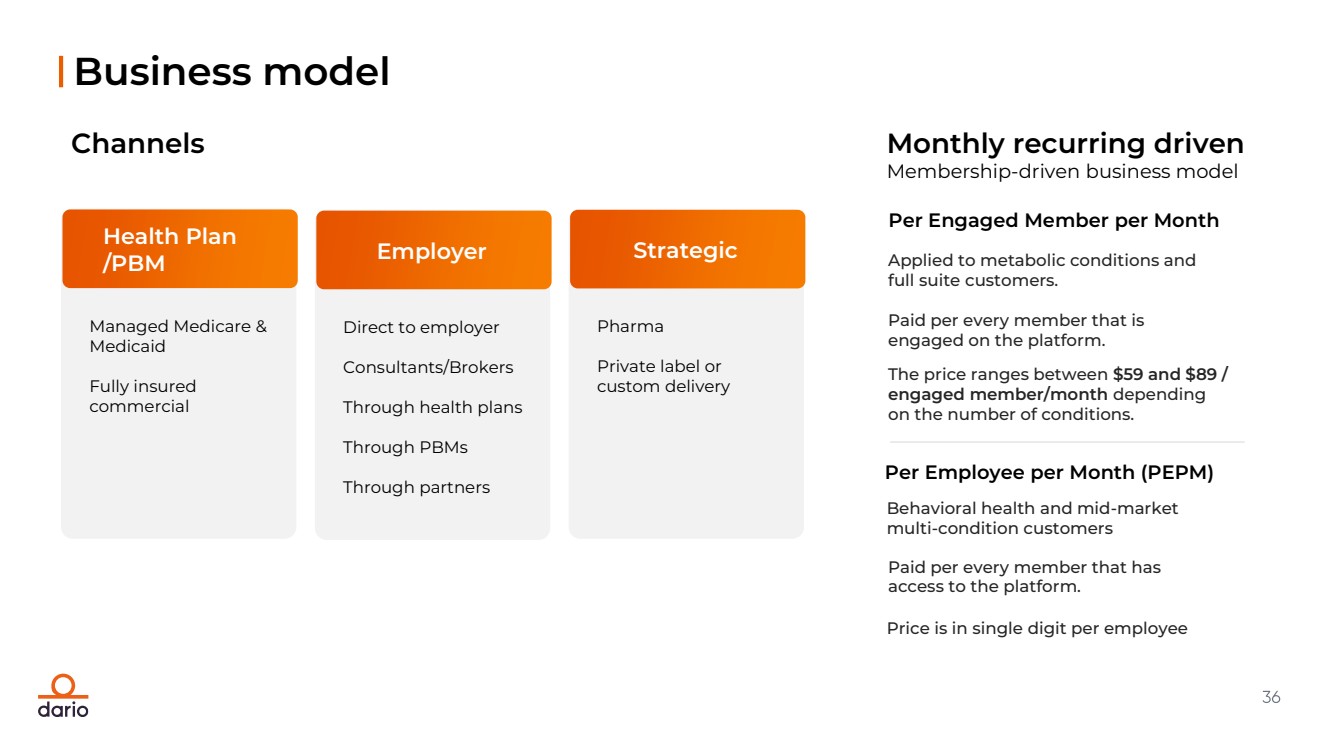
Business model Monthly recurring driven Membership-driven business model Channels Employer Direct to employer Consultants/Brokers Through health plans Through PBMs Through partners Behavioral health and mid-market multi-condition customers Paid per every member that has access to the platform. Price is in single digit per employee Per Employee per Month (PEPM) Applied to metabolic conditions and full suite customers. Paid per every member that is engaged on the platform. The price ranges between $59 and $89 / engaged member/month depending on the number of conditions. Per Engaged Member per Month Health Plan /PBM Managed Medicare & Medicaid Fully insured commercial Strategic Pharma Private label or custom delivery |
|
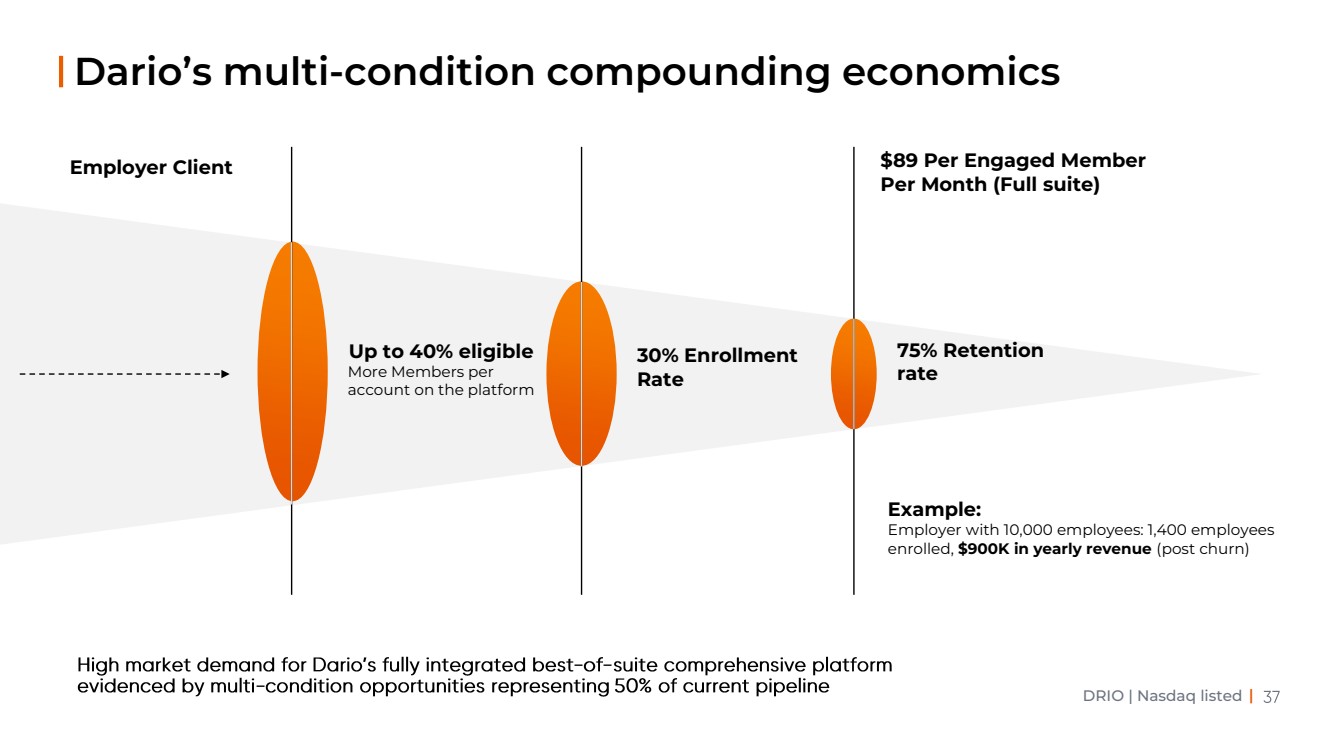
DRIO | Nasdaq listed | Dario’s multi-condition compounding economics 75% Retention rate Example: Employer with 10,000 employees: 1,400 employees enrolled, $900K in yearly revenue (post churn) 30% Enrollment Rate Employer Client $89 Per Engaged Member Per Month (Full suite) Up to 40% eligible More Members per account on the platform |
|
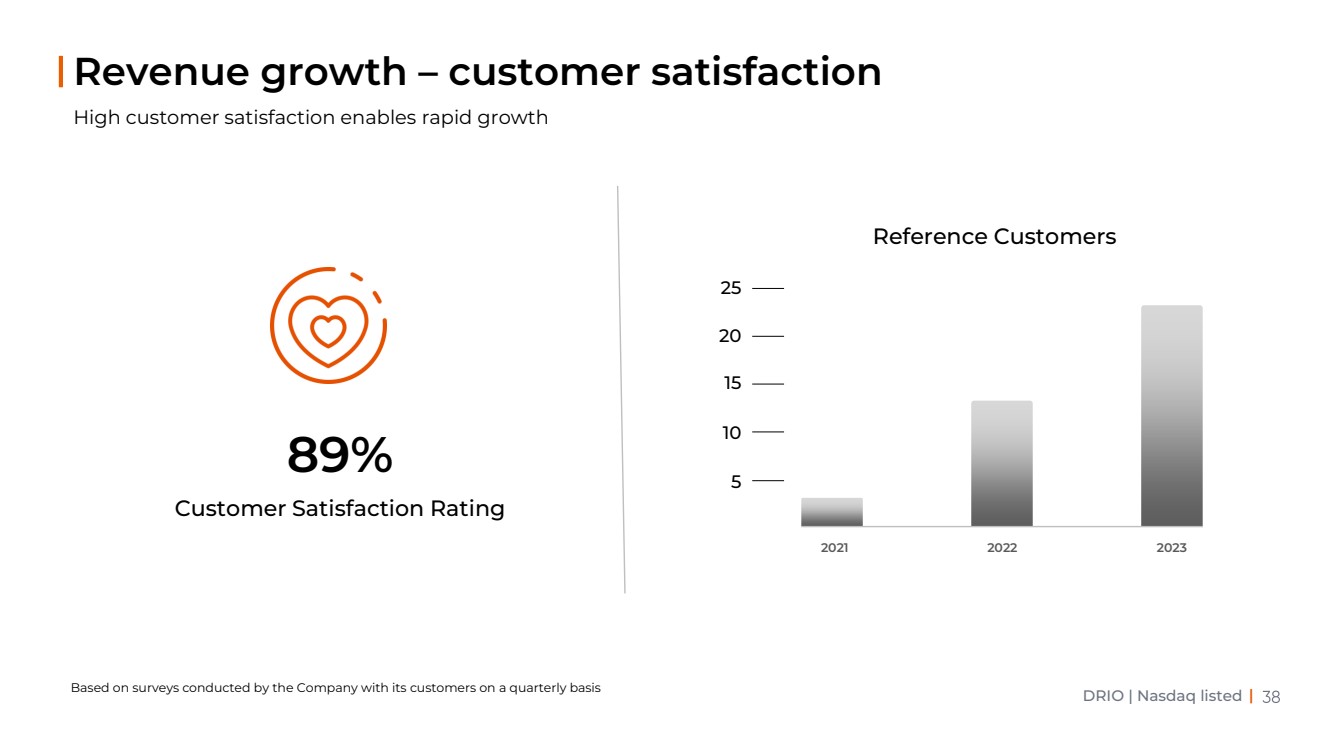
DRIO | Nasdaq listed | High customer satisfaction enables rapid growth Revenue growth – customer satisfaction Customer Satisfaction Rating 89% Reference Customers 5 10 15 20 2021 25 2022 2023 Based on surveys conducted by the Company with its customers on a quarterly basis |
|
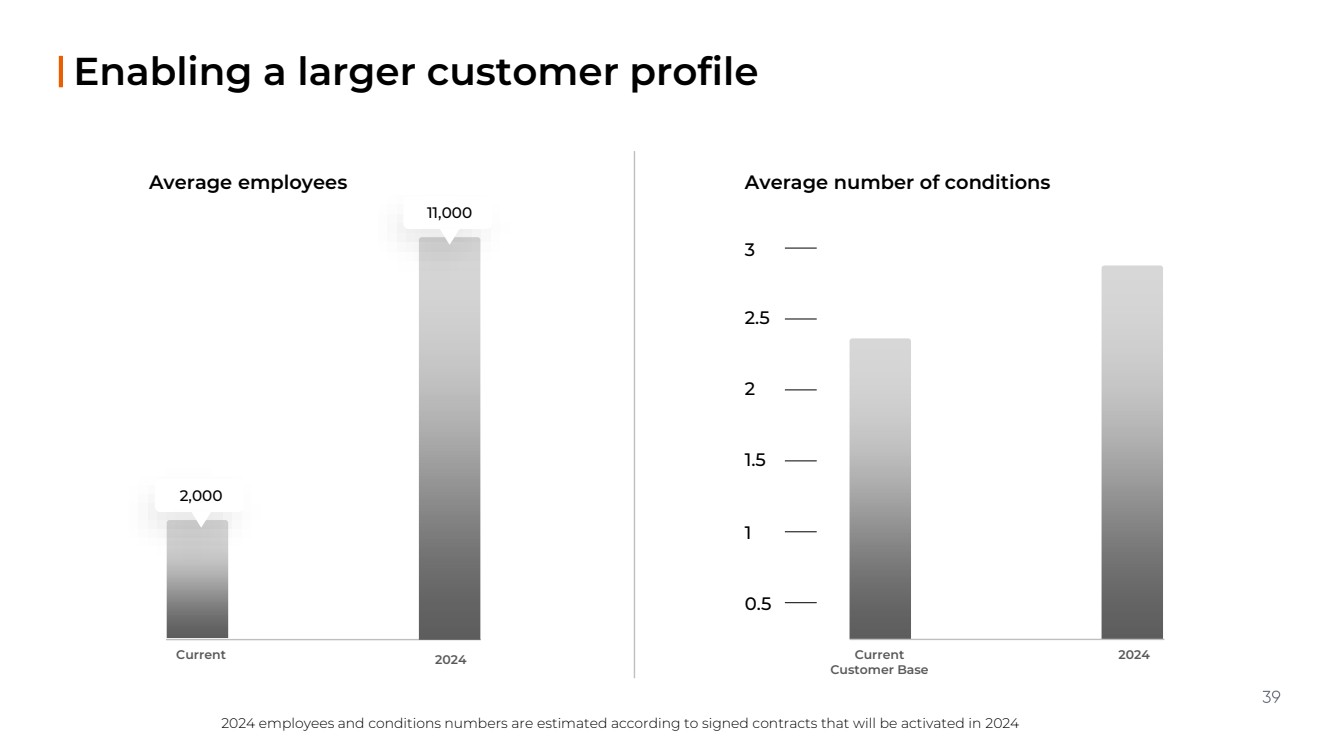
Enabling a larger customer profile Average employees Current 2024 Average number of conditions 0.5 1 1.5 2 3 Current Customer Base 2024 2.5 2,000 11,000 2024 employees and conditions numbers are estimated according to signed contracts that will be activated in 2024 |
|
Clients and Partners Matt Alberico, SVP Growth |
|
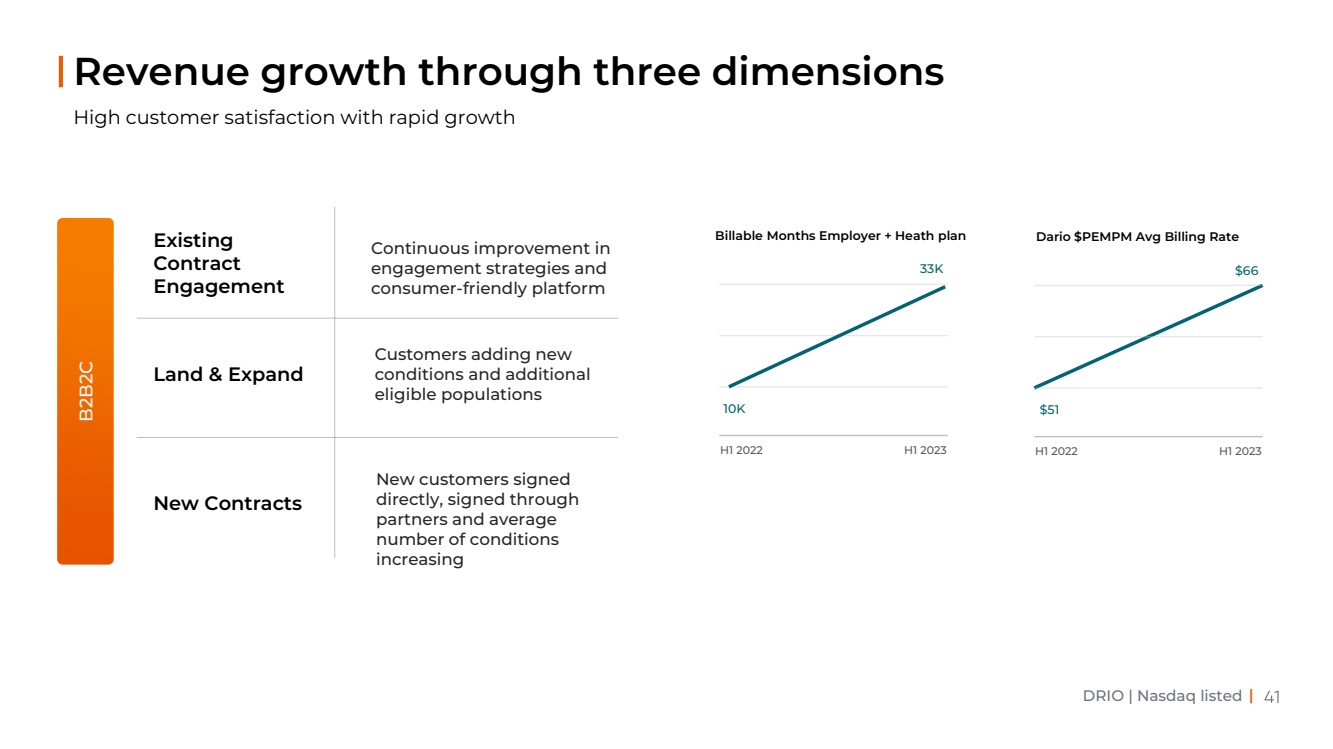
DRIO | Nasdaq listed | High customer satisfaction with rapid growth Revenue growth through three dimensions B 2 B 2 C Existing Contract Engagement Land & Expand New Contracts Customers adding new conditions and additional eligible populations Continuous improvement in engagement strategies and consumer-friendly platform New customers signed directly, signed through partners and average number of conditions increasing H1 2022 H1 2023 $51 $66 Dario $PEMPM Avg Billing Rate H1 2022 H1 2023 10K 33K Billable Months Employer + Heath plan |
|
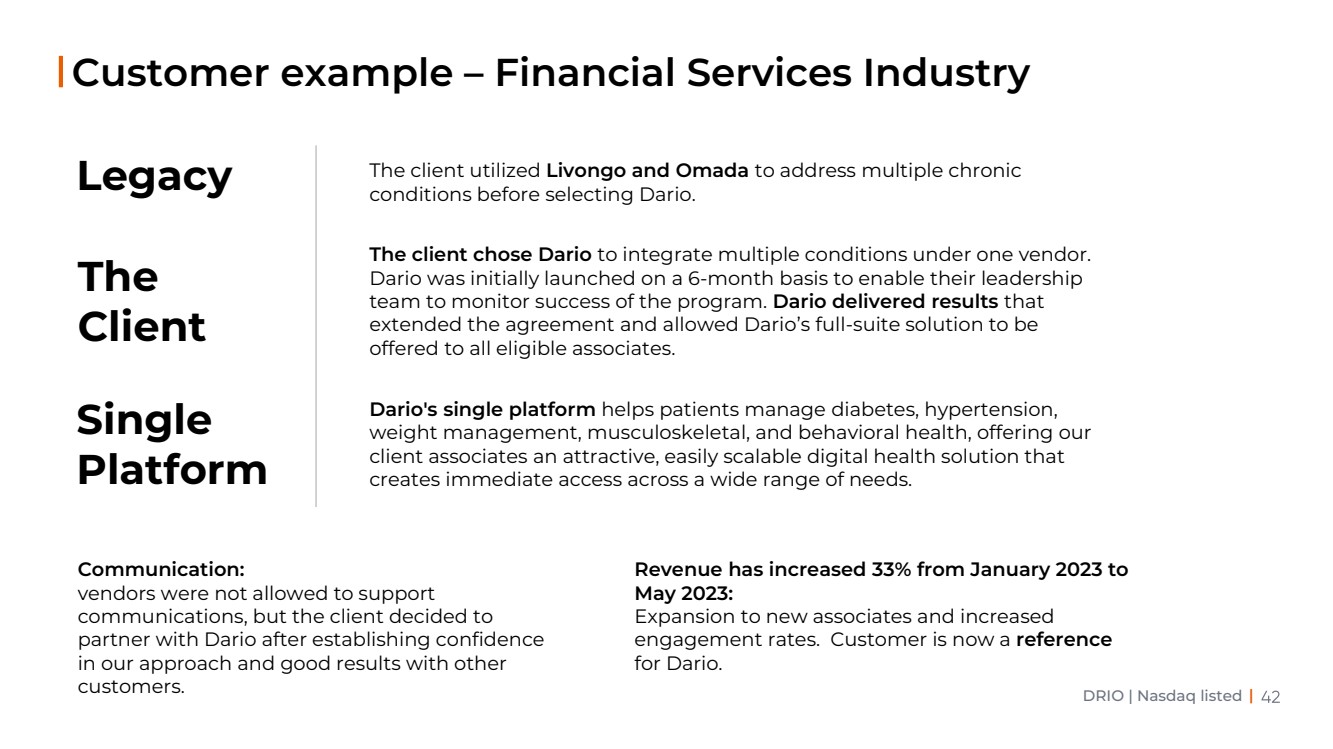
DRIO | Nasdaq listed | Customer example – Financial Services Industry Legacy The client utilized Livongo and Omada to address multiple chronic conditions before selecting Dario. The client chose Dario to integrate multiple conditions under one vendor. Dario was initially launched on a 6-month basis to enable their leadership team to monitor success of the program. Dario delivered results that extended the agreement and allowed Dario’s full-suite solution to be offered to all eligible associates. Dario's single platform helps patients manage diabetes, hypertension, weight management, musculoskeletal, and behavioral health, offering our client associates an attractive, easily scalable digital health solution that creates immediate access across a wide range of needs. Single Platform The Client Communication: vendors were not allowed to support communications, but the client decided to partner with Dario after establishing confidence in our approach and good results with other customers. Revenue has increased 33% from January 2023 to May 2023: Expansion to new associates and increased engagement rates. Customer is now a reference for Dario. |
|
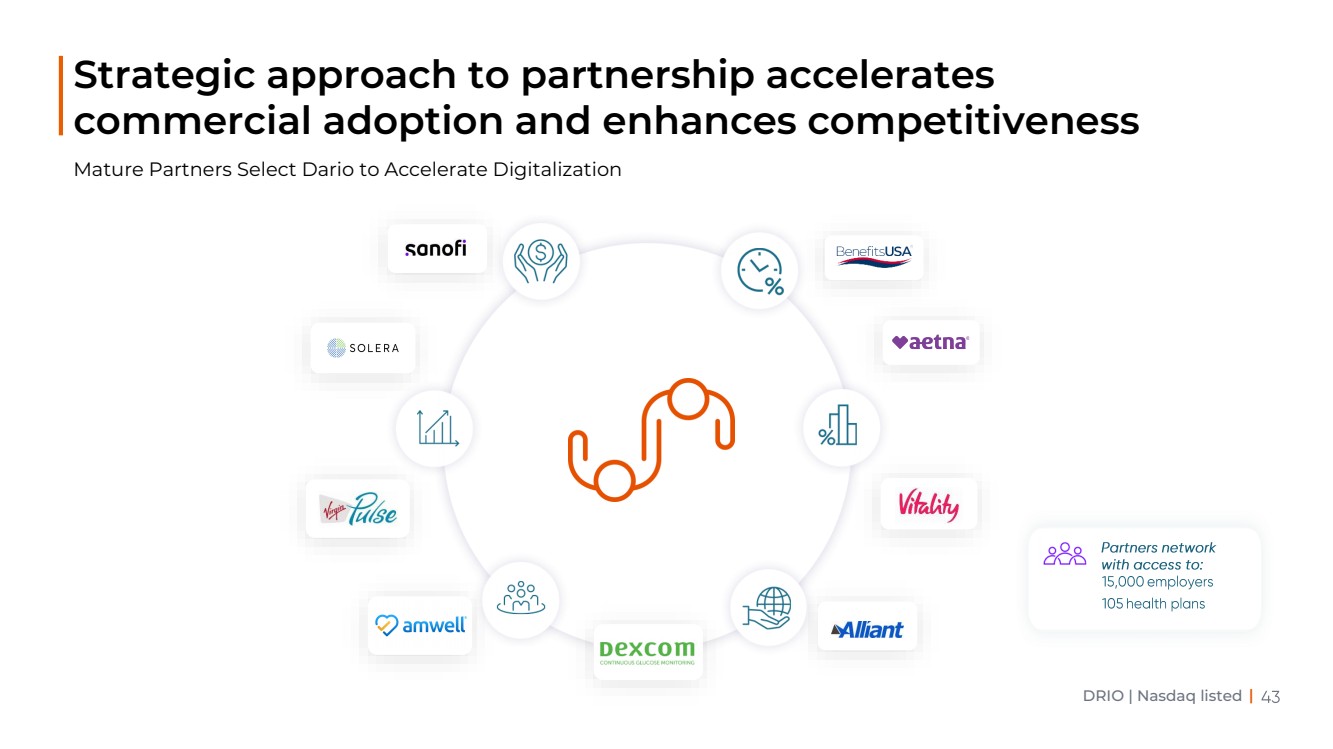
DRIO | Nasdaq listed | Mature Partners Select Dario to Accelerate Digitalization Strategic approach to partnership accelerates commercial adoption and enhances competitiveness |
|
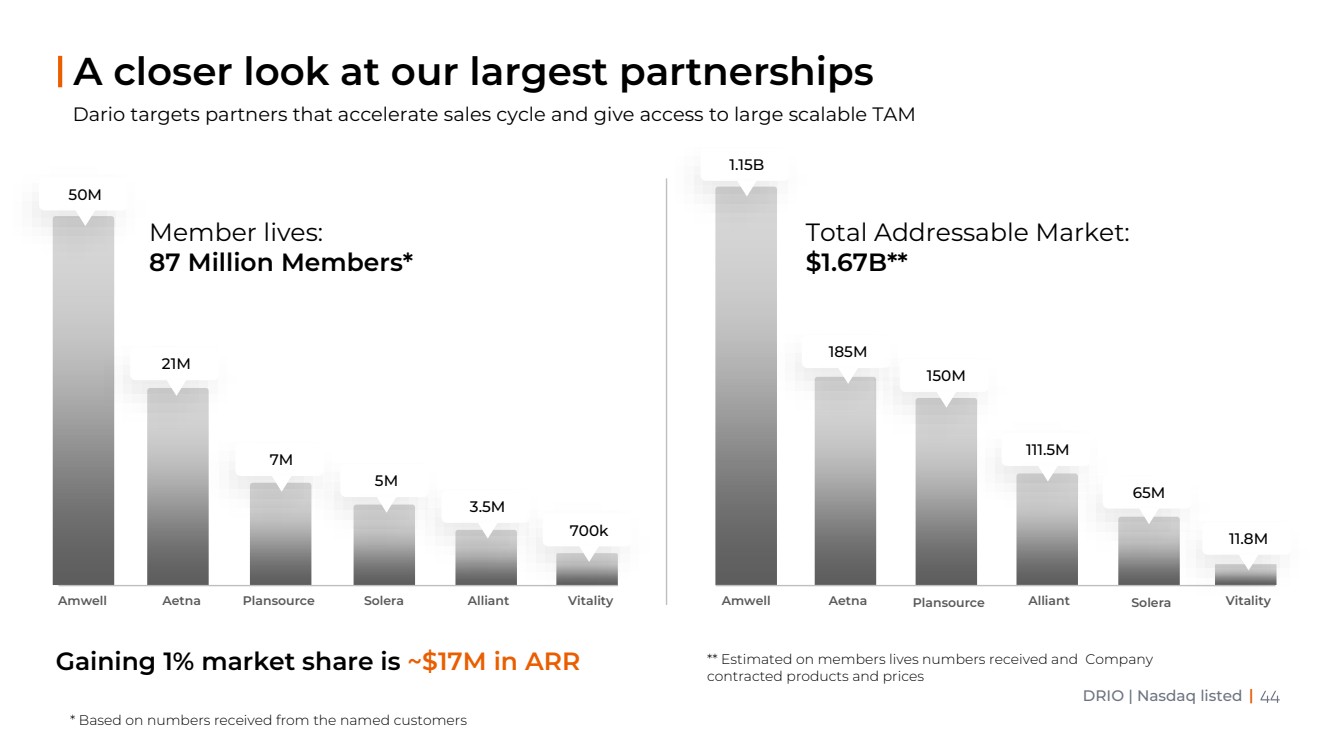
DRIO | Nasdaq listed | Dario targets partners that accelerate sales cycle and give access to large scalable TAM A closer look at our largest partnerships Gaining 1% market share is ~$17M in ARR Amwell Aetna Plansource Solera Alliant Vitality Member lives: 87 Million Members* Amwell Aetna Plansource Alliant Solera Vitality Total Addressable Market: $1.67B** 50M 21M 7M 5M 3.5M 700k 1.15B 185M 150M 111.5M 65M 11.8M * Based on numbers received from the named customers ** Estimated on members lives numbers received and Company contracted products and prices |
|
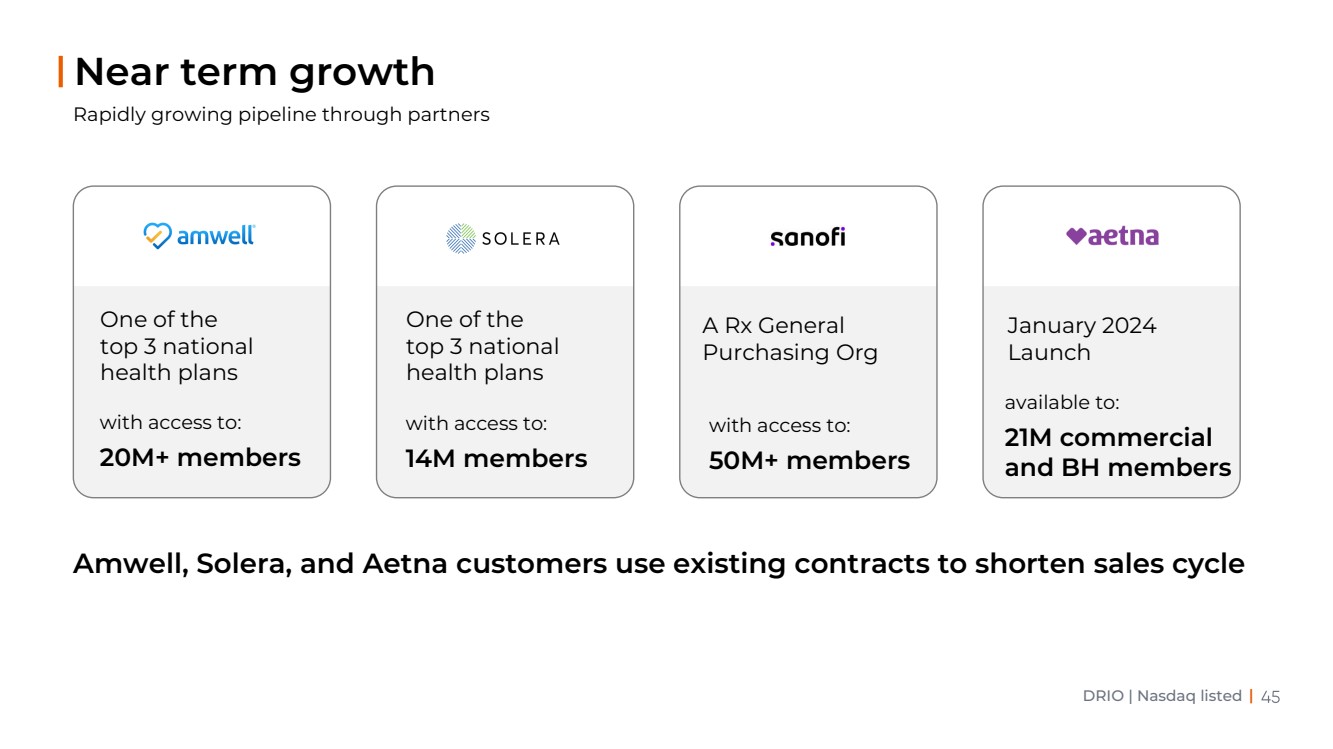
DRIO | Nasdaq listed | Rapidly growing pipeline through partners Near term growth Amwell, Solera, and Aetna customers use existing contracts to shorten sales cycle with access to: 14M members with access to: 20M+ members January 2024 Launch available to: 21M commercial and BH members with access to: 50M+ members A Rx General Purchasing Org One of the top 3 national health plans One of the top 3 national health plans |
|
Financials Long Term View Erez Raphael, CEO |
|
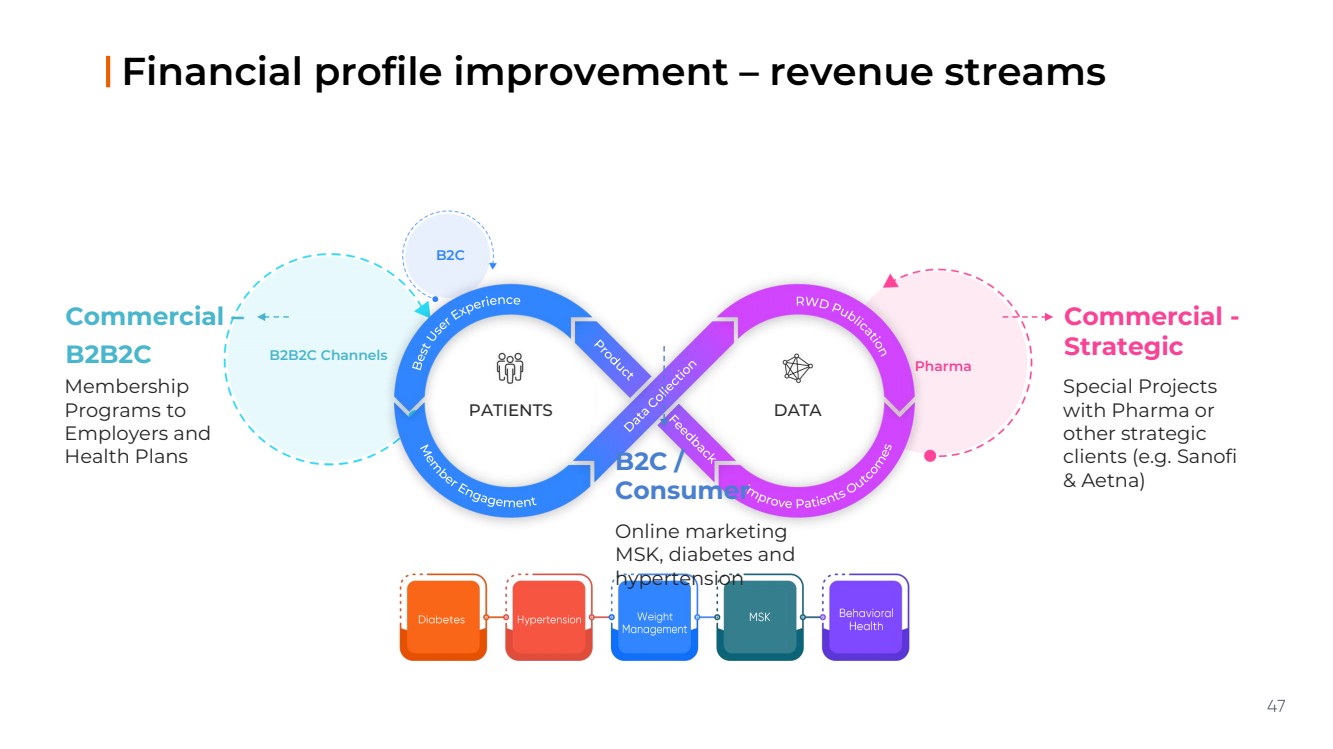
Financial profile improvement – revenue streams Pharma B2B2C Channels B2C Best User Experience Member Engagement RWD Publication Improve Patients Outcomes PATIENTS DATA Commercial - Strategic Special Projects with Pharma or other strategic clients (e.g. Sanofi & Aetna) B2C / Consumer Online marketing MSK, diabetes and hypertension Commercial – B2B2C Membership Programs to Employers and Health Plans |
|
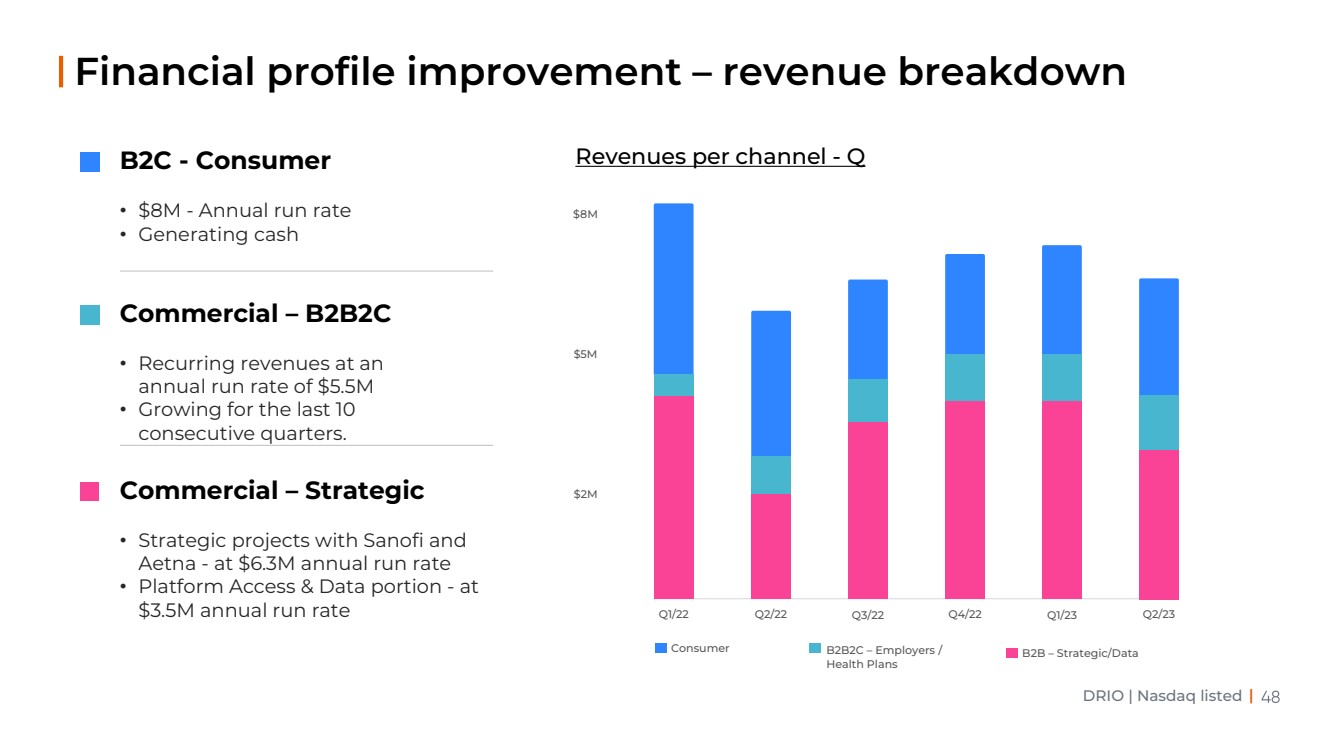
DRIO | Nasdaq listed | Financial profile improvement – revenue breakdown Q1/22 Q2/22 Q3/22 Consumer B2B2C – Employers / Health Plans B2B – Strategic/Data Q4/22 $2M $8M $5M B2C - Consumer Revenues per channel - Q • $8M - Annual run rate • Generating cash Commercial – B2B2C • Recurring revenues at an annual run rate of $5.5M • Growing for the last 10 consecutive quarters. Commercial – Strategic • Strategic projects with Sanofi and Aetna - at $6.3M annual run rate • Platform Access & Data portion - at $3.5M annual run rate Q1/23 Q2/23 |
|
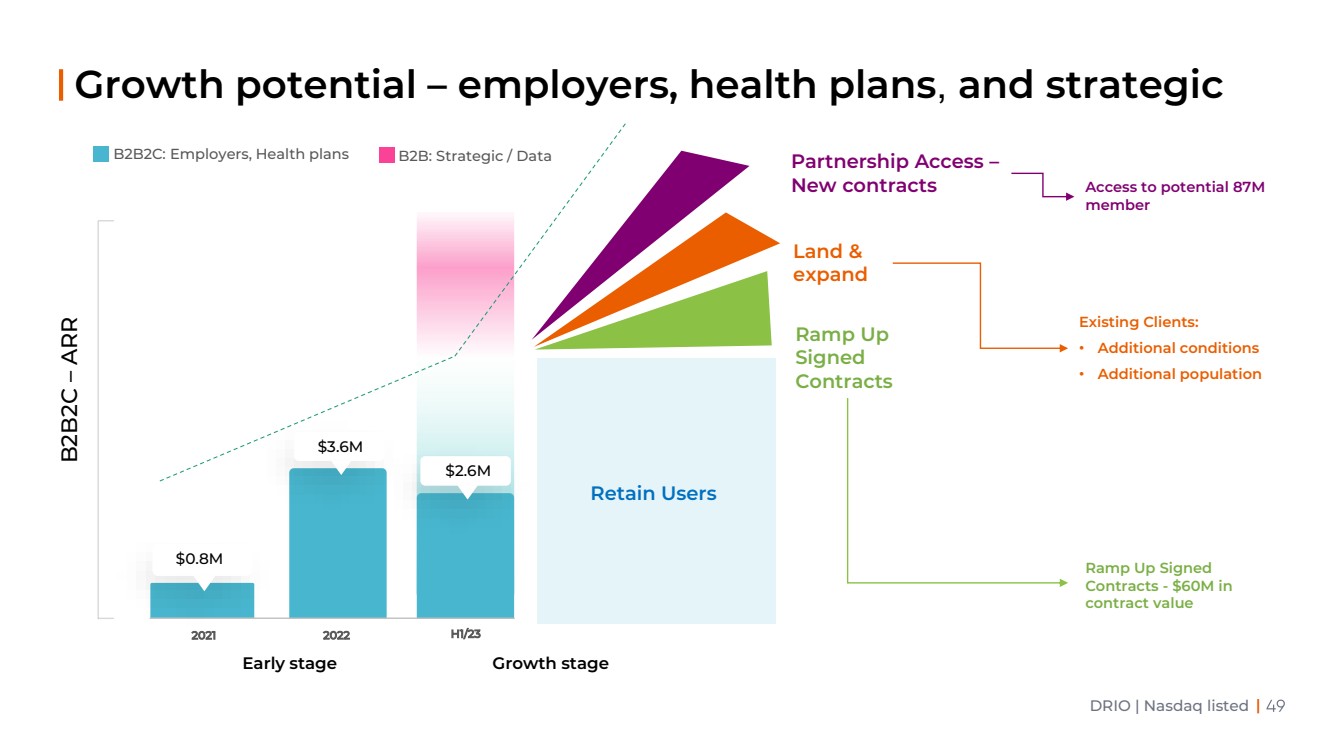
DRIO | Nasdaq listed | Growth potential – employers, health plans, and strategic Retain Users Ramp Up Signed Contracts Land & expand Partnership Access – New contracts 2021 $0.8M 2022 $3.6M H1/23 $2.6M Early stage Growth stage B 2 B 2C – ARR B2B2C: Employers, Health plans B2B: Strategic / Data Access to potential 87M member Existing Clients: • Additional conditions • Additional population Ramp Up Signed Contracts - $60M in contract value |
|
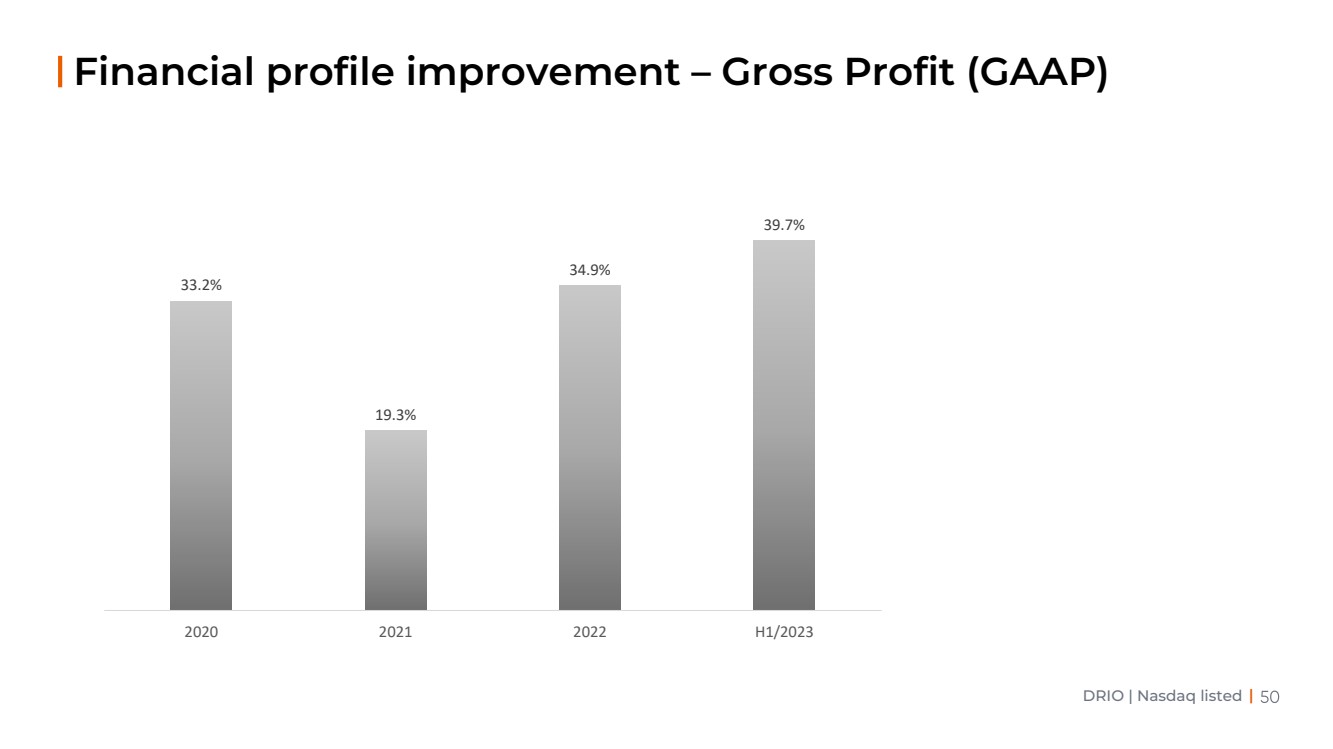
DRIO | Nasdaq listed | Financial profile improvement – Gross Profit (GAAP) 33.2% 19.3% 34.9% 39.7% 2020 2021 2022 H1/2023 |
|
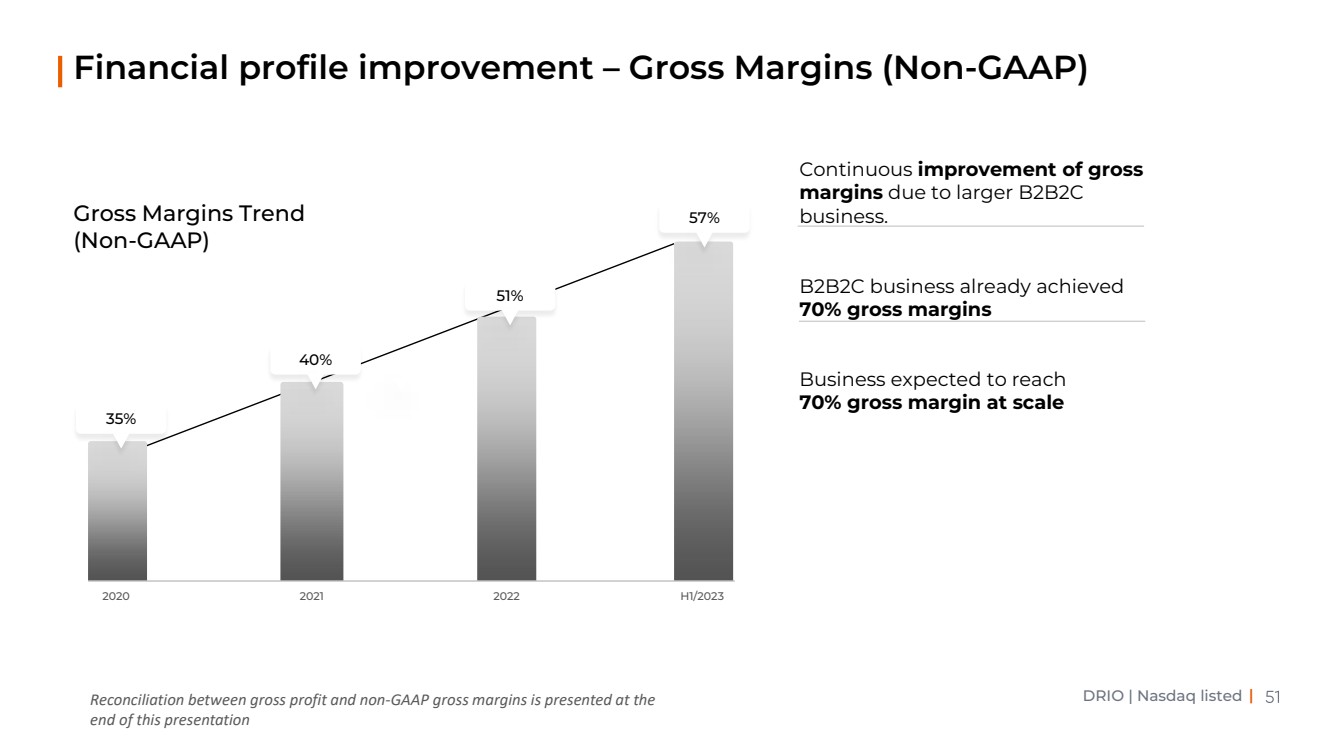
DRIO | Nasdaq listed | Financial profile improvement – Gross Margins (Non-GAAP) Gross Margins Trend (Non-GAAP) Continuous improvement of gross margins due to larger B2B2C business. B2B2C business already achieved 70% gross margins Business expected to reach 70% gross margin at scale 2020 35% 2021 40% 2022 51% H1/2023 57% Reconciliation between gross profit and non-GAAP gross margins is presented at the end of this presentation |
|
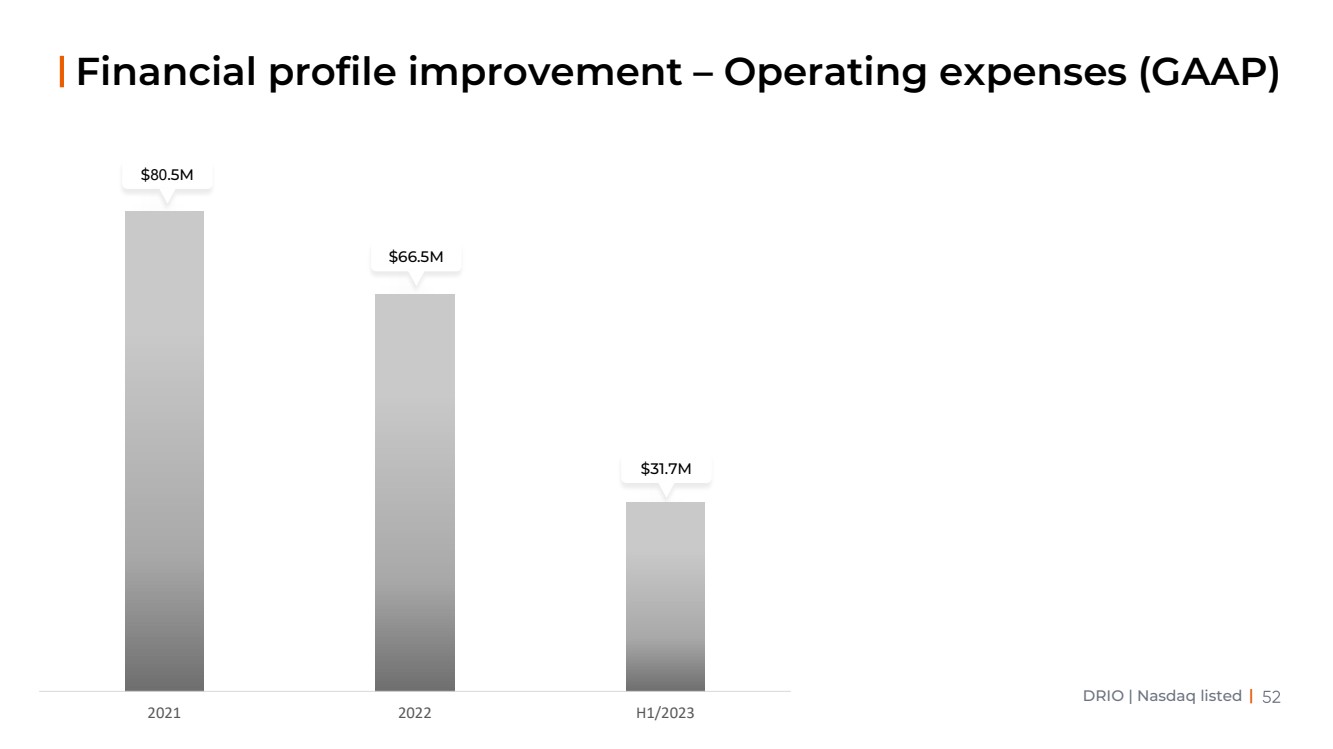
DRIO | Nasdaq listed | Financial profile improvement – Operating expenses (GAAP) $80.5M $66.5M $31.7M 2021 2022 H1/2023 |
|
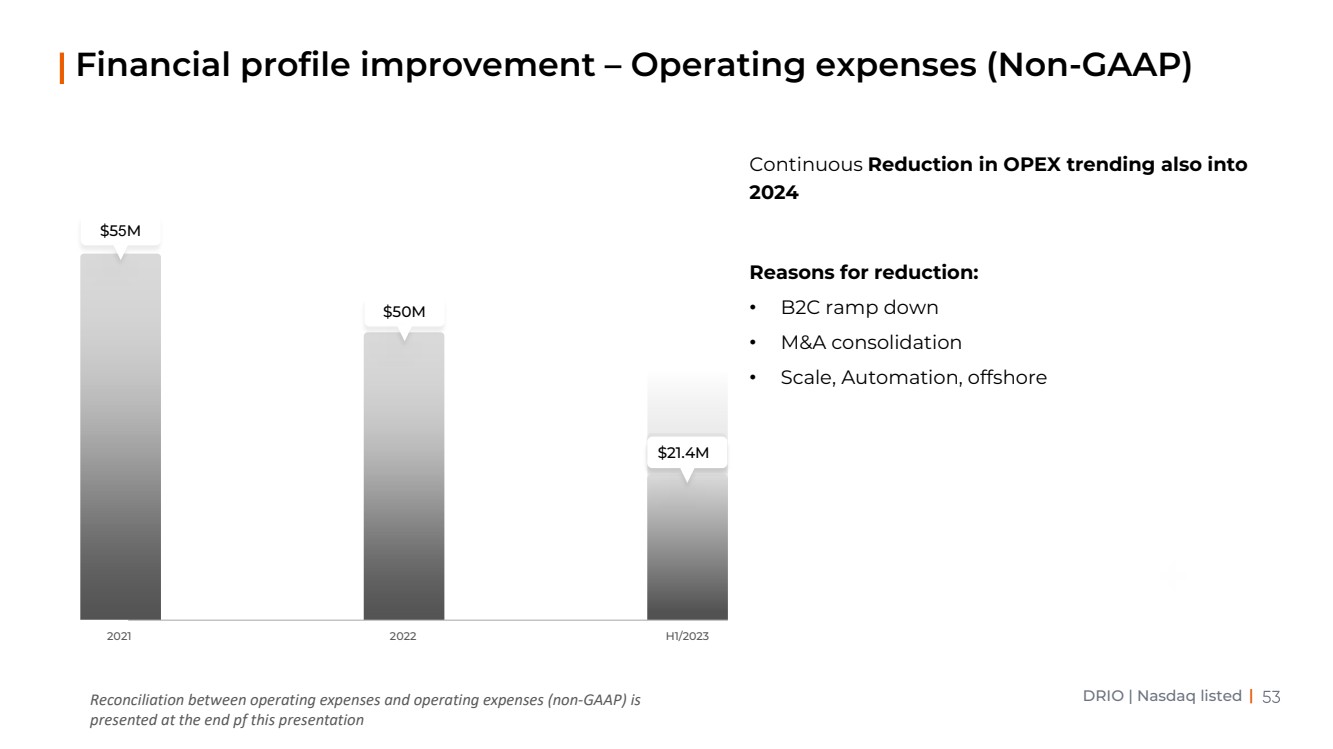
DRIO | Nasdaq listed | Financial profile improvement – Operating expenses (Non-GAAP) $50M 2022 H1/2023 $21.4M 2021 $55M Continuous Reduction in OPEX trending also into 2024 Reasons for reduction: • B2C ramp down • M&A consolidation • Scale, Automation, offshore Reconciliation between operating expenses and operating expenses (non-GAAP) is presented at the end pf this presentation |
|
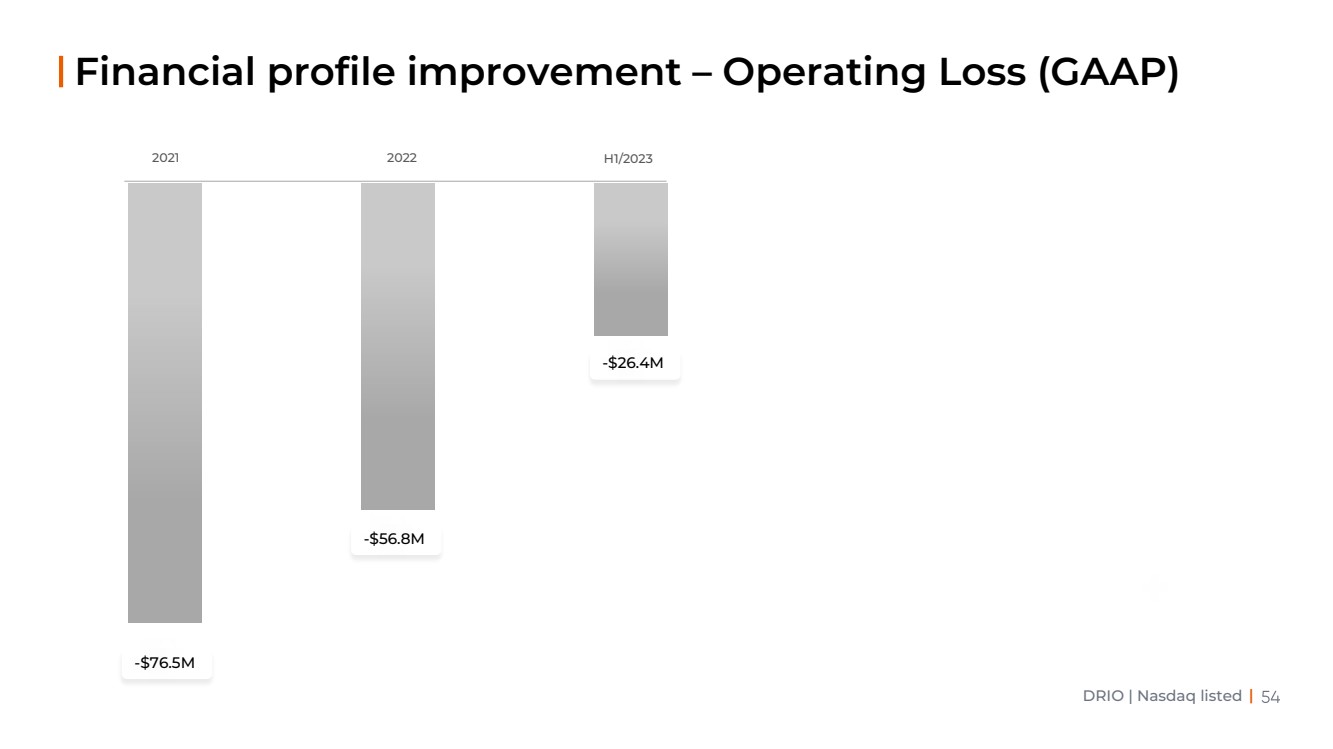
DRIO | Nasdaq listed | Financial profile improvement – Operating Loss (GAAP) 2021 2022 H1/2023 -$76.5M -$56.8M -$26.4M |
|
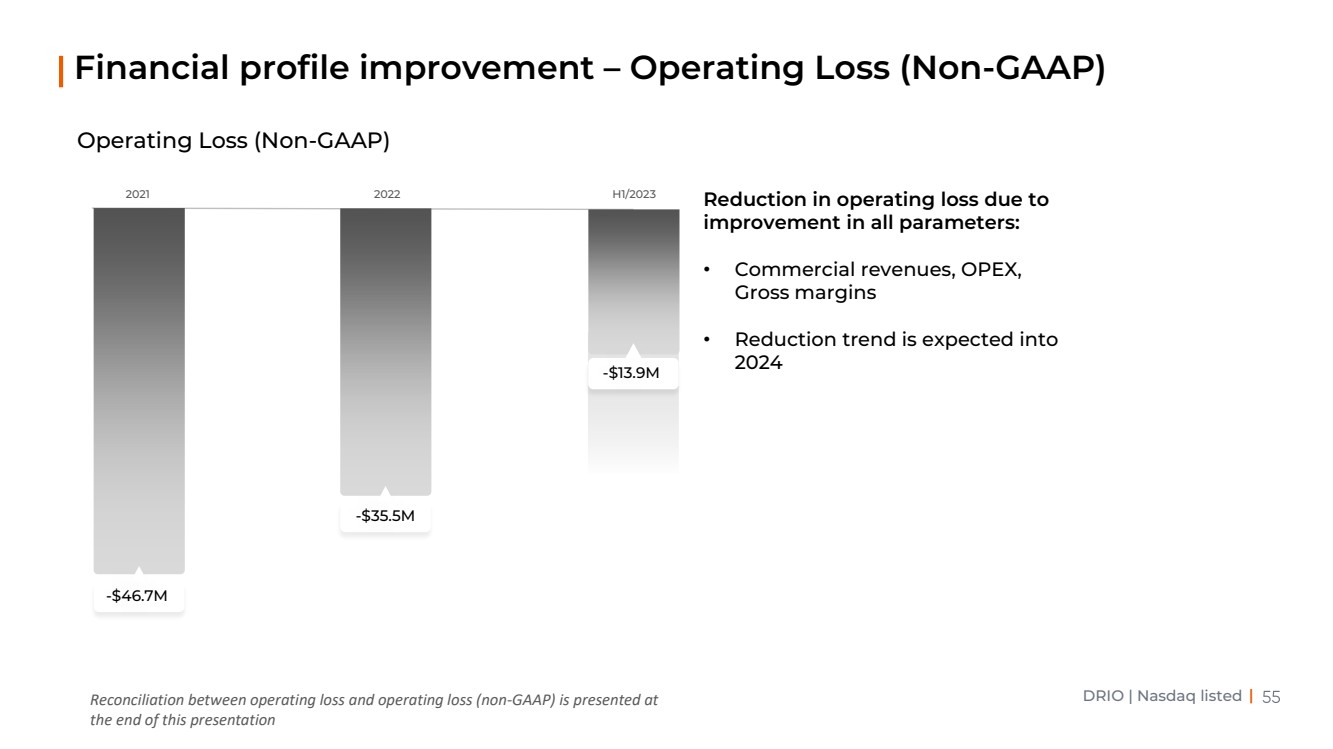
DRIO | Nasdaq listed | Financial profile improvement – Operating Loss (Non-GAAP) Reduction in operating loss due to improvement in all parameters: • Commercial revenues, OPEX, Gross margins • Reduction trend is expected into 2024 Operating Loss (Non-GAAP) 2021 2022 H1/2023 -$35.5M -$46.7M -$13.9M Reconciliation between operating loss and operating loss (non-GAAP) is presented at the end of this presentation |
|
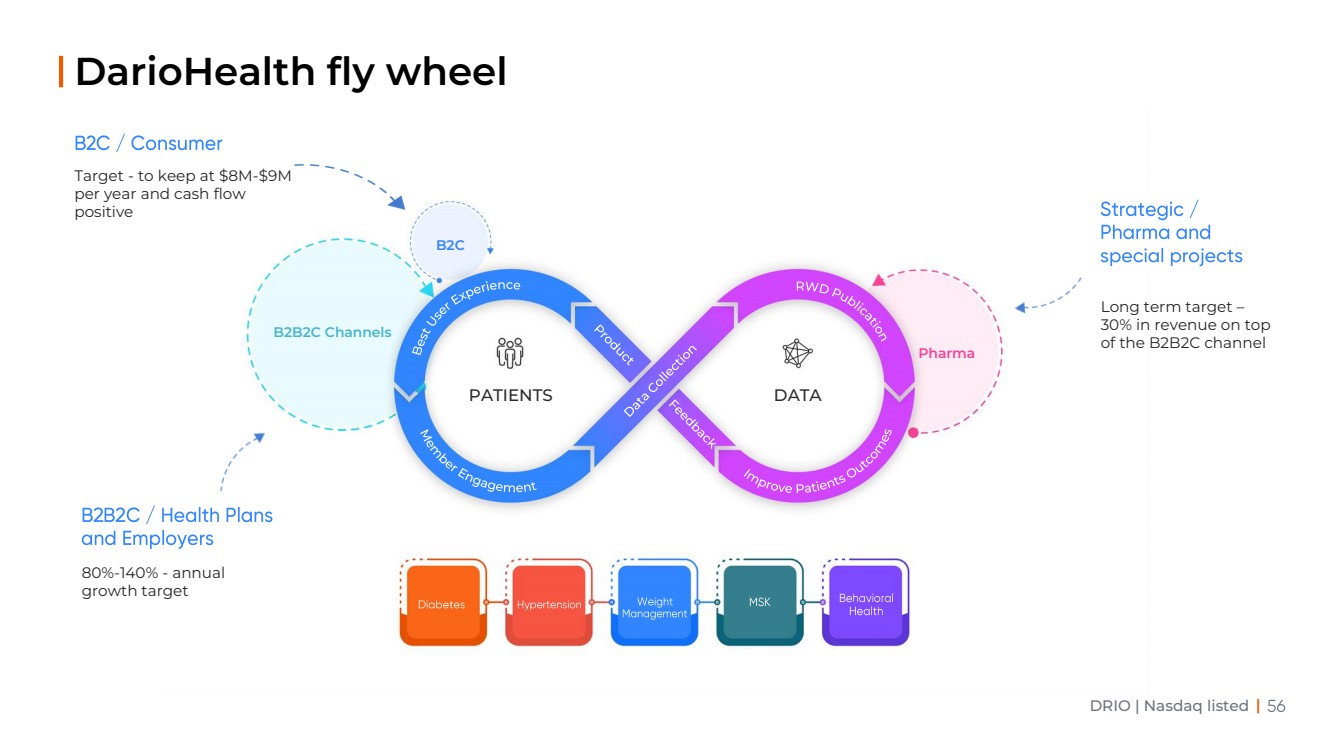
DRIO | Nasdaq listed | Best User Experience Member Engagement RWD Publication Improve Patients Outcomes PATIENTS DATA Pharma B2C B2B2C Channels DarioHealth fly wheel Target - to keep at $8M-$9M per year and cash flow positive 80%-140% - annual growth target Long term target – 30% in revenue on top of the B2B2C channel |
|
Q&A |
|
Thank You! |
|
DRIO | Nasdaq listed | Appendix |
|
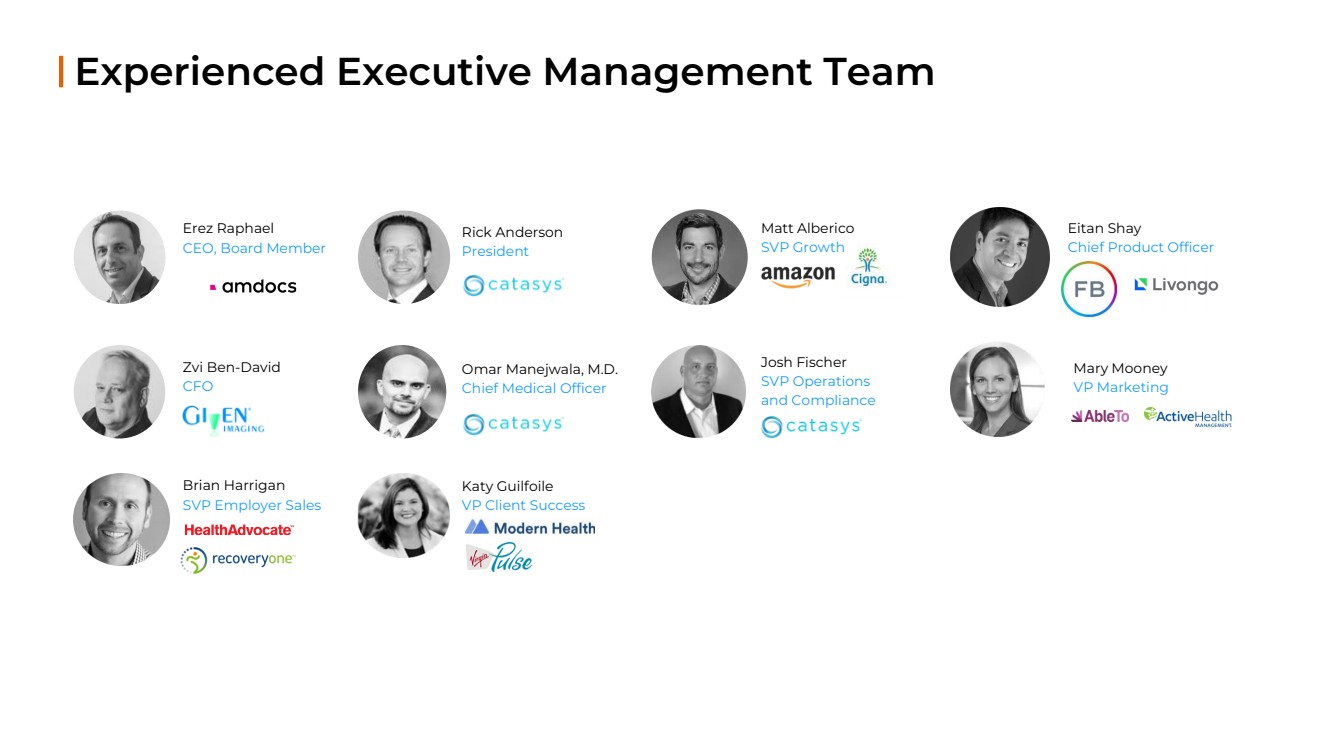
Zvi Ben-David CFO Rick Anderson President Omar Manejwala, M.D. Chief Medical Officer Katy Guilfoile VP Client Success Josh Fischer SVP Operations and Compliance Matt Alberico SVP Growth Mary Mooney VP Marketing Eitan Shay Chief Product Officer Experienced Executive Management Team Erez Raphael CEO, Board Member Brian Harrigan SVP Employer Sales |
|
Yoav Shaked Chairman of the Board Allen Kamer Advisory Board Dennis Matheis Board Member Eric Milledge Chairman of the Scientific Advisory Board Board of Directors and Advisors Dennis M. McGrath Chair of Audit - Board Member Adam Stern Board Member Hila Karah Board Member Arnaud Robert Strategic Advisor Yadin Shemer Advisory Board Marilyn Ritholz, PHD Scientific Advisory Board Dr. David A. Horwitz, MD. Scientific Advisory Board Lisa Marie Giacinti Strategic Partnerships |
|
DRIO | Nasdaq listed | Non-GAAP Financial Measures We have provided in this presentation financial information that has not been prepared in accordance with Generally Accepted Accounting Principles (GAAP). These non-GAAP financial measures are not based on any standardized methodology prescribed by GAAP and are not necessarily comparable to similar measures presented by other companies. We use these non-GAAP financial measures internally in analyzing our financial results and believe they are useful to investors, as a supplement to GAAP measures, in evaluating our ongoing operational performance. We believe that the use of these non-GAAP financial measures provides an additional tool for investors to use in evaluating ongoing operating results and trends and in comparing our financial results with peer companies, many of which present similar non-GAAP financial measures to investors. Non-GAAP financial measures should not be considered in isolation from, or as a substitute for, financial information prepared in accordance with GAAP. Investors are encouraged to review the reconciliation of these non-GAAP financial measures to their most directly comparable GAAP financial measures provided in the financial statement tables below. Gross profit and gross margin (non-GAAP). Our presentation of non-GAAP gross profit and gross margin excludes amortization of acquired intangible assets, depreciation and stock-based compensation. We exclude these non-cash expenses, as we believe doing so better explains the profitability of our products on a cash basis as well as better presents the cash generation potential of our products. Operating expenses (non-GAAP). Our presentation of non-GAAP operating expenses excludes stock-based compensation expenses, depreciation and amortization, earn out revaluation and acquisition costs. Due to varying available valuation methodologies, subjective assumptions, and the variety of equity instruments that can impact a company's non-cash operating expenses, we believe that providing non-GAAP financial measures that exclude non-cash expense and one-time expenses provides us with an important tool for financial and operational decision making and for evaluating our own core business operating results over different periods of time. Net loss (non-GAAP). Our presentation of adjusted net loss excludes the effect of certain items that are non-GAAP financial measures. Adjusted net loss represents net loss determined under GAAP without regard to stock-based compensation expenses, amortization of acquired intangible assets, depreciation of fixed assets, amortization, earn out revaluation and one time acquisition costs. We believe these measures provide useful information to management and investors for analysis of our operating results. |
|
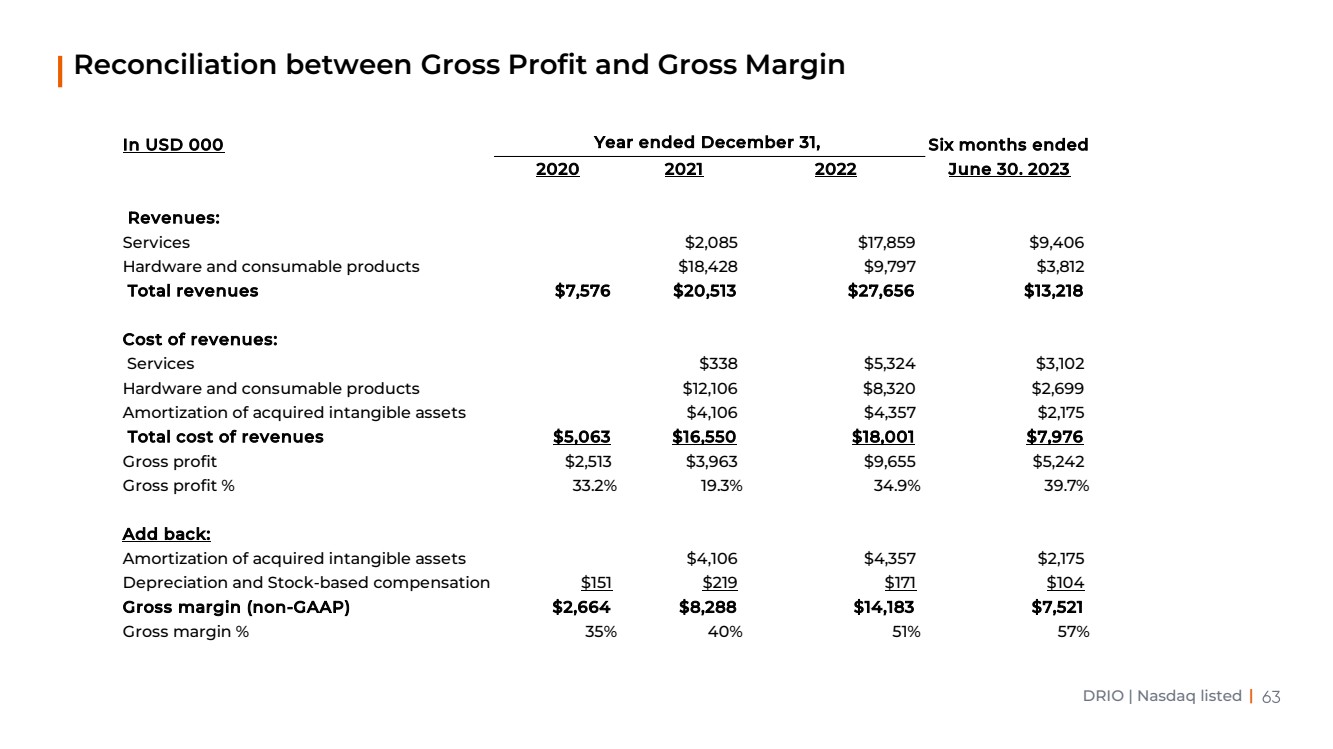
DRIO | Nasdaq listed | Reconciliation between Gross Profit and Gross Margin In USD 000 Six months ended 2020 2021 2022 June 30. 2023 Revenues: Services $2,085 $17,859 $9,406 Hardware and consumable products $18,428 $9,797 $3,812 Total revenues $7,576 $20,513 $27,656 $13,218 Cost of revenues: Services $338 $5,324 $3,102 Hardware and consumable products $12,106 $8,320 $2,699 Amortization of acquired intangible assets $4,106 $4,357 $2,175 Total cost of revenues $5,063 $16,550 $18,001 $7,976 Gross profit $2,513 $3,963 $9,655 $5,242 Gross profit % 33.2% 19.3% 34.9% 39.7% Add back: Amortization of acquired intangible assets $4,106 $4,357 $2,175 Depreciation and Stock-based compensation $151 $219 $171 $104 Gross margin (non-GAAP) $2,664 $8,288 $14,183 $7,521 Gross margin % 35% 40% 51% 57% Year ended December 31, |
|
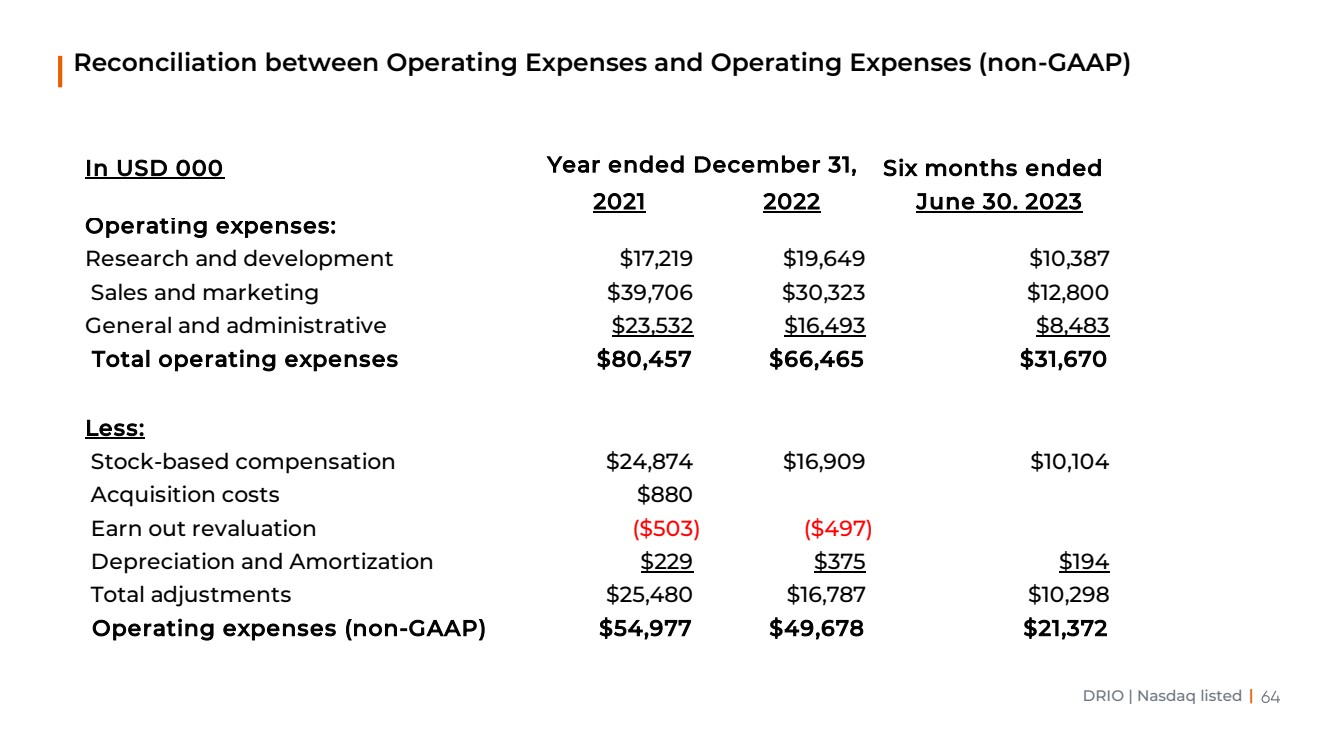
DRIO | Nasdaq listed | Reconciliation between Operating Expenses and Operating Expenses (non-GAAP) In USD 000 Six months ended 2021 2022 June 30. 2023 Operating expenses: Research and development $17,219 $19,649 $10,387 Sales and marketing $39,706 $30,323 $12,800 General and administrative $23,532 $16,493 $8,483 Total operating expenses $80,457 $66,465 $31,670 Less: Stock-based compensation $24,874 $16,909 $10,104 Acquisition costs $880 Earn out revaluation ($503) ($497) Depreciation and Amortization $229 $375 $194 Total adjustments $25,480 $16,787 $10,298 Operating expenses (non-GAAP) $54,977 $49,678 $21,372 Year ended December 31, |
|
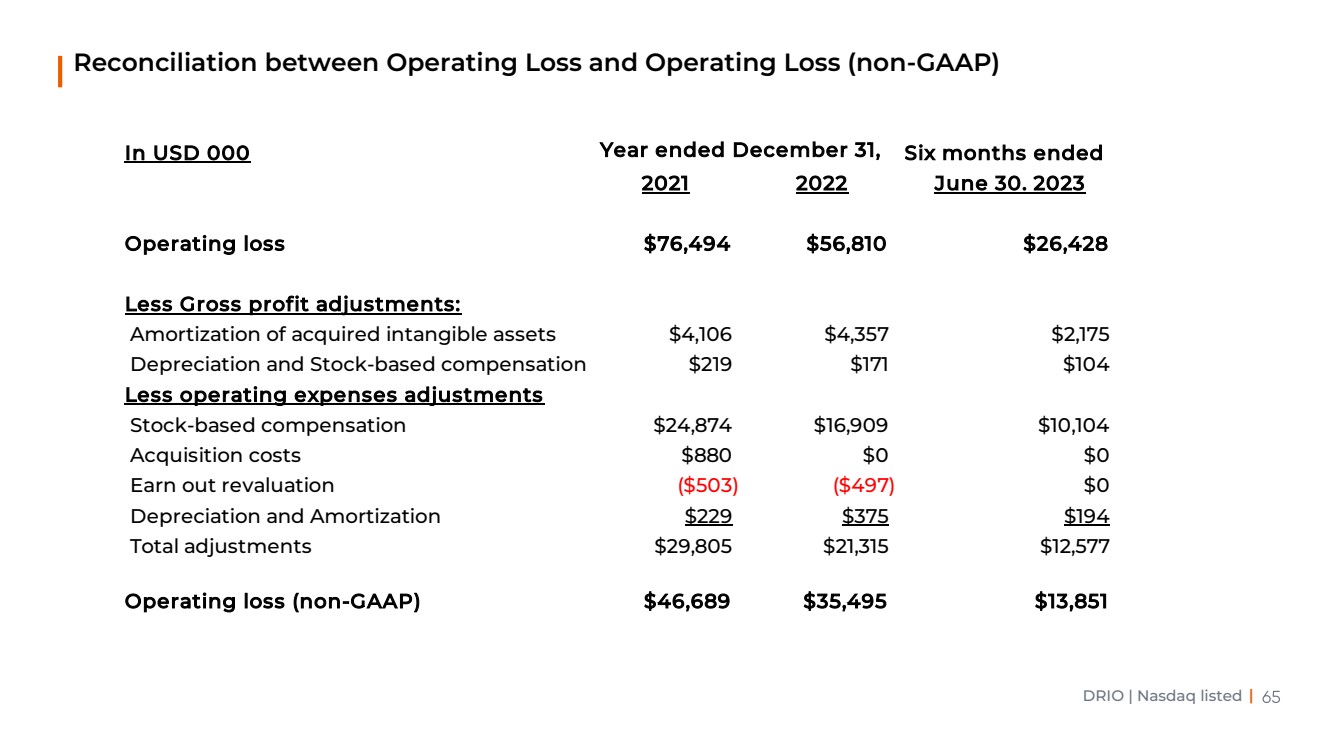
DRIO | Nasdaq listed | Reconciliation between Operating Loss and Operating Loss (non-GAAP) In USD 000 Six months ended 2021 2022 June 30. 2023 Operating loss $76,494 $56,810 $26,428 Less Gross profit adjustments: Amortization of acquired intangible assets $4,106 $4,357 $2,175 Depreciation and Stock-based compensation $219 $171 $104 Less operating expenses adjustments Stock-based compensation $24,874 $16,909 $10,104 Acquisition costs $880 $0 $0 Earn out revaluation ($503) ($497) $0 Depreciation and Amortization $229 $375 $194 Total adjustments $29,805 $21,315 $12,577 Operating loss (non-GAAP) $46,689 $35,495 $13,851 Year ended December 31, |