UNITED
STATES
SECURITIES AND EXCHANGE COMMISSION
Washington, D.C. 20549
FORM 6-K
REPORT OF FOREIGN PRIVATE ISSUER
Pursuant to Rule 13a-16 or 15d-16 of
the Securities Exchange Act of 1934
For the month of September 2023
SKEENA RESOURCES LIMITED
(Translation of Registrant's Name into English)
| 001-40961 | ||
| (Commission File Number) | ||
| 1021 West Hastings Street, Suite 650, Vancouver, British Columbia, V6E 0C3, Canada | ||
| (Address of Principal Executive Offices) | ||
Indicate by check mark whether the registrant files or will file annual reports under cover of Form 20-F or Form 40-F:
Form 20-F ¨ Form 40-F 🗹
Indicate by check mark if the registrant is submitting the Form 6-K in paper as permitted by Regulation S-T Rule 101(b)(1): ¨
Indicate by check mark if the registrant is submitting the Form 6-K in paper as permitted by Regulation S-T Rule 101(b)(7): ¨
Exhibits 99.1, 99.2, 99.3, 99.4, 99.5, and 99.6 to this report, furnished on Form 6-K, are furnished, not filed, and will not be incorporated by reference into any registration statement filed by the registrant under the Securities Act of 1933, as amended.
EXHIBIT INDEX
SIGNATURES
Pursuant to the requirements of the Securities Exchange Act of 1934, the registrant has duly caused this report to be signed on its behalf by the undersigned, thereunto duly authorized.
Date: September 26, 2023
| SKEENA RESOURCES LIMITED | ||
| By: | /s/ Andrew MacRitchie | |
| Andrew MacRitchie | ||
| Chief Financial Officer | ||
Exhibit 99.1

|

|
Skeena Files Technical Report for Snip MRE
Vancouver, BC (September 26, 2023) Skeena Resources Limited (TSX: SKE, NYSE: SKE) (“Skeena” or the “Company”) is pleased to announce that it has filed a detailed Technical Report (the “Report”) for the Mineral Resource Estimate (“MRE”) at its 100% owned Snip Gold Project (“Snip” or the “Project”). The Report is titled “Independent Technical Report for the Snip Project, Canada” and is compliant with National Instrument 43-101 Standards of Disclosure for Mineral Projects. The key results from the Report were summarized in the Company’s news release dated September 5, 2023. A copy of the full report is available on Skeena’s website and has been filed on SEDAR+ at www.sedarplus.ca and EDGAR at www.sec.gov.
About Skeena
Skeena Resources Limited is a Canadian mining exploration and development company focused on revitalizing the Eskay Creek and Snip Projects, two past-producing mines located in Tahltan Territory in the Golden Triangle of northwest British Columbia, Canada. The Company released a Feasibility Study for Eskay Creek in September 2022 which highlights an after-tax NPV5% of C$1.4B, 50% IRR, and a 1-year payback at US$1,700/oz Au and US$19/oz Ag. Skeena is currently continuing exploration drilling and plans on releasing a Definitive Feasibility Study for Eskay Creek in Q4 2023.
On behalf of the Board of Directors of Skeena Resources Limited,
| Walter Coles | Randy Reichert | |
| Executive Chairman | President & CEO |
Contact Information
Investor Inquiries: info@skeenaresources.com
Office Phone: +1 604 684 8725
Company Website: www.skeenaresources.com
Qualified Persons
In accordance with National Instrument 43-101 Standards of Disclosure for Mineral Projects, Paul Geddes, P.Geo., Senior Vice President, Exploration & Resource Development, is the Qualified Person for the Company and has reviewed and approved the technical and scientific content of this news release.
Sheila Ulansky, P.Geo., Senior Resource Geologist for SRK Consulting (Canada) Inc., is an independent Qualified Person as defined by National Instrument 43-101 and has reviewed and approved the contents of this news release. Ms. Ulansky is responsible for the 2023 Mineral Resources Estimate for the Snip Project.
Jeff Austin, P.Eng., President of International Metallurgical and Environmental Inc., is an independent Qualified Person as defined by National Instrument 43-101 and has reviewed and approved the contents of this news release. Mr. Austin is responsible for mineral processing and metallurgical testing for the Snip Project.
 |
 |
 |

The Company strictly adheres to CIM Best Practices Guidelines in conducting, documenting, and reporting the exploration activities on its projects.
Cautionary note regarding forward-looking statements
Certain statements and information contained or incorporated by reference in this press release constitute “forward-looking information” and “forward-looking statements” within the meaning of applicable Canadian and United States securities legislation (collectively, “forward-looking statements”). These statements relate to future events or our future performance. The use of words such as “anticipates”, “believes”, “proposes”, “contemplates”, “generates”, “progressing towards”, “in search of”, “targets”, “is projected”, “plans to”, “is planned”, “considers”, “estimates”, “expects”, “is expected”, “often”, “likely”, “potential” and similar expressions, or statements that certain actions, events or results “may”, “might”, “will”, “could”, or “would” be taken, achieved, or occur, may identify forward-looking statements. All statements other than statements of historical fact are forward-looking statements. Specific forward-looking statements contained herein include, but are not limited to, statements regarding the results of the Feasibility Study, processing capacity of the mine, anticipated mine life, probable reserves, the potential impact of the Definitive Feasibility Study for Eskay Creek, and the Maiden Engineering Study for Snip on the anticipated mine life and/or the conversion of resource ounces from the Inferred to Indicated categories or from Measured or Indicated categories to the Reserve category, estimated project capital and operating costs, potential reductions in process plant capital and operating costs, sustaining costs, results of test work and studies, planned environmental assessments, the future price of metals, metal concentrate, and future exploration and development generally and specifically in relation to the potential for additional mineralization in the recently increased land package. Such forward-looking statements are based on material factors and/or assumptions which include, but are not limited to, the estimation of mineral resources and reserves, the realization of resource and reserve estimates, metal prices, taxation, the estimation, timing and amount of future exploration and development, capital and operating costs, the availability of financing, the receipt of regulatory approvals, environmental risks, title disputes and the assumptions set forth herein and in the Company’s MD&A for the year ended December 31, 2022, its most recently filed interim MD&A, and the Company’s Annual Information Form (“AIF”) dated March 22, 2023. Such forward-looking statements represent the Company’s management expectations, estimates and projections regarding future events or circumstances on the date the statements are made, and are necessarily based on several estimates and assumptions that, while considered reasonable by the Company as of the date hereof, are not guarantees of future performance. Actual events and results may differ materially from those described herein, and are subject to significant operational, business, economic, and regulatory risks and uncertainties. The risks and uncertainties that may affect the forward-looking statements in this news release include, among others: the inherent risks involved in exploration and development of mineral properties, including permitting and other government approvals; changes in economic conditions, including changes in the price of gold and other key variables; changes in mine plans and other factors, including accidents, equipment breakdown, bad weather and other project execution delays, many of which are beyond the control of the Company; environmental risks and unanticipated reclamation expenses; and other risk factors identified in the Company’s MD&A for the year ended December 31, 2022, its most recently filed interim MD&A, the AIF dated March 22, 2023, the Company’s short form base shelf prospectus dated January 31, 2023, and in the Company’s other periodic filings with securities and regulatory authorities in Canada and the United States that are available on SEDAR+ at www.sedarplus.ca or on EDGAR at www.sec.gov.
Readers should not place undue reliance on such forward-looking statements. Any forward-looking statement speaks only as of the date on which it is made and the Company does not undertake any obligations to update and/or revise any forward-looking statements except as required by applicable securities laws.
|
|
|
Cautionary note to U.S. Investors concerning estimates of mineral Reserves and mineral Resources
Skeena’s mineral Reserves and mineral Resources included or incorporated by reference herein have been estimated in accordance with National Instrument 43-101 – Standards of Disclosure for Mineral Projects (“NI 43-101”) as required by Canadian securities regulatory authorities, which differ from the requirements of U.S. securities laws. The terms “mineral reserve”, “proven mineral reserve”, “probable mineral reserve”, “mineral resource”, “measured mineral resource”, “indicated mineral resource” and “inferred mineral resource” are Canadian mining terms as defined in accordance with NI 43-101 and the Canadian Institute of Mining, Metallurgy and Petroleum (“CIM”) “CIM Definition Standards – For Mineral Resources and Mineral Reserves” adopted by the CIM Council (as amended, the “CIM Definition Standards”). These standards differ significantly from the mineral property disclosure requirements of the U.S. Securities and Exchange Commission in Regulation S-K Subpart 1300 (the “SEC Modernization Rules”). Skeena is not currently subject to the SEC Modernization Rules. Accordingly, Skeena’s disclosure of mineralization and other technical information may differ significantly from the information that would be disclosed had Skeena prepared the information under the standards adopted under the SEC Modernization Rules.
In addition, investors are cautioned not to assume that any part or all of Skeena’s mineral Resources constitute or will be converted into Reserves. These terms have a great amount of uncertainty as to their economic and legal feasibility. Accordingly, investors are cautioned not to assume that any “measured”, “indicated”, or “inferred” mineral Resources that Skeena reports are or will be economically or legally mineable. Further, “inferred mineral Resources” have a great amount of uncertainty as to their existence, and great uncertainty as to their economic and legal feasibility. It cannot be assumed that all or any part of an “inferred mineral resource” will ever be upgraded to a higher category. Under Canadian securities laws, estimates of “inferred mineral Resources” may not form the basis of feasibility or prefeasibility studies, except in rare cases where permitted under NI 43-101.
For these reasons, the mineral reserve and mineral resource estimates and related information presented herein may not be comparable to similar information made public by U.S. companies subject to the reporting and disclosure requirements under the U.S. federal securities laws and the rules and regulations thereunder.
|
|
|
Exhibit 99.2

Independent Technical Report for the Snip Project, Canada
Prepared for
Skeena Resources Ltd
Prepared by

SRK Consulting (Canada) Inc.
| Effective Date: | September 05, 2023 |
| Issue Date: | September 26, 2023 |
| Project: | CAPR002721 |
Independent Technical Report for the Snip Project, Canada
Effective Date: September 05, 2023
Release Date: September 26, 2023
| Prepared for | Prepared by |
|
Skeena Resources Ltd 650 – 1021 West Hastings Street Vancouver, BC, V6E 0C3
|
SRK Consulting (Canada) Inc. 2700 - 320 Granville Street Vancouver, BC, V6C 1S9 Canada |
|
Tel: +1 604-684-8725 Web: www.skeenaresources.com |
Tel: +1 604 681 4196 Web: www.srk.com |
Authored By
| Sheila Ulansky, PGeo | Jeff Austin, P.Eng |
| SRK Consulting (Canada) Inc. | International Metallurgical and Environmental Inc. |
| Project No: | CAPR002721 | |
| File Name: | Skeena Resources_Snip_NI43-101_Report_CAPR002721_20230926.docx |
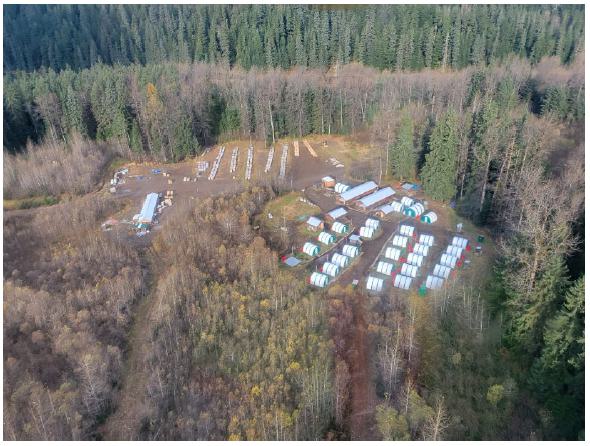
Cover image: Snip camp. Courtesy of R. Markel 2021.
Copyright © SRK Consulting (Canada) Inc., 2023

| SRK Consulting (Canada) Inc Skeena Resources Limited NI 43 -101 Snip Project Canada |
Page |
Important Notice
This report was prepared as a National Instrument 43-101 Technical Report for Skeena Resources Limited (Skeena) by SRK Consulting (Canada) Inc. (SRK). The quality of information, conclusions, and estimates contained herein is consistent with the level of effort involved in SRK’s services, based on: i) information available at the time of preparation, ii) data supplied by outside sources, and iii) the assumptions, conditions, and qualifications set forth in this report. This report is intended for use by Skeena subject to the terms and conditions of its contract with SRK and relevant securities legislation. The contract permits Skeena to file this report as a Technical Report with Canadian securities regulatory authorities pursuant to National Instrument 43-101, Standards of Disclosure for Mineral Projects. Except for the purposes legislated under provincial securities law, any other uses of this report by any third party is at that party’s sole risk. The responsibility for this disclosure remains with Skeena. The user of this document should ensure that this is the most recent Technical Report for the property as it is not valid if a new Technical Report has been issued.
Copyright
© 2023 SRK Consulting (Canada) Inc.
This document is protected by copyright vested in SRK Consulting (Canada) Inc. It may not be reproduced or transmitted in any form or by any means whatsoever to any person without the written permission of the copyright holder, other than in accordance with stock exchange and other regulatory authority requirements.
| SU/AD | September 2023 |
| SRK Consulting (Canada) Inc Skeena Resources Limited NI 43 -101 Snip Project Canada |
Page |
| 1 | Executive Summary |
| 1.1 | Introduction |
The Snip Project, located in northwest British Columbia (BC), is a past producing underground mine that hosts high-grade structurally controlled mineralized veins in a brittle-ductile shear zone system. Skeena is a Canadian junior mining exploration company focused on developing prospective precious and base metal properties in the Golden Triangle of northwest British Columbia, Canada.
In June 2023, Skeena commissioned SRK to provide resource estimation technical support and validation for an updated Mineral Resource Estimate on the Snip deposit, as well as provide a NI-43101 compliant Technical Report. The effective date of the 2023 Mineral Resource is September 05, 2023.
The services were rendered between June and September 2023 leading to the preparation of the Mineral Resource Statement that was disclosed publicly by Skeena in a news release on September 05, 2023. The effective date of the 2020 NI 43-101 Technical Report is September 26, 2023.
The Technical Report was prepared following the guidelines of the Canadian Securities Administrators’ National Instrument 43-101 and Form 43-101F1. The Mineral Resource Statement reported herein was prepared in conformity with generally accepted CIM “Estimation of Mineral Resources and Mineral Reserves Best Practice Guidelines”.
| 1.2 | Property Location and Ownership |
The Snip Project occurs within the Iskut River region of the Golden Triangle in British Columbia. Stewart, BC, is the nearest district municipality, 105 km to the south southeast. The property is located wholly within NTS map sheet 104B/11 as well as on the Tahltan National Traditional Territory.
The Project covers a total of 4,724.07 hectares (11,673.43 acres) and consists of nine (9) mineral claims and one (1) mineral lease.
In July 2017, Skeena exercised their right to acquire all of Barrick Gold Inc.’s (“Barrick”) 100% “right, title and interest in and to the Property and the Permits” (the “Original Snip Property”), subject to the retention by Barrick of a 51% Back-In Right. In September 2018, Skeena and Hochschild entered into an option agreement for Hochschild to earn in a 60% undivided interest in the Original Snip Property by spending twice the amount Skeena had spent since it originally optioned the Original Snip Property from Barrick. In October of 2021 Hochschild gave notice of its intention to start its earn in. On April 5th, 2023, Hochschild terminated its option to earn 60% of the Snip Gold Project resulting in Skeena reassuming management of the Project and retaining 100% ownership.
| SU/AD | September 2023 |
| SRK Consulting (Canada) Inc Skeena Resources Limited NI 43 -101 Snip Project Canada |
Page |
| 1.3 | Accessibility, Climate, Local Resources, Infrastructure and Physiography |
Access to the Snip Property can be gained either by direct air or boat transportation to the 1.5 km long Bronson Airstrip on the Iskut River. Direct charter flights by fixed wing aircraft can land at the Bronson airstrip maintained by SnipGold Corp., a subsidiary of Seabridge Gold. Vehicle access from Smithers can be achieved by route of Hwy 16 to Kitwanga, then north along highway 37 to the Eskay Mine Road, 3 km south of Bob Quinn. Road access to the McLymont staging area is 45 km west of Bob Quinn and requires a road usage permit from AltaGas. From McLymont, it is a 10-minute helicopter flight to the Snip camp.
Support services for mining and other resource sector industries in the region are provided primarily from the communities of Smithers (pop. 5,400) and Terrace (pop. 11,500). Both communities are accessible by commercial airlines with daily flights to and from Vancouver.
The Snip property lies within the Coast Mountains. The dominant feature of the region is the Stikine Icecap which is centered 80 km to the NW of the property along the Alaska border. The Snip Property lies between the Iskut River, Craig River and Bronson Creek within the Stikine Watershed.
The property lies within the Coastal Western Hemlock zone. The Snip property has almost no alpine vegetation, with sub-alpine flora dominated by scattered Sitka Spruce, with transition to Engelmann Spruce, farther East. At the Bronson Creek level, natural vegetation is Western Hemlock and Sitka Spruce, with riparian populations of cottonwood and spruce. Natural regrowth is rapid, with hemlock and spruce growing to 5 m within 20 years.
| 1.4 | History, Exploration and Drilling |
The history of the camp goes back to the early 1900’s when the Iskut Mining Company staked the first claims on the west side of Bronson Creek in 1907. Following this, the Red Bluff claims were staked in 1909. The first mining was completed between 1908 and 1911 when several short adits were driven into the Red Bluff Porphyry to obtain a bulk sample. The area saw limited work until 1929 when Cominco Ltd. staked 42 claims, however little of interest was found and the claims were abandoned.
Thirty-five years would pass before the Tuksi Mining Company acquired crown grants in 1964. In the same year Jodee Exploration company, Cominco Ltd. and Copper Soo Mining company all staked claims around Tuksi’s grants. In 1965 the Snip discovery outcrop was made by geologists who were surveying a creek gully; the outcrop contained visible gold in a vein. The following year, in 1966, channel sampling on the vein returned assays up to 244 ppm Au over 1.2 m.
The area once again lay dormant for nearly a decade and a half until 1980 when Cominco Ltd. restaked the discovery outcrop on the Snip claims. Between 1980 to 1986, grass roots exploration, soil sampling and trenching were conducted by Cominco. In 1986, Cominco signed a JV agreement with Delaware Resources Corp., who provided funding for the project, and over two years, drilled over 15,000 m. The work outlined the Main Twin Zone on 50 m centers.
| SU/AD | September 2023 |
| SRK Consulting (Canada) Inc Skeena Resources Limited NI 43 -101 Snip Project Canada |
Page |
In 1988, a decision was made to go underground via a portal at the 300 m elevation. An additional 6,800 m of surface drilling, coupled with underground development and related drilling on 12.5 m centers, was completed and by 1989 the first reserve estimate for the Main Twin Zone was calculated at 940,000 tonnes grading 28.5 g/t Au.
The Snip Mine operated between January 1991 and June 1999, first by Cominco Ltd. and then, beginning in 1996, by Homestake Canada Inc. The mine was successfully closed in October 1999. In 2001, the property was acquired by Barrick Gold Inc. (Barrick) as part of its acquisition of Homestake Canada Inc.
The property lay dormant until 2016 when Skeena entered into an agreement with Barrick granting an option to acquire 100% interest in the past producing gold mine and mineral claims.
In 2016, Skeena completed 7,422 m of diamond drilling in 28 holes, collected 668 soil samples and completed 171-line kilometers of airborne magnetic surveying. The majority of drilling was completed on the portion covering the mining lease and was designed to test the targets in the Main Twin and Twin West zones as well as regional targets located on the mineral claims portion of the property. Infill soil sampling was conducted to test the continuity of historical gold anomalies and to add multi-element data in areas which previously only had gold.
In 2017, Skeena acquired 100% right, title and interest in and to the Property and Permits and worked entirely on the mining lease. Work focused on camp expansion along with reopening the 300-portal access road and rehabilitation of the underground. A total of 8,703 m from 62 holes were drilled from underground testing targets including the Main Twin Zone, 150 Veins, 412 Corridor and other footwall structures. In addition, Skeena commissioned a surface mapping LiDAR survey of the property having 25 cm pixel resolution.
In 2018, Skeena completed 6 surface holes totalling 2,121 m targeting the Jim Porphyry and Sky Creek Shear zone, as well as below the western vein extension of the Main Twin Zone. In addition, 46 holes totalling 9,088 m targeting the Main Twin Zone, 412 Corridor and the 200 Footwall Zone was completed to further delineate areas of known mineralization with increased drill density, to expand new zones and confirm historical drilling.
In 2019 Skeena drilled 8 surface holes totalling 1,816 m targeting the 200 Footwall Zone and footwall veins. They were successful in intersecting the footwall, as well as identifying mineralization 75 m deeper. A petrography study to compare biotitic phyllite and Biotite Spotted Unit (BSU) was conducted to test composition relations.
In 2020, Skeena drilled 9 surface holes totaling 5,327 m some of which were designed as infill holes and others to test vein extensions. The main targets were the 130 and 150 veins, and the Main Twin zone.
In 2021, Skeena drilled 95 surface holes totaling 14,608 m and 134 underground holes totaling 15,955 m. The objective was two-fold: to infill drill areas and to test vein extensions predominantly in the S-Veins. This campaign included 8 drill holes that that corresponded spatially in 3-D orientation to 8 historical holes being no more than several meters in 3-D separation. These holes (known as “Twin Holes”) were designed to validate historical drilling at the Snip Mine. The remaining holes targeted the 130 and 150 veins, the 200 Footwall corridor, the 412-corridor, the Main Twin zone, and other footwall structures.
| SU/AD | September 2023 |
| SRK Consulting (Canada) Inc Skeena Resources Limited NI 43 -101 Snip Project Canada |
Page |
In September 2018, Skeena granted Hochschild an option to earn in 60% of the Original Snip Property and Hochschild gave notice in October of 2021 of its intention to start earning-in 60% of Skeena’s interest in the Original Snip Property.
In 2022, Hochschild completed 68 underground holes totaling 9,876 meters. This campaign included 20 drill holes that corresponded spatially in 3-D orientation to 20 historical holes being no more than several meters in 3-D separation. These Twin Holes were designed to validate historical drilling at the Snip Mine. An additional 48 holes were drilled to infill untested areas and to evaluate for vein extensions in the S-Veins and deeper footwall structures. One surface hole totalling 501 m was drilled to target the deep, western down hole extents of the V-Vein sets.
On April 5th, 2023, Hochschild terminated its option to earn 60% of the Snip Gold Project resulting in Skeena reassuming management of the Project and retaining 100% ownership.
| 1.5 | Geology and Mineralization |
The Snip Au (Cu-Mo-Zn) deposit, located within the economically important “Golden Triangle” region, is a structurally controlled mineralized vein and brittle-ductile shear zone system, hosted within a sequence of laminated turbidites of the Upper Triassic Stuhini Group. Mineralization has both Orogenic style gold characteristics as well as mineralogical and paragenetic similarities to porphyry related vein systems, being contemporaneous with the adjacent Early Jurassic Red Bluff porphyry, a calc-alkaline, I-type, magnetite-series intrusion of quartz monzodioritic composition.
Regional investigations have indicated the importance of the Stuhini Group unconformity with the overlying Lower Jurassic Hazelton Group and a major northwest-southeast trending zone, the Bronson corridor. Throughout the “Golden Triangle” major deposits, including the Snip deposit, occur within 2.5 km of this unconformity and numerous mineral occurrences are associated with the Bronson corridor, characterized by the Sky fault system. This wide fault zone likely formed close to the boundary of a rift-type basin, controlled plutonism, fluid circulation and mineralization.
Gold mineralization at the Snip Project has been reported from at least six historical zones, the Main Twin Zone, the 150 Vein, the 130 Vein, the Hangingwall Zone, the Footwall Zone, and the Twin-West Zone. The Main Twin Zone shear-vein system which averages 2.5 m in width and dips 30-60°to the southwest is characterized by mineralogical banding of chlorite-biotite, calcite, quartz, and pyrrhotite-pyrite, with wallrock alteration dominated by inner biotite and outer K-feldspar-calcite-quartz-sericite. Metal association and the importance of potassic alteration suggest a magmatic origin for the ore fluid, supported by the proximity of the Main Twin Zone to the Red Bluff porphyry and lead-isotopic data. More distal veins to the Red Bluff porphyry contain higher zinc, lead and silver contents as expected in a zoned porphyry system. The distribution and abundance of biotite in areas distal to the Red Bluff porphyry and extensive areas containing mineralized veins, suggest a more regional fluid source, possibly an underlying batholithic parent to the Red Bluff porphyry.
| SU/AD | September 2023 |
| SRK Consulting (Canada) Inc Skeena Resources Limited NI 43 -101 Snip Project Canada |
Page |
A distinctive unit at Snip is the Biotite Spotted Unit, a basic to intermediate biotitic dyke that has intruded the vein mineralization. Widths range from several decimeters up to five m with an average width of 2.5-3 m. Although it is unmineralized, it is moderately to strongly altered and biotitized with calcite-pyrite-quartz-sericite-chlorite alteration and is considered to have been emplaced late in the deformation history, after ore formation, but during the waning stages of the hydrothermal system.
In addition to the Red Bluff porphyry other intrusives recognised on the property include the Bronson stock, a poorly documented heterogeneous, medium-grained equigranular plagioclase-rich clinopyroxene-amphibole bearing diorite; the Jim Porphyry stock, interpreted solely from drill hole information comprising both felsic extrusive and intrusive units; and recent lamprophyre and basalt dykes.
| 1.6 | Metallurgical Test Work |
The objective of the metallurgical testing program was to quantify the metallurgical response of samples from the Snip deposit. The programs were designed with the intent to confirm the parameters for process design criteria. The 2020 metallurgical program was completed at Base Metallurgical Laboratories Ltd. (BaseMet Labs) in Kamloops, BC as Project BL661. The testing scope included chemical composition, mineralogy, comminution testing, flotation and gravity testing on two composite samples. Both samples showed excellent gold recovery of 96% and 98%. A Phase 1 metallurgical program was completed in 2021 at BaseMet Labs in Kamloops, BC as Project BL891. The testing scope included mineralogy, gravity concentration testing, flotation and leaching testing on a single composite sample. The sample showed high amenability to gravity concentration, flotation and leaching. The Phase 2 was performed in 2022 also at BaseMet identified as BL1002 on 18 samples. Samples were designed to represent a range of potential mining options and, the range of expected grades. The testing scope included mineralogy, comminution tests, gravity concentration, flotation, leach tests and cyanide destruction tests. The samples showed high resistance to impact breakage and medium hardness in ball mill grinding. Scaled up gravity gold recoveries ranged from 28% to 37%. Combined gravity and flotation gold recoveries ranged from 85% to 96%. Combined gravity and leach gold extractions averaged 96.9% from all samples. Average reagent consumptions included 0.49 kg/t for sodium cyanide and 0.57 kg/t for hydrated lime. Review of the leach test results showed a minor relationship between head grade and leach residue grade but showed no relationship between head grade and recovery. A constant recovery was estimated for economic analysis. The overall plant gold recovery used in the economic analysis is 96%.
| 1.7 | Mineral Resource and Mineral Reserve Estimates |
The Mineral Resource Estimate for the Snip Project (the “2023 Mineral Resource Estimate”) herein was prepared by Skeena Resources using all available information and reviewed and validated by Ms. S. Ulansky, Professional Geologist of SRK Consulting (Canada).
| SU/AD | September 2023 |
| SRK Consulting (Canada) Inc Skeena Resources Limited NI 43 -101 Snip Project Canada |
Page |
The resource is based on historical surface and underground diamond drilling completed by previous Operators in addition to holes drilled on surface and underground by Skeena (2016 to 2021) and Hochschild (2022). The database used to estimate the Snip resource contains a total of 3,999 drill holes for 355,388 m of drilling. Of this total amount, historical holes total 3,542 for a meterage of 279,971 m. Skeena has drilled a total of 388 holes totalling 65,040 m, and Hochschild has drilled 69 holes totalling 10,377 m. All historical and recent drilling was audited by SRK. SRK believes that the drilling information is sufficiently reliable to interpret with confidence the boundaries for gold mineralization domains, and that assay data is sufficiently reliable to support estimating mineral resources.
In the opinion of SRK, the block model resource estimates reported herein are a reasonable representation of the global gold mineral resources found on the Snip Project at the current level of sampling. Mineral resources are reported in accordance with the guidelines of the Canadian Securities Administrators National Instrument 43-101; and have been estimated in conformity with generally accepted CIM “Estimation and Mineral Resource and Reserve Best Practices” guidelines (CIM, 2019). Mineral resources are not mineral reserves and do have demonstrated economic viability.
The vein model was created in Leapfrog GeoTM using economic composite intervals greater than or equal to 1.0 g/t Au if following interpreted structures and displaying mineralization continuity. Locally, lower grades were included in the veins if continuity was displayed. Local minor edits were performed in Maptek Vulcan software. Ninety-four high-grade veins were created to constrain the block model estimate. These were combined into three broad and distinct zones (V-Veins, S-Veins, and TW-Veins), which are unique in orientation, structural interpretation, and statistics; therefore, they were made discrete for resource estimation purposes.
Mineral resources were estimated using Maptek’s Vulcan® software. Two block models were created for computer efficiency: (1) the Main block model, which encompasses the V- and S- Veins and the (2) Twin West block model which encompasses the TW-Veins. Both models were created with 4 m x 4 m x 4 m parent block sizes and 0.5 m x 0.5 m x 0.5 m sub blocks sizes. The models were unrotated.
Assays were composited to 1.5 m using distributed tails methodology within the wireframes, which were also length weighted during estimation. Outlier composites were capped prior to estimation with gold capping values of 350 g/t Au, 100 to 215 g/t Au and 45 to 110 g/t Au in the V-, S- and TW- Veins, respectively.
Variograms were used to determine nuggets, sills and ranges used during estimation as well as for search orientations. In the V- and -S veins that were continuous and greater than 235,000 tonnes, and TW-veins greater than 100,000 tonnes, a dynamic anisotropy (DA) surface was utilized during estimation to honour locally varying vein orientations. Gold grades were estimated in three progressively larger passes using Ordinary Kriging, along with inverse distance squared and polygonal methods for comparisons and validation. The models were validated using visual and statistical methods as well as swath plots. Block tonnages were estimated from volumes using a density of 2.91 g/cm3 within the veins, except for the unmineralized BSU (Biotite Spotted Unit) which used a density of 2.84 g/cm3. The historical holes were validated from a set of twin holes drilled by Skeena and Hochschild in 2021 and 2022. Comparative statistics showed good correlations between the historical and the twin hole gold assays. Blocks within the BSU were coded as waste. Mineral resources have been depleted to account for past production as well as exclude mineralization within a 1 m buffer around historical underground development.
| SU/AD | September 2023 |
| SRK Consulting (Canada) Inc Skeena Resources Limited NI 43 -101 Snip Project Canada |
Page |
Classification followed CIM guidelines (CIM, 2019) and Indicated and Inferred resources were classified as follows.
| · | The Indicated category is defined by blocks interpolated during Pass 1 and 2 only, using a minimum of 3 drill holes, and an average distance of less than 35 meters (approximately 70% of the average variogram range). |
| · | The Inferred category is defined by blocks interpolated during Pass 1, 2 and 3, using a minimum of 2 drill holes and an average distance less than 75 meters (approximately 50% more than the average variogram range) |
| · | Blocks were locally reclassified to reduce ‘spotted’ Indicated resources within Inferred resources, and vice versa. |
The calculated underground cut-off grade was determined to be 2.5 g/t Au. Reasonable prospects for eventual economic extraction were determined by means of applying reasonable stope optimizer parameters in Deswik® software. The resources are reported in-situ and undiluted within the veins in potentially economical and minable underground long hole stope shapes.
The Snip Project contains 2.739 million tonnes grading 9.35 g/t Au in the Indicated category and 0.499 million tonnes grading 7.10 g/t Au in the Inferred category. The mineral resources as estimated and reported on September 05, 2023, are summarized in Table 1-1.
Table 1-1: Mineral Resource Statement*, Snip Project, Iskut River Region, SRK Consulting, effective date September 05, 2023
| Category | Zone | Tonnes (000) |
Contained Grade Au (g/t) |
Contained Ounces Au (000) |
||||||||||
| Main – V | 850 | 9.59 | 262 | |||||||||||
| Indicated | Main – S | 1,718 | 9.28 | 513 | ||||||||||
| Twin West | 171 | 8.69 | 48 | |||||||||||
| Total Indicated | 2,739 | 9.35 | 823 | |||||||||||
| Main – V | 115 | 7.38 | 27 | |||||||||||
| Inferred | Main – S | 323 | 6.22 | 65 | ||||||||||
| Twin West | 61 | 11.02 | 22 | |||||||||||
| Total Inferred | 499 | 7.10 | 114 | |||||||||||
*Notes to accompany the Mineral Resource Estimate statement:
| · | Mineral resources are not mineral reserves as they do not have demonstrated economic viability. |
| SU/AD | September 2023 |
| SRK Consulting (Canada) Inc Skeena Resources Limited NI 43 -101 Snip Project Canada |
Page |
| · | As defined by NI 43-101, the Independent and Qualified Person is Ms. S. Ulansky, PGeo of SRK Consulting (Canada) who has reviewed and validated the Mineral Resource Estimate. |
| · | The effective date of the Mineral Resource Estimate is September 05, 2023. |
| · | The number of metric tonnes and ounces were rounded to the nearest thousand. Any discrepancies in the totals are due to rounding. |
| · | Reasonable prospects for eventual economic extraction were determined by means of applying stope optimization parameters summarized in Table 14-14. Resources are reported in-situ and undiluted within the veins contained in potentially economical and minable underground long hole stope shapes. |
| · | Cut-off grades are based on a price of US$1,700 per ounce of gold. |
| · | Estimates use metric units (meters, tonnes and g/t). Metals are reported in troy ounces (metric tonne * grade / 31.10348) |
| · | CIM definitions were followed for the classification of mineral resources. |
| · | Neither the company nor SRK is aware of any known environmental, permitted, legal, title-related, taxation, socio-political, marketing or other relevant issue that could materially affect this mineral resource estimate. |
| 1.8 | Interpretations and Conclusions |
Key interpretations and conclusions are based on SRK’s development of the Mineral Resource estimate, knowledge of the Snip mineralization system, as well as from site visit evaluations conducted in July 2020:
| · | Gold mineralization occurs in structurally controlled mineralized veins in a brittle-ductile shear zone system, hosted within a sequence of laminated turbidites of the Upper Triassic Stuhini Group. Mineralization has both Orogenic style gold characteristics as well as mineralogical and paragenetic similarities to porphyry related vein systems, being contemporaneous with the adjacent Early Jurassic Red Bluff porphyry, a calc-alkaline, I-type, magnetite-series intrusion of quartz monzodioritic composition. |
| · | Ninety-four narrow, high-grade lodes were modelled, which were combined into three distinct zones based on structure and orientation (V-, S-, TW- Veins). |
| · | The understanding of the regional geology and lithological and structural controls of mineralization are sufficient to support estimation of Mineral Resources. |
| · | The quantity and quality of the lithological, collar and down-the-hole survey data collected are sufficient to support Mineral Resources. Sample data density and distribution is adequate to build meaningful litho-structural models reflective of the overall deposit type. |
| · | SRK reviewed the database and is of the opinion that the current sample preparation, security, and analytical procedures meet industry-standard practices. SRK also believes that the Skeena validated database is of a standard that is acceptable for creating an unbiased, representative Mineral Resource Estimate of the Snip deposit. |
| SU/AD | September 2023 |
| SRK Consulting (Canada) Inc Skeena Resources Limited NI 43 -101 Snip Project Canada |
Page |
| · | SRK reviewed the analytical quality control data accumulated by Skeena during 2016 to 2021 and Hochschild in 2022. SRK confirms that gold grades are reasonably well reproduced and reliable for resource estimation purposes. Similarly, a QA/QC analysis showed no obvious bias or errors. |
| · | Twin drill hole evaluations of historical and recent drill holes show comparable gold intercepts and grade, allowing the historical dataset to be utilized without any constraints. |
| · | Geostatistical analyses were carried out on the composite data to select capping levels and derive estimation parameters. Gold was estimated into the block model using Ordinary Kriging informed from capped, composited data. Density, used for deriving tonnages, was coded into each block based on specific gravity measurements in select lithology groupings. |
| · | Mineral Resources were estimated and classified following CIM best practices. |
| · | The 2023 Mineral Resource demonstrates that the project has development potential as an underground mining operation. Stope optimized shapes were created using reasonable assumptions for long hole mining with a cut-off grade of 2.5 g/t Au. |
| · | Modelled veins delineate in-situ gold grade and do not consider minimum width or potential planned mining dilution, which would be considered during conversion of mineral resources to mineral reserves. |
| · | Indicated Mineral Resources are estimated to be 2.739 million tonnes grading 9.35 g/t Au. |
| · | Inferred Mineral Resources are estimated to be 0.499 million tonnes grading 7.10 g/t Au. |
| · | Approximately one tenth of the resource is classified as Inferred. It is reasonable to expect that part of the Inferred mineral resource may be upgraded to the Indicated mineral resource category with continued drilling. |
| · | Additionally, it is reasonable to expect an increase to the Inferred category if future exploration campaigns test underexplored areas and/or the continuity of sparsely drilled regions. |
The 2023 Mineral Resource Estimate involves several key changes when compared to the 2020 Mineral Resource Estimate. The changes are as follows:
| · | Additional drill holes included. |
| · | Expanded and updated mineralization vein model volumes. |
| · | Overall reduction in grade in the additional drill holes. |
| · | Twin drilling program validation of all historical holes. |
| · | Lifting of the 2020 40-meter omnidirectional 3-D buffer for the Indicated category due to the twin drilling program. |
| · | Stope optimizer adjustments. |
| SU/AD | September 2023 |
| SRK Consulting (Canada) Inc Skeena Resources Limited NI 43 -101 Snip Project Canada |
Page |
| · | Additional specific gravity measurements collected and used to update the model density values. |
| 1.9 | Recommendations |
In reviewing the compiled drill hole database, geological interpretation and mineral resource estimate for the Snip Project, SRK makes the following recommendations:
| 1.9.1 | Geology/Exploration |
| · | The intimate association of biotite with shear zones and veining and overall homogeneity of potassic (biotitic) alteration suggests that the alteration envelope may help constrain fluid and mineralization pathways. It is recommended that alteration data are used to investigate the potential to delineate alteration domains and generate alteration models to identity potential ore shoots within the shear zone system. This should be completed as a part of the standard geological logging and mapping observations, and as such, does not need a separate budget. |
| · | All occurrences and locations of visible gold should be standardized and combined with drill hole data to generate a high-grade gold model. This should be used to define zones of high grade that can potentially be used as a predictive tool to delineate further zones of higher-grade gold and/or ore shoots within the shear zone system. This will assist in improved local resolution of high-grade zones for resource estimation. This should be completed as a part of the standard geological logging and mapping process, and as such, would not require a separate budget. |
| · | A detailed vein model was constructed in Leapfrog Geo®. To further substantiate the model and elucidate the finer project scale structural details that are relevant to Snip mineralization, an onsite structural mapping survey is recommended. Budget recommendations are provided in Table 18-1. |
| · | Regional geology and structure play a significant role in interpreting exploration geological datasets. To effectively understand geological context within the broader district, an improved regional geology map needs to be sourced and included into the Leapfrog Geo® model. |
| · | The existing LiDAR survey covers the mineral lease area only. To extract subtle property-wide structural details, which may be applied to regional exploration, an expanded LiDAR survey that covers the entire property is recommended with an appropriate structural interpretation: |
| – | In tandem with the LiDAR survey, a high-resolution magnetics survey using drone surveying technologies would enhance future structural interpretations. This geophysical survey may be combined with the regional LiDAR survey to reduce exploration costs. Costs associated with this LiDAR-add one have not been included. |
| · | Knowing that Snip ore is structurally controlled, advancing the project depends heavily on understanding the structural complexities of the deposit. Oriented core drilling facilitates measurements of the directional properties in the rock and is used to measure bedding, foliation, vein orientations, shear fabrics and other kinematic indicators. SRK recommends the use of oriented core drilling for future drilling campaigns. |
| SU/AD | September 2023 |
| SRK Consulting (Canada) Inc Skeena Resources Limited NI 43 -101 Snip Project Canada |
Page |
| · | Limited drilling has been conducted on the Jim Porphyry and Jim Porphyry south areas which exhibit similar alteration and lithological similarities with the Main Twin Zone. Knowing the narrow and variable nature of mineralization on the property, an additional 2 holes are recommended to fully test these targets. |
| 1.9.2 | Sampling |
| · | The grade appropriate standard needs to be inserted into the sample series. This is particularly important for the high-grade standards where they should, ideally, be inserted into a series of high-grade intervals only. |
| · | Preparation and pulp duplicates are inserted by the lab at a sequence that the lab defines. Additional preparation and pulp duplicates should be requested at intervals defined by Skeena to avoid intralab bias and to reflect the entire gold range that defines the Snip Project. This should be completed as a part of the standard sampling process, and as such, does not need a separate budget. |
| · | External check samples need to be consistently taken and processed at SGS Canada in a timely manner. This should be completed as a part of the standard sampling process, and as such, does not need a separate budget. |
| · | Sample rejects and pulps are not currently saved and stored. In the event of core damage, loss or tampering, rejects and pulps will serve to validate the deposit’s primary asset – the assay database. Therefore, sample rejects and pulps should be stored as a part of the standard QA/QC process, and as such, does not need a separate budget. |
| 1.9.3 | Resource Model |
| · | Due to the high degree of grade variability within the Snip deposit, SRK recommends conducting a conditional simulation study to assess the impact of localized grade variability within the mineral resource estimate and on future mine design and production planning. The simulated model could also be used to reconcile against historical production based on available historical stope and underground development wireframes. |
| 1.9.4 | Historical Confirmation |
| · | A basic property survey was conducted in 2017, whereby a new survey control point network was established. Differential GPS points from the 300-level portal were expanded underground and traversed up the ramp using a total station. To further this survey and to validate the volume of depleted material, a study to determine the accuracy of the levels relative to the historical wireframes is recommended. This should be completed as part of the standard data management process for the Snip Project, and as such, does not need a separate budget: |
| – | Depending on the outcome of the study, and if there are major differences in elevation and position, a more detailed survey will need to be undertaken. |
| SU/AD | September 2023 |
| SRK Consulting (Canada) Inc Skeena Resources Limited NI 43 -101 Snip Project Canada |
Page |
| – | Measured blocks have not been accounted for in the 2023 Mineral Resource Statement due to Client-specific requests. However, blocks that qualify in terms of having quantity, grade or quality, densities, shape and physical characteristics that are estimated with confidence to allow the application of modifying factors, are currently accessible. To convert additional areas from Indicated to Measured, having approximately 12.5 m centers, updated classification parameters need to be generated in future resource model runs. This process may be conducted as part of SRK’s proposed resource model conditional simulation study, whereby mineral resource classification criteria are reassessed to potentially support Measured resources. |
| SU/AD | September 2023 |
| SRK Consulting (Canada) Inc Skeena Resources Limited NI 43 -101 Snip Project Canada |
Page |
Table of Contents
| 1 | Executive Summary | ii | ||
| 1.1 | Introduction | ii | ||
| 1.2 | Property Location and Ownership | ii | ||
| 1.3 | Accessibility, Climate, Local Resources, Infrastructure and Physiography | iii | ||
| 1.4 | History, Exploration and Drilling | iii | ||
| 1.5 | Geology and Mineralization | v | ||
| 1.6 | Metallurgical Test Work | vi | ||
| 1.7 | Mineral Resource and Mineral Reserve Estimates | vi | ||
| 1.8 | Interpretations and Conclusions | ix | ||
| 1.9 | Recommendations | xi | ||
| 1.9.1 | Geology/Exploration | xi | ||
| 1.9.2 | Sampling | xii | ||
| 1.9.3 | Resource Model | xii | ||
| 1.9.4 | Historical Confirmation | xii | ||
| 2 | Introduction and Terms of Reference | 1 | ||
| 2.1 | Scope of Work | 1 | ||
| 2.2 | Work Program | 2 | ||
| 2.3 | Basis of Technical Report | 2 | ||
| 2.4 | Qualifications of SRK and SRK Team | 3 | ||
| 2.5 | Site Visit | 4 | ||
| 2.6 | Acknowledgement | 4 | ||
| 2.7 | Declaration | 4 | ||
| 3 | Reliance on Other Experts | 5 | ||
| 4 | Property Description and Location | 6 | ||
| 4.1 | Mineral Tenure | 8 | ||
| 4.2 | Underlying Agreements | 11 | ||
| 4.3 | Barrick Agreement | 11 | ||
| 4.4 | Hochschild Option | 11 | ||
| 4.5 | Historical NSR | 12 | ||
| 4.6 | Environmental Issues | 12 | ||
| 5 | Accessibility, Climate, Local Resources, Infrastructure and Physiography | 13 | ||
| 5.1 | Accessibility | 13 | ||
| 5.1.1 | Aircraft Infrastructure | 13 | ||
| 5.1.2 | Road Access | 15 | ||
| 5.2 | Local Resources and Infrastructure | 15 | ||
| SU/AD | September 2023 |
| SRK Consulting (Canada) Inc Skeena Resources Limited NI 43 -101 Snip Project Canada |
Page |
| 5.3 | Climate and Vegetation | 15 | ||
| 5.3.1 | Climate | 15 | ||
| 5.3.2 | Vegetation | 16 | ||
| 5.4 | Physiography | 16 | ||
| 6 | History | 18 | ||
| 6.1 | Exploration, 1900 - 1987 | 18 | ||
| 6.2 | Development and Mining, 1988 – 1999 | 19 | ||
| 6.3 | Post Mining, 1999-2016 | 25 | ||
| 6.4 | Mine Closure | 25 | ||
| 6.5 | Environmental Monitoring | 26 | ||
| 7 | Geological Setting and Mineralization | 27 | ||
| 7.1 | Regional Geology | 27 | ||
| 7.2 | Property Geology | 29 | ||
| 7.2.1 | Lithology | 31 | ||
| 7.3 | Structure | 33 | ||
| 7.4 | Mineralization | 34 | ||
| 8 | Deposit Types | 36 | ||
| 9 | Exploration | 38 | ||
| 9.1 | 2016 | 38 | ||
| 9.1.1 | Geochemistry | 38 | ||
| 9.1.2 | Geophysics | 41 | ||
| 9.2 | 2017 | 41 | ||
| 9.2.1 | LiDAR Survey | 41 | ||
| 9.3 | 2019 | 41 | ||
| 9.3.1 | Petrography | 41 | ||
| 10 | Drilling | 44 | ||
| 10.1 | Historical Drilling (pre-1999) | 44 | ||
| 10.2 | Skeena Resources Drilling (2016 to 2021) | 47 | ||
| 10.3 | Hochschild Drilling (2022) | 47 | ||
| 10.4 | Drill Coordinates, Downhole Surveys and Contractors | 48 | ||
| 10.4.1 | Historical | 48 | ||
| 10.4.2 | Skeena Drilling | 48 | ||
| 10.4.3 | Hochschild Drilling | 49 | ||
| 10.5 | Drill Hole Logging | 50 | ||
| 10.6 | Recovery | 50 | ||
| 10.7 | Completion of Drilling | 50 | ||
| SU/AD | September 2023 |
| SRK Consulting (Canada) Inc Skeena Resources Limited NI 43 -101 Snip Project Canada |
Page |
| 10.8 | Skeena Drilling | 50 | ||
| 10.8.1 | 2016 – Surface Drilling | 50 | ||
| 10.8.2 | 2017 – Underground Drilling | 51 | ||
| 10.8.3 | 2018 – Surface Drilling | 54 | ||
| 10.8.4 | Skeena Underground Drilling, 2018 | 54 | ||
| 10.8.5 | Skeena Surface Drilling, 2019 | 56 | ||
| 10.8.6 | Skeena Surface Drilling, 2020 | 56 | ||
| 10.8.7 | Skeena Surface Drilling, 2021 | 56 | ||
| 10.8.8 | Skeena Underground Drilling, 2021 | 57 | ||
| 10.8.9 | Hochschild Surface Drilling, 2022 | 57 | ||
| 10.8.10 | Hochschild Underground Drilling, 2022 | 57 | ||
| 10.9 | SRK Comments | 57 | ||
| 11 | Sample Preparation, Analyses, and Security | 59 | ||
| 11.1 | Sample Preparation, Analysis, and Security | 59 | ||
| 11.1.1 | Drill Hole Sampling | 59 | ||
| 11.1.2 | Sample Preparation and Analysis by Analytical Laboratory | 61 | ||
| 11.1.3 | Specific Gravity and Bulk Density | 62 | ||
| 11.2 | Quality Assurance and Quality Control | 62 | ||
| 11.3 | Qualified Person’s Opinion on Quality Assurance and Quantity Control | 76 | ||
| 12 | Data Verification | 78 | ||
| 13 | Mineral Processing and Metallurgical Testing | 83 | ||
| 13.1 | Introduction | 83 | ||
| 13.2 | Metallurgical Test Work | 83 | ||
| 13.2.1 | Historical Operations at the Snip Mine | 83 | ||
| 13.2.2 | 2020 Metallurgical Test Work Program | 83 | ||
| 13.2.3 | 2021 Phase 1 Metallurgical Test Work Program | 87 | ||
| 13.2.4 | Phase 2 2022 Metallurgical Testing Program | 91 | ||
| 13.3 | Deleterious Elements | 104 | ||
| 13.4 | Recovery Estimates | 104 | ||
| 14 | Mineral Resource Estimates | 105 | ||
| 14.1 | Introduction | 105 | ||
| 14.2 | Resource Database | 106 | ||
| 14.3 | Solid Body Modelling | 109 | ||
| 14.3.1 | Geological Modelling | 109 | ||
| 14.3.2 | Mineralization Model | 109 | ||
| 14.3.3 | Historical Mining Zones | 112 | ||
| SU/AD | September 2023 |
| SRK Consulting (Canada) Inc Skeena Resources Limited NI 43 -101 Snip Project Canada |
Page |
| 14.3.4 | Underground Workings | 114 | ||
| 14.4 | Data Analysis | 116 | ||
| 14.4.1 | Sample length | 116 | ||
| 14.4.2 | Assay Grade Summary | 117 | ||
| 14.4.3 | Unsampled Intervals | 117 | ||
| 14.5 | Compositing | 118 | ||
| 14.6 | Evaluation of Outliers | 119 | ||
| 14.7 | Statistical Analysis and Variography | 123 | ||
| 14.8 | Specific Gravity | 128 | ||
| 14.9 | Block Model and Grade Estimation | 129 | ||
| 14.10 | Model Validation | 133 | ||
| 14.10.1 | Block Model Visual Validation | 133 | ||
| 14.10.2 | Global Grade Bias Check | 137 | ||
| 14.10.3 | Local Grade Bias Check | 137 | ||
| 14.11 | Mineral Resource Classification | 141 | ||
| 14.12 | Mineral Resource Statement | 143 | ||
| 14.13 | Comparison to Previous Mineral Resource Estimate | 149 | ||
| 14.14 | Factors that May Affect the Mineral Resource Estimates | 150 | ||
| 14.15 | Responsibility for the Snip Resource Estimate | 151 | ||
| 15 | Adjacent Properties | 152 | ||
| 15.1 | SnipGold Corp. (a Subsidiary of Seabridge Gold) | 152 | ||
| 15.1.1 | Stonehouse Deposit | 152 | ||
| 15.1.2 | Bronson Slope | 154 | ||
| 16 | Other Relevant Information | 155 | ||
| 16.1 | Road Access | 155 | ||
| 16.2 | Hydroelectric Infrastructure | 155 | ||
| 17 | Interpretation and Conclusions | 156 | ||
| 17.1 | Mineral Tenure, Surface Rights, Agreements, and Royalties | 156 | ||
| 17.2 | Geology and Mineralization | 156 | ||
| 17.3 | Data Analysis | 156 | ||
| 17.4 | Mineral Resource Estimation | 157 | ||
| 18 | Recommendations | 158 | ||
| 18.1 | Geology/Exploration | 158 | ||
| 18.2 | Sampling | 159 | ||
| 18.3 | Resource Model | 159 | ||
| 18.4 | Historical Confirmation | 159 | ||
| SU/AD | September 2023 |
| SRK Consulting (Canada) Inc Skeena Resources Limited NI 43 -101 Snip Project Canada |
Page |
| 19 | Acronyms and Abbreviations | 161 |
| 20 | References | 162 |
| 21 | Date and Signature Page | 166 |
| SU/AD | September 2023 |
| SRK Consulting (Canada) Inc Skeena Resources Limited NI 43 -101 Snip Project Canada |
Page |
List of Tables
| Table 1-1: Mineral Resource Statement*, Snip Project | viii |
| Table 2-1: Qualified Persons who prepared or contributed to the Technical Report | 3 |
| Table 2-2: Other Experts who assisted the Qualified Persons | 3 |
| Table 4-1: Mineral claim information | 10 |
| Table 4-2: Mineral lease information | 10 |
| Table 6-1: Snip Mine production by zone (Homestake, 1998) | 21 |
| Table 6-2: Snip Mine production by mining method | 21 |
| Table 6-3: Plant production annual summaries | 22 |
| Table 7-1: Mineralization types in the Main Twin Zone (Rhys, 1993) | 35 |
| Table 10-1: Summary of historical surface and underground holes drilled by year | 44 |
| Table 10-2: Skeena surface and underground drill hole targets | 47 |
| Table 10-3: Skeena surface and underground drill hole targets | 47 |
| Table 10-4: Significant Intercepts from the 2016 drill program | 51 |
| Table 10-5: Significant Intercepts from the 2019 drill program | 56 |
| Table 11-1: Sample preparation and analytical methods conducted on Snip Project | 61 |
| Table 11-2: Specific gravity measurements between 2016 and 2022 | 62 |
| Table 11-3: Summary of field control samples per assay year | 65 |
| Table 11-4: Standards utilized between the 2016 and 2022 drilling campaigns | 66 |
| Table 11-5: Summary of standards inserted per assay year, including failure results | 66 |
| Table 11-6: Blank failures per assay year | 72 |
| Table 11-7: No. of duplicates and percentages per year | 74 |
| Table 13-1: 2020 Samples - Chemical Analysis | 84 |
| Table 13-2: Bond Mill Work Index Determination Determined at 106 microns Classification Size | 85 |
| Table 13-3: Rougher/Gravity results | 86 |
| Table 13-4: 2021 Master Composite Sample Assays | 88 |
| Table 13-5: 2021 Master Composite Sample - Bulk Mineralogy Analysis | 88 |
| Table 13-6: 2021 Master Composite Sample Sulphur Deportment Results | 89 |
| Table 13-7: Snip 2021 E-GRG Test Results | 89 |
| Table 13-8: Snip Phase 1 Leach Test Conditions | 90 |
| Table 13-9: Snip 2021 Leach Test Results | 90 |
| SU/AD | September 2023 |
| SRK Consulting (Canada) Inc Skeena Resources Limited NI 43 -101 Snip Project Canada |
Page |
| Table 13-10: Snip 2021 Combined Gravity/Flotation Leach Test Results | 90 |
| Table 13-11: 2022 Metallurgical Samples | 91 |
| Table 13-12: Snip Phase 2 Sample Assays | 94 |
| Table 13-13: 2022 Samples Bulk Mineralogy Analysis (BMA) | 95 |
| Table 13-14: Snip Comminution Tests Results | 97 |
| Table 13-15: Snip Phase 2 E-GRG Test Results | 97 |
| Table 13-16: Snip 2022 Flotation Tests Results | 98 |
| Table 13-17: 2022 Leach Test Results | 99 |
| Table 13-18: 2022 Variability Samples Leach Test Result | 100 |
| Table 13-19: Snip Pre-Leach Dynamic Thickening Results | 103 |
| Table 13-20: Snip Pre-Leach Thickener Underflow Rheology Test Results | 103 |
| Table 14-1: Skeena drill hole database | 106 |
| Table 14-2: Zone volume difference between 2020 and 2023 | 109 |
| Table 14-3: Model naming convention and volumes | 110 |
| Table 14-4: Zones, number of veins, and associated historical name equivalents | 112 |
| Table 14-5: Summary statistics of length-weighted gold assays by zone | 117 |
| Table 14-6: Number of meters and percent of non-sampled meters within each of the zones | 118 |
| Table 14-7: Comparison of assay data to 1.5 m gold composites by domain | 119 |
| Table 14-8: Outlier threshold values and summary statistics of 1.5 m gold composites | 120 |
| Table 14-9: Gold variogram parameters per domain | 124 |
| Table 14-10: Specific gravity by lithology | 128 |
| Table 14-11: Block model details and specifications | 129 |
| Table 14-12: Estimation parameters | 132 |
| Table 14-13: Global gold grade bias | 137 |
| Table 14-14: Assumptions considered for stope optimization | 143 |
| Table 14-15: Snip underground Mineral Resource Statement as of September 05, 2023. | 144 |
| Table 14-16 Mean assay grade comparison | 149 |
| Table 14-17: Percent difference between the 2020 and 2023 MRE’s | 150 |
| Table 18-1: Estimated Cost for the Exploration Program Proposed for the Snip Project | 160 |
| SU/AD | September 2023 |
| SRK Consulting (Canada) Inc Skeena Resources Limited NI 43 -101 Snip Project Canada |
Page |
List of Figures
| Figure 4-1: General location of the Snip Project | 7 |
| Figure 4-2: Land tenure map | 9 |
| Figure 5-1: Project access | 14 |
| Figure 5-2: View of the Snip Project looking south west | 17 |
| Figure 6-1: Snip mining operation, circa 1998, looking southwest | 20 |
| Figure 6-2: Recovery of gold from historical Snip Mine, circa 1998 | 22 |
| Figure 6-3: Mining at the historical Snip Mine, circa 1998 | 23 |
| Figure 6-4 Snip Mine underground mine workings | 24 |
| Figure 7-1: Regional Geology of the Bronson corridor area (Kyba and Nelson, 2015) | 28 |
| Figure 7-2 Property geology map | 30 |
| Figure 8-1: Schematic Geologic History of the Iskut River | 37 |
| Figure 9-1: Gold soil survey sample locations in ppb | 40 |
| Figure 9-2: 2016 geophysical survey magnetics, total field intensity | 42 |
| Figure 9-3: LiDAR survey map of Twin West and the Main Twin Zone area | 43 |
| Figure 10-1 Distribution of surface drilling on the Snip Project | 45 |
| Figure 10-2 Distribution of underground drilling at the Snip Project | 46 |
| Figure 10-3: Cross section 4895E of the unmined eastern Main Twin Zone | 52 |
| Figure 10-4: Cross section 4475E of the lower unmined Main Twin Zone | 53 |
| Figure 10-5: Cross section 4850E of the eastern Main Twin Zone | 55 |
| Figure 10-6: Cross section 4850E of the 412 area showing expansion of the veins from the 2021 drill program | 58 |
| Figure 11-1: Snip camp site core shack | 59 |
| Figure 11-2: Drill core cross piles at the Snip camp (photograph courtesy of C. Chung, 2020) | 60 |
| Figure 11-3: Routine quality control flow chart | 63 |
| Figure 11-4: Quarterly quality control flow chart | 64 |
| Figure 11-5: 2021 and 2022 gold control chart for standard CDN-GS-7J | 68 |
| Figure 11-6: 2021 and 2022 gold control chart for standard CDN-GS-25A | 69 |
| Figure 11-7: 2021 and 2022 gold control chart for standard CDN-GS-2W | 70 |
| Figure 11-8: 2021 and 2022 gold control chart for standard CDN-ME-1709 | 71 |
| Figure 11-9: 2020 to 2021 marble garden rock blanks | 72 |
| SU/AD | September 2023 |
| SRK Consulting (Canada) Inc Skeena Resources Limited NI 43 -101 Snip Project Canada |
Page |
| Figure 11-10: 2022 certified blank material (CDN-BL-10 Coarse) | 73 |
| Figure 11-11: 2022 prep duplicate scatter plot | 74 |
| Figure 11-12: 2022 pulp duplicate scatter plot | 75 |
| Figure 11-13: 2022 resample duplicate scatter plot | 75 |
| Figure 11-14: 2022 check assay chart | 76 |
| Figure 12-1: Log Q-Q plot of historical holes (Y axis) | 78 |
| Figure 12-2: Down dip view of all twin holes (in black) in relation to all Snip drilling | 79 |
| Figure 12-3. Equivalent vein intercepts for a twin pair | 80 |
| Figure 12-4. Thompson Howarth plot of all the equivalent vein intercept pairs | 81 |
| Figure 13-1: Sample Locations of the 2020 Metallurgical Intervals. Red = Composite 1 and Blue = Composite 2 | 84 |
| Figure 13-2: 2021 Snip Metallurgical Drill Hole Locations | 87 |
| Figure 13-3: Snip Phase 2 Metallurgical Test Samples Locations; Part 1 | 93 |
| Figure 13-4: 2022 Metallurgical Test Samples Locations; Part 2 | 93 |
| Figure 13-5: 2022 Comminution Test Samples Locations | 94 |
| Figure 13-6: 2022 Leach Tests Recovery as a Function of Head Grade | 101 |
| Figure 13-7: Dynamic Thickening Test Apparatus | 102 |
| Figure 14-1: Plan view of drill hole traces in the Snip database, excluding furthermost holes | 107 |
| Figure 14-2: Plan view of the new drill holes used in the updated 2023 MRE | 108 |
| Figure 14-3: Oblique view of the Snip vein model showing the V-veins | 111 |
| SU/AD | September 2023 |
| SRK Consulting (Canada) Inc Skeena Resources Limited NI 43 -101 Snip Project Canada |
Page |
| Figure 14-4: Oblique view showing the V- and S- vein domains in relation to historical areas | 113 |
| Figure 14-5: Section 4500E showing historical underground development | 115 |
| Figure 14-6: Histogram statistics of vein-coded assay sample lengths | 116 |
| Figure 14-7: Log probability curve | 117 |
| Figure 14-8: V-veins cumulative log probability showing the chosen capping threshold for each domain | 121 |
| Figure 14-9: S-veins cumulative log probability plot showing the chosen capping thresholds for each domain | 122 |
| Figure 14-10: TW-veins cumulative log probability plot showing the chosen capping thresholds for each domain | 123 |
| Figure 14-11: V-veins experimental variograms and models | 125 |
| Figure 14-12: S-vein experimental variograms and models in domain 201 only | 125 |
| Figure 14-13: S-vein experimental variograms and models vein in domain 202 only | 126 |
| Figure 14-14: S-vein experimental variograms and models in domain 203 only | 126 |
| Figure 14-15: S-vein experimental variograms and models in domain 200 (all remaining veins) | 127 |
| Figure 14-16: TW experimental variograms and models | 127 |
| Figure 14-17: Snip Project block model extents for the Main and Twin West block model areas | 130 |
| Figure 14-18: Visual validation of blocks grades versus composites on Section 4540E, looking west | 134 |
| Figure 14-19: Visual validation of blocks grades versus composites on Section 4470E, looking west | 135 |
| Figure 14-20: Visual validation of blocks grades versus composites on Section 4775E, looking west | 136 |
| Figure 14-21: Swath plots for the domains 101 (left) and 102 (right) of the V-veins. Black= OK model, blue= ID2 model, yellow =NN_declus model | 138 |
| Figure 14-22: Swath plots for the domains 201 (left), 202 (middle), and 203 (right) domains of the S-veins. Black= OK model, blue= ID2 model, yellow =NN_declus model | 139 |
| Figure 14-23: Swath plots for the domains 301 (left) and 300 (right) domains of the TW-Veins. Black= OK model, blue= ID2 model, yellow =NN_declus model | 140 |
| Figure 14-24: Plan view of the distribution of Indicated and Inferred classed blocks | 142 |
| Figure 14-25 Plan view and view looking west (inset) of the distribution of potentially economical minable underground stope shapes (orange) | 146 |
| Figure 14-26 Oblique view looking west of the reported resources within the stope optimized shapes in the Main Model | 147 |
| Figure 14-27: Oblique view of the distribution of the reported resources within the stope optimized shapes in the Twin West Model. | 148 |
| Figure 15-1: Adjacent properties to the Snip Project | 153 |
| SU/AD | September 2023 |
| SRK Consulting (Canada) Inc Skeena Resources Limited NI 43 -101 Snip Project Canada |
Page |
| 2 | Introduction and Terms of Reference |
The Snip Project, located in northwest BC, is a high-grade underground gold deposit that has been historically partially mined. The Project is located in the Iskut River region in the Golden Triangle of British Columbia.
Skeena, a junior Canadian mining exploration company focused on developing prospective precious and base metal properties in the Golden Triangle of northwest British Columbia, Canada, owns 100% of the Snip Project.
On June 07, 2023, Skeena commissioned SRK to provide technical support and validation of the updated in-house resource model for the Snip Project, together with an NI 43-101 compliant resource estimate and report. The services were rendered between June and September 2023 leading to the preparation of the mineral resource statement reported herein that was disclosed publicly by Skeena in a news release on September 05, 2023 with a release date of September 26, 2023 for the Technical Report.
This Technical Report documents the mineral resource statement for the Snip Project validated by SRK. It was prepared following the guidelines of the Canadian Securities Administrators’ National Instrument 43-101 and Form 43-101F1. The Mineral Resource Statement reported herein was prepared in conformity with generally accepted CIM “Estimation of Mineral Resources and Mineral Reserves Best Practice Guidelines”.
| 2.1 | Scope of Work |
The scope of work, as defined in a letter of engagement executed on June 07, 2023 between Skeena and SRK, was to provide Skeena with ongoing support and validation of an updated in-house resource estimate that will be used for future preliminary engineering, accompanied by the preparation of an independent technical report published by SRK in compliance with National Instrument 43-101. This work involved the creation, review, and assessment of the following aspects of this project:
| · | Perform a thorough review of the Client-provided database and quality control and quantity control (QA/QC) data and assess for errors or flaws that may hinder the mineral resource estimation process. |
| · | Review the twin drilling data to assess for gold assay and mineralized interval similarities or differences. From the results, evaluate the risk of allowing all historical drill holes (without a 40 m buffer constraint) into the Indicated category, if fulfilling the additional class requirements. |
| · | Review the Snip deposit estimation domains ensuring that they are consistent and appropriate for the underlying interpretation of lithology and mineralization. |
| · | Provide resource estimate guidance and complete an independent check model on the Snip deposit. SRK will suggest appropriate exploratory data analysis values and estimation input parameters. |
| SU/AD | September 2023 |
| SRK Consulting (Canada) Inc Skeena Resources Limited NI 43 -101 Snip Project Canada |
Page |
| · | Fulfill Reasonable Prospects of Eventual Economic Extraction (RPEEE) criteria by running a stope optimizer on the underground resources. |
| · | Review, update, validate and sign-off on a NI 43-101 compliant technical report. |
| · | Recommendations for additional work. |
| 2.2 | Work Program |
The mineral resource statement reported herein is a collaborative effort between Skeena and SRK personnel. The exploration database was compiled and maintained by Skeena and was subsequently audited by SRK. The geological structural model and mineralization domains were initially constructed by SRK in 2020 but have subsequently been updated by Skeena with the 2020 to 2022 drilling data. In the opinion of SRK, the geological model is a reasonable representation of the distribution of the targeted mineralization at the current level of sampling. The geostatistical analysis, variography and grade models were validated by SRK during the months July and August 2023. The mineral resource statement reported herein was disclosed publicly in a news release dated September 05, 2023
The mineral resource statement reported herein was prepared in conformity with generally accepted CIM “Exploration Best Practices” and “Estimation of Mineral Resource and Mineral Reserves Best Practices” guidelines. This technical report was prepared following the guidelines of the Canadian Securities Administrators National Instrument 43-101.
The technical report was assembled in the SRK Vancouver office during the month of September 2023.
| 2.3 | Basis of Technical Report |
This report is based on information provided by Skeena throughout the course of SRK’s investigations. SRK performed a site visit to the Snip Project on July 27 to July 30, 2020 and has no reason to doubt the reliability of the information provided by Skeena. This technical report is based on the following sources of information:
| · | Regional geological maps, papers and assessment reports; |
| · | Property geology maps, papers, assessment reports and data; |
| · | Rhys (1993) Master’s Thesis; |
| · | Discussions with Skeena personnel; |
| · | Inspection of the Snip Project area, including portals, outcrop and drill core surface collars; and |
| · | Drill core evaluations and inspection. |
| SU/AD | September 2023 |
| SRK Consulting (Canada) Inc Skeena Resources Limited NI 43 -101 Snip Project Canada |
Page |
| 2.4 | Qualifications of SRK and SRK Team |
The SRK Group comprises over 1,000 professionals, offering expertise in a wide range of resource engineering disciplines. The SRK Group’s independence is ensured by the fact that it holds no equity in any project and that its ownership rests solely with its staff. This fact permits SRK to provide its clients with conflict-free and objective recommendations on crucial judgment issues. SRK has a demonstrated track record in undertaking independent assessments of Mineral Resources and Mineral Reserves, project evaluations and audits, technical reports and independent feasibility evaluations to bankable standards on behalf of exploration and mining companies and financial institutions worldwide. The SRK Group has also worked with a large number of major international mining companies and their projects, providing mining industry consultancy service inputs.
The resource evaluation work and the compilation of this technical report was completed by Ms. Kathi Dilworth, GIT under the supervision of the Qualified Person, Ms. Sheila Ulansky, PGeo [EGBC#36085] (Table 2-1). By virtue of her education, membership to a recognized professional association and relevant work experience, Ms. Ulansky is an independent Qualified Person as this term is defined by National Instrument 43-101. The names and details of Other Experts who have contributed to this Technical Report are listed in Table 2-2. Mr. Andre Deiss, Pr.Sci.Nat Principal Resource Geologist with SRK, reviewed and provided guidance with estimation parameters. He also reviewed drafts of this technical report prior to delivery to Skeena as per SRK internal quality management procedures.
Table 2-1: Qualified Persons who prepared or contributed to the Technical Report
| Qualified Person | Company | Responsibility
/ Role |
Site Visit | Report Section(s) |
| Sheila Ulansky, P.Geo. | SRK | Mineral Resource Estimation | July 2020 | 1 to 12, 14 to 18 |
| Diana Nakou, P.Eng. | SRK | Stope Optimization | n/a | 14 |
| Andre Deiss, Pr,Sci.Nat. | SRK | Peer Review | n/a | All |
| Jeff Austin, P.Eng. | International Metallurgical and Environmental Inc. | Metallurgy | n/a | 13 |
Table 2-2: Other Experts who assisted the Qualified Persons
| Expert | Company | Position | Report Sections |
| Katherine (Kathi) Dilworth GIT | Skeena Resources | Director: Resources and Reserves | 1 to 10, 14 to 16 |
|
Michael Mayer, ADP GIS |
Skeena Resources | Manager, Technical Services | Maps and Figures |
| SU/AD | September 2023 |
| SRK Consulting (Canada) Inc Skeena Resources Limited NI 43 -101 Snip Project Canada |
Page |
| 2.5 | Site Visit |
In accordance with National Instrument 43-101 guidelines, Ms. Ulansky visited the Snip Project between July 27 and July 31, 2020 accompanied by Ms. Dilworth of Skeena Resources.
The purpose of the site visit was to ground truth historical and current surface collar locations, examine drill core intervals within the main lodes, and collect all relevant information for the compilation of this technical report.
During the visit, attention was given to geological and structural controls on the distribution of gold mineralization to validate the extent that mineralization had been extended in the three-dimensional gold mineralization vein model.
SRK was given full access to relevant data and conducted interviews with Skeena’s personnel to obtain information on past exploration work, and to understand procedures used to collect, record, store and analyze historical and current exploration data.
| 2.6 | Acknowledgement |
SRK would like to acknowledge the support and collaboration provided by Skeena personnel for this assignment. Their collaboration was greatly appreciated and instrumental to the success of this project.
| 2.7 | Declaration |
SRK’s opinion contained herein and effective September 05, 2023, is based on information collected by SRK throughout the course of SRK’s investigations, which in turn reflect various technical and economic conditions at the time of writing. Given the nature of the mining business, these conditions can change significantly over relatively short periods of time. Consequently, actual results may be significantly more or less favorable.
This report may include technical information that requires subsequent calculations to derive sub-totals, totals and weighted averages. Such calculations inherently involve a degree of rounding and consequently introduce a margin of error. Where these occur, SRK does not consider them to be material.
SRK is not an insider, associate, or an affiliate of Skeena and neither SRK nor any affiliate has acted as advisor to Skeena, its subsidiaries, or its affiliates in connection with this project. The results of the technical review by SRK are not dependent on any prior agreements concerning the conclusions to be reached, nor are there any undisclosed understandings concerning any future business dealings.
| SU/AD | September 2023 |
| SRK Consulting (Canada) Inc Skeena Resources Limited NI 43 -101 Snip Project Canada |
Page |
| 3 | Reliance on Other Experts |
Skeena contributors to this report include Ms. Dilworth and Mr. Mayer. Not all the authors of this report have met the current requirements of a “Qualified Person”, but all work has been performed under the supervision of independent Qualified Persons.
SRK has not performed an independent verification of land title and tenure information as summarized in Section 4.1 of this report. SRK did not verify the legality of any underlying agreements(s) that may exist concerning the permits or other agreement(s) between third parties.
SRK was informed by Skeena that there are no known litigations potentially affecting the Snip Project.
| SU/AD | September 2023 |
| SRK Consulting (Canada) Inc Skeena Resources Limited NI 43 -101 Snip Project Canada |
Page |
| 4 | Property Description and Location |
The Snip Property is located in the Golden Triangle region of British Columbia, Canada, 105 km north north-west of Stewart and 330 km northwest of Smithers (Figure 4-1). The Snip Project is located at an elevation of 150 m at it’s lowest level to 500 m at it’s highest point above sea level, centered at latitude 56° 39’ 51.35” and longitude 131° 07’ 32.00” or UTM 6282650 N and 369390 E (NAD 83, Zone 9N) (Figure 4-1). The property is located wholly within NTS map sheet 104B/11.
The Snip Project is located on the south side of the Iskut River, 2.0 km south of its confluence with Bronson Creek (Figure 5-1). It is accessible by a 58.5 km, all-weather road, which departs from the Stewart-Cassiar Highway (Highway 37) just south of the Bob Quinn airstrip to McLymont Staging area. From McLymont, it is a 15-minute helicopter flight to the Snip camp location. The mill and mine site were previously located within the Bronson Creek Valley, 1.5 km northeast of the deposit and 120 m above sea level (ASL).
There are no known federal, provincial or regional parks, wilderness or conservancy areas, ecological reserves, or recreational areas near the Snip Property. The area is within the Traditional Territory assertions of the Tahltan Central Government.
| SU/AD | September 2023 |
| SRK Consulting (Canada) Inc Skeena Resources Limited NI 43 -101 Snip Project Canada |
Page |
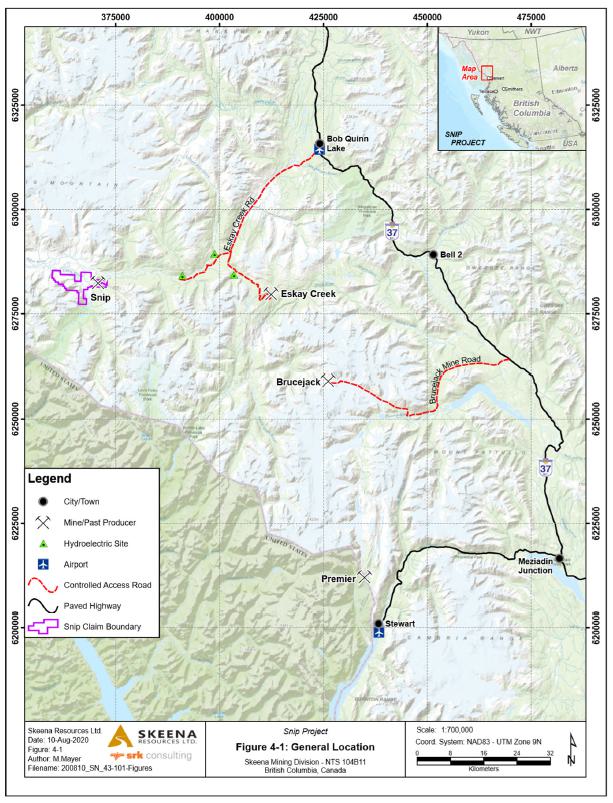
Figure 4-1: General location of the Snip Project
| SU/AD | September 2023 |
| SRK Consulting (Canada) Inc Skeena Resources Limited NI 43 -101 Snip Project Canada |
Page |
| 4.1 | Mineral Tenure |
The status of all mining titles was verified using Mineral Titles Online (“MTO”), the British Columbia government’s online mineral titles administration system at:
http://www2.gov.bc.ca/gov/content/industry/mineral-exploration-mining/mineral-titles/mineral-placer-titles/mineraltitlesonline.
The Snip Project covers a total of 4,724.07 hectares (11,673.43 acres) and is comprised of the following (Figure 4-2).
| · | Nine (9) mineral claims totaling 4,242 hectares (10,482.21 acres) (Table 4-1); and |
| · | One (1) mineral lease totaling 482.07 hectares (1,191.22 acres) (Table 4-2). |
All nine mineral claims and the mineral lease are 100% registered to Skeena Resources Limited.
| SU/AD | September 2023 |
| SRK Consulting (Canada) Inc Skeena Resources Limited NI 43 -101 Snip Project Canada |
Page |
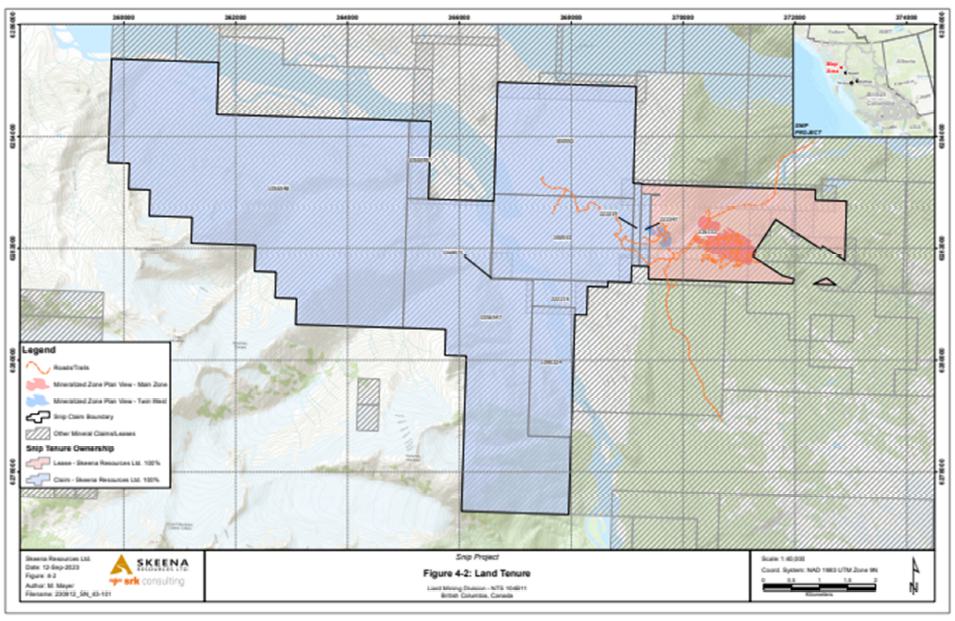
Figure 4-2: Land tenure map
| SU/AD | September 2023 |
| SRK Consulting (Canada) Inc Skeena Resources Limited NI 43 -101 Snip Project Canada |
Page |
Table 4-1: Mineral claim information
| Tenure Number |
Claim Name | Description | Issue Date | Good to Date | Area (Hectares) |
Owner Name | No. of Owners |
| 222219 | SKY 3 | Four Post Claim | 1982-09-13 | 2029-07-15 | 500 | SKEENA RESOURCES LIMITED | 1 |
| 222347 | SNIP 3 | Four Post Claim | 1983-10-20 | 2029-07-15 | 75 | SKEENA RESOURCES LIMITED | 1 |
| 300552 | JIM 1 | Four Post Claim | 1986-07-22 | 2029-07-15 | 500 | SKEENA RESOURCES LIMITED | 1 |
| 300553 | JIM 2 | Four Post Claim | 1986-07-22 | 2029-07-15 | 375 | SKEENA RESOURCES LIMITED | 1 |
| 1056547 | WESTSIDE | Mineral Cell Title Submission | 2017-11-21 | 2029-05-22 | 925.13 | SKEENA RESOURCES LIMITED | 1 |
| 1056548 | CLEA | Mineral Cell Title Submission | 2017-11-21 | 2029-05-22 | 1617.85 | SKEENA RESOURCES LIMITED | 1 |
| 1056595 | PHIZGAP | Mineral Cell Title Submission | 2017-11-22 | 2029-05-22 | 53.32 | SKEENA RESOURCES LIMITED | 1 |
| 1069071 | SNIP 4 | Mineral Cell Title Submission | 2019-06-11 | 2024-06-11 | 17.78 | SKEENA RESOURCES LIMITED | 1 |
| 1095324 | TRAPPER DAVE | Mineral Cell Title Submission | 2022-04-24 | 2024-04-24 | 177.92 | SKEENA RESOURCES LIMITED | 1 |
Table 4-2: Mineral lease information
| Tenure Number | Issue Date | Good to Date | Term Expiry | Area (Hectares) |
Owner Name | No. of Owners |
| 226132 | 1989-07-21 | 2024-07-21 | 2039-07-21 | 482.07 | SKEENA RESOURCES LIMITED | 1 |
| SU/AD | September 2023 |
| SRK Consulting (Canada) Inc Skeena Resources Limited NI 43 -101 Snip Project Canada |
Page |
| 4.2 | Underlying Agreements |
The Snip Property is comprised of 9 mining claims and 1 mining lease that cover a total area of 4,724.07 hectares (Figure 4-2, Table 4-1, and Table 4-2). The property is contiguous except for a small outlier remnant of Mining Lease 226132 from an earlier claim swap with Skyline Gold Corp., a predecessor of Seabridge Gold Inc. In March 2016, Skeena Resources Ltd. entered into an option agreement with Barrick Gold Inc. for the Mining Lease and the four easternmost claims (222219, 222347, 300552, 300553). Three mining claims acquired in late 2017 (1056547, 1056548, 1056595), one mining claim acquired in 2019 (1069071), and one claim acquired in 2022 (1095324), expanded the property to the west; however, they are not subject to the terms of the agreement with Barrick Gold Inc.
| 4.3 | Barrick Agreement |
The initial expenditure requirements of the agreement with Barrick were satisfied by Skeena in July 2017, at which time Skeena exercised their right to acquire all of Barrick Gold Inc.’s 100% “right, title and interest in and to the Property and the Permits”, subject to the retention by Barrick of a 51% Back-In Right exercisable upon definition of a Mineral Resource, or extraction from the property, of 2 million ounces of contained gold or gold equivalent and a 1% NSR Royalty. The “Back In Agreement” requires a repayment to Skeena of an amount three times their cumulative expenditures by Barrick.
| 4.4 | Hochschild Option |
In September 2018, Skeena and Hochschild entered into an option agreement for Hochschild to earn a 60% undivided interest in the Snip Project by spending twice the amount Skeena has spent since it originally optioned Snip from Barrick. Hochschild had three years to provide notice to Skeena of its intention to exercise the Option which it did on October 14th, 2021. To earn in its interest Hochschild was required to:
| · | Incur, over a three-year period (the “Option Period”), expenditures on Snip that are no less than twice the amount of such expenditures incurred by Skeena from March 23, 2016 up until the time of exercise of the Option by Hochschild; |
| · | Incur no less than C$7.5 million in exploration or development expenditures on Snip in each 12-month period of the Option Period; and |
| · | Provide 60% of the financial assurance required by governmental authorities for the Snip mining properties; after completing a minimum spend of CAD $22,500,000, Hochschild may extend the Option Period by a further period of 12 months by making a cash payment to Skeena of CAD $1.0 million. |
On April 5th, 2023, Hochschild terminated its option to earn 60% of the Snip Gold Project resulting in Skeena reassuming management of the Project and retaining 100% ownership.
| SU/AD | September 2023 |
| SRK Consulting (Canada) Inc Skeena Resources Limited NI 43 -101 Snip Project Canada |
Page |
| 4.5 | Historical NSR |
The historical property purchase “buy-out” agreement executed in March 1996 between owners Cominco Ltd. and Prime Resource Group (now Teck and Barrick, respectively) included a 5% net smelter return retained by Cominco from the sale or disposition of 60% of the gold recovered from ore, containing 0.3 ounces per ton or greater, mined from the Snip Property after December 31, 1995 which ore is in excess of 480,660 tonnes. The reported total of proven, probable, and possible reserves tonnages on January 01, 1996 were 480,672 tonnes (Minfile 104B 250).
| 4.6 | Environmental Issues |
Skeena is not aware of any environmental issues or liabilities that may directly affect exploration efforts on the property. Historical mine closure, reclamation, remediation, and monitoring programs have been carried out responsibly (Sibbick and MacGillivray, 2006), and ongoing monitoring indicates that there are no current issues with the tailings dam or water discharge at the site (Hull and Wickland, 2014; Shelbourne, 2015).
A multi-year exploration permit for surface work was issued by the BC Ministry of Energy and Mines in June 2020 (Permit MX-1-959) and expires in March 2025. Underground exploration of up to 200 holes and surface disturbance up to 120.96 hectares is currently granted on the mining lease under Ministry of Mines Permit Approving Mine Plan and Reclamation Program (M190).
This permit does not expire and is subject to amendment from time to time to accommodate company plans for further exploration and development.
| SU/AD | September 2023 |
| SRK Consulting (Canada) Inc Skeena Resources Limited NI 43 -101 Snip Project Canada |
Page |
| 5 | Accessibility, Climate, Local Resources, Infrastructure and Physiography |
| 5.1 | Accessibility |
| 5.1.1 | Aircraft Infrastructure |
Access to the Snip Property can be gained either by direct air to the 1.6 km long Bronson Airstrip or by boat transportation along the Iskut River (Figure 5-1). Charter fixed wing flights are available from nearby centers, such as Smithers and Stewart, to the unpaved 1,600 m Bronson airstrip immediately adjacent to the property, which is managed and maintained by Snip Gold Corp, a subsidiary of Seabridge. Rotary wing aircraft can also be chartered from numerous available operators in northwestern British Columbia. Staging of equipment and supplies takes place from the McLymont staging area near the westernmost end of an access road for the AltaGas Run of River Hydroelectric Project. The Snip camp is a ten-minute helicopter flight (19 km) from the McLymont staging area.
| SU/AD | September 2023 |
| SRK Consulting (Canada) Inc Skeena Resources Limited NI 43 -101 Snip Project Canada |
Page |
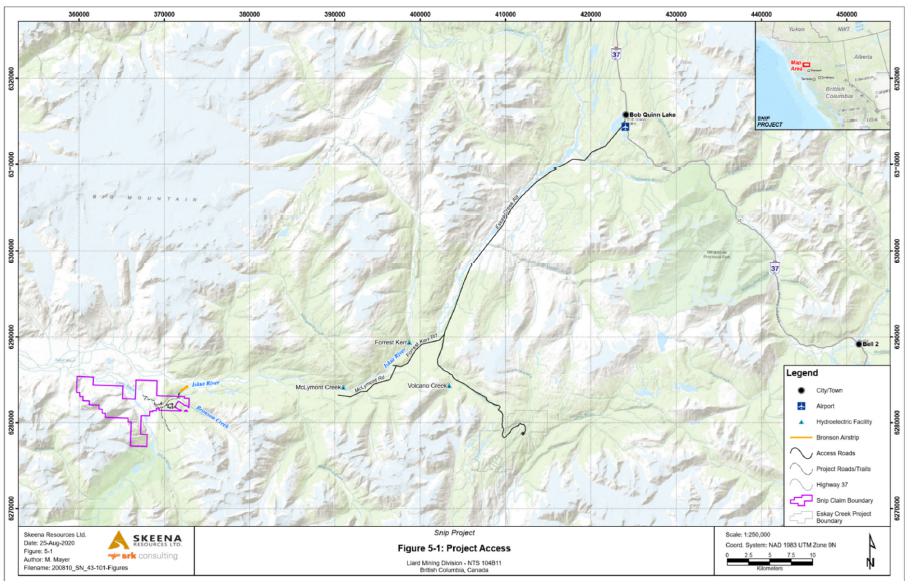
Figure 5-1: Project access
| SU/AD | September 2023 |
| SRK Consulting (Canada) Inc Skeena Resources Limited NI 43 -101 Snip Project Canada |
Page |
| 5.1.2 | Road Access |
The nearest road access to the Snip Property is McLymont road, located due east approximately 19 km upstream on the Iskut River to the McLymont Creek Run of River Hydroelectric Power Station, owned and operated by AltaGas Ltd (Figure 5-1). From Smithers, McLymont Road can be reached by following Highway 16 west for 111 km to Highway 37, near Kitwanga, then taking Highway 37 north for 295 km to the Eskay Creek Mine Road turnoff, which is 3 km south of Bob Quinn. Access to the further 45 km of road to the Staging Area at McLymont Creek requires a road usage permit from AltaGas.
| 5.2 | Local Resources and Infrastructure |
The Snip Project is located in the Pacific Northwest region of British Columbia, Canada. Support services for mining and other resource sector industries in the region are provided primarily by the communities of Smithers (pop. 5,400) and Terrace (pop. 11,500) (https://www12.statcan.gc.ca), which are both accessible by commercial airlines with daily flights to and from Vancouver. Volume freight service in the region is supported by rail connections that extend from tidewater ports in Prince Rupert and Vancouver. The closest tidewater port to the project is in Stewart, approximately 260 km from the Snip Project. Stewart is an ice-free shipping location and provides access for bulk shipping 365 days/year.
Road infrastructure in the region is well developed. Highway 16 (Yellowhead Highway) extends from Prince George in central British Columbia, through several communities including Smithers and Terrace, and terminates at the Port of Prince Rupert. Highway 37 (Stewart Cassiar Highway) connects to Highway 16 at Kitwanga and extends to the Alaska Highway in the Yukon. The Eskay Mine Road connects to Highway 37 roughly 295 km from Kitwanga. Driving time from either Smithers or Terrace to the Eskay Creek Mine is approximately 5 hours.
The region is supported by the Provincial power grid. A 287 kV transmission line extends from a grid connection at Terrace to Bob Quinn, primarily following Highway 37. Power supply opportunities exist close to the Snip Project. The Forest Kerr, McLymont, and Volcano Creek hydroelectric plants are within 20 km and collectively produce up to 277 MW (www.altagas.ca).
Services, workforce, supply chains, and infrastructure are all well established in the region to support mining operations.
| 5.3 | Climate and Vegetation |
| 5.3.1 | Climate |
There are no long-term weather datasets available for the region. Data recorded from a weather station located on the Bronson airstrip from 1994 to 1998 (Lawrence and Seen, 2009) recorded annual precipitation between 1,300 and 2,100 mm, of which 30% fell as snow. Precipitation levels were highest in September and October and lowest in May through August. Mean daily temperatures were highest in July and August reaching approximately 16° C, and lowest in January falling to -15° C. The highest temperature recorded on site over the 5-year period was 31° C and the lowest temperature recorded was -32° C.
| SU/AD | September 2023 |
| SRK Consulting (Canada) Inc Skeena Resources Limited NI 43 -101 Snip Project Canada |
Page |
| 5.3.2 | Vegetation |
For a review of flora and fauna, the reader is directed to the report by Burgoyne (2010), which provides a list covering species on and around Johnny Mountain.
The property lies within the Coastal Western Hemlock zone and a small portion of the eastern property is mapped as Mountain Hemlock. The Snip property has almost no alpine vegetation, with sub-alpine flora dominated by scattered Sitka Spruce transitioning to Engelmann Spruce further east.
At lowermost elevations, at the Bronson Creek level, the natural vegetation is Western Hemlock and Sitka Spruce with riparian populations of cottonwood and spruce. Devil’s club and slide alder can be thick in low to moderate elevations and disturbed areas are overrun with the same vegetation. Huckleberry, blueberry, grouseberry and mountain arnica grow at various elevations. Natural regrowth is rapid, with hemlock and spruce growing to five meters within 20 years.
| 5.4 | Physiography |
The Snip Property lies within the Coast Mountains, a major regional chain extending from Alaska through British Columbia and into Washington State, U.S.A. The dominant feature of the region is the Stikine Icecap, which is centered 80 km to the Northwest of the Snip Property along the Alaska border. The Snip Property lies between the Iskut River, Craig River and Bronson Creek within the Stikine Watershed.
Local elevations vary from just over 100 m ASL at Bronson Creek, to 900 m ASL in the subalpine located in the far south-eastern portion of the property.
| SU/AD | September 2023 |
| SRK Consulting (Canada) Inc Skeena Resources Limited NI 43 -101 Snip Project Canada |
Page |
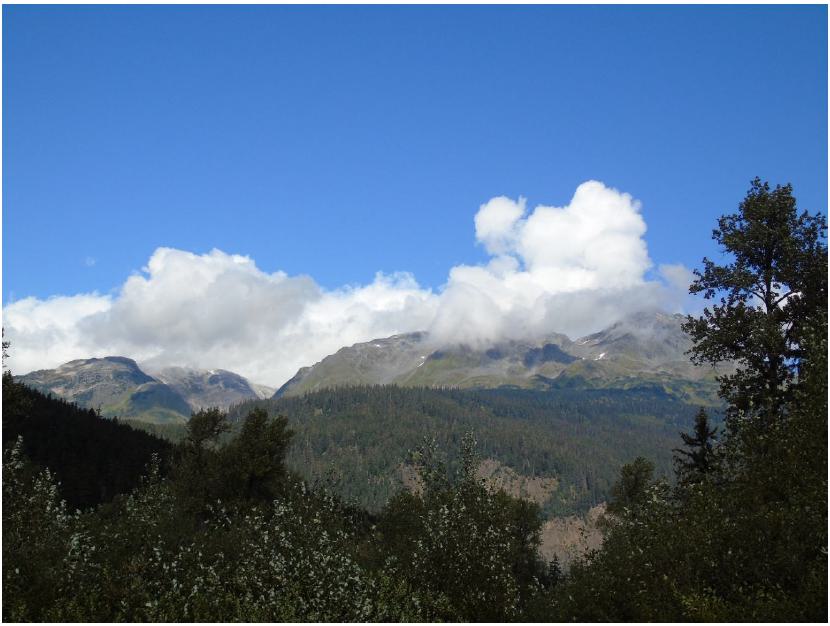
Figure 5-2: View of the Snip Project looking south west - the Red Bluff Porphyry is shown in the foreground
| SU/AD | September 2023 |
| SRK Consulting (Canada) Inc Skeena Resources Limited NI 43 -101 Snip Project Canada |
Page |
| 6 | History |
| 6.1 | Exploration, 1900 - 1987 |
The history of the Snip property and adjacent surrounding area was previously provided in detail by Nichols and Giles (2017) and Moors (2018).
The Iskut area has been subjected to extensive exploration dating back well over 100 years. In 1907, a prospecting syndicate from Wrangell Alaska termed the “Iskut Mining Company” recorded claims on Bronson Creek. These claims would later become Crown Granted and still exist to this day. In 1909, the Red Bluff claims were staked, and from 1908 to 1911, several short adits were driven into the Red Bluff porphyry to obtain a bulk sample (King, 1988).
From 1911 to 1920, the Iskut Mining Company reported trenching, stripping and drifting on a number of gold bearing veins on the Red Bluff and Iskut claims on, and adjacent to, the current Snip property. Extracted material from the original Iskut claims assayed 0.06 oz Au, 44.2 oz Ag and 12.4% Cu (King, 1988).
In 1929 Cominco Ltd. staked 42 claims on Johnny Mountain, however these claims lapsed soon after and the area experienced no recorded work until 1954 (King, 1988).
Geologist Forrest Kerr mapped portions of the Iskut River region from 1926-1929, and published GSC map 311A in 1935. Kerr's memoir 246 on the area was published posthumously in 1948. The Geological Survey of Canada's "Operation Stikine" in 1956 mapped the Stikine-Iskut area on a regional basis, publishing it as GSC Map 9-1957 (Nichols, 1989).
From 1954 to 1960, Hudson Bay Mining and Smelting Co. Ltd.’s drilling resulted in copper discoveries on, and near, the Johnny Mountain Gold Mine. In 1964, Cominco Ltd. targeting copper, optioned claims from Tuksi Mining Company and Jodi Explorations Ltd. and in 1965 completed drilling on the Red Bluff claim north and east of the property. In 1973 and 1974, the same property was examined by Texas Gulf Sulphur Inc. for its copper and base metal content (King, 1988).
In 1964, the Tuksi Mining Co. acquired Crown Grants, and Jodi Exploration Co., Cominco Ltd. and Copper Soo Mining Co. staked claims around Tuksi’s property. Further work at that time discussed the regional geology of the Iskut area, details of which may be found in Mawer (1964), Parsons (1965), Nagy (1966) and Bagshaw (1968). The following year Cominco Ltd. concentrated an exploration program on the Red Bluff porphyry copper deposit and discovered visible gold in a vein exposed in a nearby creek bed. In 1966, channel sampling on the vein returned assays up to 244 ppm Au over 1.2 m.
From 1980 to 1986, grass roots exploration, soil sampling and trenching were conducted on the Snip property by Cominco. In 1986, Cominco signed a JV agreement with Delaware Resources Corp., who provided the funding for the project, and over two years, drilled over 15,000 m. The work outlined the Main Twin Zone, and a decision was made to go underground in 1988, via a portal at 300 m ASL elevation. An additional 6,800 m of surface drilling, coupled with underground development and related drilling at 12.5 m centers, produced a first reserve estimate for the Main Twin Zone of 940,000 tonnes grading 28.5 g/t Au (Nichols, 1989).
| SU/AD | September 2023 |
| SRK Consulting (Canada) Inc Skeena Resources Limited NI 43 -101 Snip Project Canada |
Page |
| 6.2 | Development and Mining, 1988 – 1999 |
The history of development and mining on the Snip property area has been covered by many authors and is summarized hereafter. The Snip Mine operated between January 1991 and June 1999. A photo of the mine circa 1998 is shown in Figure 6-1. Prime Resources Group Inc. assimilated Delaware Resources in 1995 then bought Cominco’s 60% interest of the Snip Property in March 1996. Homestake Canada Inc. owned a controlling interest in Prime Resource Group at the time and operated the mine until closure and reclamation. In 2001 the property was acquired by Barrick Gold Inc. (Barrick) as part of its acquisition of Homestake Canada Inc.
All historical reports of resources and reserves, including statements of grades and tonnages, were prepared internally by Cominco Ltd. in 1989 prior to the implementation of National Instrument 43-101 standards and should not be relied upon. Past production figures are from audited company records and government sources, including Canada Revenue Agency and BC Mines Branch, and may be relied upon.
The Snip Mine went into production in January 1991 and officially opened on July 25th. Gold ore was mined using conventional shrinkage and cut and fill methods in the lower parts of the orebody, while mechanized cut and fill methods were used in the upper, wider parts of the orebody.
Initial plant design was planned for a daily production of 300 tonnes. Diluted ore reserves at start-up using a 12 g/t gold cut-off totalled 940,000 tonnes grading 28.5 g/t, with a mine life of 10 years at an annual output of 2.9 million grams (93,000 oz).
In the first year, mine production totalled 119,812 ounces from 122,648 tonnes mined. That same year, the first resource estimate on the 150 Vein was calculated at 46,300 tonnes grading 32.0 g/t Au. Peak total ounces produced occurred in 1992 with 165,713 tonnes grading 31.6 g/t (168,011 ounces). A peak production rate of 470 tonnes per day (172,254 tonnes) at an average grade of 25.3 g/t Au occurred two years later.
| SU/AD | September 2023 |
| SRK Consulting (Canada) Inc Skeena Resources Limited NI 43 -101 Snip Project Canada |
Page |
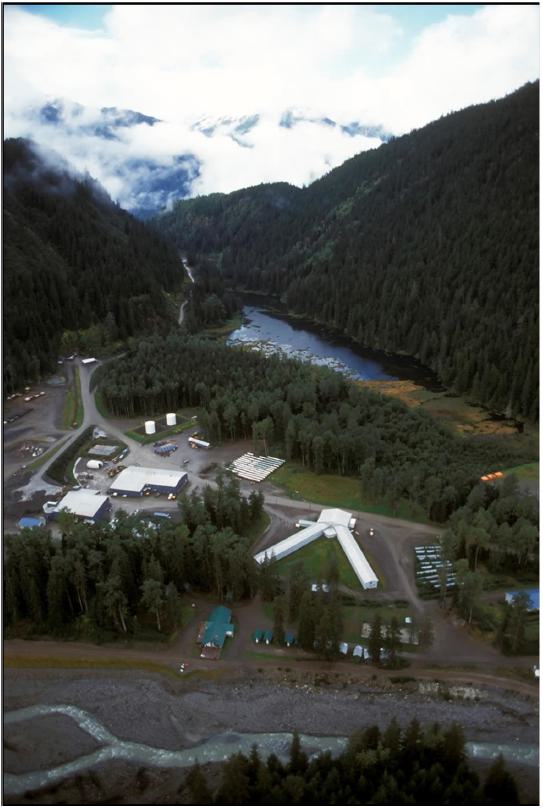
Figure 6-1: Snip mining operation, circa 1998, looking southwest
The Snip Mine consisted of an underground mining operation, mill, tailings impoundment and ancillary facilities. The mine was a fly-in/fly-out operation which was serviced by air flights from Wrangell, Alaska, Bob Quinn Lake and Smithers to the Bronson airstrip located adjacent to the Snip Mine.
Access to the underground workings was provided by a series of portals that accessed the Main Twin Zone (130, 180, 300, 340, 400, 420, 440, and 520 portals) and Twin West Zone (150 and 225 portals). Access and haulage from the Main Twin Zone workings were provided by the 130 and 180 portals. The mill and ancillary facilities were located north of the mine between Monsoon and Bronson Creeks. The tailings impoundment was constructed in the saddle of a narrow valley forming the headwaters to both Monsoon Creek and Sky Creek. Dams were constructed at each end to form a tailings impoundment approximately 150 m wide and 800 m long. Discharge from the impoundment was directed towards Sky Creek (Sibbick and MacGillivray, 2006).
| SU/AD | September 2023 |
| SRK Consulting (Canada) Inc Skeena Resources Limited NI 43 -101 Snip Project Canada |
Page |
Ore was mined predominantly by the “cut and fill” method in the wider, generally higher elevation parts of the ore-body where mechanized drilling and mucking occurred, while the narrowest parts saw conventional jack-leg drilling and slushers. Veins intermediate in thickness saw various combinations of these methods. Broken ore was sent down ore-passes to haulage trucks and taken predominantly via the 130 haulage level to the mill. The proportion of mechanized/semi mechanized mining relative to conventional mining dropped significantly over the lifetime of the mine, from 81% of the total mining in 1991, to 42% in 1994, to 16% in 1998 (final full year of production). Annual production rate totals by the various veins is provided in Table 6-1 and production summaries by mining method and recovered gold in Table 6-2 and Table 6-3, respectively. Photos from underground during mining are shown in Figure 6-3.
Table 6-1: Snip Mine production by zone (Homestake, 1998)
| Zone | Tonnes | Tonnes (%) |
Grade (g/t) |
Grade (oz/t) |
Total Grams |
Total Ounces |
Ounces % |
|||||||||||||||||||||
| Main Twin | 762,437 | 61 | % | 28.95 | 0.93 | 22,070,709 | 709,601 | 64 | % | |||||||||||||||||||
| 150 Vein | 277,926 | 22 | % | 25.41 | 0.82 | 7,060,746 | 227,012 | 21 | % | |||||||||||||||||||
| HW min | 89,288 | 7 | % | 26.86 | 0.86 | 2,398,031 | 77,100 | 7 | % | |||||||||||||||||||
| FW min | 67,712 | 5 | % | 28.31 | 0.91 | 1,916,875 | 61,630 | 6 | % | |||||||||||||||||||
| 130 Vein | 26,582 | 2 | % | 19.90 | 0.64 | 528,929 | 17,006 | 2 | % | |||||||||||||||||||
| Twin-West | 9,668 | 1 | % | 18.10 | 0.58 | 174,967 | 5,625 | 1 | % | |||||||||||||||||||
| Misc | 16,585 | 1 | % | 16.01 | 0.51 | 265,536 | 8,537 | 1 | % | |||||||||||||||||||
| Total | 1,250,198 | 100 | % | 27.53 | 0.88 | 34,415,793 | 1,106,510 | 100 | % | |||||||||||||||||||
Table 6-2: Snip Mine production by mining method
| Mine Production | 1991 | 1992 | 1993 | 1994 | 1995 | 1996 | 1997 | 1998 | ||||||||||||||||||||||||
| Ore Tonnes Milled | 122,648 | 165,731 | 170,566 | 172,254 | 170,180 | 154,859 | 150,190 | 145,723 | ||||||||||||||||||||||||
| Average Head Grade (g/t Au) | 30.38 | 31.60 | 29.80 | 25.30 | 25.80 | 26.92 | 26.80 | 23.82 | ||||||||||||||||||||||||
| Production (tpd, 365 days/year) | 335 | 450 | 470 | 470 | 465 | 425 | 410 | 400 | ||||||||||||||||||||||||
| Conventional (slusher) Stopes | 18.8 | % | - | - | 42.0 | % | - | - | - | 84.2 | % | |||||||||||||||||||||
| Mech. & Semi-mech. Stopes | 81.2 | % | - | - | 58.0 | % | - | - | - | 15.8 | % | |||||||||||||||||||||
| Active Stopes | 14 | 20 | 21 | 25 | 31 | 45 | 46 | 57 | ||||||||||||||||||||||||
| Average Tonnes per Stope | 8,761 | 8,287 | 8,122 | 6,890 | 5,490 | 3,441 | 3,265 | 2,557 | ||||||||||||||||||||||||
| SU/AD | September 2023 |
| SRK Consulting (Canada) Inc Skeena Resources Limited NI 43 -101 Snip Project Canada |
Page |
Table 6-3: Plant production annual summaries
| Plant Production | 1991 | 1992 | 1993 | 1994 | 1995 | 1996 | 1997 | 1998 | ||||||||||||||||||||||||
| Au Gravity Recovery (%) | 21.4 | 24.9 | 36.0 | 36.6 | 34.0 | 34.1 | 34.1 | 34.1 | ||||||||||||||||||||||||
| Au Floatation Recovery (%) | 68.9 | 66.4 | 55.6 | 54.8 | 57.4 | 57.4 | 57.4 | 57.4 | ||||||||||||||||||||||||
| Au Recover (%) | 90.3 | 91.3 | 91.6 | 91.4 | 91.4 | 91.5 | 91.5 | 91.5 | ||||||||||||||||||||||||
| Ounces as Bullion | 28,272 | 34,900 | 58,830 | 51,282 | 47,995 | 45,664 | 44,057 | 38,022 | ||||||||||||||||||||||||
| Tonnes Concentrate | 5,719 | 8,322 | 8,897 | 8,150 | 8,124 | 7,393 | 7,170 | 6,956 | ||||||||||||||||||||||||
| Ave. Concentrate Grade (g/t) | 432 | 417 | 319 | 295 | 323 | 310 | 310 | 310 | ||||||||||||||||||||||||
The milling operation consisted of a ball mill with gravity jig and a sulphide flotation circuit. Free milling gold came from a gravity jig on the ball mill and separated from the other heavy minerals on a shaker table (Figure 6-2). Gold ore bars were then poured and flown off site. The remaining portion of the gold associated with the sulphide minerals was recovered via flotation resulting in a concentrate containing upwards of 300 g/t gold.
The concentrate was shipped in 1.5 tonne “heavy bags” by hovercraft along the Iskut and Stikine Rivers to Wrangell, Alaska (Figure 6-2). Hovercraft shipments were augmented by air cargo flights through the early years of operation until the hovercraft was phased out completely in 1997 due to high operating costs and inoperability through the winter months. Cargo aircraft capacity was then correspondingly increased to satisfy shipment schedules. Diesel fuel for power transmission at the mine was brought in on the return leg of these trips.
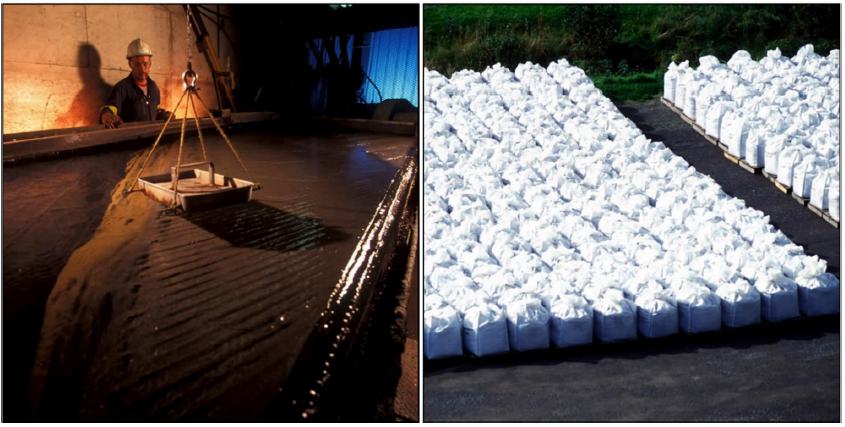
Figure 6-2: Recovery of gold from historical Snip Mine, circa 1998. (Left) Free gold on shaker table, (Right) Heavy bags of sulphide concentrate
| SU/AD | September 2023 |
| SRK Consulting (Canada) Inc Skeena Resources Limited NI 43 -101 Snip Project Canada |
Page |
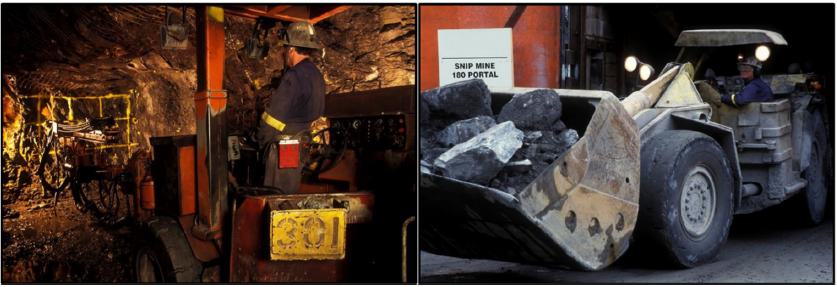
Figure 6-3: Mining at the historical Snip Mine, circa 1998. (Left) Jumbo mechanized drilling, (Right) scoop tram exiting 180 level portal
Mine waste generated during operations included waste rock and tailings. During operation, limited waste rock (180,000 Mt) was stockpiled in dumps adjacent to five portals (130, 180, 300, 440 and 150). The majority of the waste rock was ground down and used as hydraulic backfill (280,000 Mt), or placed directly as rock fill underground (344,648 Mt). Tailings were discharged to the tailings pond (Sibbick and MacGillivray, 2006).
When mining ceased in June 1999, the total production of gold from the Snip property was 1,106,510 ounces of gold in 1,250,198 tonnes of rock at an average grade of 27.53 g/t (Black, 1999).
The British Columbia Government reports slightly different totals than company records: “From 1991 to 1999, the Snip Mine produced 32.093 million grams of gold (1,031,822 ounces troy), 12.183 million grams of silver (391,696 ounces) and 249,276 kilograms of copper from about 1.2 million tonnes.” (MEMBC Minfile 104B 250).
The total gold production at closure was roughly 30% greater than the gold resources defined at opening. A significant portion of these extra ounces came from the 150 and 130 footwall veins as they were not part of the initial resource and delineated after production commenced.
An oblique longitudinal section displaying all mined out areas in the Main and Twin West mines are shown in Figure 6-4.
| SU/AD | September 2023 |
| SRK Consulting (Canada) Inc Skeena Resources Limited NI 43 -101 Snip Project Canada |
Page |
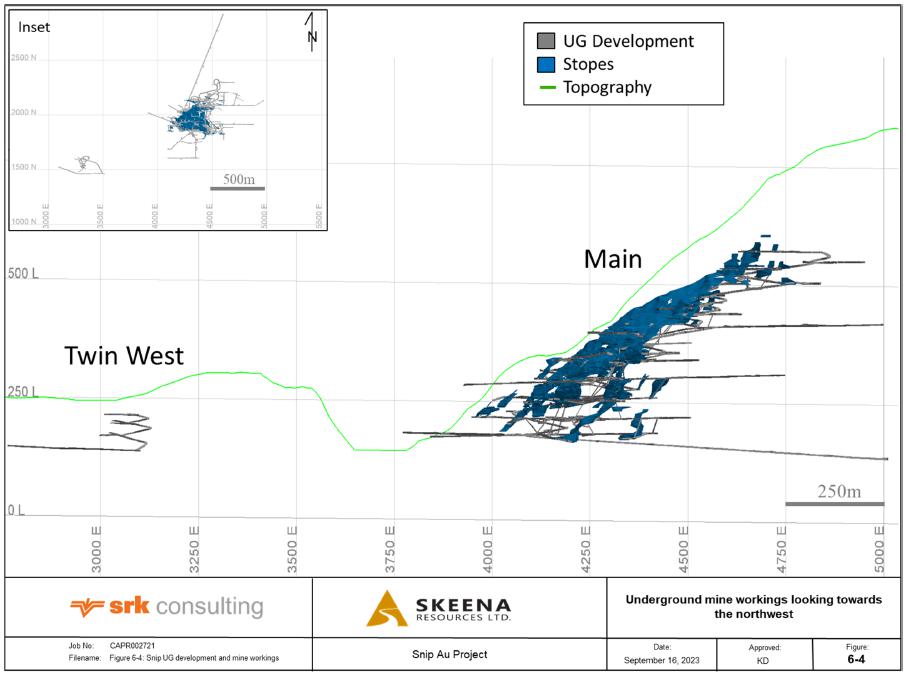
Figure 6-4 Snip Mine underground mine workings
| SU/AD | September 2023 |
| SRK Consulting (Canada) Inc Skeena Resources Limited NI 43 -101 Snip Project Canada |
Page |
| 6.3 | Post Mining, 1999-2016 |
No further mining or mineral exploration work occurred on the property after mine closure until the option agreement was reached in March 2016 between Skeena Resources and Barrick Gold Corp; the owner of the property since assimilation of Homestake Canada Inc. in 2001. Work performed by Skeena since the agreement is described in Sections 9 (Exploration) and 10(Drilling).
| 6.4 | Mine Closure |
Sibbick and MacGillivray (2006) provide a detailed description of the Snip Property mine closure process.
Closure of the mine was initiated following the completion of mining and the suspension of production in June 1999. Site closure operations were completed in October 1999. The isolated location of the mine and its restricted access posed several challenges for closure. Therefore, a comprehensive program was developed to ensure that the site closure could be sustained long-term with minimal post-closure maintenance. Key activities for closure were the:
| · | Sealing of the underground workings; |
| · | Decommissioning of the waste dumps; |
| · | Reclamation of the tailings impoundment; and |
| · | Demolition of the site buildings and structures. |
Reclamation activities were successfully completed by the end of 1999.
The underground workings contained backfill and rock surfaces considered to be potentially acid generating. Therefore, to minimize the potential for acid generation, the mine was flooded to the 300 level, the highest elevation possible. Concrete bulkheads were installed in the 130 and 180 portals to prevent discharge of mine water. The 340, 400, 420, 440, and 520 portals were sealed with a mixture of waste rock and concrete to limit airflow and prevent public access into the mine.
Waste rock dumps that were identified as being potentially acid generating were dismantled and either placed in the subsequently flooded portion of the underground or encapsulated within the tailings pond. The two dumps that were determined to be non-acid generating, the 150 and 180, were used as cover material for the tailings pond. The 300 dump, also non acid generating, was left in place to provide access to the 300 portal, the location of the underground mine drainage.
The tailings were regraded to promote drainage towards Sky Creek, and then capped with a layer of non-acid generating waste rock from the 150 and 180 dumps. A spillway was built at the south end of the impoundment to allow discharge into Sky Creek. The spillway elevation was constructed to maintain the water level within the waste rock layer capping the tailings. A coarse rock blanket was placed in the spillway to prevent potential damming as a result of beaver dam construction. Subsequent settlement of the tailings has resulted in the formation of shallow ponding behind the embankment which ensures saturation during drier periods. Consolidation of the tailings and the migration of vegetation onto the cap have resulted in the development of a naturally formed wetland.
| SU/AD | September 2023 |
| SRK Consulting (Canada) Inc Skeena Resources Limited NI 43 -101 Snip Project Canada |
Page |
The mill and all ancillary buildings were dismantled and salvaged or buried on site. Small volumes of hydrocarbon contaminated soils were excavated and continue to be land farmed on a lined facility at the old mill site. Recontouring and seeding was carried out on the building areas and roads; revegetation to date has been highly successful.
| 6.5 | Environmental Monitoring |
Sibbick and MacGillivray (2006) provide a detailed description of environmental monitoring on the Snip Property.
Barrick maintained a rigorous monitoring program as part of its Closure Management Manual for the site that includes water quality sampling, geotechnical inspections of the tailings dam and underground portal plugs, aquatic resource monitoring, and land use inspections.
The compliance monitoring point for the Snip Mine site is the tailings pond discharge (TPD) into Sky Creek. This site has been sampled 54 times since closure. Water quality of the discharge has been well below the permitted levels.
Based on the current success of the closure works, and continued success throughout 2006, a reduction in frequency and parameters analyzed for, will be pursued, if prudent. Geotechnical monitoring will also be conducted for the long-term; however, continued consolidation of the tailings over time further mitigates against future potential tailings facility stability issues.
| SU/AD | September 2023 |
| SRK Consulting (Canada) Inc Skeena Resources Limited NI 43 -101 Snip Project Canada |
Page |
| 7 | Geological Setting and Mineralization |
| 7.1 | Regional Geology |
The Iskut River area witnessed an abundance of geological and metallogeny studies from the late 1980’s through the early 1990’s following numerous discoveries and exploration campaigns, becoming known as the “Golden Triangle”.
Earliest work by Tipper and Richards, (1976), Anderson (1989), and MacDonald et al. (1992) among others, established the Triassic (Stuhini Group) and Jurassic (Hazelton Group) stratigraphy of the area, within the Intermontane Belt on the western margin of the Stikine terrane. The unconformity separating the two groups was mapped throughout the “Golden Triangle” by Kyba and Nelson (2015), who established that most of the major deposits in the region, including the Snip deposit, occur within 2.5 km of the unconformity.
Numerous intrusive suites were identified, with the metallogenetically important Texas Creek Plutonic Suite considered coeval with volcanic components of the Hazelton Group. Further regional work by Kyba and Nelson (2015), coinciding with increasing exploration in 2014, resulted in the Bronson corridor map (Figure 7-1) showing the Hazelton and Stuhini Groups intruded by the Lehto plutonic suite.
The Snip property lies at the western margin of their study with applicable portions of their summary and interpretations provided below. In general, strata are gently dipping, as shown by major contacts that follow topographic contours, interrupted by minor, steep, northeast-striking faults. Stuhini Group rocks at the base of the Snippaker Ridge section consist of laminated to thick-bedded greywacke, argillite, siltstone, sandstone, crystal tuff, and rare fossiliferous limestone. Most common are grey-green, fine-grained, locally graded, tuffaceous volcanic wackes containing subhedral to anhedral plagioclase feldspar and up to 10% mafic minerals (replaced by chlorite) and rare detrital quartz (Kyba and Nelson, 2015).
Intrusive rocks in greater Iskut River region comprize five plutonic suites. The Stikine plutonic suite is represented by Late Triassic calc-alkaline intrusions which are coeval with group strata. Copper Mountain, Texas Creek and Three Sisters plutonic suites are variable in composition but are roughly coeval and co-spatial with Hazelton Group volcanic strata. The Tertiary age Coast Plutonic Complex is represented by predominantly granodioritic to monzonitic Eocene intrusions of the Hyder plutonic suite, exposed 12 km south of the Bronson Slope deposit (Britton et al., 1990).
The age, mineralogy and texture of the adjacent Red Bluff porphyry stock (associated with the adjacent Bronson Slope deposit), suggest that it belongs to the economically important Early Jurassic Texas Creek plutonic suite (see Alldrick, 1985; Alldrick et al, 1987; Brown, 1987). Plutons of this suite are located in the Stewart, Iskut River region and range in age from 196 to 185 My (Anderson, 1993; MacDonald et al., 1992., Alldrick et al., 1990).
| SU/AD | September 2023 |
| SRK Consulting (Canada) Inc Skeena Resources Limited NI 43 -101 Snip Project Canada |
Page |
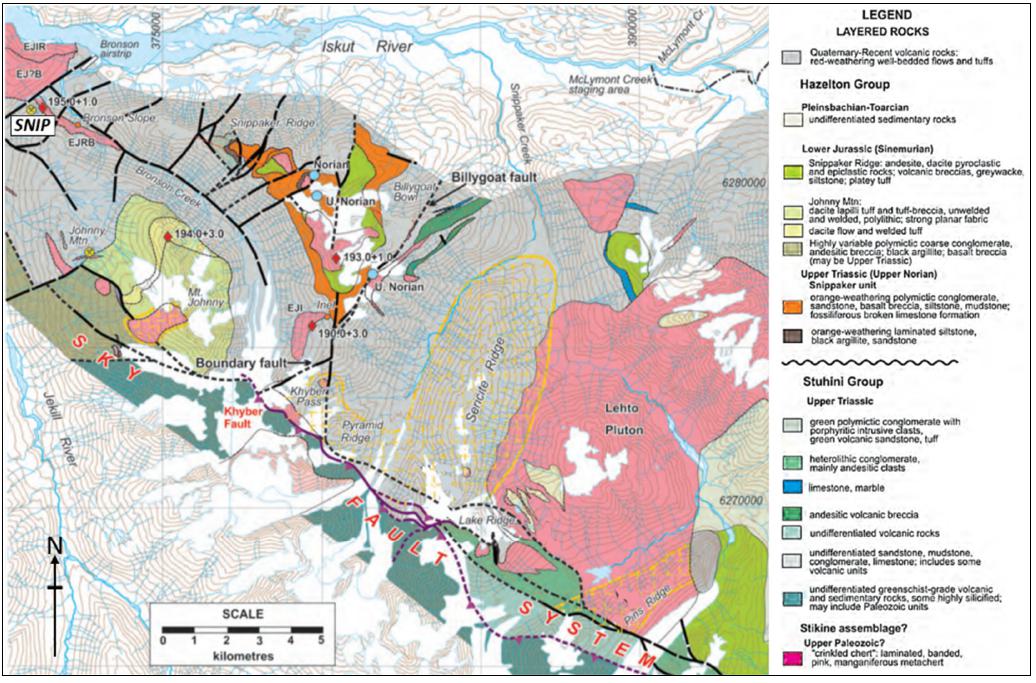
Figure 7-1: Regional Geology of the Bronson corridor area (Kyba and Nelson, 2015) . Note the distribution of the Early Jurassic Lehto plutonic suite. Red diamonds show locations of U-Pb ages, blue dots represent fossil localities
| SU/AD | September 2023 |
| SRK Consulting (Canada) Inc Skeena Resources Limited NI 43 -101 Snip Project Canada |
Page |
Kyba and Nelson (2015) noted the spatial relationship of many mineral showings and deposits in the region, and in particular large zones of “quartz-sericite-pyrite” (QSP) alteration, with a major northwest-southeast trending structure named the “Sky fault system” (Figure 7-1). Their interpretation impacts on the Snip Property geology as the western extension of this fault system and broad zones of QSP are found within its boundaries.
“Our analysis of the Sky fault system suggests that the Bronson corridor of alteration and mineralization (Metcalfe and Moors, 1992) was controlled by regional structures. Normal faulting, emplacement of Lehto intrusive rocks, and alteration appear to be genetically related, as indicated by synkinematic dikes and the increased intensity of QSP alteration, polymetallic mineralization, and dike density at the Inel and Khyber prospects toward the Sky fault system.
In this study, we have observed many instances of normal sense motion on strands of the Sky fault system. However, the stress regime during the Early Jurassic may not have been purely extensional. There is limited evidence of dextral sense motion on the Sky fault south of Mt. Johnny. Detailed underground structural study of the Snip vein showed that it formed during normal-oblique (dextral) motion on the minor west-northwesterly, southeast-dipping fault zone that hosts it (Rhys, 1995). Northeasterly faults and trends of intrusions and alteration zones are an important feature of the Bronson corridor” (Kyba, J. and Nelson, J.L., 2015).
“The Lehto pluton, as shown in the Lewis (2013) compilation, is a large, northeast-trending, uniform intrusive body. More detailed observations show a wider diversity of phases, and distribution of Lehto plutonic rocks throughout the belt in small, high-level intrusive centers (e.g., Snippaker Ridge and Mt. Johnny) and as dikes near the Sky fault system. Analysis of the Sky fault system indicates that early normal faults, likely genetically related to alteration, mineralization, and Lehto plutonism, reactivated in a thrust sense during post- Early Jurassic regional shortening. The Sky fault system likely formed close to the boundary of a rift-type basin and enhanced circulation of hydrothermal fluids generated during Lehto suite plutonism to form the deposits of the Bronson corridor” (Kyba, and Nelson, 2015).
| 7.2 | Property Geology |
Extensive geological work was performed on the property through its early exploration and production period. Studies focused on structural geology, alteration and mineralization as they were the principal controls on ore development. The Master’s Thesis by Rhys (1993) from the University of British Columbia remains the most systematic and detailed evaluation of the property.
A property geology map accurately representing historical and more recent work was produced by Nichols and Giles (2017) (Figure 7-2). It is discussed in subsequent sections.
| SU/AD | September 2023 |
| SRK Consulting (Canada) Inc Skeena Resources Limited NI 43 -101 Snip Project Canada |
Page |
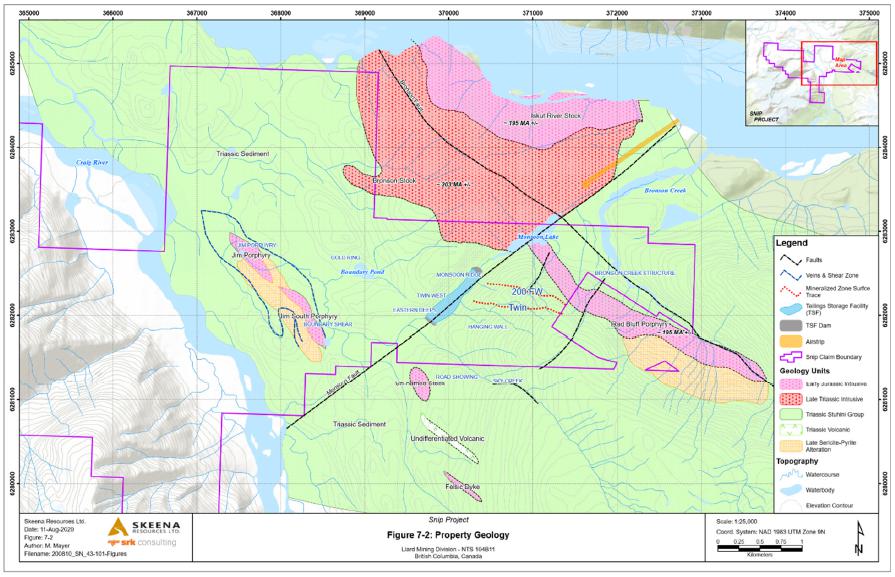
Figure 7-2 Property geology map
| SU/AD | September 2023 |
| SRK Consulting (Canada) Inc Skeena Resources Limited NI 43 -101 Snip Project Canada |
Page |
| 7.2.1 | Lithology |
| 7.2.1.1 | Triassic Stuhini Group |
The Stuhini Group that hosts the Snip mineralization was described in detail by Rhys (1993). Rocks exposed in the Snip mine workings were interpreted to represent strata from a stratigraphically intermediate position in the clastic lower succession of Johnny Mountain likely representing turbidites proximal to a volcanic source. Between 70 and 850 m of true thickness in the sequence has been intersected by the Snip underground workings and drilling, measured from west of the 130 portal adjacent to the Red Bluff porphyry to drilling in the south central end of 180 level.
Bedding dips moderately to steeply north to northwest with younging directions, determined from laminated graded beds, are upright and face north. Dips range from 60 to 80 degrees north on 180 level to shallower dips of between 30 to 50 degrees on the 230 to 340 levels. Bedding dips are variable but generally steeply to the north to northwest above the 340 level and on surface above the workings.
Rocks consist primarily of grey weathering massive fine to medium grained poorly sorted and feldspathic to lithic greywacke. Laminated and graded beds of siltstone and mudstone comprizes between 3 and 15% of the sequence with massive coarse-grained greywacke comprising 5-10%. Less abundant matrix supported volcanic conglomerate also occurs throughout. Greywackes sediment comprizes plagioclase (mainly albitic), quartz, K-feldspar, siltstone/mudstone and volcanic rock fragments. The coarser-grained greywackes and the lithic greywackes often contain 0.5-10 cm-sized subrounded biotized mafic minerals and K-feldspar porphyritic intermediate to mafic volcanic clasts, and clasts of tan coloured siltstone or dark grey mudstone. Clasts constitute generally less than 10% by volume.
| 7.2.1.2 | Red Bluff Porphyry and associated alteration |
The Red Bluff Porphyry lies between 500 and 800 m northeast of the Snip deposit and is considered significant in the alteration and mineralization on the Snip Property (Rhys, 1995) (Figure 7-2). It is approximately 2 km long and 250 m wide, and trends northwest along the northeast edge of Johnny Ridge. Contact relationships with the country rock are poorly defined but where intersected by drilling and mine development, are faulted or intrusive.
The Red Bluff Porphyry is a hydrothermally altered K-feldspar megacrystic, plagioclase porphyritic intrusion of probably quartz diorite to quartz monzodiorite composition. The porphyry and adjacent rocks are affected by several styles of alteration and veining that are dominated by pervasive potassic alteration and associated quartz-magnetite-hematite veins. Veinlet and brown biotite ± pyrite occurs broadly and abundantly throughout the greywacke sequence of northern and western Johnny Mountain. Biotite abundance is greatest over an approximately 15 km2 zone in the greywackes within the Snip mine workings, the southernmost kilometer of the Bronson stock, the northwestern end of Snippaker Ridge, and in greywacke and volcanic conglomerate units along the west side of Johnny Mountain.
| SU/AD | September 2023 |
| SRK Consulting (Canada) Inc Skeena Resources Limited NI 43 -101 Snip Project Canada |
Page |
The possible genetic relationship interpreted by Rhys between the Red Bluff porphyry, alteration and mineralization is important to consider during further exploration of the Snip Property. Rhys’ conclusions are based upon spatial association, alteration assemblages, mineralization and metal zoning, structural fabrics and kinematics, and temporal relationships between alteration, intrusion and mineralization.
Taken together, these relationships suggest that: (1) mineralized structures on Johnny Mountain characterised by Early Jurassic galena Pb isotopic signatures, formed during one magmatically driven hydrothermal event that was synchronous with deformation; (2) metals were not mobilized into the structures by later fluid circulation during a younger phase of hydrothermal activity or deformation; (3) hydrothermal activity and mineralization in the Red Bluff porphyry and the Main Twin Zone were synchronous, and thus the Red Bluff porphyry is a potential local fluid source for the Main Twin Zone; and (4) the biotite envelopes on the Main Twin Zone and shear veins are contemporaneous with potassic alteration on the property.
The distribution and abundance of biotite in areas distal to the Red Bluff porphyry along the west side of Johnny Mountain and the extensive area containing mineralized veins, suggests a more regional fluid source, possibly an underlying batholithic parent to the Red Bluff porphyry (Rhys, 1995) rather than an origin related solely to the Red Bluff hydrothermal system.
| 7.2.1.3 | Biotite Spotted Unit |
A distinctive unit at Snip Mine is the Biotite Spotted Unit, or ‘BSU’. This distinctive dike, that is often found in the core of the principal vein, divides it into two “Twin” portions.
Nichols and Giles (2017) described the unit as a non-mineralized basic to intermediate biotitic dyke that has intruded the vein mineralization. Mining revealed that it mostly followed the plane of the Main Twin Zone, with dips from 50°-70° at the lower and upper elevations, with shallower dips at mid-elevations. Widths range from several decimeters up to 5 m with an average width of 2.5-3 m. It is moderately to strongly biotitized and hosts calcite-pyrite-quartz-sericite-chlorite alteration minerals. Biotite content ranges from 2 to 20% as disseminations, veins and fracture infill.
| 7.2.1.4 | Bronson Stock |
A small portion of the Snip Property overlies an intrusive body that forms the hillside on the opposite side of a large fault gully to the northwest of the historic Snip mine, termed the “Bronson Stock” described in Nichols and Giles (2017).
The Bronson Stock is a poorly documented heterogeneous, medium-grained equigranular plagioclase-rich clinopyroxene-amphibole bearing diorite. The stock has a poorly constrained Late Triassic U-Pb zircon age of between 197 Ma and 225 Ma obtained from a K-feldspar and plagioclase phyric monzodiorite phase of this unit (Macdonald et al, 1992). It has also been noted by various authors that the stock has been intruded by several dykes, sills; and small stocks, of unknown age and intermediate to mafic composition.
| SU/AD | September 2023 |
| SRK Consulting (Canada) Inc Skeena Resources Limited NI 43 -101 Snip Project Canada |
Page |
Contacts of the stock with country rocks are not well defined, but where observed in drill core, are either faulted or intrusive. The southwest and northeast contacts appear to be southwesterly dipping. Screens of altered greywacke up to 40 m wide are common throughout the intrusion.
| 7.2.1.5 | Jim Porphyry |
The Jim Porphyry has been interpreted solely from drill hole information as there is very limited outcrop in the southwest portion of the property. Geophysics does not provide strong evidence for an intrusive body of significant size. 2016 drilling on the Jim claims intersected an extrusive unit and possibly an associated intrusive unit. Rocks are described as feldspar-phyric, feldspar-quartz rich pyroclastic fall, ash-lapilli, agglomeratic, debris flow and volcaniclastic sections intruded by mineralogically similar dykes and sills.
Feldspar porphyroblastic dacitic intrusions may have been intersected in previous holes (based on conclusions, and inferences drawn from 2016 core, past drill logs and Rhys (1997) reported images) with some intercepts suggesting they could represent additional porphyry copper targets. Their extents are unknown due to lack of outcrop and drill density and it is conceivable that they may represent Hazelton Group equivalent rocks. Rhys (1997), suggests some of the feldspar porphyroblastic dykes ascribed to the loosely termed and even more loosely defined ‘Jim Porphyry system’, are related to the Jurassic age Texas Creek Plutonic suite. His generalized definition of the ‘Jim Porphyry System’ is based on examination of over a dozen holes. A quartz (vein) stockwork is near ubiquitous in drill holes with several intersecting megacrystic K-feldspar porphyry dykes. Alteration is an assemblage of quartz-sericite-chlorite-albite-pyrite-carbonate. (Nichols and Giles, 2017).
| 7.2.1.6 | Recent Lamprophyre and Basalt dykes |
Undeformed lamprophyre dykes of probable Tertiary (Oligocene) age have been mapped and seen in drill core at several locations on the property, as have basalt dykes, possibly correlative with recent volcanism.
| 7.3 | Structure |
Rhys (1993) provides a very thorough and detailed analysis of the structural geology of the Snip Project and surrounding area and its role in focusing fluid flow and mineralization. His work was accurately summarized by Nichols and Giles, 2017.
Several periods of deformation and veining have affected the Snip Mine sequence. Earliest quartz calcite veining is superseded by a (single) shear vein phase, followed by extensional veining. These features are cut by northwest dipping gouge filled faults that have oblique right lateral displacements. At least one set of the extension veins displays reverse shear sense relative to shear veining.
Rhys (1993) cites “consistency of mineralogy, identical progression of the same alteration facies from vein to wallrock, and the continuity of structural thickness from biotite-pyrite veinlets to shear veins suggest that these structures were formed during the same hydrothermal event.” The intimate association of biotite to shears, veining and the overall homogeneity of the alteration envelope are suggestive of a close relationship to the same event. Ore type formation and alteration were in his words, ‘synchronous and part of a protracted process’. Evidence for this is:
| SU/AD | September 2023 |
| SRK Consulting (Canada) Inc Skeena Resources Limited NI 43 -101 Snip Project Canada |
Page |
| · | Deformed and undeformed auriferous quartz and sulphide veins in single exposure, and deformed veins cross-cutting foliation. |
| · | Stacked repetitive sets of quartz and sulphide veins. |
| · | Biotitic envelopes on deformed and shear veins suggesting alteration from the time of vein formation and continuing after the intrusion of the BSU. |
| · | Multiple quartz-sulphide veining with various styles and clear cross-cutting relationships. |
Rhys (1993) concluded the BSU dyke was intruded late in the deformation history of the Main Twin Zone, after ore formation, but during the waning stages of the hydrothermal system. Importantly, displacement on the Main Twin Zone and shear veins during the event that offset the extension veins, must have had only minor offset since there is no offset along the dyke, which predates the extension veins. The displacement of the extension veins must thus define a late reactivation of the shear veins that is minor and temporally unrelated to the main period of offset on the Main Twin Zone (Nichols and Giles, 2017).
| 7.4 | Mineralization |
Gold mineralization at the Snip Mine has been reported from at least six historical zones including the Main Twin Zone, the 150 Vein, the Hangingwall Zone, the Footwall Zone, the 130 Vein and the T-West (‘Twin West”) Zone.
Gangue mineralization is predominately calcite, iron-carbonate, quartz, pyrite, chlorite, and biotite in decreasing order.
Mineralization was divided into the following four types by Rhys (1993):
| · | Carbonate Type: Banded to laminated calcite and chlorite/biotite with up to 70% carbonate. Quartz is disseminated to vein(let) in nature. Sulphides are trace to approximately 5%. |
| · | Chlorite-Biotite Type: Up to 60% phyllosilicates and 30-40% calcite. Minor to moderate to predominant quartz with significant vein-type or ‘augen’ quartz. Sulphides approximately 5% (pyrite and pyrrhotite). |
| · | Sulphide Type: Pyrite, chalcopyrite, pyrrhotite, arsenopyrite, galena, sphalerite can occur in varying percentages and combinations, as threads, veinlets, vein, semi- massive concentrations or disseminations. |
| · | Quartz Type: Banded-parallel or ‘foliation-parallel’ white to milky in colour, with sulphides as in previous types. Pyrrhotite and chalcopyrite were reported as more abundant than in the Sulphide Type. Veins were also reported as commonly fractured with quartz and Fe-carbonate infill. |
| SU/AD | September 2023 |
| SRK Consulting (Canada) Inc Skeena Resources Limited NI 43 -101 Snip Project Canada |
Page |
The mineral association and occurrence of gold within the different types is summarized in Table 7-1.
Table 7-1: Mineralization types in the Main Twin Zone (Rhys, 1993)
| Type | Mineral Association | Gold Occurrence |
| Sulphide Type | Pyrite, chalcopyrite, pyrrhotite, magnetite, arsenopyrite, chlorite, biotite, tellurides, sulfosalts, native bismuth | Enclosed in, within fractures, or rimming sulphide grains; also free in gangue with chlorite or biotite. Often intergrown with tellurides, native bismuth, tetrahedrite or chalcopyrite |
| Quartz Type | Pyrite, chalcopyrite, pyrrhotite, chlorite | Rimming or spatially associated with these minerals, but less commonly occurs without them free in quartz |
| Carbonate and Biotite/Chlorite Type | Pink carbonate with fine-grained biotite; chlorite, molybdenite; associated with and alteration of biotite to chlorite, calcite and rarer actinolite | Streaked on chlorite foliation surfaces; or as coarse flakes and seams spatially associated with pink carbonate. Commonly intergrown with or rimmed by molybdenite |
| SU/AD | September 2023 |
| SRK Consulting (Canada) Inc Skeena Resources Limited NI 43 -101 Snip Project Canada |
Page |
| 8 | Deposit Types |
Mineralization on the Snip property is unique as it displays structural geological similarities to many Orogenic style gold occurrences yet displays mineralogical and paragenetic similarities to porphyry related veins deposits. An excellent summary classification of the deposit style on the Snip property was provided in Sillitoe and Thompson (1998).
The Snip Au-Cu-Mo-Zn deposit, in the Stewart-Iskut River area of northwestern British Columbia, lies adjacent to the Red Bluff porphyry, an Early Jurassic calc-alkaline, I-type, magnetite-series intrusion of quartz monzodioritic composition. The porphyry hosts a quartz-magnetite-hematite stockwork containing a low-grade gold-copper resource (Rhys, 1995), Similar intrusions associated with porphyry copper-gold mineralization occur throughout the region and were emplaced over an approximately 10 Ma time period in the Early Jurassic (Macdonald et al., 1996). The lead-isotopic signatures of the intrusions, porphyry mineralization and related veins fall in a tight cluster (Godwin et al., 1991).
The Snip deposit exploits the Main Twin Zone shear-vein system, which starts approximately 600 m from the Red Bluff intrusion and extends for >1000 m to the west-northwest. The vein, hosted by Triassic sedimentary rocks, averages 2.5 m in width and dips 30-60° to the southwest (Rhys, 1995). The vein system is characterized by internal mineralogical banding, typically parallel layers of chlorite-biotite, calcite, quartz and pyrrhotite-pyrite, with wallrock alteration dominated by inner biotite and outer K-feldspar-calcite-quartz-sericite (Rhys, 1995).
The historical mining and reserve grades averaged 27–30 g/t Au, with elevated copper (0.15–0.5 %), minor molybdenum (0.01– 0.05 %) and zinc (Zn: Cu<5:1) (Rhys, 1995).
Structural features in the Main Twin Zone indicate oblique-directed shearing under semi-brittle conditions (Rhys,1995). The shear fabrics associated with the gold mineralization in the Main Twin Zone are similar to those described from many orogenic vein gold deposits. The metal association in the veins (Au-Cu-Mo-Zn) and the importance of potassic alteration suggest a magmatic origin for the ore fluid. This is supported by the proximity of the Main Twin Zone to the Red Bluff porphyry as well as the lead-isotopic data (Rhys, 1995). Veins more distal with respect to the Red Bluff porphyry contain higher zinc, lead and silver contents as expected in a zoned porphyry system. The veins in the district can therefore be classified as porphyry related, similar to those in many other porphyry copper systems, although the Main Twin Zone is unusual because of its economic grades and widths, the metal suite and the synchronicity of mineralization and semi-brittle deformation.
The relation of the Snip Property style of gold mineralization relative to the many other styles in the Stewart-Iskut River area was portrayed in Macdonald (1996). His diagram depicting the metallogenetic evolution of the area is provided in Figure 8-1.
| SU/AD | September 2023 |
| SRK Consulting (Canada) Inc Skeena Resources Limited NI 43 -101 Snip Project Canada |
Page |
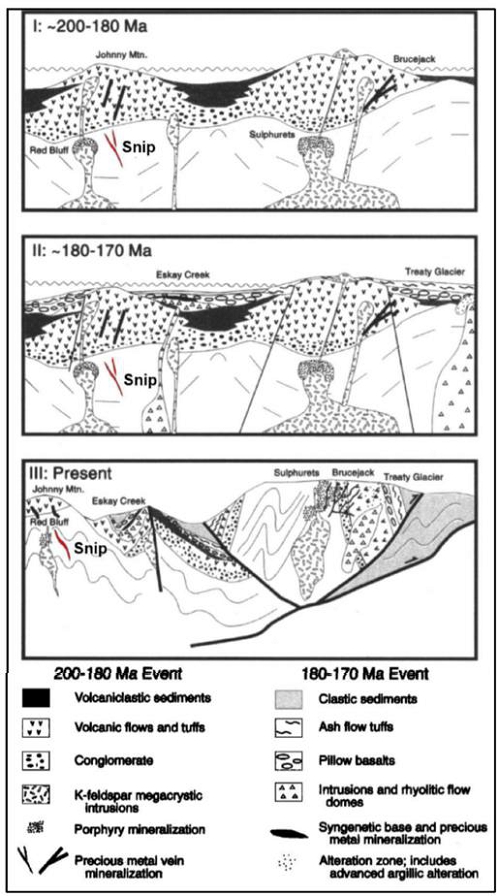
Figure 8-1: Schematic Geologic History of the Iskut River area and relation to the Snip mineralization (MacDonald, 1996)
| SU/AD | September 2023 |
| SRK Consulting (Canada) Inc Skeena Resources Limited NI 43 -101 Snip Project Canada |
Page |
| 9 | Exploration |
A significant amount of historical exploration work has been conducted on the Snip Property to date. Knowing that mineralization in the region is typically discontinuous and narrow in nature, a unique strategy of discovering an ore body of economic significance is needed. For example, the Main Twin Zone produced greater than 700,000 ounces of gold from a tabular body of rock with dimensions of roughly 2.5 m thick by 200 m across by 500 m in length. Seeing as zones of significant ore can be hidden so surreptitiously, additional holes should be planned for every primary drill target, to fully consider and cover the area of interest. Furthermore, due to the variable nature of these gold deposits, drill hole spacing distances should be as low as possible for effective mineral resource classification.
Exploring for high-grade targets like the Main Twin Zone, which has a small footprint with limited surface expression is hampered by its poor response to geophysical surveys and the area’s thick vegetation and local glacial overburden cover.
Previous work has indicated that high grade mineralization on the Snip Property is contemporaneous with the emplacement of the Red Bluff Porphyry and that, on a broad scale, base metal (Cu-Zn) content in associated veins increases with distance from the porphyry at the expense of gold and silver. The Jim Porphyry to the west represents the only known other intrusive body on the property with a possible affinity to the Red Bluff Porphyry and is a possible exploration target.
Since acquiring the project in 2016, Skeena Resources has focussed exploration efforts on: (1) confirming the existence of gold mineralization previously defined by historical drilling, and (2) delineating further mineralization both proximal and distal to the historical orebody. Skeena has performed surface geochemistry, airborne geophysical surveys and surface and underground diamond drilling (using historical underground workings).
| 9.1 | 2016 |
| 9.1.1 | Geochemistry |
Details of the soil sampling survey are provided in Nichols and Giles (2017).
Reconnaissance soil sampling was conducted on the Jim and West Monsoon Lake grids, whereby a total of 668 samples were collected. Of these, 556 covered portions of the Jim 1, Jim 2, Sky 3 and Snip 3 mineral claims, while 112 were sampled on mining lease 226132 (Figure 9-1).
The programme was designed to expand previous geochemical coverage of the property, specifically over westernmost portions sampling north and north-west of the Twin West Zone, and westward from the easternmost portions of the Jim claims. Stations along GPS navigated lines were at approximately 25 m intervals, with some variance due to topography and extensive forest cover. Line spacing was approximately 100 to 125 m, with consideration for slope of terrain and areas with prominent drainage. Individual sample sites were flagged and marked with respective location numbers. Sample depth was very much dependent on the depth of organic (‘A’ horizon) material, which, in this area can be considerable. A well-developed ‘B’ horizon was sampled, albeit with variable oxidation. Traverses and sample locations were recorded on handheld Garmin GPS instruments. For all samples, sample depth, basic colour, local topography, outcrop and drainage information, were recorded. Several areas planned for sampling were covered with recent sediments and/or were poorly drained; these stations were not sampled.
| SU/AD | September 2023 |
| SRK Consulting (Canada) Inc Skeena Resources Limited NI 43 -101 Snip Project Canada |
Page |
Analysis of the soil samples suggested the following:
| · | There was no linear correlation between gold and silver; |
| · | West central areas returned poor results, in part due to higher clay-silt content in the substrate (notably around the pond north of Sky Creek); |
| · | Highest gold values may be associated with anomalous Zinc, Copper, Bismuth and Tungsten, and to a lesser extent, Boron and Cadmium, this assessment based on a review of the ICP analyses; |
| · | In general, multi-element anomalies suggest orogenic gold targets with a minor contribution from late stage high-level base metal enriched fluids; |
| · | Epithermal targets signatures, arguably defined by As-Sb-Cd-Hg-(Au)-(Ag), do not necessarily appear, although re-analysing for Hg by a more appropriate method is required (Nichols and Giles, 2017). |
| · | Heberlein (2017) compiled the geochemistry surveys and recommended that the Ah soil horizon be sampled when at elevations below the treeline. This will limit the “noise” from substrate variability (i.e. till) and more accurately represent bedrock metal content. |
| SU/AD | September 2023 |
| SRK Consulting (Canada) Inc Skeena Resources Limited NI 43 -101 Snip Project Canada |
Page |
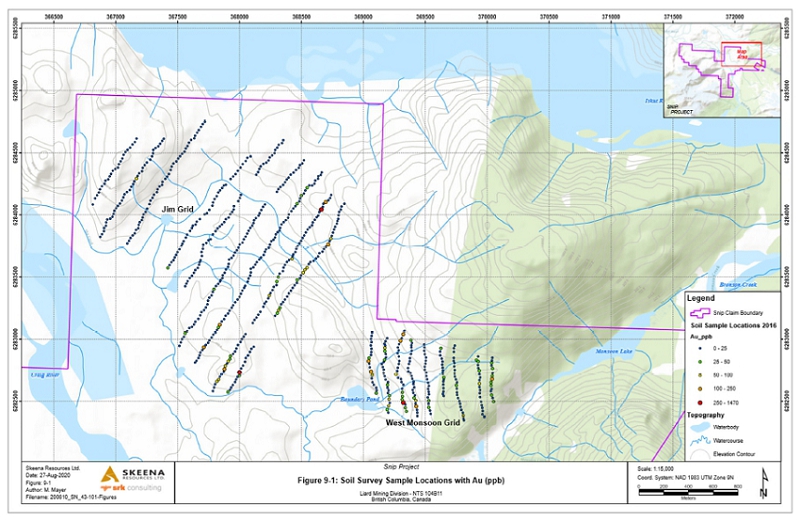
Figure 9-1: Gold soil survey sample locations in ppb
| SU/AD | September 2023 |
| SRK Consulting (Canada) Inc Skeena Resources Limited NI 43 -101 Snip Project Canada |
Page |
| 9.1.2 | Geophysics |
Airborne Geophysical surveying of the Snip Property was carried out in 2016 with a C-824 Cesium Magnetometer using a 10Hz sampling rate. It was flown at 100 m spacing on a heading of 045°/225° with 1000 m spaced tie lines. A total of 171 line-km of data was collected.
Results provide a broad correlation with mapped geology on the property, however topography and thick overburden cover on the southwest portion of the property masked the geophysical response of the area. Figure 9-2 shows the results of the Geophysical Magnetics survey.
| 9.2 | 2017 |
| 9.2.1 | LiDAR Survey |
Skeena commissioned a surface mapping LiDAR (Light Detection and Ranging) survey of the property in 2017 at a density of 16 points per square m resulting in a 25 cm pixel resolution. The portion of the survey over the Main Twin Zone is provided in Figure 9-3.
| 9.3 | 2019 |
| 9.3.1 | Petrography |
In January and February 2019, four polished thin sections were sent to Oliver Geoscience International Ltd. for petrography analysis to compare a biotitic phyllite and BSU units (Oliver, 2019). Biotitic phyllites observed near the Jim Porphyry were thought to be related to the BSU at Snip as they were compositionally similar.
The study highlighted the following points with regards to biotite grain morphology:
| · | Mafic intrusions, although they may have extensively recrystallized biotite grains within their matrix, are likely to have weaker foliation or compositional layers as defined by the alignment of biotite grains; |
| · | Mafic intrusions, even when extensively re-crystalized, may have stronger evidence for blunt shaped, biotite replaced, clinopyroxene grains within the matrix; and |
| · | The colour of biotite will likely differ between biotite rich rocks derived from mafic intrusions versus biotite hosted within biotitic phyllites. The biotite formed in biotite recrystallized mafic intrusions will be medium green-brown in colour. The sample overall will have a greenish cast to the matrix. Biotite associated with biotitic phyllites, however, will be medium to rich brown in colour. |
The study concluded that that the biotite phyllites were not related to the BSU unit.
| SU/AD | September 2023 |
| SRK Consulting (Canada) Inc Skeena Resources Limited NI 43 -101 Snip Project Canada |
Page |
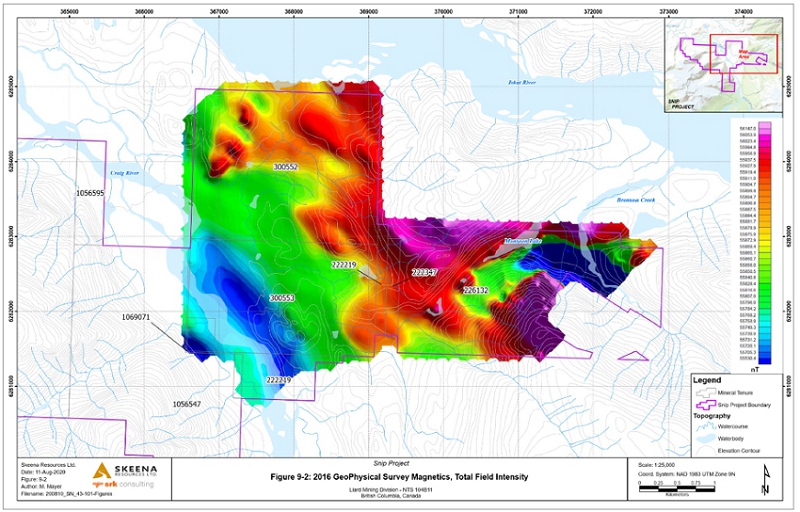
Figure 9-2: 2016 geophysical survey magnetics, total field intensity
| SU/AD | September 2023 |
| SRK Consulting (Canada) Inc Skeena Resources Limited NI 43 -101 Snip Project Canada |
Page |
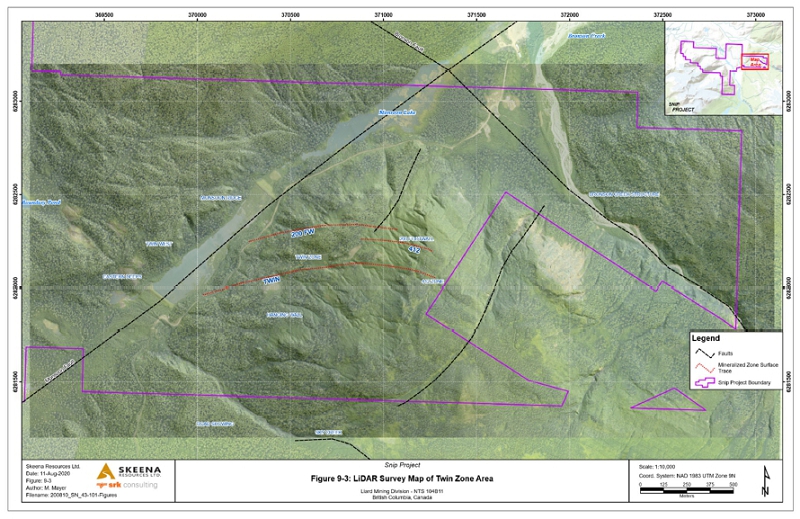
Figure 9-3: LiDAR survey map of Twin West and the Main Twin Zone area
| SU/AD | September 2023 |
| SRK Consulting (Canada) Inc Skeena Resources Limited NI 43 -101 Snip Project Canada |
Page |
| 10 | Drilling |
Surface drilling on the Snip Property has been carried out by multiple operators, with the first drill hole by Cominco in 1986. Since that time, 456 diamond drill holes totalling 102,976 m have been drilled from surface. Figure 10-1 shows the locations of all surface diamond drill holes.
Underground drilling began in 1988. A total of 3,543 underground drill holes have been drilled totalling 252,411 m. Figure 10-2 shows the locations of all underground diamond drill holes.
| 10.1 | Historical Drilling (pre-1999) |
309 surface holes totalling 71,181 m were drilled between 1986 and 1998 (Figure 10-1) and 3,233 underground drill holes totalling 208,790 m were drilled from 1988 to 1999 (Figure 10-2). A summary of all historical holes drilled by year on surface and underground is presented in Table 10-1.
Table 10-1: Summary of historical surface and underground holes drilled by year
| Historical Surface | ||||||||
| Year | No. of Holes | Length | ||||||
| 1986 | 13 | 1,621.00 | ||||||
| 1987 | 69 | 13,253.90 | ||||||
| 1988 | 24 | 7,059.30 | ||||||
| 1989 | 2 | 283.50 | ||||||
| 1993 | 20 | 3,896.20 | ||||||
| 1994 | 41 | 10,985.20 | ||||||
| 1995 | 76 | 17,244.40 | ||||||
| 1996 | 33 | 8,639.10 | ||||||
| 1997 | 30 | 7,330.50 | ||||||
| 1998 | 1 | 867.50 | ||||||
| TOTAL | 309 | 71,181.60 | ||||||
| Historical Underground | ||||||||
| Year | No. of Holes | Length | ||||||
| 1988 | 146 | 11,328.80 | ||||||
| 1989 | 492 | 29,481.02 | ||||||
| 1991 | 88 | 3599.20 | ||||||
| 1992 | 191 | 16,294.48 | ||||||
| 1993 | 292 | 15,164.90 | ||||||
| 1994 | 361 | 19,126.47 | ||||||
| 1995 | 293 | 15,787.55 | ||||||
| 1996 | 530 | 33,763.45 | ||||||
| 1997 | 567 | 47,217.25 | ||||||
| 1998 | 249 | 16,415.94 | ||||||
| 1999 | 24 | 610.75 | ||||||
| Total | 3,233 | 208,789.80 | ||||||
| SU/AD | September 2023 |
| SRK Consulting (Canada) Inc Skeena Resources Limited NI 43 -101 Snip Project Canada |
Page |
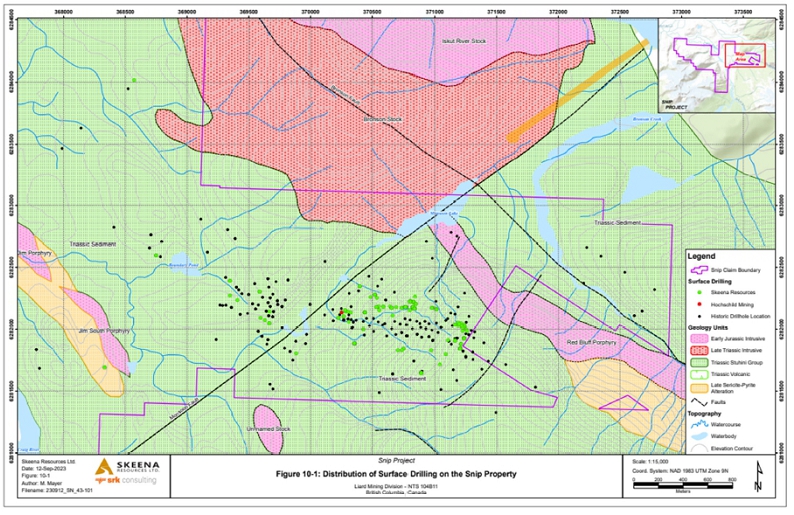
Figure 10-1 Distribution of surface drilling on the Snip Project
| SU/AD | September 2023 |
| SRK Consulting (Canada) Inc Skeena Resources Limited NI 43 -101 Snip Project Canada |
Page |
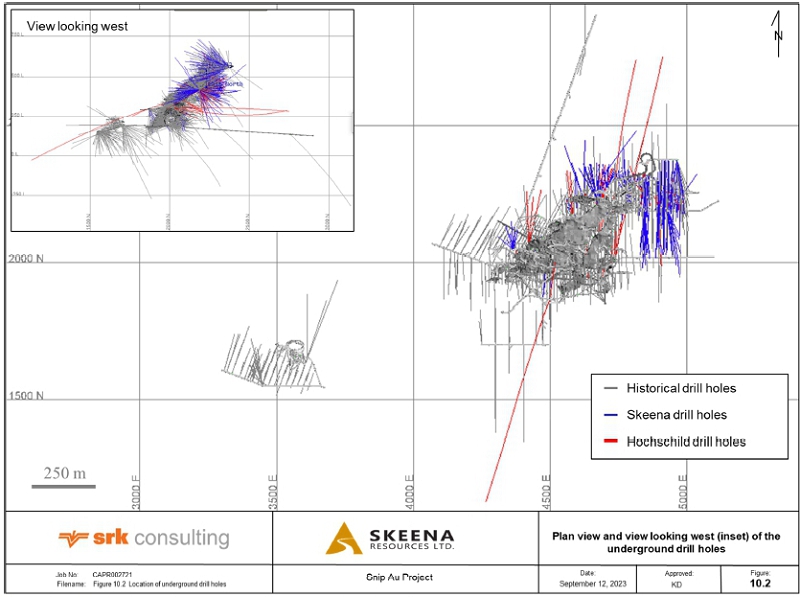
Figure 10-2 Distribution of underground drilling at the Snip Project
| SU/AD | September 2023 |
| SRK Consulting (Canada) Inc Skeena Resources Limited NI 43 -101 Snip Project Canada |
Page |
| 10.2 | Skeena Resources Drilling (2016 to 2021) |
Since the resumption of exploration on the Snip Property in 2016 until 2021, Skeena have drilled a total of 388 holes totaling 64,040m (Table 10-2). This includes 146 surface drill holes totalling 31,294 m and 242 underground drill holes totalling 33,746 m (Table 10-2), Figure 10-1 and Figure 10-2 respectively).
Table 10-2: Skeena surface and underground drill hole targets
| Skeena Surface | ||||||||||
| Year | No. of Holes | Length | Target | |||||||
| 2016 | 28 | 7,422 | 412 Corridor, Twin West, 200 Footwall, 130 Vein, | |||||||
| Gold Ring and Jim Porphyry | ||||||||||
| 2018 | 6 | 2,121 | Lower Main Twin Zone | |||||||
| Jim Claim and Sky Creek Shear | ||||||||||
| 2019 | 8 | 1,816 | 200 Footwall | |||||||
| 2020 | 9 | 5,327 | Main Twin Zone, 130 and 150 veins | |||||||
| 2021 | 95 | 14,608 | Infill drilling of the S-Veins including the 130 and 150 veins and 412 corridor | |||||||
| Subtotal | 146 | 31,294 | - | |||||||
| Skeena Underground | ||||||||||
| Year | No. of Holes | Length | Target | |||||||
| 2017 | 62 | 8,703 | Eastern Main Twin Zone, 150 Vein, 130 Vein, | |||||||
| 412 Corridor and 200 Footwall | ||||||||||
| 2018 | 46 | 9,088 | Main Twin Zone, 200 Footwall, 412 Corridor | |||||||
| 2021 | 134 | 15,955 | Infill drilling of the S-Veins including the 130 and 150 veins, 412 corridor | |||||||
| Subtotal | 242 | 33,746 | - | |||||||
| 10.3 | Hochschild Drilling (2022) |
During 2022, Hochschild drilled a total of 69 holes totaling 10,377 m (Table 10-2). This includes 1 surface drill holes totalling 501 m and 68 underground drill holes totalling 9,876 m (Table 10-3, Figure 10-1 and Figure 10-2 respectively).
Table 10-3: Skeena surface and underground drill hole targets
| Hochschild Surface | ||||||||||
| Year | No. of Holes | Length | Target | |||||||
| 2022 | 1 | 501 | Deep down dip extensions of the western V- and S-veins | |||||||
| Subtotal | 1 | 501 | ||||||||
| Hochschild Underground | ||||||||||
| Year | No. of Holes | Length | Target | |||||||
| 2022 | 68 | 9,876 | Main Twin Veins, infill of S-Veins and twin drilling | |||||||
| Subtotal | 68 | 9,876 | ||||||||
| SU/AD | September 2023 |
| SRK Consulting (Canada) Inc Skeena Resources Limited NI 43 -101 Snip Project Canada |
Page |
| 10.4 | Drill Coordinates, Downhole Surveys and Contractors |
| 10.4.1 | Historical |
The Snip Mine closed prior to the implementation of NI 43-101 compliance requirements. Reclamation of the mine in 1999 included the disposal of drill core, and all documentation of procedures and methods of drilling, contractors and core size from previous operators.
| 10.4.2 | Skeena Drilling |
| 10.4.2.1 | 2016 Surface |
Omineca Drilling of Burns Lake, BC used a Multi Power Discovery 2 drill to drill HQ-sized core. A Geologist determined the azimuth and inclination of the hole using a hand-held compass. Down hole surveys were conducted by the drilling contractor using a Reflex EZ-Shot® tool. At the completion of the drilling program, all collars were digitally surveyed by Meridian Mapping of Nanaimo, B.C. Equipment using a Trimble® Pro6 using H-Star for post processing differential correction, and a Trimble R8 GNSS Model 2 for the Base Station position.
| 10.4.2.2 | 2017 Underground |
DMAC Drilling of Langley, BC used two 600V, 100 HP electric hydraulic Hydracore 2000® underground drill rigs, equipped with fire suppression, to drill HQ-sized drill core. Downhole surveying was completed at the end of a hole using a Reflex EZ-Shot tool. All collar surveys were obtained by Skeena staff using a Total Station Theodolite in conjunction with a regular array of permanent ground control stations that were established by Progressive Survey Solutions in 2017.
| 10.4.2.3 | 2018 Surface |
DMAC Drilling of Langley, BC and Hy-Tech drilling of Smithers, BC were both contracted to perform the drilling work using NQ2-sized drill core (excepting one drill hole S18-031 which was NQ-sized). Downhole surveys were completed every 30 m using a Reflex EZ-Shot or Reflex EZ-Trac tool; measurements of which the drilling contractors collected. Drill collars were surveyed by Skeena staff using a Trimble Geo 7X handheld GNSS system combined with a Zephyr Model 3 Rover Antenna.
| 10.4.2.4 | 2018 Underground |
DMAC Drilling of Langley, BC used two 600V, 100 HP electric hydraulic Hydracore 2000 underground drill rigs, equipped with fire suppression, to drill NQ2-sized drill core. Oriented drill core was collected for holes UG18-063 to UG18-098 using the ACTIII tool. Drillers were trained to accurately mark the bottom of the drill core run. Oriented core measurements were subsequently completed with an EZlogger® tool using a down-the-hole right hand rule. Downhole surveying was completed every 30 m using a Reflex EZ-Shot, which was completed by the drilling contractor. All collar surveys were obtained by Skeena staff using a total station theodolite in conjunction with a regular array of permanent ground control stations that were established by Progressive Survey Solutions in 2017.
| SU/AD | September 2023 |
| SRK Consulting (Canada) Inc Skeena Resources Limited NI 43 -101 Snip Project Canada |
Page |
| 10.4.2.5 | 2019 Surface |
Omineca Drilling of Burns Lake, BC used one Hydracore 2000 drill rig to drill NQ-sized drill core. Downhole surveying was completed every 30 m using a Reflex-EZ-Shot; measurements of which were taken by the drilling contractor. Drill collars were surveyed by Skeena staff using a Trimble Geo 7X handheld GNSS system combined with a Zephyr Model 3 Rover Antenna.
| 10.4.2.6 | 2020 Surface |
Omineca Drilling of Burns Lake was contracted to carry out the drilling work using a Hydracore 2000 drill rig to drill core using NQ-sized drill core and a combination of HQ and NQ diameters in long holes. Down hole surveying was completed every 30 meters using a Reflex EZ-Shot or Reflex EZ-Trac tool; measurements were collected by the drilling contractor. Drill collars were surveyed by Skeena personnel using either a Trimble Geo 7X handheld GNSS system combined with a Zephyr Model 3 mobile antenna, or a handheld GPS.
| 10.4.2.7 | 2021 Surface |
Tahltech Drilling Services, Konaleen Drilling Limited, Helm Diamond Drilling and Omineca Drilling were contracted to carry out the drilling work using an NQ-sized drill core. Down hole surveying was completed every 30 m using the Reflex EZ-Shot, Reflex EZ-Trac, Devico Devishot or Devico EZ-Shot tools; the measurements were collected by drilling contractor. Drill collars were surveyed by Skeena personnel using a Trimble Geo 7X handheld GNSS system combined with a Zephyr Model 3 mobile antenna.
| 10.4.2.8 | 2021 Underground |
Tahltech Drilling Services, Konaleen Drilling Limited, Helm Diamond Drilling and Omineca Drilling were contracted to carry out the drilling work using NQ-sized drill core. Downhole surveying were collected every 30 m using a Reflex EZ-Trac or Devico Devishot tools; measurements were collected by the drilling contractor. Drill collars were surveyed by Skeena personnel using a total station in conjunction with a regular series of permanent ground control stations that were established by Progressive Survey Solutions in 2017.
| 10.4.3 | Hochschild Drilling |
| 10.4.3.1 | 2022 Surface |
More Core Diamond Drilling Service from Stewart, BC, was contracted to carry out the drilling work using an NQ-sized drill core. Down hole surveying was completed every 30 m; measurements were collected by the drilling contractor. Drill collars were surveyed by Hochschild personnel using a Trimble Geo 7X handheld GNSS system combined with a Zephyr Model 3 mobile antenna.
| SU/AD | September 2023 |
| SRK Consulting (Canada) Inc Skeena Resources Limited NI 43 -101 Snip Project Canada |
Page |
| 10.4.3.2 | 2022 Underground |
More Core Diamond Drilling Service from Stewart, BC were contracted to carry out the drilling work using NQ-sized drill core. Downhole surveying were collected every 30 m by the drilling contractor. Drill collars were surveyed by Hochschild personnel using a total station in conjunction with a regular series of permanent ground control stations that were established by Progressive Survey Solutions in 2017.
| 10.5 | Drill Hole Logging |
Drill core was transported daily by truck or helicopter to the logging facility at the Snip camp. Drill core was logged and sampled at the core logging facility located at the Snip site. Core logging was conducted in a well-lit core shack in appropriately labelled core boxes. Details on core handling and sampling are presented in Section 11. All drill core was geotechnically assessed (recovery, RQD, faults, etc.) and geologically logged (lithology, structure, veining, alteration, and mineralization) prior to being marked up for sampling and photography. Core logging information was recorded in the GeoSpark® core logging software, which includes data validation, picklists, and minimum required fields to ensure data captured was consistent and valid. Additional data validation was conducted by the Skeena’s database manager.
| 10.6 | Recovery |
Diamond core recovery data is available for all Skeena drill holes. The overall average core is excellent averaging 97.2% recovery.
| 10.7 | Completion of Drilling |
Upon completion of surface drilling in 2016, 2018, 2020 and 2021 casing was left in the hole. In 2019, holes that were drilled below the 300-portal level were cemented. All man-made materials and set-up timbers were removed from the drill sites and all trees felled were cut into 1.3 to 2 m lengths. Before and after pictures are taken at each site and then submitted to the BC Provincial Government as part of the Notice of Closure (NOC).
All drill core is stored on the Snip site, across the road from the Snip camp.
| 10.8 | Skeena Drilling |
| 10.8.1 | 2016 – Surface Drilling |
A total of 28 drill holes totalling 7,422 m of helicopter-supported surface diamond drilling was undertaken by Skeena between early August and mid-October 2016 (Figure 10-1). The program was designed to confirm and expand historical drill results in the eastern Main Twin Zone, 130 Vein, 200 Footwall and Twin West. In these areas, the drill program encountered many prospective intercepts greater than 10 g/t Au over widths of >2 m. The more distal Jim Porphyry and Gold Ring targets provided less prospective results with isolated values reaching a maximum of 1.44 g/t Au over a length of 1.8 m.
| SU/AD | September 2023 |
| SRK Consulting (Canada) Inc Skeena Resources Limited NI 43 -101 Snip Project Canada |
Page |
Highlights of the 2016 program confirmed and expanded significant high-grade vein structures, including the 200 Footwall zone, as shown in results in Table 10-4.
Table 10-4: Significant Intercepts from the 2016 drill program
| Drill Hole No. | Zone | From | To | Length | Au (g/t) | |||||||||||||
| S16-02 | eastern Main Twin Zone | 132.50 | 133.40 | 0.90 | 49.40 | |||||||||||||
| 156.60 | 159.00 | 2.40 | 33.07 | |||||||||||||||
| S16-03 | eastern Main Twin Zone | 143.80 | 145.20 | 1.40 | 59.50 | |||||||||||||
| 156.95 | 158.10 | 1.15 | 21.30 | |||||||||||||||
| S16-06 | 200 Footwall | 103.50 | 117.00 | 13.50 | 16.24 | |||||||||||||
| including | 111.00 | 115.50 | 4.50 | 30.99 | ||||||||||||||
| S16-09 | 130 Vein | 68.30 | 70.30 | 2.00 | 19.65 | |||||||||||||
| S16-10 | 130 Vein | 52.00 | 52.70 | 0.70 | 47.00 | |||||||||||||
| S16-11 | Twin West | 88.30 | 88.80 | 0.70 | 16.01 | |||||||||||||
| including | 97.85 | 99.50 | 1.65 | 37.70 | ||||||||||||||
| S16-16 | Twin West | 158.50 | 161.70 | 3.20 | 24.40 | |||||||||||||
| including | 158.50 | 160.40 | 1.90 | 38.30 | ||||||||||||||
| 10.8.2 | 2017 – Underground Drilling |
Underground access was gained to the rehabilitated historical mine workings above the 300-level portal in October 2017. This facilitated more efficient and accurate drilling of targeted areas within and proximal to existing historical mine workings.
Drilling priorities were fourfold: (1) Explore prospective areas adjacent to existing underground developments for immediate resource expansion. (2) Target the numerous mineralized footwall structures not previously included into the historical mine plan. (3) Confirm and/or define the mineralization extents of the remaining ore left unmined in the Main Twin Zone and 150 Vein. (4) Test unmined areas deeper in the footwall including the 130 Vein, 412 Corridor and 200 Footwall.
In total, 62 holes totaling 8,703 m was drilled, which confirmed and extended the targeted areas. Figure 10-3 and Figure 10-4 highlight the results of the 2017 underground drilling campaign.
| SU/AD | September 2023 |
| SRK Consulting (Canada) Inc Skeena Resources Limited NI 43 -101 Snip Project Canada |
Page |
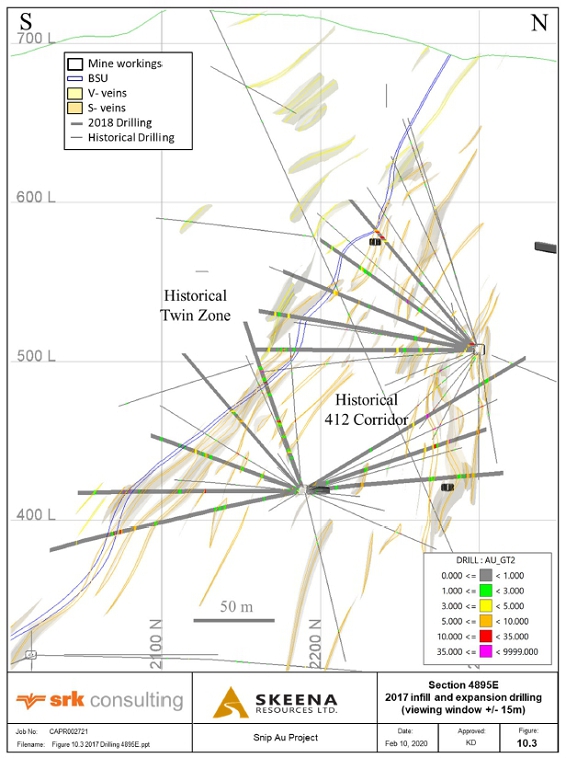
Figure 10-3: Cross section 4895E of the unmined eastern Main Twin Zone and 412 Corridor, facing west (infill, confirmation and expansion drilling)
| SU/AD | September 2023 |
| SRK Consulting (Canada) Inc Skeena Resources Limited NI 43 -101 Snip Project Canada |
Page |
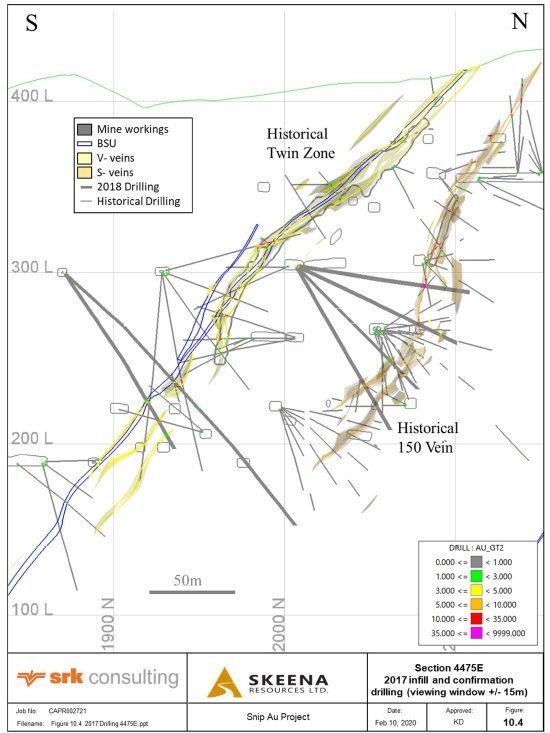
Figure 10-4: Cross section 4475E of the lower unmined Main Twin Zone and 150 Vein, facing west (2017 confirmation and infill drilling)
| SU/AD | September 2023 |
| SRK Consulting (Canada) Inc Skeena Resources Limited NI 43 -101 Snip Project Canada |
Page |
| 10.8.3 | 2018 – Surface Drilling |
Six drill holes totalling 2,121 m were drilled from surface collars to target the lower Main Twin Zone, Jim Claim and Sky Creek Shear Zone (Figure 10-1).
Two holes drilled on the Jim Porphyry target were designed to test a high gold anomaly in soils, while attempting to extend a mapped potassic zone with quartz stockwork veining to the south. A notable interval of quartz-calcite veining (>10%) was intersected in hole S18-033 from 169.00 to 212.00 m associated with 2-10% disseminated to blebby pyrite ± galena, sphalerite, chalcopyrite and pyrrhotite. The mafic phyllite intersected intermittently from 298.26 to 342.43 m was initially interpreted as the BSU due to its high biotite content and similar phenocryst-spotted texture. Petrographic analysis of several samples showed that these mafic phyllites have higher iron and titanium contents reflecting chemistry and sources differences to the BSU. No significant assay results were returned for either of these drill holes and they were unsuccessful in extending zones of potassic alteration reported further to the south.
Hole S18-034 was drilled north of the Sky Creek Shear Zone, close to the Bronson Stock, which targeted a high gold soil anomaly. This hole collared into a quartz monzonite and progressed to a homogenous greywacke sequence at 24.15 m, which continued through to the end of the hole. No significant assay results were returned.
Three deep holes were drilled to test the western vein extension down dip of the Main Twin Zone. No significant assay results were returned.
| 10.8.4 | Skeena Underground Drilling, 2018 |
Forty-six holes totalling 9,088 m were drilled from underground. The 2018 program was designed to: (1) further delineate areas of known mineralization with increased drill density, and (2) expand newly modelled zones with the use of widely spaced exploratory drill step outs. The primary targets were the eastern Main Twin Zone, the 412 Corridor and the 200 Footwall zone, as well as other footwall structures.
The eastern part of the Main Twin Zone was less densely drill defined by the former operators and never developed. The 2018 drilling focused on infill drilling in this drilling as well as testing depth extensions (Figure 10-5)
The 412 Corridor is characterized by a network of discrete, structurally controlled veins geologically akin to the historically mined 130 and 150 veins.
The 200 Footwall Zone is a parallel structure geologically and structurally analogous to the mineralization hosted in the Main Twin Zone. The Footwall received limited underground drilling from previous operators. The lack of drilling and geological similarities to the Main Twin Zone make it a strategic exploration target and the 2018 program was designed to expand upon this newly modelled and largely untested area.
The program demonstrated confirmation and grade continuity in the eastern Main Twin Zone and 412 Corridor and expansion of the 200 Footwall Zone.
| SU/AD | September 2023 |
| SRK Consulting (Canada) Inc Skeena Resources Limited NI 43 -101 Snip Project Canada |
Page |
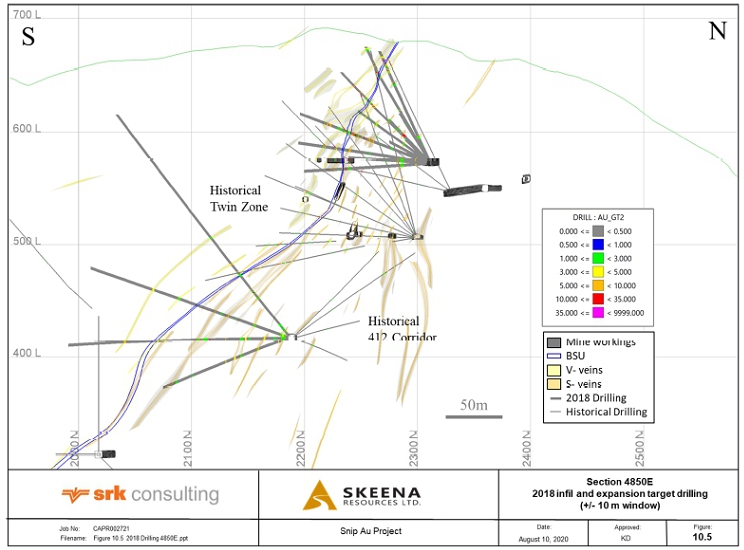
Figure 10-5: Cross section 4850E of the eastern Main Twin Zone, facing west (2018 infill and expansion drilling)
| SU/AD | September 2023 |
| SRK Consulting (Canada) Inc Skeena Resources Limited NI 43 -101 Snip Project Canada |
Page |
| 10.8.5 | Skeena Surface Drilling, 2019 |
Skeena drilled 8 surface drill holes totalling 1,816 m targeting the 200 Footwall (further west of the holes drilled during the 2018 Program). The program was designed to validate an isolated historical and incompletely sampled high grade intersection in the 200 Footwall zone drilled in 1997. The hole intersected 200 Footwall mineralization, as well as identified mineralization 75 m deeper where historical holes had not formerly tested. Significant intervals also intersected mineralization in the hanging wall of the 200 Footwall zone (Table 10-5).
Table 10-5: Significant Intercepts from the 2019 drill program
| Hole No. | Zone | From (m) | To (m) | Length (m) | Au (g/t) |
| S19-044 | New
structure 75m below 200 Footwall |
249.60 | 251.10 | 1.50 | 1,131.91 |
| including | 250.10 | 250.60 | 0.50 | 3,390.00 | |
| S19-035 | 130 Vein | 40.70 | 41.20 | 0.50 | 25.60 |
| S19-035 | 200 Footwall | 128.65 | 133.75 | 5.10 | 16.64 |
| including | 128.65 | 129.15 | 0.50 | 96.20 |
| 10.8.6 | Skeena Surface Drilling, 2020 |
Nine holes totaling 5,327 m were drilled from the surface to target the eastern and western zone of the Twin South structure, with the objective to intercept the extensions of the Main Twin Zone and the 130, 150, 200 footwall and 412 vein structures (Figure 10-5). The latter vein structures are sub-parallel and analogous to mineralization in the Main Twin Zone.
Situated in the below the Main Twin Zone, two new occurrences of high-grade, vein-hosted gold mineralization have been discovered during the 2020 exploration program. Drill hole S20-049 intersected a previously unidentified zone averaging 29.52 g/t Au over 4.03 m including 65.60 g/t Au over 1.14 m and 31.10 g/t Au over 1.03 m. The second zone occurs 20 m further downhole averaging 37.78 g/t Au over 2.86 m including 29.60 g/t Au over 1.32 m and 44.80 g/t Au over 1.54 m. These new intercepts occur in an area devoid of previous drilling and are open for expansion. The same drill hole also predictably intersected the known Main Twin Zone mineralization which graded 45.76 g/t Au over 5.60 m including 41.80 g/t Au over 0.90 m and 177.00 g/t Au over 1.16 m.
| 10.8.7 | Skeena Surface Drilling, 2021 |
A total of 95 holes were drilled from surface for 14,608 m of drilling (Figure 10-6). The 2021 drilling program was designed to: (1) delineate zones of known mineralization with increased drilling density and (2) expand known orebodies. The main drilling targets were the Main Twin Zone, Corridor 412, 200 Footwall vein, the extension of the 130 and 150 veins, as well as other mineralized structures in the Footwall zone. This program was successful in expanding veins and confirming vein interpretations through the increased drill density.
| SU/AD | September 2023 |
| SRK Consulting (Canada) Inc Skeena Resources Limited NI 43 -101 Snip Project Canada |
Page |
| 10.8.8 | Skeena Underground Drilling, 2021 |
A total of 134 holes with 15,955 m of drilling were completed from underground drilling stations located in the central and northern areas of the Project (Table 10-5). This campaign focused on the S-veins and footwall structures.
Access to the underground workings was through the rehabilitated historical workings above level 300, this facilitated more efficient and precise drilling of specific areas within and close to the existing historical mining workings. The priorities for this drilling campaign were fourfold: (1) explore prospective areas adjacent to existing underground development for immediate mineral resource expansion, (2) target numerous mineralized footwall structures that were not included in previous drilling campaigns, (3) test deeper unmined areas in the Footwall zone, including the 130 vein, Corridor 412 and the 200 Footwall vein, and (4) twin drill 8 holes to validate the historical assays and mineralized intervals. The program was successful in meeting its objectives.
Figure 10-6 shows an example of the expansion of the vein system in 2023 relative to the 2020 model.
| 10.8.9 | Hochschild Surface Drilling, 2022 |
One hole totalling 501 m was drilled from surface to test the deep, down dip and western extension of the most western V-Veins and S-Veins. No significant assay results were returned.
| 10.8.10 | Hochschild Underground Drilling, 2022 |
Sixty-eight holes totalling 9,876 m were drilled. Twenty of these holes were drilled to validate historical assays and intervals.
The priorities for this drilling campaign were to test and confirm the structures in the Footwall zone, including the 130 vein, 150 vein, 412 Corridor and the 200 Footwall vein. The program was successful in expanding and confirming vein continuity in these zones.
Two deep drill holes (~750m) were drilled to test for structures below the 200 Footwall. No significant assays were returned.
One shallow, long hole was drilled towards the southeast to test the up-dip potential for veins in the hangingwall above the Main Twin Zone. No significant assays were returned.
| 10.9 | SRK Comments |
The QP is of the opinion that the drilling, core logging, and sample handling procedures have been conducted using industry best practices. The appropriate level and quality of information has been obtained to provide sufficient confidence in drill hole spatial location for 3-D geological and grade modelling of the Snip Project. There are no apparent drilling or recovery factors that would materially impact the accuracy and reliability of the drilling results.
| SU/AD | September 2023 |
| SRK Consulting (Canada) Inc Skeena Resources Limited NI 43 -101 Snip Project Canada |
Page |
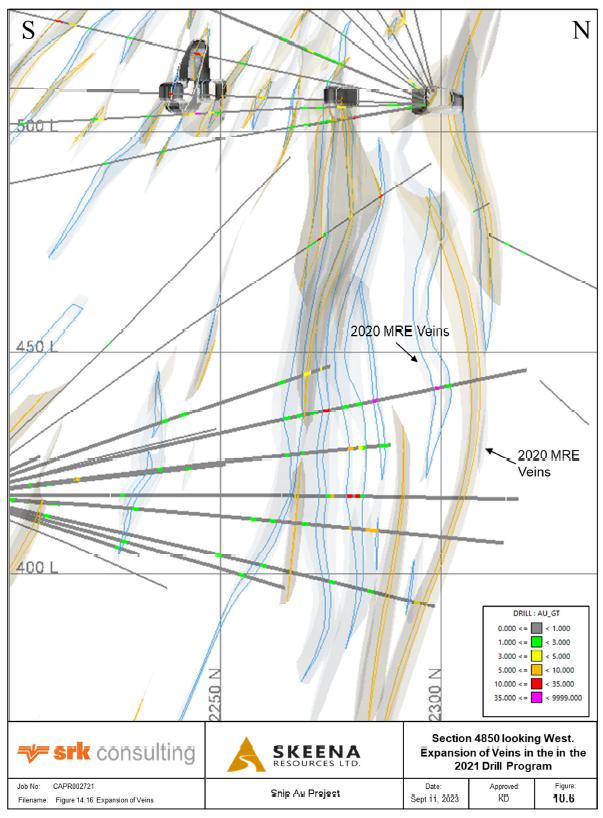
Figure 10-6: Cross section 4850E of the 412 area showing expansion of the veins from the 2021 drill program
| SU/AD | September 2023 |
| SRK Consulting (Canada) Inc Skeena Resources Limited NI 43 -101 Snip Project Canada |
Page |
| 11 | Sample Preparation, Analyses, and Security |
Sample preparation, analysis, and security for the years 2016 to 2022 inclusive are summarized in this section. Sample preparation and analysis information prior to 2016 were not retained by the previous owner.
| 11.1 | Sample Preparation, Analysis, and Security |
| 11.1.1 | Drill Hole Sampling |
Most of the samples collected between 2016 and 2022 were from NQ or NQ2-diameter diamond drill core. Drill core was placed in core boxes at the drill rig (both on surface and underground), with drill footage markers recorded on wooden spacers and drill hole numbers and box numbers recorded on each box. Core boxes were nailed shut and transported via helicopter (for surface holes) or by truck (for underground holes) to Skeena’s core logging facility at the Snip camp site (Figure 11-1). Core was then geologically and geotechnically logged and photographed prior to being cut. Each box was marked with Dymo® tape with drill hole ID, box number and depth and stored in cross piles at the Snip camp site (Figure 11-2).
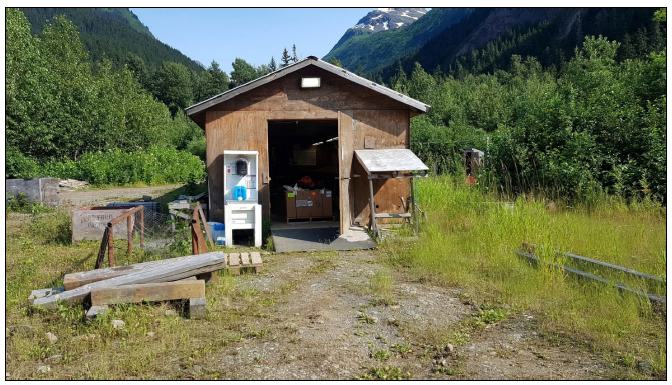
Figure 11-1: Snip camp site core shack
Assay sample intervals were delineated by the core logging geologist, taking geology into account. Sample intervals were generally broken at key lithological and mineralization lode contacts using no less than 0.5 m and no more than 1.5 m lengths. Sample intervals were marked in red china marker on the core and the corresponding sample assay tag was placed within the denoted interval to be sampled. All underground and surface drilling were half core sampled leaving the remaining half in the core yard for reference purposes.
| SU/AD | September 2023 |
| SRK Consulting (Canada) Inc Skeena Resources Limited NI 43 -101 Snip Project Canada |
Page |
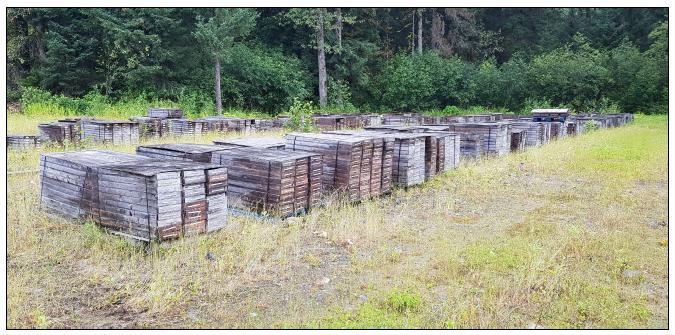
Figure 11-2: Drill core cross piles at the Snip camp (photograph courtesy of C. Chung, 2020)
Geological and geotechnical logging was performed in Geospark® software using Panasonic Toughbooks®. Geotechnical measurements included ‘from’ and ‘to’ measurements, recovery length, RQD and number of joints and longest stick. Geological attributes recorded included lithology, alteration, veining, mineralization, faults, breccias and structures. For each attribute, an intensity range between 1 and 5 may have also been recorded.
Sampled drill core was placed in numbered polybags with appropriate sample tags. Sample bags were then grouped and sealed in appropriately labelled rice sacks with tie wraps, and flown via helicopter to the McLymont staging area where they were locked in a Sea-Can® container before being shipped by ground transportation to the respective preparation facilities: ALS in Terrace, BC in 2016, Actlabs in Kamloops, BC in 2017, ALS in Kamloops, BC between 2018, and 2022. Hard copies of sample manifests were enclosed with each shipment and emailed directly to the sample preparation facilities ahead of shipping. Ground sample preparation using Rugged Edge Holdings picked up the samples and delivered them to Bandstra in Smithers, BC, for shipping. The preparation facilities sent an email once samples were received and that date was recorded.
Once the samples had been prepared, they were sent directly to their respective analytical laboratory: ALS in North Vancouver, BC in 2016, Actlabs in Kamloops, BC, Timmins, ON, or Thunder Bay, ON in 2017, and ALS in North Vancouver, BC between 2018 and 2022.
Skeena’s protocol is to conduct routine laboratory site visits to address any concerns with the preparation or analytical procedures. In February 2019, Mr. Geddes from Skeena Resources visited the ALS analytical facility in North Vancouver. He was satisfied with the condition of the equipment, the cleanliness of the facility, the sample logging methodology, the process methodology, and overall attention to quality control.
| SU/AD | September 2023 |
| SRK Consulting (Canada) Inc Skeena Resources Limited NI 43 -101 Snip Project Canada |
Page |
| 11.1.2 | Sample Preparation and Analysis by Analytical Laboratory |
ALS Vancouver has been the primary analytical laboratory for the analysis of samples from the Snip Gold Project in 2016, 2018, 2019, 2020, 2021 and 2022, whereas Activation Laboratories Ltd. (Actlabs Kamloops) was used during the 2017 drilling campaign. The umpire check analytical laboratory in 2016, 2018, and 2022 was SGS Canada Inc., and ALS Vancouver in 2017. The ALS analytical laboratory in Vancouver is an International Organization for Standardization (ISO) 9001-2015 certified and ISO 17025:2005 United Kingdom Accreditation Service (UKAS) ref. 4028 accredited laboratory. Actlabs has both ISO 17025:2017 and ISO 9001:2015 accreditation and SGS Mineral Services is ISO 9001:2015 certified. These laboratories are all independent of Skeena.
The addresses of the laboratories are as follows:
| · | ALS Canada Ltd. - 2103 Dollarton Hwy, North Vancouver, B.C., V7H OA7, Canada |
| · | Activation Laboratories Ltd. – 9989 Dallas Drive, Kamloops, B.C., V2C 6T4, Canada |
| · | SGS Canada Inc. – 3260 Production Way, Burnaby, B.C., V5A 4W4, Canada |
Primary sample preparation methods and analytical packages used for the Snip Project from 2016 to 2022 are summarized in Table 11-1.
Table 11-1: Sample preparation and analytical methods conducted on Snip Project drill samples between 2016 and 2022
| Year/Lab | Sample Preparation | Gold Analytical Methods | ||
| 2016/ALS |
1. Crush entire sample to 70% passing <2 mm 2. Riffle split 3. Pulverize 1,000 g to 85% <75 µm (PREP33D) |
50 g charge weight fire assay by AA finish at 10 g/t (Au-AA24) Au overlimit trigger at 10 g/t to complete 50 g fire assay with gravimetric finish (Au-GRA22) Visible gold samples bearing assayed by metallic screen fire assay (Au-SCR24) and gravimetry finish |
||
| 2017/Actlabs |
1. Crush entire sample to 90% passing <2mm 2. Riffle split 3. Pulverize 1,000 g to 95% passing <105 µm |
50 g charge weight fire assay by AA finish at 10 g/t (IA2-50) Au overlimit trigger at 10 g/t to complete a 50 g fire assay with gravimetric finish (IA3-50) |
||
|
2018/ 2019/ 2020/ 2021/ 2022/ ALS |
1. Crush entire sample to 70% passing <2 mm 2. Riffle split 3. Pulverize 1,000 g to 85% <75 µm (PREP-31B) |
50 g charge weight fire assay by AA finish at 10 g/t (Au-AA26) Au overlimit trigger at 10 g/t to complete 1 kg metallic screen fire assay (Au-SCR24) with gravimetric finish (Au-GRA22) |
Notes: AA – Atomic Absorption Spectroscopy
After sample shipments reach the sample preparation facility, they are in the facilities custody for sample preparation, inter-laboratory shipping, and analyses. It is ALS’s standard operating procedure to check all samples received from Skeena against the electronic and hard copy sample manifests, as well as for any potentially missing sample material, compromized plastic sample bags, broken zip closures, or torn/broken rice bags upon receipt. Skeena has not been alerted to any potential sample tampering by ALS. Laboratory sample preparation and analytical procedures have been conducted by independent accredited companies using industry standard methods. Skeena ensured quality control was monitored through the frequent insertion of blanks, certified reference materials, and duplicates.
| SU/AD | September 2023 |
| SRK Consulting (Canada) Inc Skeena Resources Limited NI 43 -101 Snip Project Canada |
Page |
| 11.1.3 | Specific Gravity and Bulk Density |
Density determinations to support the resource model were carried out between 2016 to 2021. A total of 3,198 specific gravity (SG) measurements from key lithologies were collected (Table 11-2). Specific gravity measurements were conducted at the Snip core processing facility. Solid pieces of uncut core approximately 10 to 15 cm in length were selected approximately every 20 m. Specific gravity was calculated using the water displacement method and lithology was recorded along with the SG calculations.
Table 11-2: Specific gravity measurements between 2016 and 2022
| Year | No. of SG Samples | |
| 2016 | 398 | |
| 2017 | 378 | |
| 2018 | 572 | |
| 2019 | 97 | |
| 2020 | 290 | |
| 2021 | 1,463 | |
| 2022 | 0 | |
| Total | 3,198 |
| 11.2 | Quality Assurance and Quality Control |
Skeena has designed and implemented sampling and assay quality control guidelines for drill core programs on the Snip Project (Bloom and Jolette, 2019). Within this guideline, QA/QC protocols include tests for data accuracy, precision, and sample cross-contamination. Field control samples are submitted together with drill hole samples to control and assess these key indicators of database quality.
Skeena’s routine quality control for diamond drill core is summarized in Figure 11-3, where the objective is to include 10 to 15% total quality control samples and actively monitor the results. In addition, a check assay program using a secondary laboratory is to be conducted on a quarterly basis to assess for bias within the primary laboratory (Figure 11-4).
| SU/AD | September 2023 |
| SRK Consulting (Canada) Inc Skeena Resources Limited NI 43 -101 Snip Project Canada |
Page |
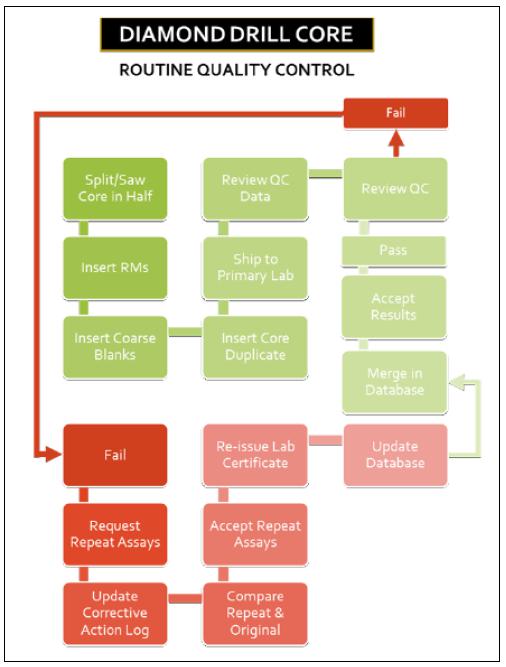
Source: Bloom and Jolette, 2019
Figure 11-3: Routine quality control flow chart
Accuracy, a measure of the closeness to the true value, was tested using round-robin certified standard samples that were processed with equivalent assaying techniques to Snip Project samples. Analytical precision (repeatability of results) was checked using duplicate samples. Potential cross-contamination between samples because of smearing of high-grade samples was checked using blank samples.
| SU/AD | September 2023 |
| SRK Consulting (Canada) Inc Skeena Resources Limited NI 43 -101 Snip Project Canada |
Page |
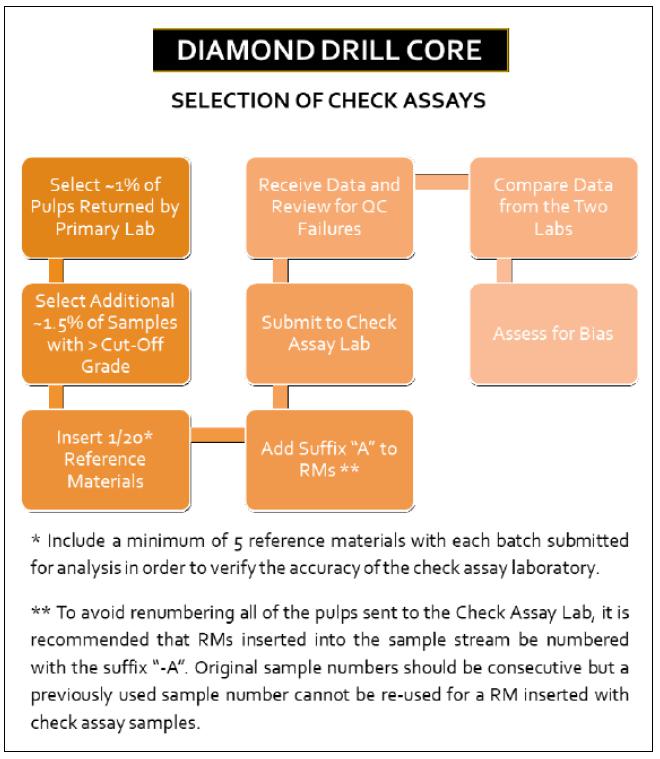
Source: Bloom and Jolette, 2019
Figure 11-4: Quarterly quality control flow chart
SRK has formerly reviewed all QA/QC data between 2016 and 2019; details of which have been filed in previous technical reports. SRK considers the 2016 to 2019 QA/QC data to be valid and disclosed, therefore all ensuing charts pertain to the 2020 to 2022 drilling programs only.
| SU/AD | September 2023 |
| SRK Consulting (Canada) Inc Skeena Resources Limited NI 43 -101 Snip Project Canada |
Page |
QA/QC results have been monitored and documented by Skeena geologists verifying the quality of the Snip Project assay data and its applicability for use in resource estimation. QA/QC results for the 2017, 2018 and 2019 programs are summarized in Snip (2017), Snip (2018) and Snip (2019), respectively; three in-house QA/QC reports. Two QA/QC reports for exploration samples during the 2020/2021 and 2022 drilling programs are summarized in Snip (2021) and Hochschild (2022). Table 11-3 summarizes the number of quality control samples inserted per assay year (this table excludes in-lab preparation and pulp duplicates and external lab check assays, which are presented in subsequent sections).
Table 11-3: Summary of field control samples per assay year
| Assay Year | No. QC Samples | Standards | Blanks | Duplicates | ||||
| 2016 | 299 | 151 | 90 | 58 | ||||
| 2017 | 663 | 95 | 75 | 493 | ||||
| 2018 | 1,652 | 719 | 437 | 496 | ||||
| 2019 | 208 | 89 | 53 | 66 | ||||
| 2020 | 288 | 179 | 109 | 0 | ||||
| 2021 | 1,409 | 878 | 531 | 0 | ||||
| 2022 | 3,832 | 1,646 | 962 | 1,224 | ||||
| Total QC | 8,351 | 3,757 | 2,257 | 2,337 |
Note: Assay year refers to the date that assays were finalized, however for QC assays in progress at the end of a drill campaign, they were assigned to the following year.
| 11.2.1.1 | Standards |
All certified reference material was acquired from CDN Resource Laboratories having an address of:
#2, 20148 – 102nd Avenue, Langley, B.C., V1M 4B4, Canada
In 2018, additional standards from Ore Research & Exploration Pty Ltd. (OREAS) were utilized for several months, however they were discontinued due to poor performance. The laboratory has an address of:
37A Hosie Street, Bayswater North, VIC 3153, Australia
The number and type of standards utilized between 2016 to 2022 have been summarized in Table 11-4. Standards representing ultra-low, low, medium, medium-high, and high-grade ranges in relation to the average Snip Project values were selected. A total of 20 individual standards were used between 2016 and 2022.
| SU/AD | September 2023 |
| SRK Consulting (Canada) Inc Skeena Resources Limited NI 43 -101 Snip Project Canada |
Page |
Table 11-4: Standards utilized between the 2016 and 2022 drilling campaigns
| Standards | Gold
Expected Used Value (g/t) |
Between
Lab Two Standard Deviations (g/t) |
Method | Year | ||||
| CDN-GS-22 | 22.94 | 1.12 | 30 g FA, gravimetric | 2016, 2017, 2018 | ||||
| CDN-GS-40A | 40.31 | 0.79 | 30 g FA, gravimetric | 2016, 2017, 2018 | ||||
| CDN-GS-1Q | 1.24 | 0.08 | 30 g FA, instrumental | 2016, 2017 | ||||
| CDN-GS-5T | 4.76 | 0.21 | 30 g FA, instrumental | 2016, 2017, 2018, 2019 | ||||
| CDN-GS-5T (for overlimits) | 4.86 | 0.26 | 30 g FA, gravimetric | 2017, 2018, 2019 | ||||
| CDN-GS-1T | 1.08 | 0.10 | 30 g FA, instrumental | 2018 | ||||
| CDN-GS-16 | 16.48 | 0.63 | 30 g FA, gravimetric | 2018 | ||||
| OREAS 601 | 0.780 | 0.062 | 20-40 g FA, various | 2018 | ||||
| OREAS 602 | 1.95 | 0.132 | 20-40 g FA, various | 2018 | ||||
| OREAS 603 | 5.18 | 0.302 | 20-40 g FA, various | 2018 | ||||
| CDN-GS-12B | 11.88 | 0.57 | 30 g FA, gravimetric | 2018, 2019 | ||||
| CDN-GS-1P5R | 1.81 | 0.14 | 30 g FA, instrumental | 2018, 2019, 2020 | ||||
| CDN-GS-5T | 4.86 | 0.52 | 50 g FA, gravimetric | 2020 | ||||
| CDN-GS-2W | 2.1 | 0.28 | 50 g FA, gravimetric | 2022 | ||||
| CDN-10G | 9.99 | 1.02 | 50 g FA, gravimetric | 2022 | ||||
| CDN-GS-25A | 27.7 | 1.8 | 50 g FA, gravimetric | 2022 | ||||
| CDN-ME-1706 | 2.062 | 0.312 | 50 g FA, gravimetric | 2020, 2021, 2022 | ||||
| CDN-ME-1709 | 0.178 | 0.032 | 50 g FA, gravimetric | 2021, 2022 | ||||
| CDN-GS-12B | 11.88 | 1.14 | 50 g FA, gravimetric | 2020, 2021 | ||||
| CDN-GS-7J | 7.34 | 0.58 | 50 g FA, gravimetric | 2020, 2021 |
Notes: FA – fire assay
Skeena evaluated the standards by means of using a 3 standard deviation tolerance from the expected gold value. A result in excess or below 3 standard deviations were considered failures. Field failures whereby the QC sample was incorrectly referenced in the logging sheet were all rectified in the database prior to being evaluated statistically.
Table 11-5 summarizes the total number of failures per year relative to each individual standard. Field failures were resolved prior to this tabulation. Of the 3,703 QC samples evaluated between 2016 and 2022, 61 standards failed the 3 standard deviation tests. A failure percentage of 2% is overall an acceptable amount considering that one standard (CDN-GS-40A which has been discontinued) accounted for the most failures.
Table 11-5: Summary of standards inserted per assay year, including failure results
| Year | Standard | No. of Samples | Failures at 3 Standard Deviations |
Failure % | ||||
| CDN-GS-1Q | 27 | 1 | 4% | |||||
| CDN-GS-22 | 49 | 0 | 0% | |||||
| 2016 | CDN-GS-40A | 27 | 2 | 7% | ||||
| CDN-GS-5T | 29 | 0 | 0% | |||||
| CDN-GS-1Q | 23 | 1 | 4% | |||||
| CDN-GS-22 | 29 | 0 | 0% | |||||
| 2017 | CDN-GS-40A | 16 | 3 | 19% | ||||
| CDN-GS-5T | 25 | 0 | 0% |
| SU/AD | September 2023 |
| SRK Consulting (Canada) Inc Skeena Resources Limited NI 43 -101 Snip Project Canada |
Page |
| Year | Standard | No. of Samples | Failures at 3 Standard Deviations |
Failure % | ||||
| CDN-GS-1Q | 46 | 0 | 0% | |||||
| CDN-GS-22 | 155 | 3 | 2% | |||||
| 2018 | CDN-GS-40A | 70 | 15 | 21% | ||||
| CDN-GS-1T | 76 | 1 | 1% | |||||
| CDN-GS-5T | 110 | 4 | 4% | |||||
| CDN-GS-16 | 76 | 6 | 8% | |||||
| OREAS 601 | 72 | 0 | 0% | |||||
| OREAS 602 | 1 | 0 | 0% | |||||
| OREAS 603 | 88 | 4 | 5% | |||||
| CDN-GS-12B | 11 | 0 | 0% | |||||
| CDN-SG-1P5R | 5 | 1 | 20% | |||||
| CDN-GS-12B | 28 | 0 | 0% | |||||
| 2019 | CDN-SG-1P5R | 30 | 0 | 0% | ||||
| CDN-GS-5T | 31 | 0 | 0% | |||||
| CDN-GS-12B | 36 | 0 | 0% | |||||
| CDN-GS-1P5R | 7 | 0 | 0% | |||||
| 2020 | CDN-GS-5T | 8 | 0 | 0% | ||||
| CDN-GS-7J | 59 | 0 | 0% | |||||
| CDN-ME-1706 | 68 | 0 | 0% | |||||
| CDN-ME-1706 | 388 | 3 | 1% | |||||
| 2021 | CDN-GS-12B | 372 | 0 | 0% | ||||
| CDN-GS-7J | 369 | 0 | 0% | |||||
| CDN-GS-2W | 391 | 0 | 0% | |||||
| CDN-GS-10G | 391 | 5 | 1% | |||||
| 2022 | CDN-GS-25A | 400 | 10 | 3% | ||||
| CDN-ME-1709 | 190 | 2 | 1% | |||||
| Total | ALL | 3,703 | 61 | 2% |
| Note: | Several standards that reached the upper detection limit were not tested with overlimit methods; these samples were removed from this tabulation. |
A total of 9 different standards were used during the 2020, 2021 and 2022 drilling campaigns. Five different types from Skeena and 4 distinct types from Hochschild. The standard expected value ranges cover the ultra low to ultra high gold grade ranges found at Snip. Skeena’s standard insertion protocol is to insert five standards every 100 samples. During the 3 drilling campaigns (2020, 2021, and 2022) a total of 2,703 standard were inserted into a total of 35,724 assays, which represents an 8% standard insertion rate. Four standards are certified for gold only, while 3 are certified for gold and silver. One standard (CDN-ME-1709) is a polymetallic standard.
| SU/AD | September 2023 |
| SRK Consulting (Canada) Inc Skeena Resources Limited NI 43 -101 Snip Project Canada |
Page |
Skeena adopts the procedure to fail a standard if the results fall outside the 3 standard deviation limits. In most failure cases, the standard had been wrongly labelled and the sample is simply reassigned the correct standard code. For those samples that failed for other reasons, Skeena requested that the lab re-assay approximately 9 shoulder samples before and after the failed standard within the assay certificate. Re-assay results were routinely conducted on failed samples, except when a high standard was in and amongst a series of low gold grades as re-assaying would likely result in a second failure. Constant monitoring of assay grades at the time of inserting the appropriate standard is the best course of action for preventing failures of this nature. Skeena monitored the re-assay results in 2020 to 2021 and ensured that they passed the second time around before finalizing the database.
A selection of standards representing ultra-low, low, medium, medium-high, and high-grade gold values for the years 2020 to 2022 are discussed and presented below.
Standards from 2020 all passed the 3 standard deviation limits; therefore, charts have not been displayed for this time frame. In addition, obvious biases were not observed.
Gold standard CDN-GS-7J, utilized during the 2021 drilling campaign represents the medium-grade samples having an expected value of 7.34 ± 0.29 g/t Au. Figure 11-5 display the actual values in relation to the expected value and standard deviation limits. This medium-grade gold standard is unbiased and falls within an acceptable tolerance range.
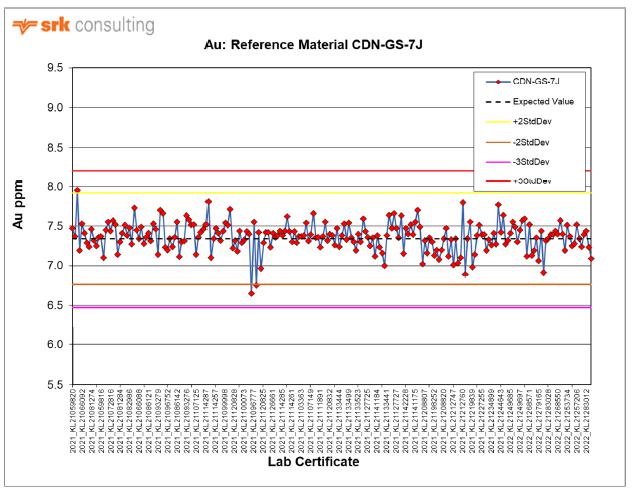
Figure 11-5: 2021 and 2022 gold control chart for standard CDN-GS-7J
| SU/AD | September 2023 |
| SRK Consulting (Canada) Inc Skeena Resources Limited NI 43 -101 Snip Project Canada |
Page |
Gold standard CDN-GS-25A was inserted primarily during the 2022 drilling campaigns and represent the high-grade range of the Snip deposit, having an expected value of 27.7 ± 0.9 g/t Au. Figure 11-6 displays the actual values in relation to the expected value and standard deviation limits. The high-grade gold standard is unbiased and falls generally within an acceptable tolerance range. There are, however, several failed samples, two of which assay higher than the 3 standard deviation limit, and 7 assaying lower than the 3 standard deviation limits. Inserting appropriate standards depending on the assay grade range in the sample series is of primary importance, especially for high grade standards which require specific analytical techniques. Adopting this strategy will likely reduce the number of failures for standard CDN-GS-25A.
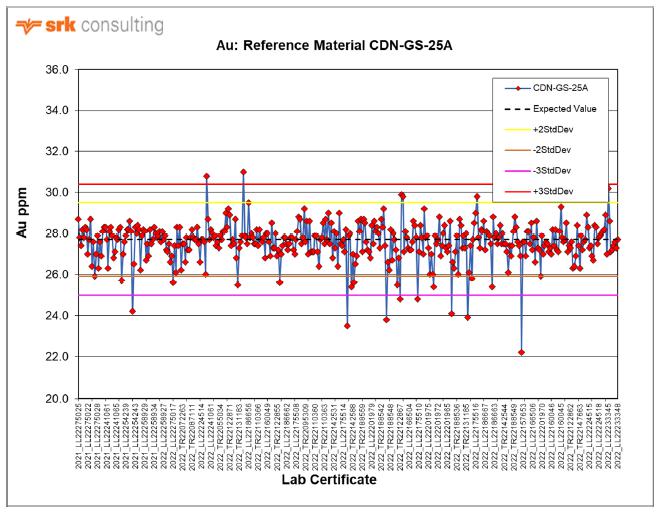
Figure 11-6: 2021 and 2022 gold control chart for standard CDN-GS-25A
Gold standard CDN-GS-2W was inserted during the 2021 and 2022 drilling campaigns and represents the low-grade range of the Snip deposit, having an expected value of 2.1 ± 0.14 g/t Au. Figure 11-7 displays the actual values in relation to the expected value and standard deviation limits. The low-grade gold standard is unbiased and falls within an acceptable tolerance range.
| SU/AD | September 2023 |
| SRK Consulting (Canada) Inc Skeena Resources Limited NI 43 -101 Snip Project Canada |
Page |
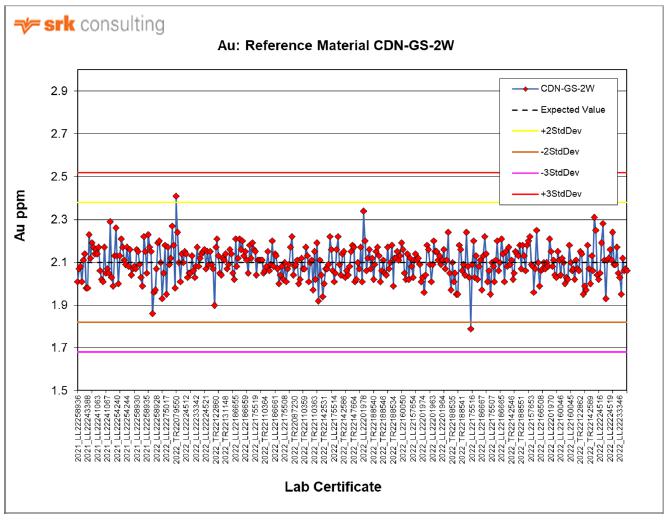
Figure 11-7: 2021 and 2022 gold control chart for standard CDN-GS-2W
Multielement standard CDN-ME-1709 was inserted during the 2021 and 2022 drilling campaigns and represents the ultra low-grade range of the Snip deposit, having an expected value of 0.178 ± 0.016 g/t Au. Figure 11-8 displays the actual values in relation to the expected value and standard deviation limits. The low-grade gold standard is unbiased and falls within an acceptable tolerance range.
| SU/AD | September 2023 |
| SRK Consulting (Canada) Inc Skeena Resources Limited NI 43 -101 Snip Project Canada |
Page |
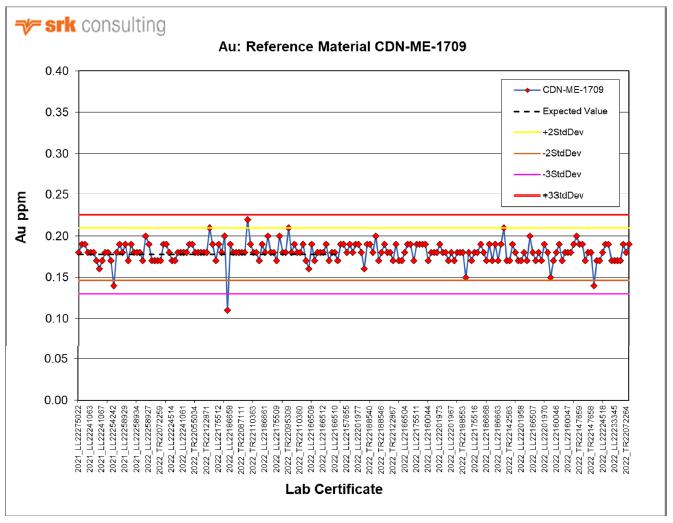
Figure 11-8: 2021 and 2022 gold control chart for standard CDN-ME-1709
| 11.2.1.2 | Blanks |
A total of 1,602 blanks have been inserted into the sample stream by Skeena and Hochschild between 2020 and 2022 (Table 11-3), representing 4% of the total samples assayed during 2020 to 2022. Blank material has come from 3 sources: (1) a certified powder purchased from CDN Resource Laboratories (CDN-BL-10), (2) certified coarse rock purchased from CDN Resource Laboratories (CDN-BL-10 Coarse), and (3) a marble garden rock obtained from Home Hardware in Smithers, BC, otherwise called “Rock Blanks”.
Skeena considered a blank sample to have failed when the result was greater than 10x the lower detection limit (>0.025 g/t Au). Table 11-6 summarizes the number of failures and failure percent per drilling year. All failed results were re-assayed in the same manner as standard samples, whereby approximately 9 shoulder samples before and after the failed blank within a certificate were re-analyzed. Should the re-assayed shoulder samples differ >10% from the original result then the Geospark® database was updated accordingly.
| SU/AD | September 2023 |
| SRK Consulting (Canada) Inc Skeena Resources Limited NI 43 -101 Snip Project Canada |
Page |
Table 11-6: Blank failures per assay year
| Assay Year | No. Samples | No. of Failures | Failure Percent | |||
| 2020 | 109 | 0 | 0.0% | |||
| 2021 | 681 | 3 | 0.4% | |||
| 2022 | 812 | 3 | 0.4% | |||
| Total | 1,602 | 6 | 0.4% |
The certified blank powder comes in two forms (CDN-BL-10 and CDN-BL-10 Coarse). Seeing that the pulp form of this blank material (CDN-BL-10) misses the crushing stage, it is important to continue to use CDN-BL-10 Coarse so that the sample is passed through the crusher, the stage most likely to detect contamination. Figure 11-9 depicts the marble garden rock results used in the 2020 to 2021 drilling campaigns, whereas Figure 11-10 depicts the coarse certified powder used during 2022 (CDN-BL-10 Coarse).
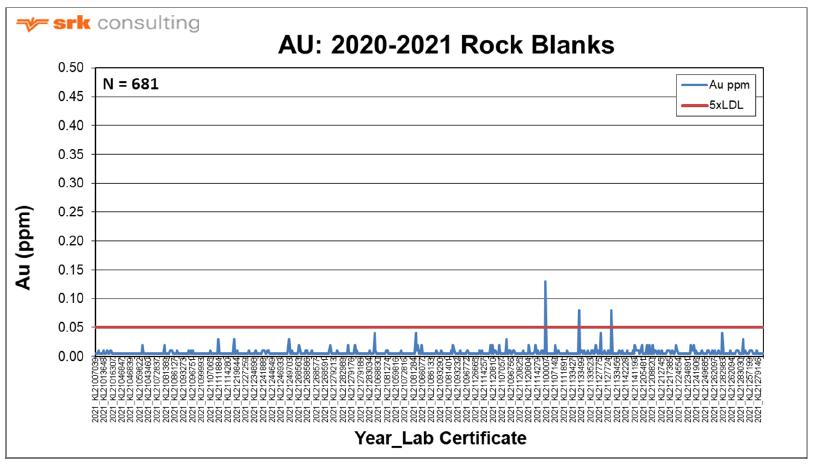
Figure 11-9: 2020 to 2021 marble garden rock blanks
| SU/AD | September 2023 |
| SRK Consulting (Canada) Inc Skeena Resources Limited NI 43 -101 Snip Project Canada |
Page |
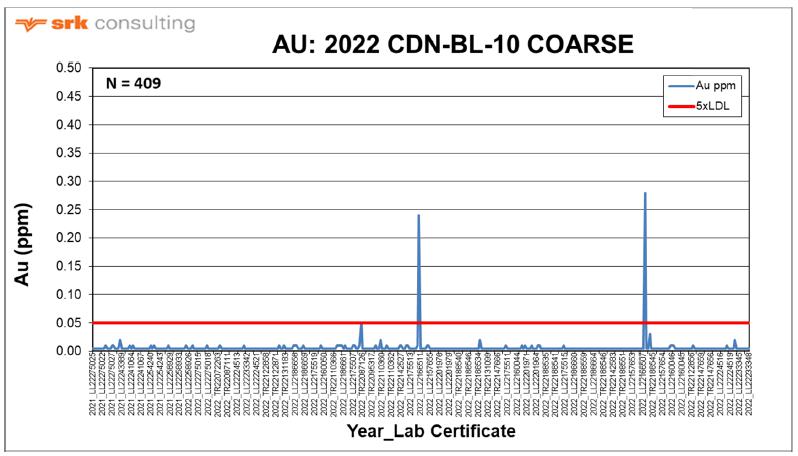
Figure 11-10: 2022 certified blank material (CDN-BL-10 Coarse)
| 11.2.1.3 | Duplicates |
Duplicate samples encompass several terms, including core, preparation (prep), and pulp duplicates, all of which are inserted at the sampling stage by Skeena or Hochschild. In addition, preparation and pulp duplicates are routinely inserted by the laboratory and are known as “internal duplicates”. The main goal of these duplicates is to monitor for precision or sample repeatability.
Field control analysis refer to the sample whereby one half of the core is bagged and tagged as the original, and the remaining half core was quartered and separately bagged and tagged as the duplicate; these are referred to as core duplicates. Between 2016 to 2018 overall core duplicate precision was low, likely reflecting the strong nugget effect at the Snip Project. The practice of inserting core duplicates was halted in early 2018 due to the high nugget effect at Snip; preparation and pulp duplicates and check assays were relied on after this time to monitor repeatability.
Prep repeats refer to the sample whereby a second split from the reject is taken and pulverized every 50th sample. A pulp repeat is a duplicate of the same pulp analyzed immediately after the original sample. Skeena inserted core duplicates, prep, and pulp repeats into their sample stream during the 2017 to 2019 drilling campaigns. For the 2020 to 2021 drilling campaign, Skeena relied on the internal prep and pulp duplicates from ALS Laboratories; a total of 1,815 internal prep and pulp duplicates were analyzed at ALS (Snip, 2021).
For the 2022 drilling campaign, Hochschild inserted their own prep (coarse), pulp (fine), and twin (resample) duplicates, in addition to the internal duplicates automatically conducted by ALS. Table 11-7 summarizes the total number of external duplicates analyzed between 2016 and 2022.
| SU/AD | September 2023 |
| SRK Consulting (Canada) Inc Skeena Resources Limited NI 43 -101 Snip Project Canada |
Page |
Table 11-7: No. of duplicates and percentages per year
| Year | No. Samples | Core Duplicates | Prep Repeat | Pulp Repeat | Resample | |||||
| 2016 | 2,635 | 58 | not available | not available | ||||||
| 2017 | 1,678 | 36 | 69 | 388 | ||||||
| 2018 | 12,424 | 86 | 91 | 319 | ||||||
| 2019 | 1,622 | 0 | 7 | 59 | ||||||
| 2020 | 0 | 0 | 0* | 0* | ||||||
| 2021 | 0 | 0 | 0* | 0* | ||||||
| 2022 | 1,224 | 0 | 409 | 408 | 407 | |||||
| Total | 19,583 | 180 | 576 | 1,174 | 407 |
*Skeena relied on ALS’s internal prep and pulp duplicates
Figure 11-11, Figure 11-12, and Figure 11-13 depict scatter plots for the 2022 prep, pulp, and resample duplicates, respectively. The overall scatter is high for the lower grades, however duplicate pair correlation improves significantly for the higher grades. Overall, the duplicate pairs are acceptable considering the nuggety nature of the Snip deposit.
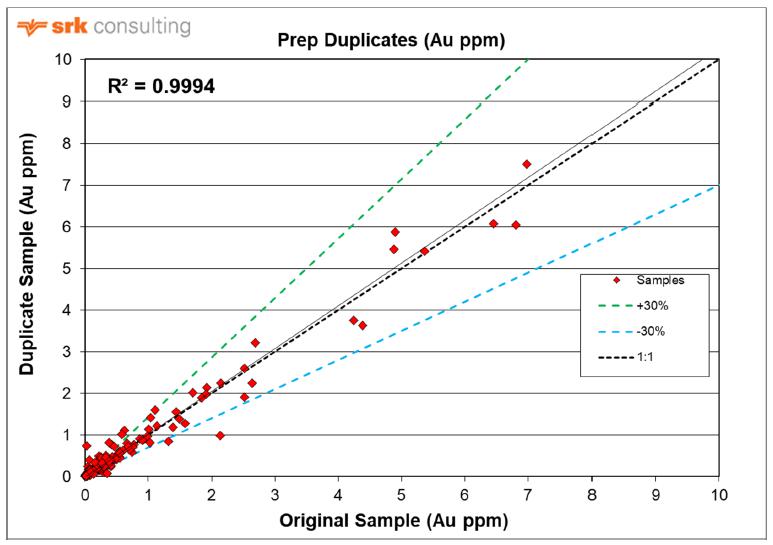
Figure 11-11: 2022 prep duplicate scatter plot
| SU/AD | September 2023 |
| SRK Consulting (Canada) Inc Skeena Resources Limited NI 43 -101 Snip Project Canada |
Page |
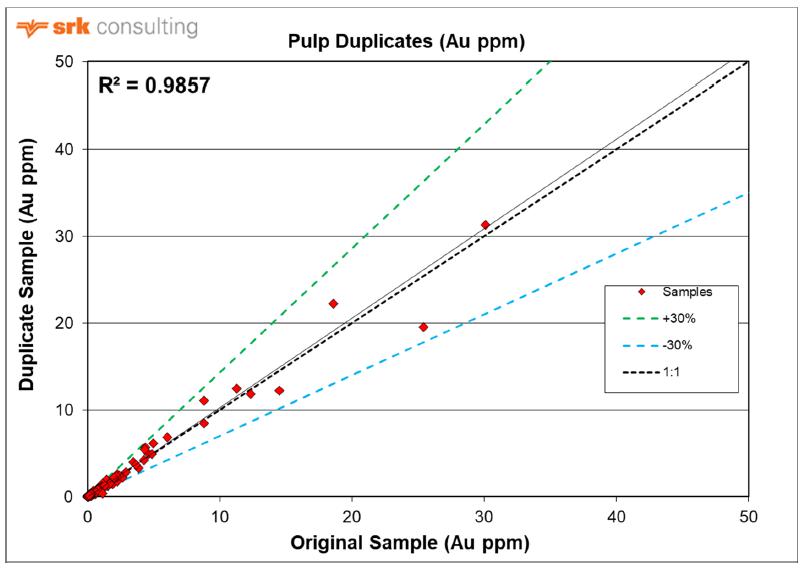
Figure 11-12: 2022 pulp duplicate scatter plot
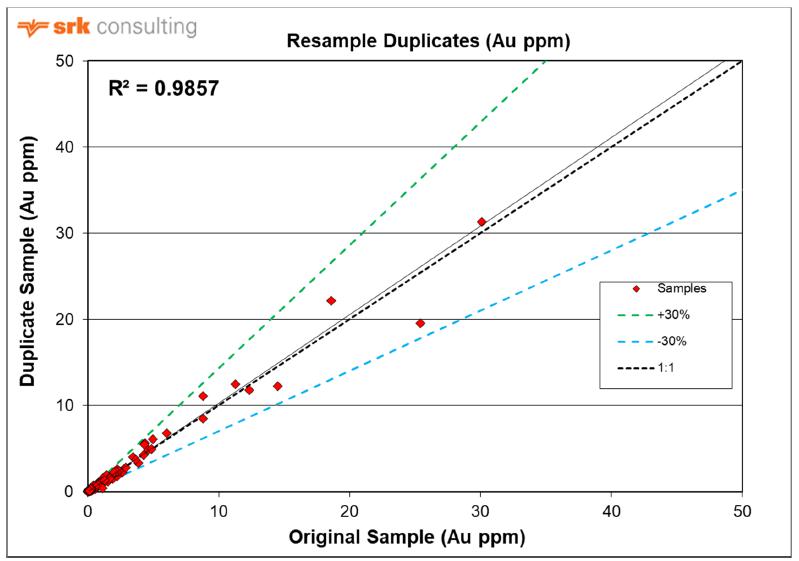
Figure 11-13: 2022 resample duplicate scatter plot
| SU/AD | September 2023 |
| SRK Consulting (Canada) Inc Skeena Resources Limited NI 43 -101 Snip Project Canada |
Page |
| 11.2.1.4 | Check Assays |
A total of 139 interlaboratory check samples were completed for the 2022 drilling campaign and the results were deemed acceptable (Figure 11-14). In addition, for the 2022 drilling campaign, 14 check standards and blanks were re-processed at an independent lab and all results fell within the respective accepted limits.
A total of 311 additional check samples submitted by Skeena are pending at SGS Laboratories at the time writing this report. The pulps that are currently being processed are from the 2022 drilling campaign. All 2021 pulps were disposed while being managed by Hochschild, and as a result, check assays could not be processed for the 2021 drilling campaign.
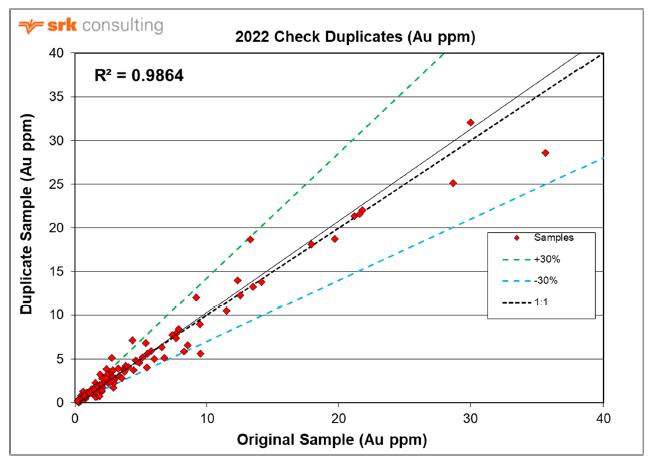
Figure 11-14: 2022 check assay chart
| 11.3 | Qualified Person’s Opinion on Quality Assurance and Quantity Control |
Skeena adopted a rigorous QA/QC program whereby field failures were corrected promptly, and re-assays were conducted where standards or blanks failed within the grade range of interest. Hochschild monitored their QC samples in a manner consistent with industry best practises. All QA/QC data and internal QA/QC reports were analyzed and disclosed to the QP.
Original assay certificates were made available to the QP, as well as all certified reference material certificates; data that was interrogated and assimilated into the QA/QC review.
| SU/AD | September 2023 |
| SRK Consulting (Canada) Inc Skeena Resources Limited NI 43 -101 Snip Project Canada |
Page |
It is the QP’s opinion that the sample preparation, sample security, analytical procedures and QA/QC are satisfactory and appropriate for generating data of suitable quality for use in resource modelling and estimation of the Snip Project. The QP’s independent assessment of standard, duplicate and blank charts indicate an acceptable level of accuracy across all of Skeena and Hochschild’s drill programs on the Snip Project. Check assay results also show a lack of bias between the primary and secondary laboratories.
The QP suggests the following QA/QC methods for future drilling campaigns at the Snip Project:
| • | At the sampling stage, care needs to be taken to insert the most appropriate gold standard into the sample series depending on the likely assay gold range. This is more important for the high-grade standard: CDN-GS-25A, as it should not be inserted into a low grade sample series. A handheld XRF calibrated for gold is one way to aid the selection process. |
| • | Continue to use the blank material: CDN-BL-10 Coarse, as this sample will be processed at the crushing stage; the crucial stage for monitoring possible contamination. |
| • | Preparation and pulp duplicates are inserted by the lab at a sequence that the lab defines. Additional preparation and pulp duplicates should be requested at intervals defined by Skeena to avoid intralab bias and to reflect the entire gold range that defines the Snip Project. |
| • | The submittal of check samples to SGS Canada should be consistent and timely, so that there is no time lag between drilling campaigns. |
| • | Sample rejects and pulps are not consistently saved and stored. In the event of core damage, loss or tampering, rejects and pulps will serve to validate the deposit’s primary asset – the assay database. Therefore, sample rejects and pulps should be stored. |
| • | Continue to collect SG measurements for every drill campaign. In 2022 SG samples were not collected and the reason for this oversight is not clear. |
| • | SG samples should be validated with external lab measurements during each drilling campaign. |
| SU/AD | September 2023 |
| SRK Consulting (Canada) Inc Skeena Resources Limited NI 43 -101 Snip Project Canada |
Page |
| 12 | Data Verification |
Due to the absence of QA/QC data for all the historical holes, SRK considered it a risk to include them into a classification category higher than Inferred. However, between 2016 and 2019 Skeena drilled 44 surface and 110 underground drill holes on the Snip Property, all of which have validated QA/QC samples. For the 2020 MRE, SRK considered an area within a “40 m buffer” around these recent holes to be a reasonable distance for upgrading material into the Indicated category, if satisfying additional classification criteria (see Section 14.11).
To substantiate this upgrade in classification, SRK compared the historical gold data distribution versus the 2016 to 2019 gold assay distribution within this 40 m buffer zone, outside of any depleted areas. The overall distribution between historical and the 2016 to 2019 drill holes was found to be comparative (Figure 12-1).
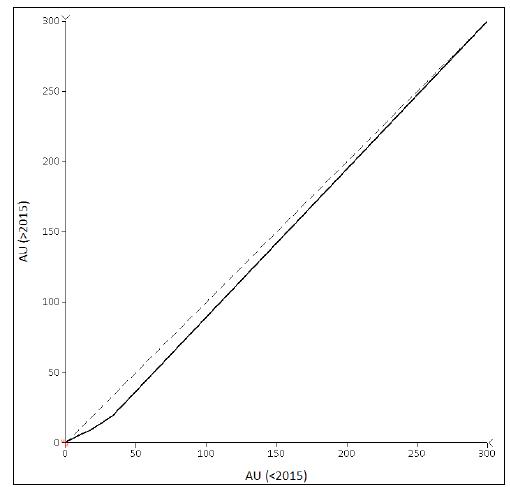
Figure 12-1: Log Q-Q plot of historical holes (Y axis) and Skeena (2016-2019) drilled holes (X axis) within the 40 m buffer zone outside of the depleted areas
| SU/AD | September 2023 |
| SRK Consulting (Canada) Inc Skeena Resources Limited NI 43 -101 Snip Project Canada |
Page |
For
the 2023 MRE, Skeena had access to 28 twin drill holes (for a total meterage of 3,318 m) that were drilled in similar 3-D orientation,
and with less than 2 m in separation distance, to the nearest historical hole. Eight of the holes were drilled by Skeena in 2021 and
20 of the holes were drilled by Hochschild in 2022. These holes (known as “Twin Holes”) were designed to validate the rest
of the historical drilling at the Snip Mine. Figure 12-2 displays the twin holes (in black) in relation to all holes drilled at Snip.
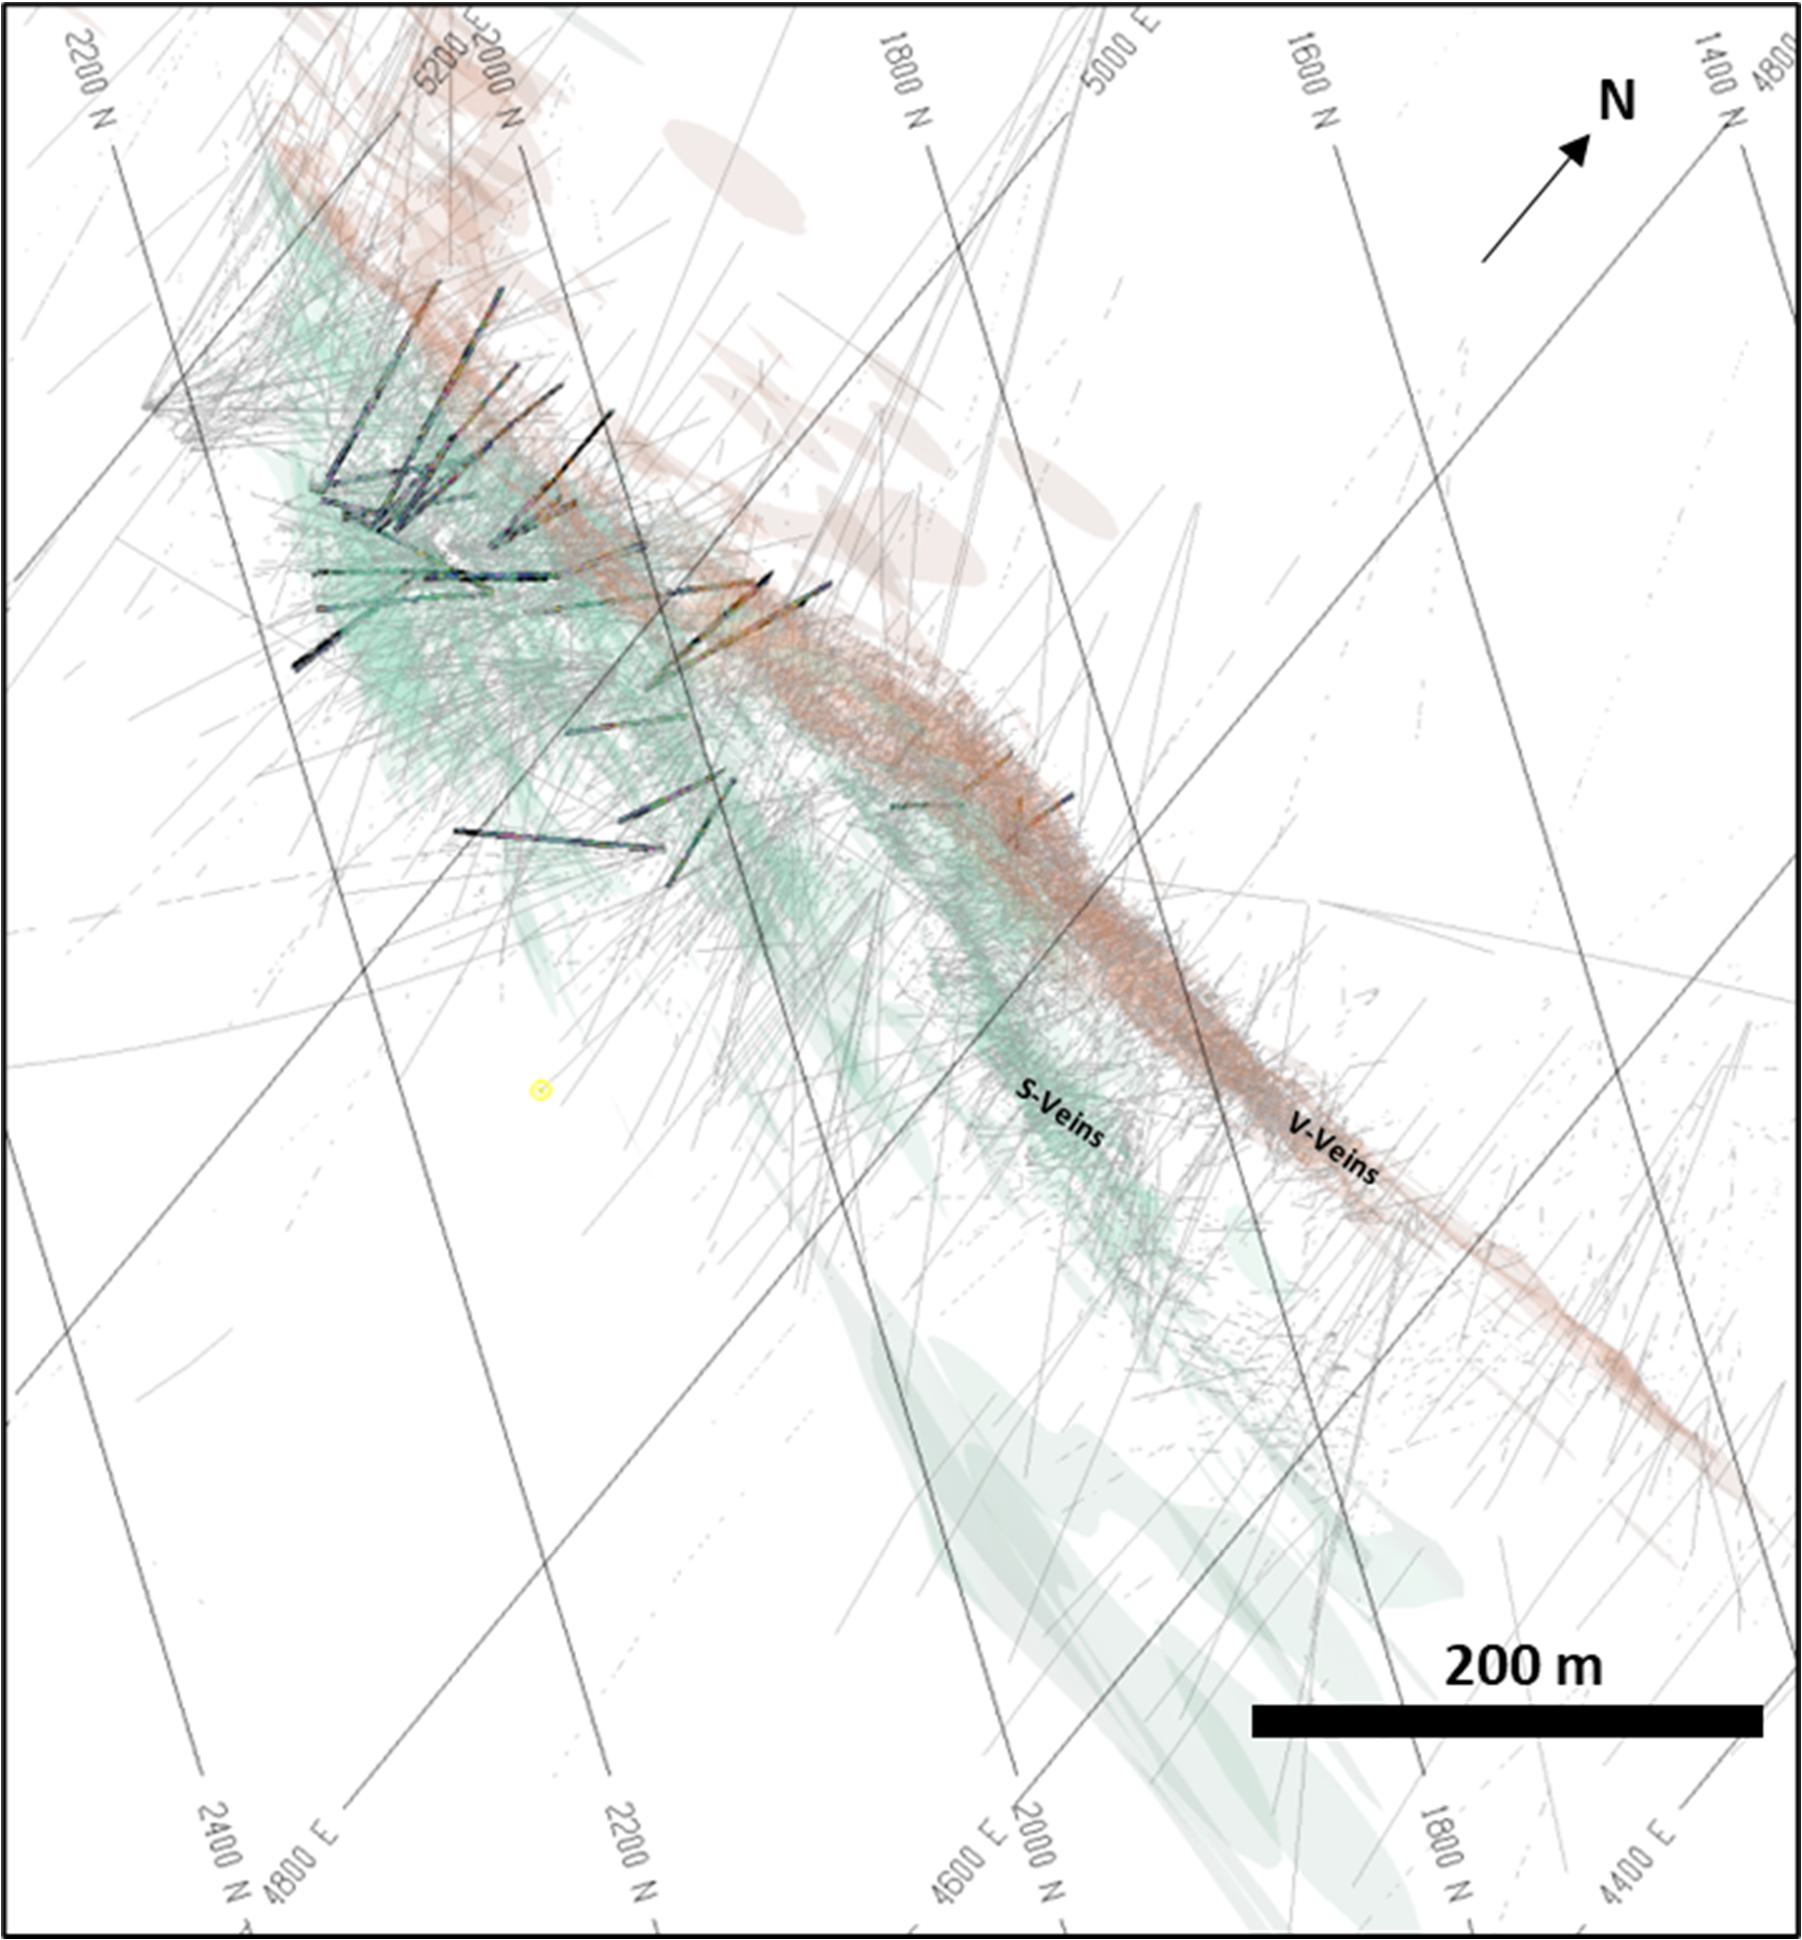
Figure 12-2: Down dip view of all twin holes (in black) in relation to all Snip drilling
The twin drilling results were compared directly by means of coding true width equivalent intervals with matching twin hole and historical hole intercepts (Figure 12-3). A total of 31 equivalent intervals were generated and their length weighted gold grades were calculated. For the twin holes an accumulated length-weighted grade of 15.73 g/t Au was calculated, whereas for the historical holes an accumulated length weighted grade of 13.09 g/t was calculated. This amounts to a 20% difference between the original and twin pairs. In addition, the twin pairs had analogous coefficient of variation results.
| SU/AD | September 2023 |
| SRK Consulting (Canada) Inc Skeena Resources Limited NI 43 -101 Snip Project Canada |
Page |
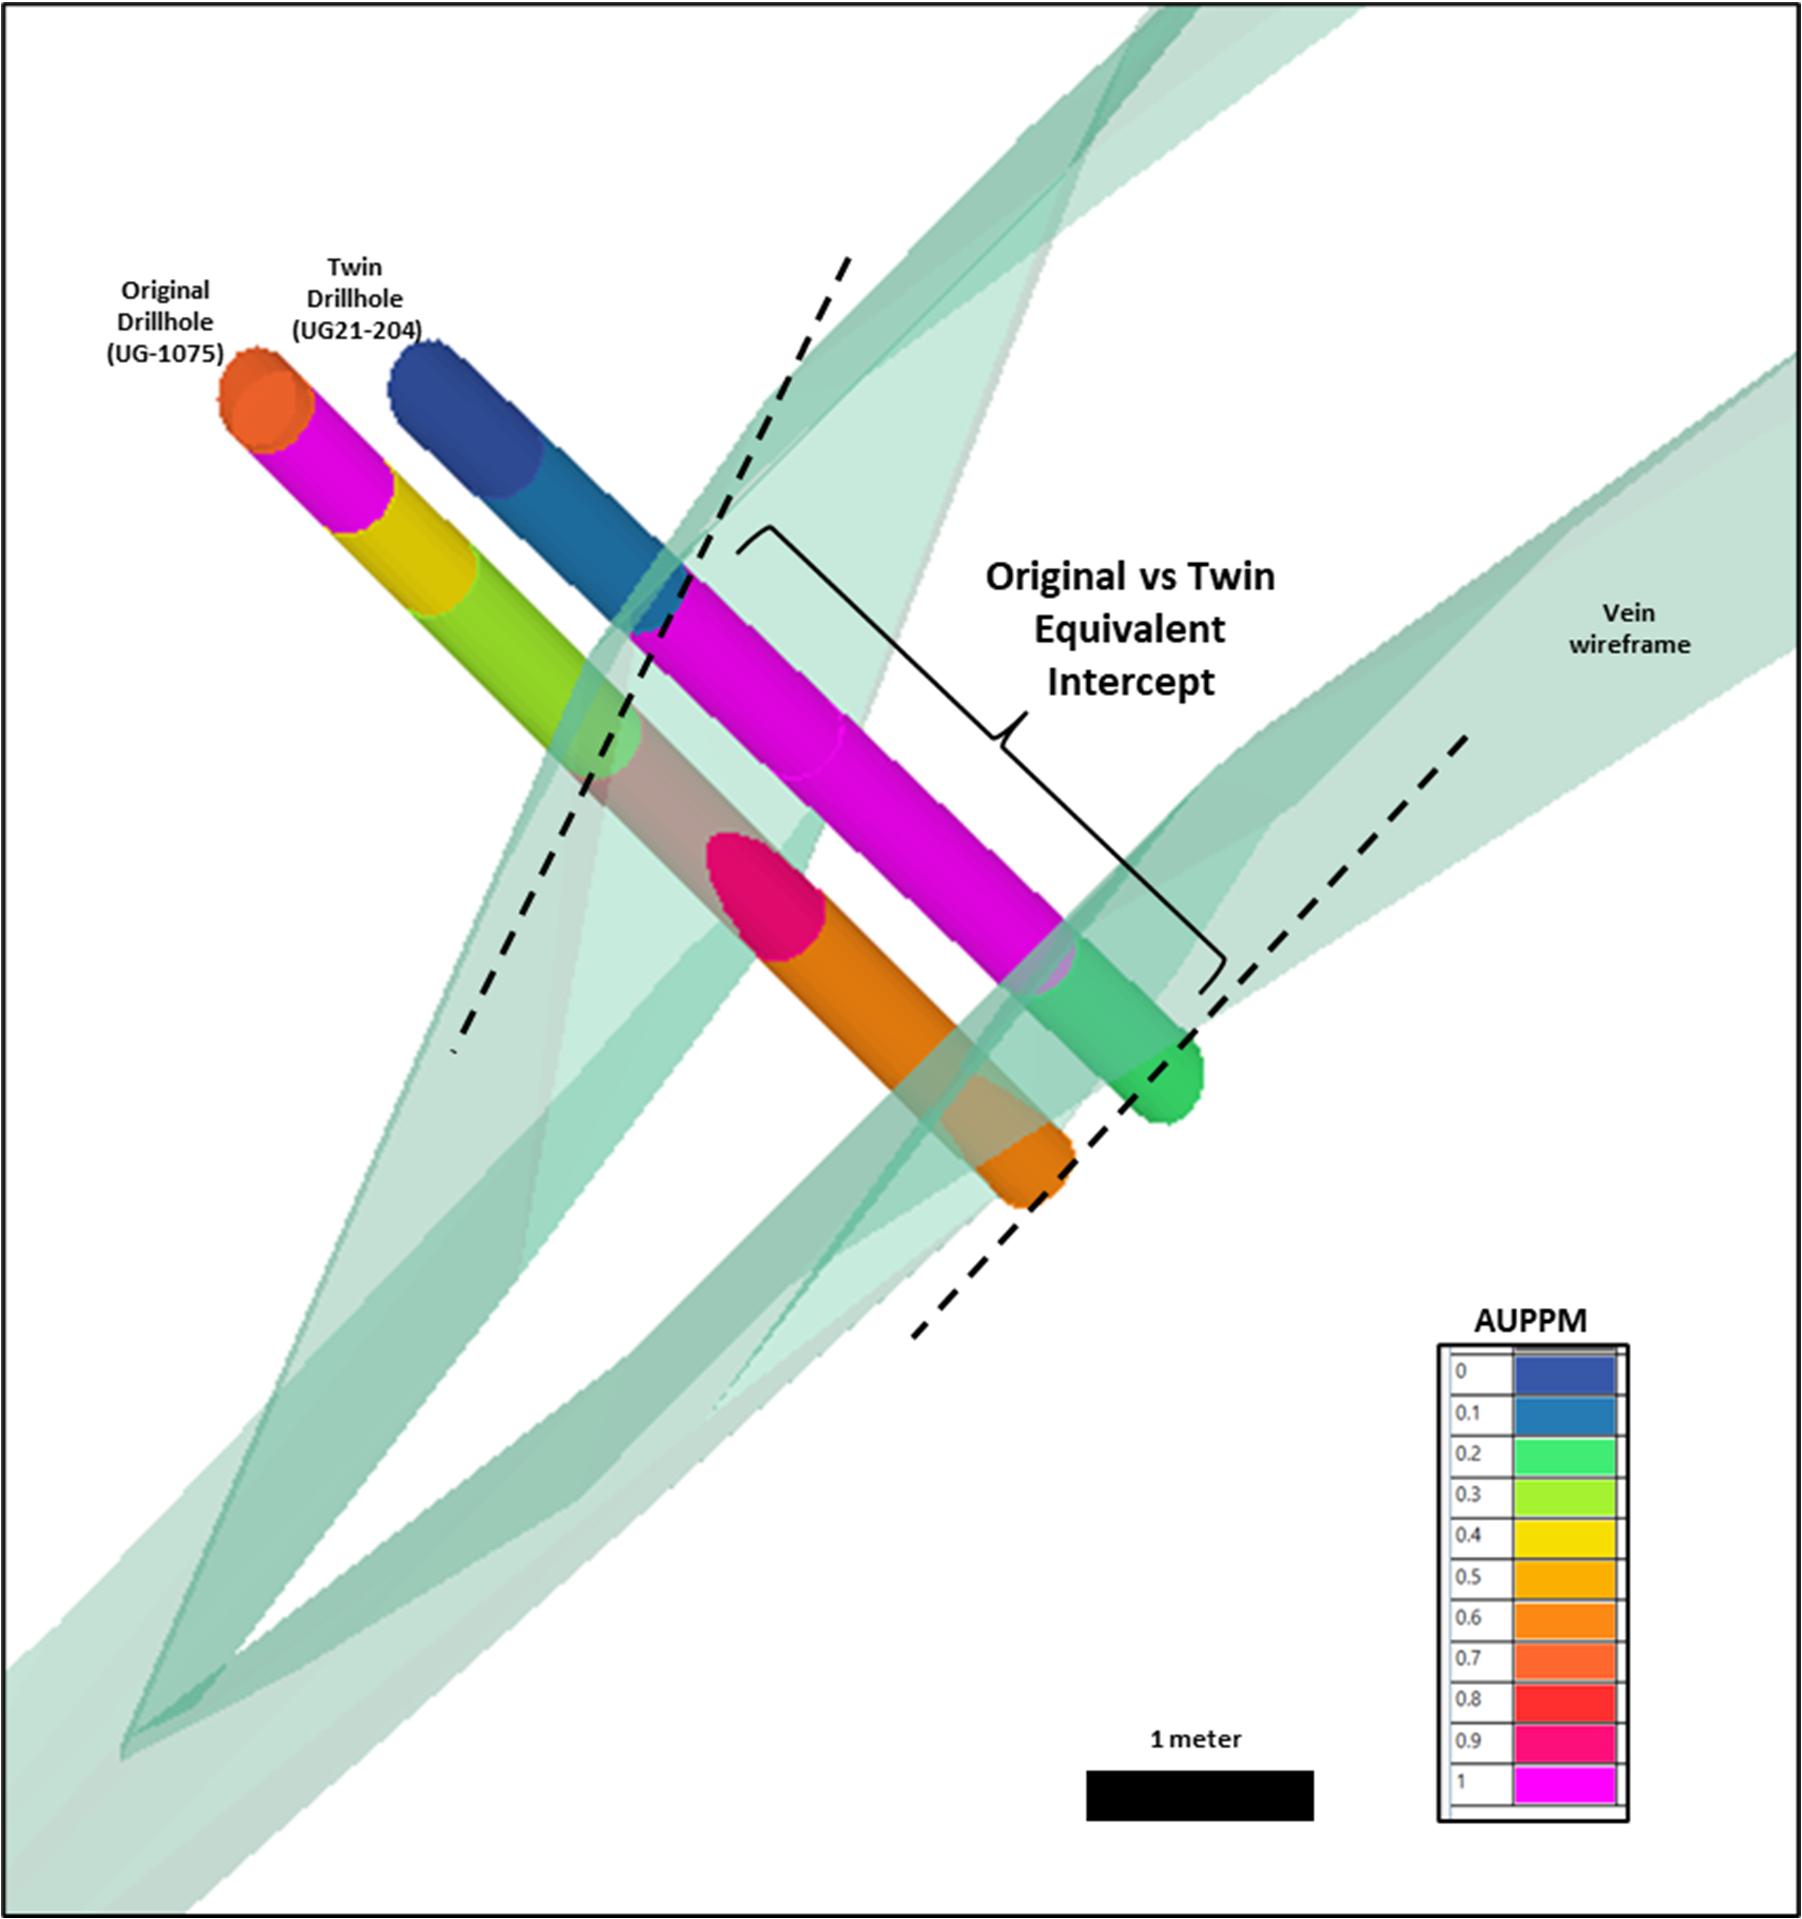
Figure 12-3. Equivalent vein intercepts for a twin pair
For the combined mineralization intercepts, the historical holes assayed lower overall than the twin holes. On a twin-pair basis, significant variability in weighted gold values was noted. For the historical holes the lowest and highest weighted gold grade was 1.08 g/t Au and 54.50 g/t Au, respectively. For the twin holes the lowest and highest weighted gold grade was 1.30 g/t Au and 113.63 g/t Au, respectively. Seeing that the nugget effect is high at the Snip mine (more than 30%) because of visible gold, it is not surprising to see large differences several meters apart.
| SU/AD | September 2023 |
| SRK Consulting (Canada) Inc Skeena Resources Limited NI 43 -101 Snip Project Canada |
Page |
The measure of precision for the historical and twin pairs were displayed on a Thompson-Howarth plot where the x-axis denotes the mean of the paired data, and the y-axis denotes the absolute difference of the pairs (Figure 12-4). The results show that all but 4 twin pairs fall below the +20% line. In addition, the correlation coefficient (R) has a value of 0.77; reasonable variability for a gold deposit of this nature.
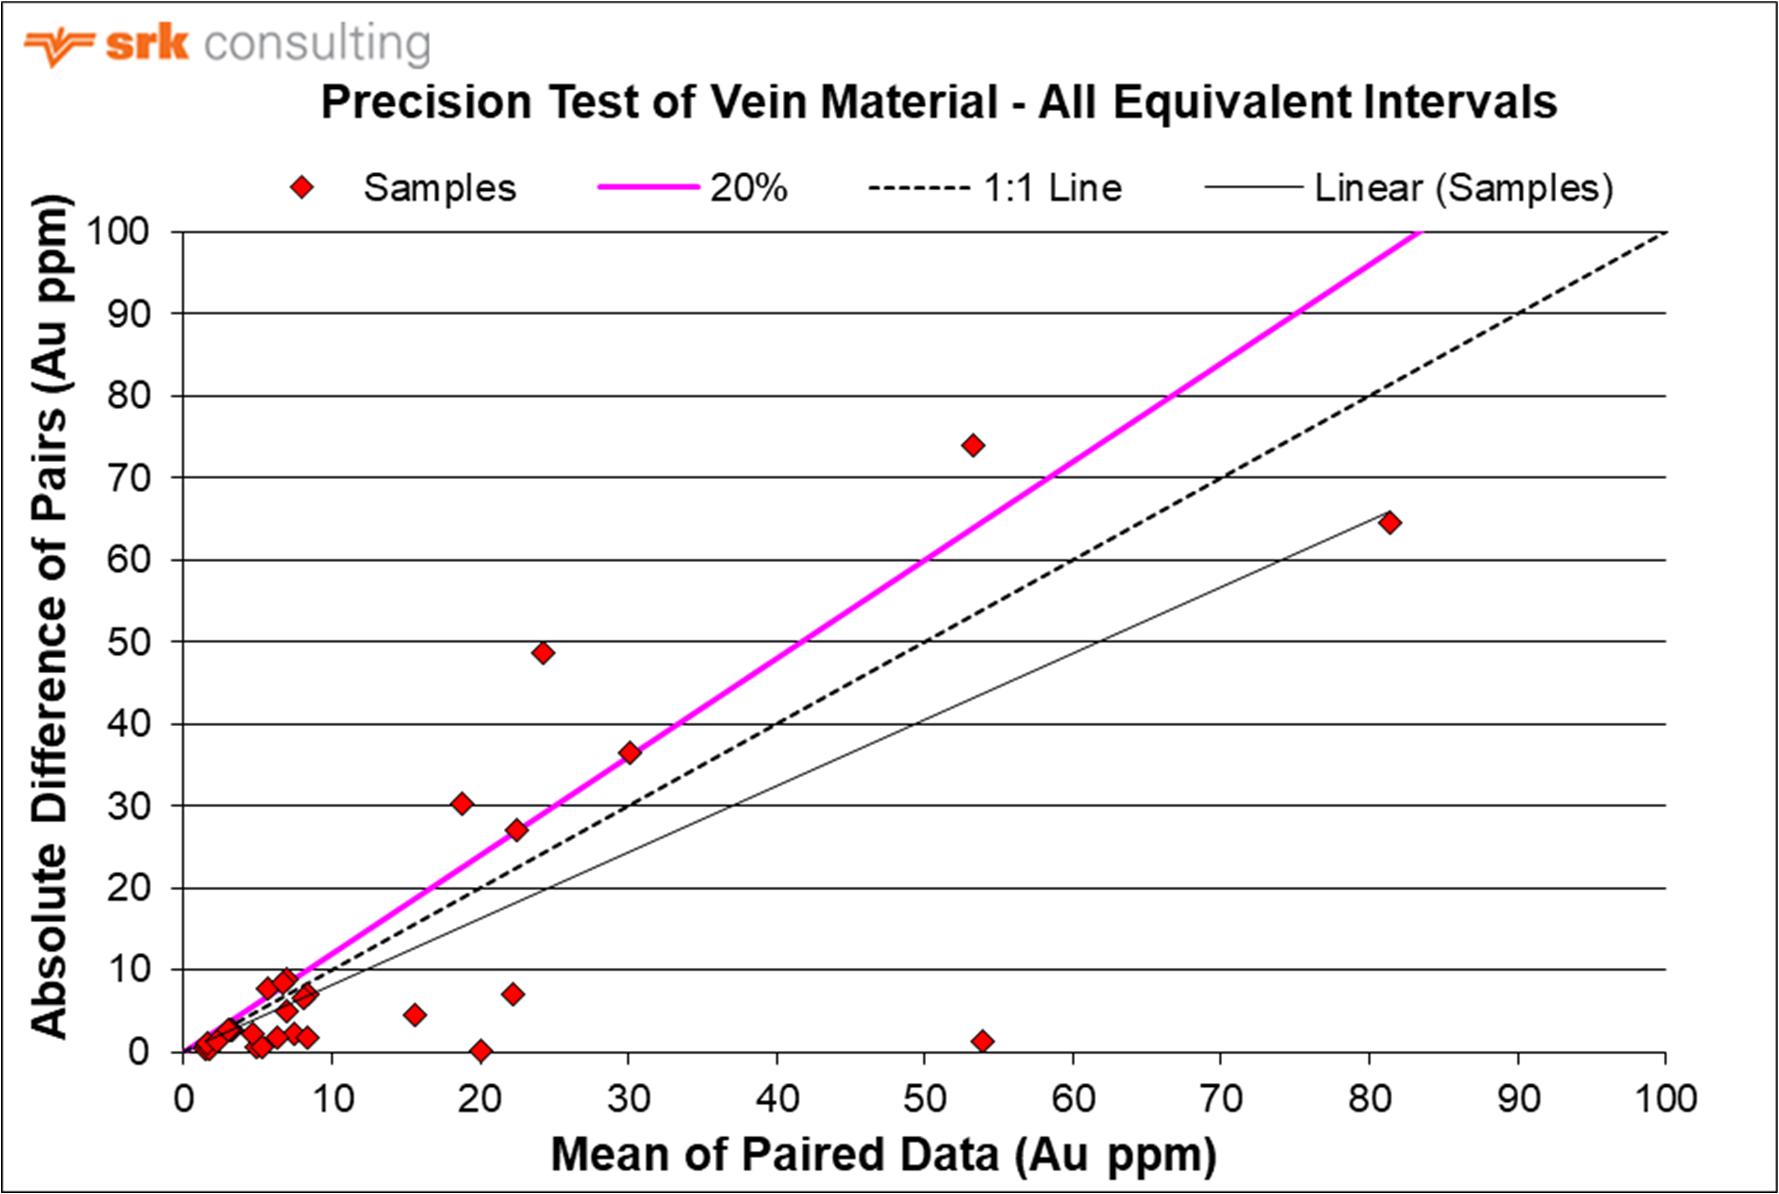
Figure 12-4. Thompson Howarth plot of all the equivalent vein intercept pairs
The twin drilling results were successful in:
| • | Validating historical drill hole mineralized intervals; |
| • | Validating equivalent gold grades between the twin and historical holes; |
| • | Validating similar variability that exists throughout the dataset; |
| • | Demonstrating that the historical holes were not biased towards the high grades; |
| • | Demonstrating that the assay techniques used in the 1990’s are consistent with assay techniques conducted in modern accredited and certified laboratories; |
| • | Demonstrating that the historical assays used suitable assaying techniques for the type and style of gold mineralization found at Snip. |
There are, however, inherent risks to using historical data where no stored evidence remains. Skeena is advized to continue to drill in areas as access is gained to levels currently inaccessible where twin drilling has not been conducted.
| SU/AD | September 2023 |
| SRK Consulting (Canada) Inc Skeena Resources Limited NI 43 -101 Snip Project Canada |
Page |
In summary, seeing that the twin drilling program was justified in terms of data precision for the twin pairs, it is reasonable to lift the classification constraint previously used.
Ms. Ulansky has been involved with the evaluation of the Snip Project since 2019 and has conducted a site visit to the Snip Property between July 27 and July 31, 2020. During her site visit, Ms. Ulansky reviewed surface and underground drill core to confirm the presence and nature of the mineralization and appropriateness of the interpreted geological framework. She observed abundant visible gold intersections in drill core, verifying the presence, and nature of gold mineralization at the Snip Project.
Sufficient checks have been completed to satisfy Ms. Ulansky that the Snip Project drilling and sampling data and geological interpretations are of suitable quality and robustness for resource modelling and estimation. She has verified Skeena’s drilling, sample preparation, handling, security, and chain of custody procedures, QA/QC procedures and results, as well as surface drill hole locations and core logs. She has also reviewed Snip’s database integrity and data quality for use in resource estimation (see Section 11). Ms. Ulansky has reviewed and been involved in all stages of the geological modelling and domain definition for the Snip Deposit and has assessed the applicability and robustness of these interpretations from the available drill core and drill logs. Ms. Ulansky completed the twin drilling data review and assessment.
| SU/AD | September 2023 |
| SRK Consulting (Canada) Inc Skeena Resources Limited NI 43 -101 Snip Project Canada |
Page |
| 13 | Mineral Processing and Metallurgical Testing |
| 13.1 | Introduction |
The Snip deposit has a history of being a past gold-producer and Skeena Resources is looking toward to resuming mining and processing operations at the Snip deposit. Newly discovered gold zones have been subject to metallurgical testing to determine processing requirements and the expected gold recoveries from these newly discovered zones. The first metallurgy program was undertaken in 2020 at Base Metallurgical Laboratories Ltd. (Base Met Labs) in Kamloops, BC as project BL661 by Skeena. The program was intended to assess the metallurgical performance of samples from Snip using conventional processes of gravity and floatation. In 2021 and 2022, two more studies were undertaken at Basemet Labs as projects BL891 and BL1002 respectively by Hochschild. These programs were completed to evaluate the gold and silver recovery from the Snip materials and to evaluate the quality of concentrates produced. The Snip Gold Mine was previously operated by Cominco.
| 13.2 | Metallurgical Test Work |
| 13.2.1 | Historical Operations at the Snip Mine |
Skeena Resources has not been able to access previous metallurgical studies related to the Snip deposit. Cominco operated the Snip mine from approximately 1991 to 1999, including an underground mining operation and a simple gravity and flotation plant, to recover gold and silver. The operation recovered approximately a million ounces of gold contained in gravity and flotation concentrates. The mine production and feed to the processing plant was approximately 27g/t gold and overall gold recoveries were in the range of 91 percent.
| 13.2.2 | 2020 Metallurgical Test Work Program |
The 2020 metallurgical testing program was completed at Base Met Labs using two composite samples. The scope of the program, identified as BL661, included:
| • | Chemical Composition |
| • | Mineral content |
| • | Communition Testing |
| • | Metallurgical Testing: |
| – | Rougher/Gravity Testing |
| – | Blend Cleaner Testing |
| 13.2.2.1 | Metallurgical Samples 2020 |
Two composite samples were generated for metallurgical testing: Composite 1 and Composite 2. Composite 1 consisted of six intervals from four holes and Composite 2 consisted of 4 intervals from 4 drill holes. The location of the intervals is spatially shown in Figure 13-1.
| SU/AD | September 2023 |
| SRK Consulting (Canada) Inc Skeena Resources Limited NI 43 -101 Snip Project Canada |
Page |
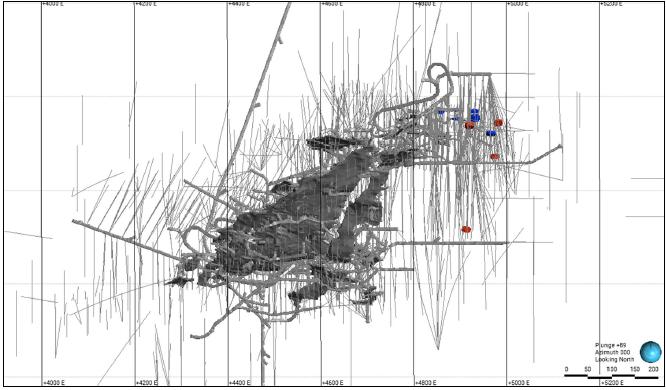
Source: Skeena 2023
Figure 13-1: Sample Locations of the 2020 Metallurgical Intervals. Red = Composite 1 and Blue = Composite 2
| 13.2.2.2 | Chemical Composition |
Detailed head assays were performed on each composite and is shown in Table 13-1.
Table 13-1: 2020 Samples - Chemical Analysis
| Composite | Assay | ||||||
|
Cu % |
Fe % |
Au g/t |
Ag g/t |
As g/t |
Sb g/t |
S % |
|
| Composite 1 | 0.15 | 14.8 | 8.15 | 15 | 138 | 11 | 11.6 |
| Composite 2 | 0.06 | 4.3 | 7.52 | 5 | 40 | 4 | 1.86 |
| 13.2.2.3 | Mineral Content |
Mineral content and sulphide distribution of the composites were determined using a bulk mineral analysis (BMA) routine via quantitative evaluation of minerals by scanning electron microscopy (QEMSCAN). The sulphide mineral content was dominated by pyrite, with minor amounts of chalcopyrite, galena and sphalerite. Composite 1 measured significantly more pyrite. The non-sulphide suite of minerals varied for the two composites but were mainly dominated by quartz, feldspars, and biotite/phlogopite.
| SU/AD | September 2023 |
| SRK Consulting (Canada) Inc Skeena Resources Limited NI 43 -101 Snip Project Canada |
Page |
| 13.2.2.4 | Communication Testing |
Composite 1 was determined to be 12.8 kW-hr/tonne and Composite 2 was determined to be 12.4 kW-hr/tonne. These values indicate it would be considered moderately soft. The results are shown in Table 13-2.
Table 13-2: Bond Mill Work Index Determination Determined at 106 microns Classification Size
| Sample | WiBM kW-hr/tonne |
| Composite 1 | 12.4 |
| Composite 2 | 12.8 |
| 13.2.2.5 | Metallurgical Testing |
Each of the two composites were tested using a standard bulk sulphide flotation process similar to the process used previously at the Snip operation. A second test was conducted on each composite which also included a gravity recovery stage to determine if the inclusion of a gravity recovery stage would benefit the overall gold and silver recovery. Results are shown in Table 13-3 below. Both samples showed very high gold recoveries and about 33 percent of the gold was recovered to a gravity concentrate. The inclusion of a gravity stage did not appreciably increase gold recovery.
| SU/AD | September 2023 |
| SRK Consulting (Canada) Inc Skeena Resources Limited NI 43 -101 Snip Project Canada |
Page |
Table 13-3: Rougher/Gravity results
| Composite | Test | Product | Mass | Assay g/t | Distribution % | ||||||||
| % | Au | Ag | As | Sb | S | Au | Ag | As | Sb | S | |||
| Composite 1 | 1 | Pan Con | |||||||||||
| Ro Con | 28.3 | 46.8 | 40 | 364 | 31 | 31.4 | 98.5 | 88.7 | 99.3 | 78.7 | 99.3 | ||
| Ro Tail | 71.7 | 0.28 | 2 | 1 | 3 | 0.09 | 1.5 | 11.3 | 0.7 | 21.3 | 0.7 | ||
| 3 | Pan Con | 0.7 | 552 | 166 | 519 | 112 | 50.9 | 36.1 | 9.5 | 4.9 | 5.1 | 4.4 | |
| Ro Con | 22.9 | 30.3 | 44 | 317 | 55 | 35.3 | 61.7 | 78.6 | 93.9 | 77.5 | 94.3 | ||
| Combined Con | 23.7 | 46.5 | 48 | 323 | 56 | 35.8 | 97.9 | 88.1 | 98.8 | 82.6 | 98.7 | ||
| Ro Tail | 76.3 | 0.32 | 2 | 1 | 4 | 0.15 | 2.1 | 11.9 | 1.2 | 17.4 | 1.3 | ||
| Composite 2 | 2 | Pan Con | |||||||||||
| Ro Con | 13.5 | 52.8 | 36 | 272 | 18 | 14.5 | 96.1 | 73.9 | 93.9 | 54.3 | 98.6 | ||
| Ro Tail | 86.5 | 0.33 | 2 | 3 | 2 | 0.03 | 3.9 | 26.1 | 6.1 | 45.7 | 1.4 | ||
| 4 | Pan Con | 0.8 | 280 | 158 | 931 | 106 | 52.3 | 30.7 | 19.6 | 19.5 | 14.3 | 21.1 | |
| Ro Con | 10.7 | 45 | 32 | 272 | 36 | 14.3 | 65.5 | 53.2 | 75.5 | 64.3 | 76.5 | ||
| Combined Con | 11.5 | 61.4 | 41 | 318 | 41 | 17 | 96.2 | 72.8 | 95 | 78.6 | 97.6 | ||
| Ro Tail | 88.5 | 0.32 | 2 | 2 | 1 | 0.06 | 3.8 | 27.2 | 5 | 21.4 | 2.4 | ||
| SU/AD | September 2023 |
| SRK Consulting (Canada) Inc Skeena Resources Limited NI 43 -101 Snip Project Canada |
Page |
| 13.2.3 | 2021 Phase 1 Metallurgical Test Work Program |
The 2021 Phase 1 metallurgical testing program was completed at BaseMet Labs in Kamloops, BC Canada using a single composite sample. The scope of the program, identified as BL891, included:
| 1. | Head Assays |
| 2. | Bulk Mineralogy |
| 3. | Gravity Recoverable |
| – | Gold |
| 4. | Flotation Testing |
| 5. | Leach Tests |
| 13.2.3.1 | Metallurgical Samples 2021 |
A single composite sample from eleven drill holes was generated for metallurgical testing. These holes are spatially shown in Figure 13-2. These samples are considered widely dispersed and representative of the deposit.
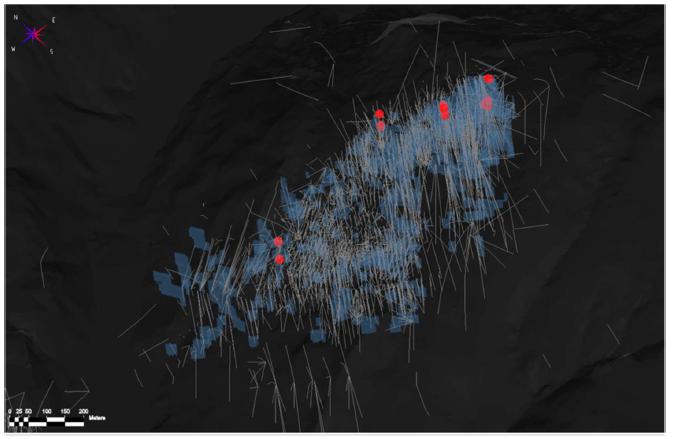
Source: Hochschild 2022
Figure 13-2: 2021 Snip Metallurgical Drill Hole Locations
| SU/AD | September 2023 |
| SRK Consulting (Canada) Inc Skeena Resources Limited NI 43 -101 Snip Project Canada |
Page |
| 13.2.3.2 | Sample Assays |
Sample assays for the 2021 Master Composite sample are shown in Table 13-4.
Table 13-4: 2021 Master Composite Sample Assays
| Analyte | ||||||||
| Sample | Au
(g/t) |
Ag
(g/t) |
ST
(%) |
SO42- (%) |
S2- (%) |
As
(g/t) |
C (%) |
TOC (%) |
| Master Composite | 5.31 | 5.6 | 2.22 | <0.01 | 2.22 | 39 | 2.55 | 0.01 |
| 13.2.3.3 | Sample Mineralogy for 2021 Master Composite |
The Master Composite sample was submitted for bulk mineral analysis (BMA) using QEMSCAN. A summary of the BMA results is shown in Table 13-5.
The BMA results indicate that pyrite is by far the most significant sulphide mineral and represents about 95 percent of all the contained sulphides. A breakdown of the sulphide mineral distribution is shown in Figure 13-7 and confirms that pyrite is the predominant sulphide mineral in the Snip materials, with lesser amounts of chalcopyrite.
Table 13-5: 2021 Master Composite Sample - Bulk Mineralogy Analysis
| Mineral Abundance (% w/w) | Master Composite |
| Pyrite | 4.26 |
| Pyrrhotite | 0.02 |
| Chalcopyrite | 0.22 |
| Sphalerite | 0.05 |
| Other Sulphides | 0.01 |
| Quartz | 11.6 |
| Plagioclase | 33.9 |
| K-Feldspar | 5.08 |
| Sericite/Muscovite | 4.67 |
| Biotite/Phlogopite | 16.8 |
| Chlorite | 2.74 |
| Clays | 1.38 |
| Other Silicates | 3.57 |
| Oxides | 0.23 |
| Carbonates | 14.5 |
| Apatite | 0.88 |
| Other | 0.06 |
| Total | 100 |
| SU/AD | September 2023 |
| SRK Consulting (Canada) Inc Skeena Resources Limited NI 43 -101 Snip Project Canada |
Page |
Table 13-6: 2021 Master Composite Sample Sulphur Deportment Results
| Mineral | Sulphur Distribution (% Normalized) |
| Pyrite | 95.8 |
| Pyrrhotite | 0.30 |
| Chalcopyrite | 3.07 |
| Sphalerite | 0.66 |
| Galena | 0.01 |
| Other Sulphides | 0.14 |
| Total | 100 |
| 13.2.3.4 | Gravity Separation |
A gravity separation test work program was completed on the Master Composite sample to investigate the efficacy of gravity-based gold separation.
A single gravity recovery test was completed, and results are summarized in Table 13-7. The gravity test work results indicate that a significant portion of the gold is amenable to being recovered in a gravity process and estimates of a gold recovery in a production setting are estimated at 30 to 50 percent of a very high-grade gold concentrate.
Table 13-7: Snip 2021 E-GRG Test Results
| Sample | Cum.
Mass Recovery (%) |
Combined
Conc. Assay (g/t Au) |
Cum.
Recovery (% Au) |
| Master Composite | 1.39 | 255 | 59.8 |
| 13.2.3.5 | Flotation Testing |
Three flotation tests were conducted on the Master Composite sample including 2 rougher tests and 1 open-circuit cleaner test. Rougher kinetics tests applied standard reagent conditions with 22 minutes of retention, 200 g/t of potassium amyl xanthate (PAX) collector to evaluate grind sizes of k80’s of 100 and 75 um. The 75 um grind was selected for a 3-stage batch cleaner test with the objective of producing a trade-off between mass rejection and gold loss. All flotation tests included an initial gravity concentration stage which included initial concentration through a Knelson concentrator with the concentrate upgraded to a low weight concentrate (0.05%) on a Mozley Super Panner.
Rougher flotation tests on gravity tailings showed overall recovery of 92% Au (13.7% mass) at 100 µm and 96.5% Au (14.5% mass) at 75 µm. Batch cleaner tests showed overall recovery of 92% Au (gravity plus flotation) when reground to 25 µm in a single stage of cleaning. Mass recovery was reduced to 6%. Locked cycle tests were not completed in this test work program.
| SU/AD | September 2023 |
| SRK Consulting (Canada) Inc Skeena Resources Limited NI 43 -101 Snip Project Canada |
Page |
| 13.2.3.6 | Cyanide Leach Test |
Cyanide leach tests were conducted on gravity tailings, rougher flotation concentrate and rougher flotation tailings samples. Test conditions are shown in Table 13-8.
Table 13-8: Snip Phase 1 Leach Test Conditions
| Sample | Grind
(k80, µm) |
Leach Time (hours) | Cyanide
Conc. (g/L NaCN) |
| Gravity Tail | 75 | 48 | 1.0 |
| Rougher Conc. | As Is | 48 | 2.0 |
| Rougher Tail | As is | 24 | 1.0 |
Cyanide leach test results are shown in Table 13-9. Results show high leach extractions with rapid kinetics. The low-grade flotation tailings sample also had high leach extraction despite its low head grade of 0.44 g/t Au.
Table 13-9: Snip 2021 Leach Test Results
| Leach Extractions (% Au) | ||||
| Sample | 2 hours | 6 hours | 24 hours | 48 hours |
| Rougher Conc. | 67.2 | 88.8 | 92.3 | 94.9 |
| Rougher Tail | 65.0 | 83.0 | 87.5 | - |
| Rougher Tail | 82.3 | 92.8 | 93.5 | 94.1 |
Overall gravity, flotation and leach extraction results are shown in Table 13-10. Gravity/leach produced superior results overall. The gravity and cleaner flotation results replicate the original Snip flowsheet which produced gold doré from gravity concentrate and shipped a high-grade pyrite concentrate. The rougher concentrate leach and tailings leach produced good results, even without regrinding of the flotation concentrate prior to leaching. Optimization work with respect to primary grind size distribution is recommended to maximize flotation and leaching recoveries.
Table 13-10: Snip 2021 Combined Gravity/Flotation Leach Test Results
| Recovery (% Au) | ||||
| Sample | Gravity | Flotation | Leach | Overall |
| Grav./Flot. Conc. Leach/Flot. Tails Leach | 29.9 | - | 63.4 | 93.3 |
| Gravity/Cleaner Flotation | 45.9 | 45.3 | - | 91.3 |
| Gravity/Leach | 30.1 | - | 65.8 | 95.9 |
| SU/AD | September 2023 |
| SRK Consulting (Canada) Inc Skeena Resources Limited NI 43 -101 Snip Project Canada |
Page |
| 13.2.4 | Phase 2 2022 Metallurgical Testing Program |
The 2022 Phase 2 metallurgical testing program was completed at BaseMet Labs in Kamloops, B.C. on 10 comminution samples and 18 metallurgical samples. The scope of the program, identified as BL1002, included:
| • | Head assays Mineralogy |
| • | Comminution testing |
| • | Extended gravity recoverable gold (E-GRG) testing. Flotation testing. |
| • | Leach tests |
| • | Cyanide detox testing. |
| • | Solids-liquids separation testing. |
| 13.2.4.1 | Phase 2 Metallurgical Samples |
The 2022 program included 18 composite samples from eleven drill holes for the metallurgical testing program and 10 comminution samples from 10 drill holes. The list of samples and their acronyms are shown in Table 13-11. The samples were selected to represent underground mining. Drill hole locations are shown in Figure 13-3 and Figure 13-4. The location of the comminution samples is shown in Figure 13-5. The flotation and metallurgical test samples are a combination of drill core and coarse assay rejects. Assay rejects were inspected for any oxidation or alteration effects prior to their use; none were found. The primary flowsheet development composites used were TMPC for the leach flowsheet and FTMPC for the flotation flowsheet.
Table 13-11: 2022 Metallurgical Samples
| Sample | Acronym |
| Twin Main Pit Flotation Variability Sample 2 | FTMPV2 |
| Twin Main Pit Flotation Variability Sample 1 | FTMPV1 |
| Twin Main Pit Flotation Low-Grade Sample | FTMPLG |
| Twin Main Pit Flotation Underground Low-Grade Sample | FTMUGLG |
| Twin Main Pit Flotation Medium-Grade Sample | FTMPMG |
| Twin Main Pit Flotation Underground Medium-Grade Sample | FTMUGMG |
| Twin Main Pit Flotation High-Grade Sample | FTMPHG |
| Twin Main Pit Flotation Very High-Grade Sample | FTMPVHG |
| Twin Main Pit Flotation Main Composite Sample | FTMPC |
| Twin Main Pit Variability Sample 2 | TMPV2 |
| Twin Main Pit Variability Sample 1 | TMPV1 |
| SU/AD | September 2023 |
| SRK Consulting (Canada) Inc Skeena Resources Limited NI 43 -101 Snip Project Canada |
Page |
| Sample | Acronym |
| Twin Main Pit Low-Grade Sample | TMPLG |
| Twin Main Pit Underground Low-Grade Sample | TMUGLG |
| Twin Main Pit Medium-Grade Sample | TMPMG |
| Twin Main Pit Underground Medium-Grade Sample | TMUGMG |
| Twin Main Pit High-Grade Sample | TMPHG |
| Twin Main Pit Very High-Grade Sample | TMVHG |
| Twin Main Pit Composite Sample | TMPC |
| Twin Main Pit Comminution Sample 1 | MCOM1 |
| Twin Main Pit Comminution Sample 2 | MCOM2 |
| Twin Main Pit Comminution Sample 3 | MCOM3 |
| Twin Main Pit Comminution Sample 4 | MCOM4 |
| Twin Main Pit Bond Work Index Variability Sample 1 | MP1 |
| Twin Main Pit Bond Work Index Variability Sample 2 | MP2 |
| Twin Main Pit Bond Work Index Variability Sample 3 | MP3 |
| Twin Main Pit Bond Work Index Variability Sample 4 | MP4 |
| Twin West Pit Bond Work Index Variability Sample 1 | TWP1 |
| Twin West Pit Bond Work Index Variability Sample 2 | TWP2 |
| SU/AD | September 2023 |
| SRK Consulting (Canada) Inc Skeena Resources Limited NI 43 -101 Snip Project Canada |
Page |
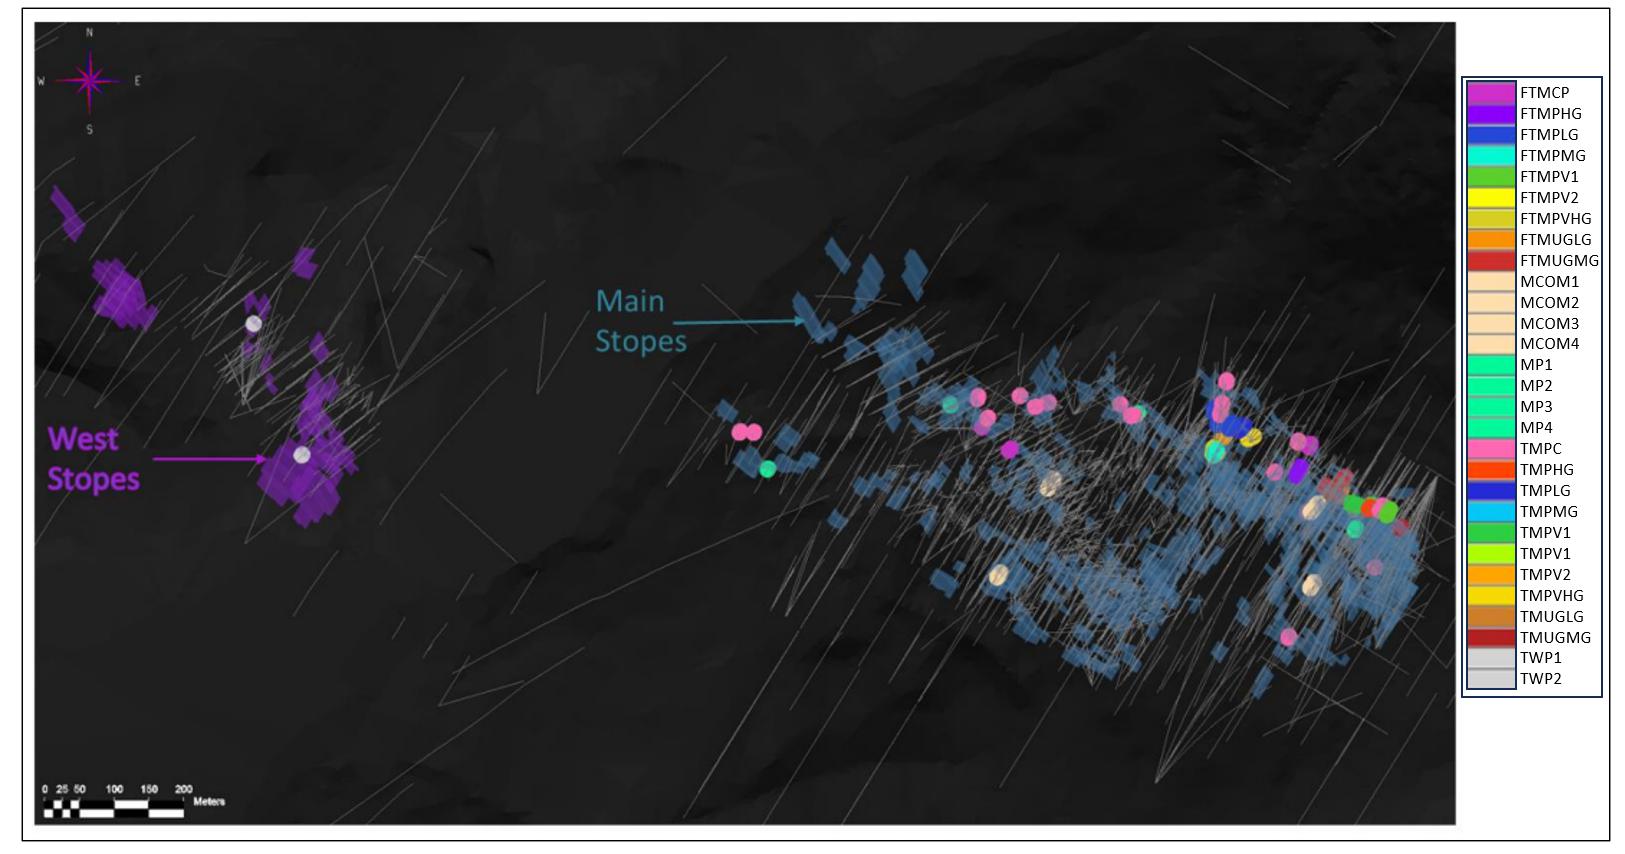
Source: Hochschild, 2020
Figure 13-3: Snip Phase 2 Metallurgical Test Samples Locations; Part 1
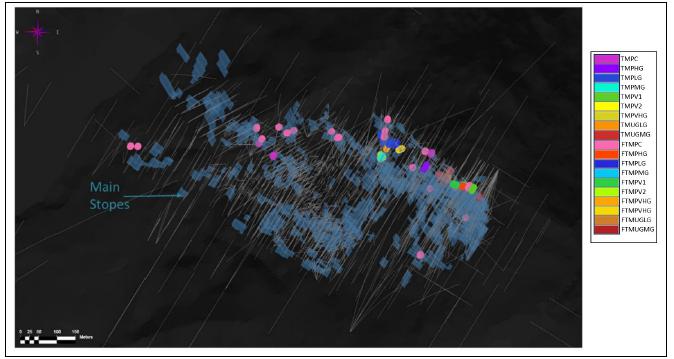
Source: Hochschild 2022
Figure 13-4: 2022 Metallurgical Test Samples Locations; Part 2
| SU/AD | September 2023 |
| SRK Consulting (Canada) Inc Skeena Resources Limited NI 43 -101 Snip Project Canada |
Page |
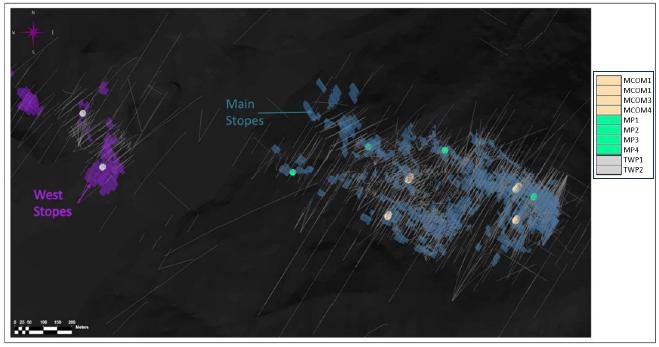
Source: Hochschild 2022
Figure 13-5: 2022 Comminution Test Samples Locations
| 13.2.4.2 | 2022 Sample Assays |
Sample assays are shown in Table 13-12. Sulphur occurs primarily as sulphide Sulphur (S2-) in all samples. Gold head grades range from 1.33 g/t to 22.2 g/t. Copper and arsenic concentrations are low and non-problematic. Mercury concentrations are very low and will not require capture within the process.
Table 13-12: Snip Phase 2 Sample Assays
| Analyte | |||||||||
| Sample | Au (g/t) |
Ag (g/t) | ST (%) |
S042 (%) |
S2-
(%) |
As (g/t) | Cu (%) | Fe (%) | Hg (mg/t) |
| FTMPV2 | 5.97 | 3.6 | 2.47 | 0.03 | 2.44 | 144 | 0.031 | 5.44 | 11 |
| FTMPV1 | 2.59 | 3.6 | 1.08 | 0.03 | 1.05 | 16.8 | 0.065 | 4.00 | 15 |
| FTMPLG | 1.33 | 0.8 | 0.75 | 0.01 | 0.74 | 13.6 | 0.009 | 3.40 | 6 |
| FTMUGLG | 4.11 | 2.3 | 1.88 | 0.04 | 1.84 | 30.4 | 0.029 | 4.72 | 16 |
| FTMPMG | 3.90 | 4.5 | 3.89 | 0.04 | 3.85 | 158 | 0.043 | 6.84 | 17 |
| FTMUGMG | 22.2 | 2.9 | 1.06 | 0.04 | 1.02 | 29.5 | 0.014 | 4.72 | < 5 |
| FTMPHG | 7.44 | 5.8 | 2.68 | 0.05 | 2.63 | 124 | 0.043 | 4.64 | 40 |
| FTMPVHG | 9.94 | 3.2 | 2.55 | 0.01 | 2.54 | 50.5 | 0.029 | 5.00 | 15 |
| FTMPC | 16.1 | 2.4 | 1.06 | 0.03 | 1.03 | 19.3 | 0.014 | 4.20 | 92 |
| SU/AD | September 2023 |
| SRK Consulting (Canada) Inc Skeena Resources Limited NI 43 -101 Snip Project Canada |
Page |
| Analyte | |||||||||
| Sample | Au (g/t) |
Ag (g/t) | ST (%) |
S042 (%) |
S2-
(%) |
As (g/t) | Cu (%) | Fe (%) | Hg (mg/t) |
| TMPV2 | 3.72 | 2.3 | 1.97 | 0.04 | 1.93 | 14.3 | 0.021 | 4.76 | 12 |
| TMPV1 | 7.05 | 2.0 | 1.79 | 0.03 | 1.76 | 38.7 | 0.037 | 4.72 | < 5 |
| TMPLG | 2.24 | 0.4 | 0.91 | 0.03 | 0.88 | 17.9 | 0.010 | 3.20 | < 5 |
| TMUGLG | 3.07 | 2.3 | 1.74 | 0.05 | 1.69 | 16.3 | 0.024 | 4.52 | 17 |
| TMPMG | 4.02 | 3.1 | 3.10 | 0.04 | 3.06 | 143 | 0.033 | 5.76 | 11 |
| TMUGMG | 20.7 | 5.4 | 3.40 | 0.04 | 3.36 | 14.2 | 0.018 | 4.08 | 11 |
| TMPHG | 5.80 | 1.8 | 0.95 | 0.05 | 0.90 | 1415 | 0.084 | 5.84 | 12 |
| TMVHG | 10.7 | 2.9 | 1.94 | 0.04 | 1.90 | 43.0 | 0.028 | 4.48 | 26 |
| TMPC | 6.11 | 4.0 | 2.62 | 0.05 | 2.57 | 46.9 | 0.029 | 5.48 | 20 |
| 13.2.4.3 | 2022 Sample Mineralogy |
Three Twin Pit samples were submitted for BMA using QEMSCAN to determine major mineral species and sulphide mineral speciation. The results are presented in Table 13-13. Key observations related to mineral abundance include:
| • | Sulphides are present primarily as pyrite, with minor amounts of chalcopyrite. |
| • | Non-sulphide gangue is predominately comprised of Plagioclase, Biotite/Phlogopite, and Calcite. The Calcite will provide some neutralization of potential acid generation in tailings. |
Table 13-13: 2022 Samples Bulk Mineralogy Analysis (BMA)
| Mineral Abundance (% w/w) | TMPC | TMPHG | TMPLG |
| Chalcopyrite | 0.07 | 0.19 | 0.02 |
| Pyrite | 3.79 | 1.88 | 1.63 |
| Pyrrhotite | 0.00 | 0.08 | 0.02 |
| Arsenopyrite | 0.00 | 0.01 | 0.19 |
| Sphalerite | 0.10 | 0.04 | 0.00 |
| Galena | 0.06 | 0.02 | 0.00 |
| Other Sulphides | 0.00 | 0.01 | 0.00 |
| Quartz | 12.6 | 15.3 | 16.6 |
| Plagioclase | 33.0 | 19.0 | 29.0 |
| SU/AD | September 2023 |
| SRK Consulting (Canada) Inc Skeena Resources Limited NI 43 -101 Snip Project Canada |
Page |
| Mineral Abundance (% w/w) | TMPC | TMPHG | TMPLG |
| K-Feldspar | 6.63 | 16.6 | 11.5 |
| Biotite | 20.5 | 18.1 | 21.6 |
| Sericite/Muscovite | 6.27 | 14.6 | 10.1 |
| Chlorite | 2.07 | 0.78 | 0.31 |
| Clays | 0.61 | 0.97 | 1.06 |
| Other Silicates | 0.76 | 0.36 | 0.42 |
| Fe Oxides | 0.02 | 0.01 | 0.17 |
| Rutile | 0.37 | 0.34 | 0.19 |
| Ilmenite | 0.11 | 0.12 | 0.00 |
| Calcite | 11.5 | 9.88 | 5.92 |
| Other Carbonates | 0.81 | 0.76 | 0.57 |
| Apatite | 0.70 | 0.74 | 0.62 |
| Other | 0.00 | 0.04 | 0.02 |
| Total | 100 | 100 | 100 |
Approximately 90 percent of the sulphide minerals are being reported as pyrite in the three BMA analysis contained above. This is consistent with previous analysis and supports the concept of using a bulk sulphide flotation process to recovery sulphide minerals.
Comminution Testing
Comminution test samples were selected from drill core received. The program included:
| 1. | SMC (completed at -31.5/+26.5mm) tests on 4 of the composite samples. |
| 2. | Bond rod mill (RWI), ball mill (BWI) and abrasion index (AI) tests on the four Twin Pit Main comminution samples |
| 3. | Bond ball mill work index tests on four Twin Pit Main and two Twin Pit West variability samples. |
Results are summarized in Table 13-14 and indicate the materials are considered hard or competent in terms of SAG mill characterization and moderate in terms of Ball Mill Work index characterization.
| SU/AD | September 2023 |
| SRK Consulting (Canada) Inc Skeena Resources Limited NI 43 -101 Snip Project Canada |
Page |
Table 13-14: Snip Comminution Tests Results
| JK Parameter | ||||||
| Description | Rel. Density | A x b | (kWh/t) | RWI (kWh/t) | BWI (kWh/t) | AI(g) |
| Average | 2.83 | 35.0 | 23.1 | 15.5 | 12.9 | 0.088 |
| 75th Percentile | 2.85 | 32.5 | 24.8 | 15.8 | 13.8 | 0.123 |
| Median | 2.82 | 33.4 | 23.8 | 15.5 | 13.3 | 0.084 |
| Maximum | 2.92 | 32.2 | 26.4 | 15.9 | 16.4 | 0.147 |
| 13.2.4.4 | Phase 2 Gravity Separation |
Gravity separation test work was completed on the TMPC composite to investigate the potential of gravity-based gold separation. The extended gravity recoverable gold procedure (E-GRG) was used for the testing as described in 13.2.2.4.
The E-GRG test results are shown in Table 13-15. The cumulative recovery of 49.9% Au was slightly lower than the Phase 1 recovery of 54.4% Au.
Table 13-15: Snip Phase 2 E-GRG Test Results
| Composite | Cum. Mass Recovery (%) |
Combined Conc. Assay (g/t Au) |
Cum. Recovery (% Au) |
| TMPC | 1.53 | 223 | 49.9 |
The 2021 and 2022 GRG test results were provided to FLS for review and modeling of the expected gold recovery when translated to an operating plant. FLS (Knelson) has developed a size-by-size mathematical model to predict gravity recovery within a grinding circuit, called KC MOD*Pro. The FLS modelling results show that the 2021 sample had a GRG content of 56% Au and the Phase 2 sample had a GRG content of 51% calibrated against the FLS database. These values are considered a moderate GRG content.
Modeling results show that:
| 1. | Treating 33% of cyclone underflow (based on 350% circulating load) will result in 28% Au recovery. |
| 2. | Treating 56% of ball mill discharge (based on 350% circulating load) will result in 33% Au recovery. |
| 3. | Treating 90% of ball mill discharge (based on 350% circulating load) will result in 37% Au recovery. |
| SU/AD | September 2023 |
| SRK Consulting (Canada) Inc Skeena Resources Limited NI 43 -101 Snip Project Canada |
Page |
| 13.2.4.5 | 2022 Flotation Testing |
Flotation tests were completed on each of the TMPC samples. Test procedures followed on the 2021 test procedures and results. These tests included a gravity concentration stage prior to rougher flotation and targeted a mass recovery of 0.05% to a gravity concentrate. The rougher flotation concentrate was reground to a k80 of 25 microns and upgraded in dilution cleaning stages. of the results showed that a single cleaner stage was sufficient to reduce concentrate mass and produce high Au concentrate grade. Conditions testing for the TMPC composite were applied for variability testing that included gravity separation followed by a single cleaner flotation stage following concentrate regrind to a k80
Test results are presented in Table 13-16. Observations on the results include the following:
| 1. | Overall high combined gravity plus flotation gold recoveries, ranging from 85.1% to 96.4%. |
| 2. | Gravity gold recoveries ranged from 16.7% to 61.3%. |
| 3. | Cleaner concentrate gold grades ranged from 28.8 g/t to 106 g/t. Range of mass recoveries to first cleaner concentrates was between 3.1% and 10.0%. |
The results demonstrate that producing a gravity concentrate and doré on site and shipping high-grade clean pyrite concentrates is a viable flowsheet, as per the historical operation. Additional flotation test work is recommended including locked cycle testing and optimization of flotation cleaning conditions.
Table 13-16: Snip 2022 Flotation Tests Results
| Composite | Gravity
Gold Conc. |
First Cleaner Concentrate |
Flotation
(Au, g/t) |
Head
Grade Au (g/t) |
Estimated Recovery Au (%)* |
||||
| (g/t) | (% rec.) |
Mass (%) |
(g/t) | (% rec.) | S
(%) |
||||
| TMPC | 718 | 21.4 | 5.9 | 59.0 | 66.8 | 37.7 | 0.54 | 5.21 | 88.2 |
| FTMPC | 1,202 | 35.2 | 3.1 | 106 | 56.4 | 31.2 | 0.39 | 5.88 | 91.5 |
| FTMPVHG | 6,416 | 61.3 | 5.9 | 83.7 | 34.1 | 42.2 | 0.47 | 14.5 | 95.4 |
| FTMPHG | 1,491 | 41.9 | 6.1 | 73.3 | 52.3 | 40.2 | 0.41 | 8.55 | 94.2 |
| FTMPUGMG | 3,759 | 55.5 | 4.8 | 148 | 40.9 | 17.9 | 0.29 | 17.2 | 96.4 |
| FTMPMG | 1,216 | 35.2 | 10.0 | 37.9 | 56.3 | 36.1 | 0.33 | 6.76 | 91.6 |
| FTMUGLG | 267 | 20.0 | 5.2 | 43.1 | 74.2 | 32.6 | 0.16 | 2.99 | 94.3 |
| FTMPLG | 128 | 16.7 | 3.5 | 28.8 | 68.4 | 22.1 | 0.20 | 1.45 | 85.1 |
| FTMPV1 | 515 | 28.6 | 4.4 | 36.4 | 66.1 | 25.9 | 0.13 | 2.44 | 94.7 |
| FTMPV2 | 896 | 34.3 | 7.3 | 42.6 | 57.0 | 33.9 | 0.48 | 5.46 | 91.3 |
*Estimated recovery is based on open circuit tests and not locked cycle testing.
| SU/AD | September 2023 |
| SRK Consulting (Canada) Inc Skeena Resources Limited NI 43 -101 Snip Project Canada |
Page |
| 13.2.4.6 | Leach Test |
Cyanide leaching of the 2022 samples was completed using standard bottle roll test procedures. All tests included a gravity concentration stage prior to leaching with a target 0.05% mass recovery to a gravity concentrate. The tailings from the gravity tests were subsequently leached under the following conditions:
| 1. | Gravity concentration prior to leach targeting 0.05% mass recovery. |
| 2. | Primary grinds evaluated K80 of 60, 75 and 90 µm. |
| 3. | 40% solids. |
| 4. | Leach times of 36 hours with kinetic samples at 8, 12, 24 and 30 hours. |
| 5. | Cyanide concentration of 1.0 g/L NaCN. |
Leaching conditions were determined to include grinding the sample material to a k80 of 75 µm, 30 hours leach retention time and a cyanide concentration of 0.5 g/L. These process conditions are industry standard. The results from tests at the selected grind and retention time of 30 hours for the TMPC sample and various cyanide concentrates are shown in Table 13-17. Results showed high gold recoveries, under all cyanide concentrations, ranging from 96.4% to 97.4%.
Table 13-17: 2022 Leach Test Results
| Sample |
NaCN (g/L) |
Grind (k80, µm) |
Consumptions
(kg/t) |
Head Grade | Leach Residue |
Recovery (%Au) |
|||
| NaCN | CaO | Direct
(g/t Au) |
Calc. (g/t Au) |
Grade (g/t Au) |
Grav. Conc. |
Total | |||
| TMPC | 1.00 | 75 | 0.67 | 1.16 | 6.11 | 5.89 | 0.16 | 19 | 97.4 |
| TMPC | 0.50 | 75 | 0.63 | 0.94 | 6.11 | 6.00 | 0.22 | 23 | 96.4 |
| TMPC | 0.75 | 75 | 0.90 | 0.84 | 6.11 | 5.94 | 0.19 | 27 | 96.9 |
| TMPC1 | 0.50 | 75 | 0.96 | 0.32 | 6.11 | 6.12 | 0.18 | 34 | 97.1 |
Note: 1. Bulk leach test used for cyanide detox testing.
The optimized TMPC conditions were used to evaluate response from the variability samples. The results are shown in Table 13-18. Average gold recovery is 96.9%, ranging from 95.5% to 98.3%. The sample with the lowest recovery, TMPHG, had a head grade lower much lower than expected. Average gold recovery from the variability sample tests is 96.9%.
Silver was monitored in the variability sample leach tests with an average recovery of 75.7% from the eight samples with a silver average head grade of 2.96 g/t.
Sodium cyanide and lime consumptions ranged from 0.31 kg/t to 0.79 kg/t and 0.35 kg/t to 0.94 kg/t respectively. These are in line for samples from similar deposits. Future testing will include testing to optimize cyanide consumption.
| SU/AD | September 2023 |
| SRK Consulting (Canada) Inc Skeena Resources Limited NI 43 -101 Snip Project Canada |
Page |
Table 13-18: 2022 Variability Samples Leach Test Result
| Sample | Grind (k80, µm) |
Consumptions
(kg/t) |
Head Grade | Leach Residue |
Recovery (% Au) | ||||
| NaCN | CaO | Direct (g/t Au) |
Calc.
(g/t Au) |
S (%) | Grade
(g/t Au) |
Grav. Conc. |
Total | ||
| TMPC | 75 | 0.63 | 0.94 | 6.11 | 6.00 | 2.62 | 0.22 | 23.4 | 96.4 |
| TMPVHG | 75 | 0.49 | 0.65 | 10.7 | 7.71 | 1.94 | 0.16 | 44.3 | 97.9 |
| TMPHG | 75 | 0.31 | 0.76 | 5.80 | 3.67 | 0.95 | 0.17 | 24.9 | 95.5 |
| TMUGMG | 75 | 0.79 | 0.50 | 20.7 | 6.48 | 3.40 | 0.25 | 21.7 | 96.1 |
| TMPMG | 75 | 0.56 | 0.49 | 4.02 | 4.52 | 3.10 | 0.19 | 29.6 | 95.8 |
| TMUGLG | 75 | 0.34 | 0.50 | 3.07 | 3.74 | 1.74 | 0.09 | 35.7 | 97.7 |
| TMPLG | 75 | 0.43 | 0.35 | 2.24 | 1.15 | 0.91 | 0.03 | 25.0 | 97.4 |
| TMPV1 | 75 | 0.34 | 0.44 | 7.05 | 6.18 | 1.79 | 0.19 | 24.8 | 97.0 |
| TMPV2 | 75 | 0.49 | 0.47 | 3.72 | 3.83 | 1.97 | 0.07 | 41.5 | 98.3 |
Leach residues for all tests are very low in terms of contained gold and cyanide leaching may have a significant metallurgical advantage over flotation processes for the recovery of gold and silver.
Figure 13-6 shows recovery as a function of head grade. The average gold recovery from the leach tests at optimum conditions is 96.9%. It is recommended that typical plant losses be applied to this recovery for process design and financial evaluation.
| SU/AD | September 2023 |
| SRK Consulting (Canada) Inc Skeena Resources Limited NI 43 -101 Snip Project Canada |
Page |
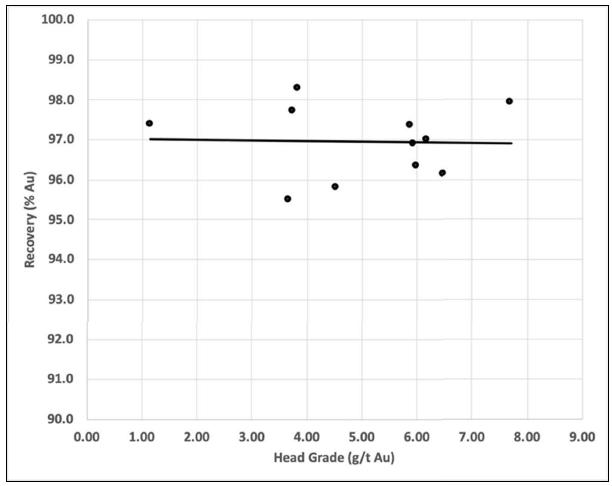
Figure 13-6: 2022 Leach Tests Recovery as a Function of Head Grade
| 13.2.4.7 | Cyanide Detoxification Testing |
Cyanide destruction tests were performed using the SO2/air process. Sulphur dioxide (SO2) plus air oxidizes cyanide into cyanate and is catalyzed by the presence of copper ions. Typical retention times to achieve <5 mg/L weak acid dissociable cyanide (CNWAD) are 1 to 2 hours, at pH levels of 8.2 to 8.4.
This SO2/air process can achieve discharge concentrations of less than one milligram per litre CNWAD. The addition rate of SO2 to cyanide is optimized for consumption and desired discharge cyanide concentration.
Process development testing for the SO2/air process is completed in two stages. The first stage is batch testing, followed by a second stage of continuous testing. A 1 L reactor was used for both batch and continuous tests. For the continuous tests, an overflow nozzle on the reactor transferred treated slurry to a storage tank. The target cyanide concentration for the detox program is <1 mg/L CNWAD. Initial concentrations to cyanide detox were 434 mg/L CNT and 244 mg/L CNWAD.
| SU/AD | September 2023 |
| SRK Consulting (Canada) Inc Skeena Resources Limited NI 43 -101 Snip Project Canada |
Page |
The first part of the program included eight batch tests to evaluate retention time, and reagent additions. All tests were run at a slurry density of 40% solids by weight. The optimal results were achieved in the final three runs with the following results:
| 1. | Retention time = 60 minutes with an SO2:CNWAD addition rate of 8:1 g/g |
| 2. | Retention time = 90 minutes with an SO2:CNWAD addition rate = 5:1 g/g |
| 3. | Copper addition = 150 mg/L Cu2+ solution concentration; and |
| 4. | Cyanide concentrations in effluent were 0.3 mg/L CNWAD and 1.7 mg/L CNT. |
| 13.2.4.8 | Solids-Liquids Separation Testing |
Static Settling Tests
Solids-liquids separation testing to support selection of the pre-leach thickener. Static settling tests (Standard Kynch) were completed on a TMPC sample and evaluated flocculant dosages using AN913SH and MF10, feed solids were diluted to approximately 15% solids with water. Static testing suggested thickening operating parameters of 30 g/t of AN913SH to achieve maximum thickened solids. Static test results and conditions formed the basis to commence optimization at the dynamic thickening level.
Dynamic Thickening
The results of the preliminary static settling-thickening data formed the basis to determine the pre-optimized conditions for dynamic testing. Semi-continuous dynamic testing was conducted using a custom test unit which consisted of a 100 mm diameter laboratory thickener, shown in Figure 13-7 equipped with feed well, dilution system, rakes and pumps.
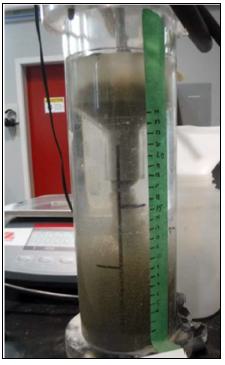
Figure 13-7: Dynamic Thickening Test Apparatus
General conditions established during static testing were applied for optimization during dynamic testing. The feedwell solids density was diluted with fresh water and set prior to introducing feed continuously; recycled overflow for auto- dilution was not tested.
| SU/AD | September 2023 |
| SRK Consulting (Canada) Inc Skeena Resources Limited NI 43 -101 Snip Project Canada |
Page |
Criteria tested included feed flux loading rate and flocculant dosage, key thickener design criteria for sizing data (unit areas, hydraulic loading, reagent consumptions), as well as residence times (rise rate) is summarized by test in Table 13-19.
Table 13-19: Snip Pre-Leach Dynamic Thickening Results
| Test | Slurry
Density (%) |
Flocculant | ||||||
| Feed | U/F | Type | Dosage
(g/t) |
pH | Rise
Rate (m/h) |
Loading
Rate (t/m2/h) |
Turbidity (mg/L) |
|
| D1-A | 15 | 64.5 | AN913SH | 30 | 8.2 | 1.8 | 0.3 | 126 |
| D1-B | 15 | 61.9 | AN913SH | 30 | 8.2 | 3.1 | 0.5 | 183 |
| D1-C | 15 | 60.6 | AN913SH | 30 | 8.2 | 4.3 | 0.7 | 242 |
| D1-D | 15 | 58.4 | AN913SH | 50 | 8.2 | 3.1 | 0.5 | 160 |
| D1-E | 15 | 60.1 | AN913SH | 10 | 8.2 | 3.0 | 0.5 | 220 |
Dynamic thickening testing was performed at the same AN913SH dosage of 30 g/t at different loading rate, ranging from 0.3 to 0.7 t/m2/h. Underflow densities from 61.9% to 64.5% solids were achieved across three tests. Lower loading rate produced lower turbidity. The highest loading rate of 0.7 t/m2/h resulted in high turbidity which would be problematic. The higher flocculant addition rate of 50 g/t resulted in a higher rise rate and acceptable overflow turbidity but lower underflow density of 58.4% solids.
Rheology Tests
The rheology tests were performed on the underflow samples generated under optimized settling conditions. Unsheared yield stress measurements were conducted on settled solids with a Brookfield DV2T viscometer using a vane spindle.
All the underflow samples displayed Bingham plastic behavior and the controlled shear deformation (CSD) for all five samples varied between 58.4 to 64.5% solids. Expected operation of the thickener will be in the range of 50% to 55% solids, below plastic flow behavior. Results are shown in Table 13-20.
Table 13-20: Snip Pre-Leach Thickener Underflow Rheology Test Results
| Test |
CSD (wt % solids) |
Yield Stress (Pa) Unsheared |
| V1-A | 64.5 | 94 |
| V1-B | 61.9 | 87 |
| V1-C | 60.6 | 75 |
| V1-D | 58.4 | 86 |
| V1-E | 60.1 | 45 |
| SU/AD | September 2023 |
| SRK Consulting (Canada) Inc Skeena Resources Limited NI 43 -101 Snip Project Canada |
Page |
| 13.3 | Deleterious Elements |
The metallurgical testing showed that no deleterious elements were present that should impact marketability of the pyrite concentrates, if this flowsheet were selected.
| 13.4 | Recovery Estimates |
The various metallurgical programs demonstrated that good metallurgical performance can be expected from the newly discovered gold zones of the Snip deposit. The results align well with the historical metallurgical performance.
Overall gold recovery is expected to be in the range of 90 to 96 percent of overall contained gold. Approximately 20 to 30 percent of the contained gold is recoverable to a high-grade gold concentrate.
In addition, the Snip samples showed very good gold extractions when using a traditional sodium cyanide leach process. Estimates of the recovery of gold using cyanide leaching process are in the range of 95.5 to 98.3 %.
Additional metallurgical work is recommended as the project is developed.
| SU/AD | September 2023 |
| SRK Consulting (Canada) Inc Skeena Resources Limited NI 43 -101 Snip Project Canada |
Page |
| 14 | Mineral Resource Estimates |
| 14.1 | Introduction |
The Mineral Resource Statement presented herein represents the updated mineral resource estimate prepared for the Snip Project.
The mineral resource model was prepared by Skeena and independently validated and signed off by SRK. SRK assessed all top capping values, experimental variograms, estimation input parameters, and performed a check block model estimate with results comparable to Skeena’s Mineral Resources. Gold was the sole element estimated. The resource model considers 3,542 historical drill holes, 388 drill holes drilled by Skeena from 2016 to 2021 and 69 holes drilled by Hochschild during 2022. The resource estimation work was completed by Ms. K. Dilworth, GIT and was reviewed and accepted by Ms. S. Ulansky, PGeo (EGBC#36085), Senior Resource Geologist with SRK, a Qualified Person as this term is defined in NI 43-101. The effective date of the resource statement is September 05, 2023.
This section describes the resource estimation methodology and summarizes the key assumptions considered by SRK. In the opinion of SRK, the mineral resource estimate reported herein is a reasonable representation of the global gold mineral resource found within the Snip Project at the current level of sampling. The mineral resources have been estimated in conformity with generally accepted CIM “Estimation of Mineral Resource and Mineral Reserves Best Practices” guidelines and are reported in accordance with the Canadian Securities Administrators’ National Instrument 43-101. Mineral resources are not mineral reserves and do not have demonstrated economic viability. There is no certainty that all or any part of the mineral resource will be converted into mineral reserve.
The database used to estimate the Snip Project Mineral Resources was audited by SRK and has a close out date of June 29, 2023. SRK is of the opinion that the current drilling information is sufficiently reliable to confidently interpret the mineralized domains of the Snip Project mineralization and that the assay data are sufficiently reliable to support mineral resource estimation.
Leapfrog GeoTM (version 2022.1) was used to construct the litho-structural model and mineralization domains that define the gold lodes in the Snip model. Snowden Supervisor® (version 8.14) was used to conduct geostatistical analyses, variography and a portion of the block model validation. For block modelling, Maptek Vulcan® (version 2023.3) software was used to prepare assay data for geostatistical analysis, construct the block model, estimate gold grades and to tabulate the mineral resources. The validation of the gold grade estimates was carried out by SRK using HxGN MinePlan TM 3-D (version 16.1.0). Deswick® software (version 2023.1 and DSO v. 5) was used for stope optimization to fulfill reasonable prospects for eventual economic extraction requirements.
| SU/AD | September 2023 |
| SRK Consulting (Canada) Inc Skeena Resources Limited NI 43 -101 Snip Project Canada |
Page |
Gold was the sole element estimated in the Snip Project resource model. To the extent currently known, there are no processing factors or deleterious elements that could have a significant impact on the mineral resources.
| 14.2 | Resource Database |
The Snip Project drill hole database contains 3,542 historical holes for a meterage of 279,971 m, 388 Skeena holes for a meterage of 65,041 m, and 69 Hochschild holes for a meterage of 10,377 m. The combined number of drill holes on the Snip Project is 3,999 for a total meterage of 355,388 m (Table 14-1 and Figure 14-1). An additional 307 drill holes for 46,267 m has been added to the database since the 2020 model. Figure 14-2 shows the distribution of post-2020 surface and underground drill holes that were included into the 2023 updated Mineral Resource Estimate (MRE).
Table 14-1: Skeena drill hole database
| Program | Location | Year | No. of Holes | Length (m) |
| Historical | Surface | pre-1999 | 309 | 71,181 |
| Underground | pre-1999 | 3,233 | 208,790 | |
| Skeena/Hochschild | Surface | 2016 | 28 | 7,422 |
| 2108 | 6 | 2,121 | ||
| 2019 | 8 | 1,816 | ||
| 2020 | 9 | 5,327 | ||
| 2021 | 95 | 14,608 | ||
| 2022 | 1 | 501 | ||
| Underground | 2017 | 62 | 8,703 | |
| 2018 | 46 | 9,088 | ||
| 2021 | 134 | 15,955 | ||
| 2022 | 68 | 9,876 | ||
| Total | ALL | ALL | 3,999 | 355,388 |
Snip drill holes were designed to intersect mineralized zones at right angles, where possible. Most of the surface drill holes are drilled towards the north on 50 m spacings, whereas underground holes are drilled towards the north and north-northeast on 12.5 m spacings. Drill hole spacing varies from as little as a few meters, where underground production drilling was drilled on a fan, up to 150 m, where exploration drilling tests the lateral extents of the deposit. The average drill hole spacing in the vicinity of the mine workings is approximately 10 to 15 m. Historically, sampling at Snip was selective and primarily based on visual estimation of sulphide content, therefore, numerous historical drill hole intervals were not sampled. For these missing intervals a gold grade of 0.001 g/t was assigned.
| SU/AD | September 2023 |
| SRK Consulting (Canada) Inc Skeena Resources Limited NI 43 -101 Snip Project Canada |
Page |
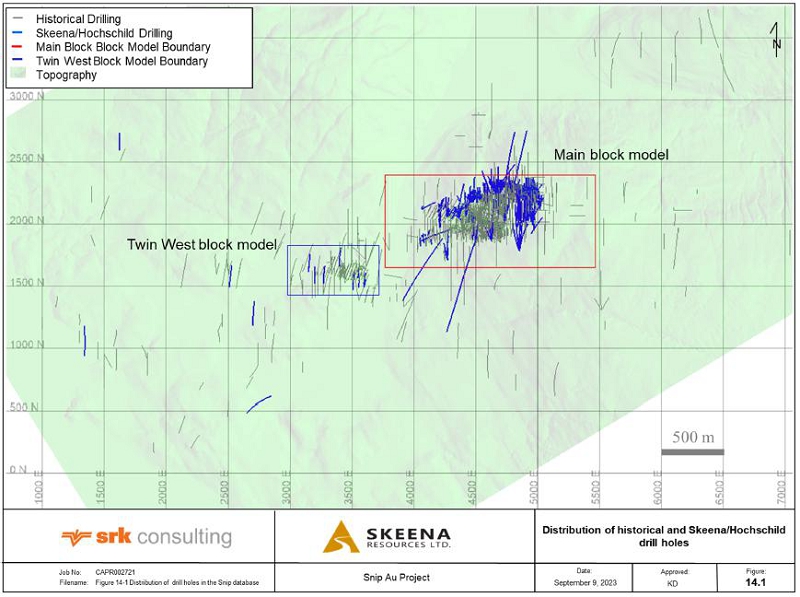
Figure 14-1: Plan view of drill hole traces in the Snip database, excluding furthermost holes
| SU/AD | September 2023 |
| SRK Consulting (Canada) Inc Skeena Resources Limited NI 43 -101 Snip Project Canada |
Page |
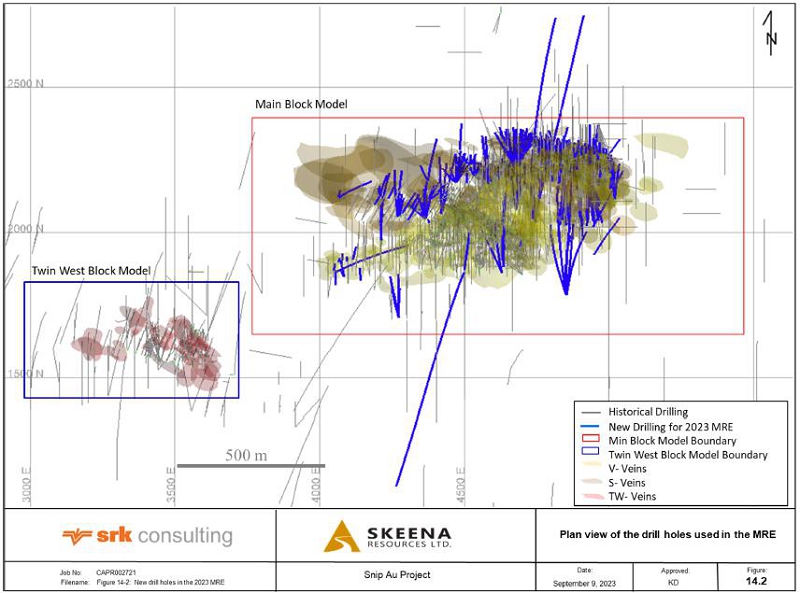
Figure 14-2: Plan view of the new drill holes used in the updated 2023 MRE
| SU/AD | September 2023 |
| SRK Consulting (Canada) Inc Skeena Resources Limited NI 43 -101 Snip Project Canada |
Page |
| 14.3 | Solid Body Modelling |
| 14.3.1 | Geological Modelling |
Most of the Snip deposit is hosted within a complex interbedded sequence of siltstone and greywacke units. This complexity prohibited the various sedimentary facies from being subdivided in the model.
The Biotite Spotted Unit (BSU), manifests as a non-mineralized basic to intermediate biotitic dyke that intrudes Main Twin Zone mineralization and, to a lesser degree, the 200 Footwall mineralization in the Main Twin Zone. The BSU was modelled as a barren dyke, which overprints mineralization.
| 14.3.2 | Mineralization Model |
The modeling of the lodes at Snip was performed using the vein modeling tool in Leapfrog Geo® (version 2022.2), using the entire drilling dataset. The mineralized zones were interpreted with the Leapfrog Geo Economic Compositing tool where composites were generated using a minimum grade threshold of 1.0 g/t over a minimum length of 1.5 m following interpreted structures and displaying mineralization continuity. Locally, lower grades were included in the veins if continuity was displayed. Local minor edits were done in Vulcan. The selection of the 1.0 g/t Au threshold corresponds to an inflection point on the gold assay log probability plot.
Ninety-four gold lodes were interpreted that were combined into “domains” and “zones” (Table 14-3) in two block models: Main and Twin West. Twin West is separated from the Main model by the Monsoon Fault, which has a (dextral?) displacement of 700 m towards the southwest.
The “zone” naming term represents the three major vein groupings based on orientation and structural interpretation. The 100, 200, and 300 series veins are V-Veins, S-Veins, and TW-Veins, respectively. The veins were further subdivided into “domains” based on overall orientation and volume of gold vein. Domain groups were used for topcapping and variogram analysis, whereas “veins” were used during estimation to prohibit blocks from grabbing composites outside of their designated wireframe (Table 14-3) .Figure 14-3 shows a plan and oblique view of the three zones (V, S, and TW)
The 2020 to 2022 infill drilling programs increased the number of veins from 72 to 94 between the 2020 and 2023 mineralization models. The additional veins increased the volume of the veins by 25%, with most of the increase occurring within the S-veins (Table 14-2).
Table 14-2: Zone volume difference between 2020 and 2023
| Zone | Volume 2020 | Volume 2023 | % Difference | |||||||||
| V-Veins | 1,127,998 | 1,221,478 | 8 | % | ||||||||
| S-Veins | 1,458,369 | 2,069,402 | 42 | % | ||||||||
| TW | 186,753 | 171,918 | -8 | % | ||||||||
| Total | 2,773,120 | 3,462,798 | 25 | % | ||||||||
| SU/AD | September 2023 |
| SRK Consulting (Canada) Inc Skeena Resources Limited NI 43 -101 Snip Project Canada |
Page |
Table 14-3: Model naming convention and volumes
| Model | Zone | Zone | Domain | Volume | % Volume |
Veins | ||||
| MAIN | V-Veins | 100 | 100 | 162,552 | 13% | 104 | 107 | 109 | 111 | 113 |
| 106 | 108 | 110 | 112 | |||||||
| 101 | 839,827 | 69% | 101 | 103 | ||||||
| 102 | ||||||||||
| 102 | 219,099 | 18% | 105 | |||||||
| S-Veins | 200 | 200 | 1,010,164 | 49% | 204 | 222 | 237 | 251 | 267 | |
| 205 | 224 | 238 | 252 | 270 | ||||||
| 206 | 225 | 239 | 253 | 271 | ||||||
| 207 | 226 | 240 | 254 | 272 | ||||||
| 209 | 227 | 241 | 255 | 273 | ||||||
| 210 | 228 | 242 | 256 | 275 | ||||||
| 211 | 229 | 243 | 257 | 276 | ||||||
| 215 | 230 | 244 | 258 | |||||||
| 216 | 231 | 245 | 259 | |||||||
| 217 | 232 | 246 | 260 | |||||||
| 218 | 233 | 247 | 261 | |||||||
| 219 | 234 | 248 | 262 | |||||||
| 220 | 235 | 249 | 264 | |||||||
| 221 | 236 | 250 | 266 | |||||||
| 201 | 286,764 | 14% | 201 | 202 | 203 | |||||
| 202 | 363,207 | 18% | 208 | 213 | 223 | |||||
| 203 | 409,267 | 20% | 212 | 214 | ||||||
| TWIN WEST | TW-Veins | 300 | 300 | 133,595 | 77% | 302 | 306 | 310 | ||
| 303 | 307 | |||||||||
| 304 | 308 | |||||||||
| 305 | 309 | |||||||||
| 301 | 38,323 | 23% | 301 | B | ||||||
| SU/AD | September 2023 |
| SRK Consulting (Canada) Inc Skeena Resources Limited NI 43 -101 Snip Project Canada |
Page |
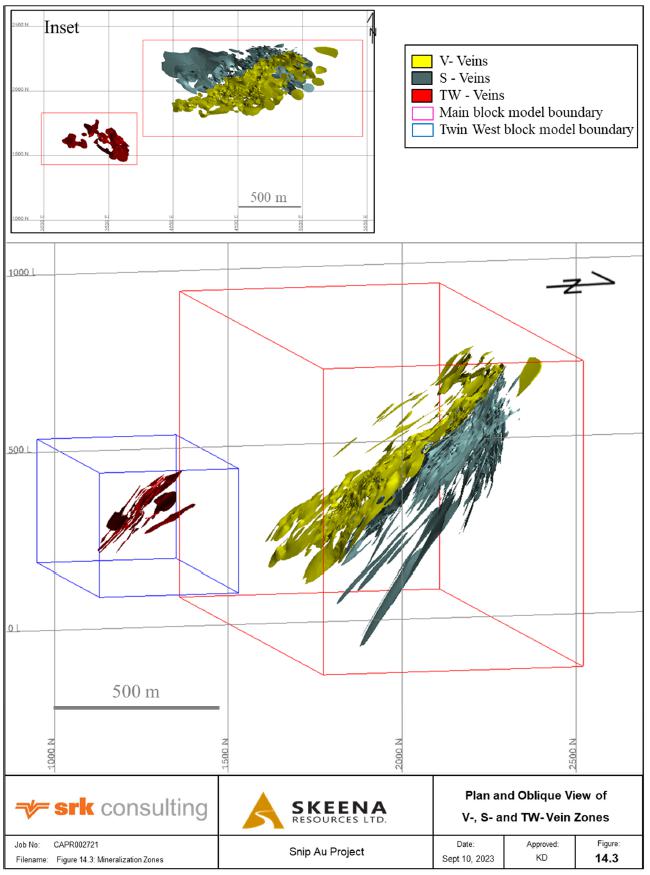
Figure 14-3: Oblique view of the Snip vein model showing the V-veins, S-veins and TW-vein zones, looking west
| SU/AD | September 2023 |
| SRK Consulting (Canada) Inc Skeena Resources Limited NI 43 -101 Snip Project Canada |
Page |
| 14.3.3 | Historical Mining Zones |
Historically, the lodes at Snip were referred to as the Main Twin Zone, 130 Vein, 150 Vein, Hangingwall, Footwall, 412 Corridor and Twin West. Due to the high cut-off grade at the time (24 g/t Au) these veins were modelled as continuous veins at a specific orientation. The 130 and 150 veins were named for the orientation that the vein followed.
In 2023, a nominal cut-off grade of 1.0 g/t Au was used to constrain mineralization, where many individual veins were interpreted to follow distinct structural pathways. Due to the number of additional veins modelled, assigning historical vein names became increasingly challenging because the original naming convention was largely constrained and subjective. Seeing that the historical naming convention was too restrictive it was updated to the V-, S- and TW- vein systems. The 2023 zones, along with equivalent historical mining areas, are summarized in Table 14-4 and shown in Figure 14-4.
Table 14-4: Zones, number of veins, and associated historical name equivalents
| Zone | Number of Veins | Mine Equivalent Zone |
| V-Veins | 13 | Main Twin Zone |
| S-Veins | 71 | 130 Vein, 150 Vein, Footwall, Hanging wall and 412 Corridor |
| TW-Veins | 10 | Twin West |
| SU/AD | September 2023 |
| SRK Consulting (Canada) Inc Skeena Resources Limited NI 43 -101 Snip Project Canada |
Page |
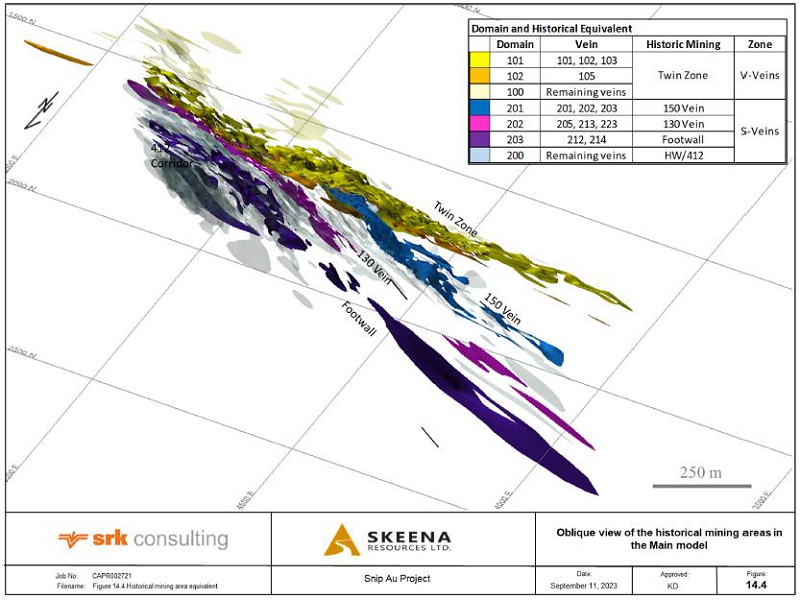
Figure 14-4: Oblique view showing the V- and S- vein domains in relation to historical areas , looking southeast
| SU/AD | September 2023 |
| SRK Consulting (Canada) Inc Skeena Resources Limited NI 43 -101 Snip Project Canada |
Page |
| 14.3.4 | Underground Workings |
The historical underground workings are a combination of stopes, lifts, and development drives. Two solid meshes representing historical stopes were independently constructed using AutoCAD® and MEDsystem® and subsequently combined into a single wireframe using Leapfrog Geo®. The MEDsystem mesh appears to represent an earlier period of mining than the AutoCAD mesh, where the former has a resolution of approximately 6 m, while the latter mesh has a resolution of approximately 15 m.
Skeena confirmed the location of underground drill holes in relation to underground workings in Maptek Vulcan® software and found no obvious spatial errors. As a measure of caution against possible discrepancies and unconfirmed ground conditions, a 1 m exclusion zone (alternatively named the 1 m buffer zone) around all underground workings were used to deplete the resources when reporting resources. An example of the underground workings and 1 m buffer zone used to deplete the model are shown in Figure 14-5.
| SU/AD | September 2023 |
| SRK Consulting (Canada) Inc Skeena Resources Limited NI 43 -101 Snip Project Canada |
Page |
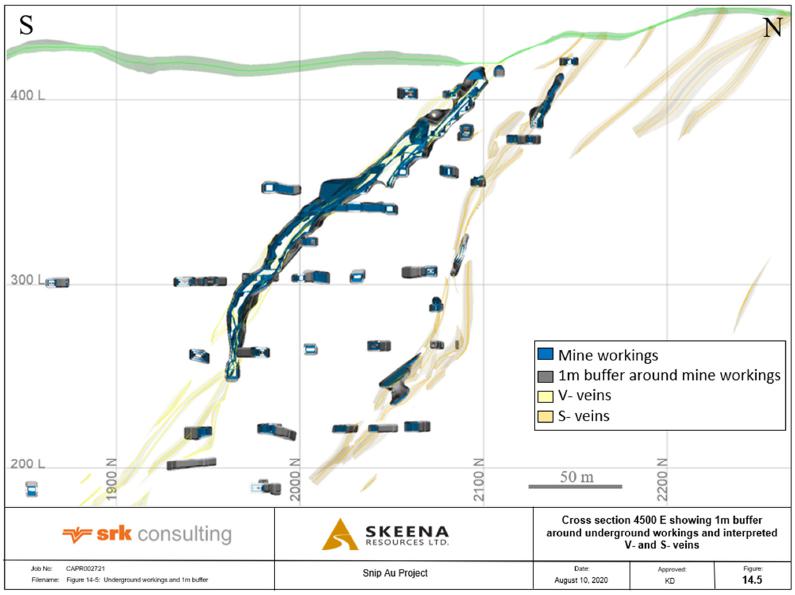
Figure 14-5: Section 4500E showing historical underground development in relation to the 1 m buffer zone, looking west. The V- and S-vein wireframes are shown for reference purposes
| SU/AD | September 2023 |
| SRK Consulting (Canada) Inc Skeena Resources Limited NI 43 -101 Snip Project Canada |
Page |
| 14.4 | Data Analysis |
Assays were assigned to domain, zone, and vein codes by back-flagging the intercepts to the applicable vein wireframes. The process was then viewed in 3-D to ensure that coding had been correctly applied. The domain code was used as the primary field to analyse assay and composite statistics and variography.
| 14.4.1 | Sample length |
Analysis of assay sample length was conducted to determine the most suitable composite length. The most common assay length within the vein sets was determined to be 1.0 m (Figure 14-6). The length selected for compositing was 1.5 m to best represent the cumulative log probability of 90% or greater (Figure 14-7).
Assay interval lengths are variable within the database, ranging from as little as 0.04 m to a maximum of 6.6 m. During the process of back flagging, some intervals were truncated artificially if the interval had not been previously snapped to the drill hole; this caused a few assay intervals to be clipped smaller than 0.1 m.
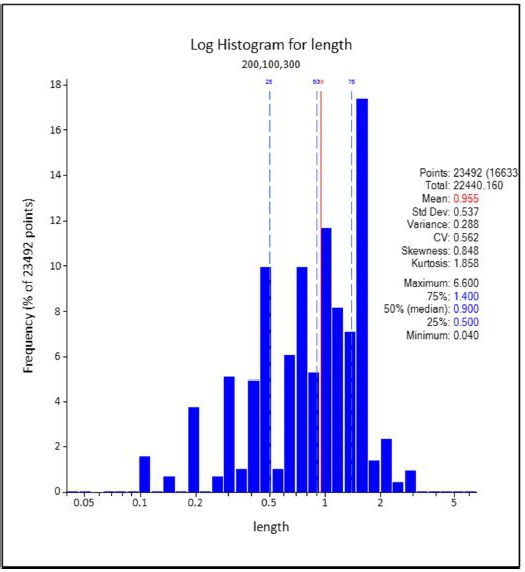
Figure 14-6: Histogram statistics of vein-coded assay sample lengths
| SU/AD | September 2023 |
| SRK Consulting (Canada) Inc Skeena Resources Limited NI 43 -101 Snip Project Canada |
Page |
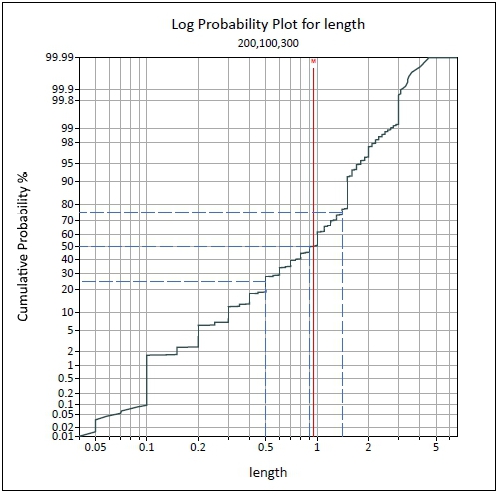
Figure 14-7: Log probability curve
| 14.4.2 | Assay Grade Summary |
A total of 23,492 assay sample intervals are contained within the zones. Table 14-5 summarizes the statistical analysis of length-weighted gold assays by zone.
Table 14-5: Summary statistics of length-weighted gold assays by zone
| Zone | No. Assays | Mean (g/t) | CV | Minimum (g/t) |
Median (g/t) |
Maximum (g/t) |
| V- Veins | 9,738 | 15.42 | 3.5 | 0 | 2.6 | 2,610 |
| S- Veins | 12,946 | 9.17 | 4.5 | 0 | 1.9 | 3,390 |
| TW- Veins | 808 | 7.79 | 2.9 | 0 | 2.3 | 417.7 |
| 14.4.3 | Unsampled Intervals |
Historical drill holes on the Snip Property were selectively sampled, where singular intervals down the hole were assayed without testing adjacent shoulder samples to gauge gold grade variances outside of the vein of interest. Furthermore, many sample intervals that pierce the currently defined ore zone over significant widths are missing. Understanding historical sample selection criteria and processes is challenging and likely fruitless; however, it is known that gold in the 1990’s was at market prices far below prices currently assessed in 2023 and likely factored into sample selection during that timeframe.
| SU/AD | September 2023 |
| SRK Consulting (Canada) Inc Skeena Resources Limited NI 43 -101 Snip Project Canada |
Page |
Handling of these unsampled intervals is critical for mineral resource estimation at Snip as there is a danger of overestimating the deposit significantly if left as missing. To err on the side of caution, all unsampled intervals were given a default gold value of 0.001 g/t during compositing Table 14-6 shows the number of meters and percent of unsampled meters within each of the zones.
Table 14-6: Number of meters and percent of non-sampled meters within each of the zones
| Zone | Meters
of Assayed Intervals |
Meters
of Non- Sampled intervals |
Total meters | Percent
of Unsampled meters (%) |
|
| V- veins | 9,969 | 253 | 10,231 | 3% | |
| S- veins | 11,821 | 618 | 12,433 | 5% | |
| TW- veins | 650 | 20 | 670 | 3% | |
| Total | 22,440 | 891 | 23,334 | 4% |
| 14.5 | Compositing |
To minimize bias due to assay sample length variances, compositing to 1.5 m intervals honouring relevant mineralization boundaries, was performed. Sample intervals less than 1.5 m represent 90% of all sample lengths, confirming that 1.5 m was the optimal composite interval for the Snip Project database. Assays were composited to 1.5 m using the distributed tails methodology, whereby samples that fell short of half the composite length were equally distributed within the vein.
Composites were assigned codes on a majority basis corresponding to the domain, zone, and lode in which they occur. The compositing and coding processes were viewed in 3-D to ensure that coding had been applied correctly.
A total of 16,652 composites were processed, during which all unsampled intervals were given a default value of 0.001 g/t. Summary statistics for length-weighted assays and 1.5 m composites are shown in Table 14-7. The 1.5 m composites were used in geostatistical analysis, top cutting, variography, and block model estimation.
| SU/AD | September 2023 |
| SRK Consulting (Canada) Inc Skeena Resources Limited NI 43 -101 Snip Project Canada |
Page |
Table 14-7: Comparison of assay data to 1.5 m gold composites by domain
| Assays | 1.5 m Composites | |||||||
| Zone | Veins | Domain | No. of
Assays |
Mean (g/t) |
CV | No. of Composites |
Mean (g/t) |
CV |
| V- Veins | Remaining Veins | 100 | 395 | 14.30 | 10.6 | 343 | 13.60 | 10.8 |
| 101,102,103 | 101 | 7,653 | 16.52 | 2.8 | 5,606 | 16.19 | 2.2 | |
| 105 | 102 | 1,690 | 10.21 | 3.2 | 1,156 | 9.81 | 2.3 | |
| S- Veins | Remaining Veins | 200 | 6,908 | 7.19 | 3.9 | 4,942 | 6.81 | 2.6 |
| 201, 202, 203 | 201 | 3,022 | 14.26 | 3.1 | 1,993 | 13.94 | 2.4 | |
| 208, 213, 223 | 202 | 2,406 | 8.49 | 4.9 | 1,454 | 8.98 | 4.2 | |
| 212,214 | 203 | 610 | 9.81 | 10.4 | 637 | 7.03 | 3.4 | |
| TW- Veins | Remaining Veins | 300 | 573 | 6.09 | 2.3 | 353 | 5.977 | 1.5 |
| 301 | 301 | 235 | 11.85 | 3.0 | 168 | 10.28 | 2.5 | |
| Total | 23,492 | 16,652 | ||||||
| 14.6 | Evaluation of Outliers |
Block grade estimates may be overly affected by very high-grade assays. Grade capping is a technique used to mitigate the effect that a small population of high-grade sample outliers may have during grade estimation. These high-grade samples are considered not to be representative of the general sample population and are therefore “capped” to a level that is more representative of the general data population. Although subjective, grade capping is commonly used by industry professionals when performing grade estimation.
An analysis of sample length versus gold grade shows that effort was taken to select samples based on visible mineralization. Seeing that gold grades are highest in the smallest sample intervals; capping was applied after compositing.
Outlier analysis was conducted for each domain. Cumulative log probability plots, histograms, CV values and percent metal loss were used for determining capping thresholds. Capping values for the domains in the V-, S- and TW-veins, are shown in Table 14-8. Figure 14-8, Figure 14-9, and Figure 14-10 display cumulative log probability plots along with the selected capped value denoted by a red line.
Percent differences of mean capped composite grades to uncapped composites is approximately equal to the amount of metal removed by capping. Metal loss ranged from -1% to -63% (Table 14-8). Metal loss for one lode within the V-vein set was high due to the capping of one extreme high-grade samples that contained 56% of the metal. All composites were capped prior to grade estimation.
| SU/AD | September 2023 |
| SRK Consulting (Canada) Inc Skeena Resources Limited NI 43 -101 Snip Project Canada |
Page |
Table 14-8: Outlier threshold values and summary statistics of 1.5 m gold composites
| Zone | Veins | Domain | Number | Cap Value (g/t) |
No. Cut | % Cut | Uncapped
Mean (g/t) |
Uncapped CV |
Capped
mean (g/t) |
Capped CV |
%
Metal Lost |
| V- Veins | Remaining
Veins |
100 | 343 | 40 | 5 | 1.5 | 13.60 | 10.8 | 4.77 | 1.4 | -65% |
| 101,102,103 | 101 | 5,606 | 350 | 10 | 0.2% | 16.19 | 2.2 | 16.038 | 2.1 | -1% | |
| 105 | 102 | 1,156 | 110 | 9 | 0.8% | 9.81 | 2.3 | 9.23 | 1.9 | -6% | |
| S- Veins | Remaining Veins | 200 | 4,942 | 150 | 10 | 0.2% | 6.81 | 2.6 | 6.53 | 2.2 | -4% |
| 201, 202, 203 | 201 | 1,993 | 215 | 14 | 0.7% | 13.94 | 2.4 | 13.47 | 2.2 | -3% | |
| 208, 21, 223 | 202 | 1,454 | 170 | 7 | 0.5% | 8.98 | 4.2 | 7.77 | 2.4 | -13% | |
| 212,214 | 203 | 637 | 100 | 9 | 1.4% | 7.03 | 3.4 | 5.86 | 2.3 | -17% | |
| TW- Veins | Remaining Veins | 300 | 353 | 45 | 4 | 1.1% | 5.977 | 1.5 | 5.86 | 1.4 | -2% |
| 301 | 301 | 168 | 110 | 2 | 1.2% | 10.28 | 2.5 | 9.40 | 1.9 | -9% | |
| Total | 16,652 | 70 | 0.4% |
| SU/AD | September 2023 |
| SRK Consulting (Canada) Inc Skeena Resources Limited NI 43 -101 Snip Project Canada |
Page |
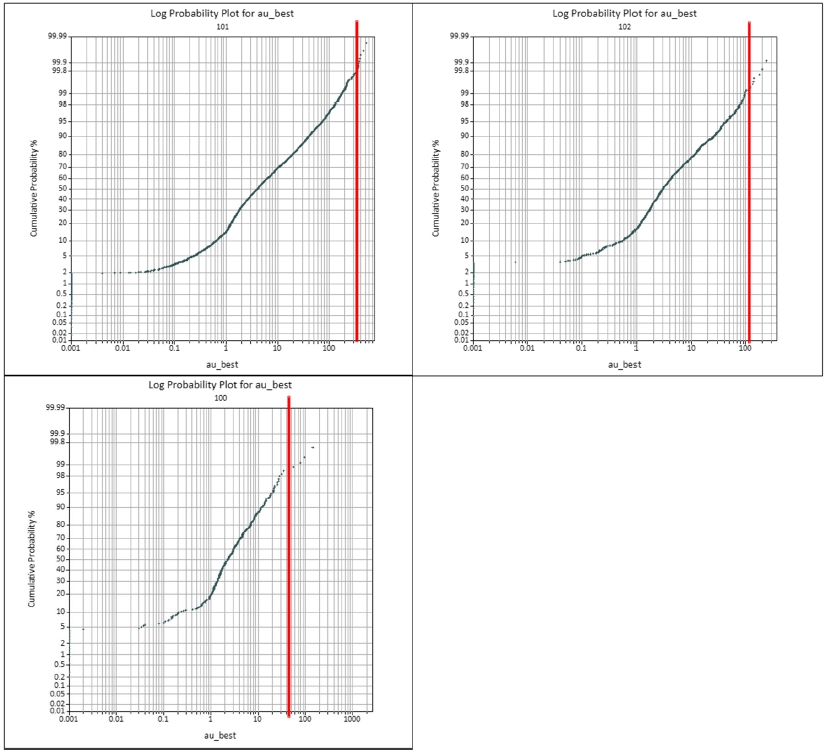
Figure 14-8: V-veins cumulative log probability showing the chosen capping threshold for each domain
| SU/AD | September 2023 |
| SRK Consulting (Canada) Inc Skeena Resources Limited NI 43 -101 Snip Project Canada |
Page |
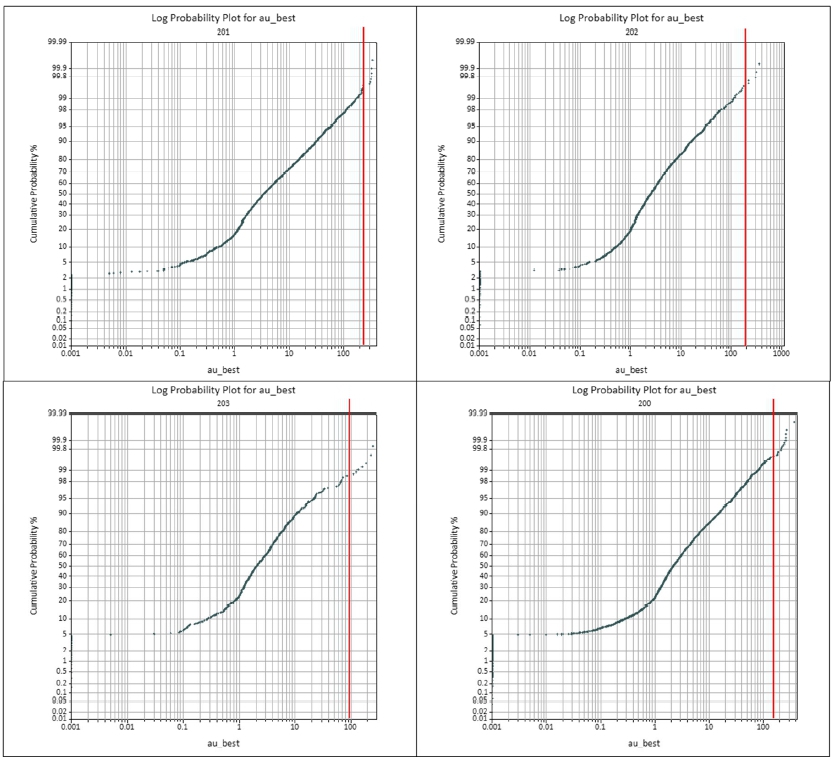
Figure 14-9: S-veins cumulative log probability plot showing the chosen capping thresholds for each domain
| SU/AD | September 2023 |
| SRK Consulting (Canada) Inc Skeena Resources Limited NI 43 -101 Snip Project Canada |
Page |
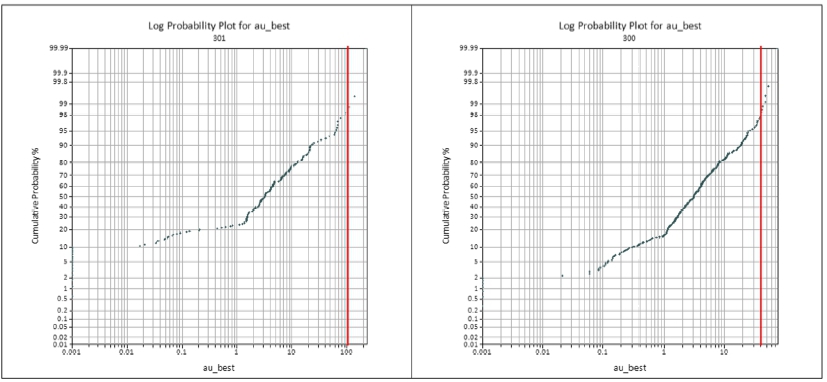
Figure 14-10: TW-veins cumulative log probability plot showing the chosen capping thresholds for each domain
| 14.7 | Statistical Analysis and Variography |
Normal-scores experimental variograms were used to assess the nugget effect, grade continuity, and spatial variability of the estimation domains to produce variogram models representative of each gold zone.
Spatial continuity was assessed using variogram maps and 3-D representations of grade continuity. The most suitable orientation was selected based on the best structural interpretation of each zone. Downhole variograms were calculated to characterize the nugget effect. Normal score variogram models were back transformed to Maptek Vulcan® software format for final rotation values. The spherical variogram models used for determining grade continuity are summarized in Table 14-9 and shown in Figure 14-11, Figure 14-12, and Figure 14-16 for the V-, S- and TW- veins, respectively.
| SU/AD | September 2023 |
| SRK Consulting (Canada) Inc Skeena Resources Limited NI 43 -101 Snip Project Canada |
Page |
Table 14-9: Gold variogram parameters per domain
| Zone | Veins
used for Variogram |
Domain | Structure | Nugget | Sill |
Major (Y) |
Semi (X) |
Minor (Z) |
Final
Rotation (YXZ) |
|
| V- Veins | 101, 102, 103* | 101 | 1 | 0.365 | 0.511 | 15 | 10 | 5 | 59.7/30/-35.3 | |
| 2 | 0.124 | 50 | 35 | 15 | ||||||
| S- Veins | 201, 202, 203 | 201 | 1 | 0.367 | 0.402 | 25 | 15 | 5 | 95.6/38.9/-42.5 | |
| 2 | 0.232 | 55 | 30 | 15 | ||||||
| 208, 213, 223 | 202 | 1 | 0.36 | 0.576 | 20 | 20 | 5 | 81.8/29.5/-42.4 | ||
| 2 | 0.064 | 55 | 35 | 15 | ||||||
| 212,214 | 203 | 1 | 0.55 | 0.456 | 35 | 15 | 5 | 90/0/-60 | ||
| 2 | 0.189 | 50 | 35 | 15 | ||||||
| Remaining Veins | 200 | 1 | 0.456 | 0.459 | 15 | 15 | 5 | 81.7/29.5/-42.4 | ||
| 2 | 0.0847 | 40 | 30 | 15 | ||||||
| TW- Veins | 301** | 301 | 1 | 0.269 | 0.289 | 30 | 15 | 10 | 82.2/32.8/-40.1 | |
| 2 | 0.442 | 45 | 40 | 15 | ||||||
| *variogram for all V-Veins | ||||||||||
| **variogram for all TW-Veins | ||||||||||
| SU/AD | September 2023 |
| SRK Consulting (Canada) Inc Skeena Resources Limited NI 43 -101 Snip Project Canada |
Page |
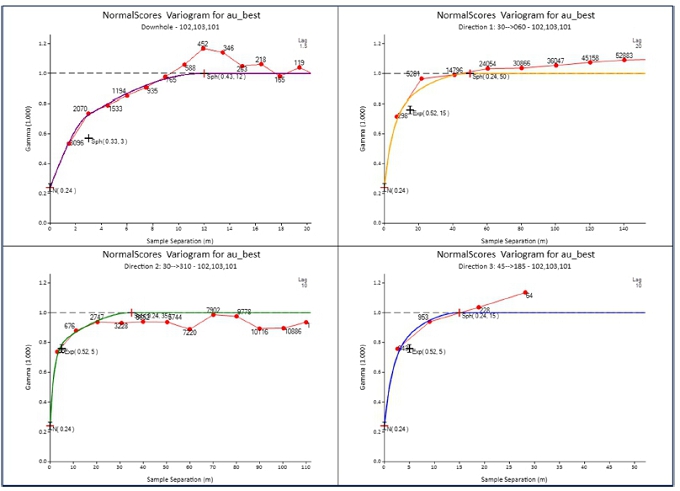
Figure 14-11: V-veins experimental variograms and models
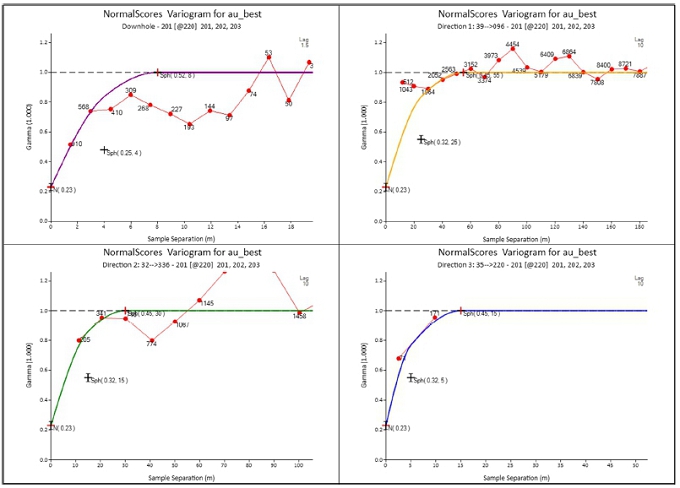
Figure 14-12: S-vein experimental variograms and models in domain 201 only
| SU/AD | September 2023 |
| SRK Consulting (Canada) Inc Skeena Resources Limited NI 43 -101 Snip Project Canada |
Page |
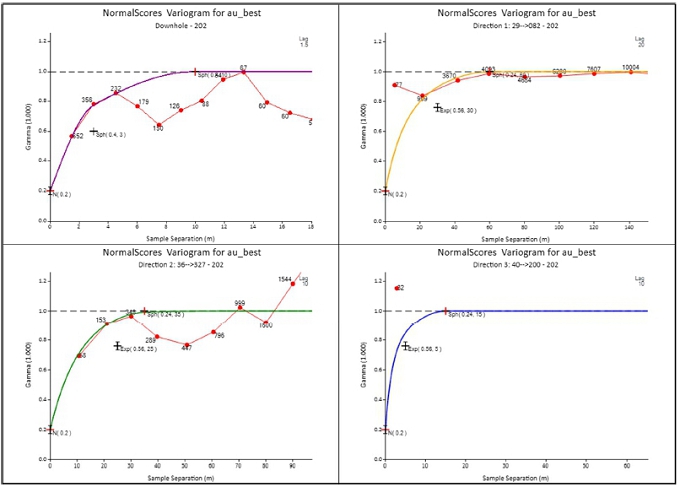
Figure 14-13: S-vein experimental variograms and models vein in domain 202 only
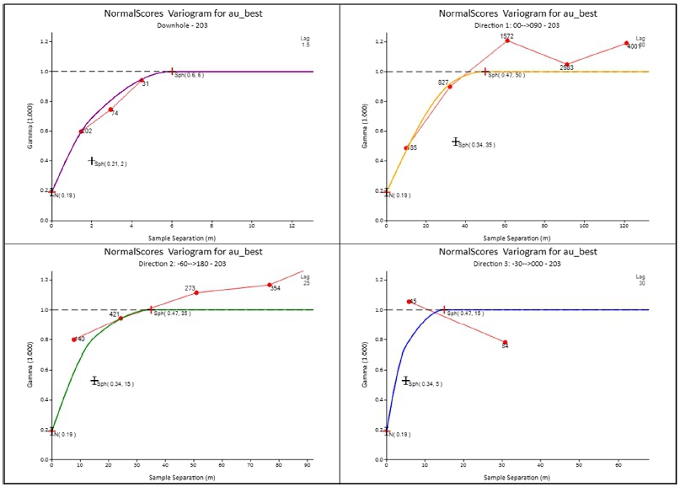
Figure 14-14: S-vein experimental variograms and models in domain 203 only
| SU/AD | September 2023 |
| SRK Consulting (Canada) Inc Skeena Resources Limited NI 43 -101 Snip Project Canada |
Page |
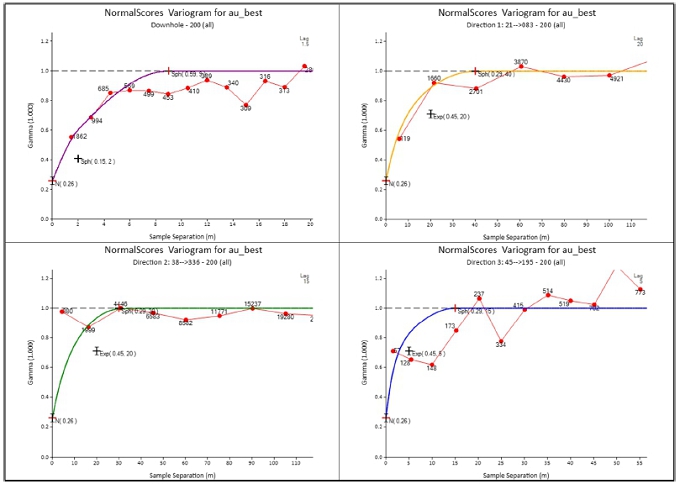
Figure 14-15: S-vein experimental variograms and models in domain 200 (all remaining veins)
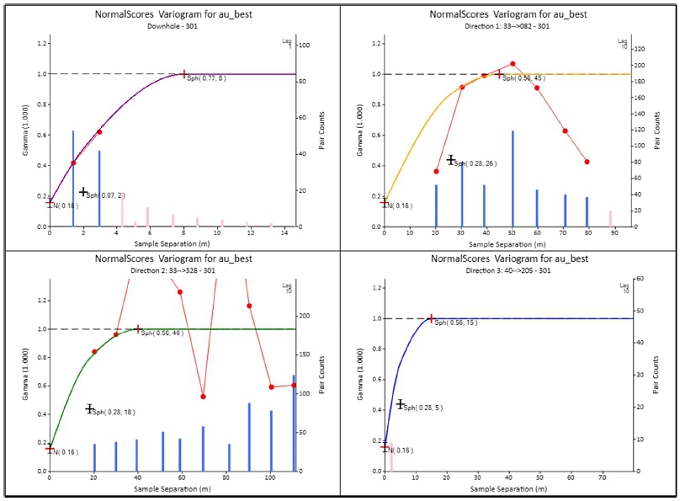
Figure 14-16: TW experimental variograms and models
| SU/AD | September 2023 |
| SRK Consulting (Canada) Inc Skeena Resources Limited NI 43 -101 Snip Project Canada |
Page |
| 14.8 | Specific Gravity |
Densities are used to calculate tonnages within the estimated volumes derived from the resource-grade block model. Specific gravity was measured by Skeena at their core logging facility using a standard weight in water/weight in air methodology on drill core.
Specific gravity was determined for all lithologies using 3,198 samples projected within the MRE model extent. Samples were measured using the buoyancy method by Skeena staff during the 2016 to 2021 drilling campaigns. Siltstones and greywackes are the most abundant host rock on the Snip Project. Seeing that other lithologies, barring the distinctive BSU, play a minor role in terms of significance, additional lithological subdivisions were not made and an average SG value of 2.78 g/cm3 was applied to all lithologies (Table 14-10). Within the BSU, a density of 2.84 g/cm3 was used. The average density within the veins was determined to be 2.91 g/cm3.
Table 14-10: Specific gravity by lithology
| Litho Code | Description | No Samples | Density |
| ARN | Arenite | 44 | 2.74 |
| AT | Ash Tuff | 18 | 2.73 |
| BC SCHT | Biotite Chlorite Schist | 3 | 2.86 |
| BSU | Biotite Spotted Unit | 12 | 2.84 |
| CGL | Conglomerate | 10 | 2.76 |
| CT | Cherty Tuff | 2 | 2.78 |
| DAC | Dacite | 3 | 2.67 |
| DC/RDC | Dacite/Rhyodacite | 3 | 2.78 |
| FESED | Ferriginous Sediment | 1 | 2.93 |
| FLT | Fault | 1 | 2.65 |
| FP | Feldspar Porphyry | 19 | 2.72 |
| FPD | Feldspar Porphyry | 2 | 2.78 |
| GRWK | GreyWacke | 1,952 | 2.79 |
| GRWK-SLST | Interbedded Greywacke/Siltstone | 390 | 2.76 |
| K-PORPH | Potassium Porphyry | 10 | 2.75 |
| LAMP | Lamprophyre | 14 | 2.78 |
| LMPR | Lamprophyre | 2 | 2.76 |
| LT | Lithic Tuff | 2 | 2.84 |
| LTHWCKE | Lithic Wacke | 237 | 2.8 |
| MD | Mafic Dyke | 1 | 2.87 |
| MS | Mafic Dyke | 1 | 3.77 |
| PT | Lapilli Tuff | 14 | 2.76 |
| QMONZ | Quartz Monzonite | 1 | 2.69 |
| RDC | Rhyodacite | 3 | 2.77 |
| SHRZ | Shear Zone | 2 | 2.81 |
| SILT | Siltstone | 1 | 2.65 |
| SLST | Siltstone | 144 | 2.81 |
| SMS | Interbedded Siltstone/Mudstone | 1 | 2.56 |
| TON | Tonalite | 1 | 2.67 |
| VCL | Volcaniclastic | 52 | 2.8 |
| VCSB | Volcaniclastic | 3 | 2.9 |
| VWCK | Volcaniclastic Wacke | 5 | 2.76 |
| WCK | Wacke | 180 | 2.78 |
| XT | Crystal Tuff | 1 | 2.85 |
| Unknown | 63 | 2.77 | |
| Total | 3,198 | ||
| SU/AD | September 2023 |
| SRK Consulting (Canada) Inc Skeena Resources Limited NI 43 -101 Snip Project Canada |
Page |
| 14.9 | Block Model and Grade Estimation |
Two block models were constructed in Maptek Vulcan® software for the 2023 Snip MRE, with details provided in Table 14-11 and displayed in Figure 14-17. The deposit was divided into two separate block models for data processing space efficiency: (1) Main model, which includes the V- and S-veins, and (2) Twin West model, which includes the TW-veins. Neither block model was rotated.
Table 14-11: Block model details and specifications
| Description |
Easting X |
Northing Y |
Elevation Z |
|
| MAIN | Block Model Origin (Lower left corner) | 3766 | 1648 | -80 |
| Parent Block Dimension | 4 | 4 | 4 | |
| Sub Block Dimension | 0.5 | 0.5 | 0.5 | |
| Number of Blocks | 425 | 187 | 215 | |
| Rotation | None | |||
| TWIN WEST | Block Model Origin (Lower left corner) | 2980 | 1430 | -80 |
| Parent Block Dimension | 4 | 4 | 4 | |
| Sub Block Dimension | 0.5 | 0.5 | 0.5 | |
| Number of Blocks | 185 | 100 | 87 | |
| Rotation | None | |||
| SU/AD | September 2023 |
| SRK Consulting (Canada) Inc Skeena Resources Limited NI 43 -101 Snip Project Canada |
Page |
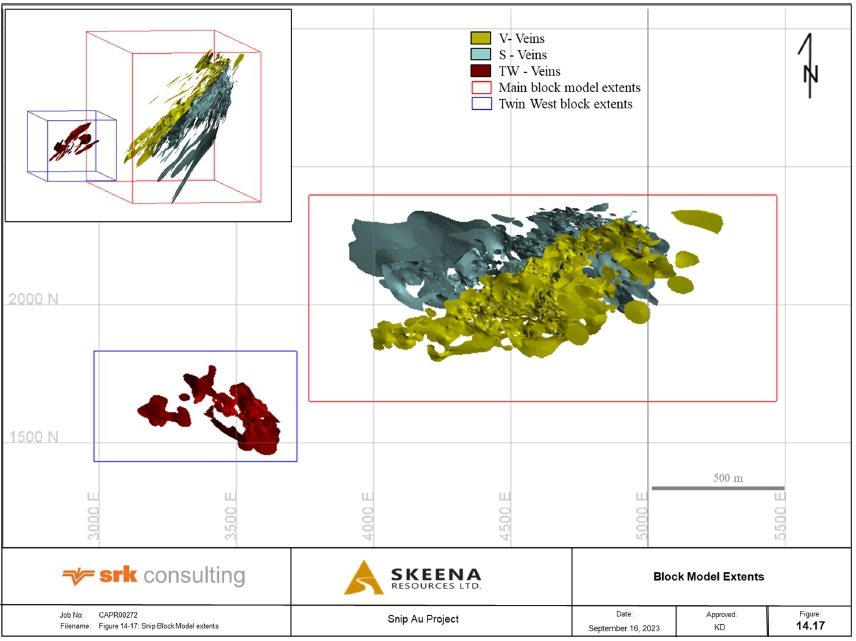
Figure 14-17: Snip Project block model extents for the Main and Twin West block model areas
| SU/AD | September 2023 |
| SRK Consulting (Canada) Inc Skeena Resources Limited NI 43 -101 Snip Project Canada |
Page |
Three interpolation passes were used to estimate gold grades using the parameters outlined in Table 14-12. The search ellipse ranges and orientations were derived from the variogram models. Pass 1 equaled 2/3 of the variogram range, Pass 2 equalled the variogram range and Pass 3 equalled two times the variogram range. A 4th Pass at four times the variogram range was used for validation purposes only.
During estimation, all composites were length weighted to the composite interval since a number of small composites (less than 0.75 m) were picked up where the vein narrowed or pinched-out. In addition, composite intervals less than 0.1 m, resulting from back-flagged clipping, were excluded during estimation. Individual lodes within the zones were estimated independently to mitigate against cross-sharing of sample intervals within the search ellipse boundary. All grade within the BSU were coded to a waste grade of 0.001 g/t.
| SU/AD | September 2023 |
| SRK Consulting (Canada) Inc Skeena Resources Limited NI 43 -101 Snip Project Canada |
Page |
Table 14-12: Estimation parameters
| Veins | Domain | Search Pass |
Search Radii | Orientation | Dynamic Anisotropy |
Number of Composites | Max composites per drill hole |
|||
| X | Y | Z | Minimum | Maximum | ||||||
| 101,102,103 | 101 | 1 | 33.5 | 18 | 10 | Yes | 9 | 15 | 3 | |
| 2 | 50 | 35 | 15 | 60 / 30 / -35 | 4 | 10 | 3 | |||
| 3 | 100 | 70 | 30 | 3 | 7 | 3 | ||||
| 105 | 102 | 1 | 33.5 | 18 | 10 | Yes | 9 | 15 | 3 | |
| 2 | 50 | 35 | 15 | 60 / 30 / -35 | 4 | 10 | 3 | |||
| 3 | 100 | 70 | 30 | 3 | 7 | 3 | ||||
| Remaining Veins | 100 | 1 | 33.5 | 18 | 10 | No | 9 | 15 | 3 | |
| 2 | 50 | 35 | 15 | 60 / 30 / -35 | 4 | 10 | 3 | |||
| 3 | 100 | 70 | 30 | 3 | 7 | 3 | ||||
| 201, 202, 203 | 201 | 1 | 37 | 20 | 10 | Yes | 9 | 15 | 3 | |
| 2 | 55 | 30 | 15 | 59 / 24 / -39 | 4 | 10 | 3 | |||
| 3 | 64 | 64 | 24 | 3 | 7 | 3 | ||||
| 208, 21, 223 | 202 | 1 | 37 | 23.5 | 10 | Yes | 9 | 15 | 3 | |
| 2 | 55 | 35 | 15 | 95 / 17 / -58* | 4 | 10 | 3 | |||
| 3 | 110 | 70 | 30 | 3 | 7 | 3 | ||||
| 212,214 | 203 | 1 | 33.5 | 18 | 10 | Yes | 9 | 15 | 3 | |
| 2 | 50 | 35 | 15 | 76 / 18 / -36 | 4 | 10 | 3 | |||
| 3 | 100 | 70 | 30 | 3 | 7 | 3 | ||||
| Remaining Veins | 200 | 1 | 27 | 20 | 10 | No | 9 | 15 | 3 | |
| 2 | 40 | 30 | 15 | 59 / 24 / -39 | 4 | 10 | 3 | |||
| 3 | 80 | 60 | 30 | 3 | 7 | 3 | ||||
| 301 | 301 | 1 | 30 | 27 | 10 | Yes | 9 | 15 | 3 | |
| 2 | 45 | 40 | 15 | 82 / 33 / -40 | 4 | 10 | 3 | |||
| 3 | 90 | 80 | 30 | 3 | 7 | 3 | ||||
| Remaining Veins | 300 | 1 | 30 | 27 | 10 | No | 9 | 15 | 3 | |
| 2 | 45 | 40 | 15 | 82 / 33 / -40 | 4 | 10 | 3 | |||
| 3 | 90 | 80 | 30 | 3 | 7 | 3 | ||||
*Vulcan rotation YXZ
| SU/AD | September 2023 |
| SRK Consulting (Canada) Inc Skeena Resources Limited NI 43 -101 Snip Project Canada |
Page |
| 14.10 | Model Validation |
| 14.10.1 | Block Model Visual Validation |
All zones were validated by completing a series of visual inspections in plan and sectional view to provide a local visual assessment of the interpolated blocks in relation to the nearest composite. Good agreement between the composite grades and block estimates was observed as shown in Figure 14-18, Figure 14-19 and Figure 14-20.
| SU/AD | September 2023 |
| SRK Consulting (Canada) Inc Skeena Resources Limited NI 43 -101 Snip Project Canada |
Page |
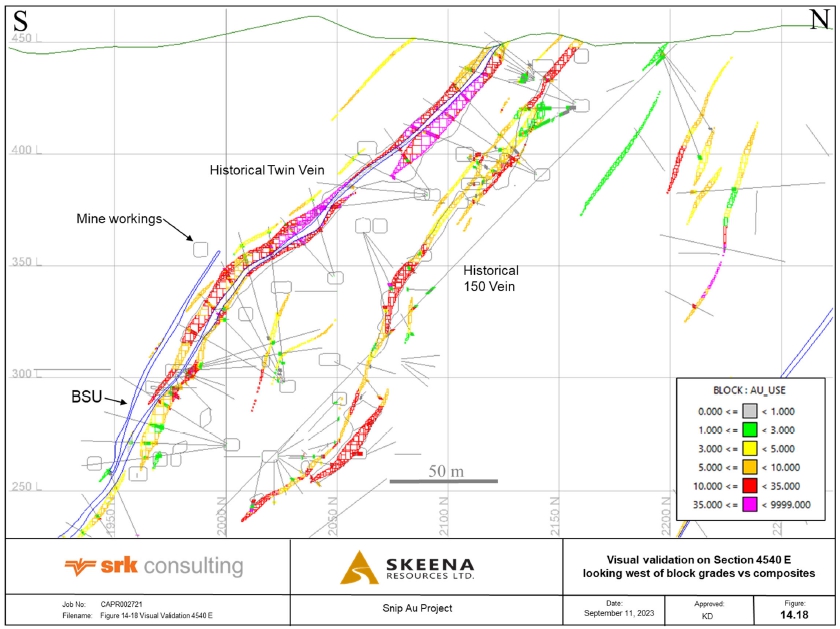
Figure 14-18: Visual validation of blocks grades versus composites on Section 4540E, looking west
| SU/AD | September 2023 |
| SRK Consulting (Canada) Inc Skeena Resources Limited NI 43 -101 Snip Project Canada |
Page |
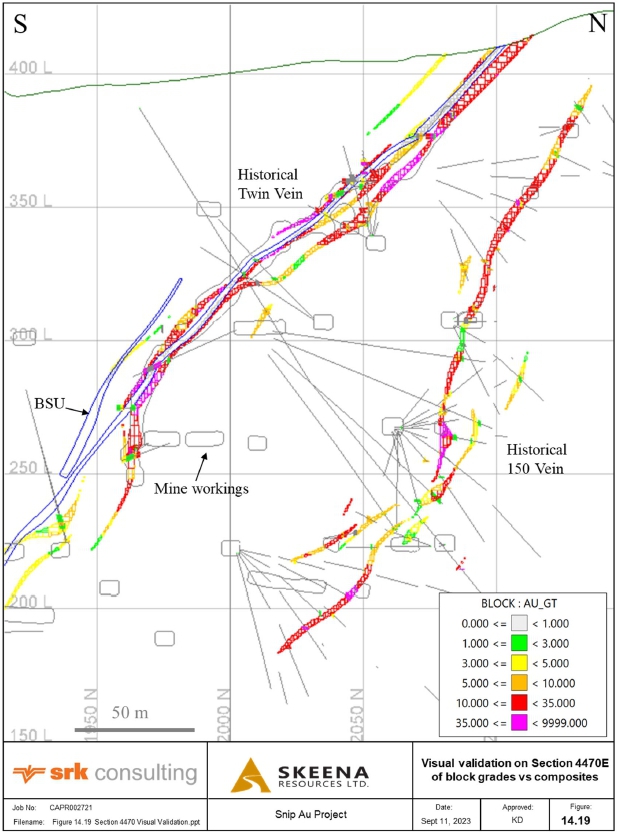
Figure 14-19: Visual validation of blocks grades versus composites on Section 4470E, looking west
| SU/AD | September 2023 |
| SRK Consulting (Canada) Inc Skeena Resources Limited NI 43 -101 Snip Project Canada |
Page |
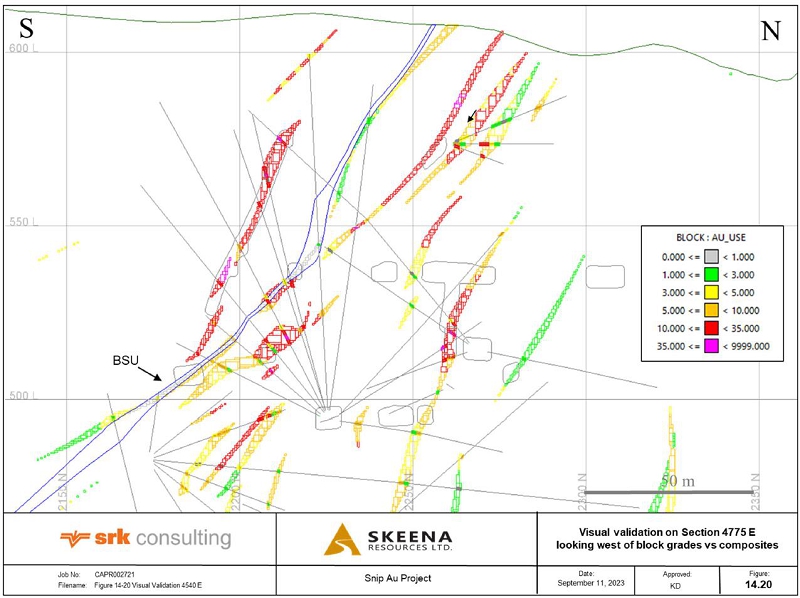
Figure 14-20: Visual validation of blocks grades versus composites on Section 4775E, looking west
| SU/AD | September 2023 |
| SRK Consulting (Canada) Inc Skeena Resources Limited NI 43 -101 Snip Project Canada |
Page |
| 14.10.2 | Global Grade Bias Check |
Inverse Distance (ID2) and Nearest Neighbour (NN) models were completed to check for global biases against the Ordinary Kriging model. In addition, a NN declustered estimate (NN_declus) using 1.5 m composites and a block grid of 1.5 m x 1.5 m x 1.5 m was performed to infer accurate declustered composite means for the 3 zones, which have highly variable drill spacings. Global bias tabulations showing declustered composites, ID2, NN_declus, and OK estimation results is summarized in Table 14-13. Overall bias was kept to a minimum and resulted in less than 6% difference for all zones; results which are within acceptable limits.
Table 14-13: Global gold grade bias
| Domain | OK | ID2 | NN_declus | OK/NN_declus | OK/ID |
| 101 | 15.32 | 15.25 | 15.72 | -3% | 0% |
| 102 | 6.72 | 6.81 | 6.92 | -3% | -1% |
| 100 | 4.99 | 4.97 | 5.05 | -3% | 0% |
| 201 | 11.02 | 10.86 | 11.86 | -7% | 2% |
| 202 | 6.00 | 5.96 | 6.03 | -1% | 1% |
| 203 | 7.27 | 7.66 | 7.93 | -8% | -5% |
| 200 | 6.03 | 6.01 | 6.34 | -5% | 0% |
| 301 | 8.56 | 8.56 | 8.54 | 0% | 0% |
| 300 | 6.58 | 6.60 | 7.19 | -9% | 0% |
| 14.10.3 | Local Grade Bias Check |
Swath plot analysis of grade profiles between OK, NN_declus and ID2 estimates in each domain were generated to assess the model for local bias along north-south, east-west and horizontal swaths (Figure 14-21, Figure 14-22 and Figure 14-23). The observed trends show reasonable comparison between estimation methods.
| SU/AD | September 2023 |
| SRK Consulting (Canada) Inc Skeena Resources Limited NI 43 -101 Snip Project Canada |
Page |
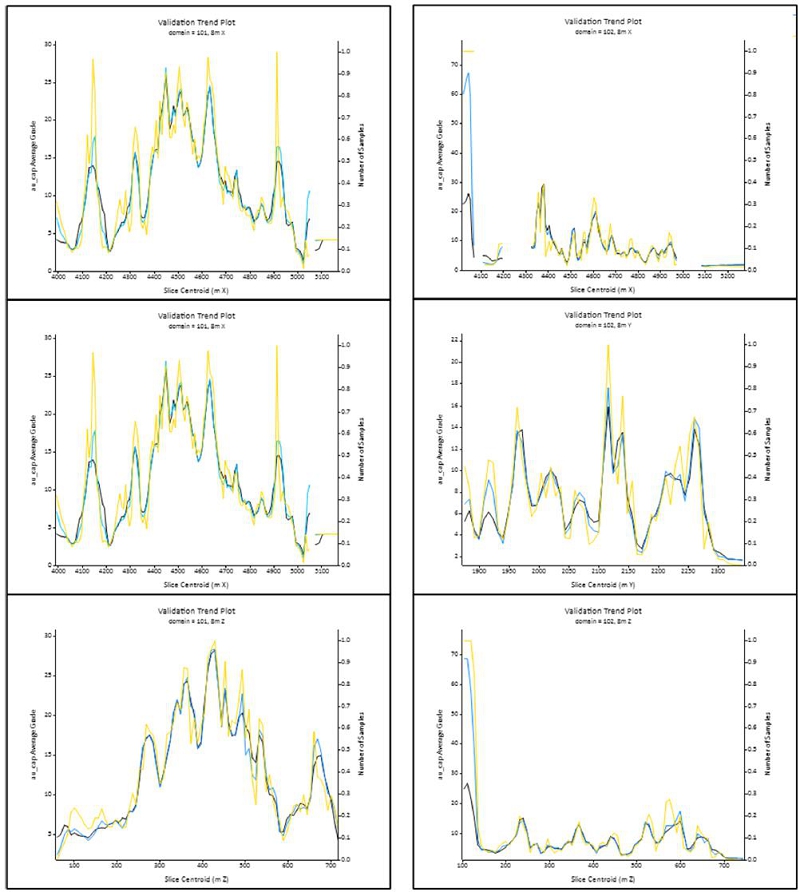
Figure 14-21: Swath plots for the domains 101 (left) and 102 (right) of the V-veins. Black= OK model, blue= ID2 model, yellow =NN_declus model
| SU/AD | September 2023 |
| SRK Consulting (Canada) Inc Skeena Resources Limited NI 43 -101 Snip Project Canada |
Page |
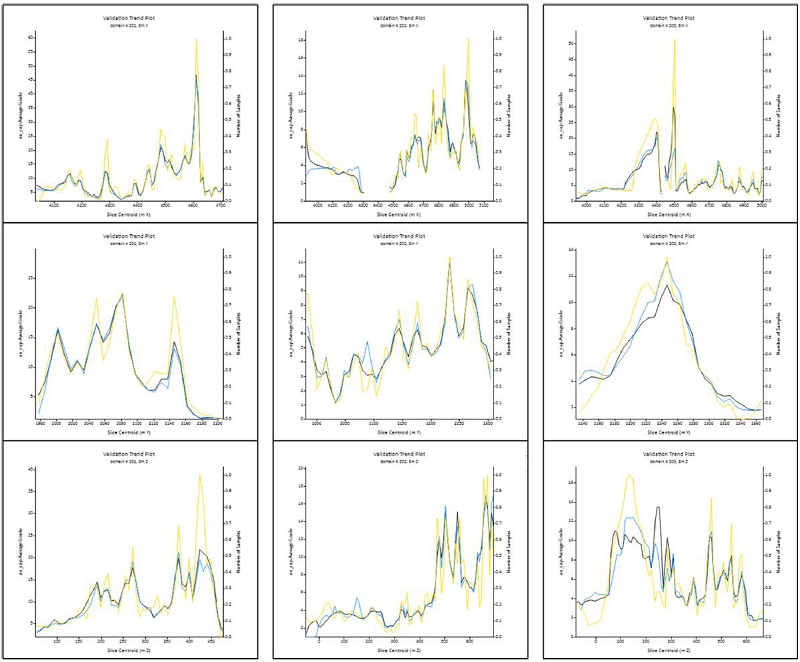
Figure 14-22: Swath plots for the domains 201 (left), 202 (middle), and 203 (right) domains of the S-veins. Black= OK model, blue= ID2 model, yellow =NN_declus model
| SU/AD | September 2023 |
| SRK Consulting (Canada) Inc Skeena Resources Limited NI 43 -101 Snip Project Canada |
Page |
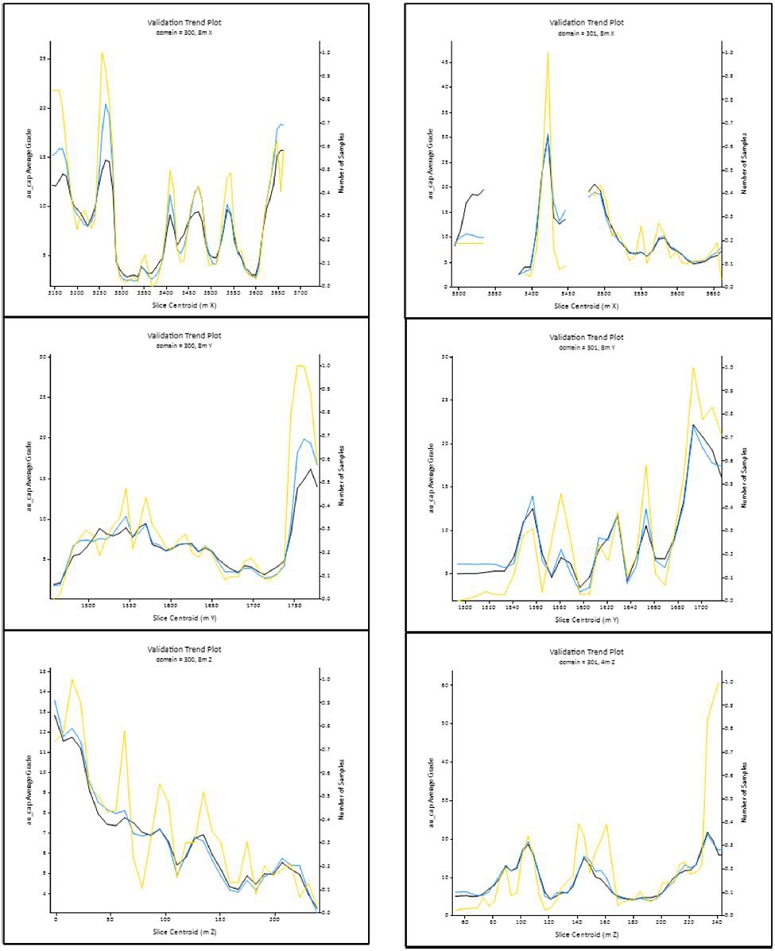
Figure 14-23: Swath plots for the domains 301 (left) and 300 (right) domains of the TW-Veins. Black= OK model, blue= ID2 model, yellow =NN_declus model
| SU/AD | September 2023 |
| SRK Consulting (Canada) Inc Skeena Resources Limited NI 43 -101 Snip Project Canada |
Page |
| 14.11 | Mineral Resource Classification |
As mineral resource classification is typically a subjective concept, industry best practices suggest that resource classification should consider both the confidence in the geological continuity of the mineralized structures, the quality and quantity of exploration data supporting the estimates and the geostatistical confidence in the tonnage and grade estimates. Appropriate classification criteria should aim at integrating both concepts to delineate regular areas at similar resource classification. SRK is satisfied that the geological modelling honours the current geological information and knowledge. The location of the samples and the assay data are sufficiently reliable to support resource estimation.
Block model quantities and grade estimates for the Snip Project were classified according to the CIM Definition Standards for Mineral Resources and Mineral Reserves (CIM, 2014). Mineral resources for the Snip Project have been classified as either Indicated or Inferred mineral resources. No Measured mineral resource has been defined for this deposit.
SRK considers that for those blocks estimated at an adequate drill hole spacing with accurately located and reliable sampling information, up to the full variogram ranges (pass 1 and 2) may be classified as Indicated. For those blocks, SRK considers that the level of confidence is sufficient to allow appropriate application of technical and economic parameters to support mine planning and to allow evaluation of the economic viability of the deposit. Furthermore, blocks estimated during the third estimation pass considering search neighbourhoods set at twice the variogram range may be appropriately classified in the Inferred category because confidence in the estimate is insufficient to allow for meaningful application of technical and economic parameters, or to enable an evaluation of economic viability.
Indicated and Inferred resources are depicted in Figure 14-24 and were classified as follows:
| • | For the Indicated category, all blocks estimated with at least 3 drill holes extending no more than 35 m maximum (approximately 70% of the range were classified as Indicated resources; |
| • | Inferred resources were partitioned using a minimum of 2 drill holes at a maximum range of 70 m (1.5 x the variogram range) range; |
| • | Blocks were locally reclassified to reduce ‘spotted’ Indicated resources within Inferred resources, and vice versa. |
| SU/AD | September 2023 |
| SRK Consulting (Canada) Inc Skeena Resources Limited NI 43 -101 Snip Project Canada |
Page |
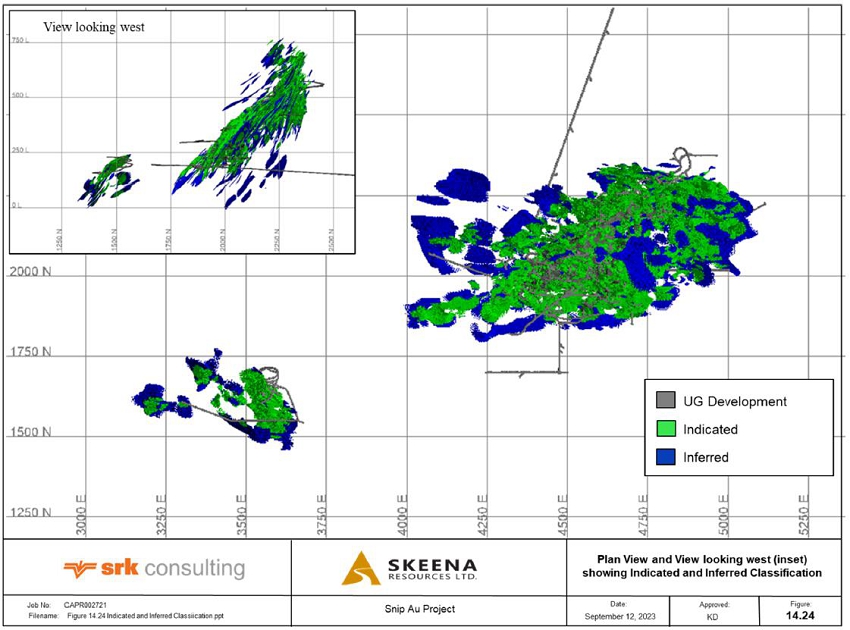
Figure 14-24: Plan view of the distribution of Indicated and Inferred classed blocks
| SU/AD | September 2023 |
| SRK Consulting (Canada) Inc Skeena Resources Limited NI 43 -101 Snip Project Canada |
Page |
| 14.12 | Mineral Resource Statement |
The QP for the mineral resource estimate is Ms. S. Ulansky, Senior Resource Geologist, PGeo (EGBC#36085), an employee of SRK Consulting (Canada).
CIM Definition Standards for Mineral Resources and Mineral Reserves (May 2014) defines a mineral resource as:
“(A) concentration or occurrence of diamonds, natural solid inorganic material, or natural solid fossilized organic material including base and precious metals, coal, and industrial minerals in or on the Earth’s crust in such form and quantity and of such a grade or quality that it has reasonable prospects for economic extraction. The location, quantity, grade, geological characteristics and continuity of a Mineral Resource are known, estimated or interpreted from specific geological evidence and knowledge”.
The “reasonable prospects for eventual economic extraction” requirement generally implies that the quantity and grade estimates meet certain economic thresholds and that the mineral resources are reported at an appropriate cut-off grade taking into account extraction scenarios and processing recoveries. In order to meet this requirement, SRK considers that portions of the Snip Project are amenable for underground mining.
In order to determine the quantities of material offering “reasonable prospects for eventual economic extraction” underground, SRK used a stope optimizer and reasonable mining assumptions to evaluate the proportions of the block model (Indicated and Inferred blocks) that could be “reasonably expected” to be mined from an underground scenario.
The optimization parameters were selected based on experience and benchmarking against similar projects as shown in (Table 14-14). The reader is cautioned that the results from the optimization are used solely for the purpose of testing the “reasonable prospects for eventual economic extraction” by underground long hole stoping and do not represent an attempt to estimate mineral reserves. There are no mineral reserves on the Snip Project. The results are used as a guide to assist in the preparation of a mineral resource statement and to select an appropriate resource reporting cut-off grade.
Table 14-14: Assumptions considered for stope optimization
| Input Parameters | Value | Unit |
| Gold Price | 1,700 | US Dollars per Ounce |
| Exchange Rate | 1.3 | CAD:USD |
| Metallurgical Recovery | 96 | Percent |
| Royalty | 1 | Percent |
| Selling Cost | 18.50 | CAD Dollars per Ounce |
| Mining Cost | 115 | CAD Dollars per Tonne |
| Process Cost | 29 | CAD Dollars per Tonne |
| G&A Cost | 17 | CAD Dollars per Tonne |
| All-in Cost | 161 | CAD Dollars per Tonne |
| Mining Method | N/A |
Longhole: 10 m H x 5 m L x 2 m W Dip: 55 – 90 degrees 1 m offset to UG workings |
| Cut-off Grade | 2.5 | Grams per tonne (g/t) |
| SU/AD | September 2023 |
| SRK Consulting (Canada) Inc Skeena Resources Limited NI 43 -101 Snip Project Canada |
Page |
SRK considers that the blocks located within the stope optimized shapes, as shown in Figure 14-25, show “reasonable prospects for eventual economic extraction” and can be reported as a mineral resource.
The cut-off grade was determined to be 2.5 g/t Au. The resources have been stated as in-situ, undiluted and in the veins contained within these potentially economical minable underground stope shapes (Table 14-15) (Figure 14-26) (Figure 14-27) and show the reported resources in the V- and S- Veins in the Main model, and TW-Veins in the Twin West model, respectively. Mineral Resources have been depleted to account for past production and exclude mineralization within a 1 m buffer around historical underground development. The post-mineral BSU unit has been nulled to a waste grade of 0.001 g/t.
Table 14-15: Snip underground Mineral Resource Statement as of September 05, 2023.
| Category | Zone | Tonnes (‘000) |
Contained
Grade Au (g/t) |
Contained
Ounces Au (‘000) |
| Indicated | Main - V | 850 | 9.59 | 262 |
| Main - S | 1,718 | 9.28 | 513 | |
| Twin West | 171 | 8.69 | 48 | |
| Total Indicated | 2,739 | 9.35 | 823 | |
| Inferred | Main - V | 115 | 7.38 | 27 |
| Main - S | 323 | 6.22 | 65 | |
| Twin West | 61 | 11.02 | 22 | |
| Total Inferred | 499 | 7.10 | 114 | |
*Notes to accompany the Mineral Resource Estimate statement:
| • | Mineral resources are not mineral reserves as they do not have demonstrated economic viability. |
| • | As defined by NI 43-101, the Independent and Qualified Person is Ms. S. Ulansky, PGeo of SRK Consulting (Canada) who has reviewed and validated the Mineral Resource Estimate. |
| • | The effective date of the Mineral Resource Estimate is September 05, 2023. |
| • | Estimates use metric units (meters, tonnes and g/t). Metals are reported in troy ounces (metric tonne * grade / 31.10348) |
| • | The number of metric tonnes and ounces were rounded to the nearest thousand. Any discrepancies in the totals are due to rounding. |
| • | Reasonable prospects for eventual economic extraction were determined by means of applying stope optimization parameters summarized in Table 14-4. Resources are reported in-situ and undiluted within the veins contained within potentially economical and minable underground long hole stope shapes. |
| • | Mineral Resources have been depleted to account for past production and exclude mineralization within a 1 m buffer around historical underground developments. This 1 m exclusion zone is low and will need to be expanded in future resource estimates. |
| SU/AD | September 2023 |
| SRK Consulting (Canada) Inc Skeena Resources Limited NI 43 -101 Snip Project Canada |
Page |
| • | Cut-off grades are based on a price of US$1,700 per ounce of gold. |
| • | The underground cut-off grade for the long hole mining method was calculated to be 2.5 g/t Au. Cut-off grades must be re-evaluated considering prevailing market conditions (including gold prices, exchange rates and costs). |
| • | CIM definitions were followed for the classification of mineral resources. |
| • | Neither the company nor SRK is aware of any known environmental, permitted, legal, title-related, taxation, socio-political, marketing or other relevant issue that could materially affect this mineral resource estimate. |
| SU/AD | September 2023 |
| SRK Consulting (Canada) Inc Skeena Resources Limited NI 43 -101 Snip Project Canada |
Page |
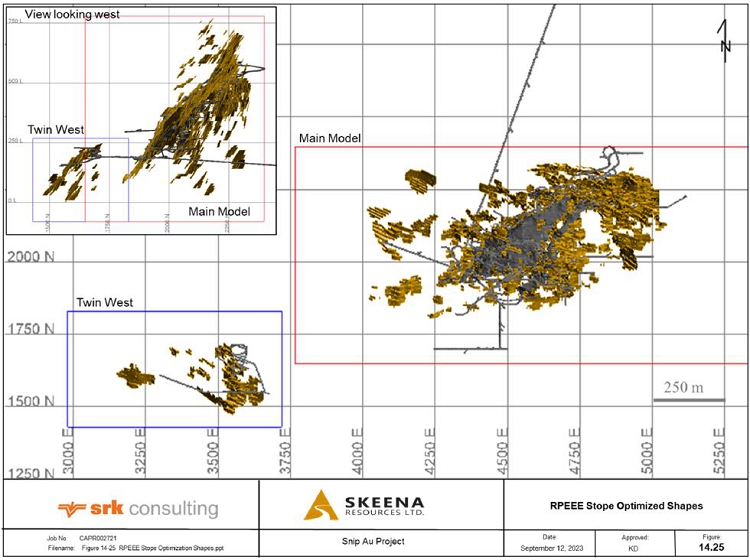
Figure 14-25 Plan view and view looking west (inset) of the distribution of potentially economical minable underground stope shapes (orange)
| SU/AD | September 2023 |
| SRK Consulting (Canada) Inc Skeena Resources Limited NI 43 -101 Snip Project Canada |
Page |
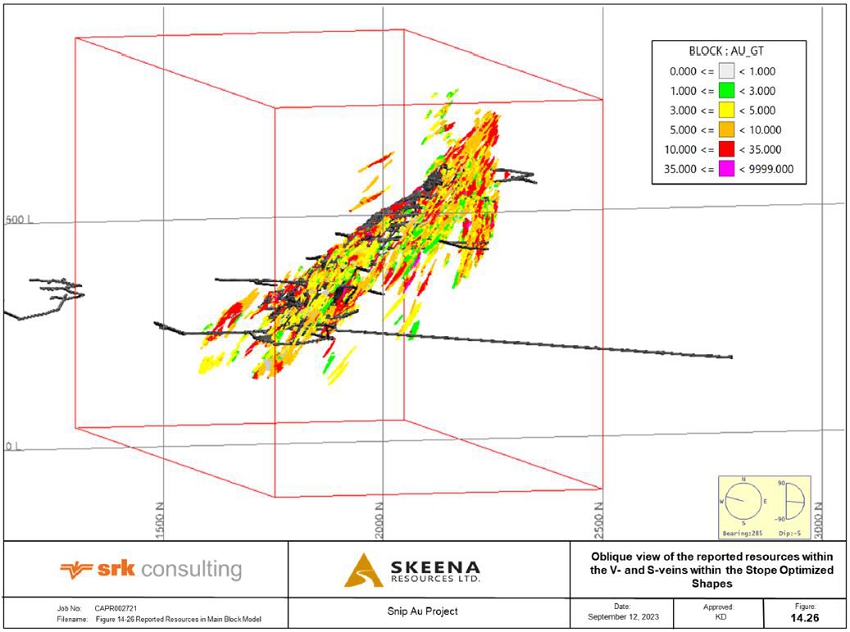
Figure 14-26 Oblique view looking west of the reported resources within the stope optimized shapes in the Main Model
| SU/AD | September 2023 |
| SRK Consulting (Canada) Inc Skeena Resources Limited NI 43 -101 Snip Project Canada |
Page |
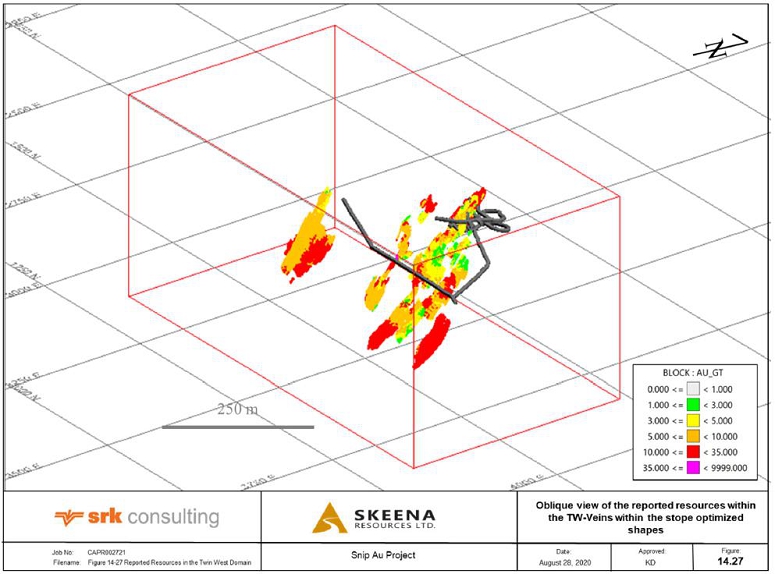
Figure 14-27: Oblique view of the distribution of the reported resources within the stope optimized shapes in the Twin West Model.
| SU/AD | September 2023 |
| SRK Consulting (Canada) Inc Skeena Resources Limited NI 43 -101 Snip Project Canada |
Page |
| 14.13 | Comparison to Previous Mineral Resource Estimate |
The 2023 Mineral Resource Estimate involves several key changes when compared to the 2020 Mineral Resource Estimate. The changes are as follows:
| • | An additional 307 drill holes for a total meterage of 46,268 m has been included into this estimate since the 2020 Maiden Mineral Resource. |
| • | The mineralization veins were updated and expanded and an additional 22 veins were identified: 3 in the V-Veins and 19 in the S-Veins. This had the net effect of increasing the volume of the mineralized lodes by 25%. |
| • | The number of assay intervals used in the interpretation of the S-Veins in the 2023 MRE increased by 40% and reduced the grade by ~9%, as evidenced in the mean assay grades from 2020 to 2023 (Table 14-16). |
Table 14-16 Mean assay grade comparison
| Zone | 2020 MRE | 2023 MRE | Difference | |||
| No. Assays | Mean (g/t) | No. Assays | Mean (g/t) | No. Assays | Mean (g/t) | |
| V- Veins | 9400 | 15.22 | 9738 | 15.40 | 4% | 1% |
| S- Veins | 9,277 | 10.08 | 12,946 | 9.17 | 40% | -9% |
| TW- Veins | 1134 | 7.637 | 808 | 7.70 | -29% | 1% |
| • | More conservative capping thresholds were used in the S-veins due to subdividing the veins into domains, rather than the more generalized zone groupings used in 2020. |
| • | In the 2020 MRE, a 40-meter omnidirectional 3-D buffer around the QA/QC validated 2016 to 2019 Skeena only holes was utilized for Indicated resources classification. All drill holes within this area were permitted into the Indicated class if upholding the additional classification criteria. All historical only areas, where assay results could not be directly substantiated, were relegated to the Inferred category if upholding all other classification criteria for this class. The removal of the 40 m buffer upgraded a large portion of the Inferred resources to Indicated. |
| • | During the 2021 and 2022 infill drilling programs, 28 twin drill holes totaling 3,318 meters were drilled to validate the historical drill intercepts. Comparative vein intervals and gold grades were captured in both the original and twin holes. Corresponding vein intervals and statistics demonstrated acceptable correlation between the historical and twin hole fire assays. This enabled the historical drill hole data to be used during the classification process without any boundary constraints. |
| • | Veins were estimated in Skeena’s 2020 MRE using the single-search ellipsoid of the variogram. In the 2023 update, dynamic anisotropy (“DA”) was used for the larger veins (volumetrically) showing good continuity, whereby the search ellipse was adjusted on a block-by-block basis using a surface that defines the overall folded orientation of the veins. DA allows the estimator to select composite intervals that are in the most suitable orientation, thereby resulting in an estimate that is locally more accurate and more in line with the original vein model interpretation. |
| SU/AD | September 2023 |
| SRK Consulting (Canada) Inc Skeena Resources Limited NI 43 -101 Snip Project Canada |
Page |
| • | The stope optimizer used for reporting RPEEE used more selective stope shape parameters in 2023. Stope dimensions of 10 H x 5 L x 2 W were utilized in 2023, whereas stope dimensions of 20 H x 10 L x 2m W were utilized in 2020. |
| • | In the 2020 MRE, two density values were applied to the model; a value of 2.78 g/cm3 for vein mineralization, and 2.86 g/cm3 for the Biotite Spotted Unit (“BSU”). An additional 1,770 specific gravity measurements were incorporated into the 2023 model, which were reassessed within their appropriate lithology and vein units. The 2023 MRE utilized a value of 2.91 g/cm3 for vein mineralization, and 2.84 g/cm3 for the BSU. |
Percent difference comparisons between the 2020 vs 2023 mineral resources are shown in Table 14-17.
Table 14-17: Percent difference between the 2020 and 2023 MRE’s
| Category |
Tonnes (‘000) |
Contained Grade Au (g/t) |
Contained Ounces Au (‘000) |
| Total Indicated | 408% | -33% | 237% |
| Total Inferred | -47% | -47% | -72% |
| 14.14 | Factors that May Affect the Mineral Resource Estimates |
Factors that may affect the Mineral Resource estimates include:
| • | Metal price and exchange rate assumptions; |
| • | Changes to the assumptions used to generate the gold equivalent cut-off grade; |
| • | Changes in local interpretations of mineralization geometry and continuity of mineralized zones; |
| • | Changes to geological and mineralization shapes, and geological and grade continuity assumptions; |
| • | Density and domain assignments; |
| • | Changes to geotechnical assumptions including mining method; |
| • | Changes to mining and metallurgical recovery assumptions; |
| • | Change to the input and design parameter assumptions that pertain to the conceptual mineable shapes constraining the estimates potentially amenable to underground mining methods; |
| • | Assumptions as to the continued ability to access the site, retain mineral and surface rights titles, obtain and maintain environment and other regulatory permits, and obtain the social license to operate. |
| SU/AD | September 2023 |
| SRK Consulting (Canada) Inc Skeena Resources Limited NI 43 -101 Snip Project Canada |
Page |
| 14.15 | Responsibility for the Snip Resource Estimate |
The geological and structural models for the Snip Project and the mineral resource estimate were completed by Skeena’s Director of Resources and Reserves, Kathi Dilworth. The geological model and structural models and the mineral resource estimate were then reviewed and validated by Sheila Ulansky, P.Geo of SRK Consulting (Canada). Ms. Ulansky is responsible for the resource estimate discussed herein, by virtue of her independent review and verified work performed by Skeena.
| SU/AD | September 2023 |
| SRK Consulting (Canada) Inc Skeena Resources Limited NI 43 -101 Snip Project Canada |
Page |
| 15 | Adjacent Properties |
The area surrounding the Snip Project saw extensive exploration throughout the 1980’s and early 1990’s. SnipGold Corp, a subsidiary or Seabridge Gold Inc., is the current owner of the two deposits in the immediate area (Figure 15-1). They are a public company regulated by Canadian securities regulators. Information pertaining to their properties have been taken from documents readily available on the respective company websites and MineFileBC. Although the information below was publicly disclosed by the Owner or Operator of the adjacent properties, the QP has not audited the associated technical data and the information is not necessarily indicative of the mineralization on the Property that is the subject of this Technical Report.
| 15.1 | SnipGold Corp. (a Subsidiary of Seabridge Gold) |
The Iskut property consists of a contiguous block of 100 BC Mineral Claims, 2 Mineral Leases and 13 Crown Grants covering 29,436 hectares (294 km2) situated in the Liard Mining Division. The property includes the former high-grade gold Johnny Mountain Mine and the copper-gold Bronson Slope deposit. The property was acquired by Seabridge Gold Inc. in June 2016.
Seabridge has reactivated the property as the “Iskut Project”, exploring for a gold-copper porphyry similar to those Seabridge discovered at its nearby KSM project. Since acquiring the property in 2016, exploration has identified the potential for large gold-copper deposits.
In 2020, a 9,000 meter drill program tested a large intrusion system that was identified in 2019. The holes were drilled across 750 m of strike and 800 m of vertical projection on coincident magnetic and IP anomalies below and west of the well-developed lithocap. The drill program provided further evidence for a large gold-copper porphyry system which may lie below the drilling completed to date. The 2022 drill program focused on zones below the Bronson Slope Deposit. The drilling encountered gold and copper in all 10 holes drilled, including the identification of a large, mineralized breccia pipe. Hole 5 returned 174 meters at 0.86 g/t Au and 0.34% copper.
An $8 Million dollar drill program is currently underway.
| 15.1.1 | Stonehouse Deposit |
The past producing Stonehouse deposit, or Johnny Mountain Mine, is described in BC Minfile No 104B 107. In November 1988, the company began operating the Johnny Mountain Mine. The mine closed in mid-August of 1990 and milling operations ceased in early September. High operating costs and low gold prices were significant factors in the closure. In 1993, a further 21,850 tonnes were milled. The total mined from 1988, 1989, 1990 and 1993 was 196,358 tonnes from which a total of 2,815,393 g of gold, 4,348,814 g of silver and 1,008,109 kg of copper were recovered. It is a structurally disrupted mesothermal gold-bearing quartz vein deposit. Mineralization includes pyrite, chalcopyrite with some sphalerite, galena and minor pyrrhotite within a number of sub parallel sulphide-K-feldspar-quartz veins and stock work systems occurring along a series of northeast-trending structures in close proximity to plagioclase porphyry dykes.
| SU/AD | September 2023 |
| SRK Consulting (Canada) Inc Skeena Resources Limited NI 43 -101 Snip Project Canada |
Page |
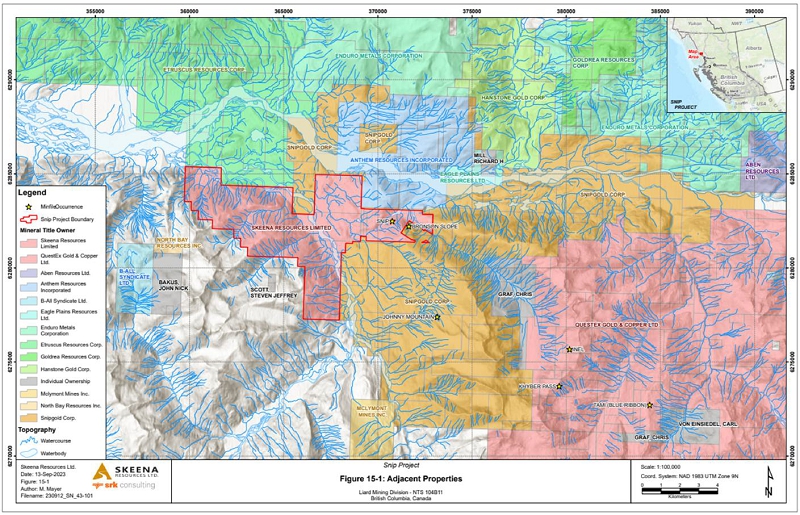
Figure 15-1: Adjacent properties to the Snip Project
| SU/AD | September 2023 |
| SRK Consulting (Canada) Inc Skeena Resources Limited NI 43 -101 Snip Project Canada |
Page |
| 15.1.2 | Bronson Slope |
The Bronson Slope prospect is immediately adjacent to the Snip Project and overlies primarily the Red Bluff Porphyry; the interpreted source of gold mineralization at Snip. It is described in BC Minfile No 104B 077. In 2008, Skyline Gold released a NI 43-101 compliant report containing updated resource estimates for Au, Ag, Cu and Mo. Combined Measured and Indicated resources were 225.1 million tonnes grading 0.36 g/t Au, 2.22 g/t Ag, 0.14% Cu, and 0.0077% Mo. Inferred resources were 91.6 million tonnes grading 0.27 g/t Au, 1.76 g/t Ag, 0.13% Cu, and 0.0080% Mo (Burgoyne and Giroux, 2008).
In 2010 Skyline Gold released a NI 43-101 compliant report containing updated magnetite resource estimates. Combined Measured and Indicated resources were 163,160,000 tonnes grading 7.28 per cent Ma. Inferred resources were 6,300,000 tonnes grading 6.92 per cent Ma, calculated using a cut-off grade of 2.00 per cent Ma (Burgoyne et al., 2010)
| SU/AD | September 2023 |
| SRK Consulting (Canada) Inc Skeena Resources Limited NI 43 -101 Snip Project Canada |
Page |
| 16 | Other Relevant Information |
The road access and hydroelectrical infrastructure history was previously provided in detail by Moors, 2018.
| 16.1 | Road Access |
Road access to the Snip Project site would likely be established via a proposed 23.2 km long road from the McLymont power station termed the “Bronson Connector Road”. A design package was completed in 2017 by Tahltan-Allnorth for a 6 m wide road including nine (9) water course crossings varying in span from 14.3 m to 66. 1m. In 2022, Knight Piesold completed a peer review of the 2017 Tahltan-Allnorth design package and concluded that it was adequate to support Pre-Feasibility Level consideration. Budgetary estimates of the Bronson Connection Road completed between 2020 and 2022 estimate a total cost of $30 – 46 million for construction inclusive of indirects and contingency. Further work is required to refine cost estimates and assess opportunity for potential construction cost sharing with other parties that hold interests in the area surrounding the Snip Project.
| 16.2 | Hydroelectric Infrastructure |
The closest source of hydroelectric power when the Snip Mine was operating until 1999 was the 138 kV line in Stewart, BC at a distance of 108 km as the crow flies, or more realistically, 180 km through more amenable topography to the same power source at Meziadin Junction on BC Highway 37. At present the nearest source of electricity for the Snip Project is the Forest Kerr power station 25 km to the east. It is supplied by both the 195-megawatt Forest Kerr Hydroelectric Facility and the 66-megawatt McLymont Creek Hydroelectric Facility. They commenced power production in 2014 and 2015, respectively, and feed the 287 kV BC Hydro substation at Bob Quinn Lake. Construction costs for a power line linking the Snip Project to the power station have not been estimated.
There is no other relevant data available about the Snip Project.
| SU/AD | September 2023 |
| SRK Consulting (Canada) Inc Skeena Resources Limited NI 43 -101 Snip Project Canada |
Page |
| 17 | Interpretation and Conclusions |
The objective of SRK’s scope of work was to provide Skeena with support and validation of the Snip resource estimate, accompanied by the preparation of an independent technical report published by SRK in compliance with National Instrument 43-101. This technical report and the Mineral Resources presented herein meet these objectives.
| 17.1 | Mineral Tenure, Surface Rights, Agreements, and Royalties |
The information provided by Skeena supports the conclusion that the mining tenure held is valid.
| 17.2 | Geology and Mineralization |
| · | Gold mineralization occurs in structurally controlled mineralized veins in a brittle-ductile shear zone system, hosted within a sequence of laminated turbidites of the Upper Triassic Stuhini Group. |
| · | Mineralization has both Orogenic style gold characteristics as well as mineralogical and paragenetic similarities to porphyry related vein systems, being contemporaneous with the adjacent to Early Jurassic Red Bluff porphyry, a calc-alkaline, I-type, magnetite-series intrusion of quartz monzodioritic composition. |
| · | ninety-four narrow, high grade lodes were modelled which were combined into three zones based on structure and orientation. |
| · | The understanding of the regional geology, lithological and structural controls of the mineralization are sufficient to support estimation of Mineral Resources. |
| 17.3 | Data Analysis |
| · | The quantity and quality of the lithological, collar and down-the-hole survey data collected are sufficient to support Mineral Resources. Sample data density and distribution is adequate to build meaningful litho-structural models reflective of the overall deposit type. |
| · | SRK reviewed the database and is of the opinion that the current sample preparation, security and analytical procedures meet industry-standard practices. SRK also believes that the Skeena validated database is of a standard that is acceptable for creating an unbiased, representative Mineral Resource Estimate of the Snip deposit. |
| · | SRK reviewed the analytical quality control data accumulated by Skeena and Hochschild during 2020 to 2022. SRK confirms that gold grades are reasonably well reproduced and reliable for resource estimation purposes. Similarly, a QA/QC analysis showed no obvious bias or errors. |
| · | The 2021 to 2022 twin drilling program was a success, where the 28 twin holes drilled in similar 3-D orientation and with less than 2 m separation, validated in terms of data precision and accuracy. |
| SU/AD | September 2023 |
| SRK Consulting (Canada) Inc Skeena Resources Limited NI 43 -101 Snip Project Canada |
Page |
| 17.4 | Mineral Resource Estimation |
| · | Geostatistical studies were carried out on the composite data to select capping levels and derive estimation parameters. Gold was estimated into the block model using Ordinary Kriging informed from capped, composited data. Density was coded into each block for deriving tonnages based on the average specific gravity for the metasediments and biotite spotted unit. |
| · | Mineral Resources were estimated and classified following CIM best practices. |
| · | The 40 m buffer constraint utilized for the 2020 MRE was lifted because the twin drilling program confirmed equivalent mineralized intervals and gold grades with the matching historical holes. |
| · | The 2023 Mineral Resource has demonstrated that the project has development potential as an underground mining operation. Stope optimized shapes were created using reasonable assumptions for long hole mining with a cut-off grade of 2.5 g/t. |
| · | Modelled veins delineate in-situ gold grade and do not consider minimum width or potential planned mining dilution which would be considered during conversion of mineral resources to mineral reserves. |
| · | Approximately 10% of the resource is classified as Inferred. It is reasonable to expect that part of the Inferred Mineral Resource could be upgraded to an Indicated Mineral Resource with continued drilling. |
| · | Additionally, it is reasonable to expect an increase to the Inferred category if future exploration campaigns test underexplored areas and/or the continuity of sparsely drilled regions . |
The 2023 Mineral Resource Estimate involves several key changes when compared to the 2020 Mineral Resource Estimate. The changes are as follows:
| · | Additional drill holes included. |
| · | Expanded and updated mineralization vein model volumes. |
| · | Overall reduction in grade in the additional drill holes. |
| · | Twin drilling program validation of all historical holes. |
| · | Lifting of the 2020 40-meter omnidirectional 3-D buffer for the Indicated category due to the twin drilling program. |
| · | Stope optimizer adjustments. |
| · | Additional specific gravity measurements collected and used to update the model density values. |
| SU/AD | September 2023 |
| SRK Consulting (Canada) Inc Skeena Resources Limited NI 43 -101 Snip Project Canada |
Page |
| 18 | Recommendations |
In reviewing the compiled drill hole database, geological interpretation and mineral resource estimate for the Snip Project, SRK makes the following recommendations:
| 18.1 | Geology/Exploration |
| · | The intimate association of biotite with shear zones and veining and overall homogeneity of potassic (biotitic) alteration suggests that the alteration envelope may help constrain fluid and mineralization pathways. It is recommended that alteration data are used to investigate the potential to delineate alteration domains and generate alteration models to identity potential ore shoots within the shear zone system. This should be completed as a part of the standard geological logging and mapping observations, and as such, does not need a separate budget. |
| · | All occurrences and locations of visible gold should be standardized and combined with drill hole data to generate a high-grade gold model. This should be used to define zones of high grade that can potentially be used as a predictive tool to delineate further zones of higher-grade gold and/or ore shoots within the shear zone system. This will assist in improved local resolution of high-grade zones for resource estimation. This should be completed as a part of the standard geological logging and mapping process, and as such, would not require a separate budget. |
| · | A detailed vein model was constructed in Leapfrog Geo® using data provided by Skeena. To further substantiate the model and elucidate the finer project scale structural details that are relevant to Snip mineralization, an onsite structural mapping survey is recommended. Budget recommendations are provided in Table 18-1. |
| · | Regional geology and structure play a significant role in interpreting exploration geological datasets. To effectively understand geological context within the broader district, an improved regional geology map needs to be sourced and included into the Leapfrog Geo® model. |
| · | The existing LiDAR survey covers the mineral lease area only. To extract subtle property-wide structural details, which may be applied to regional exploration, an expanded LiDAR survey that covers the entire property is recommended with an appropriate structural interpretation: |
| – | In tandem with the LiDAR survey, a high-resolution magnetics survey using drone surveying technologies would enhance future structural interpretations. This geophysical survey may be combined with the regional LiDAR survey to reduce exploration costs. Costs associated with this LiDAR-add one have not been included. |
| · | Knowing that Snip ore is structurally controlled, advancing the project depends heavily on understanding the structural complexities of the deposit. Oriented core drilling facilitates measurements of the directional properties in the rock and is used to measure bedding, foliation, vein orientations, shear fabrics and other kinematic indicators. SRK recommends the use of oriented core drilling for future drilling campaigns. |
| · | Limited drilling has been conducted on the Jim Porphyry and Jim Porphyry south areas which exhibit similar alteration and lithological similarities with the Main Twin Zone. Knowing the narrow and variable nature of mineralization on the property, an additional 2 holes are recommended to fully test these targets. |
| SU/AD | September 2023 |
| SRK Consulting (Canada) Inc Skeena Resources Limited NI 43 -101 Snip Project Canada |
Page |
| 18.2 | Sampling |
| · | The grade appropriate standard needs to be inserted into the sample series. This is particularly important for the high-grade standards where they should, ideally, be inserted into a series of high-grade intervals only. |
| · | Preparation and pulp duplicates are inserted by the lab at a sequence that the lab defines. Additional preparation and pulp duplicates should be requested at intervals defined by Skeena to avoid intralab bias and to reflect the entire gold range that defines the Snip Project. This should be completed as a part of the standard sampling process, and as such, does not need a separate budget. |
| · | External check samples need to be consistently taken and processed at SGS Canada in a timely manner. This should be completed as a part of the standard sampling process, and as such, does not need a separate budget. |
| · | Sample rejects and pulps are not currently saved and stored. In the event of core damage, loss or tampering, rejects and pulps will serve to validate the deposit’s primary asset – the assay database. Therefore, sample rejects and pulps should be stored as a part of the standard QA/QC process, and as such, does not need a separate budget. |
| 18.3 | Resource Model |
| · | Due to the high degree of grade variability within the Snip deposit, SRK recommends conducting a conditional simulation study to assess the impact of localized grade variability within the mineral resource estimate and on future mine design and production planning. The simulated model could also be used to reconcile against historical production based on available historical stope and underground development wireframes. |
| 18.4 | Historical Confirmation |
| · | A basic property survey was conducted in 2017, whereby a new survey control point network was established. Differential GPS points from the 300 level portal were expanded underground and traversed up the ramp using a total station. To further this survey and to validate the volume of depleted material, a study to determine the accuracy of the levels relative to the historical wireframes is recommended. This should be completed as part of the standard data management process for the Snip Project, and as such, does not need a separate budget: |
| – | Depending on the outcome of the study, and if there are major differences in elevation and position, a more detailed survey will need to be undertaken. |
| – | Measured blocks have not been accounted for in the 2023 Mineral Resource Statement due to Client-specific requests. However, blocks that qualify in terms of having quantity, grade or quality, densities, shape and physical characteristics that are estimated with confidence to allow the application of modifying factors, are currently accessible. To convert additional areas from Indicated to Measured, having approximately 12.5 m centers, updated classification parameters need to be generated in future resource model runs. This process may be conducted as part of SRK’s proposed resource model conditional simulation study, whereby mineral resource classification criteria are reassessed to potentially support Measured resources. |
| SU/AD | September 2023 |
| SRK Consulting (Canada) Inc Skeena Resources Limited NI 43 -101 Snip Project Canada |
Page |
| Table 18-1: Estimated Cost for the Exploration Program Proposed for the Snip Project | ||||
| Action Item | Estimated Cost (CAD) | |||
| Structural Geology Review | $ | 36,000 | ||
| Desktop Interpretation (LiDAR and Geophysics Lineament Analysis) | $ | 24,000 | ||
| LiDAR Survey (@CAD$5,625/km2 for 10km2) | $ | 56,250 | ||
| Exploration Drilling (@CAD$475/m) | $ | 285,000 | ||
| Oriented Drilling (@CAD$2,000/month over 4 months) | $ | 10,000 | ||
| Conditional Simulation Study | $ | 26,000 | ||
| Subtotal | 437,250 | |||
| Contingency (10%) | 43,725 | |||
| Total Estimated Program Costs (CAD) | 480,975 | |||
SRK is unaware of any other significant factors and risks that may affect access, title, or the right or ability to perform the exploration work recommended for the Snip Project.
| SU/AD | September 2023 |
| SRK Consulting (Canada) Inc Skeena Resources Limited NI 43 -101 Snip Project Canada |
Page |
| 19 | Acronyms and Abbreviations |
| Distance | Other | |||
| µm | micron (micrometer) | °C | degree Celsius | |
| mm | millimeter | °F | degree Fahrenheit | |
| cm | centimeter | Btu | British Thermal Unit | |
| m | meter | cfm | cubic feet per minute | |
| km | km | elev | elevation above sea level | |
| ” | inch | masl | m above sea level | |
| in | inch | hp | horsepower | |
| ’ | foot | hr | hour | |
| ft | foot | kW | kilowatt | |
| Area | kWh | kilowatt hour | ||
| m2 | square meter | M | Million | |
| km2 | square km | mph | miles per hour | |
| ac | acre | ppb | parts per billion | |
| Ha | hectare | ppm | parts per million | |
| Volume | s | second | ||
| l | litre | s.g. | specific gravity | |
| m3 | cubic meter | usgpm | US gallon per minute | |
| ft3 | cubic foot | V | volt | |
| usg | US gallon | W | watt | |
| lcm | loose cubic meter | Ω | ohm | |
| bcm | bank cubic meter | A | ampere | |
| Mbcm | million bcm | tph | tonnes per hour | |
| Mass | tpd | tonnes per day | ||
| kg | kilogram | mtpa | million tonnes per annum | |
| g | gram | Ø | diam | |
| t | metric tonne | Acronyms | ||
| Kt | kilotonne | SRK | SRK Consulting (Canada) Inc. | |
| lb | pound | CIM | Canadian Institute of Mining | |
| Mt | megatonne | NI 43-101 | National Instrument 43-101 | |
| oz | troy ounce | ABA | Acid- base accounting | |
| wmt | wet metric tonne | AP | Acid potential | |
| dmt | dry metric tonne | NP | Neutralization potential | |
| Pressure | NPTIC | Carbonate neutralization potential | ||
| psi | pounds per square inch | ML/ARD | Metal leaching/ acid rock drainage | |
| Pa | pascal | PAG | Potentially acid generating | |
| kPa | kilopascal | non-PAG | Non-potentially acid generating | |
| MPa | megapascal | RC | reverse circulation | |
| Elements and Compounds | IP | induced polarization | ||
| Au | gold | COG | cut-off grade | |
| Ag | silver | NSR | net smelter return | |
| Cu | copper | NPV | net present value | |
| Fe | iron | LOM | life of mine | |
| S | sulphur | Conversion Factors | ||
| CN | cyanide | 1 tonne | 2,204.62 lb | |
| NaCN | sodium cyanide | 1 oz | 31.1035 g | |
| SU/AD | September 2023 |
| SRK Consulting (Canada) Inc Skeena Resources Limited NI 43 -101 Snip Project Canada |
Page |
| 20 | References |
Altagas, https://www.altagas.ca/node/1679 (Accessed August 27, 2020)
Alldrick, D.J., 1985. Stratigraphy and Petrology of the Stewart Mining Camp (104B/1); in Geological Fieldwork 1994, B.C. Ministry of Energy, Mines, and Petroleum Resources, Paper 1985-1, p. 316-341.
Alldrick, D.J., Gabites, J.E., and Godwin., C.I., 1987. Lead Isotope Data from the Stewart Mining Camp (104B/1): in Geological Fieldwork 1986, B.C. Ministry of Energy, Mines and Petroleum Resources, Paper 1987-1, p 93-102
Anderson, R.G., 1993. A Mesozoic Stratigraphic and Plutonic Framework for Northwestern Stikinia (Iskut River Area), Northwestern British Columbia, Canada; in Dunne, G., and McDougall, K. Editors, Mesozoic Paleogeography of the Western United States, Volume II, Society of Economic Paleontologists and Mineralogists, Pacific Section.
Anderson, R.G., 1989. A stratigraphic, plutonic, and structural framework for the Iskut River map area, northwestern British Columbia. GSC paper 89-1E p. 147-154.
Burgoyne, A.A. and Giroux, G.H., 2008: Technical Report, Mineral Resource Estimate for Skyline Gold Corporation On The Bronson Slope Property, Northwestern British Columbia dated April 30, 2008.
Burgoyne, A.A., Burgert, A., Giroux, G.H., 2010: Technical Report, Magnetite Mineral Resource Estimate – Bronson Slope Deposit, Northwestern British Columbia dated January 28, 2010.
Bagshaw, R., 1968. Geological Report on the Cat Group no. 1 Johnny Mountain, Iskut River Area. ARIS Assessment Report 01657. BC MEM.
Black, T., 1999. The Snip Mine Gold Deposit, Unpublished company report, Homestake.
Bloom, L., and Jolette, C. 2019. Sampling and Assay Quality Control Guidelines: Snip & Eskay Creek Drill Core Programs, Internal report prepared for Skeena Resources Ltd. by Analytical Solutions Ltd, January 2019, Version 1.3, 32 p.
Britton, J.M. et al., 1990. Snippaker Map Area. Geological Fieldwork 1989,
Brown, D.A., 1987. Geological Setting of the Volcanic-Hosted Silbak Premier Mine, Northwestern British Columbia; Unpublished M.Sc. thesis, the University of British Columia, 216 pages.
CIM, 2014. CIM Definition Standards. Prepared by the CIM Standing Committee of Reserve Definitions: https://mrmr.cim.org/media/1088/cim_definition_standards_may10_2014.pdf, Adopted by CIM Council May 10, 2014. 12 p.
| SU/AD | September 2023 |
| SRK Consulting (Canada) Inc Skeena Resources Limited NI 43 -101 Snip Project Canada |
Page |
CIM, 2019. CIM Estimation of Mineral Resources and Mineral Reserves Best Practice Guidelines. Prepared by the CIM Mineral Resource and Mineral Reserve Committee. Adopted by the CIM Council on November 29, 2019. 75 p.
Giroux, G.H and Gray, J.H, 2010. Preliminary Assessment Update - Bronson Slope Property for the Skyline Gold Corporation.
Godwin, C.I., Pickering, A.D.R., and Gabites, J.E. 199. Interpretation of Galena Lead Isotopes form the Stewart-Iskut Area (103O, P; 104A, B, G); in Geological Fieldwork 1990, B.C. Ministry of Energy, Mines and Petroleum Resources, Paper 1991-1, p 235-245.
Heberlein, D., 2017. An Investigation of Historical Soil Geochemistry Results and Surficial Geology, Snip Mine, NW British Columbia. Internal Company Report For Skeena Resources Limited. 19 p.
Hochschild, 2022: Reporte de QA/QC – Laboratorio de ALS-Terrace Muestras de Sondajes – Proyecto Snip campana de perforacion 2022. Internal Report Prepared for Hochschild, 15 p.
Hull, J., Wickland, B., 2014. Independent Review of 2014 Dam Safety Inspection-Snip Mine Tailings Dams. Golder Associates report in response to “Notification of Chief Inspector’s Orders-Tailings Dams-Independent Review of Dam Safety and Consequence Classification” from the British Columbia Ministry of Energry Mines and Resources.
King, G.R., 1988. Geological and Geochemical Report on the Ian 6 and 8 Claims Iskut River Area, Liard Mining Division, B.C. http://aris.empr.gov.bc.ca/ArisReports/18086.PDF Kyba, J., 2015. Exploration and mining in the Skeena Region, British Columbia. In: Exploration and Mining in British Columbia, 2014. British Columbia Ministry of Energy and Mines, British Columbia Geological Survey, Information Circular 2015- 2, pp. 97- 114.
Kyba, J. and Nelson, J.L. 2015. Stratigraphic and tectonic framework of the Khyber-Sericite-Pins mineralized trend, lower Iskut River, northwest British Columbia. In: Geological Fieldwork 2014, British Columbia Ministry of Energy and Mines, British Columbia Geological Survey Paper 2015-1, pp. 41-58.
Lawrence, J.A.R., and Seen, V. 2009. Technical Report, Preliminary Economic Assessment with Mining Plan and Cost Estimate for Skyline Gold Corp., Vancouver, BC, On The Bronson Slope Property, dated March 6, 2009.
Lewis, P.D., 2013. Iskut River Area Geology, Northwest BC (104B/08, 09, 10 & part of 104B/01, 07, 11) Geoscience BC Report 2013-05.
MacDonald, A.J., et al, 1992. Geochronometry of the Iskut River Area – An update. In Geological Fieldwork 1991. BC Ministry of EMPR, Paper 1992-1, pp. 495-501.
| SU/AD | September 2023 |
| SRK Consulting (Canada) Inc Skeena Resources Limited NI 43 -101 Snip Project Canada |
Page |
MacDonald, A.J., et al., 1996. Metallogeny of an Early to Middle Jurassic Arc, Iskut River Area, Northwestern Columbia. Econ. Geol., Vol. 91, 1996, pp. 1098- 1114
Mawer, A.B., 1964. Report on Geological Survey of Bronson. 1 and 2 Groups. ARIS Assessment Report: 00630. BC MEM.
Metcalfe, P. and Moors. J.G. 1993. Refinement and Local correlation of the Upper Snippaker Ridge Section. Iskut River Area, B.C. (104B/10W and 11E:): in Geological Fieldwork 1992, B.C. Ministry of Energy, Mines and Petroleum Resources, Paper 1993-1.
MINFILE (2018): Snip, 104B 004; BC Ministry of Energy and Mines, MINFILE digital data, posted December 1988, https://minfile.gov.bc.ca/report.aspx?f=PDF&r=Minfile_Detail.rpt&minfilno=104B++004.
MINFILE (2020): Johnny Mountain, 104B 107; BC Ministry of Energy and Mines, MINFILE digital data, posted February 2018 https://minfile.gov.bc.ca/report.aspx?f=PDF&r=Minfile_Detail.rpt&minfilno=104B++107.
MINFILE (2020): Bronson Stope, 104B 077; BC Ministry of Energy and Mines, MINFILE digital data, posted April 2020. https://minfile.gov.bc.ca/report.aspx?f=PDF&r=Minfile_Detail.rpt&minfilno=104B++077
Moors, J.G., 2018. 2018 Technical Report on the Snip Property, Internal Company Report, Skeena Resources Ltd.
Nagy, L.J., 1966. 1986 Geochemical Report on the Aurum Group Iskut River Area for IORI Enterprises Inc. ARIS Assessment Report 15336A & B. BC MEM.
Nelson, J., and Kyba, J., 2014. Structural and stratigraphic control of porphyry and related mineralization in the Treaty Glacier-KSM-Brucejack-Stewart trend of western Stikinia. In: Geological Fieldwork 2013, British Columbia Ministry of Energy and Mines, British Columbia Geological Survey Paper 2014-1, pp. 111-140.
Nichols, R.F., 1989. Snip Property, Final Project Report; unpublished company report, Cominco Ltd., 22 pages
Nichols, R., and Giles, G., 2017. 2016 Assessment Report on the Snip Gold Property, Liard Mining District, ARIS Assessment Report 36883. BC MEM
Parsons, G. 1965. Geological Report on Bronson Creek No. 1-3 Claim Group. ARIS Assessment Report 00769. BC MEM.
Oliver, J.L., 2019. Interpretation of Three Polished Thin Sections and One Standard Thin Section Collected from Skeena Resources Inc., Internal report prepared for Skeena Resources Ltd, 32 p.
| SU/AD | September 2023 |
| SRK Consulting (Canada) Inc Skeena Resources Limited NI 43 -101 Snip Project Canada |
Page |
Rhys, D.A., 1993. Geology of the Snip Mine and its Relationship to Magmatic and Deformational History of the Johnny Mountain Area, Northwestern BC. MSc Thesis, UBC, 1993.
Rhys, D.A., 1995. The Red Bluff gold-copper porphyry and associated precious and base metal veins, northwestern British Columbia in Porphyry Deposits of the North- western Cordillera of North America, pages 838850, editor T. G. Schroeter, Special volume 46, Canadian Institute of Mining, Metallurgy.
Rhys, D.A., and Lewis, P.D., 1992. Geology of the Inel Deposit, Iskut River Area, Northwestern British Columbia, (104B/ll): in Geological Fieldwork 1992, B.C. Ministry of Energy, Mines and Petroleum Resources, Paper 1993-1.
Rhys, D.A., 1997 Internal memo to Homestake Canada Inc.
Shelbourne, M., 2015. Letter to Al Hoffman, Chief Inspector and Executive Director, Health and Safety, British Columbia Ministry of Energy and Mines, re: Understanding of foundation conditions, water balance adequacy and filter adequacy at the closed Snip tailings impoundment in northwest BC.
Snip, 2017: Summary of the 2017 Snip Analytical Quality Control Program. Internal Report Prepared for Skeena Resources, 35 p.
Snip, 2018: QA/QC Report for the Snip Drill Program Phase 11: April-August 2018. Internal Report Prepared for Skeena Resources, 79 p.
Snip, 2018a: Check Assay Report for the Snip Drill Program Phase 11: April-August 2018. Internal Report Prepared for Skeena Resources, 11 p.
Snip, 2018b: Check Assay Report for the Snip Drill Program Phase 111: December 2018. Internal Report Prepared for Skeena Resources, 12 p.
Snip, 2019: QA/QC Report for the Snip Drill Program October-December 2019. Internal Report Prepared for Skeena Resources, 25 p.
Snip, 2021: QA/QC Report – Exploration. For the 2020 – 2021 Snip Drill Program. Internal Report Prepared for Skeena Resources, 41 p.
Stats Canada. https://www12.statcan.gc.ca/census-recensement/2016/dp-pd/prof/details/page.cfm?Lang=E&Geo1=POPC&Code1=0765&Geo2=PR&Code2=47&Data=Count&SearchText=Smithers&SearchType=Begins&SearchPR=01&B1=All (Accessed August 27,2020)
Sibbick, S.J., and MacGillivray, R. 2006. Snip Mine: Seven years after closure. Report by AMEC Environmental Ltd., and Barrick Gold Inc.
Sillitoe R.H., Thompson, J., 1998. Intrusion Related Vein Gold Deposits, Resource Geology, Vol. 48, No.2, pp. 237-250.
Tipper, H. W. & Richards, T. A. 1976. Jurassic stratigraphy and history of north-central British Columbia. Geological Survey of Canada Bulletin 270. 73 pp., 17 figs, 2 tables, 33 pls.
Wojdak, P., 1997. Mine and Exploration Highlights, Northwest British Columbia – 1996, in Schroeter, T.G. , British Columbia Mining, Development and Exploration 1996 Overview. Ministry of Energy Mines and Petroleum Resources, British Columbia.
| SU/AD | September 2023 |
| SRK Consulting (Canada) Inc Skeena Resources Limited NI 43 -101 Snip Project Canada |
Page |
| 21 | Date and Signature Page |
This technical report was written by the following “Qualified Persons” and contributing authors. The release date of this technical report is September 26, 2023
| Qualified Person | Signature | Date |
| Sheila Ulansky, P.Geo | (signed) “Sheila Ulansky” | September 26, 2023 |
| Jeff Austin, P.Eng | (signed) “Jeffrey B. Austin” | September 26, 2023 |
Reviewed by
| (signed) “Andre Deiss” | ||
| Andre Deiss, Pri.Sci.Nat | ||
| Project Reviewer |
All data used as source material plus the text, tables, figures, and attachments of this document have been reviewed and prepared in accordance with generally accepted professional engineering and environmental practices.
| SU/AD | September 2023 |
Exhibit 99.3
September 26, 2023
VIA SEDAR
British Columbia Securities Commission, as Principal Regulator
Ontario Securities Commission
Alberta Securities Commission
Financial and Consumer Affairs Authority of Saskatchewan
The Manitoba Securities Commission
Securities, Financial and Consumer Services Commission (New Brunswick)
Nova Scotia Securities Commission
Office of the Superintendent of Securities (Prince Edward Island)
Office of the Superintendent of Securities Service Newfoundland and Labrador
Dear Sirs/Mesdames:
| Re: | Skeena Resources Limited (the "Company") Technical Report - Consent of Expert |
I, Sheila Ulansky, P.Geo., consent to the public filing by Skeena Resources Limited (the "Company") of the technical report titled "Independent Technical Report for the Snip Project, Canada" dated September 26, 2023 (the "Technical Report").
I also consent to any extracts from, or a summary of, the Technical Report in the news release of the Company dated September 26, 2023 (the "News Release").
I certify that I have read the News Release filed by the Company and that it fairly and accurately represents the information in the sections of the Technical Report for which I am responsible.
Yours truly,
|
(signed) “Sheila Ulansky” Sheila Ulansky, P.Geo - Resource Geologist SRK Consulting (Canada) |
 |
Exhibit 99.4
September 26, 2023
VIA SEDAR
British Columbia Securities Commission, as Principal Regulator
Ontario Securities Commission
Alberta Securities Commission
Financial and Consumer Affairs Authority of Saskatchewan
The Manitoba Securities Commission
Securities, Financial and Consumer Services Commission (New Brunswick)
Nova Scotia Securities Commission
Office of the Superintendent of Securities (Prince Edward Island)
Office of the Superintendent of Securities Service Newfoundland and Labrador
Dear Sirs/Mesdames:
| Re: | Skeena Resources Limited (the “Company”) |
| Technical Report – Consent of Expert |
I, Jeffrey B. Austin, P.Eng., consent to the public filing by Skeena Resources Limited (the “Company”) of the technical report titled “Independent Technical Report for the Snip Project, Canada” dated September 26, 2023 (the “Technical Report”).
I also consent to any extracts from, or a summary of, the Technical Report in the news release of the Company dated September 26, 2023 (the “News Release”).
I certify that I have read the News Release filed by the Company and that it fairly and accurately represents the information in the sections of the Technical Report for which I am responsible.
Yours truly,
| (signed) “Jeffrey B. Austin” | |
| Jeffrey B. Austin, P.Eng. - President | |
| International Metallurgical and Environmental Inc. |
Exhibit 99.5
CERTIFICATE OF QUALIFIED PERSON
To Accompany the report entitled: Independent Technical Report for the Snip Project, Canada, September 26, 2023.
I, Sheila Ulansky, residing at 2185 Gisby Street, West Vancouver, BC do hereby certify that:
| 1) | I am a Senior Resource Geologist with the firm of SRK Consulting (Canada) Inc. (“SRK”) with an office at Suite 2700- 320 Granville Street, Vancouver, BC, Canada; |
| 2) | I am a graduate of the University of Victoria, BC in 2007, I obtained a BSc in geology. In 2019 I obtained an MSc degree (geology) from Laurentian University, ON. I have practiced my profession continuously since 2007, initially in exploration geology on a variety of deposit types. Since 2012, I have worked full time as a Resource Geologist with emphasis on QA/QC, exploratory data analysis, variography, 3-D geological modelling and resource estimation. I have worked on a number of gold deposit types, including narrow vein in Orogenic systems, Carlin-style mineralization, epithermal gold mineral systems, and porphyry copper-gold systems; experience which is relevant to the Snip Project scope of work; |
| 3) | I am a Professional Geoscientist registered with the Engineers and Geoscientists BC (EGBC) with Membership Number 36085; |
| 4) | I have personally inspected the subject project July 27 to July 31, 2020; |
| 5) | I have read the definition of “qualified person” set out in National Instrument 43-101 and certify that by virtue of my education, affiliation to a professional association and past relevant work experience, I fulfill the requirements to be a “qualified person” for the purposes of National Instrument 43-101 and this technical report has been prepared in compliance with National Instrument 43-101 and Form 43-101F1; |
| 6) | I, as a qualified person, I am independent of the issuer as defined in Section 1.5 of National Instrument 43-101; |
| 7) | I am the author of this report and responsible for all the sections of the report, with the exceptions of Section 13, and accept professional responsibility for those sections of this technical report; |
| 8) | I have had no prior involvement with the subject property; |
| 9) | I have read National Instrument 43-101 and confirm that this technical report has been prepared in compliance therewith; |
| 10) | SRK Consulting (Canada) Inc. was retained by Skeena Resources Ltd. to prepare a technical audit of the Snip Project. In conducting our audit a gap analysis of project technical data was completed using CIM “Best practices” and Canadian Securities Administrators National Instrument 43-101 guidelines. The preceding report is based on a site visit, a review of project files and discussions with Ms. Kathi Dilworth, and other Skeena Resources personnel; |
| 11) | I have not received, nor do I expect to receive, any interest, directly or indirectly, in the Snip Project (Project No. 2CS042.006) or securities of Skeena Resources Ltd.; and |
| 12) | That, at the effective date of the technical report, to the best of my knowledge, information and belief, this technical report contains all scientific and technical information that is required to be disclosed to make the technical report not misleading. |
|
West Vancouver, BC September 26, 2023 |
(signed) “Sheila Ulansky” Sheila Ulansky, MSc, P.Geo Senior Resource Geologist |
 |
Exhibit 99.6
CERTIFICATE OF QUALIFIED PERSON
Jeffrey B. Austin, P.Eng.
I, Jeffrey B. Austin, P.Eng., do hereby certify that:
| 1. | I am a Consulting Engineer and President of International Metallurgical and Environmental Inc., residing at 906 Fairway Crescent, Kelowna, B.C., Canada. |
| 2. | This certificate applies to the technical report titled “Independent Technical Report for the Snip Project, Canada”, dated September 26th, 2023 (the “Technical Report”). |
| 3. | I fulfill the requirements of a qualified person for the purposes of NI 43-101 based on my academic qualifications, professional membership and relevant experience, as set out below: |
| a. | I hold the following academic qualifications: |
| BASc. | University of British Columbia | 1984 |
| b. | I am a member in good standing of the following professional and technical associations: |
| Association of Professional Engineers and Geoscientists of BC | 15708 |
| c. | I have worked in the minerals industry as a Consulting Process Engineer continuously since 1987, a period of 39 years. |
| 4. | I have not personally inspected the property. |
| 5. | I am responsible for Section 13 as well as Section 1-6(summary) of the Technical Report. |
| 6. | I am independent of Skeena Resources. as defined in section 1.5 of NI 43-101. |
| 7. | My prior involvement with the property includes metallurgical test work management for the Homestake Mining, the previous owners and developers of the project. |
| 8. | I have read and am familiar with NI 43-101 and the sections of the Technical Report for which I am responsible. To the best of my knowledge, information, and belief, the parts of the Technical Report for which I am responsible have been prepared in compliance with NI 43-101. |
| 9. | As of the date of this certificate, to the best of my knowledge, information and belief, the Technical Report contains all scientific and technical information that is required to be disclosed to make the Technical Report not misleading. |
| Dated this 26nd day of September, 2023 | ||
| (signed) “Jeffrey B. Austin” | ||
| Jeffrey B. Austin, P.Eng. |