UNITED STATES
SECURITIES AND EXCHANGE COMMISSION
Washington, D.C. 20549
FORM 8-K
CURRENT REPORT
Pursuant to Section 13 or 15(d) of the Securities Exchange Act of 1934
| Date of Report (Date of earliest event reported): | September 13, 2023 |
McEWEN MINING INC.
(Exact name of registrant as specified in its charter)
| Colorado | 001-33190 | 84-0796160 | ||
| (State or other jurisdiction of incorporation) |
(Commission File Number) |
(IRS Employer Identification No.) |
|
150 King Street West, Suite 2800 Toronto, Ontario, Canada |
M5H 1J9 |
| (Address of principal executive offices) | (Zip Code) |
| Registrant’s telephone number including area code: | (866) 441-0690 |
(Former name or former address, if changed since last report)
Check the appropriate box below if the Form 8-K filing is intended to simultaneously satisfy the filing obligation of the registrant under any of the following provisions:
¨ Written communications pursuant to Rule 425 under the Securities Act (17 CFR 230.425)
¨ Soliciting material pursuant to Rule 14a-12 under the Exchange Act (17 CFR 240.14a-12)
¨ Pre-commencement communications pursuant to Rule 14d-2(b) under the Exchange Act (17 CFR 240.14d-2(b))
¨ Pre-commencement communications pursuant to Rule 13e-4(c) under the Exchange Act (17 CFR 240.13e-4(c))
Securities registered pursuant to Section 12(b) of the Act:
| Title of each class | Trading Symbol(s) | Name of each exchange on which registered | ||
| Common Stock | MUX | New York Stock Exchange |
Indicate by check mark whether the registrant is an emerging growth company as defined in Rule 405 of the Securities Act of 1933 (§230.405 of this chapter) or Rule 12b-2 of the Securities Exchange Act of 1934 (§240.12b-2 of this chapter).
Emerging growth company ¨
If an emerging growth company, indicate by check mark if the registrant has elected not to use the extended transition period for complying with any new or revised financial accounting standards provided pursuant to Section 13(a) of the Exchange Act. ¨
| Item 7.01 | Financial Statements and Exhibits. |
On September 13, 2023, management of McEwen Mining Inc. (the “Company”) made a presentation regarding the Company and its operations, assets, plans and recent developments at the Precious Metals Summit Beaver Creek. A copy of the Power Point slides used in conjunction with the presentation is furnished with this report as Exhibit 99.1.
The information furnished under this Item 7.01, including the referenced exhibit, shall not be deemed “filed” for purposes of Section 18 of the Securities Exchange Act of 1934, nor shall it be deemed incorporated by reference in any filing under the Securities Act of 1933, except as shall be expressly set forth by reference to such filing.
| Item 9.01 | Financial Statements and Exhibits. |
(d) Exhibits. The following exhibits are furnished or filed with this report, as applicable:
| Exhibit No. | Description | |
| 99.1 | Power Point Slides from Precious Metals Summit Beaver Creek. | |
| 104 | Cover Page Interactive Data File – the cover page XBRL tags are embedded within the Inline XBRL document |
Cautionary Statement
With the exception of historical matters, the matters discussed in the presentation include forward-looking statements within the meaning of applicable securities laws that involve risks and uncertainties that could cause actual results to differ materially from projections or estimates contained therein. Such forward-looking statements include, among others, statements regarding future production and cost estimates, exploration, development, construction and production activities. Factors that could cause actual results to differ materially from projections or estimates include, among others, future drilling results, metal prices, economic and market conditions, operating costs, receipt of permits, and receipt of working capital, as well as other factors described in the Company’s Annual Report on Form 10-K for the year ended December 31, 2022, and other filings with the United States Securities and Exchange Commission. Most of these factors are beyond the Company’s ability to predict or control. The Company disclaims any obligation to update any forward-looking statement made in the press release, whether as a result of new information, future events, or otherwise. Readers are cautioned not to put undue reliance on forward-looking statements.
SIGNATURES
Pursuant to the requirements of the Securities Exchange Act of 1934, the registrant has duly caused this report to be signed on its behalf by the undersigned hereunto duly authorized.
| McEWEN MINING INC. | ||
| Date: September 13, 2023 | By: | /s/ Carmen Diges |
| Carmen Diges, General Counsel | ||
Exhibit 99.1

Gold & Silver Turnaround Story Plus: Large Exposure to Copper McEwen Mining Corporate Presentation September 2023 Cautionary Statement This presentation and the information included herein do not constitute an offer to buy or the solicitation of an offer to subscribe for or to buy any of the securities described herein, nor shall there be any sale of these securities in any jurisdiction in which such offer, solicitation or sale would be unlawful prior to registration or qualification under the securities laws of any such jurisdiction . This presentation contains certain forward - looking statements and information, including "forward - looking statements" within the meaning of the Private Securities Litigation Reform Act of 1995 ("Forward - looking Statements") . The Forward - looking Statements are intended to be subject to the safe harbor provided by Section 27 a of the Securities Act of 1933 , Section 21 e of the Securities Exchange Act of 1934 and Private Securities Litigation Reform Act of 1995 . The Forward - looking Statements express, as at the date of this presentation, McEwen Mining Inc . (the "Company") estimates, forecasts, projections, expectations or beliefs as to future events and results . Forward - looking Statements are necessarily based upon a number of estimates and assumptions that, while considered reasonable by management, are inherently subject to significant business, economic and competitive uncertainties, risks and contingencies . There can be no assurance that such statements and information will prove to be accurate . Therefore, actual results and future events could differ materially from those anticipated in such statements and information . Risks and uncertainties that could cause results or future events to differ materially from current expectations expressed or implied by the Forward - looking Statements include, but are not limited to, factors associated with fluctuations in the market price of precious metals, mining industry risks, political, economic, social and security risks associated with foreign operations, the ability of the corporation to receive or receive in a timely manner permits or other approvals required in connection with operations, risks associated with the construction of mining operations and commencement of production and the projected costs thereof, risks related to litigation, the state of the capital markets, environmental risks and hazards, uncertainty as to calculation of mineral resources and reserves, risk of delisting from a public exchange, and other risks . Readers should not place undue reliance on Forward - looking Statements, which speak only as of the date hereof . The Company undertakes no obligation to reissue or update Forward - looking Statements as a result of new information or events after the date hereof, except as required by law . See McEwen Mining's Annual Report on Form 10 - K/A for the fiscal year ended December 31 , 2022 , the Quarterly Report on Form 10 - Q for the quarter ended March 31 , 2023 , June 30 , 2023 and other filings with the Securities and Exchange Commission (the “SEC”), under the caption "Risk Factors", for additional information on risks, uncertainties and other factors relating to the Forward - looking Statements . All Forward - looking Statements made in this presentation are qualified by this cautionary statement . Unless otherwise stated, all currency information quoted in this presentation is in U . S . dollars . The technical contents of this presentation, including reserves, have been reviewed and approved by William Shaver, COO ; the exploration technical contents of this presentation including resources content have been reviewed and approved by Luke Willis, P . Geo . , Director of Resource Modelling ; all are Qualified Persons as defined by Canadian Securities Administrators National Instrument 43 - 101 "Standards of Disclosure for Mineral Projects" . Securities and Exchange Commission (“SEC”) . We are subject to the reporting requirements of the Securities and Exchange Act of 1934 , as amended (the “Exchange Act”) and applicable Canadian securities laws, and as a result, we have reported our mineral reserves and mineral resources according to two different standards . U . S . reporting requirements are governed by Item 1300 of Regulation S - K (“S - K 1300 ”), as issued by the U . S . Securities and Exchange Commission (“SEC”) . Canadian reporting requirements for disclosure of mineral properties are governed by National Instrument 43 - 101 Standards of Disclosure for Mineral Projects (“NI 43 - 101 ”), as adopted from the definitions provided by the Canadian Institute of Mining, Metallurgy and Petroleum . Both sets of reporting standards have similar goals in terms of conveying an appropriate level of confidence in the disclosures being reported, but the standards embody slightly different approaches and definitions . All disclosure of mineral resources and mineral reserves in this report are reported in accordance with S - K 1300 . Investors should be aware that the estimation of measured resources and indicated resources involve greater uncertainty as to their existence and economic feasibility than the estimation of proven and probable reserves, and therefore investors are cautioned not to assume that all or any part of measured or indicated resources will ever be converted into S - K 1300 - compliant reserves . The estimation of inferred resources involves far greater uncertainty as to their existence and economic viability than the estimation of other categories of resources . It is assumed that the majority of Inferred resources will be later upgraded to the Indicated or Measured categories . Investors are cautioned not to assume that all or any part of inferred resources exist, or that they can be mined legally or economically .
NON - GAAP Measures In this presentation, we have provided information prepared or calculated according to U . S . GAAP, as well as provided some non - U . S . GAAP ("non - GAAP") performance measures . Because the non - GAAP performance measures do not have any standardized meaning prescribed by U . S . GAAP, they may not be comparable to similar measures presented by other companies . Total Cash Costs per GEO, and All - in Sustaining Costs (“AISC”) per GEO . Total cash costs consist of mining, processing, on - site general and administrative costs, community and permitting costs related to current explorations, royalty costs, refining and treatment charges (for both doré and concentrate products), sales costs, export taxes and operational stripping costs . All - in sustaining cash costs consist of total cash costs (as described above), plus environmental rehabilitation costs, amortization of the asset retirement costs related to operating sites, sustaining exploration and development costs, and sustaining capital expenditures . In order to arrive at our consolidated all - in sustaining costs, we also include corporate general and administrative expenses . Depreciation is excluded from both total cash costs and all - in sustaining cash costs . For both total cash costs and all - in sustaining costs we include our attributable share of total cash costs from operations where we hold less than a 100 % economic share in the production, such as MSC, where we hold a 49 % interest . Total cash cost and all - in sustaining cash cost per GEO sold are calculated on a co - product basis by dividing the respective proportionate share of the total cash costs and all - in sustaining cash costs for the period attributable to each metal by the ounces of each respective metal sold . We use and report these measures to provide additional information regarding operational efficiencies both on a consolidated and an individual mine basis, and believe that these measures provide investors and analysts with useful information about our underlying costs of operations . A reconciliation to the nearest U . S . GAAP measure is provided in McEwen Mining's Annual Report on Form 10 - K/A for the year ended December 31 , 2022 . Earnings from Mining Operations The term Earnings from Mining Operations used in this presentation is a non - GAAP financial measure . We use and report this measure because we believe it provides investors and analysts with a useful measure of the underlying earnings from our mining operations . We define Earnings from Mining Operations as Gold and Silver Revenues from our El Gallo Mine, Black Fox Mine, and our 49 % attributable share of the San José Mine's Net Sales, less their respective Production Costs Applicable to Sales . To the extent that Production Costs Applicable to Sales may include depreciation and amortization expense related to the fair value increments on historical business acquisitions (fair value paid in excess of the carrying value of the underlying assets and liabilities assumed on the date of acquisition), we deduct this expense in order to arrive at Production Costs Applicable to Sales that only include depreciation and amortization expense incurred at the mine - site level . The San José Mine Net Sales and Production Costs Applicable to Sales are presented, on a 100 % basis, in Note 5 of McEwen Mining's Annual Report on Form 10 - K/A for the year ended December 31 , 2022 . Cash, Investments and Precious Metals The term cash, investments and precious metals used in this presentation is a non - GAAP financial measure . We report this measure to better understand our liquidity in each reporting period . Cash, investments and precious metals is calculated as the sum of cash, investments and ounces of doré held in inventory, valued at the London P . M . Fix spot price at the corresponding period . A reconciliation to the most directly comparable U . S . GAAP measure, Sales of Gold and Silver, is provided in McEwen Mining's Annual Report on Form 10 - K/A for the year ended December 31 , 2022 .

MUX: Cautionary Note Regarding 3 Mines Fox Complex (100%) Gold Bar (100%) San José (49%) 1 Development Project El Gallo / Fenix (100%) Los Azules Argentina Fox Complex Timmins, Canada (100%) Gold Bar Nevada (100%) Fenix Project Mexico (100%) San José Argentina ( 49 %) Elder Creek Nevada Au + Ag (Ownership) Cu McEwen Copper (52%) Elder Creek Los Azules 2023 Production Guidance 150,000 - 170,000 GEOs 1. US $82 Million @ $10/shr 2. ARS $30 Billion + US $30 Million @ ~$19/shr Financings 'Gold Equivalent Ounces’ – GEOs, are calculated based on 85:1 gold to silver price ratio. 1 - Aug 2022.

2 - Feb - Mar 2023 MUX 2 Parts to the Story Asset Rich: Offers exposure to Gold, Silver and Copper + CEO’s Large Financial Commitment $ 220 M 17 % $1/ Y r Investment 1 Ownership Salary Rob McEwen 17% Institutional 21% Retail 62% 1 - Rob McEwen’s investments: $1 40 million in McEwen Mining shares and $ 40 million (Aug 13, 2018 & Apr 5, 2022 press releases) , plus $40 million in McEwen Copper shares 2 - Average Daily Trading Volume over 3 months. Source: Bloomberg, as of September 6, 2023. Rob McEwen 8.2 M Van Eck Associates 2.0 M Mirae Asset Global 1.0 M DF Dent and Co 0.6 M Vanguard 0.6 M BlackRock 0.6 M Millennium 0.5 M Jane Street 0.5 M ETF Managers 0.5 M Two Sigma 0.5 M MUX Shares Top 10 Holders Ownership Distribution Outstanding : 47.4 M Fully Diluted : 50.9 M ADTV 2 : 396,000 Price : US$7.14 Market Cap : US$338 M Alignment with Shareholders -100 -50 0 50 100 150 200 250 2009 2011 2013 2015 2017 2019 2021 2023 MUX Gold GDX GDXJ MUX vs Gold, GDX & GDXJ Reflects 10 for 1 Share Consolidation July 2022 Source: Bloomberg.

As of Sept 6, 2023. GDXJ inception date Nov 11, 2009. % Gold +72% MUX - 74% GDX - 43% GDXJ - 66% $0 $50 $100 2005 2008 2011 2014 2017 2020 2023 MUX Share Price Aug 2005 - Sep 6, 2023 Nov 11, 2009 – Sep 6, 2023 Our Gold & Silver Mines • In prolific gold regions • Higher cost • Shorter mine lives But That’s Changing: • In the midst of a turnaround • Exploration is extending mine lives • Production is increasing & cost / oz decreasing Are Currently:


More Less Equity Higher Increasing Cash Debt Financings Cash Gross Profit Production Increasing working capital Strengthening balance sheet No MUX share issuance in 2023 Targeting cost efficiencies Operational improvements Q2 2023 Q2 2023 However H1 2023 H1 2023 H1 2023 $92.0 M $40.0 M McEwen Copper $30 M USD + $30 B ARS $16.2 M 66.1 K GEOs Q2 2022 Q2 2022 2022 H1 2022 H1 2022 $44.0 M $65.0 M $15.1 M flow - through MUX + $42.0 M McEwen Copper $5.4 M 61.4 K GEOs MUX Improving Picture ARS = Argentine Pesos. M = Millions. GEOs = gold equivalent.

2023 Production & Cost Guidance GEO – gold equivalent ounces. 2023 production guidance – December 21, 2022 press release. Q1 2023 production – August 10, 2023 press release. Numbers may not add due to rounding. G old:silver ratios: 84:1 for Q1 2023, 83:1 for Q2 2023. Ounces Q1 2023 Q2 2023 H1 2023 2023 Guidance Range Fox Complex, Canada GEO 12,700 10,400 23,100 42,000 - 48,000 Gold Bar Mine, Nevada GEO 6,500 7,900 14,400 42,000 - 48,000 San José Mine, Argentina (49%) Gold 6,700 10,500 17,200 39,000 - 43,000 Silver 381,200 570,000 951,000 2,300,000 - 2,600,000 GEO 11,200 17,400 28,600 66,000 - 74,000 Total Production Gold 25,900 28,700 54,600 123,000 - 139,000 Silver 381,200 571,000 954,000 2,300,000 - 2,600,000 GEO 30,400 35,700 66,100 150,000 - 170,000 Cash Costs / oz AISC / oz $/ GEO Sold H1 2023 2023 Guidance H1 2023 2023 Guidance Fox Complex, Canada $1,153 $1,000 $1,337 $1,320 Gold Bar Mine, Nevada $1,842 $1,400 $2,190 $1,680 San José Mine, Argentina (49%) $1,537 $1,250 $1,980 $1,550 -50 0 50 100 150 200 250 9/1/22 12/1/22 3/1/23 6/1/23 9/1/23 MUX GDX GDXJ Gold Copper Nasdaq Dow MUX Outperforming Gold, Silver, Copper, DJIA & NASDAQ Sep 1, 2022 – Sep 6, 2023 GDXJ +22% % MUX +140% GDX +23% Gold +13% Copper +10% Source: Bloomberg.

As of Sep 6, 2023 Nasdaq +18% Dow +9% Stellantis ARS $30 B Nuton - Rio Tinto $30 M Investments in McEwen Copper Los Azules 2023 PEA Published McEwen Copper Completes $81.85 M Financing Incl.

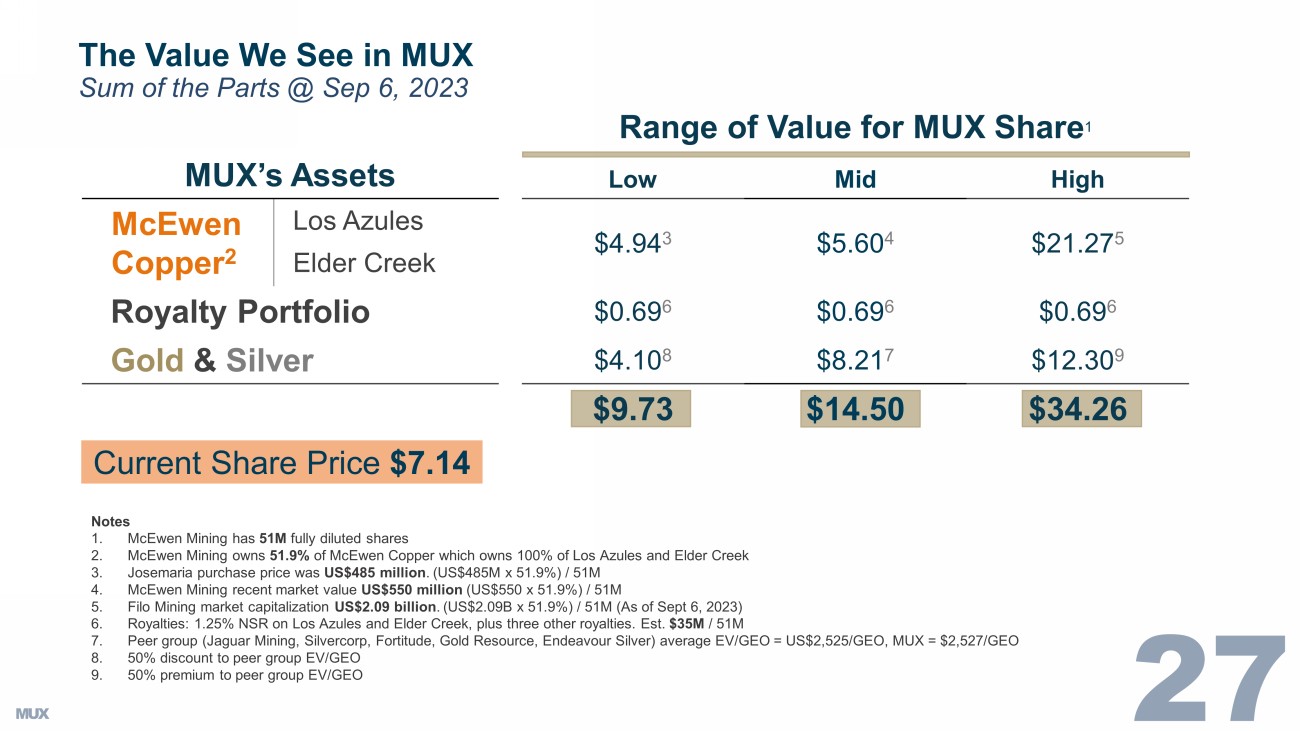
$25 M from Nuton - Rio Tinto MUX’s Assets Low Mid High McEwen Copper 2 Los Azules $4.94 3 $5.60 4 $21.27 5 Elder Creek Royalty Portfolio $0.69 6 $0.69 6 $0.69 6 Gold & Silver $4.10 8 $8.21 7 $12.30 9 $9.73 $14.50 $34.26 The Value We See in MUX Sum of the Parts @ Sep 6, 2023 Notes 1. McEwen Mining has 51M fully diluted shares 2. McEwen Mining owns 51.9% of McEwen Copper which owns 100% of Los Azules and Elder Creek 3. Josemaria purchase price was US$485 million . (US$485M x 51.9%) / 51M 4. McEwen Mining recent market value US$550 million (US$550 x 51.9%) / 51M 5. Filo Mining market capitalization US$2.09 billion . (US$2.09B x 51.9%) / 51M ( As of Sept 6 , 2023) 6. Royalties: 1.25% NSR on Los Azules and Elder Creek, plus three other royalties. Est. $35M / 51M 7. Peer group (Jaguar Mining, Silvercorp , Fortitude, Gold Resource, Endeavour Silver) average EV /GEO = US$2,525/GEO, MUX = $2,527/GEO 8. 50% discount to peer group EV/GEO 9.
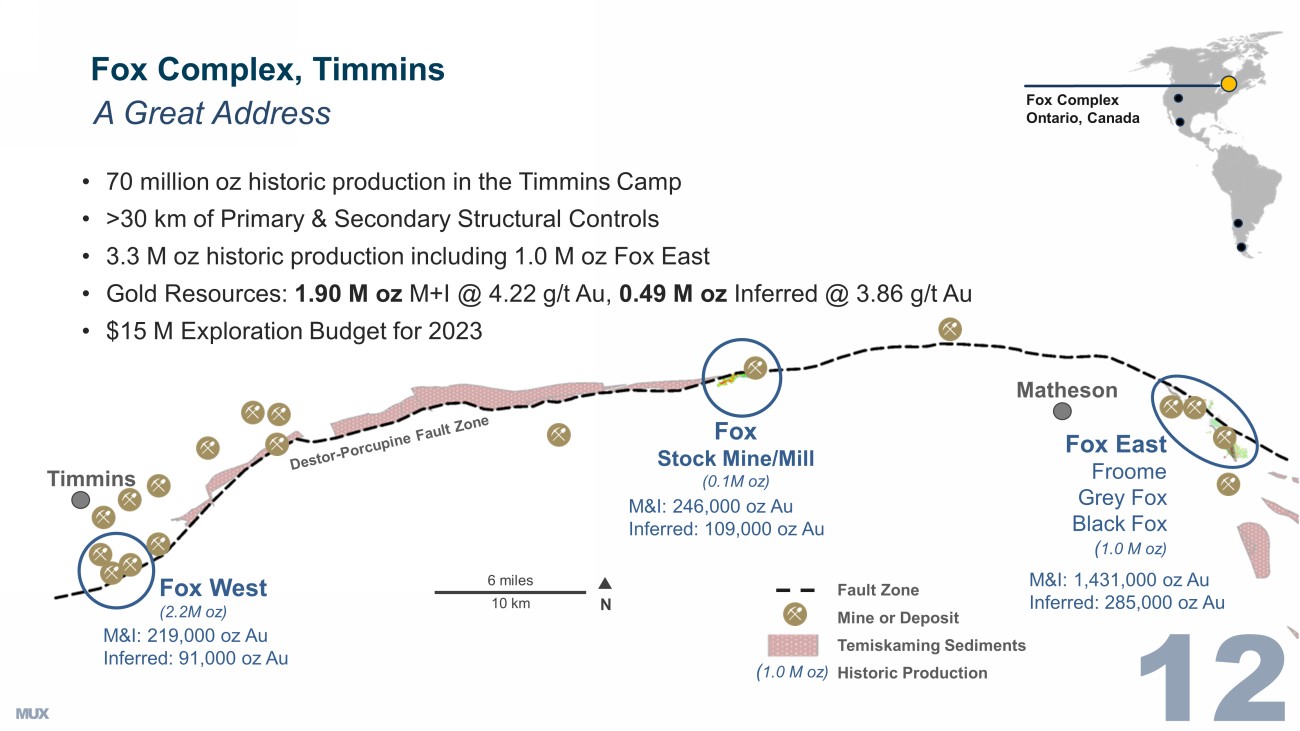
50% premium to peer group EV/GEO Range of Value for MUX Share 1 Current Share Price $7.14 Fox Stock Mine/Mill (0.1M oz) 6 miles 10 km N Fox West (2.2M oz) Fault Zone Mine or Deposit Temiskaming Sediments Historic Production Fox Complex Ontario, Canada Fox East Froome Grey Fox Black Fox ( 1.0 M oz) Timmins A Great Address • 70 million oz historic production in the Timmins Camp • >30 km of Primary & Secondary Structural Controls • 3.3 M oz historic production including 1.0 M oz Fox East • Gold Resources: 1.90 M oz M+I @ 4.22 g/t Au, 0.49 M oz Inferred @ 3.86 g/t Au • $15 M Exploration Budget for 2023 Matheson ( 1.0 M oz) M&I: 246,000 oz Au Inferred: 109,000 oz Au M&I: 1,431,000 oz Au Inferred: 285,000 oz Au M&I: 219,000 oz Au Inferred: 91,000 oz Au Fox Complex, Timmins Premier Address 1 . Includes past production and current resources Gold Bar Nevada, USA On Trend, in the Shadow of Major Gold Deposits MUX Property NGM Property Faults Mine or Deposit Legend 20 k m 12 miles N Cortez Nevada Gold Mines Cortez 50 M oz Au cluster 1 Four M ile Discovery Goldrush Gold Bar Tonkin Atlas Indicated Resource 1.45M oz Au @ 1.41 g/t Indicated Resource 452,000 oz Au @ 0.91 g/t Historic & Recent Production 575,000 oz Au Gold Bar


San José Mine N Newmont Cerro Negro Mine Production: 5 2022 278,000 oz Au 2023E 330,000 oz Au 2024E 350,000 oz Au 20 k m 12 miles San José Argentina ▪ Narrow Vein Underground Silver / Gold Mine ▪ Large Property Package ▪ Good Grade Mine Reserve Grade 1 341 g/t Silver 6.4 g/t Gold Mine Life 2 6 Years (est.) 2022 Production 3,4 2.6 M oz Silver & 39 K oz Gold 2023E Production 3,4 2.3 - 2.6 M oz Silver & 39 - 43 K oz Gold Property outline 49% MUX Ownership / Non - operator 1., 2. Hochschild “Annual Report and Accounts 2022”. 3. Based on 49% MUX ownership basis. 4. MUX March 14, 2023 press release. 5.
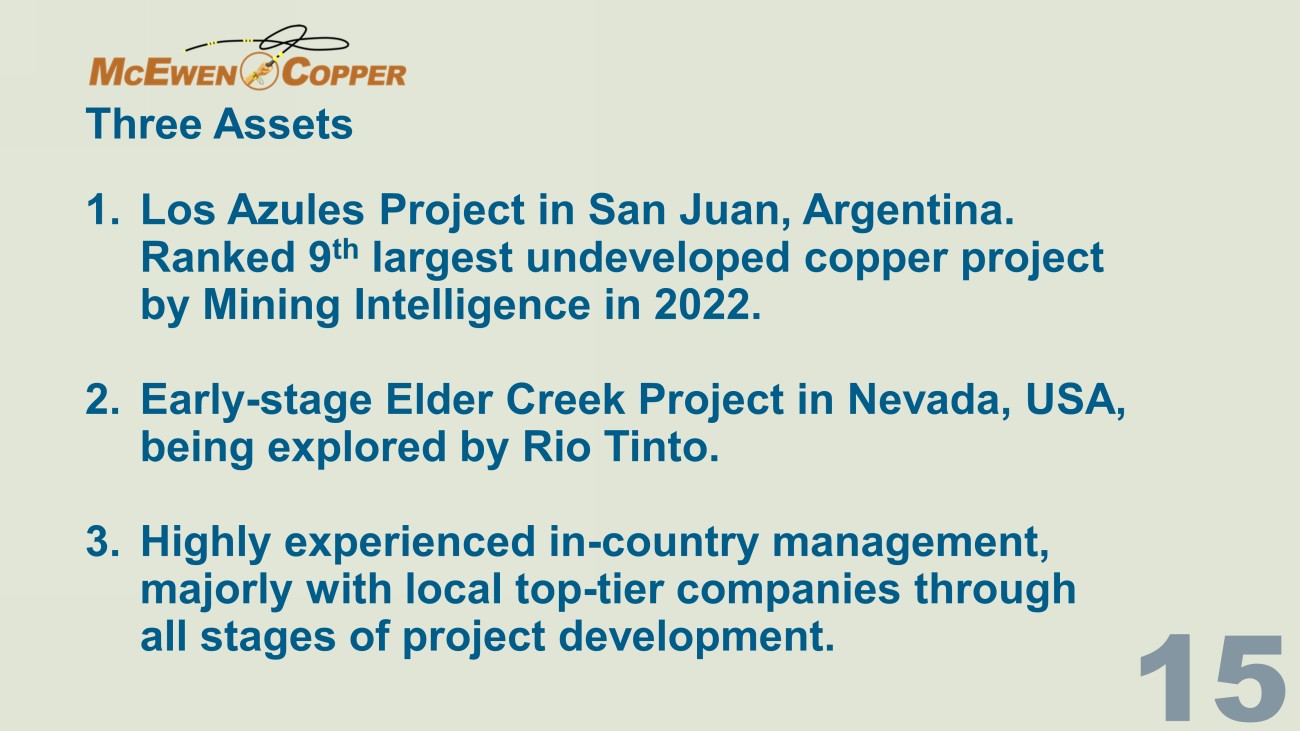
Newmont 2022 10 - K and Q1 2023 10 - Q San Jos é Mine Surrounding Newmont’s Cerro Negro 1. Los Azules Project in San Juan, Argentina. Ranked 9 th largest undeveloped copper project by Mining Intelligence in 2022. 2. Early - stage Elder Creek Project in Nevada, USA, being explored by Rio Tinto. 3. Highly experienced in - country management, majorly with local top - tier companies through all stages of project development.

Three Assets MUX 51.9 % Stellantis 14.2% Nuton / Rio Tinto Venture 14.2% Rob McEwen 13.8% Victor Smorgon Group (Australia) 3.5% Others 2.4% MUX Stellantis • Total Shares Outstanding 28.9 M • Owns 100% of Los Azules and Elder Creek copper projects • Elder Creek was optioned by Kennecott Exploration Co, a subsidiary of Rio Tinto McEwen Copper Advancing Los Azules to Increase MUX Value Chile & Peru Produce 40% of World’s Annual Copper Production *Rank based on 2021 top 20 largest copper mines in the world by production capacity.


https://elements.visualcapitalist.com/th e - l argest - copper - mines - in - the - world - by - capacity/ CHILE ARGENTINA Los Pelambres Antofagasta Andina Codelco Los Bronces Anglo American Antamina Teck Las Bambas MMG Antapaccay Glencore Cerro Verde Freeport - McMoRan PERU Taca Taca First Quantum Escondida BHP/Rio Tinto Lindero Fortuna Silver MARA Yamana Glencore & Newmont Josemaria Lundin Mining Filo del Sol Filo Mining (BHP) Pascua Lama Barrick Veladero Barrick/Shandong Los Azules McEwen Copper (MUX, Rio Tinto, Stellantis) Altar Aldebaran Resources (S32) El Pachón Glencore San Juan Rank * 6 8 5 1 11 11 MINE DEVELOPMENT Legend Los Azules: It s Amongst the World s Largest Copper Deposits Project Country Majority Owner Development Status Geology 1 Pebble United States Northern Dynasty Minerals Preliminary Economic Assessment Porphyry, Supergene Copper 2 Resolution United States Rio Tinto Feasibility Porphyry 3 La Granja Peru Rio Tinto Advanced Exploration Porphyry 4 Kerr - Sulphurets - Mitchell (KSM) Canada Seabridge Gold Prefeasibility Porphyry , Skarn 5 Nueva Union Chile Teck Resource/Newmont Prefeasibility Porphyry 6 Tampakan Philippines Sagittarius Feasibility Porphyry 7 El Pachon Argentina Glencore Advanced Exploration Porphyry 8 Lessard Canada Landore Resources Advanced Exploration Volcanic Hosted Massive Sulfide 9 Los Azules Argentina McEwen Copper Preliminary Economic Assessment Porphyry, Supergene Copper 10 Twin Metals Minnesota United States Antofagasta Prefeasibility Magmatic Sulfide World’s 9 th Largest Undeveloped Copper Project (based on 2017 PEA resource estimate, expanded significantly since then) Los Azules It s BIG! Mining Intelligence 2022 2022 & 2023 Highlights Completed financing totaling $267 M , significant value accretion for McEwen Mining & McEwen Copper shareholders, well - financed through 2023 into 2024.

Executed two comprehensive drilling campaigns from 2022 to 2023 totaling 53,427 meters. Filed the Environmental Impact Assessment for Construction & Exploitation to the San Juan regulator in Apr 2023 with Knight Piesold. Mineral resource estimate increased total copper by 27.6%. PEA with strong economics, long life of mine and significant upside potential.

PEA Highlights Reviewed several opportunities with strategic analysis based on NPV, IRR & payback Base Case 175,000 tonnes LME Grade A Cu cathode production/ yr Demonstration of Scalability 125,000 tonnes LME Grade A Cu cathode production/ yr Project defined as a Heap Leach facility using commercially available bioleaching and SXEW technology to recover copper Mining using extensive electrification – trolley - assisted haulage, electric shovels Project Metric Base Case 175k tpa Cu Alt.

Case 125k tpa Cu Mine Life 27 yrs 32 yrs Strip Ratio 1.16 1.16 Copper Production – cathode 3,938 Ktonnes 3,938 Ktonnes Initial Capital Cost $2,462 Million $2,153 Million Sustaining Capital Cost $2,243 Million $2,351 Million C1 Costs (Life of Mine) $1.07 / lb Cu $1.11/ lb Cu All - in Sustaining Costs (AISC) $1.64 / lb Cu $1.67 / lb Cu Internal Rate of Return (IRR) 21.2 % 18.4 % Net Present Value (NPV) @ 8% $2,659 Million $1,929 Million Pay Back Period 3.2 yrs 3.4 yrs MM0 Backed by Key Strategic Partners Source: Company disclosure Partnerships with key industry players and strategic sponsors will de - risk Los Azules’ path forward x One of the world’s largest miners x 14.2% ownership in McEwen Copper through Nuton; US$55 M total investment x Extensive expertise throughout the mining value chain x Active in Argentina and recent project development experience at Rincon x Nuton’s copper leaching technology could be a game - changer from economic and ESG standpoints x Participated in McEwen Copper’s last two financing rounds, with 2 nd financing at 90% higher valuation x 14.2% ownership in McEwen Copper from US$155 M investment in Feb 2023 x 4 th largest automaker in the world x Extensive operations in Argentina and across South America x Focused on securing “green copper” offtake to be produced by Los Azules x Expects McEwen Copper to become a cornerstone asset towards meeting its carbon net zero target by 2038 x 13.8% direct ownership of McEwen Copper (22% total interest in Los Azules) x Seasoned mining professional with track - record of creating value for shareholders x Headlined McEwen Copper’s initial financing round with US$40M lead order x Founder of Goldcorp, where he took the company from a US$50M market capitalization to over US$8B Rob McEwen 2 Value Reference Points, US$485 M and $2.09 B McEwen Copper's implied market cap US$550 M, based on financing announced Feb 27, 2023 In Same San Juan Province, Argentina Comparison of Los Azules With Filo Mining's Filo del Sol & Lundin’s Josemaria Copper Resources & Grades 1 Distance From Power Grid, Roads Altitude ASL $ Cost Quartile * Development Stage M&I Inferred Josemaria 7.4 B lbs Cu 0.29% 2.9 B lbs Cu 0.13% Los Azules 10.9 B lbs Cu 0.40% 26.7 B lbs Cu 0.31% Filo del Sol* 3.1 B lbs Cu 0.33% 1.2 B lbs Cu 0.27% US$ Value 4 1.

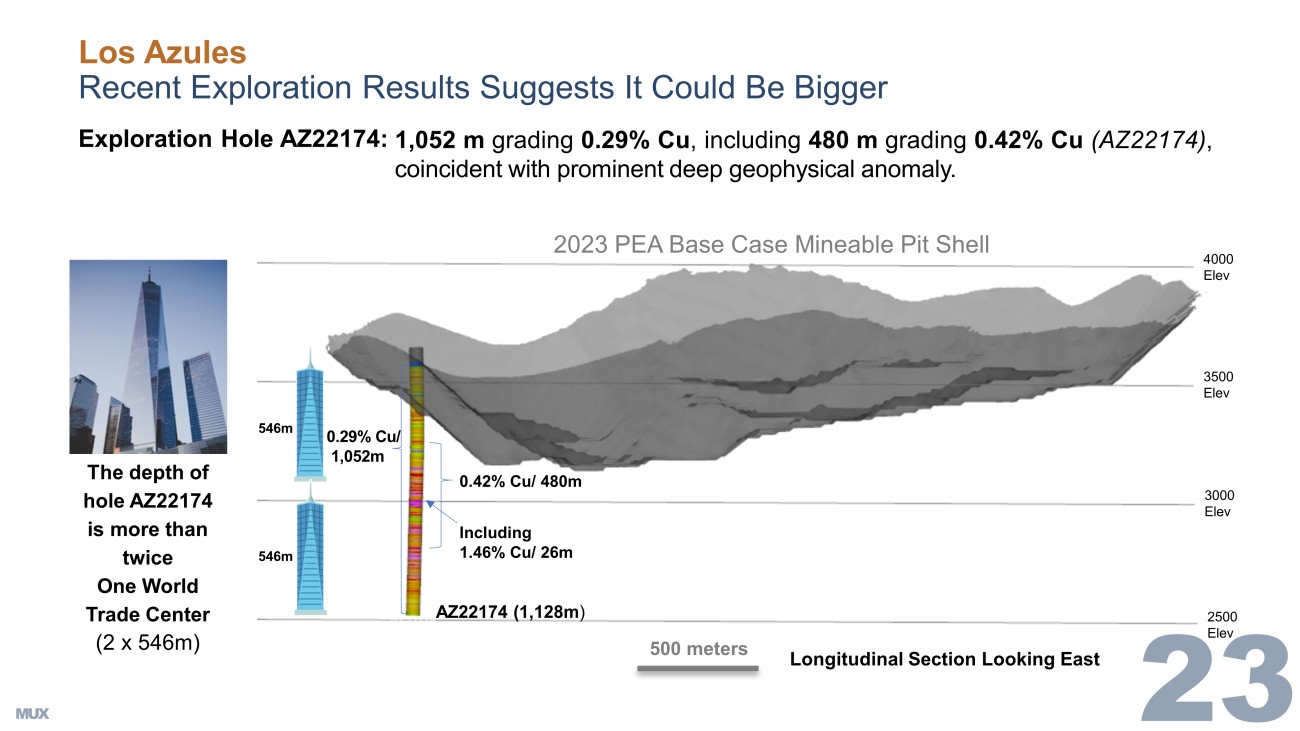
Source: company website. Los Azules cut - off grade variable NSR 0.20% Cu. Filo del Sol cut - off grade 0.15% CuEq. Josemaria cut - off grade 0.1% CuEq. 2. Source: Filo del Sol PFS 2023 . 3. Source: Josemaria FS Technical Report Nov 2020 4. Market cap as of September 6, 2023 . . $ Josemaria 4,000 - 4,900 m Los Azules 3,100 - 3,600 m Filo del Sol 4,900 - 5,400 m Josemaria - 244 km Los Azules - 70 km Filo del Sol - 77 km (Chile) Josemaria - FS Los Azules - PEA Filo del Sol - PFS Josemaria - Highest Los Azules - Lowest *Goldman Sachs Josemaria - $485 M Los Azules - $550 M Filo del Sol - $2.09 B Los Azules - It’s Valuable Los Azules Recent Exploration Results Suggests It Could Be Bigger Exploration H ole AZ22174: 3000 Elev 4000 Elev 500 meters The depth of hole AZ22174 is more than twice One World Trade Center (2 x 546m) Including 1.46% Cu/ 26m AZ22174 (1,128m ) 0.42% Cu/ 480m 0.29% Cu/ 1,052m 546m 2500 Elev 3500 Elev Longitudinal Section Looking East 2023 PEA Base Case Mineable Pit Shell 546m 1,052 m grading 0.29% Cu , including 480 m grading 0.42% Cu (AZ22174) , coincident with prominent deep geophysical anomaly.
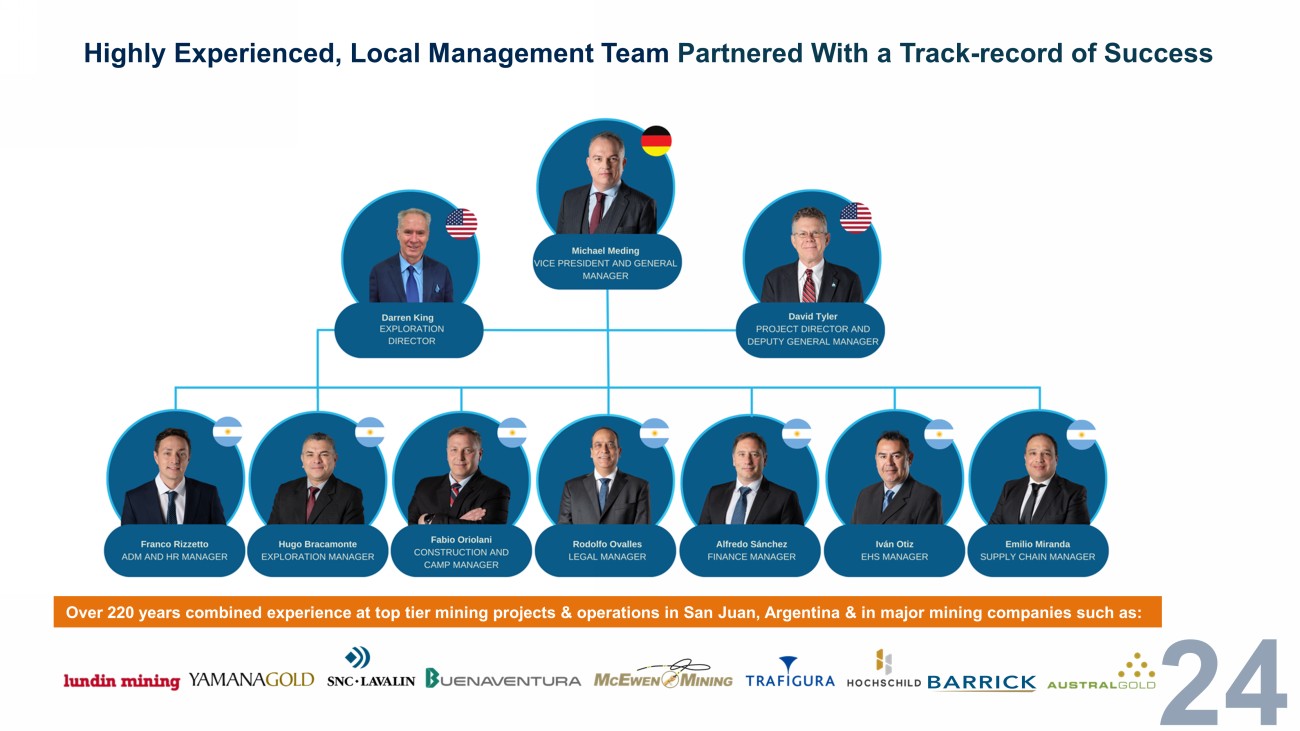
Highly Experienced, Local Management Team Partnered With a Track - record of Success Over 220 years combined experience at top tier mining projects & operations in San Juan, Argentina & in major mining companie s s uch as:

2023/2024 Program - Next Steps Advancing to Feasibility Study Drilling program slated at 45,000 meters in the 2023 - 2024 campaign 1 Upgrade Resource Model Complete infill drilling & incorporate drill results into new model, developing a significant measured mineral resource with focus on the initial 5 yrs of production ; continue to upgrade Inferred to Indicated . 2 Complete Metallurgical Testing Complete comprehensive metallurgical testing program, continue testing Nuton TM Technology for leaching of Primary copper mineralization. 3 Execute Geotechnical, Hydrogeological & Engineering Studies Complete these studies to a feasibility level of definition, including incorporation of sustainability elements to achieve net - zero by 2038 . 4 Complete Basic Engineering Design Update leach pad, processing plant & infrastructure designs to feasibility level development .

Positioning McEwen Copper as the New Vehicle for Copper Growth Backed by Key Strategic Partners 5 4 6 3 7 2 1 Mining for the Modern World Argentina is an Emerging Tier 1 Mining Jurisdiction Highly Experienced, Local Management Team World - Class Resource Not in the Hands of a Major Robust Economics Through the Cycle Significant Upside Potential Positioning McEwen Copper in the Current Market MUX’s Assets Low Mid High McEwen Copper 2 Los Azules $4.94 3 $5.60 4 $21.27 5 Elder Creek Royalty Portfolio $0.69 6 $0.69 6 $0.69 6 Gold & Silver $4.10 8 $8.21 7 $12.30 9 $9.73 $14.50 $34.26 The Value We See in MUX Sum of the Parts @ Sep 6, 2023 Notes 1.
McEwen Mining has 51M fully diluted shares 2. McEwen Mining owns 51.9% of McEwen Copper which owns 100% of Los Azules and Elder Creek 3. Josemaria purchase price was US$485 million . (US$485M x 51.9%) / 51M 4. McEwen Mining recent market value US$550 million (US$550 x 51.9%) / 51M 5. Filo Mining market capitalization US$2.09 billion . (US$2.09B x 51.9%) / 51M ( As of Sept 6 , 2023) 6. Royalties: 1.25% NSR on Los Azules and Elder Creek, plus three other royalties. Est. $35M / 51M 7. Peer group (Jaguar Mining, Silvercorp, Fortitude, Gold Resource, Endeavour Silver) average EV /GEO = US$2,525/GEO, MUX = $2,527/GEO 8. 50% discount to peer group EV/GEO 9. 50% premium to peer group EV/GEO Range of Value for MUX Share 1 Current Share Price $7.14 Thank you! NYSE & TSX Stefan Spears Vice President Corporate Development McEwen Mining Direct: (647) 408 - 1849 Email: stefan@mcewenmining.com Michael Meding Vice President and General Manager McEwen Copper Direct: (775) 375 - 7125 Email: mmeding@mcewenmining.com


Appendix

Initial financing with lead order by Rob McEwen for $ 40 M and Rio Tinto with $ 25 M closed oversubscribed at $ 82 M in Sep 2022 . Elder Creek 60 % optioned to Rio Tinto for investing $ 18 M over 7 yrs . Second financing round added Stellantis investing 30 Billion Argentine pesos ( $ 155 M at official FX), 1 st automotive company, 4 th biggest worldwide, investing in a Cu developer . Rio Tinto increased investment by $ 30 M at 90 % higher price . Los Azules’ 1 st financing implied valuation at $257 M, 2 nd financing increased implied valuation to $550 M. Attributable value to MUX increased from $175 to $285 M. Highlights of 2022 and 2023 YTD Financing Mineral Resource Improvements Improvements vs 2017 PEA – Since the 2017 PEA, additional 51 holes for 21,777 m of drilling were added to the database for the updated resource estimate.

C oupled with an increase in the copper price used for the resource (from $2.75 to $4.00/ lb) this resulted in an improved resource model with increased tonnage: +28% in Indicated and +69% in Inferred categories. Since the Dec 2022 database cut off, additional 110 holes for 30,023 m are available to be included in the next resource model update. This includes all drilling to the end of the June 2023 season. The updated resource increases the contained copper: 7.3% in the Indicated & 38.3% in the Inferred categories * Gold and silver grades and contained metals are only reported in the primary mineralization.

7.7 4.1 9.7 3.9 3.8 1.9 1.8 1.3 29.9 24.0 17.1 23.4 17.8 13.1 6.8 3.6 4.6 2.6 1.0 37.6 28.1 26.8 23.4 17.8 13.1 10.7 7.4 6.5 4.4 2.3 0 5 10 15 20 25 30 35 40 45 McEwen - Base Case Los Solaris Western Arizona Marimaca 153 146 132 88 74 36 28 0.36% 0.46% 0.39% 0.37% 0.17% 0.47% 0.36% -3.00% -2.50% -2.00% -1.50% -1.00% -0.50% 0.00% 0.50% 0 50 100 150 200 Los McEwen - Base Case SolGold Hot Western Marimaca Arizona 90 71 71 60 59 46 46 46 46 40 40 Arizona McEwen Aldebaran Western Filo NGEx Los Hot Marimaca SolGold Solaris Benchmarking McEwen Copper to Relevant Copper Developers Located in an Emerging Mining Jurisdiction Resources to Support Long - life Production Significant Production Scale Low - Cost Base to Drive High Margins LOM Average Annual Production (kt Cu) & Head Grade (% Cu) LOM Average Co - Product C1 Cash Cost (US$/lb Cu) Jurisdiction PPI (#, Fraser Institute) Total Resource vs.

Resource in Mine Plan (B lbs Cu) (1) Source: Company disclosure and technical studies (1) Calculated based on planned mill feed tonnage outlined in latest technical report (not available for resource - stage assets) Los Azules is a large - scale, low - cost copper project in a top mining jurisdiction… 21% of total resource mined per 2023 PEA base case $1.07 $1.22 $1.33 $1.46 $1.55 $1.72 $1.96 0 1 1 2 2 3 3 100% 100% 88% 47% 100% 59% 85% Copper % Total Revenue Average of Chile & San Juan PPI $244 $381 $614 $625 $665 $743 $968 $1,155 0 200 400 600 800 1000 1200 1400 Arizona McEwen - Nuton Los McEwen - Base Case Marimaca Hot SolGold Western 39 27 27 26 26 18 16 12 0 5 10 15 20 25 30 35 40 45 McEwen - Nuton McEwen - Base Case Western SolGold Los Arizona Hot Marimaca Benchmarking McEwen Copper to Relevant Copper Developers (Cont’d) Peer Leading Mine Life Low Capital Intensity Relative to Peers Mine Life ( years ) Initial Capital per Total Mine Plan Production (US$/t Cu) Source: Company disclosure and technical studies Nuton PEA case based on Rio Tinto’s Nuton copper heap leaching technology, providing opportunity to leach both primary and se con dary copper sulphides Base Case Nuton (1) …with peer - leading economics and significant value upside potential Base Case Nuton (1) +44% - 39% Robust Economics & High Returns Los Azules – … Cascabel Vizcachitas Los Azules - Base … Casino Costa Fuego $- $500 $1,000 $1,500 $2,000 $2,500 $3,000 $3,500 $4,000 $4,500 16% 18% 20% 22% 24% 26% 28% After - Tax NPV 8% (US$M) After - Tax IRR (%) Smaller - scale projects with significantly lower production profiles Bubble size represents Initial Capex (US$M) Legend NPV 8% (US$M, at US$3.75/ lb LT copper price), IRR (%) and Initial Capex (US$M) IRR - 41% IRR - 43% Benchmarking McEwen Copper to Key Comparables Filo del Sol Marimaca Vizcachitas Josemaria (Acquired) (1) Los Azules Project Metrics Base Case | Nuton Case (2) Ownership 100% 100% 100% 100% 100% Commodities Cu / Au / Ag Cu / Mo / Ag Cu / Mo / Ag Cu / Au / Ag Cu / Au / Ag Mine Type OP OP OP OP OP Stage PFS (Outdated) PEA PFS FS PEA Location Argentina & Chile Chile Chile Argentina Argentina Permitting None None None Permitted EIA Submitted Infrastructure Requirements 4 1 2 4 2 Elevation (masl) 4,900 – 5,400 n/a 2,000 4,000 – 4,900 3,100 – 3,600 Mine Life (years) n/a 12 26 19 27 | 39 Mill Feed (Mt) n/a 131 1,220 1,012 1,182 | 1,737 % Resource n/a 55% 36% 53% 21% | 30% Strip Ratio ( w:t ) n/a 0.84 2.33 0.98 1.16 | 1.43 Head Grade (% Cu) n/a 0.47% 0.36% 0.30% 0.46% | 0.41% Avg.

Annual Production (ktpa Cu) n/a 36 153 131 146 C1 Cash Cost (co - product, US$/ lb Cu) n/a $1.22 $1.33 $1.55 $1.07 | $1.04 Initial Capex (US$M) n/a $285 $2,441 $3,091 $2,462 | $2,444 Sustaining Capex (US$M) n/a $66 $1,494 $940 $2,243 | $2,793 Study Price (US$/ lb Cu) n/a $3.15 $3.68 $3.00 $3.75 Post - Tax NPV 8% (U$M, at study price) n/a $524 $2,776 $1,528 $2,659 | $2,793 Post - Tax IRR (%, at study price) n/a 34% 24% 15% 21% | 24% Market Metrics Market Cap (US$M) $2,433 $292 $360 $485 n/a EV (US$M) $2,390 $280 $362 $474 n/a P / NAV (Consensus, x) 0.69x 0.51x 0.37x 0.66x n/a EV / Resource (US $ / lb Cu) $0.54 $0.12 $0.01 $0.03 n/a Los Azules compares favorably against selected relevant peers (1) Josemaria acquisition metrics shown in lieu of market metrics (2) Nuton PEA case based on Rio Tinto’s Nuton copper heap leaching technology, providing opportunity to leach both primary and se con dary copper sulphides Source: Company disclosure, S&P Capital IQ as of July 26, 2023 Existing technical study outdated in light of recent drilling success & market expectations Argentina is an Emerging, Tier 1 Mining Jurisdiction Source: Company Disclosure, Fraser Institute and S&P Capital IQ Argentina is expected to play a significant role in the energy transition underpinned by copper and lithium - rich mining district s Multiple Key Industry Players In - Country Amongst Top Ranked Mining Jurisdictions Policy Perception Index Rank Jurisdiction …17 Ontario 26 San Juan (PPI = 71) 27 Northern Territory 28 British Columbia …38 Chile …69 Peru South America & Argentina in Focus Jurisdiction by Policy Perception Index (2022) Argentina – 60+ – 40+ – 20+ Legend (PPI Score, #) The Lithium Triangle 65% of the world’s lithium resources San Juan Los Azules Lundin Glencore Filo Aldebaran Shandong Barrick First Quantum Fortuna Silver Pan American Pan American AngloGold Ashanti Livent / Posco Allkem Hochschild Newmont Lithium Americas

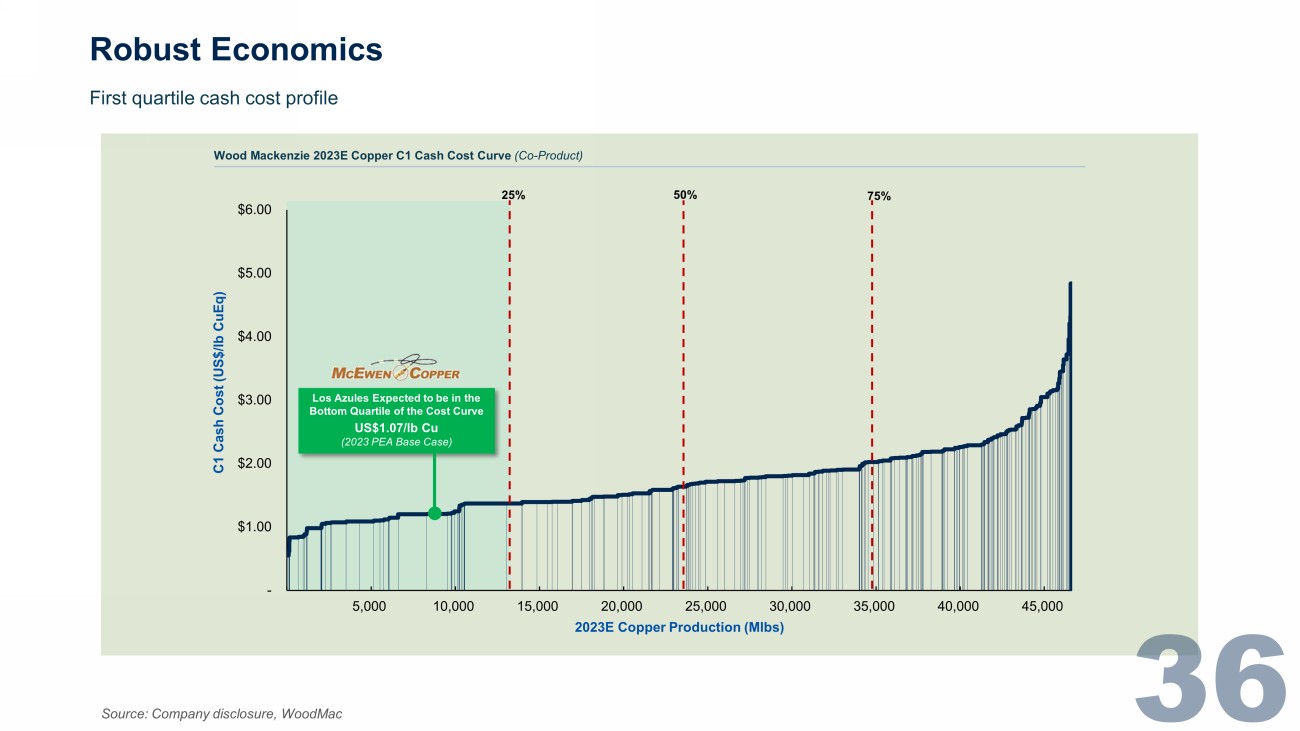
Robust Economics - $1.00 $2.00 $3.00 $4.00 $5.00 $6.00 5,000 10,000 15,000 20,000 25,000 30,000 35,000 40,000 45,000 C1 Cash Cost (US$/lb CuEq) 2023E Copper Production (Mlbs) Source: Company disclosure, WoodMac First quartile cash cost profile 25% 50% 75% Wood Mackenzie 2023E Copper C1 Cash Cost Curve (Co - Product) Los Azules Expected to be in the Bottom Quartile of the Cost Curve US$1.07/lb Cu (2023 PEA Base Case)
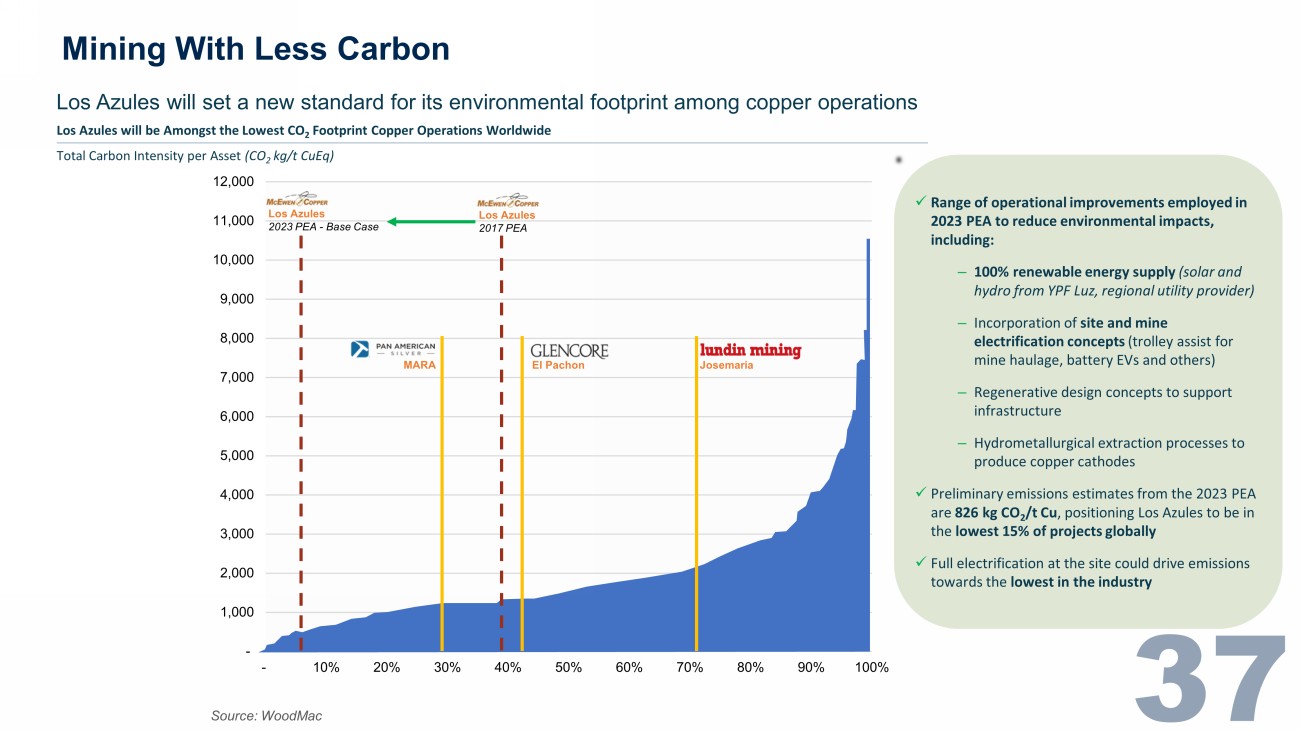
Mining With Less Carbon - 1,000 2,000 3,000 4,000 5,000 6,000 7,000 8,000 9,000 10,000 11,000 12,000 - 10% 20% 30% 40% 50% 60% 70% 80% 90% 100% Source: WoodMac Los Azules will set a new standard for its environmental footprint among copper operations Total Carbon Intensity per Asset (CO 2 kg/t CuEq) Los Azules will be Amongst the Lowest CO 2 Footprint Copper Operations Worldwide Los Azules 2017 PEA Los Azules 2023 PEA - Base Case El Pachon Josemaria MARA x Range of operational improvements employed in 2023 PEA to reduce environmental impacts, including: ‒ 100% renewable energy supply (solar and hydro from YPF Luz, regional utility provider) ‒ Incorporation of site and mine electrification concepts (trolley assist for mine haulage, battery EVs and others) ‒ Regenerative design concepts to support infrastructure ‒ Hydrometallurgical extraction processes to produce copper cathodes x Preliminary emissions estimates from the 2023 PEA are 826 kg CO 2 /t Cu , positioning Los Azules to be in the lowest 15% of projects globally x Full electrification at the site could drive emissions towards the lowest in the industry