UNITED STATES
SECURITIES AND EXCHANGE COMMISSION
Washington, D.C. 20549
FORM 8-K
CURRENT REPORT
Pursuant to Section 13 or 15(d) of the Securities Exchange Act of 1934
Date of Report (Date of earliest event reported): September 4, 2023
Tidewater Inc.
(Exact name of registrant as specified in its charter)
| Delaware | 1-6311 | 72-0487776 |
|
(State or other jurisdiction of incorporation) |
(Commission File Number) |
(IRS Employer Identification No.) |
|
842 West Sam Houston Parkway North, Suite 400 Houston, Texas |
77024 | |
| (Address of principal executive offices) | (Zip Code) |
Registrant’s telephone number, including area code: (713) 470-5300
Not Applicable
(Former Name or Former Address, If Changed Since Last Report)
Check the appropriate box below if the Form 8-K filing is intended to simultaneously satisfy the filing obligation of the registrant under any of the following provisions (see General Instruction A.2. below):
| ¨ | Written communications pursuant to Rule 425 under the Securities Act (17 CFR 230.425) |
| ¨ | Soliciting material pursuant to Rule 14a-12 under the Exchange Act (17 CFR 240.14a-12) |
| ¨ | Pre-commencement communications pursuant to Rule 14d-2(b) under the Exchange Act (17 CFR 240.14d-2(b)) |
| ¨ | Pre-commencement communications pursuant to Rule 13e-4(c) under the Exchange Act (17 CFR 240.13e-4(c)) |
Securities registered pursuant to Section 12(b) of the Act:
| Title of each class |
Trading Symbol(s) |
Name of each exchange on which registered |
||
| Common stock, $0.001 par value per share | TDW | New York Stock Exchange | ||
| Warrants to purchase shares of common stock | TDW.WS | NYSE American |
Indicate by check mark whether the registrant is an emerging growth company as defined in Rule 405 of the Securities Act of 1933 (§ 230.405) or Rule 12b-2 of the Securities Exchange Act of 1934 (§ 240.12b-2).
Emerging Growth Company ¨
If an emerging growth company, indicate by check mark if the registrant has elected not to use the extended transition period for complying with any new or revised financial accounting standards provided pursuant to Section 13(a) of the Exchange Act. ¨
Item 8.01. Other Events.
Quintin Kneen, President and CEO, of Tidewater Inc. (the “Company”) intends to take part in the Barclays CEO Energy-Power Conference taking place from September 5, 2023 to September 7, 2023. The materials to be used at the conference are furnished as Exhibit 99.1 to this Current Report and are incorporated herein by reference as if fully set forth under this item.
Forward-Looking Statements
In accordance with the safe harbor provisions of the Private Securities Litigation Reform Act of 1995, the Company notes that certain statements set forth in the presentation materials contain certain forward-looking statements. Forward-looking statements are all statements other than statements of historical fact, and are subject to risks and uncertainties, many of which are beyond the control of the Company. Except to the extent required by law, the Company expressly disclaims any obligations or undertaking to release publicly any updates or revisions to any forward-looking statements contained herein.
Item 9.01. Exhibits.
(d) Exhibits.
| Exhibit No. | Description | |
| 99.1 | Investor Presentation | |
| 104 | Cover Page Interactive Data File (embedded within the Inline XBRL document) |
SIGNATURES
Pursuant to the requirements of the Securities Exchange Act of 1934, the registrant has duly caused this report to be signed on its behalf by the undersigned hereunto duly authorized.
| TIDEWATER INC. | |||
| Date: | September 5, 2023 | By: | /s/ Daniel A. Hudson |
| Daniel A. Hudson | |||
| Executive Vice President, General Counsel and Corporate Secretary | |||
Exhibit 99.1
tdw.com Barclays CEO Energy - Power Conference September 2023

tdw.com tdw.com In accordance with the safe harbor provisions of the Private Securities Litigation Reform Act of 1995, Tidewater Inc. (the “C omp any”) notes that certain statements set forth in this presentation contain certain forward - looking statements which reflect our current view with respect to future events and future financial performance. Forward - looking statements are all statements other than statements of historical fact. All such forward - looking statements are subject to risks and uncertainties, many of which are beyond the control of the Company, and our futur e r esults of operations could differ materially from our historical results or current expectations reflected by such forward - looking statements. These risks and uncertainties include, without limitation: the risks related to fluctuations in worldwide energy demand and o il and natural gas prices, and continuing depressed levels of oil and natural gas prices without a clear indication of if, or when, prices will recover to a le vel to support renewed offshore exploration activities; fleet additions by competitors and industry overcapacity; our limited capital resources available to rep lenish our asset base as needed, including through acquisitions or vessel construction, and to fund our capital expenditure needs; uncertainty of global finan cia l market conditions and potential constraints in accessing capital or credit if and when needed with favorable terms, if at all; changes in decisions and capit al spending by customers in the energy industry and the industry expectations for offshore exploration, field development and production; consolidation of our custo mer base; loss of a major customer; changing customer demands for vessel specifications, which may make some of our older vessels technologically obsolete for ce rta in customer projects or in certain markets; rapid technological changes; delays and other problems associated with vessel maintenance; the continued ava ila bility of qualified personnel and our ability to attract and retain them; the operating risks normally incident to our lines of business, including the pot ent ial impact of liquidated counterparties; our ability to comply with covenants in our indentures and other debt instruments; acts of terrorism and piracy; the impact o f r egional or global public health crises or pandemics; the impact of potential information technology, cybersecurity or data security breaches; integration of acq uired businesses and entry into new lines of business; disagreements with our joint venture partners; natural disasters or significant weather conditions; un set tled political conditions, war, civil unrest and governmental actions, such as expropriation or enforcement of customs or other laws that are not well developed or co nsistently enforced; the risks associated with our international operations, including local content, local currency or similar requirements especially in h igh er political risk countries where we operate; interest rate and foreign currency fluctuations; labor changes proposed by international conventions; increased regu lat ory burdens and oversight; changes in laws governing the taxation of foreign source income; retention of skilled workers; enforcement of laws related to th e environment, labor and foreign corrupt practices; the potential liability for remedial actions or assessments under existing or future environmental regulat ion s or litigation; the effects of asserted and unasserted claims and the extent of available insurance coverage; and the resolution of pending legal proceedings. The fo rwa rd - looking statements should be considered in the context of the risk factors listed above and those discussed in the Annual Report on Form 10 - K for the year ended December 31, 2020, filed by the Company with the U.S. Securities and Exchange Commission (“SEC”) on March 4, 2021, as updated by subsequent filings wi th the SEC. Investors and prospective investors are cautioned not to rely unduly on such forward - looking statements, which speak only as of the date hereo f. Forward - looking Statements 2 tdw.com tdw.com 1.

Company overview 2. Market overview 3. Financials 4. Sustainability at Tidewater 5. Appendix Agenda tdw.com tdw.com 1.

Company Overview

tdw.com tdw.com Tidewater – The Premier Global OSV Fleet Global Footprint in All Major Offshore Regions Company Overview Today Company Highlights (1) ▪ The largest offshore support vessel operator in the world ▪ Strong international footprint with a presence in every major market ▪ Vessels provide support to offshore E&P and wind activities, including towing, anchor - handling and transportation of supplies and personnel, construction and seafloor evaluation ▪ Acquisition of 37 vessels from Solstad Offshore solidifies market leading position 5 Region #of OSVs >900m 2 700 - 900m 2 <700m 2 >16k 8 - 16k BHP 4 - 8k BHP Europe 51 39 7 3 2 0 0 W. Africa 49 9 16 3 4 11 6 Middle E. 42 1 8 12 1 5 15 Americas 37 12 14 5 2 2 2 A. Pac. 18 8 4 0 2 3 1 Total 197 69 49 23 11 21 24 Global OSV Fleet Summary (6) 223 Vessels; Largest OSV fleet in the world (2) 16 Hybrid vessels; Largest in the world (3) 65% High - specification OSVs (4) ~$283m Liquidity 11.6 Years average age ~$412m 2023E EBITDA (5) $3.2b Market Cap 1.2x Net Debt / 2023E EBITDA Tidewater (1) Pro forma for Tidewater’s acquisition of 37 PSVs from Solstad Offshore including the $325 million senior secured credit facility and $250 million unsecured bond issued in connection with financing the acquisition; Liquidity and leverage metrics as of Q2 2023 al so pro forma for the proceeds from 1.9 million warrant exercise in July 2023. Market data as of August 25, 2023. (2) Includes 26 vessels other than OSVs such as crew boats, maintenance vessels and tugboats. (3) Including 14 battery hybrid and 2 LNG power capable vessels. (4) High - spec defined at any PSV >700m 2 and any AHTS >16k BHP. (5) 2023E EBITDA contemplates guided vessel gross margin of ~$500 million less the $97 million of guided G&A, normalized for $6.2 million of transaction expenses and $2.4 million of bad debt. (6) Figures do not include 26 “other” vessels (crew boats, maintenance vessels and tug boats).

tdw.com tdw.com Operational and Financial Transformation In addition, TDW successfully tapped the equity market in the past 12 months, raising $183m of common equity to buyback the w arr ants issued to Swire 6 LTM June ‘21 LTM June ‘23 Nominal Change Percentage Change TDW Guidance for 2023E Operational Improvements Asset utilization 78% 79% +1% - Active vessels 118 181 +63 53% Financial Performance LTM revenue $352m $787m +435m 124% ~$1,030m LTM adjusted EBITDA $26m $234m +$208m 800% ~$412m LTM Net Income ($132) $49 +$181m 137% Market Improvements Market capitalization $509m (1) $3,241m (2) +2,732m 537% PSV day rate $11.5k $15.9k +$4.4k 38% AHTS day rate $7.9k $12.2k +$4.3k 54% Note: Historical figures above do not reflect the pro forma impact of the Solstad PSV acquisition but TDW Gudiane for 2023E does contemplate the Solstad acquisition. (1) As of June 30, 2021. (2) As of August 25, 2023, pro forma the exercise of 1.9 million warrants in July 2023.

tdw.com tdw.com Global Footprint in All Major Offshore Regions (1) 197 OSVs (2) Europe (51 OSVs) West Africa (49 OSVs) Middle East (42 OSVs) PSV AHTS Total Fleet >900 m 2 700 – 900 m 2 <700 m 2 >16K BHP 8 - 16K BHP 4 - 8K BHP PSV AHTS Americas (37 OSVs) Asia Pacific (18 OSVs) 7 39 7 3 2 9 16 3 6 11 4 1 8 12 15 5 1 12 14 5 2 2 2 8 4 1 3 2 141 56 Note: Reflects only PSVs and AHTSs, includes TDW vessels booked as AHFS; does not reflect TDW fleet of crew boats, maintenanc e v essels or tug boats. (1) Vessel count as of June 30, 2023 pro forma for Solstad PSV acquisition. (2) Excludes 26 other TDW vessels including crew boats, maintenance vessels and tug boats.
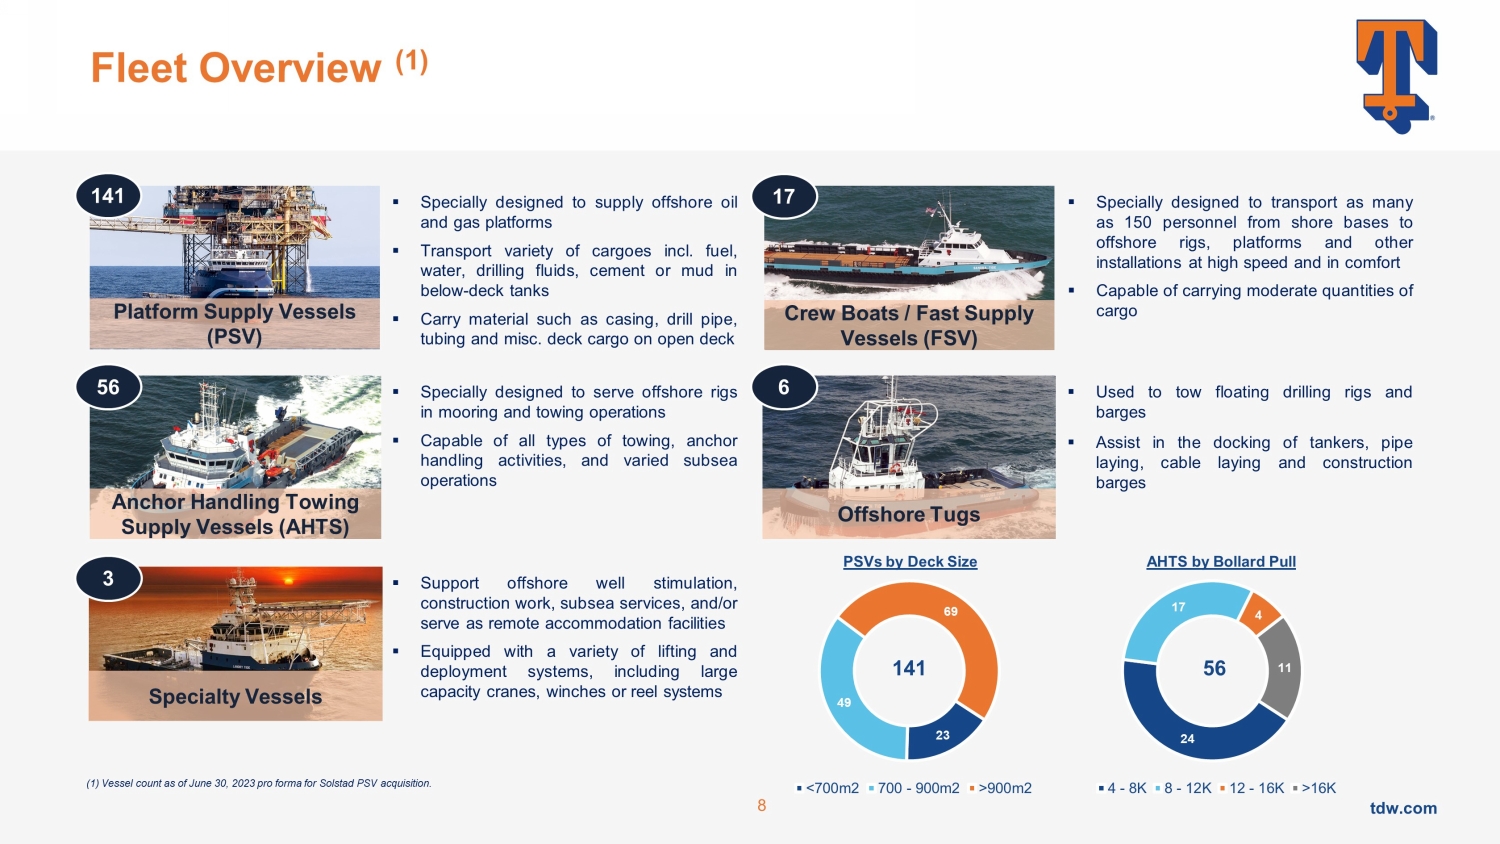
tdw.com tdw.com 24 17 4 11 AHTS by Bollard Pull 4 - 8K 8 - 12K 12 - 16K >16K Fleet Overview (1) 8 ▪ Used to tow floating drilling rigs and barges ▪ Assist in the docking of tankers, pipe laying, cable laying and construction barges ▪ Specially designed to transport as many as 150 personnel from shore bases to offshore rigs, platforms and other installations at high speed and in comfort ▪ Capable of carrying moderate quantities of cargo ▪ Specially designed to supply offshore oil and gas platforms ▪ Transport variety of cargoes incl . fuel, water, drilling fluids, cement or mud in below - deck tanks ▪ Carry material such as casing, drill pipe, tubing and misc . deck cargo on open deck ▪ Specially designed to serve offshore rigs in mooring and towing operations ▪ Capable of all types of towing, anchor handling activities, and varied subsea operations ▪ Support offshore well stimulation, construction work, subsea services, and/or serve as remote accommodation facilities ▪ Equipped with a variety of lifting and deployment systems, including large capacity cranes, winches or reel systems Platform Supply Vessels (PSV) Anchor Handling Towing Supply Vessels (AHTS) Specialty Vessels Crew Boats / Fast Supply Vessels (FSV) Offshore Tugs 141 56 3 17 6 23 49 69 PSVs by Deck Size <700m2 700 - 900m2 >900m2 141 56 (1) Vessel count as of June 30, 2023 pro forma for Solstad PSV acquisition.

tdw.com tdw.com Fleet Evolution – High - Specification Vessel Focus OSV Fleet Count (1) High - Specification OSV Fleet Size TDW has meticulously high - graded its fleet by focusing on high - quality assets, large vessels routinely in high demand and value accretive acquisitions TDW added 86 premier, high - quality vessels to its fleet via M&A over the last 18 months TDW’s fleet evolved into the largest and most relevant vessels on the market PSV AHTS 9 69 49 11 > 900 m 700 - 900 m 16,000 BHP SOFF SPO Legacy TDW 2 2 (2) (2) (3) (3) (1) Excludes 26 other TDW vessels including crew boats, maintenance vessels and tug boats. (2) SPO refers to Swire Pacific Offshore. (3) SOFF refers to Solstad Offshore ASA.
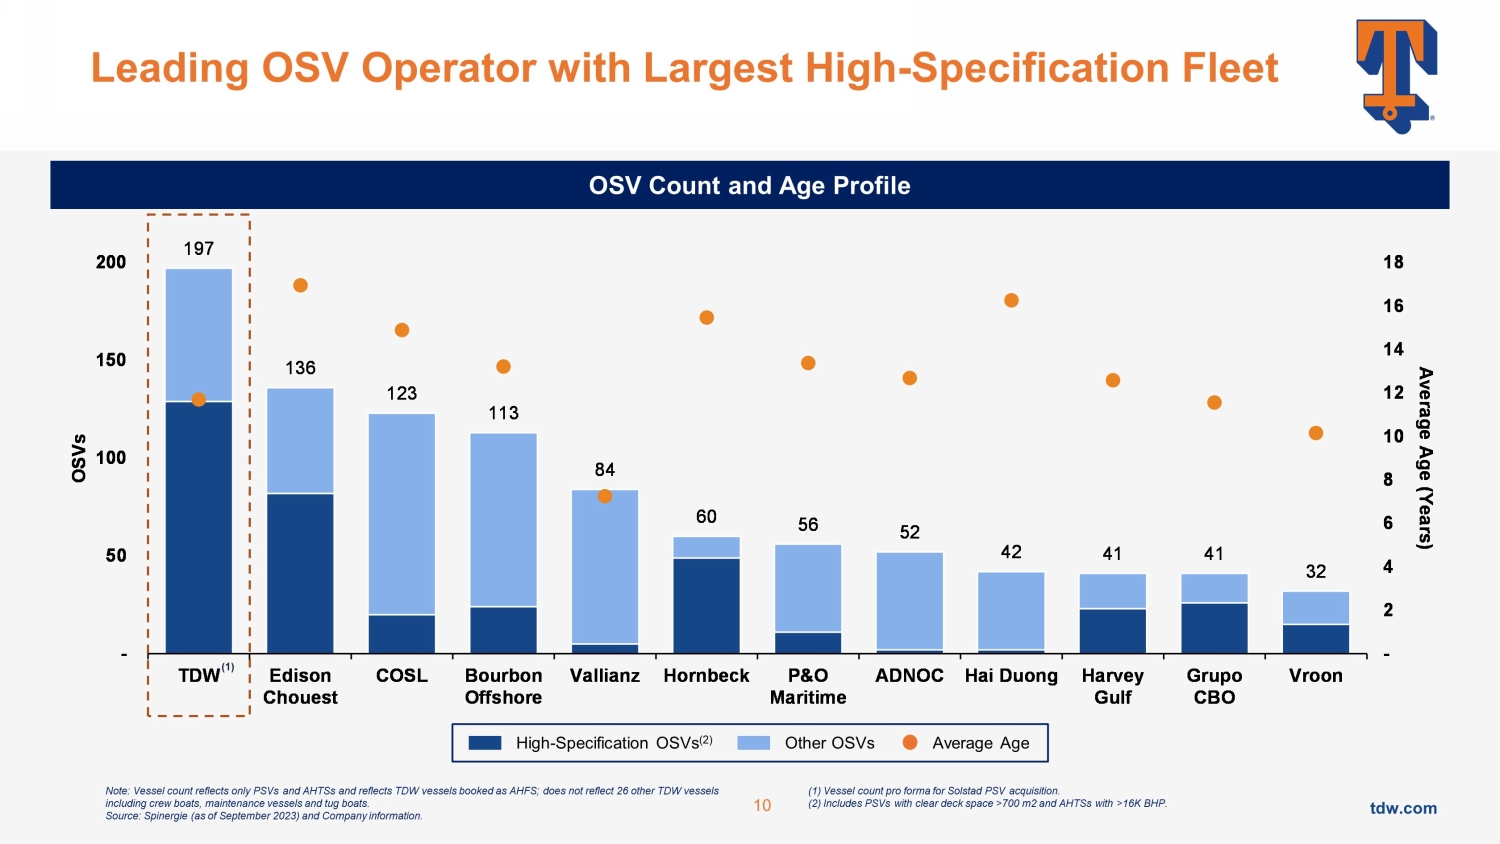
tdw.com tdw.com Leading OSV Operator with Largest High - Specification Fleet OSV Count and Age Profile 10 High - Specification OSVs (2) Other OSVs Average Age Note: Vessel count reflects only PSVs and AHTSs and reflects TDW vessels booked as AHFS; does not reflect 26 other TDW vessel s including crew boats, maintenance vessels and tug boats. Source: Spinergie (as of September 2023) and Company information. (1) Vessel count pro forma for Solstad PSV acquisition. (2) Includes PSVs with clear deck space >700 m2 and AHTSs with >16K BHP. 197 136 123 113 84 60 56 52 42 41 41 32 - 2 4 6 8 10 12 14 16 18 - 50 100 150 200 TDW Edison Chouest COSL Bourbon Offshore Vallianz Hornbeck P&O Maritime ADNOC Hai Duong Harvey Gulf Grupo CBO Vroon Average Age (Years) OSVs (1)

tdw.com tdw.com Blue Chip Customer Base Vessel Mix Customers Asia Pacific Vessel Mix Customers West Africa Vessel Mix Customers Americas Large Medium Vessel Mix Customers Europe / Med Leading Blue - Chip Operators Around the World Utilize Tidewater’s Leading, World - Class Fleet 11 Vessel Mix Customers Middle East Small 14 16 7 13 27 9 41 7 3 2 13 27 10 7 1 Strong credit counterparties provide for strong cash collections, with YTD 2023 DSO of ~83 days Note: “Large” denotes vessels with >900m2 or with >16k BHP, “Medium” denotes vessels between 700m2 - 900m2 or between 8k - 16k BHP, “Small” denotes vessels of <700m2 or with <8k BHP.
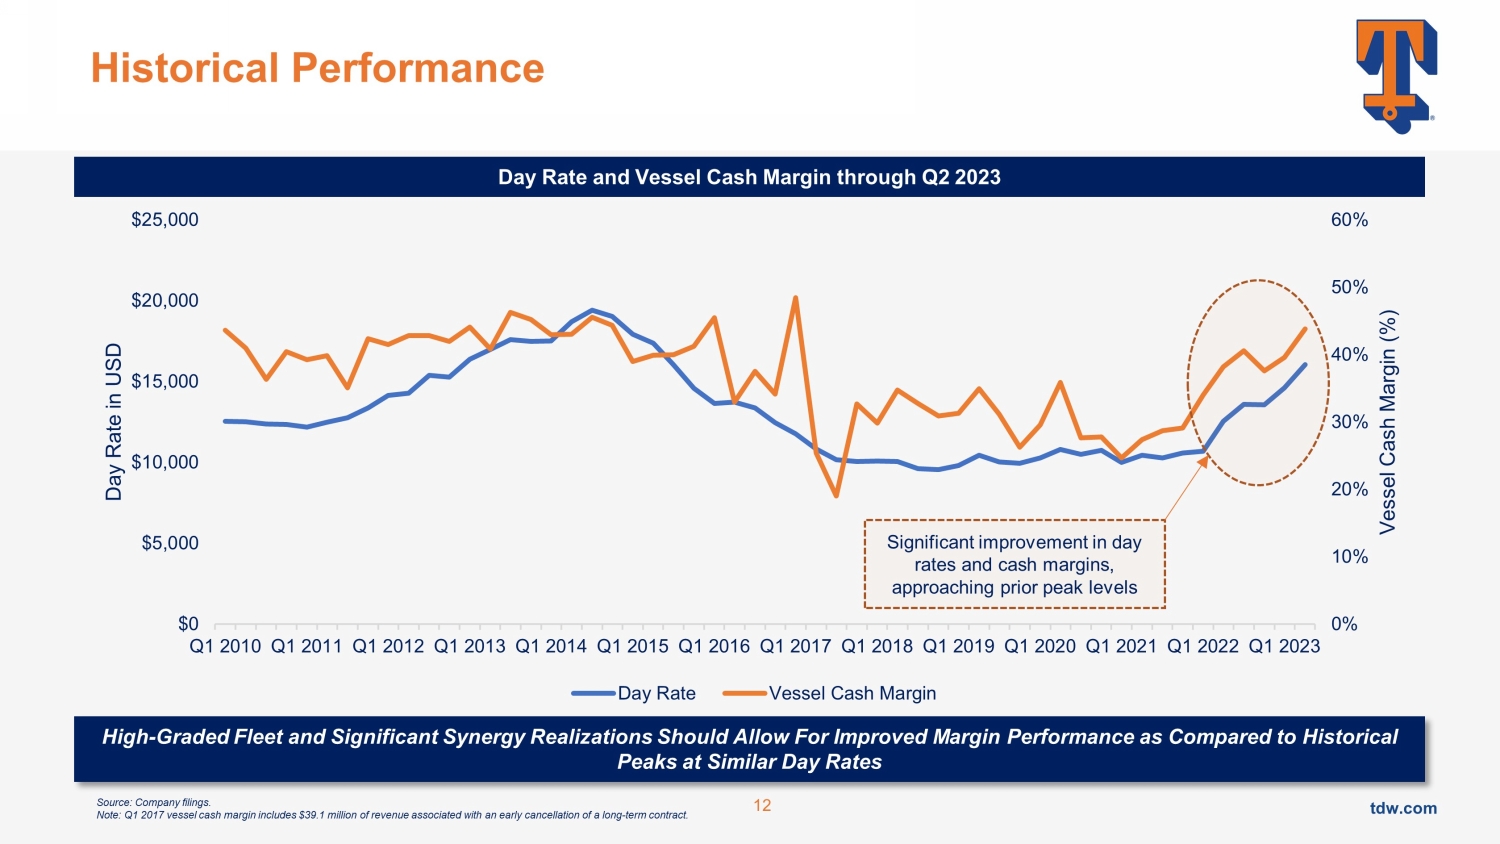
tdw.com tdw.com Historical Performance 12 Source: Company filings. Note: Q1 2017 vessel cash margin includes $39.1 million of revenue associated with an early cancellation of a long - term contract . 0% 10% 20% 30% 40% 50% 60% $0 $5,000 $10,000 $15,000 $20,000 $25,000 Q1 2010 Q1 2011 Q1 2012 Q1 2013 Q1 2014 Q1 2015 Q1 2016 Q1 2017 Q1 2018 Q1 2019 Q1 2020 Q1 2021 Q1 2022 Q1 2023 Vessel Cash Margin (%) Day Rate in USD Day Rate Vessel Cash Margin Day Rate and Vessel Cash Margin through Q2 2023 High - Graded Fleet and Significant Synergy Realizations Should Allow For Improved Margin Performance as Compared to Historical Peaks at Similar Day Rates Significant improvement in day rates and cash margins, approaching prior peak levels tdw.com tdw.com 2.

Market Overview

tdw.com tdw.com Global Offshore Spending Overview Supportive oil price environment ▪ Global oil demand continuing to show signs of recovery towards pre - Covid levels and beyond ▪ Recent softness in commodity prices has not led to any reduction in activity or expected future demand ▪ Global offshore capex expected to increase meaningfully in coming years (particularly deepwater) $36 $59 $32 $35 $38 $60 $67 $30 $44 $14 $30 $46 $39 $55 $0 $20 $40 $60 $80 $100 $120 $140 2018 2019 2020 2021 2022 2023 2024 Deepwater Shelf $23 $20 $27 $28 $8 $23 $15 $34 $24 $5 $11 $15 $11 $11 $19 $3 $16 $6 $0 $20 $40 $60 $80 $100 $120 $140 2022 2023 2024 Middle East Europe S. America N. America AsiaPac Africa 14 $21 $2 $20 $39 $69 $37 $26 $0 $6 $0 $0 $0 $20 $40 $60 $80 $100 $120 $140 2023 2024 Sanctioned $10-20/bbl $20-40/bbl $40-60/bbl $60-80/bbl $80+/bbl Global Offshore Commitments by Water Depth ($bn) Comments Capital Commitments by Breakeven Oil Price ($bn) Offshore Commitments by Region ($bn) Source: Rystad Energy (March 2023).
tdw.com tdw.com Global OSV Utilization “Lay - up” includes units confirmed to be in lay - up and out of service for an extended period. Excludes idle. Utilisation, % No. of OSVs No. of OSVs Utilisation, % 15 Utilisation, Global, PSV >1,000 dwt Utilisation, Global, AHTS >4,000 BHP Source: Clarksons Research (August 2023). 50% 55% 60% 65% 70% 75% 80% 85% 90% 95% 100% 0 200 400 600 800 1,000 1,200 1,400 1,600 1,800 2,000 Aug-14 Feb-15 Aug-15 Feb-16 Aug-16 Feb-17 Aug-17 Feb-18 Aug-18 Feb-19 Aug-19 Feb-20 Aug-20 Feb-21 Aug-21 Feb-22 Aug-22 Feb-23 Aug-23 Active No. Idle No. laid up Utilisation % 50% 55% 60% 65% 70% 75% 80% 85% 90% 95% 100% 0 200 400 600 800 1,000 1,200 1,400 1,600 1,800 Aug-14 Feb-15 Aug-15 Feb-16 Aug-16 Feb-17 Aug-17 Feb-18 Aug-18 Feb-19 Aug-19 Feb-20 Aug-20 Feb-21 Aug-21 Feb-22 Aug-22 Feb-23 Aug-23 Active No. Idle No.

laid up Utilisation % tdw.com tdw.com 0 10,000 20,000 30,000 40,000 50,000 2007 2008 2009 2010 2011 2012 2013 2014 2015 2016 2017 2018 2019 2020 2021 2022 2023 PSV 3,200dwt TC Rate PSV 4,000dwt TC Rate OSV Day Rate Progression 16 0 10,000 20,000 30,000 40,000 50,000 60,000 70,000 2007 2008 2009 2010 2011 2012 2013 2014 2015 2016 2017 2018 2019 2020 2021 2022 2023 AHTS 80t BP TC Rate AHTS 120t BP TC Rate AHTS 200t BP TC Rate AHTS TC Rates PSV TC Rates Source: Clarksons (July 2023). Note: Average of SE Asia, Mid East, Latin Am, WAFR and Med, weighted by fleet deployment.
tdw.com tdw.com Tidewater Leading Edge Contract Momentum 17 Vessel Class 2021 Day Rate 2022 Day Rate Q1 2023 Leading Edge Term Contracts Q2 2023 Leading Edge Term Contracts (1) >900m 2 PSV $14,382 $16,604 $24,522 $29,958 700 - 900m 2 PSV 11,323 13,889 22,547 24,438 <700m 2 PSV 9,643 10,477 15,999 18,417 >16k BHP AHTS 16,980 19,737 38,528 -- 12 - 16K BHP AHTS 11,383 11,695 -- -- 8 - 12K BHP AHTS 9,253 11,604 13,674 20,995 4 - 8K BHP AHTS 6,129 6,997 10,796 13,122 Total $10,950 $12,803 $21,186 $23,498 Note: Total value for leading edge contracts is a weighted average of the leading - edge contract prices based of number of vessel s in Q2 2023. Does not include the pro forma impact of the Solstad PSV acquisition. “Total” day rates reflect the aggregate day rate for the vessel classes shown and do not contemplate the day rates associated wi th non - OSV vessels (maintenance vessels, tugboats, crew boats). Term contracts are defined as time charters with a contracted duration of approximately two months or longer. Spot charter ar ran gements are not reflected in leading edge term charters. (1) One contract for a tug - boat for $19,535 is included in the Q2 2023 composite day rate of $23,498 that is not otherwise not r eflected in the table as tug - boats are not included in the table.

tdw.com tdw.com Global Fleet Profile by Vessel Type 18 Vessel Class Number of Vessels Average Age ( yrs ) Active (1) Laid - up Average Age – Laid - up ( yrs ) Active as % of Total >900m 2 PSV 398 11.7 381 17 21.2 95.7% 700 - 900m 2 PSV 384 11.6 336 48 19.2 87.5% <700m 2 PSV 1,135 24.2 761 374 32.9 67.0% PSV Sub - total 1,917 19.2 1,478 439 31.1 77.1% >16k BHP AHTS 161 12.9 146 15 18.4 90.7% 12 - 16K BHP AHTS 170 16.9 142 28 19.2 83.5% 8 - 12K BHP AHTS 225 16.2 185 40 26.1 82.2% 4 - 8K BHP AHTS 1,343 20.1 947 396 31.6 70.5% AHTS Sub - total 1,899 18.7 1,420 479 30.0 74.8% Source: Spinergie Inc. as of 9/ 1/2023. Note: Excludes vessels in China, Turkey and Russia. Average age is determined using mid - year convention based on year built. (1) “Active” includes all vessels that are on - hire, off - hire, undergoing mobilization or are otherwise available in the market.
tdw.com tdw.com Laid - up PSV Population & Limitations to Reactivation # Vessel Name Age Location 1 AIAS 20 Greece 2 KPS BARIS BEY 25 Cuba 3 GSP ALTAIR 25 Romania 4 OCEAN KARADENIZ 20 Norway 5 KARADENIZ POWERSHIP KORAY BEY 29 Senegal 6 HOS BERETTA 17 USA 7 ANDREA CHOUEST 15 USA 8 C - LIBERTY 20 Peru 9 PAO DE ACUCAR 14 USA 10 USNS VADM. K.R. WHEELER 16 USA 11 FS PEGASUS 27 Norway 12 KARADENIZ POWERSHIP GOKTAY BEY 31 Gambia 13 KARADENIZ POWERSHIP METIN BEY 31 Guinea - Bissau 14 QUEEN OFONIME 9 Nigeria 15 PRIMA NUSANTARA X 9 Indonesia 16 MARTHA'S PRIDE 5 Nigeria 17 SEPAND 48 Iraq Laid - up Vessels >900m 2 # Vessel Name Age Location 1 VICTOR 21 Greece 2 HOS POLESTAR 15 USA 3 HOS NORTH STAR 15 USA 4 HOS GREYSTONE 20 USA 5 HOS GEMSTONE 20 Indonesia 6 HOS BLUEWATER 20 USA 7 HOS SILVERSTAR 19 USA 8 HOS SWEET WATER 14 USA 9 SUBSEA RESPONDER III 24 USA 10 UP DIAMANTE 16 Brazil 11 UP TOPAZIO 17 Brazil 12 CLARK CABLE 33 Denmark 13 THUNDER 8 USA 14 GSP LICORN 16 Romania 15 TEK OCEAN SPIRIT 32 Australia 16 NANUQ 16 USA 17 ROYAL 19 USA 18 BARBARA PRINCESS 21 USA 19 KIMBERLY CANDIES 21 USA 20 C - HERO 21 USA 21 C - PACER 22 USA 22 C - RANGER 24 USA 23 C - RETRIEVER 24 USA 24 C - ROVER 24 USA # Vessel Name Age Location 25 C - RULER 24 USA 26 NFE REIMAGINE 18 USA 27 HARVEY EAGLE 13 USA 28 HARVEY RAVEN 14 USA 29 HOS COQUILLE 24 USA 30 HOS BEIGNET 23 USA 31 HOS CAYENNE 24 USA 32 HOS BOURRE 24 USA 33 HOS CORNERSTONE 23 USA 34 HOS CHICORY 23 USA 35 HOS SANDSTORM 21 USA 36 HOS STORMRIDGE 21 USA 37 HOS ROSEHILL 9 USA 38 BRAVANTE VIII 9 USA 39 MARINER SEA 44 Nigeria 40 MISS JANE TIDE 21 Trinidad and Tobago 41 KEYFIELD HELMS 5 Malaysia 42 DOS30 31 Argentina 43 AKIRA CHOUEST 28 USA 44 CROWN THALASSA 8 France 45 BELOV MARES 1 Brazil 46 DAMON B BANKSTON 21 USA 47 SETAREH 0 Ghana 48 PRINCESS AJIRIOGHENE 9 Nigeria Laid - up Vessels 700m 2 - 900m 2 Source: Spinergie Inc. as of 9/1/2023. Note: Excludes China, Turkey and Russia. “Age” of each vessel based on build year and utilizes mid - year convention to calculate age. ▪ Laid - up fleet population is further limited by age of vessels ▪ Of the 17 >900m2 vessels laid - up globally, 7 are less than 20 years old ▪ Further, of the 47 700 – 900m2 vessels laid up globally, only 19 are less than 20 years old ▪ Assuming all 26 vessels less than 20 years old are reactivated, represents a ~3% increase to global active PSV supply Denotes a vessel 20 years old or younger.
tdw.com tdw.com Newbuild Economics Considerations Assumptions Newbuild Cost ($m) $65 Assumed day rate ($k/day) $38 Opex rate ($k/day) $8.5 Drydocking Cost (every 5 years) ($m) $1.2 Utilization (%) 90% WACC 14% Years to achieve cost of capital 20 Newbuild Economics Require ~$38k/d Day Rate To Achieve its Cost of Capital Over 20 Year Useful Life 20 Source: TDW management estimate. 0 5 10 15 20 25 30 37 38 39 $37k/day $38k/day $39k/day Years to breakeven 28 yrs. Day rate ($k/day) 20 yrs. 18 yrs. Modest Movements in Day Rate Have Substantial Impact on Newbuild Economics tdw.com tdw.com 0 200 400 600 800 1,000 1,200 2004 2005 2006 2007 2008 2009 2010 2011 2012 2013 2014 2015 2016 2017 2018 2019 2020 2021 2022 2023ytd No., End Year Source: Clarksons Research.

Data as of March 2023. Shipyard Capacity & Orderbook Status Number Of ‘Active’ Shipyards (vessels of c.1,000+ GT) Active Yards: At least one vessel 1,000+ GT on order ~1,000 361 Despite improved orderbook cover at many major shipbuilders, smaller shipyards still continuing to leave the newbuild market 21 Orderbook, No. Units OSV Orderbook Development No.

units % of Fleet (RHS) 0% 5% 10% 15% 20% 25% 30% 35% 40% 45% 50% 0 100 200 300 400 500 600 700 800 900 1,000 Jan-08 Jan-09 Jan-10 Jan-11 Jan-12 Jan-13 Jan-14 Jan-15 Jan-16 Jan-17 Jan-18 Jan-19 Jan-20 Jan-21 Jan-22 Jan-23 Bulk of existing newbuild orders are legacy “stranded” assets that have been on - order for years; only 22 vessels added to orderbook since 2020 Global shipyard capacity down ~65% tdw.com tdw.com 0 10 20 30 40 50 60 ING Bank SEB Bank of China China Exim Danske Bank NORD/LB Citigroup SMBC Danish Ship Finance Bremer Landesbank Unicredit / HVB Deutsche Bank BNP Paribas HSBC Lloyds MUFG Bank DVB Credit Suisse Nordea Credit Agricole CIB KfW IPEX-Bank RBS DnB NOR Commerzbank (ex-DSB) HSH Nordbank 0 10 20 30 40 50 60 DnB NOR Standard Chartered Nordea CDB Leasing Bank of America ML SEB SocGen CIB Citigroup CMB Leasing K-Sure KEXIM Credit Suisse ING Bank SMBC ABN AMRO HSBC Sumitomo Trust MUFG Bank Credit Agricole CIB Bank of China BoCom Leasing KfW IPEX-Bank ICBC Leasing China Exim BNP Paribas Lack of Debt Availability: May Delay Newbuild Investment Leading Bank Maritime Portfolios 2008 Leading Bank Maritime Portfolios March 2023 Source: Clarksons Research, Clarksons Platou Structured, Asset Finance, Marine Money, Petrofin, Industry Sources.
tdw.com tdw.com 3. Financials
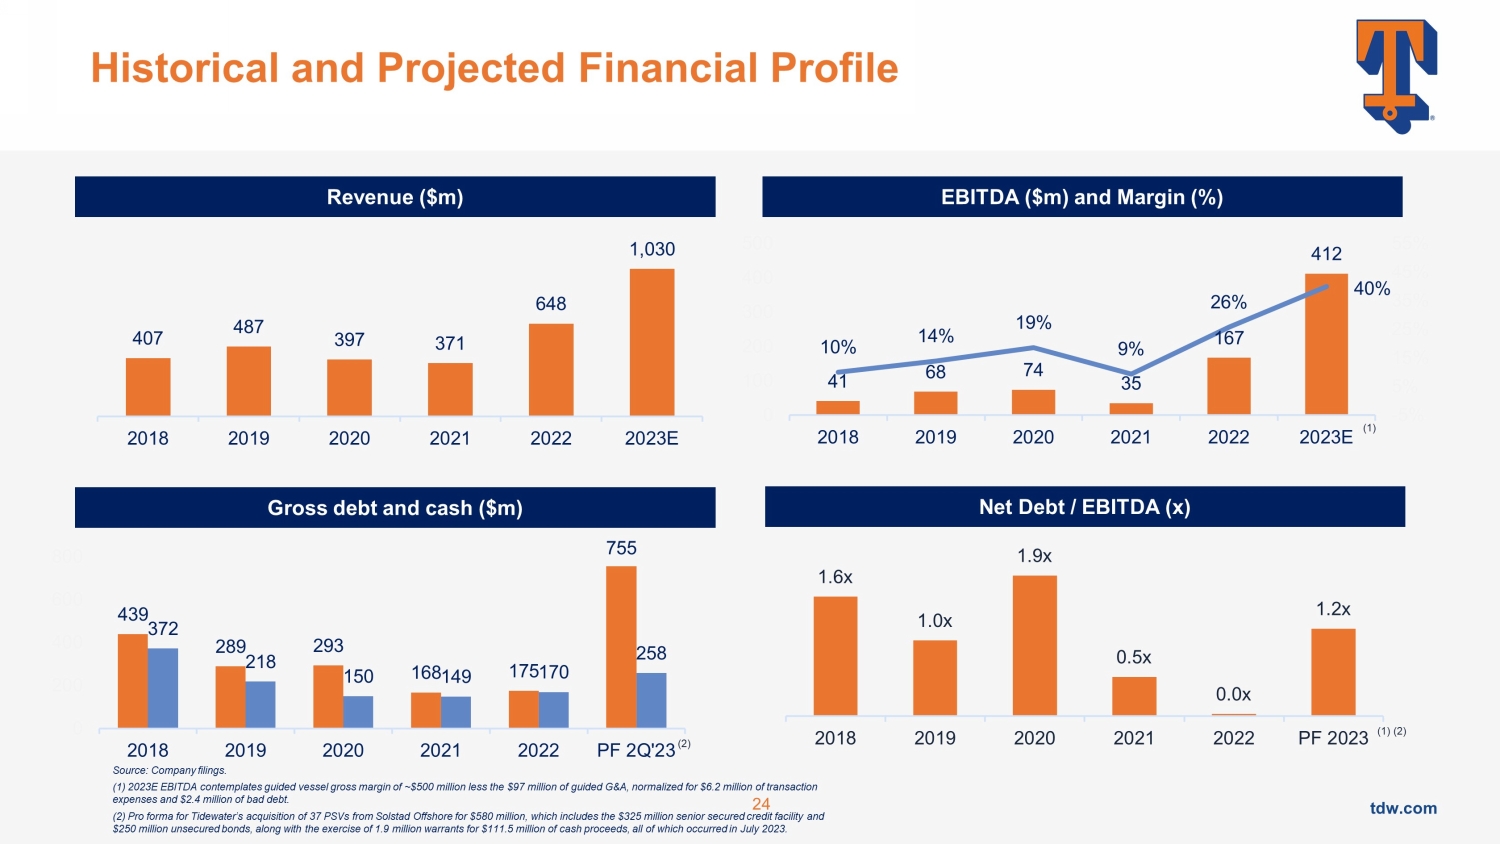
Top 10: $248bn Top 11 - 25: $144bn Portfolios in orange represent those that have either privatised or exited shipping since 2008 22 Top 10: $152bn Top 11 - 25: $91bn Portfolios in light blue represent Poseidon Principles signatories tdw.com tdw.com 439 289 293 168 175 755 372 218 150 149 170 258 0 200 400 600 800 2018 2019 2020 2021 2022 PF 2Q'23 Historical and Projected Financial Profile 24 Equity Ratio 407 487 397 371 648 1,030 2018 2019 2020 2021 2022 2023E 41 68 74 35 167 412 10% 14% 19% 9% 26% 40% -5% 5% 15% 25% 35% 45% 55% 0 100 200 300 400 500 2018 2019 2020 2021 2022 2023E 1.6x 1.0x 1.9x 0.5x 0.0x 1.2x 2018 2019 2020 2021 2022 PF 2023 EBITDA ($m) and Margin (%) Revenue ($m) Gross debt and cash ($m) Net Debt / EBITDA (x) (1) (2) (1) Source: Company filings. (1) 2023E EBITDA contemplates guided vessel gross margin of ~$500 million less the $97 million of guided G&A, normalized for $6. 2 million of transaction expenses and $2.4 million of bad debt. (2) Pro forma for Tidewater’s acquisition of 37 PSVs from Solstad Offshore for $580 million, which includes the $325 million senior secured credit facility and $250 million unsecured bonds, along with the exercise of 1.9 million warrants for $111.5 million of cash proceeds, all of whi ch occurred in July 2023. (2)

tdw.com tdw.com 412 465 574 687 801 914 1,028 1,141 1,254 1,368 0 100 200 300 400 500 600 700 800 900 1,000 1,100 1,200 1,300 1,400 2023E Adj. EBITDA 53 ~$20.0k/day Total Fleet Dayrate Utilization Uplift Solstad PSVs (to reflect full year) ~$18.5k/day Total Fleet Dayrate ~$21.5k/day Total Fleet Dayrate ~$23.0k/day Total Fleet Dayrate ~$24.5k/day Total Fleet Dayrate ~$26.0k/day Total Fleet Dayrate ~$27.5k/day Total Fleet Dayrate Significant Earnings Leverage and Cash Generation 25 Unlevered Vessel - level Cash Flow Conversion (%) 86% 88% 90% 91% 92% 93% 94% 94% Vessel - level Cash Margin 52% 56% 60% 63% 65% 67% 69% 71% Pro Forma 2023E Run - rate Adj. EBITDA with Solstad Q2 2023 Leading - Edge Composite Day Rates: $23.5k/day Pro Forma 2023E Adj. EBITDA Note: 2023 EBITDA represents the implied EBITDA based on the guidance provided on the Company’s Q2 2023 earnings call; G&A is no rmalized for $6.2 million of acquisition expenses and $2.4 million of bad debt expense. Pro forma 2023E EBITDA is an annualized figure based on 2H 2023 Solstad expected performance burdened with a full year G&A run - rate of $5 million contemplated. Utilization Uplift scenario contemplate s the pro forma combined fleet full - year 2023 utilization increasing from approximately 83% to approximately 90%. Implied full - year 2023 pro forma day rate of ~$17k/day held constant in the Utilization Uplift scenario. F ull - year benefit of the Solstad fleet is contemplated in all day rate scenarios. Operating expense assumption contemplates pro forma full - year 2023 operating expense for the combined fleet in all future periods and no cost inflation is assumed in any scenario. Un lev ered Vessel - level Cash Flow is defined as EBITDA less drydocks and capex which is assumed to be $68 million and $15 million per year, respectively, on average for the pro forma fleet and does not contemplate the impact of cash taxes, working capital or deb t service. Unlevered Vessel - level Cash Flow Conversion defined as Unlevered Vessel - level Cash Flow divided by EBITDA.

tdw.com tdw.com Fleet Focus – Drydocks and Vessel Vintage Pro Forma Historical Drydock Spend (1) Tidewater OSV Vintage Distribution (2) Significant variability in drydock spend can be seen from non - uniform distribution of vessel build dates 26 $97 $44 $48 $69 $87 2019 2020 2021 2022 2023E Source: Company financials, management estimates. Note: 2023E Drydock spend based on TDW management guidance. (1) Historical Drydock Spend represents a combination of the following: a) reported drydock spend in Company SEC filings, b) his torical drydock spend associated with acquired Swire Pacific Offshore vessels per Swire Pacific Offshore historical information provided duri ng due diligence up to the time of acquisition and c) historical drydock spend associated with the acquired Solstad Offshore vessels based on historical information received from Solstad Offshore ASA. (2) Excludes 26 non - OSV vessels including tugboats, crew boats and maintenance vessels.

Drydock spend driven primarily by the age of a vessel and its required 5 - year docking schedule Significant variability due to non - uniform distribution of vessel ages $69 5 - year Pro Forma Average Drydock Spend 1 0 0 2 4 4 1 4 5 16 19 14 22 18 29 31 13 8 2 4 0 0 0 0 0 1999 2000 2001 2002 2003 2004 2005 2006 2007 2008 2009 2010 2011 2012 2013 2014 2015 2016 2017 2018 2019 2020 2021 2022 2023 $ in millions tdw.com tdw.com Capital Structure Overview TDW Debt Maturity Profile (1) (2) 27 $25 $100 $75 $175 $250 $50 $75 2024 2027 2025 2023 2026 2028 $300 New Bank Debt New Bank Debt Amortization Senior Secured Notes New Senior Unsecured Notes Comments ($ in millions) ▪ Current capital structure features staggered maturities with the bulk of principal repayment due 2026 or later ▪ Amortization of the $325m bank facility to a balloon payment at maturity (after three years) of $75m ▪ No pre - payment penalty related to New Bank Debt ▪ Senior Secured Notes exit make - whole period in May 2024 (1) Does not reflect the amortization of $9.2m of shipyard debt that is payable over 5 years semiannually beginning second ha lf of 2023. (2) Includes undrawn $25m Super Senior Revolver maturing in November 2026.

tdw.com tdw.com 4.
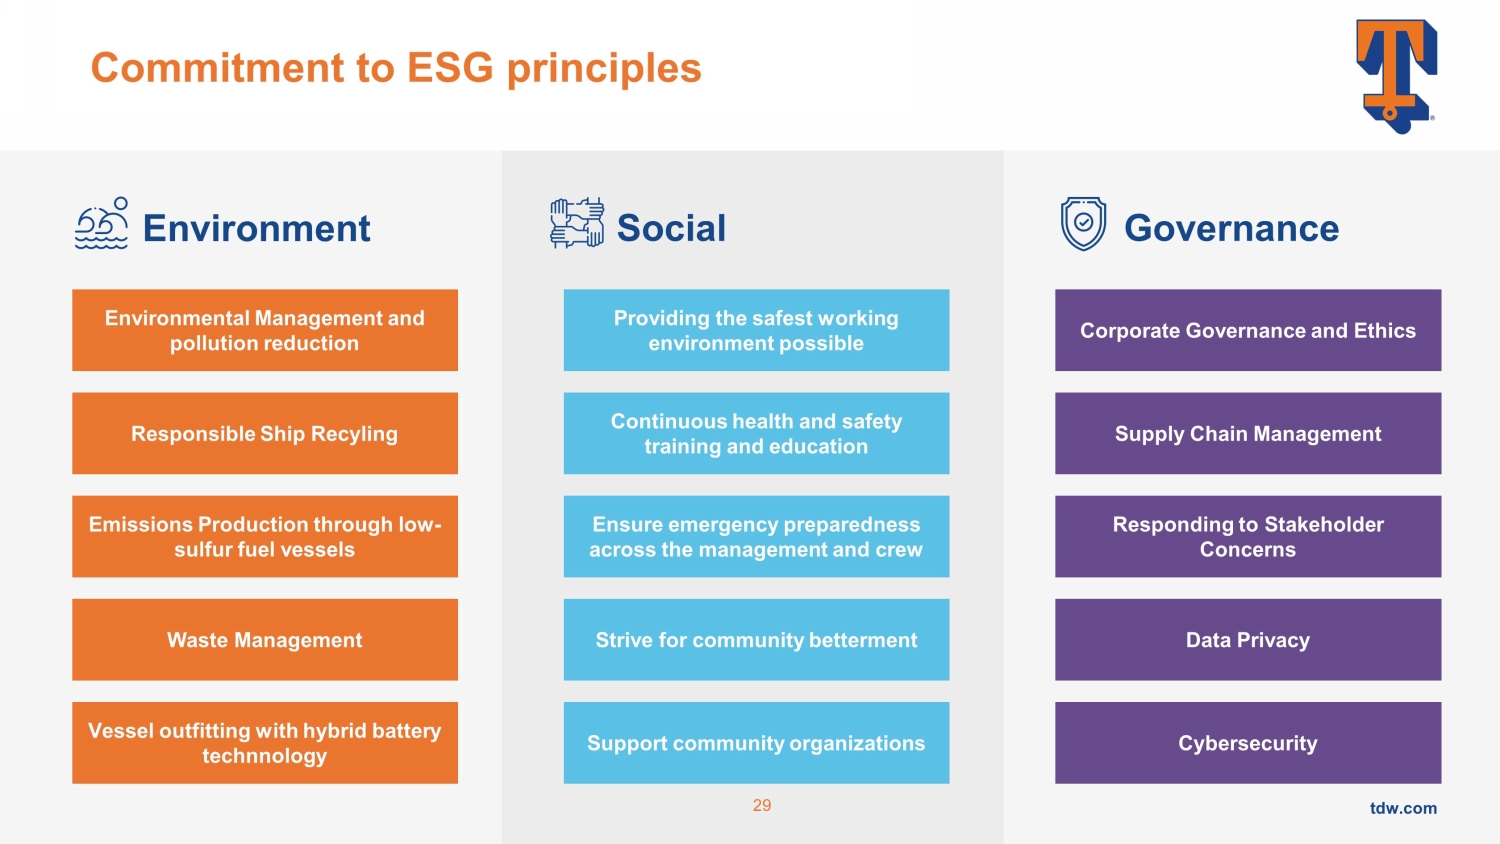
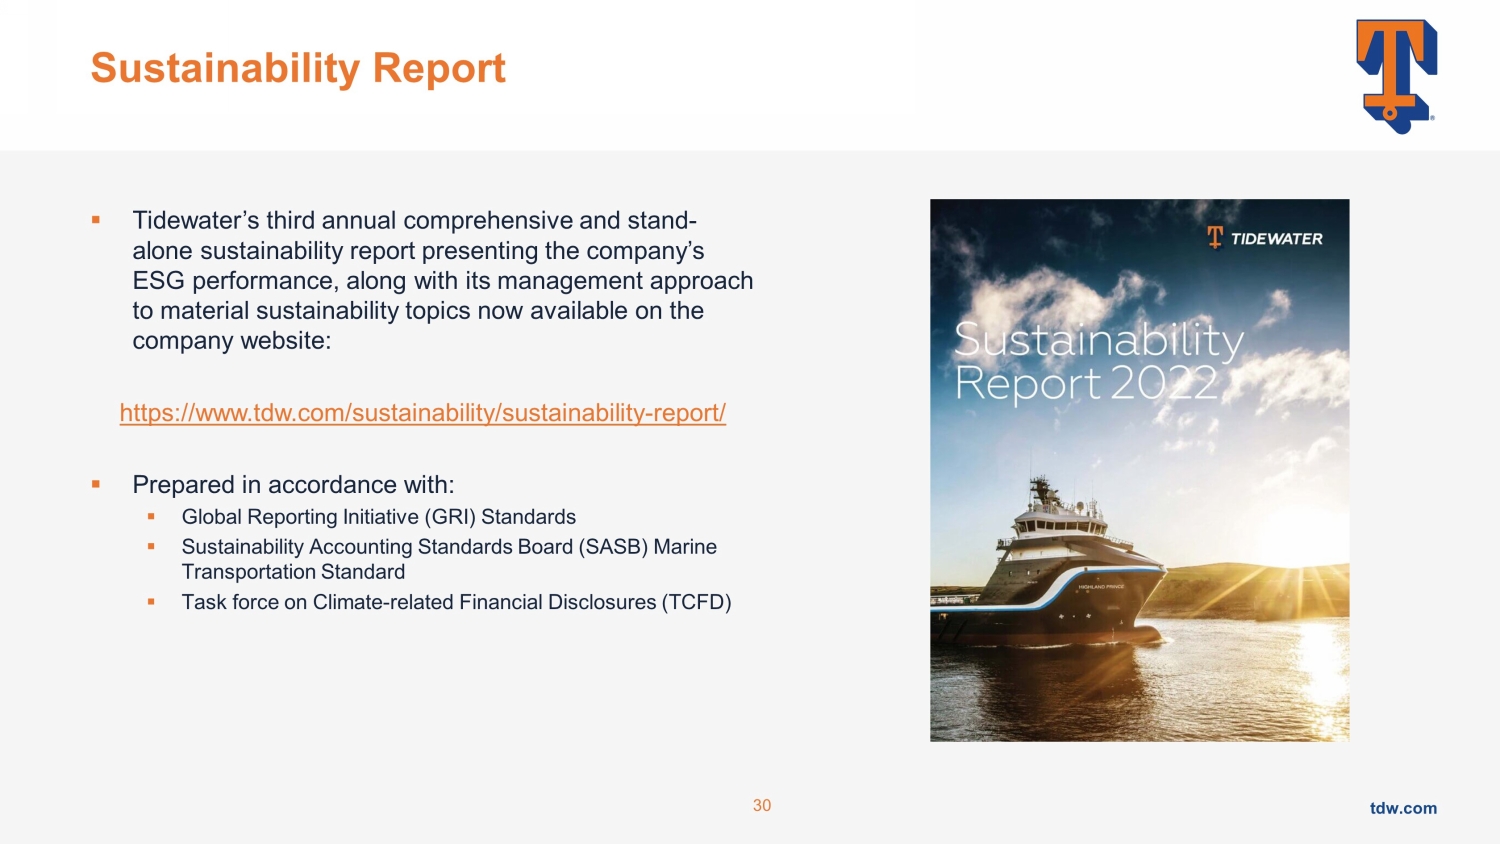
ESG at Tidewater tdw.com tdw.com Commitment to ESG principles Environment Social Governance 29 Environmental Management and pollution reduction Responsible Ship Recyling Emissions Production through low - sulfur fuel vessels Waste Management Vessel outfitting with hybrid battery technnology Providing the safest working environment possible Continuous health and safety training and education Ensure emergency preparedness across the management and crew Strive for community betterment Support community organizations Corporate Governance and Ethics Supply Chain Management Responding to Stakeholder Concerns Data Privacy Cybersecurity tdw.com tdw.com Sustainability Report ▪ Tidewater’s third annual comprehensive and stand - alone sustainability report presenting the company’s ESG performance, along with its management approach to material sustainability topics now available on the company website: https://www.tdw.com/sustainability/sustainability - report/ ▪ Prepared in accordance with: ▪ Global Reporting Initiative (GRI) Standards ▪ Sustainability Accounting Standards Board (SASB) Marine Transportation Standard ▪ Task force on Climate - related Financial Disclosures (TCFD) 30
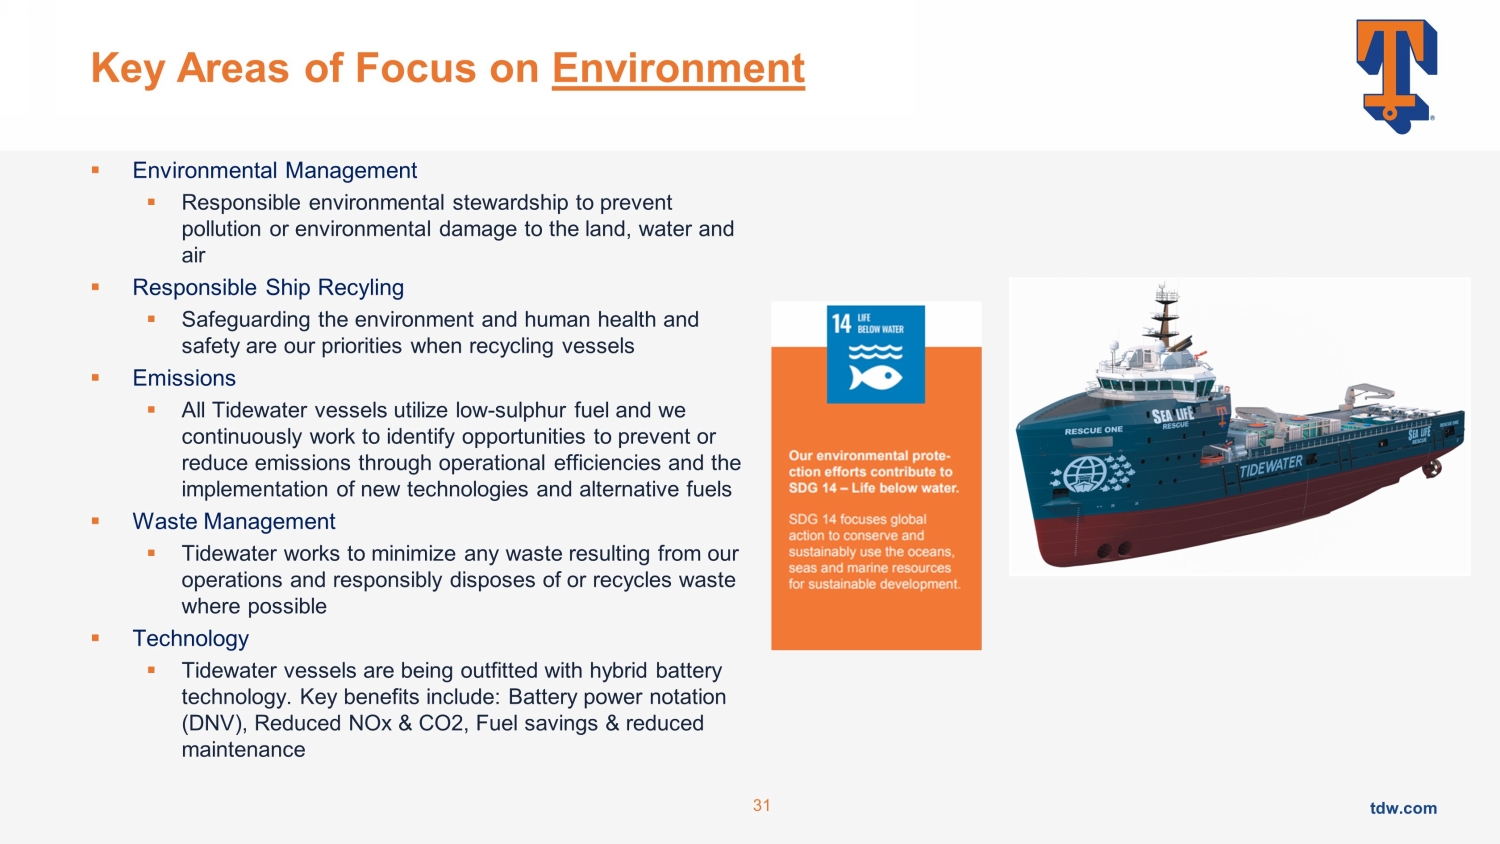
tdw.com tdw.com Key Areas of Focus on Environment ▪ Environmental Management ▪ Responsible environmental stewardship to prevent pollution or environmental damage to the land, water and air ▪ Responsible Ship Recyling ▪ Safeguarding the environment and human health and safety are our priorities when recycling vessels ▪ Emissions ▪ All Tidewater vessels utilize low - sulphur fuel and we continuously work to identify opportunities to prevent or reduce emissions through operational efficiencies and the implementation of new technologies and alternative fuels ▪ Waste Management ▪ Tidewater works to minimize any waste resulting from our operations and responsibly disposes of or recycles waste where possible ▪ Technology ▪ Tidewater vessels are being outfitted with hybrid battery technology.

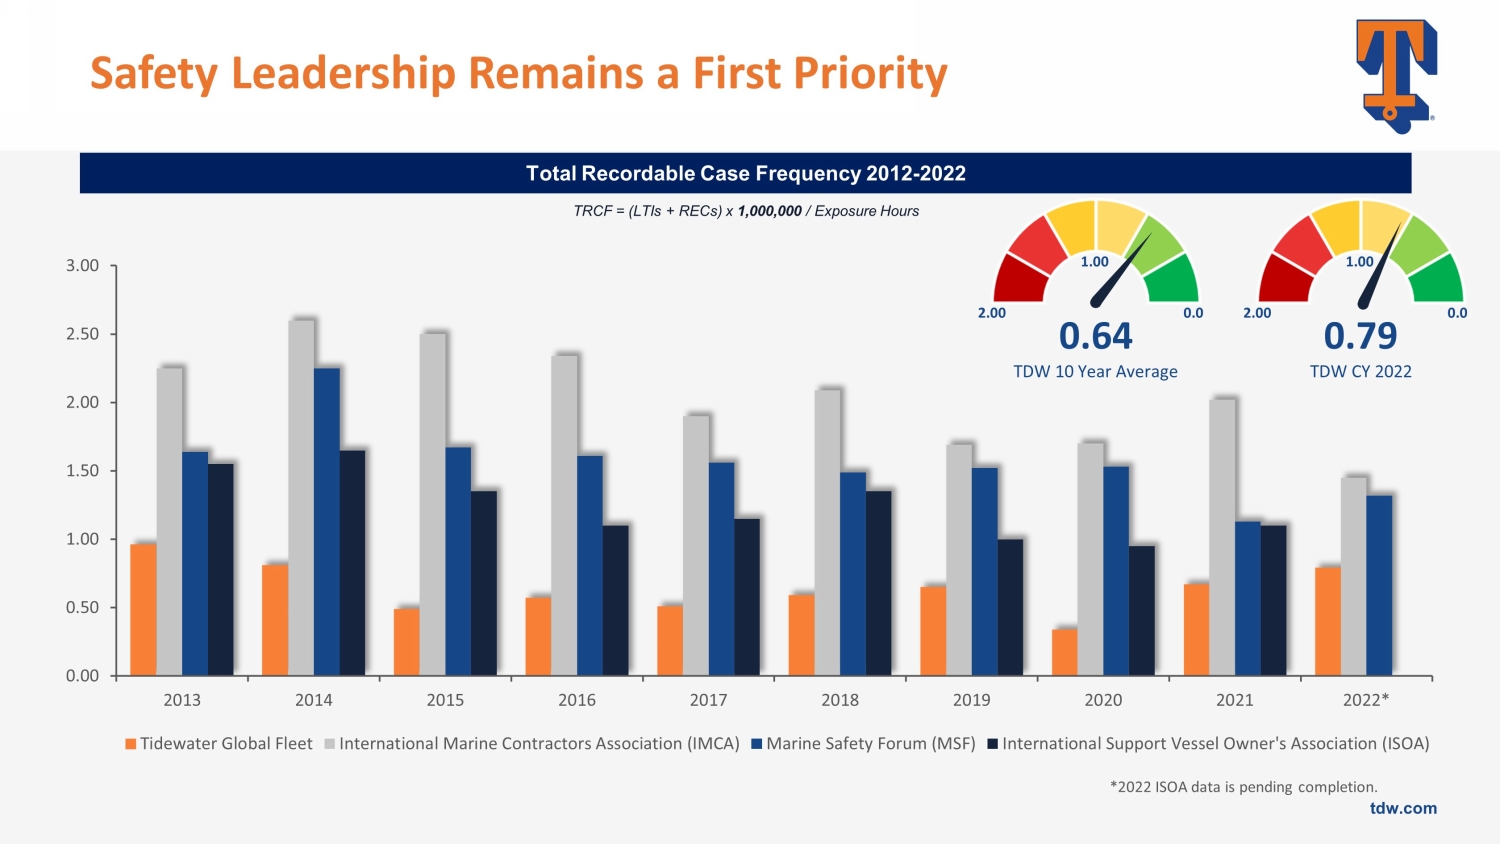
Key benefits include: Battery power notation (DNV), Reduced NOx & CO2, Fuel savings & reduced maintenance 31 tdw.com tdw.com Key Areas of Focus on Social ▪ People ▪ Committed to providing the safest working environment and the highest level of training possible ▪ Health and Safety Management ▪ We promote safety and instill safe work habits with regular training of for both our mariners and shore - based personnel ▪ Emergency Preparedness ▪ Preparation and training are core to ensuring our vessel crews and shore - based management are prepared to respond to emergencies at any time ▪ Community Betterment ▪ Tidewater recognizes its responsibility to give back to the community and encourages its employees to make a difference in the neighborhoods where they live. We support a broad range of organizations that are working to educate and build a safer and healthier future 32 Tidewater has a long track record of supporting many organizations globally, including the following: ▪ West Houston Assistance Ministries ▪ Aberdeen Seamen’s Mission ▪ United Way ▪ NHS Scotland ▪ Spindletop Charities ▪ Houston Food Bank ▪ The Salvation Army ▪ The American Cancer Society ▪ Boys and Girls Hope ▪ Second Harvest Food Bank of Greater New Orleans & Acadiana ▪ National Multiple Sclerosis Society (USA) ▪ Oilfield Education Center tdw.com tdw.com Safety Leadership Remains a First Priority TRCF = (LTIs + RECs) x 1,000,000 / Exposure Hours Total Recordable Case Frequency 2012 - 2022 0.64 TDW 10 Year Average 0.0 2.00 1.00 0.0 2.00 1.00 0.79 TDW CY 2022 0.00 0.50 1.00 1.50 2.00 2.50 3.00 2013 2014 2015 2016 2017 2018 2019 2020 2021 2022* Tidewater Global Fleet International Marine Contractors Association (IMCA) Marine Safety Forum (MSF) International Support Vessel Owner's Association (ISOA) *2022 ISOA data is pending completion.

tdw.com tdw.com Key Areas of Focus on Governance ▪ Corporate Governance and Ethics ▪ The Tidewater Board of Directors and Board committees have responsibility for strategic oversight of all company activities around the world, including sustainability ▪ Supply Chain Management ▪ Tidewater’s suppliers need to comply with all applicable laws pertaining to fair employment practices, as well as laws prohibiting forced and compulsory labor, child labor, employment discrimination, slavery and human trafficking ▪ Responding to Stakeholder Concerns ▪ The Company has established several means for shareholders or others to communicate their concerns to the Board of Directors , including a Whistleblower Policy and Anonymous Communication ▪ Data Privacy ▪ We apply physical, electronic and procedural safeguards in connection with the collection, storage and disclosure of personal data ▪ Cybersecurity ▪ Tidewater is leveraging innovative concepts and technology to monitor, mitigate threats, and otherwise enhance the resilience and security of our systems as well as critical infrastructure both onshore and offshore 34 tdw.com tdw.com Largest global OSV operator 1 Attractive market fundamentals supporting meaningful cash flow generation capability 2 Strong global footprint and increased exposure to blue - chip operators 3 Full cycle financial resilience with strong balance sheet and liquidity 4 Dedicated commitment to safety and sustainability 6 Increased scale with a platform designed for cash flow generation 5 tdw.com 35 Summary
tdw.com tdw.com 5. Appendix

tdw.com tdw.com Non - GAAP Financial Measures – EBITDA and Adjusted EBITDA Reconciliation Q12018 Q22018 Q32018 Q42018 2018 Q12019 Q22019 Q32019 Q42019 2019 Net Loss (39,029) (11,182) (31,183) (90,377) (171,771) (21,286) (15,553) (43,806) (60,574) (141,219) Interest and other debt cost 7,599 7,547 7,585 7,707 30,438 7,736 7,582 7,468 6,282 29,068 Income Tax (benefit) expense 3,321 5,797 1,278 7,856 18,252 5,830 5,542 15,071 1,281 27,724 Depreciation 11,380 11,192 11,377 17,383 51,332 19,034 19,548 19,047 19,416 77,045 Amortization of deferred drydock and survey cost 638 1,593 2,012 2,718 6,961 3,898 5,490 6,688 8,810 24,886 EBITDA (1,2,3) (16,091) 14,947 (8,931) (54,713) (64,788) 15,212 22,609 4,468 (24,785) 17,504 Long - lived asset impairments and other 6,186 1,215 16,853 44,997 69,251 - - 5,224 32,549 37,773 Affiliate credit loss impairment (credit) - - - 20,083 20,083 - - - - - Affiliate guarantee obligation - - - - - - - - - - One - time integration related costs - 1,547 3,036 12,161 16,744 3,739 460 6,293 2,123 12,615 Adjusted EBITDA (1,2,3) (9,905) 17,709 10,958 22,528 41,290 18,951 23,069 15,985 9,887 67,892 Source: Company information 1) EBITDA excludes interest and other debt costs, income tax expense, depreciation and amortization. Additionally, Adjusted EBITDA excludes impairment charges, and merger and integration related costs. 2) EBITDA and Adjusted EBITDA for each of the prior quarters includes non - cash, stock - based compensation expense respectively. 3) EBITDA and Adjusted EBITDA for each of the quarters includes foreign exchange gains (losses) respectively. Adjusted EBITDA 2018 – 2019 37 tdw.com tdw.com Non - GAAP Financial Measures – EBITDA and Adjusted EBITDA Reconciliation Source: Company information 1) EBITDA excludes interest and other debt costs, income tax expense, depreciation and amortization.

Additionally, Adjusted EBITDA excludes impairment charges, and merger and integration related costs. 2) EBITDA and Adjusted EBITDA for each of the prior quarters includes non - cash, stock - based compensation expense respectively. 3) EBITDA and Adjusted EBITDA for each of the quarters includes foreign exchange gains (losses) respectively. Q12020 Q22020 Q32020 Q42020 2020 Q12021 Q22021 Q32021 Q42021 2021 Net Loss (18,524) (110,664) (38,081) (29,427) (196,696) (35,527) (29,647) (26,407) (38,079) (129,660) Interest and other debt cost 6,142 5,959 6,071 5,984 24,156 4,541 3,944 3,681 3,417 15,583 Income Tax (benefit) expense (5,171) 2,730 5,953 (4,477) (965) 2,009 6,026 887 (3,047) 5,875 Depreciation 17,285 16,986 19,343 19,416 73,030 18,470 18,224 17,911 18,618 73,223 Amortization of deferred drydock and survey cost 9,822 11,158 11,434 11,265 43,679 11,257 10,325 10,069 9,670 41,321 EBITDA (1,2,3) 9,554 (73,831) 4,720 2,761 (56,796) 750 8,872 6,141 (9,421) 6,342 Long - lived asset impairments and other 10,207 55,482 1,945 6,475 74,109 - - 2,167 13,476 15,643 Affiliate credit loss impairment (credit) - 53,581 - (600) 52,981 - (1,000) - 1,400 400 Loss on early extinguishment of debt - - - - - - - - 11,100 11,100 Affiliate guarantee obligation - 2,000 - - 2,000 - - - - - One - time integration related costs 129 446 641 291 1,507 103 795 112 221 1,231 Adjusted EBITDA (1,2,3) 19,890 37,678 7,306 8,927 73,801 853 8,667 8,420 16,776 34,716 Adjusted EBITDA 2020 – 2021 38 tdw.com tdw.com Non - GAAP Financial Measures – EBITDA and Adjusted EBITDA Reconciliation Source: Company information 1) EBITDA excludes interest and other debt costs, income tax expense, depreciation and amortization.
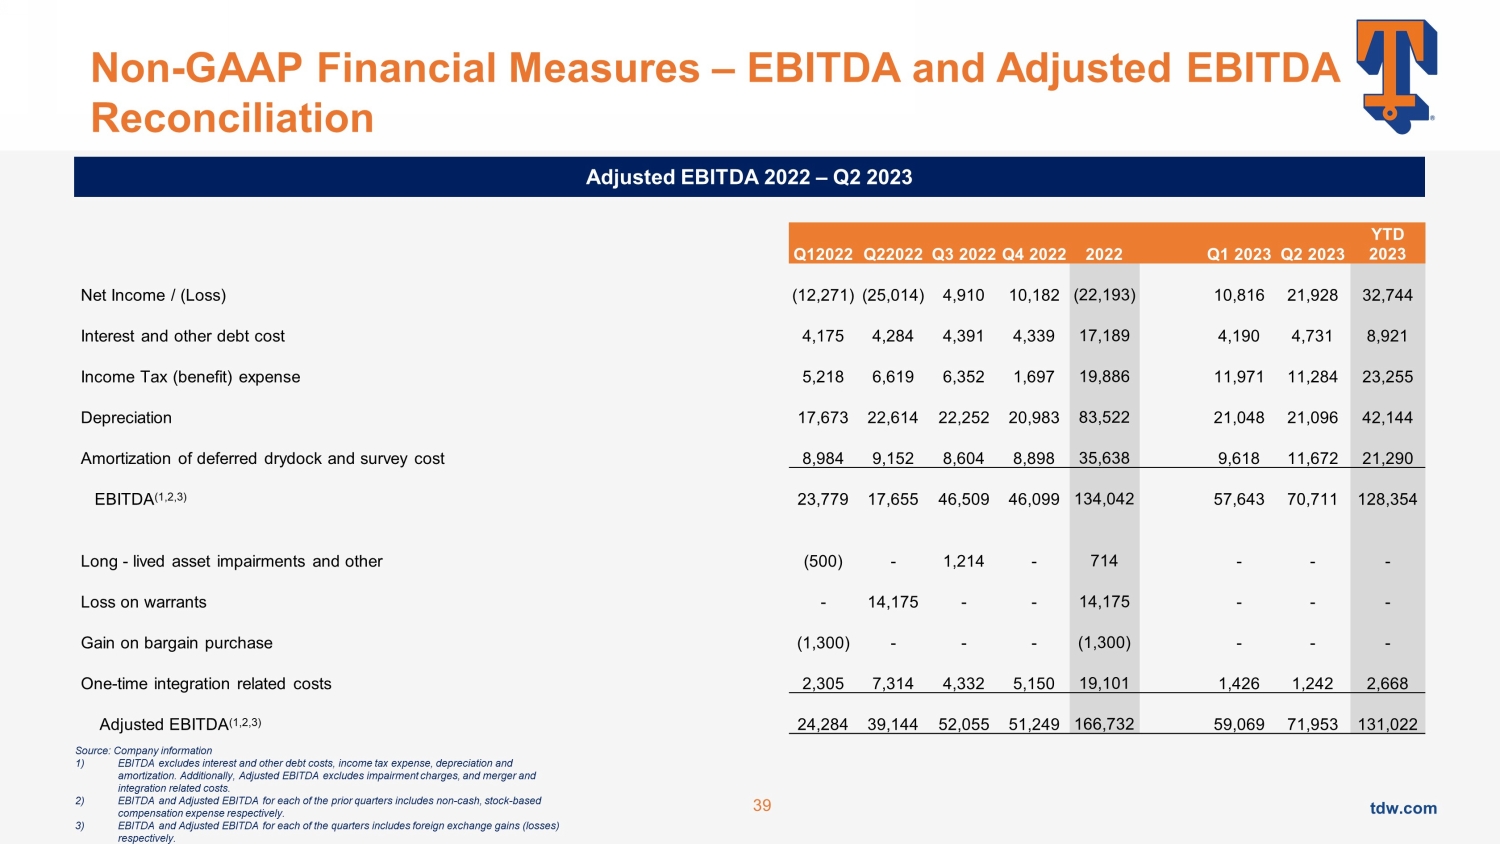
Additionally, Adjusted EBITDA excludes impairment charges, and merger and integration related costs. 2) EBITDA and Adjusted EBITDA for each of the prior quarters includes non - cash, stock - based compensation expense respectively. 3) EBITDA and Adjusted EBITDA for each of the quarters includes foreign exchange gains (losses) respectively. Q12022 Q22022 Q3 2022 Q4 2022 2022 Q1 2023 Q2 2023 YTD 2023 Net Income / (Loss) (12,271) (25,014) 4,910 10,182 (22,193) 10,816 21,928 32,744 Interest and other debt cost 4,175 4,284 4,391 4,339 17,189 4,190 4,731 8,921 Income Tax (benefit) expense 5,218 6,619 6,352 1,697 19,886 11,971 11,284 23,255 Depreciation 17,673 22,614 22,252 20,983 83,522 21,048 21,096 42,144 Amortization of deferred drydock and survey cost 8,984 9,152 8,604 8,898 35,638 9,618 11,672 21,290 EBITDA (1,2,3) 23,779 17,655 46,509 46,099 134,042 57,643 70,711 128,354 Long - lived asset impairments and other (500) - 1,214 - 714 - - - Loss on warrants - 14,175 - - 14,175 - - - Gain on bargain purchase (1,300) - - - (1,300) - - - One - time integration related costs 2,305 7,314 4,332 5,150 19,101 1,426 1,242 2,668 Adjusted EBITDA (1,2,3) 24,284 39,144 52,055 51,249 166,732 59,069 71,953 131,022 Adjusted EBITDA 2022 – Q2 2023 39
tdw.com tdw.com Thank you