UNITED STATES
SECURITIES AND EXCHANGE COMMISSION
Washington, D.C. 20549
FORM 8-K
CURRENT REPORT
PURSUANT TO SECTION 13 OR 15(d) OF THE
SECURITIES EXCHANGE ACT OF 1934
| Date of report (Date of earliest event reported): | September 1, 2023 |
| Ameris Bancorp | ||
|
(Exact Name of Registrant as Specified in Charter)
|
||
| Georgia | 001-13901 | 58-1456434 |
|
(State or Other Jurisdiction of Incorporation) |
(Commission File Number) | (IRS Employer Identification No.) |
| 3490 Piedmont Road N.E., Suite 1550, Atlanta, Georgia | 30305 | |
| (Address of Principal Executive Offices) | (Zip Code) |
| Registrant’s telephone number, including area code: | (404) 639-6500 |
| (Former Name or Former Address, if Changed Since Last Report) |
Check the appropriate box below if the Form 8-K filing is intended to simultaneously satisfy the filing obligation of the registrant under any of the following provisions (see General Instruction A.2. below):
| ¨ | Written communications pursuant to Rule 425 under the Securities Act (17 CFR 230.425) |
| ¨ | Soliciting material pursuant to Rule 14a-12 under the Exchange Act (17 CFR 240.14a-12) |
| ¨ | Pre-commencement communications pursuant to Rule 14d-2(b) under the Exchange Act (17 CFR 240.14d-2(b)) |
| ¨ | Pre-commencement communications pursuant to Rule 13e-4(c) under the Exchange Act (17 CFR 240.13e-4(c)) |
Securities registered pursuant to Section 12(b) of the Act:
| Title of each class | Trading Symbol(s) | Name of each exchange on which registered |
| Common Stock, par value $1.00 per share | ABCB | Nasdaq Global Select Market |
Indicate by check mark whether the registrant is an emerging growth company as defined in Rule 405 of the Securities Act of 1933 (§230.405 of this chapter) or Rule 12b-2 of the Securities Exchange Act of 1934 (§240.12b-2 of this chapter).
Emerging growth company ¨
If an emerging growth company, indicate by check mark if the registrant has elected not to use the extended transition period for complying with any new or revised financial accounting standards provided pursuant to Section 13(a) of the Exchange Act. ¨
| Item 7.01 | Regulation FD Disclosure. |
In connection with various upcoming investor meetings, Ameris Bancorp (the “Company”) will be using certain presentation material, a copy of which is furnished as Exhibit 99.1 to this Current Report on Form 8-K and is incorporated in Item 7.01 of this Current Report by this reference. The investor presentation material is also available on the “Investor Relations” page of the Company’s website (http://www.amerisbank.com).
The information contained in this Item 7.01 and in Exhibit 99.1 attached to this Report is being furnished and shall not be deemed filed for purposes of Section 18 of the Securities Exchange Act of 1934, as amended, or otherwise subject to the liabilities of such section. Furthermore, such information shall not be deemed to be incorporated by reference into any registration statement or other document filed pursuant to the Securities Act of 1933, as amended.
| Item 9.01 | Financial Statements and Exhibits. |
| (d) | Exhibits. |
| 99.1 | Investor Presentation dated September 2023 |
| 104 | Cover Page Interactive Data File (embedded within the Inline XBRL document) |
SIGNATURE
Pursuant to the requirements of the Securities Exchange Act of 1934, as amended, the registrant has duly caused this report to be signed on its behalf by the undersigned, hereunto duly authorized.
| AMERIS BANCORP | ||
| By: | /s/ Nicole S. Stokes | |
| Nicole S. Stokes | ||
| Chief Financial Officer | ||
| Date: September 1, 2023 | ||
Exhibit 99.1

September 2023 Investor Presentation
Cautionary Statements 1 This presentation contains forward - looking statements, as defined by federal securities laws, including, among other forward - looking statements, certain plans, expectations and goals . Words such as “may,” “believe,” “expect,” “anticipate,” “intend,” “will,” “should,” “plan,” “estimate,” “predict,” “continue” and “potential” or the negative of these terms or other comparable terminology, as well as similar expressions, are meant to identify forward - looking statements . The forward - looking statements in this presentation are based on current expectations and are provided to assist in the understanding of potential future performance . Such forward - looking statements involve numerous assumptions, risks and uncertainties that may cause actual results to differ materially from those expressed or implied in any such statements, including, without limitation, the following : general competitive, economic, unemployment, political and market conditions and fluctuations, including real estate market conditions, and the effects of such conditions and fluctuations on the creditworthiness of borrowers, collateral values, asset recovery values and the value of investment securities ; movements in interest rates and their impacts on net interest margin, investment security valuations and other performance measures ; expectations on credit quality and performance ; legislative and regulatory changes ; changes in U . S . government monetary and fiscal policy ; competitive pressures on product pricing and services ; the cost savings and any revenue synergies expected to result from acquisition transactions, which may not be fully realized within the expected timeframes if at all ; the success and timing of other business strategies ; our outlook and long - term goals for future growth ; and natural disasters, geopolitical events, acts of war or terrorism or other hostilities, public health crises and other catastrophic events beyond our control . For a discussion of some of the other risks and other factors that may cause such forward - looking statements to differ materially from actual results, please refer to the Company’s filings with the Securities and Exchange Commission, including the Company’s Annual Report on Form 10 - K for the year ended December 31 , 2022 and the Company’s subsequently filed periodic reports and other filings . Forward - looking statements speak only as of the date they are made, and the Company undertakes no obligation to update or revise forward - looking statements .
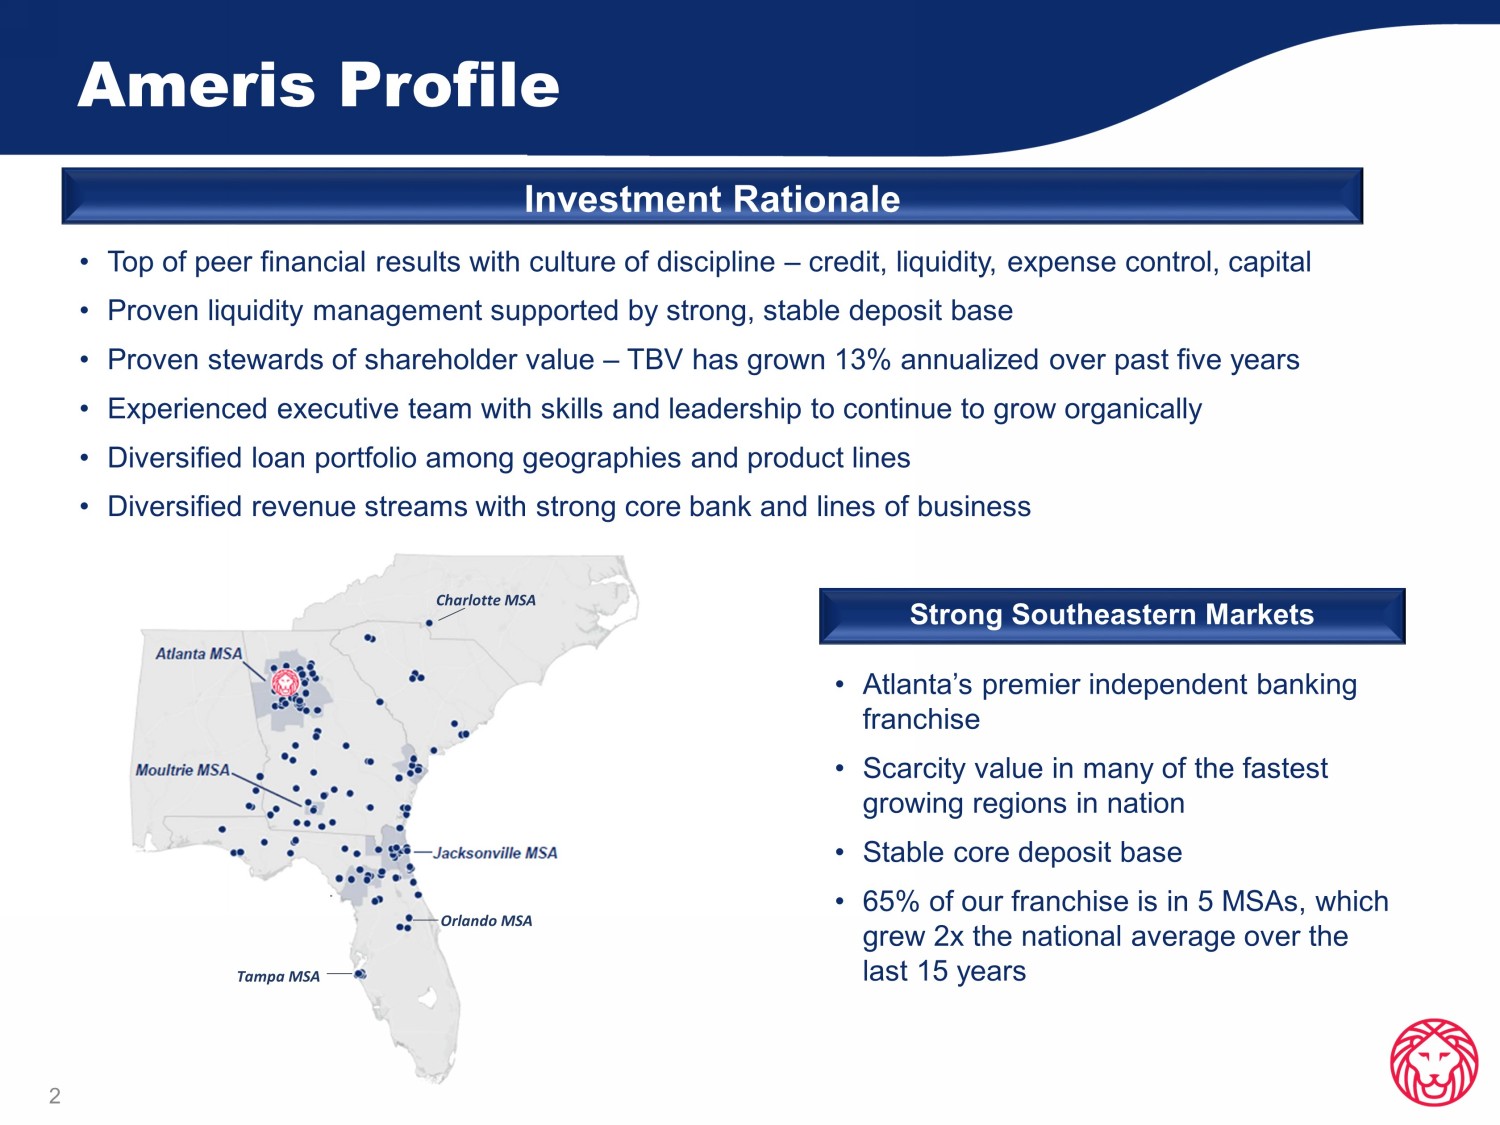
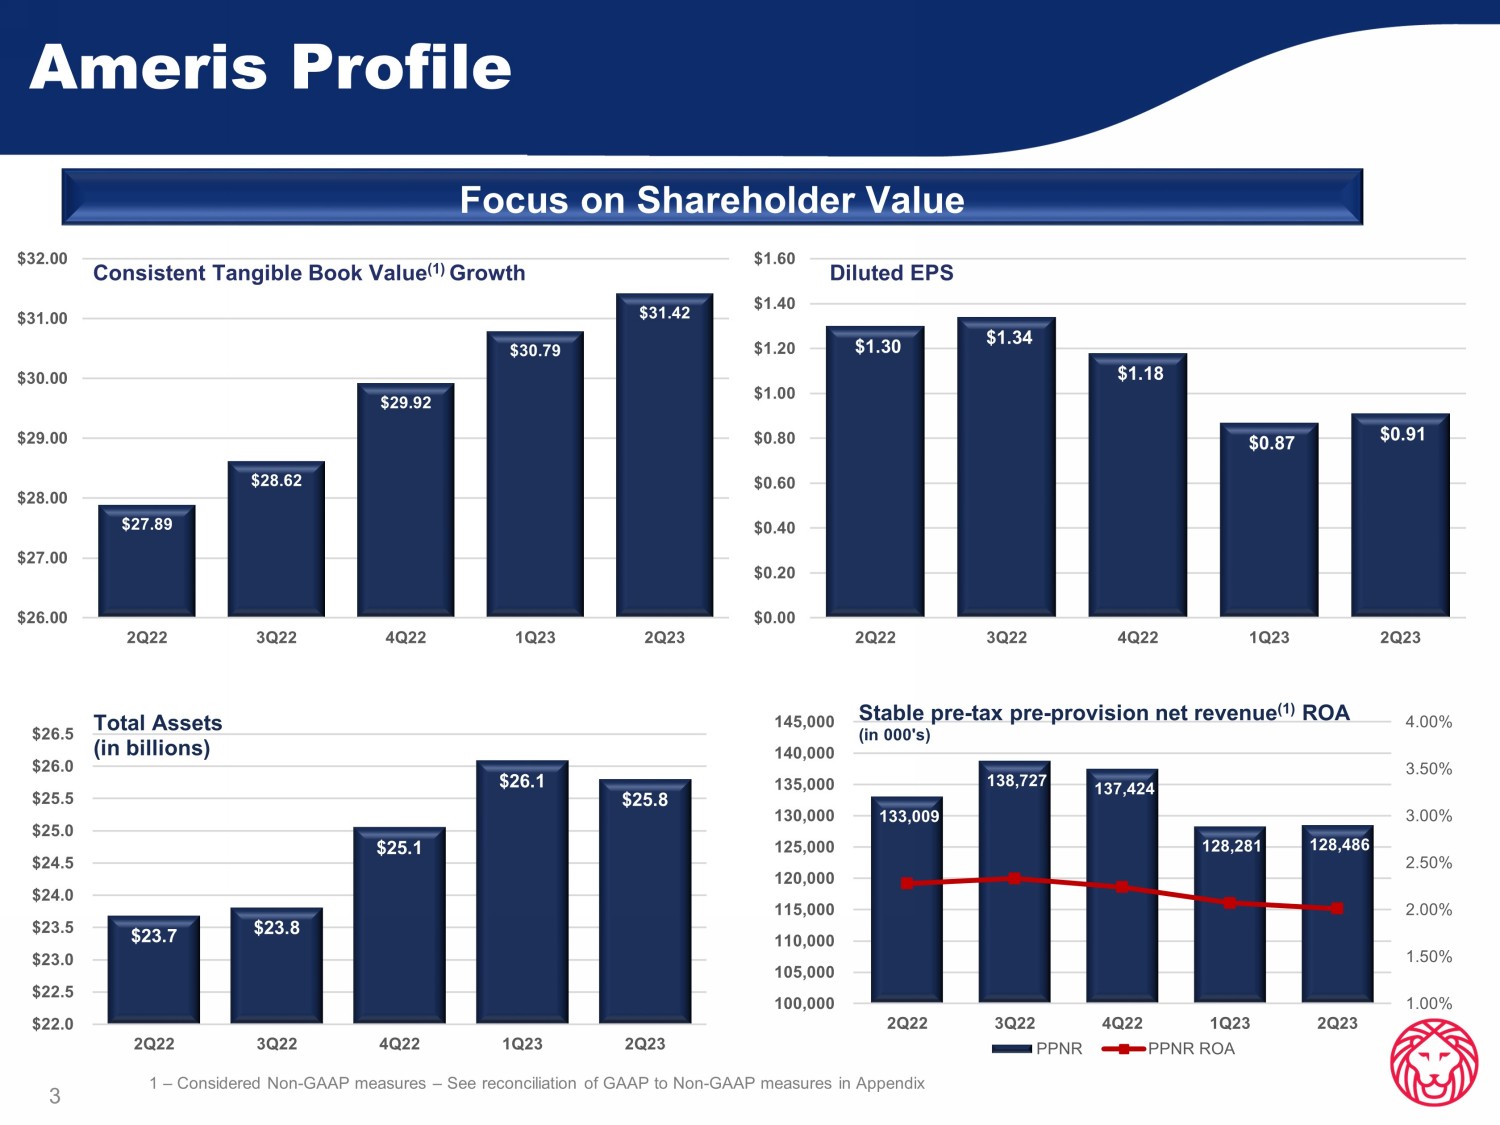
Ameris Profile Investment Rationale • Top of peer financial results with culture of discipline – credit, liquidity, expense control, capital • Proven liquidity management supported by strong, stable deposit base • Proven stewards of shareholder value – TBV has grown 13 % annualized over past five years • Experienced executive team with skills and leadership to continue to grow organically • Diversified loan portfolio among geographies and product lines • Diversified revenue streams with strong core bank and lines of business Strong Southeastern Markets • Atlanta’s premier independent banking franchise • Scarcity value in many of the fastest growing regions in nation • Stable core deposit base • 65% of our franchise is in 5 MSAs, which grew 2x the national average over the last 15 years 2 Charlotte MSA Tampa MSA Orlando MSA Ameris Profile 3 Focus on Shareholder Value $27.89 $28.62 $29.92 $30.79 $31.42 $26.00 $27.00 $28.00 $29.00 $30.00 $31.00 $32.00 2Q22 3Q22 4Q22 1Q23 2Q23 Consistent Tangible Book Value (1) Growth $1.30 $1.34 $1.18 $0.87 $0.91 $0.00 $0.20 $0.40 $0.60 $0.80 $1.00 $1.20 $1.40 $1.60 2Q22 3Q22 4Q22 1Q23 2Q23 Diluted EPS $23.7 $23.8 $25.1 $26.1 $25.8 $22.0 $22.5 $23.0 $23.5 $24.0 $24.5 $25.0 $25.5 $26.0 $26.5 2Q22 3Q22 4Q22 1Q23 2Q23 Total Assets (in billions) 133,009 138,727 137,424 128,281 128,486 1.00% 1.50% 2.00% 2.50% 3.00% 3.50% 4.00% 100,000 105,000 110,000 115,000 120,000 125,000 130,000 135,000 140,000 145,000 2Q22 3Q22 4Q22 1Q23 2Q23 Stable pre - tax pre - provision net revenue (1) ROA (in 000's) PPNR PPNR ROA 1 – Considered Non - GAAP measures – See reconciliation of GAAP to Non - GAAP measures in Appendix

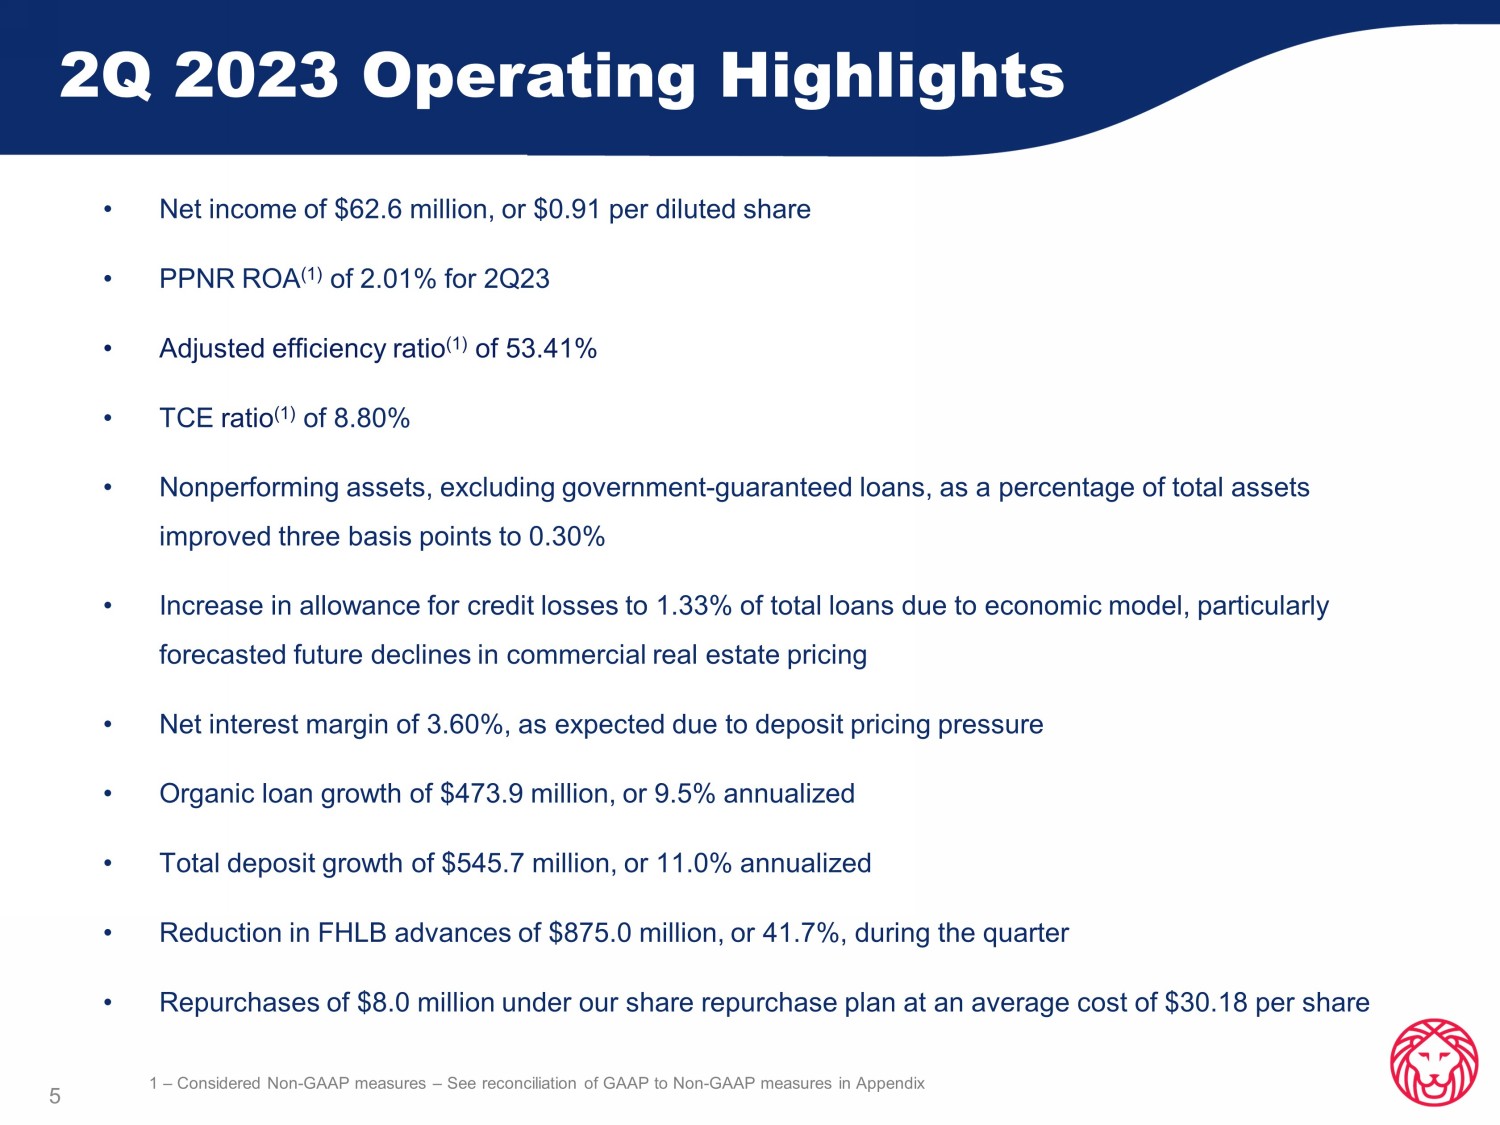
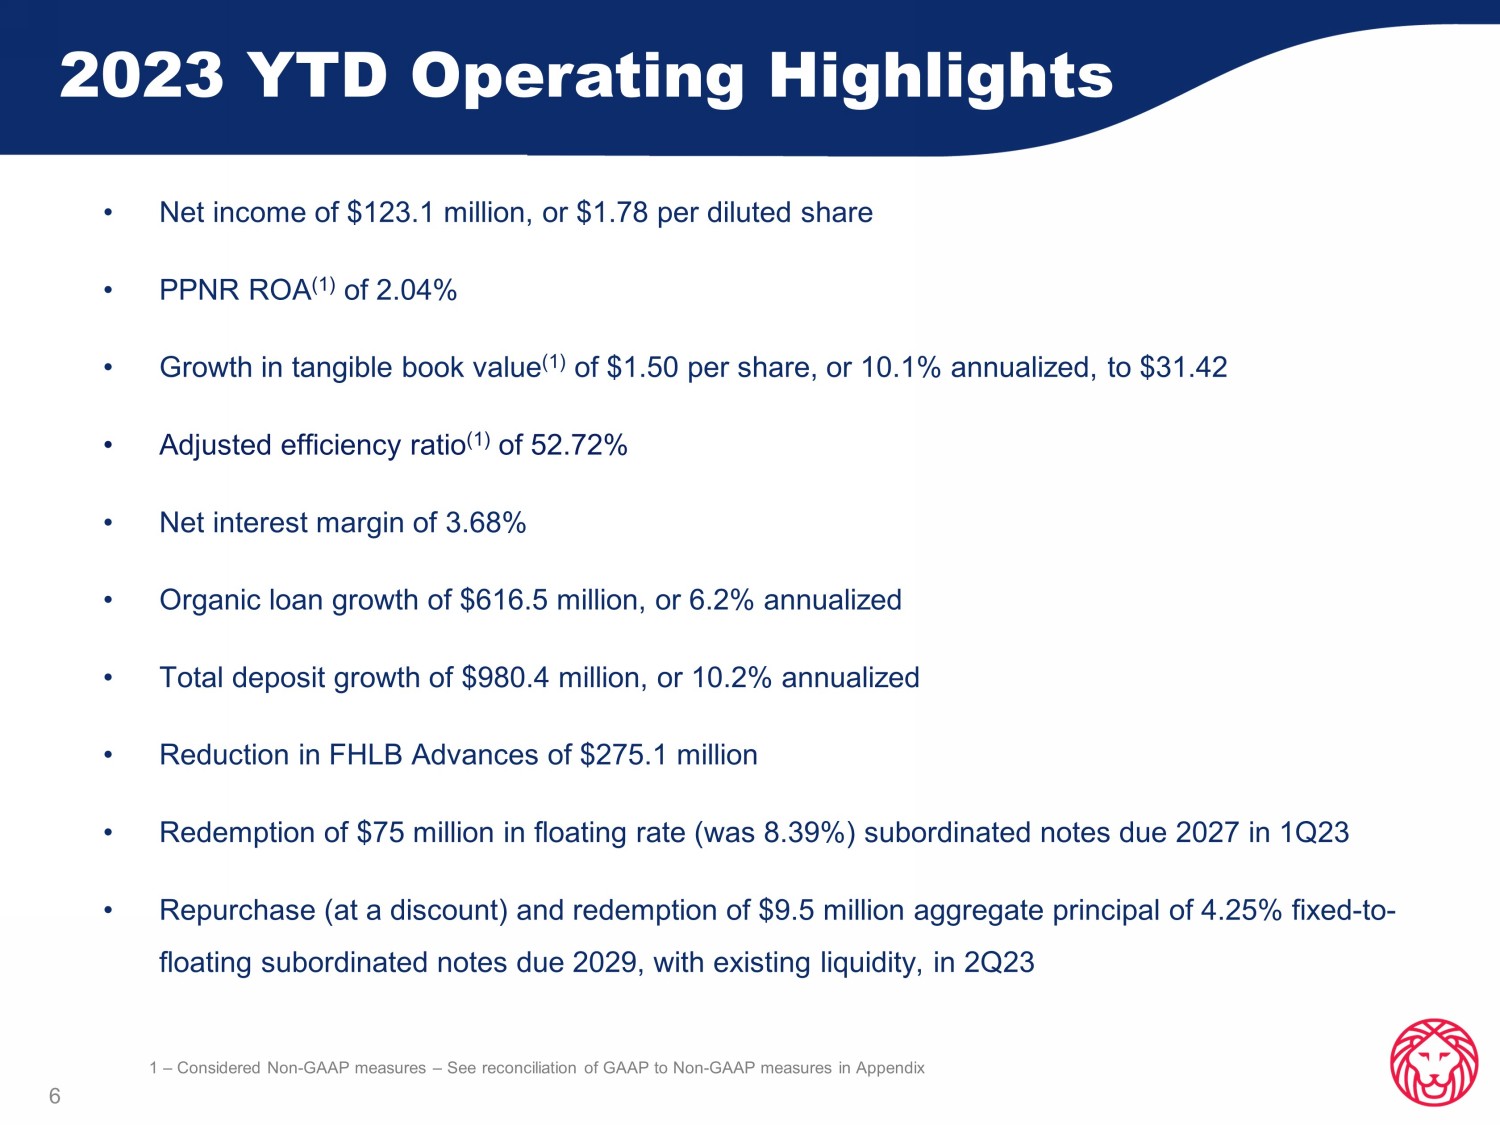
2 nd Quarter 2023 Financial Results 2Q 2023 Operating Highlights 5 • Net income of $62.6 million, or $0.91 per diluted share • PPNR ROA (1) of 2.01% for 2Q23 • Adjusted efficiency ratio (1) of 53.41% • TCE ratio (1) of 8.80% • Nonperforming assets, excluding government - guaranteed loans, as a percentage of total assets improved three basis points to 0.30% • Increase in allowance for credit losses to 1.33% of total loans due to economic model, particularly forecasted future declines in commercial real estate pricing • Net interest margin of 3.60%, as expected due to deposit pricing pressure • Organic loan growth of $473.9 million, or 9.5% annualized • Total deposit growth of $545.7 million, or 11.0% annualized • Reduction in FHLB advances of $875.0 million, or 41.7%, during the quarter • Repurchases of $8.0 million under our share repurchase plan at an average cost of $30.18 per share 1 – Considered Non - GAAP measures – See reconciliation of GAAP to Non - GAAP measures in Appendix 2023 YTD Operating Highlights 6 • Net income of $123.1 million, or $1.78 per diluted share • PPNR ROA (1) of 2.04% • Growth in tangible book value (1) of $1.50 per share, or 10.1% annualized, to $31.42 • Adjusted efficiency ratio (1) of 52.72% • Net interest margin of 3.68% • Organic loan growth of $616.5 million, or 6.2% annualized • Total deposit growth of $980.4 million, or 10.2% annualized • Reduction in FHLB Advances of $275.1 million • Redemption of $75 million in floating rate (was 8.39%) subordinated notes due 2027 in 1Q23 • Repurchase (at a discount) and redemption of $9.5 million aggregate principal of 4.25% fixed - to - floating subordinated notes due 2029, with existing liquidity, in 2Q23 1 – Considered Non - GAAP measures – See reconciliation of GAAP to Non - GAAP measures in Appendix
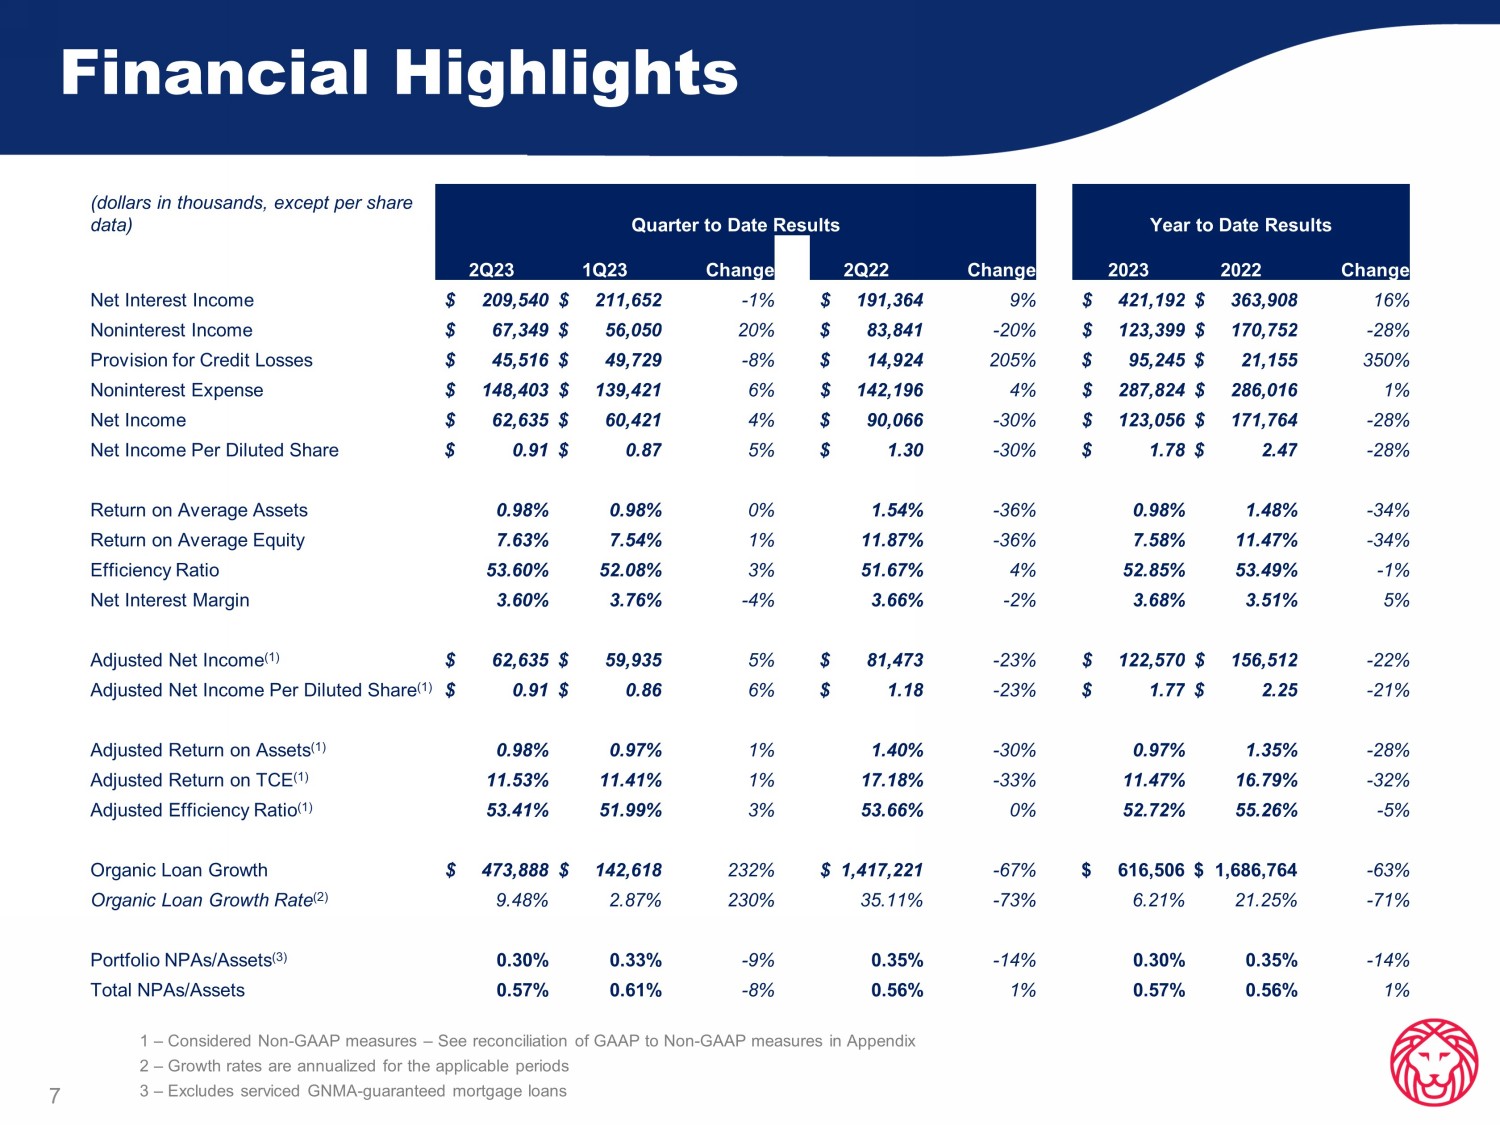
Financial Highlights 7 1 – Considered Non - GAAP measures – See reconciliation of GAAP to Non - GAAP measures in Appendix 2 – Growth rates are annualized for the applicable periods 3 – Excludes serviced GNMA - guaranteed mortgage loans (dollars in thousands, except per share data) Quarter to Date Results Year to Date Results 2Q23 1Q23 Change 2Q22 Change 2023 2022 Change Net Interest Income $ 209,540 $ 211,652 - 1% $ 191,364 9% $ 421,192 $ 363,908 16% Noninterest Income $ 67,349 $ 56,050 20% $ 83,841 - 20% $ 123,399 $ 170,752 - 28% Provision for Credit Losses $ 45,516 $ 49,729 - 8% $ 14,924 205% $ 95,245 $ 21,155 350% Noninterest Expense $ 148,403 $ 139,421 6% $ 142,196 4% $ 287,824 $ 286,016 1% Net Income $ 62,635 $ 60,421 4% $ 90,066 - 30% $ 123,056 $ 171,764 - 28% Net Income Per Diluted Share $ 0.91 $ 0.87 5% $ 1.30 - 30% $ 1.78 $ 2.47 - 28% Return on Average Assets 0.98% 0.98% 0% 1.54% - 36% 0.98% 1.48% - 34% Return on Average Equity 7.63% 7.54% 1% 11.87% - 36% 7.58% 11.47% - 34% Efficiency Ratio 53.60% 52.08% 3% 51.67% 4% 52.85% 53.49% - 1% Net Interest Margin 3.60% 3.76% - 4% 3.66% - 2% 3.68% 3.51% 5% Adjusted Net Income (1) $ 62,635 $ 59,935 5% $ 81,473 - 23% $ 122,570 $ 156,512 - 22% Adjusted Net Income Per Diluted Share (1) $ 0.91 $ 0.86 6% $ 1.18 - 23% $ 1.77 $ 2.25 - 21% Adjusted Return on Assets (1) 0.98% 0.97% 1% 1.40% - 30% 0.97% 1.35% - 28% Adjusted Return on TCE (1) 11.53% 11.41% 1% 17.18% - 33% 11.47% 16.79% - 32% Adjusted Efficiency Ratio (1) 53.41% 51.99% 3% 53.66% 0% 52.72% 55.26% - 5% Organic Loan Growth $ 473,888 $ 142,618 232% $ 1,417,221 - 67% $ 616,506 $ 1,686,764 - 63% Organic Loan Growth Rate (2) 9.48% 2.87% 230% 35.11% - 73% 6.21% 21.25% - 71% Portfolio NPAs/Assets (3) 0.30% 0.33% - 9% 0.35% - 14% 0.30% 0.35% - 14% Total NPAs/Assets 0.57% 0.61% - 8% 0.56% 1% 0.57% 0.56% 1% Diversified Revenue Stream 8 • Strong revenue base of net interest income from core banking division • Additional revenue provided by our diversified lines of business Mortgage Banking Activity • Retail mortgage activity has continued to stabilize back to pre - pandemic levels • Mortgage banking activity, exclusive of MSR valuation, was 15% of total revenue in 2Q23, down from 17% a year ago • Purchase business was near historic levels at 85% in 2Q23 due to strong core relationships with builders and realtors • Approximately 84% of the net interest income included in mortgage revenue is related to portfolio loans generated from the mortgage division • Gain on sale margin continues to improve from historic low in 4Q22 Other Noninterest Income • Other Noninterest Income has been stable contributor to total revenue • Noninterest Income from the equipment finance group was approximately $5.4 million in 2Q23 • Other Noninterest Income also includes BOLI income and gains on sale of SBA loans • Gain on debt redemption of $1.0 million 70% 77% 82% 79% 76% 17% 14% 8% 12% 15% 9% 9% 9% 9% 10% $276.2 $279.2 $273.4 $268.6 $277.8 0% 20% 40% 60% 80% 100% 120% 2Q22 3Q22 4Q22 1Q23 2Q23 FTE Revenue Sources (in millions) MSR (Impairment) Recovery Other Noninterest Income Mortgage Banking Activity (Excl.
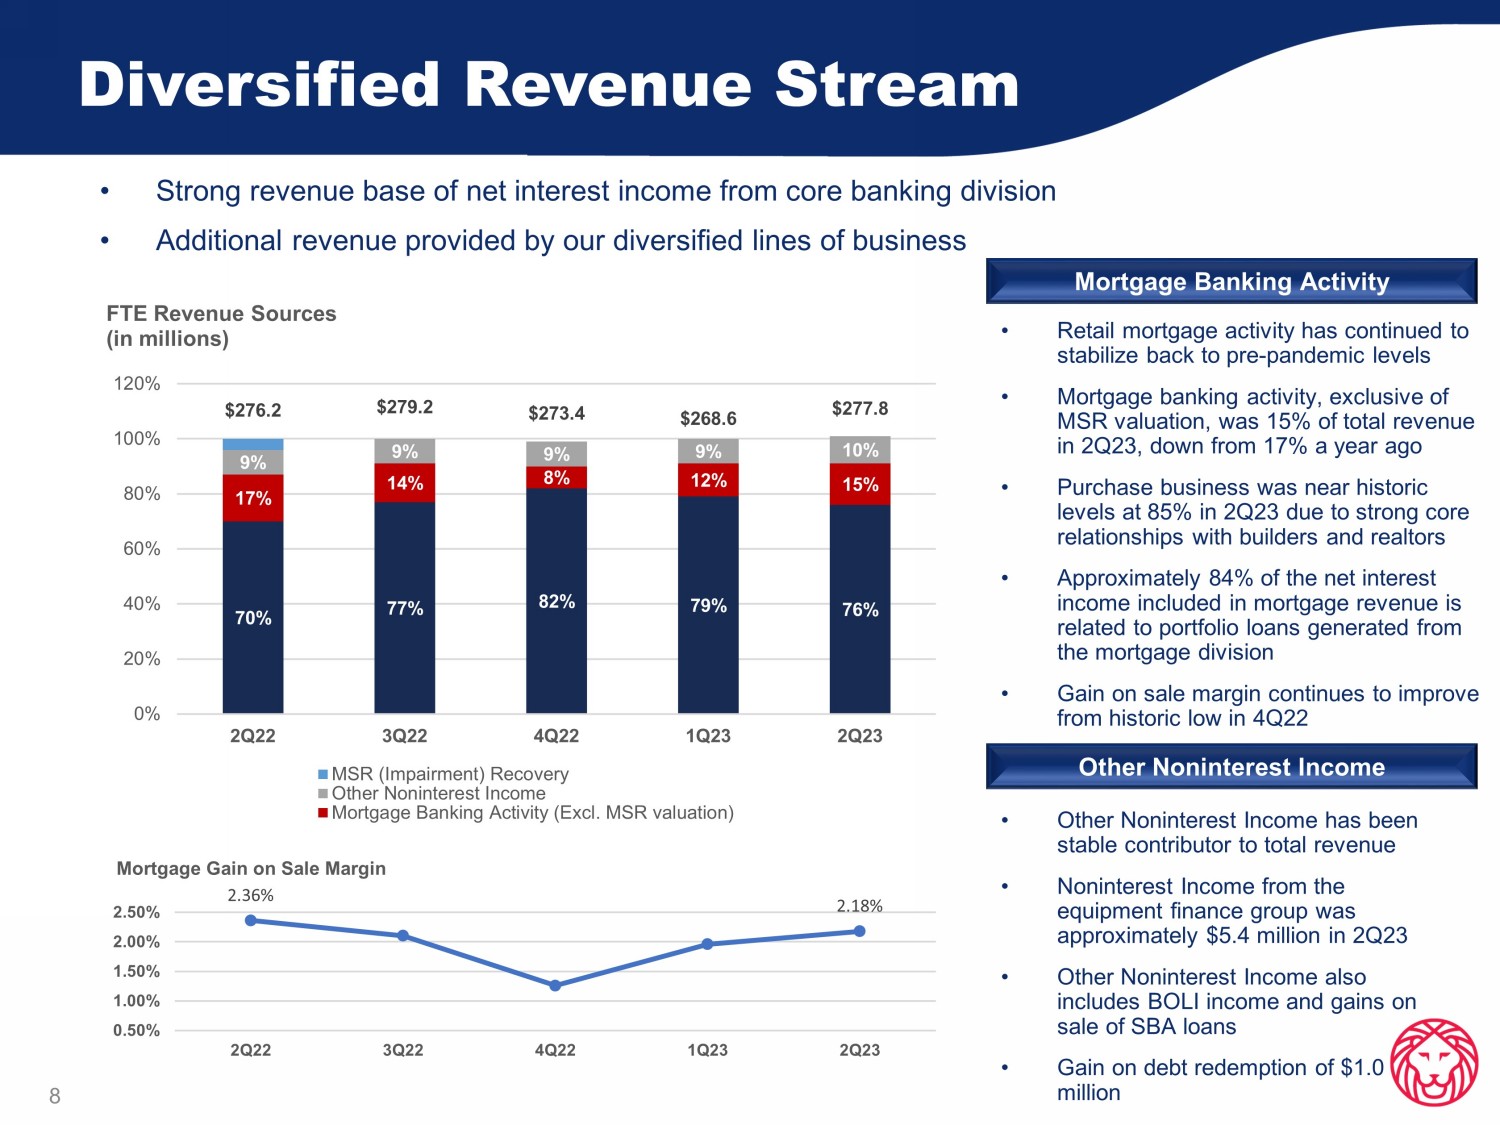
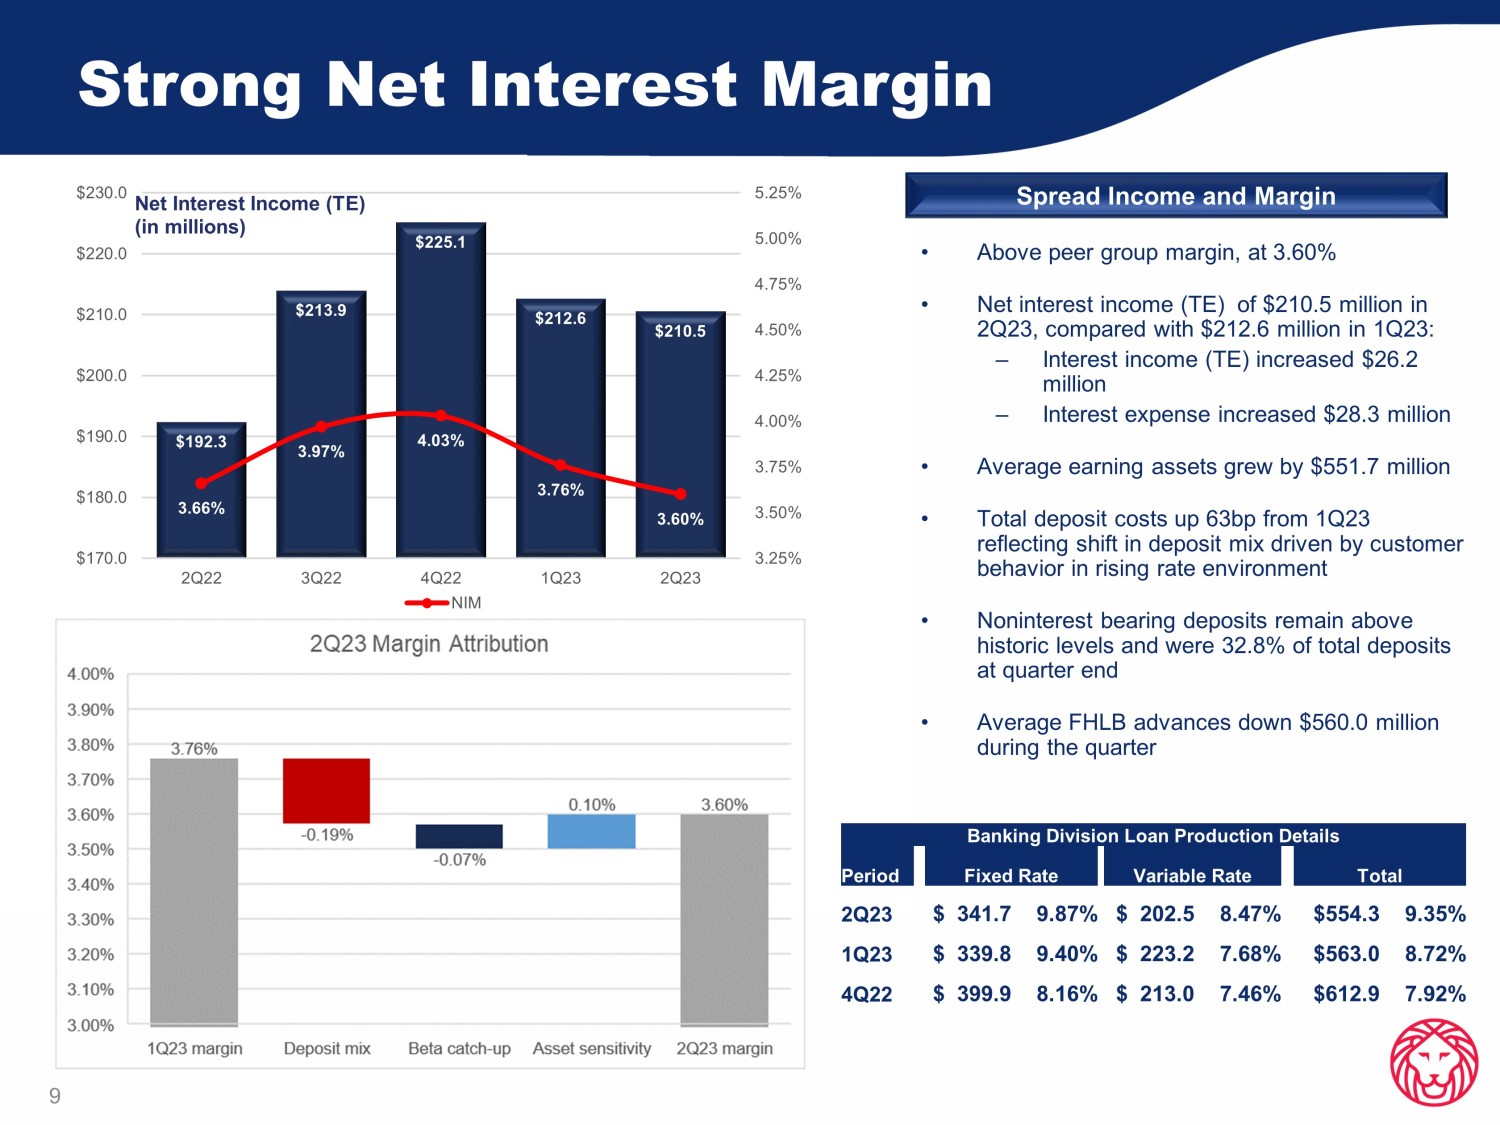
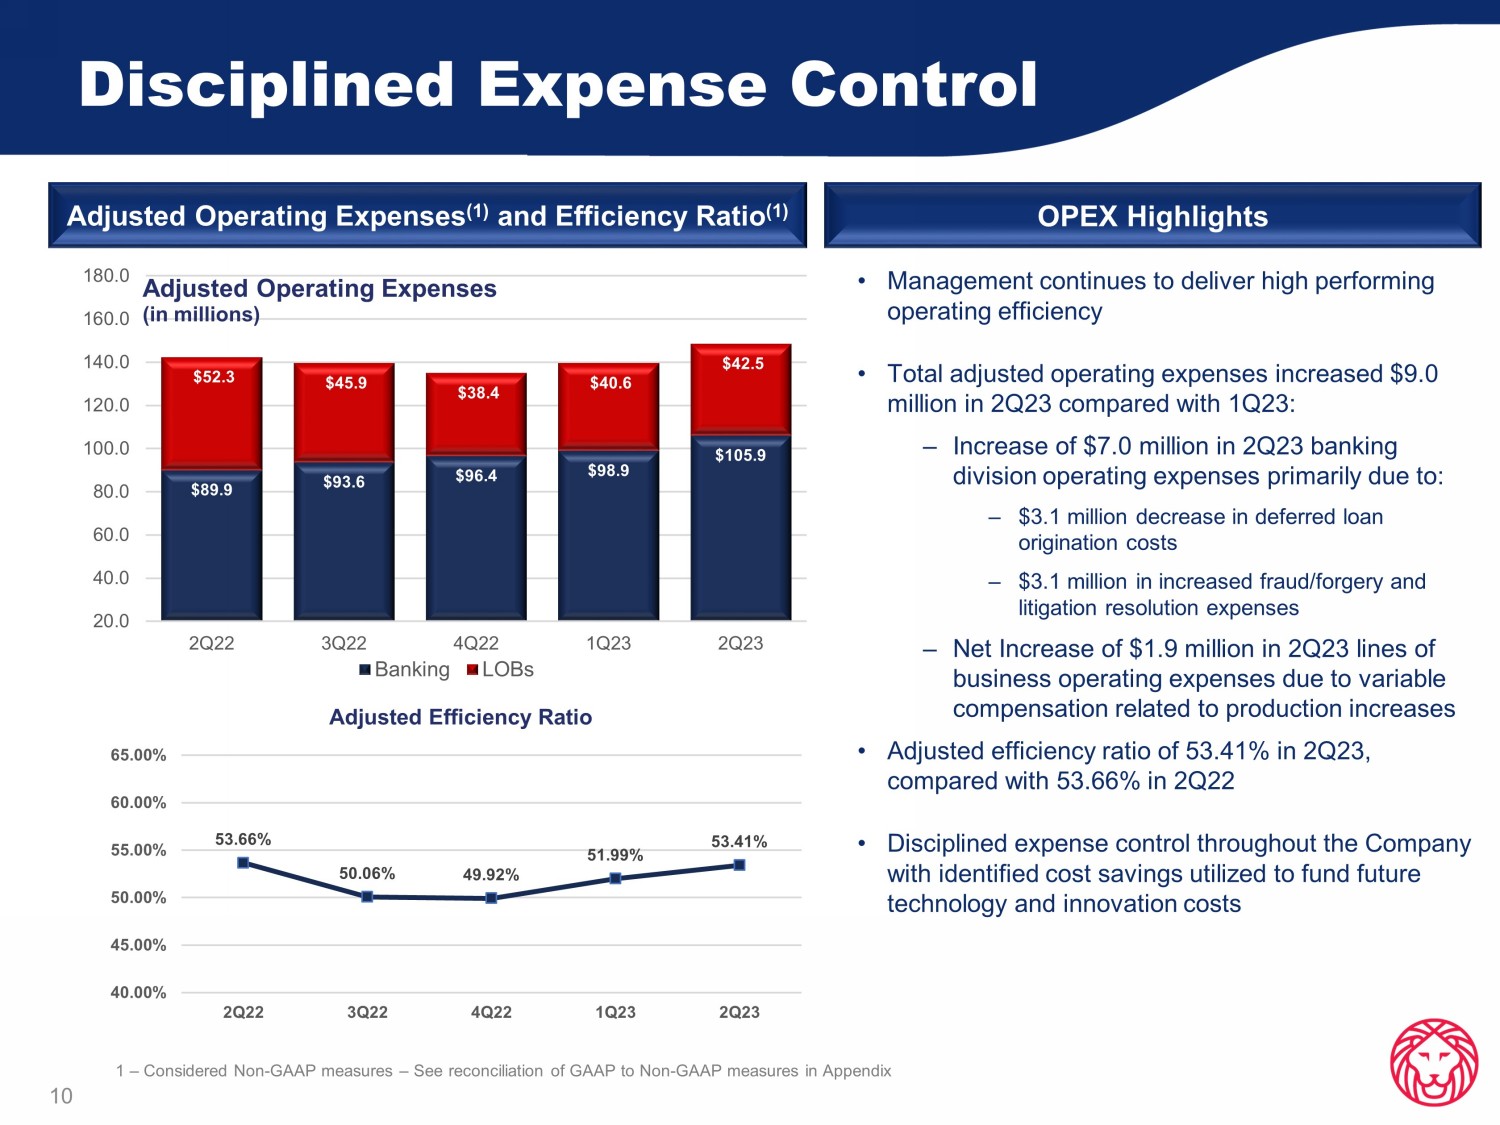
MSR valuation) 2.36% 2.18% 0.50% 1.00% 1.50% 2.00% 2.50% 2Q22 3Q22 4Q22 1Q23 2Q23 Mortgage Gain on Sale Margin Strong Net Interest Margin 9 Banking Division Loan Production Details Period Fixed Rate Variable Rate Total 2Q23 $ 341.7 9.87% $ 202.5 8.47% $554.3 9.35% 1Q23 $ 339.8 9.40% $ 223.2 7.68% $563.0 8.72% 4Q22 $ 399.9 8.16% $ 213.0 7.46% $612.9 7.92% • Above peer group margin, at 3.60% • Net interest income (TE) of $210.5 million in 2Q23, compared with $212.6 million in 1Q23: – Interest income (TE) increased $26.2 million – Interest expense increased $28.3 million • Average earning assets grew by $551.7 million • Total deposit costs up 63bp from 1Q23 reflecting shift in deposit mix driven by customer behavior in rising rate environment • Noninterest bearing deposits remain above historic levels and were 32.8% of total deposits at quarter end • Average FHLB advances down $560.0 million during the quarter Spread Income and Margin $192.3 $213.9 $225.1 $212.6 $210.5 3.66% 3.97% 4.03% 3.76% 3.60% 3.25% 3.50% 3.75% 4.00% 4.25% 4.50% 4.75% 5.00% 5.25% $170.0 $180.0 $190.0 $200.0 $210.0 $220.0 $230.0 2Q22 3Q22 4Q22 1Q23 2Q23 Net Interest Income (TE) (in millions) NIM Disciplined Expense Control Adjusted Operating Expenses (1) and Efficiency Ratio (1) OPEX Highlights 10 • Management continues to deliver high performing operating efficiency • Total adjusted operating expenses increased $9.0 million in 2Q23 compared with 1Q23: ‒ Increase of $7.0 million in 2Q23 banking division operating expenses primarily due to: ‒ $3.1 million decrease in deferred loan origination costs ‒ $3.1 million in increased fraud/forgery and litigation resolution expenses – Net Increase of $1.9 million in 2Q23 lines of business operating expenses due to variable compensation related to production increases • Adjusted efficiency ratio of 53.41% in 2Q23, compared with 53.66% in 2Q22 • Disciplined expense control throughout the Company with identified cost savings utilized to fund future technology and innovation costs 1 – Considered Non - GAAP measures – See reconciliation of GAAP to Non - GAAP measures in Appendix $89.9 $93.6 $96.4 $98.9 $105.9 $52.3 $45.9 $38.4 $40.6 $42.5 20.0 40.0 60.0 80.0 100.0 120.0 140.0 160.0 180.0 2Q22 3Q22 4Q22 1Q23 2Q23 Adjusted Operating Expenses (in millions) Banking LOBs 53.66% 50.06% 49.92% 51.99% 53.41% 40.00% 45.00% 50.00% 55.00% 60.00% 65.00% 2Q22 3Q22 4Q22 1Q23 2Q23 Adjusted Efficiency Ratio
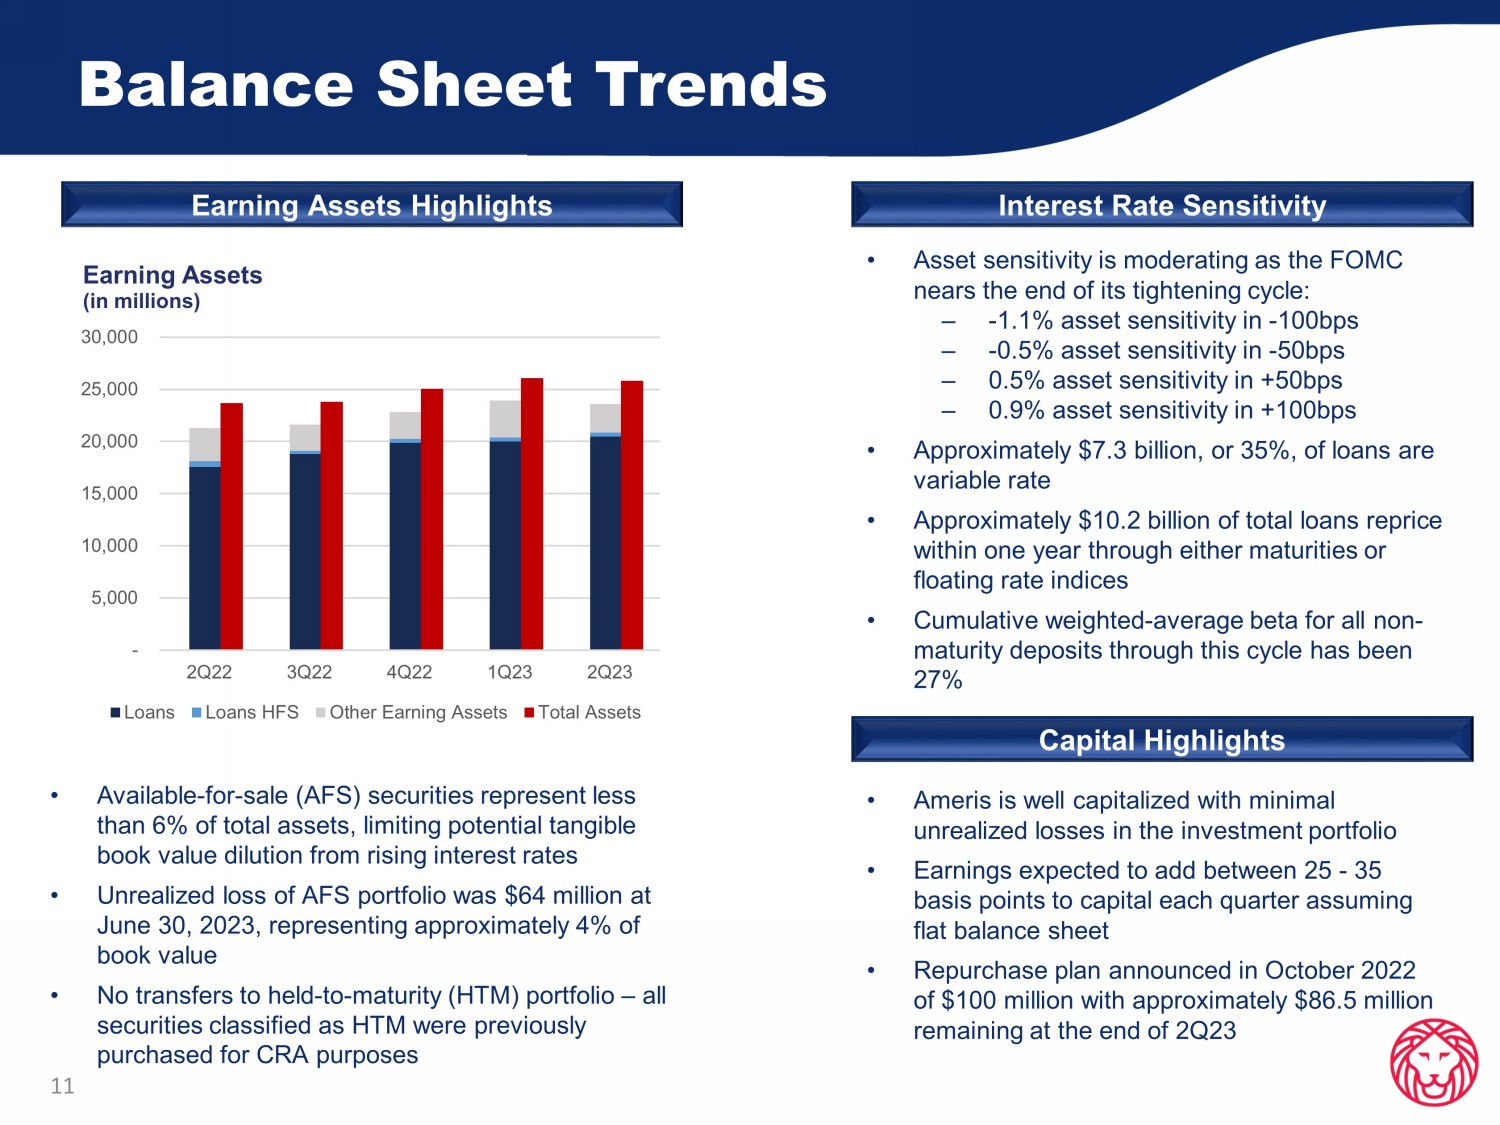
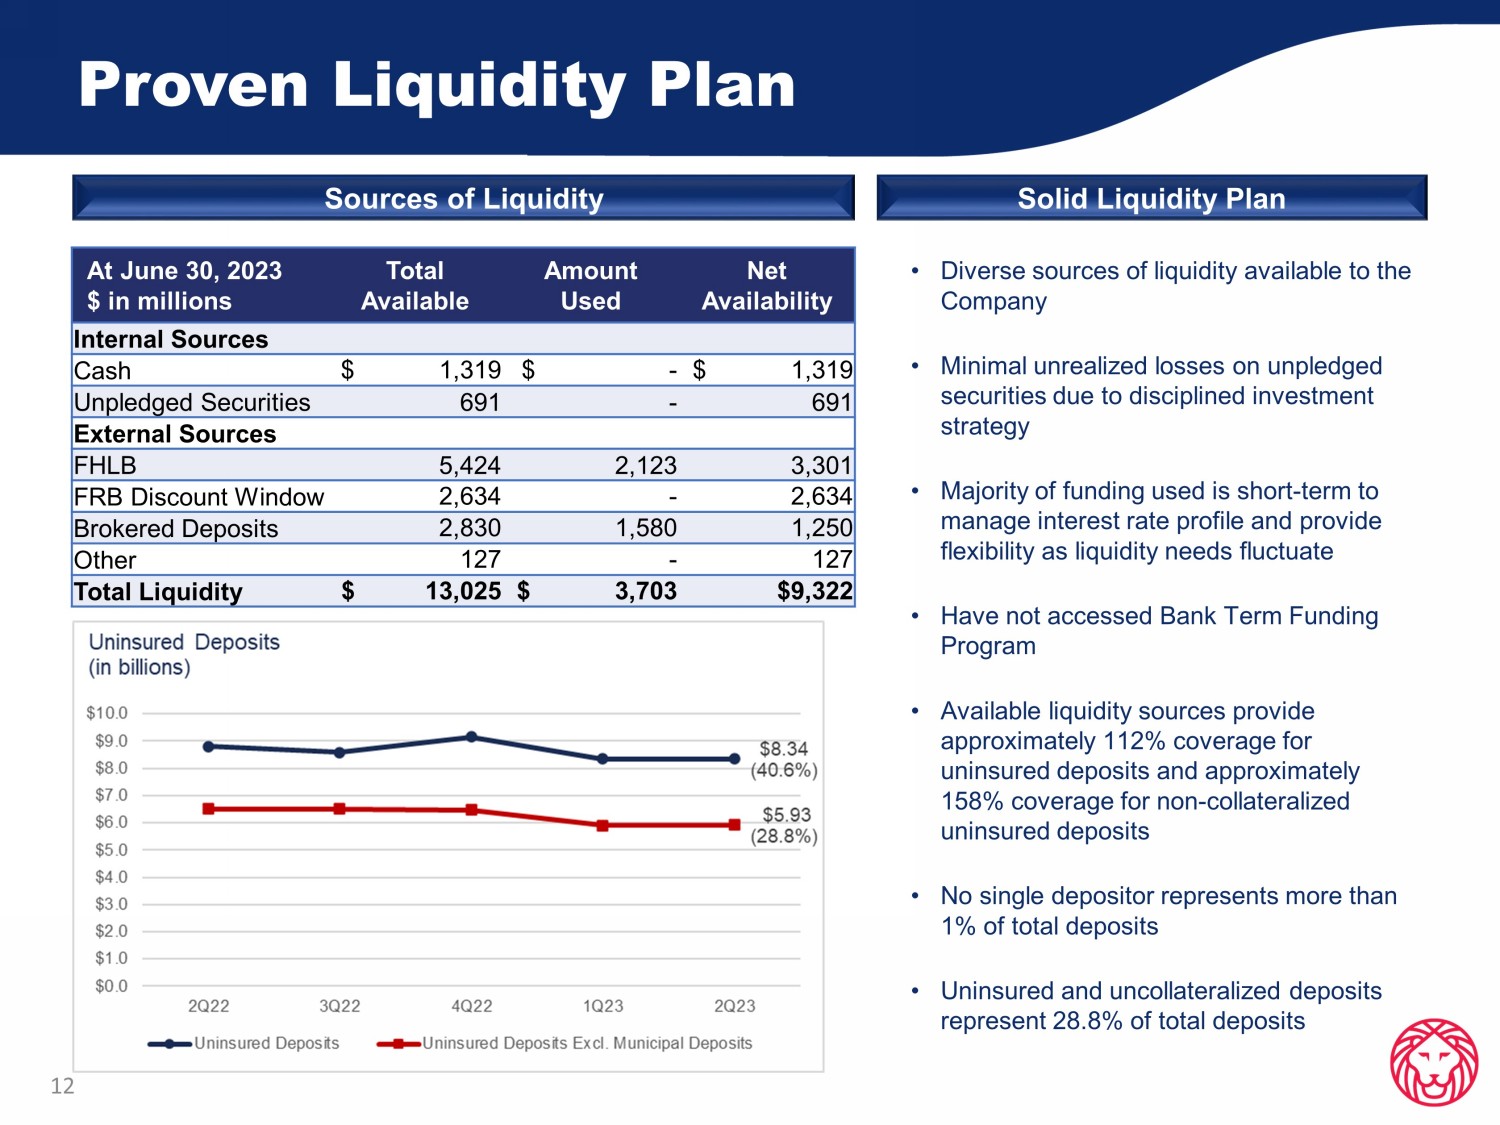
Balance Sheet Trends 11 • Asset sensitivity is moderating as the FOMC nears the end of its tightening cycle: – - 1.1% asset sensitivity in - 100bps – - 0.5% asset sensitivity in - 50bps – 0.5% asset sensitivity in +50bps – 0.9% asset sensitivity in +100bps • Approximately $7.3 billion, or 35%, of loans are variable rate • Approximately $10.2 billion of total loans reprice within one year through either maturities or floating rate indices • Cumulative weighted - average beta for all non - maturity deposits through this cycle has been 27% Interest Rate Sensitivity Earning Assets Highlights • Available - for - sale (AFS) securities represent less than 6% of total assets, limiting potential tangible book value dilution from rising interest rates • Unrealized loss of AFS portfolio was $64 million at June 30, 2023, representing approximately 4% of book value • No transfers to held - to - maturity (HTM) portfolio – all securities classified as HTM were previously purchased for CRA purposes - 5,000 10,000 15,000 20,000 25,000 30,000 2Q22 3Q22 4Q22 1Q23 2Q23 Earning Assets (in millions) Loans Loans HFS Other Earning Assets Total Assets Capital Highlights • Ameris is well capitalized with minimal unrealized losses in the investment portfolio • Earnings expected to add between 25 - 35 basis points to capital each quarter assuming flat balance sheet • Repurchase plan announced in October 2022 of $100 million with approximately $86.5 million remaining at the end of 2Q23 Proven Liquidity Plan 12 At June 30, 2023 $ in millions Total Available Amount Used Net Availability Internal Sources Cash $ 1,319 $ - $ 1,319 Unpledged Securities 691 - 691 External Sources FHLB 5,424 2,123 3,301 FRB Discount Window 2,634 - 2,634 Brokered Deposits 2,830 1,580 1,250 Other 127 - 127 Total Liquidity $ 13,025 $ 3,703 $9,322 • Diverse sources of liquidity available to the Company • Minimal unrealized losses on unpledged securities due to disciplined investment strategy • Majority of funding used is short - term to manage interest rate profile and provide flexibility as liquidity needs fluctuate • Have not accessed Bank Term Funding Program • Available liquidity sources provide approximately 112% coverage for uninsured deposits and approximately 158% coverage for non - collateralized uninsured deposits • No single depositor represents more than 1% of total deposits • Uninsured and uncollateralized deposits represent 28.8% of total deposits Sources of Liquidity Solid Liquidity Plan
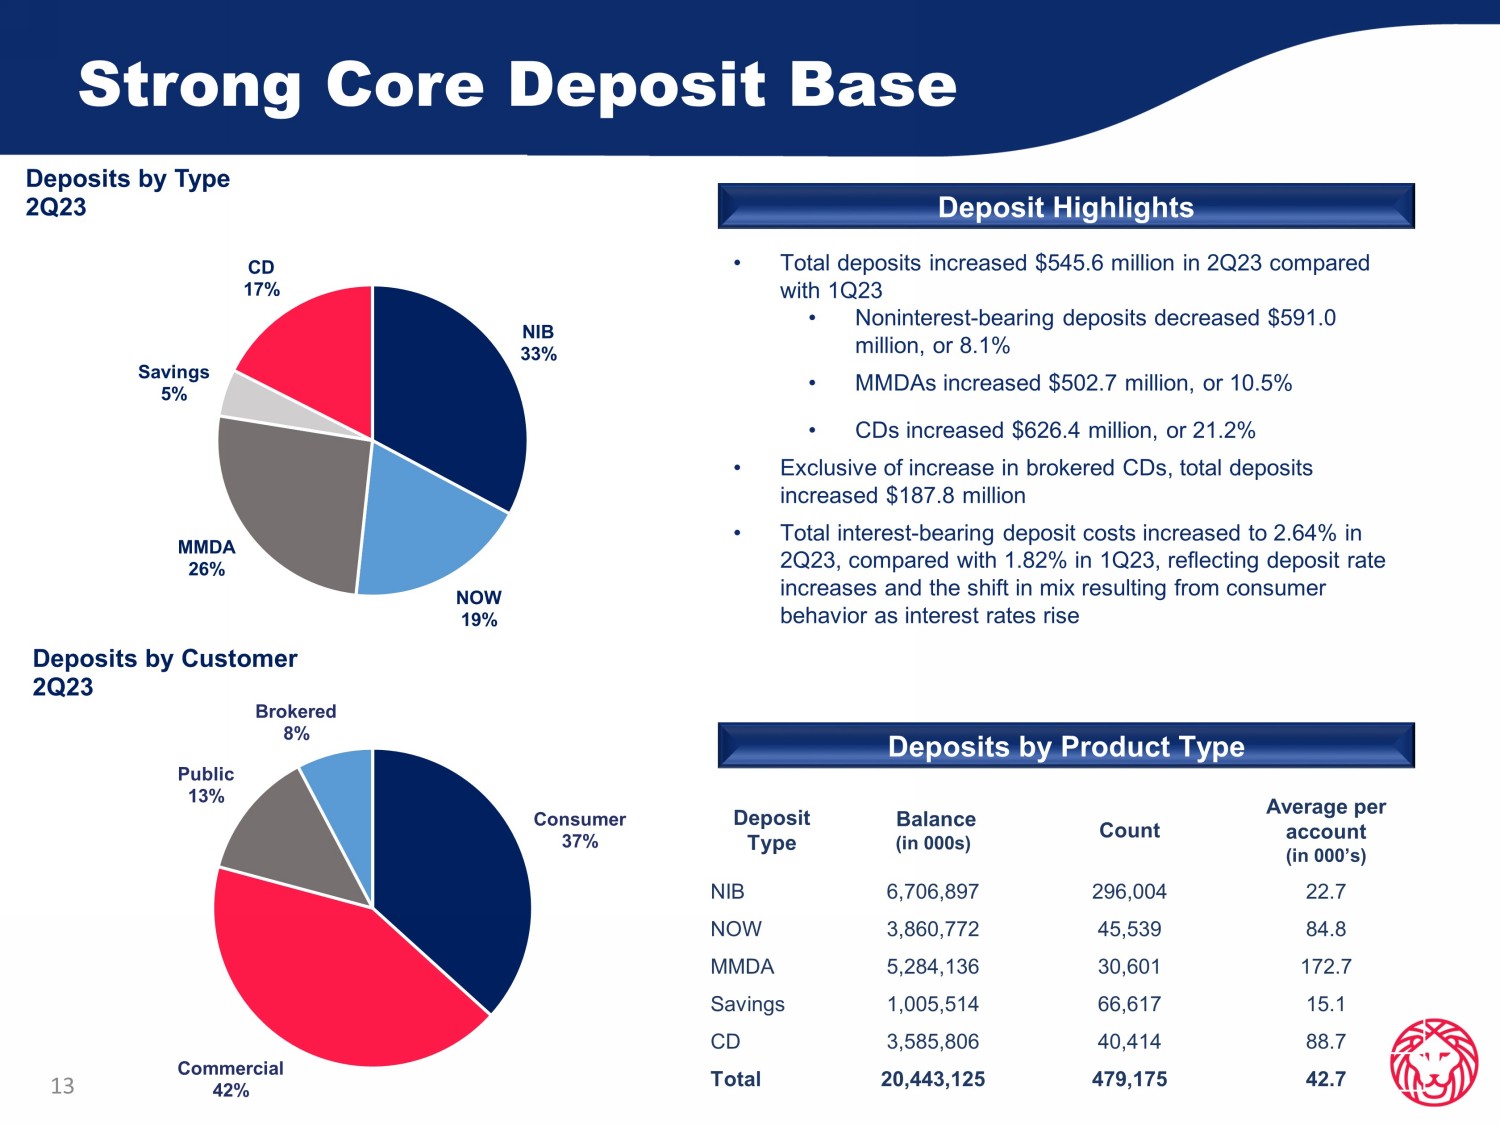
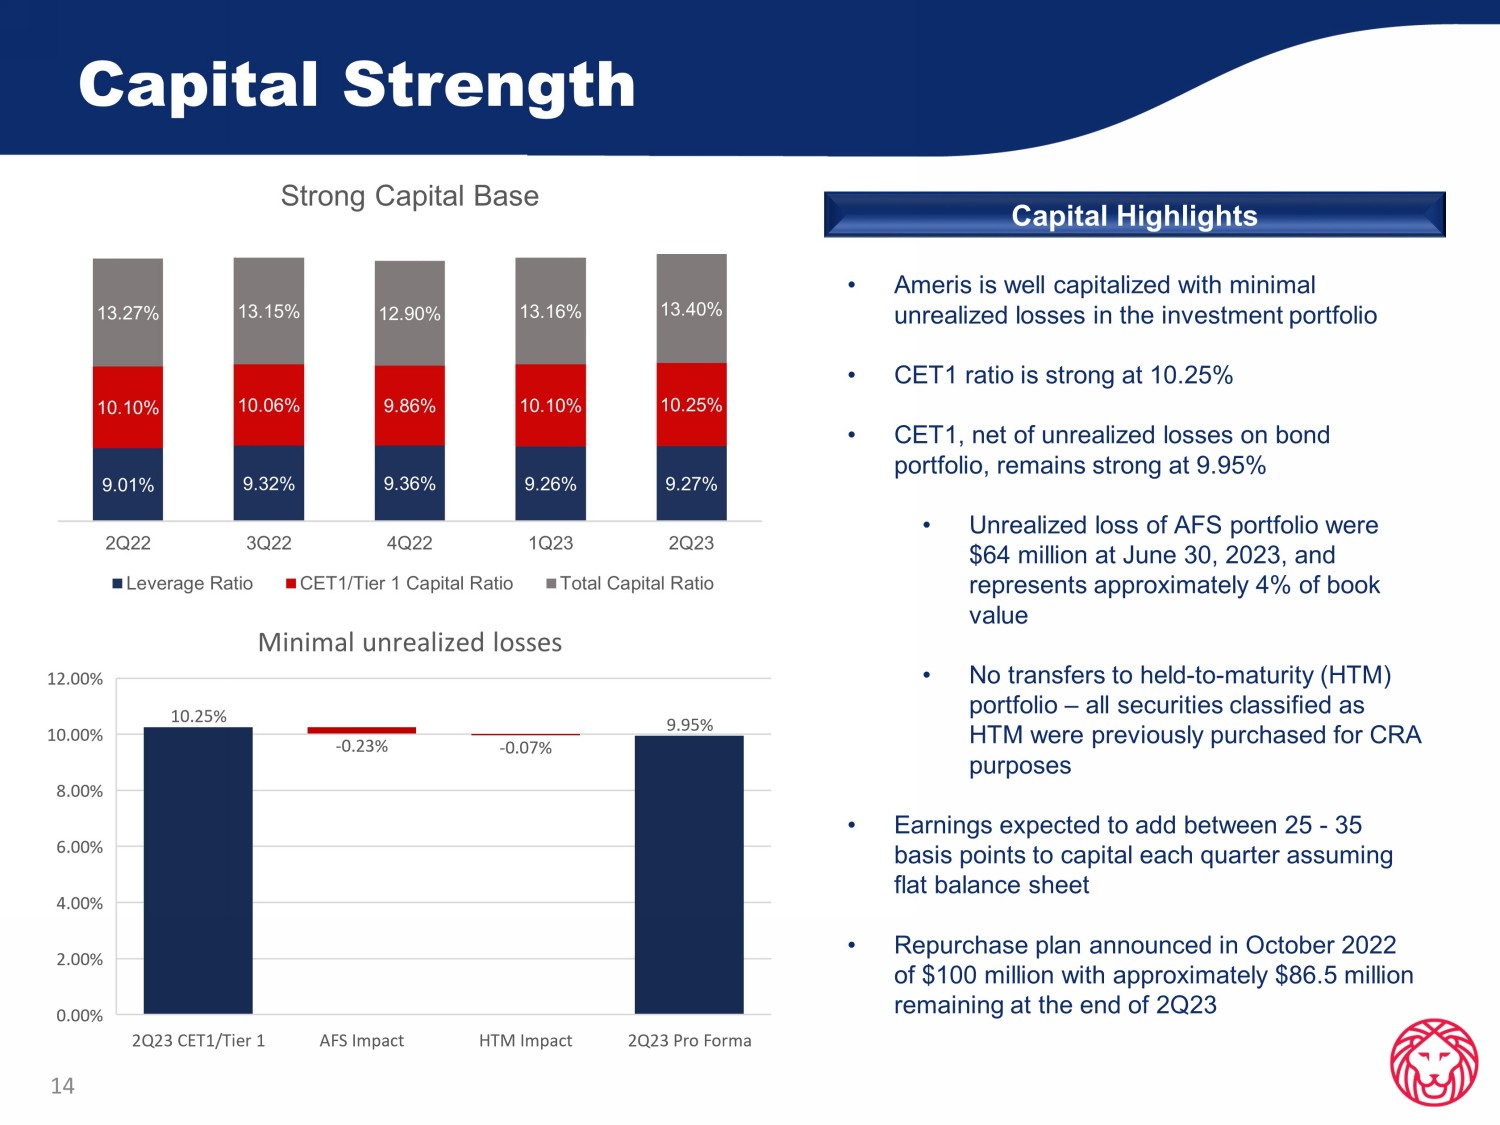
Strong Core Deposit Base 13 Deposit Highlights • Total deposits increased $545.6 million in 2Q23 compared with 1Q23 • Noninterest - bearing deposits decreased $591.0 million, or 8.1% • MMDAs increased $502.7 million, or 10.5% • CDs increased $626.4 million, or 21.2% • Exclusive of increase in brokered CDs, total deposits increased $187.8 million • Total interest - bearing deposit costs increased to 2.64% in 2Q23, compared with 1.82% in 1Q23, reflecting deposit rate increases and the shift in mix resulting from consumer behavior as interest rates rise Deposit Type Balance (in 000s) Count Average per account (in 000’s) NIB 6,706,897 296,004 22.7 NOW 3,860,772 45,539 84.8 MMDA 5,284,136 30,601 172.7 Savings 1,005,514 66,617 15.1 CD 3,585,806 40,414 88.7 Total 20,443,125 479,175 42.7 Deposits by Product Type Consumer 37% Commercial 42% Public 13% Brokered 8% Deposits by Customer 2Q23 NIB 33% NOW 19% MMDA 26% Savings 5% CD 17% Deposits by Type 2Q23 Capital Strength 14 Capital Highlights • Ameris is well capitalized with minimal unrealized losses in the investment portfolio • CET1 ratio is strong at 10.25% • CET1, net of unrealized losses on bond portfolio, remains strong at 9.95% • Unrealized loss of AFS portfolio were $64 million at June 30, 2023, and represents approximately 4% of book value • No transfers to held - to - maturity (HTM) portfolio – all securities classified as HTM were previously purchased for CRA purposes • Earnings expected to add between 25 - 35 basis points to capital each quarter assuming flat balance sheet • Repurchase plan announced in October 2022 of $100 million with approximately $86.5 million remaining at the end of 2Q23 9.01% 9.32% 9.36% 9.26% 9.27% 10.10% 10.06% 9.86% 10.10% 10.25% 13.27% 13.15% 12.90% 13.16% 13.40% 2Q22 3Q22 4Q22 1Q23 2Q23 Strong Capital Base Leverage Ratio CET1/Tier 1 Capital Ratio Total Capital Ratio
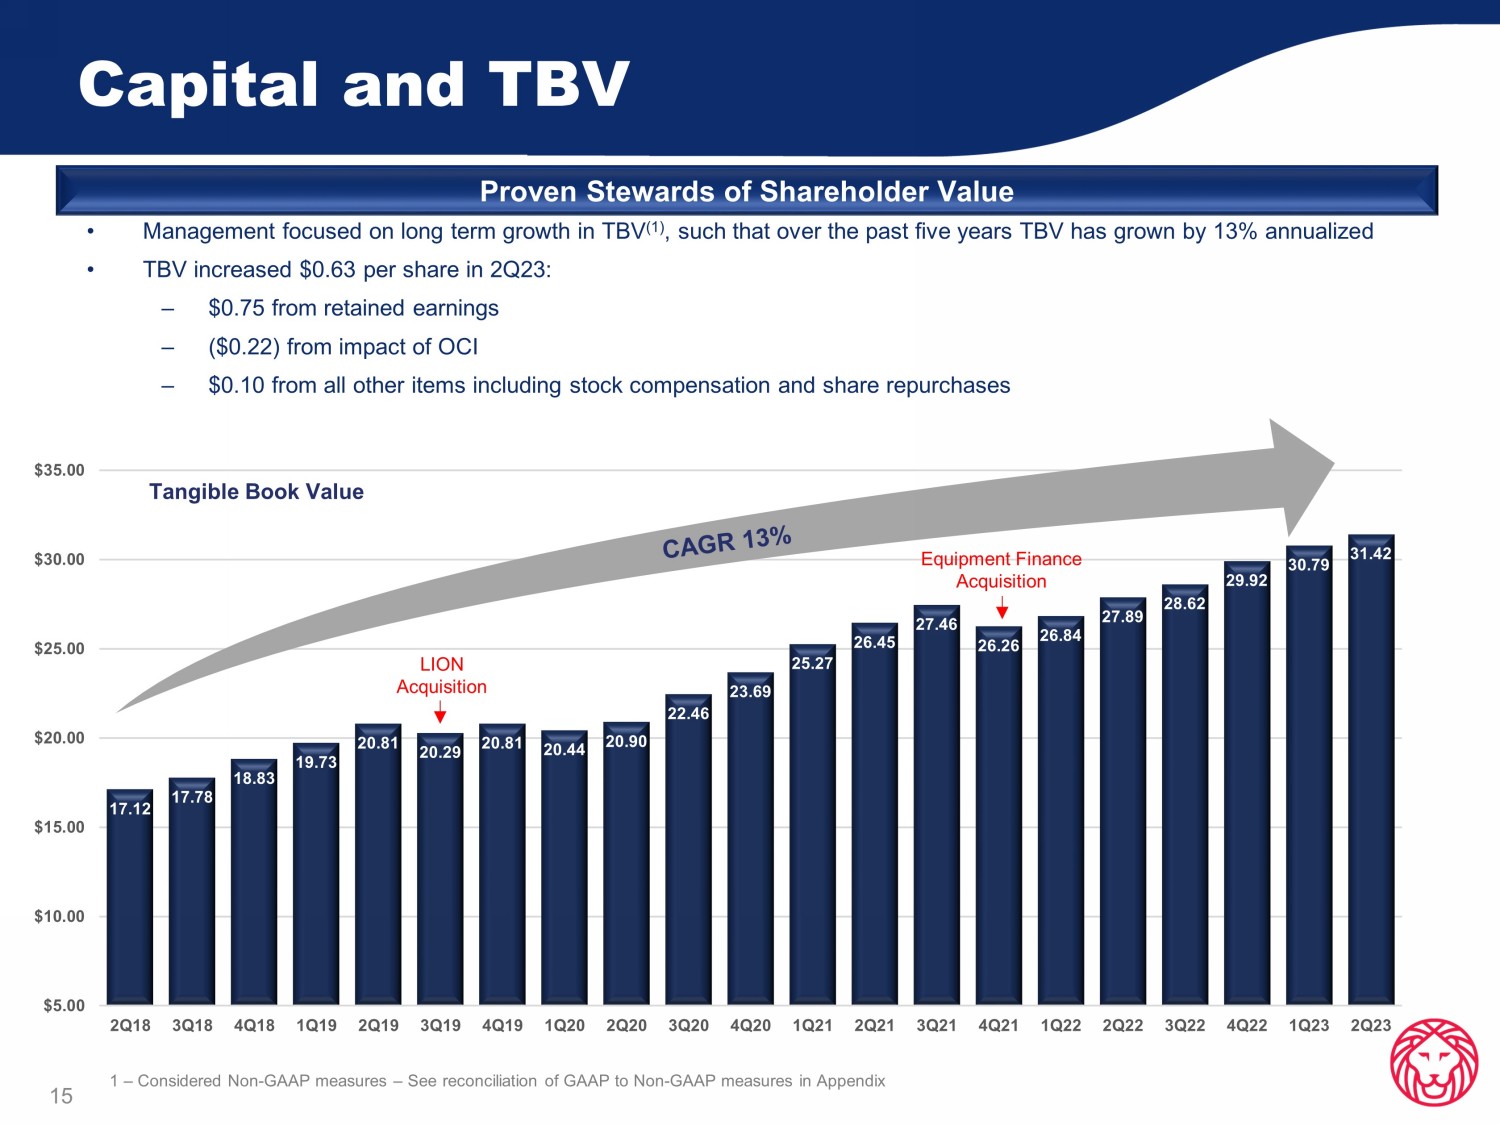
Capital and TBV Proven Stewards of Shareholder Value 15 • Management focused on long term growth in TBV (1) , such that over the past five years TBV has grown by 13% annualized • TBV increased $0.63 per share in 2Q23: – $0.75 from retained earnings – ($0.22) from impact of OCI – $0.10 from all other items including stock compensation and share repurchases 1 – Considered Non - GAAP measures – See reconciliation of GAAP to Non - GAAP measures in Appendix 17.12 17.78 18.83 19.73 20.81 20.29 20.81 20.44 20.90 22.46 23.69 25.27 26.45 27.46 26.26 26.84 27.89 28.62 29.92 30.79 31.42 $5.00 $10.00 $15.00 $20.00 $25.00 $30.00 $35.00 2Q18 3Q18 4Q18 1Q19 2Q19 3Q19 4Q19 1Q20 2Q20 3Q20 4Q20 1Q21 2Q21 3Q21 4Q21 1Q22 2Q22 3Q22 4Q22 1Q23 2Q23 Tangible Book Value Equipment Finance Acquisition LION Acquisition Loan Diversification and Credit Quality

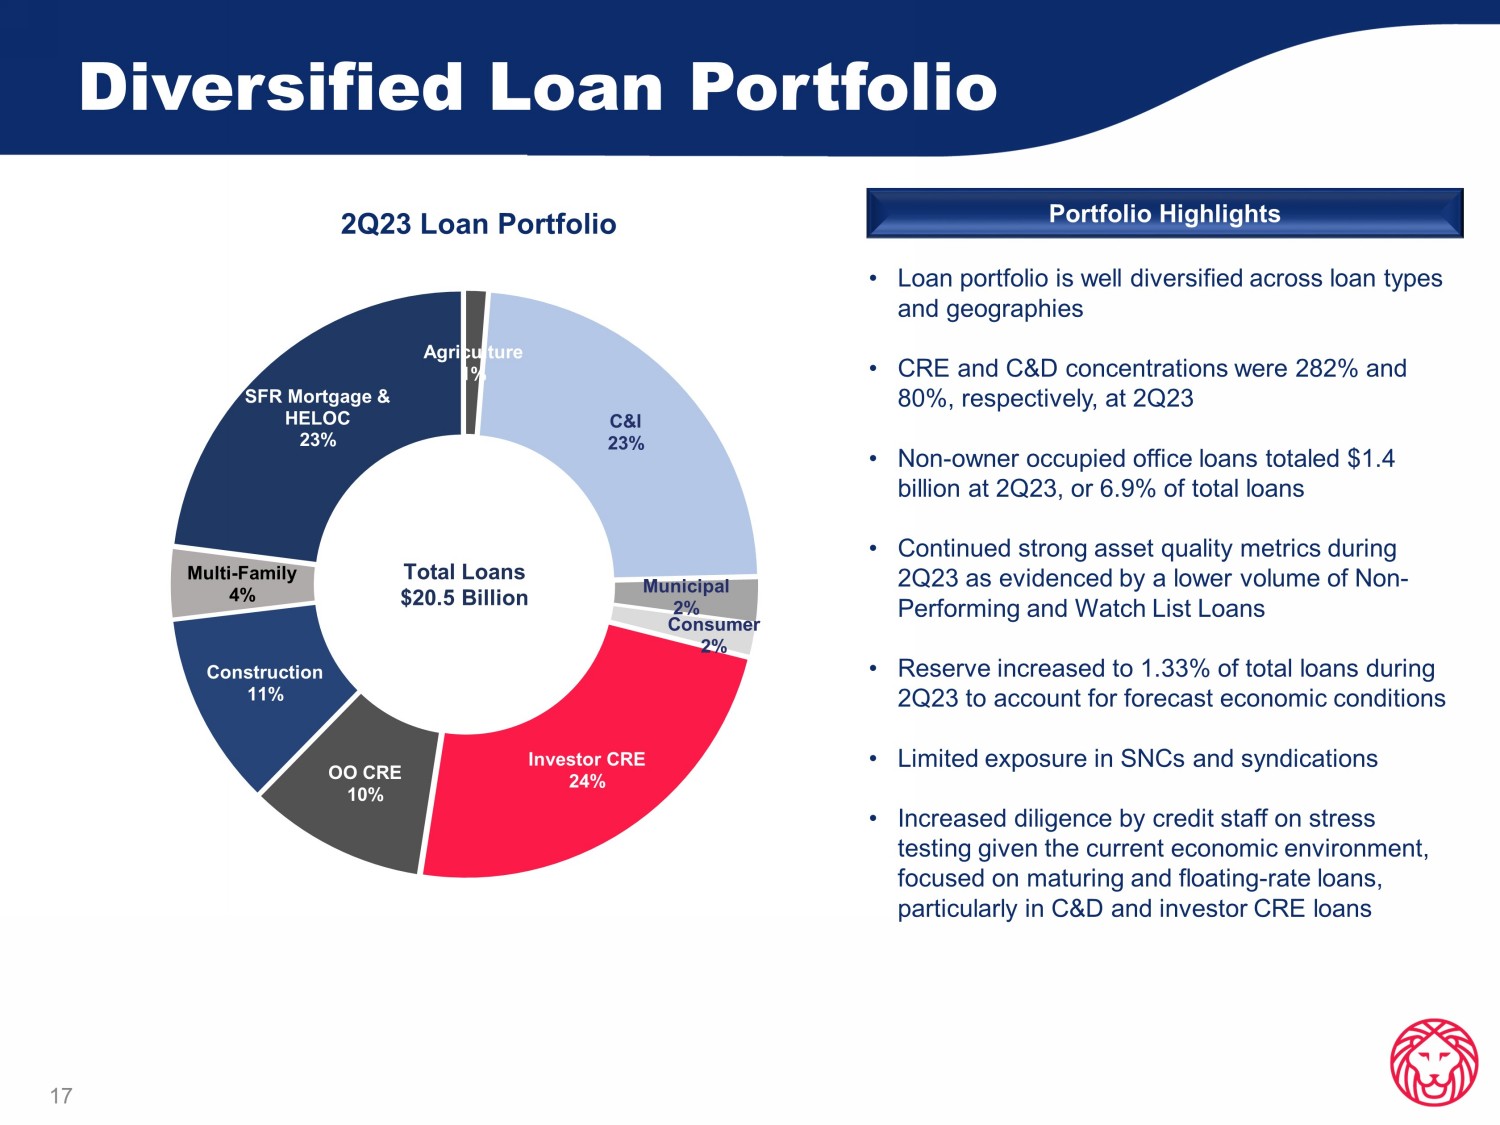
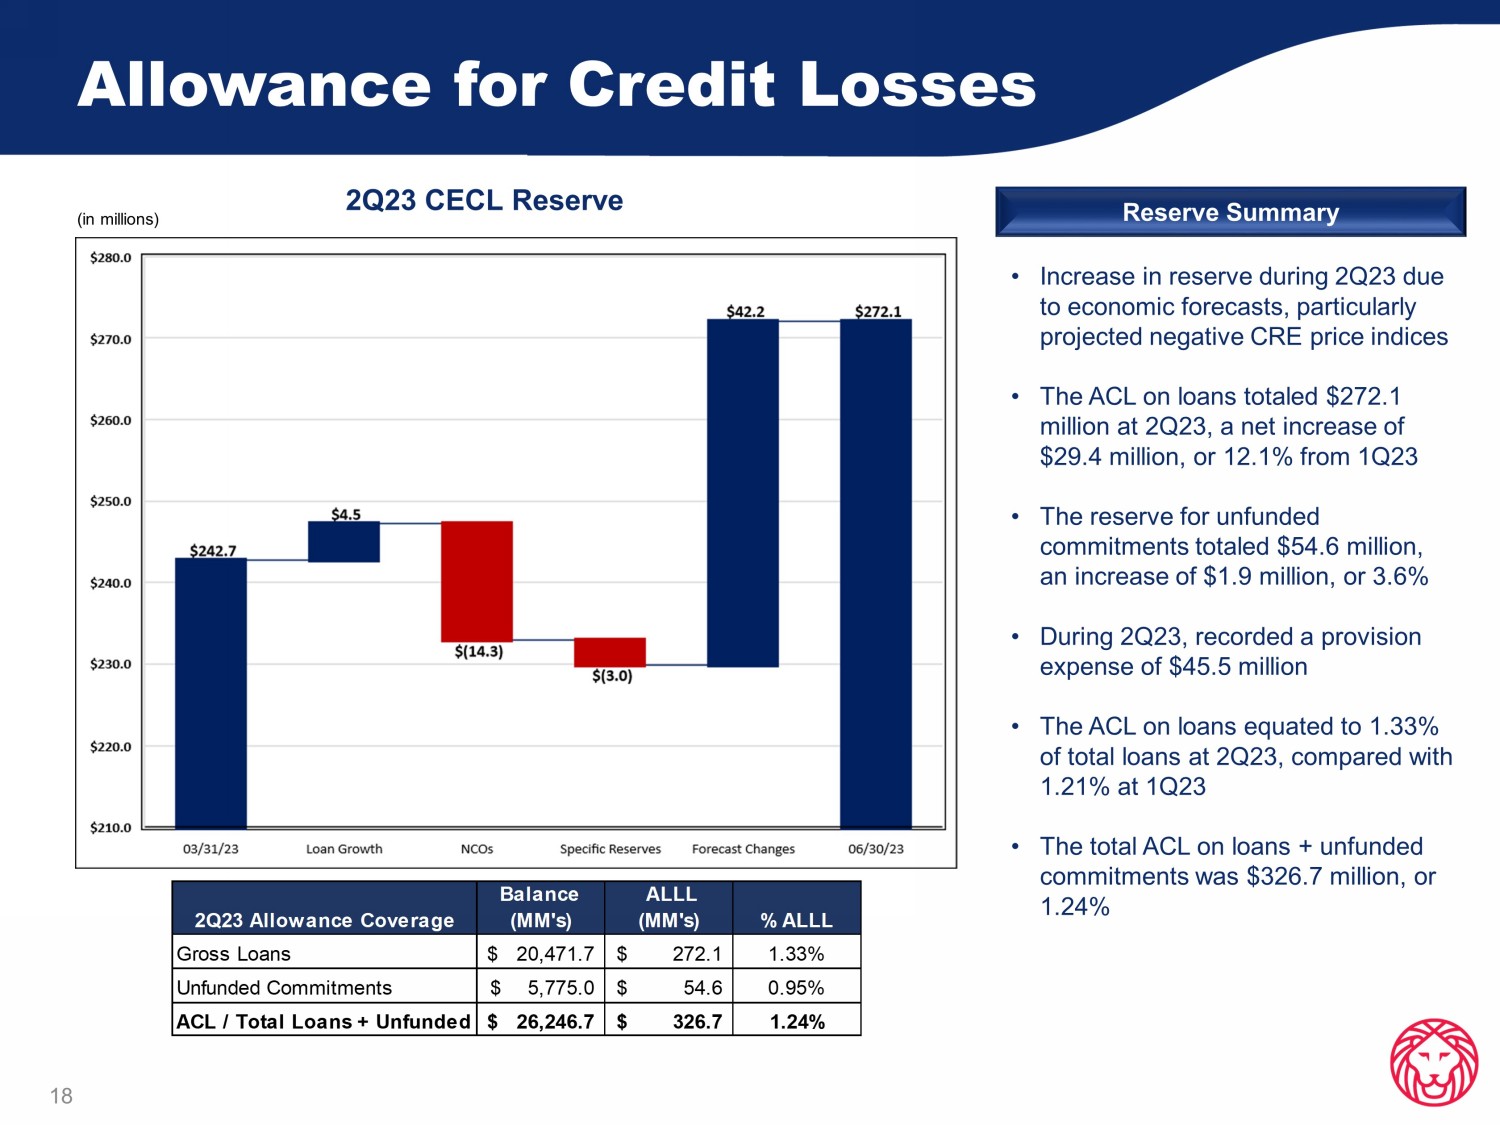
Diversified Loan Portfolio 2 Q23 Loan Portfolio 17 • Loan portfolio is well diversified across loan types and geographies • CRE and C&D concentrations were 282% and 80%, respectively, at 2Q23 • Non - owner occupied office loans totaled $1.4 billion at 2Q23, or 6.9% of total loans • Continued strong asset quality metrics during 2Q23 as evidenced by a lower volume of Non - Performing and Watch List Loans • Reserve increased to 1.33% of total loans during 2Q23 to account for forecast economic conditions • Limited exposure in SNCs and syndications • Increased diligence by credit staff on stress testing given the current economic environment, focused on maturing and floating - rate loans, particularly in C&D and investor CRE loans Portfolio Highlights Total Loans $20.5 Billion Agriculture 1% C&I 23% Municipal 2% Consumer 2% Investor CRE 24% OO CRE 10% Construction 11% Multi - Family 4% SFR Mortgage & HELOC 23% Allowance for Credit Losses 18 • Increase in reserve during 2Q23 due to economic forecasts, particularly projected negative CRE price indices • The ACL on loans totaled $272.1 million at 2Q23, a net increase of $29.4 million, or 12.1% from 1Q23 • The reserve for unfunded commitments totaled $54.6 million, an increase of $1.9 million, or 3.6% • During 2Q23, recorded a provision expense of $45.5 million • The ACL on loans equated to 1.33% of total loans at 2Q23, compared with 1.21% at 1 Q23 • The total ACL on loans + unfunded commitments was $326.7 million, or 1.24% 2Q23 CECL Reserve Reserve Summary (in millions) 2Q23 Allowance Coverage Balance (MM's) ALLL (MM's) % ALLL Gross Loans 20,471.7$ 272.1$ 1.33% Unfunded Commitments 5,775.0$ 54.6$ 0.95% ACL / Total Loans + Unfunded 26,246.7$ 326.7$ 1.24%
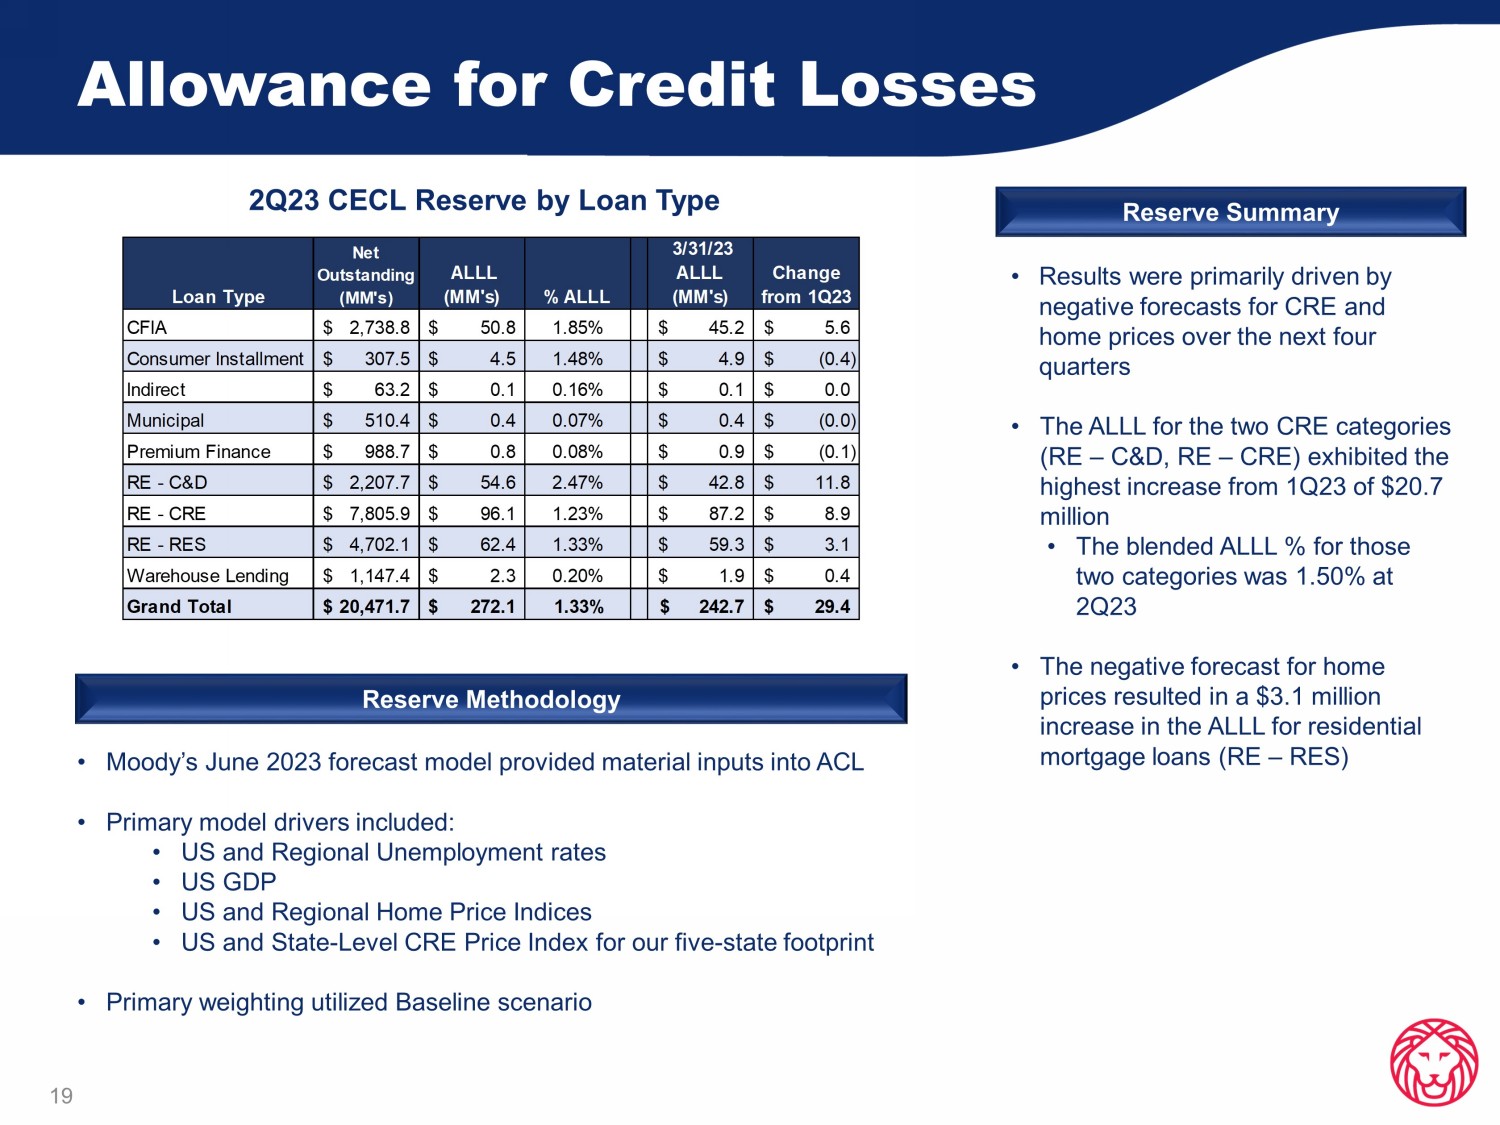
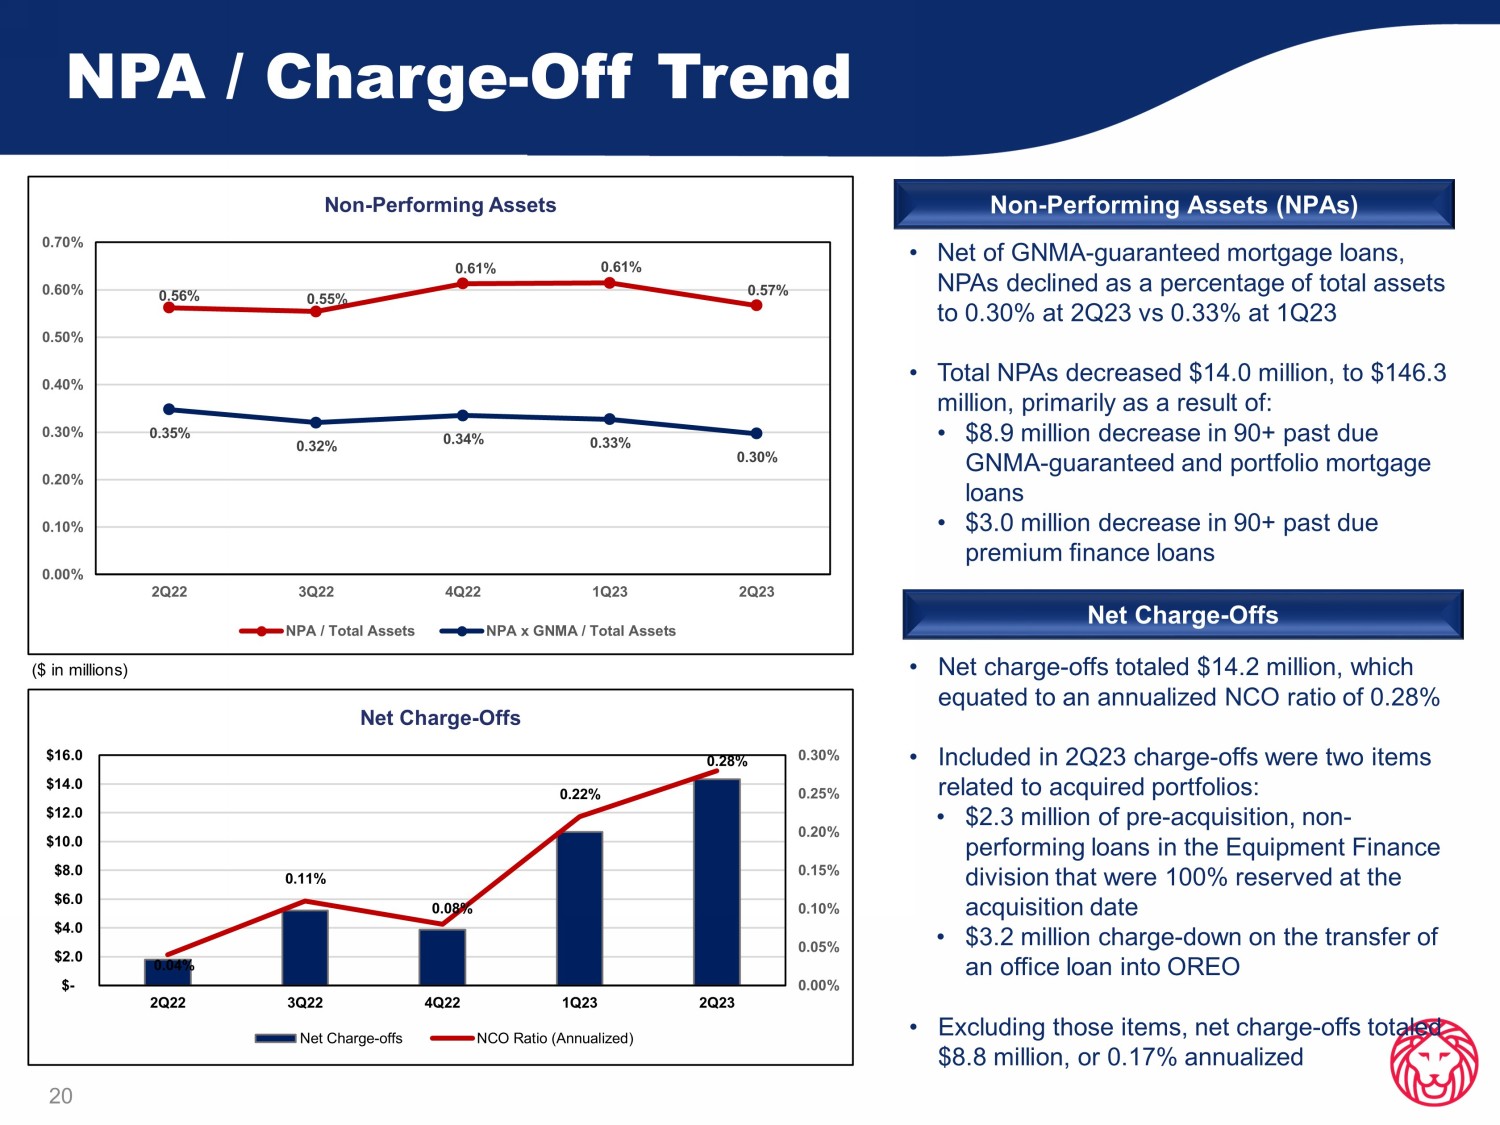
Allowance for Credit Losses 19 • Results were primarily driven by negative forecasts for CRE and home prices over the next four quarters • The ALLL for the two CRE categories (RE – C&D, RE – CRE) exhibited the highest increase from 1 Q23 of $20.7 million • The blended ALLL % fo r those two categories was 1.50% at 2Q23 • The negative forecast for home prices resulted in a $3.1 million increase in the ALLL for residential mortgage loans (RE – RES) 2 Q23 CECL Reserve by Loan Type Reserve Summary Reserve Methodology • Moody’s June 2023 forecast model provided material inputs into ACL • Primary model drivers included: • US and Regional Unemployment rates • US GDP • US and Regional Home Price Indices • US and State - Level CRE Price Index for our five - state footprint • Primary weighting utilized Baseline scenario Loan Type Net Outstanding (MM's) ALLL (MM's) % ALLL 3/31/23 ALLL (MM's) Change from 1Q23 CFIA 2,738.8$ 50.8$ 1.85% 45.2$ 5.6$ Consumer Installment 307.5$ 4.5$ 1.48% 4.9$ (0.4)$ Indirect 63.2$ 0.1$ 0.16% 0.1$ 0.0$ Municipal 510.4$ 0.4$ 0.07% 0.4$ (0.0)$ Premium Finance 988.7$ 0.8$ 0.08% 0.9$ (0.1)$ RE - C&D 2,207.7$ 54.6$ 2.47% 42.8$ 11.8$ RE - CRE 7,805.9$ 96.1$ 1.23% 87.2$ 8.9$ RE - RES 4,702.1$ 62.4$ 1.33% 59.3$ 3.1$ Warehouse Lending 1,147.4$ 2.3$ 0.20% 1.9$ 0.4$ Grand Total 20,471.7$ 272.1$ 1.33% 242.7$ 29.4$ NPA / Charge - Off Trend 20 • Net of GNMA - guaranteed mortgage loans, NPAs declined as a percentage of total assets to 0.30% at 2Q23 vs 0.33% at 1Q23 • Total NPAs de creased $14.0 million, to $146.3 million, primarily as a result of: • $8.9 million de crease in 90+ past due GNMA - guaranteed and portfolio mortgage loans • $3.0 million decrease in 90+ past due premium finance loans • Net charge - offs totaled $14.2 million, which equated to an annualized NCO ratio of 0.28% • Included in 2Q23 charge - offs were two items related to acquired portfolios: • $2.3 million of pre - acquisition, non - performing loans in the Equipment Finance division that were 100% reserved at the acquisition date • $3.2 million charge - down on the transfer of an office loan into OREO • Excluding those items, net charge - offs totaled $8.8 million, or 0.17% annualized Non - Performing Assets (NPAs) Net Charge - Offs ($ in millions) 0.56% 0.55% 0.61% 0.61% 0.57% 0.35% 0.32% 0.34% 0.33% 0.30% 0.00% 0.10% 0.20% 0.30% 0.40% 0.50% 0.60% 0.70% 2Q22 3Q22 4Q22 1Q23 2Q23 Non - Performing Assets NPA / Total Assets NPA x GNMA / Total Assets 0.04% 0.11% 0.08% 0.22% 0.28% 0.00% 0.05% 0.10% 0.15% 0.20% 0.25% 0.30% $- $2.0 $4.0 $6.0 $8.0 $10.0 $12.0 $14.0 $16.0 2Q22 3Q22 4Q22 1Q23 2Q23 Net Charge - Offs Net Charge-offs NCO Ratio (Annualized)
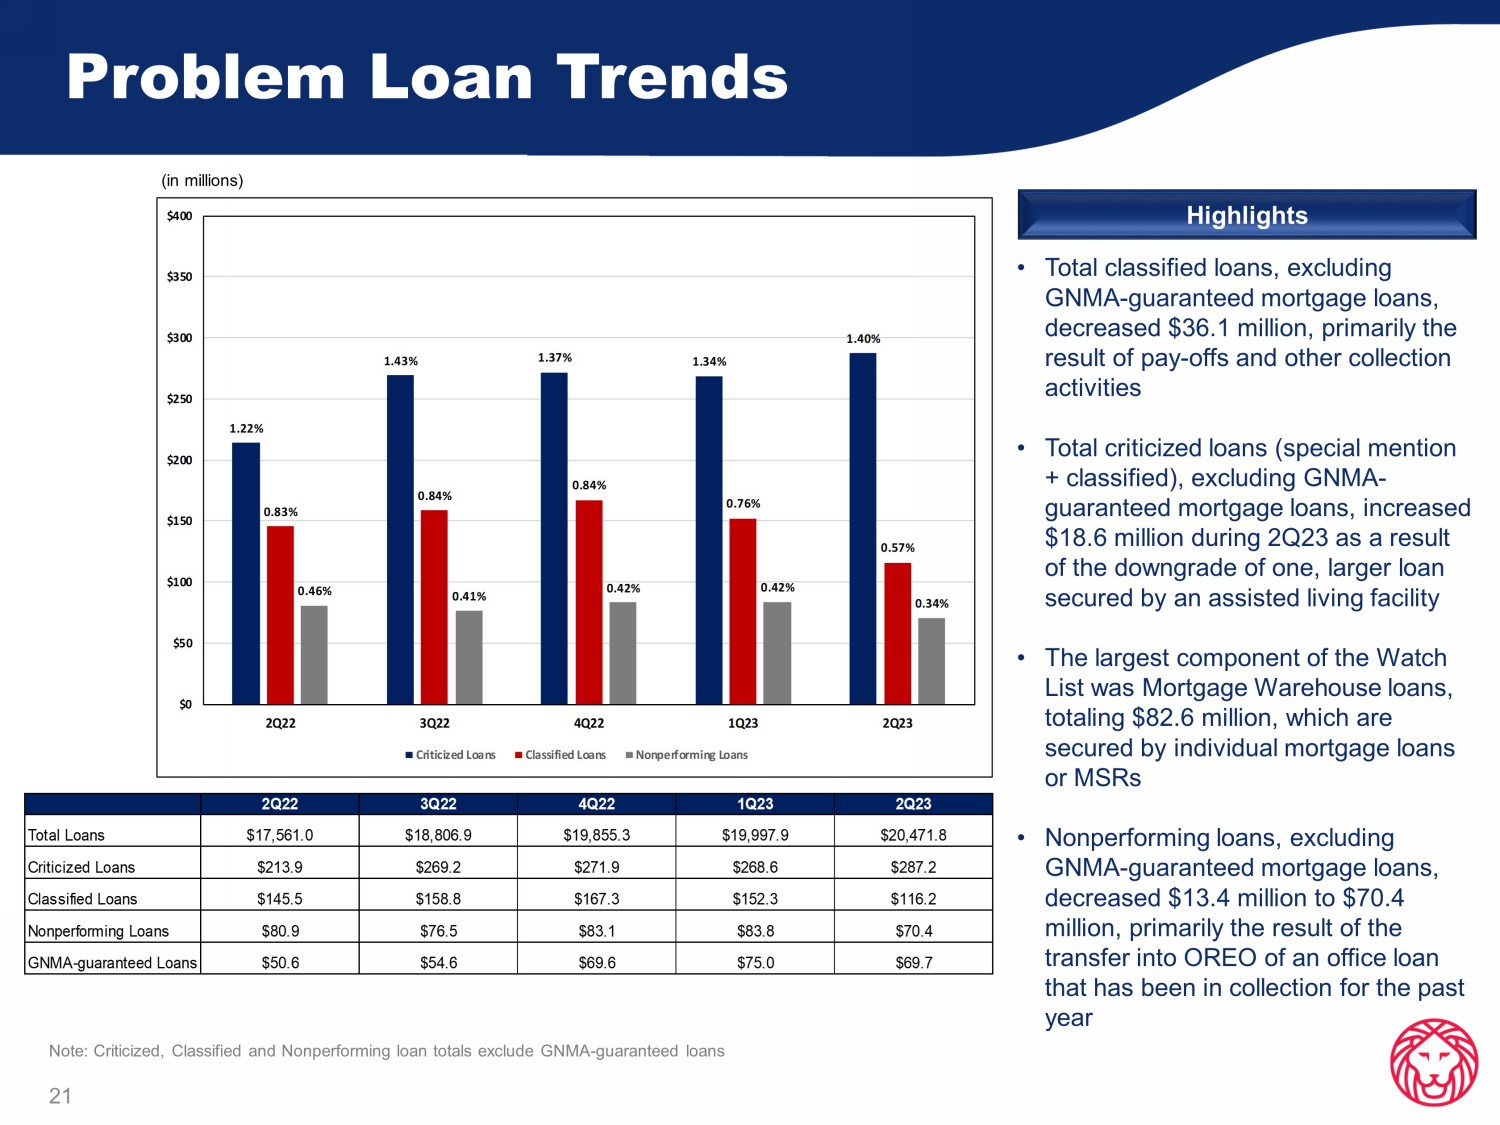
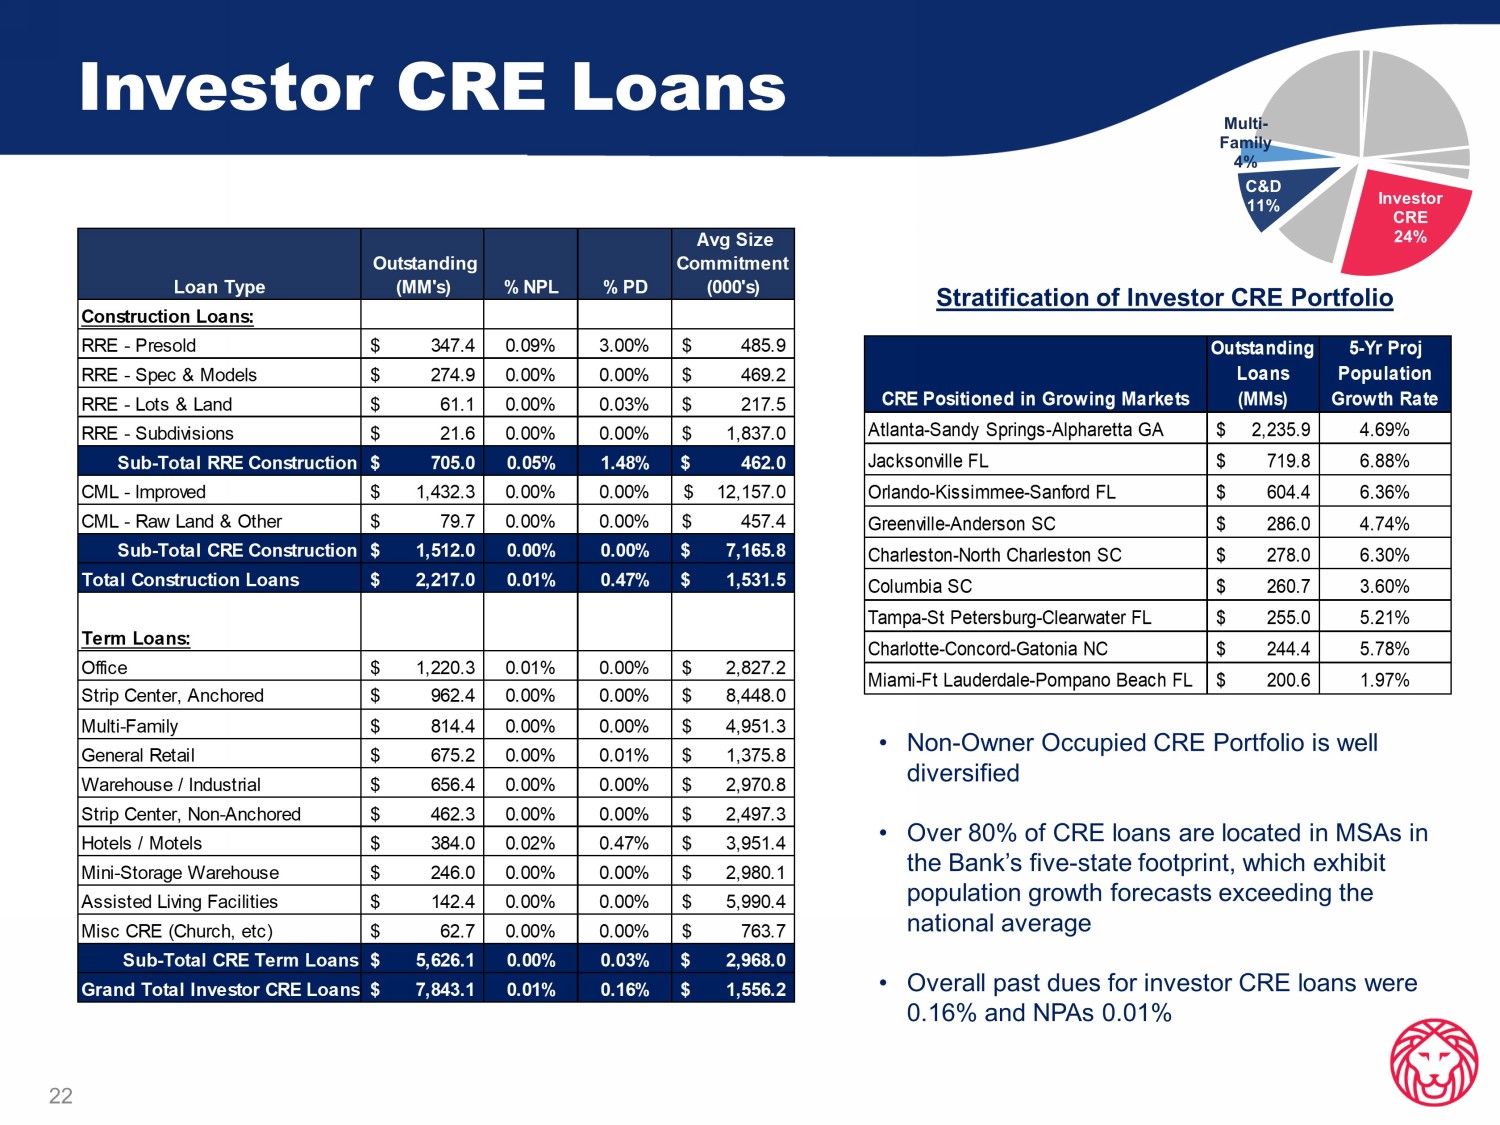
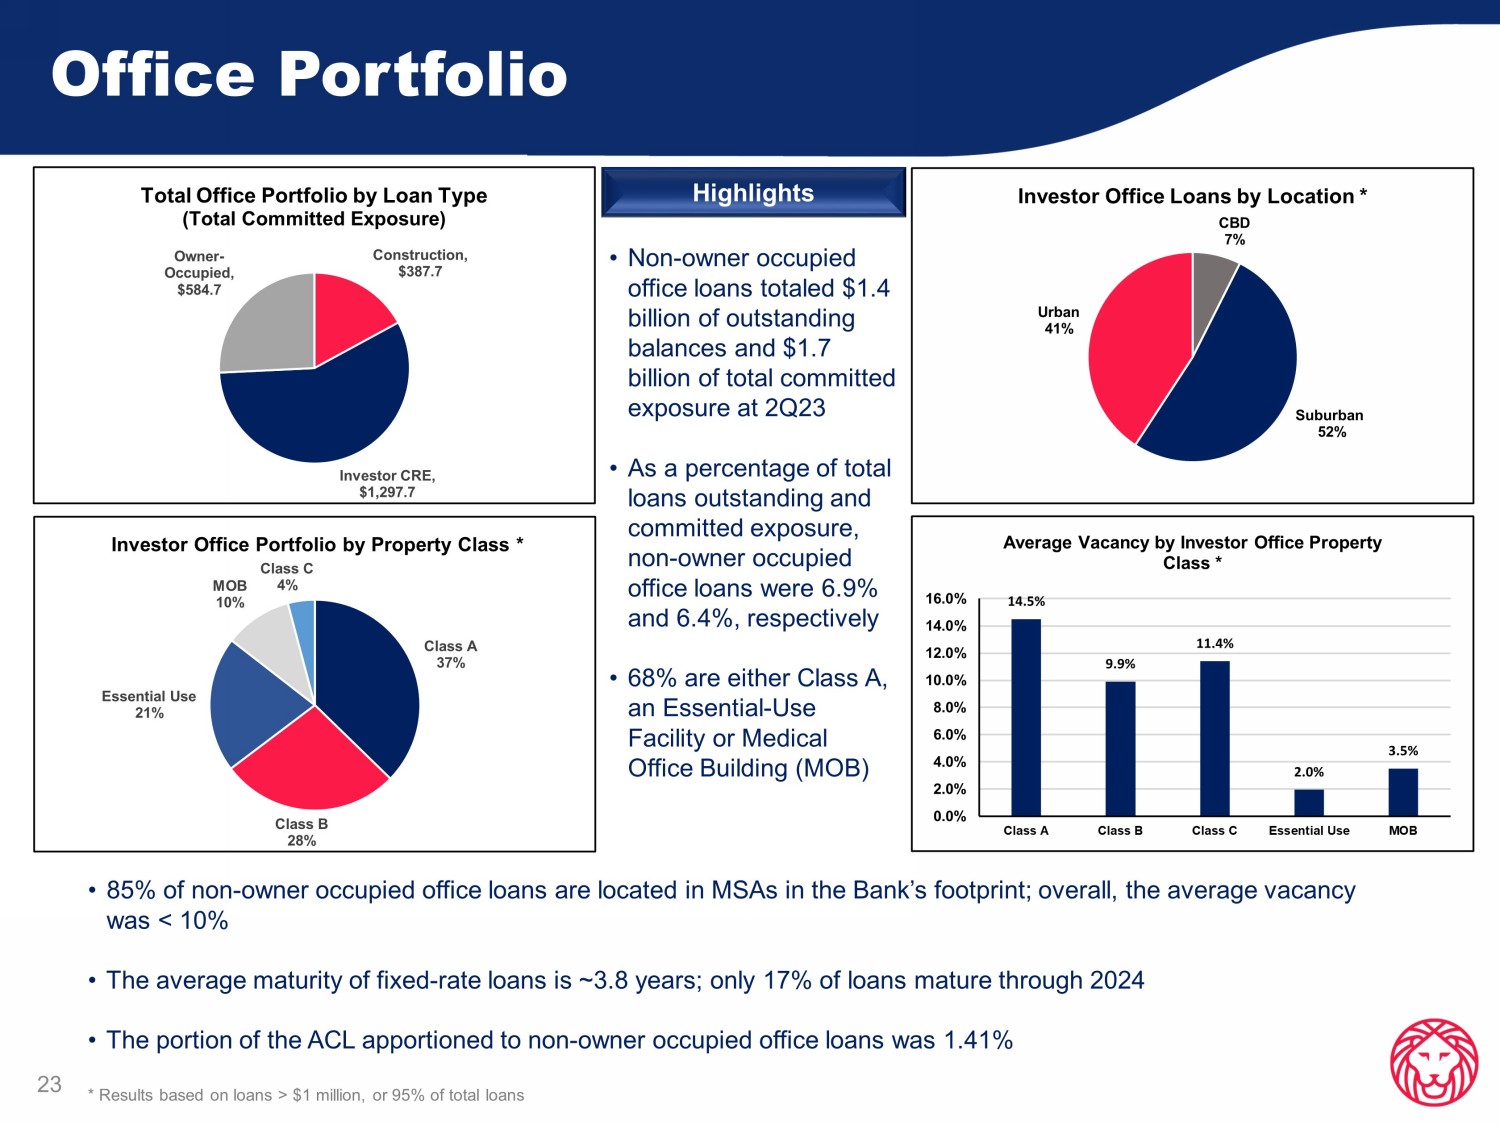
Problem Loan Trends 21 • Total classified loans, excluding GNMA - guaranteed mortgage loans, decreased $36.1 million, primarily the result of pay - offs and other collection activities • Total criticized loans (special mention + classified), excluding GNMA - guaranteed mortgage loans, increased $18.6 million during 2Q23 as a result of the downgrade of one, larger loan secured by an assisted living facility • The largest component of the Watch List was M ortgage Warehouse loans, totaling $82.6 million , which are secured by individual mortgage loans or MSRs • Nonperforming l oans, excluding GNMA - guaranteed mortgage loans, de creased $13.4 million to $70.4 million, primarily the result of the transfer into OREO of an office loan that has been in collection for the past year Highlights (in millions) Note: Criticized, Classified and Nonperforming loan totals exclude GNMA - guaranteed loans Total Loans Criticized Loans Classified Loans Nonperforming Loans GNMA-guaranteed Loans $50.6 $54.6 $69.6 $75.0 $69.7 $213.9 $80.9 $269.2 $76.5 $19,855.3 $271.9 $145.5 $158.8 $167.3 $83.1 2Q22 3Q22 4Q22 1Q23 $20,471.8$19,997.9$17,561.0 $18,806.9 $83.8 2Q23 $287.2 $70.4 $152.3 $116.2 $268.6 1.22% 1.43% 1.37% 1.34% 1.40% 0.83% 0.84% 0.84% 0.76% 0.57% 0.46% 0.41% 0.42% 0.42% 0.34% $0 $50 $100 $150 $200 $250 $300 $350 $400 2Q22 3Q22 4Q22 1Q23 2Q23 Criticized Loans Classified Loans Nonperforming Loans Investor CRE Loans 22 Investor CRE 24% C&D 11% Multi - Family 4% Stratification of Investor CRE Portfolio • Non - Owner Occupied CRE Portfolio is well diversified • Over 80% of CRE loans are located in MSAs in the Bank’s five - state footprint, which exhibit population growth forecasts exceeding the national average • Overall past dues for investor CRE loans were 0.16% and NPAs 0.01% CRE Positioned in Growing Markets Outstanding Loans (MMs) 5-Yr Proj Population Growth Rate Atlanta-Sandy Springs-Alpharetta GA 2,235.9$ 4.69% Jacksonville FL 719.8$ 6.88% Orlando-Kissimmee-Sanford FL 604.4$ 6.36% Greenville-Anderson SC 286.0$ 4.74% Charleston-North Charleston SC 278.0$ 6.30% Columbia SC 260.7$ 3.60% Tampa-St Petersburg-Clearwater FL 255.0$ 5.21% Charlotte-Concord-Gatonia NC 244.4$ 5.78% Miami-Ft Lauderdale-Pompano Beach FL 200.6$ 1.97% Loan Type Outstanding (MM's) % NPL % PD Avg Size Commitment (000's) Construction Loans: RRE - Presold 347.4$ 0.09% 3.00% 485.9$ RRE - Spec & Models 274.9$ 0.00% 0.00% 469.2$ RRE - Lots & Land 61.1$ 0.00% 0.03% 217.5$ RRE - Subdivisions 21.6$ 0.00% 0.00% 1,837.0$ Sub-Total RRE Construction 705.0$ 0.05% 1.48% 462.0$ CML - Improved 1,432.3$ 0.00% 0.00% 12,157.0$ CML - Raw Land & Other 79.7$ 0.00% 0.00% 457.4$ Sub-Total CRE Construction 1,512.0$ 0.00% 0.00% 7,165.8$ Total Construction Loans 2,217.0$ 0.01% 0.47% 1,531.5$ Term Loans: Office 1,220.3$ 0.01% 0.00% 2,827.2$ Strip Center, Anchored 962.4$ 0.00% 0.00% 8,448.0$ Multi-Family 814.4$ 0.00% 0.00% 4,951.3$ General Retail 675.2$ 0.00% 0.01% 1,375.8$ Warehouse / Industrial 656.4$ 0.00% 0.00% 2,970.8$ Strip Center, Non-Anchored 462.3$ 0.00% 0.00% 2,497.3$ Hotels / Motels 384.0$ 0.02% 0.47% 3,951.4$ Mini-Storage Warehouse 246.0$ 0.00% 0.00% 2,980.1$ Assisted Living Facilities 142.4$ 0.00% 0.00% 5,990.4$ Misc CRE (Church, etc) 62.7$ 0.00% 0.00% 763.7$ Sub-Total CRE Term Loans 5,626.1$ 0.00% 0.03% 2,968.0$ Grand Total Investor CRE Loans 7,843.1$ 0.01% 0.16% 1,556.2$ Office Portfolio • 85% of non - owner occupied office loans are located in MSAs in the Bank’s footprint; overall, the average vacancy was < 10% • The average maturity of fixed - rate loans is ~ 3 . 8 years ; only 17 % of loans mature through 2024 • The portion of the ACL apportioned to non - owner occupied office loans was 1 . 41 % * Results based on loans > $ 1 million, or 95 % of total loans • Non - owner occupied office loans totaled $1.4 billion of outstanding balances and $1.7 billion of total committed exposure at 2Q23 • As a percentage of total loans outstanding and committed exposure, non - owner occupied office loans were 6.9% and 6.4%, respectively • 68% are either Class A, an Essential - Use Facility or Medical Office Building (MOB) Highlights 23 Construction , $387.7 Investor CRE , $1,297.7 Owner - Occupied , $584.7 Total Office Portfolio by Loan Type (Total Committed Exposure) Class A 37% Class B 28% Essential Use 21% MOB 10% Class C 4% Investor Office Portfolio by Property Class * CBD 7% Suburban 52% Urban 41% Investor Office Loans by Location * 14.5% 9.9% 11.4% 2.0% 3.5% 0.0% 2.0% 4.0% 6.0% 8.0% 10.0% 12.0% 14.0% 16.0% Class A Class B Class C Essential Use MOB Average Vacancy by Investor Office Property Class *
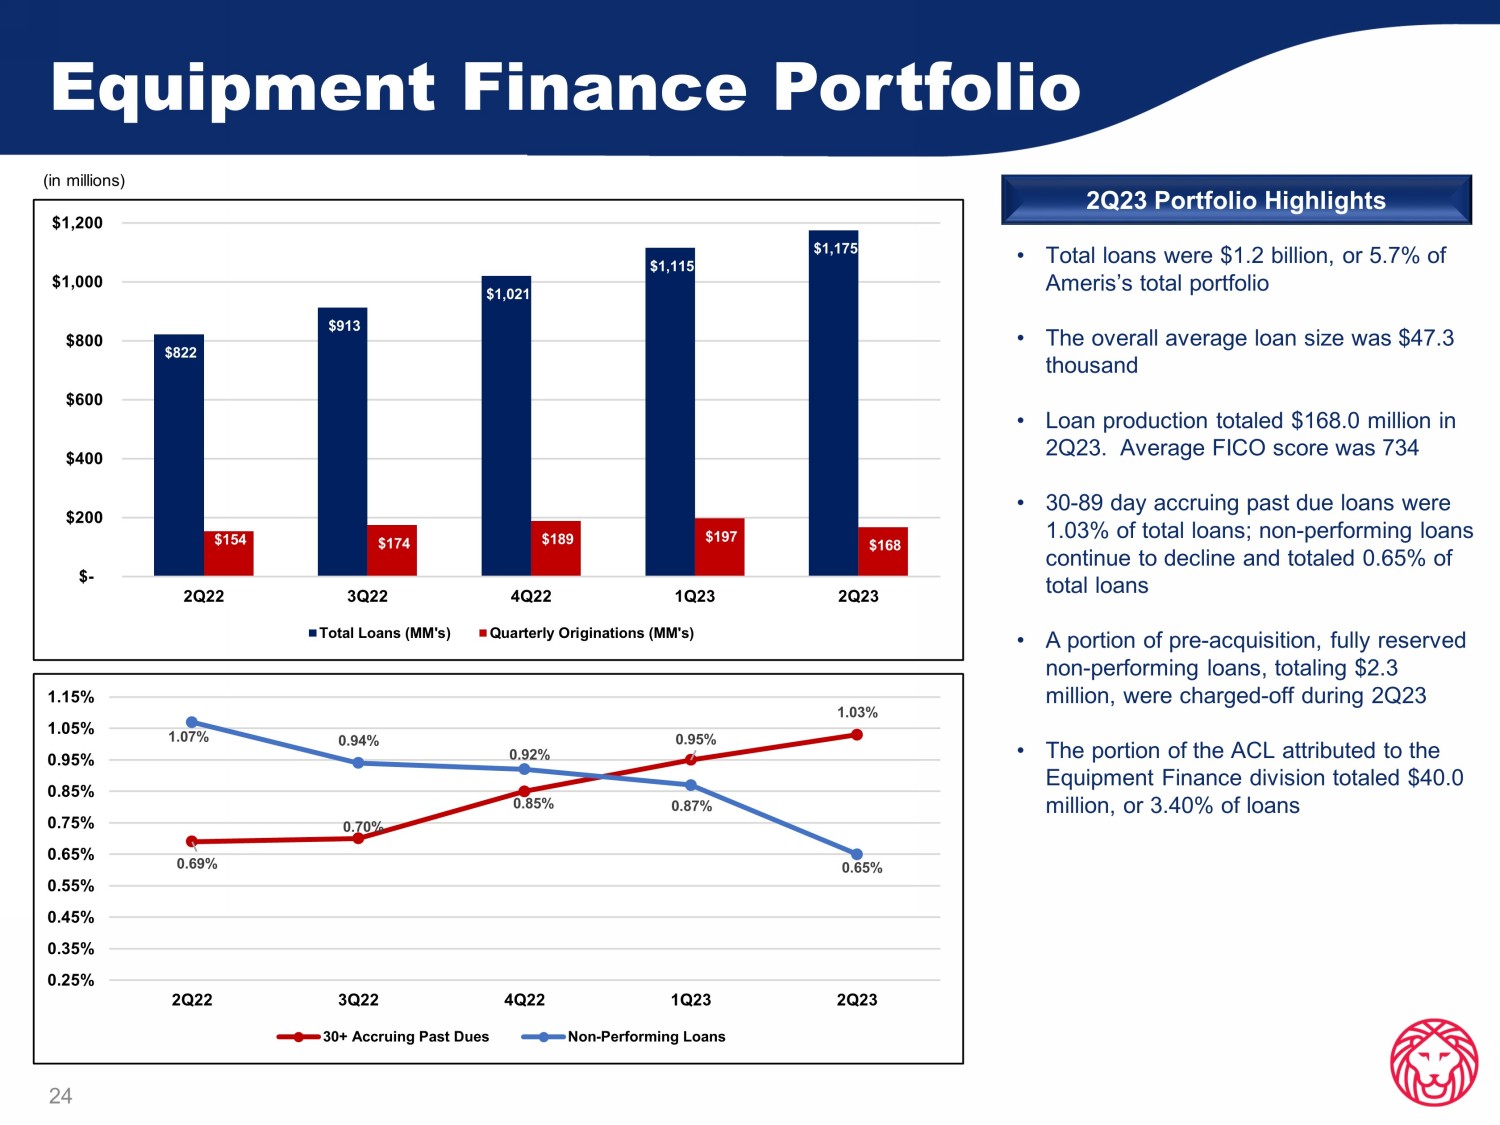
Equipment Finance Portfolio 24 • Total loans were $1.2 billion, or 5.7% of Ameris’s total portfolio • The overall average loan size was $47.3 thousand • Loan production totaled $168.0 million in 2Q23.

Appendix
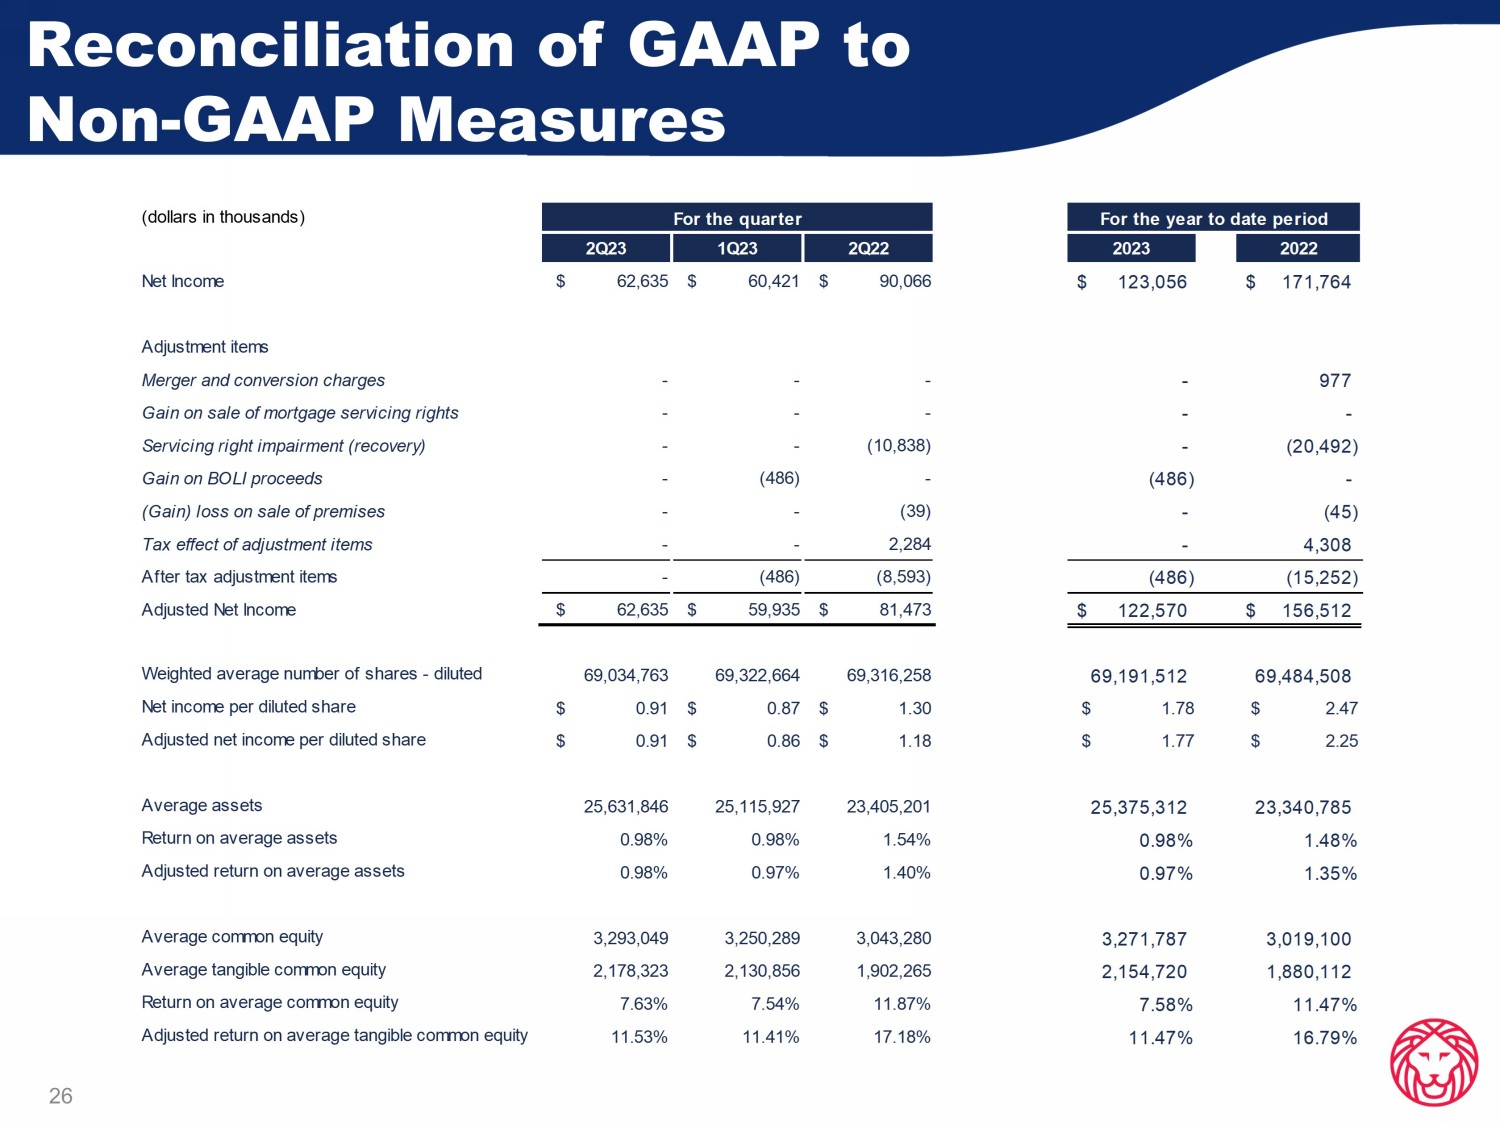
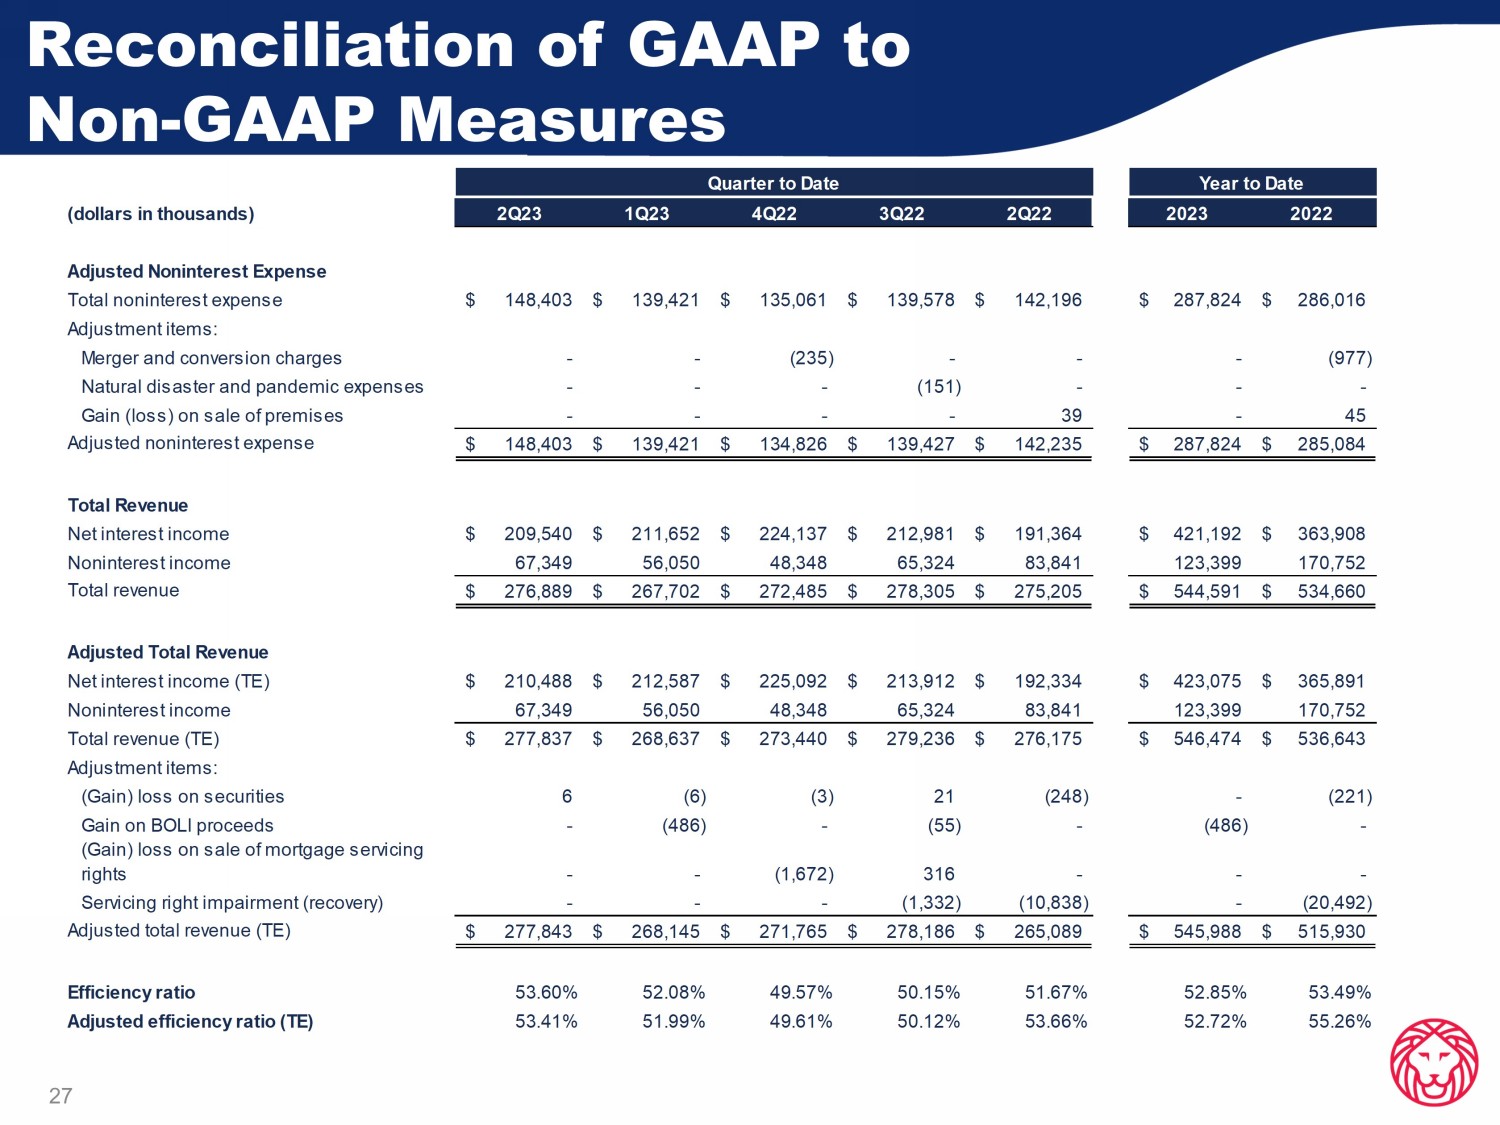
Average FICO score was 734 • 30 - 89 day accruing past due loans were 1.03% of total loans; non - performing loans continue to decline and totaled 0.65% of total loans • A portion of pre - acquisition, fully reserved non - performing loans, totaling $2.3 million, were charged - off during 2Q23 • The portion of the ACL attributed to the Equipment Finance division totaled $40.0 million, or 3.40% of loans 2Q23 Portfolio Highlights (in millions) $822 $913 $1,021 $1,115 $1,175 $154 $174 $189 $197 $168 $- $200 $400 $600 $800 $1,000 $1,200 2Q22 3Q22 4Q22 1Q23 2Q23 Total Loans (MM's) Quarterly Originations (MM's) 0.69% 0.70% 0.85% 0.95% 1.03% 1.07% 0.94% 0.92% 0.87% 0.65% 0.25% 0.35% 0.45% 0.55% 0.65% 0.75% 0.85% 0.95% 1.05% 1.15% 2Q22 3Q22 4Q22 1Q23 2Q23 30+ Accruing Past Dues Non-Performing Loans 26 Reconciliation of GAAP to Non - GAAP Measures (dollars in thousands) 2Q23 1Q23 2Q22 2023 2022 Net Income $ 62,635 $ 60,421 $ 90,066 123,056$ 171,764$ Adjustment items Merger and conversion charges - - - - 977 Gain on sale of mortgage servicing rights - - - - - Servicing right impairment (recovery) - - (10,838) - (20,492) Gain on BOLI proceeds - (486) - (486) - (Gain) loss on sale of premises - - (39) - (45) Tax effect of adjustment items - - 2,284 - 4,308 After tax adjustment items - (486) (8,593) (486) (15,252) Adjusted Net Income $ 62,635 $ 59,935 $ 81,473 122,570$ 156,512$ Weighted average number of shares - diluted 69,034,763 69,322,664 69,316,258 69,191,512 69,484,508 Net income per diluted share $ 0.91 $ 0.87 $ 1.30 $ 1.78 $ 2.47 Adjusted net income per diluted share $ 0.91 $ 0.86 $ 1.18 $ 1.77 $ 2.25 Average assets 25,631,846 25,115,927 23,405,201 25,375,312 23,340,785 Return on average assets 0.98% 0.98% 1.54% 0.98% 1.48% Adjusted return on average assets 0.98% 0.97% 1.40% 0.97% 1.35% Average common equity 3,293,049 3,250,289 3,043,280 3,271,787 3,019,100 Average tangible common equity 2,178,323 2,130,856 1,902,265 2,154,720 1,880,112 Return on average common equity 7.63% 7.54% 11.87% 7.58% 11.47% Adjusted return on average tangible common equity 11.53% 11.41% 17.18% 11.47% 16.79% For the quarter For the year to date period 27 Reconciliation of GAAP to Non - GAAP Measures (dollars in thousands) 2Q23 1Q23 4Q22 3Q22 2Q22 2023 2022 Adjusted Noninterest Expense Total noninterest expense 148,403$ 139,421$ 135,061$ 139,578$ 142,196$ 287,824$ 286,016$ Adjustment items: Merger and conversion charges - - (235) - - - (977) Natural disaster and pandemic expenses - - - (151) - - - Gain (loss) on sale of premises - - - - 39 - 45 Adjusted noninterest expense 148,403$ 139,421$ 134,826$ 139,427$ 142,235$ 287,824$ 285,084$ Total Revenue Net interest income 209,540$ 211,652$ 224,137$ 212,981$ 191,364$ 421,192$ 363,908$ Noninterest income 67,349 56,050 48,348 65,324 83,841 123,399 170,752 Total revenue 276,889$ 267,702$ 272,485$ 278,305$ 275,205$ 544,591$ 534,660$ Adjusted Total Revenue Net interest income (TE) 210,488$ 212,587$ 225,092$ 213,912$ 192,334$ 423,075$ 365,891$ Noninterest income 67,349 56,050 48,348 65,324 83,841 123,399 170,752 Total revenue (TE) 277,837$ 268,637$ 273,440$ 279,236$ 276,175$ 546,474$ 536,643$ Adjustment items: (Gain) loss on securities 6 (6) (3) 21 (248) - (221) Gain on BOLI proceeds - (486) - (55) - (486) - (Gain) loss on sale of mortgage servicing rights - - (1,672) 316 - - - Servicing right impairment (recovery) - - - (1,332) (10,838) - (20,492) Adjusted total revenue (TE) 277,843$ 268,145$ 271,765$ 278,186$ 265,089$ 545,988$ 515,930$ Efficiency ratio 53.60% 52.08% 49.57% 50.15% 51.67% 52.85% 53.49% Adjusted efficiency ratio (TE) 53.41% 51.99% 49.61% 50.12% 53.66% 52.72% 55.26% Year to DateQuarter to Date
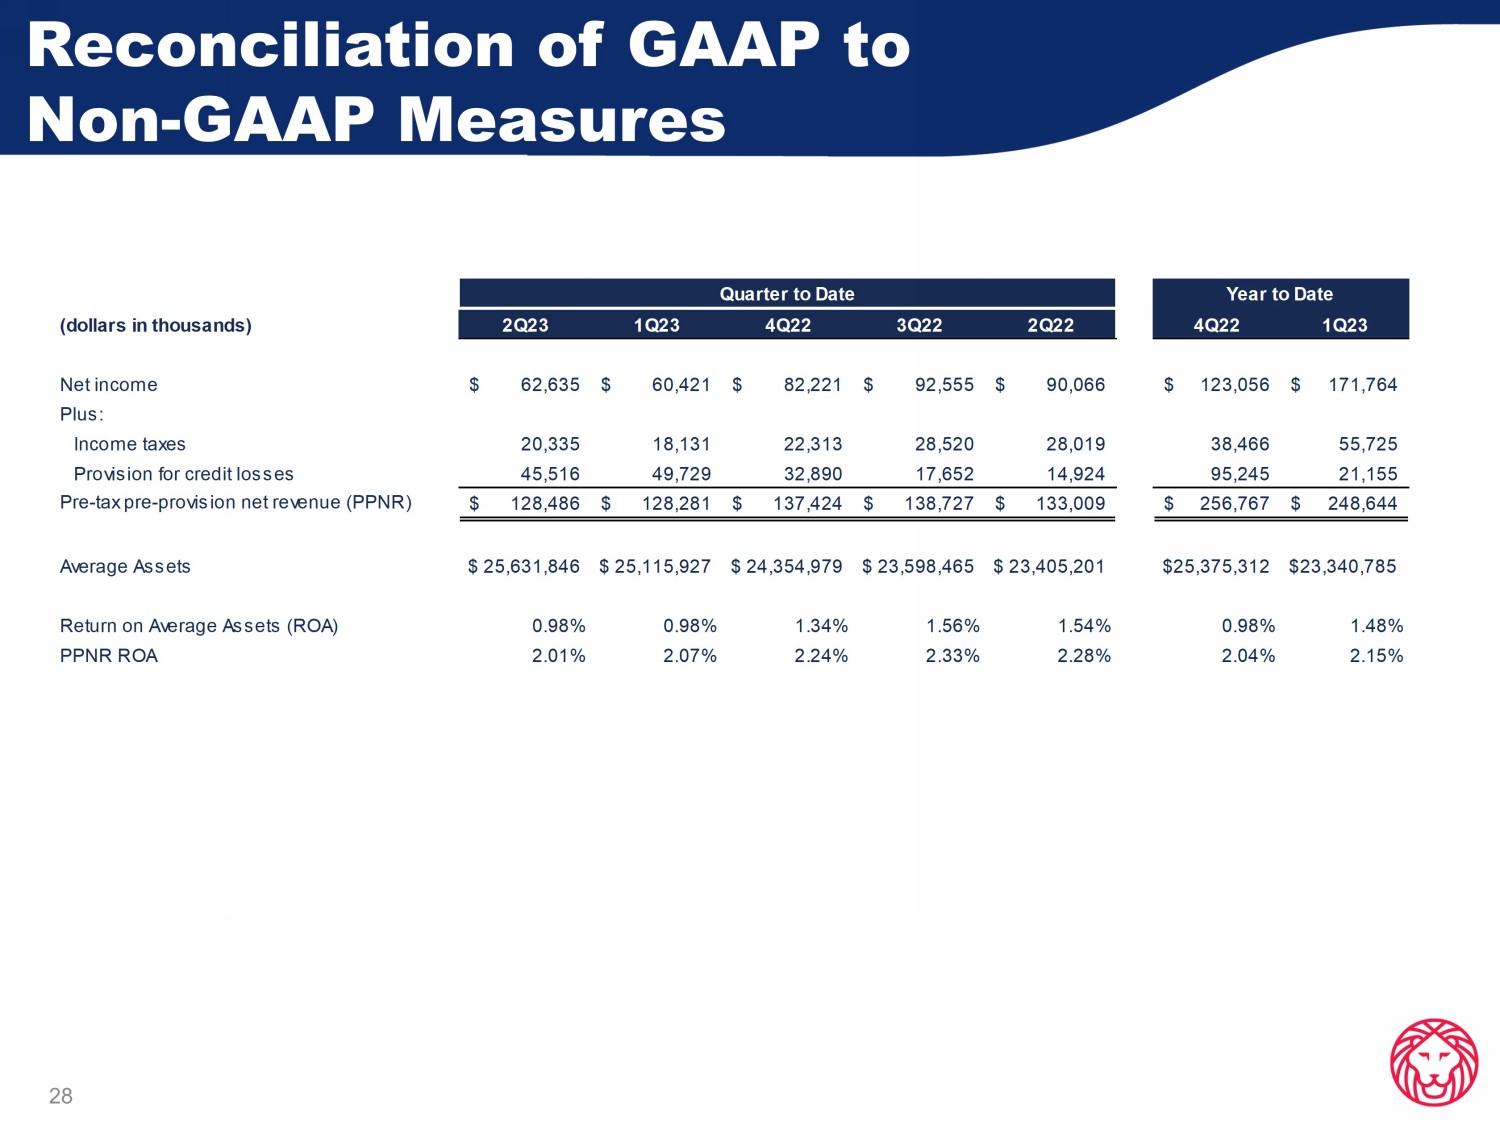
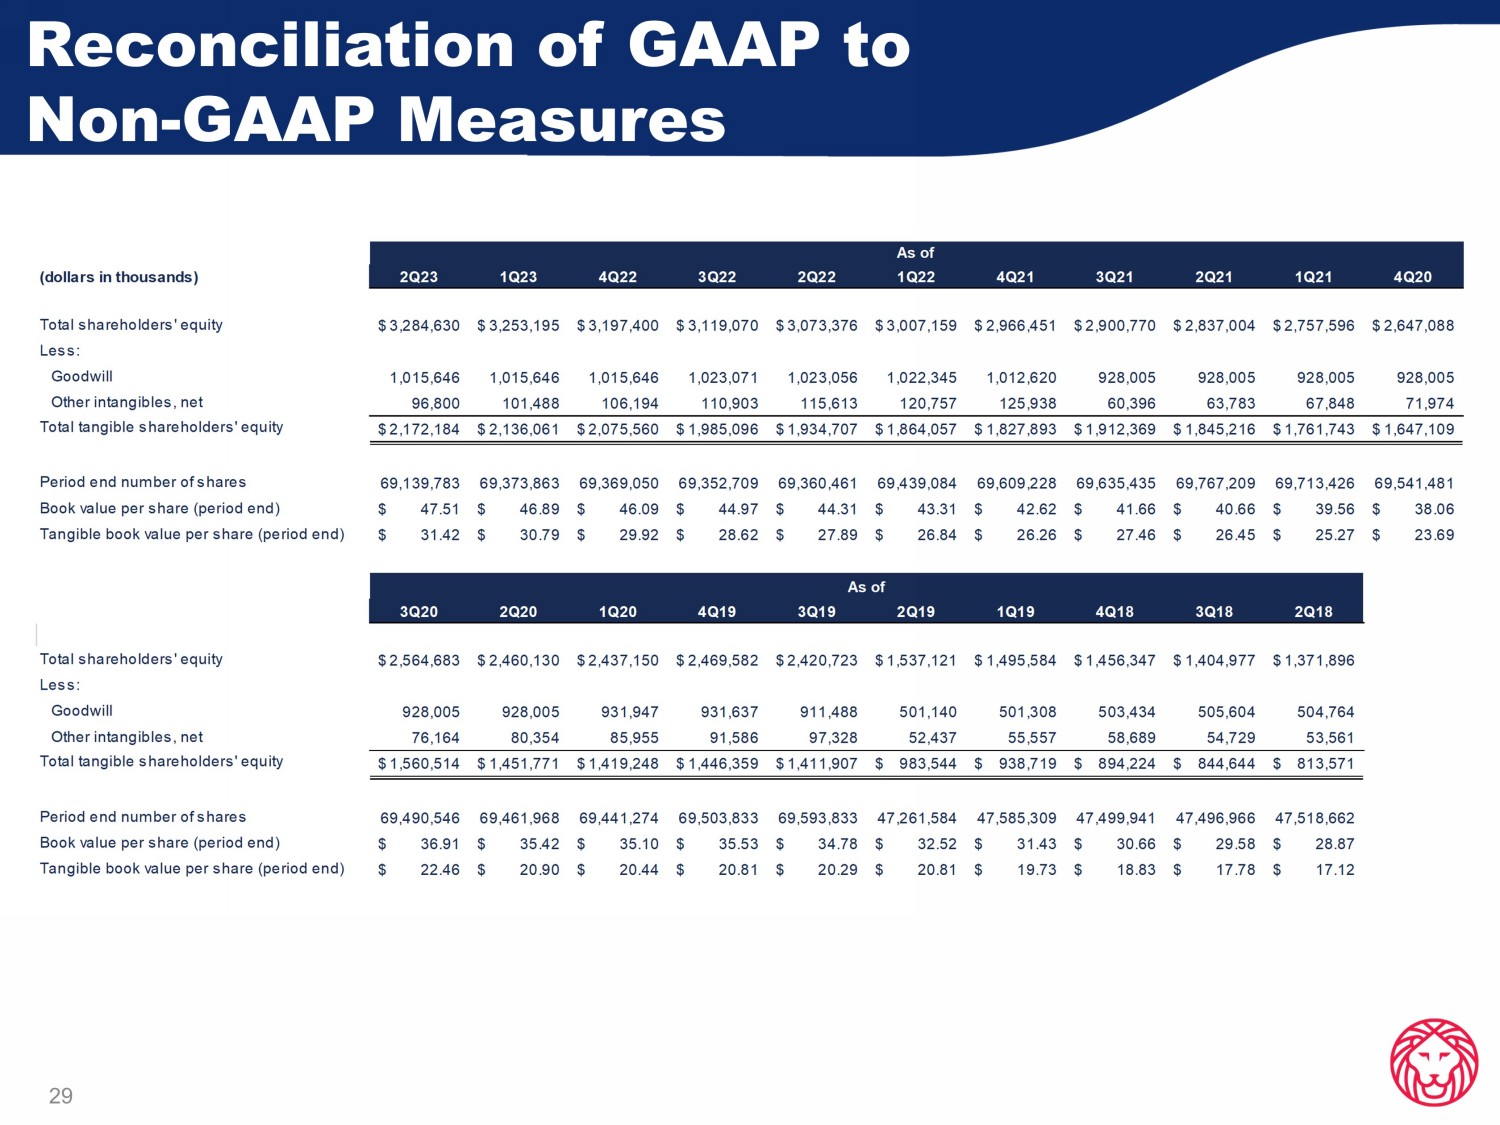
28 Reconciliation of GAAP to Non - GAAP Measures (dollars in thousands) 2Q23 1Q23 4Q22 3Q22 2Q22 4Q22 1Q23 Net income 62,635$ 60,421$ 82,221$ 92,555$ 90,066$ 123,056$ 171,764$ Plus: Income taxes 20,335 18,131 22,313 28,520 28,019 38,466 55,725 Provision for credit losses 45,516 49,729 32,890 17,652 14,924 95,245 21,155 Pre-tax pre-provision net revenue (PPNR) 128,486$ 128,281$ 137,424$ 138,727$ 133,009$ 256,767$ 248,644$ Average Assets $ 25,631,846 $ 25,115,927 $ 24,354,979 $ 23,598,465 $ 23,405,201 $25,375,312 $23,340,785 Return on Average Assets (ROA) 0.98% 0.98% 1.34% 1.56% 1.54% 0.98% 1.48% PPNR ROA 2.01% 2.07% 2.24% 2.33% 2.28% 2.04% 2.15% Quarter to Date Year to Date 29 Reconciliation of GAAP to Non - GAAP Measures (dollars in thousands) 2Q23 1Q23 4Q22 3Q22 2Q22 1Q22 4Q21 3Q21 2Q21 1Q21 4Q20 Total shareholders' equity 3,284,630$ 3,253,195$ 3,197,400$ 3,119,070$ 3,073,376$ 3,007,159$ 2,966,451$ 2,900,770$ 2,837,004$ 2,757,596$ 2,647,088$ Less: Goodwill 1,015,646 1,015,646 1,015,646 1,023,071 1,023,056 1,022,345 1,012,620 928,005 928,005 928,005 928,005 Other intangibles, net 96,800 101,488 106,194 110,903 115,613 120,757 125,938 60,396 63,783 67,848 71,974 Total tangible shareholders' equity 2,172,184$ 2,136,061$ 2,075,560$ 1,985,096$ 1,934,707$ 1,864,057$ 1,827,893$ 1,912,369$ 1,845,216$ 1,761,743$ 1,647,109$ Period end number of shares 69,139,783 69,373,863 69,369,050 69,352,709 69,360,461 69,439,084 69,609,228 69,635,435 69,767,209 69,713,426 69,541,481 Book value per share (period end) 47.51$ 46.89$ 46.09$ 44.97$ 44.31$ 43.31$ 42.62$ 41.66$ 40.66$ 39.56$ 38.06$ Tangible book value per share (period end) 31.42$ 30.79$ 29.92$ 28.62$ 27.89$ 26.84$ 26.26$ 27.46$ 26.45$ 25.27$ 23.69$ 3Q20 2Q20 1Q20 4Q19 3Q19 2Q19 1Q19 4Q18 3Q18 2Q18 Total shareholders' equity 2,564,683$ 2,460,130$ 2,437,150$ 2,469,582$ 2,420,723$ 1,537,121$ 1,495,584$ 1,456,347$ 1,404,977$ 1,371,896$ Less: Goodwill 928,005 928,005 931,947 931,637 911,488 501,140 501,308 503,434 505,604 504,764 Other intangibles, net 76,164 80,354 85,955 91,586 97,328 52,437 55,557 58,689 54,729 53,561 Total tangible shareholders' equity 1,560,514$ 1,451,771$ 1,419,248$ 1,446,359$ 1,411,907$ 983,544$ 938,719$ 894,224$ 844,644$ 813,571$ Period end number of shares 69,490,546 69,461,968 69,441,274 69,503,833 69,593,833 47,261,584 47,585,309 47,499,941 47,496,966 47,518,662 Book value per share (period end) 36.91$ 35.42$ 35.10$ 35.53$ 34.78$ 32.52$ 31.43$ 30.66$ 29.58$ 28.87$ Tangible book value per share (period end) 22.46$ 20.90$ 20.44$ 20.81$ 20.29$ 20.81$ 19.73$ 18.83$ 17.78$ 17.12$ As of As of